Open Mims Manual
MimsManual
User Manual: Pdf
Open the PDF directly: View PDF ![]() .
.
Page Count: 28
OpenMIMS ImageJ Plugin Guide
Collin Poczatek, Zeke Kaufman, Claude Lechene, and Walter Taylor
(National Resource for Imaging Mass Spectrometry)
June 5, 2017
Introduction and Installation
OpenMIMS is an ImageJ plugin to open, process and analyze images captured with NanoSIMS 50 & 50L secondary
ion mass spectrometers (Cameca). The plugin has been developed at the Center for NanoImaging (formerly the Na-
tional Resource for Imaging Mass Spectrometry) (CNI, http://nano.bwh.harvard.edu/), an NIH-supported National
Resource developing Multi-isotope Imaging Mass Spectrometry (MIMS) for biomedical research. Images and/or
stacks of images for up to 7 different isotopes can be opened, analyzed and saved. All metadata saved in the original
file are preserved. Image ratios and Hue-Saturation-Intensity (HSI) maps of any combination of isotopes can be
displayed and data from any number of Regions of Interest (ROIs) extracted, analyzed and tabulated for single
images or entire stacks.
Installation steps:
1. OpenMIMS requires Java 1.8 or later to be present on your computer. If you do not already have Java 1.8
installed, you can download it at http://www.oracle.com/technetwork/java/javase/downloads/index-jsp-138363.html
2. Download and install Fiji (aka ImageJ), which you can get at https://imagej.net/Fiji/Downloads
3. Run Fiji, then go to the ”Help” menu and select the ”Update Fiji” option. This will do an online check for
any possible updates to Fiji dependencies. If any such dependencies appear in the displayed it, click on the ”Apply
changes” button at the bottom of the window to download and apply those updates. Do not close the ImageJ
Updater yet.
4. Click on the ”Manage update sites” button at the bottom of the ImageJ updater window. A window that
shows a list of the Fiji update sites should appear. Scroll to the bottom of the list. If you see an entry for
OpenMIMS, you can close this window and move to the next step. If not, you need to add that row to the table:
Click on the ”Add update site” button. In the Name column, enter ”OpenMIMS”. In the URL column, enter
http://nrims.partners.org/OpenMIMS-Fiji/ Make sure the checkbox on the left side of this entry is checked, then
close the window. Adding this line ensures that, upon startup, Fiji will always download the newest version of
OpenMIMS from our update site at Partners whenever a new version is posted to the update site by the OpenMIMS
developers. If you do not want these updates to occur, uncheck the checkbox in the table.
5. Quit and restart Fiji. Again, go the ”Help”, menu and select the ”Update Fiji” option. It should download the
most recent copy of OpenMIMS from the Partners update site. Once again, quit and restart Fiji and the most recent
OpenMIMS plugin should be available on the ”Plugins” menu of Fiji. After you launch the OpenMIMS plugin, you
can determines the version by going to the ”Help” menu and selecting ”About Open MIMS”.
Opening MIMS images
After launching ImageJ (Fiji), place the mouse over the “Plugins” menu option and select the “Open MIMS Image”
option. This action will open the OpenMIMS graphical user interface. You then open an image by clicking “File >
Open MIMS Image” and navigate to the desired MIMS image file (files with a .im,.nrrd extension). Files can also
1
https://imagej.net/Fiji/Downloads
be opened by dragging and dropping the file from a file browser onto the main OpenMIMS window. Only .nrrd files
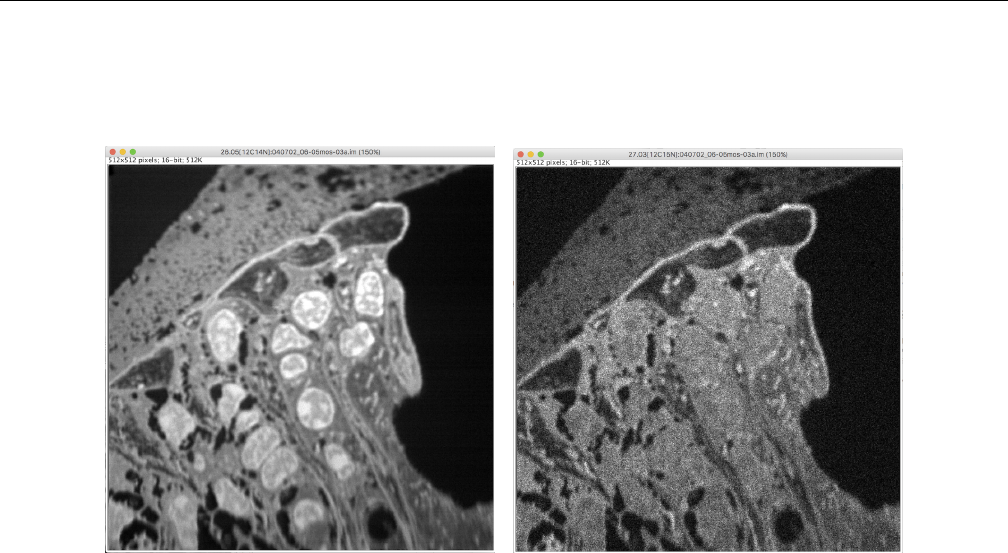
generated by the OpenMIMS plugin are guaranteed to be readable by the plugin. After the MIMS image is opened,
each mass will appear in a separate window (example below) and the OpenMIMS interface will be updated.
(a) mass 26.05, 12C14 N (b) mass 27.03, 12C15 N
Figure 1: Two different mass images of the same field of view.
2017 National Resource for Imaging Mass Spectrometry 2
https://imagej.net/Fiji/Downloads
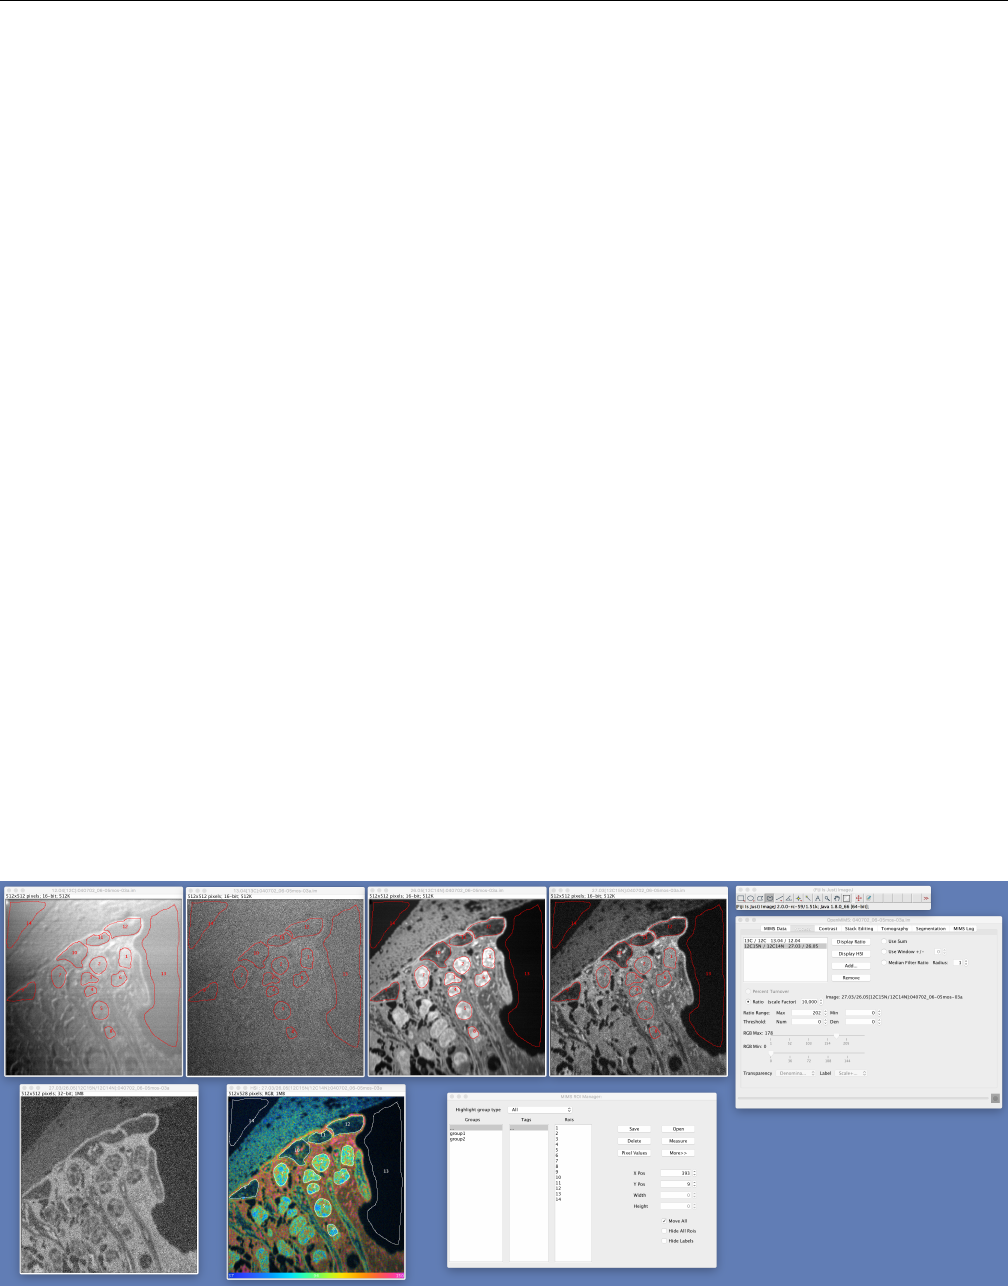
Graphical Interface
The NRIMS Analysis Module window contains 7 tabs:
•MIMS Data: Displays metadata and other information for the current file.
•Process: Used to generate ratio images and HSI maps.
•Contrast: Controls the contrast and brightness settings for mass, ratio and sum images.
•Stack Editing: Used for manipulating the mass images (applying x and y translations, dropping planes, etc).
•Tomography: Basic plotting of statistics for whole images or ROIs.
•Segmentation: Perform an algorithmic segmentation of an image.
•MIMS Log: Displays more header metadata and a record of the user’s actions and debug output.
Figure 2: A desktop screenshot of the OpenMIMS application.
2017 National Resource for Imaging Mass Spectrometry 3
https://imagej.net/Fiji/Downloads
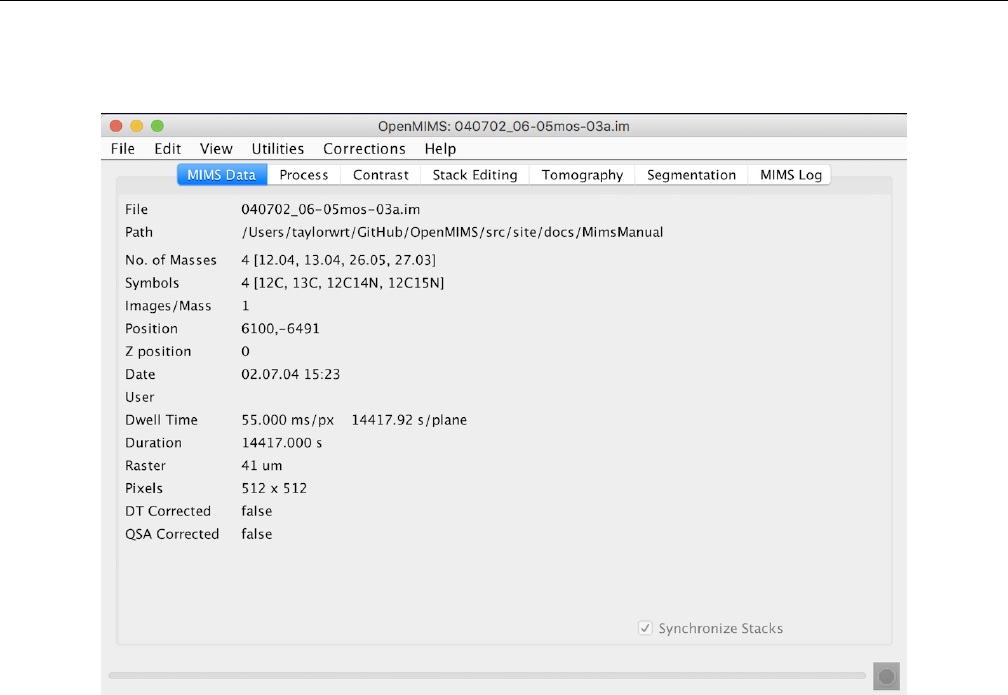
MIMS Data:
Figure 3: The MIMS Data tab displays file information and meta data.
The MIMS Data tab displays a subset of the image’s meta-data including the absolute path of the current image,
the number of masses and their AMU values, number of planes in the stack, position, date of image, user name,
dwell time, duration, raster size and image size. The Synchronize Stacks check box enables updating of all masses
simultaneously while scrolling through an image stack. Adjusting the slider (plane selector) at the bottom of any
mass automatically selects the same plane for all masses.
2017 National Resource for Imaging Mass Spectrometry 4
https://imagej.net/Fiji/Downloads
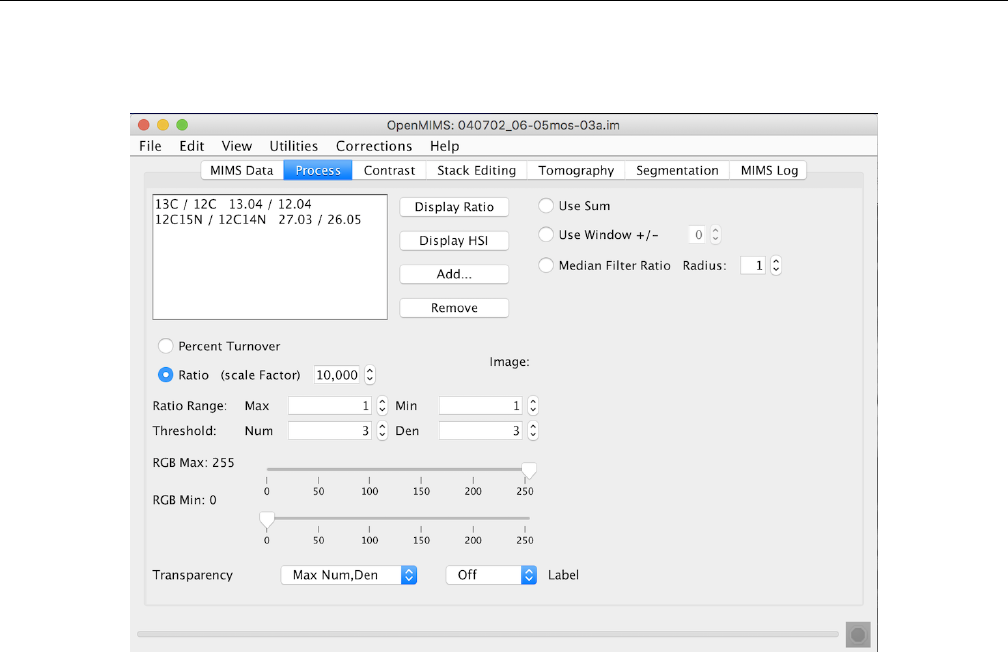
Process:
Figure 4: The Process tab is used to generate ratio and HSI images.
The Process tab allows the user to generate ratio images and HSI maps. Ratio and HSI images are the result
of dividing one mass image by another. Masses that have similar values will automatically show up in list form in
the Process tab. Others that do not show up by default can be entered manually using the Add... button. A
ratio image will appear when the user selects one (or more) in the list and clicks Display Ratio. When moving the
mouse pointer over the ratio image, the status box along the lower border of the NRIMS Analysis Module window
displays the raw numerator and denominator counts as well as the ratio value.
HSI images are similar to ratio images but differ in that they use a combination of the the ratio value of a pixel,
the counts of one of the masses for the intensity, and a constant saturation value, to generate pixels in the RGB
color space. Clicking the Display HSI button will make the selected HSI image(s) appear. An example HSI image
is provided in APPENDIX A. When displaying HSI images, the user has the option of displaying the actual ratio
values (multiplied by the Ratio Scale Factor) or displaying percent turnover by selecting the Percent Turnover
radio button. Percent turnover is determined by the naturally occurring ratio of that specific isotopic pair along
with the maximum achievable ratio based on the experimental protocol.
The Threshold option sets the minimum number of counts in the numerator and/or denominator. Any pixels
below that threshold will be ignored and appear black. The Ratio Range Min and Max values determine the
range of the colormap used to display the image. The RGB Min and RGB Max values determine the intensity
scale used in the image. The Transparency selects the method for computing the intensity component of the HSI
image, and the Label option enables a color scale bar to be become visible. Selecting the Use Sum radio button will
generate a single HSI (or ratio) image representative of the entire stack. Selecting the Use Window radio button
will use the sum of both masses over a sliding window with the specified window size. This can be very useful for
finding small features in large image stacks that have low counts. Also, a median filter can be applied to a ratio or
HSI image by selecting the Median Filter Ratio radio button.
2017 National Resource for Imaging Mass Spectrometry 5
https://imagej.net/Fiji/Downloads
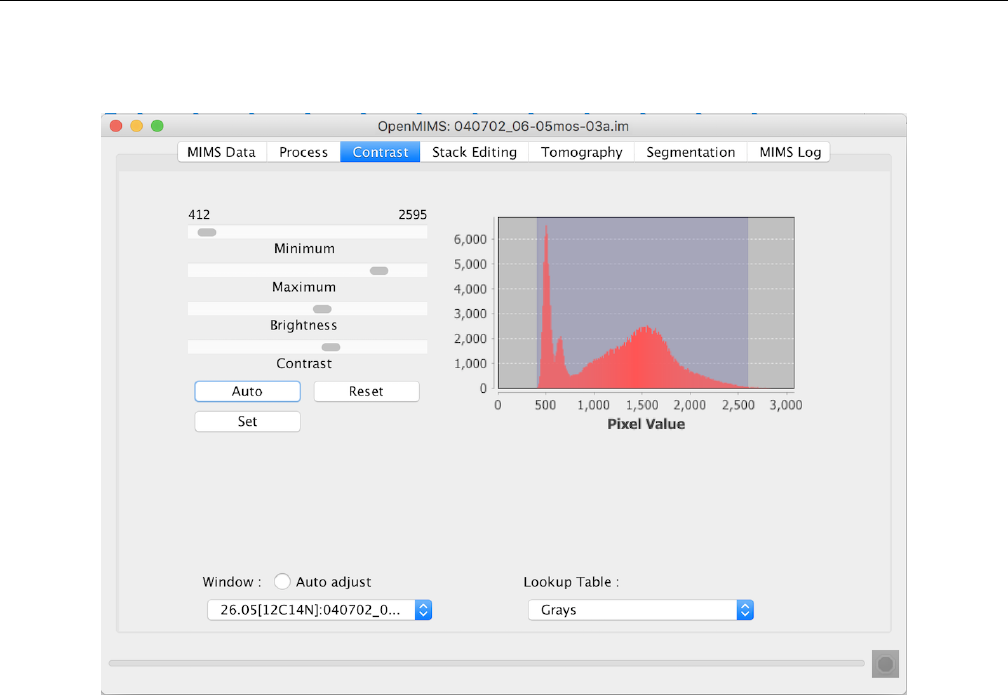
Contrast:
Figure 5: The Contrast tab controls and displays contrast settings for mass, ratio and sum images.
The Contrast tab allows the user to control the contrast settings, by adjusting the sliders, for any given mass,
ratio or sum image (HSI images do not have contrast settings, instead their display parameters are controlled using
the Process tab). It also displays a histogram of intensity values for any of these types of images. Clicking on an
image brings it into focus and the histogram and contrast settings will update to reflect the values of the current
image in focus. The histogram and contrast settings will also update by selecting the window in the combobox
located at the bottom of the Contrast tab. All mass, ratio and sum images should appear in the combobox.
If changes to the default contrast settings are made, clicking the Reset button will bring those settings back
to their default values. Clicking Auto will iterate through a set (usually 5 or 6) of contrast settings, eventually
returning back to default values. The Set button allows the user to input values for min and max that are outside
the range of those provided by the Minimum and Maximum sliders.
Mass, ratio and sum images can also be set to Auto Adjust meaning that each time a new slice is selected in
the stack, new contrast settings are calculated. If Auto Adjust is not selected, the contrast settings for the first
image in the stack are used throughout the stack.
The user has the additional capability of displaying the image using Lookup Tables other than the gray table
used by default. There are several options for displaying the data and each image can be set independently.
2017 National Resource for Imaging Mass Spectrometry 6
https://imagej.net/Fiji/Downloads
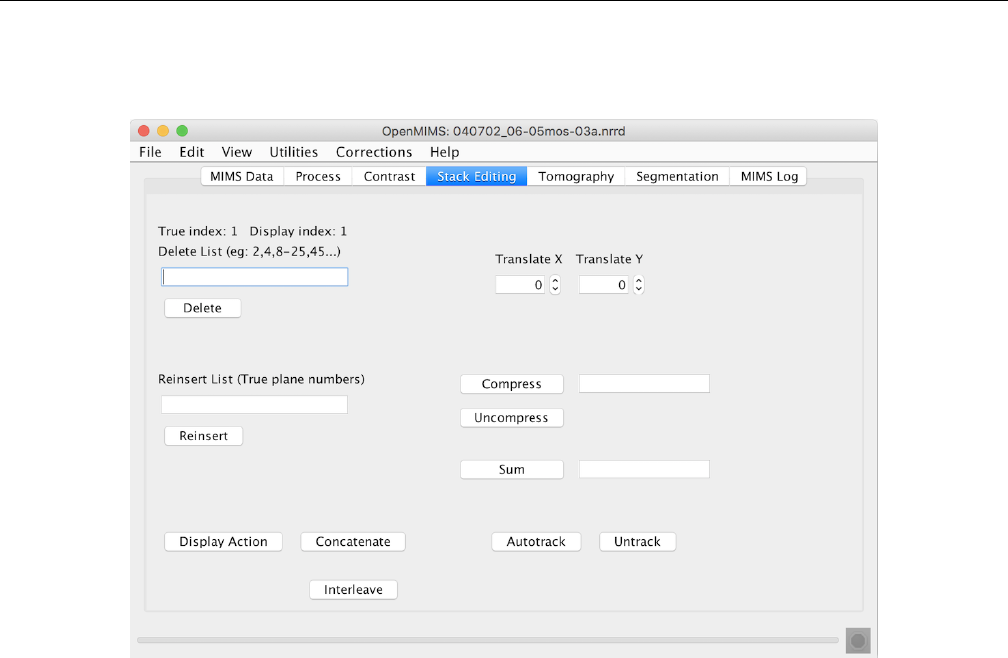
Stack Editing:
Figure 6: The Stack Editing tab is used for image manipulation.
The Stack Editing tab is reserved for functions that relate to the editing and manipulating of mass images. This
includes deleting and reinserting planes, applying translation, compressing the image and generating sum images.
One important thing to note is that there are two indices for an image, both of which are displayed: True index and
Display index. The True index of a plane in an image never changes, but the Display index depends on what planes
have been deleted. For example: entering 1-5 and clicking the Delete, then entering 6-10, and clicking Delete will
-not- delete the first 10 planes of an image. Doing that is equivalent to entering 1-5, 11-15 and clicking Delete. The
Reinsert button uses the indices of the original data, so entering entering 1-5, 11-15 would reinsert the previously
deleted planes.
A plane that is currently displayed can be translated using the Translate X or Translate Y spinners, or by
entering a value those text fields. The image can also be registered automatically by clicking on a specific mass to use
and then clicking the Autotrack button. This will call the autotrack algorithm which will automatically attempt
to determine the best per image translations for a best fit alignment throughout the stack. Clicking Untrack will
reset all translations to zero.
The Concatenate button allows another image (or image stack) to be prepended or appended to the current
image set. The Sum button will generate a sum image from whichever mass image or ratio image was most recently
clicked. If the field is blank the entire image is summed, or a range of planes can be entered in the textfield (e.g.
1-20). The Compress button compresses the images into blocks of the size entered in the text field. Entering a value
of 4 in the field will sum the pixel values in blocks of 4 planes, resulting in a stack of images 1/4 the original size. Any
remaining planes at the end of the stack are summed together into a single block. The Uncompress button undoes
the compression and restores the image to its original state - minus any translations applied and planes deleted.
The Interleave button is used to create separate images for masses that are peak-switched from one image
acquisition (or series) to the next. In this type of scenario, there are multiple acquisitions, which result in more
than one image per mass, and one or more of the mass detectors are tuned to slightly different mass values during
successive acquisitions. Analysis of files produced in this fashion can often be facilitated if all planes from masses
2017 National Resource for Imaging Mass Spectrometry 7
https://imagej.net/Fiji/Downloads
that do NOT change get combined into single images, while peak-switched masses get separated into unique mass
images, with the same number of planes as non-switched images being enforced by padding with blank planes.
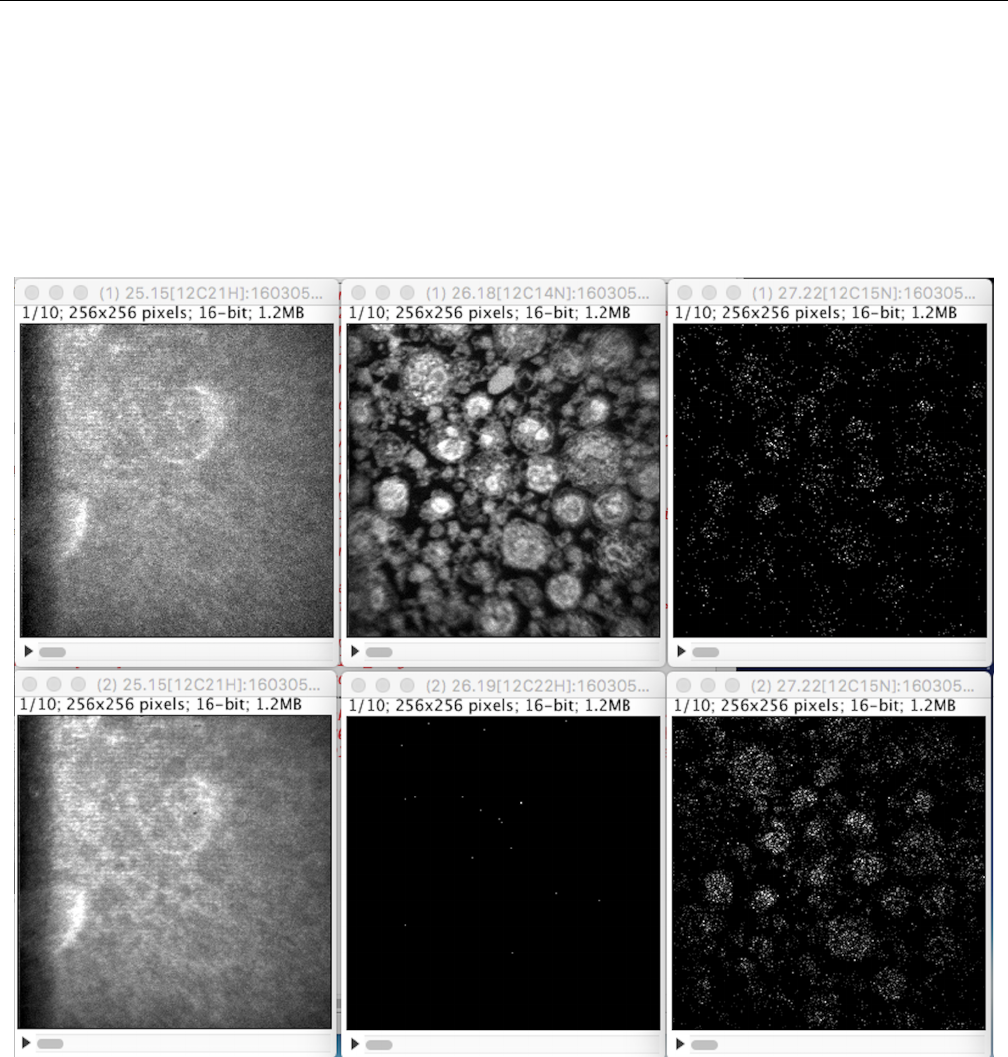
An example of interleaving is shown in Figures 7 and 8. In this experiment, two series of images were collected,
with 10 planes per image. In the first (Figure 7), masses 25.15, 26.18, 27.22, 31.28, and 32.12 were acquired. After
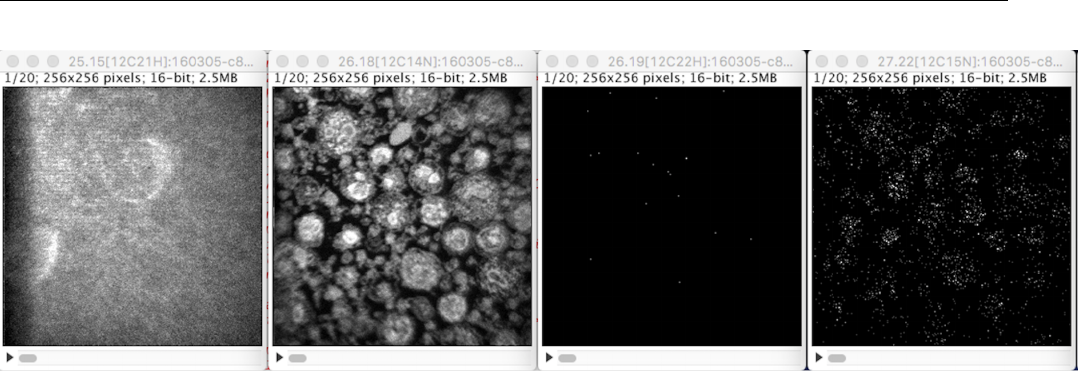
the first series acquisition, the second detector was tuned from mass 26.18 to mass 26.19. With interleaving, all
planes for each mass are combined into a single series with 20 planes per image. Separate images are created for
mass 26.18 and 26.19, and in order to have 20 images for those peak-switched masses, alternating blank planes were
inserted. (Figure 8).
Figure 7: images from 2 series with peak switching of mass 26.18 to mass 26.19. (Masses 31.28 and 32.12 not shown)
2017 National Resource for Imaging Mass Spectrometry 8
https://imagej.net/Fiji/Downloads
Figure 8: Images after interleaving. (Masses 31.28 and 32.12 again not shown)
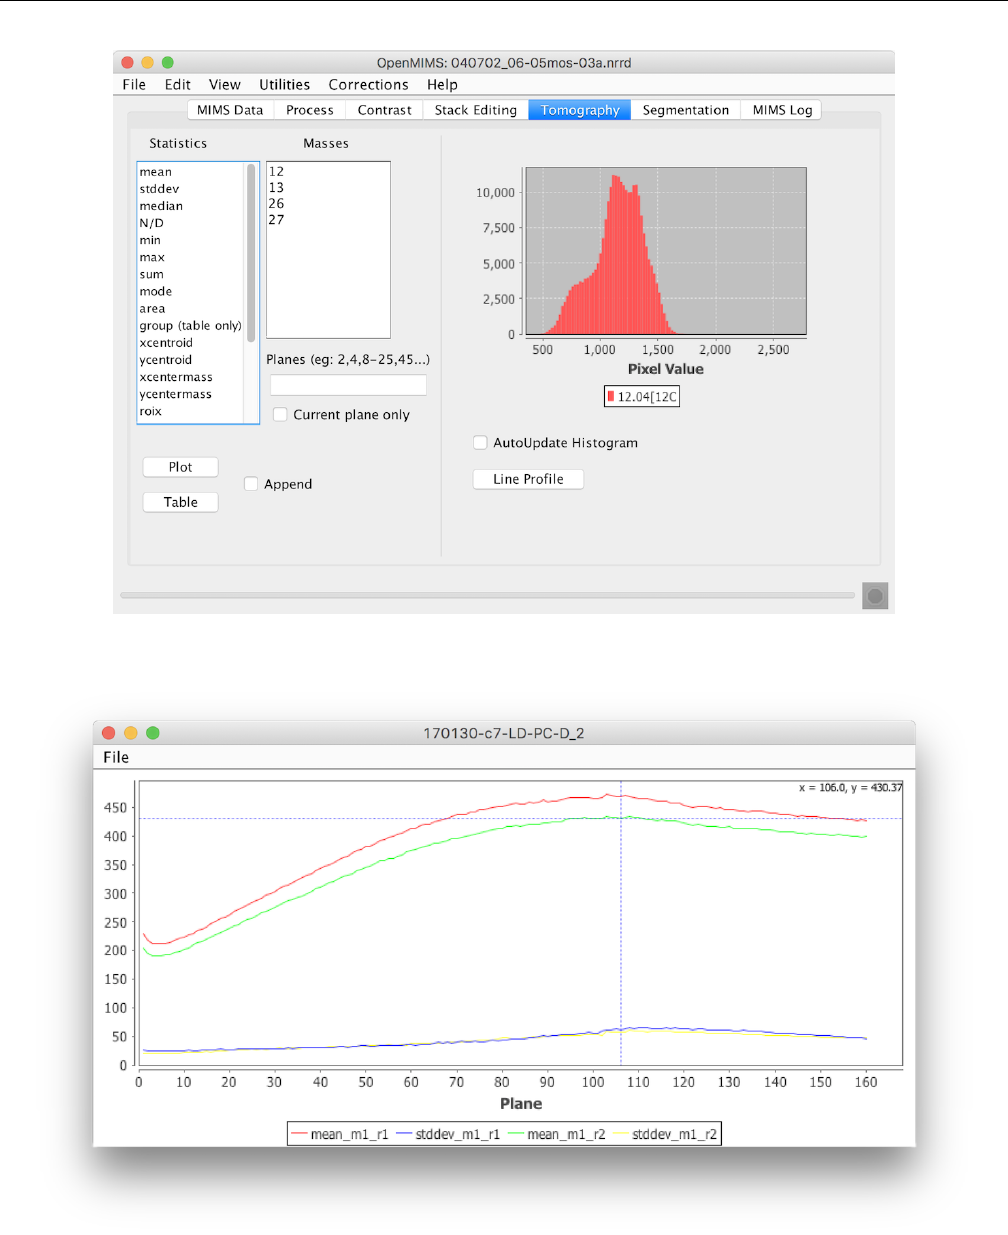
Tomography:
The Tomography tab allows the user to generate simple line plots or tables of ROI statistics through the stack
(Figure 9). Simply select a set of ROIs from the ROI Manager, the desired statistics, and the mass, ratio and/or
sum images and click Plot or Table. The Planes field allows the user to enter which planes are included in the plot
(or table). If this field is left blank, all planes will be included. Checking the Append box will append the data to
an existing plot or table if one exists, otherwise a new one will be created. An example of the type of plot produced
can be seen in Figure 10.
The table output will vary depending on the type of images for which statistics are being generating. Mass and
ratio images that are more than one plane will output one row of data per plane. In the case of sum images and
other images that are only one plane, one row of data will be produced per ROI. See APPENDIX B for a sample
data output table.
The right side of the tab includes a histogram that displays the intensity values for the pixels within a given ROI.
To set which ROI values are displayed by the histogram, the user only needs to scroll the mouse over the desired
ROI. After a ROI has been drawn, it can be moved anywhere within the image by either dragging it with the mouse,
or using the position spinners in the ROI Manager. If the Autoupdate Histogram radio button is selected, the
histogram will update as the ROI is being moved by the mouse. Otherwise, it updates when the move is complete.
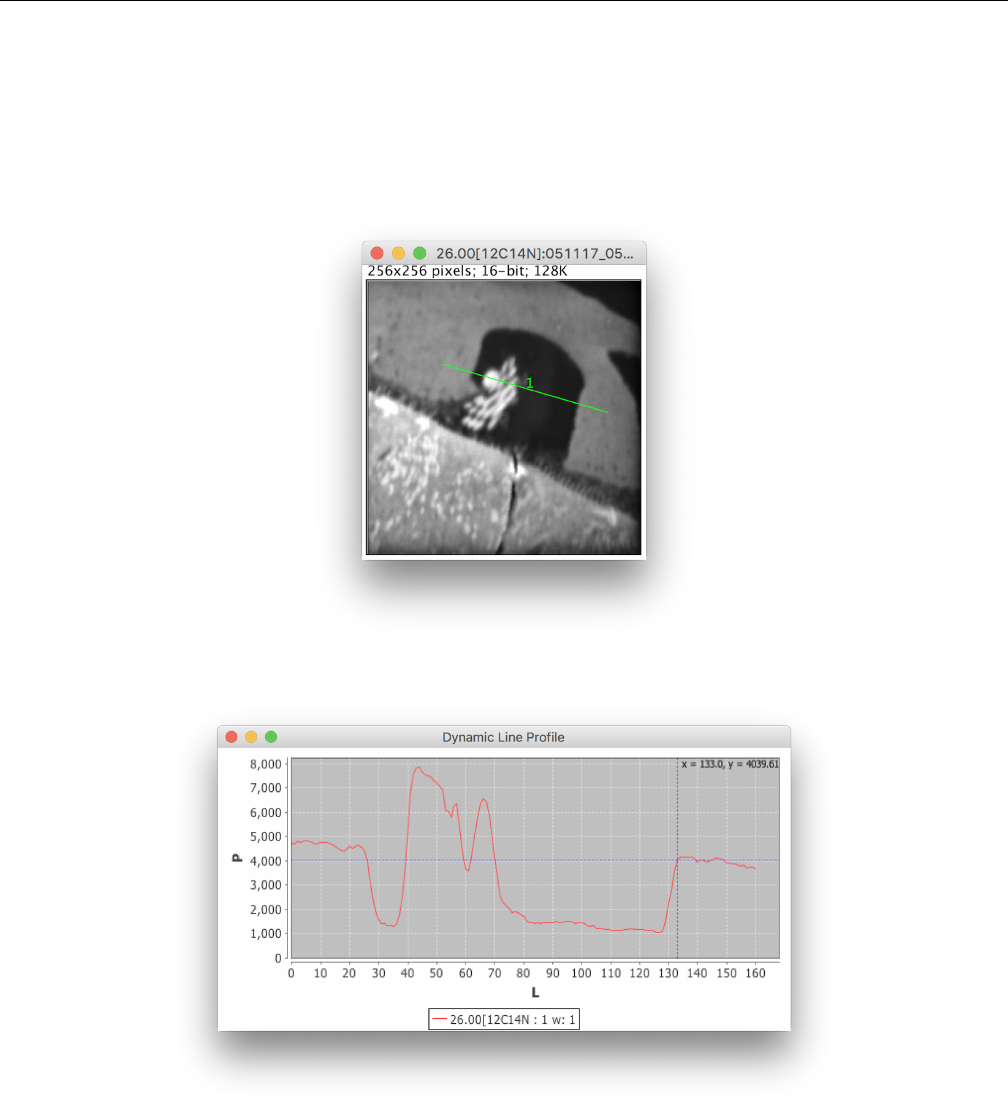
A line ROI represents a special case because it has no enclosed area, so its values will not be represented in the
histogram. Instead, the user can select the Dynamic Profile button to generate a profile plot of the pixels which
the line intersects. An example of a mass image with a line ROI and its profile plot is provided below.
2017 National Resource for Imaging Mass Spectrometry 9
https://imagej.net/Fiji/Downloads
Figure 9: The Tomography tab is used to generate plots and tables of ROI statistics.
Figure 10: An example plot of the mean and stdev statistics for two different masses.
2017 National Resource for Imaging Mass Spectrometry 10
https://imagej.net/Fiji/Downloads
(a)
(b)
Figure 11: A mass image with a line ROI (a) and its corresponding Profile Plot (b).
2017 National Resource for Imaging Mass Spectrometry 11

https://imagej.net/Fiji/Downloads
ROI Manager:
Creating Regions of Interest (ROIs)
The ROI Manager (see Figure 12) gives the user functionality relating the ROIs in a given image. It is comprised of
three lists, one labeled Groups, one labeled Tags, and one labeled ROIs, as well as a panel on the right hand side
containing buttons, spinners and checkboxes.
To create a ROI, first select the type of ROI to draw by clicking one of the corresponding toolbar buttons in
ImageJ’s main window (any of the five buttons on the left, i.e Rectangle, Circular, Polygon.. etc, see the top right
window in Figure 2). Then place the mouse over the area and drag the mouse while holding the left mouse button
down. When the left mouse button is released, the corresponding ROI will appear in all image windows as well as in
the list of ROIs in the ROI manager. Clicking on a previously drawn ROI in ROI Manager list will automatically
highlight the selected ROI in all mass, ratio, sum and HSI images.
The Groups list allows the user to organize ROIs into groups. The user can create new groups, delete existing
ones, and assign ROIs into groups. An ROI can only belong to a single groupf or tag. Clicking on a group or tag
will reduce the Rois list to only those ROIs belonging to that group or tag. Clicking on the ellipses group (...) will
always show all ROIs.
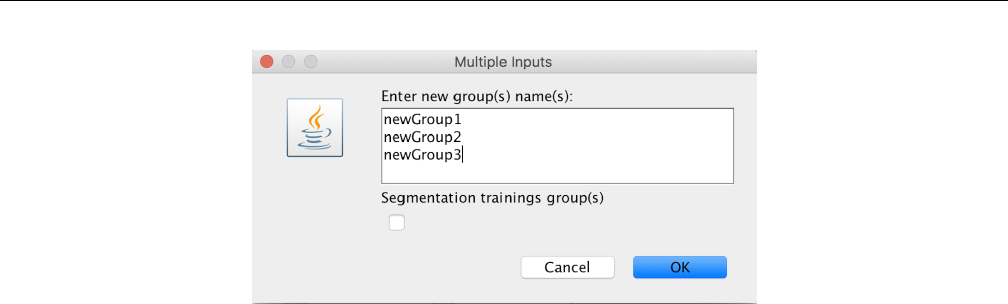
To create a new group, right click anywhere in the Groups list and select New group from the resulting popup
menu. In the subsequent dialog (Figure 13), one can create one or more new groups, and designate the groups as
segmentation training groups, if the groups will be used in segmentation.
When an ROI is created, it is placed in the currently-highlighted group. If more than one group is highlighted,
the new ROI is placed in the default group.
There are 3 types of groups. Normal,Segmentation Training, and Segmentation Result. The Highlight
group type combobox at the top of the ROI manager window can be used to highlight groups of a specific type.
You can right-click on on selected ROIs and assign or deassign them to different groups and/or tags.
When any changes are made in the ROI Manager, such as creation of new ROIs, groups, or tags, as well
as deletion of any of these items, ROI autosave is activated. After a time interval that you can change in the
Preferences dialog, OpenMIMS saves the current ROIs in a hidden subdirectory (.tmp) of the directory from which
the .im or .nrrd files was opened. For any given .im or .nrrd file, only the last 10 ROI files are kept. At the bottom
of the ROI Manager window, the remaining time before the next autosave is displayed if any edits have been done.
Right-clicking on this timer text brings up a dialog from which you can cancel the autosave countdown. When an
autosave event occurs, the time at which the autosave occurred is displayed. You can also force an autosave event
by right-clicking on the Last ROI autosave text, and this can be done even before the first display of the autosave
time. Autosave can be effectively disabled by setting the time interval in the Preferences to a large number, such
as 999,999. Changes to this time interval do not take effect until the next launch of OpenMIMS.
Delete will delete the selected ROIs in the ROI list. If none are selected then it will delete them all, after
prompting the user. Rename allows the user to rename the ROI from its default name. Open will open an ROI
file that had been saved from a previous session and overwrites the current list. Save will save a single ROI to a file
or a group of them to a .zip file. Measure will open a statistics box that will display statistics for all ROIs for the
current image. Deselect will deselect any ROIs that have been highlighted. The More>> button offers the user
some more complicated features relating to the combining and splitting of ROIs. ROIs can be moved on a pixel by
pixel basis using the X Pos. and Y Pos. spinners. ROIs can also be moved by the user by dragging them across
the image with the mouse cursor. Adjusting the Width and Height spinners will adjust those values but only for
rectangular and circular ROIs.
If the user moves an ROI, it will move for all images in the stack unless the Move All checkbox is unchecked, in
which it will only be moved for the current plane. The user can choose to hide all ROIs by checking the Hide All
Rois checkbox or just hide the labels by checking the Hide Labels checkbox.
2017 National Resource for Imaging Mass Spectrometry 12

https://imagej.net/Fiji/Downloads
(a) Mass image with ROIs, 12C14N
(b) The ROI Manager
Figure 12: A mass image with several ROIs (a) and the corresponding ROI Manager (b).
2017 National Resource for Imaging Mass Spectrometry 13
https://imagej.net/Fiji/Downloads
Figure 13: The new ROI groups dialog.
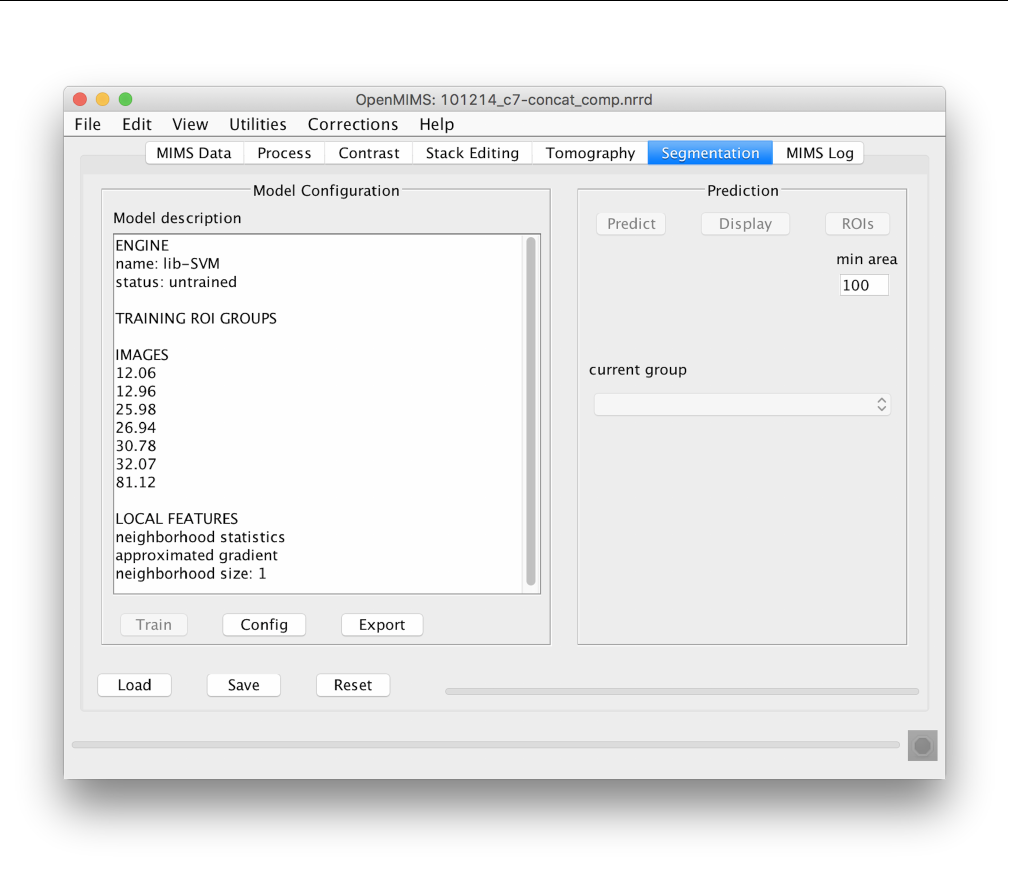
Segmentation:
The Segmentation tab allows the user to perform an algorithmic segmentation of a MIMS image to automatically
generate ROIs for a given image plane. The algorithm used is a support vector machine (SVM) based segmentation
that classifies pixels in the image using methods similar to Fuller et. al. [1]. A full description of SVM is outside
the scope of this document, but is described in more detail by Gormanns et. al. [2]. The algorithm can use many
values or features to classify a pixel: the value of that pixel in a set of mass or ratio images, the mean and standard
deviation in a neighborhood around that pixel, and the gradient around that pixel. Note that the ability to use other
features may be added later. To perform a segmentation the user clicks on the Config button and is presented with
a window as shown in Figure 15. The Export button will export the SVM and data if the SVM has been trained
using the libSVM format.
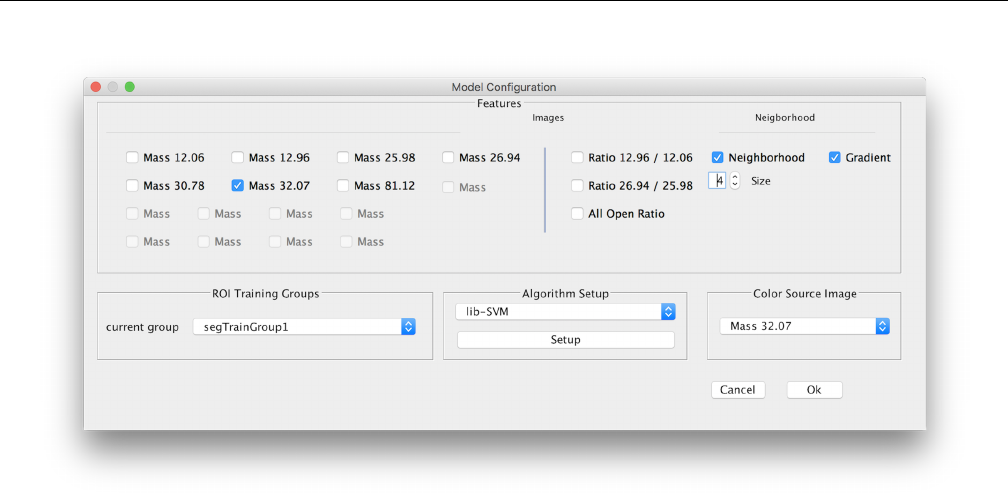
In the Model Configuration dialog (Figure 15), the user may select which mass and ratio images to use for
the segmentation (segmentation can not be performed on Sum images). One can choose whether or not to use the
Neighborhood parameters (mean and standard deviation) and the Gradient as features, as well as the size of the
neighborhood radius. Some parameters used by the SVM library (in our case libSVM [3]) by clicking the Setup
button, specifically the type of kernel to use and the level of cross validation. We recommend using the radial basis
function (RBF ) as the kernel. The level of cross validation may be reduced to increase speed at the possible cost of
accuracy.
To train the SVM the user needs to choose at least several ROIs that represent a given class of pixels. First a
class is added to the Class Manager by clicking the Add button. Then the representative ROIs are drawn. Then
the Sync button is clicked to sync the ROIs in the ROI Manger to the class in the Class Manager. Finally the
users clicks the Ok button to complete the SVM configuration.
2017 National Resource for Imaging Mass Spectrometry 14
https://imagej.net/Fiji/Downloads
Figure 14: The Segementation tab.
The SVM must be trained by clicking the Train button, located below Model description in Figure 14. It
should be noted that the SVM can be saved either before training (saving all parameter settings and training ROIs)
or after training (also saving the trained SVM). The segmentation of the entire image can be performed by clicking
Predict and the result of this prediction can be shown by clicking Display. Currently the SVM only segments 2D
images. Generating ROIs from the prediction can be done by clicking ROIs which will generate a set of ROIs for
each class ignoring groups of pixels of the same class that are below the value in the min area field. An example of
a segmentation can be seen in APPENDIX C.
2017 National Resource for Imaging Mass Spectrometry 15
https://imagej.net/Fiji/Downloads
Figure 15: SVM configuration GUI.
Registration:
The Registration script allows the user to employ the ImageJ plugin TurboReg to align the open images with
an image taken from an external source, for example, an electron microscope image of the same sample that
was used for generating the MIMS images. Detailed information about the TurboReg plugin can be found here
http://bigwww.epfl.ch/thevenaz/turboreg/
Starting the OpenMIMS Image Registration script
IMPORTANT: It is strongly recommended that you compress your OpenMIMS images before use.
1) Open your target image in File-¿Open Non-MIMS Image:
2) Create two ROI groups in the OpenMIMS Roi Manager called ”source” and ”target”:
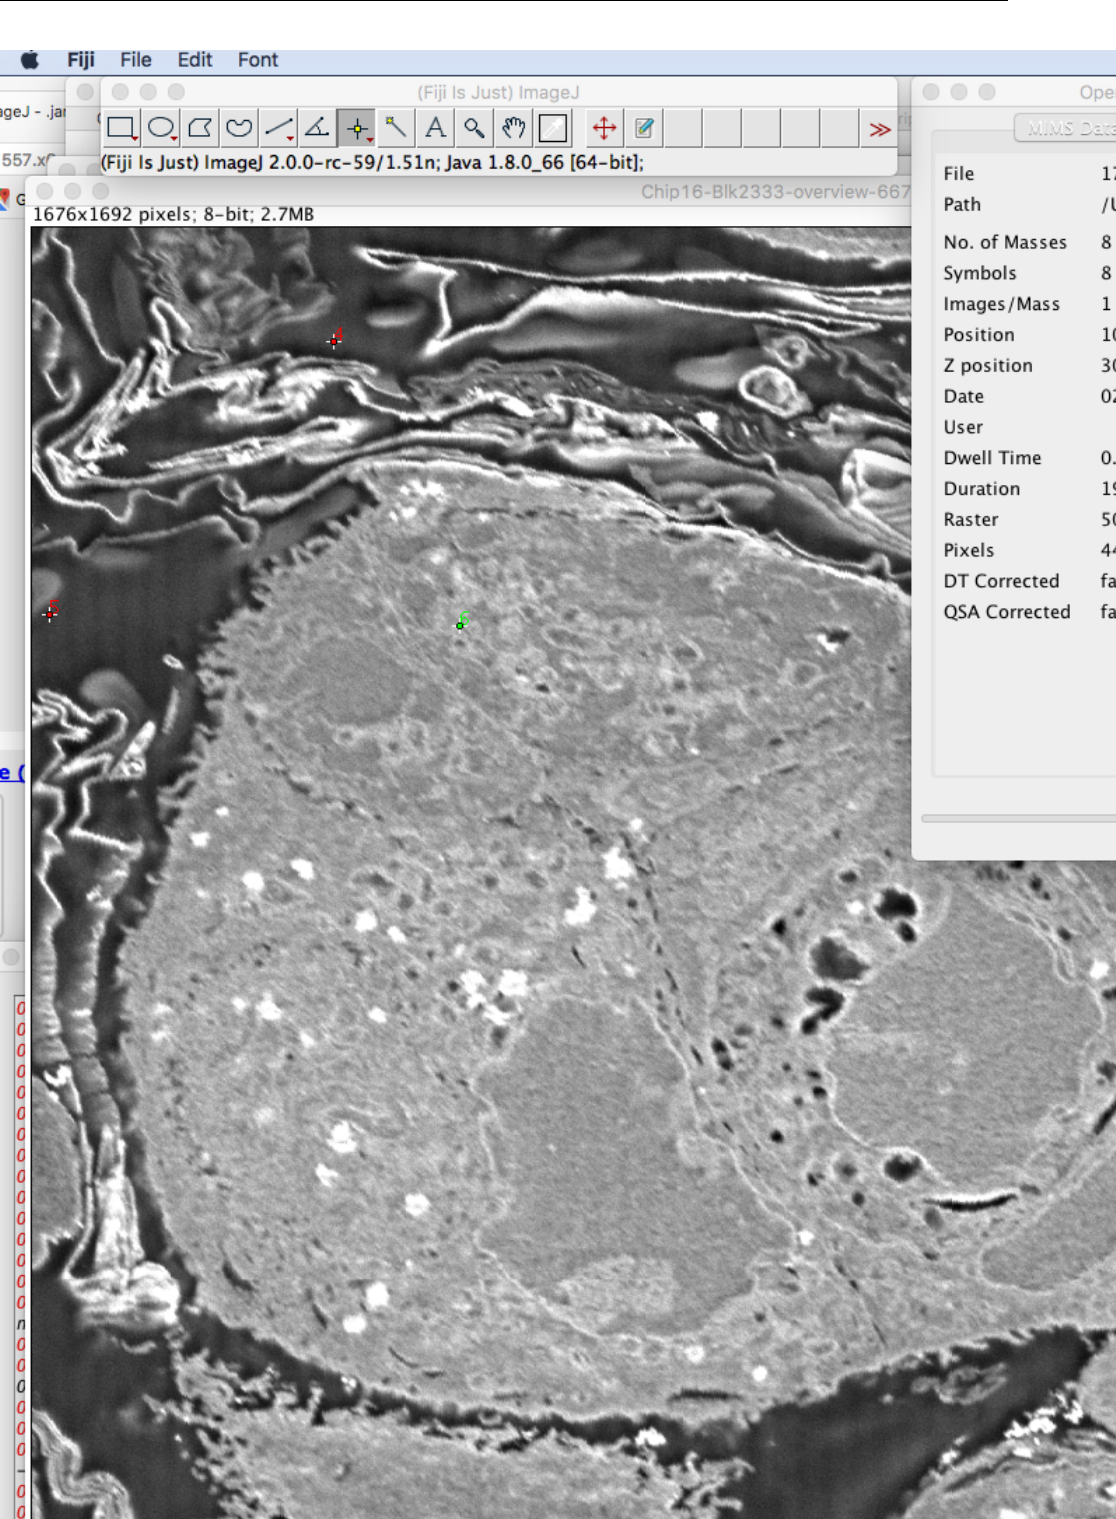
3) Select the point ROI tool (right next to the angle tool). Use this to create 3 rois on landmarks of your choice
on the non-OpenMIMS image.
4) Assign these three ROI’s to the ”target” group using the ROI Manager.
5) Create three ROI landmarks on your OpenMIMS images.
IMPORTANT: these ROI’s must be placed in the same order and desired location as the target ROI’s i.e. the
first target ROI you created will be registered to the first source ROI you create, and similarly for the second and
third.
6) Assign these three ROI’s to the ”source” group using the ROI Manager.
7) Run this script.
8) If you want to work on all the images simultaneously afterwords, use Analyze-¿Tools-¿Synchronize Windows.
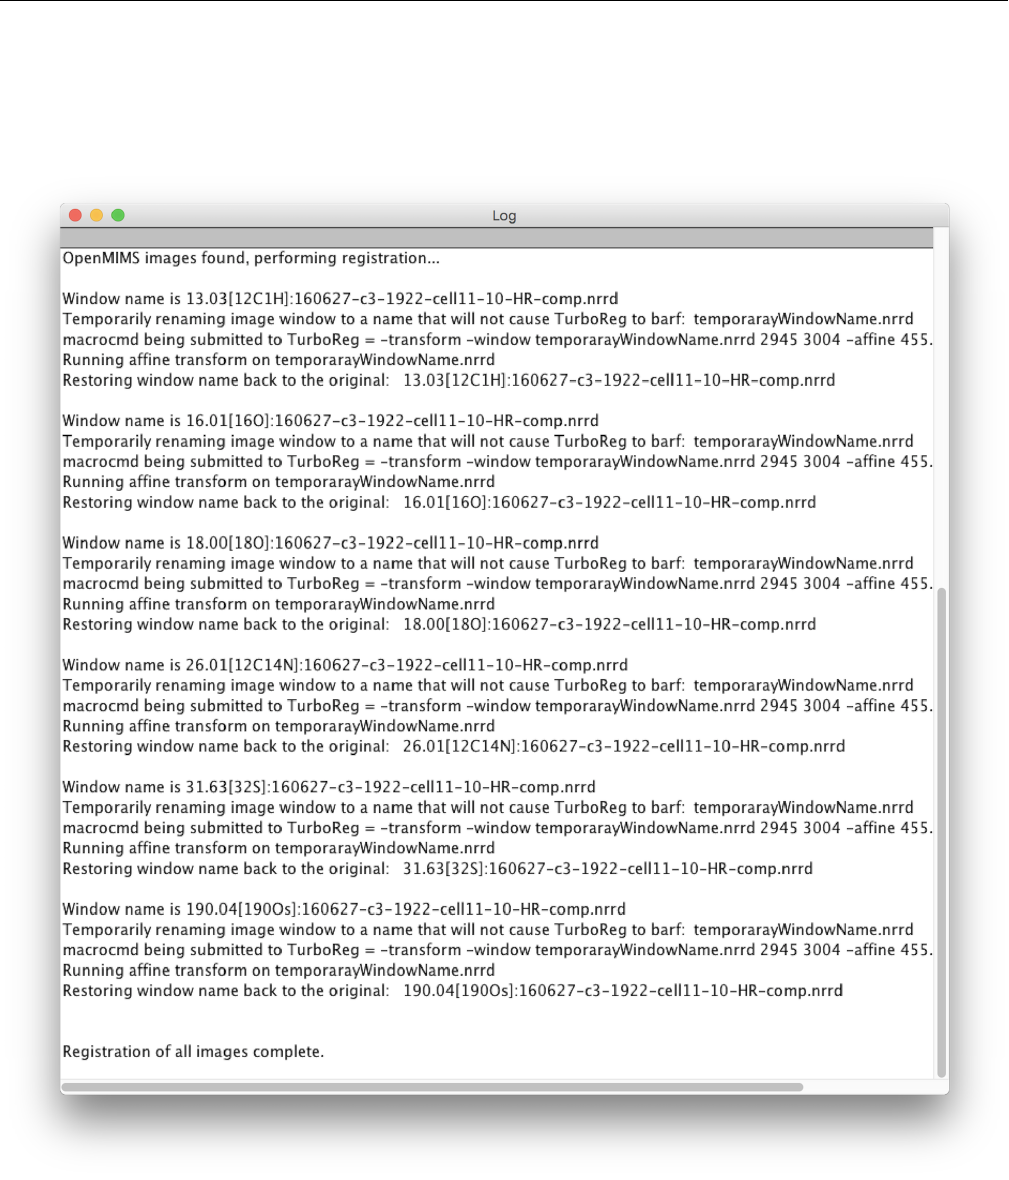
After registration is complete, you should see output in the Log window somewhat like that shown in Figure 17.
2017 National Resource for Imaging Mass Spectrometry 16

https://imagej.net/Fiji/Downloads
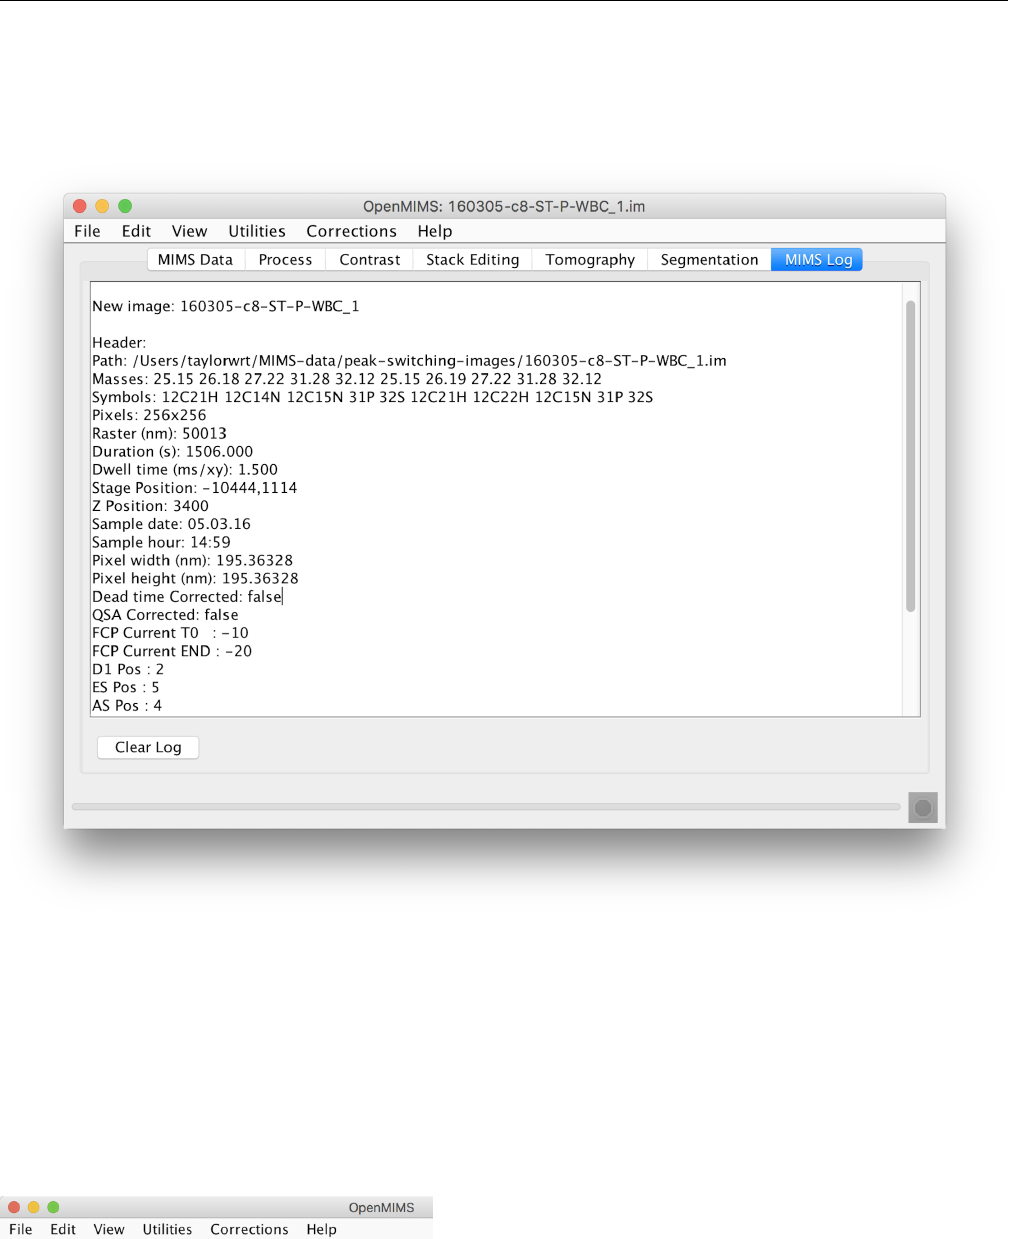
Mims Log:
The MIMS Log tab keeps a record of what the user has done: e.g. deleting planes, translating planes, autotracking,
etc. Various bits of debug data are also displayed on this tab. This information is not saved and is most likely of
little use to the most users.
2017 National Resource for Imaging Mass Spectrometry 17

https://imagej.net/Fiji/Downloads
Menu Items
This section provides a brief description of features provided in the menu items of the MIMS application
File
Open MIMS Image: This menu item will bring up a file chooser that allows the user to select which file
should be opened. The plugin can read .im files and .nrrd files [4] (It can only open the .nrrd files that
were generated by the plugin). Additionally it can open any .ratio,.hsi, and .sum file that was generated
by the plugin when saving from a previous session.
Open Non-MIMS Image: This menu item will bring up a file chooser that allows the user to open png,
tif, and jpg images. This is useful, for example, in the registration of .nrrd and .im images with electron
microscopy images.
Open Next: If a MIMS image file is already open, this menu item opens the next .im or .nrrd file in the same
directory where the original file is located.
Save Images: This menu item will save whatever modifications have been made to the original .im file (trans-
lations, dropped planes, etc.) into a new binary file with a .nrrd file extension. The OpenMIMS plugin is
capable of reading the both .im files and the .nrrd files that it generates.
Save Session: This menu item is similar to the Save Image menu item however in this case additional files
will be created for each ratio, hsi and sum image that is open at the time of saving. These files can be
opened individually at a later date so long as the .nrrd file that was created with them is stored in the
same directory.
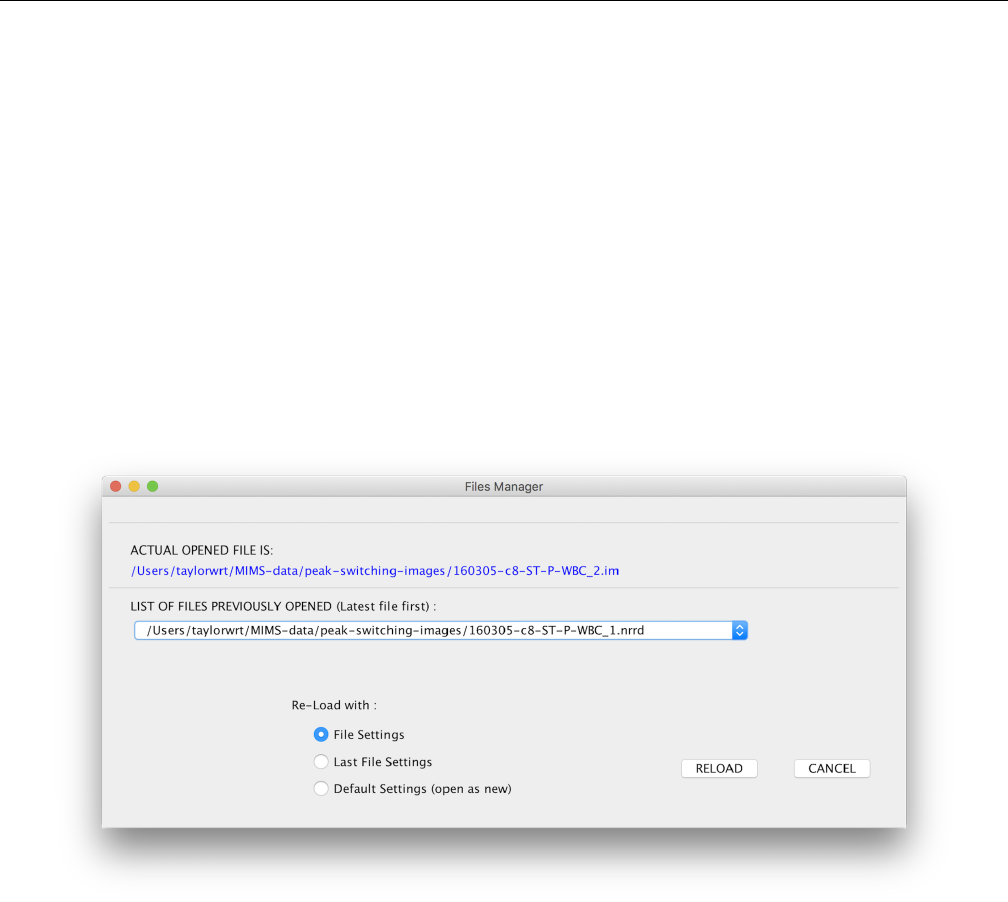
Files Manager: Display the Files Manager dialog, which shows the currently-open image file, a combobox
with a list of previously opened files, and radio buttons that allow the reloading of a previously opened
file with its file settings, the current file settings, or the default file settings. See Figure 19.
Exit: Exits the application. ImageJ stays open as well as all opened images.
Edit
Preferences: Opens a dialog box which allows the user to set customized preferences.
Restore Mims: This menu item will reset the current image to its original state, all translations will be set
back to zero and all dropped images will be reinserted. Functionally it is the same as reopening the current
image.
View
Tile Windows: This menu item will take all of the currently open *image* windows and rearrange them in
a grid on the desktop.
Close...>Close All Ratio Images: Closes all currently open ratio images.
Close...>Close All HSI Images: Closes all currently open HSI images.
Close...>Close All Sum Images: Closes all currently open sum images.
2017 National Resource for Imaging Mass Spectrometry 18

https://imagej.net/Fiji/Downloads
ROI Manager: This menu item open the ROI Manager. The ROI manager will also open whenever a ROI
is drawn.
Additional menu items are located here allowing the user to view or hide individual mass images.
Utilities
Generate Report: Opens a dialog box which captures the current image and has a text area that allows the
users to enter notes. When the user clicks OK a .rtf formated report is generated. Subsequent images
and notes can be appended to the report. This functionality is useful for recording important information
while analyzing images.
LibreOffice:
Sum All Open: Generates a sum image for all open mass and ratio images. It will not generate a sum image
for open HSI images. See the Process section to see how to generate sum images for HSI images.
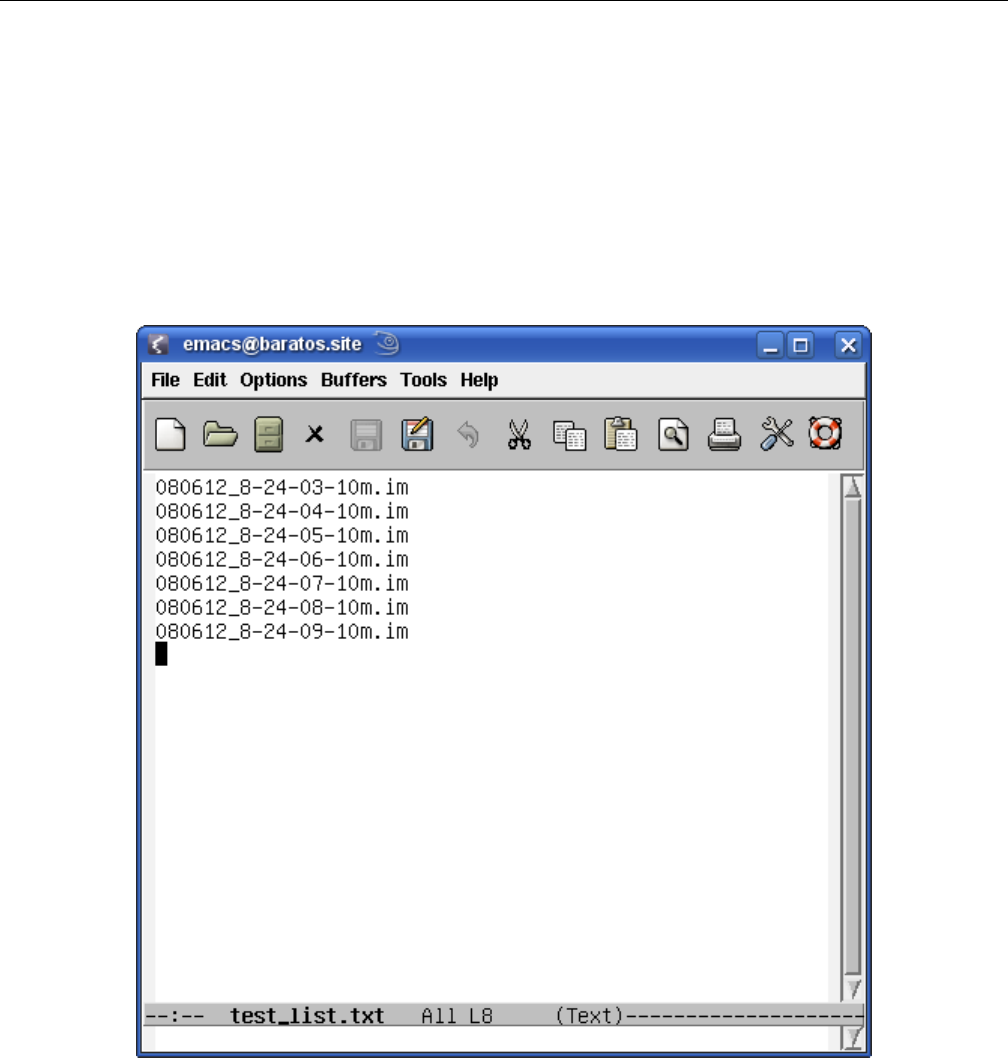
Import .im List: The OpenMIMS application has the ability to read a text file with a list of file names and
it will open those image files, appending them to one another. *NOTE* All image files must exist in the
same directory as the text file that references them. An example image list file is provided in APPENDIX
D.
Capture Current Image: Selecting this menu item will produce a screen capture of the the last image clicked
by the user (whichever image has the current focus). The new image is an RGB image of exactly what
is displayed on the screen, including things like ROI outlines.
Image Notes: Opens up a text area that allows user to enter notes regarding an image. These notes will be
stored with other metadata when saving the file.
Recompute All:
Batch convert to nrrd: Allows the user to batch convert a set of .im files into .nrrd files. Can also perform
tracking of the image while converting.
Find mosaic file:
Find stack file:
Center of mass autotrack:
Export...>Current Image: Export all images) as .png files.
Export...>Export All Derived (png): Exports all derived images (ratio, HSI and sum images) as .png
files.
Export...>HSI Image 3D (qvis): images) as .png files.
Generate HTML: Generates
Generate Table: Generates
Generate Stack: Generates a new ratio or HSI image with independent scrollbars rather than the single plane
ratio or HSI images that are generated by default.
Composite: Selecting this menu item will bring up a dialog which allows the user to quickly create a composite
image with up to 4 channels. Any mass, sum, or ratio image can be used for the Red, Green, Blue, or
Grey channels or a channel may be left blank. Each channel uses a simple color LUT. The min/max
values for each LUT are taken from the underlying images. For example if the m26 mass image is used
for the Red channel that channel will have the same min/max values. Changing the min/max values (or
brightness/contrast) on the Contrast tab for the m26 image will automatically update the Red channel in
the composite.
Corrections
2017 National Resource for Imaging Mass Spectrometry 19

https://imagej.net/Fiji/Downloads
Apply dead time correction: Applies a dead time correction to the data. A 44 nanosecond correction is
applied to the data.
Apply QSA correction: Applies a QSA correction to the data. Applying the QSA correction automatically
applies a dead correction.
Help
About OpenMIMS: Shows the OpenMIMS version number, release date, authors of OpenMIMS, recognizes
the funding sources for OpenMIMS development, and lists other open source Java packages used in
OpenMIMS development.
Documentation: This is a link to OpenMIMS on GitHub.
Sample Data: A link to some sample image files on GitHub.
[1] Fuller et. al. Segmentation of Three-dimensional Retinal Image Data. IEEE Trans. Vis. Comput. Graph.
16(6):1719-1726, 2007.
[2] Gormanns, P., Reckow, S., Poczatek, J., Turck, C., Lechene, C. Segmentation of multi-istope imaging mass
spectrometry data for semi-automatic detection of regions of interest. PLoS ONE 2012: 7(2)
[3] libSVM http://www.csie.ntu.edu.tw/ cjlin/libsvm/
[4] http://teem.sourceforge.net/nrrd/
2017 National Resource for Imaging Mass Spectrometry 20
https://imagej.net/Fiji/Downloads
Figure 16: The Registration tab.
2017 National Resource for Imaging Mass Spectrometry 21
https://imagej.net/Fiji/Downloads
Figure 17: The MIMS Log Log window showing sample registration log information.
2017 National Resource for Imaging Mass Spectrometry 22
https://imagej.net/Fiji/Downloads
Figure 18: The MIMS Log tab contains metadata and debug information.
2017 National Resource for Imaging Mass Spectrometry 23
https://imagej.net/Fiji/Downloads
Figure 19: The Files Manager dialog.
2017 National Resource for Imaging Mass Spectrometry 24
https://imagej.net/Fiji/Downloads
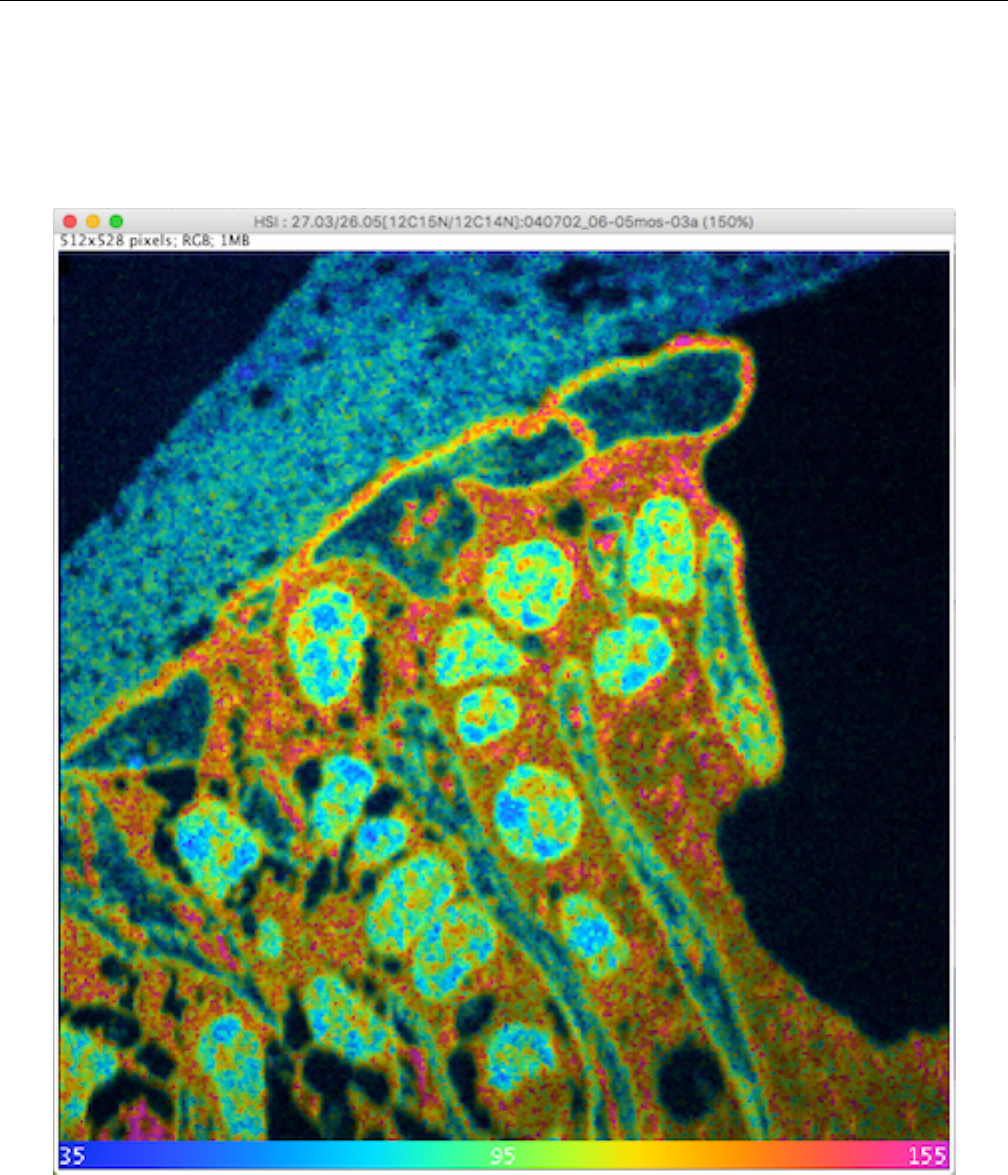
APPENDIX A
Figure 20: An example of an HSI image.
2017 National Resource for Imaging Mass Spectrometry 25
https://imagej.net/Fiji/Downloads
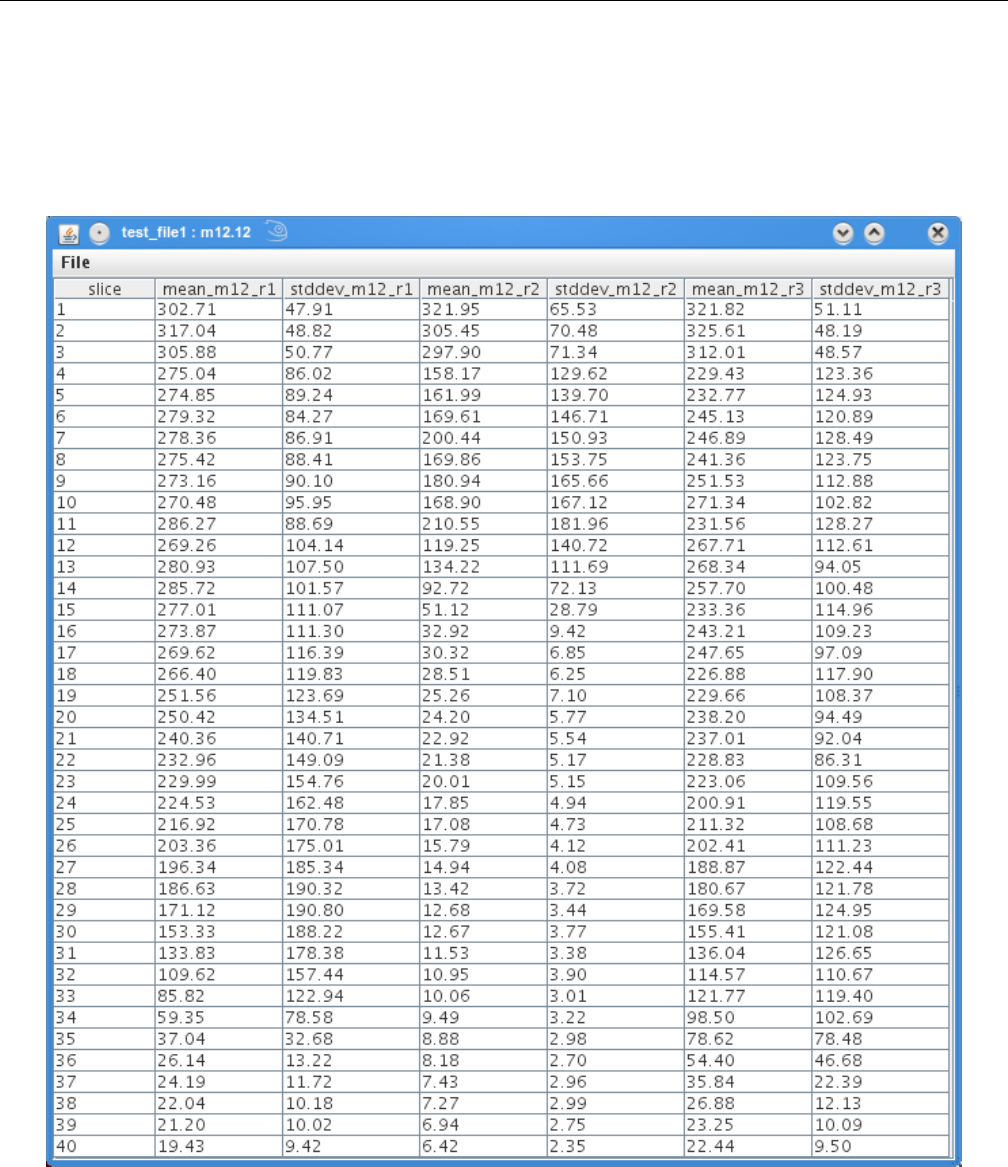
APPENDIX B
Figure 21: Sample output table showing mean and standard deviation for a 40 plane image file with three ROIs
2017 National Resource for Imaging Mass Spectrometry 26
https://imagej.net/Fiji/Downloads
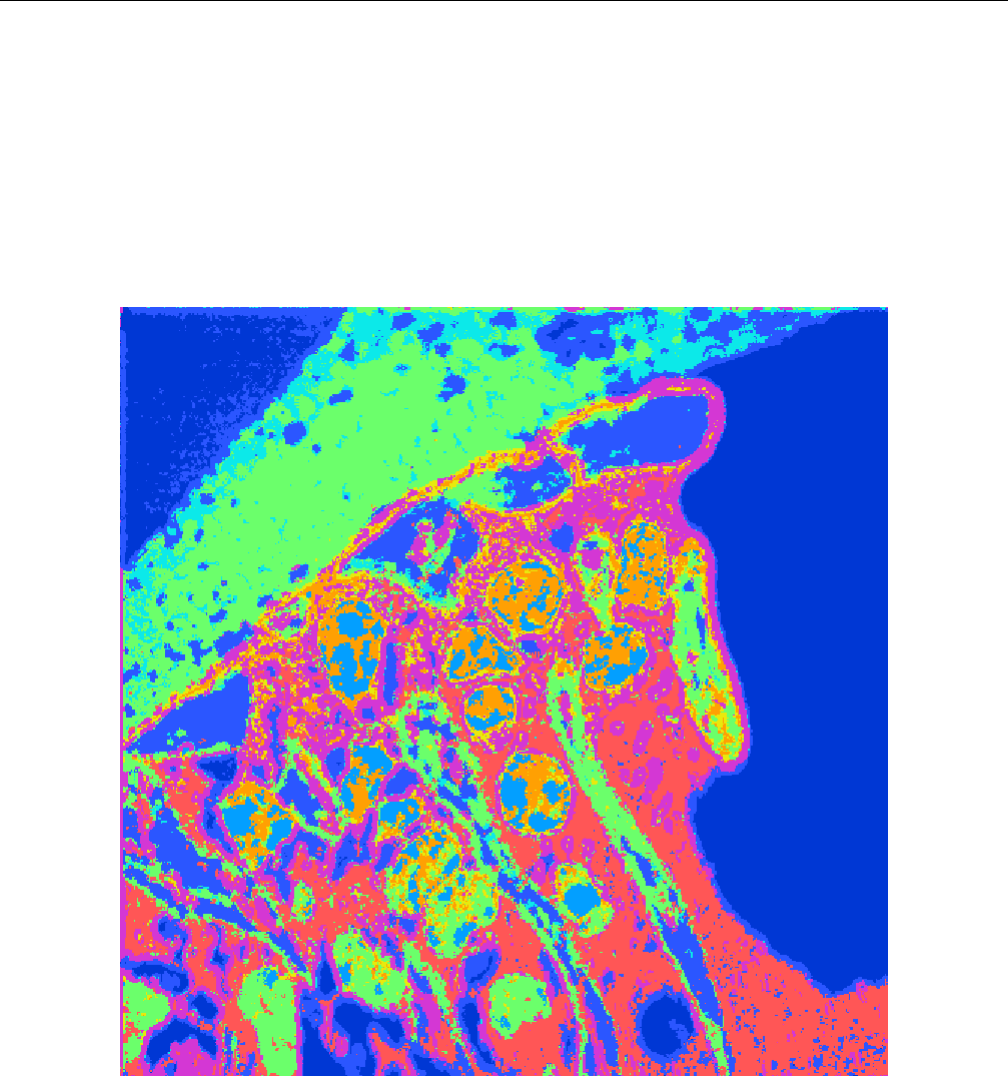
APPENDIX C
Figure 22: A segmented image with 9 classes and no post processing.
2017 National Resource for Imaging Mass Spectrometry 27
https://imagej.net/Fiji/Downloads
APPENDIX D
Figure 23: A sample image list file.
2017 National Resource for Imaging Mass Spectrometry 28
