Performance Tuning Guide Red Hat Enterprise Linux 7
User Manual: Pdf
Open the PDF directly: View PDF ![]() .
.
Page Count: 98
- Table of Contents
- Chapter 1. Introduction
- Chapter 2. Performance Monitoring Tools
- Chapter 3. Tuned
- Chapter 4. CPU
- 4.1. Considerations
- 4.2. Monitoring and diagnosing performance problems
- 4.3. Configuration suggestions
- 4.3.1. Configuring kernel tick time
- 4.3.2. Setting hardware performance policy (x86_energy_perf_policy)
- 4.3.3. Setting process affinity with taskset
- 4.3.4. Managing NUMA affinity with numactl
- 4.3.5. Automatic NUMA affinity management with numad
- 4.3.6. Tuning scheduling policy
- 4.3.7. Setting interrupt affinity
- 4.3.8. Configuring CPU, thread, and interrupt affinity with Tuna
- Chapter 5. Memory
- Chapter 6. Storage and File Systems
- 6.1. Considerations
- 6.2. Monitoring and diagnosing performance problems
- 6.3. Solid-State Disks
- 6.4. Configuration tools
- 6.4.1. Configuring tuning profiles for storage performance
- 6.4.2. Setting the default I/O scheduler
- 6.4.3. Configuring the I/O scheduler for a device
- 6.4.4. Tuning the deadline scheduler
- 6.4.5. Tuning the cfq scheduler
- 6.4.6. Tuning the noop scheduler
- 6.4.7. Configuring file systems for performance
- Data Compression
- Chapter 7. Networking
- 7.1. Considerations
- 7.2. Monitoring and diagnosing performance problems
- 7.3. Configuration tools
- 7.3.1. Tuned-adm profiles for network performance
- 7.3.2. Configuring the hardware buffer
- 7.3.3. Configuring interrupt queues
- 7.3.4. Configuring socket receive queues
- 7.3.5. Configuring Receive-Side Scaling (RSS)
- 7.3.6. Configuring Receive Packet Steering (RPS)
- 7.3.7. Configuring Receive Flow Steering (RFS)
- 7.3.8. Configuring Accelerated RFS
- Appendix A. Tool Reference
- Appendix B. Revision History

Red Hat Subject Matter ExpertsMilan Navrátil
Laura Bailey Charlie Boyle
Red Hat Enterprise Linux 7
Performance Tuning Guide
Optimizing subsystem throughput in Red Hat Enterprise Linux 7

Red Hat Enterprise Linux 7 Performance Tuning Guide
Optimizing subsystem throughput in Red Hat Enterprise Linux 7
Milan Navrátil
Red Hat Custo mer Content Services
Laura Bailey
Red Hat Custo mer Content Services
Charlie Bo yle
Red Hat Custo mer Content Services
Red Hat Subject Matter Experts
Edited by
Marek Suchánek
Red Hat Custo mer Content Services
msuchane@redhat.com

Legal Notice
Co pyright © 20 17 Red Hat, Inc.
This document is licensed by Red Hat under the Creative Co mmons Attribution-ShareAlike 3.0
Unpo rted License. If you distribute this do cument, o r a modified versio n of it, you must pro vide
attributio n to Red Hat, Inc. and pro vide a link to the o riginal. If the do cument is mo dified, all Red
Hat trademarks must be removed.
Red Hat, as the licenso r of this document, waives the right to enforce, and agrees no t to assert,
Sectio n 4d o f CC-BY-SA to the fullest extent permitted by applicable law.
Red Hat, Red Hat Enterprise Linux, the Shadowman logo, JBoss, OpenShift, Fedo ra, the Infinity
logo , and RHCE are trademarks of Red Hat, Inc., registered in the United States and o ther
co untries.
Linux ® is the registered trademark of Linus To rvalds in the United States and o ther co untries.
Java ® is a registered trademark of Oracle and/o r its affiliates.
XFS ® is a trademark of Silico n Graphics Internatio nal Co rp. or its subsidiaries in the United
States and/o r other co untries.
MySQL ® is a registered trademark of MySQL AB in the United States, the European Union and
other co untries.
No de.js ® is an o fficial trademark o f Joyent. Red Hat Software Collectio ns is no t fo rmally
related to or endorsed by the official Joyent Node.js open source o r commercial pro ject.
The OpenStack ® Wo rd Mark and OpenStack lo go are either registered trademarks/service
marks or trademarks/service marks of the OpenStack Fo undatio n, in the United States and other
co untries and are used with the OpenStack Foundatio n's permission. We are no t affiliated with,
endo rsed or spo nso red by the OpenStack Foundatio n, or the OpenStack community.
All other trademarks are the pro perty of their respective owners.
Abstract
The Red Hat Enterprise Linux 7 Perfo rmance Tuning Guide explains ho w to optimize Red Hat
Enterprise Linux 7 perfo rmance. It also do cuments perfo rmance-related upgrades in Red Hat
Enterprise Linux 7. The Perfo rmance Tuning Guide presents only field-tested and pro ven
pro cedures. No netheless, all prospective co nfiguratio ns sho uld be set up and tested in a
testing environment before being applied to a pro ductio n system. Backing up all data and
co nfiguratio n settings prior to tuning is also recommended.

. . . . . . . . . . . . . . . . . . . . . . . . . . . . . . . . . . . . . . . . . . . . . . . . . . . . . . . . . . . . . . . . . . . . . . . . . . . . . . . . . . . . . . . . . . . . . . . . . . . . . . . . . . . . . . . . . . . . . . . . . . . . . . . . . . . . . . . . . . . . . . . . . . . . . . . . . . . . . . . . . . . . . . . . . . . . . . . . . . . . . . . . . . . . . . . . . . . . . . . . . . . . . . . . . . . . . . . . . . . . . . . . . . . . . . . . . . . . . . . . . . . . . . . . . . . . . . . . . . . . . . . . . . . . . . . . . . . . . . . .
. . . . . . . . . . . . . . . . . . . . . . . . . . . . . . . . . . . . . . . . . . . . . . . . . . . . . . . . . . . . . . . . . . . . . . . . . . . . . . . . . . . . . . . . . . . . . . . . . . . . . . . . . . . . . . . . . . . . . . . . . . . . . . . . . . . . . . . . . . . . . . . . . . . . . . . . . . . . . . . . . . . . . . . . . . . . . . . . . . . . . . . . . . . . . . . . . . . . . . . . . . . . . . . . . . . . . . . . . . . . . . . . . . . . . . . . . . . . . . . . . . . . . . . . . . . . . . . . . . . . . . . . . . . . . . . . . . . . . . . .
. . . . . . . . . . . . . . . . . . . . . . . . . . . . . . . . . . . . . . . . . . . . . . . . . . . . . . . . . . . . . . . . . . . . . . . . . . . . . . . . . . . . . . . . . . . . . . . . . . . . . . . . . . . . . . . . . . . . . . . . . . . . . . . . . . . . . . . . . . . . . . . . . . . . . . . . . . . . . . . . . . . . . . . . . . . . . . . . . . . . . . . . . . . . . . . . . . . . . . . . . . . . . . . . . . . . . . . . . . . . . . . . . . . . . . . . . . . . . . . . . . . . . . . . . . . . . . . . . . . . . . . . . . . . . . . . . . . . . . . .
. . . . . . . . . . . . . . . . . . . . . . . . . . . . . . . . . . . . . . . . . . . . . . . . . . . . . . . . . . . . . . . . . . . . . . . . . . . . . . . . . . . . . . . . . . . . . . . . . . . . . . . . . . . . . . . . . . . . . . . . . . . . . . . . . . . . . . . . . . . . . . . . . . . . . . . . . . . . . . . . . . . . . . . . . . . . . . . . . . . . . . . . . . . . . . . . . . . . . . . . . . . . . . . . . . . . . . . . . . . . . . . . . . . . . . . . . . . . . . . . . . . . . . . . . . . . . . . . . . . . . . . . . . . . . . . . . . . . . . . .
. . . . . . . . . . . . . . . . . . . . . . . . . . . . . . . . . . . . . . . . . . . . . . . . . . . . . . . . . . . . . . . . . . . . . . . . . . . . . . . . . . . . . . . . . . . . . . . . . . . . . . . . . . . . . . . . . . . . . . . . . . . . . . . . . . . . . . . . . . . . . . . . . . . . . . . . . . . . . . . . . . . . . . . . . . . . . . . . . . . . . . . . . . . . . . . . . . . . . . . . . . . . . . . . . . . . . . . . . . . . . . . . . . . . . . . . . . . . . . . . . . . . . . . . . . . . . . . . . . . . . . . . . . . . . . . . . . . . . . . .
. . . . . . . . . . . . . . . . . . . . . . . . . . . . . . . . . . . . . . . . . . . . . . . . . . . . . . . . . . . . . . . . . . . . . . . . . . . . . . . . . . . . . . . . . . . . . . . . . . . . . . . . . . . . . . . . . . . . . . . . . . . . . . . . . . . . . . . . . . . . . . . . . . . . . . . . . . . . . . . . . . . . . . . . . . . . . . . . . . . . . . . . . . . . . . . . . . . . . . . . . . . . . . . . . . . . . . . . . . . . . . . . . . . . . . . . . . . . . . . . . . . . . . . . . . . . . . . . . . . . . . . . . . . . . . . . . . . . . . . .
. . . . . . . . . . . . . . . . . . . . . . . . . . . . . . . . . . . . . . . . . . . . . . . . . . . . . . . . . . . . . . . . . . . . . . . . . . . . . . . . . . . . . . . . . . . . . . . . . . . . . . . . . . . . . . . . . . . . . . . . . . . . . . . . . . . . . . . . . . . . . . . . . . . . . . . . . . . . . . . . . . . . . . . . . . . . . . . . . . . . . . . . . . . . . . . . . . . . . . . . . . . . . . . . . . . . . . . . . . . . . . . . . . . . . . . . . . . . . . . . . . . . . . . . . . . . . . . . . . . . . . . . . . . . . . . . . . . . . . . .
. . . . . . . . . . . . . . . . . . . . . . . . . . . . . . . . . . . . . . . . . . . . . . . . . . . . . . . . . . . . . . . . . . . . . . . . . . . . . . . . . . . . . . . . . . . . . . . . . . . . . . . . . . . . . . . . . . . . . . . . . . . . . . . . . . . . . . . . . . . . . . . . . . . . . . . . . . . . . . . . . . . . . . . . . . . . . . . . . . . . . . . . . . . . . . . . . . . . . . . . . . . . . . . . . . . . . . . . . . . . . . . . . . . . . . . . . . . . . . . . . . . . . . . . . . . . . . . . . . . . . . . . . . . . . . . . . . . . . . . .
Table of Contents
Chapt er 1 . Int roduct ion
Who Sho uld Read This Bo o k
Chapt er 2 . Performance Monit oring T ools
2.1. /p ro c
2.2. G NO ME System Mo nito r
2.3. Perfo rmanc e Co -Pilo t (PCP)
2.4. Tuna
2.5. Built in co mmand line to o ls
2.6 . p erf
2.7. turb o stat
2.8 . io stat
2.9 . irq b alanc e
2.10 . s s
2.11. numastat
2.12. numad
2.13. SystemTap
2.14. O Pro file
2.15. Valg rind
Chapt er 3. T uned
3.1. Tuned O verview
3.2. Perfo rmanc e Tuning with tuned and tuned -ad m
Chapt er 4 . CPU
4.1. Co ns id eratio ns
4.2. Mo nito ring and d iag no sing p erfo rmance p ro b lems
4.3. Co nfig uratio n sug g estio ns
Chapt er 5. Memory
5.1. Co ns id eratio ns
5.2. Mo nito ring and d iag no sing p erfo rmance p ro b lems
5.3. Co nfig uring Hug eTLB hug e p ag es
5.4. Co nfig uring Transp arent Hug e Pag es
5.5. Co nfig uring system memo ry c ap acity
Chapt er 6 . St orage an d File Syst ems
6 .1. Co ns id eratio ns
6 .2. Mo nito ring and d iag no sing p erfo rmanc e p ro b lems
6 .3. So lid -State Disks
6 .4. Co nfig uratio n to o ls
Chapt er 7 . Net working
7.1. Co ns id eratio ns
7.2. Mo nito ring and d iag no sing p erfo rmance p ro b lems
7.3. Co nfig uratio n to o ls
Appendix A. T ool Reference
A.1. irq b alanc e
A.2. Tuna
A.3. ethto o l
A.4. s s
A.5. tuned
A.6 . tuned -ad m
3
3
4
4
4
5
5
5
7
7
7
7
8
8
8
9
9
10
1 1
11
21
2 5
25
30
31
37
37
37
41
44
44
4 9
49
54
57
58
6 9
6 9
70
71
7 8
78
79
8 1
8 1
8 1
8 2
T able of Cont ent s
1

. . . . . . . . . . . . . . . . . . . . . . . . . . . . . . . . . . . . . . . . . . . . . . . . . . . . . . . . . . . . . . . . . . . . . . . . . . . . . . . . . . . . . . . . . . . . . . . . . . . . . . . . . . . . . . . . . . . . . . . . . . . . . . . . . . . . . . . . . . . . . . . . . . . . . . . . . . . . . . . . . . . . . . . . . . . . . . . . . . . . . . . . . . . . . . . . . . . . . . . . . . . . . . . . . . . . . . . . . . . . . . . . . . . . . . . . . . . . . . . . . . . . . . . . . . . . . . . . . . . . . . . . . . . . . . . . . . . . . . . .
A.6 . tuned -ad m
A.7. p erf
A.8 . Perfo rmance Co -Pilo t (PCP)
A.9 . vmstat
A.10 . x8 6 _energ y_p erf_p o lic y
A.11. turb o stat
A.12. numastat
A.13. numactl
A.14. numad
A.15. O Pro file
A.16 . tas ks et
A.17. SystemTap
Appendix B. Revision Hist ory
8 2
8 3
8 4
8 5
8 6
8 7
8 8
9 0
9 0
9 2
9 3
9 3
9 4
Performance T uning G uide
2

Chapter 1. Introduction
To learn about features introduced in each Red Hat Enterprise Linux 7 minor release, see the Release
Notes for respective minor versions.
The Performance Tuning Guide is a comprehensive guide to optimizing the various sub-systems that
make up Red Hat Enterprise Linux 7 for specific purposes. This guide also outlines the performance
monitoring and tuning tools available in Red Hat Enterprise Linux 7.
Before you begin tuning, Red Hat has the following important recommendations:
Back u p b efo re yo u co n f ig u re
The default settings in Red Hat Enterprise Linux 7 are suitable for most services running
under moderate loads. Improving the performance of a specific sub-system may affect
another system adversely. Back up all data and configuration information before you begin
tuning your system.
T est co n f ig u rat io n o u t of p ro d u ct ion
The procedures documented in the Performance Tuning Guide are tested extensively by
Red Hat engineers in both lab and field. Nonetheless, Red Hat recommends testing all
planned configurations in a secure testing environment before applying those
configurations to production systems.
Who Should Read T his Book
The Performance Tuning Guide has been written primarily for two distinct but overlapping audiences:
System admin ist rat o rs
The Performance Tuning Guide documents the effects of each configuration option in detail
so that system administrators can optimize Red Hat Enterprise Linux 7 for their specific
purpose. Procedures in this guide are suitable for system administrators with Red Hat
Certified Engineer (RHCE) certification or an equivalent amount of experience (3–5 years'
experience deploying and managing Linux-based systems).
System and b u sin ess an alyst s
This guide explains Red Hat Enterprise Linux 7 performance features at a high level. It
provides information about how sub-systems perform under specific workloads, allowing
analysts to determine whether Red Hat Enterprise Linux 7 is suitable for their use case.
Where possible, the Performance Tuning Guide also refers readers to more detailed feature
documentation. This allows readers to develop the in-depth knowledge required to
formulate the detailed deployment and optimization strategies necessary for infrastructure
and deployment proposals.
Chapt er 1 . Int roduct ion
3

Chapter 2. Performance Monitoring Tools
This chapter briefly describes some of the performance monitoring and configuration tools available
for Red Hat Enterprise Linux 7. Where possible, this chapter directs readers to further information
about how to use the tool, and examples of real life situations that the tool can be used to resolve.
The following knowledge base article provides a more comprehensive list of performance monitoring
tools suitable for use with Red Hat Enterprise Linux: https://access.redhat.com/site/solutions/173863.
2.1. /proc
The /proc "file system" is a directory that contains a hierarchy of files that represent the current state
of the Linux kernel. It allows users and applications to see the kernel's view of the system.
The /proc directory also contains information about system hardware and any currently running
processes. Most files in the /proc file system are read-only, but some files (primarily those in
/proc/sys) can be manipulated by users and applications to communicate configuration changes to
the kernel.
For further information about viewing and editing files in the /proc directory, refer to the Red Hat
Enterprise Linux 7 System Administrator's Reference Guide, available from
http://access.redhat.com/site/documentation/Red_Hat_Enterprise_Linux/.
2.2. GNOME Syst em Monit or
The GNOME desktop environment includes a graphical tool, System Monitor, to assist you in
monitoring and modifying the behavior of your system. System Monitor displays basic system
information and allows you to monitor system processes and resource or file system usage.
System Monitor has four tabs, each of which displays different information about the system.
Syst em
This tab displays basic information about the system's hardware and software.
Processes
This tab displays detailed information about active processes and the relationships
between those processes. The processes displayed can be filtered to make certain
processes easier to find. This tab also lets you perform some actions on the processes
displayed, such as start, stop, kill, and change priority.
R eso u rces
This tab displays the current CPU time usage, memory and swap space usage, and network
usage.
File Syst ems
This tab lists all mounted file systems, and provides some basic information about each,
such as the file system type, mount point, and memory usage.
To start System Monitor, press the Super key to enter the Activities Overview, type System Monitor, and
then press Enter.
For more information about System Monitor, see either the Help menu in the application, or the
Red Hat Enterprise Linux 7 System Administrator's Guide, available from
Performance T uning G uide
4

http://access.redhat.com/site/documentation/Red_Hat_Enterprise_Linux/.
2.3. Performance Co-Pilot (PCP)
Red Hat Enterprise Linux 7 introduces support for Perfo rman ce Co - Pilo t (PCP), a suite of tools,
services, and libraries for acquiring, storing, and analyzing system-level performance measurements.
Its light-weight distributed architecture makes it particularly well-suited for centralized analysis of
complex systems. Performance metrics can be added using the Python, Perl, C++, and C interfaces.
Analysis tools can use the client APIs (Python, C++, C) directly, and rich web applications can
explore all available performance data using a JSON interface.
The Performance Co-Pilot Collection Daemon (pmcd) is responsible for collecting performance data
on the host system, and various client tools, such as pminfo or pmstat, can be used to retrieve,
display, archive, and process this data on the same host or over the network. The pcp package
provides the command-line tools and underlying functionality. The graphical tool also requires the
pcp-gui package.
For a list of system services and tools that are distributed with PCP, see Table A.1, “ System Services
Distributed with Performance Co-Pilot in Red Hat Enterprise Linux 7” and Table A.2, “ Tools
Distributed with Performance Co-Pilot in Red Hat Enterprise Linux 7” .
Resources
The manual page named PCPIn t ro serves as an introduction to Performance Co-Pilot. It
provides a list of available tools as well as a description of available configuration options and a
list of related manual pages. By default, comprehensive documentation is installed in the
/usr/share/doc/pcp-doc/ directory, notably the Performance Co-Pilot User's and
Administrator's Guide and Performance Co-Pilot Programmer's Guide.
For information on PCP, see the Index of Performance Co-Pilot (PCP) articles, solutions, tutorials
and white papers on the Red Hat Customer Portal.
If you need to determine what PCP tool has the functionality of an older tool you are already
familiar with, see the Side-by-side comparison of PCP tools with legacy tools Red Hat
Knowledgebase article.
See the official PCP documentation for an in-depth description of the Performance Co-Pilot and
its usage. If you want to start using PCP on Red Hat Enterprise Linux quickly, see the PCP Quick
Reference Guide. The official PCP website also contains a list of frequently asked questions.
2.4. T una
Tuna adjusts configuration details such as scheduler policy, thread priority, and CPU and interrupt
affinity. The tuna package provides a command line tool and a graphical interface with equivalent
functionality.
Section 4.3.8, “Configuring CPU, thread, and interrupt affinity with Tuna” describes how to configure
your system with Tuna on the command line. For details about how to use Tuna, see Section A.2,
“ Tuna” or the man page:
$ man tuna
2.5. Built in command line t ools
Chapt er 2 . Performance Monit oring T ools
5

Red Hat Enterprise Linux 7 provides several tools that can be used to monitor your system from the
command line, allowing you to monitor your system outside run level 5. This chapter discusses each
tool briefly and provides links to further information about where each tool should be used, and how
to use them.
2.5.1. t op
The top tool, provided by the procps-ng package, gives a dynamic view of the processes in a running
system. It can display a variety of information, including a system summary and a list of tasks
currently being managed by the Linux kernel. It also has a limited ability to manipulate processes,
and to make configuration changes persistent across system restarts.
By default, the processes displayed are ordered according to the percentage of CPU usage, so that
you can easily see the processes consuming the most resources. Both the information top displays
and its operation are highly configurable to allow you to concentrate on different usage statistics as
required.
For detailed information about using top, see the man page:
$ man top
2.5.2. ps
The ps tool, provided by the procps-ng package, takes a snapshot of a select group of active
processes. By default, the group examined is limited to processes that are owned by the current user
and associated with the terminal in which ps is run.
ps can provide more detailed information about processes than top, but by default it provides a
single snapshot of this data, ordered by process identifier.
For detailed information about using ps, see the man page:
$ man ps
2.5.3. Virt ual Memory St at ist ics (vmst at )
The Virtual Memory Statistics tool, vmstat, provides instant reports on your system's processes,
memory, paging, block input/output, interrupts, and CPU activity. Vmstat lets you set a sampling
interval so that you can observe system activity in near-real time.
vmstat is provided by the procps-ng package. For detailed information about using vmstat, see the
man page:
$ man vmstat
2.5.4 . Syst em Act ivit y Report er (sar)
The System Activity Reporter, sar, collects and reports information about system activity that has
occurred so far on the current day. The default output displays the current day's CPU usage at 10
minute intervals from the beginning of the day (00:00:00 according to your system clock).
You can also use the -i option to set the interval time in seconds, for example, sar -i 60 tells sar
to check CPU usage every minute.
Performance T uning G uide
6

sar is a useful alternative to manually creating periodic reports on system activity with top. It is
provided by the sysstat package. For detailed information about using sar, see the man page:
$ man sar
2.6. perf
The perf tool uses hardware performance counters and kernel tracepoints to track the impact of other
commands and applications on your system. Various perf subcommands display and record
statistics for common performance events, and analyze and report on the data recorded.
For detailed information about perf and its subcommands, see Section A.7, “ perf” .
Alternatively, more information is available in the Red Hat Enterprise Linux 7 Developer Guide,
available from http://access.redhat.com/site/documentation/Red_Hat_Enterprise_Linux/.
2.7. t urbost at
Turbostat is provided by the kernel-tools package. It reports on processor topology, frequency, idle
power-state statistics, temperature, and power usage on Intel® 64 processors.
Turbostat is useful for identifying servers that are inefficient in terms of power usage or idle time. It
also helps to identify the rate of system management interrupts (SMIs) occurring on the system. It can
also be used to verify the effects of power management tuning.
Turbostat requires root privileges to run. It also requires processor support for the following:
invariant time stamp counters
APERF model-specific registers
MPERF model-specific registers
For more details about turbostat output and how to read it, see Section A.11, “turbostat”.
For more information about turbostat, see the man page:
$ man turbostat
2.8. iost at
The io st at tool, provided by the sysstat package, monitors and reports on system input/output
device loading to help administrators make decisions about how to balance input/output load
between physical disks. The io st at tool reports on processor or device utilization since io st at was
last run, or since boot. You can focus the output of these reports on specific devices by using the
parameters defined in the iostat(1) manual page. For detailed information on the await value and
what can cause its values to be high, see the following Red Hat Knowledgebase article: What exactly
is the meaning of value "await" reported by iostat?
2.9. irqbalance
Chapt er 2 . Performance Monit oring T ools
7

irq b ala n ce is a command line tool that distributes hardware interrupts across processors to
improve system performance. For details about irq b alan ce, see Section A.1, “ irqbalance” or the
man page:
$ man irqbalance
2.10. ss
ss is a command-line utility that prints statistical information about sockets, allowing administrators
to assess device performance over time. By default, ss lists open non-listening TCP sockets that have
established connections, but a number of useful options are provided to help administrators filter out
statistics about specific sockets.
Red Hat recommends using ss over netstat in Red Hat Enterprise Linux 7.
One common usage is ss -tmpie which displays detailed information (including internal
information) about TCP sockets, memory usage, and processes using the socket.
ss is provided by the iproute package. For more information, see the man page:
$ man ss
2.11. numast at
The n u mast a t tool displays memory statistics for processes and the operating system on a per-
NUMA-node basis.
By default, n u mast a t displays per-node NUMA hit an miss system statistics from the kernel memory
allocator. Optimal performance is indicated by high numa_hit values and low numa_miss values.
N umast at also provides a number of command line options, which can show how system and
process memory is distributed across NUMA nodes in the system.
It can be useful to cross-reference per-node n u ma st at output with per-CPU top output to verify that
process threads are running on the same node to which memory is allocated.
N umast at is provided by the numactl package. For details about how to use numastat, see
Section A.12, “ numastat”. For further information about numastat, see the man page:
$ man numastat
2.12. numad
numad is an automatic NUMA affinity management daemon. It monitors NUMA topology and resource
usage within a system in order to dynamically improve NUMA resource allocation and management
(and therefore system performance). Depending on system workload, numad can provide up to 50
percent improvements in performance benchmarks. It also provides a pre-placement advice service
that can be queried by various job management systems to provide assistance with the initial
binding of CPU and memory resources for their processes.
numad monitors available system resources on a per-node basis by periodically accessing
information in the /proc file system. It tries to maintain a specified resource usage level, and
rebalances resource allocation when necessary by moving processes between NUMA nodes. numad
attempts to achieve optimal NUMA performance by localizing and isolating significant processes on
Performance T uning G uide
8

a subset of the system's NUMA nodes.
numad primarily benefits systems with long-running processes that consume significant amounts of
resources, and are contained in a subset of the total system resources. It may also benefit
applications that consume multiple NUMA nodes' worth of resources; however, the benefits provided
by numad decrease as the consumed percentage of system resources increases.
numad is unlikely to improve performance when processes run for only a few minutes, or do not
consume many resources. Systems with continuous, unpredictable memory access patterns, such as
large in-memory databases, are also unlikely to benefit from using numad.
For further information about using numad, see Section 4.3.5, “Automatic NUMA affinity management
with numad” or Section A.14, “numad”, or refer to the man page:
$ man numad
2.13. Syst emT ap
SystemTap is a tracing and probing tool that lets you monitor and analyze operating system
activities, especially kernel activities, in fine detail. It provides information similar to the output of
tools like top, ps, netstat, and iostat, but includes additional options for filtering and analyzing
collected data.
SystemTap provides a deeper, more precise analysis of system activities and application behavior to
allow you to pinpoint system and application bottlenecks.
For more detailed information about SystemTap, see the Red Hat Enterprise Linux 7 SystemTap
Beginner's Guide and the Red Hat Enterprise Linux 7 SystemTap TapSet Reference. Both books are
available from http://access.redhat.com/site/documentation/Red_Hat_Enterprise_Linux/.
2.14. OProfile
OProfile is a system-wide performance monitoring tool. It uses the processor's dedicated
performance monitoring hardware to retrieve information about the kernel and system executables to
determine the frequency of certain events, such as when memory is referenced, the number of second-
level cache requests, and the number of hardware requests received. OProfile can also be used to
determine processor usage, and to determine which applications and services are used most often.
However, OProfile does have several limitations:
Performance monitoring samples may not be precise. Because the processor may execute
instructions out of order, samples can be recorded from a nearby instruction instead of the
instruction that triggered the interrupt.
OProfile expects processes to start and stop multiple times. As such, samples from multiple runs
are allowed to accumulate. You may need to clear the sample data from previous runs.
OProfile focuses on identifying problems with processes limited by CPU access. It is therefore not
useful for identifying processes that are sleeping while they wait for locks on other events.
For more detailed information about OProfile, see Section A.15, “ OProfile” , or the Red Hat
Enterprise Linux 7 System Administrator's Guide, available from
http://access.redhat.com/site/documentation/Red_Hat_Enterprise_Linux/. Alternatively, refer to the
documentation on your system, located in /usr/share/doc/oprofile-version.
2.15. Valgrind
Chapt er 2 . Performance Monit oring T ools
9

2.15. Valgrind
Valgrind provides a number of detection and profiling tools to help improve the performance of your
applications. These tools can detect memory and thread-related errors, as well as heap, stack, and
array overruns, letting you easily locate and correct errors in your application code. They can also
profile the cache, the heap, and branch-prediction to identify factors that may increase application
speed and minimize memory usage.
Valgrind analyzes your application by running it on a synthetic CPU and instrumenting existing
application code as it is executed. It then prints commentary that clearly identifies each process
involved in application execution to a user-specified file, file descriptor, or network socket. Note that
executing instrumented code can take between four and fifty times longer than normal execution.
Valgrind can be used on your application as-is, without recompiling. However, because Valgrind
uses debugging information to pinpoint issues in your code, if your application and support libraries
were not compiled with debugging information enabled, Red Hat recommends recompiling to include
this information.
Valgrind also integrates with the GNU Project Debugger (gdb) to improve debugging efficiency.
Valgrind and its subordinate tools are useful for memory profiling. For detailed information about
using Valgrind to profile system memory, see Section 5.2.2, “ Profiling application memory usage with
Valgrin d” .
For detailed information about Valgrind, see the Red Hat Enterprise Linux 7 Developer Guide,
available from http://access.redhat.com/site/documentation/Red_Hat_Enterprise_Linux/.
For detailed information about using Valgrind, see the man page:
$ man valgrind
Accompanying documentation can also be found in /usr/share/doc/valgrind-version when
the valgrind package is installed.
Performance T uning G uide
10

Chapter 3. Tuned
3.1. Tuned Overview
Tuned is a daemon that uses udev to monitor connected devices and statically and dynamically
tunes system settings according to a selected profile. Tuned is distributed with a number of
predefined profiles for common use cases like high throughput, low latency, or powersave. It is
possible to modify the rules defined for each profile and customize how to tune a particular device.
To revert all changes made to the system settings by a certain profile, you can either switch to
another profile or deactivate the tuned service.
Note
Starting with Red Hat Enterprise Linux 7.2, you can run Tuned in no-daemon mode, which
does not require any resident memory. In this mode, tuned applies the settings and exits. The
no-daemon mode is disabled by default because a lot of tuned functionality is missing in
this mode, including D-Bus support, hot-plug support, or rollback support for settings. To
enable no-daemon mode, set the following in the /etc/tuned/tuned-main.conf file:
daemon = 0.
Static tuning mainly consists of the application of predefined sysctl and sysfs settings and one-
shot activation of several configuration tools like et h t o o l. Tuned also monitors the use of system
components and tunes system settings dynamically based on that monitoring information.
Dynamic tuning accounts for the way that various system components are used differently
throughout the uptime for any given system. For example, the hard drive is used heavily during
startup and login, but is barely used later when the user might mainly work with applications such as
web browsers or email clients. Similarly, the CPU and network devices are used differently at different
times. Tuned monitors the activity of these components and reacts to the changes in their use.
As a practical example, consider a typical office workstation. Most of the time, the Ethernet network
interface is very inactive. Only a few emails go in and out every once in a while or some web pages
might be loaded. For those kinds of loads, the network interface does not have to run at full speed all
the time, as it does by default. Tuned has a monitoring and tuning plug-in for network devices that
can detect this low activity and then automatically lower the speed of that interface, typically resulting
in a lower power usage. If the activity on the interface increases for a longer period of time, for
example because a DVD image is being downloaded or an email with a large attachment is opened,
tuned detects this and sets the interface speed to maximum to offer the best performance while the
activity level is so high. This principle is used for other plug-ins for CPU and hard disks as well.
Dynamic tuning is globally disabled in Red Hat Enterprise Linux and can be enabled by editing the
/etc/tuned/tuned-main.conf file and changing the dynamic_tuning flag to 1.
3.1.1. Plug-ins
Tuned uses two types of plugins: monitoring plugins and tuning plugins. Monitoring plugins are used to
get information from a running system. Currently, the following monitoring plugins are implemented:
d i sk
Gets disk load (number of IO operations) per device and measurement interval.
net
Chapt er 3. T uned
11

Gets network load (number of transferred packets) per network card and measurement
interval.
l o ad
Gets CPU load per CPU and measurement interval.
The output of the monitoring plugins can be used by tuning plugins for dynamic tuning. Currently
implemented dynamic tuning algorithms try to balance the performance and powersave and are
therefore disabled in the performance profiles (dynamic tuning for individual plugins can be enabled
or disabled in the tuned profiles). Monitoring plugins are automatically instantiated whenever their
metrics are needed by any of the enabled tuning plugins. If two tuning plugins require the same data,
only one instance of the monitoring plugin is created and the data is shared.
Each tuning plugin tunes an individual subsystem and takes several parameters that are populated
from the tuned profiles. Each subsystem can have multiple devices (for example, multiple CPUs or
network cards) that are handled by individual instances of the tuning plugins. Specific settings for
individual devices are also supported. The supplied profiles use wildcards to match all devices of
individual subsystems (for details on how to change this, refer to Section 3.1.3, “Custom Profiles” ),
which allows the plugins to tune these subsystems according to the required goal (selected profile)
and the only thing that the user needs to do is to select the correct tuned profile.
Currently, the following tuning plugins are implemented (only some of these plugins implement
dynamic tuning, parameters supported by plugins are also listed):
cpu
Sets the CPU governor to the value specified by the governor parameter and dynamically
changes the PM QoS CPU DMA latency according to the CPU load. If the CPU load is lower
than the value specified by the load_threshold parameter, the latency is set to the value
specified by the latency_high parameter, otherwise it is set to value specified by
latency_low. Also the latency can be forced to a specific value without being dynamically
changed further. This can be accomplished by setting the force_latency parameter to
the required latency value.
eeepc_she
Dynamically sets the FSB speed according to the CPU load; this feature can be found on
some netbooks and is also known as the Asus Super Hybrid Engine. If the CPU load is
lower or equal to the value specified by the load_threshold_powersave parameter, the
plugin sets the FSB speed to the value specified by the she_powersave parameter (for
details about the FSB frequencies and corresponding values, see the kernel
documentation, the provided defaults should work for most users). If the CPU load is higher
or equal to the value specified by the load_threshold_normal parameter, it sets the FSB
speed to the value specified by the she_normal parameter. Static tuning is not supported
and the plugin is transparently disabled if the hardware support for this feature is not
detected.
net
Configures wake-on-lan to the values specified by the wake_on_lan parameter (it uses
same syntax as the et h t o o l utility). It also dynamically changes the interface speed
according to the interface utilization.
sysctl
Performance T uning G uide
12

Sets various sysctl settings specified by the plugin parameters. The syntax is
name=value, where name is the same as the name provided by the sysct l tool. Use this
plugin if you need to change settings that are not covered by other plugins (but prefer
specific plugins if the settings are covered by them).
usb
Sets autosuspend timeout of USB devices to the value specified by the autosuspend
parameter. The value 0 means that autosuspend is disabled.
vm
Enables or disables transparent huge pages depending on the Boolean value of the
transparent_hugepages parameter.
aud i o
Sets the autosuspend timeout for audio codecs to the value specified by the timeout
parameter. Currently snd_hda_intel and snd_ac97_codec are supported. The value 0
means that the autosuspend is disabled. You can also enforce the controller reset by
setting the Boolean parameter reset_controller to true.
d i sk
Sets the elevator to the value specified by the elevator parameter. It also sets ALPM to the
value specified by the alpm parameter, ASPM to the value specified by the aspm parameter,
scheduler quantum to the value specified by the scheduler_quantum parameter, disk
spindown timeout to the value specified by the spindown parameter, disk readahead to the
value specified by the readahead parameter, and can multiply the current disk readahead
value by the constant specified by the readahead_multiply parameter. In addition, this
plugin dynamically changes the advanced power management and spindown timeout
setting for the drive according to the current drive utilization. The dynamic tuning can be
controlled by the Boolean parameter dynamic and is enabled by default.
mo unts
Enables or disables barriers for mounts according to the Boolean value of the
disable_barriers parameter.
scri pt
This plugin can be used for the execution of an external script that is run when the profile is
loaded or unloaded. The script is called by one argument which can be start or sto p (it
depends on whether the script is called during the profile load or unload). The script file
name can be specified by the script parameter. Note that you need to correctly implement
the stop action in your script and revert all setting you changed during the start action,
otherwise the roll-back will not work. For your convenience, the functions Bash helper
script is installed by default and allows you to import and use various functions defined in
it. Note that this functionality is provided mainly for backwards compatibility and it is
recommended that you use it as the last resort and prefer other plugins if they cover the
required settings.
sysfs
Sets various sysfs settings specified by the plugin parameters. The syntax is
name=value, where name is the sysfs path to use. Use this plugin in case you need to
change some settings that are not covered by other plugins (please prefer specific plugins
if they cover the required settings).
Chapt er 3. T uned
13

vi d eo
Sets various powersave levels on video cards (currently only the Radeon cards are
supported). The powersave level can be specified by using the radeon_powersave
parameter. Supported values are: default, auto , low, mid, hi g h, and dynpm. For
details, refer to http://www.x.org/wiki/RadeonFeature#KMS_Power_Management_Options.
Note that this plugin is experimental and the parameter may change in the future releases.
bo o tl o ad er
Adds paramaters to the kernel boot command line. This plugin supports the grub-legacy and
grub2 packages and also Grub with Extensible Firmware Interface (EFI). Customized non-
standard location of the grub2 configuration file can be specified by the grub2_cfg_file
option. The parameters are added to the current grub configuration and its templates. The
machine needs to be rebooted for the kernel parameters to take effect.
The parameters can be specified by the following syntax:
cmdline=arg1 arg2 ... argn.
3.1.2. Inst allat ion and Usage
To install the tuned package, run, as root, the following command:
yum install tuned
Installation of the tuned package also presets the profile which should be the best for you system.
Currently the default profile is selected according the following customizable rules:
throughput-performance
This is pre-selected on Red Hat Enterprise Linux 7 operating systems which act as compute
nodes. The goal on such systems is the best throughput performance.
virtual-guest
This is pre-selected on virtual machines. The goal is best performance. If you are not
interested in best performance, you would probably like to change it to the balanced or
powersave profile (see bellow).
balanced
This is pre-selected in all other cases. The goal is balanced performance and power
consumption.
To start tuned, run, as root, the following command:
systemctl start tuned
To enable tuned to start every time the machine boots, type the following command:
systemctl enable tuned
For other tuned control such as selection of profiles and other, use:
tuned-adm
Performance T uning G uide
14

This command requires the tuned service to be running.
To view the available installed profiles, run:
tuned-adm list
To view the currently activated profile, run:
tuned-adm active
To select or activate a profile, run:
tuned-adm profile profile
For example:
tuned-adm profile powersave
As an experimental feature it is possible to select more profiles at once. The tuned application will try
to merge them during the load. If there are conflicts the settings from the last specified profile will take
precedence. This is done automatically and there is no checking whether the resulting combination
of parameters makes sense. If used without thinking, the feature may tune some parameters the
opposite way which may be counterproductive. An example of such situation would be setting the
disk for the hi g h throughput by using the throughput-performance profile and concurrently
setting the disk spindown to the low value by the spindown-disk profile. The following example
optimizes the system for run in a virtual machine for the best performance and concurrently tune it for
the low power consumption while the low power consumption is the priority:
tuned-adm profile virtual-guest powersave
To let tuned recommend you the best suitable profile for your system without changing any existing
profiles and using the same logic as used during the installation, run the following command:
tuned-adm recommend
Tuned itself has additional options that you can use when you run it manually. However, this is not
recommended and is mostly intended for debugging purposes. The available options can be viewing
using the following command:
tuned --help
3.1.3. Cust om Profiles
Distribution-specific profiles are stored in the /usr/lib/tuned/ directory. Each profile has its own
directory. The profile consists of the main configuration file called tuned.conf, and optionally other
files, for example helper scripts.
If you need to customize a profile, copy the profile directory into the /etc/tuned/ directory, which is
used for custom profiles. If there are two profiles of the same name, the profile included in
/etc/tuned/ is used.
You can also create your own profile in the /etc/tuned/ directory to use a profile included in
/usr/lib/tuned/ with only certain parameters adjusted or overridden.
Chapt er 3. T uned
15

The tuned.conf file contains several sections. There is one [main] section. The other sections are
configurations for plugins instances. All sections are optional including the [main] section. Lines
starting with the hash sign (#) are comments.
The [main] section has the following option:
i ncl ud e= profile
The specified profile will be included, e.g. include=powersave will include the
powersave profile.
Sections describing plugins instances are formatted in the following way:
[NAME]
type=TYPE
devices=DEVICES
NAME is the name of the plugin instance as it is used in the logs. It can be an arbitrary string. TYPE is
the type of the tuning plugin. For a list and descriptions of the tuning plugins refer to Section 3.1.1,
“ Plug-in s” . DEVICES is the list of devices this plugin instance will handle. The devices line can
contain a list, a wildcard (*), and negation (!). You can also combine rules. If there is no devices
line all devices present or later attached on the system of the TYPE will be handled by the plugin
instance. This is same as using devices=*. If no instance of the plugin is specified, the plugin will
not be enabled. If the plugin supports more options, they can be also specified in the plugin section.
If the option is not specified, the default value will be used (if not previously specified in the included
plugin). For the list of plugin options refer to Section 3.1.1, “ Plug-ins” ).
Examp le 3.1. Describ ing p lu g in s inst ances
The following example will match everything starting with sd , such as sda or sdb and doesn't
disable barriers on them:
[data_disk]
type=disk
devices=sd*
disable_barriers=false
The following example will match everything except sda1 and sda2:
[data_disk]
type=disk
devices=!sda1, !sda2
disable_barriers=false
In cases where you do not need custom names for the plugin instance and there is only one
definition of the instance in your configuration file, Tuned supports the following short syntax:
[TYPE]
devices=DEVICES
In this case, it is possible to omit the type line. The instance will then be referred to with a name,
same as the type. The previous example could be then rewritten into:
[disk]
Performance T uning G uide
16

devices=sdb*
disable_barriers=false
If the same section is specified more than once using the include option, then the settings are
merged. If they cannot be merged due to a conflict, the last conflicting definition overrides the
previous settings in conflict. Sometimes, you do not know what was previously defined. In such
cases, you can use the replace boolean option and set it to true. This will cause all the previous
definitions with the same name to be overwritten and the merge will not happen.
You can also disable the plugin by specifying the enabled=false option. This has the same effect
as if the instance was never defined. Disabling the plugin can be useful if you are redefining the
previous definition from the include option and do not want the plugin to be active in your custom
profile.
Most of the time the device can be handled by one plugin instance. If the device matches multiple
instances definitions, an error is reported.
The following is an example of a custom profile that is based on the balanced profile and extends it
the way that ALPM for all devices is set to the maximal powersaving.
[main]
include=balanced
[disk]
alpm=min_power
The following is an example of a custom profile that adds isolcpus=2 to the kernel boot command
line:
[bootloader]
cmdline=isolcpus=2
The machine needs to be rebooted after the profile is applied for the changes to take effect.
3.1.4 . T uned-adm
A detailed analysis of a system can be very time-consuming. Red Hat Enterprise Linux 7 includes a
number of predefined profiles for typical use cases that you can easily activate with the tuned-adm
utility. You can also create, modify, and delete profiles.
To list all available profiles and identify the current active profile, run:
tuned-adm list
To only display the currently active profile, run:
tuned-adm active
To switch to one of the available profiles, run:
tuned-adm profile profile_name
for example:
Chapt er 3. T uned
17

tuned-adm profile latency-performance
To disable all tuning:
tuned-adm off
The following is a list of profiles which are installed with the base package:
balanced
The default power-saving profile. It is intended to be a compromise between performance
and power consumption. It tries to use auto-scaling and auto-tunning whenever possible. It
has good results for most loads. The only drawback is the increased latency. In the current
tuned release it enables the CPU, disk, audio and video plugins and activates the
ondemand governor. The radeon_powersave is set to auto .
powersave
A profile for maximum power saving performance. It can throttle the performance in order to
minimize the actual power consumption. In the current tuned release it enables USB
autosuspend, WiFi power saving and ALPM power savings for SATA host adapters. It also
schedules multi-core power savings for systems with a low wakeup rate and activates the
ondemand governor. It enables AC97 audio power saving or, depending on your system,
HDA-Intel power savings with a 10 seconds timeout. In case your system contains
supported Radeon graphics card with enabled KMS it configures it to automatic power
saving. On Asus Eee PCs a dynamic Super Hybrid Engine is enabled.
Note
The powersave profile may not always be the most efficient. Consider there is a
defined amount of work that needs to be done, for example a video file that needs to
be transcoded. Your machine can consume less energy if the transcoding is done on
the full power, because the task will be finished quickly, the machine will start to idle
and can automatically step-down to very efficient power save modes. On the other
hand if you transcode the file with a throttled machine, the machine will consume less
power during the transcoding, but the process will take longer and the overall
consumed energy can be higher. That is why the balanced profile can be generally
a better option.
throughput-performance
A server profile optimized for high throughput. It disables power savings mechanisms and
enables sysctl settings that improve the throughput performance of the disk, network IO and
switched to the d ead l i ne scheduler. CPU governor is set to performance.
latency-performance
A server profile optimized for low latency. It disables power savings mechanisms and
enables sysctl settings that improve the latency. CPU governor is set to performance and
the CPU is locked to the low C states (by PM QoS).
network-latency
Performance T uning G uide
18

A profile for low latency network tuning. It is based on the latency-performance profile.
It additionally disables transparent hugepages, NUMA balancing and tunes several other
network related sysctl parameters.
network-throughput
Profile for throughput network tuning. It is based on the throughput-performance
profile. It additionally increases kernel network buffers.
virtual-guest
A profile designed for virtual guests based on the enterprise-storage profile that, among
other tasks, decreases virtual memory swappiness and increases disk readahead values. It
does not disable disk barriers.
vi rtual -ho st
A profile designed for virtual hosts based on the enterprise-storage profile that, among
other tasks, decreases virtual memory swappiness, increases disk readahead values and
enables more aggresive \ of dirty pages.
o racl e
A profile optimized for Oracle databases loads based on throughput-performance
profile. It additionaly disables transparent huge pages and modifies some other
performance related kernel parameters. This profile is provided by tuned-profiles-oracle
package. It is available in Red Hat Enterprise Linux 6.8 and later.
d eskto p
A profile optimized for desktops, based on the balanced profile. It additionally enables
scheduler autogroups for better response of interactive applications.
Note
There may be more product specific or 3rd party Tuned profiles available. Such profiles are
usually provided by separate RPM packages.
Additional predefined profiles can be installed with the tuned-profiles-compat package available in the
O pti o nal channel. These profiles are intended for backward compatibility and are no longer
developed. The generalized profiles from the base package will mostly perform the same or better. If
you do not have specific reason for using them, please prefer the above mentioned profiles from the
base package. The compat profiles are following:
default
This has the lowest impact on power saving of the available profiles and only enables CPU
and disk plugins of tuned.
desktop-powersave
A power-saving profile directed at desktop systems. Enables ALPM power saving for SATA
host adapters as well as the CPU, Ethernet, and disk plugins of tuned.
laptop-ac-powersave
A medium-impact power-saving profile directed at laptops running on AC. Enables ALPM
powersaving for SATA host adapters, Wi-Fi power saving, as well as the CPU, Ethernet, and
Chapt er 3. T uned
19

disk plugins of tuned.
laptop-battery-powersave
A high-impact power-saving profile directed at laptops running on battery. In the current
tuned implementation it is an alias for the powersave profile.
spindown-disk
A power-saving profile for machines with classic HD Ds to maximize spindown time. It
disables the tuned power savings mechanism, disables USB autosuspend, disables
Bluetooth, enables Wi-Fi power saving, disables logs syncing, increases disk write-back
time, and lowers disk swappiness. All partitions are remounted with the noatime option.
enterpri se-sto rag e
A server profile directed at enterprise-class storage, maximizing I/O throughput. It activates
the same settings as the throughput-performance profile, multiplies readahead settings,
and disables barriers on non-root and non-boot partitions.
Note
Use the atomic-host profile on physical machines, and the atomic-guest profile on
virtual machines.
To enable the tuned profiles for Red Hat Enterprise Linux Atomic Host, install the tuned-profiles-atomic
package. Run, as root, the following command:
yum install tuned-profiles-atomic
The two tuned profiles for Red Hat Enterprise Linux Atomic Host are:
atomic-host
A profile optimized for Red Hat Enterprise Linux Atomic Host, when used as a host system
on a bare-metal server, using the throughput-performance profile. It additionally increases
SELinux AVC cache, PID limit, and tunes netfilter connections tracking.
atomic-guest
A profile optimized for Red Hat Enterprise Linux Atomic Host, when used as a guest system
based on the virtual-guest profile. It additionally increases SELinux AVC cache, PID limit,
and tunes netfilter connections tracking.
Note
There may be more product-specific or 3rd-party tuned profiles available. These profiles are
usually provided by separate RPM packages. Three tuned profiles are available that enable
to edit the kernel command line: real ti me, realtime-virtual-host and real ti me-
virtual-guest.
To enable the real ti me profile, install the tuned-profiles-realtime package. Run, as root, the following
command:
Performance T uning G uide
20

yum install tuned-profiles-realtime
To enable the realtime-virtual-host and realtime-virtual-guest profiles, install the
tuned-profiles-nfv package. Run, as root, the following command:
yum install tuned-profiles-nfv
3.1.5. Powert op2t uned
The p o wert o p 2t u n ed utility is a tool that allows you to create custom tuned profiles from the
Po werT O P suggestions.
To install the p o wert o p 2t u n ed application, run the following command as root:
yum install tuned-utils
To create a custom profile, run the following command as root:
powertop2tuned new_profile_name
By default it creates the profile in the /etc/tuned directory and it bases it on the currently selected
tuned profile. For safety reasons all Po werT O P tunings are initially disabled in the new profile. To
enable them uncomment the tunings of your interest in the /etc/tuned/profile/tuned.conf.
You can use the --enable or -e option that will generate the new profile with most of the tunings
suggested by Po werT O P enabled. Some dangerous tunings like the USB autosuspend will still be
disabled. If you really need them you will have to uncomment them manually. By default, the new
profile is not activated. To activate it run the following command:
tuned-adm profile new_profile_name
For a complete list of the options p o wert o p 2t u n e d supports, type in the following command:
powertop2tuned --help
3.2. Performance T uning wit h t uned and t uned-adm
The tuned tuning service can adapt the operating system to perform better under certain workloads
by setting a tuning profile. The t u n ed - a d m command-line tool allows users to switch between
different tuning profiles.
t uned Profiles Overview
Several pre-defined profiles are included for common use cases, but t u n ed - ad m also enables you
to define custom profiles, which can be either based on one of the pre-defined profiles, or defined
from scratch. In Red Hat Enterprise Linux 7, the default profile is throughput-performance.
The profiles provided with t u n ed - ad m are divided into two categories: power-saving profiles, and
performance-boosting profiles. The performance-boosting profiles include profiles focus on the
following aspects:
low latency for storage and network
Chapt er 3. T uned
21

high throughput for storage and network
virtual machine performance
virtualization host performance
t uned Boot Loader plug-in
You can use the tuned Bo o tl o ad er pl ug -i n to add parameters to the kernel (boot or dracut)
command line. Note that only the GRUB 2 boot loader is supported and a reboot is required to apply
profile changes. For example, to add the quiet parameter to a tuned profile, include the following
lines in the tuned.conf file:
[bootloader]
cmdline=quiet
Switching to another profile removes the additional parameters. If you stop tuned, the parameters
persist in the g rub. cfg file.
Environment Variables and Expanding t uned Built -In Funct ions
If you run tuned-adm profile profile_name and then grub2-mkconfig -o
profile_path after updating GRUB 2 configuration, you can use Bash environment variables,
which are expanded after running grub2-mkconfig. For example, the following environment
variable is expanded to nfsro o t= /ro o t:
[bootloader]
cmdline="nfsroot=$HOME"
You can use tuned variables as an alternative to environment variables. In the following example,
${isolated_cores} expands to 1,2, so the kernel boots with the isolcpus=1,2 parameter:
[variables]
isolated_cores=1,2
[bootloader]
cmdline=isolcpus=${isolated_cores}
In the following example, ${non_isolated_cores} expands to 0,3-5, and the cpulist_invert
built-in function is called with the 0,3-5 arguments:
[variables]
non_isolated_cores=0,3-5
[bootloader]
cmdline=isolcpus=${f:cpulist_invert:${non_isolated_cores}}
The cpulist_invert function inverts the list of CPUs. For a 6-CPU machine, the inversion is 1,2,
and the kernel boots with the isolcpus=1,2 command-line parameter.
Using tuned environment variables reduces the amount of necessary typing. You can also use
various built-in functions together with tuned variables. If the built-in functions do not satisfy your
needs, you can create custom functions in Python and add them to tuned in the form of plug-ins.
Variables and built-in functions are expanded at run time when the tuned profile is activated.
Performance T uning G uide
22

The variables can be specified in a separate file. You can, for example, add the following lines to
tuned.conf:
[variables]
include=/etc/tuned/my-variables.conf
[bootloader]
cmdline=isolcpus=${isolated_cores}
If you add isolated_cores=1,2 to the /etc/tuned/my-variables.conf file, the kernel boots
with the isolcpus=1,2 parameter.
Modifying Default Syst em t uned Profiles
There are two ways of modifying the default system tuned profiles. You can either create a new
tuned profile directory, or copy the directory of a system profile and edit the profile as needed.
Pro cedu re 3.1. Creat ing a n ew t u n ed Prof ile Direct o ry
1. In /etc/tuned/, create a new directory named the same as the profile you want to create:
/etc/tuned/my_profile_name/.
2. In the new directory, create a file named tuned.conf, and include the following lines at the
top:
[main]
include=profile_name
3. Include your profile modifications. For example, to use the settings from the thro ug hput-
performance profile with the value of vm.swappiness set to 5, instead of default 10,
include the following lines:
[main]
include=throughput-performance
[sysctl]
vm.swappiness=5
4. To activate the profile, run:
# tuned-adm profile my_profile_name
Creating a directory with a new tuned.conf file enables you to keep all your profile modifications
after system tuned profiles are updated.
Alternatively, copy the directory with a system profile from /user/lib/tuned/ to /etc/tuned/. For
example:
# cp -r /usr/lib/tuned/throughput-performance /etc/tuned
Then, edit the profile in /etc/tuned according to your needs. Note that if there are two profiles of the
same name, the profile located in /etc/tuned/ is loaded. The disadvantage of this approach is that
if a system profile is updated after a tuned upgrade, the changes will not be reflected in the now-
outdated modified version.
Chapt er 3. T uned
23


Chapter 4. CPU
This chapter outlines CPU hardware details and configuration options that affect application
performance in Red Hat Enterprise Linux 7. Section 4.1, “ Considerations” discusses the CPU related
factors that affect performance. Section 4.2, “ Monitoring and diagnosing performance problems”
teaches you how to use Red Hat Enterprise Linux 7 tools to diagnose performance problems related
to CPU hardware or configuration details. Section 4.3, “ Configuration suggestions” discusses the
tools and strategies you can use to solve CPU related performance problems in Red Hat
Enterprise Linux 7.
4.1. Considerat ions
Read this section to gain an understanding of how system and application performance is affected
by the following factors:
How processors are connected to each other and to related resources like memory.
How processors schedule threads for execution.
How processors handle interrupts in Red Hat Enterprise Linux 7.
4 .1.1. Syst em T opology
In modern computing, the idea of a central processing unit is a misleading one, as most modern
systems have multiple processors. How these processors are connected to each other and to other
system resources — the topology of the system — can greatly affect system and application
performance, and the tuning considerations for a system.
There are two primary types of topology used in modern computing:
Symmet ric Mult i- Pro cessor (SMP) t o p o lo g y
SMP topology allows all processors to access memory in the same amount of time.
However, because shared and equal memory access inherently forces serialized memory
accesses from all the CPUs, SMP system scaling constraints are now generally viewed as
unacceptable. For this reason, practically all modern server systems are NUMA machines.
No n - Un if o rm Memo ry Access ( NUMA) t o p o lo g y
NUMA topology was developed more recently than SMP topology. In a NUMA system,
multiple processors are physically grouped on a socket. Each socket has a dedicated area
of memory, and processors that have local access to that memory are referred to collectively
as a node.
Processors on the same node have high speed access to that node's memory bank, and
slower access to memory banks not on their node. Therefore, there is a performance penalty
to accessing non-local memory.
Given this performance penalty, performance sensitive applications on a system with NUMA
topology should access memory that is on the same node as the processor executing the
application, and should avoid accessing remote memory wherever possible.
When tuning application performance on a system with NUMA topology, it is therefore
important to consider where the application is being executed, and which memory bank is
closest to the point of execution.
In a system with NUMA topology, the /sys file system contains information about how
Chapt er 4 . CPU
25

processors, memory, and peripheral devices are connected. The
/sys/devices/system/cpu directory contains details about how processors in the
system are connected to each other. The /sys/devices/system/node directory
contains information about NUMA nodes in the system, and the relative distances between
those nodes.
4.1 .1 .1. Det e rm ining syst em t o po lo gy
There are a number of commands that can help you understand the topology of your system. The
numactl --hardware command gives an overview of your system's topology.
$ numactl --hardware
available: 4 nodes (0-3)
node 0 cpus: 0 4 8 12 16 20 24 28 32 36
node 0 size: 65415 MB
node 0 free: 43971 MB
node 1 cpus: 2 6 10 14 18 22 26 30 34 38
node 1 size: 65536 MB
node 1 free: 44321 MB
node 2 cpus: 1 5 9 13 17 21 25 29 33 37
node 2 size: 65536 MB
node 2 free: 44304 MB
node 3 cpus: 3 7 11 15 19 23 27 31 35 39
node 3 size: 65536 MB
node 3 free: 44329 MB
node distances:
node 0 1 2 3
0: 10 21 21 21
1: 21 10 21 21
2: 21 21 10 21
3: 21 21 21 10
The lscpu command, provided by the util-linux package, gathers information about the CPU
architecture, such as the number of CPUs, threads, cores, sockets, and NUMA nodes.
$ lscpu
Architecture: x86_64
CPU op-mode(s): 32-bit, 64-bit
Byte Order: Little Endian
CPU(s): 40
On-line CPU(s) list: 0-39
Thread(s) per core: 1
Core(s) per socket: 10
Socket(s): 4
NUMA node(s): 4
Vendor ID: GenuineIntel
CPU family: 6
Model: 47
Model name: Intel(R) Xeon(R) CPU E7- 4870 @ 2.40GHz
Stepping: 2
CPU MHz: 2394.204
BogoMIPS: 4787.85
Virtualization: VT-x
L1d cache: 32K
L1i cache: 32K
Performance T uning G uide
26

L2 cache: 256K
L3 cache: 30720K
NUMA node0 CPU(s): 0,4,8,12,16,20,24,28,32,36
NUMA node1 CPU(s): 2,6,10,14,18,22,26,30,34,38
NUMA node2 CPU(s): 1,5,9,13,17,21,25,29,33,37
NUMA node3 CPU(s): 3,7,11,15,19,23,27,31,35,39
The l sto po command, provided by the hwloc package, creates a graphical representation of your
system. The lstopo-no-graphics command provides detailed textual output.
Chapt er 4 . CPU
27
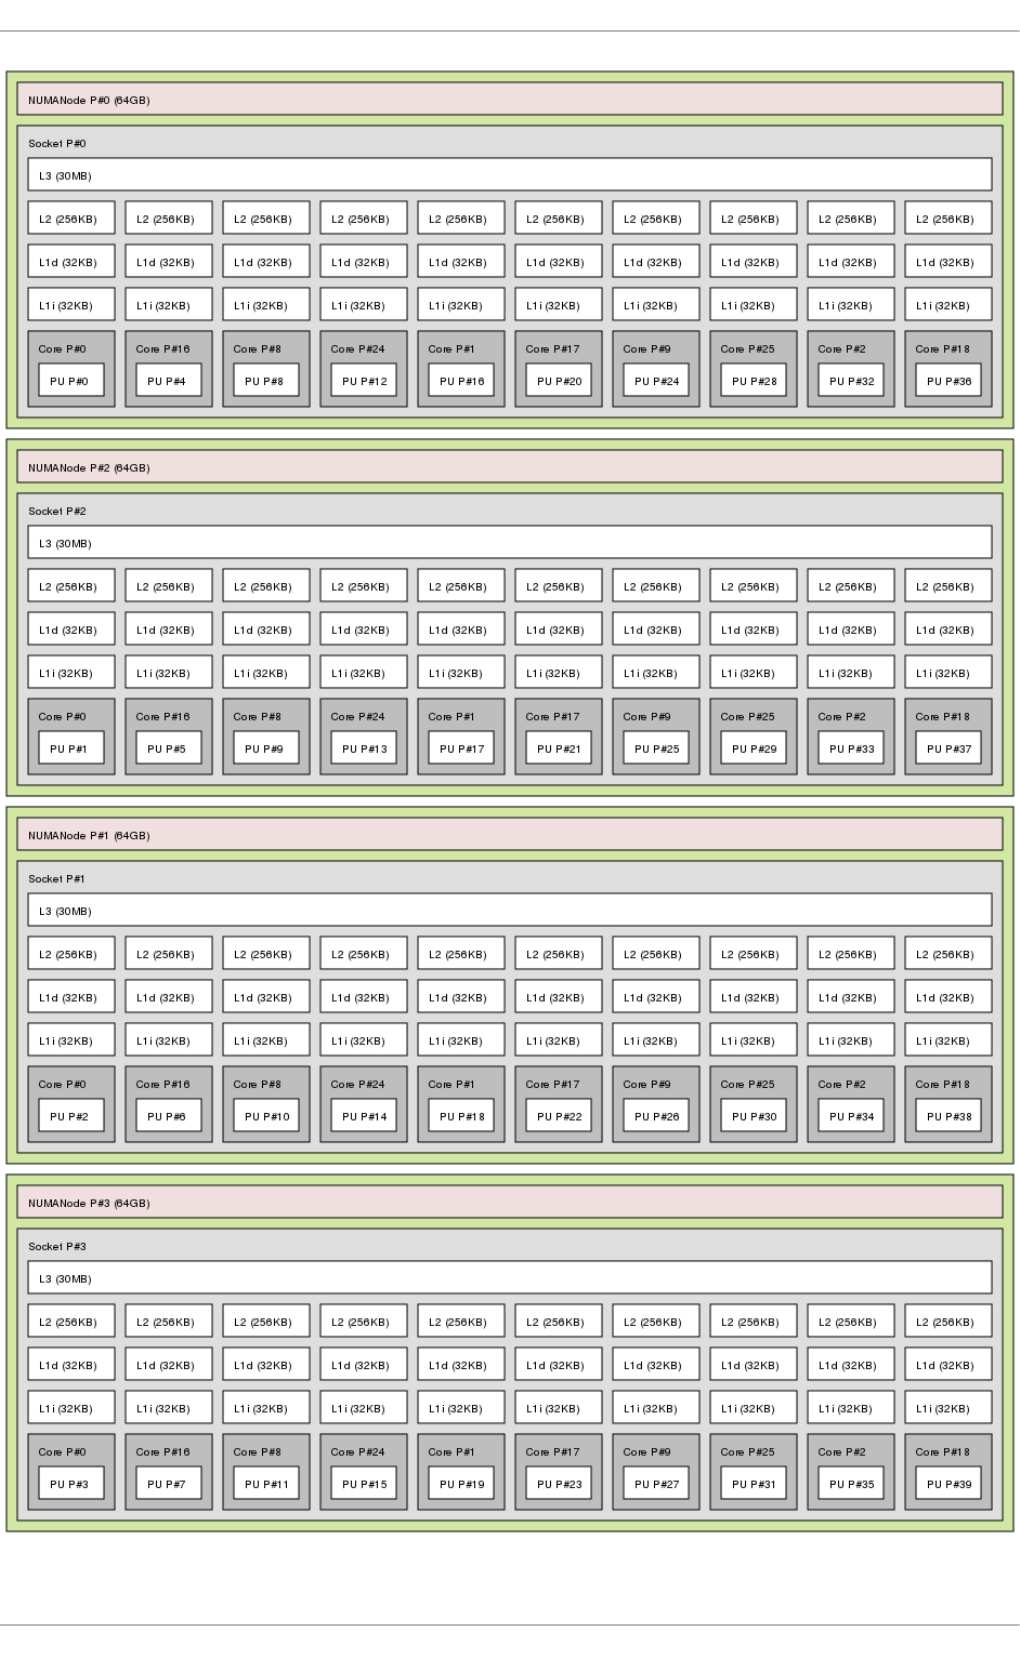
Output of lstopo command
Performance T uning G uide
28

4 .1.2. Scheduling
In Red Hat Enterprise Linux, the smallest unit of process execution is called a thread. The system
scheduler determines which processor runs a thread, and for how long the thread runs. However,
because the scheduler's primary concern is to keep the system busy, it may not schedule threads
optimally for application performance.
For example, say an application on a NUMA system is running on Node A when a processor on
Node B becomes available. To keep the processor on Node B busy, the scheduler moves one of the
application's threads to Node B. However, the application thread still requires access to memory on
Node A. Because the thread is now running on Node B, and Node A memory is no longer local to the
thread, it will take longer to access. It may take longer for the thread to finish running on Node B than
it would have taken to wait for a processor on Node A to become available, and to execute the thread
on the original node with local memory access.
Performance sensitive applications often benefit from the designer or administrator determining
where threads are run. For details about how to ensure threads are scheduled appropriately for the
needs of performance sensitive applications, see Section 4.3.6, “ Tuning scheduling policy” .
4.1 .2 .1. Kerne l T icks
In previous versions of Red Hat Enterprise Linux, the Linux kernel interrupted each CPU on a regular
basis to check what work needed to be done. It used the results to make decisions about process
scheduling and load balancing. This regular interruption was known as a kernel tick.
This tick occurred regardless of whether there was work for the core to do. This meant that even idle
cores were forced into higher power states on a regular basis (up to 1000 times per second) to
respond to the interrupts. This prevented the system from effectively using deep sleep states included
in recent generations of x86 processors.
In Red Hat Enterprise Linux 6 and 7, by default, the kernel no longer interrupts idle CPUs, which tend
to be in low power states. This behavior is known as the tickless kernel. Where one or fewer tasks are
running, periodic interrupts have been replaced with on-demand interrupts, allowing CPUs to remain
in an idle or low power state for longer, and reducing power usage.
Red Hat Enterprise Linux 7 offers a dynamic tickless option (nohz_full) to further improve
determinism by reducing kernel interference with user-space tasks. This option can be enabled on
specified cores with the nohz_full kernel parameter. When this option is enabled on a core, all
timekeeping activities are moved to non-latency-sensitive cores. This can be useful for high
performance computing and realtime computing workloads where user-space tasks are particularly
sensitive to microsecond-level latencies associated with the kernel timer tick.
For details on how to enable the dynamic tickless behavior in Red Hat Enterprise Linux 7, see
Section 4.3.1, “Configuring kernel tick time”.
4 .1.3. Int errupt Request (IRQ) Handling
An interrupt request or IRQ is a signal for immediate attention sent from a piece of hardware to a
processor. Each device in a system is assigned one or more IRQ numbers to allow it to send unique
interrupts. When interrupts are enabled, a processor that receives an interrupt request will
immediately pause execution of the current application thread in order to address the interrupt
request.
Because they halt normal operation, high interrupt rates can severely degrade system performance. It
is possible to reduce the amount of time taken by interrupts by configuring interrupt affinity or by
sending a number of lower priority interrupts in a batch (coalescing a number of interrupts).
Chapt er 4 . CPU
29

For more information about tuning interrupt requests, see Section 4.3.7, “Setting interrupt affinity” or
Section 4.3.8, “Configuring CPU, thread, and interrupt affinity with Tuna” . For information specific to
network interrupts, see Chapter 7, Networking.
4.2. Monit oring and diagnosing performance problems
Red Hat Enterprise Linux 7 provides a number of tools that are useful for monitoring system
performance and diagnosing performance problems related to processors and their configuration.
This section outlines the available tools and gives examples of how to use them to monitor and
diagnose processor related performance issues.
4 .2.1. t urbost at
T u rb o st at prints counter results at specified intervals to help administrators identify unexpected
behavior in servers, such as excessive power usage, failure to enter deep sleep states, or system
management interrupts (SMIs) being created unnecessarily.
The t u rb o s t at tool is part of the kernel-tools package. It is supported for use on systems with AMD64
and Intel® 64 processors. It requires root privileges to run, and processor support for invariant time
stamp counters, and APERF and MPERF model specific registers.
For usage examples, see the man page:
$ man turbostat
4 .2.2. numast at
Important
This tool received substantial updates in the Red Hat Enterprise Linux 6 life cycle. While the
default output remains compatible with the original tool written by Andi Kleen, supplying any
options or parameters to numastat significantly changes the format of its output.
The n u mast a t tool displays per-NUMA node memory statistics for processes and the operating
system and shows administrators whether process memory is spread throughout a system or
centralized on specific nodes.
Cross reference n u mast a t output with per-processor top output to confirm that process threads are
running on the same node from which process memory is allocated.
N umast at is provided by the numactl package. For further information about n u mast a t output, see
the man page:
$ man numastat
4 .2.3. /proc/int errupt s
The /proc/interrupts file lists the number of interrupts sent to each processor from a particular
I/O device. It displays the interrupt request (IRQ) number, the number of that type of interrupt request
handled by each processor in the system, the type of interrupt sent, and a comma-separated list of
devices that respond to the listed interrupt request.
Performance T uning G uide
30

If a particular application or device is generating a large number of interrupt requests to be handled
by a remote processor, its performance is likely to suffer. In this case, poor performance can be
alleviated by having a processor on the same node as the application or device handle the interrupt
requests. For details on how to assign interrupt handling to a specific processor, see Section 4.3.7,
“ Setting interrupt affinity” .
4.3. Configurat ion suggest ions
Red Hat Enterprise Linux provides a number of tools to assist administrators in configuring the
system. This section outlines the available tools and provides examples of how they can be used to
solve processor related performance problems in Red Hat Enterprise Linux 7.
4 .3.1. Configuring kernel t ick t ime
By default, Red Hat Enterprise Linux 7 uses a tickless kernel, which does not interrupt idle CPUs in
order to reduce power usage and allow newer processors to take advantage of deep sleep states.
Red Hat Enterprise Linux 7 also offers a dynamic tickless option (disabled by default), which is useful
for very latency-sensitive workloads, such as high performance computing or realtime computing.
To enable dynamic tickless behavior in certain cores, specify those cores on the kernel command
line with the nohz_full parameter. On a 16 core system, specifying nohz_full=1-15 enables
dynamic tickless behavior on cores 1 through 15, moving all timekeeping to the only unspecified core
(core 0). This behavior can be enabled either temporarily at boot time, or persistently in the
/etc/default/grub file. For persistent behavior, run the grub2-mkconfig -o
/boot/grub2/grub.cfg command to save your configuration.
Enabling dynamic tickless behavior does require some manual administration.
When the system boots, you must manually move rcu threads to the non-latency-sensitive core, in
this case core 0.
# for i in `pgrep rcu[^c]` ; do taskset -pc 0 $i ; done
Use the isolcpus parameter on the kernel command line to isolate certain cores from user-space
tasks.
Optionally, set CPU affinity for the kernel's write-back bdi-flush threads to the housekeeping core:
echo 1 > /sys/bus/workqueue/devices/writeback/cpumask
Verify that the dynamic tickless configuration is working correctly by executing the following
command, where stress is a program that spins on the CPU for 1 second.
# perf stat -C 1 -e irq_vectors:local_timer_entry taskset -c 1 stress -t
1 -c 1
One possible replacement for stress is a script that runs something like while :; do d=1;
d o ne.
The default kernel timer configuration shows 1000 ticks on a busy CPU:
# perf stat -C 1 -e irq_vectors:local_timer_entry taskset -c 1 stress -t
1 -c 1
1000 irq_vectors:local_timer_entry
Chapt er 4 . CPU
31

With the dynamic tickless kernel configured, you should see 1 tick instead:
# perf stat -C 1 -e irq_vectors:local_timer_entry taskset -c 1 stress -t
1 -c 1
1 irq_vectors:local_timer_entry
4 .3.2. Set t ing hardware performance policy (x86_energy_perf_policy)
The x86 _en erg y_p erf _p o l ic y tool allows administrators to define the relative importance of
performance and energy efficiency. This information can then be used to influence processors that
support this feature when they select options that trade off between performance and energy
efficiency.
By default, it operates on all processors in performance mode. It requires processor support, which
is indicated by the presence of CPUID.06H.ECX.bit3, and must be run with root privileges.
x86 _en erg y_p e rf _p o l icy is provided by the kernel-tools package. For details of how to use
x86 _en erg y_p e rf _p o l icy, see Section A.10, “ x86_energy_perf_policy” or refer to the man page:
$ man x86_energy_perf_policy
4 .3.3. Set t ing process affinit y wit h t askset
The taskset tool is provided by the util-linux package. Taskset allows administrators to retrieve and
set the processor affinity of a running process, or launch a process with a specified processor
affinity.
Important
taskset does not guarantee local memory allocation. If you require the additional
performance benefits of local memory allocation, Red Hat recommends using n u mact l
instead of taskset.
For more information about taskset, see Section A.16, “taskset” or the man page:
$ man taskset
4 .3.4 . Managing NUMA affinit y wit h numact l
Administrators can use n u ma ct l to run a process with a specified scheduling or memory placement
policy. N u ma ct l can also set a persistent policy for shared memory segments or files, and set the
processor affinity and memory affinity of a process.
In a system with NUMA topology, a processor's memory access slows as the distance between the
processor and the memory bank increases. Therefore, it is important to configure applications that
are sensitive to performance so that they allocate memory from the closest possible memory bank. It
is best to use memory and CPUs that are in the same NUMA node.
Multi-threaded applications that are sensitive to performance may benefit from being configured to
execute on a specific NUMA node rather than a specific processor. Whether this is suitable depends
on your system and the requirements of your application. If multiple application threads access the
Performance T uning G uide
32

same cached data, then configuring those threads to execute on the same processor may be
suitable. However, if multiple threads that access and cache different data execute on the same
processor, each thread may evict cached data accessed by a previous thread. This means that each
thread 'misses' the cache, and wastes execution time fetching data from disk and replacing it in the
cache. You can use the p erf tool, as documented in Section A.7, “ perf” , to check for an excessive
number of cache misses.
N u mact l provides a number of options to assist you in managing processor and memory affinity.
See Section A.12, “ numastat” or the man page for details:
$ man numactl
Note
The n u mact l package includes the libnuma library. This library offers a simple
programming interface to the NUMA policy supported by the kernel, and can be used for more
fine-grained tuning than the n u mact l application. For more information, see the man page:
$ man numa
4 .3.5. Aut omat ic NUMA affinit y management wit h numad
numad is an automatic NUMA affinity management daemon. It monitors NUMA topology and resource
usage within a system in order to dynamically improve NUMA resource allocation and management.
numad also provides a pre-placement advice service that can be queried by various job
management systems to provide assistance with the initial binding of CPU and memory resources for
their processes. This pre-placement advice is available regardless of whether numad is running as
an executable or a service.
For details of how to use numad, see Section A.14, “ numad” or refer to the man page:
$ man numad
4 .3.6. T uning scheduling policy
The Linux scheduler implements a number of scheduling policies, which determine where and for
how long a thread runs. There are two major categories of scheduling policies: normal policies and
realtime policies. Normal threads are used for tasks of normal priority. Realtime policies are used for
time-sensitive tasks that must complete without interruptions.
Realtime threads are not subject to time slicing. This means they will run until they block, exit,
voluntarily yield, or are pre-empted by a higher priority thread. The lowest priority realtime thread is
scheduled before any thread with a normal policy.
4.3.6 .1. Sche duling po licies
4 .3.6 .1.1. St atic prio rity sch ed u ling wit h SC H ED_FIFO
Chapt er 4 . CPU
33

SCHED_FIFO (also called static priority scheduling) is a realtime policy that defines a fixed priority
for each thread. This policy allows administrators to improve event response time and reduce
latency, and is recommended for time sensitive tasks that do not run for an extended period of time.
When SCHED_FIFO is in use, the scheduler scans the list of all SCHED_FIFO threads in priority
order and schedules the highest priority thread that is ready to run. The priority level of a
SCHED_FIFO thread can be any integer from 1 to 99, with 99 treated as the highest priority. Red Hat
recommends starting at a low number and increasing priority only when you identify latency issues.
Warning
Because realtime threads are not subject to time slicing, Red Hat does not recommend setting
a priority of 99. This places your process at the same priority level as migration and watchdog
threads; if your thread goes into a computational loop and these threads are blocked, they will
not be able to run. Systems with a single processor will eventually hang in this situation.
Administrators can limit SCHED_FIFO bandwidth to prevent realtime application programmers from
initiating realtime tasks that monopolize the processor.
/p ro c/sys /k ern e l/sch ed _rt _p e ri o d _u s
This parameter defines the time period in microseconds that is considered to be one
hundred percent of processor bandwidth. The default value is 1000000 μs, or 1 second.
/p ro c/sys /k ern e l/sch ed _rt _ru n t ime _u s
This parameter defines the time period in microseconds that is devoted to running realtime
threads. The default value is 950000 μs, or 0.95 seconds.
4 .3.6 .1.2. Ro u n d rob in p riorit y sch ed u ling wit h SC HED_RR
SC HED _R R is a round-robin variant of SCHED_FIFO. This policy is useful when multiple threads
need to run at the same priority level.
Like SCHED_FIFO, SC HED _R R is a realtime policy that defines a fixed priority for each thread. The
scheduler scans the list of all SC HED _R R threads in priority order and schedules the highest priority
thread that is ready to run. However, unlike SCHED_FIFO, threads that have the same priority are
scheduled round-robin style within a certain time slice.
You can set the value of this time slice in milliseconds with the sched_rr_timeslice_ms kernel
parameter (/proc/sys/kernel/sched_rr_timeslice_ms). The lowest value is 1 millisecond.
4 .3.6 .1.3. No rmal sch ed u ling with SC HED_O THER
SCHED_OTHER is the default scheduling policy in Red Hat Enterprise Linux 7. This policy uses the
Completely Fair Scheduler (CFS) to allow fair processor access to all threads scheduled with this
policy. This policy is most useful when there are a large number of threads or data throughput is a
priority, as it allows more efficient scheduling of threads over time.
When this policy is in use, the scheduler creates a dynamic priority list based partly on the niceness
value of each process thread. Administrators can change the niceness value of a process, but
cannot change the scheduler's dynamic priority list directly.
For details about changing process niceness, see the Red Hat Enterprise Linux 7 Deployment Guide,
available from http://access.redhat.com/site/documentation/Red_Hat_Enterprise_Linux/.
Performance T uning G uide
34

4.3.6 .2. Iso lat ing CPUs
You can isolate one or more CPUs from the scheduler with the isolcpus boot parameter. This
prevents the scheduler from scheduling any user-space threads on this CPU.
Once a CPU is isolated, you must manually assign processes to the isolated CPU, either with the
CPU affinity system calls or the numactl command.
To isolate the third and sixth to eighth CPUs on your system, add the following to the kernel
command line:
isolcpus=2,5-7
You can also use the Tuna tool to isolate a CPU. Tuna can isolate a CPU at any time, not just at
boot time. However, this method of isolation is subtly different from the isolcpus parameter, and
does not currently achieve the performance gains associated with isolcpus. See Section 4.3.8,
“ Configuring CPU, thread, and interrupt affinity with Tuna” for more details about this tool.
4 .3.7. Set t ing int errupt affinit y
Interrupt requests have an associated affinity property, smp_affinity, that defines the processors
that will handle the interrupt request. To improve application performance, assign interrupt affinity
and process affinity to the same processor, or processors on the same core. This allows the specified
interrupt and application threads to share cache lines.
The interrupt affinity value for a particular interrupt request is stored in the associated
/pro c/i rq /irq_number/smp_affinity file. smp_affinity is stored as a hexadecimal bit
mask representing all processors in the system. The default value is f, meaning that an interrupt
request can be handled on any processor in the system. Setting this value to 1 means that only
processor 0 can handle the interrupt.
On systems with more than 32 processors, you must delimit smp_affinity values for discrete 32 bit
groups. For example, if you want only the first 32 processors of a 64 processor system to service an
interrupt request, you could run:
# echo 0xffffffff,00000000 > /proc/irq/IRQ_NUMBER/smp_affinity
Alternatively, if the BIOS exports its NUMA topology, the irq b al an ce service can use that information
to serve interrupt requests on the node that is local to the hardware requesting service. For details
about i rq b a lan ce, see Section A.1, “ irqbalance”
Note
On systems that support interrupt steering, modifying the smp_affinity of an interrupt
request sets up the hardware so that the decision to service an interrupt with a particular
processor is made at the hardware level with no intervention from the kernel. For more
information about interrupt steering, see Chapter 7, Networking.
4 .3.8. Configuring CPU, t hread, and int errupt affinit y wit h T una
Tuna can control CPU, thread, and interrupt affinity, and provides a number of actions for each type
of entity it can control. For a full list of Tuna's capabilities, see Section A.2, “Tuna” .
Chapt er 4 . CPU
35

To move all threads away from one or more specified CPUs, run the following command, replacing
CPUs with the number of the CPU you want to isolate.
# tuna --cpus CPUs --isolate
To include a CPU in the list of CPUs that can run certain threads, run the following command,
replacing CPUs with the number of the CPU you want to include.
# tuna --cpus CPUs --include
To move an interrupt request to a specified CPU, run the following command, replacing CPU with the
number of the CPU, and IRQs with the comma-delimited list of interrupt requests you want to move.
# tuna --irqs IRQs --cpus CPU --move
Alternatively, you can use the following command to find all interrupt requests of the pattern sfc1*.
# tuna -q sfc1* -c7 -m -x
To change the policy and priority of a thread, run the following command, replacing thread with the
thread you want to change, policy with the name of the policy you want the thread to operate under,
and level with an integer from 0 (lowest priority) to 99 (highest priority).
# tuna --threads thread --priority policy:level
Performance T uning G uide
36

Chapter 5. Memory
This chapter outlines the memory management capabilities of Red Hat Enterprise Linux 7.
Section 5.1, “ Considerations” discusses memory related factors that affect performance. Section 5.2,
“ Monitoring and diagnosing performance problems” teaches you how to use Red Hat
Enterprise Linux 7 tools to diagnose performance problems related to memory utilization or
configuration details. Section 5.5, “Configuring system memory capacity” and Section 5.3,
“ Configuring HugeTLB huge pages” discuss the tools and strategies you can use to solve memory
related performance problems in Red Hat Enterprise Linux 7.
5.1. Considerat ions
By default, Red Hat Enterprise Linux 7 is optimized for moderate workloads. If your application or
workload requires a large amount of memory, changing the way your system manages virtual
memory may improve the performance of your application.
5.1.1. Larger Page Siz e
Physical memory is managed in chunks called pages. On most architectures supported by Red Hat
Enterprise Linux 7, the default size of a memory page is 4 KB. This default page size has proved to be
suitable for general-purpose operating systems, such as Red Hat Enterprise Linux 7, which support
many different kinds of workloads.
However, specific applications can benefit from using larger page sizes in certain cases. For
example, an application that works with a large and relatively fixed data set of hundreds of
megabytes or even dozens of gigabytes can have performance issues when using 4 KB pages. Such
data sets can require hundreds of thousands of 4 KB pages, which can lead to overhead in the
operating system and the CPU.
Red Hat Enterprise Linux 7 enables the use of larger page sizes for applications working with big
data sets. Using larger page sizes can improve the performance of such applications.
Two different large page features are available in Red Hat Enterprise Linux 7: the HugeTLB feature,
also called static huge pages in this guide, and the Transparent Huge Page feature.
5.1.2. T ranslat ion Lookaside Buffer siz e
Reading address mappings from the page table is time-consuming and resource-expensive, so
CPUs are built with a cache for recently-used addresses: the Translation Lookaside Buffer (TLB).
However, the default TLB can only cache a certain number of address mappings. If a requested
address mapping is not in the TLB (that is, the TLB is missed), the system still needs to read the page
table to determine the physical to virtual address mapping.
Because of the relationship between application memory requirements and the size of pages used to
cache address mappings, applications with large memory requirements are more likely to suffer
performance degradation from TLB misses than applications with minimal memory requirements. It is
therefore important to avoid TLB misses wherever possible.
Both HugeTLB and Transparent Huge Page features allow applications to use pages larger than 4
KB. This allows addresses stored in the TLB to reference more memory, which reduces TLB misses
and improves application performance.
5.2. Monit oring and diagnosing performance problems
Chapt er 5. Memory
37

Red Hat Enterprise Linux 7 provides a number of tools that are useful for monitoring system
performance and diagnosing performance problems related to system memory. This section outlines
the available tools and gives examples of how to use them to monitor and diagnose memory related
performance issues.
5.2.1. Monit oring memory usage wit h vmst at
Vmst at , provided by the procps-ng package, outputs reports on your system's processes, memory,
paging, block input/output, interrupts, and CPU activity. It provides an instantaneous report of the
average of these events since the machine was last booted, or since the previous report.
The following command displays a table of various event counters and memory statistics.
$ vmstat -s
For further details of how to use vms t at , see Section A.9, “vmstat” or the man page:
$ man vmstat
5.2.2. Profiling applicat ion memory usage wit h Valgrind
Va lg ri n d is a framework that provides instrumentation to user-space binaries. It ships with a number
of tools that can be used to profile and analyze program performance. The valg ri n d tools outlined
in this section can help you to detect memory errors such as uninitialized memory use and improper
memory allocation or deallocation.
To use val g ri n d or any of its tools, install the valgrind package:
# yum install valgrind
5.2 .2 .1. Pro filing m e m o ry usage wit h Mem che ck
Memcheck is the default valg rin d tool. It detects and reports on a number of memory errors that
can be difficult to detect and diagnose, such as:
Memory access that should not occur
Undefined or uninitialized value use
Incorrectly freed heap memory
Pointer overlap
Memory leaks
Note
Memcheck can only report these errors; it cannot prevent them from occurring. If your
program accesses memory in a way that would normally cause a segmentation fault, the
segmentation fault still occurs. However, memcheck will log an error message immediately
prior to the fault.
Performance T uning G uide
38

Because memcheck uses instrumentation, applications executed with memcheck run ten to thirty
times slower than usual.
To run memcheck on an application, execute the following command:
# valgrind --tool=memcheck application
You can also use the following options to focus memcheck output on specific types of problem.
- - lea k- ch ec k
After the application finishes executing, memcheck searches for memory leaks. The default
value is --leak-check=summary, which prints the number of memory leaks found. You
can specify --leak-check=yes or --leak-check=full to output details of each
individual leak. To disable, specify --leak-check=no.
- - u n d ef - val u e- e rro rs
The default value is --undef-value-errors=yes, which reports errors when undefined
values are used. You can also specify --undef-value-errors=no, which will disable
this report and slightly speed up Memcheck.
- - ig n o re- ran g es
Specifies one or more ranges that memcheck should ignore when checking for memory
addressability, for example, --ignore-ranges=0xPP-0xQQ,0xRR-0xSS.
For a full list of memcheck options, see the documentation included at
/usr/share/doc/valgrind-version/valgrind_manual.pdf.
5.2 .2 .2. Pro filing cache usage wit h Cache grind
C ach eg ri n d simulates application interaction with a system's cache hierarchy and branch
predictor. It tracks usage of the simulated first level instruction and data caches to detect poor code
interaction with this level of cache. It also tracks the last level of cache (second or third level) in order
to track memory access. As such, applications executed with cac h eg ri n d run twenty to one hundred
times slower than usual.
C ach eg ri n d gathers statistics for the duration of application execution and outputs a summary to
the console. To run ca ch eg ri n d on an application, execute the following command:
# valgrind --tool=cachegrind application
You can also use the following options to focus cac h eg rin d output on a specific problem.
- - I1
Specifies the size, associativity, and line size of the first level instruction cache, like so: --
I1=size,associativity,line_size.
- - D 1
Specifies the size, associativity, and line size of the first level data cache, like so: --
D1=size,associativity,line_size.
- - LL
Chapt er 5. Memory
39

Specifies the size, associativity, and line size of the last level cache, like so: --
LL=size,associativity,line_size.
- - cach e- si m
Enables or disables the collection of cache access and miss counts. This is enabled (--
cache-sim=yes) by default. Disabling both this and --branch-sim leaves ca ch eg ri n d
with no information to collect.
- - b ra n ch - sim
Enables or disables the collection of branch instruction and incorrect prediction counts.
This is enabled (--branch-sim=yes) by default. Disabling both this and --cache-sim
leaves cac h eg ri n d with no information to collect.
C ach eg ri n d writes detailed profiling information to a per-process cacheg ri nd . o ut. pid
file, where pid is the process identifier. This detailed information can be further processed by
the companion cg _an n o t at e tool, like so:
# cg_annotate cachegrind.out.pid
C ach eg ri n d also provides the cg_diff tool, which makes it easier to chart program performance
before and after a code change. To compare output files, execute the following command, replacing
first with the initial profile output file, and second with the subsequent profile output file.
# cg_diff first second
The resulting output file can be viewed in greater detail with the c g _a n n o t at e tool.
For a full list of ca ch eg rin d options, see the documentation included at
/usr/share/doc/valgrind-version/valgrind_manual.pdf.
5.2 .2 .3. Pro filing he ap and st ack space wit h Massif
Massif measures the heap space used by a specified application. It measures both useful space
and any additional space allocated for bookkeeping and alignment purposes. ma ssif helps you
understand how you can reduce your application's memory use to increase execution speed and
reduce the likelihood that your application will exhaust system swap space. Applications executed
with massi f run about twenty times slower than usual.
To run ma ssif on an application, execute the following command:
# valgrind --tool=massif application
You can also use the following options to focus mass if output on a specific problem.
- - h eap
Specifies whether mass if profiles the heap. The default value is --heap=yes. Heap
profiling can be disabled by setting this to --heap=no.
- - h eap - ad min
Specifies the number of bytes per block to use for administration when heap profiling is
enabled. The default value is 8 bytes.
- - st acks
Performance T uning G uide
4 0

Specifies whether mass if profiles the stack. The default value is --stack=no, as stack
profiling can greatly slow massi f . Set this option to --stack=yes to enable stack
profiling. Note that massi f assumes that the main stack starts with a size of zero in order to
better indicate the changes in stack size that relate to the application being profiled.
- - t ime - un it
Specifies the interval at which ma ssif gathers profiling data. The default value is i
(instructions executed). You can also specify ms (milliseconds, or realtime) and B (bytes
allocated or deallocated on the heap and stack). Examining bytes allocated is useful for
short run applications and for testing purposes, as it is most reproducible across different
hardware.
Massif outputs profiling data to a massif.out.pid file, where pid is the process identifier of the
specified application. The ms _p ri n t tool graphs this profiling data to show memory consumption
over the execution of the application, as well as detailed information about the sites responsible for
allocation at points of peak memory allocation. To graph the data from the massif.out.pid file,
execute the following command:
# ms_print massif.out.pid
For a full list of Massi f options, see the documentation included at /usr/share/doc/valgrind-
version/valgrind_manual.pdf.
5.3. Configuring HugeTLB huge pages
Starting with Red Hat Enterprise Linux 7.1, there are two ways of reserving huge pages: at bo o t
ti me and at run time. Reserving at boot time increases the possibility of success because the
memory has not yet been significantly fragmented. However, on NUMA machines, the number of
pages is automatically split among NUMA nodes. The run-time method allows you to reserve huge
pages per NUMA node. If the run-time reservation is done as early as possible in the boot process,
the probability of memory fragmentation is lower.
5.3.1. Configuring huge pages at boot t ime
To configure huge pages at boot time, add the following parameters to the kernel boot command line:
hugepages
Defines the number of persistent huge pages configured in the kernel at boot time. The
default value is 0. It is only possible to allocate huge pages if there are sufficient physically
contiguous free pages in the system. Pages reserved by this parameter cannot be used for
other purposes.
This value can be adjusted after boot by changing the value of the
/proc/sys/vm/nr_hugepages file.
In a NUMA system, huge pages assigned with this parameter are divided equally between
nodes. You can assign huge pages to specific nodes at runtime by changing the value of
the node's /sys/devices/system/node/node_id/hugepages/hugepages-
1048576kB/nr_hugepages file.
For more information, read the relevant kernel documentation, which is installed in
/usr/share/doc/kernel-doc-
kernel_version/Documentation/vm/hugetlbpage.txt by default.
Chapt er 5. Memory
4 1

h u g ep ag e sz
Defines the size of persistent huge pages configured in the kernel at boot time. Valid values
are 2 MB and 1 GB. The default value is 2 MB.
d ef au l t _h u g ep ag esz
Defines the default size of persistent huge pages configured in the kernel at boot time. Valid
values are 2 MB and 1 GB. The default value is 2 MB.
Pro cedu re 5.1. Reservin g 1 G B Pag es D u ring Early Bo o t
The page size the HugeTLB subsystem supports depends on the architecture. On the AMD64 and
Intel 64 architecture, 2 MB huge pages and 1 GB gigantic pages are supported.
1. Create a HugeTLB pool for 1 GB pages by appending the following line to the kernel
command-line options:
default_hugepagesz=1G hugepagesz=1G
2. Create a file named /usr/lib/systemd/system/hugetlb-gigantic-pages.service
with the following content:
[Unit]
Description=HugeTLB Gigantic Pages Reservation
DefaultDependencies=no
Before=dev-hugepages.mount
ConditionPathExists=/sys/devices/system/node
ConditionKernelCommandLine=hugepagesz=1G
[Service]
Type=oneshot
RemainAfterExit=yes
ExecStart=/usr/lib/systemd/hugetlb-reserve-pages
[Install]
WantedBy=sysinit.target
3. Create a file named /usr/lib/systemd/hugetlb-reserve-pages with the following
content:
nodes_path=/sys/devices/system/node/
if [ ! -d $nodes_path ]; then
echo "ERROR: $nodes_path does not exist"
exit 1
fi
reserve_pages()
{
echo $1 > $nodes_path/$2/hugepages/hugepages-
1048576kB/nr_hugepages
}
# This example reserves 2 1G pages on node0 and 1 1G page on node1.
You
# can modify it to your needs or add more lines to reserve memory
Performance T uning G uide
4 2

in
# other nodes. Don't forget to uncomment the lines, otherwise then
won't
# be executed.
# reserve_pages 2 node0
# reserve_pages 1 node1
4. Modify /usr/lib/systemd/hugetlb-reserve-pages according to the comments in the
file.
5. Run the following commands to enable early boot reservation:
# chmod +x /usr/lib/systemd/hugetlb-reserve-pages
# systemctl enable hugetlb-gigantic-pages
Note
You can try reserving more 1G pages at runtime by writing to nr_hugepages at any
time. However, such reservations can fail due to memory fragmention. The most reliable
way to reserve 1G pages is by doing it at early boot as described in step 4.
5.3.2. Configuring huge pages at run t ime
Use the following parameters to influence huge page behavior at run time:
/sys/d evic es/syst em/n o d e /node_id/h u g ep ag es/h u g ep ag es- size/n r_h u g ep ag es
Defines the number of huge pages of the specified size assigned to the specified NUMA
node. This is supported as of Red Hat Enterprise Linux 7.1. The following example moves
adds twenty 2048 kB huge pages to node2.
# numastat -cm | egrep 'Node|Huge'
Node 0 Node 1 Node 2 Node 3 Total add
AnonHugePages 0 2 0 8 10
HugePages_Total 0 0 0 0 0
HugePages_Free 0 0 0 0 0
HugePages_Surp 0 0 0 0 0
# echo 20 > /sys/devices/system/node/node2/hugepages/hugepages-
2048kB/nr_hugepages
# numastat -cm | egrep 'Node|Huge'
Node 0 Node 1 Node 2 Node 3 Total
AnonHugePages 0 2 0 8 10
HugePages_Total 0 0 40 0 40
HugePages_Free 0 0 40 0 40
HugePages_Surp 0 0 0 0 0
/p ro c/sys /vm/n r_o verco mmi t _h u g e p ag es
Defines the maximum number of additional huge pages that can be created and used by
the system through overcommitting memory. Writing any non-zero value into this file
indicates that the system obtains that number of huge pages from the kernel's normal page
pool if the persistent huge page pool is exhausted. As these surplus huge pages become
unused, they are then freed and returned to the kernel's normal page pool.
Chapt er 5. Memory
4 3

5.4. Configuring T ransparent Huge Pages
Transparent Huge Pages (THP) is an alternative solution to HugeTLB. With THP, the kernel
automatically assigns huge pages to processes, so huge pages do not need to be reserved
manually.
The THP feature has two modes of operation: system-wide and per-process. When THP is enabled
system-wide, the kernel tries to assign huge pages to any process when it is possible to allocate
huge pages and the process is using a large contiguous virtual memory area. If THP is enabled per-
process, the kernel only assigns huge pages to individual processes' memory areas specified with
the madvise() system call.
Note that the THP feature only supports 2-MB pages. Transparent huge pages are enabled by
default. To check the current status, run:
# cat /sys/kernel/mm/transparent_hugepage/enabled
To enable transparent huge pages, run:
# echo always > /sys/kernel/mm/transparent_hugepage/enabled
To prevent applications from allocating more memory resources than necessary, you can disable
huge pages system-wide and only enable them inside MADV_HUGEPAGE madvise regions by
running:
# echo madvise > /sys/kernel/mm/transparent_hugepage/enabled
To disable transparent huge pages, run:
# echo never > /sys/kernel/mm/transparent_hugepage/enabled
Sometimes, providing low latency to short-lived allocations has higher priority than immediately
achieving the best performance with long-lived allocations. In such cases, d i rect co mpacti o n
can be disabled while leaving THP enabled.
Direct compaction is a synchronous memory compaction during the huge page allocation. Disabling
direct compaction provides no guarantee of saving memory, but can decrease the risk of higher
latencies during frequent page faults. Note that if the workload benefits significantly from THP, the
performance decreases. To disable direct compaction, run:
# echo madvise > /sys/kernel/mm/transparent_hugepage/defrag
For comprehensive information on transparent huge pages, see the /usr/share/doc/kernel-
d o c-kernel_version/Documentation/vm/transhuge.txt file, which is available after
installing the kernel-doc package.
5.5. Configuring syst em memory capacit y
This section discusses memory-related kernel parameters that may be useful in improving memory
utilization on your system. These parameters can be temporarily set for testing purposes by altering
the value of the corresponding file in the /proc file system. Once you have determined the values
that produce optimal performance for your use case, you can set them permanently by using the
sysctl command.
Performance T uning G uide
4 4

Memory usage is typically configured by setting the value of one or more kernel parameters. These
parameters can be set temporarily by altering the contents of files in the /proc file system, or they can
be set persistently with the sysctl tool, which is provided by the procps-ng package.
For example, to set the overcommit_memory parameter to 1 temporarily, run the following command:
# echo 1 > /proc/sys/vm/overcommit_memory
To set this value persistently, add sysctl vm.overcommit_memory=1 in /etc/sysctl.conf then run
the following command:
# sysctl -p
Setting a parameter temporarily is useful for determining the effect the parameter has on your system.
You can then set the parameter persistently when you are sure that the parameter's value has the
desired effect.
Note
To expand your expertise, you might also be interested in the Red Hat Enterprise Linux
Performance Tuning (RH442) training course.
5.5.1. Virt ual Memory paramet ers
The parameters listed in this section are located in /proc/sys/vm unless otherwise indicated.
d irt y_rat io
A percentage value. When this percentage of total system memory is modified, the system
begins writing the modifications to disk with the pdflush operation. The default value is
20 percent.
d irt y_b ac kg ro u n d _rat i o
A percentage value. When this percentage of total system memory is modified, the system
begins writing the modifications to disk in the background. The default value is 10 percent.
o verco mmi t _memo ry
Defines the conditions that determine whether a large memory request is accepted or
denied.
The default value is 0. By default, the kernel performs heuristic memory overcommit
handling by estimating the amount of memory available and failing requests that are too
large. However, since memory is allocated using a heuristic rather than a precise algorithm,
overloading memory is possible with this setting.
When this parameter is set to 1, the kernel performs no memory overcommit handling. This
increases the possibility of memory overload, but improves performance for memory-
intensive tasks.
When this parameter is set to 2, the kernel denies requests for memory equal to or larger
than the sum of total available swap space and the percentage of physical RAM specified in
overcommit_ratio. This reduces the risk of overcommitting memory, but is recommended
only for systems with swap areas larger than their physical memory.
Chapt er 5. Memory
4 5
o verco mmi t _ra t io
Specifies the percentage of physical RAM considered when overcommit_memory is set to
2. The default value is 50 .
max_map _co u n t
Defines the maximum number of memory map areas that a process can use. The default
value (6 5530 ) is appropriate for most cases. Increase this value if your application needs
to map more than this number of files.
min _f re e_kb yt es
Specifies the minimum number of kilobytes to keep free across the system. This is used to
determine an appropriate value for each low memory zone, each of which is assigned a
number of reserved free pages in proportion to their size.
Warning
Extreme values can damage your system. Setting min_free_kbytes to an
extremely low value prevents the system from reclaiming memory, which can result in
system hangs and OOM-killing processes. However, setting min_free_kbytes too
high (for example, to 5–10% of total system memory) causes the system to enter an
out-of-memory state immediately, resulting in the system spending too much time
reclaiming memory.
o o m_ad j
In the event that the system runs out of memory and the panic_on_oom parameter is set to
0, the o o m_ki l l er function kills processes until the system can recover, starting from the
process with the highest oom_score.
The oom_adj parameter helps determine the oom_score of a process. This parameter is
set per process identifier. A value of -17 disables the o o m_ki l l er for that process. Other
valid values are from -16 to 15.
Note
Processes spawned by an adjusted process inherit the oom_score of the process.
swap p in e ss
The swappiness value, ranging from 0 to 100, controls the degree to which the system
favors anonymous memory or the page cache. A high value improves file-system
performance while aggressively swapping less active processes out of RAM. A low value
avoids swapping processes out of memory, which usually decreases latency at the cost of
I/O performance. The default value is 60.
Performance T uning G uide
4 6

Warning
Setting swappiness==0 will very aggressively avoids swapping out, which
increase the risk of OOM killing under strong memory and I/O pressure.
5.5.2. File syst em paramet ers
Parameters listed in this section are located in /proc/sys/fs unless otherwise indicated.
aio - ma x- n r
Defines the maximum allowed number of events in all active asynchronous input/output
contexts. The default value is 6 5536 . Modifying this value does not pre-allocate or resize
any kernel data structures.
f ile - max
Determines the maximum number of file handles for the entire system. The default value on
Red Hat Enterprise Linux 7 is the maximum of either 8192, or one tenth of the free memory
pages available at the time the kernel starts.
Raising this value can resolve errors caused by a lack of available file handles.
5.5.3. Kernel Paramet ers
Default values for the following parameters, located in the /proc/sys/kernel/ directory, can be
calculated by the kernel at boot time depending on available system resources.
msg max
Defines the maximum allowable size in bytes of any single message in a message queue.
This value must not exceed the size of the queue (msgmnb). To determine the current
msgmax value on your system, use:
# sysctl kernel.msgmax
msg mn b
Defines the maximum size in bytes of a single message queue. To determine the current
msgmnb value on your system, use:
# sysctl kernel.msgmnb
msg mn i
Defines the maximum number of message queue identifiers, and therefore the maximum
number of queues. To determine the current msgmni value on your system, use:
# sysctl kernel.msgmni
sh ma ll
Defines the total amount of shared memory (in bytes) that can be used on the system at one
time. To determine the current shmall value on your system, use:
Chapt er 5. Memory
4 7

# sysctl kernel.shmall
sh mmax
Defines the maximum size (in bytes) of a single shared memory segment allowed by the
kernel. To determine the current shmmax value on your system, use:
# sysctl kernel.shmmax
sh mmn i
Defines the system-wide maximum number of shared memory segments. The default value is
4096 on all systems.
t h re ad s- max
Defines the system-wide maximum number of threads available to the kernel at one time. To
determine the current threads-max value on your system, use:
# sysctl kernel.threads-max
The default value is the result of:
mempages / (8 * THREAD_SIZE / PAGE SIZE )
The minimum value is 20 .
Performance T uning G uide
4 8

Chapter 6. Storage and File Systems
This chapter outlines supported file systems and configuration options that affect application
performance for both I/O and file systems in Red Hat Enterprise Linux 7. Section 6.1,
“ Considera tions” discusses the I/O and file system related factors that affect performance.
Section 6.2, “Monitoring and diagnosing performance problems” teaches you how to use Red Hat
Enterprise Linux 7 tools to diagnose performance problems related to I/O or file system configuration
details. Section 6.4, “Configuration tools” discusses the tools and strategies you can use to solve I/O
and file system related performance problems in Red Hat Enterprise Linux 7.
6.1. Considerat ions
The appropriate settings for storage and file system performance are highly dependent on the
purpose of the storage. I/O and file system performance can be affected by any of the following
factors:
Data write or read patterns
Data alignment with underlying geometry
Block size
File system size
Journal size and location
Recording access times
Ensuring data reliability
Pre-fetching data
Pre-allocating disk space
File fragmentation
Resource contention
Read this chapter to gain an understanding of the formatting and mount options that affect file
system throughput, scalability, responsiveness, resource usage, and availability.
6.1.1. I/O Schedulers
The I/O scheduler determines when and for how long I/O operations run on a storage device. It is
also known as the I/O elevator.
Red Hat Enterprise Linux 7 provides three I/O schedulers.
d ead l in e
The default I/O scheduler for all block devices, except for SATA disks. D ead l i ne attempts
to provide a guaranteed latency for requests from the point at which requests reach the I/O
scheduler. This scheduler is suitable for most use cases, but particularly those in which
read operations occur more often than write operations.
Queued I/O requests are sorted into a read or write batch and then scheduled for execution
in increasing LBA order. Read batches take precedence over write batches by default, as
Chapt er 6 . St orage an d File Syst ems
4 9

applications are more likely to block on read I/O. After a batch is processed, d ead l i ne
checks how long write operations have been starved of processor time and schedules the
next read or write batch as appropriate. The number of requests to handle per batch, the
number of read batches to issue per write batch, and the amount of time before requests
expire are all configurable; see Section 6.4.4, “Tuning the deadline scheduler” for details.
cf q
The default scheduler only for devices identified as SATA disks. The Completely Fair
Queueing scheduler, cfq, divides processes into three separate classes: real time, best
effort, and idle. Processes in the real time class are always performed before processes in
the best effort class, which are always performed before processes in the idle class. This
means that processes in the real time class can starve both best effort and idle processes of
processor time. Processes are assigned to the best effort class by default.
Cfq uses historical data to anticipate whether an application will issue more I/O requests in
the near future. If more I/O is expected, cfq idles to wait for the new I/O, even if I/O from
other processes is waiting to be processed.
Because of this tendency to idle, the cfq scheduler should not be used in conjunction with
hardware that does not incur a large seek penalty unless it is tuned for this purpose. It
should also not be used in conjunction with other non-work-conserving schedulers, such
as a host-based hardware RAID controller, as stacking these schedulers tends to cause a
large amount of latency.
Cfq behavior is highly configurable; see Section 6.4.5, “Tuning the cfq scheduler” for
details.
noop
The no o p I/O scheduler implements a simple FIFO (first-in first-out) scheduling algorithm.
Requests are merged at the generic block layer through a simple last-hit cache. This can be
the best scheduler for CPU-bound systems using fast storage.
For details on setting a different default I/O scheduler, or specifying a different scheduler for a
particular device, see Section 6.4, “ Configuration tools” .
6.1.2. File syst ems
Read this section for details about supported file systems in Red Hat Enterprise Linux 7, their
recommended use cases, and the format and mount options available to file systems in general.
Detailed tuning recommendations for these file systems are available in Section 6.4.7, “ Configuring
file systems for performance” .
6.1 .2 .1. XFS
XFS is a robust and highly scalable 64-bit file system. It is the default file system in Red Hat
Enterprise Linux 7. XFS uses extent-based allocation, and features a number of allocation schemes,
including pre-allocation and delayed allocation, both of which reduce fragmentation and aid
performance. It also supports metadata journaling, which can facilitate crash recovery. XFS can be
defragmented and enlarged while mounted and active, and Red Hat Enterprise Linux 7 supports
several XFS-specific backup and restore utilities.
As of Red Hat Enterprise Linux 7.0 GA, XFS is supported to a maximum file system size of 500 TB,
and a maximum file offset of 8 EB (sparse files). For details about administering XFS, see the Red Hat
Enterprise Linux 7 Storage Administration Guide, available from
http://access.redhat.com/site/documentation/Red_Hat_Enterprise_Linux/. For assistance tuning XFS
for a specific purpose, see Section 6.4.7.1, “Tuning XFS” .
Performance T uning G uide
50

6.1 .2 .2. Ext 4
Ext4 is a scalable extension of the ext3 file system. Its default behavior is optimal for most work loads.
However, it is supported only to a maximum file system size of 50 TB, and a maximum file size of
16 TB. For details about administering ext4, see the Red Hat Enterprise Linux 7 Storage Administration
Guide, available from http://access.redhat.com/site/documentation/Red_Hat_Enterprise_Linux/. For
assistance tuning ext4 for a specific purpose, see Section 6.4.7.2, “ Tuning ext4”.
6.1 .2 .3. Bt rfs (T e chno lo gy Pre view)
The default file system for Red Hat Enterprise Linux 7 is XFS. Btrfs (B-tree file system), a relatively new
copy-on-write (COW) file system, is shipped as a Technology Preview. Some of the unique Btrfs
features include:
The ability to take snapshots of specific files, volumes or sub-volumes rather than the whole file
system;
supporting several versions of redundant array of inexpensive disks (RAID);
back referencing map I/O errors to file system objects;
transparent compression (all files on the partition are automatically compressed);
checksums on data and meta-data.
Although Btrfs is considered a stable file system, it is under constant development, so some
functionality, such as the repair tools, are basic compared to more mature file systems.
Currently, selecting Btrfs is suitable when advanced features (such as snapshots, compression, and
file data checksums) are required, but performance is relatively unimportant. If advanced features are
not required, the risk of failure and comparably weak performance over time make other file systems
preferable. Another drawback, compared to other file systems, is the maximum supported file system
size of 50 TB.
For more information, see Section 6.4.7.3, “ Tuning Btrfs” , and the chapter on Btrfs in the Red Hat
Enterprise Linux 7 Storage Administration Guide.
6.1 .2 .4. GFS2
Global File System 2 (GFS2) is part of the High Availability Add-On that provides clustered file
system support to Red Hat Enterprise Linux 7. GFS2 provides a consistent file system image across
all servers in a cluster, which allows servers to read from and write to a single shared file system.
GFS2 is supported to a maximum file system size of 100 TB.
For details on administering GFS2, see the Red Hat Enterprise Linux 7 Storage Administration Guide.
For information on tuning GFS2 for a specific purpose, see Section 6.4.7.4, “Tuning GFS2”.
6.1.3. Generic t uning considerat ions for file syst ems
This section covers tuning considerations common to all file systems. For tuning recommendations
specific to your file system, see Section 6.4.7, “Configuring file systems for performance” .
6.1 .3.1. Co nside rat io ns at fo rm at t im e
Chapt er 6 . St orage an d File Syst ems
51

Some file system configuration decisions cannot be changed after the device is formatted. This
section covers the options available to you for decisions that must be made before you format your
storage device.
Siz e
Create an appropriately-sized file system for your workload. Smaller file systems have
proportionally shorter backup times and require less time and memory for file system
checks. However, if your file system is too small, its performance will suffer from high
fragmentation.
Blo ck siz e
The block is the unit of work for the file system. The block size determines how much data
can be stored in a single block, and therefore the smallest amount of data that is written or
read at one time.
The default block size is appropriate for most use cases. However, your file system will
perform better and store data more efficiently if the block size (or the size of multiple blocks)
is the same as or slightly larger than amount of data that is typically read or written at one
time. A small file will still use an entire block. Files can be spread across multiple blocks, but
this can create additional runtime overhead. Additionally, some file systems are limited to a
certain number of blocks, which in turn limits the maximum size of the file system.
Block size is specified as part of the file system options when formatting a device with the
mkfs command. The parameter that specifies the block size varies with the file system; see
the mkfs man page for your file system for details. For example, to see the options available
when formatting an XFS file system, execute the following command.
$ man mkfs.xfs
G e o met ry
File system geometry is concerned with the distribution of data across a file system. If your
system uses striped storage, like RAID, you can improve performance by aligning data and
metadata with the underlying storage geometry when you format the device.
Many devices export recommended geometry, which is then set automatically when the
devices are formatted with a particular file system. If your device does not export these
recommendations, or you want to change the recommended settings, you must specify
geometry manually when you format the device with mk f s.
The parameters that specify file system geometry vary with the file system; see the mkfs man
page for your file system for details. For example, to see the options available when
formatting an ext4 file system, execute the following command.
$ man mkfs.ext4
Ext ern al jo u rn als
Journaling file systems document the changes that will be made during a write operation in
a journal file prior to the operation being executed. This reduces the likelihood that a
storage device will become corrupted in the event of a system crash or power failure, and
speeds up the recovery process.
Performance T uning G uide
52

Metadata-intensive workloads involve very frequent updates to the journal. A larger journal
uses more memory, but reduces the frequency of write operations. Additionally, you can
improve the seek time of a device with a metadata-intensive workload by placing its journal
on dedicated storage that is as fast as, or faster than, the primary storage.
Warning
Ensure that external journals are reliable. Losing an external journal device will
cause file system corruption.
External journals must be created at format time, with journal devices being specified at
mount time. For details, see the mkfs and mount man pages.
$ man mkfs
$ man mount
6.1 .3.2. Co nside rat io ns at mo unt t im e
This section covers tuning decisions that apply to most file systems and can be specified as the
device is mounted.
Barriers
File system barriers ensure that file system metadata is correctly written and ordered on
persistent storage, and that data transmitted with fsync persists across a power outage.
On previous versions of Red Hat Enterprise Linux, enabling file system barriers could
significantly slow applications that relied heavily on fsync, or created and deleted many
small files.
In Red Hat Enterprise Linux 7, file system barrier performance has been improved such that
the performance effects of disabling file system barriers are negligible (less than 3% ).
For further information, see the Red Hat Enterprise Linux 7 Storage Administration Guide,
available from http://access.redhat.com/site/documentation/Red_Hat_Enterprise_Linux/.
Access Time
Every time a file is read, its metadata is updated with the time at which access occurred
(atime). This involves additional write I/O. In most cases, this overhead is minimal, as by
default Red Hat Enterprise Linux 7 updates the atime field only when the previous access
time was older than the times of last modification (mtime) or status change (ctime).
However, if updating this metadata is time consuming, and if accurate access time data is
not required, you can mount the file system with the noatime mount option. This disables
updates to metadata when a file is read. It also enables no d i rati me behavior, which
disables updates to metadata when a directory is read.
R ead - ah ea d
Read-ahead behavior speeds up file access by pre-fetching data that is likely to be needed
soon and loading it into the page cache, where it can be retrieved more quickly than if it
were on disk. The higher the read-ahead value, the further ahead the system pre-fetches
data.
Chapt er 6 . St orage an d File Syst ems
53

Red Hat Enterprise Linux attempts to set an appropriate read-ahead value based on what it
detects about your file system. However, accurate detection is not always possible. For
example, if a storage array presents itself to the system as a single LUN, the system detects
the single LUN, and does not set the appropriate read-ahead value for an array.
Workloads that involve heavy streaming of sequential I/O often benefit from high read-
ahead values. The storage-related tuned profiles provided with Red Hat Enterprise Linux 7
raise the read-ahead value, as does using LVM striping, but these adjustments are not
always sufficient for all workloads.
The parameters that define read-ahead behavior vary with the file system; see the mount
man page for details.
$ man mount
6.1 .3.3. Maint e nance
Regularly discarding blocks that are not in use by the file system is a recommended practice for both
solid-state disks and thinly-provisioned storage. There are two methods of discarding unused
blocks: batch discard and online discard.
Bat ch d iscard
This type of discard is part of the f st rim command. It discards all unused blocks in a file
system that match criteria specified by the administrator.
Red Hat Enterprise Linux 7 supports batch discard on XFS and ext4 formatted devices that
support physical discard operations (that is, on HD D devices where the value of
/sys/block/devname/queue/discard_max_bytes is not zero, and SSD devices
where the value of /sys/block/devname/queue/discard_granularity is not 0).
O n line d iscard
This type of discard operation is configured at mount time with the d i scard option, and
runs in real time without user intervention. However, online discard only discards blocks
that are transitioning from used to free. Red Hat Enterprise Linux 7 supports online discard
on XFS and ext4 formatted devices.
Red Hat recommends batch discard except where online discard is required to maintain
performance, or where batch discard is not feasible for the system's workload.
Pre - al lo cat io n
Pre-allocation marks disk space as being allocated to a file without writing any data into
that space. This can be useful in limiting data fragmentation and poor read performance.
Red Hat Enterprise Linux 7 supports pre-allocating space on XFS, ext4, and GFS2 devices
at mount time; see the mount man page for the appropriate parameter for your file system.
Applications can also benefit from pre-allocating space by using the fallocate(2)
glibc call.
6.2. Monit oring and diagnosing performance problems
Red Hat Enterprise Linux 7 provides a number of tools that are useful for monitoring system
performance and diagnosing performance problems related to I/O and file systems and their
configuration. This section outlines the available tools and gives examples of how to use them to
monitor and diagnose I/O and file system related performance issues.
Performance T uning G uide
54

6.2.1. Monit oring syst em performance wit h vmst at
Vmstat reports on processes, memory, paging, block I/O, interrupts, and CPU activity across the
entire system. It can help administrators determine whether the I/O subsystem is responsible for any
performance issues.
The information most relevant to I/O performance is in the following columns:
si
Swap in, or reads from swap space, in KB.
so
Swap out, or writes to swap space, in KB.
b i
Block in, or block write operations, in KB.
b o
Block out, or block read operations, in KB.
wa
The portion of the queue that is waiting for I/O operations to complete.
Swap in and swap out are particularly useful when your swap space and your data are on the same
device, and as indicators of memory usage.
Additionally, the free, buff, and cache columns can help identify write-back frequency. A sudden drop
in cache values and an increase in free values indicates that write-back and page cache invalidation
has begun.
If analysis with vms t at shows that the I/O subsystem is responsible for reduced performance,
administrators can use i ost at to determine the responsible I/O device.
vms t at is provided by the procps-ng package. For detailed information about using vmst at , see the
man page:
$ man vmstat
6.2.2. Monit oring I/O performance wit h iost at
Io st at is provided by the sysstat package. It reports on I/O device load in your system. If analysis
with vmst at shows that the I/O subsystem is responsible for reduced performance, you can use
io st at to determine the I/O device responsible.
You can focus the output of io st at reports on a specific device by using the parameters defined in
the i ost at man page:
$ man iostat
6.2 .2 .1. Det aile d I/O analysis wit h blkt race
Chapt er 6 . St orage an d File Syst ems
55

B lkt race provides detailed information about how time is spent in the I/O subsystem. The
companion utility b lkp a rs e reads the raw output from b lkt rac e and produces a human readable
summary of input and output operations recorded by b lkt rac e.
For more detailed information about this tool, see the man page:
$ man blktrace
$ man blkparse
6.2 .2 .2. Analyzing blkt race o ut put wit h bt t
Btt is provided as part of the blktrace package. It analyzes b l kt ra ce output and displays the amount
of time that data spends in each area of the I/O stack, making it easier to spot bottlenecks in the I/O
subsystem.
For example, if btt shows that the time between requests being sent to the block layer (Q2Q) is larger
than the total time that requests spent in the block layer (Q2C), the I/O subsystem may not be
responsible for performance issues. If the device takes a long time to service a request (D2C), the
device may be overloaded, or the workload sent to the device may be sub-optimal. If block I/O is
queued for a long time before being assigned a request (Q2G), it may indicate that the storage in use
is unable to serve the I/O load.
For more detailed information about this tool, see the man page:
$ man btt
6.2 .2 .3. Analyzing blkt race o ut put wit h seekwat che r
The seekwatcher tool can use b lkt rac e output to graph I/O over time. It focuses on the Logical
Block Address (LBA) of disk I/O, throughput in megabytes per second, the number of seeks per
second, and I/O operations per second. This can help to identify when you are hitting the operations-
per-second limit of a device.
For more detailed information about this tool, see the man page:
$ man seekwatcher
6.2.3. St orage monit oring wit h Syst emT ap
The Red Hat Enterprise Linux 7 SystemTap Beginner's Guide includes several sample scripts that are
useful for profiling and monitoring storage performance.
The following Syst e mT a p example scripts relate to storage performance and may be useful in
diagnosing storage or file system performance problems. By default they are installed to the
/usr/share/doc/systemtap-client/examples/io directory.
d i skto p. stp
Checks the status of reading/writing disk every 5 seconds and outputs the top ten entries
during that period.
i o ti me. stp
Prints the amount of time spent on read and write operations, and the number of bytes read
and written.
Performance T uning G uide
56

and written.
tracei o . stp
Prints the top ten executables based on cumulative I/O traffic observed, every second.
tracei o 2. stp
Prints the executable name and process identifier as reads and writes to the specified
device occur.
i no d ewatch. stp
Prints the executable name and process identifier each time a read or write occurs to the
specified inode on the specified major/minor device.
inodewatch2.stp
Prints the executable name, process identifier, and attributes each time the attributes are
changed on the specified inode on the specified major/minor device.
The Red Hat Enterprise Linux 7 SystemTap Beginner's Guide is available from
http://access.redhat.com/site/documentation/Red_Hat_Enterprise_Linux/.
6.3. Solid-St at e Disks
Solid-state disks (SSD) use NAND flash chips rather than rotating magnetic platters to store
persistent data. They provide a constant access time for data across their full Logical Block Address
range, and do not incur measurable seek costs like their rotating counterparts. They are more
expensive per gigabyte of storage space and have a lesser storage density, but they also have lower
latency and greater throughput than HDDs.
Performance generally degrades as the used blocks on an SSD approach the capacity of the disk.
The degree of degradation varies by vendor, but all devices experience degradation in this
circumstance. Enabling discard behavior can help to alleviate this degradation. For details, see
Section 6.1.3.3, “ Maintenance” .
The default I/O scheduler and virtual memory options are suitable for use with SSDs.
For more information on SSD , see the Solid-State Disk Deployment Guidelines chapter in the Red Hat
Enterprise Linux 7 Storage Administration Guide.
SSD T uning Considerat ions
Consider the following factors when configuring settings that can affect SSD performance:
I/O Sched u ler
Any I/O scheduler is expected to perform well with most SSDs. However, as with any other storage
type, Red Hat recommends benchmarking to determine the optimal configuration for a given
workload. When using SSDs, Red Hat advises changing the I/O scheduler only for benchmarking
particular workloads. For instructions on how to switch between I/O schedulers, see the
/usr/share/doc/kernel-version/Documentation/block/switching-sched.txt file.
As of Red Hat Enterprise Linuxnbsp 7.0, the default I/O scheduler is D ead l i ne, except for use with
SATA drives, which use CFQ as the default I/O scheduler. For faster storage, Deadline can
outperform CFQ leading to better I/O performance without the need for specific tuning. Sometimes, the
default is not suitable for certain disks, such as SAS rotational disks. In such cases, change the I/O
Chapt er 6 . St orage an d File Syst ems
57

scheduler to CFQ.
Virt u al Memo ry
Like the I/O scheduler, virtual memory (VM) subsystem requires no special tuning. Given the fast
nature of I/O on SSD, try turning down the vm_dirty_background_ratio and vm_d i rty_rati o
settings, as increased write-out activity does not usually have a negative impact on the latency of
other operations on the disk. However, this tuning can generate more overall I/O, and is therefore not
generally recommended without workload-specific testing.
Swap
An SSD can also be used as a swap device, and is likely to produce good page-out and page-in
performance.
6.4. Configurat ion t ools
Red Hat Enterprise Linux provides a number of tools to assist administrators in configuring the
storage and file systems. This section outlines the available tools and provides examples of how they
can be used to solve I/O and file system related performance problems in Red Hat Enterprise Linux 7.
6.4 .1. Configuring t uning profiles for st orage performance
Tuned and t u n e d - ad m provide a number of profiles designed to improve performance for specific
use cases. The following profiles are particularly useful for improving storage performance.
latency-performance
throughput-performance (the default)
To configure a profile on your system, run the following command, replacing name with the name of
the profile you want to use.
$ tuned-adm profile name
The tuned-adm recommend command recommends an appropriate profile for your system. This
also sets the default profile for your system at install time, so can be used to return to the default
profile.
For further details about these profiles or additional configuration options, see Section A.6, “tuned-
adm” .
6.4 .2. Set t ing t he default I/O scheduler
The default I/O scheduler is the scheduler that is used if no other scheduler is explicitly specified for
the device.
If no default scheduler is specified, the cfq scheduler is used for SATA drives, and the d ead l i ne
scheduler is used for all other drives. If you specify a default scheduler by following the instructions
in this section, that default scheduler is applied to all devices.
To set the default I/O scheduler, you can use the Tuned tool, or modify the /etc/grub/default
file manually.
Performance T uning G uide
58

Red Hat recommends using the Tuned tool to specify the default I/O scheduler on a booted system.
To set the elevator parameter, enable the d i sk plug-in. For information on the d i sk plug-in, see
Section 3.1.1, “Plug-ins” in the Tuned chapter.
To modify the default scheduler by using GRUB 2, append the elevator parameter to the kernel
command line, either at boot time, or when the system is booted. You can use the Tuned tool, or
modify the /etc/grub/default file manually, as described in Procedure 6.1, “Setting the Default
I/O Scheduler by Using GRUB 2” .
Pro cedu re 6 .1. Set t in g t h e Def au lt I/O Sched u ler by Using G RUB 2
To set the default I/O Scheduler on a booted system and make the configuration persist after reboot:
1. Add the elevator parameter to the GRUB_CMDLINE_LINUX line in the
/etc/grub/default file.
# cat /etc/default/grub
...
GRUB_CMDLINE_LINUX="crashkernel=auto rd.lvm.lv=vg00/lvroot
rd.lvm.lv=vg00/lvswap elevator=noop"
...
In Red Hat Enterprise Linux 7, the available schedulers are d ead l i ne, no o p, and cfq. For
more information, see the cfq-iosched.txt and d ead l i ne-i o sched . txt files in the
documentation for your kernel, available after installing the kernel-doc package.
2. Create a new configuration with the elevator parameter added.
The location of the GRUB 2 configuration file is different on systems with the BIOS firmware
and on systems with UEFI. Use one of the following commands to recreate the GRUB 2
configuration file.
On a system with the BIOS firmware, use:
# grub2-mkconfig -o /boot/grub2/grub.cfg
On a system with the UEFI firmware, use:
# grub2-mkconfig -o /boot/efi/EFI/redhat/grub.cfg
3. Reboot the system for the change to take effect.
For more information on version 2 of the GNU GRand Unified Bootloader (GRUB 2), see the
Working with the GRUB 2 Boot Loader chapter of the Red Hat Enterprise Linux 7 System
Administrator's Guide.
6.4 .3. Configuring t he I/O scheduler for a device
To set the scheduler or scheduler preference for a particular storage device, edit the
/sys/block/devname/queue/scheduler file, where devname is the name of the device you want
to configure.
# echo cfq > /sys/block/hda/queue/scheduler
6.4 .4 . T uning t he deadline scheduler
Chapt er 6 . St orage an d File Syst ems
59

When d ead l i ne is in use, queued I/O requests are sorted into a read or write batch and then
scheduled for execution in increasing LBA order. Read batches take precedence over write batches
by default, as applications are more likely to block on read I/O. After a batch is processed,
d ead l i ne checks how long write operations have been starved of processor time and schedules
the next read or write batch as appropriate.
The following parameters affect the behavior of the d ead l i ne scheduler.
f if o _b at ch
The number of read or write operations to issue in a single batch. The default value is 16 . A
higher value can increase throughput, but will also increase latency.
f ro n t _merg es
If your workload will never generate front merges, this tunable can be set to 0. However,
unless you have measured the overhead of this check, Red Hat recommends the default
value of 1.
read _exp ire
The number of milliseconds in which a read request should be scheduled for service. The
default value is 500 (0.5 seconds).
writ e _exp ire
The number of milliseconds in which a write request should be scheduled for service. The
default value is 5000 (5 seconds).
writ e s_st arved
The number of read batches that can be processed before processing a write batch. The
higher this value is set, the greater the preference given to read batches.
6.4 .5. T uning t he cfq scheduler
When cfq is in use, processes are placed into three classes: real time, best effort, and idle. All real
time processes are scheduled before any best effort processes, which are scheduled before any idle
processes. By default, processes are classed as best effort. You can manually adjust the class of a
process with the i o ni ce command.
You can further adjust the behavior of the cfq scheduler with the following parameters. These
parameters are set on a per-device basis by altering the specified files under the
/sys/block/devname/queue/iosched directory.
back_seek_max
The maximum distance in kilobytes that cfq will perform a backward seek. The default
value is 16 KB. Backward seeks typically damage performance, so large values are not
recommended.
back_seek_penalty
The multiplier applied to backward seeks when the disk head is deciding whether to move
forward or backward. The default value is 2. If the disk head position is at 1024 KB, and
there are equidistant requests in the system (1008 KB and 1040 KB, for example), the
back_seek_penalty is applied to backward seek distances and the disk moves forward.
f if o _exp i re _a syn c
Performance T uning G uide
60

The length of time in milliseconds that an asynchronous (buffered write) request can remain
unserviced. After this amount of time expires, a single starved asynchronous request is
moved to the dispatch list. The default value is 250 milliseconds.
f if o _exp i re _s yn c
The length of time in milliseconds that a synchronous (read or O_DIRECT write) request
can remain unserviced. After this amount of time expires, a single starved synchronous
request is moved to the dispatch list. The default value is 125 milliseconds.
g ro u p _id le
This parameter is set to 0 (disabled) by default. When set to 1 (enabled), the cfq scheduler
idles on the last process that is issuing I/O in a control group. This is useful when using
proportional weight I/O control groups and when slice_idle is set to 0 (on fast storage).
g ro u p _iso la t io n
This parameter is set to 0 (disabled) by default. When set to 1 (enabled), it provides
stronger isolation between groups, but reduces throughput, as fairness is applied to both
random and sequential workloads. When group_isolation is disabled (set to 0),
fairness is provided to sequential workloads only. For more information, see the installed
documentation in /usr/share/doc/kernel-doc-
versi o n/D o cumentati o n/cg ro ups/bl ki o -co ntro l l er. txt.
lo w_lat e n cy
This parameter is set to 1 (enabled) by default. When enabled, cfq favors fairness over
throughput by providing a maximum wait time of 300 ms for each process issuing I/O on a
device. When this parameter is set to 0 (disabled), target latency is ignored and each
process receives a full time slice.
quantum
This parameter defines the number of I/O requests that cfq sends to one device at one time,
essentially limiting queue depth. The default value is 8 requests. The device being used
may support greater queue depth, but increasing the value of quantum will also increase
latency, especially for large sequential write work loads.
sli ce_as yn c
This parameter defines the length of the time slice (in milliseconds) allotted to each process
issuing asynchronous I/O requests. The default value is 40 milliseconds.
sli ce_id le
This parameter specifies the length of time in milliseconds that cfq idles while waiting for
further requests. The default value is 0 (no idling at the queue or service tree level). The
default value is ideal for throughput on external RAID storage, but can degrade throughput
on internal non-RAID storage as it increases the overall number of seek operations.
sli ce_syn c
This parameter defines the length of the time slice (in milliseconds) allotted to each process
issuing synchronous I/O requests. The default value is 100 ms.
6.4 .5 .1. T uning cfq fo r fast st o rage
Chapt er 6 . St orage an d File Syst ems
61

The cfq scheduler is not recommended for hardware that does not suffer a large seek penalty, such
as fast external storage arrays or solid-state disks. If your use case requires cfq to be used on this
storage, you will need to edit the following configuration files:
Set /sys/block/devname/queue/ionice/slice_idle to 0
Set /sys/block/devname/queue/ionice/quantum to 6 4
Set /sys/block/devname/queue/ionice/group_idle to 1
6.4 .6. T uning t he noop scheduler
The no o p I/O scheduler is primarily useful for CPU-bound systems using fast storage. Requests are
merged at the block layer, so no o p behavior is modified by editing block layer parameters in the files
under the /sys/block/sdX/queue/ directory.
ad d _ra n d o m
Some I/O events contribute to the entropy pool for /dev/random. This parameter can be
set to 0 if the overhead of these contributions becomes measurable.
max_sect o rs_kb
Specifies the maximum size of an I/O request in kilobytes. The default value is 512 KB. The
minimum value for this parameter is determined by the logical block size of the storage
device. The maximum value for this parameter is determined by the value of
max_hw_sectors_kb.
Some solid-state disks perform poorly when I/O requests are larger than the internal erase
block size. In these cases, Red Hat recommends reducing max_hw_sectors_kb to the
internal erase block size.
n o merg e s
Most workloads benefit from request merging. However, disabling merges can be useful for
debugging purposes. Set this parameter to 0 to disable merging. It is enabled (set to 1) by
default.
n r_re q u est s
Specifies the maximum number of read and write requests that can be queued at one time.
The default value is 128; that is, 128 read requests and 128 write requests can be queued
before the next process to request a read or write is put to sleep.
For latency-senstitive applications, lower the value of this parameter and limit the command
queue depth on the storage so that write-back I/O cannot fill the device queue with write
requests. When the device queue fills, other processes attempting to perform I/O operations
are put to sleep until queue space becomes available. Requests are then allocated in a
round-robin fashion, preventing one process from continuously consuming all spots in the
queue.
o p t ima l_io _si z e
Some storage devices report an optimal I/O size through this parameter. If this value is
reported, Red Hat recommends that applications issue I/O aligned to and in multiples of the
optimal I/O size wherever possible.
read _ah ead _kb
Defines the number of kilobytes that the operating system will read ahead during a
Performance T uning G uide
62

sequential read operation in order to store information likely to be needed soon in the page
cache. D evice mappers often benefit from a high read_ahead_kb value; 128 KB for each
device to be mapped is a good starting point.
ro t a t io n al
Some solid-state disks do not correctly advertise their solid-state status, and are mounted
as traditional rotational disks. If your solid-state device does does not set this to 0
automatically, set it manually to disable unnecessary seek-reducing logic in the scheduler.
rq _af f in i t y
By default, I/O completions can be processed on a different processor than the processor
that issued the I/O request. Set rq_affinity to 1 to disable this ability and perform
completions only on the processor that issued the I/O request. This can improve the
effectiveness of processor data caching.
6.4 .7. Configuring file syst ems for performance
This section covers the tuning parameters specific to each file system supported in Red Hat
Enterprise Linux 7. Parameters are divided according to whether their values should be configured
when you format the storage device, or when you mount the formatted device.
Where loss in performance is caused by file fragmentation or resource contention, performance can
generally be improved by reconfiguring the file system. However, in some cases the application may
need to be altered. In this case, Red Hat recommends contacting Customer Support for assistance.
6.4 .7 .1. T uning XFS
This section covers some of the tuning parameters available to XFS file systems at format and at
mount time.
The default formatting and mount settings for XFS are suitable for most workloads. Red Hat
recommends changing them only if specific configuration changes are expected to benefit your
workload.
6 .4 .7.1.1. Fo rmat t in g op t io n s
For further details about any of these formatting options, see the man page:
$ man mkfs.xfs
Directo ry b lo ck siz e
The directory block size affects the amount of directory information that can be retrieved or
modified per I/O operation. The minimum value for directory block size is the file system
block size (4 KB by default). The maximum value for directory block size is 64 KB.
At a given directory block size, a larger directory requires more I/O than a smaller directory.
A system with a larger directory block size also consumes more processing power per I/O
operation than a system with a smaller directory block size. It is therefore recommended to
have as small a directory and directory block size as possible for your workload.
Red Hat recommends the directory block sizes listed in Table 6.1, “ Recommended maximum
directory entries for directory block sizes” for file systems with no more than the listed
number of entries for write-heavy and read-heavy workloads.
Chapt er 6 . St orage an d File Syst ems
63

T able 6 .1. Recommend ed maximu m d irect o ry ent ries f o r direct o ry blo ck siz es
Directo ry b lo ck siz e Max. en t ries ( read-
h eavy)
Max. en t ries ( writ e-
h eavy)
4 KB 100000–200000 1000000–2000000
16 KB 100000–1000000 1000000–10000000
64 KB >1000000 >10000000
For detailed information about the effect of directory block size on read and write workloads
in file systems of different sizes, see the XFS documentation.
To configure directory block size, use the mkfs.xfs -l option. See the mkfs.xfs man
page for details.
Allocat io n g ro u p s
An allocation group is an independent structure that indexes free space and allocated
inodes across a section of the file system. Each allocation group can be modified
independently, allowing XFS to perform allocation and deallocation operations
concurrently as long as concurrent operations affect different allocation groups. The
number of concurrent operations that can be performed in the file system is therefore equal
to the number of allocation groups. However, since the ability to perform concurrent
operations is also limited by the number of processors able to perform the operations,
Red Hat recommends that the number of allocation groups be greater than or equal to the
number of processors in the system.
A single directory cannot be modified by multiple allocation groups simultaneously.
Therefore, Red Hat recommends that applications that create and remove large numbers of
files do not store all files in a single directory.
To configure allocation groups, use the mkfs.xfs -d option. See the mkfs.xfs man
page for details.
G rowt h con st raint s
If you may need to increase the size of your file system after formatting time (either by
adding more hardware or through thin-provisioning), you must carefully consider initial file
layout, as allocation group size cannot be changed after formatting is complete.
Allocation groups must be sized according to the eventual capacity of the file system, not
the initial capacity. The number of allocation groups in the fully-grown file system should
not exceed several hundred, unless allocation groups are at their maximum size (1 TB).
Therefore for most file systems, the recommended maximum growth to allow for a file system
is ten times the initial size.
Additional care must be taken when growing a file system on a RAID array, as the device
size must be aligned to an exact multiple of the allocation group size so that new allocation
group headers are correctly aligned on the newly added storage. The new storage must
also have the same geometry as the existing storage, since geometry cannot be changed
after formatting time, and therefore cannot be optimized for storage of a different geometry
on the same block device.
Ino d e siz e an d inlin e at t rib u t es
If the inode has sufficient space available, XFS can write attribute names and values
directly into the inode. These inline attributes can be retrieved and modified up to an order
of magnitude faster than retrieving separate attribute blocks, as additional I/O is not
required.
Performance T uning G uide
64

The default inode size is 256 bytes. Only around 100 bytes of this is available for attribute
storage, depending on the number of data extent pointers stored in the inode. Increasing
inode size when you format the file system can increase the amount of space available for
storing attributes.
Both attribute names and attribute values are limited to a maximum size of 254 bytes. If
either name or value exceeds 254 bytes in length, the attribute is pushed to a separate
attribute block instead of being stored inline.
To configure inode parameters, use the mkfs.xfs -i option. See the mkfs.xfs man
page for details.
RAID
If software RAID is in use, mkfs.xfs automatically configures the underlying hardware
with an appropriate stripe unit and width. However, stripe unit and width may need to be
manually configured if hardware RAID is in use, as not all hardware RAID devices export
this information. To configure stripe unit and width, use the mkfs.xfs -d option. See the
mkfs.xfs man page for details.
Lo g siz e
Pending changes are aggregated in memory until a synchronization event is triggered, at
which point they are written to the log. The size of the log determines the number of
concurrent modifications that can be in-progress at one time. It also determines the
maximum amount of change that can be aggregated in memory, and therefore how often
logged data is written to disk. A smaller log forces data to be written back to disk more
frequently than a larger log. However, a larger log uses more memory to record pending
modifications, so a system with limited memory will not benefit from a larger log.
Logs perform better when they are aligned to the underlying stripe unit; that is, they start
and end at stripe unit boundaries. To align logs to the stripe unit, use the mkfs.xfs -d
option. See the mkfs.xfs man page for details.
To configure the log size, use the following mkfs.xfs option, replacing logsize with the
size of the log:
# mkfs.xfs -l size=logsize
For further details, see the mkfs.xfs man page:
$ man mkfs.xfs
Lo g st rip e un it
Log writes on storage devices that use RAID5 or RAID6 layouts may perform better when
they start and end at stripe unit boundaries (are aligned to the underlying stripe unit).
mkfs.xfs attempts to set an appropriate log stripe unit automatically, but this depends on
the RAID device exporting this information.
Setting a large log stripe unit can harm performance if your workload triggers
synchronization events very frequently, because smaller writes need to be padded to the
size of the log stripe unit, which can increase latency. If your workload is bound by log write
latency, Red Hat recommends setting the log stripe unit to 1 block so that unaligned log
writes are triggered as possible.
Chapt er 6 . St orage an d File Syst ems
65

The maximum supported log stripe unit is the size of the maximum log buffer size (256 KB).
It is therefore possible that the underlying storage may have a larger stripe unit than can be
configured on the log. In this case, mkfs.xfs issues a warning and sets a log stripe unit of
32 KB.
To configure the log stripe unit, use one of the following options, where N is the number of
blocks to use as the stripe unit, and size is the size of the stripe unit in KB.
mkfs.xfs -l sunit=Nb
mkfs.xfs -l su=size
For further details, see the mkfs.xfs man page:
$ man mkfs.xfs
6 .4 .7.1.2. Mo u n t o p t ion s
Ino d e allo cat io n
compress=zlib – Better compression ratio. It is the default and safe for older kernels.
compress=lzo – Faster compression but does not compress as much as zlib.
compress=no – Disables compression.
compress-force=method – Enable compression even for files that do not compress well,
such as videos and images of disks. The options are compress-force=zlib and
compress-force=lzo.
Highly recommended for file systems greater than 1 TB in size. The inode64 parameter
configures XFS to allocate inodes and data across the entire file system. This ensures that
inodes are not allocated largely at the beginning of the file system, and data is not largely
allocated at the end of the file system, improving performance on large file systems.
Lo g b u f f er siz e and n u mb er
The larger the log buffer, the fewer I/O operations it takes to write all changes to the log. A
larger log buffer can improve performance on systems with I/O-intensive workloads that do
not have a non-volatile write cache.
The log buffer size is configured with the logbsize mount option, and defines the
maximum amount of information that can be stored in the log buffer; if a log stripe unit is not
set, buffer writes can be shorter than the maximum, and therefore there is no need to reduce
the log buffer size for synchronization-heavy workloads. The default size of the log buffer is
32 KB. The maximum size is 256 KB and other supported sizes are 64 KB, 128 KB or power
of 2 multiples of the log stripe unit between 32 KB and 256 KB.
The number of log buffers is defined by the logbufs mount option. The default value is 8
log buffers (the maximum), but as few as two log buffers can be configured. It is usually not
necessary to reduce the number of log buffers, except on memory-bound systems that
cannot afford to allocate memory to additional log buffers. Reducing the number of log
buffers tends to reduce log performance, especially on workloads sensitive to log I/O
latency.
Delay chan g e lo g g in g
XFS has the option to aggregate changes in memory before writing them to the log. The
delaylog parameter allows frequently modified metadata to be written to the log
Performance T uning G uide
66

periodically instead of every time it changes. This option increases the potential number of
operations lost in a crash and increases the amount of memory used to track metadata.
However, it can also increase metadata modification speed and scalability by an order of
magnitude, and does not reduce data or metadata integrity when fsync, fdatasync, or
sync are used to ensure data and metadata is written to disk.
6.4 .7 .2. T uning e xt 4
This section covers some of the tuning parameters available to ext4 file systems at format and at
mount time.
6 .4 .7.2.1. Fo rmat t in g op t io n s
Ino d e t able in it ializ at io n
Initializing all inodes in the file system can take a very long time on very large file systems.
By default, the initialization process is deferred (lazy inode table initialization is enabled).
However, if your system does not have an ext4 driver, lazy inode table initialization is
disabled by default. It can be enabled by setting lazy_itable_init to 1). In this case,
kernel processes continue to initialize the file system after it is mounted.
This section describes only some of the options available at format time. For further formatting
parameters, see the mkfs.ext4 man page:
$ man mkfs.ext4
6 .4 .7.2.2. Mo u n t o p t ion s
Ino d e t able in it ializ at io n rat e
When lazy inode table initialization is enabled, you can control the rate at which
initialization occurs by specifying a value for the init_itable parameter. The amount of
time spent performing background initialization is approximately equal to 1 divided by the
value of this parameter. The default value is 10 .
Au t o mat ic f ile synch ro n iz at io n
Some applications do not correctly perform an fsync after renaming an existing file, or
after truncating and rewriting. By default, ext4 automatically synchronizes files after each of
these operations. However, this can be time consuming.
If this level of synchronization is not required, you can disable this behavior by specifying
the noauto_da_alloc option at mount time. If noauto_da_alloc is set, applications
must explicitly use fsync to ensure data persistence.
Jou rn al I/O priorit y
By default, journal I/O has a priority of 3, which is slightly higher than the priority of normal
I/O. You can control the priority of journal I/O with the journal_ioprio parameter at
mount time. Valid values for journal_ioprio range from 0 to 7, with 0 being the highest
priority I/O.
This section describes only some of the options available at mount time. For further mount options,
see the mount man page:
$ man mount
Chapt er 6 . St orage an d File Syst ems
67

6.4 .7 .3. T uning Bt rfs
Starting with Red Hat Enterprise Linux 7.0, Btrfs is provided as a Technology Preview. Tuning should
always be done to optimize the system based on its current workload. For information on creation
and mounting options, see the chapter on Btrfs in the Red Hat Enterprise Linux 7 Storage
Administration Guide.
Dat a Compression
The default compression algorithm is zlib, but a specific workload can give a reason to change the
compression algorithm. For example, if you have a single thread with heavy file I/O, using the lzo
algorithm can be more preferable. Options at mount time are:
compress=zlib – the default option with a high compression ratio, safe for older kernels.
compress=lzo – compression faster, but lower, than zlib.
compress=no – disables compression.
compress-force=method – enables compression even for files that do not compress well, such
as videos and disk images. The available methods are zl i b and lzo.
Only files created or changed after the mount option is added will be compressed. To compress
existing files, run the following command after you replace method with either zl i b or lzo:
$ btrfs filesystem defragment -cmethod
To re-compress the file using lzo, run:
$ btrfs filesystem defragment -r -v -clzo /
6.4 .7 .4. T uning GFS2
This section covers some of the tuning parameters available to GFS2 file systems at format and at
mount time.
Directo ry sp acin g
All directories created in the top-level directory of the GFS2 mount point are automatically
spaced to reduce fragmentation and increase write speed in those directories. To space
another directory like a top-level directory, mark that directory with the T attribute, as shown,
replacing dirname with the path to the directory you wish to space:
# chattr +T dirname
chattr is provided as part of the e2fsprogs package.
Redu ce co n t en t ion
GFS2 uses a global locking mechanism that can require communication between the
nodes of a cluster. Contention for files and directories between multiple nodes lowers
performance. You can minimize the risk of cross-cache invalidation by minimizing the areas
of the file system that are shared between multiple nodes.
Performance T uning G uide
68

Chapter 7. Networking
The networking subsystem is comprised of a number of different parts with sensitive connections.
Red Hat Enterprise Linux 7 networking is therefore designed to provide optimal performance for most
workloads, and to optimize its performance automatically. As such, it is not usually necessary to
manually tune network performance. This chapter discusses further optimizations that can be made
to functional networking systems.
Network performance problems are sometimes the result of hardware malfunction or faulty
infrastructure. Resolving these issues is beyond the scope of this document.
7.1. Considerat ions
To make good tuning decisions, you need a thorough understanding of packet reception in Red Hat
Enterprise Linux. This section explains how network packets are received and processed, and where
potential bottlenecks can occur.
A packet sent to a Red Hat Enterprise Linux system is received by the network interface card (NIC)
and placed in either an internal hardware buffer or a ring buffer. The NIC then sends a hardware
interrupt request, prompting the creation of a software interrupt operation to handle the interrupt
request.
As part of the software interrupt operation, the packet is transferred from the buffer to the network
stack. Depending on the packet and your network configuration, the packet is then forwarded,
discarded, or passed to a socket receive queue for an application and then removed from the
network stack. This process continues until either there are no packets left in the NIC hardware buffer,
or a certain number of packets (specified in /proc/sys/net/core/dev_weight) are transferred.
The Red Hat Enterprise Linux Network Performance Tuning Guide available on the Red Hat Customer
Portal contains information on packet reception in the Linux kernel, and covers the following areas of
NIC tuning: SoftIRQ misses (netdev budget), tuned tuning daemon, numad NUMA daemon, CPU
power states, interrupt balancing, pause frames, interrupt coalescence, adapter queue (netd ev
backlog), adapter RX and TX buffers, adapter TX queue, module parameters, adapter offloading,
Jumbo Frames, TCP and UDP protocol tuning, and NUMA locality.
7.1.1. Before you t une
Network performance problems are most often the result of hardware malfunction or faulty
infrastructure. Red Hat highly recommends verifying that your hardware and infrastructure are
working as expected before beginning to tune the network stack.
7.1.2. Bot t lenecks in packet recept ion
While the network stack is largely self-optimizing, there are a number of points during network packet
processing that can become bottlenecks and reduce performance.
T h e NIC h ard ware b u f f er o r rin g b u f f er
The hardware buffer might be a bottleneck if a large number of packets are being dropped.
For information about monitoring your system for dropped packets, see Section 7.2.4,
“ ethtool” .
T h e h ard ware o r so f t ware int errup t q u eu es
Interrupts can increase latency and processor contention. For information on how
Chapt er 7 . Net working
69

interrupts are handled by the processor, see Section 4.1.3, “Interrupt Request (IRQ)
Handling”. For information on how to monitor interrupt handling in your system, see
Section 4.2.3, “/proc/interrupts” . For configuration options that affect interrupt handling,
see Section 4.3.7, “Setting interrupt affinity” .
T h e socket receive qu eu e fo r th e ap p licat io n
A bottleneck in an application's receive queue is indicated by a large number of packets
that are not copied to the requesting application, or by an increase in UDP input errors
(InErro rs) in /proc/net/snmp. For information about monitoring your system for these
errors, see Section 7.2.1, “ ss” and Section 7.2.5, “ /proc/net/snmp” .
7.2. Monit oring and diagnosing performance problems
Red Hat Enterprise Linux 7 provides a number of tools that are useful for monitoring system
performance and diagnosing performance problems related to the networking subsystem. This
section outlines the available tools and gives examples of how to use them to monitor and diagnose
network related performance issues.
7.2.1. ss
ss is a command-line utility that prints statistical information about sockets, allowing administrators
to assess device performance over time. By default, ss lists open non-listening TCP sockets that
have established connections, but a number of useful options are provided to help administrators
filter out statistics about specific sockets.
Red Hat recommends ss over n et s t at in Red Hat Enterprise Linux 7.
ss is provided by the iproute package. For more information, see the man page:
$ man ss
7.2.2. ip
The ip utility lets administrators manage and monitor routes, devices, routing policies, and tunnels.
The ip mo ni to r command can continuously monitor the state of devices, addresses, and routes.
ip is provided by the iproute package. For details about using ip, see the man page:
$ man ip
7.2.3. dropwat ch
D ro p wat ch is an interactive tool that monitors and records packets that are dropped by the kernel.
For further information, see the d ro p wat ch man page:
$ man dropwatch
7.2.4 . et ht ool
The et h t o o l utility allows administrators to view and edit network interface card settings. It is useful
for observing the statistics of certain devices, such as the number of packets dropped by that device.
Performance T uning G uide
70

You can view the status of a specified device's counters with ethto o l -S and the name of the
device you want to monitor.
$ ethtool -S devname
For further information, see the man page:
$ man ethtool
7.2.5. /proc/net /snmp
The /proc/net/snmp file displays data that is used by snmp agents for IP, ICMP, TCP and UDP
monitoring and management. Examining this file on a regular basis can help administrators identify
unusual values and thereby identify potential performance problems. For example, an increase in
UDP input errors (InErro rs) in /proc/net/snmp can indicate a bottleneck in a socket receive
queue.
7.2.6. Net work monit oring wit h Syst emT ap
The Red Hat Enterprise Linux 7 SystemTap Beginner's Guide includes several sample scripts that are
useful for profiling and monitoring network performance.
The following Syst e mT a p example scripts relate to networking and may be useful in diagnosing
network performance problems. By default they are installed to the /usr/share/doc/systemtap-
client/examples/network directory.
netto p. stp
Every 5 seconds, prints a list of processes (process identifier and command) with the
number of packets sent and received and the amount of data sent and received by the
process during that interval.
socket-trace.stp
Instruments each of the functions in the Linux kernel's net/socket.c file, and prints trace
data.
d ro pwatch. stp
Every 5 seconds, prints the number of socket buffers freed at locations in the kernel. Use the
--all-modules option to see symbolic names.
The latencytap.stp script records the effect that different types of latency have on one or more
processes. It prints a list of latency types every 30 seconds, sorted in descending order by the total
time the process or processes spent waiting. This can be useful for identifying the cause of both
storage and network latency. Red Hat recommends using the --all-modules option with this
script to better enable the mapping of latency events. By default, this script is installed to the
/usr/share/doc/systemtap-client-version/examples/profiling directory.
For further information, see the Red Hat Enterprise Linux 7 SystemTap Beginner's Guide, available from
http://access.redhat.com/site/documentation/Red_Hat_Enterprise_Linux/.
7.3. Configurat ion t ools
Chapt er 7 . Net working
71

Red Hat Enterprise Linux provides a number of tools to assist administrators in configuring the
system. This section outlines the available tools and provides examples of how they can be used to
solve network related performance problems in Red Hat Enterprise Linux 7.
However, it is important to keep in mind that network performance problems are sometimes the result
of hardware malfunction or faulty infrastructure. Red Hat highly recommends verifying that your
hardware and infrastructure are working as expected before using these tools to tune the network
stack.
Further, some network performance problems are better resolved by altering the application than by
reconfiguring your network subsystem. It is generally a good idea to configure your application to
perform frequent posix calls, even if this means queuing data in the application space, as this allows
data to be stored flexibly and swapped in or out of memory as required.
7.3.1. T uned-adm profiles for net work performance
t u n ed - ad m provides a number of different profiles to improve performance in a number of specific
use cases. The following profiles can be useful for improving networking performance.
latency-performance
network-latency
network-throughput
For more information about these profiles, see Section A.6, “ tuned-adm”.
7.3.2. Configuring t he hardware buffer
If a large number of packets are being dropped by the hardware buffer, there are a number of
potential solutions.
Slo w t h e inp u t t raf f ic
Filter incoming traffic, reduce the number of joined multicast groups, or reduce the amount
of broadcast traffic to decrease the rate at which the queue fills. For details of how to filter
incoming traffic, see the Red Hat Enterprise Linux 7 Security Guide. For details about multicast
groups, see the Red Hat Enterprise Linux 7 Clustering documentation. For details about
broadcast traffic, see the Red Hat Enterprise Linux 7 System Administrator's Reference Guide, or
documentation related to the device you want to configure. All Red Hat Enterprise Linux 7
documentation is available from
http://access.redhat.com/site/documentation/Red_Hat_Enterprise_Linux/.
Resiz e t h e h ard ware bu f f er q u eu e
Reduce the number of packets being dropped by increasing the size of the queue so that
the it does not overflow as easily. You can modify the rx/tx parameters of the network device
with the ethtool command:
# ethtool --set-ring devname value
Ch ang e t h e drain rat e of t h e qu eu e
Device weight refers to the number of packets a device can receive at one time (in a single
scheduled processor access). You can increase the rate at which a queue is drained by
increasing its device weight, which is controlled by the dev_weight parameter. This
parameter can be temporarily altered by changing the contents of the
Performance T uning G uide
72

/proc/sys/net/core/dev_weight file, or permanently altered with s ysct l, which is
provided by the procps-ng package.
Altering the drain rate of a queue is usually the simplest way to mitigate poor network performance.
However, increasing the number of packets that a device can receive at one time uses additional
processor time, during which no other processes can be scheduled, so this can cause other
performance problems.
7.3.3. Configuring int errupt queues
If analysis reveals high latency, your system may benefit from poll-based rather than interrupt-based
packet receipt.
7.3.3.1. Co nfiguring busy po lling
Busy polling helps reduce latency in the network receive path by allowing socket layer code to poll
the receive queue of a network device, and disabling network interrupts. This removes delays caused
by the interrupt and the resultant context switch. However, it also increases CPU utilization. Busy
polling also prevents the CPU from sleeping, which can incur additional power consumption.
Busy polling is disabled by default. To enable busy polling on specific sockets, do the following.
Set sysctl.net.core.busy_poll to a value other than 0. This parameter controls the number
of microseconds to wait for packets on the device queue for socket poll and selects. Red Hat
recommends a value of 50 .
Add the SO_BUSY_POLL socket option to the socket.
To enable busy polling globally, you must also set sysctl.net.core.busy_read to a value other
than 0. This parameter controls the number of microseconds to wait for packets on the device queue
for socket reads. It also sets the default value of the SO_BUSY_POLL option. Red Hat recommends a
value of 50 for a small number of sockets, and a value of 100 for large numbers of sockets. For
extremely large numbers of sockets (more than several hundred), use epoll instead.
Busy polling behavior is supported by the following drivers. These drivers are also supported on
Red Hat Enterprise Linux 7.
bnx2x
be2net
ixgbe
mlx4
myri10ge
As of Red Hat Enterprise Linux 7.1, you can also run the following command to check whether a
specific device supports busy polling.
# ethtool -k device | grep "busy-poll"
If this returns busy-poll: on [fixed], busy polling is available on the device.
7.3.4 . Configuring socket receive queues
Chapt er 7 . Net working
73

If analysis suggests that packets are being dropped because the drain rate of a socket queue is too
slow, there are several ways to alleviate the performance issues that result.
Decrease th e sp eed o f in comin g t raf f ic
Decrease the rate at which the queue fills by filtering or dropping packets before they reach
the queue, or by lowering the weight of the device.
Increase t h e dep t h o f t h e app licat io n ' s so cket qu eue
If a socket queue that receives a limited amount of traffic in bursts, increasing the depth of
the socket queue to match the size of the bursts of traffic may prevent packets from being
dropped.
7.3.4 .1. Decre ase t he spe e d o f inco m ing t raffic
Filter incoming traffic or lower the network interface card's device weight to slow incoming traffic. For
details of how to filter incoming traffic, see the Red Hat Enterprise Linux 7 Security Guide, available from
http://access.redhat.com/site/documentation/Red_Hat_Enterprise_Linux/.
Device weight refers to the number of packets a device can receive at one time (in a single scheduled
processor access). Device weight is controlled by the dev_weight parameter. This parameter can
be temporarily altered by changing the contents of the /proc/sys/net/core/dev_weight file, or
permanently altered with sysct l , which is provided by the procps-ng package.
7.3.4 .2. Incre asing queue de pt h
Increasing the depth of an application socket queue is typically the easiest way to improve the drain
rate of a socket queue, but it is unlikely to be a long-term solution.
To increase the depth of a queue, increase the size of the socket receive buffer by making either of the
following changes:
Increase t h e valu e of /p ro c/sys/n et/co re/rmem_d ef ault
This parameter controls the default size of the receive buffer used by sockets. This value
must be smaller than or equal to the value of /proc/sys/net/core/rmem_max.
Use set so ckop t t o con f ig u re a larg er SO _RCVBU F valu e
This parameter controls the maximum size in bytes of a socket's receive buffer. Use the
g etso cko pt system call to determine the current value of the buffer. For further
information, see the socket(7) manual page.
7.3.5. Configuring Receive-Side Scaling (RSS)
Receive-Side Scaling (RSS), also known as multi-queue receive, distributes network receive
processing across several hardware-based receive queues, allowing inbound network traffic to be
processed by multiple CPUs. RSS can be used to relieve bottlenecks in receive interrupt processing
caused by overloading a single CPU, and to reduce network latency.
To determine whether your network interface card supports RSS, check whether multiple interrupt
request queues are associated with the interface in /proc/interrupts. For example, if you are
interested in the p1p1 interface:
# egrep 'CPU|p1p1' /proc/interrupts
CPU0 CPU1 CPU2 CPU3 CPU4 CPU5
89: 40187 0 0 0 0 0 IR-PCI-MSI-edge
Performance T uning G uide
74

p1p1-0
90: 0 790 0 0 0 0 IR-PCI-MSI-edge
p1p1-1
91: 0 0 959 0 0 0 IR-PCI-MSI-edge
p1p1-2
92: 0 0 0 3310 0 0 IR-PCI-MSI-edge
p1p1-3
93: 0 0 0 0 622 0 IR-PCI-MSI-edge
p1p1-4
94: 0 0 0 0 0 2475 IR-PCI-MSI-edge
p1p1-5
The preceding output shows that the NIC driver created 6 receive queues for the p1p1 interface
(p1p1-0 through p1p1-5). It also shows how many interrupts were processed by each queue, and
which CPU serviced the interrupt. In this case, there are 6 queues because by default, this particular
NIC driver creates one queue per CPU, and this system has 6 CPUs. This is a fairly common pattern
amongst NIC drivers.
Alternatively, you can check the output of ls -1
/sys/devices/*/*/device_pci_address/msi_irqs after the network driver is loaded. For
example, if you are interested in a device with a PCI address of 0000:01:00.0, you can list the
interrupt request queues of that device with the following command:
# ls -1 /sys/devices/*/*/0000:01:00.0/msi_irqs
101
102
103
104
105
106
107
108
109
RSS is enabled by default. The number of queues (or the CPUs that should process network activity)
for RSS are configured in the appropriate network device driver. For the bnx2x driver, it is configured
in num_queues. For the sfc driver, it is configured in the rss_cpus parameter. Regardless, it is
typically configured in /sys/class/net/device/queues/rx-queue/, where device is the name
of the network device (such as eth1) and rx-queue is the name of the appropriate receive queue.
When configuring RSS, Red Hat recommends limiting the number of queues to one per physical CPU
core. Hyper-threads are often represented as separate cores in analysis tools, but configuring
queues for all cores including logical cores such as hyper-threads has not proven beneficial to
network performance.
When enabled, RSS distributes network processing equally between available CPUs based on the
amount of processing each CPU has queued. However, you can use the ethto o l --show-rxfh-
indir and --set-rxfh-indir parameters to modify how network activity is distributed, and weight
certain types of network activity as more important than others.
The irqbalance daemon can be used in conjunction with RSS to reduce the likelihood of cross-
node memory transfers and cache line bouncing. This lowers the latency of processing network
packets.
7.3.6. Configuring Receive Packet St eering (RPS)
Chapt er 7 . Net working
75

Receive Packet Steering (RPS) is similar to RSS in that it is used to direct packets to specific CPUs
for processing. However, RPS is implemented at the software level, and helps to prevent the hardware
queue of a single network interface card from becoming a bottleneck in network traffic.
RPS has several advantages over hardware-based RSS:
RPS can be used with any network interface card.
It is easy to add software filters to RPS to deal with new protocols.
RPS does not increase the hardware interrupt rate of the network device. However, it does
introduce inter-processor interrupts.
RPS is configured per network device and receive queue, in the
/sys/class/net/device/queues/rx-queue/rps_cpus file, where device is the name of the
network device (such as eth0 ) and rx-queue is the name of the appropriate receive queue (such as
rx-0 ).
The default value of the rps_cpus file is 0. This disables RPS, so the CPU that handles the network
interrupt also processes the packet.
To enable RPS, configure the appropriate rps_cpus file with the CPUs that should process packets
from the specified network device and receive queue.
The rps_cpus files use comma-delimited CPU bitmaps. Therefore, to allow a CPU to handle
interrupts for the receive queue on an interface, set the value of their positions in the bitmap to 1. For
example, to handle interrupts with CPUs 0, 1, 2, and 3, set the value of rps_cpus to f, which is the
hexadecimal value for 15. In binary representation, 15 is 0 0 0 0 1111 (1+2+4+8).
For network devices with single transmit queues, best performance can be achieved by configuring
RPS to use CPUs in the same memory domain. On non-NUMA systems, this means that all available
CPUs can be used. If the network interrupt rate is extremely high, excluding the CPU that handles
network interrupts may also improve performance.
For network devices with multiple queues, there is typically no benefit to configuring both RPS and
RSS, as RSS is configured to map a CPU to each receive queue by default. However, RPS may still
be beneficial if there are fewer hardware queues than CPUs, and RPS is configured to use CPUs in
the same memory domain.
7.3.7. Configuring Receive Flow St eering (RFS)
Receive Flow Steering (RFS) extends RPS behavior to increase the CPU cache hit rate and thereby
reduce network latency. Where RPS forwards packets based solely on queue length, RFS uses the
RPS backend to calculate the most appropriate CPU, then forwards packets based on the location of
the application consuming the packet. This increases CPU cache efficiency.
RFS is disabled by default. To enable RFS, you must edit two files:
/proc/sys/net/core/rps_sock_flow_entries
Set the value of this file to the maximum expected number of concurrently active
connections. We recommend a value of 32768 for moderate server loads. All values entered
are rounded up to the nearest power of 2 in practice.
/sys/class/net/device/queues/rx-queue/rps_flow_cnt
Replace device with the name of the network device you wish to configure (for example,
eth0 ), and rx-queue with the receive queue you wish to configure (for example, rx-0 ).
Performance T uning G uide
76

Set the value of this file to the value of rps_sock_flow_entries divided by N, where N is
the number of receive queues on a device. For example, if rps_flow_entries is set to
32768 and there are 16 configured receive queues, rps_flow_cnt should be set to 20 4 8.
For single-queue devices, the value of rps_flow_cnt is the same as the value of
rps_sock_flow_entries.
Data received from a single sender is not sent to more than one CPU. If the amount of data received
from a single sender is greater than a single CPU can handle, configure a larger frame size to reduce
the number of interrupts and therefore the amount of processing work for the CPU. Alternatively,
consider NIC offload options or faster CPUs.
Consider using numactl or taskset in conjunction with RFS to pin applications to specific cores,
sockets, or NUMA nodes. This can help prevent packets from being processed out of order.
7.3.8. Configuring Accelerat ed RFS
Accelerated RFS boosts the speed of RFS by adding hardware assistance. Like RFS, packets are
forwarded based on the location of the application consuming the packet. Unlike traditional RFS,
however, packets are sent directly to a CPU that is local to the thread consuming the data: either the
CPU that is executing the application, or a CPU local to that CPU in the cache hierarchy.
Accelerated RFS is only available if the following conditions are met:
Accelerated RFS must be supported by the network interface card. Accelerated RFS is supported
by cards that export the ndo_rx_flow_steer() netdevice function.
ntuple filtering must be enabled.
Once these conditions are met, CPU to queue mapping is deduced automatically based on
traditional RFS configuration. That is, CPU to queue mapping is deduced based on the IRQ affinities
configured by the driver for each receive queue. Refer to Section 7.3.7, “Configuring Receive Flow
Steering (RFS)” for details on configuring traditional RFS.
Red Hat recommends using accelerated RFS wherever using RFS is appropriate and the network
interface card supports hardware acceleration.
Chapt er 7 . Net working
77

Appendix A. Tool Reference
This appendix provides a quick reference for the various tools in Red Hat Enterprise Linux 7 that can
be used to tweak performance. See the relevant man page for your tool for complete, up-to-date,
detailed reference material.
A.1. irqbalance
irq b ala n ce is a command line tool that distributes hardware interrupts across processors to
improve system performance. It runs as a daemon by default, but can be run once only with the --
oneshot option.
The following parameters are useful for improving performance.
- - p o we rt h re sh
Sets the number of CPUs that can idle before a CPU is placed into powersave mode. If more
CPUs than the threshold are more than 1 standard deviation below the average softirq
workload and no CPUs are more than one standard deviation above the average, and
have more than one irq assigned to them, a CPU is placed into powersave mode. In
powersave mode, a CPU is not part of irq balancing so that it is not woken unnecessarily.
- - h in t p o lic y
Determines how irq kernel affinity hinting is handled. Valid values are exact (irq affinity
hint is always applied), subset (irq is balanced, but the assigned object is a subset of the
affinity hint), or i g no re (irq affinity hint is ignored completely).
- - p o licyscrip t
Defines the location of a script to execute for each interrupt request, with the device path
and irq number passed as arguments, and a zero exit code expected by irq b alan ce. The
script defined can specify zero or more key value pairs to guide irq b a la n ce in managing
the passed irq.
The following are recognized as valid key value pairs.
b an
Valid values are true (exclude the passed irq from balancing) or false (perform
balancing on this irq).
b ala n ce_le vel
Allows user override of the balance level of the passed irq. By default the balance
level is based on the PCI device class of the device that owns the irq. Valid values
are none, package, cache, or co re.
numa_node
Allows user override of the NUMA node that is considered local to the passed irq.
If information about the local node is not specified in ACPI, devices are
considered equidistant from all nodes. Valid values are integers (starting from 0)
that identify a specific NUMA node, and -1, which specifies that an irq should be
considered equidistant from all nodes.
- - b an irq
The interrupt with the specified interrupt request number is added to the list of banned
Performance T uning G uide
78

The interrupt with the specified interrupt request number is added to the list of banned
interrupts.
You can also use the IRQBALANCE_BANNED_CPUS environment variable to specify a mask of CPUs
that are ignored by i rq b a lan ce.
For further details, see the man page:
$ man irqbalance
A.2. T una
Tuna allows you to control processor and scheduling affinity. This section covers the command line
interface, but a graphical interface with the same range of functionality is also available. Launch the
graphical utility by running tuna at the command line.
Tuna accepts a number of command line parameters, which are processed in sequence. The
following command distributes load across a four socket system.
tuna --socket 0 --isolate \
--thread my_real_time_app --move \
--irq serial --socket 1 --move \
--irq eth* --socket 2 --spread \
--show_threads --show_irqs
- - g u i
Starts the graphical user interface.
- - cp u s
Takes a comma-delimited list of CPUs to be controlled by Tuna. The list remains in effect
until a new list is specified.
- - co n f ig _f il e_ap p ly
Takes the name of a profile to apply to the system.
- - co n f ig _f ile_list
Lists the pre-loaded profiles.
- - cg ro u p
Used in conjunction with --show_threads. Displays the type of control group that
processes displayed with --show_threads belong to, if control groups are enabled.
Requires -P
- - af f ect _ch ild ren
When specified, Tuna affects child threads as well as parent threads.
- - f ilt e r
Disables the disolay of selected CPUs in --gui. Requires -c
- - iso l at e
Takes a comma-delimited list of CPUs. Tuna migrates all threads away from the CPUs
Appendix A. T ool Reference
79

Takes a comma-delimited list of CPUs. Tuna migrates all threads away from the CPUs
specified. Requires -c or -s
- - in clu d e
Takes a comma-delimited list of CPUs. Tuna allows all threads to run on the CPUs
specified. Requires -c or -s
- - n o _kt h read s
When this parameter is specified, Tuna does not affect kernel threads.
- - mo ve
Moves selected entities to CPU-List. Requires -c or -s.
- - p rio rit y
Specifies the scheduler policy and priority for a thread. Valid scheduler policies are OTHER,
FIFO, RR, BATCH, or IDLE.
When the policy is FIFO or RR, valid priority values are integers from 1 (lowest) to 99
(highest). The default value is 1. For example, tuna --threads 7861 --
priority=RR:40 sets a policy of RR (round-robin) and a priority of 40 for thread 7861.
When the policy is OTHER, BATCH, or IDLE, the only valid priority value is 0, which is also
the default. Requires -t.
- - sh o w_t h re ad s
Show the thread list.
- - sh o w_irq s
Show the IRQ list.
- - irq s
Takes a comma-delimited list of IRQs that Tuna affects. The list remains in effect until a new
list is specified. IRQs can be added to the list by using + and removed from the list by using
-.
- - save
Saves the kernel threads schedules to the specified file.
- - so cket s
Takes a comma-delimited list of CPU sockets to be controlled by Tuna. This option takes
into account the topology of the system, such as the cores that share a single processor
cache, and that are on the same physical chip.
- - t h read s
Takes a comma-delimited list of threads to be controlled by Tuna. The list remains in effect
until a new list is specified. Threads can be added to the list by using + and removed from
the list by using -.
- - n o _u t h re ad s
Prevents the operation from affecting user threads.
- - wh at _is
Performance T uning G uide
80

To see further help on selected entities. Requires -t
- - sp re ad
Distribute the threads specified with --threads evenly between the CPUs specified with --
cpus. Requires -t or -q.
- - h elp
Print a list of options. tuna will exit after this action, ignoring the remainder of the command-
line.
- - versi o n
Shows version.
A.3. et ht ool
The et h t o o l utility allows administrators to view and edit network interface card settings. It is useful
for observing the statistics of certain devices, such as the number of packets dropped by that device.
et h t o o l, its options, and its usage, are comprehensively documented on the man page.
$ man ethtool
A.4 . ss
ss is a command-line utility that prints statistical information about sockets, allowing administrators
to assess device performance over time. By default, ss lists open non-listening TCP sockets that
have established connections, but a number of useful options are provided to help administrators
filter out statistics about specific sockets.
One commonly used command is ss -tmpie, which displays all TCP sockets (t, internal TCP
information (i), socket memory usage (m), processes using the socket (p), and detailed socket
information (i).
Red Hat recommends ss over n et s t at in Red Hat Enterprise Linux 7.
ss is provided by the iproute package. For more information, see the man page:
$ man ss
A.5. t uned
Tuned is a tuning daemon that can adapt the operating system to perform better under certain
workloads by setting a tuning profile. It can also be configured to react to changes in CPU and
network use and adjusts settings to improve performance in active devices and reduce power
consumption in inactive devices.
To configure dynamic tuning behavior, edit the dynamic_tuning parameter in the
/etc/tuned/tuned-main.conf file. You can also configure the amount of time in seconds
between tuned checking usage and updating tuning details with the update_interval parameter.
For further details about tuned, see the man page:
Appendix A. T ool Reference
81

$ man tuned
A.6. t uned-adm
t u n ed - ad m is a command line tool that provides a number of different profiles to improve
performance in a number of specific use cases. It also provides a sub-command (tuned-adm
recommend) that assesses your system and outputs a recommended tuning profile. This also sets
the default profile for your system at install time, so can be used to return to the default profile.
As of Red Hat Enterprise Linux 7, t u n ed - ad m includes the ability to run any command as part of
enabling or disabling a tuning profile. This allows you to add environment specific checks that are
not available in t u n ed - ad m, such as checking whether the system is the master database node
before selecting which tuning profile to apply.
Red Hat Enterprise Linux 7 also provides the include parameter in profile definition files, allowing
you to base your own t u n ed - a d m profiles on existing profiles.
The following tuning profiles are provided with t u n ed - ad m and are supported in Red Hat
Enterprise Linux 7.
t h ro u g h p u t - p e rf o rma n ce
A server profile focused on improving throughput. This is the default profile, and is
recommended for most systems.
This profile favors performance over power savings by setting intel_pstate and
min_perf_pct=100. It enables transparent huge pages, uses cp u p o wer to set the
performance cpufreq governor, and sets the input/output scheduler to d ead l i ne. It also
sets kernel.sched_min_granularity_ns to 10 μs,
kernel.sched_wakeup_granularity_ns to 15 μs, and vm.dirty_ratio to 40% .
lat e n cy- p erf o rman ce
A server profile focused on lowering latency. This profile is recommended for latency-
sensitive workloads that benefit from c-state tuning and the increased TLB efficiency of
transparent huge pages.
This profile favors performance over power savings by setting intel_pstate and
max_perf_pct=100. It enables transparent huge pages, uses c p u p o wer to set the
performance cpufreq governor, and requests a cpu_dma_latency value of 1.
n et wo rk - la t en cy
A server profile focused on lowering network latency.
This profile favors performance over power savings by setting intel_pstate and
min_perf_pct=100. It disables transparent huge pages, and automatic NUMA balancing.
It also uses cp u p o wer to set the performance cpufreq governor, and requests a
cpu_dma_latency value of 1. It also sets busy_read and busy_poll times to 50 μs,
and tcp_fastopen to 3.
n et wo rk - t h ro u g h p u t
A server profile focused on improving network throughput.
This profile favors performance over power savings by setting intel_pstate and
max_perf_pct=100 and increasing kernel network buffer sizes. It enables transparent
huge pages, and uses c p u p o wer to set the performance cpufreq governor. It also sets
Performance T uning G uide
82

kernel.sched_min_granularity_ns to 10 μs,
kernel.sched_wakeup_granularity_ns to 15 μs, and vm.dirty_ratio to 40% .
virt u al - g u est
A profile focused on optimizing performance in Red Hat Enterprise Linux 7 virtual machines
as well as VMware guests.
This profile favors performance over power savings by setting intel_pstate and
max_perf_pct=100. It also decreases the swappiness of virtual memory. It enables
transparent huge pages, and uses cp u p o we r to set the performance cpufreq governor. It
also sets kernel.sched_min_granularity_ns to 10 μs,
kernel.sched_wakeup_granularity_ns to 15 μs, and vm.dirty_ratio to 40% .
virt u al - h o st
A profile focused on optimizing performance in Red Hat Enterprise Linux 7 virtualization
hosts.
This profile favors performance over power savings by setting intel_pstate and
max_perf_pct=100. It also decreases the swappiness of virtual memory. This profile
enables transparent huge pages and writes dirty pages back to disk more frequently. It
uses c p u p o wer to set the performance cpufreq governor. It also sets
kernel.sched_min_granularity_ns to 10 μs,
kernel.sched_wakeup_granularity_ns to 15 μs, kernel.sched_migration_cost
to 5 μs, and vm.dirty_ratio to 40% .
For detailed information about the power saving profiles provided with tuned-adm, see the Red Hat
Enterprise Linux 7 Power Management Guide, available from
http://access.redhat.com/site/documentation/Red_Hat_Enterprise_Linux/.
For detailed information about using t u n ed - ad m, see the man page:
$ man tuned-adm
A.7. perf
The p erf tool provides a number of useful commands, some of which are listed in this section. For
detailed information about p e rf , see the Red Hat Enterprise Linux 7 Developer Guide, available from
http://access.redhat.com/site/documentation/Red_Hat_Enterprise_Linux/, or refer to the man pages.
p erf stat
This command provides overall statistics for common performance events, including
instructions executed and clock cycles consumed. You can use the option flags to gather
statistics on events other than the default measurement events. As of Red Hat
Enterprise Linux 6.4, it is possible to use perf stat to filter monitoring based on one or
more specified control groups (cgroups).
For further information, read the man page:
$ man perf-stat
p erf record
This command records performance data into a file which can be later analyzed using
perf report. For further details, read the man page:
Appendix A. T ool Reference
83

$ man perf-record
p erf repo rt
This command reads the performance data from a file and analyzes the recorded data. For
further details, read the man page:
$ man perf-report
p erf list
This command lists the events available on a particular machine. These events vary based
on the performance monitoring hardware and the software configuration of the system. For
further information, read the man page:
$ man perf-list
p erf t o p
This command performs a similar function to the top tool. It generates and displays a
performance counter profile in realtime. For further information, read the man page:
$ man perf-top
p erf t race
This command performs a similar function to the strace tool. It monitors the system calls
used by a specified thread or process and all signals received by that application.
Additional trace targets are available; refer to the man page for a full list:
$ man perf-trace
A.8. Performance Co-Pilot (PCP)
Performance Co-Pilot (PCP) provides a large number of command-line tools, graphical tools, and
libraries. For more information on these tools, see their respective manual pages.
T able A.1. Syst em Services Dist rib u t ed wit h Perf o rman ce Co - Pilo t in Red Hat En t erp rise
Linu x 7
N ame D escri p t io n
pmcd The Performance Co-Pilot Collection Daemon (PMCD).
pmi e The Performance Metrics Inference Engine.
pml o g g er The performance metrics logger.
pmmgr Manages a collection of PCP daemons for a set of discovered local and
remote hosts running the Performance Co-Pilot Collection Daemon
(PMCD) according to zero or more configuration directories.
pmproxy The Performance Co-Pilot Collection Daemon (PMCD) proxy server.
pmwebd Binds a subset of the Performance Co-Pilot client API to RESTful web
applications using the HTTP protocol.
T able A.2. T o o ls D ist rib u t ed wit h Perfo rman ce Co - Pilo t in R ed Hat En t erp rise Lin u x 7
Performance T uning G uide
84

N ame D escri p t io n
pcp Displays the current status of a Performance Co-Pilot installation.
pmato p Shows the system-level occupation of the most critical hardware
resources from the performance point of view: CPU, memory, disk, and
network.
pmchart Plots performance metrics values available through the facilities of the
Performance Co-Pilot.
pmclient Displays high-level system performance metrics by using the
Performance Metrics Application Programming Interface (PMAPI).
pmco l l ectl Collects and displays system-level data, either from a live system or from
a Performance Co-Pilot archive file.
pmconfig Displays the values of configuration parameters.
pmdbg Displays available Performance Co-Pilot debug control flags and their
values.
pmd i ff Compares the average values for every metric in either one or two
archives, in a given time window, for changes that are likely to be of
interest when searching for performance regressions.
pmdumplog D isplays control, metadata, index, and state information from a
Performance Co-Pilot archive file.
pmdumptext Outputs the values of performance metrics collected live or from a
Performance Co-Pilot archive.
pmerr D isplays available Performance Co-Pilot error codes and their
corresponding error messages.
pmfind Finds PCP services on the network.
pmi e An inference engine that periodically evaluates a set of arithmetic, logical,
and rule expressions. The metrics are collected either from a live system,
or from a Performance Co-Pilot archive file.
pmieconf Displays or sets configurable pmie variables.
pminfo Displays information about performance metrics. The metrics are
collected either from a live system, or from a Performance Co-Pilot archive
file.
pmi o stat Reports I/O statistics for SCSI devices (by default) or d evi ce- map p e r
devices (with the -x dm option).
pml c Interactively configures active pml o g g er instances.
pmlogcheck Identifies invalid data in a Performance Co-Pilot archive file.
pml o g co nf Creates and modifies a pml o g g er configuration file.
pml o g l abel Verifies, modifies, or repairs the label of a Performance Co-Pilot archive
file.
pmlogsummary Calculates statistical information about performance metrics stored in a
Performance Co-Pilot archive file.
pmprobe D etermines the availability of performance metrics.
pmrep Reports on selected, easily customizable, performance metrics values.
pmsocks Allows access to a Performance Co-Pilot hosts through a firewall.
pmstat Periodically displays a brief summary of system performance.
pmsto re Modifies the values of performance metrics.
pmtrace Provides a command line interface to the trace Performance Metrics
Domain Agent (PMDA).
pmval Displays the current value of a performance metric.
A.9. vmst at
Appendix A. T ool Reference
85

Vmst at outputs reports on your system's processes, memory, paging, block input/output, interrupts,
and CPU activity. It provides an instantaneous report of the average of these events since the
machine was last booted, or since the previous report.
- a
Displays active and inactive memory.
- f
Displays the number of forks since boot. This includes the fo rk, vfork, and cl o ne
system calls, and is equivalent to the total number of tasks created. Each process is
represented by one or more tasks, depending on thread usage. This display does not
repeat.
- m
Displays slab information.
- n
Specifies that the header will appear once, not periodically.
- s
Displays a table of various event counters and memory statistics. This display does not
repeat.
d ela y
The delay between reports in seconds. If no delay is specified, only one report is printed,
with the average values since the machine was last booted.
count
The number of times to report on the system. If no count is specified and delay is defined,
vms t at reports indefinitely.
- d
Displays disk statistics.
- p
Takes a partition name as a value, and reports detailed statistics for that partition.
- S
Defines the units output by the report. Valid values are k (1000 bytes), K (1024 bytes), m
(1000000 bytes), or M (1048576 bytes).
- D
Report summary statistics about disk activity.
For detailed information about the output provided by each output mode, see the man page:
$ man vmstat
A.10. x86_energy_perf_policy
Performance T uning G uide
86

The x86 _en erg y_p erf _p o l ic y tool allows administrators to define the relative importance of
performance and energy efficiency. It is provided by the kernel-tools package.
To view the current policy, run the following command:
# x86_energy_perf_policy -r
To set a new policy, run the following command:
# x86_energy_perf_policy profile_name
Replace profile_name with one of the following profiles.
p erf o rman ce
The processor does not sacrifice performance for the sake of saving energy. This is the
default value.
n o rmal
The processor tolerates minor performance compromises for potentially significant energy
savings. This is a reasonable saving for most servers and desktops.
p o we rs ave
The processor accepts potentially significant performance decreases in order to maximize
energy efficiency.
For further details of how to use x86 _en erg y_p e rf _p o l icy, see the man page:
$ man x86_energy_perf_policy
A.11. t urbost at
The t u rb o s t at tool provides detailed information about the amount of time that the system spends in
different states. T u rb o st at is provided by the kernel-tools package.
By default, t u rb o s t at prints a summary of counter results for the entire system, followed by counter
results every 5 seconds, under the following headings:
p kg
The processor package number.
co re
The processor core number.
CPU
The Linux CPU (logical processor) number.
%c0
The percentage of the interval for which the CPU retired instructions.
G Hz
Appendix A. T ool Reference
87

When this number is higher than the value in TSC, the CPU is in turbo mode
T SC
The average clock speed over the course of the entire interval.
%c1, %c3, an d % c6
The percentage of the interval for which the processor was in the c1, c3, or c6 state,
respectively.
%p c3 or %p c6
The percentage of the interval for which the processor was in the pc3 or pc6 state,
respectively.
Specify a different period between counter results with the -i option, for example, run turbo stat -
i 10 to print results every 10 seconds instead.
Note
Upcoming Intel processors may add additional c-states. As of Red Hat Enterprise Linux 7.0,
t u rb o s t at provides support for the c7, c8, c9, and c10 states.
A.12. numast at
The n u mast a t tool is provided by the numactl package, and displays memory statistics (such as
allocation hits and misses) for processes and the operating system on a per-NUMA-node basis. The
default tracking categories for the numastat command are outlined as follows:
n u ma_h it
The number of pages that were successfully allocated to this node.
n u ma_miss
The number of pages that were allocated on this node because of low memory on the
intended node. Each numa_miss event has a corresponding numa_foreign event on
another node.
n u ma_f o re ig n
The number of pages initially intended for this node that were allocated to another node
instead. Each numa_foreign event has a corresponding numa_miss event on another
node.
in t erlea ve_h it
The number of interleave policy pages successfully allocated to this node.
lo ca l_n o d e
The number of pages successfully allocated on this node, by a process on this node.
o t h er_n o d e
The number of pages allocated on this node, by a process on another node.
Performance T uning G uide
88

Supplying any of the following options changes the displayed units to megabytes of memory
(rounded to two decimal places), and changes other specific n u mast a t behaviors as described
below.
- c
Horizontally condenses the displayed table of information. This is useful on systems with a
large number of NUMA nodes, but column width and inter-column spacing are somewhat
unpredictable. When this option is used, the amount of memory is rounded to the nearest
megabyte.
- m
Displays system-wide memory usage information on a per-node basis, similar to the
information found in /proc/meminfo.
- n
Displays the same information as the original numastat command (numa_hit,
numa_miss, numa_foreign, interleave_hit, l o cal _no d e, and o ther_no d e), with
an updated format, using megabytes as the unit of measurement.
- p pat t ern
Displays per-node memory information for the specified pattern. If the value for pattern is
comprised of digits, n u mast at assumes that it is a numerical process identifier. Otherwise,
n u mast a t searches process command lines for the specified pattern.
Command line arguments entered after the value of the -p option are assumed to be
additional patterns for which to filter. Additional patterns expand, rather than narrow, the
filter.
- s
Sorts the displayed data in descending order so that the biggest memory consumers
(according to the total column) are listed first.
Optionally, you can specify a node, and the table will be sorted according to the node
column. When using this option, the node value must follow the -s option immediately, as
shown here:
numastat -s2
Do not include white space between the option and its value.
- v
Displays more verbose information. Namely, process information for multiple processes will
display detailed information for each process.
- V
Displays numastat version information.
- z
Omits table rows and columns with only zero values from the displayed information. Note
that some near-zero values that are rounded to zero for display purposes will not be
omitted from the displayed output.
Appendix A. T ool Reference
89

A.13. numact l
N u mact l lets administrators run a process with a specified scheduling or memory placement policy.
N u mact l can also set a persistent policy for shared memory segments or files, and set the processor
affinity and memory affinity of a process.
N u mact l provides a number of useful options. This appendix outlines some of these options and
gives suggestions for their use, but is not exhaustive.
- - h ard wa re
Displays an inventory of available nodes on the system, including relative distances
between nodes.
- - memb i n d
Ensures that memory is allocated only from specific nodes. If there is insufficient memory
available in the specified location, allocation fails.
--cpunodebind
Ensures that a specified command and its child processes execute only on the specified
node.
- - p h ycp u b in d
Ensures that a specified command and its child processes execute only on the specified
processor.
- - lo cal allo c
Specifies that memory should always be allocated from the local node.
- - p ref erred
Specifies a preferred node from which to allocate memory. If memory cannot be allocated
from this specified node, another node will be used as a fallback.
For further details about these and other parameters, see the man page:
$ man numactl
A.14 . numad
numad is an automatic NUMA affinity management daemon. It monitors NUMA topology and
resource usage within a system in order to dynamically improve NUMA resource allocation and
management.
Note that when numad is enabled, its behavior overrides the default behavior of automatic NUMA
balancing.
A.14 .1. Using numad from t he command line
To use numad as an executable, just run:
# numad
Performance T uning G uide
90

While numad runs, its activities are logged in /var/l o g /numad . l o g . It will run until stopped with
the following command:
# numad -i 0
Stopping numad does not remove the changes it has made to improve NUMA affinity. If system use
changes significantly, running numad again will adjust affinity to improve performance under the
new conditions.
To restrict numad management to a specific process, start it with the following options.
# numad -S 0 -p pid
- p pid
This option adds the specified pid to an explicit inclusion list. The process specified will not
be managed until it meets the numad process significance threshold.
- S 0
This sets the type of process scanning to 0, which limits numad management to explicitly
included processes.
For further information about available numad options, refer to the numad man page:
$ man numad
A.14 .2. Using numad as a service
While numad runs as a service, it attempts to tune the system dynamically based on the current
system workload. Its activities are logged in /var/l o g /numad . l o g .
To start the service, run:
# systemctl start numad.service
To make the service persist across reboots, run:
# chkconfig numad on
For further information about available numad options, refer to the numad man page:
$ man numad
A.14 .3. Pre-placement advice
numad provides a pre-placement advice service that can be queried by various job management
systems to provide assistance with the initial binding of CPU and memory resources for their
processes. This pre-placement advice is available regardless of whether numad is running as an
executable or a service.
A.14 .4 . Using numad wit h KSM
Appendix A. T ool Reference
91

If KSM is in use on a NUMA system, change the value of the /sys/kernel/mm/ksm/merge_nodes
parameter to 0 to avoid merging pages across NUMA nodes. Otherwise, KSM increases remote
memory accesses as it merges pages across nodes. Furthermore, kernel memory accounting
statistics can eventually contradict each other after large amounts of cross-node merging. As such,
numad can become confused about the correct amounts and locations of available memory, after the
KSM daemon merges many memory pages. KSM is beneficial only if you are overcommitting the
memory on your system. If your system has sufficient free memory, you may achieve higher
performance by turning off and disabling the KSM daemon.
A.15. OProfile
OProfile is a low overhead, system-wide performance monitoring tool provided by the oprofile
package. It uses the performance monitoring hardware on the processor to retrieve information about
the kernel and executables on the system, such as when memory is referenced, the number of
second-level cache requests, and the number of hardware interrupts received. OProfile is also able to
profile applications that run in a Java Virtual Machine (JVM).
OProfile provides the following tools. Note that the legacy o pco ntro l tool and the new operf tool
are mutually exclusive.
o p h elp
Displays available events for the system’s processor along with a brief description of each.
o p imp o rt
Converts sample database files from a foreign binary format to the native format for the
system. Only use this option when analyzing a sample database from a different
architecture.
o p an n o t at e
Creates annotated source for an executable if the application was compiled with debugging
symbols.
opcontrol
Configures which data is collected in a profiling run.
o p erf
Intended to replace o pco ntro l . The operf tool uses the Linux Performance Events
subsystem, allowing you to target your profiling more precisely, as a single process or
system-wide, and allowing OProfile to co-exist better with other tools using the performance
monitoring hardware on your system. Unlike o pco ntro l , no initial setup is required, and it
can be used without the root privileges unless the --system-wide option is in use.
o p rep o rt
Retrieves profile data.
o p ro f i led
Runs as a daemon to periodically write sample data to disk.
Legacy mode (o pco ntro l , oprofiled, and post-processing tools) remains available, but is no
longer the recommended profiling method.
For further information about any of these commands, see the OProfile man page:
Performance T uning G uide
92

$ man oprofile
A.16. t askset
The taskset tool is provided by the util-linux package. It allows administrators to retrieve and set the
processor affinity of a running process, or launch a process with a specified processor affinity.
Important
taskset does not guarantee local memory allocation. If you require the additional
performance benefits of local memory allocation, Red Hat recommends using n u mact l
instead of taskset.
To set the CPU affinity of a running process, run the following command:
# taskset -c processors pid
Replace processors with a comma delimited list of processors or ranges of processors (for example,
1,3,5-7. Replace pid with the process identifier of the process that you want to reconfigure.
To launch a process with a specified affinity, run the following command:
# taskset -c processors -- application
Replace processors with a comma delimited list of processors or ranges of processors. Replace
application with the command, options and arguments of the application you want to run.
For more information about taskset, see the man page:
$ man taskset
A.17. Syst emT ap
Syst emT a p is extensively documented in its own guides. The Red Hat Enterprise Linux 7 versions of
the SystemTap Beginner's Guide and the SystemTap TapSet Reference are both available from
http://access.redhat.com/site/documentation/Red_Hat_Enterprise_Linux/.
Appendix A. T ool Reference
93

Appendix B. Revision History
Revisio n 10.13- 50 Th u Ju l 27 2017 Milan N avrát il
Document version for 7.4 GA publication.
Revisio n 10.13- 4 4 T u e Dec 13 2016 Milan N avrát il
Asynchronous update.
Revisio n 10.08- 38 Wed No v 11 2015 Jan a Heves
Version for 7.2 GA release.
Revisio n 0.3-23 T u e Feb 17 2015 Laura Bailey
Building for RHEL 7.1 GA.
Revisio n 0.3-3 Mon Ap r 07 2014 Laura Bailey
Rebuilding for RHEL 7.0 GA.
Performance T uning G uide
94
