Rigel Vital Signs Rev 1.2 USA
2016-12-21
: Pdf Rigel-Vital-Signs-Rev-1.2-Usa Rigel-Vital-Signs-Rev-1.2-USA 12 2016 x7mag uploads wp-content
Open the PDF directly: View PDF ![]() .
.
Page Count: 44

Innovating Together
An introduction to
measuring and simulating
Vital Signs
rigelmedical.com Innovating Together
We’ve picked your brains to develop the
world’s most advanced vital signs simulator.
Your ideas have had us thinking. Some of you wondered why the
functions of an ECG patient simulator, NIBP and SPO2 simulator
couldn’t be combined into one compact tester?
So we put our heads together and used our unrivalled expertise
to create the hand-held Rigel UNI-SIM. To see the result, or to
contribute your own ideas, call us on 813-886-2775,
email us at enquiry@rigelmedical.com or visit rigelmedical.com

1
Contents
Foreword 2
1 Introduction 2
1.1 Visual inspection 3
1.2 Who should verify the correct operation? 3
2 Physiology of the Respiratory System 4
3 Blood Pressure 5
3.1 Measuring blood pressure 6
3.2 Testing your NIBP monitor 7
3.3 Test setup 7
3.3.1 System pressure leak test: 7
3.3.2 System overpressure valve test 8
3.3.3 Static pressure or linearity test 9
3.3.4 Dynamic pressure 9
3.4 Considerations 9
4 Invasive Blood Pressure 11
4.1 Testing IBP function 11
4.2 Test setup 11
4.2.1 Static pressure or linearity test 12
(verify alarm testing)
4.2.2 Dynamic pressure 12
5 Pulse Oxymetry 13
5.1 Artifacts 14
5.2 Testing your SPO2 monitor – 15
pulse oximeter
5.3 Test setup 16
5.3.1 Testing monitor accuracy 16
5.3.2 Alarms and time response test 17
5.3.3 Sensitivity test 17
5.3.4 Testing the SPO2 probe 17
6 Electrocardiographs (ECG) 18
6.1 Einthoven Triangle 19
6.2 Precordial leads 20
6.3 Unipolar vs. bipolar leads 21
6.4 Color coding 21
6.5 The ECG machine 22
6.6 Testing ECG monitor 22
6.6.1 Linearity of heart rate measurement 23
6.6.2 QRS beep 23
6.6.3 Alarms (high and low) 23
6.6.4 Arrhythmias recognition (Asystolic) 23
6.6.5 Sensitivity test (Gain) 23
6.6.6 Zero offset 23
6.6.7 Frequency response 24
6.6.8 Printer calibration (amplitude, timing) 24
7 Respiration 24
7.1 Testing respiration function 26
7.1.1 Linearity of respiration measurement 26
7.1.2 Sleep apnea 26
7.1.3 Testing apnea alarms 26
8 Temperature 27
8.1 Testing temperature function 27
on multiparametric monitors
8.1.1 Linearity of temperature measurement 27
8.1.2 Testing temperature alarms 28
9 Record Keeping 28
Conclusion 29
Considerations and Recommendations: 29
Appendix A 30
IEC 60601-1 collateral standards
Appendix B 31
IEC 60601-2 particular standards
Appendix C 34
YSI 400 & 700 resistance reference table
Appendix D 35
Example documentation template
I
nnovating
T
ogether

Introduction
For decades, considerable work has been
carried out across many industries; to reduce the
risk of injury and occupational death to members
of the general public. In addition, to aid the
process of treating members of the general
public, the health sector has evolved, offering an
ever increasing portfolio of treatments,
monitoring and diagnostic tools.
Risks due to injuries or fatalities during medical
treatment or examination are reduced through
the introduction of industry practises (i.e.
disinfection), guidelines (i.e. best practise),
standards (i.e. design criteria, quality processes)
and regulations (i.e. mandatory criteria).
To ensure the safety of patients, operators and
the members of public, all medical electronic
devices must meet the design criteria of the
internationally published IEC 60601 standard (or
local equivalent where applicable). First
published in the 1970’s, the IEC 60601 standard
(then referred to as IEC 601) describes the
design criteria of medical electronic equipment
(ME Equipment) in areas such as:
■Electrical safety
■Functional accuracy
■Mechanical safety
■Radiation safety
■Operator safety and errors (labelling,
unambiguous instructions)
■Safety of software
■Risk assessment and preventative actions
IEC 60601-1-X (X representing a specific
standard number between 1 - 12) is the primary
standard and has eleven (sub) standards directly
relating to the safety of medical equipment. IEC
60601-2-X (X representing a specific standard
number between 1—65). This part of the standard
is specific to various types of medical equipment
2
Foreword
This booklet is written as a guideline for people involved in testing medical, electrical equipment. All
reasonable care has been taken to ensure that the information, reference figures and data are accurate
and have been taken from the latest versions of various standards, guidance notes and recognized
“best practises” to establish the recommended testing requirements. Rigel Medical, their agents and
distributors, accept no responsibility for any error or omissions within this booklet or for any misinter-
pretations by the user. For clarification on any part of this booklet please contact Rigel Medical before
operating any test instrument.
No part of this publication shall be deemed to form, or be part of any contract for training or equipment
unless specifically referred to as an inclusion within such contract.
Rigel Medical assumes that the readers of this booklet are electronically and technically competent and
therefore does not accept any liability arising form accidents or fatalities directly or indirectly from the
tests described in this booklet.

3
rigelmedical.com
and provides additional information to the four
basic standards.
Appendix A and B provide an overview of the IEC
60601-1-X and IEC 60601-2-X standards.
This booklet describes the common aspects of
vital signs monitoring and performance testing of
those vital signs.
The main vital signs described are:
■Blood pressure
(Invasive or non invasive methods)
■Temperature
■Electro cardiogram (ECG )
■Respiration
■Blood oxygen saturation (SpO2)
To ensure the correct treatment, diagnoses or
monitoring of patients, it is of critical importance
that the vital signs monitor is able to provide
accurate data across all available vital signs. Such
accuracy is verified on a regular basis, based on
risk assessment, manufacturer recommendations
and stages of the monitor’s life cycle.
Performances tests (also referred to as quality or
functional tests) are typically executed using
calibrated simulators across a number of
applications and are all part of an acceptance
test, preventative maintenance cycle or repair.
A typical test cycle for a vital signs monitor might
include:
■Visual inspection
■Self tests (where applicable)
■Electrical safety testing
(ground bonding, leakage currents)
■Integrity of the device under test
(i.e. leak test, over pressure test)
■Parameter accuracy (temperature, pressure,
SpO2, time etc….)
■Check alarms (pitch, frequency, volume)
■Physiological simulations (Dynamic Patient
Simulation)
1.1 Visual Inspection
The process of visual inspection is not clearly
defined by any standard, however visual
inspections form a critical part of the general
safety and performance inspections during the
functional life of medical equipment.
Visual inspections are a relatively easy procedure
to ensure that the medical equipment in use, still
conforms to the specifications as released by the
manufacturer and has not suffered from any
external damage and / or contamination.
These can include the following inspections:
■Housing - Enclosure; look for damage, cracks etc.
■Contamination; look for obstruction of moving
parts, connector pins, etc.
■Cabling (supply, Applied Parts etc); Look for
cuts, wrong connections, etc.
■Fuse rating; check correct values after
replacement
■Markings and Labelling; check the integrity of
safety markings
■Integrity of mechanical parts; check for any
obstructions
1.2 Who should verify the correct operation?
The correct function and operation of medical
equipment is equally as important as the function
it performs. An incorrect reading or missed
condition might have considerable consequences
for the patient therefore; the person carrying out
I
nnovating
T
ogether
the maintenance must be technically competent,
appropriately trained and aware of the various
parameters being verified.
It is the responsibility of the medical equipment
manufacturer to provide verification procedures
to ensure optimum performance is being
achieved. The person or organization carrying
out the maintenance must make themselves
aware of the required procedures and operation
of the medical equipment. When in doubt,
contact the manufacturer.
2 Physiology of the respiratory system
All vital signs are related to the operation and
functioning of the respiratory system. While the
Electro Cardiogram (see chapter 6) shows the
electrical activity of the human heart pumping the
oxygenated blood (see chapter 5) around the
arteries, blood pressure (see chapter 3 & 4) is
generated. Respiration (see chapter 7) rates
might show any obstruction (apnea) in the
airways thus affecting the oxygen absorption in
the lungs. The core body temperature, together
with blood pressure being the most commonly
measured vital signs, is maintained through good
blood circulation (see chapter 8).
The human heart is central to the respiratory
system and can be seen as the main engine
within. The heart circulates blood through the
body and lungs (the carburetor of the body
attaching oxygen to the hemoglobin protein in
the red blood cells) in order to ensure oxygen is
able to reach the (brain) tissues and organs in
order to sustain life.
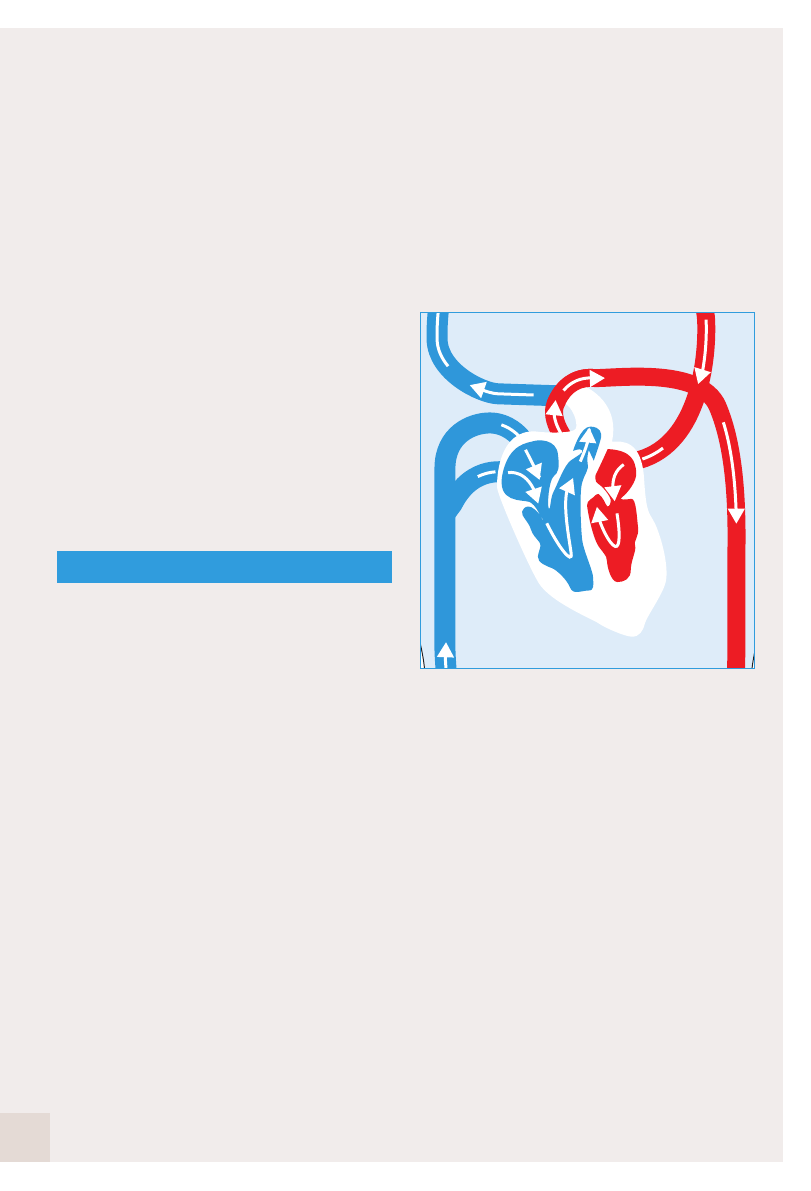
Figure 1: A simplified representation of the
circulatory system
To establish a single circulation cycle, blood flows
through the heart twice, passing through the left
and right side of the heart respectively. Acting as
two “pumps”, the heart circulates oxygenated
blood (red circuit, systemic circulation) from the
lungs through the left side of the heart, while
deoxygenated blood from the tissues flows
through the right side of the heart to the lungs in
order to re-oxygenate the blood cells (blue
circuit, pulmonary circulation).
The two ventricles (chambers) provide the blood
from the heart while blood is entering the heart in
the two atria (chambers). Valves in and between
the different chambers ensure the chambers can
fill up with blood during the diastolic phase (the
heart muscle relaxes) and pressures can build-up
in the ventricles to provide the required condition
to allow circulation from a high pressure (systolic
4

5
rigelmedical.com
phase) to the lower pressure areas. A complete
cycle of events is referred to as the cardiac cycle,
a single heart beat and involves;
1. Atrial systole,
2. Ventricular systole and
3. Complete cardiac diastole.
Cardiac muscles are electrically stimulated and the
cardiac cycle is triggered by Sinoatrial Node (S.A.
Node), then synchronized through timing (delays)
(Atrioventricular A.V. Node and bundle of His) which
ensures coordinated contraction and relaxation of
the different heart muscles to allow the individual
chambers to fill-up and empty. While the heart is
self-exciting and able to maintain it’s own pace (S.A.
Node), the heart rate can be altered due
tometabolic demands (e.g. exercise, emotion,
anxiety).
During the cardiac diastolic phase, the heart
relaxes and blood is able to fill the two atria. As the
atria fill up to around 70%, the pressure in the atria
releases the valves to the ventricles (tricuspid and
mitral valve). The remaining 30% of blood volume
in the atria is pumped out as the atria contract
(atrial systole) at the start of the heart beat. The
ventricles contract (ventricle systole) resulting in
the blood flowing out of the heart through the main
heart valves (aortic and pulmonary valves) into the
pulmonary and systemic circulation.
The number of circulations per minute (or beats per
minute) can vary due to age, as a result of exercise,
hormone levels (ie caused by anxiety or stress) and
physical condition (related to cardiac output).
The greater the need for oxygen by the body, the
greater the need for oxyhemoglobin. A human
heart has a certain capacity to circulate blood
(cardiac output) therefore; oneway to increase
blood supply is to increase heart rate. In general;
■The smaller the cardiac output, the higher the
heart rate.
■The greater the cardiac output, the lower the
heart rate.
This is evident in infants and children, having a
relatively small cardiac output, thus higher heart
rate. Their resting heart rate can be between
100—150 bpm. In comparison, a trained athlete has
been able to increase their cardiac output through
build up of exercise. The resting heart rate can be
as low as 40 bpm or even lower. Cardiac output is
not classed as a vital sign and therefore not
considered further in this booklet.
3 Blood pressure
The most common vital sign parameter being
monitored or measured is the (arterial) blood
pressure. During the cardiac cycle, the ventricles
contract (systole) and the blood pressure is at its
highest (systolic) and during complete cardiac
diastole, the blood pressure is at its lowest
(diastolic) which enables the blood to circulate
through the body through the systemic and
pulmonary circulation. The blood flow and pressure
change with each stage of the cardiac cycle and are
reported in millimeters of mercury (mmHg).
This is represented in figure 2.
In a healthy patient, the average values for the
different pressure variations are:
■Systolic pressure 120 mmHg
■Diastolic pressure 80 mmHg
■Mean arterial pressure 90—93 mmHg
I
nnovating
T
ogether
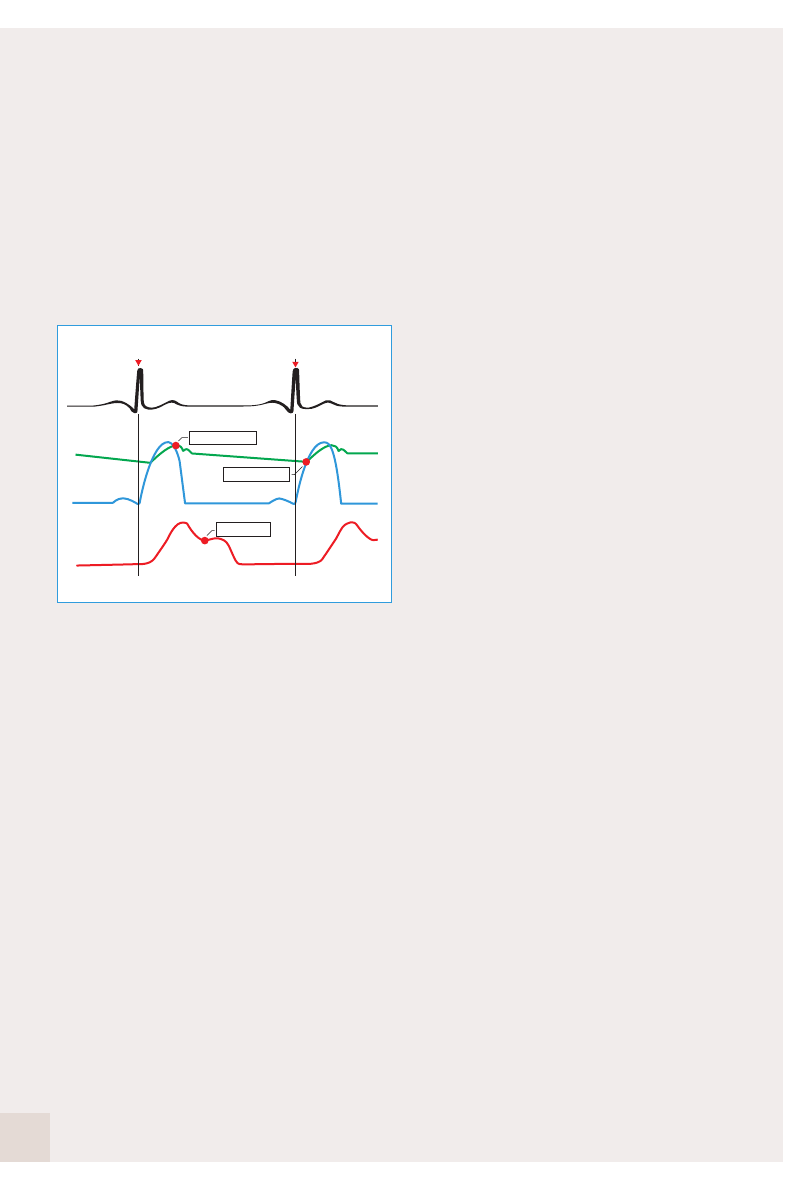
Figure 2: ECG waveform vs aortic pressure
and plethymograph
It is not uncommon to have deviations from these
values which can be the result of for example;
emotions, anxiety, drug-use, cardiac conditions,
life style, fitness, age and diet.
■Hypotension Blood pressure being
abnormally lower
than average
■Hypertension Blood pressure being
abnormally higher
than average
3.1 Measuring blood pressure
Blood pressure can be measured both
noninvasively (NIBP) and invasively (IBP) and is
associated with the pressure in the arterial blood
vessels. While the invasive method (see 4) is
more accurate, the non-invasive method (NIBP)
is the most common. While invasive procedures
require highly skilled people, the non-invasive
method is relatively simple and can be done by
both skilled and unskilled people. NIBP monitors
range from domestic use to comprehensive multi
parameter monitors used in healthcare facilities.
The principles of measuring NIBP can vary from:
■Palpation method (feeling) —an indication of
the minimum (systolic) blood pressure obtained
through the touch/feel sensation at determined
positions (radial, femoral, carotid) of the body.
Palpation is often used in emergency and trauma
cases where rapid detection of a present blood
pressure is required or rapid loss of blood pressure
is expected.
■Auscultatory method (listening) – as blood flow
is interrupted (blocked by external cuff) and released
(deflation of the cuff), sounds can be associated with
the systolic and diastolic pressures. When a cuff is
positioned around the upper arm and inflated to the
point the artery is blocked (no blood flow), the cuff is
then deflated. The pressure at which blood flow
regains is the systolic pressure and is accompanied
by a specific beating sound (referred to as first
korotkoff sound) caused by turbulent blood flow in
the artery. The pressure at which the sound stops
(fifth korotkoff sound) is referred to as the diastolic
pressure. Observation is done by listening through a
stethoscope (or can be automated through
microphone electronic pick-up), positioned directly
on the elbow artery and the use of a calibrated
manometer. (The mean arterial pressure is
calculated from the systolic and diastolic pressures.
There is no agreed standard but the formula below
is often referred to:
■Mean BP = 1⁄3* (systolic + 2 x diastolic)
■Oscillometric method (measuring) – Unlike
the auscultatory method, the oscillometric method
measures the mean arterial pressure and calculates
6
SPO2
Ventricular pressure
Aortic pressure SystolicpressureSystolicpressure
Diastolic pressure
Dicrotic notch
QS
PT
R
QS
PT
R

7
rigelmedical.com
the systolic and diastolic pressures from pressure
variations in the cuff when inflated (blocking the
blood flow) and then deflated (blood flow regains).
While the auscultatory method often relies on
human interpretation (listening), the oscillometric
method is done through automation and the use of
electronic pressure sensors. Due to the use of
electronic pressure transducers, regular calibrations
are required and often advised by the manufacturer.
3.2 Testing your NIBP monitor
As explained above, oscillometric NIBP monitors
require regular performance verifications to
ensure the correct operation. Common issues
relating to the accuracy of the NIBP monitor are:
■A leak in the cuff or pressure system,
resulting in a lower blood pressure reading.
■Acoustic variance of the cuff due to incorrect
cuff volume, variety in materials used and
positioning or applying cuff on patient.
■Incorrect operation of the overpressure valve
caused by a leak or complete malfunction.
■Deviation in accuracy of the electronic
pressure transducer caused by wear and tear
of electronic components.
■Changes in atmospheric pressure including
pressure variations caused by closing
doors/windows.
A number of tests are provided to determine the
correct operation of the NIBP monitors. These
are:
■Pressure leak test (see 3.3.1)
■Over pressure valve test (see 3.3.2)
■Static pressure & linearity test (see 3.3.3)
■Dynamic pressure (see 3.3.4)
3.3 Test setup
In the example below, the Rigel BP-SIM or UNI-
SIM is used to reflect the NIBP simulator. Ensure
the correct cuff size and positioning to reduce
acoustic errors. An additional 500cc cylinder may
also be used to provide a consistent reading.
In order for the NIBP simulator to measure the
pressure in the cuff and simulate into the NIBP
monitor any pressure variations associated with
the oscillometric method, the simulator must be
inserted in (one of) the pressure tubes to the cuff
as shown in the figure below.
Figure 3: Test setup: Connecting the NIBP
simulator
3.3.1System pressure leak test
The purpose of the pressure leak test is to verify
and ensure the integrity of pressure system
including the tubing and cuff. The leak test
measures the pressure drop over time and must
fall within acceptable values as documented by
the supplier or manufacturer of the monitor and
or cuffs. Often, the pressure drop is documented
I
nnovating
T
ogether
SYS 120 mmHg
DIA 80 mmHg
HR 70 bpm
UNI-SiM
NIBP Monitor Cuff
as mmHg / min from a certain start pressure e.g.
200 mmHg. Refer to the service or maintenance
instructions provided with the monitor as it may
have to be set in service or calibration mode.
For example: a manufacturer could specify a
system leak test for a duration of three minutes
where the expected total pressure drop must not
exceed 15 mmHg. This is equal to 5 mmHg per
minute.
Some NIBP simulators like the Rigel UNI-SIM
have a built-in pump to generate the required
pressure levels. Inflate the pressure into the
system and monitor the pressure drop and time.
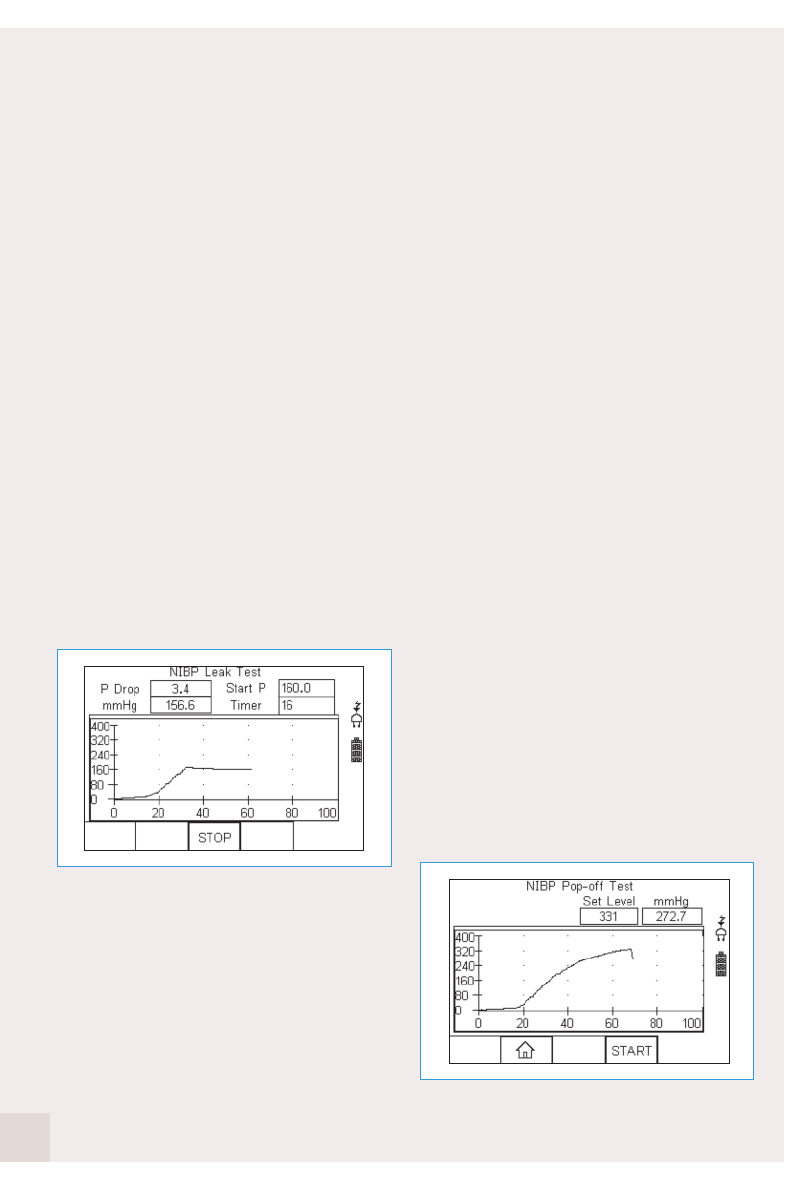
Figure 4 shows a sample screenshot from the
Rigel UNI-SIM while performing the leak test.
Figure 4: NIBP leak test on the Rigel UNI-SIM
Once the selected pressure is stabilized, the
timer starts and the UNI-SIM will show real-time
system pressure over time.
3.3.2 System overpressure valve test
When dealing with pressure systems, it is
important to ensure the system is able to vent
when pressures reach a value exceeding the
safety of the patient or operator and the correct
functioning of the monitor itself.
The purpose of the overpressure test is to
determine whether the internal safety valve(s) are
functioning correctly and release the internal
pressure when it reaches the maximum allowable
system pressure set by the monitor’s
manufacturer. Refer to the service or maintenance
instructions provided with the monitor as it may
have to be set in service or calibration mode.
For example: a manufacturer could specify the
set-point of 300 mmHg as the maximum
allowable system pressure for an adult setting
and 150 mmHg for a pediatric setting (+/-10%).
Some NIBP simulators like the Rigel UNI-SIM
have a built-in pump to generate the required
pressure levels. Inflate the pressure into the
system until the monitor releases the
overpressure valve, resulting in an almost
instantaneous pressure drop. The inclusion of the
original cuff or air reservoir of 500cc during this
test is advised to provide consistency with the
normal operation of the monitor. Figure 5 shows
an example screen shot from the Rigel UNI-SIM
displaying the set-point at which the pressure
drop (valve release) occurred.
Figure 5: NIBP pop-off test on the Rigel UNI-SIM
8
9
rigelmedical.com
In the example above, the test demonstrates that
the valve was released at 331 mmHg.
3.3.3 Static pressure or linearity test
The static pressure tests are useful for verifying
the performance of the pressure transducer and
verifying the integrity of tubing systems internal,
external and cuff). In addition, the static pressure
test can be used to test the accuracy over a
range of pressures. Refer to the service or
maintenance instructions provided with the
monitor as it may have to be set in service or
calibration mode.
For example: A manufacturer could ask to perform
a linearity test on the following static pressures:
250mmHg, 200mmHg, 150mmHg, 100mmHg,
50mmHg and 0mmHg. The reading values
should be at +/-3mmHg from expected value.
Some NIBP simulators like the Rigel UNI-SIM have
a built-in pump to generate the required pressure
levels. Inflate the pressure into the system (monitor
with or without the cuff) and compare the reading
from the monitor with that of the calibrated
manometer (UNI-SIM). The inclusion of the original
cuff or air reservoir of 500cc during this test is
advised to provide consistency with the normal
operation of the monitor.
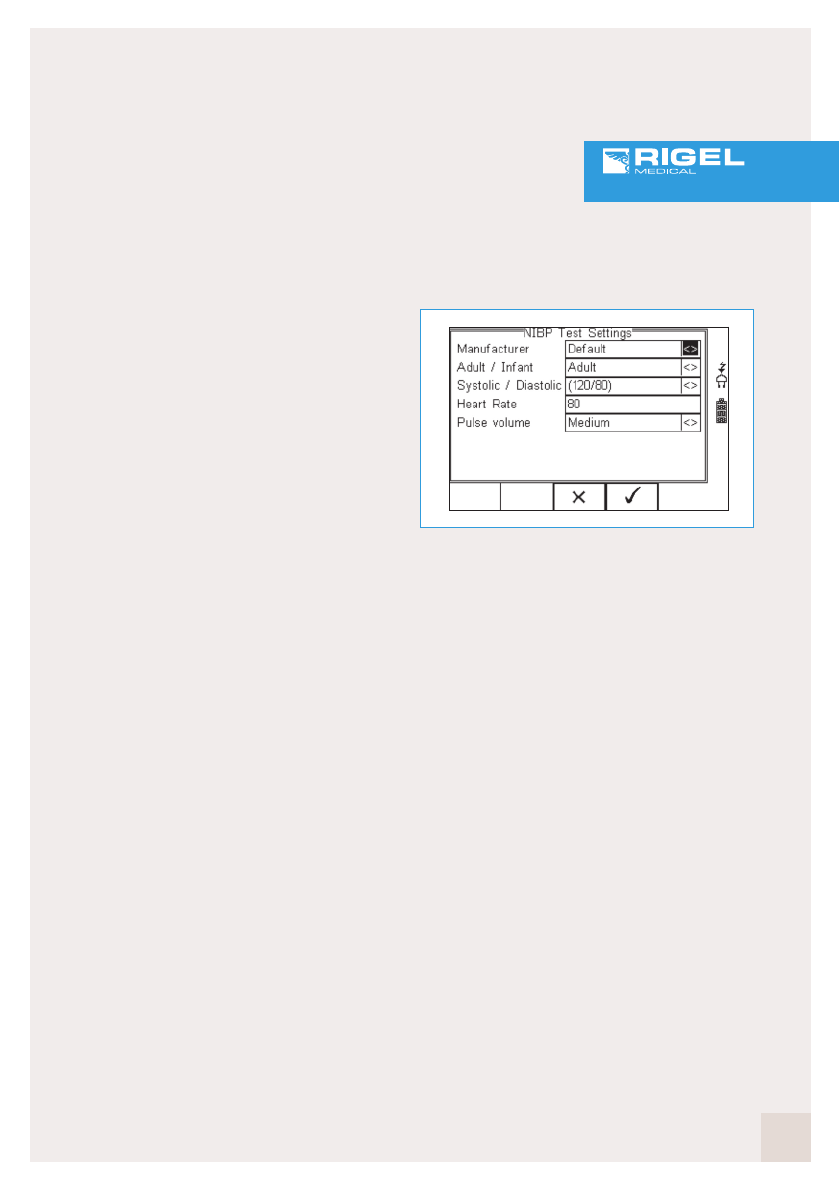
3.3.4 Dynamic pressure
Static testing is useful for verifying the
performance of the pressure transducer but it
does not prove the accuracy of the monitor under
dynamic pressures. The performances of the
computing algorithms that enable calculation of
systolic, diastolic and mean blood pressures are
tested in real conditions.
Figure 6: Dynamic pressure simulation
settings on the Rigel UNI-SIM
Patient simulations —It maybe necessary to
perform verifications using different patient
settings for example; a low (hypotension), normal
and high (hypertension) blood pressure;
■Patient A : 80/40 Heart rate 80
■Patient B : 120/80 Heart rate 80
■Patient C : 180/140 Heart rate 80
Testing alarms – Most monitors are equipped
with both audible and visual alarms. It is
important to verify these alarms are working
correctly. Refer to the monitor’s manual to
understand the different alarm conditions.
The simulator can be used to introduce certain
conditions and arrhythmias that will trigger an
alarm, subject to monitor and simulator features.
Figure 6 shows an example screenshot from the
Rigel UNI-SIM displaying the various dynamic
pressure simulation settings available.
3.4 Considerations
There are some physiological variations from one
patient to another. Different patients have
different arterial pulse shapes, arterial
I
nnovating
T
ogether

compliance, flesh rigidity and other factors which
simply make the BP cuff respond differently. The
oscillometric signal is complex and changes not
only in size but in shape in relation to the cuff
pressure.
Manufacturers of automated NIBP monitors are
using different methods and aspects to
determine the systolic and diastolic pressures.
These methods and aspects can include:
■Measuring the pulse size
■Measuring the average pulse size
■Determining the peak of the pulse size
envelope
■Measuring the average cuff pressure at a set
point
■Extracting data during cuff inflation or deflation
All different methods and aspects will result in
different readings on the same patient. As such,
a single NIBP simulator will read different on a
range of different makes of NIBP monitors.
During a dynamic simulation, the NIBP monitor
will inflate the cuff to a level above the expected
systolic pressure. The NIBP simulator, such as
the Rigel UNI-SIM is connected to the pressure
system, and is able to measure the pressure
drop in the cuff introduced by the monitor.
When the system (cuff) pressure is above the
systolic pressure, blood flow is unable to flow
past the cuff. The pressure variations
(oscillations) created by the simulator in the cuff
are minimal and is the result of simulating the
pulsating arterial blood against the cuff.
As the pressure in the cuff drops, the simulator will
simulate greater oscillations in the cuff, simulating
that blood flow is able to resume further along the
artery (along the length of the cuff).
When blood flow in the artery has been
established across the full length of the cuff, the
systolic pressure has been achieved although the
monitor is not able to establish this at this time as
the oscillations in the cuff continue to increase
until the cuff pressure is equal to the mean arterial
pressure.
When the pressure drops below the mean arterial
pressure, the oscillations from the simulator
decrease again (simulating a reduced pressure on
the artery). When the simulated oscillations reach
a minimum, the monitor stops the deflation
process and determines the systolic and diastolic
pressures from the measured mean arterial blood
pressure and or any of the aspects detailed above
depending on the manufacturer.
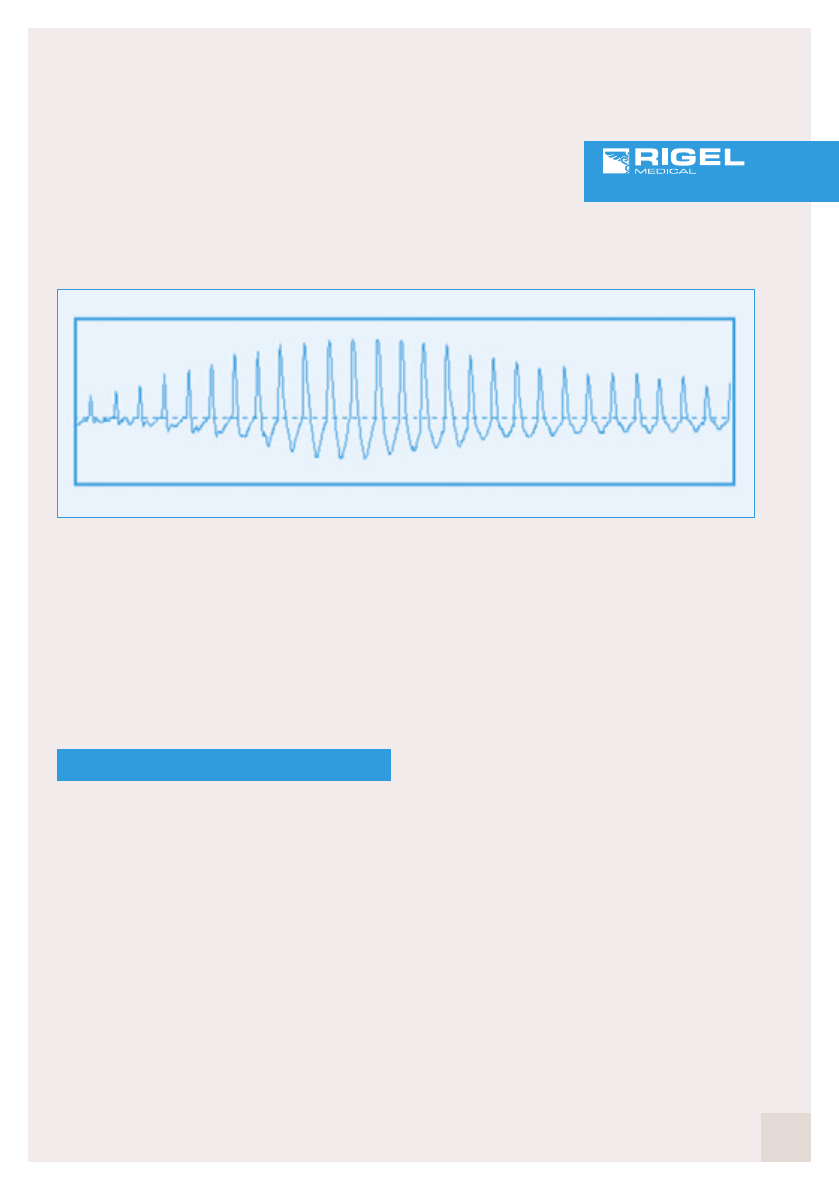
An example of the shape of the oscillometric
wave form captured by the NIBP monitor is
provided in figure 7.
The deviation in NIBP simulation values
compared to the values displayed on the monitor,
varies between manufacturers of NIBP monitors
and of NIBP simulators. Depending on shape of
the simulated oscillometric waveform, each type
of monitor might give a different interpretation of
the systolic and diastolic values. Consistency in
deviations is one way of ensuring that the monitor
function hasn’t deteriorated though accurate
simulation of the manufacturer’s oscillometric
waveform will allow the verification of whether the
correct components are being used (i.e.
compatible or recommended cuffs and tubing),
determine the accuracy of the calibration and
accurately simulate alarm conditions.
10
11
rigelmedical.com
To improve the accuracy of simulation, it is
essential that the NIBP simulator can simulate
manufacturer specific curves so the calculated
data is taken from identical parts of the envelop.
The Rigel UNI-SIM has the ability to create or
upload manufacturer specific envelopes to
ensure repeatable and accurate simulations.
4 Invasive blood pressure
Arterial pressure can be monitored both
invasively (IBP) and non-invasively (NIBP) as
discussed in the previous chapter however, it
must also be noted that the automated NIBP
method can only provide an indirect and non-real
time arterial pressure as it calculates pressures
based on a typically 30 second cycle.
When a greater accuracy or a real time arterial
pressure is required e.g. when a patient’s blood
pressure is expected to vary greatly during
surgical procedures, it’s most common to use
the invasive method.
During an invasive blood pressure measurement,
a liquid filled catheter is placed in the artery
(radial, brachial, femoral or axillary). The arterial
pressure is directly transferred to the liquid inside
the catheter and tubing to the pressure
transducer (non-invasive but external from the
monitor). The pressure transducer converts the
pressure to an electronic signal which is then
connected to the monitor for further processing
such as determining systolic and diastolic
pressures.
4.1 Testing IBP function
A number of tests are provided to determine the
correct operation of the IBP monitors. These are:
■Static pressure & linearity test (see 4.2.1)
■Dynamic pressure (see 4.2.2)
4.2 Test setup
The external pressure transducer produces a milli
Volt (mV) signal. The IBP simulator will produce
corresponding mV signals on the signal and
excitation connections to the IBP monitor to
simulate the external pressure transducer.
I
nnovating
T
ogether
Figure 7: Oscillometric wave form

There are several types of connections
depending on the monitor make and the
sensitivity of the pressure transducer
(mV/mmHg) will also vary by model. It is advised
that the correct connections are made and
tested prior to the simulations to avoid errors in
the simulations.
In this example we connect the Rigel UNI-SIM to
the IBP monitor and simulate dynamic pressure
values.
Figure 8: Test setup: Connecting the IBP
simulator
4.2.1 Static pressure or linearity test
(verify alarm testing)
The static pressure tests are useful for verifying
the performance of the pressure transducer. A
linearity test can be done similar to that during
the NIBP simulations, in order to verify the
accuracy of the IBP monitor over a pressure
range.
Start by setting the transducer sensitivity,
typically 5µV/V/mmHg. Zero the system by
simulating a zero pressure with the simulator and
set up the zero value on the monitor (refer to the
service or maintenance manual for instructions).
Once the zero is established, a number of
different pressure values can be simulated.
Forexample: A manufacturer could ask to perform
a linearity test on the following static pressures:
250mmHg, 200mmHg, 150mmHg, 100mmHg,
50mmHg and 0mmHg. The reading values
should be within +/-3mmHg from expected
value.
Record whether the alarm on the monitor occurs
at the set value(s) and whether the alarm(s) is at
the correct pitch and frequency (refer to the
instruction manual).
4.2.2 Dynamic pressure
The accuracy of the pressure transducer can
also be verified using a dynamic pressure
simulation. The performance of the computing
algorithms that enable calculation of systolic,
diastolic and mean blood pressures are tested in
real conditions.
Patient simulations —It may be necessary to
perform verifications using different patient
settings for example; a low (hypotension), normal
and high (hypertension) blood pressure;
■Patient A : 80/40 heart rate 80
■Patient B : 120/80 heart rate 80
■Patient C : 180/140 heart rate 80
Testing alarms – Most monitors are equipped
with both audible and visual alarms. It is
12
SYS 120 mmHg
DIA 80 mmHg
HR 70 bpm
UNI-SiM
IBP Monitor
13
rigelmedical.com
important to verify these alarms are working
correctly. Refer to the monitor’s manual to
understand the different alarm conditions.
5 Pulse oxymetry
If we consider the heart as the engine of the
respiratory system (see chapter 2) and the lungs
as the carburetor, oxygenated blood can be
considered the fuel whereby the level of oxygen
can be directly related to the potential capacity in
the blood (or octane level in fuel 95—98% being a
typical value).
Oxygen is absorbed by the blood as it passes
through the lungs, as oxygen sticks to the
hemoglobin protein in the red blood cells. The
quantity of oxygen absorbed (oxyhemoglobin) is a
sign of the respiratory system’s vitality
(performance), hence it is one of the most
common monitored vital signs. Displayed in
percentage oxyhemoglobin (SaO2, a direct
measurement) in relation to hemoglobin, pulse
oximeters can provide a real-time indication of the
total oxygen saturation (SpO2) in the blood.
To establish an indication of the oxygen saturation,
the pulse oximeter relies on the different light
absorption characteristics of oxyhemoglobin and
hemoglobin at different spectrums of light. Using a
red (650—700 nm) and infrared (850—950 nm)
spectrum light source, a pulse oximeter can
determine the oxygen concentration by measuring
the difference between the red and infrared light
being absorbed by the arterial blood.
To do so, a finger probe (or ear probe) is placed
on the finger. A red and infrared spectrum LED is
driven by the monitor at consecutive intervals of
typically 0.2 ms (5kHz). On the opposite side of
the finger probe, a broadband receiver converts
the unabsorbed red and infrared light signals into
electrical signals. Other types of probes (i.e. foot
probes) or techniques are available such as a
reflective method used on the forehead. These
however, are not part of this booklet although the
principles are similar.
Figure 9: The finger probe pulse oximeter
The red light is absorbed more in relation to infrared
light when passing through hemoglobin (Hb, de-
oxygenated blood cells) whilst infrared light is
absorbed more by oxyhemoglobin (HbO2,
oxygenated blood cells). The ratio at which the light
is being received can therefore provide an
indication of the level of oxygen concentration:
In principle, this translates to:
■Less infrared than red light being received:
higher concentration of oxyhemoglobin (HbO2)
■Less red than infrared light being received:
lower concentration of oxyhemoglobin (Hb)
A simplified representation of the absorption
properties of hemoglobin and oxyhemoglobin is
provided in figure 10. Note that this is not suitable
for clinical use.
I
nnovating
T
ogether
SPO2
Red LED
Infrared LED
PhotoDetector
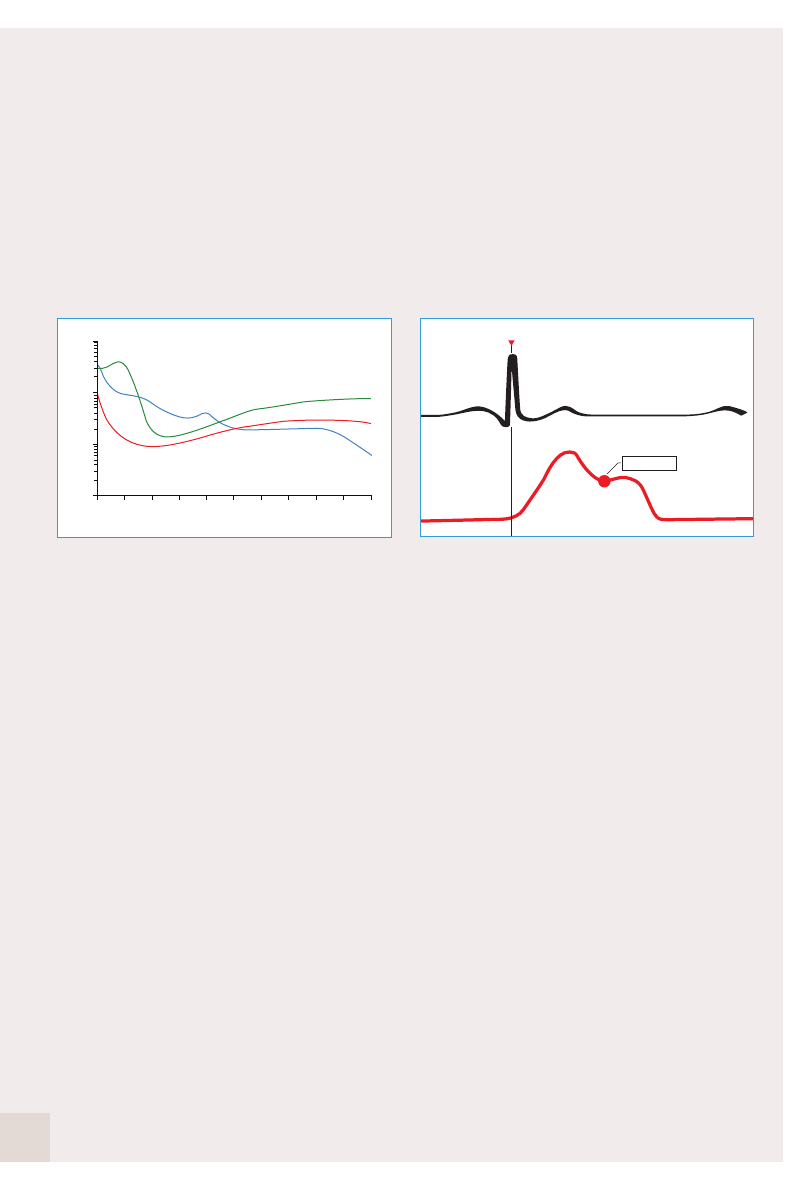
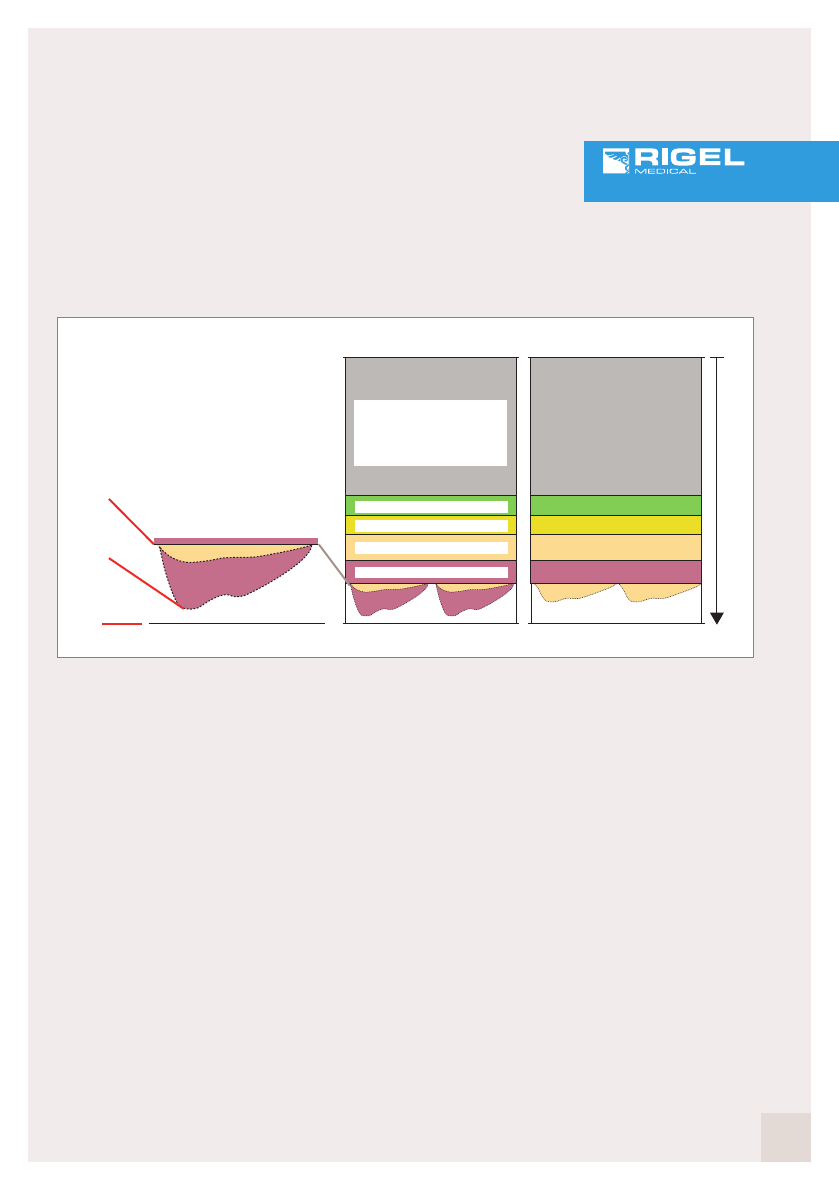
Figure 10: Absorption properties of
hemoglobin and oxyhemoglobin.
The red line shows the fully oxygenated
hemoglobin (HbO2 - 100% SpO2) while the blue
line shows the fully deoxygenated hemoglobin
(Hb - 0% SpO2). At around 800nm wavelength
the absorption is equal for both HbO2 and Hb,
this is referred to as the isosbestic point (803nm)
Typical ratio values are:
■100% SpO2 R/IR approximate ratio of 0.5
■82% SpO2 R/IR approximate ratio of 1.0
■0% SpO2 R/IR approximate ratio of 2.0
Different manufacturers use different wavelengths
(within the described spectrum) and have different
absorption look-up tables. This is referred to as
the R-curves for each manufacturer.
5.1 Artifacts
It is important to realize that light is passing
through different types of tissue (skin, muscle,
bone), cells and vessels (arterial and venous).
Therefore, to determine the amount of arterial
oxyhemoglobin, the monitor will look at the
“pulsating” light absorption waveform, the so
called plethysmograph (see figure 11).
Figure 11: An example plethysmograph vs
ECG waveform
As the heart pumps the blood through the lungs,
the level of oxyhemoglobin is “restored” (typically
5% of oxygen in lungs) at every systolic cycle after
which it will be absorbed at the capillaries
(typically around 40%) until the next systolic cycle.
At the peak of the plethysmograph, the monitor
measures the total light absorption (arterial and
other cells, tissues, venous vessels) while at the
troughs, the monitor measures all but the arterial
absorption (all remaining cells and tissues). By
subtracting peak from the trough, the monitor is
able to determine the arterial oxyhemoglobin, the
value for SpO2. See figure 12.
14
Dicrotic notch
QS
PT P
R
10.0
1.0
0.1
0.01
600 640 680 720 760 800 840 600 920
Methemoglobin
Oxyhemoglobin
Reduced hemoglobin
Wavelength (nm)
Extinction Coefficient
960 1000
15
rigelmedical.com
The monitor will therefore only respond to peak
values in a pulsating plethysmograph.
The measurement process within pulse oximetry
can be affected by motion and low perfusion
(peak to trough value less than 5%). Motion
introduces varying levels of oxyhemoglobin which
might introduce incorrect readings (heart rate and
SpO2 %) where as low perfusion can introduce
higher inaccuracy due to noise signal ratio.
External light sources may also introduce errors
when they contain red and infrared spectrum
light. These light sources could introduce a stable
amount of light (DC or non pulsating) or a
pulsating amount (AC) at frequencies of 50, 60Hz
or their harmonics.
Monitors must therefore be able to differentiate
between a normal plethysmograph and one with
artifacts.
Modern technologies in pulse oximeters are able
to differentiate and provide accurate readings
during low perfusion, motion and light artifacts
however, it is suggested that the performance
under such conditions is verified on a regular
basis. Recent developments in pulse oximetry
see the use of additional light spectrums to obtain
more detailed information on the exact content of
the arterial blood including methemoglobin
(MetHb) and carboxyhemoglobin (COHb).
5.2 Testing your SPO2 monitor – Pulse oximeter
Most pulse oximeters on the market are capable
of measuring under extreme conditions (artifacts,
low perfusion). In order to establish the correct
operation under these conditions, it is important
to verify both the performance of the monitor as
well as the SpO2 probe and its connection
cables.
I
nnovating
T
ogether
Figure 12: Light absorption in the
red spectrum
Transmitter RED 660nm Transmitter RED 660nm
INCIDENT LIGHT
Reciever Sp02 = 80% Reciever Sp02 = 100%
absorption due tobone,
skin and other tissues
and pigment
absorption due to MetHb
absorption due to COHb
Hb02: DC absorption
Hb: DC absorption
remaining light
Light Signal Max is normally called IDC
Light Signal Min is normally called IDC + AC
Light Signal
Max
Light Signal
Max
Light Signal
Max
All parts of the SpO2 probe (LED’s, broad band
detector, lens and cabling) are subject to wear
and tear and when faulty (or in poor quality) might
introduce inconsistent and inaccurate
performance with potentially serious implications
on the treatment of well-being of patients.
For this reason, we include both the monitor and
the SpO2 probe when discussing the testing
procedures for pulse oximetry.
Common issues relating to the accuracy of the
SpO2 monitor are:
■Faulty (near faulty) LED’s (red and infrared)
■Non-OEM probes (white label)
■Contaminated lens / probe window
■Damaged wiring or extension cable
■Inaccurate calibration of SpO2 monitor
■Testing of audible alarms
■Display of plethysmograph
A number of tests are provided to determine the
correct operation of the SpO2 monitors. These are:
■Testing monitor accuracy (see 5.3.1)
■Testing alarms and response time (see 5.3.2)
■Testing under low perfusion (see 5.3.3)
■Testing probe quality (see 5.3.4)
5.3 Test setup
In the example below, the Rigel SP-SIM or UNI-
SIM is used to represent the SpO2 simulator.
Ensure the correct adaptor module is provided
during the test as connector shape and pin-out
configuration differ between different makes of
SpO2 probes and monitors.
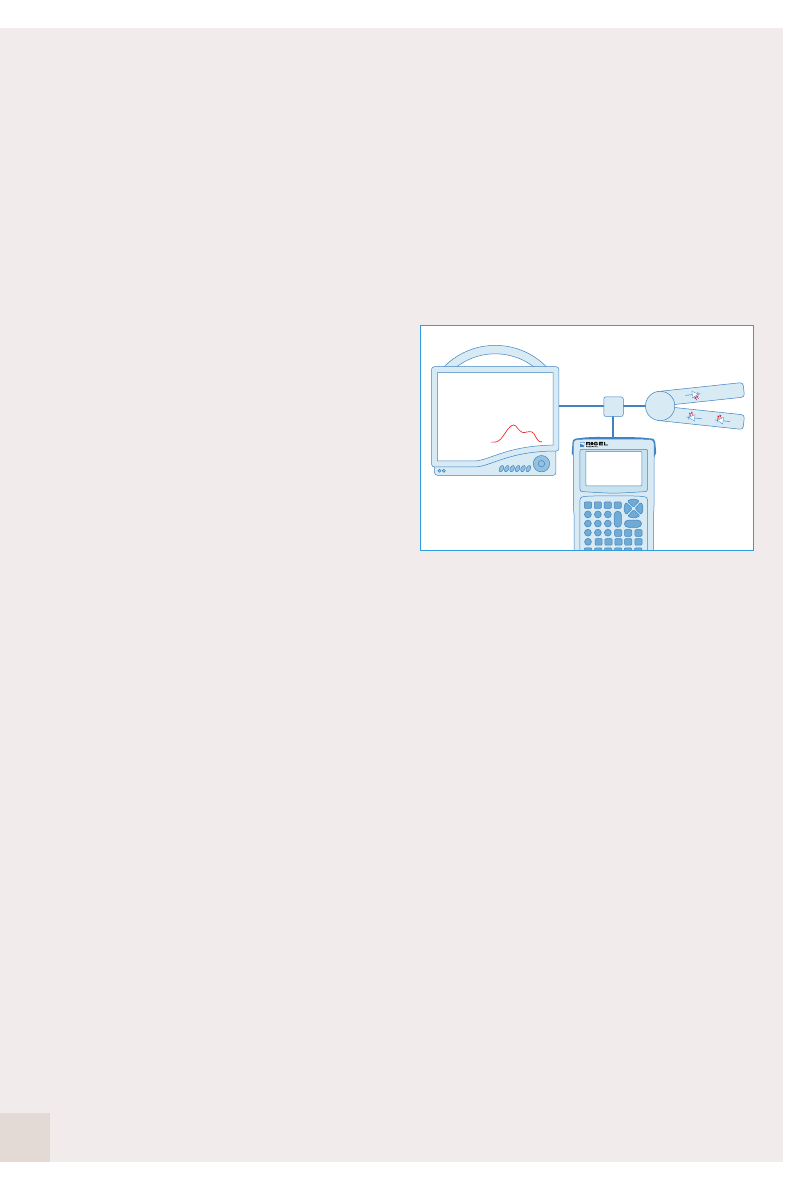
Figure 13: Test setup: Connecting the
SPO2 simulator (opto-electronic method)
5.3.1 Testing monitor accuracy
The purpose of this test is to verify the performance
of the monitor measurement circuits and SpO2
probe characteristics by simply displaying the
SpO2% value and heart rate on the monitor.
To simulate the heart rate, the UNI-SIM simulates
the (pulsating) plethysmograph at rates of 30 to
300 beats per minute (bpm). Simulated saturation
levels can be set between 50 and 100%. In order
to verify a range of possible measurements, some
simulations can be performed across a number of
critical values (see alarm testing) as example:
normal, low and critical.
In addition, artifacts (light, motion and
arrhythmia’s) can be introduced to test the
performance of SpO2 monitors either for
evaluation, acceptance and as part of preventative
maintenance.
Note that the precision of pulse oximeters can
vary greatly between brands but typically does
not exceed +/-2%.
16
SPO2 98%
HR 70 bpm
UNI-SiM
SpO2 Monitor
SPO2
SpO2 Probe
Probe
Interface

17
rigelmedical.com
5.3.2 Alarms and time response test
Use the different values of SpO2 simulation to
trigger audible alarms. Alarms of medical devices
are specified by the IEC 60601 standard and
must be documented by the manufacturer, such
as pitch, frequency and strength. Consult the
monitor’s service or instruction manual for details
on the types of alarms available.
In addition, the SpO2 value is updated at set
intervals e.g. every 15 seconds. The set
response time can be verified using the
chronometer function in the UNI-SIM. The
response time and alarm function can be
combined in a single test setup i.e. by setting the
SpO2 value to 94% with a target of 85%. Wait for
the SpO2 monitor to display the 94% SpO2.
Activate the chronometer function on the UNI-
SIM. This will change the simulation to 85%
SpO2 and starts the timer. When the monitor
reaches the alarm (i.e. when set to 85% SpO2),
press the capture button on the UNI-SIM to
display the time taken to alarm.
Record whether the alarm on the monitor occurs
at the set value(s) and whether the alarm(s) is at
the correct pitch and frequency (refer to the
instruction manual).
5.3.3 Sensitivity test
To determine whether the SpO2 monitor is able to
measure accurately under different pulse
volumes, e.g. as a result of different types of
patients (normal adult, obese, pediatric, skin color
variation), the UNI-SIM can be used to simulate a
variety of pulse volumes and skin colors.
Using the SpO2 simulator, the pulse volume can be
reduced until the monitor displays “no SpO2
signal”. The value before this point highlights the
minimum sensitivity of the monitor. It is important to
realize that the quality of the probe can affect the
outcome of this test as non-original probes might
have poorer quality components and have less
sensitivity compared to the original probes (OEM).
Record the sensitivity value over time to monitor
the performance of the oximeter.
5.3.4 Testing the SPO2 probe
The SpO2 sensor is often the weakest link in the
chain of SpO2 measurement. Probes are
considered consumables as they suffer
significant wear and tear thus are easily
replaceable.To test the functionality of the probe
it is important to realize the different parts that
make up the probe and connections:
1. Red LED
2. Infrared LED
3. Broadband detector
4. Lens
5. Cabling
6. Connector
7. Extension cable (where applicable)
The quality or function of the LED’s will
deteriorate over time. To test the accuracy, the
UNI-SIM is able to simulate through the red and
infrared circuit individually. This will allow for
comparison between the two circuits as the
reading on the monitor should be within 1% of
each other. When one of the LED’s has
deteriorated, the readings will differentiate by
more than 2% of SpO2 value. Replace the probe
and repeat the test again to ensure the new
probe is as expected.
I
nnovating
T
ogether
Other forms of problems associated with the
quality of the SpO2 LED’s are a deterioration of
the perfusion sensitivity (see 5.3.3). This could be
due to quality of the LED’s, broadband detector
or the lens (contamination or cuts).
When testing the probe, always ensure that the
cable and extension leads are flexed during the
tests so that open or short circuits cause an
alarm or a “no reading” on the monitor.
Suggestion: Always record the findings on each
type of SpO2 probe to build-up an expected
performance reference list (perfusion, Delta R / IR
reading). This will help in identifying poor or (near)
faulty SpO2 probes in the future.
Consideration: Some simulators on the market
might make use of an optical finger, capturing the
signals from the SpO2 probe and changing the
characteristics before converting them back to
red and infrared signals. The advantage would be
the elimination of probe adaptor boxes however,
the disadvantages are significant; Red – Infrared
light / blood absorption characteristics have a
strong and direct link with the wave length used
(LED spectrum). An optical finger may use
different wave length or single LED compared to
the manufacturer (OEM). This could result in
inaccurate readings. Probe placement will also
affect the result and as such can be influenced
thus not able to form an accurate reference value.
6 Electrocardiographs (ECG)
The heart, central in the respiratory system,
converts bio-electric pulses to a bio- mechanical
operation (blood flow). The function of the heart
is monitored by measuring the electrical activity
(milli-volt signals) generated in the heart and is
referred to as Electrocardiography.
The most common ECG tracing of a cardiac cycle
(heart beat) is represented below and consists of
a P wave, the QRS complex and a T wave. The
typical duration of the electrical activity is usually
around 400-600 ms. The ECG trace represents
the change in voltage across different parts of the
body (limbs) because of depolarization
(contracting or systole) and repolarisation
(relaxing or diastole) in the heart muscles. The
baseline voltage of the ECG is referred to as the
isoelectric line.
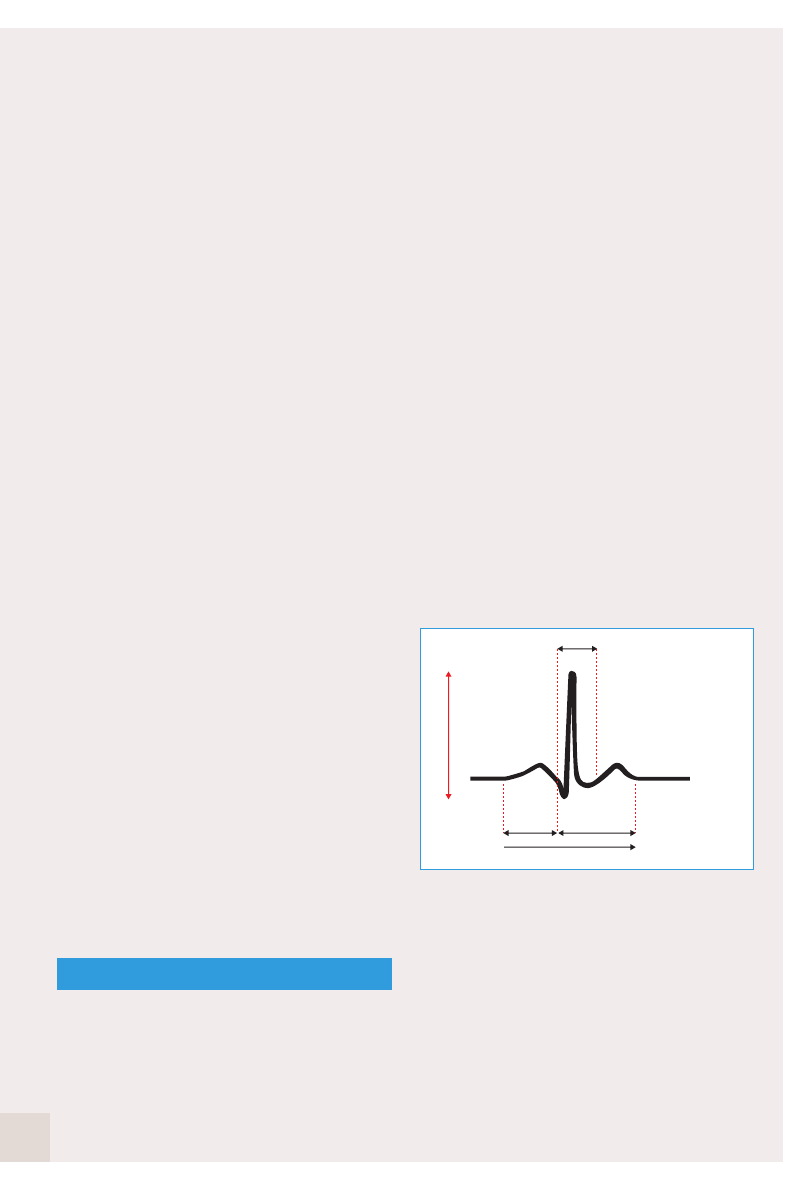
Figure 14: An example of an ECG trace
1. The P wave is generated during the atrial
depolarization.
2. Following this, the right and left ventricles are
depolarized, generating the QRS complex.
3. During the T wave, the ventricles re-polarize.
4. During the latter part of the T wave, the
human heart is most vulnerable against
disturbance or fibrillation.
18
Q
S
PT
R
PR QT
100-200 300-400
400-600
QRS
isoelectric line
appr. 1-2mV
19
rigelmedical.com
6.1 Einthoven Triangle
As a result of the body’s natural impedance, the
electrical activity results in different potentials
across the body. One of the most referred to
means of measuring the electrical potentials is by
positioning electrodes (limb leads) on the patient in
a triangular shape, the einthoven triangle, placed
on the left leg (LL), right arm (RA) and left arm (LA).
These limbs can also be referred to as:
Left leg (LL) = Left foot or foot (F)
Right arm (RA) = Right (R)
Left arm (LA) = Left (L)
Right leg (RL) = Neutral (N)
This is represented in the diagram below:
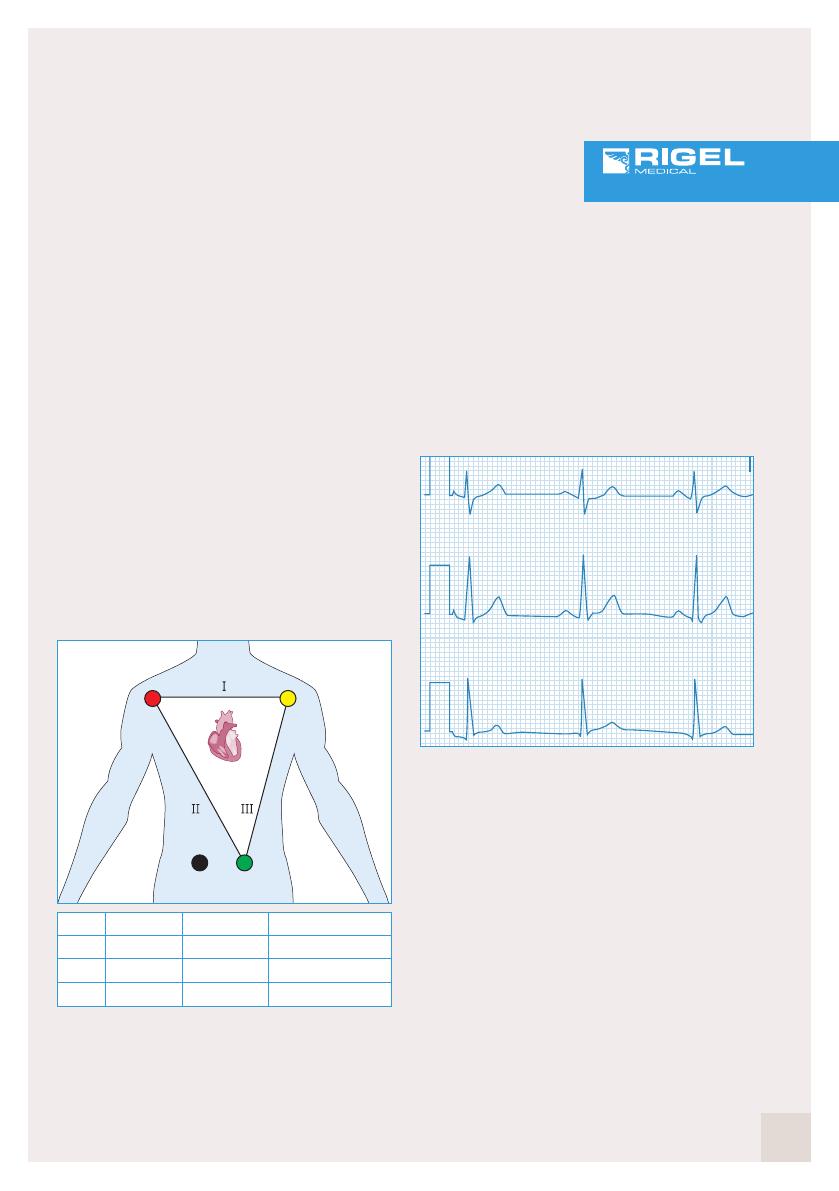
Figure 15: The Einthoven triangle
Whereby you can calculate that Lead I + Lead III
= Lead 2 (Kirchhoff’s law)
(ΦLA-ΦRA)+(ΦLL-ΦLA)=ΦLL-ΦRA
The ECG waveform, (PQRST) can now be
determined at various locations of the body, to
specifically highlight anomalies in a specific part
of the waveform. These can be directly related to
the performance of the atrium and ventricle
muscles.
Figure 16: A typical waveform (Lead I) and
the derived shapes (Lead II and III)
Using vectors, Lead I, II and III can be separated
into Augmented limb leads whereby the potential
is measured from one (positive) of the three
positions on the Einthoven triangle and the
combined other two (negative) as shown in figure
17 on the following page.
I
nnovating
T
ogether
RL
NF
_+
++
__
l
l
Potential
V1= ΦLA-ΦRA
V2= ΦLL-ΦRA
V3= ΦLL-ΦLA
(-) negative
RA
RA
LA
(+) positive
LA
LL
LL
Lead
I
II
III
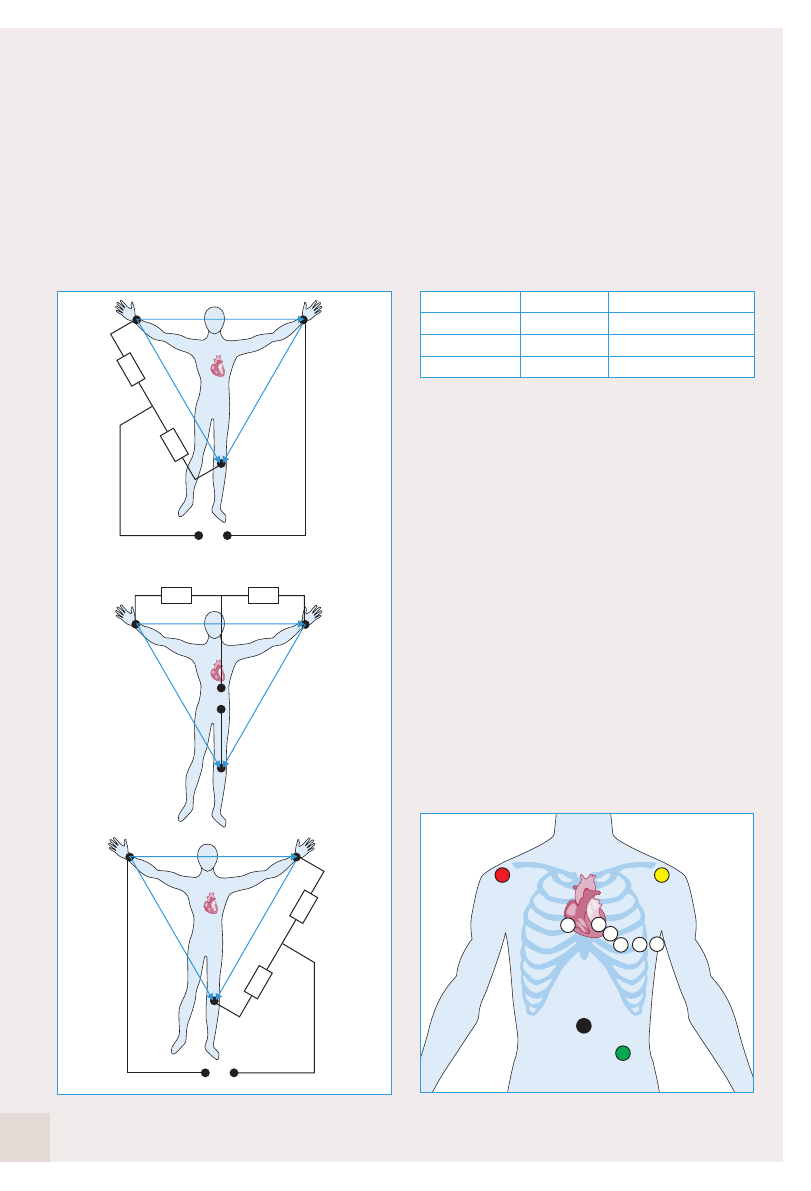
Figure 17: Augmented limb leads
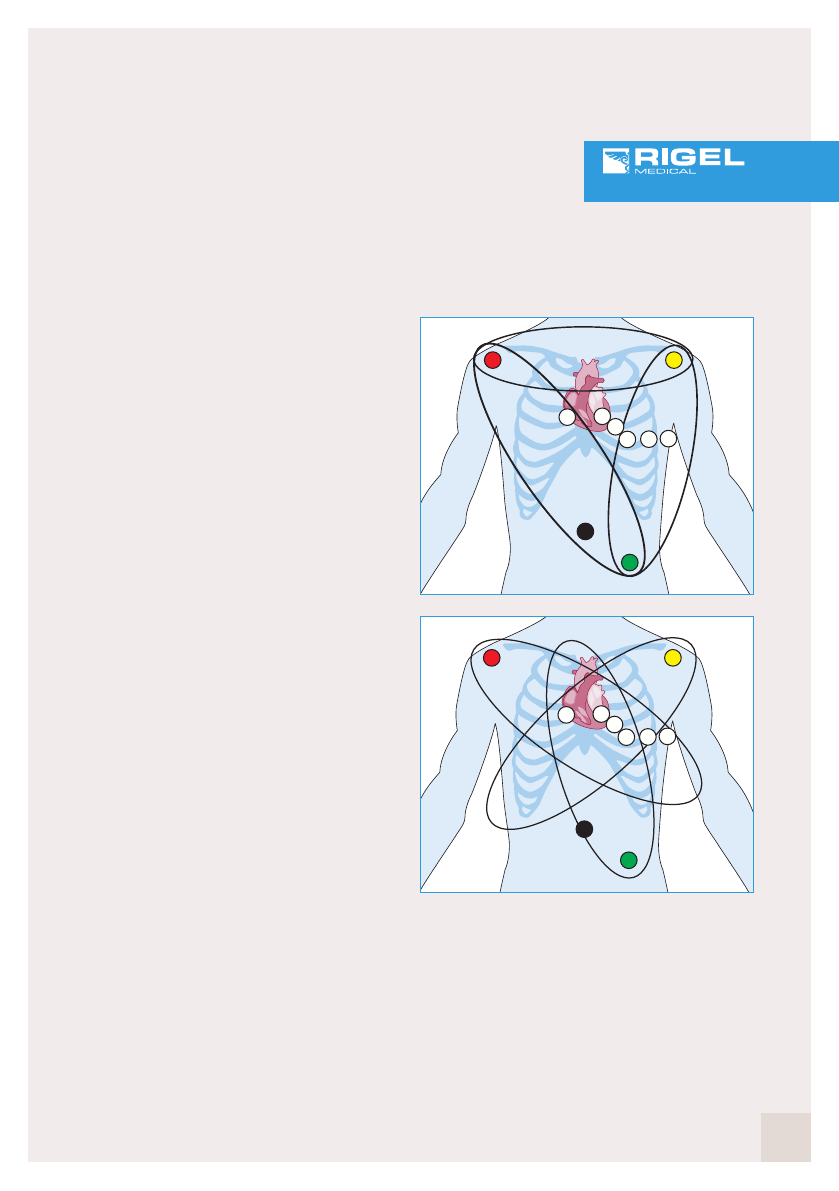
6.2 Precordial leads
When a more detailed electrocardiogram is
required, additional leads, the precordial leads,
are placed on the chest. The different lead
configurations will allow diagnosis of numerous
heart conditions by studying relative amplitudes,
heart rates and uniformity across the different
leads.
The precordial leads (V1,V2,V3,V4,V5 and V6)
are placed in close proximity to the heart to
ensure sufficient signal strength and accuracy.
Placements of the leads are in accordance with
figure 18 below.
Figure 18: Precordial lead placement
For figure 18 use IEC Code 1 for lead
identification, not those shown, including the
chest leads which should be C1 – C6 not ‘Y’.
20
R
N
L
C1C2
C3
C4C5C6
F
RL
F
RL
F
RL
F
aVL
aVR
aVF
5 KΩ
5 KΩ
5 KΩ
5 KΩ5 KΩ
5 KΩ
-
R (RA) + F (LL)
L(LA) + (RA)
L(LA) + F(LL)
+
L (LA)
F(LL)
R(RA)
Lead
aVL
aVF
aVR
21
rigelmedical.com
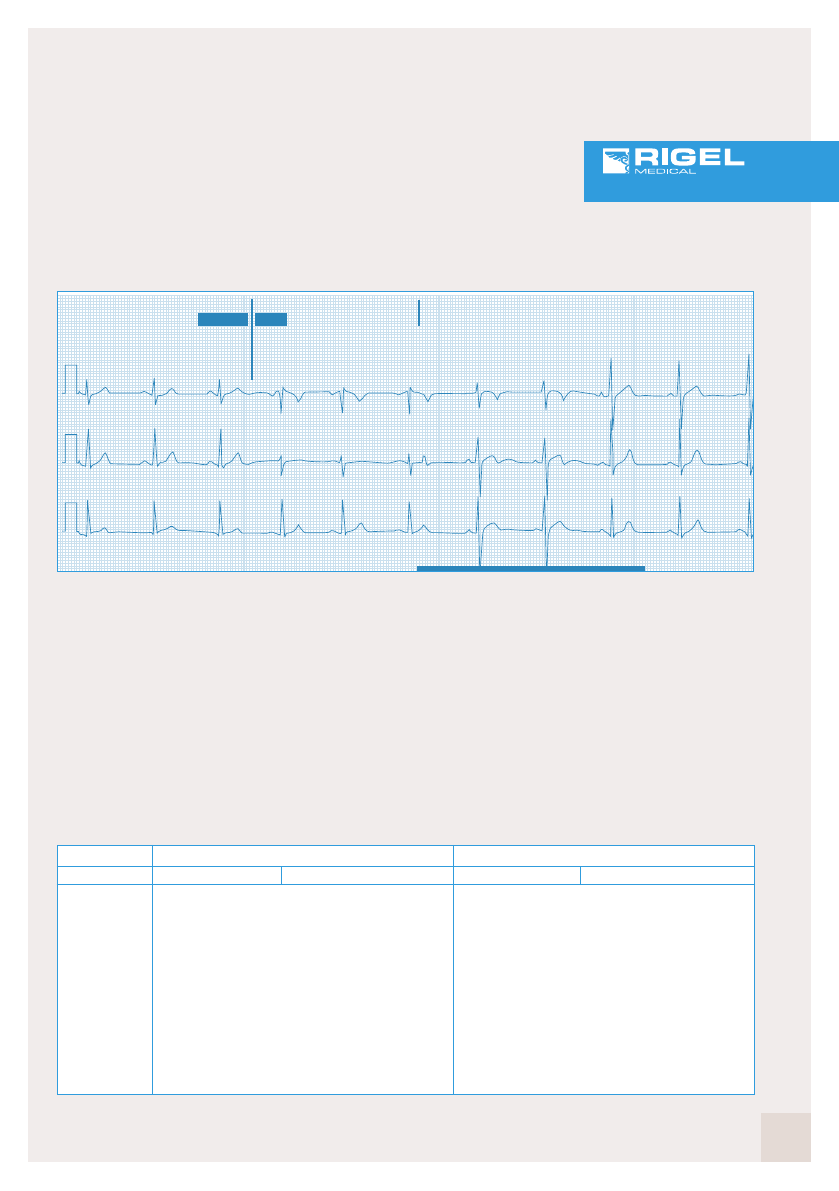
Figure 19: Example of a 12 lead ECG
6.3 Unipolar vs. bipolar leads
ECG leads are split between unipolar and bipolar
leads. The limb leads (I, II and III) are bipolar,
having both a positive and negative pole. The
augmented leads (aVL, aVF and aVR) and
precordial leads (V1-6) are considered unipolar,
having only a true positive pole. The negative
pole consists of signals from other poles.
6.4 Color coding
ECG leads are marked with both abbreviations
and color coding according to the corresponding
placement on the body. There are 2 common
markings available on the market today. These
are shown in the table below.
I
nnovating
T
ogether
HR 62 bpm
14:37:18
QRS 0:112s
0.390s/0.395s
27 80 49
x1.0 .05-150Hz 25mm/sec
Name:
ID:
Patient ID
Incident:
Age: 26
12-Lead 2
hhh
PR0.138s
QT/QTc
P-QRS-Axes
aVR
Normal ECG **Unconfirmed**
Normal sinusrhythm
Sex:
o
ooo
o
lv1lv4
lv5lv2l aVL
l aVF lv3lv6
Table 1: ECG Abbreviations and color coding
Colour
White ❑
Black ■
Green ■
Red ■
Brown/Red ■
Brown/Yellow ■
Brown/Green ■
Brown/Blue ■
Brown/Orange ■
Brown/Violet ■
Abbreviation
RA
LA
RL
LL
V1
V2
V3
V4
V5
V6
Colour
Red ■
Yellow ■
Black ■
Green ■
White/Red ■
White/Yellow ■
White/Green ■
White/Brown ■
White/Black ■
White/Violet ■
Abbreviation
R
L
N
F
C1
C2
C3
C4
C5
C6
Right Arm
Left Arm
Right Leg
Left Leg
Chest 1
Chest 2
Chest 3
Chest 4
Chest 5
Chest 6
Elecrode IEC Code 1 IEC Code 2 (American)
6.5 The ECG Machine
To observe an ECG, the difference between two
electrical signals at different points on the body
must be amplified. Then the electrical potentials
can be displayed on the screen. ECG machines
may typically use 3 lead, 5 lead or 12 lead
configurations.
Placement of the ECG leads is standardized so
that the interpretation of the ECG is consistent.
Cardiac conditions that can be diagnosed using
ECG’s include abnormally fast heart rate
(tachycardia), abnormally slow rate
(bradychardia), heart block, acute myocardial
infraction (a blood clot in the heart), ischemia (a
restriction in the blood supply to a part of the
heart) and numerous other conditions. These
conditions come under the generic term of heart
arrhythmias.
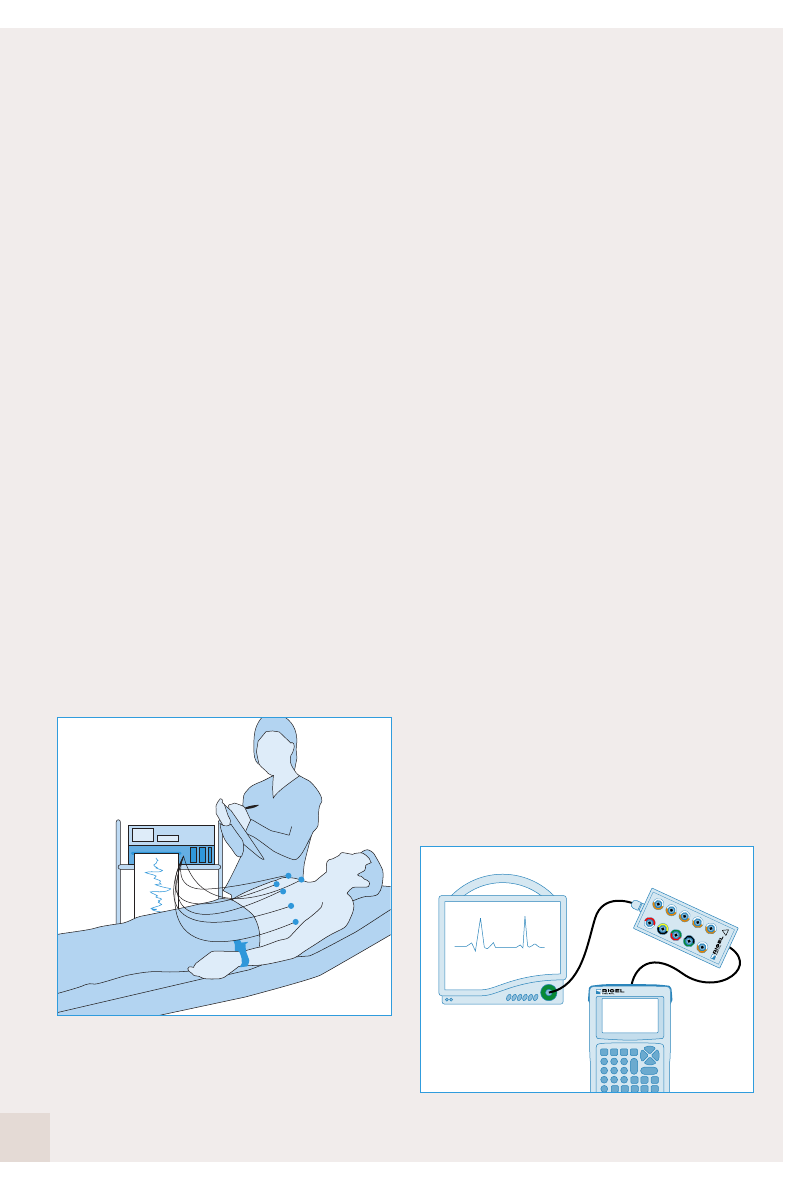
Figure 20: Patient on ECG recorder
6.6 Testing ECG monitor
Due to the important analyzing role of the ECG
monitor, it is crucial to ensure that the input
circuits of the ECG monitor are able to measure
the small ECG signals accurately. That the
software is able to interpret these signals to the
corresponding conditions and that alarms are
visible and audible according to the
manufacturers specifications.
Therefore, the following simulations and
performance tests are often part of the regular
maintenance:
■Linearity of heart rate measurement
■QRS Beep
■Alarms (high and low)
■Alarms for disconnected electrodes
■Arrhythmias recognition (asystolic)
■Sensibility test
■Zero offset
■Frequency response
■Printer calibration (amplitude, timing)
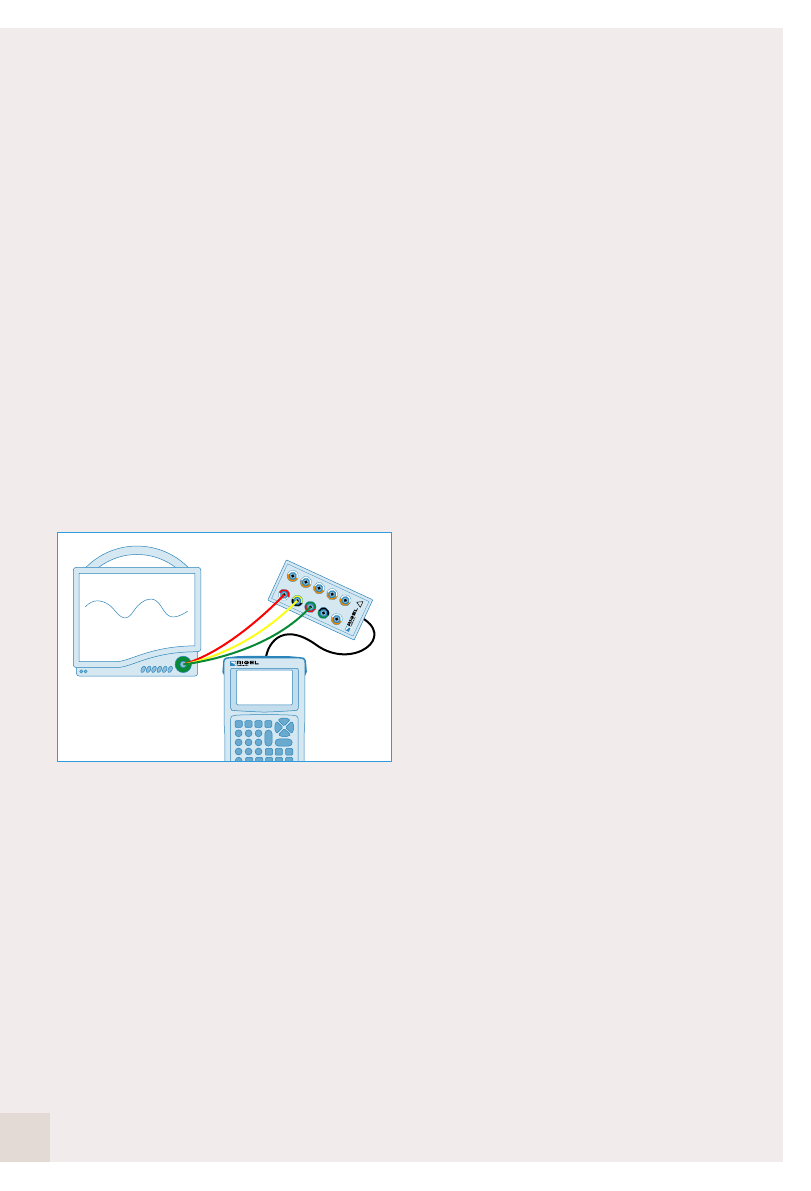
The most common instrument used for the
above is a patient or ECG simulator. In the
example below, the patient simulator from the
UNI-SIM is used;
Figure 21: Test setup: Connecting the ECG
simulator
22
HR 70 BPM
UNI-SiM
ECG Recorder
1
2
3
4
5
RA
LA
LL
RL
1V
V2
V3
V4
V5
V6
6
7
8
9
10
!
ECG
Interface
ECG

23
rigelmedical.com
6.6.1 Linearity of heart rate measurement
The purpose of this test is to verify the capability
of the monitor to measure and display heart rate
accurately. It is recommended to simulate several
values in range spanning 30-300 beats per
minute (bpm).
Compare the readings with the simulated values
and check whether this is within manufacturer
specifications (normally +/- 1 bpm or +/- 1% of
reading).
6.6.2 QRS beep
To aid the monitoring process, it is a requirement
to fit the ECG monitor with an audible QRS beep.
This provides a clear “beep” each time the QRS
wave passes. Frequency and pitch variations can
provide a clear indication of the heart rate without
having to have line of sight to the ECG recorder.
6.6.3 Alarms (high and low)
IEC 60601-1-8 provides the requirements for
alarms on medical devices. Alarms can vary in
frequency, pitch, volume and melody. In general,
the greater the urgency, the higher the pitch,
volume and pulse frequency (or melody).
During the performance test of the ECG recorder,
alarms can be tested by simulating different heart
rates and arrhythmias using a patient simulator.
At the end of the test, the final alarm condition
can be tested by disconnecting the leads one by
one. The monitor should go into alarm condition
when this happens.
Record whether the alarm on the monitor occurs
at the set value(s) and whether the alarm(s) is at
the correct pitch and frequency (refer to the
instruction manual).
6.6.4 Arrhythmias recognition (asystolic)
ECG monitors, which are able to interpret the
ECG recording, are required to provide an alarm
when they detect a seizure in blood circulation (or
lack of pulse). This is the case during ventricular
fibrillation and asystole (flat line) when no electrical
nor mechanical activity is present in the heart.
Ventricular fibrillation is a condition whereby the
ventricles contract erratically with the net result of
poor to no blood circulation from the ventricles to
the body. During coarse VFIB, the waveform
amplitudes are significantly larger than during fine
VFIB. The latter is close to an asystole.
All cases of VFIB lead to rapid loss of
consciousness in the patient and must be
treated immediately with the use of a defibrillator.
6.6.5 Sensitivity test (gain)
To ensure the input circuits of the ECG recorder
are sensitive enough to measure the ECG mV
signals, the input amplifier settings are tested by
supplying a normal sinus rhythm (NSR) at (e.g.)
60 bpm and with a 1mV amplitude.
When the NSR is displayed on the screen, change
the gain of the monitor and check if the changes
in amplitude are relative to the gain change i.e. a
doubling in gain would result in a doubling of
amplitude. The heart rate should not be affected.
Some ECG recorders are supplied with a printer
and can allow for gain and amplitude settings to
be easily crossed referenced.
6.6.6 Zero offset
The zero offset test demonstrates the aligning of the
isoelectric line of the ECG wave form with the zero
line of the ECG recorder. This is achieved by
checking whether the ECG line (flat line on the
I
nnovating
T
ogether
recorder) is at zero mV when no leads are
connected. When the recorder is equipped (usually)
with a printer, the printed line shall be at zero mVolt.
6.6.7 Frequency response
To limit the sensitivity of the ECG recorder from
external signals i.e. mains frequency and other
artifacts, the input circuits are equipped (usually)
with filters. So called high pass filters – HPF’s
(allowing signals of greater frequency to pass
through) and low pass filters – LPF’s (allowing
frequencies of lower frequencies to pass through)
provide a bandwidth of allowable frequencies.
Typical values are 0.5Hz / 1 Hz for HPF’s and 40 Hz
for LPF’s inmonitormode and 0.05 Hz for HPF and
40 / 100 / 150 Hz for LPF’s in diagnostic mode.
These filter settings can be selected based upon
the application. To test the settings of the filters,
performance wave forms such as a sinus of
triangular waveform can be simulated to the ECG
recorder. By varying the frequency in-and outside
the bandwidth, the performance can be verified.
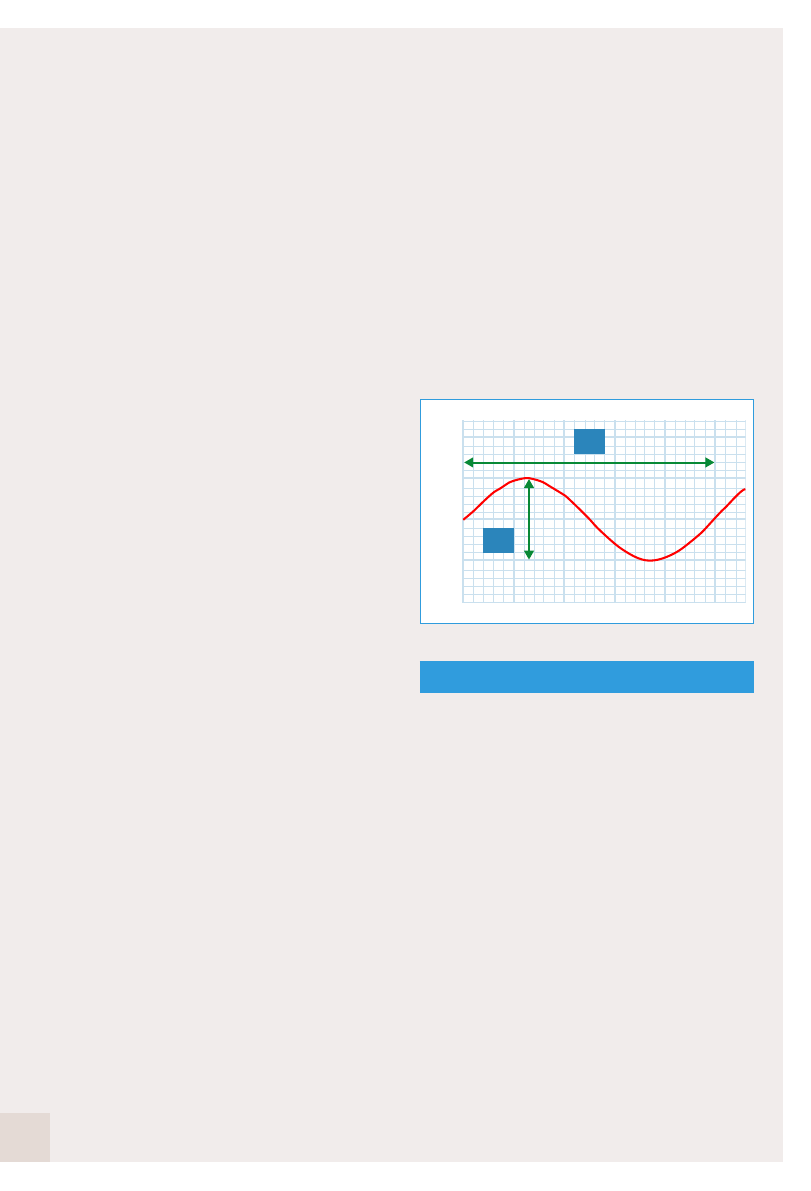
6.6.8 Printer calibration (amplitude, timing)
ECG recorders with build-in printer facility are
required to be tested for linearity of the printer
speed. Printer rolls typically move at 25 mm /
seconds. To test printer speed and linearity, a
fixed frequency sinusoidal wave can be
simulated. This should result in a consistent wave
length width across the print out and must
correspond to the print speed.
ECG recording paper consists of a matrix of
squares each 1mm x 1mm. At a speed of
25mm/s and a sensitivity of 10mm/mV each
square represents 0.04s and 0.1mV respectively.
A signal with an amplitude of 1 mV and frequency
of 1 Hz should have an amplitude of 10 mm and
wave length of 25 mm.
Figure 22: A sinusoidal test signal of 1Hz
and 1mV amplitude
7 Respiration
Unless a human is subject to mechanical
ventilation, inspiration of the lungs is controlled
by the increase in volume of the thoracic cavity.
The thoracic cavity volume is increased as a
result of (Involuntary) contraction of the
diaphragm (layer between lungs and abdominal
cavity). In addition to the diaphragm, the
intercostal muscles also aid the breathing
process by lifting the lower and upper ribs.
Expiration of the lungs is a result of the elasticity
of the lungs, forcing air out when the diaphragm
and intercostals muscles relax.
When a patient is under general anaesthetic,
he/she might no longer be able to sustain the
involuntary control of the diaphragm and
intercostals muscles. A mechanical ventilator is
then required to deliver a set volume per breath
24
1 mV
-1mV
0
1s
1mV
25
rigelmedical.com
and respiratory rate (breaths per minute).
Monitoring the respiration rate on patients
subject to anesthesia is vital as it provides
immediate warning of changes to the respiration
rate including obstruction of the trachea (airpipe).
An obstruction in the trachea stops the oxygen
supply to the lungs and stops the expiring of
carbon dioxide from the blood which can lead to
a cardiac arrest and subsequent death if
untreated e.g. removing the obstruction via an
endotrachea tube).
There are several ways of deriving respiration rate
from the ECG leads and signals.
1. Most commonly used, is the measurement of
the transthoracic impedance between the ECG
leads ie Lead I, II or III. As the thoracic cavity
expands (inspiration), the impedance of the chest
increases. While during expiration, the thoracic
cavity reduces in volume thus decreasing its
impedance.
2. Another method of determining the respiration
is through observing the change in the ECG
amplitude (ECG Derived Respiration – EDR) as a
result of changes in the position between
electrodes and heart as the chest cavity expands
and the heart moves as a result of changes in the
position of the diaphragm. This method can be
visualized on a recorded ECG.
3. A third method to establish the respiration rate
is by observing the changes in R-R intervals.
(time between the R-peaks of two successive
QRS waves).
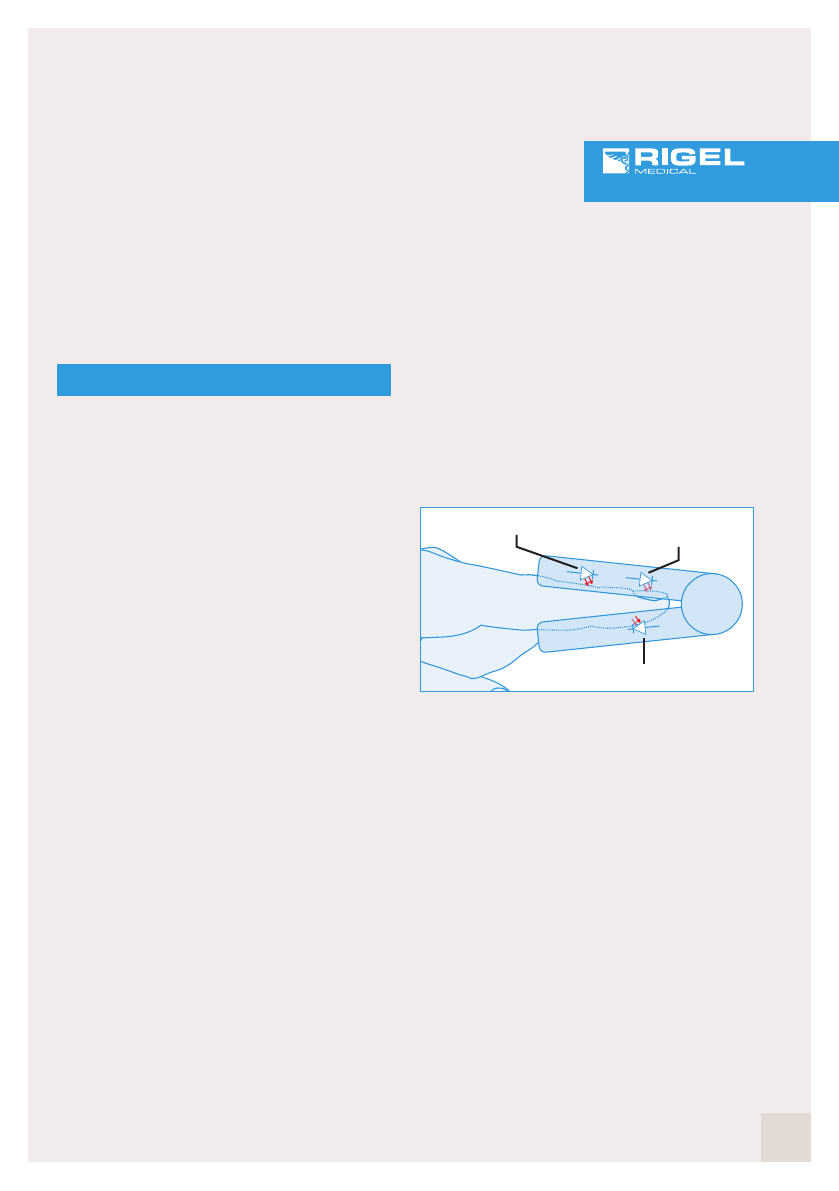
Figure 23: Respiration through limb and
augmented leads
In all instances, the ECG leads are placed on a
human chest as shown above. Respiration rates
can be monitored through all limb and
augmented leads. Most monitors and recorders
allow a selection of leads.
I
nnovating
T
ogether
R
N
L
C1C2
C3
C4C5C6
F
R
N
L
C1C2
C3
C4C5C6
F
7.1 Testing respiration function
The most common method of monitoring
respiration at bedside is through impedance
measurement across the ECG leads.
The tests to perform on such monitor are:
■Linearity of respiration measurement
■Sleep apnea
■Alarms (high and low)
Figure 24: Test setup: Connecting the
respiration / ECG simulator
7.1.1 Linearity of respiration measurement
The purpose of this test is to verify the capability
of the monitor to measure and display respiration
rate values. It is recommended to simulate
several values across a range rates from 100
bpm down to (sleep) apnea (see 7.1.2).
Check the specification of the monitor to verify
the readings are within the required accuracy.
Typical accuracies are within +/- 1bpm.
7.1.2 Sleep apnea
During our sleep, our airways can become
obstructed, preventing oxygen to reach the lungs
and stopping the expiring of carbon dioxide from
the blood. As a result, the level of carbon dioxide
increases in the blood (level of oxyhemoglobin
drops) as it is not able to pass out through the
lungs and no new oxyhemoglobin enter the
blood stream. While this is not a direct health risk
as the brain will signal a wake-up, when left
untreated, it can lead to more serious conditions
such as high blood pressure and heart failure.
While sleep apnea can be monitored indifferent
ways (CO2 monitoring, SpO2 etc), its most
commonly monitored through the respiration rate
on bedside monitors via ECG leads. Sleep apnea
will appear as an absence in breath rate (breath
rate = 0) and a respiration monitor should sound
an alarm when sleep apnea is detected.
7.1.3 Testing apnea alarms
In order to act swiftly to a deteriorating condition
of the patient, respiration monitors are supplied
with alarms to indicate a unacceptable change in
respiration rate (too high, too low or apnea).
Using a patient simulator, normal (e.g. 15 breath
per minute —bpm), low (e.g. 5 bpm), high (e.g. 30
bpm) and apnea (0 bpm) can be simulated.
Depending on the application of the monitor (i.e.
adult or pediatric monitoring), the range of values
could vary due to natural change in respiration
rate in infants (higher) and adults (lower) or when
testing monitors used for exercise stress testing
(>30 bpm).
Record whether the alarm on the monitor occurs
at the set value(s) and whether the alarm(s) is at
the correct pitch and frequency (refer to the
instruction manual).
26
RESP 15 bpm
UNI-SiM
ECG Recorder
1
2
3
4
5
RA
LA
LL
RL
1V
V2
V3
V4
V5
V6
6
7
8
9
10
!
ECG
Interface
27
rigelmedical.com
8 Temperature
One of the most commonly monitored vital signs is
the body temperature. Several devices have been
marketed over the years from contact based
temperature measurement such as the mercury
filled thermometers (no longer available due to the
toxic nature of mercury) and resistor based sensors
to non-contact infrared based temperature sensors.
Our core body temperature (Tc) varies by gender
and can vary between different stages of the day.
In women, the core body temperature also
changes during the menstrual cycle, peaking at
the time of ovulation.
The average core body temperature is 37°C ±
0.5°C. Depending on the placement, application
and method, different temperature readings are
expected in healthy individuals as shown in table
2 on the following page.
The most common temperature sensors used on
bedside monitoring are electrical temperature
sensors based on a temperature related varying
resistor (thermistors). These thermistors are
commonly known as NTC’s (negative temperature
coefficient – meaning that that the resistance
decreases when temperature increases) and PTC’s
(positive temperature coefficient – meaning that the
resistance is increasing as temperature increases).
The YSI 400 and YSI 700 have become the
standard NTC’s used in the medical industry.
While the YSI 400 is slightly more accurate over
the range of 0-75ºC, the YSI 700, which contains
a dual element (Ra = 6kΩ@ 25ºC and Rb = 30kΩ
@ 25ºC), is able to provide it’s accuracy over a
wider range (-25ºC to 100ºC).
Body temperature is simulated by the different
resistor values corresponding to the required
temperature.
Please see table 3 on the following page.
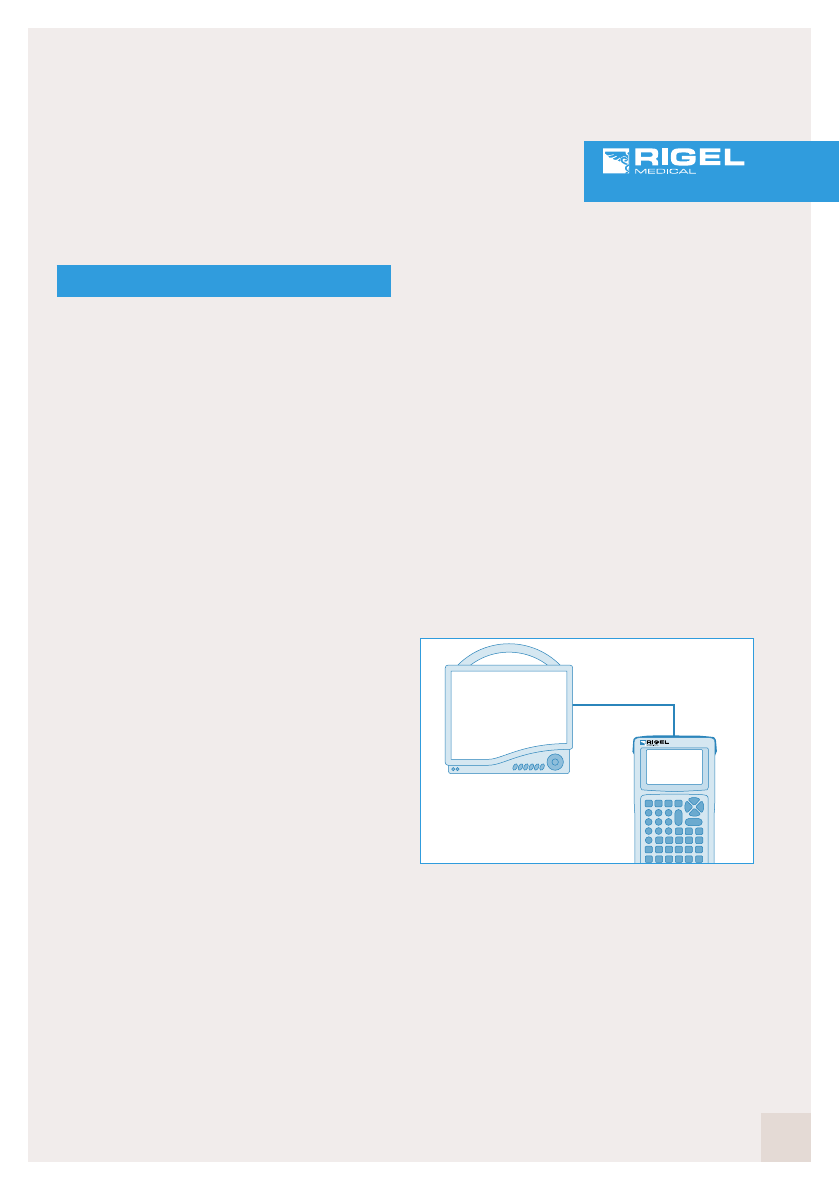
8.1 Testing temperature function on
multiparametric monitors
We have the following performance tests :
■Linearity of temperature measurement
■Alarms (high and low)
Ensure the correct temperature sensor (YSI400
or 700) on the patient simulator is selected.
Figure 25: Test setup: Connecting the
temperature simulator
8.1.1 Linearity of temperature measurement
The purpose of this test is to verify the linearity of
the monitor over the most typical range of
temperatures such as body normal, fever (high),
hypothermia (low) and room temperature.
A patient simulator is often able to simulate
across this range between 25-41°C. Check the
specification of the monitor to verify the readings
are within the required accuracy.
I
nnovating
T
ogether
T1 37 C
T2 25 C
YSI 400
o
o
UNI-SiM
Temperature
Monitor

8.1.2 Testing temperature alarms
In order to act swiftly to a deteriorating condition
of the patient, temperature monitors are supplied
with alarms to indicate an acceptable change in
core or skin temperature. (too high or too low).
Using a patient simulator, normal (37°C), low
(33°C), high (41°C ) and room (25°C) temperature
may be simulated.
Record whether the alarm on the monitor occurs
at the set value(s) and whether the alarm(s) is at
the correct pitch and frequency (refer to the
instruction manual).
9 Record keeping
Overall, the area of risk assessment and the
creation of risk management files has become a
growing feature of routine safety and performance
testing decisions, with different organizations and
departments drawing-up individual plans to deal
with specific safety hazards. Comparison with
previous and expected test results will therefore
allow you to monitor deterioration of the device
under test and prevent potential failure before a
fault occurs.
To ensure proper record keeping is maintained it
is important to provide a procedure in which data
is collected regarding:
■Inspection date
■Visual inspection
■Electrical safety
■Functional testing
■Next inspection date
Rigel Medical have developed Med-eBase, a
software package to automate the generation of
test reports including visual inspection, electrical
safety and performance testing. An example of
such test template is provided in Appendix D.
28
Table 2: Different temperature reading methods
Accuracy
Core temperature (Tc)
Core temperature (Tc)
0.3 to 0.6˚C < Tc
0.6 to 1.2˚C < Tc
Depending on direct environment
Method
contact and non-contact
contact
contact
contact
contact and non-contact
Application
Non-invasive
Invasive
Invasive
Non-invasive
Non-invasive
Placement
Ear (Tympanic)
Rectally
Orally
Armpit (Axillary)
Skin temperature
Table 3: Resistor values on YSI 400 and 700 sensors
YSI 700 (b)
15,520 Ω
18,210 Ω
21,430 Ω
30,000 Ω
YSI 700 (a)
3,070 Ω
3,610 Ω
4,260 Ω
6,000 Ω
Resistor Value
YSI 400
1,152 Ω
1,355 Ω
1,599 Ω
2,252 Ω
(Body) temperature
41˚C
37˚C
33˚C
25˚C (room)
A more detailed range of resistor values vs temperature is provided in Appendix C.

29
rigelmedical.com
Going forward, determining the appropriate
levels of both electrical and functional testing will
be central to the introduction of cost effective yet
reliable preventative maintenance campaigns.
Conclusion
Planned preventative maintenance is an important
aspect during the useful life of a medical electronic
device. To ensure safety of the patient and
operator, procedures are required to cover:
■Visual inspection
■Electrical safety testing (see IEC 62353)
■Performance or functional testing
■Record keeping
This booklet has provided a basic introduction to
vital signs monitoring and suggested test
procedures for each vital sign. Always ensure that
the function and operation of the DUT is
understood before commencing on the planned
preventative maintenance. Without fully
understanding the function and or operation,
visual inspections, electrical safety tests and
functional tests might be incorrect or incomplete.
Prior to any testing, ensure that the manufacturer’s
recommendations are available as they often
supersede any general inspection guidelines.
Considerations and recommendations
1. Ensure that the operator of test equipment is
properly trained on both the test equipment and
DUT to ensure that valid measurements are
taken and understood and prevent unnecessary
danger during the safety test.
2. Always ensure that the DUT does not pose
any danger to the user and / or people within the
vicinity to the safety test. (e.g. moving parts,
open conductors, live components, heat etc).
3. Ensure that manufacturer’s instructions are
followed and any performance is checked
against manufacturer’s documentation.
4. Ensure high accuracy and repeatability of
simulations and measurement readings (some
manufacturers might specify full scale accuracy
which will effect the accuracy of low value
readings or measurements).
5. When determining the correct means of
testing a specific medical device, ensure that the
chosen test procedures are applicable to the
DUT and are clearly documented for future use.
Rigel Medical offers a range of test equipment to
cover simulation and performance testing as well
as a range of electrical safety analyzers to meet
the IEC 62353 and IEC 60601 requirements.
Please visit our website www.rigelmedical.com
for a full overview of our product offering or
register online for our free newsletter on future
product releases and product innovations.
For further questions or comments relating to this
booklet or on the Rigel Medical product offering,
please contact John Backes via email at
johnb@rigelmedical.com
I
nnovating
T
ogether

Appendix A
IEC 60601-1 Collateral Standards (© IEC Geneva, Switzerland)
30
IEC 60601-1-1
IEC 60601-1-2 (ACDV)
IEC 60601-1-3
IEC 60601-1-4
IEC 60601-1-6
IEC 60601-1-8 (CCDV)
IEC 60601-1-9
IEC 60601-1-10
IEC 60601-1-11
IEC 60601-1-12 (CDM)
MEDICAL ELECTRICAL EQUIPMENT – PART 1: GENERAL REQUIREMENTS FOR SAFETY 1: COLLATERAL
STANDARD: SAFETY REQUIREMENTS FOR MEDICAL ELECTRICAL SYSTEMS
MEDICAL ELECTRICAL EQUIPMENT - PART 1-2: GENERAL REQUIREMENTS FOR BASIC SAFETY AND
ESSENTIAL PERFORMANCE - COLLATERAL STANDARD: ELECTROMAGNETIC PHENOMENA -
REQUIREMENTS AND TESTS
MEDICAL ELECTRICAL EQUIPMENT – PART 1: GENERAL REQUIREMENTS FOR SAFETY – COLLATERAL
STANDARD: GENERAL REQUIREMENTS FOR RADIATION PROTECTION IN DIAGNOSTIC X-RAY EQUIPMENT
MEDICAL ELECTRICAL EQUIPMENT: PART 1-4: GENERAL REQUIREMENTS FOR COLLATERAL STANDARD:
PROGRAMMABLE ELECTRICAL MEDICAL SYSTEMS
MEDICAL ELECTRICAL EQUIPMENT - PART 1-6: GENERAL REQUIREMENTS FOR BASIC SAFETY AND
ESSENTIAL PERFORMANCE - COLLATERAL STANDARD: USABILITY
MEDICAL ELECTRICAL EQUIPMENT - PART 1-8: GENERAL REQUIREMENTS FOR BASIC SAFETY AND
ESSENTIAL PERFORMANCE - COLLATERAL STANDARD: GENERAL REQUIREMENTS, TESTS AND
GUIDANCE FOR ALARM SYSTEMS IN MEDICAL ELECTRICAL EQUIPMENT AND MEDICAL ELECTRICAL
SYSTEMS
MEDICAL ELECTRICAL EQUIPMENT - PART 1-9: GENERAL REQUIREMENTS FOR BASIC SAFETY AND
ESSENTIAL PERFORMANCE - COLLATERAL STANDARD: REQUIREMENTS FOR ENVIRONMENTALLY
CONSCIOUS DESIGN
MEDICAL ELECTRICAL EQUIPMENT - PART 1-10: GENERAL REQUIREMENTS FOR BASIC SAFETY AND
ESSENTIAL PERFORMANCE - COLLATERAL STANDARD: REQUIREMENTS FOR THE DEVELOPMENT OF
PHYSIOLOGIC CLOSED-LOOP CONTROLLERS
MEDICAL ELECTRICAL EQUIPMENT - PART 1-11: GENERAL REQUIREMENTS FOR BASIC SAFETY AND
ESSENTIAL PERFORMANCE - COLLATERAL STANDARD: REQUIREMENTS FOR MEDICAL ELECTRICAL
EQUIPMENT AND MEDICAL ELECTRICAL SYSTEM USED IN HOME CARE APPLICATIONS
MEDICAL ELECTRICAL EQUIPMENT - PART 1-12: GENERAL REQUIREMENTS FOR BASIC SAFETY AND
ESSENTIAL PERFORMANCE - COLLATERAL STANDARD: REQUIREMENTS FOR MEDICAL ELECTRICAL
EQUIPMENT AND MEDICAL ELECTRICAL SYSTEMS USED IN THE EMERGENCY MEDICAL SERVICES
ENVIRONMENT

31
rigelmedical.com
Appendix B
IEC 60601-2 Particular Standards (© IEC Geneva, Switzerland)
I
nnovating
T
ogether
IEC 60601-2-1
IEC 60601-2-2
IEC 60601-2-3 (ADIS)
IEC 60601-2-4
IEC 60601-2-5
IEC 60601-2-6 (ADIS)
IEC 60601-2-7
IEC 60601-2-8
IEC 60601-2-10 (CCDV)
IEC 60601-2-11
IEC 60601-2-13
IEC 60601-2-16 (RDIS)
IEC 60601-2-17
IEC 60601-2-18
IEC 60601-2-19
IEC 60601-2-20
IEC 60601-2-21
IEC 60601-2-22
MEDICAL ELECTRICAL EQUIPMENT - PART 2-1: PARTICULAR REQUIREMENTS FOR THE SAFETY OF
ELECTRON ACCELERATORS IN THE RANGE 1 MEV TO 50 MEV
MEDICAL ELECTRICAL EQUIPMENT - PART 2-2: PARTICULAR REQUIREMENTS FOR THE SAFETY OF
HIGH FREQUENCY SURGICAL EQUIPMENT
MEDICAL ELECTRICAL EQUIPMENT PART 2: PARTICULAR REQUIREMENTS FOR THE SAFETY OF
SHORT-WAVE THERAPY EQUIPMENT
MEDICAL ELECTRICAL EQUIPMENT PART 2: PARTICULAR REQUIREMENTS FOR THE SAFETY OF
CARDIAC DEFIBRILLATORS AND CARDIAC DEFIBRILLATORS MONITORS
MEDICAL ELECTRICAL EQUIPMENT - PART 2-5: PARTICULAR REQUIREMENTS FOR THE SAFETY OF
ULTRASONIC PHYSIOTHERAPY EQUIPMENT
MEDICAL ELECTRICAL EQUIPMENT - PART 2: PARTICULAR REQUIREMENTS FOR THE SAFETY OF
MICROWAVE THERAPY EQUIPMENT
MEDICAL ELECTRICAL EQUIPMENT - PART 2-7: PARTICULAR REQUIREMENTS FOR THE SAFETY OF
HIGH-VOLTAGE GENERATORS OF DIAGNOSTIC X-RAY GENERATORS
MEDICAL ELECTRICAL EQUIPMENT - PART 2-8: PARTICULAR REQUIREMENTS FOR THE SAFETY OF
THERAPEUTIC X-RAY EQUIPMENT OPERATING IN THE RANGE 10 KV TO 1 MV
MEDICAL ELECTRICAL EQUIPMENT PART 2: PARTICULAR REQUIREMENTS FOR THE SAFETY OF
NERVE AND MUSCLE STIMULATORS
MEDICAL ELECTRICAL EQUIPMENT PART 2: PARTICULAR REQUIREMENTS FOR THE SAFETY OF
GAMMA BEAM THERAPY EQUIPMENT
MEDICAL ELECTRICAL EQUIPMENT - PART 2-13: PARTICULAR REQUIREMENTS FOR THE SAFETY OF
ANAESTHETIC WORKSTATIONS
MEDICAL ELECTRICAL EQUIPMENT - PART 2-16: PARTICULAR REQUIREMENTS FOR BASIC SAFETY
AND ESSENTIAL PERFORMANCE OF HAEMODIALYSIS, HAEMODIAFILTRATION AND
HAEMOFILTRATION EQUIPMENT
MEDICAL ELECTRICAL EQUIPMENT - PART 2: PARTICULAR REQUIREMENTS FOR THE SAFETY OF
REMOTE-CONTROLLED AUTOMATICALLY DRIVEN GAMMARAY AFTER-LOADING EQUIPMENT
MEDICAL ELECTRICAL EQUIPMENT PART 2: PARTICULAR REQUIREMENTS FOR THE SAFETY OF
ENDOSCOPIC EQUIPMENT
MEDICAL ELECTRICAL EQUIPMENT - PART 2: PARTICULAR REQUIREMENTS OF SAFETY OF BABY
INCUBATORS
MEDICAL ELECTRICAL EQUIPMENT - PART 2: PARTICULAR REQUIREMENTS FOR THE SAFETY OF
TRANSPORT INCUBATORS
MEDICAL ELECTRICAL EQUIPMENT PART 2: PARTICULAR REQUIREMENTS FOR THE SAFETY OF
INFANT RADIANT WARMERS
MEDICAL ELECTRICAL EQUIPMENT - PART 2: PARTICULAR REQUIREMENTS FOR THE SAFETY OF
DIAGNOSTIC AND THERAPEUTIC LASER EQUIPMENT

32
IEC 60601-2-23
IEC 60601-2-24 (ADIS)
IEC 60601-2-25
IEC 60601-2-26 (ADIS)
IEC 60601-2-27
IEC 60601-2-28
IEC 60601-2-29
IEC 60601-2-31
IEC 60601-2-32
IEC 60601-2-33
IEC 60601-2-34
IEC 60601-2-36 (1CD)
IEC 60601-2-37
IEC 60601-2-39
IEC 60601-2-40
IEC 60601-2-41 (CCDV)
IEC 60601-2-43
IEC 60601-2-44 (CCDV)
MEDICAL ELECTRICAL EQUIPMENT - PART 2-23: PARTICULAR REQUIREMENTS FOR THE SAFETY,
INCLUDING ESSENTIAL PERFORMANCE, OF TRANSCUTANEOUSPARTIAL PRESSURE MONITORING
EQUIPMENT
MEDICAL ELECTRICAL EQUIPMENT - PART 2-24: PARITCULAR REQUIREMENTS FOR THE SAFETY OF
INFUSION PUMPS AND CONTROLLERS
MEDICAL ELECTRICAL EQUIPMENT - PART 2-25: PARTICULAR REQUIREMENTS FOR THE SAFETY OF
ELECTROCARDIOGRAPHS
MEDICAL ELECTRICAL EQUIPMENT PART 2: PARTICULAR REQUIREMENTS FOR THE SAFETY OF
ELECTROENCEPHALOGRAPHS
MEDICAL ELECTRICAL EQUIPMENT - PART 2: PARTICULAR REQUIREMENTS FOR THE SAFETY OF
ELECTROCARDIOGRAPHIC MONITORING EQUIPMENT
MEDICAL ELECTRICAL EQUIPMENT - PART 2: PARTICULAR REQUIREMENTS FOR THE SAFETY OF X-
RAY SOURCE ASSEMBLIES AND X-RAY TUBE ASSEMBLIES FOR MEDICAL DIAGNOSIS
MEDICAL ELECTRICAL EQUIPMENT - PART 2-29: PARTICULAR REQUIREMENTS FOR THE SAFETY OF
RADIOTHERAPY SIMULATORS
MEDICAL ELECTRICAL EQUIPMENT - PART 2: PARTICULAR REQUIREMENTS FOR THE SAFETY OF
EXTERNAL CARDIAC PACEMAKERS WITH INTERNAL POWER SOURCE
MEDICAL ELECTRICAL EQUIPMENT PART 2: PARTICULAR REQUIREMENTS FOR THE SAFETY OF
ASSOCIATED EQUIPMENT OF X-RAY EQUIPMENT
MEDICAL ELECTRICAL EQUIPMENT - PART 2: PARTICULAR REQUIREMENTS FOR THE SAFETY OF
MAGNETIC RESONANCE EQUIPMENT FOR MEDICAL DIAGNOSIS
MEDICAL ELECTRICAL EQUIPMENT - PART 2: PARTICULAR REQUIREMENTS FOR THE SAFETY,
INCLUDING ESSENTIAL PERFORMANCE, OF INVASIVE BLOOD PRESSURE MONITORING EQUIPMENT
MEDICAL ELECTRICAL EQUIPMENT - PART 2: PARTICULAR REQUIREMENTS FOR THE SAFETY OF
EQUIPMENT FOR EXTRACORPOREALLY INDUCED LITHOTRIPSY
MEDICAL ELECTRICAL EQUIPMENT - PART 2-37: PARTICULAR REQUIREMENTS FOR THE BASIC
SAFETY AND ESSENTIAL PERFORMANCE OF ULTRASONIC MEDICAL DIAGNOSTIC AND MONITORING
EQUIPMENT
MEDICAL ELECTRICAL EQUIPMENT - PART 2-39: PARTICULAR REQUIREMENTS FOR THE SAFETY OF
PERITONEAL DIALYSIS EQUIPMENT
MEDICAL ELECTRICAL EQUIPMENT - PART 2-40: PARTICULAR REQUIREMENTS FOR THE SAFETY OF
ELETROMYOGRAPHS AND EVOKED RESPONSE EQUIPMENT
MEDICAL ELECTRICAL EQUIPMENT - PART 2-41: PARTICULAR REQUIREMENTS FOR THE SAFETY OF
SURGICAL LUMINAIRES AND LUMINAIRES FOR DIAGNOSIS
MEDICAL ELECTRICAL EQUIPMENT - PART 2-43: PARTICULAR REQUIREMENTS FOR THE SAFETY OF
X-RAY EQUIPMENT FOR INTERVENTIONAL PROCEDURES
MEDICAL ELECTRICAL EQUIPMENT - PART 2-44: PARTICULAR REQUIREMENTS FOR THE SAFETY OF
X-RAY EQUIPMENT FOR COMPUTED TOMOGRAPHY

33
rigelmedical.com
I
nnovating
T
ogether
IEC 60601-2-45
IEC 60601-2-46
IEC 60601-2-47 (RDIS)
IEC 60601-2-49
IEC 60601-2-50
IEC 60601-2-51
IEC 60601-2-52
IEC 60601-2-53
IEC 60601-2-54
IEC 60601-2-56
IEC 60601-2-57
IEC 60601-2-62 (ACDV)
IEC 60601-2-63 (CCDV)
IEC 60601-2-65 (CCDV)
MEDICAL ELECTRICAL EQUIPMENT - PART 2-45: PARTICULAR REQUIREMENTS FOR THE SAFETY OF
MAMMOGRAPHIC X-RAY EQUIPMENT AND MAMMOGRAPHIC STEREOTACTIC DEVICES
MEDICAL ELECTRICAL EQUIPMENT - PART 2-46: PARTICULAR REQUIREMENTS FOR THE SAFETY OF
OPERATING TABLES
MEDICAL ELECTRICAL EQUIPMENT - PART 2-47: PARTICULAR REQUIREMENTS FOR THE SAFETY,
INCLUDING ESSENTIAL PERFORMANCE, OF AMBULATORY ELECTROCARDIOGRAPHIC SYSTEMS
MEDICAL ELECTRICAL EQUIPMENT - PART 2-49: PARTICULAR REQUIREMENTS FOR THE SAFETY OF
MULTIFUNCTION PATIENT MONITORING EQUIPMENT
MEDICAL ELECTRICAL EQUIPMENT - PART 2-5O: PARTICULAR REQUIREMENTS FOR THE SAFETY OF
INFANT PHOTOTHERAPY EQUIPMENT
MEDICAL ELECTRICAL EQUIPMENT - PART 2-51: PARTICULAR REQUIREMENTS FOR SAFETY,
INCLUDING ESSENTIAL PERFORMANCE, OF RECORDING AND ANALYSING SINGLE CHANNEL AND
MULTICHANNEL ELECTROCARDIOGRAPHS
MEDICAL ELECTRICAL EQUIPMENT - PART 2-52: PARTICULAR REQUIREMENTS FOR BASIC SAFETY
AND ESSENTIAL PERFORMANCE OF MEDICAL BEDS
MEDICAL ELECTRICAL EQUIPMENT, PART 2-53: PARTICULAR REQUIREMENTS FOR THE SAFETY AND
ESSENTIAL PERFORMANCE OF A STANDARD COMMUNICATIONS PROTOCOL FOR COMPUTER
ASSISTED ELECTROCARDIOGRAPHY
MEDICAL ELECTRICAL EQUIPMENT - PART 2-54: PARTICULAR REQUIREMENTS FOR BASIC SAFETY
AND ESSENTIAL PERFORMANCE OF X-RAY EQUIPMENT FOR RADIOGRAPHY AND RADIOSCOPY
MEDICAL ELECTRICAL EQUIPMENT - PART 2-56: PARTICULAR REQUIREMENTS FOR BASIC SAFETY
AND ESSENTIAL PERFORMANCE OF SCREENING THERMOGRAPHS FOR HUMAN FEBRILE
TEMPERATURE SCREENING
PARTICULAR REQUIREMENTS FOR THE SAFETY AND ESSENTIAL PERFORMANCE OF INTENSE LIGHT
SOURCES USED ON HUMANS AND ANIMALS FOR MEDICAL AND COSMETIC PURPOSES
MEDICAL ELECTRICAL EQUIPMENT - PART 2-62: PARTICULAR REQUIREMENTS FOR BASIC SAFETY
AND ESSENTIAL PERFORMANCE OF HIGH INTENSITY THERAPEUTIC ULTRASOUND (HITU) SYSTEMS
MEDICAL ELECTRICAL EQUIPMENT - PART 2-63: PARTICULAR REQUIREMENTS FOR BASIC SAFETY
AND ESSENTIAL PERFORMANCE OF DENTAL EXTRA-ORAL X-RAY EQUIPMENT
MEDICAL ELECTRICAL EQUIPMENT - PART 2-65: PARTICULAR REQUIREMENTS FOR BASIC SAFETY
AND ESSENTIAL PERFORMANCE OF DENTAL INTRA-ORAL X-RAY EQUIPMENT

34
Appendix C
YSI 400 & 700 resistance reference table
-1˚C
0˚C
1˚C
2˚C
3˚C
4˚C
5˚C
6˚C
7˚C
8˚C
9˚C
10˚C
11˚C
12˚C
13˚C
14˚C
15˚C
16˚C
17˚C
18˚C
19˚C
20˚C
21˚C
22˚C
23˚C
24˚C
25˚C
7741Ω
7355Ω
6989Ω
6644Ω
6319Ω
6011Ω
5719Ω
5444Ω
5183Ω
4937Ω
4703Ω
4482Ω
4273Ω
4074Ω
3886Ω
3708Ω
3539Ω
3378Ω
3226Ω
3081Ω
2944Ω
2814Ω
2690Ω
2572Ω
2460Ω
2354Ω
2252Ω
20620Ω
19590Ω
18620Ω
17700Ω
16830Ω
16010Ω
15240Ω
14500Ω
13810Ω
13150Ω
12530Ω
11940Ω
11380Ω
10850Ω
10350Ω
9878Ω
9428Ω
9000Ω
8594Ω
8210Ω
7844Ω
7496Ω
7166Ω
6852Ω
6554Ω
6270Ω
6000Ω
99800Ω
94980Ω
90410Ω
86090Ω
81990Ω
78110Ω
74440Ω
70960Ω
67660Ω
64530Ω
61560Ω
58750Ω
56070Ω
53540Ω
51130Ω
48840Ω
46670Ω
44600Ω
42640Ω
40770Ω
38990Ω
37300Ω
35700Ω
34170Ω
32710Ω
31320Ω
30000Ω
Temp 'C YSI 400
Resistance
YSI 700
Resistance A
YSI 700
Resistance B
26˚C
27˚C
28˚C
29˚C
30˚C
31˚C
32˚C
33˚C
34˚C
35˚C
36˚C
37˚C
38˚C
39˚C
40˚C
41˚C
42˚C
43˚C
44˚C
45˚C
46˚C
47˚C
48˚C
49˚C
50˚C
51˚C
2156Ω
2064Ω
1977Ω
1894Ω
1815Ω
1739Ω
1667Ω
1599Ω
1533Ω
1471Ω
1412Ω
1355Ω
1301Ω
1249Ω
1200Ω
1152Ω
1107Ω
1064Ω
1023Ω
983.8Ω
946.2Ω
910.2Ω
875.8Ω
842.8Ω
811.3Ω
781.1Ω
5744Ω
5500Ω
5266Ω
5046Ω
4834Ω
4634Ω
4442Ω
4260Ω
4084Ω
3918Ω
3760Ω
3610Ω
3466Ω
3328Ω
3196Ω
3070Ω
2950Ω
2836Ω
2726Ω
2620Ω
2520Ω
2424Ω
2334Ω
2246Ω
2162Ω
2080Ω
28740Ω
27540Ω
26400Ω
25310Ω
24270Ω
23280Ω
22330Ω
21430Ω
20570Ω
19740Ω
18960Ω
18210Ω
17490Ω
16800Ω
16150Ω
15520Ω
14920Ω
14350Ω
13800Ω
13280Ω
12770Ω
12290Ω
11830Ω
11390Ω
10970Ω
10570Ω
Temp 'C YSI 400
Resistance
YSI 700
Resistance A
YSI 700
Resistance B
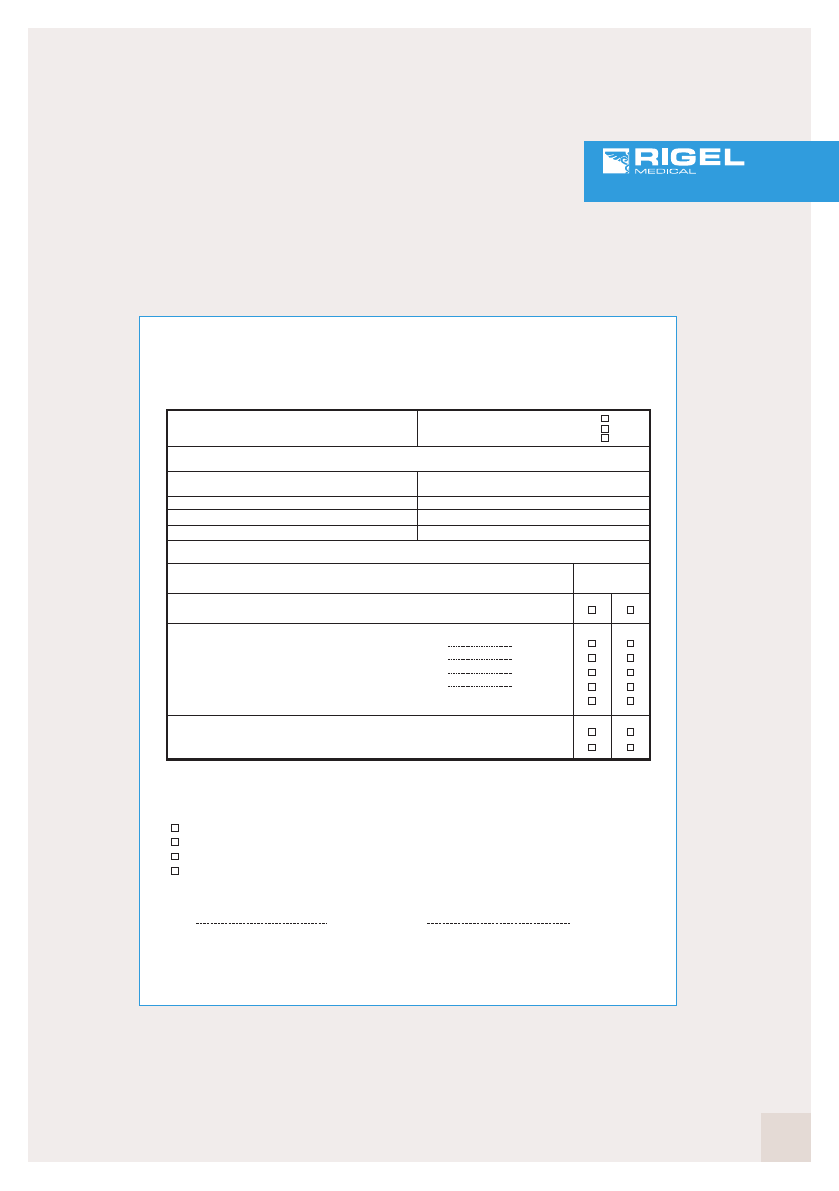
35
rigelmedical.com
I
nnovating
T
ogether
Appendix D
Example documentation template
Appendix D Example documentation template
Testing organization: Test before putting into service (reference value)
Recurrent Test
Test after repair
Name of testing person:
Responsible organization:
Equipment:
Type: Production No./Serial Nr.:
Manufacturer: Class of protection: I II Battery
Applied part type: 0 B BF CF
Accessories:
Visual inspection:
Functional Test (parameters tested):
Deficiency / Note:
Overall Assessment:
Name:
PIE PERMANENT INSTALLED EQUIPMENT
NPS NON-DETACHABLE POWER SUPPLY CORD
DPS DETACHABLE POWER SUPPLY CORD
Date/Signature:
Next recurrent test necessary in 6 / 12 / 24 / 36 months
No safety or functional deficiencies were detected
No direct risk, deficiencies detected may be corrected on short term
Equipment shall be taken out of operation until deficiencies are corrected
Equipment does not comply – Modifications / Exchange of components / Taking out of service – is recommended
Measurements: Measured value
Protective ground resistance Ω
Equipment leakage current (according to Figure.....) mA
Patient leakage current (according to Figure....) mA
Insulation resistence (according to Figure.....) MΩ
Test:
Measurement equipment:
Complies
Yes No
Mains connection: PIE NPS DPS
ID Number:
1)
1)
Bibliography
Jacobson, B., & Murray, A. (2007). Medical Devices; Use and Safety, Churchill Livingstone: Elsevier.
Webster,G.J., (Ed.). (1997). Design of Pulse Oximeters (1st ed.), New York: Medical Science Series
12-Lead ECG System, http://www.bem.fi/book/15/15.htm (Aug 2011)
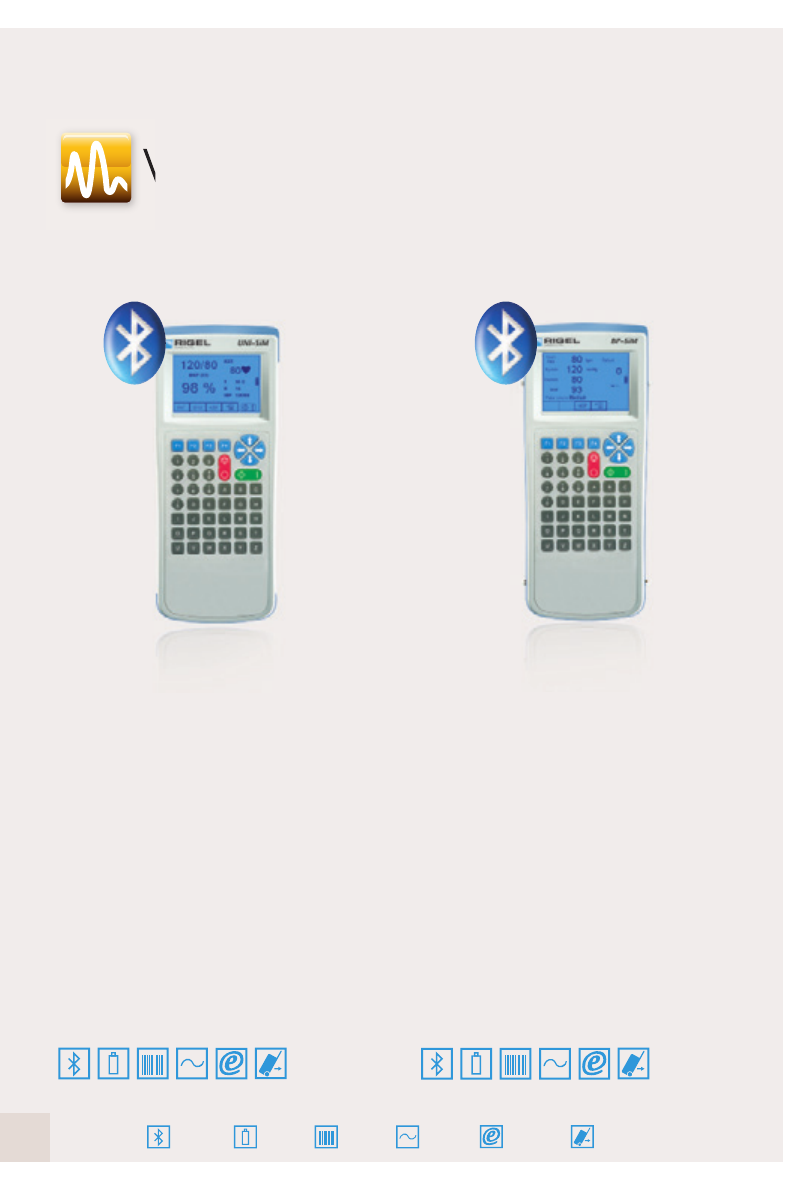
36
Rigel UNI-SIM
Vital Signs Simulator
The world’s first combined, fully functional
NIBP, SpO2 and patient simulator in a single
hand-held unit. Extremely accurate and featuring
full synchronized functionality. A breakthrough in
the way safety testing is implemented, the
UNI-SIM saves time and money, as well as
simplifying the testing process.
Features include:
■Light, hand-held, battery operation
■Combined NIBP, SpO2 and
patient simulator in one unit
■User configurable simulations
■Full sychronised functionality
■Memory for up to 10,000 devices
Rigel BP-SIM
NIBP Simulator
The first hand-held NIBP simulator to incorporate
custom settings, including pediatric and adult
NIBP pressure simulations, pulse volume
adjustments, heart rate and manufacturer-
specific envelopes. Large capacity internal
memory for data capture, storage and
downloading of test results via Bluetooth.
Features include:
■Light, hand-held, battery operation
■Adult & pediatric NIBP simulations
■Manufacturer specific O-curves
■Overpressure and leak test
■Memory for up to 10,000 devices
Med-ekit
compatible
Med-eBase
compatible
Mains
powered
Barcode
scanner
Battery
powered
Bluetooth
compatible
Vital Signs Simulators
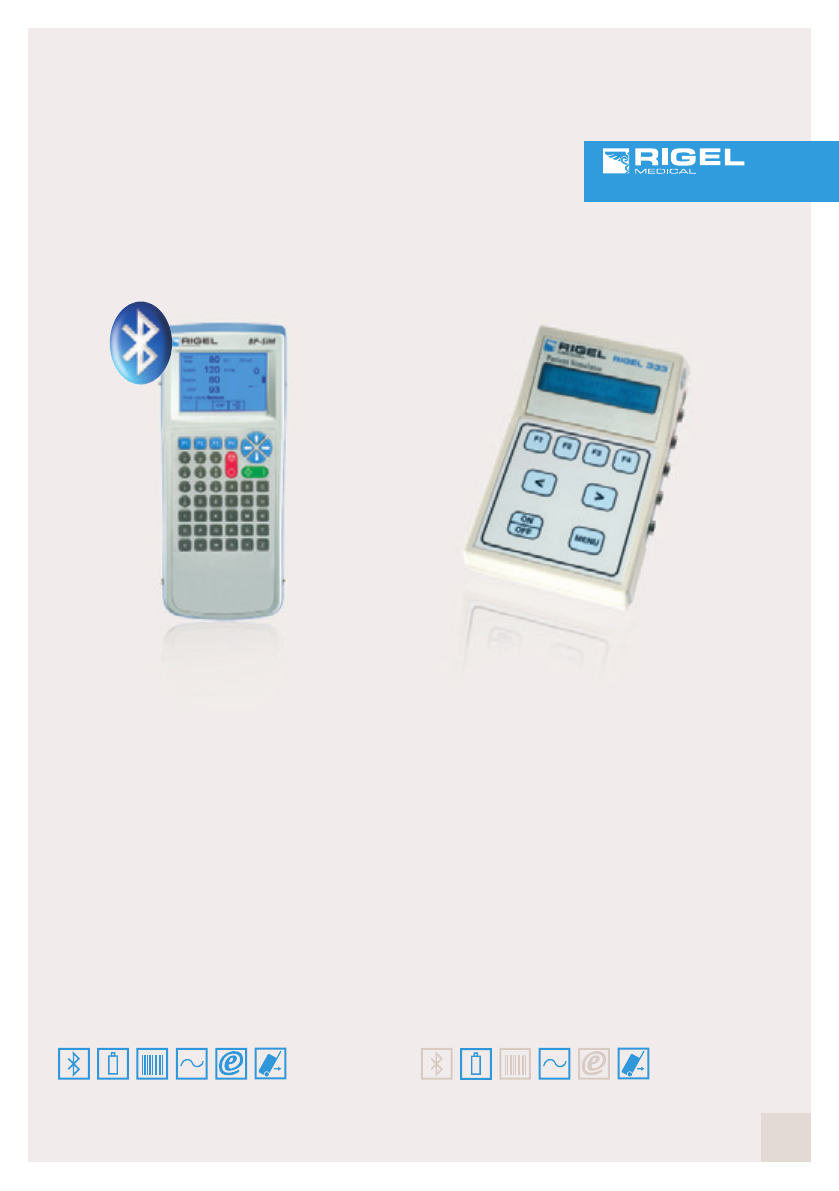
37
rigelmedical.com
I
nnovating
T
ogether
Please visit rigelmedical.com for more information
Rigel SP-SIM
SpO2 Simulator
The first hand-held SpO2 simulator featuring
pulse volume adjustments, heart rate and
manufacturer-specific R-curves. The large
capacity internal memory enables test results
to be captured, stored and downloaded
via Bluetooth.
Features include:
■Light, hand-held, battery operation
■Tests probe and monitor both at the same time
■User configurable simulations
■Manufacturer R-curves
■Memory for up to 10,000 devices
Rigel 333
Patient Simulator
The 333 is one of the smallest, most powerful
and fully comprehensive patient simulators
available. Providing a true 12 lead ECG signal
with 43 arrhythmias, dual invasive blood
pressure, respiration, temperature and
industry standard waveforms.
Features include:
■Light, hand-held, battery operation
■Accurate 12-lead simulation of 43 arrhythmias
■Invasive blood pressure
■Temperature & respiration
■Performance wave forms
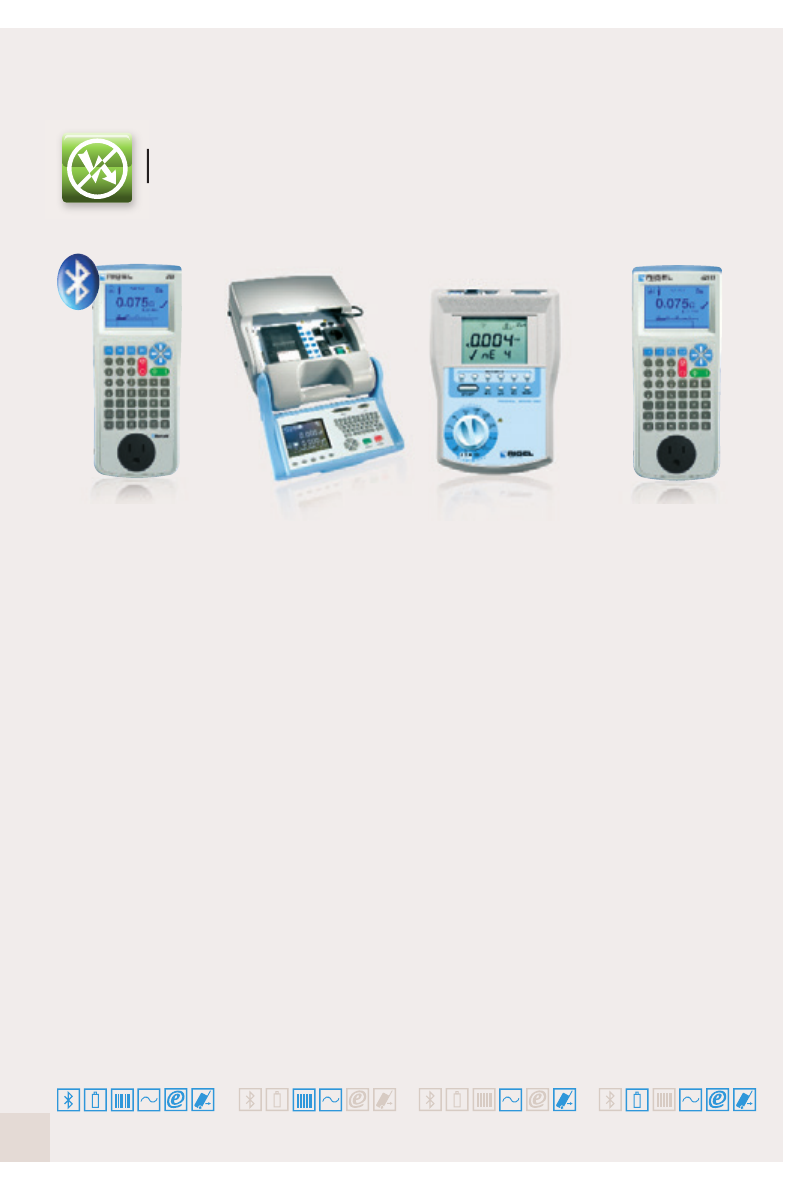
38
Electrical Safety Analyzers
Rigel 266 Plus
Electrical Safety
Analyzer
The Rigel 266 Plus is a
highly compact,
easy-to-use safety
analyzer designed to test
in accordance with
IEC/EN 60601-1, MDA
DB9801 and AS/NZ
3200. This compact unit
provides a highly effective
and portable test solution.
Features include:
■Small and compact
■Conform IEC 60601,
MDA DB 9801
■1-25A ground bond
test current
■Up to 5 applied parts
■Direct print facility
Rigel 288
Electrical Safety
Analyzer
The 288 is the first truly
hand-held medical
electrical safety analyzer to
combine the features of an
automatic/manual tester
with a data logging/asset
management facility.
Control is through a menu
driven GUI. A large data
memory and Bluetooth
facility make this an
effective mobile unit.
Features include:
■Light, hand-held,
battery operation
■Conform IEC 62353 /
60601/ VDE 0751 /
NFPA-99 /
AS-NZS 3551
■Memory for up to
10,000 devices
■Bluetooth
communication
■Full, semi automatic &
manual tests
Rigel 277 Plus
Electrical Safety
Analyzer
The Rigel 277 Plus is a
fully comprehensive
electrical medical safety
analyzer used within the
widest possible range of
applications. The ability to
manage results and print
records means that the
user can manage the test
and re-test procedure
more productively.
Features include:
■Conform IEC 60601 /
61010 / AAMI /
NFPA-99 /
S-NZS 3200
■Onboard printer &
QWERTY keyboard
■100mA to 25A
ground bond current
■Full, semi automatic &
manual tests
■Memory for up to
2,500 devices
Rigel 62353
Electrical Safety
Analyzer
The Rigel 62353 is a cost
effective automatic safety
analyzer dedicated to the
IEC 62353 standard for
routine and testing after
repair of medical devices.
Offering automatic test
sequences, data entry
and storage as well as PC
download capabilities.
Features include:
■Light, hand-held,
battery operation
■Conform IEC 62353
■Fully customisable test
sequences
■Data entry and storage
■PC download
■Full, semi automatic
& manual tests
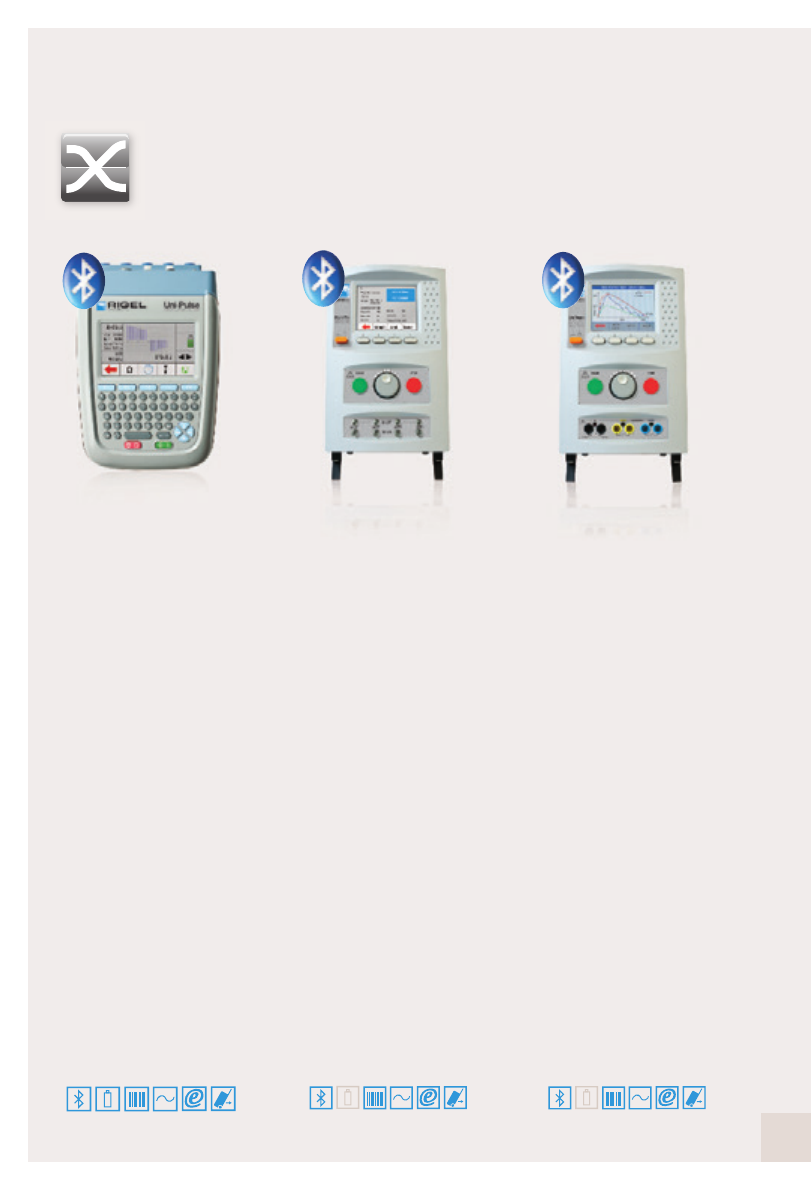
39
Rigel Multi-Flo
Infusion Pump
Analyzer
The market defining Rigel
Multi-Flo infusion pump
analyzer is a portable
instrument to accurately
and swiftly verify the
performance of all infusion
devices. Offering
instantaneous flow and
available in 1, 2 and 4
individual channel
configuration. The Multi-Flo
boasts a large color
screen, providing precise
information on flow rate,
occlusion and back
pressure and trumpet
curves.
Features include:
■IEC 60601-2-24
compliant
■Instant flow and
pressure
■Compatible with all
infusion devices
■On-screen trumpet
curve
■Onboard data storage
Performance Analyzers
rigelmedical.com
Rigel Uni-Pulse
Defibrillator Analyzer
The innovative Rigel Uni-Pulse
defibrillator analyzer is the
most compact and
versatile instrument on the
market, able to accurately
verify all mono and bi-
phasic defibrillators and
AED’s. Features include:
onscreen waveform
capture, built-in 12-lead
ECG simulator, onboard
memory and optional
variable load box ensuring
the Rigel Uni-Pulse meets all
the requirements
of IEC 60601-2-4.
Features include:
■IEC 60601-2-4
compliant
■Mono and bi-phasic
■Waveform capture,
store & replay
■Built-in 12 lead ECG
simulator
■Auto AED testing
Rigel Uni-Therm
Electrosurgical
Analyzer
The Rigel Uni-Therm
offers the latest
technology in high
frequency power
measurement. It’s small,
easy-to-use, has a large
color display and
innovative navigation
making this a fast,
efficient test tool for
testing the performance
of all diathermy machines.
A large internal memory
and PC communication
provides traceability of the
test data.
Features include:
■HF leakage test
■Power distribution from
0-5100Ω
■Current measurement
up to 6A RMS
■Return plate security
test (Rem)
■Onboard data storage

40
Med-eKit Elite
The Med-eKit Elite is a
handy and more
specialised carrying
solution. It has a hard-
wearing pelican case
which can be customised
to hold up to two
individual testers (the
Rigel 288 and UNI-SIM,
for instance). It can also
include a label and results
printer, barcode scanner
and PC software.
Features include:
■Configurable with up
to 4 tester functions
■Lightweight design
■Durable and robust
enclosure
■Water-proof design
■Secure locking
Med-eKit Lite
This new case is a
standard accessory for
the Rigel 288,
UNI-SIM and Uni-Pulse
biomedical testing
instruments. It can be
configured to hold a
number of different items
of test equipment and
accessories like
a label results printer and
a barcode scanner.
Features include:
■Carry securely on
back/ easy access
from front
■Configurable
compartments for
testers and accessories
■Extremely lightweight
design
■Suitable for up to 5
tester functions
■Durable and water
repellent design
Med-eKit Plus
The Med-eKit Plus is a
solution package offering
a complete test set that
includes electrical safety,
vital signs simulator,
ventilator test and more. It
can also feature a laptop
of your specification
and our latest asset
management software.
You could make life a lot
more efficient for yourself
if you included a range of
accessories like the
compact barcode scanner
and results/label printer.
Features include:
■Cost effective package
deal
■Configurable including
up to 5 tester functions
■Optional laptop
included
■Extremely lightweight
design
■Durable and water
repellent design
Med-eKit Pro
If you’re after a complete
biomedical workshop on
wheels, take a look at our
configurable Rigel Med-
eKit Pro. Housed in a
durable and handy trolley
case, it accommodates up
to 10 different testers and
simulators, so you can
carry your analyzer, vital
signs simulator, defib
analyzer, ventilator tester
and more, safely and
conveniently.
Features include:
■Integral wheels and
extendable handle for
easy use
■Configurable with up
to 10 tester functions
■Durable and robust
enclosure
■Water-proof design
■Secure locking
Med-eKit Solutions
41
You saw database management and work order
schedules as a major benefit, as they lead to fast,
efficient test device configuration. You asked for time
and money-saving software to provide monthly schedule
tests you could upload to your testers for easy re-test.
You also wanted preventative maintenance which
analysed and compared results and which also sent you
an alarm when devices could be deteriorating or needed
to be replaced.
And you asked for test certificate software customisable
for details and logos in PDF format.
So we created Med-eBase software which can be
used in a number of database environments,
including: SQL and SQLite. This way your data’s secure
and easily accessible. It can also be easily interrogated
by third party software which makes compatibility with
other software packages easy and straightforward.
Asset Management Software
rigelmedical.com

Rigel Medical, Seaward Group USA,
6304 Benjamin Road, Suite 506,
Tampa, Florida, 33634, United States
Tel: 813-886-2775 Email: enquiry@rigelmedical.com
Web: rigelmedical.com
Version 1.2 - 2012
Part of
