SAFE WATERS Guide
User Manual: Pdf SAFE-WATERS-Guide
Open the PDF directly: View PDF ![]() .
.
Page Count: 54
SAFE WATERS, HEALTHY WATERS: A Guide for Citizen Groups on Bacteria Monitoring in Local Waterways
1
A Guide for Citizen Groups
on Bacteria Monitoring in Local Waterways
April 2016
3290 North Ridge Road, Suite 290
Ellicott City, Maryland 21043
Safe WaterS,
HealtHy WaterS:

Table of Contents
1 Background on Bacteria in Local Waterways . . . . . . . . . . . . . . . . . . . . 4
1.1 Basics of Water Quality Standards . . . . . . . . . . . . . . . . . . . . . . . . . . 4
1.2 Sources of Bacteria in Local Waterways . . . . . . . . . . . . . . . . . . . . . . 6
1.3 The Role of Citizen Monitoring. . . . . . . . . . . . . . . . . . . . . . . . . . . . . 9
1.4 Resources ......................................... 10
2 Designing Your Baseline Bacteria Monitoring Program . . . . . . . . . . . . 12
2.1 Determine Goal of Monitoring Program . . . . . . . . . . . . . . . . . . . . . . 12
2.2 Baseline Sampling and Analysis Plan . . . . . . . . . . . . . . . . . . . . . . . 13
2.3 Quality Control...................................... 14
2.4 Equipment and Materials . . . . . . . . . . . . . . . . . . . . . . . . . . . . . . . 16
2.5 Bacterial Analysis .................................... 16
2.6 Collecting a Water Sample. . . . . . . . . . . . . . . . . . . . . . . . . . . . . . 18
2.7 Determining Exceedance . . . . . . . . . . . . . . . . . . . . . . . . . . . . . . . 19
2.8 Resources ......................................... 19
3 Investigating Potential Pollutant Sources . . . . . . . . . . . . . . . . . . . . . . . 21
3.1 Survey of Potential Pollutant Sources . . . . . . . . . . . . . . . . . . . . . . . . 21
3.2 Supplemental Sampling ................................ 23
3.3 Track Down Methods.................................. 24
3.4 Resources ......................................... 25
4 Sharing Your Findings & Taking Action . . . . . . . . . . . . . . . . . . . . . . . 26
4.1 Communicating Your Findings . . . . . . . . . . . . . . . . . . . . . . . . . . . . 26
4.2 Strategies to Reduce Bacterial Pollution . . . . . . . . . . . . . . . . . . . . . . 29
4.3 Resources ......................................... 31
Appendix A: References ........................................ 32
Appendix B: How to Collect Samples . . . . . . . . . . . . . . . . . . . . . . . . . . . . . . . 34
Appendix C: Case Studies ...................................... 37
Case Study #1: Surfrider’s Blue Water Task Force . . . . . . . . . . . . . . . . . . . . . 37
Case Study #2: Hudson River – Riverkeeper. . . . . . . . . . . . . . . . . . . . . . . . . 40
Case Study #3: StreamWatch.................................. 43
Case Study #4: Chattahoochee Riverkeeper – Neighborhood Water Watch . . . 45
Case Study #5: Poultney Mettowee Natural Resources Conservation District –
Pawlet Village Septic Survey ................................... 48
Case Study #6: Canine Sewage Sniffers . . . . . . . . . . . . . . . . . . . . . . . . . . . 50
Case Study #7: Reedy Creek Coalition and Alliance for the Chesapeake Bay . . 52

SAFE WATERS, HEALTHY WATERS: A Guide for Citizen Groups on Bacteria Monitoring in Local Waterways
3
About This Guide
In urban waters across the U.S., reports of discharges of untreated or partially treated sewage are
regrettably not uncommon. Sources of sewage discharges can include sanitary sewer overflows (SSOs)
and leaks from old and deteriorating systems, dumping, illegal sewer connections and failing septic systems.
Water that is contaminated with sewage presents a serious health risk to the public, particularly in areas
where people recreate, such as beaches and swimming holes.
The Center for Watershed Protection has been working at both the local and federal levels to address the
important issue of sewage discharges, including authoring a national guidance on illicit discharge detection
and elimination (IDDE) in 2004 and working with more than 20 communities to apply the monitoring
protocols for identifying and tracking the sources of illicit discharges, such as sewage. The Center’s work
has shown some surprising results about the prevalence and contribution of sewage discharges in urban
areas. Even in cities such as Baltimore, Maryland, where MS4 permit requirements and consent decrees
for SSOs are being enforced, initial sampling showed that 53% of outfalls tested had bacteria levels above
the recommended threshold for contact recreation. In the same Baltimore watershed, the bacteria load
from outfalls with suspected illicit discharges was estimated to be 51% of the bacteria reductions required
under a local TMDL. Other communities have missed detecting a portion of their illicit discharges simply
because they don’t sample small outfalls or do not use ammonia as an indicator. Our work also showed
that eliminating illicit discharges can be significantly more cost-effective than most other practices, including
green infrastructure, to reduce nutrients and other pollutants.
It is clear from these findings that many local governments need help to effectively address sewage
discharges, and the success of Blue Water Baltimore in supporting the Baltimore City government with
outfall monitoring has highlighted the important role of citizen volunteers. Citizen monitoring programs can
help to sample where other agencies aren’t testing or provide data to convince local agencies to establish
monitoring programs. Citizen monitoring is also an effective way to improve the public’s knowledge of the
safety of their water and to act as a “watchdog” to ensure that local agencies are addressing the problem.
The Center’s 2004 IDDE manual was intended for regulated MS4 communities tasked with setting up a
program, but did not address the role of volunteers. To fill this gap, the Safe Waters, Healthy Waters
document provides guidance for citizen groups on how to identify, narrow down sources and communicate
about bacterial contamination, with a specific focus on human sewage sources and monitoring techniques
that are simple, reliable and low-cost.
This guide was written by Karen Cappiella, Carol Wong, Lori Lilly and Laurel Williamson and designed by
Kim Roberts. The authors would like to acknowledge the Ittleson Foundation for generously providing funding
to develop this guide and to the Cornell Douglas Foundation for funding local case studies in Vermont.
Thank you to the following people who provided a review of the guide: Sarah Bounty, Neponset River
Watershed Association; Jennifer Epstein and Dan Shapley, Hudson Riverkeeper; James Beckley, Virginia
Department of Environmental Quality; Sarah Devries, Arkansas Highway & Transportation Department; and
Jim Pease, Vermont Department of Environmental Conservation. Thanks also to the following individuals
who contributed case studies and other content to the guide: Mara Dias, Surfrider Foundation; Jason
Ulseth, Chattahoochee Riverkeeper; David Hannah, Rivanna River StreamWatch; Anna Mathis and Bill
Shanabruch, Alliance for the Chesapeake Bay/Reedy Creek Coalition; Hilary Solomon, Poultney Mettowee
Natural Resources Conservation District; Karen Reynolds, Environmental Canine Services; and Dana Allen,
Watershed Consulting Associates. For more information about this guide, contact Laurel Williamson,
Stormwater and Watershed Planner, Center for Watershed Protection, at lw@cwp.org.
SAFE WATERS, HEALTHY WATERS: A Guide for Citizen Groups on Bacteria Monitoring in Local Waterways
4
1 Background on Bacteria in Local Waterways
Contaminated water presents a serious health risk at beaches and in rivers and streams throughout the United States.
This is particularly the case in urban areas where numerous pollution sources (and water users) are concentrated within
a relatively small area. The most recent estimate from the US Environmental Protection Agency (EPA) shows that 39% of
assessed rivers and streams, 13% of assessed lakes, reservoirs and ponds, and 30% of assessed bays and estuaries in
the US are not clean enough to support recreational uses such as fishing or swimming (US EPA, 2015).
One of the most commonly identified pollutants in our Nation’s
waters is bacteria. Bacteria exist naturally in all surface water
and are not typically harmful to humans, but certain types of
bacteria present in fecal contamination can cause infections in
humans. Detecting fecal bacteria is an effective way to determine
the likelihood of presence of pathogenic organisms in water.
Fecal bacteria are microorganisms that inhabit the gastrointestinal
tract of humans and most other warm-blooded animals. Fecal
waste can contain pathogens such as harmful bacteria, viruses
and protozoa. Pathogens can cause disease in humans,
including minor illnesses such as gastroenteritis or upper
respiratory infections, and, occasionally, more serious diseases
(Figure 1). Pathogens are difficult and expensive to detect,
therefore fecal indicator bacteria such as E. coli and Enterococci, are used to determine the presence of fecal waste in
surface water. Most fecal indicator bacteria are non-pathogenic, but are good indicators of fecal contamination. The
actual risk of contracting a disease from a pathogen depends on a host of factors, such as the method of exposure or
transmission, pathogen concentration, incubation period and the age and health status of the infected party.
Researchers and regulatory agencies have determined that conducting indicator bacteria monitoring can help to identify
human health risks associated with drinking, shellfish consumption and recreational water contact. The Clean Water Act
structure for conducting this monitoring is described below.
1.1 Basics of Water Quality Standards
The Clean Water Act (CWA) sets forth the goal of restoring and maintaining the chemical, physical, and biological
integrity of the nation’s waters so that they can support—among other uses—“the protection and propagation of
fish, shellfish, and wildlife and recreation in and on the water.” Water Quality Standards are the foundation of the
Clean Water Act and regulate how clean a water body should be. Water Quality Standards include three parts:
1) designation of uses for all water bodies, 2) establishment of Water Quality Criteria to protect those uses, and 3)
development of provisions to protect water quality from pollutants. Each state and tribe is responsible for designating
uses--for instance public water supply, recreation, or navigation--for all waters under its jurisdiction. For each designated
use, Water Quality Criteria are defined to protect these intended uses. Water Quality Criteria are limits on particular
chemicals or conditions in a water body and can be expressed numerically or as narrative statements.
In 2012, the EPA released the Recreational Water Quality Criteria designed to protect waters designated for primary
contact recreation, including swimming, bathing, surfing, water skiing, tubing, water play by children, and similar
water contact activities where a high degree of bodily contact with the water, immersion and ingestion are likely. Water
1
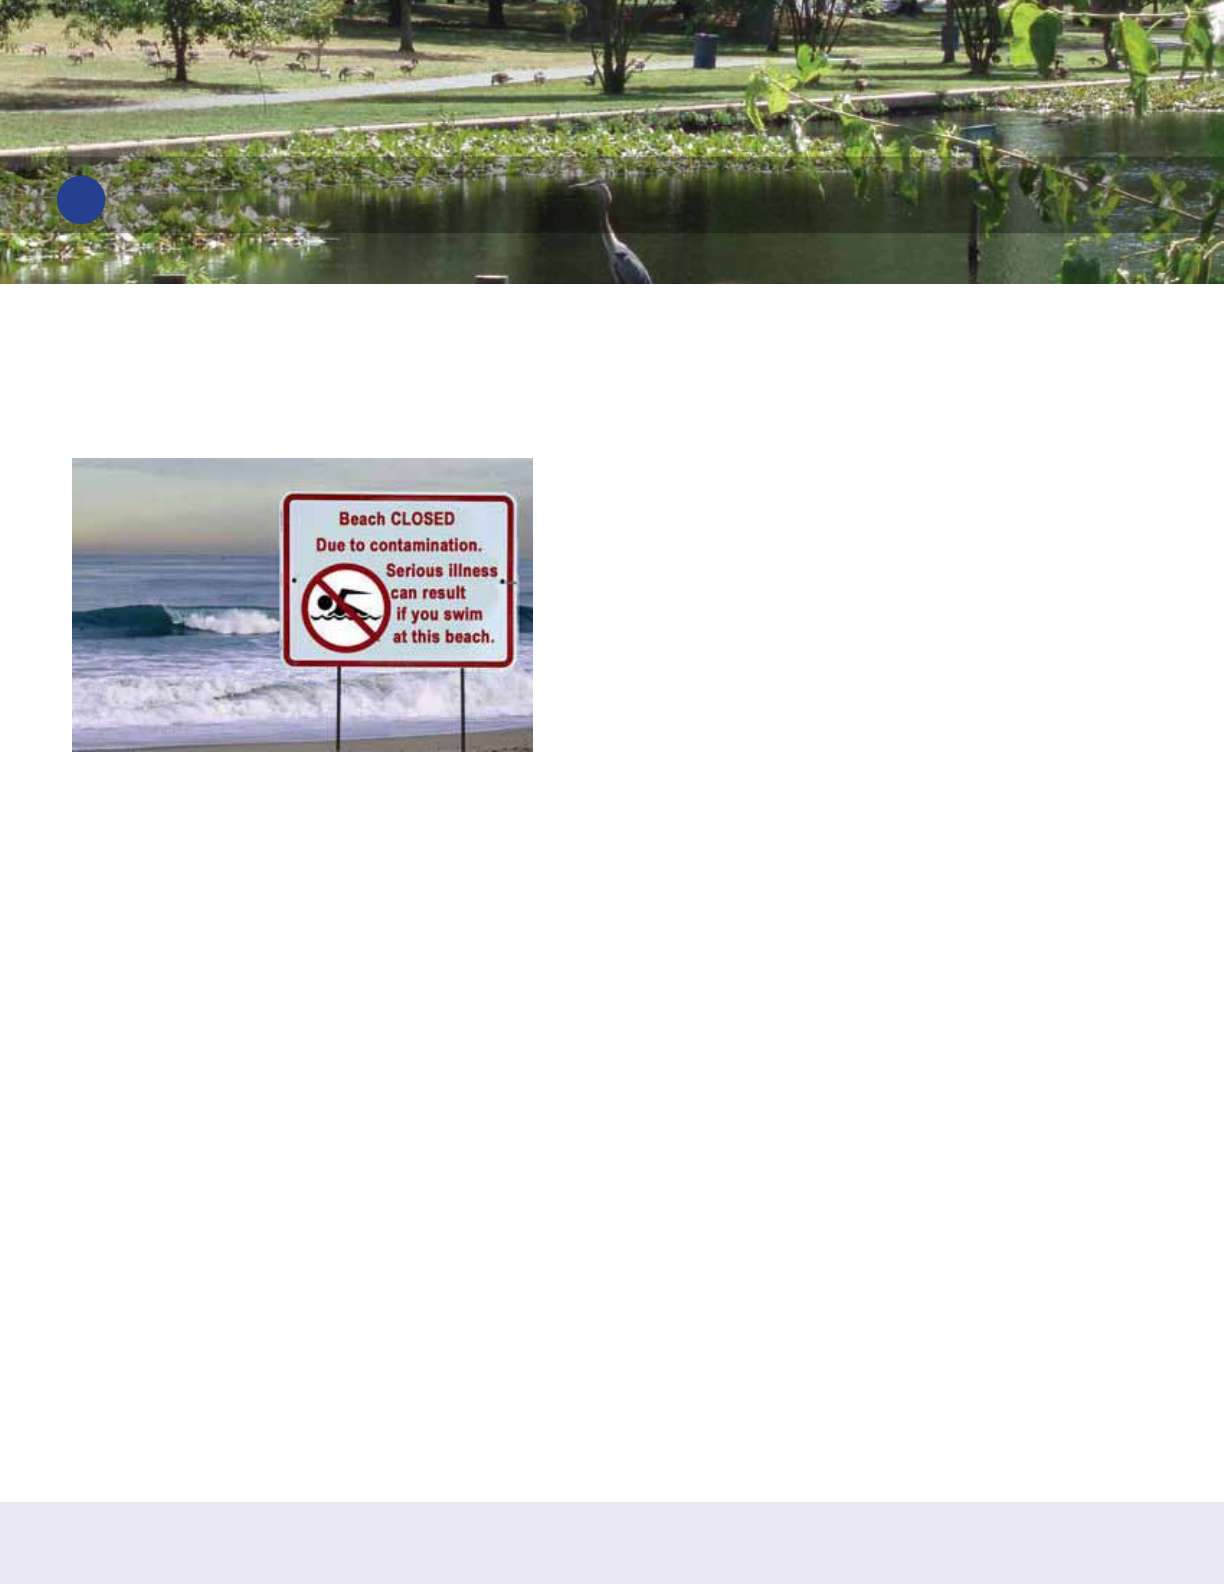
Figure 1. Beach closing due to fecal contamination
(Source: South Carolina Department of Natural Resources)
SAFE WATERS, HEALTHY WATERS: A Guide for Citizen Groups on Bacteria Monitoring in Local Waterways
5
Quality Criteria for recreation are based on the use of bacterial indicators of fecal contamination as a result of studies
that show a link between illness and fecal contamination in recreational waters. The detection and enumeration of
fecal indicator bacteria provides a practical method to determine the potential health risk from water exposure.
EPA’s 2012 Water Quality Criteria for recreational waters are based on the use of two bacterial indicators of fecal
contamination, enterococci (recommended for marine and fresh water) and E. coli (fresh water only). Previously, fecal
coliform was used as the basis for recreational water quality criteria, but recent studies have shown that E. coli and
enterococci are better indicators for predicting health risks. The EPA criteria include two sets of concentration thresholds
for fecal bacteria, measured as the geometric mean of colony-forming units, or cfu, in water quality samples. Both
concentration thresholds will protect primary contact recreational use; but Option 2, which is based on an illness rate
of approximately 1 in 31 people, encourages some incremental improvement over Option 1, which is based on an
illness rate of approximately 1 in 28 people. For both options, the waterbody geometric mean should not be greater
than the selected geometric mean magnitude (Table 1) in any 30-day interval. The statistical threshold value serves as
a backstop or secondary level of concentration to protect public health. No more than 10% of samples taken should
exceed the statistical threshold value in the same 30-day period. It should be noted that these thresholds are calculated
differently than in the past, and are based on a revised definition of gastrointestinal illness.
Table 1. EPA Recreational Water Quality Criteria Recommendations
Criteria Elements Option 1 Option 2
Indicator Geometric Mean
(cfu/100 mL)
Statistical Threshold
Value (cfu/100 mL)
Geometric Mean
(cfu/100 mL)
Statistical Threshold
Value (cfu/100 mL)
Enterococci (marine
and fresh) 35 130 30 110
E. coli (fresh) 126 410 100 320
In addition to these criteria, the EPA Recreational Water Quality Criteria provides Beach Action Values (BAVs), which
are single sample maximum values that can be used to issue health advisories at beaches. The BAVs for enterococcus
are 70 cfu/100mL for a risk of infection of 1 in 28, and 60 cfu/100mL for a risk of infection of 1 in 31. The BAVs
for E. coli are 235 cfu/100mL for a risk of infection of 1 in 28, and 190 cfu/100mL for a risk of infection of 1 in
31. These values, while not recommended for determining use attainment, can be used as a precautionary tool for
making beach notification decisions. EPA’s Water Quality Criteria recommendations are intended as guidance in
establishing new or revised water quality standards, and states and authorized tribes have the discretion to adopt,
where appropriate, other scientifically defensible water quality criteria. Check with your state agency to determine the
applicable fecal indicator bacteria criteria for your local jurisdiction or watershed.
After setting Water Quality Standards, states assess their waters to determine the degree to which these standards are
being met. To do so, states may take biological, chemical, and physical measures of their waters; sample fish tissue and
sediments; and evaluate land use data, predictive models, and surveys. Waters that do not meet one or more of their
designated uses are placed on the impaired waters list also known as the 303(d) list, named for the section of the Clean
Water Act that requires it. States must submit a biennial report on the status of all its assessed waters (as required under
section 305(b) of the Clean Water Act), a listing of its impaired waters and the causes of impairment, and the status
of actions being taken to restore impaired waters. For impaired waters, a total maximum daily load (TMDL) must be
developed that quantifies how much of the pollutant of concern can be discharged into the waterbody while still meetings
its designated uses. Usually, a TMDL implementation plan is also developed that outlines how the TMDL will be met.
Nationally, pathogens are the cause of impairment for more river and stream miles than any other pollutant, and
more TMDLs (over 12,000) have been developed to address pathogens than any other pollutant. The majority of
these TMDLs have been for fecal coliform (6,447) and E. coli (4,014). Table 2 summarizes the status of pathogen
impairments in the U.S.

SAFE WATERS, HEALTHY WATERS: A Guide for Citizen Groups on Bacteria Monitoring in Local Waterways
6
Table 2. National Summary of Pathogen Impairments
Water Body Type Length/Area Impaired by Pathogens
Rivers and streams 159,451 miles
Lakes, reservoirs and ponds 248,878 acres
Bays and estuaries 6,157 square miles
Coastal shoreline 1,085 miles
Ocean and near coastal waters 81 square miles
Wetlands 72,349 acres
Great Lakes shoreline 492 miles
Source: EPA Watershed Assessment, Tracking and Environmental Results System (WATERS) database: http://water.epa.gov/
scitech/datait/tools/waters/index.cfm
1.2 Sources of Bacteria in Local Waterways
So how did all these rivers, streams and lakes become impaired in the first place? Bacteria make their way into urban
surface waters indirectly through stormwater runoff (a “nonpoint source”) or are discharged directly into streams, rivers
and lakes at a single point of entry (a “point source”). The most common point and nonpoint sources of bacteria in
urban waters are described below, along with applicable federal regulations to control them. The bacteria monitoring
and source identification methods presented in this guide focus primarily on human sewage sources because it is
thought that human fecal material is more likely to contain organisms that are the most pathogenic to humans than
is fecal material from other animals. Additionally, human fecal matter is typically more controllable than non-human
sources, such as wildlife.
Stormwater runoff
Numerous studies have consistently documented high concentrations of bacteria in urban stormwater runoff (Pitt, 1998;
Schueler, 2000). Stormwater picks up bacteria and other pollutants as it flows across hard surfaces, such as rooftops,
roads and parking lots, and transports them through the storm sewer system and ultimately into a surface water body.
The bacteria found on impervious surfaces may come from pet waste, wildlife or other sources. The Clean Water Act
Section 402 regulates stormwater discharges through the National Pollutant Discharge Elimination Program (NPDES).
Dischargers who must obtain a permit include certain municipal separate storm sewer system (MS4) communities and
operators of construction sites disturbing one acre or more and industrial stormwater discharges. Reductions from
MS4s and other point sources identified in TMDL plans are enforced through the NPDES permit program.
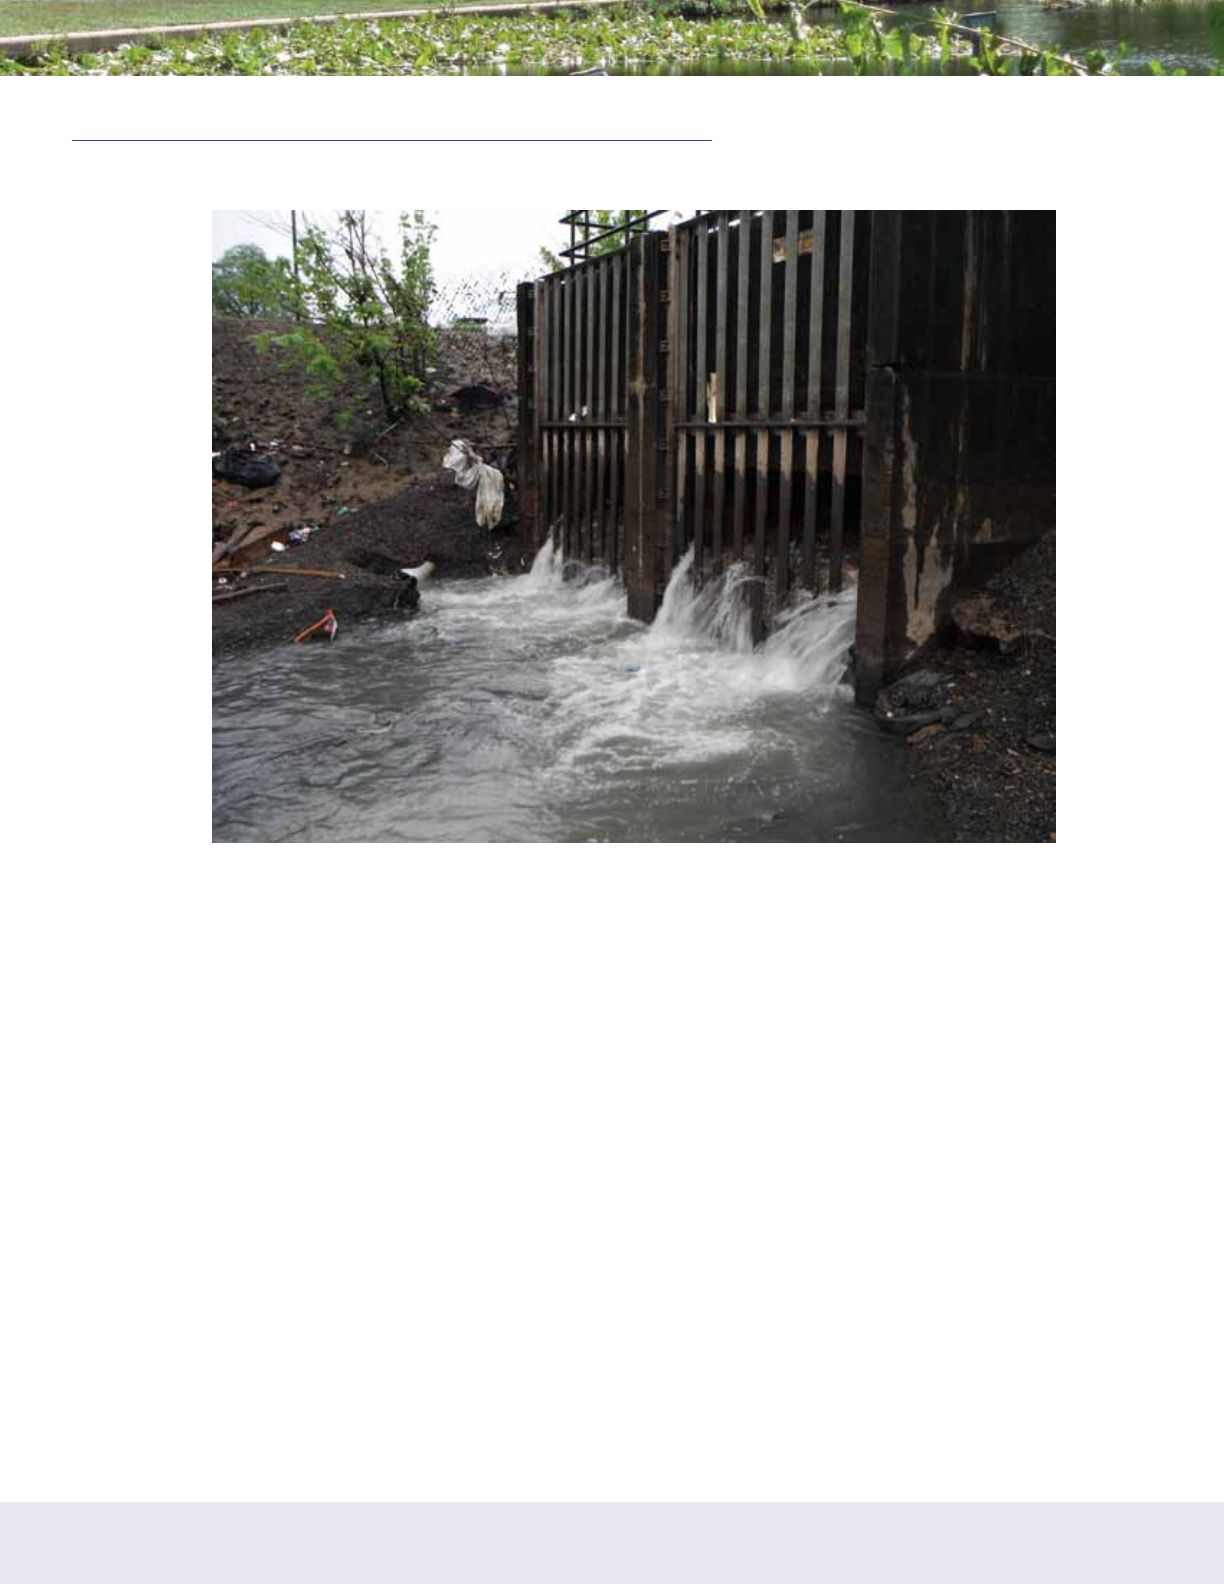
Combined sewer overflows (CSOs)
Many older cities have a sewer system that carries both wastewater and stormwater. These systems were often
constructed before the risks of combined sewers were fully understood. During some storms, the capacity of the
treatment system and pipe network is exceeded, and a combination of stormwater and wastewater is discharged
directly into surface water without treatment (Figure 2). This discharge is known as a combined sewer overflow, or
CSO. CSOs have extremely high bacteria levels due to the presence of untreated sewage and deserve immediate
attention as a bacteria source when they are present in any watershed. EPA’s Combined Sewer Overflow Control
Policy is a national framework for control of CSOs through the NPDES permitting program. CSO communities must
implement nine minimum controls, which are measures that can reduce the prevalence and impacts of CSOs and that
are not expected to require significant engineering studies or major construction. They are also expected to develop
long-term CSO control plans that will ultimately provide for full compliance with the Clean Water Act, including
SAFE WATERS, HEALTHY WATERS: A Guide for Citizen Groups on Bacteria Monitoring in Local Waterways
7
attainment of water quality standards. Visit this web-site to determine if your community has a combined sewer system:
http://www.epa.gov/npdes/pubs/csossoRTC2004_AppendixD.pdf
Figure 2. Combined sewer overflow (Photo courtesy of EPA)
Sanitary sewer overflows (SSOs)
Human sewage can be introduced into surface waters even when storm and sanitary sewers are separated. Leaks
and overflows are common in many older sanitary sewers where capacity is exceeded, high rates of infiltration and
inflow occur (i.e., outside waters gets into pipes, reducing capacity), frequent blockages occur, or aging pipes fail
due to the pipe material or joints. Power failures at pumping stations are also a common cause of SSOs. Sanitary
sewage discharged into a street during an SSO will enter the stormwater system through the nearest catch basin and
can then find its way into the receiving water without treatment. The greatest risk of a SSO occurs during storm events;
however, little comprehensive data is available to quantify SSO frequency and bacteria loads in most watersheds.
MS4 communities regulated under the NPDES stormwater program are required to establish a program to detect and
eliminate illicit discharges to the stormwater system, which include SSOs. SSO may also be identified as sources
of impairments in TMDLs, or threats to drinking water supply or endangered species. For these latter situations, the
Safe Drinking Water Act and Endangered Species Act come into play to help ensure these problems are corrected
promptly. Some states track and publish SSO discharges and some states do not; check with your state department of
environmental protection to determine if this information is available to the public.
Illicit connections to storm sewers
Sewage can be introduced into storm sewers and surface waters by accident or design (Figure 3). The hundreds
of miles of storm and sanitary sewer pipes in a community create a confusing underground network of utilities, so
it should not be surprising that improper connections are made to the wrong sewer. For example, Johnson (1998)
reported that almost 10% of all businesses in Wayne County, Michigan had illicit connections, with an average of 2.6
illicit connections found at each detected business. While most illicit connections did not contain raw sewage (e.g.,
SAFE WATERS, HEALTHY WATERS: A Guide for Citizen Groups on Bacteria Monitoring in Local Waterways
8
floor drains, sinks), 11% of the Wayne County illicit connections
included toilet discharges. Illicit connections are one type of illicit
discharge, which are regulated under the MS4 Permits.
Illegal dumping
There is quite a bit of anecdotal evidence of illegal transient dumping
of raw sewage into storm drain from septage vacuum trucks (i.e.,
honey wagons), recreational vehicles, and portable toilets (Johnson,
1998) or improperly disposed diapers. In addition, there may be
inadvertent dumping from moving vehicles, such as livestock carriers
and recreational vehicles. The overall significance of illegal or
inadvertent dumping as a watershed bacteria source, however, is
hard to quantify. Most types of illegal dumping qualify as an illicit
discharge and are regulated but are difficult to catch or enforce.
Failing septic systems
About one-fifth of all American households rely on on-site septic
systems to dispose of their wastewater, which translates to about 26
million individual systems (U.S. Census Bureau, 2007). After solids
are trapped in a septic tank, wastewater is distributed through a
subsurface drain field and allowed to percolate through the soil.
Bacteria are effectively removed by filtering and straining water
through the soil profile, if the septic system is properly located,
installed and maintained. A large number of septic systems fail,
however, when wastewater breaks out or passes through the soil
profile without adequate treatment. According to the U.S. EPA, about 10 percent of all septic systems in the U.S. are
estimated to be malfunctioning at any given time (US EPA, 2003), with rates as high as 70% being reported in some
areas. The causes of septic system failure are numerous: inadequate soils, poor design, siting, testing or inspection,
hydraulic overloading, tree growth in the drain field, old age, and failure to clean out. In rarer cases, septic systems
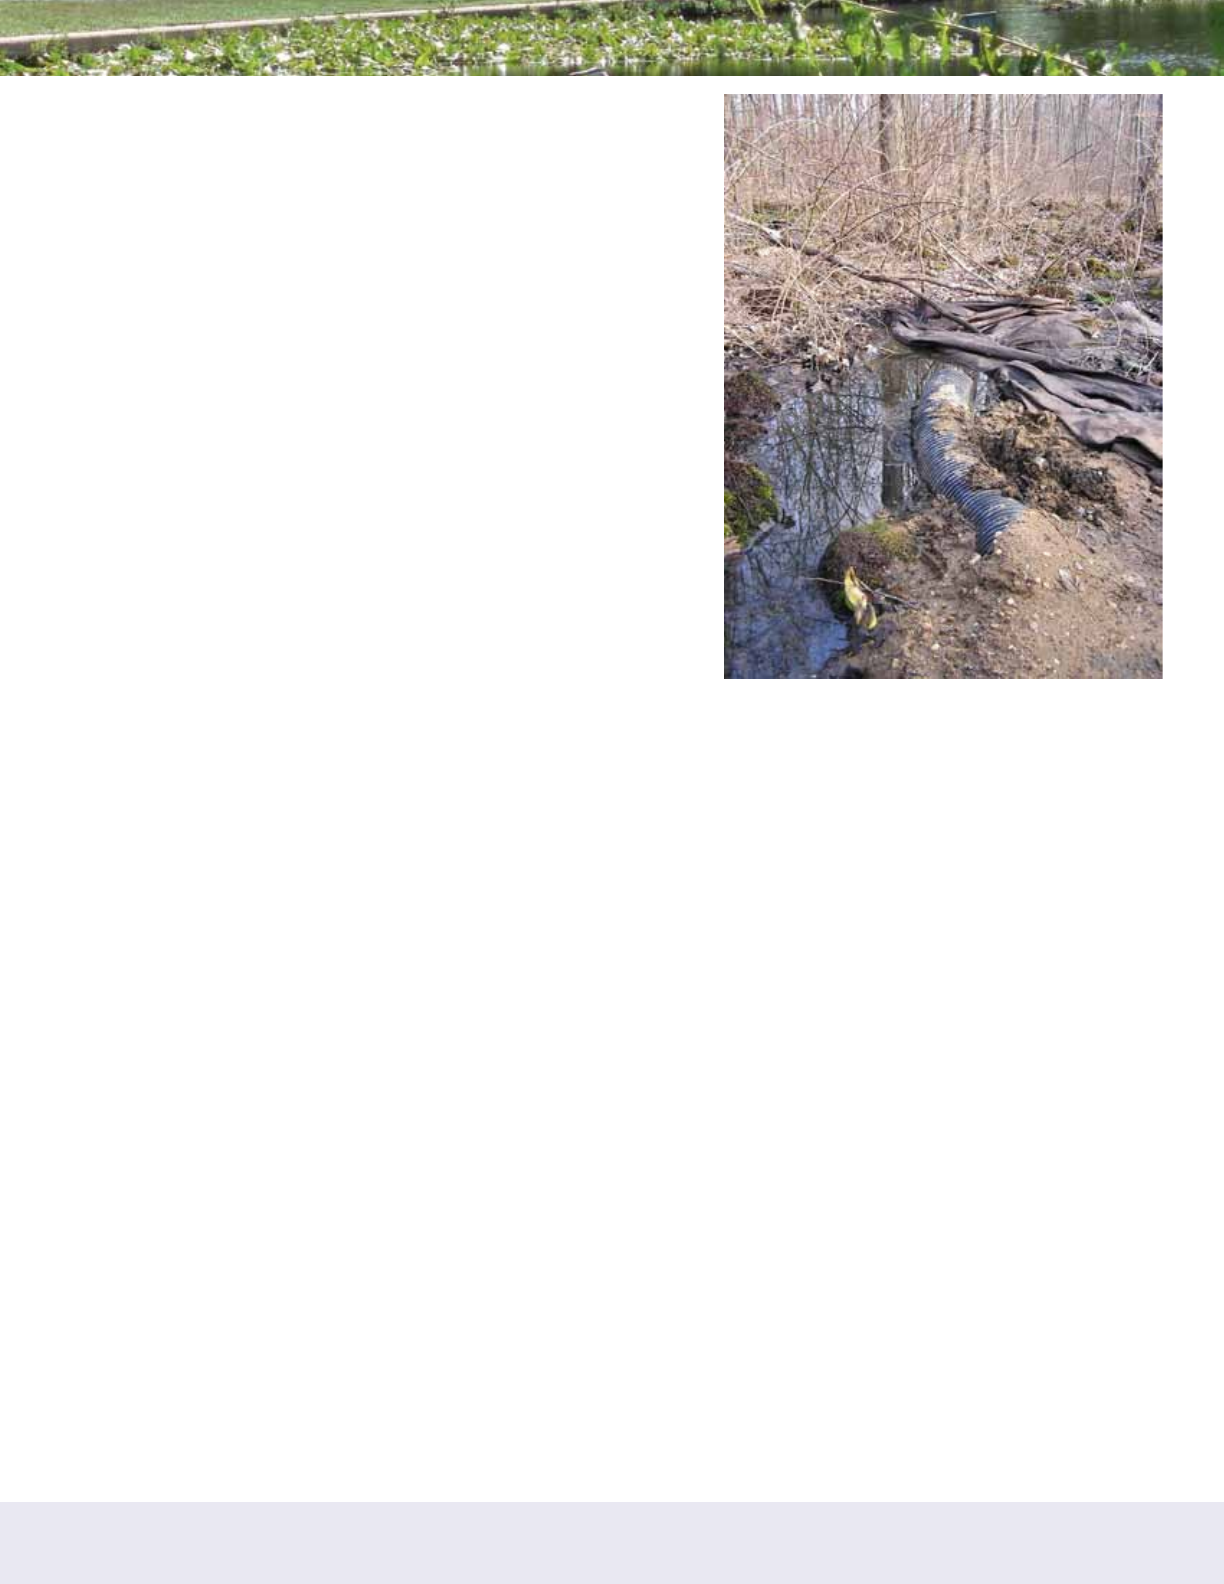
are illegally diverted directly to surface waters as shown in Figure 3. States, tribes and local governments are
responsible for regulating individual onsite systems and property owners are responsible for the maintenance.
Wildlife and domestic animals
Documented non-human sources of fecal coliform bacteria in urban watersheds are dogs, cats, raccoons, rats, beaver,
gulls, geese, pigeons and even insects. Dogs in particular appear to be a major source of coliform bacteria and other
microbes, which is not surprising given their population density, daily defecation rate, and pathogen infection rates.
According to van der Wel (1995), a single gram of dog feces contains 23 million fecal coliform bacteria. Dog feces
can be a significant issue in a watershed where dog handlers dispose waste in catch basins or directly into water
bodies. In highly urban areas, rats and pigeons can be a major source of bacteria (Lim and Oliveri, 1982). Geese,
gulls and ducks are speculated to be a major bacterial source in urban areas, particularly at lakes and stormwater
ponds where large resident populations become established. Livestock can even be a major source of fecal coliform
in unsewered urban watersheds, particularly those areas of the urban fringe that have horse pastures, “hobby” farms
and ranchettes. Bacteria from wild and domestic animals may indicate the presence of the parasites Giardia or
Cryptosporidium.
Marinas / marine sanitation devices (MSDs)
MSDs are used to collect and, in some applications, treat the wastewater that is generated on marine vessels.
Although certain MSDs are designed to be pumped out, they are too frequently discharged overboard, resulting in
a direct discharge of untreated sewage to the water. Discharge of sewage directly overboard is actually a legal
practice outside the US territorial waters (3 or more miles from shore), which unfortunately may discourage MSD
operators from properly disposing of their stored waste. An exception is “no discharge zones,” established by EPA or
Figure 3. Illegal discharge of septic system effluent
to a local waterway (Photo courtesy of EPA)

SAFE WATERS, HEALTHY WATERS: A Guide for Citizen Groups on Bacteria Monitoring in Local Waterways
9
the states in sensitive areas and where discharge of treated or untreated sewage is prohibited. Marinas may also be
a source of bacteria from spills during pumpout of MSDs. The EPA and the U.S. Coast Guard jointly regulate MSDs
under CWA section 312; however, detection and enforcement of discharges that do not meet the effluent standards
is very difficult because the source of the discharge (watercraft) is mobile. Efforts to encourage pumpouts and best
practices to reduce spills have been most effective.
1.3 The Role of Citizen Monitoring
You might wonder, with the current Clean Water Act regulatory structure to protect water quality, why should citizen
groups conduct bacteria monitoring? Citizen monitoring programs can help to support and inform state and local
agency programs by testing where other agencies aren’t testing, providing data to convince local agencies to
establish monitoring programs, or providing essential data for TMDL development and implementation. Citizen
monitoring is also an effective way to improve the public’s knowledge of the safety of their water and to act as a
“watchdog” to ensure the local agencies are addressing the problem.
Bacteria can be difficult to sample and analyze, for many reasons. Natural bacteria levels in streams can vary
significantly. For example, they can rise sporadically in response to passing waterfowl or other wildlife. One
Massachusetts beach study found that sampling at ankle depth yielded consistently higher E. coli readings than
sampling at waist level, which gave higher readings than samples collected at chest level (Doolittle, 2002). Bacteria
conditions are strongly correlated with rainfall, and thus comparing wet and dry weather bacteria data can be a
problem. Many analytical methods have a low level of precision yet can be quite complex, and absolutely sterile
conditions are required to collect and handle samples. Given these challenges, regular monitoring is important for any
waterbody that is used for recreation to better quantify the potential health risks. Volunteer bacteria monitoring has the
ability to provide tremendous insight on local waters, helping local and state agencies improve water quality.
There are also some limitations to the Water Quality Standards development process that make collection of additional
and/or different types of data important for answering the question “is the water safe?” Existing monitoring data may
not be adequate for the reasons described below.
Use of outdated bacterial indicators
Studies conducted by EPA to determine the correlation between different bacterial indicators and the occurrence of
digestive system illness at swimming beaches suggest that the best indicators of health risk from recreational water
contact in fresh water are E. coli and enterococci (EPA, 2012). For salt water, enterococci are the best (EPA, 2012).
Although these indicators have been shown to correlate better with the risk of digestive system illness, many states still
use fecal coliform as their primary fecal indicator bacteria.
If your state is still using total or fecal coliforms as the indicator bacteria and you want to know whether the water
meets state water quality standards, you should monitor fecal coliforms. However, if you want to know the health risk
from recreational water contact, the results of EPA studies suggest that you should consider switching to the E. coli or
enterococci method for testing fresh water. In any case, it is best to consult with the water quality division of your state’s
environmental agency, especially if you expect them to use your data.
Limited spatial extent of sampling
Ambient (background) monitoring networks are typically designed to characterize water quality conditions at a broad
scale and may not be as useful for assessing the health of a specific stream reach. EPA’s guidance on monitoring
design for the 305(b) assessment program encourages states and tribes to include a probability-based network for
making statistically valid inferences about the condition of all state water types over time as part of the monitoring
design. As an example, Maryland Department of the Environment uses the approach that if greater than 10 percent of
the streams monitored do not meet biological indicator standards, the entire 8-digit Hydrologic Unit Code watershed
is considered impaired. Therefore, simply being located in a watershed designated as impaired does not necessarily
mean that your specific stream is unsafe and additional monitoring may be warranted.

SAFE WATERS, HEALTHY WATERS: A Guide for Citizen Groups on Bacteria Monitoring in Local Waterways
10
Infrequent sampling
Due to the notoriously variable nature of bacteria data, regular sampling is important for recreational waters such
as swimming beaches. A one-time sampling effort is not sufficient to determine the safety of these waters today,
especially if there have been changes to land use/land cover since the monitoring was conducted. However, the
EPA does not specify a minimum number of samples needed, as it depends on concentration of bathers, historical
records, accessibility, potential pollution sources, and other factors (EPA, 2002). For recreational beach waters, the
EPA recommends water quality samples to be taken at least once a week, and more frequently at locations with a
more dense population of swimmers (EPA, 2012). It is important to consider that these recommendations are for states
to design their recreational water quality criteria and monitoring programs. For a volunteer monitoring program, the
number of volunteers and available resources may limit the ability to sample as frequently.
The remainder of this guide lays out protocols for a bacteria sampling program for citizen groups that addresses the
above limitations. It is important to note that there is no one-size-fits-all approach for citizen monitoring programs. The
needs of each organization may vary greatly, and this guide attempts to summarize the pieces needed for a successful
program. Depending on the status of your citizen group, you may want to begin at the section that best fits your
needs.
• Section 2. Designing Your Baseline Bacteria Monitoring Program. This section covers the basic information
needed to design a bacteria monitoring program. Depending on the goals of the program, different levels of
effort will be needed to ensure success.
• Section 3. Investigating Potential Pollutant Sources. If you already suspect a potential pollutant source OR you
found a suspicious hotspot through monitoring, this section will help you to understand the steps needed to in-
vestigate a pollutant source as a citizen group. It is important to note that there is limited action a citizen group
can take to investigate the pollutant source—local officials will be needed in most situations.
• Section 4. Sharing Your Findings and Taking Action. After developing your monitoring program, it is impor-
tant to share the data with your community. If the pollution is suspected to come from a controllable source,
education and outreach is important to help address the problem. A strong relationship with local authorities is
also vital to help reduce or eliminate the pollutant source.
1.4 Resources
If your stream is a recognized public recreation area, there may be other groups already conducting bacteria
sampling to determine if the water is safe and allow for notification about public health risks if bacteria concentrations
exceed the recommended levels. The best place to start may be your local health department, environmental agency
or citizen groups such as Waterkeeper organizations. If no local monitoring data is available, state data collected as
part of water quality assessment may be the next best source.
• State and tribal Water Quality Standards as well as federally promulgated standards can be accessed on
EPA’s Water Quality Standards Repository: http://water.epa.gov/scitech/swguidance/standards/wqsli-
brary/index.cfm
• Many of the state Water Quality Standards are organized by major river basin. To determine what river basin
you are located in, go to EPA’s Surf Your Watershed: http://cfpub.epa.gov/surf/locate/index.cfm
• Many larger, developed volunteer monitoring programs can provide tremendous amounts of resources for
newer programs. The Chattahoochee Riverkeeper has a guide to develop a Neighborhood Water Watch,
which is a very successful volunteer monitoring program in Atlanta. http://chattahoochee.org/wp-content/
uploads/2013/05/NWW-guide_FINALFINAL.pdf

SAFE WATERS, HEALTHY WATERS: A Guide for Citizen Groups on Bacteria Monitoring in Local Waterways
11
• The best source to determine if your stream has been designated as impaired for bacteria is EPA’s Watershed
Assessment, Tracking and Environmental ResultS (WATERS) database, which can be searched by state: http://
iaspub.epa.gov/waters10/attains_nation_cy.control?p_report_type=T.%20Accessed%2015%20June%20
2010
• EPA also provides a GIS shapefile of impaired waters that can be downloaded to see the designated reach in
greater detail: http://water.epa.gov/scitech/datait/tools/waters/data/downloads.cfm
• EPA’s Water Quality Standards website has state-by-state links to information on Water Quality Standards:
http://water.epa.gov/scitech/swguidance/standards/regions.cfm. The state agency responsible for Water
Quality Standards should be able to provide data collected for 305(b) monitoring requirements.
Other national sources of monitoring data for your stream include:
• EPA’s STOrage and RETreival (STORET) Data Warehouse: http://www.epa.gov/storet/
• USGS, EPA and the National Water Quality Monitoring Council’s Water Quality Portal: http://www.water-
qualitydata.us/
• USGS water quality data: http://water.usgs.gov/owq/data.html

SAFE WATERS, HEALTHY WATERS: A Guide for Citizen Groups on Bacteria Monitoring in Local Waterways
12
2 Designing Your Baseline Bacteria Monitoring Program
This section provides general guidance on the design of a bacteria monitoring program for citizen groups and
volunteers to perform baseline assessments of their surface waters in order to help answer the question “is my water
safe?” A baseline assessment is useful when there is limited data on the waterway and can be used to evaluate long-
term trends. Bacteria monitoring programs can vary tremendously from location to location based on factors such as
weather, resource availability, recreational water usage, available data, site accessibility and community involvement.
Before any monitoring begins, it is important to develop a plan that addresses these factors and that will produce
meaningful results if some factors change. Because consistency is particularly important in long-term monitoring
programs, the plan should identify standardized procedures that will be adhered to by volunteers, which helps to ensure
replicability of results since volunteers may change from year to year. The basic elements of a bacteria monitoring
program and plan are described below.
2.1 Determine Goal of Monitoring Program
The first decision is to determine the goal of the bacteria monitoring
program and how the data will be used. Depending on the goal,
different methods of sampling and analysis will be needed. If your goal
is to educate citizens or promote clean water practices, you can use
more cost-effective methods that have a low degree of resolution. If your
goal is to help local agencies by providing supplemental data, you
may need better resolution and a higher level of quality assurance and
quality control (QA/QC), and you should also meet with these agencies
to determine how any new data can support their water quality goals.
In general, the funding and time requirements of monitoring methods
increase with the accuracy of the resulting data. It is imperative that you
work with potential users of your data to ensure that your efforts are in
line with their needs.
Below is a diagram of an example range of monitoring and the
resources needed. As the goals approach regulatory use, the resources
and government involvement increase.
Review Existing Data
Prior to developing a bacteria
monitoring program, available TMDLs,
watershed plans, monitoring data and
other relevant information should be
reviewed to determine the scope of
previous monitoring efforts and whether
any potential bacteria sources have
already been identified. These plans
may simply parse out the estimated
bacteria load from urban versus
agricultural versus wildlife sources, or
they may be more specific such as
estimating the number of failing septic
systems in the watershed. The point
is to get a general sense of the types
of sources you are dealing with in the
watershed and find out if any specific
sources have been pinpointed as a
problem to help guide your monitoring
effort. Plans that include the locations
of state or regional monitoring sites
can also be used as a guide for
locating additional monitoring sites to
supplement the data. Local officials,
such as health officers or beach
managers, can also help to identify
areas where high bacteria is suspected.
Community members that know their
local streams well are also a good
way to learn more about water quality
issues.
2
Goal of Monitoring
Awareness
and
Education
Locating
Problem
Areas
Regulatory
Use
Increase in time, money, resources,
government involvement, accuracy

SAFE WATERS, HEALTHY WATERS: A Guide for Citizen Groups on Bacteria Monitoring in Local Waterways
13
If the data collected from sampling and analysis need to have a high level of credibility, state-certified contract lab
or in-house testing using approved EPA methods and proper sampling training will be necessary. The approved EPA
methods for recreational waters are listed in Table 3. To increase your credibility, you can also have an EPA approved
Quality Assurance Program Plan (QAPP). See Section 2.3 for more information. If credibility is not a priority, an in-
house, less robust method can be used. While it is certainly acceptable to use EPA methods for less stringent uses, but
it may not be cost- or time-effective. If you need high quality data, it is advised to send the samples to certified labs if
you are a new organization or do not have laboratory facilities to perform the analysis.
You will want to use more stringent, EPA-approved methods if:
• You plan to provide your data to the State or another regulatory body;
• You want to provide scientific evidence of a problem that needs to be addressed; or
• Providing defensible data is a priority for some other reason.
You may want to start with a simpler method if:
• You are just starting a bacteria monitoring program and are not ready for or do not have funds for big invest-
ments;
• You may later want to use more stringent and expensive method for a particular sampling location;
• You will be using the data gathered for internal management decisions only;
• You are looking to get a sense of baseline or magnitude of bacteria in your area of concern; or
• Ease of collection and analysis is a priority.
2.2 Baseline Sampling and Analysis Plan
A monitoring plan should be developed that includes the location of
sampling sites, frequency of sampling, timing and duration of sampling, and
sampling parameters and analysis methods. The plan should also include
other pertinent information, such as a field supply list; transport instructions,
if applicable; references for analytic methods; instructions for collection
of duplicates or other quality control procedures, and data reporting
requirements. This latter information could alternatively be included in a
QAPP, which is useful (and sometimes required) for a sampling program, and
is discussed in Section 2.3.
Location of Sampling Sites
Sampling should be targeted to waterbodies that are frequently used for recreation. Specific sampling locations
within these areas should be selected on the basis of the ability of a small number of samples to adequately describe
water quality at the site (EPA, 2010). However, these is no standard formula for determining the number of sites
needed. Locations where water quality can be best characterized are those with relatively low variability in bacteria
concentrations (based on historical data where available) and those near known or likely human sewage pollution
sources, such as stormwater outfalls, and away from non-human sources (e.g., bird nesting areas) or areas where
resuspension/mixing may occur (EPA, 2010). Another option is to sample at a location where contamination is
unlikely, providing a reference location.
Frequency of Sampling
For recreational beach waters, the EPA recommends water quality samples be taken at least once a week, and more
frequently at locations with a more dense population of swimmers (EPA, 2012). There is no minimum recommendation
for other waters, and the number of volunteers and available resources may limit the ability of a volunteer monitoring
program to sample this frequently. Therefore, decisions about sampling frequency will need to balance the available
capacity of volunteers with the need for information, and will also be influenced by the number of sampling locations.
In general, the more samples, the better information you’ll have when interpreting your data.
Lake and Coastal Monitoring
Monitoring in lakes, coastal waters
or other deepwater environments
may require sampling from a boat
and other unique planning and
equipment considerations.

SAFE WATERS, HEALTHY WATERS: A Guide for Citizen Groups on Bacteria Monitoring in Local Waterways
14
When samples exceed established Water Quality Criteria, more frequent or daily sampling may be appropriate, to
determine whether the area should be closed to recreational use. Subsequent sampling is also needed to determine
when to reopen the recreational area.
Timing of Sampling
Sampling should occur at each location at generally the same time of day, preferably in the morning before the sun
degrades the bacteria. For crowded beaches, sampling when recreational use is highest may be appropriate (e.g.,
mid-afternoon). Using a contract lab for analysis may affect the timing of sampling since samples can only be kept on
ice for a short period before they are brought to the lab. Labs are also not typically open 24/7 and staff may not be
available 24-48 hours later to read the results. Also keep in mind that bacteria levels change frequently and analysis
results often take 24 hours. Therefore the data provided is less effective (in terms of beach closures, for instance) the
older it gets or if weather conditions change.
If possible, samples should be collected immediately following a large storm event as well. Both baseline and storm-
event sampling can be useful to help identify general sources of the bacteria. Storm event sampling can be useful
to identify sources that are associated with stormwater runoff. If you are sampling during a storm, you will need to
determine if your organization has the manpower to collect samples and ensure that it is safe for volunteers to sample.
See the Resources section and the rainfall sidebar in Section 3 for more information on sampling during and after
storms. Dry weather sampling is important for identifying sources such as continuous illicit discharges or leaking septic
systems and is also important because recreational use of water typically occurs during dry weather. Dry weather
discharges can also contain very high counts of bacteria, since there isn’t the stormwater to dilute the discharge.
Duration of Sampling Period
If you are monitoring recreational water, sampling only during those months of recreational use should be sufficient
(e.g., April through October).
Number of Samples
It is best to have field duplicate samples for 10% of the sample sites to ensure proper monitoring technique, but this will
increase the cost of monitoring. See Quality Control for more details.
Monitoring Parameters and Analysis Methods
The plan should include instructions on which bacteria to monitor and what type of bacterial analysis method will be
used to assess the water quality. The best indicators of health risk from recreational water contact are E. coli (fresh
water) and Enterococci (fresh and salt water). If the waterbodies you plan to sample vary in salinity levels, or if you
plan to compare results between freshwater and salt water areas, use Enterococci as the indicator. However, some
states still use total coliform and fecal coliform as indicator bacteria. You will want to research what the regulations
are for your state (see the Resources in Section 1). If you want to know whether your water meets state water quality
standards then you will need to use those same criteria. If you are monitoring to determine the health risk from
recreational water contact, enterococci and E. coli are best. Section 2.4 summarizes the different bacterial analysis
methods for each parameter.
As stated in the previous section, how your data will be used will determine if your sampling and analysis methods
need to be EPA approved. If you are new at bacteria monitoring, it is advised to either send out the sample for
analysis to an experienced laboratory or start with simpler in-house methods, as being compliant with regulations can
be costly and time intensive.
2.3 Quality Control
The monitoring project should ensure that data collected is good-quality data that is consistent over time and across
projects and group members. You can develop a Quality Assurance Project Plan (QAPP) to have uniform monitoring
procedures for all volunteers. Although a QAPP is not always necessary, it provides a cohesive document that can
be referred to by volunteers. Due to the transient nature of volunteer work, it is helpful to have this document to aid

SAFE WATERS, HEALTHY WATERS: A Guide for Citizen Groups on Bacteria Monitoring in Local Waterways
15
new volunteers. QAPPs are also sometimes required by funders. The
QAPP will include information from the sampling and analysis plan, as
well as other details that ensure quality control. Check with your local or
state government to see if there is a QAPP already written for volunteer
monitoring. The EPA also has a guideline for how to write QAPPs. See the
resources section for more information.
Samples should be collected and analyzed using standardized, accepted
techniques so that results are comparable to data collected through other
assessments using the same methods. Few water quality agencies will use
volunteer data unless methods of data collection, storage, and analysis are
documented. Clear and concise documentation of procedures also allows
newcomers to the project to continue monitoring using the same methods as
those who came before them. This is particularly important to a volunteer
project that may see volunteers come and go and that intends to establish a
baseline of water quality information that can be compared over time.
It is also important to remember that repetition is the best way to have a
meaningful analysis. A single bacteria sample result only represents that
waterway at that specific point in time–it doesn’t tell us information about
the environment and the factors affecting the water quality of that stream.
Below are some typical quality control procedures. Not all organizations
can have this level of testing, but that does not mean the data is wrong–
you will just need to interpret the data differently. There are protocols to
determine how to interpret data depending on your level of quality control. The manufacturer of the test setup you
select will often provide information to help you understand how to interpret the results. The EPA standards may also
include guidance for interpretation, as well
as local or state guidance.
Field Quality Control
• Make sure all volunteers are
regularly trained in sample collection
methods
• Collect field blanks using distilled
water at 10% of sample sites
• Collect field duplicates at 10% of
sample sites
Lab Quality Control
Although laboratory instructions are not
provided in this guidance, the following
EPA website describes some quality control
measures that should be taken https://
www.epa.gov/polluted-runoff-nonpoint-
source-pollution/nonpoint-source-volunteer-
monitoring:
• Conduct lab replicates on 10% of
bacteria plates for counting
• Test positive and negative controls
• Split one of the samples equally and
analyze one sample in your lab, and
send the other to a different lab
Quality Assurance Project Plan
A QAPP is an important tool
to help defend the data that
volunteers collect. A QAPP contains
information such as:
• Project Description
• Training Requirement/Certi-
fication
• Sampling Methods
• Sampling Handling and
Custody Requirements
• Analytical Methods
• Quality Control
• Instrument/Equipment Test-
ing, Inspection, and Main-
tenance
• Data Management
QAPP development resources can
be found in the resources section.
Definitions:
Field Blanks: These are filled with sterile water at the sample
collection site to make sure that there is no contamination with the
sampling method. Results should detect no bacteria.
Field Duplicates: At 10% of the sites (random), there should be
two samples taken at the same site. This is used to determine the
sampling and analysis precision.
Lab Replicates: Samples are split into subsamples at the lab and
tested. The results are compared for precision in laboratory analysis.
Positive Control: Known target bacteria is tested and results should
be positive. This is used to detect errors in the laboratory analysis
and equipment.
Negative Control: A non-target bacteria is tested and results should
be negative. This is used to detect laboratory or growth media
contamination.
Split Sample: One sample is divided equally and analyzed by
different analyst or lab. This is used to compare the results from
different labs.

SAFE WATERS, HEALTHY WATERS: A Guide for Citizen Groups on Bacteria Monitoring in Local Waterways
16
2.4 Equipment and Materials
Some general equipment you will need for sample collection include:
• Sterile sample bags, such as Whirl-pak, or sterile bottles (contracted
labs may provide these items)
• Labels and clear tape to label bottles or bags (contracted labs may
provide these items)
• Rubber gloves
• Cooler with ice
• Clipboard
• Pencil (better for wet weather)
• Data sheets/ field sheets (example sheets found in resources section)
• First aid kit
• Permanent marker
• Clock/watch
• Chain of custody record (some agencies may require this)
• Important phone numbers, including contact person for local agency
to report immediate pollution concerns
• Site map
• Camera
The equipment needed for the bacterial analysis depends primarily on which method you use and secondarily on cost
and accuracy. For bacteria analysis, the primary options are to do the laboratory analysis in-house or to contract with
a local laboratory. If you decide to use a contract lab, the only supplies that you will need are the sampling materials
listed above. The lab may have specific sampling and storage procedures for you to follow.
If you are performing the analysis in-house, you may need an incubator plus other equipment and supplies, depending
on the method that you choose to use. An inexpensive incubator such as the Hovabator (~$60) is worth the minimal
expense and will produce more reliable results than room temperature incubation. It is important to note that for
regulatory use, a professional incubator will be needed due to the temperature variability and limitations of the
inexpensive incubators.
2.5 Bacterial Analysis
There are multiple methods that can be used for bacteria testing, depending on your resources and goals. For all of
the methods, the area where you perform the analysis should be wiped clean with lab quality paper products, such as
Kimwipes, and alcohol to decrease chances of cross contamination. Gloves should be worn during the entire analysis.
For direct inoculation, membrane filtration and most probable number analyses, the sample is either plated or mixed with
a growth media (sterile pipettes might be needed). The sample is typically incubated at a specific temperature per the
media manufacturer. Sterile water is used for dilutions (if needed) and to plate blanks (see the Quality Control section).
Dilutions may be needed if you believe that there is a high bacteria count in your sample. See the instructions for the
analysis method you are using for how to perform a dilution. For IDEXX and Multiple Tube Fermentation, the results are
reported as Most Probable Number (MPN). 1 MPN is assumed to be equal to 1 CFU.
You will need to dispose of your waste in accordance with provisions for incubated samples. If you do not plan on
using the data beyond educating the volunteers and local community or getting a general baseline reading, then simpler
methods such as 3M Petrifilm plates or Coliscan easy-gel are probably sufficient. If compliance with EPA-approved
methods is necessary, the more stringent procedures should be used in order to have more accurate results. To comply
with these requirements, all materials used must be sterile, either by autoclave or using one-time use sterile equipment.
Table 3 presents a summary of the most common bacteria analysis methods. The summary includes which indicator
bacteria is tested, if the method is approved by the EPA, relative cost of the analysis, and equipment needed. Specific
Whirl-pak bags or bottles
Traditionally, plastic or glass
bottles are used to collect samples.
These containers must be sterilized
in an autoclave, which is typically
only available in laboratories.
Plastic and glass bottles can be
reused for a very long time and
are easier to use during analysis
because they stand upright. Whirl-
pak bags are one-time use, sterile
bags made by Nasco. They are
convenient because they do not
need to be autoclaved, but cannot
be reused. There are also pre-
sterilized single use bottles, but
these are usually more expensive
than Whirl-pak bags.

SAFE WATERS, HEALTHY WATERS: A Guide for Citizen Groups on Bacteria Monitoring in Local Waterways
17
details can be easily found through the EPA website or on the manufacturers’ websites, and in the resources section of
this document. References are provided in the resources section for the different methods.
Table 3: Bacterial Analysis Methods
Method Type
E. coli
Enterococci
Coliform
EPA Approved
Method for Ambient
Water
Relative
Startup
Cost
Relative
Cost per
Sample
Other Materials
Needed Comment
Direct
Inoculation
(cfu)
Coliscan Easygel x x Only approved for
drinking water $ $
• Coliscan Easy gel
bottles
• Petri dishes
• Incubator (optional)
Easy to use, low level
of training
3M Petrifilm Plates x x x None $ $ • 3M Petrifilm plates
• Incubator
Easy to use, low level
of training
Membrane
Filtration (cfu)
mTEC, modified
mTEC x 1103.1, 1603 $-$$
$-$$
• Nutrient/culture
medium, agar
• Petri dishes
• Filter and vacuum
• Forceps and flame
source
• Incubator
• Autoclave (optional)
Commonly used
method
MI X x 1604 (Total
Coliform) $-$$
mE-EIA, mEI x 1106.1, 1600 $-$$
mColiBlue24® x x 10029 (Total
Coliform) $-$$
Most
Probable
Number
(MPN)
Multiple Tube
Fermentation x
1680 (Total
Coliform), 1681
(Fecal Coliform)
$$ $-$$
• Nutrient or culture
medium
• Test tubes, rack
• Pipettes
• Incubator
• Sterile flame set up
• Autoclave
Labor and glassware
intensive relative to
membrane filtration
and IDEXX
IDEXX: Enterolert x
Approved, ASTM
#D6503-99,
9230D
$$$ $$
• IDEXX Quanti-Tray
Sealer, rubber
insert, and trays
• 100-ml plastic
IDEXX bottles
• Reagent
• UV light
• Sterile water (if
sampling in salt
water)
Easy to use after
sufficient training.
Less potential of cross
contamination than
other methods due to
single use materials.
IDEXX: Colilert,
Colilert-18 x x Approved,
SM9223B $$$ $$
Quantitative
Polymerase
Chain
Reaction
(qPCR)
x
Others
Not approved for
Ambient water:
1609, 1611
$$$$ $$$
Extensive and
expensive materials-
This is not feasible to
be performed outside
of the laboratory
setting and extensive
training is needed
A developing
technology not
typically accessible to
communities. Could
work with a university.
Expensive, but
accurate
$: Average cost <$3 per test. Minimal (<$200) laboratory equipment.
$$: Average cost <$5 per test. Less than $4,000 in essential laboratory equipment startup costs
$$$: Average cost >$5 per test. $4,000 to $7,000 in essential laboratory startup costs.
$$$$: >$7,000 in essential laboratory startup costs.
*These costs estimates were made in 2014. Prices are subject to change.

SAFE WATERS, HEALTHY WATERS: A Guide for Citizen Groups on Bacteria Monitoring in Local Waterways
18
2.6 Collecting a Water Sample
You will need to properly train your volunteers how to collect water samples. For compliance with EPA methods, it is
essential that you follow the instructions below to ensure that the sample is not contaminated. Appendix B contains the
guidance from the EPA on collecting samples using bottles and sterile bags.
Dos and Don’ts of Sampling
Do:
• Develop quality assurance and quality control procedures – see Section 2.3
• If using a contract lab, make sure it is accredited by either the state or a national accreditation body such as
NELAC or A2LA.
• Contact the lab where you plan on sending your samples to ensure they are prepared to analyze the sample
• Label the bag/bottle with location, date, and sample code or number with a permanent market before you
sample
• Sample in the main current of streams and wadeable rivers. For lakes and swimming beaches, sample where
most people recreate, at knee depth (12-24 inches deep). Check with your local authorities to see if there is a
specified depth range.
• To minimize potential for cross-contamination, stand facing upstream and reach as far upstream as possible to
collect the sample
• If sampling from a boat, make sure that the vehicle is securely anchored and do not bring up the anchor until
sampling is completed. Sample well away from the propeller.
• Fill out a field sheet for each event (see below)
• Store the samples in a cooler, on ice for up to 6 hours (general recommendations from EPA; holding time may
vary with parameter and analysis method)
• Note the length of time between collecting and processing on the field sheet
• Allow sufficient time to get the samples to the lab within the specified holding period
Do not:
• Disturb bottom sediment (as much as feasible)
• Touch the inside of the sterile bag or bottle or the cap with your fingers or with any other equipment
• Hold the sample for more than the recommended holding time. EPA recommends up to 6 hours; however you
will need to check with the regulatory authority (if used for regulation purposes) because your state may have a
more flexible holding time (e.g., 24-48 hours if held on ice), and this can vary with the parameter and analy-
sis method
• Collect your sample from stagnant water
In addition to collecting the water sample, volunteers should always be on the lookout for environmental clues that
might help explain the data. A visual assessment of the monitoring site can provide invaluable information and make
interpretation of other data easier and more meaningful. The most value is gained when volunteers assess the same
area each time they collect samples. In this way, the volunteers will become the local experts—growing familiar with
baseline conditions and land and water uses, and being better able to identify changes over time.
On the data sheet, record basic information that describes conditions during your sampling event. This may include:
• Stream level (normal, high, low)
• Current weather conditions – rainy, clear, cloudy
• Depth of rainfall in past 48 hours
• Turbidity
• Water temperature

SAFE WATERS, HEALTHY WATERS: A Guide for Citizen Groups on Bacteria Monitoring in Local Waterways
19
Also record any unusual conditions. Descriptive notes should be as detailed as possible. Volunteers should bring
such conditions to the attention of the program leaders so that they can report them to the appropriate authority, if
warranted. Some things to be on the look-out for while monitoring include:
• Obvious pollution issues (e.g. leaking sanitary pipe);
• Visible discharge from a pipe or outfall into the water;
• Discolored or foul-smelling water;
• Toilet paper and other materials commonly flushed;
• Outfall pipes flowing during dry weather;
• Patches of algal growth or vegetation;
• Scums or films on or under outfall pipes;
• Potential sources of bacteria such as pet, wildlife or livestock waste; and
• Other unusual conditions.
2.7 Determining Exceedance
As described in Section 1, your state’s Water Quality Standards or Beach Action Values will contain the necessary
information to determine what levels of bacteria are considered unsafe for recreational use. Some calculations may be
required to compare your results to the established thresholds. The geometric mean is a popular metric used to keep
track of long term conditions because it can show how the data may fluctuate with natural events, such as rain or tide,
and it accounts for extreme variability in data points. See Costa (N.D.) in the reference section for an explanation of
how to calculate the geometric mean for your data.
2.8 Resources
Other Monitoring Guides
• EPA Volunteer Monitoring: https://www.epa.gov/polluted-runoff-nonpoint-source-pollution/nonpoint-source-
volunteer-monitoring
• EPA Volunteer Estuary Monitoring: https://www.epa.gov/polluted-runoff-nonpoint-source-pollution/nonpoint-
source-volunteer-monitoring
• Volunteer Monitor Supplies, Field Sheets, Methods, Sample Training Agenda and More: http://www.usawa-
terquality.org/volunteer/EColi/June2008Manual/Chpt_Appendices_ecoli.pdf
• Vermont Citizen Monitoring Guide: http://www.vtwaterquality.org/lakes/docs/lp_citbactmonguide.pdf
• Virginia Citizen Monitoring Guide: http://www.deq.virginia.gov/Programs/Water/WaterQualityInforma-
tionTMDLs/WaterQualityMonitoring/CitizenMonitoring/Guidance.aspx
• Neighborhood Water Watch, A Guide for Developing a Volunteer Bacteria Monitoring Program: http://chat-
tahoochee.org/wp-content/uploads/2013/05/NWW-guide_FINALFINAL.pdf
Field Methods
• Maine Healthy Beaches Program Field Methods: http://www.mainehealthybeaches.org/documents/Field_
methods.pdf
Volunteer Quality Assurance Quality Control Plans, QAPP
• https://www.epa.gov/polluted-runoff-nonpoint-source-pollution/nonpoint-source-volunteer-monitoring
SAFE WATERS, HEALTHY WATERS: A Guide for Citizen Groups on Bacteria Monitoring in Local Waterways
20
Tips for Safety
• http://www.usawaterquality.org/volunteer/EColi/June2008Manual/Final_ecoli_06c1.pdf
• https://www.epa.gov/polluted-runoff-nonpoint-source-pollution/nonpoint-source-volunteer-monitoring
Example Data Sheets
• http://www.usawaterquality.org/volunteer/EColi/June2008Manual/Final_ecoli_06c1.pdf
• https://www.epa.gov/polluted-runoff-nonpoint-source-pollution/nonpoint-source-volunteer-monitoring
Bacterial Analysis Methods
• https://www.epa.gov/cwa-methods
• http://www.usawaterquality.org/volunteer/EColi/June2008Manual/Chpt5_ecoli.pdf
• https://www.epa.gov/polluted-runoff-nonpoint-source-pollution/nonpoint-source-volunteer-monitoring
• http://www.ohiowea.org/docs/E_Coli_Presentation.pdf
Method Instructions
3M Petrifilm Plates http://multimedia.3m.com/mws/media/236246O/petrifilm-ecoli-coliform-
interpretation-guide.pdf
mTEC, Method 1103.1 https://www.epa.gov/sites/production/files/2015-08/documents/meth-
od_1103-1_2010.pdf
Modified mTEC, Method 1603 https://www.epa.gov/sites/production/files/2015-08/documents/meth-
od_1603_2009.pdf
MI, Method 1604 https://www.epa.gov/sites/production/files/2015-08/documents/meth-
od_1604_2002.pdf
mE-EIA, Method 1106.1 https://www.epa.gov/sites/production/files/2015-08/documents/meth-
od_1106-1_2009.pdf
mEI, Method 1600 https://www.epa.gov/sites/production/files/2015-08/documents/meth-
od_1600_2009.pdf
mColiBlue24® http://www.hach.com/asset-get.download.jsa?id=7639984023
Multiple Tube Fermentation,
Method 1680
https://www.epa.gov/sites/production/files/2015-08/documents/meth-
od_1680_2010.pdf
Multiple Tube Fermentation,
Method 1681
https://www.epa.gov/sites/production/files/2015-08/documents/meth-
od_1681_2006.pdf
The EPA also provides a website containing all EPA approved laboratory methods for the Clean Water Act at www.
epa.gov/cwa-methods

SAFE WATERS, HEALTHY WATERS: A Guide for Citizen Groups on Bacteria Monitoring in Local Waterways
21
Rainfall Data
When analyzing your data
results, comparison of the bacteria
concentrations with the rainfall
conditions recorded at the time
of sample collection can tell
you how much of the bacteria
problem is associated with rainfall
events, and can be used to inform
recommendations on beach closings
and notification of the public about
potential health risks of water contact
in the days following a storm.
Access to rainfall data is important
for this step. Weather Underground
(wunderground.com) has hourly
precipitation data for many locations.
If stormwater is suspected to be a
significant source, and the area is
used for recreation, a rainfall threshold
study may be useful to determining
peak bacteria concentrations for given
rainfall amounts and the potential
duration of impairment. This would be
used to inform beach closures.
3 Investigating Potential Pollutant Sources
The baseline monitoring program described in Section 2 will generate
data that can be compared to established water quality benchmarks to
determine if the water exceeds these thresholds and whether it is safe
for recreational use. While for recreational waters, such as swimming
beaches, the more immediate concern is to notify the public of the health
risk and/or close the beach (see Section 4), it is also important to begin
to narrow down the source of the bacteria so that the problem can be
corrected. In addition, volunteer monitors can use the methods described in
this section to investigate complaints.
As described in Section 1, there are numerous sources of bacteria in
urban watersheds, such as stormwater runoff, sewer overflows, and failing
septic systems. The number of sources combined with the complexity of
the urban drainage system and the patchwork of public and private lands
make tracking down bacteria to a specific source a challenge. While
not all sources of fecal contamination can be identified, targeting human
sources first should result in a measurable improvement in water quality and
decrease in health risk.
Prior to setting up your baseline monitoring program, you will have
already reviewed existing plans and data to identify the primary sources
of bacteria in your watershed. A more detailed analysis is needed to
further narrow down these sources. The first step is to plot the problem
stations (sites with exceedances) on a map. The next step is to begin to
narrow down the potential sources of bacteria though a survey of pollutant
sources. If the number of stations with high bacteria concentrations is very
large and/or the problems are widespread throughout the watershed,
you may want to begin with the sites that are most heavily used for recreation. This is followed up by supplemental
sampling at stormwater outfalls, the results of which can be provided to the local authority to help them identify
pollutant sources. As this is an iterative process, the supplemental sampling may require going back to do a more
detailed survey of pollutant sources for a particular outfall where bacteria concentrations are high, followed again
by more detailed sampling with co-indictors (see Section 3.2) until the source is narrowed down as far as possible
without the assistance of the local government authority. When contacting the local government, it is important for you
to provide all of your evidence of a potential sewage leak and be fairly certain there is a violation as the resources
needed to investigate potential hotspots can be substantial. The supplemental sampling described in this section is
investigative and may require adjusting the sampling sites as you go–unlike the baseline monitoring program, where
consistency of sampling sites over time is important. For both types of sampling, the protocols described in Section 2
should be followed.
3.1 Survey of Potential Pollutant Sources
A survey of potential pollutant sources for a particular bacteria hotspot can help to narrow down the sources of
bacterial contamination so that they can be eliminated. This type of survey is not necessarily a linear process and
involves both desktop analysis and field assessment. In addition to better understanding local pollution sources through
maps and data, conversations with the local government or community members may be helpful to identify hotspots or
begin to narrow down sources.
3
SAFE WATERS, HEALTHY WATERS: A Guide for Citizen Groups on Bacteria Monitoring in Local Waterways
22
Evaluate drainage areas
For each sampling site that exceeds recommended bacteria concentrations (or for each reported complaint), the first
step is to evaluate the land area draining to that point. This can help to narrow down probable sources of bacteria
to the waterbody. Drainage areas or watersheds may already be available in geographic information system (GIS)
format from your local planning or environmental agency. These layers can be viewed using free online mapping
software such as ArcGIS Explorer: http://www.esri.com/software/arcgis/explorer/. More savvy GIS users can
delineate the drainage areas themselves using hydrologic, stormwater infrastructure, and topographic maps (see the
Resources section). If neither of these are options, online aerial photos such as Google Earth can be used to get an
approximate view of the land and land use types draining to the site. It is important to note that sewersheds do not
necessarily follow surface drainage lines. Although surface water may flow downstream to the selected waterway,
a storm sewer system could collect and divert some stormwater from outside of the drainage area to the waterway,
making it important to know both the drainage area and the sewershed. A sewershed delineation may be available
from local agencies or can be done through detailed delineation using GIS layers of the storm sewer system.
Leverage information from other sources
Land use maps and existing water-related studies of the area are great tools to help find potential bacteria sources.
Land use maps can be used to identify the location of properties with high potential for discharges of bacteria and
other pollutants. Maps of stream networks and storm drainage systems can help to determine the potential flow path
of the contamination and identify supplemental sampling locations. For groups with limited GIS capability, this step can
be done using paper maps or online mapping sources such as Google Earth and Bing Maps. For more savvy GIS
users, (or where the local planning agency is willing to provide maps), GIS layers and other data may be available
from national, state, and local sources and can help to form a picture of where potential bacteria sources are in
relation to the problem site (Table 4).
Table 4. Types of Data
Type of Data Where to Find it How to Use it
Tax maps/parcels Local planning or tax assessment agency To identify older developed areas with higher
likelihood of sewer problems; identify land
owners of suspected problem sites
Land use/zoning
maps Local planning agency To identify land use types with higher potential
for pollution
EPA Envirofacts http://www.epa.gov/enviro/index.html To determine locations of permitted dischargers
(and in some cases, discharge info)
Sanitary sewer system
maps Local sewer authority To identify location of sewer pipes and
infrastructure
Storm sewer system
maps Local stormwater /public works agency To identify location of stormwater outfalls for
sampling
SSO/CSO
occurrences
Some state agencies may track SSOs in
a database; local sewer authority should
have data on CSOs
To identify any known CSO locations or sites
with a history of SSOs
Water resource
studies Local or state environmental agency To locate previously identified sources of
bacteria
In addition to mapping data, historical data may be useful to determine if any past land use or recent land use
changes could be contributing to the problem, and complaint records can tell you about the history of any previous
problems or investigations at that site.
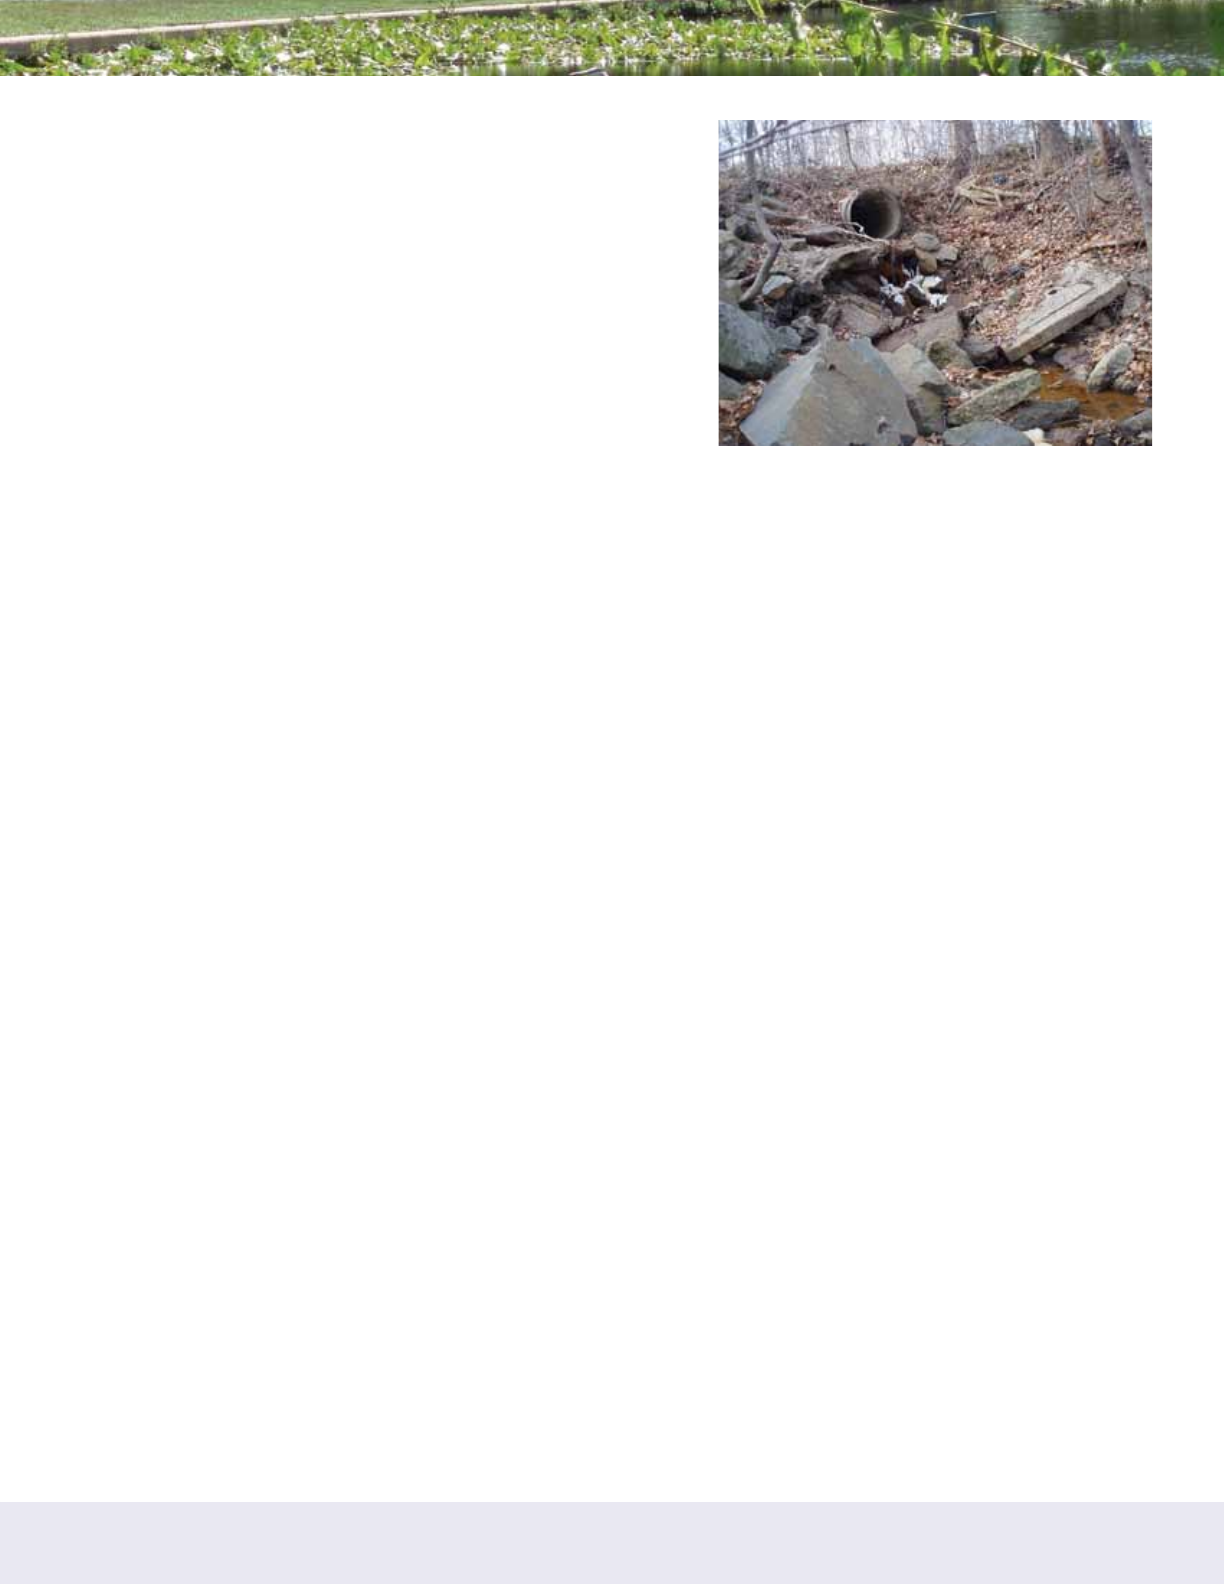
SAFE WATERS, HEALTHY WATERS: A Guide for Citizen Groups on Bacteria Monitoring in Local Waterways
23
Conduct a visual field study of bacteria hotspots
Once you have a better understanding of the drainage area and its
potential bacteria sources, the next step is to return to the problem
sampling sites to perform a visual field survey. An example field data
sheet is provided in the resource section. If the area is accessible
and does not require landowner permission, you can drive and/
or walk around the area on public roads and trails to evaluate the
characteristics of the waterway and note potential problem areas.
Storm drain outfalls, manholes, and catch basins, significant wildlife,
marinas, recreational uses, and impervious surfaces should all be
noted. The presence of specific operations that have higher potential
to generate waste, such as wastewater facilities, vets and kennels,
should also be noted. Volunteers should not survey private areas
without local government staff and/or landowner permission. If
your focus area is large, you may need to narrow down the area
in which you perform your field study using information from the
previous sections.
3.2 Supplemental Sampling
Your review of mapping data and relevant plans and the visual survey of the sampling site should give you some
ideas of where in the drainage area additional sampling would be useful. For example, if there are a handful of
potential sources in the watershed that are highly suspect (e.g., point sources with previous discharge violations, a
stretch of sewer line with a history of leaks and overflows), you may want to sample above and below these locations
(called “bracket sampling”). If no one source stands out over the other, you could simply work your way up the
drainage network from the original sampling site and sample at stormwater outfalls or right above each major stream
confluence as you go to help narrow down which sub-drainage area may be the source of the problem. The extent of
your sampling will depend to some degree on your available time and budget. If you have a very limited budget for
supplemental sampling, you may want to choose one point (at a major stormwater outfall or just above the confluence
with another stream, for example) about midway up the drainage area. If that sample is “clean,” you can assume
that everything above that is clean and choose another sampling site midway between there and the original bacteria
hotspot. In this manner, you can continually “zoom-in” to a more refined target area and collect additional samples.
This approach is most applicable for smaller drainage areas. As with the baseline bacteria monitoring, it is helpful to
sample during both wet and dry weather, and preferably at several different times, to catch any intermittent discharges.
Conduct investigative sampling at selected stormwater outfalls
An outfall is the point where stormwater from pipes and ditches empties into a river, lake or stream. Sampling the flow
from stormwater outfalls is a common practice to identify illicit discharges and is a requirement for some communities
under the Clean Water Act. Outfall sampling is particularly important for narrowing down sources of bacteria in urban
watersheds because so much of the stream network has been put in pipes underground and outfalls are the most
convenient sampling location. Outfall screening is typically performed after at least 48 hours of dry weather because
the intent is to identify non-stormwater sources of pollution (e.g., sewage). For a citizen monitoring program, it is not
likely that these guidelines can be strictly adhered to, however it is recommended to record recent rainfall conditions
during sampling so that the resulting bacteria concentrations can be related to rainfall to give a better sense of whether
any exceedances are related to wet or dry weather.
The same methods that are described in Section 2 can be used for the sampling. It is important to choose a location
that can be safely accessed. Flow should be measured using different methods outlined in the Illicit Discharge
Detection and Elimination Manual, chapter 11 (Brown et. al, 2004). It is also important to note the odor, color,
turbidity and floatables to help determine the source of pollution. Some other visual indicators are corrosion, cracking
or chipping in the pipe; oily water; staining of the pipe or rocks around it; and suds or excessive algae in the water.
Trends in concentrations should be examined for “hotspots” within the drainage network and the investigation locations
should be adjusted based on the results. For example, if a monitoring station has high bacteria levels and the next
station upriver is clean, continue to adjust the location of the upriver site to further narrow the problem area.
Figure 4: Visual Evidence of Sewage Debris

SAFE WATERS, HEALTHY WATERS: A Guide for Citizen Groups on Bacteria Monitoring in Local Waterways
24
Conduct Co-indicator water quality tests
Many sources of bacteria are derived from human sewage. To determine if a high bacteria sample is potentially
due to human sources, sampling for co-indicators at your regular monitoring station or at suspect locations can be
conducted. Sampling with co-indicators other than bacteria provides you with more reasonable assertion of potential
human sources. Some co-indicators are only useful in either freshwater or saltwater due to interference with test
methods. The co-indicators listed in Table 5 are recommended for this approach.
Table 5. Co-indicators of Human Sewage Sources
Co-indicator Appropriate
for
Freshwater?
Appropriate
for
Saltwater? Notes Suggested
Methodology
Ammonia Yes Yes Presence of ammonia is a human waste
indicator Colorimetric
techniques
Caffeine Yes Yes A developing co-indicator for human waste.
Not useful if sampling a short distance
downstream of a wastewater plant outfall
Lab analysis
recommended
Optical
brighteners Yes No
Optical brighteners are found in detergents
and indicate the presence of washwater or
wastewater. Simple presence / absence
studies can be conducted or a more
sophisticated analysis using a fluorometer.
Optical brightener
pads
Fluorometry
Detergents
/ Anionic
Surfactants Yes No Detergents and anionic surfactants indicate
the presence of washwater or wastewater. Colorimetric
techniques
Boron Yes Yes An indicator for sewage or washwater Spectrophotometer
or Colorimetric
techniques
Potassium Yes Yes Indicator for sewage or industrial or
commercial liquid waste
Spectrophotometer
or Colorimetric
techniques
Conductivity Yes No Indicator of sewage discharge. History of
conductivity readings at the site are needed Conductivity meter
pH Yes Yes Indicator for washwater Meter
3.3 Track Down Methods
With the data collected in the previous section, the next step would be to track down the pollutant source. Although
there are various different track down methods, most of these processes are time consuming and may take several
months to perform. The methods used for track down require technical expertise and equipment and also usually
involve entering private property so are not typically appropriate for a citizen group. Some activities, such as dye-
testing septic systems and checking sewer connections, require the expertise and training of professionals like code
enforcement officers, plumbing inspectors, public utility staff, and state and federal agency staff. The different methods
are discussed below as background, but citizen groups should not perform these tasks without the assistance of trained
professionals and permission from the appropriate authorities.
Once a bacteria problem is tracked as far up the stream/storm network as possible, the local government could be
brought in to perform Storm drain Investigations to pinpoint the pollutant source. Storm drain investigations narrow
the source of a discharge problem to a single segment of a storm sewer. The investigation starts at the outfall, and the

SAFE WATERS, HEALTHY WATERS: A Guide for Citizen Groups on Bacteria Monitoring in Local Waterways
25
field crew must decide how it will explore the upstream pipe network. Inspection can begin at the furthest upstream
point in the storm drain pipe network and work towards the outfall, or work upstream in the pipe network from the
outfall. Each method may be appropriate for different circumstances depending on access to manholes, level of
contamination, and configuration of the pipe network. Next, crews select the most appropriate investigative methods
to track down the source. Common methods include:
• Visual inspection at manholes: field crew can inspect manholes to inspect for physical indicators that can iso-
late discharge to a specific segment of the network
• Sandbagging or damming the trunk: A sandbag or other material is used to block flow in a storm drain pipe
for a period of at least 24 hours. Flow behind the dam is assessed using chemical or physical indicators.
• Dye testing: Release non-toxic dye into toilets, sinks, shop drains, and other plumbing fixtures and if there is
dye at the storm drain, an illicit connection exists.
• Smoke testing: Release smoke into a storm drain and track where the smoke exits the pipe. Smoke tests can
find improper connection or damages to the storm drain.
• Video testing: A mobile video camera is guided down a storm drain pipe to locate the connection producing
an illicit discharge.
• Thermal imaging: An infrared camera is used to determine if there is a temperature difference at storm drains,
which may indicate a sewage source.
• Canine scent tracking: Canines are trained to alert the presence of human fecal sources and ignore animal
sources. See Case Study #6 for an example
In conjunction with these track down methods, a more detailed desktop assessment of potential pollution sources is
usually made, following the methods for Drainage Area Investigations described in Brown et al (2004).
3.4 Resources
Outfall Screening:
• Center for Watershed Protection Illicit Discharge Detection and Elimination Guidance Manual https://www.
epa.gov/sites/production/files/2015-11/documents/idde_manualwithappendices_0.pdf
Delineating watersheds:
• http://www.personal.psu.edu/acb5054/blogs/abisher/Instruction%20Set.pdf
• http://www.nrcs.usda.gov/Internet/FSE_DOCUMENTS/nrcs144p2_014819.pdf
Field Data Sheets:
• http://www.epa.gov/npdes/pubs/idde_appendix-d.pdf

SAFE WATERS, HEALTHY WATERS: A Guide for Citizen Groups on Bacteria Monitoring in Local Waterways
26
4 Sharing Your Findings & Taking Action
Testing water for the sake of building a repository of bacteria data can be useful for historical and academic ends;
however, your data is put to better use if they are shared in a meaningful way. Your group’s findings can be shared
narrowly (e.g., with your local utility department) or widely (e.g., to the general public). How and to whom you
communicate your findings and what actions you take as a result of those findings will depend on: the severity of
bacteria problems in your areas of concern, the known and potential sources of bacteria in problem areas, and the
resources and skills available (or absent) to your group.
Citizen groups and watershed organizations around the country have used a wide array of approaches to
communicate their water quality findings to their members, the general public and regulatory agencies. Many of their
strategies are described in this section. In addition, the case studies in Appendix C tell the real-life stories of volunteers
doing the hard work of testing bacteria levels in their local waters, sharing their data, and being the catalyst for
positive change.
4.1 Communicating Your Findings
In this section, we present a range of communication strategies your group may consider adopting in your bacteria
monitoring program. Some approaches are best suited for sharing data findings throughout the year on a regular
basis, while others may be used semi-annually or annually. Even other means of analysis may only be useful once
significant data have been collected for several years in a row.
Reporting Immediate Pollution Concerns
Because volunteer groups cannot fix public sewer pipes or enforce illicit discharge regulations, having a good rapport
with your local utility or water resources department may be the most effective way to ensure that bacteria sources are
eliminated quickly. Prior to sampling, it may be useful (especially in larger jurisdictions with numerous agencies that
deal with water) to meet in person or by phone with agency contacts to identify the appropriate contact and clarify
the process for reporting complaints. The benefits to having volunteers sampling regularly go beyond just collecting
bacteria data. As mentioned in Section 3, volunteers’ regular visits to waterways make for more eyes on the water,
which greatly increases the likelihood that an illicit discharge will be noticed and reported. Perhaps this is the greatest
benefit of all.
In the case that your volunteers come across visible signs of an illicit discharge at their monitoring site (e.g., cloudy
water from paint dumping, strong smell from leaking sewage pipe) they should be armed with a map or GPS to
record the specific location and with the appropriate contact information to report any such pollution sources. This
information should already be included in the monitoring program plan. A picture taken on a smart phone is a great
way to keep track of the location, as most phones will mark the location where the picture was taken. They should
either have on hand the phone number for the volunteer water quality program coordinator who can then contact the
local authorities or know how to contact the appropriate local authorities directly. There are some mobile applications,
such as Creek Watch, that are created for this purpose and leveraging those resources can be valuable.
If a piece of public infrastructure has been found as a source (e.g., broken sewer pipe), the local utility staff should be
able to respond quickly to fix and eliminate the discharge. It may be helpful to have a protocol in place for following
up with the utility and/or notifying the enforcement agency if, for example, more than 48 hours has gone by without
a response. Sometimes the source will be on private property (e.g., leaking septic system or grease container at a
restaurant). In most communities, one department is designated as the starting point for reporting illicit discharges
from both private and public properties. We recommend that you research which specific departments(s) to contact in
your community for bacteria discharges of different types and sources. If the local utility or business does not respond
within 48 hours, it is advised to follow-up with a phone call and notify the local utility or business that the enforcement
agency will also be notified of the issue.
4

SAFE WATERS, HEALTHY WATERS: A Guide for Citizen Groups on Bacteria Monitoring in Local Waterways
27
Sharing Data with Regulatory Agencies
If your water quality monitoring program intends to provide its data to regulatory agencies, you will want to become
familiar with how those agencies prefer to receive your data. This may influence how you organize your own
database so that your data can easily be transferred into the agency’s database on a routine or annual basis.
Consider researching the following, as well as meeting with the agencies in question, if you intend to share your data
beyond the local level.
• State Water Quality Agency: Certain states will accept water quality data from volunteer monitoring groups to
use in identifying officially “impaired” waterways. As mentioned previously, each of these states sets minimum
requirements for the level of quality assurance and quality control needed for the data to qualify for regulatory
use.
• Example: In developing its 2012 list of impaired waters in the state, the Virginia Department of Environ-
mental Quality used its own monitoring data, plus the data from 27 citizen groups and academic institu-
tions. These non-agency groups provided data for 695 sites across the state. Just over half of those sites
were tested for bacteria levels (VADEQ, 2013).
• EPA’s STOrage and RETreival (STORET) Data Warehouse – This is a national “repository for water quality,
biological, and physical data and is used by state environmental agencies, EPA and other federal agencies,
universities, private citizens, and many others.” Data is submitted to STORET through the Water Quality Ex-
change (WQX) tool which has a set template for how to format data entries.
• EPA’s STORET Database: http://www.epa.gov/storet/
• Water Quality Exchange tool for uploading data to STORET: http://www.epa.gov/storet/wqx/index.
html
• Other National Water Quality Databases –
• USGS, EPA and the National Water Quality Monitoring Council’s Water Quality Portal: http://www.
waterqualitydata.us/
• USGS Water Quality Data for the Nation website: http://water.usgs.gov/owq/data.html
Sharing Findings with Members and the Public
Citizen groups should strive to reach their local “constituents” frequently to share the findings of their bacteria
monitoring. After all, a major reason we test bacteria is out of concern for public health. Volunteers will want to
learn about what other monitors are finding at their sites and your organization’s larger membership body is probably
curious too. Below are several strategies your group can consider using to share your water quality data and trends
with not only your membership, but also your community at-large.
• Present to Local Boards & Associations – Speaking directly to City/Town/County Councils, Boards of Supervi-
sors, Neighborhood Associations, and other decision-making bodies is an excellent way to bring attention to
your most significant water quality findings and garner local support for your group’s monitoring efforts. Present
your action plan to your stakeholders, what you hope to accomplish and how you plan to accomplish it.
• Online Database & Map – Volunteers or staff upload data to a database or spreadsheet after data have
received quality control check. Public can access and view and/or download data freely. Advanced da-
tabases that also generate charts and graphs can help users better interpret data and trends. Often included
is an interactive map that allows users to see the specific locations of monitoring stations. These maps often
allow users to also view and download the data for a specific station by clicking on its reference point.
• Examples:
Chattahoochee Riverkeeper Neighborhood Water Watch Monitoring Data: http://www.
chattahoochee.org/nww/
Virginia Save Our Streams Public Access webpage: http://vasos.wrayesian.com/form_
submissions/list
Santa Barbara Channelkeeper: http://www.sbck.org/current-issues/water-quality-monitoring/
download-our-data/

SAFE WATERS, HEALTHY WATERS: A Guide for Citizen Groups on Bacteria Monitoring in Local Waterways
28
Hudson Riverkeeper: http://www.riverkeeper.org/water-quality/citizen-data/
http://www.bwdh2o.org/beaver-lake/lakesmart/
Illinois River Watershed Partnership: http://www.irwp.org/water-quality-monitoring/monitoring-
projects/
• Press Releases – A tried and true means of reaching the general public via newspapers, radio, and television
outlets. This may be most useful for sharing major findings of public health concern or reflecting on annual or
multi-year trends in your monitoring data. As much as possible, findings should be presented in simple, non-
technical language.
• Examples:
Rivanna River StreamWatch Program press release: http://www.cvilletomorrow.org/news/
article/18329-streamwatch-releases-water-quality-findings/
• Member Newsletters – Your organization’s newsletters provide an opportunity to inform your membership of
water quality results. Consider including regular updates about bacteria levels at priority sites and/or an an-
nual look back on trends from the past year.
• Examples:
Lake Pend Oreille Waterkeeper: http://www.lakependoreillewaterkeeper.org/semi-annual-report.
html#.VBdSgaOTHOk
White River Partnership Spring 2014 Currents Newsletter: http://whiteriverpartnership.org/wp-
content/uploads/2014/04/Spring-2014-Currents.pdf
• Social Media – Facebook, Twitter, Tumbler, etc. Especially good for success stories and issues conducive to
short snippets. Beware of creating misinformation or even panic due to lack of detailed explanation. May not
be an appropriate venue for sharing topics that require longer explanations.
• Examples:
Great Miami Citizens’ Water Quality Monitoring Facebook page: https://www.facebook.com/
pages/Great-Miami-Citizens-Water-Quality-Monitoring/125510374198280
Friends of Casco Bay Twitter page: https://twitter.com/CascoBay
TAPP Twitter page: https://twitter.com/TAPP_Water
• Smart Phone Apps – Formatted for smart phones, apps can especially be useful for people interested in current
conditions at recreational areas.
• Examples:
Waterkeeper Swim Guide: https://www.theswimguide.org/#29.88960612352294/-
113.09555499999999/43.126158746668736/-70.90805499999999/6
Kansas City KCWaterBug app: http://www.kcwaters.org/kcwaterbug.html
• Annual Reports: An annual review of bacteria data from all your monitoring sites can provide a comprehen-
sive look at variability related to weather events and other environmental conditions as well as trends across
several years.
• Examples:
Charles River Watershed Association: http://cdn2.hubspot.net/hub/311892/file-955523132-
pdf/Our_Work_/Field_Science/Volunteer_Monthly_Monitoring_Program/Water_Quality_
Reports_and_Data/Year_End_Reports/VMM_2013_Final.pdf?t=1410364824593
Wicomico Creekwatchers 2012 Water Quality Monitoring Results: http://www.salisbury.edu/
wicomicocreekwatchers/docs/Wicomico%20Creekwatchers%202012%20FINAL.pdf
Hudson Riverkeeper “How’s the Water?” reports: http://www.riverkeeper.org/about-us/
publications/reports/
• Annual Report Card – This is often a simplified version of the annual report which gives a score and/or rank-
ing to each monitoring site. This type of tool can easily convey to readers the relative level of bacteria pollu-
tion at each site using “grades”.

SAFE WATERS, HEALTHY WATERS: A Guide for Citizen Groups on Bacteria Monitoring in Local Waterways
29
• Examples:
2010 - 2012 Reedy Creek Report Card: https://allianceforthebay.org/wp-content/
uploads/2010/08/Reedy-Creek-Report-Card-2012_web.pdf
Milwaukee Riverkeeper 2012 River Report Card: http://www.mkeriverkeeper.org/content/2012-
river-report-card
• Annual Forum/Presentation – Once a year, organize a forum or workshop for your volunteers and the public to
discuss the results of the group’s collective bacteria monitoring. This also gives volunteers a rare opportunity to
see each other in person and compare notes and stories.
• Examples:
Huron River Watershed Council 2013 Field Data Presentation for Volunteers: http://www.hrwc.
org/wp-content/uploads/2013/12/2013_Volunteer_WQ.pdf
• Warning Signs or Flags at Recreational Areas – Posting flags of different colors to rank level of bacteria in
water and risk to swimmers and boaters. Used most commonly at beaches. It is only appropriate to set such
warnings based on predictive model or real-time/immediate data (i.e., for minimal lag time).
• Examples:
Charles River Watershed Association Water Quality Notification System: http://www.crwa.org/
fieldscience/water-quality-notification
Indiana Beaches Alert: http://www.in.gov/beachesalert/signs.html
Chicago Park District’s Flag Notification System: http://www.chicagoparkdistrict.com/facilities/
beaches1/
4.2 Strategies to Reduce Bacterial Pollution
There will likely come a time when your group finds a specific point source of bacteria pollution that needs to be dealt
with. How that source is reduced or eliminated depends on a number of factors. In this section we provide a list
of common urban sources of bacterial pollution you may identify through your monitoring efforts and an introduction
to just some of the strategies that can be used to mitigate them. Most of these strategies must be undertaken by a
governmental agency, but your group can be the catalyst to start the process and can advocate for follow-through. It
is important to note that complete removal of all indicator bacteria may not be achievable. There are sources of fecal
indicator bacteria (pathogenic and non-pathogenic) that occur natural that may not necessarily be removed.
Broken or Leaking Sewer Pipes
While most sewer breaks are underground and are not easily detected, breaks can occur alongside, above, and
under waterways. Pipe junctions, especially where the sewer infrastructure is old, are vulnerable to leaking. And
sections of pipe that are exposed to the force of floodwaters are vulnerable to breakage or collapse. Therefore, these
are not uncommon sources of chronic bacteria pollution. Volunteer monitors who discover sewer breaks or leaks
should contact the appropriate utility department right away so that their staff can make repairs or replacements. If the
pipe in question is on private property, the local or regional water quality agency will have to enforce illicit discharge
rules in order to have the leak fixed by the property owner.
Combined Sewer Overflows
Common in older cities, combined sewer systems use a single pipe to collect stormwater and sanitary sewage. All
stormwater and sanitary sewage flows are pumped to and treated at the wastewater treatment plant. However, large
storms can overburden the system and cause the stormwater/sewage mixture to overflow into waterways. Cities with
this type of infrastructure are required by federal regulation to reduce these combined sewer overflows (CSOs) over
time by creating more storage for treatment and/or separating the stormwater pipes from sewage pipes.
In conducting these infrastructure renovations, some sanitary sewer pipes may be overlooked and accidently remain
connected with the stormwater network. It is possible that volunteer water quality monitors will isolate a specific
stormwater outfall with consistently high bacteria levels in its flow. If the local utility department confirms a connected
sanitary sewer pipe (through tracking methods described in Section 3) the best mitigation strategy is, of course, to
separate the sewer line from the stormwater network. In many situations, dry weather CSOs can also occur that are

SAFE WATERS, HEALTHY WATERS: A Guide for Citizen Groups on Bacteria Monitoring in Local Waterways
30
maintenance-related. These can be identified through citizen monitoring and can be readily corrected. See Case
Study #4 in Appendix C for an example of this situation.
Sanitary Sewer Overflows
Sanitary sewer overflows (SSOs) can occur for a variety of reasons. Sometimes sewage surcharges out of manholes
during very heavy rainfall when too much stormwater leaks into the sanitary sewer pipes via cracks and manholes.
Other times blockages from debris or grease or power failures at pumping stations cause the sewage to back-up and
overflow onto street surfaces or into waterways. Like CSO events, these sanitary sewer overflows are usually transient
occurrences that cause the bacteria levels in surface water to spike temporarily. Toilet paper on the ground or a
misplaced sewer manhole cover are potential signs of a past SSO event. Volunteer monitors who come across an
active or recently past SSO should contact the appropriate utility department right away so that their staff may remove
any blockages that may still exist or attend to a pumping station that may have lost power.
Failing Septic Systems
Sewage discharges from failing septic systems are often quite difficult to isolate because they seep out from the ground
rather than from a pipe. However, if your group has confirmed a failing septic system, several potential options exist to
mitigate the problem. They include:
Pump out the septic tank
Repair failing septic system
Replace old, failing septic system with newer technology
Connect septic areas to sewer (large scale, long term approach)
The last two of these options is not always feasible in every location. Contact your local or regional health department
to find out if there are any regulations requiring periodic septic tank pump outs or system upgrades. Some regions
have cost-share funding available to help property owners to pay for having their septic systems pumped out or
upgraded. Your role may be to provide information to property owners about their options and advocate that they
take action to fix the source.
Marinas and Boats
Volunteer groups monitoring in coastal areas should pay special attention to marinas and boats as potential sources of
sewage. If dumping of on-board sewage is common in your area of concern, consider working with marina owners
and coastal resource management agencies to adopt the following strategies (USEPA, 2005):
Distribute educational materials about the impact of improper vessel sewage discharges on beach closures,
shellfish contamination, etc.
Encourage marina owners to provide clean and safe onshore restrooms and pumpout facilities for sewage
from boats.
Encourage boaters to install and properly maintain a Coast Guard certified Marine Sanitation Device (MSD)
that is appropriate for their vessel.
Petition the State for the creation of a No Discharge Area where bacteria levels near shore are too high.
Pet Waste
Animals, of course, can also be sources of fecal bacteria pollution. Bacteria from pet waste are only likely to be
confirmed through water monitoring when waste is found in concentration. Such sources include dog parks, veterinary
clinics, SPCAs and kennel facilities where dogs are walked outside. Local watershed organizations can play a
meaningful role in reducing both point sources and non-point sources of pet waste pollution. Consider the following
strategies (U.S.EPA 2005):
Compose and distribute “pooper scooper” public service announcements and signage about picking up after
pets.
Encourage park authorities and other property managers to install pet waste receptacles and pet waste
composters in their dog parks and dog-walking areas.
Work with vet clinics and kennels to encourage them to keep dogs away from waterways and contain or
compost pet waste.
Ensure that swimming areas are either off-limits to pets or subject to certain ordinances to control fecal
contamination.

SAFE WATERS, HEALTHY WATERS: A Guide for Citizen Groups on Bacteria Monitoring in Local Waterways
31
If they do not already exist, campaign for local ordinances that require pet owners to correctly dispose of pet
waste.
Look for outfalls from vet clinics and kennels where the kennel cleanout is flushed down floor drains and
potentially out to the waterway
Wildlife
Wildlife can also be a significant source of bacteria pollution even in urban areas. Certain types of wild animals
are easier to control than others. Ducks and geese can be especially problematic in urban waterways such as
ponds. They can be found in large concentrations where people feed them. Therefore, one of the first strategies to
reduce waterfowl numbers should be to request property managers to post “no feeding” signs at such locations and
enforce that rule. If this is a significant problem in your waterways, consider also campaigning for a community-wide
ordinance to prohibit feeding of wildlife. An example can be found in the Town of Bourne, Massachusetts which
incorporated into its bylaws a rule prohibiting feeding waterfowl. Other urban communities have used herding dogs to
scare away waterfowl.
4.3 Resources
• Detection of Septic Effluent in Lake Coves:
http://www.ozarkswaterwatch.org/wp-content/uploads/2016/02/SepticEffluentStudy20-2.pdf

SAFE WATERS, HEALTHY WATERS: A Guide for Citizen Groups on Bacteria Monitoring in Local Waterways
32
Appendix A: References
• Brown, E., D. Caraco, and R. Pitt. 2004. Illicit discharge detection and elimination: A guidance manual for
program development and technical assessments. Prepared by the Center for Watershed Protection and Univer-
sity of Alabama. EPA X-82907801-0. Washington, DC: US Environmental Protection Agency, Office of Waste-
water Management.
• Costa, J. N.D. Calculating Geometric Means. Buzzards Bay National Estuary Program. http://www.water-
boards.ca.gov/water_issues/programs/swamp/docs/cwt/guidance/3413.pdf
• Doolittle, M., 2002. Presentation of EPA-funded Wollaston Beach EMPACT study. Meeting of USEPA Regional
Workgroup on Beach Monitoring and Closures, Chelmsford, MA.
• Johnson, B. 1998. The Impact of On-site Sewage Systems and Illicit Connections in the Rouge River Basin.
Unpublished manuscript. Rouge River Program Office. Camp Dresser and McKee. Detroit, MI.
• Lim, S. and V. Olivieri. 1982. Sources of Microorganisms in Urban Runoff. John Hopkins School of Public
Health and Hygiene. Jones Falls Urban Runoff Project. Baltimore, MD. 140 pp.
• Pitt, R. 1998. “Epidemiology and Stormwater Management.” In Stormwater Quality Management. CRC/Lewis
Publishers. New York, NY.
• Schueler, T. 2000. Microbes in Urban Watersheds: Concentrations, Sources, & Pathways: The Practice of Wa-
tershed Protection. Center for Watershed Protection, Ellicott City, MD. Pages 74-84.
• Town of Bourne. 2012. Town of Bourne Bylaws. Section 3.4.3. Bourne, MA. http://www.townofbourne.com/
sites/bournema/files/file/file/14_town_bylaw_thru_2014_oct_stm.pdf
• U.S. Census Bureau. 2007. “American Housing Survey for the United States: 2007”. Government Printing Of-
fice, Washington D.C. 20401.
• U.S. Environmental Protection Agency, 2002. “National BEACH Guidance and Required Performance Criteria -
Appendix 4B1: Data Quality and Sampling Design Considerations”.
• U.S. Environmental Protection Agency, 2003. “Voluntary National Guidelines for Management of Onsite and
Clustered (decentralized) Wastewater Treatment Systems”. Office of Water. EPA 832-B-03-001.
• U.S. Environmental Protection Agency, 2005. Mitigation Measures to Address Pathogen Pollution in Surface
Waters: A TMDL Implementation Guidance Manual for Massachusetts. Environmental Protection Agency, New
England Region 1.

SAFE WATERS, HEALTHY WATERS: A Guide for Citizen Groups on Bacteria Monitoring in Local Waterways
33
• U.S. Environmental Protection Agency, 2012. “Recreational Water Quality Criteria”. Office of Water. 820-F-
12-058.
• U.S. Environmental Protection Agency, 2015. National Summary of State Information. http://iaspub.epa.
gov/waters10/attains_nation_cy.control
• van der Wel, B. 1995. Dog Pollution. The Magazine of the Hydrological Society of South Australia. 2(1)1.
• Vermont Department of Environmental Conservation (VDEC). 2014. Vermont Surface Water Assessment and
Listing Methodology. Montpelier, VT: Vermont Department of Environmental Conservation.
• Virginia Department of Environmental Quality (VADEQ). 2013. 2013 Citizen/Non-Agency Monitoring Activ-
ity Report. http://www.deq.virginia.gov/Portals/0/DEQ/Water/WaterQualityMonitoring/CitizenMonitor-
ing/2013_Citizen_Report.pdf
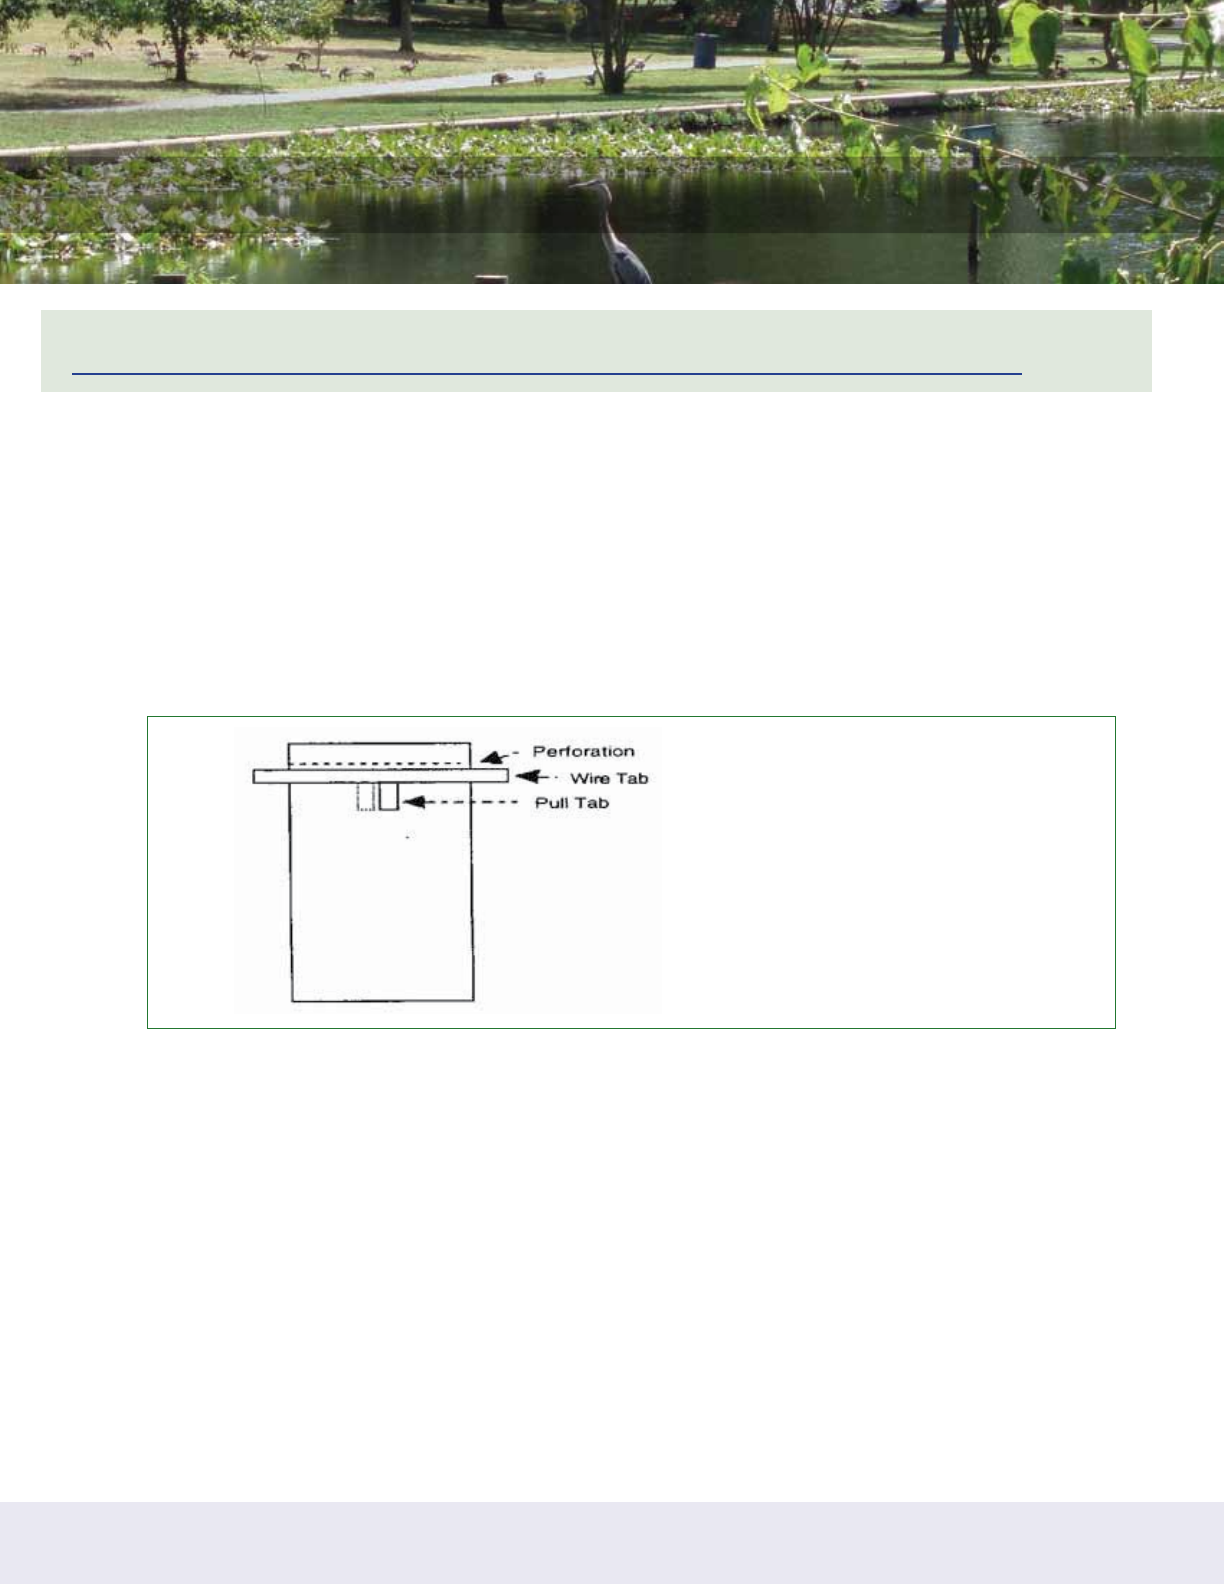
SAFE WATERS, HEALTHY WATERS: A Guide for Citizen Groups on Bacteria Monitoring in Local Waterways
34
Appendix B: How To Collect Samples
This information is taken directly from the EPA’s “Volunteer Stream Monitoring: A Methods Manual,” available at
https://www.epa.gov/polluted-runoff-nonpoint-source-pollution/nonpoint-source-volunteer-monitoring.
In general, sample away from the streambank in the main current. Never sample stagnant water. The outside curve
of the stream is often a good place to sample, since the main current tends to hug this bank. In shallow stretches,
carefully wade into the center current to collect the sample.
A boat will be required for deep sites. Try to maneuver the boat into the center of the main current to collect the water
sample.
When collecting a water sample for analysis in the field or at the lab, follow the steps below.
For Whirl-pak® Bags
1. Label the bag with the site number, date, and time.
2. Tear off the top of the bag along the perforation above the wire tab just prior to sampling (Fig. 5.1). Avoid
touching the inside of the bag. If you accidentally touch the inside of the bag, use another one.
3. Wading. Try to disturb as little bottom sediment as possible. In any case, be careful not to collect water that
contains bottom sediment. Stand facing upstream. Collect the water sample in front of you.
Boat. Carefully reach over the side and collect the water sample on the upstream side of the boat.
4. Hold the two white pull tabs in each hand and lower the bag into the water on your upstream side with the
opening facing upstream. Open the bag midway between the surface and the bottom by pulling the white
pull tabs. The bag should begin to fill with water. You may need to “scoop” water into the bag by drawing it
through the water upstream and away from you. Fill the bag no more than 3/4 full!
5. Lift the bag out of the water. Pour out excess water. Pull on the wire tabs to close the bag. Continue holding the
wire tabs and flip the bag over at least 4-5 times quickly to seal the bag. Don’t try to squeeze the air out of the
top of the bag. Fold the ends of the wire tabs together at the top of the bag, being careful not to puncture the
bag. Twist them together, forming a loop.
Figure 5.1 Sketch of a Whirl-pak® bag
Volunteers can be easily trained to use these
factory-sealed, disposable water sample
collection bags.
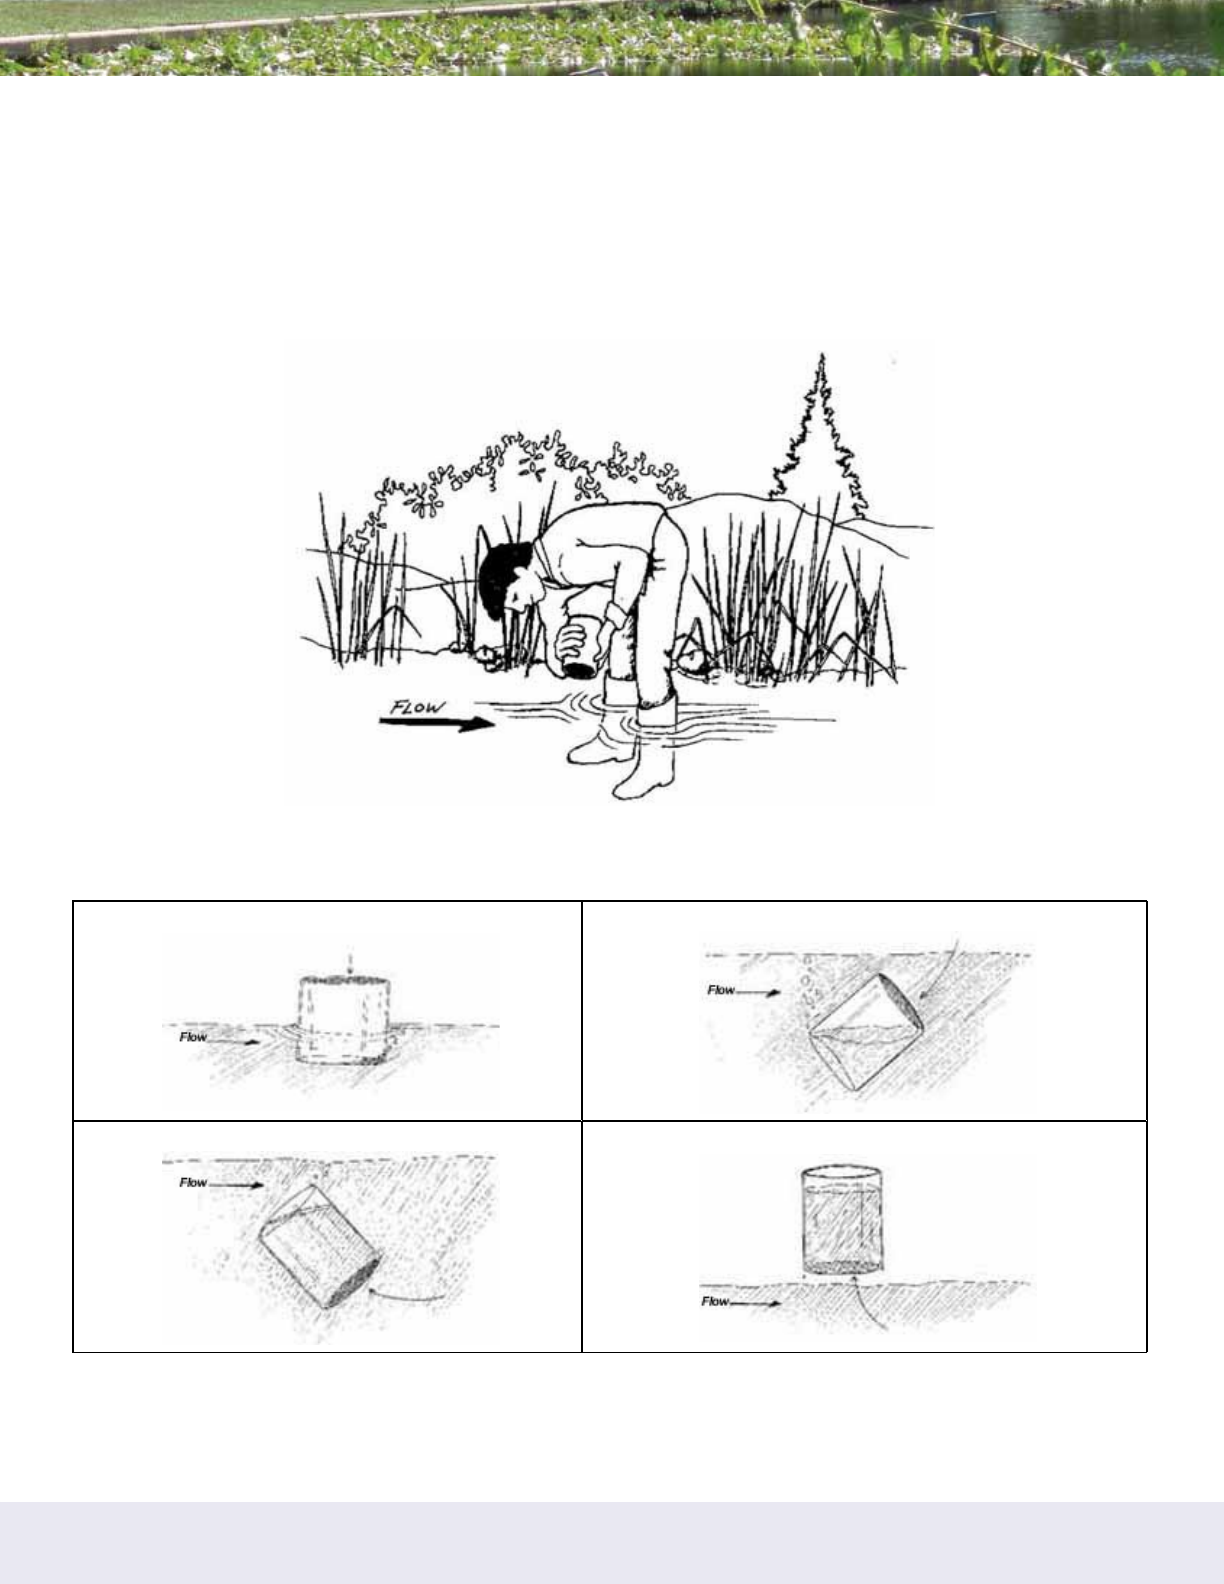
SAFE WATERS, HEALTHY WATERS: A Guide for Citizen Groups on Bacteria Monitoring in Local Waterways
35
6. Fill in the bag number and/or site number on the appropriate field data sheet. This is important! It is the only
way the lab coordinator know which bag goes with which site.
7. If samples are to be analyzed in a lab, place the sample in the cooler with ice or cold packs. Take all samples
to the lab.
For Screw-cap Bottles
To collect water samples using screw-cap sample bottles, use the following procedures (Fig. 5.2 and 5.3):
Figure 5.2 Getting into position to take a water sample
Volunteers should sample in the mail current, facing upstream.
1.
2.
3.
4.
Figure 5.3 Taking a water sample
Turn the bottle into the current and scoop in an upstream direction.

SAFE WATERS, HEALTHY WATERS: A Guide for Citizen Groups on Bacteria Monitoring in Local Waterways
36
1. Label the bottle with the site number, date, and time.
2. Remove the cap from the bottle just before sampling. Avoid touching the inside of the bottle or the cap. If you
accidentally touch the inside of the bottle, use another one.
3. Wading. Try to disturb as little bottom sediment as possible. In any case, be careful not to collect water that
has sediment from bottom disturbance. Stand facing upstream. Collect the water sample on your upstream
side, in front of you. You may also tape your bottle to an extension pole to sample from deeper water.
Boat. Carefully reach over the side and collect the water sample on the upstream side of the boat.
4. Hold the bottle near its base and plunge it (opening downward) below the water surface. If you are using an
extension pole, remove the cap, turn the bottle upside down, and plunge it into the water, facing upstream.
Collect a water sample 8 to 12 inches beneath the surface or mid-way between the surface and the bottom if
the stream reach is shallow.
5. Turn the bottle underwater into the current and away from you. In slow-moving stream reaches, push the bottle
underneath the surface and away from you in an upstream direction.
6. Leave a 1-inch air space (Except for DO and BOD samples). Do not fill the bottle completely (so that the
sample can be shaken just before analysis). Recap the bottle carefully, remembering not to touch the inside.
7. Fill in the bottle number and/or site number on the appropriate field data sheet. This is important because it
tells the lab coordinator which bottle goes with which site.
8. If the samples are to be analyzed in the lab, place them in the cooler for transport to the lab.
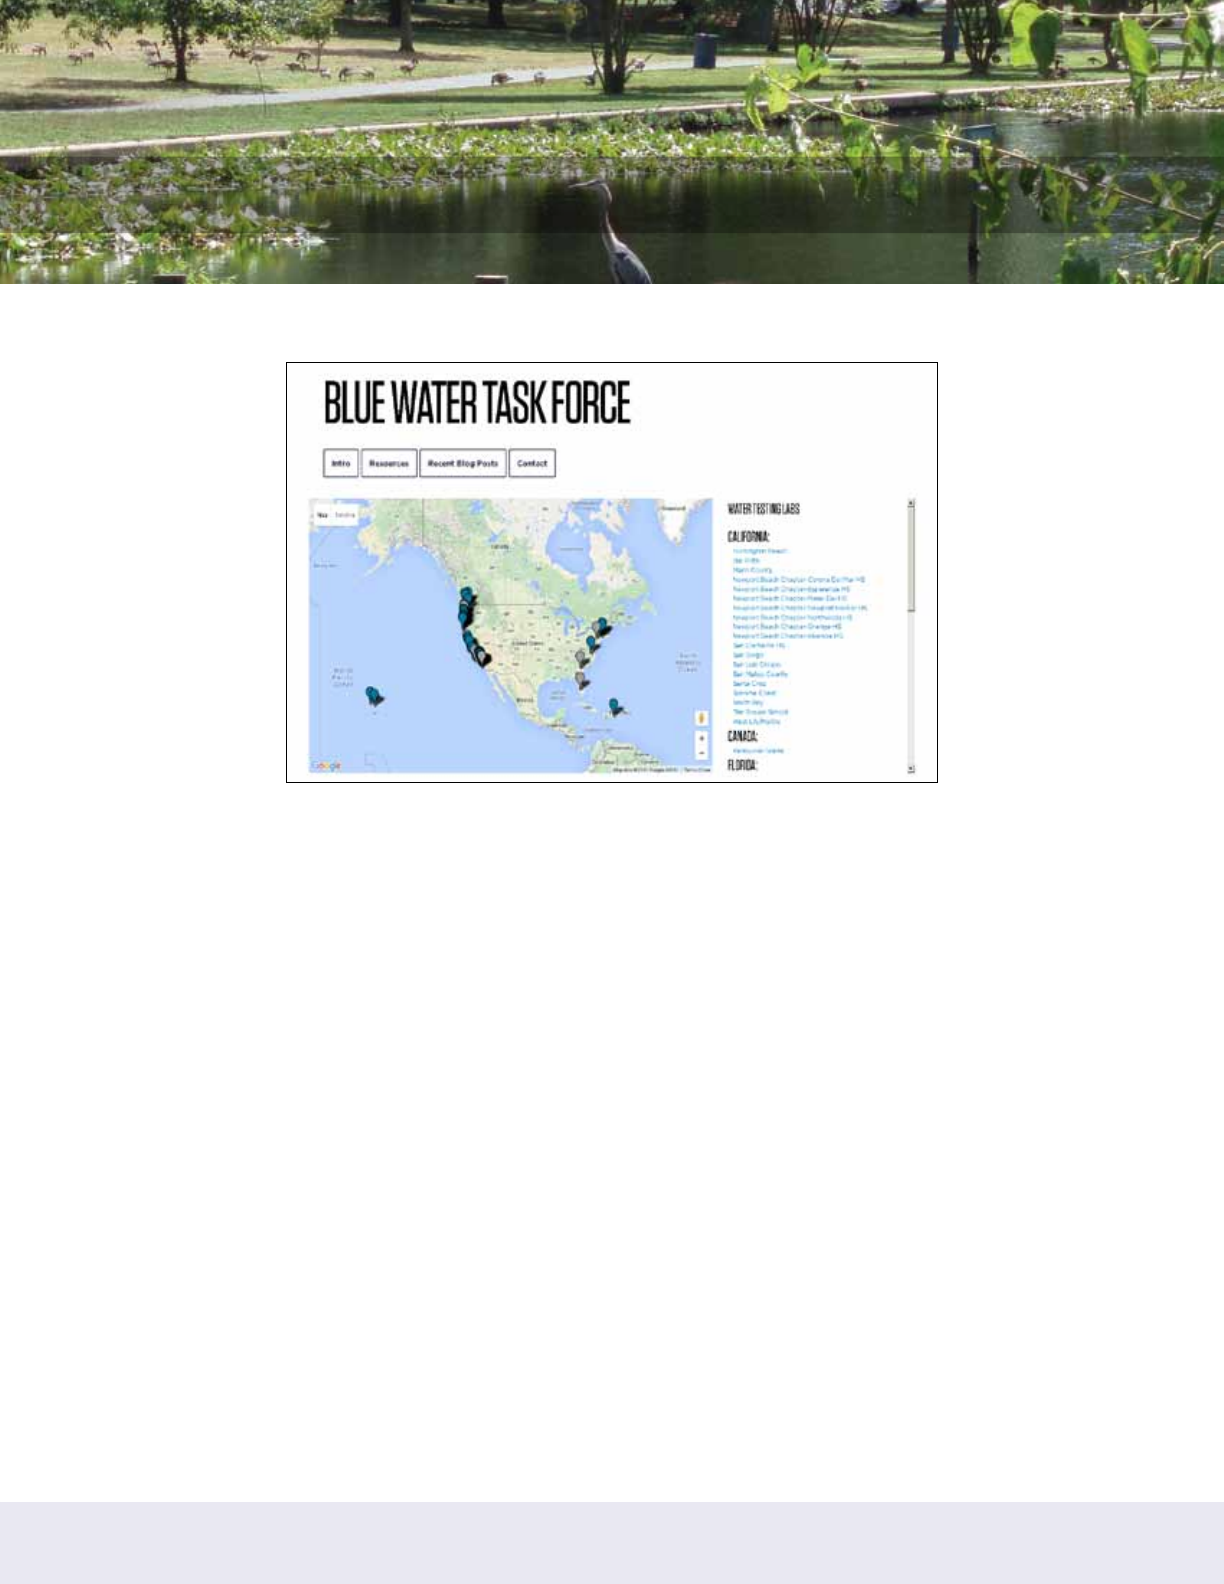
SAFE WATERS, HEALTHY WATERS: A Guide for Citizen Groups on Bacteria Monitoring in Local Waterways
37
Appendix C: Case Studies
Case Study #1: Surfrider’s Blue Water Task Force
About the Group
Surfrider Foundation’s Blue Water Task Force (BWTF) is a water quality monitoring program organized at the local
chapter level. In 2013, there were 28 labs actively monitoring water quality and 3,127 samples reported in total for
the year.
Most of the chapters conducting monitoring are on the West Coast, with more than half in California. BWTF primarily
monitors beaches, especially surfing areas, and locations where freshwater sources discharge onto the beach.
Goals of Monitoring
Blue Water Task Force members monitor water quality to meet several goals, including:
1. To identify the healthiest areas for surfing and swimming and those areas which require further testing.
2. To fill in gaps in geography and time. Chapters that monitor tend to focus especially where and when there is
no other monitoring by local or state agencies.
3. They also test where they suspect pollution, such as below stormwater outfalls and at the mouth of streams.
(Wave breaks popular with surfers are often located where rivers meet the sea).
Monitoring Approach
Each Surfrider chapter that participates in BWTF designs its own monitoring program based on local resources
available and based on their priorities. In choosing monitoring sites, for example, chapters that are primarily interested
in engaging many volunteers take water samples from areas that are most accessible and convenient. In contrast,
other chapters may decide to focus their sampling at beaches with known sources of pollution or at beaches that are
not covered by local agencies because they are more remote. Many chapters monitor weekly and others sample
monthly, based on how much funding and how many volunteers they have. In addition to taking water samples,
Source: Surfrider Foundation
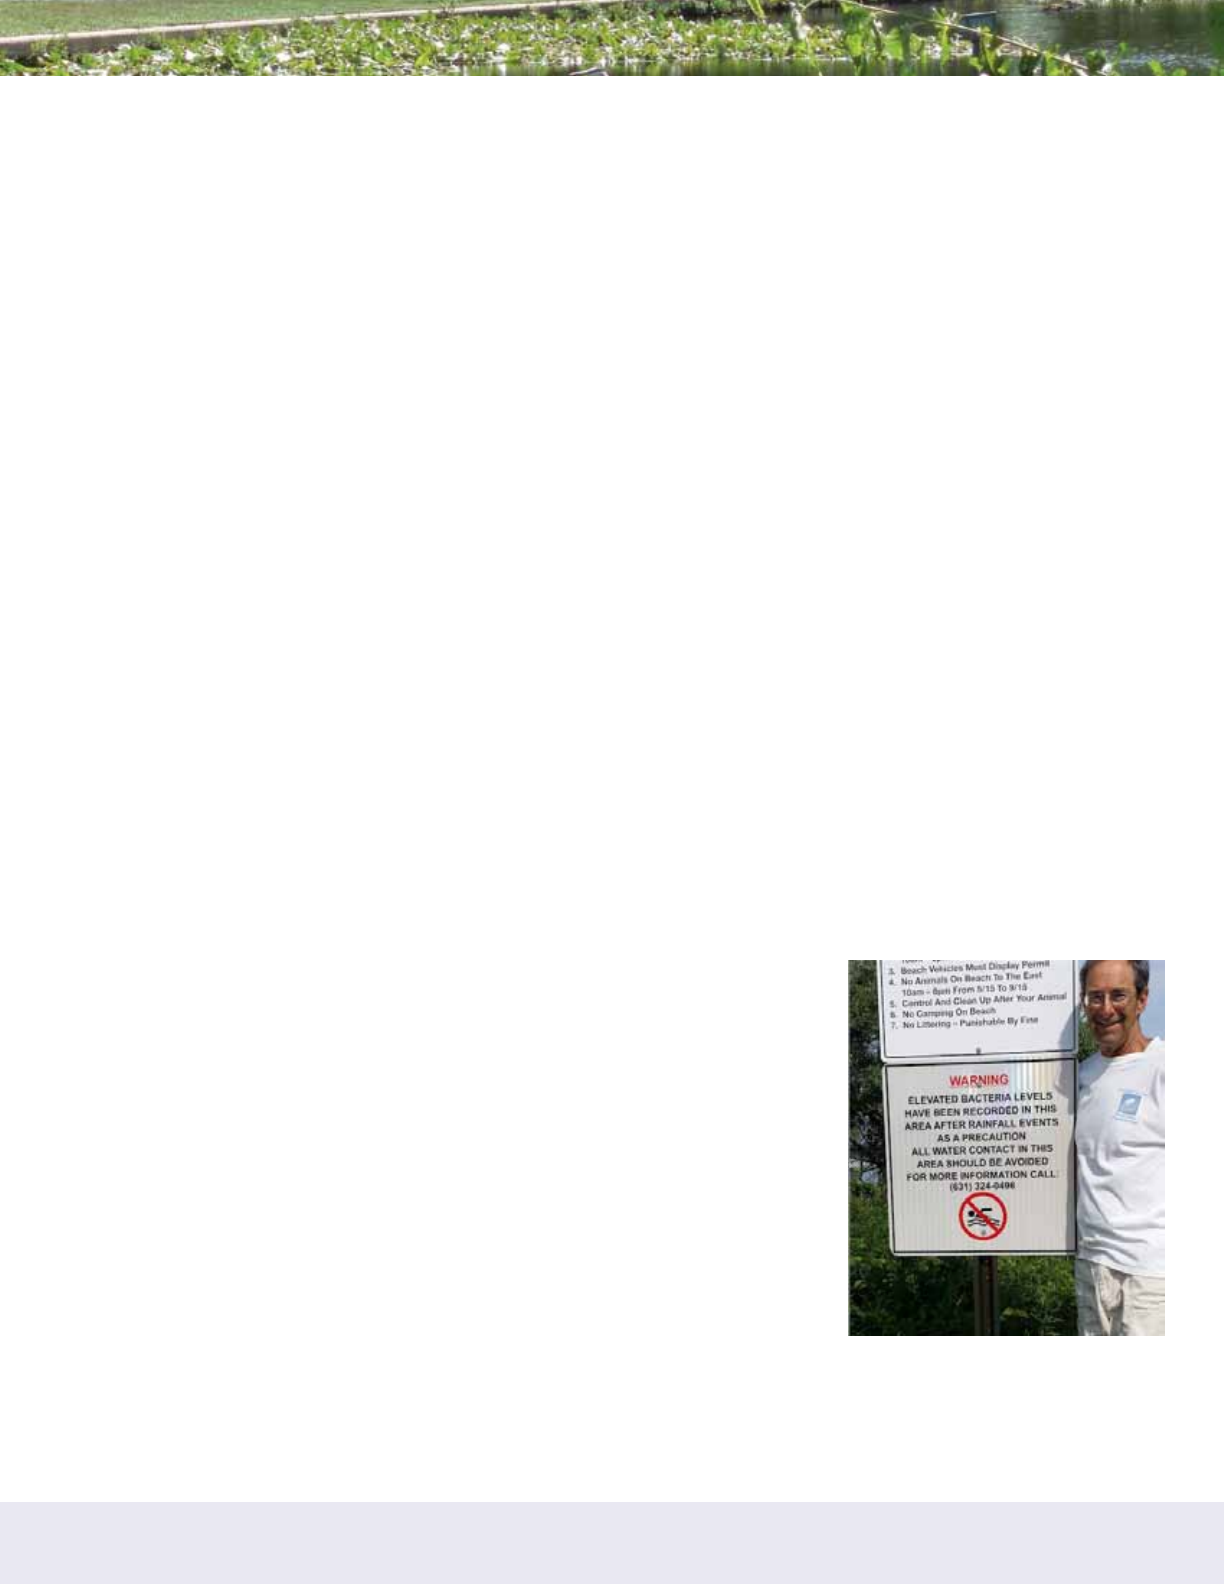
SAFE WATERS, HEALTHY WATERS: A Guide for Citizen Groups on Bacteria Monitoring in Local Waterways
38
volunteers collect environmental observations on a data sheet. They note air and water temperature, recent rainfall,
current weather, wind strength and direction, wave height, and tide stage.
In terms of analyzing water samples, some chapters collect water samples for an existing local or state monitoring
program and deliver the samples to those agencies’ laboratories. Some chapters partner with universities, aquariums,
or other research institutions who conduct the water quality tests for the BWTF program. And others run their own labs
using EPA approved methodology to test for enterococcus bacteria with the IDEXX Enterolert and Quantitray/2000
system. The IDEXX method is easy for volunteers to perform, scientifically thorough, and produces quantifiable results.
Surfrider Chapters present their Enterococcus bacteria results as High, Medium, or Low based on the EPA’s water
quality recommendations for recreational exposure, as follows (MPN/100 ml):
• (0-35) Low Bacteria
• (36-104) Medium Bacteria
• (> 104) High Bacteria
How Are Data Shared/Reported?
All of the BWTF water quality data is posted online in an interactive map on the national BWTF website, open to the
public. The website is simple to use – data can be viewed on the map or downloaded into a spreadsheet. As a
culmination of the BWTF effort each year, Surfrider headquarters also compiles an annual report of the water quality
findings nationally.
At the chapter level, BWTF members use a variety of methods to share their water quality data. Each chapter posts its
data on its own chapter website and often shares results via social media outlets. Some chapters send out email blasts
with weekly or monthly water quality reports and make presentations in the community and to local governments (e.g.,
city council meetings). Some also have good relationships with local media outlets that will run press releases written
up by Surfrider volunteers.
Most importantly, the chapters share their data with local governments and other agencies, especially when
problems are found. BWTF volunteers provide the service of collecting and sometimes testing water quality samples,
but their authority and resources are limited when it comes to correcting certain bacteria sources (e.g., sewage
leaks). Therefore, Surfrider’s partnerships with these agencies are essential for tracking down sources of pollution,
brainstorming solutions, and implementing them.
Surfrider chapters have especially good connections with local and state beach
programs and share their data with the agencies that administer them. The BWTF
data is not used to ‘close’ beaches, but rather to build evidence of chronic pollution
problems and to alert the agencies that they need to conduct follow up monitoring
in those areas. There are a few exceptions where a Surfrider lab has an approved
QAPP and submits its data for use in official beach closings or impaired waters
designations. This has happened in Oregon for TMDL work and in Kauai where
the Surfrider chapter is contracted to perform official beach testing for Hawaii
Department of Health.
What Was the Outcome of Providing Data?
As mentioned above, water monitoring by Surfrider volunteers has often served
as a catalyst to mobilize local agencies to look for and solve sources of pollution
problems. One specific example comes out of the Eastern Long Island, NY
Chapter of Surfrider. This new chapter started monitoring in 2013 in partnership
with Concerned Citizens of Montauk (CCOM). Chapter volunteers monitor
popular ocean and bay beaches in and around Montauk, NY as well as several
freshwater inputs and a large coastal pond in downtown.
Source: Surfrider Foundation

SAFE WATERS, HEALTHY WATERS: A Guide for Citizen Groups on Bacteria Monitoring in Local Waterways
39
Three of their monitoring stations are located at an enclosed bay beach on Lake Montauk that is a popular swimming
spot for families with young children. Unfortunately, the Chapter’s water quality tests have showed that bacteria levels
at the beach and in two of the incoming freshwater creeks frequently exceed health standards, especially after rainfall
events. In response to the data that the volunteers have collected, the Town of East Hampton has posted permanent
signage to warn the public about the chronic pollution problem at the beach. The Town has also taken account of
the Chapter’s water quality data while developing a watershed management plan for Lake Montauk. One of the
recommendations outlined in the draft watershed plan (completed in July 2014) is to do more water monitoring,
especially to locate failing septic systems. It appears that the Surfrider volunteers will have plenty more work to do!
References & Links
• Blue Water Task Force homepage: http://www.surfrider.org/blue-water-task-force
• Blue Water Task Force 2013 Annual Report: http://www.surfrider.org/images/uploads/publications/
BWTF_Annual_Report_2013.pdf
• Eastern Long Island Chapter of Surfrider, Blue Water Task Force page: http://easternli.surfrider.org/blue-wa-
ter-task-force-water-testing-program/
• Surfrider Blog. July 22, 2014. “New Beach Signs Warn the Public of Polluted Conditions.” http://www.
surfrider.org/coastal-blog/entry/new-beach-signs-warn-the-public-of-polluted-conditions
• Lake Montauk Watershed Management Plan (July 2014 DRAFT): http://www.town.east-hampton.ny.us/Html-
Pages/NaturalResources/LakeMTKStudy.html
• The East Hampton Star. June 16, 2014. “Lake Montauk Pollution Solutions.” http://easthamptonstar.com/
Lead-article/2014619/Lake-Montauk-Pollution-Solutions
• 27east.com. June 10, 2014. “Montauk Lake Watershed Study Finished, Recommendations Include Testing
And Remediation.” http://www.27east.com/news/article.cfm/Montauk/65945/Montauk-Lake-Watershed-
Study-Finished-Recommendations-Include-Education-Testing-And-Septic-Remediation
SAFE WATERS, HEALTHY WATERS: A Guide for Citizen Groups on Bacteria Monitoring in Local Waterways
40
Case Study #2: Hudson River – Riverkeeper
About the Group
Riverkeeper is a member-supported watchdog organization
dedicated to defending the Hudson River and its tributaries and
protecting the drinking water supply of nine million New York City
and Hudson Valley residents. The group has helped to establish
globally recognized standards for waterway and watershed
protection and serve as the model and mentor for the growing
Waterkeeper movement that includes more than 200 Keeper
programs across the country and around the globe.
To conduct its fecal contamination monitoring program in the
Hudson River Estuary, Riverkeeper partners with scientists from
Lamont-Doherty Earth Observatory of Columbia University and
CUNY Queens College. It also partners with watershed groups,
environmental advisory committees, and concerned local residents to conduct citizen-led monitoring on waterfront
areas and tributaries of the Hudson River. These groups include the Catskill Creek Watershed Awareness Project,
the New York City Water Trail Association, the Quassaick Creek Watershed Alliance, Save the Wallkill, the Sparkill
Creek Watershed Alliance, and the environmental advisory boards in the towns of Gardiner, Montgomery, Rosendale,
Rochester and Wawarsing.
Goals of Monitoring
The three primary goals of Riverkeeper’s citizen science program are to:
1- Fill a data gap. In New York State, testing for fecal contamination is required only at official swimming
beaches. There are only four official swimming beaches along the 212 miles of tributaries where Riverkeeper
and its citizen partner’s sample, but these waterways contain numerous informal swimming areas that are
heavily used but not monitored by the state.
2- Inform the public about fecal contamination in their watersheds. In most of the places where Riverkeeper
samples, their data is the only source of information about fecal contamination. By involving local residents in
collecting data, and educating the public about its findings, Riverkeeper is raising awareness about this issue.
3- Involve local citizens in finding and eliminating sources of contamination. Fecal contamination sources
vary by location and over time, and the potential solutions depend on local conditions and priorities.
Riverkeeper engages local citizens and leaders to generate further inquiry and discussion and to advocate for
improvements.
Monitoring Approach
Riverkeeper and its citizen partners test for Enterococcus, an EPA-recommended indicator of fecal contamination. They
sample at least monthly from May to October (the recreational season) in seven tributary watersheds and along the
NYC waterfront. In most areas, Riverkeeper coordinates samplers and processes the samples in its onboard lab.
Some of the partners operate more independent programs; in these cases, Riverkeeper has helped design the study
and train samplers, but samples are processed at other laboratories. In all cases, Riverkeeper publishes the data on its
website, helps interpret the data, and shares the lessons learned from monitoring throughout the Hudson Valley.
How Are Data Shared/Reported?
Riverkeeper categorizes water quality at each site as “Acceptable” or “Beach Advisory” for the date sampled,
according to the EPA’s recommended primary contact standard. Riverkeeper publishes the data on its website and
also emails results to samplers.
Source: Riverkeeper
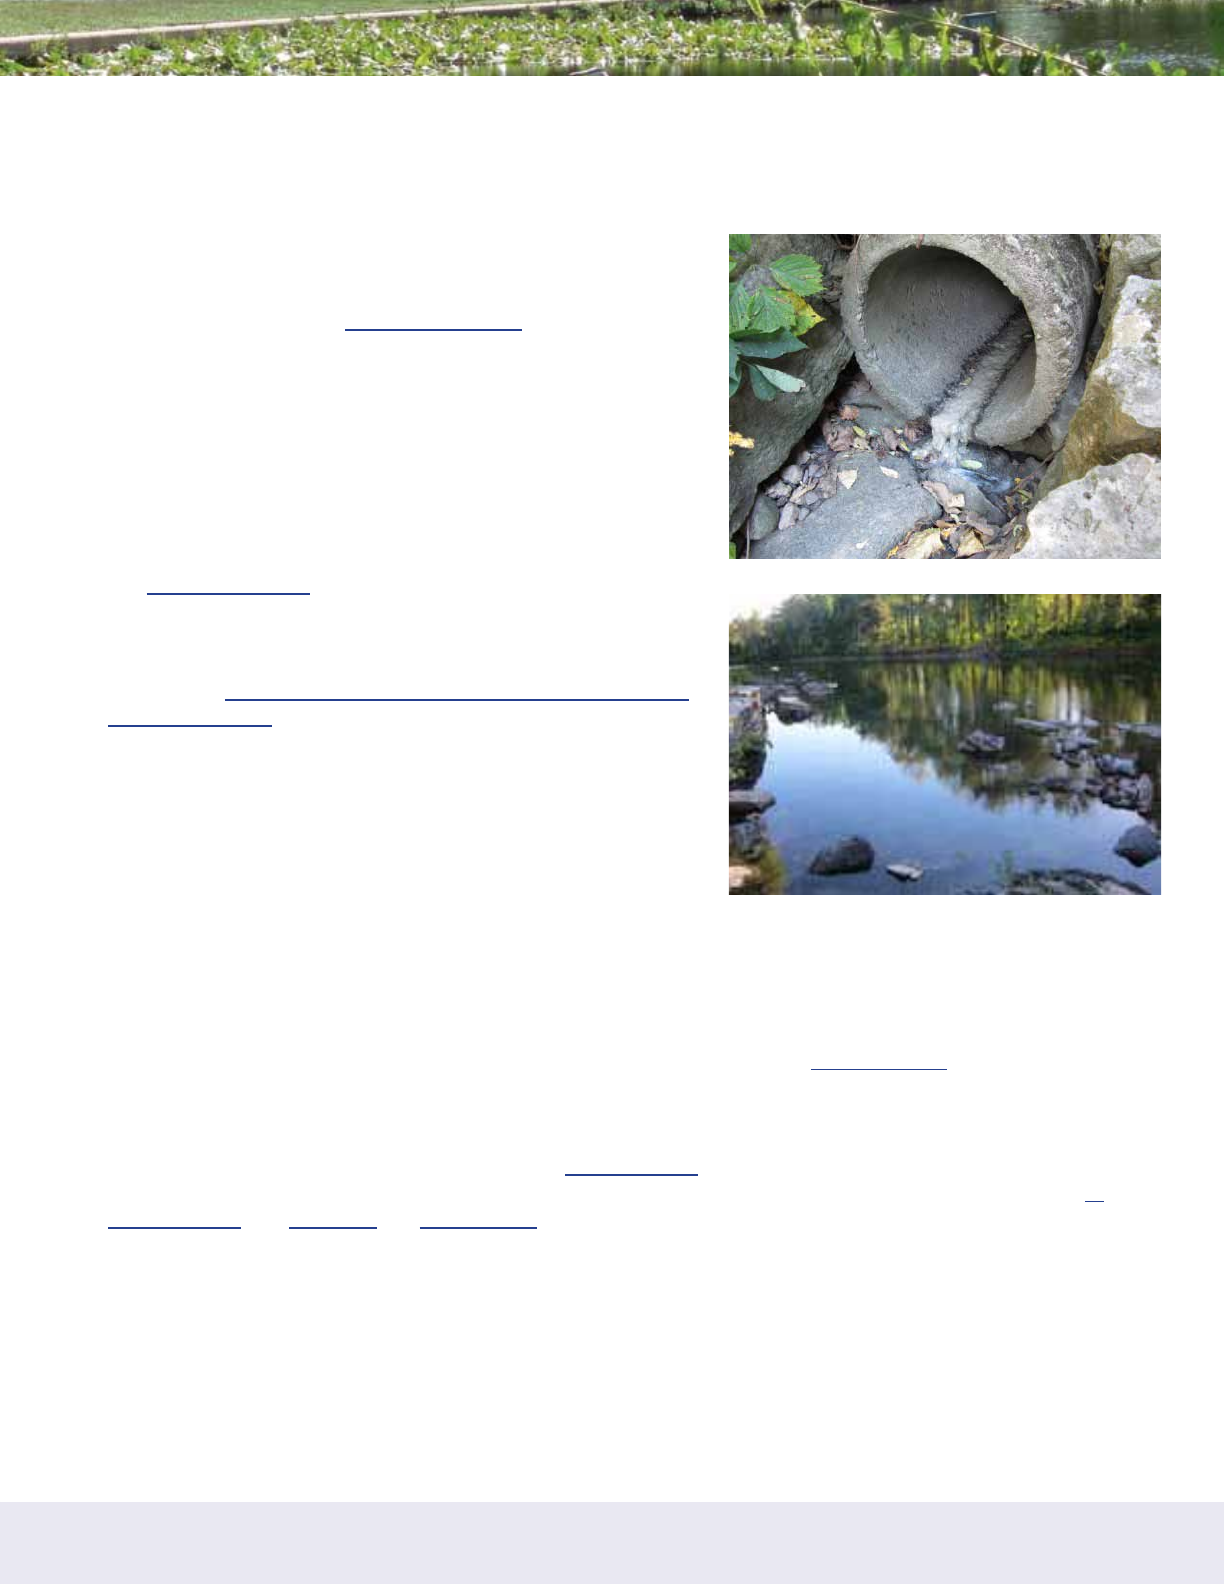
SAFE WATERS, HEALTHY WATERS: A Guide for Citizen Groups on Bacteria Monitoring in Local Waterways
41
Riverkeeper makes public presentations and produces a digital monthly ‘Trib Report’ that is featured on their Boat
Blog and e-mailed to members. Riverkeeper also displays and discusses its water quality monitoring results at tabling
events throughout the Hudson River watershed, and shares the data with local leaders in both public and one-on-one
meetings.
What Was a Particularly Successful Outcome of Doing this
Monitoring?
Since tributary monitoring began at a handful of sites in 2010 as
an outgrowth of Riverkeeper’s Hudson River study, the program has
grown to include monthly (or more) monitoring of 148 sites in seven
tributary watersheds and along the NYC waterfront. This reflects a
growing awareness throughout the Hudson Valley and New York City
area of the potential threat of fecal contamination in these waterways,
as well as a strong desire for swimmable water.
Riverkeeper and its partners can point to several specific positive
outcomes of this monitoring program:
1. The Quassaick Creek Watershed Alliance began testing for
Enterococcus in August 2014, with a sampling plan that
includes locations upstream of drinking water sources for two
municipalities. On the first sampling day, one of the City of
Newburgh’s drinking water reservoir feeder streams had a very
high Entero count (1300 cells/100 mL). On the next sampling
outing, QCWA members investigated upstream of the sampling
site and smelled raw sewage at a permitted outfall. They reported
the issue to the City of Newburgh, which immediately shut off
inflow from this stream to the reservoir, reported the incident to the
NYS Department of Environmental Conservation, and launched
an investigation of possible fecal contamination sources to the
reservoir feeder stream. The City is currently conducting additional
Enterococcus sampling in the area as a step toward permanently
addressing fecal contamination (which has continued to be observed on subsequent sampling dates) in this stream.
2. In early 2012, the Town of Orangetown, in Rockland County, voted unanimously to spend $104,000 on the
first repairs to the Piermont pump station since it was built in 1964. This station failed dozens of times in 2011
alone, resulting in sewage discharges to the Sparkill Creek. As of 2012, the Sparkill Creek Watershed Alliance
had been testing water quality on the creek for a year. Their engagement and advocacy were instrumental in the
decision to make repairs to the system.
3. Suspected illegal sewage discharges in the lower Catskill Creek prompted the Catskill Creek Watershed
Awareness Project to partner with Riverkeeper in 2010. Citizen samplers began testing for Enterococcus at a
suspect outfall, plus upstream and downstream reference locations, and gradually expanded testing to cover about
10 miles of the creek. The data was submitted to state and local agencies investigating the illicit connections, and
enforcement action was taken in 2012. In 2014, Riverkeeper expanded the Catskill Creek monitoring program to
the creek’s headwaters and brought several new citizen samplers into the fold.
Source: Riverkeeper
Source: Riverkeeper

SAFE WATERS, HEALTHY WATERS: A Guide for Citizen Groups on Bacteria Monitoring in Local Waterways
42
References & Links
• Riverkeeper Citizen Testing Data: http://www.riverkeeper.org/water-quality/citizen-data/
• Riverkeeper Boat Blog (often features water quality): http://www.riverkeeper.org/blog/patrol/
• How’s the Water? 2014: Water Quality Monitoring, Fecal Contamination and Achieving a Swimmable Hud-
son River: http://www.riverkeeper.org/wp-content/uploads/2014/07/Riverkeeper_Water_Quality_Hows-
the-Water-Report_2014-lr.pdf
• Hudson Riverkeeper Water Quality Program: http://www.riverkeeper.org/water-quality/testing/
• Riverkeeper. 2012. How is the Water? 2012: Sewage Contamination in the Hudson River Estuary 2006-
2011. http://www.riverkeeper.org/wp-content/uploads/2012/12/RvK_How-Is-the-Water-2012.pdf
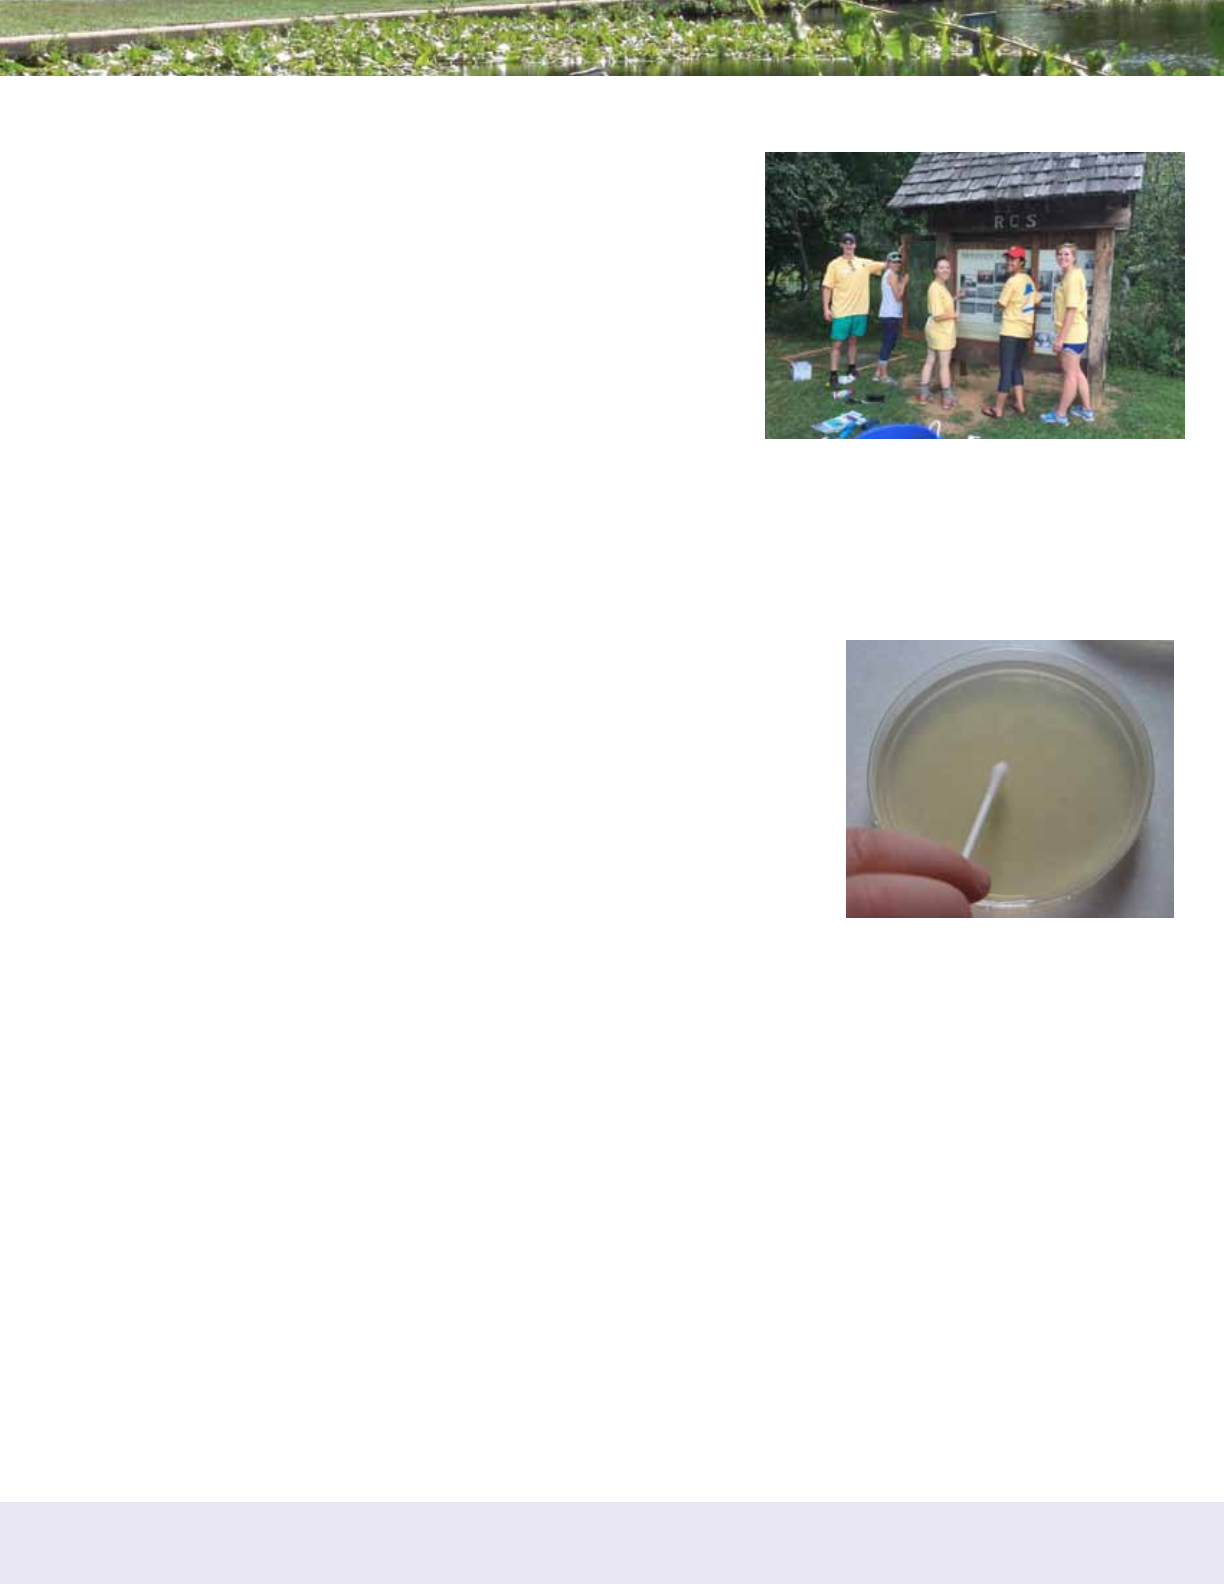
SAFE WATERS, HEALTHY WATERS: A Guide for Citizen Groups on Bacteria Monitoring in Local Waterways
43
Case Study #3: StreamWatch
About the Group
StreamWatch is a community-based water monitoring program ofthe
Rivanna Conservation Alliance in central Virginia. StreamWatch
volunteers have conducted macroinvertebrate sampling in the Rivanna
River watershed since its inception in 2002. Inspired by a bacteria
impairment in Moore’s Creek (tributary to the Rivanna) and the TMDL
process, the group decided to start testing for E. coli in 2012. The
Rivanna River Basin Commission was also a partner during the first phases
of the work, which started as a pilot project.
Goals of Monitoring
The major goal for StreamWatch’s bacteria monitoring is to provide the public with information about the safety of the
waters in which they swim and boat. The group also wants to get a general picture of what the baseline values are
for fecal bacteria in local waters to supplement the stream health information gathered through their macroinvertebrate
sampling)
Monitoring Approach
During the first two years of bacteria monitoring, StreamWatch members sampled
at seven recreational sites – primarily boat launches and other common access
points for recreation – and 6 sites in the Moores Creek watershed. After they were
able to see trends at each station, they adjusted their sampling locations slightly.
They moved away from stations that showed consistently good bacteria results and
added more monitoring locations on stream reaches with higher bacteria levels.
By honing in geographically to problem areas, the group is able to maximize its
resources.
StreamWatch volunteers sample each monitoring station every first Sunday of the
month from about February through October, which generally mirrors the sampling
season used by the Virginia Department of Environmental Quality (VADEQ). (In
winter time, bacteria levels are assumed to be relatively low.) Approximately 40
volunteers are available to collect water samples. Those who collect samples in a given month bring their bottles to
put on ice at a central location – a local government building. A set of four volunteers then take the samples to the
StreamWatch office on the following Monday to process them for bacteria.
StreamWatch has chosen to use Coliscan Easygel. This is a method that VADEQ staff has taught citizen water
monitoring groups across the state to use because it is relatively low cost and easy to use. StreamWatch works closely
with VADEQ which is the agency that approved their QAPP. The agency also provides StreamWatch with advice on
where to position the monitoring stations.
How Are Data Shared/Reported?
StreamWatch’s bacteria data are posted to its website immediately, below a map which shows the locations of the
monitoring sites. The bacteria levels that do not meet the state standards for recreational waters are shown in red.
Each month, Rivanna Conservation Alliance posts a “Can you Swim Here” poster at those boat launches that have
kiosks, which show the most current bacteria results. When bacteria results show something newsworthy, the group
will issue a press release to local news outlets. They will also occasionally do presentations to local governments and
community organizations, sharing their findings.
Source: StreamWatch

SAFE WATERS, HEALTHY WATERS: A Guide for Citizen Groups on Bacteria Monitoring in Local Waterways
44
At the end of each monitoring season, StreamWatch staff put together a report for their members and the public,
synthesizing all the bacteria data. They send out this report to local partnering organizations and localities in which
they test for bacteria. Finally, StreamWatch sends its data to VADEQ for use as “Level 2” data which is not used for
listing or de-listing impaired streams, but which can at least inform the agency’s own monitoring efforts.
What Was a Particularly Successful Outcome of Doing this Monitoring?
Luckily, E. coli levels in most of the stream reaches where StreamWatch volunteers have been monitoring have met
state water quality standards. However, one particular stretch of stream in a highly urban area tested very high for
E. coli three months in a row. Upon seeing these results, StreamWatch staff contacted the environmental officials
from the City of Charlottesville. The city responded immediately by walking the stretch of stream and then conducting
dye testing to look for any leaking sewer lines. The dye testing relatively quickly revealed a broken underground
sewer lateral pipe on private property. Within days, the landowner had the pipe fixed to stop the sewage leak. By
partnering closely with the City, StreamWatch had one of its first illicit discharge elimination successes!
References & Links
• StreamWatch Bacteria Monitoring website: http://streamwatch.org/stream-conditions/bacteria-monitoring
• StreamWatch’s bacteria monitoring results from 2012-2013: http://streamwatch.org/bacteria
• Local article about one of StreamWatch’s successes: http://www.cvilletomorrow.org/news/article/18329-
streamwatch-releases-water-quality-findings/

SAFE WATERS, HEALTHY WATERS: A Guide for Citizen Groups on Bacteria Monitoring in Local Waterways
45
Case Study #4:
Chattahoochee Riverkeeper – Neighborhood Water Watch
About the Group
Chattahoochee Riverkeeper is a watershed-based advocacy
organization out of Atlanta, GA that was established in 1994. The
group works to protect and preserve the Chattahoochee and its
tributaries through a variety of programs, many of which involve citizen
volunteers.
In 2010, the organization initiated Neighborhood Water Watch
(NWW), a large-scale E. coli monitoring effort by local volunteers.
Since its inception, the program has grown significantly and in 2014
they monitored over 70 sites throughout Atlanta and Gainesville,
Georgia. The program is coordinated in partnership with 30 groups
such as schools and neighborhood associations. Through the work
of Riverkeeper staff and approximately 50 volunteers, the Neighborhood Water Watch program collects more than
1,600 samples a year. NWW is described in detail in a new publication produced by Chattahoochee Riverkeeper
entitled, Neighborhood Water Watch: A Guide for Developing a Volunteer Bacteria Monitoring Program. Much of
the information contained in this case study is distilled from that document.
Goals of Monitoring
The Neighborhood Water Watch Program has set 5 overarching goals for its bacteria monitoring efforts:
1. Increase public awareness of water quality issues and local waterway conditions.
2. Provide citizen groups with tools and training to protect their local waterways.
3. Collect quality baseline data.
4. Form new partnerships between citizen groups, non-profit organizations and government agencies.
5. Address and resolve poor water quality detected during monitoring.
Monitoring Approach
Throughout the year, NWW volunteer monitors collect water from creeks and river segments every Thursday and
drop off their samples at the closest Riverkeeper office. The volunteers monitor at parks, swimming areas, and other
recreational areas (which are of highest priority). The stream reaches to monitor were originally chosen according
to where the volunteers were most interested in sampling and then Riverkeeper staff helped identify specific locations
on each stream reach where the volunteers should collect a sample. Volunteers participating in NWW commit to
being part of the program for the long term. The initial commitment
is one year minimum, but most volunteers have continued beyond that
timeframe. By observing conditions and water quality results at a
particular site over a long period, each volunteer starts to understand
what is considered “normal” or baseline for that stream. Conversely,
he/she knows when conditions are problematic and should be
brought to the attention of the City.
Each of the three Chattahoochee Riverkeeper offices now has a lab
set up for analyzing the water samples. After the volunteers drop off
the water samples each Thursday, the samples are immediately tested
for turbidity, specific conductivity, optical brighteners, and E.coli
using the IDEXX Colilert system. Combining all these parameters can
provide a more robust indication of illicit discharges than bacteria Source: Chattahoochee Riverkeeper
Source: Chattahoochee Riverkeeper
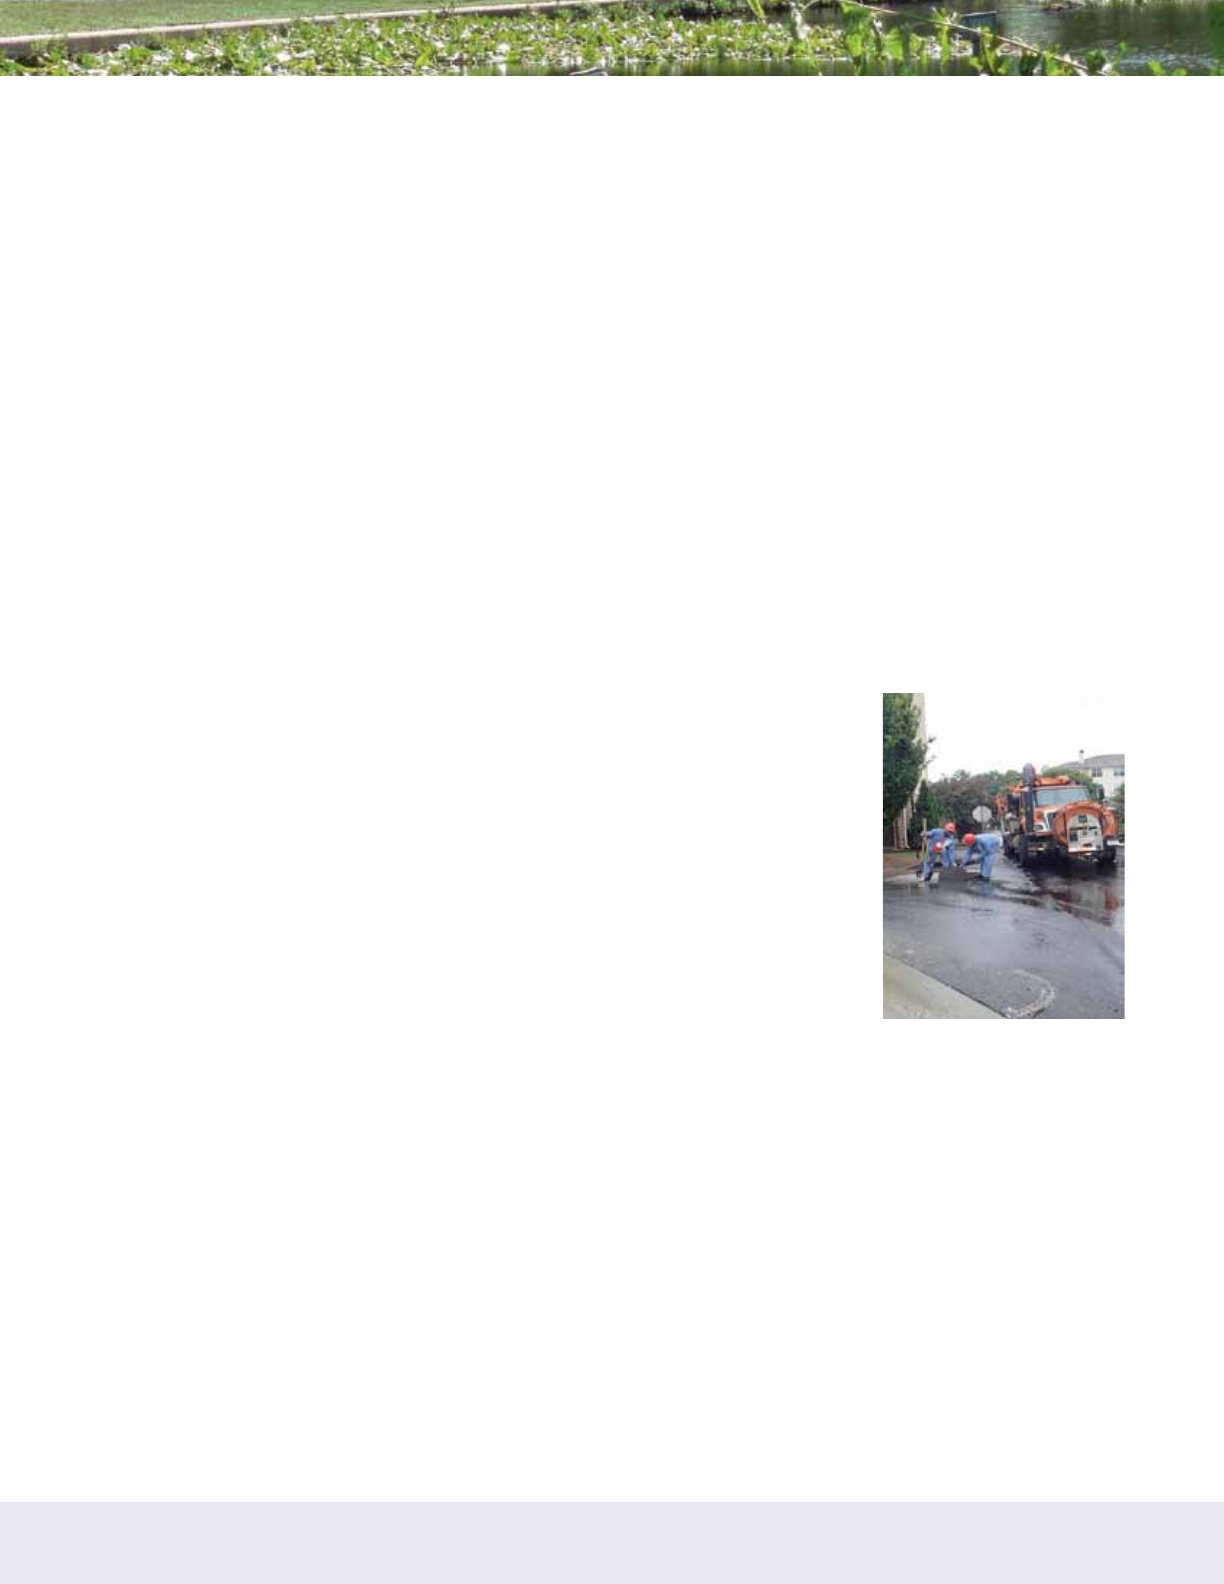
SAFE WATERS, HEALTHY WATERS: A Guide for Citizen Groups on Bacteria Monitoring in Local Waterways
46
tests alone and, over time, reveal the baseline conditions for each site. On Friday mornings the Colilert tests are ready
to be analyzed. Riverkeeper interns provide most of the labor force to process the water samples and analyze the
bacteria tests. Funding for NWW comes primarily from EPA grants.
Where an unusually high bacteria level is found, Riverkeeper staff (and sometimes volunteers) goes out to do further
monitoring and/or try to track down any obvious sources of the problem. Almost every week one or more hits of
concern are found – often due to sewage line or manhole leaks. For this reason, Riverkeeper employees stay in fairly
regular contact with the City’s Department of Watershed Management (who is in charge of drinking water, sewer,
and stormwater) to inform them of problem spots. The City has expressed its gratitude for and support of the NWW
program, as evident by the letters of support it provides when Chattahoochee Riverkeeper submits grant proposals to
fund the program. An example of such a letter is included at the end of this case study.
How Are Data Shared/Reported?
All of the Neighborhood Water Watch data is made publically available through several outlets: (1) on an in-house
database on the NWW websites, (2) through the state-run Georgia Adopt-A-Stream database, and (3) in the federal
EPA STORET database. The program has an EPA-approved quality assurance plan (QAPP), which is how Riverkeeper
is able to submit its data to the state and national databases. The data for some of the monitoring sites is also shared
with neighborhood associations.
Every year Chattahoochee Riverkeeper hosts an annual forum attended by NWW volunteers and anyone else who is
interested. Prior to the forum, they do a full analysis of all the water quality data collected by the group and share the
results at the forum. This event also gives volunteers an opportunity to share stories from the field and exchange ideas.
What Was the Outcome of Providing Data?
In its short lifetime so far, Neighborhood Water Watch has had an impressive number
of successes. Just a few of these are described below:
In the mid-2000s, the City of Atlanta renovated an underground pipe system that had
served as combined sewers for decades. The renovation was intended to separate
stormwater flows from sewage being sent to the wastewater treatment plant. In
2013, Riverkeeper volunteers tested one area of Proctor Creek in the city where
they kept finding chronically high levels of bacteria. They contacted City staff about
their findings. The City followed up by conducting an extensive camera survey (over
20 miles of stormwater pipe) in proximity to the problem area to look for sources of
sewage into the stormwater pipes. What they found was at least thirteen sewer pipes
that had inadvertently remained connected to the stormwater system and had been
discharging raw sewage to the stream since the renovations. Since this discovery,
eleven of the illicit connections have been fixed.
In Orme Creek, in the winter of 2013-201414, Chattahoochee Riverkeeper and the Piedmont Park Conservancy
identified a sewage overflow in a local park. While investigating the source of elevated E. coli levels in the creek,
they discovered an outfall pipe sending untreated waste directly into the creek within this popular park. Riverkeeper
immediately notified the city’s Department of Watershed Management who responded quickly. City crews found that
the sanitary sewer was clogged with debris and grease. Sewer crews cleared the blockage and jetted the sewer to
restore normal operation. This stopped the overflow of the untreated waste from entering Orme Creek. Subsequent
monitoring of the stream shows bacteria levels have returned to typical baseline levels.
In partnership with the Watershed Alliance of Sandy Springs and Kennesaw State University, Chattahoochee
Riverkeeper conducted bacteria testing on a series of stations along Long Island Creek in June 2014. Regular testing
at one of the monitoring stations had indicated periodic increases in bacteria levels that exceeded EPA surface-water
quality standards. Large scale tests and tracking revealed high bacteria concentrations in a tributary of Long Island
Creek. Once tests indicated the source of pollutants, the group notified officials with the city of Sandy Springs who
Source: Chattahoochee
Riverkeeper
SAFE WATERS, HEALTHY WATERS: A Guide for Citizen Groups on Bacteria Monitoring in Local Waterways
47
worked with Fulton County’s Department of Water Resources to find and stop the source - an overflowing manhole that
had been invaded and compromised by vegetative roots. Recent tests in this area indicate that repairs made have
caused dramatic improvements in water quality in this stretch of the creek.
References & Links
• Chattahoochee Riverkeeper. 2014. Neighborhood Water Watch: A Guide for Developing a Volunteer
Bacteria Monitoring Program. Atlanta, GA.
• Chattahoochee Riverkeeper’s Neighborhood Water Watch website: http://www.chattahoochee.org/neigh-
borhood-water-watch.php
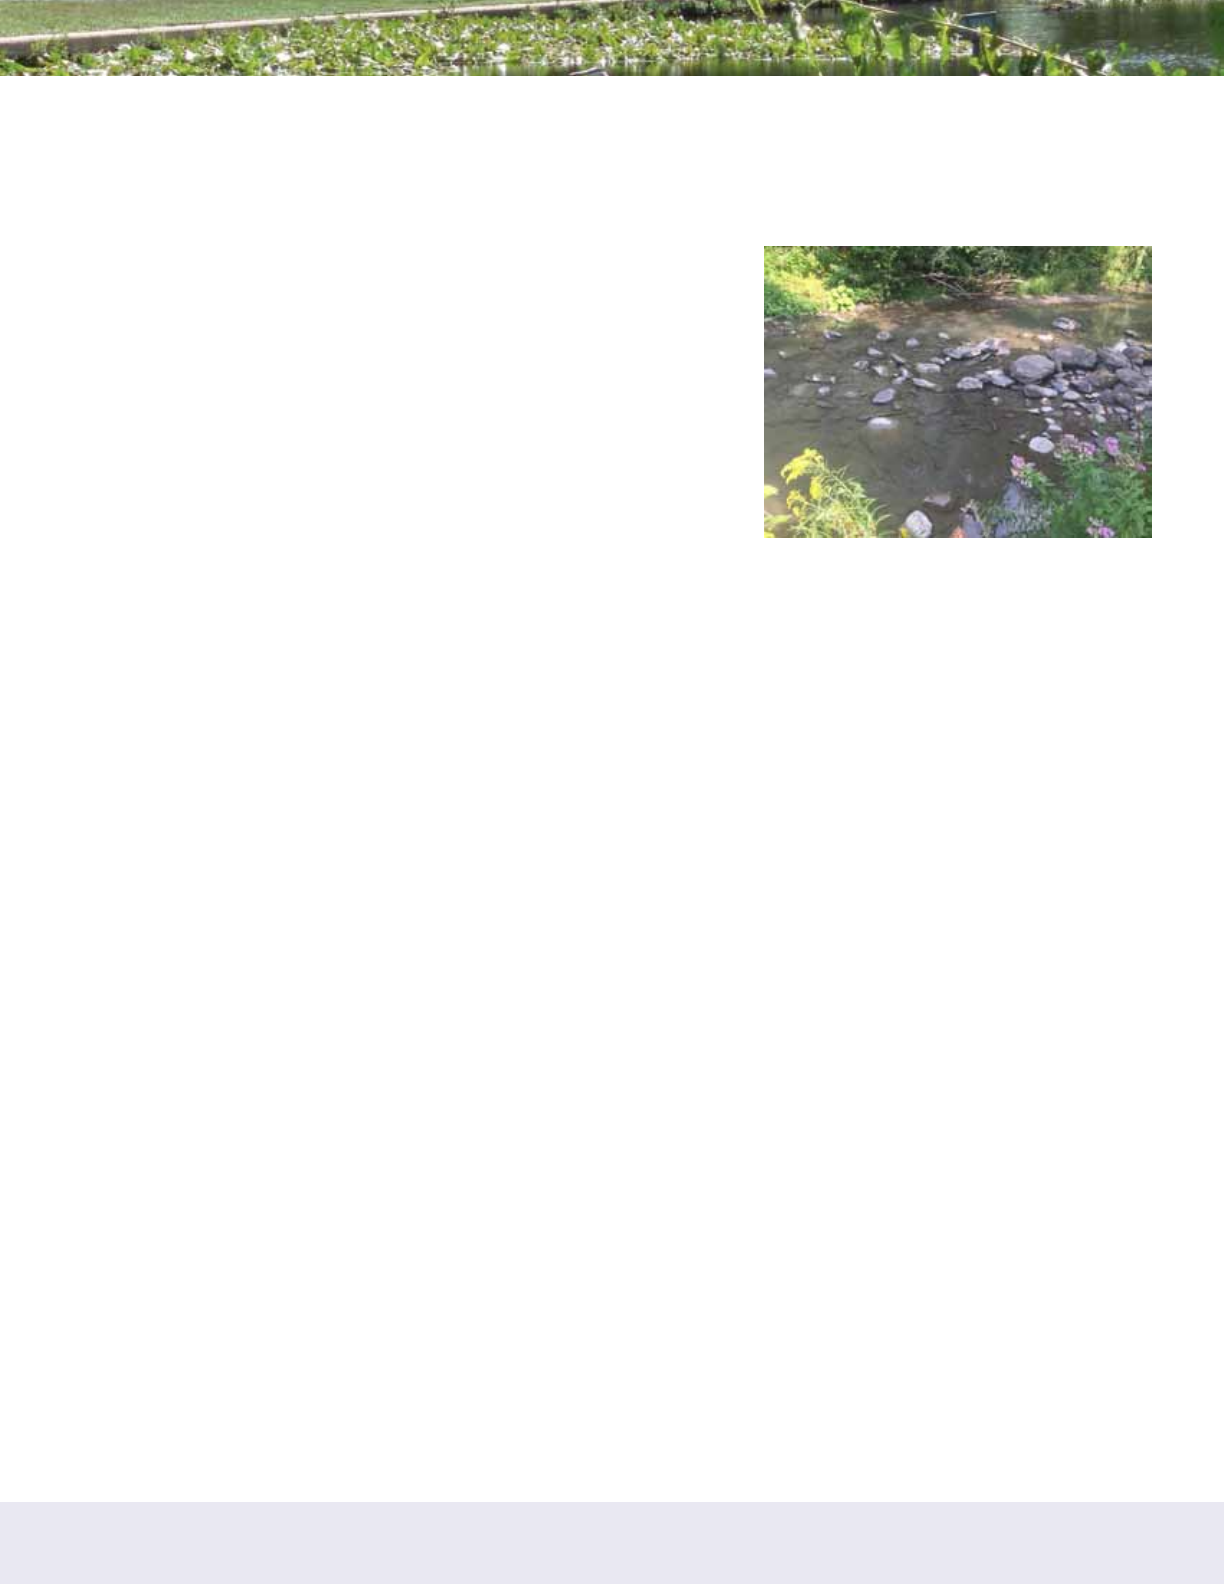
SAFE WATERS, HEALTHY WATERS: A Guide for Citizen Groups on Bacteria Monitoring in Local Waterways
48
Case Study #5:
Poultney Mettowee Natural Resources Conservation District –
Pawlet Village Septic Survey
About the Group
The Poultney Mettowee Natural Resources Conservation District (the
District) is located in Rutland County, Vermont. Created in 1940, the
District is a local government entity that is governed by an elected
volunteer supervisory board. The mission of the District is to provide
educational outreach, technical assistance, and financial support to
communities and landowners to protect healthy soil and clean water and
preserve the ecological integrity and economic vitality of communities.
The District brings together the efforts of citizens and organizations that
share the common goals of conserving, protecting, and enhancing the
natural and cultural resources of the watershed.
The District and the Vermont Agency of Natural Resources monitor the water quality in Flower Brook. In 2012,
Flower Brook in the Village of Pawlet was listed as impaired for bacteria. E. coli concentrations exceeded the State
standard of 235 colonies per single grab sample of 100 ml of water, or the geometric mean of six or more samples
not to exceed 126 colonies per 100 ml of water. Bacteria levels were found to be chronically high, regardless
of the water level or weather conditions. The presence of fecal bacteria in streams during low-flow conditions can
indicate that septic systems may be leaking partially-untreated effluent to the groundwater. The Vermont Department
of Environmental Conservation and the US Geologic Survey’s Microbial Source Tracking Study also confirmed the
presence of bacteria of human origin in downstream reaches near Pawlet.
Goals of Monitoring
Sewage treatment throughout most of Pawlet is provided through on-site wastewater treatment systems. The District
conducted a septic survey in the Town to better understand where septic leaks could be coming from and work
towards eliminating those sources. They also wanted to know the potential risk of leaks from the different types
of septic systems, including holding tanks, leach fields, mound systems, and dry wells. The District also felt it was
important to educate the public on septic issues and the required maintenance associated with the systems. During
the same time frame, Watershed Consulting, Inc. conducted an illicit discharge survey at stormwater outfalls in Pawlet,
and the District collected samples from Flower Brook at two locations in the Pawlet Village. The results of these studies
were used to target certain pipes and stream sections for field surveys using sewage sniffing dogs to narrow down
sources of human sewage (Case Study #6).
Monitoring Approach
The septic survey involved walking door-to-door to interview landowners about the type and location of wastewater
treatment system they use. In addition to collecting anecdotal information about the type of septic system, the survey
included questions about maintenance frequency and activities, condition of the tank and treatment area, and any
landowner concerns or comments. It also included recording GPS coordinates of drinking water wells, septic tank
locations, and septic treatment area locations.
The District conducted the survey from June to September of 2015. Data was collected at various times during the
day and on both weekdays and weekends to facilitate conversations with all residents in town. Sixty-one parcels in
the Pawlet Village were targeted for this survey. The parcels were located in areas where groundwater and/or the
stormdrain system appear to drain to Flower Brook. The data was analyzed with respect to on-site septic treatment
type, proximity to the stream, and parcel size to develop scores representing potential risk of septic effluent reaching
groundwater for each parcel.
Source: PMNRCD
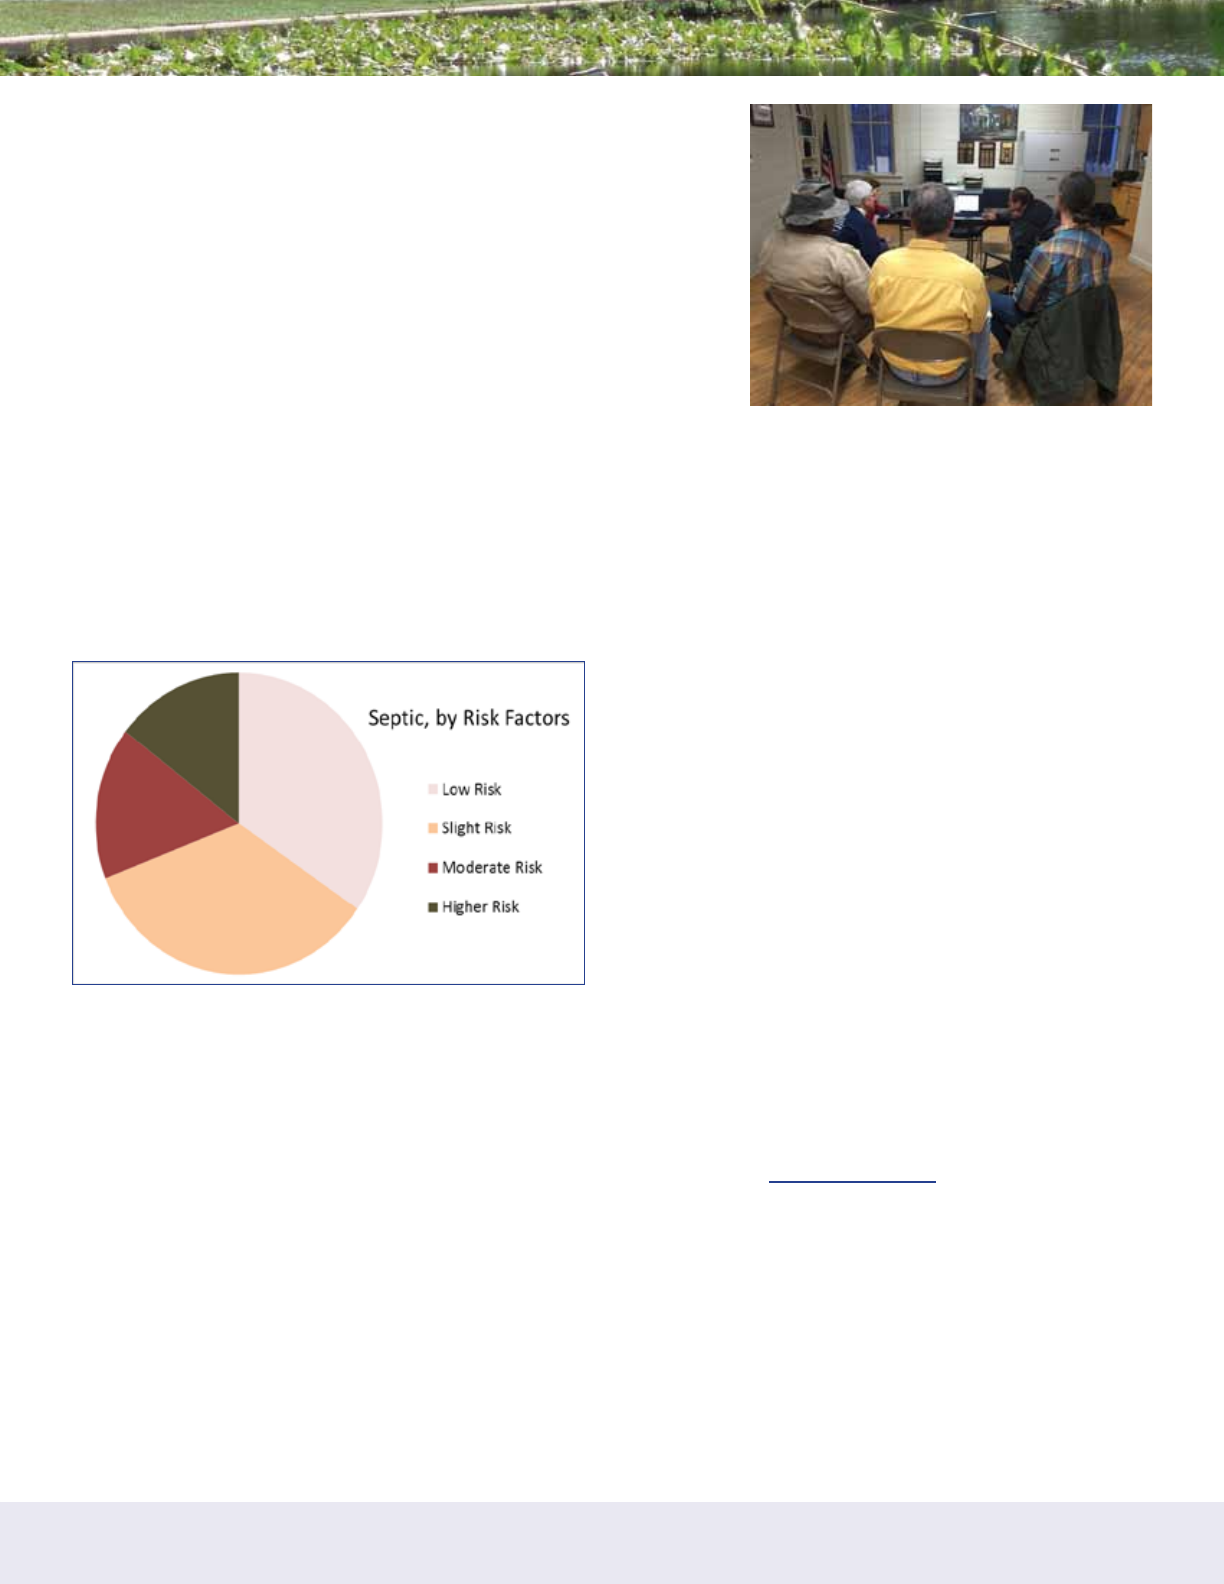
SAFE WATERS, HEALTHY WATERS: A Guide for Citizen Groups on Bacteria Monitoring in Local Waterways
49
How Are Data Shared/Reported?
The District provided ongoing communication to Pawlet landowners and
town officials through multiple meetings and information published in the
Pawlet Newsletter and the Lakes Region Free Press. Another avenue of
information dissemination was the local wastewater advisory committee,
which consisted of landowners and town officials and helped to field
questions from the residents. The illicit discharge survey results are
available through Vermont Department of Environmental Conservation’s
Stormwater Division, the Village offices, and the District.
What Was the Outcome of Providing Data?
The results of the septic risk analysis indicate that approximately
17 properties have moderate to high risk of causing groundwater
contamination under certain conditions. The remaining 38 properties
are evenly split within the low and slight risk categories. These data are useful to provide an estimate of the potential
collective risk posed by the group of systems found in the Village.
Through the illicit discharge survey, one system was found to potentially connect to the storm drain system and officials
are working with the property owner to explore the path of the connection. Several other locations were identified
as having potential groundwater contamination, though bacteria found at these locations were suspected to originate
from older systems outside the properties in question.
The continued high bacteria levels measured in the brook
through the District’s summer water quality monitoring
program indicate that a source (or sources) of bacteria
exists in the Village of Pawlet. The District recommends that
the Village exercise their authority to continue investigating
potential septic leaks and may want to revisit their zoning
and septic regulations to help address the bacteria levels in
Flower Brook. The latest septic rules ensure that as septic
systems fail, they will be replaced with modern, state-
approved systems. This may help to slowly decrease the
bacteria levels in the brook.
References & Links
• Poultney Mettowee Natural Resources Conservation District, 2016. Pawlet Village Septic Survey, Final Report.
• Poultney Mettowee Natural Resources Conservation District website. www.pmnrcd.org
Source: PMNRCD
Source: PMNRCD

SAFE WATERS, HEALTHY WATERS: A Guide for Citizen Groups on Bacteria Monitoring in Local Waterways
50
Case Study #6: Canine Sewage Sniffers
About the Group
Approximately six years ago, Karen and Scott Reynolds took it upon themselves to start
training dogs to identify the smell of human sewage to assist with IDDE efforts. They
created the consulting company Environmental Canine Services, LLC (ECS) to help various
organizations detect human sewage contamination in stormwater systems, streams, rivers,
and lakes. ECS has worked in over 10 states around the US, with offices in the east
coast, west coast, and the Midwest.
The Center for Watershed Protection recently worked with ECS and other partners to
identify human sewage hotspots in the Town of Bennington and the Village of Pawlet
in southwestern Vermont. The Vermont Department of Environmental Conservation has
been systematically supporting illicit discharge investigations in different parts of the state
with the overall aim of reducing bacteria levels in its waterways and has been focusing
its efforts recently in Bennington and Pawlet. In early 2015, Watershed Consulting
Associates had inspected outfall pipes in both locations to identify indicators of sewage
discharges. At the same time, the Poultney Mettowee Natural Resources Conservation
District conducted a door-to-door septic system survey in Pawlet to provide insight into
whether and where failing septics are contributing to the bacteria problem (see Case Study #5). The project partners
used the results of these efforts to target certain pipes and stream sections in each locality and brought in Environmental
Canine Services to use their sewage sniffing dogs to detect human sewage.
Goals of Monitoring
The goal of the canine sewage sniffers is to detect potential human sewage in streams, springs, outfalls, catch
basins, and manholes. Since the dogs are trained specifically to identify human sewage, it is not only quicker than
conventional bacteria sampling; it also narrows down the source of the contaminant. The dogs’ noses are able to pick
up traces of sewage that may otherwise go undetected using conventional tracking methods.
Monitoring Approach
Once trained, the canines can take a sniff at catch basin or an outfall and identify within seconds if human wastewater
is (or recently was) present, even at very low concentrations. On the other hand, it takes minutes for us humans to
arrive at the same conclusion using field and lab equipment – IF there is even enough flow available to take a sample.
Each of ECS’s dogs has adopted a different way to alert their human handlers that they have found a positive hit for
sewage: Logan sits down, and Sable barks. Their noses have different levels of sensitivity, so when the canines work
as a team, they can even provide some perspective on where sewage presence is mild and where it is strong.
The dogs’ ability to sniff out sewage is not completely protected from outside interference, such as smells from nearby
sewage vent stacks. Even so, the canine method is quite innovative for IDDE field work, which can often be clunky and
slow going. The dogs decrease the amount of time spent in the field and allow the investigator to track down sources
that the normal equipment might have otherwise missed.
How Are Data Shared/Reported?
ECS has completed over 50 projects in 10 different states for cities, counties, environmental organizations, and private
consulting companies. Based on the success of ECS on projects in Michigan, in 2011 the Michigan Department
of Environmental Quality added ECS’s canine source tracking procedures to their Quality Assurance Project Plan
(QAPP) template for all beach monitoring projects. When these QAPPs have been used to apply for federal grants to
fund projects, the QAPPs have been reviewed and approved by the US EPA. Currently, the state of New Hampshire
is undergoing a similar process to add ECS’s canine source tracking procedures to their QAPP template.
Results from these studies have been shared in local press releases and social media.
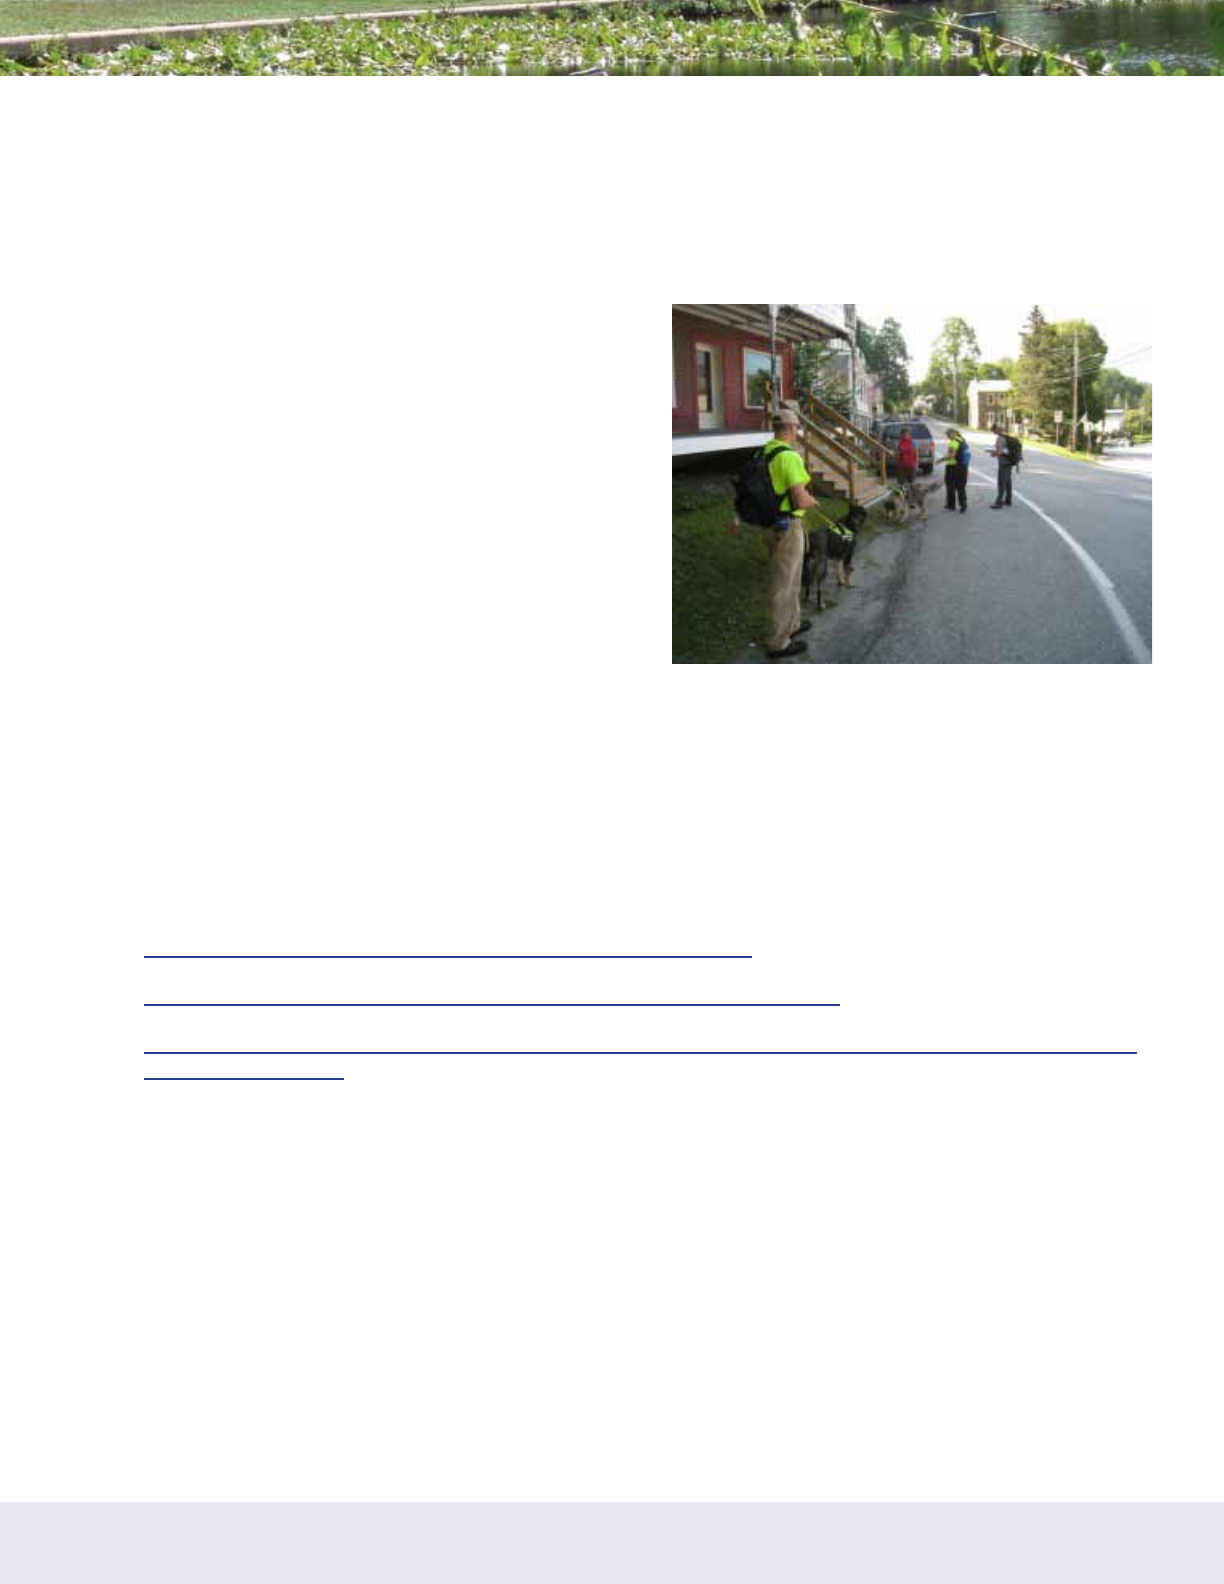
SAFE WATERS, HEALTHY WATERS: A Guide for Citizen Groups on Bacteria Monitoring in Local Waterways
51
What Was a Particularly Successful Outcome of Doing this Monitoring?
After three days of field work in Bennington and Pawlet, the canine team found at least three highly likely sources of
wastewater pollution. Findings include: an underground spring flow that may be intermingling with a residential septic
system and leaching sewage into the stream; a roof drain that may be funneling septic field leachate into a road-side
ditch; and a sanitary sewer leaking into a storm drain pipe where they are in close proximity to each other under
a street. A smoke test was conducted at one of these locations and an illegal connection was found. The property
owner, the State, and the town are working to resolve this issue.
Two studies have documented the success of this innovative
approach. The City of Santa Barbara Creeks Division and the
University of California, Santa Barbara conducted a study in
2010 to evaluate how canine source tracking compared to
traditional sewage identification methods. Side-by-side lab
testing for bacterial, chemical, and human DNA markers was
done for the locations investigated by the canines. The final
research report found:
• The canines were 100% accurate on sites/samples
where the lab results did not find any human waste
indicators.
• One canine was 100% accurate and the other was
86% accurate (when factoring for a scent volume phe-
nomena) where the lab results found at least 1 human
waste indicator.
• There are benefits to adding canine scent tracking to the source tracking toolbox. The major advantages
include real time results, the ability to test a high number of sites per day, and low cost per sample.
A follow up to this Water Environment Research Foundation-funded study found that ECS canine source tracking is a
useful approach for prioritizing sampling sites for which DNA-based and other expensive laboratory tests can then
confirm and quantify the human waste contamination.
References & Links
• http://www.cwp.org/working-with-dogs-to-sniff-out-sewage-leaks/
• http://vtwatershedblog.com/2015/09/11/dogs-helping-in-water-quality/
• http://www.townofbennington.org/TOB/2015/08/28/press-release-town-stormwater-study-being-conduct-
ed-over-next-60-days/
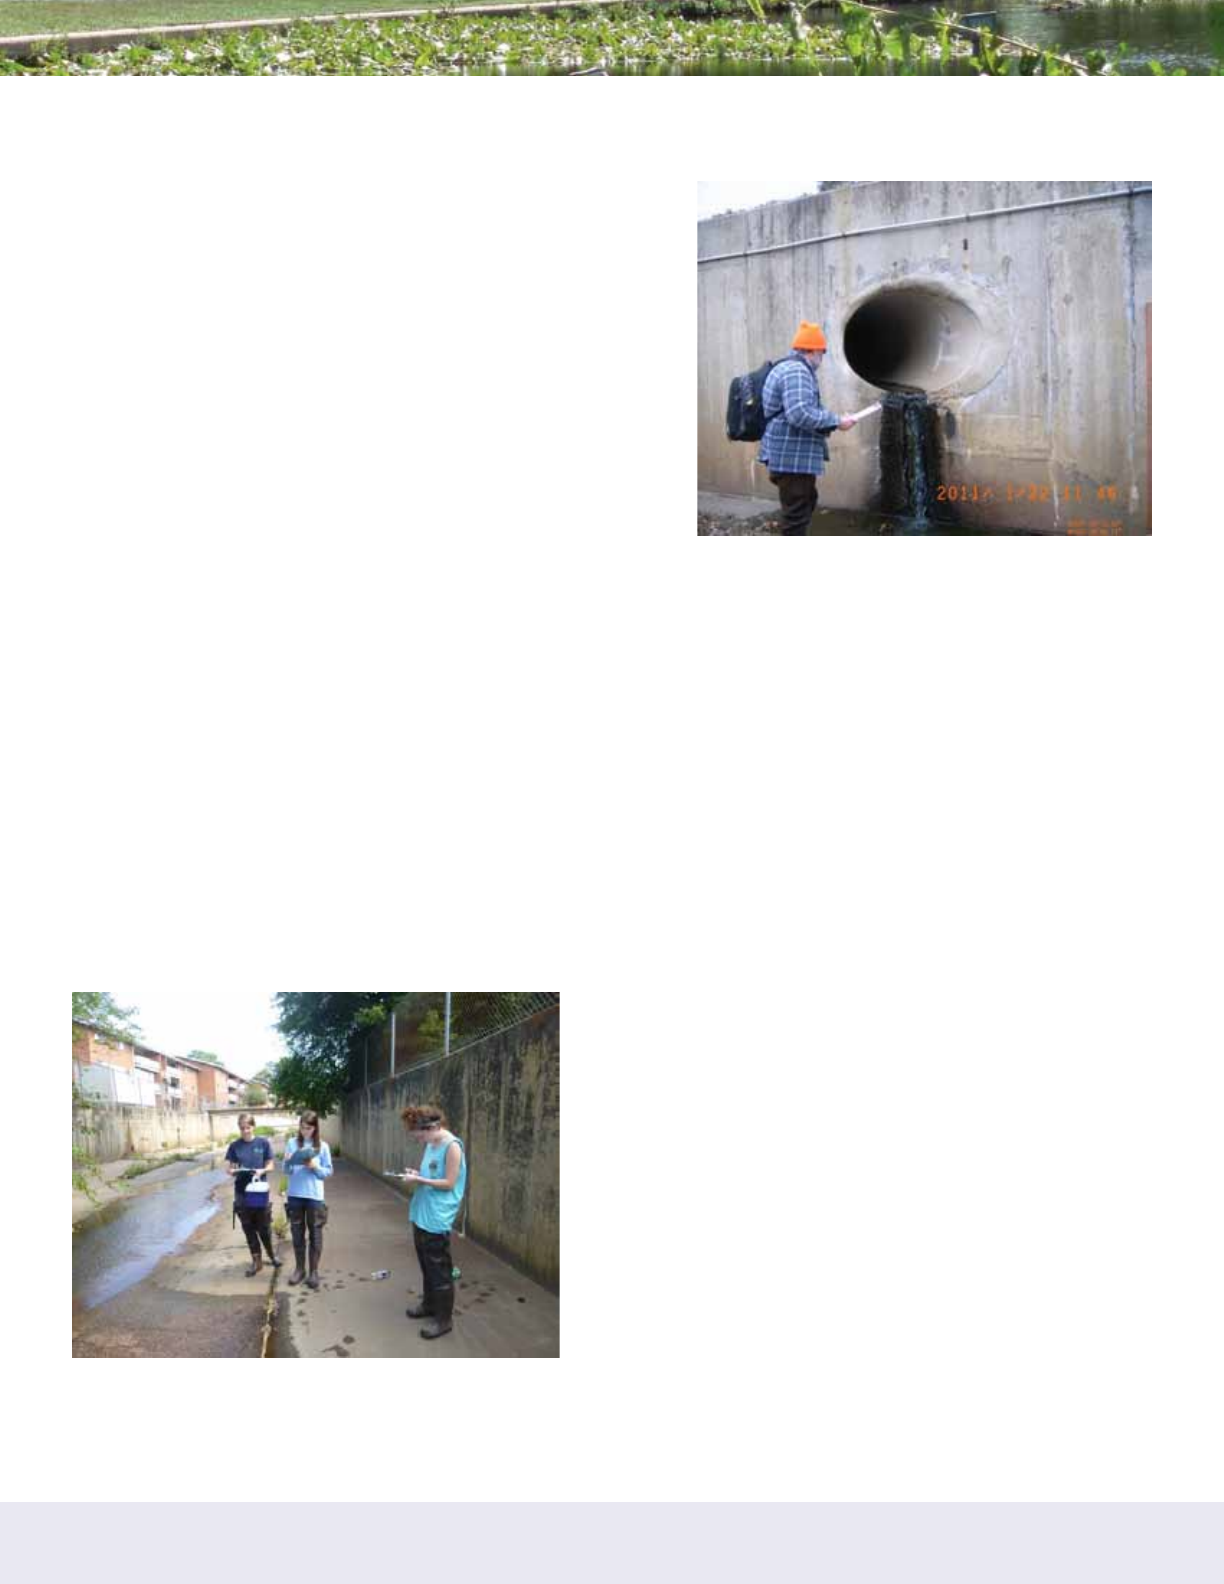
SAFE WATERS, HEALTHY WATERS: A Guide for Citizen Groups on Bacteria Monitoring in Local Waterways
52
Case Study #7: Reedy Creek Coalition and Alliance for the Chesapeake Bay
About the Groups
The Reedy Creek Coalition is a volunteer organization “committed
to restoring the health and beauty of Reedy Creek through
education, training, and collaboration with all residents and
users of the Reedy Creek Watershed and its natural resources.”
Reedy Creek is a small, highly urbanized stream in Richmond,
Virginia that is just under 4.0 miles long and encompasses a
watershed area under 3,000 acres in size. Impervious surface
covers approximately 40% of the drainage and Reedy Creek has
been subjected to many of the typical insults of urban streams
including over 1.0 mile of concrete channel. Reedy Creek is on
the state’s impaired waters list for elevated fecal bacteria. A TMDL
implementation plan for the James River and tributaries, including
Reedy Creek, was completed in 2014. The Reedy Creek
Coalition initiated a comprehensive monitoring plan in 2010 with
the assistance of the Alliance for the Chesapeake Bay and the City of Richmond Department of Public Utilities.
The Alliance for the Chesapeake Bay leads, supports, and inspires local action to restore and protect the land and
waters of the Chesapeake Bay watershed. The Alliance’s RiverTrends volunteer water quality monitoring program
has been providing support to local monitoring groups for thirty years. Reedy Creek Coalition volunteers are trained
to collect high-quality data, which is shared with the City of Richmond and the Virginia Department of Environmental
Quality and used to identify pollution issues.
Goals of Monitoring
The monitoring plan has three related goals:
1. Obtain baseline data so improvements to Reedy Creek can be documented over time.
2. Localize and ultimately help identify specific sources of pollution.
3. Provide training and educational opportunities for citizen scientists.
Monitoring Approach
Starting in 2010, volunteers monitored 4 sites on a monthly
basis. Three of the sites are scattered along the “mainstem”
of Reedy Creek and the fourth site is located on a perennial
tributary (known locally as Crooked Branch) that is buried
underground until it daylights a few hundred yards from its
mouth. In addition to fecal bacteria samples, monitors also
collect samples for nutrient and suspended solid analysis
and record field data (temperature, pH, dissolved oxygen,
water clarity). For the first 18 months, the City of Richmond
provided in-kind analytical services at its wastewater treatment
laboratory.
Over the years, the monitoring program has continually
evolved in response to new information and resource
availability. Starting in 2011, volunteers started performing
E. coli analysis using Coliscan Easygel when City of Richmond analytical resources were no longer available. In
2012, a fifth site was added for E. coli testing to determine whether the source of an E. coli hotspot was stormwater
pipes discharging into the long concrete channel and/or a small tributary that daylights and enters Reedy Creek
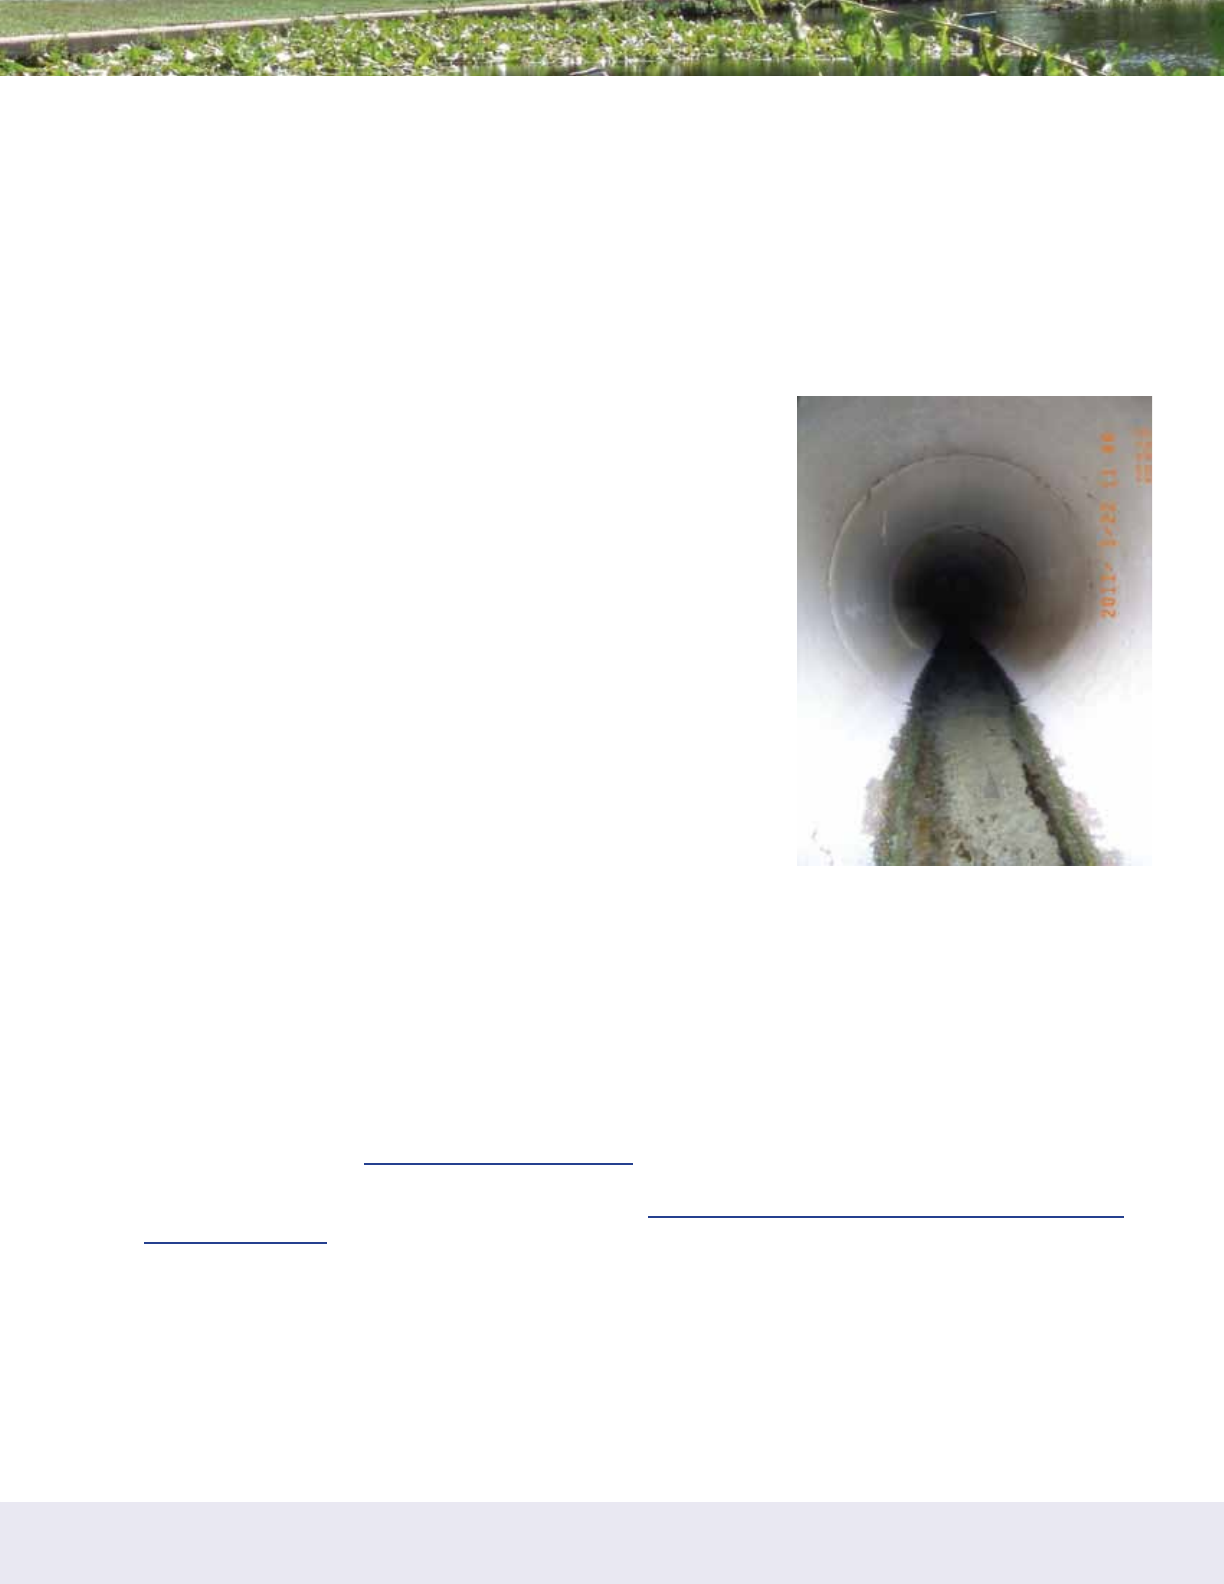
SAFE WATERS, HEALTHY WATERS: A Guide for Citizen Groups on Bacteria Monitoring in Local Waterways
53
just upstream of the identified hotspot. (Answer: It is both.) During the last three years, the Reedy Creek Coalition
switched to bimonthly monitoring at the baseline sites and began performing streamwalks in the alternate months. This
strategy has provided valuable new information about the creek, saved on analytical costs for other parameters, and
provided monitors with new skills and motivation.
During streamwalks, trained volunteers document the condition of all stormwater pipes and ditches that discharge to
Reedy Creek; test outfalls with flowing water during dry weather conditions for E. coli as well as temperature, pH,
and dissolved oxygen; assess stream conditions (erosion, sedimentation, in-stream habitat, riparian area, floodplain
connection, etc.); and identify areas that should be considered for green infrastructure improvements. Over the last
four years, volunteers have walked nearly the entirety of Reedy Creek and all of its tributaries.
How Are Data Shared/Reported?
Data is entered into the Alliance for the Chesapeake Bay volunteer monitoring
database. From there, it is easily provided to Virginia DEQ and the City of
Richmond on an annual basis. In addition, the Alliance for the Chesapeake
Bay obtained funding to do a report card in 2012 summarizing the first
two and one-half years of monitoring data. The Reedy Creek Coalition
periodically provides monitoring information on its website and also
incorporates monitoring data into presentations at neighborhood meetings
and educational workshops.
What Was a Particularly Successful Outcome of Doing
this Monitoring?
Reedy Creek Coalition has identified several illicit discharges over the span
of the monitoring program. In 2011, during a streamwalk, a dry weather
discharge was detected at a large stormwater pipe, along with a strong
sanitary sewer odor and bacteria growth. This along with follow up testing
from Randolph Macon College students, which showed very high levels of
E. coli, prompted the City of Richmond to investigate. They discovered a
damaged sanity sewer line nearby and repaired it.
Also, in 2012, the water quality monitors identified foul odors and elevated E. coli counts at a monitoring site on
Crooked Branch, a tributary of Reedy Creek. The RCC notified the City of Richmond’s Department of Public Utilities
(DPU) regarding their observations and the DPU Pretreatment Program began an investigation. Their monitoring
confirmed the volunteers’ findings and they traced the contamination to a blocked sanitary sewer line. This was fixed,
and follow up sampling showed much lower concentrations of E. coli.
References & Links
• Reedy Creek Coalition: www.reedycreekcoalition.org
• Alliance for the Chesapeake Bay RiverTrends program: https://allianceforthebay.org/our-work/connecting-
people/rivertrends/

The Center for Watershed Protection, Inc. is a 501(c)(3) non-profit organization dedicated to fostering
responsible land and water management through applied research, direct assistance to communities,
award-winning training, and access to a network of experienced professionals. The Center is your first
source for best practices in stormwater and watershed management. The Center was founded in 1992
and is headquartered in Ellicott City, Maryland. As national experts in stormwater and watersheds,
our strength lies in translating science into practice and policy, and providing leadership across
disciplines and professions. To learn more about the Center’s commitment to protect and restore
our streams, rivers, lakes, wetlands and bays, go to www.cwp.org.
3290 North Ridge Road, Suite 290
Ellicott City, MD 21043
410-461-8323
