Thoughtspot User Guide 3.4
User Manual: Pdf
Open the PDF directly: View PDF ![]() .
.
Page Count: 185 [warning: Documents this large are best viewed by clicking the View PDF Link!]
- Contents
- Introduction
- About search
- About starting a new search
- About charts
- About chart types
- Change the chart
- About filters
- Advanced searches
- About pinboards
- Working with data
- About the Help Center
- Reference guide
- Contact ThoughtSpot
- Copyright

User Guide
Version 3.4
September 2016

Table of Contents
User Guide Copyright © 2016 by ThoughtSpot. All Rights Reserved. 2
Contents
Chapter 1: Introduction............................................................................... 5
Finding your way around.................................................................................................. 6
Log in to ThoughtSpot from a browser........................................................... 8
Log out of ThoughtSpot.........................................................................................9
About the user profile...................................................................................................... 10
Understanding privileges..................................................................................................12
About stickers.......................................................................................................................13
Apply a sticker.......................................................................................................... 13
Filter by a sticker.....................................................................................................14
Chapter 2: About search..........................................................................16
About starting a new search.......................................................................................... 17
Start a new search...................................................................................................18
About choosing sources...................................................................................... 20
About the search bar............................................................................................. 21
Search suggestions.................................................................................................23
About attributes and measures.........................................................................26
What am I looking at?.......................................................................................... 26
Last data refresh time........................................................................................... 27
About charts.........................................................................................................................32
About chart types...................................................................................................32
Change the chart.....................................................................................................53
About filters..........................................................................................................................73
About simple filters................................................................................................74
About bulk filters.....................................................................................................78
Delete a filter............................................................................................................. 81

Table of Contents
User Guide Copyright © 2016 by ThoughtSpot. All Rights Reserved. 3
Chapter 3: Advanced searches............................................................. 82
About keyword searches.................................................................................................84
Search using growth over time......................................................................... 85
About worksheets from searches................................................................................88
Worksheet from a search example scenarios..............................................90
Save a search as a worksheet.............................................................................91
Create a search from a search saved as a worksheet...............................93
About formulas in searches...........................................................................................94
Add a formula to a search.................................................................................. 95
View or edit a formula in a search...................................................................97
About formulas and aggregation................................................................................ 99
About cumulative formulas............................................................................... 103
About grouping formulas...................................................................................107
About moving formulas......................................................................................108
About conversion formulas............................................................................................113
About pivot tables............................................................................................................ 114
Chapter 4: About pinboards..................................................................117
Create a pinboard..............................................................................................................118
Add an answer to a pinboard.......................................................................................119
Edit the layout of a pinboard......................................................................................120
About pinboard filters.....................................................................................................122
Create a pinboard filter.......................................................................................123
Other pinboard actions.................................................................................................. 126
Search actions within a pinboard....................................................................126
Copy a pinboard.................................................................................................... 128
Copy the link for a pinboard or visualization............................................. 129
Reset a visualization..............................................................................................131
Reset the layout of a pinboard........................................................................ 133

Table of Contents
User Guide Copyright © 2016 by ThoughtSpot. All Rights Reserved. 4
Start a slideshow................................................................................................... 134
Delete a visualization........................................................................................... 136
Chapter 5: Working with data............................................................. 138
Generate CSV files with the data to be loaded................................................... 140
Load data from a web browser...................................................................................141
Append data from a web browser............................................................................ 143
About sharing.....................................................................................................................146
Share a pinboard................................................................................................... 146
Share answers......................................................................................................... 149
Share uploaded data............................................................................................150
Revoke access (unshare).................................................................................... 152
Chapter 6: About the Help Center.....................................................155
What you can find in the Help Center.....................................................................156
Chapter 7: Reference guide..................................................................159
Keyword reference........................................................................................................... 160
Formula reference.............................................................................................................166
Date and time formats reference...............................................................................180
Chapter 8: Contact ThoughtSpot.......................................................183
Chapter 9: Copyright...............................................................................185

User Guide Copyright © 2016 by ThoughtSpot. All Rights Reserved. 5
Chapter 1: Introduction
Introduction
Topics:
•Finding your way around
•About the user profile
•Understanding privileges
•About stickers
This ThoughtSpot User Guide contains information
on navigating and searching data with ThoughtSpot.
It will assist you with starting new searches,
managing your pinboards, and troubleshooting.
ThoughtSpot enables you to view and analyze
your data through a search-based user interface.
You can create your searches on the fly by typing
them into a search bar, like you do when using an
internet search engine. ThoughtSpot makes it easy
to see your data, get your questions answered,
create interactive graphs, and customize pinboards.
You do not need to understand how the data is
stored, attend days of training, or know SQL to do
these things. Collaboration and security features
make it easy for to protect sensitive data and share
information safely with others.
ThoughtSpot gives administrators the ability to
modify data properties to meet business needs, for
example by providing search synonyms for common
terms, boosting the importance of a column in search
results, or formatting how the data appears. So if
you are not getting the answers you expect when
using ThoughtSpot, check with your ThoughtSpot
administrator to see if some settings may need to be
changed.

Introduction
User Guide Copyright © 2016 by ThoughtSpot. All Rights Reserved. 6
Finding your way around
ThoughtSpot is organized into several sections to make navigation easy. You can
reach them by using the menu bar.
Figure 1: Menu bar
These are the different sections in ThoughtSpot:
Home
Click the logo to go to the home page. The home page contains:
• Search bar - Click in the search bar to start a new search. This is the same
thing as clicking Search in the top navigation bar.
• Last viewed pinboard - The home page shows the last pinboard you looked at.
The dropdown box on the top left of the pinboard lets you choose a different
pinboard without having to leave the home page.
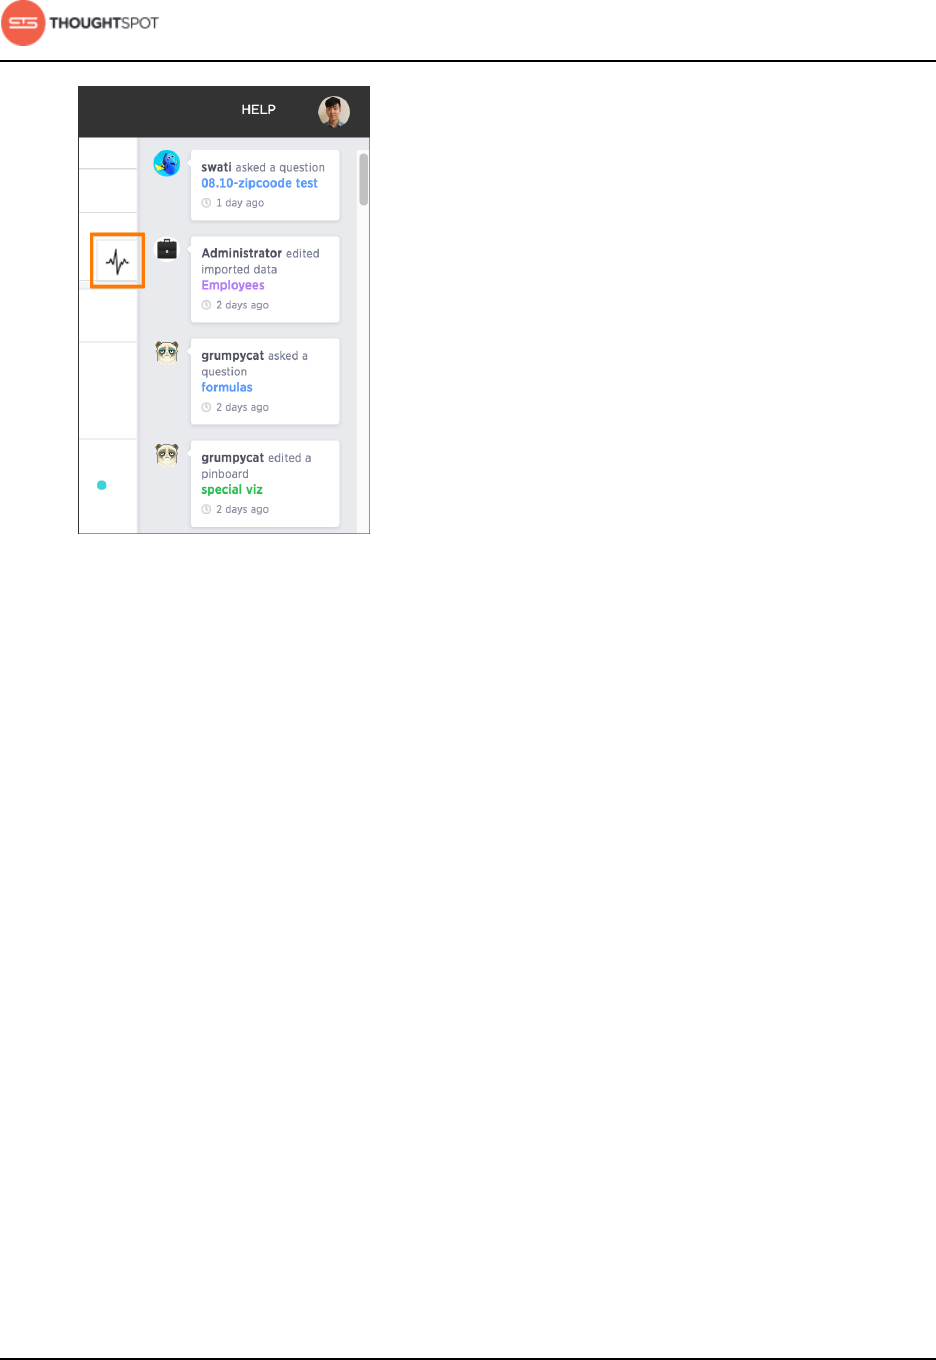
• Activity - The activity button shows recent actions performed by other
people.
To view the activity panel, click on the activity icon on the right side of the
home page.
Introduction
User Guide Copyright © 2016 by ThoughtSpot. All Rights Reserved. 7
Figure 2: Activity bar
You can even click on one of the object names to jump to its location.
Search
Search is where you will spend most of your time. It allows you to search and
explore your data. Choose your data sources and type in the search bar at the
top. As you type your search, results will appear in the main part of the screen as
either a table or a chart.
To learn more about this section, visit About search.
Answers
Answers are the result of a single search. You can save an answer you want to
work more on later, or just keep for your personal use. Answers are for you alone,
until you share them with others.
Pinboards
Pinboards are collections of related search results. You can create your own
pinboard or add to an existing one. Once a pinboard has been saved, it can be

Introduction
User Guide Copyright © 2016 by ThoughtSpot. All Rights Reserved. 8
shared with others or viewed as a slideshow. The pinboards page shows a list of
saved pinboards. Click on one to view, edit, or share it.
To learn more about pinboards, visit About pinboards.
Data
Data contains a list of data sources (tables and worksheets). These are usually
loaded and managed by your administrator. However, you may be able to import
a spreadsheet (Excel or CSV) here, if you have the correct privileges.
To learn more about this section, visit Working with data.
Admin
Admin only appears if you have administrator privileges. This section is covered
in the ThoughtSpot Administrator Guide.
Help
Help is a support resource for ThoughtSpot. It contains short videos, a keyword
reference, links to documentation, and other useful materials. You can also find
the support contact information and software version number here.
User
The user icon allows you to either view your preferences or log out. You can also
change your icon here.
To learn more about this section, visit About the user profile.
Log in to ThoughtSpot from a browser
To set up and explore your data, access ThoughtSpot from a standard Web
browser using a username and password.
Before accessing ThoughtSpot, you need:
• The Web address (IP address or server name) for ThoughtSpot.
• A network connection.
Introduction
User Guide Copyright © 2016 by ThoughtSpot. All Rights Reserved. 9
• A Web browser.
• A username and password for ThoughtSpot.
Supported Web browsers include:
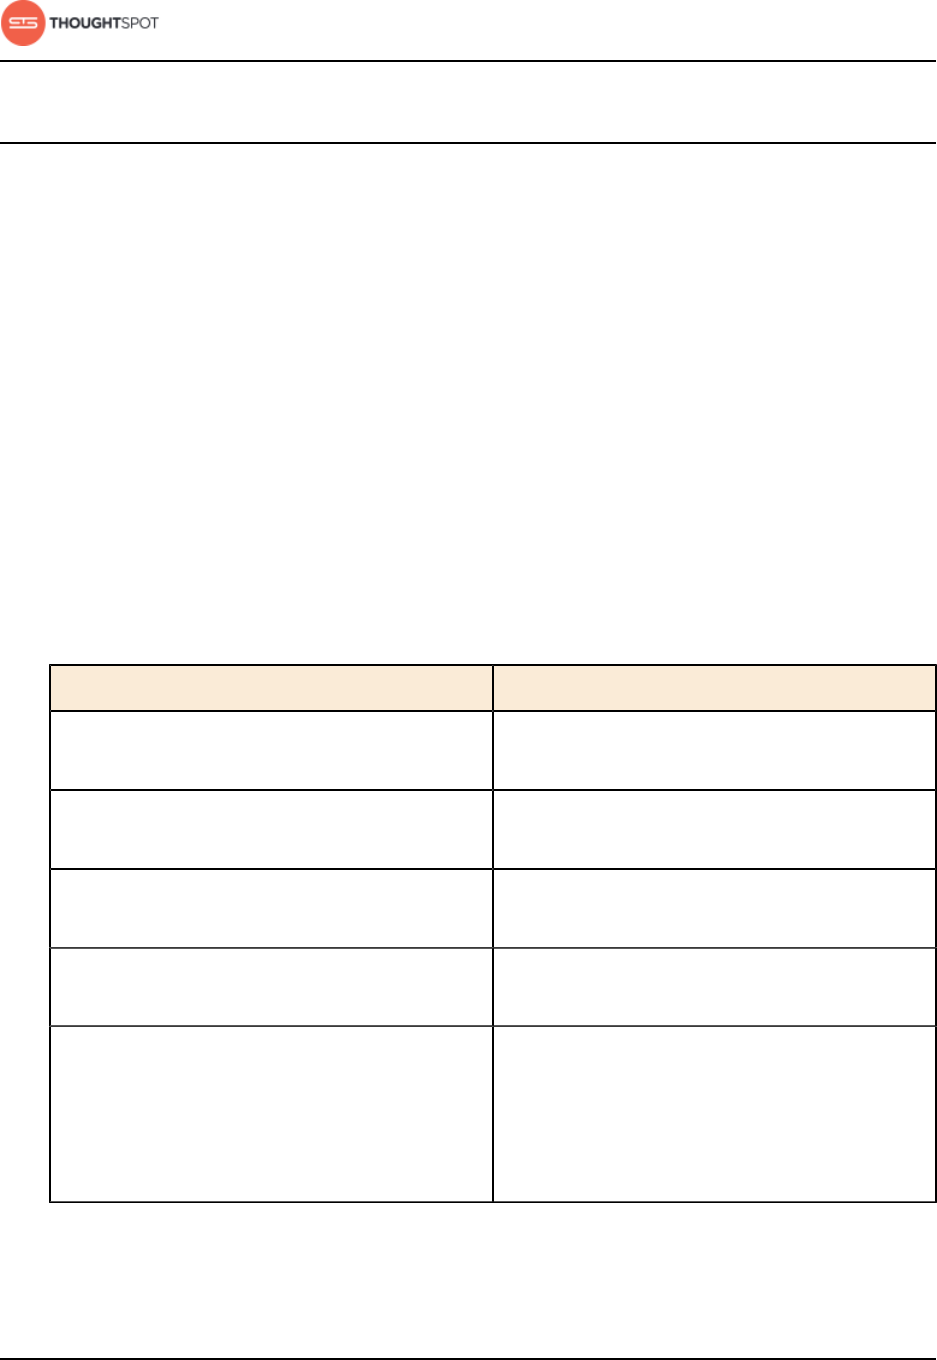
Table 1: Supported browsers
Browser Version Operating System
Google Chrome 20 and above • Windows 7 or greater
• Linux
• MacOS
Mozilla Firefox 14 and above • Windows 7 or greater
• Linux
• MacOS
Internet Explorer 10 and 11 • Windows 7 or greater
To log in to ThoughtSpot from a browser:
1. Open the browser and type in the Web address for ThoughtSpot:
http://<hostname_or_IP>
2. Enter your username and password and click Enter Now.
Log out of ThoughtSpot
Once you're done with your search session, you can optionally log out of
ThoughtSpot.
To log out of ThoughtSpot from a browser:
1. Click your user icon at the top right hand corner of the screen.
2. Click Sign out.
Introduction
User Guide Copyright © 2016 by ThoughtSpot. All Rights Reserved. 10
Figure 3: Sign out of ThoughtSpot
About the user profile
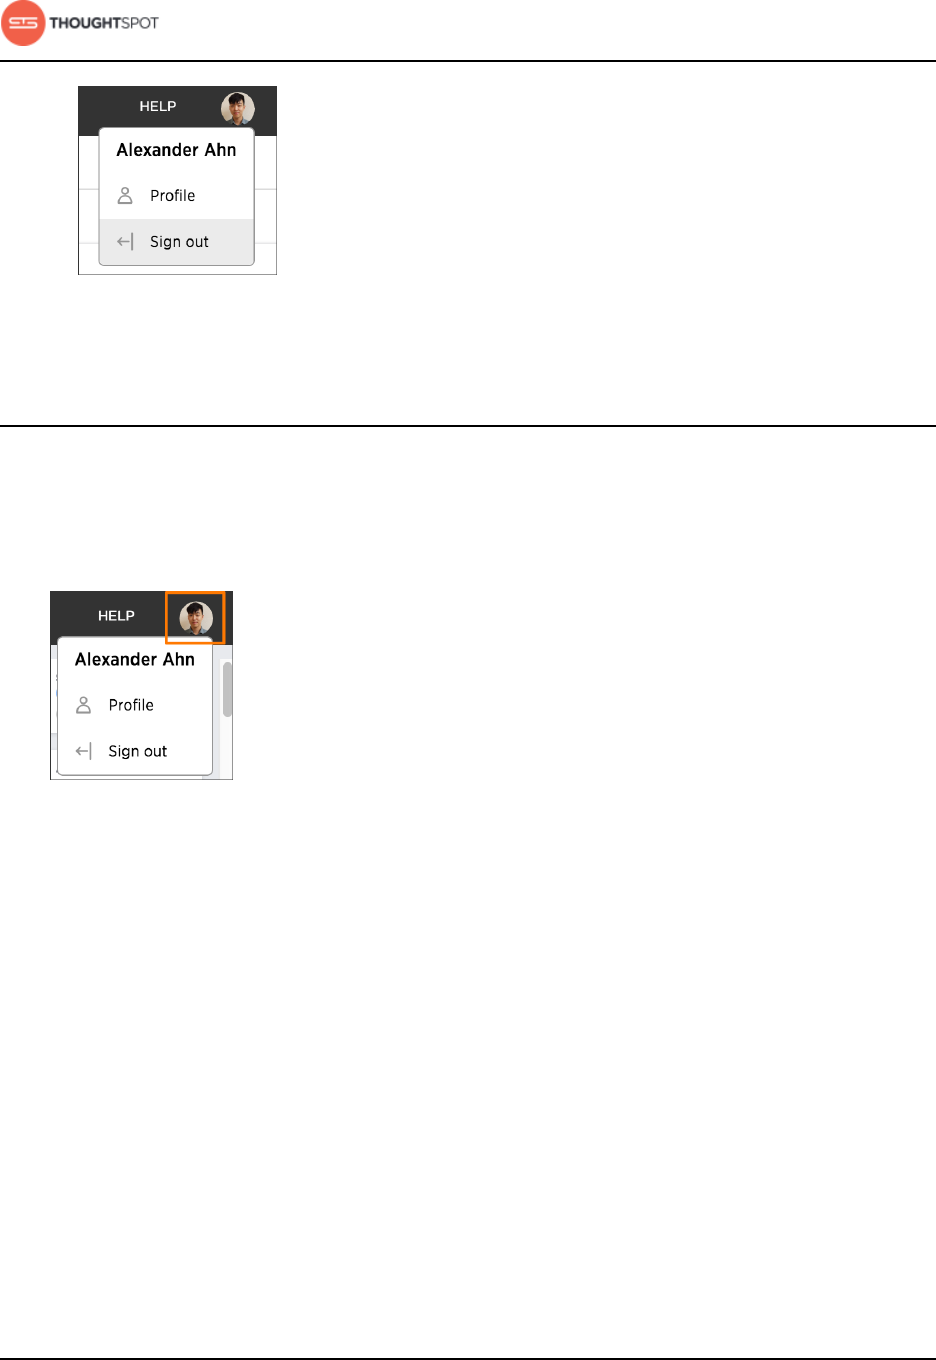
The user icon lets you view your profile or sign out of ThoughtSpot.
To view the user actions, click on your user icon on the top right corner of the
page.
Figure 4: User icon
Click Profile to go to your profile preference page, where you can change your
icon, email preferences, or password.
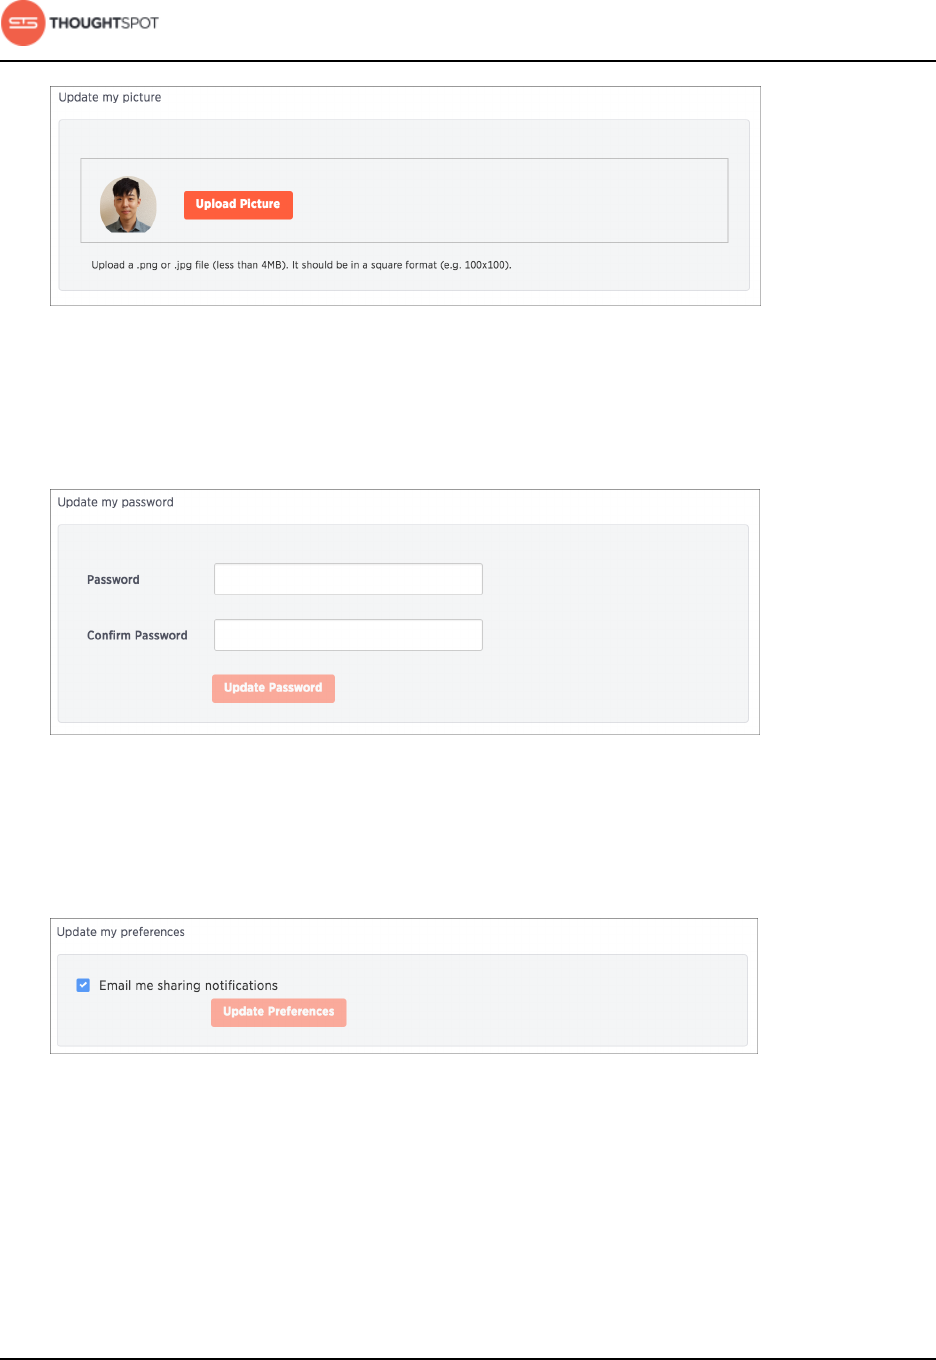
You can change your picture by clicking Upload Picture. The system accepts
PNG or JPEG files that are under 4MB.
Introduction
User Guide Copyright © 2016 by ThoughtSpot. All Rights Reserved. 11
Figure 5: Update my picture
You can change your password by entering your new password and clicking
Update Password.
Figure 6: Update my password
You can change your email notifications preferences by checking or unchecking
Email me sharing notifications and clicking Update Preferences.
Figure 7: Update my preferences
Clicking Sign out logs you out of ThoughtSpot, and takes you back to the sign in
page.
Introduction
User Guide Copyright © 2016 by ThoughtSpot. All Rights Reserved. 12
Understanding privileges
The things you can do in ThoughtSpot are determined by the privileges you
have. These are set at the group level.
If you are trying to do something in ThoughtSpot, and cannot access the screens
to accomplish it, you may not have the correct privileges. In this case, you should
contact your administrator and explain what you want to accomplish. Your
administrator may be able to grant you additional privileges.
Note that permissions to see and edit tables, worksheets, and pinboards are not
affected by privileges. They are given when these itmes are shared with you.
Here are the privileges that the administrator sets, and the capabilities they
enable:
Table 2: Group Permissions
Privilege Description
Has administration privileges Can manage Users and Groups and has view
and edit access to all data.
Can upload user data Can upload their own data from the browser
using Import Data.
Can download data Can download data from search results and
pinboards.
Can share with all users Can see the names of and share with users
outside of the groups the user belongs to.
Can manage data Can create a worksheet. Can also create an
aggregated worksheet from the results of a
search by selecting Save as worksheet. Can
also use ThoughtSpot Data Connect, if it is
enabled on your cluster.
Introduction
User Guide Copyright © 2016 by ThoughtSpot. All Rights Reserved. 13
About stickers
You can create stickers to make it easier for people to find data sources and
pinboards.
About stickers
Stickers enable you to create categories for classification of objects, including
pinboards, answers, data sources, and worksheets. Only administrators can
create stickers, and they are global in scope. This means that everyone can see
the stickers and use them to tag objects. They can also filter lists of objects by
sticker. Stickers are often used to designate subject areas, such as sales, HR, and
finance, but you can use them any way you like.
This is the workflow for using stickers:
1. Only administrators can create stickers.
2. Anyone can Apply a sticker.
3. Anyone can Filter by a sticker.
Apply a sticker
Apply a sticker whenever you want to tag a data source, worksheet, or pinboard
to make it easier to find.
Only administrators create stickers, but anyone with edit privileges can tag an
object with a sticker.
To tag an object with a sticker:
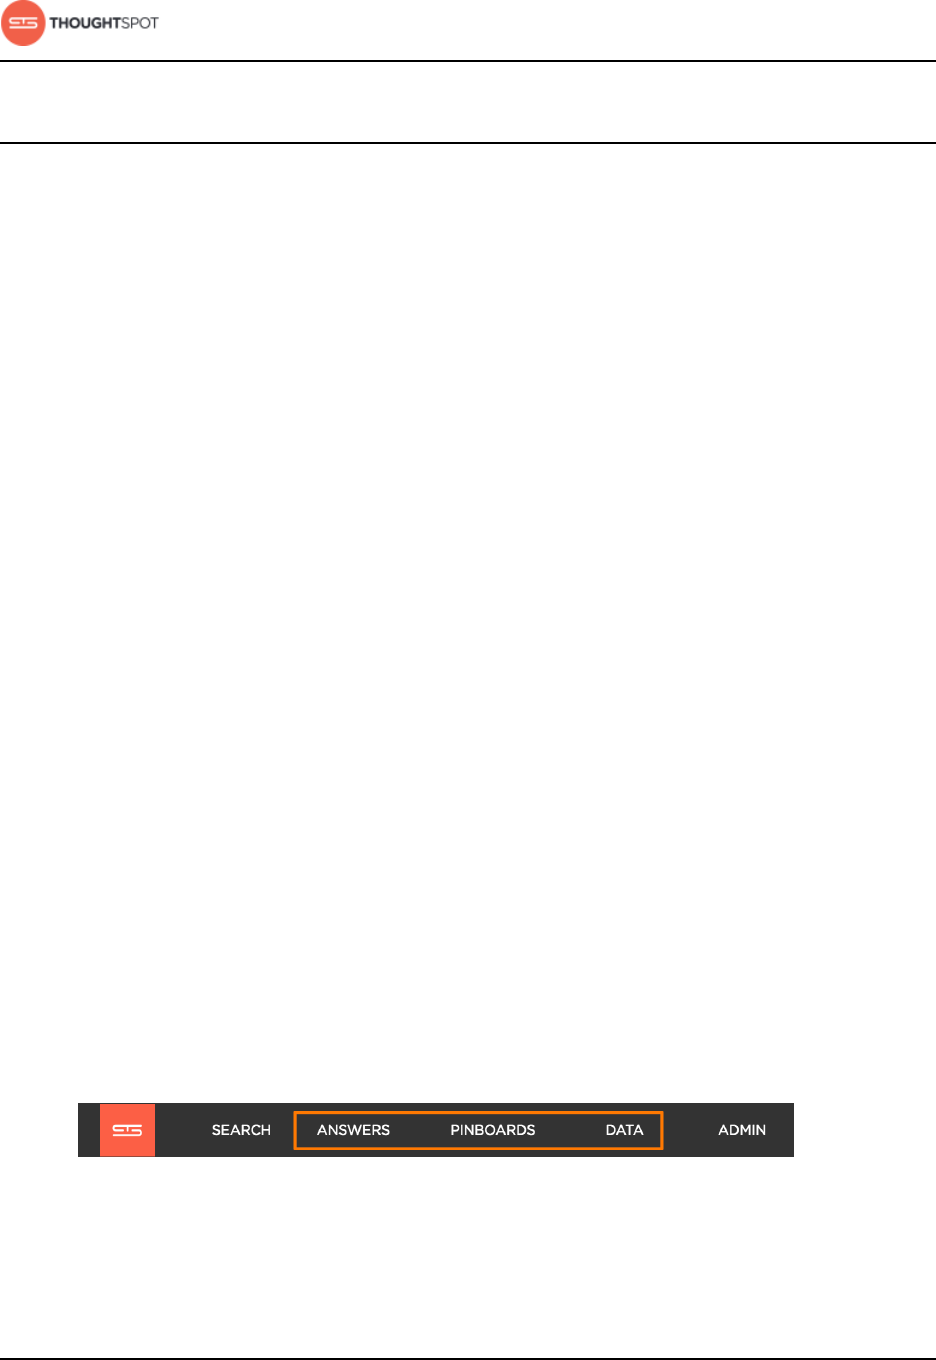
1. From the top menu, choose Answers, Pinboards, or Data.
Figure 8: Choose Answers, Pinboards, or Data
Introduction
User Guide Copyright © 2016 by ThoughtSpot. All Rights Reserved. 14
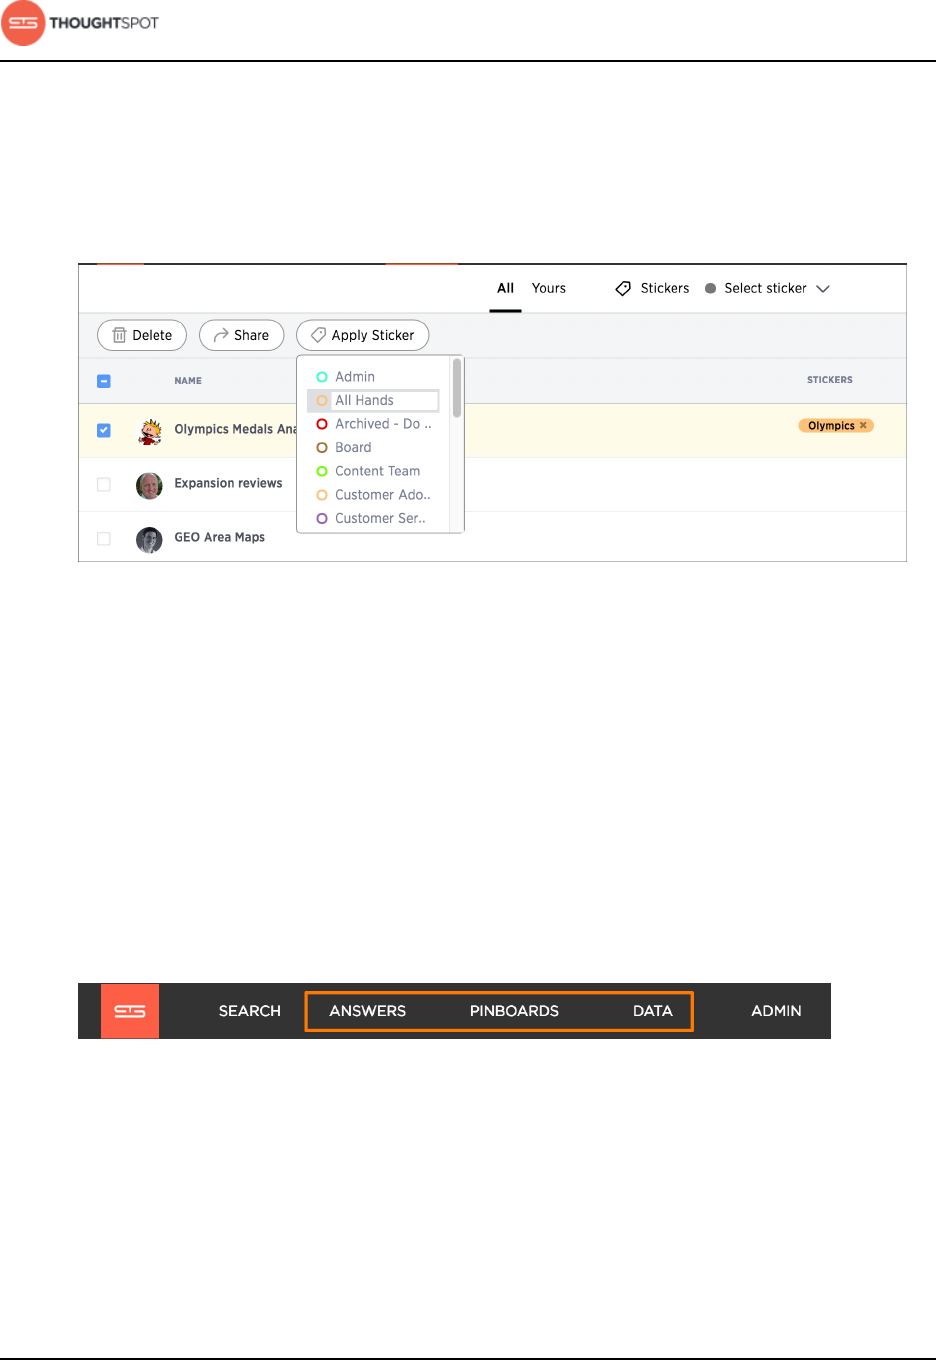
2. Find the item(s) you want to tag in the list, and check the box next to its
name.
3. Click the apply sticker icon and choose one from the list.
You can apply as many stickers as you like to an object.
Figure 9: Choose a sticker to apply
Filter by a sticker
Whenever you are selecting objects from a list, you can filter by sticker to find
what you're looking for.
Anyone can use stickers to filter lists of pinboards or data sources. You can also
filter by sticker when selecting data sources.
To filter by sticker:
1. From the top menu, choose Answers, Pinboards, or Data.
Figure 10: Choose Answers, Pinboards, or Data
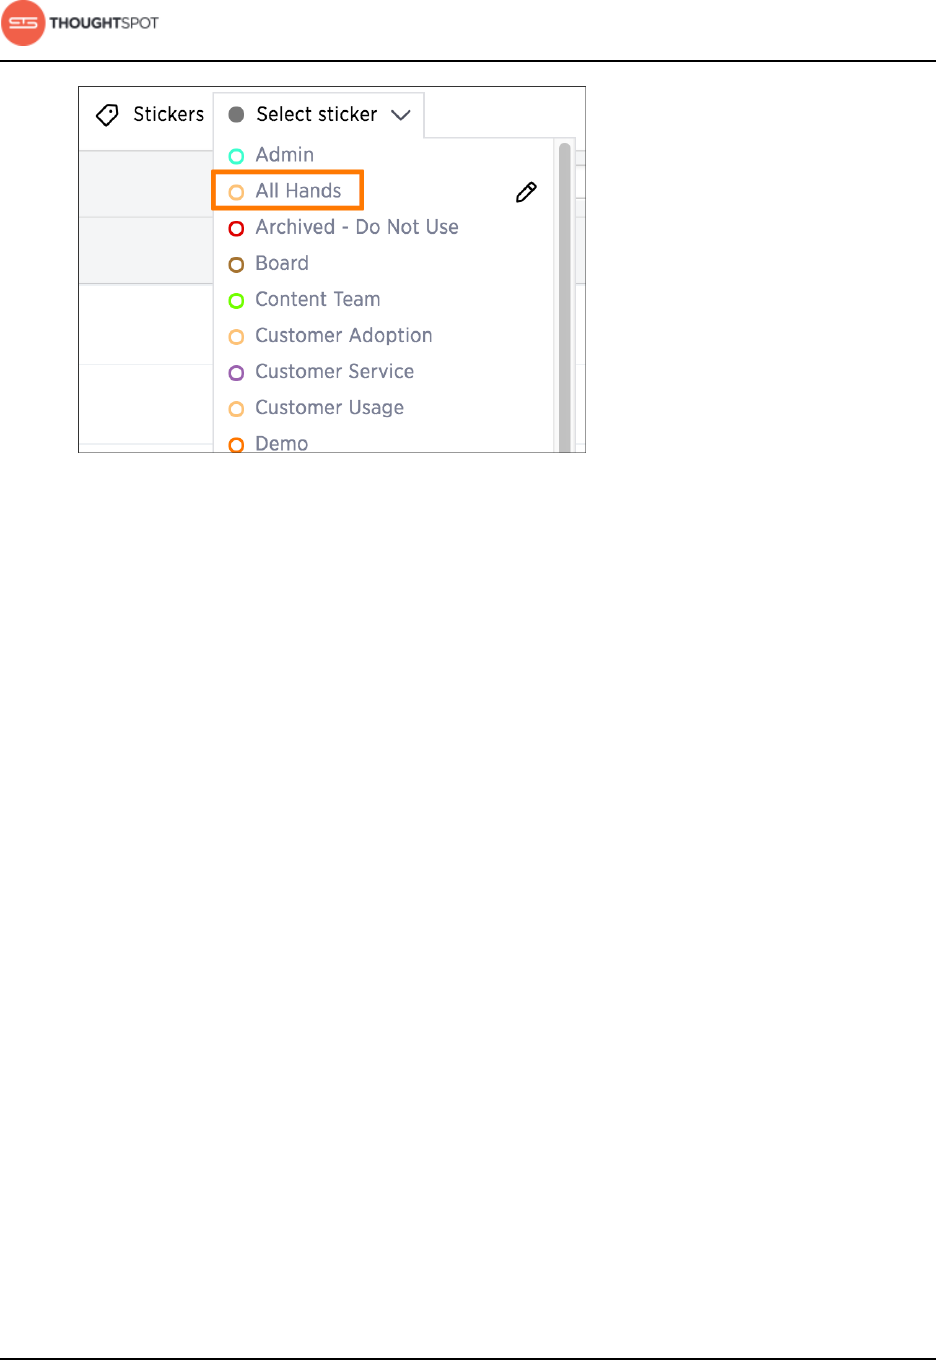
2. Click on Select sticker, and select a sticker to filter by. Click on its name.
Introduction
User Guide Copyright © 2016 by ThoughtSpot. All Rights Reserved. 15
Figure 11: Filter by a sticker

About search
User Guide Copyright © 2016 by ThoughtSpot. All Rights Reserved. 16
Chapter 2: About search
About search
Topics:
•About starting a new
search
•About charts
•About filters
Use search to get instant answers about your data
without having to consult a data analyst.
Using ThoughtSpot's relational search is simple,
so anyone can use it. In the search bar, type what
you are interested in exploring, for example revenue
midwest sales rep. ThoughtSpot will return an answer
based on your searched terms.
As you get better with ThoughtSpot's search tools,
you will be able to get more out of your data by
performing more complex searches. For more
information on complex searches, refer to the
advanced searches section.
About search
User Guide Copyright © 2016 by ThoughtSpot. All Rights Reserved. 17
About starting a new search
There are a few basic things you should understand before starting a new
ThoughtSpot search.
How do I search data?
You’ve probably seen one of these before:
Figure 12: Search bar
Click in the box and start typing some letters. As soon as you begin typing,
search suggestions appear. Type slowly and use the suggestions to find what
you're looking for.
Whenever you finish typing a word, you'll see an answer in the form of a chart or
a table.
You should know that search in ThoughtSpot is more like an Amazon search than
a conversation. For example. Instead of:
Find me all books by Lewis Carroll with the title Alice in Wonderland
You'd type:
carroll alice
Or consider Google. You wouldn’t type in:
Find me the largest city by population
You’d type:
largest city by population
About search
User Guide Copyright © 2016 by ThoughtSpot. All Rights Reserved. 18
or simply:
largest city population
That’s how search works in ThoughtSpot. You can use some helping words like
“by” and “for” but they can also be left out, and the search will return the same
answer.
What kinds of things can I type?
Search is based on the tables that exist in your data. Tables are made of rows
and columns, like spreadsheets.
So you can search by typing in any of these words:
• The column name: like revenue, product name, or store
• Any of the values in the columns: like 20000, kitten chow, or richmond
• One of the special keywords ThoughtSpot understands: like yesterday, >, or
contains
Start a new search
Starting a new ThoughtSpot search is simple, like starting a new Google search.
To start a new search:
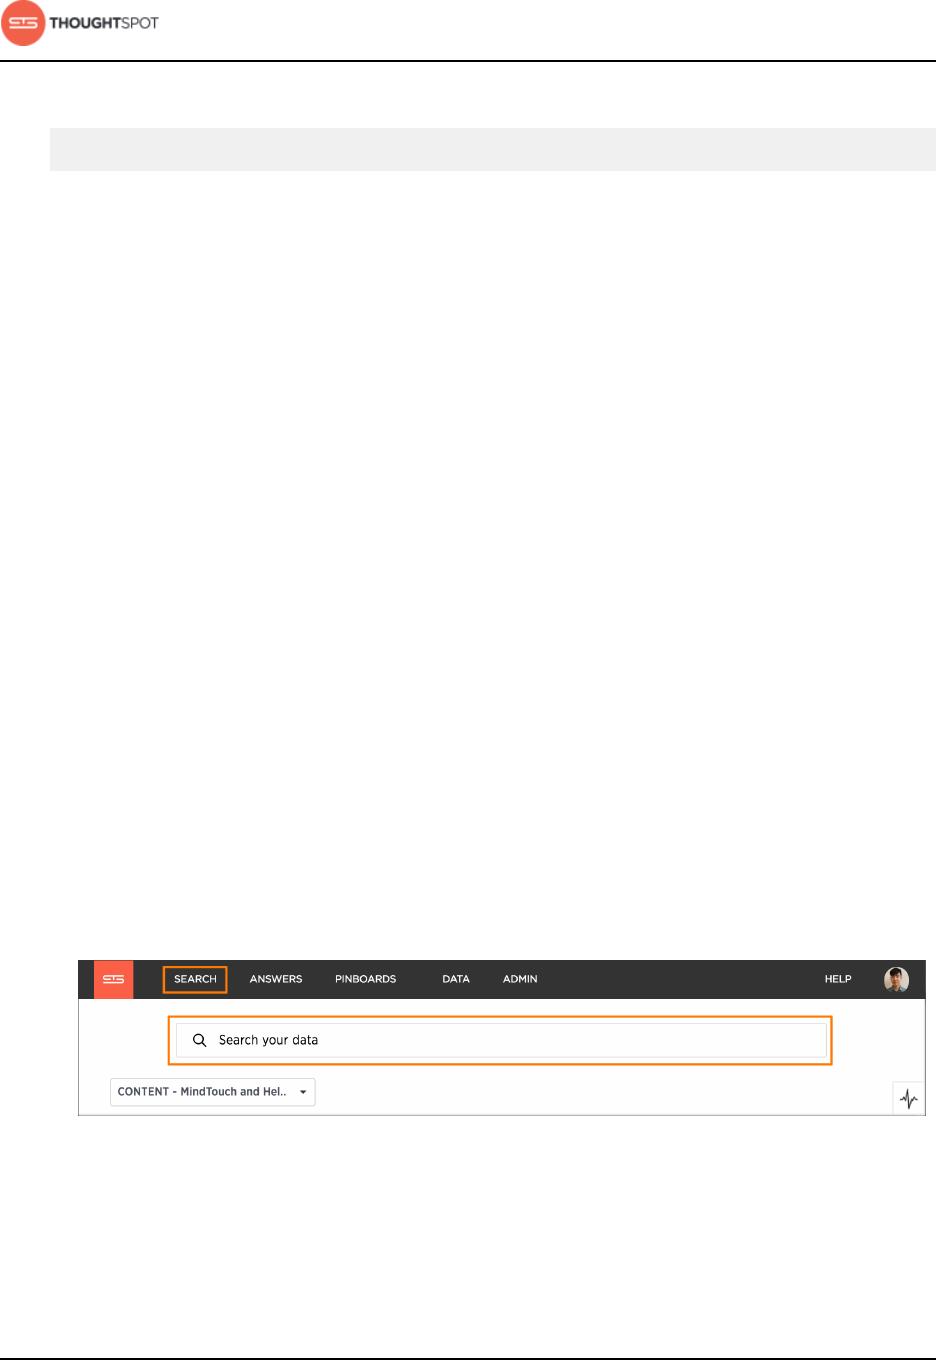
1. Click Search on the top navigation bar. You can also click Search your data at
the top of the home page.
Figure 13: Start a new search
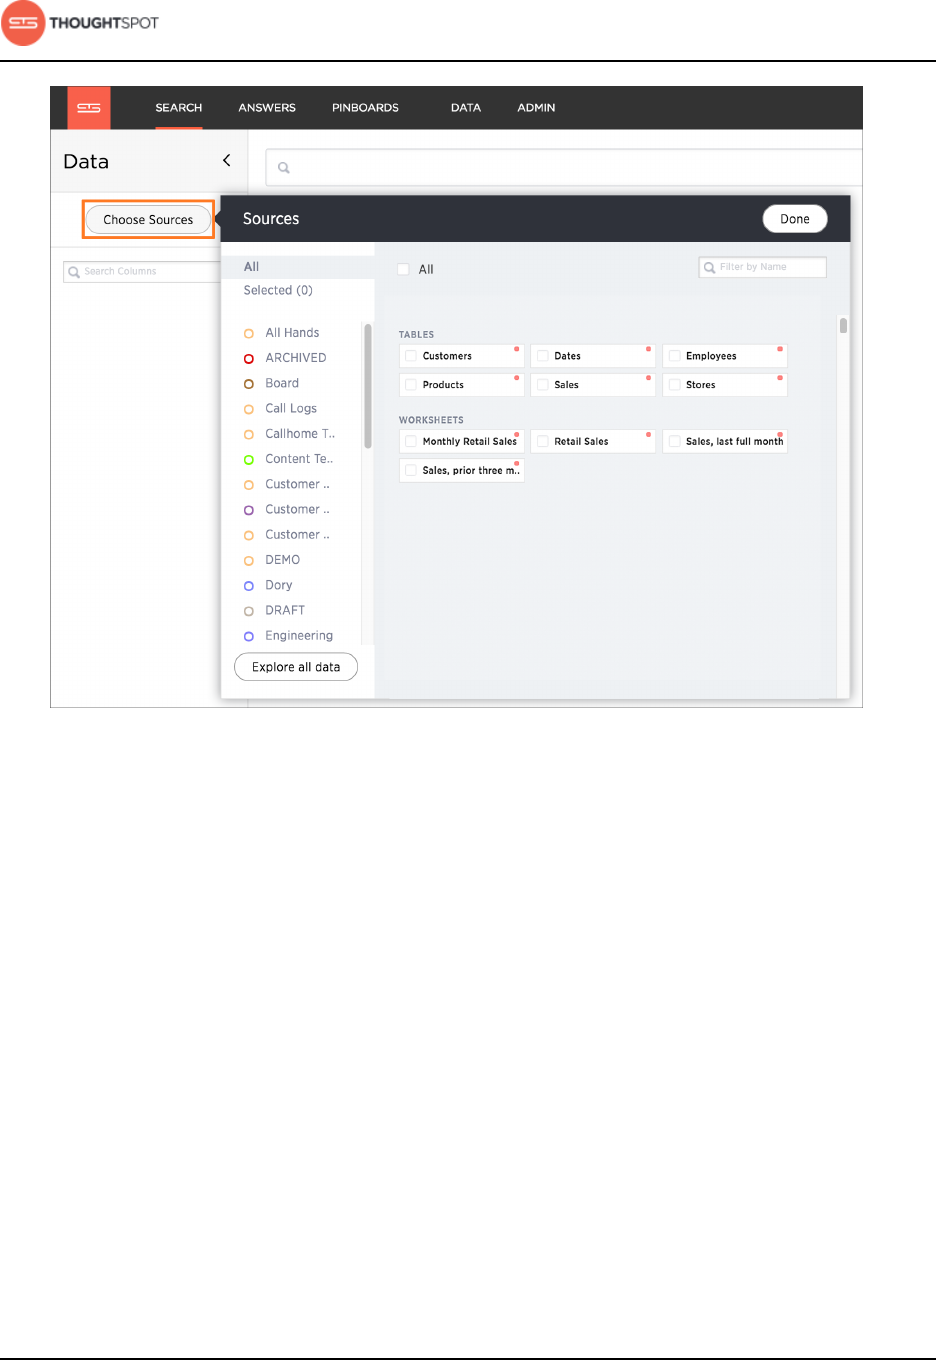
2. Choose your sources by clicking Choose Sources.
About search
User Guide Copyright © 2016 by ThoughtSpot. All Rights Reserved. 19
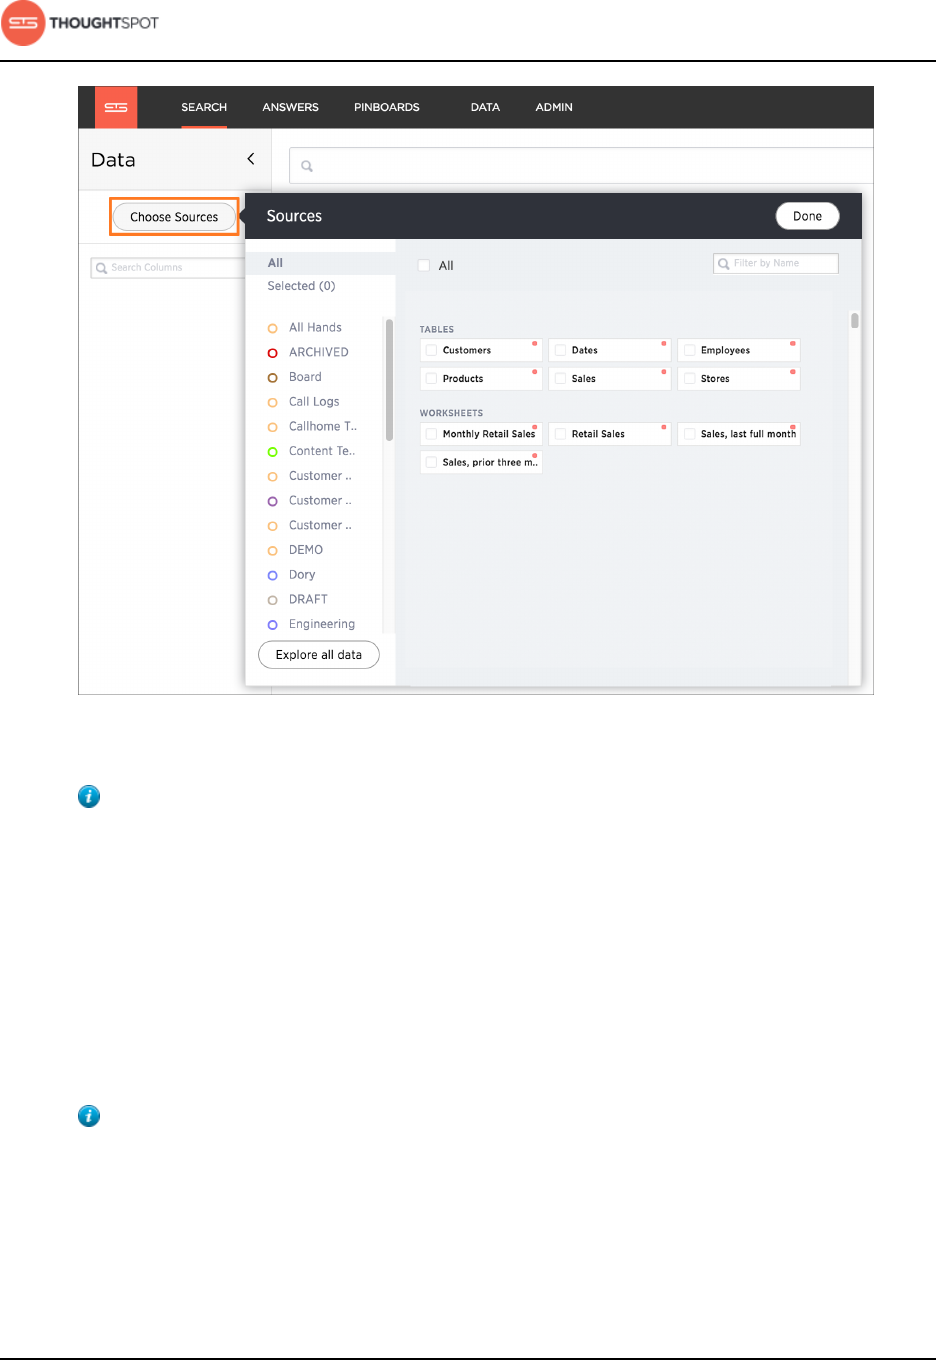
Figure 14: Choose sources menu
Tip: To see details of all of the data, click Explore all data.
a) Filter through all available sources by using the search bar or stickers.
b) Select your sources.
c) Click Done.
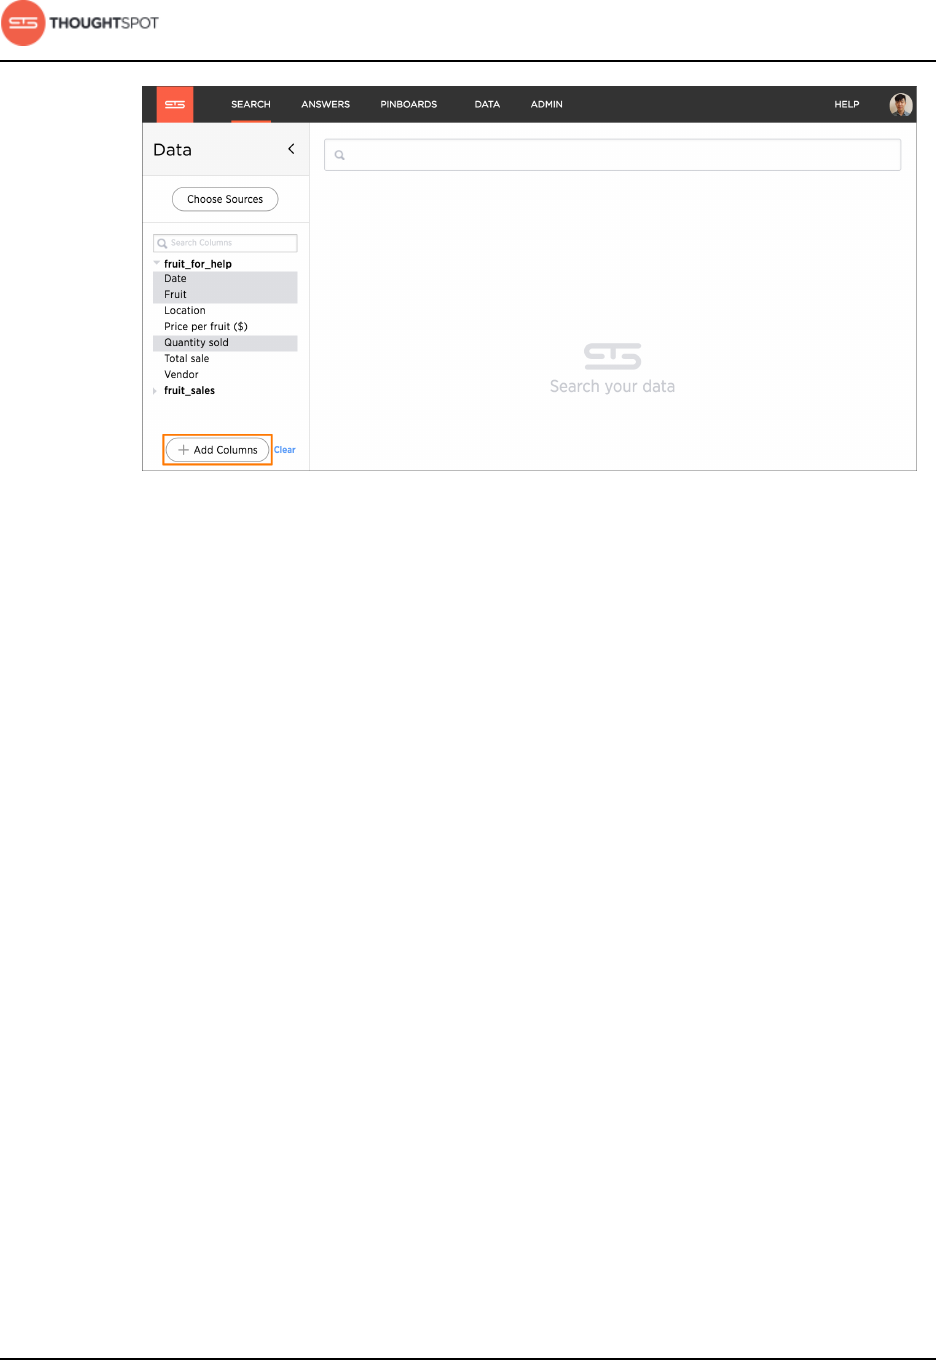
3. Add columns to the search bar, or double click columns in the Data column
in the left panel. The columns listed in the left panel are grouped together by
data sources for discoverability and ease of access.
Tip: You can also add multiple columns at once by clicking each column
to select it, and then click + Add Columns.
About search
User Guide Copyright © 2016 by ThoughtSpot. All Rights Reserved. 20
Figure 15: Add multiple columns at once
Your search is given an automatic title based on your search columns, and is
displayed as either a table or chart, depending on how it is best represented.
You can change the view to fit your needs.
About choosing sources
Before you start a new search, make sure you have chosen the right data
sources.
To begin a new search, you must first select your data sources by clicking on the
Choose Sources button. You will see a list of data sources that have been shared
with you. The data sources are usually created by your administrator, though you
can also upload your own data.
About search
User Guide Copyright © 2016 by ThoughtSpot. All Rights Reserved. 21
Figure 16: Choose sources
Searches happen in the context of the selected data sources. ThoughtSpot will
also make suggestions from other data sources for you, if what you're typing
can't be found in the selected data source.
About the search bar
The search bar is designed to make it easy for you to identify your search terms.
A lot of work has gone into making ThoughtSpot's search bar intuitive and easy
to use. However, it still helps to know some details of how the search bar works.
Boxed search phrases
The search bar shows boxes around each search phrase, so you can easily see
where it begins and ends. Your search phrases still appear as text when you are
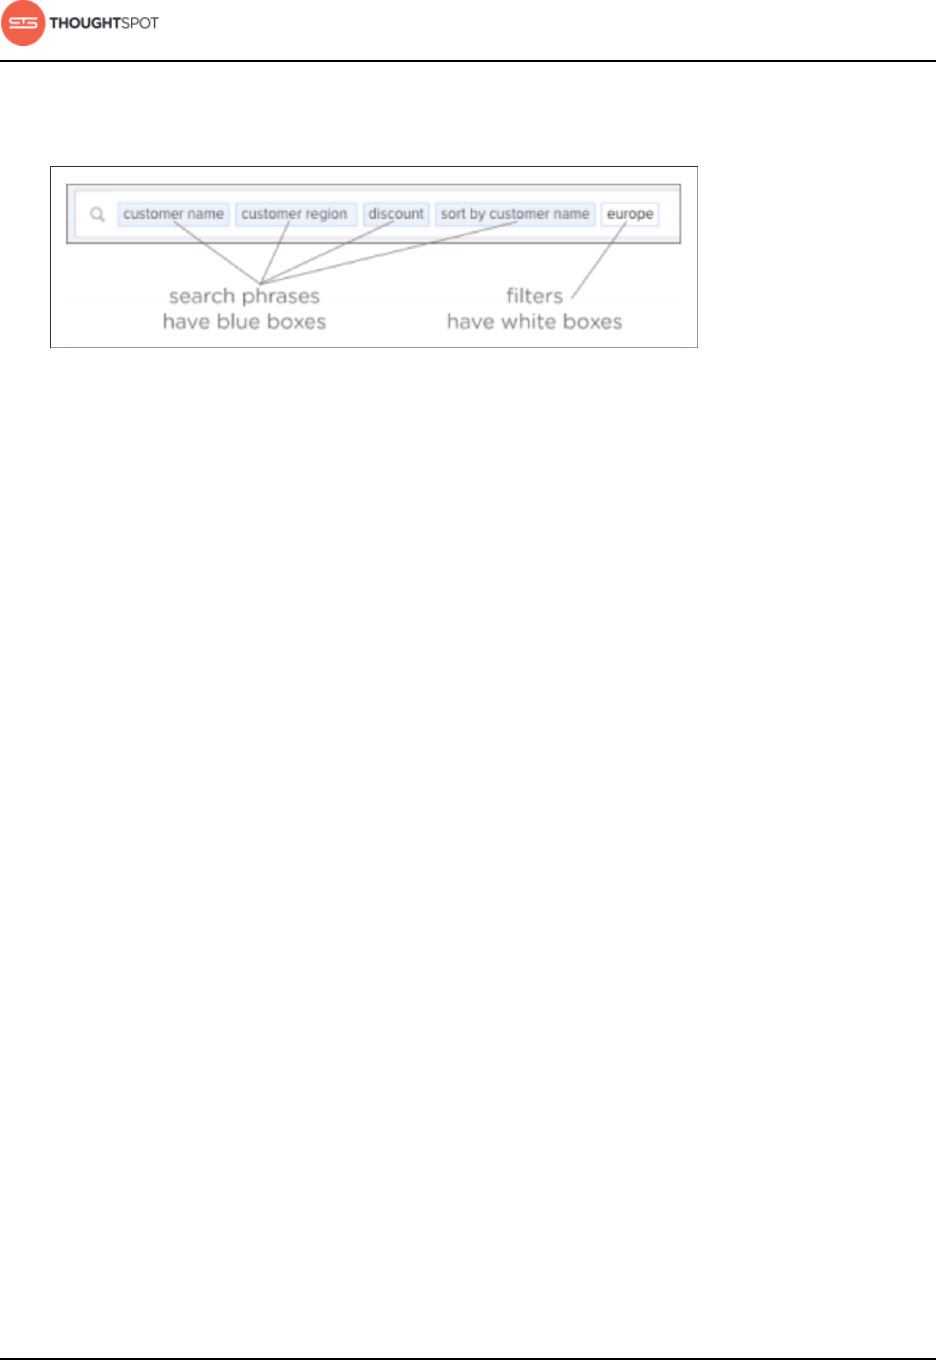
About search
User Guide Copyright © 2016 by ThoughtSpot. All Rights Reserved. 22
typing, but whenever you click out of the search bar, they are boxed. Search
phrases have blue boxes, and filters have white boxes.
Figure 17: Search bar with boxed phrases
Removing search phrases
When you click on a search phrase, it is highlighted, so you can easily replace it
with one of the suggestions. When you hover over on a boxed phrase, you'll see
an x, which you can click to remove it. When you delete a phrase, your search
will automatically update.
If you find yourself looking at a table or chart, but it doesn't seem to contain all
the data you expect, try looking in the search bar for white boxes (filters). If you
remove all the filters, you will again see all the available data for that search.
Spell check
The search bar includes spell check. If you spell or type a term incorrectly, your
suggestions will include the correct spelling of the term or keyword.
The spell check in the search bar also performs a metaphone check for similar
sounding words on text data values.
Dictionary synonyms
A dictionary of common word synonyms is bundled with ThoughtSpot. The
dictionary contains synonyms for common terms that occur in data. For
example, if you type in “gross”, and that word is not found, ThoughtSpot will
consider it a synonym for “revenue”. We use the WordNet library of terms, which
About search
User Guide Copyright © 2016 by ThoughtSpot. All Rights Reserved. 23
takes word proximity into account, and weights words by similarity to the target
term.
This frees you from having to know the exact term or column name used in a
data source. You can still find the answer in many cases, if you type a word with
the same meaning as a different word that occurs in the data.
Search help
If you type an unrecognized search term, you will be offered tips on searching.
The search help appears when you type a term that isn’t understood by
ThoughtSpot and then presses the Enter key.
Figure 18: Search help box
Search suggestions
Search suggestions include complete recent searches that are similar to the
search you are constructing. You can also search for saved objects, such as
pinboards.
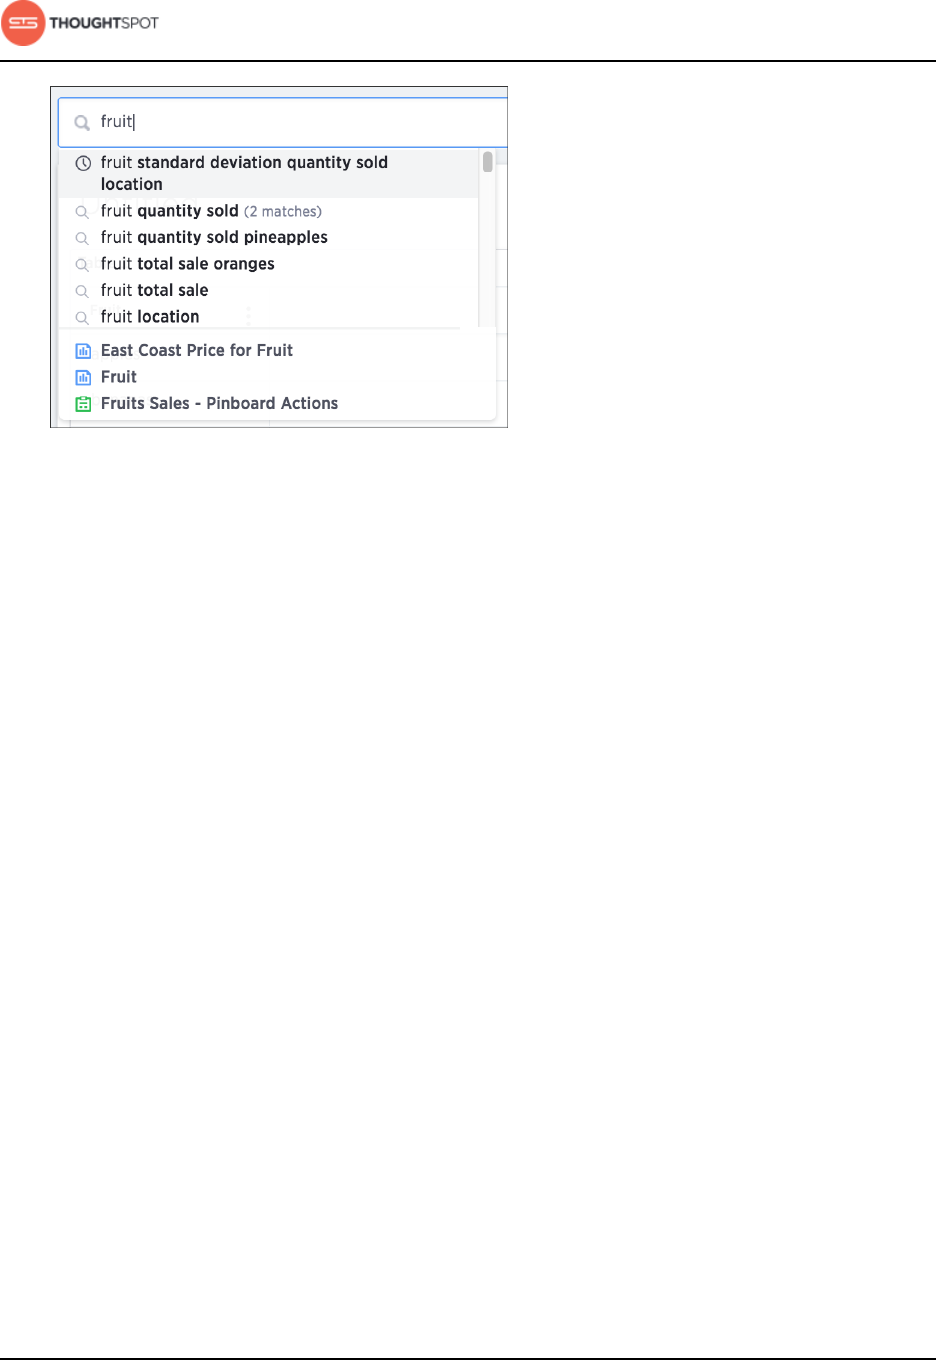
About search
User Guide Copyright © 2016 by ThoughtSpot. All Rights Reserved. 24
Figure 19: Search suggestions
Usage-based ranking
Search suggestions are relevant to the data and personalized to your search
behavior. ThoughtSpot learns over time what columns are most important to you
and to your company as a whole, and uses this knowledge to rank the search
terms it offers. This is accomplished through usage-based ranking. So if you
frequently type terms related to finance or to a particular product, you will see
related suggestions more frequently. ThoughtSpot does this by keeping usage
statistics on frequency of search terms in its local cache. Using this information,
frequently used terms and phrases are offered in search suggestions more often
than those that are not commonly used. This personalization based on search
patterns makes ThoughtSpot more valuable over time. Search suggestions
become more helpful the more searches you complete.
Recent searches
As you type in the search bar, you are given search suggestions that include
recent searches. This makes it easier to learn what you can do with ThoughtSpot.
In addition to displaying your own recent searches, the search bar also learns
from searches made by other people. This should provide you with interesting
searches that you may not have been aware of. You'll see recent searches in
About search
User Guide Copyright © 2016 by ThoughtSpot. All Rights Reserved. 25
a separate section of search suggestions, as recent searches appear higher in
suggestions than other terms.
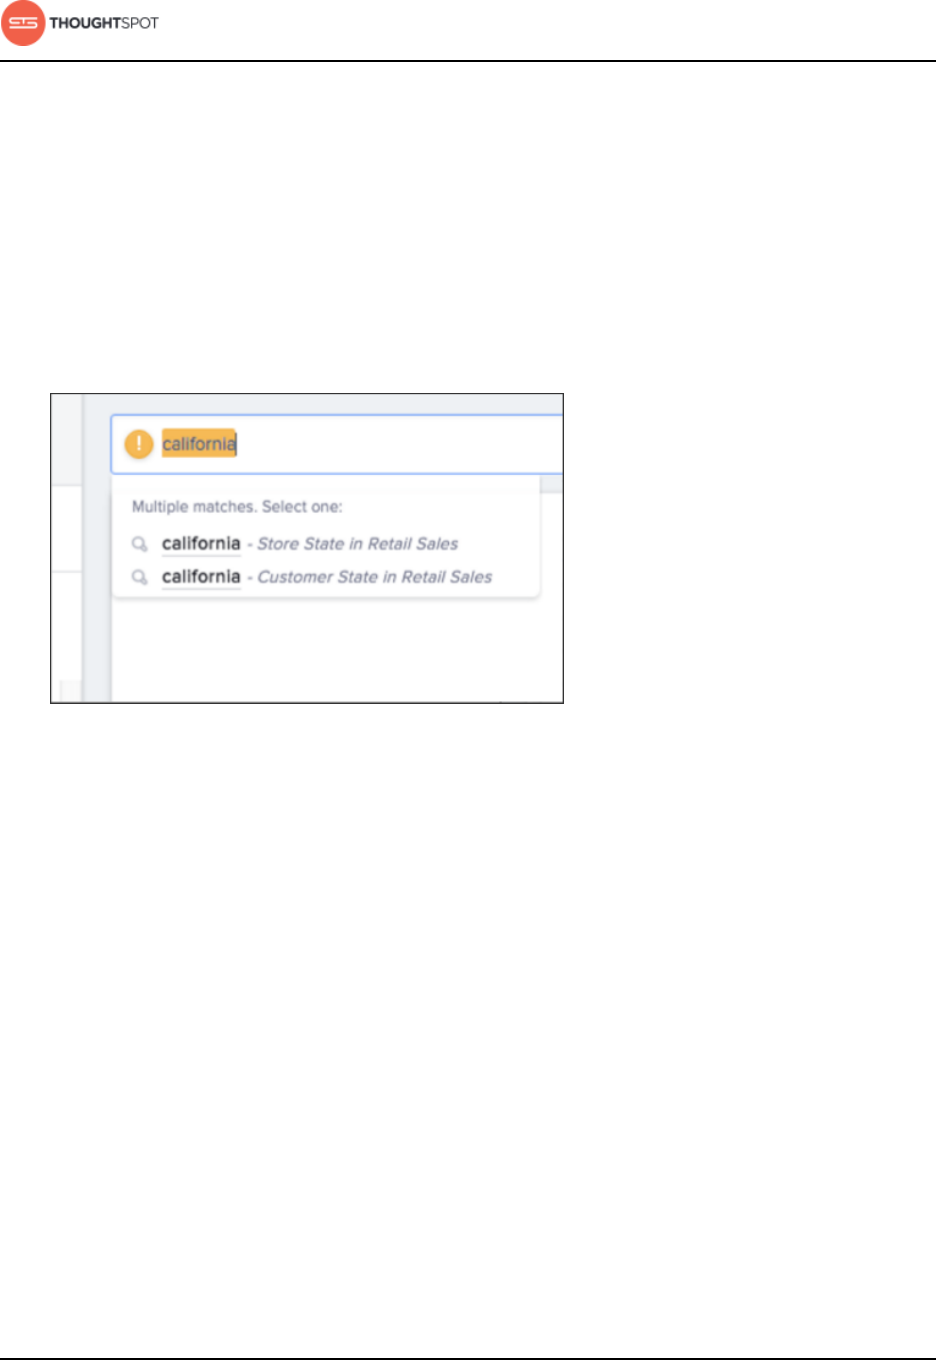
Auto-disambiguation in search
When there are more than one possible meaning for a search term, you can
provide disambiguation by selecting from a list of choices. Now your choice is
sticky. That means you won’t have to select it again, in the scope of the current
search.
Figure 20: Auto-disambiguation example
Out of scope columns
Search suggestions are not limited in scope to the columns that you select as the
data sources. Suggestions can include columns that are out of scope, too. If you
choose one of these suggestions, the columns will be added to the data sources
scope for you.
Object searches
Search suggestions also include relevant pinboards that have already been
created. This means that if a pinboard that is similar to the search you're trying
to do already exists, it will appear in search suggestions.

About search
User Guide Copyright © 2016 by ThoughtSpot. All Rights Reserved. 26
About attributes and measures
Searches in ThoughtSpot use columns that are defined as either attributes or
measures.
ThoughtSpot identifies search columns as either attributes or measures. For
several chart types, your search needs to contain a certain number of attributes
and a certain number of measures.
Attributes
Attribute are primarily text or date values. Attributes make up the x-axis of your
chart most of time. Some examples of attributes in terms of a person include
name, eye color, occupation, social security number, address, employee ID, and
phone number.
Measures
Measures are numeric values you can do math on, with meaningful results. You
will most likely find your measures on the y-axis of your chart. Some examples of
measures in terms of a person are age, height, and weight.
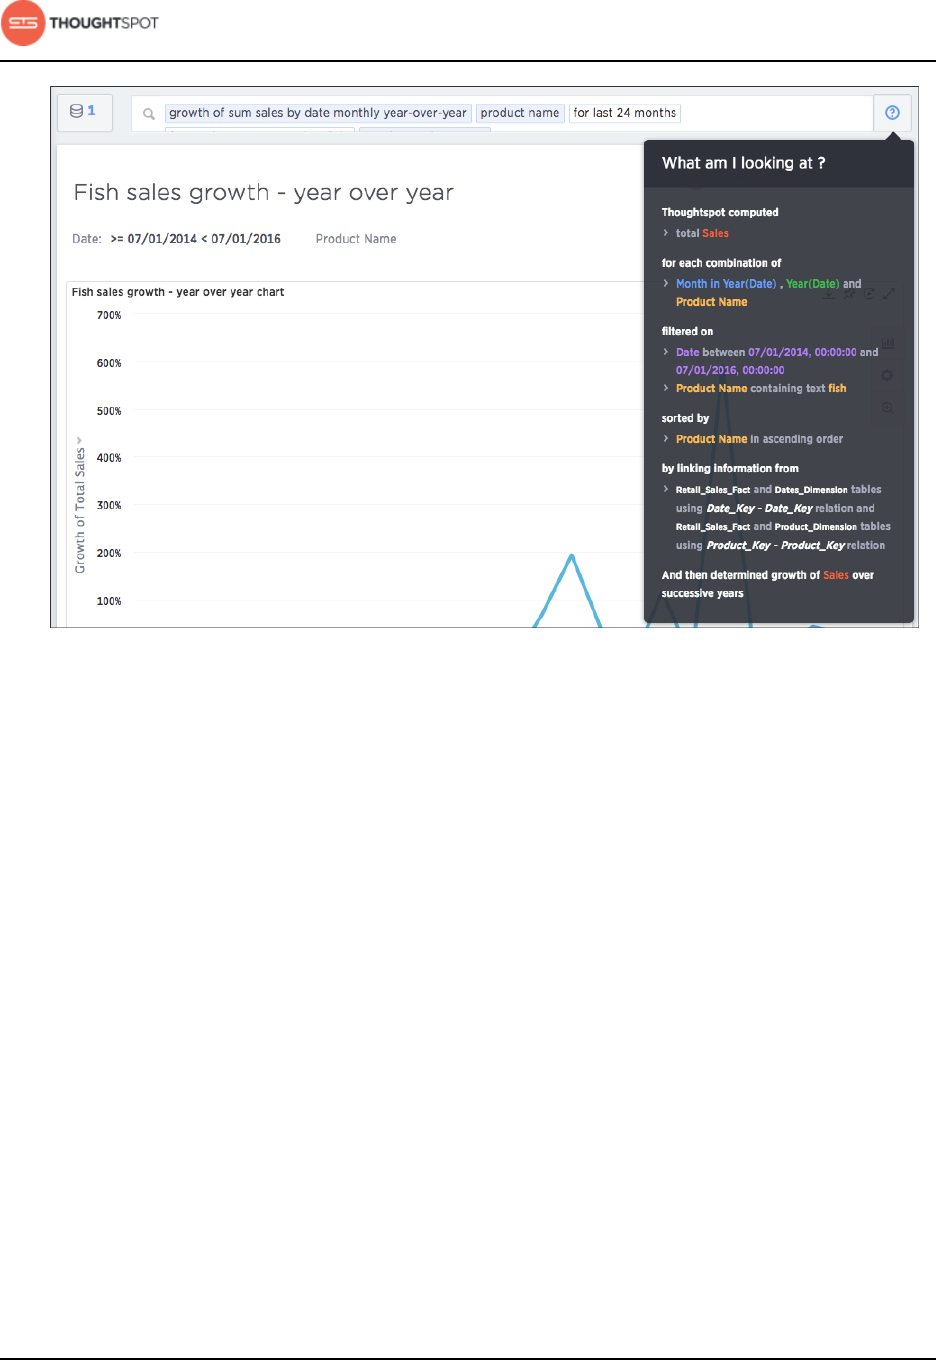
What am I looking at?
After, or while completing a search, you can see how ThoughtSpot came up with
the answer.
Click the question mark on the right hand side of the search bar to open the
“What am i looking at?” dialogue box.
You’ll be shown what measures ThoughtSpot computed, for each combination of
attributes. You’ll also see filters of the search, and how the tables were linked and
used.
About search
User Guide Copyright © 2016 by ThoughtSpot. All Rights Reserved. 27
Figure 21: What am I looking at?
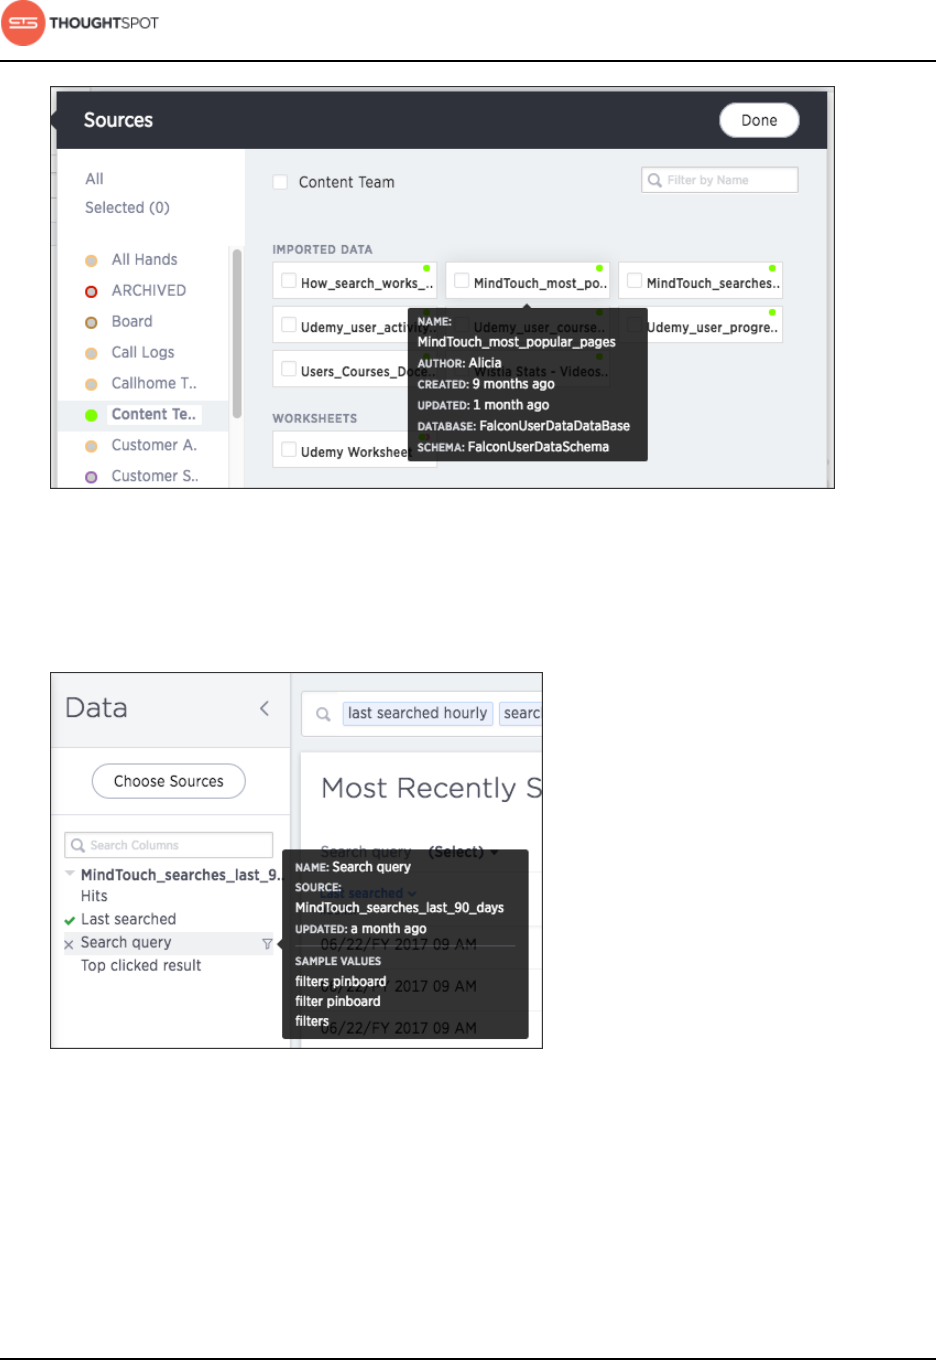
Last data refresh time
You can see the last time at which data was refreshed without having to visit the
Data page.
Hover over the data when choosing a data source to see the last time it was
updated. You will also see when it was created and by whom.
About search
User Guide Copyright © 2016 by ThoughtSpot. All Rights Reserved. 28
Figure 22: Last updated in source selection
You can also hover over a column in the Data column to see when it was last
refreshed. This popup will also show sample values from that column.
Figure 23: Last updated in Data column
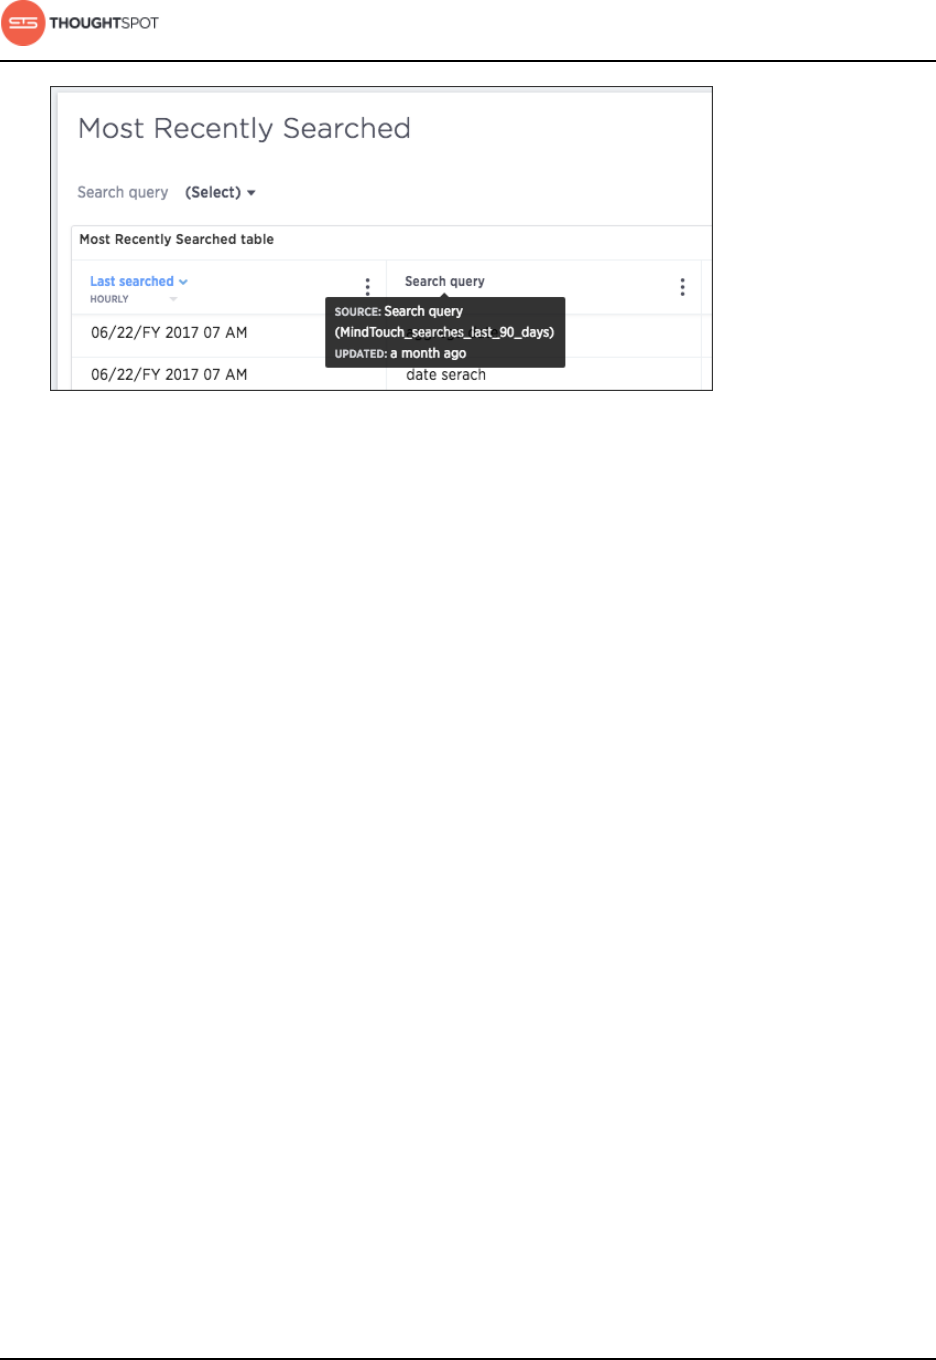
And lastly, you can hover over a column or column name in an answer to see last
updated information.
About search
User Guide Copyright © 2016 by ThoughtSpot. All Rights Reserved. 29
Figure 24: Last updated in answer column
About tables
Tables display your answer in a format similar to an Excel spreadsheet.
Your search is not limited by the number of attributes or columns in order to be
presented as a table. You can have a table with just one attribute or measure.
When you choose to display your answer as a table, ThoughtSpot will create the
columns for you and any relevant headlines.
Sometimes when you view a table, the results will be aggregated (combined).
For example, if you only type "revenue", you'll see the total sum of all the
revenue the table contains as one combined number. If you include the keyword
"monthly", the results will be aggregated by month.
Change the table
You can rearrange the column order of your table among other search actions.
Every table gives you the option to rearrange the column order and change the
column widths.
Rearrange column order
You can rearrange the column order of your table after adding all of your search
terms.
To rearrange the column order:

About search
User Guide Copyright © 2016 by ThoughtSpot. All Rights Reserved. 30
1. While viewing your answer as a table, click the column header you would like
to move.
2. Drag it across to its new position.
Resize column widths
You can resize the column widths of your table after adding all of your search
terms.
Any adjustments you make to the column widths of your table are saved when
you pin the table to a pinboard.
To resize the column widths:
1. While viewing your answer as a table, hover over a column border in the
column header row.
2. Click and drag the border to create your preferred column width.
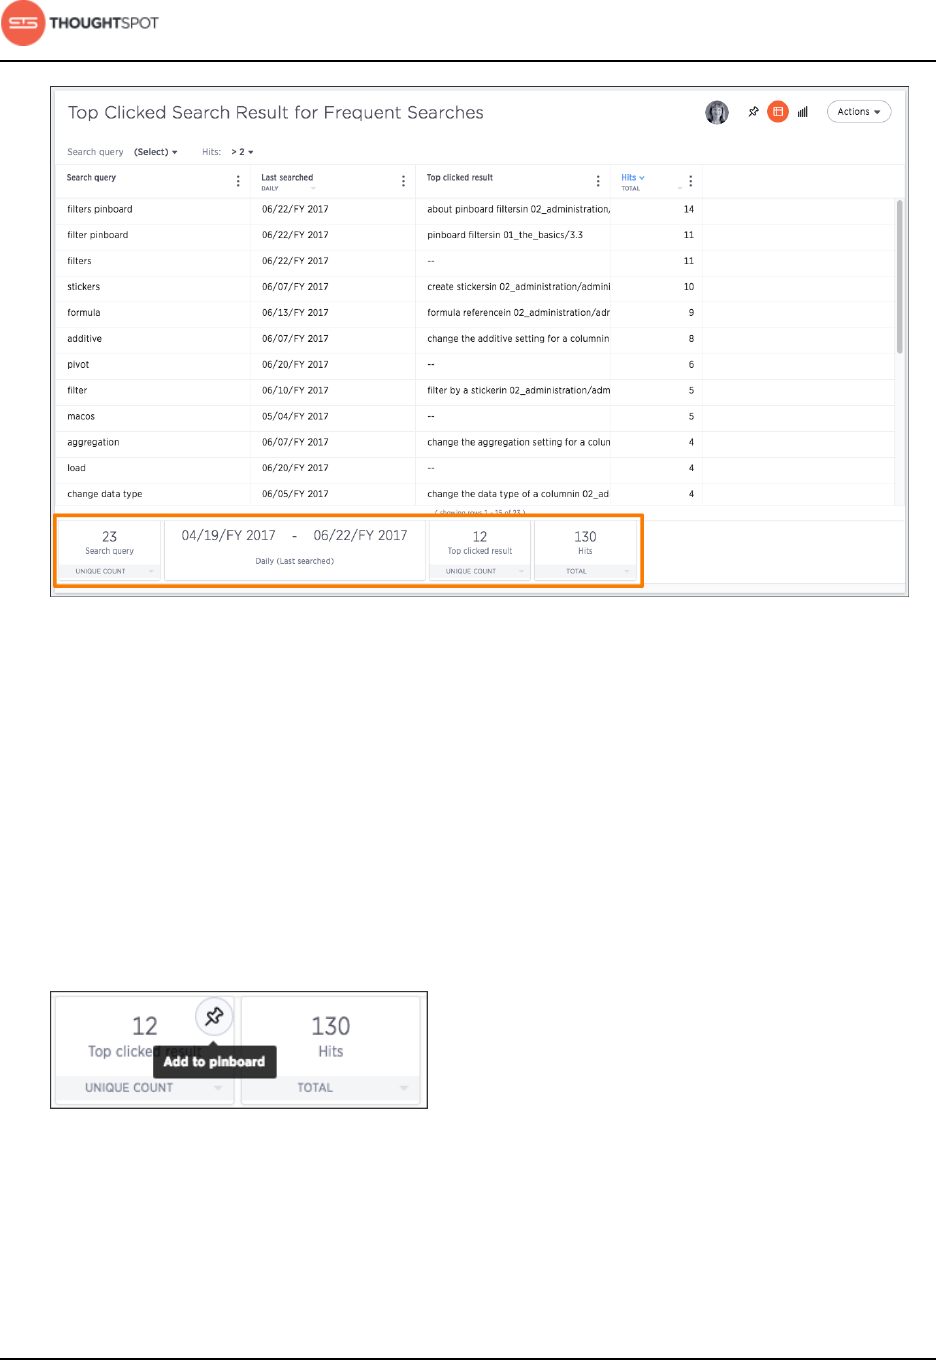
About headlines
Headlines display summary information of a table result.
Headlines contain summary information for each column of a table. They appear
at the bottom of the table in individual boxes.
About search
User Guide Copyright © 2016 by ThoughtSpot. All Rights Reserved. 31
Figure 25: Headlines at the bottom of a table
You can modify how you'd like the value to be displayed by clicking the
dropdown on a headline and selecting a different type of aggregation. The usual
available aggregations are total, average, standard deviation, variance, minimum,
and maximum. There are also unique count and total count values available for
the appropriate columns.
To add a headline to a pinboard, hover over it and click the Add to pinboard
icon.
Figure 26: Add a headline to a pinboard
About search
User Guide Copyright © 2016 by ThoughtSpot. All Rights Reserved. 32
About charts
Charts display your answer in a visual way.
Your search needs at least one attribute and one measure to be presented as
a chart. When you choose to display your answer as a chart, ThoughtSpot will
assign it the best fit chart type.
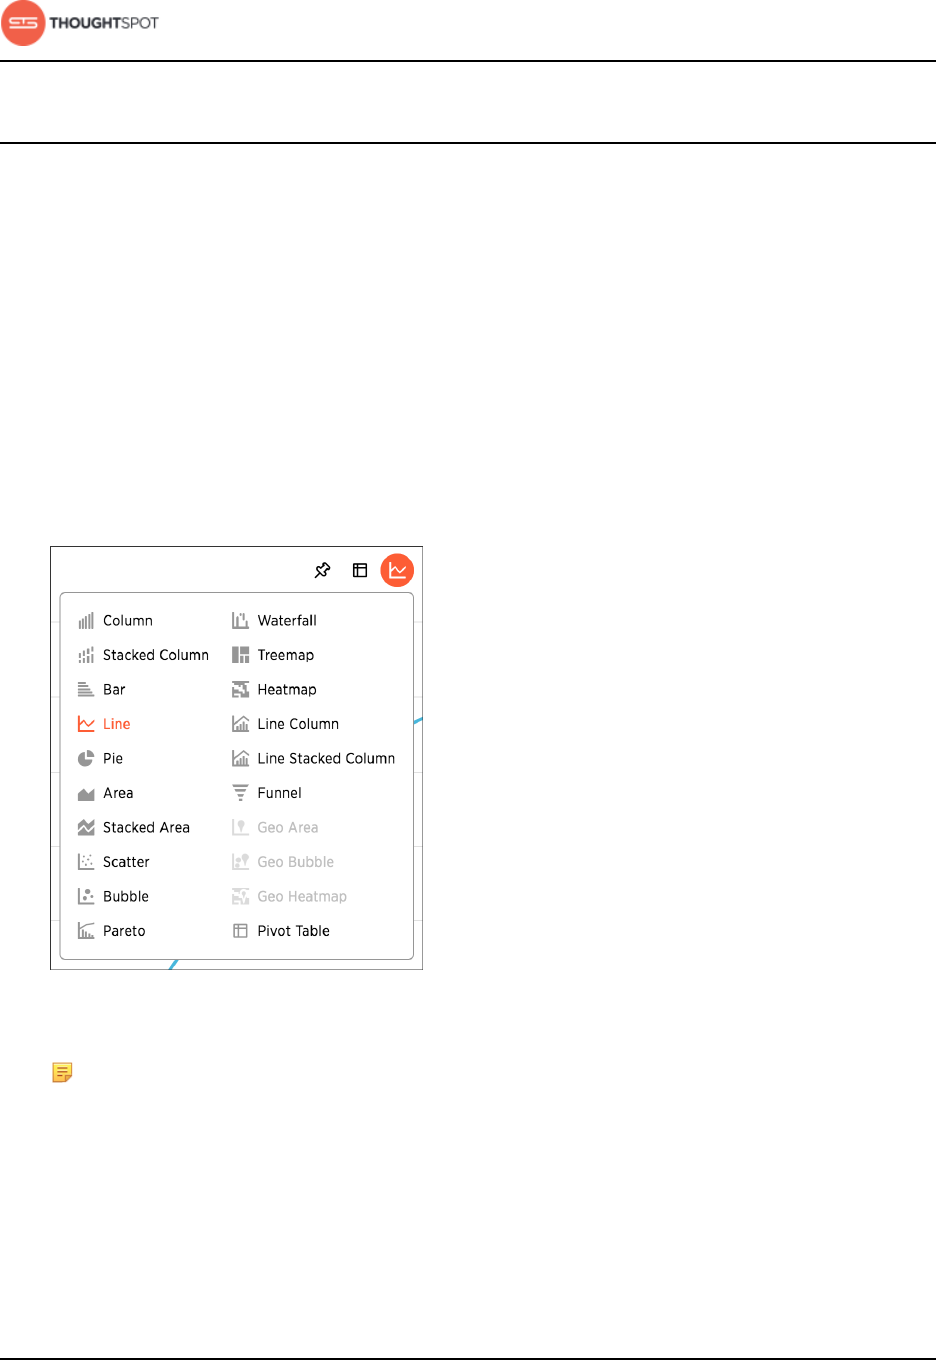
About chart types
You can choose from a large number of chart types in ThoughtSpot. Each chart
type provides you with a different visualization for your answer.
You can change the chart type of your answer by clicking Select Chart Type.
Figure 27: ThoughtSpot chart types
Note: Some chart types may be unavailable for you to select depending
on the columns of your search. For example, if your search does not
contain at least one geographical column then you will not be able to
select any of the geo chart types. Unavailable chart types are grayed out.
Hovering over one will tell you what columns are needed before you can
choose it.
About search
User Guide Copyright © 2016 by ThoughtSpot. All Rights Reserved. 33
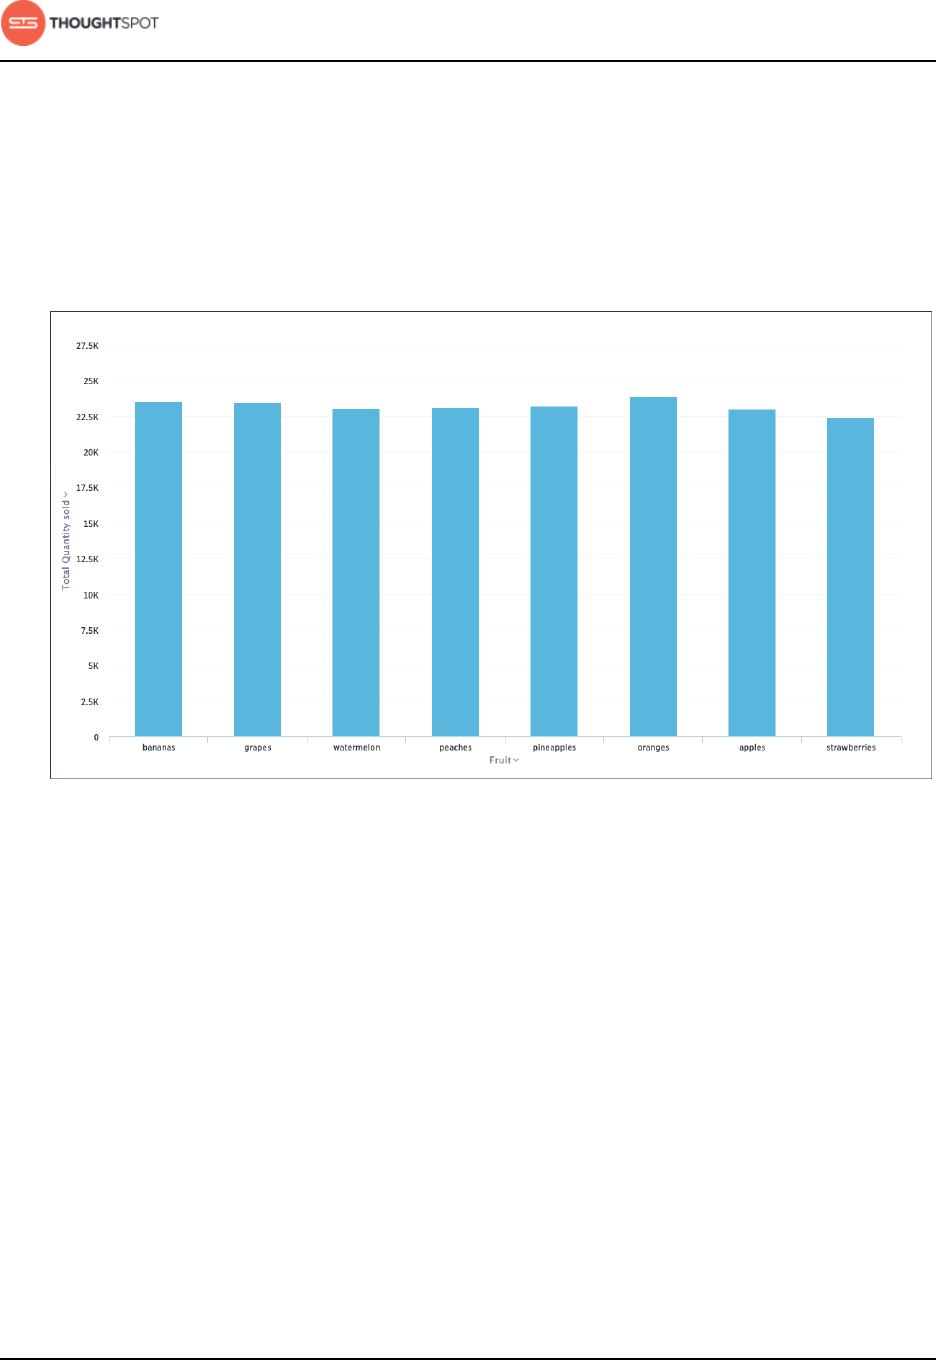
Column charts
The column chart is one of ThoughtSpot's simplest, yet most versatile chart type.
More often than not, the column chart will be chosen as your default chart type.
Column charts are vertical bar charts that display your data using rectangular
bars. The length of the bar is proportional to the data value.
Figure 28: Column chart example
Your search needs at least one attribute and one measure to be represented as a
column chart.
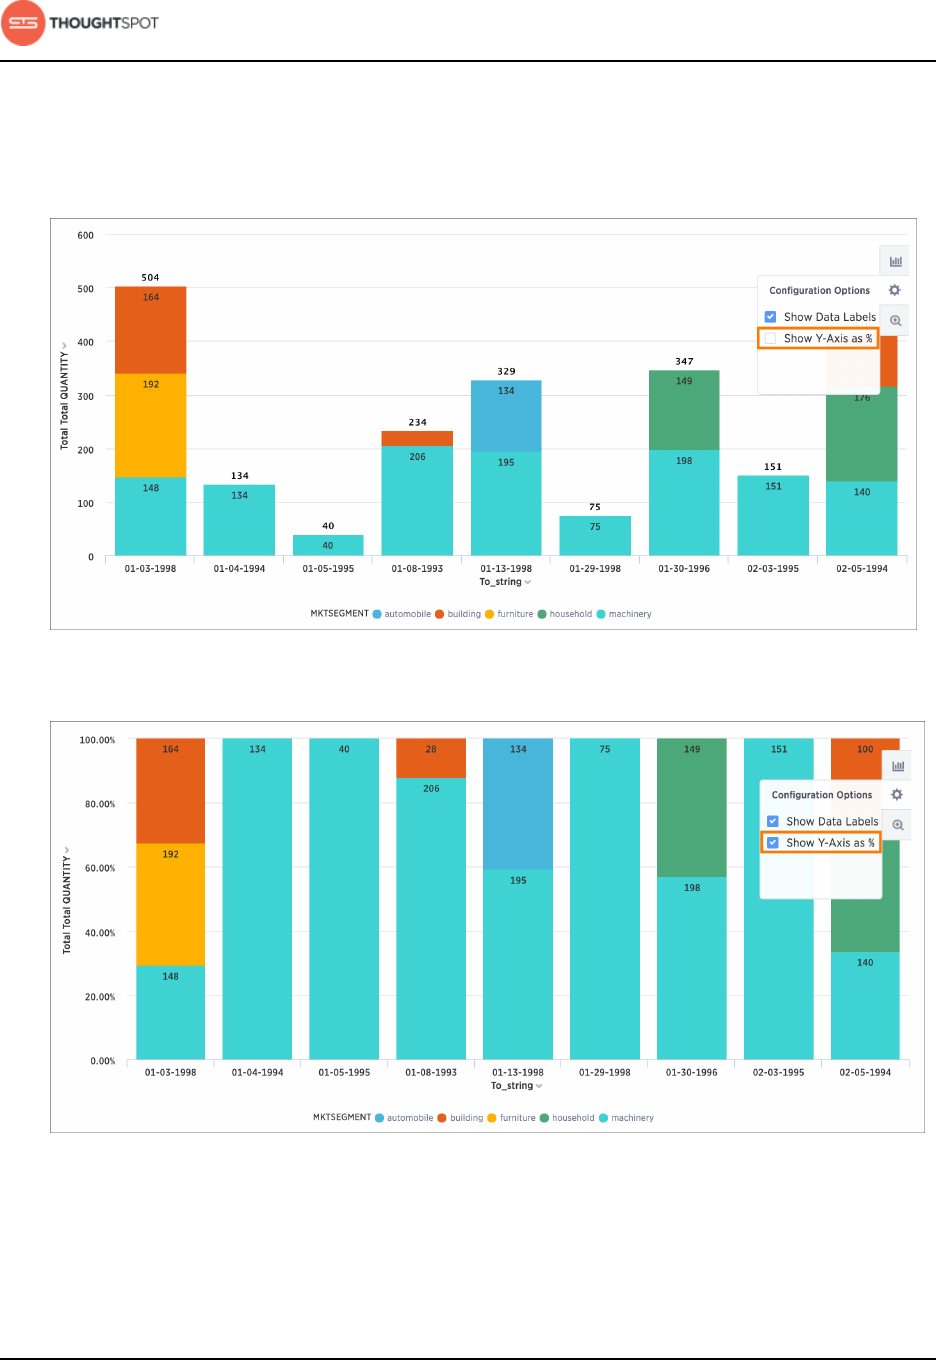
Stacked column charts
The stacked column chart is similar to the column chart, but with one major
difference. It includes a legend, which divides each column into additional
sections by color.
Stacked column charts are typically used when you want to compare aggregated
data and the data that it includes together. This chart type benefits when you
add the Show Data Labels option. Turning it on will show the sum of the stacks
at the top of each stack.
About search
User Guide Copyright © 2016 by ThoughtSpot. All Rights Reserved. 34
It is important to note that stacked column charts plot the y-axis as a percentage
by default. You can choose to toggle Show Y-Axis as % on or off in the
Configuration Options. This feature is also available for stacked area charts.
Figure 29: Stacked column chart example: "Show Y-Axis as a %" toggled off
Figure 30: Stacked column chart example: "Show Y-Axis as a %" toggled on
Your search needs at least two attributes and one measure to be represented as
a stacked column chart.
About search
User Guide Copyright © 2016 by ThoughtSpot. All Rights Reserved. 35
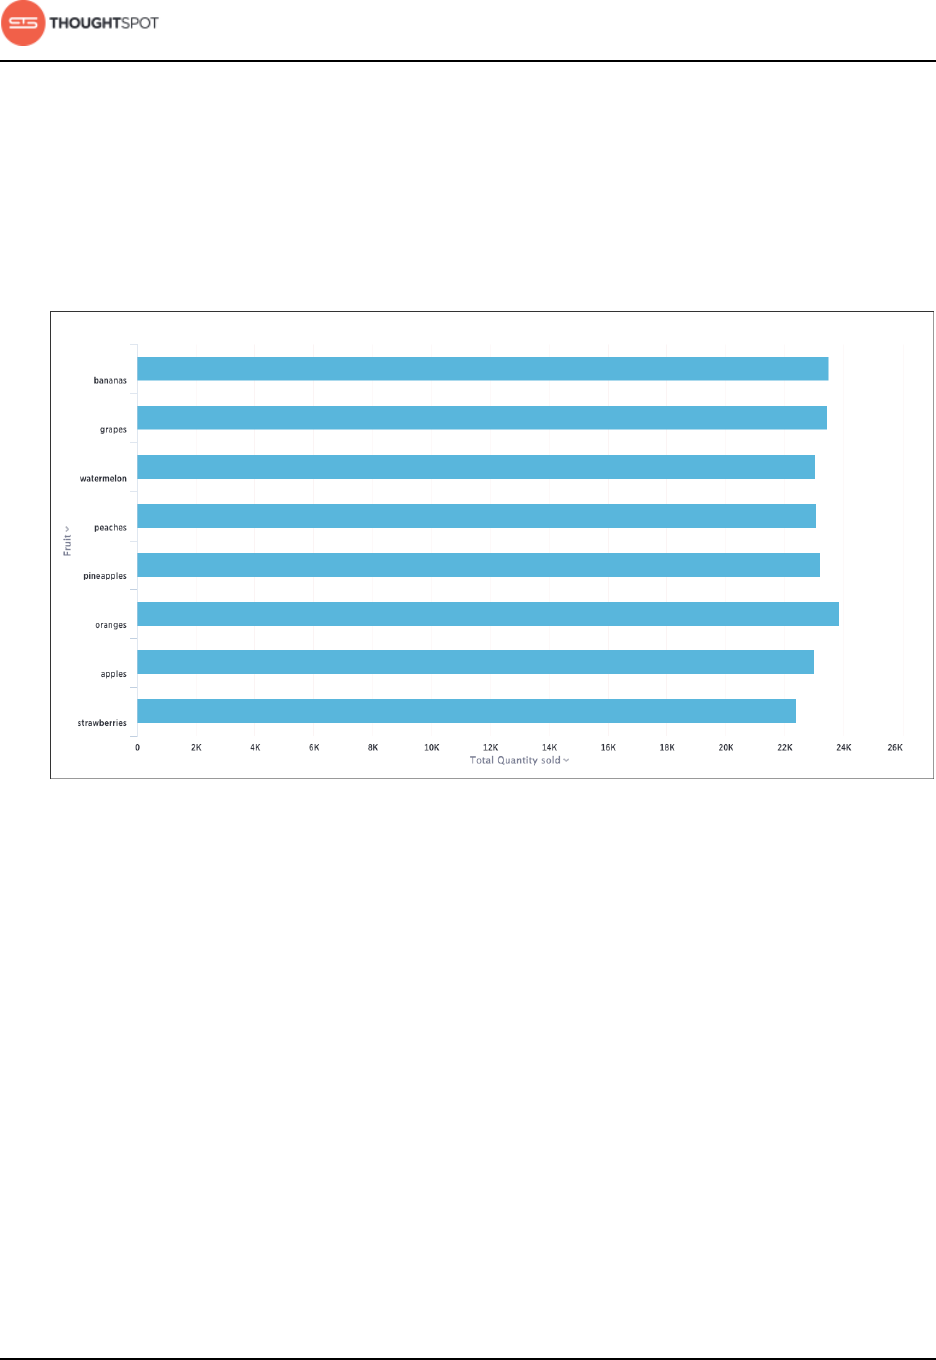
Bar charts
The bar chart is very similar to the column chart. The only difference is that it is
oriented the other way.
Bar charts display your data using horizontal rectangular bars. The length of the
bar is proportional to the data value.
Figure 31: Bar chart example
Your search needs at least one attribute and one measure to be represented as a
bar chart.
Line charts
Like the column chart, the line chart is one of ThoughtSpot's simplest, yet most
versatile chart type. More often than not the line chart will be chosen as your
default chart type.
Line charts displays your data as a series of data points connected by straight
line segments. The measurement points are ordered by the x-axis value. Line
charts are good at showing trends over intervals of time.
About search
User Guide Copyright © 2016 by ThoughtSpot. All Rights Reserved. 36
Figure 32: Line chart example
Your search needs at least one attribute and one measure to be represented as a
line chart.
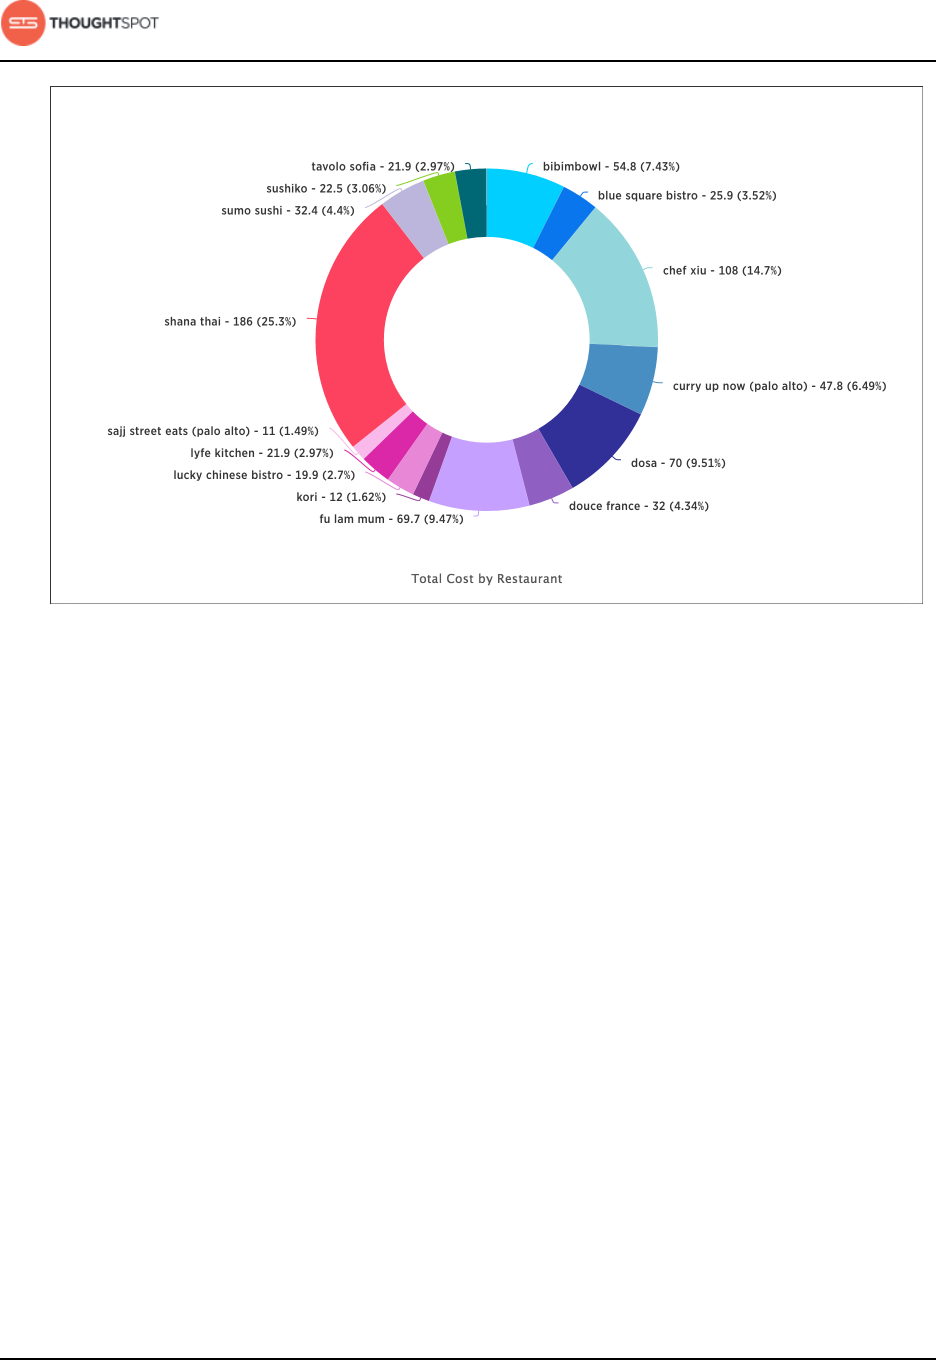
Pie charts
The pie chart is a classic chart type that displays your search in a circle. The pie
chart ThoughtSpot shows is in the shape of a doughnut.
Pie charts divide your data into sectors that each represent a proportion of a
whole circle. You can display the exact values of each slice, in addition to the
percentage values by toggling on Show Data Labels found under Change chart
configuration.
About search
User Guide Copyright © 2016 by ThoughtSpot. All Rights Reserved. 37
Figure 33: Pie chart example
Your search needs at least one attribute and one measure to be represented as a
pie chart. Also, there must be fewer than 50 values in the attribute column.
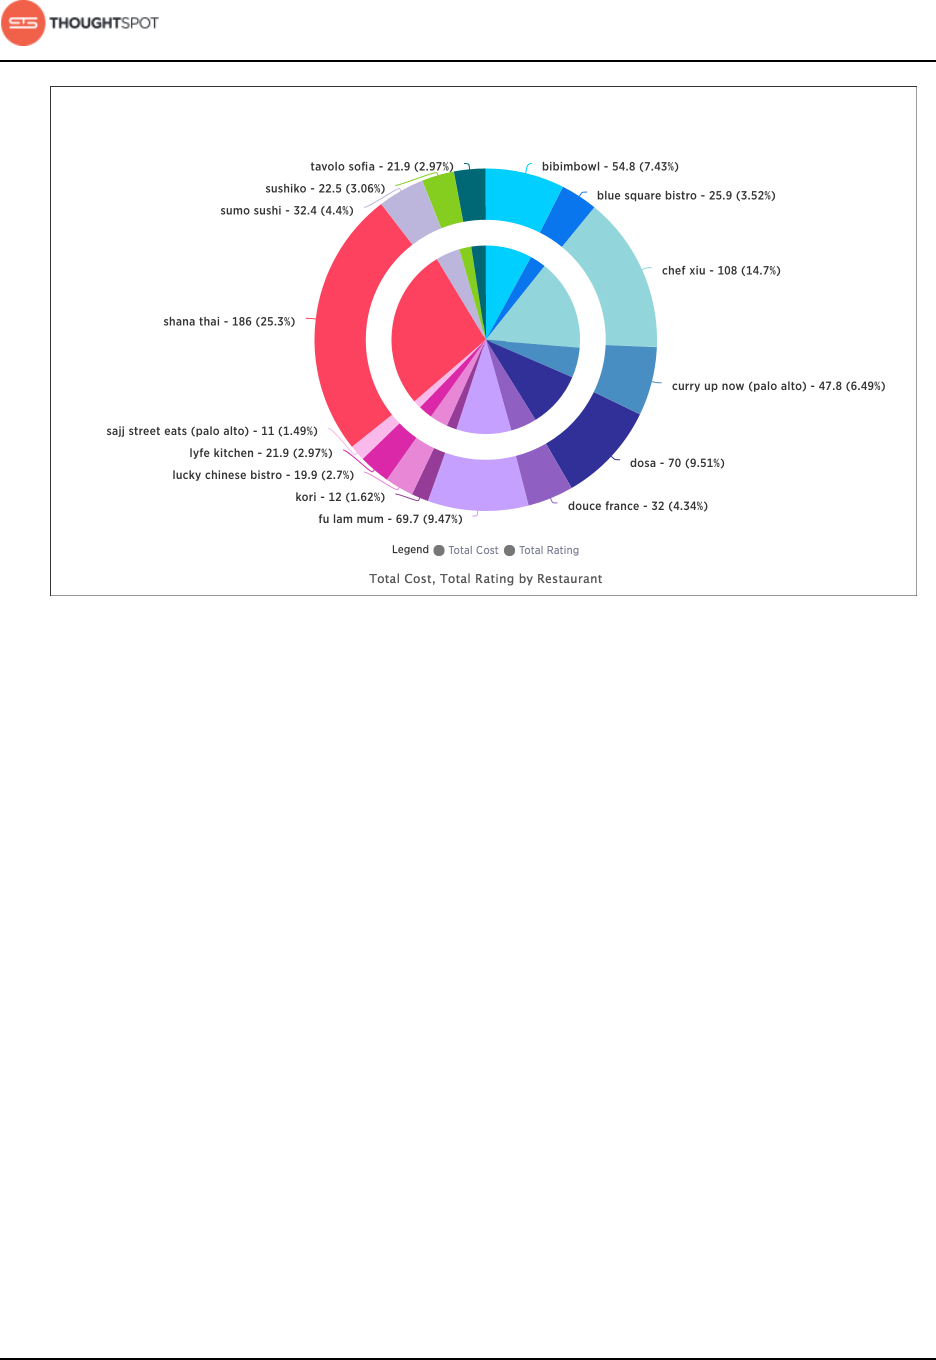
Pie in pie charts
The pie in pie chart can be created from a regular pie chart in order to compare
more than one component of an attribute.
Pie in pie charts show two concentric pie charts comparing different measures.
To see a pie in pie chart, assign two different measures to the y-axis under
Configure Chart.
About search
User Guide Copyright © 2016 by ThoughtSpot. All Rights Reserved. 38
Figure 34: Pie in pie chart example
Your search needs at least one attribute and two measures to be represented
as a pie in pie chart. Also, there must be fewer than 50 values in the attribute
column.
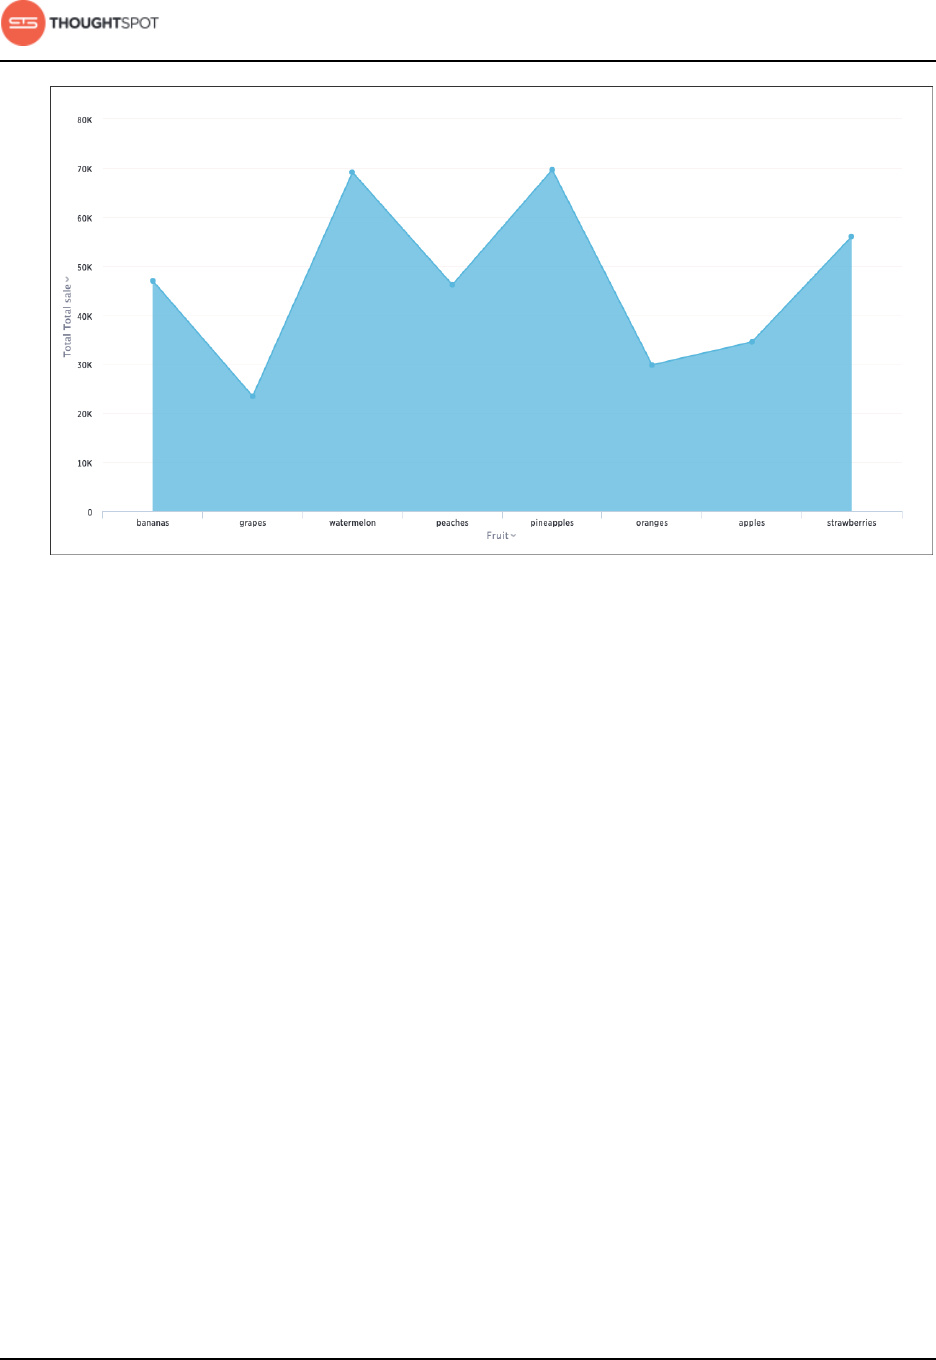
Area charts
The area chart is based on the line chart, but has filled in regions.
Area charts display quantitative data graphically. The area between the x-axis
and the line are colored in to help you compare different portions of the chart.
About search
User Guide Copyright © 2016 by ThoughtSpot. All Rights Reserved. 39
Figure 35: Area chart example
Your search needs at least one attribute and one measure to be represented as
an area chart.
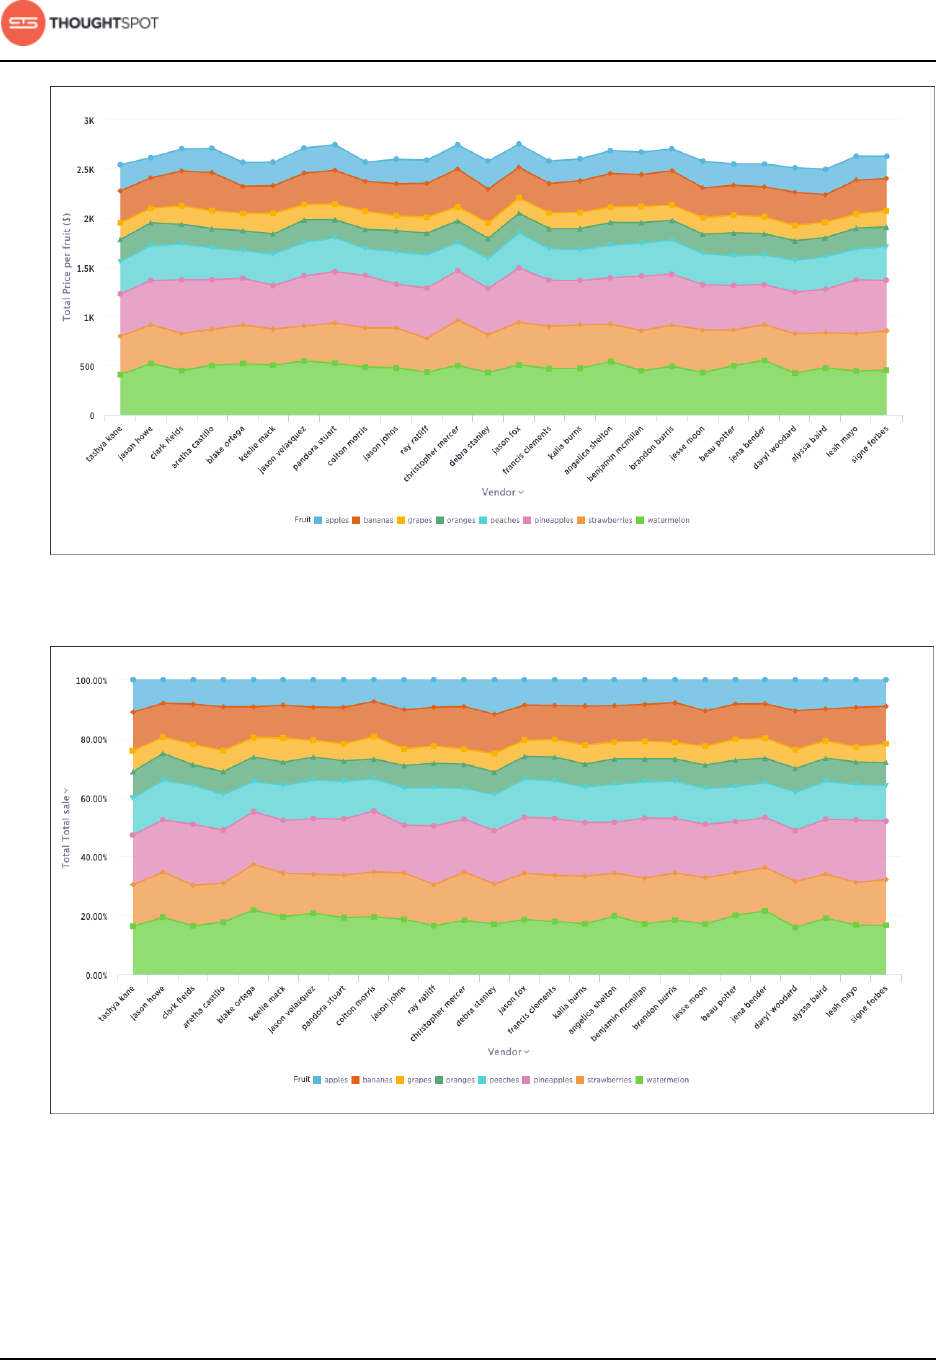
Stacked area charts
The stacked area chart is an area chart with an attribute in the legend, which
divides the area into layers.
Stacked area charts show the relative contribution to the accumulated total of a
measure over time.
Stacked area charts plot the y-axis as a percentage by default. You can choose
to toggle Show Y-Axis as % on or off in the Configuration Options to create your
own mountain-style charts.
About search
User Guide Copyright © 2016 by ThoughtSpot. All Rights Reserved. 40
Figure 36: Stacked area chart example: "Show Y-Axis as %" toggled off
Figure 37: Stacked area chart example: "Show Y-Axis as %" toggled on
Your search needs at least two attributes and one measure to be represented as
a stacked area chart.
About search
User Guide Copyright © 2016 by ThoughtSpot. All Rights Reserved. 41
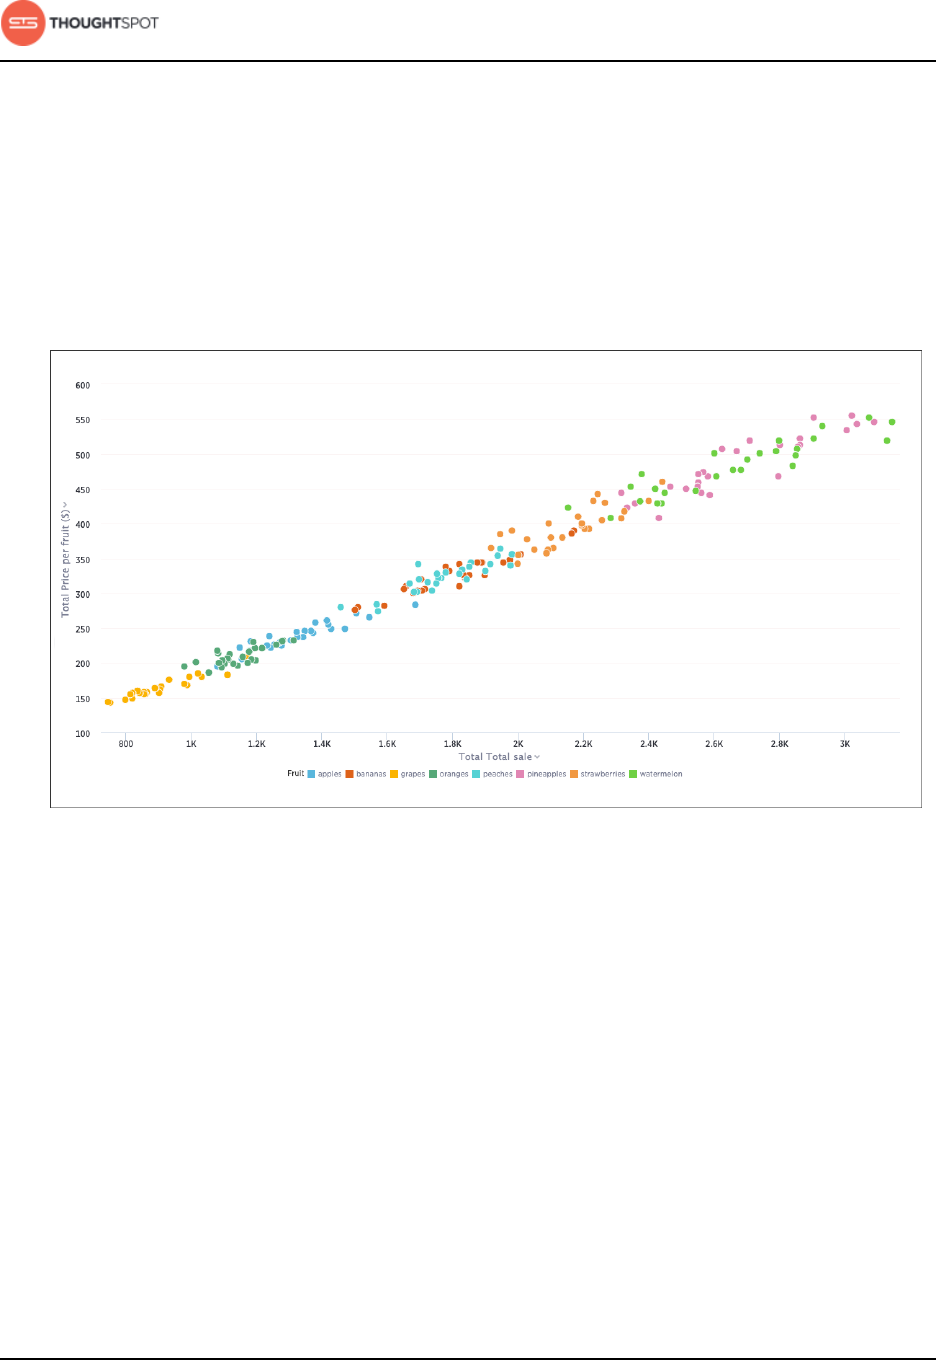
Scatter charts
The scatter chart is useful for finding correlations or outliers in your data.
Scatter charts display your data as a collection of points, which can either be
evenly or unevenly distributed. Each point is plotted based on its own axes
values. This helps you determine if there is a relationship between your searched
columns.
Figure 38: Scatter chart example
Your search needs at least one attribute and one measure to be represented as a
scatter chart.
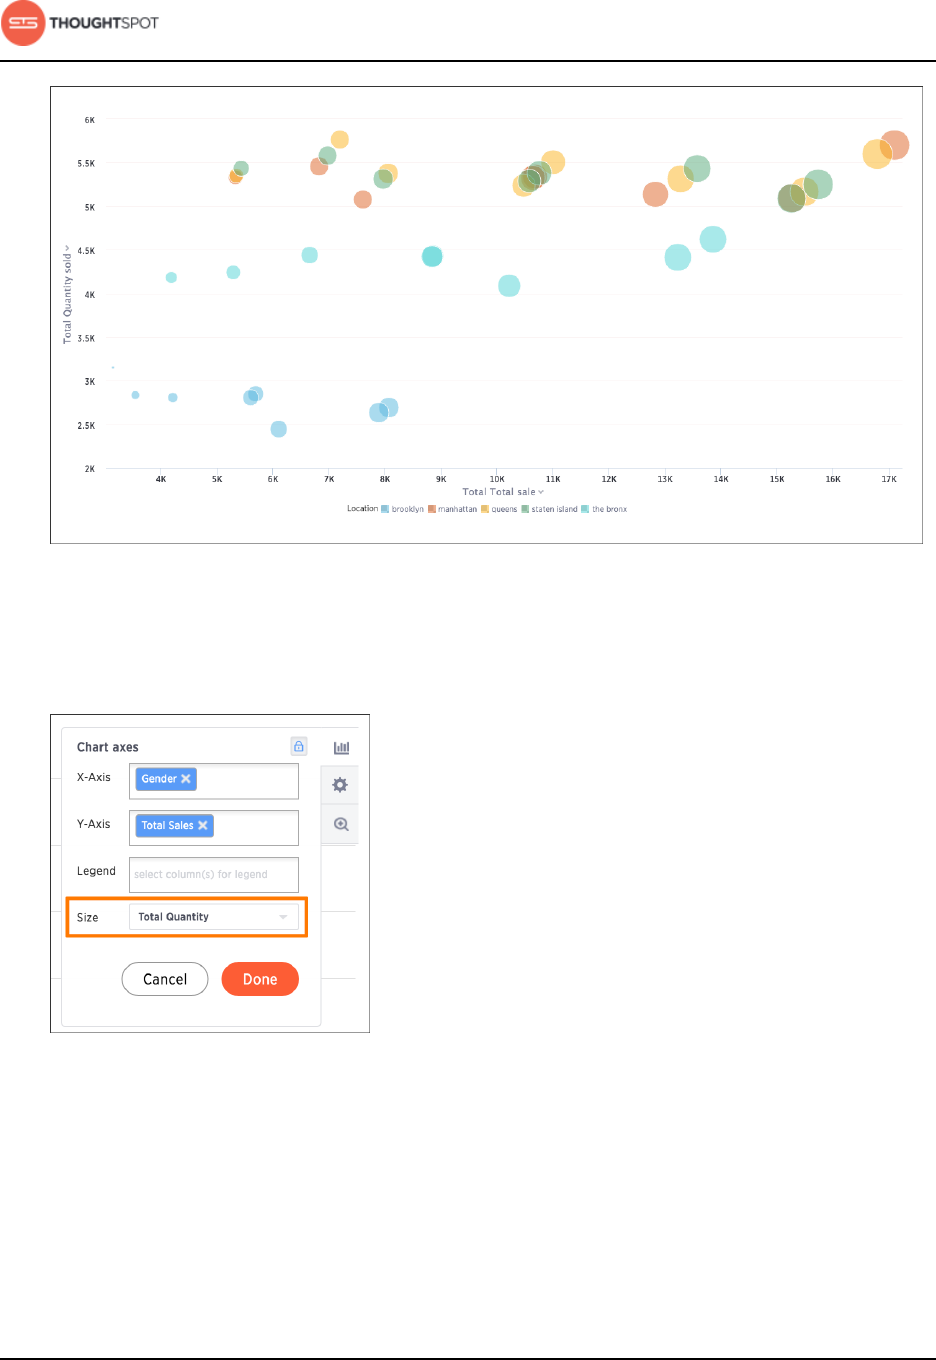
Bubble charts
The bubble chart displays three dimensions of data with each containing a set of
values.
The bubble chart is a variation of the scatter chart, with the data points replaced
with bubbles. These bubbles add a third data dimension to your answer.
About search
User Guide Copyright © 2016 by ThoughtSpot. All Rights Reserved. 42
Figure 39: Bubble chart example
The size of each bubble depends on the measure you choose under Configure
Chart.
Figure 40: Bubble size dropdown
Your search needs at least one attribute and two measures to be represented as
a bubble chart.
About search
User Guide Copyright © 2016 by ThoughtSpot. All Rights Reserved. 43
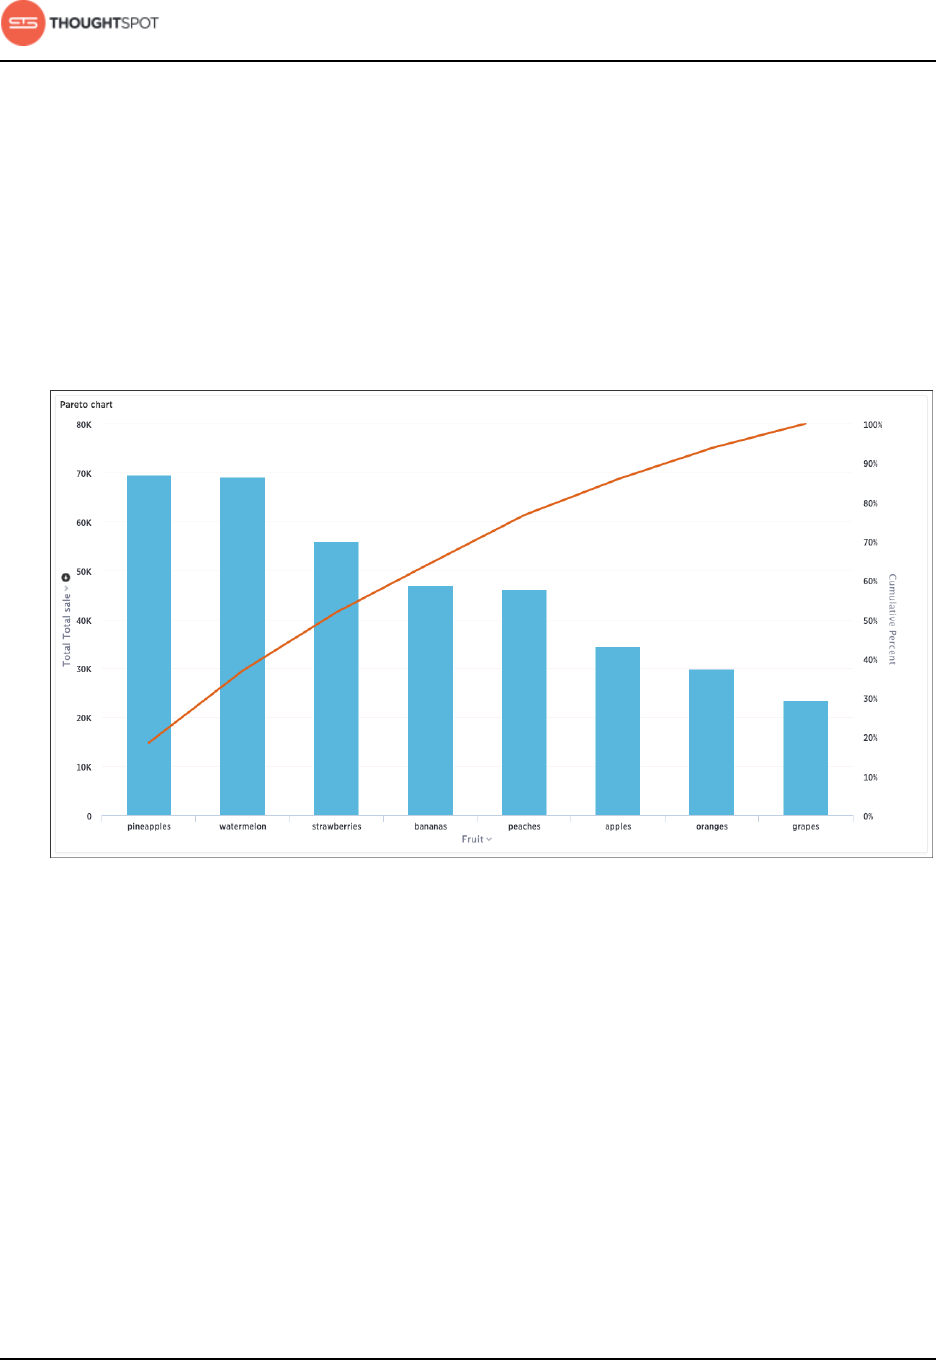
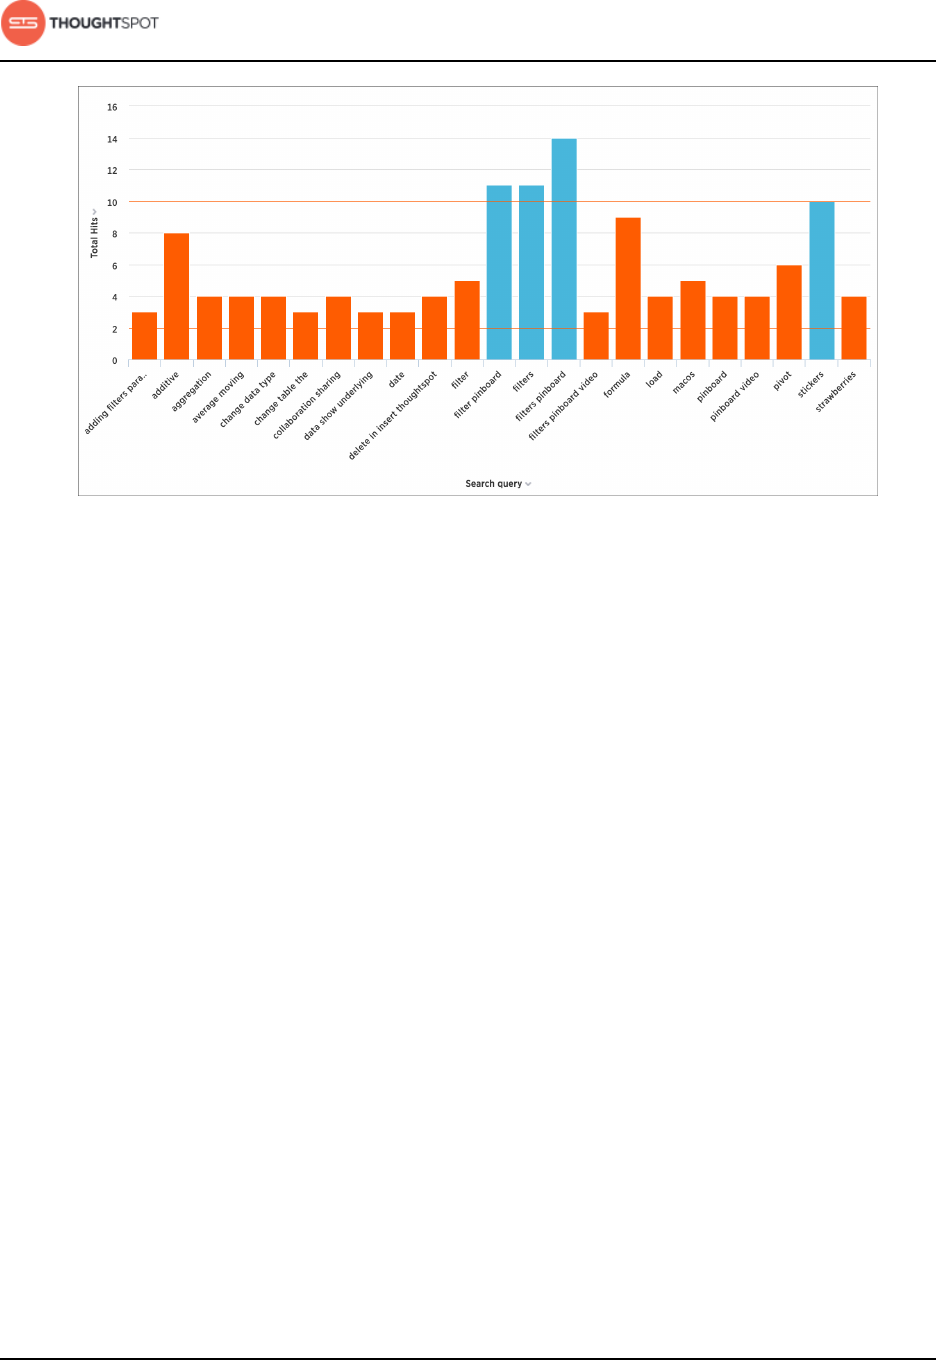
Pareto charts
The pareto chart is a type of chart that contains both columns and a special type
of line chart.
The individual values of a pareto chart are represented in descending order by
columns, and the cumulative percent total is represented by the line. The y-axis
on the left is paired with the columns, while the y-axis on the right is paired with
the line. By the end of the line, the cumulative percent total reaches 100 percent.
Figure 41: Pareto chart example
Your search needs at least one attribute and one measure to be represented as a
pareto chart.
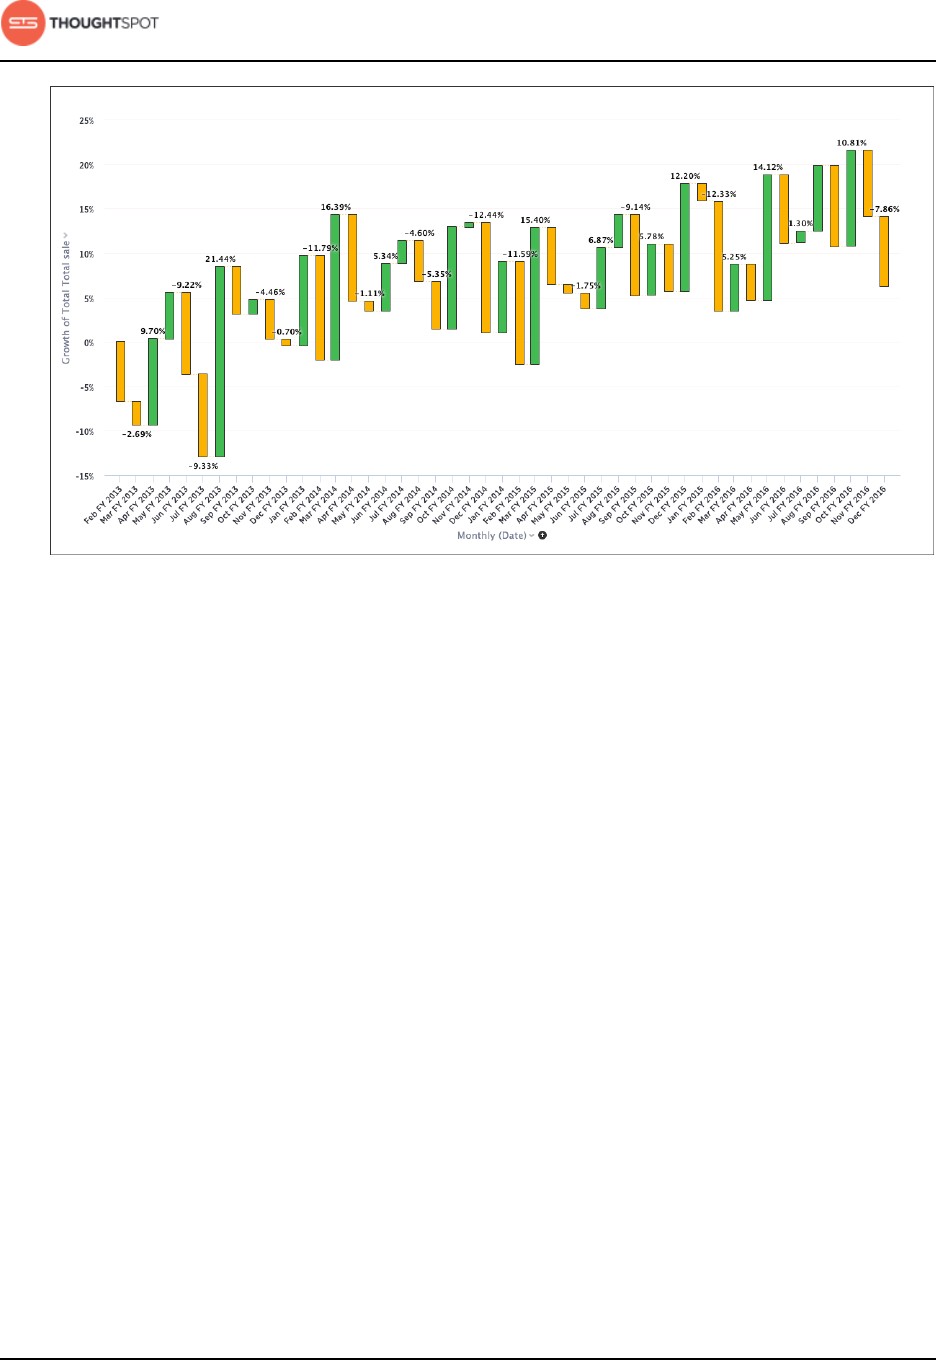
Waterfall charts
The waterfall chart is used to show how an initial value is affected by a series of
intermediate positive or negative values.
Waterfall charts are good for visualizing positive and negative growth, and
therefore work well with the growth over time keyword. The columns are color-
coded to distinguish between positive and negative values.
About search
User Guide Copyright © 2016 by ThoughtSpot. All Rights Reserved. 44
Figure 42: Waterfall chart example
Your search needs at least one attribute and one measure to be represented as a
waterfall chart.
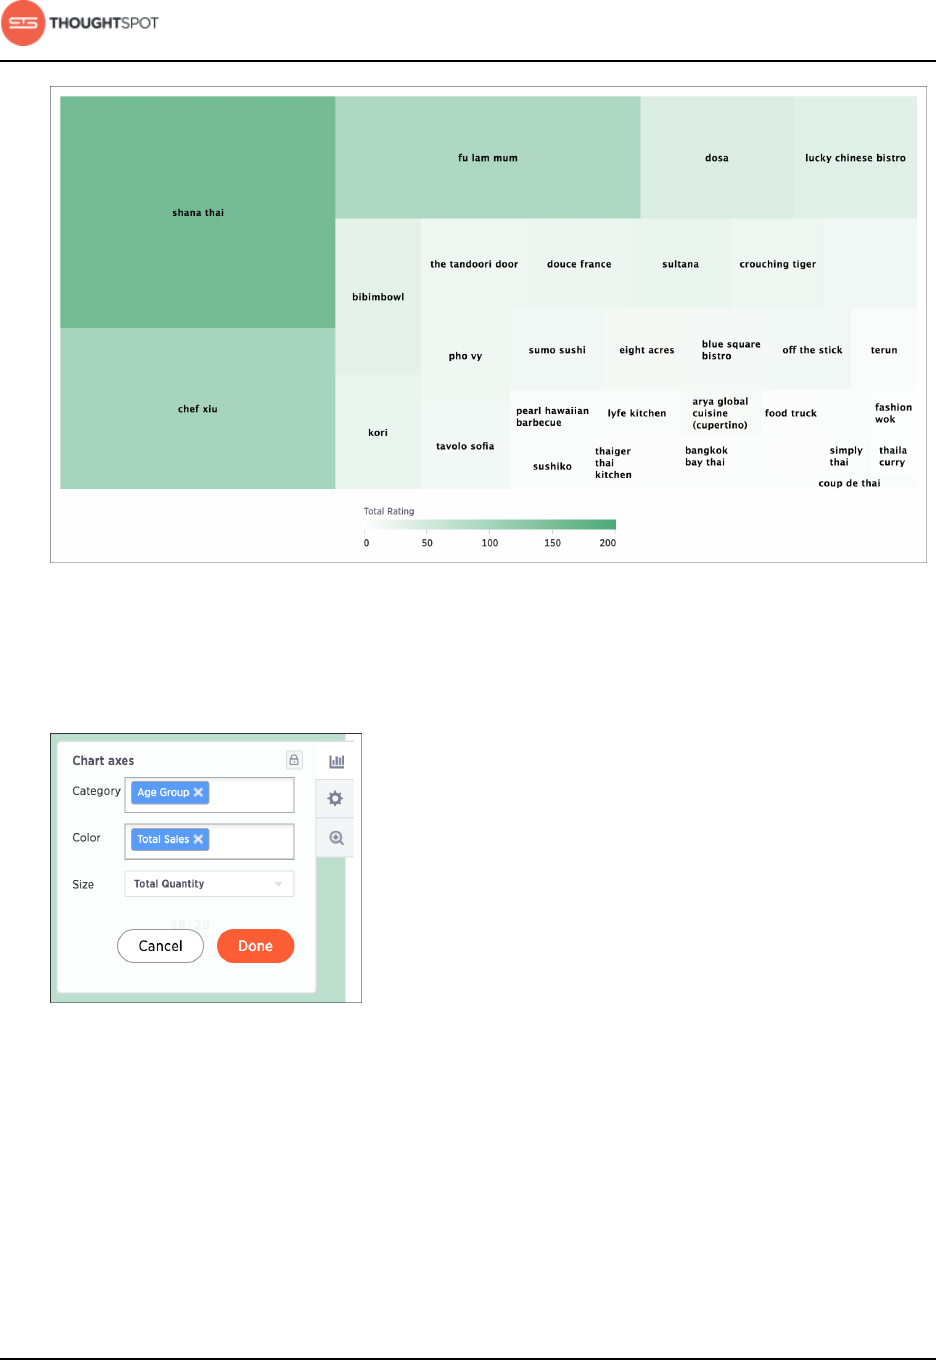
Treemap charts
The treemap chart displays hierarchical data as a set of nested rectangles.
Treemap charts use color and rectangle size to represent two measure values.
Each rectangle, or branch, is a value of the attribute. Some branches can contain
smaller rectangles, or sub-branches. This setup makes it possible to display a
large number of items in an efficient way.
About search
User Guide Copyright © 2016 by ThoughtSpot. All Rights Reserved. 45
Figure 43: Treemap chart example
You can rearrange the columns of your search into category, color, and size
under Configure Chart.
Figure 44: Branch category, color, and size
Your search needs at least one attribute and two measures to be represented as
a treemap chart.

About search
User Guide Copyright © 2016 by ThoughtSpot. All Rights Reserved. 46
Heatmap charts
The heatmap chart displays individual data values in a matrix following a color
scale.
Heatmap charts are similar to treemap charts in that they both use a similar
system of color-coding to represent data values. However, the heatmap does not
use size to measure data, and instead requires an additional attribute.
Figure 45: Heatmap chart example
The value of each cell depends on the measure you choose under Configure
Chart.
About search
User Guide Copyright © 2016 by ThoughtSpot. All Rights Reserved. 47
Figure 46: Heatmap value dropdown
Your search needs at least two attributes and one measure to be represented as
a heatmap chart.
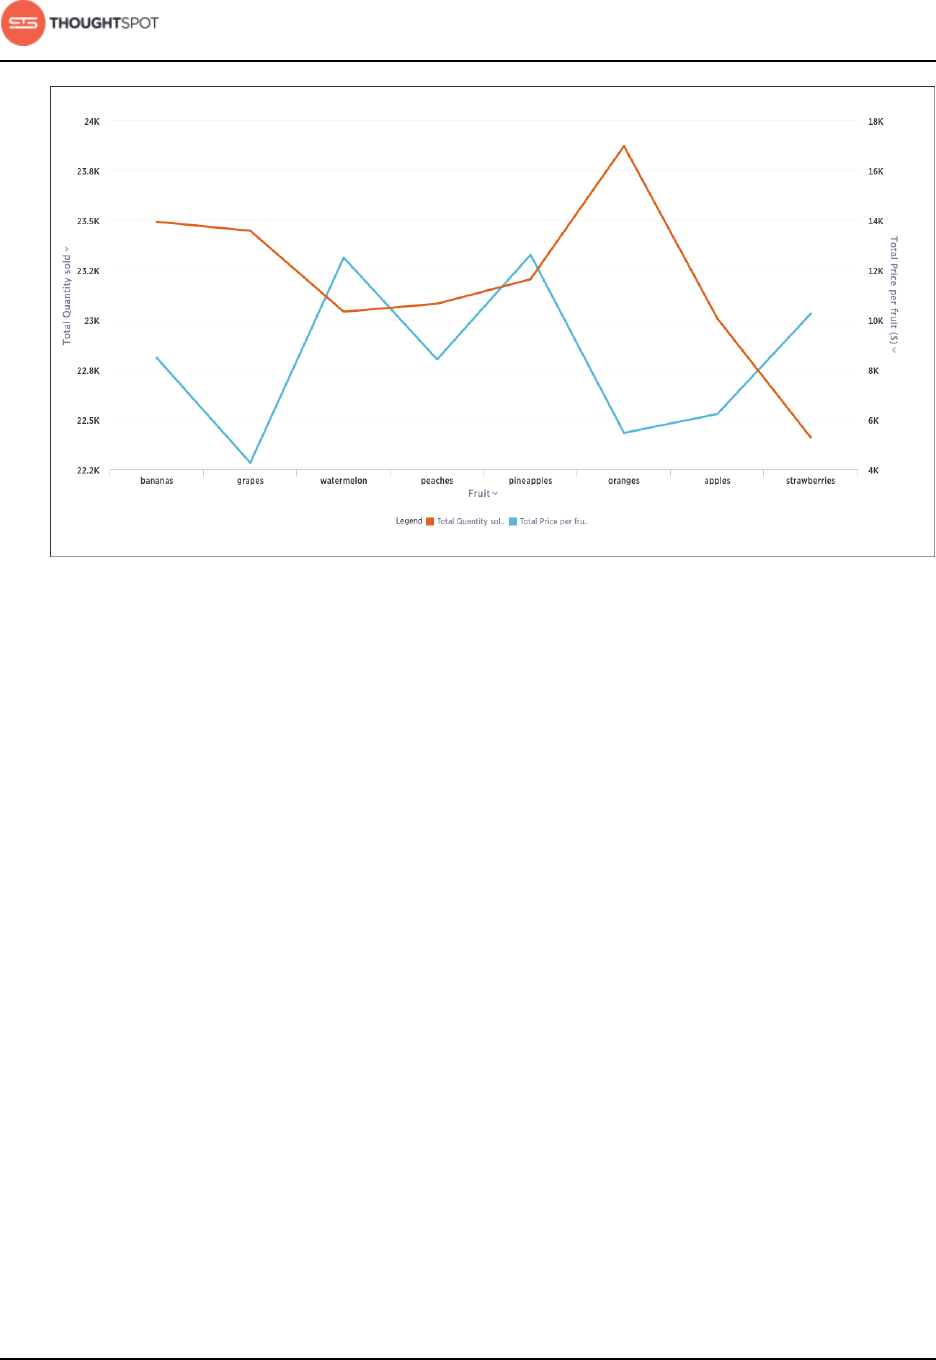
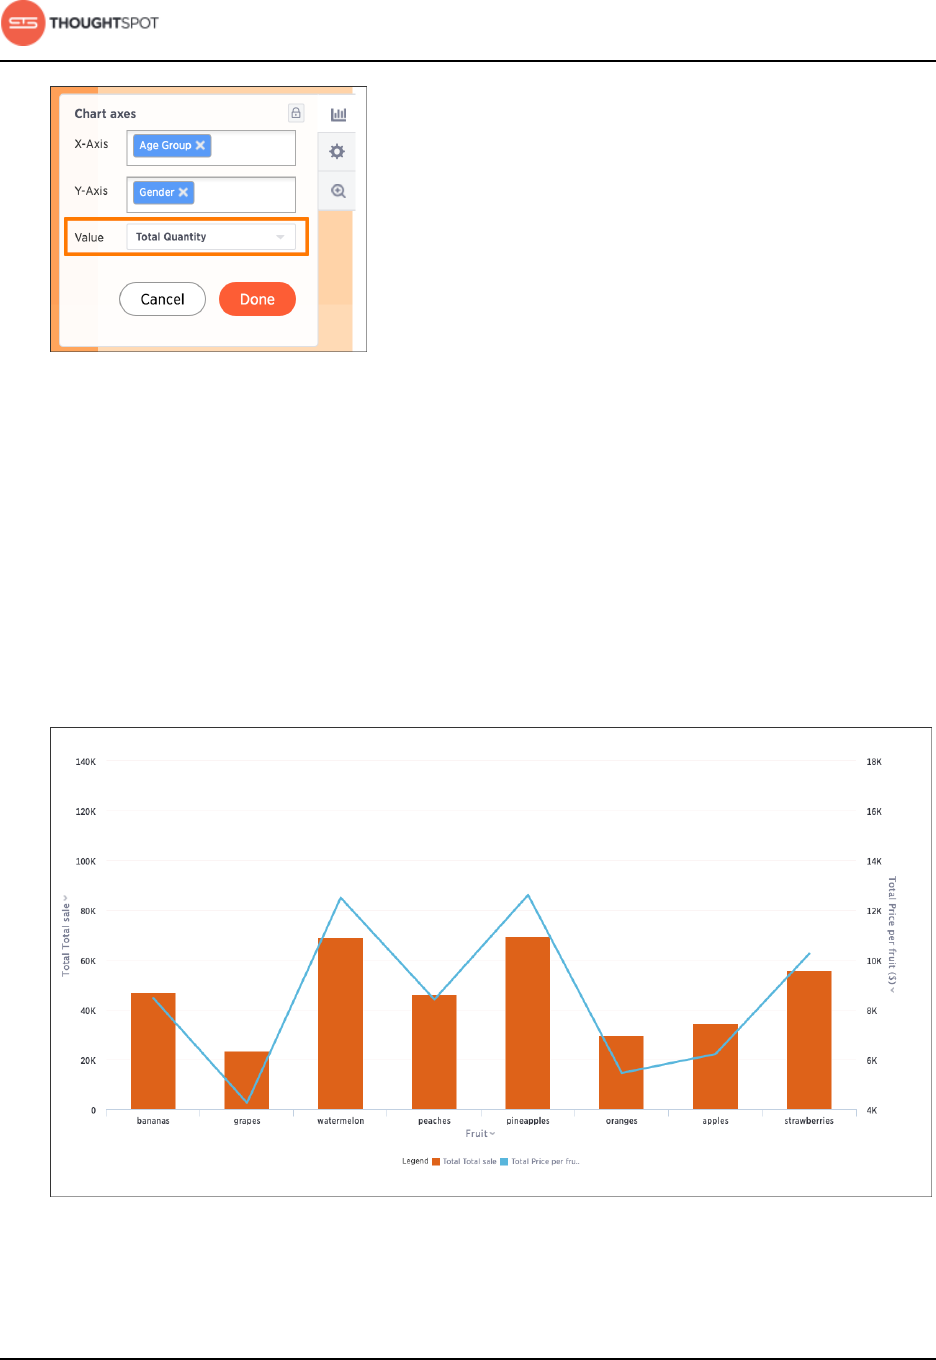
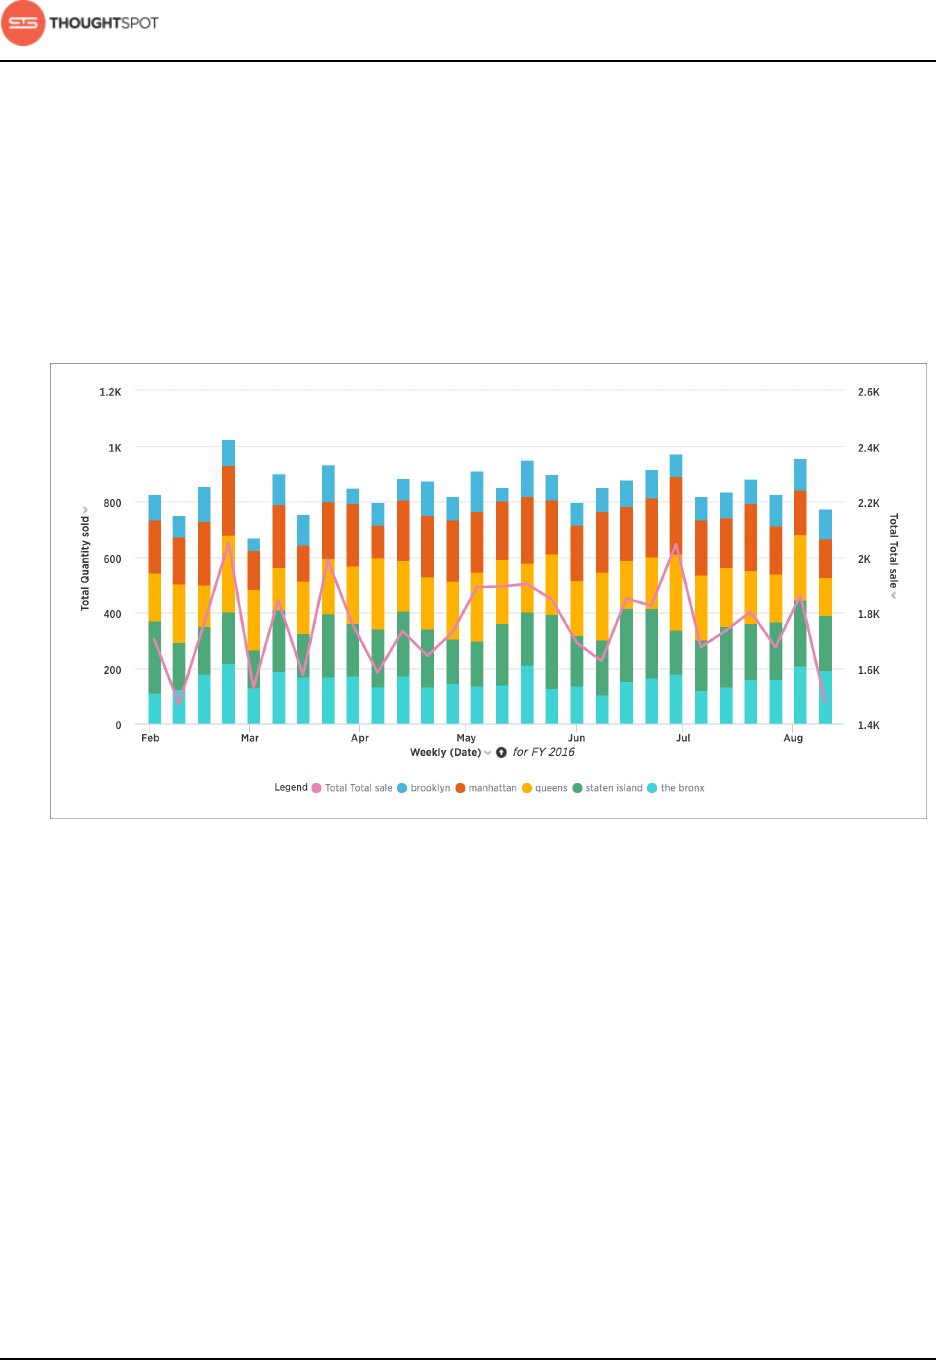
Line column charts
The line column chart combines the column and line charts.
Line column charts display one measure as a column chart and the other as a
line chart. Each of these measures has its own y-axis.
Figure 47: Line column chart example
About search
User Guide Copyright © 2016 by ThoughtSpot. All Rights Reserved. 48
Your search needs at least one attribute and two measures to be represented as
a line column chart.
Line stacked column charts
The line stacked column chart combines stacked column and line charts.
This chart is similar to the line column chart, except that it divides its columns
with an attribute in the legend. There are two y-axes, one for each measure.
Figure 48: Line stacked column chart example
Your search needs at least two attributes and two measures to be represented as
a line stacked column chart.
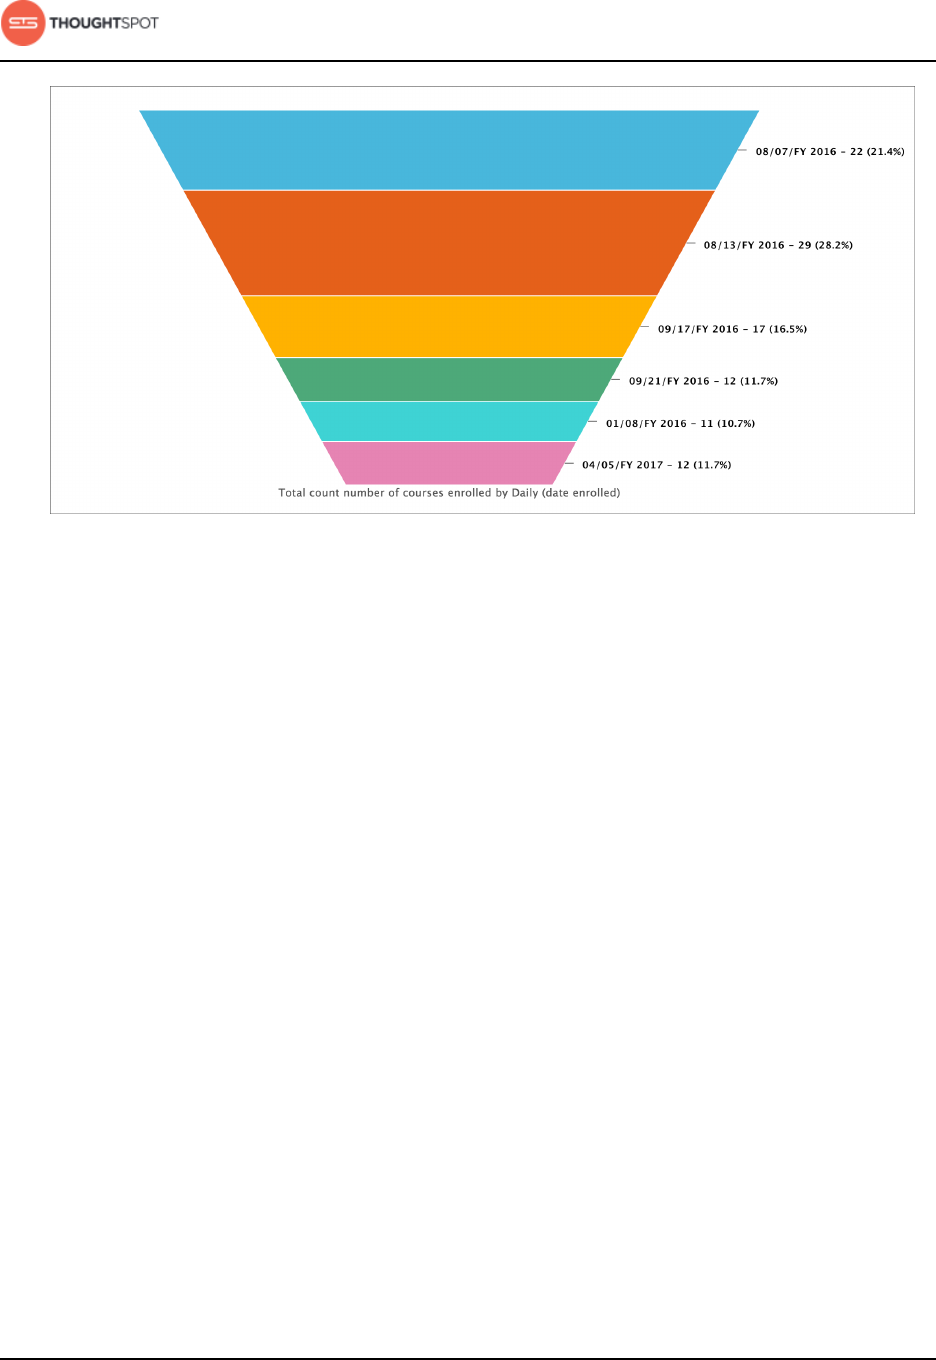
Funnel charts
The funnel chart shows a process with progressively decreasing proportions
amounting to 100 percent in total.
This chart is similar to a stacked percent column chart, and is often used to
represent stages in a sales process. You can visualize the progression of data as
it passes from one phase to another. Data in each of these phases is represented
as different proportions.
About search
User Guide Copyright © 2016 by ThoughtSpot. All Rights Reserved. 49
Figure 49: Funnel chart example
Your search needs at least one attribute and one measure to be represented as a
column chart. The attribute must contain 50 or fewer values.
About geo charts
There are three geo charts that let you visualize geographical data in
ThoughtSpot.
These geo charts show data on a map by location. There are three different
types of geo charts. They are geo area, geo bubble, and geo heatmap charts.
And these geo charts can display five types of geographical data, which are:
• Country
• State
• County
• Zipcode
• Point (latitude/longitude)
Here is a table that shows which GeoType data can be displayed using which geo
chart type.
About search
User Guide Copyright © 2016 by ThoughtSpot. All Rights Reserved. 50
Table 3: GeoTypes and their geo chart types
GeoType Geo chart type Notes
Country Geo area (default), geo bubble,
geo heatmap
• Can also be regions.
County Geo area (default), geo bubble,
geo heatmap
• Only for counties in the United States.
Point Geo bubble (default), geo
heatmap
• Must use both latitude and longitude
columns.
State Geo area (default), geo bubble,
geo heatmap
• Only for states in the United States.
Zipcode Geo area, geo bubble (default),
geo heatmap
• Zip codes and zip codes +4 in the United
States.
In order for data to be displayed using geo charts, your administrator must
configure it as geographical data. If you are expecting to be able to get a map
visualization, but it isn't available, contact your administrator so they can make
the configuration.
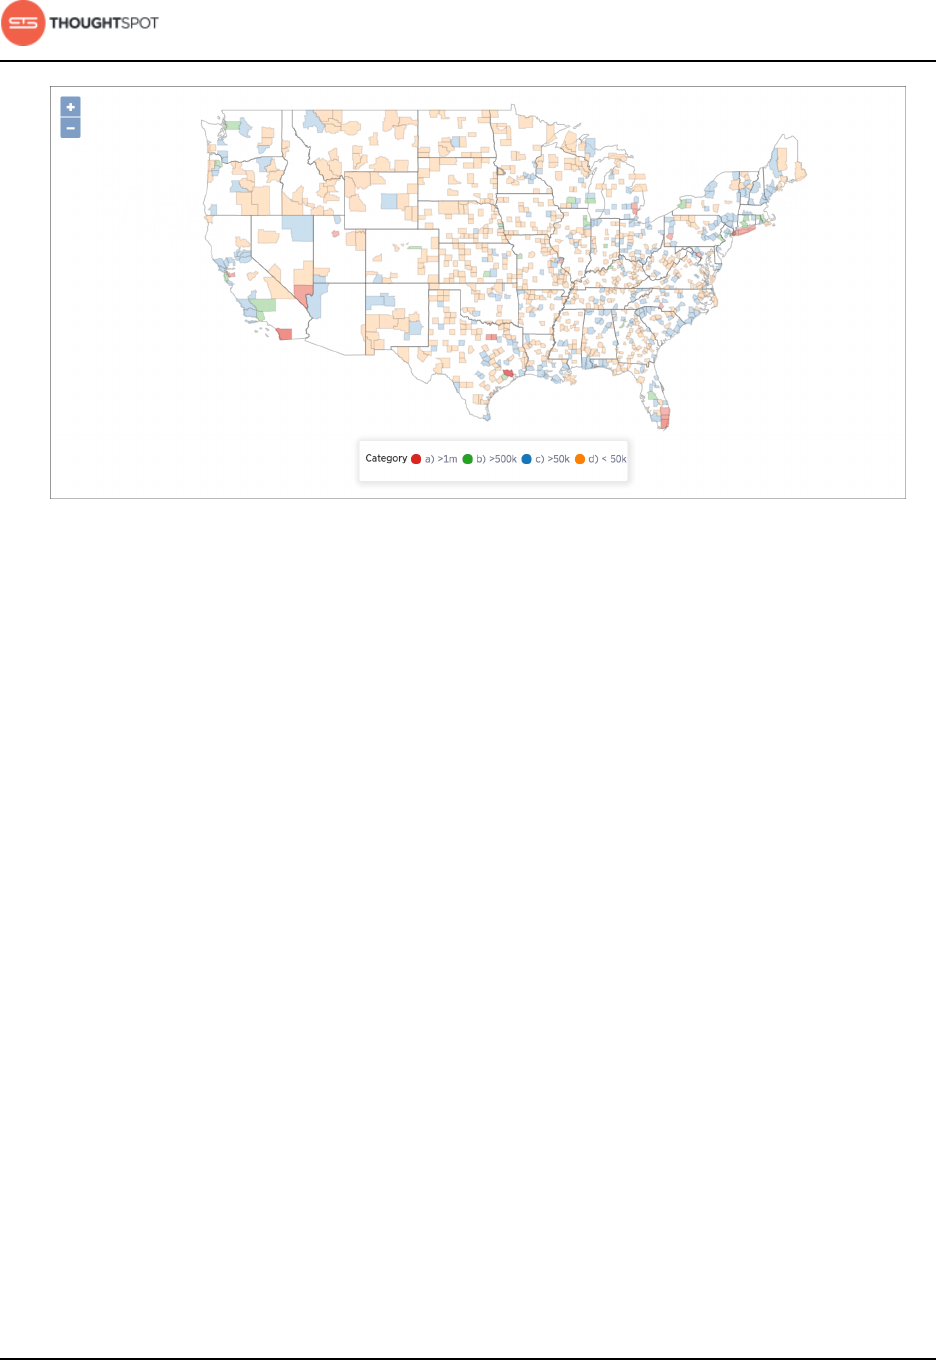
Geo area charts
The geo area chart displays country, county, state and zipcode data on a
geographical chart.
Geo area charts highlight the regions of interest. Point data (longitude/latitude)
doesn't work on geo area charts. Also, only geo area charts display boundaries
for counties.
About search
User Guide Copyright © 2016 by ThoughtSpot. All Rights Reserved. 51
Figure 50: Geo area chart example
Your search needs one geographical column of granularity higher than ZIP code
to be represented as a geo area chart.
Geo bubble charts
The geo bubble chart displays country, county, point, state, and zipcode data on
a geographical chart.
Geo bubble charts, like bubble charts, display the value of the measure by the
size of the bubble. Zip code data makes the most sense for geo bubble charts.
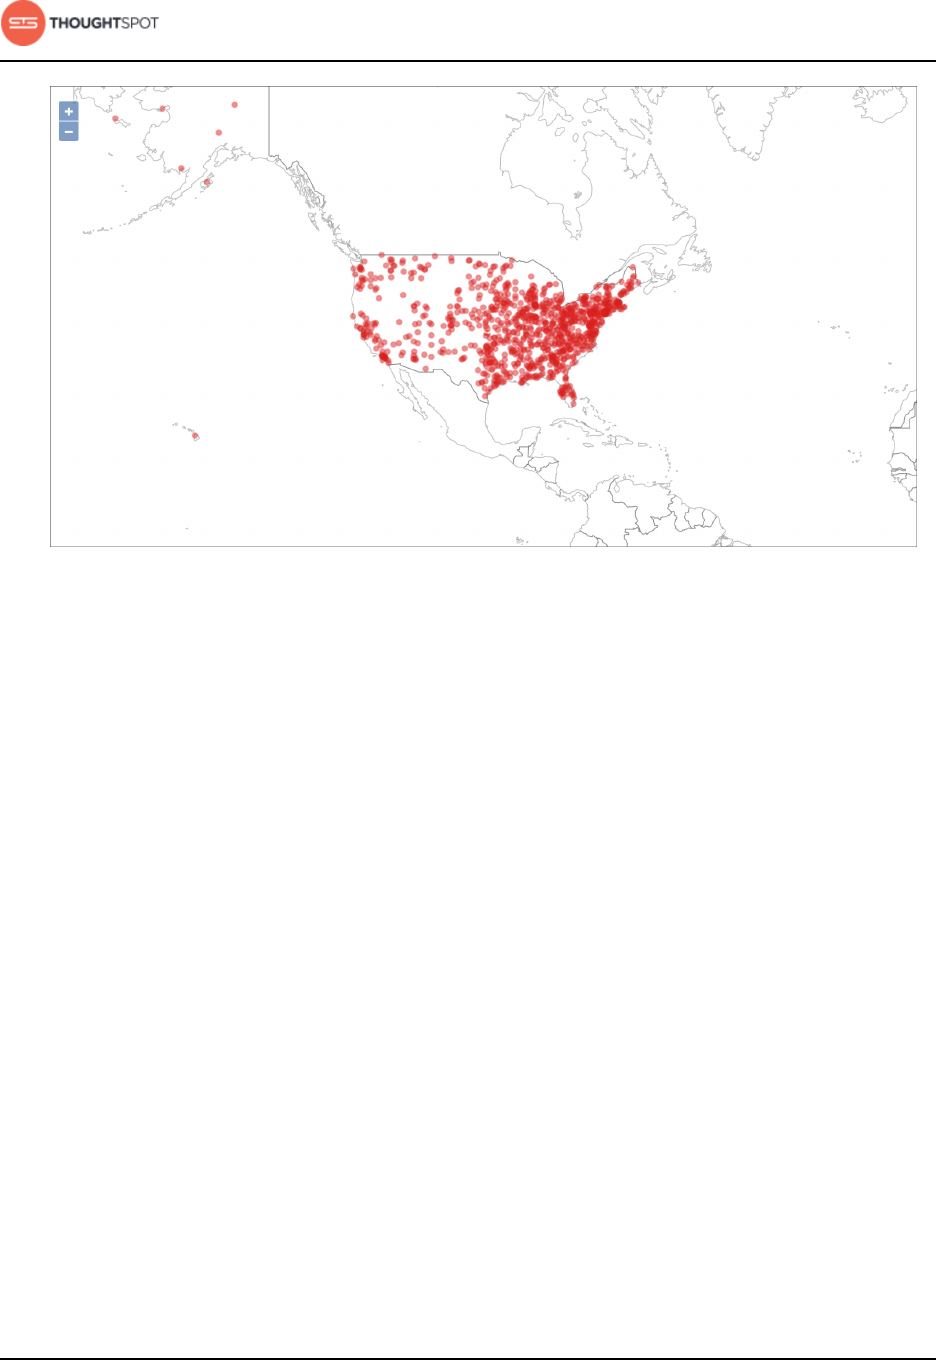
About search
User Guide Copyright © 2016 by ThoughtSpot. All Rights Reserved. 52
Figure 51: Geo bubble chart example
Your search needs one geographical column or a pair of latitude and longitude
columns to be represented as a geo bubble chart.
Geo heatmap charts
The geo heatmap chart displays country, county, point, state, and zipcode data
on a geographical chart.
Geo heatmap charts, like heatmap charts, display the value of the measure with
color intensity.
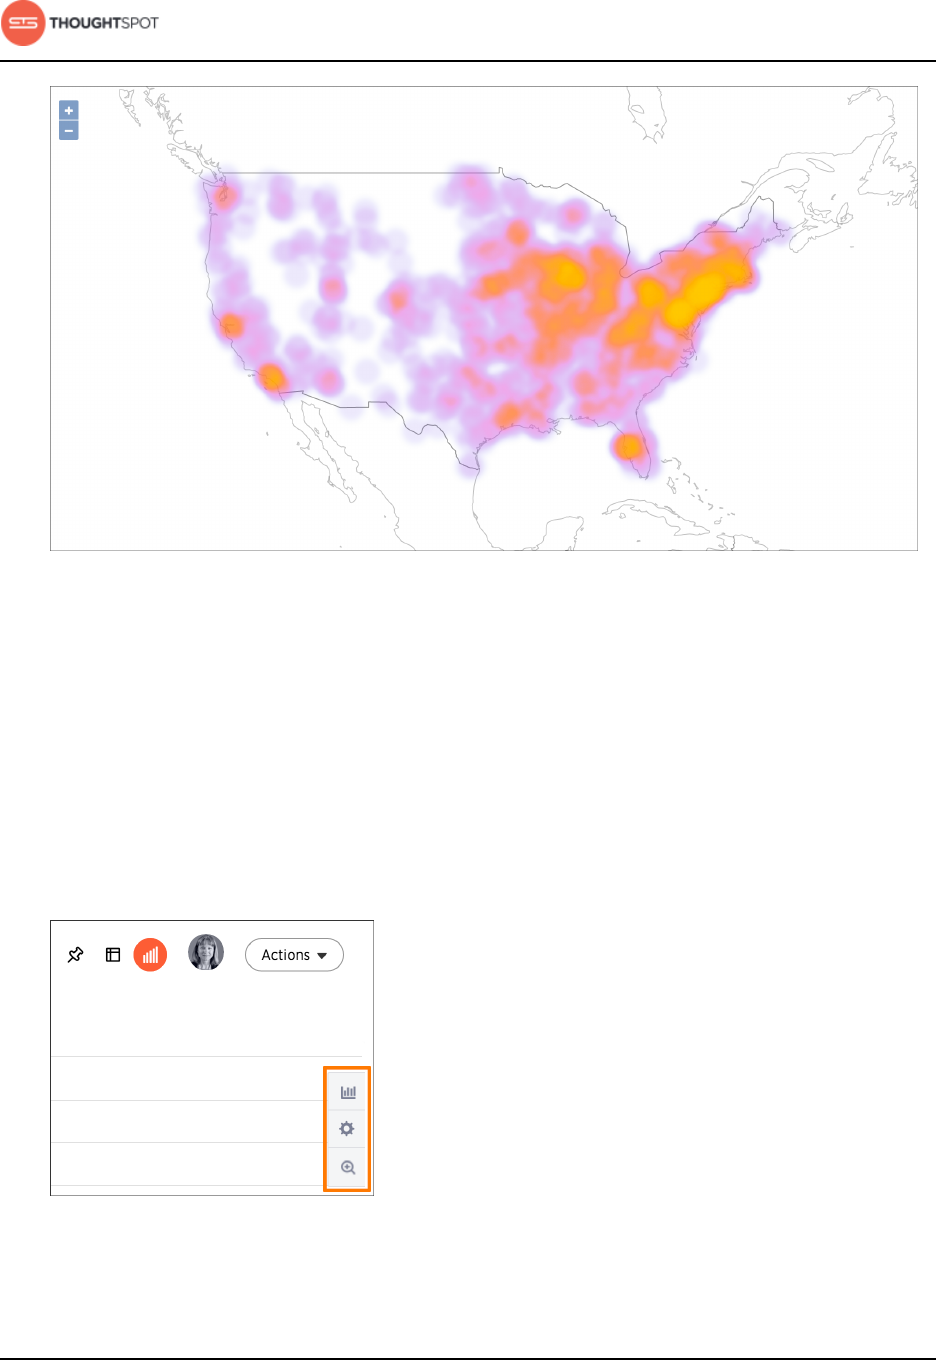
About search
User Guide Copyright © 2016 by ThoughtSpot. All Rights Reserved. 53
Figure 52: Geo heatmap chart example
Your search needs one geographical column or a pair of latitude and longitude
columns to be represented as a geo heatmap chart.
Change the chart
You can adjust the axes, labels, and view of the chart.
Every chart gives you the option to move columns between the x- and y-axes,
hide or show data labels, and zoom.
Figure 53: Configure chart icons
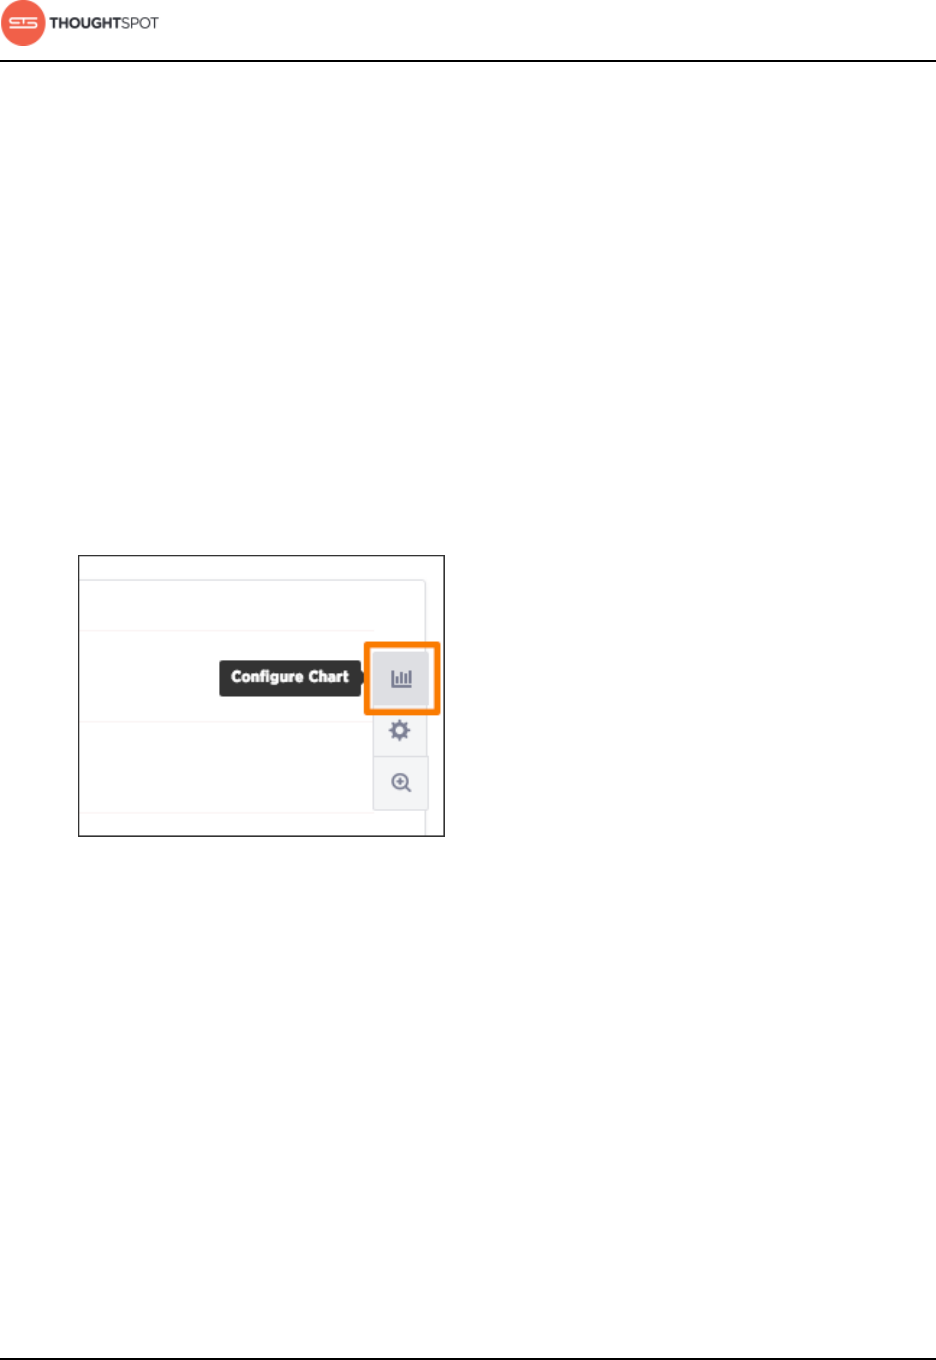
About search
User Guide Copyright © 2016 by ThoughtSpot. All Rights Reserved. 54
The configure chart option (the top icon which looks like a small bar chart) gives
you the ability to edit the chart axes and legends. Click on the icon to view the
chart axes, add a legend, lock axes, and more.
Change chart colors
You can easily change the legend colors in a chart.
To change the colors used in the legend of a chart, click on the square next to
the attribute whose color you wish to change.
To change the chart colors:
1. While viewing your answer as a chart, hover over it and click Configure Chart
on the right.
Figure 54: Configure Chart icon
2. Make sure you have a column in the Legend field.
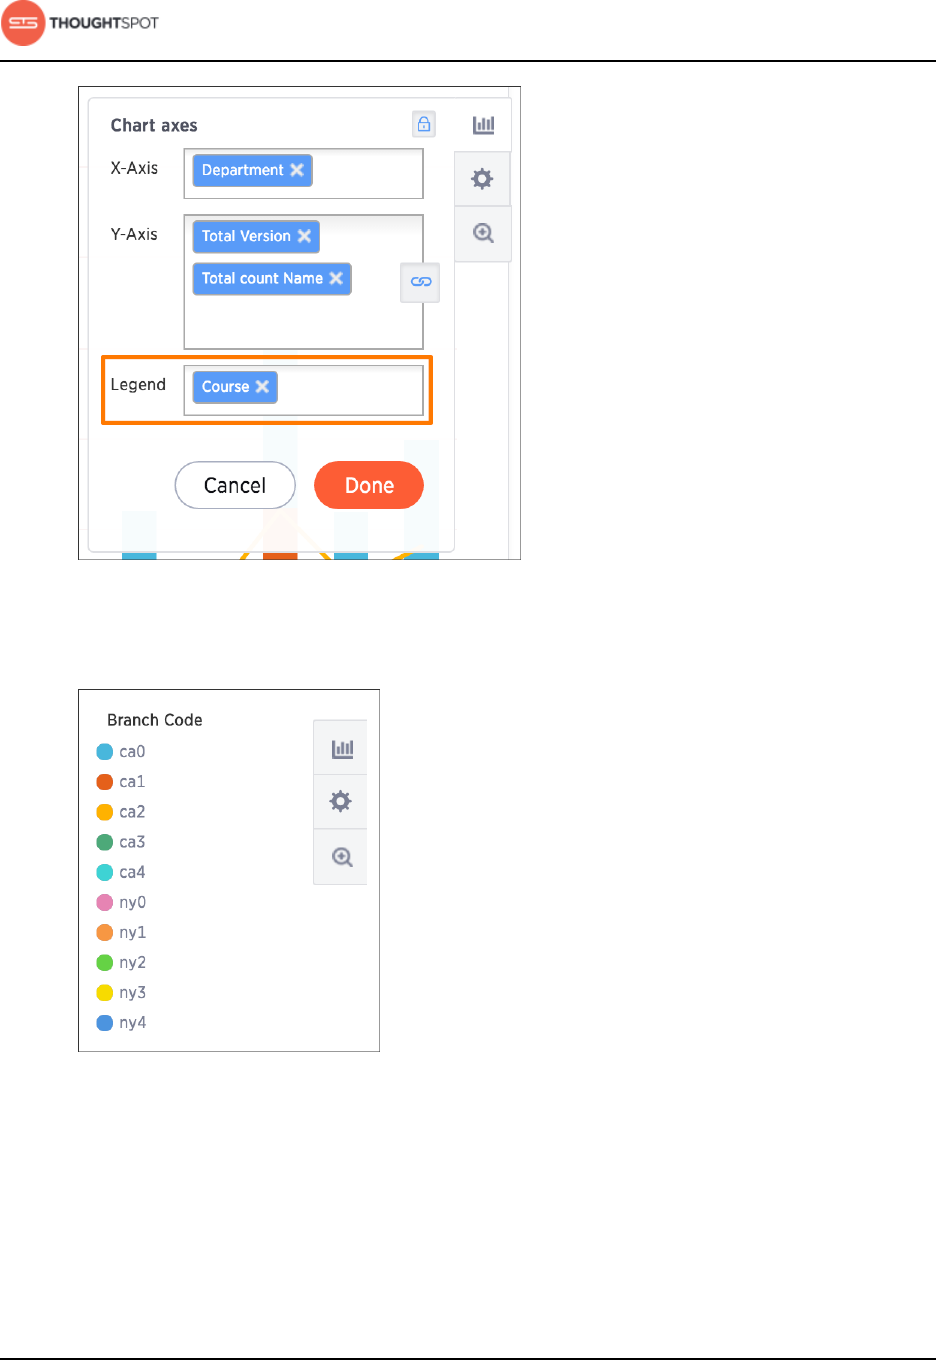
About search
User Guide Copyright © 2016 by ThoughtSpot. All Rights Reserved. 55
Figure 55: Legend field
3. On the chart, click the legend value you would like to change the color of.
Figure 56: Legend values list
4. Use the color selector to choose a new color to represent that legend value.
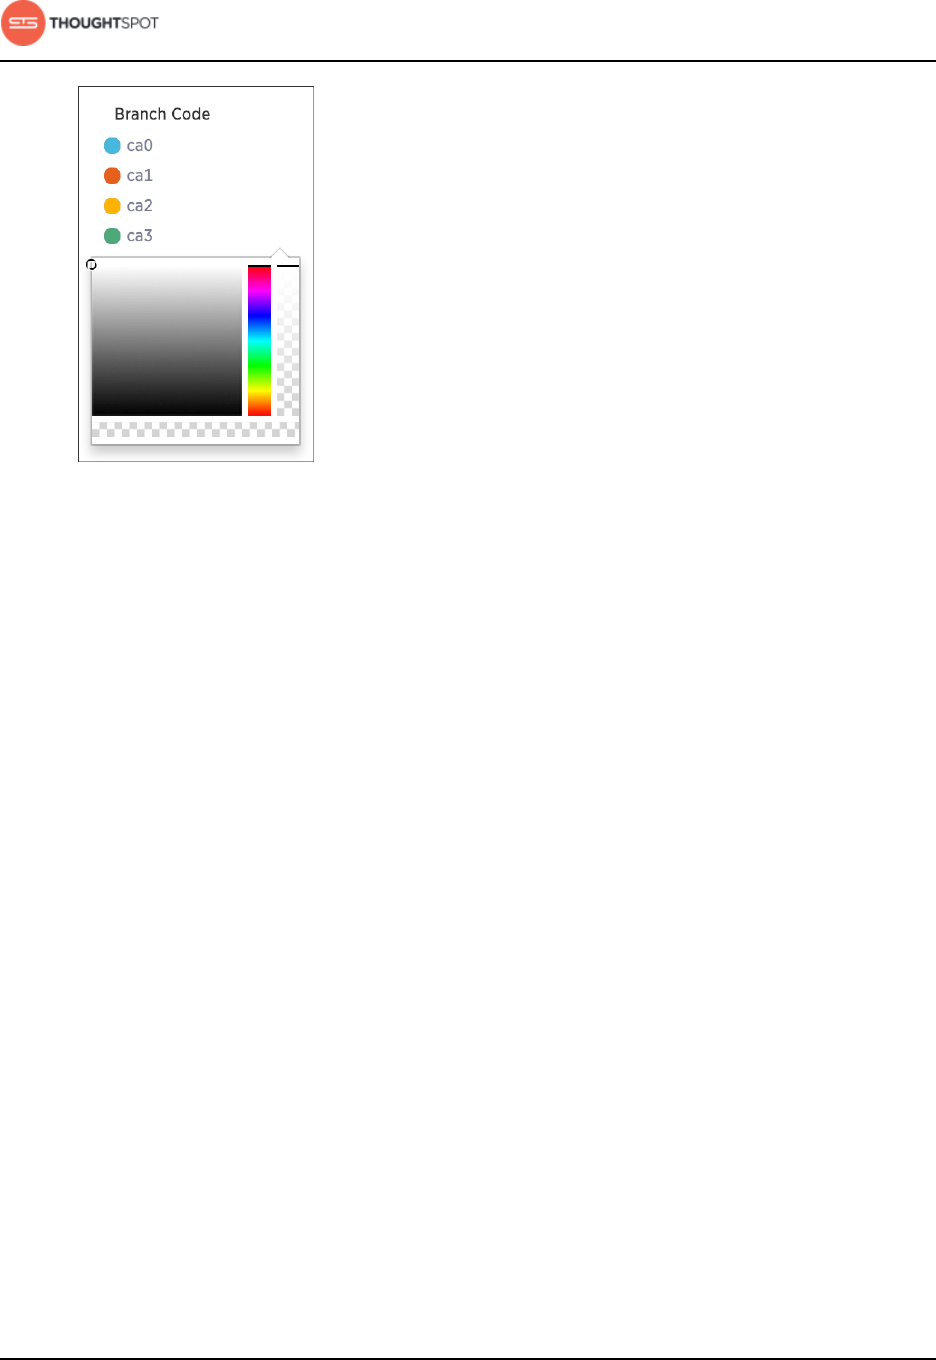
About search
User Guide Copyright © 2016 by ThoughtSpot. All Rights Reserved. 56
Figure 57: Configure Chart icon
5. Click outside of the selector to apply your change.
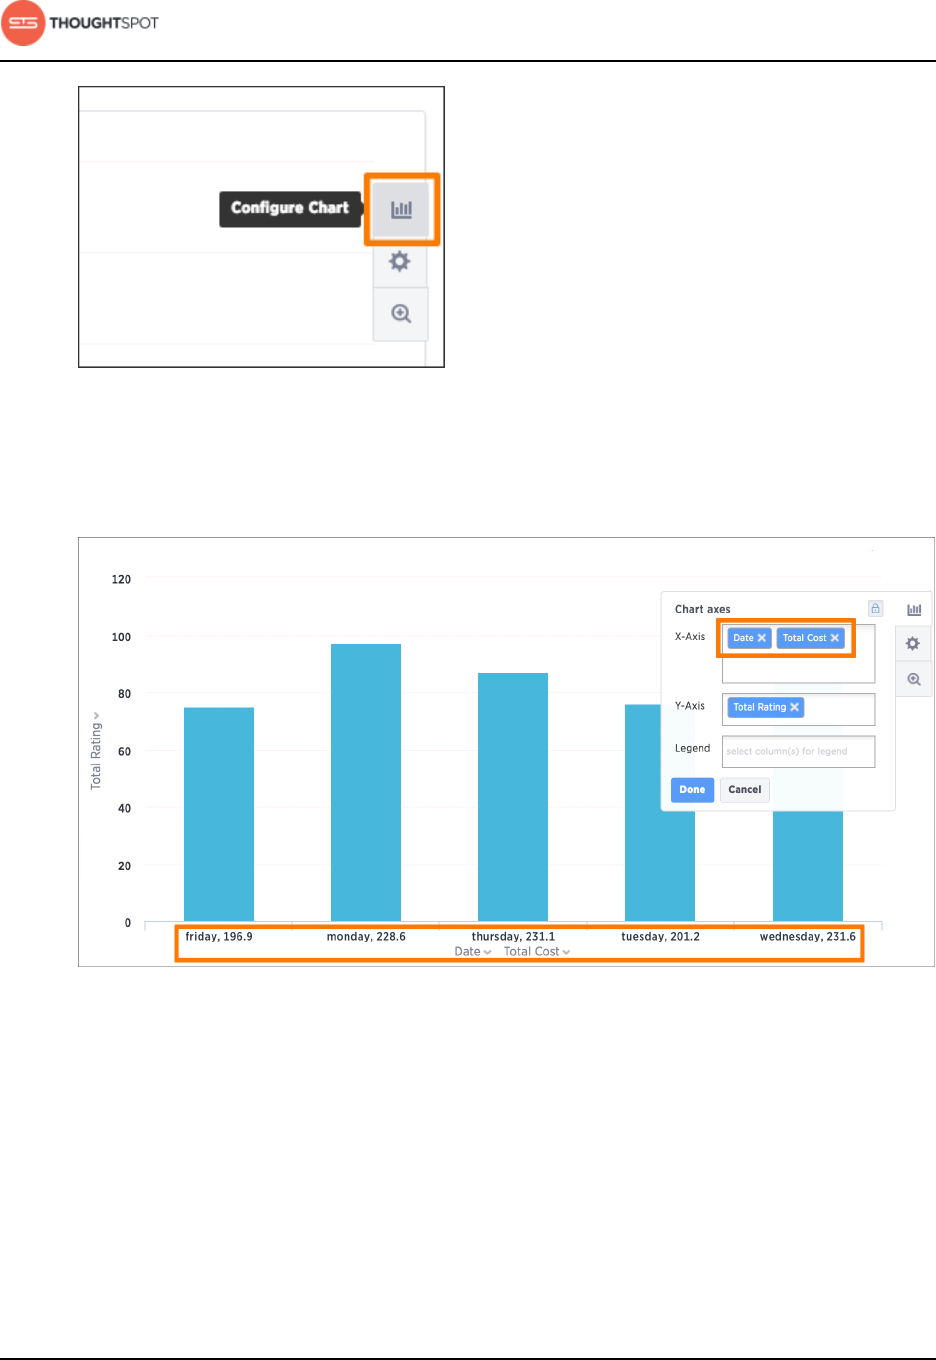
Reorder labels on the axis
When there are multiple columns on the x- or y-axis of a chart, you can reorder
them by using the Configure Chart icon.
The order in which columns appear on the axis is based on the sequence they
are added. The first field is used as the primary sorting field for the chart. Adding
another field adds it after the first one on the axis label. If you want to change
the order, you can remove the fields and re-add them in the reverse order.
This example shows you how to reorder the x-axis columns.
1. While viewing your answer as a chart, hover over it and click Configure Chart
near the top right.
About search
User Guide Copyright © 2016 by ThoughtSpot. All Rights Reserved. 57
Figure 58: Configure Chart icon
2. In the X-Axis box, delete the values. Then re-add them in the new preferred
order.
Figure 59: Reordering X-Axis columns
3. Click Done.
Your chart will reorganize itself to reflect the new label order.
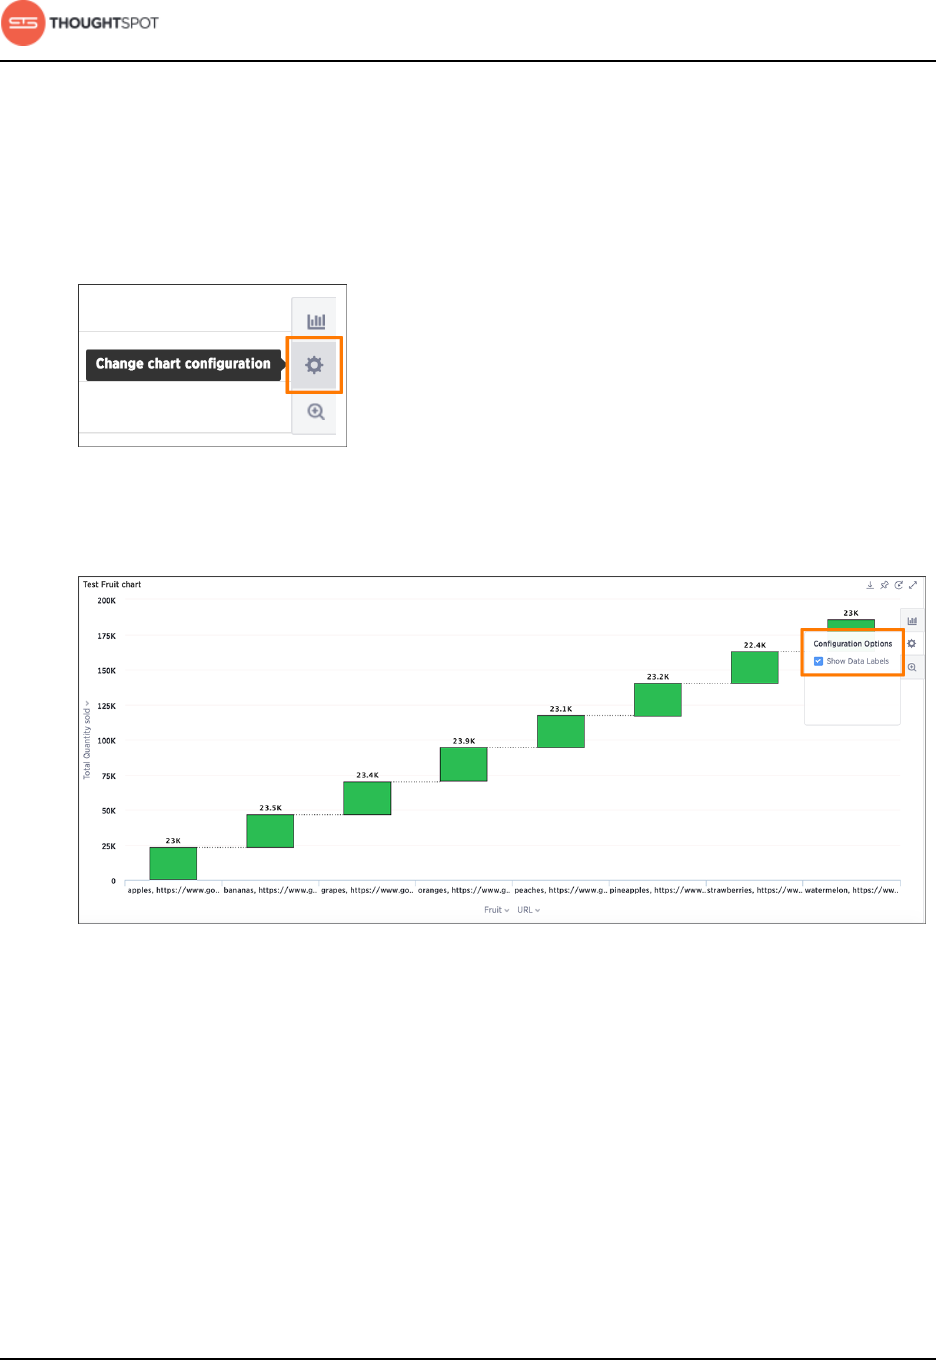
Show data labels
You can configure charts to show the y-axis data values.
About search
User Guide Copyright © 2016 by ThoughtSpot. All Rights Reserved. 58
Some charts have additional options under Configuration Options that are
covered in each chart type topic.
To show data labels:
1. While viewing your answer as a chart, click Change chart configuration.
Figure 60: Configure Chart icon
2. Select Show Data Labels.
Figure 61: Toggle on Show Data Labels
Other search actions
There are other search actions you can perform by interacting directly with your
answer.
These actions can be performed in an ad hoc way, or you can pin your answer to
a pinboard to save your configurations.
About search
User Guide Copyright © 2016 by ThoughtSpot. All Rights Reserved. 59
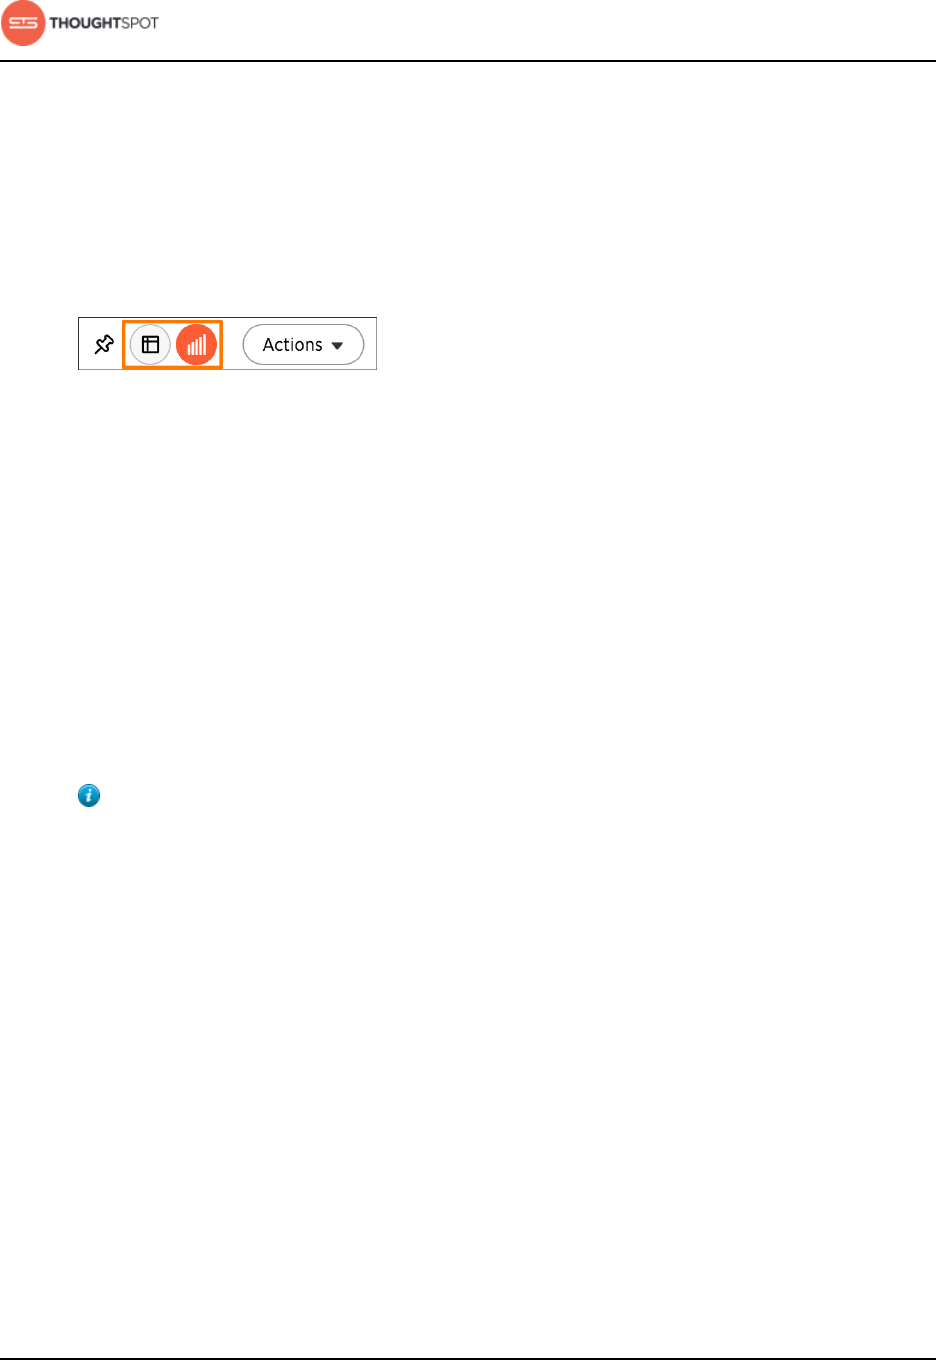
Change the view
You can change the view of your answer so it appears as a table or a chart.
To change the view of your answer:
While viewing your answer, toggle between the two views by clicking either
Data View for a table or Select Chart Type for a chart.
Figure 62: Toggle between the two views
Sort your search
Sorting your search allows you to order your answer, making it easier to read.
By default, sorting applies in descending order. You can click on a column header
to sort again to sort in ascending order.
To sort your search:
1. If you are in the data (table) view, click the column header you would like to
sort on.
Tip: Hold shift and click another column to add a secondary sort. You
can even add tertiary sorting and so on by continuing to use this trick.
2. If you are in the chart view, click the axis label of your chart and select Sort.
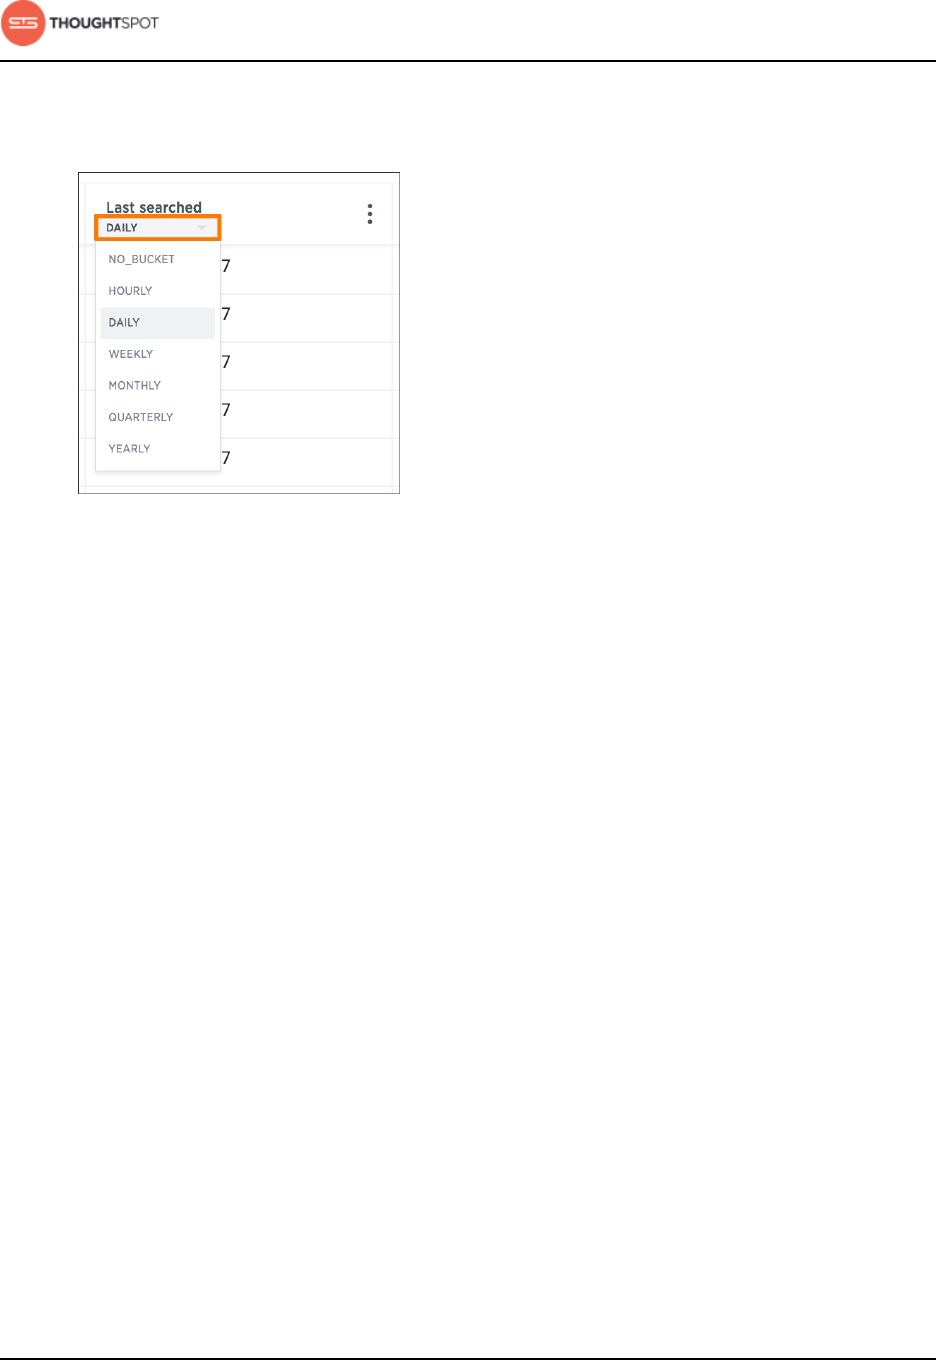
Change the date bucketing
You can change the date bucketing on tables and charts for columns with date
values.
The default date bucketing takes the entire search result into account. For
example, if your search includes last month, dates will be bucketed daily instead
of monthly. You can change this default bucketing choice.
To change the date bucketing:
About search
User Guide Copyright © 2016 by ThoughtSpot. All Rights Reserved. 60
1. Click the date bucket dropdown on the column header of your table or on the
axis label of your chart.
Figure 63: Date bucketing chooser
2. Select a different date bucket.
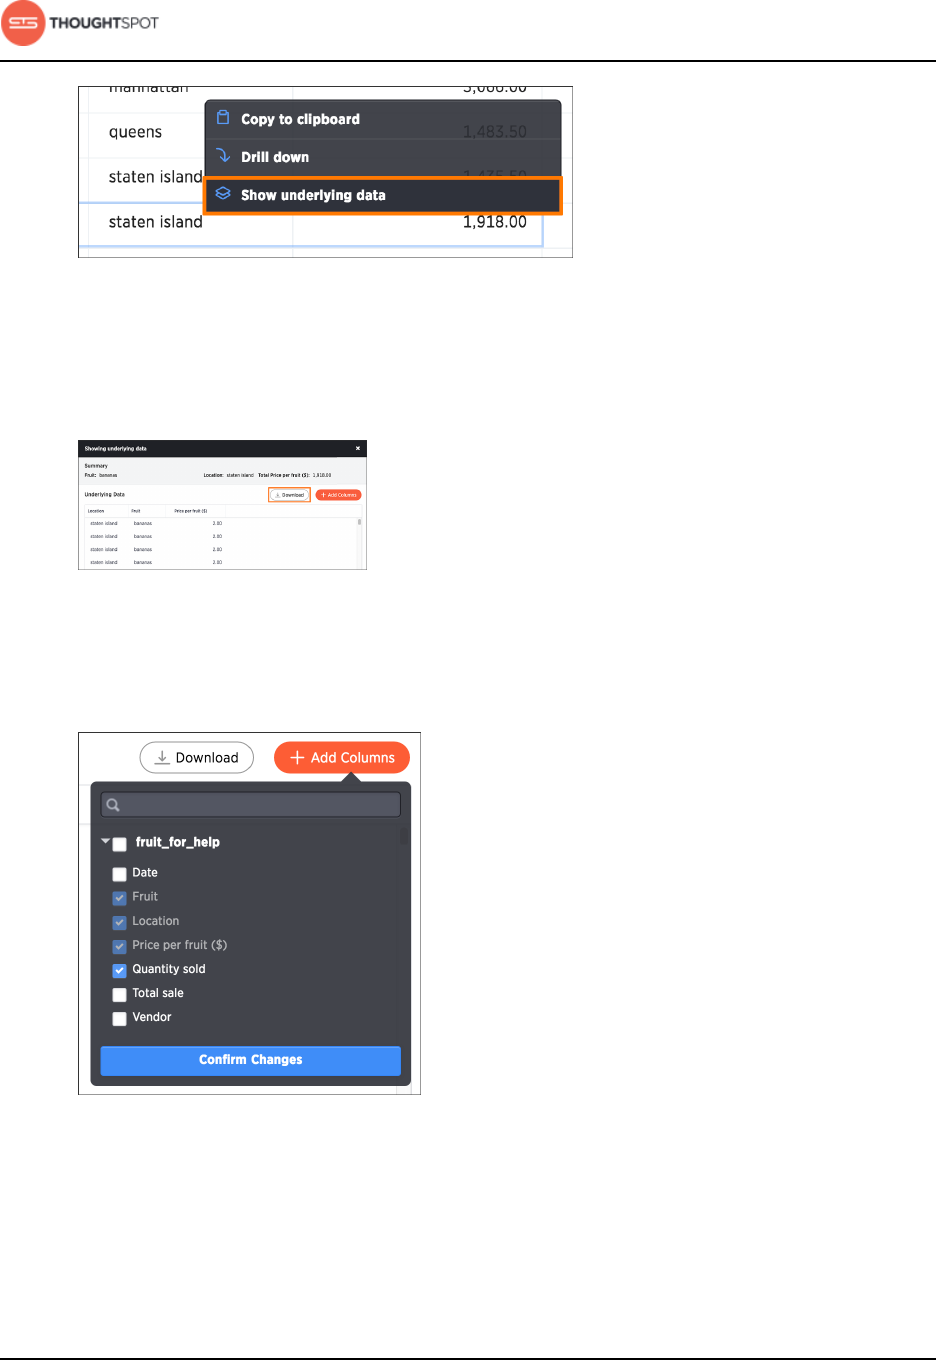
Show underlying data
Viewing the underlying data of your answer gives you an un-aggregated view of
the underlying data.
You can see the most granular details of a given result set, i.e. it shows the un-
aggregated view. This feature lets you understand what an answer consists of.
For example, if you search for "customer region revenue", the answer shows
the aggregate revenue value for each customer region. You can then click on
any row and then on Show underlying data, to see each value that "revenue"
constitutes of, for any given region. You can even download the results shown
when you choose Show underlying data from a chart. The download file limit is
100,000 rows.
To show underlying data:
1. Right click on the visualization or table cell of interest, and select Show
underlying data.
About search
User Guide Copyright © 2016 by ThoughtSpot. All Rights Reserved. 61
Figure 64: Show underlying data option
A new window will open, displaying a summary and the underlying data.
2. Click Download to download a CSV file of the data.
Figure 65: Download underlying data
3. Click + Add Column to add more columns. After selecting columns to add,
click Confirm Changes.
Figure 66: Add columns to underlying data
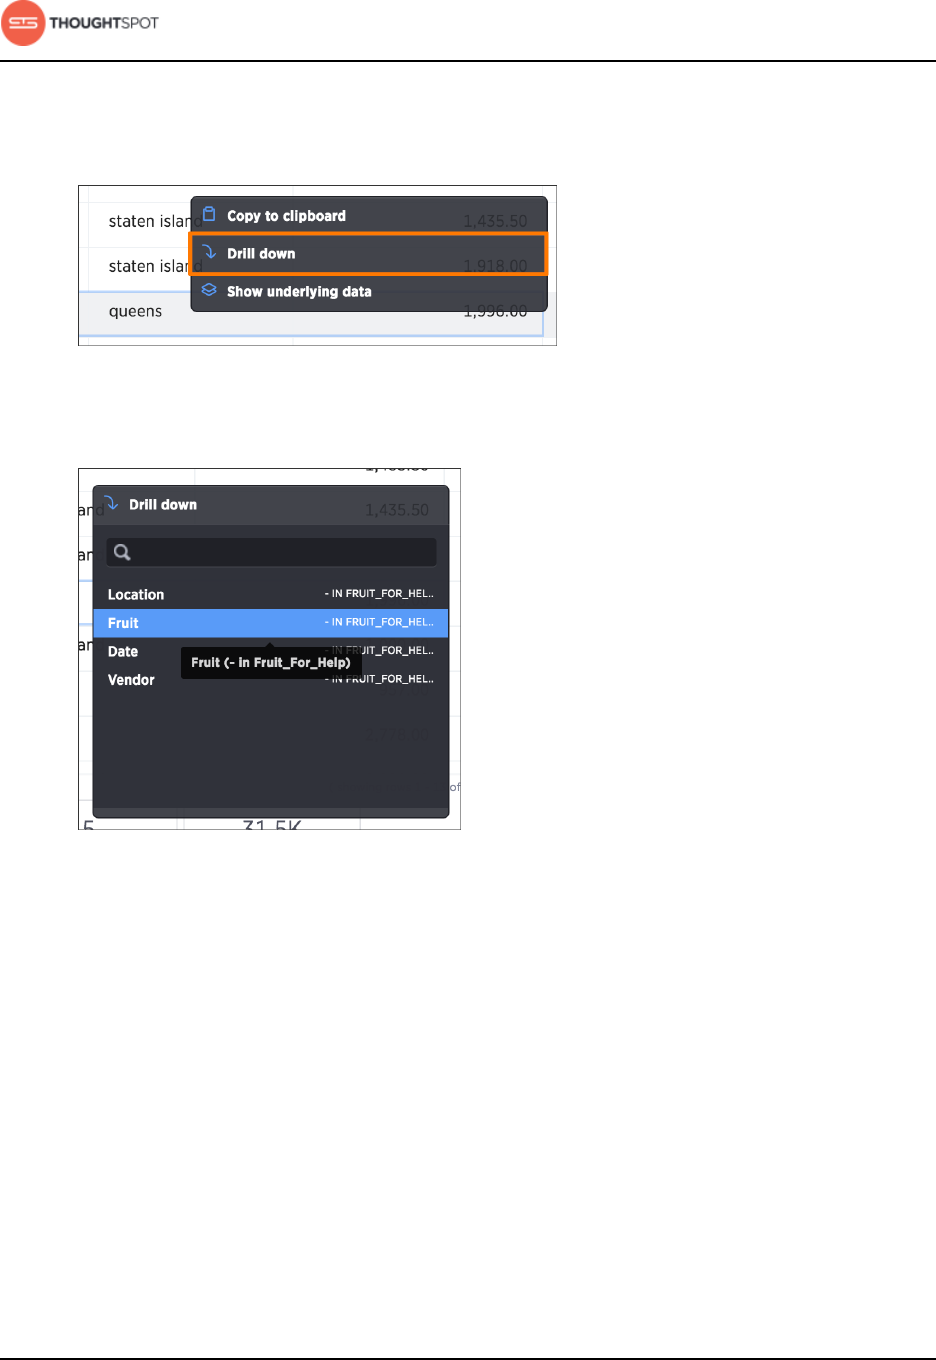
Drill down
Drilling down allows you to see more information about the columns used within
your search.
About search
User Guide Copyright © 2016 by ThoughtSpot. All Rights Reserved. 62
To drill down:
1. Right click on the visualization or table cell of interest, and select Drill down.
Figure 67: Drill down option
2. Click on any of the listed data to recreate the search with that data included.
Figure 68: Drill down list
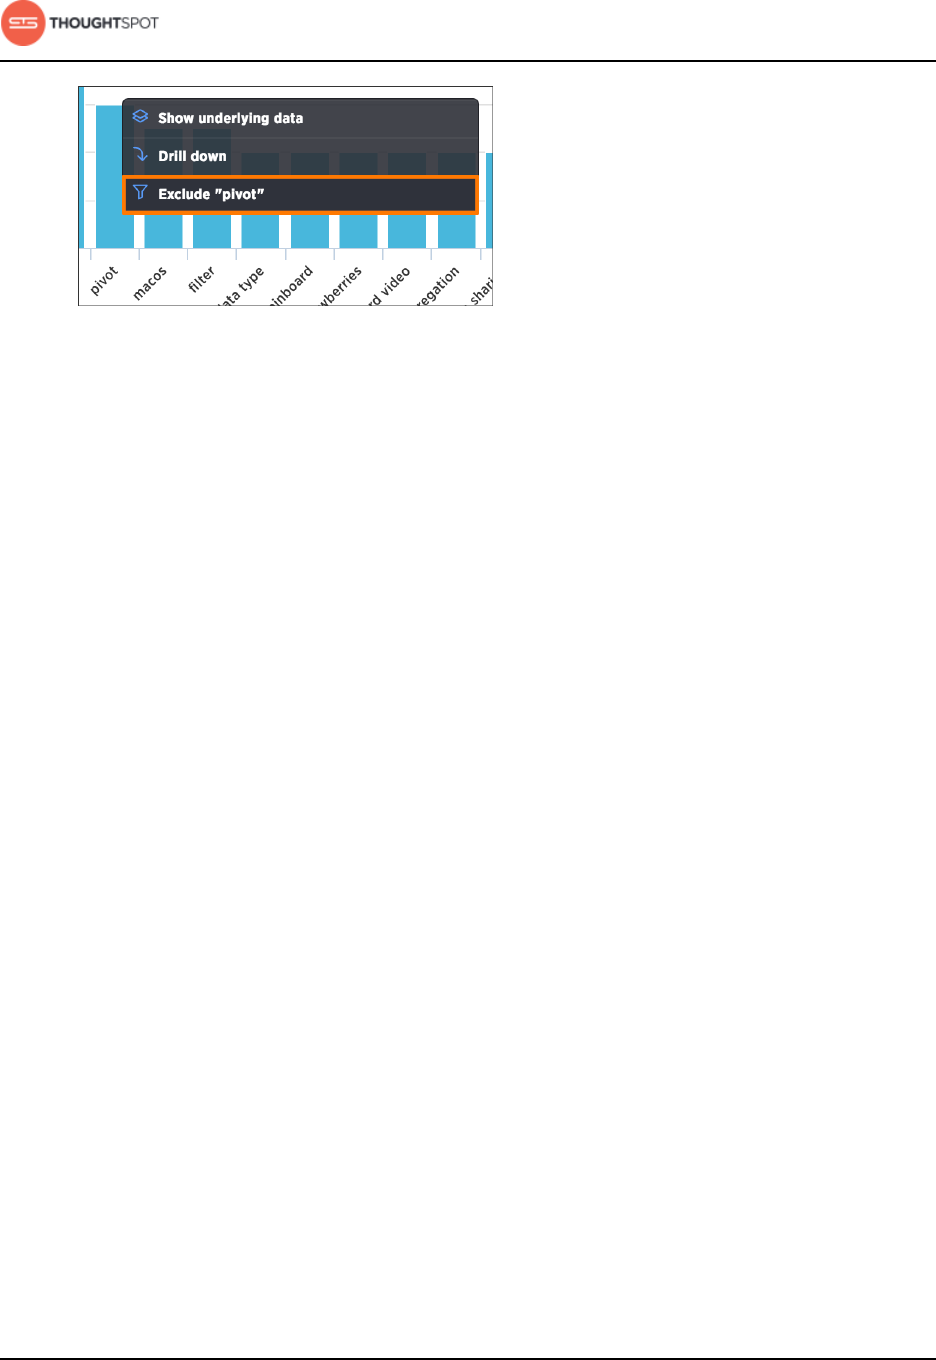
Exclude and include row values
You can include or exclude row values from your answer.
To exclude or include row values:
Right click on the visualization or table cell of interest, and select Exclude
"value" or Include "value" if available.
About search
User Guide Copyright © 2016 by ThoughtSpot. All Rights Reserved. 63
Figure 69: Exclude value option
About conditional formatting
You can apply conditional formatting to tables or charts to highlight values in the
data. This makes values above, below, or within a particular threshold stand out.
You can add visual cues for KPIs (Key Performance Indicators) or threshold
metrics to charts and tables, to easily show where you are falling short
or exceeding targets. These visual cues are called conditional formatting,
which applies color formatting to your search result. For tables, you can add
conditional formatting to set the background color of cells in a table based on
the values they contain. For charts, you can add conditional formatting to show
the threshold(s) you defined, and the data that falls within them will be shown
using the same color.
Many companies create pinboards with key metrics they want to track in daily or
weekly staff meetings. Using conditional formatting, they can see at a glace how
they are performing relative to these metrics.
Apply conditional formatting to a table
You can use conditional formatting to show table cells with a background color
determined by the value they contain.
To apply conditional formatting to a table:
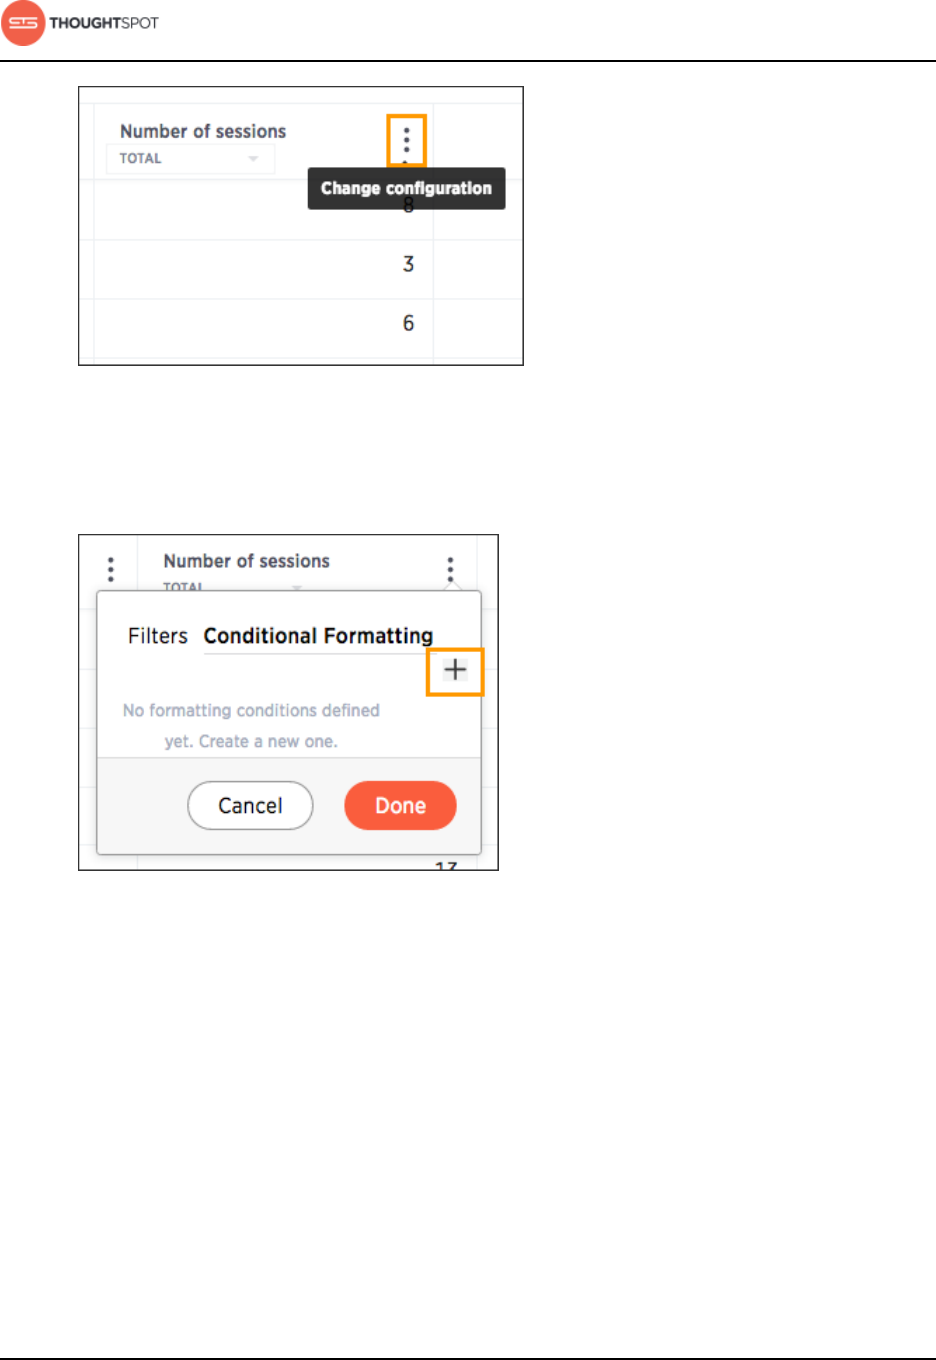
1. In the column header of your table for the column you want to apply
formatting to, click the three dot Change Configuration icon.
About search
User Guide Copyright © 2016 by ThoughtSpot. All Rights Reserved. 64
Figure 70: Three dot menu
2. Select Conditional Formatting.
3. Click the + icon in the Conditional Formatting menu.
Figure 71: Conditional formatting menu
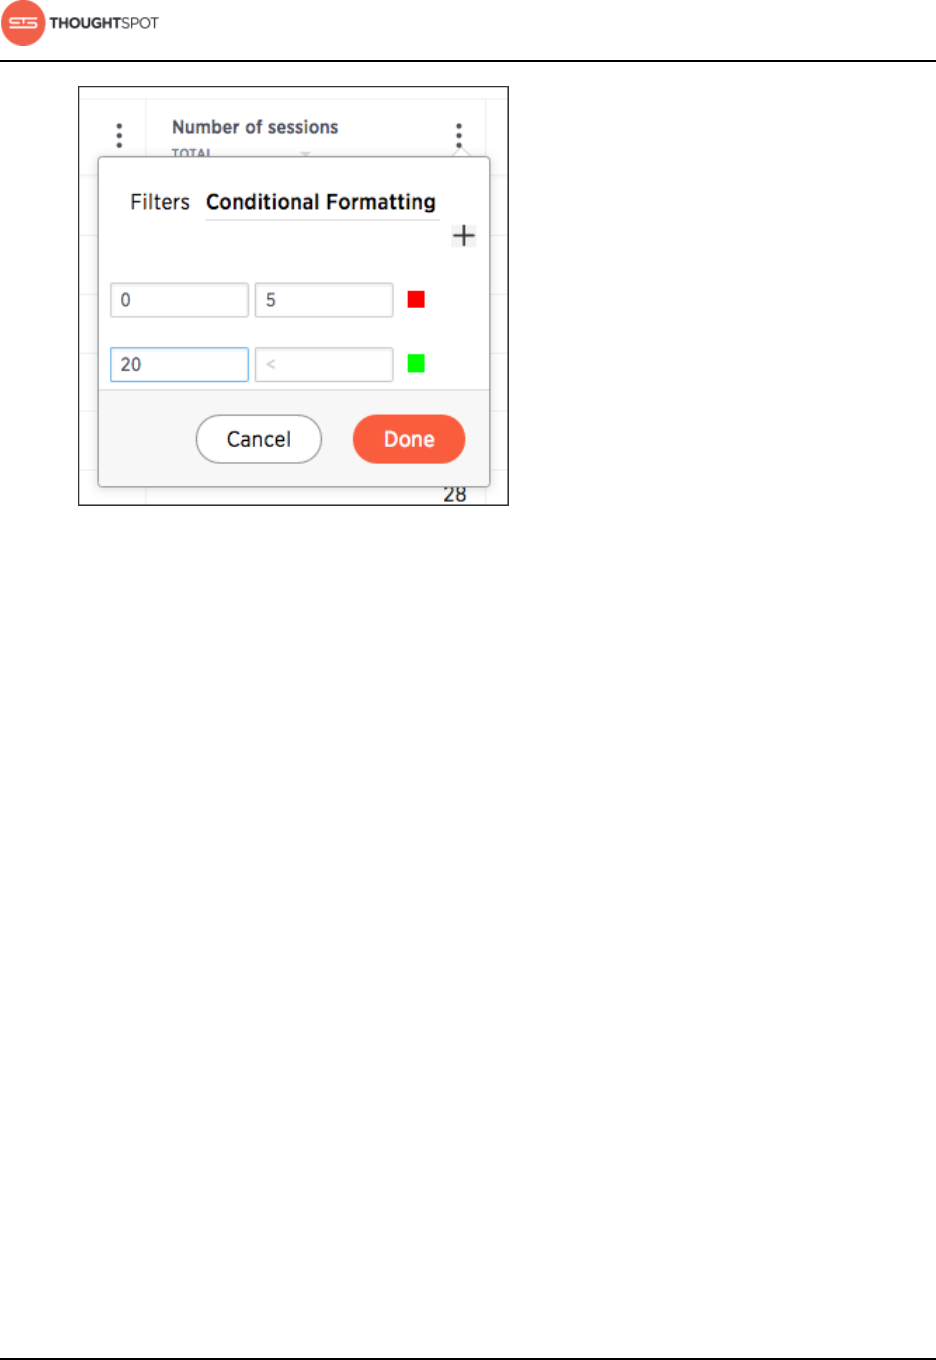
4. Define the sets of values and the color to use for each set.
About search
User Guide Copyright © 2016 by ThoughtSpot. All Rights Reserved. 65
Figure 72: Define the sets of values and color
5. Click Done after defining all of your conditional formatting sets.
About search
User Guide Copyright © 2016 by ThoughtSpot. All Rights Reserved. 66
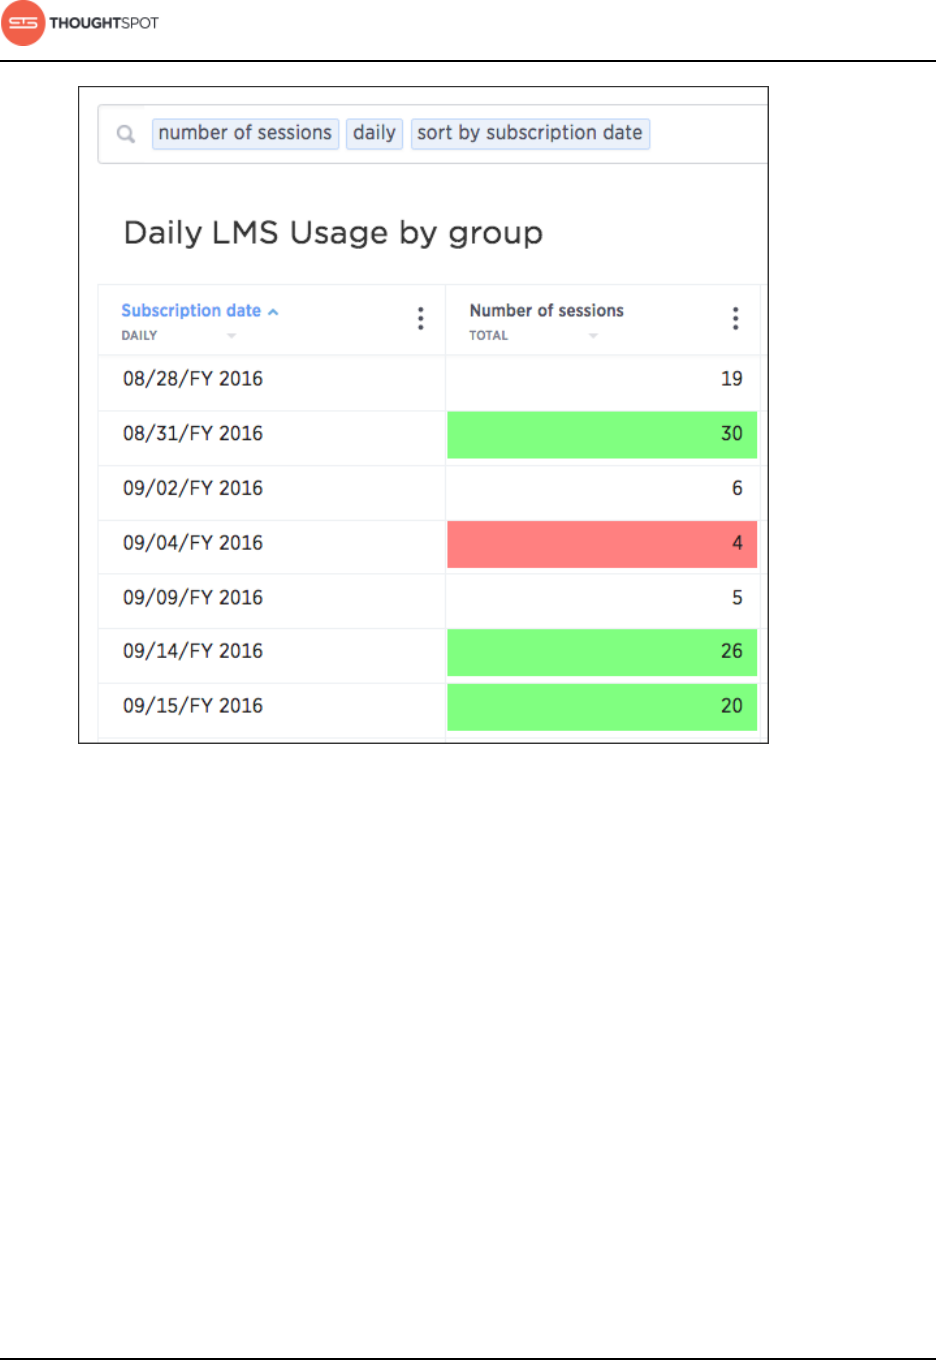
Figure 73: Table with conditional formatting
6. Note that if you change to a chart type, you will need to apply conditional
formatting again. Conditional formatting is tied to the specific visualization.
Apply conditional formatting to a chart
You can use conditional formatting to show charts with a target value or range
drawn as a line in the chart, and the legend colors determined by where values
fall relative to the target.
To apply conditional formatting to a chart:
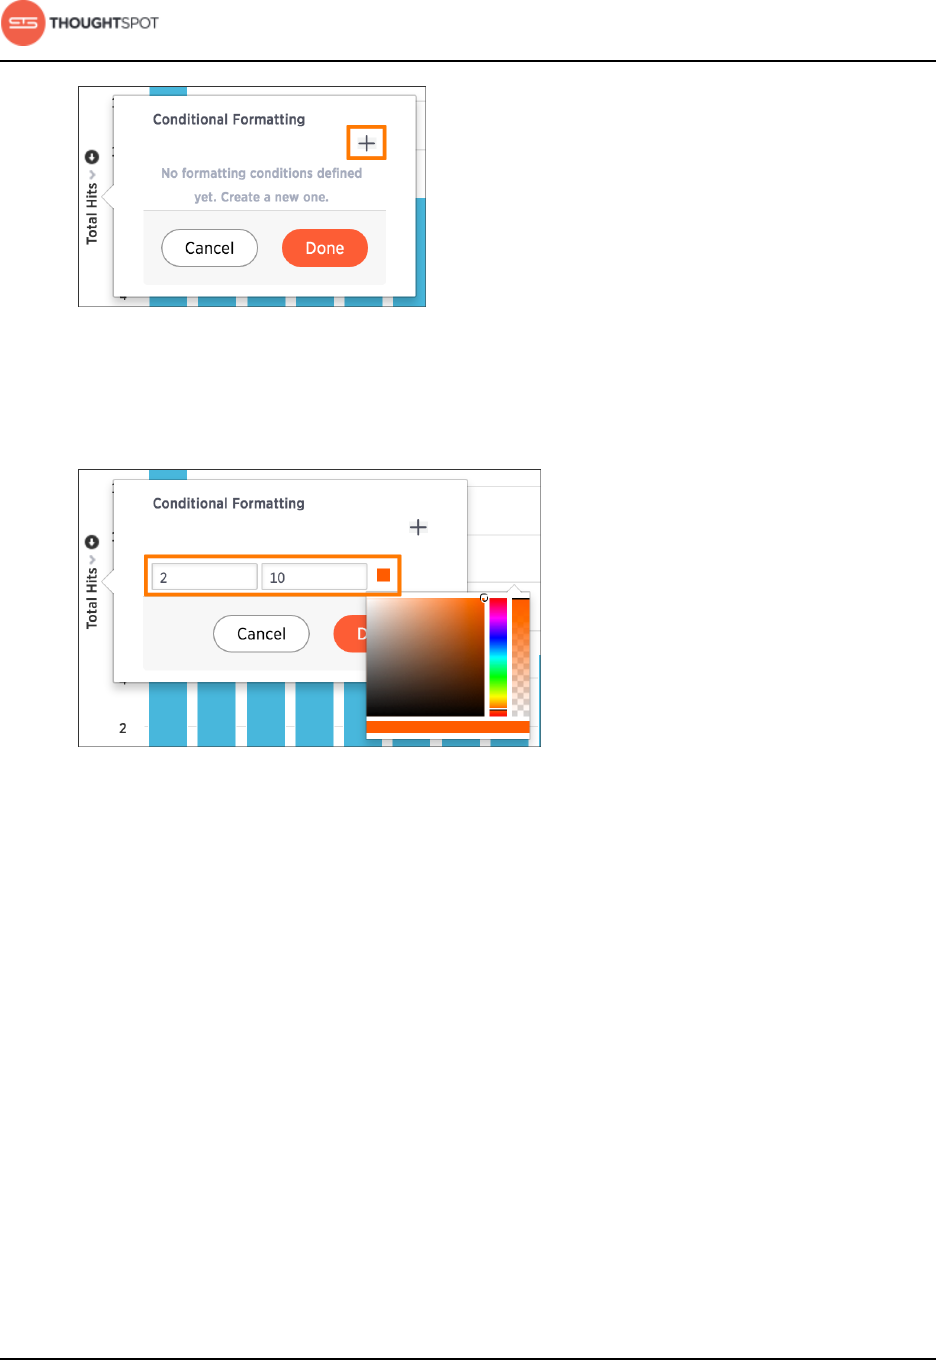
1. Click the axis label of your chart. Select Conditional Formatting.
2. Click the + icon in the Conditional Formatting menu.
About search
User Guide Copyright © 2016 by ThoughtSpot. All Rights Reserved. 67
Figure 74: Conditional formatting menu
3. Define the ranges of values and the color to use for each range you want to
track. To add another range, click the + icon and repeat.
Figure 75: Define the sets of values and color
4. Click Done after defining all of your conditional formatting ranges.
About search
User Guide Copyright © 2016 by ThoughtSpot. All Rights Reserved. 68
Figure 76: Chart with conditional formatting
5. Note that if you change the chart type, you will need to apply conditional
formatting again. It is tied to the specific visualization.
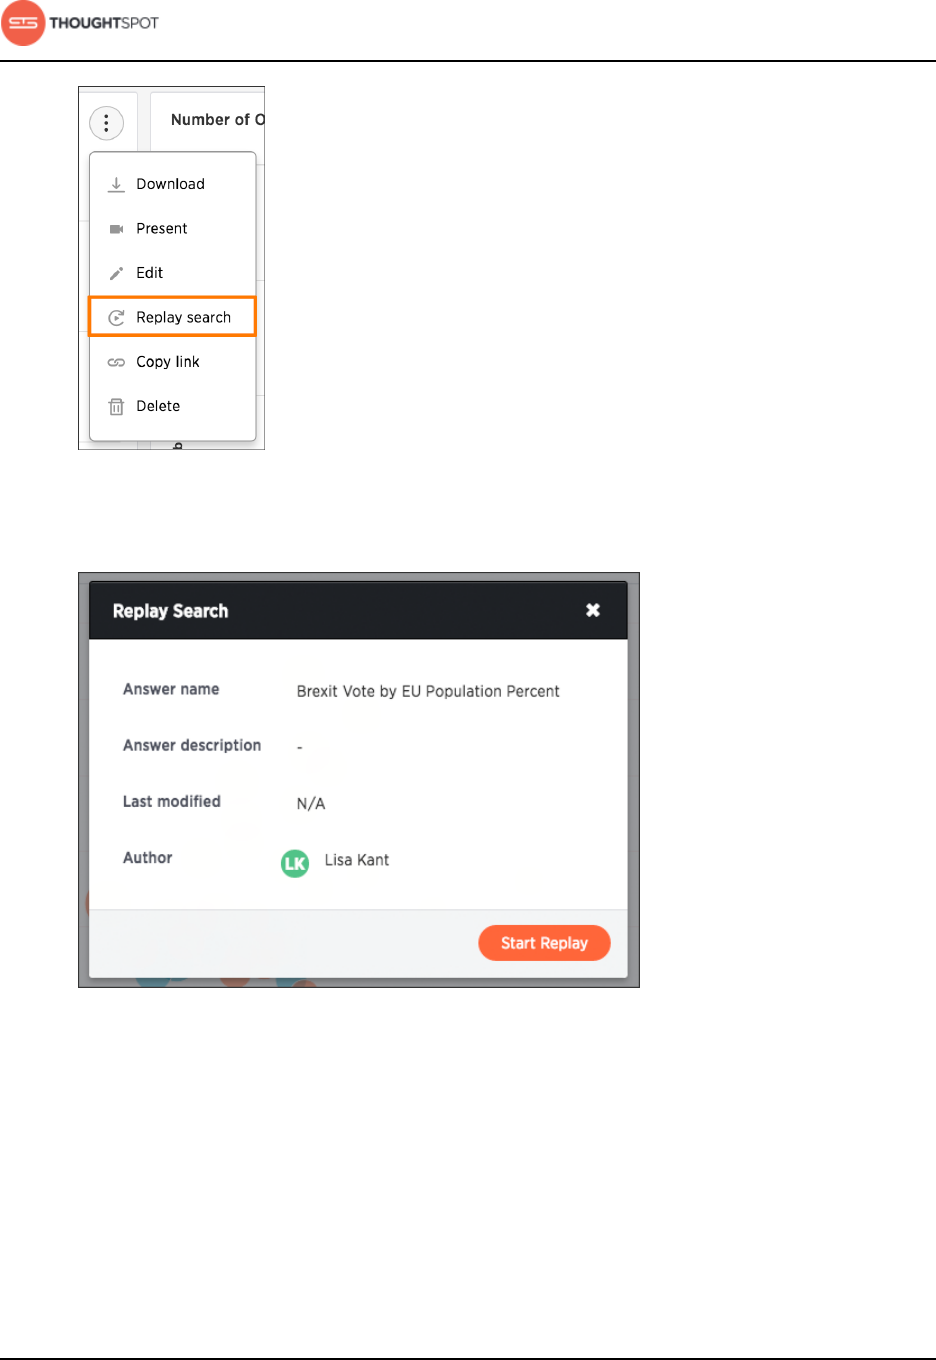
Replay search
You can instantly generate a step-by-step replay showing the creation of a table
or chart.
The replay feature shows how to create the chart or table you are viewing. Use
it to teach yourself, or take a screencam of it and create your own ThoughtSpot
training for your team.
1. When viewing a chart or table, select Replay search.
About search
User Guide Copyright © 2016 by ThoughtSpot. All Rights Reserved. 69
Figure 77: The Replay search icon
2. Then, select Start Replay to view the video.
Figure 78: Start Replay
The replay will start automatically. You can pause and resume it by clicking on
it.
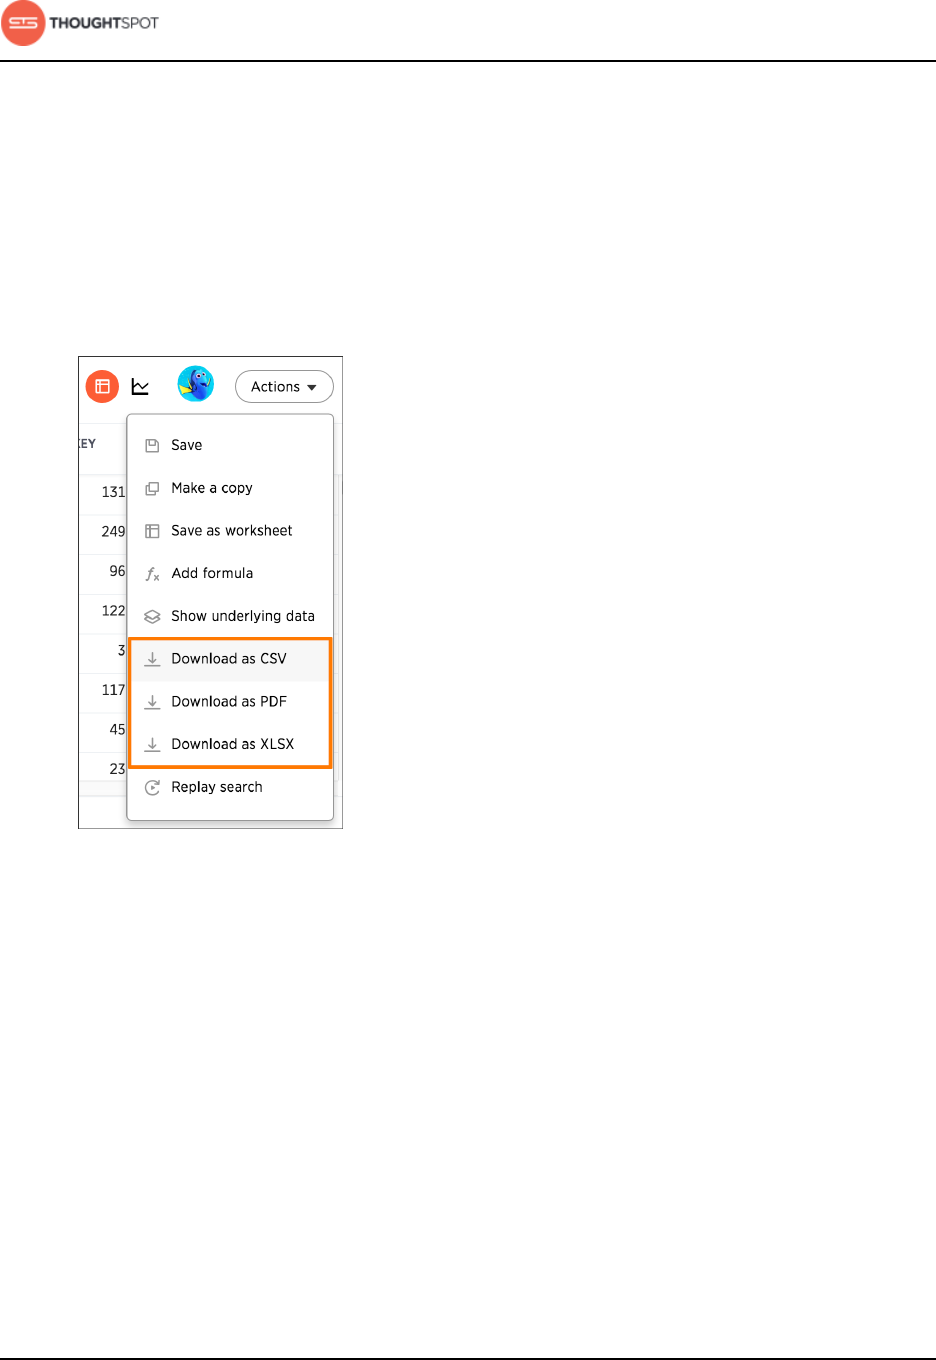
Download your search
You can download your search as either a table or chart.
About search
User Guide Copyright © 2016 by ThoughtSpot. All Rights Reserved. 70
You have the option to download your table as a CSV (comma separated values),
PDF, or XLSX (Excel) file. When you download a chart, it will be a PNG file.
To download your search:
Click Actions.
For a table, choose between Download as CSV, Download as PDF, or
Download as XLSX.
Figure 79: Download your table options
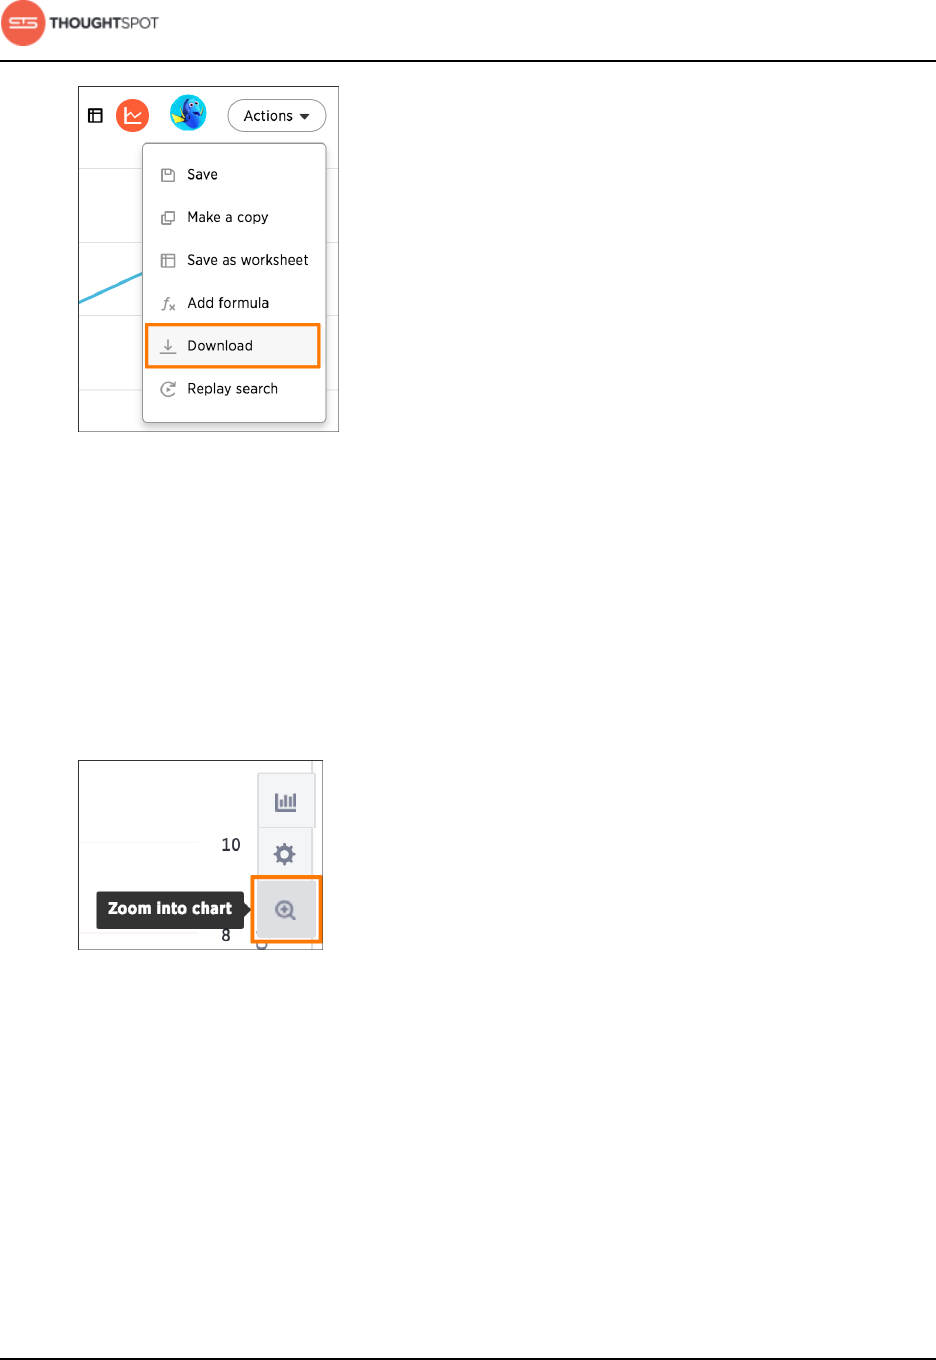
For a chart, select Download.
About search
User Guide Copyright © 2016 by ThoughtSpot. All Rights Reserved. 71
Figure 80: Download your chart option
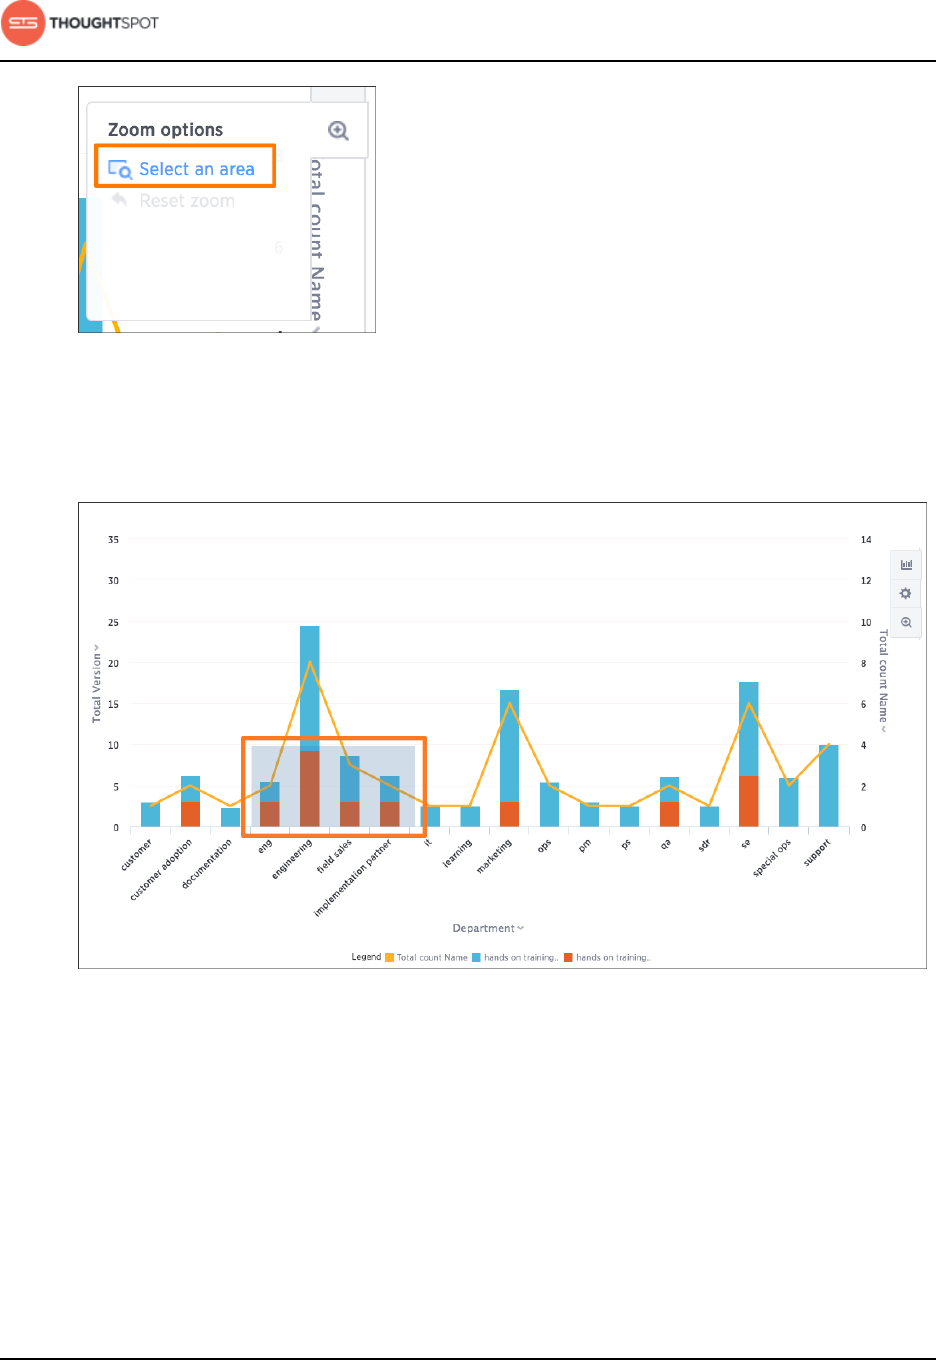
Zoom into a chart
You can zoom into your chart by selecting an area with your mouse.
To zoom into a chart:
1. While viewing your answer as a chart, click Zoom into chart on the right side
of the chart.
Figure 81: Zoom into chart icon
2. Click Select an area.
About search
User Guide Copyright © 2016 by ThoughtSpot. All Rights Reserved. 72
Figure 82: Select an area to zoom
3. Select an area on your chart to zoom into by clicking and dragging your
mouse.
Figure 83: Click and drag to select an area
Your chart will be reconfigured to only show the selected area.
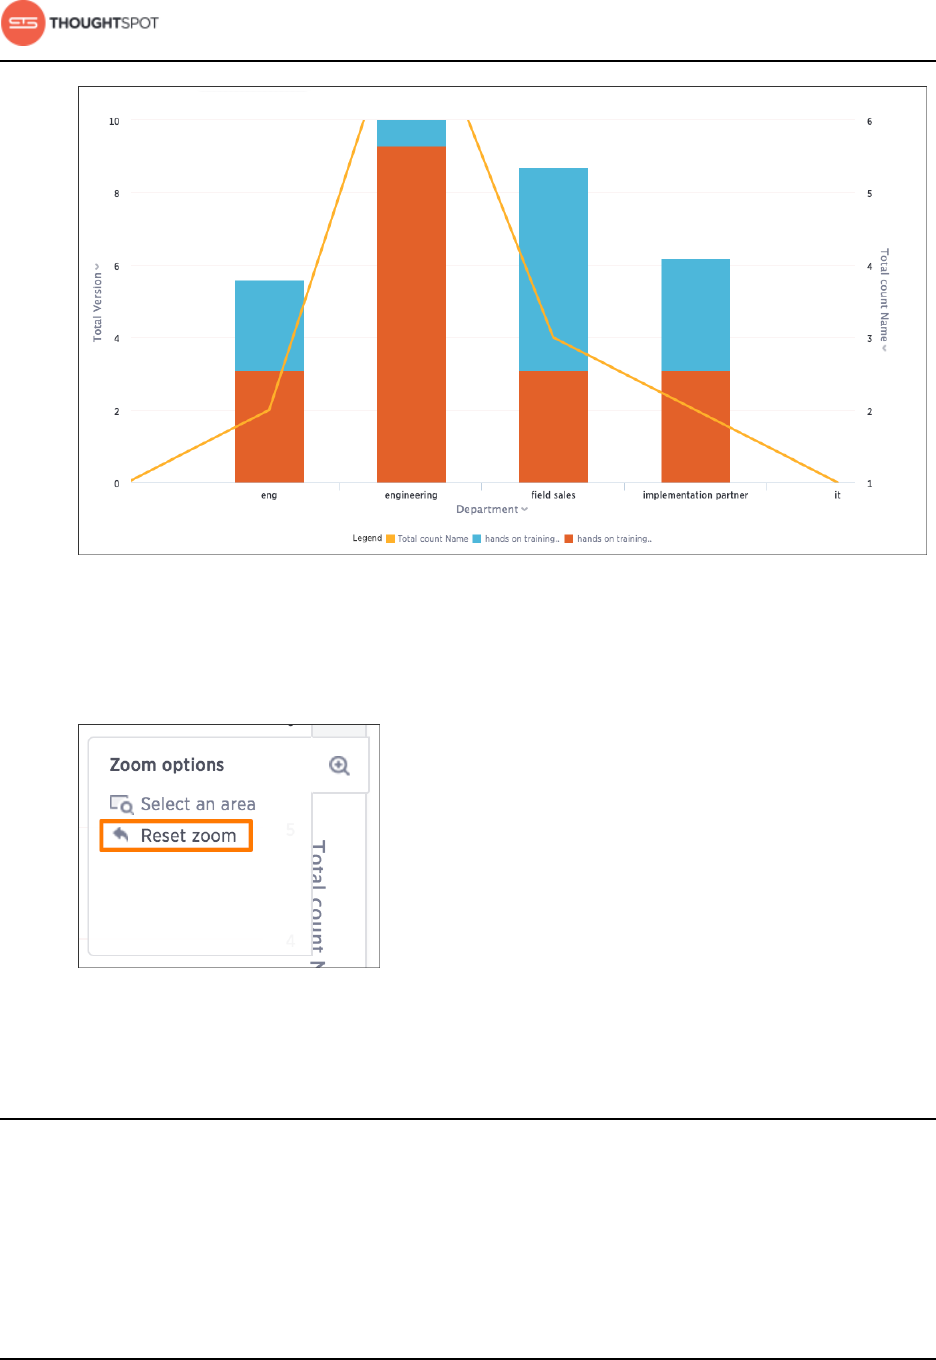
About search
User Guide Copyright © 2016 by ThoughtSpot. All Rights Reserved. 73
Figure 84: Zoomed in chart area
4. If you would like to return to the original chart view, click Reset zoom under
Zoom options.
Figure 85: Reset zoom option
About filters
Filters narrow down the search result to only include the data you want to see.
When you add a value to your search, it becomes a filter. Simple filters can be
applied to an answer, while pinboard filters can be applied to all visualizations
About search
User Guide Copyright © 2016 by ThoughtSpot. All Rights Reserved. 74
of a pinboard. You can find out more about pinboard filters in the pinboards
section.
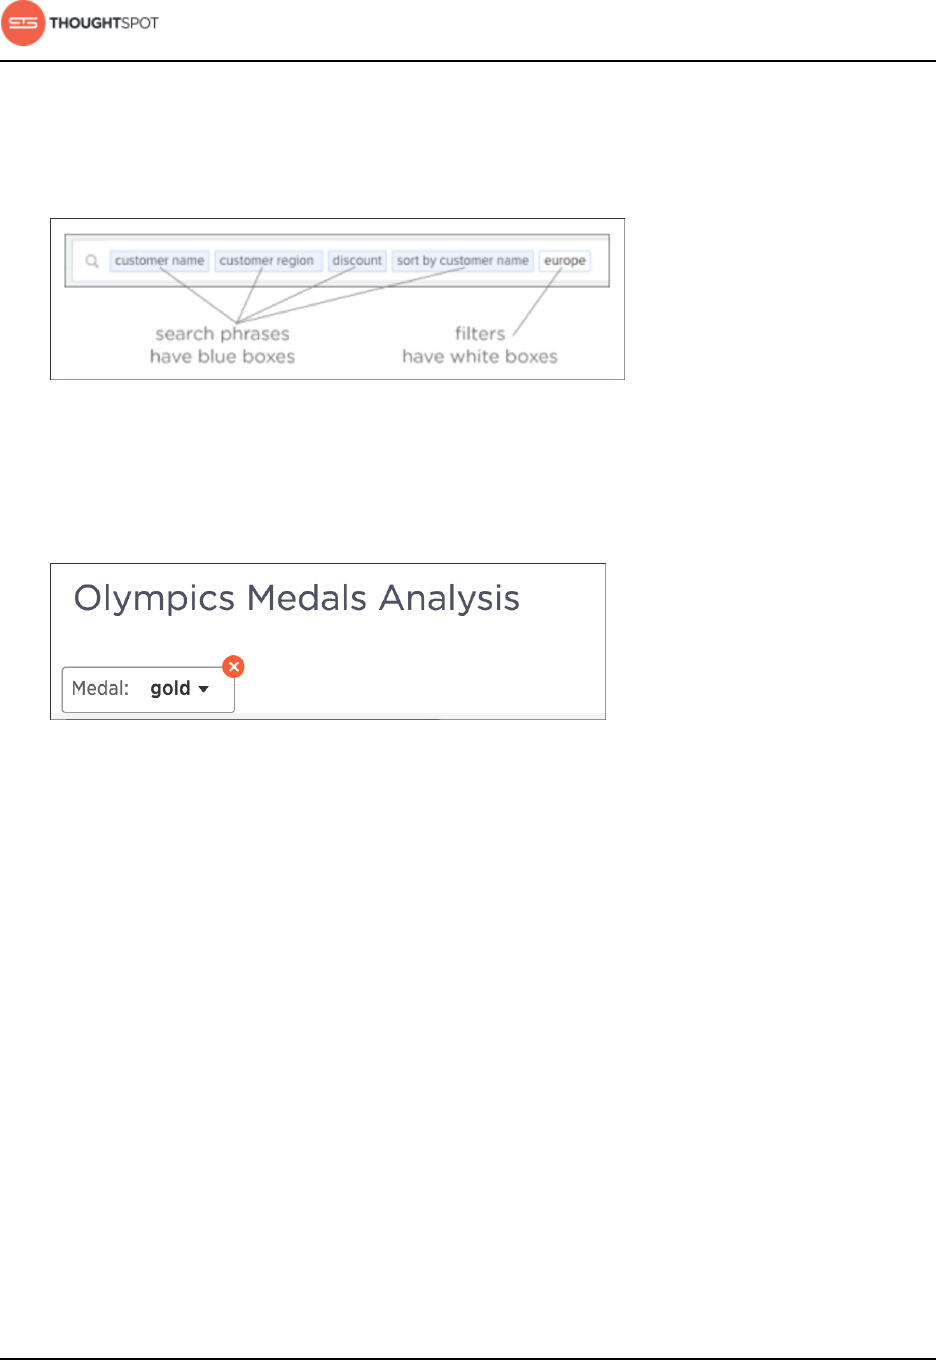
In search, filters appear in white boxes in the search bar.
Figure 86: Search bar with filters
In an answer or a pinboard, filters appear just below the title. For pinboards, your
filters apply to all worksheet-based visualizations in the pinboard.
Figure 87: Pinboard filters
If you ever find that your search or pinboard does not appear to contain all the
data you want to see, check for any existing filters and remove them by clicking
the X to see all the data.
About simple filters
Simple filters can be applied to searches in a few different ways.
You can use the search bar or the Change Configuration menu to add a filter to
a search. You can apply simple filters to your search, whether it shows a table
or a chart. Your filters remain part of the search even when you change the
visualization type.
When adding a filter from the Change Configuration menu, numeric columns
and text columns provide you with a checkbox selector for values. If the column
About search
User Guide Copyright © 2016 by ThoughtSpot. All Rights Reserved. 75
contains a date, you'll see a calendar selector when applying a filter. This is also
where you'll go to apply bulk filters.
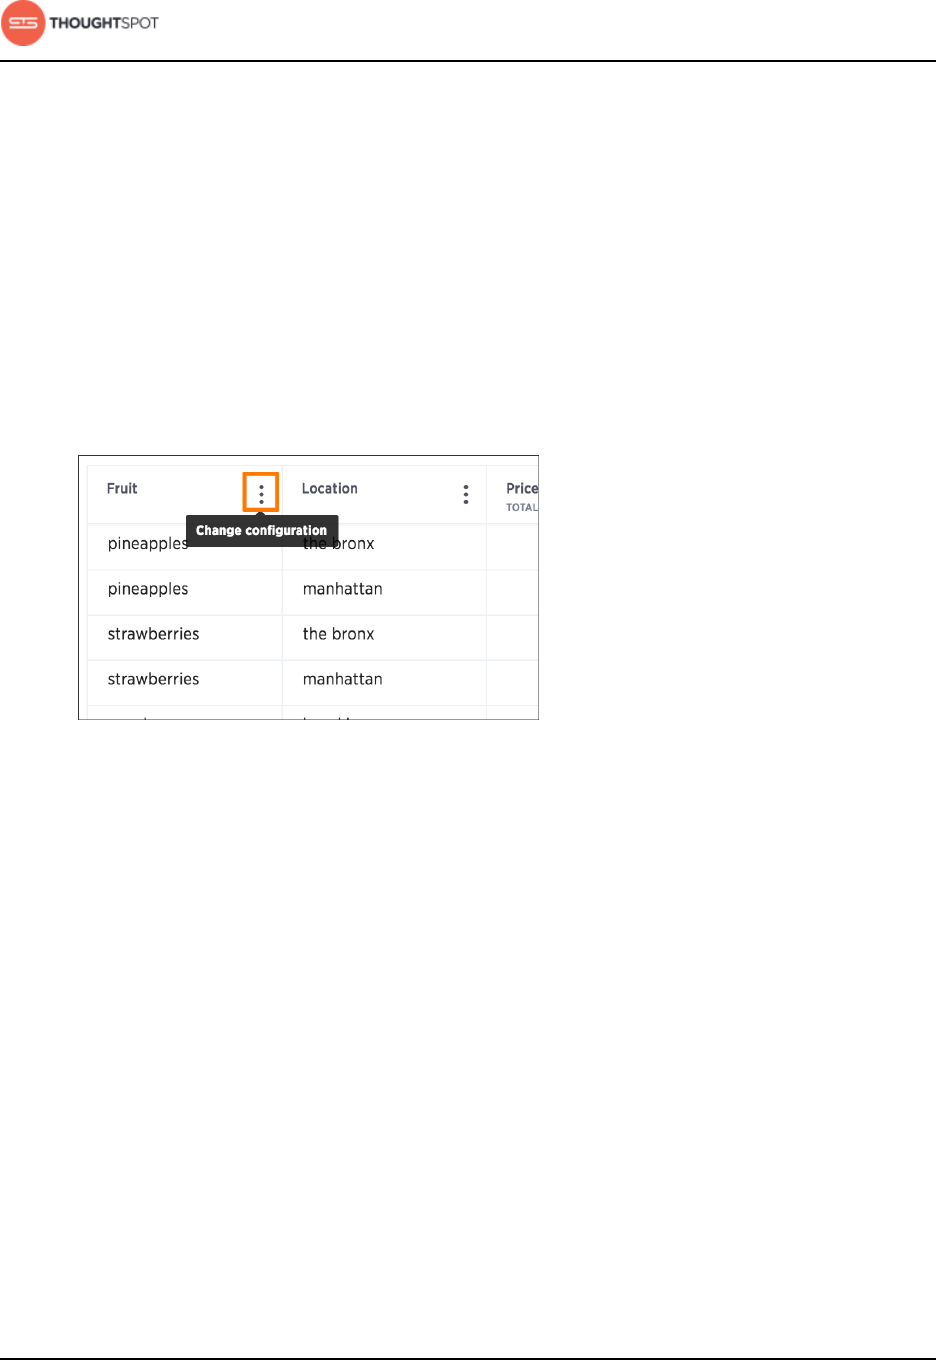
Add a filter to a table
You can add a simple filter from a column header while viewing your answer as a
table.
To add a filter from column headers:
1. While viewing your answer as a table, click Change configuration on the
column header you want to filter, and select Filters.
Figure 88: Change configuration of a column
2. Select the values to include in your answer. Then click Done. If there are too
many values, you can use the filter search bar to find the ones you want.
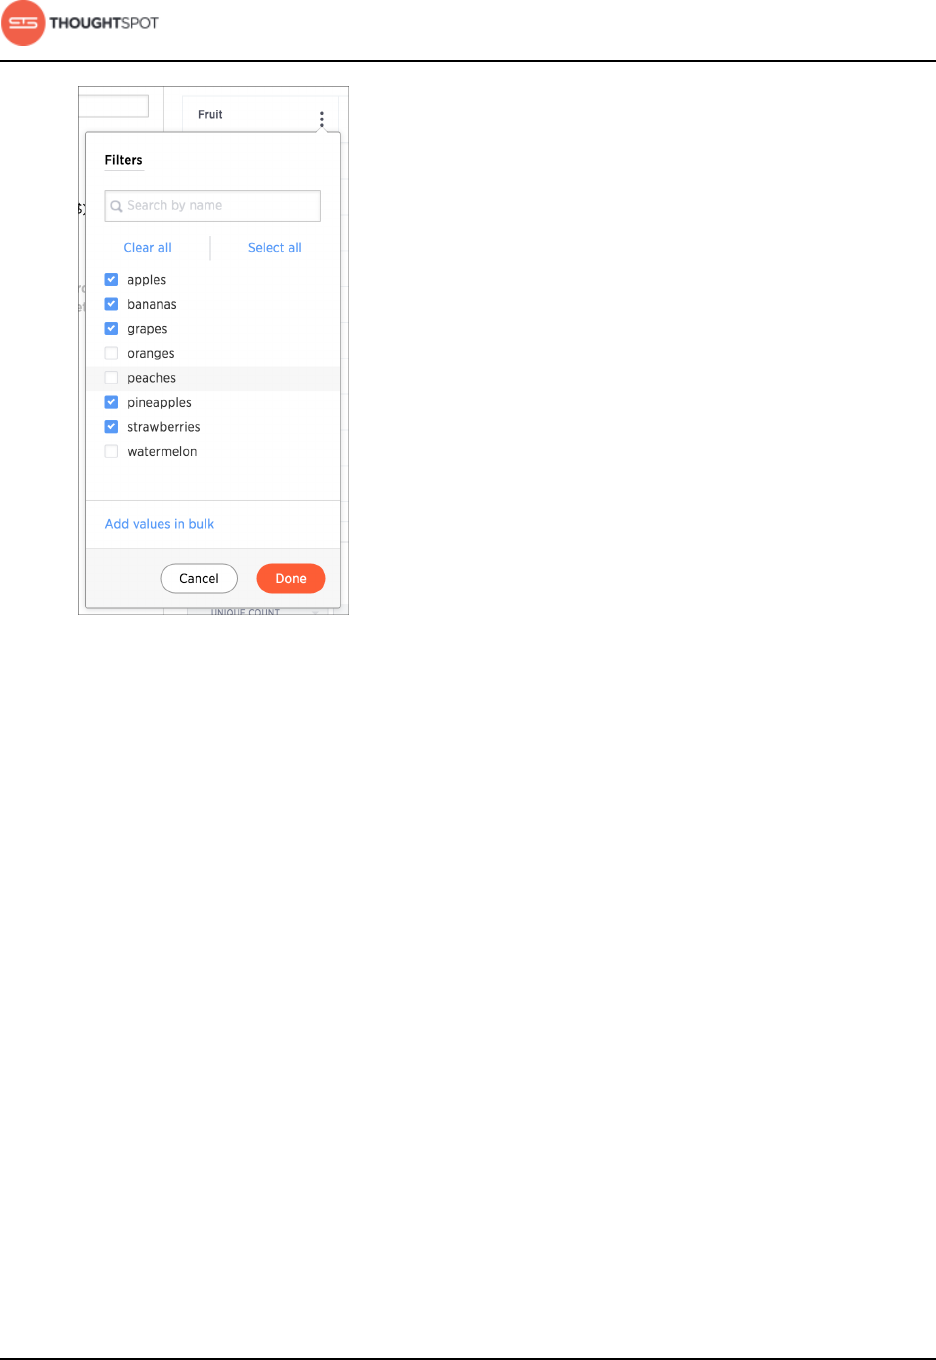
About search
User Guide Copyright © 2016 by ThoughtSpot. All Rights Reserved. 76
Figure 89: Column filters value box
Add a filter to a chart
You can add a simple filter from a chart axis while viewing your answer as a
chart.
You can filter a chart in two ways:
1. Click on the legend labels to toggle the values on or off.
2. Follow the steps shown here to filter on the axis values.
To add a filter from the chart axes:
1. While viewing your answer as a chart, click the chart axis you want to filter on,
and select Filter.
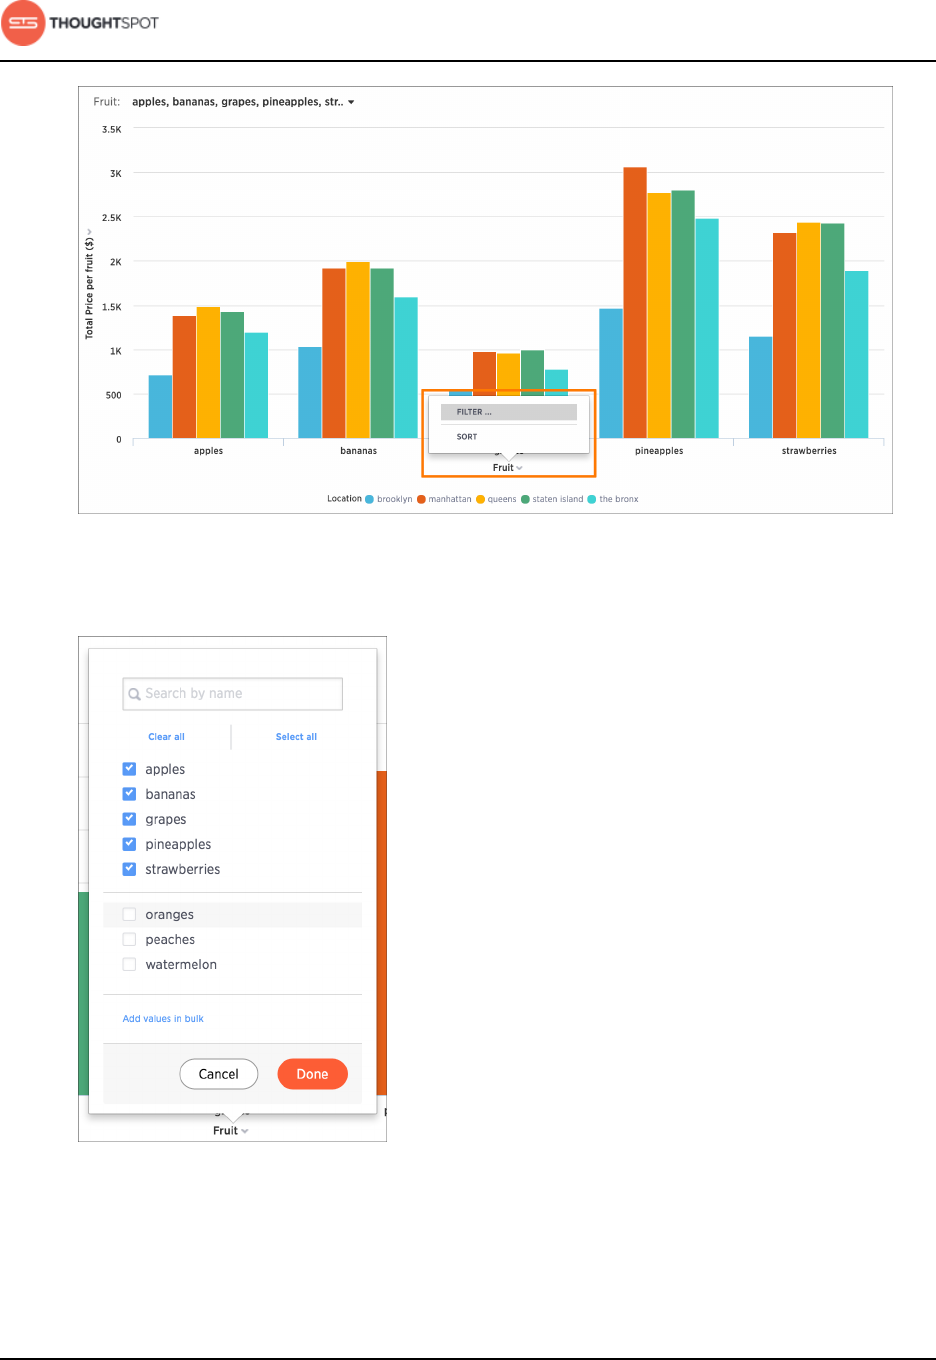
About search
User Guide Copyright © 2016 by ThoughtSpot. All Rights Reserved. 77
Figure 90: Choose filter from a chart axis
2. Select the values you would like to include in your answer. Then click Done.
Figure 91: Axis filters value box

About search
User Guide Copyright © 2016 by ThoughtSpot. All Rights Reserved. 78
Add a filter from the search bar
You can add a simple filter from the search bar while creating your answer.
To add a filter from the search bar:
1. Click in the search bar and type the values you want to include in the search.
Typing a value in the search bar acts as a filter.
Figure 92: Filter from the search bar
You can also use filter keywords like yesterday, after, next month, 2016 to filter
your search. To see more filter keywords, refer to the keyword reference.
2. Click outside of the search bar or push enter to apply your filter.
About bulk filters
If you have a large worksheet or table with thousands or millions of rows, you
may want to create bulk filters. You can paste in a list of filter values, without
having to click the box next to each value in the filter selector.
Bulk filters can be very useful when you have a very large worksheet or table.
You can use them to filter a large list of values easily. For example, this is useful
if you want to only search on a list of products that your manager sent to you in
an email. You can cut and paste those values into the bulk filter box to quickly
generate a report or chart that includes only those items of interest.
Create a bulk filter
You can create a bulk filter by pasting a list of values, separated by commas,
semicolons, new lines, or tabs, into the bulk filter box. This allows you to easily
search a large list of filters repeatedly.
About search
User Guide Copyright © 2016 by ThoughtSpot. All Rights Reserved. 79
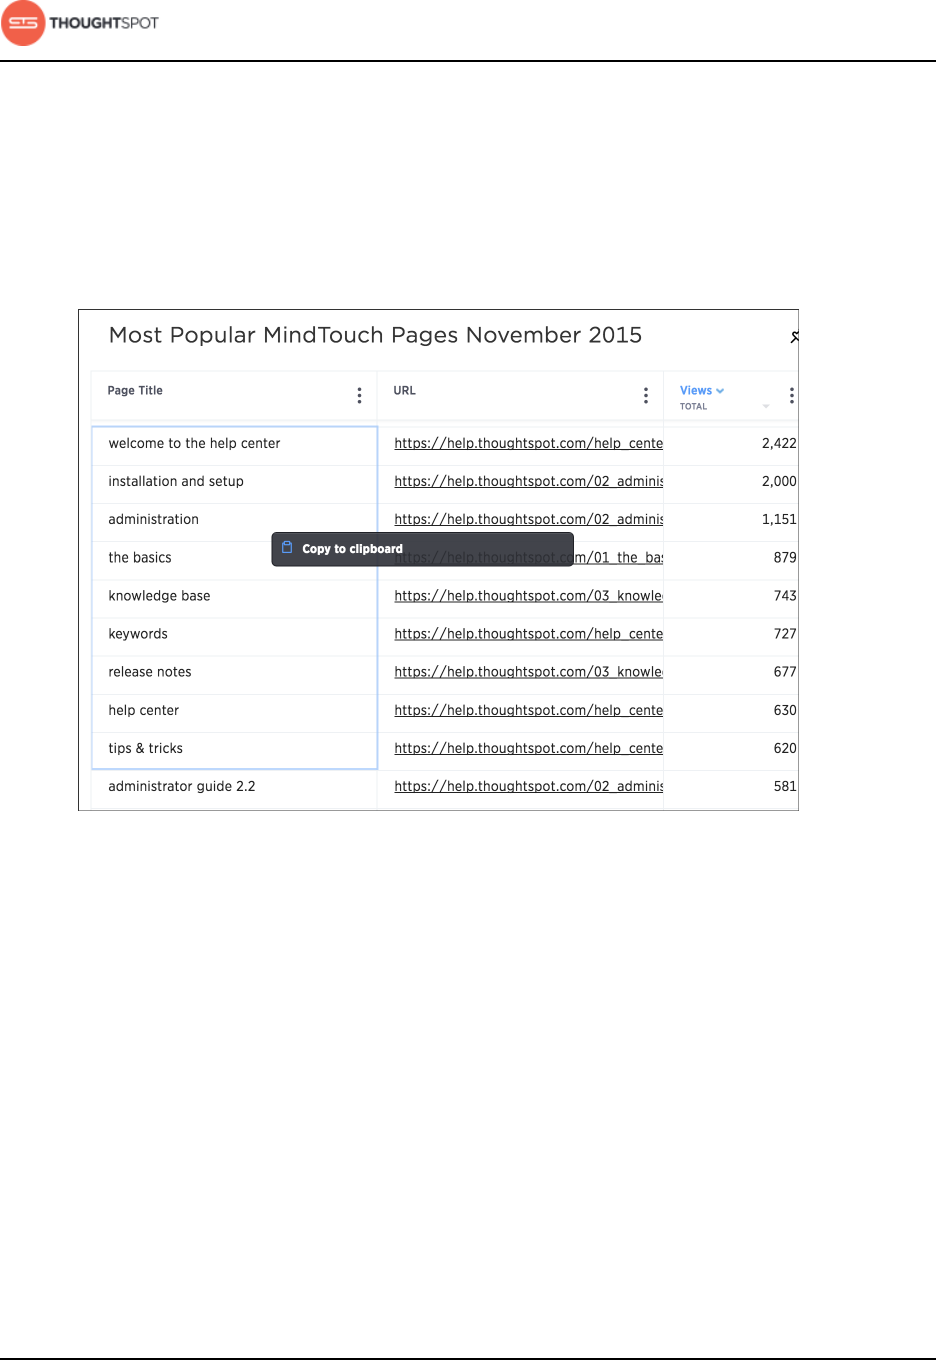
In this example, we will cut and paste values to create a bulk filter. You could also
do this by pasting in a list of text values from an email or cells from an Excel or
Google Sheets spreadsheet.
1. When viewing a table, select multiple cells by clicking and dragging.
2. Right click and choose Copy to Clipboard.
Figure 93: Copy to the Clipboard
3. Click the Filters icon in the column header, and click Add values in bulk:
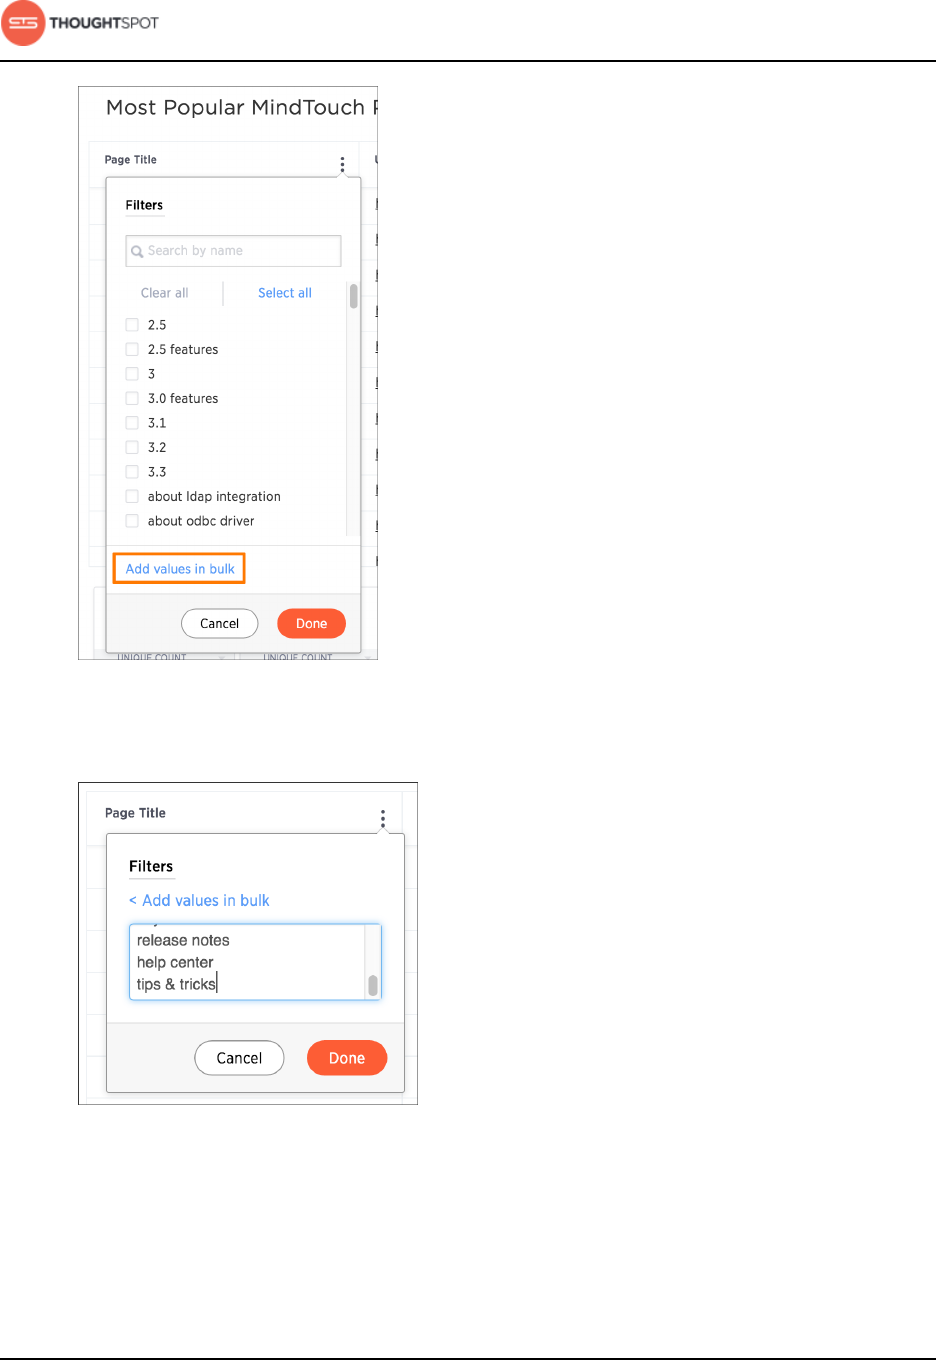
About search
User Guide Copyright © 2016 by ThoughtSpot. All Rights Reserved. 80
Figure 94: Add values in bulk
4. Paste the values into the bulk filter box.
Figure 95: Paste values into the bulk filter box
5. Click Done.
About search
User Guide Copyright © 2016 by ThoughtSpot. All Rights Reserved. 81
Delete a filter
You can delete a filter from an answer to return to the original unfiltered search
result.
There are multiple ways to delete a filter.
To delete a filter:
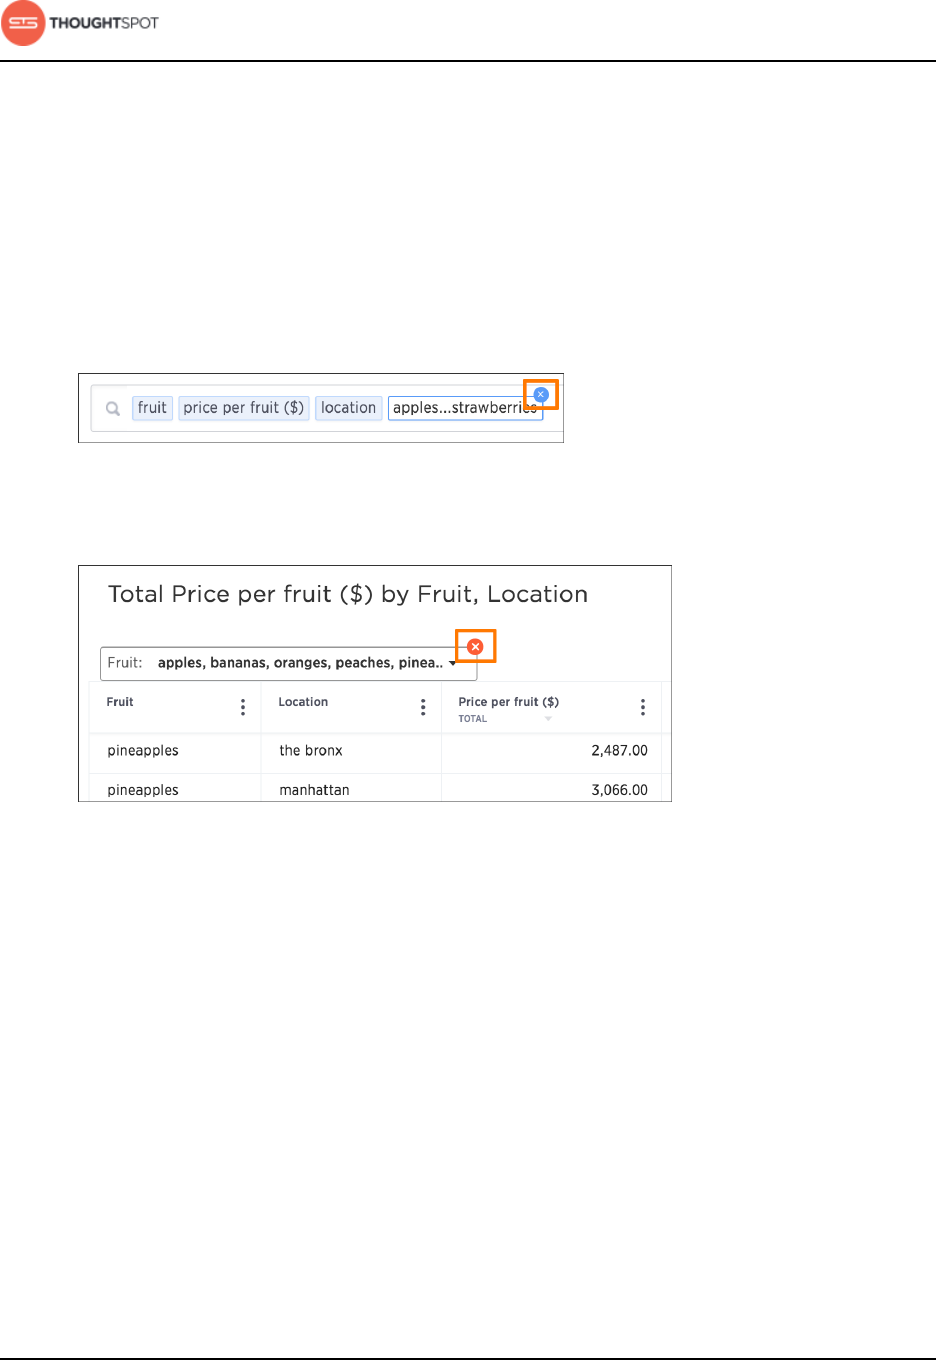
1. Click the x on the filter term in the search bar.
Figure 96: Delete the filter term from the search bar
2. You can also click the x on the filter bar above the answer.
Figure 97: Delete the filter term from the filter bar

Advanced searches
User Guide Copyright © 2016 by ThoughtSpot. All Rights Reserved. 82
Chapter 3: Advanced searches
Advanced searches
Topics:
•About keyword searches
•About worksheets from
searches
•About formulas in
searches
•About formulas and
aggregation
•About conversion
formulas
•About pivot tables
Most searches in ThoughtSpot are easy to do without
training. But there are some advanced search
features that are very powerful. This section explains
how to use the more advanced features.
Some of the more advanced features are:
•Keyword searches allow you augment your search
with predefined keywords. These keywords range
from date, time, number, and filter words.
•Worksheets created from searches allow you to
save a search as a worksheet, optionally link it to
other data sources, and do another search on top
of it. This workflow allows you to produce some
complex reports, like those that would require
nested SQL queries in some other tools.
•Formulas in searches brings the power of formulas
to regular searches, instead of requiring that you
first create a worksheet. This allows any user to do
mathematical operations, use if...then...else logic,
check for empty (null) values, bucket their data,
etc.
•Aggregation formulas are widely used in business
intelligence since they provide better insight into
data. They provide the ability to aggregate a
numeric value (measure) at specific attribute levels
or subsets of the full dataset.

Advanced searches
User Guide Copyright © 2016 by ThoughtSpot. All Rights Reserved. 83
•Conversion formulas allow you to convert data
types when you want to use them in another
formula that only accepts specific data types.
•Pivot tables derived their name from their ability
to rotate, or pivot, their own graphical structure.
You can drag and drop fields to change the
display to get different summaries or create cross
tabulations.

Advanced searches
User Guide Copyright © 2016 by ThoughtSpot. All Rights Reserved. 84
About keyword searches
Use keywords when asking a question to narrow and further define your search.
In addition to column names, values, and filters, the search bar also accepts
keywords. These keywords serve a variety of predefined purposes, and are
divided into different groups. The groups are as follows:
•Basic keywords
You can use keywords such as "top" and "bottom" to, for example, only see
results for the best or worst performing sales rep.
•Date keywords
Date keywords give you the freedom to narrow your search by days, weeks,
months, quarters, or years. There are also a number of date related keywords
such as "after", "before", and "year-over-year". Use the new date keywords
to describe dates in the future. This is useful for exploring things that are
scheduled for a future date, such as shipments due to go out in the next week.
•Time keywords
Time keywords are the most useful when trying to figure out how many
visitors you've received within the last "n minutes or hours".
•Text keywords
You can use text keywords to find similar words or phrases that contains a
certain word. For example, product name contains "green".
•Number keywords
These keywords allows you to define your search by sum, average, count, max,
min, and other accumulations.
•Filter keywords
Filter keywords work in the same way as filters on table columns or chart axes.
Advanced searches
User Guide Copyright © 2016 by ThoughtSpot. All Rights Reserved. 85
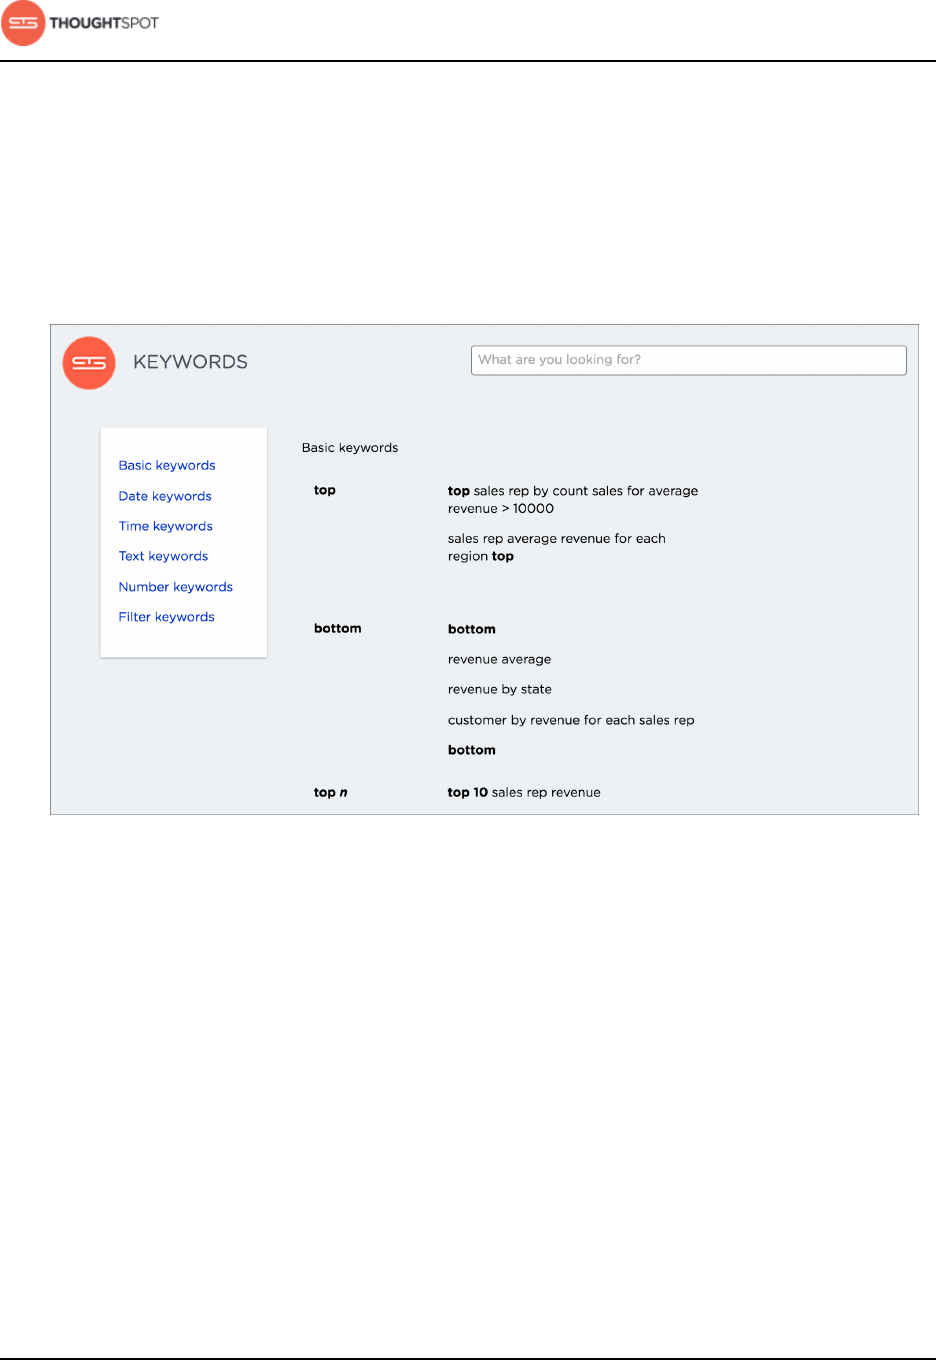
You can access a list of keywords and other reference materials in the references
section or in the help center. Open the help center by clicking Help on the top
navigation bar. Within the help center, you’ll find videos and documentation
that pertain to the current version of ThoughtSpot. Here is where you can also
find a list of keywords. You can expand each section to see which keywords are
available and examples on how to use them.
Figure 98: Help center keywords list
Search using growth over time
You can show growth over time by using the "growth of" keyword in your search.
This keyword compares the data from different date periods, and returns a
percentage of growth.
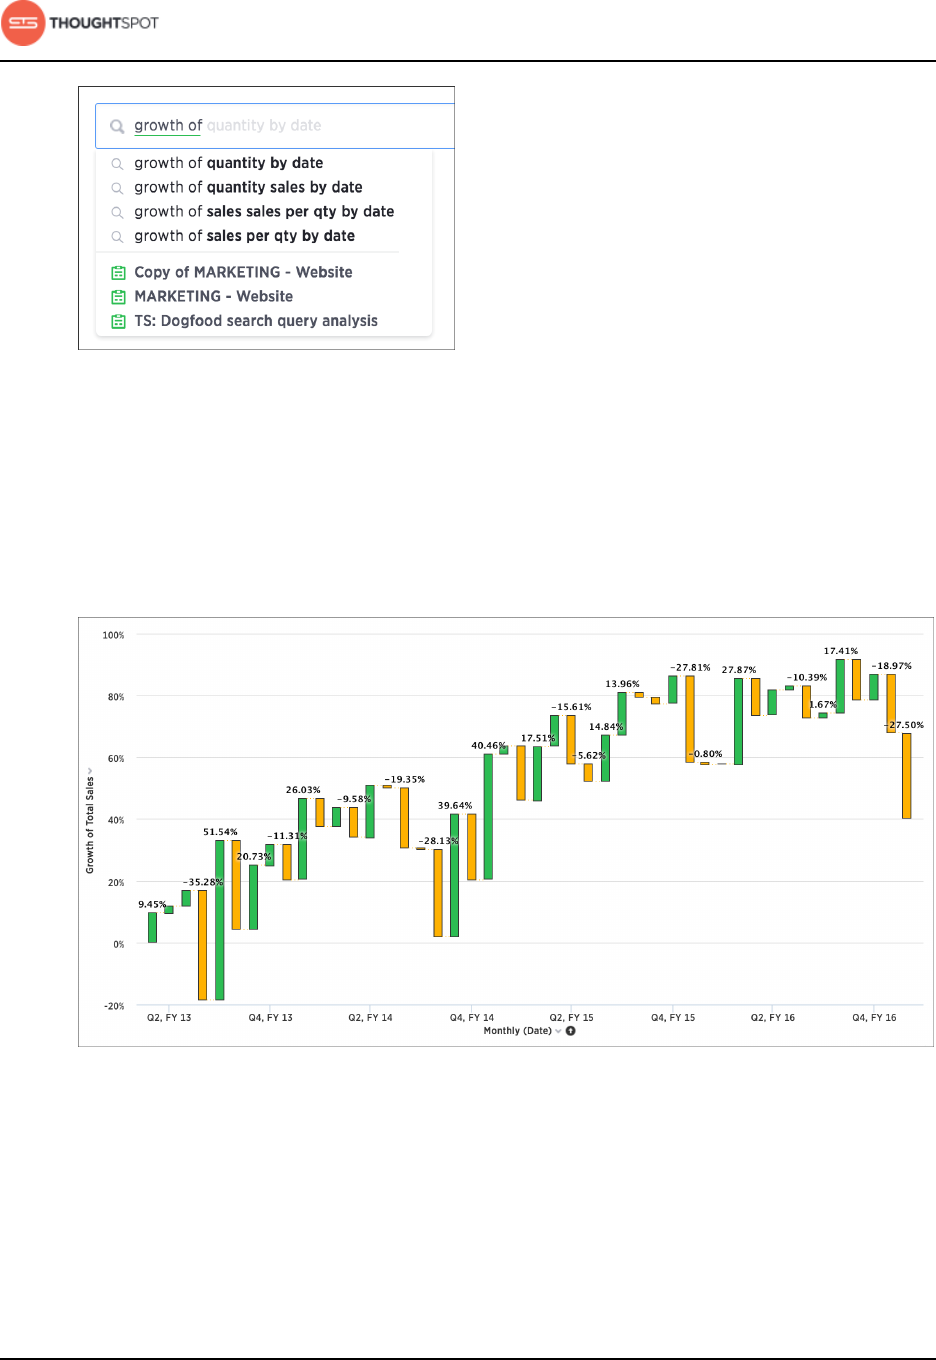
To search using growth over time:
1. Type growth of into the search bar, and choose a measure you're interested
in seeing the growth of.
Advanced searches
User Guide Copyright © 2016 by ThoughtSpot. All Rights Reserved. 86
Figure 99: Growth of suggestions
You will see a list of suggestions to choose from based on your sources. You
can also type a different column name containing numeric data to compare.
2. Then, type by, followed by a date column name.
3. Switch to the Chart view for a visual representation of your search.
Figure 100: Growth of total sales waterfall chart
The growth is calculated as a positive or negative percentage, for each period
relative to the last period in the series. The line chart is a good way to display
your data, but the waterfall chart is especially effective to show growth.
Advanced searches
User Guide Copyright © 2016 by ThoughtSpot. All Rights Reserved. 87
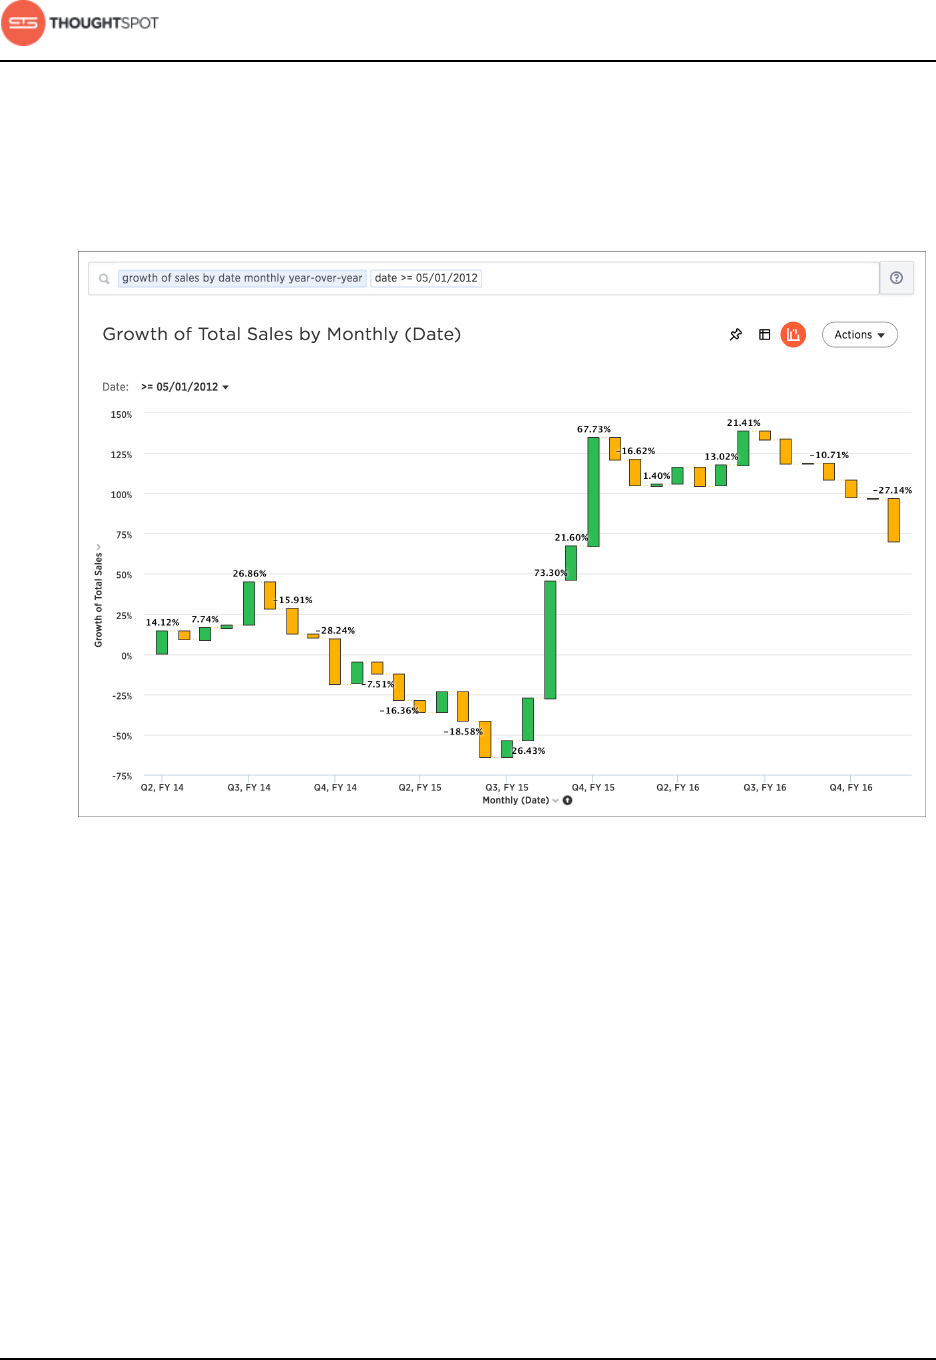
4. You can also do year-over-year analysis, which compares each time period to
the corresponding time period in the prior year. This type of growth analysis
is more common in retail and other seasonal businesses. To do this, type
monthly year-over-year after your growth of phrase in the search bar.
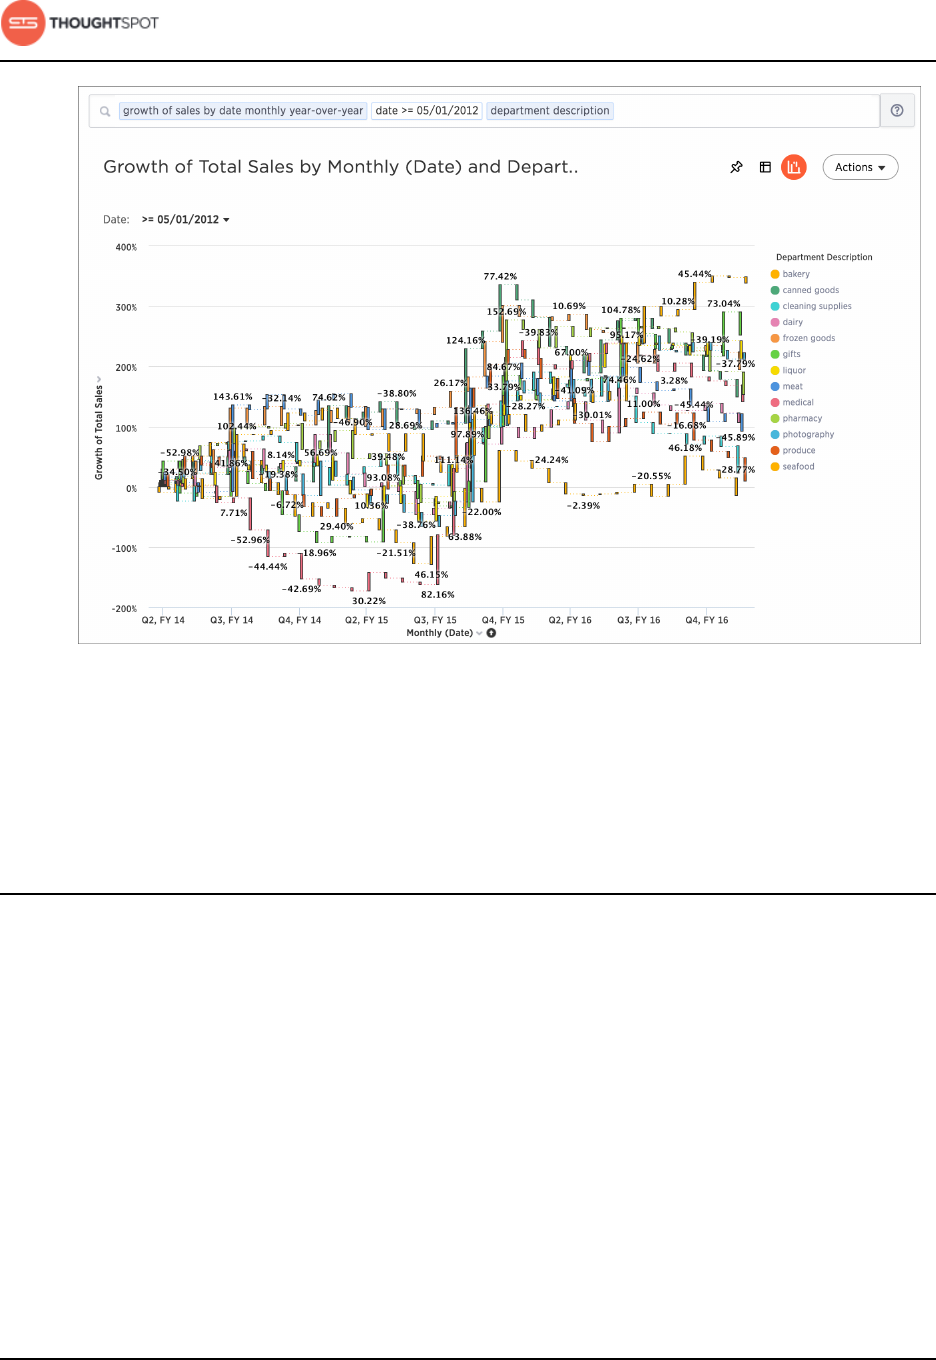
Figure 101: Growth of by monthly year-over-year
This compares data between the same month from different years. For
example, it will allow you to compare sales from June of this year to the
sales from June of last year. Note that for the first year, values are labeled as
"{Blank}" in the Data View since there are no previous data to compare them
to.
5. Add an attribute to your search see the breakdown of how each grouping
of the attribute contributed to the overall growth of your measure. Click
Configure Chart and add your attribute to the Legend field.
Advanced searches
User Guide Copyright © 2016 by ThoughtSpot. All Rights Reserved. 88
Figure 102: Growth of broken up by category
It looks like Q4, FY 15 was a much more productive period for a number of
categories compared to a year ago.
About worksheets from searches
If you want to do an advanced search that involves what is essentially a search
on top of another search, try saving your search as a worksheet. Then you can
use the saved worksheet as a data source for a new search.
Introduction to worksheets from searches
Although a worksheet created from a search is effectively the same as any
worksheet, we'll call it an "aggregated worksheet" here to avoid confusion. When
you do a search on a data source, ThoughtSpot is only able to aggregate one
column by one other column. Because of this, you may come across searches

Advanced searches
User Guide Copyright © 2016 by ThoughtSpot. All Rights Reserved. 89
you can't do in one pass, because they are essentially nested queries. But you
can create the equivalent of nested queries using an aggregated worksheet,
which is essentially an answer that you save as a worksheet. Then you can use
that worksheet just like any other data source. You can even link it to other
sources by defining a relationship. When you save an answer as a worksheet, and
then use it as a source in a new search, it is similar to doing a nested query in
SQL, only much easier to create.
In order to create a worksheet from a search, you must belong to a group that
has the privilege Has administration privileges or Can Manage Data. If you are
not able to create aggregated worksheets, contact your administrator and
request the Can Manage Data privilege.
Aggregated worksheet workflow
Suppose you have created a search on the sales fact table that shows the top
ten Sales Reps by revenue for the first quarter. Then you want to do some
further investigations on that set of data, like ranking them by how much they
discounted a specific product using data from the orders fact table. Unless you
save your first answer as a worksheet, certain explorations like this won't be
possible. If you want to do this, here are the steps at a high level:
1. Create the first search, and save it as an aggregated worksheet.
2. Link your worksheet to any other data sources you'll need.
3. Create a new search that includes your aggregated worksheet and the other
sources you linked with it.
4. You may want to create a new worksheet that includes these data sources.
This will make it easy for people to search using the same group of
aggregated worksheet and tables that you created.

Advanced searches
User Guide Copyright © 2016 by ThoughtSpot. All Rights Reserved. 90
Best practices for using aggregated worksheets
Aggregated worksheets can be used in a variety of ways. But keep in mind these
details about how they work:
• Only users with administrative privileges are able to create aggregated
worksheets and link them.
• You can't link an aggregated worksheet with a sharded table. If you do this
and try to search on it, you will get an error.
• Joins are directional, meaning that the order of the objects being linked
matters. The table/aggregated worksheet with the foreign key needs to occur
in the first (left) position. The one with the primary key needs to go in the
second (right) position.
Worksheet from a search example scenarios
Here are two common examples of when you would need to use aggregated
worksheets.
Example 1
Our first example involves creating an aggregated worksheet with a default filter.
Say you want to create a worksheet that only shows data for a particular US
state. In your search, enter “customer state = texas”. Then click Actions, and
select Save as worksheet. Give your worksheet a name, then click Save to create
your worksheet.
Now you have a worksheet that only contains data that pertains to Texas. You
can share this worksheet with others to search across. Another popular example
of this concept includes creating a worksheet with only active employee data.
Example 2
Our second example involves joining two aggregated worksheets.

Advanced searches
User Guide Copyright © 2016 by ThoughtSpot. All Rights Reserved. 91
Say you want to plot the revenue of the top five states over time. Search for
revenue, store state, and top 5. Save this answer as an aggregated worksheet
called "Top 5 states". Then start another search with the tokens revenue, store
state, and date. Save this answer as an aggregated worksheet called "Total
monthly purchases".
Now you want join these two worksheets. Navigate to the Data tab and make a
relationship between the two worksheets, involving store state.
Now, to start a new search, select your two aggregated worksheets as data
sources, selecting the appropriate columns: store state from Top 5 States, and
date and total sales from Total Monthly Purchases. You will only see data for the
top five revenue states.
Save a search as a worksheet
This procedure walks you through creating a worksheet from a search.
To create a worksheet from a search (i.e. an aggregated worksheet):
1. Start a new search, or edit an existing visualization from a pinboard.
Any filters or aggregations created during this search will be reflected in the
worksheet.
2. If you want to use a different aggregation than the default one for any column,
set it from the column header.
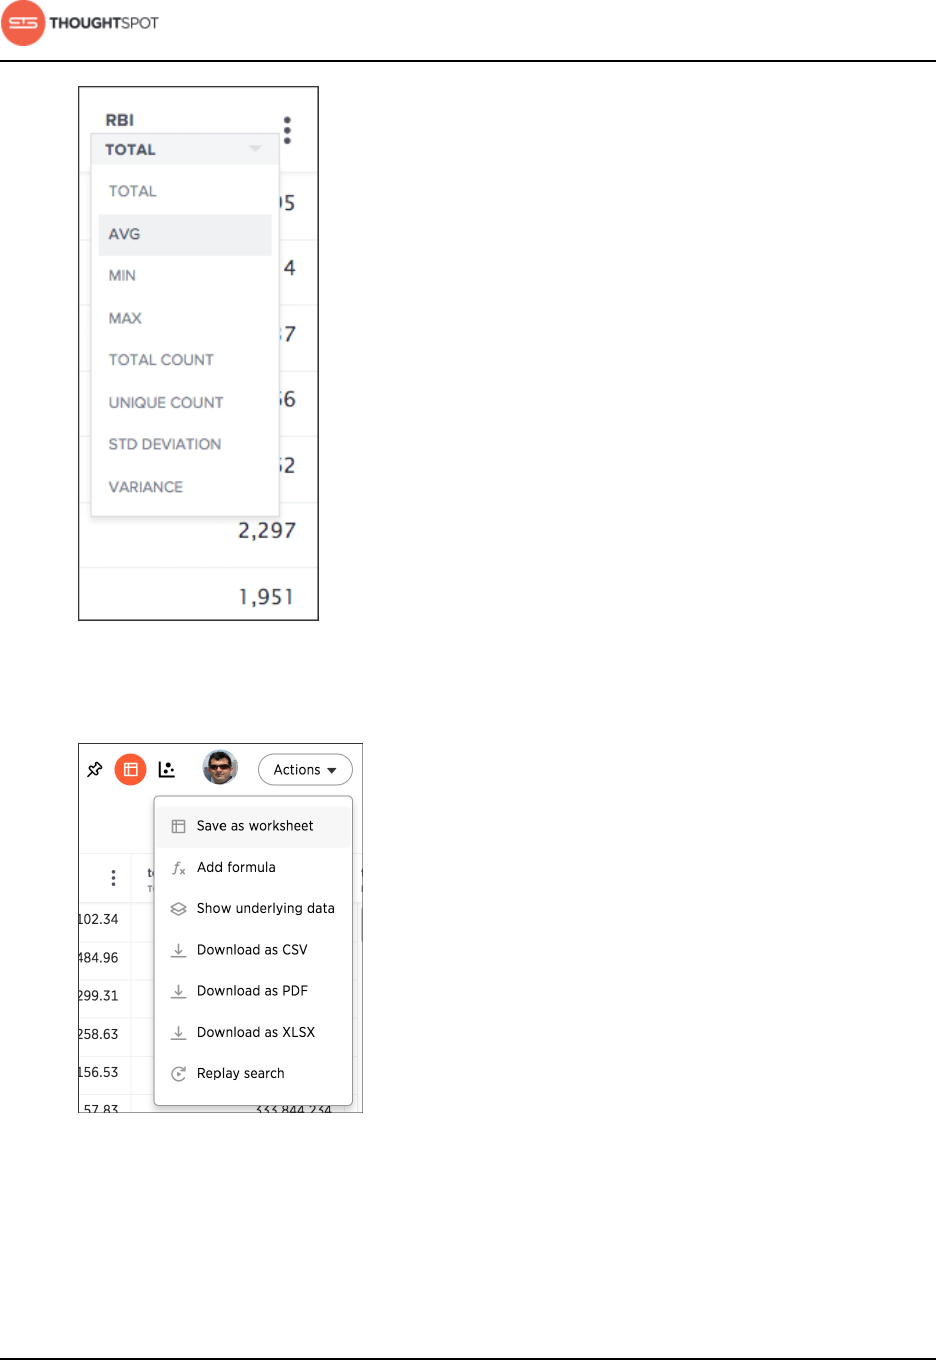
Advanced searches
User Guide Copyright © 2016 by ThoughtSpot. All Rights Reserved. 92
Figure 103: Select an aggregation
3. Save the answer as a Worksheet.
Figure 104: Save as a Worksheet
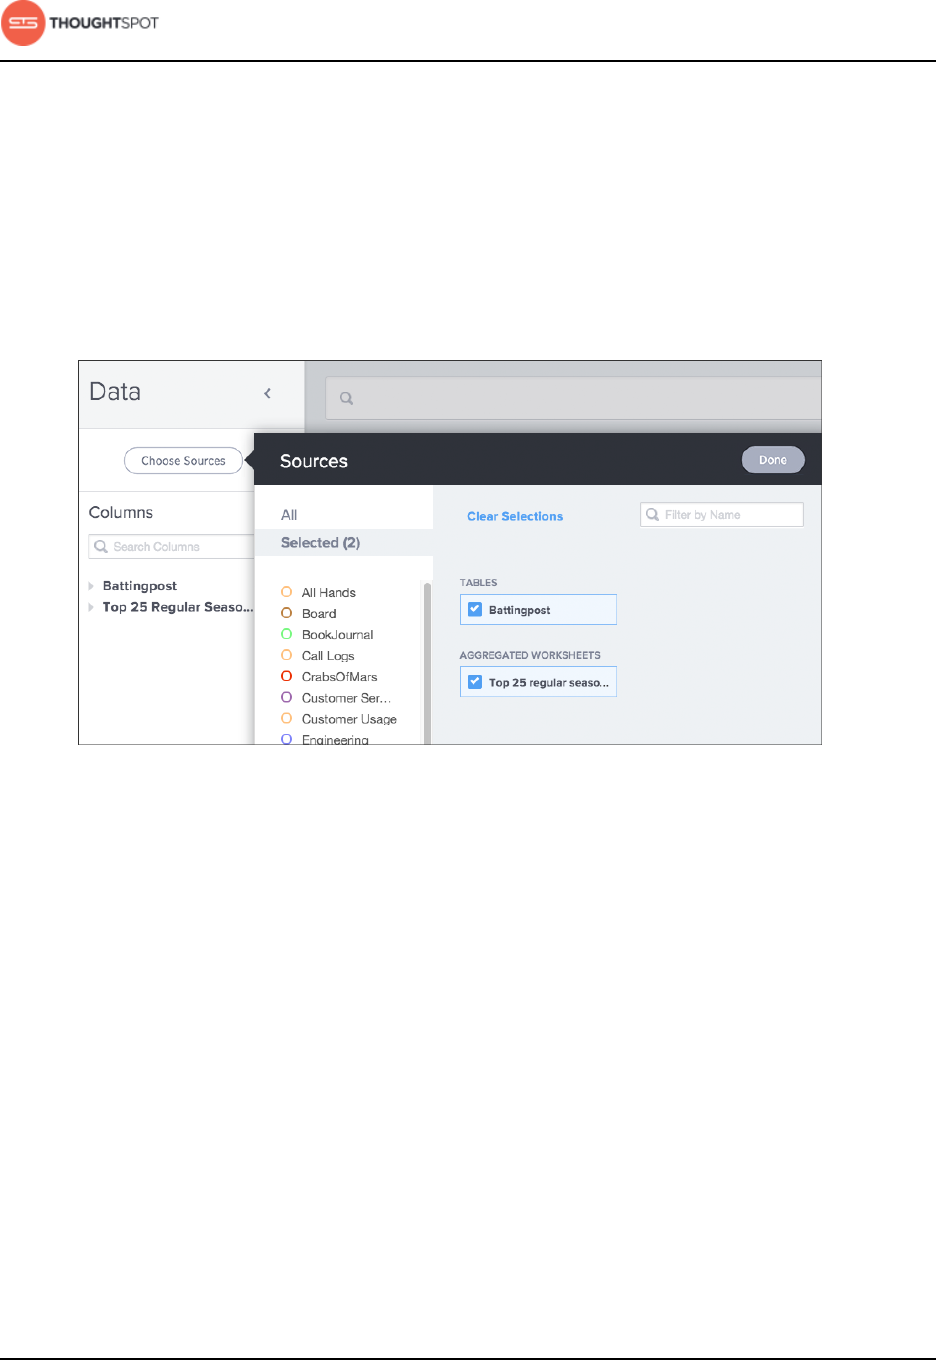
Advanced searches
User Guide Copyright © 2016 by ThoughtSpot. All Rights Reserved. 93
Create a search from a search saved as a worksheet
After creating a worksheet from a search (also called an aggregated worksheet)
and linking it to related data, you're ready to create your new search.
To do a search on the aggregated worksheet, along with any data sources you
linked:
1. Click the search icon, and select Data Source. Choose your linked sources.
Figure 105: Select sources
2. Do a search using columns from the linked sources, including any
aggregations you created.
3. Test the result, to make sure it’s what you expect.
If your search shows no data found or doesn't look right to you, it is possible
that one of the links between your sources was made on the incorrect column.
Check the relationships you created and try linking using a different column,
to see if that gives the expected search results.
4. Once you have the expected answer, you can create a worksheet to make it
easier for you and other people to use. To do this, click the Data icon.
5. Click the Actions icon from the upper right side of the screen, and select
Create worksheet.
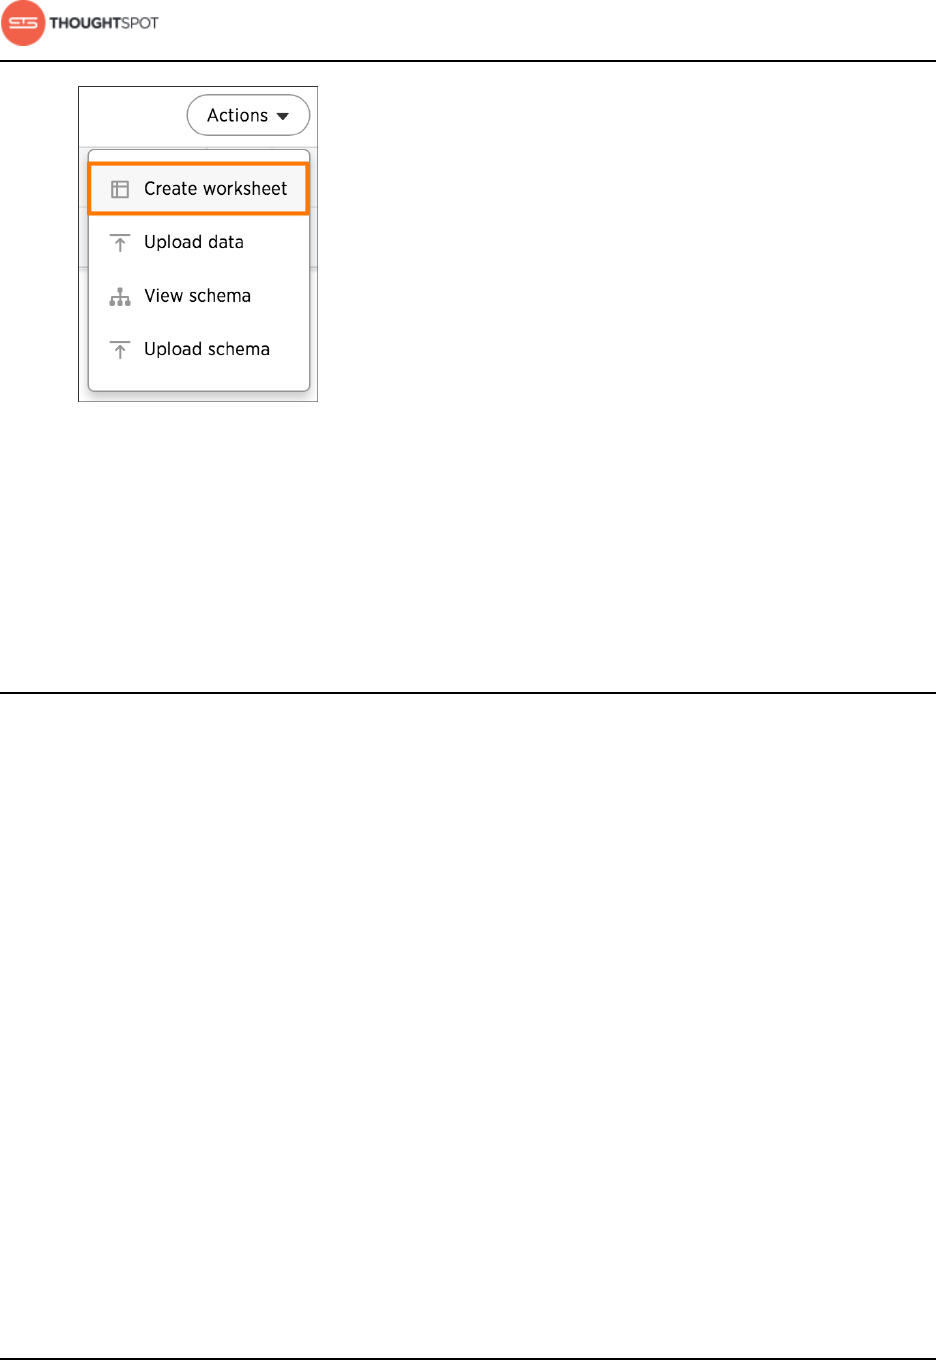
Advanced searches
User Guide Copyright © 2016 by ThoughtSpot. All Rights Reserved. 94
Figure 106: The Create worksheet icon
6. Choose both views using Choose Sources.
7. You may need to rename some columns appropriately for searching.
8. Share the worksheet with the appropriate users and groups.
About formulas in searches
To provide richer insights, you can add a formula to your search. The Formula
Builder includes many types of operators, such as logical (if, then, else), math,
date, and text string functions.
You can create a formula from directly within a search. If you have the privilege
that allows you to create or edit worksheets, you can also create a formula within
a worksheet. Formulas in worksheets act as derived columns, so that anyone
who uses the worksheet as a data source will see the formula as just another
column.
Adding a formula within a search works much the same way as adding a formula
to a worksheet. However, you will be able to edit the formula directly from
within the answer. If you add the answer to a pinboard and share it with the Edit
privilege, other people can see the formula results, too. In order to make edits to
the formula, they also need to have the Edit privilege on the underlying data.
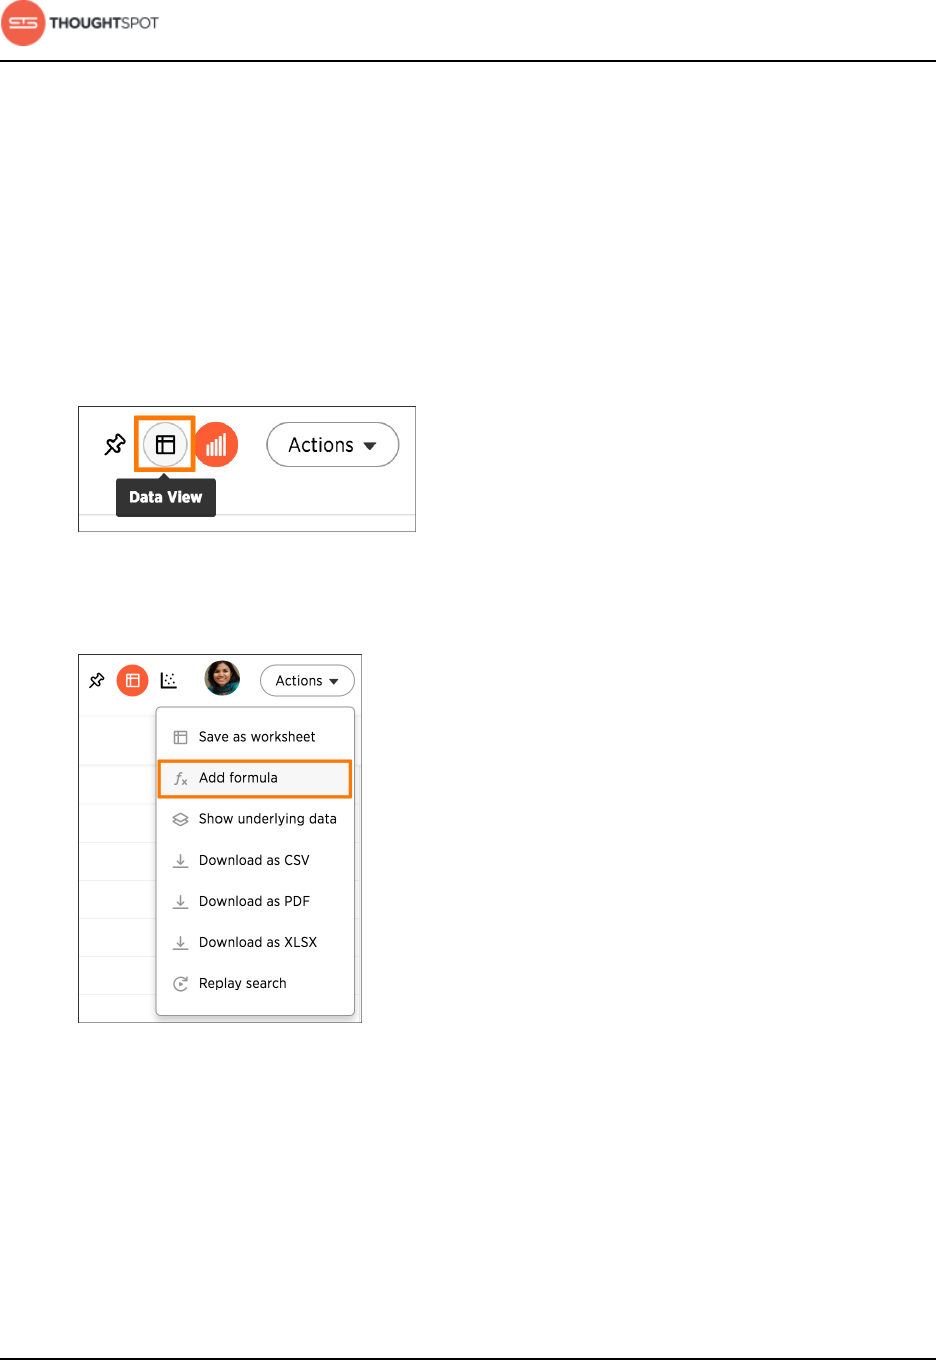
Advanced searches
User Guide Copyright © 2016 by ThoughtSpot. All Rights Reserved. 95
Add a formula to a search
You can add a formula directly within a search. Some common reasons for using
a formula in a search are to perform mathematical functions, check for and
replace null values, or add if...then...else logic.
To create a formula in a search:
1. Start a new search, or choose an existing answer from a pinboard to edit.
2. If the answer shows a chart, switch to Data View.
Figure 107: Switch to Data View
3. Click the formula icon in the upper right hand side of the table.
Figure 108: Create a new formula in an answer
4. Type your formula in the Formula Builder.
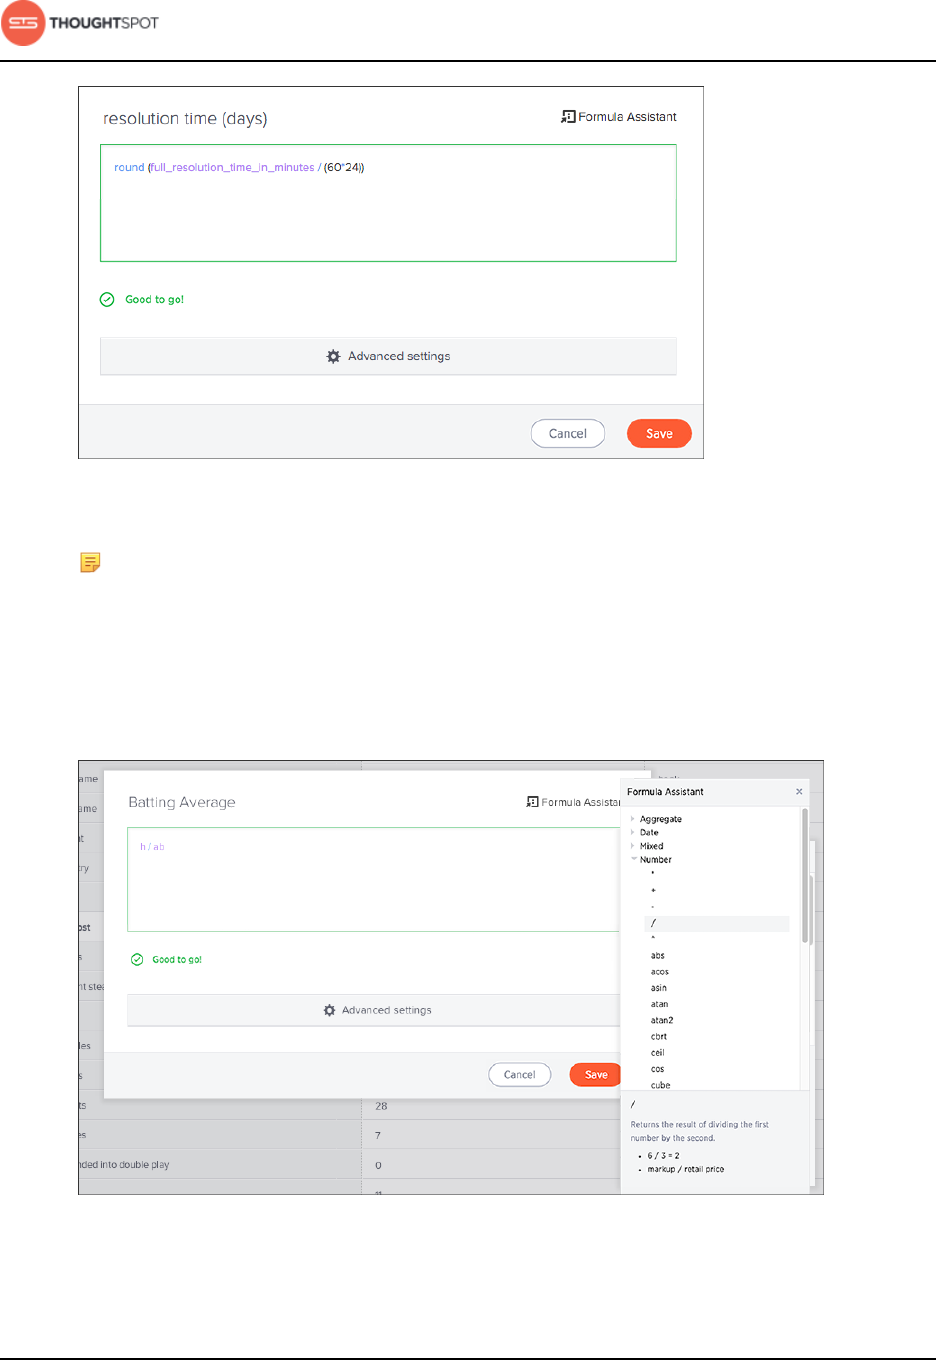
Advanced searches
User Guide Copyright © 2016 by ThoughtSpot. All Rights Reserved. 96
Figure 109: Use the Formula Builder
Note: Formulas elements are color coded by type and can include the
formula operators and functions (blue), the names of columns (purple),
and/or constants (black).
5. You can see a list of formula operators with examples by clicking on Formula
Assistant.
Figure 110: Examples in the Formula Assistant
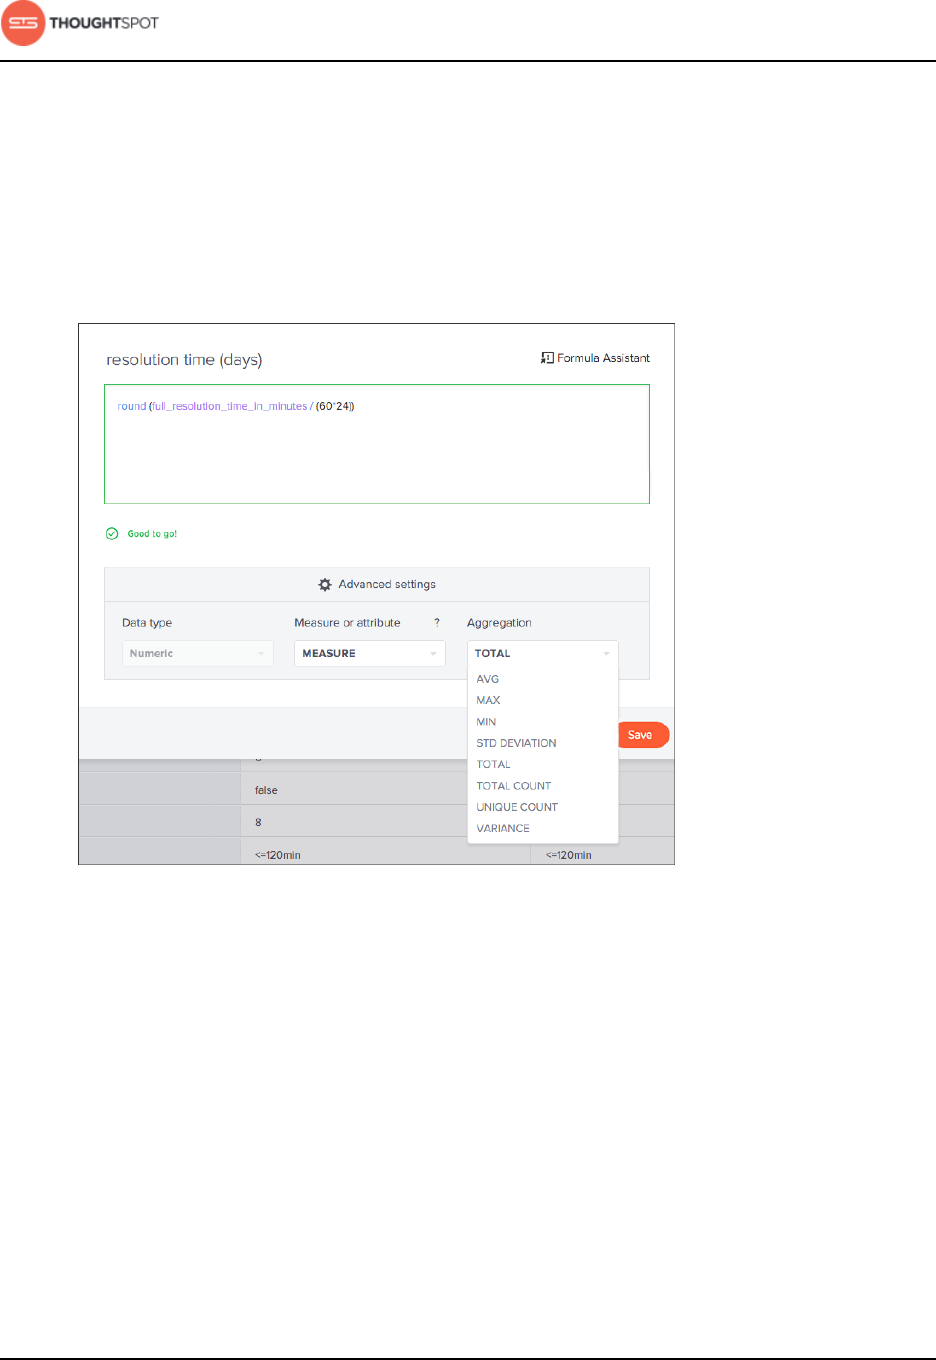
Advanced searches
User Guide Copyright © 2016 by ThoughtSpot. All Rights Reserved. 97
6. If you want to change what your formula returns, use the Advanced settings.
Depending on your formula, you may be able to change:
• Data type
• ATTRIBUTE or MEASURE
• Aggregation type
Figure 111: Advanced settings in the Formula Builder
7. Name the formula by clicking on its title and typing the new name. Click Save.
View or edit a formula in a search
You can always go back and view or edit a formula that has been added to a
search. Do this by clicking the edit icon next to its name in the Columns listing.
Anyone who has edit privileges on an answer can also edit any formulas it
contains. To view or edit an existing formula in an answer:
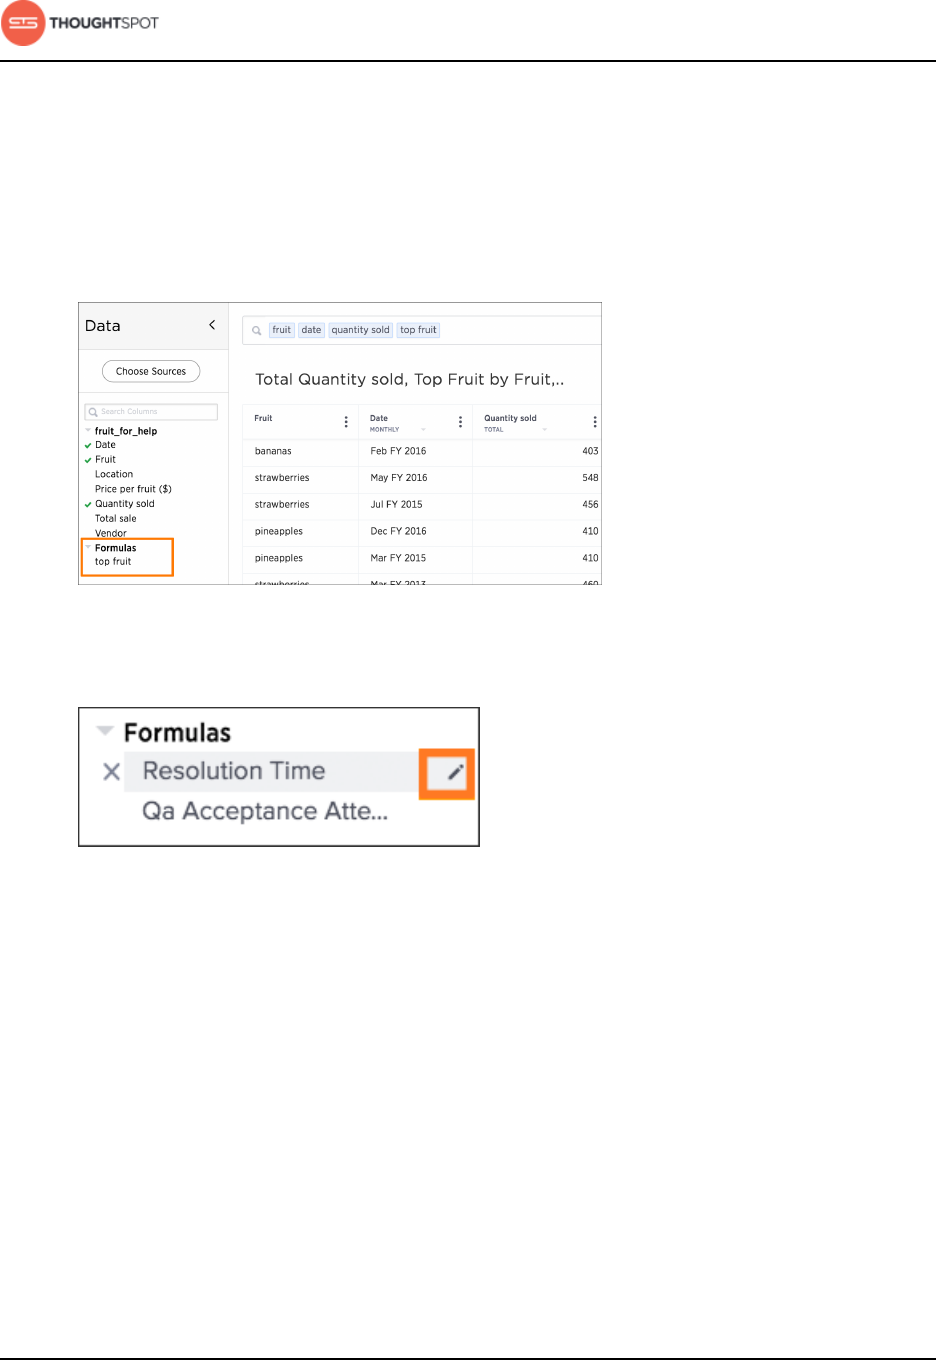
Advanced searches
User Guide Copyright © 2016 by ThoughtSpot. All Rights Reserved. 98
1. Navigate to the pinboard that contains the answer with the formula, and open
it.
2. Scroll down to the bottom of the Columns listing. You will see a data source
called Formulas.
3. Expand Formulas, and you'll see a list of all the formulas in this answer.
Figure 112: Formulas section expanded to show formulas in the answer
4. Click the edit icon next to the formula name.
Figure 113: The edit formula icon
5. Type your formula in the Formula Builder.
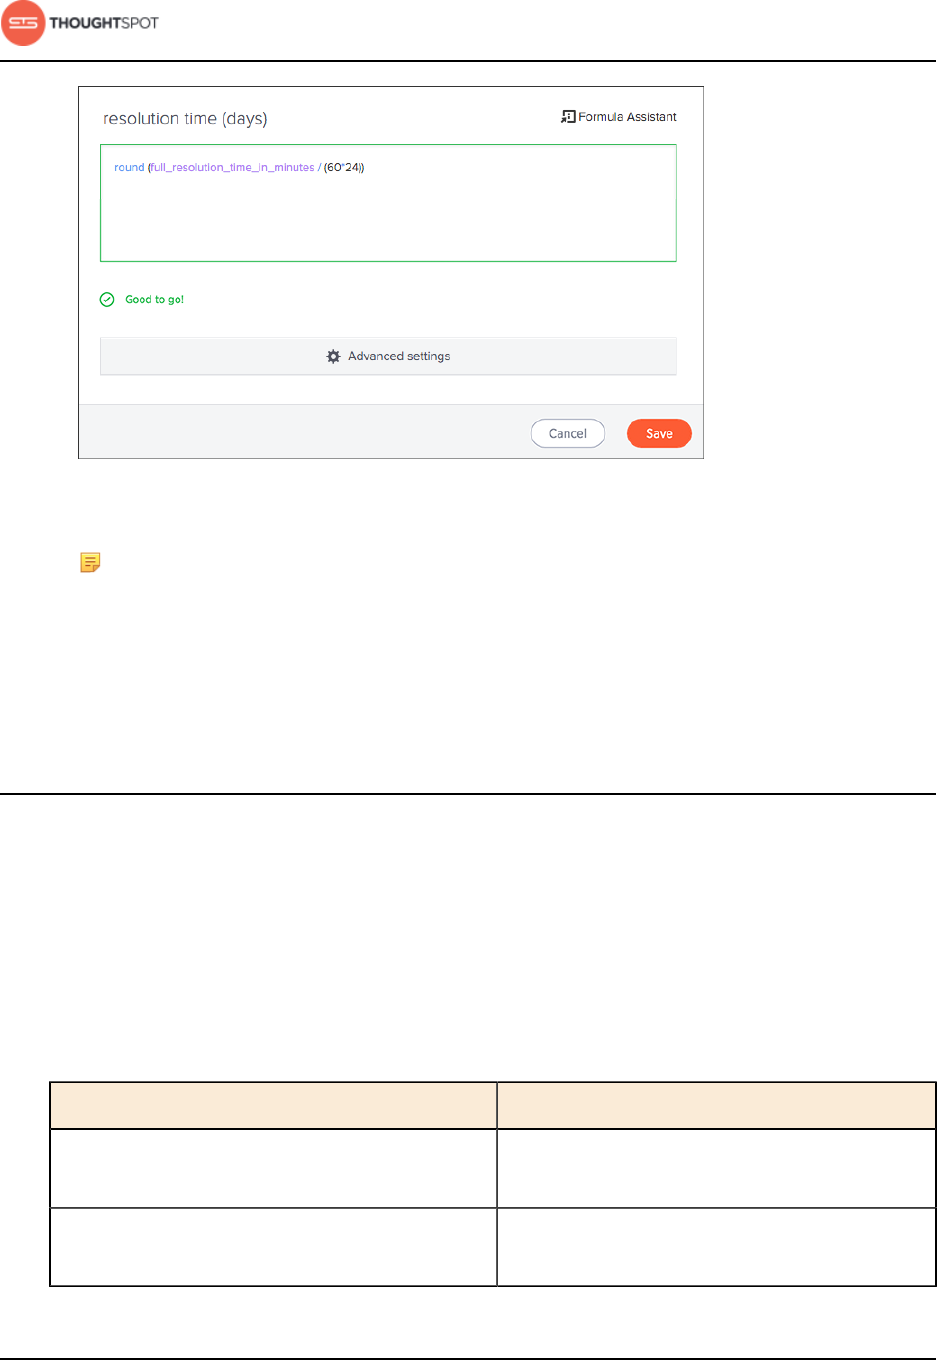
Advanced searches
User Guide Copyright © 2016 by ThoughtSpot. All Rights Reserved. 99
Figure 114: Use the Formula Builder
Note: Formulas elements are color coded by type and can include the
formula operators and functions (blue), the names of columns (purple),
and/or constants (black).
6. Click Save to save the formula with your changes.
About formulas and aggregation
When working with formulas, it is useful to understand the difference between
regular (or row-wise) formulas and aggregation formulas.
Regular and aggregation formulas
Formulas can be broken down into two types:
Table 4: Regular and aggregation formulas
Formula Aggregation formula
Acts on individual rows and returns one result
per row.
Combines rows together and returns a single
result for a group of rows.
Examples: add, subtract, multiply, divide,
contains, if...then...else
Examples: Average, cumulative sum, moving
average, standard deviation
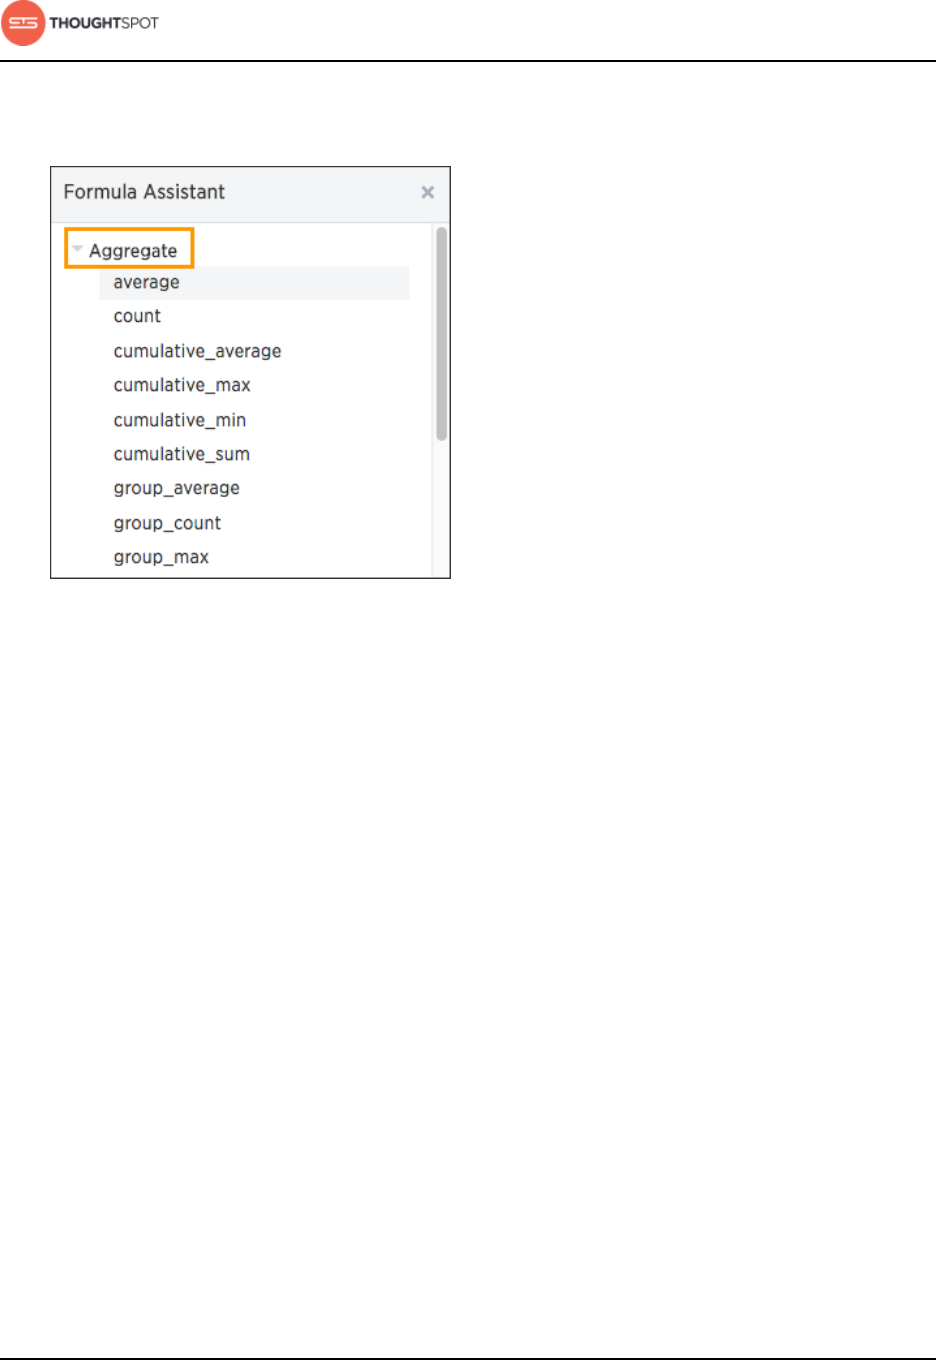
Advanced searches
User Guide Copyright © 2016 by ThoughtSpot. All Rights Reserved. 100
You can tell which formulas are aggregation formulas by looking at the Formula
Assistant. Aggregation formulas have their own section.
Figure 115: Aggregation formulas in the Formula Assistant
Advanced aggregation formulas
Some more advanced aggregation formulas are widely used in business
intelligence, since they provide better insight into data. Some of the more
advanced aggregation formulas are:
•Grouping formulas apply a specific aggregate to a value, and group the results
by an attribute in the data.
•Cumulative formulas measure from the start of your data to the current point.
They're often applied on time-based data.
•Moving formulas measure within a window (usually time-based) that you
define.
Data from any rows that are not included in the search result will not be
incorporated, and you cannot create a filter on aggregated data.
Advanced searches
User Guide Copyright © 2016 by ThoughtSpot. All Rights Reserved. 101
Using division with aggregation in a search
Whenever your search result combines rows, your formula will get aggregated
automatically. For example, if your search contains words like "region",
"monthly", or "department", the results will be grouped (aggregated) by that
category. The administrator can change the default aggregation that gets
applied through a configuration, and you can also change it using the dropdown
list in the column header of the search result.
For example, this search would typically return a sum of total sales by
department:
sum sales department
This search would return an average of sales by month:
average sales monthly
When you're using division in your formula, and the search is aggregated like
this, you may have to change the order of operations to get the result you
expect. This is best understood by using a real world example.
Suppose you want to calculate the gross margin by department for a grocery
store. The formula for gross margin is:
profit / sales
But if you use that as your formula, you won't get the expected calculation.
Why? It's because the formula will be evaluated in this order: For each row,
divide profit by sales and then total up all the results. As you can see, the results
do not look like gross margin values, which should be between 0 and 1.
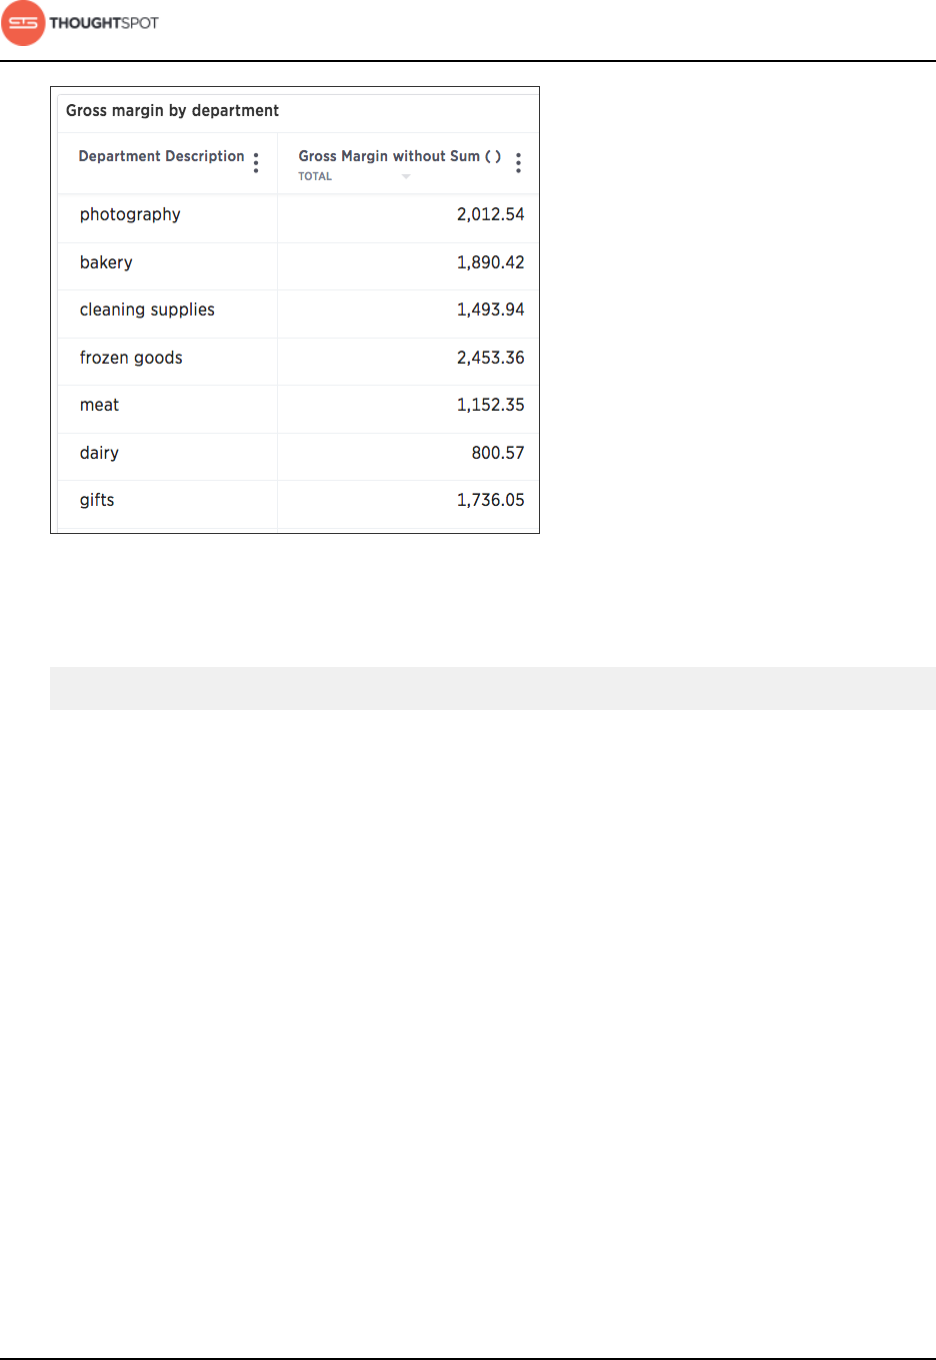
Advanced searches
User Guide Copyright © 2016 by ThoughtSpot. All Rights Reserved. 102
Figure 116: Aggregated search with a division formula
Instead, you'd need to use a formula that uses the order of operations you want:
sum (profit) / sum (sales)
Now the result is as expected, because the formula totals the profits for all rows,
and then divides that by the total of sales for all rows, returning an average gross
margin:
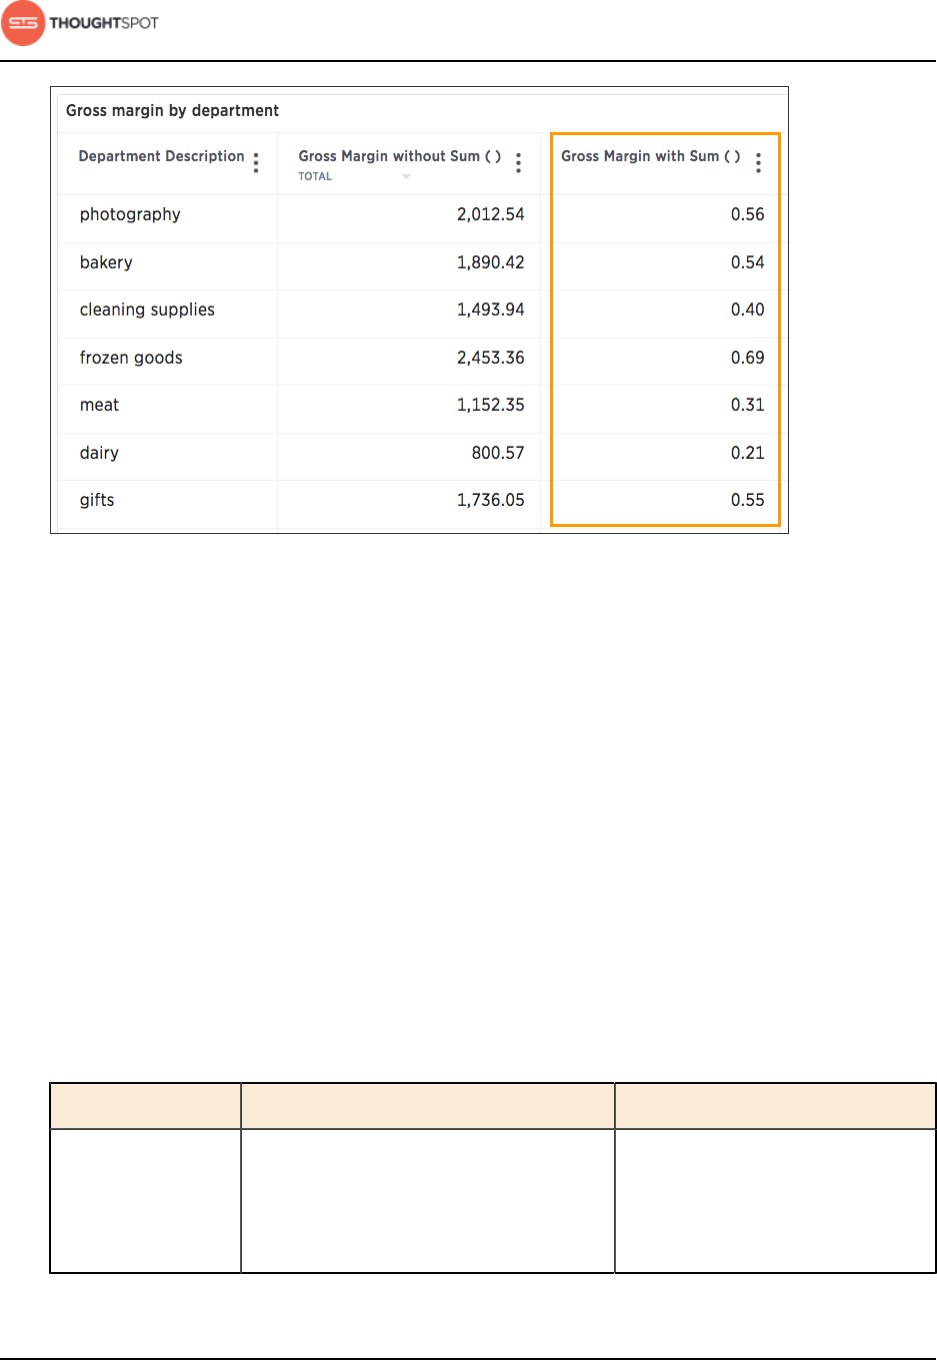
Advanced searches
User Guide Copyright © 2016 by ThoughtSpot. All Rights Reserved. 103
Figure 117: Aggregated search with a corrected division formula
About cumulative formulas
Cumulative formulas are aggregate formulas that allow you to calculate the
average, max, min, or sum or your data over time, optionally grouped by an
attribute (like region or department).
Each of the cumulative formulas accepts a measure and one or more attributes.
And each returns the aggregate of the measure accumulated by the attribute(s)
in the order specified. Although we usually talk about cumulative formulas over
time, you could use them over any other sequential data.
The cumulative formulas include:
Table 5: Cumulative formulas
Function Description Examples
cumulative_average Takes a measure and one or more
attributes. Returns the average of
the measure, accumulated by the
attribute(s) in the order specified.
•cumulative_average
(revenue, order date,
state)
Advanced searches
User Guide Copyright © 2016 by ThoughtSpot. All Rights Reserved. 104
Function Description Examples
cumulative_max Takes a measure and one or more
attributes. Returns the maximum of
the measure, accumulated by the
attribute(s) in the order specified.
•cumulative_max (revenue,
state)
cumulative_min Takes a measure and one or more
attributes. Returns the minimum of
the measure, accumulated by the
attribute(s) in the order specified.
•cumulative_min (revenue,
campaign)
cumulative_sum Takes a measure and one or more
attributes. Returns the sum of
the measure, accumulated by the
attribute(s) in the order specified.
•cumulative_sum (revenue,
order date)
Calculate the cumulative sum
You can use the cumulative function in a search to measure from the start of
your data to the current point.
This example will demonstrate using the cumulative_sum formula, also known as
a running total. To use the cumulative function in a search:
1. Start a new search.

Advanced searches
User Guide Copyright © 2016 by ThoughtSpot. All Rights Reserved. 105
Figure 118: Aggregation Answer example
2. Click the formula icon in the upper right hand side of the table.
Figure 119: Create a new formula in an answer
3. Enter the cumulative_sum formula, providing a measure and one or more
attributes. The example will return the sum of revenue, accumulated by the
commit date.
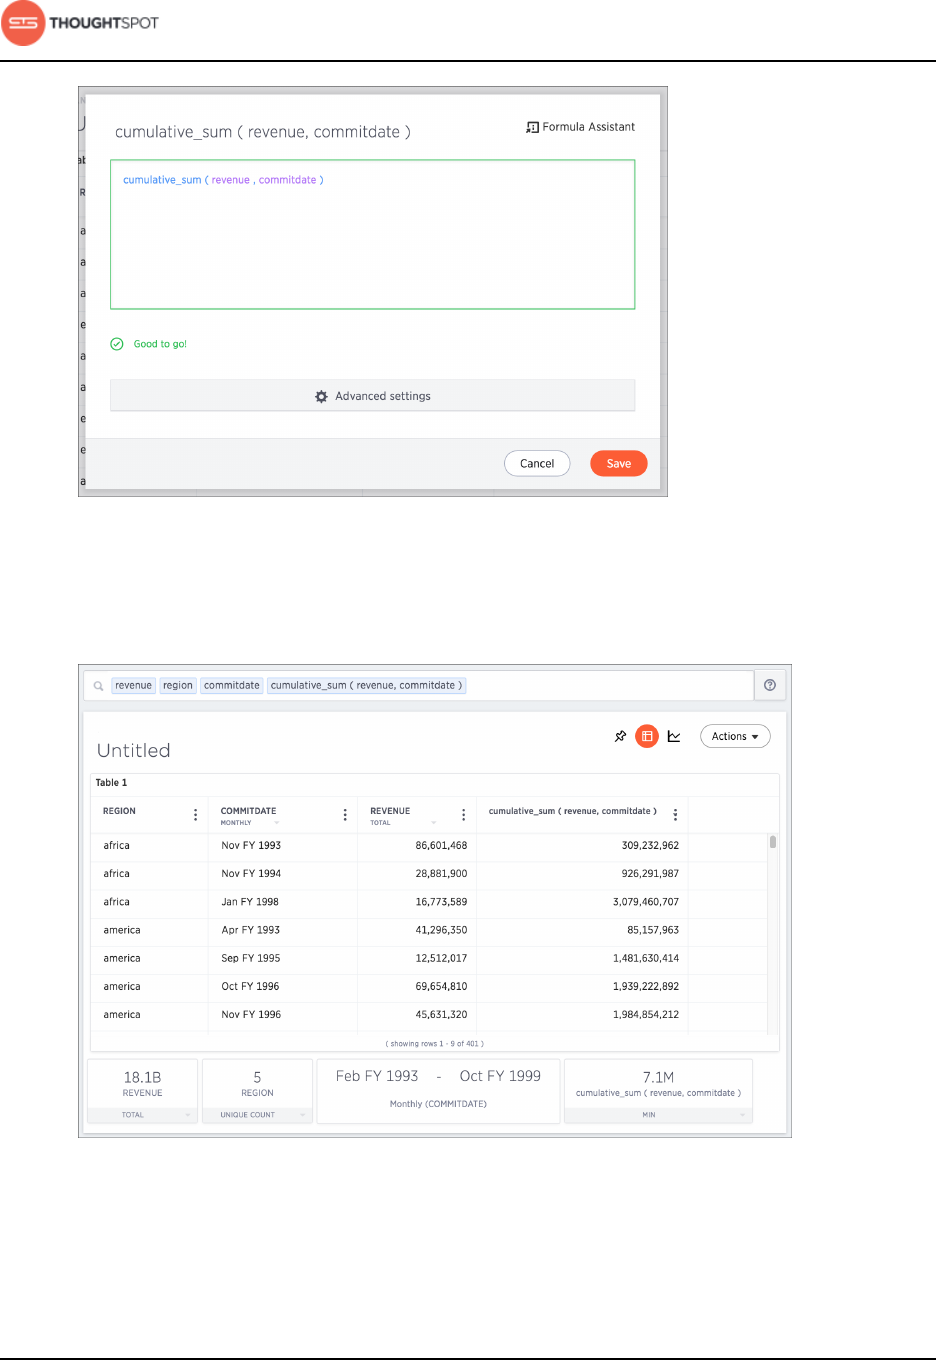
Advanced searches
User Guide Copyright © 2016 by ThoughtSpot. All Rights Reserved. 106
Figure 120: Cumulative Sum Formula
4. Name the formula by clicking on its title and typing the new name. Click Save.
5. The formula will appear in the search bar and in the table as its own column.
Figure 121: Cumulative Sum Table
Advanced searches
User Guide Copyright © 2016 by ThoughtSpot. All Rights Reserved. 107
A headline box displaying the cumulative sum within the entire table will
appear at the bottom. You can click on it to toggle between different
aggregations.
About grouping formulas
What if you want to aggregate a value by a specific attribute (for example, show
revenue by product)? This is known as a grouped aggregation, but some people
call it a pinned measure or level-based measure.
You can do this for any aggregation using the grouping formulas. Each of the
grouping formulas accepts a measure and one or more attributes. And each
returns the aggregate of the measure grouped by the attribute(s).
The grouping formulas include:
Table 6: Grouping formulas
Function Description Examples
group_average Takes a measure and one or more
attributes. Returns the average of the
measure grouped by the attribute(s).
•group_average (revenue,
customer region)
group_count Takes a measure and one or more
attributes. Returns the count of the
measure grouped by the attribute(s).
•group_count (revenue,
customer region)
group_max Takes a measure and one or more
attributes. Returns the maximum
of the measure grouped by the
attribute(s).
•group_max (revenue,
customer region)
group_min Takes a measure and one or more
attributes. Returns the minimum
of the measure grouped by the
attribute(s).
•group_min (revenue,
customer region)
Advanced searches
User Guide Copyright © 2016 by ThoughtSpot. All Rights Reserved. 108
Function Description Examples
group_stddev Takes a measure and one or more
attributes. Returns the standard
deviation of the measure grouped by
the attribute(s).
•group_stddev (revenue,
customer region)
group_sum Takes a measure and one or more
attributes. Returns the sum of the
measure grouped by the attribute(s).
•group_sum (revenue,
customer region)
group_unique_count Takes a column name and one or
more attributes. Returns the number
of unique values in a column, grouped
by the attribute(s).
•group_unique_count
( product, supplier)
group_variance Takes a measure and one or more
attributes. Returns the variance of the
measure grouped by the attribute(s).
•group_variance (revenue,
customer region)
About moving formulas
Moving formulas are aggregate formulas that allow you to calculate the average,
max, min, or sum of your data over a predetermined interval, or window, with an
adjustable range.
Each of the moving formulas accepts a measure, two integers to define the
window, and one or more attributes. And each returns the aggregate of the
measure over the given window. Moving formulas can be used to smooth out
any irregularities in your data to easily recognize trends. The larger the interval
you set, the more the peaks and valleys are smoothed out. While the smaller the
interval, the closer the moving averages are to the actual data points.
The moving formulas include:

Advanced searches
User Guide Copyright © 2016 by ThoughtSpot. All Rights Reserved. 109
Table 7: Moving formulas
Function Description Examples
moving_average Takes a measure, two integers to define
the window to aggregate over, and one
or more attributes. Returns the average
of the measure over the given window.
The attributes are the ordering columns
used to compute the moving average.
The window is (current - Num1...Current
+ Num2) with both end points being
included in the window. For example,
"1,1" will have a window size of 3. To
see periods in the past, use a negative
number for the second endpoint, as in
the example "moving_average(sales, 1, -1,
date)".
•moving_average (revenue,
2, 1, customer region)
moving_max Takes a measure, two integers to define
the window to aggregate over, and one
or more attributes. Returns the maximum
of the measure over the given window.
The attributes are the ordering columns
used to compute the moving maximum.
The window is (current - Num1...Current
+ Num2) with both end points being
included in the window. For example,
"1,1" will have a window size of 3. To
see periods in the past, use a negative
number for the second endpoint, as in
the example "moving_max(sales, 1, -1,
date)".
•moving_max (complaints,
1, 2, store name)
moving_min Takes a measure, two integers to define
the window to aggregate over, and one
or more attributes. Returns the minimum
of the measure over the given window.
The attributes are the ordering columns
•moving_min (defects, 3,
1, product)

Advanced searches
User Guide Copyright © 2016 by ThoughtSpot. All Rights Reserved. 110
Function Description Examples
used to compute the moving minimum.
The window is (current - Num1...Current
+ Num2) with both end points being
included in the window. For example,
"1,1" will have a window size of 3. To
see periods in the past, use a negative
number for the second endpoint, as in
the example "moving_min(sales, 1, -1,
date)".
moving_sum Takes a measure, two integers to define
the window to aggregate over, and one
or more attributes. Returns the sum of
the measure over the given window. The
attributes are the ordering columns used
to compute the moving sum. The window
is (current - Num1...Current + Num2)
with both end points being included
in the window. For example, "1,1" will
have a window size of 3. To see periods
in the past, use a negative number for
the second endpoint, as in the example
"moving_sum(sales, 1, -1, date)".
•moving_sum (revenue, 1,
1, order date)
Calculate the moving average
You can use the moving formulas to compute a measure within a moving
window of your data, usually defined by time.
This example will demonstrate using the moving_average formula. To use the
moving function in a search:
1. Start a new search.
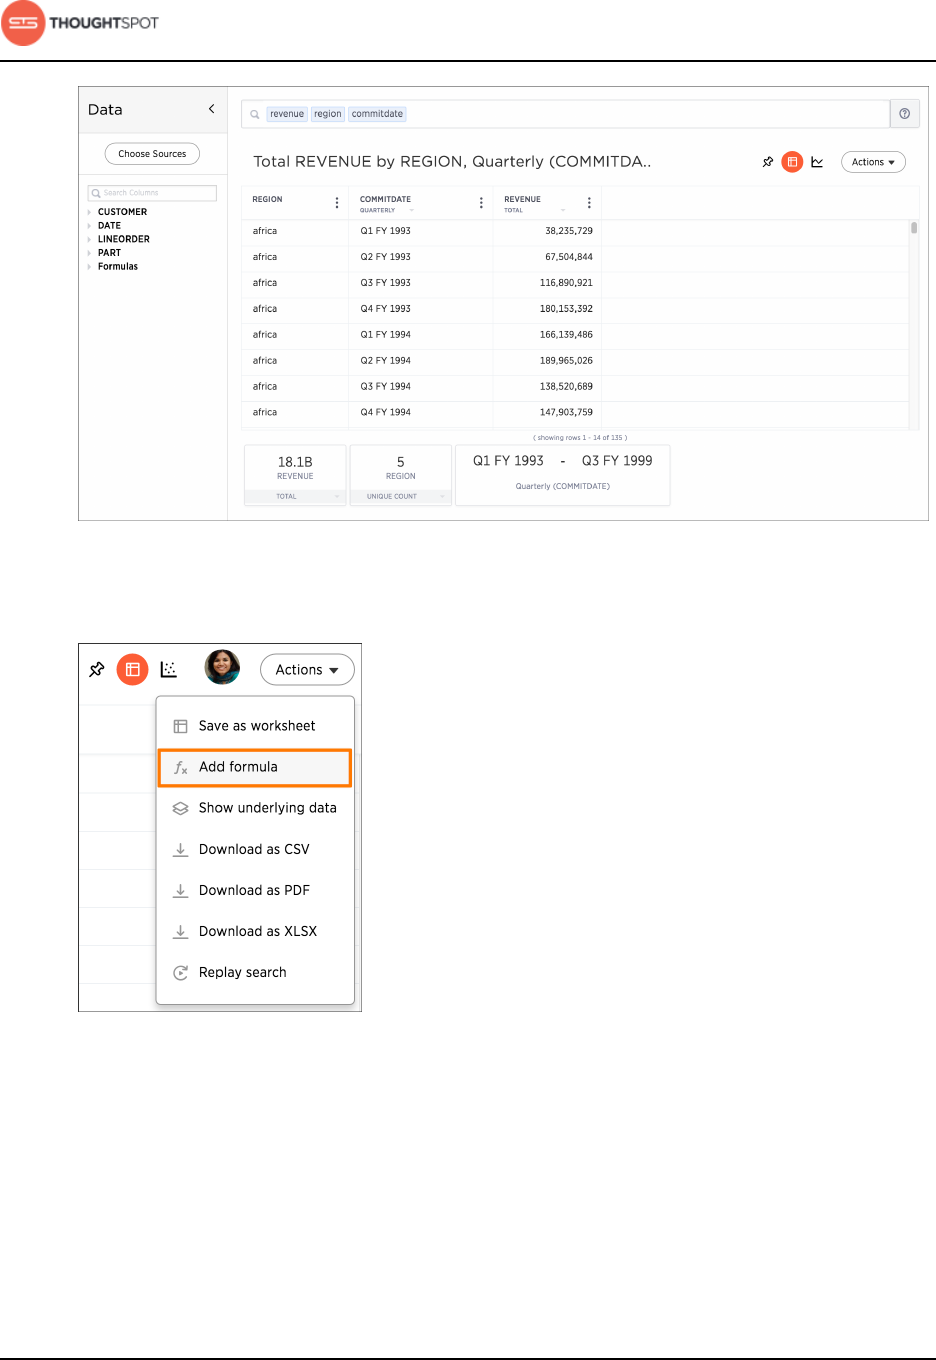
Advanced searches
User Guide Copyright © 2016 by ThoughtSpot. All Rights Reserved. 111
Figure 122: Aggregation Answer example
2. Click the formula icon in the upper right hand side of the table.
Figure 123: Create a new formula in an answer
3. Enter the moving_average formula, providing a measure, a window, and one
or more attributes. The example will return the average of revenue, within the
commit date window size of 3. The window includes the previous, current, and
next rows.
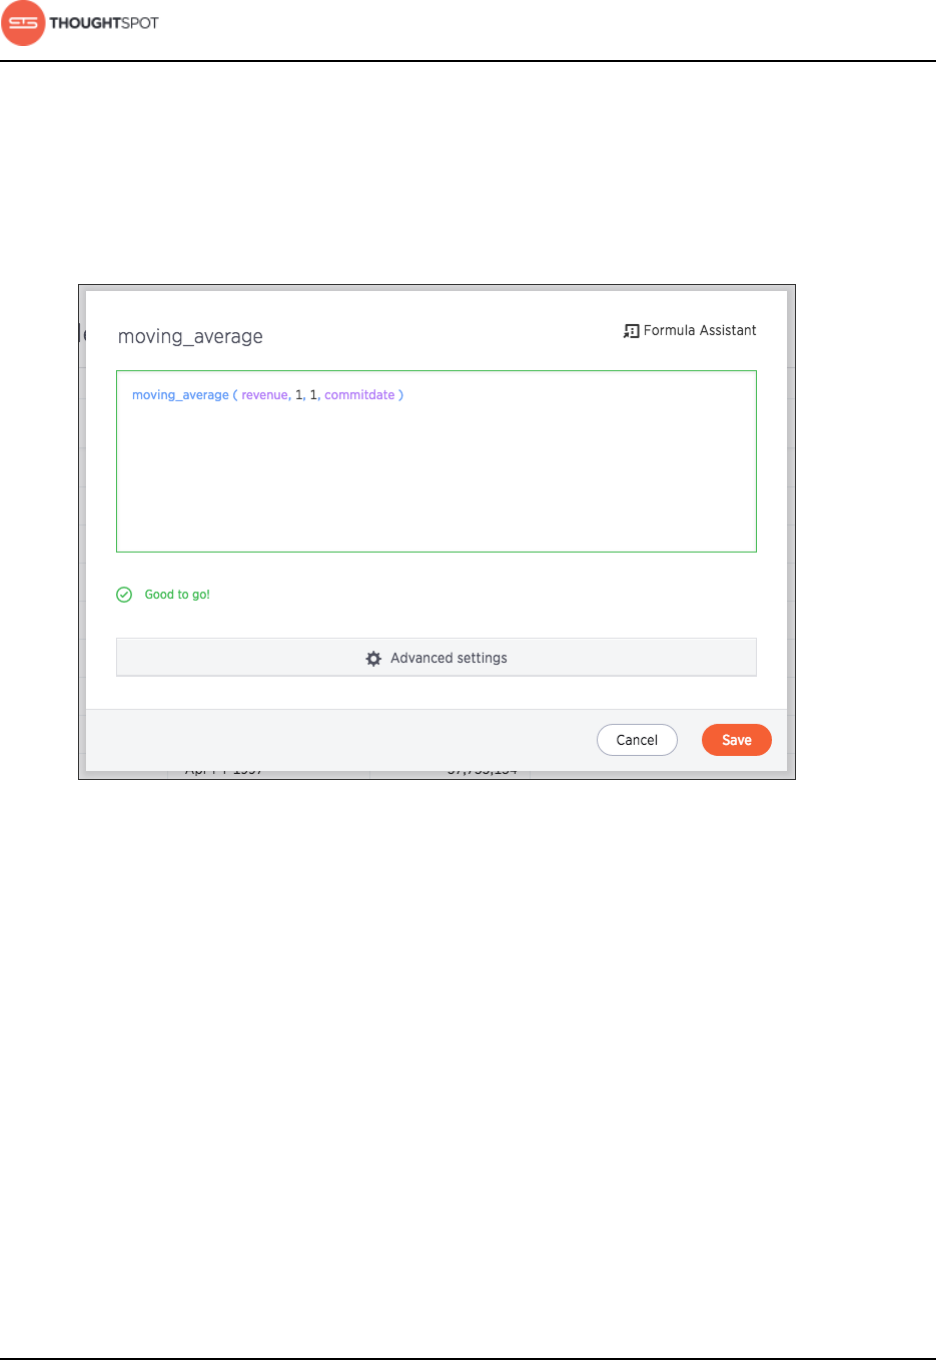
Advanced searches
User Guide Copyright © 2016 by ThoughtSpot. All Rights Reserved. 112
The attributes are the ordering columns used to compute the moving average.
The window is (current - Num1...Current + Num2) with both end points being
included in the window. For example, "1,1" will have a window size of 3. To see
periods in the past, use a negative number for the second endpoint, as in the
example "moving_average(sales, 1, -1, date)".
Figure 124: Moving Average Formula
4. Name the formula by clicking on its title and typing the new name. Click Save.
5. The formula will appear in the search bar and in the table as its own column.
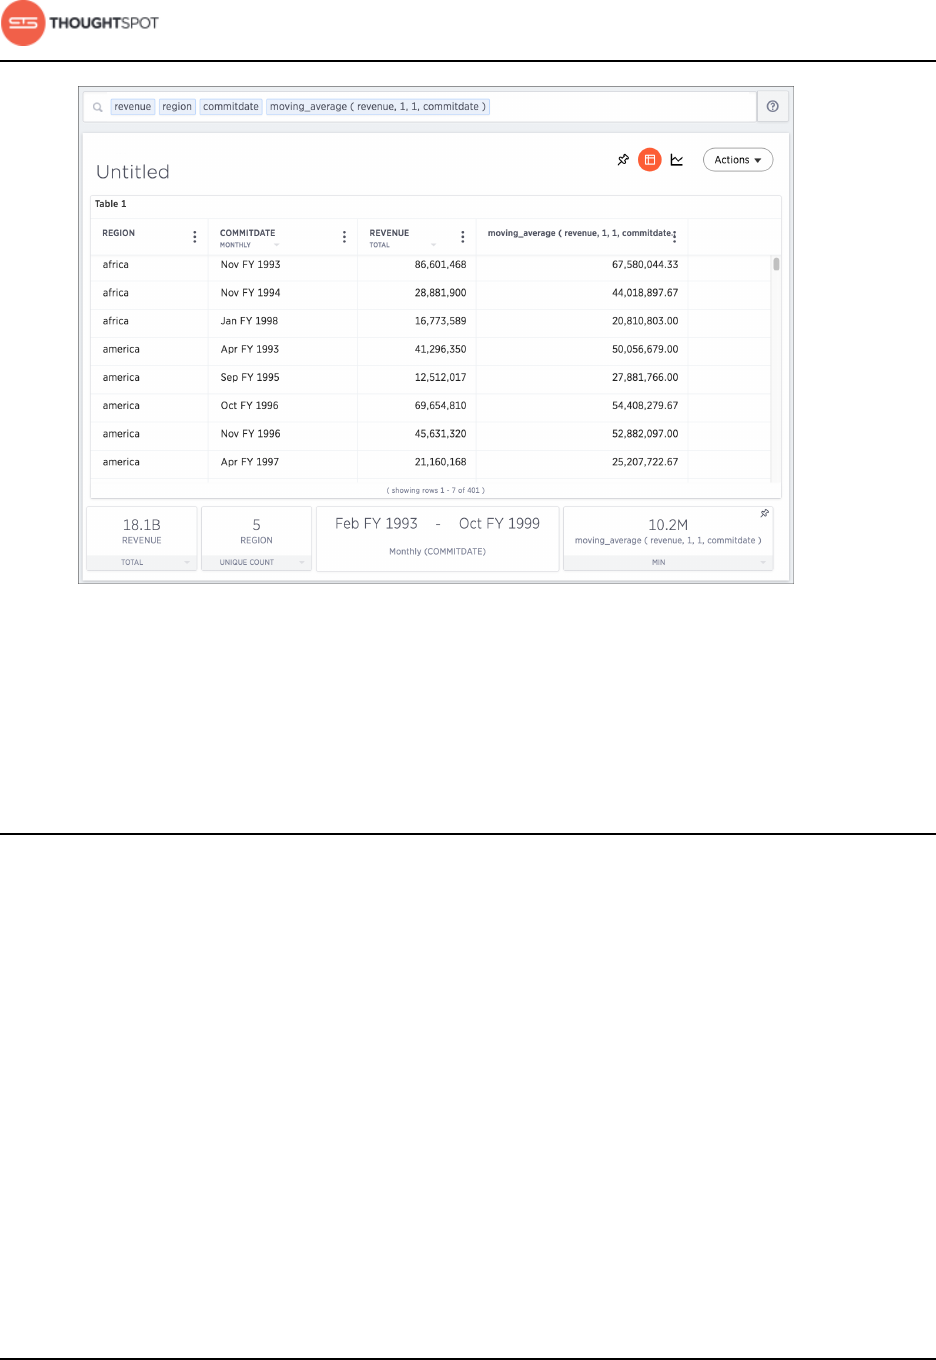
Advanced searches
User Guide Copyright © 2016 by ThoughtSpot. All Rights Reserved. 113
Figure 125: Moving Average Table
A box displaying the moving average within the entire table will appear at the
bottom. You can click on it to toggle between aggregation types.
About conversion formulas
Some formulas require the input to be of a particular data type. If you find that
you want to pass a value to the function, but it is of the wrong data type, you
can convert it using a conversion formula.
The following are the default conversion formulas:
• to_bool
• to_integer
• to_string
• to_float
Information on the usage for these formulas is in the Formula reference.
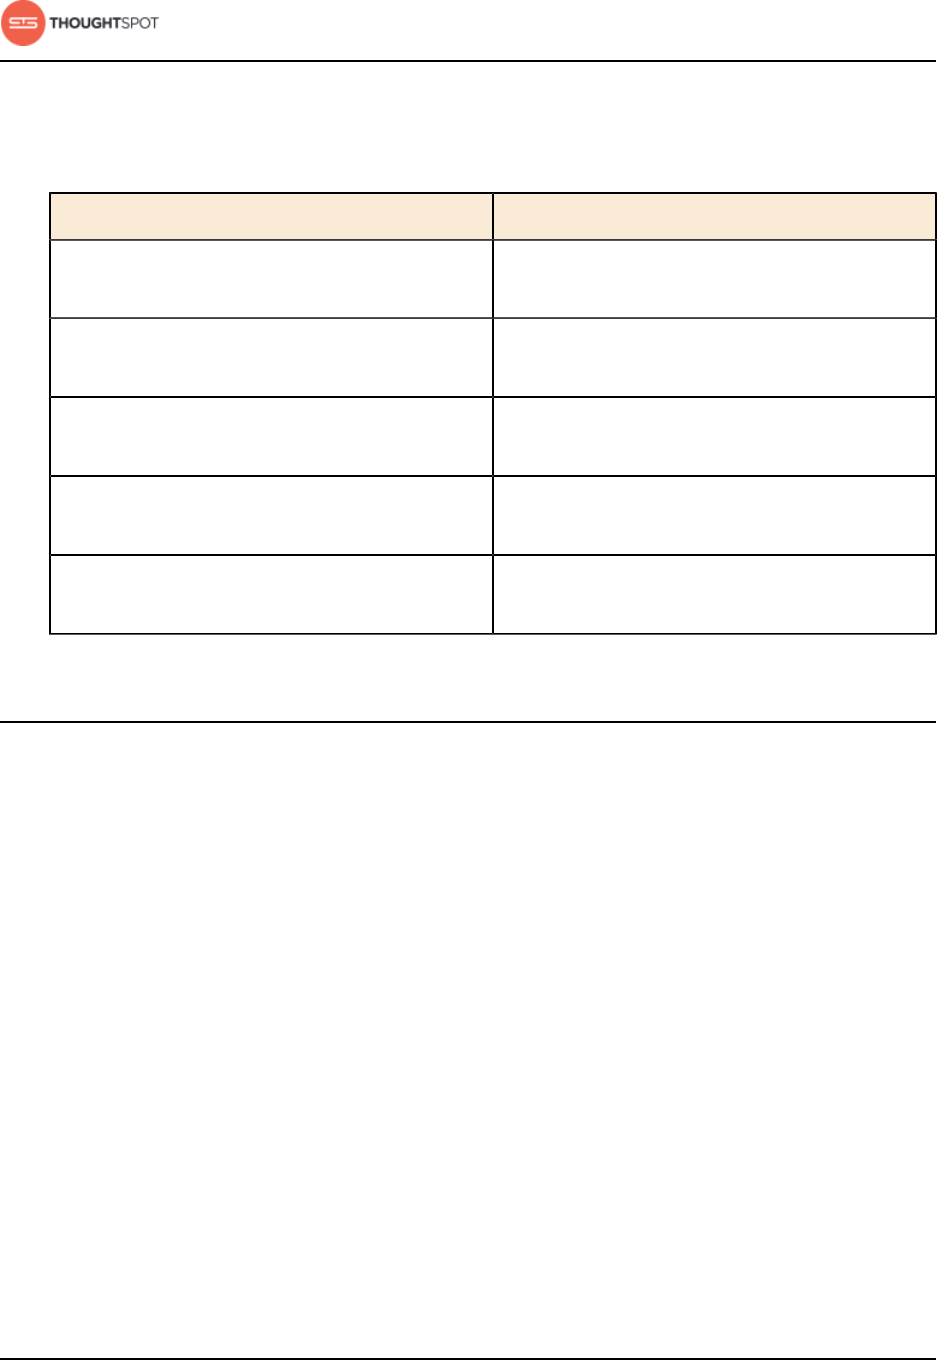
Advanced searches
User Guide Copyright © 2016 by ThoughtSpot. All Rights Reserved. 114
Booleans are interpreted in the following ways:
Table 8: How Boolean Values are Interpreted when Changing Data Type
Data Type Description
to_bool(integer) Boolean true maps to integer 1 and boolean
false to integer 0.
to_bool(string) Boolean true maps to string "true" and boolean
false to string "false".
to_double(boolean) 0 maps to boolean false, everything else to
boolean true.
to_integer(boolean) 0 maps to boolean false, everything else to
boolean true.
to_string(boolean) The string "true" maps to boolean true,
everything else to boolean false.
About pivot tables
Pivot tables in ThoughtSpot use the well known drag-and-drop interface.
Creating a pivot table enables exploring alternate visualization of data in a
wide table. The basic idea is that some data is easier to consume when laid out
horizontally, while others, vertically.
Previously, ThoughtSpot used a pivot keyword to select which fields can be
columns and which can be rows, thus moving columns to be rows and vice versa.
Now, the pivot table is a chart type.
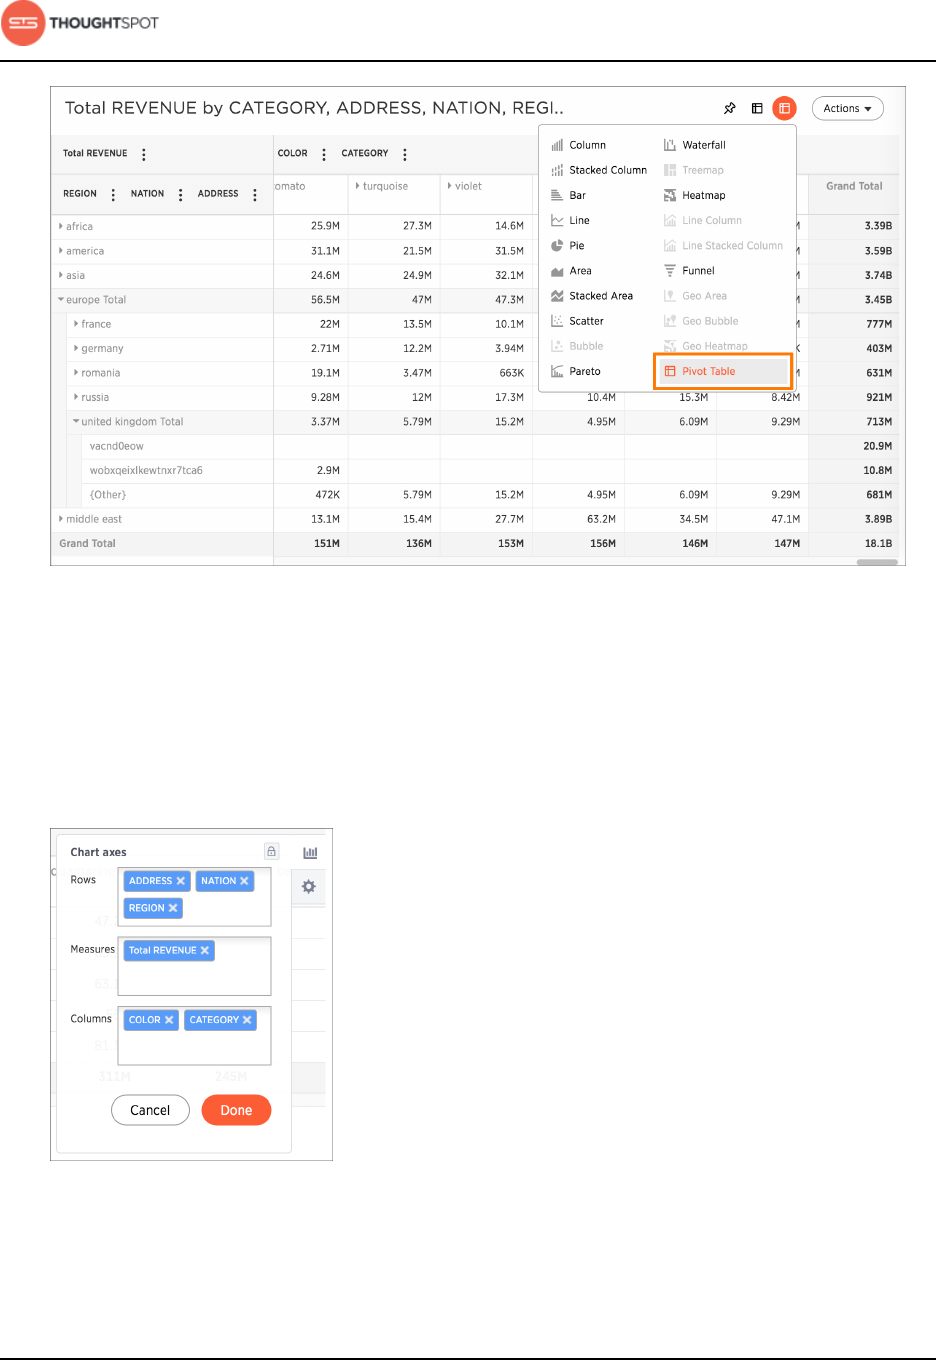
Advanced searches
User Guide Copyright © 2016 by ThoughtSpot. All Rights Reserved. 115
Figure 126: Pivot table chart type
Choose Pivot Table under Select Chart Type to view your search as a pivot table.
Add rows, measures, and columns to the search bar and restructure your table
by moving these values under Configure Chart or by dragging and dropping
them.
Figure 127: Chart axes: rows, measures, columns
Some additional details about pivot tables include:
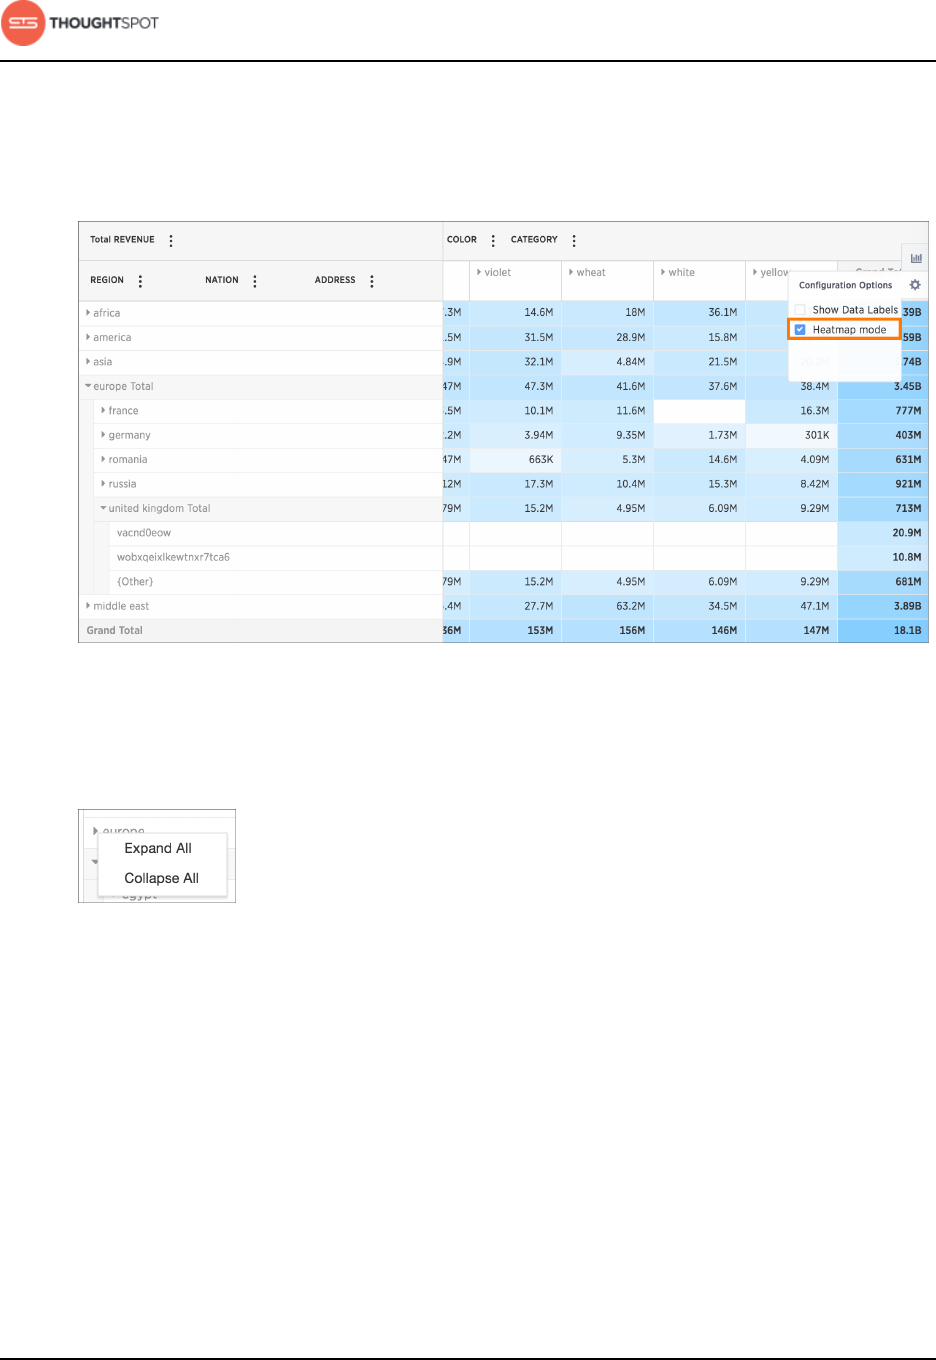
Advanced searches
User Guide Copyright © 2016 by ThoughtSpot. All Rights Reserved. 116
• Pivot tables show the grand totals for columns and rows.
• You can toggle on the Heatmap mode found under Configuration Options to
add color coordination to your data.
Figure 128: Heatmap mode enabled
• Click a column or row to expand it. Additionally, you can expand or collapse all
by right clicking the arrow on the top left of a cell.
Figure 129: Expand or collapse all option
• When you pin a pivot table to a pinboard, it will retain your expansion
settings.
The pivot table chart type has these limitations:
• Pivot table is not available if the dataset contains more than 100,000 rows.
• Columns with cardinality beyond 100 are grouped into {Other}.

User Guide Copyright © 2016 by ThoughtSpot. All Rights Reserved. 117
Chapter 4: About pinboards
About pinboards
Topics:
•Create a pinboard
•Add an answer to a
pinboard
•Edit the layout of a
pinboard
•About pinboard filters
•Other pinboard actions
Pinboards act like live dashboards, and are
collections of your related charts, tables, and
headline.
You can pin charts and tables to any pinboard which
you created, and those that have been shared with
you with the Edit privilege. When you create a
pinboard, you can share it with other people with
either the View or Edit privilege. Pinboards are
interactive, allowing you to perform actions like
filtering, excluding values, and drilldown on the
visualizations.
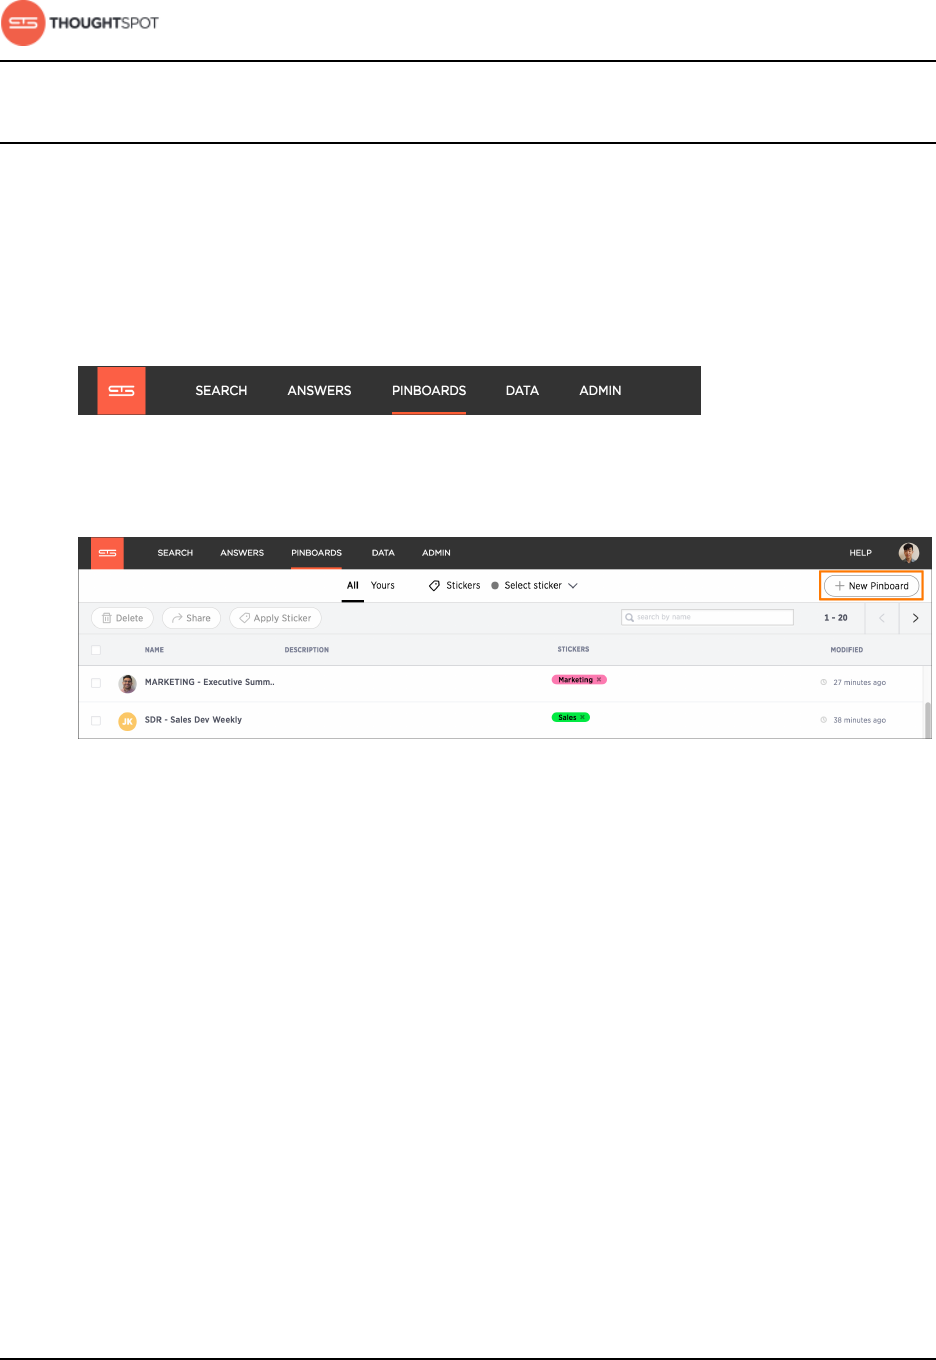
About pinboards
User Guide Copyright © 2016 by ThoughtSpot. All Rights Reserved. 118
Create a pinboard
Create a new pinboard to group and manage related search results.
You can also create a new pinboard when you add an answer to a pinboard.
To create a pinboard:
1. Click on Pinboards, on the top navigation bar.
Figure 130: Pinboards
2. Click + New Pinboard on the pinboards list page.
Figure 131: New Pinboard button
3. In the New Pinboard dialog box, give your pinboard a name and description.
Then click Create.
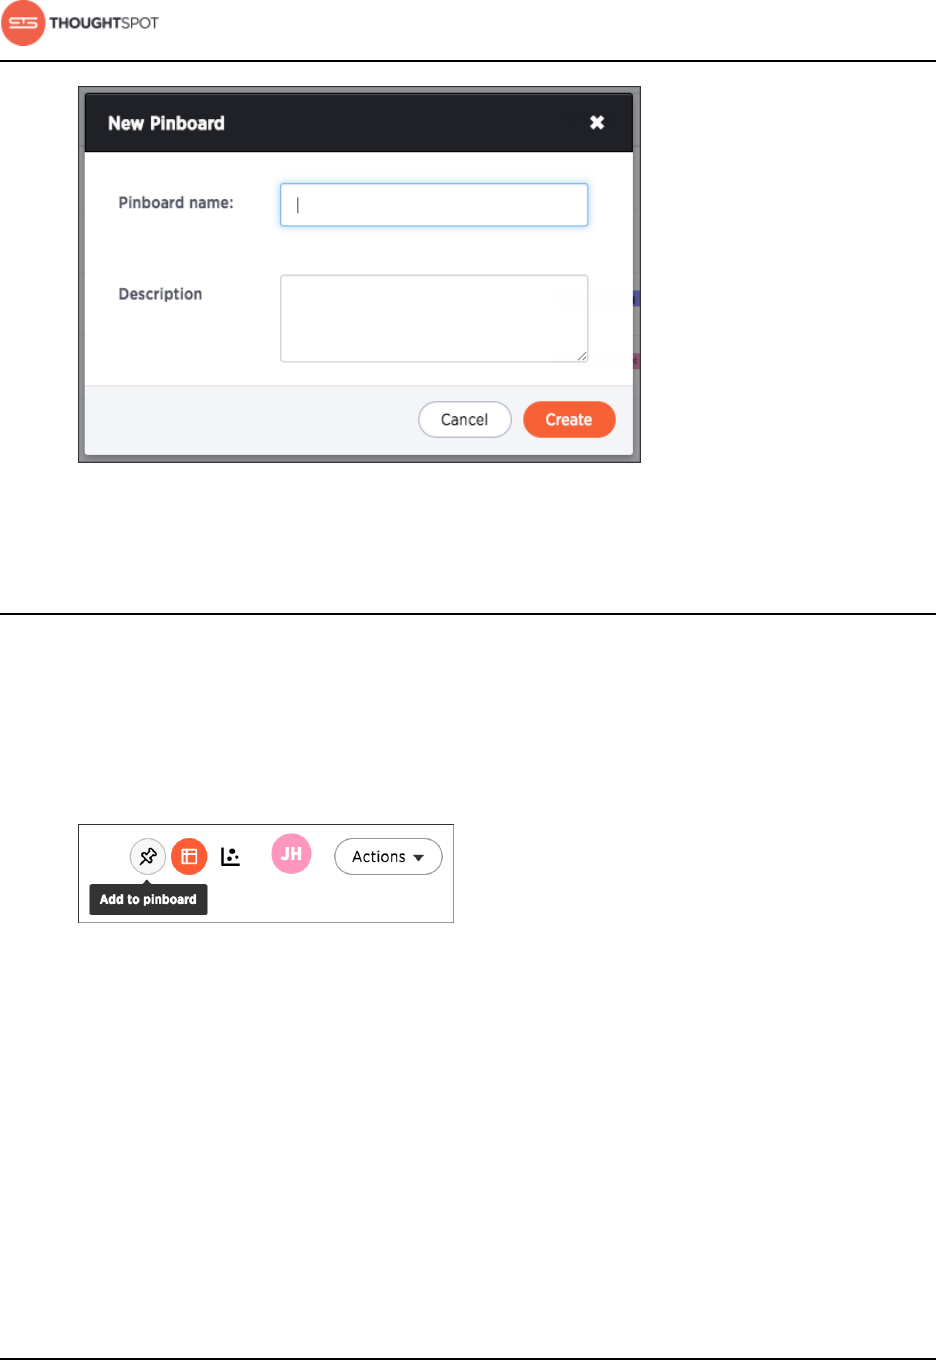
About pinboards
User Guide Copyright © 2016 by ThoughtSpot. All Rights Reserved. 119
Figure 132: New Pinboard menu
Add an answer to a pinboard
Instead of saving an answer you can add it to a pinboard by pinning it.
To add an answer to a pinboard:
1. While viewing your answer of interest, click the Add to pinboard icon on the
top right of the answer.
Figure 133: Pin an answer to a pinboard icon
2. In the Copy to pinboard(s) dialog box, click the + icons next to the pinboards
you would like to add your answer to.
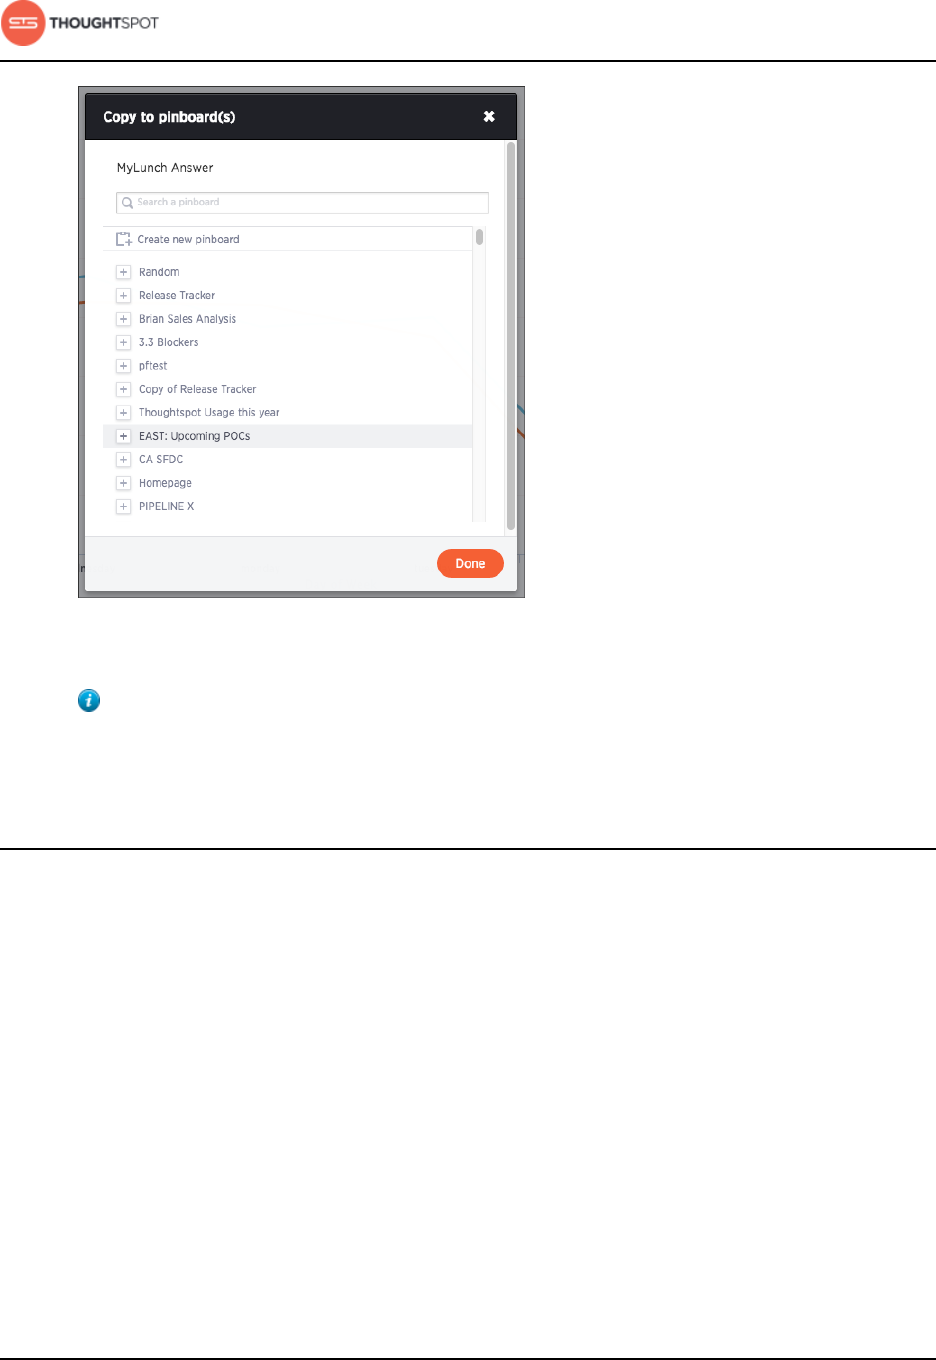
About pinboards
User Guide Copyright © 2016 by ThoughtSpot. All Rights Reserved. 120
Figure 134: Add filters menu
Tip: You can also select Create new pinboard at the top of the list to
create a new pinboard, then add your answer to it.
Edit the layout of a pinboard
Editing the layout of a pinboard lets you snap visualizations into place, choose
between set visualization sizes, and reset your layout.
Visualizations within a pinboard are easy to move around and snap into place on
a relative flow layout. Your pinboard layout is also responsive to your browser
resolution. This helps keep the layout of your pinboard neat and organized.
In addition, the size picker at the bottom of a visualization dropdown lets you
toggle between predetermined sizes for each visualization. Charts and graphs
can be toggled between a small, medium, and full width size, while headlines
can be only one size (small). One row of the pinboard can hold a predetermined
number of visualizations of each size.
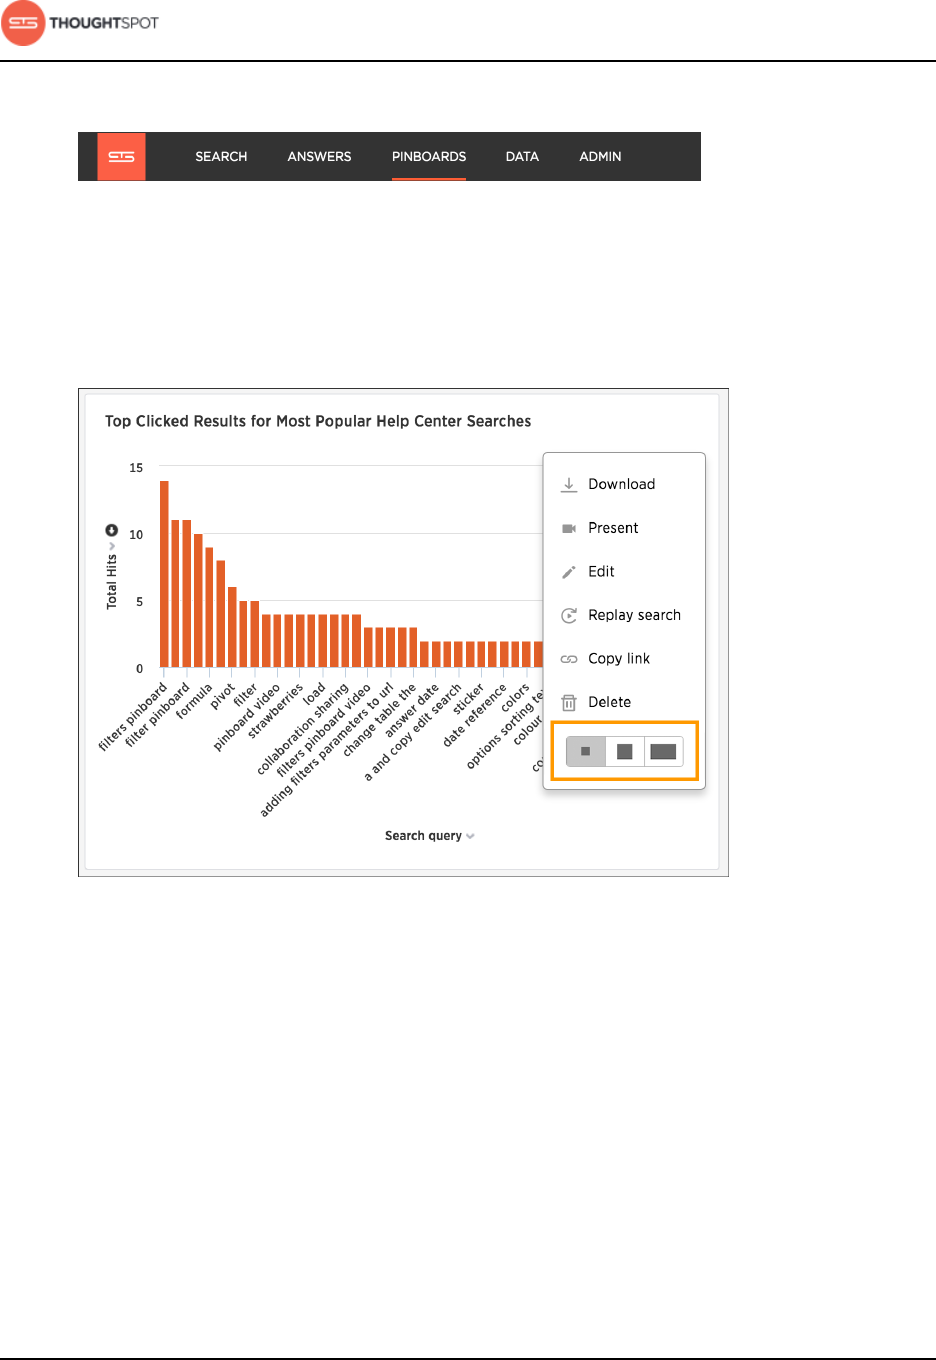
About pinboards
User Guide Copyright © 2016 by ThoughtSpot. All Rights Reserved. 121
1. Click on Pinboards, on the top navigation bar.
Figure 135: Pinboards
2. On the pinboard list page, click the pinboard you would like to edit.
3. Resize your visualizations by choosing between the predetermined sizes
under the visualization dropdown menu.
Figure 136: Resize your visualization
4. Drag and drop your visualizations on the layout grid to reorder your pinboard.
5. If you are unhappy with your layout or you would like ThoughtSpot to
configure your layout for you, go ahead and reset your layout.
6. Save your pinboard by clicking Actions and Save.
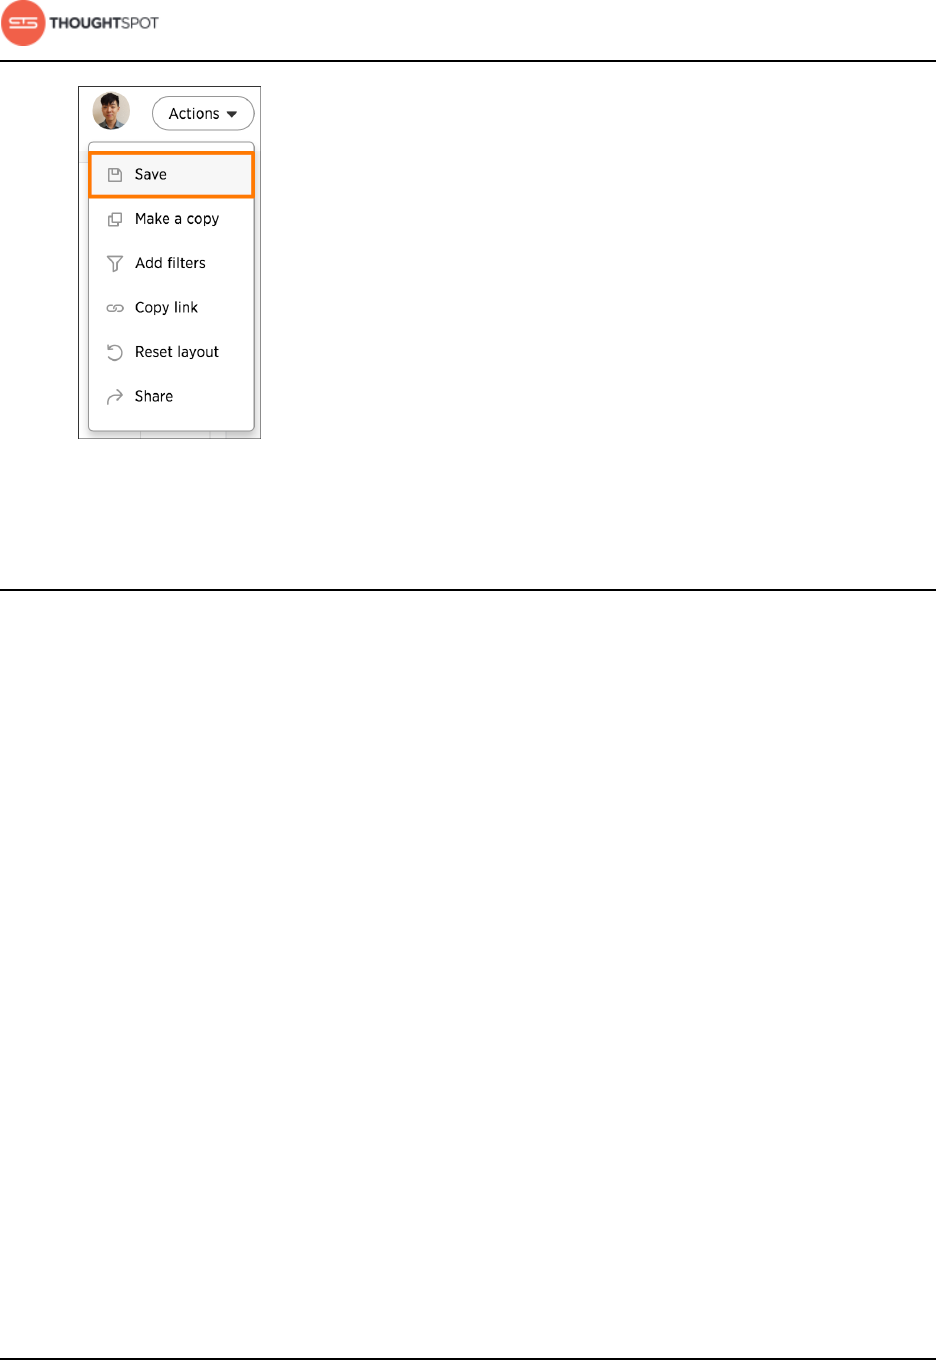
About pinboards
User Guide Copyright © 2016 by ThoughtSpot. All Rights Reserved. 122
Figure 137: Save your pinboard
About pinboard filters
Filters, including bulk filters, can be applied to pinboards just as with tables and
charts. These kinds of filters apply to an entire pinboard, making it easy to see
only the data that you are interested in across the tables and charts within a
pinboard.
Pinboard filters can be very useful when you want to apply the same filters to
more than one related visualization. You can narrow the focus of your pinboard
for specific purposes or audiences.
When you apply a filter, the pinboard is not automatically saved with your filter
applied. This is to encourage ad hoc filtering. Therefore, people with read-only
access can create pinboard filters. You must have edit access to the pinboard,
and view access (or higher) to the underlying data source in order save a
pinboard filter.
Note that pinboard filters only apply to the tables and charts that are based on
worksheets. If a pinboard also includes tables and charts that were created from
underlying tables or on user uploaded data, the filters don’t apply to them.
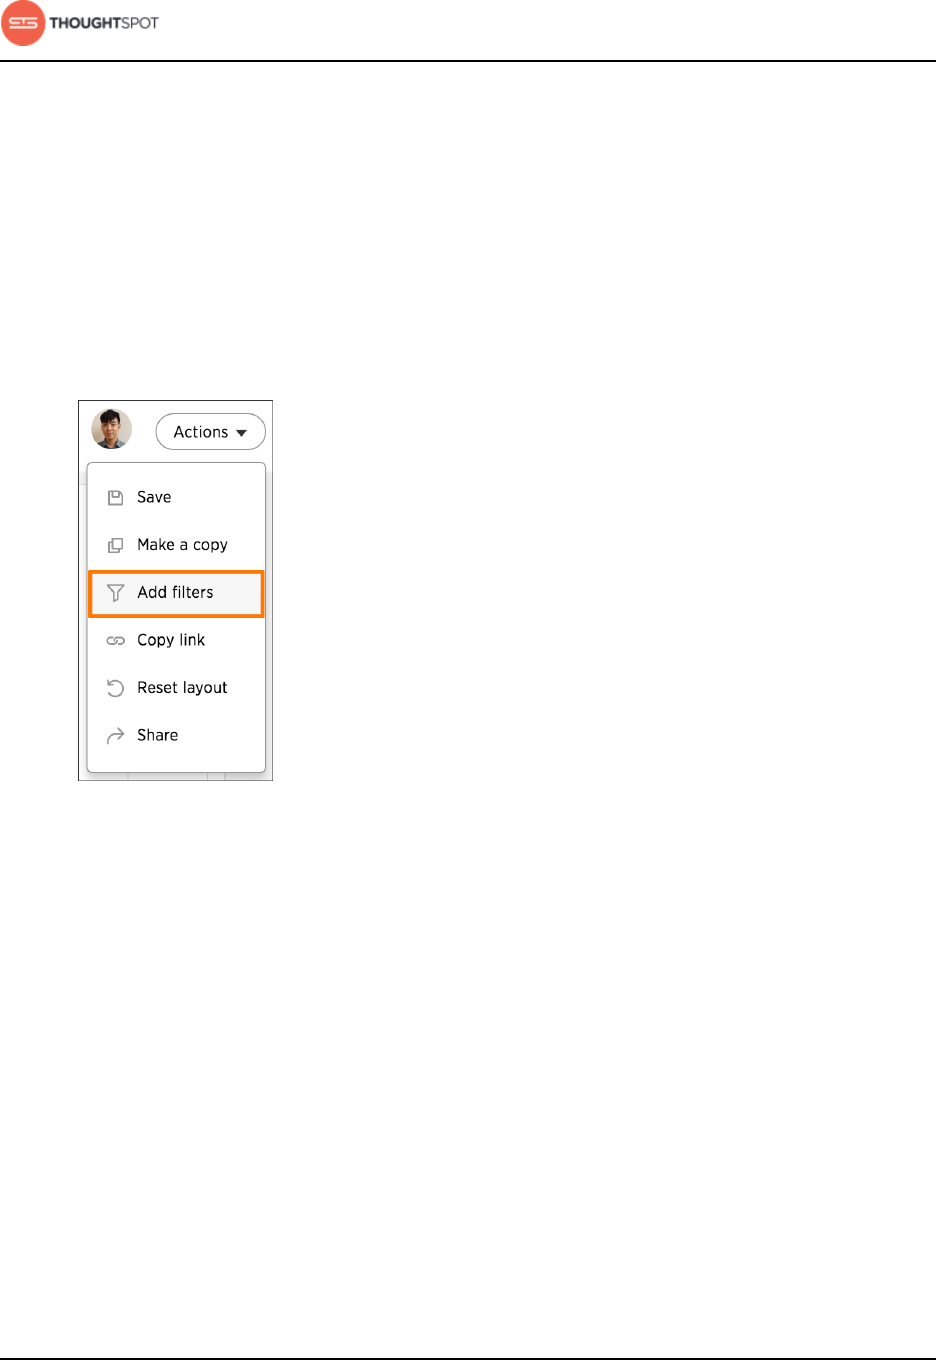
About pinboards
User Guide Copyright © 2016 by ThoughtSpot. All Rights Reserved. 123
Create a pinboard filter
You can create a filter in the pinboard view for any pinboard. This allows you to
easily manipulate the visualizations and view the modified presentation in one
place.
Here is an example that shows you how to add a single filter to a pinboard. To
create a pinboard filter:
1. Click the Actions button, and click Add filters.
Figure 138: Add filters under Actions
2. In the populated columns menu, click the Add filter icon next to the columns
you would like to use as filters.
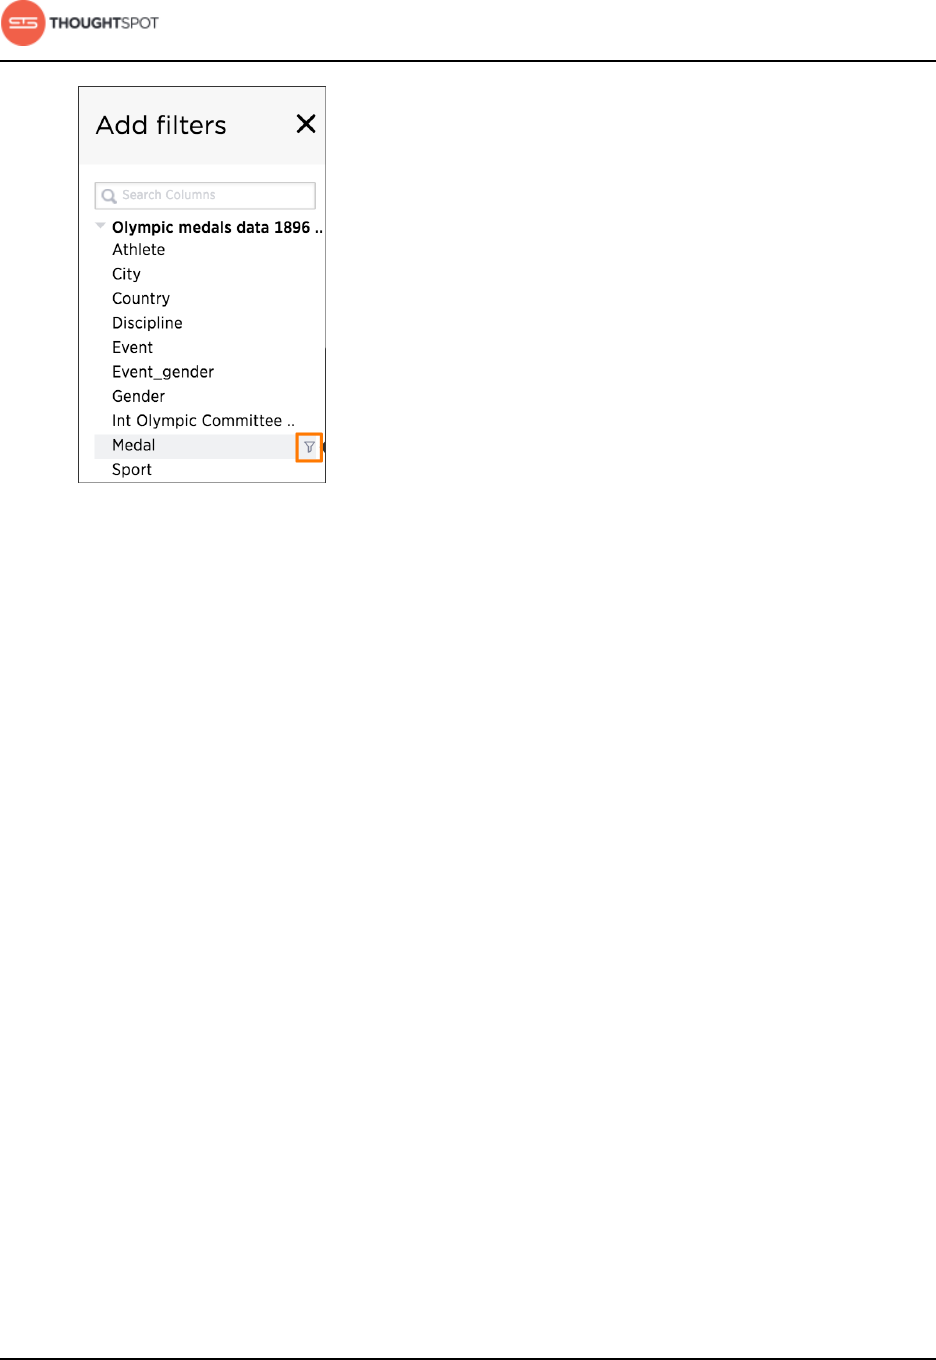
About pinboards
User Guide Copyright © 2016 by ThoughtSpot. All Rights Reserved. 124
Figure 139: Add filters menu
3. Choose the values you are interested in by typing them in, selecting the
appropriate checkboxes, or using Add values in bulk. Then click Done.
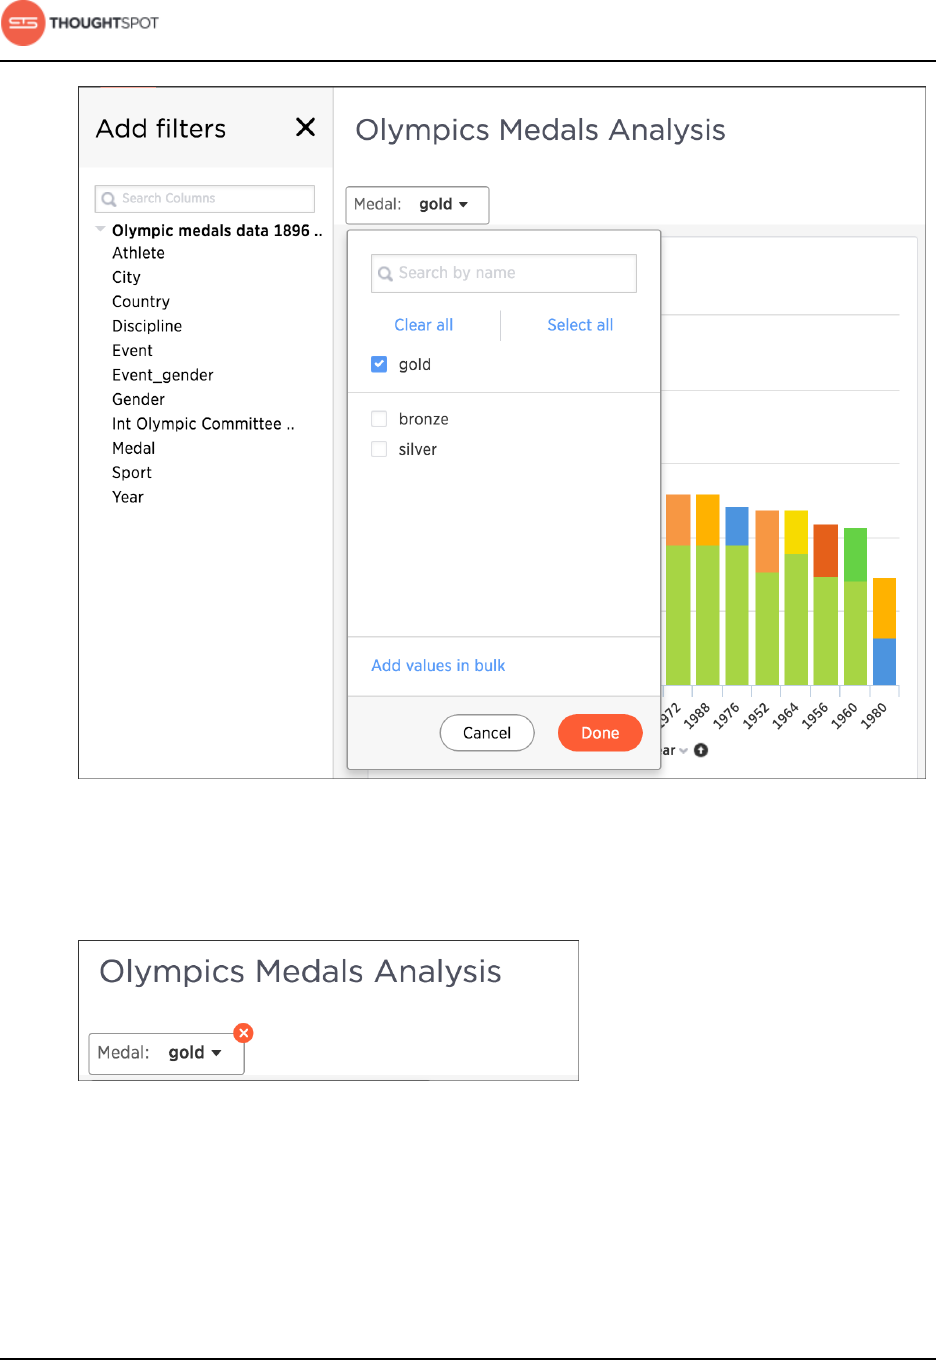
About pinboards
User Guide Copyright © 2016 by ThoughtSpot. All Rights Reserved. 125
Figure 140: Select Filter Values
4. Your applied filter will sit at the top of the pinboard, where you can either edit
or delete it.
Figure 141: Applied Pinboard Filter
When you apply a filter, the pinboard is not automatically saved with
your filter applied to every object in the pinboard that was created from a
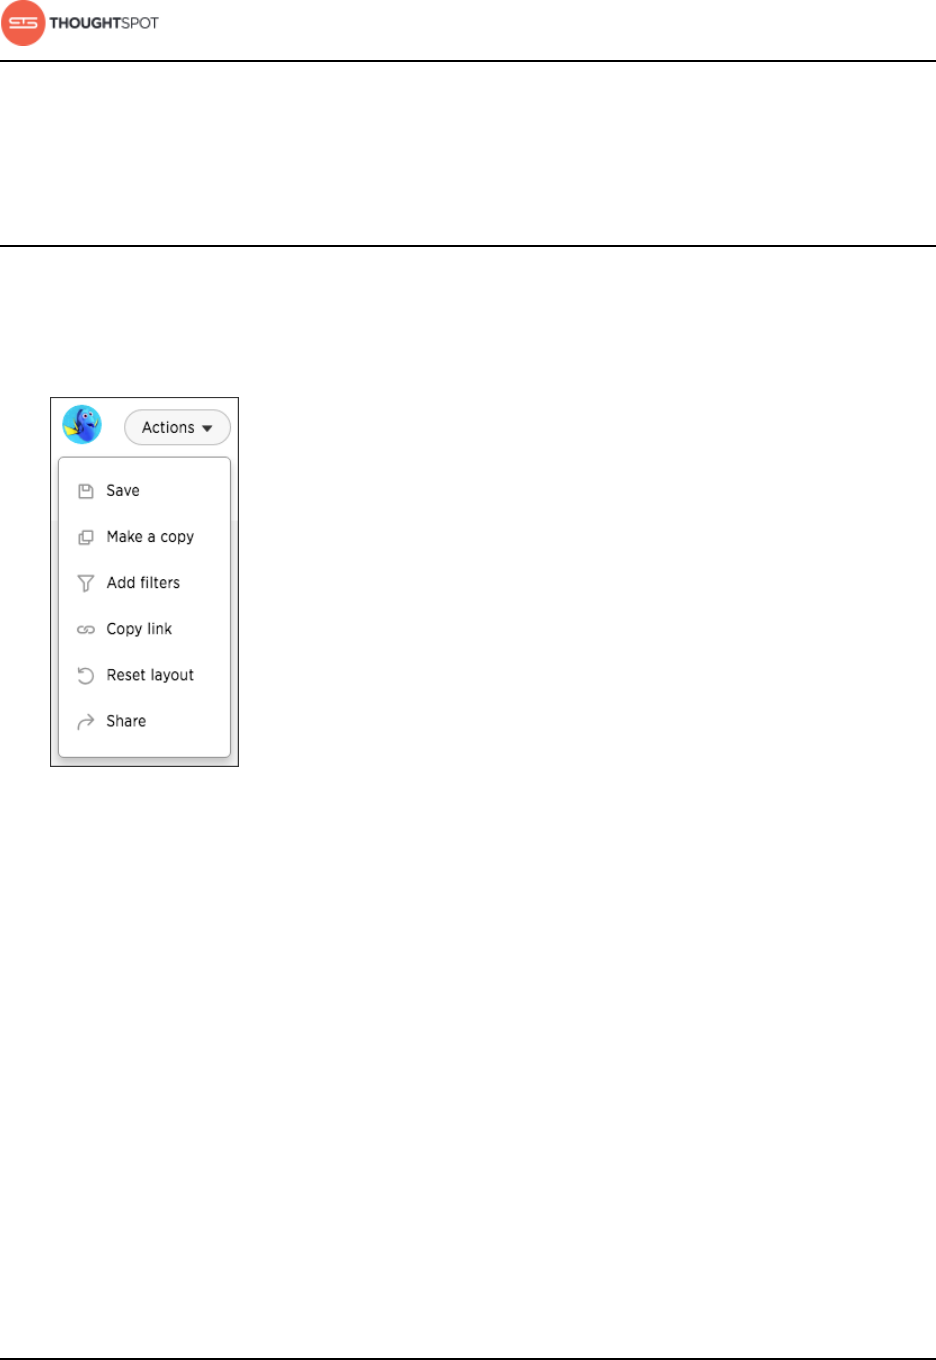
About pinboards
User Guide Copyright © 2016 by ThoughtSpot. All Rights Reserved. 126
worksheet. Pinboard filters do not apply to tables and charts built directly on
top of base tables.
Other pinboard actions
Other pinboard actions include actions you normally perform on your search as
well as actions that you can only perform on a pinboard.
Most of these actions are found under the Actions button.
Figure 142: Pinboard actions button
Search actions within a pinboard
You can perform many of the same search actions on individual visualizations
within a pinboard as you can within a search.
You can interact directly with a visualization of a pinboard to perform ad hoc
searches or edit it. These search actions include the following:
• Editing a search - You can edit the original search and reconfigure the answer.
In the dropdown of a visualization, click Edit.
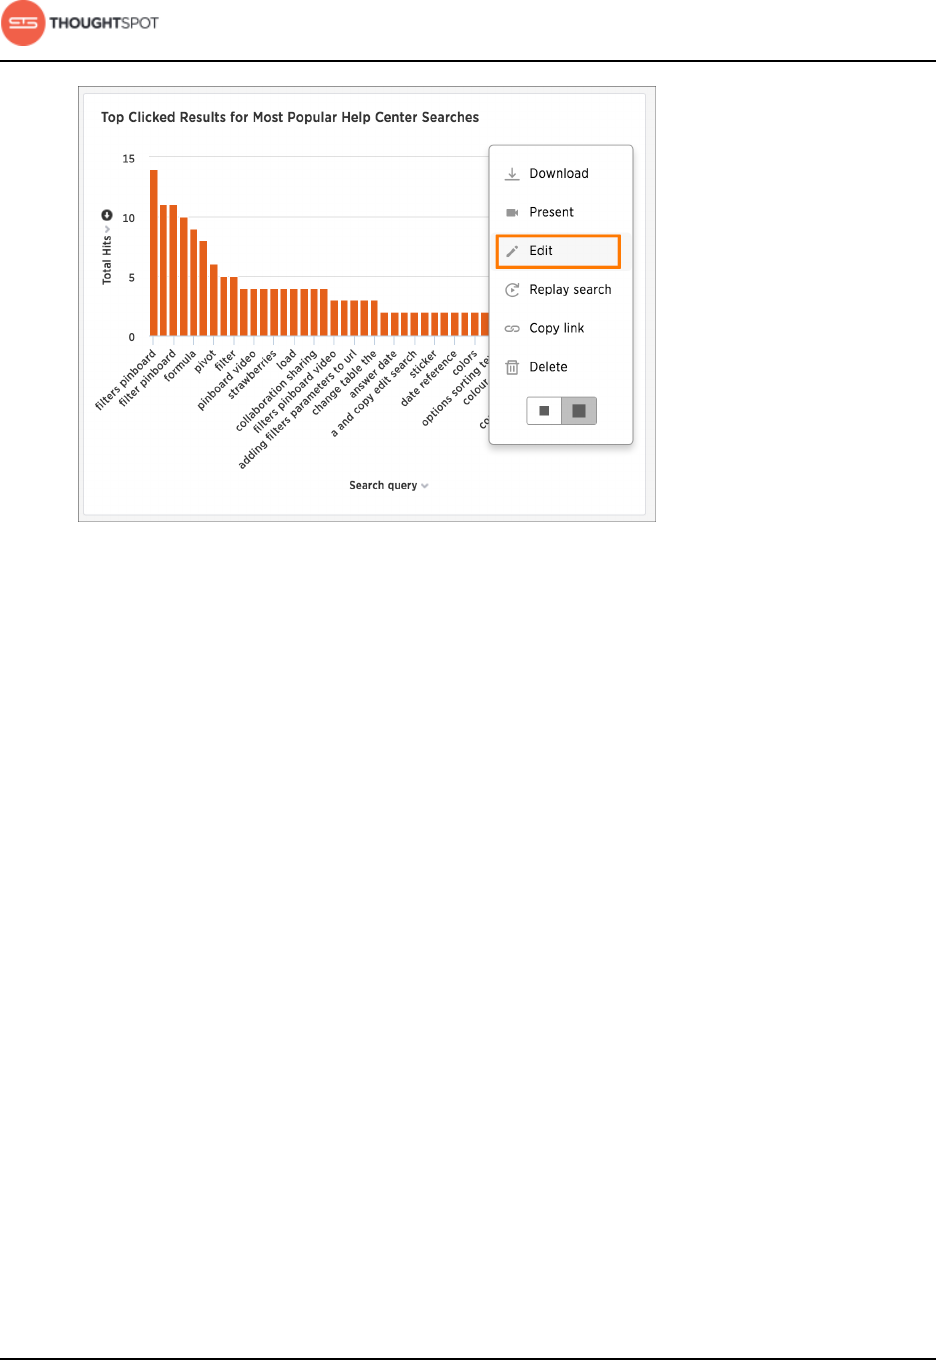
About pinboards
User Guide Copyright © 2016 by ThoughtSpot. All Rights Reserved. 127
Figure 143: Edit a pinboard visualization
You will be taken to an edit mode, where you can view and change sources,
search different columns, see the what am I looking at option, change the
view, save the answer as a worksheet, add a formula, change the table, and
change the chart.
•Sorting
•Changing the date bucketing
•Showing underlying data
•Drilling down
•Excluding and including row values
•Applying conditional formatting
•Filtering
•Downloading the answer
•Replaying the search
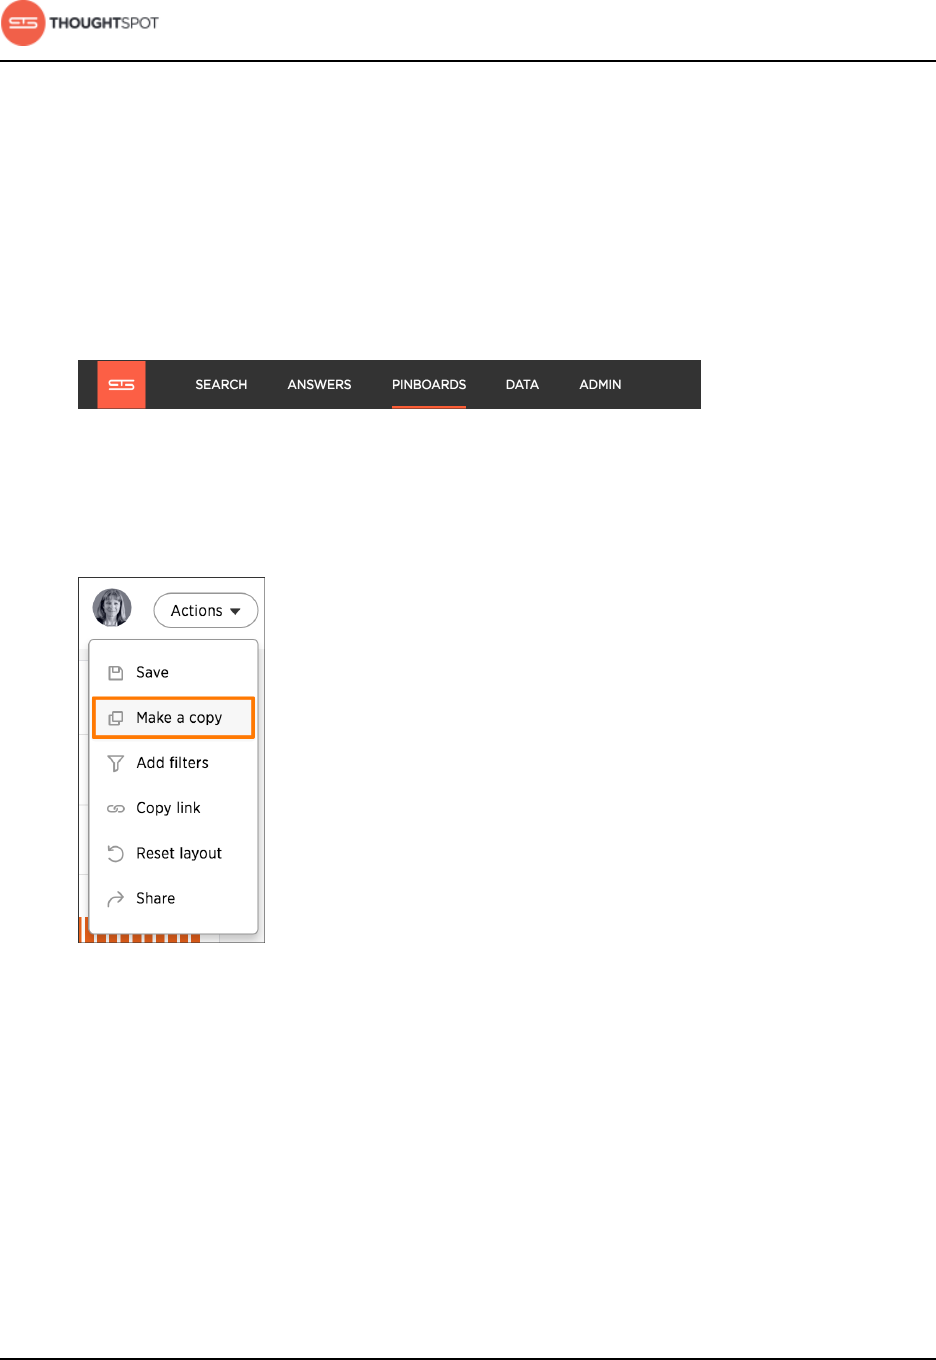
About pinboards
User Guide Copyright © 2016 by ThoughtSpot. All Rights Reserved. 128
Copy a pinboard
You can make a copy of a pinboard if you would like to make edits without
changing the original pinboard.
Making a copy of a pinboard allows you to make your own edits without
overwriting the original. When saving a copy, you can type in a new name.
1. Click on Pinboards, on the top navigation bar.
Figure 144: Pinboards
2. On the pinboard list page, click the pinboard you would like to copy.
3. Click Actions and select Make a copy.
Figure 145: Make a copy of the pinboard
4. Give your pinboard a new name and description. Then click Save.
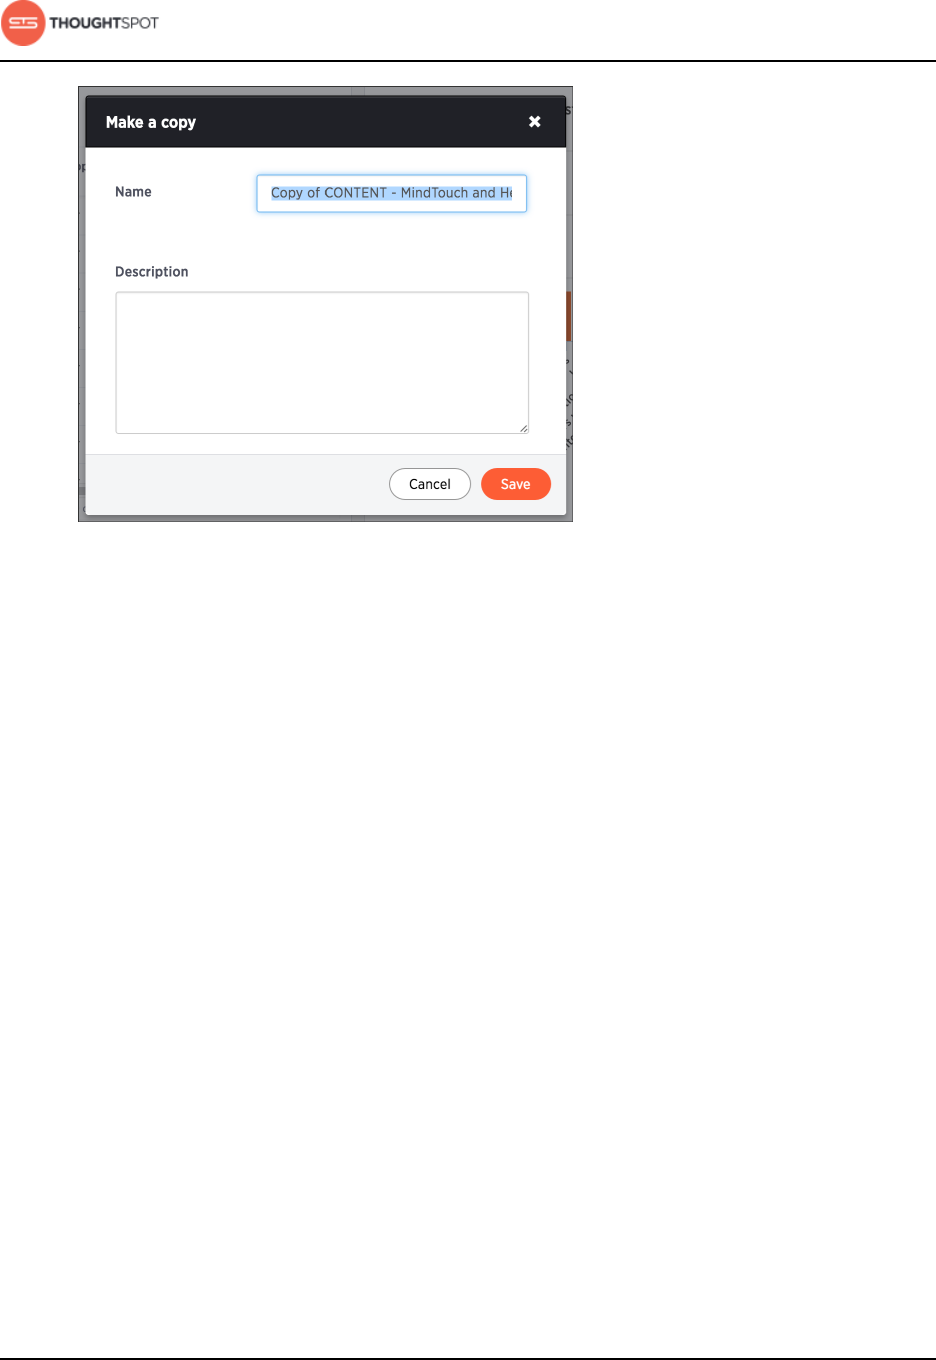
About pinboards
User Guide Copyright © 2016 by ThoughtSpot. All Rights Reserved. 129
Figure 146: Name and save your pinboard copy
Copy the link for a pinboard or visualization
In pinboards, there is a copy link option that lets you copy the link to access the
pinboard and visualizations directly.
You can copy and paste the copied link to include in a presentation or
spreadsheet, or email or Slack it to other people in your company. Note that
when clicking the link, the person must be authenticated to ThoughtSpot to see
the visualization (e.g. by logging in or LDAP).
You can also use this link for embedding the chart or table in another Web page,
Web portal, or application when using the ThoughtSpot JavaScript API with
Embedding or the REST API. For details, read the ThoughtSpot Application
Integration Guide.
To copy the link for a pinboard:
1. Click on Pinboards, on the top navigation bar.
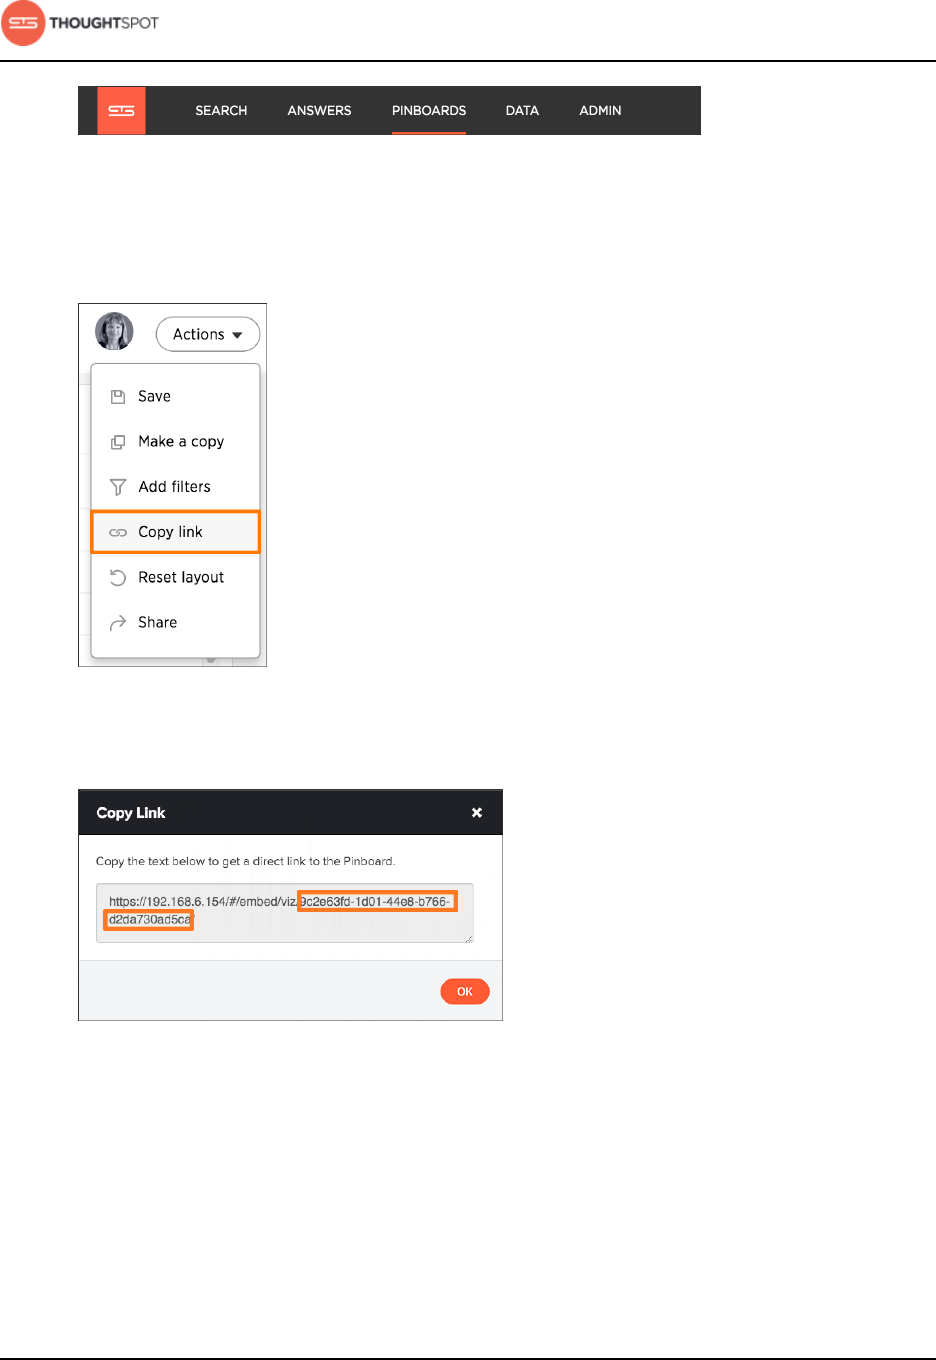
About pinboards
User Guide Copyright © 2016 by ThoughtSpot. All Rights Reserved. 130
Figure 147: Pinboards
2. On the pinboard list page, click the pinboard you would like to get a link for.
3. Click Actions and select Copy link.
Figure 148: Copy pinboard link option
4. Copy the pinboard link. The highlighted portion is the pinboard ID.
Figure 149: Copy pinboard link
5. To copy an individual visualization link, click Copy link under the dropdown
menu of the visualization you would like to get a link for.
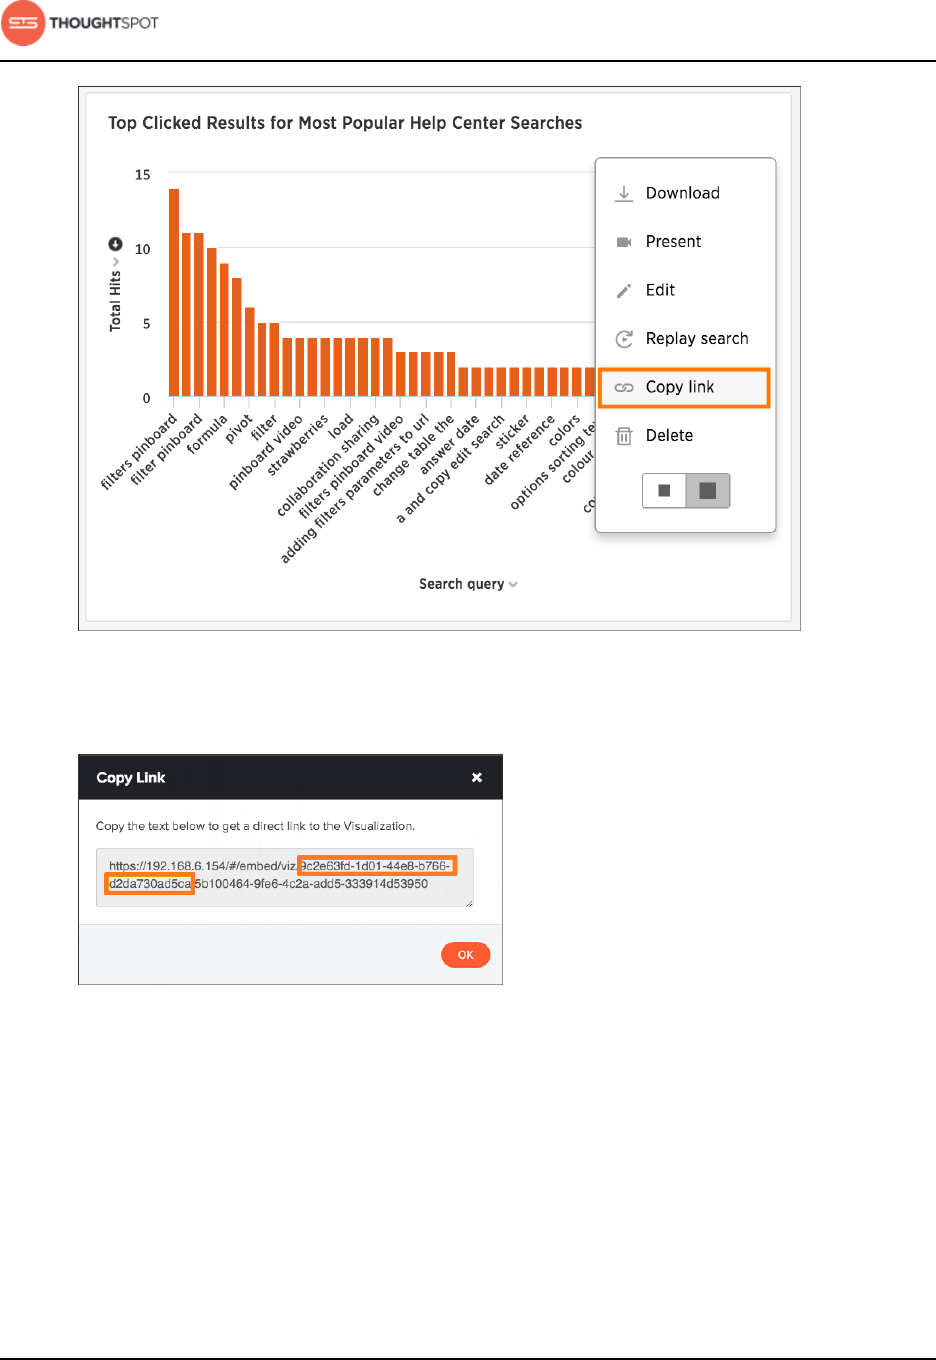
About pinboards
User Guide Copyright © 2016 by ThoughtSpot. All Rights Reserved. 131
Figure 150: Copy visualization link option
6. Copy the visualization link. The highlighted portion is the visualization ID.
Figure 151: Copy visualization link
Reset a visualization
Resetting a visualization removes any changes you've made to its form.
After performing ad hoc actions or edits to a visualization of your pinboard, you
can reset the visualization to its original form.
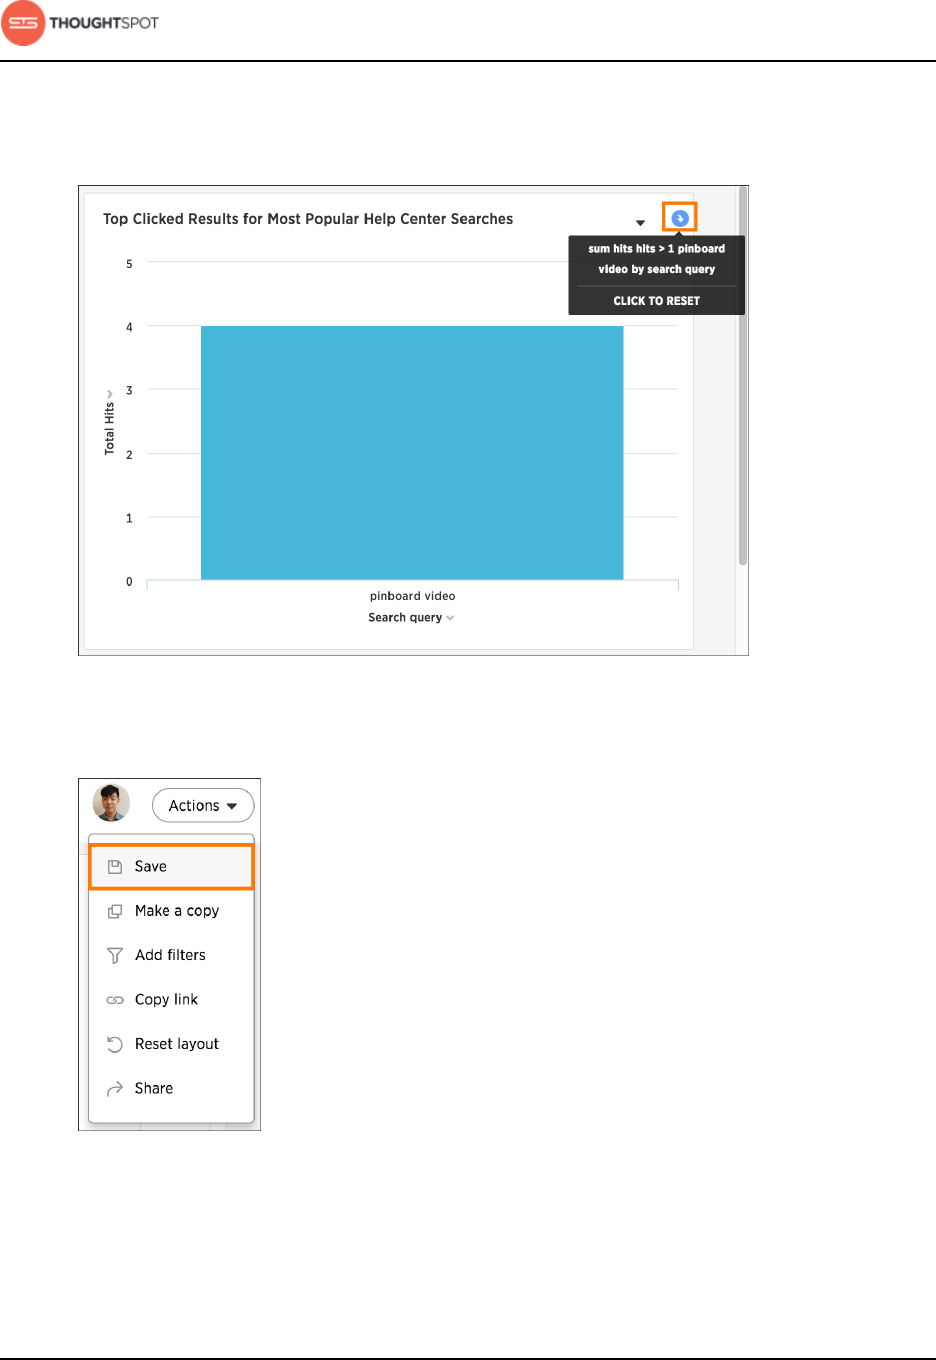
About pinboards
User Guide Copyright © 2016 by ThoughtSpot. All Rights Reserved. 132
To reset a visualization:
1. On an altered visualization, click the reset icon.
Figure 152: Save your pinboard
2. Save your pinboard by clicking Actions and Save.
Figure 153: Save your pinboard
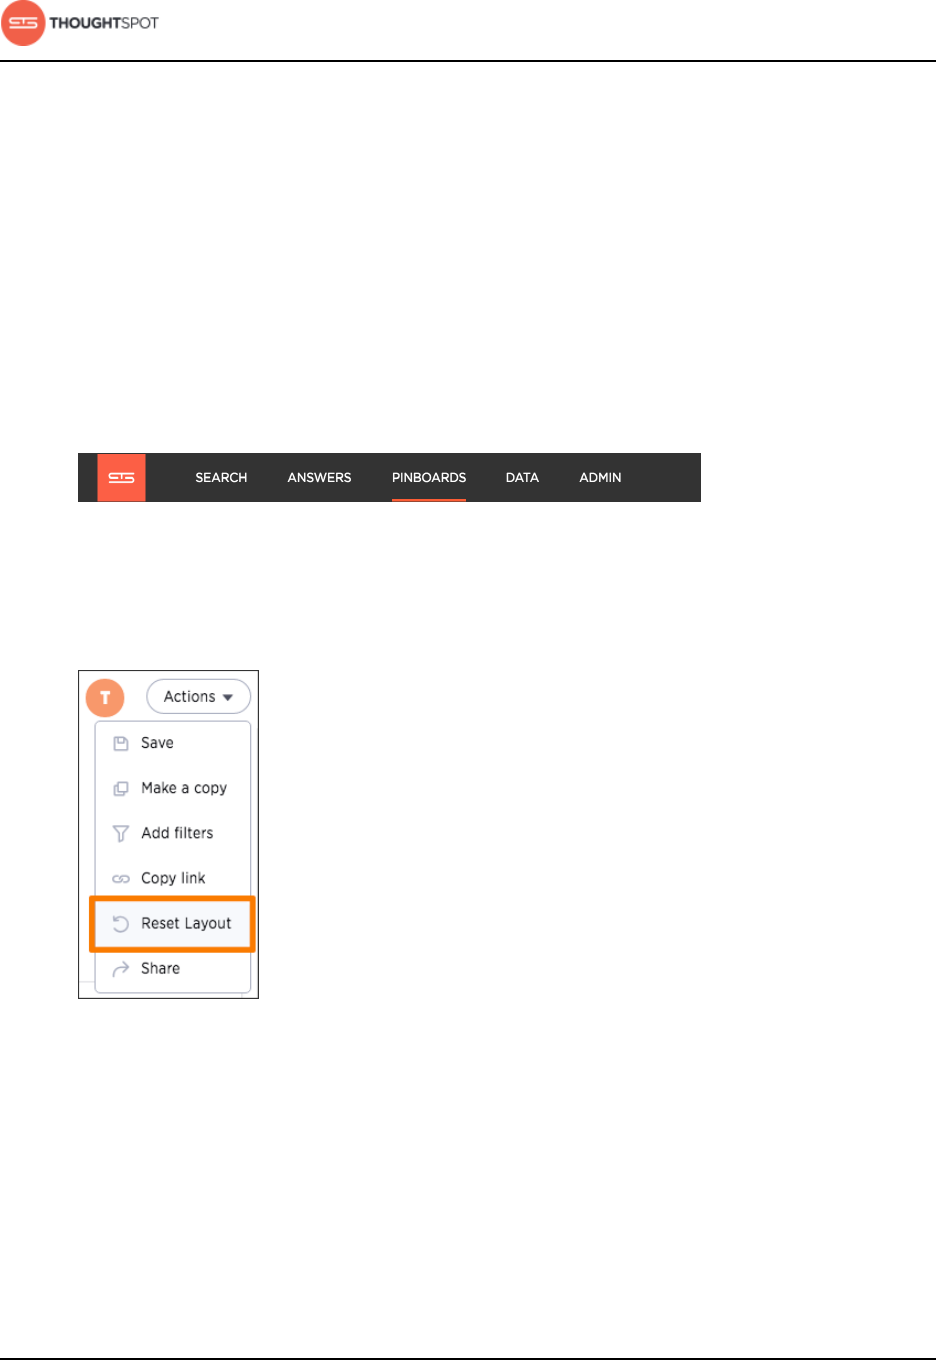
About pinboards
User Guide Copyright © 2016 by ThoughtSpot. All Rights Reserved. 133
Reset the layout of a pinboard
Reset the layout of a pinboard to undo your changes or have ThoughtSpot
create a layout for you.
You can reset the layout of your pinboard if you would like to undo your edits or
have ThoughtSpot optimize your layout space for you. This action will keep the
sizes of your visualizations, but not the order.
To reset the layout of a pinboard:
1. Click on Pinboards, on the top navigation bar.
Figure 154: Pinboards
2. On the pinboard list page, click the pinboard you would like to edit.
3. Click Actions and select Reset layout.
Figure 155: Reset your pinboard layout option
4. Save your pinboard by clicking Actions and Save.
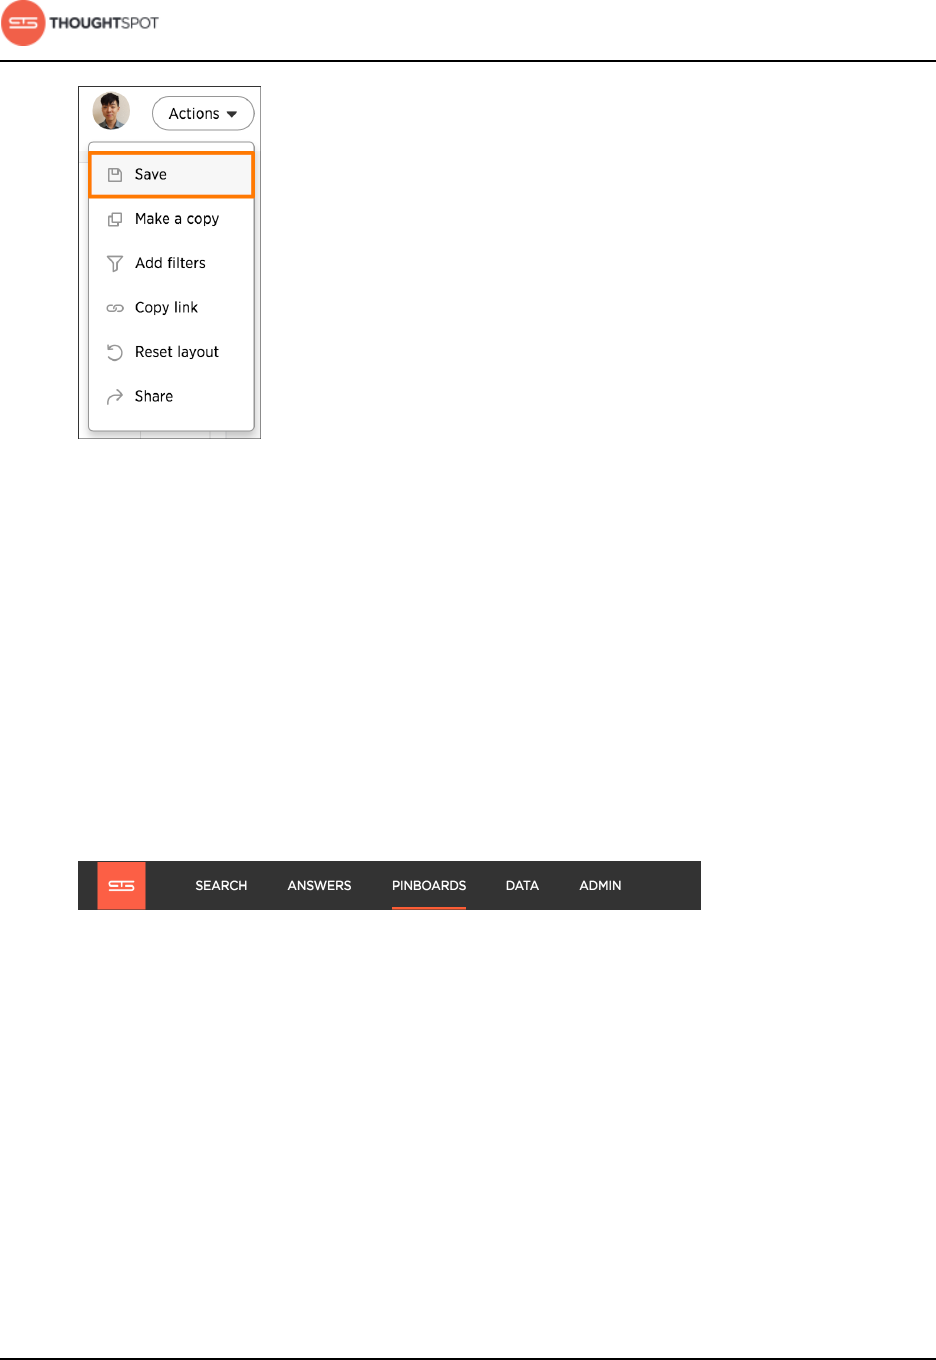
About pinboards
User Guide Copyright © 2016 by ThoughtSpot. All Rights Reserved. 134
Figure 156: Save your pinboard
Start a slideshow
Displaying your pinboard as a slideshow is a good way to present its contents to
others.
Presenting your pinboard displays your visualizations in order from left to right
and top to bottom.
To start a slideshow:
1. Click on Pinboards, on the top navigation bar.
Figure 157: Pinboards
2. On the pinboard list page, click the pinboard you would like to present.
3. Click Present under the dropdown menu of the visualization you would like to
start the slideshow with.
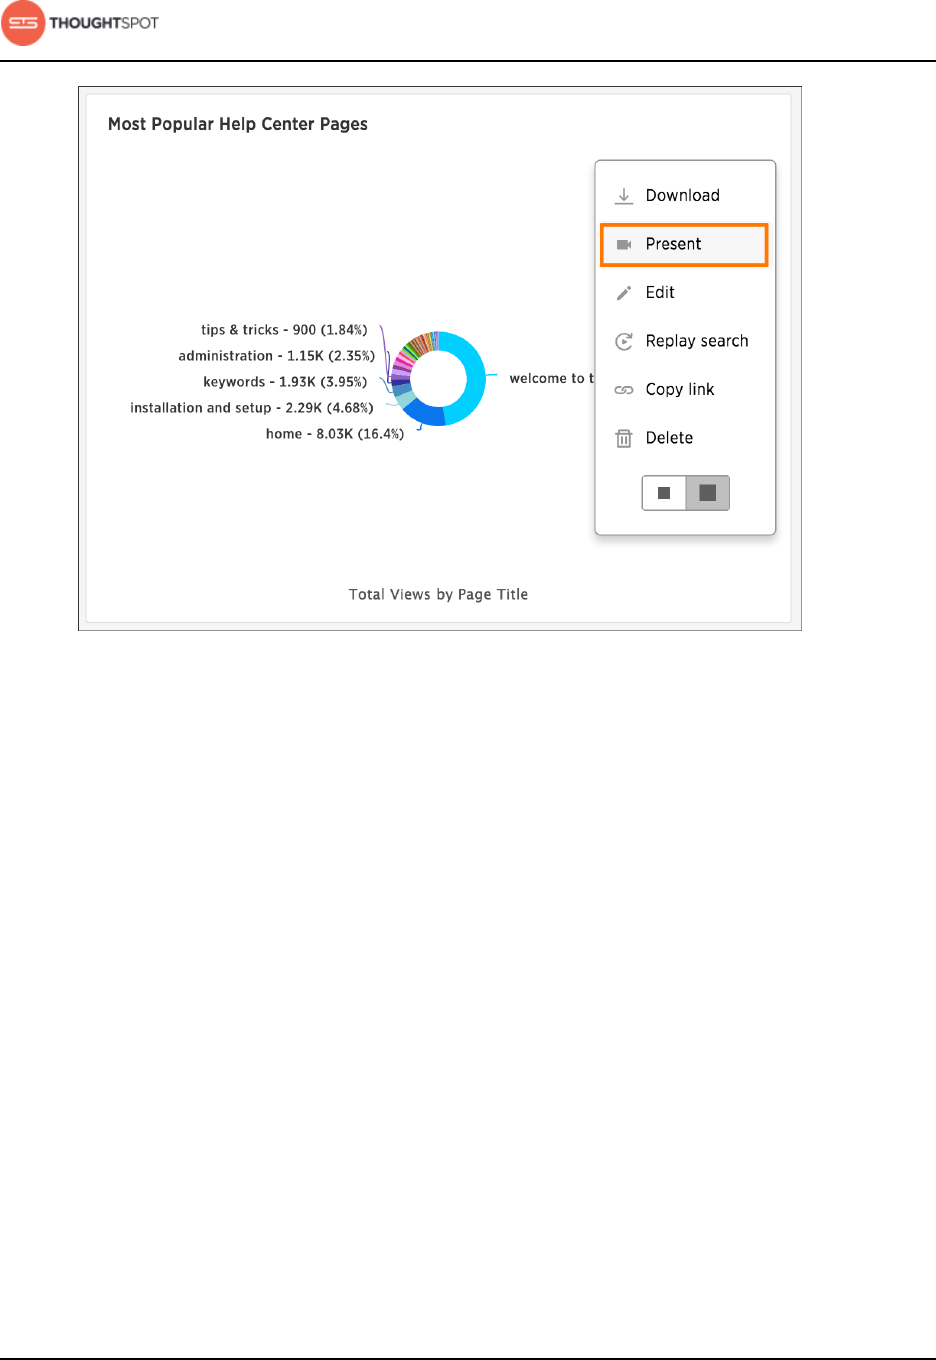
About pinboards
User Guide Copyright © 2016 by ThoughtSpot. All Rights Reserved. 135
Figure 158: Present a visualization
4. Use the left and right arrow keys to navigate between your pinboard's
visualizations.
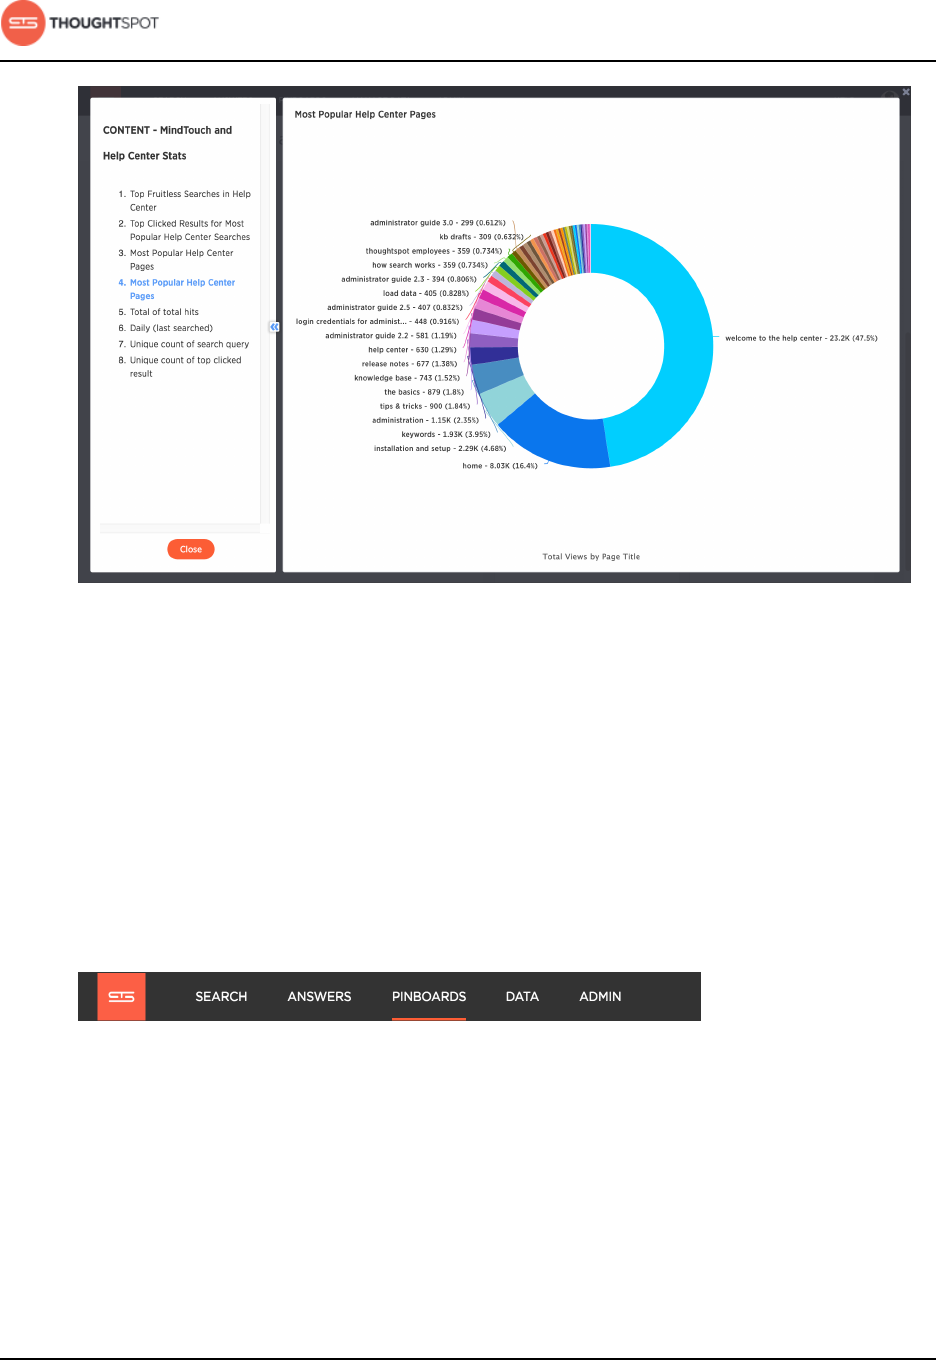
About pinboards
User Guide Copyright © 2016 by ThoughtSpot. All Rights Reserved. 136
Figure 159: Pinboard slideshow view
Click the x at the top right of the screen or push the Esc key to exit the
slideshow view.
Delete a visualization
You can remove a visualization from your pinboard.
To delete a visualization:
1. Click on Pinboards, on the top navigation bar.
Figure 160: Pinboards
2. On the pinboard list page, click the pinboard you would like to edit.
3. Click Delete under the dropdown menu of the visualization you would like to
delete.
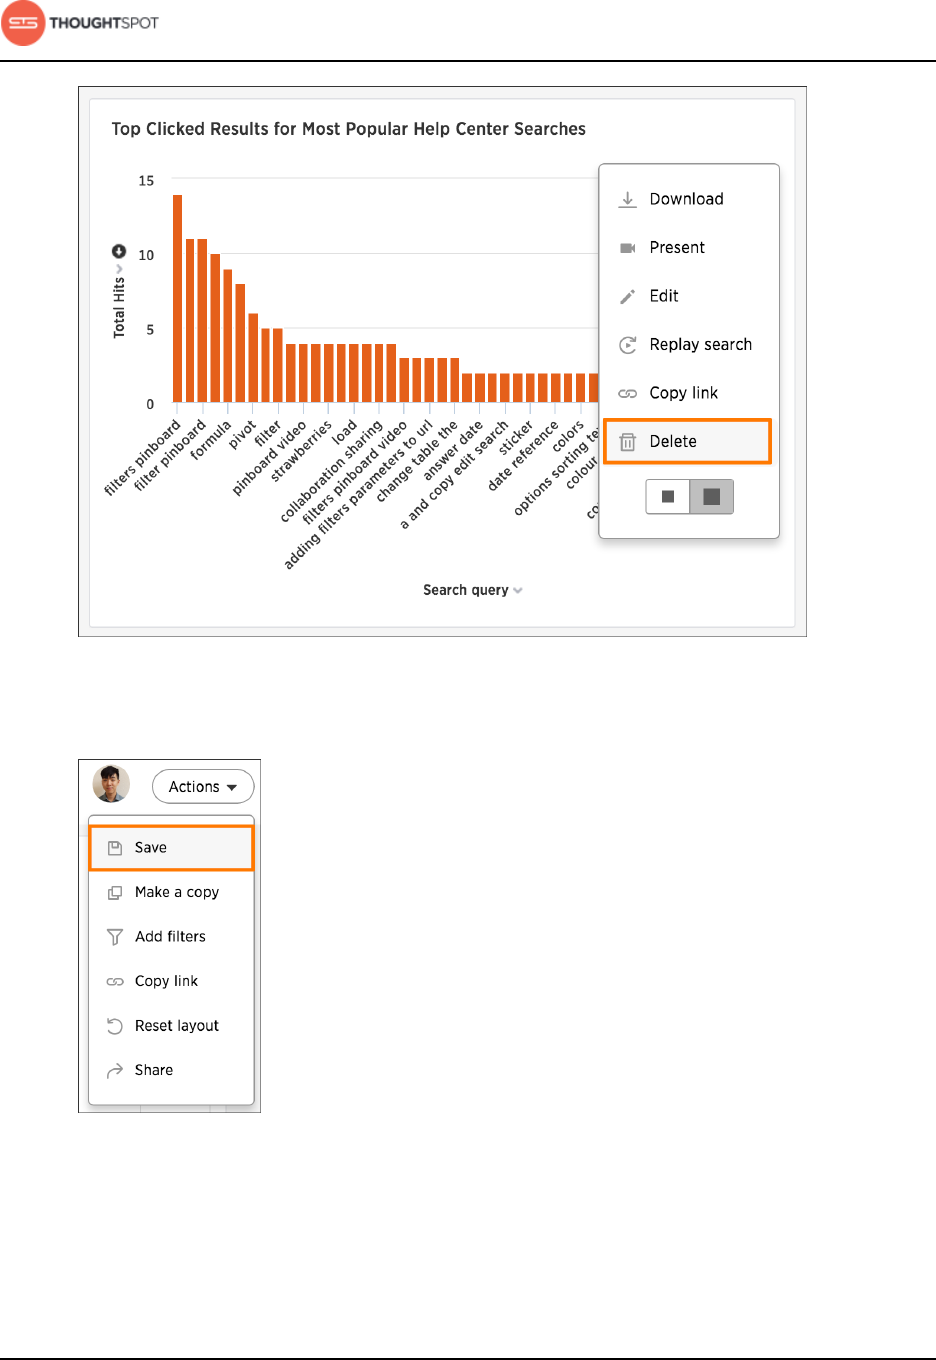
About pinboards
User Guide Copyright © 2016 by ThoughtSpot. All Rights Reserved. 137
Figure 161: Delete a visualization
4. Save your pinboard by clicking Actions and Save.
Figure 162: Save your pinboard
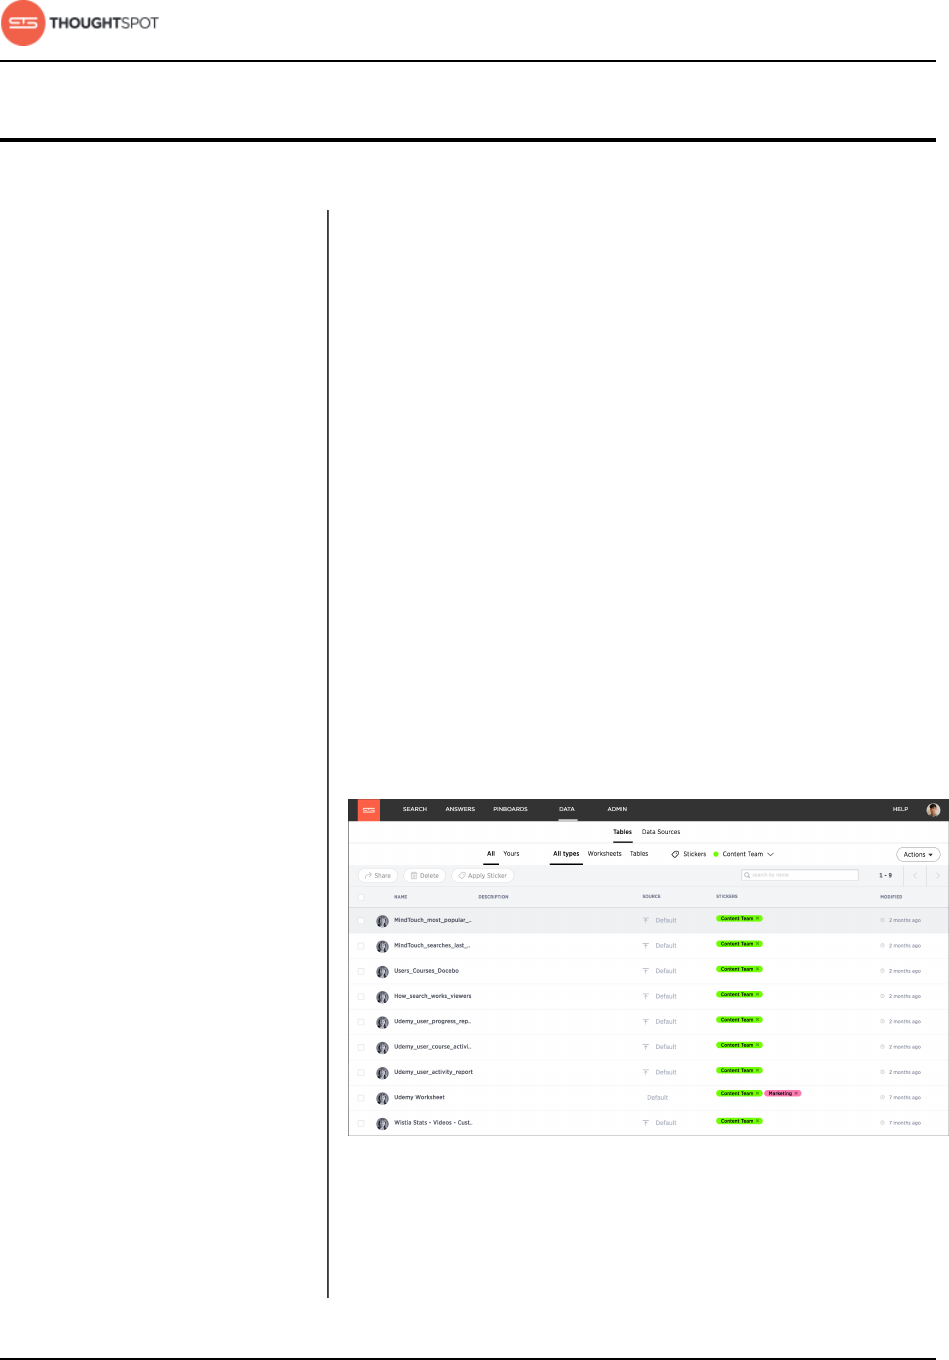
Working with data
User Guide Copyright © 2016 by ThoughtSpot. All Rights Reserved. 138
Chapter 5: Working with data
Working with data
Topics:
•Generate CSV files with
the data to be loaded
•Load data from a web
browser
•Append data from a web
browser
•About sharing
The Data tab takes you to a list page of all of the
tables and data sources available to you.
Use the filters at the top of the page to find the
data you are interested in. Clicking on the name of
one of a table or data source shows you detailed
information about it. You won't be able to change
these settings or edit the table unless it was shared
with you with the Edit privilege. To see how to edit a
data source, refer to the ThoughtSpot Administrator
Guide.
From the Data screen, you can also delete or apply
stickers to tables and data sources in bulk by
selecting them and clicking the appropriate action
button.
Figure 163: Data page
There are three types of data sources that you may
see in the data list. They are tables, worksheets, and
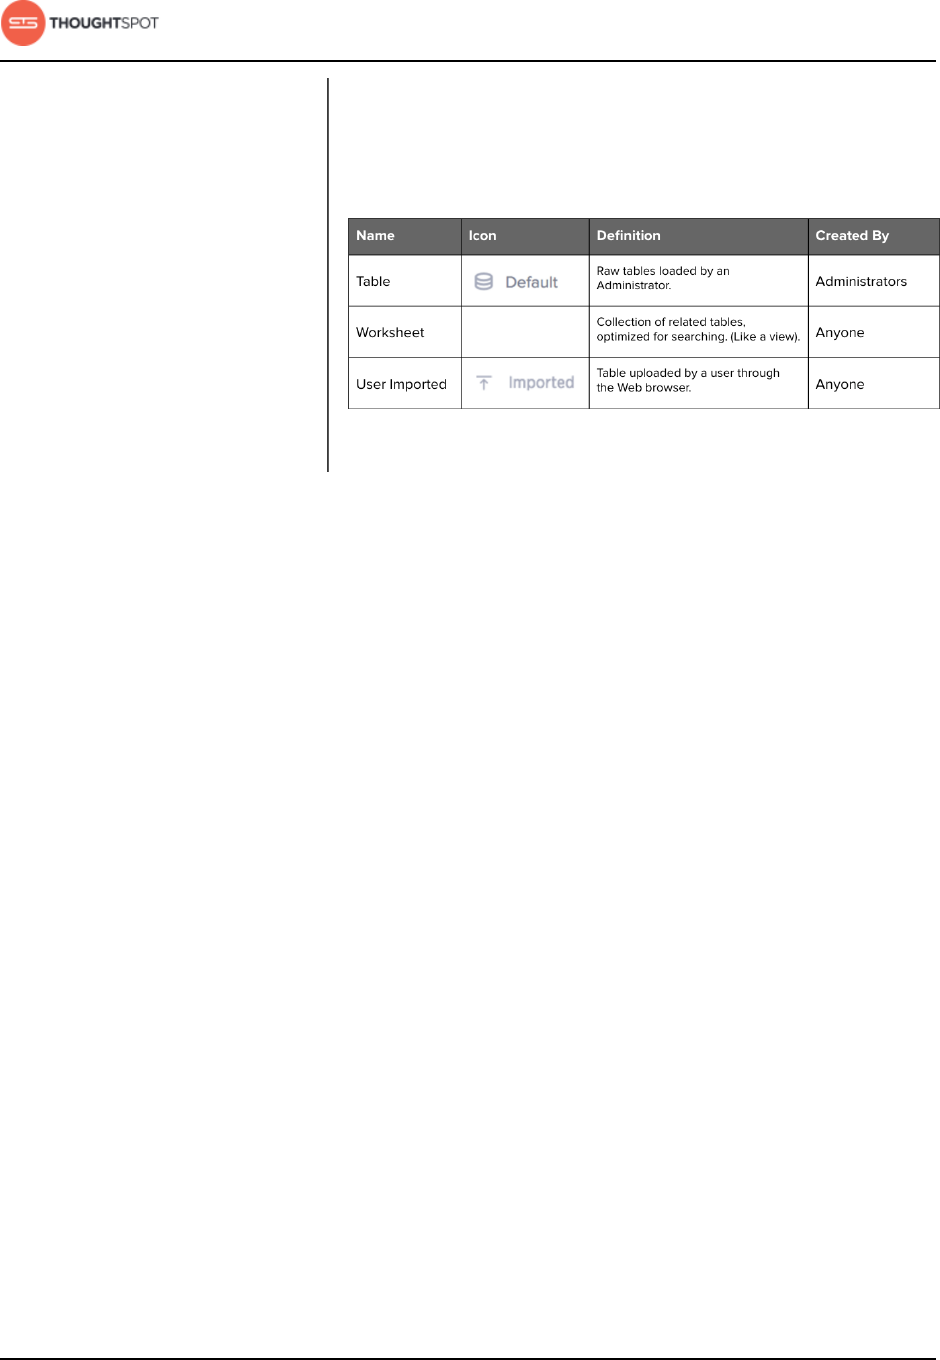
Working with data
User Guide Copyright © 2016 by ThoughtSpot. All Rights Reserved. 139
user uploaded data. You will most likely only see
worksheets and user uploaded sources. These are the
most commonly used data sources for searching.
Figure 164: Types of Data Sources

Working with data
User Guide Copyright © 2016 by ThoughtSpot. All Rights Reserved. 140
Generate CSV files with the data to be loaded
The first step in loading data is to obtain or create one or more flat files that
contain the data to be loaded into ThoughtSpot.
Your data should be in a CSV (comma separated values) or delimited flat file
before you load it. A CSV file is a text file made up of data fields separated by
a delimiter and optionally enclosed with an enclosing character. If your data
contains multiple tables, you'll have a separate CSV for each table.
A CSV file contains:
• A delimiter that marks the separation between fields in the data. The delimiter
is usually comma, but it can be any character.
• Fields optionally enclosed with double quotes.
Use these guidelines when creating the CSV file:
• Columns in the CSV file must be in the same order as defined in the target
table.
• If the CSV contains column headers, they must match the column names in
the database exactly.
• Often a | (pipe) or tab is used as the delimiter, because it may be less likely to
occur within the data values.
• When a field contains a double quote, it must be escaped with the character
specified in the escape character argument in tsload.
• When a field contains the delimiter, the field must be enclosed in double
quotes.
For more information about CSV files and the rules for creating them, check
http://en.wikipedia.org/wiki/Comma-separated_values.
1. If your source is another database:
a) Connect to the source database.

Working with data
User Guide Copyright © 2016 by ThoughtSpot. All Rights Reserved. 141
b) Export each of the tables you wish to import into ThoughtSpot as a CSV
file, specifying a delimiter of comma, | (pipe) or tab.
2. If your source is an Excel spreadsheet, save it as a CSV file.
Load data from a web browser
The simplest way to load data is to upload a CSV or Excel file from the
ThoughtSpot Web interface. This method is recommended for small, one time
data loads. Using this method, the data schema is created for you automatically.
Loading data from a Web browser requires your data to be in a CSV (comma
separated values) or a native Excel file.
Any user who belongs to a group that has the privilege Has administration
privileges or Can upload user data will be able to upload their own data from
the browser.
CSV is a common format for transferring data between databases. Your ETL
(extract, transform, load) process will typically generate CSV files. You can also
create a CSV file from a Microsoft Excel spreadsheet by opening the spreadsheet
in Excel, choosing Save As and selecting CSV.
ThoughtSpot supports a wide range of date and timestamp formats in the CSV
file.
Loading data through the Web browser is recommended for smaller tables
(under 50MB) with simple relationships between them. If you are loading a fact
table that joins to dimension tables, you must load the fact table first, and then
the dimension tables. The joining key must be a single column of unique values in
the dimension table. NULL values in the fact table will not be able to be joined.
Blank values in user uploaded CSV files are interpreted as NULL values. These
include the values (case insensitive):
• NULL
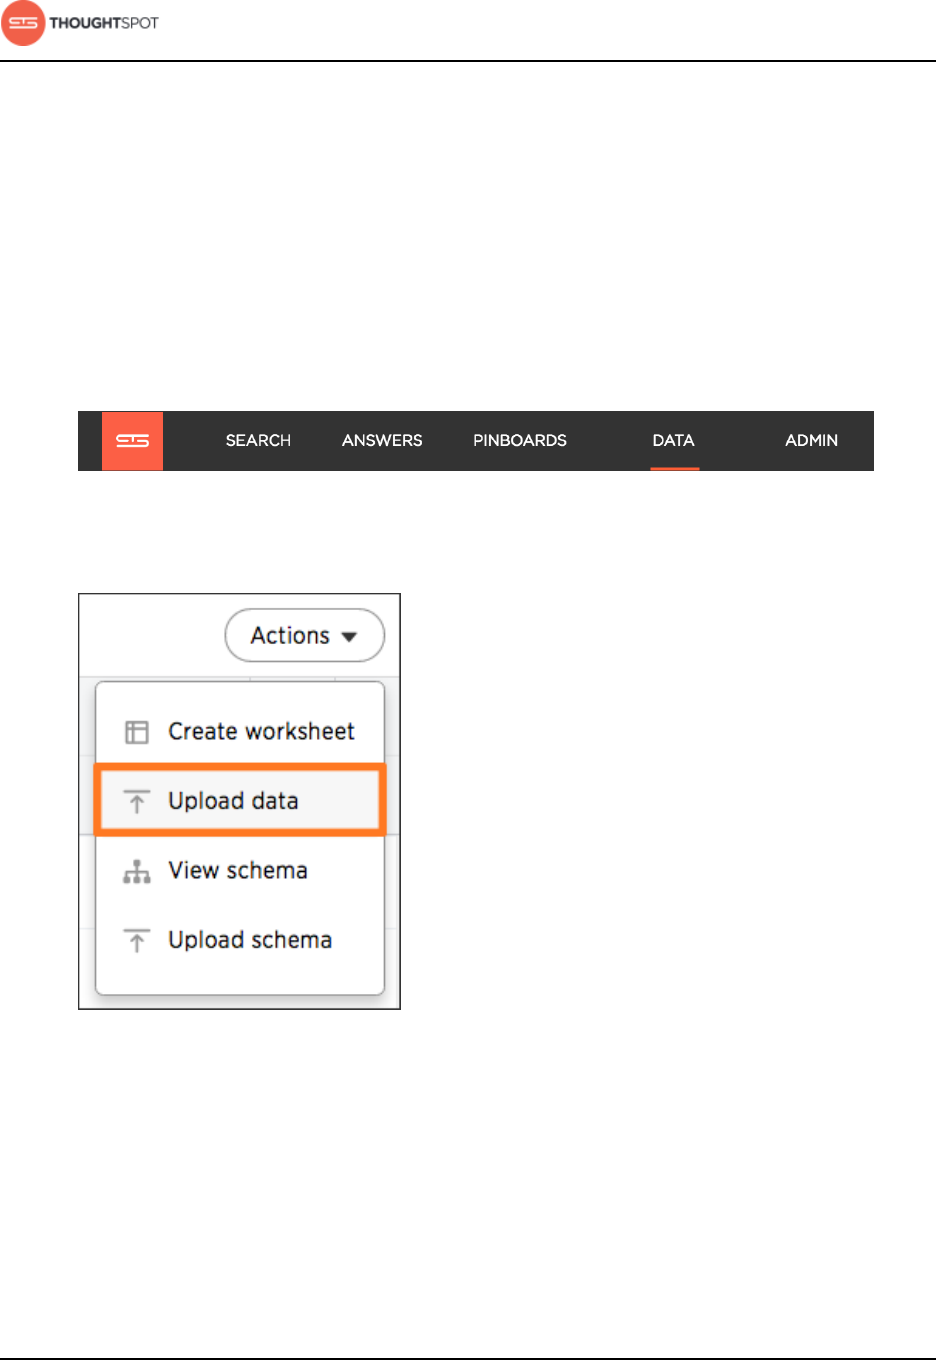
Working with data
User Guide Copyright © 2016 by ThoughtSpot. All Rights Reserved. 142
• \N
• NA
• N/A
• [space]
To load the CSV or Excel file into ThoughtSpot:
1. Log in to ThoughtSpot from a browser.
2. Click on Data, on the top navigation bar.
Figure 165: Data
3. Click the Actions button in the upper right corner, and select Upload Data.
Figure 166: Upload data
4. Upload the CSV or Excel file by doing one of these options:
• Click on Browse your files and select the file.
• Drag and drop the file into the drop area.

Working with data
User Guide Copyright © 2016 by ThoughtSpot. All Rights Reserved. 143
5. Answer the question Are the column names already defined in the file
header?
6. Answer the question Are the fields separated by? Click Next.
7. Click on the column header names to change them to more useful names, if
you'd like. Click Next.
8. Review the automatically generated data types for each column, and make
any changes you want. There are four data types: Text, Integer, Decimal, and
Date.
9. Click Import.
10.Click Link to Existing Data if you want to link the data you uploaded to the
data in another table or worksheet. Or click Search if you want to begin a new
search.
Append data from a web browser
You can append data to your existing system tables through the ThoughtSpot
application, even if the tables were initially loaded using Data Connect or tsload.
Loading data from a Web browser requires your data to be in a CSV (comma
separated values) or a native Excel file. The file must have the same structure as
the table it is being loaded into, including number and type of columns, in the
same order as the target table.
Any user who belongs to a group that has the privilege Has administration
privileges or Can upload user data will be able to upload their own data from
the browser.
CSV is a common format for transferring data between databases. Your ETL
(extract, transform, load) process will typically generate CSV files. You can also
create a CSV file from a Microsoft Excel spreadsheet by opening the spreadsheet
in Excel, choosing Save As and selecting CSV.
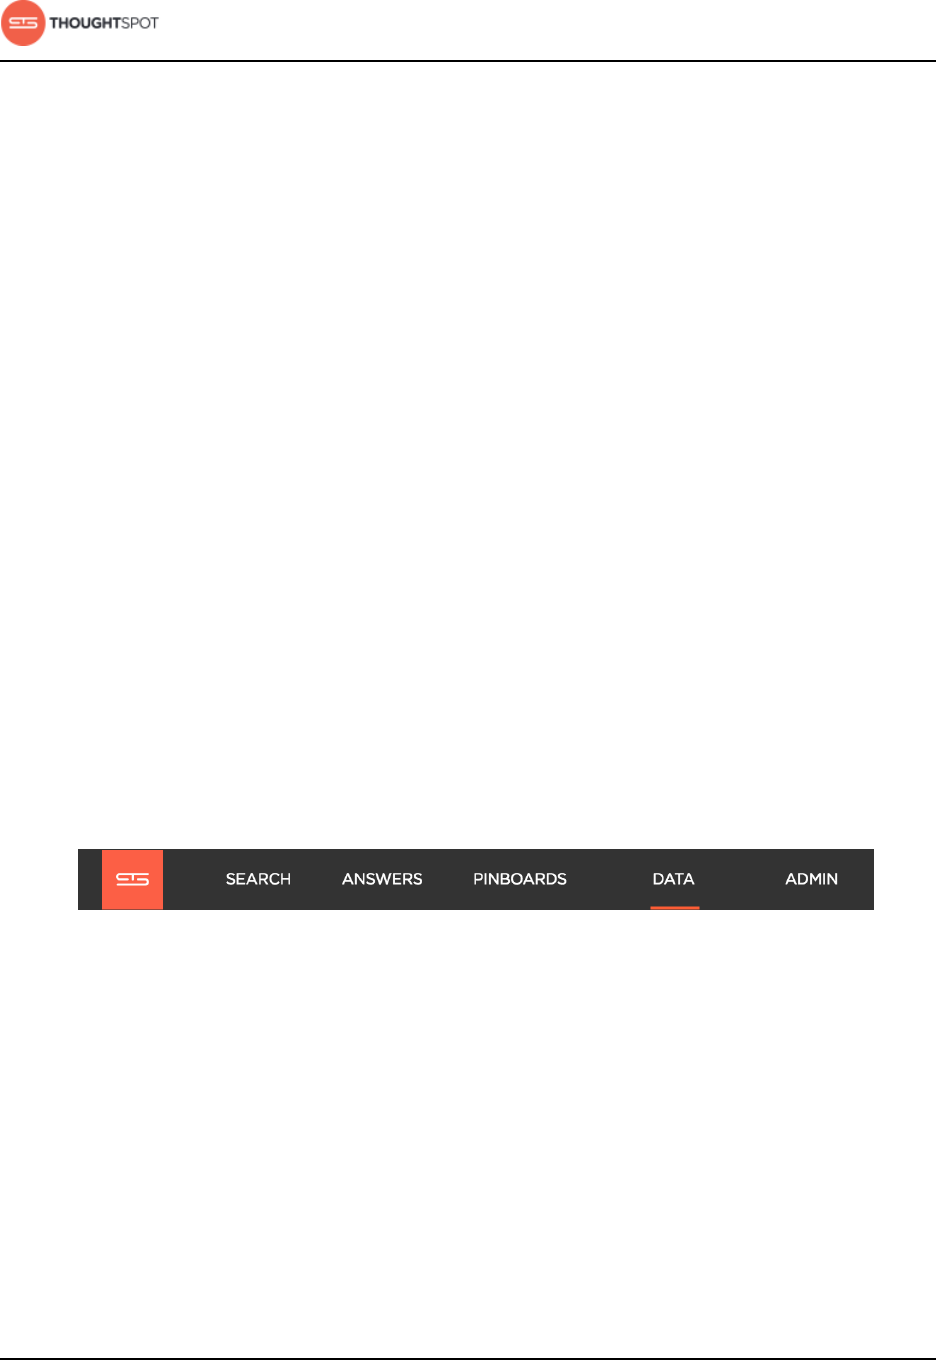
Working with data
User Guide Copyright © 2016 by ThoughtSpot. All Rights Reserved. 144
ThoughtSpot supports a wide range of date and timestamp formats in the CSV
file.
Loading data through the Web browser is recommended for smaller tables
(under 50MB) with simple relationships between them. If you are loading a fact
table that joins to dimension tables, you must load the fact table first, and then
the dimension tables. The joining key must be a single column of unique values in
the dimension table. NULL values in the fact table will not be able to be joined.
Blank values in user uploaded CSV files are interpreted as NULL values. These
include the values (case insensitive):
• NULL
• \N
• NA
• N/A
• [space]
To append data into ThoughtSpot:
1. Log in to ThoughtSpot from a browser.
2. Click on Data, on the top navigation bar.
Figure 167: Data
3. Click the on the table you would like to append data to.
4. Click the Load data button.
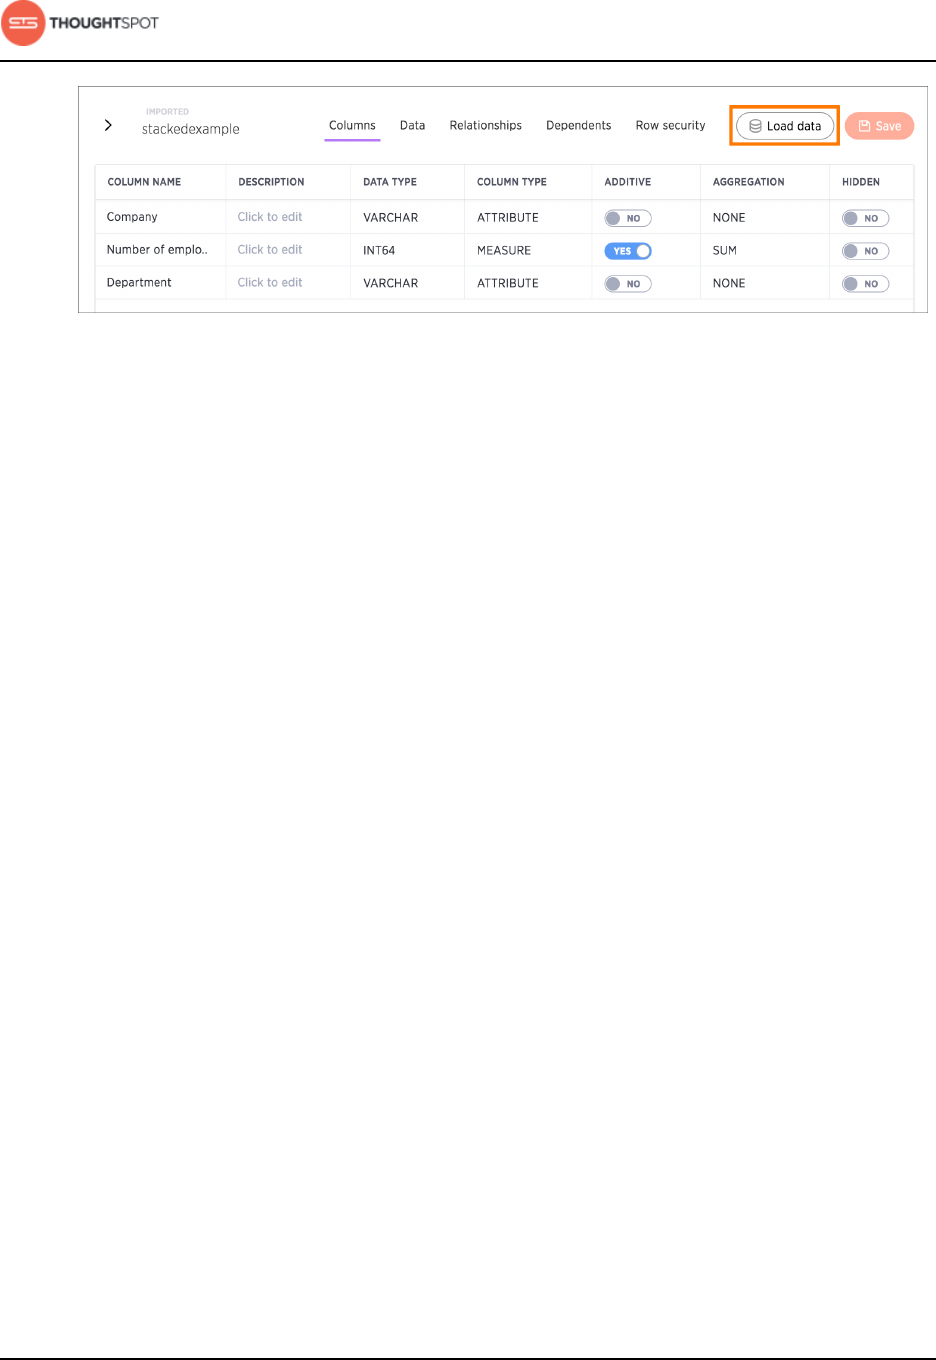
Working with data
User Guide Copyright © 2016 by ThoughtSpot. All Rights Reserved. 145
Figure 168: Load data
5. Upload the CSV or Excel file by doing one of these options:
• Click on Browse your files and select the file.
• Drag and drop the file into the drop area.
6. Answer the question Are the column names already defined in the file
header?
7. Answer the question Do you want to append to the existing data or
overwrite it?
8. Answer the question Are the fields separated by? Click Next.
9. Click on the column header names to change them to more useful names, if
you'd like. Click Next.
10.Review the automatically generated data types for each column, and make
any changes you want. There are four data types: Text, Integer, Decimal, and
Date.
11. Click Import.
12.Click Link to Existing Data if you want to link the data you uploaded to the
data in another table or worksheet. Or click Search if you want to begin a new
search.
Working with data
User Guide Copyright © 2016 by ThoughtSpot. All Rights Reserved. 146
About sharing
Whenever you are working in ThoughtSpot, you are in your own private
environment until you share your work with others. This applies to searches,
pinboards, and any data you upload.
Objects you can share
This is a list of objects a regular, non-administrator user can share. Administrators
have more granular control over data security.
You can share with groups and with individual people. You can share several
different types of objects:
Table 9: What you can share
Object type Description Default security model Sharing
procedure
Uploaded data Data that was
uploaded using a
Web browser.
Only the user who uploaded the data (and
any user with administrator privileges)
has access to it by default. They can share
a table (or selected columns) with other
people or groups.
Share
uploaded
data
Pinboards A pinboard of saved
search results.
Anyone who can view a pinboard can
share it.
Share a
pinboard
Answers The result of a single
search.
Anyone who can view an answer can share
it.
Share
answers
Share a pinboard
You do not have to be an administrator or the owner to share saved pinboards.
Any user can share them, based on the access levels the user has.
Whenever you view a pinboard you have the option of sharing it with others.
What you are really sharing is a live link to the pinboard, when you click Share
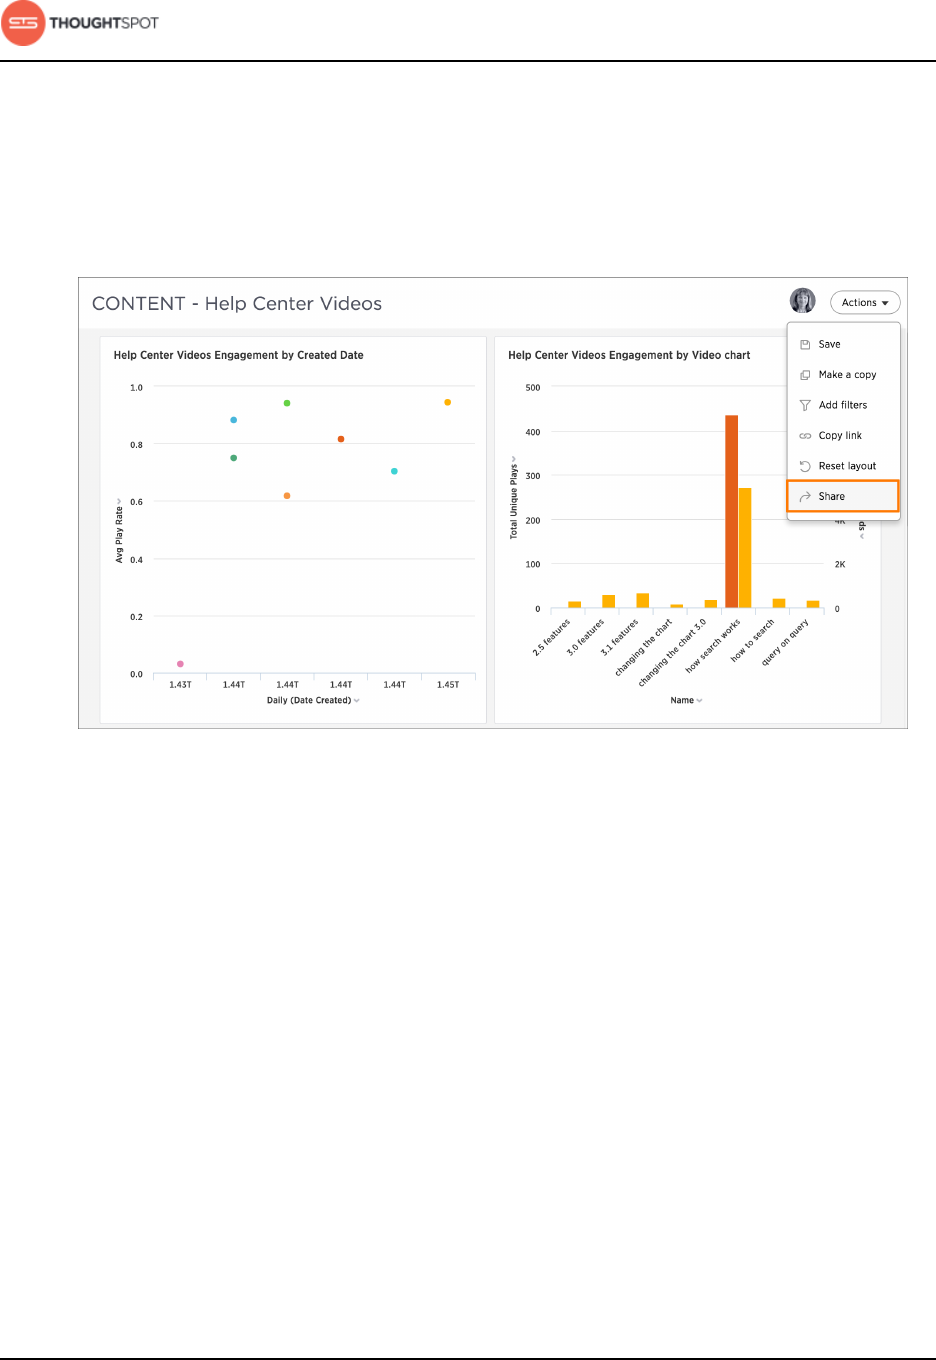
Working with data
User Guide Copyright © 2016 by ThoughtSpot. All Rights Reserved. 147
with.... So whenever someone else views it, they will see the most recently saved
version with the most recent data.
1. Configure the pinboard to look as you'll want it to appear when shared.
2. Click the Share icon.
Figure 169: Share with option
3. Click + Add users or groups and select users or groups that you want to share
with.
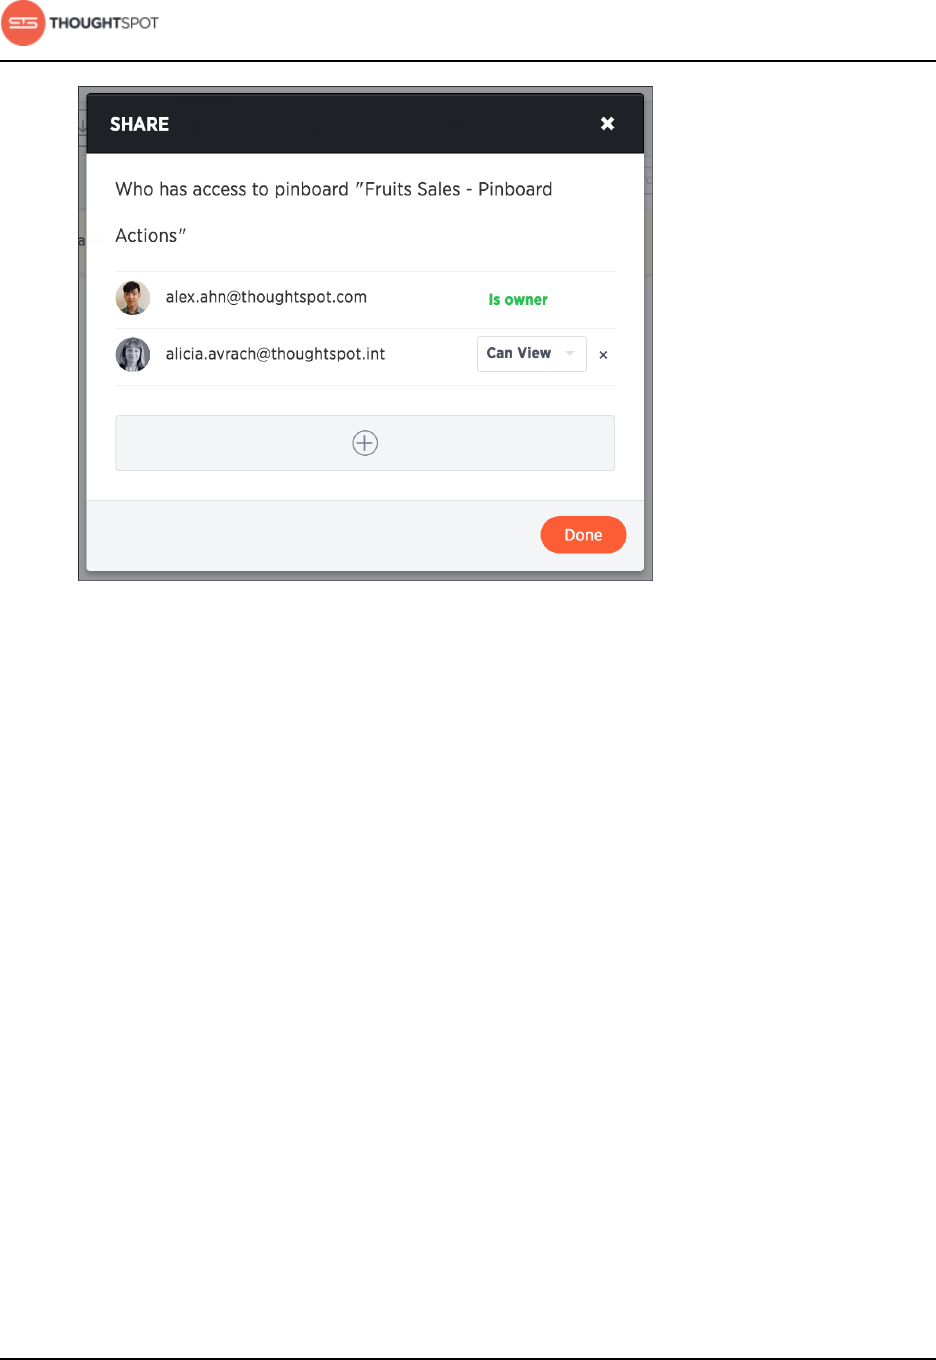
Working with data
User Guide Copyright © 2016 by ThoughtSpot. All Rights Reserved. 148
Figure 170: Configure sharing settings
4. Configure the level of access by selecting from the dropdown list. You will
only see options available, based on your own access level. For example, if you
have only View access, you cannot share as Edit. You can select:
•Can View to provide read-only access. If the person doesn't have access to
the underlying data, they can only view a shared pinboard. If they change
anything on the pinboard, their changes are not saved. In order to persist
the changes, the user would need to make a copy of the modified pinboard.
•Can Edit to allow modification. Enables renaming or deleting the shared
pinboard. If a person with edit privileges modifies a shared pinboard, their
changes will be saved to it.
5. Click Add and Save.
6. Click Add Permissions.
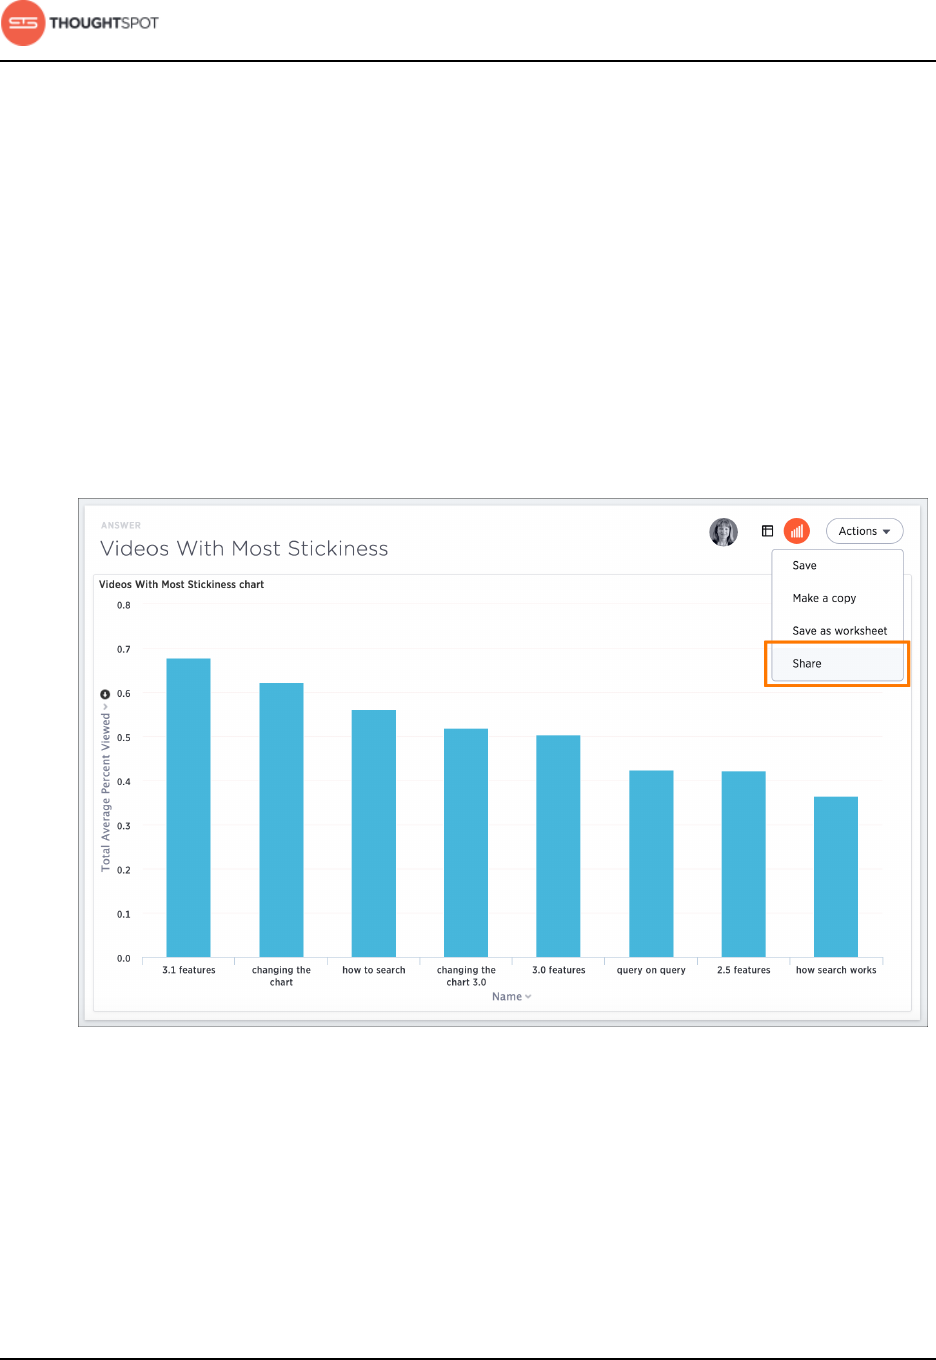
Working with data
User Guide Copyright © 2016 by ThoughtSpot. All Rights Reserved. 149
Share answers
You do not have to be an administrator or the owner, to share saved answers.
Any user can share them, based on the access levels the user has.
Whenever you view an answer, you have the option of sharing it with others.
It will be shared in its current state, so if you have modified the answer by
interacting with the table or chart, the modified version is what will be shared.
1. Configure the answer to look as you'll want it to appear when shared.
2. Save the answer by clicking Actions and Save.
3. Click Actions and then Share.
Figure 171: Share an answer
4. Click + Add users or groups and select users or groups that you want to share
with.

Working with data
User Guide Copyright © 2016 by ThoughtSpot. All Rights Reserved. 150
Figure 172: Configure answer sharing settings
5. Configure the level of access by selecting from the dropdown list. You can
select:
•Can View to provide read-only access. If the user doesn't have access to the
underlying worksheet, they can only view the shared answer.
•Can Edit to allow modification. Enables renaming or deleting the shared
answer. If a user with edit privileges modifies a shared answer, their
changes will be saved to it.
6. Click Add and Save.
7. Click Done.
Share uploaded data
If you upload a spreadsheet, you can share Can View or Can Edit privileges with
other people, who can further share them with others.
Data that you uploaded from a Web browser is only visible to you and to the
administrator. You can share the entire uploaded table, or only some of its
columns.
Share uploaded data by following these steps:
1. Click on Data, on the top navigation bar.
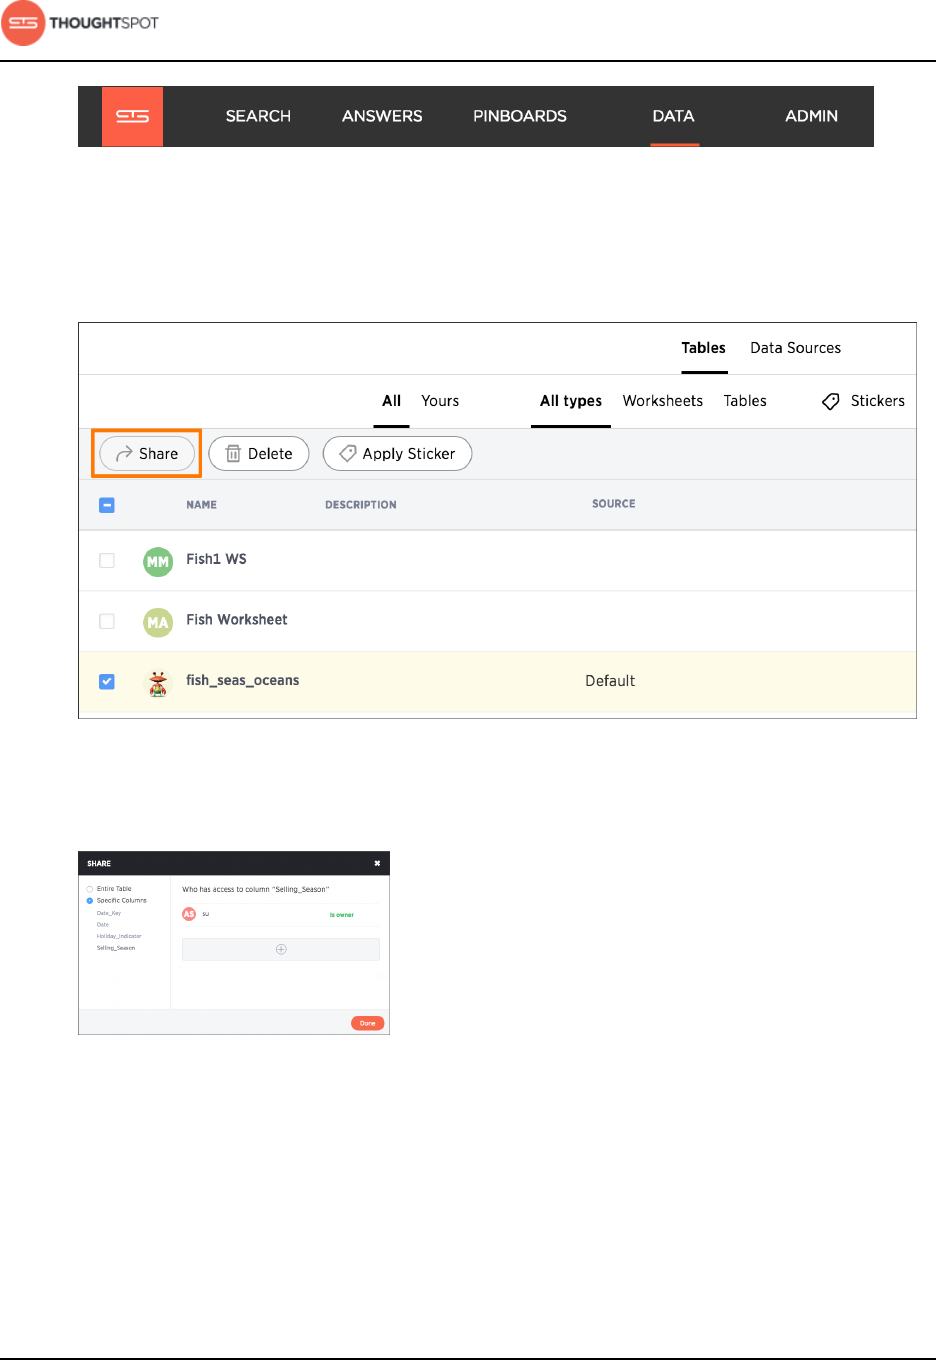
Working with data
User Guide Copyright © 2016 by ThoughtSpot. All Rights Reserved. 151
Figure 173: Data
2. Click on the name of the uploaded data you want to share.
3. Click the Share icon.
Figure 174: Select tables to share
4. Select Entire Table or Specific Columns.
Figure 175: Configure table sharing settings
5. If you selected Specific Columns, select the column(s) to share.
6. Click + Add users or groups and select the users and groups that you want to
share with.
Figure 176: Select people to share with
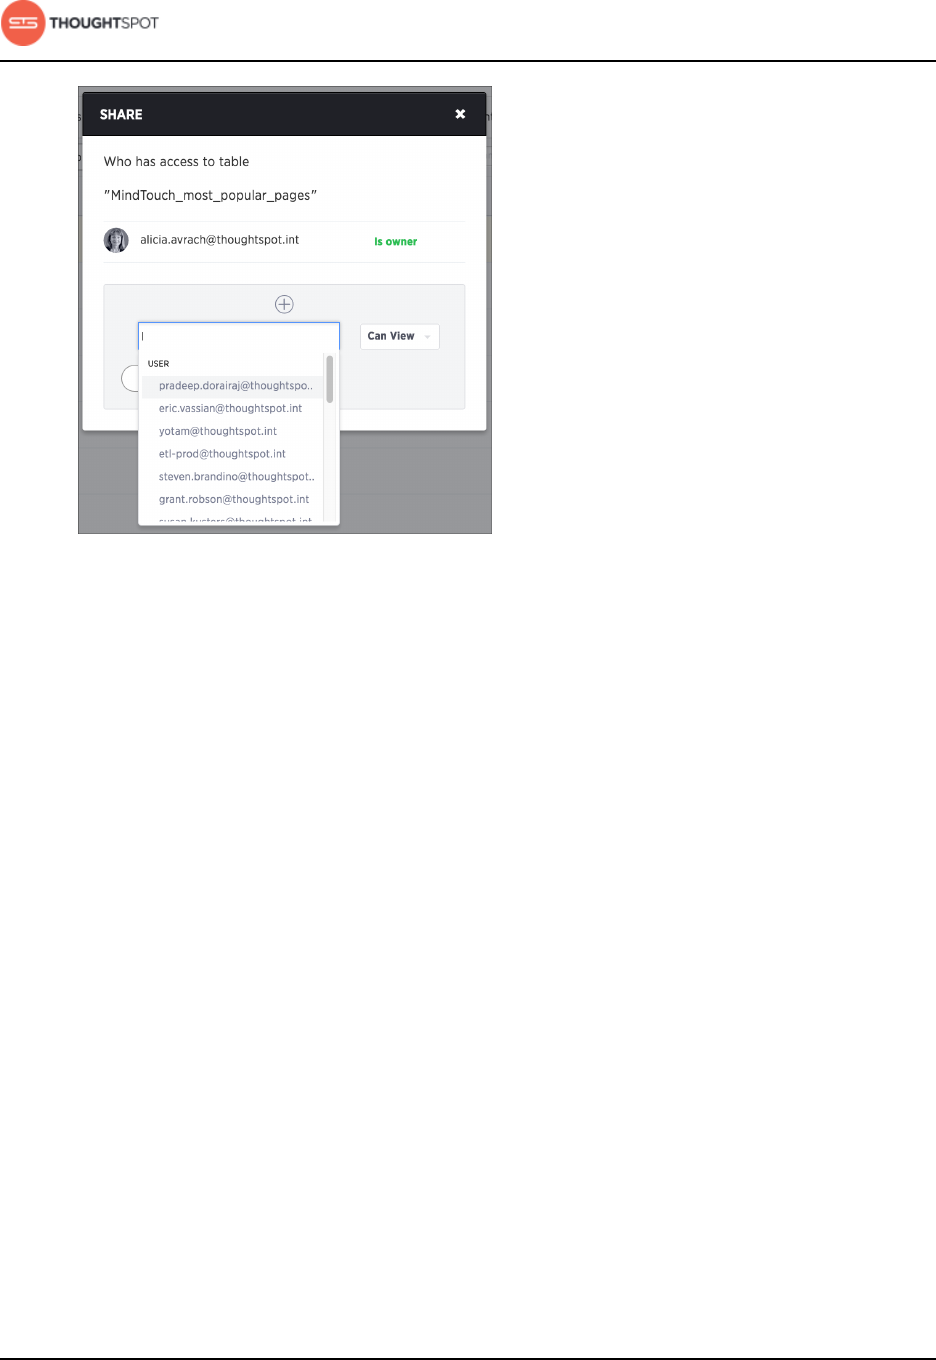
Working with data
User Guide Copyright © 2016 by ThoughtSpot. All Rights Reserved. 152
7. Configure the level of access by selecting from the dropdown list. You can
select:
•Can View to provide read-only access. This enables viewing the table data
and defining worksheets on the table.
•Can Edit to allow modification. This enables renaming, modifying, or
deleting the entire table and adding or removing its columns.
8. Click Add and Save.
9. Click Done.
Revoke access (unshare)
You may need to revoke access to an object (table, worksheet, or pinboard) that
you have previously shared. Unsharing an object is very similar to sharing it.
To unshare one or more objects:
1. Go to the area where the object(s) you want to unshare is located. From the
top menu bar:
• If the object is a table or worksheet, click Data.
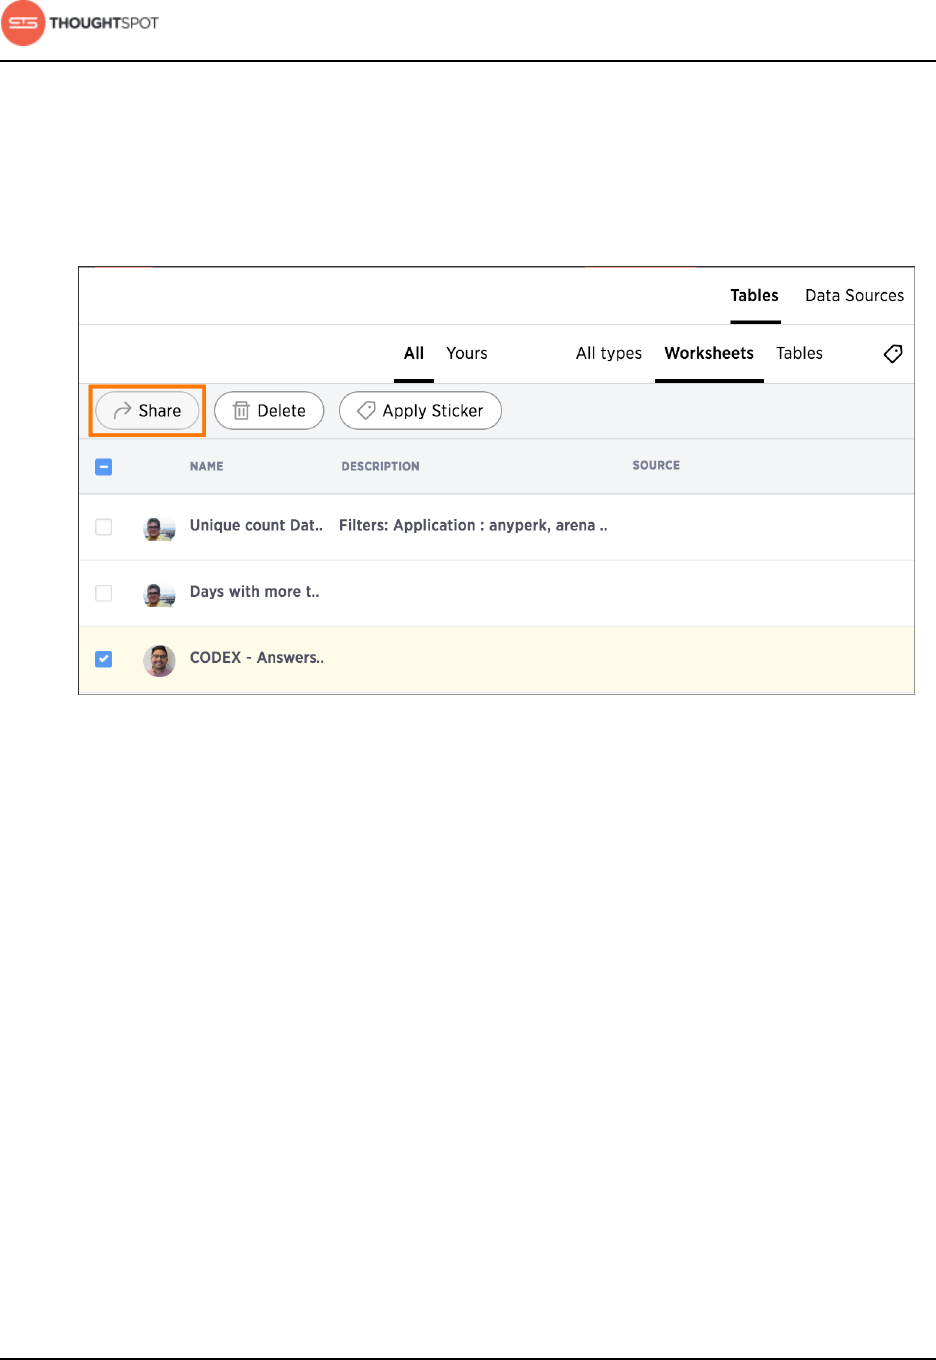
Working with data
User Guide Copyright © 2016 by ThoughtSpot. All Rights Reserved. 153
• If the object is a pinboard, click Pinboards.
• If the object is an answer, click Answers.
2. Find the object(s) in the list, and check the corresponding box(es).
3. Click the Share icon.
Figure 177: The Share icon
4. Click the X next to the users and groups that you want to remove from
sharing.
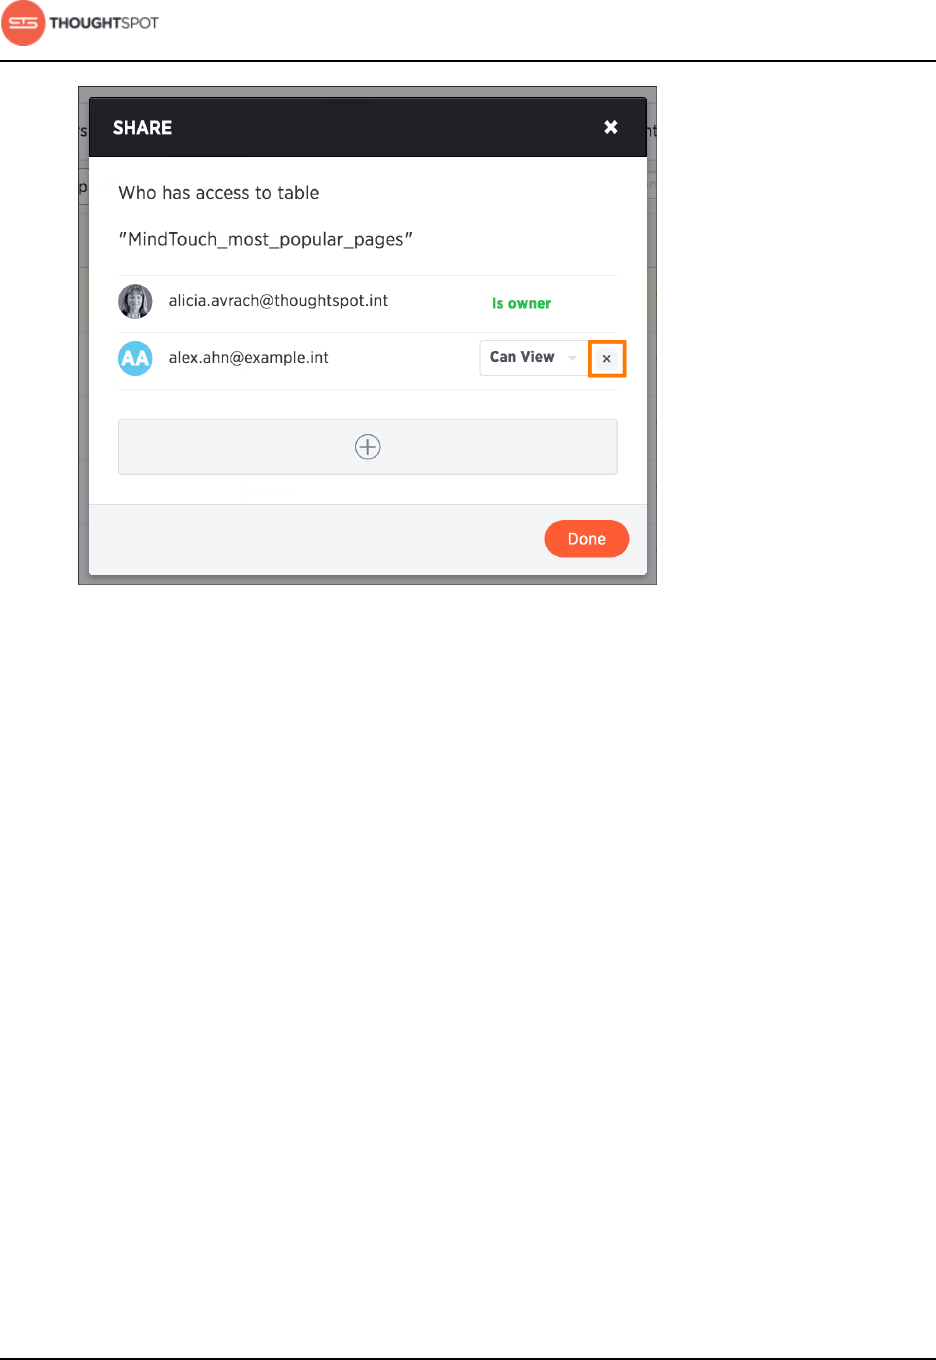
Working with data
User Guide Copyright © 2016 by ThoughtSpot. All Rights Reserved. 154
Figure 178: Click the X to unshare
5. Click Done.

User Guide Copyright © 2016 by ThoughtSpot. All Rights Reserved. 155
Chapter 6: About the Help Center
About the Help Center
Topics:
•What you can find in the
Help Center
The online Help Center serves as your first line of
support for when you run into any questions while
using ThoughtSpot.
The Help Center can be accessed by clicking on Help
on the top navigation bar. This opens a simple dialog
box with links to How to search, Keywords, Release
notes, Documentation, and Downloads. Click one of
them to open a new tab containing your selected
topic.

About the Help Center
User Guide Copyright © 2016 by ThoughtSpot. All Rights Reserved. 156
What you can find in the Help Center
The Help Center provides links to different resources that were created to help
you use ThoughtSpot.
The Help Center provides the following resources:
•A search bar - You can use the search bar to search through all of
ThoughtSpot's documentation and videos.
•Short training videos - Each of these videos cover a popular topic or feature,
especially those that have just been released.
•Keyword reference - This reference contains all of the keywords that you can
use to improve your search experience. The keywords are categorized into
sections, and each of them are accompanied by an example.
•Release Notes - A new Release Notes is made available with every major,
minor, and patch release. It contains information on new features and bug
fixes.
•Documentation - The Documentation section includes links to various
documentation guides and topics.
•Downloads - You can download ThoughtSpot clients and API files from here,
including ODBC and JDBC drivers and the Data API.
•Support contact information - If you still can't find what you're looking for,
you can contact support.
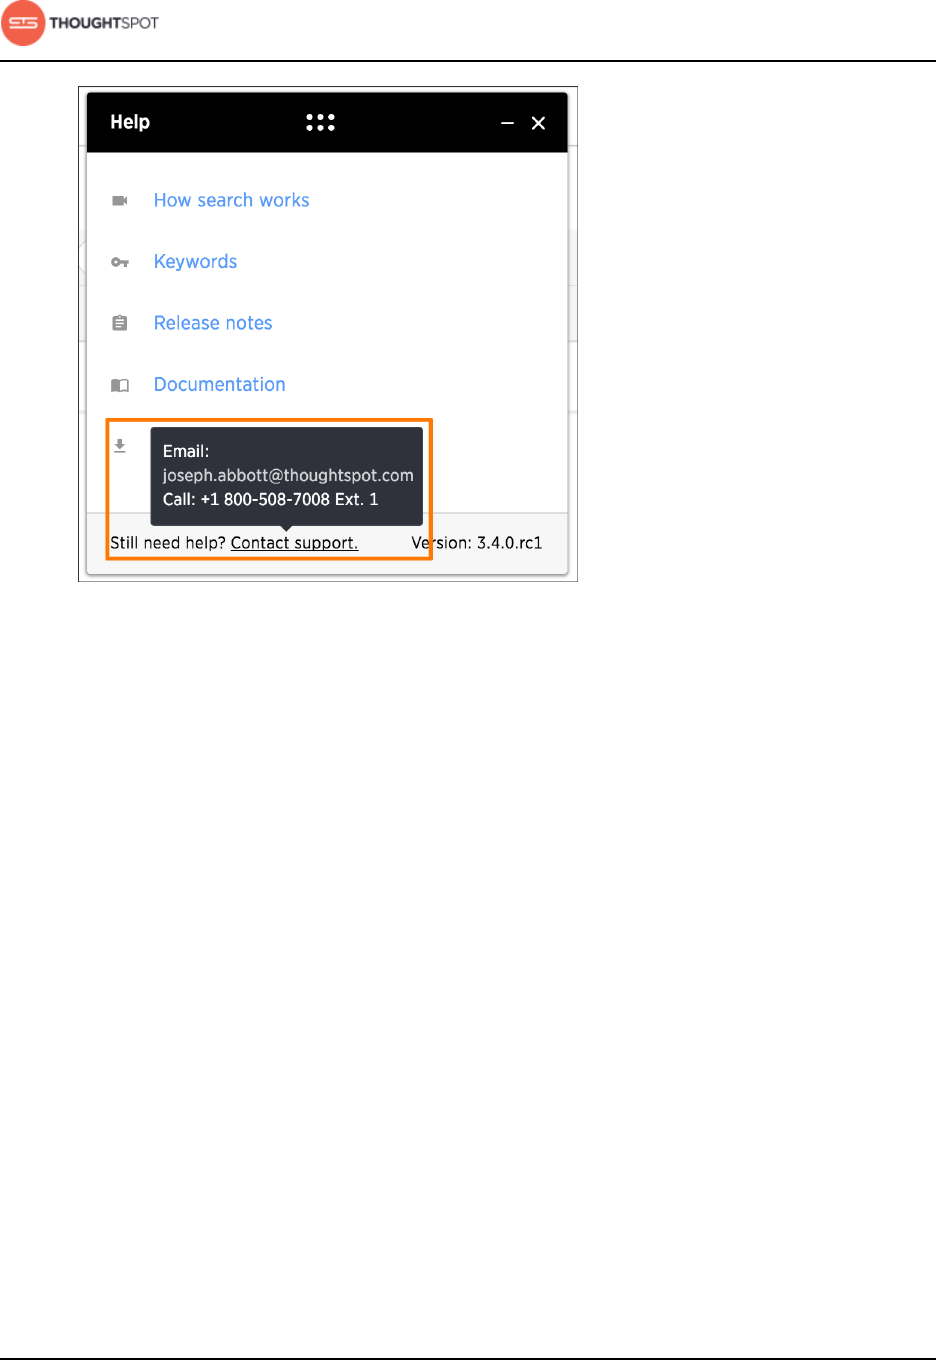
About the Help Center
User Guide Copyright © 2016 by ThoughtSpot. All Rights Reserved. 157
Figure 179: Contact support
• Version information: The version number of the ThoughtSpot instance you are
currently using can be found in the Help Center.
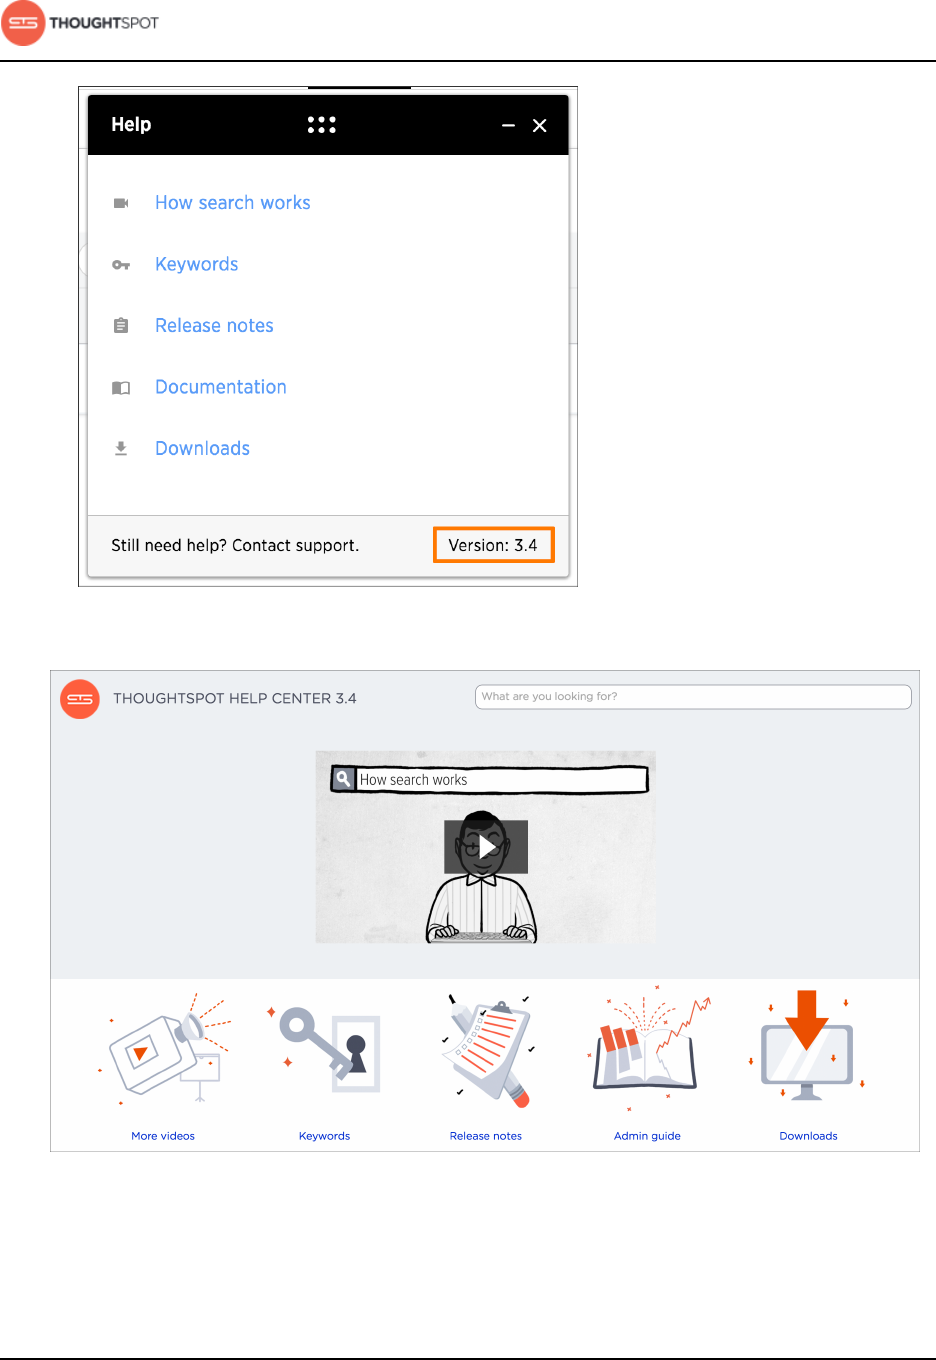
About the Help Center
User Guide Copyright © 2016 by ThoughtSpot. All Rights Reserved. 158
Figure 180: Version number
Figure 181: Help Center home page

User Guide Copyright © 2016 by ThoughtSpot. All Rights Reserved. 159
Chapter 7: Reference guide
Reference guide
Topics:
•Keyword reference
•Formula reference
•Date and time formats
reference
This Reference Guide contains keyword, formula, and
date and time format lists with examples to use with
all the features found in ThoughtSpot.
Included in this guide are:
•Keyword reference lists the available keywords to
use in your search. These are also listed in the Help
Center, which is available from Help on the top
navigation bar in ThoughtSpot.
•Formula reference lists the available formula
operators and functions. These are also listed in
the Formula Assistant, which is available from the
place in ThoughtSpot where you build formulas.
•Date and time formats reference lists the accepted
date, time, and timestamp formats that you
can use when uploading data through the Web
interface or using the ThoughtSpot Loader.
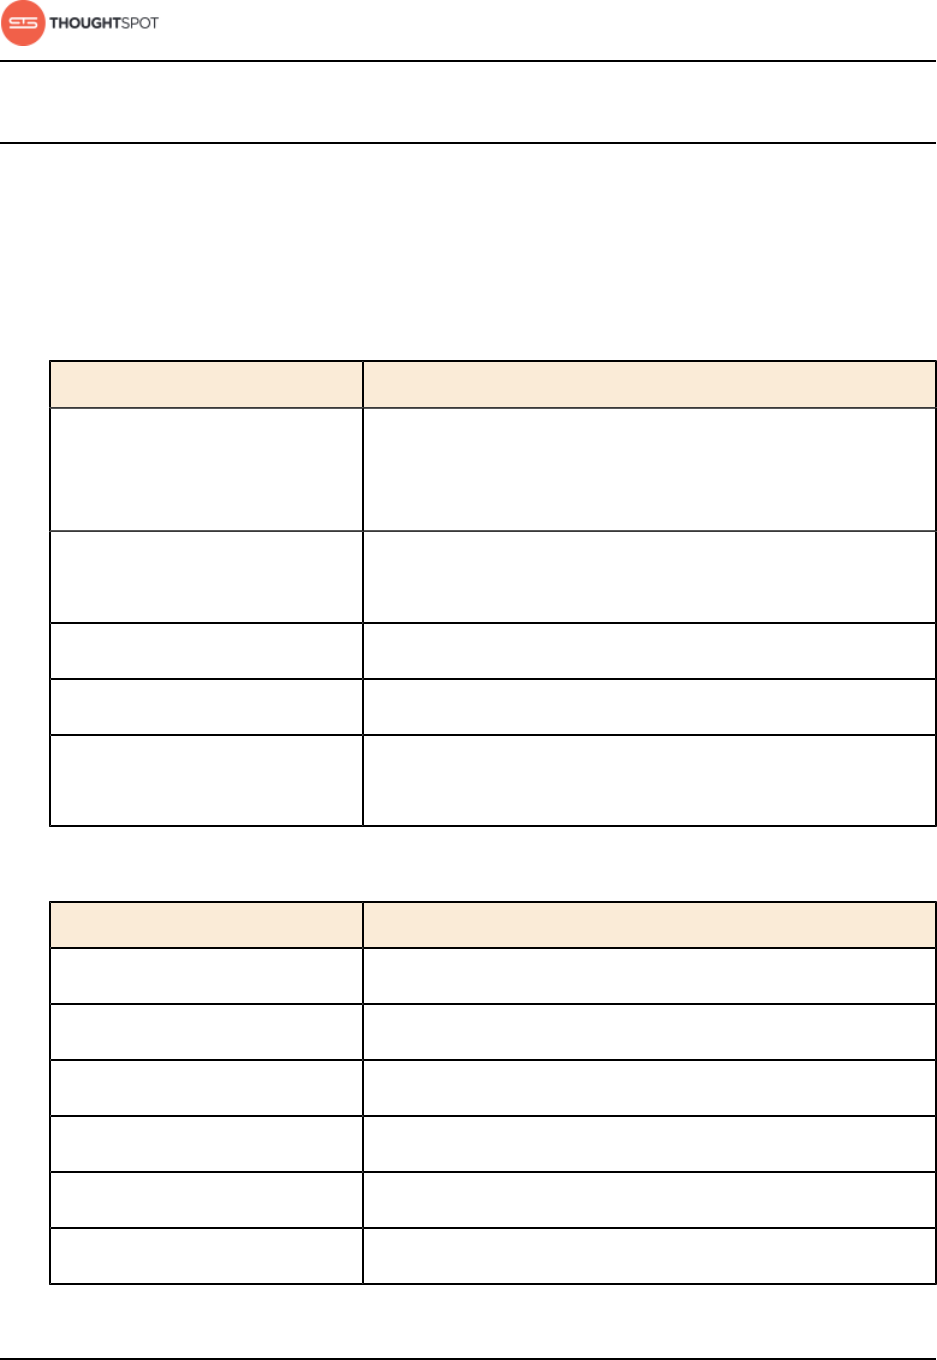
Reference guide
User Guide Copyright © 2016 by ThoughtSpot. All Rights Reserved. 160
Keyword reference
You can use keywords when asking a question to help define your search. This
reference lists the various keywords.
You can also see this list of keywords and examples from within the help center.
Table 10: Basic keywords
Function Examples
top •top sales rep by count sales for average revenue
>10000
•sales rep average revenue for each region top
bottom •bottom revenue average revenue by state
•customer by revenue for each sales rep bottom
top n•top 10 sales rep revenue
bottom n•bottom 25 customer by revenue for each sales rep
sort by •revenue by state sort by average revenue
•revenue by customer sort by region
Table 11: Date keywords
Function Examples
after •order date after 10/31/2014
before •order date before 03/01/2014
between … and ... •order date between 01/01/2012 and 01/01/2013
day of week •revenue by day of week last 6 months
week •revenue by week last quarter
month •revenue by month last year
Reference guide
User Guide Copyright © 2016 by ThoughtSpot. All Rights Reserved. 161
Function Examples
daily •shipments by region daily
weekly •revenue weekly
monthly •commission > 10000 monthly
quarterly •sales quarterly for each product
yearly •shipments by product yearly
day of week •count shipments Monday
month •commission January
month year •commission by sales rep February 2014
year •revenue by product 2013 product name contains
snowboard
yesterday •sales yesterday for pro -ski200 by store
week to date •sales by order date week to date for pro-ski200
month to date •sales by product month to date sales > 2400
quarter to date •sales by product quarter to date for top 10
products by sales
year to date •sales by product year to date
last day •customers last day by referrer
last week •customers last week by store
last month •customers last month by day
last quarter •customers last quarter sale >300
last year •top 10 customers last year by sale by store for
region west
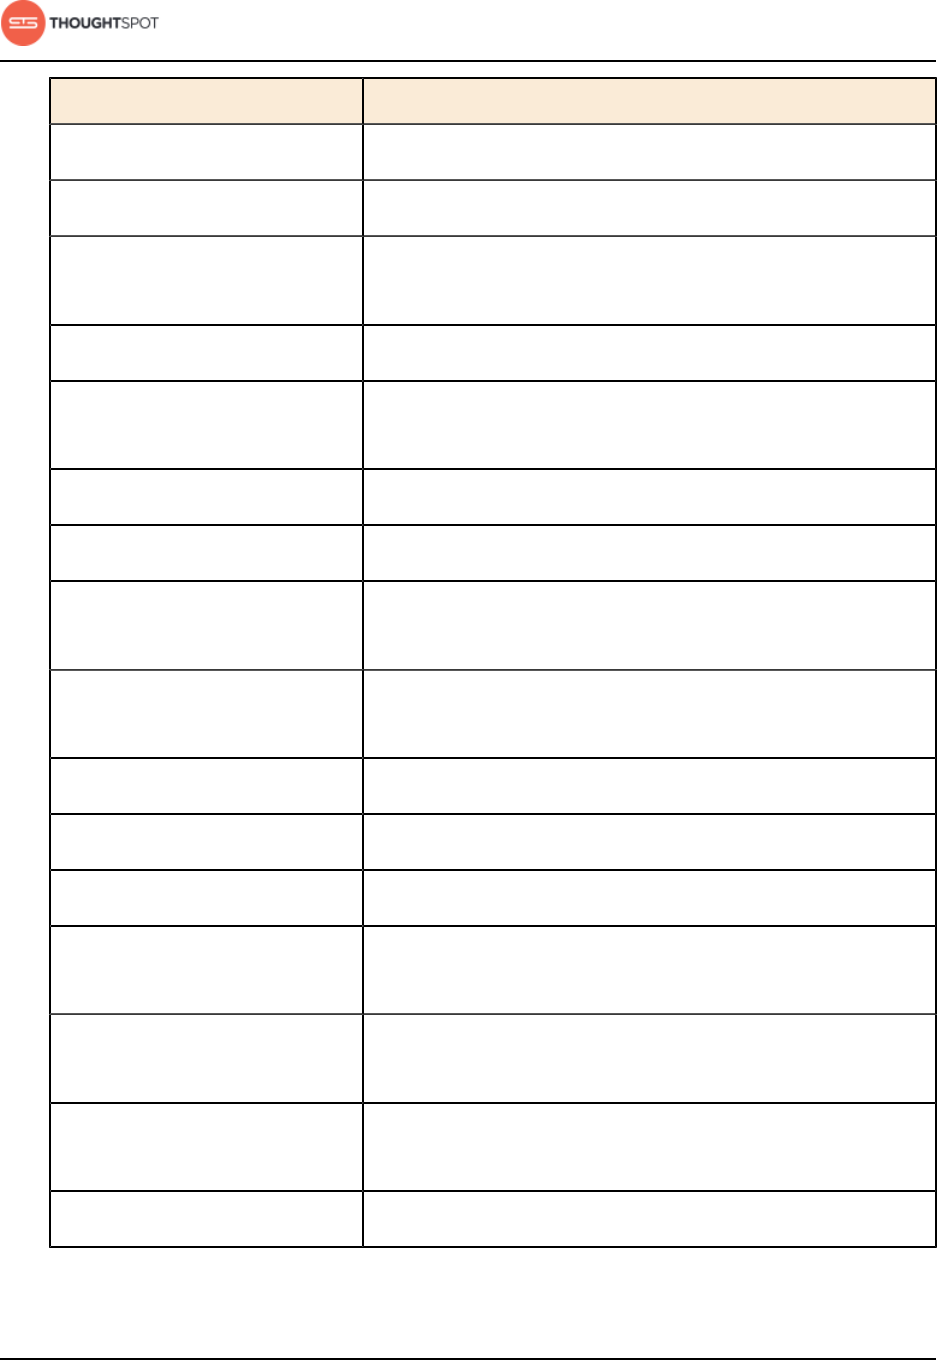
Reference guide
User Guide Copyright © 2016 by ThoughtSpot. All Rights Reserved. 162
Function Examples
last n days •visitors last 7 days
last n weeks •visitors last 10 weeks by day
last n months •visitors last 6 months for homepage visits > 30 by
month
last n quarters •visitors last 2 quarters by month by campaign
last n years •visitors last 5 years by revenue for sum revenue
>5000
growth of … by ... •growth of sales by order date
growth of … by … daily •growth of sales by order date daily
growth of … by … monthly •growth of sales by date shipped monthly sales >
24000
growth of … by … weekly •growth of sales by receipt date weekly for
proski2000
growth of … by … quarterly •growth of sales by date shipped quarterly
growth of … by … yearly •growth of sales by date closed yearly
daily year-over-year •growth of revenue by order date daily year-over-year
weekly year-over-year •growth of revenue by date shipped weekly year-over-
year
monthly year-over-year •growth of revenue by receipt date monthly year-
over-year
quarterly year-over-year •growth of revenue by date shipped quarterly year-
over-year
n days ago •sales 2 days ago
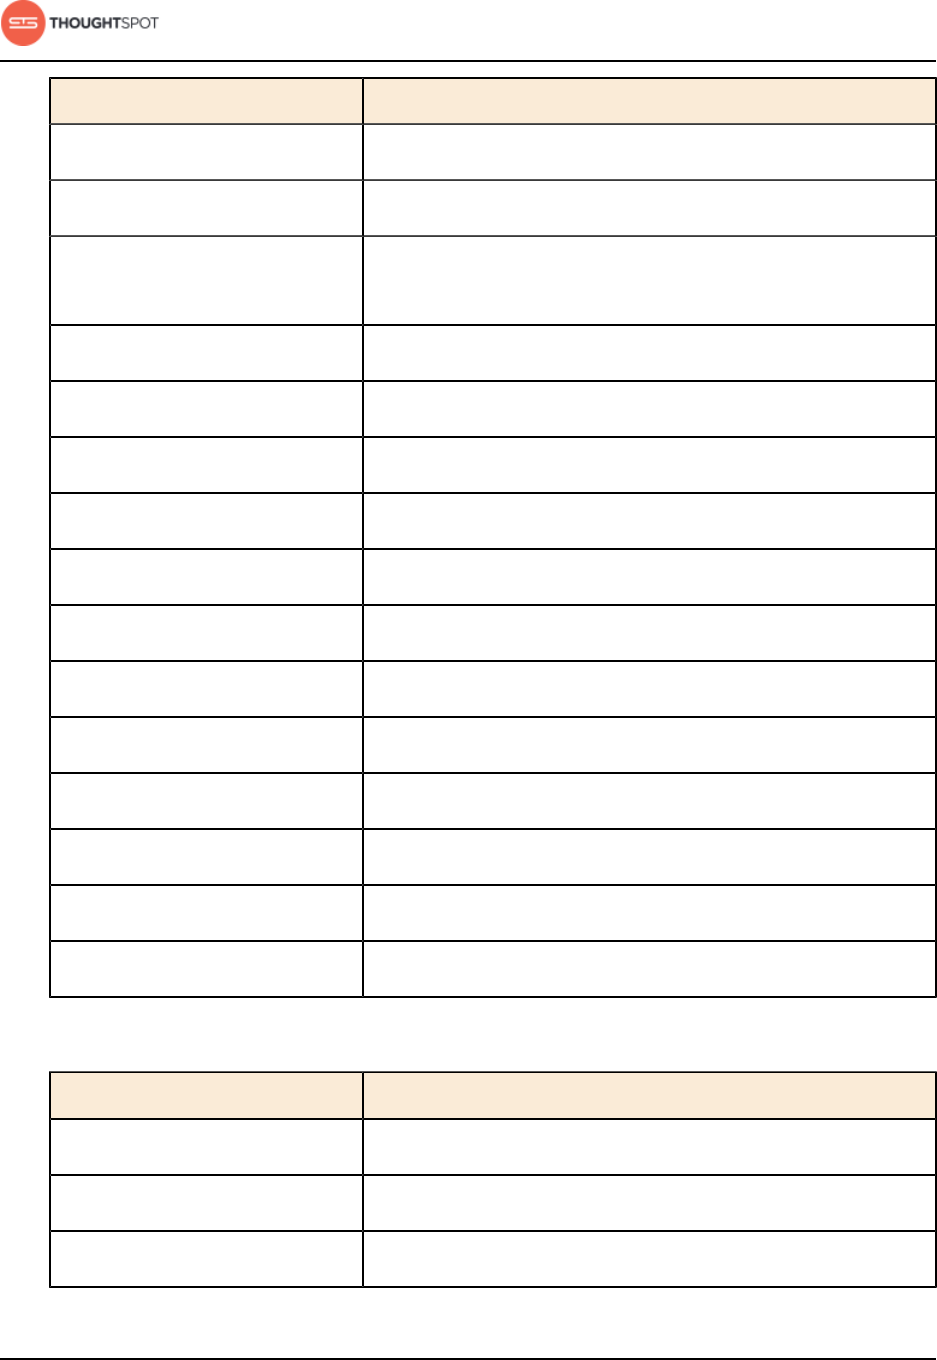
Reference guide
User Guide Copyright © 2016 by ThoughtSpot. All Rights Reserved. 163
Function Examples
n weeks ago •sales 4 weeks ago by store
n months ago •sales 2 months ago by region
n quarters ago •sales 4 quarters ago by product name contains
deluxe
n years ago •sales 5 years ago by store for region west
today •sales today by store
next day •shipments next day by order
next week •shipments next week by store
next month •appointments next month by day
next quarter •opportunities next quarter amount > 30000
next year •opportunities next year by sales rep
next n days •shipments next 7 days
next n weeks •shipments next 10 weeks by day
next n months •openings next 6 months location
next n quarters •opportunities next 2 quarters by campaign
next n years •opportunities next 5 years by revenue
Table 12: Time keywords
Function Examples
detailed •ship time detailed
last minute •count homepage views last minute
last hour •count unique visits last hour
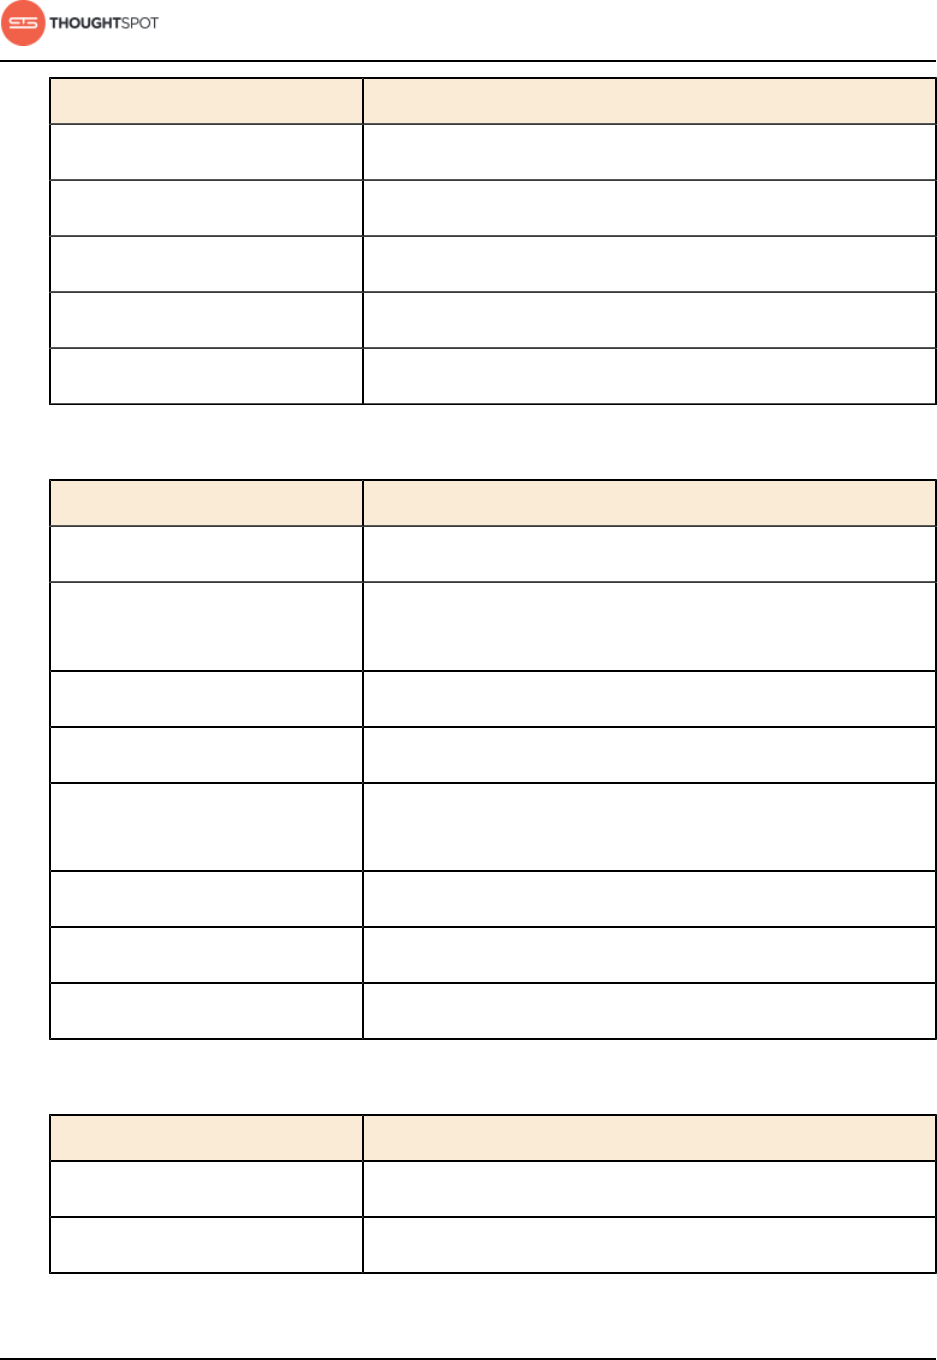
Reference guide
User Guide Copyright © 2016 by ThoughtSpot. All Rights Reserved. 164
Function Examples
last n minutes •count visitors last 30 minutes
last n hours •count visitors last 12 hours
hourly •visitors by page name hourly
n minutes ago •sum inventory by product 10 minutes ago
n hours ago •sum inventory by product by store 2 hours ago
Table 13: Text keywords
Function Examples
begins with •product name begins with 'pro'
contains •product name contains "alpine" description
contains "snow shoe"
ends with •product name ends with 'deluxe'
not begins with •product name not begins with "tom's"
not contains •product color not contains 'tan' product color not
contains 'red'
not ends with •product name not ends with "trial"
similar to •course name similar to 'hand'
not similar to •course name not similar to 'hand'
Table 14: Number keywords
Function Examples
sum •sum revenue
average •average revenue by store
Reference guide
User Guide Copyright © 2016 by ThoughtSpot. All Rights Reserved. 165
Function Examples
count •count visitors by site
max •max sales by visitor by site
min •min revenue by store by campaign for cost > 5000
standard deviation •standard deviation revenue by product by month for
date after 10/31/2010
unique count •unique count visitor by product page last week
variance •variance sale amount by visitor by product for
last year
Table 15: Filter keywords
Function Examples
between... and •revenue between 0 and 1000
>•sum sale amount by visitor by product for last
year sale amount > 2000
<•unique count visitor by product by store for sale
amount < 20
>= •count calls by employee lastname >= m
<= •count shipments by city latitude <= 0
=•unique count visitor by store purchased products
= 3 for last 5 days
!= •sum sale amount region != canada region != mexico
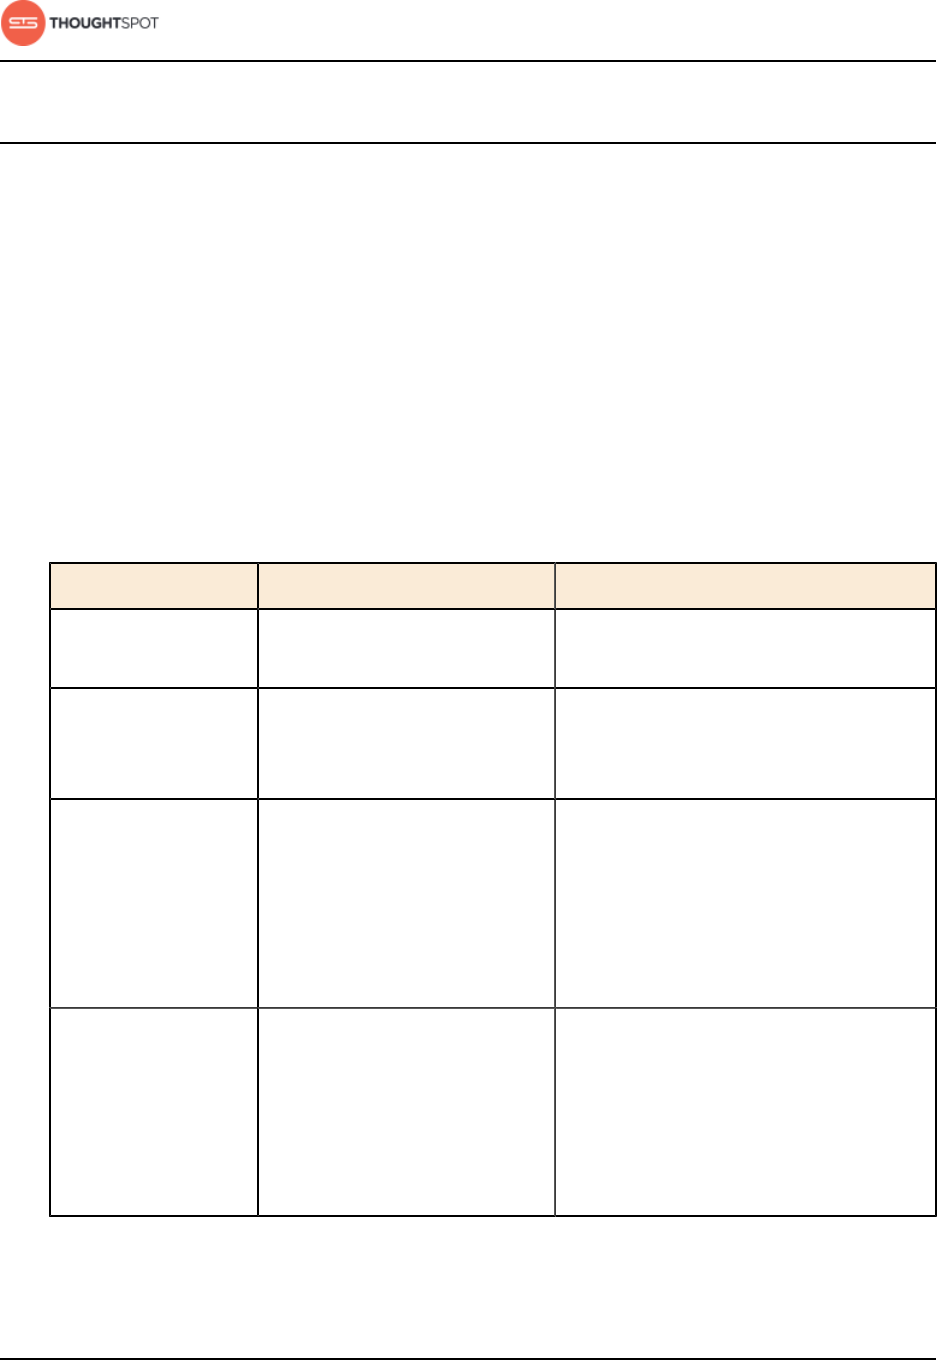
Reference guide
User Guide Copyright © 2016 by ThoughtSpot. All Rights Reserved. 166
Formula reference
ThoughtSpot allows you to create derived columns in worksheets using formulas.
This reference lists the various operators and functions you can use to create
formulas.
You can also see this list of operators and examples from within the Formula
Builder by selecting Formula Assistant.
Aggregate functions
These functions can be used to aggregate data.
Table 16: Mixed functions for use in formulas
Function Description Examples
average Returns the average of all the
values of a column.
•average (revenue)
count Returns the number of rows
in the table containing the
column.
•count (product)
cumulative_average Takes a measure and
one or more attributes.
Returns the average of the
measure, accumulated by
the attribute(s) in the order
specified.
•cumulative_average (revenue,
order date, state)
cumulative_max Takes a measure and
one or more attributes.
Returns the maximum of the
measure, accumulated by
the attribute(s) in the order
specified.
•cumulative_max (revenue, state)

Reference guide
User Guide Copyright © 2016 by ThoughtSpot. All Rights Reserved. 167
Function Description Examples
cumulative_min Takes a measure and
one or more attributes.
Returns the minimum of the
measure, accumulated by
the attribute(s) in the order
specified.
•cumulative_min (revenue,
campaign)
cumulative_sum Takes a measure and
one or more attributes.
Returns the sum of the
measure, accumulated by
the attribute(s) in the order
specified.
•cumulative_sum (revenue, order
date)
group_average Takes a measure and one
or more attributes. Returns
the average of the measure
grouped by the attribute(s).
•group_average (revenue,
customer region, state)
group_count Takes a measure and one or
more attributes. Returns the
count of the measure grouped
by the attribute(s).
•group_count (revenue, customer
region)
group_max Takes a measure and one or
more attributes. Returns the
maximum of the measure
grouped by the attribute(s).
•group_max (revenue, customer
region)
group_min Takes a measure and one
or more attributes. Returns
the minimum of the measure
grouped by the attribute(s).
•group_min (revenue, customer
region)
group_stddev Takes a measure and one
or more attributes. Returns
the standard deviation of
the measure grouped by the
attribute(s).
•group_stddev (revenue, customer
region)

Reference guide
User Guide Copyright © 2016 by ThoughtSpot. All Rights Reserved. 168
Function Description Examples
group_sum Takes a measure and one or
more attributes. Returns the
sum of the measure grouped
by the attribute(s).
•group_sum (revenue, customer
region)
group_unique_count Takes a measure and one or
more attributes. Returns the
unique count of the measure
grouped by the attribute(s).
•group_unique_count (product ,
supplier)
group_variance Takes a measure and one
or more attributes. Returns
the variance of the measure
grouped by the attribute(s).
•group_variance (revenue,
customer region)
max Returns the maximum value of
a column.
•max (sales)
min Returns the minimum value of
a column.
•min (revenue)
moving_average Takes a measure, two integers
to define the window to
aggregate over, and one or
more attributes. The window
is (current - Num1...Current +
Num2) with both end points
being included in the window.
For example, "1,1" will have a
window size of 3. To define
a window that begins before
Current, specify a negative
number for Num2. Returns
the average of the measure
over the given window. The
attributes are the ordering
columns used to compute the
moving average.
•moving_average (revenue, 2, 1,
customer region)

Reference guide
User Guide Copyright © 2016 by ThoughtSpot. All Rights Reserved. 169
Function Description Examples
moving_max Takes a measure, two integers
to define the window to
aggregate over, and one or
more attributes. The window
is (current - Num1...Current +
Num2) with both end points
being included in the window.
For example, "1,1" will have a
window size of 3. To define
a window that begins before
Current, specify a negative
number for Num2. Returns
the maximum of the measure
over the given window. The
attributes are the ordering
columns used to compute the
moving maximum.
•moving_max (complaints, 1, 2,
store name)
moving_min Takes a measure, two integers
to define the window to
aggregate over, and one or
more attributes. The window
is (current - Num1...Current +
Num2) with both end points
being included in the window.
For example, "1,1" will have a
window size of 3. To define
a window that begins before
Current, specify a negative
number for Num2. Returns
the minimum of the measure
over the given window. The
attributes are the ordering
columns used to compute the
moving minimum.
•moving_min (defects, 3, 1,
product)

Reference guide
User Guide Copyright © 2016 by ThoughtSpot. All Rights Reserved. 170
Function Description Examples
moving_sum Takes a measure, two integers
to define the window to
aggregate over, and one or
more attributes. The window
is (current - Num1...Current +
Num2) with both end points
being included in the window.
For example, "1,1" will have a
window size of 3. To define
a window that begins before
Current, specify a negative
number for Num2. Returns the
sum of the measure over the
given window. The attributes
are the ordering columns used
to compute the moving sum.
•moving_sum (revenue, 1, 1,
order date)
stddev Returns the standard deviation
of all values of a column.
•stddev (revenue)
sum Returns the sum of all the
values of a column.
•sum (revenue)
unique count Returns the number of unique
values of a column.
•unique count (customer)
variance Returns the variance of all the
values of a column.
•variance (revenue)
Conversion functions
These functions can be used to convert data from one data type to another.
Conversion to or from date data types is not supported.
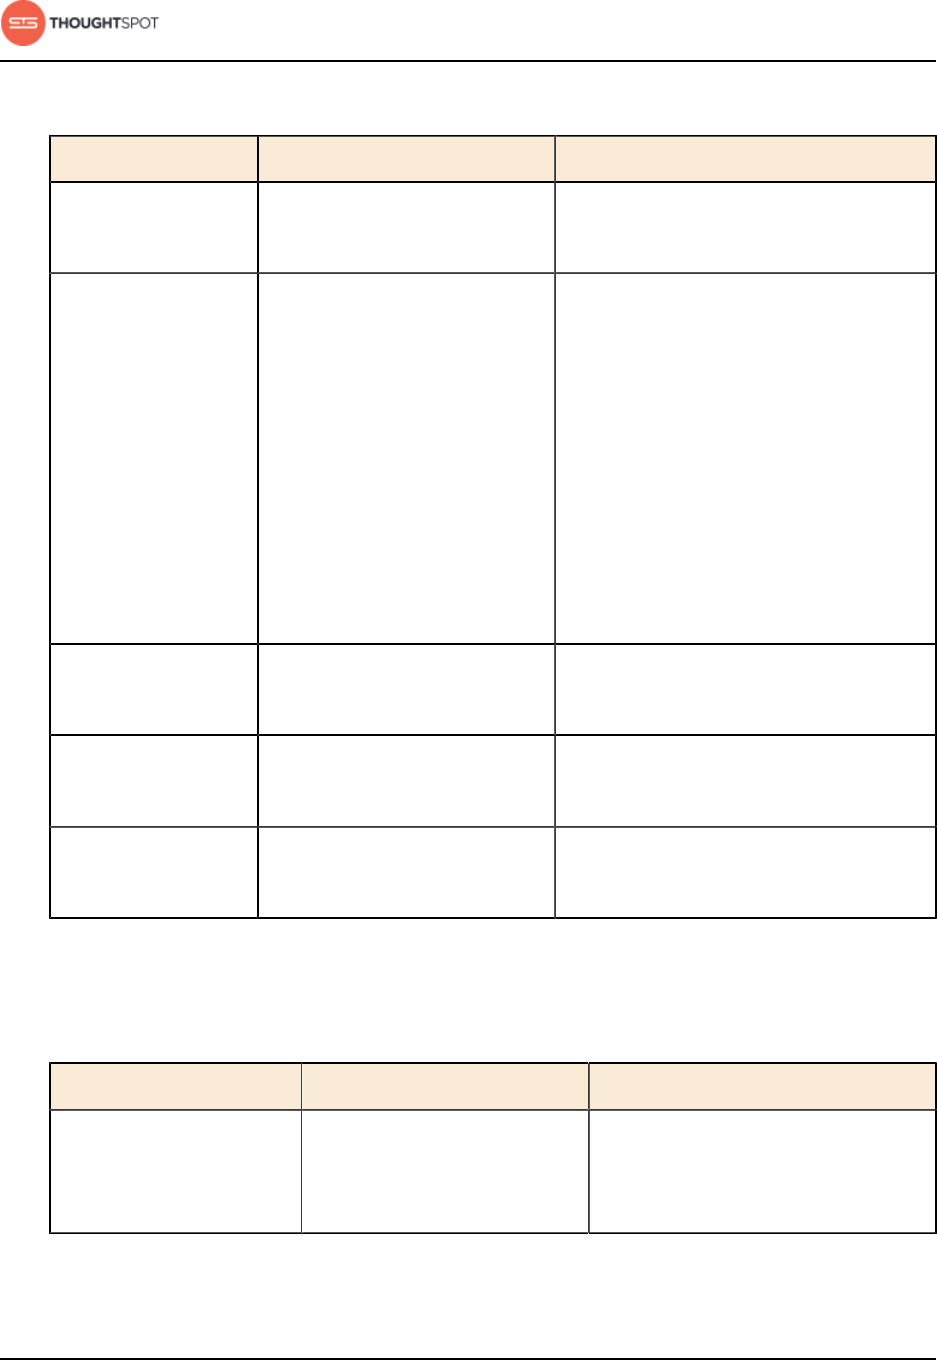
Reference guide
User Guide Copyright © 2016 by ThoughtSpot. All Rights Reserved. 171
Table 17: Conversion functions for use in formulas
Function Description Examples
to_bool Returns the input as a boolean
(true or false).
•to_bool (0) = false
•to_bool (married)
to_date Accepts a date represented
as an integer or text string,
and a second string parameter
that can include strptime date
formatting elements. Replaces
all the valid strptime date
formatting elements with their
string counterparts and returns
the result. Does not accept
epoch formatted dates as
input.
•to_date (date_sold, '%Y-%m-%d')
to_double Returns the input as a double. •to_double ('3.14') = 3.14
•to_double (revenue * .01)
to_integer Returns the input as an integer. •to_integer ('45') + 1 = 46
•to_integer (price + tax - cost)
to_string Returns the input as a text
string.
•to_string (45 + 1) = '46'
•to_string (revenue - cost)
Date functions
Table 18: Date functions for use in formulas
Function Description Examples
add_days Returns the result of adding
the specified number of days
to the given date.
•add_days (01/30/2015, 5) =
02/04/2015
•add_days (invoiced, 30)
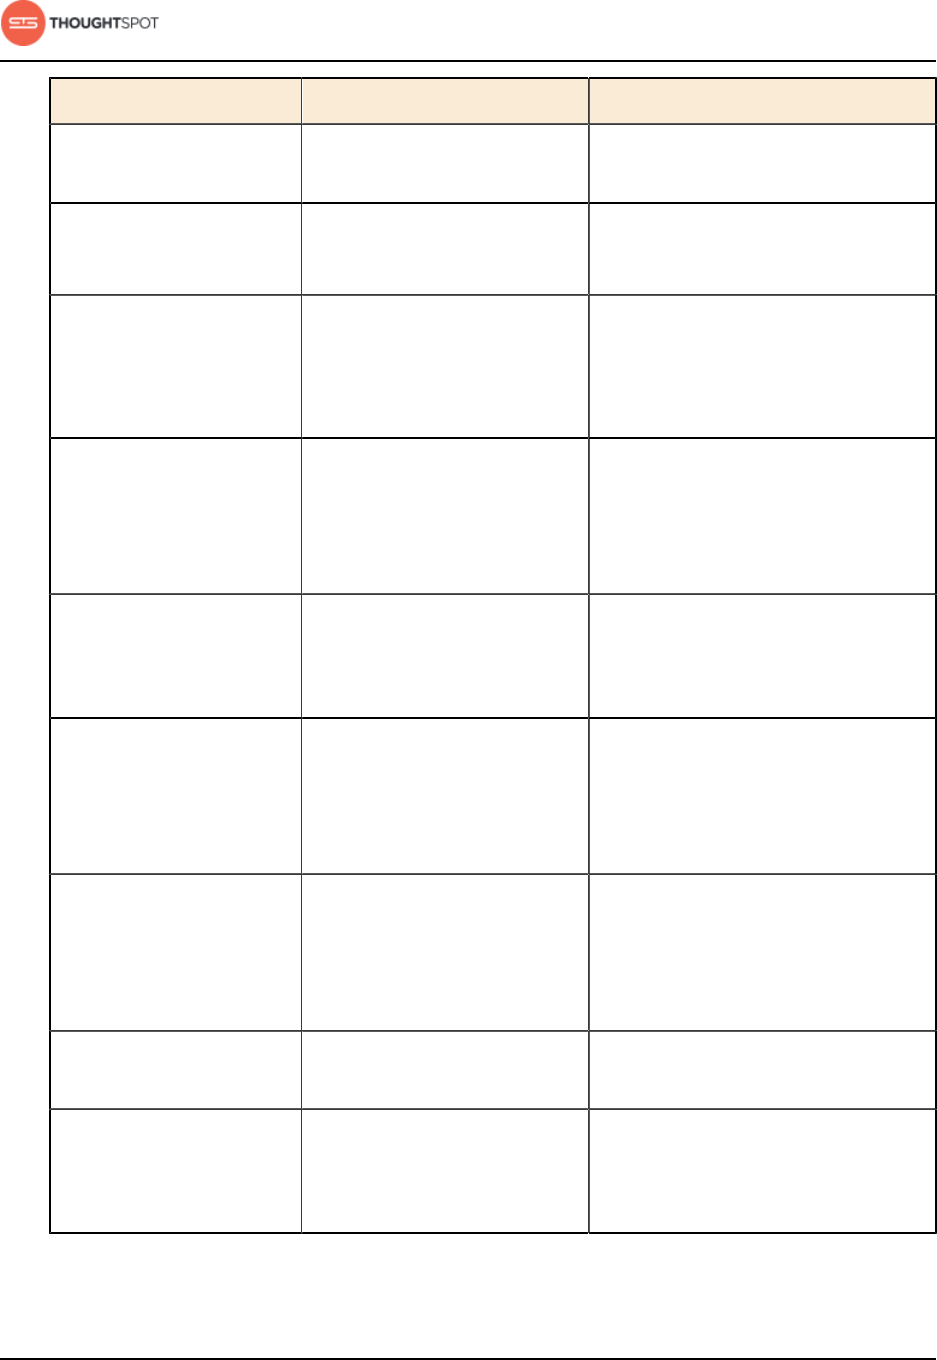
Reference guide
User Guide Copyright © 2016 by ThoughtSpot. All Rights Reserved. 172
Function Description Examples
date Returns the date portion of a
given date.
•date (home visit)
day Returns the number (1-31) of
the day for the given date.
•day (01/15/2014) = 15
•day (date ordered)
day_number_of_week Returns the number (1-7)
of the day in a week for
the given date with 1 being
Monday and 7 being Sunday.
•day_number_of_week
(01/30/2015) = 6
•day_number_of_week (shipped)
day_number_of_year Returns the number (1-366) of
the day in a year for the given
date.
•day_number_of_year
(01/30/2015) = 30
•day_number_of_year
(invoiced)
day_of_week Returns the day of the week
for the given date.
•day_of week (01/30/2015) =
Friday
•day_of_week (serviced)
diff_days Subtracts the second date
from the first date and returns
the result in number of days,
rounded down if not exact.
•diff_days (01/15/2014,
01/17/2014) = -2
•diff_days (purchased,
shipped)
diff_time Subtracts the second date
from the first date and returns
the result in number of
seconds.
•diff_time (01/01/2014,
01/01/2014) = -86,400
•diff_time (clicked,
submitted)
hour_of_day Returns the hour of the day
for the given date.
•hour_of_day (received)
is_weekend Returns true if the given date
falls on a Saturday or Sunday.
•is_weekend (01/31/2015) =
true
•is_weekend (emailed)
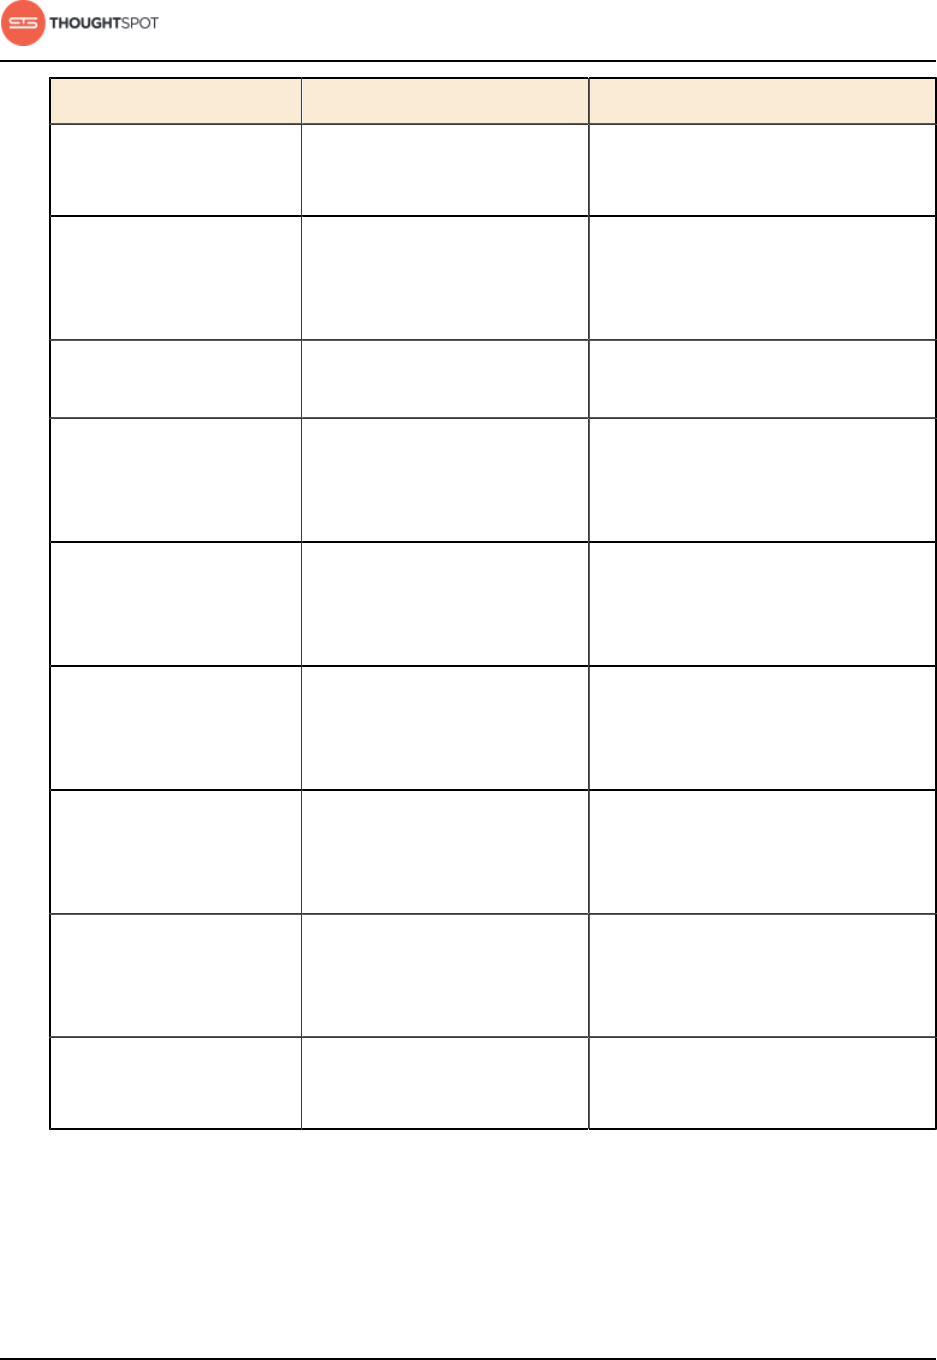
Reference guide
User Guide Copyright © 2016 by ThoughtSpot. All Rights Reserved. 173
Function Description Examples
month Returns the month from the
given date.
•month (01/15/2014) = January
•month (date ordered)
month_number Returns the number (1-12) of
the month for the given date.
•month_number (09/20/2014) =
9
•month_number (purchased)
now Returns the current
timestamp.
•now ()
start_of_month Returns the date for the first
day of the month for the
given date.
•start_of_month
( 01/31/2015 ) = Jan FY 2015
•start_of_month (shipped)
start_of_quarter Returns the date for the first
day of the quarter for the
given date.
•start_of_quarter
( 09/18/2015 ) = Q3 FY 2015
•start_of_quarter (sold)
start_of_week Returns the date for the first
day of the week for the given
date.
•start_of_week ( 06/01/2015 )
= 05/30/2015 Week
•start_of_week (emailed)
start_of_year Returns the date for the first
day of the year for the given
date.
•start_of_year ( 02/15/2015 )
= FY 2015
•start_of_year (joined)
time Returns the time portion of a
given date.
•time (3/1/2002 10:32) =
10:32
•time (call began)
year Returns the year from the
given date.
•year (01/15/2014) = 2014
•year (date ordered)
Mixed functions
These functions can be used with text and numeric data types.
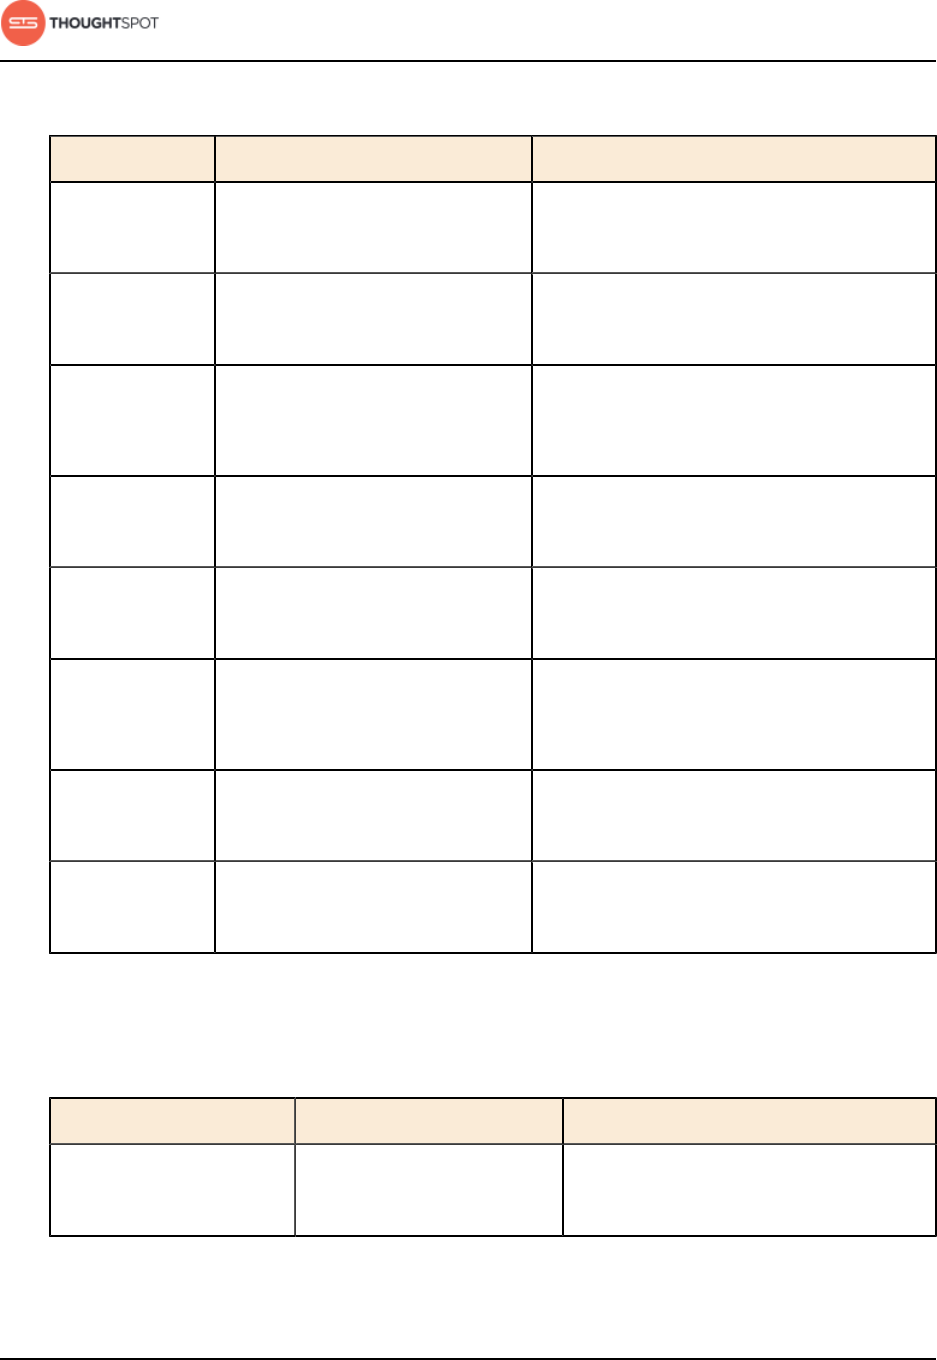
Reference guide
User Guide Copyright © 2016 by ThoughtSpot. All Rights Reserved. 174
Table 19: Mixed functions for use in formulas
Function Description Examples
!= Returns true if the first value is
not equal to the second value.
•3 != 2 = true
•revenue != 1000000
< Returns true if the first value is
less than the second value.
•3 < 2 = false
•revenue < 1000000
<= Returns true if the first value is
less than or equal to the second
value.
•1 <= 2 = true
•revenue <= 1000000
= Returns true if the first value is
equal to the second value.
•2 = 2 = true
•revenue = 1000000
> Returns true if the first value is
greater than the second value.
•3 > 2 = true
•revenue > 1000000
>= Returns true if the first value
is greater than or equal to the
second value.
•3 >= 2 = true
•revenue >= 1000000
greatest Returns the larger of the values. •greatest (20, 10) = 20
•greatest (q1 revenue, q2 revenue)
least Returns the smaller of the values. •least (20, 10) = 10
•least (q1 revenue, q2 revenue)
Number functions
Table 20: Number functions for use in formulas
Function Description Examples
* Returns the result of
multiplying both numbers.
•3 * 2 = 6
•price * taxrate
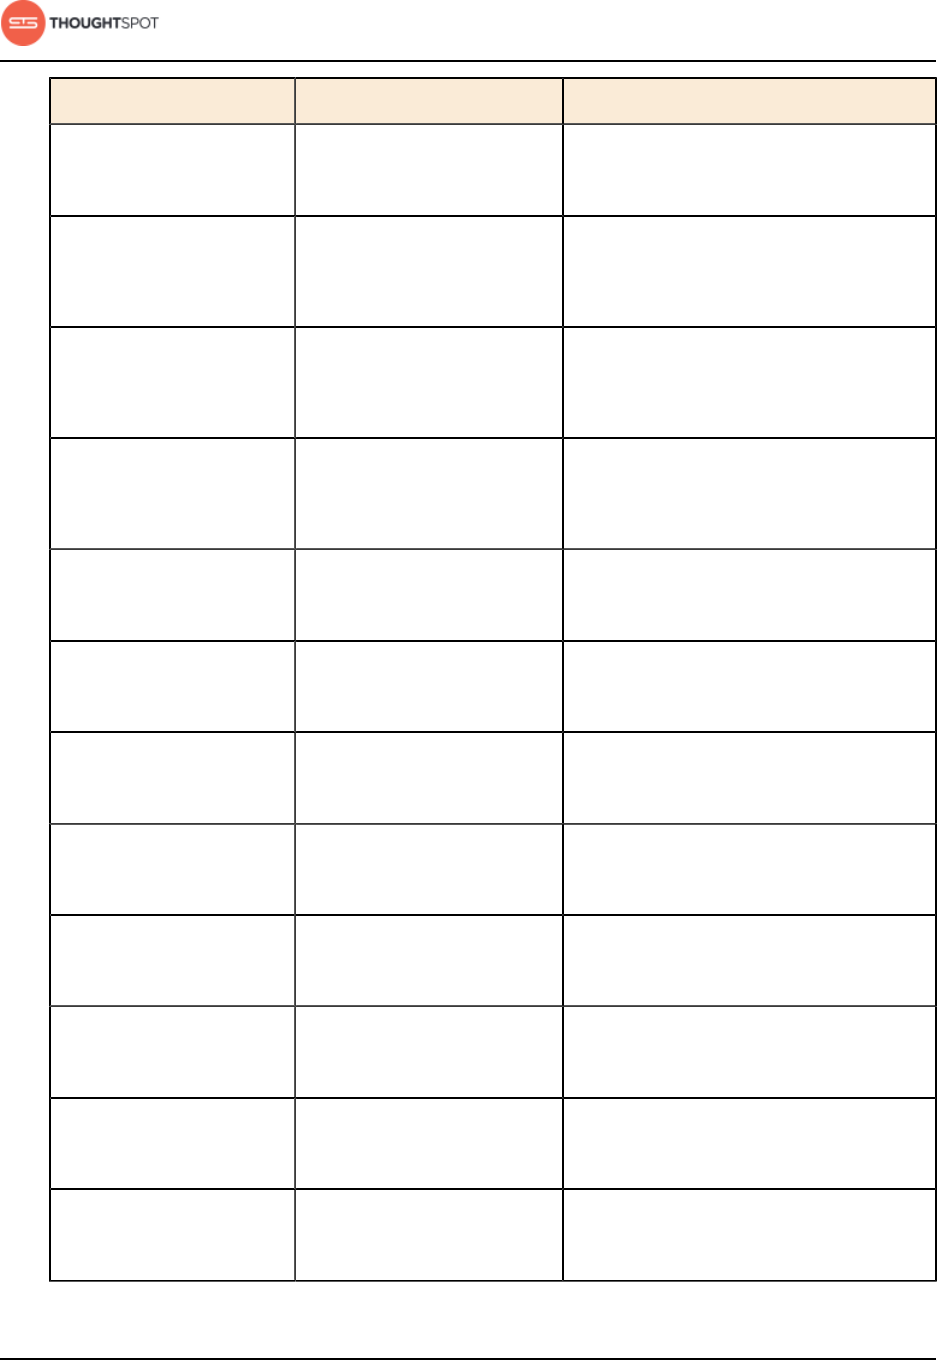
Reference guide
User Guide Copyright © 2016 by ThoughtSpot. All Rights Reserved. 175
Function Description Examples
+ Returns the result of adding
both numbers.
•1 + 2 = 3
•price + shipping
- Returns the result of
subtracting the second
number from the first.
•3 - 2 = 1
•revenue - tax
/ Returns the result of
dividing the first number by
the second.
•6 / 3 = 2
•markup / retail price
^ Returns the first number
raised to the power of the
second.
•3 ^ 2 = 9
•width ^ 2
abs Returns the absolute value. •abs (-10) = 10
•abs (profit)
acos Returns the inverse cosine
in degrees.
•acos (0.5) = 60
•acos (cos-satellite-angle)
asin Returns the inverse sine
(specified in degrees).
•asin (0.5) = 30
•asin (sin-satellite-angle)
atan Returns the inverse tangent
in degrees.
•atan (1) = 45
•atan (tan-satellite-angle)
atan2 Returns the inverse tangent
in degrees.
•atan2 (10, 10) = 45
•atan2 (longitude, latitude)
cbrt Returns the cube root of a
number.
•cbrt (27) = 3
•cbrt (volume)
ceil Returns the smallest
following integer.
•ceil (5.9) = 6
•ceil (growth rate)
cos Returns the cosine of an
angle (specified in degrees).
•cos (63) = 0.45
•cos (beam angle)
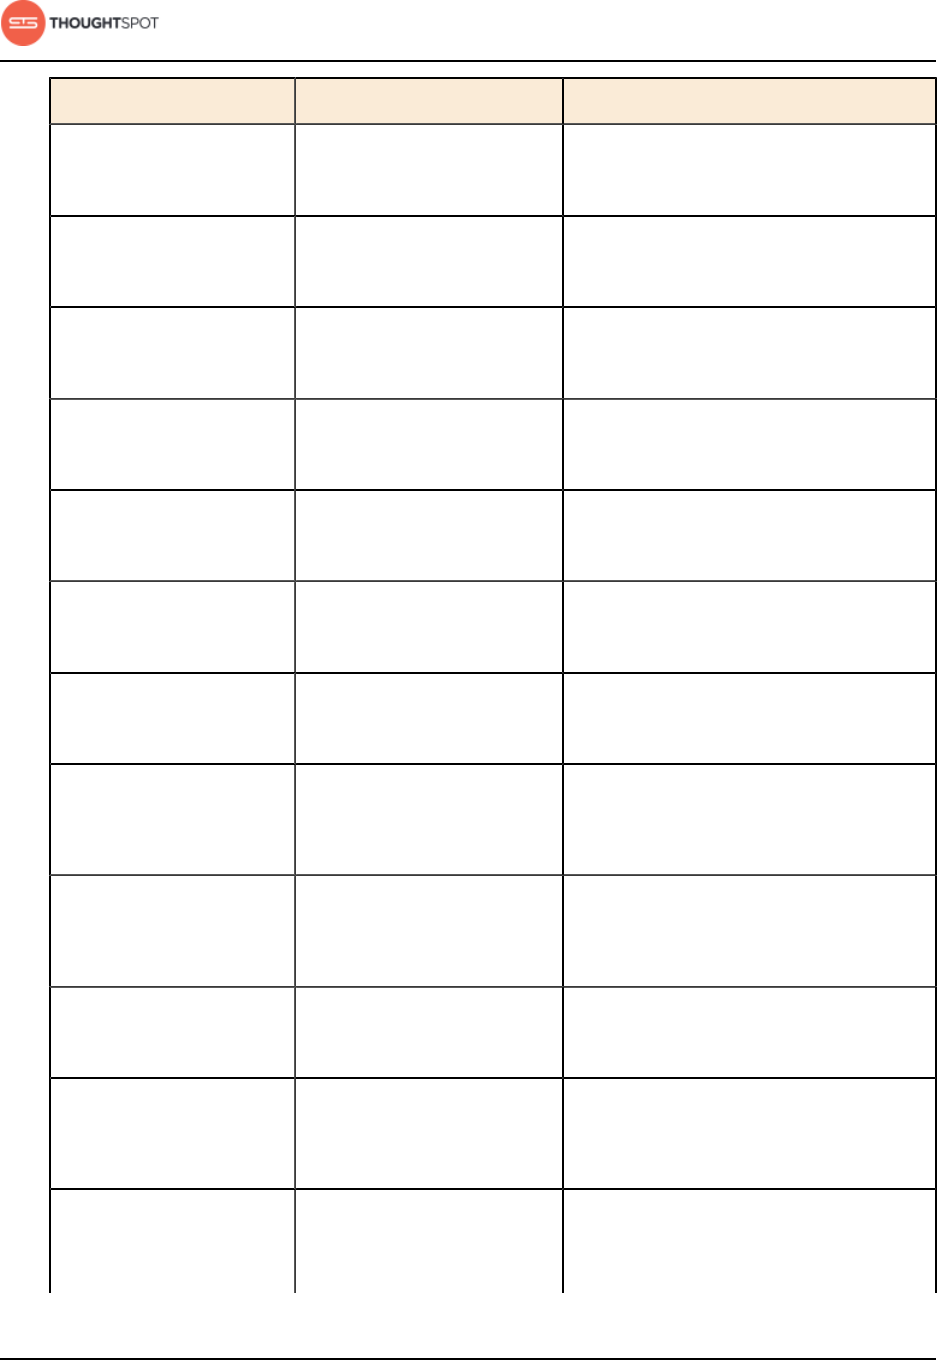
Reference guide
User Guide Copyright © 2016 by ThoughtSpot. All Rights Reserved. 176
Function Description Examples
cube Returns the cube of a
number.
•cube (3) = 27
•cube (length)
exp Returns Euler's number
(~2.718) raised to a power.
•exp (2) = 7.38905609893
•exp (growth)
exp2 Returns 2 raised to a power. •exp2 (3) = 8
•exp2 (growth)
floor Returns the largest previous
integer.
•floor (5.1) = 5
•floor (growth rate)
ln Returns the natural
logarithm.
•ln (7.38905609893) = 2
•ln (distance)
log10 Returns the logarithm with
base 10.
•log10 (100) = 2
•log10 (volume)
log2 Returns the logarithm with
base 2 (binary logarithm).
•log2 (32) = 5
•log2 (volume)
mod Returns the remainder of
first number divided by the
second number.
•mod (8, 3) = 2
•mod ( revenue , quantity )
pow Returns the first number
raised to the power of the
second number.
•pow (5, 2) = 25
•pow (width, 2)
random Returns a random number
between 0 and 1.
•random ( ) = .457718
•random ( )
round Returns the first number
rounded to the second
number (the default is 1).
•round (35.65, 10) = 40
•round (battingavg, 100)
safe_divide Returns the result of
dividing the first number by
the second. If the second
•safe_divide (12, 0) = 0
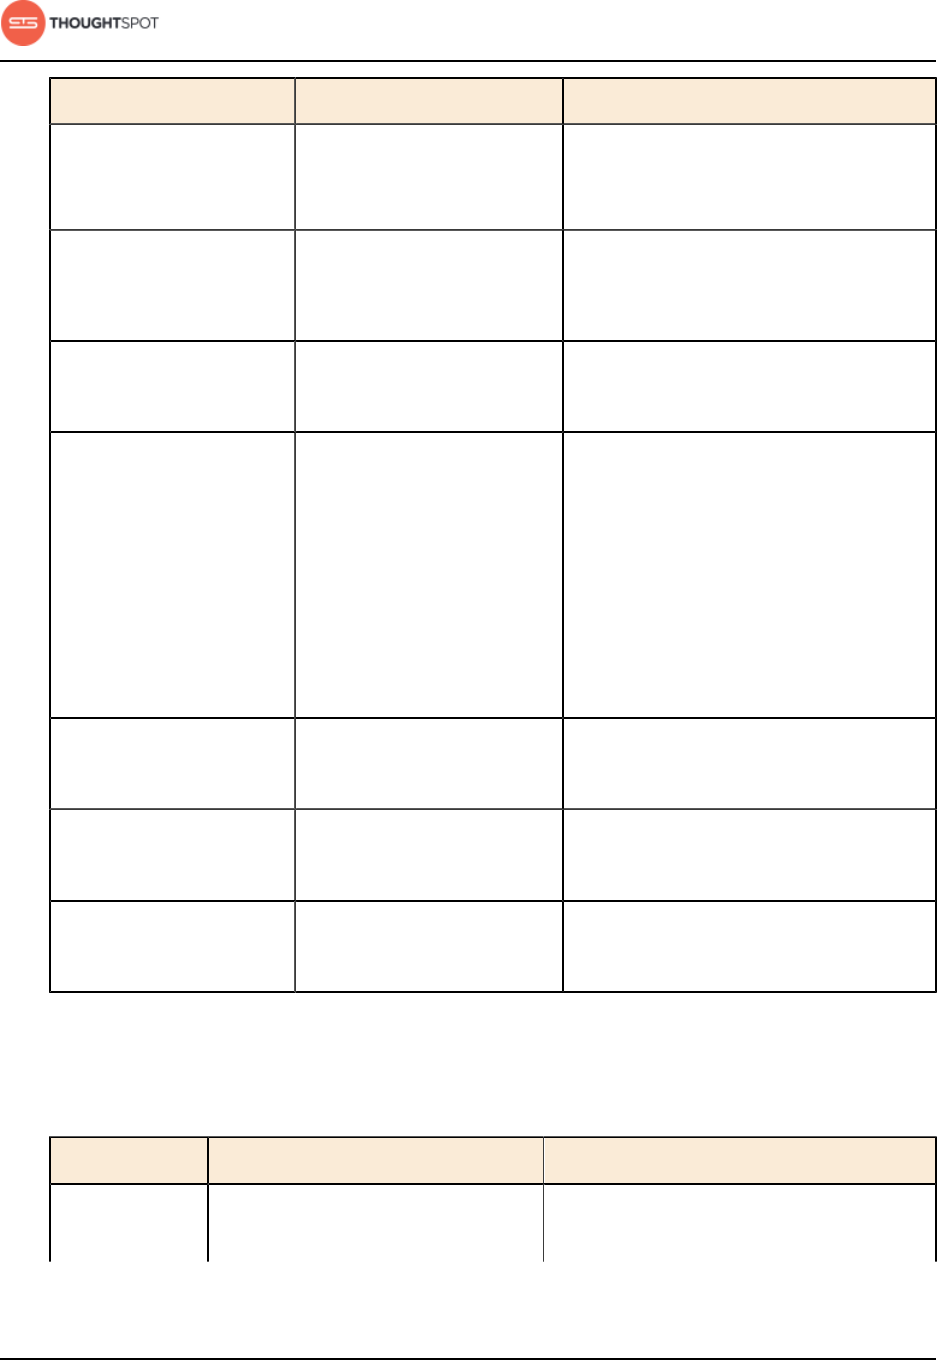
Reference guide
User Guide Copyright © 2016 by ThoughtSpot. All Rights Reserved. 177
Function Description Examples
number is 0, returns 0
instead of NaN (not a
number).
•safe_divide (total_cost,
units)
sign Returns +1 if the number is
greater than zero, -1 if less
than zero, 0 if zero.
•sign (-250) = -1
•sign (growth rate)
sin Returns the sine of an angle
(specified in degrees).
•sin (35) = 0.57
•sin (beam angle)
spherical_distance Returns the distance in km
between two points on
Earth.
•spherical_distance (37.465191,
-122.153617, 37.421962,
-122.142174) = 4,961.96
•spherical_distance
(start_latitude,
start_longitude,
start_latitude,
start_longitude)
sq Returns the square of a
numeric value.
•sq (9) = 81
•sq (width)
sqrt Returns the square root. •sqrt (9) = 3
•sqrt (area)
tan Returns the tangent of an
angle (specified in degrees).
•tan (35) = 0.7
•tan (beam angle)
Operators
Table 21: Operators for use in formulas
Operator Descriptions Examples
and Returns true when both conditions
are true, otherwise returns false.
•(1 = 1) and (3 > 2) = true
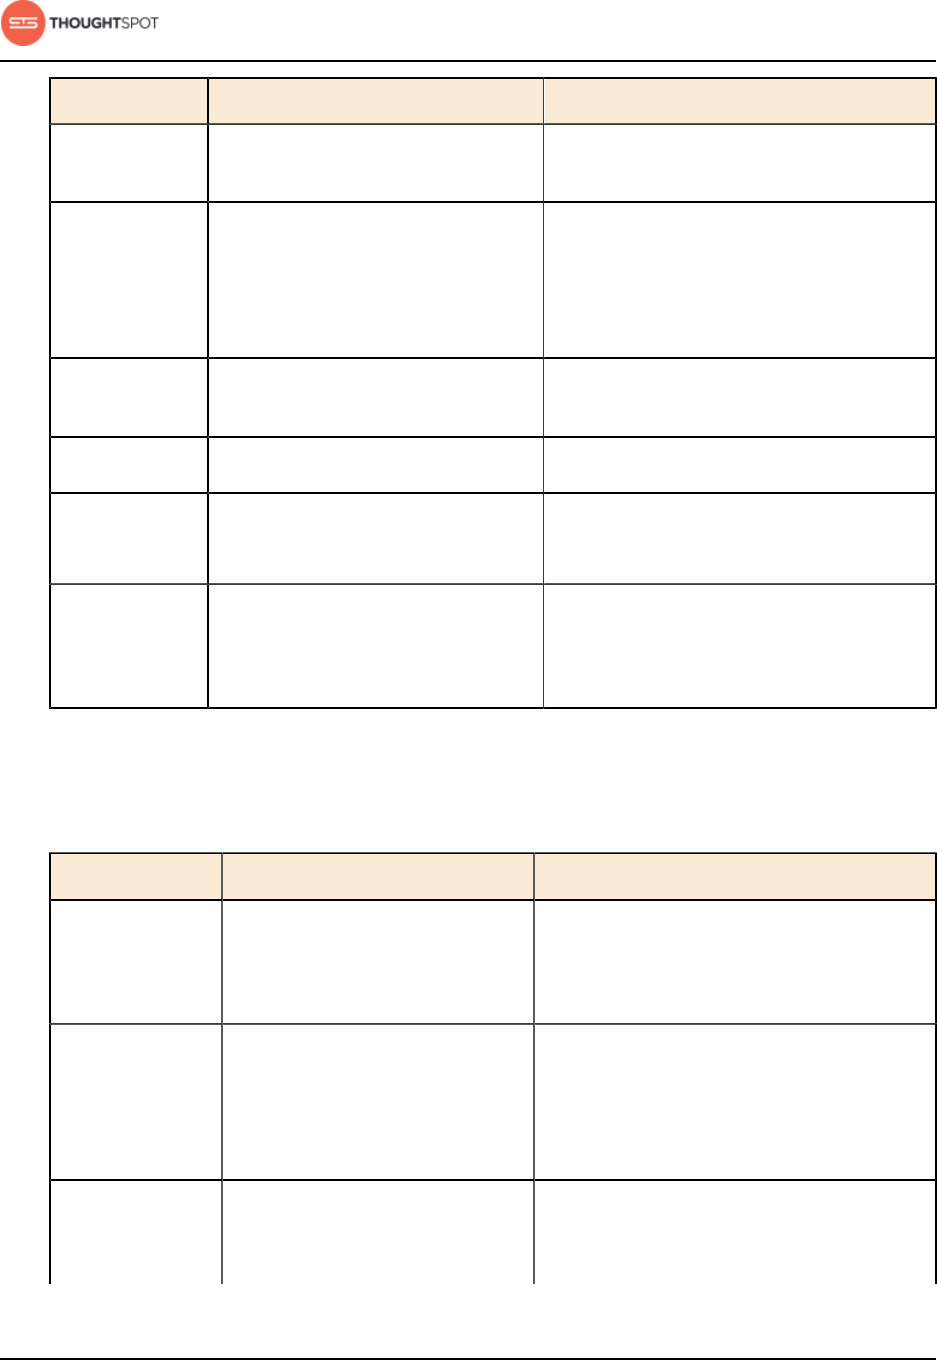
Reference guide
User Guide Copyright © 2016 by ThoughtSpot. All Rights Reserved. 178
Operator Descriptions Examples
•lastname = 'smith' and state
='texas'
if...then...else Conditional operator. •if (3 > 2) then 'bigger' else
'not bigger'
•if (cost > 500) then 'flag' else
'approve'
ifnull Returns the first value if it is not
null, otherwise returns the second.
•ifnull (cost, 'unknown')
isnull Returns true if the value is null. •isnull (phone)
not Returns true if the condition is
false, otherwise returns false.
•not (3 > 2) = false
•not (state = 'texas')
or Returns true when either condition
is true, otherwise returns false.
•(1 = 5) or (3 > 2) = true
•state = 'california' or state
='oregon'
Text functions
Table 22: Text functions for use in formulas
Function Description Examples
concat Returns the two values as a
concatenated text string.
•concat ( 'hay' , 'stack' ) =
'haystack'
•concat (last_name , first_name)
contains Returns true if the first string
contains the second string,
otherwise returns false.
•contains ('broomstick', 'room') =
true
•contains (product, 'trial
version')
edit_distance Accepts two text strings. Returns
the edit distance (minimum
number of operations required
•edit_distance ('attorney',
'atty') = 4

Reference guide
User Guide Copyright © 2016 by ThoughtSpot. All Rights Reserved. 179
Function Description Examples
to transform one string into the
other) as an integer. Works with
strings under 1023 characters.
•edit_distance (color, 'red')
edit_distance_with_capAccepts two text strings and
an integer to specify the upper
limit cap for the edit distance
(minimum number of operations
required to transform one
string into the other). If the edit
distance is less than or equal to
the specified cap, returns the
edit distance. If it is higher than
the cap, returns the cap plus 1.
Works with strings under 1023
characters.
•edit_distance_with_cap ('pokemon
go', 'minecraft pixelmon', 3) = 4
•edit_distance_with_cap (event,
'burning man', 3)
similar_to Accepts a document text string
and a search text string. Returns
true if relevance score (0-100)
of the search string with respect
to the document is greater than
or equal to 20. Relevance is
based on edit distance, number
of words in the query, and length
of words in the query which are
present in the document.
•similar_to ('hello world', 'hello
swirl') = true
•similar_to (current team, drafted
by)
similarity Accepts a document text string
and a search text string. Returns
the relevance score (0-100) of
the search string with respect
to the document. Relevance is
based on edit distance, number
of words in the query, and length
of words in the query which are
present in the document. If the
•similarity ('where is the burning
man concert', 'burning man') = 46
•similarity (tweet1, tweet2)
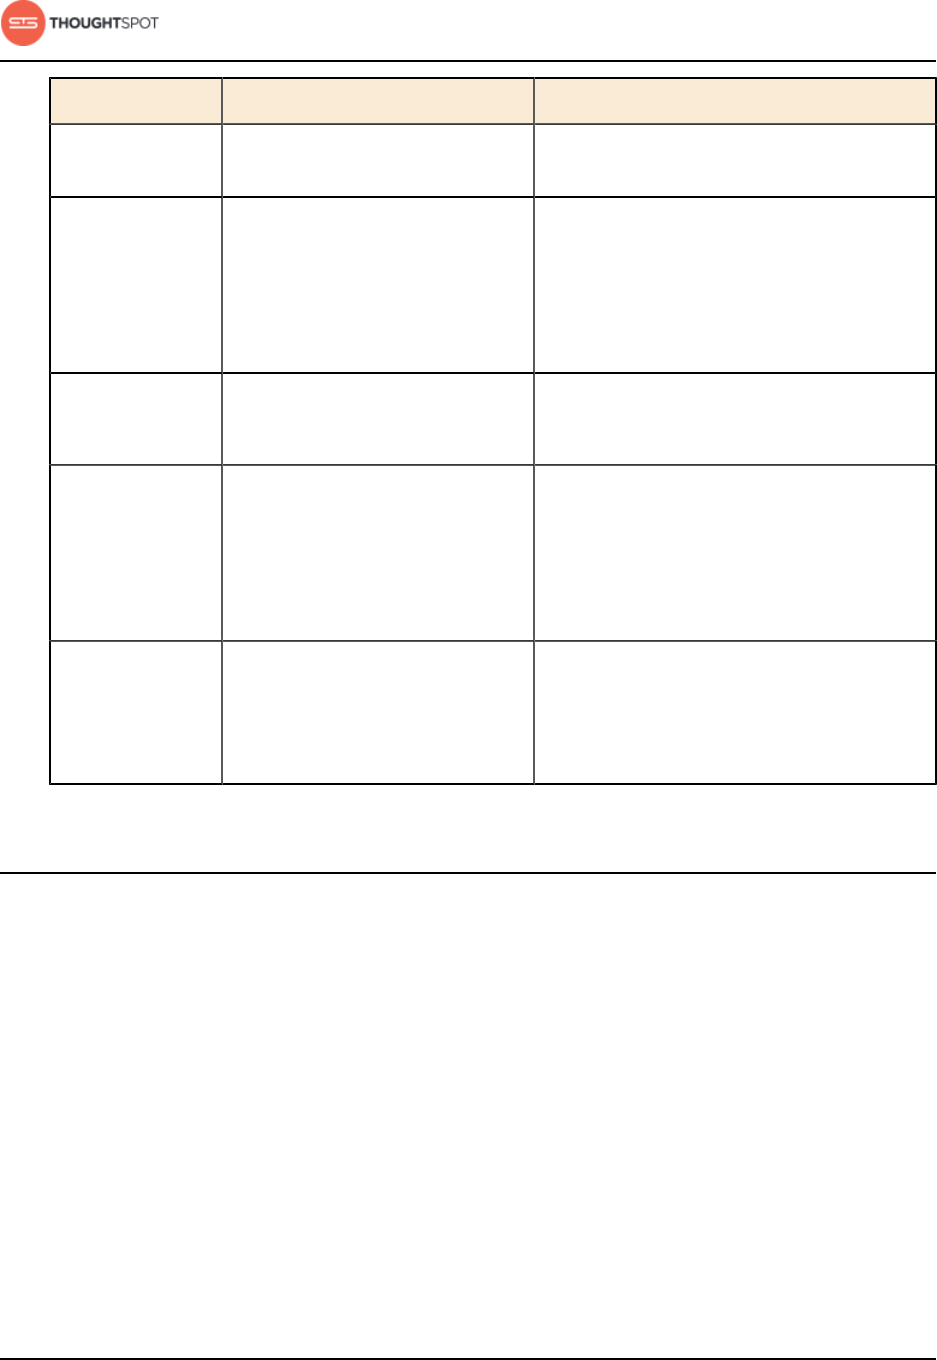
Reference guide
User Guide Copyright © 2016 by ThoughtSpot. All Rights Reserved. 180
Function Description Examples
two strings are an exact match,
returns 100.
spells_like Accepts two text strings.
Returns true if they are spelled
similarly and false if they are not.
Works with strings under 1023
characters.
•spells_like ('thouhgtspot',
'thoughtspot') = true
•spells_like (studio, distributor)
strlen Returns the length of the text. •strlen ('smith') = 5
•strlen (lastname)
strpos Returns the numeric position
(starting from 0) of the first
occurrence of the second string
in the first string, or -1 if not
found.
•strpos ('haystack_with_needles',
'needle') = 14
•strpos (complaint, 'lawyer')
substr Returns the portion of the given
string, beginning at the location
specified (starting from 0), and
of the given length.
•substr ('persnickety', 3, 7) =
snicket
•substr (lastname, 0, 5)
Date and time formats reference
This is a list of all the date and time formats you can load into ThoughtSpot,
whether using data upload from the browser or tsload.
Using ThoughtSpot Loader
For date data types, the default format is yearmonthday e.g. "Dec 30th, 2001"
and is represented as 20011230. Use the date format specifications supported in
the strptime library function.
For time and datetime data types, the default is yearmonthday
hour:minute:second e.g. Dec 30th, 2001 1:15:12 and is represented as 20011230

Reference guide
User Guide Copyright © 2016 by ThoughtSpot. All Rights Reserved. 181
01:15:12. Use the datetime format specifications supported in the strptime library
function.
Using data upload from a browser
These date and time formats are supported in an Excel or CSV file when
uploading via the browser:
• 1/30/2014
• 2014-01-30
• 2014-1-9
• 30-Jan-2014
• 2014-Jan-13
• 2014-01-30 10:32 AM
• 2014-01-30 14:52
• 2014-01-30 10:32:22
• 2014-01-30 10:32:22 AM
• 2014-01-30 10:32:22.0
• 2014-01-30 10:32:22.0 AM
• 2014-01-30 10:32:22.000
• 2014-01-30 10:32:22.000 AM
• 1/9/2014
• 30-Jan-14
• 01-Mar-02 (assumes 2002)
• 3/1/2002 10:32 AM
• 3/1/2002 14:52
• 3/1/2002 10:32:22
• 3/1/2002 10:32:22 AM
• 3/1/2002 10:32:22.0
• 3/1/2002 10:32:22.0 AM

Reference guide
User Guide Copyright © 2016 by ThoughtSpot. All Rights Reserved. 182
• 3/1/2002 10:32:22.000
• 3/1/2002 10:32:22.000 AM
• 30-Jan-14 10:32 AM
• 30-Jan-14 14:52
• 30-Jan-14 10:32:22
• 30-Jan-14 10:32:22 AM
• 30-Jan-14 10:32:22.0
• 30-Jan-14 10:32:22.0 AM
• 30-Jan-14 10:32:22.000
• 30-Jan-14 10:32:22.000 AM
• Fri Oct 04 2013 3:26 PM
• Fri Oct 04 2013 13:46
• Fri Oct 04 2013 10:32:22
• Fri Oct 04 2013 10:32:22 AM
• Fri Oct 04 2013 10:32:22.0
• Fri Oct 04 2013 10:32:22.0 AM
• Fri Oct 04 2013 10:32:22.000
• Fri Oct 04 2013 10:32:22.000 AM
• 14:52
• 10:32 AM
• 10:32:22
• 10:32:22 AM
• 10:32:22.0
• 10:32:22.000
• 10:32:22.0 AM
• 10:32:22.000 AM
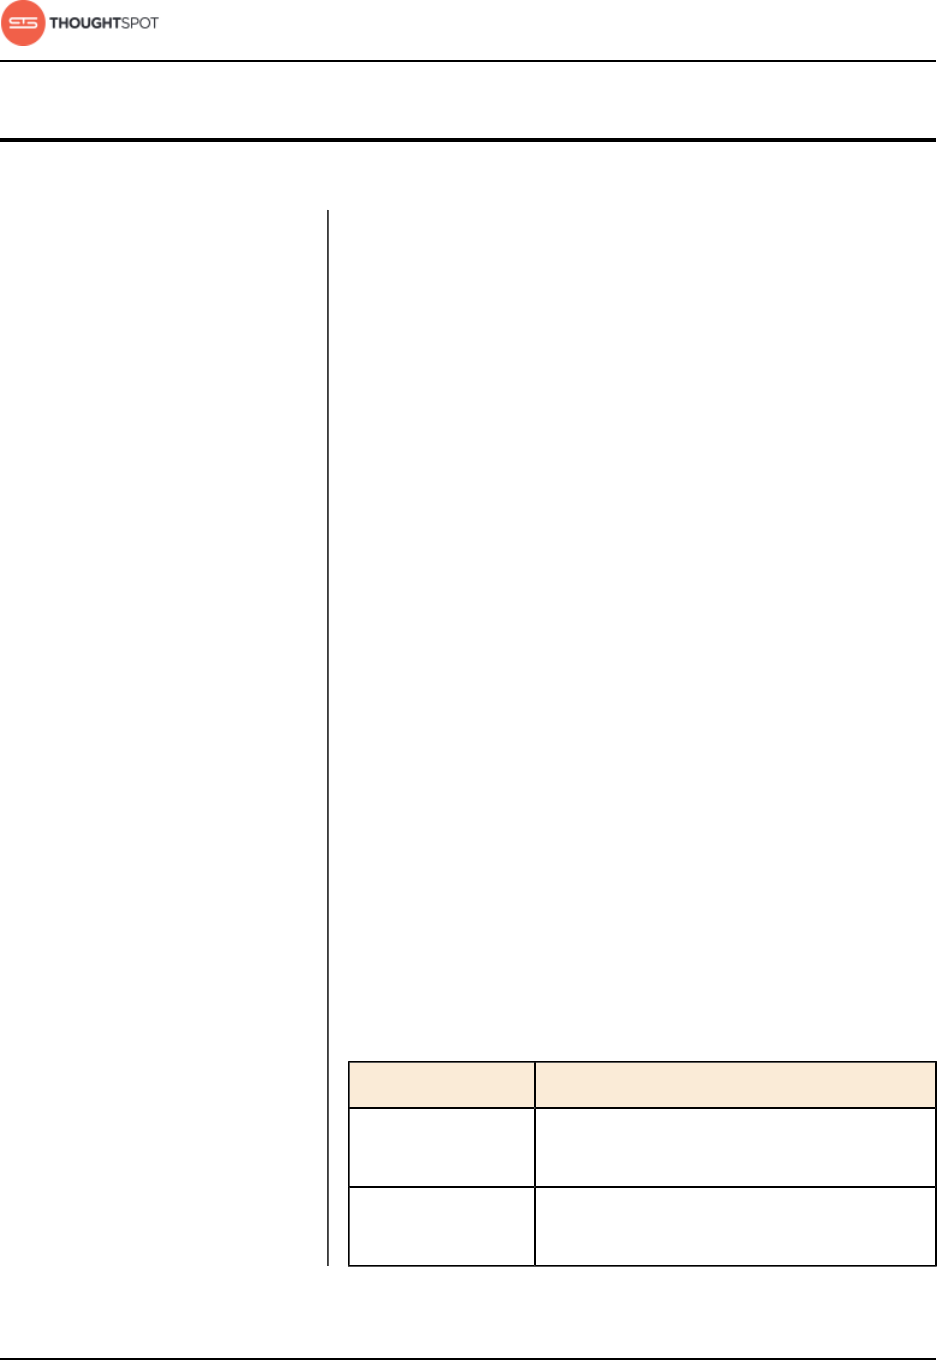
User Guide Copyright © 2016 by ThoughtSpot. All Rights Reserved. 183
Chapter 8: Contact ThoughtSpot
Contact ThoughtSpot
You can contact ThoughtSpot by phone, mail, email,
or by filing a support ticket.
File a support ticket
If you encounter a technical issue, file a support ticket
using the Support Portal ticket filing system at:
http://support.thoughtspot.com/
Please provide as much detail as possible about your
issue, to help us resolve it quickly.
You need a Support Portal login to file a ticket. Please
contact ThoughtSpot to get an account, if necessary.
Address
ThoughtSpot, Inc.
1 Palo Alto Square, Building 1, Suite 200
Palo Alto, CA 94306
Phone numbers
Table 23: Phone numbers
Phone Number Description
1-800-508-7008
ext 1
ThoughtSpot Support
1-800-508-7008 Toll free number for ThoughtSpot
headquarters.
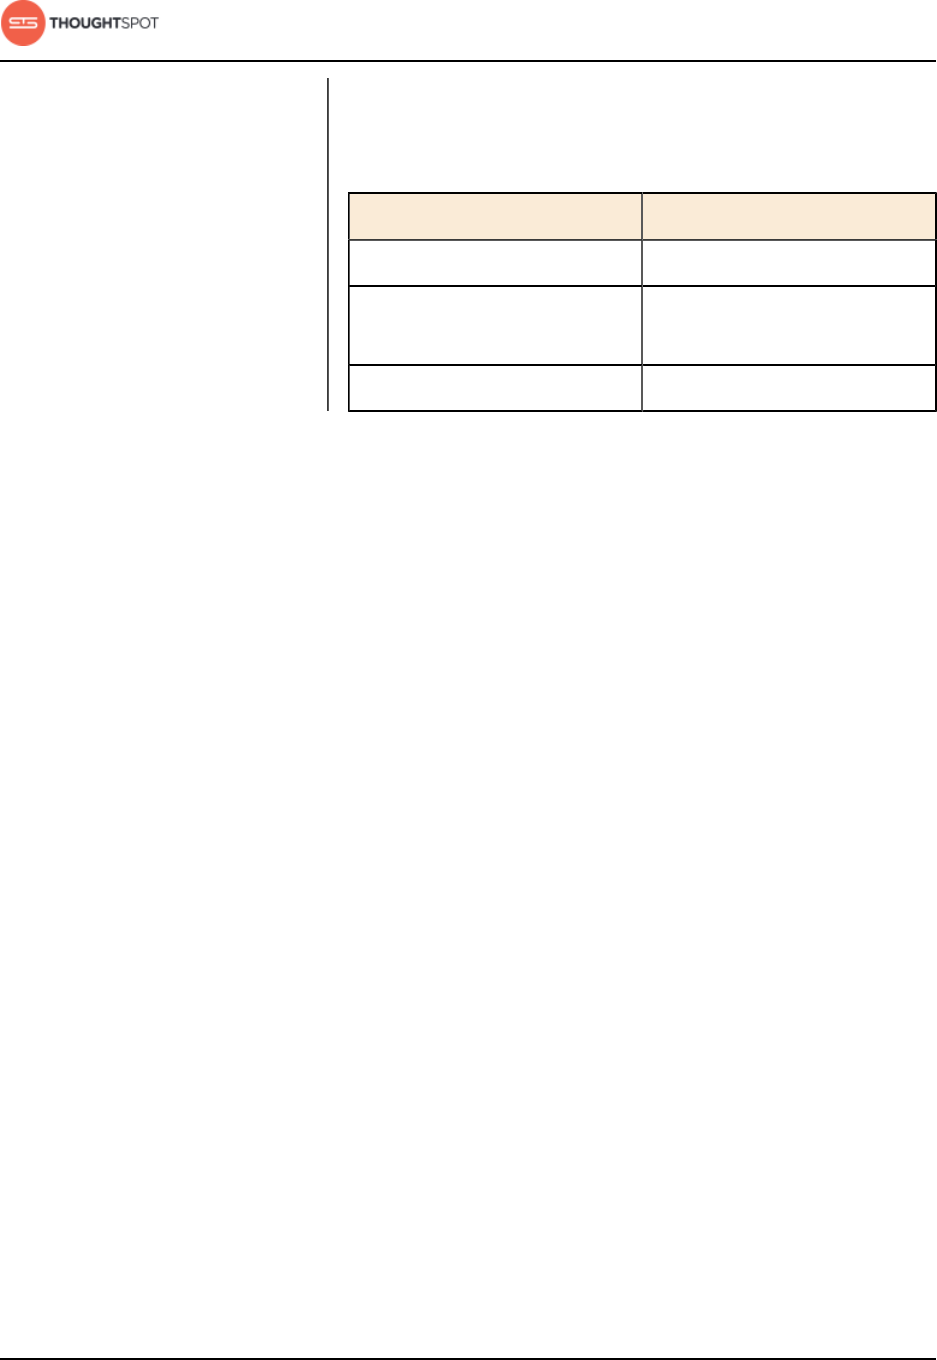
Contact ThoughtSpot
User Guide Copyright © 2016 by ThoughtSpot. All Rights Reserved. 184
Email
Table 24: Email addresses
Reason for contacting Email
For sales inquiries. sales@thoughtspot.com
For customer support and
software update inquiries.
support@thoughtspot.com
For other inquiries. hello@thoughtspot.com

User Guide Copyright © 2016 by ThoughtSpot. All Rights Reserved. 185
Chapter 9: Copyright
Copyright
Copyright for ThoughtSpot publications.
©2016 ThoughtSpot, Inc. All rights reserved.
ThoughtSpot, Inc. 1 Palo Alto Square, Building 1, Suite
200, Palo Alto, CA 94306
All rights reserved. This product is protected by U.S.
and international copyright and intellectual property
laws. ThoughtSpot is a trademark of ThoughtSpot,
Inc. in the United States and/or other jurisdictions.
All other marks and names mentioned herein may be
trademarks of their respective companies.
