Visual Studio Performance Ing Quick Reference Guide
User Manual: Pdf
Open the PDF directly: View PDF ![]() .
.
Page Count: 153 [warning: Documents this large are best viewed by clicking the View PDF Link!]
Visual Studio Performance Testing Quick Reference Guide Page 1
MICROSOFT
Visual Studio Performance
Testing Quick Reference
Guide
A quick reference for users of the Team Testing
performance features of Visual Studio
Visual Studio Performance Testing Quick Reference Guide
4/1/2010
VSTS Rangers
This content was created by Geoff Gray
mission is to accelerate the adoption of Visual Studio by delivering out of band solutions for
missing features or guidance. We work closely with members of Microsoft Services to make sure
-- Bijan Javidi, VSTS Rangers Lead

Visual Studio Performance Testing Quick Reference Guide Page 2
Summary
This document is a collection of items from public blog sites, Microsoft® internal discussion aliases
(sanitized) and experiences from various Test Consultants in the Microsoft Services Labs. The idea is to
provide quick reference points around various aspects of Microsoft Visual Studio® performance testing
features that may not be covered in core documentation, or may not be easily understood. The different
types of information cover:
How does this feature work under the covers?
How can I implement a workaround for this missing feature?
This is a known bug and here is a fix or workaround.
How do I troubleshoot issues I am having?
The document contains two Tables of Contents (high level overview, and list of every topic covered) as
well as an index. The current plan is to update the document on a regular basis as new information is
found.
The information contained in this document represents the current view of Microsoft Corporation
on the issues discussed as of the date of publication. Because Microsoft must respond to changing
market conditions, it should not be interpreted to be a commitment on the part of Microsoft, and
Microsoft cannot guarantee the accuracy of any information presented after the date of
publication.
This document is for informational purposes only. MICROSOFT MAKES NO WARRANTIES, EXPRESS,
IMPLIED OR STATUTORY, AS TO THE INFORMATION IN THIS DOCUMENT.
Microsoft grants you a license to this document under the terms of the Creative Commons
Attribution 3.0 License. All other rights are reserved.
2010 Microsoft Corporation.
Microsoft, Active Directory, Excel, Internet Explorer, SQL Server, Visual Studio, and Windows are
trademarks of the Microsoft group of companies.
All other trademarks are property of their respective owners.

Visual Studio Performance Testing Quick Reference Guide Page 3
Revision History
Version 2.0
o Released 2/16/09
o Available externally on CodePlex
o Major reformat of document
o Added comprehensive index
Version 3.0
o Release Candidate published 3/23/2010
o Added many VS 2010 performance testing articles
o Added and updated articles about VS 2010 how-
o
o Updated many articles on issues with VS 2008
o Added some deep dive articles about how VS performance testing works (both 2008 and
2010)
Version 3.0a
o Final release version for 3.0. This is the official release that should be used.
o Published on 4/1/2010
NOTE
All items that are not marked with a version note should be considered to apply to both VS 2008 and VS 2010

Visual Studio Performance Testing Quick Reference Guide Page 4
List of Topics
NOTE FROM THE AUTHOR 8
HOW IT WORKS 9
How Web Tests Handle HTTP Headers 9
General Info (including order of execution) of load and web test plugins and rules 9
Client Code does not execute because Web Tests Work at the HTTP Layer 12
File Downloads, Download Size and Storage of files during Web Tests 12
12
12
Test timeout setting for load test configuration does not affect web tests 13
Between Test Iterations 13
Load test warmup and cool down behaviors 13
What is the difference between Unique, Sequential and Random Data Sources 14
Comparing new users to return users 14
Goal based user behavior after the test finishes the warmup period 17
Threading models in Unit tests under load 18
Simulation of Browser Caching during load tests 19
The difference between Load Test Errors and Error Details 20
How parameterization of HIDDEN Fields works in a webtest 21
Testing execution order in Unit Tests 23
How machines in the test rig communicate 25
Changing the Default Port for Agent-Controller Communication 26
How to Add Agents To A Test Rig 26
ITEMS NEW TO VS 2010 27
27
28
Recorder Log Available 29
Add extraction rule directly from the playback UI 30
31
LoadTestResultsTables now differentiate between GET and POST requests 32
Virtual user visualization now available 33
New Excel reporting features built into load test results 39
New Load Test and Load Test Rig Licensing and configurations 40
Test Mix 44
Query String and FORM POST URLs get parameterized 46
New options on Load Test Scenarios 47
Loops and Conditionals 48
CONFIGURATIONS AND SETTINGS 50
How to Change the Location Where Agents Store Run Files 50
How to set a proxy server for web tests 50
How to configure Web Tests so Fiddler can capture playback info 50

Visual Studio Performance Testing Quick Reference Guide Page 5
Controlling the amount of memory that the SQL Server Results machine consumes 51
How to configure the timeouts for deployment of load tests to agents 51
How to set the number of Load Test Errors and Error Details saved 52
Multi-proc boxes used as agents should have .NET garbage collection set to server mode 53
Location of list of all agents available to a controller 53
NETWORKS, IP SWITCHING, TEST STARTUPS 54
IP Address Switching anatomy (how it works) 54
Gotcha: IP Address Switching is ONLY for WEB TESTS 54
Gotcha: IP Addresses used for switching are not permanent 54
How to Setup IP Switching 55
Troubleshooting invalid view state and failed event validation 58
Startup: Slowness Restarting a Test Rig 58
Startup: Multiple Network Cards can cause tests in a rig to not start 59
Startup: Slow startup can be caused by _NT_SYMBOL_PATH environment variable 59
Startup: tests on a Rig with Agents on a Slow Link 60
60
How to configure the timeout for deployment of load tests to agents 61
PERFORMANCE COUNTERS AND DATA 62
Customizing the Available Microsoft System Monitor counter sets 62
Performance Counter Considerations on Rigs with slow links 64
Increase the performance counter sampling interval for longer tests 65
Changing the default counters shown in the graphs during testing 65
65
How and where Performance data gets collected 66
DATA AND RESULTS 67
Custom Data Binding in UNIT Tests 67
Verifying saved results when a test hangs in the 67
The metrics during and after a test differ from the results seen. 68
How new users and return users affect caching numbers 69
data sources for data driven tests get read only once 70
Consider including Timing Details to collect percentile data 71
Consider enabling SQL Tracing through the Load Test instead of separately 72
How to collect SQL counters from a non-default SQL instance 72
How 90% and 95% response times are calculated 72
Transaction Avg. Response Time vs. Request Avg. Response Time 73
Considerations for the location of the Load Test Results Store 73
Set the recovery model for the database to simple 73
How to clean up results data from runs that did not complete 74
InstanceName field in results database are appended with (002), (003), etc. 74
Layout for VSTS Load Test Results Store 74
How to view Test Results from the GUI 75
SQL Server Reporting Services Reports available for download 75
How to move results data to another system 75
Load Test Results without SQL NOT stored 76

Visual Studio Performance Testing Quick Reference Guide Page 6
Unable to EXPORT from Load Test Repository 76
Web Test TRX file and the NAN (Not a Number) Page Time entry 77
Proper understanding of TRX files and Test Results directory 78
Understanding the Response Size reported in web test runs 79
ERRORS AND KNOWN ISSUES 80
CSV files created in VSTS or saved as Unicode will not work as data sources 80
Incorrect SQL field type can cause errors in web tests 80
Leading zeroes dropped from datasource values bound to a CSV file 80
Recorded Think Times and paused web test recordings 80
After opening a webtest with the VS XML Editor, it will not open in declarative mode. 81
Calls to HTTPS://Urs.Microsoft.Com show up in your script 81
Possible DESKTOP HEAP errors when driving command line unit tests 81
Goal based load tests in VSTS 2008 do not work after applying SP1 82
Using Named Transactions in a Goal-Based Load Profile can cause errors 82
Debugging Errors in Load Tests 83
Debugging OutOfMemory Exceptions in Load Tests 83
Memory leak on load test when using HTTPS 83
84
Detail Logging 85
Error details and stack traces no longer available in VSTS 2010 85
VSTS does not appear to be using more than one processor 85
Changes made to Web Test Plugins may not show up properly 85
86
87
Hidden Field extraction rules do not handle some fields 87
Test results iteration count may be higher than the max test iterations set 87
In flight test iterations may not get reported 88
Completion of Unit Test causes spawned CMD processes to terminate 88
Bug with LoadProfile.Copy() method when used in custom goal based load tests 89
Errors in dependent requests in a Load Test do not show up in the details test log 90
WCF service load test gets time-outs after 10 requests 92
Loadtestitemresults.dat size runs into GBs 92
TROUBLESHOOTING 93
How to enable logging for test recording 93
Diagnosing and fixing Web Test recorder bar issues 93
User Account requirements and how to troubleshoot authentication 94
How to enable Verbose Logging on an agent for troubleshooting 95
Error that Browser Extensions are disabled when recording a web test 95
Troubleshooting invalid view state and failed event validation 96
Troubleshooting the VSTS Load Testing IP Switching Feature 97
Troubleshooting Guide for Visual Studio Test Controller and Agent 99
HOW TO, GOTCHAS AND BEST PRACTICES 111
How to call one coded web test from another 111
How to use methods other than GET and POST in a web test 111

Visual Studio Performance Testing Quick Reference Guide Page 7
How to filter out certain dependent requests 111
How to handle ASP.NET Cookie-less Sessions 112
How to use Client-side certificates in web tests 112
-Modified-Since 113
How to handle custom data binding in web tests 113
How to add a datasource value to a context parameter 113
How to test Web Services with Unit Tests 114
How to add random users to web tests 114
How to add think time to a Unit Test 114
How to add details of a validation rule to your web test 115
How to mask a 404 error on a dependent request 116
How to parameterize Web Service calls within Web Tests 117
How to pass Load Test Context Parameters to Unit Tests 117
How to create Global Variables in a Unit Test 117
How to use Unit Tests to Drive Load with Command Line Apps 118
How to add Console Output to the results store when running Unit tests under load 118
How to add parameters to Load Tests 119
How to Change the Standard Deviation for a NormalDistribution ThinkTime 119
How to programmatically access the number of users in Load Tests 120
How to create a webtest plugin that will only execute on a predefined interval 120
How to support Context Parameters in a plug-in property 121
How to stop a web test in the middle of execution 122
How To: Modify the ServicePointManager to force SSLv3 instead of TLS (Default) 122
How To: Stop a Test in the PreRequest event 123
How to make a validation rule force a redirection to a new page 123
How to add a Web Service reference in a test project 127
How to remotely count connections to a process 129
How to hook into LoadTest database upon completion of a load test 129
How to deploy DLLs with MSTEST.EXE 130
How to authenticate with proxy before the test iteration begins 131
How to enumerate WebTextContext and Unit TestContext objects 132
How to manually move the data cursor 132
How to programmatically create a declarative web test 133
How to modify the string body programmatically in a declarative web test 134
Gotcha: Check Your Validation Level in the Load Test Run Settings 134
Gotcha: Do not adjust goals too quickly in your code 134
Gotcha: Response body capture limit is set to 1.5 MB by default 134
Gotcha: Caching of dependent requests is disabled when playing back Web Tests 135
Best Practice: Blog on various considerations for web tests running under load 135
Best Practice: Coded web tests and web test plug-ins should not block threads 135
Best Practice: considerations when creating a dynamic goal based load test plugin: 136
Best Practice: Add an Analysis Comment 136
Best Practice Using comments in declarative webtests 136
EXTENSIBILITY 138
New Inner-text and Select-tag rules published on Codeplex 138

Visual Studio Performance Testing Quick Reference Guide Page 8
How to Add Custom Tabs to the Playback UI 139
ITEMS NOT SPECIFIC TO THE VSTS TESTING PLATFORM 146
Using the VSTS Application Profiler 146
VSTS 2008 Application Profiler New Features 146
Using System.NET Tracing to debug Network issues 146
Logparser tips and tricks 147
Logparser WEB Queries 147
LogParser Non-Web Queries 148
OLDER ARTICLES 149
Content-Length header not available in Web Request Object 149
SharePoint file upload test may post the file twice 149
Some Hidden Fields are not parameterized within AJAX calls 149
(FIX) Unit Test threading models and changing them 149
Bug in VSTS 2008 SP1 causes think time for redirected requests to be ignored in a load test 150
New Load Test Plugin Enhancements in VSTS 2008 SP1 150
Four New Methods added to the WebTestPlugin Class for 2008 SP1 150
INDEX 151
Note from the author
This new version of the Quick Reference Guide has been rearranged to attempt to make things easier to
find. Many of the sub-topics have been removed and all of the main topics have been changed to reflect
actions or needs instead of the components of the tool.
There is a full section near the beginning just on new features in Visual Studio 2010. This list is not even
close to complete WRT all of the new Performance Testing features, let alone the tons of other testing
features in general. You will also find information about changes to 2010 and issues with 2010
throughout the rest of the document. All of these should have a balloon stating that it is new or
different.
Also please note that the Microsoft Visual Studio team has renamed the suite. Now the full suite (which
contains the load testing features
Thanks to all of the people who have contributed articles and information. I look forward to hearing
feedback as well as suggestions moving forward.
Sincerely,
Geoff Gray, Senior Test Consultant Microsoft Testing Services Labs
Visual Studio Performance Testing Quick Reference Guide Page 9
How It Works
How Web Tests Handle HTTP Headers
There are three different types of HTTP headers handled by Web tests:
1) Recorded Headers and headers explicitly added to the request. By default, the Web test
recorder only records these headers:
-microsoftajax
-Type
2) You can change the list of headers that the Visual Studio 2008 and 2010 web test recorder
records in the registry by using regedit to open:
HKEY_CURRENT_USER\Software\Microsoft\VisualStudio\9.0\EnterpriseTools\QualityTools\Web
LoadTest
Add a string value under this key with the name "RequestHeadersToRecord
value="SOAPAction;Pragma;x-microsoftajax;Content-Type; Referrer"
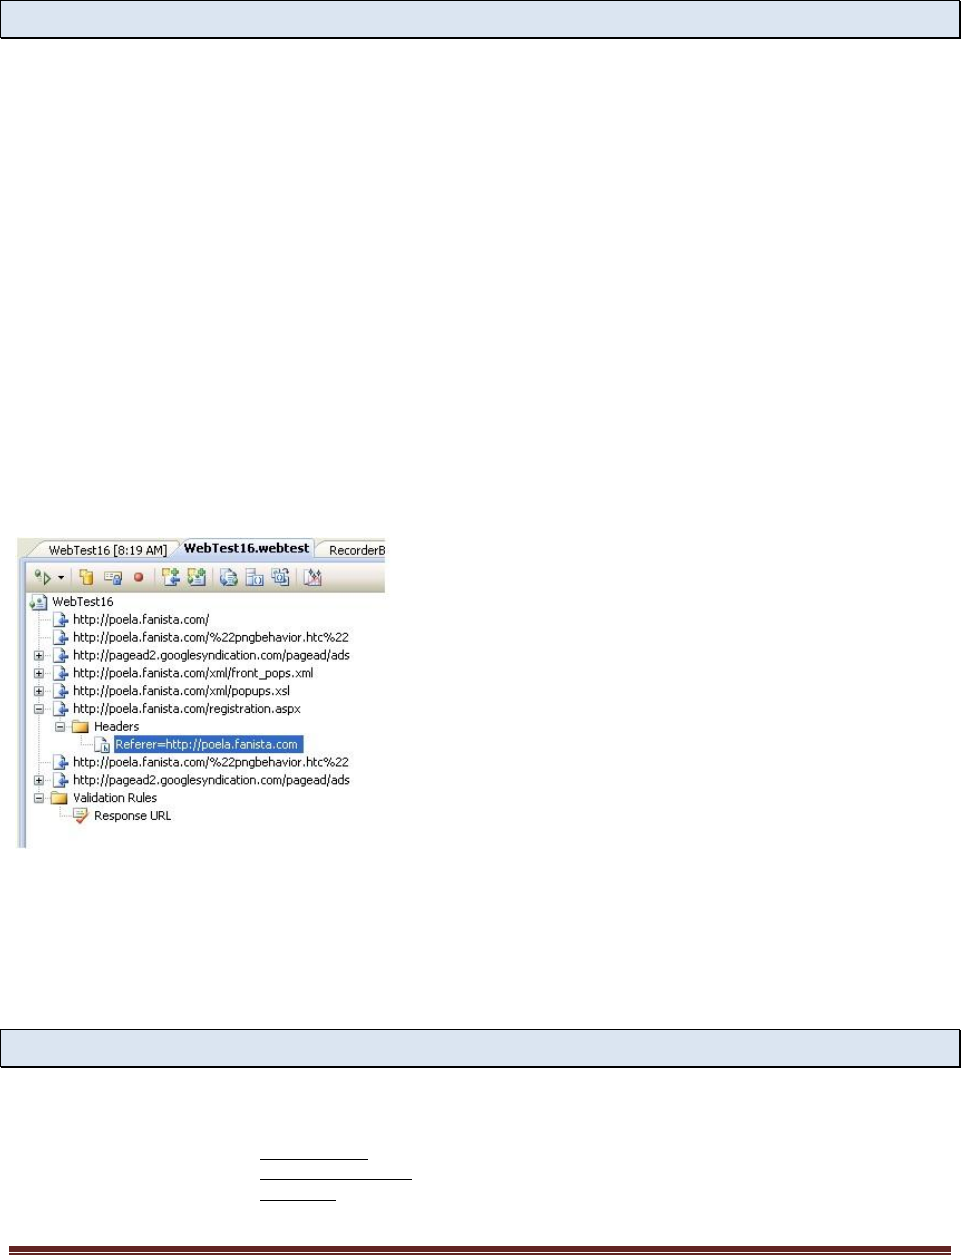
If you do this and re-record your Web test, the Referrer header should be included in the request like
this:
Referrer header in a declarative web test
3) Headers handled automatically by the engine. Two examples: 1) headers sent and received as
part of authentication. These headers are handled in the We
controlled by the test. 2) cookies, which can be controlled through the API.
General Info (including order of execution) of load and web test plugins and rules
WebTestPlugins get tied to a webtest at the main level of the test. The order of precedence is:
class WebTestPluginMethods : WebTestPlugin
{
public override void PreWebTest(object sender, PreWebTestEventArgs e) { }
public override void PreTransaction(object sender, PreTransactionEventArgs e) {}
public override void PrePage(object sender, PrePageEventArgs e) {}

Visual Studio Performance Testing Quick Reference Guide Page 10
public override void PreRequestDataBinding(object sender,
PreRequestDataBindingEventArgs e) {}
public override void PreRequest(object sender, PreRequestEventArgs e) {}
public override void PostRequest(object sender, PostRequestEventArgs e) {}
public override void PostPage(object sender, PostPageEventArgs e) {}
public override void PostTransaction(object sender, PostTransactionEventArgs e) { }
public override void PostWebTest(object sender, PostWebTestEventArgs e) { }
}
PreWebTest fires before the first request is sent.
PreTransaction is fired before all user defined transaction in the test.
PrePage fires before any explicit request in the webtest. It also fires before any
PreRequest method.
PreRequestDataBinding fires before data from the context has been bound into
the request. Gives an opportunity to change the data binding.
PreRequest fires before ALL requests made, including redirects and dependant
requests. If you want it to act on only redirects, or skip redirects. use the
e.Request.IsRedirectFollow property to handle code flow.
All Post<method> follow the exact opposite order as the Pre<method>
WebTestRequestPlugins get set at an individual request level and only operate on the request(s) they
are explicitly tied to, and all redirects/dependant requests of that request.
class WebTestRequestPluginMethods : WebTestRequestPlugin
{
public override void PreRequestDataBinding(object sender,
PreRequestDataBindingEventArgs e) {}
public override void PreRequest(object sender, PreRequestEventArgs e) { }
public override void PostRequest(object sender, PostRequestEventArgs e) { }
}
ValidationRules can be assigned at the request level and at the webtest level. If the rule is assigned at
the webtest level, it will fire after every request in the webtest. Otherwise it will fire after the request it
is assigned to.
public class ValidationRule1 : ValidationRule
{
public override void Validate(object sender, ValidationEventArgs e) { }
}
ExtractionRules can be assigned at the request level. It will fire after the request it is assigned to.
public class ExtractionRule1 : ExtractionRule
{
public override void Extract(object sender, ExtractionEventArgs e) { }
}
NOTE: If you have multiple items attached to a request, then the order of
precedence is:
1) PostRequest (request plugins fire before WebTestRequest plugins)
2) Extract
3) Validate

Visual Studio Performance Testing Quick Reference Guide Page 11
LoadTestPlugins get tied to the load tests directly. With VS 2005 and VS 2008, there can be only 1
plugin per loadtest, while VS 2010 adds >1 per test as well as LoadTestPlugin properties such that they
are consistent with WebTestPlugins. The methods available are divided into three categories as shown
below:
class LoadTestPlugins : ILoadTestPlugin
{
void LoadTest_LoadTestStarting(object sender, EventArgs e) { }
void LoadTest_LoadTestFinished(object sender, EventArgs e) { }
void LoadTest_LoadTestAborted(object sender, LoadTestAbortedEventArgs e) { }
void LoadTest_LoadTestWarmupComplete(object sender, EventArgs e) { }
void LoadTest_TestFinished(object sender, TestFinishedEventArgs e) { }
void LoadTest_TestSelected(object sender, TestSelectedEventArgs e) { }
void LoadTest_TestStarting(object sender, TestStartingEventArgs e) { }
void LoadTest_ThresholdExceeded(object sender, ThresholdExceededEventArgs e) { }
void LoadTest_Heartbeat(object sender, HeartbeatEventArgs e) { }
}
1) These fire based on the load test (meaning each one will fire only once during a full test run)
2) These fire once per test iteration, per vUser.
3) Heartbeat fires once every second, on every agent.
4) ThresholdExceeded fires each time a given counter threshold is exceeded.
NOTE: Each method in section 1 will fire once PER physical agent machine, however since the agent
machines are independent of each other, you do not need to worry about locking items to avoid
contention.
NOTE: If you create or populate a context parameter inside the LoadTest_TestStarting method, it will
not carry across to the next iteration.
In VSTS 2010, you can have more than one LoadTest plugin, although there is no guarantee about
the order in which they will execute.
You can now control whether a validation rule fires BEFORE or AFTER dependent requests.
at the end of recording a Web test, we now automatically add a Response Time Goal Validation rule
ch unless you click on the Toolbar button that lets you
edit the response time goal as well as Think Time and Reporting Name for the Page for all recorded
requests in a single grid
1
2
3
Changed in 2010
Visual Studio Performance Testing Quick Reference Guide Page 12
Client Code does not execute because Web Tests Work at the HTTP Layer
The following blog outlines where and how web tests work. This is important to understand if you are
wondering why client side code is not tested.
http://blogs.msdn.com/slumley/pages/web-tests-work-at-the-http-layer.aspx
File Downloads, Download Size and Storage of files during Web Tests
specify a location for the file.
It does read the entire response back to the client, but only stores the first 1.5M of the response in
memory
You can override that using the WebTestRequest.ResponseBodyCaptureLimit property in the
When is the “Run unit tests in application domain” needed?
When a unit test is run by itself, a separate application domain is created in the test process for each
unit test assembly. There is some overhead associated with marshalling tests and test results across the
application domain boundary. An app domain is created by default when running unit tests in a load
test. You can turn off the app domain using the load test run by
This provides some performance boost in terms of the
number of tests per second that the test process can execute before running out of CPU. The app
domain is required for unit tests that use an app.config file.
How the “Test Iterations” Setting impacts the total number of tests executed
VSTS how many tests iterations to run during a load test. This is a global setting, so if you choose to run
5 iterations and you have 10 vusers, you will get FIVE total passes, not fifty. NOTE: you must enable this
Visual Studio Performance Testing Quick Reference Guide Page 13
Test timeout setting for load test configuration does not affect web tests
-> Edit
menu) does not have an effect in all cases.
Uses the setting
o Running a single unit test, web test, ordered test, or generic test by itself
o Running any of the above types of tests in a test run started from Test View, the Test
List editor, or mstest.
o Tests running in a load test (except Web tests)
Does not use the setting
o Running a Web test in a load test
o The load test itself
This particular test timeout is enforced by the agent test execution code, but load test and Web test
execution are tightly coupled for performance reasons and when a load test executes a Web test, the
agent test execution code that enforces the test timeout setting is bypassed.
How user pacing and “Think Time Between Test Iterations” work
Between Test Iterationsscenario.
This value is applied when a user completes one test, then the think time delay is applied before the
user starts the next iteration. The setting applies to each iteration of each test in the scenario mix.
If you create a load test that has a tes
Between Test Iterations
Load test warmup and cool down behaviors
For information about how warmup and cooldown affect the results, see the next section.
Warmup:
When you set a warmup time for a load test, VSTS will start running test iterations with a single
user, and will ramp up to the proper initial user count over the duration of the warmup. The number
of users ramped up are as follows:
o Constant User Load the total number of users listed
o Step Load Pattern the initial user count. The test will ramp from this number to the
maximum number of users during the actual test run.
Cool down:
In 2008
The Load test Terminate method does not fire unless you use a cool down period.
In 2010
The Load test Terminate method always fires.
Changed in 2010
Visual Studio Performance Testing Quick Reference Guide Page 14
What is the difference between Unique, Sequential and Random Data Sources
Single Machine running tests
Sequential This is the default and tells the web test to start with the first row then fetch rows in order
from the data source. When it reaches the end of the data source, loop back to the beginning and start
again. Continue until the load test completes. In a load test, the current row is kept for each data source
in each web test, not for each user. When any user starts an iteration with a given Web test, they are
given the next row of data and then the cursor is advanced.
Random This indicates to choose rows at random. Continue until the load test completes.
Unique This indicates to start with the first row and fetch rows in order. Once every row is used, stop
the web test. If this is the only web test in the load test, then the load test will stop.
Multiple machines running as a rig
Sequential This works that same as if you are on one machine. Each agent receives a full copy of the
data and each starts with row 1 in the data source. Then each agent will run through each row in the
data source and continue looping until the load test completes.
Random This also works the same as if you run the test on one machine. Each agent will receive a full
copy of the data source and randomly select rows.
Unique This one works a little differently. Each row in the data source will be used once. So if you
have 3 agents, the data will be spread across the 3 agents and no row will be used more than once. As
with one machine, once every row is used, the web test will stop executing.
Comparing new users to return users
There is a property in the Load Test Scenario
impact on a few different aspects of the load test execution. The percentage is a measure of how many
to be
A better term to describe a new user is “One Time User”. This is because a new user goes away at
the end of its iteration. It does not “replace” a different user in the pool. Therefore, the term “New
User” should be considered to be a “One Time” user.

Visual Studio Performance Testing Quick Reference Guide Page 15
are Web tests or unit tests:
The value of the LoadTestUserId in the LoadTestUserContext object. This only matters for unit
tests and coded Web tests that use this property in their code. On the other hand if you set
the number of test iterations equal to the user load, then you should get a different
(until the load test completes), and then the TerminateTest runs (which might be during the
cool-down period).
w UsersWeb test features that are not applicable for unit
tests:
The simulation of browser caching. The option affects how the VUser virtual browser cache is
maintained between iterations of Tests.
f this value is
100% all Vusers starting a Test will be starting with an empty browser cache. If this value is 0%
all VUsers will maintain the state of the browser cache between iterations of Web Tests. This
setting affects the amount of content that is downloaded. If an object sits in a Vuser cache and if
the object has not been modified since the last time the Vuser downloaded it, the object will not
be downloaded. Therefore, new users will download more content versus returning users with
items it their browser cache.
The handling of cookie for a Web test virtual user: new users always start running a Web test
one run, the cookies set during previous Web tests for that virtual user are present.
Visual Studio Performance Testing Quick Reference Guide Page 16
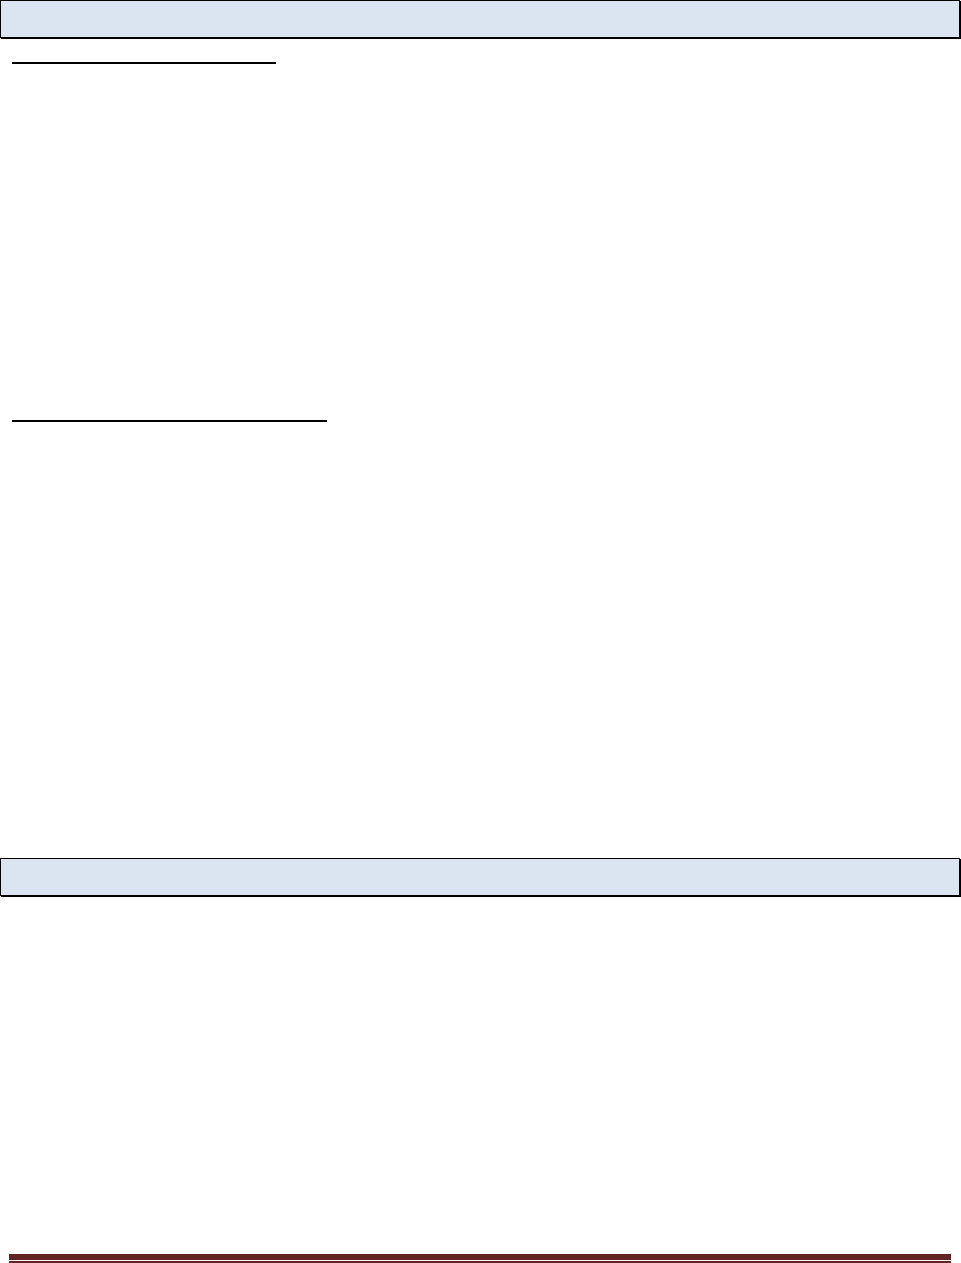
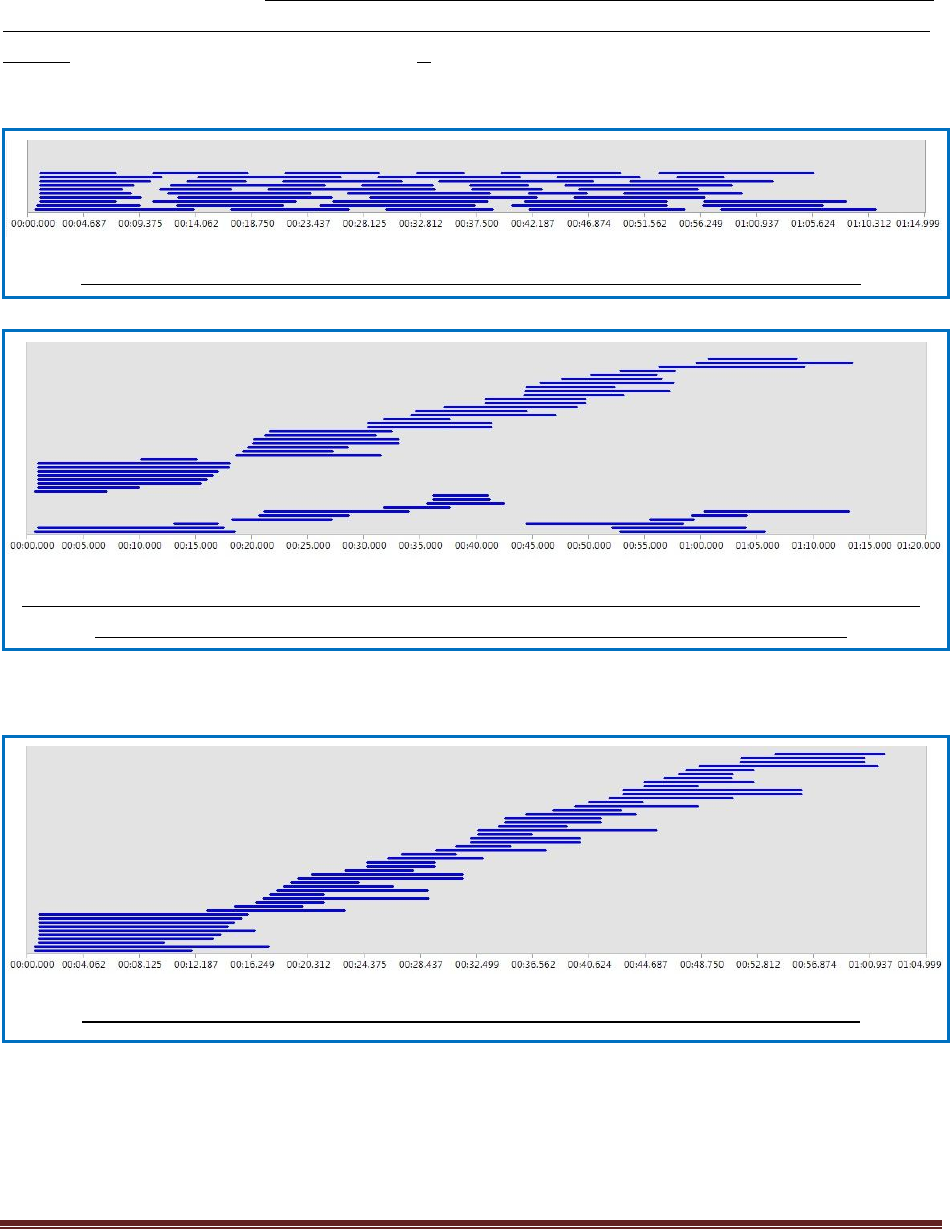
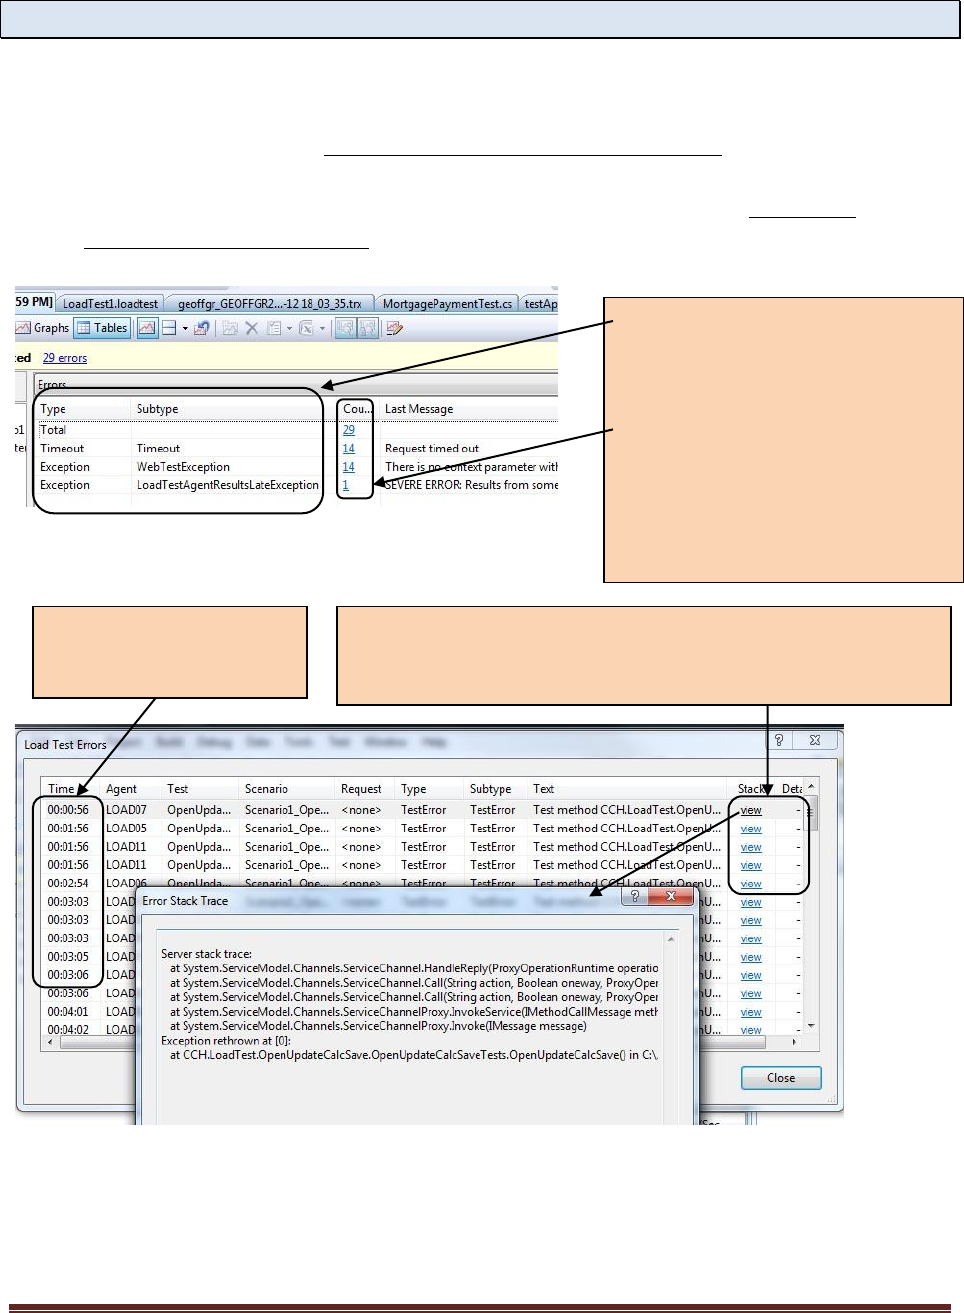
The below graphs (taken from test runs in VSTS 2010) demonstrate the difference between a new user
and a return user. The graphs are based on a 10 user / 50 iteration run, but with different percentages
NOTE: The graphs below are new to VSTS 2010, but the way in which users
are simulated is the same as in VSTS 2008. For a better understanding of these graphs, go to the section
Virtual user visualization now available
Zero percent new users shows a graph where each of the 10 vusers is constantly reused.
Fifty percent new users shows a graph where each of the 10 vusers is constantly reused by half of the
iterations, but the other half are split out among new vusers which never get reused.
One hundred percent new users shows a graph where none of the vusers is ever reused.

Visual Studio Performance Testing Quick Reference Guide Page 17
Goal based user behavior after the test finishes the warmup period
1. The user load starts at the value specified by the Initial User Count property of the Goal Based
Load Pattern.
2.
Rate defined in the goal based
load remains the same.)
3.
Range for Performance Counter
4.
same.
5. If the value is not within the boundaries of t
adjusted as follows:
The midpoint of the target range for the goal is divided by the sample valued for the goal
performance counter
For exam
is 60. If the sampled value for % Processor Time is 40, then AdjustmentFactor = 60/40 =
1.5, or if the sampled value is 80, the AdjustmentFactor = 60/80 = 0.75.
The AdjustmentFactor is multiplied by the current user load to get the new user load.
However, if the difference between the new user load and the current user load is greater
applies), then the
user load is only adjusted by as much as max increase/decrease property. My experience
has been that keeping these values fairly small is a good idea; otherwise the algorithm tends
to cause too much fluctuation (the perf counter keeps going above and below the target
range).
MaximumUserCount property or less than the Minimum User Count property.
Two more considerations based on special properties of the goal based load pattern:
o
use for example for a performance count such as Memory\Available Mbytes), then
the user load is adjusted in the opposite direction: the user load is decreased when
the sampled counter value is less than the Low End of the target range and
increased when the user load is greater than the High End of the target range.
o
the sampled goal performance counter is within the target range for 3 consecutive
sampling intervals, then the user load is no longer adjusted and remains constant
for the remainder of the load test.
Lastly, as is true for all of the user load patterns, in a test rig with multiple agents, the new

Visual Studio Performance Testing Quick Reference Guide Page 18
Threading models in Unit tests under load
When running unit tests in a load test, there is one thread for each virtual user that is currently running
a unit
on a separate thread to ensure that a thread will be available to start the next unit test without delay.
However, if you specify the Test Mix Based on User Pace feature (or specify a non-
Time Between Test Iterationsoad test)), then the number of
concurrent virtual users is less than the total number of virtual users, and there is only one thread
needed in the thread pool for each concurrent virtual user.
There is an extra thread for each unit test execution thread that is used to monitor the execution of the
unit test, implement timing out of the test, etc. However, the stack size for this thread is smaller than
the default size so it should take up less memory.
More information can be found at: http://blogs.msdn.com/billbar/pages/features-and-behavior-of-load-
tests-containing-unit-tests-in-vsts-2008.aspx

Visual Studio Performance Testing Quick Reference Guide Page 19
Simulation of Browser Caching during load tests
In a VSTS load test that contains Web tests, the load test attempts to simulate the caching behavior of
the browser. Here are some notes on how that is done:
There is a property named on each request in a Web Control
object in the API used by coded Web
tests).
When the Cache Control property on a request in the Web test is false, the request is always
issued.
When the Cache Control property is true, the VSTS load test runtime code attempts to emulate
the Internet Explorer
and following the HTTP cache control directives.
The Cache Control property is automatically set to true for all dependent requests (typically for
images, style sheets, etc embedded on the page).
In a load test, the browser caching behavior is simulated separately for each user running in the
load test.
When a virtual user in a load test completes a Web test and a new Web test session is started to
a clean cache, and sometimes the load test simulates a return user that has items cached from a
previous session.
Scenario in the load test. The default .
Important Note: When running a Web test by itself (outside of the load test), the Cache Control
property is automatically set to false for all dependent requests so they are always fetched; this is so
that they can be displayed in the browser pane of the Web test results viewer without broken images.
Visual Studio Performance Testing Quick Reference Guide Page 20
The difference between Load Test Errors and Error Details
There's a distinction between "Errors" and "Error Details" within Load Test results.
1. Load Test Errors
user/requestURI/error text information. By default the load test results will save only 1000
errors of a particular type. This value is configured through a config file.
2. "Load Test Error Details" refers to the additional detail we capture for errors on Web test
requests: mostly the request and response body. The default value is 100. This value is
configured in the Load Test GUI.
This is the display of the Errors table in the test results viewer.
Each of these is a separate type of
error and gets its own quantity of
the Count column. Clicking on one
of the numbers will bring up the
Load Test Errors dialog below. There
Each line here is one of the
have a link in one or both of the last columns. Click on these to
get the details about that specific error instance.

Visual Studio Performance Testing Quick Reference Guide Page 21
How parameterization of HIDDEN Fields works in a webtest
For each extract items
with the same name will be removed prior to extracting the new values. So if request 1 extracts 4
to a context
extracted for request 2.
“Hidden Field Buckets”
In the example above, Hidden1 and Hidden2 represent hidden field buckets. We call the number at the
end as the bucket number, e.g. $HIDDEN0 is bucket 0.
The easiest example to explain is a frames page with two frames. Each frame will have an independent
bucket, and requests can be interleaved across the frames. Other examples that require multiple
buckets are popup windows and certain AJAX calls (since web tests support correlation of viewstate in
ASP.NET AJAX responses).
Hidden field matching
The algorithm to determine that a given request matches a particular bucket uses the heuristic that the
hidden fields parsed out of the response will match form post fields on a subsequent request.
E.g. if the recorder parses out of a response
<INPUT type=hidden ID=Field1 value=v1>
<INPUT type=hidden ID=Field2 value=v2>
Then on a subsequent post we see Field1 and Field2 posted, then this request and response match and a
hidden field bucket will be created for them. The first available bucket number is assigned to the hidden
field bucket.
by a subsequent request via binding, that bucket is made available again.
So if the test has a single frame, it will always reuse bucket 0:
Page 1
o Extract bucket 0
Page 2
o Bind bucket 0 params
Page 3
o Extract bucket 0
Page 4
o Bind bucket 0 params
If a test has 2 frames that interleave requests, it will use two buckets:

Visual Studio Performance Testing Quick Reference Guide Page 22
Frame 1, Page 1
o Extract bucket 0
Frame 2, Page 1
o Extract bucket 1
Frame 2, Page 2
o Bind bucket 1 params
Frame 1, Page 2
o Bind bucket 0 params
Or if a test uses a popup window, or Viewstate, you would see a similar pattern as the frames page
where multiple buckets are used to keep the window state.
Why are some fields unbound?
Some hidden fields values are modified in java script, such as
work to simply extract the value from the hidden field in the response and play it back. If the recorder
detects this is the case, it put the actual value that was posted back as the form post parameter value
rather than binding it to the hidden field.
A single page will have have just one hidden field extraction rule applied. If there are multiple forms on a
given page, there is still just one down-stream post of form fields, resulting in one application of the
hidden field extraction rule.

Visual Studio Performance Testing Quick Reference Guide Page 23
Testing execution order in Unit Tests
to execute like the Nunit
framework. They execute differently since Nunit instantiates a test class only once when executing all
execution process, with each instantiation occurring on a separate thread. This design affects 3 specific
things which often confuse users of MSTest:
1. ClassInitialize and ClassCleanup: Since ClassInitialize and ClassCleanUp are static, they are only
executed once even though several instances of a test class can be created by MSTest.
ClassInitialize executes in the instance of the test class corresponding to the first test method in
the test class. Similarly, MSTest executes ClassCleanUp in the instance of the test class
corresponding to the last test method in the test class.
2. Execution Interleaving: Since each instance of the test class is instantiated separately on a
different thread, there are no guarantees regarding the order of execution of unit tests in a
single class, or across classes. The execution of tests may be interleaved across classes, and
potentially even assemblies, depending on how you chose to execute your tests. The key thing
here is all tests could be executed in any order, it is totally undefined.
3. TextContext Instances: TestContexts are different for each test method, with no sharing
between test methods.
For example, if we have a Test Class:
[TestClass]
public class VSTSClass1
{
private TestContext testContextInstance;
public TestContext TestContext
{
get
{
return testContextInstance;
}
set
{
testContextInstance = value;
}
}
[ClassInitialize]
public static void ClassSetup(TestContext a)
{
Console.WriteLine("Class Setup");
}
[TestInitialize]
public void TestInit()
{
Console.WriteLine("Test Init");
}

Visual Studio Performance Testing Quick Reference Guide Page 24
[TestMethod]
public void Test1()
{
Console.WriteLine("Test1");
}
[TestMethod]
public void Test2()
{
Console.WriteLine("Test2");
}
[TestMethod]
public void Test3()
{
Console.WriteLine("Test3");
}
[TestCleanup]
public void TestCleanUp()
{
Console.WriteLine("TestCleanUp");
}
[ClassCleanup]
public static void ClassCleanUp ()
{
Console.WriteLine("ClassCleanUp");
}
}
(This consists of 3 Test Methods, ClassInitialize, ClassCleanup, TestInitialize, TestCleanUp and an explicit
declaration of TestContext)
The execution order would be as follows:
Test1 [Thread 1]: new TestContext -> ClassInitialize -> TestInitialize -> TestMethod1 ->
TestCleanUp
Test2 [Thread 2]: new TestContext -> TestInitialize -> TestMethod2 -> TestCleanUp
Test3 [Thread 3]: new TestContext -> TestInitialize -> TestMethod2 -> TestCleanUp ->
ClassCleanUp
The output after running all the tests in the class would be:
Class Setup
Test Init
Test1
TestCleanUp
Test Init
Test2
TestCleanUp
Test Init
Test3
TestCleanUp
ClassCleanUp
Visual Studio Performance Testing Quick Reference Guide Page 25
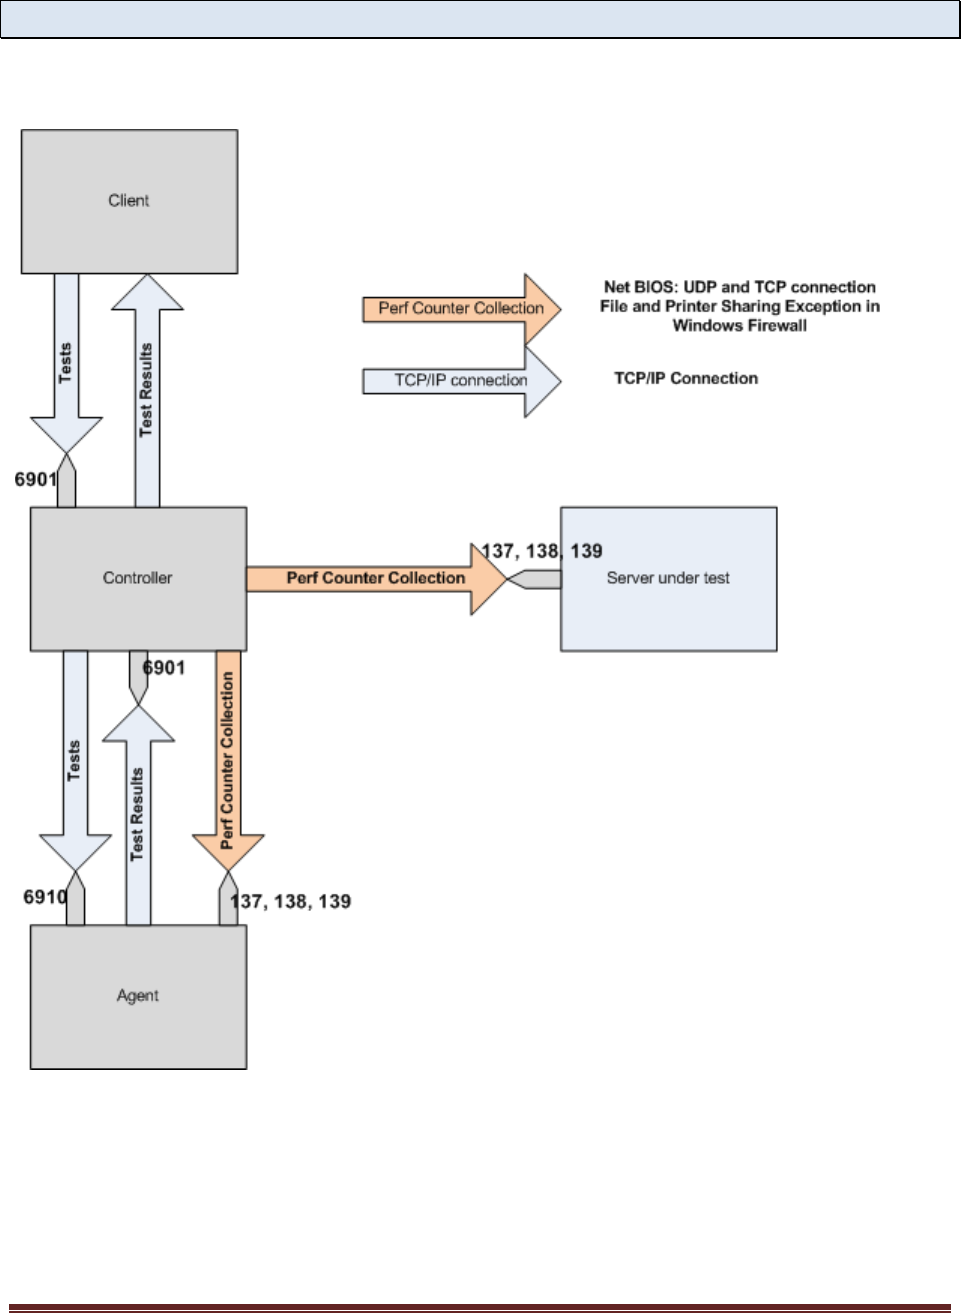
How machines in the test rig communicate
The below Visio diagrams that shows which ports are used during setup and when the agent and
controller run tests.
Controller-Agent Communications
And here are the connections used during agent setup:
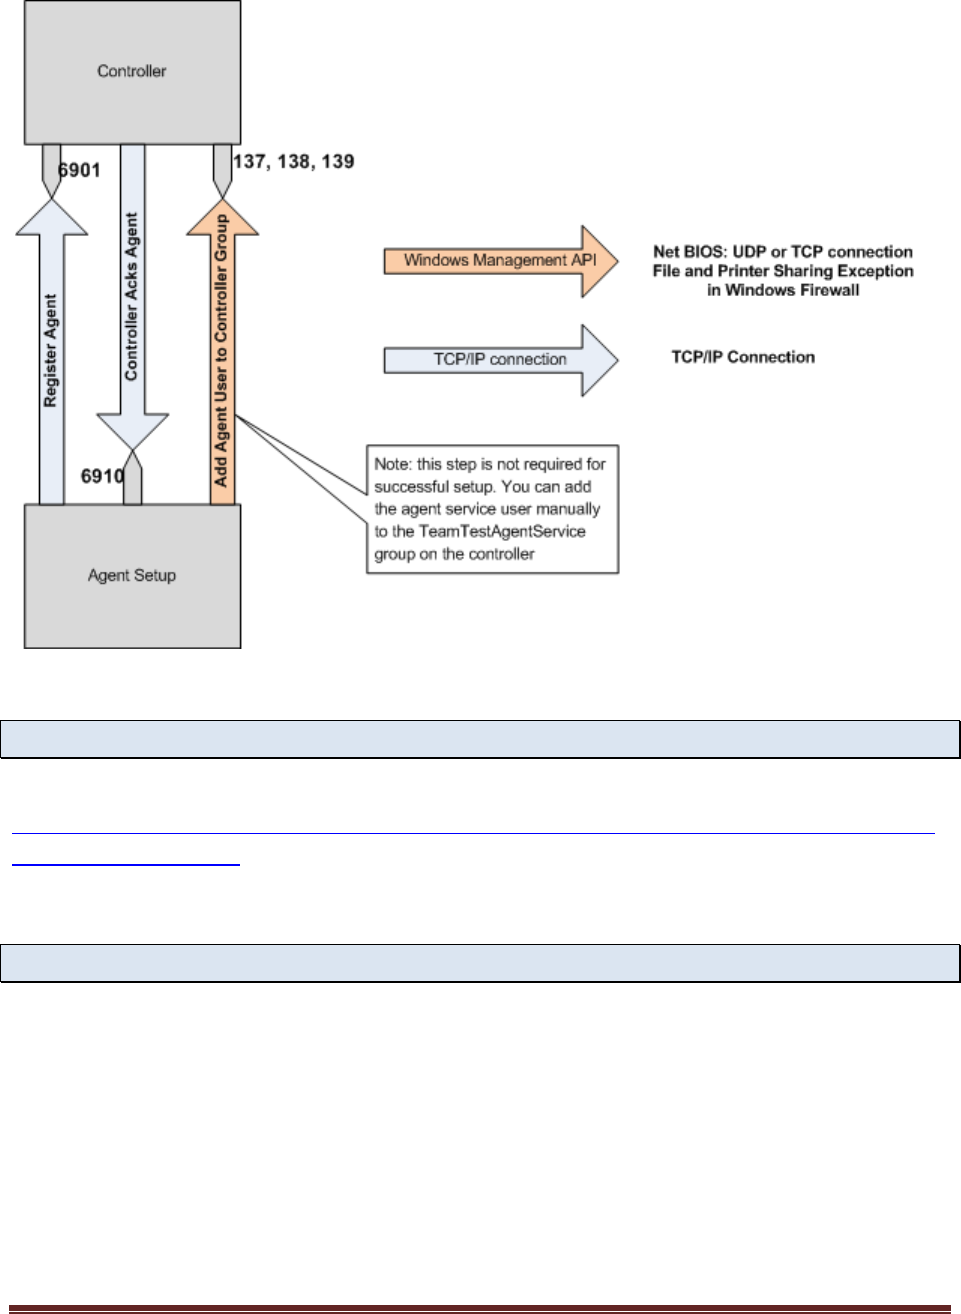
Visual Studio Performance Testing Quick Reference Guide Page 26
Controller-Agent Communications
Changing the Default Port for Agent-Controller Communication
The default port for communication is 6910. To change this, see the following post:
http://blogs.msdn.com/billbar/archive/2007/07/31/configuring-a-non-default-port-number-for-the-vs-
team-test-controller.aspx
How to Add Agents To A Test Rig
When you uninstall the controller software and reinstall it, the local user group that contains the agent
accounts used to connect is reset. You must repopulate the group with the appropriate users. From
Start -> Run,
Next, open VSTS and open up the Test Rig Management dialog (Test -> Administer Test Controllers) and
add each agent back to the list.
Or if you have VS 2010, you can go to each agent and re-run the config tool, which will automatically add
the agent back to the controller.
Visual Studio Performance Testing Quick Reference Guide Page 27
Items new to VS 2010
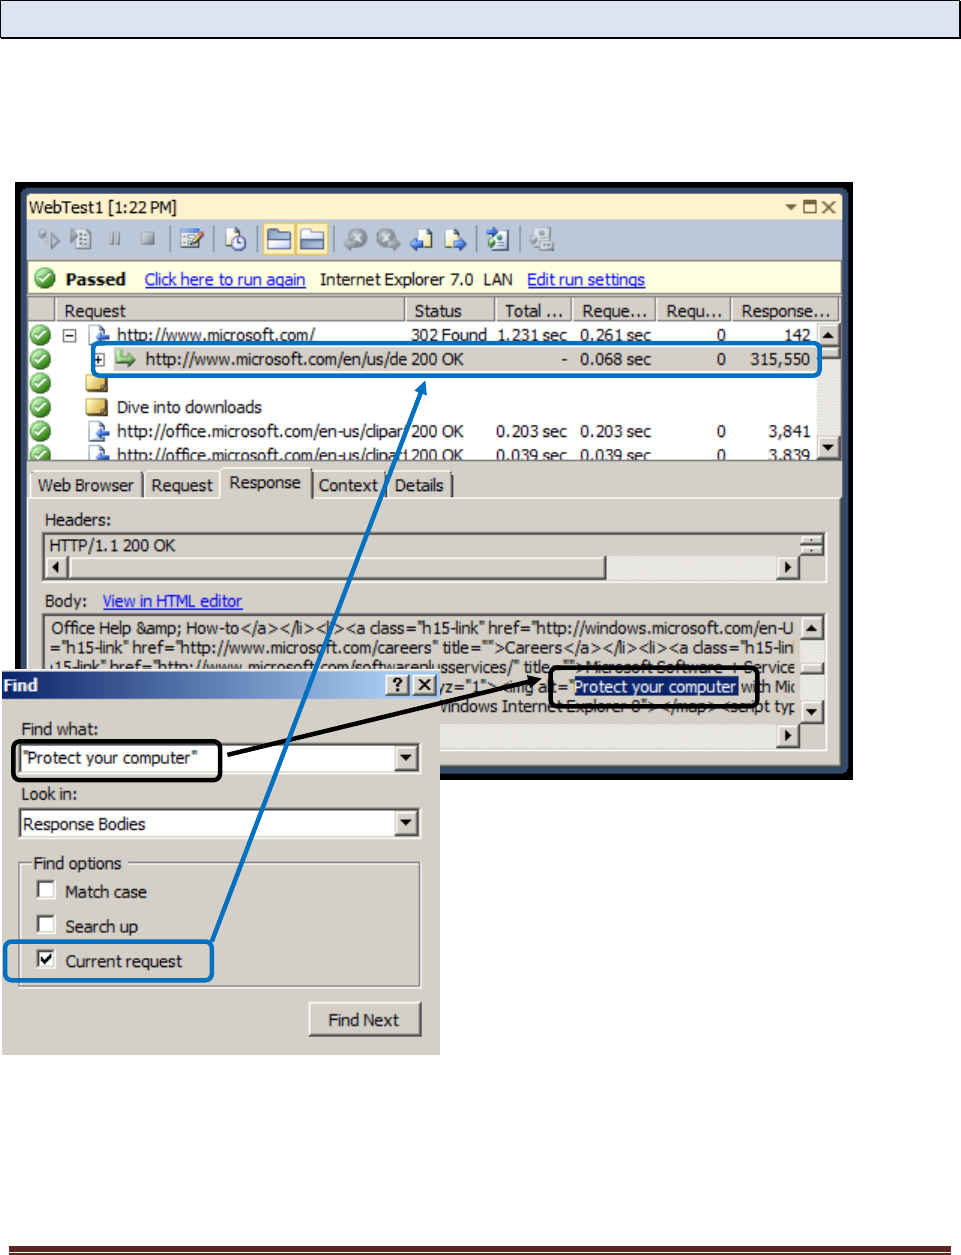
“Find” feature now available in Webtest playback UI
In VS 2010, you can now directly search for values in the playback window of the UI. With the playback
window active, press Ctrl-
can also choose whether to look in the request, the response, the headers, all text, etc. You can further
refine the search by limiting to the currently highlighted request.
You can also right-click on a form post or query string parameter in the request tab to start a search.
Visual Studio Performance Testing Quick Reference Guide Page 28
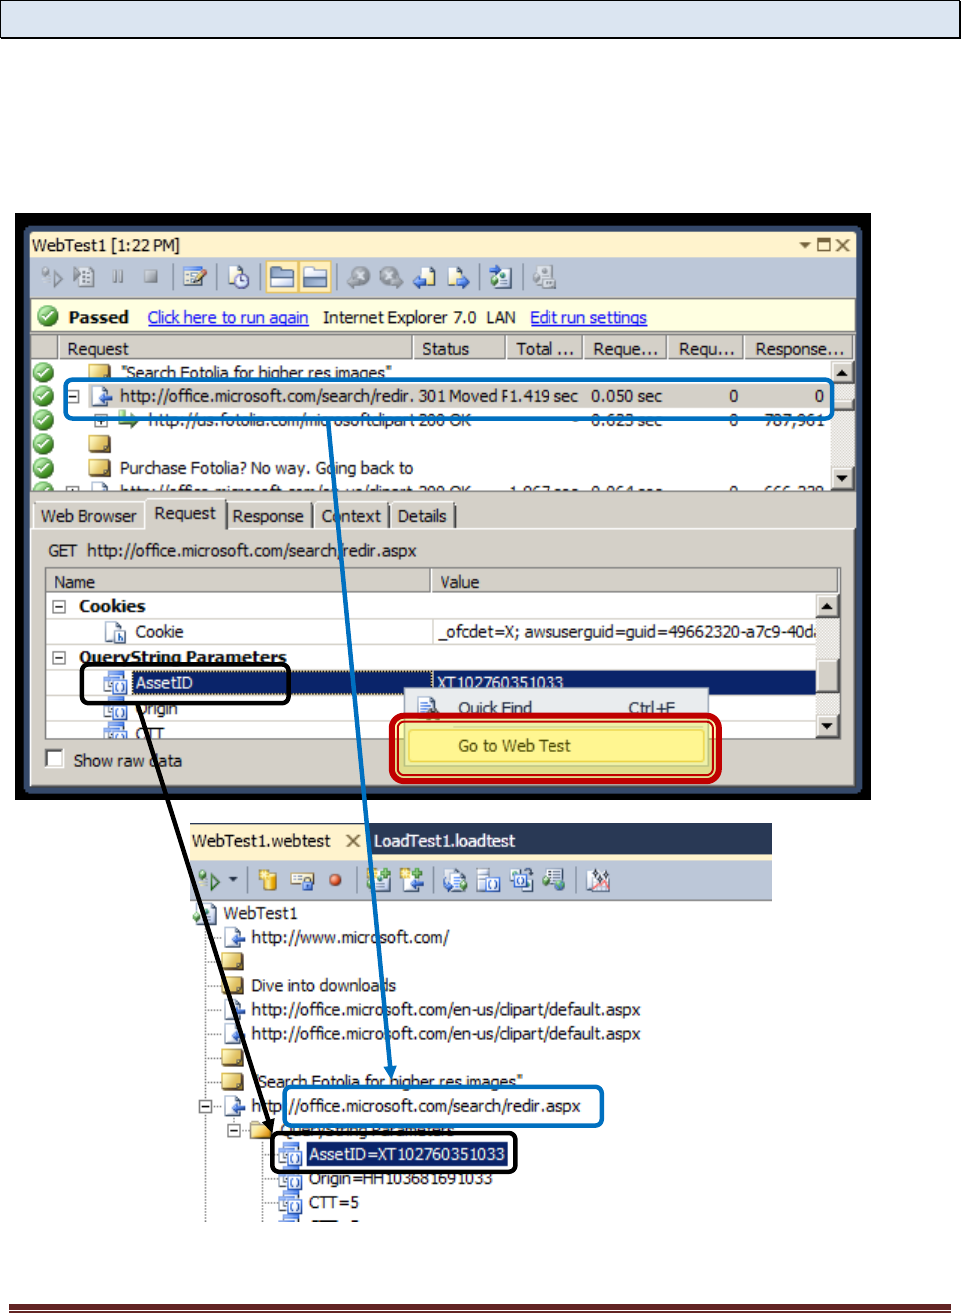
“Go To Web Test” feature now available in Webtest playback UI
In VS 2010, you can now highlight a specific value shown in the playback window, right-click, and choose
chose. The feature works on the specific request currently highlighted, so if you have several requests
with the same parameter name, you will be directed to the request that directly corresponds to the
request you were looking at in the playback window.
Visual Studio Performance Testing Quick Reference Guide Page 29
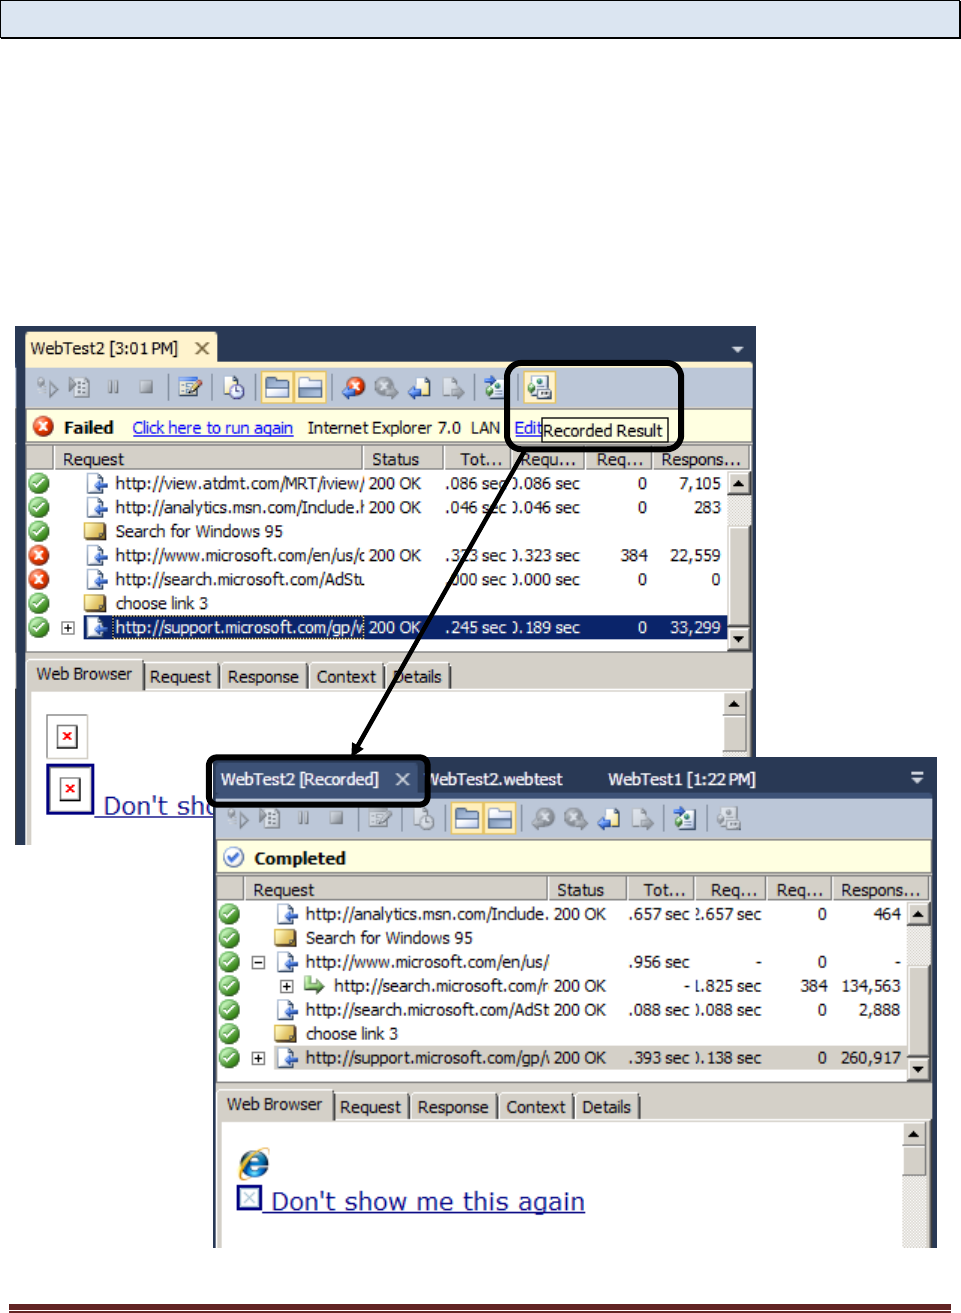
Recorder Log Available
In VS 2010, as you record a new Web test the recorded requests are saved to a Web test log file. Any
time you are in a new playback screen for this Web test, you can click on the Recorded Result menu bar
command to open the recorded requests and responses. (NOTE: if you upgrade a project from 2008 or
if you manually delete the original playback file, the button will be grayed out).
The recording . This gives you the ability to see
the requests the browser made and the responses during recording, and compare them to what the
web test is sending and receiving. You can also search the recording for specific values that were
recorded.
Visual Studio Performance Testing Quick Reference Guide Page 30
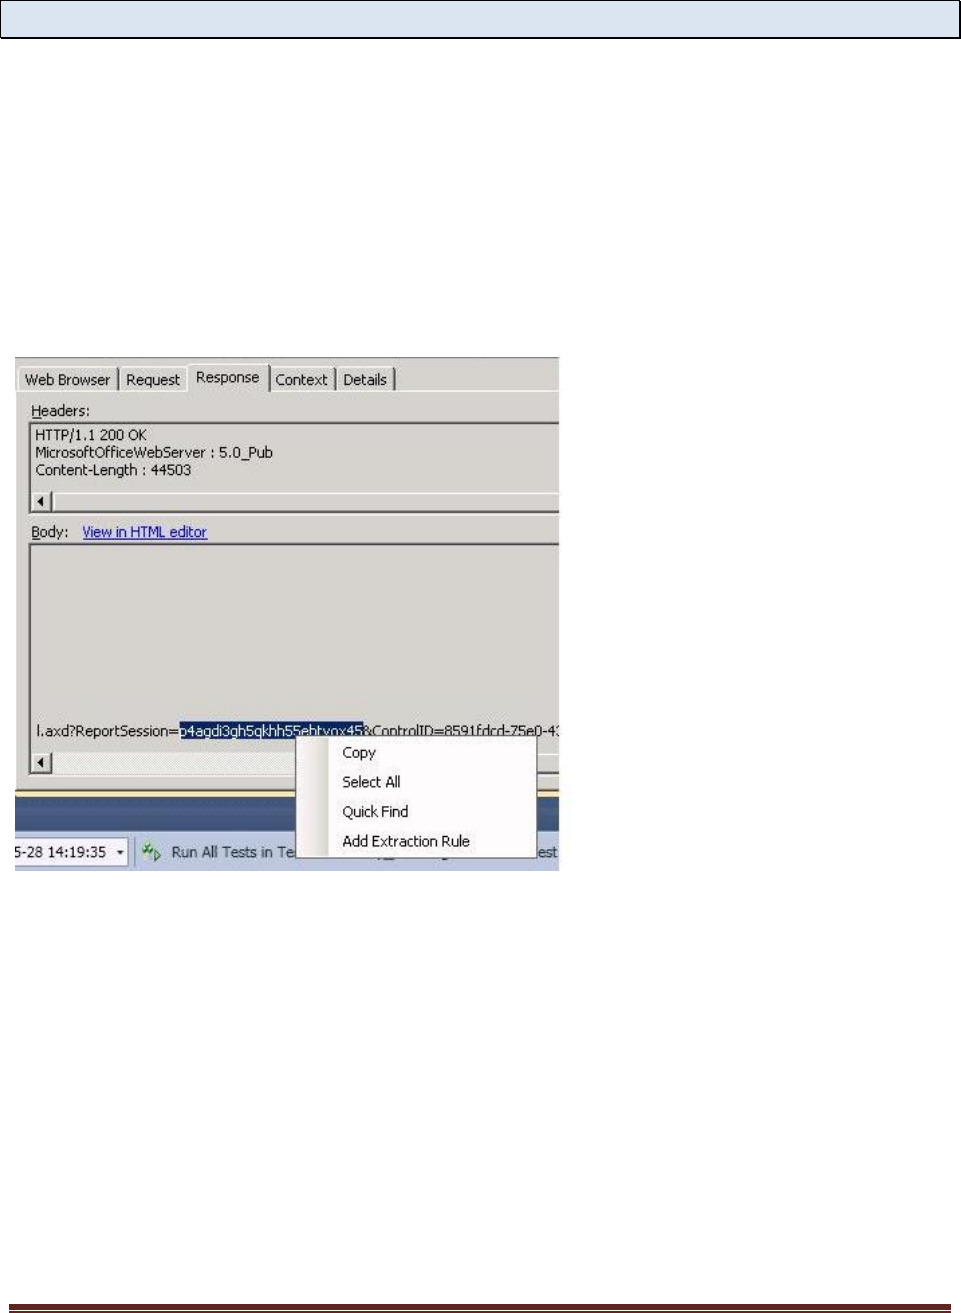
Add extraction rule directly from the playback UI
In the playback window, you can highlight any static value from a response that you wish to extract for
use in future requests. Simply highlight the value, right click, and choose Add Extraction Rule. It will
automatically name the rule, name the parameter and add the rule to the right request in the test. You
will still have to go to the subsequent request(s) where you want to use the parameter and add the
parameter to the request. If the value is found in the Web test, you will also be prompted to do a search
and replace of the value with the context parameter binding.
Tip: if this is value changes each time the test is run, the value from the result viewer will not be in the
editor. So rather than adding the extraction rule from the test result, add it from the recorder log
instead (since this will have the recorded value, which will also be in the Web test).
Visual Studio Performance Testing Quick Reference Guide Page 31
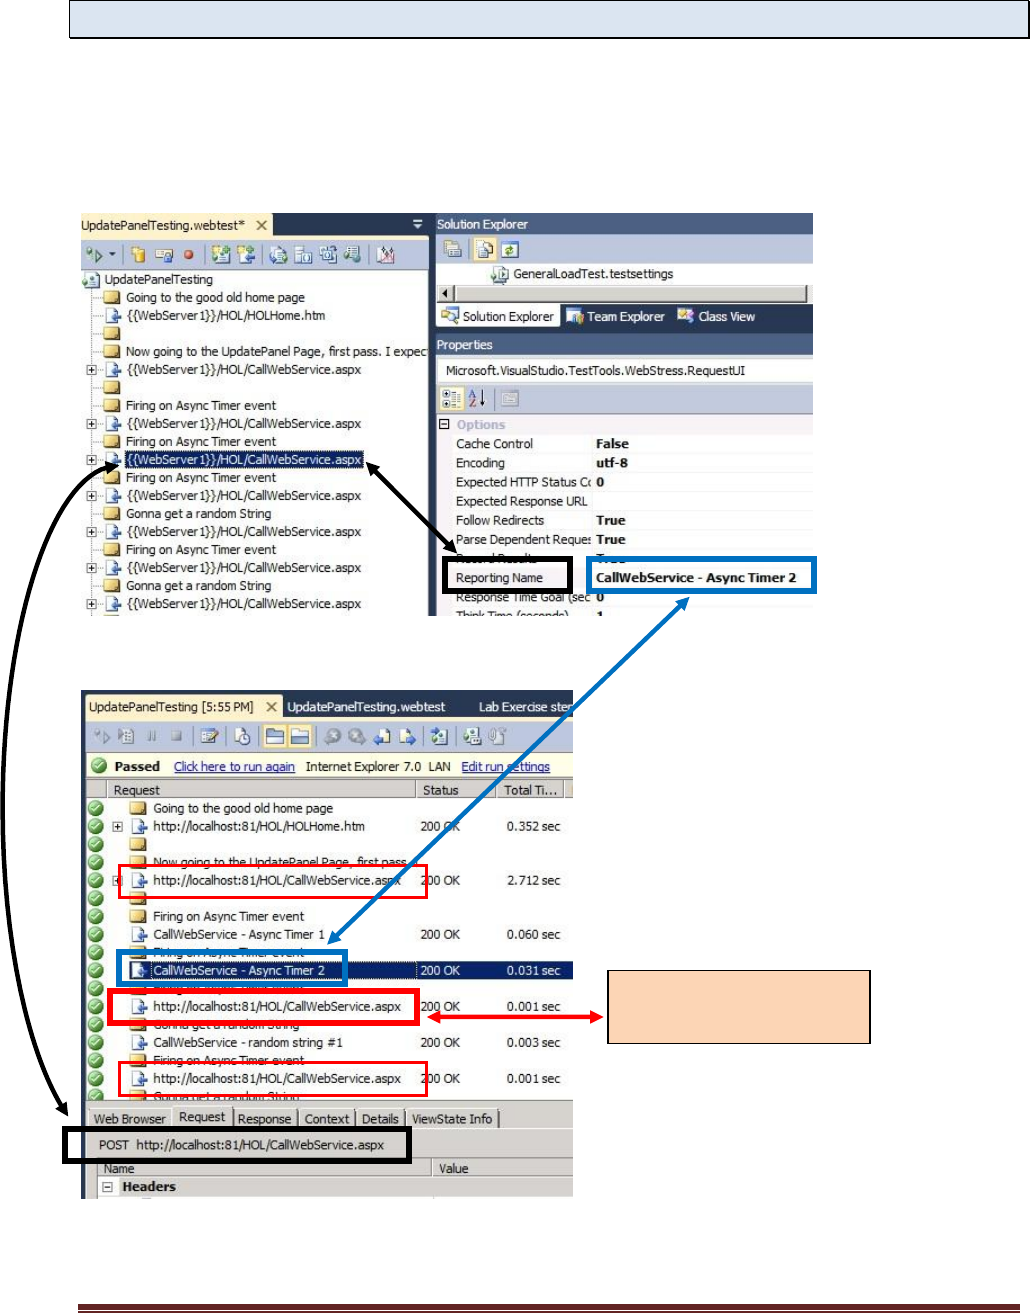
New “Reporting Name” property for web requests
ing Name
define any string to use in test results instead of the actual request URL. This is very handy for requests
with very long URLS or tests where there are several requests to the exact same URL. In the following
Web
A request without any
reporting name defined.
Visual Studio Performance Testing Quick Reference Guide Page 32
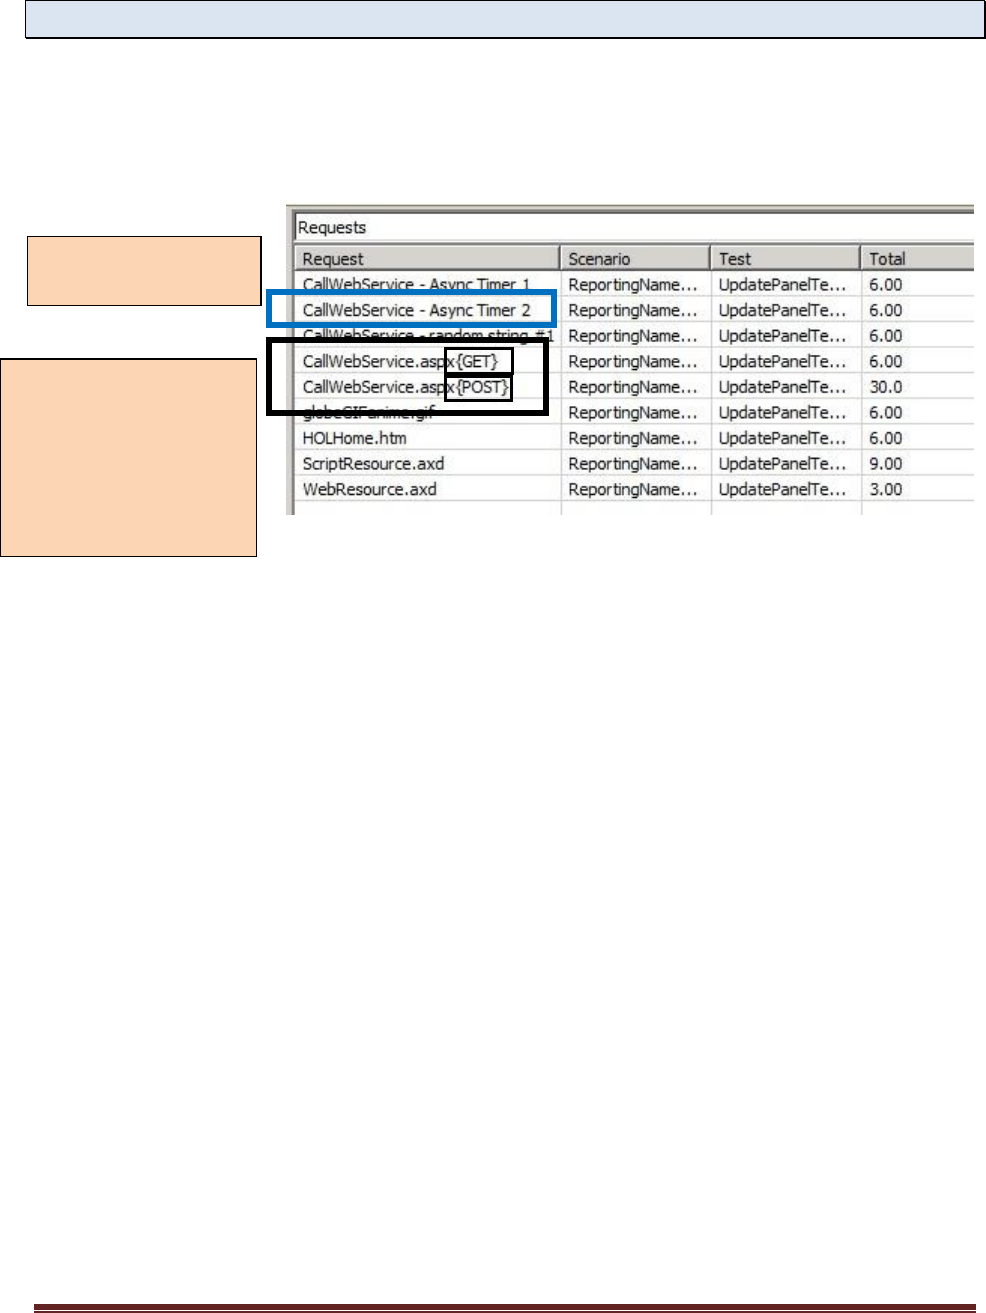
LoadTestResultsTables now differentiate between GET and POST requests
If the webtest in the prev
two features you can see in the results.
1) Any Reporting Names you used will show up in the results table.
2) Any requests with the same name but with different methods will be reported separately.
The call from above
with a reporting name
The calls from above
without a reporting
name. Even though they
are the same requests,
some have a GET
method and some have
a POST method.
Visual Studio Performance Testing Quick Reference Guide Page 33
Virtual user visualization now available
Run
How to view activity visualization
In VSTS 2010, you can view a map of the virtual users activity AFTER a test run completes by clicking on
ton in the results window.
Visual Studio Performance Testing Quick Reference Guide Page 34
What is shown in the visualization window
3 choices:
1) Test
2) Transaction
3) Page
View shows users in relation to each other
(Y-axis) and durations of a single instance
-axis).
For complete details on this, see the entry
control how much of the test details
you wish to see.
Hover the mouse pointer over an
instance to get a popup of the info
about that instance.
Visual Studio Performance Testing Quick Reference Guide Page 35
More Information
Here are the table definitions from the LoadTest2010 Results Store:
For the LoadTestTestDetail table, the big differences are that you get the outcome of the tests, which
virtual user executed it, and the end time of the test.
[LoadTestRunId] [int] NOT NULL ,
[TestDetailId] [int] NOT NULL ,
[TimeStamp] [datetime] NOT NULL ,
[TestCaseId] [int] NOT NULL ,
[ElapsedTime] [float] NOT NULL,
[AgentId] [int] NOT NULL,
[BrowserId] [int],
[NetworkId] [int],
[Outcome] [tinyint],
[TestLogId] [int] NULL,
[UserId] [int] NULL,
[EndTime] [datetime] NULL,
[InMeasurementInterval] [bit] NULL
For the LoadTestPageDetail table, you now get the end time of the page as well as the outcome of the
page.
[LoadTestRunId] [int] NOT NULL ,
[PageDetailId] [int] NOT NULL ,
[TestDetailId] [int] NOT NULL ,
[TimeStamp] [datetime] NOT NULL ,
[PageId] [int] NOT NULL ,
[ResponseTime] [float] NOT NULL,
[ResponseTimeGoal] [float] NOT NULL,
[GoalExceeded] [bit] NOT NULL,
[EndTime] [datetime] NULL,
[Outcome] [tinyint] NULL,
[InMeasurementInterval] [bit] NULL
New to 2010
New to 2010
Visual Studio Performance Testing Quick Reference Guide Page 36
For the LoadTestTransactionDetail table the big changes are you get the response time of the
transaction and the end time. Statistics for transactions such as Min, Max, Avg, Mean, StdDev, 90%,
95% and 99% are being calculated. These statistics are based on the ResponseTime column, not the
ElapsedTime. The difference between the 2 is that elapsed time includes think time whereas the
response time does not.
[LoadTestRunId] [int] NOT NULL ,
[TransactionDetailId] [int] NOT NULL ,
[TestDetailId] [int] NOT NULL ,
[TimeStamp] [datetime] NOT NULL ,
[TransactionId] [int] NOT NULL ,
[ElapsedTime] [float] NOT NULL,
[EndTime] [datetime] NULL,
[InMeasurementInterval] [bit] NULL,
[ResponseTime] [float] NULL
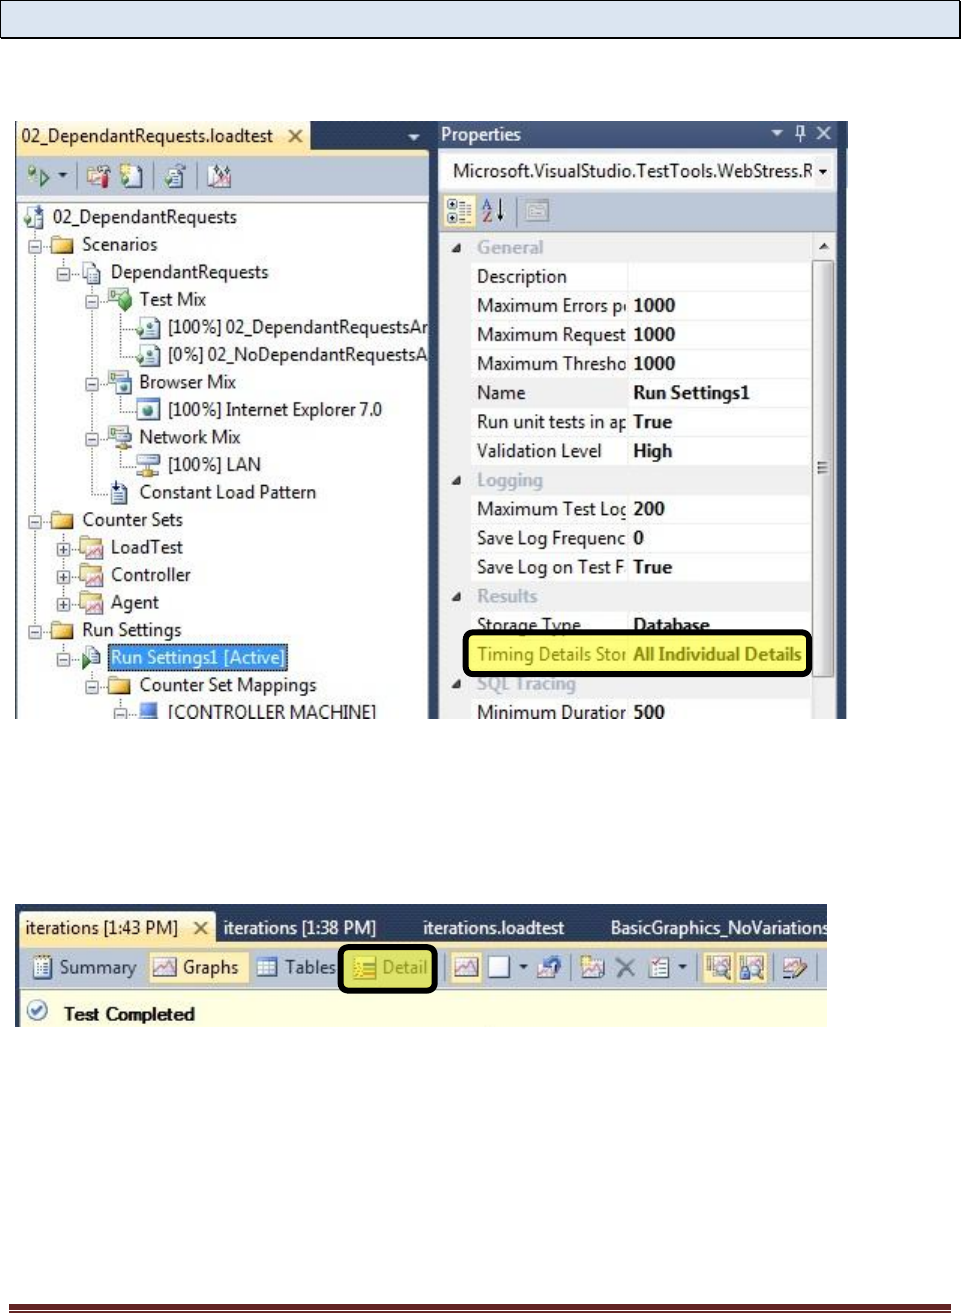
Another change in VS 2010 is that the default for whether or not to collect details has changed. In VS
2005 and VS 2008 the default was to not collect this detail data. In VS 2010, the default is to collect the
detail data. This is controlled by the Timing Details Storage property on the Run Settings node in a load
test.
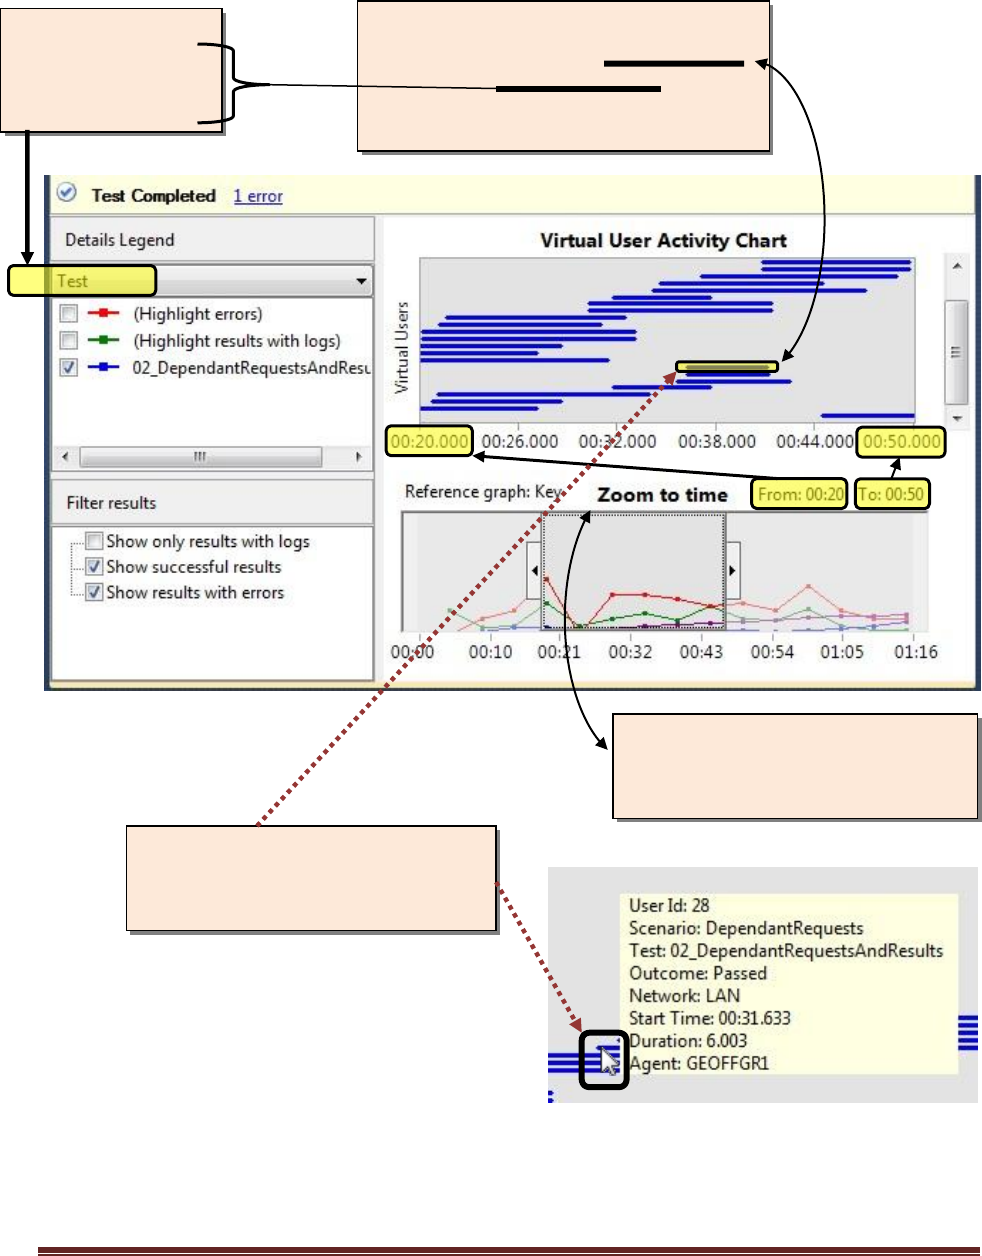
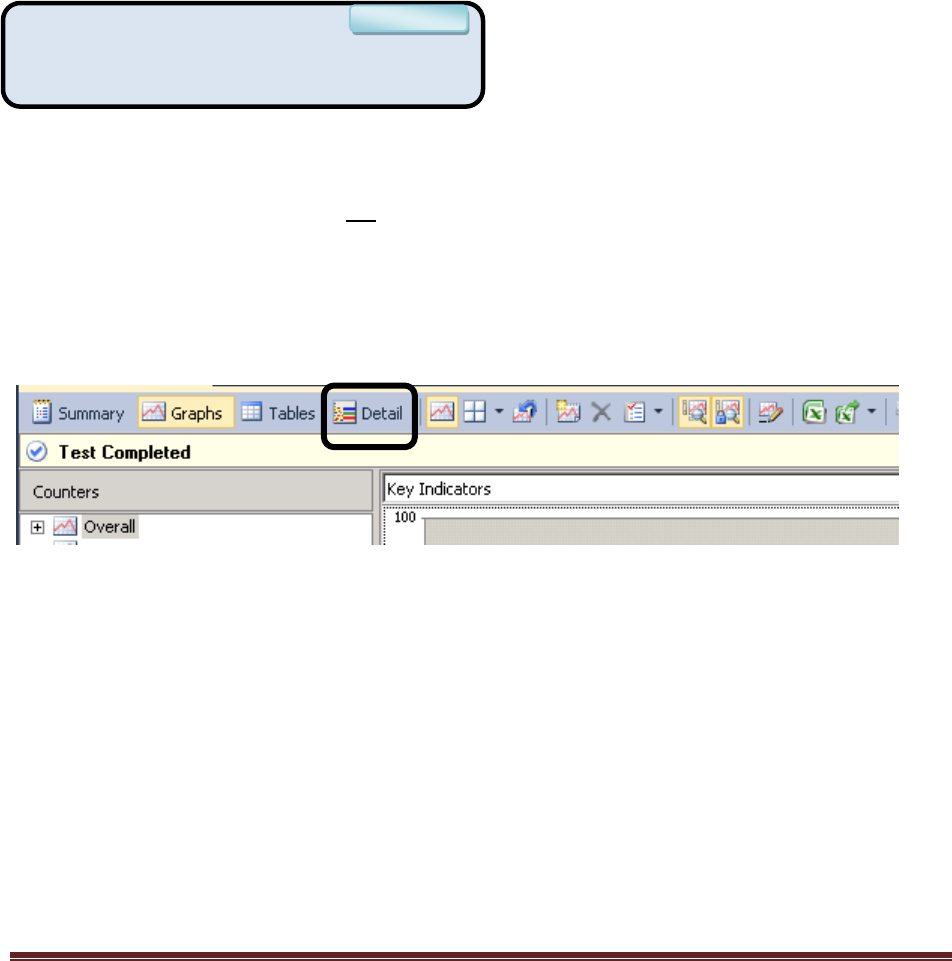
So you can still run your own analysis on this data, but there is also a new view in VS that you can use to
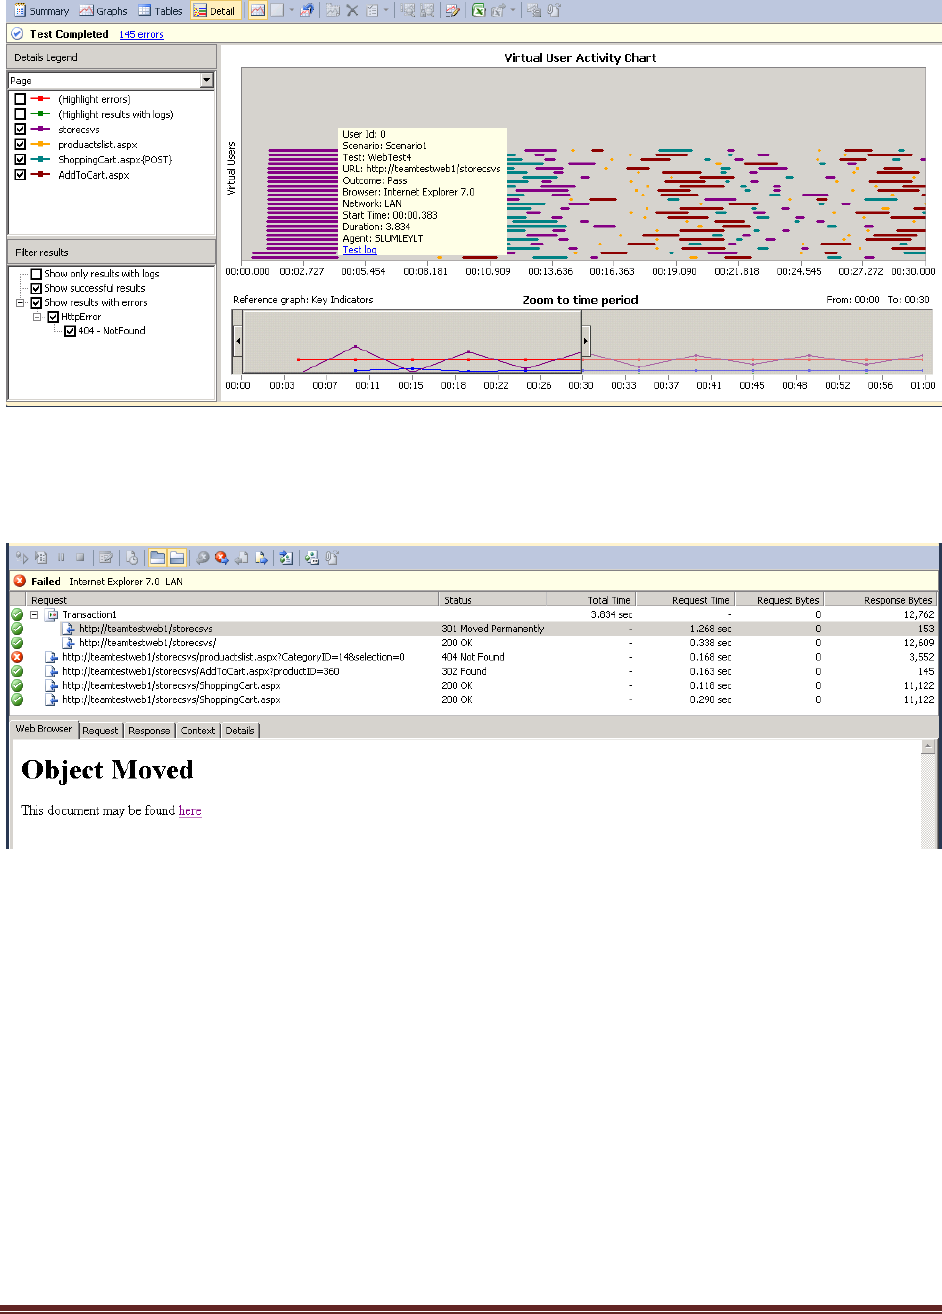
get a look at the data. The view is the Virtual User Activity Chart. When a load test completes, there will
be a new button enabled on the load test execution toolbar. It is the detail button below:
When you click on this button you will brought to the Virtual User Activity Chart. It looks like the
following:
New to 2010
Visual Studio Performance Testing Quick Reference Guide Page 37
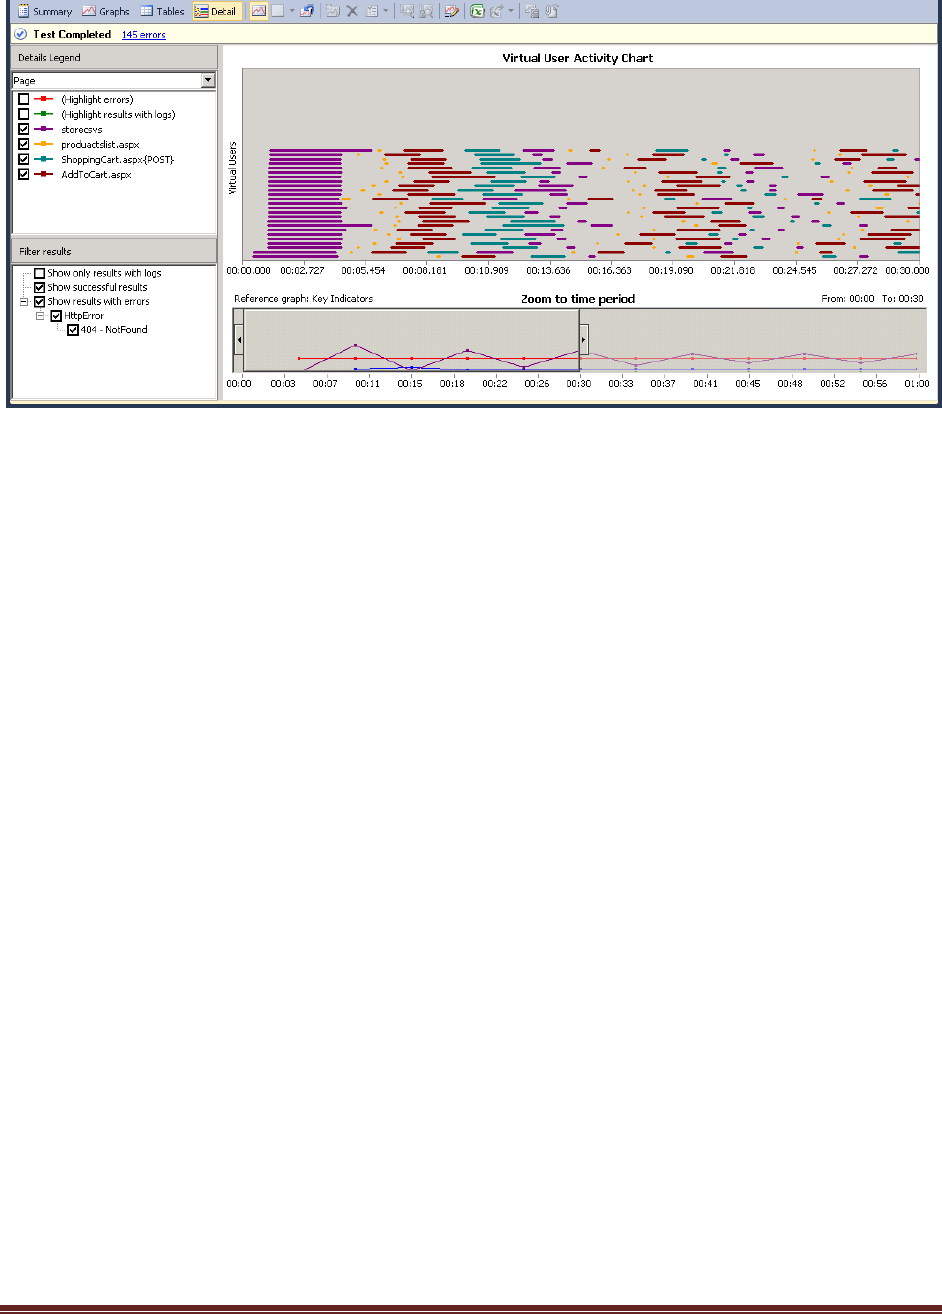
Here is what you are looking at. Each horizontal row represents a virtual user. Each line in a horizontal
row represents a test, page or transaction. If you look at top left of this view, you will see a combo box
that shows which type of detail you are looking at. So in my case this is showing pages. Each color
represents a different page in the test. The length of the line represents the duration of the page. So
you can quickly tell which pages are running long.
If you look at the bottom of the chart, you will see a zoom bar. The zoom bar allows you to change the
range that you are looking at. The zoom bar overlays one of the graphs from the graph view. So
whichever graph is selected in the graph view, you will see that on the zoom bar. This makes it very
easy to correlate spikes in a graph with what tests/pages/transactions are occurring during that spike.
The legend on the left also has some filtering and highlight options. If you uncheck a page, then all
instances of that page are removed from the chart. If you click to Highlight Errors, then all pages that
failed will have their color changed to red. If you look at bottom part of the legend, you will see all the
errors that occurred during the test. You can choose to remove pages with certain errors or remove all
successful pages so you only see errors.
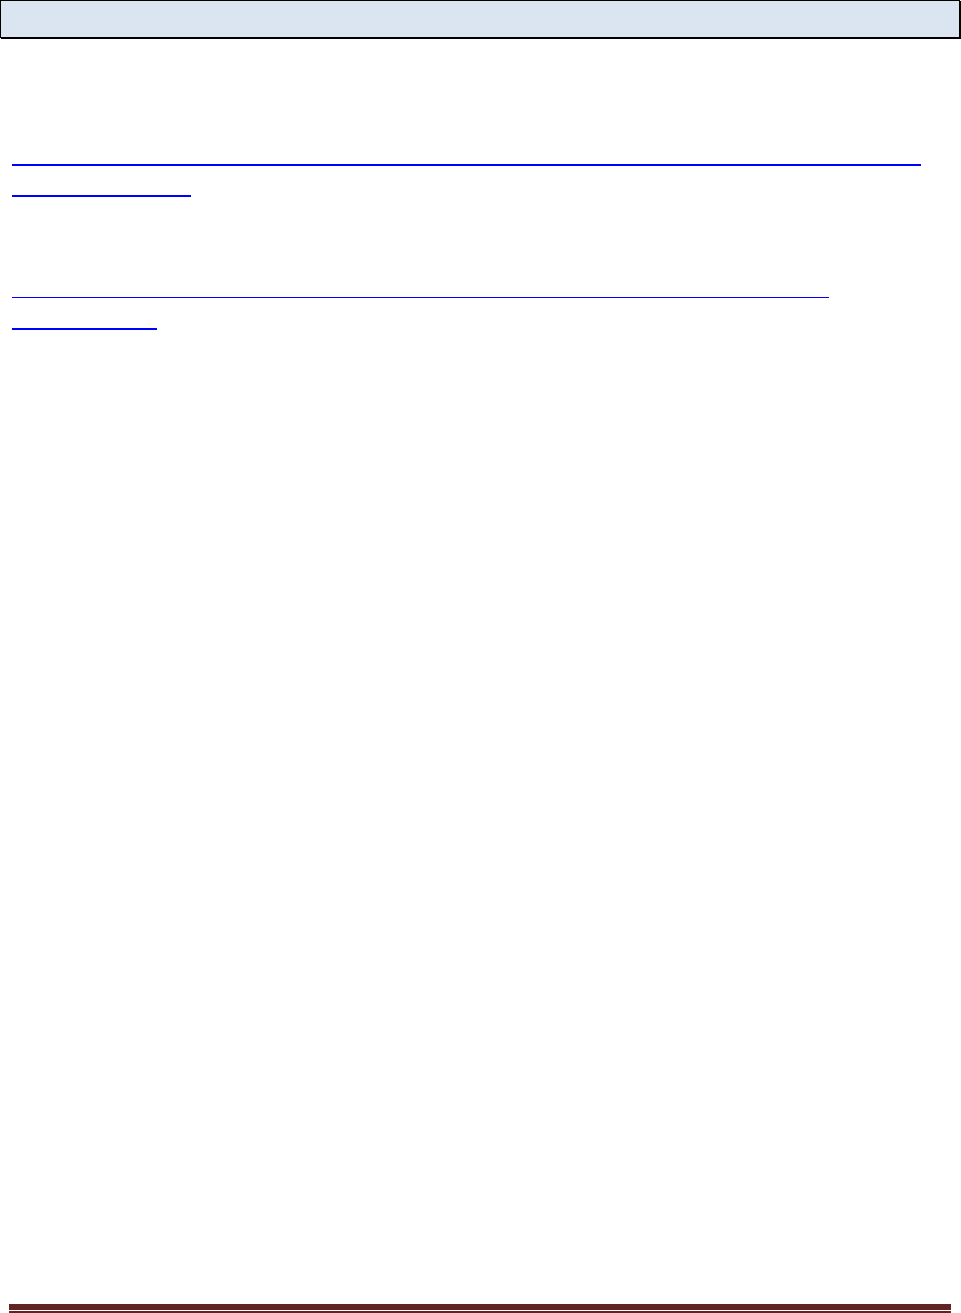
There is one other very useful feature of this view. You can hover over any line to get more information
about the detail and possibly drill into the tests that the detail belongs to. For example this is what it
looks like when you hover a detail:
Visual Studio Performance Testing Quick Reference Guide Page 38
You see information about user, scenario, test, url , outcome, etc. For this detail, there is also a test log
link. If you click this, you will see the actual test that the page was a part of. For example, when I click
test log, I see the following:
You see the full set of details collected for the test in the usual web test playback view that you are use
to. If it was a unit test, you would have seen the unit test viewer instead.
Visual Studio Performance Testing Quick Reference Guide Page 39
New Excel reporting features built into load test results
There are two new features for reporting through Excel built into the load test results window
1) Load Testing Run Comparison Report
http://blogs.msdn.com/slumley/archive/2009/11/07/vsts-2010-feature-load-testing-run-comparison-
report-in-excel.aspx
2) Load Test Trend Report
http://blogs.msdn.com/slumley/archive/2009/05/22/dev10-feature-load-test-excel-report-
integration.aspx
Visual Studio Performance Testing Quick Reference Guide Page 40
New Load Test and Load Test Rig Licensing and configurations
This information was taken straight from a blog post by Ed Glas
(http://blogs.msdn.com/edglas/archive/2010/02/07/configuration-options-for-load-testing-with-visual-
studio-2010.aspx)
Using Visual Studio Ultimate enables you to generate 250 virtual users of load. To go higher than 250
users, you need to purchase a Virtual User Pack, which gives you 1000 users. You can use the 1000 users
on any number of agents. Note that if you install the Virtual User Pack on the same machine as Visual
Studio Ultimate, you do not get 1250 users on the controller. The 250 virtual users you get with Ultimate
purchase additional Virtual User Packs, which aggregate or accumulate on the Test Controller. In other
words, installing 2 Virtual User Packs on one controller gives you 2000 Virtual Users, which can be run
on any number of agents.
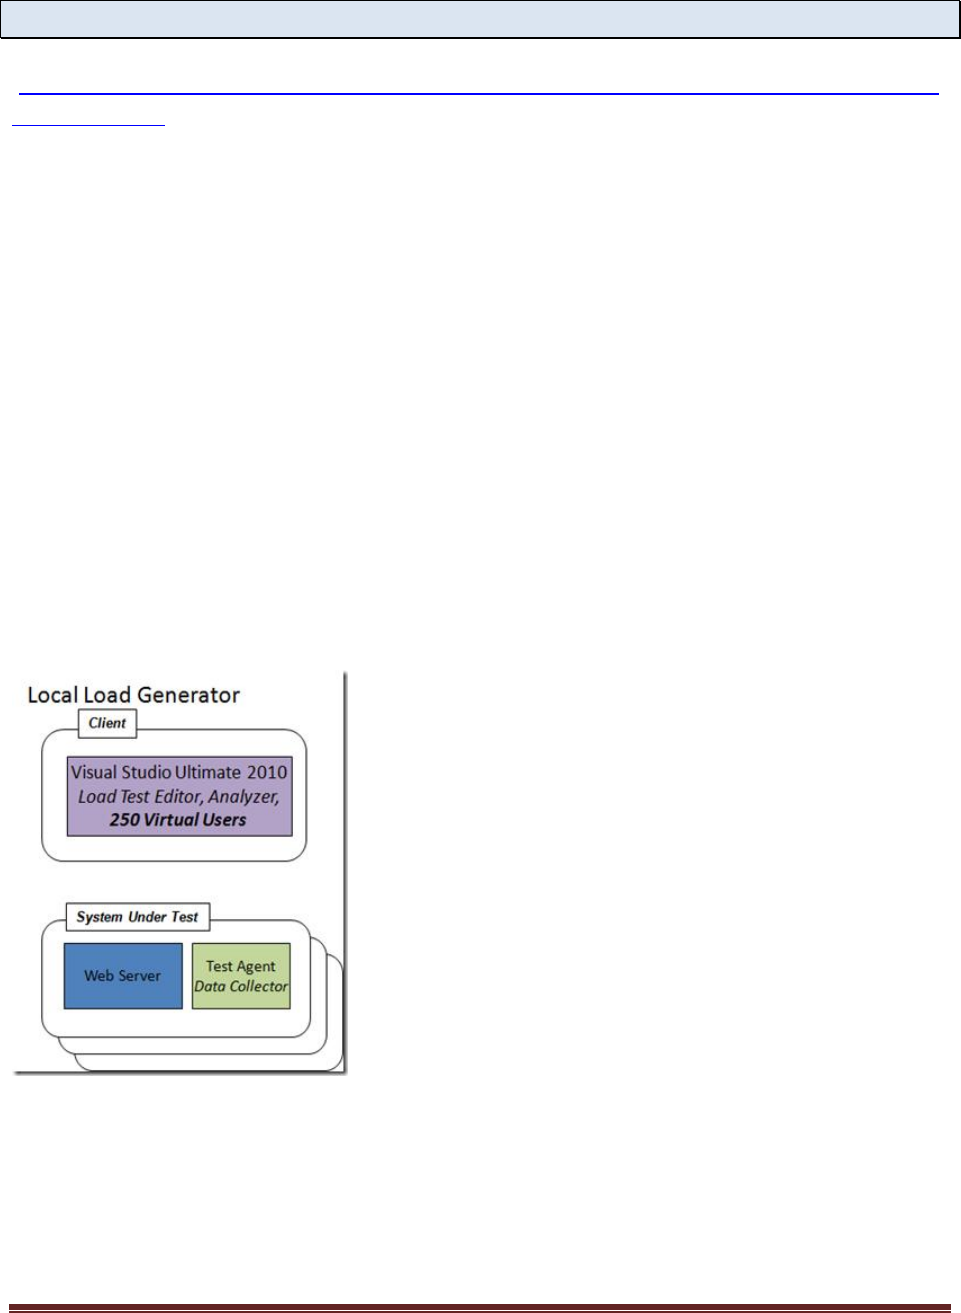
Configuration 1: “Local” Load Generation
This is what you get when you install Visual Studio Ultimate, which is the ability to generate
load “locally” using the test host process on the same machine that VS is running on. In addition
to limiting load to 250 users, it is also limited to one core on the client CPU.
Note that purchasing Ultimate also gives you the ability to collect ASP.NET profiler traces by
using a Test Agent as a data collector on the Web server.
Visual Studio Performance Testing Quick Reference Guide Page 41
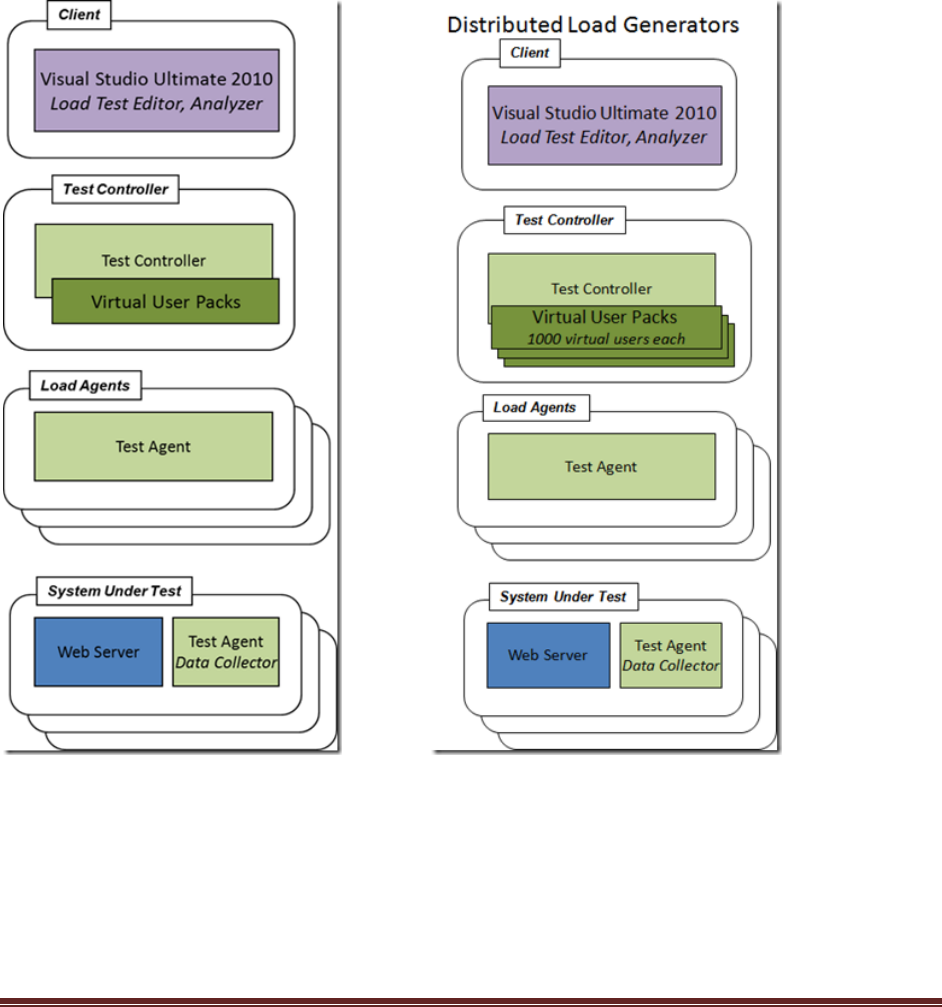
Configuration 2: Distributed Test Controller and Test Agents
This is a common configuration if you are scaling out your load agents. With this configuration,
the Test Controller and each Test Agent is on a separate machine.
The advantage of this configuration is the controller is easily shared by team members, and
overhead from the controller does not interfere with load generation or operation of the client.
Note the Test Controller must have one or more Virtual User Packs installed to enable load
testing. Load agents in this configuration always use all cores on the machine.
Visual Studio Performance Testing Quick Reference Guide Page 42
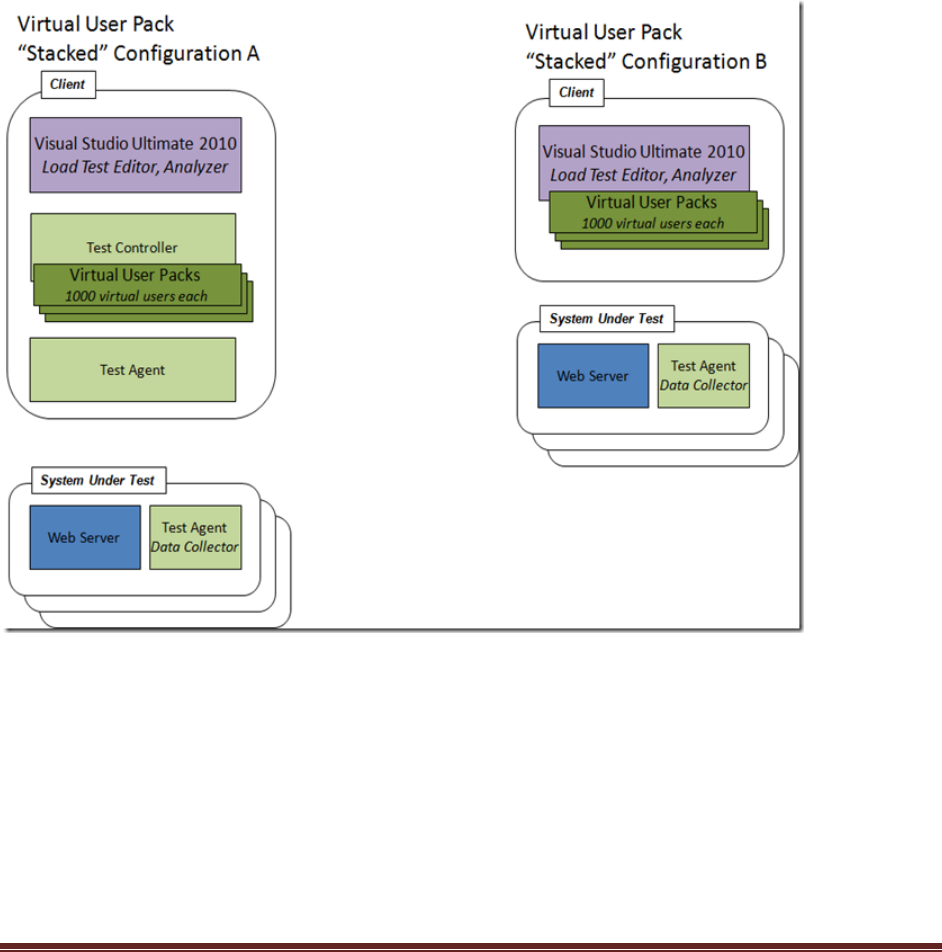
Configuration 3 A and B: Stacked Configuration
With configuration A, you install the Test Controller and Test Agent on the same machine as VS,
then configure the Test Controller with Virtual User Packs. This enables you to generate >250
virtual users from the client machine, and unlocks all cores in the processor. Configuration B
shows an alternative configuration, enabled if you configure the machine with Virtual User
Packs using the VSTestConfig command line.
Note that a Virtual User Pack can only be used on one machine at a time, and configuring it on a
machine ties it to that machine for 90 days. So you can’t have the same Virtual User Pack
installed on both the VS client and a separate machine running the Test Controller. See the
Virtual User Pack license for details.
Visual Studio Performance Testing Quick Reference Guide Page 43
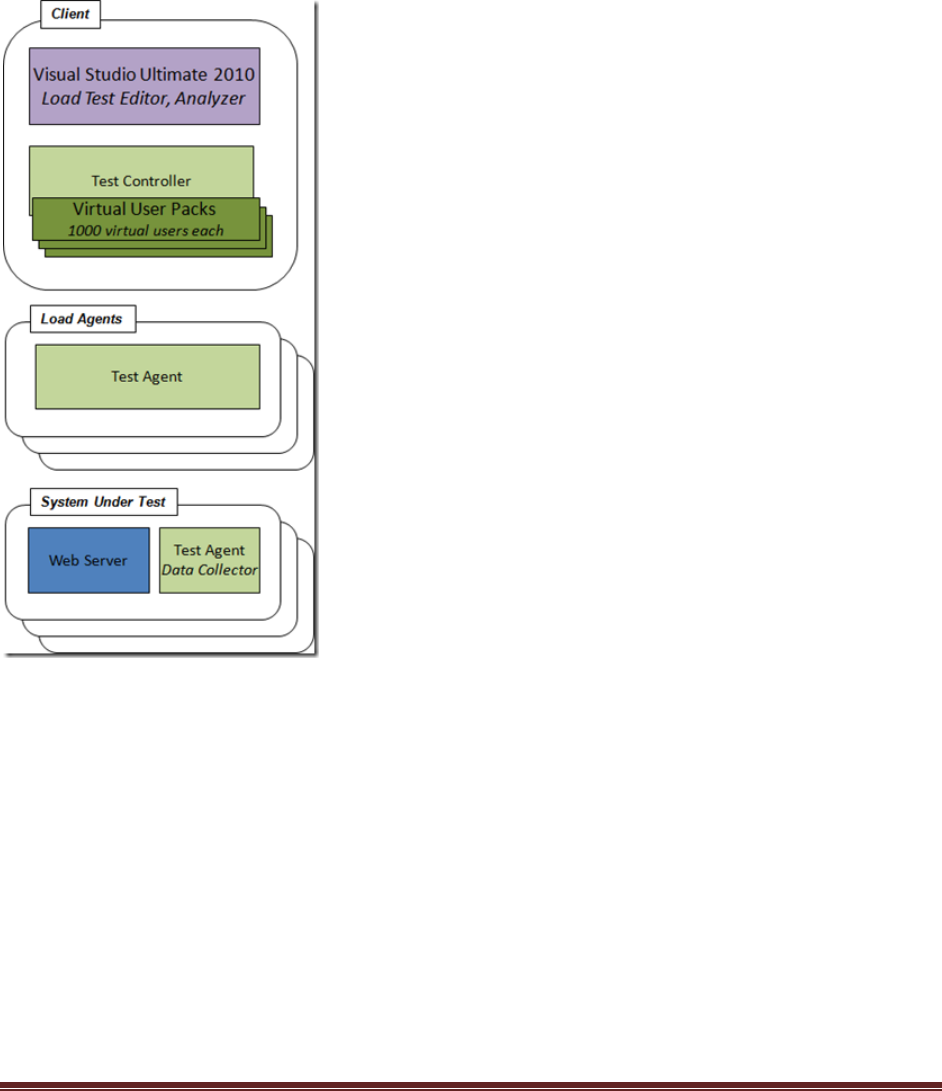
Configuration 4: Stacked Controller, Distributed Agents
In this configuration, the controller is running on the same machine as the Test client, with
distributed agents running as load generators. This configuration is recommended if you have a
solo performance tester. If your test controller and test agents will be shared by a team, we
recommend running the controller on a separate box. Note that test agents are tied to a single test
controller. You can’t have two test controllers controlling the same agent.
If you are using Visual Studio 2008, these options should look familiar to you as the VS 2008
load agents and controller offered the same configuration options. The new twist with VS 2010 is
the Virtual User Packs, which offer you more flexibility in how you configure your load agents.
Visual Studio Performance Testing Quick Reference Guide Page 44
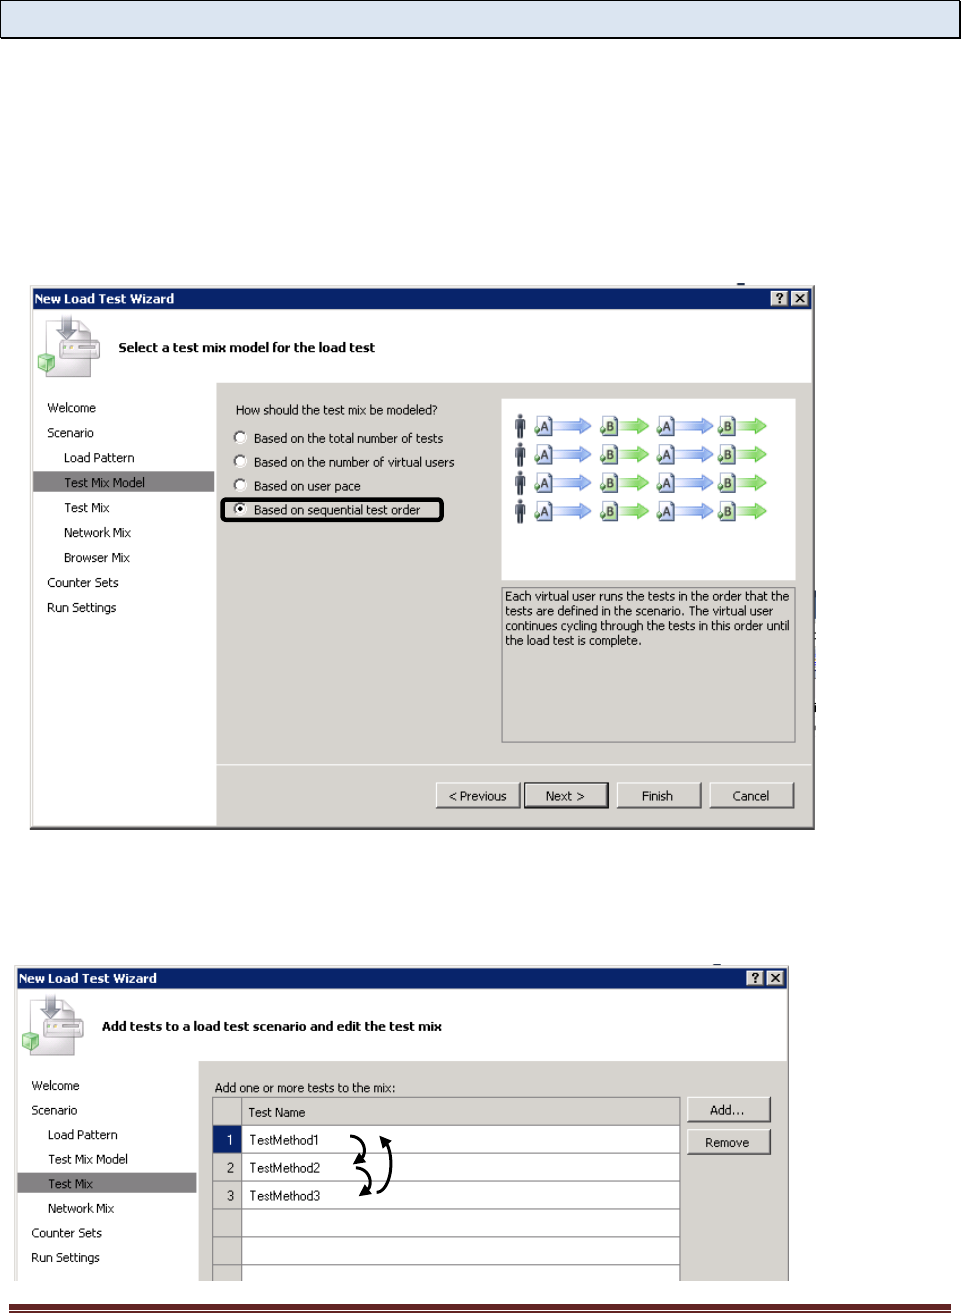
New test mix: “Sequential Test Mix”
It is not recommended to use ordered tests in a load test. In the load test results, you do not get the
pass/fail results, test timings or transaction timings for any of the inner tests. You just get a Pass/Fail
result and duration for the overall ordered test.
To address this issue, there is a new test mix type in VS2010 called Sequential Test Mix. Here is what it
looks like in the load test wizard:
For this mix type, you set the order of tests that each virtual user will run through. You can mix web and
unit tests in the mix and you will get the individual test, page and transaction results. When a virtual
user completes the last test in the mix, it will cycle back to the first test in the mix and start over.
Visual Studio Performance Testing Quick Reference Guide Page 45
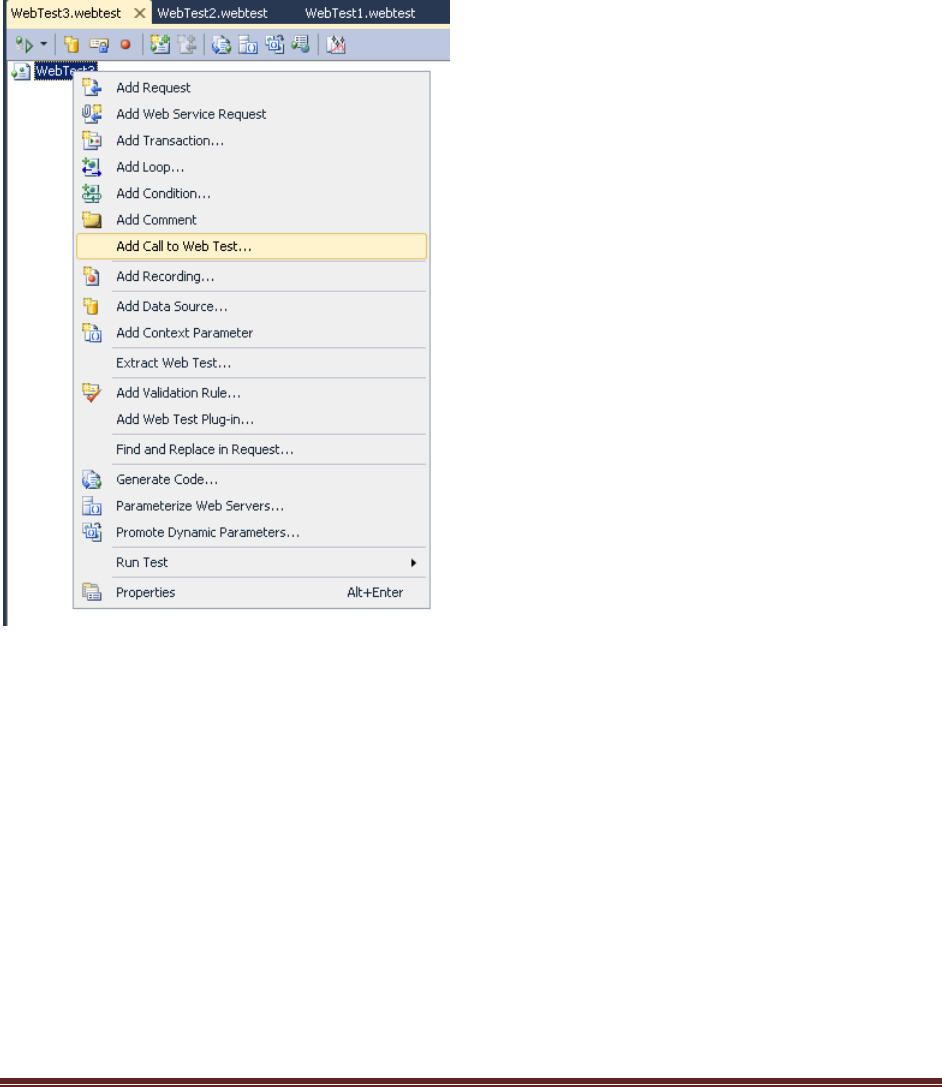
If you just want to control the order of web tests, you could also use a main web test that calls all of the
. Web Test CompositionFor example, suppose I have
WebTest1 and WebTest2 and I want 1 to run before 2. I would create a third web test that has no
requests, but references tests 1 and 2. To create this kind of test, first record web tests 1 and 2. Then
add a third web test and just hit stop in the web test recorder. When you are back in the web test
editor, right click on the root node
This will launch a dialog and then select WebTest1. Then do same steps and add WebTest2. Now just
run WebTest3 and you will execute both tests. WebTest composition has been available since VS2008
Visual Studio Performance Testing Quick Reference Guide Page 46
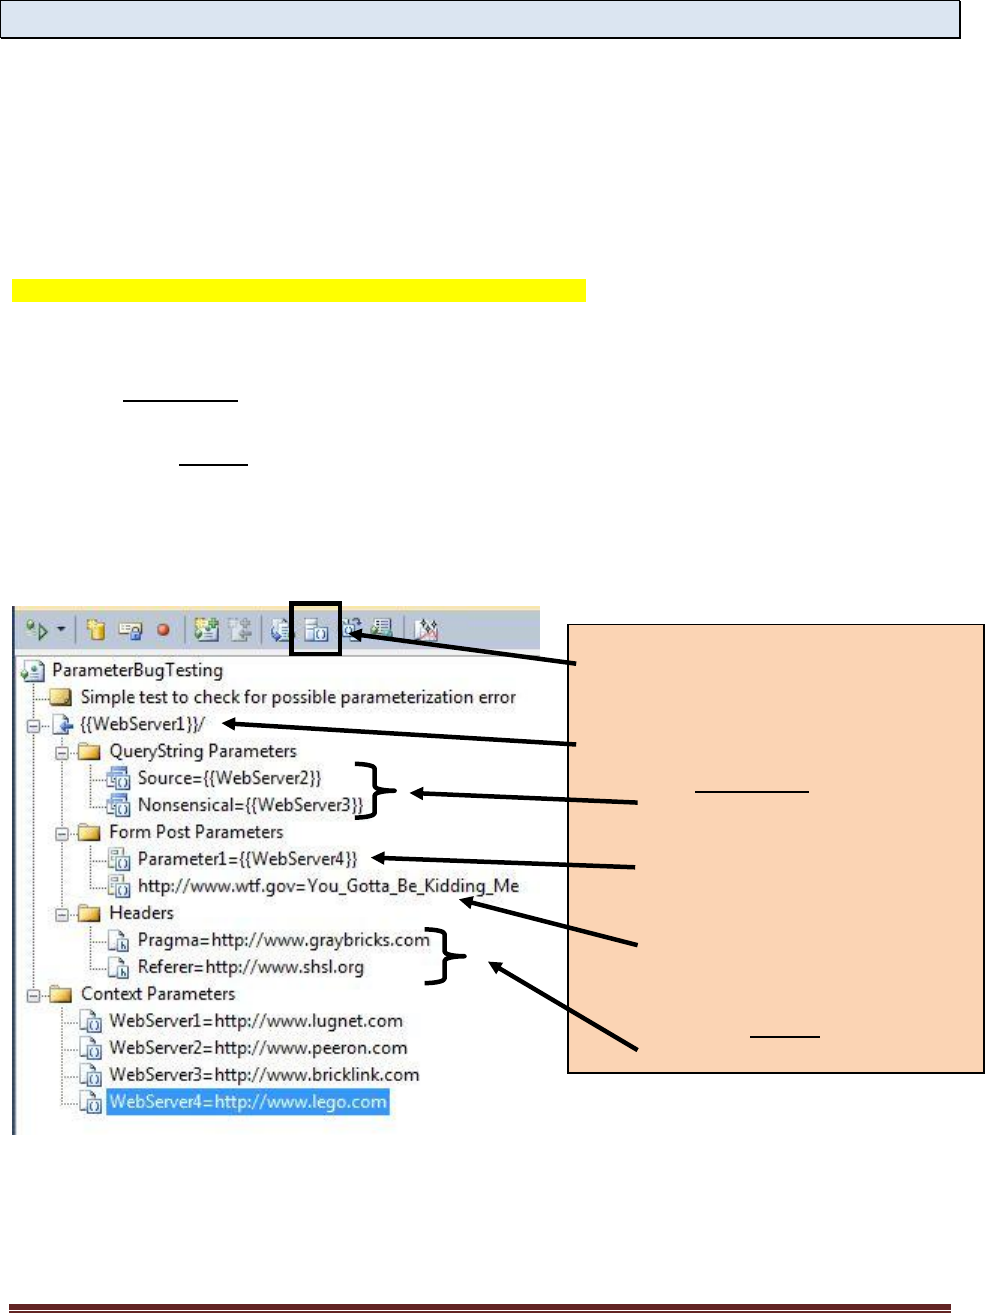
Query String and FORM POST URLs get parameterized
When you choose to parameterize the web servers in a web test, you may see more webservers listed
than your test actually calls. This is expected behavior.
that the parameter parser is finding websites that reside inside query strings. Notice this in the .webtest
file:
<QueryStringParameter Name="Source"
Value="http%3A%2F%2Flocalhost%3A17012%2Fdefault%2Easpx"
RecordedValue="http%3A%2F%2Flocalhost%3A17012%2Fdefault%2Easpx" CorrelationBinding=""
UrlEncode="False" UseToGroupResults="False" />
Any Query String that has a URL gets added to the server list
Any Form Post parameter that has a URL gets added to the server list
NO added header value makes it into the list
If the form post or query parameter NAME is a URL (not the value, but the name of the
parameter), it does NOT get added.
This button will cause VSTS to detect URLs
and create parameters for them.
This web test has only ONE request, but
VSTS detects four web servers.
Any Query String that has a URL
gets added to the server list
Any Form Post parameter that has
a URL gets added to the server list
If the form post or query
parameter NAME is a URL (not the
value, but the name of the
parameter), it does NOT get
added.
NO added header value makes it
into the list
Visual Studio Performance Testing Quick Reference Guide Page 47
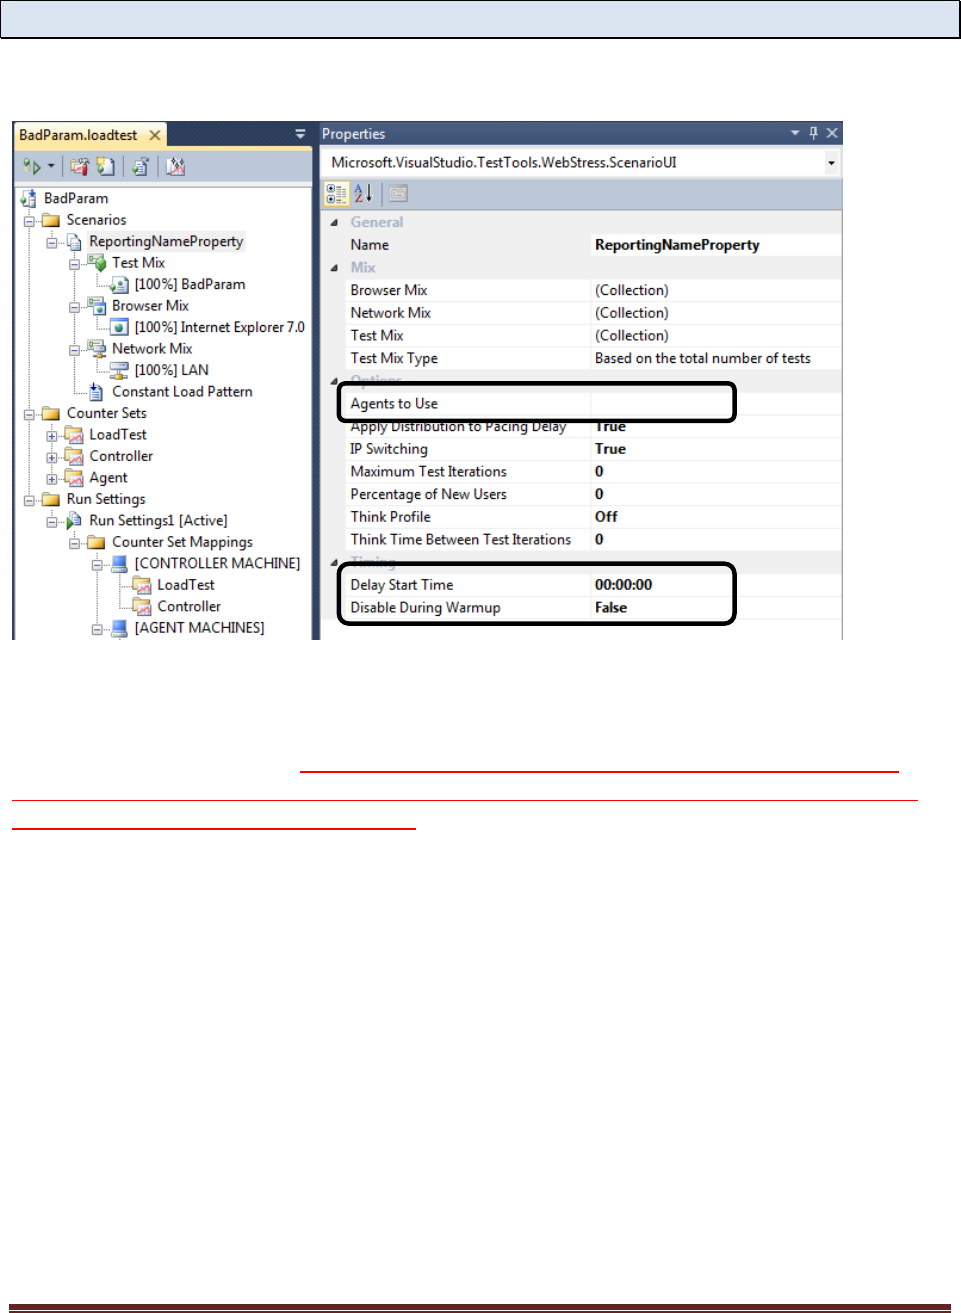
New options on Load Test Scenarios
There are some new properties exposed for load test scenarios that make it easier to control how your
tests run.
Agents to Use
The agent names that are entered should be the names of agents that are connected to the controller to which the
load test will be submitted.
Unfortunately, at this time, if you switch to submitting the load test to a
different controller, you will need to change the value for “Agents to Use” as there is no way to parameterize
this list to vary depending on the controller used. This list of agents designates a subset of those the agents that
are connected to the controller, and are in the Ready state when the load tests starts (they may be running a
different load test or other test run when the load test is queued as long as they become Ready when the load test
is taken out of the Pending state and starts running), and that meet any agent selection criteria to allow the test
run to be run on the agent. The Scenario will run on all agents in the list that meet these criteria, and the user
load for the Scenario will be distributed among these agents either evenly (by default) or according to any agent
al
Studio).
Delay Start Time
Amount of time to wait after the load test starts before starting any tests in this scenario.
Disable During Warmup
If true, the delay time does not begin until after warmup completes.
Visual Studio Performance Testing Quick Reference Guide Page 48
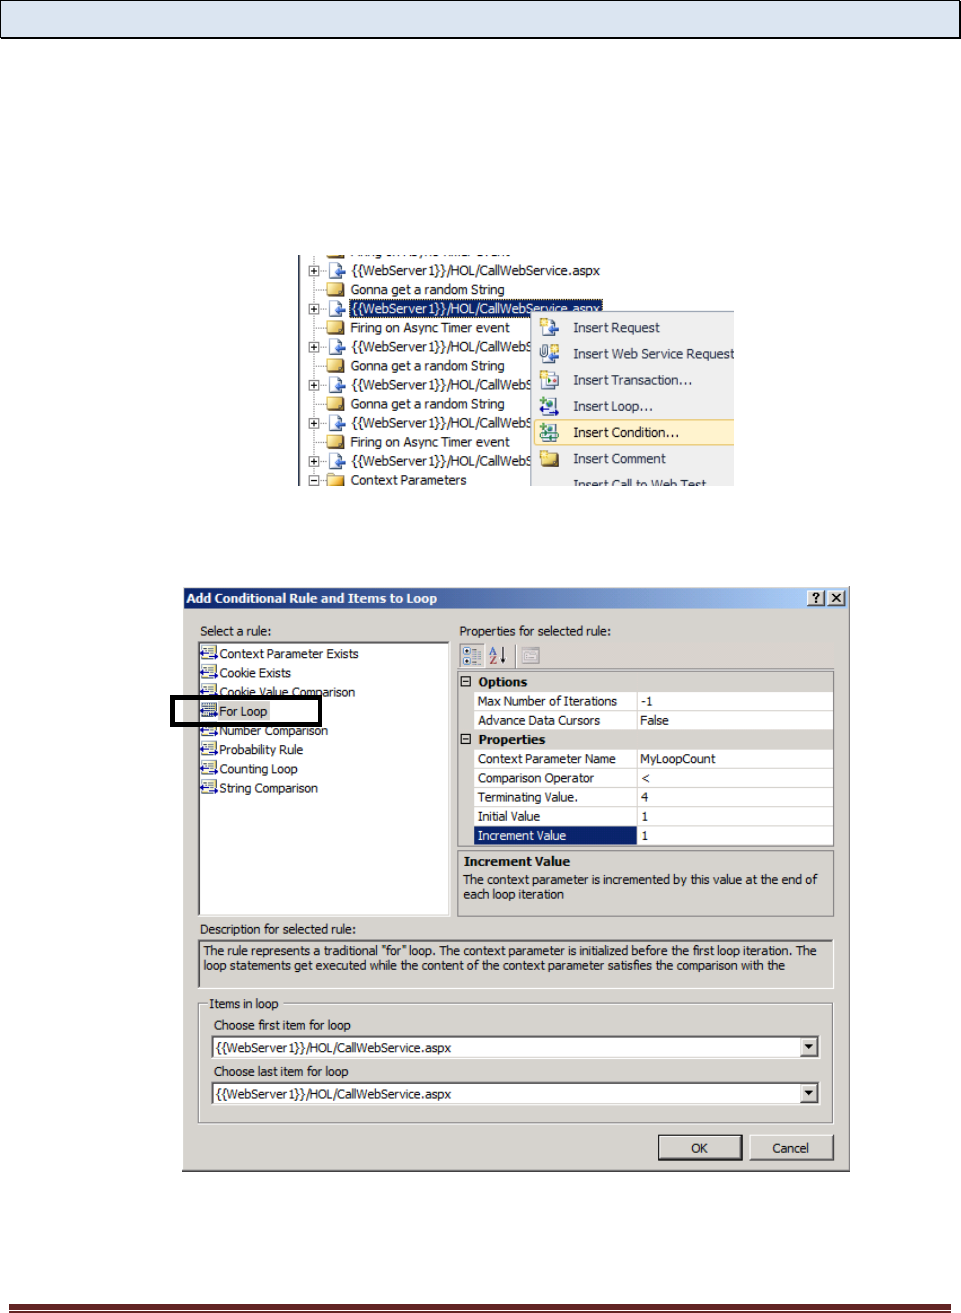
Loops and Conditionals
In Visual Studio 2008, if you wanted to conditionally execute some requests or you wanted to
loop through a series of requests for a given number of times, you had to convert a declarative
web test to a coded web test. In VS2010, these options are exposed directly in declarative
webtests.
The ability to add these are exposed by right-clicking on a request and selecting the option you
want from the context menu:
The context menu showing the loop and condition insert options
Sample dialog box for setting the properties of a loop
Visual Studio Performance Testing Quick Reference Guide Page 49
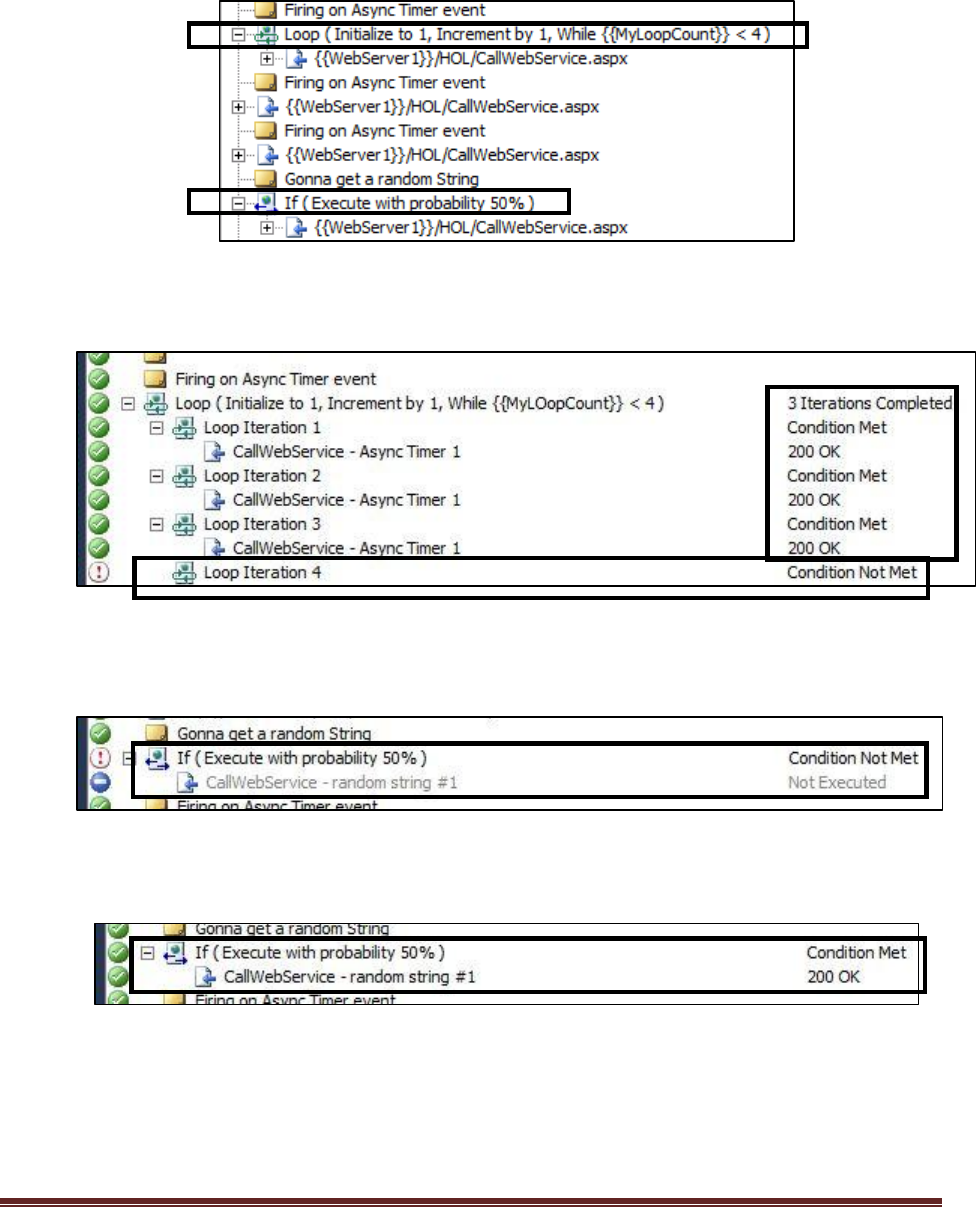
What the entries look like in the declarative test
Loop results when the test is played back
What results look like if a conditional call fails
What the results look like if a conditional call succeeds.
Visual Studio Performance Testing Quick Reference Guide Page 50
Configurations and Settings
How to Change the Location Where Agents Store Run Files
If you need to move the location that an agent uses to store the files downloaded to it for executing
tests, the following steps will take care of this. On each agent machine,
Open QTAgentService.exe.config
Add "<add key="WorkingDirectory" value="<location to use>"/>" under the <appSettings> node.
Create the <location to use> folder.
How to set a proxy server for web tests
By default, there is no proxy set on a web the Internet Explorer
proxy settings are. If your test sets a specific proxy server within the web test then the IE setting is still
not used. In coded web tests or web test plug-ins, you can set the proxy name using the WebProxy
property of the WebTest class. NOTE that this method is broken in Visual Studio Team Test (“VSTT”)
2008 RTM, but is fixed in SP1 for VSTT 2008.
I default
(without the quotes). In this case you should turn off Automatic Proxy Detection on each agent.
Automatic Proxy detection is very slow and can greatly impact the amount of load you can drive on an
agent.
How to configure Web Tests so Fiddler can capture playback info
In 2008
By default, web test playback ignores proxy servers set for localhost, so enabling a proxy for 127.0.0.1
(which is where Fiddler captures) will not result in any captured data. To make this work, either add a
plugin with the following code, or put the following code in the Class constructor for a coded web test:
this.Proxy = "http://localhost:8888";
WebProxy webProxy = (WebProxy)this.WebProxy;
webProxy.BypassProxyOnLocal = false;
In 2010
To get fiddler to work in VS 2010, simply open Fiddler, then start playing the web test. There is no need
to code for anything.
Changed in 2010
Visual Studio Performance Testing Quick Reference Guide Page 51
Controlling the amount of memory that the SQL Server Results machine consumes
The default behavior for SQL Server is to consume as much memory as it thinks it can, the workload on
the machine may not be allowing SQL Server to correctly identify memory pressure and hence give back
some memory. You can configure SQL Server to a max memory limit, which if all you are doing is
inserting results should be fine.
The below is how you can set memory to 512mb. The size of the memory you use will vary based on the
machine, testing and how much memory you have.
sp_configure 'show advanced options', 1
RECONFIGURE
GO
sp_configure 'max server memory', 512
RECONFIGURE
GO
How to configure the timeouts for deployment of load tests to agents
\Xml\Schemas\vstst.xsd
meout
<xs:element name="Timeouts" minOccurs="0">
<xs:complexType>
<xs:attribute name="runTimeout" type="xs:int" use="optional"
default="0"/>
<xs:attribute name="testTimeout" type="xs:int"
use="optional" default="1800000"/>
<xs:attribute name="agentNotRespondingTimeout" type="xs:int"
use="optional" default="300000"/>
<xs:attribute name="deploymentTimeout" type="xs:int"
use="optional" default="300000"/>
<xs:attribute name="scriptTimeout" type="xs:int"
use="optional" default="300000"/>
</xs:complexType>
</xs:element>
Change the values as needed and note that the time is in milliseconds.
Visual Studio Performance Testing Quick Reference Guide Page 52
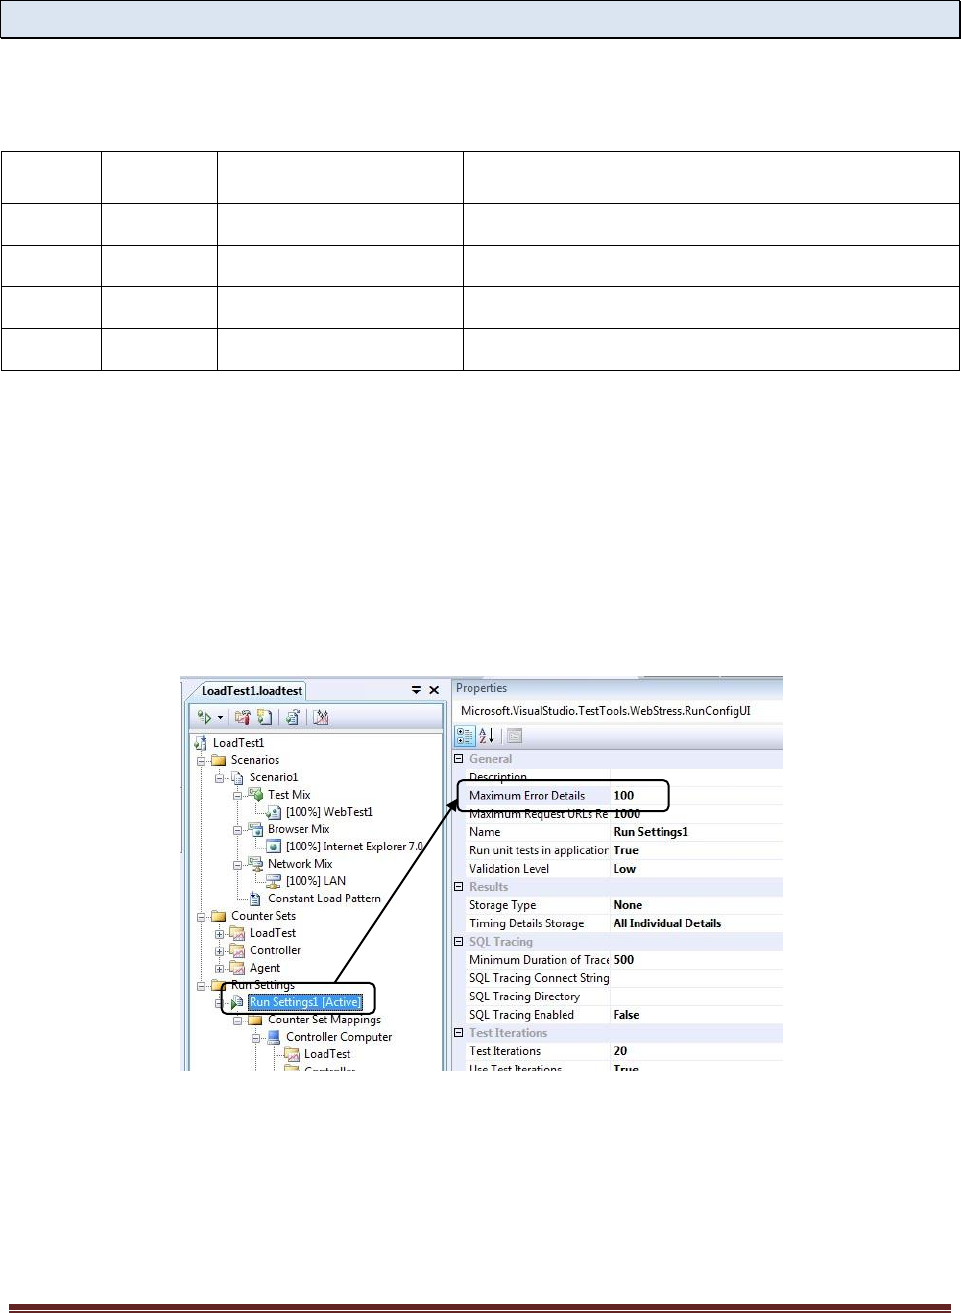
How to set the number of Load Test Errors and Error Details saved
Load Test Errors:
You can change the total number of errors stored for a run in the appropriate configuration file
(depending on whether this is for local runs or for test rig runs):
Version
Run Type
File Name
Location
2008
Local
VSTestHost.exe.config
<Program Files>\Microsoft Visual Studio
9\Common7\IDE\
2008
Remote
QTController.exe.config
<Program Files>\Microsoft Visual Studio 9.0
Team Test Load Agent\LoadTest\
2010
Local
DevEnv.exe.config
<Program Files>\Microsoft Visual Studio
9\Common7\IDE\
2010
Remote
QTController.exe.config
<Program Files>\Microsoft Visual Studio
9\Common7\IDE\
Add a key to the "appSettings" section of the file (add the "appSettings" section if needed) with the
name "LoadTestMaxErrorsPerType" and the desired value.
<appSettings>
<add key="LoadTestMaxErrorsPerType" value="5000"/>
</appSettings>
Load Test Error Details:
Visual Studio Performance Testing Quick Reference Guide Page 53
Multi-proc boxes used as agents should have .NET garbage collection set to server
mode
In 2008
To enable your application to use Server GC, you need to modify either the VSTestHost.exe.config or
the QTAgent.exe.config. If you are not using a Controller and Agent setup, then you need to modify the
VSTesthost.exe.config. If you are using a controller and agent, then modify the QTAgent.exe.config for
each agent machine. Open the correct file. The locations are
VSTestHost.exe.config - C:\Program Files\Microsoft Visual Studio 9.0\Common7\IDE
QTAgent.exe.config - C:\Program Files\Microsoft Visual Studio 9.0 Team Test Load
Agent\LoadTest
To enable gcserver you need to add the following highlighted line in the runtime section:
<?xml version ="1.0"?>
<configuration>
<runtime>
<gcServer enabled="true" />
<assemblyBinding xmlns="urn:schemas-microsoft-com:asm.v1">
<probing
privatePath="PrivateAssemblies;PublicAssemblies"/>
</assemblyBinding>
</runtime>
</configuration>
In 2010
The agent service in VS 2010 is now set to Server GC by default. No need to take any action here.
Location of list of all agents available to a controller
To retrieve a list of agents assigned to a controller without using the VSTS IDE, look in:
In 2008
<install point>\Microsoft Visual Studio 9.0 Team Test Load
Agent\LoadTest\QTControllerConfig.xml
In 2010
<install point>\Microsoft Visual Studio
10.0\Common7\IDE\QTControllerConfig.xml
Changed in 2010
Changed in 2010
Visual Studio Performance Testing Quick Reference Guide Page 54
Networks, IP Switching, Test Startups
IP Address Switching anatomy (how it works)
Each agent is assigned a range of up to 256 IP addresses to use. At the start of a test run, the agent
service configures the IP addresses on the network card. When the test starts running, new connections
are round-robined through the pool of IP addresses.
The most common use for IP Switching is when load testing against a load balancer. Load balancer
typically use the IP address to route requests to a particular Web server in the farm. So if you have 2
agents driving load to 3 Web servers, since all traffic is coming from two IPs (one on each agent), only
two of the web servers would get all the traffic. IP Switching provides a way to have traffic come from
multiple IPs on the same agent, enabling the load balancer to balance load across the farm.
VSTT currently limits the number of unique IP addresses to 256 per agent. In most testing situations, this
will be plenty of addresses. The main place where this limitation might impact you is if you are running a
large test where every single user must have a separate IP Address for some sort of session state. This is
pretty unusual.
In VS 2008, there is no way to have a given virtual user use the same IP. That is, with IP switching turned
on, a given user will multiple IPs out of the IP pool, and may use different IPs on subsequent iterations.
In VS 2010, the Web test engine tries to ensure that the same user will always use the same IP address,
but there is no guarantee that it will be the case.
The biggest problem with assigning unique IP Addresses to every user is that currently the IP switching
configuration limits you to a range of 256 IP addresses per agent, which would mean you would also be
limited to 256 virtual users per agent. One solution is to use VMs to get multiple load test agents on a
single physical machine.
Gotcha: IP Address Switching is ONLY for WEB TESTS
The IP Switching feature will NOT work with Unit Tests
Gotcha: IP Addresses used for switching are not permanent
When you choose to use multiple IP addresses from each agent machine during load testing (known as
IP address switching or spoofing), most testing tools require you to add those IP addresses to the NIC of
the machine, and they are always available and always show up on the machines. VSTS allows you to
set a range of IP addresses directly in the test project. Then VSTS dynamically adds the addresses to the
agent(s) when the test run starts, and removes them when the test run stops. . If you need to perform
IP switching, a controller/agent setup is required.
Visual Studio Performance Testing Quick Reference Guide Page 55
How to Setup IP Switching
There are 2 parts to setting up IP Switching. First, you must configure the Test Rig Agents to use IP
Switching. Then you must tell the Load Test itself that it should take advantage of that. Here are the
steps and the pitfalls involved:
Setting up the agents
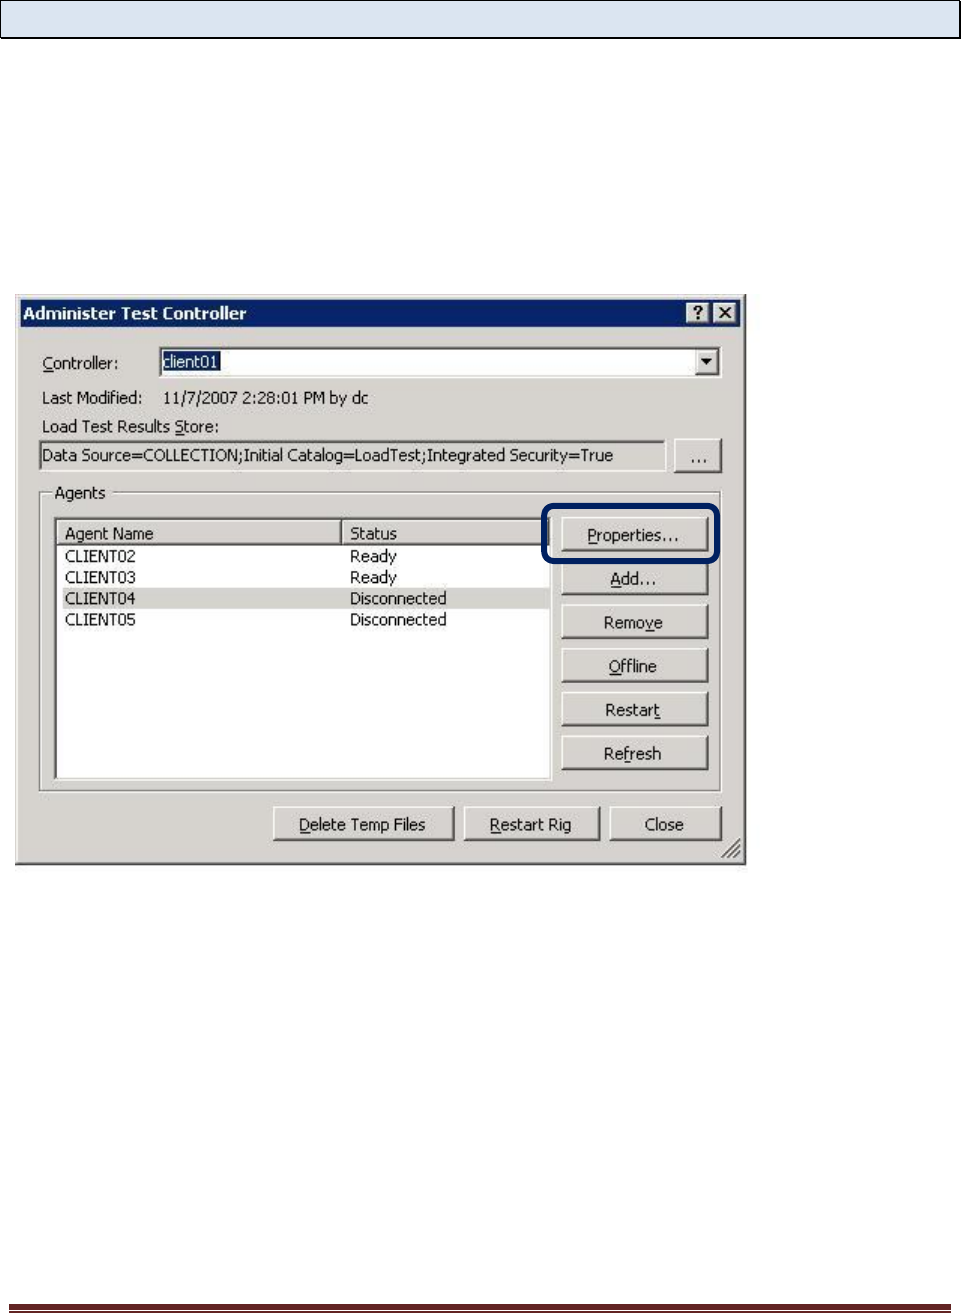
1. Open up the Test Rig Administration dialog (Test -> Administer Test Controller)
2. Highlight each of the agents and bring up the Properties for the agent
3. Fill out all of the appropriate information (as outlined in the picture below)
Where to configure Agent Properties

Visual Studio Performance Testing Quick Reference Guide Page 56
Make sure you pick the correct
adapter here. Use the Network
Connections properties built into
Windows along with the IPCONFIG
command to see which NIC is
assigned to what subnet (see below).
The base address is 3 octets and
should be representative of the
subnet you are on. If you are using a
class B subnet, you still need a third
octet for the base.
The output from the IPCONFIG
command in a CMD window.
C:\Documents and Settings>ipconfig
Windows IP Configuration
Ethernet adapter Secondary:
Connection-specific DNS Suffix . :
IP Address. . . . . . . . . . . . : 10.69.200.3
Subnet Mask . . . . . . . . . . . : 255.255.0.0
Default Gateway . . . . . . . . . : 10.69.0.1
Ethernet adapter Primary:
Connection-specific DNS Suffix . :
IP Address. . . . . . . . . . . . : 10.99.3.3
Subnet Mask . . . . . . . . . . . : 255.255.0.0
Default Gateway . . . . . . . . . : 10.99.0.1
Getting the proper IP Address info for spoofing
The information as shown in the
Network Connections dialog box in
Windows. You may need to hover the
mouse over the NIC to see the entire
name of the NIC.
Visual Studio Performance Testing Quick Reference Guide Page 57
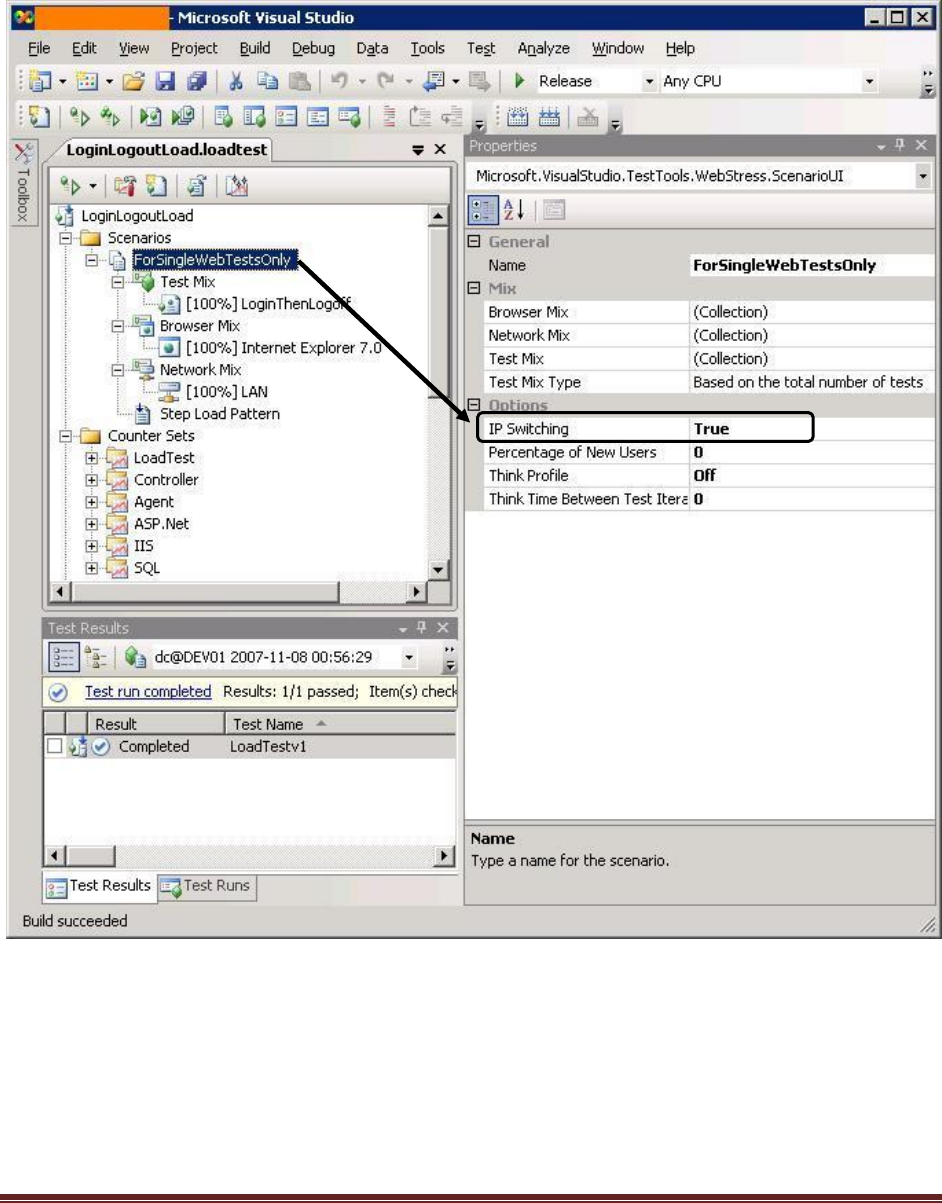
Setting up The Load Test
Once the test rig is setup, you can configure which Load Test will actually use IP Switching by setting the
correct property for the Load Test:
Where to enable IP Switching for the Load Test Itself (after configuring the agents to use it)
Visual Studio Performance Testing Quick Reference Guide Page 58
Troubleshooting invalid view state and failed event validation
ASP.NET uses __VIEWSTATE and __EVENTVALIDATION hidden fields to round-trip information across
HTTP requests. The values for these fields are generated on the server and should be posted unchanged
on a post back request. By default, these values are signed with a so-called validationKey to prevent
tampering with the values on the client.
If you just record the values in a web test and post the recorded values, you can run into ASP.NET error
messages about invalid view state or failed event validation. The Visual Studio web test recorder will
normally automatically detect the __VIEWSTATE and __EVENTVALIDATION hidden fields as dynamic
parameters. This means the dynamically extracted values will be posted back instead of the recorded
values.
However, if the web server is load balanced and part of a web farm you may still run into invalid view
state and failed event validation errors. This occurs when not all servers in the web farm use the same
validationKey and the post back request is routed to a different server in the farm than the one on
which the page was rendered.
To troubleshoot, ViewState MAC checking can be disabled by setting enableViewStateMac to false.
However, this is not suitable for use on a production environment because it disables an important
security feature and has performance implications. The recommended fix is to define the same value for
the validationKey on all machines.
Instructions for manually creating a validationKey are detailed at http://msdn.microsoft.com/en-
us/library/ms998288.aspx. For IIS 7 a machine key can easily be created through IIS Manager, see
http://technet.microsoft.com/en-us/library/cc772287(WS.10).aspx.
For more background information on ViewState and EventValidation go to
http://msdn.microsoft.com/en-us/magazine/cc163512.aspx.
Startup: Slowness Restarting a Test Rig with Agents Marked as “Offline”
If you have agent machines that are either disabled (powered off, service stopped, etc) or that no longer
dialog, restarting the rig
will take a long time. The controller will attempt to contact all agents listed in the dialog regardless of
their status, and it will take approximately one minute or more for each missing machine.

Visual Studio Performance Testing Quick Reference Guide Page 59
Startup: Multiple Network Cards can cause tests in a rig to not start
Problem: When running tests against a controller and test agents the tests start with pending state but
then nothing else happens.
Visual Studio Client Resolution: The problem is that you have two network adapters on the client
machine. The following entries in the controller log confirm that this is the problem:
[I, 2972, 11, 2008/06/26 13:02:59.780] QTController.exe: ControllerExecution: Calling
back to client for deployment settings.
[E, 2972, 11, 2008/06/26 13:06:51.155] QTController.exe: StateMachine(RunState):
Exception while handling state Deploying: System.Net.Sockets.SocketException: A
connection attempt failed because the connected party did not properly respond after a
period of time, or established connection failed because connected host has failed to
respond 65.52.230.25:15533
This is exactly the type of error message we see when the controller communication with Visual Studio
fails because the client has network cards: To configure your Visual Studio installation to communicate
with the controller, try this:
In regedit:
Find the key:
HKEY_LOCAL_MACHINE\SOFTWARE\Microsoft\VisualStudio\9.0\EnterpriseTools\QualityTools
address for the client (65.52.230.25 in your case) as the BindTo value.
Test Rig Resolution:
Read the following support article for the steps to resolve this issue on a test rig:
http://support.microsoft.com/kb/944496
Startup: Slow startup can be caused by _NT_SYMBOL_PATH environment variable
If you have the environment variable _NT_SYMBOL_PATH defined on your systems, your tests may stay
h defines a symbol server
that is external to your environment and you do not have a local cache of symbols available. To work
around this, do the following:
1. Remove the _NT_SYMBOL_PATH in the environment where you start devenv.exe from.
2. Change _NT_SYMBOL_PATH, by putting a cache location in front of the symbol store location.
For more information about symbol paths and symbol servers, go to:
http://msdn.microsoft.com/en-us/library/ms681416(VS.85).aspx

Visual Studio Performance Testing Quick Reference Guide Page 60
Startup: tests on a Rig with Agents on a Slow Link
The load test does not actually start on any agents until deployment of all files has occurred to all agents
(by the way, this means that the slow up start of a load test on a rig with many agents could have been
caused by slow deployment to one or more agents).
A common root cause is the _NT_SYMBOLS_PATH variable defined in the environment that points to
somewhat slow symbol server (like \\symbols\symbols).
Try one these workarounds:
- Undefine _NT_SYMBOLS_PATH in the environment where you start devenv.exe from.
- Change _NT_SYMBOLS_PATH, by putting a cache in front, such as cache*c:\symcache. This is
will make 1st run same slow but all subsequent runs fast.
“Not Bound” Exception when using IP Switching is not really an error
The below error may appear several times when running a load test where you are using IP Switching. In
most cases, this can be ignored.
00:51:35 AGENT02 <none> <none> <none> Exception
LoadTestException 151 Web test requests were not bound to either the correct IP
address for IP switching, or the correct port number for network emulation, or both.
The one situation where the presence of this error may indicate a real issue with the test is when the
application is relying on a given iteration to always come through on the same IP address for purposes of
maintaining a session (such as a load balancer like Microsoft ISA Server with the IP Sticky setting turned
on).
New to 2010
Visual Studio Performance Testing Quick Reference Guide Page 61
How to configure the timeout for deployment of load tests to agents
You might encounter timeouts when deploying load tests to agents when the deployment contains
many or large files. In that case you can increase the timeout for deployment. The default value is 300
seconds.
In 2010
You have to change the .testsettings file that corresponds to your active test settings in Visual Studio,
because the deployment timeout setting is not exposed via the Visual Studio UI. Check via the menu
Test | Select Active Test Settings (Visual Studio 2010) which file is active. You can find the file in the
The TestSettings element will have an Execution element. Add a child element called Timeouts, if not
already present, to the Execution element. Give it a deploymentTimeout attribute with the desired
timeout value in milliseconds. For example:
<?xml version="1.0" encoding="UTF-8"?>
<TestSettings name="Controller" id="330da597-4a41-4ae7-8b95-60c32ab793fb"
xmlns="http://microsoft.com/schemas/VisualStudio/TeamTest/2010">
(…)
<Execution location="Remote">
<Timeouts deploymentTimeout="600000" />
IntelliSense should help you out when adding/editing this.
In 2008
In 2008 you have to change the .testrunconfig file that corresponds to your active test run configuration,
Add a child element Timeouts under the TestRunConfiguration element if no such element is already
present. Check via the menu Test | Select Active Test Run Configuration which file is active. You can find
the file in the Solution Items folder of your solution. Give it a deploymentTimeout attribute with the
desired timeout value in milliseconds. For example:
<?xml version="1.0" encoding="UTF-8"?>
<TestRunConfiguration name="Controller" id="af5824b3-56fa-4534-a3f8-6e763a56869a"
xmlns="http://microsoft.com/schemas/VisualStudio/TeamTest/2006">
<Timeouts deploymentTimeout="600000"/>
IntelliSense should help you out when adding/editing this.
Changed in 2010
Visual Studio Performance Testing Quick Reference Guide Page 62
Performance Counters and Data
Customizing the Available Microsoft System Monitor counter sets
The counter set templates for VSTS are located in the following directory (assuming a typical install):
In 2008
C:\Program Files\Microsoft Visual Studio
9.0\Common7\IDE\Templates\LoadTest\CounterSets
In 2010
C:\Program Files\Microsoft Visual Studio
10.0\Common7\IDE\Templates\LoadTest\CounterSets
These files are standard XML files and can be modified to allow for quick and easy re-use of custom sets.
It is recommended that you copy the counter set you wish to enhance and add the name CUSTOM to it
so you will always remember that it is a custom counter set. Or you can create your own totally
independent counter set. The following shows the layout of the file:
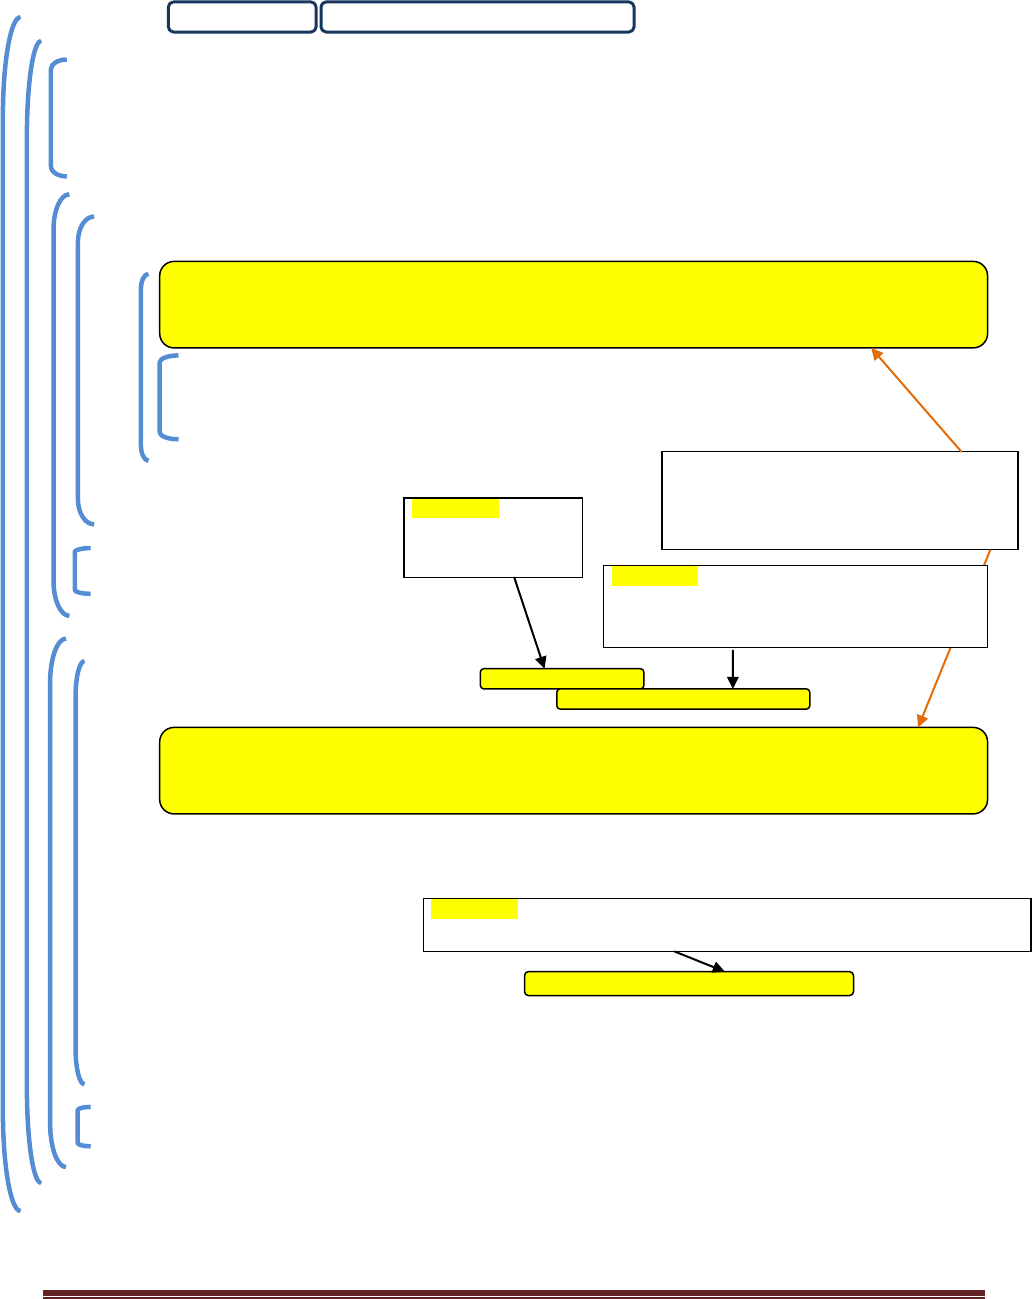
Visual Studio Performance Testing Quick Reference Guide Page 63
<?xml version="1.0" encoding="utf-8"?>
<CounterSet Name="Custom" CounterSetType="Custom Set">
<CounterCategories>
<CounterCategory Name="Memory">
<Counters>
<Counter Name="% Committed Bytes In Use" />
<Counter Name="Available Mbytes" />
</Counters>
</CounterCategory>
<CounterCategory Name="Processor">
<Counters>
<Counter Name="% Processor Time">
<ThresholdRules>
<ThresholdRule
Classname="Microsoft.VisualStudio.TestTools.WebStress.Rules.Thresh
oldRuleCompareConstant,
Microsoft.VisualStudio.QualityTools.LoadTest">
<RuleParameters>
<RuleParameter Name="AlertIfOver" Value="True" />
<RuleParameter Name="WarningThreshold" Value="80" />
<RuleParameter Name="CriticalThreshold" Value="95" />
</RuleParameters>
</ThresholdRule>
</ThresholdRules>
</Counter>
</Counters>
<Instances>
<Instance Name="*" />
</Instances>
</CounterCategory>
<CounterCategory Name="PhysicalDisk">
<Counters>
<Counter Name="% Disk Read Time" Range="100" />
<Counter Name="% Idle Time" Range="100" HigherIsBetter="true">
<ThresholdRules>
<ThresholdRule
Classname="Microsoft.VisualStudio.TestTools.WebStress.Rules.Thresh
oldRuleCompareConstant,
Microsoft.VisualStudio.QualityTools.LoadTest">
<RuleParameters>
<RuleParameter Name="AlertIfOver" Value="False" />
<RuleParameter Name="WarningThreshold" Value="40" />
<RuleParameter Name="CriticalThreshold" Value="20" />
</RuleParameters>
</ThresholdRule>
</ThresholdRules>
</Counter>
<Counter Name="Avg. Disk Bytes/Read" RangeGroup="DiskBytesRate" />
<Counter Name="Avg. Disk Bytes/Transfer" RangeGroup="DiskBytesRate" />
<Counter Name="Avg. Disk Bytes/Write" RangeGroup="DiskBytesRate" />
<Counter Name="Avg. Disk Queue Length" RangeGroup="Disk Queue Length" />
<Counter Name="Split IO/Sec" RangeGroup="Disk Transfers sec" />
</Counters>
<Instances>
<Instance Name="*" />
</Instances>
</CounterCategory>
</CounterCategories>
</CounterSet>
This all needs to be on one line. Make
sure you format it properly when
putting it in the final file.
New To 2010
HigherIsBetter is used for highlighting better
or worse results in the Excel reports.
New To 2010
Range specifies the
graph range.
New To 2010
RangeGroup uses a common range for all counters in that range group.
Visual Studio Performance Testing Quick Reference Guide Page 64
Performance Counter Considerations on Rigs with slow links
Having a slow WAN between the controller and agents may definitely cause some timeouts or delays in
performance counter collection. Each performance counter category is read in a separate operation:
just one or more than one network read.
There are some timeout settings for performance counter collection that you can change by editing the
QTController.exe.config file (or VSTestHost.exe.config file when running locally on VSTS 2008, or in
devenv.config.exe for 2010) and adding these lines:
<appSettings>
<add key="LoadTestCounterCategoryReadTimeout" value="9000"/>
<add key="LoadTestCounterCategoryExistsTimeout" value="30000"/>
</appSettings>
The values are in ms, so 9000 is 9 seconds. If you make this change, also change the load test sample
rate to be larger than this: at least 10 or preferably 15 seconds, and yes with many agents located far
from the controller, it is recommended to delete most of the categories in the Agent counter set
(perhaps just leave Processor and Memory).
The .NET API that used to read the performance counters is
PerformanceCounterCategory.ReadCategory(), so the entire category is read even if the counter set
definition only includes one counter and one instance. This is a limitation at the OS level in the way
performance counters are read.
The defaults in VSTS are:
LoadTestCounterCategoryReadTimeout: 2000 ms (2 seconds)
LoadTestCounterCategoryExistsTimeout: 10000 ms
Visual Studio Performance Testing Quick Reference Guide Page 65
Increase the performance counter sampling interval for longer tests
length of your load test. A smaller sample rate, such as the default value of five seconds, requires more
space in the load test results database. For longer load tests, increasing the sample rate reduces the
amount of data collected.
Here are some guidelines for sample rates:
Load Test Duration Recommended Sample Rate
< 1 Hour 5 seconds
1 - 8 Hours 15 seconds
8 - 24 Hours 30 seconds
> 24 Hours 60 seconds
Changing the default counters shown in the graphs during testing
If you want to change the default set of counters that show up in the graphs when you start a test, you
can go into each of the .counterset XML files (same directory as above) and set or add to the
DefaultCounter entries in the following section (at the bottom of the files):
<DefaultCountersForAutomaticGraphs>
<DefaultCounter CategoryName="Memory" CounterName="Available MBytes"/>
</DefaultCountersForAutomaticGraphs>
Possible method for fixing “missing perfmon counters” issues
On the controller machine for your rig, map a drive to each of the machines you will be collecting perf
counters for within the load test. Then, before you kick off a test, open each drive you mapped and
verify that you have connectivity. Leave the window open during the test.

Visual Studio Performance Testing Quick Reference Guide Page 66
How and where Performance data gets collected
There are two types of data collected by VSTS during a test run: Real perfmon counters and pseudo
perfmon counters. All real perfmon counters are collected directly by the VSTS Controller machine.
In the Load Test editor, all of the performance counter
LoadTest counter set in the load test editor) is data that is collected on the agents by the load test
runtime engine. These are not real Perfmon counters in the sense that if you try to look at them with
e them look like Perfmon counters for consistency in the
load test results database and display. The agents send this some of this data (see below) in messages to
the controller every 5 seconds which rolls up the agent (e.g. Requests / sec across the entire rig rather
than per agent). The controller returns the rolled up results to Visual Studio for display during the run
and also stores them in the load test results database.
[Requests Per Second Counters] The VS RPS does not count cached requests, even though VSTS is
sending an http GET with if-modified-since headers.
What data is sent every 5 seconds? we do everything possible to limit how much data is sent back in
that message. What we do send back is the average, min, max values for all of the pseudo
performance counters
Note that the biggest factor in the size of these result messages is the number of performance counter
instances, which for Web tests is mostly determined by the number of unique URLs reported on during
the load test. We also send back errors in these 5 seconds messages, but details about the failed
requests are not sent until the end of the test, so tests with lots of errors will have bigger messages.
Lastly, we only send back metadata such as the category names and counter names once and use
numeric identifiers in subsequent messages, so the messages at the start of the load test may be slightly
larger than later messages.
One thing you could do to reduce the size of the messages is to reduce the level of reporting on
dependent requests
WebTestRequest object to false. This eliminate the page and request level reporting for that request,
but you could add a transaction around that request single request and that would really match the
page time for that request
Visual Studio Performance Testing Quick Reference Guide Page 67
Data and Results
Custom Data Binding in UNIT Tests
The first thing to do is create a custom class that does the data initialization (as described in the first
part of this post: http://blogs.msdn.com/slumley/pages/custom-data-binding-in-web-tests.aspx). Next,
instantiate the class inside your unit test as follows:
[TestClass]
public class VSTSClass1
{
private TestContext testContextInstance;
public TestContext TestContext
{
get { return testContextInstance; }
set { testContextInstance = value; }
}
[ClassInitialize]
public static void ClassSetup(TestContext a)
{
string m_ConnectionString = @"Provider=SQLOLEDB.1;Data
Source=dbserver;Integrated Security=SSPI;Initial Catalog=Northwind";
CustomDs.Instance.Initialize(m_ConnectionString);
}
[TestMethod]
public void Test1()
{
Dictionary<string, string> dictionary = customDs.Instance.GetNextRow();
//......Add the rest of your code here.
}
Verifying saved results when a test hangs in the “In Progress” state after the test has
finished
If you run a test and either the test duration or the number of iterations needed for completion of the
of the results have been written to the load test results repository by running this SQL query against the
LoadTest database:
select LoadTestName, LoadTestRunId, StartTime, EndTime from
LoadTestRun where LoadTestRunId=(select max(LoadTestRunId) from
LoadTestRun);
If the EndTime has a non-NULL value then the controller is done writing results to the load test results
database and it should be safe to restart the rig (killing anything if needed).
written to the load test database, but it does mean t
agents/tests.
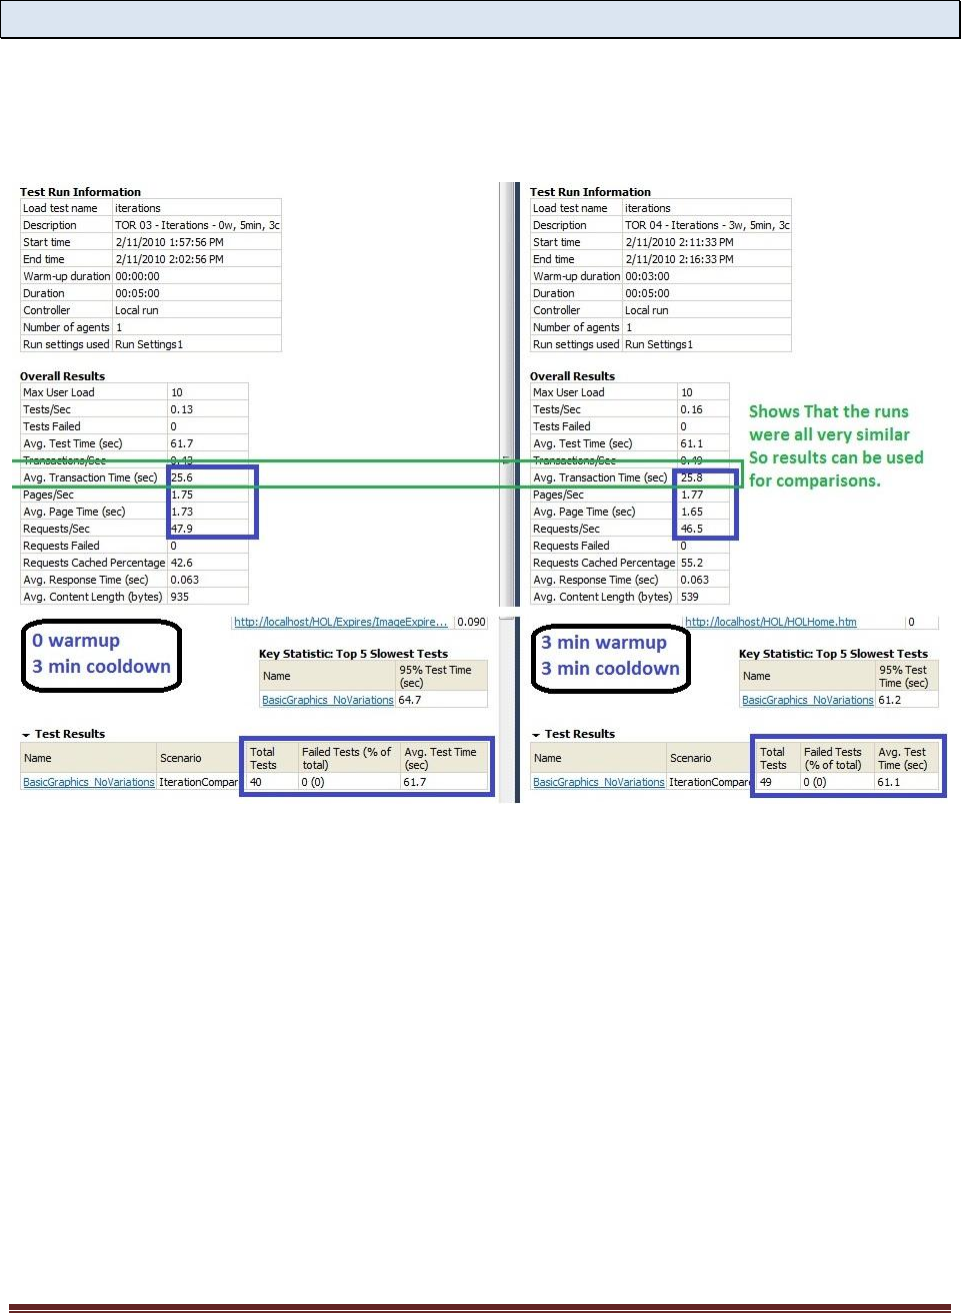
Visual Studio Performance Testing Quick Reference Guide Page 68
The metrics during and after a test differ from the results seen.
Scenario 1:
When you run load tests and look at the numbers you get while the tests are running, the values you see
may not be the same values that you get when you load the completed test results at a later point. This
behavior is not unexpected, based on warmup and cooldown settings.
Comparison of a test with and without warmup. Notice the total number of tests run is different, but the recorded times are
close enough to be valid for reporting.
Scenario 2:
When you compare the summary page results to the detailed results values, there can be a difference in
what is reported. This is due to the implementation of collecting the timing details, which are currently
flushed when a test iteration ends. For iterations that are in progress with in-flight requests, we give the
iteration 10 seconds (configurable via cooldown) to complete any in-flight requests. If they do not
complete, the transactions in those iterations are not counted in the details, but are counted in the
summary page.
Visual Studio Performance Testing Quick Reference Guide Page 69
From
IIS Logs
From
IIS Logs
From
IIS Logs
From
IIS Logs
How new users and return users affect caching numbers
Comparing VSTS Results to IIS Results for 100% new vs. 100% return
This section shows how VSTS handles caching and how to interpret the numbers shown for total
requests and cached requests.
TOR 09 - Caching - ReturnUsers
HTM 268
HTML 263
GIF 83
BMP 32719
200 OK - 3871
304 Not Modified - 29462
VSTS Requests: 33,333
VSTS Requests Cached: 84,507
TOR 10 - Caching - NewUsers
HTM 276
HTML 271
GIF 276
BMP 90243
200 OK - 46639
304 Not Modified - 44427
VSTS Requests: 89,384
VSTS Requests Cached: 43,758
Comparing the same tests using HTML’s Content Expiration setting
TOR 12 - Caching - ReturnUsers - Content Expiration
HTM 270
HTML 264
GIF 85
BMP 3330
200 OK - 3874
304 Not Modified - 75
VSTS Requests: 3,949
VSTS Requests Cached: 84,842
TOR 11 - Caching - NewUsers - Content Expiration
HTM 268
HTML 262
GIF 268
BMP 44622
200 OK - 45286
304 Not Modified - 134
VSTS Requests: 44,742
VSTS Requests Cached: 42,090
Comparing New Users to Return Users (WRT caching):
New users are simulated
each new iteration, whereas the cache is carried from iteration
to iteration for return users.
This results in many more requests being cached with return
users.
NOTE: The total # of requests made by VSTS is a sum of the two
not include cached requests.
overall network and web server activity (For more
Add an Expires or a
Cache-Control Header
http://developer.yahoo.com/performance/rules.html).
Notice that VSTS honors the content expiration (this is
actually handled by the underlying System.NET
component). However, VSTS still reports the cached
file request, even though no call went out the wire.
This is expected behavior since the request was a part
of the site. In order to see how many requests went on
the wire, you need to use IIS logs or network traces.
Visual Studio Performance Testing Quick Reference Guide Page 70
Notes:
All 4 tests above were run for the same duration with the same number of users executing the same
test.
Although the numbers do not match exactly, they are close enough to show the behavior of the
tests. The discrepancy is due to a few things, including cool down of the test and the possible mis-
alignment of the query I used to gather data from the IIS logs.
-
following query:
SELECT
sc-status, COUNT(*) AS Total
FROM *.log
WHERE
to_timestamp(date, time) between
timestamp('2010-02-12 02:13:22', 'yyyy-MM-dd hh:mm:ss')
and
timestamp('2010-02-12 02:18:22', 'yyyy-MM-dd hh:mm:ss')
GROUP BY
sc-status
data sources for data driven tests get read only once
When initializing data driven tests the data is read ahead of time, and only retrieved once. Therefore
there is no need to optimize the connection to the data source.

Visual Studio Performance Testing Quick Reference Guide Page 71
Consider including Timing Details to collect percentile data
There is a property on the Run Settings in the Load Test Editor named "Timing Details Storage". If
Timing Details Storage is enabled, then the time to execute each individual test, transaction, and page
during the load test will be stored in the load test results repository. This allows 90th and 95th
percentile data to be shown in the load test analyzer in the Tests, Transactions, and Pages tables. VS
2010 adds 99th percentile and standard deviation stats. Also, in VS 2010 this setting is on by default.
Consider turning it off for very large load tests, as with a many-agent test it can take up to half the time
of the load test to process all the timing details. In other words, if you have a 12 hour load test running
on 30 agents it could take 6 hours to collect and crunch all the data. In VS 2010, the details data is also
used to populate the virtual user activity chart.
The amount of space required in the load test results repository to store the Timing Details data may be
very large, especially for longer running load tests. Also, the time to store this data in the load test
results repository at the end of the load test is longer because this data is stored on the load test agents
until the load test has finished executing at which time the data is stored into the repository. For these
reasons, Timing Details is disabled by default. However if sufficient disk space is available in the load
test results repository, you may wish to enable Timing Details to get the percentile data. Note that
there are two choices for enabling Timing Details in the Run Settings properties named "StatisticsOnly"
and "AllIndividualDetails". With either option, all of the individual tests, pages, and transactions are
timed, and percentile data is calculated from the individual timing data. The difference is that with the
StatisticsOnly option, once the percentile data has been calculated, the individual timing data is deleted
from the repository. This reduces the amount of space required in the repository when using Timing
Details. However, advanced users may want to process the timing detail data in other way using SQL
tools, in which case the AllIndividualDetails option should be used so that the timing detail data is
available for that processing.
Visual Studio Performance Testing Quick Reference Guide Page 72
Consider enabling SQL Tracing through the Load Test instead of separately
There is a set of properties on the Run Settings in the Load Test Editor that allow the SQL tracing feature
of Microsoft SQL Server to be enabled for the duration of the load test. If enabled, this allows SQL trace
data to be displayed in the load test analyzer on the "SQL Trace" table available in the Tables dropdown.
This is a fairly easy-to-use alternative to starting a separate SQL Profiler session while the load test is
running to diagnose SQL performance problems. To enable this feature, the user running the load test
(or the controller user in the case of a load test run on a rig) must have the SQL privileges needed to
perform SQL tracing, and a directory (usually a share) where the trace file will be written must be
specified. At the completion of the load test, the trace file data is imported into the load test repository
and associated with the load test that was run so that it can be viewed at any later time using the load
test analyzer.
How to collect SQL counters from a non-default SQL instance
If you want to collect performance counters from a SQL Server instance while running a load test, you
can do this easily by checking the SQL counter set in the "Manager Counter Sets" dialog in the VSTS load
test editor. Doing this includes the default counter set for SQL Server in your load test. The
performance counter category names that are specified in this counter set begin with "SQLServer:": for
example "SQLServer:Locks".
However, if you are trying to monitor another SQL Server instance that is not the default SQL server
instance, the names of the performance counter categories for that instance will have different category
names. For example, if your SQL server instance is named "INST_A", then this performance counter
category will be named "MSSQL$INST_A:Locks". To change the load test to collect these performance
counters, the easiest thing to do is open the .loadtest file with the XML editor or a text editor and
replace all instances of "SQLServer:" by "MSSQL$INST_A:Locks" (correcting the replacement string for
your instance name).
How 90% and 95% response times are calculated
Within the load test results summary page, the percentile values mean that:
90% of the total transactions were completed in less than <time> seconds
95% of the total transactions were completed in less than <time> seconds
The calculation of the percentile data for transactions is based not on the sampled data that is shown in
the graph, but on the individual timing details data that is stored in the table
LoadTestTransactionDetail. The calculation is done using a SQL stored procedure that orders the data
transactions then uses the min() function on that set of rows to get the value for the 90th percentile
time. The stored procedure in the LoadTest database that does this is
Prc_UpdateTransactionPercentiles”.
Visual Studio Performance Testing Quick Reference Guide Page 73
Transaction Avg. Response Time vs. Request Avg. Response Time
For each HTTP request (including each dependent request) there is a request response time, and these
graphed, but is not be default) that is the average time to download the request that is in the web test
plus the time to download all dependents (dependents may be downloaded in parallel). Then for
transactions
the average of the sum of all of the page times (without the think times), and the latter is the same but
includes the think times.
For more descriptions see this online doc page: http://msdn.microsoft.com/en-
us/library/ms404656.aspx.
Considerations for the location of the Load Test Results Store
When the Visual Studio Team Test Controller is installed, the Load Test Results Store is set up to use an
instance of SQL Express that is installed on the controller computer. SQL Express is limited to using a
maximum of 4 GB of disk space. If you are going to run many load tests and want to keep the results for
a while, you should consider configuring the Load Test Results Store to use an instance of the full SQL
Server product if available. See the Visual Studio Team Test documentation for instructions on setting
up the database to be used as the Load Test Results Store.
Set the recovery model for the database to simple
VSTS 2008
You should change this to simple.
VSTS 2010 There was a change in the way the recovery model was configured in the
loadtestresultsrepository.sql command that ships with VSTS 2010, but the change does not take effect
due to a different command further down in the script. This issue is known and will be resolved in a
future version.
To change either version - Open SQL Management Studio and connect to the server that has the
Explo
Visual Studio Performance Testing Quick Reference Guide Page 74
How to clean up results data from runs that did not complete
If you have a Load Test Run that abnormally aborts and does not show data in a consistent manner (or
does not show up in the list of runs as either completed or aborted), you can use the following query on
the SQL repository server to clean up the database:
update LoadTestRun set Outcome=’Aborted’ where Outcome=’InProgress’
The Outcome field is left blank until the test either completes or is manually aborted. Any test results in
the DB cannot be accessed through the GUI until the Outcome field has one of the two values
InstanceName field in results database are appended with (002), (003), etc.
Question:
etc.
have two transactions. Also, I have a URL pointing to RenderWebPartContent and I have several
entries. Can someone give me a quick explanation?
Answer: To make a long story short it is a unique identifier that is used mostly internally to distinguish
between cases where you have the same test name in two different scenarios in the load test or the
same page name (simple file name) in different folders in two different requests.
Layout for VSTS Load Test Results Store
For VSTS 2008:
http://blogs.msdn.com/billbar/articles/529874.aspx
For VSTS 2010:
http://blogs.msdn.com/slumley/archive/2010/02/12/description-of-tables-and-columns-in-vs-
2010-load-test-database.aspx
Changed in 2010
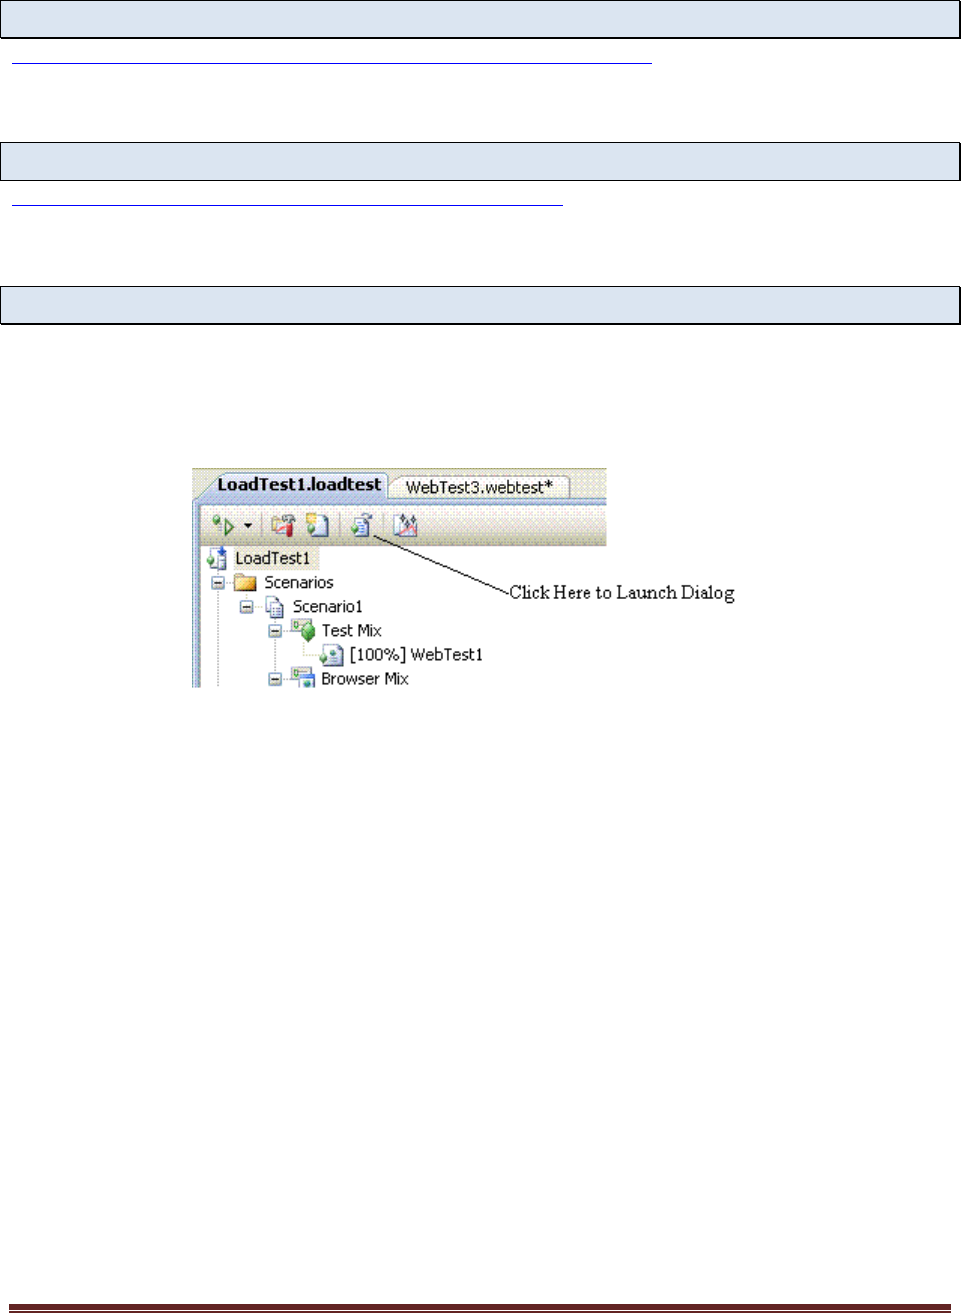
Visual Studio Performance Testing Quick Reference Guide Page 75
How to view Test Results from the GUI
http://blogs.msdn.com/slumley/pages/managing-load-test-results.aspx
SQL Server Reporting Services Reports available for download
http://blogs.msdn.com/slumley/pages/load-test-reports.aspx
How to move results data to another system
VSTS 2008 introduces a GUI results manager. The manager works on the Load Test Results Store that is
e local repository. To open the
results manager, you must have a load test opened and set as the active window. Then click on the icon
shown below:
How to launch the “Manage Load Test Results” dialog box
Once in the manager, you choose a controller name from the drop down list (or <local> if you want the
results from the local database) and the manager will populate with the tests it finds. You can select
d
with an extension of .ltrar). That file can be moved to another machine and then imported into a new
results store.
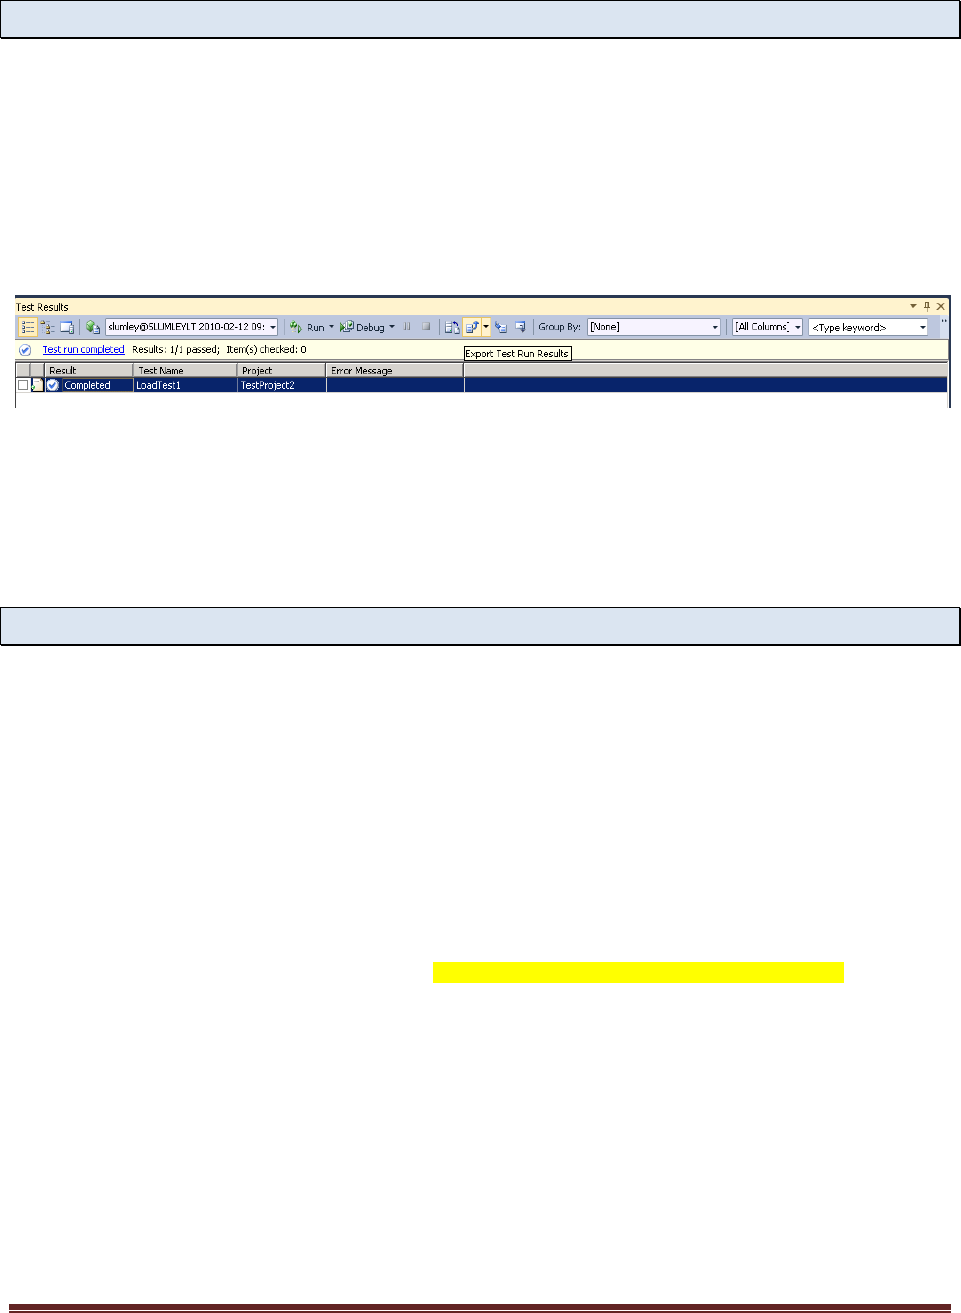
Visual Studio Performance Testing Quick Reference Guide Page 76
Load Test Results without SQL NOT stored
It is possible to configure a load test to run without a SQL load test repository. This is configured by
changing the Storage Type property on the Run Settings node in the load test editor. There are 2
options for this property: Database and None. I strongly recommend that you always use database. If
you run a load test with the storage property set to none, the results are only kept in memory. So as
soon as you close the Load Test Execution UI, the results are gone.
You might wonder why there is still an entry in the Test Results window and what effect
importing/exporting the test result would have.
For most result types all of the data needed to display the result can be exported into a TRX file. This is
not true for load tests. The only thing that a TRX file stores for a load test is the connection string to the
database with the results and the run id of the run to load. So if you do not run the load test with
storage type set to database, then exporting the TRX file is useless. It will contain no useable data that
you can use for later analysis. So ALWAYS use a database when running load tests.
Unable to EXPORT from Load Test Repository
import/export functionality in VSTT 2008 will not work. This is a known issue and is fixed in VS2010.
The error will look like:
[V, 3160, 6, 2009/11/30 16:06:15.808] devenv.exe: StateMachine(AgentState): calling
state handler for Online
[V, 3160, 7, 2009/11/30 16:06:15.813] devenv.exe: ControllerObject: RunQueueThread
waiting for runs...
[I, 3160, 4, 2009/11/30 16:06:15.889] devenv.exe: WebLoadTestAdapter: Opened
connection to results repository
[I, 3160, 4, 2009/11/30 16:06:16.426] devenv.exe: WebLoadTestAdapter: Closed
connection to results repository
[V, 3160, 4, 2009/11/30 16:06:36.201] devenv.exe: WebLoadTestAdapter:
LoadTestExporterImporter running: bcp "select * from LoadTest.dbo.LoadTestRun where
LoadTestRunId in (278)" queryout
"C:\Users\sellak\AppData\Local\Temp\3\LoadTestResults.7408358f-3580-4a38-9781-
409d90c52a22\LoadTestRun.dat" -S AXPERFORMANCE -T -N
[V, 3160, 4, 2009/11/30 16:06:36.367] devenv.exe: WebLoadTestAdapter: bcp output:
SQLState = 42S02, NativeError = 208
Error = [Microsoft][SQL Native Client][SQL Server]Invalid object name
'LoadTest.dbo.LoadTestRun'.
Notice the call to LoadTest.dbo.LoadTestRun is hardcoded, which is what causes the feature to break.
In general, we recommend you use the LoadTest database name (or in the case of 2010, the database is
named LoadTest2010).
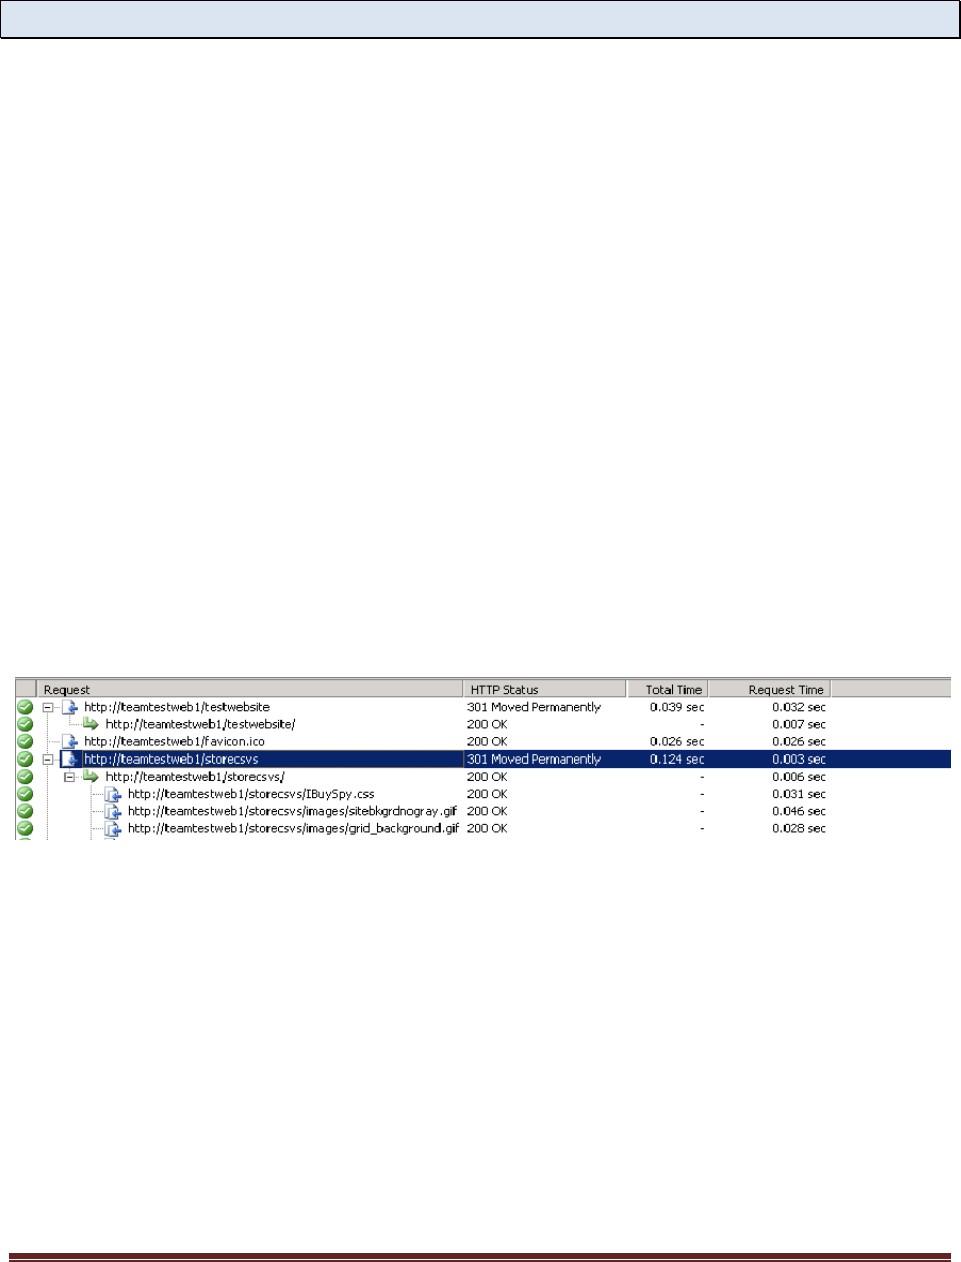
Visual Studio Performance Testing Quick Reference Guide Page 77
Web Test TRX file and the NAN (Not a Number) Page Time entry
In VSTS 2008, if a Web Test trx file is opened in an XML editor, you may notice the NAN page time for
some of the responses.
<Response url="http://teamtestweb1/storecsvs/"
contentType="text/html; charset=utf-8"
statusLine="HTTP/1.1 200 OK"
pageTime="NaN"
time="0.006"
statusCodeString="200 OK"
contentLength="12609">
When/why does this happen?
This only happens to non top-level requests, i.e. redirects and dependents.
At the end of Web test execution, all results (objects and their members) are serialized to a trx file,
including the pageTime. NAN is the result of doing a .ToString() on a float or double value that has not
been initialized. This means that the pageTime is not known at the time this entry was written to the trx.
The following is the screenshot of the Web test result file opened in the Playback window. It shows how
this property is set in the code.
The high-lighted one is the top-level page. It is redirected and the redirected to page has some
dependent requests. The for the top-level page, i.e. the page time, refers to the time to
send all requests and receive all responses (including the redirects and dependents) from the Web
server. It is only calculated and populated for the primary request, and the
dependents. This is why that you are seeing Nan page time in the XML file.
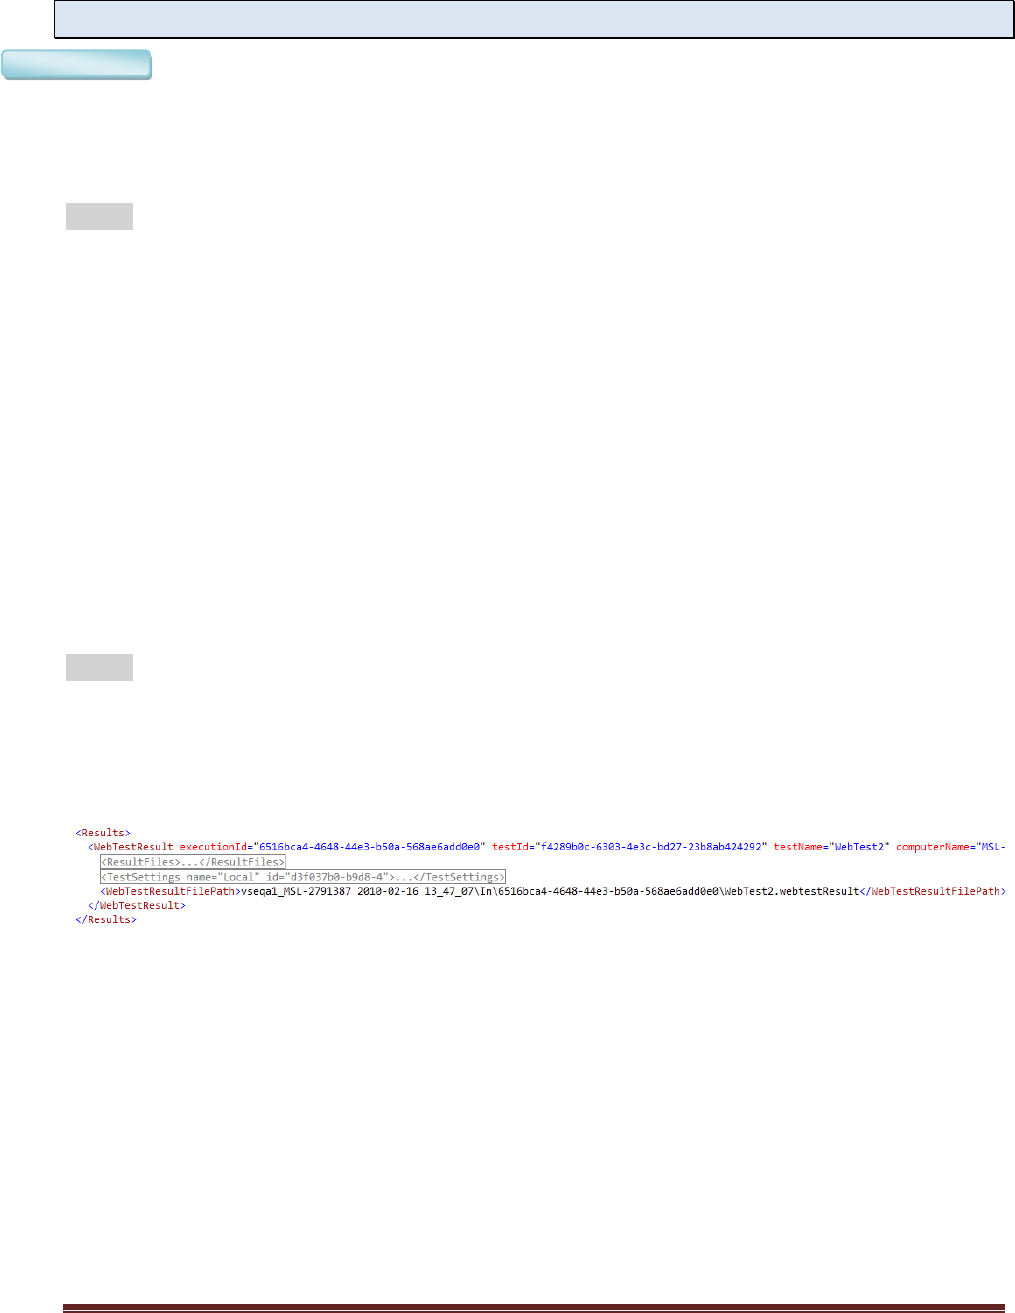
Visual Studio Performance Testing Quick Reference Guide Page 78
Proper understanding of TRX files and Test Results directory
TRX files are the result files created when you run a unit or web test in Visual Studio. There are two
pieces here. The first describes how TRX files are constructed in VSTS 2008, and the second part shows
how things have changed for VS 2010
In 2008
In VS 2008, if you run a Web test outside a load test, the entire Web test result is serialized to the trx
file. So each request and response in the test is serialized. If the test runs multiple iterations, the trx file
can get very large.
We added optimizations to control the amount data that is stored in the TRX for request/response
bodies by only storing one copy of a unique response bodies (in multi-iteration runs you may end up
with multiple identical responses). Also, the request and response bodies are compressed to
dramatically reduce the amount of space they require in the TRX.
There is a test context snapshot stored before every request (including dependent requests).
in a test context that can make them really large.
The request/response headers and the test context snapshots are not compressed and duplicates are
not eliminated, so they have the potential to become bloated.
In 2010
In VSTS2010, there is one major change on how the WebTestResultDetails class is persisted upon test
completion. Instead of writing the WebTestResultDetails class to a trx file, VSTS serializes the object to a
*.webtestResult file. The relative path of this file is added as an element to the trx file. By saying
relative to the path of the corresponding trx file.
The file only exists on the machine that you run the Web test from, i.e. the VSTS / mstest machine.
For a local run, the file goes to \TestResults\prefix_Timestamp\In\TestExecuId.
For a remote run, the file goes to \TestResults\prefix_Timestamp\In \Agent\TestExecuId.
When you open a Web test trx file from the Test Results window, VSTS reads the value of
WebTestResultFilePath from the trx file, and then loads the .webtestResult from
TrxDirecory\WebTestResultFilePath into Web Test Result window.
Note about Data Collectors and TRX files
If you have data collector(s) turned on for a unit/Web test, the collector data, e.g. event log, go to
\TestResults\prefix_Timestamp\In\TestExecuId\Agent. For a Load test, collector data go to
\TestResults\prefix_Timestamp\In\Agent.
Changed in 2010

Visual Studio Performance Testing Quick Reference Guide Page 79
Understanding the Response Size reported in web test runs
If you look at the size of a response shown for a single pass of a web test (within the test results
window), it may differ from the size reported from tools such as Fiddler or Netmon. This is due to the
fact that VSTS is measuring the size of the response after it has been uncompressed, while Fiddler and
Netmon will look at the size of the response on the wire.
This behavior has been changed in SP1, HOWEVER, there are a couple of gotchas to be aware of:
The compressed size will only be reported in VSTS i
The test results window will not indicate whether the reported size is the compressed or the
uncompressed size.
VSTS has a receive buffer that defaults to 1,500,000 bytes and it throws away anything over
that. The number reported is what is saved in the buffer, not the number of bytes received.
You can increase the size of this buffer by altering the ResponseBodyCaptureLimit at the start of
your test. This needs to be done in code and cannot be modified in a declarative test.
Visual Studio Performance Testing Quick Reference Guide Page 80
Errors and Known Issues
CSV files created in VSTS or saved as Unicode will not work as data sources
If you create a CSV file in VSTS, it saves the file with a 2 byte prefix indicating encoding type, which is
hidden. When you select the file as a data source, the first column will be prefixed with two unusual
characters. The problem is the two bytes on the front that cannot be seen unless the file is viewed in
hex format. The solution is to open the file in notepad and save as ANSI.
Also, if a data file is created in Windows® Notepad or Microsoft® Excel® and saved as Unicode, it looks
good in Notepad or VSTS, but cannot be read in web tests. The solution is to open the file in notepad
and save as ANSI.
Incorrect SQL field type can cause errors in web tests
If you create a SQL table to hold test parameters and you use the default SQL column type nchar(50),
you will get failed requests and the context
show the bad parameters. The nchar field pads all entries to the specified length with hidden characters
on th
will indicate that the wrong SQL field type is being used.
Leading zeroes dropped from datasource values bound to a CSV file
If you have a datasource which contains values that start with the number 0, and you have this
datasource in a CSV file, VSTT will strip the leading zero(es) from the values when using them. The same
behavior does NOT occur to data values in a SQL datasource.
Recorded Think Times and paused web test recordings
When you are recording a web test, VSTS uses the time between steps as you record to generate the
ThinkTime values after each request. When you add a comment, the recorder switches from RECORD
mode to PAUSE mode, however, the timer to calculate think times does not pause, so you end up with
think times that include the time you spent typing in the comment. This is also true if you manually
pause the recording for any other reason. To fix this, do the following:
In 2008
Go through the test after recording is complete and adjust the think times manually.
In 2010
VS 2010 offers a new dialog to make this easy. See the section
requests
Changed in 2010
Visual Studio Performance Testing Quick Reference Guide Page 81
After opening a webtest with the VS XML Editor, it will not open in declarative mode.
and then close the window, the next time you double click on the webtest to open it, the file should
open in the default declarative view. However, in VSTS 2010 there is a known issue that causes the
webtest to always be opened in XML mode.
To work around this issue:
1) open the test project file (e.g. .csproj),
2) look for the web test that is opened as XML,
3)
4) save the test project.
Example of the section needing to be changed:
---------------------------------------------------------------------
<None Include="WebTest1.webtest">
<CopyToOutputDirectory>Always</CopyToOutputDirectory>
<SubType>Designer</SubType>
</None>
---------------------------------------------------------------------
Calls to HTTPS://Urs.Microsoft.Com show up in your script
If you record a script using IE7 and you have phishing enabled, you can get extra calls to
Urs.Microsoft.Com. These calls are being made by IE as part of the phishing filter in IE (for more
information, please go to: http://download.microsoft.com/download/2/8/e/28e60dcc-123c-4b27-b397-
1f6b2b6cb420/Part1_MM.pdf). You may either remove these calls, or disable phishing in IE before you
make the calls. To disable phishing, go to TOOLS -> PHISHING FILTER -> TURN OFF AUTOMATIC WEBSITE
CHECKING.
Possible DESKTOP HEAP errors when driving command line unit tests
When you run a large number of unit tests that call command line apps, and they are run on a test rig
(this does not happen when running tests locally), you could have several of the tests fail due to running
out of desktop heap. You need to increase the amount of heap that is allocated to a service and
decrease the amount allocated to the interactive user. See the following post for in depth information,
and consider changing the registry as listed below:
http://blogs.msdn.com/ntdebugging/archive/2007/01/04/desktop-heap-overview.aspx
HKEY_LOCAL_MACHINE\SYSTEM\CurrentControlSet\Control\Session Manager\SubSystems
OLD SETTING: “Windows SharedSection=1024,3072,512”
NEW SETTING: “Windows SharedSection=1024,1024,2460”
Applies only to 2010

Visual Studio Performance Testing Quick Reference Guide Page 82
Goal based load tests in VSTS 2008 do not work after applying SP1
There is a QFE available that fixes the following bugs with Goal Based Load Patterns that were
introduced in VSTS 2008 SP1:
If you defined a goal based load pattern using a performance counter from any of the
according to the goal.
(for
example Memory\Available Mbytes), an error would occur and the user load not be not
adjusted according to the goal.
If the Machine Name property entered for the goal based performance counter did not exactly
match the casing for the computer name, an error would occur and the user load would not be
adjusted according to the goal.
The hotfix can be obtained from:
http://support.microsoft.com/kb/957451
This is no longer an issue in VS 2010
Using Named Transactions in a Goal-Based Load Profile can cause errors
When keeping track of transactions in a test, VSTS postpends the transaction name with a number in
parentheses. This is to differentiate transactions that use the same name in different tests and keep the
collected metrics separate. Because of this, using a specific transaction name in a goal based load profile
will most likely give you the error: “A LoadTestPlugin attempted to set the 'MinTargetValue' property of
the load profile for Scenario Scenario1 of Load Test LoadTest1; this not allowed after the
LoadTestLoadProfile has been assigned to the LoadProfile property of the LoadTestScenario.” This is due
to the naming convention used by VSTS described above. There is no way to use wildcards in the fields
so you would have to know the exact postpended value.
Also, Even if you know the value, you may see the error near the beginning, since the transaction may
not have run yet, so the instance to check may not yet exist.
Changed in 2010
Visual Studio Performance Testing Quick Reference Guide Page 83
Debugging Errors in Load Tests
http://blogs.msdn.com/slumley/pages/debugging-errors-in-load-test.aspx
Debugging OutOfMemory Exceptions in Load Tests
http://blogs.msdn.com/billbar/pages/diagnosing-outofmemoryexceptions-that-occur-when-running-
load-tests.aspx
Memory leak on load test when using HTTPS
Problem: There is a memory leak in VS 2008 when running load tests that contain both HTTP and HTTPS
requests.
Resolution: We've analyzed this memory leak and determined that this is a bug in the
System.Net.HttpWebRequest class (used to issue Web test requests) that occurs when the Web test
target https Web sites. A workaround is to set the Load Test to use the "Connection Pool" connection
model. This problem is fixed in VS 2010.
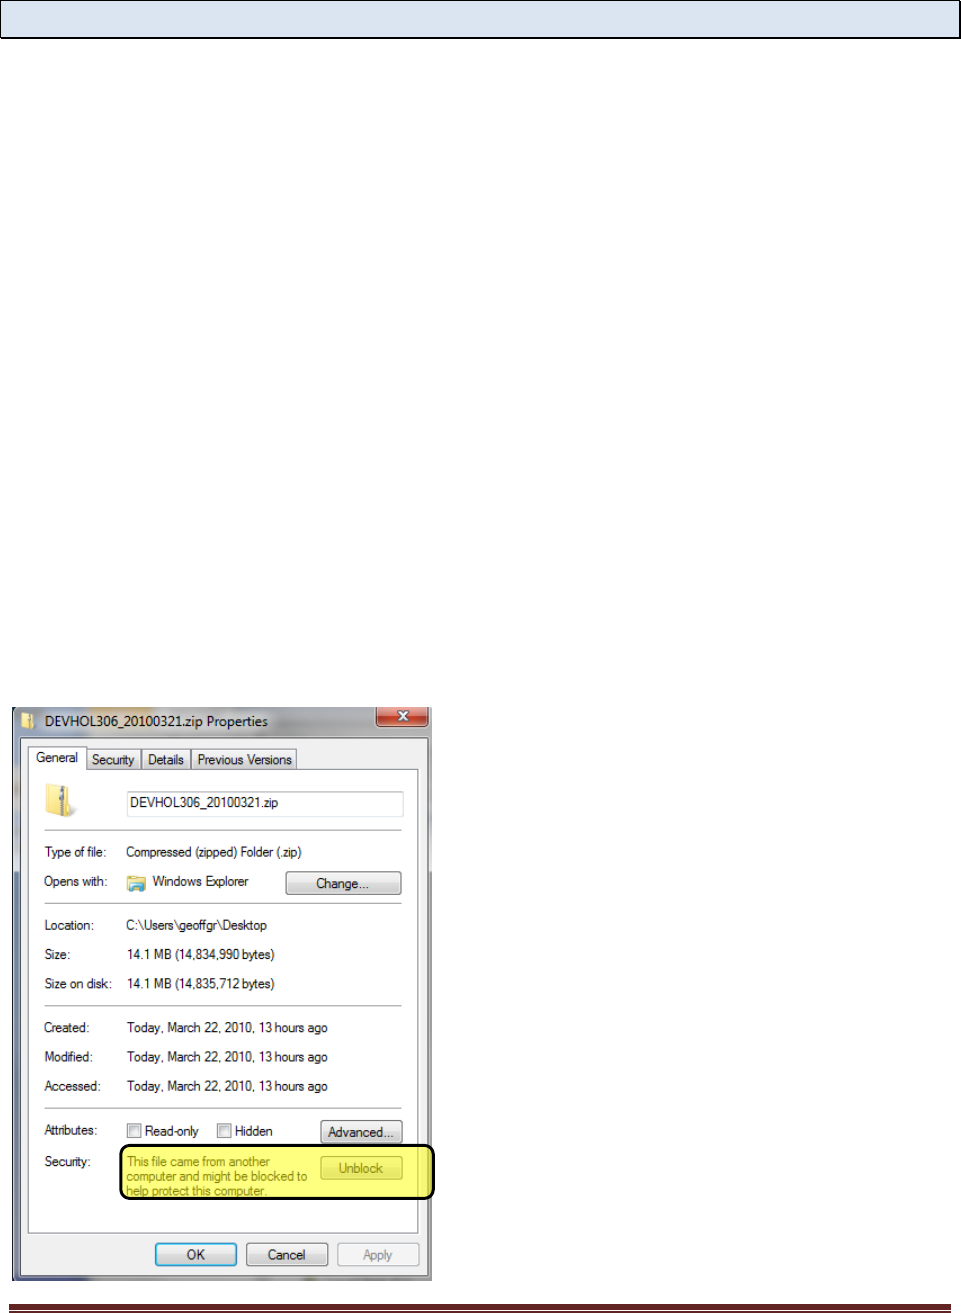
Visual Studio Performance Testing Quick Reference Guide Page 84
“Not Trusted” error when starting a load test
When you start a load test, you may get the following error:
“The location of the file or directory xxx is not trusted”
This can occur if you have signed code in your test harness and you make changes to some of the code
without resigning it. You can try either one of the below options to attempt to resolve it:
OPTION 1:
1. In the .NET Framework 2.0 Configuration, Go to Runtime Security Policy | Machine | All_Code
2. Right click All_Code, select "New...", and select any name for your new group. Click Next
3. Select URL as your condition
4. Type \\machine_name\shared_folder\assembly.dll or \\machine_name\shared_folder\* and
click Next
5. Make sure permission is set to FullTrust
6. Click Next, and Finish
7. Close all your Visual Studio IDEs, restart, and try again
OPTION 2:
caspol -machine -addgroup 1 -url file:<location XXX>/* FullTrust -name
FileW
This issue can also occur if you have a downloaded zip file (or other) that is flagged in the properties as
click on the file and go to the properties:

Visual Studio Performance Testing Quick Reference Guide Page 85
Detail Logging may cause “Out of disk space” error
When you use the new feature in VS 2010
the logs being saved can be very large(for instance, a webtest that uploads and/or downloads large
files).
Error details and stack traces no longer available in VSTS 2010
When a particular request
Details r and see the
information specific to that request. This option is no longer in VS 2010. It has been replaced by the new
detailed logging feature that logs the entire Web test or unit test result for a failed virtual user iteration.
VSTS does not appear to be using more than one processor
If you are running a load test on a multi processor machine but notice that only one processor is being
Local
multiple processors on an Agent/Controller setup. This is by design due to licensing considerations. In
order to take advantage of multi-proc systems, please use an agent and controller setup. It is possible to
setup the controller and agent on the same machine as VSTS.
While the limitation in the product still exists in 2010, however, you can unlock all processors by
New Load Test and Load Test Rig Licensing and
configurations
Changes made to Web Test Plugins may not show up properly
If you have a plugin that is part of the same project as a declarative web test, and you make changes in
the plugin, you may not always see those changes reflected in the test run. For instance, if you have a
plugin that writes a certain string out to an event log, and you change the string in the plugin, you still
see the old string value in the event log. This is a known issue and may be fixed in VSTT 2008 SP1 (it is
not in the beta release of SP1). In order for the bug to appear, the following conditions must be met:
You must be running on a controller/Agent test rig
Your web test must be declarative (bug does not occur with coded web tests)
If you are experiencing the bug, you can work around it by:
Generating a coded web test
New to 2010
New to 2010

Visual Studio Performance Testing Quick Reference Guide Page 86
Socket errors or “Service Unavailable” errors when running a load test
When running a load test, you might receive several errors similar to:
Exception SocketException Only one usage of
each socket address (protocol/network address/port) is normally
permitted
HttpError 503 - ServiceUnavailable 503 -
ServiceUnavailable
These are often due to exhaustion of available connection ports either on the VSTS machine(s) or on the
machines under test. To see if this could be happening, open a CMD window on your VSTS machine(s)
and on the machine(s) under test, and run the following command:
“netstat –anp tcp”
If you see this, then you are suffering from port exhaustion. The following explains what is happening
and talks about some ways to deal with it.
TCP establishes connections based on the following items:
Client port + Client IP = Client Socket
Server Port + Server IP = Server Socket
Client Socket + Server Socket = connection
The TIME_WAIT state is a throwback from the old days (well more accurately the default of 4 minutes is
the throwback). The idea is that if the client closes a connection, the server puts the socket into a
TIME_WAIT state. That way, if the client decides to reconnect, the TCP negotiation does not need to
occur again and can save a little bit of time and overhead. The concept was created because creating a
TCP connection was a costly operation years ago when networks were very slow).
To get around this issue, you need to make more connections available and/or decrease the amount of
time that a connection is kept in TIME_WAIT
either add or modify the values for the two keys shown:
[HKEY_LOCAL_MACHINE\SYSTEM\CurrentControlSet\Services\Tcpip\Parameters
]
"TcpTimedWaitDelay"=dword:0000001e (30 seconds)
"MaxUserPort"=dword:0000fffe (65,535 ports)
If you are experiencing the issue on one of the VSTT load machines, you may also need to change the
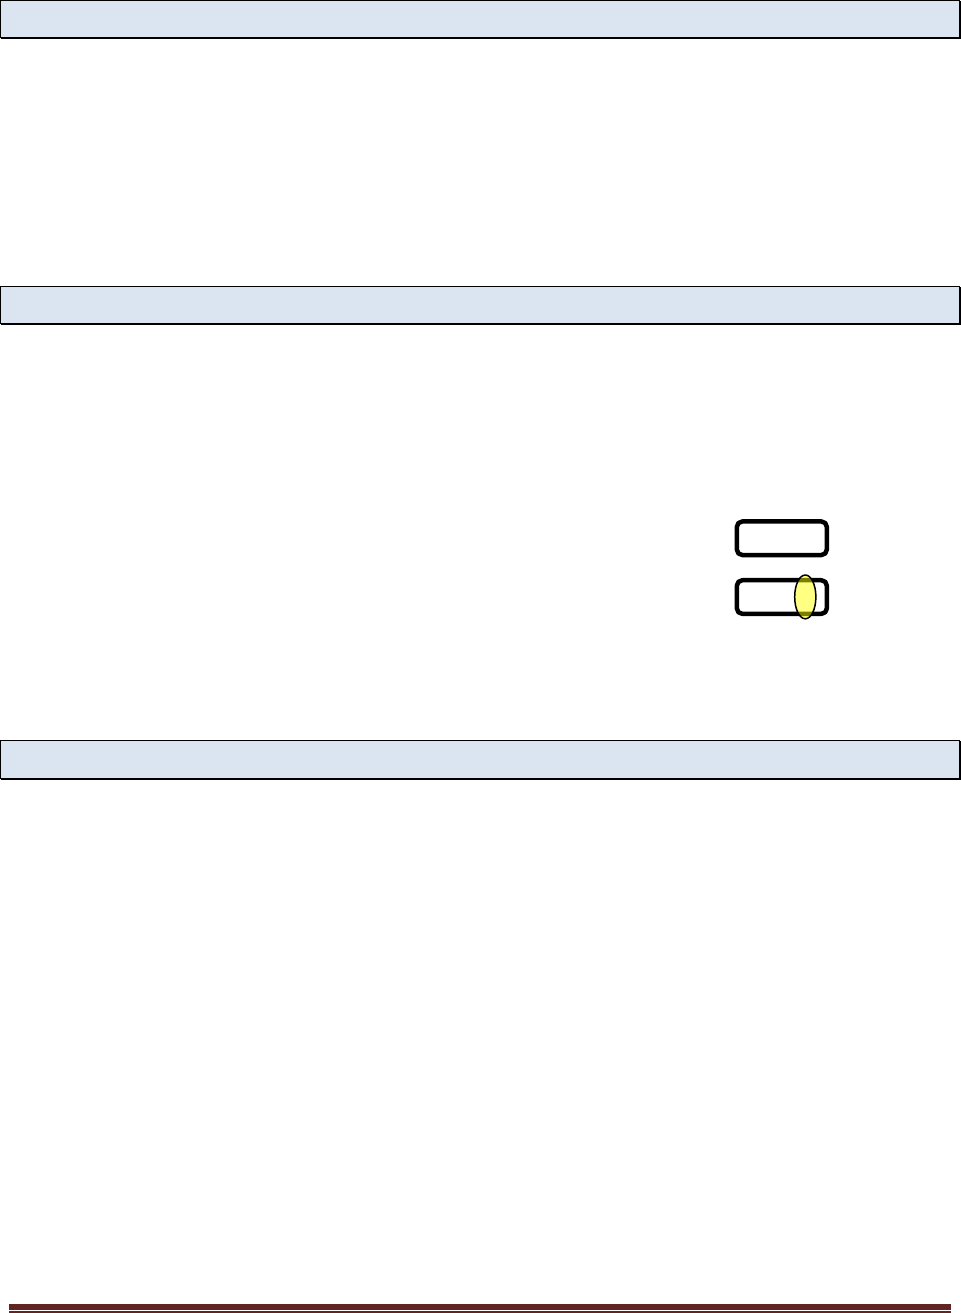
Visual Studio Performance Testing Quick Reference Guide Page 87
Error “Failed to load results from the load test results store”
trying to retrieve
load test results from the DB inside VSTS.
This error will occur if you get a NULL value in the LoadTest column of the LoadTestRun table. To fix it,
go to the table and delete the row that has the NULL value. The occurrence of this issue should be
extremely rare.
Hidden Field extraction rules do not handle some fields
Some responses may contain hidden fields whose formats have an extra character that causes the build
Hidden Fields entry in a response:
<input type="hidden" name="_ListSchemaVersion_{9fcdfcc2-6d4f-4a22-a379-
8224954c1d9a}" id="_ListSchemaVersion_{9fcdfcc2-6d4f-4a22-a379-8224954c1d9a}"
value="1" />
A default Hidden extraction rule was added to the request. When the rule fired, the result was:
$HIDDEN2._ListSchemaVersion_{9fcdfcc2-6d4f-4a22-a379-8224954c1d9a
It should have been
$HIDDEN2._ListSchemaVersion_{9fcdfcc2-6d4f-4a22-a379-8224954c1d9a}
This is not a bug, but just a side effect of how VS process context parameters.
Test results iteration count may be higher than the max test iterations set
When a test run that defines a specific number of test iterations is complete, you may see more tests
run than the iterations set in the run properties. This is rare and is caused by the load test process
crashes and restarts. This issue exists in VSTS 2008 and VS 2010. The reason for this is that the Restart
file we use to handle restarting a load test after QTAgent dies was never updated to include info about
the tests completed, so it will always run the initial number of test iterations after restart.
Resolution:
Find out what is causing QTAgent to crash and fix that issue.

Visual Studio Performance Testing Quick Reference Guide Page 88
In flight test iterations may not get reported
When --
flight requests 10 seconds to stop. Ithe request and
request detail or test detail.
A way to control this is to specify a Cool-
settings. Assuming that the requests in your Web test have the default request timeout of 5 minutes,
all in-flight requests at the time load test completion at one hour should either finish or be timed out in
5 minutes and then the in-flight tests should be displayed in the User Details Test chart.
Completion of Unit Test causes spawned CMD processes to terminate
If you spawn a process from within a web test, and then that process spawns a separate CMD window
method is used for Unit tests or for Windows applications, it will work as expected. However, web tests
will kill the spawned process. Here is an excerpt from an email thread with the product team:
Here’s what I’ve discovered. There is an option in VSTT that allows you to keep VSTestHost alive after a
test run completes: go to “Tools”, “Options”, “Test Tools”, “Test Execution” and see the check box “Keep
test execution engine running between test runs”. This is on by default, and I’m guessing it is on for
you. When you run just a unit test in a test run, this option works and VSTestHost does not get killed
when the test run completes, so neither does its child processes. However, when you run a Web test, this
option seems to be ignored and VSTestHost is killed by a call to Process.Kill() which I believe does kill the
child processes of VSTestHost as well (if you uncheck this option, you’ll see that running the unit test has
the same behavior). I’m not sure why VSTestHost goes away even when this option is set when a Web
test is run – this may have been intentional. Here’s a workaround that seems to work instead:
create a unit test that sleeps for 10 seconds (or whatever time is needed)
create an ordered test that includes your coded Web test first then the unit test that sleeps
run the ordered test rather than the coded Web test
NOTE: an example of this scenario is firing off a batch file that starts a NETCAP.EXE window to gather
trace data during the test run. This NETCAP process must run asynchronously so it will not block the web
test. It must also complete by itself or the resultant trace file will not get written.
Web tests should not be starting other processes, or performing any blocking operations as they will
cause problems with the load test engine. For the netcap example, a better solution is to write this as a
VS2010 data collector.

Visual Studio Performance Testing Quick Reference Guide Page 89
Bug with LoadProfile.Copy() method when used in custom goal based load tests
If you create a custom goal based load test plugin and use the LoadProfile method Copy(), you will get
an error saying: “A LoadTestPlugin attempted to set the 'MinTargetValue' property of the load profile for
Scenario Scenario1 of Load Test LoadTest1; this not allowed after the LoadTestLoadProfile has been
assigned to the LoadProfile property of the LoadTestScenario.” This is due to a regression in hotfix
957451. There is currently no fix for this, however there is a workaround. You need to create your own
copy method and use it to populate the custom LoadProfile. Make sure that you do NOT set the
s where the bug lies. Here is some sample code:
The Copy() Method usage that will fail:
LoadTestGoalBasedLoadProfile newGoalProfile = _scenario.LoadProfile.Copy() as
LoadTestGoalBasedLoadProfile;
The custom method to replace the Copy() method:
private LoadTestGoalBasedLoadProfile ProfileCopy(LoadTestGoalBasedLoadProfile
_profile)
{
LoadTestGoalBasedLoadProfile _goalLoadProfile = new
LoadTestGoalBasedLoadProfile();
_goalLoadProfile.CategoryName = _profile.CategoryName;
_goalLoadProfile.CounterName = _profile.CounterName;
_goalLoadProfile.InstanceName = _profile.InstanceName;
_goalLoadProfile.InitialUserCount = _profile.InitialUserCount;
_goalLoadProfile.MinUserCount = _profile.MinUserCount;
_goalLoadProfile.MaxUserCount = _profile.MaxUserCount;
_goalLoadProfile.MaxUserCountIncrease = _profile.MaxUserCountIncrease;
_goalLoadProfile.MaxUserCountDecrease = _profile.MaxUserCountDecrease;
_goalLoadProfile.MinTargetValue = _profile.MinTargetValue;
_goalLoadProfile.MaxTargetValue = _profile.MaxTargetValue;
return _goalLoadProfile;
}
Using the method in your HeartBeat event handler:
void _loadTest_Heartbeat(object sender, HeartbeatEventArgs e)
{
// Make a private instance of the profile to edit
LoadTestGoalBasedLoadProfile _goalLoadProfile =
ProfileCopy((LoadTestGoalBasedLoadProfile)_scenario.LoadProfile);
// Do your modifications to the private copy of the profile here
// [some code]
// Assign your private profile back to the test profile
_scenario.LoadProfile = _goalLoadProfile;
}
}
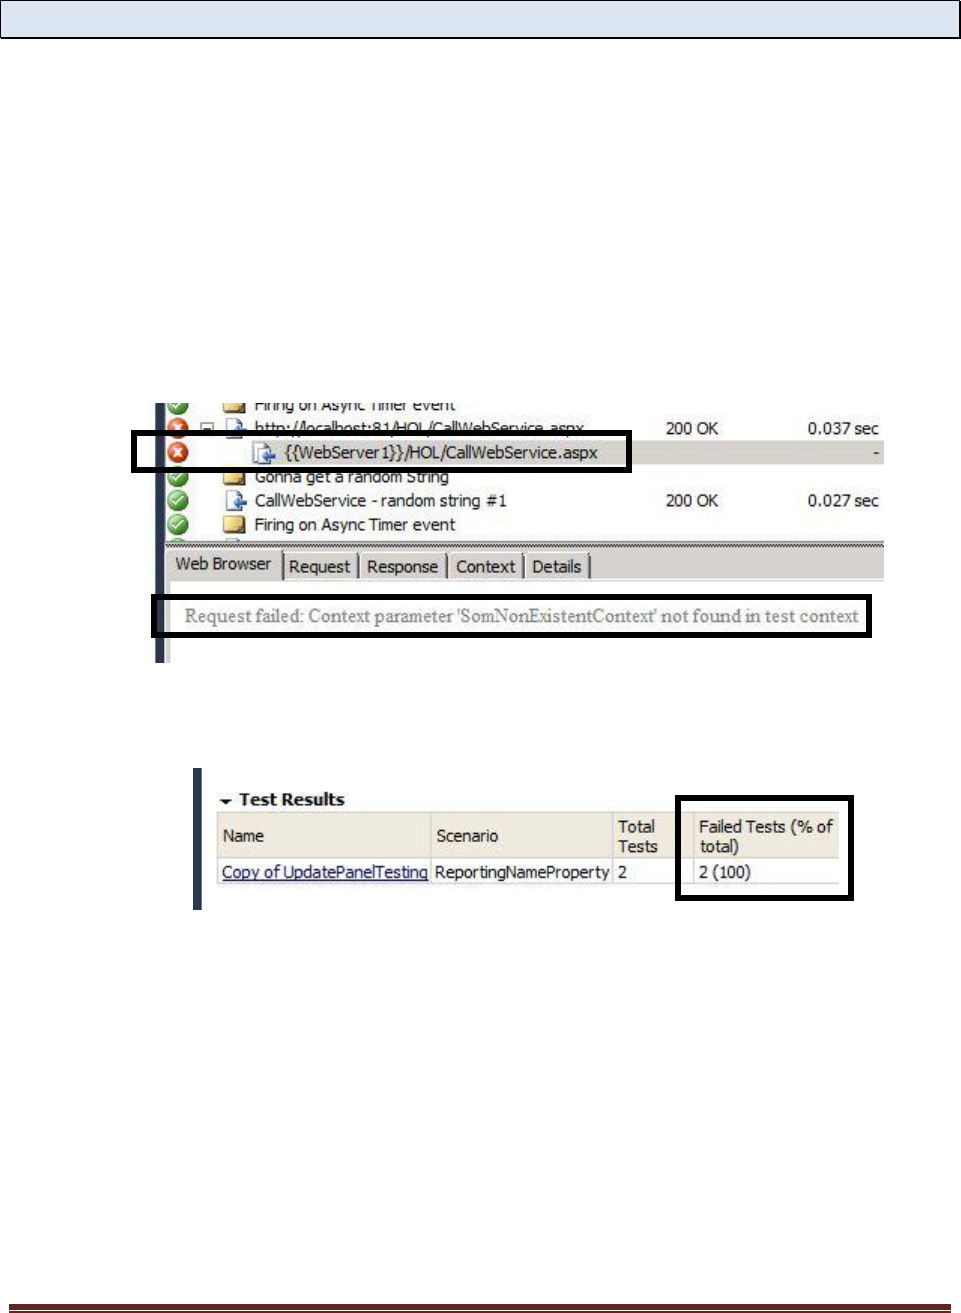
Visual Studio Performance Testing Quick Reference Guide Page 90
Errors in dependent requests in a Load Test do not show up in the details test log
The new Detailed Test Logging feature will not allow you to see the details of errors that
occur inside dependent requests during a load test (like AJAX or JSON requests)
The problem is that if a dependent request has an error, even though the test will be flagged
as failed, and the log for that iteration will be stored, the log does not contain any details for
any dependent requests. Therefore you do not get any details about why the failure
occurred.
To work around this issue, you need to make sure any dependent requests that are having
problems get moved back up to main requests, at least during a test debugging phase.
Web Test execution shows the failure
Load Test execution shows that there is a failure
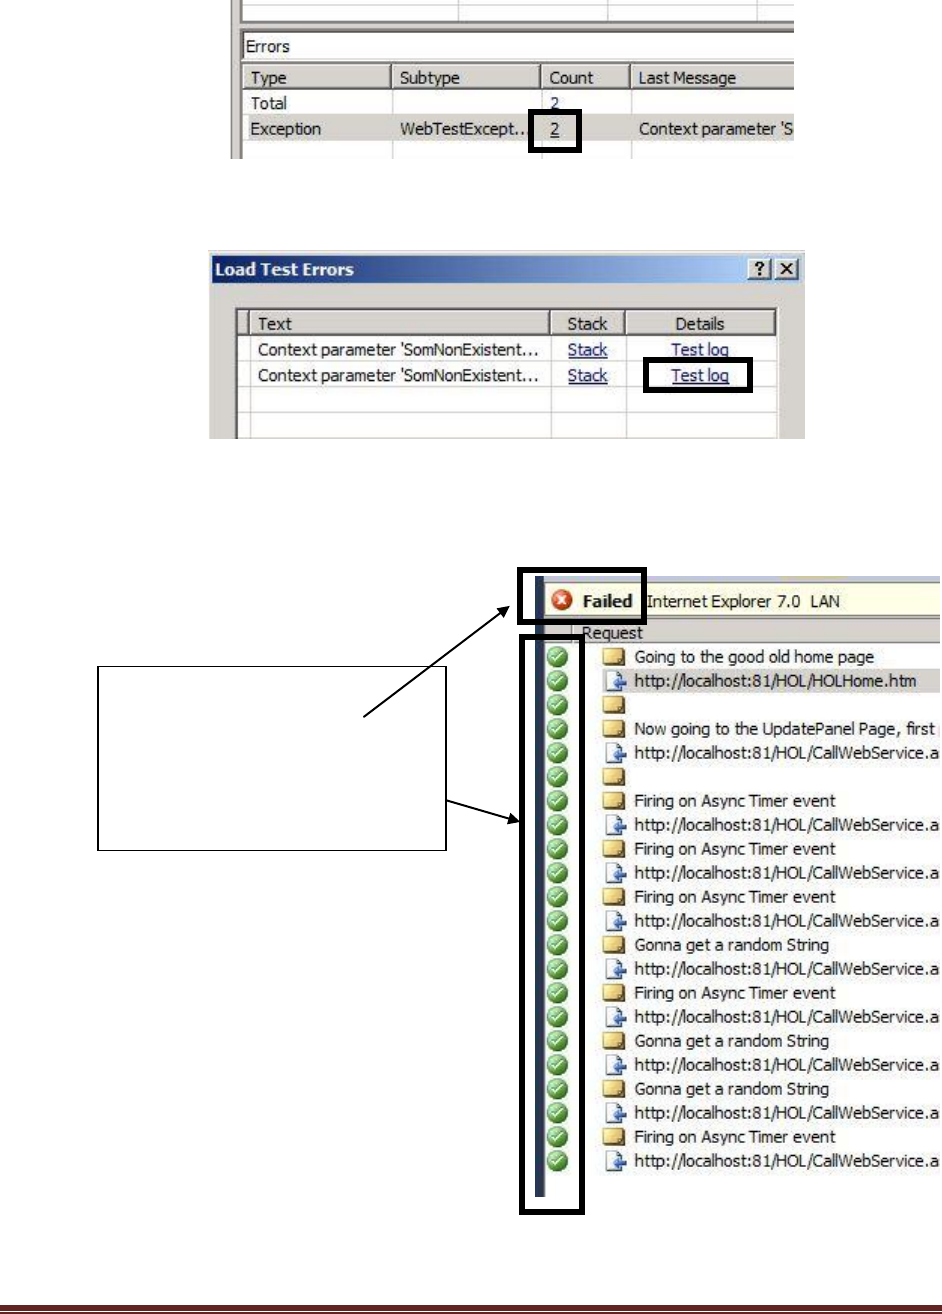
Visual Studio Performance Testing Quick Reference Guide Page 91
The errors table in the results shows the exception count and allows you to drill into the details. The picture below shows
you how to display the full details log for this failed iteration
Here you see the details log. It
shows that there is a failure, but
the request details do not show
where the error occurred, nor can
you get any details about the error.

Visual Studio Performance Testing Quick Reference Guide Page 92
WCF service load test gets time-outs after 10 requests
If you encounter time-outs when running a load test against a WCF service that uses message-level
security, this could be caused by the WCF service running out of security sessions. The maximum
number of simultaneous security sessions is a WCF configuration setting with a default value of 10. Any
additional requests to the service that would lead to more security sessions will be queued.
If you want the service support more than 10 simultaneous clients, you will need to change it in the WCF
configuration setting. Another re
properly closing those sessions after it is done with the service.
A WCF security session is established by a security handshake between client and service in which
asymmetric encryption is used to establish a symmetric encryption key for additional requests in the
same session. The initial asymmetric encryption is more computationally expensive than the symmetric
encryption that is used for subsequent requests. A client must explicitly close the security session to
release server resources or they will only be released by the server after a time-out in the order of
minutes.
If the client only needs to call the web service once, the message exchange with the symmetric key is
unnecessary and you can save a roundtrip by disabling security sessions. Set the
clients that do not properly close the session, but do keep in mind that this will skew your performance
results. So only use this workaround while you fix the client.
http://msdn.microsoft.com/en-us/library/ms731107.aspx
Loadtestitemresults.dat size runs into GBs
During a load test the load agents will write to a file called loadtestitemsresults.dat. If you are planning
to execute a long running load test, you need to be sure that the loadtestitemsresults.dat file will be on
a drive with enough disk space because it can grow into many GBs.
The loadtestitemsresults.dat file is created by the QTAgent or QTAgent32 process. You should add the
key WorkingDirectory to QTAgent.exe.config and/or QTAgent32.exe.config to point to the right drive.
For example, add <add key="WorkingDirectory" value="D:\Logs"/> to the appSettings section.
For Visual Studio 2010, see http://blogs.msdn.com/lkruger/archive/2009/06/08/visual-studio-team-test-
load-agent-goes-64-bit.aspx for more information about when QTAgent.exe or QTAgent32.exe is used.
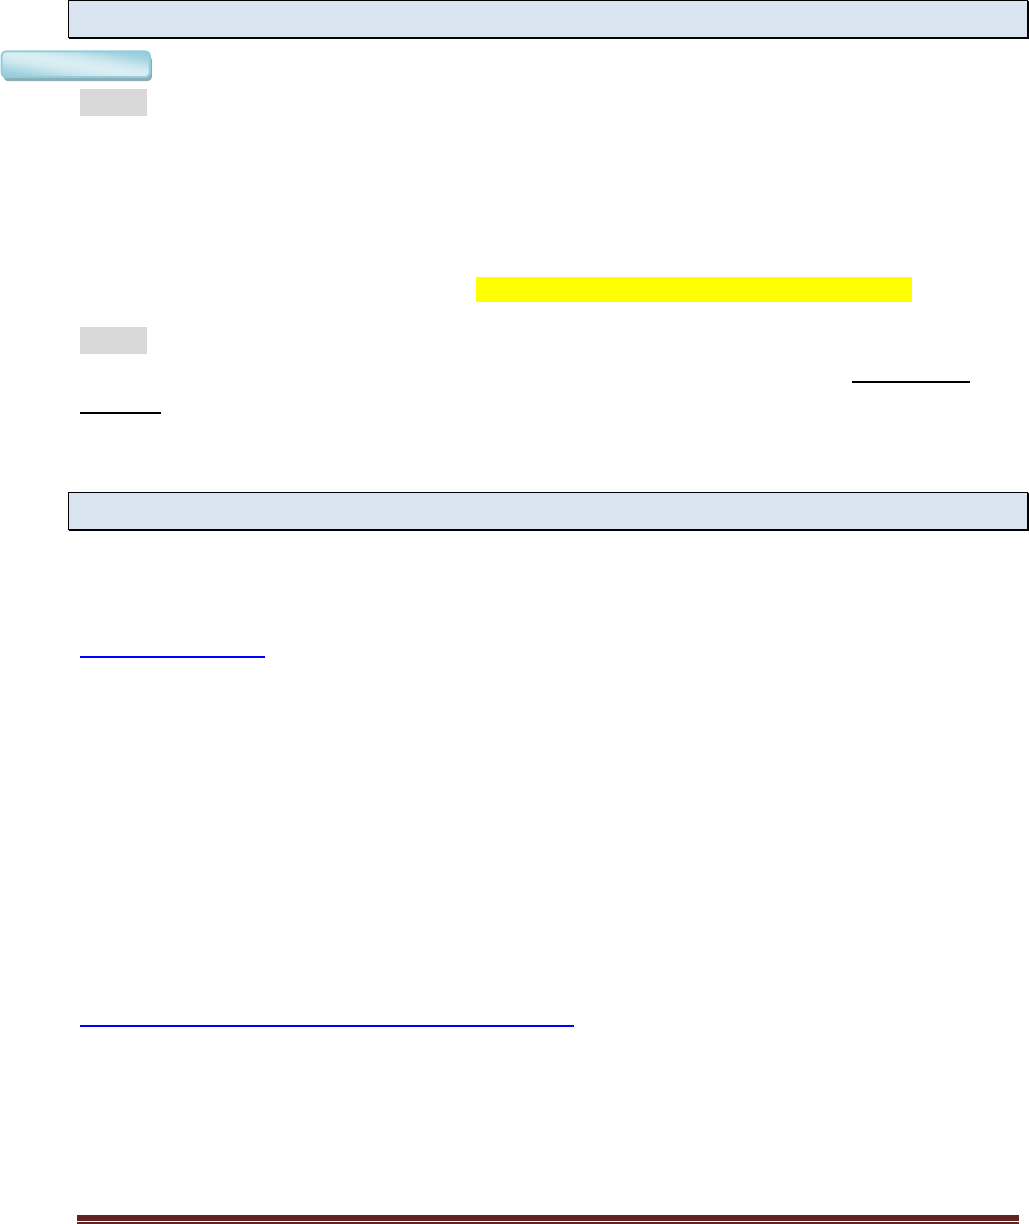
Visual Studio Performance Testing Quick Reference Guide Page 93
Troubleshooting
How to enable logging for test recording
In 2008
You can create a log file of each recording which will show headers and post body as well as returned
headers and response. The way to enable this is to add the following 2 keys:
[HKEY_CURRENT_USER\Software\Microsoft\VisualStudio\9.0\EnterpriseTools
\QualityTools\WebLoadTest]
"CreateLog"=dword:00000001 [NOTE: 1=create; 0=do not create]
"RecorderLogFolder"="C:\\recordlogs"
In 2010
The Web test recorder automatically logs the requests and responses. See the section Recorder Log
Available
Diagnosing and fixing Web Test recorder bar issues
to diagnose and fix the issue.
Michael Taute's blog provides a list with common reasons for this to happen and potential fixes for each.
Most of the times the reasons are security related. One of the most common reasons for this problem is:
Issue: recorder bar comes up, but the controls are disabled.
Fix: the web test recorder bar does not work with Internet Explorer Enhanced Security Configuration (IE
ESC) enabled. IE ESC can be removed from within the Control panel -> Add Remove Programs / Windows
Components and uncheck ESC (Windows Server 2003, Vista).
Windows Server 2008 requires a different process to disable this security feature. Start the Server
Manager, browse to the Security Information section and click Configure IE ESC. In the next window
decide for whom you want to enable or disable this feature. For more details and screenshots:
http://blogs.techrepublic.com.com/datacenter/?p=255
Changed in 2010

Visual Studio Performance Testing Quick Reference Guide Page 94
User Account requirements and how to troubleshoot authentication
The following information comes from a blog entry by Durgaprasad Gorti. The link at the end of this
section will take you to the full article which includes a walkthrough on troubleshooting authentication
issues on a test rig.
Workgroup authentication
In a Microsoft® Windows® domain environment, there is a central authority to validate credentials. In a
workgroup environment, there is no such central authority. Still, we should be able to have computers in
a workgroup talk to each other and authenticate users. To enable this, local accounts have a special
characteristic that allows the local security authority on the computer to authenticate a "principal" in a
special way.
If you have two computers and a principal "UserXYZ" on both machines the security identifiers are
different for MACHINE1\UserXYZ and MACHINE2\UserXYZ and for all practical purposes they are two
completely different "Principals". However if the passwords are the same for them on each of these
computers, the local security authority treats them as the same principal.
So when MACHINE1\UserXYZ tries to authenticate to MACHINE2\UserXYZ, and if the passwords are the
same, then on MACHINE2, the UserXYZ is authenticated successfully and
is treated as MACHINE2\UserXYZ. Note the last sentence. The user MACHINE1\UserXYZ
is authenticated as MACHINE2\UserXYZ if the passwords are the same.
http://blogs.msdn.com/dgorti/archive/2007/10/02/vstt-controller-and-agent-setup.aspx
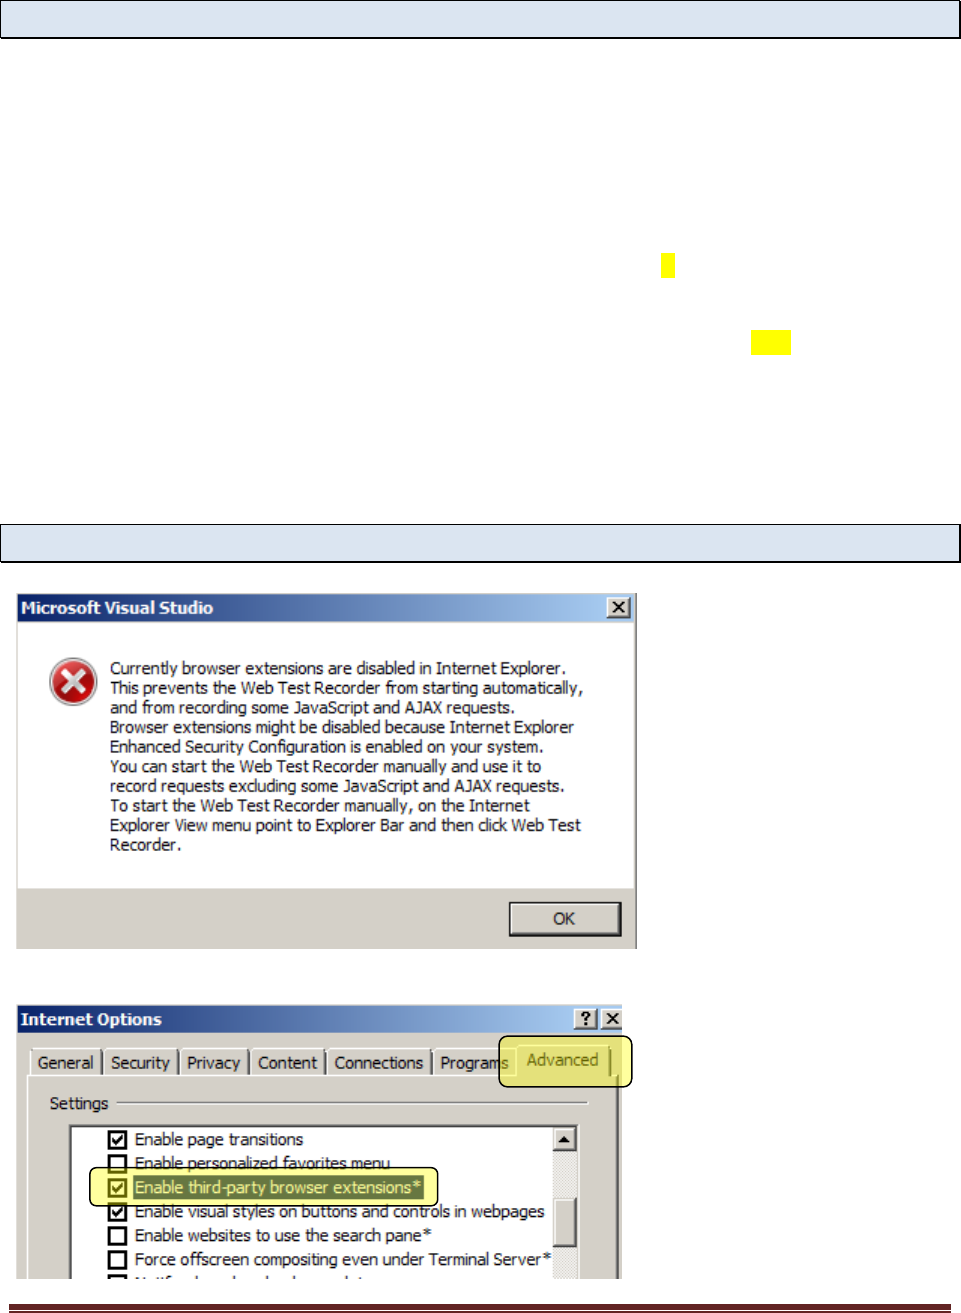
Visual Studio Performance Testing Quick Reference Guide Page 95
How to enable Verbose Logging on an agent for troubleshooting
If you need to have verbose logging to debug or isolate issues with the agents including IP switching, you
can turn on verbose logging in the config files.
1. Go to c:\Program files\Microsoft Visual Studio 2008 Team Test Load Agent\LoadTest on the agent
machine.
2. Edit the QTAgentServiceUI.exe.config file
a. change the EqtTraceLevel to 4
<switches>
<add name="EqtTraceLevel" value="4" />
b. Change the CreateTraceListener value to yes
<appSettings>
<add key="CreateTraceListener" value="yes"/>
The above settings also apply to the QTAgent.exe.config, QTController.exe.config and the
QTControllerService.exe.config files.
Note: These files have moved in VS 2010 to C:\Program Files\Microsoft Visual Studio
10.0\Common7\IDE.
Error that Browser Extensions are disabled when recording a web test
You might see the following error when trying to record a web test:
-

Visual Studio Performance Testing Quick Reference Guide Page 96
Troubleshooting invalid view state and failed event validation
ASP.NET uses __VIEWSTATE and __EVENTVALIDATION hidden fields to round-trip information across
HTTP requests. The values for these fields are generated on the server and should be posted unchanged
on a post back request. By default, these values are signed with a so-called validationKey to prevent
tampering with the values on the client.
If you just record the values in a web test and post the recorded values, you can run into ASP.NET error
messages about invalid view state or failed event validation. The Visual Studio web test recorder will
normally automatically detect the __VIEWSTATE and __EVENTVALIDATION hidden fields as dynamic
parameters. This means the dynamically extracted values will be posted back instead of the recorded
values.
However, if the web server is load balanced and part of a web farm you may still run into invalid view
state and failed event validation errors. This occurs when not all servers in the web farm use the same
validationKey and the post back request is routed to a different server in the farm than the one on
which the page was rendered.
To troubleshoot, ViewState MAC checking can be disabled by setting enableViewStateMac to false.
However, this is not suitable for use on a production environment because it disables an important
security feature and has performance implications. The recommended fix is to define the same value for
the validationKey on all machines.
Instructions for manually creating a validationKey are detailed at http://msdn.microsoft.com/en-
us/library/ms998288.aspx. For IIS 7 a machine key can easily be created through IIS Manager, see
http://technet.microsoft.com/en-us/library/cc772287(WS.10).aspx.
For more background information on ViewState and EventValidation go to
http://msdn.microsoft.com/en-us/magazine/cc163512.aspx.

Visual Studio Performance Testing Quick Reference Guide Page 97
Troubleshooting the VSTS Load Testing IP Switching Feature
1) Make sure that the Agent Service is running as a user than is an admin on the agent machine; this is
required because the agent service attempts to configure the IP addresses specified in the agent
properties on the chosen NIC, and admin permission is required to do this.
2) Make sure that none of the IP addresses in the range specified for a particular agent are already
configured on the chosen NIC.
3) Enable verbose logging for the Agent Service:
* Edit the file QTAgentService.exe.config: (located at: <Program Files>\Microsoft Visual Studio
9.0 Team Test Load Agent\LoadTest\QTAgentService.exe.config)
* Change:
<add key="CreateTraceListener" value="no"/> to "yes"
* Change:
<add name="EqtTraceLevel" value="3" /> to
* Restart the Load Test Agent service
* The file "VSTTAgent.log" will be created in the same directory as QTAgentService.exe.config.
* Re-run the load test with verbose logging configured, and look for lines in the log file that contain the
text: "Attempting to configure IP address:" and "Configured IP address:" This will tell you whether or not
you the agent service is attempting to configure the IP address you've specified. If you see the
"Configured IP address:" line, it has succeeded in configuring this IP address. If not, there should be
some error logged.
If you have verified the items in step 1 & 2 above, and the log indicates that the configuration of the IP
address is failing but you cannot determine the cause of the failure from the error message in the log (or
if there is no error message in the log), post a new thread to the Web and Load testing forum, or open a
Microsoft Support incident for further assistance, and provide details on the setup including the relevant
portions of the log file.
4) Make sure that the load test you are running is set to use IP Switching: Click on each of the "Scenario"
nodes in the load test editor, go to the property sheet, and verify that the "IP Switching" property is set
to True (normally it should be since this is the default, but it's worth checking).
5) Enable verbose logging for the Agent process.
If the log file created in step 3 shows that the IP addresses are being successfully configured, the next
step is to check the agent process log file to verify that the load test is actually sending requests using
those IP addresses.

Visual Studio Performance Testing Quick Reference Guide Page 98
To enable verbose logging for the agent process:
* Edit the file QTAgent.exe.config: (located at <Program Files>\Microsoft Visual Studio 9.0 Team
Test Load Agent\LoadTest\QTAgent.exe.config)
* Change:
<add key="CreateTraceListener" value="no"/> to
* Change:
<add name="EqtTraceLevel" value="3" /> to
* The file "VSTTAgentProcess.log" will be created in the same directory as QTAgent.exe.config.
* Re-run the load test, and look for lines in the log file that look something like: "Bound request on
connection group M to IP address NNN.NNN.NNN.NNN" If verbose logging is enabled and these lines are
present in the log file, IP Switching should be working.
6) If the number of unique IP addresses being used as shown by the log entries in step 5 is less than the
number in the range that was configured, it could be because your load test is configured to use a
connection pool with a smaller number of connections than the number of IP addresses specified. If
this is the case, you can increase the size of the connection pool, or switch to "Connection per User"
mode in the load test's run settings properties.
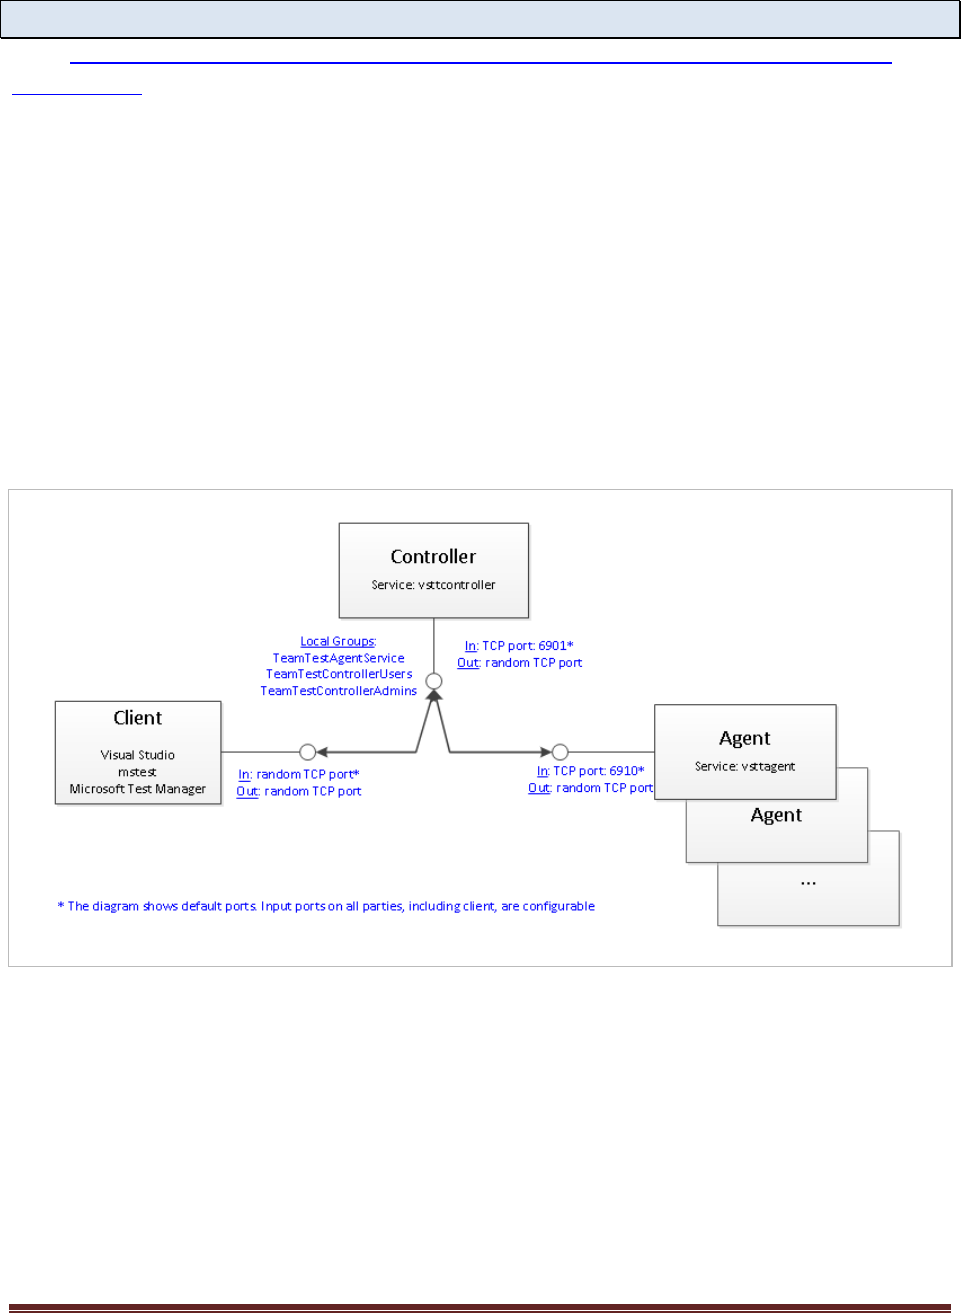
Visual Studio Performance Testing Quick Reference Guide Page 99
Troubleshooting Guide for Visual Studio Test Controller and Agent
From: http://social.msdn.microsoft.com/Forums/en-US/vststest/thread/df043823-ffcf-46a4-9e47-
1c4b8854ca13
This guide is to help troubleshoot connection issues between Visual Studio Test Controller and Agent as
well as remote test execution issues. It gives an overview of main connection points used by Test
Controller and Agent and walks through general troubleshooting steps. In the end it provides a list of
common errors we have seen and ways to fix them, and a description of tools that can be useful for
troubleshooting as well as how to obtain diagnostics information for test execution components.
We would like to use this guide as running document, please reply to this post to add your comments.
2. Remote Test Execution: connection points
The following diagram illustrates main connection points between Test Controller, Agent and Client. It
outlines which ports are used for incoming and outgoing connections as well as security restrictions
used on these ports.
The technology used to connect remote test execution components is .Net Remoting over Tcp ports. For
incoming connections, by default, Test Controller uses Tcp port 6901 and Test Agent uses port 6910. The
Client also needs to accept incoming connection in order to get test results from Controller, and, by
default, it is using random port for that. For information on how to configure incoming ports, refer to
the Tools section in Appendix. For outgoing connections random Tcp ports are used. For all incoming
connections Test Controller authenticates calling party and checks that it belongs to specific security
group.
All connectivity issues can be divided into 2 main groups: network issues and security/permission issues.

Visual Studio Performance Testing Quick Reference Guide Page 100
2.1. Network/Firewall issues (mainly implied by .Net Remoting technology):
Controller :
Listens on TCP port 6901 (can be configurable to use different port).
Needs to be able to make outgoing connection to Agents and to the Client.
Agent:
Listens on TCP port 6910 (can be configurable to use different port).
Needs to be able to make outgoing connection to Controller.
Client:
Needs to be able to accept incoming calls. Usually you would get Firewall notification
when Controller tries to connect to Client 1<sup>st</sup> time. On Windows 2008
Server the notifications are disabled by default and you would need to manually add
Firewall exception for Client program (devenv.exe, mstest.exe, mlm.exe) so that it can
accept incoming connections.
By default, random TCM port is used for incoming connections. If needed, the incoming
port can be configured (see the Tools section in Appendix).
Needs to be able to make outgoing connection to Controller.
2.2. Permissions
There are two scenarios which are different by how Test Controller is operating, and the permissions
used by Controller differ depending on the scenario:
Test Controller runs as standalone: physical environments (VS2008 or VS2010).
Test Controller is connected to TFS server: virtual environments (VS2010 only).
2.2.1. Permissions: Test Controller not connected to TFS server:
To run tests remotely, Client user must belong to either TeamTestControllerUsers, or
TeamTestControllerAdmins, or Administrators local group on Controller machine.
To manage Controller/Agent, Client user must belong to TeamTestControllerAdmins or
Administrators local group on Controller machine.
Agent service account must belong to either TeamTestAgentService or Administrators local
group on Controller machine.
Controller service account must belong to either TeamTestControllerUsers or Administrators
local group on Controller machine.
Service accounts with empty/no passwords are not supported.
2.3. Connection Points: Summary
Review of the connections gives high level picture of what can fail in Test Controller/Agent connectivity.
At this point you can already have a clear idea which requirement is not met for your specific scenario.
Next section provides step-by-step troubleshooting.

Visual Studio Performance Testing Quick Reference Guide Page 101
3. Step-by-step troubleshooting
-by-step manner.
Before following these steps you may take a look at Known Issues section in the Appendix to see if your
issue is one of known common issues. The troubleshooting is based on the key connection points and in
essence involves making sure that:
The services are up and running.
Permissions are set up correctly.
Network connectivity/Firewall issues.
There are two scenarios which are different by how Test Controller is operating, and troubleshooting
steps differ depending on the scenario; hence we will consider each scenario separately:
Test Controller runs as standalone: physical environments (VS2008 or VS2010).
Test Controller is connected to TFS server: virtual environments (VS2010 only).
3.1. Step-by-step troubleshooting: VS2008 or VS2010 physical environments
Pre-requisites. Make sure you have necessary permissions.
Depending on what you need to troubleshoot, you may need Administrator permissions on
Agent and/or Controller machines.
Step 1. Make sure that the Controller is up and running and Client can connect to Controller.
Use Visual Studio or Microsoft Test Manager (see Tools section above) to view Controller status.
e is running:
On Controller machine (you can also do that remotely) re/start controller service (see
Tools section in Appendix).
connections through Firewall
Open port 6901 (or create exception for the service program/executable).
Add Firewall Exception for File and Printer Sharing.
missions to
connect to Controller:
On Controller machine, add Client user to the TeamTestControllerAdmins local group.
is not blocking incoming
and outgoing connections:
Make sure that there is Firewall exception for Client program (devenv.exe, mstest.exe,
mlm.exe) so that it can accept incoming connections.
Make sure that Firewall is not blocking outgoing connections.

Visual Studio Performance Testing Quick Reference Guide Page 102
VS2010 only: the simplest at this time is to re-configure the Controller:
On Controller machine log on as local Administrator, run the Test Controller
Configuration Tool (see Tools section above) and re-configure the Controller.
All steps should be successful.
section in Tools section above)
Step 2. Make sure that there is at least one Agent registered on Controller.
Use Visual Studio (Manage Test Controllers dialog) or Microsoft Test Manager (see Tools section
in the Appendix) to view connected Agents.
If there are no Agents on the Controller, connect the Agent(s).
VS2010 only:
On Agent machine log in as user that belongs to TeamTestAgentServiceAdmins.
On Agent machine open command line and run the Test Agent Configuration
Tool (see Tools section in the Appendix).
click on
VS2008 only:
In Visual Studio (Manage Test Controllers dialog) click on Add Agent.
You may need to restart the Agent service.
Step 3. Make sure that Agent is running and Ready (for each Agent)
Agent status can be one of: Ready/Offline (temporary excluded from Test Rig)/Not Responding/Running
Tests.
Use Visual Studio or Microsoft Test Manager (see Tools section in the Appendix) to check Agent
status.
If one of the Agents is not shown as Ready, make sure that Agent service is running:
On Agent machine (you can also do that remotely) re/start Agent service (see Tools
section in the Appendix).
(if Agent is still not Ready)
VS2010 only: the simplest at this time is to re-configure the Agent:
On Agent machine log on as local Administrator and run the Test Agent
Configuration Tool (see Tools section in the Appendix) and re-configure the
Agent.
All steps should be successful.
(if Agent is still not Ready)
If Agent is shown as Offline, select it and click on the Online button.

Visual Studio Performance Testing Quick Reference Guide Page 103
On Agent machine make sure that agent service can accept incoming connections on
port 6901 (if Firewall in on, there must be Firewall exception either for the port or for
the service program/executable).
Make sure that Agent service account belongs to the TeamTestAgentService on the
Controller.
On Controller machine use Computer Management->Local Groups to add Agent
user to the TeamTestAgentService group.
Restart services: Stop Agent service/Stop Controller service/Start Controller
service/Start Agent service.
Make sure that Agent machine can reach Controller machine (use ping).
Restart Agent service (see the Service Management commands section in Tools section
above).
Step 4. If all above did not help, it is time now to analyze diagnostics information.
(VS2010 only) Agent/Controller services by default log errors into Application Event Log (see
Tools section in the Appendix).
Check for suspicious log entries there.
Enable tracing see Diagnostics section above.
Get trace for the components involved in your scenario, some/all of:
Controller
Agent
Client
Test Agent/Controller Configuration Tool
Make sure that Controller/Agent service accounts have write access to trace files.
Step 5. Take a look at Known Issues section in the Appendix to see if your issue is similar to one of those.
Step 6. Collect appropriate diagnostics information and send to Microsoft (create Team Test Forum post
or Microsoft Connect bug).

Visual Studio Performance Testing Quick Reference Guide Page 104
4. References
The following is a list of useful information sources related to Test Agent/Controller
troubleshooting.
Troubleshooting Test Execution in MSDN.
Troubleshooting Controllers, Agents and Rigs (VS2008) in MSDN.
Installing and Configuring Visual Studio Agents (VS2010) in MSDN.
Understanding Visual Studio Load Agent Controller (Load Test team blog).
Troubleshooting errors in lab management (Team Lab blog).
Visual Studio Team System Test Forum.
Microsoft Connect report bugs/suggestions.
Appendix 1. Tools
The following tools can be useful for remote execution/Agent/Controller troubleshooting:
Visual Studio: Premium (VS2010 only), Team Test Edition (VS2008 only).
Manage Test Controllers dialog (Main menu->Test->Manage Test Controllers): see status
of Controller and all connected Agents, add/remove Agents to Controller, restart
Agents/the whole test rig, bring Agents online/offline, configure Agent properties.
Note: on VS2008 this dialog is called Administer Test Controllers.
Run tests remotely:
VS2008: update Test Run Configuration to enable remote execution (Main Menu->Test-
>Edit Test Run Configurations->(select run config)->Controller and Agent->Remote-
>provide Test Controller name), then run a test.
VS2010: update Test Settings to use remote execution role (Main Menu->Test->Edit Test
Settings -> (select test settings)->Roles->Remote Execution), then run a test.
Microsoft Test Manager (VS2010 only)
Lab Center->Controllers: see status of Controller and all connected Agents, add/remove
Agents to Controller, restart Agents/the whole test rig, bring Agents online/offline,
configure Agent properties. Note that Lab Center only shows controllers that are
associated with this instance of TFS.
Test Controller Configuration Tool (TestControllerConfigUI.exe, VS2010 only):
It is run as last step of Test Controller setup.
You can use it any time after setup to re-configure Controller. The tool has embedded
diagnostics which makes it easier to detect issues.
Test Agent Configuration Tool (TestAgentConfigUI.exe, VS2010 only):
It is run as last step of Test Controller setup.

Visual Studio Performance Testing Quick Reference Guide Page 105
You can use it any time after setup to re-configure Agent. The tool has embedded
diagnostics which makes it easier to detect issues.
Diagnostics information
Both Agent and Controller can be configured to trace diagnostics information (from
errors to verbose) to Application Event Log or trace file. Clients can also be configured to
trace (from errors to verbose) to trace file.
Tracing can be enabled via .config file or registry (VS2010 only), registry wins. Choose
the method that is more convenient for your scenario.
Enable tracing via .config file(s):
One of the advantages of using config files is that you can enable tracing for
each component separately and using trace settings specific only to this
component.
For Controller Service/Agent Service/Agent Process, you need the following
sections in the corresponding .config file (qtcontroller.exe.config,
qtagentservice.exe.config, qtagent.exe.config, qtagent32.exe.config which by
default are located in C:\Program Files (x86)\Microsoft Visual Studio
10.0\Common7\IDE):
Inside the <appSettings> section:
<add key="CreateTraceListener" value="yes"/>
Inside the <configuration>
<system.diagnostics>
<switches>
<add name="EqtTraceLevel" value="Verbose" />
</switches>
</system.diagnostics>
Trace files:
Controller: vsttcontroller.log
Agent Service: vsttagent.log
Agent Process: VSTTAgentProcess.log
For Client, add the following section to appropriate .config file
(devenv.exe.config, mstest.exe.config, mlm.exe.config):
Inside the <configuration> section (not
<system.diagnostics>
<trace autoflush="true" indentsize="4">
<listeners>

Visual Studio Performance Testing Quick Reference Guide Page 106
<add name="EqtListener"
type="System.Diagnostics.TextWriterTraceListener"
initializeData="C:\EqtTrace.log" />
</listeners>
</trace>
<switches>
<add name="EqtTraceLevel" value="Verbose" />
</switches>
</system.diagnostics>
Trace file: trace will go to the file specified by the initializeData
attribute.
Important: please make sure that the location is writable by
controller/agent service/process.
Enable tracing via registry (VS2010 only):
One of the advantages of using registry is that you can enable tracing for all
components using just one setting, you don't have to modify multiple
configuration files.
Create a file with the following content, rename it so that it has .reg extension
and double click on it in Windows Explorer:
Windows Registry Editor Version 5.00
[HKEY_CURRENT_USER\Software\Microsoft\VisualStudio\10.0\EnterpriseTools
\QualityTools\Diagnostics]
"EnableTracing"=dword:00000001
"TraceLevel"=dword:00000004
"LogsDirectory"="C:\"
Notes:
In case of Test Controller/Agent services the HKEY_CURRENT_USER is
the registry of the user the services are running under.
TraceLevel: 0/1/2/3/4 = Off/Error/Warning/Info/Verbose.
LogsDirectory is optional. If that is not specified, %TEMP% will be used.
Trace file name is <Process name>.EqtTrace.log, e.g.
devenv.EqtTrace.log.
Tracing from Test Controller Configuration Tool and Test Agent Configuration Tool:
on the view log hyperlink in the bottom.
SysInternals
Application configuration files
Controller, Agent and Client use settings from application configuration files:

Visual Studio Performance Testing Quick Reference Guide Page 107
Controller service: qtcontroller.exe.config
Agent service: qtagentservice.exe.config
Agent process: qtagent.exe.config (neutral/64bit agent), qtagent32.exe.config
(32bit agent).
VS: Devenv.exe.config.
Command line test runner: mstest.exe.config.
By default these files are located in C:\Program Files (x86)\Microsoft Visual
Studio 10.0\Common7\IDE.
How to configure listening ports:
This may be useful in the following scenarios:
Default ports used by Controller/Agent/Client can be used by some
other software.
There is firewall between controller and client. In this case you would
need to know which port to enable in the firewall so that Controller can
send results to the Client.
Controller Service: qtcontroller.exe.config:
<appSettings><add key="ControllerServicePort"
value="6901"/></appSettings>
Agent Service:
<appSettings><add key="AgentServicePort"
value="6910"/></appSettings>
Client: add the following registry values (DWORD). The Client will use one of the
ports from this range for receiving data from Controller:
HKEY_LOCAL_MACHINE\SOFTWARE\MICROSOFT\VisualStudio\10.0\EnterpriseTools\Qu
alityTools\ListenPortRange\PortRangeStart
HKEY_LOCAL_MACHINE\SOFTWARE\MICROSOFT\VisualStudio\10.0\EnterpriseTools\Qu
alityTools\ListenPortRange\PortRangeEnd
Service Management commands
UI: Start->Computer->Right-click->Manage-> Services and Applications->Services
§ Visual Studio Test Controller
Visual Studio Test Agent
Command line: net start/net stop: use to start/stop Agent/Controller
net start vsttcontroller
net start vsttagent
Windows Firewall

Visual Studio Performance Testing Quick Reference Guide Page 108
Start->Control Panel->Windows Firewall.
IP Security Policy
Start->Run->rsop.msc (on both Agent and Controller machines)
Go to Computer configuration->windows settings->security settings->ip security policies
Check if there are any policies that may prevent connections. By default there are no
policies at all.
Computer Management
Local Groups
Start->Computer->Manage->Local Users and Groups->Groups.
Event Log (Application)
Start->Computer->Manage->Event Viewer->Windows Logs->Application.
Ping
You can use ping to make sure that general TCP/IP network connectivity works.
Telnet
You can use telnet to check that you can connect to Agent/Controller, i.e. Firewall is not
blocking, etc.
telnet <ControllerMachineName> 6901
telnet <AgentMachineName> 6910
Visual Studio Team System Test Forum.
Microsoft Connect report bugs/suggestions.
Appendix 2. Known issues
The following is a list of known issues and suggested resolutions for them.
2.1. The message or signature supplied for verification has been altered (KB968389)
Symptom: Agent cannot connect to Controller.
Affected scenarios: Windows XP/Windows 7 connecting to Windows 2003 Server.
Additional information:
EventL Log (Agent): The message or signature supplied for verification has been altered.
Trace file (Agent) contains:
I, <process id>, <thread id>, <date>, <time>, <machine name>\QTAgentService.exe,
AgentService: The message or signature supplied for verification has been altered.
I, <process id>, <thread id>, <date>, <time>, <machine name>\QTAgentService.exe,
AgentService: Failed to connect to controller.
Microsoft.VisualStudio.TestTools.Exceptions.EqtException: The agent can connect to the
controller but the controller cannot connect to the agent because of following reason:
An error occurred while processing the request on the server: System.IO.IOException:
The write operation failed, see inner exception. --->
System.ComponentModel.Win32Exception: The message or signature supplied for
verification has been altered
at System.Net.NTAuthentication.DecryptNtlm(Byte[] payload, Int32 offset, Int32 count,
Int32& newOffset, UInt32 expectedSeqNumber)
at System.Net.NTAuthentication.Decrypt(Byte[] payload, Int32 offset, Int32 count,

Visual Studio Performance Testing Quick Reference Guide Page 109
Int32& newOffset, UInt32 expectedSeqNumber)
at System.Net.Security.NegoState.DecryptData(Byte[] buffer, Int32 offset, Int32 count,
Int32& newOffset)
at System.Net.Security.NegotiateStream.ProcessFrameBody(Int32 readBytes, Byte[]
buffer, Int32 offset, Int32 count, AsyncProtocolRequest asyncRequest)
at System.Net.Security.NegotiateStream.ReadCallback(AsyncProtocolRequest asyncRequest)
--- End of inner exception stack trace ---
at System.Net.Security.NegotiateStream.EndRead(IAsyncResult asyncResult)
at
System.Runtime.Remoting.Channels.SocketHandler.BeginReadMessageCallback(IAsyncResult
ar)
Server stack trace:
at
Microsoft.VisualStudio.TestTools.Controller.AgentMachine.VerifyAgentConnection(Int32
timeout)
Root cause: You installed KB968389 either via Windows Update or manually.
Resolution: uninstall KB968389 from Start->Control Panel->Programs and Features->View Installed
Updates.
2.2. Controller/Agent in untrusted Windows domains or one is in a workgroup and another one
is in domain.
Symptom: Agent cannot connect to Controller.
Affected scenarios: Test Controller and Agent are not in the same Windows domain. They are either in
untrusted domains or one of them is in a domain and another one is in a workgroup.
Additional information:
Trace file (Agent) contains:
W, <process is>, <thread id>, <date>, <time>, <mMachine name>\QTController.exe,
Exception pinging agent <agent name>:
System.Security.Authentication.AuthenticationException: Authentication failed on the
remote side (the stream might still be available for additional authentication
attempts). ---> System.ComponentModel.Win32Exception: No authority could be contacted
for authentication
Server stack trace:
at System.Net.Security.NegoState.ProcessReceivedBlob(Byte[] message, LazyAsyncResult
lazyResult)
at System.Net.Security.NegotiateStream.AuthenticateAsClient(NetworkCredential
credential, ChannelBinding binding, String targetName, ProtectionLevel
requiredProtectionLevel, TokenImpersonationLevel allowedImpersonationLevel)
at System.Net.Security.NegotiateStream.AuthenticateAsClient(NetworkCredential
credential, String targetName, ProtectionLevel requiredProtectionLevel,
TokenImpersonationLevel allowedImpersonationLevel)
at
System.Runtime.Remoting.Channels.Tcp.TcpClientTransportSink.CreateAuthenticatedStream(
Stream netStream, String machinePortAndSid)
at
System.Runtime.Remoting.Channels.BinaryClientFormatterSink.SyncProcessMessage(IMessage
msg)
Root cause: Due to Windows security, Agent cannot authenticate to Controller, or vice versa.
Resolution:

Visual Studio Performance Testing Quick Reference Guide Page 110
The simplest is to use Workgroup authentication mode:
Mirror user account on Controller and Agent: create a user account with same user
name and password on both Controller and Agent machine.
Use mirrored user account to run Controller and Agent services under this account.
If you are using VS2010 RC+ version (i.e. RC or RTM but not Beta2), add the following
line to the qtcontroller.exe.config file under the <appSettings> node:
<add key="AgentImpersonationEnabled" value="no"/>
Restart Controller/Agent services (see Tools section in the Appendix).
Make sure there is no IP Security Policy that prevents the connection (see IP Security Policy
under Tools section in the Appendix).
By default for domain machines Windows uses domain (Kerberos) authentication, but if
it fails it will fall back to workgroup (NTLM) authentication. This behavior can be and
often is altered by IP Security policies, for instance, there could be a policy to block
connections from machines which do not belong to the domain.
Restart or re-configure Controller and Agent.
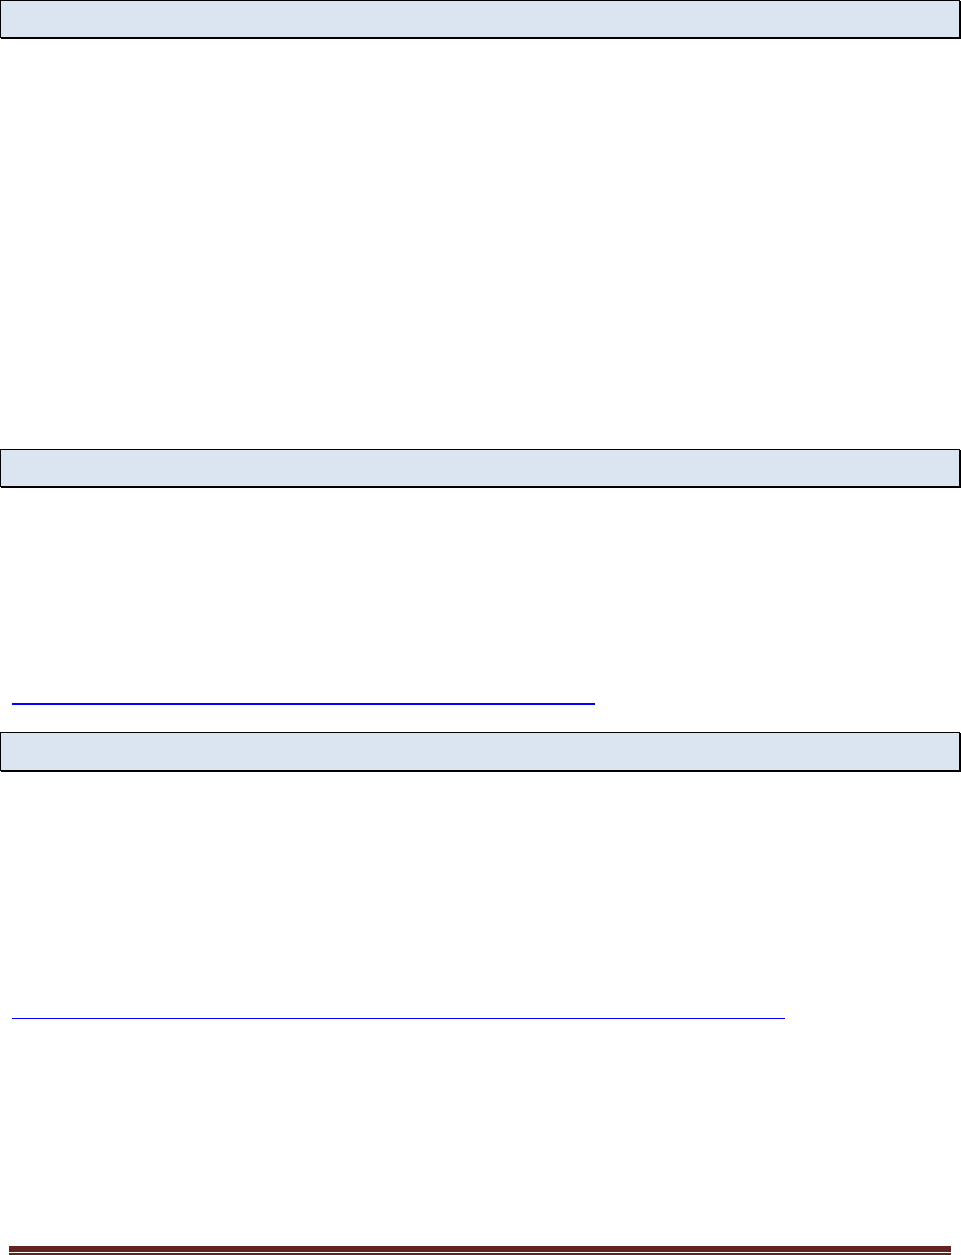
Visual Studio Performance Testing Quick Reference Guide Page 111
How To, Gotchas and Best Practices
How to call one coded web test from another
If you want to have two coded web tests and have one called from within the other, you need to follow
a certain order to make it work:
1. Record the web tests
2. Generate code for the child
3. Include a call to the coded child in the declarative
4. Generate code for the parent
If you try to connect the two web tests before generating any code, your test will fail with the following
error:
There is no declarative Web test with the name 'DrillDown_Coded' included in this Web
test; the string argument to IncludeWebTest must match the name specified in an
IncludeDeclarativeWebTest attribute.
How to use methods other than GET and POST in a web test
Summary
FormPostHttpBody and StringHttpBody are the two built-in classes for generating HTTP request bodies.
If you need to generate requests containing something other than form parameters and strings then you
can implement an IHttpBody class.
More information
http://blogs.msdn.com/joshch/archive/2005/08/24/455726.aspx
How to filter out certain dependent requests
Summary
One of the new Web Test features in Visual Studio 2008 is the ability to filter dependent requests. If you
have a request in your web test that fetches a lot of content such as images, JavaScript files or CSS files,
programmatically determine which requests are allowed to execute during the course of
the web test, and which aren't.
More information
http://blogs.msdn.com/densto/pages/new-in-orcas-filtering-dependent-requests.aspx
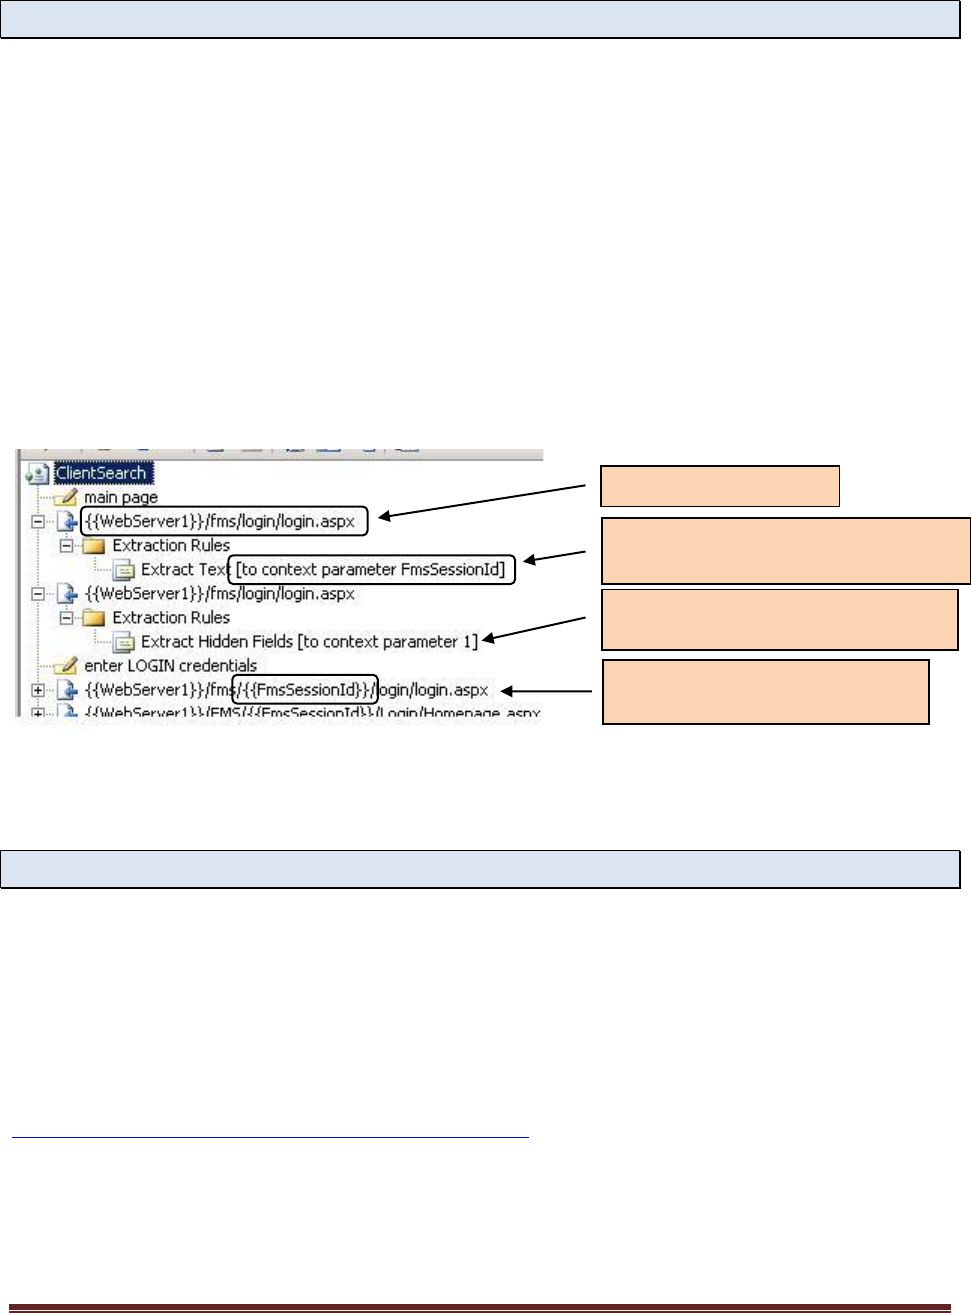
Visual Studio Performance Testing Quick Reference Guide Page 112
How to handle ASP.NET Cookie-less Sessions
ASP.NET allows session IDs to be passed as part of the URL requests, which can cause problems with
VSTS playback. To deal with this issue, use the following steps:
1. Record the web test as normal
2. When the recording is done, you should see the very first request has no session ID in it, but all
of the rest do. This first request also has a REDIRECT to the same URL, but with the session ID
included.
3. rule to get the value of
the session (see example below).
4. Since you turned off redirects on the first request, you need to add a second request manually
to the redirected page to capture any HIDDEN parameters.
5. -coded session IDs to the context you extracted in
step 3
How to use extracted values inside Web Request URLs
How to use Client-side certificates in web tests
Client-side certificates are also supported in web tests, but additional code is required. The certificates
need to be added to the WebTestRequest.ClientCertificates collection. This can be done in a coded web
test, or by using a request plug-in in a declarative web test.
The following link describes how to use X509 certificate collections to make a SOAP request in .NET;
code for using them in a web test will be similar.
More information
http://msdn.microsoft.com/en-us/library/ms819963.aspx
Turn off Redirects here
Context ID added to URL here
and in all subsequent requests
This is a copy of first request with
EXTRACT HIDDEN FIELDS added
Visual Studio Performance Testing Quick Reference Guide Page 113
How to remove the “If-Modified-Since” header from dependent requests
The reason that If-Modified-Since headers are sent by default with dependent requests is that the web
test engine attempts to emulate the behavior of Internet Explorer in its default caching mode. In many
cases IE will send If-Modified-Since headers.
However, with VSTS 2008 if you want to completely disable caching of all dependent requests and
always fetch them, you can so with the following WebTestPlugin:
public class WebTestPlugin_DisableDependentCaching : WebTestPlugin
{
public override void PostRequest(object sender, PostRequestEventArgs e)
{
foreach (WebTestRequest dependentRequest in e.Request.DependentRequests)
{
dependentRequest.Cache = false;
}
}
}
How to handle custom data binding in web tests
In 2008
Summary
It is possible to create a custom data binding to bind to something other than a table, such as a select
statement. This blog post describes one possible method creating one class which will manage the
data and creating a web test plug-in to add the data into the web test context.
More information
http://blogs.msdn.com/slumley/pages/custom-data-binding-in-web-tests.aspx
In 2010
http://blogs.msdn.com/slumley/archive/2010/01/04/vsts-2010-feature-data-source-
enhancements.aspx
How to add a datasource value to a context parameter
If you try to assign a datasource value to a context parameter in a web test, it will not work properly.
This is because VSTT does not replace datasource values in the context parameters. To work around this,
you can add code directly into a coded web test or in a web test plugin. Use the following syntax for
adding the binding:
this.Context.Add(“ContextNameToUse”,this.Datasource1[“ColumnToUse”]);
Changed in 2010
Visual Studio Performance Testing Quick Reference Guide Page 114
How to test Web Services with Unit Tests
If you need some help or a starting point for building Web Service tests using Unit tests, the below blog
gives a great walkthrough.
http://blogs.msdn.com/slumley/pages/load-testing-web-services-with-unit-tests.aspx
How to add random users to web tests
The following code can be used to generate random users for loading up sample sites with user
accounts. The key to this is to randomize against a time stamp and to add another unique number (in
this case, the vuser ID) so that two different instances
same user. Issues can occur where multiple agent machines randomly generate the same user when
significantly increases the chance of never hitting it.
public string sRndName = "User";
public string sRndExt = @"@contoso.lab";
public int x,y;
public string sUserName;
// Generate our random user
Random randObj = new Random();
x = randObj.Next();
y = this.Context.WebTestUserId;
sUserName = sRndName + Convert.ToString(x) + Convert.ToString(y) +
sRndExt;
Or, in a declarative test this can be achieved by setting the username value to:
UserName{{$Random(0,10000)}}{{$WebTestUserId}}UserNameExt
How to add think time to a Unit Test
When you use a web test, the VSTS environment provides a property for each request called ThinkTime.
This is the preferred method to use. However, there is no such property for Unit Tests. In order to
simulate think time within Unit Tests, use the
(the parameter for sleep is in milliseconds, so use 1000 to simulate 1 second of sleep time). The Sleep
API will work well here because it is a non-CPU intensive API. The reason it is NOT recommended for
web tests is because it is a blocking API and more than one web test can share a thread, therefore it can
adversely affect more than one vuser. Unit tests do not share threads, therefore they are not affected
by this.

Visual Studio Performance Testing Quick Reference Guide Page 115
How to add details of a validation rule to your web test
There are no properties on the WebTestResponse object or WebTestRequest object that indicate the
outcome of a specific validation rule. The best approach is to have the validation rule place the result
text in the WebTestContext, and then access the WebTestContext object from the WebTest
Context property in the PostRequest or PostWebTest event handler. The following approach should
work. If you have multiple validation rules, you may want to use different names for the key on the call
to this.Context.Add.
public class WebTest13Coded : WebTest
{
public WebTest13Coded()
{
this.PreAuthenticate = true;
}
public override IEnumerator<WebTestRequest> GetRequestEnumerator()
{
WebTestRequest request1 = new WebTestRequest("http://vsncts01/StoreCSVS");
request1.ExpectedResponseUrl = "http://vsncts01/StoreCSVS/";
if ((this.Context.ValidationLevel >=
Microsoft.VisualStudio.TestTools.WebTesting.ValidationLevel.High))
{
// request1.ValidateResponse += new
EventHandler<ValidationEventArgs>(validationRule2.Validate);
// Specify a wrapper validation event handler …
request1.ValidateResponse += new
EventHandler<ValidationEventArgs>(request1_ValidateResponse);
}
yield return request1;
request1 = null;
// Check the validation rule result of the previous request
if ((bool)(this.Context["validationRule_Passed"]))
{
WebTestRequest request2 = new
WebTestRequest("http://vsncts01/testwebsite");
yield return request2;
}
}
private void request1_ValidateResponse(object source, ValidationEventArgs
validationEventArgs)
{
ValidationRuleRequiredAttributeValue validationRule = new
ValidationRuleRequiredAttributeValue();
validationRule.TagName = "DIV";
validationRule.AttributeName = "id";
validationRule.MatchAttributeName = "id";
validationRule.MatchAttributeValue = "LeftContent";
validationRule.ExpectedValue = "LeftContent";
validationRule.IgnoreCase = false;
validationRule.Index = -1;
validationRule.Validate(source, validationEventArgs);
// Add the validation rule result to the WebTestContext
this.Context.Add("validationRule_Passed", validationEventArgs.IsValid);
this.Context.Add("validationRule_Message", validationEventArgs.Message);
}
}
Visual Studio Performance Testing Quick Reference Guide Page 116
How to mask a 404 error on a dependent request
When running web tests, you may find that certain dependent requests always fail with a 404 error.
Normally you would resolve this issue by fixing the broken link, or removing the reference. However,
sometimes (for the sake of moving forward with your testing) you might want to have VSTT ignore the
error. Ed Glas has a blog outlining one way to do this quickly
(http://blogs.msdn.com/edglas/archive/2008/08/06/masking-a-404-error-in-a-dependent-request.aspx)
but that may not work in all cases. For example if an ASPX page has some code that returns a link to a
local file that is not present, then the blog post above will not work. In this case, you should consider
using a plugin similar to the following (thanks to Ed Glas for the sample):
//************************************************************************************
*************
// WebTestDependentFilter.cs
// Owner: Ed Glas
//
// This web test plugin filters dependents from a particular site.
// For example, if the site you are testing has ads served by another company
// you probably don't want to hit that site as part of a load test.
// This plugin enables you to filter all dependents from a particular site.
//
// Copyright(c) Microsoft Corporation, 2008
//************************************************************************************
*************
using Microsoft.VisualStudio.TestTools.WebTesting;
namespace SampleWebTestRules
{
public class WebTestDependentFilter : WebTestPlugin
{
string m_startsWith;
public string FilterDependentRequestsThatStartWith
{
get { return m_startsWith; }
set { m_startsWith = value; }
}
public override void PostRequest(object sender, PostRequestEventArgs e)
{
WebTestRequestCollection depsToRemove = new WebTestRequestCollection();
// Note, you can't modify the collection inside a foreach, hence the
second collection
// requests to remove.
foreach (WebTestRequest r in e.Request.DependentRequests)
{
if (!string.IsNullOrEmpty(FilterDependentRequestsThatStartWith) &&
r.Url.StartsWith(FilterDependentRequestsThatStartWith))
{
depsToRemove.Add(r);
}
}
foreach (WebTestRequest r in depsToRemove)
{
e.Request.DependentRequests.Remove(r);
}
}
}
}
Visual Studio Performance Testing Quick Reference Guide Page 117
How to parameterize Web Service calls within Web Tests
By default, VSTS does not expose an automated way of parameterizing the data passed in the body of a
Web Service call. However, it does still honor the syntax used to define parameters in the string. To
manually add a parameter definition in the body, edit the string and add the parameters where you
need them. The syntax is:
{{Datasource.Table.Column}}
Here is a sample:
<?xml version="1.0" encoding="utf-8"?>
<soap:Envelope xmlns:xsi="http://www.w3.org/2001/XMLSchema-instance"
xmlns:xsd="http://www.w3.org/2001/XMLSchema"
xmlns:soap="http://schemas.xmlsoap.org/soap/envelope/">
<soap:Body>
<OrderItem xmlns="http://tempuri.org/">
<userName>jb@ibuyspy.com</userName>
<password>IBS_007</password>
<productID>{{DataSource1.Products.ProductID}}</productID>
<quantity>1</quantity>
</OrderItem>
</soap:Body>
</soap:Envelope>
How to pass Load Test Context Parameters to Unit Tests
http://blogs.msdn.com/slumley/archive/2006/05/15/passing-load-test-context
How to create Global Variables in a Unit Test
If you need to have a global variable shared among iterations of a unit test, use the following:
Define a static member variable of the unit test class, or if you have multiple unit test classes that need
to share the data, create a singleton object that is accessed by all of the unit tests. The only case in
which this would not work is if you have multiple unit test assemblies being used in the same load test
Domain
own copy of the static or singleton object.
CAVEAT: This will not work in a multi-agent test rig. If you have a multi-agent rig and you want truly
access.
Visual Studio Performance Testing Quick Reference Guide Page 118
How to use Unit Tests to Drive Load with Command Line Apps
The following code can be used in a Unit Test to drive a command line tool (such as a testing tool). The
Unit test can then be driven by a load test to emulate multiple copies of the app.
using System.Threading;
using System.Diagnostics;
using System.IO;
.......
[TestMethod]
public void TestMethod1()
{
int x=0;
int iDuration = 10000;
try
{
Process myProcess = new Process();
myProcess = Process.Start("c:\\temp\\conapp2.exe", “arg1”, “arg2”);
myProcess.WaitForExit(iDuration); //Max iDuration milliseconds to return
if (!myProcess.HasExited) //If the app has not exited, kill it manually
{
myProcess.Kill();
Console.WriteLine("Application hung and was killed manually.");
}
else
{
x = myProcess.ExitCode;
Console.WriteLine("Completed. Exit Code was {0}", x);
}
}
catch (Exception e)
{
Console.WriteLine("The following exception was raised: " + e.Message);
}
finally
{
}
}
How to add Console Output to the results store when running Unit tests under load
The following link points to a write-up on how to allow unit tests to write custom output messages to
the Load Test Results Store database from Unit tests while they are running in a load test:
http://blogs.msdn.com/billbar/pages/adding-console-output-to-load-tests-running-unit-tests.aspx
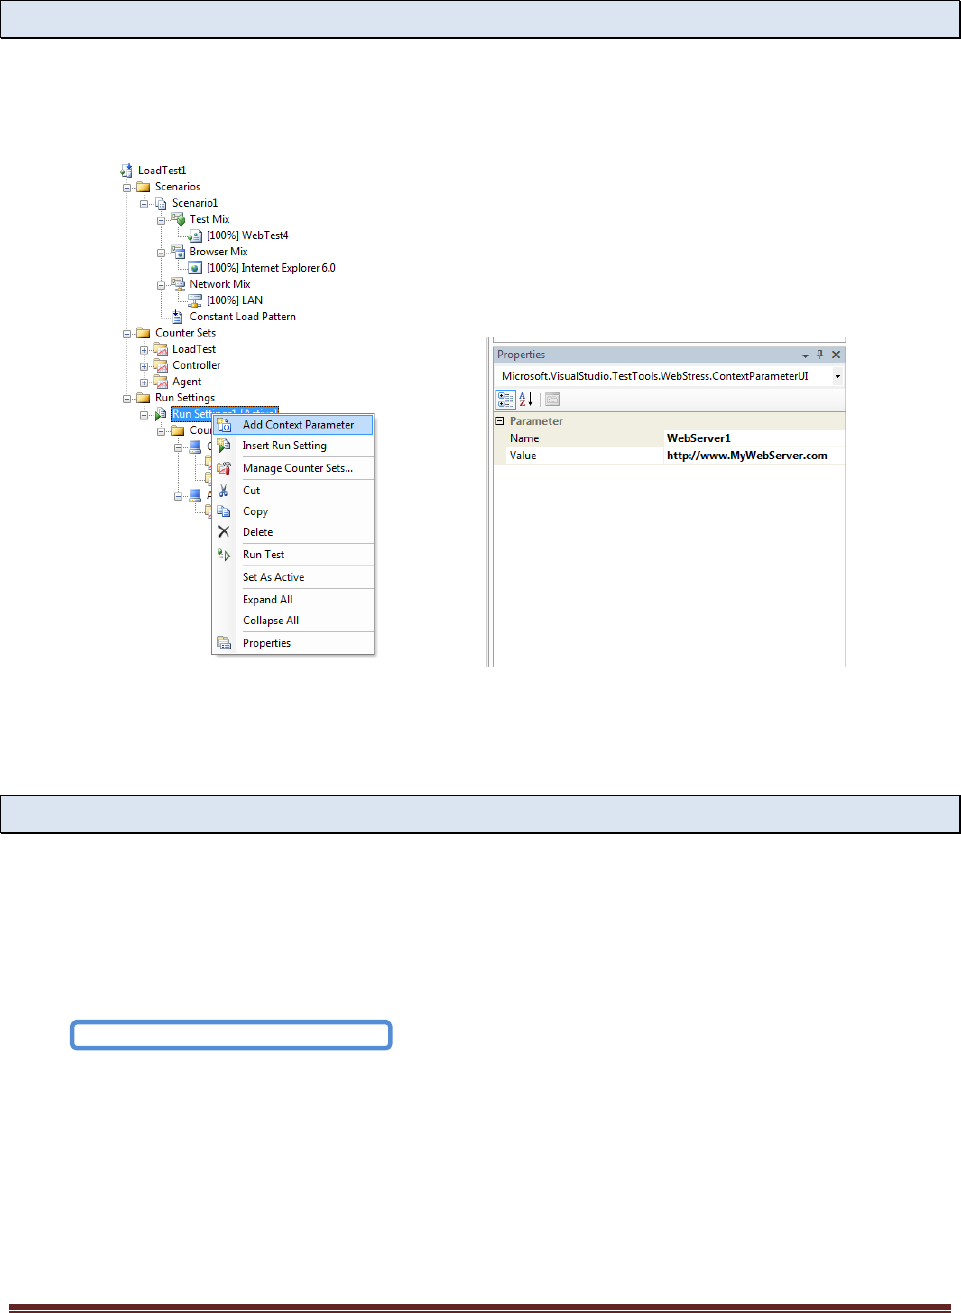
Visual Studio Performance Testing Quick Reference Guide Page 119
How to add parameters to Load Tests
To add a parameter to a Load Test, open the load test and right-
wherever you want to add the parameter) and then choose to add a context parameter. Make sure it
uses the same name as the parameter you wish to override in the web tests if that is your intent.
Adding parameters to load tests
How to Change the Standard Deviation for a NormalDistribution ThinkTime
Find the <test_name>.loadtest file in the VSTT project directory and edit it directly. You will find a
section like the one below for each scenario in the loadtest. Change the ThinkProfile Value to whatever
standard deviation you wish to use. The default value in VSTT is 20% (0.2)
<Scenario Name="Scenario1" DelayBetweenIterations="2"
PercentNewUsers="0" IPSwitching="true"
TestMixType="PercentageOfTestsStarted">
<ThinkProfile Value="0.2" Pattern="NormalDistribution" />
Any ThinkTime that has a value of zero will remain zero regardless of the distribution settings.
Visual Studio Performance Testing Quick Reference Guide Page 120
How to programmatically access the number of users in Load Tests
In a load test plug-in, you can get the current user load. For an exam
at: http://blogs.msdn.com/edglas/archive/2006/02/06/525614.aspx
This blog post actually does much more than that, but the line
where it updates the current load is:
((LoadTestScenario)m_loadTest.Scenarios[0]).CurrentLoad = newLoad;
In VS 2008 SP1 and later, you can access the load profile using the LoadTestScenario.LoadProfile
property, and casting this to the appropriate LoadProfile class (such as LoadTestConstantLoadProfile).
How to create a webtest plugin that will only execute on a predefined interval
If you want to write a webtest plugin that will only fire on certain intervals (maybe for polling or
reporting), then use the following as a starting point.
public class WebTestPluginActingInfrequently : WebTestPlugin
{
public override void PostWebTest(object sender, PostWebTestEventArgs e)
{
if (e.WebTest.Context.WebTestIteration % 100 == 1)
{
// Do something
}
}
}
The WebTestIteration property is guaranteed to be unique, so no need to worry about locking. If you
run this web test by itself it will
the web test by itself with multiple iterations or data binding).
Rather than hard coding the frequency as 1 in 100, you could make the frequency a property of the
plugin that you set in the Web test editor, or a Web test context parameter or a load test context
parameter: the LoadTestPlugin would need to pass that down to the WebTestPlugin either by setting it
in the WebTestContext or just make the frequency a property on the plugin.
Note that the WebTestIteration property is incrememented separately for each Scenario (on each agent)
in the load test, but if you want the frequency to be across all Web iterations on an agent then you
could define a static int in the WebTestPlugin (and use Interlocked.Increment to atomically increment
it).
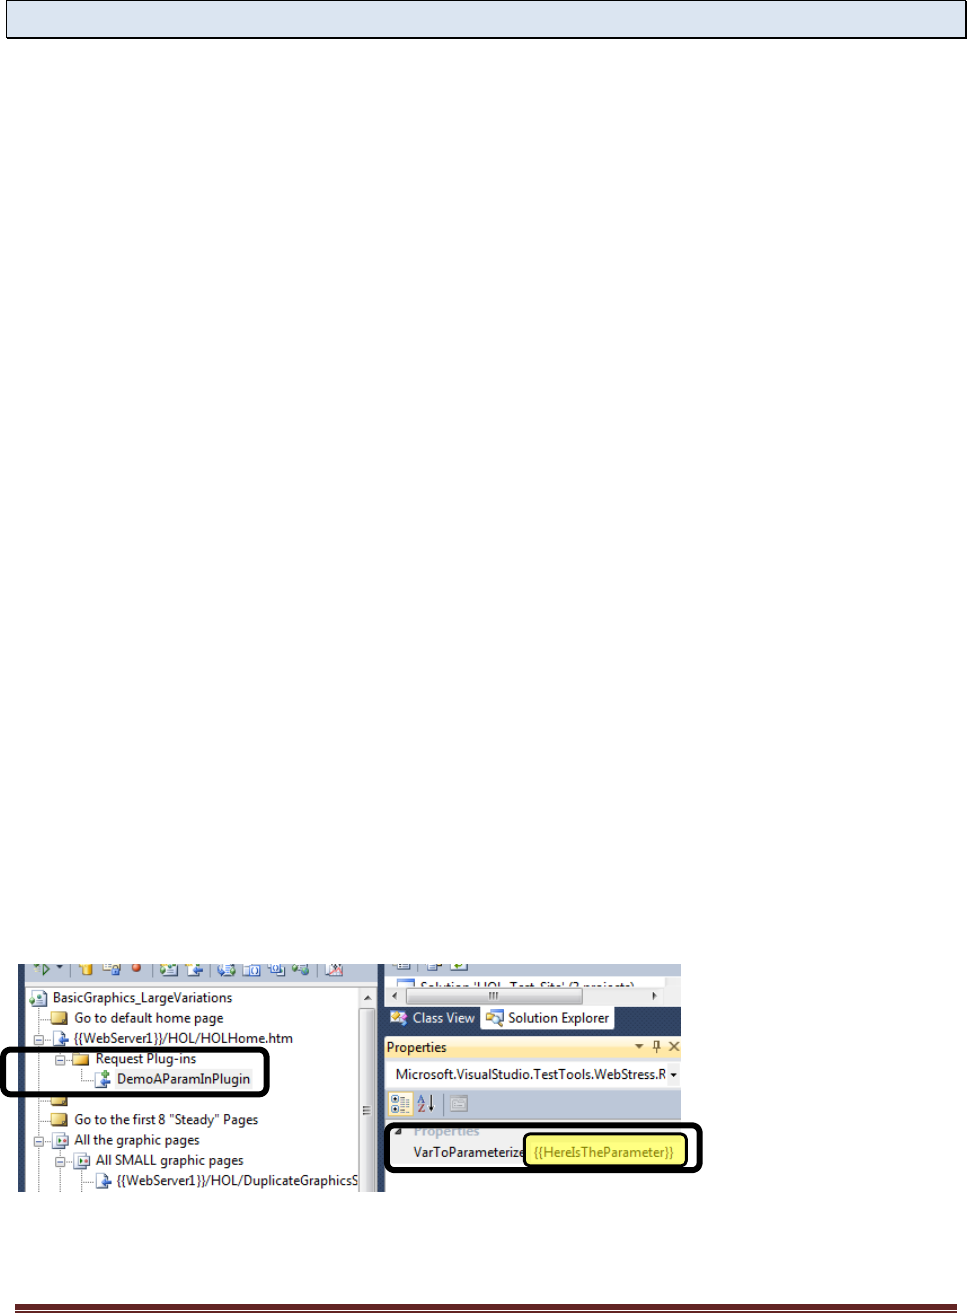
Visual Studio Performance Testing Quick Reference Guide Page 121
How to support Context Parameters in a plug-in property
If you develop a plug-in or an extraction rule and you want to allow the properties you expose to be
Context Parameters that the user specifies you need to add some code to your plugin to check for the
existence of a Context Paramter
For example suppose the user had a Context Parameter {{ComparisonEventTarget}} that they want to
provide as the property value for the EventTarget property in your plugin, (see the screen shot), then
use the following code snippet to have your extraction/plugin checks the value supplied to determine if
{{
Here is a partial code snippet:
public class DynamicFormFields : WebTestRequestPlugin
{
// this is our property that is exposed in the Visual Studio UI
//we want to allow either supplying a string literal, or a context
paramerter name
public string EventTarget {get;set;}
public override void PreRequest(object sender, PreRequestEventArgs e)
{
//we will check to see if our EventTarget is a string or do
they want us to get it from a context param
if ( this.EventTarget.Contains("{{") )
{
string contextParamKey = this.EventTarget.Replace("{{",
string.Empty).Replace("}}", string.Empty);
this.EventTarget =
e.WebTest.Context[contextParamKey].ToString();
}
//. . . . . . . code to do your work starts here…
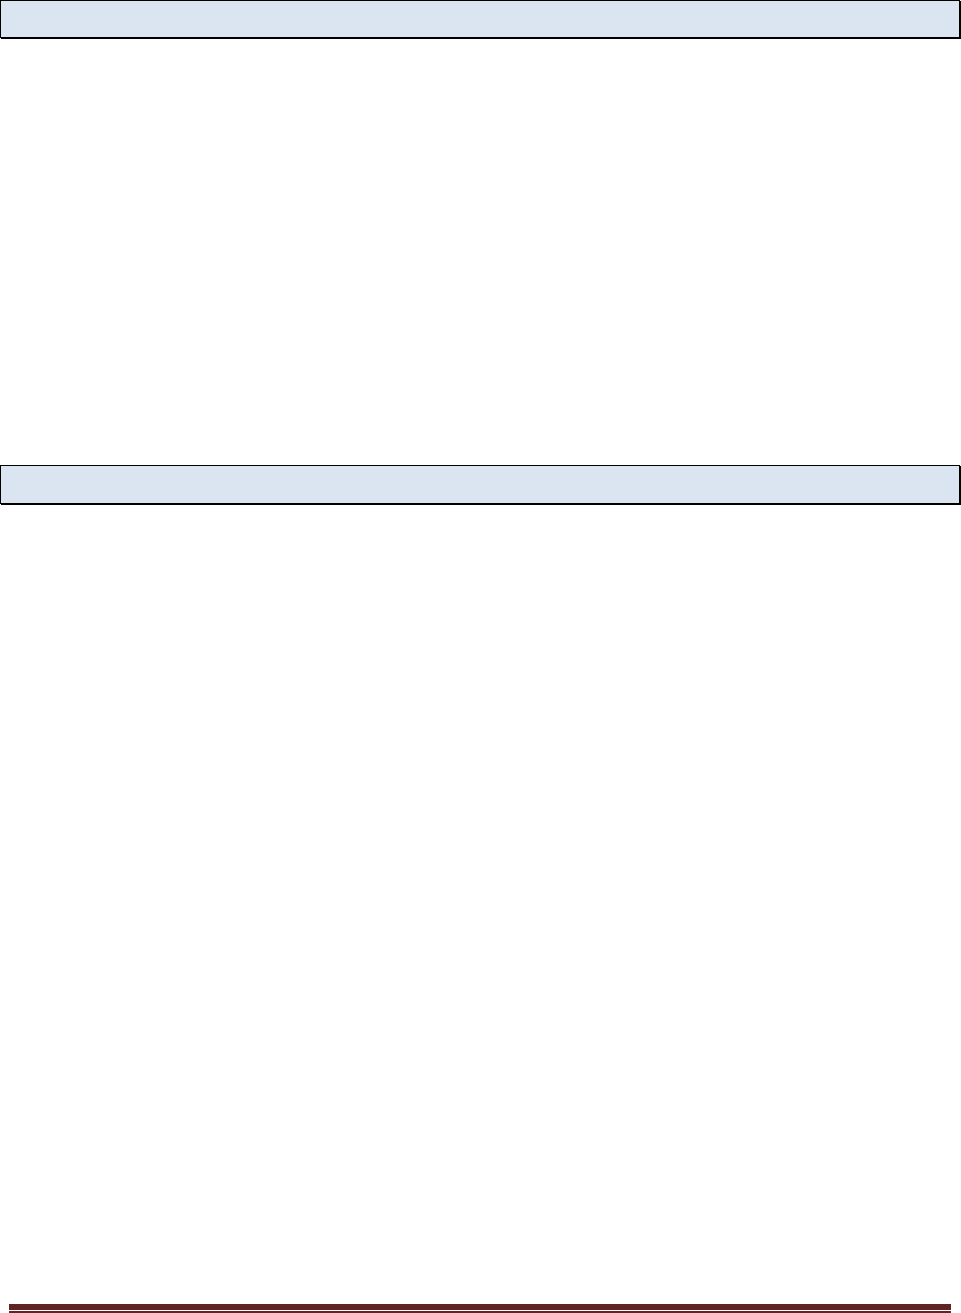
Visual Studio Performance Testing Quick Reference Guide Page 122
How to stop a web test in the middle of execution
If you want to stop a web test in the middle of execution based on a certain condition, you can hook into
a couple of methods (GetRequestEnumerator or PostRequestEvent) and use the following code to stop
the execution:
Coded Web Test
if (<condition>)
{
this.Stop();
yield break;
}
WebTest Plugin Event)
{
e.WebTest.Stop();
}
How To: Modify the ServicePointManager to force SSLv3 instead of TLS (Default)
If you need to modify the type of SSL connection to force SSLv3 instead of TLS (Default) then you must
modify the ServicePointManager.SecurityProtocol property to force this behavior. This can happen if
you are working with a legacy server that requires an older SSLv3 protocol and cannot negotiate for the
higher TLS security protocol. In addition, you may need to write code in your test to handle the
ServerCertificateValidationCallback to determine if the server certificate provided is valid. A code
snippet is provided below.
[TestMethod]
public void TestMethod1()
{
// We're using SSL3 here and not TLS. Without this line, nothing works.
ServicePointManager.SecurityProtocol = SecurityProtocolType.Ssl3;
//we wire up the callback so we can override the behavior, force it to
accept the cert from the server.
ServicePointManager.ServerCertificateValidationCallback =
RemoteCertificateValidationCB;
--------- <XX SNIPPED XX> ---------
public static bool RemoteCertificateValidationCB(Object sender, X509Certificate
certificate, X509Chain chain, SslPolicyErrors sslPolicyErrors)
{
//If it is really important, validate the certificate issuer here.
//string resultsTrue = certificate.Issuer.ToString(true);
//For now, accept any certificate
return true;
}
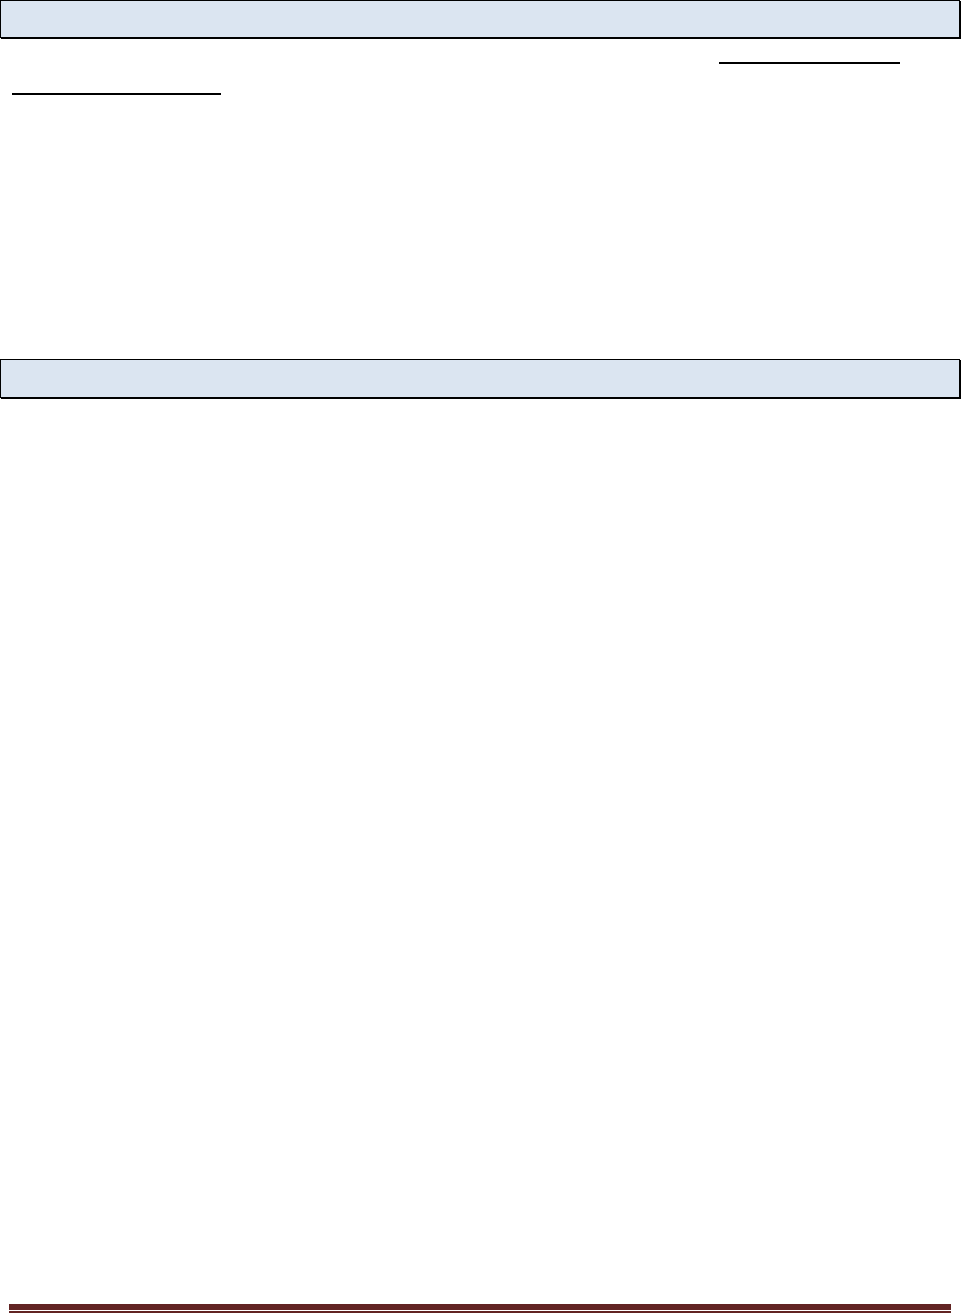
Visual Studio Performance Testing Quick Reference Guide Page 123
How To: Stop a Test in the PreRequest event
Stopping a test using the WebTest.Stop() method in the PreRequest event will not stop the current
request from executing. If you wish to stop the current request from firing then you need to set the
current request Instruction property to WebTestExecutionInstruction.Skip and then issue the
WebTest.Stop().
void MSDNsiteCoded_PreRequest(object sender, PreRequestEventArgs e)
{
e.Instruction = WebTestExecutionInstruction.Skip;
e.WebTest.Stop();
}
How to make a validation rule force a redirection to a new page
Suppose you have a scenario in which you have a custom validation rule which detects an error
condition. When you hit that error condition, you want to redirect to a new error page. Here are three
ways to accomplish this.
coded test.
In a coded test, you can easily add new requests that get returned in the body of the test. You would
just create a new WebTestRequest
parameter called ErrorUrl, you would have following in code:
if(this.Context.ContainsKey("ErrorUrl"))
{
WebTestRequest request4 = new
WebTestRequest(this.Context["ErrorUrl"].ToString());
request4.Encoding = System.Text.Encoding.GetEncoding("utf-8");
yield return request4;
request4 = null;
}
Validation rule.
First you will need to add a dummy request after the page you want to check. The URL is not important
because you are going to change it based on outcome of the validation rule. In your validation rule set a
context parameter that contains the URL you want to redirect to. Here is a very simple rule that does
this. If return code is great than 400, it adds the URL to the context. In this case, it is just redirecting to
home page of the site.
public class ErrorCheckValidationRule : ValidationRule
{
public override void Validate(object sender, ValidationEventArgs e)
{
if (((int) e.Response.StatusCode) >= 400)
{
e.WebTest.Context.Add("ErrorUrl",
e.WebTest.Context["WebServer1"].ToString()+"/storecsvs/");
}
}
}
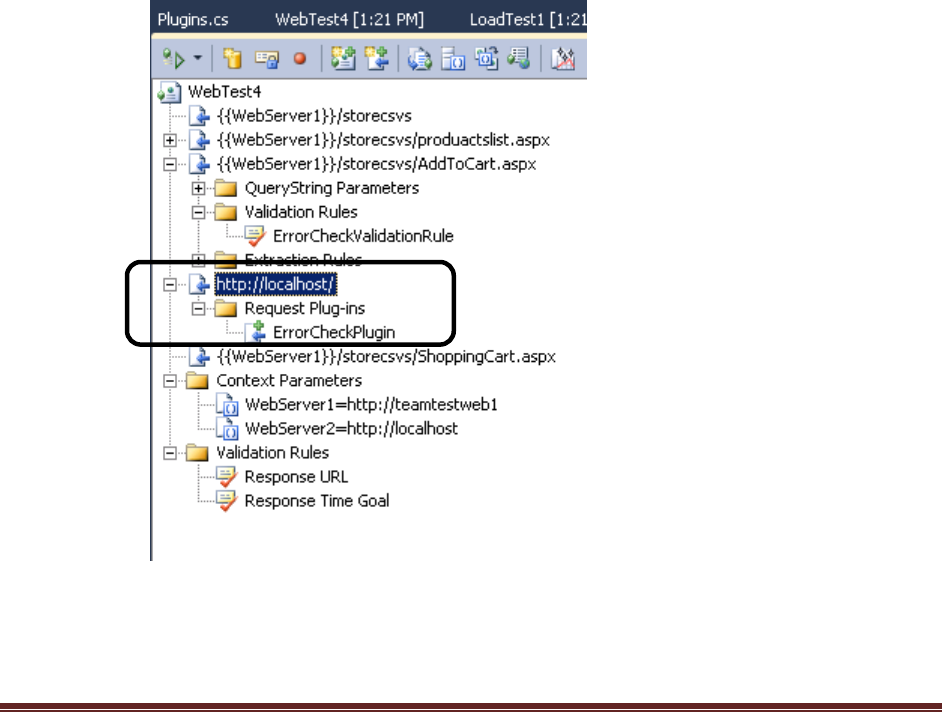
Visual Studio Performance Testing Quick Reference Guide Page 124
WebTestRequestPlugin
First you will need to add a dummy request after the page you want to check. The URL is not important
because you are going to change it in the plugin. Add a WebTestRequestPlugin to the dummy request.
The plug-in will look for the parameter and if it exists, it will change URL of request. If the parameter
does not exist, it will set the skip instruction for the request. Here is a simple plug-in which does this:
public class ErrorCheckPlugin : WebTestRequestPlugin
{
public override void PreRequest(object sender, PreRequestEventArgs e)
{
object errorUrl;
if (e.WebTest.Context.TryGetValue("ErrorUrl", out errorUrl))
{
e.Request.Url = errorUrl.ToString();
}
else
{
//if it does not exist then skip the request
e.Instruction = WebTestExecutionInstruction.Skip;
}
}
}
Here is what the web test looks like: The dummy request is http://localhost.
Visual Studio Performance Testing Quick Reference Guide Page 125
Here is what the result looks likes when it is skipped. You can see the status of Not Executed:
a. Here is what it looks when it does the redirect:
A solution for VS 2010 using the new conditional rule logic that works for declarative editor. In VS 2010
you can now do branching and looping in declarative editor. So instead of a web test request plug-in,
we can do the redirect with a conditional rule. So you would do the following:
1. Add the validation rule to a request.
2. Still add the dummy request below the one that the validation rule is on
3. Set the URL for this dummy request to {{ErrorUrl}}
4.
5. Choose the Context Parameter Exists rule
6. Set the context parameter Name to ErrorUrl. This rule will execute if the ErrorUrl parameter is
in the context.
7. Click Ok
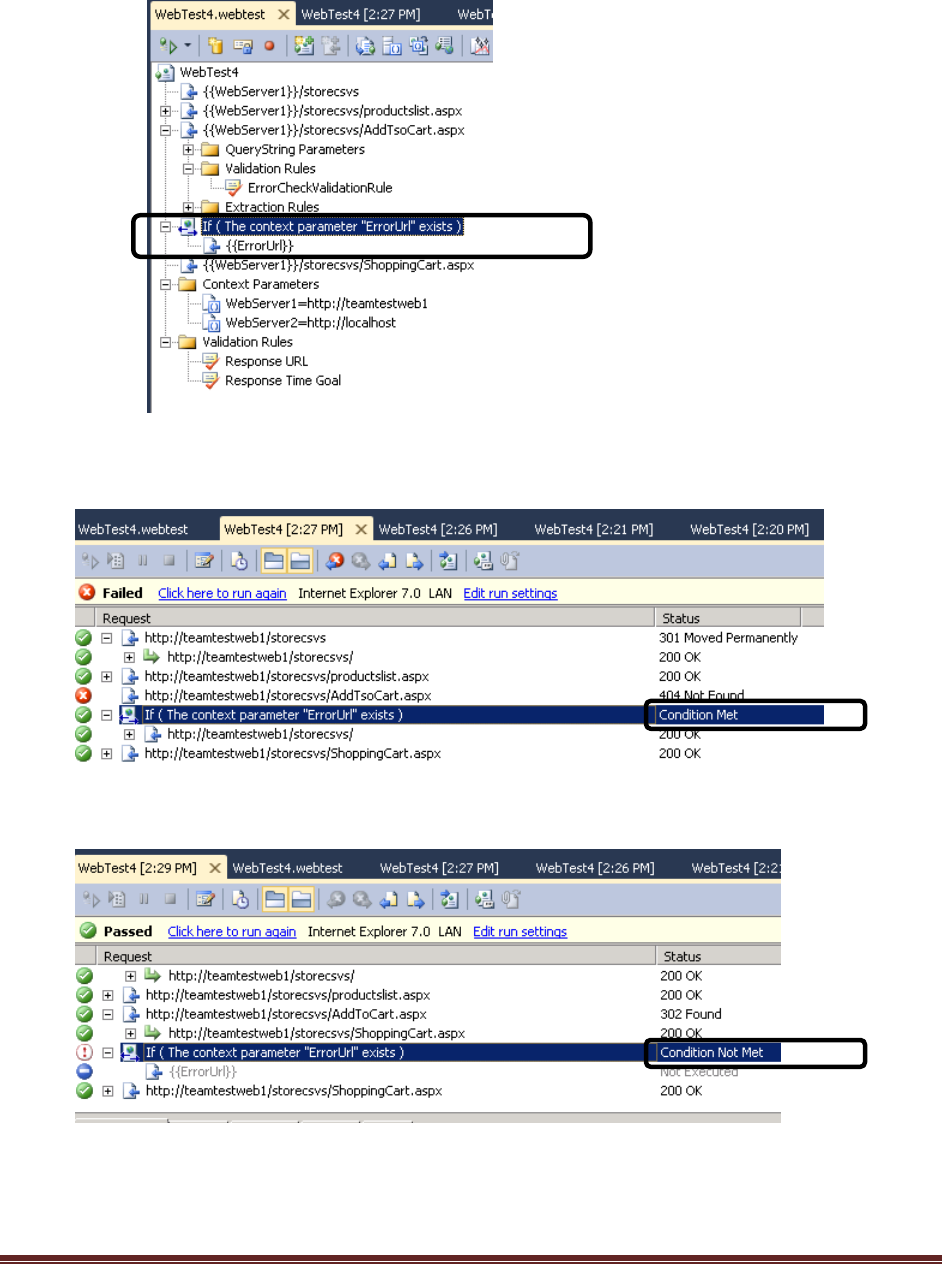
Visual Studio Performance Testing Quick Reference Guide Page 126
Here is what editor looks like with the conditional rule:
Here is what it looks like when the condition is met.
Here is what it looks like when condition is not met:
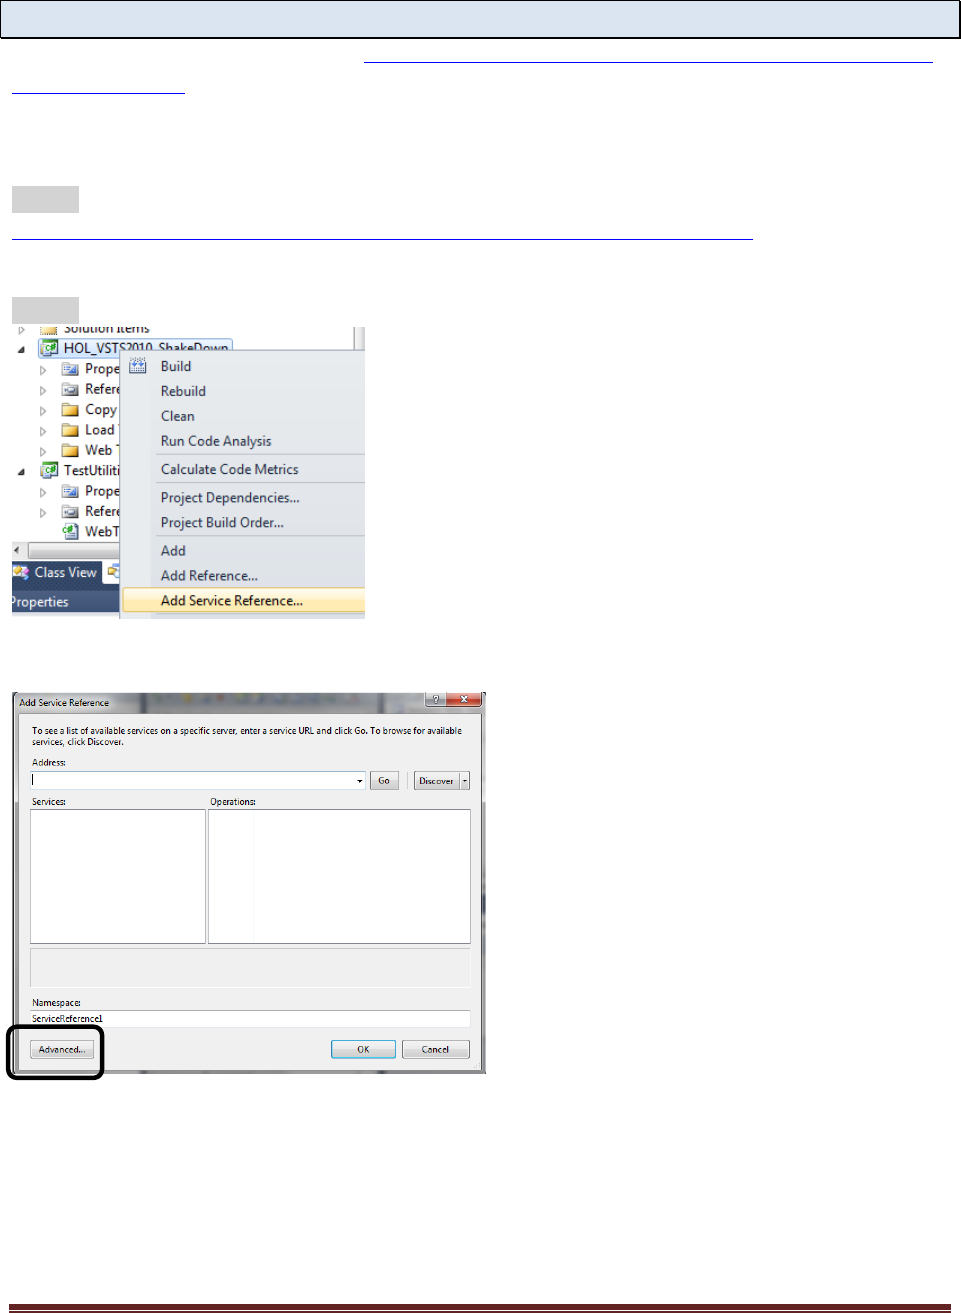
Visual Studio Performance Testing Quick Reference Guide Page 127
How to add a Web Service reference in a test project
og (http://blogs.msdn.com/slumley/pages/load-testing-web-services-
with-unit-tests.aspxte a New Web
Reference. Unfortunately, right-clicking on either the project or references does not give you the option
for Add Web Reference. To add the reference, add a service reference:
In 2008
http://blogs.msdn.com/slumley/pages/load-testing-web-services-with-unit-tests.aspx
In 2010
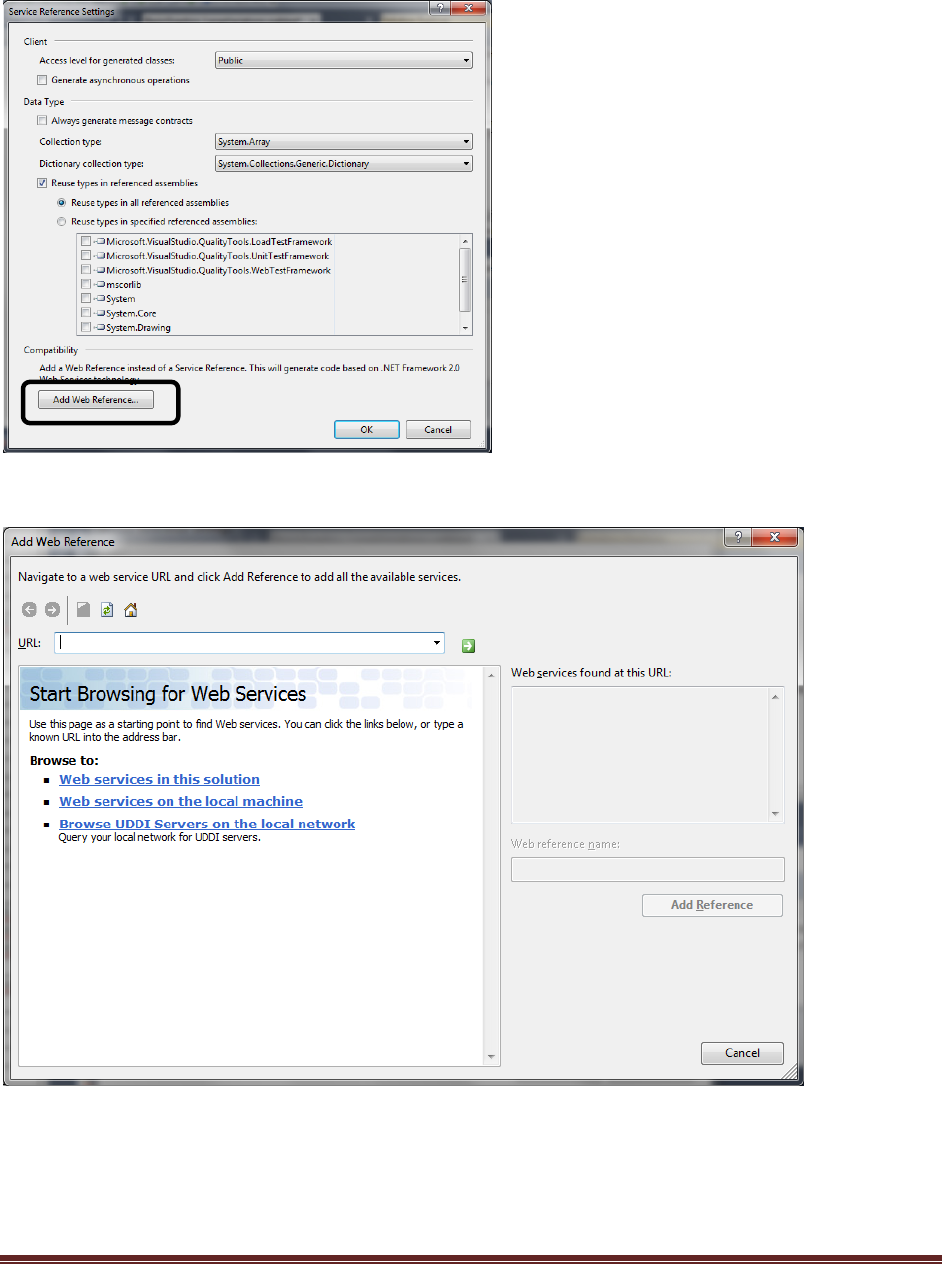
Visual Studio Performance Testing Quick Reference Guide Page 128
You will get the following dialog and can add the reference there:
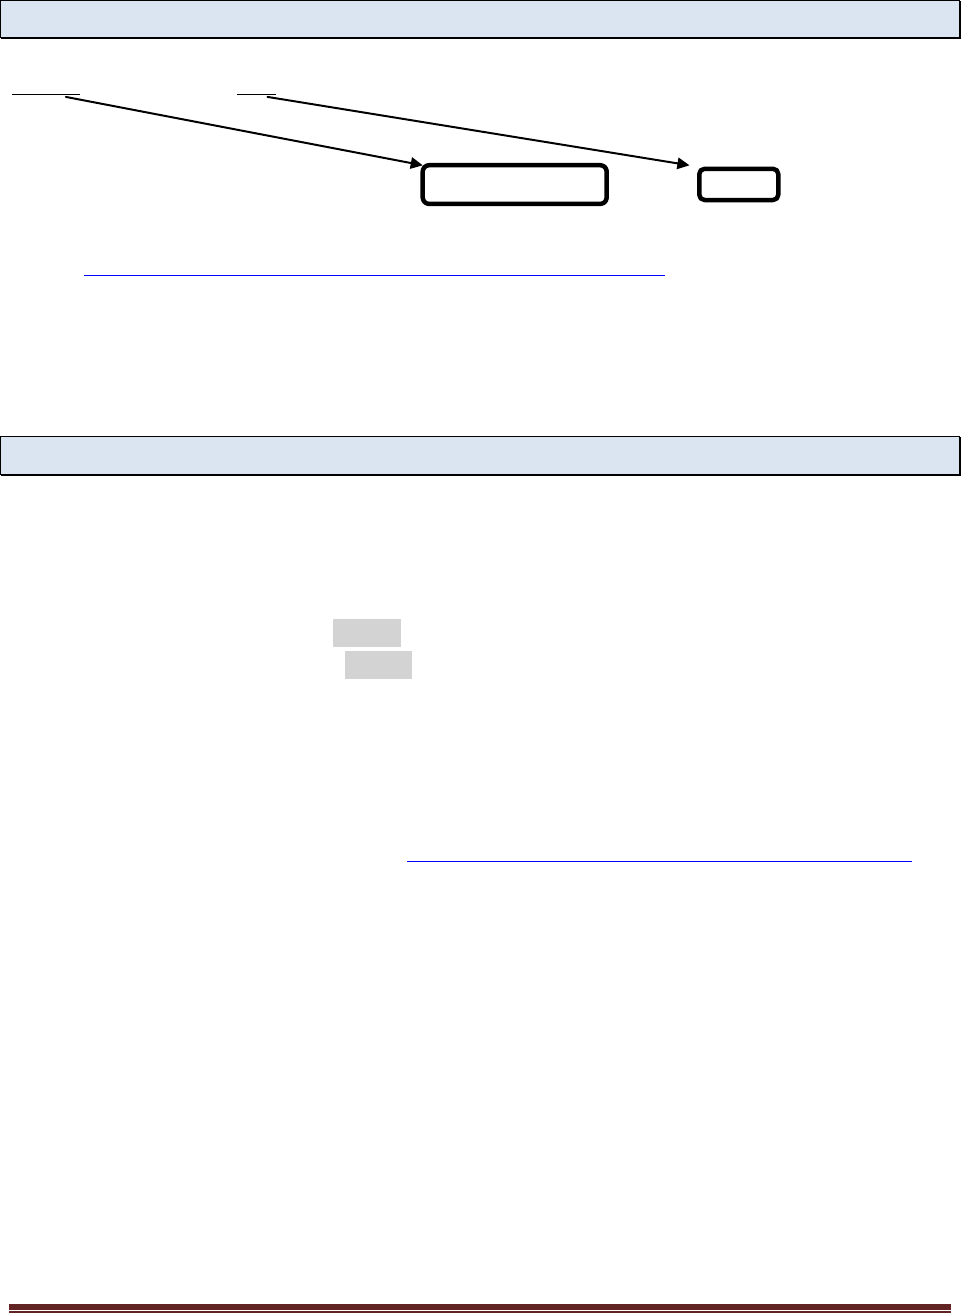
Visual Studio Performance Testing Quick Reference Guide Page 129
How to remotely count connections to a process
If you are troubleshooting connectivity issues, you may need to count connections to a particular
process over a particular port. You can easily do this using TCPVCON.EXE and a filter:
D:\TcpView>Tcpvcon.exe -c smsvchost.exe | find "808" /c
TCPView
http://technet.microsoft.com/en-us/sysinternals/bb795532.aspx
PsTools
same web page.
How to hook into LoadTest database upon completion of a load test
You might want to run automatic custom actions after the completion of a load test, for example doing
some automated reporting. To do this, you must change the LoadTest database used by Visual Studio.
For Visual Studio 2010 the default name of the database is LoadTest2010.
The stored procedure
Prc_UpdateSummaryData [In 2008]
Prc_UpdateSummaryData2 [In 2010]
is the last one that is called when the load test finishes, assuming the Timing Details Storage is set to
something other than None in the Run Settings for your load test.
You can change this stored procedure by appending a call to your own stored procedure that
implements or starts your custom action. That stored procedure could be implemented as .NET code by
employing a CLR SQL Stored Procedure (see http://msdn.microsoft.com/en-us/library/5czye81z.aspx).
NOTE: changing the LoadTest database is an unsupported action that might interfere with automatic
upgrades to new versions of the database schema.
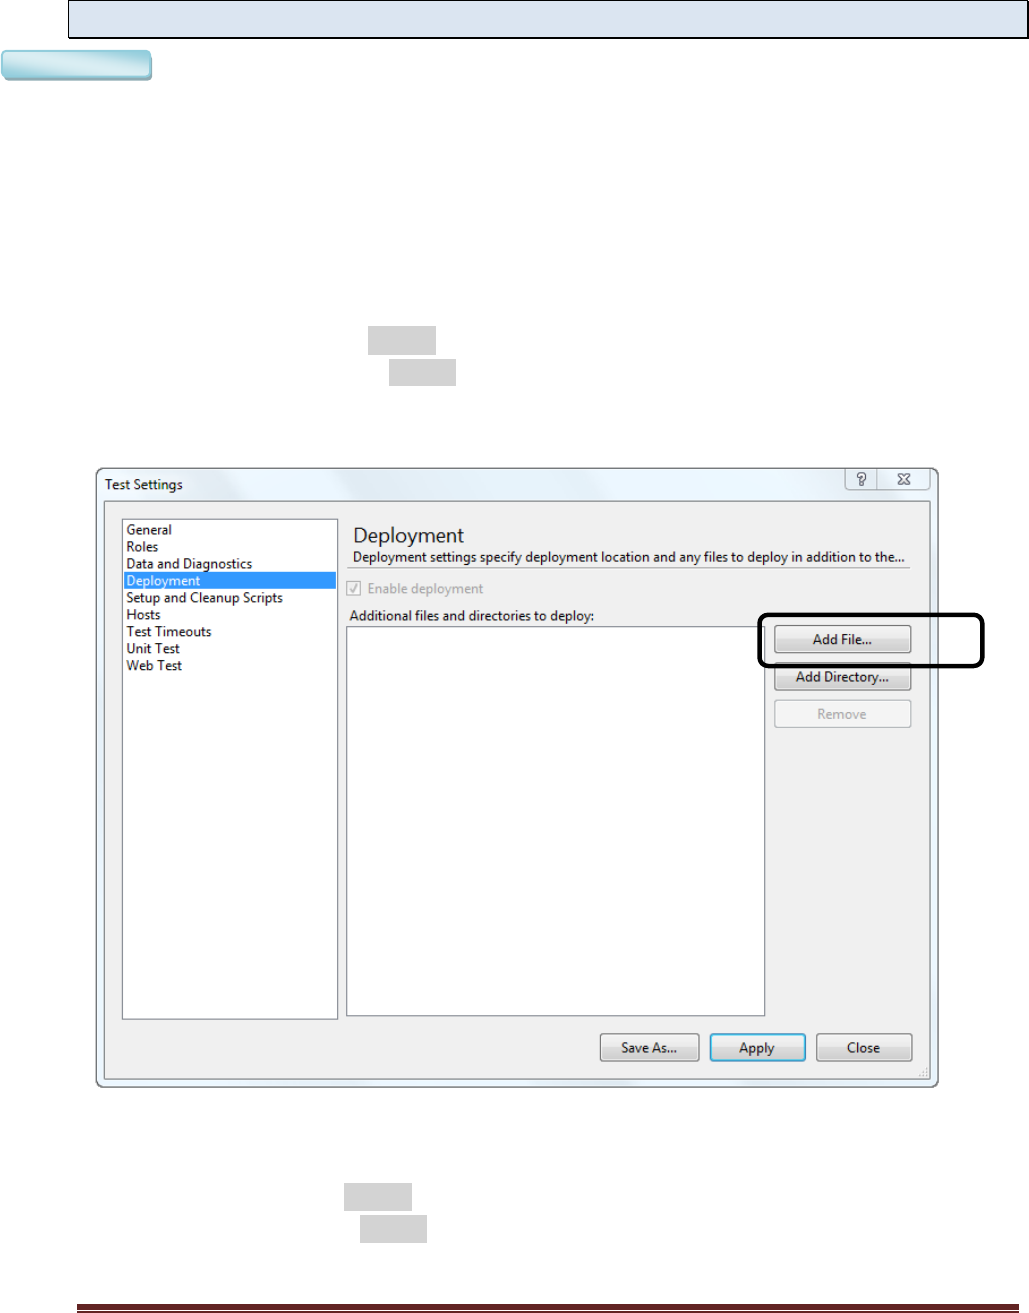
Visual Studio Performance Testing Quick Reference Guide Page 130
How to deploy DLLs with MSTEST.EXE
You can use MSTEST.EXE to start your load test outside Visual Studio. In that case you might run into
errors with missing DLLs for plugins that you do not encounter when running your load test inside Visual
Studio. Visual Studio looks at references to figure out what to deploy, while MSTEST.EXE does not. To fix
this you have to manually add the DLLs as deployment items in the test settings (VS2010) or test run
configuration file (VS2008).
Select the test settings file that you want to use with MSTEST.EXE. This will be one of the files in the
Solution Items folder of your solution with the
.testsettings extension [In 2010]
.testrunconfig extension [In 2008]
Open it in the Test Settings Editor. Go to the Deployment
you want to deploy.
Specify the test settings file you have edited on the command line for MSTEST.EXE with the
/testsettings switch [In 2010]
/testrunconfig switch [In 2008]
Changed in 2010

Visual Studio Performance Testing Quick Reference Guide Page 131
How to authenticate with proxy before the test iteration begins
If you encounter HTTP 407 Proxy authentication required errors while playing back your web test, you
might have to explicitly authenticate to a proxy server first to be able to run your web test. First you
have to consider if you really need to go through this proxy server to be able to reach the web server
under test. If you cannot get around the proxy server, you can authenticate through code in a
WebTestPlugin. You have to use a plugin for this since you cannot set the credentials through the Visual
Studio UI.
using System;
using Microsoft.VisualStudio.TestTools.WebTesting;
using System.Net;
namespace WebTestPluginNamespace
{
public class MyWebTestPlugin : WebTestPlugin
{
public override void PreWebTest(object sender, PreWebTestEventArgs e)
{
// Create credentials to authenticate to your proxy
NetworkCredential proxyCredentials = new NetworkCredential();
proxyCredentials.Domain = "yourDomain";
proxyCredentials.UserName = "yourUserName";
proxyCredentials.Password = "yourPassword";
// Create a WebProxy object for your proxy
WebProxy webProxy = new WebProxy("<http://yourproxy>");
webProxy.Credentials = proxyCredentials;
//Set the WebProxy so that even local addresses use the proxy
// webProxy.BypassProxyOnLocal = false;
// Use this WebProxy for the Web test
e.WebTest.WebProxy = webProxy;
e.WebTest.PreAuthenticate = true;
}
}
}

Visual Studio Performance Testing Quick Reference Guide Page 132
How to enumerate WebTextContext and Unit TestContext objects
Web and Unit TestContext objects contain similar information, but are actually collections of different
types of objects. The Microsoft.VisualStudio.TestTools.WebTesting.WebTestContext class is a collection
of KeyValuePair<string,object> objects, but the
Microsoft.VisualStudio.TestTools.UnitTesting.TestContext class has a property called Properties that is a
collection of DictionaryEntry objects. Thus, the collections need to be enumerated in a slightly different
way.
// Web Test
// using System.Collections.Generic;
// using Microsoft.VisualStudio.TestTools.WebTesting;
public static void DumpArgs(WebTestContext context)
{
foreach (KeyValuePair<string, object> kvp in context)
{
Debug.WriteLine(kvp.Key + " = " + kvp.Value);
}
}
// Unit Test
// using System.Collections;
// using Microsoft.VisualStudio.TestTools.UnitTesting;
public static void DumpArgs(TestContext context)
{
foreach (DictionaryEntry kvp in context.Properties)
{
Debug.WriteLine(kvp.Key + " = " + kvp.Value );
}
}
How to manually move the data cursor
Add the following line of code to force the parameter database to advance by one row. This is useful if
you need to loop through sections of code in a single iteration and want to use different data.
this.MoveDataTableCursor(”DataSource1”, ”Products”);
VS 2010 also allows you to set the cursor to a specific row:
this.MoveDataTableCursor(”DataSource1”, ”Products”,32);
New to 2010

Visual Studio Performance Testing Quick Reference Guide Page 133
How to programmatically create a declarative web test
Declarative web tests are non-coded web tests that can be displayed and modified in the web test UI. In
Visual Studio 2008 the APIs needed to programmatically create declarative web tests have been
exposed. If you want to programmatically generate web tests you can now do this using the
DeclarativeWebTest and DeclarativeWebTestSerializer classes.
DeclarativeWebTestSerializer loads the contents of a .webtest file into an instance of the
DeclarativeWebTest class and can also save an instance of the DeclarativeWebTest class back out to a
.webtest file.
DeclarativeWebTest exposes all of the properties, requests, and rules of the loaded web test so they can
be manipulated in whatever way necessary and then resaved.
For example, if something in your web application has changed that affects a large group of your existing
Web Tests, rather than modify the tests by hand you could write some code to do this for you. Here's an
example of modifying an existing declarative web test in a C# console application:
static void Main(string[] args)
{
DeclarativeWebTest decWebTest
DeclarativeWebTestSerializer.Open(@"c:\test.webtest");
//Add a Request to this WebTest
WebTestRequest newRequest = new
WebTestRequest("http://newRequest/default.aspx");
decWebTest.Items.Add(newRequest);
//Set ExpectedHttpStatus to 404 on the 1st Request
WebTestRequest reqToModify = null;
foreach (WebTestItem item in decWebTest.Items)
{
if (item is WebTestRequest)
{
reqToModify = item as WebTestRequest;
break;
}
}
if (reqToModify != null)
{
reqToModify.ExpectedHttpStatusCode = 404;
}
//Save Test
DeclarativeWebTestSerializer.Save(decWebTest, @"c:\test.webtest");
}
Visual Studio Performance Testing Quick Reference Guide Page 134
How to modify the string body programmatically in a declarative web test
The string body of a web test may be modified programmatically by setting e.Request.Body.BodyString
in the request.
public class EditBodyString : WebTestRequestPlugin
{
public override void PreRequest(object sender, PreRequestEventArgs e)
{
StringHttpBody body = e.Request.Body as StringHttpBody;
if (body != null)
{
body.BodyString = "blah";
}
e.Request.Body = body;
}
}
Gotcha: Check Your Validation Level in the Load Test Run Settings
By default, all validation rules added to a web test are marked HIGH. By default, all load tests have a
validation level of LOW. This means that NONE of the validation rules will run in a load test by default.
You either need to lower the level in the web test, or raise the level in the load test.
Gotcha: Do not adjust goals too quickly in your code
When you are changing the goals used for the test, or if you are using multiple goals and switching
between them, be careful not to change the goal too often. One thing that may not be obvious is that
as the user load decreases because of the goal, the number of tests running does not decrease until
some tests complete. If your tests take more time than the time used to change the goals you use
quite possible the effective user load will never go down when the goal changes and will only go up.
Gotcha: Response body capture limit is set to 1.5 MB by default
The ResponseBodyCaptureLimit property on a web test defaults to 1,500,000 bytes. If you are trying to
parse or extract data beyond this size, your test will fail. In order to work around this use a coded web
test or a plugin with a declarative web test and set the RequestBodyCaptureLimit property. Here is a
sample of a web test plug-in that sets this property in the PreWebTest event.
public class MyWebTestPlugin : WebTestPlugin
{
public override void PreWebTest(object sender, PreWebTestEventArgs e)
{
e.WebTest.RequestBodyCaptureLimit = 10 * 1024 * 1024; // 10 MB
}
}
Visual Studio Performance Testing Quick Reference Guide Page 135
Gotcha: Caching of dependent requests is disabled when playing back Web Tests
Caching for all dependent requests is disabled when you are playing back a web test in Visual Studio.
You will notice that if, for example, the same image file is used in multiple web pages in your web test,
the image will be fetched multiple times from the web server.
Best Practice: Blog on various considerations for web tests running under load
The following blog entry describes a number of different features and settings to consider when running
web tests under a load test in VSTT (a link to the blog entry is at the bottom of this topic). The following
topics are covered:
General Load Test Considerations
o Verify web tests and unit tests
o Choose an appropriate load profile
Using a Step Load Profile
Using a Goal-Based Load Profile
o Choosing the location of the Load Test Results Store
o Consider including Timing Details to collect percentile data
o Consider enabling SQL Tracing
o Don’t Overload the Agent(s)
o Add an Analysis Comment
Consideration for Load Tests that contain Web Tests
o Choose the Appropriate Connection Pool Model
ConnectionPerUser
ConnectionPool
o Consider setting response time goals for web test requests
o Consider setting timeouts for web test requests
o Choose a value for the “Percentage of New Users” property
o Consider setting the “ParseDependentRequests” property of your web test requests to false
http://blogs.msdn.com/billbar/articles/517081.aspx
Best Practice: Coded web tests and web test plug-ins should not block threads
http://blogs.msdn.com/billbar/archive/2007/06/13/coded-web-tests-and-web-test-plug-ins-should-not-
block-the-thread.aspx
Visual Studio Performance Testing Quick Reference Guide Page 136
Best Practice: considerations when creating a dynamic goal based load test plugin:
If there is a chance that the load test will be run on a test rig, be sure to limit the code to running on
only one agent machine. Running the code on multiple agents will cause contention in the behavior and
will yield unexpected results. You will not receive an error. The following code from a load test plugin
Initialize method will force the code to run on only one agent and will work for rigs AND for locally run
tests:
public void Initialize(LoadTest loadTest)
{
// ONLY run this on one agent to avoid contention.
if (loadTest.Context.AgentId == 1)
{
LoadTestGoalBasedLoadProfile goalLoadProfile = new LoadTestGoalBasedLoadProfile();
// Since the heartbeat handler is inside the conditional, The event will be setup
// only on one machine All LoadProfile changes are sent to the controller and
// propogated across the rig automatically
loadTest.Heartbeat += new EventHandler<HeartbeatEventArgs>(_loadTest_Heartbeat);
}
}
Best Practice: Add an Analysis Comment
After the load test is complete and you have spent some time analyzing the results, you can add a short
one line description and an arbitrarily long analysis comment to be stored permanently with the load
brings up a dialog that allows you to enter your analysis text which is stored in the load test results
database when you click OK to close the dialog. NOTE: This can be done while the test is running. You do
not need to wait for the test to finish.
make it much easier to determine which result set maps to the test run you wish to look at.
Best Practice – Using comments in declarative webtests
The graphic on the next page shows a sample declarative web test with a bunch of comments that are
used to make the web test more readable and to make it easier to correlate results. The comments in
the test do NOT affect the performance at all.

Visual Studio Performance Testing Quick Reference Guide Page 137
Use comments with dashes to
break up info. Include a header
section with general test info.
Add comments that mention
settings etc. that are important.
Use a blank comment between request sets.
Wrap every request set (even if the set is
one request) in a transaction and name
the transaction based on the user action
it represents. Make the first part of the
transaction name an abbreviation of
which us
can still be correlated back to the proper
webtest.
Use comments inside the transaction
Note items that are not completed
Note items that can be confusing, like
here there are two calls to the same
plugin, but the comment explains why
and identified which is which.
These are still part of the above
transaction, but I separated
them since they are AJAX calls
and the previous call is where I
need to do all of my initial work.
Show end of test and separate
the overall items from the
requests.
Visual Studio Performance Testing Quick Reference Guide Page 138
Extensibility
New Inner-text and Select-tag rules published on Codeplex
In 2008
All of the rules in this release on CodePlex relate to the inner text of a tag. For example, for a select tag
(list box and combo box), the option text is stored in inner text rather than an attribute:
<select name="myselect1">
<option>Milk </option>
<option>Coffee</option>
<option selected="selected">Tea</option>
</select>
In order to extract the value of the list box, we need to parse out the inner text of the selected option.
TextArea is another tag that does this, but there are also a lot of other examples in HTML where you
might want to extract or validate inner text. The new project has these new rules as well as a parser for
inner text and select tag:
1. ExtractionRuleInnerText
2. ExtractionRuleSelectTag
3. ValidationRuleInnerText
4. ValidationRuleSelectTag
Download location
http://codeplex.com
In 2010
Many of the features above are now built into VS 2010. Here is a list of these:
http://msdn.microsoft.com/en-us/library/bb385904(VS.100).aspx
Changed in 2010
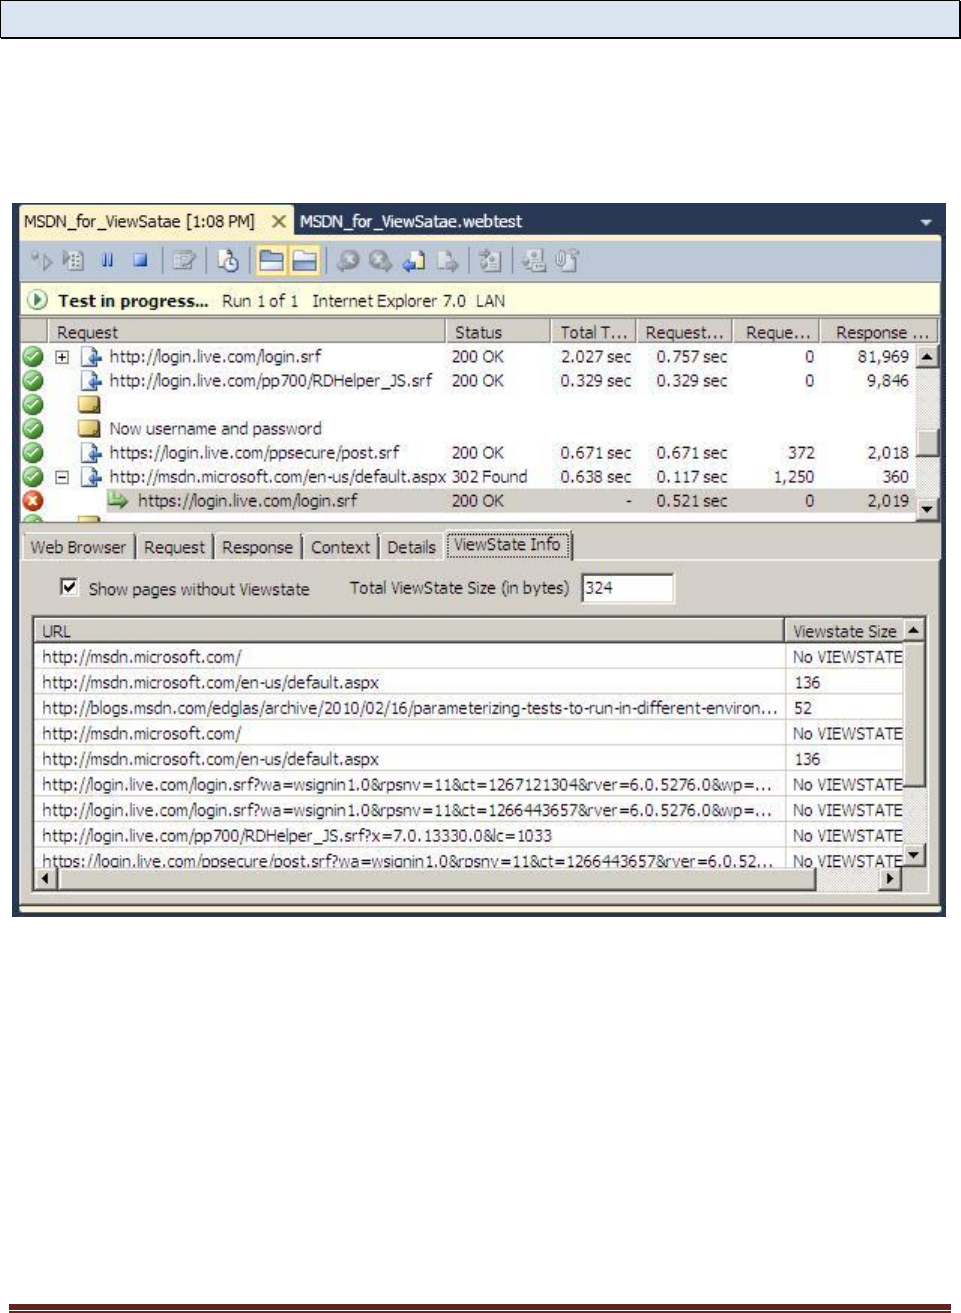
Visual Studio Performance Testing Quick Reference Guide Page 139
How to Add Custom Tabs to the Playback UI
Another new feature of the 2010 Web Test Playback UI is the ability to add new tabs to the
WebTestResultViewer. Here is a tab that demonstrates how to get VIEWSTATE data from webtest
responses and add that data to a table in a custom results tab:
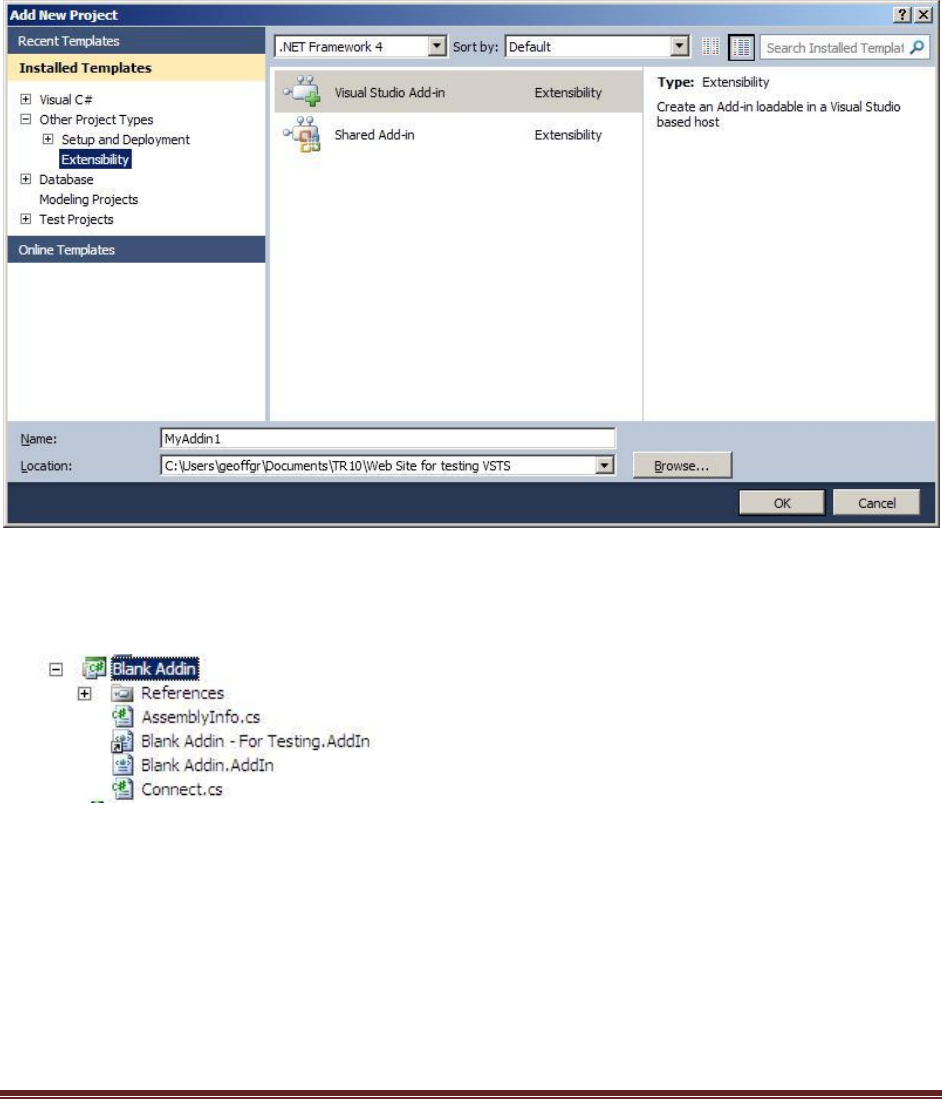
Visual Studio Performance Testing Quick Reference Guide Page 140
Steps to implement your own custom tab
1) Create the new project
Create a Visual Studio Add-In: Create a new Visual Studio Add-In project (see picture below).
This starts the Add-In Wizard. Complete the wizard
You should now have a project that looks like:
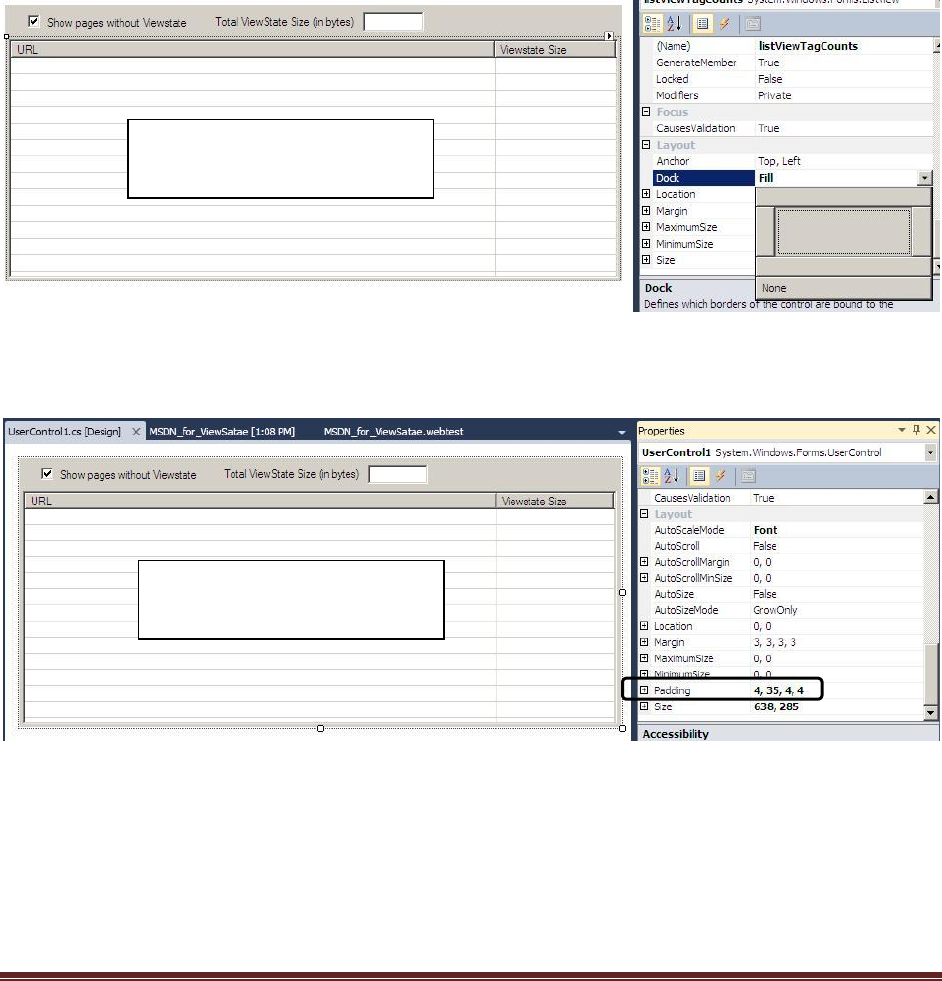
Visual Studio Performance Testing Quick Reference Guide Page 141
Reference the following assemblies directly in the project:
o Microsoft.VisualStudio.QualityTools.LoadTestFramework
o Microsoft.VisualStudio.QualityTools.WebTestFramework
o Any other assemblies or code you will need to do the functional work of your addin.
Add a user control to the project (right click -> Add new -> user control). This will house the
items to be displayed on the tab.
Add the necessary controls to the main user control. For my example, I needed a checkbox,
textbox and a listbox.
Set the listbox Dock property to Fill: Note that when you do this, it will cause the listbox to
cover the other controls. We will fix this next.
Set the margins for the main control. This will correct the size of the listbox from the previous
step. Make sure the value for TOP is big enough to uncover the other controls.
Make sure just the listbox is
highlighted
Make sure the main control is
highlighted
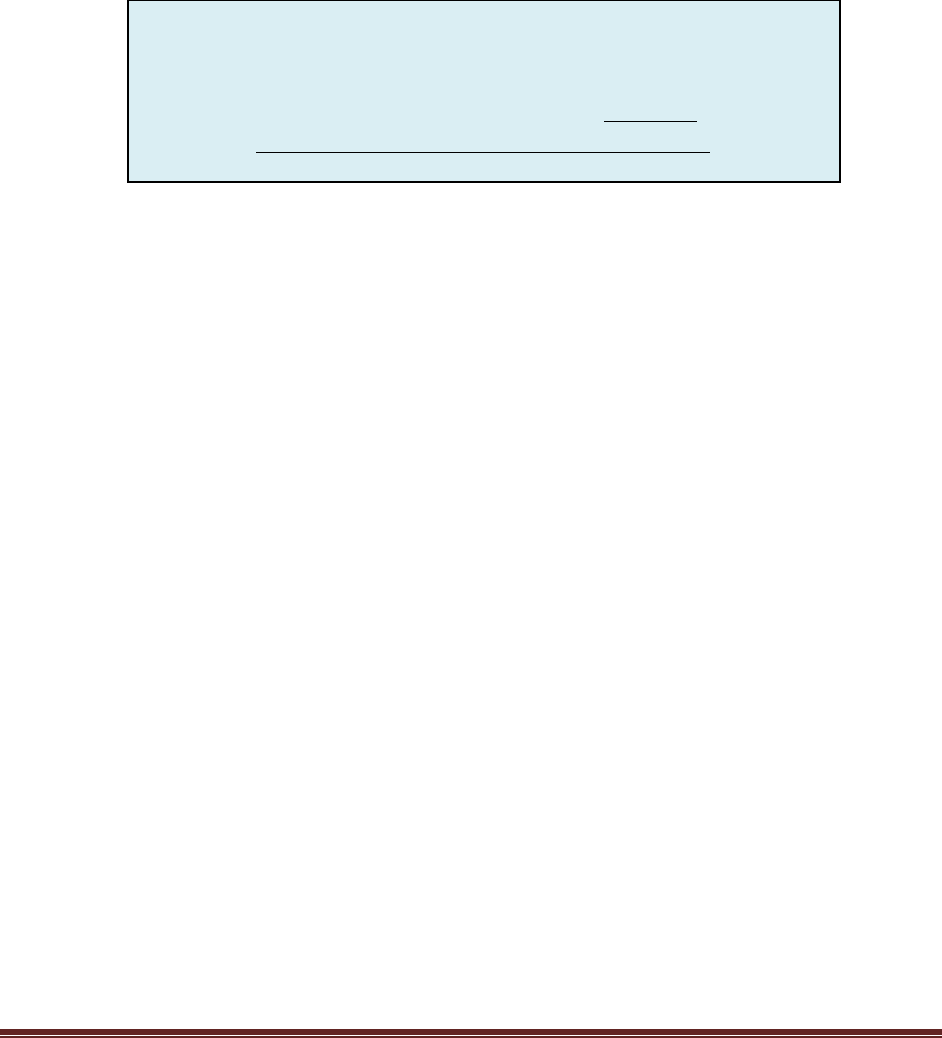
Visual Studio Performance Testing Quick Reference Guide Page 142
2) Modify and add the tab control code
you should have your functional code (or at least the shell of it) in place before doing the connect.cs
work so the methods you reference will already exist. For my example, the only extra code I need is the
backing code for the user control. Double-Click on the listview and add the following methods:
public void AddAValueToTheListView(string sReqName, string sSize, int iTotalSize)
{
tbTotalSize.Text = iTotalSize.ToString();
tbTotalSize.Update();
ListViewItem item = new ListViewItem(new string[] { sReqName, sSize });
listViewTagCounts.Items.Add(item);
}
private void cbShowNonViewState_CheckedChanged(object sender, EventArgs e)
{
// Add code to handle hiding non viewstate pages
}
sReqName is the URL of the current request.
sSize is the calculated size of the ViewState.
iTotalSize is the cumulative value.
All of these properties are calculated and set in the connect.cs code. The
code here is solely for modifying the values displayed in the tab.
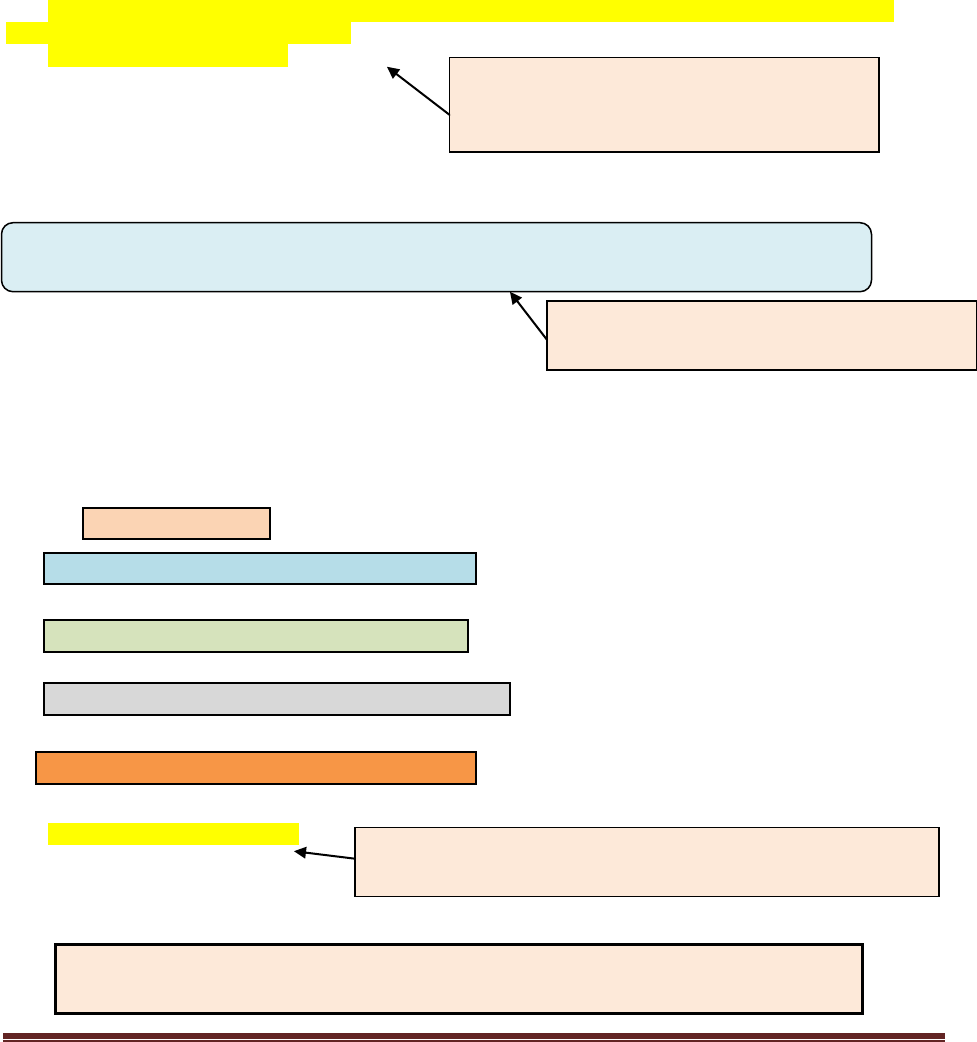
Visual Studio Performance Testing Quick Reference Guide Page 143
3) Modify and add the Addin handler code
Now we can jump into the connect.cs code. Here are the main items of interest for us:
public class Connect : IDTExtensibility2
{
Dictionary<Guid, Dictionary<Guid, UserControl>> m_controls = new Dictionary<Guid,
Dictionary<Guid, UserControl>>();
LoadTestPackageExt wpe;
int iViewStateTotalSize = 0;
public void OnConnection(object application, ext_ConnectMode connectMode, object
addInInst, ref Array custom)
{
_applicationObject = (DTE2)application;
_addInInstance = (AddIn)addInInst;
wpe =
_applicationObject.GetObject("Microsoft.VisualStudio.TestTools.LoadTesting.LoadTestPackag
eExt") as LoadTestPackageExt;
//process open windows
foreach (WebTestResultViewer p in wpe.WebTestResultViewerExt.ResultWindows)
{
WindowCreated(p);
}
wpe.WebTestResultViewerExt.WindowCreated += new
EventHandler<WebTestResultViewerExt.WindowCreatedEventArgs>(wpe_WebtestPlaybackWindowCrea
ted);
wpe.WebTestResultViewerExt.WindowClosed += new
EventHandler<WebTestResultViewerExt.WindowClosedEventArgs>(WebTestResultViewerExt_WindowC
losed);
wpe.WebTestResultViewerExt.SelectionChanged += new
EventHandler<WebTestResultViewerExt.SelectionChangedEventArgs>(WebTestResultViewerExt_Sel
ectionChanged);
wpe.WebTestResultViewerExt.TestCompleted += new
EventHandler<WebTestResultViewerExt.TestCompletedEventArgs>(WebTestResultViewerExt_TestCo
mpleted);
iViewStateTotalSize = 0;
}
The iViewStateTotalSize is specific to my
particular addin. The highlighted lines need
to be added to all web test addins.
This method already exists. Delete
everything in the method and add this code.
This line of code is specific to my addin. You should add any
initialization code you might need right here.
The highlighted method names correspond to the matching method definitions below.
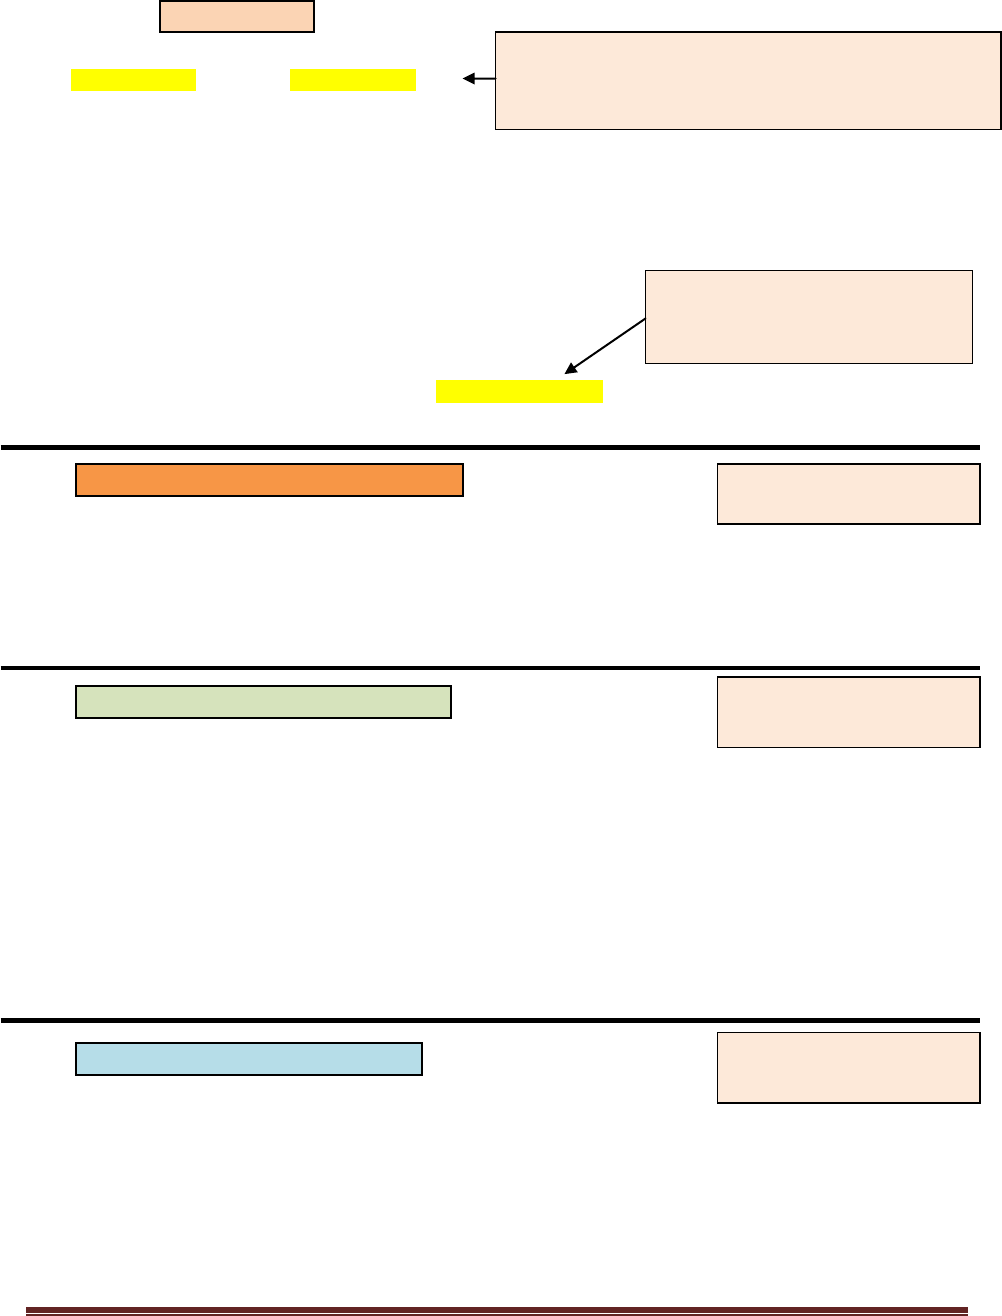
Visual Studio Performance Testing Quick Reference Guide Page 144
private void WindowCreated(WebTestResultViewer viewer)
{
UserControl1 c = new UserControl1();
c.Dock = DockStyle.Fill;
//add the dictionary of open playback windows
System.Diagnostics.Debug.Assert(!m_controls.ContainsKey(viewer.TestResultId));
Dictionary<Guid, UserControl> userControls = new Dictionary<Guid, UserControl>();
//add the summary
Guid summaryGuid = Guid.NewGuid();
Guid responseGuid = Guid.NewGuid();
userControls.Add(responseGuid, c);
m_controls.Add(viewer.TestResultId, userControls);
//add tabs to playback control
viewer.AddResultPage(responseGuid, "ViewState Info", c);
}
void WebTestResultViewerExt_TestCompleted(object sender,
WebTestResultViewerExt.TestCompletedEventArgs e)
{
foreach (UserControl userControl in m_controls[e.TestResultId].Values)
{
}
}
void WebTestResultViewerExt_WindowClosed(object sender,
WebTestResultViewerExt.WindowClosedEventArgs e)
{
if (m_controls.ContainsKey(e.WebTestResultViewer.TestResultId))
{
//process open windows
foreach (Guid g in m_controls.Keys)
{
e.WebTestResultViewer.RemoveResultPage(g);
}
m_controls.Remove(e.WebTestResultViewer.TestResultId);
}
}
void wpe_WebtestPlaybackWindowCreated(object sender,
WebTestResultViewerExt.WindowCreatedEventArgs e)
{
WindowCreated(e.WebTestResultViewer);
}
This is stock code. Copy all of it and simply change
the user control name to whatever name you gave
your control in the previous section.
The text here is the name that
appears on the added tab
This is stock code. No
modification is needed.
This is stock code. No
modification is needed.
This is stock code. No
modification is needed.
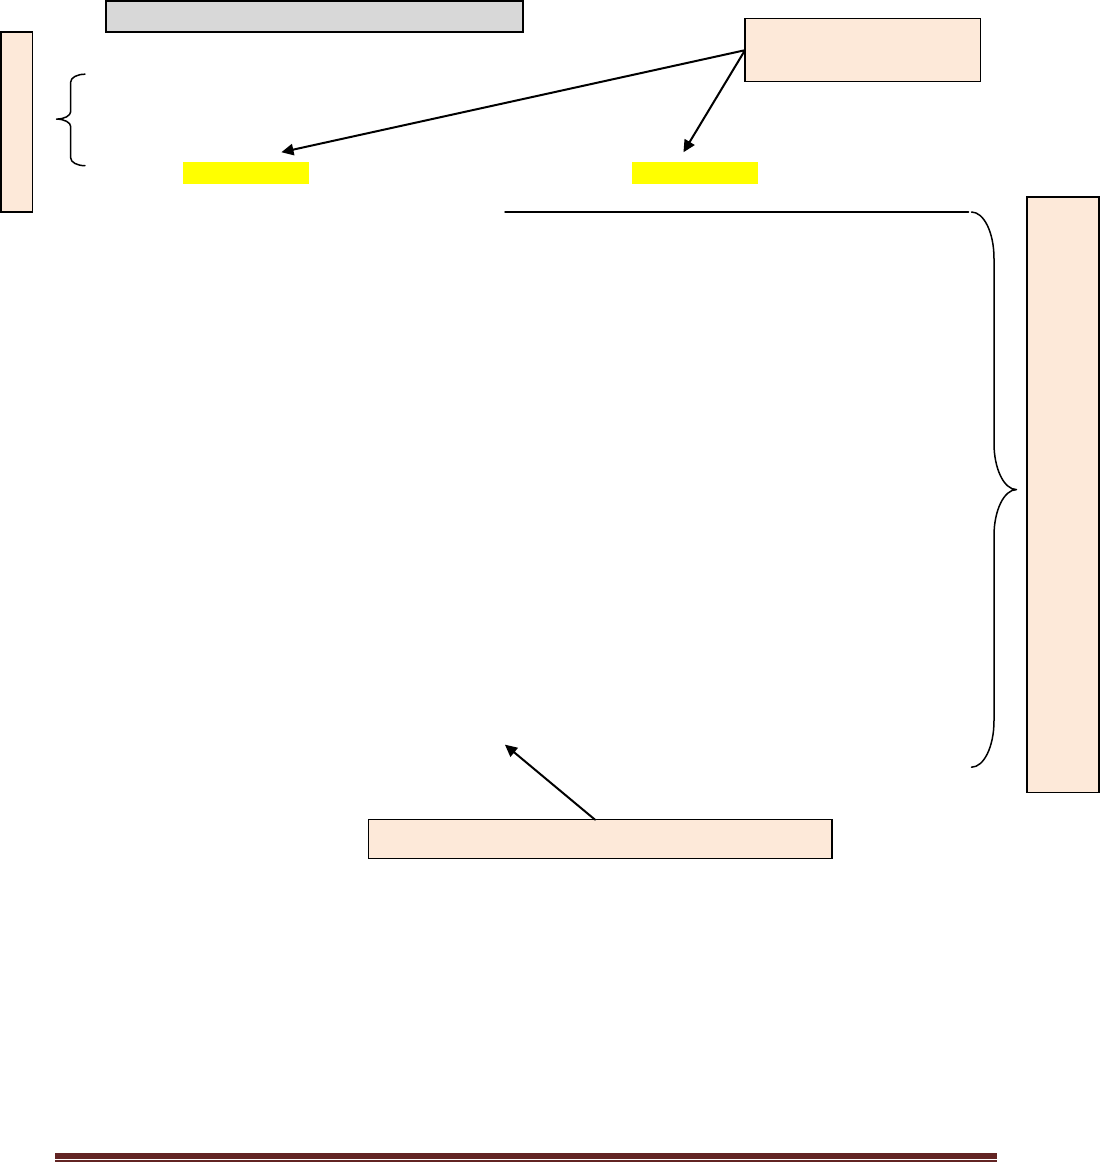
Visual Studio Performance Testing Quick Reference Guide Page 145
And here is the workhorse method:
void WebTestResultViewerExt_SelectionChanged(object sender,
WebTestResultViewerExt.SelectionChangedEventArgs e)
{
if (e.WebTestRequestResult != null)
{
foreach (UserControl userControl in m_controls[e.TestResultId].Values)
{
UserControl1 userControl1 = userControl as UserControl1;
if (userControl1 != null)
{
WebTestResponse response = e.WebTestRequestResult.Response;
// Count the number of occurrences of each tag in the response
Dictionary<string, int> tagCounts = new Dictionary<string,
int>(StringComparer.OrdinalIgnoreCase);
if (response != null && response.BodyBytes != null)
{
string str1 = response.ResponseUri.ToString();
string str2 = "No VIEWSTATE Detected";
if (response.BodyString.Contains("__VIEWSTATE"))
{
//<input type="hidden" name="__VIEWSTATE" id="__VIEWSTATE"
value="/wEPQUe...z+aZmiNA==" />
int x = response.BodyString.IndexOf("id=\"__VIEWSTATE\"
value=\"");
int y = response.BodyString.IndexOf("\" />", x);
if ((y - x - 24) > 0)
{
str2 = Convert.ToString(y - x - 24);
iViewStateTotalSize = iViewStateTotalSize + (y - x - 24);
}
}
userControl1.AddAValueToTheListView(str1, str2, iViewStateTotalSize);
}
}
}
}
}
This is stock code.
This is the user control
you created.
This is code that does the work for the addin. Here I get all of the
data and then call my control to populate the tab.
The call to my user control to populate the tab.
Visual Studio Performance Testing Quick Reference Guide Page 146
Items not specific to the VSTS testing platform
Using the VSTS Application Profiler
Various articles to consider:
http://blogs.msdn.com/profiler/archive/2008/10/15/walkthroughs-using-vsts-test-and-profilers-to-find-
performance-issues.aspx
http://msdn.microsoft.com/en-us/magazine/cc337887.aspx?pr=blog
http://www.codeguru.com/cpp/v-s/devstudio_macros/visualstudionet/article.php/c14823__1/
VSTS 2008 Application Profiler New Features
The VSTS perf team has added some blog posts outlining new features of the VSTS profiler and how to
performance counters to enhance your profiler diagnosis. See the following links to get this info:
http://blogs.msdn.com/profiler/archive/2007/10/19/articles-on-new-visual-studio-team-system-2008-
profiler-features.aspx
Using System.NET Tracing to debug Network issues
http://blogs.msdn.com/dgorti/archive/2005/09/18/471003.aspx

Visual Studio Performance Testing Quick Reference Guide Page 147
Logparser tips and tricks
1. Use square brackets around an alias name to allow spaces in the names. Example: [User Data]
2. If you need to get a substring but also need to delete characters at the end of the substring, you
can use an abbreviated syntax:
Substr(mystring, 1, sub(strlen(mystring),19)) can be written as Substr(mystring,1,-19)
Logparser WEB Queries
Count (and percentage) of status codes from Web Logs
-i:IISW3C -recurse:-1 -Q:on "SELECT sc-status, COUNT(*), MUL(PROPCOUNT(*),100.0) AS
Percentage INTO StatusCount.txt FROM ex*.log GROUP BY sc-status ORDER BY sc-status”
Breakdown of web status codes by pagetype from Web Logs
-i:IISW3C -recurse:-1 -Q:on "SELECT EXTRACT_EXTENSION(TO_UPPERCASE(cs-uri-stem)) AS
PageType, sc-status, COUNT(*) AS Amount INTO StatusCodes.txt FROM ex*.log GROUP BY sc-
status, PageType ORDER BY sc-status ASC" -o:TSV
Number of hits by pagetype
-i:IISW3C -recurse:-1 -Q:on "SELECT EXTRACT_EXTENSION(TO_UPPERCASE(cs-uri-stem)) AS
PageType, COUNT(*) AS Amount INTO pagetype.txt FROM ex*.log GROUP BY PageType ORDER BY
Amount DESC" -o:TSV
List of requests asking for non existant pages
-i:IISW3C -recurse:-1 -Q:on "SELECT DISTINCT cs-uri-stem AS Url USING sc-status AS
statuscode INTO not-found.txt FROM ex*.log WHERE statuscode = 404" -o:TSV
Top 10 slowest page responses
-i:IISW3C -recurse:-1 -Q:on "SELECT TOP 10 MAX(time-taken) AS Processing-Time,
AVG(time-taken) AS Average, MIN(time-taken) AS Minimum, cs-uri-stem AS Url, COUNT(cs-
uri-stem) AS PageCount INTO longrunning.txt FROM ex*.log GROUP BY cs-uri-stem ORDER BY
Average DESC" -o:TSV
Average Max and Min time taken for each page type
-i:IISW3C -recurse:-1 -Q:on "SELECT EXTRACT_EXTENSION(cs-uri-stem) as Type, AVG(time-
taken) AS Average, MAX(time-taken) AS Maximum, MIN(time-taken) AS Minimum INTO
PageTimes.txt FROM ex*.log WHERE time-taken &amp;gt; 0 GROUP BY Type ORDER BY
Average DESC"
Requests and Total Bytes per hour
-i:IISW3C -recurse:-1 -Q:on "SELECT QUANTIZE(TO_TIMESTAMP(date, time), 3600) AS Hour,
COUNT(*) AS Total, SUM(sc-bytes) AS TotBytesSent INTO HitsByHour.txt FROM ex*.log
GROUP BY Hour ORDER BY Hour" -o:TSV
List and count of pages returning a status code of 500
-i:IISW3C -recurse:-1 -Q:on "SELECT cs-uri-stem, sc-status, COUNT(*) FROM ex*.log
WHERE sc-status=500 GROUP BY cs-uri-stem, sc-status ORDER BY cs-uri-stem" -o:TSV

Visual Studio Performance Testing Quick Reference Guide Page 148
LogParser Non-Web Queries
Parsing Event Viewer files on Vista with LogParser
You need to convert the files to Vista format. The following command line will do this:
wevtutil epl app.evtx app.evt /lf:true
Query For Text Strings in a file
-i:TEXTLINE "SELECT LTRIM(extract_token(text, 1,'Text to find')) as string FROM *.txt
WHERE string is not null"
Pulling data from inside the body string of event viewer logs
logparser -i:evt "SELECT extract_prefix(extract_suffix(Strings,0,'left text'),0,'right
text') as String INTO optimizer.txt FROM *.EVT WHERE Strings LIKE '%Optimizer
Results%'" -q:ON
(variation) Pulling data from inside the body string of event viewer logs constrained by timeframe
logparser -i:evt -q:ON "SELECT Count(*) AS Qty, SUBSTR(extract_suffix(Message, 0,
'Message :'), 0, 75) as String FROM Error! Hyperlink reference not
valid.name>\Application WHERE SourceName LIKE '%Enterprise%' AND Message LIKE
'%Timestamp: %' AND TimeGenerated > TIMESTAMP ('2008-06-06 07:23:15', 'yyyy-MM-dd
hh:mm:ss' ) GROUP BY String ORDER BY Qty DESC"
List of exceptions from saved event logs searching for keywords in the text output
-I:evt "SELECT QUANTIZE(TimeGenerated, 3600) AS Hour, COUNT(*) As Total, ComputerName
FROM *.evt WHERE EventID = 100 AND strings like '%overflow%' GROUP BY ComputerName,
hour"
Logparser command for querying netstat
netstat.exe -anp TCP | LogParser “SELECT [Local Address] AS Server,[Foreign Address]
AS Client,State FROM STDIN WHERE Server LIKE '%:443' OR Server LIKE '%:80'” -i:TSV -
iSeparator:space -nSep:2 -fixedSep:OFF -nSkipLines:3 -o:TSV -headers:ON
Command to query Active Directory®
Logparser -i:ADS "SELECT * FROM 'LDAP://Redmond/CN=Microsoft.com FTE,OU=Distribution
Lists,DC=redmond,DC=corp,DC=microsoft,DC=com'" -objClass:user
Command to query IIS and get site configuration information
Logparser “select * from IIS://localhost”
Command to query Netmon file and list out data on each TCP conversation
LogParser -fMode:TCPConn -rtp:-1 "SELECT DateTime, TO_INT(TimeTaken) AS Time,
DstPayloadBytes, SUBSTR(DstPayload, 0, 128) AS Start_Of_Payload INTO IE-Take2.txt FROM
IE-Take2.cap WHERE DstPort=80 ORDER BY DateTime ASC" -headers:ON
Command to query Netmon and find frame numbers based on specific text in payload
LogParser -fMode:TCPIP -rtp:-1 "SELECT Frame, Payload INTO 3dvia.txt FROM 3dvia.cap
WHERE DstPort=80 AND Payload LIKE '%ppContent%' " -headers:ON
Command to get logged start time of an entry in custom log files
LogParser –i:TEXTLINE " SELECT TOP 1 TO_TIME(TO_TIMESTAMP(EXTRACT_PREFIX(Text,2,' '),
'M/dd/yyyy h:mm:ss tt')) AS [Start Time], 'FirstStartTime' FROM *.log WHERE Text LIKE
'%text tag to search for%' ORDER BY [Start Time] ASC
Visual Studio Performance Testing Quick Reference Guide Page 149
Older articles
Content-Length header not available in Web Request Object
Currently the w- object. This is
expected to be changed in SP1
SharePoint file upload test may post the file twice
If you have a web test that posts a file to a SharePoint site, the test may try to post the file twice.
SharePoint will only process one copy, but the request time and upload size will be incorrect due to the
double attempt. This occurs if you are using integrated authentication. The client requests a POST
expecting a 100-continue response. It gets a 404 instead (this is expected behavior). However, instead of
VSTS restarting the request with credentials, it continues posting the initial request (which SharePoint
ignores). When the initial request is done, VSTS will re-post with credentials, and this post will succeed.
A fix is available in SP1.
Some Hidden Fields are not parameterized within AJAX calls
When recording web tests with AJAX panel updates, you may find some FORM POST parameters where
HIDDEN values (such as VIEWSTATE) are not parameterized. From an email thread:
The problem is that in the Microsoft-Ajax partial rendering (update panel) responses, hidden fields can
appear in two places: a field that is marked by the type “|hiddenField|” (where we were looking), but
also in a regular hidden field input tag in the HTML within an “|updatePanel|” field in the Ajax response
(which we were not looking at).
A fix is being worked on and may appear in SP1. In the meantime, to work around the issue, simply
remove the hard-coded value and replace it with a parameterized value: {{$HIDDEN0.__VIEWSTATE}}
(where the bucket (0,1,2, etc matches the bucket of the other HIDDEN parameters in the request)
(FIX) Unit Test threading models and changing them
The default threading model for unit tests is STA. The fix in SP1 was to have load tests honor this setting
(unit test in a load test would not honor the ApartmentState property). See the following blog for more
info:
http://blogs.msdn.com/irenak/archive/2008/02/22/sysk-365-how-to-get-your-unit-tests-test-project-in-
visual-studio-2008-a-k-a-mstest
Visual Studio Performance Testing Quick Reference Guide Page 150
Bug in VSTS 2008 SP1 causes think time for redirected requests to be ignored in a
load test
When a web test is run in a load test, any test requests that result in redirects suffer from a timing bug.
Any think time that is specified on the request is ignored. This is fixed in a POST-SP1 hotfix:
KB 956397 (http://support.microsoft.com/kb/956397/en-us)
http://blogs.msdn.com/billbar/archive/2008/08/04/bug-in-vsts-2008-sp1-causes-think-time-for-
redirected-requests-to-be-ignored-in-a-load-test.aspx
New Load Test Plugin Enhancements in VSTS 2008 SP1
http://blogs.msdn.com/billbar/pages/load-test-api-enhancements-in-vsts-2008-sp1-beta.aspx
Four New Methods added to the WebTestPlugin Class for 2008 SP1
http://blogs.msdn.com/billbar/pages/web-test-api-enhancements-available-in-vsts-2008-sp1-beta.aspx

Visual Studio Performance Testing Quick Reference Guide Page 151
Index
.
.NET Garbage Collection, 5, 53
A
AJAX, 8, 21, 90, 149
ANSI, 80
Application Domain, 12, 117
authentication, 6, 9, 94, 109, 110, 131, 149
C
Caching, 4, 5, 7, 15, 19, 59, 60, 69, 113, 135
caspol, 84
CodePlex, 3, 138
context, 7, 10, 11, 21, 30, 48, 78, 80, 87, 112, 113, 114,
115, 117, 119, 120, 121, 123, 124, 125, 132, 136
correlation, 21
CSV Files, 6, 80
D
Data Collectors, 78
data source, 4, 5, 6, 7, 14, 67, 70, 80, 113
declarative web test, 6, 7, 9, 48, 49, 79, 81, 85, 111, 112,
114, 125, 133, 134, 136
dependent requests, 6, 7, 11, 19, 66, 77, 78, 90, 111, 113,
116, 135
Deployment, 5, 51, 59, 60, 61, 130
E
Execution Interleaving, 23
extract, 4, 6, 10, 21, 22, 30, 87, 112, 121, 134, 138, 148
F
Fiddler, 4, 50, 79
H
HIDDEN parameters, 8, 87, 112, 149
HTTP Headers, 4, 9, 27, 66, 78, 93, 113, 148
Content-Type, 9
If-Modified-Since, 7, 113
Pragma, 9
Referrer, 9
SOAPAction, 9
x-microsoftajax, 9
I
Internet Explorer, 19, 50, 93, 113
IP Address, 5, 54
L
Licensing, 4, 40, 85
Load Test Options
Agents to Use, 47
Delay Start Time, 47
Disable During Warmup, 47
Logging, 6, 85, 90, 93, 95
lusrmgr.msc, 26
M
MSTest, 13, 23, 78, 100, 101, 105, 107, 149
N
Network
Firewall, 100, 101, 103, 107, 108
Netmon, 79, 148
Netstat, 86, 148
TCP Parameters, 86
TCPView, 129
Tracing, 5, 8, 72, 103, 105, 106, 135, 146
NUnit, 23
P
Parameter Data
Data Source, 4, 5, 6, 14, 67, 70, 80
Random, 4, 7, 14, 99, 100, 114
Sequential, 4, 14, 44
Unique, 4, 14, 54, 66, 74, 78, 98, 114, 120
Parameters, 7, 11, 22, 28, 30, 46, 58, 80, 86, 87, 96, 111,
113, 114, 117, 119, 120, 121, 123, 124, 125, 132, 149
performance counters, 5, 17, 62, 64, 65, 66, 72, 82, 146
Performance Monitor, 5, 65, 66
Permissions, 100, 101
phishing, 81
processor, 6, 17, 42, 63, 64, 85
proxy server, 4, 7, 50, 131

Visual Studio Performance Testing Quick Reference Guide Page 152
R
random, 4, 7, 14, 99, 100, 114
redirection, 7, 123
regedit, 9, 59
REGISTRY Settings
HKEY_CURRENT_USER, 9, 93, 106
HKEY_LOCAL_MACHINE, 59, 81, 86, 107
Reporting Name, 4, 11, 31, 32, 80
RequestHeadersToRecord, 9
Results
WebTestResult, 6, 76, 77, 78
S
SOAP, 112
SSL
Certificates, 7, 112, 122
HTTPS, 6, 81, 83
ServicePointManager, 7, 122
SecurityProtocol, 122
SecurityProtocolType, 122
ServicePointManager.
ServerCertificateValidationCallback, 122
SSLv3, 7, 122
TLS, 7, 122
X509Certificate, 112, 122
Symbols, 59, 60
Sysinternals
PsTools, 129
Sysinternals, 106
T
TeamTestAgentService, 26, 100, 103
test rig, 4, 5, 17, 25, 26, 40, 52, 55, 57, 58, 59, 81, 85, 94,
102, 104, 117, 136
TIME_WAIT, 86
timeouts, 4, 5, 13, 51, 61, 64, 88, 109, 135
Transactions, 6, 36, 37, 68, 71, 72, 73, 74, 82
U
Unicode, 6, 80
URL, 31, 46, 74, 84, 112, 123, 124, 125
V
validate, 5, 6, 7, 10, 11, 58, 94, 96, 115, 122, 123, 125, 134,
138
verbose logging, 95, 97, 98
VIEWSTATE, 21, 58, 78, 96, 139, 142, 144, 145, 149
Virtual User Pack, 40, 41, 42, 43
VSTT 2010
branching, 125
conditional rule, 125, 126
looping, 14, 125
VSTT Classes
FormPostHttpBody, 111
IHttpBody, 111
StringHttpBody, 111, 134
WebTest, 45, 50, 115, 120, 121, 122, 123, 124, 131,
133, 134
WebProxy, 50, 131
WebTestContext, 115, 120, 132
WebTestPlugin, 8, 9, 113, 116, 120, 131, 134, 150
WebTestRequest, 12, 19, 66, 112, 113, 115, 116, 123,
133, 149
ClientCertificates, 112
WebTestResponse, 115, 145
VSTT Configuration Files
Counterset files
DefaultCounter, 65
DefaultCountersForAutomaticGraphs, 65
HigherIsBetter, 63
LoadTestCounterCategoryExistsTimeout, 64
LoadTestCounterCategoryReadTimeout, 64
Range, 63
RangeGroup, 63
QTAgent.exe.config, 53, 92, 95, 98
QTAgentService.exe.config, 50, 97
QTAgentServiceUI.exe.config, 95
QTController.exe.config, 52, 64, 95
Test Run Configuration files, 61
Test Setting files, 61
VSTestHost.exe.config, 52, 53, 64
vstst.xsd, 51
VSTT Extraction Rules
ExtractionRuleInnerText, 138
ExtractionRuleSelectTag, 138
VSTT Methods
Add Call to Web Test, 45
adding a context parameter, 113, 115
ClassCleanUp, 23, 24
ClassInitialize, 23, 24, 67
GetRequestEnumerator, 115, 122
PostRequest, 10, 113, 115, 116
PostRequestEvent, 122
StringHttpBody, 111, 134
System.Net.HttpWebRequest, 83
TestCleanUp, 24
TestInitialize, 23, 24
WebTestExecutionInstruction, 123, 124

Visual Studio Performance Testing Quick Reference Guide Page 153
VSTT Plugins
LoadTestAborted, 11
LoadTestFinished, 11
LoadTestStarting, 11
LoadTestWarmupComplete, 11
PostPage, 10
PostRequest, 10, 113, 115, 116
PostTransaction, 10
PostWebTest, 10, 115, 120
PrePage, 9, 10
PreRequest, 7, 10, 121, 122, 123, 124, 134
PreTransaction, 9, 10
PreWebTest, 9, 10, 131, 134
TestFinished, 11
TestSelected, 11
TestStarting, 11
ThresholdExceeded, 11
VSTT Properties
All Individual Details, 33, 71, 85
Cache Control, 19
EventTarget, 121
Follow Redirects, 112
Goal Based Load Pattern, 17, 82
Initial User Count, 17
LoadTestMaxErrorsPerType, 52
Lower Values Imply Higher Resource Use, 17
MaximumUserCount, 17
Percentage of New Users, 15, 19, 135
ResponseBodyCaptureLimit, 12, 79, 134
Run unit tests in application domain, 4, 12
Sample Rate, 17, 65
Statistics Only, 71
Stop Adjusting User Count When Goal Achieved, 17
Target Range for Performance Counter, 17
Test Iterations, 4, 6, 12, 13, 15, 18, 87, 88
Think Time, 4, 6, 7, 8, 11, 13, 18, 36, 73, 80, 114, 119,
150
TimingDetailsStorage, 5, 33, 36, 71, 85, 129, 135
Use Test Iterations, 12
WebTestIteration, 120
VSTT Runtime
QTAgent, 53, 87, 92, 95, 98
QTController, 52, 59, 64, 95, 109
VSTestHost, 52, 53, 64, 88
VSTT Settings
Administer Test Controllers, 26, 47, 58, 104
Analysis Comment, 7, 135, 136
Follow Redirects, 112
VSTT Test Types
Sequential Test Mix, 4, 44
Web Test Composition, 45
VSTT Validation Rules
ValidationRuleInnerText, 138
ValidationRuleSelectTag, 138
