Visualization Data Sheet Web
2012-09-19
: Pdf Visualization Datasheet Web Visualization_DataSheet_web
Open the PDF directly: View PDF ![]() .
.
Page Count: 2
FTK Add-On: AccessData Visualization
Our new Visualization module allows users to graphically analyze both le
and email data in seconds, including timelines, cluster graphs, pie charts and
more.
AccessData Visualization is another market
innovation brought to you by the leader
in forensic technology, AccessData. This
exciting new add-on for FTK® integrates a
graphical analysis engine into our market
leading forensic product. AD Visualization
extends the capabilities of the product to
provide another powerful way to improve
efciency and enrich communication about
case specics.
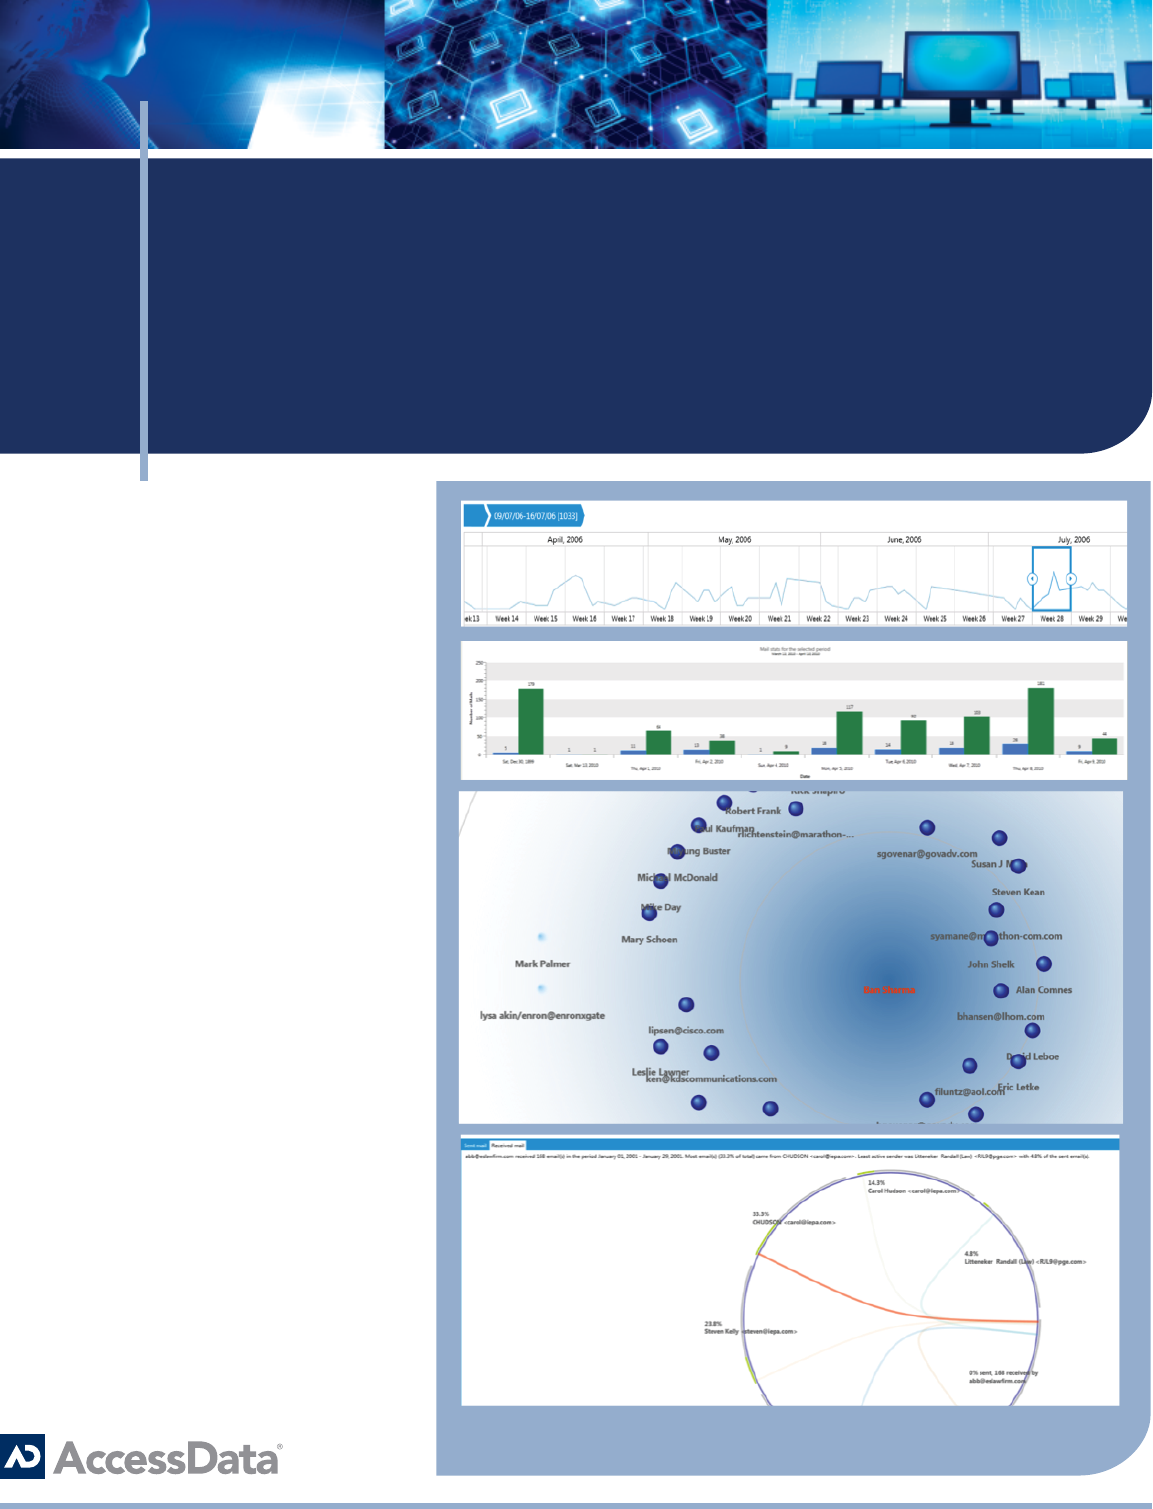
Email Visualization
• Adjust scale and focus of
communication periods in days, weeks,
months, years and decades.
• Quickly determine and convey peak
communication periods in a graphical
format.
• View email custodian level details
including sent and received statistics to
pinpoint periods of interest.
• Graphically represents the social
network of an email custodian to
determine strength/frequency of
communication.
• Obtain key insight into the interaction
among potential persons of interest and
ag these email exchanges in FTK®
Contact Us:
NORTH AMERICA SALES
800.574.5199
801.765.4370 (fax)
sales@accessdata.com
INTERNATIONAL SALES
Ofce: +44 (0)20 7010 7800
internationalsales@accessdata.com
No longer are investigators, forensic
analysts and researchers forced to
rely on third-party tools like Analyst
Notebook, Microsoft Excel or difcult-to-
learn opensource software to visualize
relationships in data elements. FTK® can
now provide a vivid and intuitive view into
case facts, enabling rapid decision making
and time to resolution.
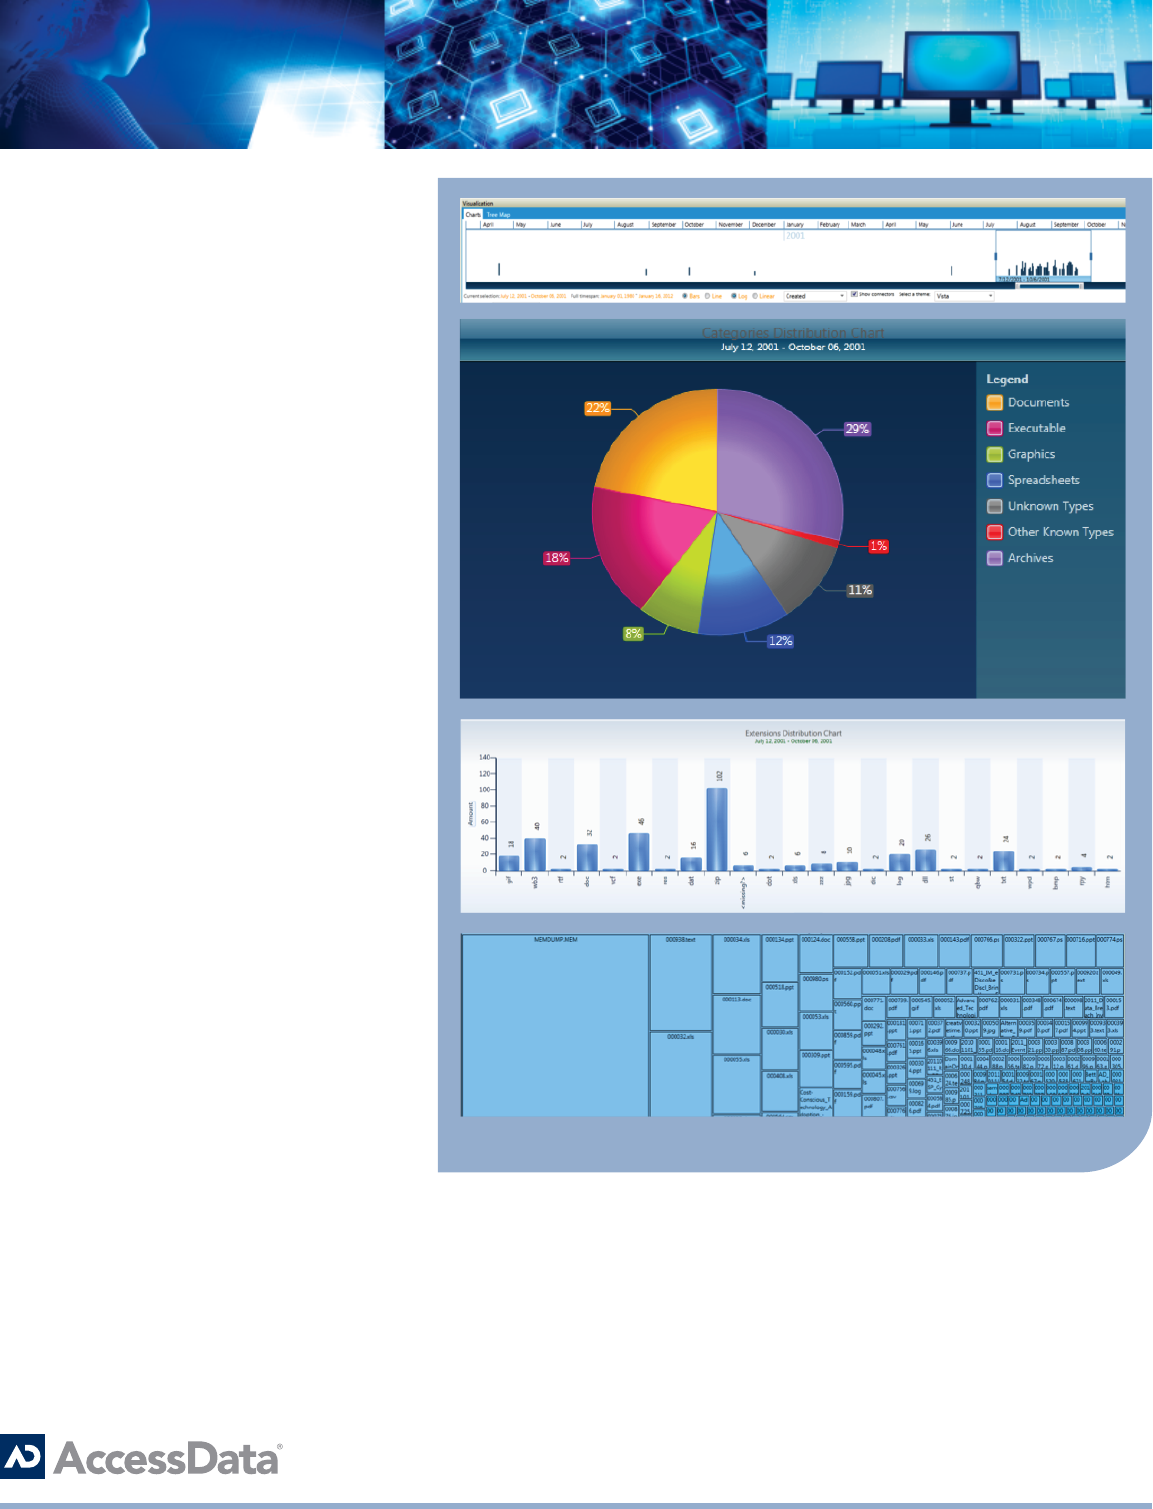
File Visualization
• Adjust scale and focus of create,
modify and last accessed le dates
to quickly identify gaps or areas of
interest.
• Immediately provide a complete picture
of the data prole and makeup.
• Understand the le volume and counts
through an interactive interface.
• Sort and group les by a variety of
metadata attributes.
• Efciently identify and tag les for
check marking in FTK®
• Change the graphical theme to match
the context of reports and case les.
• Create a treemap of the underlying
directory structure of the target
machine for an understanding of
relative le size and location.
