Whitebox Tools Manual
User Manual: Pdf
Open the PDF directly: View PDF ![]() .
.
Page Count: 122 [warning: Documents this large are best viewed by clicking the View PDF Link!]
- WhiteboxTools User Manual
- 1. Introduction
- 2. Installation
- 3. Usage
- 4. Available Tools
- 5. Supported Data Formats
- 6. Contributing
- 7. License
- 8. Reporting Bugs
- 9. Known Issues
- 10. Frequently Asked Questions
- Do I need Whitebox GAT to use WhiteboxTools?
- How do I request a tool be added?
- Can WhiteboxTools be incorporated into other software and open-source GIS projects?
- What platforms does WhiteboxTools support?
- What are the system requirements?
- Are pre-compiled executables of WhiteboxTools available?
- Why is WhiteboxTools programmed in Rust?
- Do I need Rust installed on my computer to run WhiteboxTools?
- How does WhiteboxTools' design philosophy differ?

Bringing the power of Whitebox GAT to the world at large
2WhiteboxTools User Manual / Lindsay
WhiteboxTools Version 0.4
Dr. John B. Lindsay © Feb. 18, 2018
Geomorphometry and Hydrogeomatics Research Group
The University of Guelph
Guelph, Canada
WhiteboxTools User Manual / Lindsay 3
WhiteboxTools User Manual
Contents
1. Introduction
2. Installation
3. Usage
• 3.1. Interacting with WhiteboxTools from the command prompt
• 3.2. Interacting with WhiteboxTools using Python scripting
• 3.3. The WhiteboxTools Runner
4. Available Tools
5. Supported Data Formats
6. Contributing
7. License
8. Reporting Bugs
9. Known Issues
10. Frequently Asked Questions
•Do I need Whitebox GAT to use WhiteboxTools?
•How do I request a tool be added?
•Can WhiteboxTools be incorporated into other software and open-source GIS projects?
•What platforms does WhiteboxTools support?
•What are the system requirements?
•Are pre-compiled executables of WhiteboxTools available?
•Why is WhiteboxTools Programmed in Rust?
•Do I need Rust installed on my computer to run WhiteboxTools?
•How does WhiteboxTools’ design philosophy differ?

4WhiteboxTools User Manual / Lindsay
1. Introduction
WhiteboxTools is an advanced geospatial data analysis engine developed by Prof. John Lindsay (webpage;
jblindsay) at the University of Guelph’s Geomorphometry and Hydrogeomatics Research Group.Whitebox-
Tools can be used to perform common geographical information systems (GIS) analysis operations,
such as cost-distance analysis, distance buffering, and raster reclassification. Remote sensing and
image processing tasks include image enhancement (e.g. panchromatic sharpening, contrast adjust-
ments), image mosaicing, numerous filtering operations, simple classification (k-means), and common
image transformations. WhiteboxTools also contains advanced tooling for spatial hydrological analysis
(e.g. flow-accumulation, watershed delineation, stream network analysis, sink removal), terrain analysis
(e.g. common terrain indices such as slope, curvatures, wetness index, hillshading; hypsometric analysis;
multi-scale topographic position analysis), and LiDAR data processing. LiDAR point clouds can be inter-
rogated (LidarInfo, LidarHistogram), segmented, tiled and joined, analyized for outliers, interpolated to
rasters (DEMs, intensity images), and ground-points can be classified or filtered. WhiteboxTools is not a
cartographic or spatial data visualization package; instead it is meant to serve as an analytical backend
for other data visualization software, mainly GIS.
Although WhiteboxTools is intended to serve as a source of plugin tools for the Whitebox Geospatial Analysis
Tools (GAT) open-source GIS project, the tools contained in the library are stand-alone and can run outside
of the larger Whitebox GAT project. See Usage for further details. There have been a large number of re-
quests to call Whitebox GAT tools and functionality from outside of the Whitebox user-interface (e.g. from
Python automation scripts). WhiteboxTools is intended to meet these usage requirements. Eventually
most of the approximately 450 tools contained within Whitebox GAT will be ported to WhiteboxTools. In ad-
dition to separating the processing capabilities and the user-interface (and thereby reducing the reliance
on Java), this migration should significantly improve processing efficiency. This is because Rust, the pro-
gramming language used to develop WhiteboxTools, is generally faster than the equivalent Java code and
because many of the WhiteboxTools functions are designed to process data in parallel wherever possible.
In contrast, the older Java codebase included largely single-threaded applications.
In this manual, WhiteboxTools refers to the standalone geospatial analysis library, a col-
lection of tools contained within a compiled binary executable command-line program
and the associated Python scripts that are distributed alongside the binary file (e.g. white-
box_tools.py and wb_runner.py). Whitebox Geospatial Analysis Tools and Whitebox GAT refer
to the complete GIS software, which includes a user-interface (front-end), point-and-click
tool interfaces, and cartographic data visualization capabilities.
The WhiteboxTools project is related to the GoSpatial project, which has similar goals but is designed using
the Go programming language instead of Rust. WhiteboxTools has however superseded the GoSpatial
project, having subsumed all of its functionality.
2. Installation
WhiteboxTools is a stand-alone executable command-line program with no actual installation. Pre-
compiled binaries can be downloaded from the Geomorphometry and Hydrogeomatics Research Group

WhiteboxTools User Manual / Lindsay 5
software web site for various supported operating systems. It is likely that WhiteboxTools will work
on a wider variety of operating systems and architectures. If you do not find your operating sys-
tem/architecture in the list of available WhiteboxTool binaries, then compilation from source code will be
necessary. WhiteboxTools can be compiled from the source code with the following steps:
1. Install the Rust compiler; Rustup is recommended for this purpose. Further instruction can be found
at this link.
2. Download the Whitebox GAT source code. Note: WhiteboxTools is currently housed as a sub-
repository of the main Whitebox GAT repo. To download the code, click the green Clone or down-
load button on the GitHub repository site.
3. Decompress the zipped download file.
4. Open a terminal (command prompt) window and change the working directory to the white-
box_tools sub-folder, which is contained within the decompressed downloaded Whitebox GAT
folder:
>> cd /path/to/folder/whitebox_tools/
5. Finally, use the rust package manager Cargo, which will be installed alongside Rust, to compile the
executable:
>> cargo build --release
Depending on your system, the compilation may take several minutes. When completed, the compiled bi-
nary executable file will be contained within the whitebox_tools/target/release/ folder. Type ./whitebox_tools
–help at the command prompt (after cd’ing to the containing folder) for information on how to run the
executable from the terminal.
Be sure to follow the instructions for installing Rust carefully. In particular, if you are installing on MS
Windows, you must have a linker installed prior to installing the Rust compiler (rustc). The Rust webpage
recommends either the MS Visual C++ 2015 Build Tools or the GNU equivalent and offers details for each
installation approach. You should also consider using RustUp to install the Rust compiler.
3. Usage
WhiteboxTools is a command-line program and can be run either by calling it, with appropriate commands
and arguments, from a terminal application, or, more conveniently, by calling it from a script. The following
commands are recognized by the WhiteboxTools library:
Command Description
--cd, --wd Changes the working directory; used in conjunction with --run flag.
-h, --help Prints help information.
-l, --license Prints the whitebox-tools license.
--listtools Lists all available tools, with tool descriptions. Keywords may also be used, --listtools slope.
-r, --run Runs a tool; used in conjunction with --cd flag; -r=“LidarInfo”.
--toolbox Prints the toolbox associated with a tool; --toolbox=Slope.
6WhiteboxTools User Manual / Lindsay
Command Description
--toolhelp Prints the help associated with a tool; --toolhelp=“LidarInfo”.
--toolparameters Prints the parameters (in json form) for a specific tool; --toolparameters=”LidarInfo”.
-v Verbose mode. Without this flag, tool outputs will not be printed.
--viewcode Opens the source code of a tool in a web browser; --viewcode=”LidarInfo”.
--version Prints the version information.
Generally, the Unix convention is that single-letter arguments (options) use a single hyphen (e.g. -h) while
word-arguments (longer, more descriptive argument names) use double hyphens (e.g. --help). The same
rule is used for passing arguments to tools as well. Use the --toolhelp argument to print information about
a specific tool (e.g. --toolhelp=Clump).
Tool names can be specified either using the snake_case or CamelCase convention (e.g.
lidar_info or LidarInfo).
For examples of how to call functions and run tools from WhiteboxTools, see the whitebox_example.py
Python script, which itself uses the whitebox_tools.py script as an interface for interacting with the exe-
cutable file.
In addition to direct command-line and script-based interaction, a very basic user-interface called WB Run-
ner can be used to call the tools within the WhiteboxTools executable file, providing the required tool argu-
ments.
3.1 Interacting with WhiteboxTools from the command prompt
The following is an example of calling the WhiteboxTools binary executable file directly from the command
prompt:
>>./whitebox_tools --wd='/Users/johnlindsay/Documents/data/'
--run=DevFromMeanElev --input='DEM clipped.dep' --output='DEV raster.dep' -v
Notice the quotation marks (single or double) used around directories and filenames, and string tool ar-
guments in general. Use the ‘-v’ flag (run in verbose mode) to force the tool print output to the command
prompt. Please note that the whitebox_tools executable file must have permission to be executed; on
some systems, this may require setting special permissions. The ‘>>’ is shorthand used in this document
to denote the command prompt and is not intended to be typed. Also, the above example uses the forward
slash character (/), the directory path separator used on unix based systems. On Windows, users should
use the back slash character (\) instead. Also, it is sometimes necessary to break commands across multi-
ple lines, as above, in order to better fit with the documents format. Actual command prompts should be
contained to a single line.

WhiteboxTools User Manual / Lindsay 7
3.2 Interacting with WhiteboxTools using Python scripting
Note that all of the following material assumes the user system is configured with Python
3. The code snippets below are not guaranteed to work with Python 2.
Interacting with WhiteboxTools from Python scripts is easy. To begin, each script must start by importing
the WhiteboxTools class, contained with the whitebox_tools.py script, and creating a new object:
from whitebox_tools import WhiteboxTools
wbt =WhiteboxTools()
The WhiteboxTools class expects to find the WhiteboxTools executable file (whitebox_tools.exe on Win-
dows and whitebox_tools on other platforms) within the same directory as the whitebox_tools.py script. If
the binary file is located in a separate directory, you will need to set the executable directory as follows:
wbt.set_whitebox_dir('/local/path/to/whitebox/binary/')
# Or alternatively...
wbt.exe_path ='/local/path/to/whitebox/binary/'
Individual tools can be called using the convenience methods provided in the WhiteboxTools class:
# This line performs a 5 x 5 mean filter on 'inFile.tif':
wbt.mean_filter('/path/to/file/inFile.tif','/path/to/file/outFile.tif',5,5)
Each tool has a cooresponding convenience method. Tools can also be called using the run_tool()
method, specifying the tool name and a list of tool arguments. Each of the tool-specific convenience
methods collect their arguments into a properly formated list and then ultimately call the run_tools()
method. Notice that while internally, whitebox_tools.exe uses CamelCase (e.g. MeanFilter) to denote tool
names, the Python interface of whitebox_tools.py uses snake_case (e.g. mean_filter), according to Python
style conventions. The only exceptions are tools with names that clash with Python keywords (e.g. And(),
Not(), and Or()).
The return value can be used to check for errors during operation:
if wbt.ruggedness_index('/path/DEM.flt','/path/ruggedness.flt')!= 0:
# Non-zero returns indicate an error.
print('ERROR running ruggedness_index')
8WhiteboxTools User Manual / Lindsay
If, like me, your data files tend to be burried deeply in layers of sub-directories, specifying complete file
names as input parameters can be tedius. In this case, the best option is setting the working directory:
from whitebox_tools import WhiteboxTools
wbt =WhiteboxTools()
wbt.work_dir ="/path/to/data/" # Sets the Whitebox working directory
# Because the working directory has been set, file arguments can be
# specified simply using file names, without paths.
wbt.d_inf_flow_accumulation("DEM.dep","output.dep", log=True)
An advanced text editor, such as VS Code or Atom, can provide hints and autocomplete for available tool
convenience methods and their parameters, including default values. Sometimes, however, it can be
useful to print a complete list of available tools:
print(wbt.list_tools()) # List all tools in WhiteboxTools
The list_tools() method will also take an optional keywords list to search for tools:
# Lists tools with 'lidar' or 'LAS' in tool name or description.
print(wbt.list_tools(['lidar','LAS']))
To retrieve more detailed information for a specific tool, use the tool_help() method:
print(wbt.tool_help("elev_percentile"))
tool_help() prints tool details including a description, tool parameters (and their flags), and example
usage at the command line prompt. The above statement prints this report:
> ElevPercentile
> Description:
> Calculates the elevation percentile raster from a DEM.
> Toolbox: Geomorphometric Analysis
> Parameters:
>
> Flag Description
> ----------------- -----------
> -i, --input, --dem Input raster DEM file.
> -o, --output Output raster file.
WhiteboxTools User Manual / Lindsay 9
> --filterx Size of the filter kernel in the x-direction.
> --filtery Size of the filter kernel in the y-direction.
> --sig_digits Number of significant digits.
>
> Example usage:
> >>./whitebox_tools -r=ElevPercentile -v --wd="/path/to/data/" --dem=DEM.dep
> >>-o=output.dep --filterx=25
Tools will frequently print text to the standard output during their execution, including warnings, progress
updates and other notifications. Sometimes, when users run many tools in complex workflows and in
batch mode, these output messages can be undesirable. Most tools will have their outputs suppressed
by setting the verbose mode to False as follows:
wbt.set_verbose_mode(False)
# Or, alternatively...
wbt.verbose =False
Alternatively, it may be helpful to capture the text output of a tool for custom processing. This is achieved
by specifying a custom callback function to the tool’s run method:
# This callback function suppresses printing progress updates,
# which always use the '%' character. The callback function
# approach is flexible and allows for any level of complex
# interaction with tool outputs.
def my_callback(value):
if not "%" in value:
print(value)
wbt.slope('DEM.tif','slope_raster.tif', callback=my_callback)
The whitebox_tools.py script provides several other functions for interacting with the WhiteboxTools library,
including:
# Print the WhiteboxTools help...a listing of available commands
print(wbt.help())
# Print the WhiteboxTools license
print(wbt.license())
# Print the WhiteboxTools version
print("Version information: {}".format(wbt.version()))
10 WhiteboxTools User Manual / Lindsay
# Get the toolbox associated with a tool
tb =wbt.toolbox('lidar_info')
# Retrieve a JSON object of a tool's parameters.
tp =tool_parameters('raster_histogram')
# Opens a browser and navigates to a tool's source code in the
# WhiteboxTools GitHub repository
view_code('watershed')
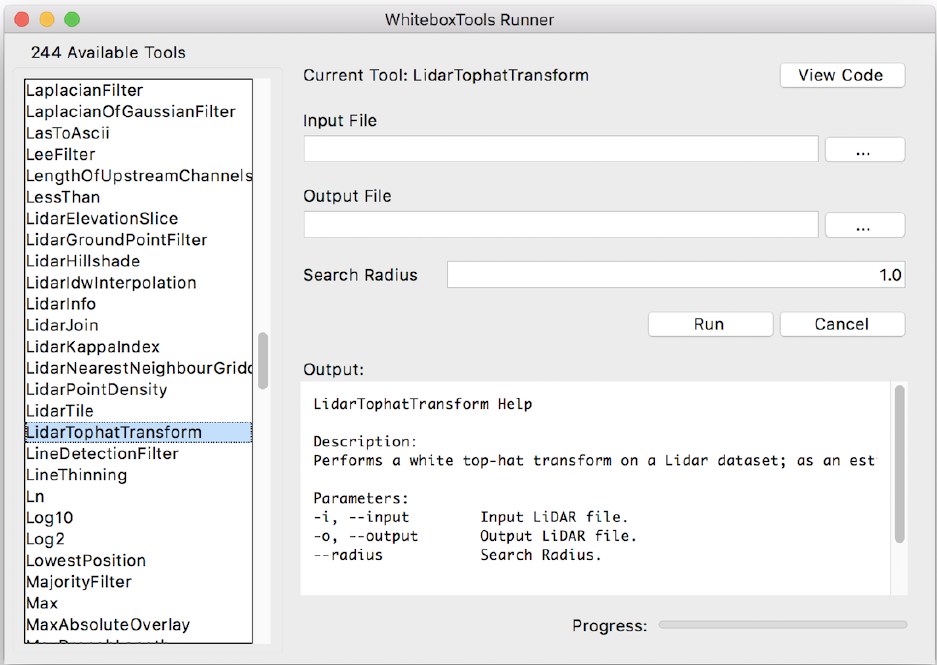
3.3 The WhiteboxTools Runner
There is a Python script contained within the WhiteboxTools directory called ‘wb_runner.py’. This script is
intended to provide a very basic user-interface for running the tools contained within the WhiteboxTools
library. The user-interface uses Python’s TkInter GUI library and is cross-platform. The user interface is
currently experimental and is under heavy testing. Please report any issues that you experience in using
it.
The WhiteboxTools Runner user-interface

WhiteboxTools User Manual / Lindsay 11
The WhiteboxTools Runner does not rely on the Whitebox GAT user interface at all and can therefore be
used indepedent of the larger project. The script must be run from a directory that also contains the
‘whitebox_tools.py’ Python script and the ‘whitebox_tools’ executable file. There are plans to link tool help
documentation in WhiteboxTools Runner and to incorporate toolbox information, rather than one large
listing of available tools.
4. Available Tools
Eventually most of Whitebox GAT’s approximately 400 tools will be ported to WhiteboxTools, although this is
an immense task. Support for vector data (Shapefile/GeoJSON) reading/writing and a topological analysis
library (like the Java Topology Suite) will need to be added in order to port the tools involving vector spatial
data. Opportunities to parallelize algorithms will be sought during porting. All new plugin tools will be
added to Whitebox GAT using this library of functions.
The library currently contains the following 270 tools, which are each grouped based on their main func-
tion into one of the following categories: Data Tools,GIS Analysis,Hydrological Analysis,Image Analysis,LiDAR
Analysis,Mathematical and Statistical Analysis,Stream Network Analysis, and Terrain Analysis. To retrieve de-
tailed information about a tool’s input arguments and example usage, either use the -/-toolhelp command
from the terminal, or the tool_help(‘tool_name’) function from the whitebox_tools.py script. The following is
a complete listing of available tools, with brief descriptions, tool parameter, and example usage.
1. AbsoluteValue
Description: Calculates the absolute value of every cell in a raster.
Toolbox: Math and Stats Tools
Parameters:
Flag Description
-i, --input Input raster file.
-o, --output Output raster file.
Example usage:
>>./whitebox_tools -r=AbsoluteValue -v --wd="/path/to/data/" -i='input.dep'
-o=output.dep
2. AdaptiveFilter
Description: Performs an adaptive filter on an image.
Toolbox: Image Processing Tools/Filters
Parameters:
Flag Description
-i, --input Input raster file.

12 WhiteboxTools User Manual / Lindsay
Flag Description
-o, --output Output raster file.
--filterx Size of the filter kernel in the x-direction.
--filtery Size of the filter kernel in the y-direction.
--threshold Difference from mean threshold, in standard deviations.
Example usage:
>>./whitebox_tools -r=AdaptiveFilter -v --wd="/path/to/data/" -i=DEM.dep
-o=output.dep --filter=25 --threshold = 2.0
3. Add
Description: Performs an addition operation on two rasters or a raster and a constant value.
Toolbox: Math and Stats Tools
Parameters:
Flag Description
--input1 Input raster file or constant value.
--input2 Input raster file or constant value.
-o, --output Output raster file.
Example usage:
>>./whitebox_tools -r=Add -v --wd="/path/to/data/" --input1='in1.dep'
--input2='in2.dep' -o=output.dep
4. AggregateRaster
Description: Aggregates a raster to a lower resolution.
Toolbox: GIS Analysis
Parameters:
Flag Description
-i, --input Input raster file.
-o, --output Output raster file.
--agg_factor Aggregation factor, in pixels.
--type Statistic used to fill output pixels.
Example usage:
>>./whitebox_tools -r=AggregateRaster -v --wd="/path/to/data/"
-i=input.dep -o=output.dep --output_text

WhiteboxTools User Manual / Lindsay 13
5. And
Description: Performs a logical AND operator on two Boolean raster images.
Toolbox: Math and Stats Tools
Parameters:
Flag Description
--input1 Input raster file.
--input2 Input raster file.
-o, --output Output raster file.
Example usage:
>>./whitebox_tools -r=And -v --wd="/path/to/data/" --input1='in1.dep'
--input2='in2.dep' -o=output.dep
6. Anova
Description: Performs an analysis of variance (ANOVA) test on a raster dataset.
Toolbox: Math and Stats Tools
Parameters:
Flag Description
-i, --input Input raster file.
--features Feature definition (or class) raster.
-o, --output Output HTML file.
Example usage:
>>./whitebox_tools -r=Anova -v --wd="/path/to/data/" -i=data.tif
--features=classes.tif -o=anova.html
7. ArcCos
Description: Returns the inverse cosine (arccos) of each values in a raster.
Toolbox: Math and Stats Tools
Parameters:
Flag Description
-i, --input Input raster file.
-o, --output Output raster file.

14 WhiteboxTools User Manual / Lindsay
Example usage:
>>./whitebox_tools -r=ArcCos -v --wd="/path/to/data/"
-i='input.dep' -o=output.dep
8. ArcSin
Description: Returns the inverse sine (arcsin) of each values in a raster.
Toolbox: Math and Stats Tools
Parameters:
Flag Description
-i, --input Input raster file.
-o, --output Output raster file.
Example usage:
>>./whitebox_tools -r=ArcSin -v --wd="/path/to/data/" -i='input.dep'
-o=output.dep
9. ArcTan
Description: Returns the inverse tangent (arctan) of each values in a raster.
Toolbox: Math and Stats Tools
Parameters:
Flag Description
-i, --input Input raster file.
-o, --output Output raster file.
Example usage:
>>./whitebox_tools -r=ArcTan -v --wd="/path/to/data/" -i='input.dep'
-o=output.dep
10. Aspect
Description: Calculates an aspect raster from an input DEM.
Toolbox: Geomorphometric Analysis
Parameters:
Flag Description
-i, --dem Input raster DEM file.
-o, --output Output raster file.

WhiteboxTools User Manual / Lindsay 15
Flag Description
--zfactor Optional multiplier for when the vertical and horizontal units are not the same.
Example usage:
>>./whitebox_tools -r=Aspect -v --wd="/path/to/data/" --dem=DEM.dep
-o=output.dep
11. Atan2
Description: Returns the 2-argument inverse tangent (atan2).
Toolbox: Math and Stats Tools
Parameters:
Flag Description
--input_y Input y raster file or constant value (rise).
--input_x Input x raster file or constant value (run).
-o, --output Output raster file.
Example usage:
>>./whitebox_tools -r=Atan2 -v --wd="/path/to/data/" --input_y='in1.dep'
--input_x='in2.dep' -o=output.dep
12. AverageFlowpathSlope
Description: Measures the average slope gradient from each grid cell to all upslope divide cells.
Toolbox: Hydrological Analysis
Parameters:
Flag Description
-i, --dem Input raster DEM file.
-o, --output Output raster file.
Example usage:
>>./whitebox_tools -r=AverageFlowpathSlope -v --wd="/path/to/data/" -i=DEM.dep
-o=output.dep
13. AverageOverlay
Description: Calculates the average for each grid cell from a group of raster images.
Toolbox: GIS Analysis/Overlay Tools

16 WhiteboxTools User Manual / Lindsay
Parameters:
Flag Description
-i, --inputs Input raster files.
-o, --output Output raster file.
Example usage:
>>./whitebox_tools -r=AverageOverlay -v --wd='/path/to/data/'
-i='image1.dep;image2.dep;image3.dep' -o=output.dep
14. AverageUpslopeFlowpathLength
Description: Measures the average length of all upslope flowpaths draining each grid cell.
Toolbox: Hydrological Analysis
Parameters:
Flag Description
-i, --dem Input raster DEM file.
-o, --output Output raster file.
Example usage:
>>./whitebox_tools -r=AverageUpslopeFlowpathLength -v --wd="/path/to/data/"
-i=DEM.dep -o=output.dep
15. BalanceContrastEnhancement
Description: Performs a balance contrast enhancement on a colour-composite image of multispectral data.
Toolbox: Image Processing Tools/Image Enhancement
Parameters:
Flag Description
-i, --input Input colour composite image file.
-o, --output Output raster file.
--band_mean Band mean value.
Example usage:
>>./whitebox_tools -r=BalanceContrastEnhancement -v --wd="/path/to/data/"
--input=image.dep -o=output.dep --band_mean=120
16. Basins

WhiteboxTools User Manual / Lindsay 17
Description: Identifies drainage basins that drain to the DEM edge.
Toolbox: Hydrological Analysis
Parameters:
Flag Description
–d8_pntr Input raster D8 pointer file.
-o, –output Output raster file.
–esri_pntr D8 pointer uses the ESRI style scheme.
Example usage:
>>./whitebox_tools -r=Basins -v --wd="/path/to/data/" --d8_pntr='d8pntr.dep'
-o='output.dep'
17. BilateralFilter
Description: A bilateral filter is an edge-preserving smoothing filter introduced by Tomasi and Manduchi
(1998).
Toolbox: Image Processing Tools/Filters
Parameters:
Flag Description
-i, –input Input raster file.
-o, –output Output raster file.
–sigma_dist Standard deviation in distance in pixels.
–sigma_int Standard deviation in intensity in pixels.
Example usage:
>>./whitebox_tools -r=BilateralFilter -v --wd="/path/to/data/" -i=image.dep
-o=output.dep --sigma_dist=2.5 --sigma_int=4.0
18. BlockMaximum
Description: Creates a block-maximum raster from an input LAS file.
Toolbox: LiDAR Tools
Parameters:
Flag Description
-i, –input Input LiDAR file.
-o, –output Output file.
–resolution Output raster’s grid resolution.

18 WhiteboxTools User Manual / Lindsay
Example usage:
>>./whitebox_tools -r=BlockMaximum -v --wd="/path/to/data/" -i=file.las
-o=outfile.dep --resolution=2.0"
./whitebox_tools -r=BlockMaximum -v --wd="/path/to/data/" -i=file.las
-o=outfile.dep --resolution=5.0 --palette=light_quant.plt
19. BlockMinimum
Description: Creates a block-minimum raster from an input LAS file.
Toolbox: LiDAR Tools
Parameters:
Flag Description
-i, –input Input LiDAR file.
-o, –output Output file.
–resolution Output raster’s grid resolution.
Example usage:
>>./whitebox_tools -r=BlockMinimum -v --wd="/path/to/data/" -i=file.las
-o=outfile.dep --resolution=2.0"
./whitebox_tools -r=BlockMinimum -v --wd="/path/to/data/" -i=file.las
-o=outfile.dep --resolution=5.0 --palette=light_quant.plt
20. BreachDepressions
Description: Breaches all of the depressions in a DEM using Lindsay’s (2016) algorithm. This should be
preferred over depression filling in most cases.
Toolbox: Hydrological Analysis
Parameters:
Flag Description
-i, –dem Input raster DEM file.
-o, –output Output raster file.
–max_depth Optional maximum breach depth (default is Inf).
–max_length Optional maximum breach channel length (in grid cells; default is Inf).
Example usage:
>>./whitebox_tools -r=BreachDepressions -v --wd="/path/to/data/" --dem=DEM.dep
-o=output.dep
21. BreachSingleCellPits

WhiteboxTools User Manual / Lindsay 19
Description: Removes single-cell pits from an input DEM by breaching.
Toolbox: Hydrological Analysis
Parameters:
Flag Description
-i, –dem Input raster DEM file.
-o, –output Output raster file.
Example usage:
>>./whitebox_tools -r=BreachSingleCellPits -v --wd="/path/to/data/"
--dem=DEM.dep -o=output.dep
22. BufferRaster
Description: Maps a distance-based buffer around each non-background (non-zero/non-nodata) grid cell
in an input image.
Toolbox: GIS Analysis/Distance Tools
Parameters:
Flag Description
-i, –input Input raster file.
-o, –output Output raster file.
–size Buffer size.
–gridcells Optional flag to indicate that the ‘size’ threshold should be measured in grid cells instead of the default map units.
Example usage:
>>./whitebox_tools -r=BufferRaster -v --wd="/path/to/data/" -i=DEM.dep -o=output.dep
23. Ceil
Description: Returns the smallest (closest to negative infinity) value that is greater than or equal to the
values in a raster.
Toolbox: Math and Stats Tools
Parameters:
Flag Description
-i, –input Input raster file.
-o, –output Output raster file.
Example usage:

20 WhiteboxTools User Manual / Lindsay
>>./whitebox_tools -r=Ceil -v --wd="/path/to/data/" -i='input.dep' -o=output.dep
24. Centroid
Description: Calculates the centroid, or average location, of raster polygon objects.
Toolbox: GIS Analysis
Parameters:
Flag Description
-i, –input Input raster file.
-o, –output Output raster file.
–text_output Optional text output.
Example usage:
>>./whitebox_tools -r=Centroid -v --wd="/path/to/data/" -i=polygons.dep -o=output.dep
>>./whitebox_tools -r=Centroid -v --wd="/path/to/data/" -i=polygons.dep -o=output.dep
--text_output
25. Closing
Description: A closing is a mathematical morphology operating involving an erosion (min filter) of a dilation
(max filter) set.
Toolbox: Image Processing Tools
Parameters:
Flag Description
-i, –input Input raster file.
-o, –output Output raster file.
–filterx Size of the filter kernel in the x-direction.
–filtery Size of the filter kernel in the y-direction.
Example usage:
>>./whitebox_tools -r=Closing -v --wd="/path/to/data/" -i=image.dep
-o=output.dep --filter=25
26. Clump
Description: Groups cells that form physically discrete areas, assigning them unique identifiers.
Toolbox: GIS Analysis
Parameters:

WhiteboxTools User Manual / Lindsay 21
Flag Description
-i, –input Input raster file.
-o, –output Output raster file.
–diag Flag indicating whether diagonal connections should be considered.
–zero_back Flag indicating whether zero values should be treated as a background.
Example usage:
>>./whitebox_tools -r=Clump -v --wd="/path/to/data/" -i=input.dep
-o=output.dep --diag
27. ConservativeSmoothingFilter
Description: Performs a conservative-smoothing filter on an image.
Toolbox: Image Processing Tools/Filters
Parameters:
Flag Description
-i, –input Input raster file.
-o, –output Output raster file.
–filterx Size of the filter kernel in the x-direction.
–filtery Size of the filter kernel in the y-direction.
Example usage:
>>./whitebox_tools -r=ConservativeSmoothingFilter -v --wd="/path/to/data/"
-i=image.dep -o=output.dep --filter=25
28. ConvertNodataToZero
Description: Converts nodata values in a raster to zero.
Toolbox: Data Tools
Parameters:
Flag Description
-i, –input Input raster file.
-o, –output Output raster file.
Example usage:
>>./whitebox_tools -r=ConvertNodataToZero -v --wd="/path/to/data/"
--input=in.dep -o=NewRaster.dep

22 WhiteboxTools User Manual / Lindsay
29. ConvertRasterFormat
Description: Converts raster data from one format to another.
Toolbox: Data Tools
Parameters:
Flag Description
-i, –input Input raster file.
-o, –output Output raster file.
Example usage:
>>./whitebox_tools -r=ConvertRasterFormat -v --wd="/path/to/data/"
--input=DEM.dep -o=output.dep
30. Cos
Description: Returns the cosine (cos) of each values in a raster.
Toolbox: Math and Stats Tools
Parameters:
Flag Description
-i, –input Input raster file.
-o, –output Output raster file.
Example usage:
>>./whitebox_tools -r=Cos -v --wd="/path/to/data/" -i='input.dep'
-o=output.dep
31. Cosh
Description: Returns the hyperbolic cosine (cosh) of each values in a raster.
Toolbox: Math and Stats Tools
Parameters:
Flag Description
-i, –input Input raster file.
-o, –output Output raster file.
Example usage:
>>./whitebox_tools -r=Cosh -v --wd="/path/to/data/" -i='input.dep'

WhiteboxTools User Manual / Lindsay 23
-o=output.dep
32. CostAllocation
Description: Identifies the source cell to which each grid cell is connected by a least-cost pathway in a
cost-distance analysis.
Toolbox: GIS Analysis/Distance Tools
Parameters:
Flag Description
–source Input source raster file.
–backlink Input backlink raster file generated by the cost-distance tool.
-o, –output Output raster file.
Example usage:
>>./whitebox_tools -r=CostAllocation -v --wd="/path/to/data/"
--source='source.dep' --backlink='backlink.dep' -o='output.dep'
33. CostDistance
Description: Performs cost-distance accumulation on a cost surface and a group of source cells.
Toolbox: GIS Analysis/Distance Tools
Parameters:
Flag Description
–source Input source raster file.
–cost Input cost (friction) raster file.
–out_accum Output cost accumulation raster file.
–out_backlink Output backlink raster file.
Example usage:
>>./whitebox_tools -r=CostDistance -v --wd="/path/to/data/" --source=src.dep
--cost=cost.dep --out_accum=accum.dep --out_backlink=backlink.dep
34. CostPathway
Description: Performs cost-distance pathway analysis using a series of destination grid cells.
Toolbox: GIS Analysis/Distance Tools
Parameters:
Flag Description
–destination Input destination raster file.

24 WhiteboxTools User Manual / Lindsay
Flag Description
–backlink Input backlink raster file generated by the cost-distance tool.
-o, –output Output cost pathway raster file.
–zero_background Flag indicating whether zero values should be treated as a background.
Example usage:
>>./whitebox_tools -r=CostPathway -v --wd="/path/to/data/"
--destination=dst.dep --backlink=backlink.dep --output=cost_path.dep
35. CreateColourComposite
Description: Creates a colour-composite image from three bands of multispectral imagery.
Toolbox: Image Processing Tools
Parameters:
Flag Description
–red Input red band image file.
–green Input green band image file.
–blue Input blue band image file.
–opacity Input opacity band image file (optional).
-o, –output Output colour composite file.
–enhance Optional flag indicating whether a balance contrast enhancement is performed.
Example usage:
>>./whitebox_tools -r=CreateColourComposite -v --wd="/path/to/data/"
--red=band3.dep --green=band2.dep --blue=band1.dep -o=output.dep
>>./whitebox_tools -r=CreateColourComposite -v --wd="/path/to/data/"
--red=band3.dep --green=band2.dep --blue=band1.dep --opacity=a.dep -o=output.dep
36. CreatePlane
Description: Creates a raster image based on the equation for a simple plane.
Toolbox: GIS Analysis
Parameters:
Flag Description
–base Input base raster file.
-o, –output Output raster file.
–gradient Slope gradient in degrees (-85.0 to 85.0).
–aspect Aspect (direction) in degrees clockwise from north (0.0-360.0).
–constant Constant value.

WhiteboxTools User Manual / Lindsay 25
Example usage:
>>./whitebox_tools -r=CreatePlane -v --wd="/path/to/data/" --base=base.dep
-o=NewRaster.dep --gradient=15.0 --aspect=315.0
37. CrispnessIndex
Description: Calculates the Crispness Index, which is used to quantify how crisp (or conversely how fuzzy)
a probability image is.
Toolbox: Math and Stats Tools
Parameters:
Flag Description
-i, –input Input raster file.
-o, –output Optional output html file (default name will be based on input file if unspecified).
Example usage:
>>./whitebox_tools -r=CrispnessIndex -v --wd="/path/to/data/" -i=input.dep
>>./whitebox_tools -r=CrispnessIndex -v --wd="/path/to/data/" -o=crispness.html
38. CrossTabulation
Description: Performs a cross-tabulation on two categorical images.
Toolbox: Math and Stats Tools
Parameters:
Flag Description
–i1, –input1 Input raster file 1.
–i2, –input2 Input raster file 1.
-o, –output Output HTML file (default name will be based on input file if unspecified).
Example usage:
>>./whitebox_tools -r=CrossTabulation -v --wd="/path/to/data/" --i1="file1.tif"
--i2="file2.tif" -o=outfile.html
39. CumulativeDistribution
Description: Converts a raster image to its cumulative distribution function.
Toolbox: Math and Stats Tools
Parameters:

26 WhiteboxTools User Manual / Lindsay
Flag Description
-i, –input Input raster file.
-o, –output Output raster file.
Example usage:
>>./whitebox_tools -r=CumulativeDistribution -v --wd="/path/to/data/"
-i=DEM.dep -o=output.dep
40. D8FlowAccumulation
Description: Calculates a D8 flow accumulation raster from an input DEM.
Toolbox: Hydrological Analysis
Parameters:
Flag Description
-i, –dem Input raster DEM file.
-o, –output Output raster file.
–out_type Output type; one of ‘cells’, ‘specific contributing area’ (default), and ‘catchment area’.
–log Optional flag to request the output be log-transformed.
–clip Optional flag to request clipping the display max by 1%.
Example usage:
>>./whitebox_tools -r=D8FlowAccumulation -v --wd="/path/to/data/"
--dem=DEM.dep -o=output.dep --out_type='cells'
>>./whitebox_tools -r=D8FlowAccumulation -v --wd="/path/to/data/"
--dem=DEM.dep -o=output.dep --out_type='specific catchment area' --log --clip
41. D8MassFlux
Description: Performs a D8 mass flux calculation.
Toolbox: Hydrological Analysis
Parameters:
Flag Description
–dem Input raster DEM file.
–loading Input loading raster file.
–efficiency Input efficiency raster file.
–absorption Input absorption raster file.
-o, –output Output raster file.

WhiteboxTools User Manual / Lindsay 27
Example usage:
>>./whitebox_tools -r=D8MassFlux -v --wd="/path/to/data/" --dem=DEM.dep
--loading=load.dep --efficiency=eff.dep --absorption=abs.dep -o=output.dep
42. D8Pointer
Description: Calculates a D8 flow pointer raster from an input DEM.
Toolbox: Hydrological Analysis
Parameters:
Flag Description
-i, –dem Input raster DEM file.
-o, –output Output raster file.
–esri_pntr D8 pointer uses the ESRI style scheme.
Example usage:
>>./whitebox_tools -r=D8Pointer -v --wd="/path/to/data/" --dem=DEM.dep -o=output.dep
43. DInfFlowAccumulation
Description: Calculates a D-infinity flow accumulation raster from an input DEM.
Toolbox: Hydrological Analysis
Parameters:
Flag Description
-i, –dem Input raster DEM file.
-o, –output Output raster file.
–out_type Output type; one of ‘cells’, ‘sca’ (default), and ‘ca’.
–threshold Optional convergence threshold parameter, in grid cells; default is inifinity.
–log Optional flag to request the output be log-transformed.
–clip Optional flag to request clipping the display max by 1%.
Example usage:
>>./whitebox_tools -r=DInfFlowAccumulation -v --wd="/path/to/data/"
--dem=DEM.dep -o=output.dep --out_type=sca
>>./whitebox_tools -r=DInfFlowAccumulation -v --wd="/path/to/data/"
--dem=DEM.dep -o=output.dep --out_type=sca --threshold=10000 --log --clip
44. DInfMassFlux
Description: Performs a D-infinity mass flux calculation.
Toolbox: Hydrological Analysis

28 WhiteboxTools User Manual / Lindsay
Parameters:
Flag Description
–dem Input raster DEM file.
–loading Input loading raster file.
–efficiency Input efficiency raster file.
–absorption Input absorption raster file.
-o, –output Output raster file.
Example usage:
>>./whitebox_tools -r=DInfMassFlux -v --wd="/path/to/data/" --dem=DEM.dep
--loading=load.dep --efficiency=eff.dep --absorption=abs.dep -o=output.dep
45. DInfPointer
Description: Calculates a D-infinity flow pointer (flow direction) raster from an input DEM.
Toolbox: Hydrological Analysis
Parameters:
Flag Description
-i, –dem Input raster DEM file.
-o, –output Output raster file.
Example usage:
>>./whitebox_tools -r=DInfPointer -v --wd="/path/to/data/" --dem=DEM.dep
46. Decrement
Description: Decreases the values of each grid cell in an input raster by 1.0.
Toolbox: Math and Stats Tools
Parameters:
Flag Description
-i, –input Input raster file.
-o, –output Output raster file.
Example usage:
>>./whitebox_tools -r=Decrement -v --wd="/path/to/data/" -i='input.dep'
-o=output.dep
47. DepthInSink

WhiteboxTools User Manual / Lindsay 29
Description: Measures the depth of sinks (depressions) in a DEM.
Toolbox: Hydrological Analysis
Parameters:
Flag Description
-i, –dem Input raster DEM file.
-o, –output Output raster file.
–zero_background Flag indicating whether the background value of zero should be used.
Example usage:
>>./whitebox_tools -r=DepthInSink -v --wd="/path/to/data/" --dem=DEM.dep
-o=output.dep --zero_background
48. DevFromMeanElev
Description: Calculates deviation from mean elevation.
Toolbox: Geomorphometric Analysis
Parameters:
Flag Description
-i, –input, –dem Input raster DEM file.
-o, –output Output raster file.
–filterx Size of the filter kernel in the x-direction.
–filtery Size of the filter kernel in the y-direction.
Example usage:
>>./whitebox_tools -r=DevFromMeanElev -v --wd="/path/to/data/" --dem=DEM.dep
-o=output.dep --filter=25
49. DiffFromMeanElev
Description: Calculates difference from mean elevation (equivalent to a high-pass filter).
Toolbox: Geomorphometric Analysis
Parameters:
Flag Description
-i, –input, –dem Input raster DEM file.
-o, –output Output raster file.
–filterx Size of the filter kernel in the x-direction.
–filtery Size of the filter kernel in the y-direction.

30 WhiteboxTools User Manual / Lindsay
Example usage:
>>./whitebox_tools -r=DiffFromMeanElev -v --wd="/path/to/data/" --dem=DEM.dep
-o=output.dep --filter=25
50. DiffOfGaussianFilter
Description: Performs a Difference of Gaussian (DoG) filter on an image.
Toolbox: Image Processing Tools/Filters
Parameters:
Flag Description
-i, –input Input raster file.
-o, –output Output raster file.
–sigma1 Standard deviation distance in pixels.
–sigma2 Standard deviation distance in pixels.
Example usage:
>>./whitebox_tools -r=DiffOfGaussianFilter -v --wd="/path/to/data/"
-i=image.dep -o=output.dep --sigma1=2.0 --sigma2=4.0
51. DirectDecorrelationStretch
Description: Performs a direct decorrelation stretch enhancement on a colour-composite image of multi-
spectral data.
Toolbox: Image Processing Tools/Image Enhancement
Parameters:
Flag Description
-i, –input Input colour composite image file.
-o, –output Output raster file.
-k Achromatic factor (k) ranges between 0 (no effect) and 1 (full saturation stretch), although typical values range from 0.3 to 0.7.
–clip Optional percent to clip the upper tail by during the stretch.
Example usage:
>>./whitebox_tools -r=DirectDecorrelationStretch -v --wd="/path/to/data/"
--input=image.dep -o=output.dep -k=0.4
52. DirectionalRelief
Description: Calculates relief for cells in an input DEM for a specified direction.
Toolbox: Geomorphometric Analysis

WhiteboxTools User Manual / Lindsay 31
Parameters:
Flag Description
-i, –dem Input raster DEM file.
-o, –output Output raster file.
–azimuth Wind azimuth in degrees.
–max_dist Optional maximum search distance (unspecified if none; in xy units).
Example usage:
>>./whitebox_tools -r=DirectionalRelief -v --wd="/path/to/data/" -i='input.dep'
-o=output.dep --azimuth=315.0
53. DistanceToOutlet
Description: Calculates the distance of stream grid cells to the channel network outlet cell.
Toolbox: Stream Network Analysis
Parameters:
Flag Description
–d8_pntr Input raster D8 pointer file.
–streams Input raster streams file.
-o, –output Output raster file.
–esri_pntr D8 pointer uses the ESRI style scheme.
–zero_background Flag indicating whether a background value of zero should be used.
Example usage:
>>./whitebox_tools -r=DistanceToOutlet -v --wd="/path/to/data/" --d8_pntr=D8.dep
--streams=streams.dep -o=output.dep
>>./whitebox_tools -r=DistanceToOutlet -v --wd="/path/to/data/" --d8_pntr=D8.flt
--streams=streams.flt -o=output.flt --esri_pntr --zero_background
54. DiversityFilter
Description: Assigns each cell in the output grid the number of different values in a moving window centred
on each grid cell in the input raster.
Toolbox: Image Processing Tools/Filters
Parameters:
Flag Description
-i, –input Input raster file.
-o, –output Output raster file.

32 WhiteboxTools User Manual / Lindsay
Flag Description
–filterx Size of the filter kernel in the x-direction.
–filtery Size of the filter kernel in the y-direction.
Example usage:
>>./whitebox_tools -r=DiversityFilter -v --wd="/path/to/data/" -i=image.dep
-o=output.dep --filter=25
55. Divide
Description: Performs a division operation on two rasters or a raster and a constant value.
Toolbox: Math and Stats Tools
Parameters:
Flag Description
–input1 Input raster file or constant value.
–input2 Input raster file or constant value.
-o, –output Output raster file.
Example usage:
>>./whitebox_tools -r=Divide -v --wd="/path/to/data/" --input1='in1.dep'
--input2='in2.dep' -o=output.dep
56. DownslopeDistanceToStream
Description: Measures distance to the nearest downslope stream cell.
Toolbox: Hydrological Analysis
Parameters:
Flag Description
-i, –dem Input raster DEM file.
–streams Input raster streams file.
-o, –output Output raster file.
Example usage:
>>./whitebox_tools -r=DownslopeDistanceToStream -v --wd="/path/to/data/"
--dem='dem.dep' --streams='streams.dep' -o='output.dep'
57. DownslopeFlowpathLength
Description: Calculates the downslope flowpath length from each cell to basin outlet.

WhiteboxTools User Manual / Lindsay 33
Toolbox: Hydrological Analysis
Parameters:
Flag Description
–d8_pntr Input D8 pointer raster file.
–watersheds Optional input watershed raster file.
–weights Optional input weights raster file.
-o, –output Output raster file.
–esri_pntr D8 pointer uses the ESRI style scheme.
Example usage:
>>./whitebox_tools -r=DownslopeFlowpathLength -v --wd="/path/to/data/"
--d8_pntr=pointer.dep -o=flowpath_len.dep
>>./whitebox_tools -r=DownslopeFlowpathLength -v --wd="/path/to/data/"
--d8_pntr=pointer.flt --watersheds=basin.flt --weights=weights.flt -o=flowpath_len.flt
--esri_pntr
58. DownslopeIndex
Description: Calculates the Hjerdt et al. (2004) downslope index.
Toolbox: Geomorphometric Analysis
Parameters:
Flag Description
-i, –dem Input raster DEM file.
-o, –output Output raster file.
–drop Vertical drop value (default is 2.0).
–out_type Output type, options include ‘tangent’, ‘degrees’, ‘radians’, ‘distance’ (default is ‘tangent’).
Example usage:
>>./whitebox_tools -r=DownslopeIndex -v --wd="/path/to/data/" --dem=pointer.dep
-o=dsi.dep --drop=5.0 --out_type=distance
59. EdgeProportion
Description: Calculate the proportion of cells in a raster polygon that are edge cells.
Toolbox: GIS Analysis/Patch Shape Tools
Parameters:
Flag Description
-i, –input Input raster file.

34 WhiteboxTools User Manual / Lindsay
Flag Description
-o, –output Output raster file.
–output_text flag indicating whether a text report should also be output.
Example usage:
>>./whitebox_tools -r=EdgeProportion -v --wd="/path/to/data/" -i=input.dep
-o=output.dep --output_text
60. ElevAbovePit
Description: Calculate the elevation of each grid cell above the nearest downstream pit cell or grid edge
cell.
Toolbox: Geomorphometric Analysis
Parameters:
Flag Description
-i, –dem Input raster DEM file.
-o, –output Output raster file.
Example usage:
>>./whitebox_tools -r=ElevAbovePit -v --wd="/path/to/data/" --dem=DEM.dep
-o=output.dep
61. ElevPercentile
Description: Calculates the elevation percentile raster from a DEM.
Toolbox: Geomorphometric Analysis
Parameters:
Flag Description
-i, –input, –dem Input raster DEM file.
-o, –output Output raster file.
–filterx Size of the filter kernel in the x-direction.
–filtery Size of the filter kernel in the y-direction.
–sig_digits Number of significant digits.
Example usage:
>>./whitebox_tools -r=ElevPercentile -v --wd="/path/to/data/" --dem=DEM.dep
-o=output.dep --filter=25

WhiteboxTools User Manual / Lindsay 35
62. ElevRelativeToMinMax
Description: Calculates the elevation of a location relative to the minimum and maximum elevations in a
DEM.
Toolbox: Geomorphometric Analysis
Parameters:
Flag Description
-i, –dem Input raster DEM file.
-o, –output Output raster file.
Example usage:
>>./whitebox_tools -r=ElevRelativeToMinMax -v --wd="/path/to/data/"
--dem=DEM.dep -o=output.dep
63. ElevRelativeToWatershedMinMax
Description: Calculates the elevation of a location relative to the minimum and maximum elevations in a
watershed.
Toolbox: Geomorphometric Analysis
Parameters:
Flag Description
-i, –dem Input raster DEM file.
–watersheds Input raster watersheds file.
-o, –output Output raster file.
Example usage:
>>./whitebox_tools -r=ElevRelativeToWatershedMinMax -v --wd="/path/to/data/" --dem=DEM.dep
--watersheds=watershed.dep -o=output.dep
64. ElevationAboveStream
Description: Calculates the elevation of cells above the nearest downslope stream cell.
Toolbox: Hydrological Analysis
Parameters:
Flag Description
-i, –dem Input raster DEM file.
–streams Input raster streams file.
-o, –output Output raster file.

36 WhiteboxTools User Manual / Lindsay
Example usage:
>>./whitebox_tools -r=ElevationAboveStream -v --wd="/path/to/data/" --dem='dem.dep'
--streams='streams.dep' -o='output.dep'
65. EmbossFilter
Description: Performs an emboss filter on an image, similar to a hillshade operation.
Toolbox: Image Processing Tools/Filters
Parameters:
Flag Description
-i, –input Input raster file.
-o, –output Output raster file.
–direction Direction of reflection; options include ‘n’, ‘s’, ‘e’, ‘w’, ‘ne’, ‘se’, ‘nw’, ‘sw’
–clip Optional amount to clip the distribution tails by, in percent.
Example usage:
>>./whitebox_tools -r=EmbossFilter -v --wd="/path/to/data/" -i=image.dep
-o=output.dep --direction='s' --clip=1.0
66. EqualTo
Description: Performs a equal-to comparison operation on two rasters or a raster and a constant value.
Toolbox: Math and Stats Tools
Parameters:
Flag Description
–input1 Input raster file or constant value.
–input2 Input raster file or constant value.
-o, –output Output raster file.
Example usage:
>>./whitebox_tools -r=EqualTo -v --wd="/path/to/data/" --input1='in1.dep'
--input2='in2.dep' -o=output.dep
67. EuclideanAllocation
Description: Assigns grid cells in the output raster the value of the nearest target cell in the input image,
measured by the Shih and Wu (2004) Euclidean distance transform.
Toolbox: GIS Analysis/Distance Tools
Parameters:

WhiteboxTools User Manual / Lindsay 37
Flag Description
-i, –input Input raster file.
-o, –output Output raster file.
Example usage:
>>./whitebox_tools -r=EuclideanAllocation -v --wd="/path/to/data/" -i=DEM.dep
-o=output.dep
68. EuclideanDistance
Description: Calculates the Shih and Wu (2004) Euclidean distance transform.
Toolbox: GIS Analysis/Distance Tools
Parameters:
Flag Description
-i, –input Input raster file.
-o, –output Output raster file.
Example usage:
>>./whitebox_tools -r=EuclideanDistance -v --wd="/path/to/data/" -i=DEM.dep
-o=output.dep
69. Exp
Description: Returns the exponential (base e) of values in a raster.
Toolbox: Math and Stats Tools
Parameters:
Flag Description
-i, –input Input raster file.
-o, –output Output raster file.
Example usage:
>>./whitebox_tools -r=Exp -v --wd="/path/to/data/" -i='input.dep' -o=output.dep
70. Exp2
Description: Returns the exponential (base 2) of values in a raster.
Toolbox: Math and Stats Tools
Parameters:

38 WhiteboxTools User Manual / Lindsay
Flag Description
-i, –input Input raster file.
-o, –output Output raster file.
Example usage:
>>./whitebox_tools -r=Exp2 -v --wd="/path/to/data/" -i='input.dep' -o=output.dep
71. ExtractRasterStatistics
Description: Extracts descriptive statistics for a group of patches in a raster.
Toolbox: Math and Stats Tools
Parameters:
Flag Description
-i, –input Input data raster file.
–features Input feature definition raster file.
-o, –output Output raster file.
–stat Statistic to extract.
–out_table Output HTML Table file.
Example usage:
>>./whitebox_tools -r=ExtractRasterStatistics -v --wd="/path/to/data/"
-i='input.dep' --features='groups.dep' -o='output.dep' --stat='minimum'
>>./whitebox_tools -r=ExtractRasterStatistics -v --wd="/path/to/data/"
-i='input.dep' --features='groups.dep' --out_table='output.html'
72. ExtractStreams
Description: Extracts stream grid cells from a flow accumulation raster.
Toolbox: Stream Network Analysis
Parameters:
Flag Description
–flow_accum Input raster D8 flow accumulation file.
-o, –output Output raster file.
–threshold Threshold in flow accumulation values for channelization.
–zero_background Flag indicating whether a background value of zero should be used.
Example usage:
>>./whitebox_tools -r=ExtractStreams -v --wd="/path/to/data/" --flow_accum='d8accum.dep'

WhiteboxTools User Manual / Lindsay 39
-o='output.dep' --threshold=100.0 --zero_background
73. ExtractValleys
Description: Identifies potential valley bottom grid cells based on local topolography alone.
Toolbox: Stream Network Analysis
Parameters:
Flag Description
-i, –dem Input raster DEM file.
-o, –output Output raster file.
–variant Options include ‘lq’ (lower quartile), ‘JandR’ (Johnston and Rosenfeld), and ‘PandD’ (Peucker and Douglas); default is ‘lq’.
–line_thin Optional flag indicating whether post-processing line-thinning should be performed.
–filter Optional argument (only used when variant=‘lq’) providing the filter size, in grid cells, used for lq-filtering (default is 5).
Example usage:
>>./whitebox_tools -r=ExtractValleys -v --wd="/path/to/data/" --dem=pointer.dep
-o=out.dep --variant='JandR' --line_thin
>>./whitebox_tools -r=ExtractValleys -v --wd="/path/to/data/" --dem=pointer.dep
-o=out.dep --variant='lq' --filter=7 --line_thin
74. FD8FlowAccumulation
Description: Calculates an FD8 flow accumulation raster from an input DEM.
Toolbox: Hydrological Analysis
Parameters:
Flag Description
-i, –dem Input raster DEM file.
-o, –output Output raster file.
–out_type Output type; one of ‘cells’, ‘specific contributing area’ (default), and ‘catchment area’.
–exponent Optional exponent parameter; default is 1.1.
–threshold Optional convergence threshold parameter, in grid cells; default is inifinity.
–log Optional flag to request the output be log-transformed.
–clip Optional flag to request clipping the display max by 1%.
Example usage:
>>./whitebox_tools -r=FD8FlowAccumulation -v --wd="/path/to/data/" --dem=DEM.dep
-o=output.dep --out_type='cells'
>>./whitebox_tools -r=FD8FlowAccumulation -v --wd="/path/to/data/" --dem=DEM.dep
-o=output.dep --out_type='catchment area' --exponent=1.5 --threshold=10000 --log --clip

40 WhiteboxTools User Manual / Lindsay
75. FD8Pointer
Description: Calculates an FD8 flow pointer raster from an input DEM.
Toolbox: Hydrological Analysis
Parameters:
Flag Description
-i, –dem Input raster DEM file.
-o, –output Output raster file.
Example usage:
>>./whitebox_tools -r=FD8Pointer -v --wd="/path/to/data/" --dem=DEM.dep
-o=output.dep
76. FarthestChannelHead
Description: Calculates the distance to the furthest upstream channel head for each stream cell.
Toolbox: Stream Network Analysis
Parameters:
Flag Description
–d8_pntr Input raster D8 pointer file.
–streams Input raster streams file.
-o, –output Output raster file.
–esri_pntr D8 pointer uses the ESRI style scheme.
–zero_background Flag indicating whether a background value of zero should be used.
Example usage:
>>./whitebox_tools -r=FarthestChannelHead -v --wd="/path/to/data/" --d8_pntr=D8.dep
--streams=streams.dep -o=output.dep
>>./whitebox_tools -r=FarthestChannelHead -v --wd="/path/to/data/" --d8_pntr=D8.flt
--streams=streams.flt -o=output.flt --esri_pntr --zero_background
77. FeaturePreservingDenoise
Description: Reduces short-scale variation in an input DEM using a modified Sun et al. (2007) algorithm.
Toolbox: Geomorphometric Analysis
Parameters:
Flag Description
-i, –dem Input raster DEM file.

WhiteboxTools User Manual / Lindsay 41
Flag Description
-o, –output Output raster file.
–filter Size of the filter kernel.
–norm_diff Maximum difference in normal vectors, in degrees.
–num_iter Number of iterations.
–zfactor Optional multiplier for when the vertical and horizontal units are not the same.
Example usage:
>>./whitebox_tools -r=FeaturePreservingDenoise -v --wd="/path/to/data/"
--dem=DEM.dep -o=output.dep
78. FetchAnalysis
Description: Performs an analysis of fetch or upwind distance to an obstacle.
Toolbox: Geomorphometric Analysis
Parameters:
Flag Description
-i, –dem Input raster DEM file.
-o, –output Output raster file.
–azimuth Wind azimuth in degrees in degrees.
–hgt_inc Height increment value.
Example usage:
>>./whitebox_tools -r=FetchAnalysis -v --wd="/path/to/data/" -i='input.dep'
-o=output.dep --azimuth=315.0
79. FillDepressions
Description: Fills all of the depressions in a DEM. Depression breaching should be preferred in most cases.
Toolbox: Hydrological Analysis
Parameters:
Flag Description
-i, –dem Input raster DEM file.
-o, –output Output raster file.
–fix_flats Optional flag indicating whether flat areas should have a small gradient applied.
Example usage:
>>./whitebox_tools -r=FillDepressions -v --wd="/path/to/data/" --dem=DEM.dep

42 WhiteboxTools User Manual / Lindsay
-o=output.dep --fix_flats
80. FillMissingData
Description: Fills nodata holes in a DEM.
Toolbox: Geomorphometric Analysis
Parameters:
Flag Description
-i, –input Input raster file.
-o, –output Output raster file.
–filter Filter size (cells).
Example usage:
>>./whitebox_tools -r=FillMissingData -v --wd="/path/to/data/" -i=DEM.dep
-o=output.dep --filter=25
81. FillSingleCellPits
Description: Raises pit cells to the elevation of their lowest neighbour.
Toolbox: Hydrological Analysis
Parameters:
Flag Description
-i, –dem Input raster DEM file.
-o, –output Output raster file.
Example usage:
>>./whitebox_tools -r=FillSingleCellPits -v --wd="/path/to/data/" --dem=DEM.dep
-o=NewRaster.dep
82. FilterLidarScanAngles
Description: Removes points in a LAS file with scan angles greater than a threshold.
Toolbox: LiDAR Tools
Parameters:
Flag Description
-i, –input Input LiDAR file.
-o, –output Output LiDAR file.
–threshold Scan angle threshold.

WhiteboxTools User Manual / Lindsay 43
Example usage:
>>./whitebox_tools -r=FilterLidarScanAngles -v --wd="/path/to/data/" -i="input.las"
-o="output.las" --threshold=10.0
83. FindFlightlineEdgePoints
Description: Identifies points along a flightline’s edge in a LAS file.
Toolbox: LiDAR Tools
Parameters:
Flag Description
-i, –input Input LiDAR file.
-o, –output Output file.
Example usage:
>>./whitebox_tools -r=FindFlightlineEdgePoints -v --wd="/path/to/data/" -i="input.las"
-o="output.las"
84. FindMainStem
Description: Finds the main stem, based on stream lengths, of each stream network.
Toolbox: Stream Network Analysis
Parameters:
Flag Description
–d8_pntr Input raster D8 pointer file.
–streams Input raster streams file.
-o, –output Output raster file.
–esri_pntr D8 pointer uses the ESRI style scheme.
–zero_background Flag indicating whether a background value of zero should be used.
Example usage:
>>./whitebox_tools -r=FindMainStem -v --wd="/path/to/data/" --d8_pntr=D8.dep
--streams=streams.dep -o=output.dep
>>./whitebox_tools -r=FindMainStem -v --wd="/path/to/data/" --d8_pntr=D8.flt
--streams=streams.flt -o=output.flt --esri_pntr --zero_background
85. FindNoFlowCells
Description: Finds grid cells with no downslope neighbours.
Toolbox: Hydrological Analysis

44 WhiteboxTools User Manual / Lindsay
Parameters:
Flag Description
-i, –dem Input raster DEM file.
-o, –output Output raster file.
Example usage:
>>./whitebox_tools -r=FindNoFlowCells -v --wd="/path/to/data/" --dem=DEM.dep
-o=NewRaster.dep
86. FindParallelFlow
Description: Finds areas of parallel flow in D8 flow direction rasters.
Toolbox: Hydrological Analysis
Parameters:
Flag Description
–d8_pntr Input D8 pointer raster file.
–streams Input raster streams file.
-o, –output Output raster file.
Example usage:
>>./whitebox_tools -r=FindParallelFlow -v --wd="/path/to/data/"
--d8_pntr=pointer.dep -o=out.dep
>>./whitebox_tools -r=FindParallelFlow -v --wd="/path/to/data/"
--d8_pntr=pointer.dep -o=out.dep --streams='streams.dep'
87. FindPatchOrClassEdgeCells
Description: Finds all cells located on the edge of patch or class features.
Toolbox: GIS Analysis/Patch Shape Tools
Parameters:
Flag Description
-i, –input Input raster file.
-o, –output Output raster file.
Example usage:
>>./whitebox_tools -r=FindPatchOrClassEdgeCells -v --wd="/path/to/data/" -i=input.dep
-o=output.dep

WhiteboxTools User Manual / Lindsay 45
88. FindRidges
Description: Identifies potential ridge and peak grid cells.
Toolbox: Geomorphometric Analysis
Parameters:
Flag Description
-i, –dem Input raster DEM file.
-o, –output Output raster file.
–line_thin Optional flag indicating whether post-processing line-thinning should be performed.
Example usage:
>>./whitebox_tools -r=FindRidges -v --wd="/path/to/data/" --dem=pointer.dep -o=out.dep
--line_thin
89. FlightlineOverlap
Description: Reads a LiDAR (LAS) point file and outputs a raster containing the number of overlapping flight
lines in each grid cell.
Toolbox: LiDAR Tools
Parameters:
Flag Description
-i, –input Input LiDAR file.
-o, –output Output file.
–resolution Output raster’s grid resolution.
Example usage:
>>./whitebox_tools -r=FlightlineOverlap -v --wd="/path/to/data/" -i=file.las
-o=outfile.dep --resolution=2.0"
./whitebox_tools -r=FlightlineOverlap -v --wd="/path/to/data/" -i=file.las
-o=outfile.dep --resolution=5.0 --palette=light_quant.plt
90. FlipImage
Description: Reflects an image in the vertical or horizontal axis.
Toolbox: Image Processing Tools
Parameters:
Flag Description
-i, –input Input raster file.

46 WhiteboxTools User Manual / Lindsay
Flag Description
-o, –output Output raster file.
–direction Direction of reflection; options include ‘v’ (vertical), ‘h’ (horizontal), and ‘b’ (both).
Example usage:
>>./whitebox_tools -r=FlipImage -v --wd="/path/to/data/" --input=in.dep
-o=out.dep --direction=h
91. FloodOrder
Description: Assigns each DEM grid cell its order in the sequence of inundations that are encountered
during a search starting from the edges, moving inward at increasing elevations.
Toolbox: Hydrological Analysis
Parameters:
Flag Description
-i, –dem Input raster DEM file.
-o, –output Output raster file.
Example usage:
>>./whitebox_tools -r=FloodOrder -v --wd="/path/to/data/" --dem=DEM.dep
-o=output.dep
92. Floor
Description: Returns the largest (closest to positive infinity) value that is less than or equal to the values in
a raster.
Toolbox: Math and Stats Tools
Parameters:
Flag Description
-i, –input Input raster file.
-o, –output Output raster file.
Example usage:
>>./whitebox_tools -r=Floor -v --wd="/path/to/data/" -i='input.dep'
-o='output.dep'
93. FlowAccumulationFullWorkflow
Description: Resolves all of the depressions in a DEM, outputting a breached DEM, an aspect-aligned non-

WhiteboxTools User Manual / Lindsay 47
divergent flow pointer, a flow accumulation raster.
Toolbox: Hydrological Analysis
Parameters:
Flag Description
-i, –dem Input raster DEM file.
–out_dem Output raster DEM file.
–out_pntr Output raster flow pointer file.
–out_accum Output raster flow accumulation file.
–out_type Output type; one of ‘cells’, ‘sca’ (default), and ‘ca’.
–log Optional flag to request the output be log-transformed.
–clip Optional flag to request clipping the display max by 1%.
–esri_pntr D8 pointer uses the ESRI style scheme.
Example usage:
>>./whitebox_tools -r=FlowAccumulationFullWorkflow -v --wd="/path/to/data/"
--dem='DEM.dep' --out_dem='DEM_filled.dep' --out_pntr='pointer.dep'
--out_accum='accum.dep' --out_type=sca --log --clip
94. FlowLengthDiff
Description: Calculates the local maximum absolute difference in downslope flowpath length, useful in
mapping drainage divides and ridges.
Toolbox: Hydrological Analysis
Parameters:
Flag Description
–d8_pntr Input D8 pointer raster file.
-o, –output Output raster file.
–esri_pntr D8 pointer uses the ESRI style scheme.
Example usage:
>>./whitebox_tools -r=FlowLengthDiff -v --wd="/path/to/data/"
--d8_pntr=pointer.dep -o=output.dep
95. GammaCorrection
Description: Performs a sigmoidal contrast stretch on input images.
Toolbox: Image Processing Tools/Image Enhancement
Parameters:

48 WhiteboxTools User Manual / Lindsay
Flag Description
-i, –input Input raster file.
-o, –output Output raster file.
–gamma Gamma value.
Example usage:
>>./whitebox_tools -r=GammaCorrection -v --wd="/path/to/data/" -i=input.dep
-o=output.dep --gamma=0.5
96. GaussianFilter
Description: Performs a Gaussian filter on an image.
Toolbox: Image Processing Tools/Filters
Parameters:
Flag Description
-i, –input Input raster file.
-o, –output Output raster file.
–sigma Standard deviation distance in pixels.
Example usage:
>>./whitebox_tools -r=GaussianFilter -v --wd="/path/to/data/" -i=image.dep
-o=output.dep --sigma=2.0
97. GreaterThan
Description: Performs a greater-than comparison operation on two rasters or a raster and a constant value.
Toolbox: Math and Stats Tools
Parameters:
Flag Description
–input1 Input raster file or constant value.
–input2 Input raster file or constant value.
-o, –output Output raster file.
–incl_equals Perform a greater-than-or-equal-to operation.
Example usage:
>>./whitebox_tools -r=GreaterThan -v --wd="/path/to/data/" --input1='in1.dep'
--input2='in2.dep' -o=output.dep --incl_equals

WhiteboxTools User Manual / Lindsay 49
98. HackStreamOrder
Description: Assigns the Hack stream order to each tributary in a stream network.
Toolbox: Stream Network Analysis
Parameters:
Flag Description
–d8_pntr Input raster D8 pointer file.
–streams Input raster streams file.
-o, –output Output raster file.
–esri_pntr D8 pointer uses the ESRI style scheme.
–zero_background Flag indicating whether a background value of zero should be used.
Example usage:
>>./whitebox_tools -r=HackStreamOrder -v --wd="/path/to/data/" --d8_pntr=D8.dep
--streams=streams.dep -o=output.dep
>>./whitebox_tools -r=HackStreamOrder -v --wd="/path/to/data/" --d8_pntr=D8.flt
--streams=streams.flt -o=output.flt --esri_pntr --zero_background
99. HighPassFilter
Description: Performs a high-pass filter on an input image.
Toolbox: Image Processing Tools/Filters
Parameters:
Flag Description
-i, –input Input raster file.
-o, –output Output raster file.
–filterx Size of the filter kernel in the x-direction.
–filtery Size of the filter kernel in the y-direction.
Example usage:
>>./whitebox_tools -r=HighPassFilter -v --wd="/path/to/data/" -i=image.dep
-o=output.dep --filter=25
100. HighestPosition
Description: Identifies the stack position of the maximum value within a raster stack on a cell-by-cell basis.
Toolbox: GIS Analysis/Overlay Tools
Parameters:

50 WhiteboxTools User Manual / Lindsay
Flag Description
-i, –inputs Input raster files.
-o, –output Output raster file.
Example usage:
>>./whitebox_tools -r=HighestPosition -v --wd='/path/to/data/'
-i='image1.dep;image2.dep;image3.dep' -o=output.dep
101. Hillshade
Description: Calculates a hillshade raster from an input DEM.
Toolbox: Geomorphometric Analysis
Parameters:
Flag Description
-i, –dem Input raster DEM file.
-o, –output Output raster file.
–azimuth Illumination source azimuth in degrees.
–altitude Illumination source altitude in degrees.
–zfactor Optional multiplier for when the vertical and horizontal units are not the same.
Example usage:
>>./whitebox_tools -r=Hillshade -v --wd="/path/to/data/" -i=DEM.dep -o=output.dep
--azimuth=315.0 --altitude=30.0
102. Hillslopes
Description: Identifies the individual hillslopes draining to each link in a stream network.
Toolbox: Hydrological Analysis
Parameters:
Flag Description
–d8_pntr Input raster D8 pointer file.
–streams Input raster streams file.
-o, –output Output raster file.
–esri_pntr D8 pointer uses the ESRI style scheme.
Example usage:
>>./whitebox_tools -r=Hillslopes -v --wd="/path/to/data/" --d8_pntr='d8pntr.dep'
--streams='streams.dep' -o='output.dep'

WhiteboxTools User Manual / Lindsay 51
103. HistogramEqualization
Description: Performs a histogram equalization contrast enhancment on an image.
Toolbox: Image Processing Tools/Image Enhancement
Parameters:
Flag Description
-i, –input Input raster file.
-o, –output Output raster file.
–num_tones Number of tones in the output image.
Example usage:
>>./whitebox_tools -r=HistogramEqualization -v --wd="/path/to/data/" -i=input.dep
-o=output.dep --num_tones=1024
104. HistogramMatching
Description: Alters the statistical distribution of a raster image matching it to a specified PDF.
Toolbox: Image Processing Tools/Image Enhancement
Parameters:
Flag Description
-i, –input Input raster file.
–histo_file Input reference probability distribution function (pdf) text file.
-o, –output Output raster file.
Example usage:
>>./whitebox_tools -r=HistogramMatching -v --wd="/path/to/data/" -i=input1.dep
--histo_file=histo.txt -o=output.dep
105. HistogramMatchingTwoImages
Description: This tool alters the cumulative distribution function of a raster image to that of another image.
Toolbox: Image Processing Tools/Image Enhancement
Parameters:
Flag Description
–i1, –input1 Input raster file to modify.
–i2, –input2 Input reference raster file.
-o, –output Output raster file.

52 WhiteboxTools User Manual / Lindsay
Example usage:
>>./whitebox_tools -r=HistogramMatchingTwoImages -v --wd="/path/to/data/" --i1=input1.dep
--i2=input2.dep -o=output.dep
106. HorizonAngle
Description: Calculates horizon angle (maximum upwind slope) for each grid cell in an input DEM.
Toolbox: Geomorphometric Analysis
Parameters:
Flag Description
-i, –dem Input raster DEM file.
-o, –output Output raster file.
–azimuth Wind azimuth in degrees.
–max_dist Optional maximum search distance (unspecified if none; in xy units).
Example usage:
>>./whitebox_tools -r=HorizonAngle -v --wd="/path/to/data/" -i='input.dep'
-o=output.dep --azimuth=315.0
107. HortonStreamOrder
Description: Assigns the Horton stream order to each tributary in a stream network.
Toolbox: Stream Network Analysis
Parameters:
Flag Description
–d8_pntr Input raster D8 pointer file.
–streams Input raster streams file.
-o, –output Output raster file.
–esri_pntr D8 pointer uses the ESRI style scheme.
–zero_background Flag indicating whether a background value of zero should be used.
Example usage:
>>./whitebox_tools -r=HortonStreamOrder -v --wd="/path/to/data/" --d8_pntr=D8.dep
--streams=streams.dep -o=output.dep
>>./whitebox_tools -r=HortonStreamOrder -v --wd="/path/to/data/" --d8_pntr=D8.flt
--streams=streams.flt -o=output.flt --esri_pntr --zero_background
108. HypsometricAnalysis
Description: Calculates a hypsometric curve for one or more DEMs.

WhiteboxTools User Manual / Lindsay 53
Toolbox: Geomorphometric Analysis
Parameters:
Flag Description
-i, –inputs Input DEM files.
–watershed Input watershed files (optional).
-o, –output Output HTML file (default name will be based on input file if unspecified).
Example usage:
>>./whitebox_tools -r=HypsometricAnalysis -v --wd="/path/to/data/"
-i="DEM1.tif;DEM2.tif" --watershed="ws1.tif;ws2.tif" -o=outfile.html
109. ImageAutocorrelation
Description: Performs Moran’s I analysis on two or more input images.
Toolbox: Math and Stats Tools
Parameters:
Flag Description
-i, –inputs Input raster files.
–contiguity Contiguity type.
-o, –output Output HTML file (default name will be based on input file if unspecified).
Example usage:
>>./whitebox_tools -r=ImageAutocorrelation -v --wd="/path/to/data/"
-i="file1.tif, file2.tif, file3.tif" -o=outfile.html --contiguity=Bishops
110. ImageCorrelation
Description: Performs image correlation on two or more input images.
Toolbox: Math and Stats Tools
Parameters:
Flag Description
-i, –inputs Input raster files.
-o, –output Output HTML file (default name will be based on input file if unspecified).
Example usage:
>>./whitebox_tools -r=ImageCorrelation -v --wd="/path/to/data/"
-i="file1.tif, file2.tif, file3.tif" -o=outfile.html

54 WhiteboxTools User Manual / Lindsay
111. ImageRegression
Description: Performs image regression analysis on two input images.
Toolbox: Math and Stats Tools
Parameters:
Flag Description
–i1, –input1 Input raster file (independent variable, X).
–i2, –input2 Input raster file (dependent variable, Y).
-o, –output Output HTML file for regression summary report.
–out_residuals Output raster regression resdidual file.
–standardize Optional flag indicating whether to standardize the residuals map.
Example usage:
>>./whitebox_tools -r=ImageRegression -v --wd="/path/to/data/" --i1='file1.tif'
--i2='file2.tif' -o='outfile.html' --out_residuals='residuals.tif' --standardize
112. Increment
Description: Increases the values of each grid cell in an input raster by 1.0.
Toolbox: Math and Stats Tools
Parameters:
Flag Description
-i, –input Input raster file.
-o, –output Output raster file.
Example usage:
>>./whitebox_tools -r=Increment -v --wd="/path/to/data/" -i='input.dep'
-o=output.dep
113. IntegerDivision
Description: Performs an integer division operation on two rasters or a raster and a constant value.
Toolbox: Math and Stats Tools
Parameters:
Flag Description
–input1 Input raster file or constant value.
–input2 Input raster file or constant value.
-o, –output Output raster file.

WhiteboxTools User Manual / Lindsay 55
Example usage:
>>./whitebox_tools -r=IntegerDivision -v --wd="/path/to/data/" --input1='in1.dep'
--input2='in2.dep' -o=output.dep
114. IntegralImage
Description: Transforms an input image (summed area table) into its integral image equivalent.
Toolbox: Image Processing Tools
Parameters:
Flag Description
-i, –input Input raster file.
-o, –output Output raster file.
Example usage:
>>./whitebox_tools -r=IntegralImage -v --wd="/path/to/data/" -i=image.dep
-o=output.dep
115. IsNoData
Description: Identifies NoData valued pixels in an image.
Toolbox: Math and Stats Tools
Parameters:
Flag Description
-i, –input Input raster file.
-o, –output Output raster file.
Example usage:
>>./whitebox_tools -r=IsNoData -v --wd="/path/to/data/" -i='input.dep'
-o=output.dep
116. Isobasins
Description: Divides a landscape into nearly equal sized drainage basins (i.e. watersheds).
Toolbox: Hydrological Analysis
Parameters:
Flag Description
-i, –dem Input raster DEM file.
-o, –output Output raster file.

56 WhiteboxTools User Manual / Lindsay
Flag Description
–size Target basin size, in grid cells.
Example usage:
>>./whitebox_tools -r=Isobasins -v --wd="/path/to/data/" --dem=DEM.dep
-o=output.dep --size=1000
117. JensonSnapPourPoints
Description: Moves outlet points used to specify points of interest in a watershedding operation to the
nearest stream cell.
Toolbox: Hydrological Analysis
Parameters:
Flag Description
–pour_pts Input raster pour points (outlet) file.
–streams Input raster streams file.
-o, –output Output raster file.
–snap_dist Maximum snap distance in map units.
Example usage:
>>./whitebox_tools -r=JensonSnapPourPoints -v --wd="/path/to/data/"
--pour_pts='pour_pts.dep' --streams='streams.dep' -o='output.dep'
--snap_dist=15.0
118. KMeansClustering
Description: Performs a k-means clustering operation on a multi-spectral dataset.
Toolbox: Image Processing Tools
Parameters:
Flag Description
-i, –inputs Input raster files.
-o, –output Output raster file.
–out_html Output HTML report file.
–classes Number of classes
–max_iterations Maximum number of iterations
–class_change Minimum percent of cells changed between iterations before completion
–initialize How to initialize cluster centres?
–min_class_size Minimum class size, in pixels

WhiteboxTools User Manual / Lindsay 57
Example usage:
>>./whitebox_tools -r=KMeansClustering -v --wd='/path/to/data/'
-i='image1.tif;image2.tif;image3.tif' -o=output.tif --out_html=report.html
--classes=15 --max_iterations=25 --class_change=1.5 --initialize='random'
--min_class_size=500
119. KNearestMeanFilter
Description: A k-nearest mean filter is a type of edge-preserving smoothing filter.
Toolbox: Image Processing Tools/Filters
Parameters:
Flag Description
-i, –input Input raster file.
-o, –output Output raster file.
–filterx Size of the filter kernel in the x-direction.
–filtery Size of the filter kernel in the y-direction.
-k k-value in pixels; this is the number of nearest-valued neighbours to use.
Example usage:
>>./whitebox_tools -r=KNearestMeanFilter -v --wd="/path/to/data/" -i=image.dep
-o=output.dep --filter=9 -k=5
>>./whitebox_tools -r=KNearestMeanFilter -v --wd="/path/to/data/" -i=image.dep
-o=output.dep --filtery=7 --filtery=9 -k=5
120. KSTestForNormality
Description: Evaluates whether the values in a raster are normally distributed.
Toolbox: Math and Stats Tools
Parameters:
Flag Description
-i, –input Input raster file.
-o, –output Output HTML file.
–num_samples Number of samples. Leave blank to use whole image.
Example usage:
>>./whitebox_tools -r=KSTestForNormality -v --wd="/path/to/data/" -i=input.dep
-o=output.html --num_samples=1000
>>./whitebox_tools -r=KSTestForNormality -v --wd="/path/to/data/" -i=input.dep
-o=output.html

58 WhiteboxTools User Manual / Lindsay
121. KappaIndex
Description: Performs a kappa index of agreement (KIA) analysis on two categorical raster files.
Toolbox: Math and Stats Tools
Parameters:
Flag Description
–i1, –input1 Input classification raster file.
–i2, –input2 Input reference raster file.
-o, –output Output HTML file.
Example usage:
>>./whitebox_tools -r=KappaIndex -v --wd="/path/to/data/" --i1=class.tif
--i2=reference.tif -o=kia.html
122. LaplacianFilter
Description: Performs a Laplacian filter on an image.
Toolbox: Image Processing Tools/Filters
Parameters:
Flag Description
-i, –input Input raster file.
-o, –output Output raster file.
–variant Optional variant value. Options include 3x3(1), 3x3(2), 3x3(3), 3x3(4), 5x5(1), and 5x5(2) (default is 3x3(1)).
–clip Optional amount to clip the distribution tails by, in percent.
Example usage:
>>./whitebox_tools -r=LaplacianFilter -v --wd="/path/to/data/" -i=image.dep
-o=output.dep --variant='3x3(1)' --clip=1.0
123. LaplacianOfGaussianFilter
Description: Performs a Laplacian-of-Gaussian (LoG) filter on an image.
Toolbox: Image Processing Tools/Filters
Parameters:
Flag Description
-i, –input Input raster file.
-o, –output Output raster file.
–sigma Standard deviation in pixels.

WhiteboxTools User Manual / Lindsay 59
Example usage:
>>./whitebox_tools -r=LaplacianOfGaussianFilter -v --wd="/path/to/data/"
-i=image.dep -o=output.dep --sigma=2.0
124. LasToAscii
Description: Converts one or more LAS files into ASCII text files.
Toolbox: LiDAR Tools
Parameters:
Flag Description
-i, –inputs Input LiDAR files.
Example usage:
>>./whitebox_tools -r=LasToAscii -v --wd="/path/to/data/"
-i="file1.las, file2.las, file3.las" -o=outfile.las"
125. LeeFilter
Description: Performs a Lee (Sigma) smoothing filter on an image.
Toolbox: Image Processing Tools/Filters
Parameters:
Flag Description
-i, –input Input raster file.
-o, –output Output raster file.
–filterx Size of the filter kernel in the x-direction.
–filtery Size of the filter kernel in the y-direction.
–sigma Sigma value should be related to the standarad deviation of the distribution of image speckle noise.
-m M-threshold value the minimum allowable number of pixels within the intensity range
Example usage:
>>./whitebox_tools -r=LeeFilter -v --wd="/path/to/data/" -i=image.dep
-o=output.dep --filter=9 --sigma=10.0 -m=5
>>./whitebox_tools -r=LeeFilter -v --wd="/path/to/data/" -i=image.dep
-o=output.dep --filtery=7 --filtery=9 --sigma=10.0 -m=5
126. LengthOfUpstreamChannels
Description: Calculates the total length of channels upstream.
Toolbox: Stream Network Analysis

60 WhiteboxTools User Manual / Lindsay
Parameters:
Flag Description
–d8_pntr Input raster D8 pointer file.
–streams Input raster streams file.
-o, –output Output raster file.
–esri_pntr D8 pointer uses the ESRI style scheme.
–zero_background Flag indicating whether a background value of zero should be used.
Example usage:
>>./whitebox_tools -r=LengthOfUpstreamChannels -v --wd="/path/to/data/"
--d8_pntr=D8.dep --streams=streams.dep -o=output.dep
>>./whitebox_tools -r=LengthOfUpstreamChannels -v --wd="/path/to/data/"
--d8_pntr=D8.flt --streams=streams.flt -o=output.flt --esri_pntr
--zero_background
127. LessThan
Description: Performs a less-than comparison operation on two rasters or a raster and a constant value.
Toolbox: Math and Stats Tools
Parameters:
Flag Description
–input1 Input raster file or constant value.
–input2 Input raster file or constant value.
-o, –output Output raster file.
–incl_equals Perform a less-than-or-equal-to operation.
Example usage:
>>./whitebox_tools -r=LessThan -v --wd="/path/to/data/" --input1='in1.dep'
--input2='in2.dep' -o=output.dep --incl_equals
128. LidarElevationSlice
Description: Outputs all of the points within a LiDAR (LAS) point file that lie between a specified elevation
range.
Toolbox: LiDAR Tools
Parameters:
Flag Description
-i, –input Input LiDAR file.

WhiteboxTools User Manual / Lindsay 61
Flag Description
-o, –output Output LiDAR file.
–minz Minimum elevation value (optional).
–maxz Maximum elevation value (optional).
–class Optional boolean flag indicating whether points outside the range should be retained in output but reclassified.
–inclassval Optional parameter specifying the class value assigned to points within the slice.
–outclassval Optional parameter specifying the class value assigned to points within the slice.
Example usage:
>>./whitebox_tools -r=LidarElevationSlice -v --wd="/path/to/data/" -i="input.las"
-o="output.las" --minz=100.0 --maxz=250.0
>>./whitebox_tools -r=LidarElevationSlice -v -i="/path/to/data/input.las"
-o="/path/to/data/output.las" --minz=100.0 --maxz=250.0 --class
>>./whitebox_tools -r=LidarElevationSlice -v -i="/path/to/data/input.las"
-o="/path/to/data/output.las" --minz=100.0 --maxz=250.0 --inclassval=1
--outclassval=0
129. LidarGroundPointFilter
Description: Identifies ground points within LiDAR dataset using a slope-based method.
Toolbox: LiDAR Tools
Parameters:
Flag Description
-i, –input Input LiDAR file.
-o, –output Output LiDAR file.
–radius Search Radius.
–slope_threshold Maximum inter-point slope to be considered an off-terrain point.
–height_threshold Inter-point height difference to be considered an off-terrain point.
Example usage:
>>./whitebox_tools -r=LidarGroundPointFilter -v --wd="/path/to/data/"
-i="input.las" -o="output.las" --radius=10.0
130. LidarHillshade
Description: Calculates a hillshade value for points within a LAS file and stores these data in the RGB field.
Toolbox: LiDAR Tools
Parameters:

62 WhiteboxTools User Manual / Lindsay
Flag Description
-i, –input Input LiDAR file.
-o, –output Output file.
–azimuth Illumination source azimuth in degrees.
–altitude Illumination source altitude in degrees.
–radius Search Radius.
Example usage:
>>./whitebox_tools -r=LidarHillshade -v --wd="/path/to/data/" -i="input.las"
-o="output.las" --radius=10.0
>>./whitebox_tools -r=LidarHillshade -v --wd="/path/to/data/" -i="input.las"
-o="output.las" --azimuth=180.0 --altitude=20.0 --radius=1.0
131. LidarHistogram
Description: Creates a histogram from LiDAR data.
Toolbox: LiDAR Tools
Parameters:
Flag Description
-i, –input Input LiDAR file.
-o, –output Output HTML file (default name will be based on input file if unspecified).
–parameter Parameter; options are ‘elevation’ (default), ‘intensity’, ‘scan angle’, ’class.
–clip Amount to clip distribution tails (in percent).
Example usage:
>>./whitebox_tools -r=LidarHistogram -v --wd="/path/to/data/"
-i="file1.tif, file2.tif, file3.tif" -o=outfile.htm --contiguity=Bishopsl
132. LidarIdwInterpolation
Description: Interpolates LAS files using an inverse-distance weighted (IDW) scheme.
Toolbox: LiDAR Tools
Parameters:
Flag Description
-i, –input Input LiDAR file (including extension).
-o, –output Output raster file (including extension).
–parameter Interpolation parameter; options are ‘elevation’ (default), ‘intensity’, ‘class’, ‘scan angle’, ‘user data’.
–returns Point return types to include; options are ‘all’ (default), ‘last’, ‘first’.
–resolution Output raster’s grid resolution.

WhiteboxTools User Manual / Lindsay 63
Flag Description
–weight IDW weight value.
–radius Search Radius.
–exclude_cls Optional exclude classes from interpolation; Valid class values range from 0 to 18, based on LAS specifications. Example, –exclude_cls=‘3,4,5,6,7,18’.
–minz Optional minimum elevation for inclusion in interpolation.
–maxz Optional maximum elevation for inclusion in interpolation.
Example usage:
>>./whitebox_tools -r=LidarIdwInterpolation -v --wd="/path/to/data/" -i=file.las
-o=outfile.dep --resolution=2.0 --radius=5.0"
./whitebox_tools -r=LidarIdwInterpolation --wd="/path/to/data/" -i=file.las
-o=outfile.dep --resolution=5.0 --weight=2.0 --radius=2.0
--exclude_cls='3,4,5,6,7,18' --palette=light_quant.plt
133. LidarInfo
Description: Prints information about a LiDAR (LAS) dataset, including header, point return frequency, and
classification data and information about the variable length records (VLRs) and geokeys.
Toolbox: LiDAR Tools
Parameters:
Flag Description
-i, –input Input LiDAR file.
-o, –output Output HTML file for regression summary report.
–vlr Flag indicating whether or not to print the variable length records (VLRs).
–geokeys Flag indicating whether or not to print the geokeys.
Example usage:
>>./whitebox_tools -r=LidarInfo -v --wd="/path/to/data/" -i=file.las
--vlr --geokeys"
./whitebox_tools -r=LidarInfo --wd="/path/to/data/" -i=file.las
134. LidarJoin
Description: Joins multiple LiDAR (LAS) files into a single LAS file.
Toolbox: LiDAR Tools
Parameters:
Flag Description
-i, –inputs Input LiDAR files.
-o, –output Output LiDAR file.

64 WhiteboxTools User Manual / Lindsay
Example usage:
>>./whitebox_tools -r=LidarJoin -v --wd="/path/to/data/"
-i="file1.las, file2.las, file3.las" -o=outfile.las"
135. LidarKappaIndex
Description: Performs a kappa index of agreement (KIA) analysis on the classifications of two LAS files.
Toolbox: LiDAR Tools
Parameters:
Flag Description
–i1, –input1 Input LiDAR classification file.
–i2, –input2 Input LiDAR reference file.
-o, –output Output HTML file.
Example usage:
>>./whitebox_tools -r=LidarKappaIndex -v --wd="/path/to/data/" --i1=class.tif
--i2=reference.tif -o=kia.html
136. LidarNearestNeighbourGridding
Description: Grids LAS files using nearest-neighbour scheme.
Toolbox: LiDAR Tools
Parameters:
Flag Description
-i, –input Input LiDAR file (including extension).
-o, –output Output raster file (including extension).
–parameter Interpolation parameter; options are ‘elevation’ (default), ‘intensity’, ‘class’, ‘scan angle’, ‘user data’.
–returns Point return types to include; options are ‘all’ (default), ‘last’, ‘first’.
–resolution Output raster’s grid resolution.
–radius Search Radius.
–exclude_cls Optional exclude classes from interpolation; Valid class values range from 0 to 18, based on LAS specifications. Example, –exclude_cls=‘3,4,5,6,7,18’.
–minz Optional minimum elevation for inclusion in interpolation.
–maxz Optional maximum elevation for inclusion in interpolation.
Example usage:
>>./whitebox_tools -r=LidarNearestNeighbourGridding -v --wd="/path/to/data/"
-i=file.las -o=outfile.dep --resolution=2.0 --radius=5.0"
./whitebox_tools -r=LidarNearestNeighbourGridding --wd="/path/to/data/"
-i=file.las -o=outfile.dep --resolution=5.0 --radius=2.0

WhiteboxTools User Manual / Lindsay 65
--exclude_cls='3,4,5,6,7,18' --palette=light_quant.plt
137. LidarPointDensity
Description: Calculates the spatial pattern of point density for a LiDAR data set.
Toolbox: LiDAR Tools
Parameters:
Flag Description
-i, –input Input LiDAR file (including extension).
-o, –output Output raster file (including extension).
–returns Point return types to include; options are ‘all’ (default), ‘last’, ‘first’.
–resolution Output raster’s grid resolution.
–radius Search Radius.
–exclude_cls Optional exclude classes from interpolation; Valid class values range from 0 to 18, based on LAS specifications. Example, –exclude_cls=‘3,4,5,6,7,18’.
–minz Optional minimum elevation for inclusion in interpolation.
–maxz Optional maximum elevation for inclusion in interpolation.
Example usage:
>>./whitebox_tools -r=LidarPointDensity -v --wd="/path/to/data/" -i=file.las
-o=outfile.dep --resolution=2.0 --radius=5.0"
./whitebox_tools -r=LidarPointDensity -v --wd="/path/to/data/" -i=file.las
-o=outfile.dep --resolution=5.0 --radius=2.0 --exclude_cls='3,4,5,6,7,18'
--palette=light_quant.plt
138. LidarPointStats
Description: Creates several rasters summarizing the distribution of LAS point data.
Toolbox: LiDAR Tools
Parameters:
Flag Description
-i, –input Input LiDAR file.
–resolution Output raster’s grid resolution.
–num_points Flag indicating whether or not to output the number of points raster.
–num_pulses Flag indicating whether or not to output the number of pulses raster.
–z_range Flag indicating whether or not to output the elevation range raster.
–intensity_range Flag indicating whether or not to output the intensity range raster.
–predom_class Flag indicating whether or not to output the predominant classification raster.
Example usage:
>>./whitebox_tools -r=LidarPointStats -v --wd="/path/to/data/" -i=file.las --resolution=1.0

66 WhiteboxTools User Manual / Lindsay
--num_points
138. LidarRemoveOutliers
Description: Removes outliers (high and low points) in a LiDAR point cloud.
Toolbox: LiDAR Tools
Parameters:
Flag Description
-i, –input Input LiDAR file.
-o, –output Output LiDAR file.
–radius Search Radius.
–elev_diff Max. elevation difference.
Example usage:
>>./whitebox_tools -r=LidarRemoveOutliers -v --wd="/path/to/data/" -i="input.las"
-o="output.las" --radius=10.0 --elev_diff=25.0
139. LidarSegmentation
Description: Segments a LiDAR point cloud based on normal vectors.
Toolbox: LiDAR Tools
Parameters:
Flag Description
-i, –input Input LiDAR file.
-o, –output Output file.
–dist, –radius Search Radius.
–norm_diff Maximum difference in normal vectors, in degrees.
–maxzdiff Maximum difference in elevation (z units) between neighbouring points of the same segment.
Example usage:
>>./whitebox_tools -r=LidarSegmentation -v --wd="/path/to/data/" -i="input.las"
-o="output.las" --radius=10.0 --norm_diff=2.5 --maxzdiff=0.75
140. LidarSegmentationBasedFilter
Description: Identifies ground points within LiDAR point clouds using a segmentation based approach.
Toolbox: LiDAR Tools
Parameters:

WhiteboxTools User Manual / Lindsay 67
Flag Description
-i, –input Input LiDAR file.
-o, –output Output file.
–dist, –radius Search Radius.
–norm_diff Maximum difference in normal vectors, in degrees.
–maxzdiff Maximum difference in elevation (z units) between neighbouring points of the same segment.
–classify Classify points as ground (2) or off-ground (1).
Example usage:
>>./whitebox_tools -r=LidarSegmentationBasedFilter -v --wd="/path/to/data/"
-i="input.las" -o="output.las" --radius=10.0 --norm_diff=2.5 --maxzdiff=0.75
--classify
141. LidarTile
Description: Tiles a LiDAR LAS file into multiple LAS files.
Toolbox: LiDAR Tools
Parameters:
Flag Description
-i, –input Input LiDAR file.
–width_x Width of tiles in the X dimension; default 1000.0.
–width_y Width of tiles in the Y dimension.
–origin_x Origin point X coordinate for tile grid.
–origin_y Origin point Y coordinate for tile grid.
–min_points Minimum number of points contained in a tile for it to be saved.
Example usage:
>>./whitebox_tools -r=LidarTile -v -i=/path/to/data/input.las --width_x=1000.0
--width_y=2500.0 -=min_points=100
142. LidarTophatTransform
Description: Performs a white top-hat transform on a Lidar dataset; as an estimate of height above ground,
this is useful for modelling the vegetation canopy
Toolbox: LiDAR Tools
Parameters:
Flag Description
-i, –input Input LiDAR file.
-o, –output Output LiDAR file.

68 WhiteboxTools User Manual / Lindsay
Flag Description
–radius Search Radius.
Example usage:
>>./whitebox_tools -r=LidarTophatTransform -v --wd="/path/to/data/" -i="input.las"
-o="output.las" --radius=10.0
143. LineDetectionFilter
Description: Performs a line-detection filter on an image.
Toolbox: Image Processing Tools/Filters
Parameters:
Flag Description
-i, –input Input raster file.
-o, –output Output raster file.
–variant Optional variant value. Options include ‘v’ (vertical), ‘h’ (horizontal), ‘45’, and ‘135’ (default is ‘v’).
–absvals Optional flag indicating whether outputs should be absolute values.
–clip Optional amount to clip the distribution tails by, in percent.
Example usage:
>>./whitebox_tools -r=LineDetectionFilter -v --wd="/path/to/data/" -i=image.dep
-o=output.dep --variant=h --clip=1.0
144. LineThinning
Description: Performs line thinning a on Boolean raster image; intended to be used with the RemoveSpurs
tool.
Toolbox: Image Processing Tools
Parameters:
Flag Description
-i, –input Input raster file.
-o, –output Output raster file.
Example usage:
>>./whitebox_tools -r=LineThinning -v --wd="/path/to/data/" --input=DEM.dep
-o=output.dep
145. Ln

WhiteboxTools User Manual / Lindsay 69
Description: Returns the natural logarithm of values in a raster.
Toolbox: Math and Stats Tools
Parameters:
Flag Description
-i, –input Input raster file.
-o, –output Output raster file.
Example usage:
>>./whitebox_tools -r=Ln -v --wd="/path/to/data/" -i='input.dep' -o=output.dep
146. Log10
Description: Returns the base-10 logarithm of values in a raster.
Toolbox: Math and Stats Tools
Parameters:
Flag Description
-i, –input Input raster file.
-o, –output Output raster file.
Example usage:
>>./whitebox_tools -r=Log10 -v --wd="/path/to/data/" -i='input.dep' -o=output.dep
147. Log2
Description: Returns the base-2 logarithm of values in a raster.
Toolbox: Math and Stats Tools
Parameters:
Flag Description
-i, –input Input raster file.
-o, –output Output raster file.
Example usage:
>>./whitebox_tools -r=Log2 -v --wd="/path/to/data/" -i='input.dep' -o=output.dep
148. LowestPosition
Description: Identifies the stack position of the minimum value within a raster stack on a cell-by-cell basis.

70 WhiteboxTools User Manual / Lindsay
Toolbox: GIS Analysis/Overlay Tools
Parameters:
Flag Description
-i, –inputs Input raster files.
-o, –output Output raster file.
Example usage:
>>./whitebox_tools -r=LowestPosition -v --wd='/path/to/data/'
-i='image1.dep;image2.dep;image3.dep' -o=output.dep
149. MajorityFilter
Description: Assigns each cell in the output grid the most frequently occurring value (mode) in a moving
window centred on each grid cell in the input raster.
Toolbox: Image Processing Tools/Filters
Parameters:
Flag Description
-i, –input Input raster file.
-o, –output Output raster file.
–filterx Size of the filter kernel in the x-direction.
–filtery Size of the filter kernel in the y-direction.
Example usage:
>>./whitebox_tools -r=MajorityFilter -v --wd="/path/to/data/" -i=image.dep
-o=output.dep --filter=25
150. Max
Description: Performs a MAX operation on two rasters or a raster and a constant value.
Toolbox: Math and Stats Tools
Parameters:
Flag Description
–input1 Input raster file or constant value.
–input2 Input raster file or constant value.
-o, –output Output raster file.
Example usage:

WhiteboxTools User Manual / Lindsay 71
>>./whitebox_tools -r=Max -v --wd="/path/to/data/" --input1='in1.dep' --input2='in2.dep' -o=output.dep
151. MaxAbsoluteOverlay
Description: Evaluates the maximum absolute value for each grid cell from a stack of input rasters.
Toolbox: GIS Analysis/Overlay Tools
Parameters:
Flag Description
-i, –inputs Input raster files.
-o, –output Output raster file.
Example usage:
>>./whitebox_tools -r=MaxAbsoluteOverlay -v --wd='/path/to/data/'
-i='image1.dep;image2.dep;image3.dep' -o=output.dep
152. MaxAnisotropyDev
Description: Calculates the maximum anisotropy (directionality) in elevation deviation over a range of spa-
tial scales.
Toolbox: Geomorphometric Analysis
Parameters:
Flag Description
-i, –dem Input raster DEM file.
–out_mag Output raster DEVmax magnitude file.
–out_scale Output raster DEVmax scale file.
–min_scale Minimum search neighbourhood radius in grid cells.
–max_scale Maximum search neighbourhood radius in grid cells.
–step Step size as any positive non-zero integer.
Example usage:
>>./whitebox_tools -r=MaxAnisotropyDev -v --wd="/path/to/data/" --dem=DEM.dep
-out_mag=DEVmax_mag.dep --out_scale=DEVmax_scale.dep --min_scale=1 --max_scale=1000 --step=5
153. MaxBranchLength
Description: Lindsay and Seibert’s (2013) branch length index is used to map drainage divides or ridge
lines.
Toolbox: Geomorphometric Analysis
Parameters:

72 WhiteboxTools User Manual / Lindsay
Flag Description
-i, –dem Input raster DEM file.
-o, –output Output raster file.
–log Optional flag to request the output be log-transformed.
Example usage:
>>./whitebox_tools -r=MaxBranchLength -v --wd="/path/to/data/" --dem=DEM.dep
-o=output.dep
154. MaxDownslopeElevChange
Description: Calculates the maximum downslope change in elevation between a grid cell and its eight
downslope neighbors.
Toolbox: Geomorphometric Analysis
Parameters:
Flag Description
-i, –dem Input raster DEM file.
-o, –output Output raster file.
Example usage:
>>./whitebox_tools -r=MaxDownslopeElevChange -v --wd="/path/to/data/"
--dem=DEM.dep -o=out.dep
155. MaxElevationDeviation
Description: Calculates the maximum elevation deviation over a range of spatial scales.
Toolbox: Geomorphometric Analysis
Parameters:
Flag Description
-i, –dem Input raster DEM file.
–out_mag Output raster DEVmax magnitude file.
–out_scale Output raster DEVmax scale file.
–min_scale Minimum search neighbourhood radius in grid cells.
–max_scale Maximum search neighbourhood radius in grid cells.
–step Step size as any positive non-zero integer.
Example usage:
>>./whitebox_tools -r=MaxElevationDeviation -v --wd="/path/to/data/"

WhiteboxTools User Manual / Lindsay 73
--dem=DEM.dep -out_mag=DEVmax_mag.dep --out_scale=DEVmax_scale.dep --min_scale=1
--max_scale=1000 --step=5
156. MaxOverlay
Description: Evaluates the maximum value for each grid cell from a stack of input rasters.
Toolbox: GIS Analysis/Overlay Tools
Parameters:
Flag Description
-i, –inputs Input raster files.
-o, –output Output raster file.
Example usage:
>>./whitebox_tools -r=MaxOverlay -v --wd='/path/to/data/'
-i='image1.dep;image2.dep;image3.dep' -o=output.dep
157. MaxUpslopeFlowpathLength
Description: Measures the maximum length of all upslope flowpaths draining each grid cell.
Toolbox: Hydrological Analysis
Parameters:
Flag Description
-i, –dem Input raster DEM file.
-o, –output Output raster file.
Example usage:
>>./whitebox_tools -r=MaxUpslopeFlowpathLength -v --wd="/path/to/data/"
-i=DEM.dep -o=output.dep
>>./whitebox_tools -r=MaxUpslopeFlowpathLength -v --wd="/path/to/data/"
--dem=DEM.dep -o=output.dep --log --clip
158. MaximumFilter
Description: Assigns each cell in the output grid the maximum value in a moving window centred on each
grid cell in the input raster.
Toolbox: Image Processing Tools/Filters
Parameters:
Flag Description
-i, –input Input raster file.

74 WhiteboxTools User Manual / Lindsay
Flag Description
-o, –output Output raster file.
–filterx Size of the filter kernel in the x-direction.
–filtery Size of the filter kernel in the y-direction.
Example usage:
>>./whitebox_tools -r=MaximumFilter -v --wd="/path/to/data/" -i=image.dep
-o=output.dep --filter=25
159. MeanFilter
Description: Performs a mean filter (low-pass filter) on an input image.
Toolbox: Image Processing Tools/Filters
Parameters:
Flag Description
-i, –input Input raster file.
-o, –output Output raster file.
–filterx Size of the filter kernel in the x-direction.
–filtery Size of the filter kernel in the y-direction.
Example usage:
>>./whitebox_tools -r=MeanFilter -v --wd="/path/to/data/" -i=image.dep
-o=output.dep --filterx=25 --filtery=25
160. MedianFilter
Description: Performs a median filter on an input image.
Toolbox: Image Processing Tools/Filters
Parameters:
Flag Description
-i, –input Input raster file.
-o, –output Output raster file.
–filterx Size of the filter kernel in the x-direction.
–filtery Size of the filter kernel in the y-direction.
–sig_digits Number of significant digits.
Example usage:
>>./whitebox_tools -r=MedianFilter -v --wd="/path/to/data/" -i=input.dep

WhiteboxTools User Manual / Lindsay 75
-o=output.dep --filter=25
161. Min
Description: Performs a MIN operation on two rasters or a raster and a constant value.
Toolbox: Math and Stats Tools
Parameters:
Flag Description
–input1 Input raster file or constant value.
–input2 Input raster file or constant value.
-o, –output Output raster file.
Example usage:
>>./whitebox_tools -r=Min -v --wd="/path/to/data/" --input1='in1.dep'
--input2='in2.dep' -o=output.dep
162. MinAbsoluteOverlay
Description: Evaluates the minimum absolute value for each grid cell from a stack of input rasters.
Toolbox: GIS Analysis/Overlay Tools
Parameters:
Flag Description
-i, –inputs Input raster files.
-o, –output Output raster file.
Example usage:
>>./whitebox_tools -r=MinAbsoluteOverlay -v --wd='/path/to/data/'
-i='image1.dep;image2.dep;image3.dep' -o=output.dep
163. MinDownslopeElevChange
Description: Calculates the minimum downslope change in elevation between a grid cell and its eight
downslope neighbors.
Toolbox: Geomorphometric Analysis
Parameters:
Flag Description
-i, –dem Input raster DEM file.
-o, –output Output raster file.

76 WhiteboxTools User Manual / Lindsay
Example usage:
>>./whitebox_tools -r=MinDownslopeElevChange -v --wd="/path/to/data/"
--dem=DEM.dep -o=out.dep
164. MinMaxContrastStretch
Description: Performs a min-max contrast stretch on an input greytone image.
Toolbox: Image Processing Tools/Image Enhancement
Parameters:
Flag Description
-i, –input Input raster file.
-o, –output Output raster file.
–min_val Lower tail clip value.
–max_val Upper tail clip value.
–num_tones Number of tones in the output image.
Example usage:
>>./whitebox_tools -r=MinMaxContrastStretch -v --wd="/path/to/data/"
-i=input.dep -o=output.dep --min_val=45.0 --max_val=200.0 --num_tones=1024
165. MinOverlay
Description: Evaluates the minimum value for each grid cell from a stack of input rasters.
Toolbox: GIS Analysis/Overlay Tools
Parameters:
Flag Description
-i, –inputs Input raster files.
-o, –output Output raster file.
Example usage:
>>./whitebox_tools -r=MinOverlay -v --wd='/path/to/data/'
-i='image1.dep;image2.dep;image3.dep' -o=output.dep
166. MinimumFilter
Description: Assigns each cell in the output grid the minimum value in a moving window centred on each
grid cell in the input raster.
Toolbox: Image Processing Tools/Filters
Parameters:

WhiteboxTools User Manual / Lindsay 77
Flag Description
-i, –input Input raster file.
-o, –output Output raster file.
–filterx Size of the filter kernel in the x-direction.
–filtery Size of the filter kernel in the y-direction.
Example usage:
>>./whitebox_tools -r=MinimumFilter -v --wd="/path/to/data/" -i=image.dep
-o=output.dep --filter=25
167. ModifiedKMeansClustering
Description: Performs a modified k-means clustering operation on a multi-spectral dataset.
Toolbox: Image Processing Tools
Parameters:
Flag Description
-i, –inputs Input raster files.
-o, –output Output raster file.
–out_html Output HTML report file.
–start_clusters Initial number of clusters
–merger_dist Cluster merger distance
–max_iterations Maximum number of iterations
–class_change Minimum percent of cells changed between iterations before completion
Example usage:
>>./whitebox_tools -r=ModifiedKMeansClustering -v --wd='/path/to/data/'
-i='image1.tif;image2.tif;image3.tif' -o=output.tif --out_html=report.html
--start_clusters=100 --merger_dist=30.0 --max_iterations=25 --class_change=1.5
168. Modulo
Description: Performs a modulo operation on two rasters or a raster and a constant value.
Toolbox: Math and Stats Tools
Parameters:
Flag Description
–input1 Input raster file or constant value.
–input2 Input raster file or constant value.
-o, –output Output raster file.

78 WhiteboxTools User Manual / Lindsay
Example usage:
>>./whitebox_tools -r=Modulo -v --wd="/path/to/data/" --input1='in1.dep'
--input2='in2.dep' -o=output.dep
169. Mosaic
Description: Mosaics two or more images together.
Toolbox: Image Processing Tools
Parameters:
Flag Description
-i, –inputs Input raster files.
-o, –output Output raster file.
–method Resampling method
Example usage:
>>./whitebox_tools -r=Mosaic -v --wd='/path/to/data/'
-i='image1.dep;image2.dep;image3.dep' -o=dest.dep --method='cc
170. Multiply
Description: Performs a multiplication operation on two rasters or a raster and a constant value.
Toolbox: Math and Stats Tools
Parameters:
Flag Description
–input1 Input raster file or constant value.
–input2 Input raster file or constant value.
-o, –output Output raster file.
Example usage:
>>./whitebox_tools -r=Multiply -v --wd="/path/to/data/" --input1='in1.dep'
--input2='in2.dep' -o=output.dep
171. MultiscaleTopographicPositionImage
Description: Creates a multiscale topographic position image from three DEVmax rasters of differing spatial
scale ranges.
Toolbox: Geomorphometric Analysis
Parameters:

WhiteboxTools User Manual / Lindsay 79
Flag Description
–local Input local-scale topographic position (DEVmax) raster file.
–meso Input meso-scale topographic position (DEVmax) raster file.
–broad Input broad-scale topographic position (DEVmax) raster file.
-o, –output Output raster file.
–lightness Image lightness value (default is 1.2).
Example usage:
>>./whitebox_tools -r=MultiscaleTopographicPositionImage -v --wd="/path/to/data/"
--local=DEV_local.dep --meso=DEV_meso.dep --broad=DEV_broad.dep -o=output.dep
--lightness=1.5
172. Negate
Description: Changes the sign of values in a raster or the 0-1 values of a Boolean raster.
Toolbox: Math and Stats Tools
Parameters:
Flag Description
-i, –input Input raster file.
-o, –output Output raster file.
Example usage:
>>./whitebox_tools -r=Negate -v --wd="/path/to/data/" -i='input.dep'
-o=output.dep
173. NewRasterFromBase
Description: Creates a new raster using a base image.
Toolbox: Data Tools
Parameters:
Flag Description
-i, –base Input base raster file.
-o, –output Output raster file.
–value Constant value to fill raster with; either ‘nodata’ or numeric value.
–data_type Output raster data type; options include ‘double’ (64-bit), ‘float’ (32-bit), and ‘integer’ (signed 16-bit) (default is ‘float’).
Example usage:
>>./whitebox_tools -r=NewRasterFromBase -v --wd="/path/to/data/"

80 WhiteboxTools User Manual / Lindsay
--base=base.dep -o=NewRaster.dep --value=0.0 --data_type=integer
>>./whitebox_tools -r=NewRasterFromBase -v --wd="/path/to/data/"
--base=base.dep -o=NewRaster.dep --value=nodata
174. NormalVectors
Description: Calculates normal vectors for points within a LAS file and stores these data (XYZ vector com-
ponents) in the RGB field.
Toolbox: LiDAR Tools
Parameters:
Flag Description
-i, –input Input LiDAR file.
-o, –output Output LiDAR file.
–radius Search Radius.
Example usage:
>>./whitebox_tools -r=NormalVectors -v --wd="/path/to/data/" -i="input.las"
-o="output.las" --radius=10.0
175. NormalizedDifferenceVegetationIndex
Description: Calculates the normalized difference vegetation index (NDVI) from near-infrared and red im-
agery.
Toolbox: Image Processing Tools
Parameters:
Flag Description
–nir Input near-infrared band image.
–red Input red band image.
-o, –output Output raster file.
–clip Optional amount to clip the distribution tails by, in percent.
–osavi Optional flag indicating whether the optimized soil-adjusted veg index (OSAVI) should be used.
Example usage:
>>./whitebox_tools -r=NormalizedDifferenceVegetationIndex -v
--wd="/path/to/data/" --nir=band4.dep --red=band3.dep -o=output.dep
>>./whitebox_tools -r=NormalizedDifferenceVegetationIndex -v
--wd="/path/to/data/" --nir=band4.dep --red=band3.dep -o=output.dep
--clip=1.0 --osavi
176. Not

WhiteboxTools User Manual / Lindsay 81
Description: Performs a logical NOT operator on two Boolean raster images.
Toolbox: Math and Stats Tools
Parameters:
Flag Description
–input1 Input raster file.
–input2 Input raster file.
-o, –output Output raster file.
Example usage:
>>./whitebox_tools -r=Not -v --wd="/path/to/data/" --input1='in1.dep'
--input2='in2.dep' -o=output.dep
177. NotEqualTo
Description: Performs a not-equal-to comparison operation on two rasters or a raster and a constant value.
Toolbox: Math and Stats Tools
Parameters:
Flag Description
–input1 Input raster file or constant value.
–input2 Input raster file or constant value.
-o, –output Output raster file.
Example usage:
>>./whitebox_tools -r=NotEqualTo -v --wd="/path/to/data/" --input1='in1.dep'
--input2='in2.dep' -o=output.dep
178. NumDownslopeNeighbours
Description: Calculates the number of downslope neighbours to each grid cell in a DEM.
Toolbox: Geomorphometric Analysis
Parameters:
Flag Description
-i, –dem Input raster DEM file.
-o, –output Output raster file.
Example usage:

82 WhiteboxTools User Manual / Lindsay
>>./whitebox_tools -r=NumDownslopeNeighbours -v --wd="/path/to/data/"
-i=DEM.dep -o=output.dep
179. NumInflowingNeighbours
Description: Computes the number of inflowing neighbours to each cell in an input DEM based on the D8
algorithm.
Toolbox: Hydrological Analysis
Parameters:
Flag Description
-i, –dem Input raster DEM file.
-o, –output Output raster file.
Example usage:
>>./whitebox_tools -r=NumInflowingNeighbours -v --wd="/path/to/data/"
-i=DEM.dep -o=output.dep
180. NumUpslopeNeighbours
Description: Calculates the number of upslope neighbours to each grid cell in a DEM.
Toolbox: Geomorphometric Analysis
Parameters:
Flag Description
-i, –dem Input raster DEM file.
-o, –output Output raster file.
Example usage:
>>./whitebox_tools -r=NumUpslopeNeighbours -v --wd="/path/to/data/"
-i=DEM.dep -o=output.dep
181. OlympicFilter
Description: Performs an olympic smoothing filter on an image.
Toolbox: Image Processing Tools/Filters
Parameters:
Flag Description
-i, –input Input raster file.
-o, –output Output raster file.

WhiteboxTools User Manual / Lindsay 83
Flag Description
–filterx Size of the filter kernel in the x-direction.
–filtery Size of the filter kernel in the y-direction.
Example usage:
>>./whitebox_tools -r=OlympicFilter -v --wd="/path/to/data/"
-i=image.dep -o=output.dep --filter=25
182. Opening
Description: An opening is a mathematical morphology operating involving a dilation (max filter) of an
erosion (min filter) set.
Toolbox: Image Processing Tools
Parameters:
Flag Description
-i, –input Input raster file.
-o, –output Output raster file.
–filterx Size of the filter kernel in the x-direction.
–filtery Size of the filter kernel in the y-direction.
Example usage:
>>./whitebox_tools -r=Opening -v --wd="/path/to/data/" -i=image.dep
-o=output.dep --filter=25
183. Or
Description: Performs a logical OR operator on two Boolean raster images.
Toolbox: Math and Stats Tools
Parameters:
Flag Description
–input1 Input raster file.
–input2 Input raster file.
-o, –output Output raster file.
Example usage:
>>./whitebox_tools -r=Or -v --wd="/path/to/data/" --input1='in1.dep'
--input2='in2.dep' -o=output.dep

84 WhiteboxTools User Manual / Lindsay
184. PanchromaticSharpening
Description: Increases the spatial resolution of image data by combining multispectral bands with panchro-
matic data.
Toolbox: Image Processing Tools/Image Enhancement
Parameters:
Flag Description
–red Input red band image file. Optionally specified if colour-composite not specified.
–green Input green band image file. Optionally specified if colour-composite not specified.
–blue Input blue band image file. Optionally specified if colour-composite not specified.
–composite Input colour-composite image file. Only used if individual bands are not specified.
–pan Input panchromatic band file.
-o, –output Output colour composite file.
–method Options include ‘brovey’ (default) and ‘ihs’
Example usage:
>>./whitebox_tools -r=PanchromaticSharpening -v --wd="/path/to/data/"
--red=red.dep --green=green.dep --blue=blue.dep --pan=pan.dep
--output=pan_sharp.dep --method='brovey'
>>./whitebox_tools -r=PanchromaticSharpening -v --wd="/path/to/data/"
--composite=image.dep --pan=pan.dep --output=pan_sharp.dep --method='ihs'
185. PennockLandformClass
Description: Classifies hillslope zones based on slope, profile curvature, and plan curvature.
Toolbox: Geomorphometric Analysis
Parameters:
Flag Description
-i, –dem Input raster DEM file.
-o, –output Output raster file.
–slope Slope threshold value, in degrees (default is 3.0)
–prof Profile curvature threshold value (default is 0.1)
–plan Plan curvature threshold value (default is 0.0).
–zfactor Optional multiplier for when the vertical and horizontal units are not the same.
Example usage:
>>./whitebox_tools -r=PennockLandformClass -v --wd="/path/to/data/"
--dem=DEM.dep -o=output.dep --slope=3.0 --prof=0.1 --plan=0.0
186. PercentElevRange

WhiteboxTools User Manual / Lindsay 85
Description: Calculates percent of elevation range from a DEM.
Toolbox: Geomorphometric Analysis
Parameters:
Flag Description
-i, –input, –dem Input raster DEM file.
-o, –output Output raster file.
–filterx Size of the filter kernel in the x-direction.
–filtery Size of the filter kernel in the y-direction.
Example usage:
>>./whitebox_tools -r=PercentElevRange -v --wd="/path/to/data/" -i=DEM.dep
-o=output.dep --filter=25
187. PercentEqualTo
Description: Calculates the percentage of a raster stack that have cell values equal to an input on a cell-by-
cell basis.
Toolbox: GIS Analysis/Overlay Tools
Parameters:
Flag Description
-i, –inputs Input raster files.
–comparison Input comparison raster file.
-o, –output Output raster file.
Example usage:
>>./whitebox_tools -r=PercentEqualTo -v --wd='/path/to/data/'
-i='image1.dep;image2.dep;image3.dep' --comparison='comp.dep' -o='output.dep'
188. PercentGreaterThan
Description: Calculates the percentage of a raster stack that have cell values greather than an input on a
cell-by-cell basis.
Toolbox: GIS Analysis/Overlay Tools
Parameters:
Flag Description
-i, –inputs Input raster files.
–comparison Input comparison raster file.

86 WhiteboxTools User Manual / Lindsay
Flag Description
-o, –output Output raster file.
Example usage:
>>./whitebox_tools -r=PercentGreaterThan -v --wd='/path/to/data/'
-i='image1.dep;image2.dep;image3.dep' --comparison='comp.dep' -o='output.dep'
189. PercentLessThan
Description: Calculates the percentage of a raster stack that have cell values less than an input on a cell-
by-cell basis.
Toolbox: GIS Analysis/Overlay Tools
Parameters:
Flag Description
-i, –inputs Input raster files.
–comparison Input comparison raster file.
-o, –output Output raster file.
Example usage:
>>./whitebox_tools -r=PercentLessThan -v --wd='/path/to/data/'
-i='image1.dep;image2.dep;image3.dep' --comparison='comp.dep' -o='output.dep'
190. PercentageContrastStretch
Description: Performs a percentage linear contrast stretch on input images.
Toolbox: Image Processing Tools/Image Enhancement
Parameters:
Flag Description
-i, –input Input raster file.
-o, –output Output raster file.
–clip Optional amount to clip the distribution tails by, in percent.
–tail Specified which tails to clip; options include ‘upper’, ‘lower’, and ‘both’ (default is ‘both’).
–num_tones Number of tones in the output image.
Example usage:
>>./whitebox_tools -r=PercentageContrastStretch -v --wd="/path/to/data/"
-i=input.dep -o=output.dep --clip=2.0 --tail='both' --num_tones=1024

WhiteboxTools User Manual / Lindsay 87
191. PercentileFilter
Description: Performs a percentile filter on an input image.
Toolbox: Image Processing Tools/Filters
Parameters:
Flag Description
-i, –input Input raster file.
-o, –output Output raster file.
–filterx Size of the filter kernel in the x-direction.
–filtery Size of the filter kernel in the y-direction.
–sig_digits Number of significant digits.
Example usage:
>>./whitebox_tools -r=PercentileFilter -v --wd="/path/to/data/" -i=input.dep
-o=output.dep --filter=25
192. PickFromList
Description: Outputs the value from a raster stack specified by a position raster.
Toolbox: GIS Analysis/Overlay Tools
Parameters:
Flag Description
-i, –inputs Input raster files.
–pos_input Input position raster file.
-o, –output Output raster file.
Example usage:
>>./whitebox_tools -r=PickFromList -v --wd='/path/to/data/' --pos_input=position.dep
-i='image1.dep;image2.dep;image3.dep' -o=output.dep
193. PlanCurvature
Description: Calculates a plan (contour) curvature raster from an input DEM.
Toolbox: Geomorphometric Analysis
Parameters:
Flag Description
-i, –dem Input raster DEM file.
-o, –output Output raster file.

88 WhiteboxTools User Manual / Lindsay
Flag Description
–zfactor Optional multiplier for when the vertical and horizontal units are not the same.
Example usage:
>>./whitebox_tools -r=PlanCurvature -v --wd="/path/to/data/" --dem=DEM.dep
-o=output.dep
194. Power
Description: Raises the values in grid cells of one rasters, or a constant value, by values in another raster
or constant value.
Toolbox: Math and Stats Tools
Parameters:
Flag Description
–input1 Input raster file or constant value.
–input2 Input raster file or constant value.
-o, –output Output raster file.
Example usage:
>>./whitebox_tools -r=Power -v --wd="/path/to/data/" --input1='in1.dep'
--input2='in2.dep' -o=output.dep
195. PrewittFilter
Description: Performs a Prewitt edge-detection filter on an image.
Toolbox: Image Processing Tools/Filters
Parameters:
Flag Description
-i, –input Input raster file.
-o, –output Output raster file.
–clip Optional amount to clip the distribution tails by, in percent.
Example usage:
>>./whitebox_tools -r=PrewittFilter -v --wd="/path/to/data/" -i=image.dep
-o=output.dep --clip=1.0
196. ProfileCurvature
Description: Calculates a profile curvature raster from an input DEM.

WhiteboxTools User Manual / Lindsay 89
Toolbox: Geomorphometric Analysis
Parameters:
Flag Description
-i, –dem Input raster DEM file.
-o, –output Output raster file.
–zfactor Optional multiplier for when the vertical and horizontal units are not the same.
Example usage:
>>./whitebox_tools -r=ProfileCurvature -v --wd="/path/to/data/" --dem=DEM.dep
-o=output.dep
197. Quantiles
Description: Transforms raster values into quantiles.
Toolbox: Math and Stats Tools
Parameters:
Flag Description
-i, –input Input raster file.
-o, –output Output raster file.
–num_quantiles Number of quantiles.
Example usage:
>>./whitebox_tools -r=Quantiles -v --wd="/path/to/data/" -i=DEM.dep
-o=output.dep --num_quantiles=5
198. RadiusOfGyration
Description: Calculates the distance of cells from their polygon’s centroid.
Toolbox: GIS Analysis
Parameters:
Flag Description
-i, –input Input raster file.
-o, –output Output raster file.
–text_output Optional text output.
Example usage:
>>./whitebox_tools -r=RadiusOfGyration -v --wd="/path/to/data/" -i=polygons.dep

90 WhiteboxTools User Manual / Lindsay
-o=output.dep --text_output
199. RandomField
Description: Creates an image containing random values.
Toolbox: Math and Stats Tools
Parameters:
Flag Description
-i, –base Input raster file.
-o, –output Output raster file.
Example usage:
>>./whitebox_tools -r=RandomField -v --wd="/path/to/data/" --base=in.dep
-o=out.dep
200. RandomSample
Description: Creates an image containing randomly located sample grid cells with unique IDs.
Toolbox: Math and Stats Tools
Parameters:
Flag Description
-i, –base Input raster file.
-o, –output Output raster file.
–num_samples Number of samples
Example usage:
>>./whitebox_tools -r=RandomSample -v --wd="/path/to/data/" --base=in.dep
-o=out.dep --num_samples=1000
201. RangeFilter
Description: Assigns each cell in the output grid the range of values in a moving window centred on each
grid cell in the input raster.
Toolbox: Image Processing Tools/Filters
Parameters:
Flag Description
-i, –input Input raster file.
-o, –output Output raster file.

WhiteboxTools User Manual / Lindsay 91
Flag Description
–filterx Size of the filter kernel in the x-direction.
–filtery Size of the filter kernel in the y-direction.
Example usage:
>>./whitebox_tools -r=RangeFilter -v --wd="/path/to/data/" -i=image.dep
-o=output.dep --filter=25
202. RasterCellAssignment
Description: Assign row or column number to cells.
Toolbox: GIS Analysis
Parameters:
Flag Description
-i, –input Input raster file.
-o, –output Output raster file.
-a, –assign Which variable would you like to assign to grid cells? Options include ‘column’, ‘row’, ‘x’, and ‘y’.
Example usage:
>>./whitebox_tools -r=RasterCellAssignment -v --wd="/path/to/data/" -i='input.dep'
-o=output.dep --assign='column'
203. RasterHistogram
Description: Creates a histogram from raster values.
Toolbox: Math and Stats Tools
Parameters:
Flag Description
-i, –input Input raster file.
-o, –output Output HTML file (default name will be based on input file if unspecified).
Example usage:
>>./whitebox_tools -r=RasterHistogram -v --wd="/path/to/data/" -i="file1.tif"
-o=outfile.html
204. RasterSummaryStats
Description: Measures a rasters average, standard deviation, num. non-nodata cells, and total.

92 WhiteboxTools User Manual / Lindsay
Toolbox: Math and Stats Tools
Parameters:
Flag Description
-i, –input Input raster file.
Example usage:
>>./whitebox_tools -r=RasterSummaryStats -v --wd="/path/to/data/" -i=DEM.dep
205. Reciprocal
Description: Returns the reciprocal (i.e. 1 / z) of values in a raster.
Toolbox: Math and Stats Tools
Parameters:
Flag Description
-i, –input Input raster file.
-o, –output Output raster file.
Example usage:
>>./whitebox_tools -r=Reciprocal -v --wd="/path/to/data/" -i='input.dep'
-o=output.dep
206. Reclass
Description: Reclassifies the values in a raster image.
Toolbox: GIS Analysis/Reclass Tools
Parameters:
Flag Description
-i, –input Input raster file.
-o, –output Output raster file.
–reclass_vals Reclassification triplet values (new value; from value; to less than), e.g. ‘0.0;0.0;1.0;1.0;1.0;2.0’
–assign_mode Optional Boolean flag indicating whether to operate in assign mode, reclass_vals values are interpreted as new value; old value pairs.
Example usage:
>>./whitebox_tools -r=Reclass -v --wd="/path/to/data/" -i='input.dep'
-o=output.dep --reclass_vals='0.0;0.0;1.0;1.0;1.0;2.0'
>>./whitebox_tools -r=Reclass -v --wd="/path/to/data/" -i='input.dep'
-o=output.dep --reclass_vals='10;1;20;2;30;3;40;4' --assign_mode

WhiteboxTools User Manual / Lindsay 93
207. ReclassEqualInterval
Description: Reclassifies the values in a raster image based on equal-ranges.
Toolbox: GIS Analysis/Reclass Tools
Parameters:
Flag Description
-i, –input Input raster file.
-o, –output Output raster file.
–interval Class interval size.
–start_val Optional starting value (default is input minimum value).
–end_val Optional ending value (default is input maximum value).
Example usage:
>>./whitebox_tools -r=ReclassEqualInterval -v --wd="/path/to/data/" -i='input.dep'
-o=output.dep --interval=10.0 --start_val=0.0
208. ReclassFromFile
Description: Reclassifies the values in a raster image using reclass ranges in a text file.
Toolbox: GIS Analysis/Reclass Tools
Parameters:
Flag Description
-i, –input Input raster file.
–reclass_file Input text file containing reclass ranges.
-o, –output Output raster file.
Example usage:
>>./whitebox_tools -r=ReclassFromFile -v --wd="/path/to/data/" -i='input.dep'
--reclass_file='reclass.txt' -o=output.dep
209. RelativeAspect
Description: Calculates relative aspect (relative to a user-specified direction) from an input DEM.
Toolbox: Geomorphometric Analysis
Parameters:
Flag Description
-i, –dem Input raster DEM file.
-o, –output Output raster file.

94 WhiteboxTools User Manual / Lindsay
Flag Description
–azimuth Illumination source azimuth.
–zfactor Optional multiplier for when the vertical and horizontal units are not the same.
Example usage:
>>./whitebox_tools -r=RelativeAspect -v --wd="/path/to/data/" --dem=DEM.dep
-o=output.dep --azimuth=180.0
210. RelativeStreamPowerIndex
Description: Calculates the relative stream power index.
Toolbox: Geomorphometric Analysis
Parameters:
Flag Description
–sca Input raster specific contributing area (SCA) file.
–slope Input raster slope file.
-o, –output Output raster file.
–exponent SCA exponent value.
Example usage:
>>./whitebox_tools -r=RelativeStreamPowerIndex -v --wd="/path/to/data/"
--sca='flow_accum.dep' --slope='slope.dep' -o=output.dep --exponent=1.1
211. RelativeTopographicPosition
Description: Calculates the relative topographic position index from a DEM.
Toolbox: Geomorphometric Analysis
Parameters:
Flag Description
-i, –dem Input raster DEM file.
-o, –output Output raster file.
–filterx Size of the filter kernel in the x-direction.
–filtery Size of the filter kernel in the y-direction.
Example usage:
>>./whitebox_tools -r=RelativeTopographicPosition -v --wd="/path/to/data/"
--dem=DEM.dep -o=output.dep --filter=25

WhiteboxTools User Manual / Lindsay 95
212. RemoveOffTerrainObjects
Description: Removes off-terrain objects from a raster digital elevation model (DEM).
Toolbox: Geomorphometric Analysis
Parameters:
Flag Description
-i, –input, –dem Input raster DEM file.
-o, –output Output raster file.
–filter Filter size (cells).
–slope Slope threshold value.
Example usage:
>>./whitebox_tools -r=RemoveOffTerrainObjects -v --wd="/path/to/data/"
--dem=DEM.dep -o=bare_earth_DEM.dep --filter=25 --slope=10.0
213. RemoveShortStreams
Description: Removes short first-order streams from a stream network.
Toolbox: Stream Network Analysis
Parameters:
Flag Description
–d8_pntr Input raster D8 pointer file.
–streams Input raster streams file.
-o, –output Output raster file.
–min_length Minimum tributary length (in map units) used for network prunning.
–esri_pntr D8 pointer uses the ESRI style scheme.
Example usage:
>>./whitebox_tools -r=RemoveShortStreams -v --wd="/path/to/data/"
--d8_pntr=D8.dep --streams=streams.dep -o=output.dep
214. RemoveSpurs
Description: Removes the spurs (pruning operation) from a Boolean line image.; intended to be used on
the output of the LineThinning tool.
Toolbox: Image Processing Tools
Parameters:

96 WhiteboxTools User Manual / Lindsay
Flag Description
-i, –input Input raster file.
-o, –output Output raster file.
–iterations Maximum number of iterations
Example usage:
>>./whitebox_tools -r=RemoveSpurs -v --wd="/path/to/data/" --input=DEM.dep
-o=output.dep --iterations=10
215. Resample
Description: Resamples one or more input images into a destination image.
Toolbox: Image Processing Tools
Parameters:
Flag Description
-i, –inputs Input raster files.
–destination Destination raster file.
–method Resampling method
Example usage:
>>./whitebox_tools -r=Resample -v --wd='/path/to/data/'
-i='image1.dep;image2.dep;image3.dep' --destination=dest.dep --method='cc
216. RescaleValueRange
Description: Performs a min-max contrast stretch on an input greytone image.
Toolbox: Math and Stats Tools
Parameters:
Flag Description
-i, –input Input raster file.
-o, –output Output raster file.
–out_min_val New minimum value in output image.
–out_max_val New maximum value in output image.
–clip_min Optional lower tail clip value.
–clip_max Optional upper tail clip value.
Example usage:
>>./whitebox_tools -r=RescaleValueRange -v --wd="/path/to/data/"

WhiteboxTools User Manual / Lindsay 97
-i=input.dep -o=output.dep --out_min_val=0.0 --out_max_val=1.0
>>./whitebox_tools -r=RescaleValueRange -v --wd="/path/to/data/"
-i=input.dep -o=output.dep --out_min_val=0.0 --out_max_val=1.0 --clip_min=45.0
--clip_max=200.0
217. RgbToIhs
Description: Converts red, green, and blue (RGB) images into intensity, hue, and saturation (IHS) images.
Toolbox: Image Processing Tools
Parameters:
Flag Description
–red Input red band image file. Optionally specified if colour-composite not specified.
–green Input green band image file. Optionally specified if colour-composite not specified.
–blue Input blue band image file. Optionally specified if colour-composite not specified.
–composite Input colour-composite image file. Only used if individual bands are not specified.
–intensity Output intensity raster file.
–hue Output hue raster file.
–saturation Output saturation raster file.
Example usage:
>>./whitebox_tools -r=RgbToIhs -v --wd="/path/to/data/" --red=band3.dep
--green=band2.dep --blue=band1.dep --intensity=intensity.dep --hue=hue.dep
--saturation=saturation.dep
>>./whitebox_tools -r=RgbToIhs -v --wd="/path/to/data/" --composite=image.dep
--intensity=intensity.dep --hue=hue.dep --saturation=saturation.dep
218. Rho8Pointer
Description: Calculates a stochastic Rho8 flow pointer raster from an input DEM.
Toolbox: Hydrological Analysis
Parameters:
Flag Description
-i, –dem Input raster DEM file.
-o, –output Output raster file.
–esri_pntr D8 pointer uses the ESRI style scheme.
Example usage:
>>./whitebox_tools -r=Rho8Pointer -v --wd="/path/to/data/" --dem=DEM.dep
-o=output.dep

98 WhiteboxTools User Manual / Lindsay
219. RobertsCrossFilter
Description: Performs a Robert’s cross edge-detection filter on an image.
Toolbox: Image Processing Tools/Filters
Parameters:
Flag Description
-i, –input Input raster file.
-o, –output Output raster file.
–clip Optional amount to clip the distribution tails by, in percent.
Example usage:
>>./whitebox_tools -r=RobertsCrossFilter -v --wd="/path/to/data/" -i=image.dep
-o=output.dep --clip=1.0
220. RootMeanSquareError
Description: Calculates the RMSE and other accuracy statistics.
Toolbox: Math and Stats Tools
Parameters:
Flag Description
-i, –input Input raster file.
–base Input base raster file used for comparison.
Example usage:
>>./whitebox_tools -r=RootMeanSquareError -v --wd="/path/to/data/" -i=DEM.dep
221. Round
Description: Rounds the values in an input raster to the nearest integer value.
Toolbox: Math and Stats Tools
Parameters:
Flag Description
-i, –input Input raster file.
-o, –output Output raster file.
Example usage:
>>./whitebox_tools -r=Round -v --wd="/path/to/data/" -i='input.dep'

WhiteboxTools User Manual / Lindsay 99
-o=output.dep
222. RuggednessIndex
Description: Calculates the Riley et al.’s (1999) terrain ruggedness index from an input DEM.
Toolbox: Geomorphometric Analysis
Parameters:
Flag Description
-i, –dem Input raster DEM file.
-o, –output Output raster file.
–zfactor Optional multiplier for when the vertical and horizontal units are not the same.
Example usage:
>>./whitebox_tools -r=RuggednessIndex -v --wd="/path/to/data/" --dem=DEM.dep
-o=output.dep
223. ScharrFilter
Description: Performs a Scharr edge-detection filter on an image.
Toolbox: Image Processing Tools/Filters
Parameters:
Flag Description
-i, –input Input raster file.
-o, –output Output raster file.
–clip Optional amount to clip the distribution tails by, in percent.
Example usage:
>>./whitebox_tools -r=ScharrFilter -v --wd="/path/to/data/" -i=image.dep
-o=output.dep --clip=1.0
224. SedimentTransportIndex
Description: Calculates the sediment transport index.
Toolbox: Geomorphometric Analysis
Parameters:
Flag Description
–sca Input raster specific contributing area (SCA) file.
–slope Input raster slope file.

100 WhiteboxTools User Manual / Lindsay
Flag Description
-o, –output Output raster file.
–sca_exponent SCA exponent value.
–slope_exponent Slope exponent value.
Example usage:
>>./whitebox_tools -r=SedimentTransportIndex -v --wd="/path/to/data/"
--sca='flow_accum.dep' --slope='slope.dep' -o=output.dep --sca_exponent=0.5
--slope_exponent=1.0
225. SetNodataValue
Description: Assign a specified value in an input image to the NoData value.
Toolbox: Data Tools
Parameters:
Flag Description
-i, –input Input raster file.
-o, –output Output raster file.
–back_value Background value to set to nodata.
Example usage:
>>./whitebox_tools -r=SetNodataValue -v --wd="/path/to/data/" -i=in.dep
-o=newRaster.dep --back_value=1.0
226. ShreveStreamMagnitude
Description: Assigns the Shreve stream magnitude to each link in a stream network.
Toolbox: Stream Network Analysis
Parameters:
Flag Description
–d8_pntr Input raster D8 pointer file.
–streams Input raster streams file.
-o, –output Output raster file.
–esri_pntr D8 pointer uses the ESRI style scheme.
–zero_background Flag indicating whether a background value of zero should be used.
Example usage:
>>./whitebox_tools -r=ShreveStreamMagnitude -v --wd="/path/to/data/"

WhiteboxTools User Manual / Lindsay 101
--d8_pntr=D8.dep --streams=streams.dep -o=output.dep
>>./whitebox_tools -r=ShreveStreamMagnitude -v --wd="/path/to/data/"
--d8_pntr=D8.flt --streams=streams.flt -o=output.flt --esri_pntr --zero_background
227. SigmoidalContrastStretch
Description: Performs a sigmoidal contrast stretch on input images.
Toolbox: Image Processing Tools/Image Enhancement
Parameters:
Flag Description
-i, –input Input raster file.
-o, –output Output raster file.
–cutoff Cutoff value between 0.0 and 0.95.
–gain Gain value.
–num_tones Number of tones in the output image.
Example usage:
>>./whitebox_tools -r=SigmoidalContrastStretch -v --wd="/path/to/data/"
-i=input.dep -o=output.dep --cutoff=0.1 --gain=2.0 --num_tones=1024
228. Sin
Description: Returns the sine (sin) of each values in a raster.
Toolbox: Math and Stats Tools
Parameters:
Flag Description
-i, –input Input raster file.
-o, –output Output raster file.
Example usage:
>>./whitebox_tools -r=Sin -v --wd="/path/to/data/" -i='input.dep'
-o=output.dep
229. Sinh
Description: Returns the hyperbolic sine (sinh) of each values in a raster.
Toolbox: Math and Stats Tools
Parameters:

102 WhiteboxTools User Manual / Lindsay
Flag Description
-i, –input Input raster file.
-o, –output Output raster file.
Example usage:
>>./whitebox_tools -r=Sinh -v --wd="/path/to/data/" -i='input.dep'
-o=output.dep
230. Sink
Description: Identifies the depressions in a DEM, giving each feature a unique identifier.
Toolbox: Hydrological Analysis
Parameters:
Flag Description
-i, –dem Input raster DEM file.
-o, –output Output raster file.
–zero_background Flag indicating whether a background value of zero should be used.
Example usage:
>>./whitebox_tools -r=Sink -v --wd="/path/to/data/" --dem=DEM.dep
-o=output.dep --zero_background
231. Slope
Description: Calculates a slope raster from an input DEM.
Toolbox: Geomorphometric Analysis
Parameters:
Flag Description
-i, –dem Input raster DEM file.
-o, –output Output raster file.
–zfactor Optional multiplier for when the vertical and horizontal units are not the same.
Example usage:
>>./whitebox_tools -r=Slope -v --wd="/path/to/data/" --dem=DEM.dep
-o=output.dep
232. SlopeVsElevationPlot
Description: Creates a slope vs. elevation plot for one or more DEMs.

WhiteboxTools User Manual / Lindsay 103
Toolbox: Geomorphometric Analysis
Parameters:
Flag Description
-i, –inputs Input DEM files.
–watershed Input watershed files (optional).
-o, –output Output HTML file (default name will be based on input file if unspecified).
Example usage:
>>./whitebox_tools -r=SlopeVsElevationPlot -v --wd="/path/to/data/"
-i="DEM1.tif;DEM2.tif" --watershed="ws1.tif;ws2.tif" -o=outfile.html
233. SnapPourPoints
Description: Moves outlet points used to specify points of interest in a watershedding operation to the cell
with the highest flow accumulation in its neighbourhood.
Toolbox: Hydrological Analysis
Parameters:
Flag Description
–pour_pts Input raster pour points (outlet) file.
–flow_accum Input raster D8 flow accumulation file.
-o, –output Output raster file.
–snap_dist Maximum snap distance in map units.
Example usage:
>>./whitebox_tools -r=SnapPourPoints -v --wd="/path/to/data/"
--pour_pts='pour_pts.dep' --flow_accum='d8accum.dep' -o='output.dep'
--snap_dist=15.0
234. SobelFilter
Description: Performs a Sobel edge-detection filter on an image.
Toolbox: Image Processing Tools/Filters
Parameters:
Flag Description
-i, –input Input raster file.
-o, –output Output raster file.
–variant Optional variant value. Options include 3x3 and 5x5 (default is 3x3).
–clip Optional amount to clip the distribution tails by, in percent (default is 0.0).

104 WhiteboxTools User Manual / Lindsay
Example usage:
>>./whitebox_tools -r=SobelFilter -v --wd="/path/to/data/" -i=image.dep
-o=output.dep --variant=5x5 --clip=1.0
235. SplitColourComposite
Description: This tool splits an RGB colour composite image into seperate multispectral images.
Toolbox: Image Processing Tools
Parameters:
Flag Description
-i, –input Input colour composite image file.
-o, –output Output raster file (suffixes of ’_r’, ’_g’, and ’_b’ will be appended).
Example usage:
>>./whitebox_tools -r=SplitColourComposite -v --wd="/path/to/data/"
-i=input.dep -o=output.dep
236. Square
Description: Squares the values in a raster.
Toolbox: Math and Stats Tools
Parameters:
Flag Description
-i, –input Input raster file.
-o, –output Output raster file.
Example usage:
>>./whitebox_tools -r=Square -v --wd="/path/to/data/" -i='input.dep'
-o=output.dep
237. SquareRoot
Description: Returns the square root of the values in a raster.
Toolbox: Math and Stats Tools
Parameters:
Flag Description
-i, –input Input raster file.
-o, –output Output raster file.

WhiteboxTools User Manual / Lindsay 105
Example usage:
>>./whitebox_tools -r=SquareRoot -v --wd="/path/to/data/" -i='input.dep'
-o=output.dep
238. StandardDeviationContrastStretch
Description: Performs a standard-deviation contrast stretch on input images.
Toolbox: Image Processing Tools/Image Enhancement
Parameters:
Flag Description
-i, –input Input raster file.
-o, –output Output raster file.
–clip, –stdev Standard deviation clip value.
–num_tones Number of tones in the output image.
Example usage:
>>./whitebox_tools -r=StandardDeviationContrastStretch -v --wd="/path/to/data/"
-i=input.dep -o=output.dep --stdev=2.0 --num_tones=1024
239. StandardDeviationFilter
Description: Assigns each cell in the output grid the standard deviation of values in a moving window
centred on each grid cell in the input raster.
Toolbox: Image Processing Tools/Filters
Parameters:
Flag Description
-i, –input Input raster file.
-o, –output Output raster file.
–filterx Size of the filter kernel in the x-direction.
–filtery Size of the filter kernel in the y-direction.
Example usage:
>>./whitebox_tools -r=StandardDeviationFilter -v --wd="/path/to/data/"
-i=image.dep -o=output.dep --filter=25
240. StrahlerOrderBasins
Description: Identifies Strahler-order basins from an input stream network.
Toolbox: Hydrological Analysis

106 WhiteboxTools User Manual / Lindsay
Parameters:
Flag Description
–d8_pntr Input raster D8 pointer file.
–streams Input raster streams file.
-o, –output Output raster file.
–esri_pntr D8 pointer uses the ESRI style scheme.
Example usage:
>>./whitebox_tools -r=StrahlerOrderBasins -v --wd="/path/to/data/"
--d8_pntr='d8pntr.dep' --streams='streams.dep' -o='output.dep'
241. StrahlerStreamOrder
Description: Assigns the Strahler stream order to each link in a stream network.
Toolbox: Stream Network Analysis
Parameters:
Flag Description
–d8_pntr Input raster D8 pointer file.
–streams Input raster streams file.
-o, –output Output raster file.
–esri_pntr D8 pointer uses the ESRI style scheme.
–zero_background Flag indicating whether a background value of zero should be used.
Example usage:
>>./whitebox_tools -r=StrahlerStreamOrder -v --wd="/path/to/data/"
--d8_pntr=D8.dep --streams=streams.dep -o=output.dep
>>./whitebox_tools -r=StrahlerStreamOrder -v --wd="/path/to/data/"
--d8_pntr=D8.flt --streams=streams.flt -o=output.flt --esri_pntr
--zero_background
242. StreamLinkClass
Description: Identifies the exterior/interior links and nodes in a stream network.
Toolbox: Stream Network Analysis
Parameters:
Flag Description
–d8_pntr Input raster D8 pointer file.
–streams Input raster streams file.

WhiteboxTools User Manual / Lindsay 107
Flag Description
-o, –output Output raster file.
–esri_pntr D8 pointer uses the ESRI style scheme.
–zero_background Flag indicating whether a background value of zero should be used.
Example usage:
>>./whitebox_tools -r=StreamLinkClass -v --wd="/path/to/data/"
--d8_pntr=D8.dep --streams=streams.dep -o=output.dep
>>./whitebox_tools -r=StreamLinkClass -v --wd="/path/to/data/"
--d8_pntr=D8.flt --streams=streams.flt -o=output.flt --esri_pntr
--zero_background
243. StreamLinkIdentifier
Description: Assigns a unique identifier to each link in a stream network.
Toolbox: Stream Network Analysis
Parameters:
Flag Description
–d8_pntr Input raster D8 pointer file.
–streams Input raster streams file.
-o, –output Output raster file.
–esri_pntr D8 pointer uses the ESRI style scheme.
–zero_background Flag indicating whether a background value of zero should be used.
Example usage:
>>./whitebox_tools -r=StreamLinkIdentifier -v --wd="/path/to/data/"
--d8_pntr=D8.dep --streams=streams.dep -o=output.dep
>>./whitebox_tools -r=StreamLinkIdentifier -v --wd="/path/to/data/"
--d8_pntr=D8.flt --streams=streams.flt -o=output.flt --esri_pntr
--zero_background
244. StreamLinkLength
Description: Estimates the length of each link (or tributary) in a stream network.
Toolbox: Stream Network Analysis
Parameters:
Flag Description
–d8_pntr Input raster D8 pointer file.
–linkid Input raster streams link ID (or tributary ID) file.

108 WhiteboxTools User Manual / Lindsay
Flag Description
-o, –output Output raster file.
–esri_pntr D8 pointer uses the ESRI style scheme.
–zero_background Flag indicating whether a background value of zero should be used.
Example usage:
>>./whitebox_tools -r=StreamLinkLength -v --wd="/path/to/data/" --d8_pntr=D8.dep
--linkid=streamsID.dep --dem=dem.dep -o=output.dep
>>./whitebox_tools -r=StreamLinkLength -v --wd="/path/to/data/" --d8_pntr=D8.flt
--linkid=streamsID.flt --dem=dem.flt -o=output.flt --esri_pntr --zero_background
245. StreamLinkSlope
Description: Estimates the average slope of each link (or tributary) in a stream network.
Toolbox: Stream Network Analysis
Parameters:
Flag Description
–d8_pntr Input raster D8 pointer file.
–linkid Input raster streams link ID (or tributary ID) file.
-i, –dem Input raster DEM file.
-o, –output Output raster file.
–esri_pntr D8 pointer uses the ESRI style scheme.
–zero_background Flag indicating whether a background value of zero should be used.
Example usage:
>>./whitebox_tools -r=StreamLinkSlope -v --wd="/path/to/data/" --d8_pntr=D8.dep
--linkid=streamsID.dep --dem=dem.dep -o=output.dep
>>./whitebox_tools -r=StreamLinkSlope -v --wd="/path/to/data/" --d8_pntr=D8.flt
--linkid=streamsID.flt --dem=dem.flt -o=output.flt --esri_pntr --zero_background
246. StreamSlopeContinuous
Description: Estimates the slope of each grid cell in a stream network.
Toolbox: Stream Network Analysis
Parameters:
Flag Description
–d8_pntr Input raster D8 pointer file.
–streams Input raster streams file.
-i, –dem Input raster DEM file.

WhiteboxTools User Manual / Lindsay 109
Flag Description
-o, –output Output raster file.
–esri_pntr D8 pointer uses the ESRI style scheme.
–zero_background Flag indicating whether a background value of zero should be used.
Example usage:
>>./whitebox_tools -r=StreamSlopeContinuous -v --wd="/path/to/data/" --d8_pntr=D8.dep
--linkid=streamsID.dep --dem=dem.dep -o=output.dep
>>./whitebox_tools -r=StreamSlopeContinuous -v --wd="/path/to/data/" --d8_pntr=D8.flt
--streams=streamsID.flt --dem=dem.flt -o=output.flt --esri_pntr --zero_background
247. Subbasins
Description: Identifies the catchments, or sub-basin, draining to each link in a stream network.
Toolbox: Hydrological Analysis
Parameters:
Flag Description
–d8_pntr Input D8 pointer raster file.
–streams Input raster streams file.
-o, –output Output raster file.
–esri_pntr D8 pointer uses the ESRI style scheme.
Example usage:
>>./whitebox_tools -r=Subbasins -v --wd="/path/to/data/" --d8_pntr='d8pntr.dep'
--streams='streams.dep' -o='output.dep'
248. Subtract
Description: Performs a differencing operation on two rasters or a raster and a constant value.
Toolbox: Math and Stats Tools
Parameters:
Flag Description
–input1 Input raster file or constant value.
–input2 Input raster file or constant value.
-o, –output Output raster file.
Example usage:
>>./whitebox_tools -r=Subtract -v --wd="/path/to/data/" --input1='in1.dep'

110 WhiteboxTools User Manual / Lindsay
--input2='in2.dep' -o=output.dep
249. Tan
Description: Returns the tangent (tan) of each values in a raster.
Toolbox: Math and Stats Tools
Parameters:
Flag Description
-i, –input Input raster file.
-o, –output Output raster file.
Example usage:
>>./whitebox_tools -r=Tan -v --wd="/path/to/data/" -i='input.dep'
-o=output.dep
250. TangentialCurvature
Description: Calculates a tangential curvature raster from an input DEM.
Toolbox: Geomorphometric Analysis
Parameters:
Flag Description
-i, –dem Input raster DEM file.
-o, –output Output raster file.
–zfactor Optional multiplier for when the vertical and horizontal units are not the same.
Example usage:
>>./whitebox_tools -r=TangentialCurvature -v --wd="/path/to/data/"
--dem=DEM.dep -o=output.dep
251. Tanh
Description: Returns the hyperbolic tangent (tanh) of each values in a raster.
Toolbox: Math and Stats Tools
Parameters:
Flag Description
-i, –input Input raster file.
-o, –output Output raster file.

WhiteboxTools User Manual / Lindsay 111
Example usage:
>>./whitebox_tools -r=Tanh -v --wd="/path/to/data/" -i='input.dep'
-o=output.dep
252. ThickenRasterLine
Description: Thickens single-cell wide lines within a raster image.
Toolbox: Image Processing Tools
Parameters:
Flag Description
-i, –input Input raster file.
-o, –output Output raster file.
Example usage:
>>./whitebox_tools -r=ThickenRasterLine -v --wd="/path/to/data/"
--input=DEM.dep -o=output.dep
253. ToDegrees
Description: Converts a raster from radians to degrees.
Toolbox: Math and Stats Tools
Parameters:
Flag Description
-i, –input Input raster file.
-o, –output Output raster file.
Example usage:
>>./whitebox_tools -r=ToDegrees -v --wd="/path/to/data/" -i='input.dep'
-o=output.dep
254. ToRadians
Description: Converts a raster from degrees to radians.
Toolbox: Math and Stats Tools
Parameters:
Flag Description
-i, –input Input raster file.
-o, –output Output raster file.

112 WhiteboxTools User Manual / Lindsay
Example usage:
>>./whitebox_tools -r=ToRadians -v --wd="/path/to/data/" -i='input.dep'
-o=output.dep
255. TophatTransform
Description: Performs either a white or black top-hat transform on an input image.
Toolbox: Image Processing Tools
Parameters:
Flag Description
-i, –input Input raster file.
-o, –output Output raster file.
–filterx Size of the filter kernel in the x-direction.
–filtery Size of the filter kernel in the y-direction.
–variant Optional variant value. Options include ‘white’ and ‘black’.
Example usage:
>>./whitebox_tools -r=TophatTransform -v --wd="/path/to/data/" -i=image.dep
-o=output.dep --filter=25
256. TopologicalStreamOrder
Description: Assigns each link in a stream network its topological order.
Toolbox: Stream Network Analysis
Parameters:
Flag Description
–d8_pntr Input raster D8 pointer file.
–streams Input raster streams file.
-o, –output Output raster file.
–esri_pntr D8 pointer uses the ESRI style scheme.
–zero_background Flag indicating whether a background value of zero should be used.
Example usage:
>>./whitebox_tools -r=TopologicalStreamOrder -v --wd="/path/to/data/"
--d8_pntr=D8.dep --streams=streams.dep -o=output.dep
>>./whitebox_tools -r=TopologicalStreamOrder -v --wd="/path/to/data/"
--d8_pntr=D8.flt --streams=streams.flt -o=output.flt --esri_pntr
--zero_background
257. TotalCurvature

WhiteboxTools User Manual / Lindsay 113
Description: Calculates a total curvature raster from an input DEM.
Toolbox: Geomorphometric Analysis
Parameters:
Flag Description
-i, –dem Input raster DEM file.
-o, –output Output raster file.
–zfactor Optional multiplier for when the vertical and horizontal units are not the same.
Example usage:
>>./whitebox_tools -r=TotalCurvature -v --wd="/path/to/data/" --dem=DEM.dep
-o=output.dep
258. TotalFilter
Description: Performs a total filter on an input image.
Toolbox: Image Processing Tools/Filters
Parameters:
Flag Description
-i, –input Input raster file.
-o, –output Output raster file.
–filterx Size of the filter kernel in the x-direction.
–filtery Size of the filter kernel in the y-direction.
Example usage:
>>./whitebox_tools -r=TotalFilter -v --wd="/path/to/data/" -i=image.dep
-o=output.dep --filter=25
259. TraceDownslopeFlowpaths
Description: Traces downslope flowpaths from one or more target sites (i.e. seed points).
Toolbox: Hydrological Analysis
Parameters:
Flag Description
–seed_pts Input raster seed points file.
–d8_pntr Input D8 pointer raster file.
-o, –output Output raster file.
–esri_pntr D8 pointer uses the ESRI style scheme.

114 WhiteboxTools User Manual / Lindsay
Flag Description
–zero_background Flag indicating whether a background value of zero should be used.
Example usage:
>>./whitebox_tools -r=TraceDownslopeFlowpaths -v --wd="/path/to/data/"
--seed_pts=seeds.dep --flow_dir=flow_directions.dep --output=flow_paths.dep
260. TributaryIdentifier
Description: Assigns a unique identifier to each tributary in a stream network.
Toolbox: Stream Network Analysis
Parameters:
Flag Description
–d8_pntr Input raster D8 pointer file.
–streams Input raster streams file.
-o, –output Output raster file.
–esri_pntr D8 pointer uses the ESRI style scheme.
–zero_background Flag indicating whether a background value of zero should be used.
Example usage:
>>./whitebox_tools -r=TributaryIdentifier -v --wd="/path/to/data/"
--d8_pntr=D8.dep --streams=streams.dep -o=output.dep
>>./whitebox_tools -r=TributaryIdentifier -v --wd="/path/to/data/"
--d8_pntr=D8.flt --streams=streams.flt -o=output.flt --esri_pntr
--zero_background
261. Truncate
Description: Truncates the values in a raster to the desired number of decimal places.
Toolbox: Math and Stats Tools
Parameters:
Flag Description
-i, –input Input raster file.
-o, –output Output raster file.
–num_decimals Number of decimals left after truncation (default is zero).
Example usage:
>>./whitebox_tools -r=Truncate -v --wd="/path/to/data/" -i='input.dep'

WhiteboxTools User Manual / Lindsay 115
-o=output.dep --num_decimals=2
262. TurningBandsSimulation
Description: Creates an image containing random values based on a turning-bands simulation.
Toolbox: Math and Stats Tools
Parameters:
Flag Description
-i, –base Input base raster file.
-o, –output Output file.
–range The field’s range, in xy-units, related to the extent of spatial autocorrelation.
–iterations The number of iterations.
Example usage:
>>./whitebox_tools -r=TurningBandsSimulation -v --wd="/path/to/data/"
--base=in.dep -o=out.dep --range=850.0 --iterations=2500
263. Viewshed
Description: Identifies the viewshed for a point or set of points.
Toolbox: Geomorphometric Analysis
Parameters:
Flag Description
–dem Input raster DEM file.
–stations Input viewing station raster file.
-o, –output Output raster file.
–height Viewing station height, in z units.
Example usage:
>>./whitebox_tools -r=Viewshed -v --wd="/path/to/data/" --dem='dem.dep'
--stations='stations.dep' -o=output.dep --height=10.0
264. Watershed
Description: Identifies the watershed, or drainage basin, draining to a set of target cells.
Toolbox: Hydrological Analysis
Parameters:
Flag Description
–d8_pntr Input D8 pointer raster file.

116 WhiteboxTools User Manual / Lindsay
Flag Description
–pour_pts Input vector pour points (outlet) file.
-o, –output Output raster file.
–esri_pntr D8 pointer uses the ESRI style scheme.
Example usage:
>>./whitebox_tools -r=Watershed -v --wd="/path/to/data/" --d8_pntr='d8pntr.dep'
--pour_pts='pour_pts.dep' -o='output.dep'
265. WeightedSum
Description: Performs a weighted-sum overlay on multiple input raster images.
Toolbox: GIS Analysis/Overlay Tools
Parameters:
Flag Description
-i, –inputs Input raster files.
-o, –output Output raster file.
-w, –weights Weight values, contained in quotes and separated by commas or semicolons.
Example usage:
>>./whitebox_tools -r=WeightedSum -v --wd='/path/to/data/'
-i='image1.dep;image2.dep;image3.dep' -o=output.dep --weights='0.3;0.2;0.5'
266. WetnessIndex
Description: Calculates the topographic wetness index, Ln(A / tan(slope)).
Toolbox: Geomorphometric Analysis
Parameters:
Flag Description
–sca Input raster specific contributing area (SCA) file.
–slope Input raster slope file.
-o, –output Output raster file.
Example usage:
>>./whitebox_tools -r=WetnessIndex -v --wd="/path/to/data/"
--sca='flow_accum.dep' --slope='slope.dep' -o=output.dep
267. WriteFunctionMemoryInsertion

WhiteboxTools User Manual / Lindsay 117
Description: Performs a write function memory insertion for single-band multi-date change detection.
Toolbox: Image Processing Tools
Parameters:
Flag Description
–i1, –input1 Input raster file associated with the first date.
–i2, –input2 Input raster file associated with the second date.
–i3, –input3 Optional input raster file associated with the third date.
-o, –output Output raster file.
Example usage:
>>./whitebox_tools -r=WriteFunctionMemoryInsertion -v --wd="/path/to/data/"
-i1=input1.dep -i2=input2.dep -o=output.dep
268. Xor
Description: Performs a logical XOR operator on two Boolean raster images.
Toolbox: Math and Stats Tools
Parameters:
Flag Description
–input1 Input raster file.
–input2 Input raster file.
-o, –output Output raster file.
Example usage:
>>./whitebox_tools -r=Xor -v --wd="/path/to/data/" --input1='in1.dep'
--input2='in2.dep' -o=output.dep
269. ZScores
Description: Standardizes the values in an input raster by converting to z-scores.
Toolbox: Math and Stats Tools
Parameters:
Flag Description
-i, –input Input raster file.
-o, –output Output raster file.
Example usage:
118 WhiteboxTools User Manual / Lindsay
>>./whitebox_tools -r=ZScores -v --wd="/path/to/data/" -i=DEM.dep
-o=output.dep
5. Supported Data Formats
The WhiteboxTools library can currently support reading/writing raster data in Whitebox GAT, GeoTIFF,
ESRI (ArcGIS) ASCII and binary (.flt & .hdr), GRASS GIS, Idrisi, SAGA GIS (binary and ASCII), and Surfer 7 data
formats. The library is primarily tested using Whitebox raster data sets and if you encounter issues when
reading/writing data in other formats, you should report the issue. Please note that there are no plans to
incorporate third-party libraries, like GDAL, in the project given the design goal of keeping a pure (or as
close as possible) Rust codebase.
At present, there is limited ability in WhiteboxTools to read vector geospatial data. Support for Shapefile
(and other common vector formats) will be enhanced within the library soon.
LiDAR data can be read/written in the common LAS data format. WhiteboxTools can read and write LAS files
that have been compressed (zipped with a .zip extension) using the common DEFLATE algorithm. Note
that only LAS file should be contained within a zipped archive file. The compressed LiDAR format LAZ and
ESRI LiDAR format are not currently supported by the library. The following is an example of running a
LiDAR tool using zipped input/output files:
>>./whitebox_tools -r=LidarTophatTransform -v --wd="/path/to/data/"
-i="input.las.zip" -o="output.las.zip" --radius=10.0
Note that the double extensions (.las.zip) in the above command are not necessary and are only used
for convenience of keeping track of LiDAR data sets (i.e. .zip extensions work too). The extra work of
decoding/encoding compressed files does add additional processing time, although the Rust compression
library that is used is highly efficient and usually only adds a few seconds to tool run times. Zipping LAS
files frequently results 40-60% smaller binary files, making the additional processing time worthwhile for
larger LAS file data sets with massive storage requirements.
6. Contributing
If you would like to contribute to the project as a developer, follow these instructions to get started:
1. Fork the larger Whitebox project (in which whitebox-tools exists) ( https://github.com/jblindsay/whitebox-
geospatial-analysis-tools )
2. Create your feature branch (git checkout -b my-new-feature)
3. Commit your changes (git commit -am ‘Add some feature’)
4. Push to the branch (git push origin my-new-feature)
5. Create a new Pull Request
Unless explicitly stated otherwise, any contribution intentionally submitted for inclusion in the work shall
be licensed as above without any additional terms or conditions.
WhiteboxTools User Manual / Lindsay 119
If you would like to contribute financial support for the project, please contact John Lindsay. We also
welcome contributions in the form of media exposure. If you have written an article or blog about White-
boxTools please let us know about it.
7. License
The WhiteboxTools library is distributed under the MIT license, a permissive open-source (free software)
license.
8. Reporting Bugs
WhiteboxTools is distributed as is and without warranty of suitability for application. If you encounter flaws
with the software (i.e. bugs) please report the issue. Providing a detailed description of the conditions
under which the bug occurred will help to identify the bug. Use the Issues tracker on GitHub to report issues
with the software and to request feature enchancements. Please do not email Dr. Lindsay directly with bugs.
9. Known Issues
• There is limited support for reading, writing, or analyzing vector data yet. Plans include native sup-
port for the ESRI Shapefile format and possibly GeoJSON data.
• The LAZ compressed LiDAR data format is currently unsupported although zipped LAS files (.zip)
are.
• File directories cannot contain apostrophes (’, e.g. /John’s data/) as they will be interpreted in the
arguments array as single quoted strings.
• The Python scripts included with WhiteboxTools require Python 3. They will not work with Python
2, which is frequently the default Python version installed on many systems.
10. Frequently Asked Questions
Do I need Whitebox GAT to use WhiteboxTools?
No you do not. You can call the tools contained within WhiteboxTools completely independent from the
Whitebox GAT user interface using a Remote Procedure Call (RPC) approach. In fact, you can interact with
the tools using Python scripting or directly, using a terminal application (command prompt). See Usage
for further details.
How do I request a tool be added?
Eventually most of the tools in Whitebox GAT will be ported over to WhiteboxTools and all new tools will be
added to this library as well. Naturally, this will take time. The order by which tools are ported is partly
120 WhiteboxTools User Manual / Lindsay
a function of ease of porting, existing infrastructure (i.e. raster and LiDAR tools will be ported first since
their is currently no support in the library for vector I/O), and interest. If you are interested in making a
tool a higher priority for porting, email John Lindsay.
Can WhiteboxTools be incorporated into other software and open-source GIS projects?
WhiteboxTools was developed with the open-source GIS Whitebox GAT in mind. That said, the tools can be
accessed independently and so long as you abide by the terms of the MIT license, there is no reason why
other software and GIS projects cannot use WhiteboxTools as well. In fact, this was one of the motivating
factors for creating the library in the first place. Feel free to use WhiteboxTools as the geospatial analysis
engine in your open-source software project.
What platforms does WhiteboxTools support?
WhiteboxTools is developed using the Rust programming language, which supports a wide variety of plat-
forms including MS Windows, MacOS, and Linux operating systems and common chip architectures. Inter-
estingly, Rust also supports mobile platforms, and WhiteboxTools should therefore be capable of targeting
(although no testing has been completed in this regard to date). Nearly all development and testing of the
software is currently carried out on MacOS and we cannot guarantee a bug-free performance on other
platforms. In particularly, MS Windows is the most different from the other platforms and is therefore the
most likely to encounter platform-specific bugs. If you encounter bugs in the software, please consider
reporting an issue using the GitHub support for issue-tracking.
What are the system requirements?
The answer to this question depends strongly on the type of analysis and data that you intend to pro-
cess. However, generally we find performance to be optimal with a recommended minimum of 8-16GB
of memory (RAM), a modern multi-core processor (e.g. 64-bit i5 or i7), and an solid-state-drive (SSD). It is
likely that WhiteboxTools will have satisfactory performance on lower-spec systems if smaller datasets are
being processed. Because WhiteboxTools reads entire raster datasets into system memory (for optimal
performance, and in recognition that modern systems have increasingly larger amounts of fast RAM), this
tends to be the limiting factor for the upper-end of data size successfully processed by the library. 64-bit
operating systems are recommended and extensive testing has not been carried out on 32-bit OSs. See
“What platforms does WhiteboxTools support?” for further details on supported platforms.
Are pre-compiled executables of WhiteboxTools available?
Pre-compiled binaries for WhiteboxTools can be downloaded from the Geomorphometry and Hydrogeomat-
ics Research Group software web site for various supported operating systems. If you need binaries for
other operating systems/system architectures, you will need to compile the executable from source files.
See Installation for details.
WhiteboxTools User Manual / Lindsay 121
Why is WhiteboxTools programmed in Rust?
I spent a long time evaluating potential programming language for future development efforts for the
Whitebox GAT project. My most important criterion for a language was that it compile to native code, rather
than target the Java virtual machine (JVM). I have been keen to move Whitebox GAT away from Java because
of some of the challenges that supporting the JVM has included for many Whitebox users. The language
should be fast and productive–Java is already quite fast, but if I am going to change development languages,
I would like a performance boost. Furthermore, given that many, though not all, of the algorithms used
for geospatial analysis scale well with concurrent (parallel) implementations, I favoured languages that
offered easy and safe concurrent programming. Although many would consider C/C++ for this work, I
was looking for a modern and safe language. Fortunately, we are living through a renaissance period in
programming language development and there are many newer languages that fit the bill nicely. Over
the past two years, I considered each of Go, Rust, D, Nim, and Crystal for Whitebox development and
ultimately decided on Rust. [See GoSpatial and lidario.]
Each of the languages I examined has its own advantages of disadvantages, so why Rust? It’s a combina-
tion of factors that made it a compelling option for this project. Compared with many on the list, Rust is
a mature language with a vibrant user community. Like C/C++, it’s a high-performance and low-level lan-
guage that allows for complete control of the system. However, Rust is also one of the safest languages,
meaning that I can be confident that WhiteboxTools will not contain common bugs, such as memory use-
after-release, memory leaks and race conditions within concurrent code. Importantly, and quite uniquely,
this safety is achieved in the Rust language without the use of a garbage collector (automatic memory
management). Garbage collectors can be great, but they do generally come with a certain efficiency trade-
off that Rust does not have. The other main advantage of Rust’s approach to memory management is
that it allows for a level of interaction with scripting languages (e.g. Python) that is quite difficult to do in
garbage collected languages. Although WhiteboxTools is currently set up to use an automation approach
to interacting with Python code that calls it, I like the fact that I have the option to create a WhiteboxTools
shared library.
Not everything with Rust is perfect however. It is still a very young language and there are many pieces
still missing from its ecosystem. Furthermore, it is not the easiest language to learn, particularly for peo-
ple who are inexperienced with programming. This may limit my ability to attract other programers to
the Whitebox project, which would be unfortunate. However, overall, Rust was the best option for this
particular application.
Do I need Rust installed on my computer to run WhiteboxTools?
No, you would only need Rust installed if you were compiling the WhiteboxTools codebase from source
files.
How does WhiteboxTools’ design philosophy differ?
Whitebox GAT is frequently praised for its consistent design and ease of use. Like Whitebox GAT,White-
boxTools follows the convention of one tool for one function. For example, in WhiteboxTools assigning the
122 WhiteboxTools User Manual / Lindsay
links in a stream channel network their Horton, Strahler, Shreve, or Hack stream ordering numbers re-
quires running separate tools (i.e. HortonStreamOrder,StrahlerStreamOrder,ShreveStreamMagnitude, and
HackStreamOrder). By contrast, in GRASS GIS1and ArcGIS single tools (i.e. the r.stream.order and Stream
Order tools respectively) can be configured to output different channel ordering schemes. The Whitebox-
Tools design is intended to simplify the user experience and to make it easier to find the right tool for a
task. With more specific tool names that are reflective of their specific purposes, users are not as reliant
on reading help documentation to identify the tool for the task at hand. Similarly, it is not uncommon for
tools in other GIS to have multiple outputs. For example, in GRASS GIS the r.slope.aspect tool can be config-
ured to output slope, aspect, profile curvature, plan curvature, and several other common terrain surface
derivatives. Based on the one tool for one function design approach of WhiteboxTools, multiple outputs are
indicative that a tool should be split into different, more specific tools. Are you more likely to go to a tool
named r.slope.aspect or TangentialCurvature when you want to create a tangential curvature raster from
a DEM? If you’re new to the software and are unfamiliar with it, probably the later is more obvious. The
WhiteboxTools design approach also has the added benefit of simplifying the documentation for tools. The
one downside to this design approach, however, is that it results (or will result) in a large number of tools,
often with signifcant overlap in function.
1NOTE: It’s not my intent to criticize GRASS GIS, as I deeply respect the work that the GRASS developers
have contributed. Rather, I am contrasting the consequences of WhiteboxTools’ design philosophy to that
of other GIS.
