Findings From Recent CMS Research On Medicare Brennan
User Manual: Pdf Findings from Recent CMS Research on Medicare Wearables: The evolution in post-acute care
Open the PDF directly: View PDF ![]() .
.
Page Count: 43

Findings from Recent CMS Research on
Findings
from
Recent
CMS
Research
on
Medicare
Chair: Niall Brennan

Patent Expirations and Part D Spending on
Patent
Expirations
and
Part
D
Spending
on
Atypical Antipsychotic Medications
Eric Rollins
Director, Policy & Data Analytics Group
Office of Information Products and Data Analytics
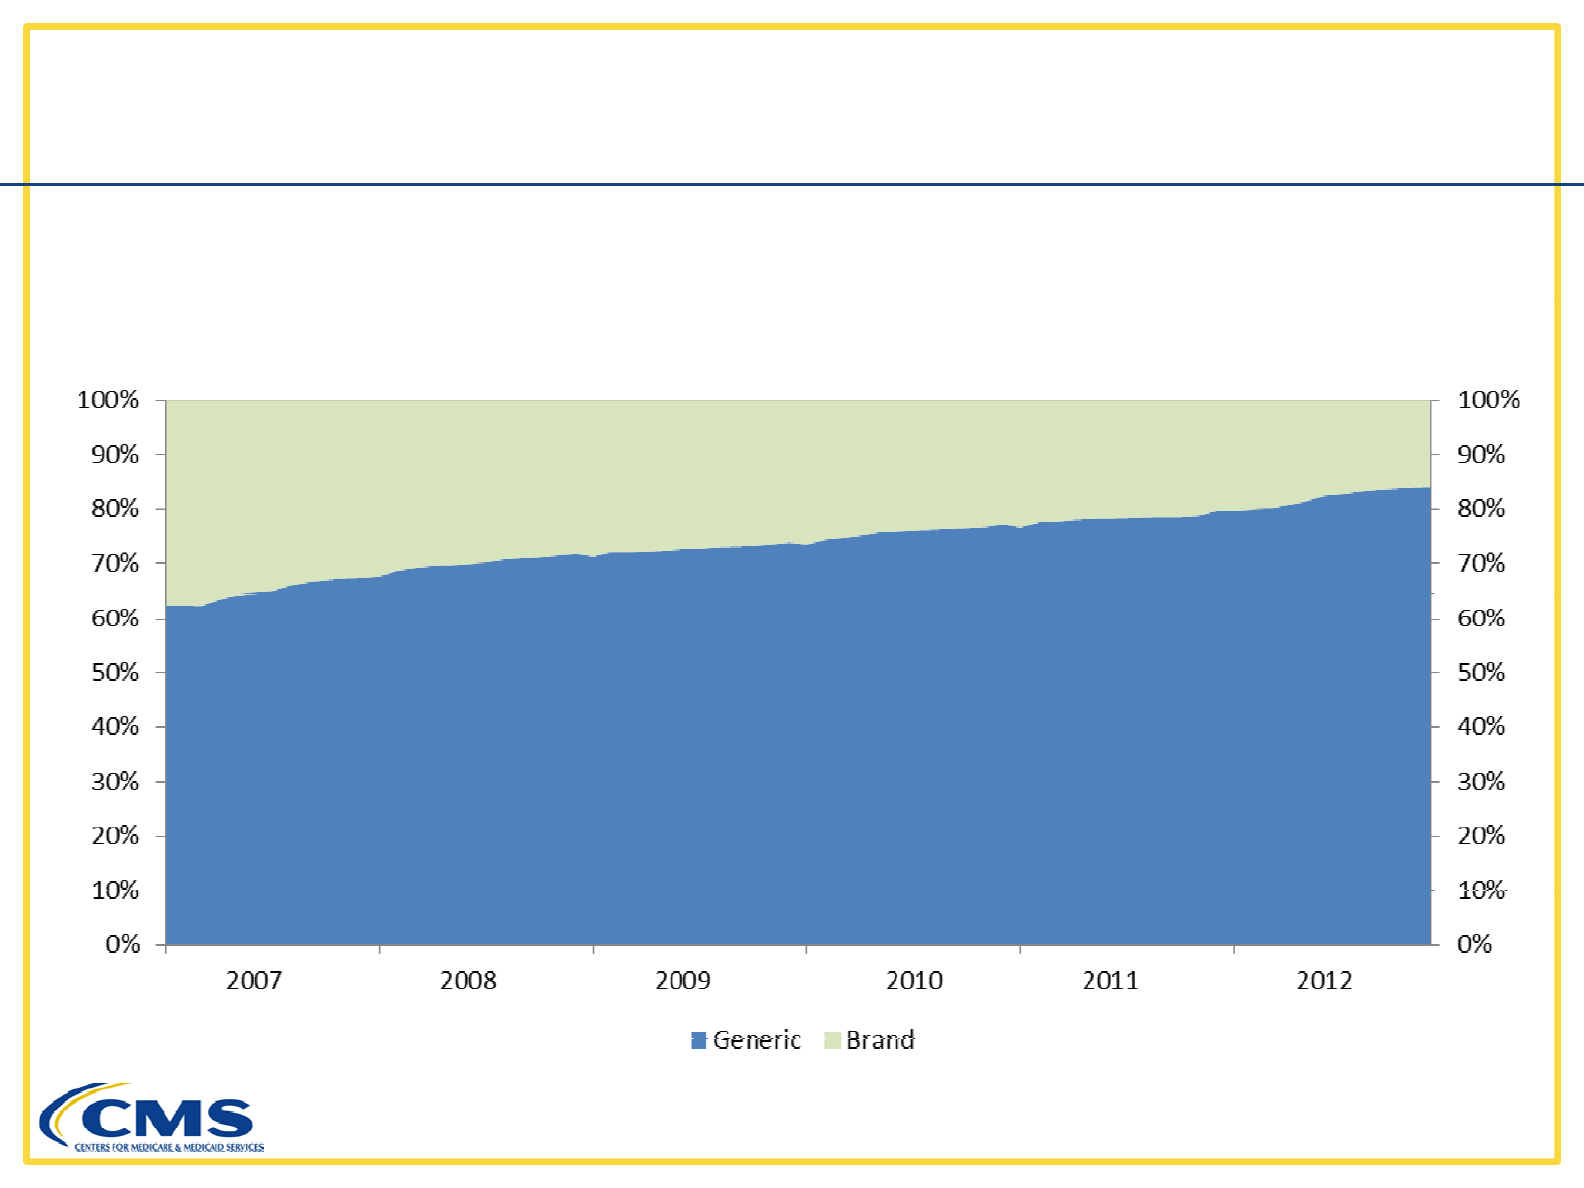
Use of Generic Drugs in Part D, 2007-2012
●The share of total prescriptions filled with generics rose from 63%
in January 2007 to 84% in December 2012
in
January
2007
to
84%
in
December
2012
3
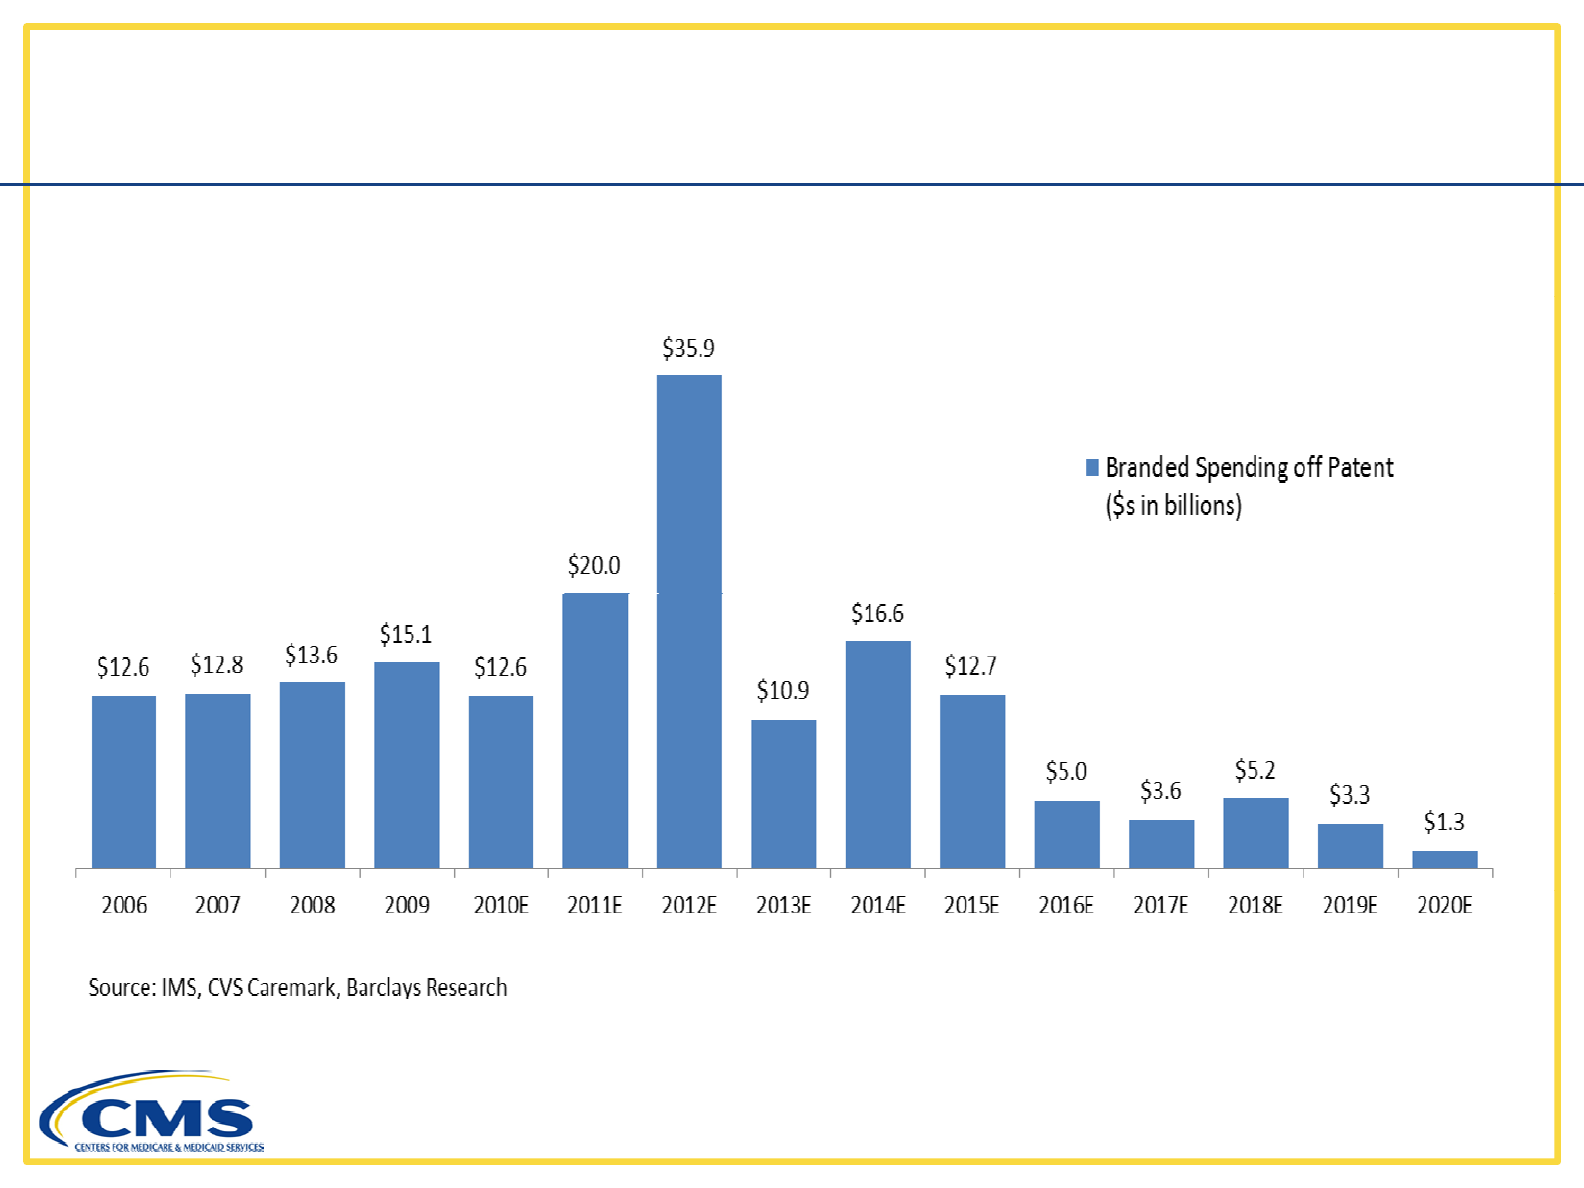
Brand-Name Drugs Losing Patent Protection
●These figures are based on total U.S. sales
4
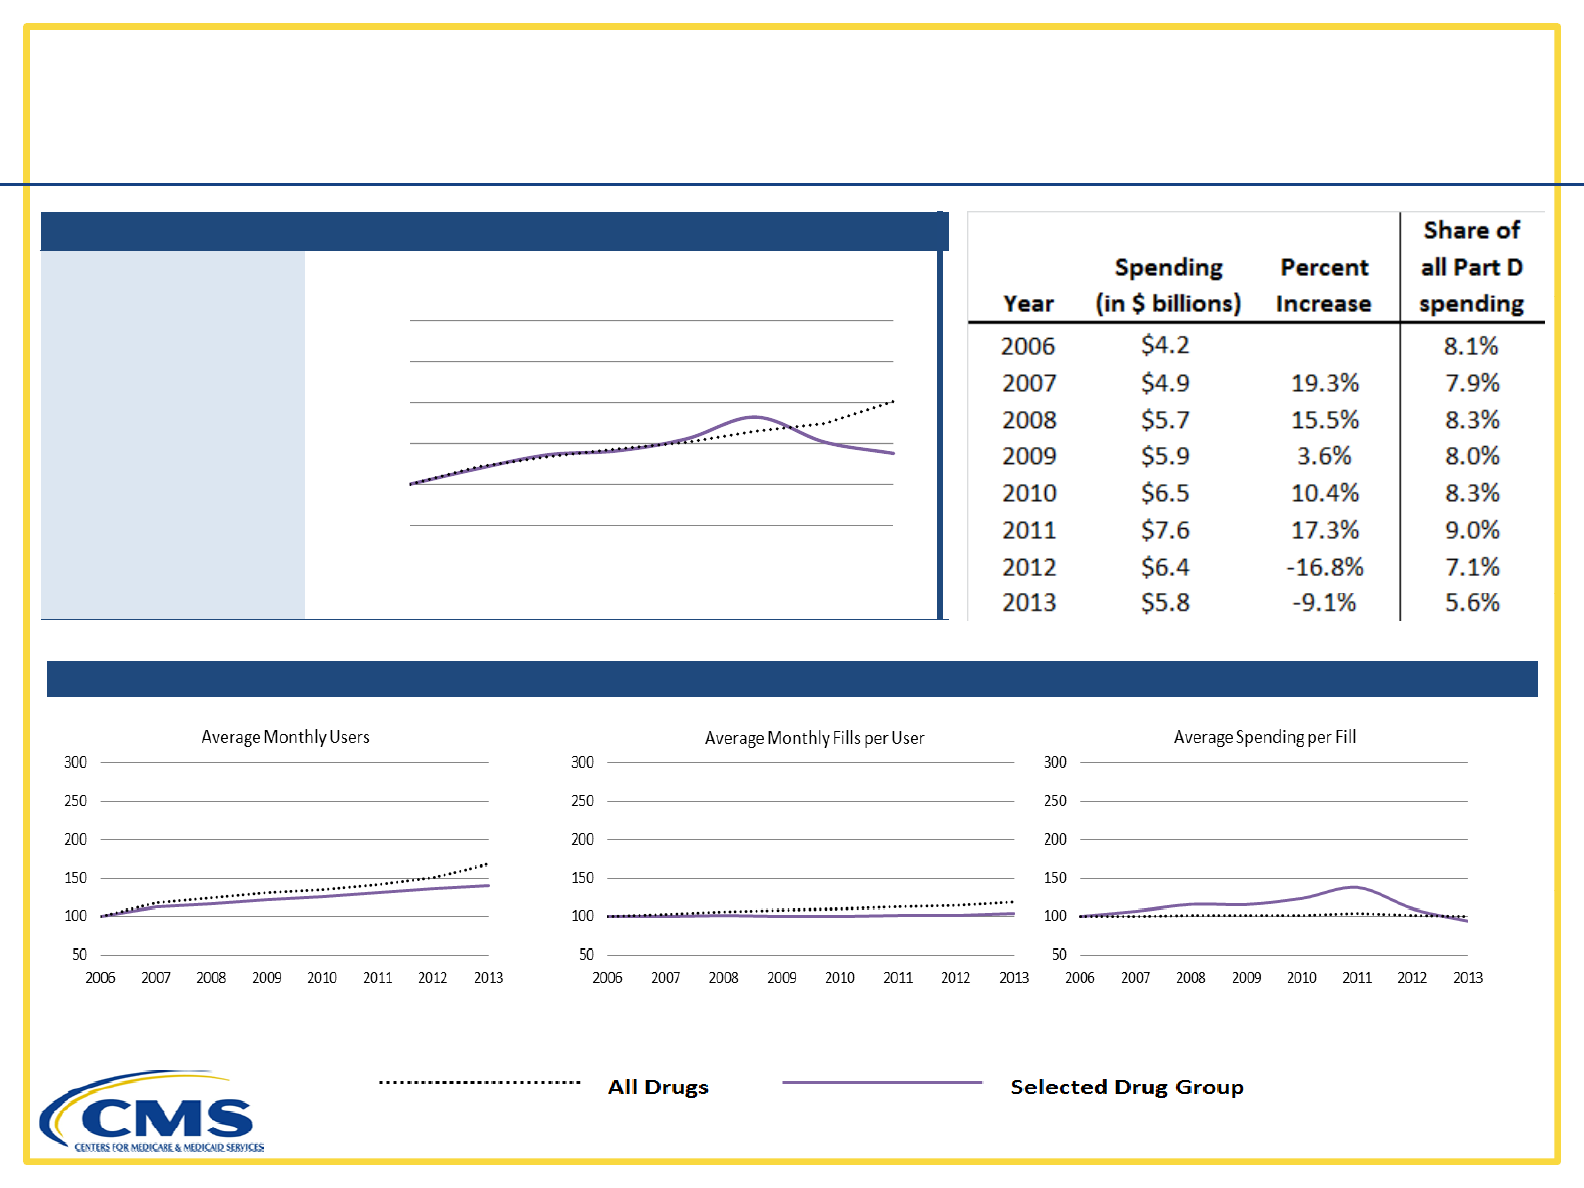
Part D Spending for Atypical Antipsychotics
ANTIPSYCHOTICS/ANTIMANIC AGENTS
2013 Spend (%)
Total Spending Trend
2013
Spend
(%)
2013 Fills (%)
$5.8 B (6%)
29 8 M (2%)
150
200
250
300
Total
Spending
Trend
29
.
8
M
(2%)
50
100
150
2006 2007 2008 2009 2010 2011 2012 2013
5

Major Atypical Antipsychotics:
Patent Expiration Dates and Part D Market Shares
Patent
Expiration
Dates
and
Part
D
Market
Shares
Drug Generic
Name
Patent
Expiration *
Forms
Affected
Percentage of
2011 Fills
Percentage of
2011 Spend
Name
Expiration
*
Affected
2011
Fills
2011
Spend
Clozaril Clozapine 30-Aug-96 Tablet 5.2 1.7
Risperdal Risperdone 30-Jun-08 Tablet 25.6 6.5
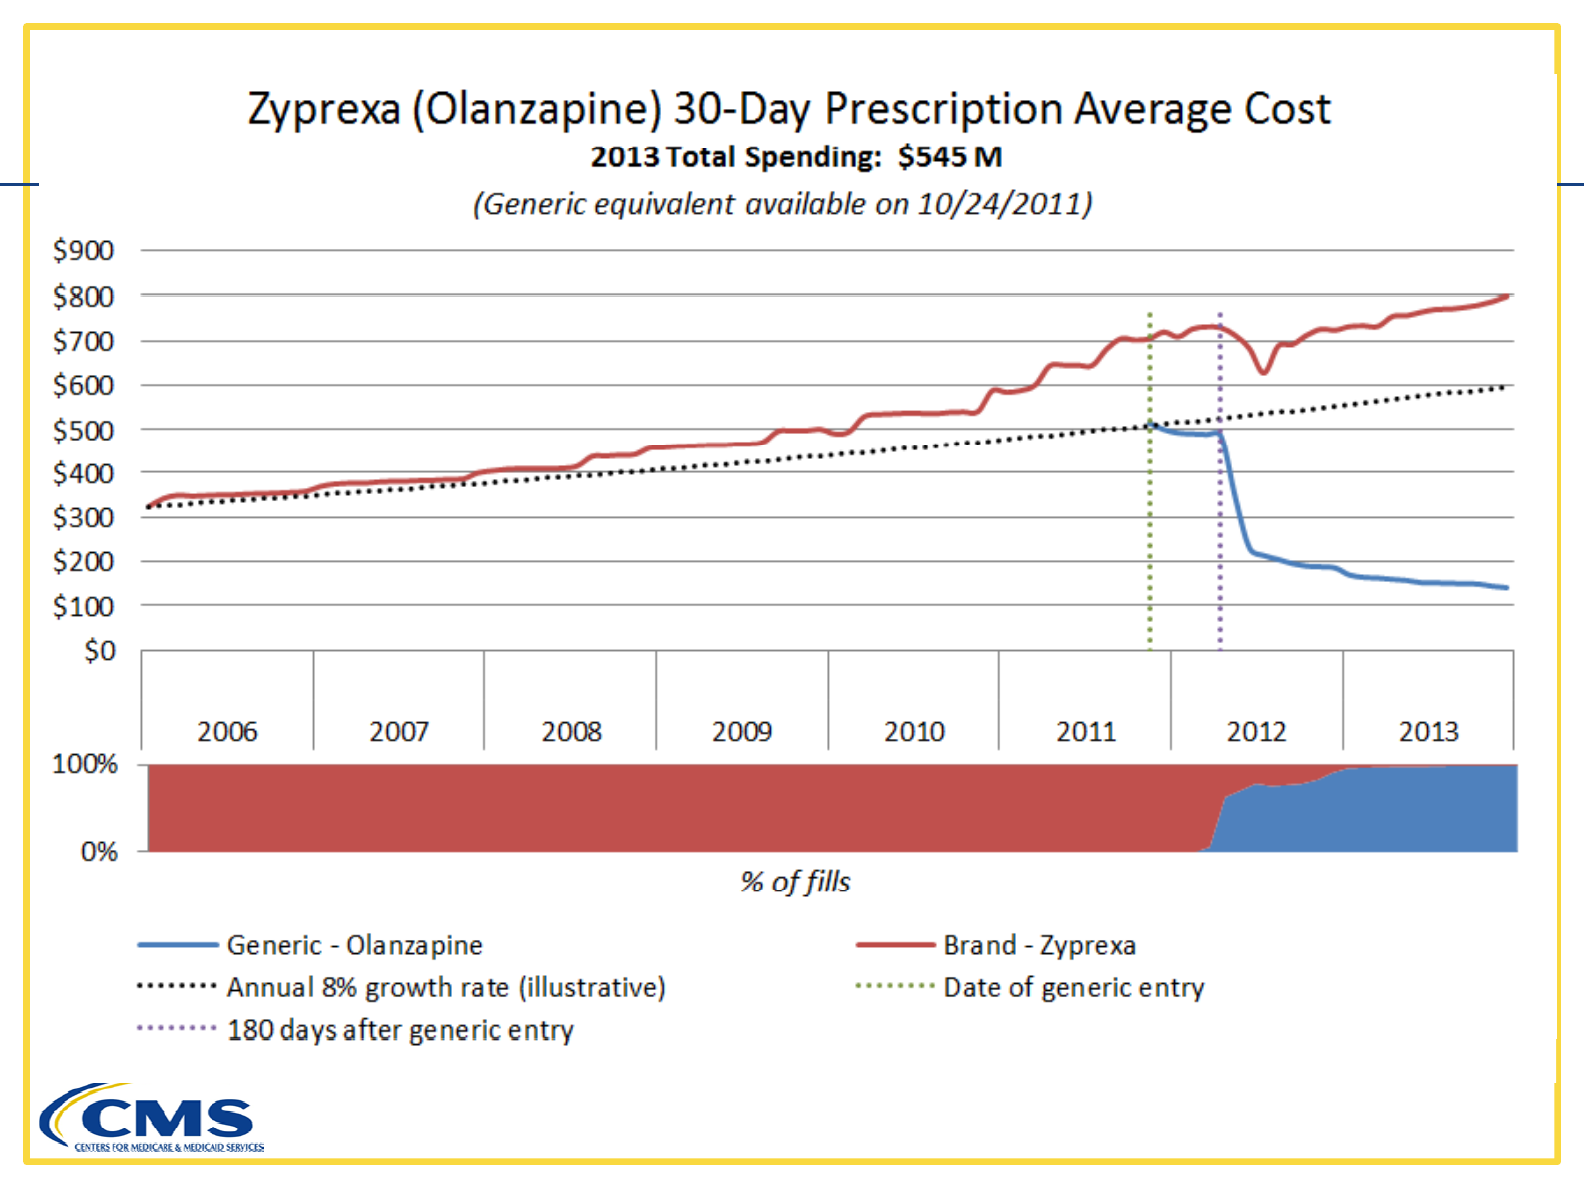
Zyprexa Olanzapine 24-Oct-11 Tablet 14.3 26.2
Geodon Ziprasidone 02-Mar-12 Capsule 5.5 7.1
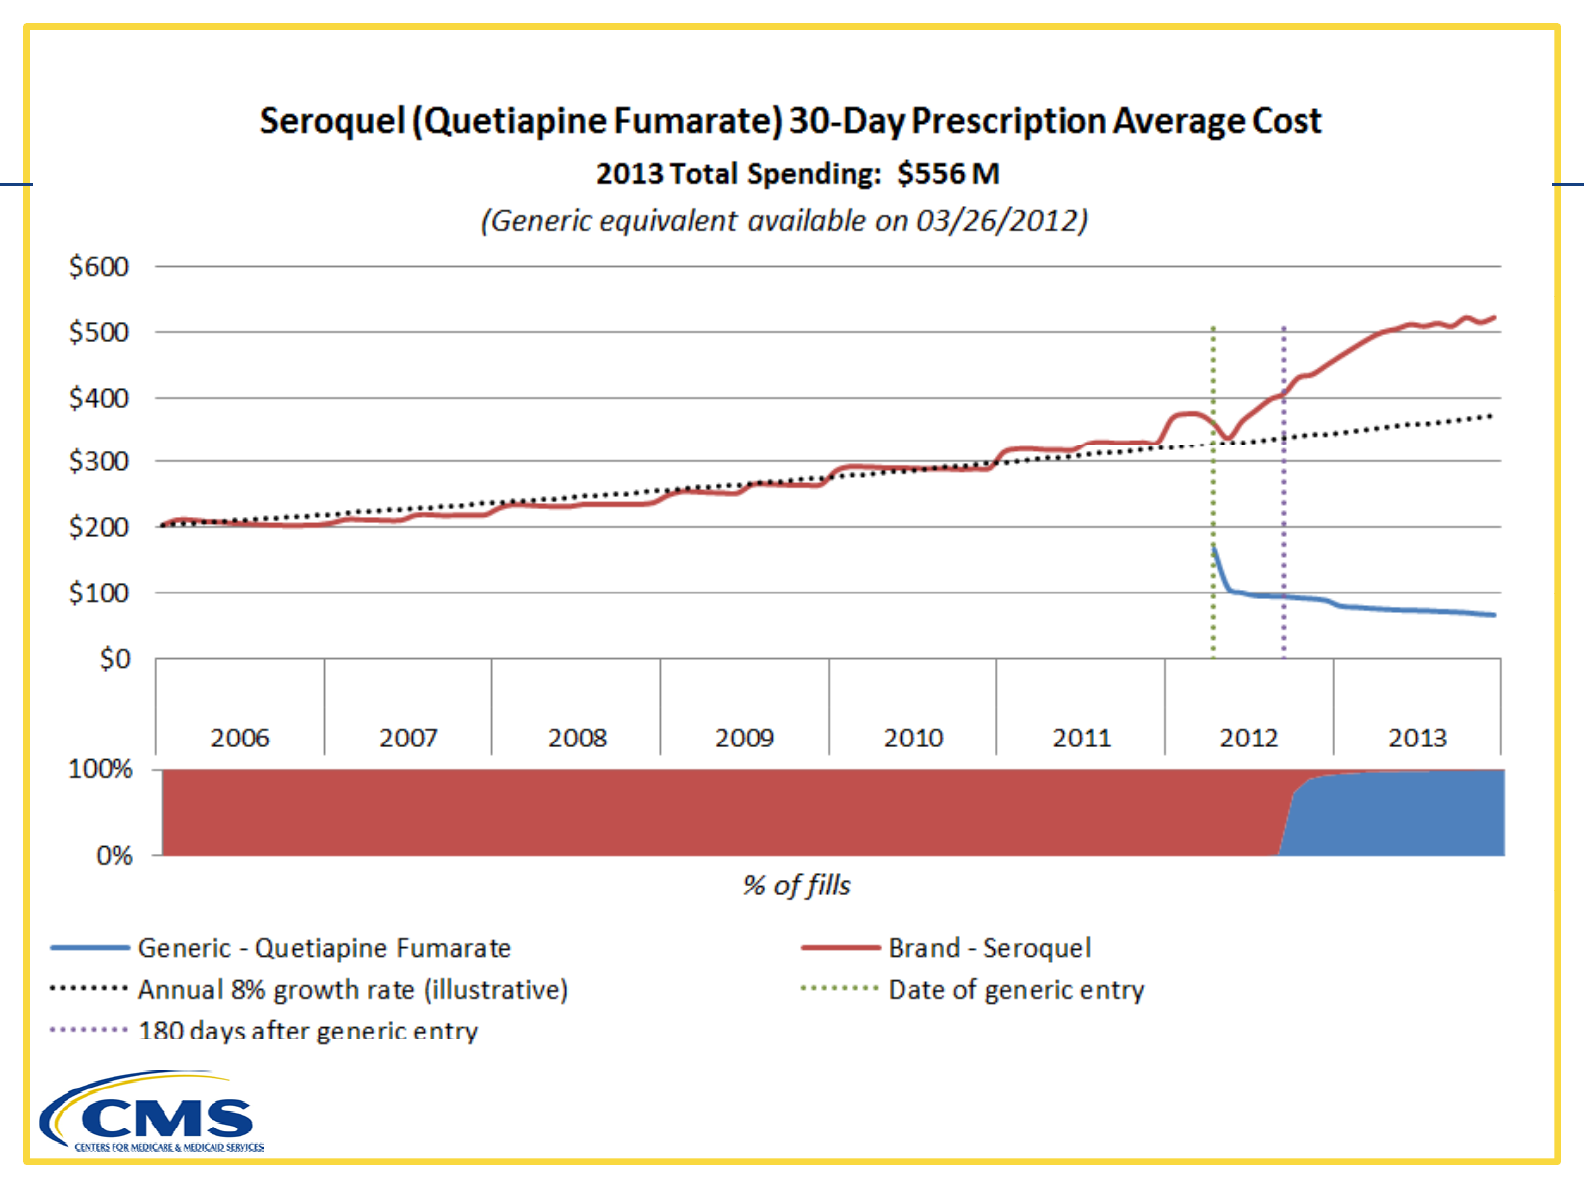
Seroquel
Quetiapine
26
-
Mar
-
12
Tablet
34
32 3
Seroquel
Fumarate
26
Mar
12
Tablet
34
32
.
3
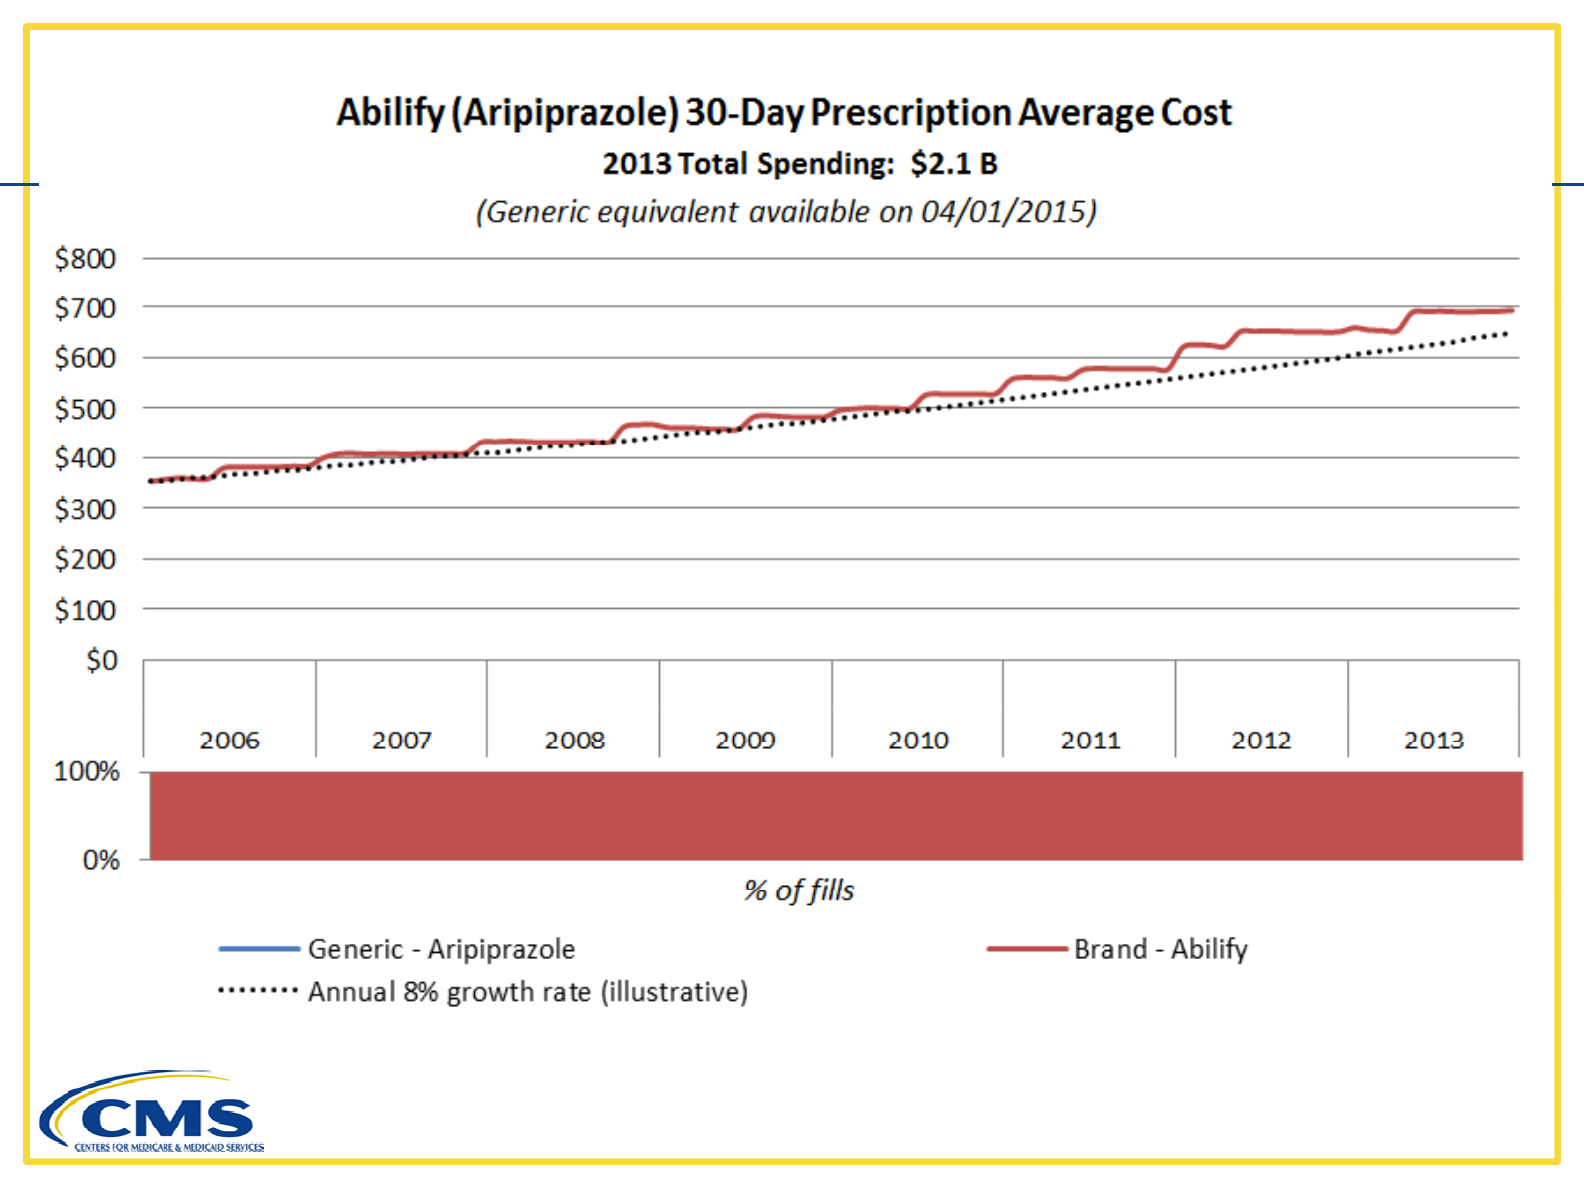
Abilify Aripiprazole Apr-15 Tablet 12.1 19.7
Total N/A N/A N/A 96.7 93.5
* This is the expiration date for the patent on the leading dosage form, as reported by the
FDA Orange Book; the date for Abilify comes from Express Scripts/Medco's file of anticipated
patent expiration dates, accessed on April 1, 2013.
6
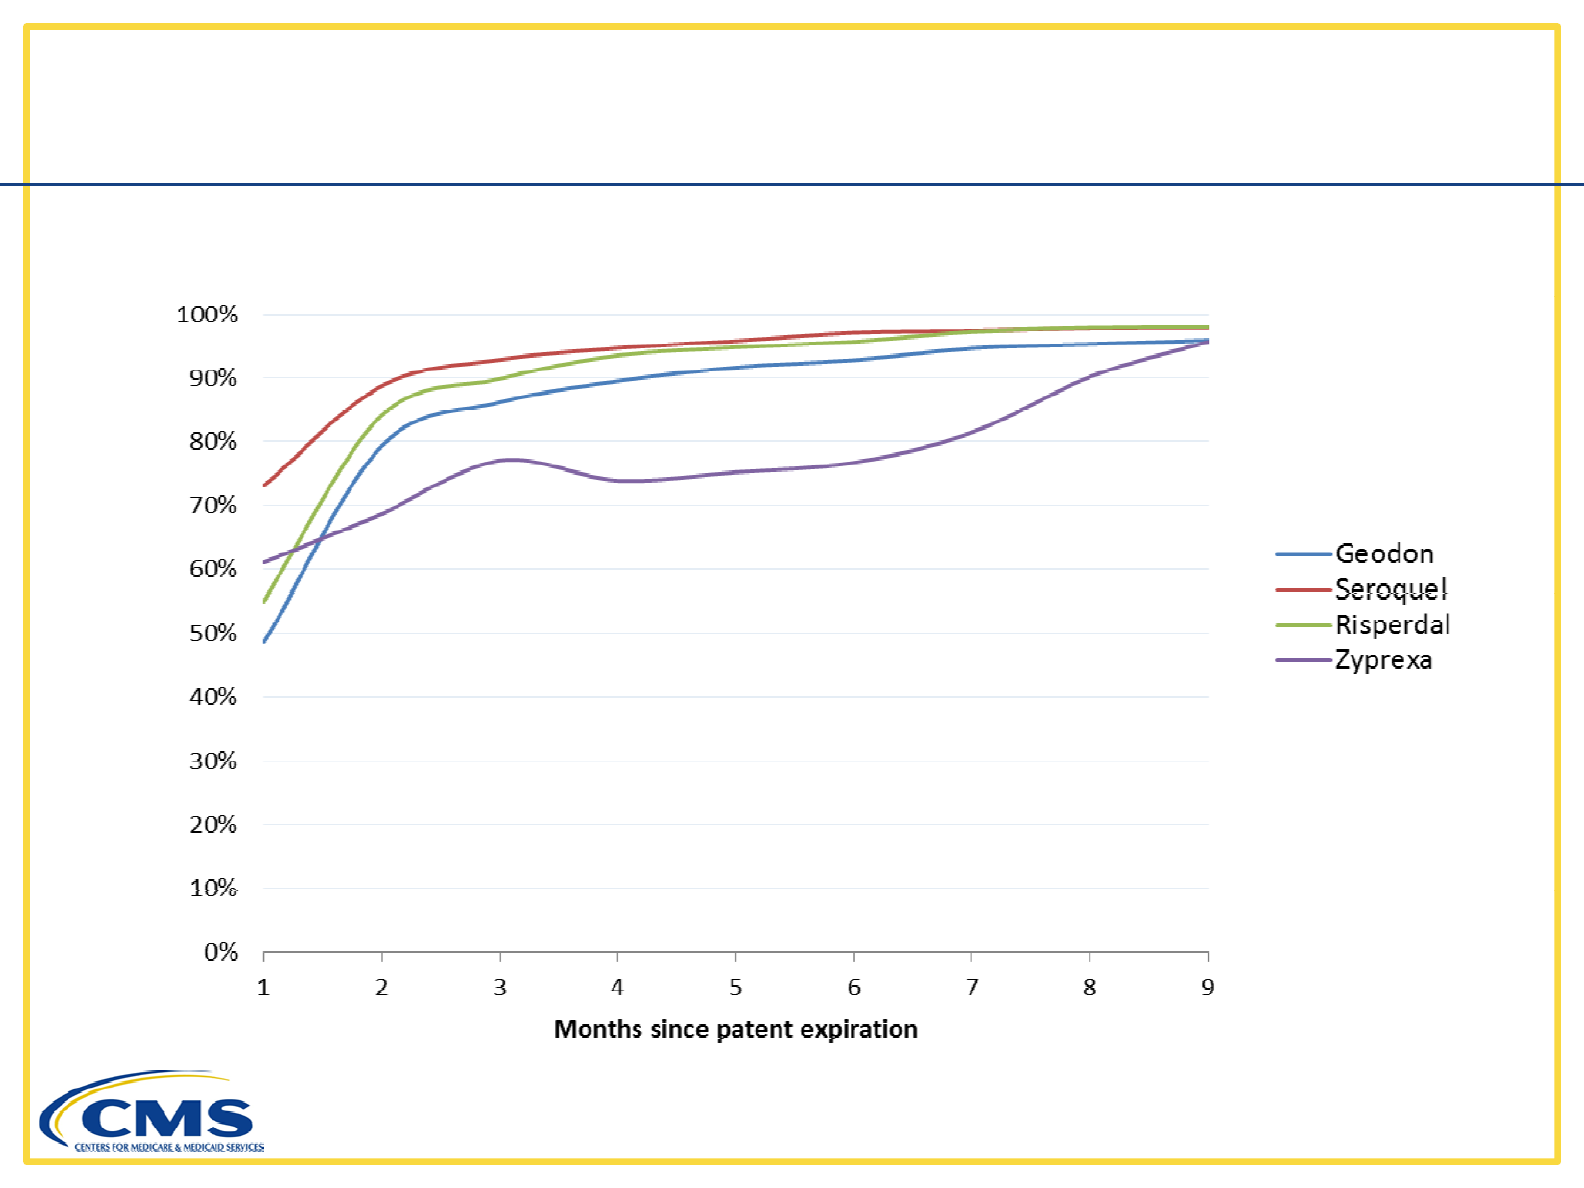
Generics as a Share of Total Prescriptions,
by Drug by Months after Patent Expiration
(Here month 1 is the month when the patent expired.)
by
Drug
,
by
Months
after
Patent
Expiration
7
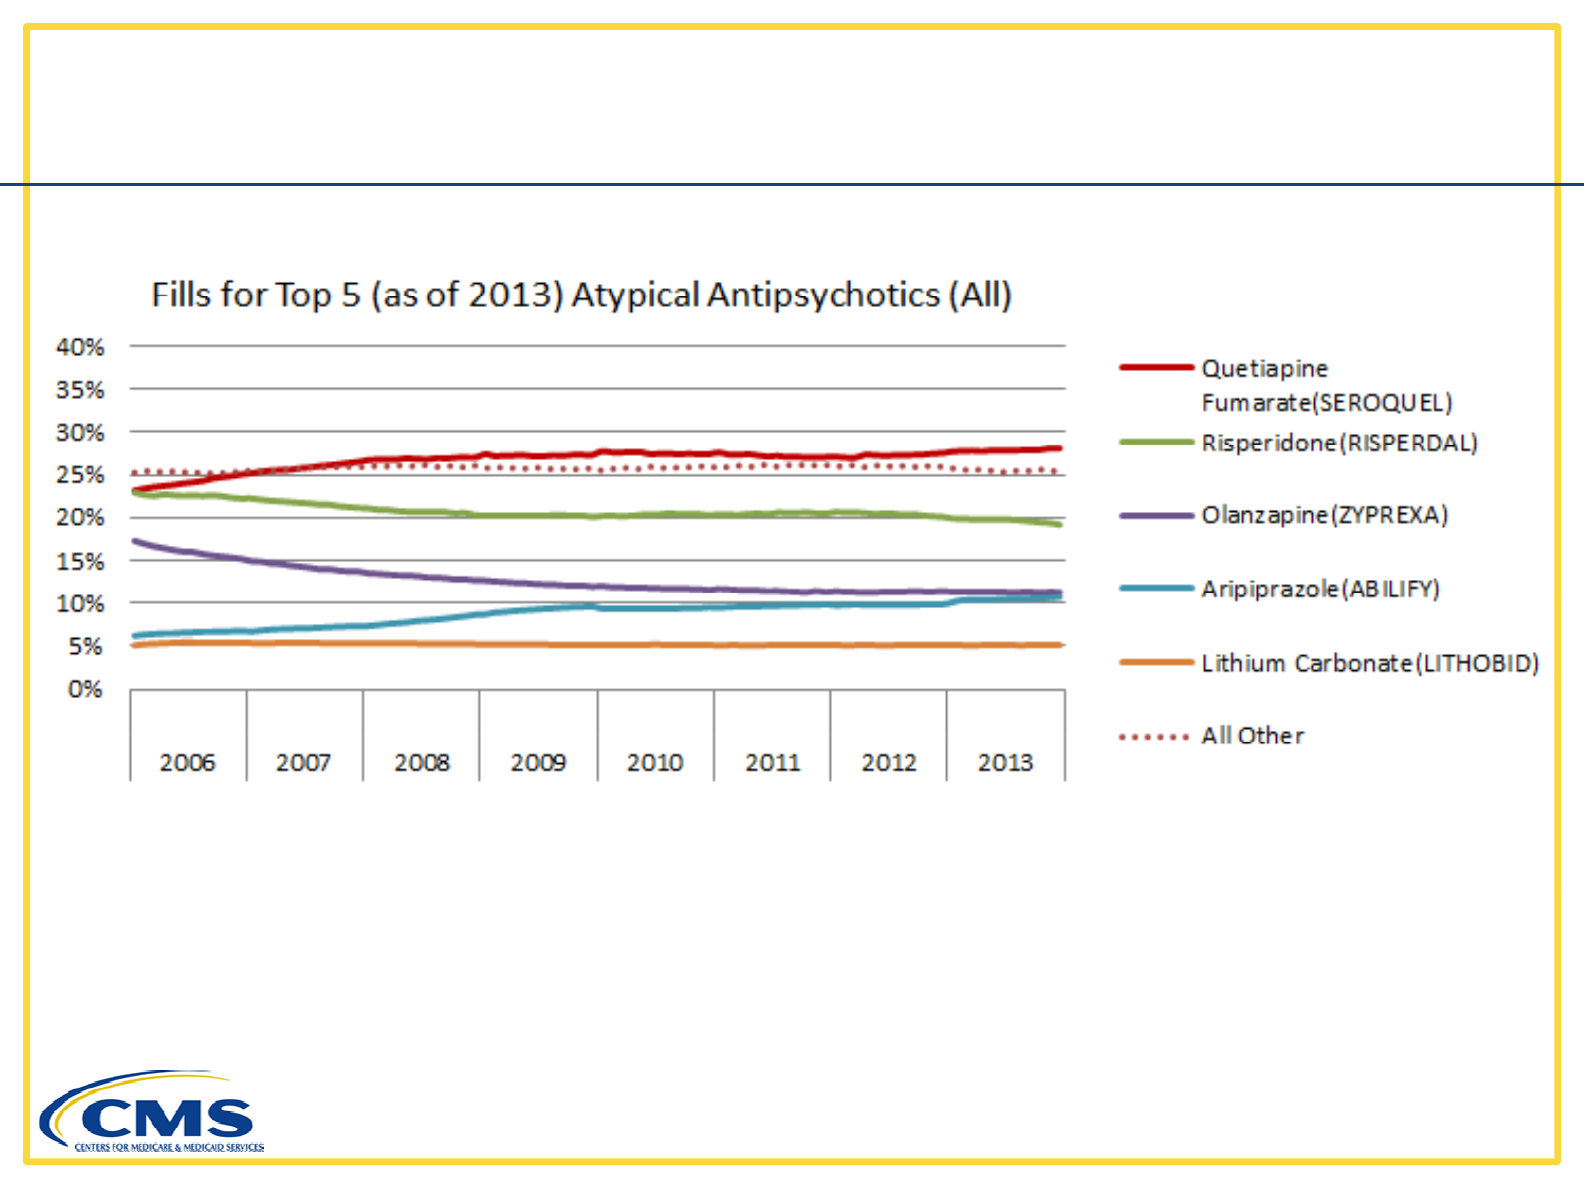
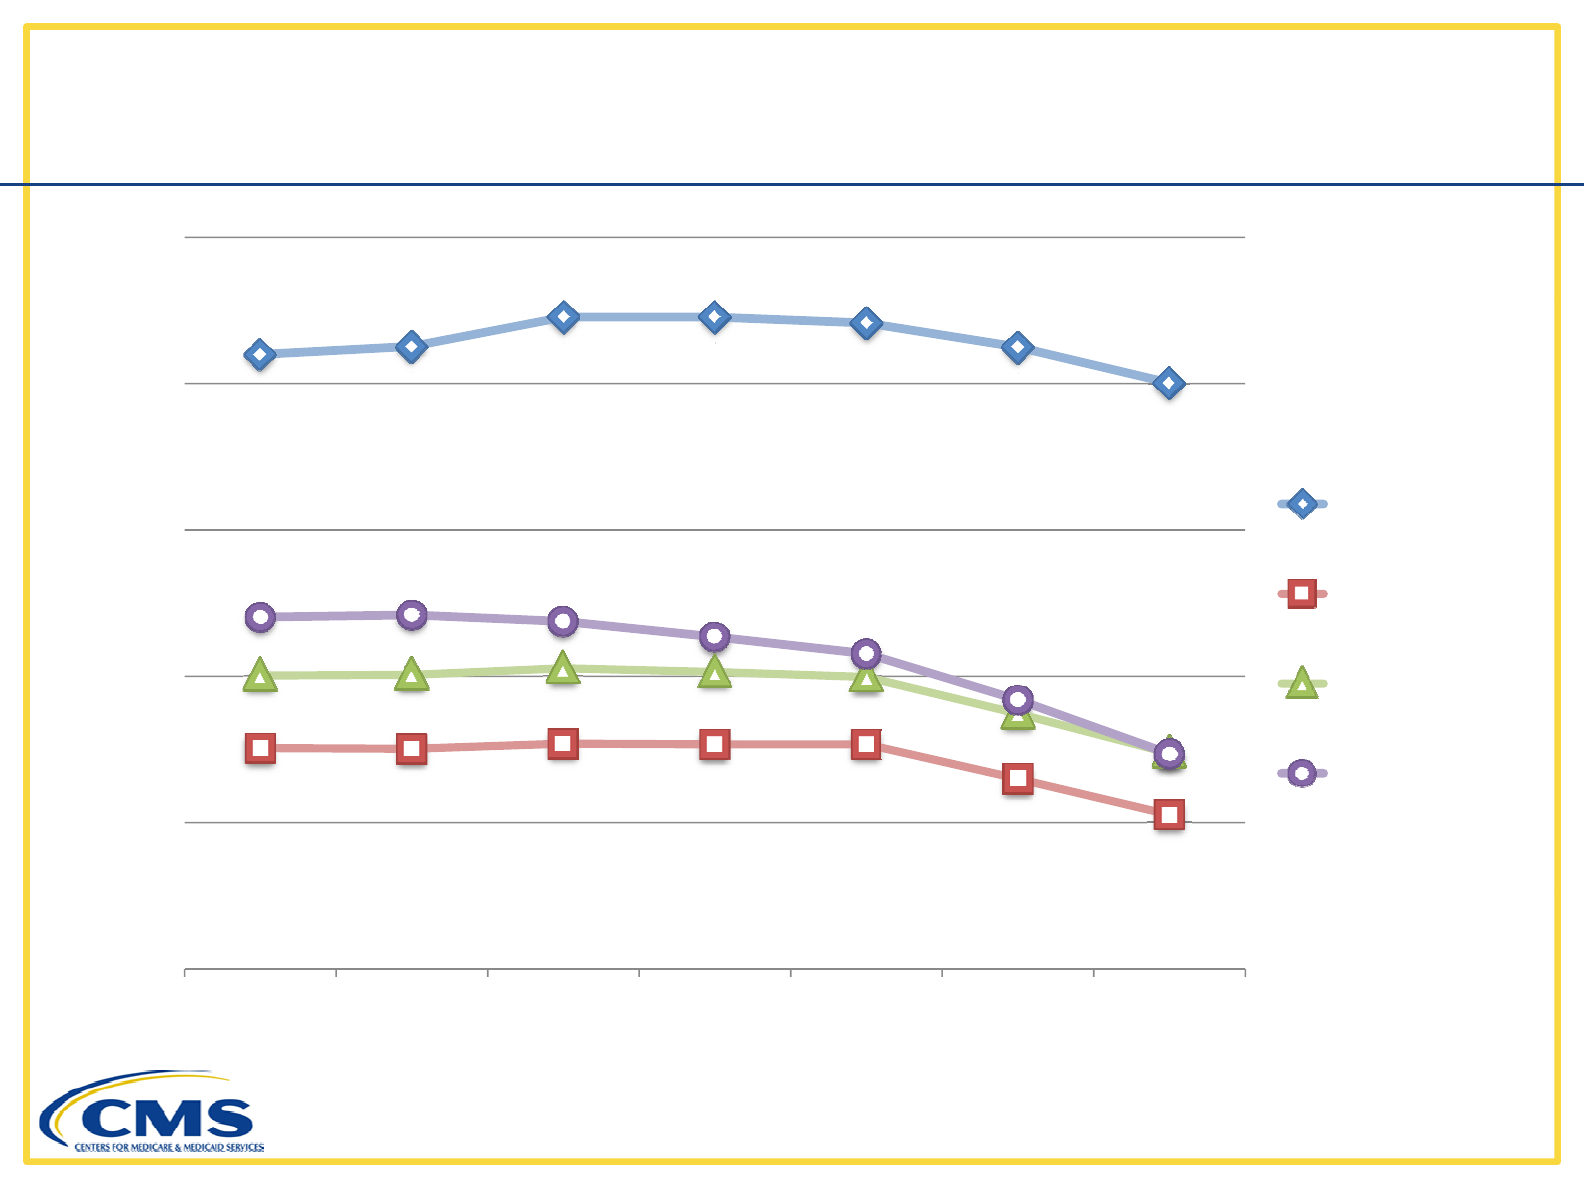
Part D Market Shares, by Prescriptions, 2006-2013
(Risperdal
patent
expires)
(Zyprexa
patent
expires)
(Seroquel
patent
expires)
8
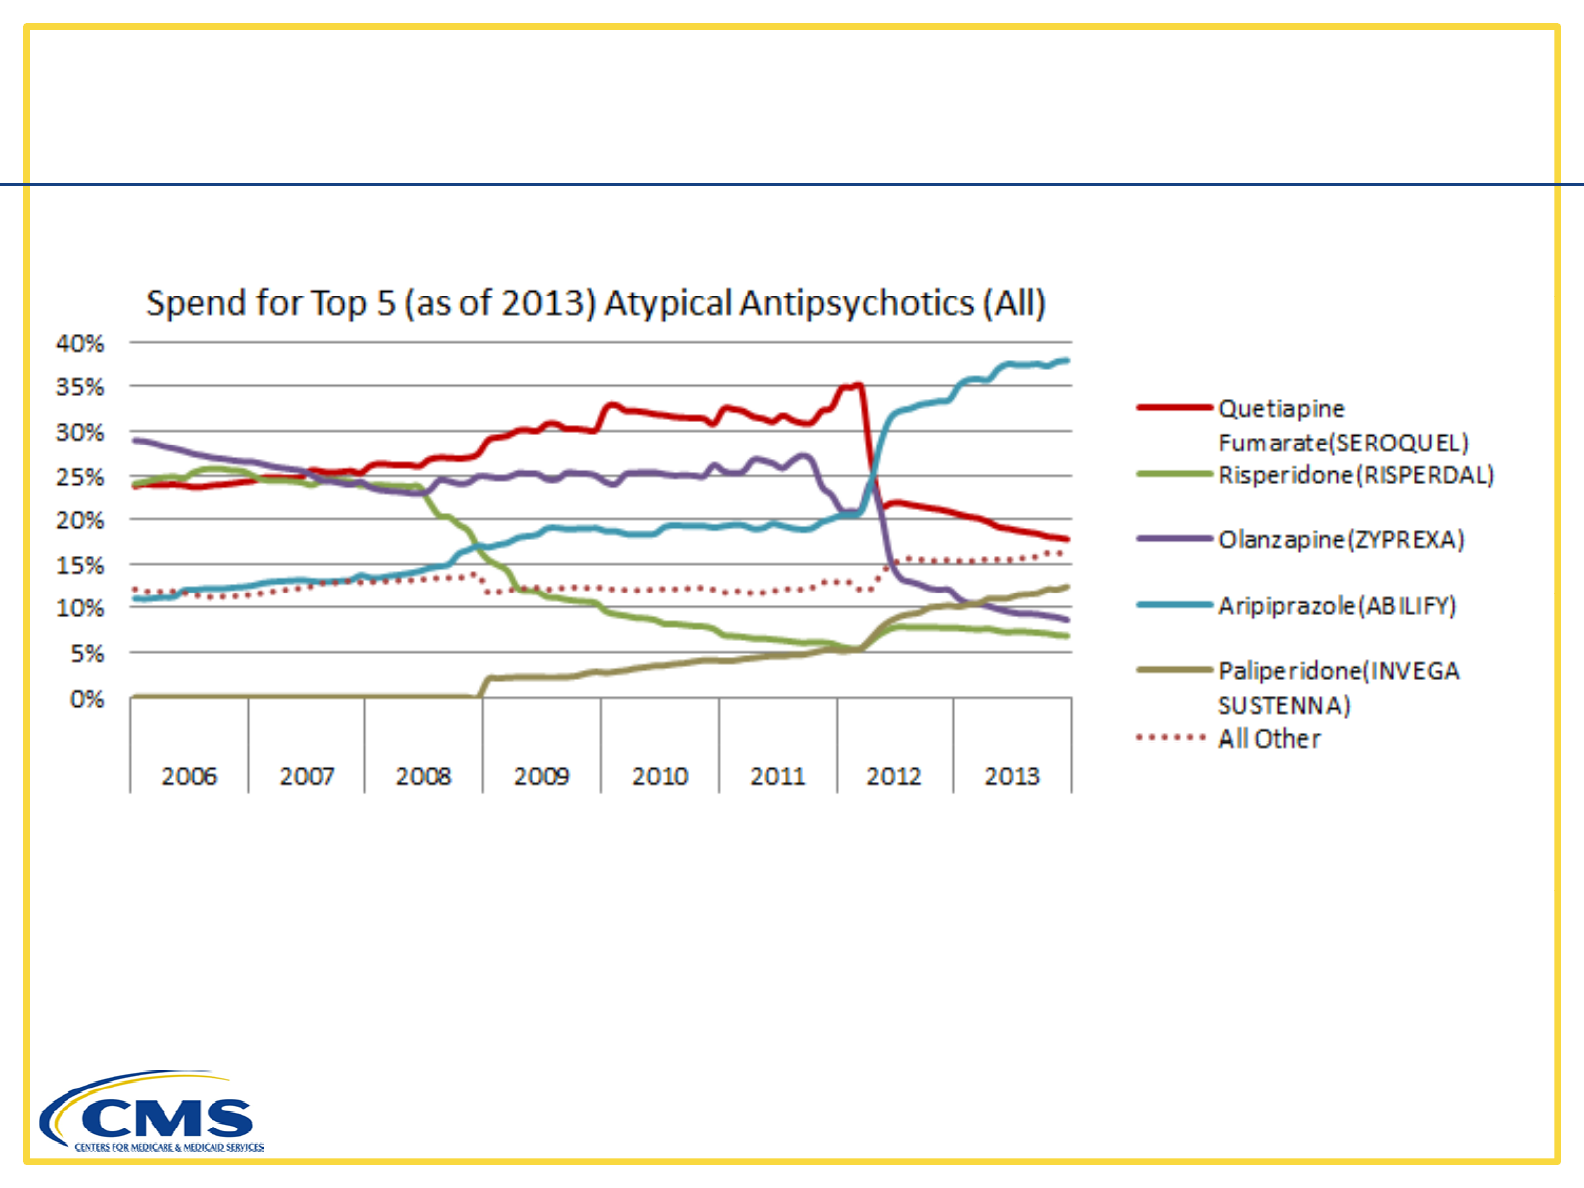
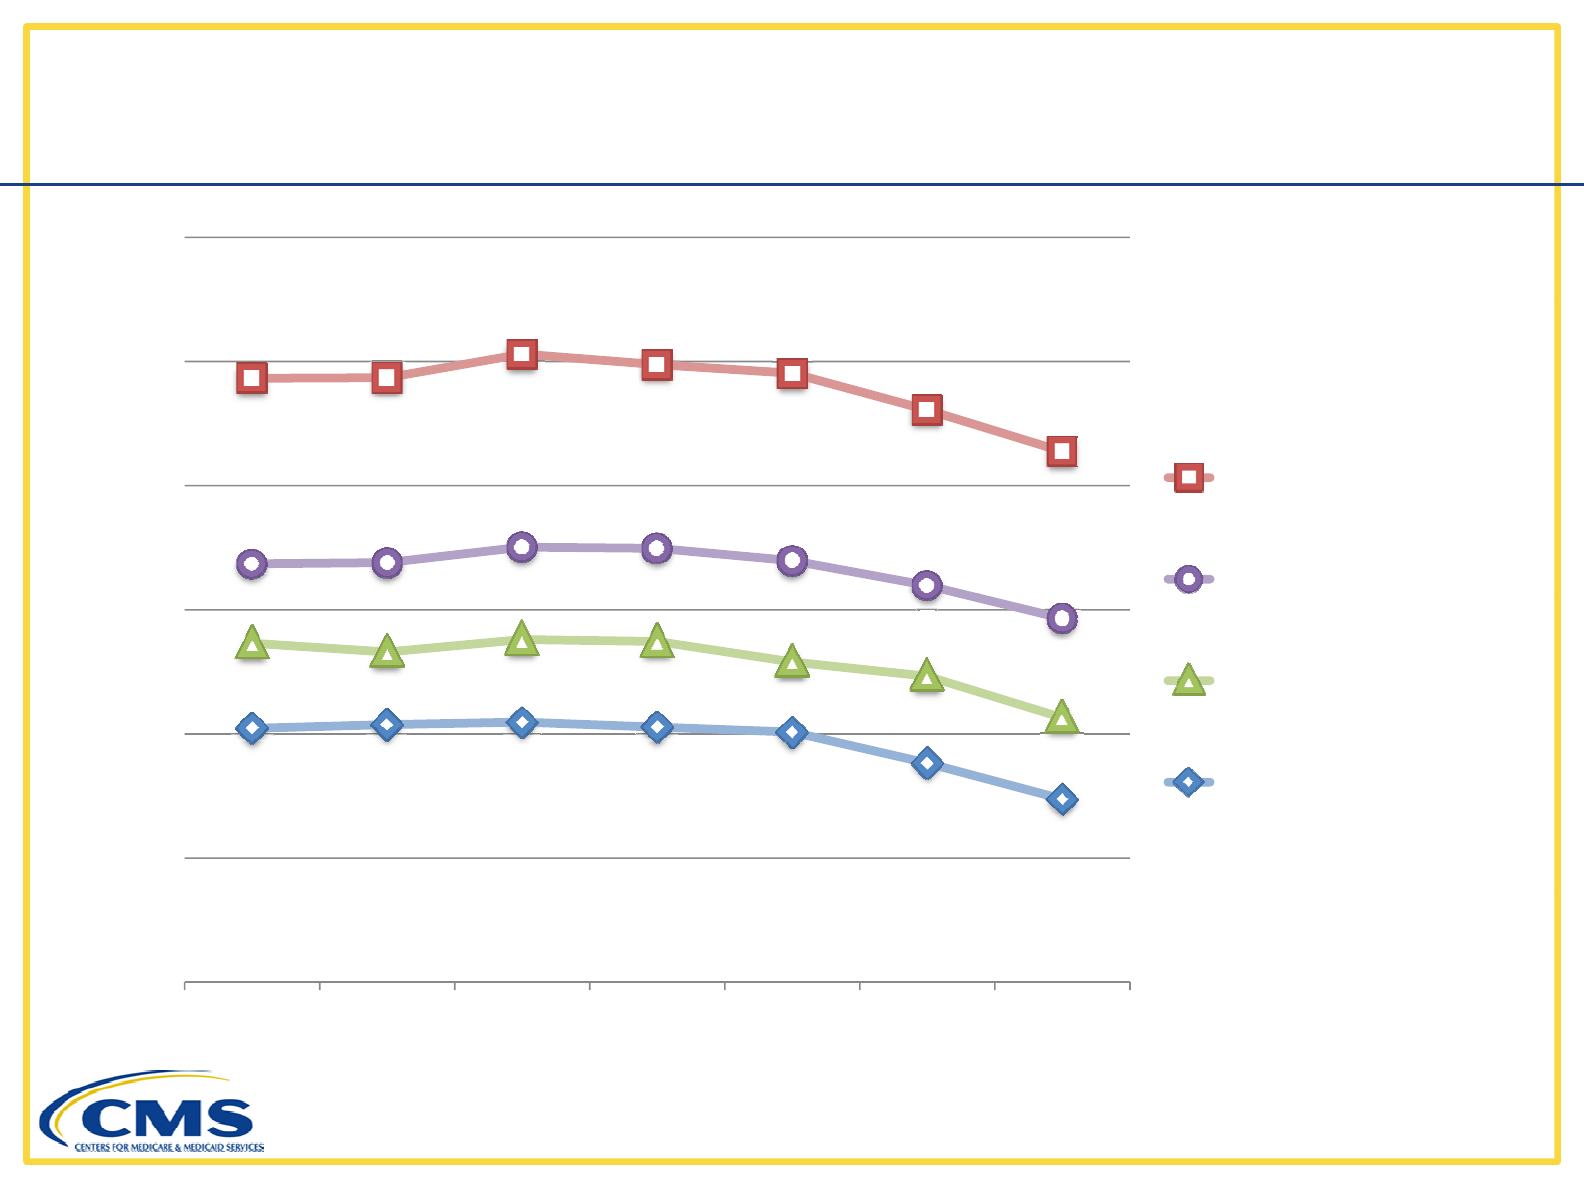
Part D Market Shares, by Spending, 2006-2013
(Risperdal
patent
expires)
(Seroquel
patent
expires)
(Zyprexa
patent
expires)
expires)
expires)
expires)
9
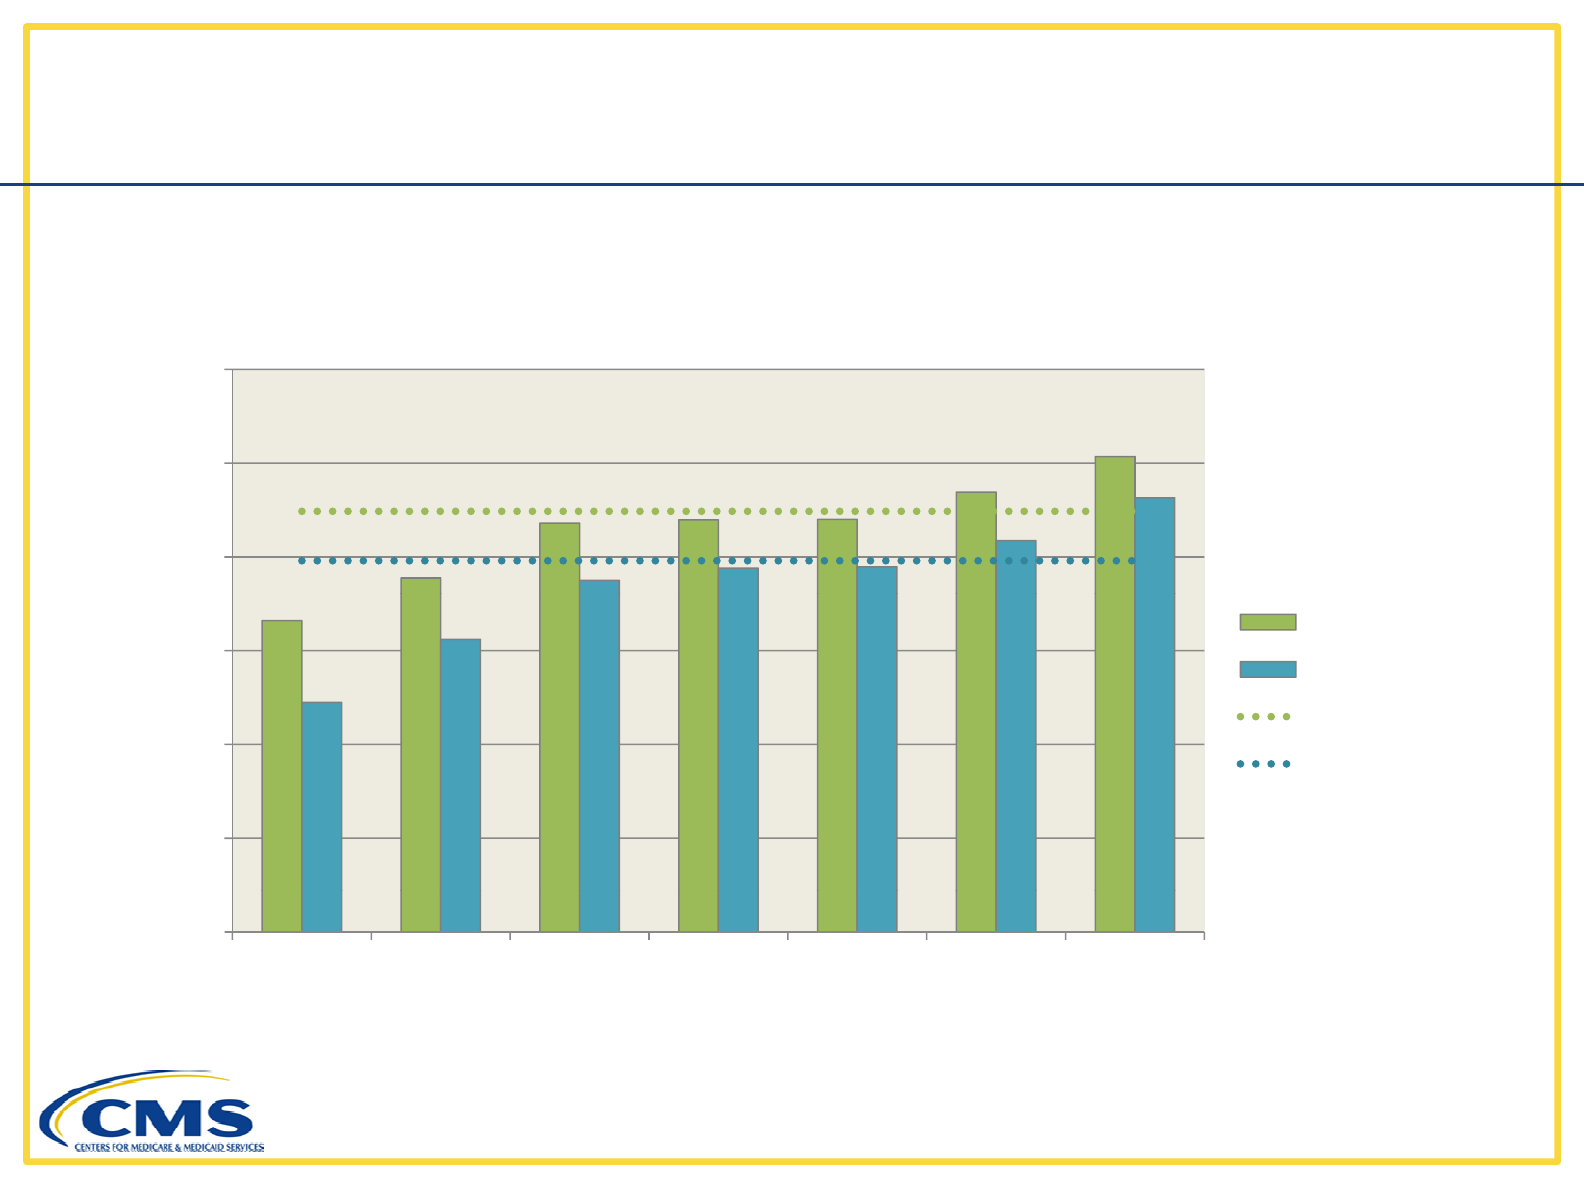
Year-over-Year Monthly Growth Rates
in Average Spending per Prescription
(Here month 0 is the month when the patent expired)
in
Average
Spending
per
Prescription
10
11
12
13
14

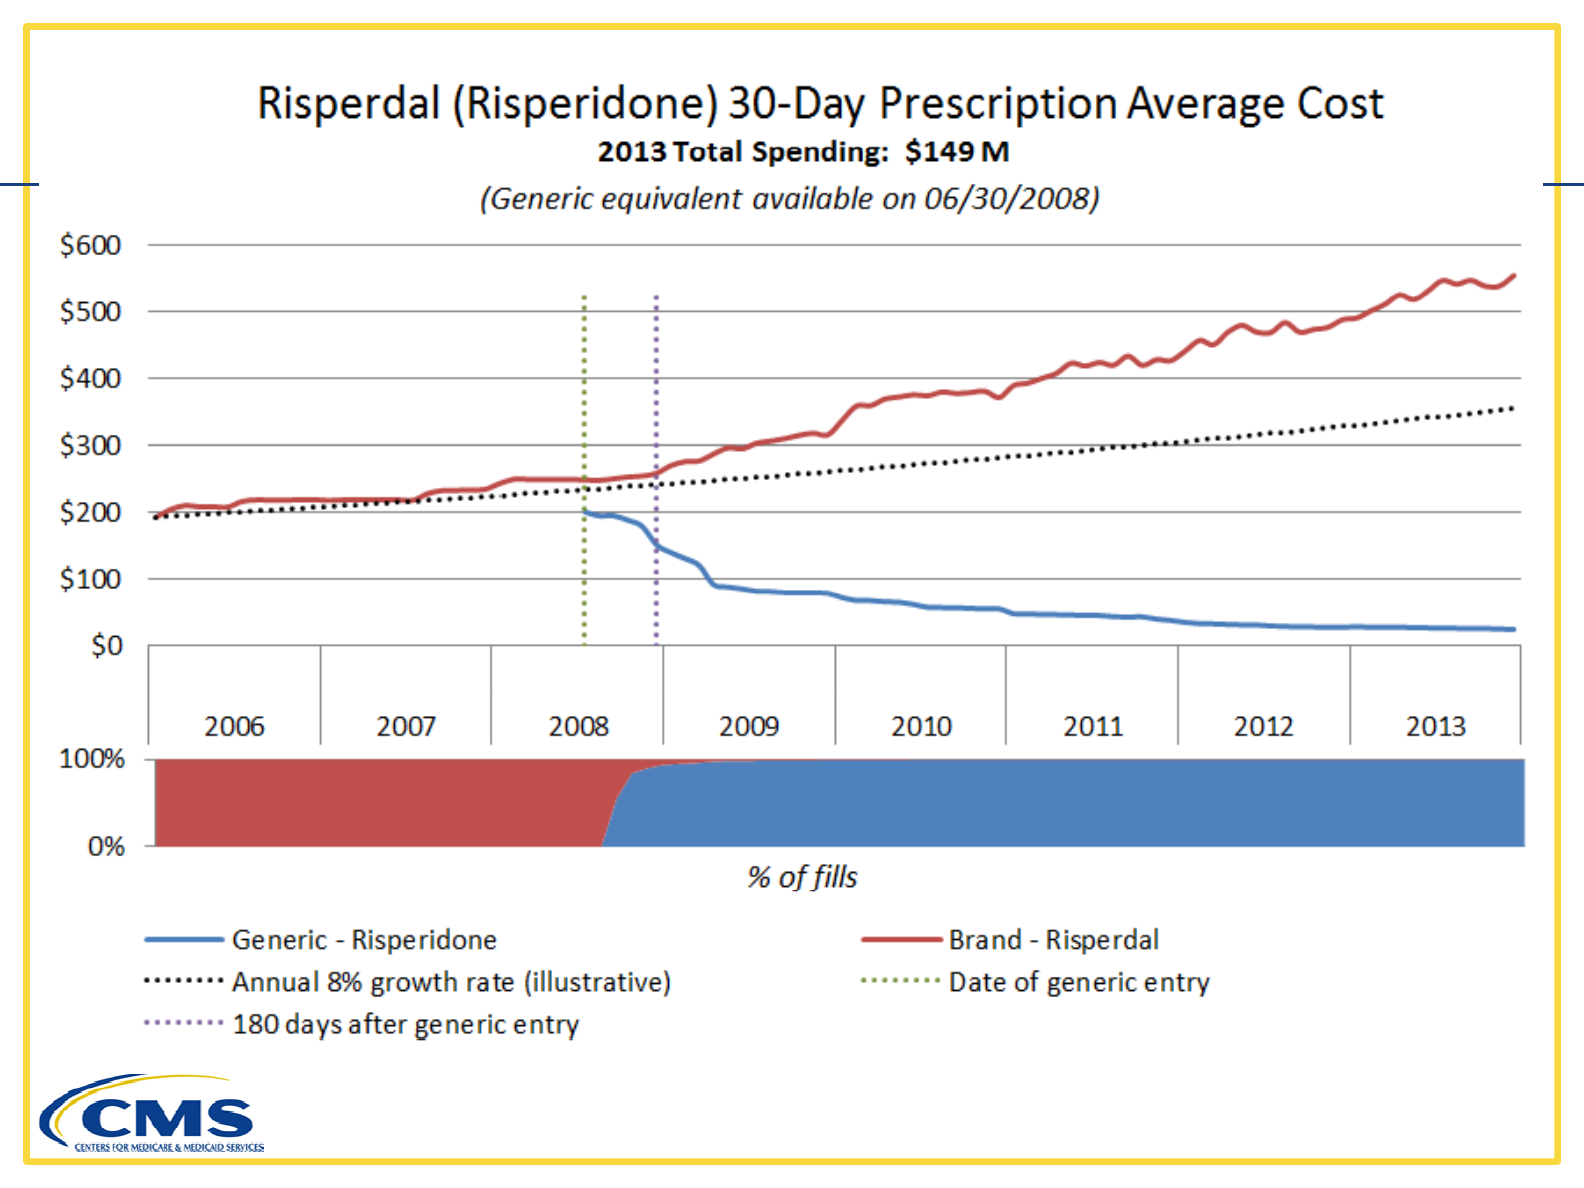
Key Findings
●Rapid generic substitution (80-90% within 2 months of patent
expiration and ~95% within 9 months) but limited therapeutic
expiration
and
~95%
within
9
months)
,
but
limited
therapeutic
substitution within the drug class
●
Savings in first 180 days after patent expiration were relatively
●
Savings
in
first
180
days
after
patent
expiration
were
relatively
limited for two drugs
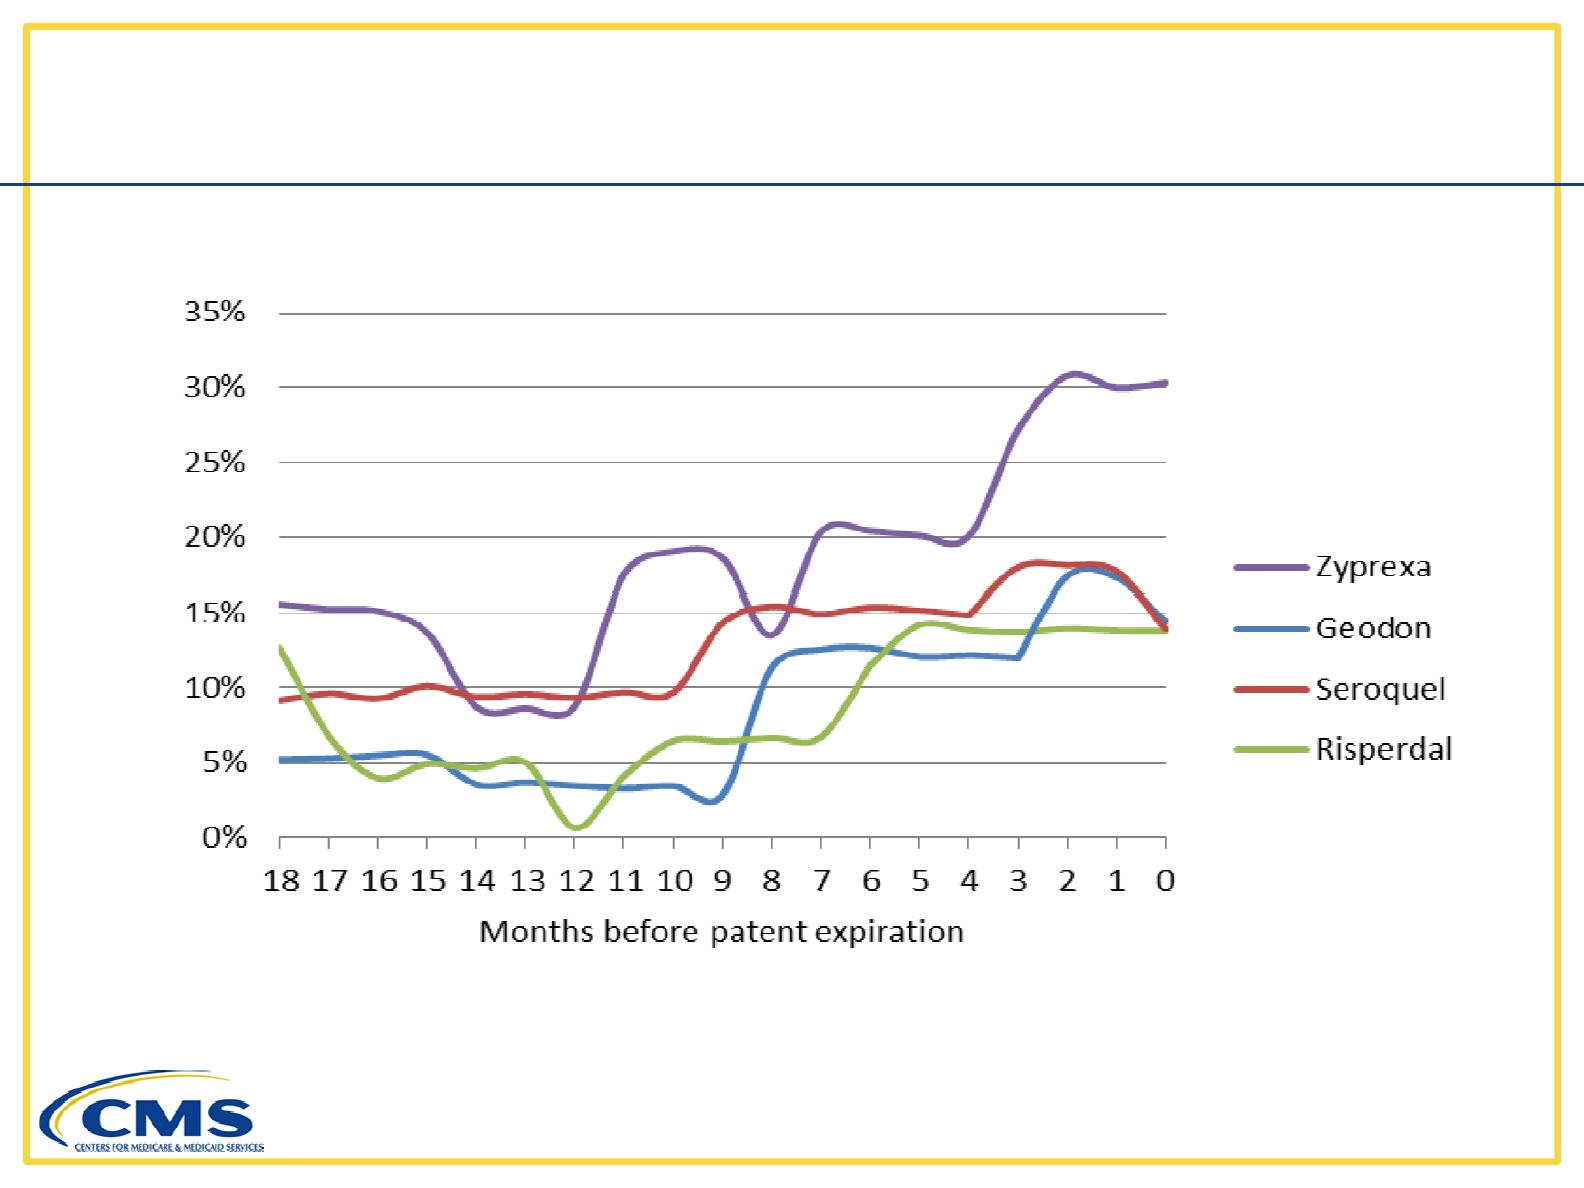
The average cost of the brand
name drug increased rapidly leading up
The
average
cost
of
the
brand
-
name
drug
increased
rapidly
leading
up
to patent expiration
When a single generic manufacturer held the market exclusivity rights
When
a
single
generic
manufacturer
held
the
market
exclusivity
rights
for the first 180 days after patent expiration, the average cost of the
generic was similar to the brand-name cost 12-24 months prior
●The average cost of generic prescriptions declined sharply after
the 180-day period, but full extent of savings may take years to
appea
r
15

Use of Post-Acute Care
Following a Hip or Knee Replacement
(DRG 470)
(DRG
470)
Allison Oelschlaeger
Allison
Oelschlaeger
Office of Information Products and Data Analytics

Episode Construction
●Episodes started with an index hospitalization that occurred in CY
2010
2010
Initial episodes had to be preceded by a 30-day clean period, during
which the beneficiary received no acute
or post
-
acute care services
which
the
beneficiary
received
no
acute
or
post
acute
care
services
●Episodes ended “naturally” with either a clean period (20 days) or
admission for certain surgical MS
-
DRGs
admission
for
certain
surgical
MS
DRGs
●PAC defined as use of home health, SNF, IRF, LTCH, or
Part B outpatient therapy (hospital outpatient therapy services
Part
B
outpatient
therapy
(hospital
outpatient
therapy
services
and therapy claims delivered by independent therapists)
17
MS-DRG 470: Profile
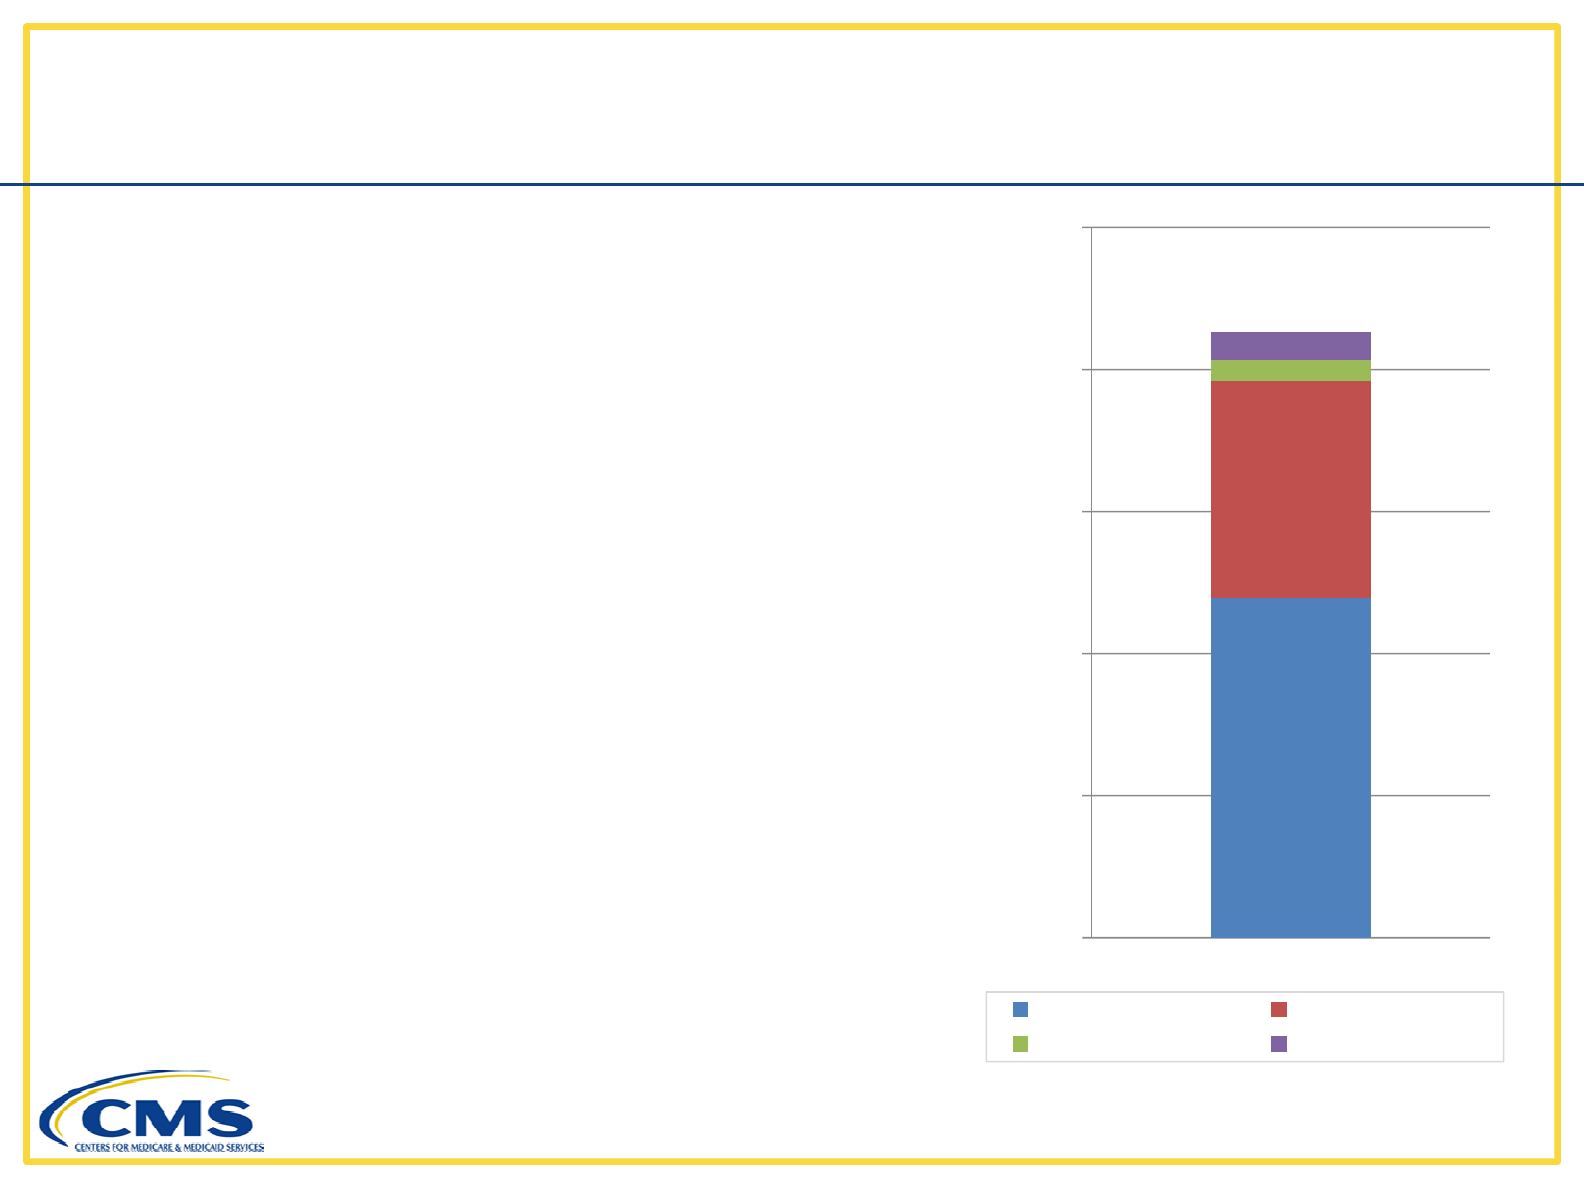
●Total Episodes = 285,520 $25,000
(Total discharges for DRG 470 = 437,981)
●Total Spending = $6.1 B $731
$990
$20,000
●Average episode cost = $21,317
●Average episode length = 56 days
$7,663
$15,000
●Beneficiaries:
Survived the index admit in 99.9% of
$10,000
episodes (285,242)
Survived the index and used PAC as the
fi t i ft th i d i 92 3% f
$11,942
$5,000
fi
rs
t
serv
i
ce a
ft
er
th
e
i
n
d
ex
i
n
92
.
3%
o
f
episodes (263,507)
●
Readmissions per episode
=
0.09
$0
Index PAC
Readmissions
Other
●
Readmissions
per
episode
0.09
18
Readmissions
Other
All figures based on standardized dollars
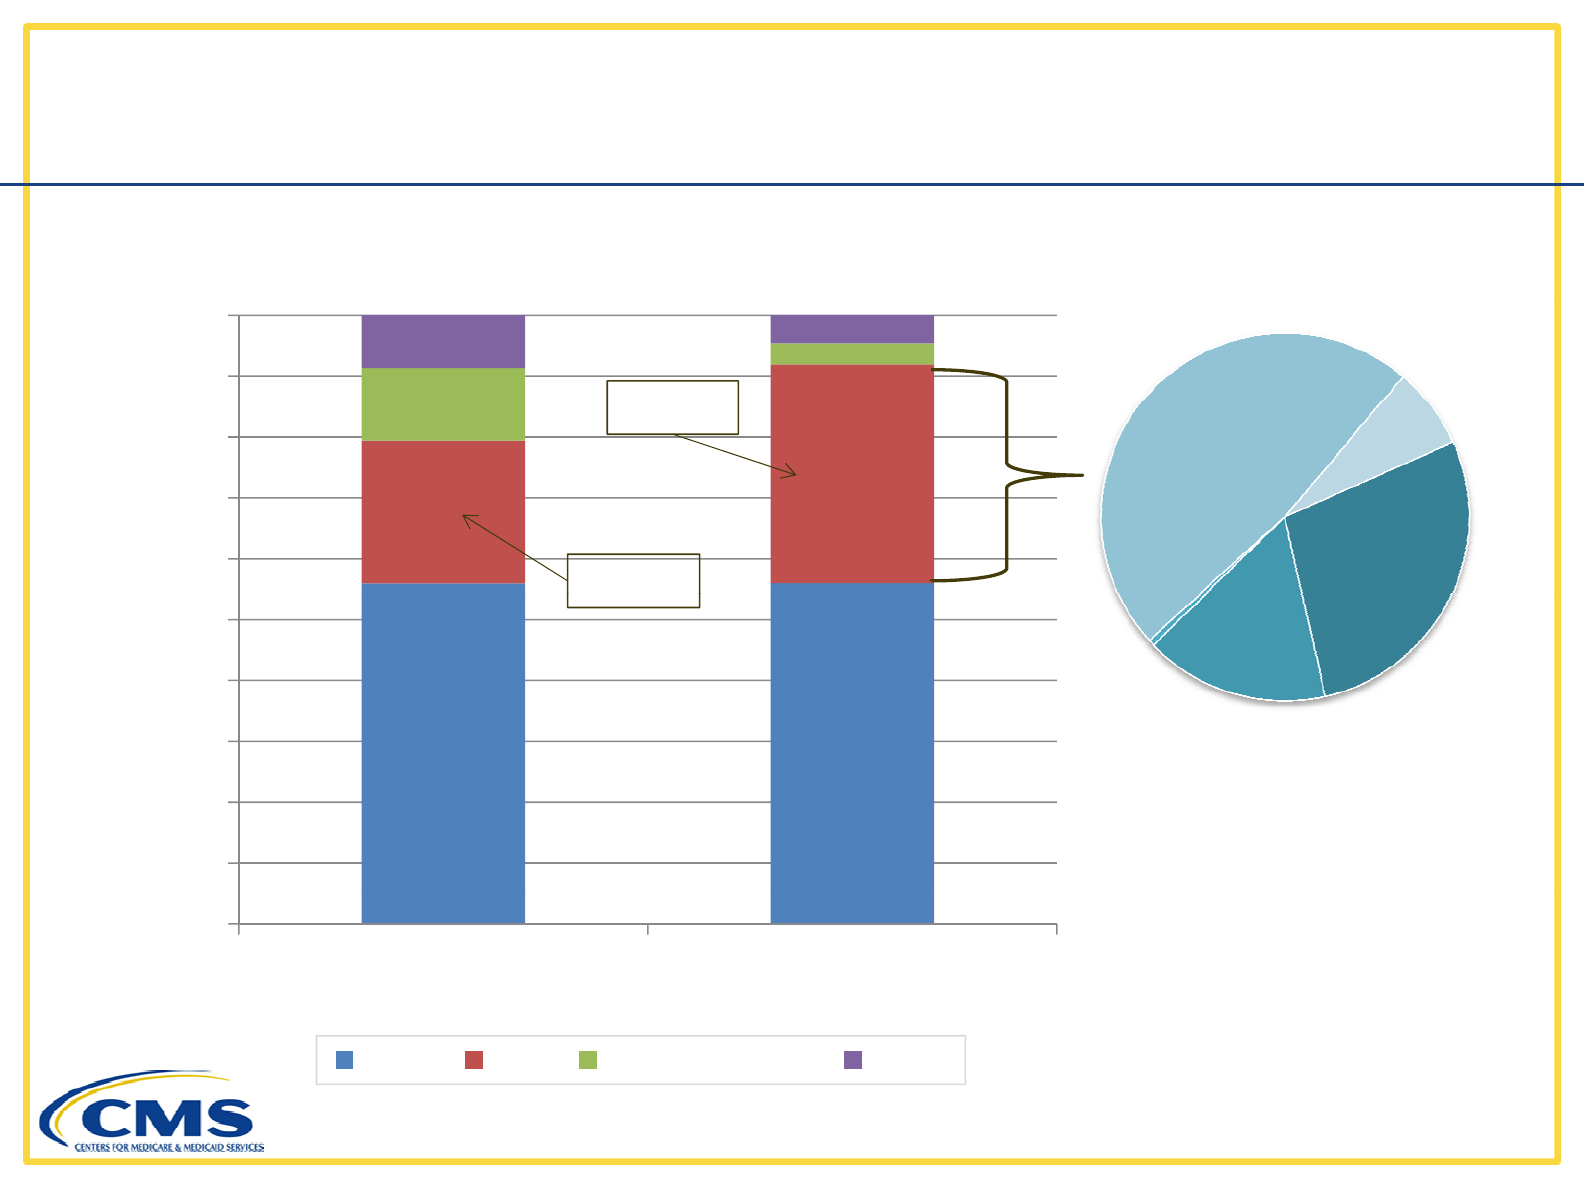
Distribution of Spending
PAC is a much larger share of episode spending for MS-DRG 470
12%
3%
9% 5%
80%
90%
100%
$7,663 SNF
48%
Therapy
7%
23%
36%
60%
70%
80%
$
3
,
770 HH
28%
30%
40%
50%
$,
28%
IRF
16%
LTCH
1%
56% 56%
10%
20%
30%
0%
All Episodes MS-DRG 470
$21,325$16,083
Avg Spending
Per E
p
isode
19
Index PAC Readmissions Other
Limited to episodes where the beneficiary survived the index admit
p
Distribution of Episodes
by First/Second Service Used after Discharge
by
First/Second
Service
Used
after
Discharge
1st Service After Index 2nd Service After Index
Service % of
Total None Therapy HHA SNF IRF LTCH Acute
Admit
None 7.1% 7.1% -- -- -- -- -- --
Therapy 11.4% 10.8% -- 0.1% * * -- 0.4%
HHA 35.2% 15.1% 18.7% -- 0.1% * * 1.2%
SNF 36.3% 5.0% 9.1% 18.9% 0.9% 0.1% * 2.4%
IRF 9.5% 0.8% 2.4% 5.2% 0.7% * * 0.4%
LTCH
*
*
*
*
*
*
*
LTCH
*
*
*
*
*
*
--
*
Acute Admit 0.5% 0.2% 0.1% 0.1% 0.1% * * *
100.0%
39.0%
30.3%
24.3%
1.8%
0.1%
*
4.4%
100.0%
39.0%
30.3%
24.3%
1.8%
0.1%
4.4%
Episodes that accounted for less than 0.1% of the total are marked with an asterisk
20
Limited to episodes where the beneficiary survived the index admit
Average Episode Cost
by
First/Second
Service Used after
Discharge
by
First/Second
Service
Used
after
Discharge
1st Service After Index 2nd Service After Index
Service
Avg.
Episode
Cost None Therapy HHA SNF IRF LTCH Acute
Admit
None
$9 301
$9 301
None
$9
,
301
$9
,
301
-- -- -- -- -- --
Therapy $14,000 $13,551 -- $18,196 * * -- $24,281
HHA $16,920 $15,689 $17,088 -- $27,202 * * $28,548
SNF $27,154 $24,860 $23,388 $26,729 $36,345 $40,065 * $45,865
IRF $32,746 $25,466 $26,887 $32,595 $50,015 * * $52,724
LTCH
*
*
*
*
*
*
*
LTCH
*
*
*
*
*
*
--
*
Acute Admit $24,319 $15,732 $20,609 $24,463 $36,599 * * *
$21,325 $15,311 $19,764 $27,944 $41,405 $39,711 * $39,881
Episodes that accounted for less than 0.1% of the total are marked with an asterisk
21
Limited to episodes where the beneficiary survived the index admit
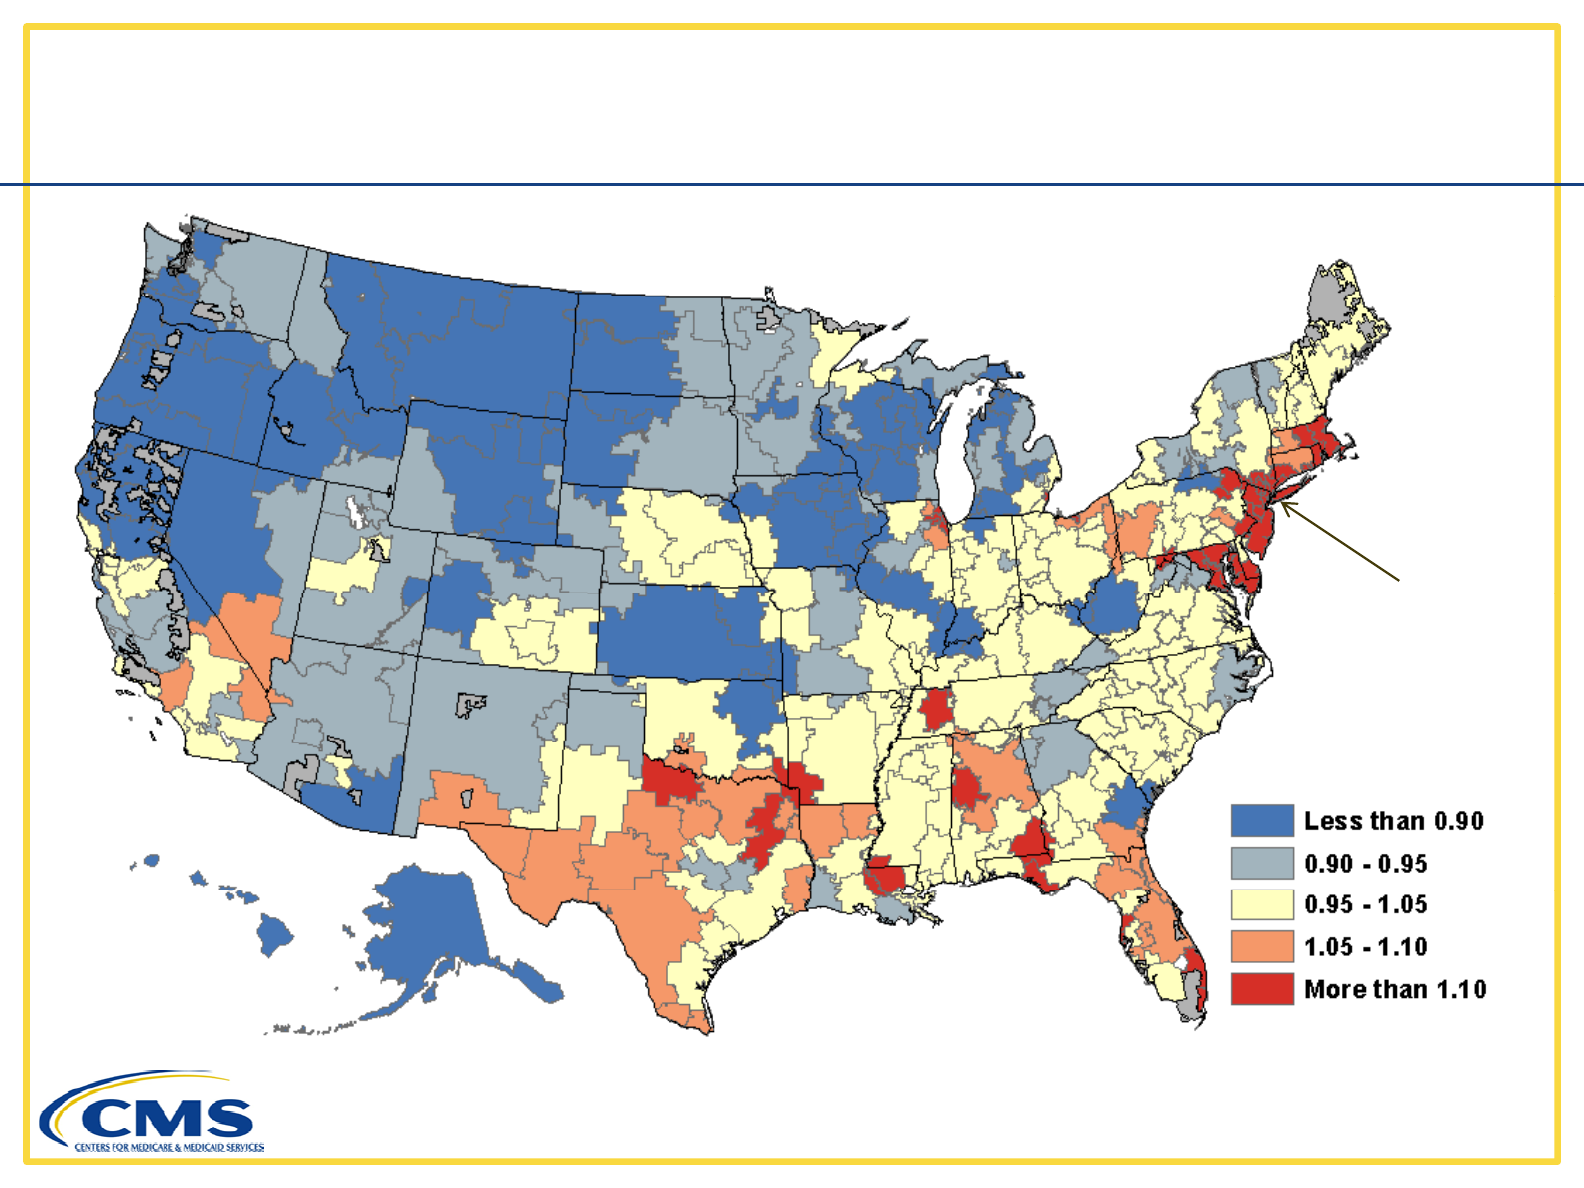
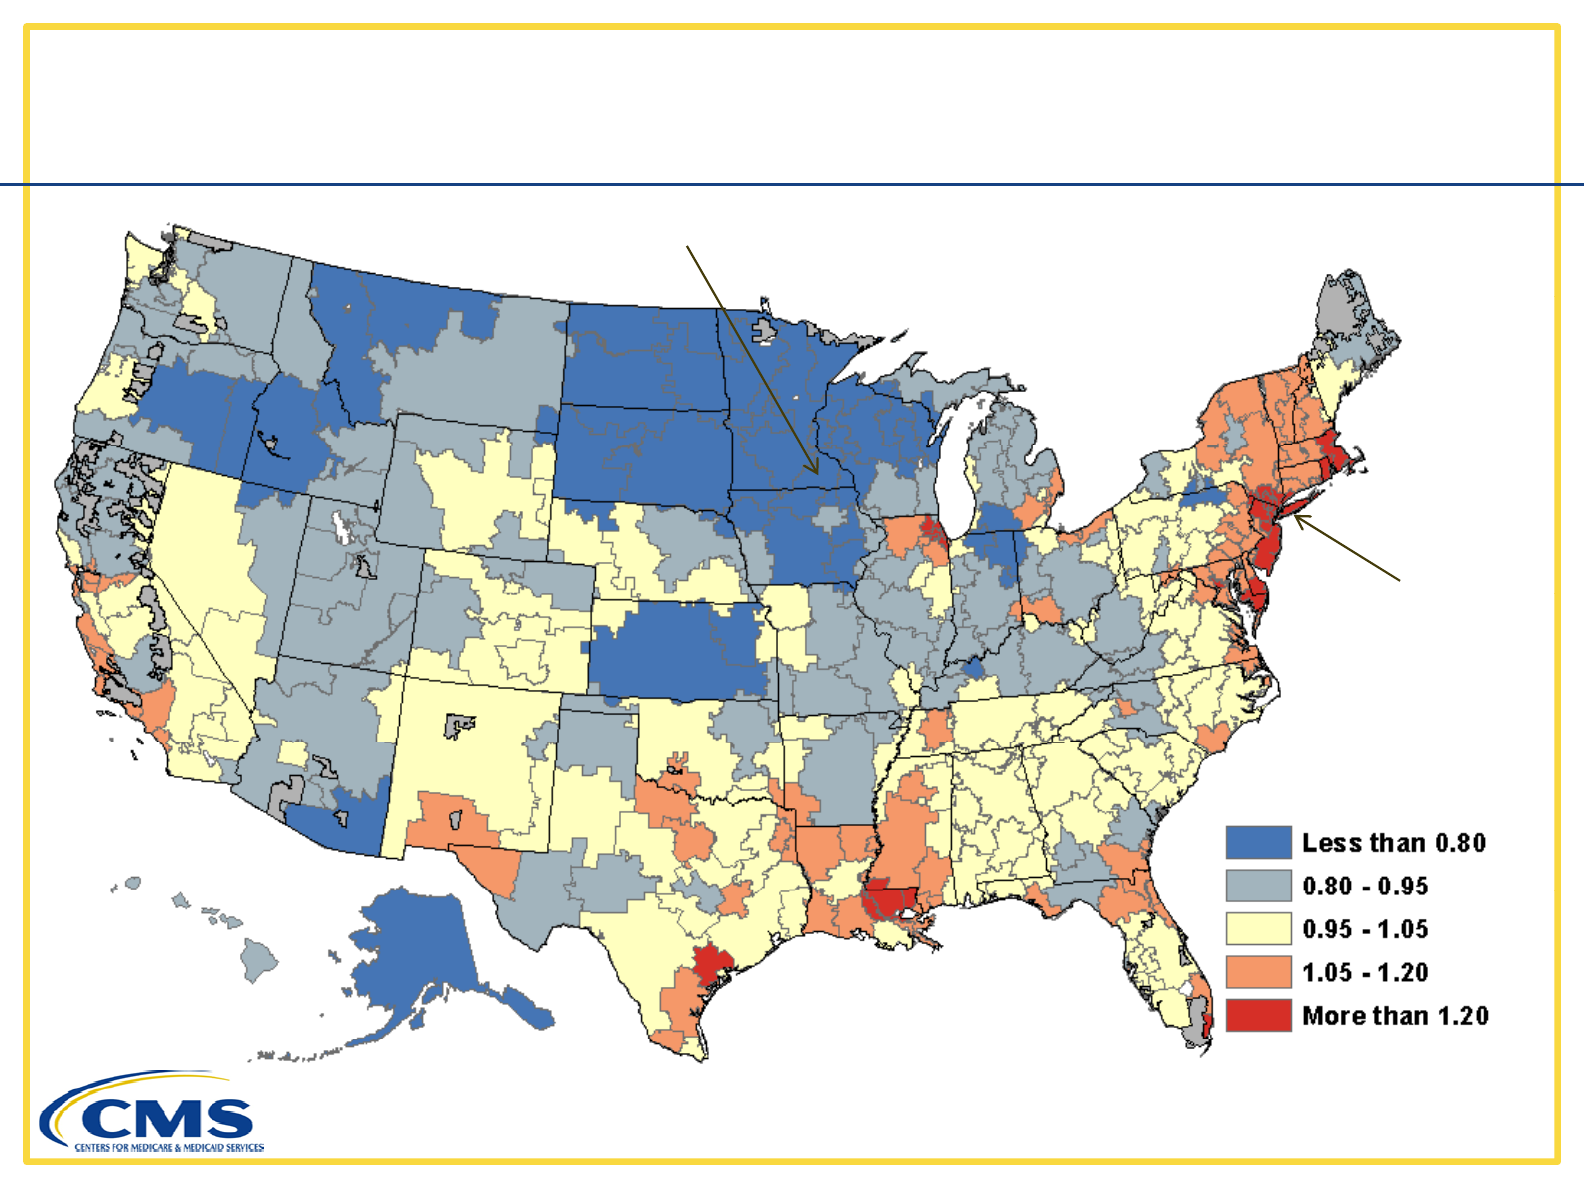
Average Episode Cost by HRR
National Average = $21,325
Hackensack, NJ
$29,254
Ah AK
Ratio to National
22
A
nc
h
orage,
AK
$15,222
Ratio
to
National
Average
Limited to episodes where the beneficiary survived the index admit

Outlier HRRs
Average
E
p
isode % of “No
PAC” Share of PAC Episode Dollars Going to . . .
p
Length Episodes SNF HHA IRF Therapy LTCH
High Outlier
HRRs
*
69 3.4% 46.40% 22.60% 24.00% 6.60% 0.40%
HRRs
($5,217) ($2,505) ($2,825) ($724) ($42)
All HRRs 56 7.1% 47.90% 28.20% 16.20% 7.20% 0.50%
($3,986) ($2,345) ($1,344) ($595) ($46)
Low Outlier
46
15 6%
54 00%
24 00%
11 10%
10 80%
0 10%
Low
Outlier
HRRs*
46
15
.
6%
54
.
00%
24
.
00%
11
.
10%
10
.
80%
0
.
10%
($3,112) ($1,332) ($648) ($601) ($6)
*Outlier HRRs had spending that was 15% above / below the national average.
23
Limited to episodes where the beneficiary survived the index admit
Average Episode Length
National Average = 56 days
Rochester, MN
29 days
Hackensack, NJ
78 days
24
Limited to episodes where the beneficiary survived the index admit
Ratio to National
Average
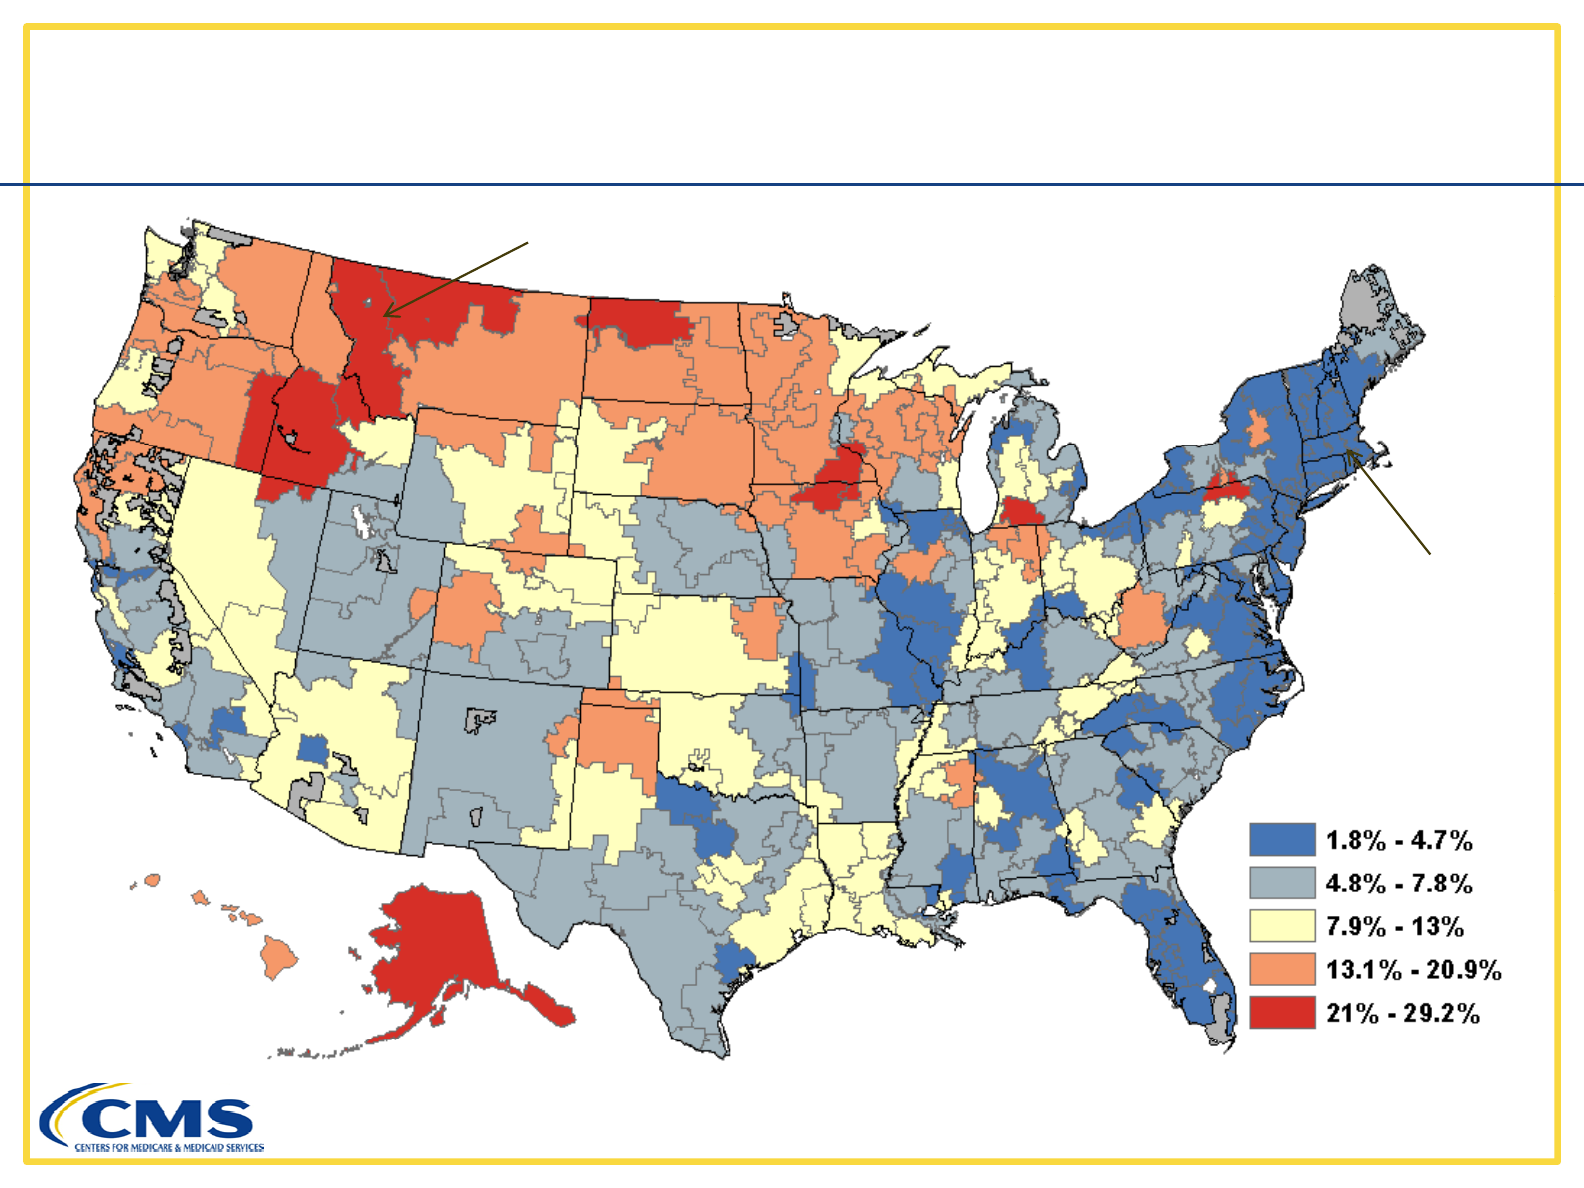
Percent of Episodes without PAC services
National Average = 7.1%
Missoula, MT
29.2%
Worchester, MA
Worchester,
MA
1.8%
25
Limited to episodes where the beneficiary survived the index admit
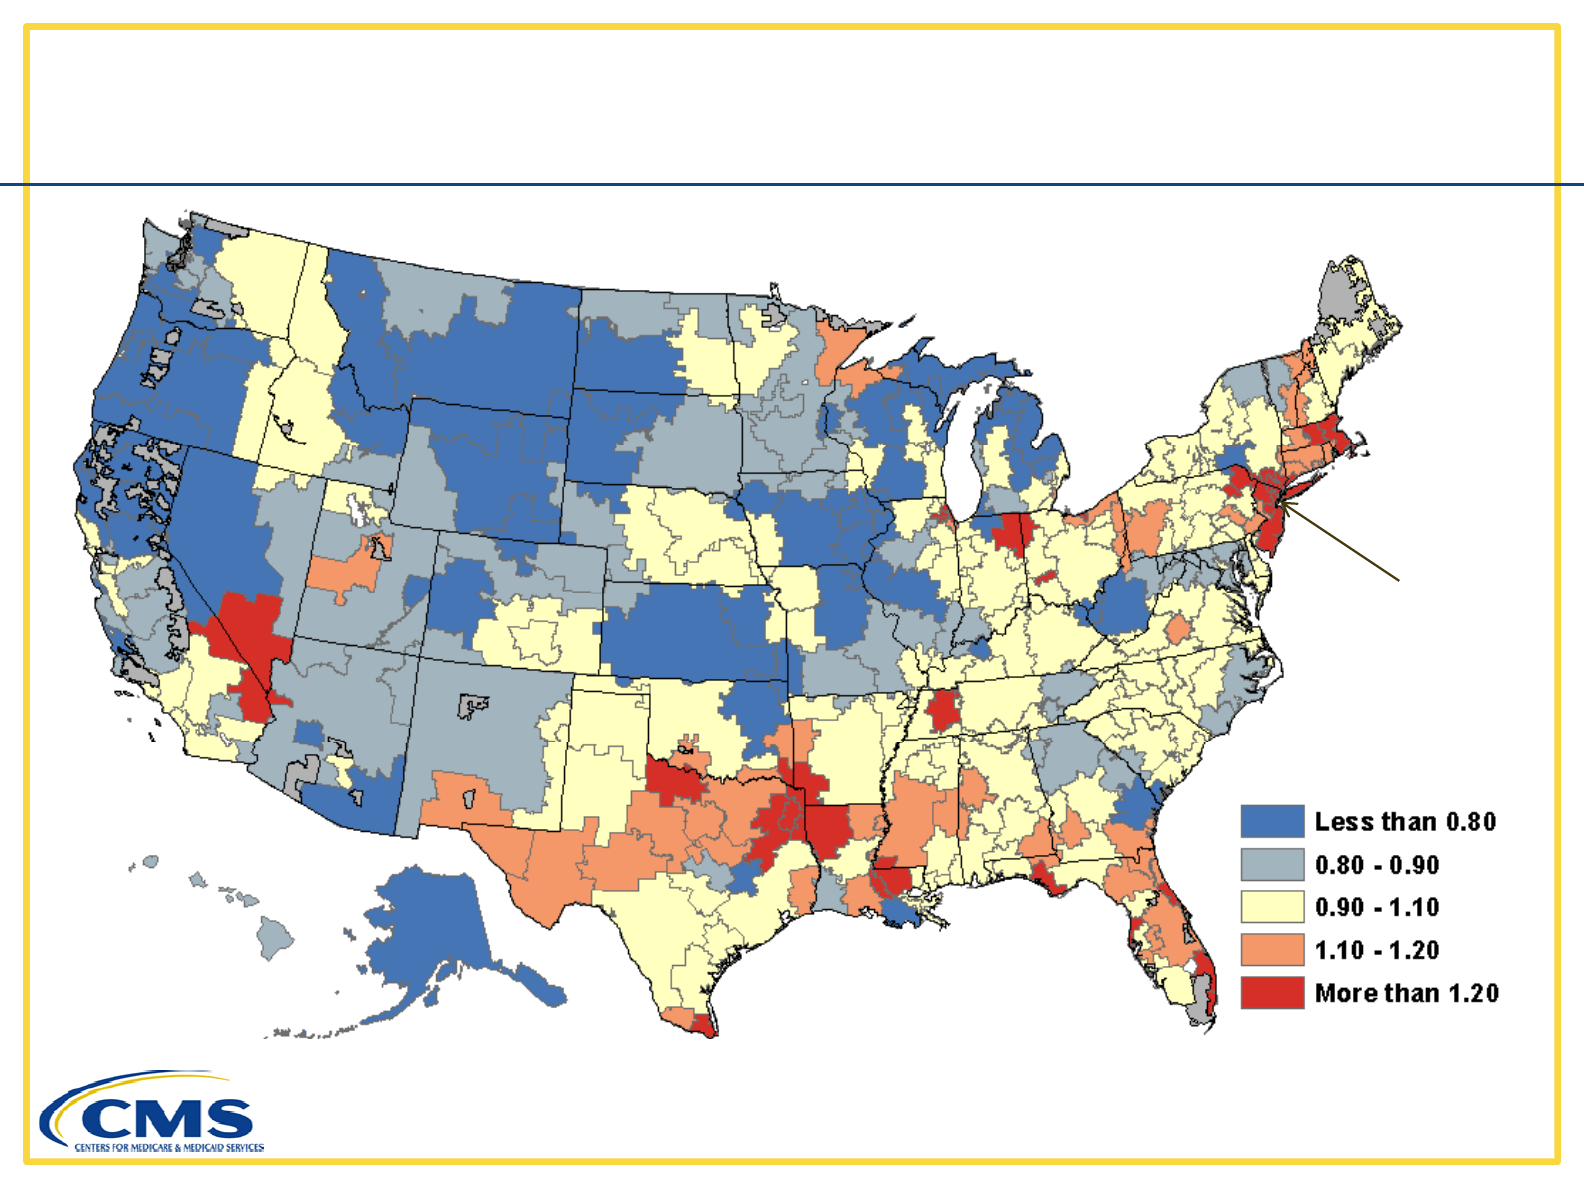
Average PAC Cost (for Episodes with PAC spending)
National Average = $8,295
Hackensack, NJ
$14,363
Ratio to National
Ah AK
26
Ratio
to
National
Average
A
nc
h
orage,
AK
$4,187
Limited to episodes where the beneficiary survived the index admit

Real
Time Reporting of Medicare
Real
-
Time
Reporting
of
Medicare
Readmissions Data
Niall Brennan
Actin
g
Director, Offices of Enter
p
rise Mana
g
ement
gpg

Why CMS is Focused on Readmissions
●Nearly one in five fee-for-service Medicare patients returns to the hospital within
30 days of being discharged
30
days
of
being
discharged
2 million readmissions each year
139,000 beneficiaries had 3 or more readmissions in 2012
139,000
beneficiaries
had
3
or
more
readmissions
in
2012
●High readmission rate can be indicator of poor quality care
●
Readmissions estimated to cost Medicare $26 billion per
-
year, $17 billion of
Readmissions
estimated
to
cost
Medicare
$26
billion
per
year,
$17
billion
of
which is potentially avoidable
●Examples of CMS initiatives to reduce readmissions:
Hospital Readmissions Reduction Program
Partnership for Patients
Shared savings programs
Quality Improvement Organizations
28

OIPDA Readmission Rate Methodology
●Source: 100% Medicare claims from Chronic Conditions Warehouse
●Medicare fee-fo
r
-service beneficiaries enrolled in Part A
●All acute care hospitals (IPPS and CAH)
●Index stay = impatient admission where patient did not die in hospital
●Readmission stay = inpatient admission within 30 days of discharge
from index stay
●Stays can count as both index admission and readmission
●Readmission is attributed to the month of index stay and location of
facility where index admission occurred
●Not risk adjusted
29

Real-Time Reporting of Readmissions Data
●Takes up to 13 months for all Medicare claims to reach final
action status
action
status
●OIPDA adjusts preliminary readmissions data to compensate for
claims that have not
reached final action
claims
that
have
not
reached
final
action
●Can report reliable monthly readmissions data after just 2 months
of claims run
out
of
claims
run
-
out
Far faster than other types of reporting
Difficult to perform risk adjustment on real-time basis
●Timely reporting improves feedback to CMS programs and
hl bl
flii
h
e
l
ps ena
bl
e
f
aster qua
li
ty
i
mprovement
30
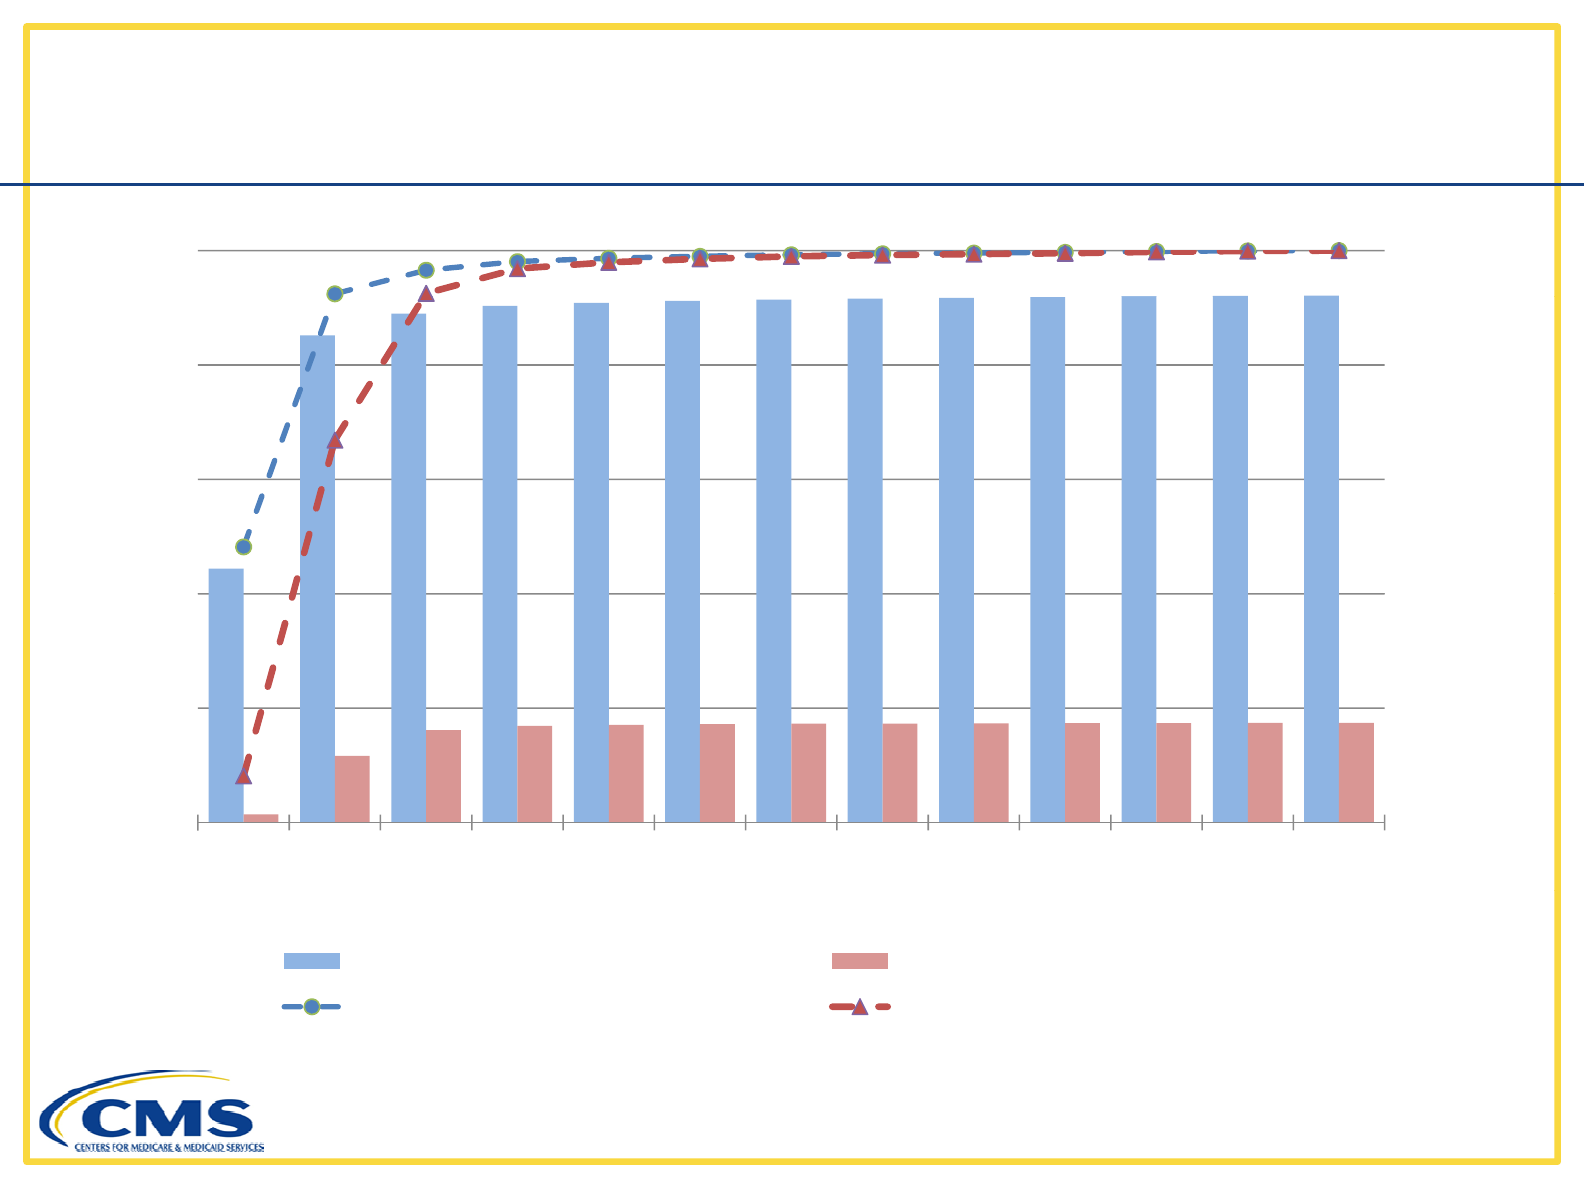
Claims Maturity for Index and Readmission Stays
For a Typical Month
For
a
Typical
Month
100%1,000
80%800
S
tays
h
ousands)
40%
60%
400
600
t
of Final
S
S
tays (in t
h
20%
40%
200
400
Percen
t
u
mber of
S
0%0
12345678910111213
N
u
Months of
Claim Run
Out
Months
of
Claim
Run
-
Out
Index Admission Stays Readmission Stays
% Index Admissions Processed % Readmissions Processed
31

Improvement in Readmission Rate Among
Medicare FFS Beneficiaries
●After holding steady at 19% over 2007-2011 period, national
readmission rate
started falling in
2012
Medicare
FFS
Beneficiaries
readmission
rate
started
falling
in
2012
18.5% in 2012 and 17.9% in 2013
●Improvement has been broad-based across geography,
demographics, and clinical conditions
●Estimate 150,000 fewer readmissions occurred during 2012-2013
than if readmission rate had remained at 19%
●Reduction in inpatient readmissions does not seem to be driven
by substitution by outpatient ED visits or observation stays
32
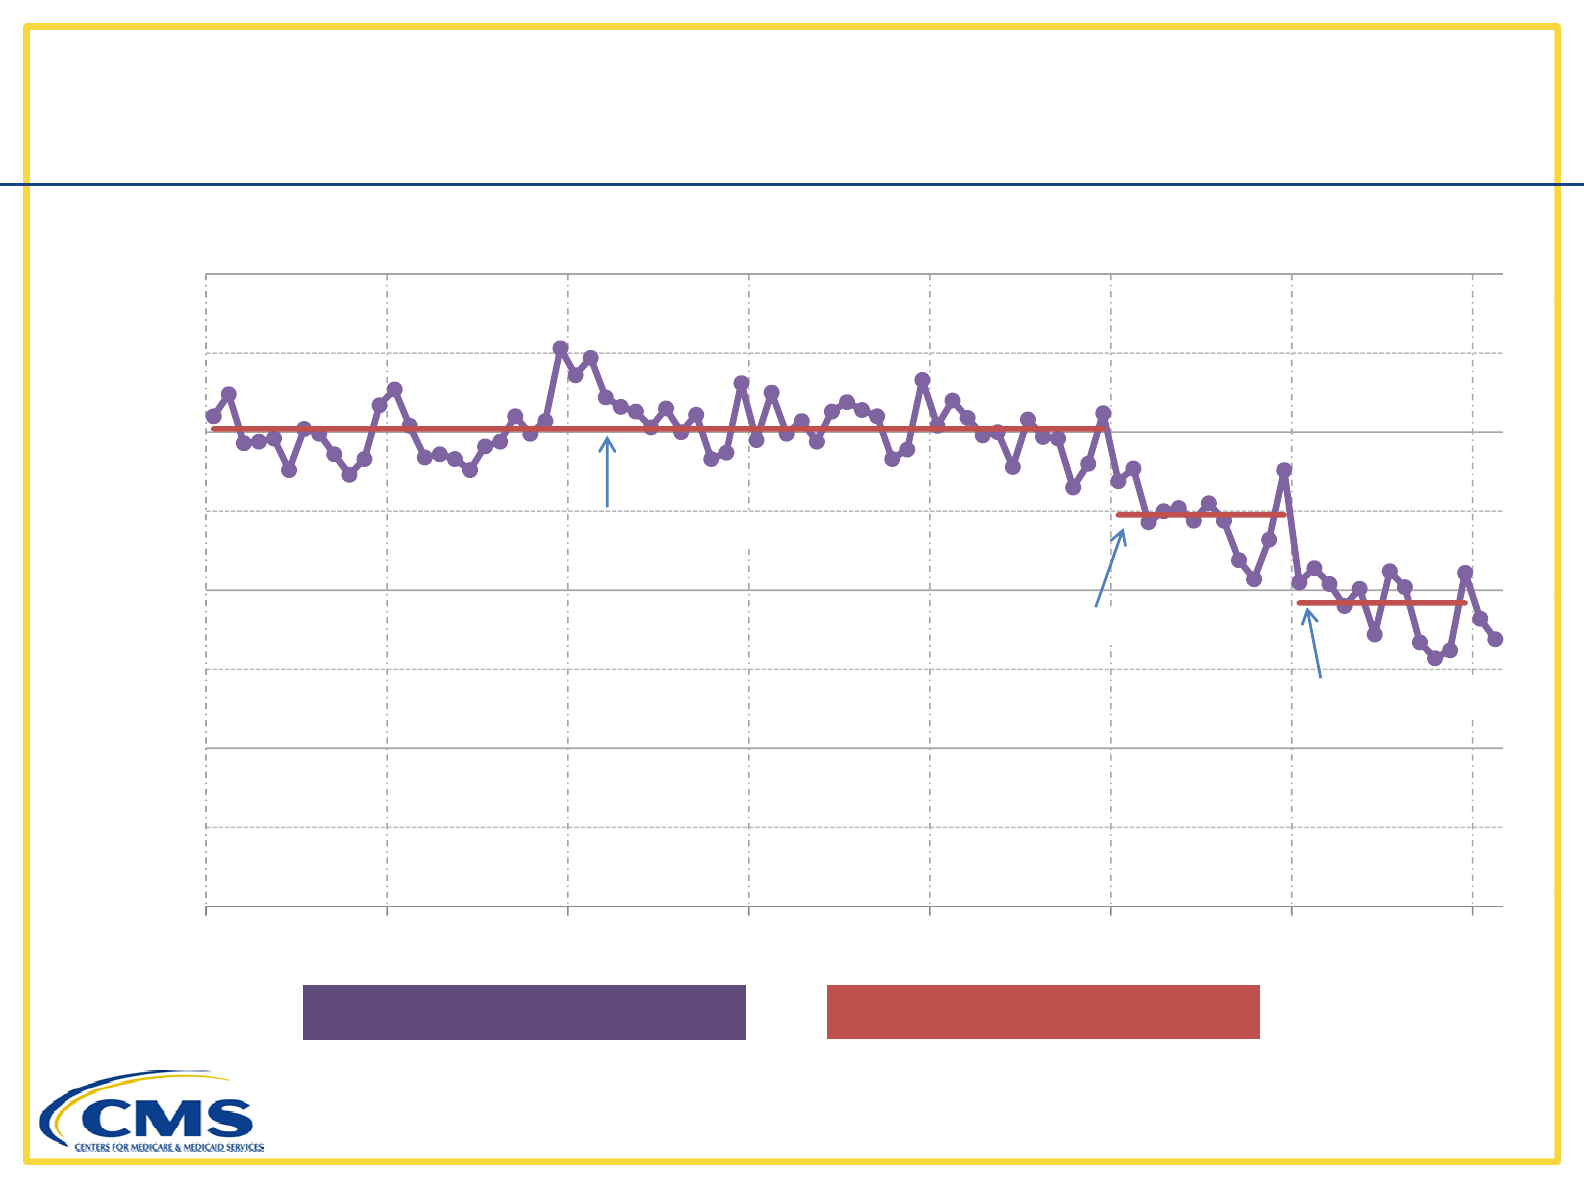
Medicare 30-Day, All-Condition Readmission Rate
January 2007
–
February 2014
January
2007
–
February
2014
20%
19%
19.0% (2007-2011)
18%
s
ion Rate
18.5% (2012)
17.9% (2013)
17%
18%
Readmis
s
17%
16%
2007 2008 2009 2010 2011 2012 2013
Mean Rate for Period
Monthly Readmission Rate
33
Medicare 30-Day, All-Condition Readmission Rate
January 2007
–
February 2014
January
2007
–
February
2014
20.0%
19.0%
19.5%
e
18.0%
18.5%
ission Rat
e
17.0%
17.5%
Readm
16.0
%
16.5%
%
JFMAMJJASOND
Month
2007-2011 2012 2013 2014
34
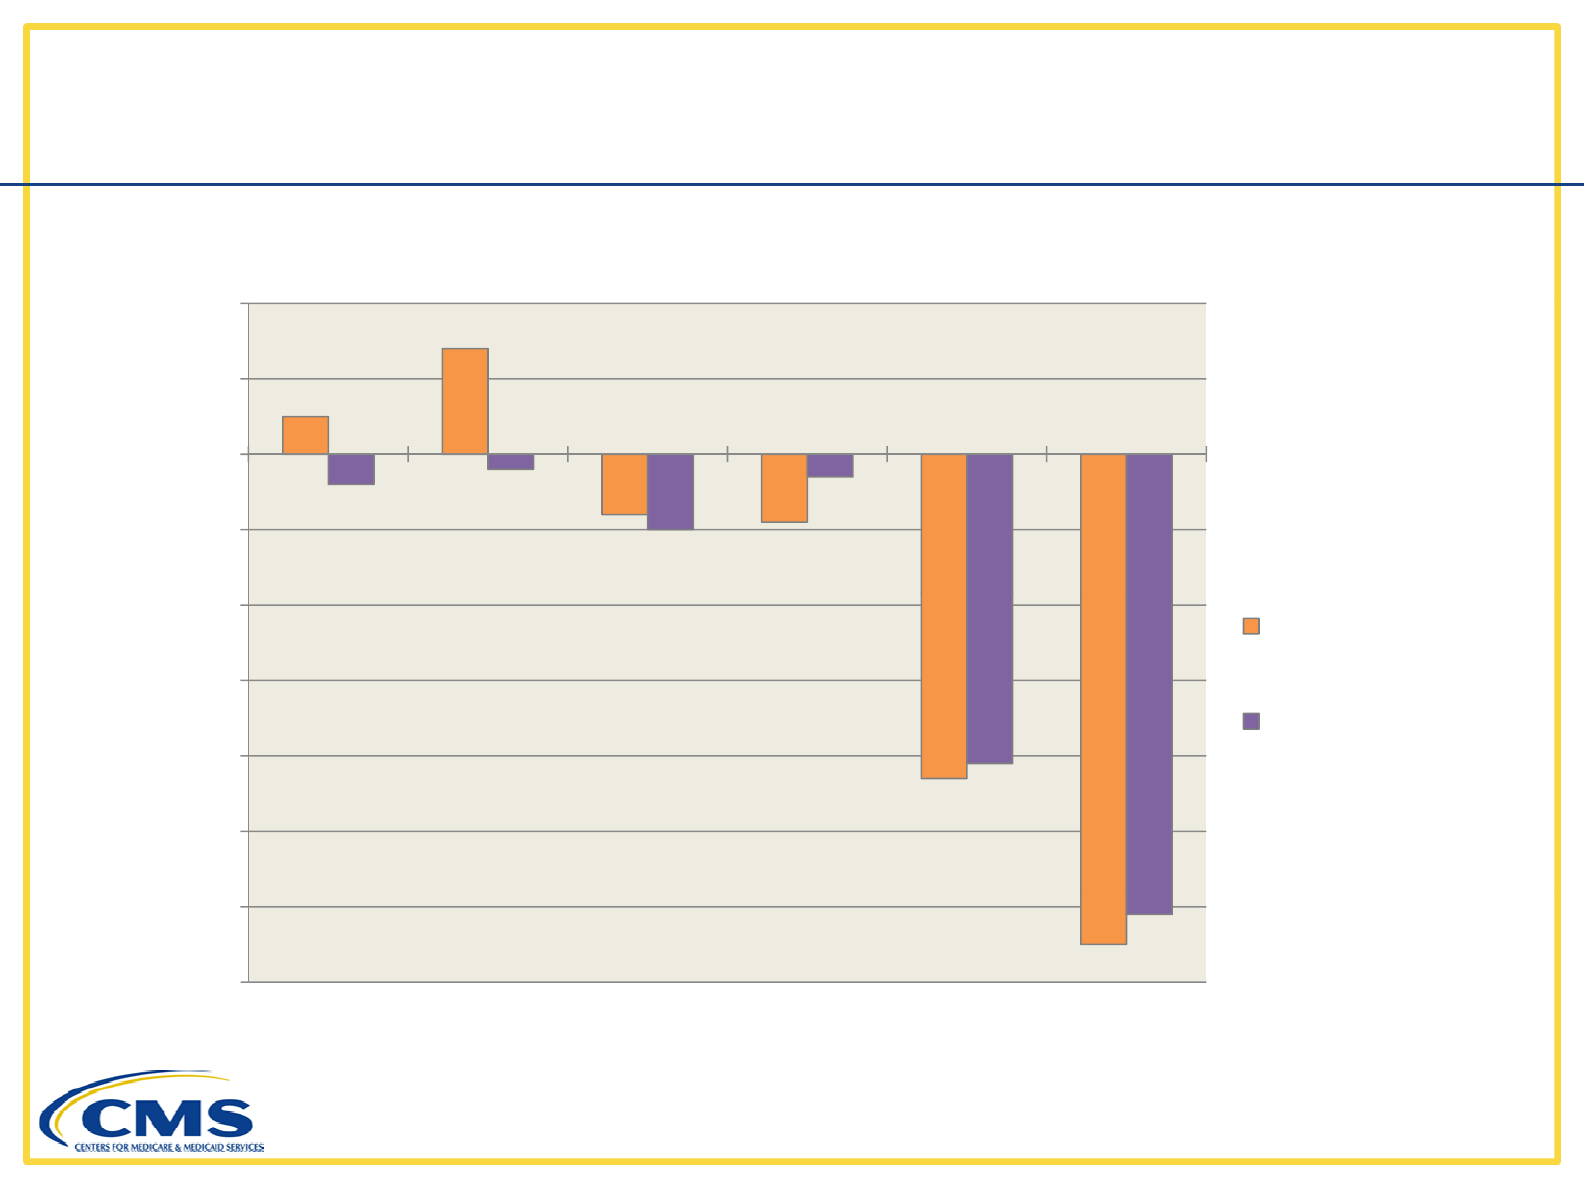
Annual Change in Hospital Services 30 Days Post
Inpatient Discharge
●Hospital outpatient services growing more slowly than readmissions
have been declining
Inpatient
Discharge
have
been
declining
40,000
60,000
t
s
0
20,000
S
tays/Visi
t
-40,000
-20,000
N
umber of
S
Inpatient Readmissions
Post-Discharge ED Visits
-80,000
-60,000
h
ange in
N
Post-Dischar
g
e Observation
Stays
-120,000
-100,000
2008 2009 2010 2011 2012
C
h
35
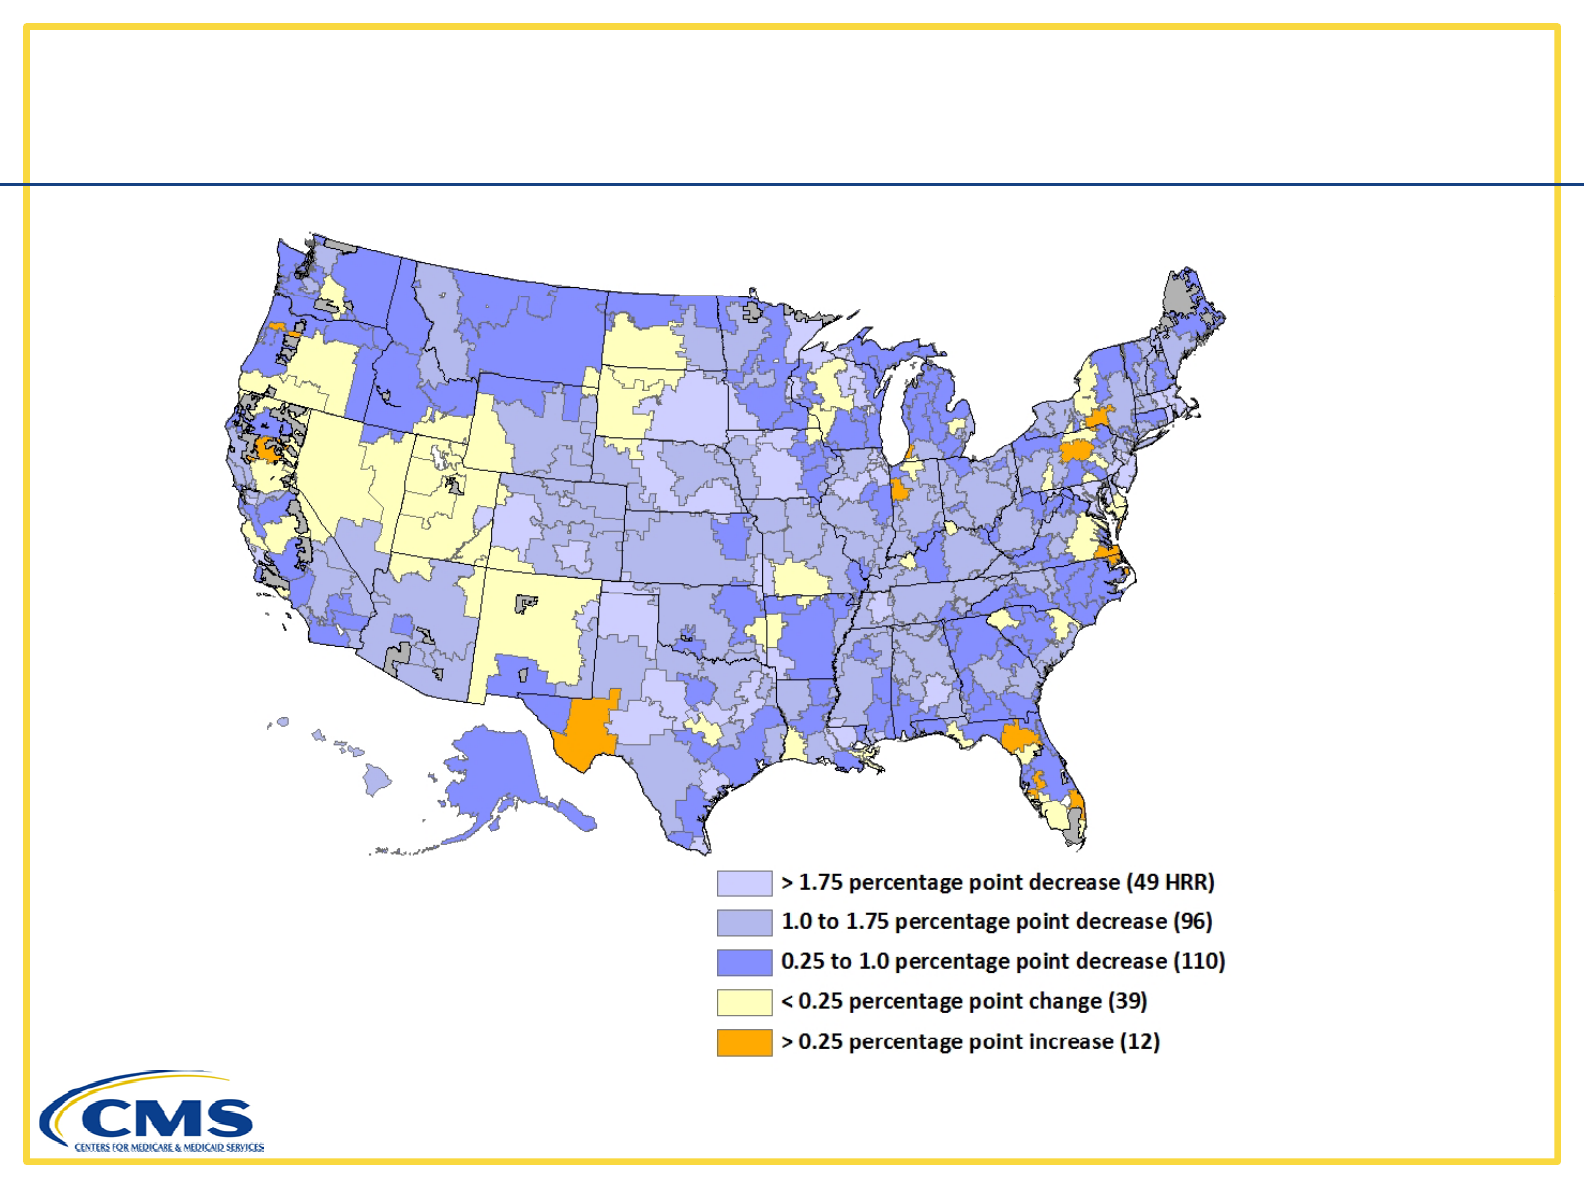
Change in Medicare All-Condition Readmission Rate
2007
-
2011 Mean to 2013 by Hospital Referral Region
2007
-
2011
Mean
to
2013
,
by
Hospital
Referral
Region
Change in national rate = -1.1 percentage point
36
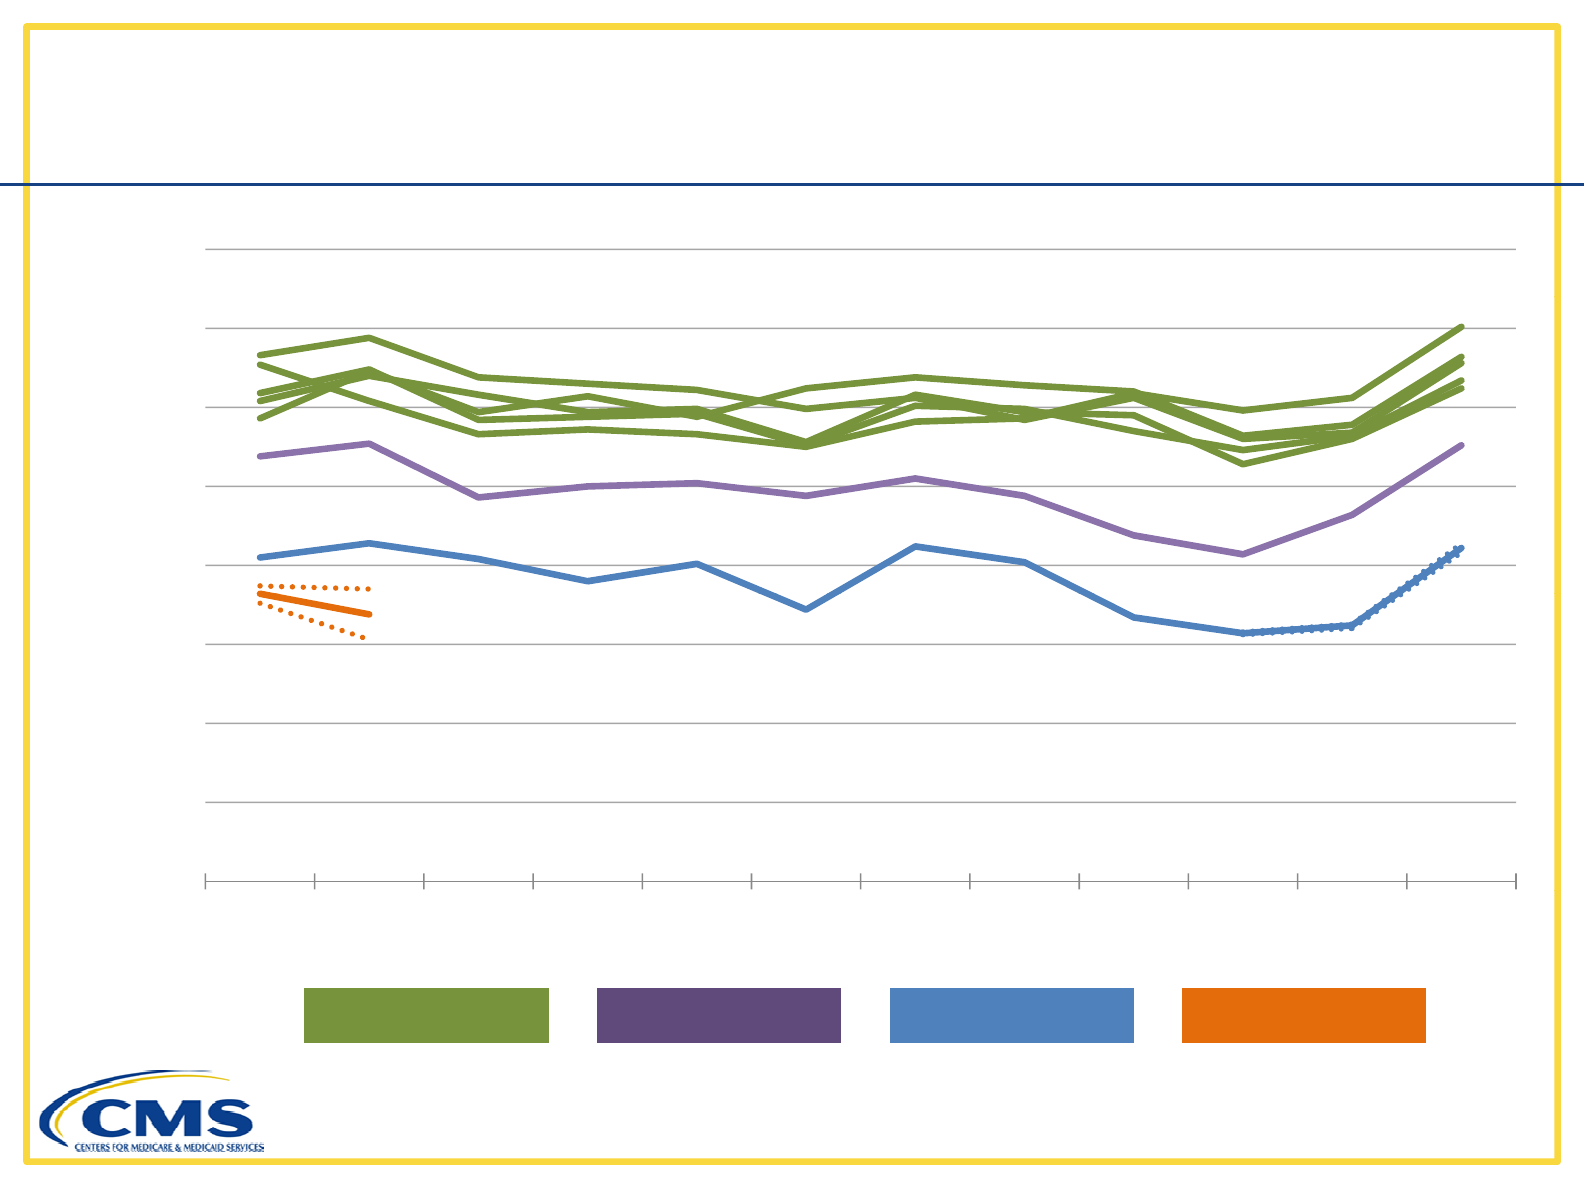
Medicare All-Condition Readmission Rate by Age
24%
22%
20%
s
ion Rate
Under 65
65
69
18%
Readmis
s
65
-
69
70-79
16%
80 and older
14%
2007 2008 2009 2010 2011 2012 2013
37
Medicare All-Condition Readmission Rate by Race
26%
24%
22%
i
on Rate
Black
His
p
anic
18%
20%
Readmiss
i
p
Other
16%
18%
Non-Hispanic White
14%
2007 2008 2009 2010 2011 2012 2013
38
Medicare All-Condition Readmission Rate by Hospital
Size
●Smaller hospitals started with lower rates, but have also seen the largest
reductions
Size
reductions
22%
18%
20%
Rate
14%
16%
e
admission
2011
2013
2011 Mean
12%
14%
R
e
2013 Mean
10%
1-49 50-99 100-199 200-299 300-399 400-499 500+
Number of Beds Per-Hospital
39
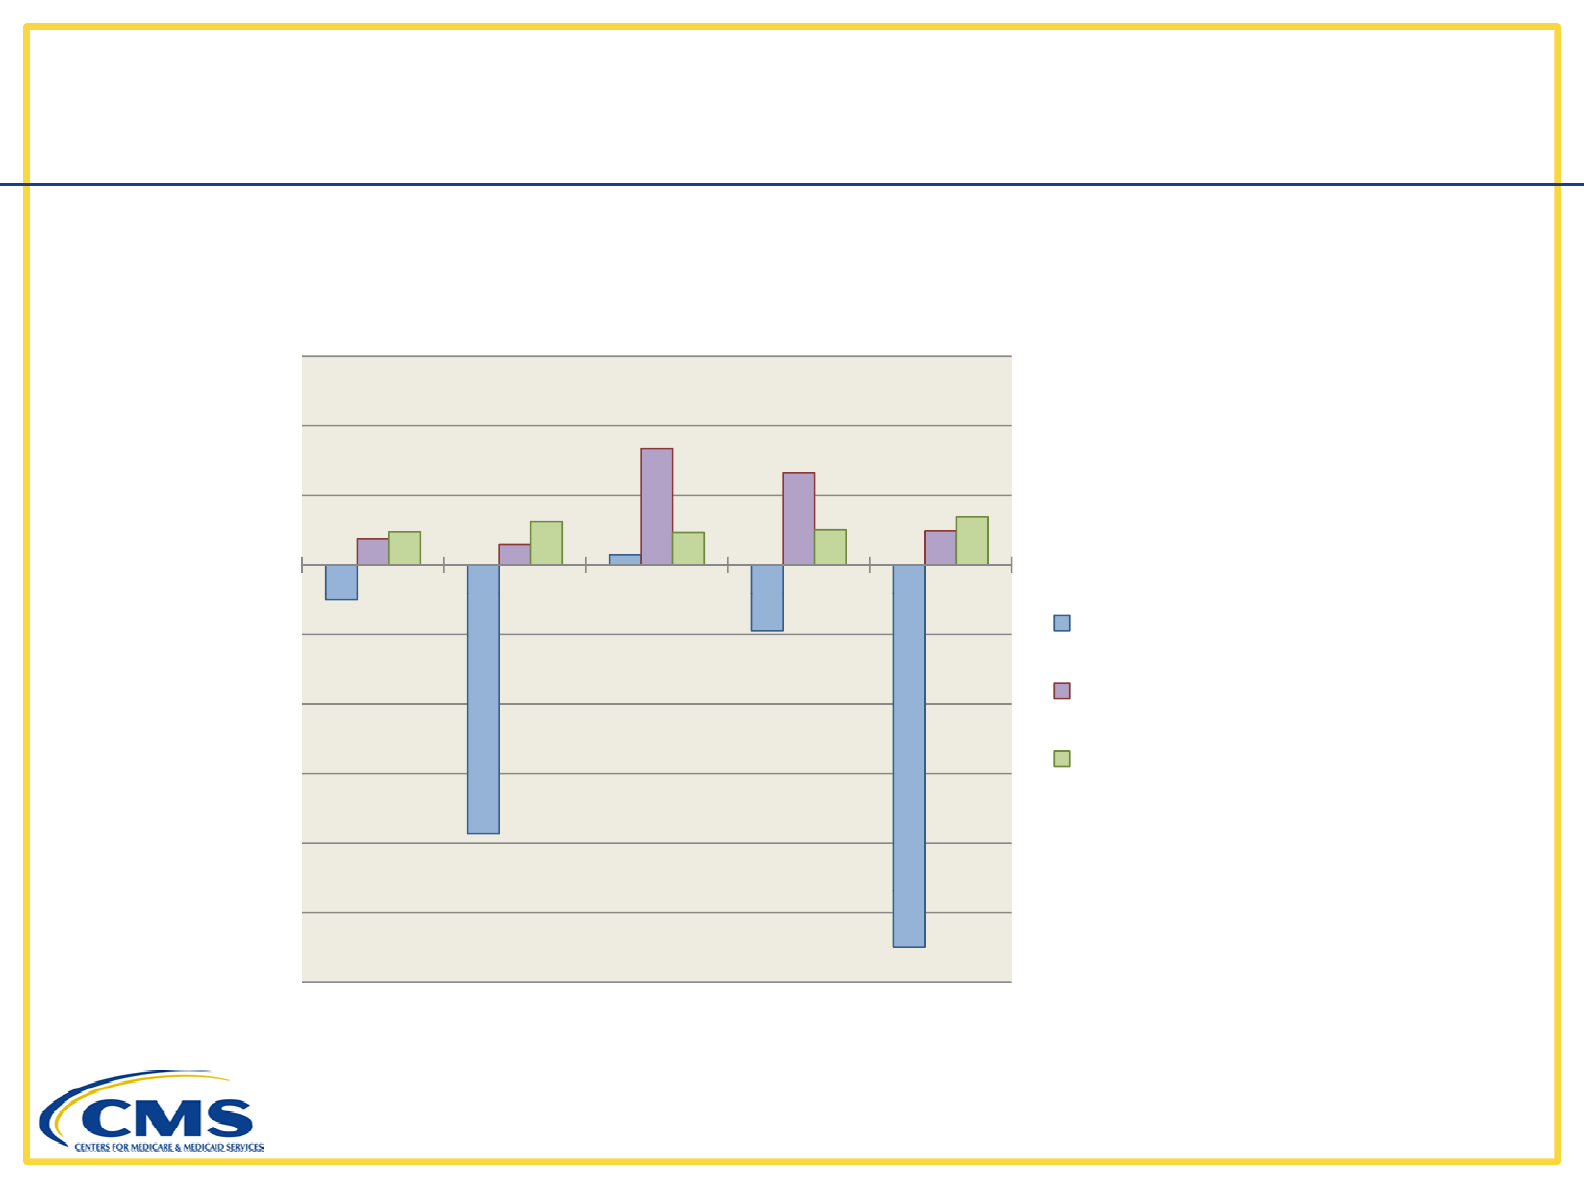
Annual Percentage Point Change in
Readmission Rate by DRG Type
●Rates have decreased across different types of services
Readmission
Rate
by
DRG
Type
02%
00%
0.1%
0
.
2%
o
n Rate
-0.1%
0
.
0%
n
Readmissi
o
-0.3%
-0.2%
n
t Change i
n
Medical DRGs
Surgical DRGs
-0.5%
-0.4%
c
entage Poi
n
-0.7%
-0.6%
2008 2009 2010 2011 2012 2013
Per
c
40
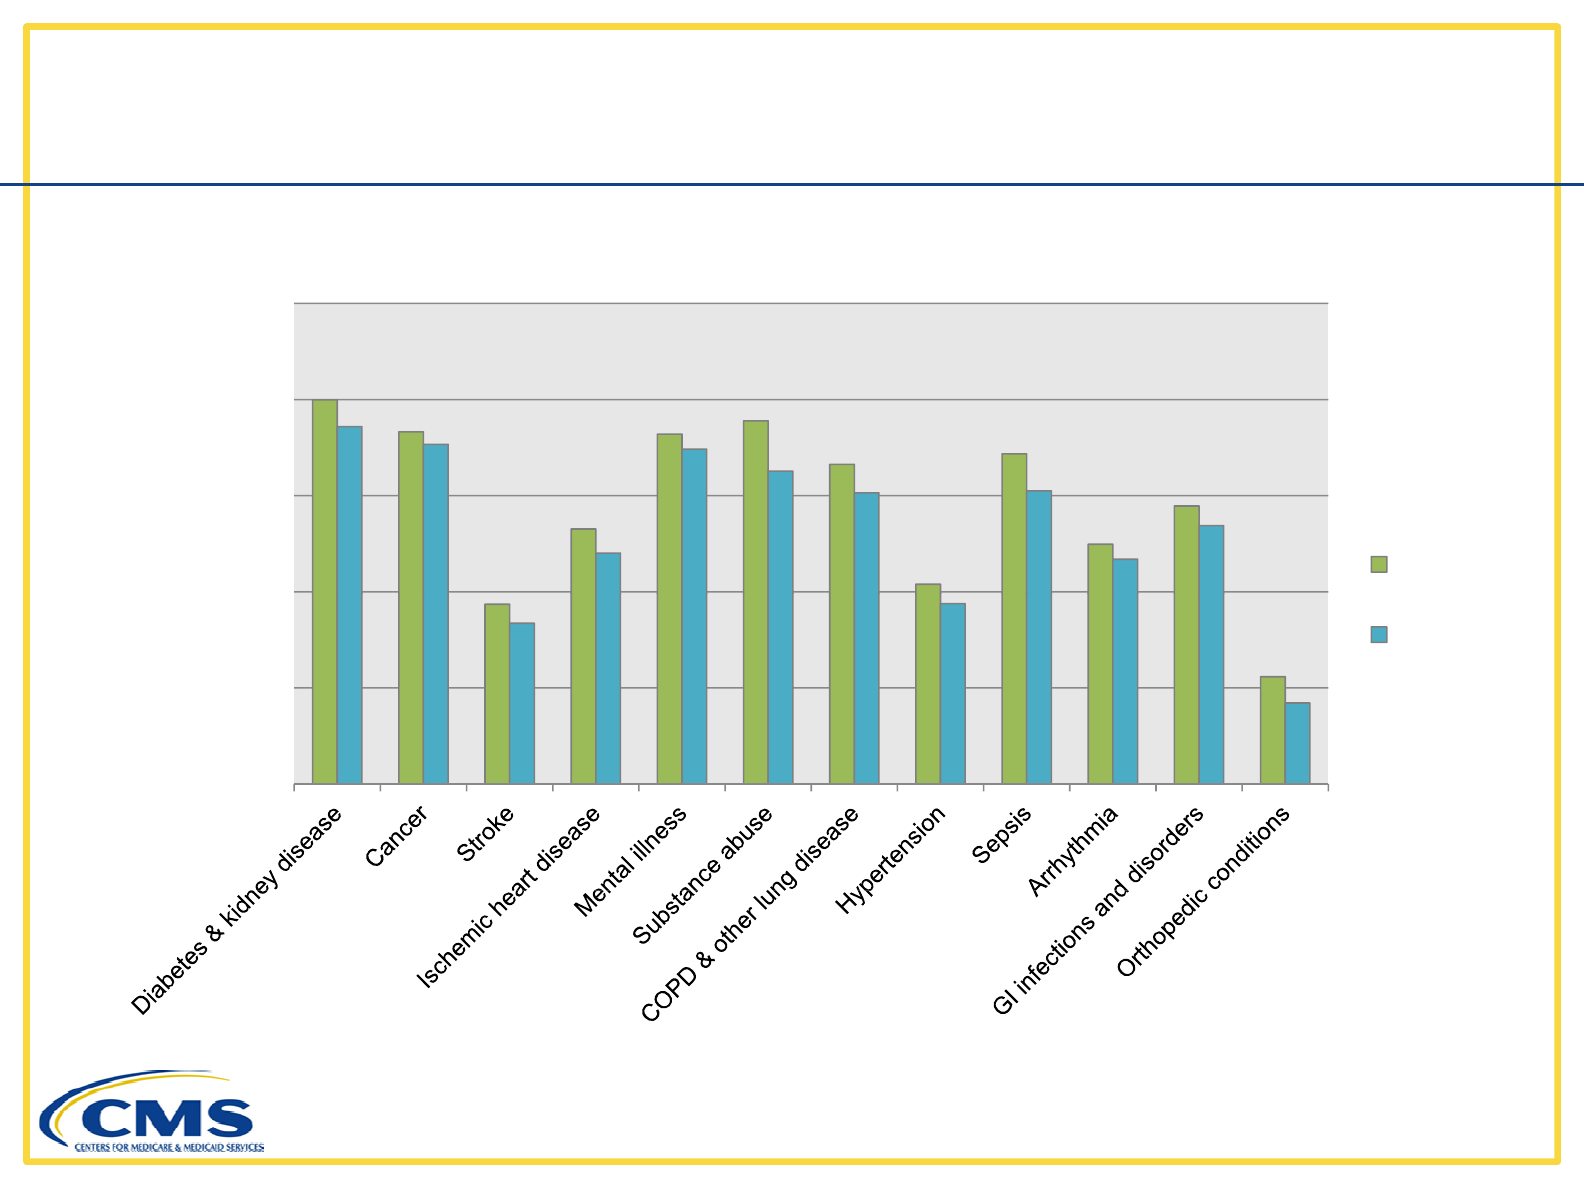
Medicare Readmission Rate for Selected Conditions
●These conditions represent about half of total readmission stays
30%
25%
30%
t
e
15%
20%
mission Ra
t
2011
10%
15%
Read
2013
5%
41

Hospital Readmissions Reduction Program (HRRP)
●Section 3025 of the Affordable Care Act
●Reduces Medicare payments to IPPS hospitals with excess
readmissions
●
Started by measuring heart failure acute myocardial infarction and
●
Started
by
measuring
heart
failure
,
acute
myocardial
infarction
,
and
pneumonia
Payment
adjustments began
in FY 2012
Payment
adjustments
began
in
FY
2012
●CMS proposing to expand measures to include COPD and elective hip
and knee re
p
lacement
p
5 conditions represent 20% of all readmissions
Payment
adjustments
based on all 5 measures would start in FY 2015
Payment
adjustments
based
on
all
5
measures
would
start
in
FY
2015
●Readmission rates for these conditions have gone down, but
im
p
rovement is not limited to these conditions
p
42
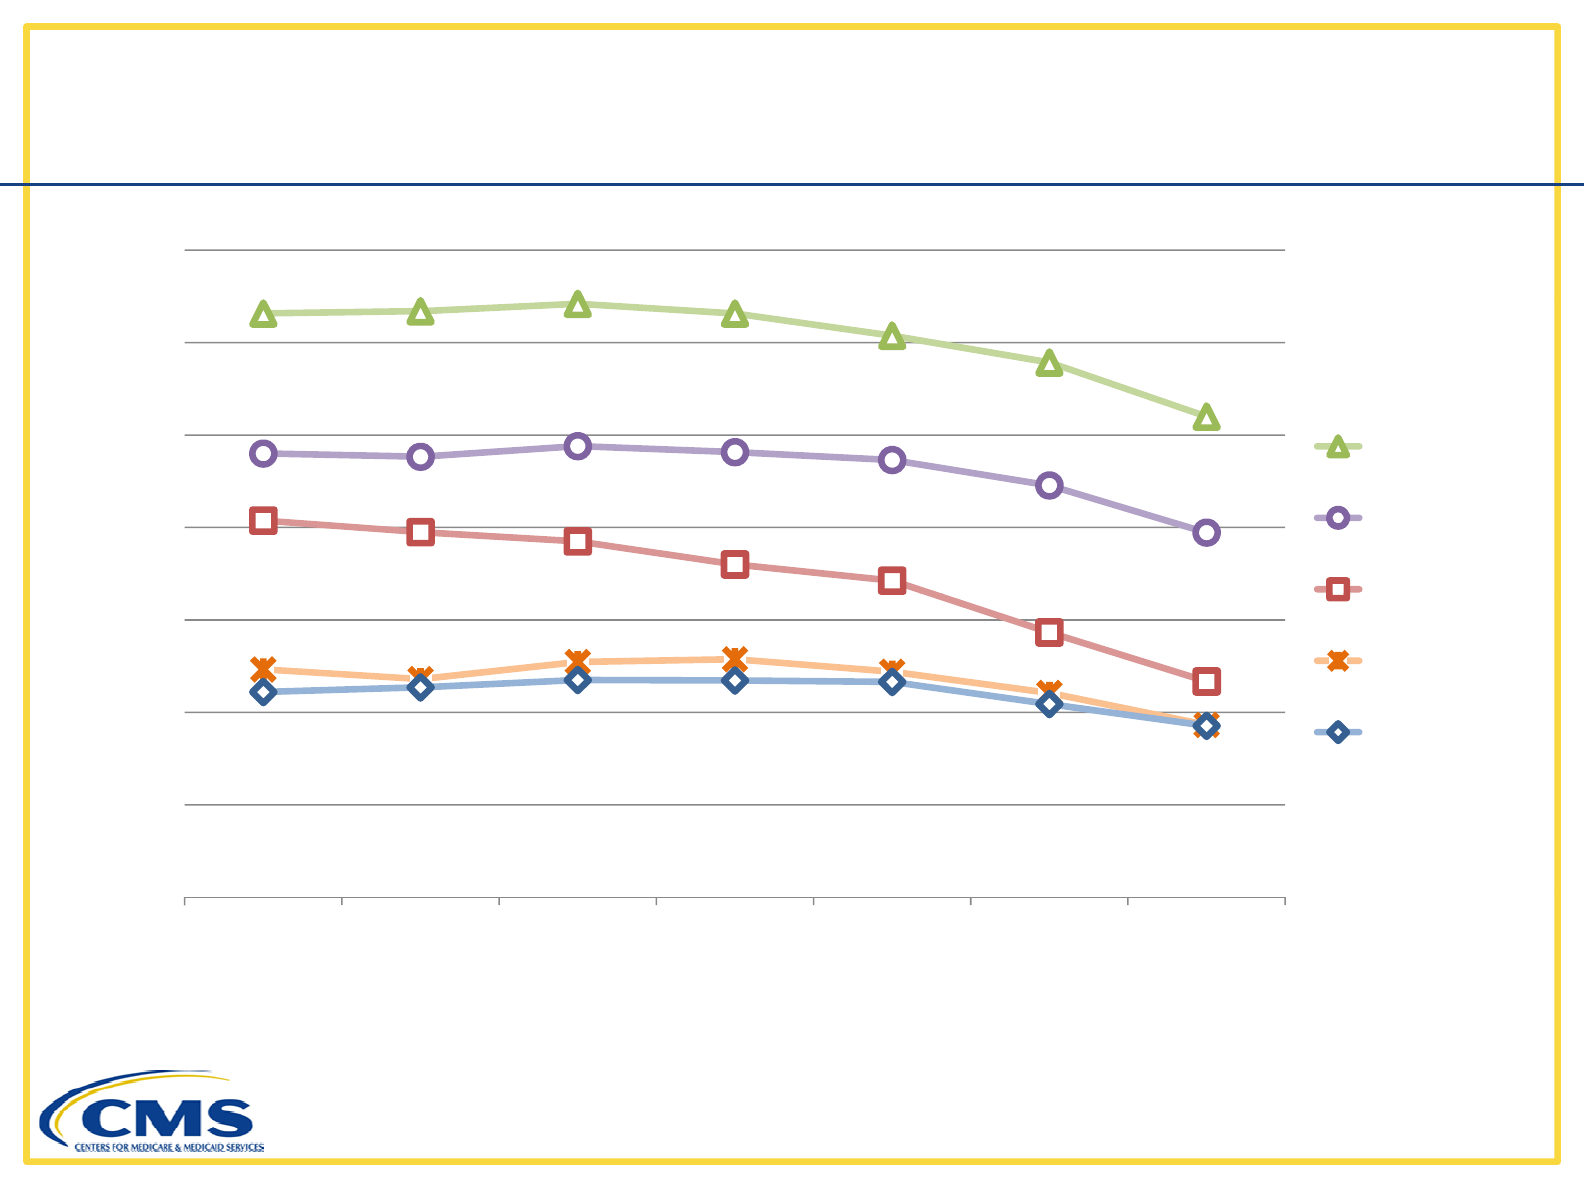
Medicare Unplanned Readmission Rate for
Conditions Measured by HRRP
Conditions
Measured
by
HRRP
28%
24%
26%
e
CHF
22%
s
sion Rat
e
CHF
COPD
AMI
18%
20%
Readmi
s
AMI
Pneumonia
All Other
14%
16%
All
Other
14%
2007 2008 2009 2010 2011 2012 2013
Readmission rate for elective hip and knee replacement fell from 4.7% in 2011
to 3.8% in 2013 (not shown).
43
