SUGI 28: Errors, Warnings, And Notes (Oh My): A Practical Guide To Debugging SAS(r) Programs
User Manual: Pdf
Open the PDF directly: View PDF ![]() .
.
Page Count: 10
- SUGI 28 Title Page
- SUGI 28 Conference Leaders
- Section Keynotes
- 2003 SASware Ballot Results
- Upcoming SUGI Conferences
- Wrapup of SUGI 27
- Advanced Tutorials
- SUGI 28: Multi-platform SAS(r), Multi-platform Code
- SUGI 28: Reducing the CPU Time of Your SAS(r) Jobs by More than 80%: Dream or Reality?
- SUGI 28: Indexing and Compressing SAS(r) Data Sets: How, Why and Why Not
- SUGI 28: Hashing: Generations
- SUGI 28: Version 9 Epiphanies
- SUGI 28: Developing SAS/AF(r) Applications with Form Viewers and Table Viewers
- SUGI 28: Fast and Easy Ways to Advance on Your Beginning SAS(r) Coworkers!
- SUGI 28: Advanced Analytics with Enterprise Guide(r)
- SUGI 28: Categorical Data Analysis with Graphics
- SUGI 28: A Serious Look at Macro Quoting
- SUGI 28: Generating Custom Excel Spreadsheets Using ODS
- SUGI 28: The Power of Pictures and Paint: Using Image Files and Color with ODS, SAS(r), and SAS/GRAPH(r)
- SUGI 28: Web Enabling Your Graphs with HTML, ActiveX, and Java Using SAS/GRAPH(r) and the Output Delivery System
- SUGI 28: PROC REPORT: Doin' It In STYLE!
- SUGI 28: Fancy MS Word Reports Made Easy: Harnessing the Power of Dynamic Data Exchange
- SUGI 28: Using Different Methods for Accessing Non-SAS(r) Data to Build and Incrementally Update That Data Warehouse
- SUGI 28: SAS/ACCESS(r) to External Databases: Wisdom for the Warehouse User
- SUGI 28: Undocumented and Hard-to-Find SQL Features
- SUGI 28: Tips from the Hood: Challenging Problems and Tips from SAS-L
- Applications Development
- SUGI 28: %WINDOW: Get the Parameters the User Wants and You Need
- SUGI 28: Next Generation Data _NULL_ Report Writing Using ODS OO Features
- SUGI 28: Hot Links: Creating Embedded URLs Using ODS
- SUGI 28: ODS to RTF: Tips and Tricks
- SUGI 28: XML in the DATA Step
- SUGI 28: Using SAS(r) Software to Analyze Web Logs
- SUGI 28: Developing SAS/AF(r) Applications Made Easy
- SUGI 28: The One-Time Methodology: Encapsulating Application Data
- SUGI 28: SAS(r) Helps Those Who Help Themselves: Creating Tools to Aid in Your Application Development
- SUGI 28: 'Watch Your Language!' -- Using SCL Lists to Store Vocabulary
- SUGI 28: Application Refactoring with Design Patterns
- SUGI 28: Using IOM and Visual Basic in SAS(r) Program Development
- SUGI 28: Using AppDev Studio(tm) and Integration Technologies for an Easy and Seamless Interface between Java and Server-Side SAS(r)
- SUGI 28: A Pinch of SAS(r), a Fraction of HTML, and a Touch of JavaScript Serve Up a Grand Recipe
- SUGI 28: Web Enable Your SAS(r) Applications
- SUGI 28: Producing American Community Survey Edit Analysis Reports Dynamically Using SAS/IntrNet(r)
- SUGI 28: Using a Dynamic SAS/IntrNet(r) Application to Create Statistical Comparison Reports and Download as SAS(r) Data Sets
- SUGI 28: 'The California Template' or 'How to Keep from Reinventing the Wheel Using SAS/IntrNet(r), JavaScript, and Process Reengineering'
- SUGI 28: UNIX Meet PC: Version 8 to the Rescue
- SUGI 28: A Table-Driven Solution for Clinical Data Submission
- SUGI 28: A Programming Development Environment for SAS(r) Programs
- SUGI 28: StARScope: A Web-Based SAS(r) Prototype for Clinical Data Visualization
- SUGI 28: Dynamically Building SQL Queries Using Metadata Tables and Macro Processing
- SUGI 28: Make Your SAS/ACCESS(r) Query More Efficient
- SUGI 28: Building Metadata Repository for Data Sets
- SUGI 28: Big Brother for SAS/IntrNet(r) Security and Tracking Agent
- SUGI 28: Advanced CRM Solution Using Java Applications
- SUGI 28: Automotive Warranty Data Analysis on the World Wide Web
- SUGI 28: Developing Data-Driven Applications Using JDBC and Java Servlet/JSP Technologies
- SUGI 28: GoodsHound -- Building Multi-functional Web-Based Applications with SAS/IntrNet(r) and JavaScript
- SUGI 28: Developing Custom Analytic Tasks for SAS(r) Enterprise Guide(r)
- Beginning Tutorials
- SUGI 28: A Beginner's Guide to Incorporating SAS(r) Output into Microsoft Office Applications
- SUGI 28: Mouse Clicking Your Way to Viewing and Manipulating Data with Versions 8 and 9 of the SAS(r) System
- SUGI 28: Connecting the SAS(r) System to the Web: An Introduction to SAS/IntrNet(r) Application Dispatcher
- SUGI 28: Describing and Retrieving Data with SAS(r) Formats
- SUGI 28: Nine Steps to Get Started Using SAS(r) Macros
- SUGI 28: How Regular Expressions Really Work
- SUGI 28: Beyond Debugging: Program Validation
- SUGI 28: Errors, Warnings, and Notes (Oh My): A Practical Guide to Debugging SAS(r) Programs
- SUGI 28: Introduction to the SAS(r) Custom Tag Library
- SUGI 28: DHTML -- GUI on the Cheap
- SUGI 28: Tips for Manipulating Data
- SUGI 28: Data Warehouse Administrator: Step by Step
- SUGI 28: Java Syntax for SAS(r) Programmers
- SUGI 28: Java Servlets and Java Server Pages for SAS(r) Programmers: An Introduction
- SUGI 28: Date Handling in the SAS(r) System
- SUGI 28: SAS(r) System Options Are Your Friends
- SUGI 28: Easy, Elegant, and Effective SAS(r) Graphs: Inform and Influence with Your Data
- SUGI 28: SAS(r) Enterprise Guide(r) -- Getting the Job Done
- SUGI 28: Getting Up to Speed with PROC REPORT
- SUGI 28: SAS(r) Reporting 101: REPORT, TABULATE, ODS, and Microsoft Office
- Coders' Corner
- SUGI 28: Space Odyssey: Concatenate Zip Files into One Master File
- SUGI 28: The URL-y Show: Using SAS(r) LE and the URL Access Method to Retrieve Stock Quotes
- SUGI 28: So Many Files, So Little Time (or Inclination) to Type Their Names: Spreadsheets by the Hundreds
- SUGI 28: Splitting a Large SAS(r) Data Set
- SUGI 28: Comparative Efficiency of SQL and Base Code When Reading from Database Tables and Existing Data Sets
- SUGI 28: Automatically Combining the Data from a Variety of DBMSs with ODBC and PROC SQL
- SUGI 28: Automatic Data File Retrieval from Different Database Engines
- SUGI 28: UNLOADing Data from Informix
- SUGI 28: Return Code from Macro; Passing Parameter by Reference
- SUGI 28: If Only 'Page 1 of 1000'
- SUGI 28: Don't Dither About Your Data, Let SAS/GRAPH(r) Trending Box Plots Drive Decision Making
- SUGI 28: A Handy Use of the %LINE Annotate Macro
- SUGI 28: A Drill-Down Diet: An Example of a Dynamic Detail Access on the Web Using SAS/GRAPH(r) and ODS
- SUGI 28: Make Your Life and Little Easier: A Collection of SAS Macro Utilities
- SUGI 28: More _Infile_ Magic
- SUGI 28: The Power of Recursive SAS(r) Macros -- How Can a Simple Macro Do So Much?
- SUGI 28: Continuous or Not: How One Can Tell
- SUGI 28: Identifying Continuity in Longitudinal Data
- SUGI 28: Determining the Dimensionality of Data: A SAS(r) Macro for Parallel Analysis
- SUGI 28: Using a SAS(r) Macro to Document the Database
- SUGI 28: An Automated MS Powerpoint Presentation Using SAS(r)
- SUGI 28: A Macro Using SAS(r) ODS to Summarize Client Information from Multiple Procedures
- SUGI 28: Multiple Graphs on One Page: The Easy Way (PDF) and the Hard Way (RTF)
- SUGI 28: Taking Control of Macro Variables
- SUGI 28: PROC SQL vs. Merge -- The Miller Lite Question of 2002 and Beyond
- SUGI 28: An Efficient Approach to Combine SAS(r) Data Sets with Voluminous Variables That Need Name and Other Changes
- SUGI 28: Danger: MERGE Ahead! Warning: BY Variable with Multiple Lengths!
- SUGI 28: The DOW (Not that DOW!!!) and the LOCF in Clinical Trials
- SUGI 28: MACRO Function with Error Handling to Automatically Generate Global Macro Date Variables
- SUGI 28: Report? Make It Easy -- An Example of Creating Dynamic Reports into Excel
- SUGI 28: Another Shot at the Holy Grail: Using SAS(r) to Create Highly-Customized Excel Workbooks
- SUGI 28: Combining Summary Level Data with Individual Records
- SUGI 28: RETAINing Information to Identify Entity Characteristics
- SUGI 28: Randomized Rounding
- SUGI 28: Logicals from Libraries: Using Storage as a Bridge between Sessions
- SUGI 28: %Fun &With %SYSFUNC
- SUGI 28: Creating Display Manager Abbreviations and Keyboard Macros for the Enhanced Editor
- SUGI 28: Build a SAS(r) Development Environment under Windows
- SUGI 28: Using SAS(r) Catalogs to Develop and Manage DATA Step Programs
- SUGI 28: Let's Play a Game: A SAS(r) Program for Creating a Word Search Matrix
- SUGI 28: SAS/CONNECT(r): The Ultimate in Distributed Processing
- SUGI 28: Run Time Comparison Macro
- SUGI 28: Parallel Processing on the Cheap: Using Unix Pipes to Run SAS(r) Programs in Parallel
- SUGI 28: Date Parameters for Interval Reporting
- SUGI 28: Keep Those Formats Rolling: A Macro to Manage the FMTSEARCH= Option
- SUGI 28: A Simplified and Efficient Way to Map Variables of a Clinical Data Warehouse
- SUGI 28: Renaming All Variables in a SAS(r) Data Set Using the Information from PROC SQL's Dictionary Tables
- SUGI 28: The BEST. Message in the SAS(r) Log
- Data Mining Techniques
- SUGI 28: Modeling Customer Lifetime Value Using Survival Analysis - An Application in the Telecommunications Industry
- SUGI 28: A Simple Bayesian Approach in Mining the Touch Point Data
- SUGI 28: Shopping for Voters: Using Association Rules to Discover Relationships in Election Survey Data
- SUGI 28: Monitoring, Analyzing, and Optimizing Waterflood Responses
- SUGI 28: Multistage Cross-Sell Model of Employers in the Financial Industry
- SUGI 28: The Use of Geographic Information Systems to Investigate Environmental Pollutants in Relationship to Medical Treatment
- Data Presentation
- SUGI 28: Dynamic Behavior from Static Web Applications
- SUGI 28: SAS(r) and the Internet for Programmers
- SUGI 28: Web Communication Effectiveness: Design and Methods to Get the Best Out of ODS, SAS(r), and SAS/GRAPH(r)
- SUGI 28: Regulatory Overview of Using SAS/IntrNet(r) to Collect Data from Thousands of Users
- SUGI 28: Using Formats and Other Techniques to Complete PROC REPORT Tables
- SUGI 28: Custom Map Displays Created with SAS/GRAPH(r) Procedures and the Annotate Facility
- SUGI 28: What's in a Map? A Macro-driven Drill-down Geo-graphical Representation System
- SUGI 28: Working with RGB and HLS Color Coding Systems in SAS(r) Software
- SUGI 28: SAS/IntrNet(r) and Census Mapping: How Low Would You Like to Get
- SUGI 28: Exporting SAS/GRAPH(r) Output: Concepts and Ideas
- SUGI 28: Innovative Graph for Comparing Central Tendencies and Spread at a Glance
- SUGI 28: A Plot and a Table Per Page Times Hundreds in a Single PDF File
- SUGI 28: Why Data _Null_ When You Can RTF Faster?
- SUGI 28: Business Intelligence Applications with JMP(r) Software
- SUGI 28: ODS or DDE for Data Presentation -- A Preliminary Comparison of Output from Different Sources
- SUGI 28: ODS PDF: It's Not Just for Printing Anymore!
- SUGI 28: It's All in the Presentation
- SUGI 28: ODS LAYOUT: Arranging ODS Output as You See Fit
- SUGI 28: Creating Drill-Down Graphs Using SAS/GRAPH(r) and the Output Delivery System
- SUGI 28: Efficient Reporting with Large Numbers of Variables: A SAS(r) Method
- Data Warehousing and Enterprise Solutions
- SUGI 28: Scaling SAS(r) Data Access to Oracle RDBMS
- SUGI 28: Using SAS(r) Strategically: A Case Study
- SUGI 28: Understanding SAS/Warehouse Administrator(r)
- SUGI 28: How to Access PC File Data Objects Directly from UNIX
- SUGI 28: SAS(r) in the Office -- IT Works
- SUGI 28: Multi-Center Study Data Management With A Distributed Application
- SUGI 28: Performance Tuning SAS/ACCESS(r) for DB2
- SUGI 28: Using Information Effectively to Make More Profitable Decisions: The Ten Letter Solution for Finance
- SUGI 28: The Value of ETL and Data Quality
- SUGI 28: The Horror of Bad Data Quality
- SUGI 28: 'How Do I Love Thee? Let Me Count the Ways.' SAS(r) Software as a Part of the Corporate Information Factory
- SUGI 28: Finding Time: SAS(r) and Data Warehouse Solutions for Determining Last Day of the Month
- SUGI 28: New Ways and Means to Summarize Files
- SUGI 28: Better Decisions Through Better Data
- SUGI 28: Deploying Enterprise Solutions: The Business and Technical Issues Faced by SAS(r) Technologists
- SUGI 28: Ring Charts
- SUGI 28: Next Generation Warehousing with Version 9
- SUGI 28: Why SAS(r) is the Best Place to Put Your Clinical Data
- SUGI 28: Transactional Records Access Clearinghouse: SAS(r) Based Warehouse and Mining Tools Keeps Tabs on U.S. Government
- Emerging Technologies
- SUGI 28: XML? We do that!
- SUGI 28: Extending SAS(r) Data Services via XML and Java
- SUGI 28: SAS Metadata, Authorization and Management Services -- Working Together for You
- SUGI 28: Future Trends and New Developments in Data Management
- SUGI 28: Flip the Bow Tie: Pushing Business Intelligence to Operational Applications
- SUGI 28: A Successful Implementation of a Complicated Web-based Application Through webAF(tm) and SAS(r) Integration Technologies
- SUGI 28: An Integrated View of the Customer
- SUGI 28: Rapid Analytic Application Deployment
- SUGI 28: Managing Clinical Trials Data with a SAS-Based Web Portal
- SUGI 28: PROLAP -- A Programmatic Approach to Online Analytical Processing
- SUGI 28: The Use of Scripting Languages, Database Technology, and SAS/IntrNet(r) to Revolutionize the Research Process
- SUGI 28: The SUGI Survey: A Case Study of Deploying a Web-Enabled SAS(r) Application to a Handheld
- SUGI 28: SAS(r) Enterprise Guide(r) Future Directions -- Analytic Business Intelligence with SAS
- SUGI 28: New Technologies for Delivering Data to Internal and External Clients
- Hands-on Workshops
- SUGI 28: Getting PC SAS(r) to Do What You Want, When You Want, How You Want
- SUGI 28: How SAS(r) Thinks or Why the DATA Step Does What It Does
- SUGI 28: PROC DATASETS: Managing Data Efficiently
- SUGI 28: Managing SAS(r) Libraries to Improve Your Programming Environment
- SUGI 28: Macro Power
- SUGI 28: XML Primer for SAS(r) Programmers
- SUGI 28: Creating Dynamic Web Based Reporting
- SUGI 28: SAS(r) with Style: Creating Your Own ODS Style Template
- SUGI 28: So You're Still Not Using PROC REPORT. Why Not?
- SUGI 28: The Simplicity and Power of the TABULATE Procedure
- SUGI 28: Introduction to JMP(r)
- SUGI 28: Making the Most of Version 9 Features
- SUGI 28: A Gentle Introduction to SAS/GRAPH(r) Software
- Posters
- SUGI 28: An Approach to Displaying Predicted Survival Data Based on the Level of a Continuous Covariate
- SUGI 28: Accelerating the Construction of Data Entry Applications in UNIX Systems for Epidemiology and Healthcare Policy Researches
- SUGI 28: Developing SAS(r) Ready Analyzable Data Systems: A Java Web Application for Creation and Management of SAS(r) Relational Databases
- SUGI 28: Linkage of Patient Registries and Clinical Data Sets without Patient Identifiers
- SUGI 28: Spectral Decomposition of Performance Variables for Dynamic System Characterization of Web Servers
- SUGI 28: What's in a Map? A Macro-Driven Drill-Down Geo-graphical Representation System
- SUGI 28: Analysis of Method Comparison Studies Using SAS(r)
- SUGI 28: P-Value Generation Simplified with a Single SAS(r) Macro
- SUGI 28: ODS in an Instant!
- SUGI 28: The Use of Formats, Concatenate, and Sum for Reporting on "Check All That Apply" Variables
- SUGI 28: An Interactive Table for the Web Using SAS(r) and JavaScript
- SUGI 28: Posting Project Status to the Web Through SAS(r) Programming
- SUGI 28: Teaching Statistical Methods Courses with Case Studies and JMP(r)
- SUGI 28: “From Data to Analysis, Results and Reports” -- A Researcher’s Dilemma but A Programmer’s Challenge
- SUGI 28: Filling Report Templates with the SAS(r) System and DDE
- SUGI 28: Creating Tables or Listings with a Zero-Record SAS(r) Data Set -- Basic Program Structure and Three Simple Techniques
- SUGI 28: Creating Multiple Graphs to Link from a Dynamic Map Using SAS(r) ODS, SAS/GRAPH(r), PROC GMAP, and MACRO
- SUGI 28: Scheduling Time with SAS(r): Project Proposal Examples
- SUGI 28: Using SAS(r) Software and Visual Basic for Applications to Produce Microsoft Graph Charts
- SUGI 28: Tell Them What's Important: Communication-Effective Web- and E-mail-Based Software-intelligent Enterprise Performance Reporting
- SUGI 28: A SAS(r) Market Basket Analysis Macro: The Poor Man's Recommendation Engine
- SUGI 28: Using SAS(r) to Automatically Generate Reports in Any Special Formats
- SUGI 28: MVS Point-and-Click Access to IMS Data with SAS/ACCESS(r)
- SUGI 28: Usage Statistics for Your Web Site: Leveraging the Flexibility of SAS(r) and Webhound
- SUGI 28: Applied Population Genetics Using SAS(r) Software
- SUGI 28: PROC FORMAT Supports PROC BOXPLOT to Handle Twofold Grouped Data
- SUGI 28: Developing a Marketing Geographic Segmentation System Using SAS(r) Software
- SUGI 28: 'I'll Have What She's Having' -- Serving-up MetaData to Academic Research Teams
- SUGI 28: Security Control System with SAS(r) Application Dispatcher
- SUGI 28: %MONDRIAAN: Presenting 3D Information in 2D
- SUGI 28: Advantages of Using a Web Based Reporting System Over Using SAS/CONNECT(r)
- SUGI 28: Working with RGB and HLS Color Coding Systems in SAS(r) Software
- SUGI 28: A SAS/IML(r) Program for Mapping QTL in Line Crosses
- SUGI 28: An Automated Reporting Macro to Create Cell Index -- An Enhanced Revisit
- SUGI 28: Metadata Application on Clinical Trial Data in Drug Development
- SUGI 28: Enhancement of Survival Graphs
- Professional Development and User Support
- SUGI 28: Practical Tips to Customize a SAS(r) Session
- SUGI 28: SAS(r) Programming Conventions
- SUGI 28: Programming Standards, Style Sheets, and Peer Reviews: A Practical Guide
- SUGI 28: SAS(r) High-speed Automated Reporting Queue (SHARQ)
- SUGI 28: Where to Go from Here: Learning More about SAS(r)
- SUGI 28: An Overview of SAS Certification and the Test Development Process
- SUGI 28: Ten Things I Wish I Knew Before I Became an Independent SAS(r) Software Consultant
- SUGI 28: SAS-L: A Very Powerful Free Resource for SAS(r) Users Worldwide
- SUGI 28: Ask and Ye Shall Receive: Getting the Most from SAS-L
- SUGI 28: Tinker, Tailor, Soldier, Spy: The Many Roles of the SAS(r) Consultant
- SUGI 28: Not All Fish Eat Worms: A SAS(r) Programmer's Guide to MS Excel and Other Fish Stories
- SUGI 28: Show-and-Tell: How to Use MS Office Products to Help with SAS(r) Applications
- Statistics and Data Analysis
- SUGI 28: Case Studies in Time Series
- SUGI 28: An Introduction to the Analysis of Mixed Models
- SUGI 28: Survival Analysis Using Cox Proportional Hazards Modeling for Single and Multiple Event Time Data
- SUGI 28: Let the Data Speak: New Regression Diagnostics Based on Cumulative Residuals
- SUGI 28: Using the SAS(r) System to Construct and Operate Control Charts with Randomized Control Limits
- SUGI 28: Logistic Regression Modeling -- JMPStart(tm) Your Analysis with a Tree
- SUGI 28: STEPWISE Methods in Using SAS(r) PROC LOGISTIC and SAS(r) Enterprise Miner(tm) for Prediction
- SUGI 28: An Introduction to Genomics and SAS(r) Scientific Discovery Solutions
- SUGI 28: How to Use the SAS(r) System as a Powerful Tool in Biomathematics
- SUGI 28: Cutpoint Determination Methods in Survival Analysis Using SAS(r)
- SUGI 28: Complex Sampling Designs Meet the Flaming Turkey of Glory
- SUGI 28: Multilevel Designs and Their Analyses
- SUGI 28: Estimating Standard Errors for CLASS Variables in Generalized Linear Models Using PROC IML
- SUGI 28: SAS/STAT(r) Version 9: Progressing into the Future
- SUGI 28: Fast and Easy Ways to Annoy a SAS(r) Programmer: A Statistician's Revenge!
- SUGI 28: Application of the LOESS Procedure for Monitoring and Detecting Critical Movements in the US Automobile Market
- SUGI 28: Smoothing with SAS(r) PROC MIXED
- SUGI 28: Beyond PROC LIFETEST: Alternative Linear Rank Tests for Comparing Survival Distributions
- SUGI 28: Estimation of Prevalence Ratios When PROC GENMOD Does Not Converge
- SUGI 28: An Alternative to PROC MI for Large Samples
- SUGI 28: Known Nonsense
- SUGI 28: Analysis of Data from Recurrent Events
- SUGI 28: Reliability, Exploratory and Confirmatory Factor Analysis for the Scale of Athletic Priorities
- SUGI 28: SAS(r) Macros and Tools for Working with Weighted Logistic Regression Models That Use Survey Data
- SUGI 28: Optimization with the SAS(r) System: What It Is, What's New, and Why You Should Be Using It
- Systems Architecture
- SUGI 28: Accelerating Performance of SAS(r) Applications via Rapid Extraction and Multiprocessing
- SUGI 28: Using a HOLAP Solution to Analyze Large Volumes of Data via the Web
- SUGI 28: Developing Client/Server Applications to Maximize SAS 9 Parallel Capabilities
- SUGI 28: SAS(r) Application Performance Monitoring for UNIX
- SUGI 28: Multi-Lingual Computing with the 9.1 SAS(r) Unicode Server
- SUGI 28: An Inside Look at Version 9 and 9.1 Threaded Base SAS(r) Procedures
- SUGI 28: SAS(r), Linux/UNIX and X-Windows Systems
- SUGI 28: Early Experiences with SAS(r) Release 9 on an OS390 Platform
- SUGI 28: SAS(r) System on Network Appliance
- SUGI 28: SAS(r) Performance Optimizations on Intel Architecture
- SUGI 28: The Bleeding Edge -- The Effects of Hardware and Software Migration on the SAS(r) System
- SUGI 28: PROC MIGRATE: How to Migrate Your Data and Know You?ve Done It Right!
- SUGI 28: SAS 9.1 on Solaris 9 Performance and Optimization Tips
- SUGI 28: Using the SAS(r) V9 Application Response Measurement System to Provide Metrics to HP-UX Workload Manager
- SUGI 28: A Case Study of the Tools, Techniques, and High Level Model Used to Tune AIX Version 5L for the SAS(r) System

Paper 59-28
ERRORS, WARNINGS, AND NOTES (OH MY)
A PRACTICAL GUIDE TO DEBUGGING SAS PROGRAMS
Lora D. Delwiche, University of California, Davis, CA
Susan J. Slaughter, Avocet Solutions, Davis, CA
A man's intelligence is not measured by how many
mistakes he makes, but how many of those mistakes he
finds. – Erik de Bie
ABSTRACT
Errors? "I never get errors!" Warnings? "I never bother to
read them, my program still runs." Notes? "Who needs
them?" This paper, is based on the belief that debugging
your programs is not only necessary, but also a good way
to gain insight into how SAS works. Once you understand
why you got an error a warning or a note, you'll be better
able to avoid problems in the future. In other words,
people who are good debuggers are good programmers.
We cover common problems including missing
semicolons, invalid data, truncated character values,
missing-data-was-generated messages, character to
numeric conversions, and the tricky problem of a DATA
step that runs without suspicious messages but
nonetheless produces the wrong results. For each
problem we decipher the message, explain possible
causes, and explain how to fix the problem. We also
cover some programming strategies to avoid errors in the
first place.
WHAT IS A BUG?
Scientists have identified approximately 1 1/4 million
species of animals. Of those about 3/4, or 932,000, are
insects. However, only the 82,000 species belonging to
the order Hemiptera are considered by scientists to be
“true bugs”(McGavin, 1993). Fortunately, a taxonomy of
SAS bugs would not identify nearly so many species.
Entomology aside, a bug is an error in a computer
program that causes an undesired, and usually
unexpected, result. One way of classifying computer bugs
is to divide them into three types of errors: syntax, data,
and logic. Syntax errors result from failing to follow SAS’s
rules about the way keywords are put together to make
statements. With data errors you have a program that is
syntactically sound but fails because the data values do
not fit the program as it was written. With logic errors you
have a program that runs, and data that fits, but the result
is wrong because the program gave the wrong
instructions to the computer.
The bugs discussed in this paper can be classified as:
Syntax
• missing semicolon
• uninitialized variable and variable not found
Data
• missing values were generated
• numeric to character conversion
• invalid data
• character field is truncated
Logic
• DATA step produces wrong results but no error
message.
LISTEN TO THE SAS LOG
The first and most important rule in debugging SAS
programs is to always, always check the SAS log. After
running a SAS program many people turn immediately to
the output. This is understandable, but not advisable. It
is entirely possibleand sooner of later it happens to all
of usto get output that looks fine but is totally bogus.
Often, checking the SAS log is the only way to know
whether a program has run properly.
The second most important rule in debugging is to always
start at the beginning of the log. This may seem obvious,
but if you are running SAS in the windowing environment,
then the SAS log fills up the Log window and you are left
looking at the end of the log, not the beginning. There is a
temptation to try to fix the first error you see, which is not
necessarily the first error in the log. Often times one error
early in the program can generate many messages, and
only the first message will give you a clue as to what the
problem is. If you are using the SAS windowing
environment, then you may want to get in the habit of
clearing the SAS log before you submit programs. This
way the beginning of the SAS log for the program just
submitted is always at the top of the Log window. If you
don’t clear the window, then SAS just tacks the log from
what you just submitted onto whatever was already in the
Log window making it hard to find the beginning of the log.
SAS logs contain 3 types of messages: errors, warnings,
and notes.
Errors
If you get an error message in your program, you will
know it. Error messages get your attention because SAS
will not run a job with one of these bugs. Error messages
are not quiet, discreet, or subtle; they are the loud, rabble-
SUGI 28 Beginning Tutorials

2
rousers of SAS messages. This message, for example:
ERROR: No CARDS or INFILE statement.
stops a program dead in its tracks. This message tells
you that SAS could not find any data to read with the
INPUT statement.
Warnings
Warnings are less dire than errors. SAS prints warnings
in your log and then goes ahead and runs the job anyway.
Many people, including some professional programmers,
try to ignore warnings. Don’t you be one of them.
Sometimes the situations that result in warnings are
indeed harmless; other times they indicate grave
problems which, if unresolved, will render your results
worthless. You should check all warnings to see if they
are harmless or hazardous. This message:
WARNING: The data set WORK.SPECIES may
be incomplete. When this step was
stopped there were 0 observations
and 3 variables.
tells you that SAS did run a DATA step, but for some
reason there are zero observations. This could be OK,
but generally speaking when you go to the trouble of
creating a data set, you want some data in it.
Notes
Notes are the most innocuous messages that SAS writes
in your SAS log. They simply inform you of the status of
your program. Notes contain information such as the
number of records input from an external file, or the
number of observations written in a SAS data set. Don’t
be fooled by demure little notes; they are a critically
important way of catching errors. These messages:
NOTE: 29 records were read from the
infile 'bugspeci.dat'.
The minimum record length was 27.
The maximum record length was 27.
NOTE: The data set WORK.SPECIES has 14
observations and 3 variables.
tell you that while 29 records where read from a raw data
file, the resulting SAS data set contains only 14
observations. If you were expecting only 14 observations,
then this would be fine. But if you were expecting 29
observations, one observation for each input record, then
this would tip you off that something went wrong.
Another type of note can help you write efficient programs.
At the end of every step SAS prints a note similar to this:
NOTE: The PROCEDURE PRINT used 6.98
seconds.
If you are running a one-time report, you may not care, but
if you run the same program over and over then you may
want to check your notes to see which steps can benefit
the most from streamlining.
THE SPECIES DATA
The data for the next few examples appear in Table 1.
Each observation contains data about one order in the
class Insecta (La Plante, 1996). The variables are the
name of the order (Order), the number of species in that
order found in North America (InNorthAmerica), and the
number of species found outside North America
(OutsideNorthAmerica).
Table 1 Species data.
Order
InNorth
America
OutsideNorth
America
Thysanura 20 230
Diplura 30 370
Protura 30 70
Collembola 325 1675
Ephemeroptera 550 950
Odonata 425 4575
Plecoptera 34 1266
Grylloblattodea . 6
Saltatoria 110 21890
Phasmida . .
Dictyptera . .
Isoptera 45 .
Dermaptera 20 1080
Embioptera 10 140
Psocoptera 150 950
Zoraptera 2 17
Mallophaga 320 2280
Anoplura 65 285
Thysanoptera 625 2375
Hemiptera 8750 46250
Neuroptera 350 4350
Mecoptera 70 280
Trichoptera 950 3550
Lepidoptera 10500 189500
Diptera 16700 68300
Siphonaptera 250 850
Hymenoptera 14600 90400
Coleoptera 27000 530000
Strepsiptera 120 180
THE MISSING SEMICOLON
A syntax error
Even the newest of SAS programmers knows that every
SAS statement ends with a semicolon; so it is ironic that
one of the most common bugs is the missing semicolon.
While most SAS error messages are clear and easy to
understand, the hallmark of a missing semicolon is
confusion. Missing semicolons often produce a long
stream of baffling messages. In the following example,
the absence of a semicolon at the end of the DATA
statement causes two error messages, three warnings,
and a suspicious note.
SUGI 28 Beginning Tutorials

3
1 DATA species
2 INFILE 'bugspecies.dat';
3 INPUT Order $ 1-15 InNorthAmerica
OutsideNorthAmerica;
4 RUN;
ERROR: No CARDS or INFILE statement.
ERROR: Memtype field is invalid.
NOTE: The SAS System stopped processing
this step because of errors.
WARNING: The data set WORK.SPECIES may
be incomplete. When this step was
stopped there were 0 observations
and 3 variables.
WARNING: Data set WORK.SPECIES was not
replaced because this step was
stopped.
WARNING: The data set WORK.INFILE may
be incomplete. When this step was
stopped there were 0 observations
and 3 variables.
The message “No CARDS or INFILE statement” is
especially odd since there obviously is an INFILE
statement. Without a semicolon, the DATA statement
becomes concatenated with the INFILE statement. SAS
then interprets the keyword INFILE as a data set name in
the DATA statement resulting in the warning “data set
WORK.INFILE may be incomplete.”
If you find that the messages in your log make no sense,
check for missing semicolons.
DATASTMTCHK system option
Some cases of missing semicolons, like the one given in
the previous example, may be easier to find if you use the
DATASTMTCHK=ALLKEYWORDS system option. By
default you cannot use the words MERGE, RETAIN, SET,
or UPDATE as SAS data set names. If you set the
DATASTMTCHK system option equal to
ALLKEYWORDS, then SAS will not accept any keyword
as a SAS data set name. For example, if you add the
OPTIONS statement to the previous example, you will get
the following messages in your SAS log:
1 OPTIONS DATASTMTCHK=ALLKEYWORDS;
2 DATA species
3 INFILE 'bugspecies.dat';
------
57
ERROR 57-185: INFILE is not allowed in
the DATA statement when option
DATASTMTCHK=ALLKEYWORDS.
Check for a missing semicolon in
the DATA statement, or use
DATASTMTCHK=NONE.
4 INPUT Order $ 1-15 InNorthAmerica
5 OutsideNorthAmerica;
6 RUN;
This system option has the added advantage in that it
produces an error and therefore prevents SAS from
writing over a good data set with a bad one just because
you forgot a semicolon at the end of the DATA statement.
Syntax-sensitive editors
The Enhanced Editor is the default editor for the Windows
operating environment and the Program Editor is the
default for all other operating environments. Both the
Enhanced Editor and the Program Editor (starting with
version 9 of SAS) color code your program. All the
different elements of a SAS program (e.g. keywords,
comments, quoted strings, constants and variables) show
up in a different color as you type them in the editor. This
can be extremely valuable in catching missing semicolons
(and also un-matched quotes) as you type your program,
because the program will most likely not be colored
properly if you have a missing semicolon. If you are not
using Windows, and you do not have version 9 of SAS,
you may still be able to use the color coding feature. In
the OS/390 operating environment, the color coding
feature became the default starting with version 8.2. For
information on using the color editor under UNIX (8.1 or
higher) see the SAS note SN-003114
(http://www.sas.com/service/techsup/unotes/SN/003/0031
14.html).
UNINITIALIZED VARIABLE AND VARIABLE NOT
FOUND
A syntax error
These two related messages tell you that SAS was unable
to find one of your variables. The first time you see one of
these messages you will probably wonder what SAS is
babbling about, after all you remember creating the
variable.
In the following SAS log, the INPUT statement reads the
species data using the variable name InNorthAmerica for
the number of species in North America. Then a
subsetting IF statement contains the misspelled variable
name NorthAmerica.
1 DATA species (KEEP = Order World);
2 INFILE 'bugspecies.dat';
3 INPUT Order $ 1-15 InNorthAmerica
OutsideNorthAmerica;
4 IF NorthAmerica > 100;
5 World = InNorthAmerica +
OutsideNorthAmerica;
6 RUN;
NOTE: Variable NorthAmerica is
uninitialized.
When SAS is unable to find a variable in a DATA step,
SAS prints the variable-is-uninitialized message. Then
SAS creates the variable, sets its values to missing for all
observations, and runs the DATA step. It’s nice that SAS
runs the DATA step, but you probably don’t want the
variable to have missing values for all observations.
A more serious problem ensues when SAS is unable to
find a variable in a PROC step. In the following example,
SAS cannot find the variable InNorthAmerica. This
variable did exist, but was accidentally dropped in the
previous DATA step because it was not listed in the KEEP
option. SAS prints the variable-not-found message and
does not run the procedure at all.
SUGI 28 Beginning Tutorials

4
7 PROC PRINT DATA=species;
8 VAR Order InNorthAmerica World;
ERROR: Variable INNORTHAMERICA not
found.
9 RUN;
Another version of the variable-not-found message
appears as a warning when the problem occurs in a less
critical statement such as a LABEL statement. Because
this is a warning, not an error, SAS runs the step.
Possible causes of the variable-is-uninitialized and
variable-not-found messages include:
• A misspelled variable name.
• Using a variable that has been dropped.
• Using the wrong data set.
• Using a variable before it is created.
MISSING VALUES WERE GENERATED
A data error
The missing-values-were-generated note tells you that
SAS was unable to compute the value of a new variable
because of existing missing values in your data. This may
not indicate a problem, but it warrants an investigation.
In the following example, SAS computes the variable
World by adding the two variables InNorthAmerica and
OutsideNorthAmerica.
1 DATA species;
2 INFILE 'bugspecies.dat';
3 INPUT Order $ 1-15 InNorthAmerica
OutsideNorthAmerica;
4 World = InNorthAmerica +
5 OutsideNorthAmerica;
6 RUN;
NOTE: Missing values were generated as
a result of performing an
operation on missing values.
Each place is given by: (Number
of times) at (Line):(Column).
4 at 4:27
This missing-values-were-generated note tells you that
SAS assigned missing values to four observations at line
4 column 27 of the program. A quick look back at the
species data shows that 4 observations have missing data
for InNorthAmerica or OutsideNorthAmerica. Therefore,
SAS was unable to compute a value for the variable
World for those particular observations.
The SUM function and its cousin the MEAN function can
lessen this problem because they use only non-missing
values. If you decided that you just wanted to sum the
non-missing values in the preceding program, you would
use this statement:
World = SUM(InNorthAmerica,
OutsideNorthAmerica);
However, if you have an observation with missing values
for all of the variables named in the function, then the
result would still be missing and you would still get the
missing-values note for that observation.
THE INSECTICIDE DATA
Data about the effectiveness of insecticides appears in
Table 2 (based on Conklin, 1996). The variables are the
name of the insecticide (Insecticide), its residual effect on
insects (ToxInsect), and its toxicity to mammals
(ToxMammal). The toxicity to insects and mammals are
both rated on a scale of 0 to 6 where 0 indicates no effect
and 6 means extreme toxicity.
Table 2 Insecticide data.
Insecticide ToxInsect ToxMammal
DDT 6 3
Malathion 4 1
Pyrethrins 2 1
Sulfur 6 0
Chlordane 6 4
Diazinon 4 4
Heptachlor 6 5
Nicotine sulfate 1 6
Nicotine sulfate is a lousy insecticide. It has almost no
residual effect against insects, but is extremely toxic to
people.
NUMERIC TO CHARACTER CONVERSION
A data error
If you accidentally mix numeric and character variables,
SAS will convert the data from one type to the other, run
the program anyway, and print the values-have-been-
converted note as shown in this log:
1 DATA poisons;
2 INFILE 'bugtox.dat';
3 INPUT Insecticide $ 1-16 ToxInsect
$ 18 ToxMammal $ 20;
4 Difference = ToxInsect - ToxMammal;
5 RUN;
NOTE: Character values have been converted
to numeric values at the places given by:
(Line):(Column).
4:16 4:28
In this example, the variables ToxInsect and ToxMammal
are input as character variables but are used in an
arithmetic expression. Since you can’t subtract character
values, SAS must convert these variables to numeric.
Specifically, the note tells you that SAS converted data at
columns 16 and 28 in line 4 of the program. These
columns correspond to the variable names ToxInsect and
ToxMammal.
It’s nice that SAS tries to fix the problem for you, but this
doesn’t mean that you can ignore the message. If you let
SAS convert your variables, it can come back to haunt
you at a later time when the variable that you think is
numeric is now character or vice versa. If a variable
SUGI 28 Beginning Tutorials

5
needs to be converted, you should do it yourself, explicitly,
so there are no surprises.
To convert from character to numeric you use the INPUT
function. To convert from numeric to character, you use
the PUT function. The basic forms of these statements
are:
character to numeric:
newvar
= INPUT(
oldvar
,
informat.
);
numeric to character:
newvar
= PUT(
oldvar
,
format.
);
In either case, the informat or format must be numeric. To
convert the variables ToxInsect and ToxMammal, you
could use these statements:
NewToxInsect = INPUT(ToxInsect, 1.);
NewToxMammal = INPUT(ToxMammal, 1.);
The resulting variables—now numeric—will have a length
of 8 bytes which is the default for numeric variables.
Possible causes of the values-have-been converted
message include:
• Setting a variable equal to another variable of a
different type.
• Using a variable with the wrong type of function.
• Using a character variable in an arithmetic expression.
INVALID DATA
A data error
The invalid-data note may be the ugliest message you’ll
ever see in a SAS log, but once you know how to read it,
you’ll know exactly what the problem is every time.
Whenever SAS encounters invalid data while reading with
an INPUT statement, SAS sets the problematic variable to
missing for that observation and then prints a detailed
message like this:
1 DATA poisons;
2 INFILE ‘bugtox.dat’;
3 INPUT Insecticide $ 1-15 ToxInsect
ToxMammal;
4 RUN;
NOTE: Invalid data for ToxInsect in
line 8 16-16.
RULE: ----+----1----+----2----+---
8 Nicotine sulfate 1 6
Insecticide=Nicotine sulfat ToxInsect=.
ToxMammal=1 _ERROR_=1 _N_=8
The first line of this message is a note telling you which
variable had a problem, ToxInsect, in this case; the line of
data at which the problem occurred, line 8; and the
column SAS was trying to read, column 16. Next SAS
prints a line labeled RULE which is a handy ruler for
counting columns. On this ruler 1 indicates the 10th
column, 2 the 20th, and so on. Then SAS dumps the
actual line of raw data so you can see the little
troublemaker for yourself. Finally, SAS prints the values
of the variables as it has read them plus two automatic
variables: _ERROR_ and _N_. _ERROR_ always has a
value of 1 if there is a data error, and 0 if there is not. _N_
is the number of times SAS has looped through the
current data step.
In this case, you can see that column 16 contains the
letter “e”. SAS was trying to read the “e” as the value for
ToxInsect, but ToxInsect is a numeric variable.
Unfortunately, the INPUT statement told SAS to read
Insecticide from columns 1-15, but it should have said 1-
16.
Possible causes of the invalid-data message include:
• Forgetting to specify that a variable is character (SAS
assumes it is numeric).
• Incorrect column specifications producing embedded
spaces in numeric data.
• Incorrect column specifications producing character
values for a numeric variable.
• List-style data with two periods in a row and no space
in between.
• Failing to mark a missing value with a period in list-
style input, causing SAS to read the data for the next
variable.
• Using the letter O instead of the number zero.
• Special characters such as carriage-return-line-feed
and page-feed.
• Invalid dates (such as September 31) read with a
date informat.
• Using the wrong informat such as MMDDYY. instead
of DDMMYY.
CHARACTER FIELD TRUNCATED
A data error
This bug does not generate any error messages or
suspicious notes, but you know that you have this
problem when you print your data and find the end of a
character variable has been lopped off.
The length of a character variable is set when SAS first
encounters the variable, typically in an INPUT or
assignment statement. If you use list-style input, the
default length for character variables is eight bytes. With
column-style input it is the number of columns you
specify. With formatted-style input it is the length of the
informat. If you create a new variable with assignment
statements, SAS sets its length based on the first
occurrence of the variable.
In the following example, the variable Toxicity is first set
equal to “high”. Therefore SAS gives Toxicity a length of
four bytes, and any subsequent longer values will be
truncated.
DATA poisons (DROP = ToxInsect);
INFILE 'bugtox.dat';
INPUT Insecticide $ 1-16 ToxInsect
ToxMammal;
IF ToxMammal >= 5 THEN
Toxicity = 'High';
SUGI 28 Beginning Tutorials

6
ELSE IF ToxMammal >= 3 THEN
Toxicity = 'Moderate';
ELSE IF ToxMammal >= 1 THEN
Toxicity = 'Low';
ELSE Toxicity = 'No Effect';
RUN;
Using a PROC PRINT you can see the truncated values
for Toxicity.
The SAS System 1
Tox
Obs Insecticide Mammal Toxicity
1 DDT 3 Mode
2 Malathion 1 Low
3 Pyrethrins 1 Low
4 Sulfur 0 No E
5 Chlordane 4 Mode
6 Diazinon 4 Mode
7 Heptachlor 5 High
8 Nicotine sulfate 6 High
You could fix this problem by padding the value “high” with
blanks, but a more elegant and explicit solution is to use
the LENGTH statement. In this example, you would insert
this statement in the DATA step before the first
occurrence of the variable Toxicity.
LENGTH Toxicity $9;
Here’s the output you get when using the LENGTH
statement. The values of Toxicity are no longer truncated.
The SAS System 2
Tox
Obs Insecticide Mammal Toxicity
1 DDT 3 Moderate
2 Malathion 1 Low
3 Pyrethrins 1 Low
4 Sulfur 0 No Effect
5 Chlordane 4 Moderate
6 Diazinon 4 Moderate
7 Heptachlor 5 High
8 Nicotine sulfate 6 High
Perhaps some future release of SAS will warn you when
character values are truncated, but for now you are on
your own.
THE MOTH FLIGHT DATA
Data about the flight of 15 individual moths appears in
Table 3 (Callahan, 1971). The variables are the moth’s
species (Species), its family (Family, where n=noctid and
s=sphingid), sex (Sex), weight in grams (Weight), and lift
in grams at three, six, and twelve degrees of pitch (Lift3,
Lift6, and Lift12).
Table 3 Moth flight data.
corn earworm n m 0.107 0.118 0.168 0.249
corn earworm n m 0.226 0.131 0.186 0.281
corn earworm n f 0.161 0.108 0.150 0.232
corn earworm n f 0.239 0.154 0.218 0.327
corn earworm n f 0.279 0.158 0.222 0.336
fall armyworm n m 0.140 0.113 0.159 0.241
fall armyworm n m 0.139 0.113 0.159 0.241
fall armyworm n f 0.156 0.131 0.186 0.277
white-lined s m 0.600 0.322 0.458 0.681
white-lined s m 0.322 0.313 0.436 0.654
white-lined s f 0.660 0.276 0.386 0.581
white-lined s f 0.853 0.336 0.472 0.708
tobacco hornworm s f 1.199 0.721 1.017 1.525
tobacco hornworm s f 1.604 0.617 0.872 1.307
satellite s f 1.726 0.767 1.076 1.616
DATA STEP PRODUCES WRONG RESULTS BUT
NO ERROR
A logic error
Sometimes a DATA step can seem like a “black box.”
You know what goes in, and you know what comes out,
but what goes on in the middle can be a mystery. If what
comes out is not what you want, then you have a bug.
Problems like this are really logic errors. Somewhere
along the way SAS got the wrong instructiona classic
case of the computer doing what you tell it to do, not what
you want.
An example
For a moth, a bird, or even a supersonic jet, flight occurs
when lift exceeds weight. Using the moth flight data and a
series of IF-THEN/ELSE statements, the following
program finds the angle of attack at which each moth can
sustain flight. The new variable ANGLE equals 3, 6, or 12
depending on the angle at which the moth’s lift exceeds
its weight.
DATA moths;
INFILE 'bugwing.dat';
INPUT Species $ 1-16 Family $ Sex $
Weight Lift3 Lift6 Lift12;
IF Lift3 >= Weight THEN Angle = 3;
ELSE IF Lift6 >= Weight THEN
Angle = 6;
ELSE IF Lift12 >= Weight THEN
Angle = 12;
PROC PRINT DATA=moths;
TITLE 'Angle of Attack to Sustain
Flight';
VAR Species Angle;
RUN;
This program runs fine (without errors, warnings, or
suspicious notes), but looking at the following output you
can see several observations have missing values for
Angle.
SUGI 28 Beginning Tutorials

7
Angle of Attack to Sustain Flight 1
Obs Species Angle
1 corn earworm 3
2 corn earworm 12
3 corn earworm 12
4 corn earworm 12
5 corn earworm 12
6 fall armyworm 6
7 fall armyworm 6
8 fall armyworm 6
9 white-lined 12
10 white-lined 6
11 white-lined .
12 white-lined .
13 tobacco hornworm 12
14 tobacco hornworm .
15 satellite .
One way to figure out what went wrong is just to look at
the program and the output from PROC PRINT. When
that doesn’t work, then there are two ways to solve the
mystery: the traditional method using PUT statements,
and the DATA step debugger.
Using PUT statements
PUT statements are like INPUT statements in reverse.
Instead of reading data, they write it. The basic idea
behind using PUT statements to debug a DATA step is to
print data values at intermediate points in the DATA step.
When used without a FILE statement, PUT statements
write values in the log, a handy place for them to be for
debugging. The following statement tells SAS to print the
values of selected variables for every observation with a
missing value for Angle.
IF Angle = . THEN PUT Weight= Lift3= Lift6=
Lift12=;
After inserting this statement in the program and
rerunning it, the log looks like this:
1 DATA moths;
2 INFILE 'bugwing.dat';
3 INPUT Species $ 1-16 Family $ Sex
$ Weight
4 Lift3 Lift6 Lift12;
5 IF Lift3 >= Weight THEN Angle = 3;
6 ELSE IF Lift6 >= Weight THEN
Angle = 6;
7 ELSE IF Lift12 >= Weight THEN
Angle = 12;
8 IF Angle = . THEN PUT Weight=
9 Lift3= Lift6= Lift12=;
10 RUN;
NOTE: The infile 'bugwing.dat' is:
FILENAME=C:\bugwing.dat,RECFM=V,
LRECL=256
WEIGHT=0.628 LIFT3=0.236 LIFT6=0.331
LIFT12=0.504
WEIGHT=0.66 LIFT3=0.276 LIFT6=0.386
LIFT12=0.581
WEIGHT=0.853 LIFT3=0.336 LIFT6=0.472
LIFT12=0.708
WEIGHT=1.604 LIFT3=0.617 LIFT6=0.872
LIFT12=1.307
WEIGHT=1.726 LIFT3=0.767 LIFT6=1.076
LIFT12=1.616
NOTE: 15 records were read from the
infile 'bugwing.dat'.
The minimum record length was 48.
The maximum record length was 48.
NOTE: The data set WORK.MOTHS has 15
observations and 9 variables.
NOTE: The DATA statement used 1.86
seconds.
Looking at the data values in the log, you can see that lift
never exceeds weight for these moths. Apparently, these
moths need an angle of attack greater than 12 to get off
the ground. The IF-THEN/ELSE series should be
rewritten so that it takes into account the possibility that
some moths may not sustain flight at 12 degrees.
In this example, the problem was simple enough that you
could have solved it by using a PROC PRINT after the
DATA step. In real life, the PUT statement technique is
most useful when you have a long and convoluted DATA
step, especially if that DATA step was written by someone
else and you are handed the whole step rather than
having the luxury of building it piece by piece.
USING THE DATA STEP DEBUGGER
The DATA step debugger offers SAS programmers an
alternative way to investigate logic errors. To understand
the DATA step debugger, you have to know that SAS runs
programs in two phases. First SAS compiles your
program, then SAS executes your program. Syntax errors
and some data errors such as numeric to character
conversions occur at compile time. Other errors such as
logic errors and some data errors compile just fine, but
cause you to get bad results. Since the DATA step
debugger works during the execution phase, it is only
useful for identifying errors that occur at that time.
Space limits do not allow for a detailed discussion of the
DATA step debugger, but the information here should be
enough to get you started. For more information see the
SAS OnlineDoc.
To invoke the debugger, add “/ DEBUG” to the end of your
DATA statement. Then run the DATA step in the SAS
windowing environment. For the preceding example you
would submit this.
DATA moths / DEBUG;
INFILE 'bugwing.dat';
INPUT Species $ 1-16 Family $ Sex $
Weight Lift3 Lift6 Lift12;
IF Lift3 >= Weight THEN Angle = 3;
ELSE IF Lift6 >= Weight THEN
Angle = 6;
ELSE IF Lift12 >= Weight THEN
Angle = 12;
RUN;
SUGI 28 Beginning Tutorials
8
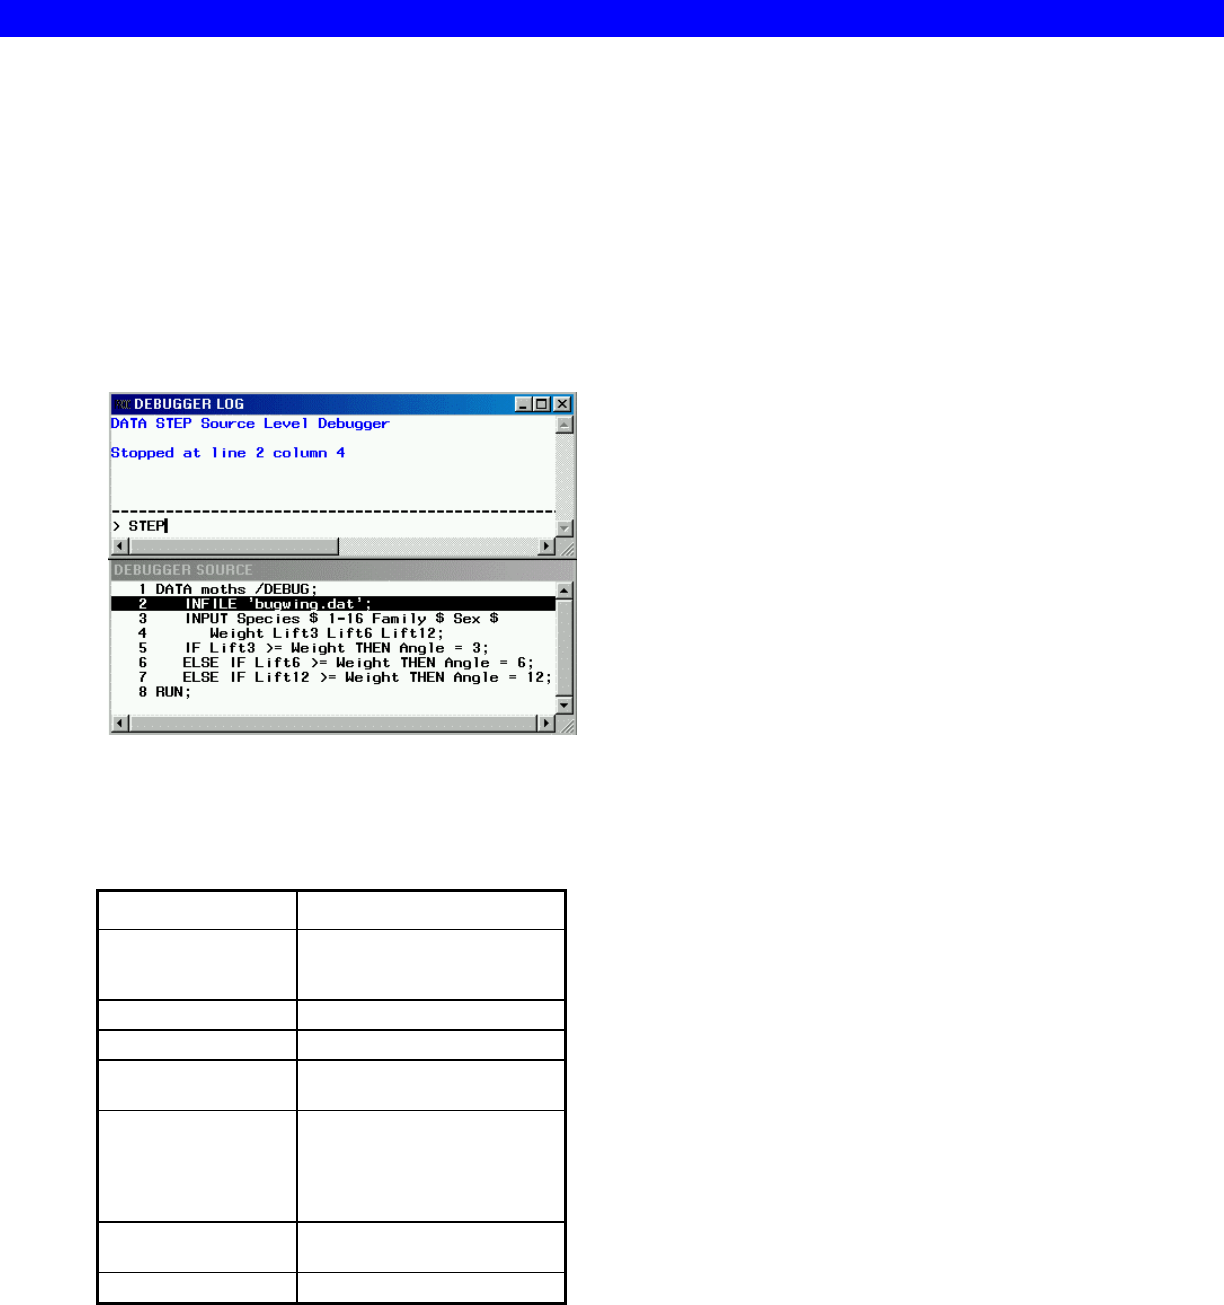
After you submit the DATA step, two windows will appear
(see Figure 1). These are the DEBUGGER LOG window
and the DEBUGGER SOURCE window. The
DEBUGGER LOG window contains messages from the
debugger and a command line. The SOURCE window
contains your DATA step statements with the current line
highlighted. By watching the highlighting move, you can
see how SAS executes your program. SAS executes
each-line of your program for the first observation, then
returns to the top of the DATA step for the second
observation, and so on.
Figure 1 DATA Step Debugger screen.
By using commands you can control how many lines SAS
executes, and you can print the current values of variables
you specify. Some of the basic commands that you can
issue appear in the following table.
Table 4 DATA step debugger commands.
Commands
EXAMINE variable-list Prints the values of specified
variables. Must specify
variable names or _ALL_.
STEP Executes one statement.
<return> Executes one statement.
SET variable = value Assigns a new value to a
specified variable.
BREAK linenumber Tells SAS to execute
statements up to the line
number specified. Use the
GO command to begin
execution.
GO Starts or resumes execution of
the DATA step.
QUIT Ends a debugger session.
To get a feel for the debugger, you may want to start by
stepping through your DATA step line by line. When you
want to know the current values of variables, issue an
EXAMINE command such as
EXAMINE _ALL_
for all variables, or
EXAMINE Weight Lift3 Lift6 Lift12 Angle
to choose specific variables. To end your debugging
session enter the command
QUIT
DATA STEP DEBUGGER VS. PUT STATEMENTS
Some programmers will probably find the DATA step
debugger very useful, others may choose to stay with the
traditional PUT statement method. The debugger is
designed to be used in the SAS windowing environment,
so people who normally use SAS in batch will probably
prefer the PUT statement method. The debugger can
work in batch in some environments (by popping you into
an interactive window), but it makes more sense for
people who work interactively.
Since the DATA step debugger is more interactive, it is
better suited to an exploratory approach, printing a few
data values here and there, making decisions as you go.
If you have a general idea of which part of your DATA
step is causing the problem, then you may find it simpler
to use PUT statements. Some logic errors may be easier
to debug by looking at more than one observation at a
time. In those cases the observation-by-observation
nature of the debugger may give less insight than the PUT
statement method.
One nice bonus of the DATA step debugger is the ability
to watch SAS execute a DATA step line-by-line and
observation-by-observation. For a beginner, this alone
could be very enlightening.
AVOIDING ERRORS
Learning how to find bugs in your programs and knowing
how to fix errors is critical, but the best strategy for
debugging is avoiding the errors in the first place. There
are several strategies you can use to help you write
programs that work:
• Write programs in a neat and organized manner.
• Develop programs piece by piece.
• Test programs with small sample data sets.
Write programs in a neat and organized manner
SAS does not require your program to be neat and
organized, but you will be doing yourself a big favor if you
follow a few simple guidelines when writing your
programs.
• Never put more than one SAS statement on a
line.
• Use indentation to show the different parts of
your program and to show which statements
belong together.
• Use comment statements.
Programs that are easy to read are much easier to debug.
SUGI 28 Beginning Tutorials

9
Develop programs piece by piece
We can’t emphasize this point enough. When you are
developing programs that involve several steps, or you
have complicated DATA steps that do several different
things, don’t write the whole program at one sitting! It will
improve your programming efficiency greatly if you start
simply, test, and build from there.
For example, you may need to write a program that will
read data from a text file, calculate some new variables,
produce means, merge with another data set, and then
output to an Excel file. It is possible to run this entire
program and not have any results in your SAS Output
window, and once you are sure the program is working
properly, you probably don’t want to produce any SAS
output – only the Excel file. But when you are developing
the program, you will want to see some intermediate
results.
First you would want to write a simple DATA step with an
INPUT statement to read in the data. Then always use
PROC PRINT to make sure the data were read correctly.
Once you are convinced that the INPUT statement is
working, add the statements to create the new variables,
and once again use PROC PRINT to make sure the
results are correct. Then write the PROC MEANS
statements, and once again check to see if your results
are correct. Keep adding on to the program, testing as
you go, until you get your final result. If you write the
program all at once, and you end up with an empty Excel
sheet, then you won’t know where to start looking for the
problem. But if you have tested your program every step
along the way and you encounter a problem, then you
know to look at the last step that you added. So use
PROC PRINT liberally!
Test programs with small sample data sets
Sometimes it is just not practical to test your program with
your entire data set. If the data file is very large, it may
take a long time to run your program, or all those PROC
PRINTs may produce volumes of output that are difficult
to wade through to see what is going on. There are at
least three ways to test your program with smaller data
sets:
• Create a small subset of your data.
• Use the OBS= and FIRSTOBS= options.
• Make up data.
You can create a small sample data set and use that for
testing purposes, but this may not always be easy to do,
or you may not want another data file floating around that
could get mistaken for the real thing. An alternative to this
is to use the OBS= and/or FIRSTOBS= options. The
OBS= option on the INFILE statement tells SAS how
many data lines to read. For example, the following
statement tells SAS to read the first 100 data lines from
the file ‘allinsects.dat’.
INFILE ‘allinsects.dat’ OBS=100;
You can use the OBS= option in combination with the
FIRSTOBS= option to read from the middle of a file. For
example, the following statement tells SAS to start reading
at the 101st data line and stop at line 200.
INFILE ‘allinsects.dat’ FIRSTOBS=101
OBS=200;
If you are reading one line of data for each observation,
this will produce a data set with 100 observations, but if
you are reading two lines of data for each observation,
then you will only get 50 observations.
You can also use the OBS= and FISRTOBS= options in
procedures. For example, the following prints only the
first 10 observations of the SAS data set SPECIES.
PROC PRINT DATA=species(OBS=10);
This next example shows how you can use these options
on a SET statement to create a new SAS data set,
SOMEINSECTS, that consists of just observations 50 to
100 of the data set INSECTS.
DATA someinsects;
SET insects (FIRSTOBS=50 OBS=100);
Sometimes it is even more useful to make up data to use
when you are testing your program. When you make up
data, you can often create a very compact data set that
has all possible combinations of data. And, since you
made up the data, you know exactly what results to
expect. Of course this method will not test for data types
you had not anticipated, so if you use this method always
test again with the real data.
CONCLUSIONS
This paper has discussed some of the most common SAS
programming bugs and how to exterminate them as well
as strategies for avoiding errors in the first place. You
should always check your SAS log even when the output
looks fine. Notes are just as important as error messages
and warnings in debugging your programs. Once you
understand why you got an error, you’ll be better able to
avoid it in the future.
REFERENCES
Callahan, Philip S. (1971). Insects and How They
Function. Holiday House, NY.
Conklin, Gladys (1996). Insects. Encyclopedia
Americana, International Edition. Grolier, Danbury,
CT, vol. 15, pp. 197-208.
LaPlante, Albert A. (1996). Insect Control. Encyclopedia
Americana, International Edition (1996). Grolier,
Danbury, CT, vol. 15, pp. 197-208.
McGavin, George C. (1993). Bugs of the World. Facts on
File, Inc., New York.
RECOMMENDED READING
Carpenter, Arthur L (1996). Programming for Job
Security: Tips and Techniques to Maximize Your
Indispensability. Proceedings of the Twenty-First
Annual SAS Users Group International
Conference, 19, pp. 1637-1640.
SUGI 28 Beginning Tutorials

10
Carpenter, Arthur L (2000). Long Names and Other V8
Tips: A Bit More on Job Security. Western Users of
SAS Software Proceedings of the Seventh Annual
Regional Conference. pp. 448-453.
Delwiche, Lora D. and Susan J. Slaughter (2002). The
Little SAS Book: A Primer, Revised Second
Edition. SAS Institute, Cary, NC.
Hayes, Brian (1995). Debugging Myself. American
Scientist, 83, pp. 404-408.
Staum, Roger (2002). To Err is Human: To Debug Divine.
Proceedings of the Twenty-Seventh Annual SAS
Users Group International Conference, paper 64-
27.
ABOUT THE AUTHORS
Lora Delwiche and Susan Slaughter are also the authors
of The Little SAS Book: A Primer published by SAS
Institute, and may be contacted at:
Lora D. Delwiche (530) 752-7457
llddelwiche@ucdavis.edu
Susan J. Slaughter (530) 756-8434
susan@avocetsolutions.com
SAS and all other SAS Institute Inc. product or service
names are registered trademarks or trademarks of SAS
Institute Inc. in the USA and other countries. ® indicates
USA registration.
Other brand and product names are registered
trademarks or trademarks of their respective companies.
SUGI 28 Beginning Tutorials
