Practical Guide To Calculating Customer Lifetime Value (CLV) Gormanalysis.com CLV
User Manual: Pdf
Open the PDF directly: View PDF ![]() .
.
Page Count: 9
Ben April 19, 2016
Practical Guide to Calculating Customer Lifetime Value
(CLV)
gormanalysis.com/practical-guide-to-calculating-customer-lifetime-value-clv/
Customer Lifetime Value (CLV) is an estimation of the entire net profit attributed to a
single customer. It’s an important metric to understand because it helps businesses
determine how much is too much to spend on advertising to acquire a single customer.
Estimating CLV can be tricky, and there’s really no standard way of doing it. What follows is
a technique I use that is both practical and effective.
Data Exploration
For this example we’ll calculate CLV from a dataset of roughly 4,200 transactions.
TransactionID TransactionDate CustomerID Amount
1 2012-09-04 1 20.96
2 2012-05-15 2 10.87
3 2014-05-23 2 2.21
4 2014-10-24 2 10.48
5 2012-10-13 2 3.94
6 2013-01-23 2 12.37
4176 2012-09-18 1000 9.69
4177 2013-06-23 1000 3.86
4178 2011-08-07 1000 4
4179 2012-10-07 1000 18.37
4180 2014-01-09 1000 3.65
4181 2011-04-30 1000 5.18
As with any analysis, the first thing we’ll do is look at some basic summary statistics.
Transactions Customers MinTransactionDate MaxTransactionDate Amount
4181 1000 2010-01-04 2015-12-31 33729.91
Note that the data consists of 1000 customers who made transactions between 2010
and 2015.
1/9
TransactionsPerCustomer AmountPerTransaction AmountPerCustomer
4.181 8.07 33.73
Furthermore, each customer made about 4 transactions for 8 bucks a piece, totaling close
to $34. This amount can be considered a lower bound on CLV since it’s the total amount
spent by each customer, but we still expect existing customers to make future purchases.
Before continuing, we need to consider outlier transactions and possible data errors. For
example, suppose a single transaction has Amount = $15,0000. If this is a data error, we
should remove the transaction from the data entirely. If it’s a legitimate but rare transaction
(a baseball signed by Babe Ruth perhaps?), we need to decide how probable it is that such
a transaction will occur again in the future. Depending on the likelihood of another monster
purchase, we should either keep the transaction, cap it at some lower value like $5,000, or
remove the transaction entirely.
Here we inspect the largest transactions
TransactionID TransactionDate CustomerID Amount
2758 2013-08-31 691 38.35
261 2012-06-21 69 38.29
53 2015-01-29 13 37.27
2488 2011-07-13 632 36.94
2271 2013-04-13 573 32.81
2642 2011-05-16 663 31.4
583 2013-03-16 145 30.43
416 2013-12-31 100 30.31
3961 2013-07-28 957 30.01
1342 2013-06-28 345 29.99
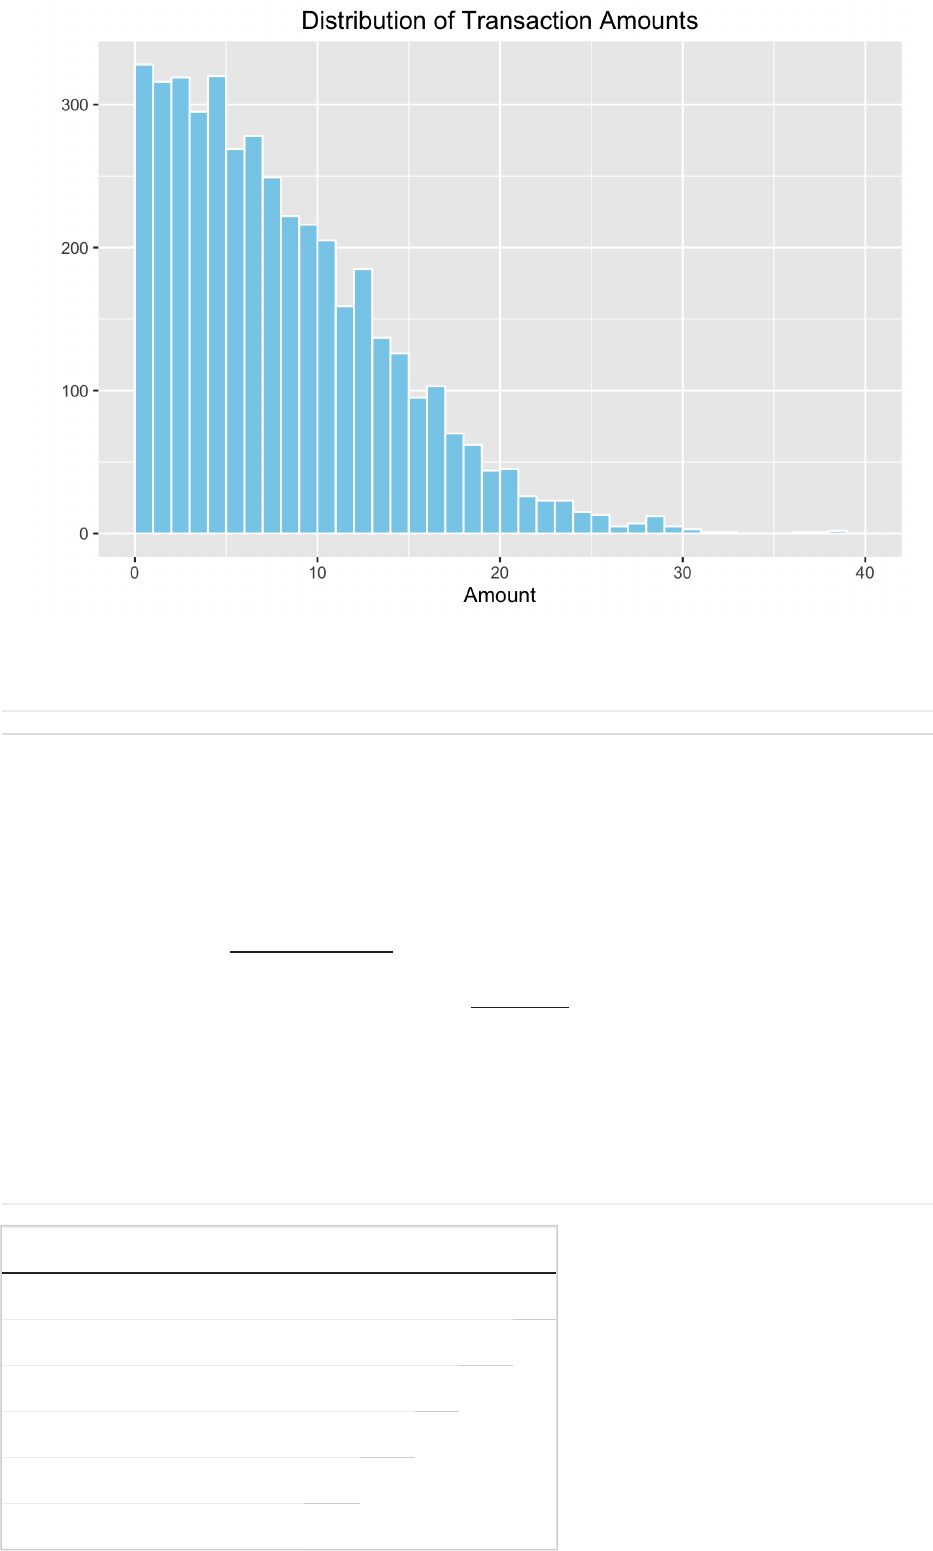
We could use a statistical test to check for outliers, but here it’s pretty clear that none exist.
Plotting the entire distribution of transaction amounts should give us more confidence in
our assertion.
2/9
Measuring Historic CLV
Now we need to consider the biggest source of error in our $34 CLV lower bound – some
of the underlying customers are brand new and others have been customers for almost five
years. Obviously the newer customers will have (generally) spent less on average than the
old ones. So, we need to separate the customers into groups based on how long ago they
were acquired (e.g. customers acquired in 2010, vs customers acquired in 2011, …).
Fortunately, there’s a free app for that.
Since we have 5 years worth of data, let’s use Trinalysis to separate customers into annual
origin periods starting on 2010-01-01, and measure their purchases annually. (Note: Using
annual periods will remove any effects/biases of seasonality purchasing.)
Now let’s take a look at some of the important triangles for our analysis.
ActiveCustomers
Origin 12 24 36 48 60 72
2010-01-01 – 2010-12-31 172 93 104 91 103 82
2011-01-01 – 2011-12-31 170 92 98 89 88
2012-01-01 – 2012-12-31 163 109 98 90
2013-01-01 – 2013-12-31 180 103 102
2014-01-01 – 2014-12-31 155 90
2015-01-01 – 2015-12-31 160
3/9
NewCustomers.cmltv
Origin 12 24 36 48 60 72
2010-01-01 – 2010-12-31 172 172 172 172 172 172
2011-01-01 – 2011-12-31 170 170 170 170 170
2012-01-01 – 2012-12-31 163 163 163 163
2013-01-01 – 2013-12-31 180 180 180
2014-01-01 – 2014-12-31 155 155
2015-01-01 – 2015-12-31 160
Transactions
Origin 12 24 36 48 60 72
2010-01-01 – 2010-12-31 260 177 195 164 163 128
2011-01-01 – 2011-12-31 263 189 192 155 142
2012-01-01 – 2012-12-31 263 195 179 155
2013-01-01 – 2013-12-31 276 195 213
2014-01-01 – 2014-12-31 251 185
2015-01-01 – 2015-12-31 241
Amount.cmltv
Origin 12 24 36 48 60 72
2010-01-01 – 2010-12-31 2255.07 3613.85 5271.87 6627.43 7922.95 8956.55
2011-01-01 – 2011-12-31 2238.46 3758.03 5465.12 6702.14 7861.77
2012-01-01 – 2012-12-31 2182.92 3878.26 5230.43 6505.42
2013-01-01 – 2013-12-31 2181.85 3611.81 5230.75
2014-01-01 – 2014-12-31 1833.85 3263.05
2015-01-01 – 2015-12-31 1912.37
Now we can use these triangles to build other useful triangles like
CustomerRetention = ActiveCustomers/NewCustomers.cmltv
Origin 12 24 36 48 60 72
2010-01-01 – 2010-12-31 1 0.54 0.6 0.53 0.6 0.48
2011-01-01 – 2011-12-31 1 0.54 0.58 0.52 0.52
2012-01-01 – 2012-12-31 1 0.67 0.6 0.55
2013-01-01 – 2013-12-31 1 0.57 0.57
4/9
2014-01-01 – 2014-12-31 1 0.58
2015-01-01 – 2015-12-31 1
Origin 12 24 36 48 60 72
TransactionsPerCustomer = Transactions/ActiveCustomers
Origin 12 24 36 48 60 72
2010-01-01 – 2010-12-31 1.51 1.9 1.88 1.8 1.58 1.56
2011-01-01 – 2011-12-31 1.55 2.05 1.96 1.74 1.61
2012-01-01 – 2012-12-31 1.61 1.79 1.83 1.72
2013-01-01 – 2013-12-31 1.53 1.89 2.09
2014-01-01 – 2014-12-31 1.62 2.06
2015-01-01 – 2015-12-31 1.51
AmountPerTransaction = Amount/Transactions
Origin 12 24 36 48 60 72
2010-01-01 – 2010-12-31 8.67 7.68 8.5 8.27 7.95 8.07
2011-01-01 – 2011-12-31 8.51 8.04 8.89 7.98 8.17
2012-01-01 – 2012-12-31 8.3 8.69 7.55 8.23
2013-01-01 – 2013-12-31 7.91 7.33 7.6
2014-01-01 – 2014-12-31 7.31 7.73
2015-01-01 – 2015-12-31 7.94
Some takeaways thus far:
Roughly 55% ~ 60% of customers are retained into a 2nd year, at which point
retention is very strong
2nd+ year retained customers make more transactions on average than all 1st year
customers combined
Transaction amounts are generally flat over time across all groups
Customer retention, transaction frequency, and transaction amount are all variables that
contribute to estimating an accurate CLV. However, we can encapsulate these variable by
simply measuring the cumulative amount spent per customer over time. Dividing the
Amount.cmltv triangle by the NewCustomers.cmltv triangle will give us annual
measurements of the cumulative amount spent per customer in each group of annually
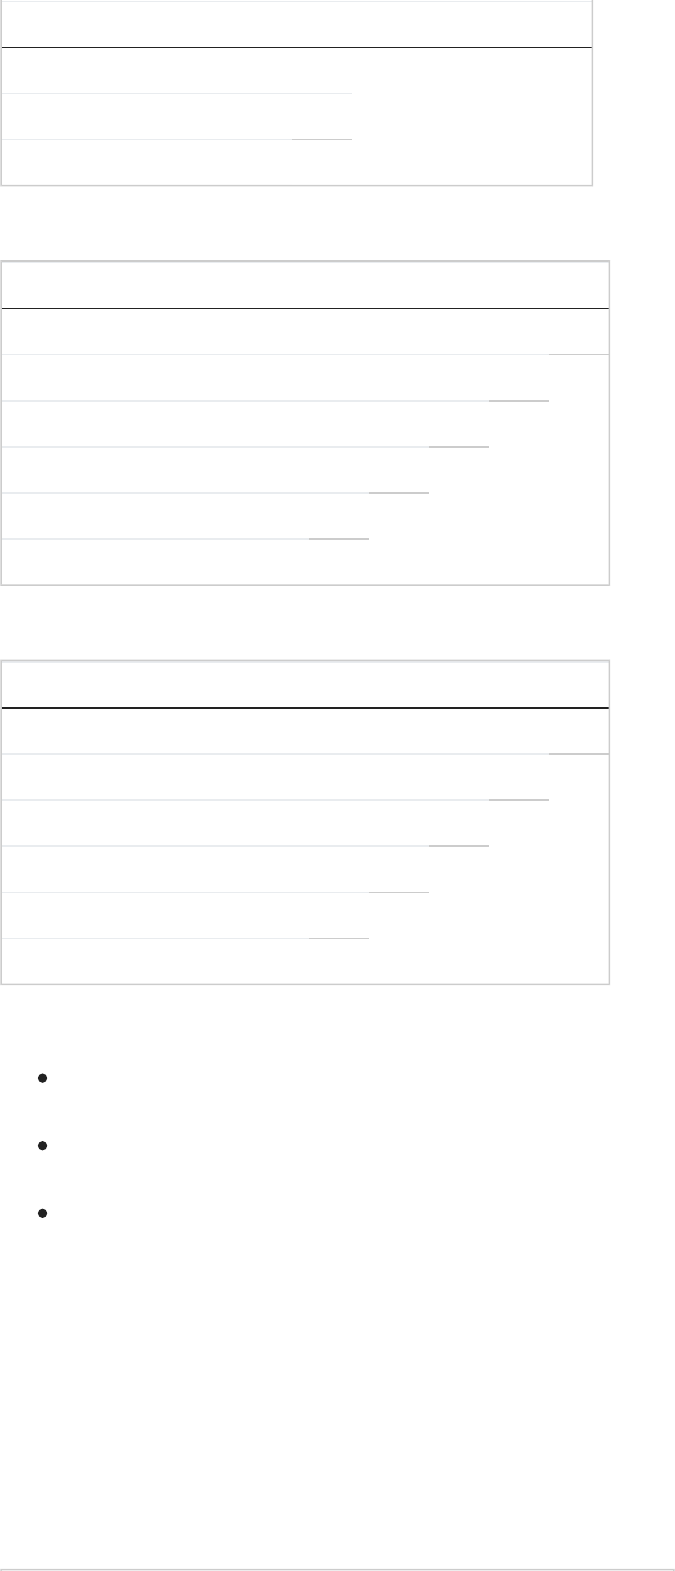
acquired customers. This is also known as Historic CLV.
HistoricCLV=Amount.cmltv/NewCustomers.cmltv
5/9
Origin 12 24 36 48 60 72
2010-01-01 – 2010-12-31 13.11 21.01 30.65 38.53 46.06 52.07
2011-01-01 – 2011-12-31 13.17 22.11 32.15 39.42 46.25
2012-01-01 – 2012-12-31 13.39 23.79 32.09 39.91
2013-01-01 – 2013-12-31 12.12 20.07 29.06
2014-01-01 – 2014-12-31 11.83 21.05
2015-01-01 – 2015-12-31 11.95
A plot of the historic CLV for each cohort looks like this
Here we can draw some nice conclusions. Firstly, customers acquired in 2010 have spent
$52.07 to date. Secondly, each group of customers appears to exhibit a very similar pattern
of spending. This should give us confidence in assuming $52.07 is a decent lower bound
on CLV.
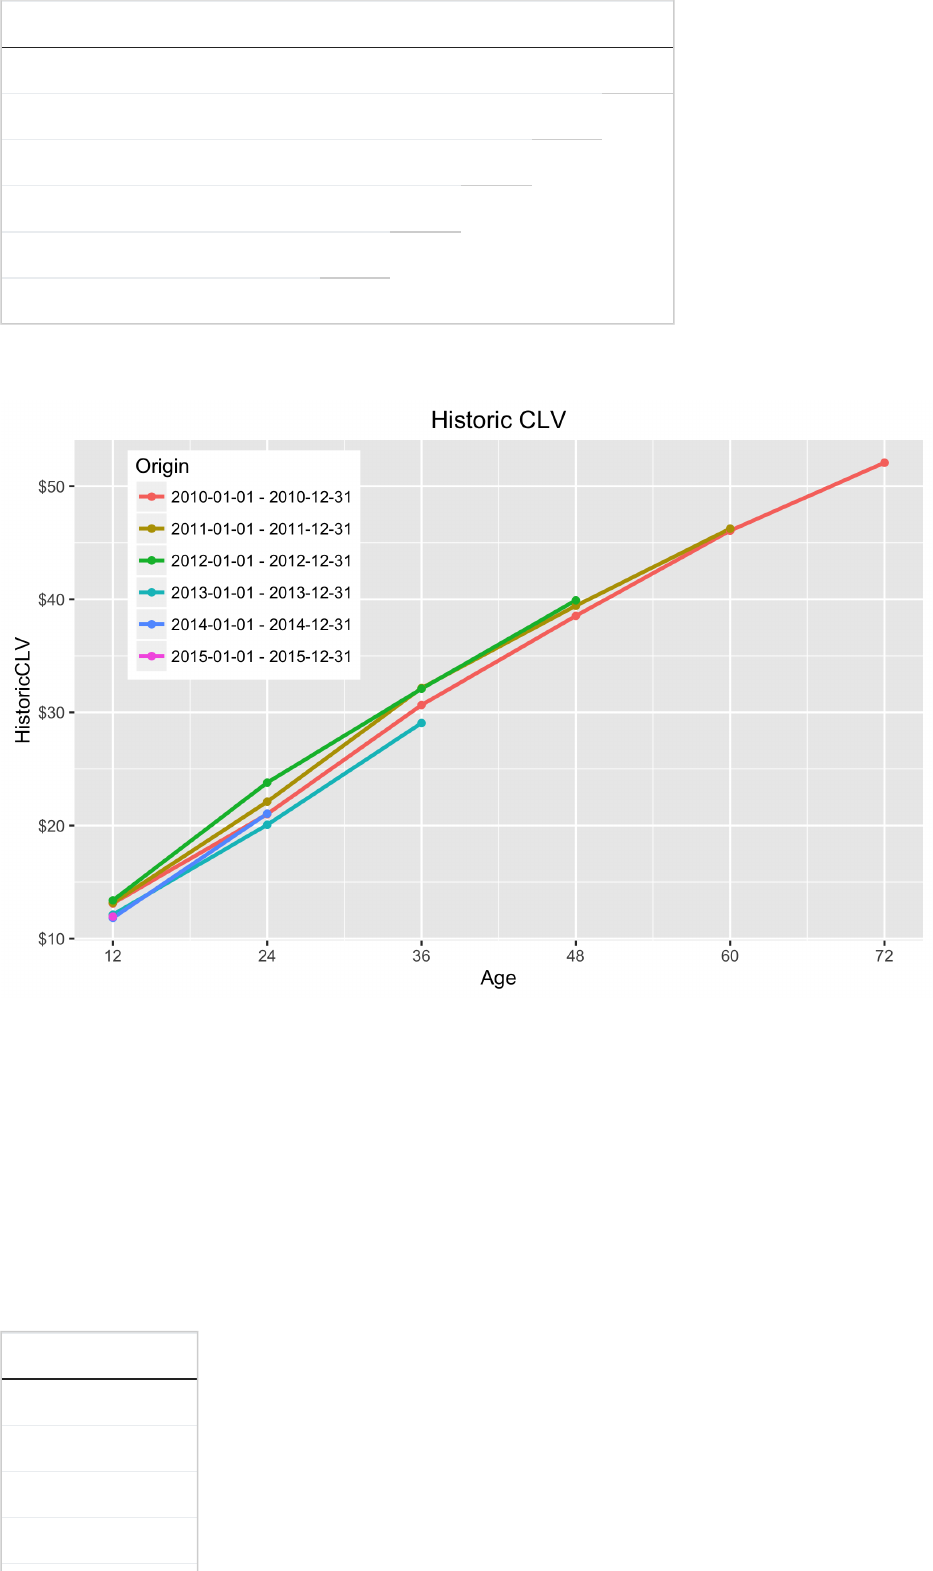
At this point, we’d like to combine all of our data to create a single curve of Historic CLV. A
simple, but effective approach to doing this is to take a volume weighted average of the
Historic CLV for each group at each Age, weighted by the number of customers in each
group. In this example, we’d get
Age HistoricCLV
12 12.6
24 21.58
36 30.95
48 39.28
6/9
60 46.15
72 52.07
Age HistoricCLV
(Note: Age represents the time elapsed since the start of each customer group. So, when a
customer group is 12 months old, the average customer in that group is actually 6 months
old.)
Extrapolation
Perhaps the hardest part of estimating CLV is extrapolating the Historic CLV to account for
the entire relationship of a customer with your business. This is particularly difficult because
businesses change over time, so using a purely mathematical model is rarely the best
approach. Nonetheless, here’s one way we can extrapolate our Historic CLV curve to
account for the entire future relationship with a customer.
First, calculate the percent change in HistoricCLV from Age_i to Age_i+1.
Age HistoricCLV PcntChange
12 12.6 0.71
24 21.58 0.43
36 30.95 0.27
48 39.28 0.18
60 46.15 0.13
7/9
72 52.07
Age HistoricCLV PcntChange
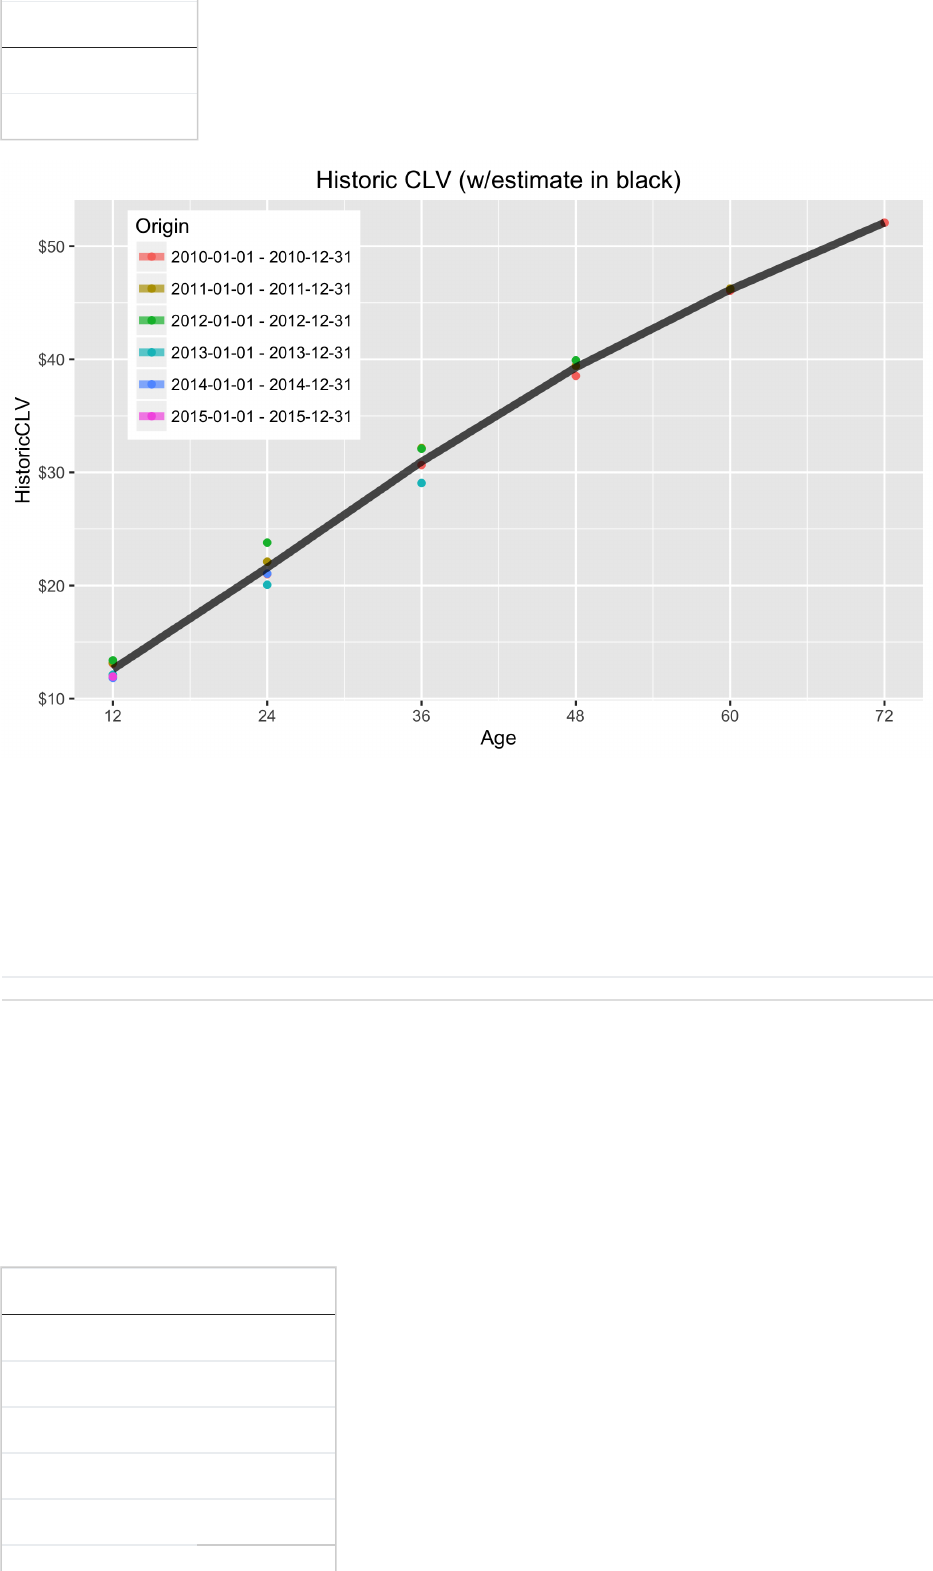
Next, observe that the PcntChange has a log-linear relationship with Age. That is, the log
of the percent change in Historic CLV from year to year is linearly correlated with
Age. This means we can use linear regression to extrapolate log(PcntChange) based on
Age.
In this case we find that log(PcntChange) = 0.0443 – 0.0361 * Age which means
PcntChange = exp(0.0443 – 0.0361 * Age). With this model, we can build the following
table.
Age ModelLogPcntChange ModelPcntChange CLVFactor
12 -0.39 0.68 5.1
24 -0.82 0.44 3.04
36 -1.26 0.28 2.11
48 -1.69 0.18 1.64
60 -2.12 0.12 1.39
72 -2.56 0.08 1.24
180 -6.46 0 1
192 -6.89 0 1
204 -7.33 0 1
216 -7.76 0 1
228 -8.19 0 1
8/9

240 -8.63 0 1
Age ModelLogPcntChange ModelPcntChange CLVFactor
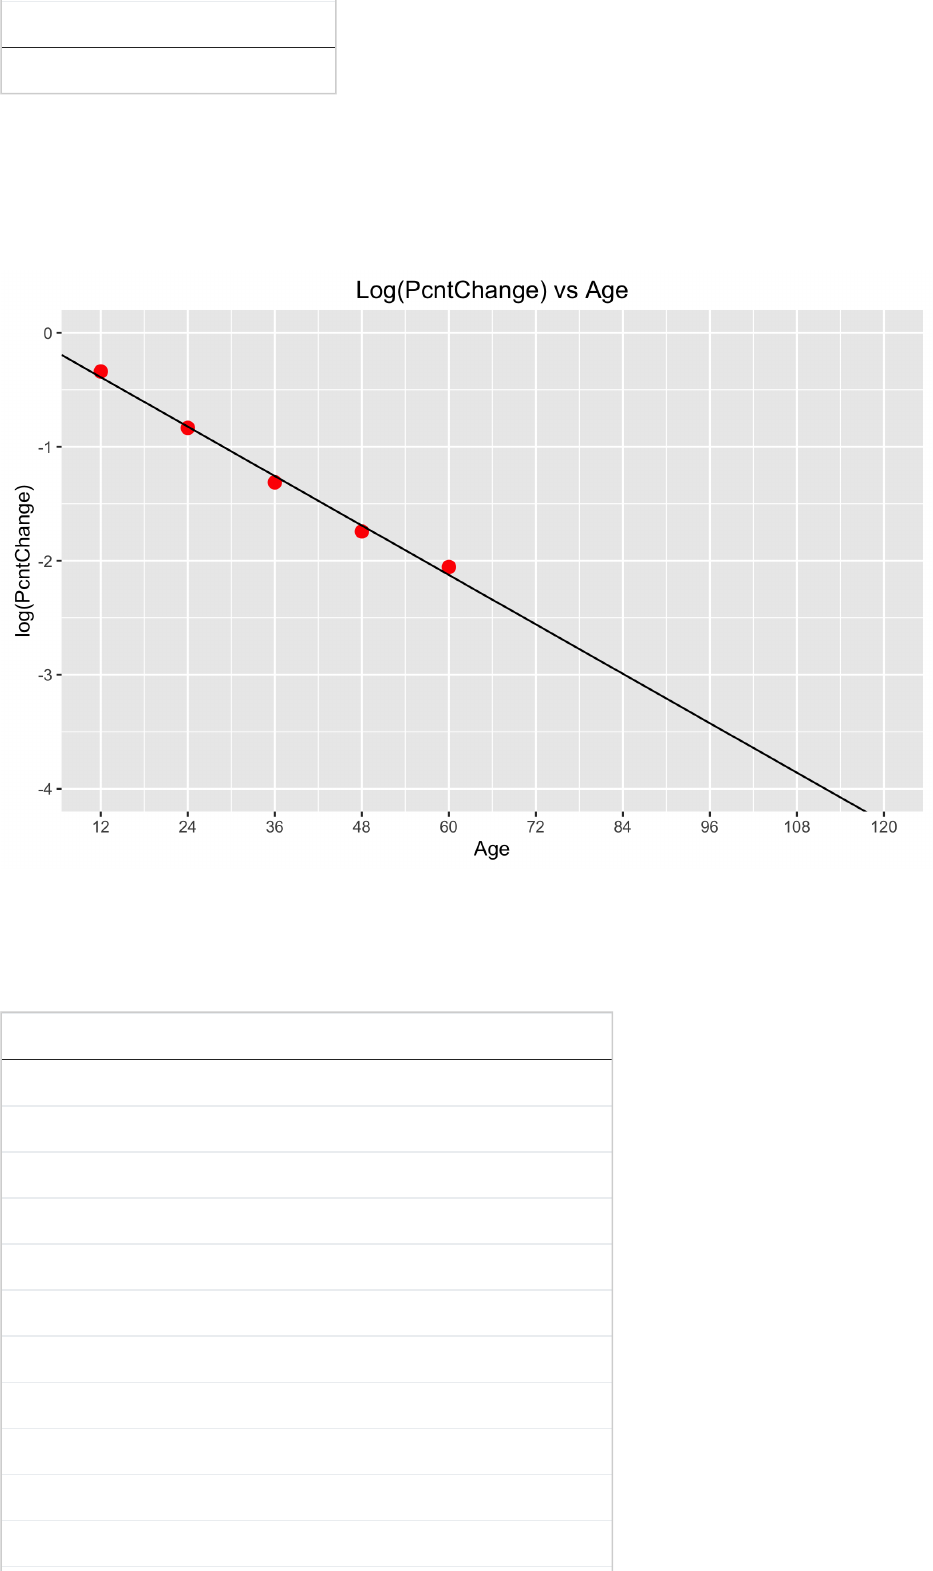
Now we can extrapolate the Historic CLV to any future point in time. The CLV estimate
should converge as age goes to infinity, but for the sake of practicality it’s often best to
extrapolate CLV to year 20 or 30 depending on the nature of your business.
Here’s a look at our previously calculated Historic CLV estimates extrapolated out to year
20.
If we extrapolate our global model (which combines information from every period), we find
that CLV = 1.39 * $52.07 ≈ $72.
Going Further
There are a few last things to be aware of regarding this methodology…
1. It does not take into account expenses. So, our CLV estimate isn’t actually
measuring customer value as much as it’s measuring customer spend or revenue.
However, you can deduct expenses from the HistoricCLV triangle to get a more
accurate estimate of CLV if you’d like.
2. We didn’t take inflation into account. (Again this is not hard to do, if you have
accurate annual inflation estimates.)
3. We didn’t segment our customers into different qualitative groups which could distort
our estimate. For example, it might make sense to estimate CLV for men and
women separately depending on the nature of the business.
9/9
