Guide
guide
User Manual: Pdf
Open the PDF directly: View PDF ![]() .
.
Page Count: 20

User Manual
Charlie Street Kelsey McKenna Matthew Broadway
Michael Oultram Theo Styles
Thursday 24th March, 2016
Thanks for downloading Simulizer! Simulizer is a piece of software that allows you simulate and
visualize (hence Simulizer) the running of a MIPS processor in the comfort of your own home.
With Simulizer, you don’t get to just run programs, you get to write and edit files with our
own integrated text editor. As well as this, Simulizer provides a whole range of options to help
you understand your MIPS code (and the processor) that little bit more. If you want to see
your code moving through the CPU, then choose our CPU visualisation! If you want to see
your algorithm running to check you’ve got you logic correct then a high-level visualisation is
the option for you. If you’ve never been able to get your head round pipelining then nows your
chance, Simulizer visualises that too!
Simulizer also provides you with loads of handy debugging tools, such as a logger for standard,
error and debug streams, as well as windows to let you peek inside the memory/registers of
the CPU. Another really clever thing included is a JavaScript-based annotation system. Gone
are the days of adding print statements throughout your code, instead you can put it in the
comments. You can control the high level visualizations, as well as large amounts of the CPU in
just a little bit of JavaScript!
Throughout this guide, we’ll refer to our version of the MIPS language as ‘SIMP’.
Finally, enjoy your time using Simulizer!

Simulizer – User Guide CONTENTS
Contents
1 User Interface 1
1.1 MenuBar ....................................... 1
1.2 InternalWindows................................... 2
1.2.1 CPUVisualisation .............................. 2
1.2.2 Editor ..................................... 3
1.2.3 High Level Visualisation . . . . . . . . . . . . . . . . . . . . . . . . . . . 3
1.2.4 Labels ..................................... 4
1.2.5 ProgramI/O ................................. 4
1.2.6 MemoryView................................. 5
1.2.7 Options .................................... 5
1.2.8 PipelineView................................. 7
1.2.9 Registers.................................... 8
1.3 Layouts ........................................ 9
1.3.1 LoadingaLayout............................... 9
1.3.2 SavingaLayout................................ 9
1.4 Themes ........................................ 9
2 Annotations 10
2.1 Syntax......................................... 10
2.2 Targets......................................... 10
2.3 Gotcha......................................... 10
2.4 Grouping ....................................... 11
2.4.1 Gotcha..................................... 11
2.5 Scope ......................................... 11
3 Annotation API 11
3.1 DebugBridge ..................................... 11
3.2 SimulationBridge................................... 12
3.3 VisualisationBridge ................................. 12
3.4 GlobalVariables.................................... 13
3.5 GlobalFunctions ................................... 13
3.6 SomeNotes ...................................... 13
4 High-level Visualisations 14
4.1 TowerofHanoi .................................... 14
4.2 ListVisualisation................................... 15
5 Low-level Visualisations 16
5.1 CPUVisualisation .................................. 16
5.2 PipelineVisualisation................................. 17
5.3 MemoryView..................................... 18

Simulizer – User Guide 1 USER INTERFACE
1 User Interface
The user interface is designed to be as configurable as possible, so that the application can fulfil
your needs. Don’t need to visualise the internals of the CPU? Just close the CPU visualiser.
Need to make the editor a bit bigger? Then resize the editor. It’s very simple.
1.1 Menu Bar
The menu bar contains a collection of useful controls organised for easy of use. Below describes
the tree structure of the menu so that is clear what each menu item is for.
•File: Contains the standard controls found in most applications.
– New
(
CTRL+N
): Creates a new blank program and opens the Editor Internal Window.
– Open (CTRL+O): Opens an existing program and puts it in the Editor.
– Save (CTRL+S): Saves the current program to the file loaded in the Editor.
– Save as: Saves the current program to a new file.
– Options: Opens the Options Internal Window.
– Exit: Exits Simulizer.
•Edit: Contains standard controls found in most text editor.
– Cut (CTRL+X): Cuts text from the editor.
– Copy (CTRL+C): Copies text from the editor.
– Paste (CTRL+V): Pastes text in the editor.
– Find (CTRL+F): Finds text in the editor.
– Go To Line (CTRL+G): Goes to a specified line in the editor.
– Insert Breakpoint
(
CTRL+B
): Inserts a Breakpoint for the simulation on the cur-
rently selected line in the editor.
– Increase Font Size (CTRL++): Increases the font size of the editor.
– Decrease Font Size (CTRL+-): Decreases the font size of the editor.
– Toggle Word Wrap: Switches between line wrapping and not.
•Simulation: Controls for the simulation of the MIPS processor.
– Assemble and Run
(
F5
): Assembles the SIMP Program and (if it is a valid program)
executes it. On an invalid program, hints to what went wrong will be displayed in
the Editor.
– Pause/Resume Simulation
(
F6
): Pauses or Resumes the currently running/paused
SIMP program.
– Single Step
(
F7
): On a paused SIMP program, this option completes one cycle of
the simulated CPU.
– End Simulation
(
F8
): Completely ends the simulation and resets the CPU to it’s
initial state.
1

Simulizer – User Guide 1 USER INTERFACE
– Toggle CPU Pipelining
: Switches between the pipelined and non-pipelined CPU.
– Set clock speed
: Opens a dialog box so that you can change at what speed the
simulated CPU is running at. Note: this is measured in Hertz, and setting this value
too high may have performance issue.
•Windows
: This contains a sub-menu with all the Internal Windows. This allows you to
open and close each Internal Windows more easily.
– Close All: Closes all open Internal Windows.
•Layouts
: Contains a list of all layouts saved in the layouts folder. This allows you to
easily switch between different common workspace layouts.
– Save Layout: Saves the current workspace layout to a new file
– Refresh Layouts: Refreshes the list of layouts.
•Help: Useful help materials.
– Guide: Opens this user guide.
– Syscall Reference
: Opens an Internal Window describing what each syscall is for.
– Instruction Reference
: Opens an Internal Window describing what each instruc-
tion is for.
– Register Reference
: Opens an Internal Window describing the common use for
each register.
– Editor Shortcuts
: Opens the web browser to a page describing keyboard shortcuts
for the Editor.
1.2 Internal Windows
Each pane inside the application is called an Internal Window. This section will give a brief
description of what all the different Internal Windows are for, and why you might want to use
them.
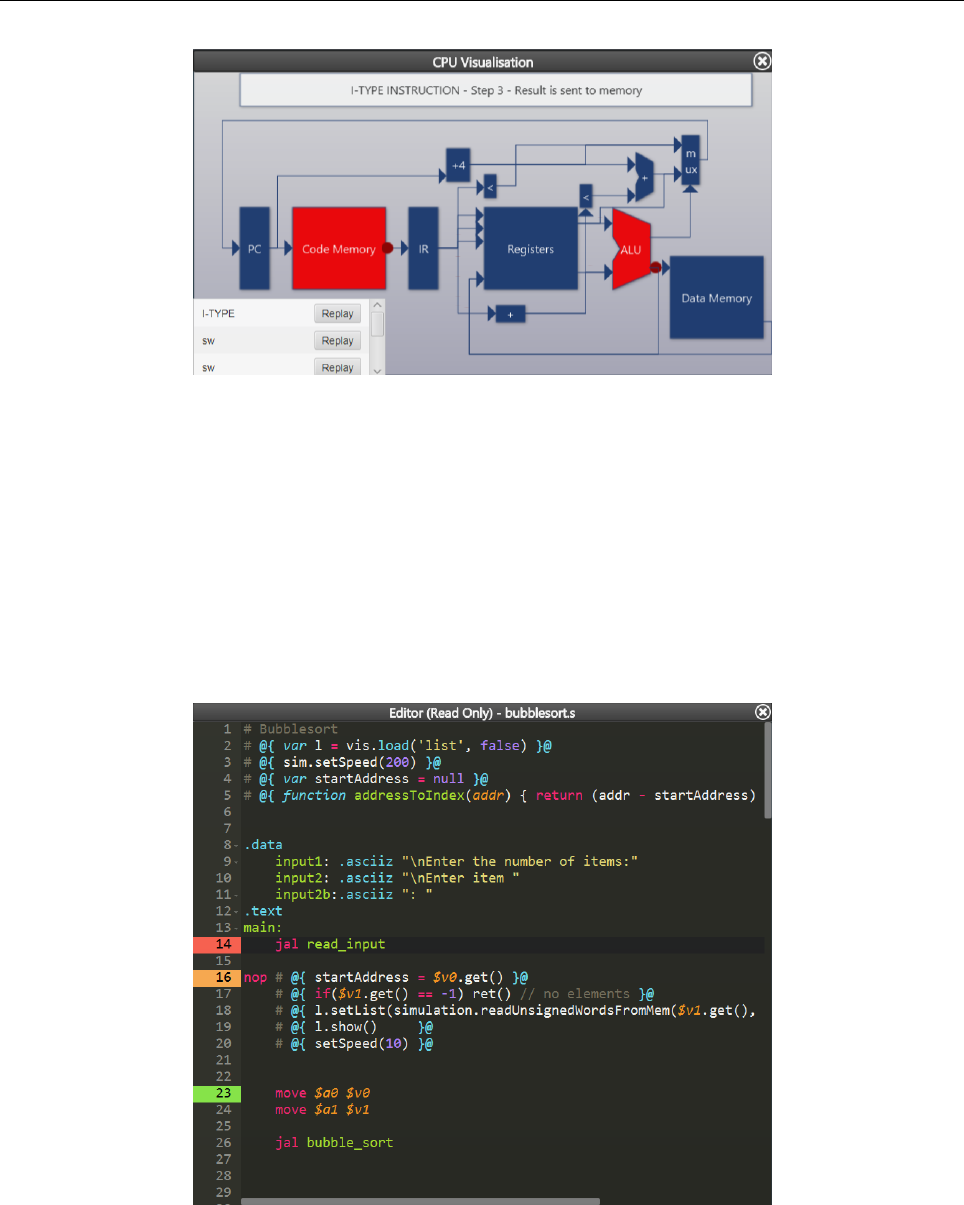
1.2.1 CPU Visualisation
CPU visualisation is for demonstrating how the MIPS processor fetches, decodes and executes
assembly instructions. To use this view, you must set the clock speed to below 2Hz (see clock
speed).
2
Simulizer – User Guide 1 USER INTERFACE
For more information about the CPU Visualiser other low level visualisation see Low Level
Visualisations
1.2.2 Editor
The editor is the place to write assembly code. The program that is contained in the Editor is
the one to be run on the MIPS processor. You will most likely want to keep this window open
(as without it, you can’t run any assembly code).
1.2.3 High Level Visualisation
The High Level Visualisation window is where visualisations from the annotations are displayed.
There purpose is to demonstrate what your SIMP program is actually doing from a more human
understandable view.
3
Simulizer – User Guide 1 USER INTERFACE
For more information about the different data structures Simulizer can visualise, see High Level
Visualisation
1.2.4 Labels
The labels window allows you to view a quick outline of the labels in your program. By clicking
on a row in the table, it will jump to the line where the label is defined. You can move to the
next/previous occurrence of the label by clicking on the Next/Previous buttons. The Select
All
button will select each occurrence of the selected label, allowing you to easily see its usage.
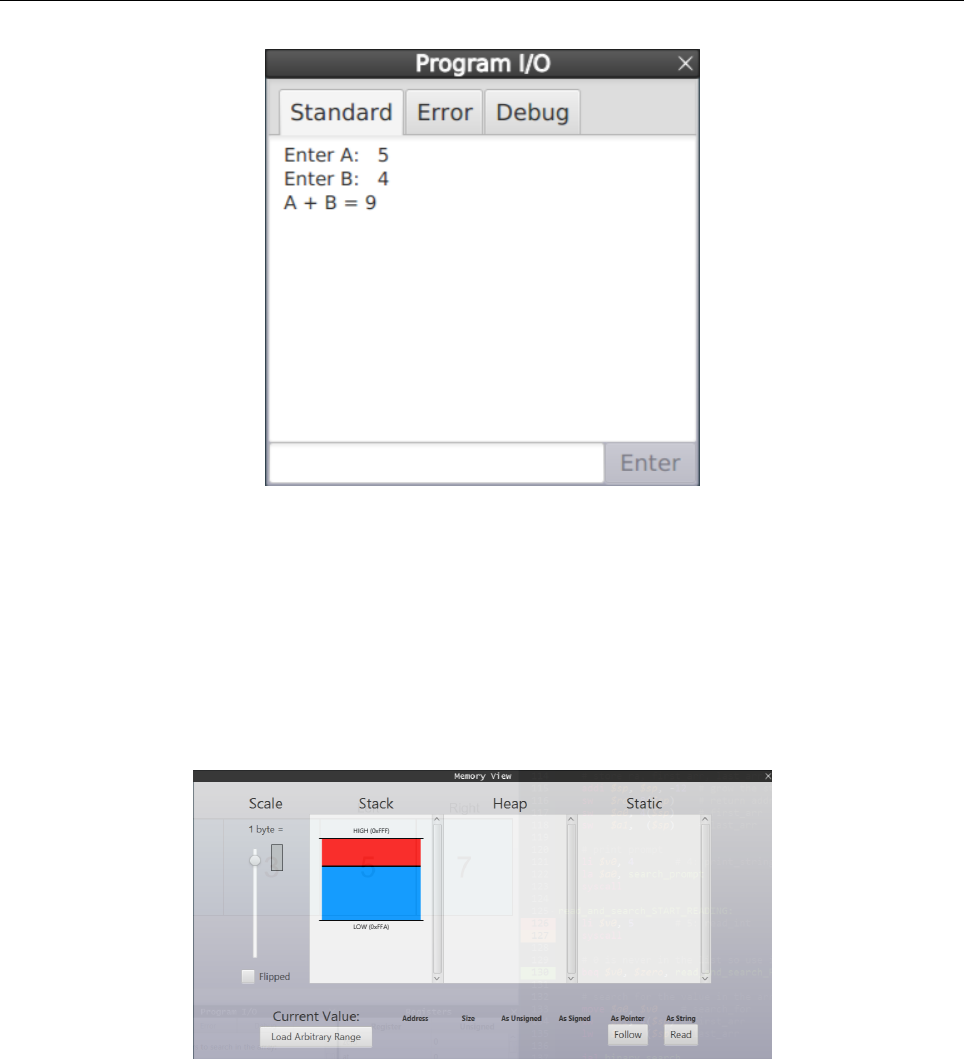
1.2.5 Program I/O
The program I/O window provides a command line interface to communicate with your SIMP
programs.
4
Simulizer – User Guide 1 USER INTERFACE
This window has a three different tabs designed to keep the different I/O streams separate. The
first tab is Standard which is where SIMP programs interact. The second tab outputs runtime
errors in the SIMP program. The third tab is where the annotations communicate through, and
so any log annotations will write to.
1.2.6 Memory View
This section is currently still in development.
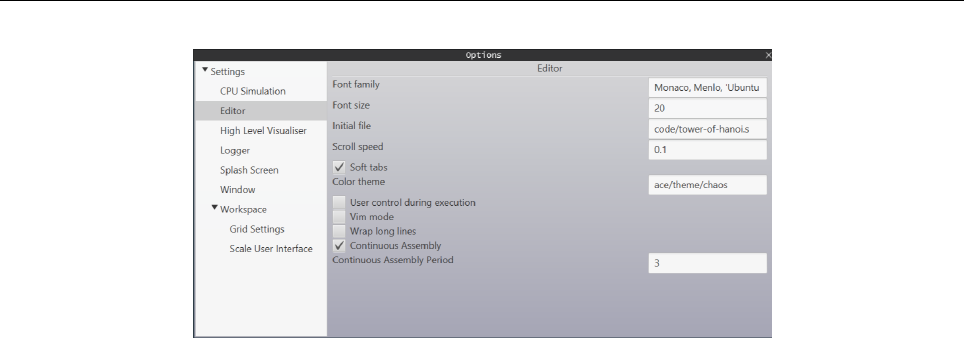
1.2.7 Options
The options window allows you to configure different aspects of Simulizer. These settings are
laid out in a tree like fashion to make finding each setting easier.
5
Simulizer – User Guide 1 USER INTERFACE
The full settings tree is printed out below.
•Settings
– Debug Menu: Show debug menu in the Menu Bar
– Window
∗Width: Default window width
∗Height:Default window height
– Workspace
∗Default Theme: The default theme to load
∗Default Layout: The default layout to load
∗Scale User Interface
·Allow autosizing of Internal Windows
: Resize all Internal Windows
when the main window resizes
·Delay before resize: How long to wait until the Internal Windows resize
∗Grid Settings: Configure when Internal Windows should snap to a grid
·Allow grid snapping
: Enables/Disable snapping Internal Windows to a
grid
·Horizontal Lines: Number of horizontal gridlines to snap to
·Vertical Lines: Number of vertical gridlines to snap to
·Sensitivity
: How close the window needs to be to the gridline before it
snaps
·Delay before snap: How long to wait until the window snaps
∗Lock to main window
: Stops InternalWindows from exiting the Main Window
– CPU Simulation
∗Default CPU cycle frequency
: Default number of cycles (runs of
fetch+decode+execute) per second (Hz)
∗Use Pipelined CPU: Sets whether to use the pipelined CPU or not
– Editor
6

Simulizer – User Guide 1 USER INTERFACE
∗Font family
: Font family (optional). Supports all installed monospace fonts,
use single quotes for names with spaces. Separate multiple choices with commas
∗Font size: Font size in px
∗Initial file: Path to a file to load at startup (optional)
∗Scroll speed: Scroll speed
∗Soft tabs: Soft tabs
∗Color theme
: Name of the color scheme to load. Supported: (pre-
fix: /ace/theme/) default, high-viz, monokai, ambiance, chaos, tomor-
row night eighties, predawn, flatland
∗User control during execution
: Whether the user is allowed to scroll freely
during execution of a program
∗Vim mode: Vim keybindings for the editor
∗Wrap long lines: Wrap long lines
∗Continuous Assembly
: Repeatedly assemble the program behind the scenes
as you type, and highlight problems in the editor
∗Continuous Assembly Period
: The time between refreshing the highlighted
problems by assembling the program (milliseconds)
– Splash Screen
∗Show splash screen: Toggles whether the splash screen is shown on launch
∗Display Time (in ms)
: Minimum time the splash screen should be shown for
∗Splash Screen Width: Width of the splash screen
∗Splash Screen Height: Height of the splash screen
– Logger
∗Emphasise Logger
: Toggles whether to emphasise logger when requesting
input
∗Font Size: Font size for the Program I/O
– High Level Visualiser
∗Automatically Open High Level Visualiser
: Automatically Open High
Level Visualiser when a new visualisation is shown
1.2.8 Pipeline View
7
Simulizer – User Guide 1 USER INTERFACE
Here you can see the contents of the pipeline during each CPU cycle. To view the contents of
this window, the CPU must be running and in pipelined mode. Once the simulation is running,
you will see the screen start to fill up (from left to right) with instructions. The numbers at the
bottom indicate which CPU cycle is shown in that column.
The two horizontal lines in the center separate the pipeline instructions from the waiting and
completed instructions, as indicated by the labels at the left of the window. The red circles
indicate hazards.
The control bar at the bottom of the window has the following features:
1. Follow
checkbox: when this is selected, the window will snap to the most recent cycle,
otherwise the window will keep showing what it currently shows.
2.
Left/right arrows: clicking the left and right arrows will move backwards/forwards cycles.
You can also move backwards and forwards cycles by pressing the left and right arrow
keys.
3. Go to
field: you can enter a cycle number here, e.g.
56
and the window will snap to that
cycle, showing it as the leftmost column.
4.
Information label: when hovering over an instruction or a hazard, information about that
instruction/hazard will be displayed in this label.
Clicking on an instruction will highlight all of its occurrences. For more information about the
pipeline visualisation, see Pipeline Visualisation
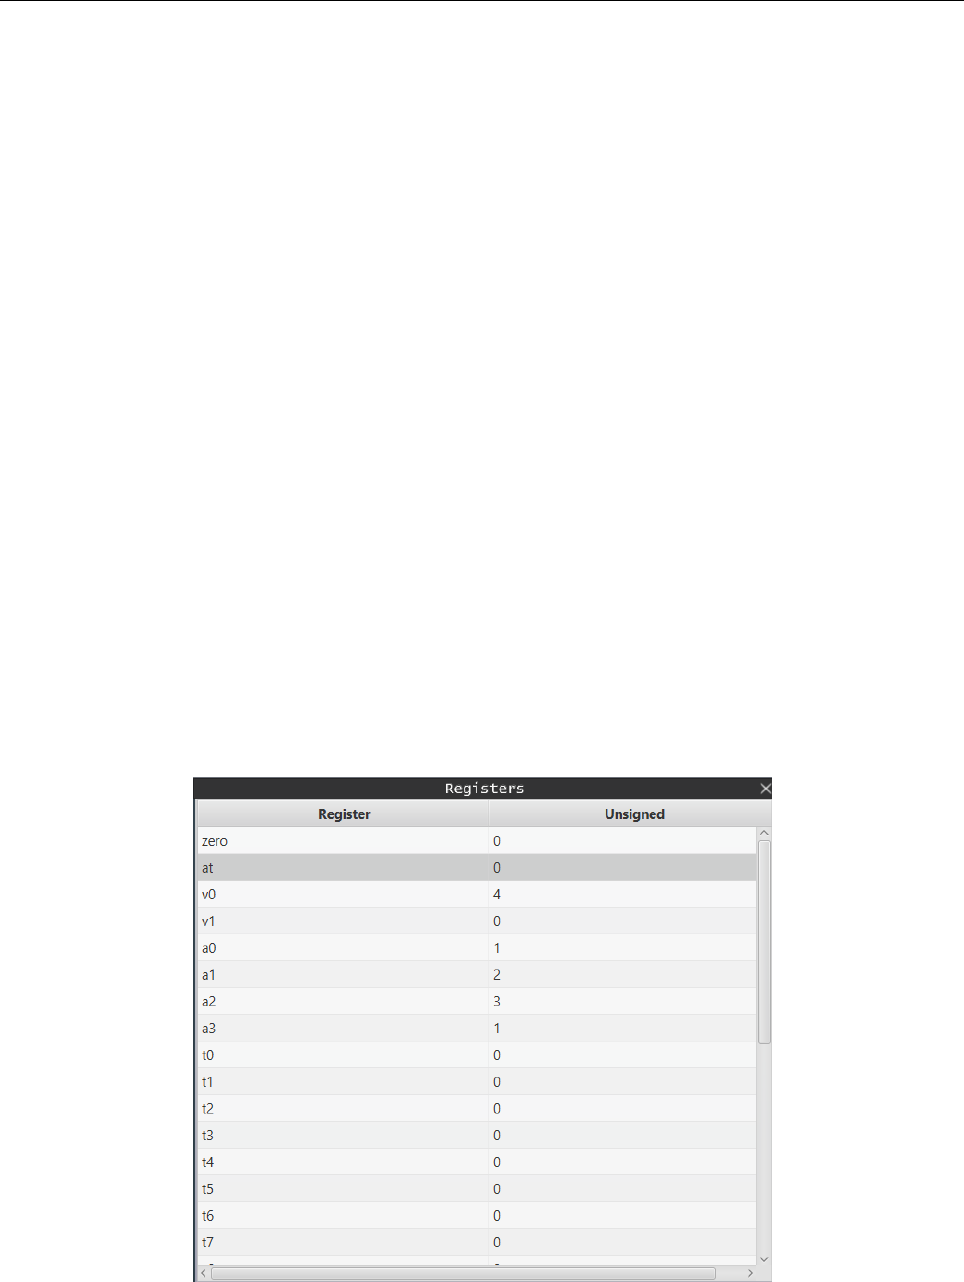
1.2.9 Registers
The Registers window provides a realtime view of the current value stored in each register.
This value can be interpreted in three different ways (unsigned integer, signed integer and
hexadecimal). To switch between these interpretations, right click on the column heading and
select the interpretation you want.
8
Simulizer – User Guide 1 USER INTERFACE
1.3 Layouts
Layouts determine the configuration that all the Internal Windows are in. They allow you to
quickly switch between different arrangements to optimise your workflow.
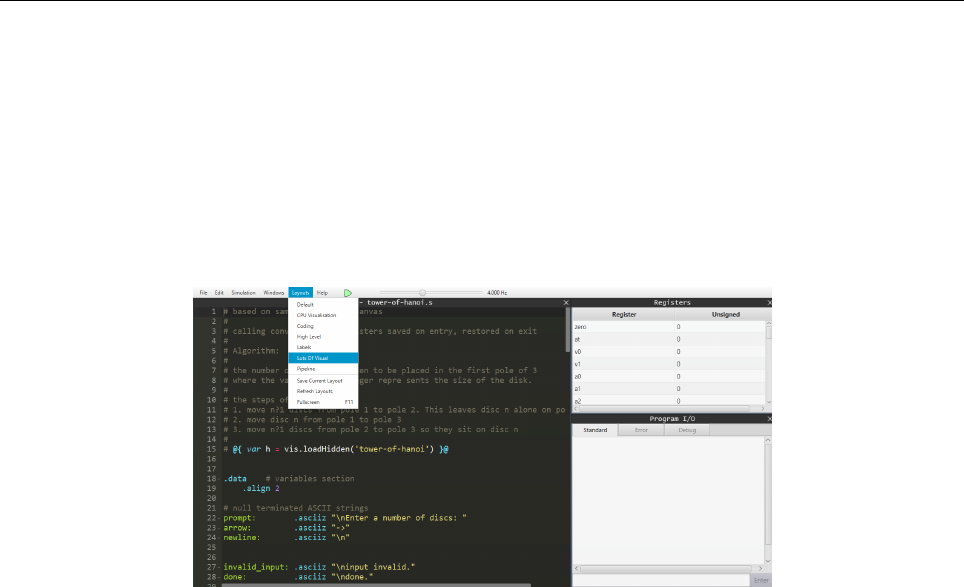
1.3.1 Loading a Layout
Simulizer includes many layouts for you to try. To change to one of these layout, go to the
Menu Bar and click Layouts. This will bring up a list of all the layouts that you can choose.
Just click one and the internal windows will rearrange themselves.
1.3.2 Saving a Layout
If none of the included layouts are up to your standards then why not make your own.
Add/Remove and rearrangement the Internal Windows until it is in a configuration that
you are happy with. You can then save the layout by clicking Layouts
→
Save Layout. Enter a
name for this new layout and click the save button. That new layout should show up on the
Layouts drop down menu.
1.4 Themes
Themes provide a way to change the visual appearance of the software. This feature is currently
in beta (and therefore requires the debug menu). A theme is just a folder in the
themes
folder.
It contains some CSS files to define the theme, as well as a
theme.json
file which contains some
meta data about the theme (like theme name, author, version, etc.). To switch between themes,
navigate to Debug →Themes and click on your preferred theme.
9

Simulizer – User Guide 2 ANNOTATIONS
2 Annotations
The annotation system in Simulizer is a mechanism for tagging SIMP statements with JavaScript
code which is executed after the statement has executed.
2.1 Syntax
The syntax is as follows:
add $s0 $s0 $s1 # comment @{ // annotation }@
The annotation begins with
@{
and ends with
}@
. These must be placed inside a comment of
the assembly program (denoted using #).
2.2 Targets
Annotations may be placed before any
.data
or
.text
segments, in which case they are executed
before the first instruction of the program executes. This is useful for setting up the environment
for the duration of the simulation, for example getting handles to high level visualisations or
setting an appropriate clock speed.
Annotations may be placed after statement, and before any label or another statement. In this
case the annotation is bound to that statement.
Annotations may be placed after a label and before the next statement, in which case the
annotation binds to the statement which the label binds to. This works with multiple labels. In
the example below all 5 annotations are grouped and bound to the nop instruction
syscall
label1: # @{ // annotation 1 }@
label2: # @{ // annotation 2 }@
# @{ // annotation 3 }@
nop # @{ // annotation 4 }@
# @{ // annotation 5 }@
2.3 Gotcha
Be careful when binding annotations to branch instructions because the annotations will be
executed regardless of whether the jump was made or not eg
beq $s0 $s1 TAKE_BRANCH
# @{ log(’branch not taken’) }@
nop
j END
TAKE_BRANCH:
# @{ log(’branch taken’) }@
nop
END: nop
10

Simulizer – User Guide 3 ANNOTATION API
The intended behaviour is that a single message is printed when the branch is taken or not
taken. This is not what happens.
The above code will log
BOTH
messages if the branch is taken and just the first message if
the branch is not taken. To get the intended behaviour you can instead bind the
branch not
taken annotation to a nop instruction just after the beq.
2.4 Grouping
Annotations bound to the same target are concatenated with newline characters placed in
between, this allows more complex expressions to be written clearly such as:
# @{function f(x) { }@
# @{if(x) }@
# @{return 1;}@
# @{else }@
# @{return 0;}@
# @{ } }@
2.4.1 Gotcha
this has the effect that if an exception is thrown in an annotation, none of the annotations
below it that are bound to the same instruction are executed.
nop # @{ throw ’my exception’; }@
# @{ log(’never executed’) }@
2.5 Scope
Any variables defined at the scope of an annotation (ie not inside an inner code block or function,
is accessible throughout the duration of the simulation (global). This is regardless of using
var
,
ie var x = 10; y = 20 both have the same scope.
3 Annotation API
3.1 Debug Bridge
The debug bridge (named
debug
in JS) gives the annotations access to components of the system
that are useful for tracing the execution of the program and relaying information to the user for
debugging purposes. Also during the development of Simulizer, the debug gives access to the
runtime system which can be useful for introspection.
Methods:
•debug.log(msg)
write a message (implicitly converted to string) to the DEBUG output
of program I/O
11

Simulizer – User Guide 3 ANNOTATION API
•debug.assertTrue(cond)
check that a condition holds. If it does not then a helpful
message is displayed in the program I/O
•debug.alert(msg) show a popup message (implicitly converted to string)
•debug.getCPU() get the Java CPU object
3.2 Simulation Bridge
The simulation bridge (named
simulation
and
sim
in JS) gives limited access to the internals
of the simulation, for example reading register values and setting the clock speed
(note: the methods for accessing registers are more easily accessed through the register global
variables (see below))
Methods:
•sim.pause() pause the simulation (are able to resume)
•sim.stop() stop the simulation (not able to resume)
•sim.setSpeed(frequency) set the simulation speed (cycle frequency)
•Word[] sim.getRegisters()
•long sim.getRegisterS(Register)
get the current signed value of a register (identified
using its enum)
•long sim.getRegisterU(Register)
get the current unsigned value of a register (identi-
fied using its enum)
•sim.setRegisterS(Register, long)
set the value (treated as signed) of a register (iden-
tified using its enum)
•sim.setRegisterU(Register, long)
set the value (treated as unsigned) of a register
(identified using its enum)
3.3 Visualisation Bridge
The visualisation bridge (named
visualisation
and
vis
in JS) manages the high level visuali-
sation window, can load high level visualisations and feed them information about the state of
the simulation so that they can visualise and animate the algorithm running in the simulation.
The annotations have full public access to the methods and attributes of the
DataStructureVisualisation
that it requests, see their documentation for details about
what they are capable of.
Methods:
•DataStructureModel viz.load(name)
load a visualisation by name and show the visu-
alisation in the High Level Visualisation window (whether the window is also opened is
determined by the setting: high-level.autoopen)
–‘tower-of-hanoi’
–‘list’
–‘frame’
•DataStructureModel loadHidden(name)
load a visualisation by name but do not show it
in the High Level Visualisation window (call
show
on the model later to show it) (whether
the window is also opened is determined by the setting: high-level.autoopen).
•viz.show() show the visualisation window (no effect if already showing)
•viz.hide() hide the visualisation window (no effect if already hidden)
12

Simulizer – User Guide 3 ANNOTATION API
3.4 Global Variables
Each of the 32 general purpose registers are assigned as global variables (named with the dollar
prefix eg $s0) with the following members:
•id the enum value of the register
•long getS() a method which corresponds to simulation.getRegisterS(this.id)
•long getU() a method which corresponds to simulation.getRegisterU(this.id)
•setS(long)
a method which corresponds to
simulation.setRegisterS(this.id,
long)
•setU(long)
a method which corresponds to
simulation.setRegisterU(this.id,
long)
•long get() a method which corresponds to simulation.getRegisterS(this.id)
•set(long)
a method which corresponds to
simulation.setRegisterS(this.id, long)
Other variables
•The variables Register and reg refer to the Register enum class in Java.
•convert
refers to the
DataConverter
class in java which encodes and decodes from
signed/unsigned integer representations
3.5 Global Functions
To increase brevity, certain commonly used methods from the bridges are assigned to global
functions which can be called without qualification:
// Debug Bridge
log = debug.log
print = debug.log
alert = debug.alert
assert = debug.assertTrue
// Simulation Bridge
pause = simulation.pause
stop = simulation.stop
exit = simulation.stop
quit = simulation.stop
setSpeed = simulation.setSpeed
// Visualisation Bridge
// Misc
ret() // behaves like a return statement, stops execution of the current annotation
3.6 Some Notes
•
the annotation end sequence:
}@
takes precedence over any javascript grammar rule. This
means that in order to obtain the string }@you must use }+@
13
Simulizer – User Guide 4 HIGH-LEVEL VISUALISATIONS
4 High-level Visualisations
The high-level visualisations in Simulizer allow you to view the output of your algorithms in
a more visual way than tediously scanning through the contents of registers, variables, etc.
There are several high-level visualisations available in Simulizer, including a list visualisation
and Tower of Hanoi. There are features for the list visualisation that allow you to swap and
highlight elements, and place markers above them. This could be useful for algorithms such as
binary search, where you may want to highlight the current element being inspected, and place
Land Rmarkers over the left and right end points of the current section of the list.
As well as making your programs easier to view and debug, the high-level visualisations also
provide a satisfying result when an algorithm is implemented correctly, which will hopefully
make writing assembly more fun!
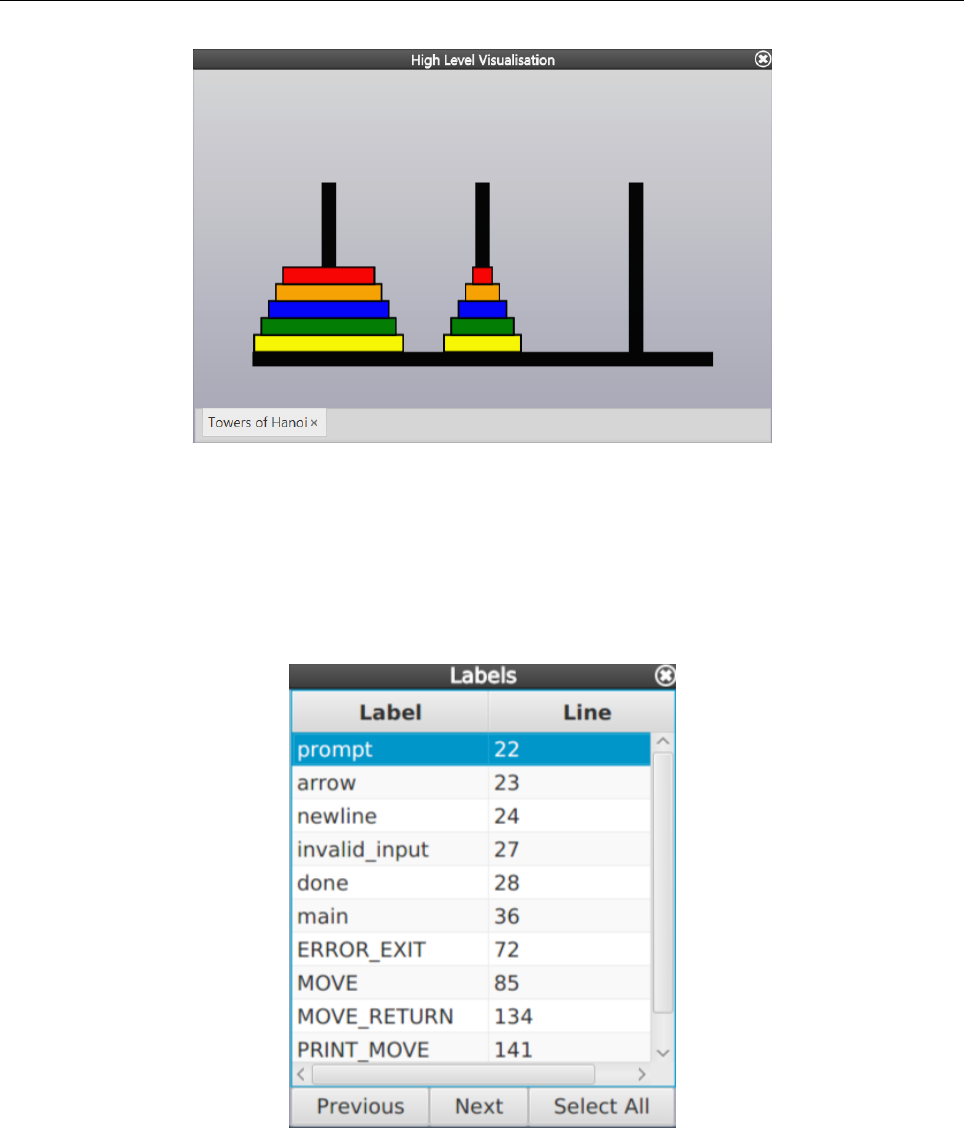
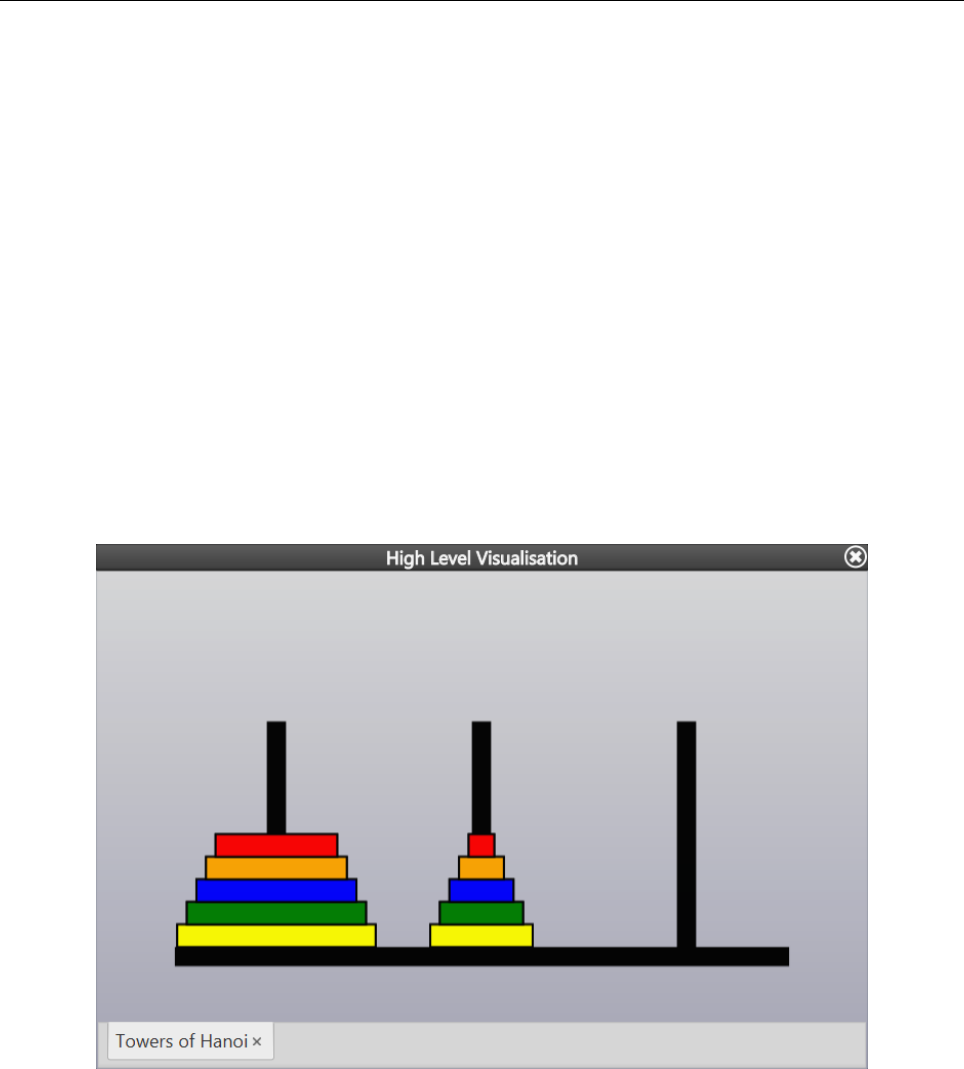
4.1 Tower of Hanoi
Tower of Hanoi is a simple game where the player’s goal is to move all
n
discs from the initial
peg to another peg by moving one disc at a time without ever placing a larger disc on top of a
smaller disc.
To use the Tower of Hanoi visualisation, add the comment
# @{ var h = vis.load(’tower-of-hanoi’) }@
to the start of your program. To set the initial number of discs, add
#@{h.setNumDisks(4)}@
,
where 4 can be replaced with any positive integer you wish. To show the visualiser window, call
#@{vis.show()}@
. Finally, to indicate that you want to move a disc from peg
i
to peg
j
, write
#@{h.move(i,j)}@.
14
Simulizer – User Guide 4 HIGH-LEVEL VISUALISATIONS
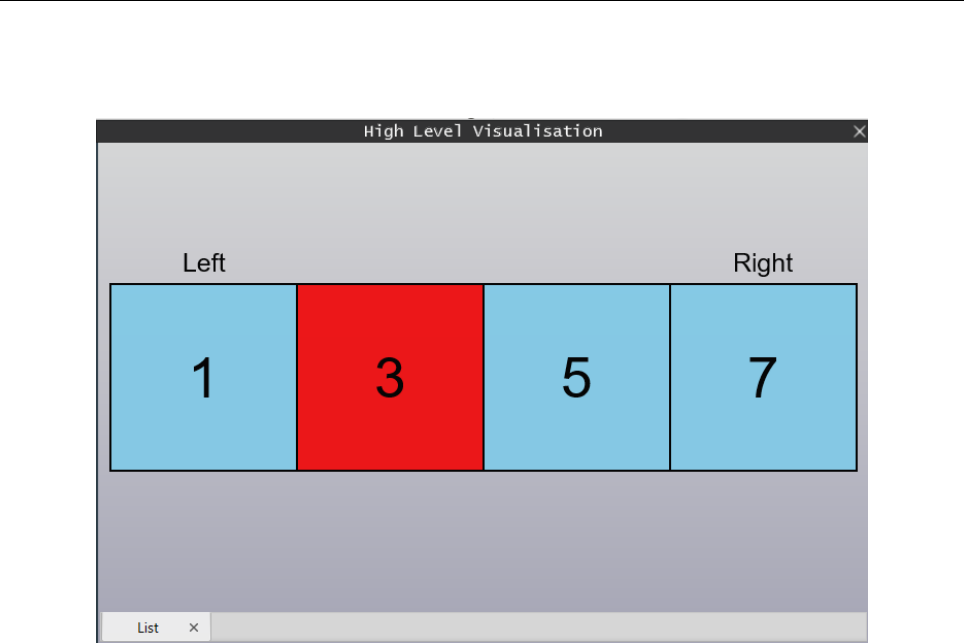
4.2 List Visualisation
To use the list visualisation, add the comment
# @{ var l = vis.load(’list’) }@
to the start of your program. To set the list, write
# @{ l.setList(simulation.readUnsignedWordsFromMem(start, end)) }@
To show the visualiser, write
#@{vis.show()}@
. To swap elements with indices
i
and
j
, write
#@{l.swap(i,j)}@
. To emphasise the element as position
i
write
#@{l.emph(i)}@
. To add a
marker over the element at position iwrite
# @{l.setMarker(i,"<label-text>")}@
15
Simulizer – User Guide 5 LOW-LEVEL VISUALISATIONS
5 Low-level Visualisations
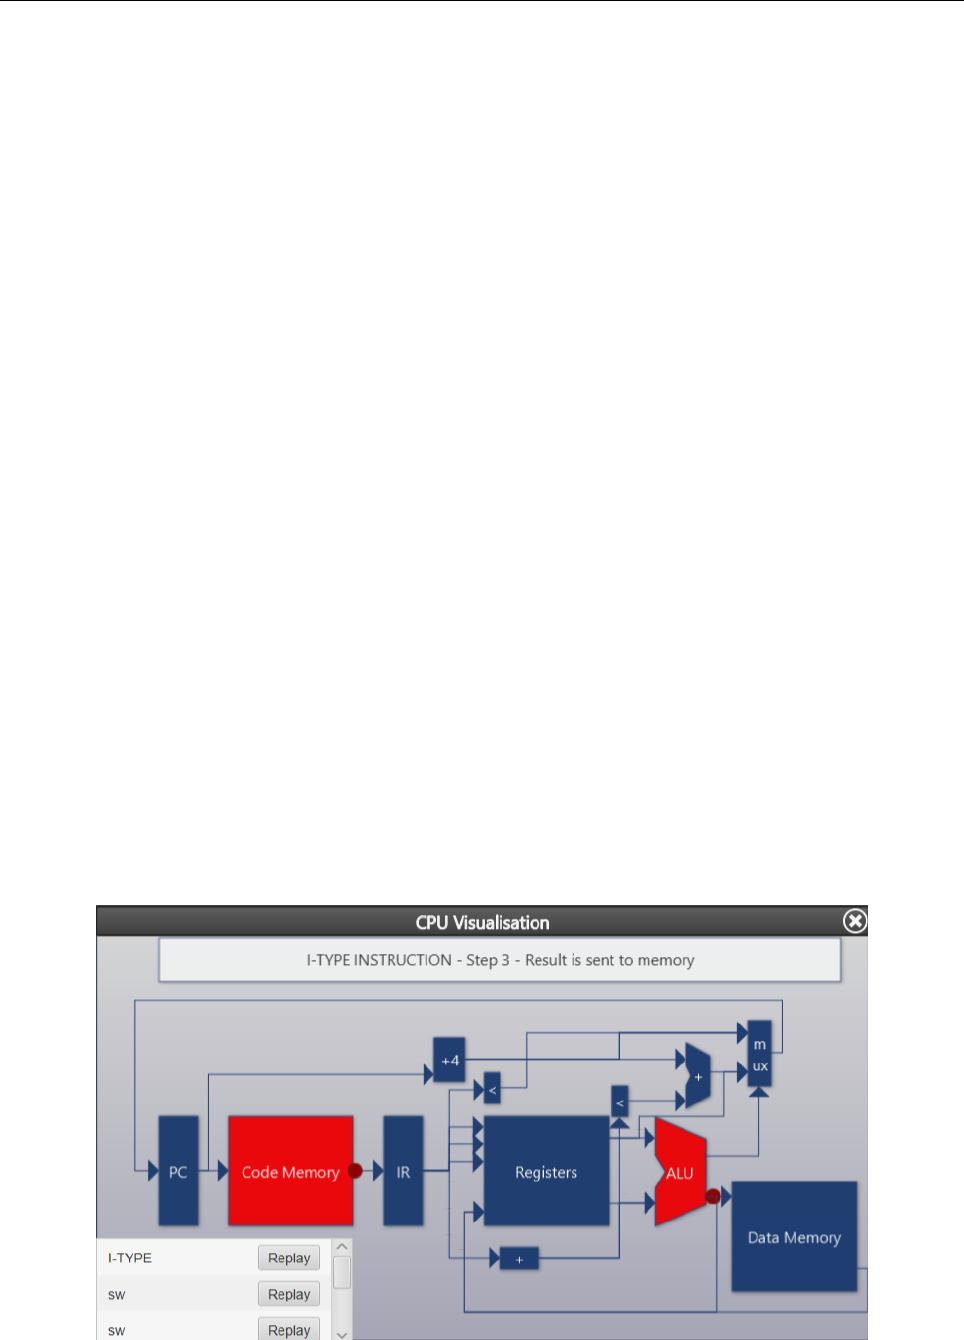
5.1 CPU Visualisation
The CPU visualisation window allows you to view the processes involved when fetching, decoding
and executing different types of MIPS instructions as the program is being executed. The
window shows a block diagram containing different components of the CPU, for example the
ALU along with others such as the main memory and program counter. When instructions are
being executed, text will show at the top of the window, containing useful information about
different stages of execution, for example that the values of two registers are being compared
using the ALU.
To use the CPU visualisation, make sure you set a low clock speed. Animations will only be
shown at a clock speed of less than 2Hz. Although to effectively make use of the information,
it’s recommended to set a very low clock speed, such as 0.05Hz or lower. Alternatively, the
single step feature is very useful when combined with the CPU visualisation and can be used to
see how each instruction is executed one by one.
When viewing the CPU visualisation, you will notice several things:
•
Components highlighting: This shows when different components are performing operations
or are about to send data/signals to other components.
•
Data moving: These small circles show when data/signals are moving between components
of the CPU, for example sending data to the ALU for comparison.
•
Replay window: This window contains the previous 10 instructions that have been executed,
the “Replay” button can be used to replay the instruction if you missed anything.
You can also view more information about each component by hovering over it with your mouse,
a tooltip will show with a detailed description about the role of the component. This can be
used to further your knowledge about how each component of the CPU works.
16
Simulizer – User Guide 5 LOW-LEVEL VISUALISATIONS
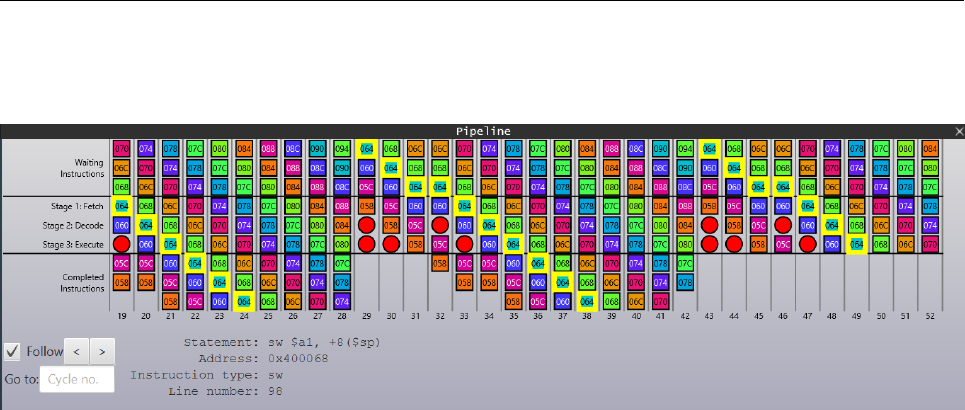
5.2 Pipeline Visualisation
The pipeline visualisation window allows you to view the contents of the pipeline, as well as the
waiting and completed instructions, as the CPU is running. The middle third of the window
shows the fetch, decode, and execute portions of the pipeline at each state, including hazards
where appropriate (represented as red circles).
Firstly, to use the pipeline view, the CPU must be running and in pipelined mode (to turn on
pipelining, go to the
Simulation
menu and make sure
Toggle CPU Pipelining
is selected).
Once running, the window will start to fill up from left to right with instructions being processed.
Let’s look at the components in the control bar at the bottom of the window:
•Follow
checkbox: allows you to toggle whether or not you want to snap to the most recent
stage of the pipeline.
•
Left/Right buttons: allows you to move backwards/forwards cycles in the pipeline (this
can also be achieved by using the left and right keys on your keyboard).
•Goto:
field: allows you to jump to a specified cycle (indicated at the bottom of each stage
of the pipeline) by entering the cycle number, e.g. 67, and then pressing enter. If you
enter a number greater than the number of cycles, then it will jump to the last cycle.
You can view information about instructions in the window by hovering over them with your
mouse. Summary information about the instruction will appear at the bottom of a screen. If
you hover a hazard, the window will tell you what type of hazard was encountered at this time.
You can highlight all occurrences of a particular instruction by clicking on it. This can be useful
to track the state of the instruction through the pipeline and to spot past/future occurrences of
the instruction.
A maximum of 10,000 pipeline stages can currently be displayed (this is to mitigate problems
with infinite loops etc.)
17
Simulizer – User Guide 5 LOW-LEVEL VISUALISATIONS
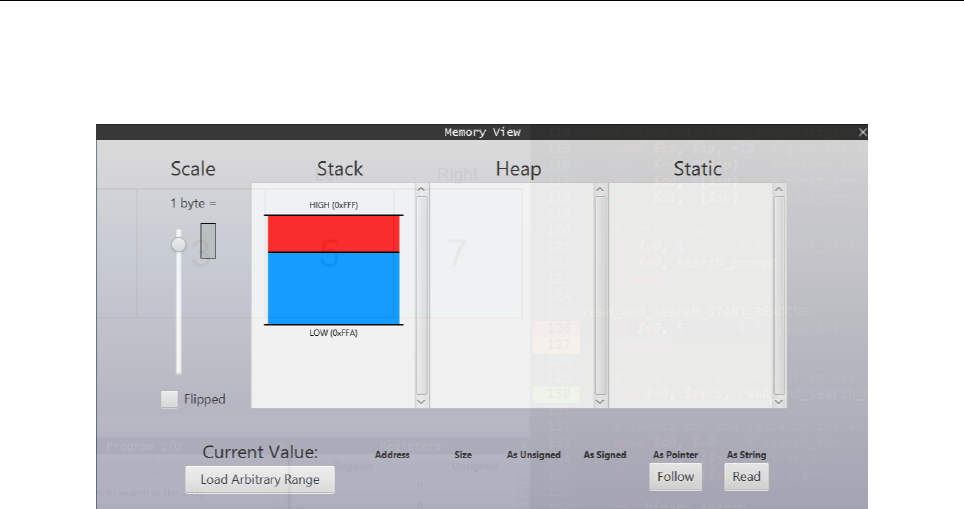
5.3 Memory View
This component is still under development and so does not bear any functionality at this time.
18
