Instructions
User Manual: Pdf
Open the PDF directly: View PDF ![]() .
.
Page Count: 5
Lab 9: Bufferbloat
50.012 Networks
Hand-out: December 1
eDimension hand-in: December 10
1 Objectives
• Experiment with buffer sizes, network scheduling, and TCP congestion window
• Goal: Understand why larger buffers can be disadvantageous if leaky bucket is used
• This exercise is based on the Stanford CS244 class lab1 from 2014
2 Setup
• This exercise again assumes that you have a running miniNet installation
• Download the lab9.zip from eDimension and unpack to some local folder, e.g. ~/lab9/
• Change into the lab9 folder, and open up another terminal tab with CTRL+SHIFT+T
• Before starting mininet, it might be a good idea to disconnect the wifi, e.g. using
3 Introduction
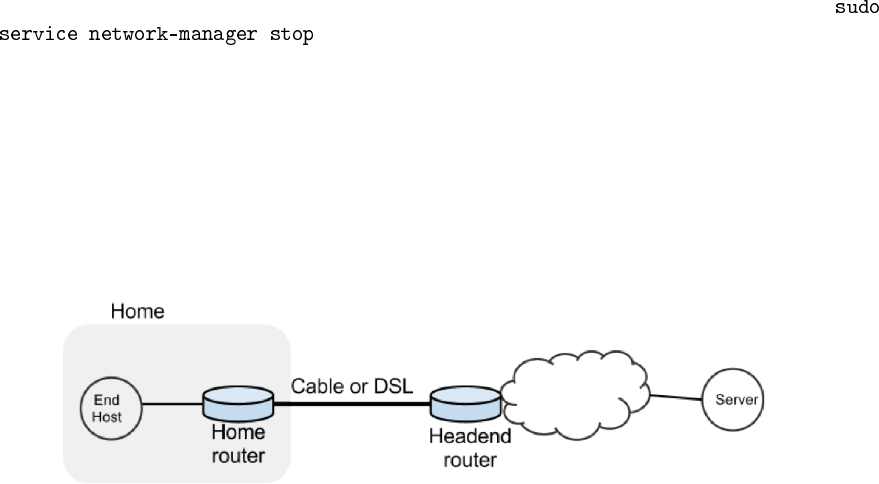
In this exercise we will study the dynamics of TCP in home networks. Take a look at the figure
below which shows a “typical” home network with a "Home Router" connected to an end host.
The "Home Router" is connected via Cable or DSL to a Headend router at the Internet access
provider’s office. We are going to study what happens when we download data from a remote
server to the End Host in this home network.
Problem overview
1
In a real network it’s hard to measure the TCP congestion window (because it’s private to
the Server) and the buffer occupancy (because it’s private to the router). Luckily, we have mininet
to help allow us to get these values easily.
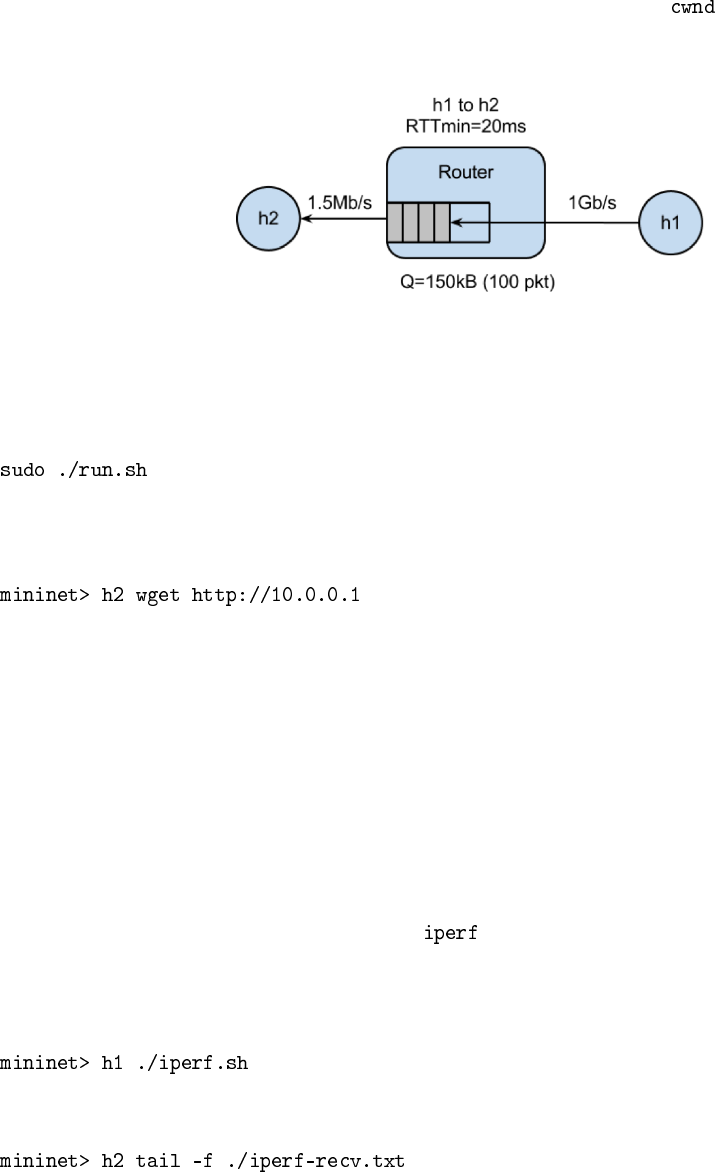
Topology for Mininet
3.1 Warming up
• Start up mininet
• In the running mininet simulator, test how long it takes to download a webpage on h1 from
h2
• We discussed the TCP congestion window in the last lecture again, what is your expectation
how the cwnd changes during this HTTP session? Please note this down somewhere to
compare with results later.
3.2 With parallel load (iperf)
• To see how the dynamics of a long flow differs from a short flow (which never leaves slow-
start), we are going to repeat Part 2 for a “streaming video flow”. Instead of actually watching
videos on your machine, we are going to set up a long-lived high speed TCP connection
instead, to emulate a long-lived video flow.
• You can generate long flows using the command. iperf is a tool for performing network
throughput measurements. It can test either TCP or UDP throughput. To perform an iperf
test the user must establish both a server (to discard traffic) and a client (to generate traffic).
We have wrapped iperf in a script that you can run as follows:
• You can see the throughput of TCP flow from H1 to H2 by running:
• You can quit viewing throughput by pressing CTRL-C.
• Think about the congestion window of the TCP stream again. How will it look for a long-
established connection?
2
• You can also use ping to observe RTT while iperf is running
The Impact on the Short Flow
• To see how our long-lived iperf flow affects our web page download, download the webpage
again - while iperf is running. Observe how long it takes.
• Why does the web page take so much longer to download?
3.3 Measuring the real cwnd and buffer occupancy values.
We provided a script that lets you measure cwnd and buffer occupancy values (in terms of values
for cwnd and buffer occupancy). We are going to re-run a couple of the experiments and plot the
real values.
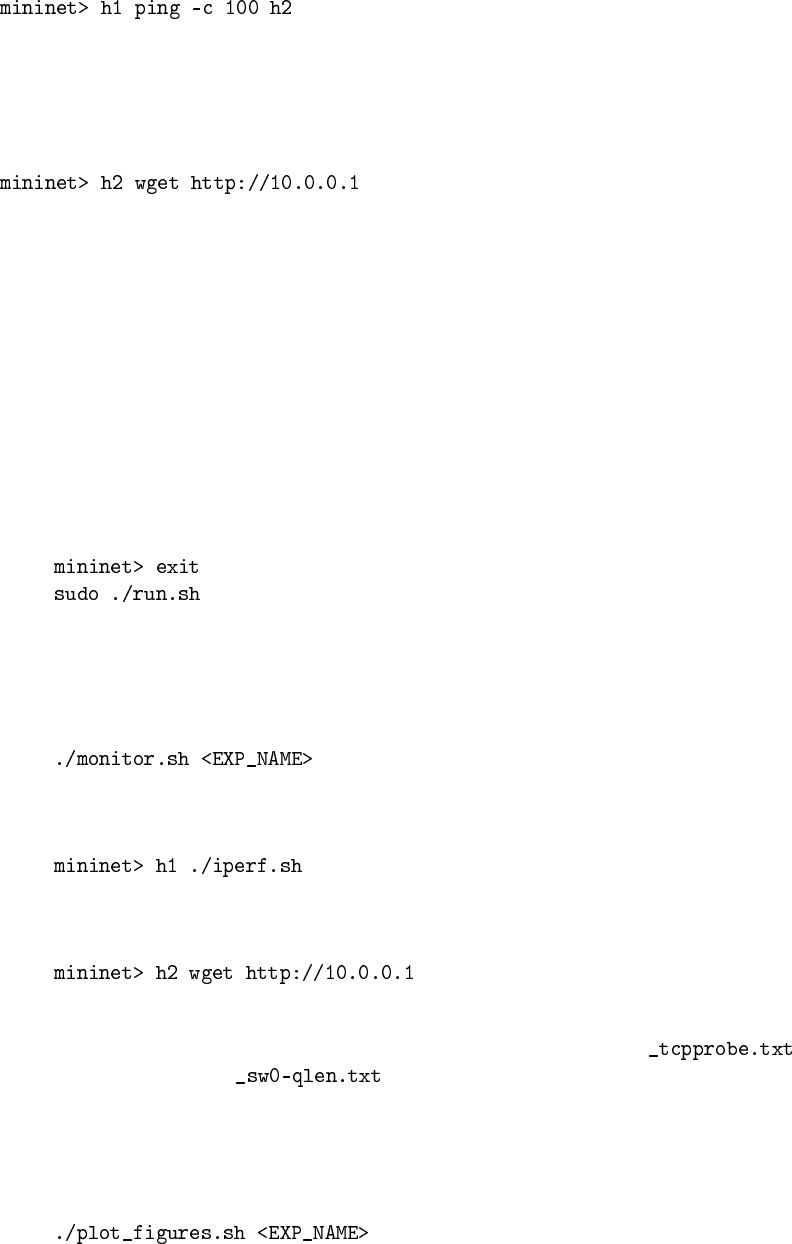
1. Restart Mininet
• Stop and restart Mininet and the monitor script, then re-run the above experiment as
follows.
2. Monitor TCP CWND and Buffer Occupancy in Mininet
• In your other terminal tab, type the following giving a name for your experiment.
• In your first tab with the running mininet, start iperf again
• (wait for 70 seconds . . . )
• Wait for the wget to complete, then stop the python monitor script followed by the in-
structions on the screen. The cwnd values are saved in and the buffer
occupancy in .
3. Plot CWND and Queue Occupancy
• Plot the TCP cwnd and queue occupancy from the output file
3
• Adjust command line parameters to generate the figure you want.
• The script will also host a webserver on the machine and you can use the url the script
provided to access to your figures. If you are unable to see the cwnd, ensure you run
wget after you started the monitor.sh script.
• By now you will have realized that the buffer in the Headend router is so large that when
it fills up with iperf packets, it delays the short wget flow. Next we’ll look at two ways to
reduce the problem.
3.4 Solution 1: Make the router buffer smaller. Reduce it from 100 packets to 20
packets.
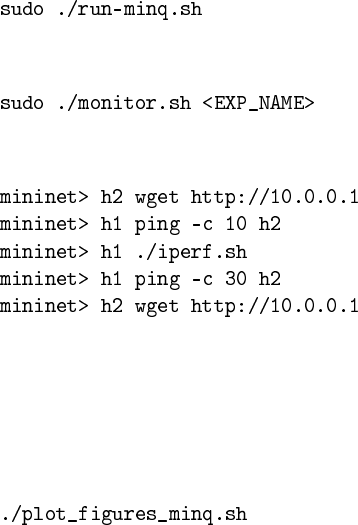
Restart Mininet with small buffer
• Stop any running Mininet and start Mininet again, but this time we will make the buffers 20
packets long instead:
• Let’s also run the monitor script on the side:
• Repeat the earlier simple tests
• What do you think the cwnd and queue occupancy will be like in this case?
• Plot the figure for cwnd and queue occupancy, this time using the script “./plot_figures_minq.sh”
• Then again, use the url to see your figures. Why does reducing the queue size reduce the
download time for wget?
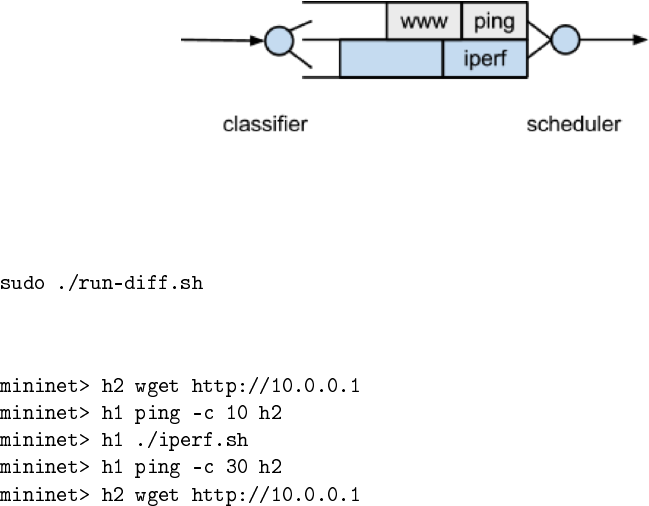
3.5 Solution 2: Different queues
• The problem seems to be that packets from the short flow are stuck behind a lot of packets
from the long flow.
–What if we maintain a separate queue for each flow and then put iperf and wget traffic
into different queues?
–We discussed this scheduling in the lecture, how did we call it?
For this experiment, we put the iperf and wget/ping packets into separate queues in the Head-
end router. The scheduler implements fair queueing so that when both queues are busy, each flow
will receive half of the bottleneck link rate.
4
Solution based on queues
1. Restart Mininet
Start Mininet again, but this time we will create two queues, one for each type of traffic.
2. Repeat the steps in Parts 2 and 3
• You should see the ping delay (and the wget download time) doesn’t change much
before and after we start the iperf.
4 What to Hand in
4.1 eDimension submission:
Please provide a writeup (in PDF format with your name) that includes the following information:
• What is the normal time required to download the webpage on h1 from h2?
• What was your initial expectation for the congestion window size over time?
• After starting iperf on h1, did you observe something interesting in the ping RTT?
• After starting iperf on h1, why does the web page take so much longer to download?
• Please provide the figures for the first experiment (with qlen 100 and only one queue)
–Please comment on what you can see in the figures
• Please provide the figures for the second experiment (with qlen 20 and only one queue)
–Please comment on what you can see in the figures, and what is different (and why)
• Please provide the figures for the third experiment (with qlen 100 and two queues)
–Please comment on what you can see in the figures, and what is different (and why)
4.2 Checkoff:
• No checkoff required if you submitted your reply sheet
5
