Manual
User Manual: Pdf
Open the PDF directly: View PDF ![]() .
.
Page Count: 53

ASA³P
User Manual
Version 1.0.4
Oliver Schwengers
12.02.2018
Introduction
Workflow
User
Internal
Common data structure
Versions
Docker
Setup
Execution
Example
Cloud - OpenStack
Introduction
OpenStack configurations
Transfer ASA³P master & slave images into your OpenStack cloud project:
Setup a network
Configure the default security group
Create a SSH key pair
Setup and start the gateway instance
ASA³P installation and configuration
Create data volumes
Install and configure the ASA³P cloud version
Start ASA³P in the cloud
Custom installation on private cluster systems
Download Files
Common files
ASA³P directory
OpenStack
Analyses
Quality Control / Clipping
Assembly
Scaffolding
Annotation
Taxonomic Classification
Multilocus Sequence Typing (MLST)
Antibiotic Resistance Detection (ABR)
Virulence Factor (VF) Detection
Reference Mapping
Single Nucleotide Polymorphism (SNP)
Core - pan genome
Phylogeny
1
Results
Quality clipping overview
Content - Widgets
Downloads
Links
Glossary
Quality clipping genome details
Content - Widgets
Glossary
Assembly overview
Content - Widgets
Downloads
Links
Glossary
Assembly genome details
Content - Widgets
Downloads
Glossary
Scaffolding overview
Content - Widgets
Downloads
Links
Glossary
Scaffolding genome details
Content - Widgets
Downloads
Glossary
Annotation overview
Content - Widgets
Downloads
Links
Glossary
Annotation genome details
Content - Widgets
Downloads
Links
Glossary
Taxonomic classification overview
Content - Widgets
Downloads
Links
2
Glossary
Taxonomic classification genome details
Content - Widgets
Downloads
Glossary
Multilocus Sequence Typing (MLST) overview
Content - Widgets
Downloads
Links
Glossary
Antibiotic Resistance Detection (ABR) overview
Content - Widgets
Downloads
Links
Glossary
Antibiotic Resistance Detection (ABR) genome details
Content - Widgets
Links
Downloads
Glossary
Virulence factor detection overview
This page provides an overview on the number of virulence factors and categories
detected in each genome.
Content - Widgets
Downloads
Links
Glossary
Virulence factor detection genome details
Content - Widgets
Downloads
Glossary
Reference mapping
Content - Widgets
Downloads
Links
Glossary
Single Nucleotide Polymorphism (SNP) overview
Content - Widgets
Downloads
Links
Single Nucleotide Polymorphism (SNP) genome details
Content - Widgets
3

Introduction
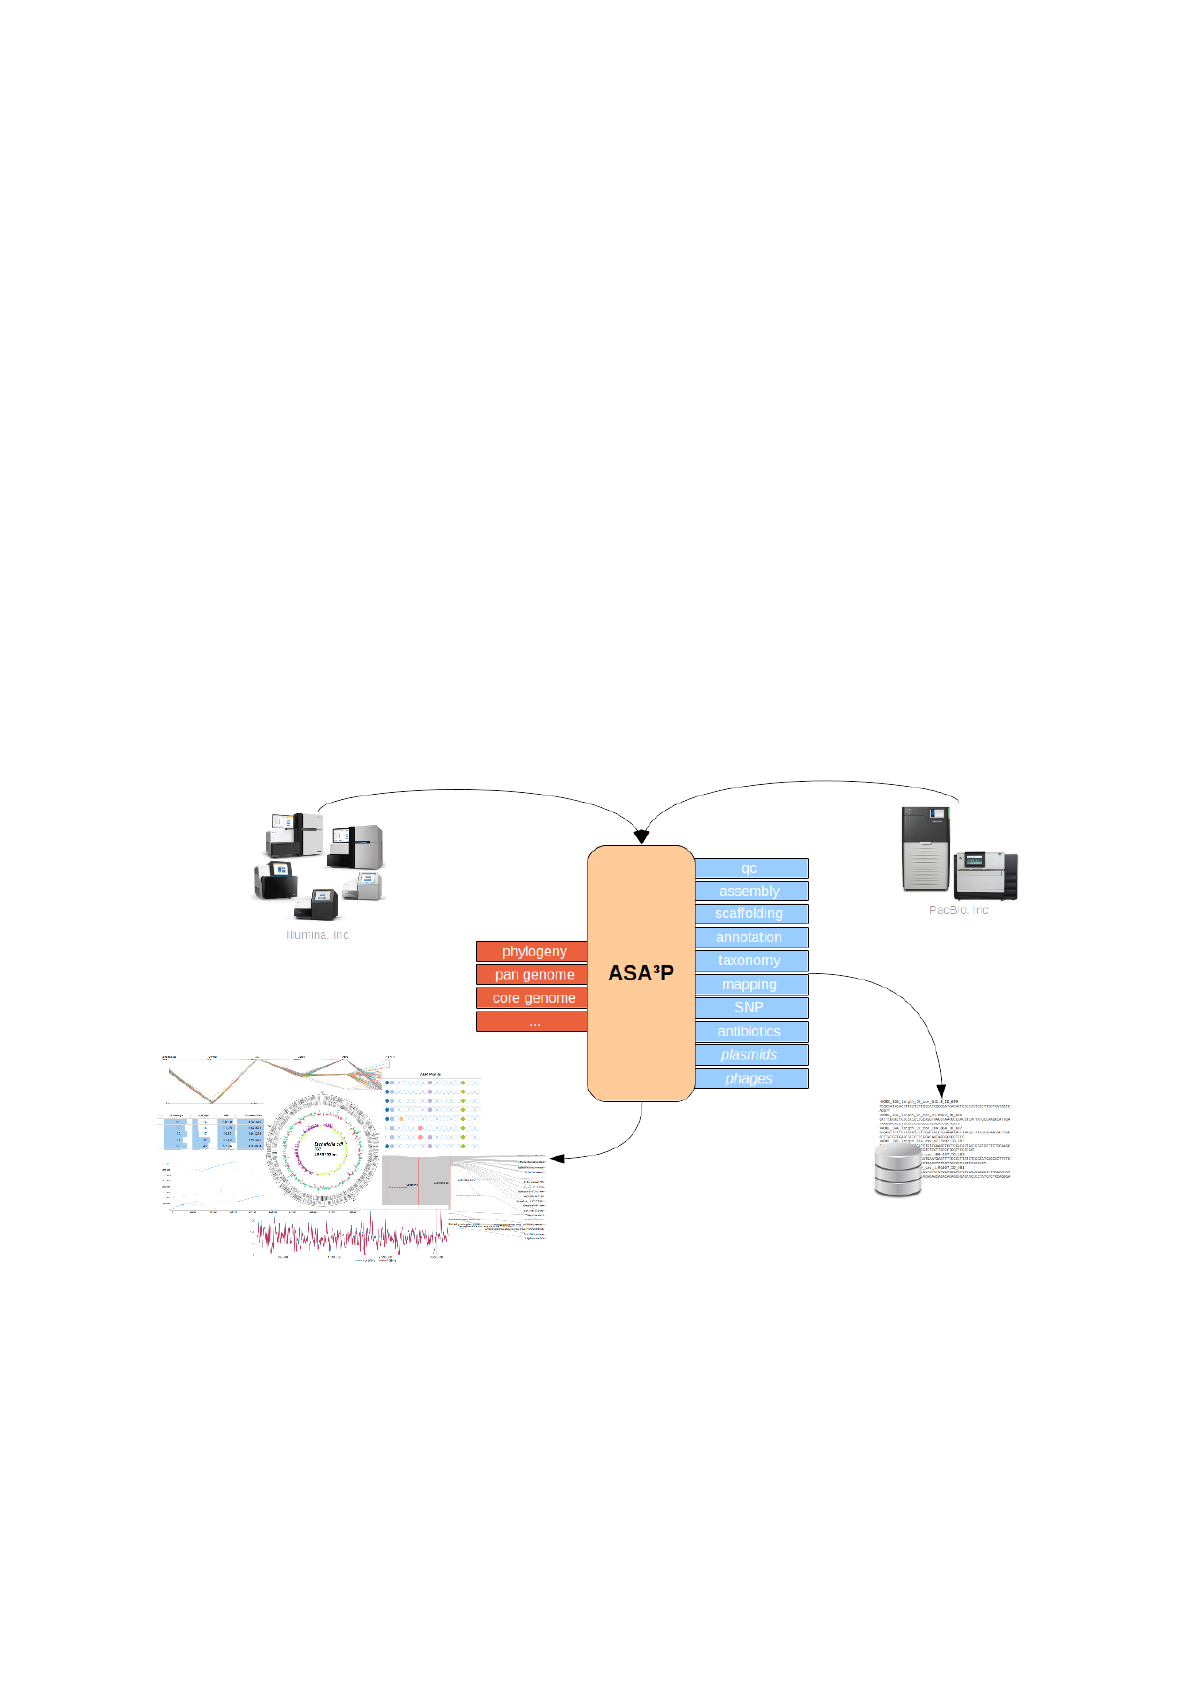
ASA³P is an automatic and highly scalable assembly, annotation and higher-level analyses
pipeline for closely related bacterial isolates. It is developed as a command line tool creating
standard bioinformatics file formats as well as sophisticated HTML5 documents.
Its main purpose is the automatic processing of large scale NGS data, thus transforming raw
reads into assembled and annotated genomes and finally getting as much information on
every single bacterial genome as possible. Per-isolate analyses are finally complemented by
first comparative insights. Hereby, the software incorporates many best-in-class open source
bioinformatics tools and thus takes away the burden of ever repeating tasks from its users.
Envisaged as an upfront tool it provides comprehensive insights as well as a general
overview and comparison of analysed genomes along with all necessary result files for
subsequent deeper analyses presenting all this by interactive modern HTML5 documents to
the user.
5

Processing big data created by modern NGS technologies easily outscales traditional
compute resources. Targeting this bottleneck, ASA³P is able to use already installed SGE
compute clusters or even to automatically create such on cloud computing infrastructures.
Using modern bioinformatic frameworks combined with state of the art cloud computing
ASA³P easily scales up underlying compute nodes and thus adopt to project sizes at any
scale. Hence, processing and analyzing even thousands of bacterial genomes becomes a
routine task.
This manual is intended for both normal users without deeper computer skills and advanced
bioinformaticians who like to setup their own installations.
Normal users analyzing rather small projects (< 10 genomes) are highly encouraged to use
the Docker based version as it is by far the simplest and easiest way to analyze a set of
genomes.
Facing bigger projects or higher demands in terms of runtime or throughput one should take
advantage of the ASA³P cloud version.
6
Workflow
User
Although conducting a rather complex set of analyses ASA³P was developed to hide as
much complexity as possible. Therefore, for each run (or project as we call it) it expects a
distinct directory containing a configuration file named config.xls as well as a subdirectory
named data comprising all input data, e.g. reference genome files and isolates’ read files.
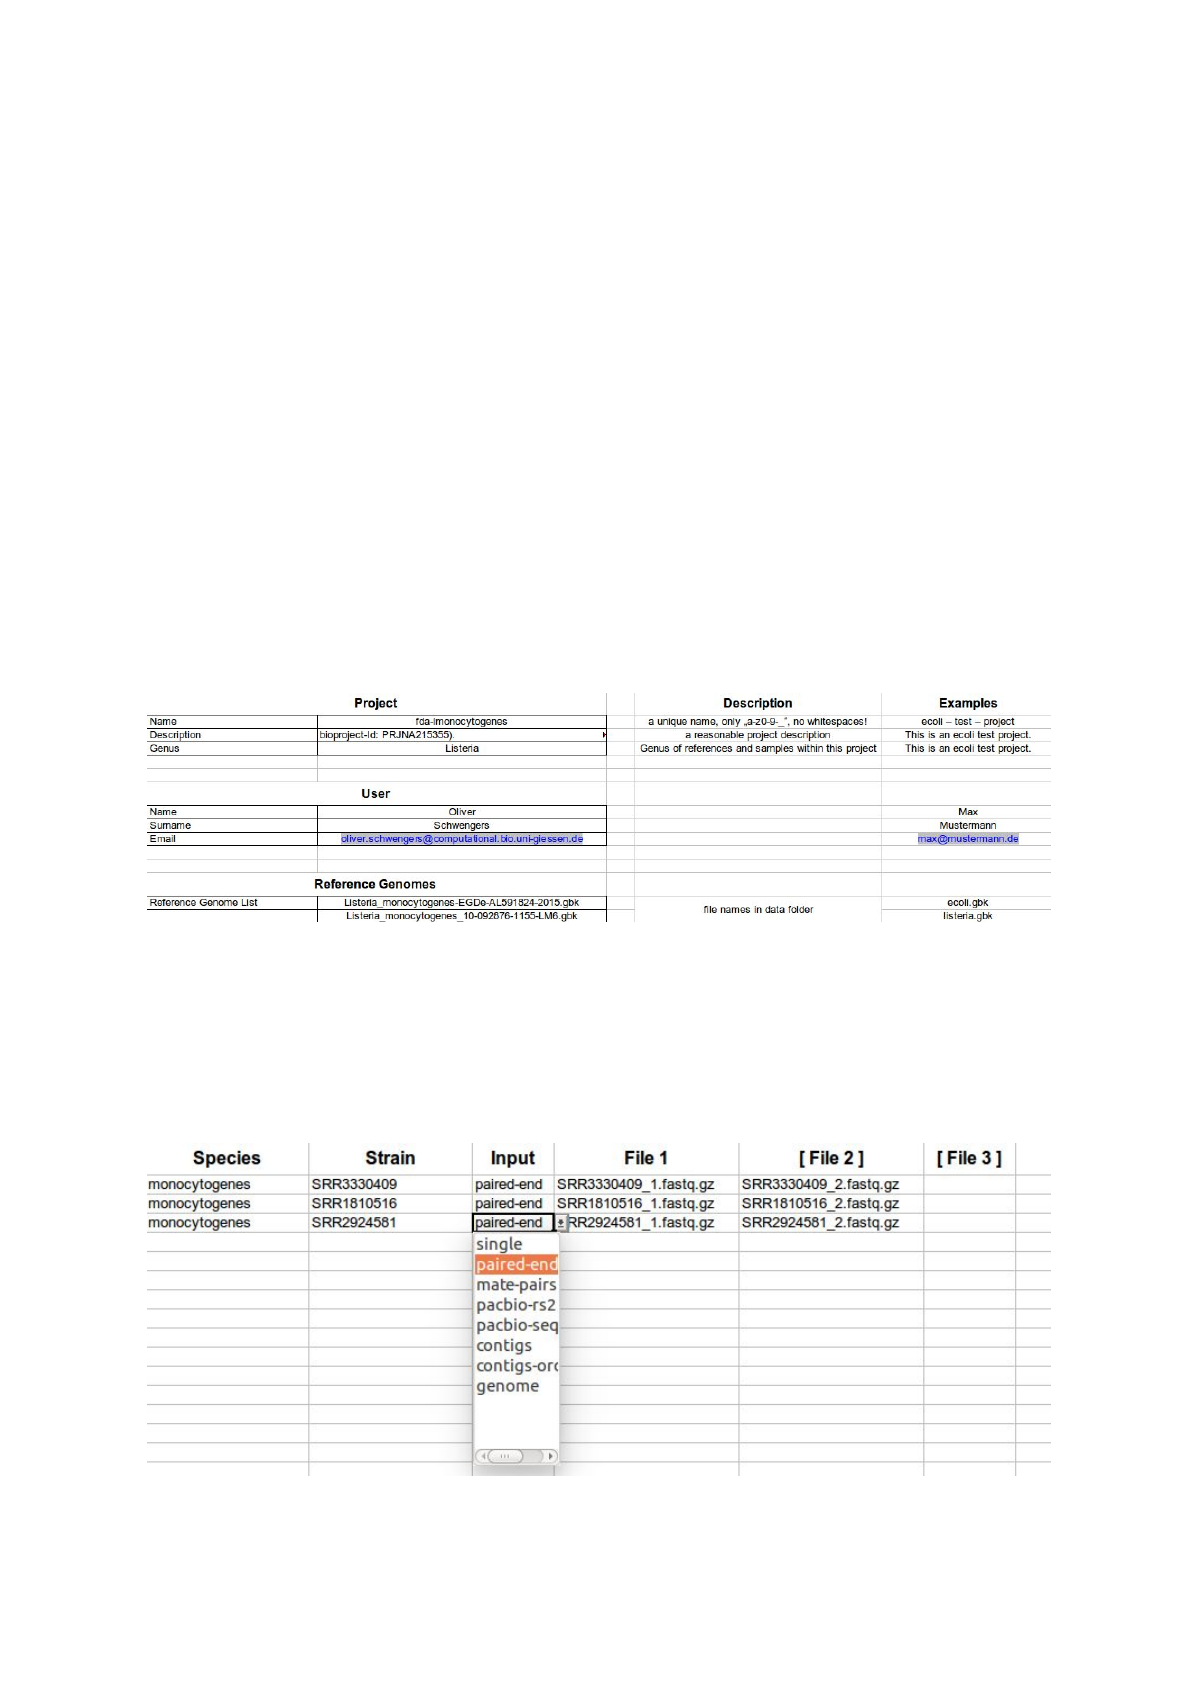
In order to simplify the intake of information ASA³P comes with a custom Excel®template
comprising two sheets. The first one accepts project meta and user information as well as
file names of reference genomes. Latter can be provided as genbank, embl or (multi) fasta
files. Newer multi-genbank files (.gbff) are also supported. All files need to uncompressed.
A second sheet accepts all necessary information on single isolates, e.g. expected species,
strain name, input type and related data files:
7

The latest version of the Excel®template can be downloaded here:
https://s3.computational.bio.uni-giessen.de/swift/v1/asap/latest/config.xls
Before starting ASA³P a proper project directory contains the following files and subdirectory:
- config.xls
- data/
- reference genome files
- isolate raw reads, contigs, genome files
Internal
In order to speed up runtime ASA³P execute as many analyses as possible in parallel.
Hereby, its internal workflow is divided into four stages:
1) processing per-isolate input data
2) per-isolate analyses and genome characterizations
3) comparative analyses
4) creating HTML5 reports
As a first step the pipeline incorporates raw sequencing reads, pre-assembled contigs as
well as annotated genomes and subsequently conducts diverse quality control, assembly,
scaffolding and annotation steps in order to process input data into assembled and
annotated genomes as a starting point for step 2.
Based on these annotated genomes ASA³P performs several genome characterization
steps, e.g. taxonomic classifications, MLST typing and detection of antibiotic resistances.
Hereby, ASA³P tries to gather as much information as it is possible for an automatic pipeline.
In a third stage, ASA³P performs comparative analyses such as a calculation of the core and
pan genome as well as the creation of a phylogenetic tree.
Finally, all information and results get collected and presented in HTML5 documents taking
advantage of modern interactive visualizations and widgets.
Common data structure
Following a convention-over-configuration approach ASA³P organizes all input and
intermediate data as well as result files in a standardized directory structure. Thus, all
8

analyzed projects have the same directory and file structure allowing users to easily find and
extract all created data files.
As described before ASA³P expects a distinct directory for each project containing an ASA³P
configuration file named config.xls and a directory called data comprising all input data:
- config.xls
- data/
- reference genome files
- isolate raw reads
After ASA³P has successfully finished the project directory contains the listed additional files
and directories:
-asap.log: a log file for debugging purposes
-config.json: a technical internal configuration file
-references/: all provided reference genomes, necessary file format
conversions and mapping indices
-reads_raw/: raw reads and quality information files
-reads_qc/: quality clipped read files and quality information files
-assemblies/: one subfolder for each isolate containing assembled contigs
and discarded contigs
-scaffolds/: one subfolder for each isolate containing scaffolded contigs and a
pseudo genome containing linked scaffolds and contigs
-annotation/: one subfolder for each isolate containing genome annotation
files (.gbk, .gff, .ffa, .ffn)
-taxonomy/: special information on each genome in distinct JSON files
-mlst/: special information on each genome in distinct JSON files
-abr/: special information on each genome in distinct JSON files
-vf/: special information on each genome in distinct JSON files
-mappings/: special information on each genome in distinct JSON files
-snps/: special information on each genome in distinct JSON files
-corepan/: core and pan genome as fasta files, a pan-genome-matrix file, a
single JSON file for each isolate containing information on accessory
and singleton genes
-phylogeny/: a newick file and the consensus sequences of all isolates
-reports/: HTML5 documents along with necessary CSS, JavaScripts and
linked data files
Versions
ASA³P is a complex software with many external dependencies which makes it hard to
distribute and install. To overcome this bottleneck we provide two portable versions, i.e. a
Docker based container with disabled cluster support and a highly scalable cloud version
based on OpenStack.
9

Docker
For users without access to SGE based compute
clusters or cloud infrastructures ASA³P provides an
easy to use version based on the famous Docker®
containerization software. The necessary container
images are publicly hosted at Docker Hub®. Hereby,
users can take advantage of utmost simplicity.
Unfortunately, this comes at the cost of lacking
scalability. In principle, using Docker ASA³P could
run on a powerful laptop albeit in most cases a
high-class desktop machine in terms of hardware
capacity will be needed.
Docker itself is an open-source and free software which creates and provides software
containers which contain applications as well as necessary dependencies, e.g. software
libraries, system tools, etc... Therefore, containers isolate the software from its surrounding
environment and ensure the same conditions apply for every execution of the software. For
further information please have a look at the official Docker manual
(https://www.docker.com/what-docker).
Setup
To setup ASA³P Docker containers users need to perform two steps:
1) pull the Docker image from Docker Hub
2) download and extract the ASA³P directory
Pull the ASA³P Docker image:
docker pull oschwengers/asap
Due to its huge size the container itself does not include the actual ASA³P software and
necessary database which are ~5.2 Gb and ~142 Gb in size. These two components must
be downloaded (once) and mounted to the container at execution.
Download and extract the ASA³P directory:
wget \
https://s3.computational.bio.uni-giessen.de/swift/v1/asap/latest/asap
.tar.gz
tar -xzf asap.tar.gz
rm asap.tar.gz
10

Execution
Start Docker container:
sudo docker run --rm -d --name <optional_name_for_container> \
-v <asap>:/asap/:ro \
-v <project>:/data/ \
oschwengers/asap
Docker parameters:
1. name: (optional) allows to assign a name to the container (i.e. a running instance of
an image)
2. rm: removes the container after the run
3. d: starts the container in the background (detached mode)
4. v: mounts a folder from the host system into the container
Mounted volumes:
-<asap>: absolute path to downloaded and extracted ASA³P directory (asap.tar.gz)
-<project>: absolute path to local ASA³P project directory (containing config.xls and
data subdirectory)
Now, ASA³P runs in the background within a new container and saves result and log files
into the mounted project directory on the local system. When the container has finished, the
docker client will shut it down and remove all obsolete temporary files. Of course, mounted
volumes will not be removed!
Example
Given you are logged in as a user called ubuntu just execute the following commands:
Setup (only perform once):
cd ~
wget \
https://s3.computational.bio.uni-giessen.de/swift/v1/asap/latest/asap
.tar.gz
tar -xzf asap.tar.gz
rm asap.tar.gz
sudo docker pull oschwengers/asap
Start ASA³P analysis of an example project:
wget \
https://s3.computational.bio.uni-giessen.de/swift/v1/asap/example-lmo
nocytogenes.tar.gz
tar -xzf example-lmonocytogenes.tar.gz
sudo docker run --name asap_example_container -d --rm \
-v /home/ubuntu/asap:/asap/:ro \
-v /home/ubuntu/example-lmonocytogenes:/data/ \
11

oschwengers/asap
After ASA³P has successfully finished you can use your browser to open the HTML5 report
index page located at:
~/example-lmonocytogenes/reports/index.html
Cloud - OpenStack
Introduction
As ASA³P Docker containers lack parallel execution of analyses via a compute cluster a
scalable OpenStack based cloud solution has been developed. Especially, analyses of
larger projects often need massive compute resources in order to finish in a reasonable
amount of time. Therefore, the ASA³P cloud version has a built in support for the Sun Grid
Engine (SGE) which automatically sets up all necessary infrastructure. Hereby, ASA³P also
12
assesses and configures the optimal amount of slave nodes taking into account configurable
limits and thus meeting specific cloud project quotas.
Technical background
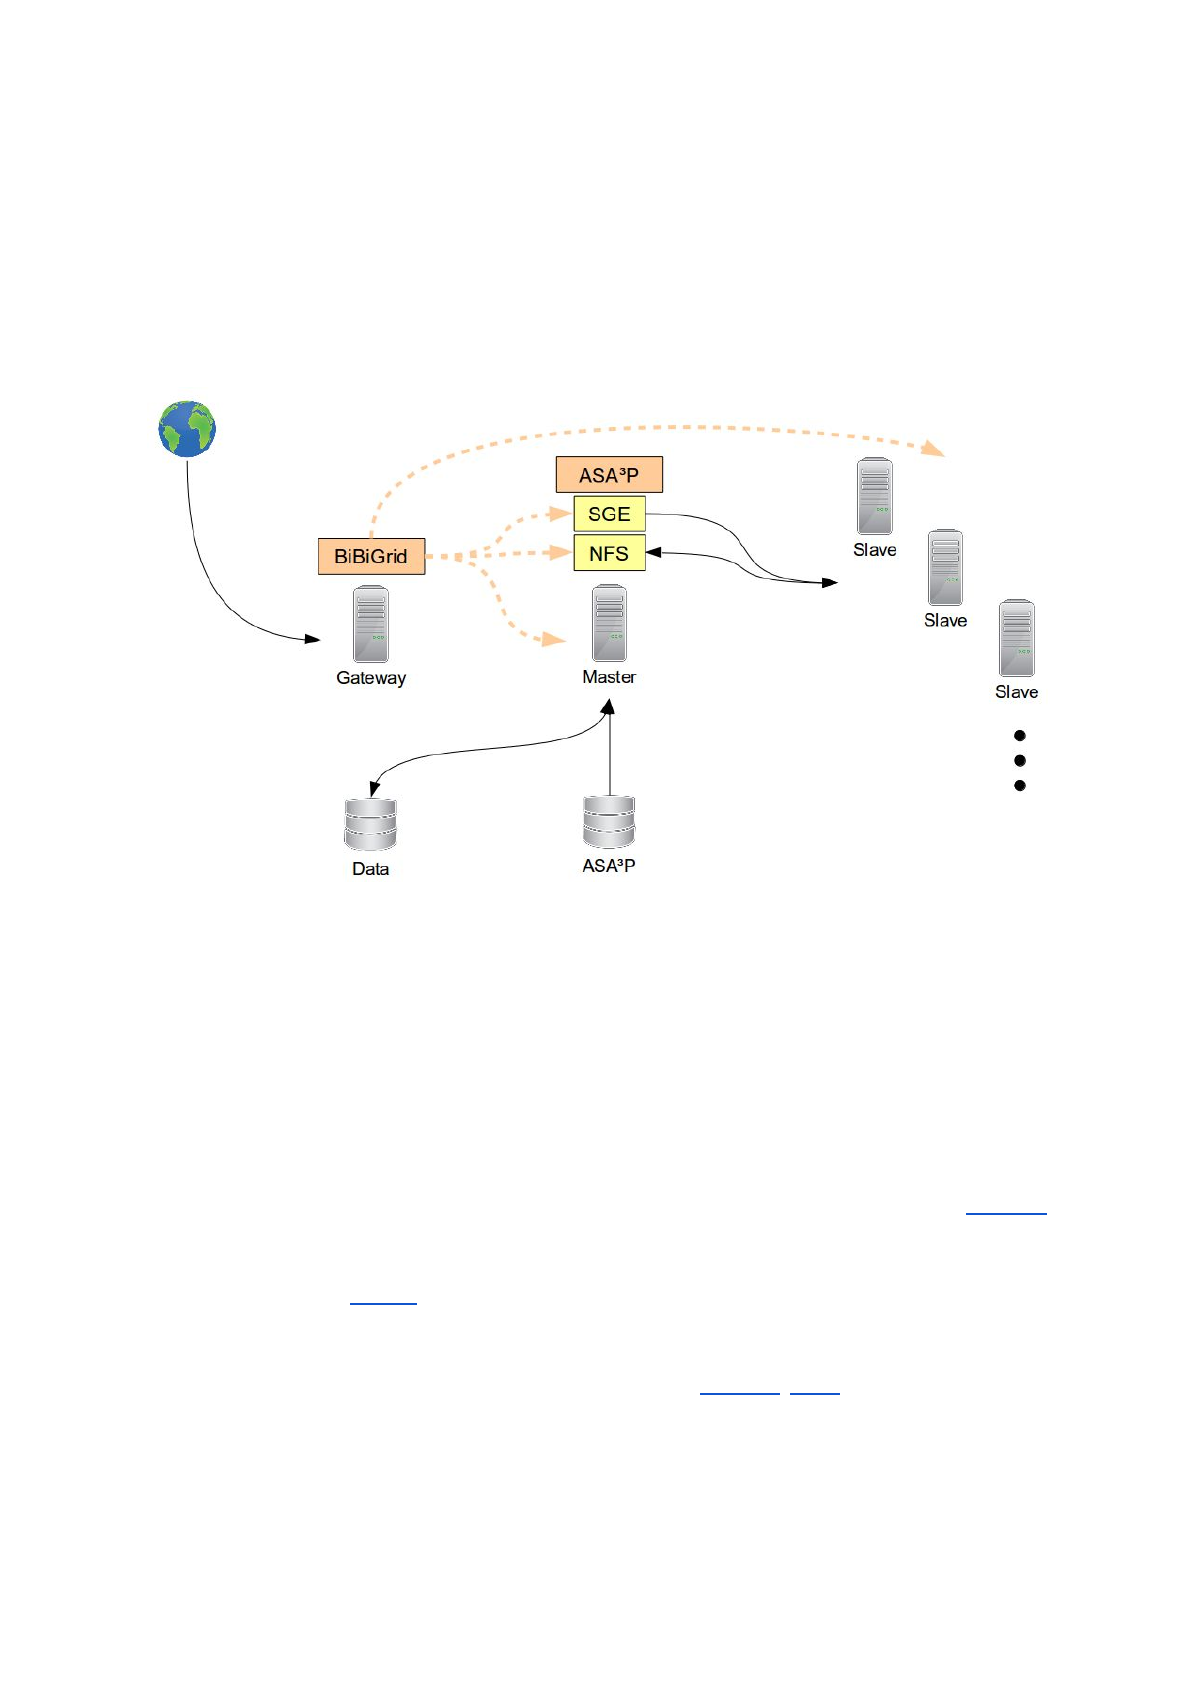
In order to horizontally scale out and to distribute underlying analyses ASA³P needs a quite
complex technical setup. The figure below shows an exemplary hardware/software setup
during while the pipeline is running:
The whole workflow starts with a virtual machine (VM) which acts as a gateway into your
ASA³P cloud setup. The ASA³P software and all necessary databases are stored on a
reusable volume, actual data a user likes to analyze are stored on a separate one. The
pipeline is executed on a so called master instance as this VM also runs a SGE scheduler
and a Network File System (NFS) server instance. All analyses are distributed via the master
instance to automatically started slave instances which are connected to the SGE scheduler
and NFS server.
Setup and configuration of the SGE based compute cluster is conducted via the BiBiGrid
framework, developed at the university of Bielefeld. The BiBiGrid framework is implemented
in Java and only requires user cloud credentials as well as some cloud/project specific
information. For the de.NBI Openstack cloud the login credentials (except your password)
can be downloaded in form of the Openstack RC v3 file. This file can be found under
‘Access & Security’ -> ‘API Access’ in your Openstack web interface. As the BiBiGrid
framework is currently compatible with Openstack and Amazon AWS support for Amazon
AWS is planned for near future.
Orchestration of necessary VMs and subsequent setup and configuration of required
software is a crucial but complex task. In order to hide and automate almost all technical
13

complexity and thus simplifying the whole cloud workflow ASA³P comes with a dedicated
cloud script. The following section provides information on all necessary steps in order to
configure an Openstack cloud project, install the ASA³P pipeline and finally analyze your
bacterial isolates.
Note:
In order to setup and run ASA³P in the cloud you need at least some basic knowledge on
Linux, basic command line tools, cloud computing and OpenStack. As explaining everything
in detail would be out of scope of this manual we kindly ask users with little or no linux /
cloud experience to read detailed external documents or to ask your administrators and
colleagues for further help.
Note:
Please, bear in mind ASA³P was developed and tested on Ubuntu 16.04. Due to
uncountable combinations of Linux distributions and versions we cannot give support for
other setups than the tested one.
OpenStack configurations
Before ASA³P can be executed in the cloud users need to set up their OpenStack project.
This step has to be performed only once for each OpenStack project
1) transfer ASA³P master & slave images into your OpenStack project
2) setup a network within your project
3) configure the default security group
4) create a SSH key pair
5) setup and start a gateway instance
Transfer ASA³P master & slave images into your OpenStack cloud project:
a) download the master and slave OpenStack images:
14
- master:
https://s3.computational.bio.uni-giessen.de/swift/v1/asap/lates
t/asap-cloud-master-1.0.qcow2
- slave:
https://s3.computational.bio.uni-giessen.de/swift/v1/asap/lates
t/asap-cloud-slave-1.0.qcow2
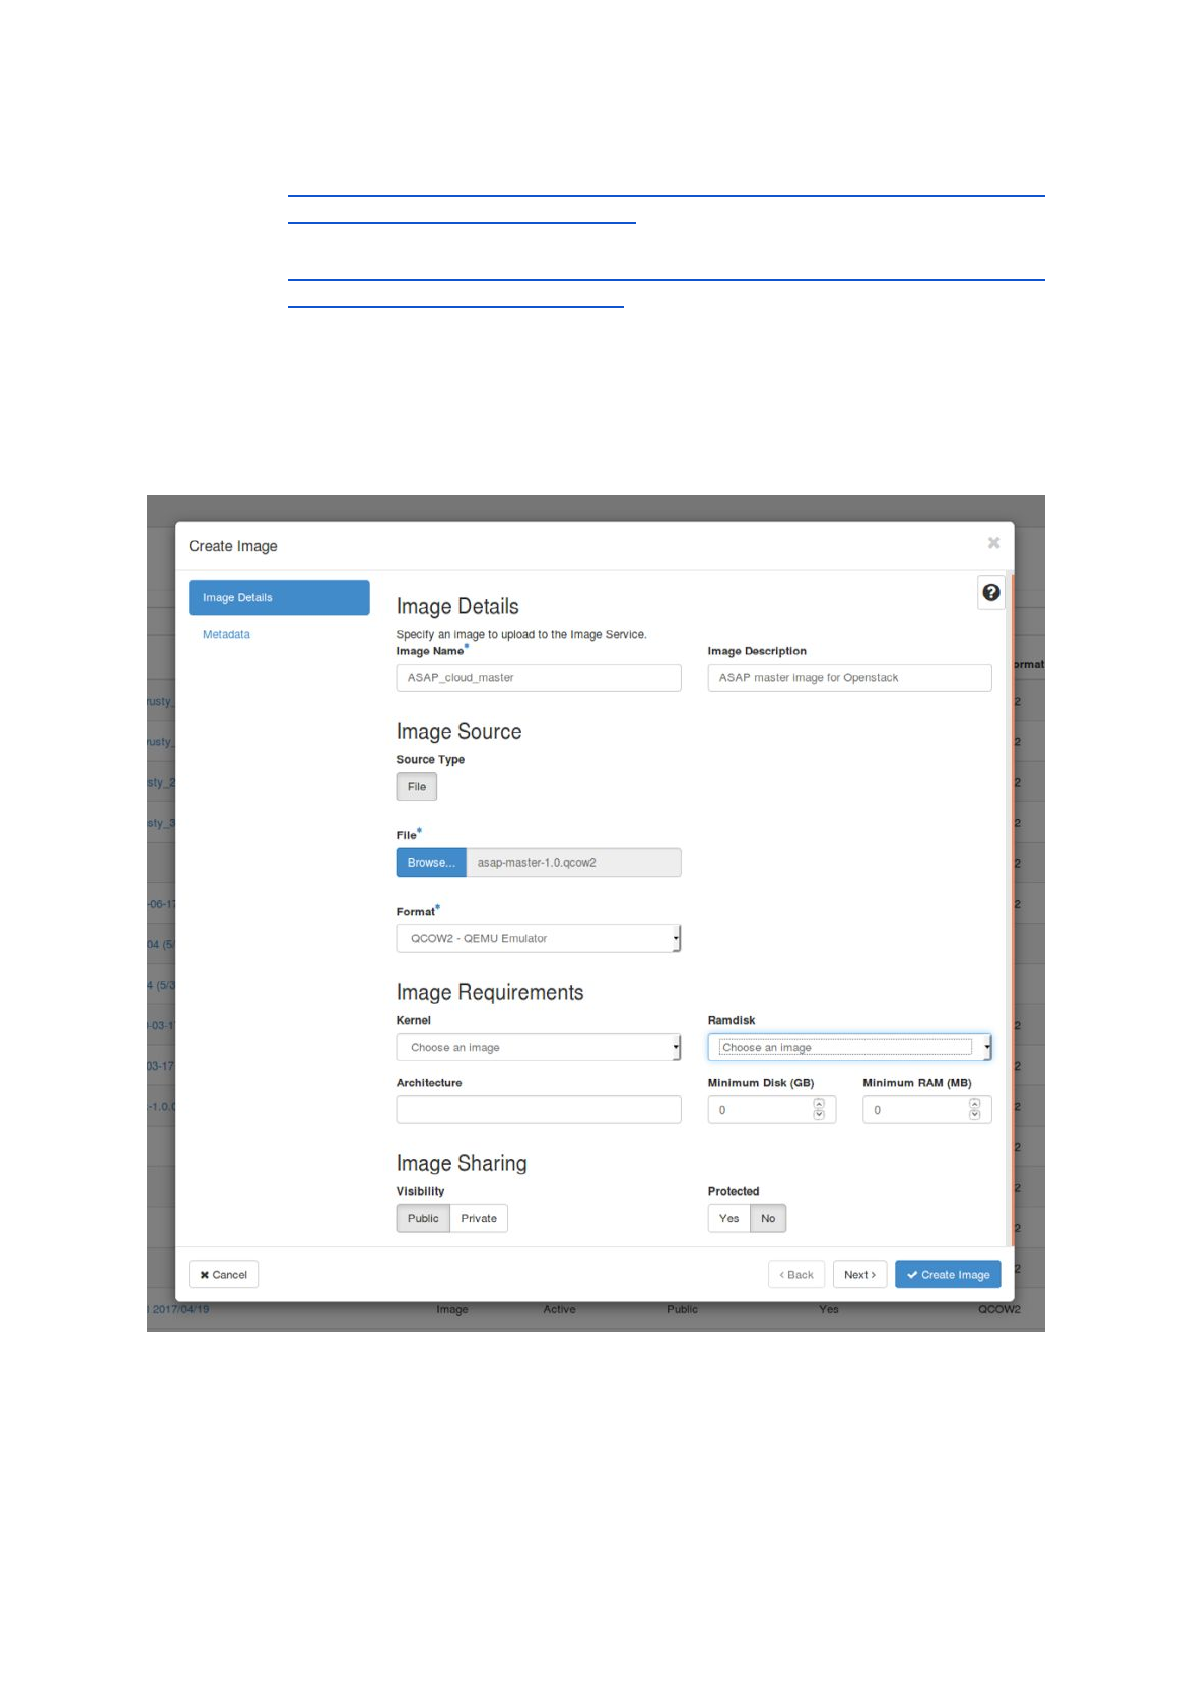
b) upload both images into your cloud project:
- The easiest way to upload the images is to use the OpenStack web interface
(Dashboard). After logging in choose ‘Images’ -> ‘+ Create Image’, fill out the
necessary information and choose ‘Create Image’. After the upload has
finished successfully the images should be available in the list at ‘images’.
- By using the Openstack RC file and a local installation of the OpenStack
command line client it is also possible to upload the images via command
line. For more details please refer to the OpenStack manual.
15
Setup a network
Just like a physical network is needed to connect your local computer to the internet, virtual
machines inside a cloud project need a virtual network. Such networks consist of a router,
an internal network and a subnet to connect to each other and allow user access via SSH.
All the following exemplary steps are shown inside the OpenStack web interface.
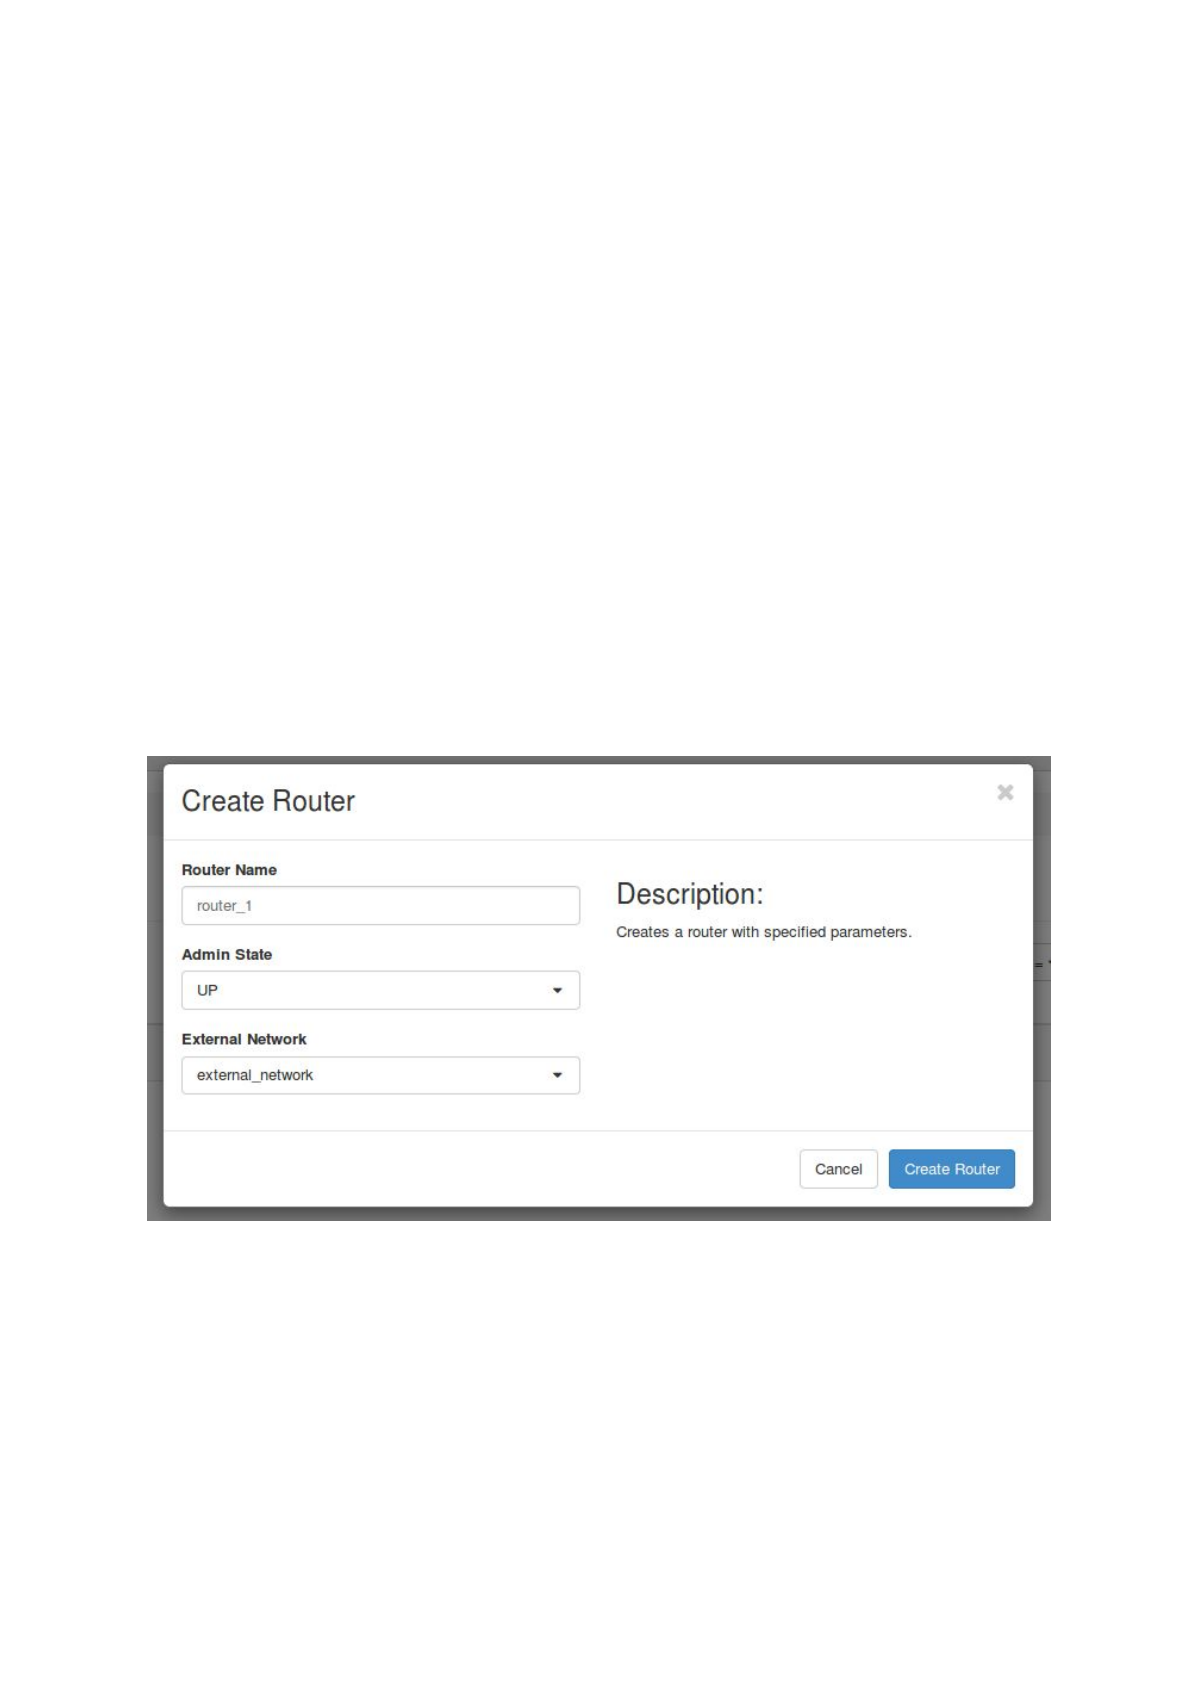
a. set up a router by choosing ‘Network’ -> ‘Routers’ and click on ‘+ Create Router’.
Set a name for the router, choose ‘Admin State’ UP and select an external
network.
(Note: the external network should already have been set up by your cloud
administrator.)
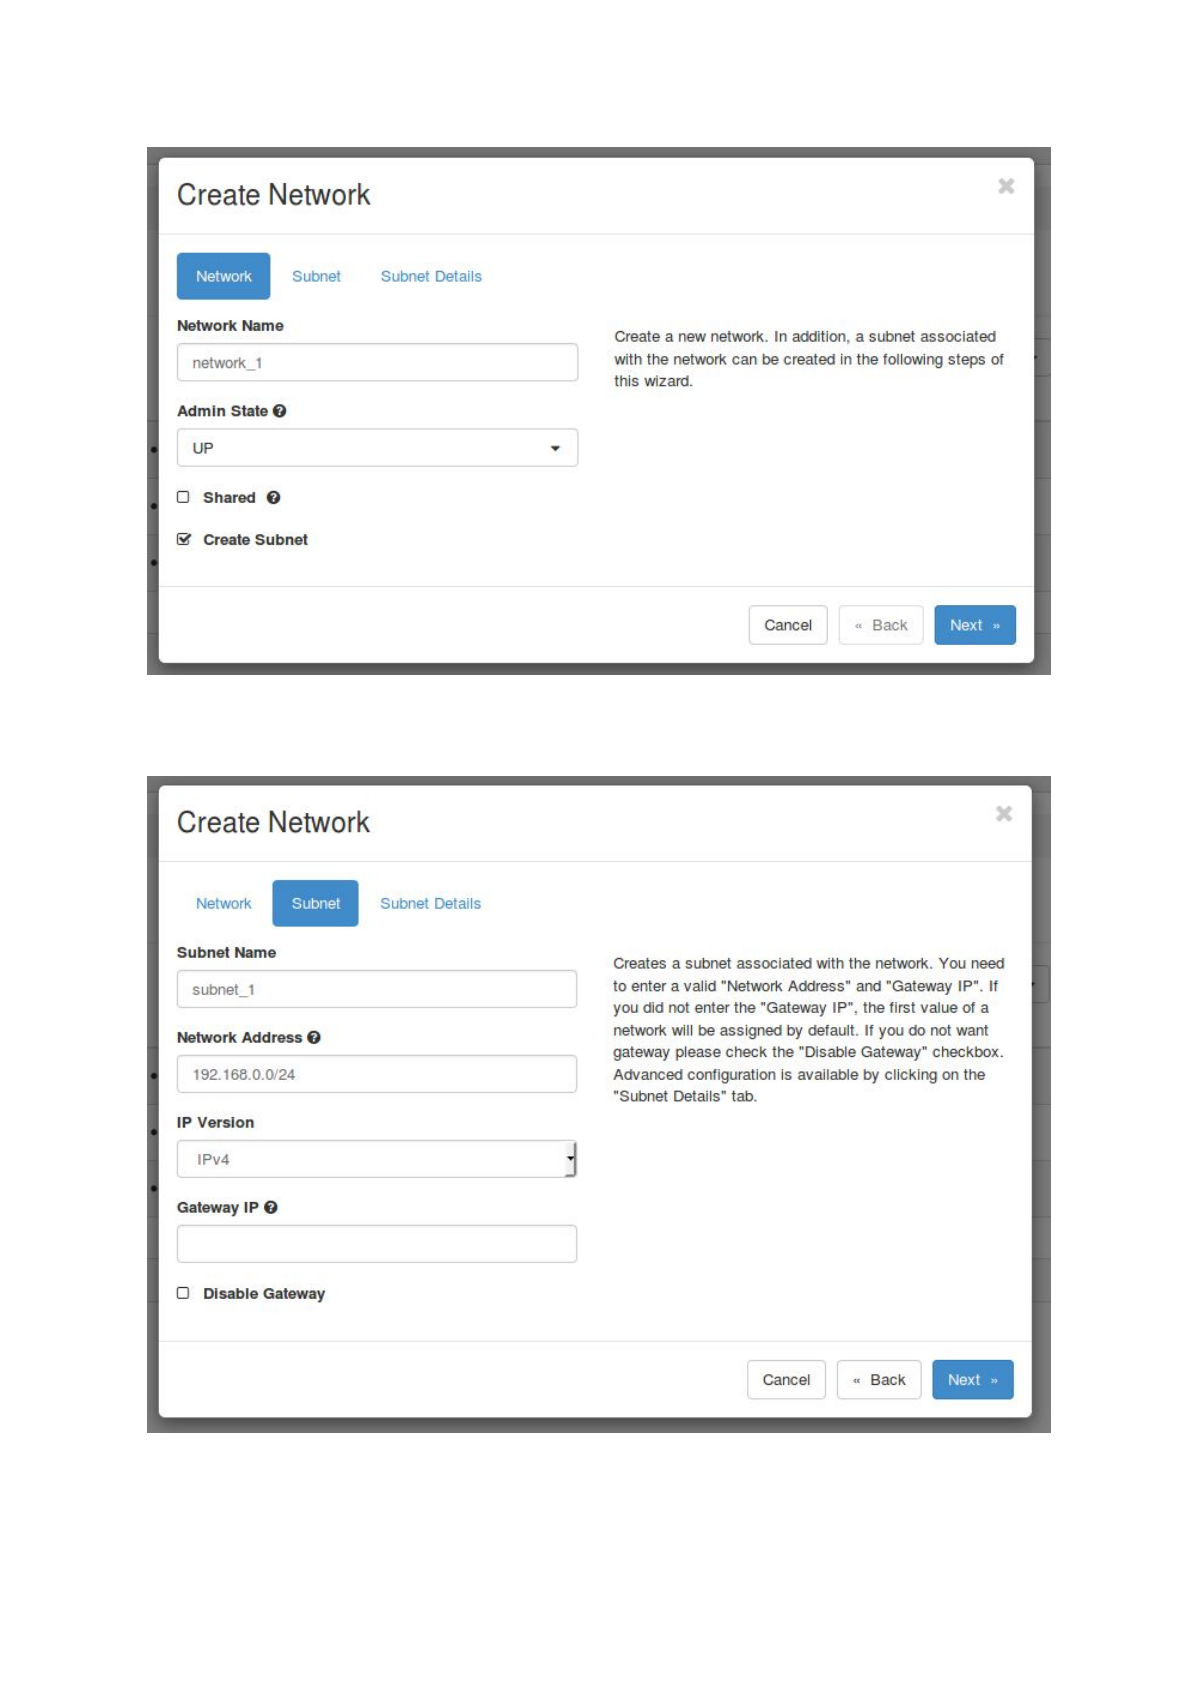
b. Set up a network and a subnet by selecting ‘Network’ -> ‘Networks’ and click on ‘+
Create Network’. Choose a name for the network, select ‘UP’ as ‘Admin State’,
uncheck ‘Shared’ and check ‘Create Subnet’.
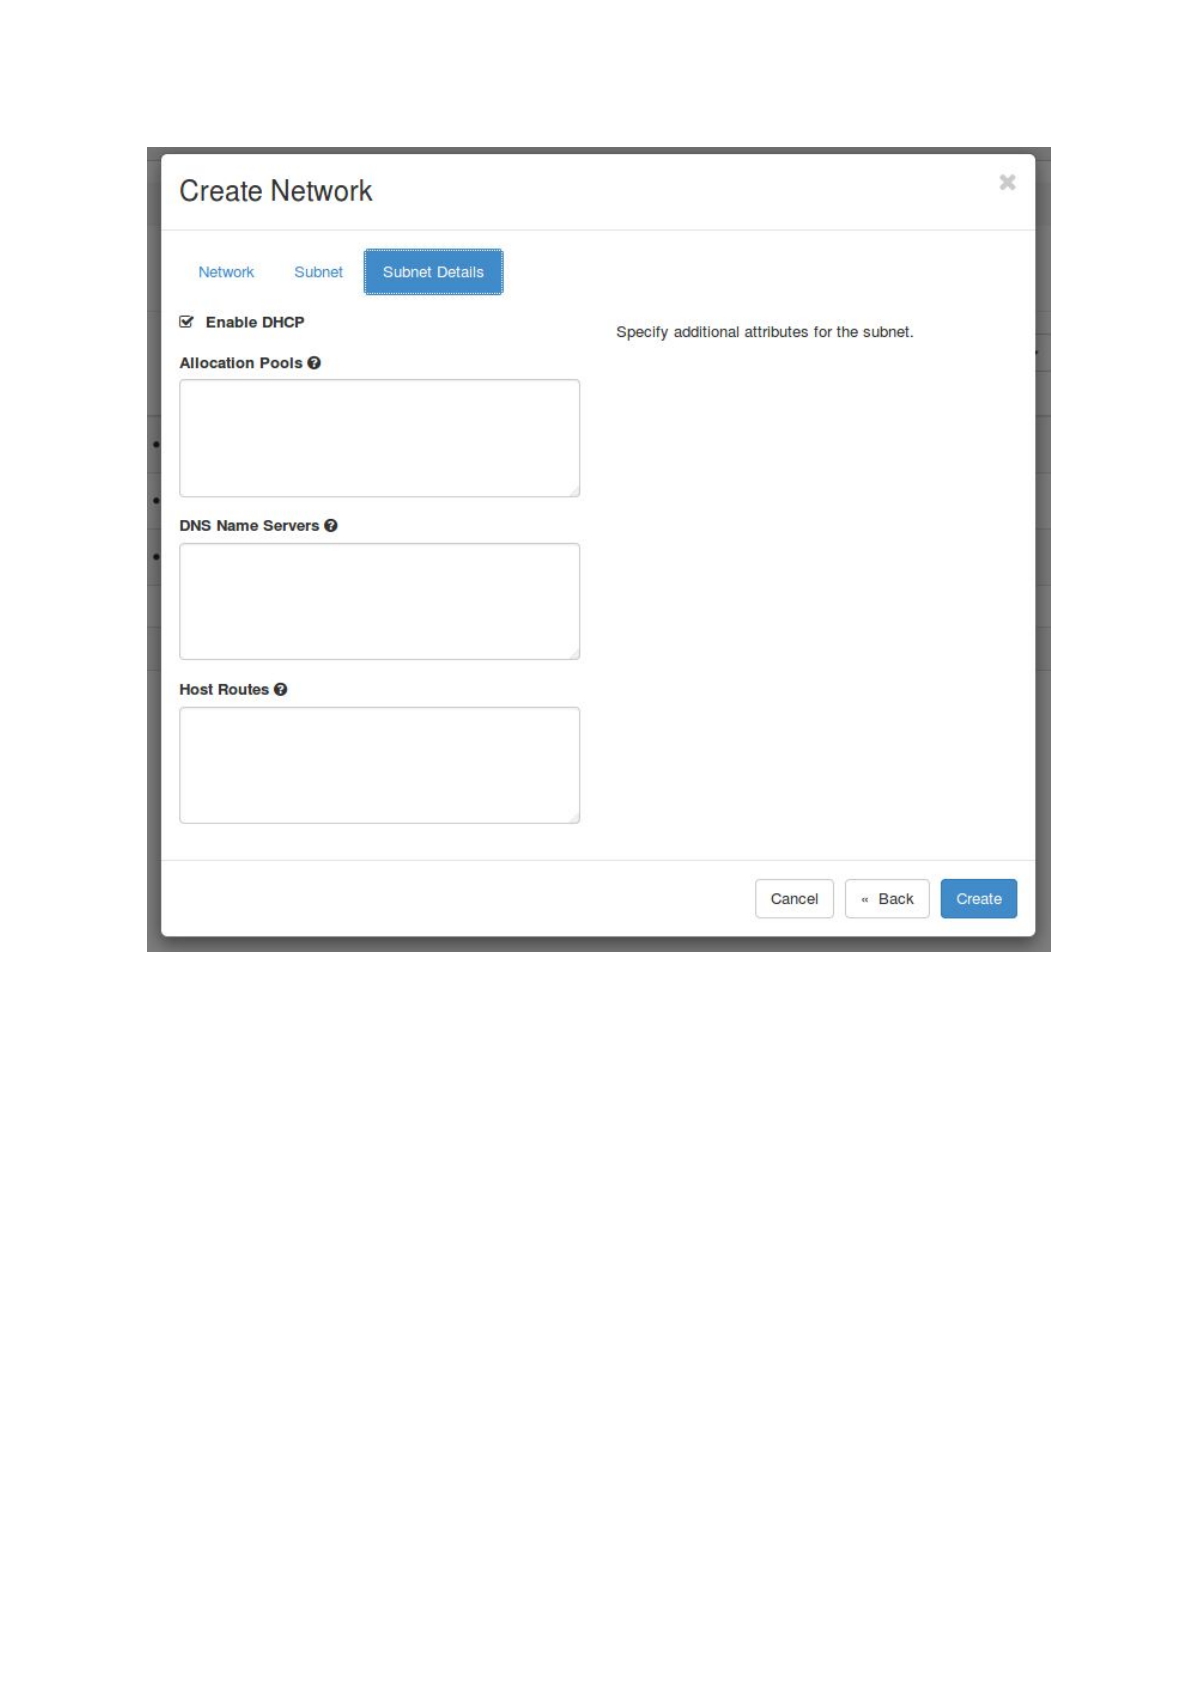
Next select ‘Subnet’ and choose a name for the subnet. Fill in a ‘Network Address’,
e.g. 192.168.0.0/24, select IPv4 and leave the Gateway IP empty. Also leave the
‘Subnet Details’ unchanged and click on ‘Create’.
16
17
c. Finally, the router needs to be connected to the newly created network. Choose
‘Network’ -> ‘Routers’ and click on the created router. Select ‘Interfaces’ -> ‘+ Add
Interface’, choose your subnet and click on ‘Submit’.
18
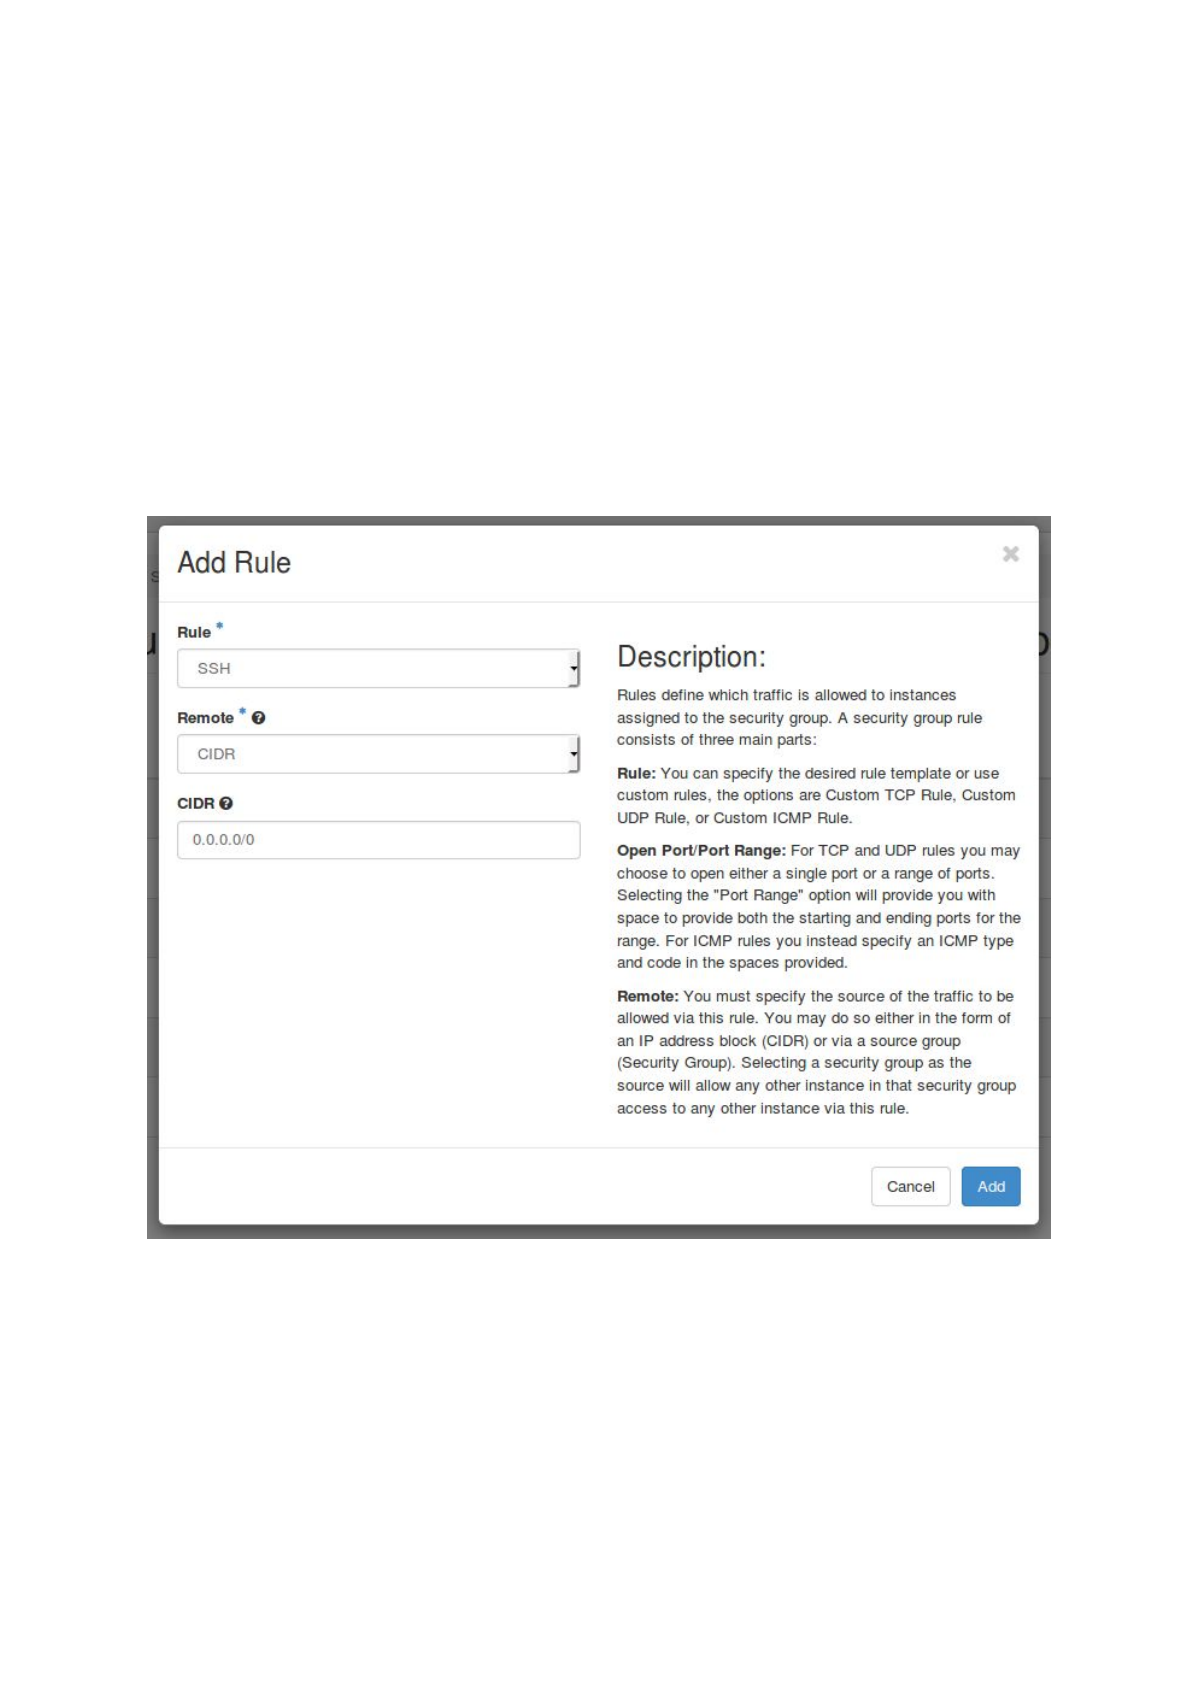
Configure the default security group
In OpenStack security groups define the allowed in- or outgoing traffic for your virtual
machines. Each OpenStack project has its own default security group which usually does
not allow ssh access to the virtual machines (Port 22). As access to the gateway instance
via SSH is mandatory to run ASA³P, an extra rule has to be added to the default security
group.
a. login to the Openstack web interface and choose ‘Access & Security’ -> ‘Security
Groups’
b. Select ‘Manage Rules’ for the default security group
c. Select ‘+ Add Rule’, choose SSH as ‘Rule’ and click on ‘Add’
19

Create a SSH key pair
To access the gateway instance later via a secure shell (SSH), a SSH key pair has to be
generated. This can easily be done via the OpenStack web interface. Therefore, login and
choose ‘Access & Security’ -> ‘Key Pairs’ and click ‘+ Create Key Pair’. Then fill in a
name and select ‘Create Key Pair’. Afterwards, the newly created public key will be
automatically stored in OpenStack and a dialogue will open to download the private key file.
It is also possible to import an already created SSH key to OpenStack. Therefore, choose
‘Access & Security’ -> ‘Key Pairs’ and click ‘Import Key Pair’. Fill in a name for the key
pair and paste the public key in the text field. Afterwards, choose ‘Import Key Pair’ to
upload the SSH key.
Setup and start the gateway instance
Start a new virtual machine instance. This VM merely acts as a starting point to transfer all
data and finally executing ASA³P in the cloud. All analyses will be carried out on additional
VMs orchestrated by the ASA³P cloud script. Therefore, this VM only needs rather small
hardware capacities:
- min. 1 vCPU
- min. 2 GB RAM
- min. 20 GB storage
After the startup assign a Floating IP to the gateway instance via the OpenStack web
interface. Therefore, select ‘Compute’ -> ‘Instances’ and click the ‘arrow-down button’ in
the ‘Action’ column of the gateway instance. In the drop down menu choose ‘Associate
Floating IP’ and select an IP address. If no IP address is available, a new address can be
assigned with the ‘+’ button. The gateway instance is now accessible via ssh and the
assigned Floating IP address.
Note:
Floating IP addresses are usually limited for each OpenStack project, so please remove
Floating IPs from unused virtual instances!
ASA³P installation and configuration
1) create two volumes storing ASA³P including its databases and project data
20

2) download the Openstack RC v3 file
3) install and configure the ASA³P cloud version
Create data volumes
a) create two new volumes:
-volume 1: 250 GB size
-volume 2: depends on the size of your project
b) attach both volumes to the gateway instance via the Openstack web interface
c) login into the gateway instance
d) lookup identifier of attached volumes:
sudo fdisk -l
e) create an ext4 file system on both volumes:
mkfs -t ext4 /dev/<asap-device>
mkfs -t ext4 /dev/<data-device>
f) mount volume 1 to /mnt/asap/
sudo mkdir /mnt/asap/
sudo mount /dev/<asap-device> /mnt/asap/
g) download ASA³P and extract it into the volume:
cd /mnt/asap/
wget \
https://s3.computational.bio.uni-giessen.de/swift/v1/asap/latest/asap
-os.tar.gz
tar -xzf asap-os.tar.gz
rm asap-os.tar.gz
mv ./asap-os/* .
rmdir ./asap-os/
h) unmount volume 1
sudo umount /mnt/asap/
i) detach volume 1 via the OpenStack web interface
j) mount volume 2 to /mnt/data/
sudo mkdir /mnt/data/
sudo mount /dev/<data-device> /mnt/data/
k) upload your project data directory (containing config.xls and data subdirectory) via
scp
Install and configure the ASA³P cloud version
a) download the Openstack RC v3 file (via the OpenStack web interface)
- login to the Openstack web interface
- choose ‘Access & Security’ -> ‘API Access’ and select ‘Download
OpenStack RC File v3’
21

- the OpenStack RC File contains required environment variables for the
subsequent cluster creation
- copy the file to the gateway instance (e.g. via scp)
b) login to the gateway instance
c) install Java OpenJDK 8
sudo apt-get install openjdk-8-jdk
d) install OpenStack
sudo apt-get install python-openstackclient
e) download and extract necessary ASA³P cloud files to the home directory
wget \
https://s3.computational.bio.uni-giessen.de/swift/v1/asap/latest/asap
-cloud.tar.gz
tar -xzf asap-cloud.tar.gz
f) fill out the asap.properties file (~/asap-cloud/asap.properties)
Edit the file with a command line editor (e.g. nano) replacing the bold values
to your OpenStack project.
-cloud.zone=<openstack-name-zone>
zone of the used cloud
-cloud.region=<openstack-name-region>
region of the used cloud
- cloud.subnet=<openstack-name-subnet>
* subnet in your cloud to host the BiBiGrid cluster
- cloud.quota.cpu=<max-vcpus>
max. number of accessible VCPUs
- master.instance=<openstack-name-master-flavour>
name of the instance flavor for the master instance
- master.cpu=<vcpus-master>
number of VCPUs in the master flavor
- master.image=<openstack-id-master-image>
ID of the BiBiGrid master image
- slaves.instance=<openstack-name-slave-flavour>
name of the instance flavor for the slave instances
- slaves.cpu=<vcpus-slaves>
number of VCPUs in the slave flavor
- slaves.image=<openstack-id-master-image>
ID of the BiBiGrid slave image
- volume.asap=<openstack-id-asap-volume>
* ID of the volume containing ASA³P (volume 1)
- volume.data=<openstack-id-data-volume>
* ID of the volume containing the ASA³P
project directory (volume 2)
When using the de.NBI cloud at Justus-Liebig-University Gießen the
asap-denbi-giessen.properties template can be used and only the
marked *informations have to be added. Rename the template to
asap.properties before actually using it.
Example:
22

cloud.region=RegionOne
cloud.quota.cpu=100
master.instance=de.NBI.large
master.cpu=16
Start ASA³P in the cloud
Once you have setup and configured everything the only thing you have to do is to log into
your gateway instance (if not already logged in) and start the execution:
sh ~/asap-cloud/asap.sh -i <instance_id> -o <openstack.rc> -p
<project>
The script accepts three parameters:
<instance_id>: OpenStack ID of the gateway instance
<openstack.rc>: absolute path to the Openstack RC v3 file
<project>: absolute path to local ASA³P project directory (containing config.xls and
data subdirectory, e.g. /mnt/data/my-first-project)
At runtime the script asks for the Openstack user password. This is a necessity in order to
perform all internal steps such as attaching/detaching volumes, starting/stopping VMs, etc...
Note:
As the script waits until ASA³P has finished execution, we strongly encourage users to
execute the script inside a detachable session with tmux or screen. For further information
please read the official documentations.
After ASA³P has finished execution the script will automatically stop all started SGE and NFS
servers and terminate master and slave VMs. Now, all data, results as well as HTML5
reports are stored within the project directory:
/mnt/data/<your-project-dir>/
Custom installation on private cluster systems
As ASA³P comes with a very high number of external dependencies we highly discourage
everyone from custom installations. Nevertheless, if you need to do so, please note that we
cannot offer any support for this! We apologize for any inconvenience but this would simply
be way out of our capabilities.
23

Before setting everything up step by step please, take notice of the following pre
requirements:
1) a shared directory (e.g. NFS) for
a) ASA³P home directory
b) ASA³P database directory
c) your project data
2) a working compute cluster based on either Sun Grid Engine or Open Grid Scheduler
3) access to all shared directories mentioned in 1) from the executing machine as well
as all cluster slave nodes
We developed and tested ASA³P on Ubuntu LTS 16.04. All installation instructions are
related to this specific Linux distribution. If you use an alternative one, please bear in mind
that certain packages might be missing. In this case you would need to figure out all lacking
dependencies by your own.
If you meet all listed pre requirements follow the subsequent steps:
1) Install all necessary Ubuntu packages via apt-get:
a) gnuplot-nox
b) libdatetime-perl
c) libxml-simple-perl
d) libdigest-md5-perl
e) bioperl
f) libtbb2
g) openjdk-8-jdk
h) python-pip
i) roary
2) Install biopython via python pip
3) Download and extract the ASA³P home directory containing all scripts, configs and
shared executables to a shared directory:
https://s3.computational.bio.uni-giessen.de/asap/asap.tar.gz
4) Download and extract the ASA³P database directory containing all databases to a
shared directory: https://s3.computational.bio.uni-giessen.de/asap/asap-db.tar.gz
5) Set and export environment variables “ASAP_HOME” and “ASAP_DB” pointing to the
aforementioned home directory and database directory, respectively.
Download Files
As ASA³P offers 2 distinct versions, i.e. ways of how to download, install and use it. As each
one needs different files to properly run users might be confused which files to download.
Therefore, the following section provides information on all available versions, releases and
necessary files.
All necessary files can be downloaded from our public S3 bucket at:
https://s3.computational.bio.uni-giessen.de/swift/v1/asap
24

Example project
exemplary data project:
https://s3.computational.bio.uni-giessen.de/swift/v1/asap/example-lmonocytogenes.tar.gz
Releases
For each published release there is a distinct subdirectory e.g. latest or v1.0 containing
necessary files for both Docker and OpenStack versions. Thus, users need to replace
<VERSION> by a published release tag in subsequent URLs, e.g. latest:
Common files
- ASA³P directory (software & databases) [Docker]:
https://s3.computational.bio.uni-giessen.de/swift/v1/asap/<VERSION>/asap.tar.gz
- ASA³P directory (software & databases) [OpenStack]:
https://s3.computational.bio.uni-giessen.de/swift/v1/asap/<VERSION>/asap-os.tar.gz
- MD5 checksum file (to check file integrities):
https://s3.computational.bio.uni-giessen.de/swift/v1/asap/<VERSION>/MD5SUM
OpenStack
- cloud executables:
https://s3.computational.bio.uni-giessen.de/swift/v1/asap/<VERSION>/asap-cloud.tar
.gz
- OpenStack master image:
https://s3.computational.bio.uni-giessen.de/swift/v1/asap/<VERSION>/asap-cloud-m
aster-1.0.qcow2
- OpenStack slave image:
https://s3.computational.bio.uni-giessen.de/swift/v1/asap/<VERSION>/asap-cloud-sla
ve-1.0.qcow2
Analyses
Quality Control / Clipping
This step provides a quality overview of all sequenced reads before and after the actual
quality clipping. In the quality clipping process reads unsuitable for subsequent analysis
steps are filtered out. Quality of sequenced reads is measured via FastQC. A check for
potential contaminations is conducted via FastQ Screen. Reads which were sequenced on
an Illumina platform are quality clipped with Trimmomatic using the following settings:
"ILLUMINACLIP: and :2:30:10", 'LEADING:15', 'TRAILING:15', 'SLIDINGWINDOW:4:20',
25

'MINLEN:20', 'TOPHRED33'. Reads which were sequenced on a Pacific Bioscience platform
are not quality clipped as this internally performed by the HGAP 4 assembler.
Assembly
Reads that passed quality control get assembled into contigs. PacBio and Illumina reads are
assembled with HGap4 and SPAdes, respectively.
Scaffolding
Orders and orientations of assembled contigs are somewhat arbitrary. During a scaffolding
step ASA³P tries to map those contigs onto a set of closely related (user provided) reference
genomes in order to rearrange them. With this additional information scaffolders can fix the
order and orientation and merge multiple contigs into scaffolds. As a modern multi-reference
scaffolder ASA³P internally takes advantage of the tool MeDuSa. As joined contigs pose an
artificial bridge an artificial six frame stop codon sequence is used to mark such positions
'NNNNNNNNNNCTAGCTAGCTAGCNNNNNNNNNN'. By using this sequence to link all
scaffolds and contigs ASA³P also provides pseudo genomes. Finally, raw contigs as well as
oriented and linked scaffolds are mapped onto all provided reference genomes in order to
compare the results of this step.
Annotation
To annotate contigs and scaffolds ASA³P internally uses Prokka and Barrnap. For high
quality annotation genus specific information is used. Therefore, ASA³P uses genus specific
Blast databases comprising all RefSeq genome annotations related to a certain genus. In
order to further increase annotation quality ASA³P uses a combination of small specialised
high quality databases such as CARD for antimicrobial resistance genes and VFDB for
virulence factors.
Taxonomic Classification
For the taxonomic classification of bacterial isolates ASA³P uses three distinct methods:
- Kmer profiles
- 16S sequence homology
- Comparison of average nucleotide identities (ANI)
The first two are reference free solutions where the last one is reference based approach.
Kmer profiles are analyzed via the Kraken tool and subsequent kmer profile hits are
extracted from a custom RefSeq based database. In order to search for 16S homology the
pipeline uses Infernal to extract the best scoring 16S sequence and subsequently queries it
against the RDP 16S database.
26

Finally, the pipeline uses a proprietary ANI implementation based on Nucmer to calculate
whole genome sequence identity as a reference based solution.
Multilocus Sequence Typing (MLST)
MLST is a typing method for closely related bacterial strains within a species. Therefore,
genomes are blasted against public databases containing 5 to 7 thoroughly selected loci for
each typed organism. Each combination of alleles determines a unique sequence type.
ASA³P uses a proprietary implementation based on BLASTn and the public database
PubMLST. If a genome contains exactly one reference loci set the classification was
successful. Otherwise, the most similar reference is shown in case there were sufficient
matches.
Antibiotic Resistance Detection (ABR)
There are many different molecular mechanisms for ABR posing a major bioinformatic
challenge. Addressing this issue ASA³P takes advantage of the Comprehensive Antibiotic
Resistance Database (CARD) and its corresponding search tool. The database is manually
curated and updated on a monthly basis. Additionally, CARD provides its own sophisticated
ontology in order to classify detected ABRs. To our best knowledge it’s the only
database/tool which can detect, classify and describe several different types of ABR, e.g.
gene homology and mutations driven mechanisms.
Virulence Factor (VF) Detection
As VF have a major impact on whether a bacterial strain is harmless or a severe pathogen
ASA³P provides a detection of potential VFs. Therefore, the pipeline identifies VFs via a
BLASTn search against the virulence factor database (VFDB). Hits with a coverage of at
least 80 % and a percent identity of 90 % or higher are taken into account. The
corresponding loci are only assigned with their highest scoring hit.
Reference Mapping
In order to assess an isolate genome size compared to a reference genome and
subsequently enable the calling of single nucleotide variants sequenced and quality clipped
reads are mapped to the reference genome at the first position in a project. For Illumina and
Pacific Bioscience reads ASA³P uses Bowtie 2 and blasr, respectively. Finally, generated
Sequence Alignment/Map (SAM) files are converted to ordered Binary Alignment/Map (BAM)
files via SAMtools.
27

Single Nucleotide Polymorphism (SNP)
This analysis provides information on SNPs compared to the reference genome. Via the
mpileup function of SAMtools mapped BAM files together with the reference genome are
used to compute the likelihood of each possible genotype. The resulting likelihoods
containing genomic positions are stored as Binary Variant Call Format (BCF) files. BCFtools
is then used to call variants in the sequence compared to the reference. Genomic variants in
the resulting Variant Call Format (VCF) file are then filtered via SnpSift. Finally, filtered
variants get annotated via SnpEff to predict resulting effects.
Core - pan genome
Coding sequences (CDS) of the analysed genomes get clustered and assigned to gene
abundance groups via Roary. These groups consist of genes present in all analysed
genomes (`core`), genes present at least in one other analysed genome (`accessory`) and
genes unique to one a single genome (`singletons`). Internally, Roary uses CD-HIT and
BLAST+ and is provided with .gff files resulting from prior annotation.
Phylogeny
Based on a consensus sequence created via BCFtools ASA³P uses FastTreeMP to
calculate a phylogenetic tree of all analyzed genomes. FastTreeMP follows an
approximately-maximum-likelihood approach on nucleotide level. The resulting newick file
(.nwk) contains the tree representation including edge lengths. ASA³P provides a
comprehensive visualization of such trees via the web based JavaScript library
Phylocanvas.
Results
The ASA³P workflow comprises several steps which each of output their own data files and
information. All results are stored in a standardized directory structure explained before for
follow-up analyses. Additionally, ASA³P creates interactive and responsive HTML5 reports
providing aggregated information in a dense and user friendly manner. Therefore, ASA³P
presents certain information via specialized HTML5/Javascript widgets from both open
source and private sources. Result pages also inform users on failed or skipped analyses.
The following sections provide comprehensive information on which reports contain which
results and how to interact with related widgets.
28

Quality clipping overview
Content - Widgets
Interactive data table
Individual sorting can be applied via clicking on the respective column header. Use the
Search function (top right of the table) to display only genomes that contain the search term
in any of their table fields. The number of entries displayed per page can be chosen on the
top left of the table. Blue horizontal bar plots are displayed in '# Reads' column. Their data
field filling ratio corresponds to the ratio of field value to column maximum. Mouse over on
underlined table headers to display further information on it.
Downloads
The table can be saved as comma separated value (csv) file via click on the csv button
(search and sorting are contained in the downloaded file).
Links
-Details on the quality control of a particular genome can be accessed via click on the
magnifying glass in the overview table.
-FastQC; Simon Andrews (2010). FastQC: A quality control tool for high throughput
sequence data.
-FastQ Screen; Steven Wingett (2011). FastQ Screen allows you to screen a library
of sequences in FastQ format against a set of sequence databases so you can see if
the composition of the library matches with what you expect.
-Trimmomatic: Bolger, A. M., Lohse, M., & Usadel, B. (2014). Trimmomatic: A flexible
trimmer for Illumina Sequence Data. Bioinformatics, btu170. PubMed.
Glossary
-GC: GC content in percent.
-Genome: Name of the processed genome.
-Length: Minimal/ mean/ maximal read length for this particular genome.
-PC: Read percentage of potential contaminations. Based on a 10% random subset
mapping against a contamination references data base (e.g. containing phiX
sequences).
-Quality: Minimal/ mean/ maximal PHRED score of sequenced reads for this
particular genome (error probability; PHRED 20: 1 in 100; PHRED 30: 1 in 1000).
-# Reads: Number of sequenced reads for this particular genome.
29

Quality clipping genome details
Content - Widgets
Table raw
Displays the properties of the raw data, including File names, the # Reads, read Lengths,
Quality and GC percentage.
Table QC
Displays the properties of data after quality control, including File names, the # Reads, read
Lengths, Quality and GC percentage.
Boxplot potential contaminations
The percentage of reads that could not be mapped to the reference but to different
contamination targets is shown per target. The different targets include human, mouse PhiX
and vectors.
Interactive diagram groups
The first diagram of each quartet refers to the forward reads of raw data, the second to
forward quality controlled data, the third to reverse reads of raw data and the fourth to
reverse reads of quality controlled data. Via mouseover on the diagram the according
filename is displayed.
Per base qualities
Diagrams with the quality scores across all bases. On the x-axis the base position in the
reads is displayed. On the y-axis the Quality as PHRED score is shown.
Per sequence qualities
Diagrams with the quality score distribution over all sequences. On the x-axis the mean
sequence Quality as PHRED score of a read is shown. On the y-axis the number of reads is
display.
Per base sequence contents
Diagrams with the sequence content across all bases. On the x-axis the base position in the
reads is displayed. On the y-axis the percentage of each base (A, C, G, T) across all reads
is displayed.
Per sequence GC contents
Diagrams with the GC distribution over all sequences. The red graph shows the GC count
per read, the blue graph shows the theoretical distribution. On the x-axis the mean GC
content of the reads is display. On the y-axis the number of reads is display.
Per base N contents
30

Diagrams with the N content across all bases. On the x-axis the base position in the reads is
displayed. On the y-axis the percentage of bases characterised as 'N' (not assignable) is
displayed.
Sequence length distributions
Diagrams with the distribution of sequence lengths over all sequences. On the x-axis the
sequence lengths of the reads are displayed. On the y-axis the number of reads is
displayed.
Kmer profiles
Diagrams with the log2 ratio from observations to expected kmers. The six kmers with the
highest log2 obs/exp are displayed. On the x-axis the base position in the reads is display.
On the y-axis the log2 ratio from observations to expected kmers is displayed.
Glossary
-GC: GC content in percent.
-Length: Minimal/ mean/ maximal read length for this particular file.
-Potential Contaminations: Read percentage of potential contaminations. Based on
a 10% random subset mapping against a contamination references data base (e.g.
containing phiX sequences).
-Quality: Minimal/ mean/ maximal PHRED score of sequenced reads for this
particular genome (error probability; PHRED 20: 1 in 100; PHRED 30: 1 in 1000).
- # Reads: Number of sequenced reads for this particular file.
Assembly overview
Content - Widgets
Interactive dotplot
Via the radio buttons on the right key data for X and Y axis can be selected. Mouse over a
dot of interest to display the according genome name as well as horizontal and vertical value
extensions. Zooming can be applied via marking the area of interest with left mouse button
down. To reset the view right click.
Interactive data table
Individual sorting can be applied via clicking on the respective column header. Use the
Search function (top right of the table) to display only genomes that contain the search term
in any of their table fields. The number of entries displayed per page can be chosen on the
top left of the table. Blue horizontal bar plots are displayed in most columns containing
numeric values. Their data field filling ratio corresponds to the ratio of field value to column
maximum. Mouse over on underlined table headers to display further information on it.
31

Downloads
The table can be saved as comma separated value (csv) file via click on the csv button
(search and sorting are contained in the downloaded file). To download the fasta file of a
particular genome assembly click on fasta in the data table.
Links
-Details on the assembly of a particular genome can be accessed via click on the
magnifying glass in the overview table.
-HGap: Chin, Chen-Shan, et al. "Nonhybrid, finished microbial genome assemblies
from long-read SMRT sequencing data." Nature methods 10.6 (2013): 563-569.
PubMed.
-SPAdes: Bankevich A., Nurk S., Antipov D., Gurevich A., Dvorkin M., Kulikov A. S.,
Lesin V., Nikolenko S., Pham S., Prjibelski A., Pyshkin A., Sirotkin A., Vyahhi N.,
Tesler G., Alekseyev M. A., Pevzner P. A. SPAdes: A New Genome Assembly
Algorithm and Its Applications to Single-Cell Sequencing. Journal of Computational
Biology, 2012. PubMed.
Glossary
-# Contigs: Number of contigs (set of overlapping DNA segments).
-GC: GC content in percent.
-Genome: Name of the processed genome.
-Genome size: Genome size in 1000 bases [kb].
-Mean contig lengths: Mean contig lengths of this particular genome.
-Median contig lengths: Median contig lengths of this particular genome.
-N50: Given ordered contigs from longest to smallest, length of the contig at 50% of
the genome length.
-N50 coverage: Length weighted mean coverage of sequences with N50 length or
longer.
-N90: Given ordered contigs from longest to smallest, length of the contig at 90% of
the genome length.
-N90 coverage: Length weighted mean coverage with sequenced reads of N90
contigs.
Assembly genome details
Content - Widgets
Histograms of contig specifications
Contig lengths
32

Histogram of contig length in kb. Via mouse over the number of contigs in each bin is
displayed.
Contig coverage
Histogram of the average read coverage per contig. Via mouse over the average coverage
of each bin is displayed.
Contig GC contents
Stacked histogram of GC contents per contig. Via mouse over the GC content of each
individual contig is displayed.
Basic assembly statistics
Provides information on the assembly in general and on the contig length.
Interactive data table contigs
Individual sorting can be applied via clicking on the respective column header. Use the
Search function (top right of the table) to display only genomes that contain the search term
in any of their table fields. The number of entries displayed per page can be chosen on the
top left of the table. Mouseover on underlined table headers to display further information on
it.
Downloads
The contigs and scaffolds used in this assembly as well as the ones discarded (not used for
assembly) can be downloaded as fasta on the right below the histograms. The table can be
saved as comma separated value (csv) file via click on the csv button (search and sorting
are contained in the downloaded file).
Glossary
-Contigs: Set of overlapping DNA segments (reads).
-Coverage: Mean read coverage of this contig.
-# Gaps: Amount of space (bp) between assembled nucleotides in this contig.
-GC: GC content in percent.
-Length: Length of the contig in base pairs.
-N50 length: Given ordered contigs from longest to smallest, length of the contig at
50% of the genome length.
-N90 length: Given ordered contigs from longest to smallest, length of the contig at
90% of the genome length.
-Name: Name of this contig.
-Scaffolds: Consists of aligned contigs with the sequence
'NNNNNNNNNNCTAGCTAGCTAGCNNNNNNNNNN' in between them.
33

Scaffolding overview
Content - Widgets
Interactive data table
Individual sorting can be applied via clicking on the respective column header. Use the
Search function (top right of the table) to display only genomes that contain the search term
in any of their table fields. The number of entries displayed per page can be chosen on the
top left of the table. Blue horizontal bar plots are displayed in columns containing numeric
values. Their data field filling ratio corresponds to the ratio of field value to column maximum.
Mouse over on underlined table headers to display further information on it.
Downloads
The table can be saved as comma separated value (csv) file via click on the csv button
(search and sorting are contained in the downloaded file). To download a fasta file
containing the Scaffolds or the generated Pseudo genome click on the according name in
the data table.
Links
-Details on the contig layout of a particular genome can be accessed via click on the
magnifying glass in the overview table.
-MeDuSa: E Bosi, B Donati, M Galardini, S Brunetti, MF Sagot, P Lió, P Crescenzi, R
Fani, and M Fondi. MeDuSa: a multi-draft based scaffolder. Bioinformatics (2015):
btv171. PubMed.
-MUMmer/Nucmer: Open source MUMmer 3.0 is described in "Versatile and open
software for comparing large genomes." S. Kurtz, A. Phillippy, A.L. Delcher, M.
Smoot, M. Shumway, C. Antonescu, and S.L. Salzberg, Genome Biology (2004),
5:R12. PubMed.
Glossary
-# Contigs: Number of contigs (set of overlapping DNA segments).
-Genome: Name of the processed genome.
-N50: Given ordered contigs from longest to smallest, length of the contig at 50% of
the genome length.
-Pseudo genome: Genome generated via joining all sequence elements after
scaffolding with the sequence 'NNNNNNNNNNCTAGCTAGCTAGCNNNNNNNNNN'.
-# Scaffolds: Number of scaffolds (joined, aligned and assigned contigs) after
polishing. Joined with the sequence
'NNNNNNNNNNCTAGCTAGCTAGCNNNNNNNNNN'.
34

Scaffolding genome details
Provides information on contig alignment and assignment to reference genome(s). The
contigs of the particular Whole Genome Assembly (WGA) are compared to each of the
reference genomes via Synteny plots. In order to visualize the scaffolding quality the
comparison is done before and after the scaffolding process.
Content - Widgets
Basic scaffolding statistics
Provides information on scaffolding in general and on the scaffold length.
DNA synteny plots
The upper synteny plot of each genome comparison displays the position of all contigs in
both genomes before the scaffolding process (Pre Scaffolding). The lower synteny plot after
scaffolding (Post Scaffolding). On the x-axis the contig position in the reference genome is
displayed. On the y-axis the contig position in the WGA is displayed. Contigs referenced to
the minus strand are displayed in orange the ones referenced to the plus strand are
displayed in blue. Mouse over a contig to receive information on its name, length assigned
strand as well as start and end position in the reference.
Downloads
The scaffolds and the generated pseudo genome can be downloaded as fasta on the top
right.
Glossary
-# Contigs: Number of contigs (set of overlapping DNA segments).
-Genome Size [Mb]: Size of the WGA in million/mega bases.
-N50: Given ordered contigs from longest to smallest, length of the contig at 50% of
the genome length.
-N90: Given ordered contigs from longest to smallest, length of the contig at 90% of
the genome length.
-# Scaffolds: Number of scaffolds (joined, aligned and assigned contigs) after
polishing.
-WGA: Whole Genome Assembly generated via joining all sequence elements after
scaffolding with the sequence 'NNNNNNNNNNCTAGCTAGCTAGCNNNNNNNNNN'.
35

Annotation overview
Content - Widgets
Interactive dotplot
Via the radio buttons on the right key data for X and Y axis can be selected. Mouse over a
dot of interest to display the according genome name as well as horizontal and vertical value
extensions. Zooming can be applied via marking the area of interest with left mouse button
down. To reset the view right click.
Interactive data table
Individual sorting can be applied via clicking on the respective column header. Use the
Search function (top right of the table) to display only genomes that contain the search term
in any of their table fields. The number of entries displayed per page can be chosen on the
top left of the table. Blue horizontal bar plots are displayed in columns containing numeric
values. They visualize the relative relation of this value compared to the according values of
the other genomes.
Downloads
The table can be saved as comma separated value (csv) file via click on the csv button
(search and sorting are contained in the downloaded file). To download the GenBank (gbk)
or General Feature Format (gff) file of a particular genome assembly click on gbk or gff in the
data table.
Links
-Barrnap; Barrnap predicts the location of ribosomal RNA genes in genomes. It
supports bacteria (5S,23S,16S), archaea (5S,5.8S,23S,16S), mitochondria (12S,16S)
and eukaryotes (5S,5.8S,28S,18S). GitHub.
-Details on the annotation of a particular genome can be accessed via click on the
magnifying glass in the overview table.
-Prokka: Seemann T. Prokka: rapid prokaryotic genome annotation. Bioinformatics.
2014 Jul 15;30(14):2068-9. PMID:24642063. PubMed.
-RefSeq: O'Leary, Nuala A., et al. "Reference sequence (RefSeq) database at NCBI:
current status, taxonomic expansion, and functional annotation." Nucleic acids
research (2015): gkv1189. PubMed.
-CARD; Jia et al. 2017. CARD 2017: expansion and model-centric curation of the
Comprehensive Antibiotic Resistance Database. Nucleic Acids Research, 45,
D566-573. PubMed.
-VFDB: Chen LH, Zheng DD, Liu B, Yang J and Jin Q, 2016. VFDB 2016: hierarchical
and refined dataset for big data analysis-10 years on. Nucleic Acids Res.
44(Database issue):D694-D697. PubMed.
36

Glossary
-# CDS: Number of coding DNA sequences found.
-# CRISPR/CAS: Number of CRISPR cassettes found.
-# Genes: Number of genes found.
-Genome: Name of the processed genome.
-# Hyp. Proteins: Number of hypothetical protein coding genes found.
-# ncRNA: Number of non coding RNA genes found.
-# rRNA: Number of ribosomal RNA genes found.
-# tRNA: Number of transfer RNA genes found.
Annotation genome details
Content - Widgets
Interactive genome plot
The circular genome plot is generated utilising the BioCircos.js library. The most outer circle
displays the position reference in million base pairs. The most outer gene feature circles
display all annotated gene features from forward and reverse strand. Mouse over the gene
features to show feature start, end, type, gene name and product. The CDSs are displayed
in grayscale, RNAs in green and misc features in orange. The outer circular box plot
visualizes the GC content of 1 kb bins. GC contents above the genome mean are colored in
green and the ones below are colored in red. The inner circular box plot visualizes the GC
Skew of 1 kb bins. GC Skews above the genome mean are colored in purple and the ones
below are colored in neon green. Positioning of the whole genome plot can be applied via
drag and drop and Zooming can be applied via mouse wheel.
Basic annotation statistics
Abundance of the annotated feature types found in this genome. Visualization of the
annotation prediction rate.
Interactive data table features
Individual sorting can be applied via clicking on the respective column header. Use the
Search function (top right of the table) to display only genomes that contain the search term
in any of their table fields. The number of entries displayed per page can be chosen on the
top left of the table.
Downloads
Several annotation based files can be downloaded, including the genome as gbk,
annotations as gff, gene sequences as ffn, coding sequences as faa and the circular
genome plot as svg file. The features table can be saved as comma separated value (csv)
file via click on the csv button (search and sorting are contained in the downloaded file).
37

Links
-BioCircos.js; BioCircos.js: an Interactive Circos JavaScript Library for Biological
Data Visualization on Web Applications. Cui, Y., et al. Bioinformatics. (2016).
PubMed.
Glossary
-End: End position of the feature in base pairs.
-Gene: Gene name in case it is provided by the feature reference.
-Inference: Source the feature prediction is based on.
-Locus: Designation of the annotated genomic region.
-Misc features: Miscellaneous feature an annotated genomic area that is neither CDS
nor RNA.
-Product: Short description of the product associated with the feature.
-Start: Start position of the feature in base pairs.
-Strand: The forward/plus strand is marked via '+' and the reverse/minus strand is
marked with '-'.
-Type: Designated group of this gene feature.
Taxonomic classification overview
Here an overview on the taxonomy of the analysed genomes with key data from reference
free classification and highest reference average nucleotide identity is provided.
Content - Widgets
Interactive data tables
Individual sorting can be applied via clicking on the respective column header. Use the
Search function (top right of the table) to display only genomes that contain the search term
in any of their table fields. The number of entries displayed per page can be chosen on the
top left of the table. Mouse over on underlined table headers to display further information on
it.
Reference free classifications
The results from Kraken and Infernal are displayed.
Highest reference ANIs
The results from Nucmer based ANI classification are displayed.
Downloads
The table can be saved as comma separated value (csv) file via click on the csv button
(search and sorting are contained in the downloaded file).
38

Links
-ANI: Goris, Johan, et al. "DNA–DNA hybridization values and their relationship to
whole-genome sequence similarities." International journal of systematic and
evolutionary microbiology 57.1 (2007): 81-91. PubMed.
-Details on the taxonomy of a particular genome can be accessed via click on the
magnifying glass in the overview table.
-Kmer column value redirects to kmer taxonomic classification in the ncbi Taxonomy
Browser.
-16S rRNA column value redirects to 16S rRNA taxonomic classification in the ncbi
Taxonomy Browser.
-Kraken: Wood DE, Salzberg SL: Kraken: ultrafast metagenomic sequence
classification using exact alignments. Genome Biology 2014, 15:R46. PubMed.
-Infernal: E. P. Nawrocki and S. R. Eddy, Infernal 1.1: 100-fold faster RNA homology
searches, Bioinformatics 29:2933-2935 (2013). PubMed.
-MUMmer/Nucmer: Open source MUMmer 3.0 is described in "Versatile and open
software for comparing large genomes." S. Kurtz, A. Phillippy, A.L. Delcher, M.
Smoot, M. Shumway, C. Antonescu, and S.L. Salzberg, Genome Biology (2004),
5:R12. PubMed.
-RDP: Cole, J. R., Q. Wang, J. A. Fish, B. Chai, D. M. McGarrell, Y. Sun, C. T. Brown,
A. Porras-Alfaro, C. R. Kuske, and J. M. Tiedje. 2014. Ribosomal Database Project:
data and tools for high throughput rRNA analysis Nucl. Acids Res. 42(Database
issue):D633-D642; doi: 10.1093/nar/gkt1244. PubMed.
Glossary
-16S Classification: Rfam 16S based taxonomic classification via Infernal.
-ANI [%]: Percent average nucleotide identity. Based on the ANI publication the
sequenced genome is split into 1020 bp fragments which are compared against the
reference (in our approach Nucmer was used instead of blastN). For the calculation
the length of the fragments with less than 30% non identities and an alignment length
higher than 70% are summed and divided by the total length of the sequenced
genome.
-Conserved DNA [%]: Percent conserved DNA. Based on the ANI publication the
sequenced genome is split into 1020 bp fragments which are compared against the
reference (in our approach Nucmer was used instead of blastN). For the calculation
the length of the fragments that matched with 90% sequence identity or higher are
summed and divided by the total length of the sequenced genome.
-Genome: Name of the processed genome.
-Kmer Classification: Kmer based taxonomic classification via Kraken.
-Reference: ID of the reference genome used for taconomic classification.
39

Taxonomic classification genome details
Content - Widgets
Interactive phylogeny visualization
The height of the phylogenetic levels symbolizes the number of contigs classified as such.
The number of classified contigs may decreases with classification depth. On mouse over
the current and the next lower phylogenetic level together with the number of contigs
classified (weight) is displayed.
Kmer contig classifications
Here the phylogeny was calculated based on kmers.
16S rRNA classifications
Here the phylogeny was calculated based on 16S rRNAs.
Interactive data table features
Individual sorting can be applied via clicking on the respective column header. Use the
Search function (top right of the table) to display only genomes that contain the search term
in any of their table fields. The number of entries displayed per page can be chosen on the
top left of the table. Mouse over on underlined table headers to display further information on
it.
Kmer contig classifications
Contains the set of kmer classification results of all contigs.
16S rRNA classifications
Contains the set of 16S rRNA classification results of all contigs based on highest scoring
16S RNA.
Reference ANIs
Table of reference genomes and their percent average nucleotide identity and percentage of
conserved DNA.
Downloads
The table can be saved as comma separated value (csv) file via click on the csv button
(search and sorting are contained in the downloaded file).
Glossary
-ANI [%]: Percent average nucleotide identity. Based on the ANI publication the
sequenced genome is split into 1020 bp fragments which are compared against the
reference (in our approach Nucmer was used instead of blastN). For the calculation
40

the length of the fragments with less than 30% non identities and an alignment length
higher than 70% are summed and divided by the total length of the sequenced
genome.
-Classification: Deepest phylogenetic classification level for a single or group of
contigs/16S RNAs.
-Contigs [#]: Number of contigs that have been identified to this phylogenetic level
depth.
-Contigs [%]: Percentage out all contigs that have been identified to this phylogenetic
level depth.
-Hits [#]: Number of 16S RNAs in the analysed genome that match this 16S RNA
database entry.
-Hits [%]: Percentage of all 16S RNAs in the analysed genome that match this 16S
RNA database entry.
-Linage: List of phylogenetic levels this particular level and the according contigs are
included.
-Reference: Accession of the reference genome.
-Conserved DNA [%]: Percent conserved DNA. Based on the ANI publication the
sequenced genome is split into 1020 bp fragments which are compared against the
reference (in our approach Nucmer was used instead of blastN). For the calculation
the length of the fragments that matched with 90% sequence identity or higher are
summed and divided by the total length of the sequenced genome.
Multilocus Sequence Typing (MLST) overview
Content - Widgets
Interactive donut chart
The distribution of the different Sequence Types, Clonal Clusters and Lineages are
displayed.
Interactive data table
Individual sorting can be applied via clicking on the respective column header. Use the
Search function (top right of the table) to display only genomes that contain the search term
in any of their table fields. The number of entries displayed per page can be chosen on the
top left of the table. In green the found classification elements are displayed.
Downloads
The table can be saved as comma separated value (csv) file via click on the csv button
(search and sorting are contained in the downloaded file).
Links
-MLST; R. Urwin & M.C. Maiden, 2003, Multi-locus sequence typing: a tool for global
epidemiology. Trends Microbiol., 11, 479-487. PubMed.
41

-PubMLST; Database.
Glossary
-Alleles: Contiguous nucleotide sequence 350 to 600 base pairs in length of a
housekeeping gene fragment used in MLST analysis.
-Clonal Cluster: Group of related sequence types.
-Genome: Name of the processed genome.
-Lineage: Members of particular clonal complexes.
-Scheme: Group of bacterial variants.
-Sequence Type: Unique combination of MLST allele designations used in an MLST
scheme.
Antibiotic Resistance Detection (ABR) overview
The antibiotic resistance profile of each genome is visualized on this page.
Content - Widgets
Interactive data table
Individual sorting can be applied via clicking on the respective column header. Use the
Search function (top right of the table) to display only genomes that contain the search term
in any of their table fields. The number of entries displayed per page can be chosen on the
top left of the table. Blue horizontal bar plots are displayed in columns containing numeric
values. They visualize the relation of this value compared to the according values of the
other genomes. In the ABR Profile column found antibiotic drug resistances are visualized as
colored circles. A popup appears on mouse-overs on the circles to display the individual
resistances. Mouse-overs on underlined terms display further information on it.
Downloads
The table can be saved in comma separated value (csv) file format via a click on the csv
button (search and sorting are contained in the downloaded file).
Links
-Details on the resistance of a particular genome can be accessed via click on the
magnifying glass in the overview table.
-CARD; Jia et al. 2017. CARD 2017: expansion and model-centric curation of the
Comprehensive Antibiotic Resistance Database. Nucleic Acids Research, 45,
D566-573. PubMed.
42

Glossary
-# ABR Genes: Number of antibiotic resistance genes found.
-ABR Profile: Found antibiotic agent resistances.
-# ABR Target Drugs: Number of antibiotic agent resistances.
-Genome: Name of the processed genome.
-# Potential ABR Genes: Number of potential antibiotic resistance genes found.
Antibiotic Resistance Detection (ABR) genome details
Content - Widgets
Interactive data tables
Individual sorting can be applied via clicking on the respective column header. Use the
Search function (top right of the table) to display only genomes that contain the search term
in any of their table fields. The number of entries displayed per page can be chosen on the
top left of the table. To display additional model information mouse over a model. The 'Seq
Identity' is categorised into four groups based on value. Entries below 80% sequence identity
are highlighted in red, blow 95% in yellow, blow 98% in light green and above in green. To
display the aligned sequence mouse over the bit score value. Mouse over on underlined
term to display further information on it.
ABR Genes
Provides information on the genes with a perfect reference match (100%) in the ABR
database.
Potential ABR genes - best hits
Provides information on genes and their best non perfect reference ABR database match
(40% < match <=100%).
Potential ABR genes - all hits
Provides information on genes with all their non perfect reference ABR database matches
(40% < match <=100%).
Links
Click on a model redirects to this model reference in the CARD database.
Downloads
The table can be saved as comma separated value (csv) file via click on the csv button
(search and sorting are contained in the downloaded file).
43

Glossary
-Model: Name of the resistance mechanism.
-ABR Target Drugs: The drug or drug family the resistance is associated with.
-Start: Start position of this resistance gene in this genome.
-End: End position of this resistance gene in this genome.
-Length: Length of this resistance gene in this genome.
-Strand: The forward/plus strand is marked via '+' and the reverse/minus strand is
marked with '-'.
-Bit Score: Normalized chance to find the score or a higher one of this match by
chance given in bit (bit score of 3 equals a chance of 2³= 8 -> 1 : 8).
-eValue: Expected number of alignments in the database used with a score
equivalent or higher than this match.
-Seq Identity: Percentage of identical positioned nucleotides in the alignment.
Virulence factor detection overview
This page provides an overview on the number of virulence factors and categories detected
in each genome.
Content - Widgets
Interactive data table
Individual sorting can be applied via clicking on the respective column header. Use the
Search function (top right of the table) to display only genomes that contain the search term
in any of their table fields. The number of entries displayed per page can be chosen on the
top left of the table. Blue horizontal bar plots are displayed in columns containing numeric
values. They visualize the relative relation of this value compared to the according values of
the other genomes. Mouse over on underlined term to display further information on it.
Downloads
The table can be saved as comma separated value (csv) file via click on the csv button
(search and sorting are contained in the downloaded file).
Links
-Details on the virulence factors of a particular genome can be accessed via click on
the magnifying glass in the overview table.
-VFDB: Chen LH, Zheng DD, Liu B, Yang J and Jin Q, 2016. VFDB 2016:
hierarchical and refined dataset for big data analysis-10 years on. Nucleic Acids Res.
44(Database issue):D694-D697. PubMed.
44

Glossary
-Genome: Name of the processed genome.
-Locus: Designation of the annotated genomic region.
-# VFs: Number of assigned virulence factors hits per genome.
-# VF categories: Number of virulence factor categories per genome.
Virulence factor detection genome details
Content - Widgets
Interactive data table
Individual sorting can be applied via clicking on the respective column header. Use the
Search function (top right of the table) to display only genomes that contain the search term
in any of their table fields. The number of entries displayed per page can be chosen on the
top left of the table.
Downloads
The table can be saved as comma separated value (csv) file via click on the csv button
(search and sorting are contained in the downloaded file).
Glossary
●Category: Virulence factor category designation according to its function.
●Coverage: Sequence coverage of this data base hit in percent.
●eValue: Expected number of virulence factors in the database used with a score
equivalent or higher than this match.
●Gene: Gene name in case it is provided by the virulence factor database.
●Locus: Designation of the annotated genomic region.
●Product: Short description of the product associated with the locus.
●# VFs: Number of assigned virulence factors hits per genome.
●# VF categories: Number of virulence factor categories per genome.
Reference mapping
Content - Widgets
Interactive data table
Individual sorting can be applied via clicking on the respective column header. Use the
Search function (top right of the table) to display only genomes that contain the search term
in any of their table fields. The number of entries displayed per page can be chosen on the
top left of the table. Mouse over on underlined term to display further information on it.
45

Downloads
The table can be saved as comma separated value (csv) file via click on the csv button
(search and sorting are contained in the downloaded file). To download the bam file of a
particular genome mapping click on bam in the data table.
Links
-SAMtools; Li H., Handsaker B., Wysoker A., Fennell T., Ruan J., Homer N., Marth
G., Abecasis G., Durbin R. and 1000 Genome Project Data Processing Subgroup
(2009) The Sequence alignment/map (SAM) format and SAMtools. Bioinformatics,
25, 2078-9. PubMed.
-Bowtie 2; Langmead B, Salzberg S. Fast gapped-read alignment with Bowtie 2.
Nature Methods. 2012, 9:357-359. PubMed.
Glossary
-Genome: Name of the processed genome.
-# Multiple: Number of reads that mapped multiple times.
-Ratio: Ratio of total reads that could be mapped to the reference.
-# Reads: Total number of analysed reads.
-# Unique: Number of reads that mapped once.
-# Unmapped: Number of reads that could not be mapped to the reference.
Single Nucleotide Polymorphism (SNP) overview
This page provides an average SNP distribution mapping and a SNP comparison of the
analysed genome.
Content - Widgets
SNP distribution graph
The mean number of SNPs per 10 kb compared to the reference genome are displayed.
Mouse over the graph to display the position and mean SNP number of an individual peak.
Interactive data table
Individual sorting can be applied via clicking on the respective column header. Use the
Search function (top right of the table) to display only genomes that contain the search term
in any of their table fields. The number of entries displayed per page can be chosen on the
top left of the table. Blue horizontal bar plots are displayed in most columns containing
numeric values. They visualize the relative relation of this value compared to the according
values of the other genomes. Mouse over on underlined term to display further information
on it.
46

Downloads
The table can be saved as comma separated value (csv) file via click on the csv button
(search and sorting are contained in the downloaded file). The vcf file of each genome can
be downloaded.
Links
-Details on the SNPs of a particular genome can be accessed via click on the
magnifying glass in the overview table.
-SAMtools; Li H., Handsaker B., Wysoker A., Fennell T., Ruan J., Homer N., Marth
G., Abecasis G., Durbin R. and 1000 Genome Project Data Processing Subgroup
(2009) The Sequence alignment/map (SAM) format and SAMtools. Bioinformatics,
25, 2078-9. PubMed.
-BCFtools; Included in SAMtools.
-SnpSift; "Using Drosophila melanogaster as a model for genotoxic chemical
mutational studies with a new program, SnpSift", Cingolani, P., et. al., Frontiers in
Genetics, 3, 2012. PubMed.
-SnpEff; "A program for annotating and predicting the effects of single nucleotide
polymorphisms, SnpEff: SNPs in the genome of Drosophila melanogaster strain
w1118; iso-2; iso-3.", Cingolani P, Platts A, Wang le L, Coon M, Nguyen T, Wang L,
Land SJ, Lu X, Ruden DM. Fly (Austin). 2012 Apr-Jun;6(2):80-92. PubMed.
-HTSlib; Included in SAMtools.
- Glossary
-Change Range: Ratio of number single nucleotide polymorphisms to genome size.
-Genome: Name of the processed genome.
-HI SNPs: Number of high impact single nucleotide polymorphisms. SNPs are
considered high impact if they result in the gain or loss of a start or stop codon.
-SNPs: Number of single nucleotide polymorphisms.
-TS/TV: Ratio of number nucleotide transitions to number nucleotide transversions.
Single Nucleotide Polymorphism (SNP) genome details
Content - Widgets
SNP distribution graph
Displays the number of SNPs per 10 kb of this particular genome in red and of the mean of
all analysed genomes in blue. Mouse over the graph to display the position and the number
of SNPs of an individual peak.
Histograms
Mouse over the individual bar to display the number of SNP occurrences for this individual
category.
47

Region
Displays the position distribution of SNPs relative to known genes.
Classes
Display the effect type distribution of the SNPs of this genome.
Impacts
Display the severity type distribution of the SNPs of this genome.
Statistics
Statistical summary of the SNPs and their effects of this genome. Mouse over on underlined
term to display further information on it.
Interactive data table high impact SNPs
The table contains all SNPs that have been rated as 'high' by SnpEff. This includes the
SnpEff categories: chromosome_number_variation, exon_loss_variant, frameshift_variant,
rare_amino_acid_variant, splice_acceptor_variant, splice_donor_variant, start_lost,
stop_gained, stop_lost, transcript_ablation. Individual sorting can be applied via clicking on
the respective column header. Use the Search function (top right of the table) to display only
genomes that contain the search term in any of their table fields. The number of entries
displayed per page can be chosen on the top left of the table. Mouse over on underlined
term to display further information on it.
Downloads
The table can be saved as comma separated value (csv) file via click on the csv button
(search and sorting are contained in the downloaded file).
Glossary
-Change Range: Ratio of number single nucleotide polymorphisms to genome size.
-Contig: Reference genome accession of the contig this SNP was found.
-Downstream: Number of SNPs that are located 3' toward the transcription direction
of the closest gene.
-Alt: Base(s) at the SNP position.
-Coverage: Number of reads that display this SNP.
-Effect: Of High Impact SNPs including stop gain and lost and start lost.
-Exon: In this eucaryotic setting referring to the number of SNPs that are located in a
translated region of the genome.
-Gene: Reference gene name for this SNP.
-HI SNPs: Number of high impact single nucleotide polymorphisms.
-High: Includes the SnpEff categories: chromosome_number_variation,
exon_loss_variant, frameshift_variant, rare_amino_acid_variant,
splice_acceptor_variant, splice_donor_variant, start_lost, stop_gained, stop_lost,
transcript_ablation.
48

-Intergenic: Number of SNPS that are located in non transcribed regions of this
genome.
-Low: Includes the SnpEff categories: 5_prime_UTR_premature
start_codon_gain_variant, initiator_codon_variant, splice_region_variant,
start_retained, stop_retained_variant, synonymous_variant.
-Mean Qual: Mean quality of the detected SNP base as PHRED score (error
probability; 20: 1 in 100; 30: 1 in 1000).
-Missense: Number of SNPs that lead to a different amino acid in the resulting
protein.
-Moderate: Includes the SnpEff categories: 3_prime_UTR_truncation +exon_loss,
5_prime_UTR_truncation +exon_loss_variant, coding_sequence_variant,
disruptive_inframe_deletion, disruptive_inframe_insertion, inframe_deletion,
inframe_insertion, missense_variant, regulatory_region_ablation,
splice_region_variant, TFBS_ablation.
-Modifier: Includes the SnpEff categories: 3_prime_UTR_variant,
5_prime_UTR_variant, coding_sequence_variant, conserved_intergenic_variant,
conserved_intron_variant, downstream_gene_variant, exon_variant,
feature_elongation, feature_truncation, gene_variant, intergenic_region,
intragenic_variant, intron_variant, mature_miRNA_variant, miRNA,
NMD_transcript_variant, non_coding_transcript_exon_variant,
non_coding_transcript_variant, regulatory_region_amplification,
regulatory_region_variant, TF_binding_site_variant, TFBS_amplification,
transcript_amplification, transcript_variant, upstream_gene_variant.
-Nonsense: Number of SNPs that lead to a new stop codon in the translated
sequence.
-Position: Position in the reference genome this SNP occurred in base pairs.
-Ref: Base at the reference position.
-SNPs: Number of single nucleotide polymorphisms.
-Silent: Number of SNPs with no direct effect on the resulting amino acid sequence.
-Start lost: This SNP causes start codon loss of the associated gene.
-Stop Gained: This SNP causes stop codon gain of the associated gene.
-Stop lost: This SNP causes stop codon loss of the associated gene.
-Synonymous Variant: Numbers of SNPs that do not lead to a change in the encoded
amino acid.
-TS/TV: Ratio of number nucleotide transitions to number nucleotide transversions.
-Upstream: SNPs that are located 5' toward the transcription direction of the closest
gene.
Core - pan genome
Content - Widgets
Interactive donut chart
The percentage distribution of Core, Accessory and Singleton genes is displayed.
49

Gene Numbers
Provides absolute numbers on Core, Pan, Accessory and Singleton genes.
Interactive PAN / Core / Singleton Development chart
Displays changes in number of CDS (loci) in pan, core and singletons with increasing
numbers of genomes included (x-axis). For each comparison the number of genomes is
picked randomly ten times and the average values are displayed. Pan and core genome size
is referenced by the left y-axis. The number of singletons is referenced by the right y-axis.
Highlighting of an individual graph can be done via clicking on the graph or the according
legend. Individual values on the graphs can be accessed via mouseover. Individual data
points can be highlighted via clicking on them.
Skipped Genome
In case a sequenced genome could not be analysed this frame is displayed and shows the
affected genomes.
Interactive data tables
Individual sorting can be applied via clicking on the respective column header. Use the
search function (top right of the table) to display only genomes that contain the search term
in any of their table fields. The number of entries displayed per page can be chosen on the
top left of the table. Blue horizontal bar plots are displayed in columns containing numeric
values. They visualize the relation of this value compared to the according values of the
other genomes.
Overview
Provides information on the accessory genome size and number of singletons genes for
each genome.
Core Genome
Provides information on the product (function) for each loci of the core genome.
Accessory Genome
Provides information on the product (function) and the abundance for each loci of the
accessory genome.
Singletons
Provides information on each locus, its product (function) and the genome it was found.
Downloads
The table can be saved as comma separated value (csv) file via click on the csv button
(search and sorting are contained in the downloaded file). A fasta file with all core gene
sequences and a file with all the pan gene sequences can be downloaded. The matrix maps
which gene is present in which sequenced organism (present = 1, absent = 0) can be
downloaded as tab separated value 'tsv' file.
50

Links
-Details on the core and pan genome distribution of a particular genome can be
accessed via click on the magnifying glass in the overview table.
-Roary; "Roary: Rapid large-scale prokaryote pan genome analysis", Andrew J. Page,
Carla A. Cummins, Martin Hunt, Vanessa K. Wong, Sandra Reuter, Matthew T. G.
Holden, Maria Fookes, Daniel Falush, Jacqueline A. Keane, Julian Parkhill,
Bioinformatics, (2015). PubMed.
Glossary
-Abundance: Number of locus occurrence in this analysis.
-Accessory: Number of genes that are contained in at least one other analysed
organism (also known as dispensable genome).
-Core: Number of genes contained in all analysed genomes.
-Genome: Name of the processed genome.
-Locus: Defined contiguous nucleotide sequence in the genome.
-Pan: Total number of individual genes in this analysis.
-Pan Genome Matrix: The matrix maps which gene is present in which sequenced
organism (present = 1, absent = 0).
-Product: Functional information on the associated locus.
-Singletons: Number of genes contained only in this genome out of the analysed set.
Phylogeny
Content - Widgets
Phylogenetic tree display
A tree type (rectangular, radial, circular, diagonal and hierarchical) can be chosen via the
drop down menu. The tree can be positioned via mouse drag and drop. The zoom function is
controlled via mouse wheel. Via right clicks in a blank area of the diagram further display and
export options show up (like Export as Image). Via a mouseover on a tree node the number
of leaves associated with this subtree is displayed. Via a left click on a tree node the subtree
is highlighted in blue. Via a right click on a tree node additional display and export options
are available (including Collapse/Expand Subtree and Export Subtree as Newick File)
Downloads
The SNP based phylogenetic distances can be downloaded in newick file format on the top
right (‘Downloads’).
51

Links
●FastTreeMP; Price, M.N., Dehal, P.S., and Arkin, A.P. (2010) FastTree 2 --
Approximately Maximum-Likelihood Trees for Large Alignments. PLoS ONE,
5(3):e9490. doi:10.1371/journal.pone.0009490. PubMed.
●Phylocanvas; Centre for Genomic Pathogen Surveillance (2016 ). Interactive tree
visualisation for the web.
52
