Guide To RTIViewer Manual
User Manual: Pdf
Open the PDF directly: View PDF ![]() .
.
Page Count: 28

2
Guide to RTIViewer v 1.1
2013 Cultural Heritage Imaging and Visual Computing Lab, ISTI - Italian National Research Council. All rights reserved.
This work is licensed under the Creative Commons Attribution-Noncommercial-No Derivative Works 3.0 United States
License.
To view a copy of this license, visit http://creativecommons.org/licenses/by-nc-nd/3.0/us/
or send a letter to Creative Commons, 171 Second Street, Suite 300, San Francisco California 94105 USA.
Attribution should be made to Cultural Heritage Imaging, http://CulturalHeritageImaging.org.
The RTIViewer software described in this guide is made available under the Gnu General Public License version 3.
Acknowledgments
The RTIViewer tool, designed for cultural heritage and natural science applications, was primarily developed by the
Italian National Research Council's (CNR) Institute for Information Science and Technology's (ISTI) Visual Computing
Laboratory (http://vcg.isti.cnr.it) The work was financed by Cultural Heritage Imaging
(http://CulturalHeritageImaging.org) with majority funding from the US Institute of Museum and Library Services' (IMLS)
National leadership Grant Program (Award Number LG-25-06-0107-06) in partnership with the University of Southern
California's West Semitic Research Project. RTIViewer also contains significant software and design contributions from
the University of California Santa Cruz, the Universidade do Minho in Portugal, Tom Malzbender of HP Labs, and Cultural
Heritage Imaging.
Core research under the IMLS grant to develop the multi-view RTI technique along with the RTI and MVIEW file formats,
and hemispherical harmonics fitter was largely performed at UC Santa Cruz under Professor James Davis, in
collaboration with Tom Malzbender of HP Labs and staff of Cultural Heritage Imaging. Additional funding for this work
was provided by the University of California Center for Information Technology Research in the Interest of Society
(CITRIS), and a ARCS Foundation Fellowship to graduate student Oliver Wang.
Along the way others contributed testing, feature ideas, reviews of the guide and other helpful work. It is impossible to
name everyone who contributed, but we would especially like to acknowledge Roberto Scopigno and Paolo Cignoni of
CNR Visual Computing Lab for providing management, technical oversight, and licensing advice, as well as general
support of the project.
The updated 1.1 version of the RTIViewer software and User Guide was partially funded by a 21st Century Museum
Professionals grant from the IMLS, along with volunter efforts and private contributions. The Bookmarks feature added in
the 1.1 release is based on work done by Leif Isaksen of the University of Southampton, UK. We would especially like to
acknowledge the work of Ronald Bourret and Gianpaolo Palma for the development work for this release.
This guide and the RTIViewer software were funded in part by a grant from the Institute of Museum and Library Services.
Its contents are solely the responsibility of the authors and do not necessarily represent the official position or policies of
the Institute of Museum and Library Services.
Additional funding was provided by charitable contributions to Cultural Heritage Imaging.
Special thanks to Judy Bogart for donating her time and expertise in the development and writing of this guide.

3
Installing RTIViewer
RTIViewer is available in separate versions for 32-bit Windows, 64-bit Windows, and Mac OS. It does not run
on Mac PowerPC.
Download RTIViewer for your platform from the CHI web site:
http://CulturalHeritageImaging.org/downloads/
To install the application in Mac OSX, copy the alias in the disk image into the destination folder.
To install the application in 32-bit or 64-bit Windows, run the installer. See Installation notes for
Windows below.
This viewer allows you to load PTMs and RTIs from your local machine or over the web. The download site
also offers a utility, RTI Webmaker, that allows you to break up large PTMs into a folder with smaller chunks
(like a zoom browser) in order to distribute large PTMs over the web; see “Preparing images for remote
viewing” on page 27.
Installation notes for Windows
For older versions of Windows, if you try to start the application and it doesn’t work, download and install
the Microsoft Visual C++ 2010 Redistribution Package:
32-bit Windows: http://www.microsoft.com/en-us/download/details.aspx?id=5555
64-bit Windows: http://www.microsoft.com/en-us/download/details.aspx?id=14632
Memory usage in 32-bit Windows
The viewer offers the option of using a large (3GB) virtual address space, in order to optimize the handling
of large images. If you are running a 32-bit version of Windows, you must set an operating-system
parameter in order to take advantage of this ability. Log in as administrator and run the following
command in a command shell:
If you do not do this, the virtual address space is limited to 2 GB.
In order for the viewer to work properly, the memory required by an RTI you wish to load should be no
more than 80% of the available virtual memory. If the RTI is too large, applying a rendering method can
cause RTIViewer to crash.
To load large RTI files, you must use a 64-bit Windows system and the 64-bit Windows version of RTIViewer.
In Windows XP bootcfg /raw "/3GB" /A /id 1
In Windows 7/Vista bcedit /set increaseuserva 3072

Installing RTIViewer New in this release 4
Required OpenGL library version
RTIViewer relies on the Open Graphics Library (OpenGL) version 2.1 or later for rendering graphics using
the Graphics Processing Unit (GPU). The OpenGL 2.1 specification was released in July 2006, and is
supported on most newer computers.
If you have an older computer, or one that uses an Intel integrated GPU from 2010 or earlier, it might not
support Open GL 2.1 or later. In this case, the RTI image in the main viewing panel can appear as a red
rectangle, although you will see a thumbnail of the RTI in the Navigation tab.
If you experience this problem, you might be able to solve it by updating the graphics drivers on your
computer. If not, you will not be able to use RTIViewer on that computer. This issue appeared in the prior
1.0.2 version of RTIViewer, and still exists in the 1.1 version of RTIViewer. It has been reported by some
users, but appears to be rare.
For more information on graphics cards that support OpenGL 2.1 and later, see:
http://en.wikipedia.org/wiki/Comparison_of_Nvidia_graphics_processing_units
http://en.wikipedia.org/wiki/Comparison_of_Intel_graphics_processing_units
http://en.wikipedia.org/wiki/Comparison_of_AMD_graphics_processing_units
New in this release
Release 1.1 of RTIViewer provides these new features:
Numeric parameter values
All parameters, including the rendering parameter values and the values for an RTI view’s pan position
and lighting angle, are now displayed with specific numeric controls as well as sliders, so that you can
describe, share, and reproduce specific views accurately.
Snapshot data record
When you create a snapshot image of the current view, the specific numeric parameter values that
were applied to the original RTI file to create the snapshot image are saved to a sidecar XML file; that is,
an XML file with the same base name as the RTI file.
Bookmarks
The entire set of parameters that describes a view, including the pan position, lighting angle, and all
rendering values, can now be saved as a named view called a bookmark. You can create multiple
bookmarks for a single RTI file, and you can associate any number of notes with a bookmark.
You can reload a saved bookmark to recreate a specific view. You can edit a new or saved view. If you
edit a bookmarked view, you can re-save the bookmark with the new values, or save the edited view
as a new bookmark in order to create variations of a given view. See “Bookmarking views” on page 11
for more information.
Normals visualization viewing mode
The Normals Visualization viewing mode creates a false-color view of the subject of an RTI that makes
it possible to visualize the normals information that describes the surface contours and orientation.
See “Normals Visualization mode” on page 23 for an example.
5
Using RTIViewer
RTIViewer allows you to load and examine images created with reflectance transformation techniques.
These techniques calculate both color and shape information from a set of images illuminated from
different directions, and store that information in files. This tool supports these file formats, collectively
called RTI files:
Polynomial Texture Map (PTM file)
Reflectance Transformation Imaging (RTI file)
Multi-view RTI (MVIEW file) This is a collection of single-view images together with optical flow data
that allows the generation of intermediate views.
RTIViewer offers interactive rendering of images, allowing you to change the view and alter the apparent
direction of lighting. In addition, it offers a number of enhancement modes, which apply mathematical
transformations to the color and shape information to enhance or emphasize particular features of the
target object. These transformations do not alter the original data, but can be saved separately so that
they can be reapplied.
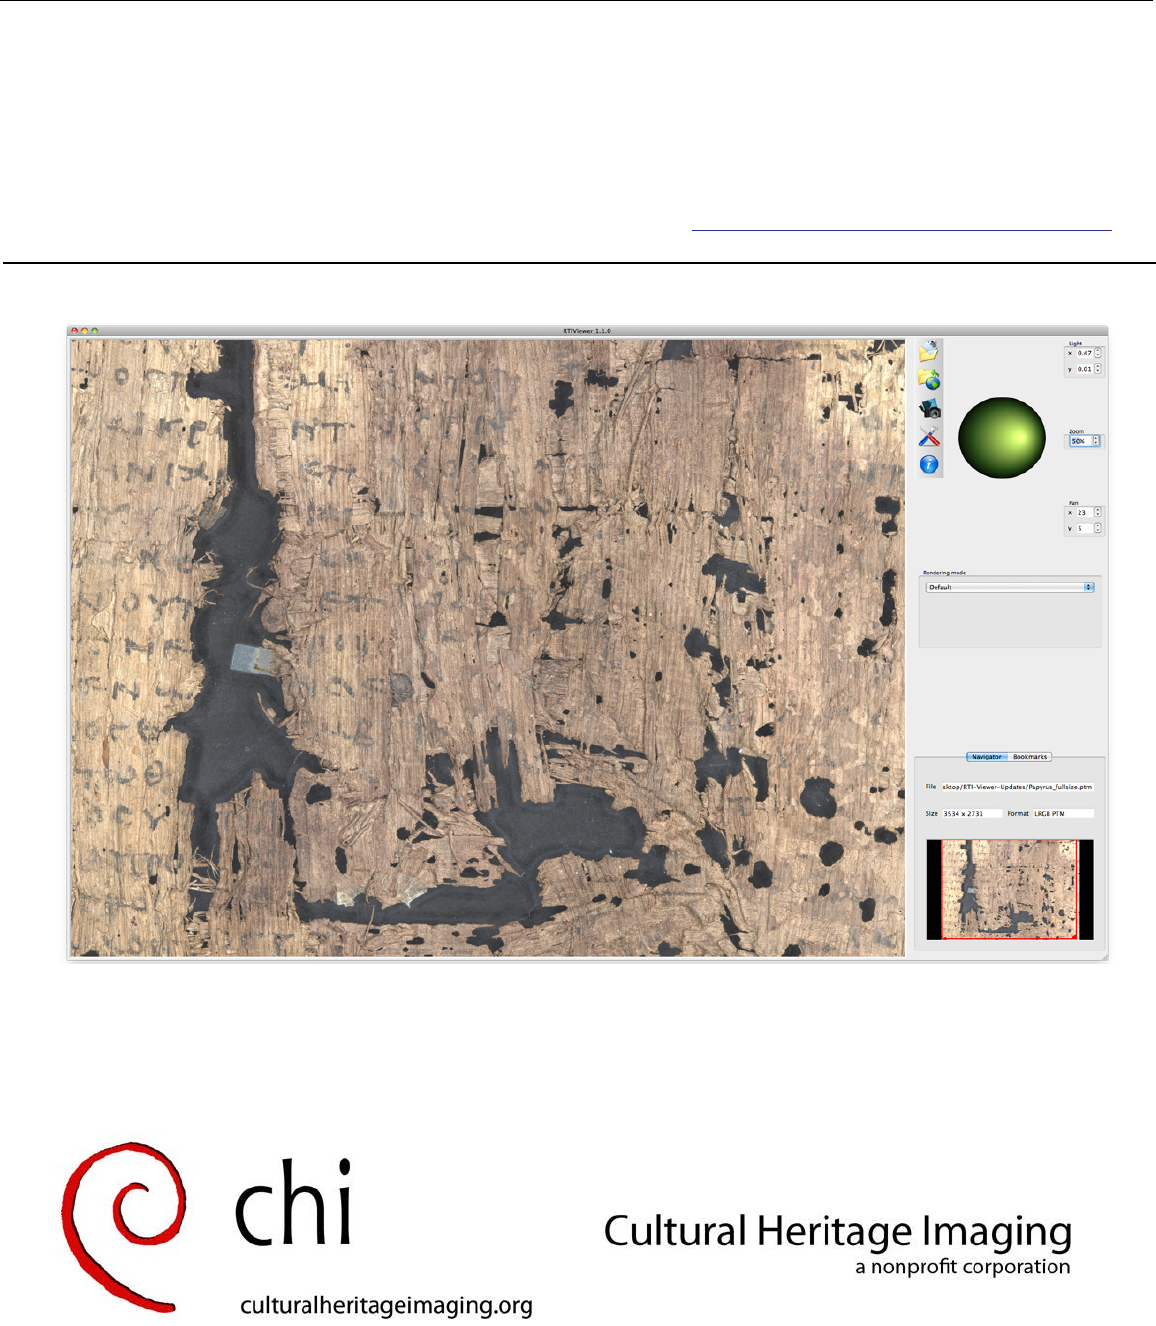
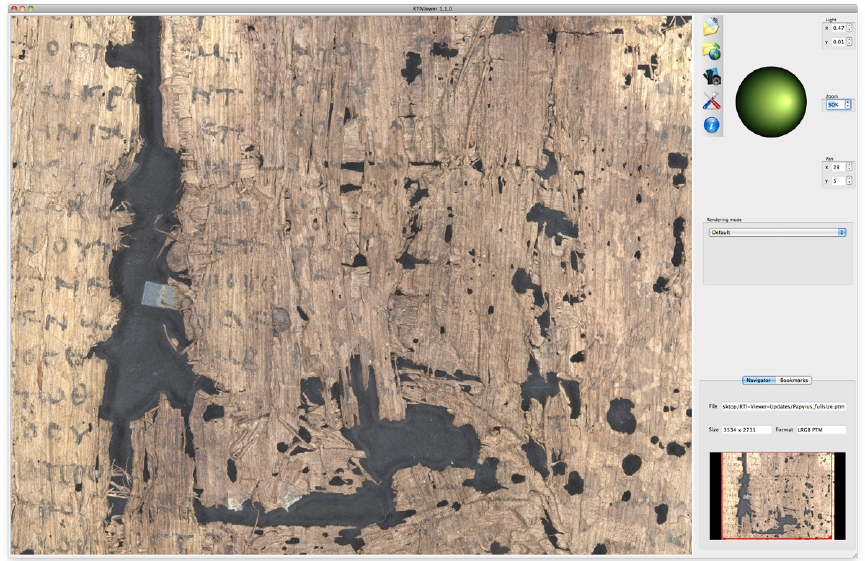
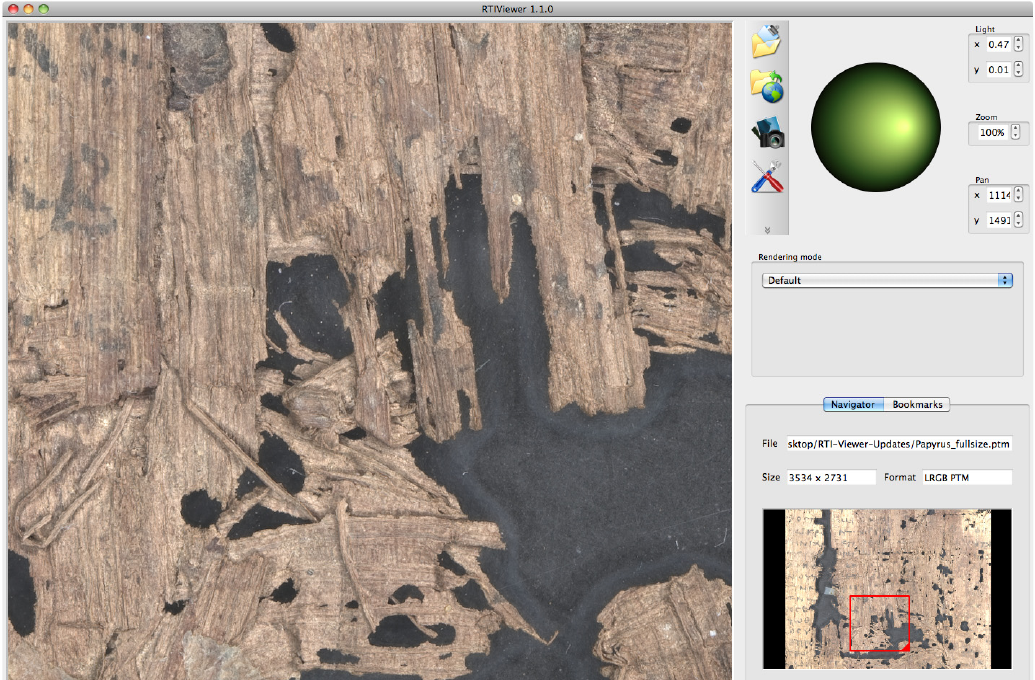
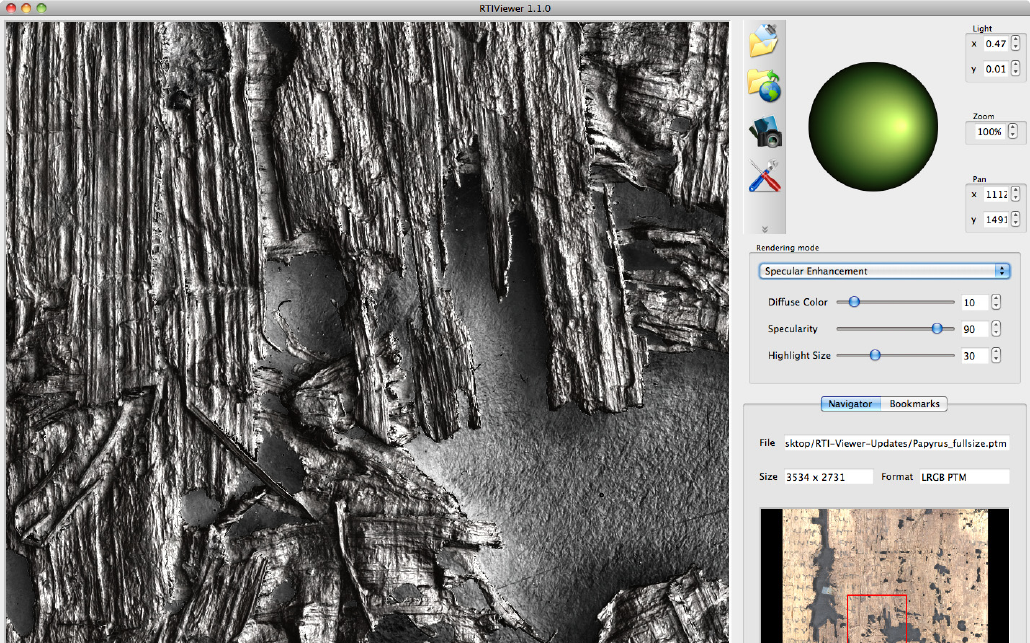
The RTIViewer window
The RTIViewer GUI allows you to load and examine image files, providing options for manipulating the
image to take advantage of the captured surface data in ways that help you study the target object.
Main viewing panel Control panel
Using RTIViewer The RTIViewer window 6
The control panel on the right allows you to load image files, save views, move the angle of the virtual
light on the image, and configure the view in a number of ways.
The main viewing panel on the left displays the current image, rendered and lit according to your
choices in the control panel.
Menu bar
Light controller
Rendering mode selector
Current file details
Image navigator
Control Panel
Zoom factor
Resize handle
Pan position
Light position
Navigator tab
Using RTIViewer The RTIViewer window 7
Menu bar and file details
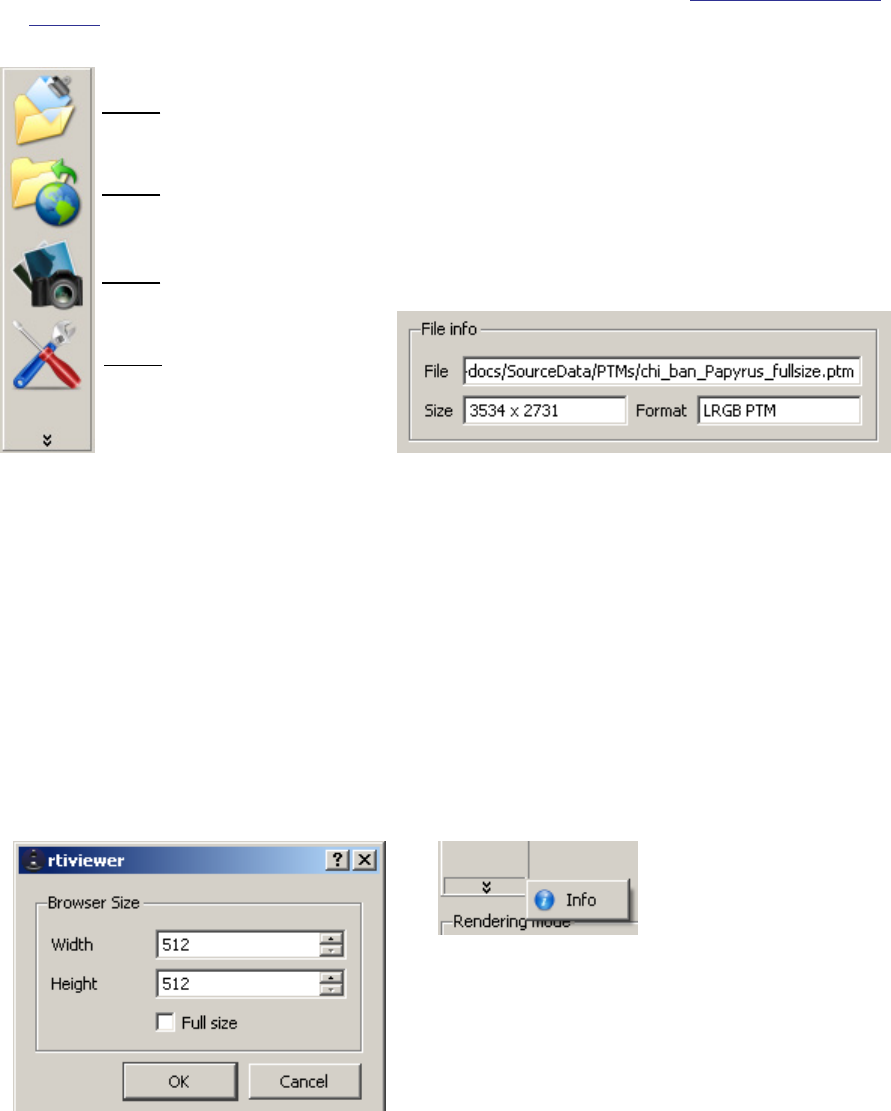
The icons on the menu bar allow you to:
Browse your local disk to find and load image files for viewing.
Browse the internet to find and load image files kept on remote servers; see “Remote Viewing” on
page 27.
When you have loaded a file, the location, size, and format are shown in the File info box.
The menu also allows you to:
Save a snapshot, which is a PNG or JPEG image of the current view shown in the main viewing panel;
that is, the currently selected portion of the file, with the currently selected lighting angle and
rendering style. This also saves a record of the specific parameters that were applied to produce this
image, in a sidecar XML file.
Configure the viewer; the configuration dialog allows you to set the size of the viewer window. Check
the “Full size” box to maximize the image within the main viewing panel.
Bring up the About box, which provides version information and contact information for the
developers and sponsors.
Load from local disk
Load from network
Save snapshot of current view
Configure the viewer
Bring up About box
Using RTIViewer Image navigation and lighting 8
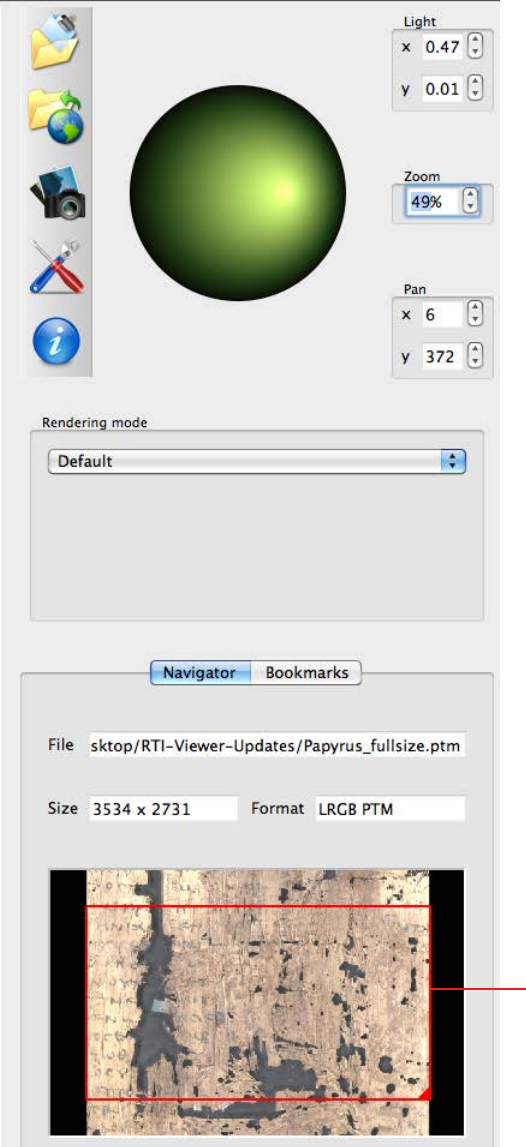
Image navigation and lighting
You can control the portion of the image you are viewing, and the angle of the virtual light; the light
controller and image navigator in the control panel allow you to make changes, and also reflect the
current state when you change the view by directly manipulating the image in the main viewing panel.
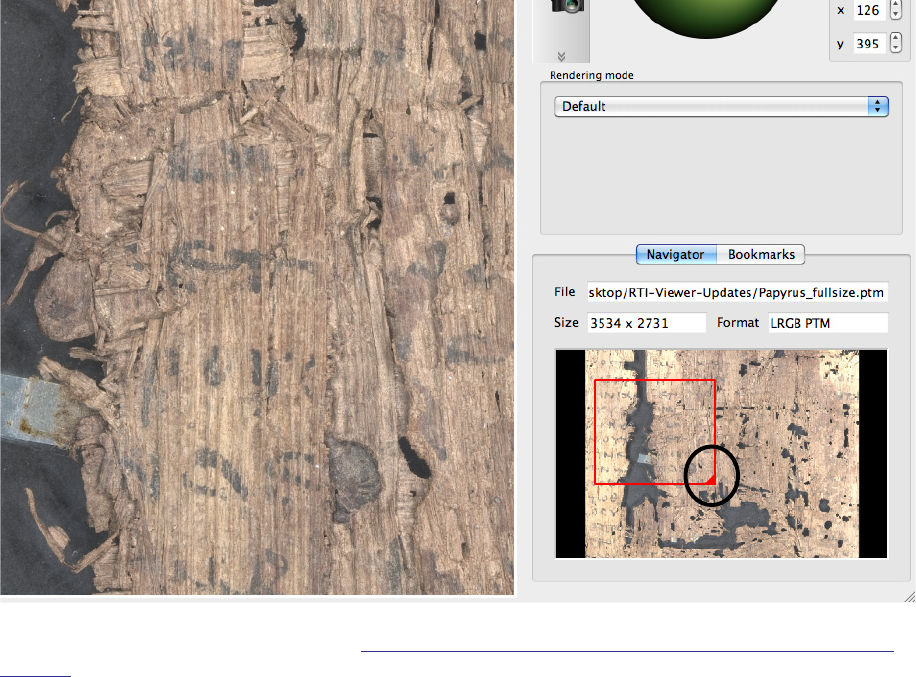
Using the image navigator
The small image at the bottom right allows you to select a subset of the image to show in the main image
panel.
Click anywhere in the red square to drag it around the small image. The portion of the image inside
the square is shown in the large viewing panel.
Drag the triangle in the lower right corner of the red square to resize the selection (within the built-in
constraints).
You can also use the scroll wheel on the mouse to zoom in and out interactively, from either the image
navigator or the main viewing panel. See “Manipulating the image view in the main viewing panel” on
page 10
Using the light controller
The green circle controls the angle of the virtual light in the large viewing panel. The bright spot is the light
source, shown as if it were reflected in a dome. You can drag the spot around the dome to change the
angle interactively.
Resize
Using RTIViewer Image navigation and lighting 9
When the light source is in the center of the dome, the virtual light comes from the “high noon”
position, directly above (or in front of ) the object.
As you drag the light source to the top, bottom, right, or left, the virtual light approaches the horizon
in that direction, creating a raked-lighting effect.
Next to the light controller, numeric controls show the specific coordinates and zoom factor that are
reflected in the current view. The controls are all synchronized; as you change the view interactively, the
numeric values update. You can also change the view by changing the numeric values. When you change
the virtual light values, for example, the light controller updates to show that angle.
Zooming and panning
The Zoom selector allows you to change the magnification at which the image is displayed, and the Pan
controls allow you to move the view to a different portion of the image. You can also change these values
interactively in the image navigator below the light controller, or in the main image view.
By default, an image is displayed at a magnification factor that allows the entire image to be seen in the
viewing area. You can use the up and down arrows in the Zoom selector to increase and decrease the
magnification by 1% increments, or you can type a new zoom factor into the text box and press return.
You can zoom in to a magnification above 100%, although this requires interpolation beyond your real
data. Rendering modes that contain color are less sharp above 100%. You can use the Specular
Enhancement mode and exclude color information for an image that remains reasonably sharp at zoom
factors exceeding 100%.
Current virtual light position
Current pan position
Current magnification
Using RTIViewer Image navigation and lighting 10
If you resize the displayed image using the resize handle in the image navigator, or zoom in or out using
the scroll button on the mouse, the current zoom factor is reflected in the Zoom selector.
You can drag the red box in the image navigator to a new position, or drag the main image to a new
position, and the position is reflected in the Pan controls. The pan position coordinates are the offset in
pixels for the upper left corner of the red box in the image navigator, relative to the upper left corner of the
original image.
Manipulating the image view in the main viewing panel
You can manipulate the image view directly from the main viewing panel; the navigator updates to show
you what part of the image is currently displayed, the light controller updates to show you the current
light angle, and the zoom selector updates to show the current magnification.
Left-click in the large image and drag in any direction to move the image in that direction.
Right-click in the large image and drag to adjust the lighting angle.
Use the scroll wheel in the large image to zoom in and out. (You can also zoom in with the keyboard
shortcut CTRL+ and zoom out with CTRL-.)
In Mac OS, you can use a two-finger gesture on the mouse pad, separating the fingers to zoom in, and
bringing them together to zoom out.
Using RTIViewer Bookmarking views 11
All interactive adjustments are reflected in the numeric controls, and when you enter numeric values they
are reflected in the interactive controls and in the view.
Bookmarking views
When you have completed a set of adjustments to the position, zoom factor, and light direction, you can
save information about the resulting view as a bookmark. All of the numeric values that describe the view
are saved to an XMP sidecar file, allowing the viewer to recreate that view when you select the bookmark.
All bookmarks are included in this file.
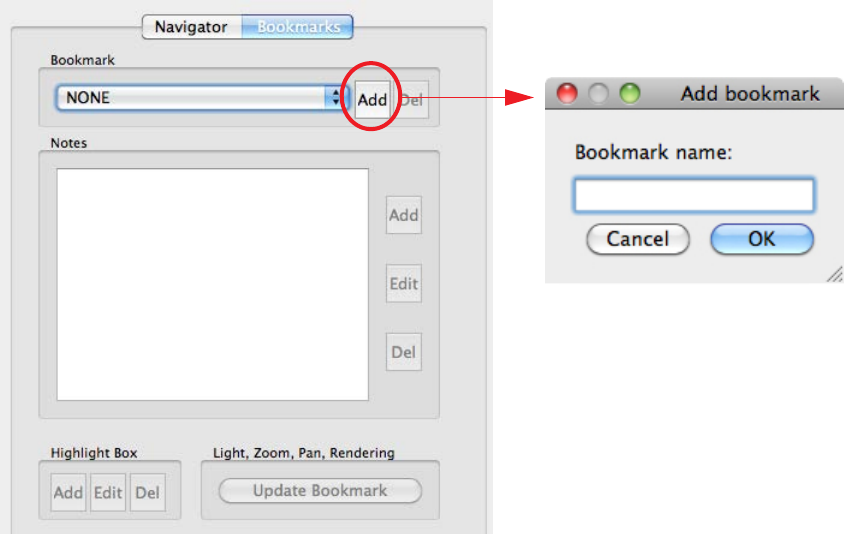
The Bookmarks tab in the control panel allows you to save new bookmarks, display bookmarked views
that you have previously saved, and edit, annotate, or delete existing bookmarked views.
When you select an existing bookmark, the view is immediately displayed. The Del button allows you to
delete the currently selected bookmark.
You can associate Notes with a bookmarked view, and add to or change the comments in the notes.
You can overlay a Highlight Box on the image to highlight something of interest, and later edit or
delete the box. The highlight box is part of the bookmark data, and does not alter your original image
data in any way.
The file for an existing bookmark is automatically updated when you make changes to the box or
comments.
You can open a bookmarked view and manipulate the viewing parameters, then click Update
Bookmark to resave it with the new parameter set.
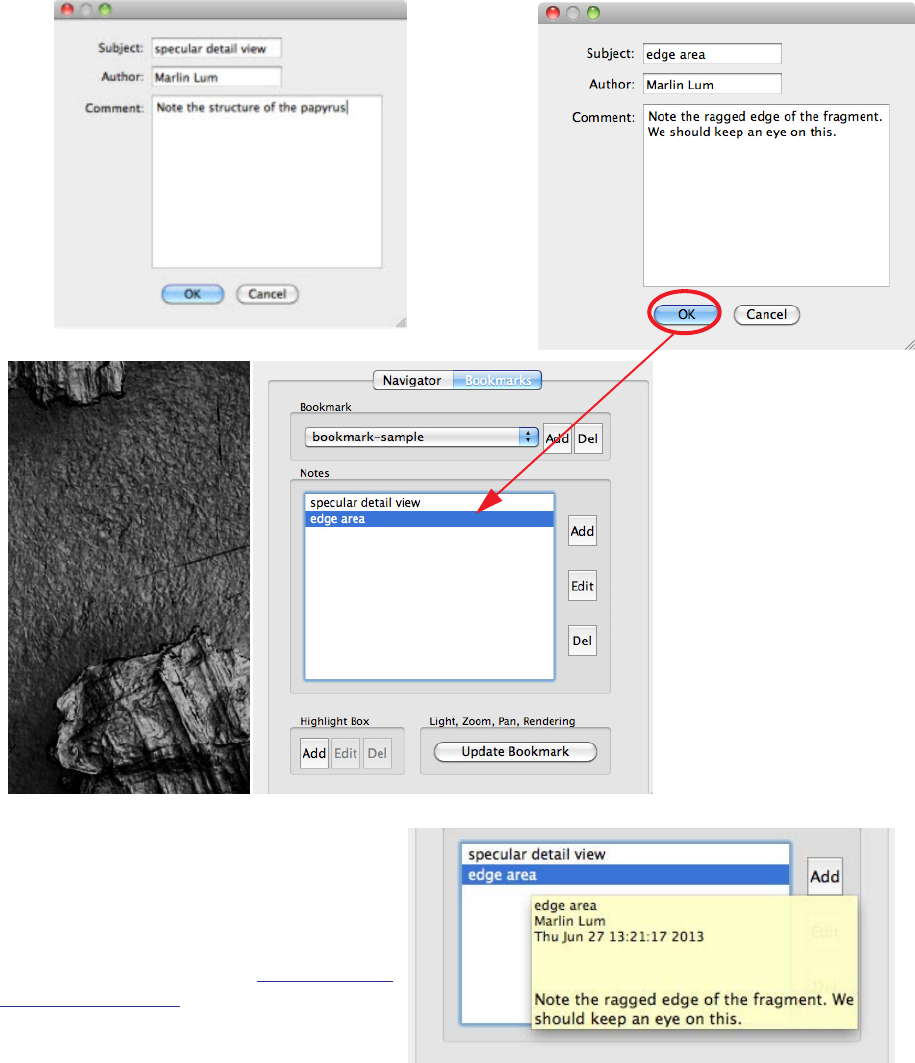
To create a bookmark from the current view,
simply give it a name.
When you click OK here, the bookmark file is
saved and the name appears in the
Bookmark pulldown list.
If you already have a bookmark file for this
RTI, the new bookmark is added to that file.
Using RTIViewer Bookmarking views 12
Bookmark notes
You can associate notes with a bookmarked view in order to comment on it. This is a powerful feature that
can be especially useful for collaboration. When a named bookmark is selected, you can add one or more
notes to it.
Click Add in the Notes box to associate a new note with the currently selected bookmark. A note must
have a Subject. It can also have an Author and a Comment.
When you click OK for
each new note, the
subject is added to the
Notes box.
You can select an
existing note to edit
the comments, or to
delete it.
When the cursor hovers over a note, the
contents of that note appear; the timestamp
of the latest edit is added automatically.
The Bookmark feature is not available for
multi-view (MVIEW) files. See “Multi-view RTI
viewing” on page 24 for information on this
format.
Using RTIViewer Rendering modes 13
Rendering modes
While traditional image files record only color information for each pixel, an RTI also records the subject’s
surface normals along with the RGB color information at each pixel. Each normals value encoded into the
RTI image corresponds to a point on the subject, and records the angle of reflectance of light coming from
any direction at that point. The normals data provides accurate information about the subject's surface
shape. As you change the direction of the virtual light source in the RTIViewer, the reflectance provides
your brain's perceptual system with everything it needs for you to see the subject in three dimensions.
Applications such as Adobe Photoshop can digitally enhance traditional images (to lighten or darken
them, or change the color tone, for instance) by applying mathematical transformations to the color
information at each pixel. Various kinds of transformations (often called filters or effects) consider the
relations between pixels to find edges, for example, and perform sharpening or blurring.
RTIViewer can also apply mathematical transformations to the surface normals as well as the RGB color
information, resulting in reflectance enhancements of various kinds. These enhancement tools (or
rendering modes) use information from surface shape and color in combination or surface shape or color
by themselves. By using the shape data in RTI images, the enhancement functions in RTIViewer can
disclose far more information about the subject than filters that use only RGB color data at each pixel.
RTIViewer’s enhancement functions do not manipulate the color information as such (although the
Specular Enhancement mode can remove color information from a rendering in order to emphasize only
the reflectivity, as show in the figure below). After applying the desired lighting conditions and
shape-based enhancement functions to an image, you can export it from RTIViewer. You can then use
applications like Photoshop to do further color-based transformation on the exported image that already
includes the desired shape-based effects.
Using RTIViewer Rendering modes 14
Basic rendering modes
The rendering mode that you choose controls how the information in the RTI is transformed to an image
on the screen. When you select a rendering mode, the UI provides appropriate controls with which to set
the parameters that mode uses.
Not all rendering modes can be applied to all types of images; only those that can be applied to the
current image are offered in the drop-down menu.
Rendering mode Description
Default Presents the RTI image without mathematical enhancement. This mode has no
parameters.
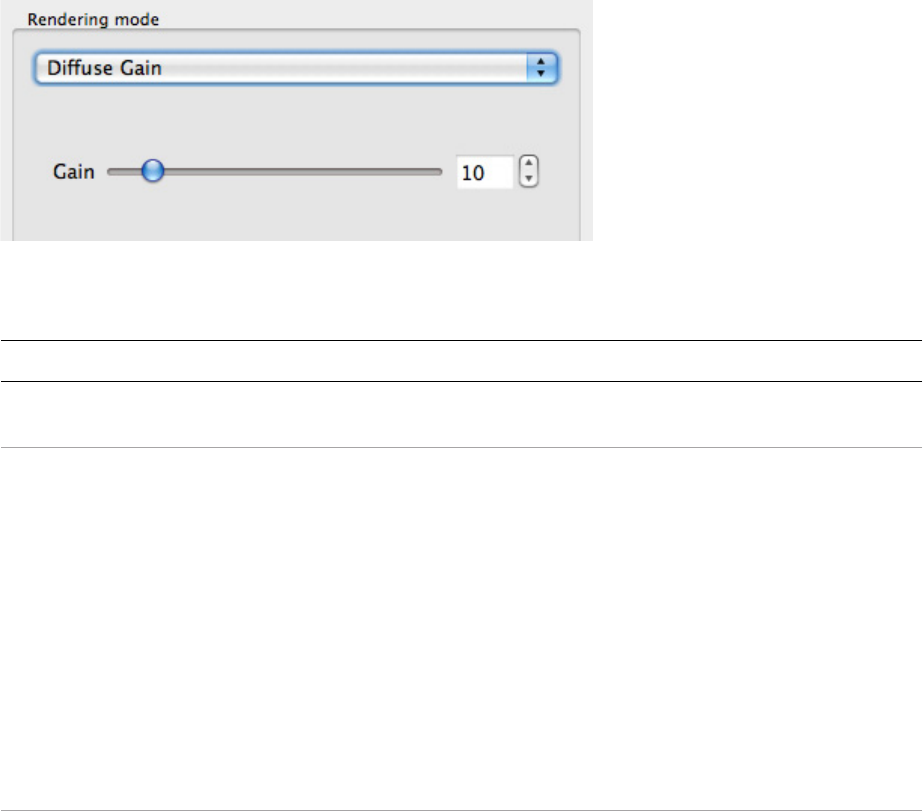
Diffuse gain Increases the representation of quickly-changing height and depth on the
subjects surface. For example, if a surface area has a quickly-changing sequence
of normals directions that form a depression, this enhancement function deepens
the depression by increasing the directional rate of change (the second
derivative) of the surface's slope.
This mode enhances the perception of surface shape features of the subject for
interpretive purposes.
This mode can have the side effect of introducing false color in some images. Use
caution in assessing the reliability of RGB color values in the resulting image.
Parameters:
Gain: Adjusts the amount of enhancement.
Specular
enhancement
Different materials have different degrees of shininess. Matte objects (such tennis
balls) have large and soft specular reflections while very smooth materials (such
as billiard balls) have small and sharp specular reflections.
This algorithm separates out the diffuse RGB color, specular reflection derived
from the surface shape of the subject, and the size of the specular highlights. It
can then render the shape-based reflections and RGB color either separately or in
combination.
This mode also enhances the perception of the surface shape.
Using RTIViewer Rendering modes 15
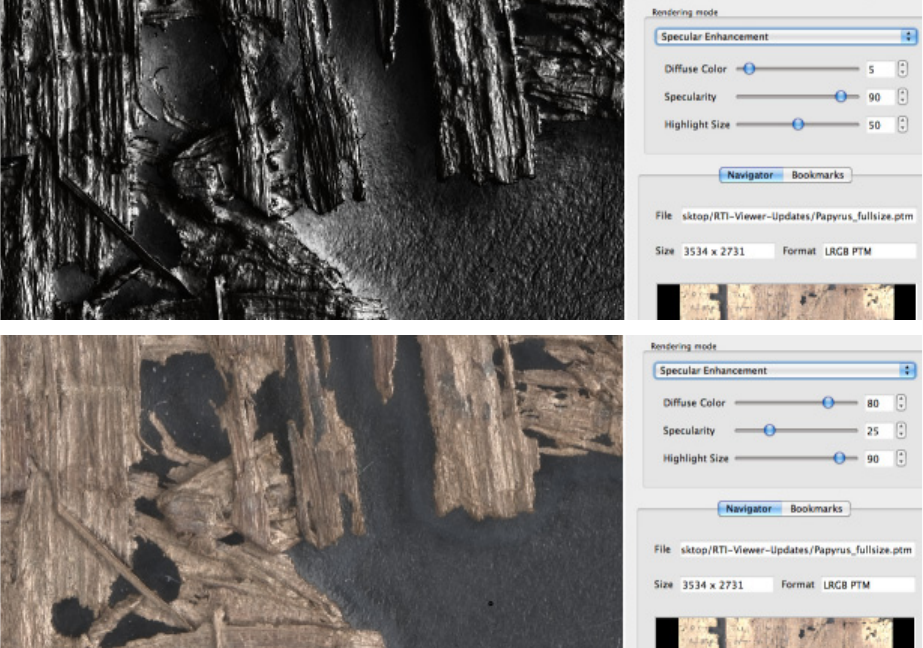
These figures show examples of the application of diffuse gain and specular enhancement to the same
portion of the same image, with the same initial lighting angle.
Specular
enhancement
(cont’d)
Parameters:
The parameter names are based on variables in the computer rendering
algorithm, the Phong reflectance model.
Diffuse Color: Adjusts the percentage of diffuse RGB color information used
in the rendering. When Diffuse Color is at 100% and Specularity is at 0%, only
diffuse RGB color is rendered.
Specularity: Adjusts the percentage of specular reflection, derived from the
surface shape of the subject and its reflection of light from any given
direction. When Specularity is at 100% and Diffuse Color is at 0%, only the
effects of reflected light from a given direction are rendered.
Highlight Size: Describes the size of the area encompassed by individual
specular reflections. A low value produces a large, soft (matte) reflection. A
high value produces a small sharp (shiny) reflection. The range is 0-150.
When using specular enhancement in isolation from the RGB color information,
you can reduce the Highlight Size value to spread the area influenced by the
specular reflections, in order to illuminate the entire surface. This can be helpful
when composing a rendering for image export.
Rendering mode Description
Using RTIViewer Rendering modes 16
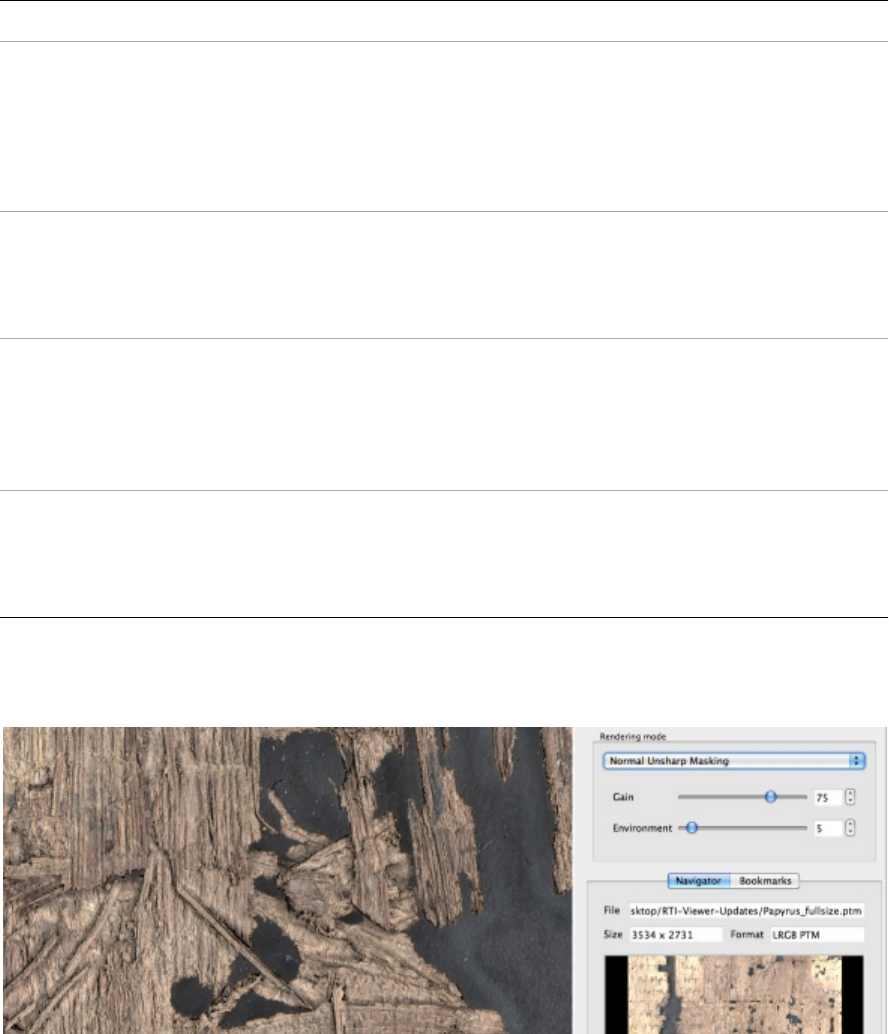
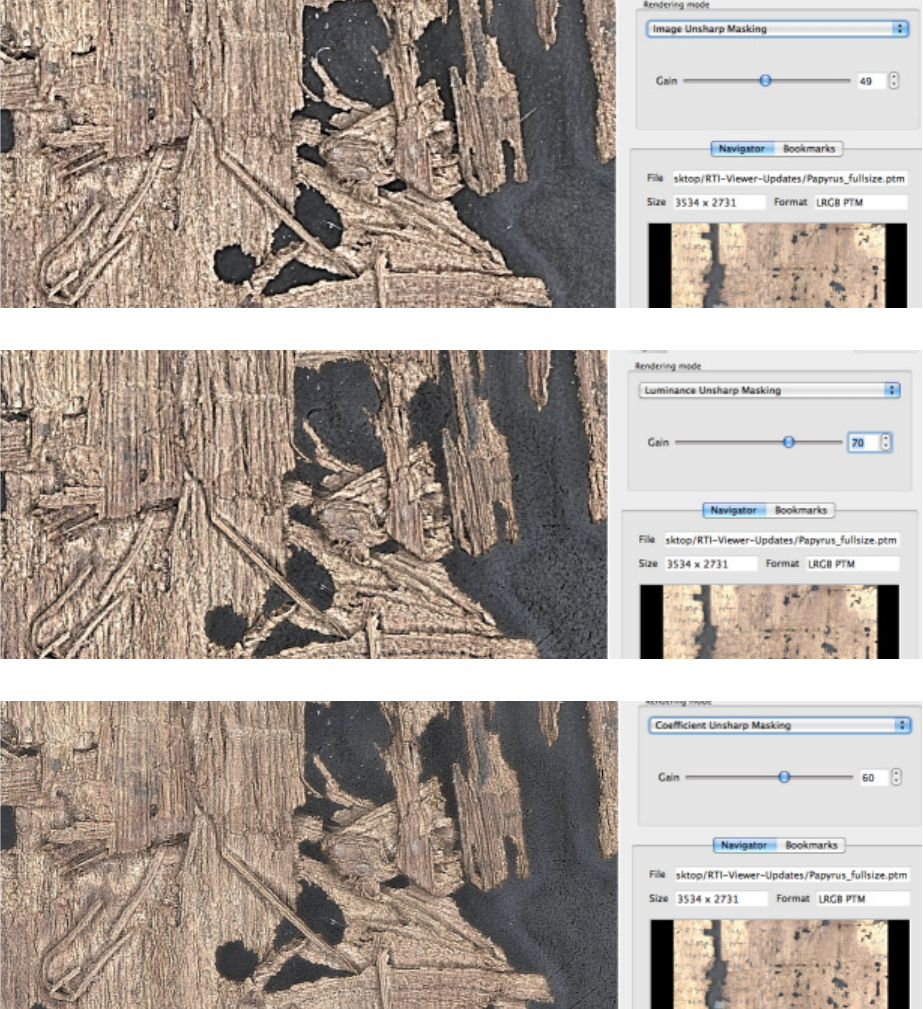
Sharpening modes
Sharpening applies an unsharp mask to the image data in order to enhance the high frequency details and
increase the edge contrast of the image. Sharpening algorithms look for discontinuities in the data that
typically indicate edges in the photographed object. In an RTI, the mask can be applied to the normals
data, finding and emphasizing sharp changes in depth as well as color.
RTIViewer offers several variations on the sharpening algorithm:
Image unsharp masking enhances edge contrast by applying the specified gain factor to image color
data.
Normals unsharp masking enhances surface contrast by applying the specified gain factor to image
normals data, as well as color data.
Luminance unsharp masking creates a different effect, amplifying depth discontinuities without
affecting the color, by applying the specified gain factor only to normals data.
Coefficient unsharp masking emphasizes discontinuities in reflectivity, by applying the gain factor to
each coefficient of the reflectance function.
Using RTIViewer Rendering modes 17
These figures show the application of various sharpening modes to the same portion of the same image,
with the same initial lighting angle.
Rendering mode Description
Normals Unsharp
Masking
Applies an unsharp mask to the surface normals.
Parameters:
Gain: Adjusts the amount of enhancement.
Environment: Adjusts the amount of indirect lighting.
Image Unsharp
Masking
Applies an unsharp mask to the Y channel of the color space YUV.
Parameters:
Gain: Adjusts the amount of enhancement.
Luminance Unsharp
Masking
Applies an unsharp mask to the luminance component of an LRGB PTM;
cannot be applied to simple RGB files, which do not include luminance data.
Parameters:
Gain: Adjusts the amount of enhancement.
Coefficient Unsharp
Masking
Applies an unsharp mask to the coefficients of the polynomial of the PTM.
Parameters:
Gain: Adjusts the amount of enhancement.
Using RTIViewer Rendering modes 18
Using RTIViewer Rendering modes 19
Multi-light enhancement modes
The multi-light enhancement modes choose different lighting angles for parts of an image in order to
enhance surface details, optimizing sharpness and brightness. For example, if you choose a low, raking
light to maximize contrast, there will be areas that are in deep shadow and show no detail. These
rendering modes can add detail back to those areas by choosing a higher lighting angle for them, without
changing the lighting angle in the areas that are already sharp. The resulting view looks as if light was
coming from several directions, in addition to the virtual light source you have chosen using the Light
Controller.
To achieve this effect, the algorithm subdivides the image into tiles, then, for each tile, chooses a light
direction that maximizes a chosen energy function. It chooses a nearby light direction that increases local
contrast, in order to enhance as many details as possible in a single view.
The image is first divided into an initial number of tiles, and the choice of lighting angles for each tile is
constrained to be within a specified offset from the original light direction, as indicated by the Light
Controller. The optimal lighting angle chosen for each initial tile then influences the choice of angles when
that tile is subdivided.
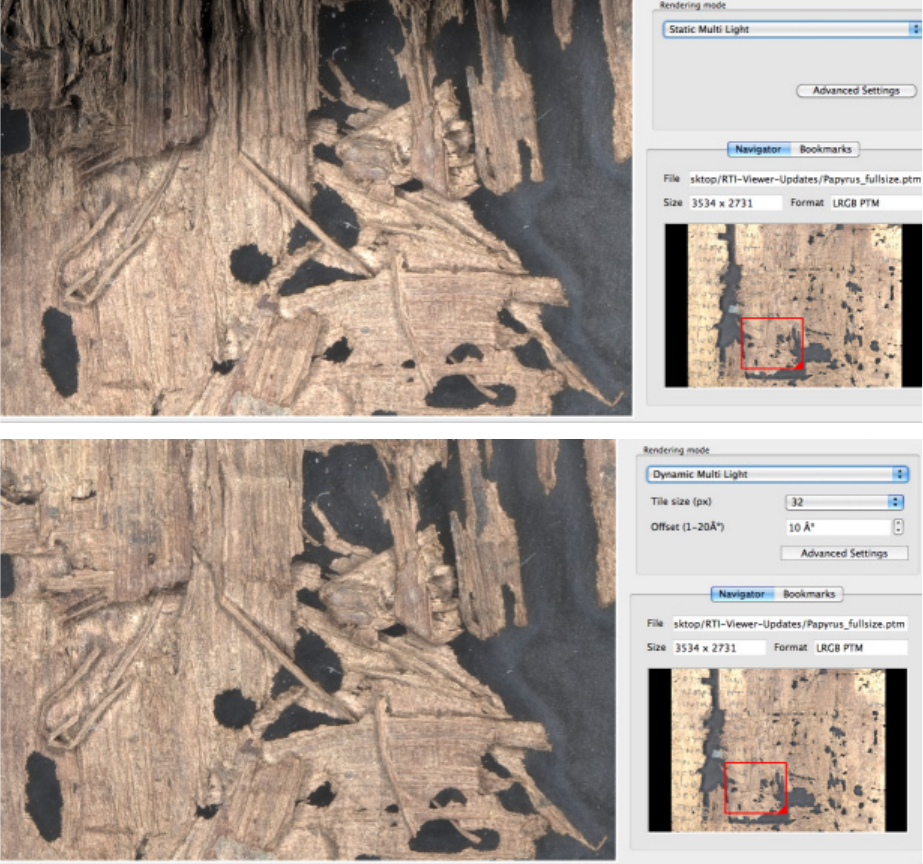
There is a static mode, and a dynamic mode:
The static mode applies the rendering you have chosen to the current view; you cannot change the
starting light source interactively while this view is displayed. This is a special case of the dynamic
mode, which is optimized to produce a high-contrast, well-illuminated static image, suitable for
stand-alone presentation, high-quality printing, and so on.
The dynamic mode automatically re-applies the rendering as you change the starting light source
interactively, using the Light Controller. This mode allows more detailed control, but can also produce
visual artifacts where there are great lighting variations across the image.
These figures show an application of static and dynamic multi-light renderings to the same portion of the
same image with the same initial lighting angle.
Using RTIViewer Rendering modes 20
Multi-light enhancement parameters
The two multi-light enhancement modes have a number of parameters that allow you to vary the effects.
You can specify the number and size of the tiles, the energy function to maximize, and various factors in
the algorithm.
The parameters are offered slightly differently for the two modes, but are essentially the same. The
dynamic mode offers different defaults and more range of choices (although this means, of course, that
the calculations take longer).
Using RTIViewer Rendering modes 21
Click Advanced Settings to bring up the
configuration dialog.
In Dynamic mode, you can apply a set of
parameters, then change the initial lighting
angle and re-apply the same rendering.

Using RTIViewer Rendering modes 22
Multi-light mode parameters
Local offset (static)
Offset (1-20o) (dynamic)
Constrains the choice space of additional light directions to be within a
chosen offset from the starting direction chosen in the Light Controller.
For Static mode, you can choose from these values:
5o (9 samples)
10o (25 samples)
15o (49 samples)
For Dynamic mode, you can choose any value between 1 and 20
degrees.
Tile size (px) Sets the size of the tiles in square pixels.
For Static mode, you can choose from these values:
8
16
32
For Dynamic mode, you can choose from these values:
8
16
24
32
N. initial tiles Sets the initial number of tiles for Static mode. This constrains the
selection of light directions to avoid rendering imperfections.
For Static mode only, you can choose from these values:
4
16
64
Sharpness operator The method used to compute the sharpness of each tile.
You can choose from these values:
Max Laplacian
Max Energy of Laplacian
L1 norm Sobel
L2 norm Sobel
Light sampling The strategy used to select the light direction.
You can choose from these values:
Isotropic
Anisotropic
K1 (Sharpness)(0-1) The weighting factor for the sharpness value.
You can choose a percentage value from 0.0 to 1.0.
Using RTIViewer Rendering modes 23
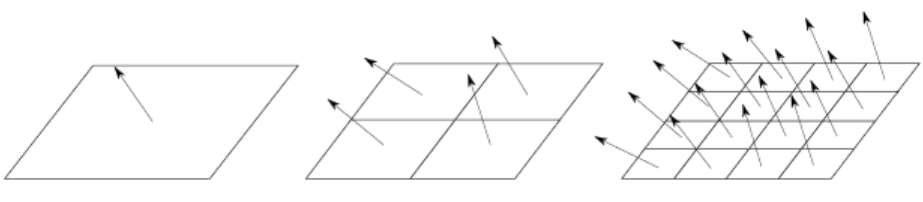
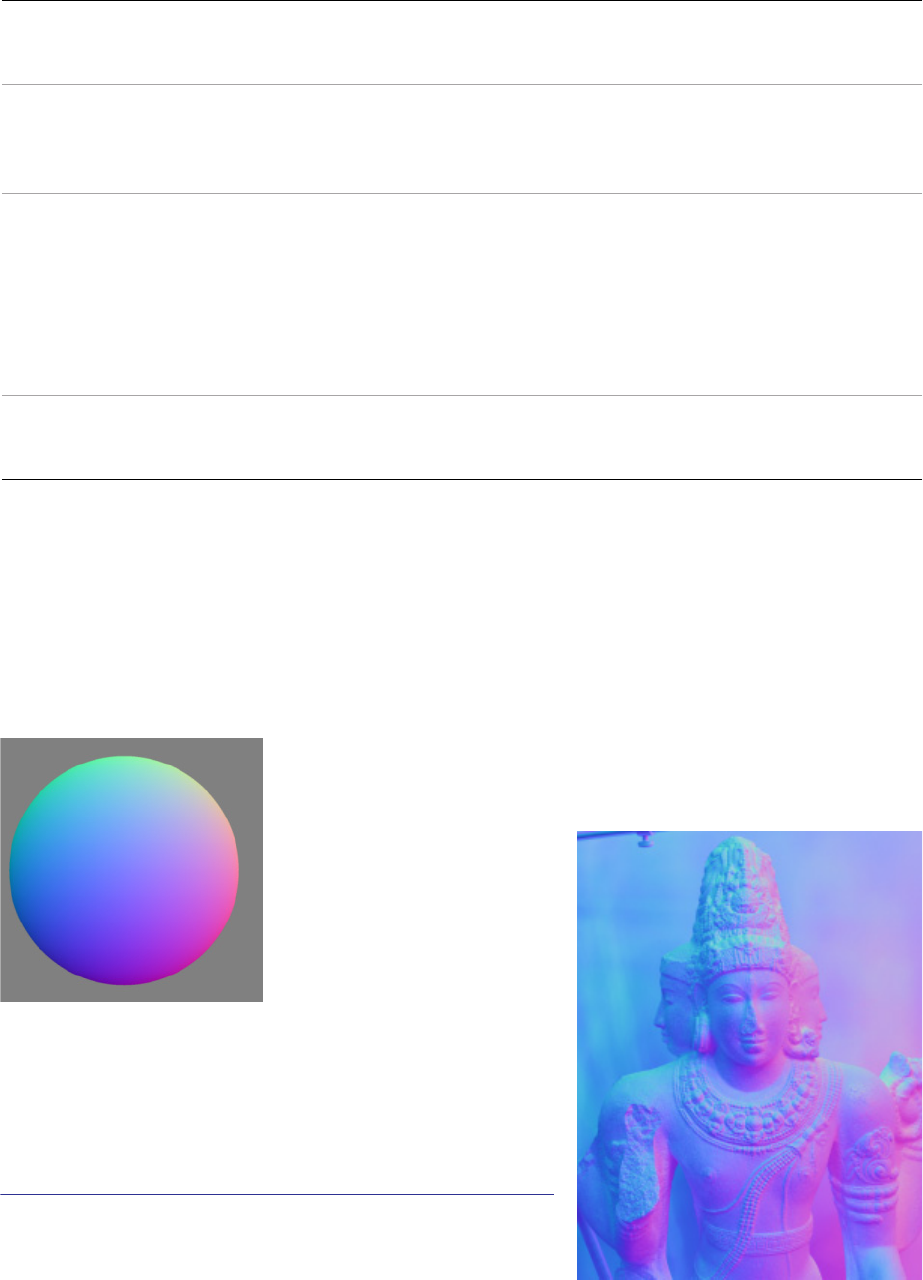
Normals Visualization mode
RTIViewer's Normals Visualization mode creates a false-color rendering that shows the subject's
pixel-by-pixel surface orientation. In this rendering, the X, Y, and Z components of the normal value at each
pixel are represented as red, green, and blue, respectively.
K2 (Lightness)(0-1) The weighting factor for the brightness value.
You can choose a percentage value from 0.0 to 1.0.
Threshold (0-1) A factor that affects the choice of candidates for the light direction for
each tile.
You can choose a percentage value from 0.0 to 1.0.
Smoothing filter The size in tiles of a filter used to smooth the selected light direction
over the entire image.
You can choose from these values:
3x3
5x5
7x7
N. iteration smoothing The number of times to apply the smoothing filter.
You can choose a value from 0 to 10.
T
he result is that the normal direction at each pixel (which represents the surface orientation in the image
d
ata) is represented by a particular color. This false-color normals visualization of a hemisphere shows how
the colors correspond to specific surface directions.
Below, the visualization is applied to an RTI image of a sculpture (in front of
a flat background which is out of focus).
As the surface orientation
changes around the surface of
the sphere, the false color
representation changes with it.
For example, the green colors on
the part of the sphere where the
surface orientation is pointed
upward correspond to the color of the upward facing areas on
t
he Shiva sculpture.
T
his rendering makes it much easier to visualize the normals
information that describes the surface contours.
For more information about surface normals, see:
http://culturalheritageimaging.org/Technologies/RTI/#how_RTI
Using RTIViewer Multi-view RTI viewing 24
Multi-view RTI viewing
RTIViewer allows you to view multi-view RTIs; that is, a set of RTIs that were created from multiple camera
viewpoints and can be viewed in an integrated manner. This type of image is contained in a set of files with
the .mview extension. When you load such an image, the viewer indicates that the file is of type Multiview
RTI.
This technology was developed at the University of California Santa Cruz. The current MVIEW file format
specification can be downloaded at http://CulturalHeritageImaging.org/downloads/. The software to
build an MVIEW file from appropriate captured and numbered sequences of RTIs is available under the
GNU General Public License version 3, by writing to info@c-h-i.org.
NOTE: The Bookmark feature of RTIViewer is not available for multi-view (MVIEW) files.
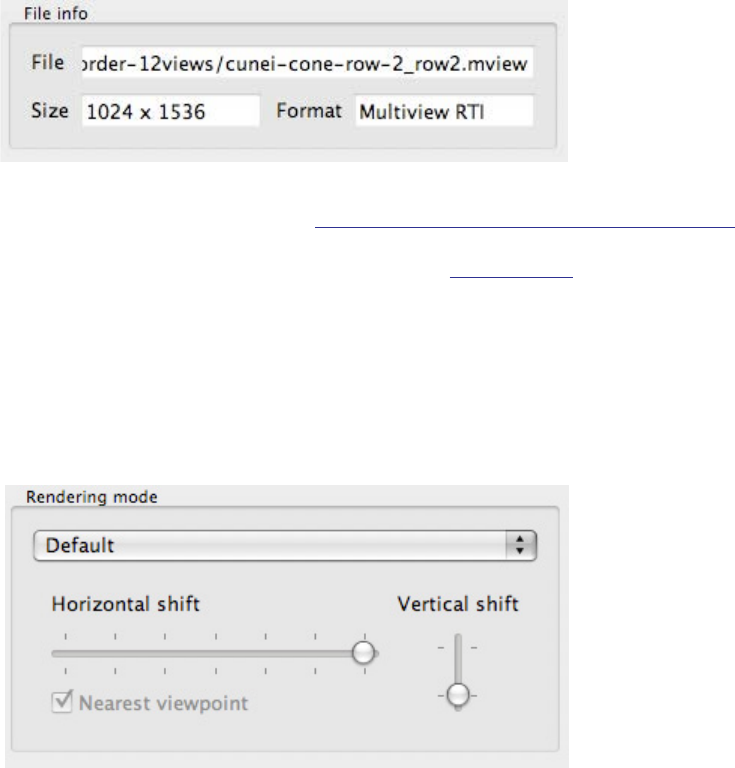
The default rendering mode for multi-view images allows you to choose among the contained set of
viewpoints. As determined by the number of latitudinal samples (horizontal rotation of viewpoint right of
left around the subject) and the number of longitudinal samples (vertical rotation of the viewpoint up and
down around the subject), you are offered a choice of horizontal and vertical viewpoints from which to
explore the subject.
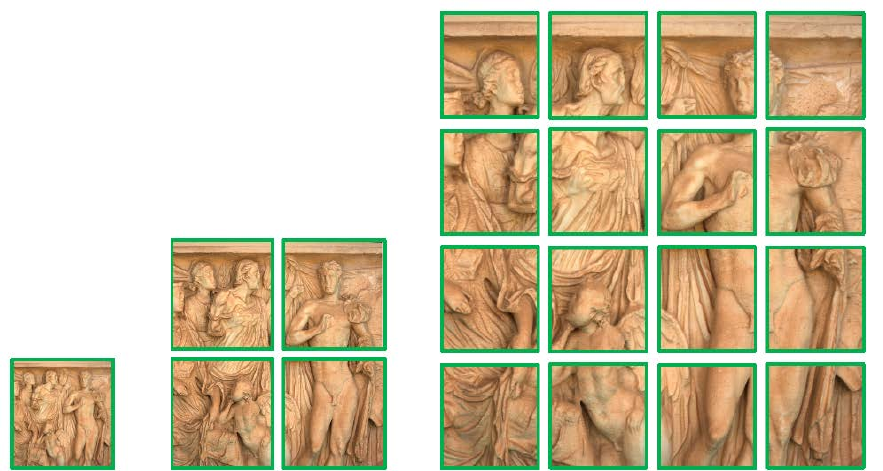
The number of views on each scale corresponds to the number of available sampled viewpoints. Images
with more viewpoints are, of course, much larger than those with fewer.
In the case where all the acquired Multi-view RTI viewpoints that encompass the subject are along the
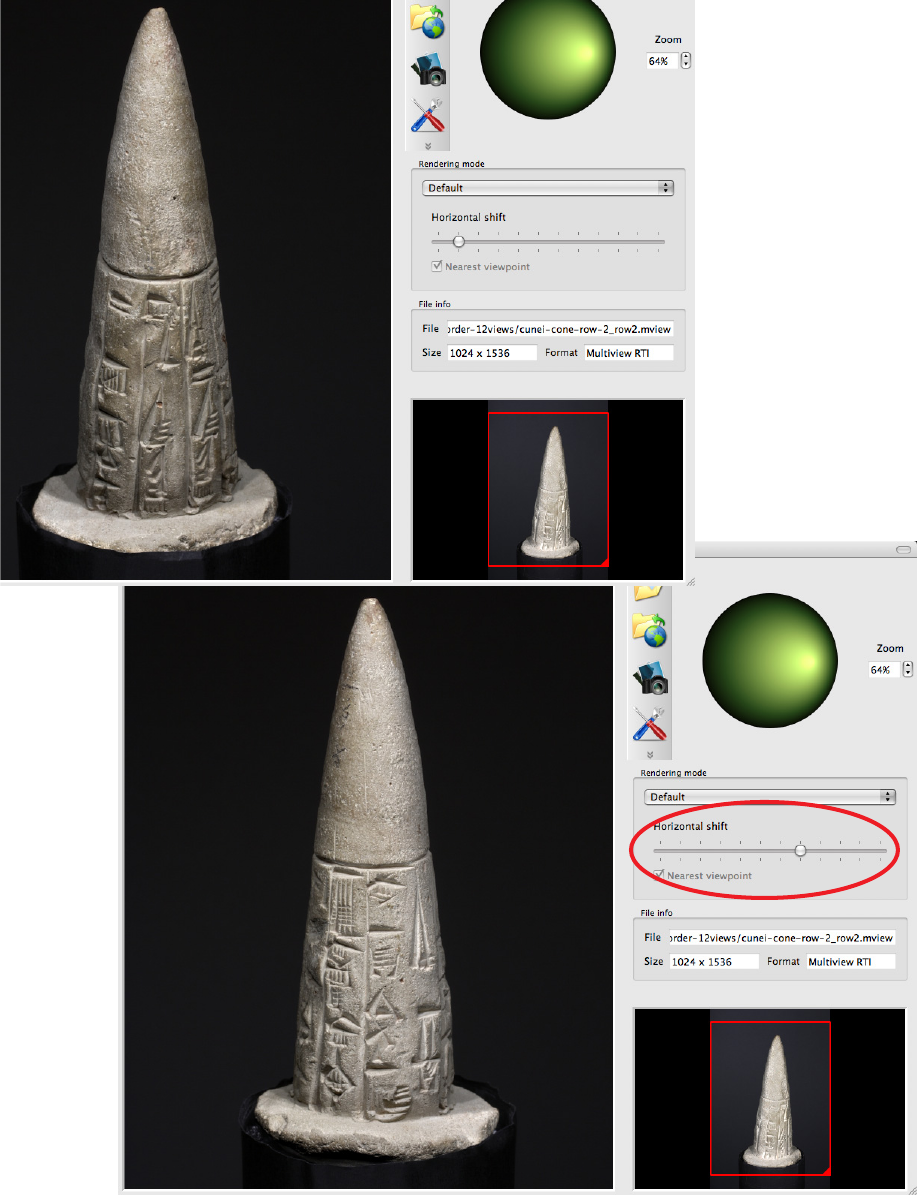
same latitude, RTIViewer is configured as shown in the following figures.
The top left figure is displaying the second viewpoint from the left-most viewpoint. The figure in the lower
right displays the subject six viewpoints further to the right. You can display and relight the subject at each
of the sampled viewpoints.
Using RTIViewer Multi-view RTI viewing 25
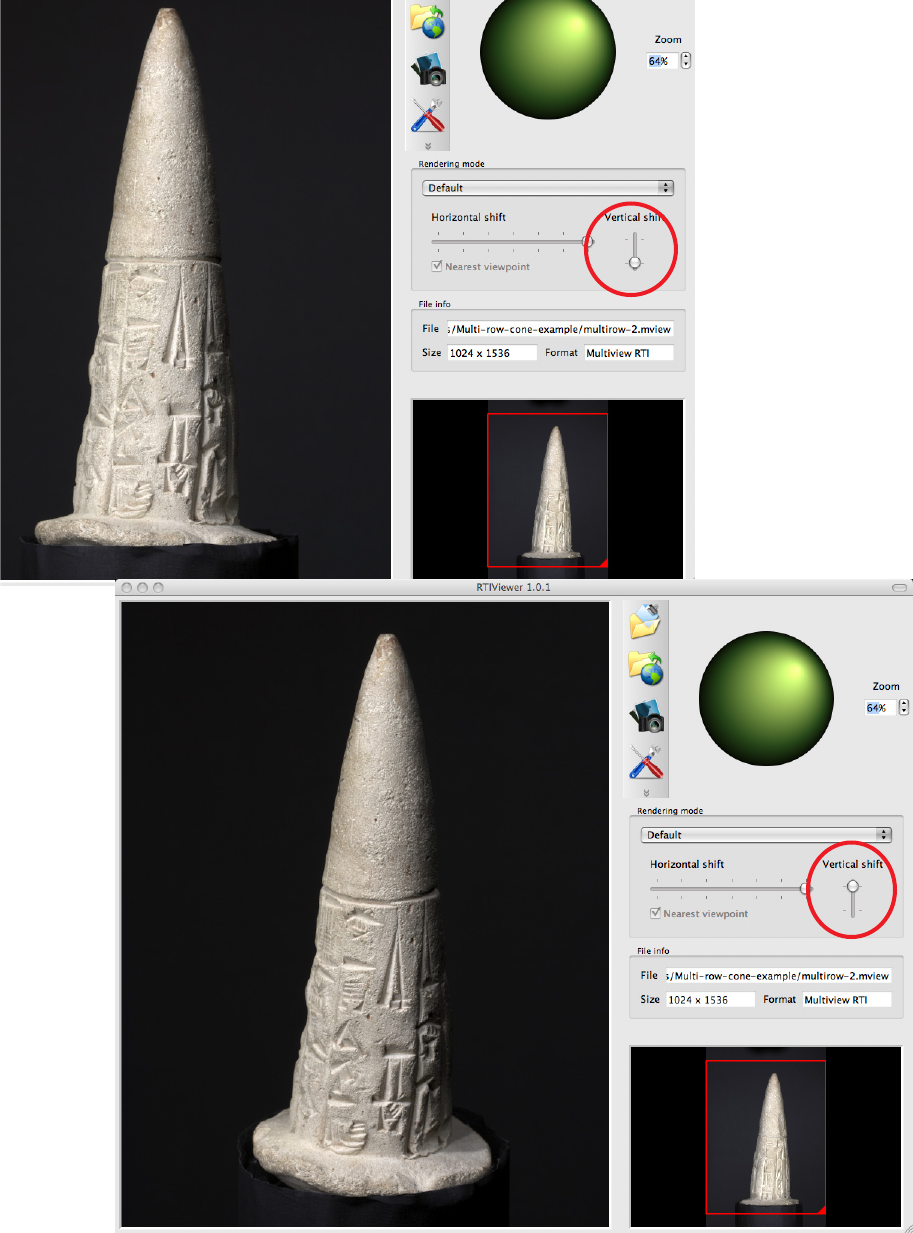
When a Multi-view RTI is captured at more that one latitude, a Vertical shift tool appears to the right of the
Horizontal shift tool. These figures show the subject at two different longitudinal viewpoints.
As you change the
horizontal viewpoint,
the object appears to
rotate in the horizontal
plane.
Using RTIViewer Multi-view RTI viewing 26
As you change the
vertical viewpoint, the
object appears to
rotate toward or away
from you.
Using RTIViewer Remote Viewing 27
Exploring an RTI subject between viewpoints
RTIViewer is designed to accommodate the integration of new features for rotating and relighting
multi-view RTI subjects that will allow you to explore a subject between the captured viewpoints. When
appropriate optical-flow data is available, the viewer can display the subject from any desired rotational
position between the captured viewpoints, and relight the subject interactively; activate this mode by
deselecting the “Nearest viewpoint” check box.
NOTE: This feature is still in the early research stage of development, and is of experimental quality that is
not user-friendly. Much of the functionality is currently designed for use with relatively low resolution files.
Even within the significant limitations, the research team has used optical flow technology to demonstrate
that it is possible to create highly information-rich and interactive three-dimensional displays between
captured viewpoints. Future implementations may address the generation and display of arbitrary
rotation and relighting within high-resolution MVIEW files.
Remote Viewing
RTIs are typically large files with very fine resolution; for this reason, it can be more practical to store the
images on servers for sharing. The RTIViewer allows you to load and display images stored on a local hard
drive, or on a remote server through an HTTP connection.
Preparing images for remote viewing
Remote viewing is available only for files in the LRGB PTM and HSH RTI formats. In order to use it, you must
preprocess the target file using the RTI Webmaker command-line tool. This tool converts the PTM images
into a more compact format that permits remote loading in chunks through HTTP. The command takes
two arguments, the path to the PTM or RTI file, and the resolution level, which controls level and number of
chunks to produce. For example:
RTIWebmaker ..\rtiImage\test.ptm 3
The tool produces a folder containing the converted files; you can copy the entire folder to the server. The
URL of the image is the path of the file in that folder that has the extension .ptm or .rti.
To install the RTI WebMaker in Mac OSX, copy the alias in the disk image into the same folder as RTIViewer.
In Windows, run the installer.
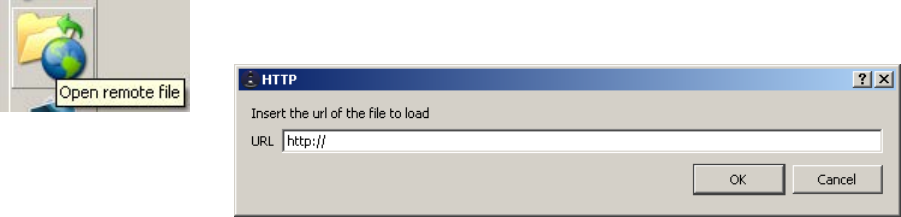
Viewing remote image files
To browse for a remote image file, click the “Open remote file” icon, and enter the URL in the resulting
dialog.
Using RTIViewer Remote Viewing 28
Tiled image data with increasing resolution allows incremental loading from a remote site. Efficient
storage of RTIs using multi-resolution tiling and JPEG2000 compression allows asynchronous loading, with
increasing resolution as loading proceeds.
Images courtesy of the VISUAL
Computing Lab of CNR Pisa
