Mycodo Manual
User Manual: Pdf
Open the PDF directly: View PDF ![]() .
.
Page Count: 33
- Mycodo Manual
- Table of Contents
- About Mycodo
- Brief Overview
- Frequently Asked Questions
- Upgrading
- Features
- PID Tuning
- Configuration Settings
- Miscellaneous
- Troubleshooting
- Device Interfaces
- Device Specific Information
Mycodo Manual
Table of Contents
About Mycodo
Brief Overview
Frequently Asked Questions
Upgrading
Features
•Data
•Output
•Function
•Timers
•LCDs
•Methods
PID Tuning
•PID Control Theory
•Quick Setup Examples
•Exact-Temperature Regulation
•High-Temperature Regulation
Configuration Settings
•General Settings
•Output Usage Settings
•Users
•User Roles
•Alert Settings
•Camera Settings
Miscellaneous
•Dashboard
•Live Measurements
•Asynchronous Graphs
•Export-Import
•Camera
•Output Usage
•Backup-Restore
•System Information
Troubleshooting
•Daemon Not Running
•More
Device Interfaces
•1-Wire
•GPIO
•UART
•I2C
•Edge Detection
•I2C Multiplexers
Device Specific Information
LCD Displays
Temperature Sensors
•Raspberry Pi
•Atlas Scientific PT-1000
•DS18B20
•TMP006, TMP007
Temperature, Humidity Sensors
•AM2315
•DHT11
1

•DHT22, AM2302
•HTU21D
•SHT1x
•SHT7x
CO2 Sensors
•K-30
•MH-Z19
Moisture Sensors
•Chirp
pH Sensors
•Atlas Scientific pH
Pressure Sensors
•BME280
•BMP085, BMP180
Luminosity Sensors
•BH1750
•TSL2561
Analog to Digital Converters
•ADS1x15
•MCP342x
Diagrams
•DHT11 Diagrams
•DS18B20 Diagrams
•Raspberry Pi and Relay Diagrams
About Mycodo
Mycodo is an automated monitoring and regulation system that was built to run on the []Raspberry Pi](https://en.wikipedia.org/wiki/Raspberry_Pi)
(versions Zero, 1, 2, and 3).
Orignially designed to cultivate edible mushrooms, Mycodo has grown to include the ability to do much more, including cultivating
plants, culturing microorganisms, maintaining honey bee apiary homeostasis, incubating animals and eggs, maintaining aquatic
systems, aging cheeses, fermenting foods and tobacco, cooking food (vous-vide), and more.
The system comprises a backend (daemon) and a frontend (user interface). The backend conducts measurements from sensors and
devices, then coordinate a diverse set of responses to those measurements, including the ability to modulate outputs (relays, PWM,
wireless outlets), regulate environmental conditions with electrical devices under PID control (steady regulation or changing over
time), schedule timers, capture photos and stream video, trigger actions when measurements meet certain conditions (modulate
relays, execute commands, notify by email, etc.), and more. The frontend is a web interface that enables easy navigation and
configuration from any browser-enabled device.
Brief Overview
There are a number of different uses for Mycodo. Some users simply store sensor measurements to monitor conditons remotely from
their phone, others regulate the environmental conditions of a physical space, while others capture motion-activated or timelapse
photography, and more.
Input controllers acquire measurements and store them in a time series database. Measurements typically come from sensors, but
may also be configured to use the return value of a linux command, making integrating new inputs very easy.
Output controllers produce changes to the general input/output (GPIO) pins or may be configured to execute linux commands
in order to allow an unlimited number of potential uses. There are a few different types of outputs: simple switching of pins
(HIGH/LOW), generating pulse-width modulated (PWM) signals, switching 433 MHz wireless relays, and linux command execution.
The most common setup is using a relay to switch electrical devices on and off.
When Inputs and Outputs are combined, PID controllers may be used to create a feedback loop that uses the Output device to
modulate an environmental condition the Input detects. Certain Inputs may be coupled with certain Outputs to create a variety of
different control and regulation applications. Beyond simple regulation, Methods may be used to create changing setpoints over
2

time, enabling such things as thermal cyclers, reflow ovens, environmental simulation for terrariums, food and beverage fermentation
or curing, and cooking food (sous-vide), to name a few.
Timers can be set to trigger events based on specific dates and times or according to durations of time. Timers are fairly basic, but
can be configured in very complex ways. Don’t underestimate a good timer.
Frequently Asked Questions
How do I set up simple regulation?
Here is how I generally set up Mycodo to monitor and regulate:
1.
Determine what environmental condition you want to measure or regulate. Consider the devices that must be coupled to
achieve this. For instance, temperature regulation require a temperature sensor as the input and an electric heater as the
output.
2.
Determine what relays you will need to power your electric devices. The Raspberry Pi is capable of directly switching relays
(using a 3.3-volt signal), although opto-isolating the circuit is advisable. Be careful when selecting a relay not to exceed the
current draw of the Raspberry Pi’s GPIO pins.
3. See the Device Specific Information for information about what sensors are supported. Acquire one or more of these sensors
and relays and connect them to the Raspberry Pi according to the manufacturer’s instructions.
4.
On the
Data
page, create a new input using the dropdown to select the correct sensor or input device. Configure the input
with the correct communication pins and other options. Activate the input to begin recording measurements to the database..
5. Go to the Info -> Live Measurements page to ensure there is recent data being acquired from the input.
6.
On the
Ouput
page, add a relay and configure the GPIO pin that switches it, whether the relay switches On when the signal is
HIGH or LOW, and what state (On or Off) to set the relay when Mycodo starts. A pulse-width modulated (PWM) output
may also be used..
7.
Test the relay by switching it On and Off or generating a PWM signal from the
Output
page and make sure the device
connected to the relay turns On when you select “On”, and Off when you select “Off”.
8. On the Function page, create a PID controller with the appropriate input, output, and other parameters.
9.
On the
Info
->
Live Graphs
page, create a graph that includes the input measurement, the output that is being used by the
PID, and the PID setpoint. This provides a good visualization for tuning the PID. See Quick Setup Examples for a greater
detail of this process and tuning tips.
How do I add an Input (like a sensor) to the system that’s not currently supported?
Currently, adding an Input device that’s not currently supported can be achieved by two different methods:
The first involves editing several files. There has been effort to make the addition process as simple as possible. See the Adding
Support for a New Input Wiki page for how to do this. All changes will be lost during an upgrade, therefore it is suggested to make
a GitHub pull request with your changes to permanently integrate them into Mycodo.
The second way to add an Input is to create a script that obtains and returns a numerical value when executed in the linux system
of the Raspberry Pi. This script may be configured to be executed by a “Linux Command” Input type. This will periodically
execute the command and store the returned value to the database for use with the rest of the Mycodo system.
Can I variably-control the speed of motors or other devices with the PWM output signal from the PID?
Yes, as long as you have the proper hardware to do that. The PWM signal being produced by the PID should be handled
appropriately, whether by a fast-switching solid state relay, an AC modulation circuit, DC modulation circuit, or something else.
What should I do if I have an issue?
First, read though this manual to make sure you understand how the system works and you’re using the system properly. Also
check out the Mycodo Wiki. You may even want to look through recent GitHub Issues. If you haven’t resolved your issue by this
point, make a New GitHub Issue describing the issue and attaching a sufficient amount of evidence (screenshots, log files, etc.) to
aid in diagnosing the issue.
Upgrading
If you already have Mycodo installed (version >= 4.0.0), you can perform an upgrade to the latest Mycodo Release by either using
the Upgrade option in the web interface (recommended) or by issuing the following command in a terminal. A log of the upgrade
process is created at /var/log/mycodo/mycodoupgrade.log
sudo /bin/bash ~/Mycodo/mycodo/scripts/upgrade_commands.sh upgrade
3

Features
The following sections describe the essential modules of Mycodo that can be used to perform functions or communicate with other
parts of Mycodo. Each section performs specific tasks or groups of related tasks.
Data
Data includes controllers that produce and store data in the measurement database. Input controllers generally acquire measurements
from sensors, but they may also come from executed commands. Math controllers, on the other hand, perform math on already-stored
values to create new values that are stored.
Input
Inputs (such as sensors or analog signals) measure environmental conditions, which will be stored in a time-series database (InfluxDB).
This database will provide measurements for Graphs, LCDs, PID Controllers, Conditional Statements, and other parts of Mycodo to
operate from.
In addition to several supported sensors and devices, a Linux command may be specified that will be executed and the return value
stored in the measurement database to be used throughout the Mycodo system.
Setting Description
Activate After the sensor has been properly configured, activation begins acquiring
measurements from the sensor. Any activated conditional statements will now
being operating.
Deactivate Deactivation stops measurements from being acquired from the sensor. All
associated conditional statements will cease to operate.
Save Save the current configuration entered into the input boxes for a particular
sensor.
Delete Delete a particular sensor.
Up/Down Move a particular sensor up or down in the order displayed.
Power Output Select a output that powers the sensor. This enables powering cycling (turn off
then on) when the sensor returns 3 consecutive errors to attempt to fix the issue.
Transistors may also be used instead of a relay (note: NPN transistors are
preferred over PNP for powering sensors).
Location Depending on what sensor is being used, you will need to either select a serial
number (DS18B20 temperature sensor), a GPIO pin (in the case of sensors read
by a GPIO), or an I2C address. and channel if using the TCA9548A I2C
multiplexer.
I2C Bus
The bus to be used to communicate with the I2C address. If you’re using an I2C
multiplexer that provides multiple buses, this allows you to select which bus the
sensor is connected to.
Period (seconds) After the sensor is successfully read and a database entry is made, this is the
duration of time waited until the sensor is measured again.
Pre Output If you require a output to be activated before a measurement is made (for
instance, if you have a pump that extracts air to a chamber where the sensor
resides), this is the output number that will be activated. The output will be
activated for a duration defined by the Pre Duration, then once the output turns
off, a measurement by the sensor is made.
Pre Output Duration (seconds) This is the duration of time that the Pre Output runs for before the sensor
measurement is obtained.
Command
A linux command (executed as the user ‘mycodo’) that the return value becomes
the measurement
Command Measurement The measured condition (e.g. temperature, humidity, etc.) from the linux
command
Command Units The units of the measurement condition from the linux command
Edge Edge sensors only: Select whether the Rising or Falling (or both) edges of a
changing voltage are detected. A number of devices to do this when in-line with
a circuit supplying a 3.3-volt input signal to a GPIO, such as simple mechanical
switch, a button, a magnet (reed/hall) sensor, a PIR motion detector, and more.
Bounce Time (ms)
Edge sensors only: This is the number of milliseconds to bounce the input signal.
This is commonly called debouncing a signal. and may be necessary if using a
mechanical circuit.
Reset Period (seconds) Edge sensors only: This is the period of time after an edge detection that
another edge will not be recorded. This enables devices such as PIR motion
sensors that may stay activated for longer periods of time.
4

Setting Description
Multiplexer (MX) If connected to the TCA9548A I2C multiplexer, select what the I2C address of
the multiplexer is.
Mx I2C Bus If connected to the TCA9548A I2C multiplexer, select the I2C bus the
multiplexer is connected to.
Mx Channel If connected to the TCA9548A I2C multiplexer, select the channel of the
multiplexer the device is connected to.
Measurement Analog-to-digital converter only: The type of measurement being acquired by
the ADC. For instance, if the resistance of a photocell is being measured
through a voltage divider, this measurement would be “light”.
Units
Analog-to-digital converter only: This is the unit of the measurement. With the
above example of “light” as the measurement, the unit may be “lux” or
“intensity”.
Channel Analog-to-digital converter only: This is the channel to obtain the voltage
measurement from the ADC.
Gain
Analog-to-digital converter only: set the gain when acquiring the measurement.
Volts Min Analog-to-digital converter only: What is the minimum voltage to use when
scaling to produce the unit value for the database. For instance, if your ADC is
not expected to measure below 0.2 volts for your particular circuit, set this to
“0.2”.
Volts Max Analog-to-digital converter only: This is similar to the Min option above,
however it is setting the ceiling to the voltage range. Units Min Analog-to-digital
converter only: This value will be the lower value of a range that will use the
Min and Max Voltages, above, to produce a unit output. For instance, if your
voltage range is 0.0 - 1.0 volts, and the unit range is 1 - 60, and a voltage of 0.5
is measured, in addition to 0.5 being stored in the database, 30 will be stored as
well. This enables creating calibrated scales to use with your particular circuit.
Units Max Analog-to-digital converter only: This is similar to the Min option above,
however it is setting the ceiling to the unit range.
Weighting
The This is a number between 0 and 1 and indicates how much the old reading
affects the new reading. It defaults to 0 which means the old reading has no
effect. This may be used to smooth the data.
Pulses Per Rev The number of pulses for a complete revolution.
Port The server port to be queried (Server Port Open input).
Times to Check The number of times to attempt to ping a server (Server Ping input).
Deadline (seconds) The maximum amount of time to wait for each ping attempt, after which 0
(offline) will be returned (Server Ping input).
Math
Math controllers allow one or more Inputs to have math applied to produce a new value that may be used within Mycodo.
Type Description
Average Stores the statistical mean of the selected Inputs
Difference Stores the mathematical difference (value_1 - value_2)
Equation Stores the calculated value of an equation
Median Stores the statistical median from the selected Inputs
Maximum Stores the largest measurement from the selected Inputs
Minimum Stores the smallest measurement from the selected Inputs
Humidity Calculates and stores the percent relative humidity from the dry-bulb and
wet-bulb temperatures, and optional pressure
Verification Ensures the greatest difference between any selected Inputs is less than Max
Difference, and if so, stores the average of the selected Inputs
Setting Description
Input Select the Inputs to use with the particular Math controller
Period (seconds) The duration of time between calculating and storing a new value
Max Age (seconds)
The maximum allowed age of the Input measurements. If an Input measurement
is older than this period, the calculation is cancelled and the new value is not
stored in the database. Consequently, if another controller has a Max Age set
and cannot retrieve a current Math value, it will cease functioning. A PID
controller, for instance, may stop regulating if there is no new Math value
created, preventing the PID controller from continuing to run when it should
not.
5

Setting Description
Measurement This is the condition being measured. For instance, if all of the selected
measurements are temperature, this should also be temperature. A list of the
pre-defined measurements that may be used is below.
Units This is the units to display along with the measurement, on Graphs. If a
pre-defined measurement is used, this field will default to the units associated
with that measurement.
Reverse Equation
For Difference calculations, this will reverse the equation order, from
value_1 -
value_2 to value_2 - value_1.
Absolute Value
For Difference calculations, this will yield an absolute value (positive number).
Max Difference If the difference between any selected Input is greater than this value, no new
value will be stored in the database.
Dry-Bulb Temperature The measurement that will serve as the dry-bulb temperature (this is the
warmer of the two temperature measurements)
Wet-Bulb Temperature
The measurement that will serve as the wet-bulb temperature (this is the colder
of the two temperature measurements)
Pressure This is an optional pressure measurement that can be used to calculate the
percent relative humidity. If disabled, a default 101325 Pa will be used in the
calculation.
Equation
An equation that will be solved with Python’s eval() function. Let “x” represent
the input value. Valid equation symbols include: + - * / ˆ
Pre-defined Measurements
If a pre-defined measurement is used, the newly-generated value will use that default y-axes on a Graph. For instance, if two
temperature measurements are selected for averaging, and Measurement is set to ‘temperature’ (lowercase ‘t’), the new average
value will use the same y-axis as the other temperatures.
Measurement Units
altitude m
boolean None
co2 ppmv
cpu_load_1m 1 min
cpu_load_5m 5 min
cpu_load_15m 15 min
dewpoint °C
disk_space MB
duration_sec sec
duty_cycle %
edge edge
frequency Hz
humidity %
humidity_ratio kg/kg
lux lx
moisture moisture
ph pH
pid_output sec
pressure Pa
pulse_width µs
rpm rpm
setpoint None
specific_enthalpy kJ/kg
specific_volume m3/kg
temperature °C
temperature_die °C
temperature_object °C
voltage volts
Output
Outputs are various signals that can be generated that operate devices. An output can be a PWM signal, a simple HIGH/LOW
signal to operate a relay, or a 433MHz signal to switch a radio frequency-operated relay, or an execution of a command on the linux
system Mycodo runs on.
6

PWM
Pulse-width modulation (PWM) is a modulation technique used to encode a message into a pulsing signal, at a specific frequency in
Hertz (Hz). The average value of voltage (and current) fed to the load is controlled by turning the switch between supply and load
on and off at a fast rate. The longer the switch is on compared to the off periods, the higher the total power supplied to the load.
The PWM switching frequency has to be much higher than what would affect the load (the device that uses the power), which is to
say that the resultant waveform perceived by the load must be as smooth as possible. The rate (or frequency) at which the power
supply must switch can vary greatly depending on load and application, for example
Switching has to be done several times a minute in an electric stove; 120 Hz in a lamp dimmer; between a few kilohertz
(kHz) to tens of kHz for a motor drive; and well into the tens or hundreds of kHz in audio amplifiers and computer
power supplies.
The term duty cycle describes the proportion of ‘on’ time to the regular interval or ‘period’ of time; a low duty cycle corresponds to
low power, because the power is off for most of the time. Duty cycle is expressed in percent, 100% being fully on.
PWM pins can be set up on the Output page, then it may be used by a PWM PID Controller.
Setting Description
Library Select the method for producing the PWM signal. Hardware pins can produce
up to a 30 MHz PWM signal, while any other (non-hardware PWM) pin can
produce up to a 40 kHz PWM signal. See the table, below, for the hardware
pins on various Pi boards.
BCM Pin This is the GPIO that will output the PWM signal, using BCM numbering.
Hertz This is frequency of the PWM signal.
Duty Cycle This is the proportion of the time on to the time off, expressed in percent (0 -
100).
Current Draw (amps)
This is the current draw, in amps, when the duty cycle is 100%. Note: this value
should be calculated based on the voltage set in the Output Usage Settings.
Non-hardware PWM Pins
When using non-hardware PWM pins, there are only certain frequencies that can be used. These frequencies in Hertz are 40000,
20000, 10000, 8000, 5000, 4000, 2500, 2000, 1600, 1250, 1000, 800, 500, 400, 250, 200, 100, and 50 Hz. If you attempt to set a
frequency that is not listed here, the nearest frequency from this list will be used.
Hardware PWM Pins
The exact frequency may be set when using hardware PWM pins. The same PWM channel is available on multiple GPIO. The
latest frequency and duty cycle setting will be used by all GPIO pins which share a PWM channel.
BCM Pin PWM Channel Raspberry Pi Version
12 0 All models except A and B
13 1 All models except A and B
18 0 All models
19 1 All models except A and B
40 0 Compute module only
41 1 Compute module only
45 1 Compute module only
52 0 Compute module only
53 1 Compute module only
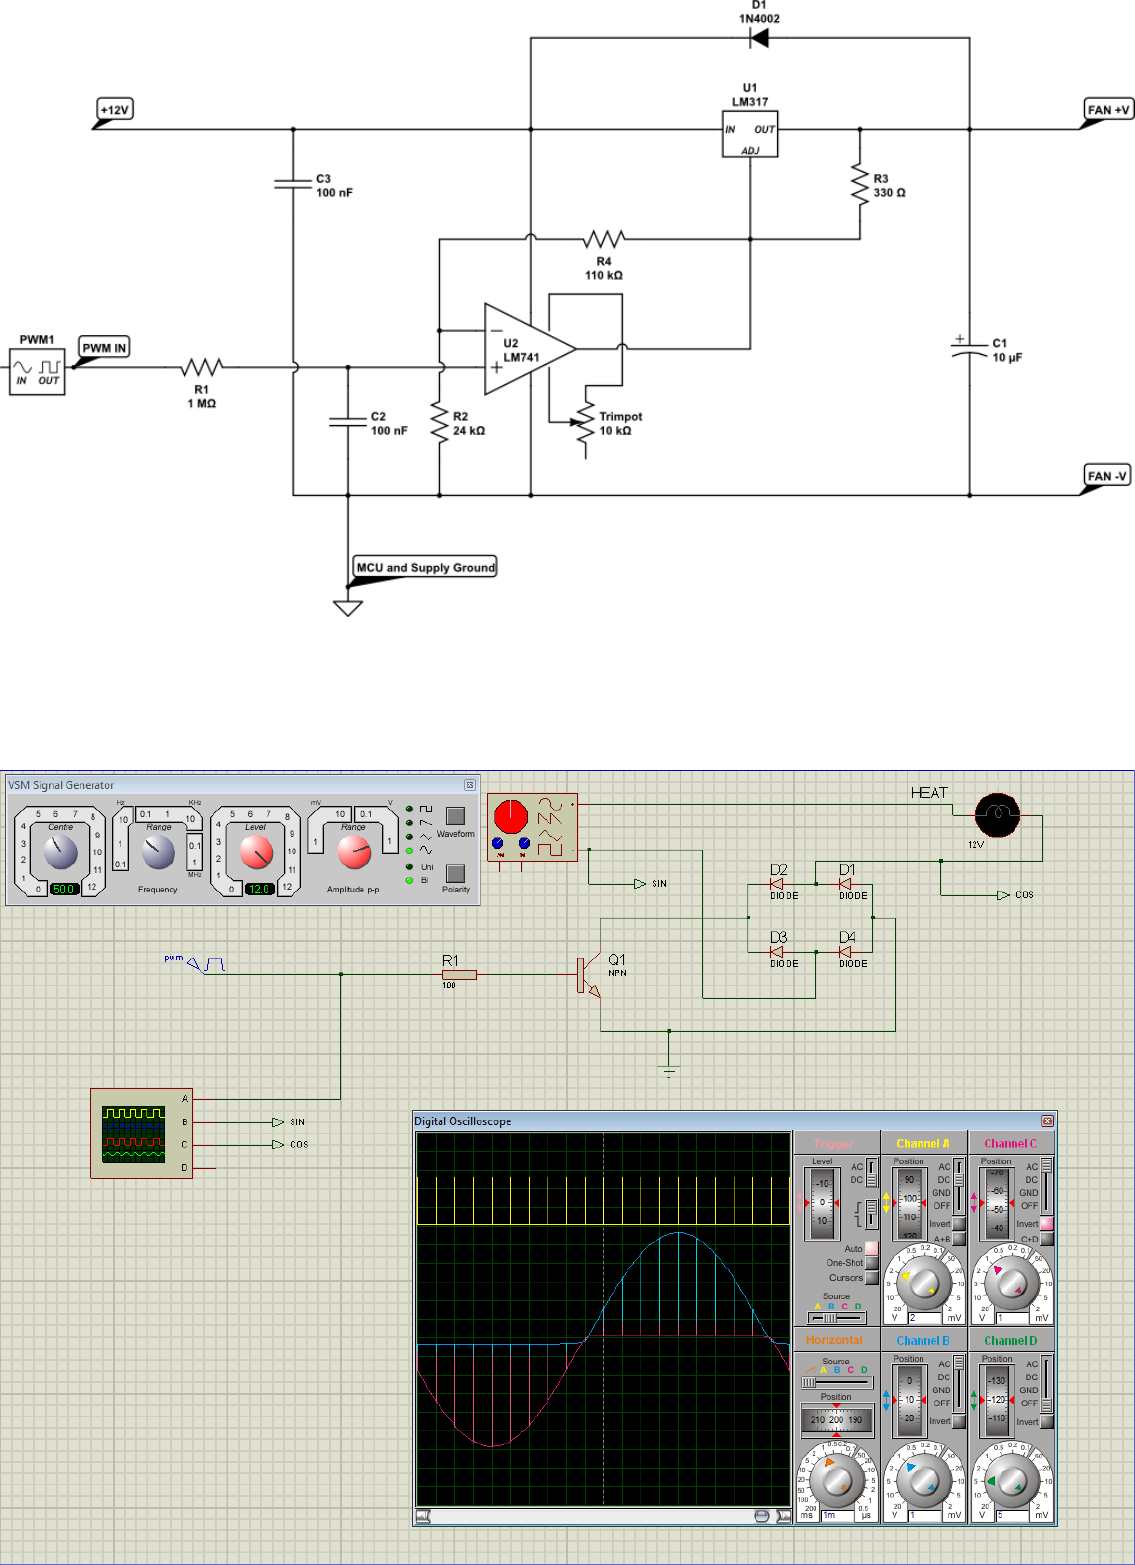
Schematics for DC Fan Control
Below are hardware schematics that enable controlling direct current (DC) fans from the PWM output from Mycodo.
PWM output controlling a 12-volt DC fan (such as a PC fan)
7
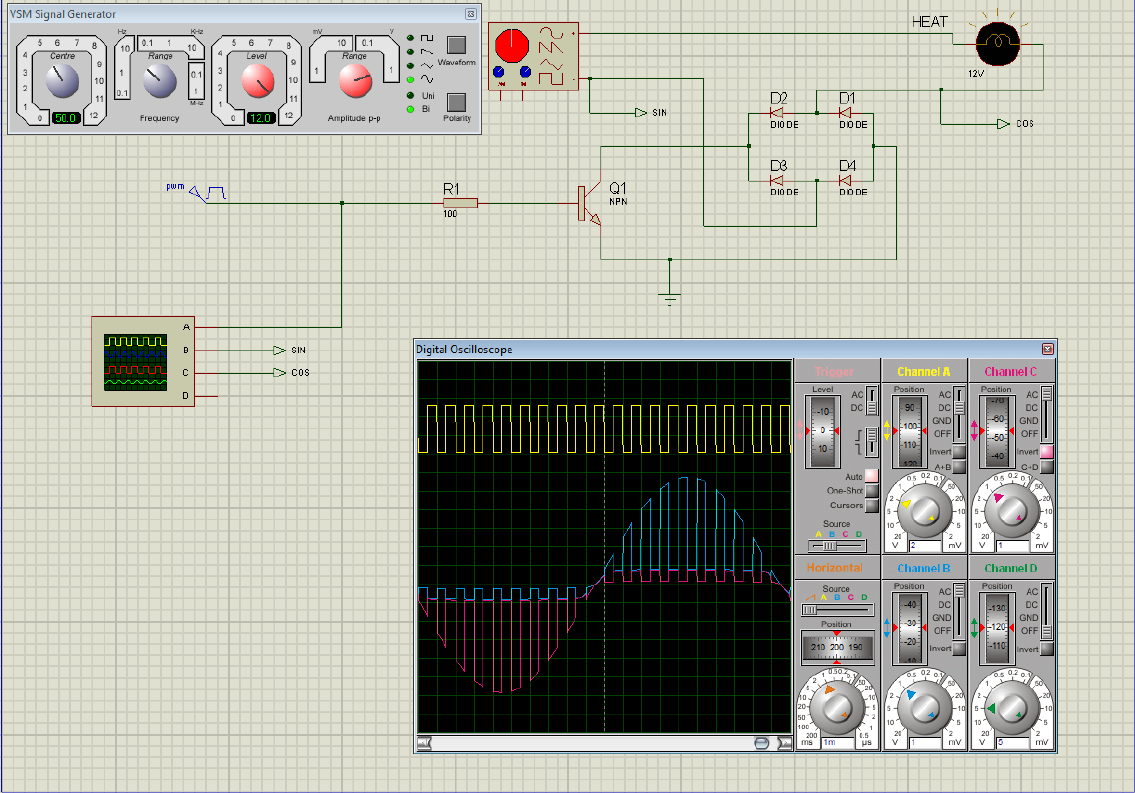
Schematics for AC Modulation
Below are hardware schematics that enable the modulation of alternating current (AC) from the PWM output from Mycodo.
PWM output modulating alternating current (AC) at 1% duty cycle
PWM output modulating alternating current (AC) at 50% duty cycle
8
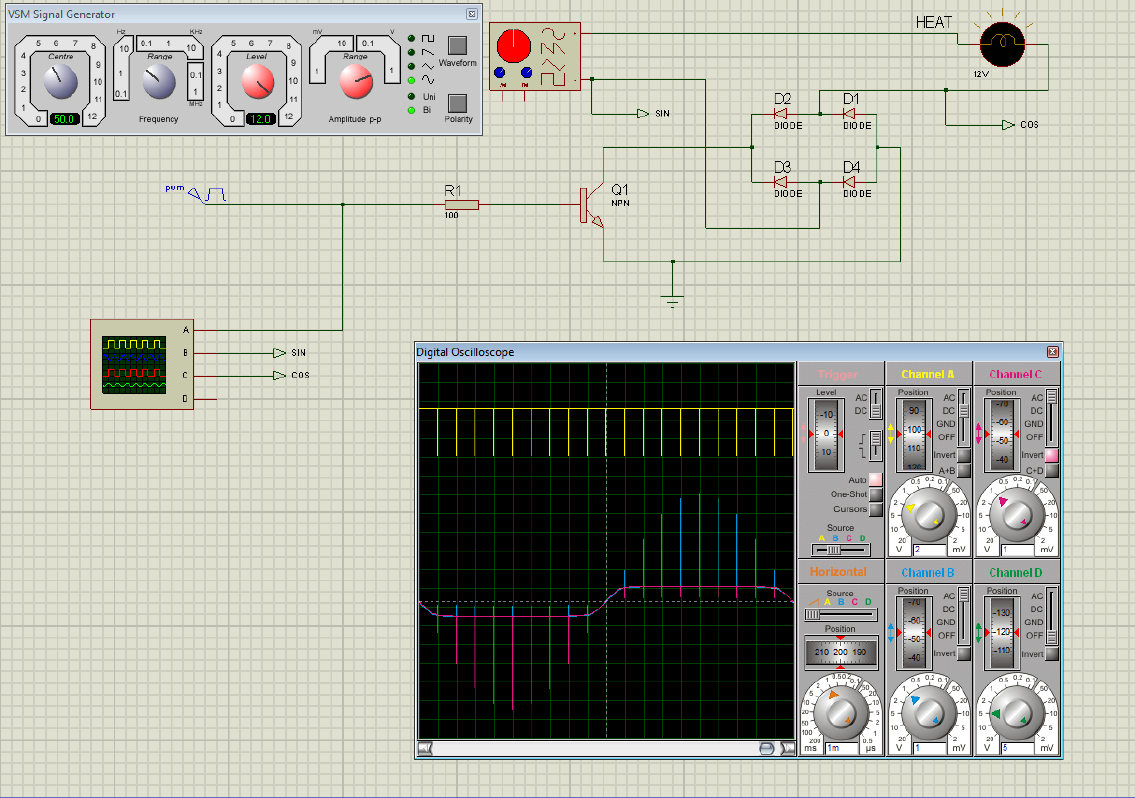
PWM output modulating alternating current (AC) at 99% duty cycle
9
Relays
Relays are electromechanical or solid-state devices that enable a small voltage signal (such as from a microprocessor) to activate a
much larger voltage, without exposing the low-voltage system to the dangers of the higher voltage.
Add and configure outputs in the Output tab. Outputs must be properly set up before PID regulation can be achieved.
Wired
To set up a wired relay, set the “GPIO Pin” to the BCM GPIO number of each pin that activates each relay. On Trigger should be
set to the signal that activates the relay (the device attached to the relay turns on). If your relay activates when the potential
across the coil is 0-volts, set On Trigger to “Low”, otherwise if your relay activates when the potential across the coil is 3.3-volts (or
whatever switching voltage you are using, if not being driven by the GPIO pin), set it to “High”.
Wireless
Certain 433 MHz wireless relays may be used, however you will need to set the pin of the transmitter (using WiringPi numbering),
pulse length, bit length, protocol, on command, and off command. To determine your on and off commands, connect a 433 MHz
receiver to your Pi, then run the receiver script, below, and press one of the buttons (either on or off) on your remote to detect the
numeric code associated with that button.
sudo ~/Mycodo/env/bin/python ~/Mycodo/mycodo/devices/wireless_433mhz_pi_switch.py
433 MHz wireless relays have been successfully tested with SMAKN 433MHz RF Transmitters/Receivers and Etekcity Wireless
Remote Control Electrical Outlets (see Issue 88 for more information). If you have a 433 MHz transmitter/receiver and a wireless
relay that does not work with the current code (even after trying several different protocol settings), submit a new issue with details
of your hardware.
Command
Another option for output control is to execute a terminal command when the output is turned on or off. Commands will be
executed as the user ‘mycodo’.
10

Wireless and Command Output Note: Since the wireless protocol only allows 1-way communication to 433 MHz devices, wireless
relays are assumed to be off until they are turned on, and therefore will appear red (off) when added. If a wireless relay is turned off
or on outside Mycodo (by a remote, for instance), Mycodo will
not
be able to determine the state of the relay and will indicate
whichever state the relay was last. This is, if Mycodo turns the wireless relay on, and a remote is used to turn the relay off, Mycodo
will still assume the relay is on.
Setting Description
BCM Pin
This is the GPIO that will be the signal to the output, using BCM numbering.
On Trigger
This is the state of the GPIO to signal the output to turn the device on. HIGH
will send a 3.3-volt signal and LOW will send a 0-volt signal. If you output
completes the circuit (and the device powers on) when a 3.3-volt signal is sent,
then set this to HIGH. If the device powers when a 0-volt signal is sent, set this
to LOW.
WiringPi Pin This is the GPIO that will be the signal to the output, using WiringPi
numbering.
Protocol This is the protocol to use to transmit via 433MHz. Default is 1, but if this
doesn’t work, increment the number.
Pulse Length This is the pulse length to transmit via 433MHz. Default is 189 ms.
Bit Length This is the bit length to transmit via 433MHz. Default is 24-bit.
On Command
This is the command used to turn the output on. For wireless relays, this is the
numerical command to be transmitted, and for command outputs this is the
command to be executed.
Off Command
This is the command used to turn the output off. For wireless relays, this is the
numerical command to be transmitted, and for command outputs this is the
command to be executed.
Current Draw (amps) The is the amount of current the device powered by the output draws. Note:
this value should be calculated based on the voltage set in the Output Usage
Settings.
Start State This specifies whether the output should be ON or OFF when mycodo initially
starts. Wireless relays have an additional option ‘Neither’ which will not issue
an on or off command when Mycodo starts or stops.
Seconds to turn On This is a way to turn a output on for a specific duration of time. This can be
useful for testing the outputs and powered devices or the measured effects a
device may have on an environmental condition.
Function
Functions couple Inputs with Outputs to perform specific tasks. For example, this could be regulation of temperature with a
temperature sensor and heater with a PID Controller.
PID Controller
A proportional-derivative-integral (PID) controller is a control loop feedback mechanism used throughout industry for controlling
systems. It efficiently brings a measurable condition, such as the temperature, to a desired state and maintains it there with little
overshoot and oscillation. A well-tuned PID controller will raise to the setpoint quickly, have minimal overshoot, and maintain the
setpoint with little oscillation.
PID settings may be changed while the PID is activated and the new settings will take effect immediately. If settings are changed
while the controller is paused, the values will be used once the controller resumes operation.
Setting Description
Activate/Deactivate Turn a particular PID controller on or off.
Pause
When paused, the PID will not turn on the associated outputs, and settings can
be changed without losing current PID output values.
Hold When held, the PID will turn on the associated outputs, and settings can be
changed without losing current PID output values.
Resume Resume a PID controller from being held or paused.
Setpoint
This is the specific point you would like the environment to be regaulted at. For
example, if you would like the humidity regulated to 60%, enter 60.
Band (+/- Setpoint)
Hysteresis option. If set to a non-0 value, the setpoint will become a band, which
will be between the band_max=setpoint+band and band_min=setpoint-band.
If Raising, the PID will raise above band_max, then wait until the condition
falls below band_min to resume regulation. If Lowering, the PID will lower
below band_min, then wait until the condition rises above band_max to resume
regulating. If set to Both, regulation will only occur to the outside min and max
of the band, and cease when within the band. Set to 0 to disable Hysteresis.
11

Setting Description
Direction
This is the direction that you wish to regulate. For example, if you only require
the temperature to be raised, set this to “Up,” but if you require regulation up
and down, set this to “Both.”
Period
This is the duration between when the PID acquires a measurement, the PID is
updated, and the output is modulated.
Max Age The time (in seconds) that the sensor measurement age is required to be less
than. If the measurement is not younger than this age, the measurement is
thrown out and the PID will not actuate the output. This is a safety measure to
ensure the PID is only using recent measurements.
Raise Output
This is the output that will cause the particular environmental condition to rise.
In the case of raising the temperature, this may be a heating pad or coil.
Min Duration (raise)
This is the minimum that the PID output must be before the Up Output turns
on. If the PID output exceeds this minimum, the Up Output will turn on for the
PID output number of seconds.
Max Duration (raise) This is the maximum duration the Up Output is allowed to turn on for. If the
PID output exceeds this number, the Up Output will turn on for no greater
than this duration of time.
Lower Output This is the output that will cause the particular environmental condition to
lower. In the case of lowering the CO2, this may be an exhaust fan.
Min Duration (lower) This is the minimum that the PID output must be before the Down Output
turns on. If the PID output exceeds this minimum, the Down Output will turn
on for the PID output number of seconds.
Max Duration (lower)
This is the maximum duration the Down Output is allowed to turn on for. if the
PID output exceeds this number, the Down Output will turn on for no greater
than this duration of time.
KP
Proportional coefficient (non-negative). Accounts for present values of the error.
For example, if the error is large and positive, the control output will also be
large and positive.
KIIntegral coefficient (non-negative). Accounts for past values of the error. For
example, if the current output is not sufficiently strong, the integral of the error
will accumulate over time, and the controller will respond by applying a stronger
action.
KD
Derivative coefficient (non-negative). Accounts for predicted future values of the
error, based on its current rate of change.
Integrator Min
The minimum allowed integrator value, for calculating Ki_total: (Ki_total = Ki
* integrator; and PID output = Kp_total + Ki_total + Kd_total)
Integrator Max The maximum allowed integrator value, for calculating Ki_total: (Ki_total =
Ki * integrator; and PID output = Kp_total + Ki_total + Kd_total)
Conditional Statements
A conditional statement is a way to perform certain actions based on whether a condition is true. Conditional statements can be
created for both inputs and outputs. Possible conditional statements include:
•If Output #1 turns ON, turn Output #3 ON
•If Output #1 turns ON, turn Output #4 ON for 40 seconds and notify critical-issue@domain.com
•If Output #1 turns ON for any duration, turn Output #4 ON
•If Output #4 turns ON for 21 seconds, turn Output #5 ON for 50 seconds
•If Output #4 turns ON for 20 seconds, turn Output #1 OFF
•If Humidity is Greater Than 80%, turn Output #4 ON for 40 seconds
•
If Humidity if Less Than 50%, turn Output #1 ON for 21 seconds, execute ‘/usr/local/bin/script.sh’, and notify
email@domain.com
•If Temperature if Greater Than 35 C, deactivate PID #1
Before activating any conditional statements or PID controllers, it’s advised to thoroughly explore all possible scenarios and plan a
configuration that eliminates conflicts. Then, trial run your configuration before connecting devices to the outputs. Some devices or
outputs may respond atypically or fail when switched on and off in rapid succession. Therefore, avoid creating an infinite loop with
conditional statements.
Measurement Conditional Statement If Options
12

Setting Description
Setting Description
If Measurement
The measurement that will be checked every Period. By default, a measurement
will only be checked for in the past 120 seconds, unless “None Found Last x
seconds” in which case the Value will determine the measurement age. The
takeaway from this is if a measurement is more than 120 seconds
State
The conditional will trigger if the measurement Greater Than or Less Than the
set Value, or if “No Measurement” is set and the measurement age is greater
than Max Age.
Value
The value that the measurement will be checked against (greater or less than).
Period (seconds) The period (seconds) between conditional checks.
Max Age (seconds) The maximum age the measurement can be. If a measurement isn’t available
within this time frame, the conditional will not trigger. The only exception is if
State is set to “No Measurement”, which will cause the conditional to trigger
when there is no measurement available.
Output Conditional Statement If Options
Setting Description
Output The Output to monitor for a change of state.
State If the state of the output changes to On or Off the conditional will trigger. If
“On (any duration) is selected, th trigger will occur no matter how long the
output turns on for, whereas if only”On" is selected, the conditional will trigger
only when the output turns on for a duration of time equal to the set “Duration
(seconds)”.
Duration (seconds)
If “On” is selected, a optional duration (seconds) may be set that will trigger the
conditional only if the Output is turned on for this specific duration.
Edge Conditional Statement If Options
Setting Description
Edge Detected The conditional will be triggered if a change in state is detected, either Rising
when the state changes from LOW (0 volts) to HIGH (3.5 volts) or Falling when
the state changes from HIGH (3.3 volts) to LOW (0 volts), or Both (Rising and
Falling).
GPIO State The conditional will trigger if the GPIO state of HIGH (3.3 volts) or LOW (0
volts) is detected every Period.
Period (seconds) If GPIO State is selected, how often to check the state of the GPIO.
Conditional Statement Actions
Setting Description
Output Turn a output on, off, or on for a duration of time.
Command Execute a command in the linux shell (as user mycodo).
Activate PID Activate a particular PID controller.
Deactivate PID Deactivate a particular PID controller.
Email
Send an email containing information about the current condition that triggered
the conditional to send the email.
Flash LCD Have an LCD screen begin flashing in order to alert.
Photo Capture a photo with the selected camera.
Email Photo Capture a photo and email it as an attachment to the an email address.
Video Capture a video of a set duration with the selected camera.
Email Video Capture a video and email it as an attachment to the an email address.
Conditional Statement variables
Commands that are executed by conditional statements can now include variables. To use, just place the variable name, including
“((” and “))” in your command, and it will be replaced with the variable’s value before execution. See the tables below for the
currently-supported variables.
13

It is recommended to output a test string to a text file to verify the output is as expected, with a command such as the following
(for a Conditional using the Raspberry Pi CPU temperature Input as the measurement):
echo "TEST: ((measure_temperature)), ((measure_location)), ((measure_period))" > /home/mycodo/test_measure.txt
Or for an Output Conditional:
echo "TEST: ((output_pin)), ((output_action)), ((output_duration)), ((output_pwm))" > /home/mycodo/test_output.txt
Measurement Conditional command variables
Variable Description
((measure_location)) Input location (such as GPIO pin, I2C address, etc.)
((measure_period)) The period (seconds) between measurements (input, math, or PID)
((measure_linux_command)) Input measurement: Linux Command return value
((measure_altitude)) Input measurement: altitude
((measure_boolean)) Input measurement: boolean
((measure_co2)) Input measurement: CO2
((measure_cpu_load_1m)) Input measurement: CPU load (1 min)
((measure_cpu_load_5m)) Input measurement: CPU load (5 min)
((measure_cpu_load_15m)) Input measurement: CPU load (15 min)
((measure_dewpoint)) Input measurement: dew point
((measure_disk_space)) Input measurement: disk space
((measure_duty_cycle)) Input measurement: duty cycle
((measure_edge)) Input measurement: edge detected (1 or -1)
((measure_frequency)) Input measurement: frequency
((measure_humidity)) Input measurement: humidity
((measure_lux)) Input measurement: lux
((measure_moisture)) Input measurement: moisture
((measure_ph)) Input measurement: ph
((measure_pressure)) Input measurement: pressure
((measure_pulse_width)) Input measurement: pulse width
((measure_rpm)) Input measurement: RPM
((measure_temperature)) Input measurement: temperature
((measure_temperature_die)) Input measurement: temperature (die)
((measure_temperature_object)) Input measurement: temperature (object)
((measure_voltage)) Input measurement: voltage
Output Conditional command variables
Variable Description
((output_pin)) The output pin
((output_action)) The state change of the output (turned on = 1, turned off = 0)
((output_duration)) The number of seconds the output turned on for (will return 0 if not
applicable)
((output_pwm)) The PWM duty cycle the output turned on for (will return 0 if not
applicable)
Edge Conditional command variables
Variable Description
((edge_state)) The state of the GPIO pin (on/rising = 1, off/falling = 0)
Timers
Timers enable outputs to be manipulated after specific durations of time or at a specific times of the day. Timers will
only
do as
instructed, therefore if you turn a output ON from Start Time to End Time and you want that output to turn OFF at the end of
that period, you will need to create another timer that turns the output OFF at End Time + 1 minute.
There are two types of timers, one for general outputs that turn on and off, and those that generate a PWM signal.
General Output
14

For Duration Timers, both the on duration and the off duration can be defined and the timer will be turned on and off for those
durations until deactivated.
For Daily Timers, the start hour:minute can be set to turn a specific output on or off at the specific time of day.
PWM Method
This timer allows a method to be used to determine the duty cycle (as percent) of a PWM output. While creating these methods,
keep in mind a duty cycle is a percentage and the values must stay between 0 and 100.
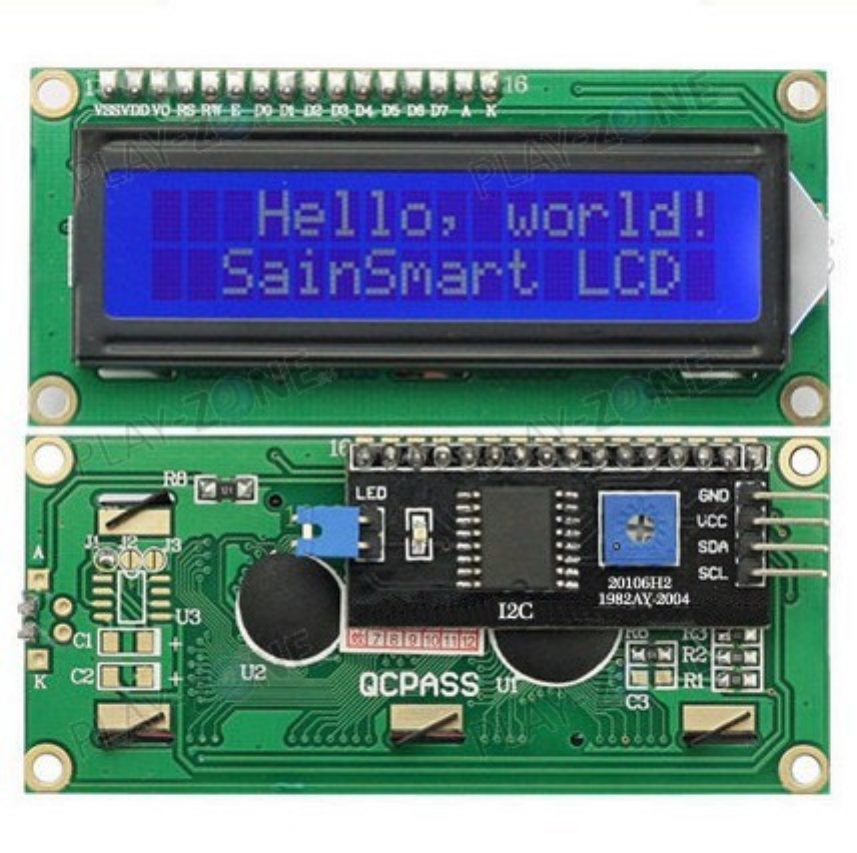
LCDs
Data may be output to a liquid crystal display (LCD) for easy viewing. Please see LCD Displays for specific information regarding
compatibility.
There may be multiple displays created for each LCD. If there is only one display created for the LCD, it will refresh at the set
period. If there is more than one display, it will cycle from one display to the next every set period.
Setting Description
Reset Flashing If the LCD is flashing to alert you because it was instructed to do so by a
triggered Conditional Statement, use this button to stop the flashing.
Type Select either a 16x2 or 20x4 character LCD display.
I2C Address Select the I2C to communicate with the LCD.
Multiplexer I2C Address If the LCD is connected to a multiplexer, select the multiplexer I2C address.
Multiplexer Channel If the LCD is connected to a multiplexer, select the multiplexer channel the
LCD is connected to.
Period This is the period of time (in seconds) between redrawing the LCD with new
data or switching to the next set of displays (if multiple displays are used).
Add Display Set Add a set of display lines to the LCD.
Display Line # Select which measurement to display on each line of the LCD.
Max Age (seconds) The maximum age the measurement is allowed to be. If no measurement was
acquired in this time frame, the display will indicate “NO DATA”.
Methods
Methods enable Setpoint Tracking in PIDs and time-based duty cycle changes in timers. Normally, a PID controller will regulate an
environmental condition to a specific setpoint. If you would like the setpoint to change over time, this is called setpoint tracking.
Setpoint Tracking is useful for applications such as reflow ovens, thermal cyclers (DNA replication), mimicking natural daily cycles,
and more. Methods may also be used to change a duty cycle over time when used with a Timer.
Universal Options
These options are shared with several method types.
Setting Description
Start Time/Date This is the start time of a range of time.
End Time/Date This is the end time of a range of time.
Start Setpoint This is the start setpoint of a range of setpoints.
End Setpoint This is the end setpoint of a range of setpoints.
Specific Method Options
Time/Date Method
A time/date method allows a specific time/date span to dictate the setpoint. This is useful for long-running methods, that may take
place over the period of days, weeks, or months.
Duration Method
A Duration Method allows a
Setpoint
(for PIDs) or
Duty Cycle
(for Timers) to be set after specific durations of time. Each new
duration added will stack, meaning it will come after the previous duration, meaning a newly-added
Start Setpoint
will begin
after the previous entry’s End Setpoint.
If the “Repeat Method” option is used, this will cause the method to repeat once it has reached the end. If this option is used, no
15

more durations may be added to the method. If the repeat option is deleted then more durations may be added. For instance, if your
method is 200 seconds total, if the Repeat Duration is set to 600 seconds, the method will repeat 3 times and then automatically
turn off the PID or Timer.
Daily (Time-Based) Method
The daily time-based method is similar to the time/date method, however it will repeat every day. Therefore, it is essential that
only the span of one day be set in this method. Begin with the start time at 00:00:00 and end at 23:59:59 (or 00:00:00, which would
be 24 hours from the start). The start time must be equal or greater than the previous end time.
Daily (Sine Wave) Method
The daily sine wave method defines the setpoint over the day based on a sinusoidal wave. The sine wave is defined by y = [A * sin(B
* x + C)] + D, where A is amplitude, B is frequency, C is the angle shift, and D is the y-axis shift. This method will repeat daily.
Daily (Bezier Curve) Method
A daily Bezier curve method define the setpoint over the day based on a cubic Bezier curve. If unfamiliar with a Bezier curve, it is
recommended you use the graphical Bezier curve generator and use the 8 variables it creates for 4 points (each a set of x and y).
The x-axis start (x3) and end (x0) will be automatically stretched or skewed to fit within a 24-hour period and this method will
repeat daily.
PID Tuning
PID Control Theory
The PID controller is the most common regulatory controller found in industrial settings, for it“s ability to handle both simple and
complex regulation. The PID controller has three paths, the proportional, integral, and derivative.
The
P
roportional takes the error and multiplies it by the constant K
p
, to yield an output value. When the error is large, there will
be a large proportional output.
The
I
ntegral takes the error and multiplies it by K
i
, then integrates it (K
i·
1/s). As the error changes over time, the integral will
continually sum it and multiply it by the constant K
i
. The integral is used to remove perpetual error in the control system. If
using K
p
alone produces an output that produces a perpetual error (i.e. if the sensor measurement never reaches the Set Point), the
integral will increase the output until the error decreases and the Set Point is reached.
The
D
erivative multiplies the error by K
d
, then differentiates it (K
d·
s). When the error rate changes over time, the output signal
will change. The faster the change in error, the larger the derivative path becomes, decreasing the output rate of change. This has
the effect of dampening overshoot and undershoot (oscillation) of the Set Point.
Using temperature as an example, the Process Variable (PV) is the measured temperature, the Setpoint (SP) is the desired
temperature, and the Error (e) is the distance between the measured temperature and the desired temperature (indicating if the
actual temperature is too hot or too cold and to what degree). The error is manipulated by each of the three PID components,
producing an output, called the Manipulated Variable (MV) or Control Variable (CV). To allow control of how much each path
contributes to the output value, each path is multiplied by a gain (represented by K
P
,K
I
, and K
D
). By adjusting the gains, the
sensitivity of the system to each path is affected. When all three paths are summed, the PID output is produced. If a gain is set to
0, that path does not contribute to the output and that path is essentially turned off.
The output can be used a number of ways, however this controller was designed to use the output to affect the measured value (PV).
This feedback loop, with a properly tuned PID controller, can achieve a set point in a short period of time, maintain regulation with
little oscillation, and respond quickly to disturbance.
Therefor, if one would be regulating temperature, the sensor would be a temperature sensor and the feedback device(s) would be
able to heat and cool. If the temperature is lower than the Set Point, the output value would be positive and a heater would activate.
The temperature would rise toward the desired temperature, causing the error to decrease and a lower output to be produced. This
feedback loop would continue until the error reaches 0 (at which point the output would be 0). If the temperature continues to rise
past the Set Point (this is may be acceptable, depending on the degree), the PID would produce a negative output, which could
be used by the cooling device to bring the temperature back down, to reduce the error. If the temperature would normally lower
without the aid of a cooling device, then the system can be simplified by omitting a cooler and allowing it to lower on its own.
Implementing a controller that effectively utilizes K
P
,K
I
, and K
D
can be challenging. Furthermore, it is often unnecessary. For
instance, the K
I
and K
D
can be set to 0, effectively turning them off and producing the very popular and simple P controller. Also
popular is the PI controller. It is recommended to start with only K
P
activated, then experiment with K
P
and K
I
, before finally
using all three. Because systems will vary (e.g. airspace volume, degree of insulation, and the degree of impact from the connected
device, etc.), each path will need to be adjusted through experimentation to produce an effective output.
16

Quick Setup Examples
These example setups are meant to illustrate how to configure regulation in particular directions, and not to achieve ideal values to
configure your K
P
,K
I
, and K
D
gains. There are a number of online resources that discuss techniques and methods that have been
developed to determine ideal PID values (such as here, here, here, here, and here) and since there are no universal values that will
work for every system, it is recommended to conduct your own research to understand the variables and essential to conduct your
own experiments to effectively implement them.
Provided merely as an example of the variance of PID values, one of my setups had temperature PID values (up regulation) of K
P
= 30, K
I
= 1.0, and K
D
= 0.5, and humidity PID values (up regulation) of K
P
= 1.0, K
I
= 0.2, and K
D
= 0.5. Furthermore, these
values may not have been optimal but they worked well for the conditions of my environmental chamber.
Exact Temperature Regulation
This will set up the system to raise and lower the temperature to a certain level with two regulatory devices (one that heats and one
that cools).
Add a sensor, then save the proper device and pin/address for each sensor and activate the sensor.
Add two outputs, then save each GPIO and On Trigger state.
Add a PID, then select the newly-created sensor. Change Setpoint to the desired temperature, Regulate Direction to “Both”. Set
Raise Output to the relay attached to the heating device and the Lower Relay to the relay attached to the cooling device.
Set KP= 1, KI= 0, and KD= 0, then activate the PID.
If the temperature is lower than the Set Point, the heater should activate at some interval determined by the PID controller until
the temperature rises to the set point. If the temperature goes higher than the Set Point (or Set Point + Buffer), the cooling device
will activate until the temperature returns to the set point. If the temperature is not reaching the Set Point after a reasonable
amount of time, increase the K
P
value and see how that affects the system. Experiment with different configurations involving only
Read Interval and K
P
to achieve a good regulation. Avoid changing the K
I
and K
D
from 0 until a working regulation is achieved
with KPalone.
View graphs in the 6 to 12 hour time span to identify how well the temperature is regulated to the Setpoint. What is meant by
well-regulated will vary, depending on your specific application and tolerances. Most applications of a PID controller would like to
see the proper temperature attained within a reasonable amount of time and with little oscillation around the Setpoint.
Once regulation is achieved, experiment by reducing K
P
slightly (~25%) and increasing K
I
by a low amount to start, such as 0.1 (or
lower, 0.01), then start the PID and observe how well the controller regulates. Slowly increase K
I
until regulation becomes both
quick and with little oscillation. At this point, you should be fairly familiar with experimenting with the system and the K
D
value
can be experimented with once both KPand KIhave been tuned.
High Temperature Regulation
Often the system can be simplified if two-way regulation is not needed. For instance, if cooling is unnecessary, this can be removed
from the system and only up-regulation can be used.
Use the same configuration as the Exact Temperature Regulation example, except change Regulate Direction to “Raise” and do not
touch the “Down Relay” section.
Configuration Settings
The settings menu, accessed by selecting the gear icon in the top-right, then the Configure link, is a general area for various
system-wide configuration options.
General Settings
Setting Description
Language Set the language that will be displayed in the web user interface.
Force HTTPS Require web browsers to use SSL/HTTPS. Any request to http:// will be
redirected to https://.
Hide success alerts Hide all success alert boxes that appear at the top of the page.
Hide info alerts Hide all info alert boxes that appear at the top of the page.
Hide warning alerts Hide all warning alert boxes that appear at the top of the page.
Opt-out of statistics
Turn off sending anonymous usage statistics. Please consider that this helps the
development to leave on.
17

Setting Description
Check for Updates Automatically check for updates every 2 days and notify through the web
interface. If there is a new update, the Configure (Gear Icon) as well as the
Upgrade menu will turn the color red.
Output Usage Settings
In order to calculate accurate output usage statistics, a few characteristics of your electrical system needs to be know. These
variables should describe the characteristics of the electrical system being used by the relays to operate electrical devices. Note:
Proper output usage calculations also rely on the correct current draw to be set for each output (see Output Settings).
Setting Description
Max Amps Set the maximum allowed amperage to be switched on at any given time. If a
output that’s instructed to turn on will cause the sum of active devices to
exceed this amount, the output will not be allowed to turn on, to prevent any
damage that may result from exceeding current limits.
Voltage Alternating current (AC) voltage that is switched by the outputs. This is
usually 120 or 240.
Cost per kWh This is how much you pay per kWh.
Currency Unit This is the unit used for the currency that pays for electricity.
Day of Month
This is the day of the month (1-30) that the electricity meter is read (which will
correspond to the electrical bill).
Users
Mycodo requires at least one Admin user for the login system to be enabled. If there isn’t an Admin user, the web server will
redirect to an Admin Creation Form. This is the first page you see when starting Mycodo for the first time. After an Admin user
has been created, additional users may be created from the User Settings page.
Setting Description
Username
Choose a user name that is between 2 and 64 characters. The user name is case
insensitive (all user names are converted to lower-case).
Email The email associated with the new account.
Password/Repeat
Choose a password that is between 6 and 64 characters and only contain letters,
numbers, and symbols.
Role
Roles are a way of imposing access restrictions on users, to either allow or deny
actions. See the table below for explanations of the four default Roles.
User Roles
Roles define the permissions of each user. There are 4 default roles that determine if a user can view or edit particular areas of
Mycodo. Four roles are provided by default, but custom roles may be created.
Role Admin Editor Monitor Guest
Edit Users X
Edit Controllers X X
Edit Settings X X
View Settings X X X
View Camera X X X
View Stats X X X
View Logs X X X
1The Edit Controllers permission protects the editing of Graphs, LCDs, Methods, PIDs, Outputs, Inputs, and Timers.
2The View Stats permission protects the viewing of usage statistics and the System Info and Output Usage pages.
Alert Settings
Alert settings set up the credentials for sending email notifications.
18

Setting Description
SMTP Host The SMTP server to use to send emails from.
SMTP Port Port to communicate with the SMTP server (465 for SSL, 587 for TSL).
Enable SSL Check to enable SSL, uncheck to enable TSL.
SMTP User The user name to send the email from. This can be just a name or the entire
email address.
SMTP Password The password for the user.
From Email
What the from email address be set as. This should be the actual email address
for this user.
Max emails (per hour) Set the maximum number of emails that can be sent per hour. If more
notifications are triggered within the hour and this number has been reached,
the notifications will be discarded.
Send Test Email Test the email configuration by sending a test email.
Camera Settings
Many cameras can be used simultaneously with Mycodo. Each camera needs to be set up in the camera settings, then may be used
throughout the software. Note that not every option (such as Hue or White Balance) may be able to be used with your particular
camera, due to manufacturer differences in hardware and software.
Setting Description
Type Select whether the camera is a Raspberry Pi Camera or a USB camera.
Library
Select which library to use to communicate with the camera. The Raspberry Pi
Camera uses picamera, and USB cameras should be set to fswebcam.
Device The device to use to connect to the camera. fswebcam is the only library that
uses this option.
Output ID This output will turn on during the capture of any still image (which includes
timelapses).
Rotate Image The number of degrees to rotate the image.
. . . Image Width, Image Height, Brightness, Contrast, Exposure, Gain, Hue,
Saturation, White Balance. These options are self-explanatory. Not all options
will work with all cameras.
Pre Command A command to execute (as user mycodo) before a still image is captured.
Post Command A command to execute (as user mycodo) after a still image is captured.
Flip horizontally Flip, or mirror, the image horizontally.
Flip vertically Flip, or mirror, the image vertically.
Miscellaneous
Dashboard
The dashboard is where you can add pieces of data for easy viewing. It is highly customizable and provides an easy way to see
exactly what data you want to see on one screen.
Graphs
A graphical data display that is useful for viewing data sets spanning relatively short periods of time (hours/days/weeks). Select a
time frame to view data and continually updating data from new sensor measurements. Multiple graphs can be created on one page
that enables a dashboard to be created of graphed sensor data. Each graph may have one or more data from inputs, outputs, or
PIDs rendered onto it. To edit graph options, select the plus sign on the top-right of a graph.
Setting Description
Width
The width of the dashboard object on the page, in 1/12th increments. Multiple
dashboard object can share the sme row if their combined fraction doesn’t
exceed 12/12.
Height (pixels) The height of the dashboard object.
x-Axis (minutes) The duration to display on the x-axis of the graph.
Enable Auto Refresh Automatically refresh the data on the graph Refresh Period.
Refresh (seconds) The duration between acquisitions of new data to display on the graph.
Inputs/Outputs/PIDs The Inputs, Outputs, and PIDs to display on the graph.
Enable X-Axis Reset
Reset the x-axis min/max every time new data comes in during the auto refresh.
19

Setting Description
Enable Title Show a title of the graph name.
Enable Navbar Show a slidable navigation bar at the bottom of the graph.
Enable Export Enable a button on the top right of the graph to allow exporting of the
currently-displayed data as PNG, JPEG, PDF, SVG, CSV, XLS.
Enable Range Selector Show a set of navigation buttons at the top of the graph to quickly change the
display duration.
Enable Graph Shift If enabled, old data points are removed when new data is added to the graph.
Only recommended to enable if Enable Navbar is enabled.
Enable Custom Colors Use custom colors for Input, Output, and PID lines. Select the colors with the
buttons that appear below this checkbox.
Enable Manual Y-Axis Min/Max Set the minimum and maximum y-axes of a particular graph. Set both the
minimum and maximum to 0 to disable for a particular y-axis.
Enable Y-Axis Align Ticks Align the ticks of several y-axes of the same graph.
Enable Y-Axis Start On Tick Start all y-axes of a graph on the same tick.
Enable Y-Axis End On Tick End all y-axes of a graph on the same tick.
Gauges
Gauges are visual objects that allow one to quickly see what the latest measurement is of an input. An example that you may be
familiar with is a speedometer in a car.
Setting Description
Width
The width of the dashboard object on the page, in 1/12th increments. Multiple
dashboard object can share the sme row if their combined fraction doesn’t
exceed 12/12.
Height (pixels) The height of the dashboard object.
Refresh (seconds) The duration between acquisitions of new data to display on the graph.
Max Age (seconds)
The maximum allowable age of the measurement. If the age is greater than this,
the gauge will turn off, indicating there is an issue.
Gauge Min The lowest value of the gauge.
Gauge Max The highest value of the gauge.
Show Timestamp Show the timestamp of the current gauge measurement.
Cameras
Cameras may be added to keep a continuous view on areas.
Setting Description
Width
The width of the dashboard object on the page, in 1/12th increments. Multiple
dashboard object can share the sme row if their combined fraction doesn’t
exceed 12/12.
Height (pixels) The height of the dashboard object.
Refresh (seconds) The duration between acquisitions of new data to display on the graph.
Max Age (seconds)
The maximum allowed age of the image timestamp before a “No Recent Image”
message is returned.
Acquire Image (and save new file) Acquire a new images and save the previous image.
Acquire Image (and erase last file)
Acquire a new image but erase the previous image.
Display Live Video Stream Automatically start a video stream and display it.
Display Latest Timelapse Image Display the latest timelapse image that exists.
Add Timestamp Append a timestamp to the image.
Live Measurements
The Live Measurements page is the first page a user sees after logging in to Mycodo. It will display the current measurements
being acquired from Input and Math controllers. If there is nothing displayed on the Live Measurements page, ensure an Input or
Math controller is both configured correctly and activated. Data will be automatically updated on the page from the measurement
database.
20

Asynchronous Graphs
A graphical data display that is useful for viewing data sets spanning relatively long periods of time (weeks/months/years), which
could be very data- and processor-intensive to view as a Live Graph. Select a time frame and data will be loaded from that time
span, if it exists. The first view will be of the entire selected data set. For every view/zoom, 700 data points will be loaded. If there
are more than 700 data points recorded for the time span selected, 700 points will be created from an averaging of the points in
that time span. This enables much less data to be used to navigate a large data set. For instance, 4 months of data may be 10
megabytes if all of it were downloaded. However, when viewing a 4 month span, it’s not possible to see every data point of that
10 megabytes, and aggregating of points is inevitable. With asynchronous loading of data, you only download what you see. So,
instead of downloading 10 megabytes every graph load, only ~50kb will be downloaded until a new zoom level is selected, at which
time only another ~50kb is downloaded.
Note: Live Graphs require measurements to be acquired, therefore at least one sensor needs to be added and activated in order to
display live data.
Export-Import
Measurements that fall within the selected date/time frame may be exported as CSV with their corresponding timestamps.
Additionally, the entire measurement database (influxdb) may be exported as a ZIP file backup. This ZIP may be imported back in
any Mycodo system to restore these measurements. Note that an import will override the current data (i.e. destroying it).
Mycodo settings may be exported as a ZIP file containing the Mycodo settings database (sqlite). This ZIP file may be used to
restore the settings database to another Mycodo install, as long as the Mycodo version and database versions are the same. Future
support for installing older (or newer) databases and performing an automatic upgrade/downgrade is in the works.
Camera
Once a cameras has been set up (in the Camera Settings), it may be used to capture still images, create time-lapses, and stream
video. Cameras may also be used by Conditional Statements to trigger a camera image or video capture (as well as the ability to
email the image/video with a notification).
Output Usage
Output usage statistics are calculated for each output, based on how long the output has been powered, the current draw of the
device connected to the output, and other Relay Usage Settings.
Backup-Restore
A backup is made to /var/Mycodo-backups when the system is upgraded or through the web interface on the Config -> Backup /
Restore page.
If you need to restore a backup, this can be done on the Config -> Backup / Restore page. Find the backup you would like restored
and press the Restore button beside it. A restore can also be initialized through the command line. Use the following commands to
initialize a restore, changing the appropriate directory names, ‘user’ to your user name, and TIME and COMMIT to the appropriate
text found as the directory names in /var/Mycodo-backups/
sudo mv /home/user/Mycodo /home/user/Mycodo_old
sudo cp -a /var/Mycodo-backups/Mycodo-TIME-COMMIT /home/user/Mycodo
sudo /bin/bash ~/Mycodo/mycodo/scripts/upgrade_post.sh
System Information
This page serves to provide information about the Mycodo frontend and backend as well as the linux system it’s running on. Several
commands and their output are listed to give the user information about how their system is running.
Command Description
Mycodo Version The current version of Mycodo, reported by the configuration file.
Python Version The version of python currently running the web user interface.
Database Version The current version of the settings database. If the current version is different
from what it should be, an error will appear indicating the issue and a link to
find out more information about the issue.
Daemon Status This will be a green “Running” or a red “Stopped”. Additionally, the Mycodo
version and hostname text at the top-left of the screen May be Green, Yellow, or
Red to indicate the status. Green = daemon running, yellow = unable to
connect, and red = daemon not running.
21

Command Description
. . .
Several other status indicators and commands are listed to provide information
about the health of the system. Use these in addition to others to investigate
software or hardware issues.
Troubleshooting
Daemon Not Running
•
Check the Logs: From the
Configure [Gear Icon]
->
Mycodo Logs
page, check the Daemon Log for any errors. If the issue
began after an upgrade, also check the Upgrade Log for indications of an issue.
•
Determine if the Daemon is Running: Execute
ps aux | grep '/var/mycodo-root/env/bin/python /var/mycodo-root/mycodo/mycodo_daemon.py'
in a terminal and look for an entry to be returned. If nothing is returned, the daemon is not running.
•
Daemon Lock File: If the daemon is not running, make sure the daemon lock file is deleted at
/var/lock/mycodo.pid
. The
daemon cannot start if the lock file is present.
•If a solution could not be found after investigating the above suggestions, submit a New Mycodo Issue on github.
Incorrect Database Version
•
Check the System Information page (from the web UI: select [Gear Icon] -> System Information or select the mycodo logo in
the top-left).
•
An incorrect database version error means the version stored in the Mycodo settings database (
~/Mycodo/databases/mycodo.db
)
is not correct for the latest version of Mycodo, determined in the Mycodo config file (~/Mycodo/mycodo/config.py).
•
This can be caused by an error in the upgrade process from an older database version to a newer version, or from a database
that did not upgrade during the Mycodo upgrade process.
•
Check the Upgrade Log for any issues that may have occurred. The log is located at
/var/log/mycodo/mycodoupgrade.log
but may also be accessed from the web UI (if you’re able to): select [Gear Icon] -> Mycodo Logs -> Upgrade Log.
•
Sometimes issues may not immediately present themselves. It is not uncommon to be experiencing a database issue that was
actually introduced several Mycodo versions ago, before the latest upgrade.
•
Because of the nature of how many versions the database can be in, correcting a database issue may be very difficult. It may
be much easier to delete your database and let Mycodo generate a new one.
•
Use the following commands to rename your database and restart the web UI. If both commands are successful, refresh your
web UI page in your browser in order to generate a new database and create a new Admin user.
mv ~/Mycodo/databases/mycodo.db ~/Mycodo/databases/mycodo.db.backup
sudo service mycodoflask restart
More
Check out the Diagnosing Mycodo Issues Wiki Page on github for more information about diagnosing issues.
Device Interfaces
Inputs are categorized below by their communication interface.
1-Wire
The 1-wire interface should be configured with these instructions.
DS18B20: Temperature link (Also works with: DS18S20, DS1822, DS28EA00, DS1825/MAX31850K)
GPIO
DHT11, DHT22/AM2302: Relative humidity and temperature link
SHT1x/SHT7x, SHT2x: Relative humidity and temperature link
22
UART
Atlas Scientific pH: pH link
Atlas Scientific PT-1000: Temperature link
K30: Carbon dioxide (CO2) in ppmv link
MH-Z19: Carbon dioxide (CO2) in ppmv link
This documentation provides specific installation procedures for configuring UART with the Raspberry Pi version 1 or 2.
The K30 may be tested by executing ~/Mycodo/mycodo/tests/manual_tests/test_uart_K30.py
For Atlas Scientific sensors, this guide may be used, as well as the above K-30 guide, to set up UART on the Raspberry Pi 1 and 2.
However, for Pi 3s, use the procedure below.
Because the UART is handled differently by the Raspberry Pi 3, from of the addition of bluetooth, there are a different set of
instructions. If installing Mycodo on a Raspberry Pi 3, you only need to perform these steps to configure UART:
Run raspi-config
sudo raspi-config
Go to Advanced Options -> Serial and disable. Then edit /boot/config.txt
sudo vi /boot/config.txt
Find the line “enable_uart=0” and change it to “enable_uart=1”, then reboot.
I2C
The I2C interface should be enabled with raspi-config.
Analog to Digital Converters
An analog to digital converter (ADC) allows the use of any analog sensor that outputs a variable voltage. A voltage divider may be
necessary to attain your desired range.
ADS1x15: Analog-to-digital converter link
MCP342x: Analog-to-digital converter link
Sensors
AM2315: Relative humidity, temperature link
Atlas Scientific pH: pH link
Atlas Scientific PT-1000: Temperature link
BH1750: Light link
BME280: Barometric pressure, humidity, temperature link
BMP085, BMP180: Barometric pressure, temperature link
HTU21D: Relative humidity and temperature link
TMP006, TMP007: Contactless temperature link
TSL2561: Light link
Chirp: link Moisture, light, and temperature
Edge Detection
The detection of a changing signal, for instance a simple switch completing a circuit, requires the use of edge detection. By detecting
a rising edge (LOW to HIGH), a falling edge (HIGH to LOW), or both, actions or events can be triggered. The GPIO chosen to
detect the signal should be equipped with an appropriate resistor that either pulls the GPIO up [to 5-volts] or down [to ground].
The option to enable the internal pull-up or pull-down resistors is not available for safety reasons. Use your own resistor to pull the
GPIO high or low.
Examples of devices that can be used with edge detection: simple switches and buttons, PIR motion sensors, reed switches, hall
effect sensors, float switches, and more.
23
I2C Multiplexers
All devices that connected to the Raspberry Pi by the I2C bus need to have a unique address in order to communicate. Some inputs
may have the same address (such as the AM2315), which prevents more than one from being connected at the same time. Others
may provide the ability to change the address, however the address range may be limited, which limits by how many you can use at
the same time. I2C multiplexers are extremely clever and useful in these scenarios because they allow multiple sensors with the
same I2C address to be connected.
TCA9548A/PCA9548A: I2C Multiplexer link (I2C): Has 8 selectable addresses, so 8 multiplexers can be connected
to one Raspberry Pi. Each multiplexer has 8 channels, allowing up to 8 devices/sensors with the same address to be
connected to each multiplexer. 8 multiplexers x 8 channels = 64 devices/sensors with the same I2C address.
Note: The TCA9548A/PCA9548A can be set up in two ways. Either by A) connecting the multiplexer to an already-existing I2C
bus and configuring each device manually in Mycodo, or B) (the easier and safer option) creating a dtoverlay to produce a new I2C
bus device for each multiplexer channel. Method A can be used with the multiplexer options already existing in Mycodo, however
option B benefits by allowing the linux driver to handle channel switching and being able to see every device on every bus at once in
Mycodo’s System Information page. To enable option B, visit GPIO-pca9548 to get the code and latest install instructions. If
successfully set up, there will be 8 new I2C busses on the Config -> System Information page.
TCA9545A: I2C Bus Multiplexer link (I2C): This board works a little differently than the TCA9548A, above. This
board actually creates 4 new I2C busses, each with their own selectable voltage, either 3.3 or 5.0 volts. Instructions to
enable the Device Tree Overlay are at https://github.com/camrex/i2c-mux-pca9545a. Nothing else needs to be done in
Mycodo after that except to select the correct I2C bus when configuring a sensor.
Device Specific Information
LCD Displays
There are only a few number fo LCDs that are supported. Only 16x2 and 20x4 character LCD displays with I2C backpacks are
supported. The below image is the type of device that should be compatible.
24
Temperature Sensors
Raspberry Pi
The Raspberry Pi has an integrated temperature sensor on the BCM2835 SoC that measure the temperature of the CPU/GPU.
This is the easiest sensor to set up in Mycodo, as it is immediately available to be used.
Atlas Scientific PT-1000
The PT1000 temperature probe is a resistance type thermometer. Where PT stands for platinum and 1000 is the measured resistance
of the probe at 0°C in ohms (1k at 0°C).
Specifications
•UART or I2C
•Accuracy ±(0.15 + (0.002*t))
•Probe type: Class A Platinum, RTD (resistance temperature detector)
•Cable length: 81cm (32“)
•Cable material: Silicone rubber
•30mm sensing area (304 SS)
•6mm Diameter
•BNC Connector
•Reaction Time: 90% value in 13 seconds
•Probe output: analog
•Full temperature sensing range: -200°C to 850°C
•Cable max temp 125°C
•Cable min temp -55°C
DS18B20
The DS18B20 is a 1-Wire digital temperature sensor from Maxim IC. Each sensor has a unique 64-Bit Serial number, allowing for a
huge number of sensors to be used on one data bus.
Specifications
•Usable temperature range: -55 to 125°C (-67°F to +257°F)
•9 to 12 bit selectable resolution
•Uses 1-Wire interface- requires only one digital pin for communication
•Unique 64 bit ID burned into chip
•Multiple sensors can share one pin
• ±0.5°C Accuracy from -10°C to +85°C
•Temperature-limit alarm system
•Query time is less than 750ms
•Usable with 3.0V to 5.5V power/data
TMP006, TMP007
The TMP006 Breakout can measure the temperature of an object without making contact with it. By using a thermopile to detect
and absorb the infrared energy an object is emitting, the TMP006 Breakout can determine how hot or cold the object is.
Specifications
•Usable temperature range: -40°C to 125°C
•Optimal operating voltage of 3.3V to 5V (tolerant up to 7V max)
Temperature Humidity Sensors
AM2315
Specifications
•0-100% humidity readings with 1% (10-90% RH) and 3% (0-10% RH and 90-100% RH) accuracy
•-20 to 80°C temperature readings ±0.1°C typical accuracy
•3.5 to 5.5V power and I/O
•10 mA max current use during conversion (while requesting data)
25
•No more than 0.5 Hz sampling rate (once every 2 seconds)
Notes
From [@Theoi-Meteoroi](https://github.com/kizniche/Mycodo/issues/315#issuecomment-344798815) on GitHub:
I figured out why this [AM2315] sensor is unreliable with Rpi3 hardware I2C. It is among a number of I2C devices that really hates
the BCM2835 clock stretching blunder (hardware bug: raspberrypi/linux#254). The wakeup attempts fail, consistently. I checked
the bitstream with a sniffer, and see that the sensor may respond once out of 20 or so tries (or not at all) but only with a single byte
returned. The solution is to use a software implementation of the I2C bus. You need to add pull-up resistors (4.7k is dandy) to 3.3v
and install the i2c_gpio device overlay. Seems to work fine now, will run for a few days, but the CRC failures are gone and I get
good readings, every time. And no twiddling the power for the sensor is required.
To enable software I2C, add the following line to your /boot/config.txt
dtoverlay=i2c-gpio,i2c_gpio_sda=23,i2c_gpio_scl=24,i2c_gpio_delay_us=4
After rebooting, a new I2C bus at /dev/i2c-3 should exist with SDA on pin 23 (BCM) and SCL on pin 24 (BCM). Make sure you
add the appropriate pull-up resistors before connecting any devices.
DHT11
Specifications
•3 to 5V power and I/O
•2.5mA max current use during conversion (while requesting data)
•20-80% humidity readings with 5% accuracy
•0-50°C temperature readings ±2°C accuracy
•No more than 1 Hz sampling rate (once every second)
DHT22, AM2302
Compared to the DHT11, this sensor is more precise, more accurate and works in a bigger range of temperature/humidity, but its
larger and more expensive. The wiring is the same as the DHT11.
Specifications
•0-100% humidity readings with 2% (10-90% RH) and 5% (0-10% RH and 90-100% RH) accuracy
•-40 to 80°C temperature readings ±0.5°C accuracy
•3 to 5V power and I/O
•2.5mA max current use during conversion (while requesting data)
•No more than 0.5 Hz sampling rate (once every 2 seconds)
HTU21D
Specifications
•0-100% humidity readings with 2% (20-80% RH) and 2%-5% (0-20% RH and 80-100% RH) accuracy
•Optimum accuracy measurements within 5 to 95% RH
•-30 to 90°C temperature readings ±1°C typical accuracy
SHT1x
(SHT10, SHT11, SHT15)
Specifications
•0-100% humidity readings with 2%-5% (10-90% RH) and 2%-7.5% (0-10% RH and 90-100% RH) accuracy
•-40 to 125°C temperature readings ±0.5°C, ±0.4°C, and ±0.3°C typical accuracy (respectively)
•2.4 to 5.5V power and I/O
•No more than 0.125 Hz sampling rate (once every 8 seconds)
SHT7x
(SHT71, SHT75)
26
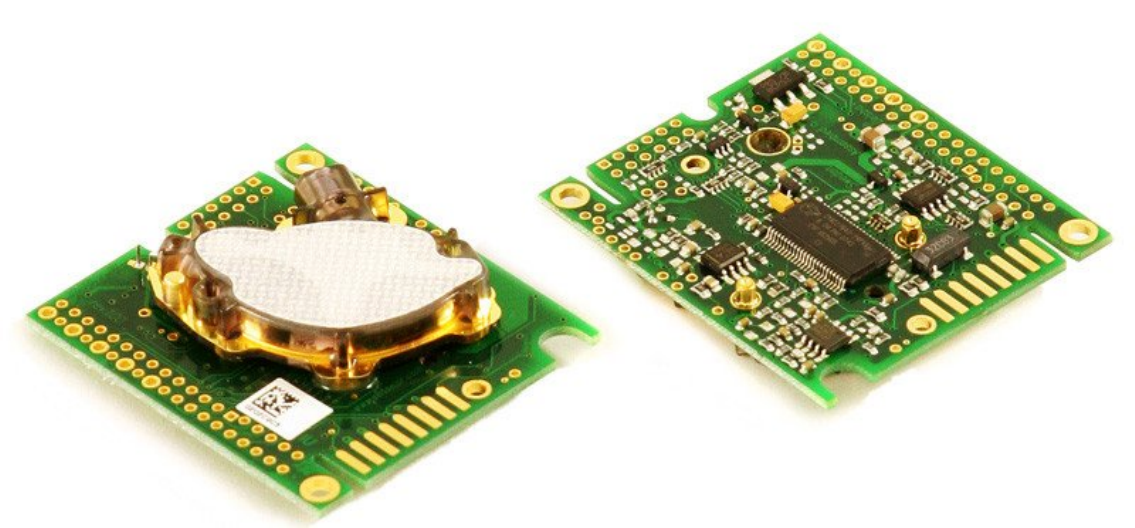
Specifications
•0-100% humidity readings with 2%-3% (10-90% RH) and 2%-5% (0-10% RH and 90-100% RH) accuracy
•-40 to 125°C temperature readings ±0.4°C and ±0.3°C typical accuracy (respectively)
•2.4 to 5.5V power and I/O
•No more than 0.125 Hz sampling rate (once every 8 seconds)
CO2 Sensors
K-30
Be very careful when connecting the K-30, as there is no reverse-voltage protection and improper connections could destroy your
sensor.
Wiring instructions for the Raspberry Pi can be found here.
Specifications
•0 – 10,000 ppmv (0 - 5,000 ppmv within specifications)
•Repeatability: ±20 ppm ±1% of measured value within specifications
•Accuracy: ±30 ppm ±3% of measured value within specifications
•Non-dispersive infrared (NDIR) technology
•Sensor life expectancy: > 15 years
•Self-diagnostics: complete function check of the sensor module
•Warm-up time: < 1 min. (@ full specs < 15 min)
•0.5 Hz sampling rate (once every 2 seconds)
MH-Z19
Specifications
•0 – 5,000 ppmv
•Accuracy: ±50 ppm ±5% of measured value within specifications
•Non-dispersive infrared (NDIR) technology
•Sensor life expectancy: > 5 years
•Warm-up time: 3 min.
•0.2 Hz sampling rate (once every 5 seconds)
Moisture Sensors
Chirp
The Chirp sensor measures moisture, light, and temperature.
27
Specifications
•Vin: 3 to 5V
•I2C 7-bit address 0x77
pH Sensors
Atlas Scientific pH
The Atlas Scientific pH sensor measures the pH of a liquid.
Specifications
•UART or I2C
•Probe Max Pressure: 690 kPa (100PSI)
•Probe Max Depth 60 M (197 ft)
•Probe Weight: 49 grams
•Probe can be fully submerged in fresh or salt water indefinitely
Pressure Sensors
BME280
The BME280 is the upgrade to the BMP085/BMP180/BMP183. It has a low altitude noise of 0.25m and the same fast conversion
time. It has the same specifications, but can use either I2C or SPI.
Specifications
•300-1100 hPa (9000m to -500m above sea level)
•-40 to +85°C operational range
• ±3% humidity accuracy tolerance
• ±1% humidity hysteresis
• ±1 hPa pressure accuracy
• ±2°C temperature accuracy
•Vin: 3 to 5V
•Logic: 3 to 5V compliant
•I2C 7-bit address 0x76 or 0x77
BMP085, BMP180
The BMP180 replaces the BMP085. It is completely identical to the BMP085 in terms of firmware/software/interfacing.
Specifications
•300-1100 hPa (9000m to -500m above sea level)
•Up to 0.03hPa / 0.25m resolution
•-40 to +85°C operational range
• ±2°C temperature accuracy
•Vin: 3 to 5V
•Logic: 3 to 5V compliant
•I2C 7-bit address 0x77
Luminosity Sensors
BH1750
The BH1750 is an I2C luminosity sensor that provides a digital value in lux (lx) over a range of 1 - 65535 lx.
TSL2561
The TSL2561 SparkFun Luminosity Sensor Breakout is a sophisticated light sensor which has a flat response across most of the
visible spectrum. Unlike simpler sensors, the TSL2561 measures both infrared and visible light to better approximate the response
of the human eye. And because the TSL2561 is an integrating sensor (it soaks up light for a predetermined amount of time), it is
capable of measuring both small and large amounts of light by changing the integration time.
28
Specifications
•Light range: 0.1 - 40k+ lux
•Vin: 3V and a low supply
•Max current: 0.6mA.
Analog to Digital Converters
ADS1x15
(ADS1015, ADS1115)
Specifications
•Interface: I2C
•I2C 7-bit addresses 0x48 - 0x4B
•Input channels: 2 (differential), 4 (single-ended)
•Power: 2.0V to 5.5V
•Sample Rate: 1015: 128SPS to 3.3kSPS, 1115: 8SPS to 860SPS
•Resolution: 1015: 12-bit, 1115: 16-bit
MCP342x
(MCP3422, MCP3423, MCP3424, MCP3426, MCP3427, MCP3428)
Specifications
•Interface: I2C
•I2C 7-bit addresses 0x68 - 0x6F
•MCP3422: 2 channel, 12, 14, 16, or 18 bit
•MCP3423: 2 channel, 12, 14, 16, or 18 bit
•MCP3424: 4 channel, 12, 14, 16, or 18 bit
•MCP3426: 2 channel, 12, 14, or 16 bit
•MCP3427: 2 channel, 12, 14, or 16 bit
•MCP3428: 4 channel, 12, 14, or 16 bit
29
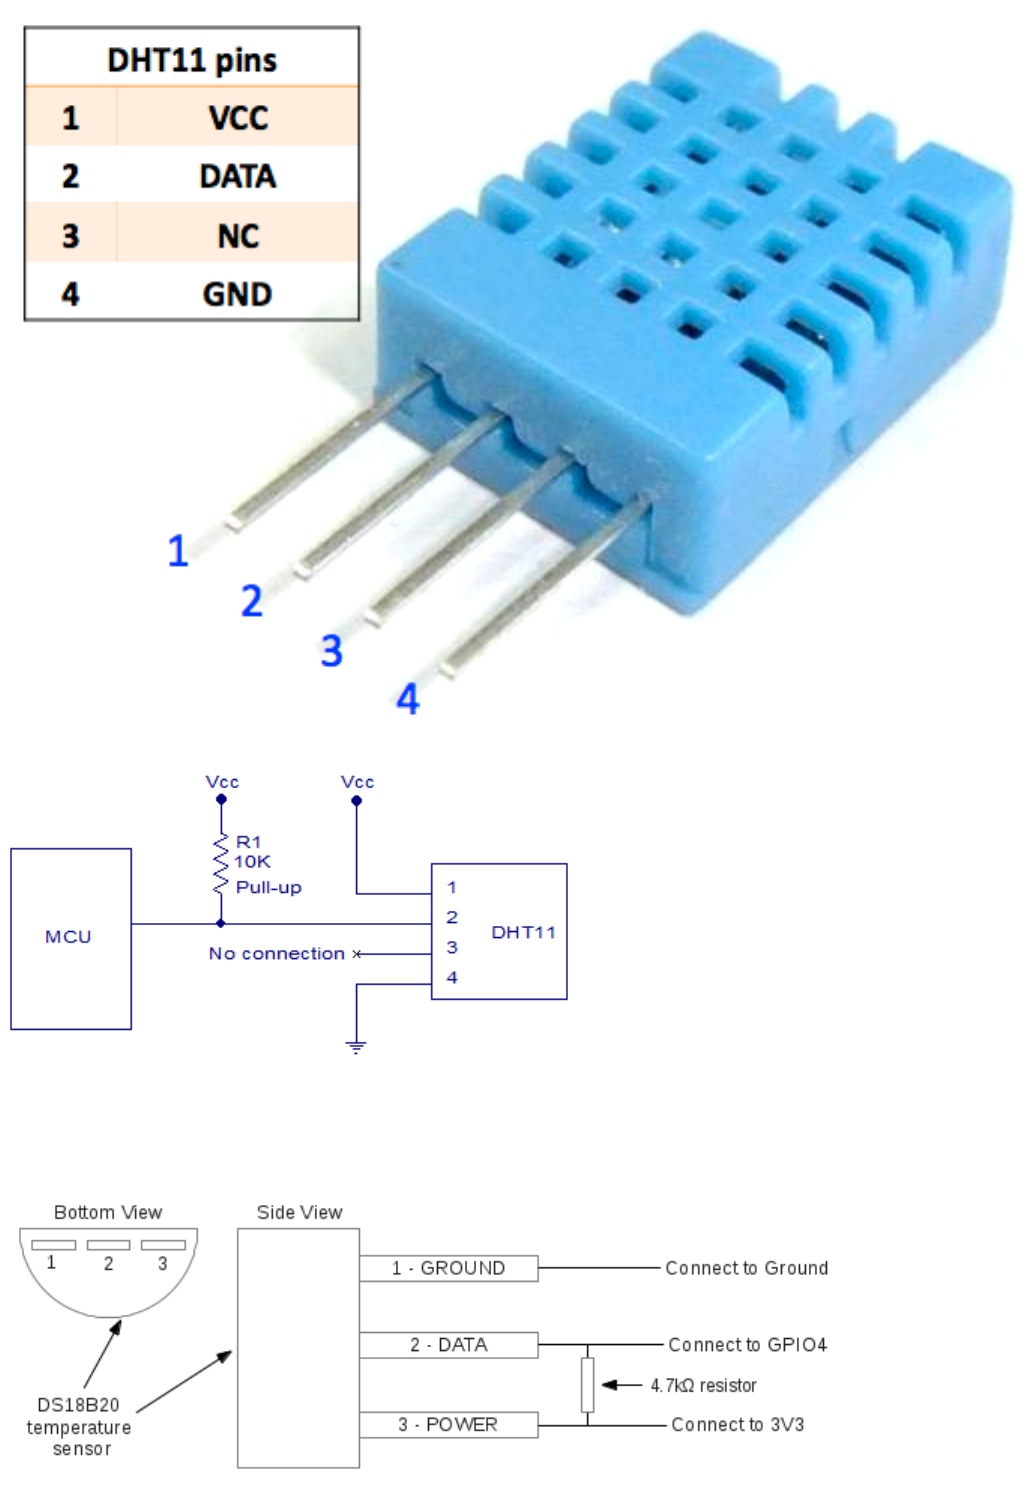
Diagrams
DHT11 Diagrams
DS18B20 Diagrams
30
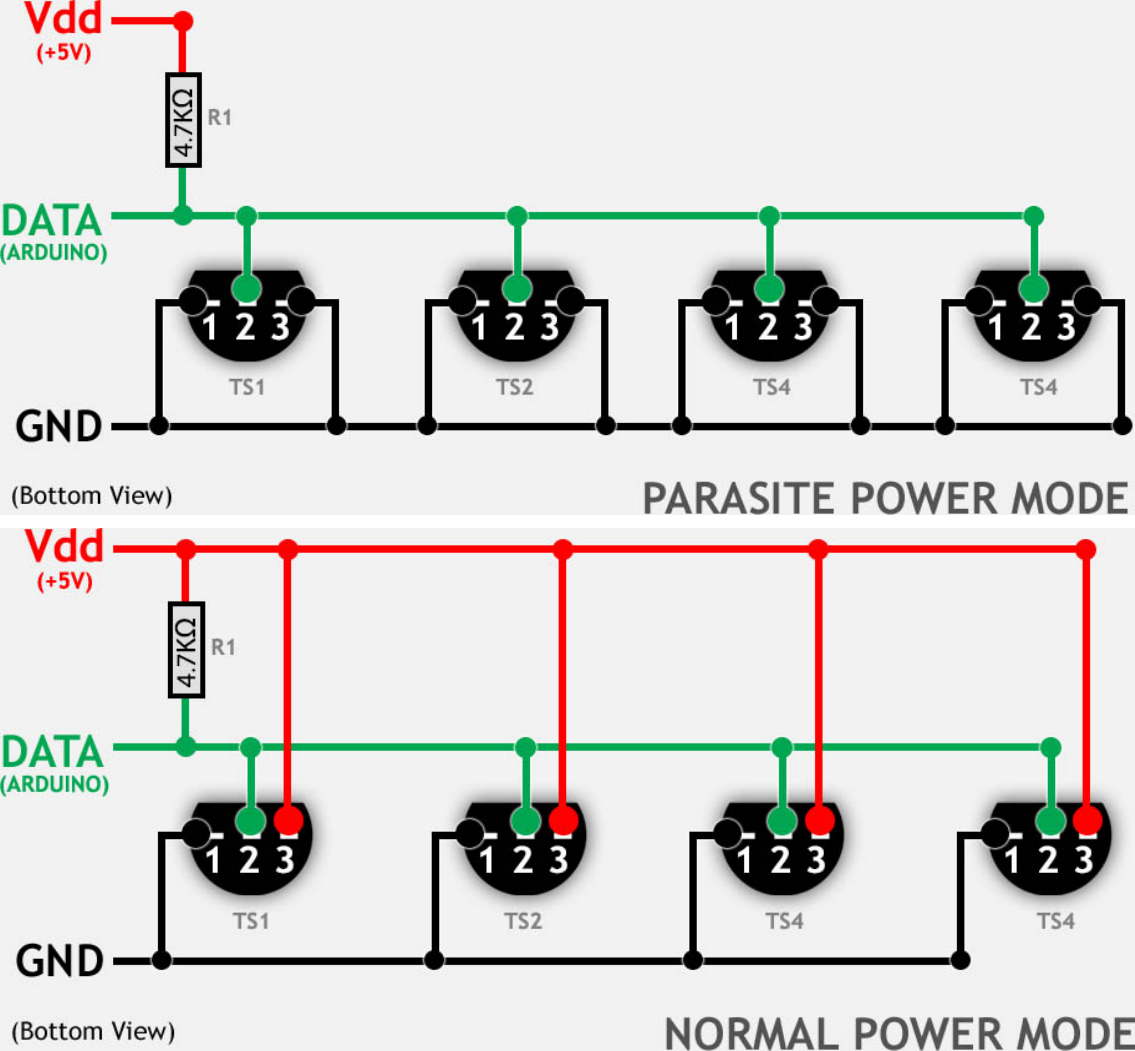
Raspberry Pi and Relay Diagrams
Raspberry Pi, 4 relays, 4 outlets, 1 DS18B20 sensor:
31
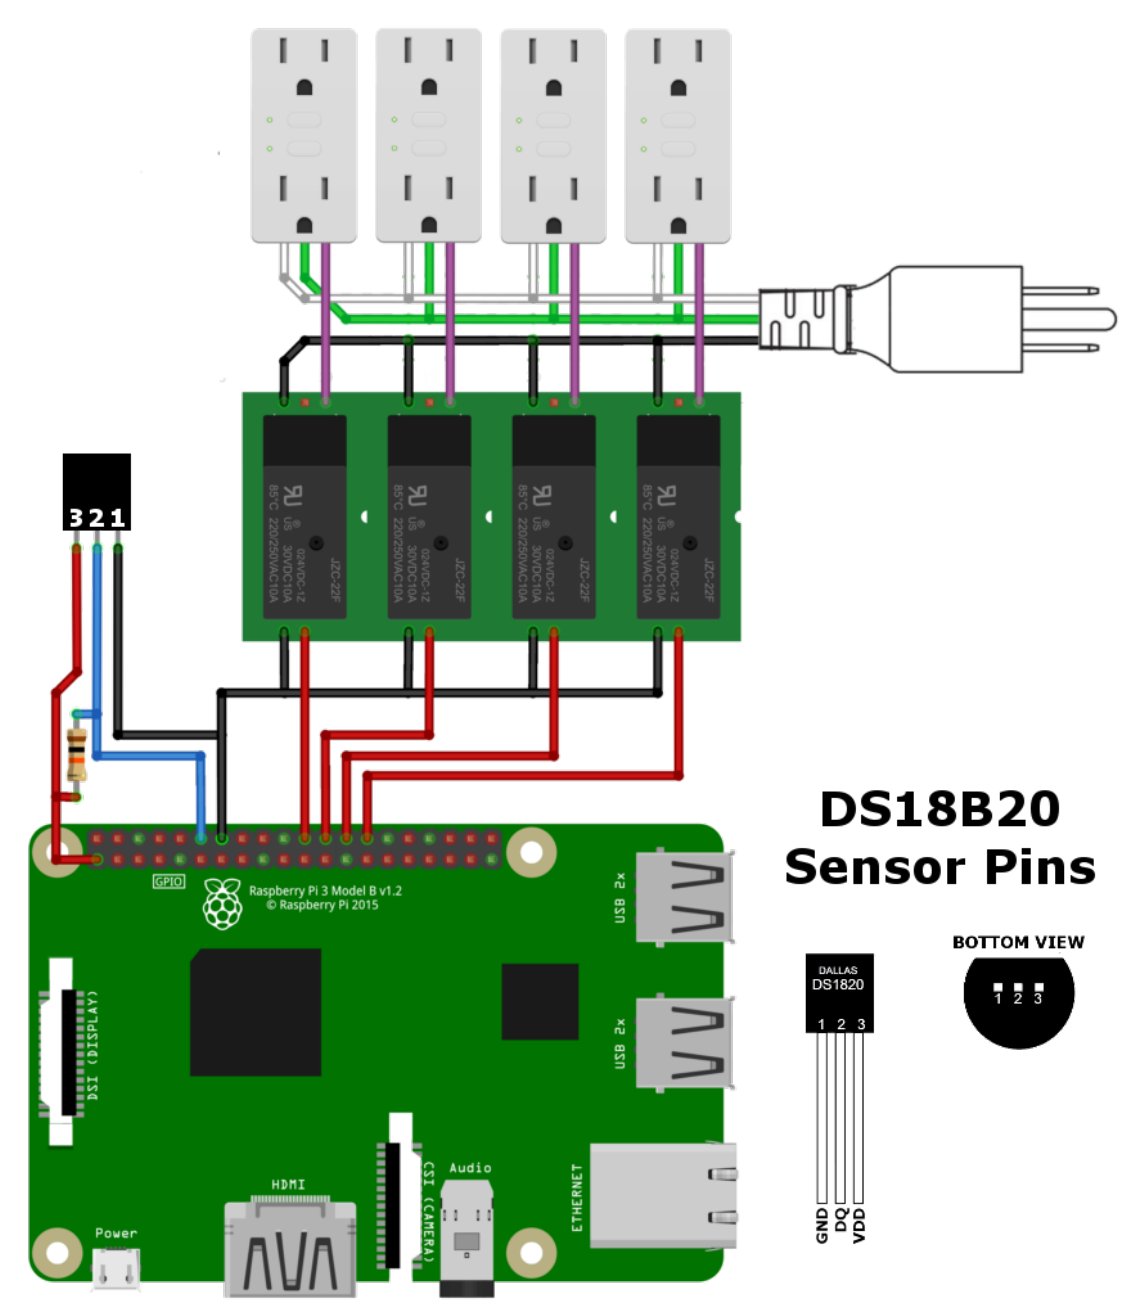
Raspberry Pi, 8 relays, 8 outlets:
32
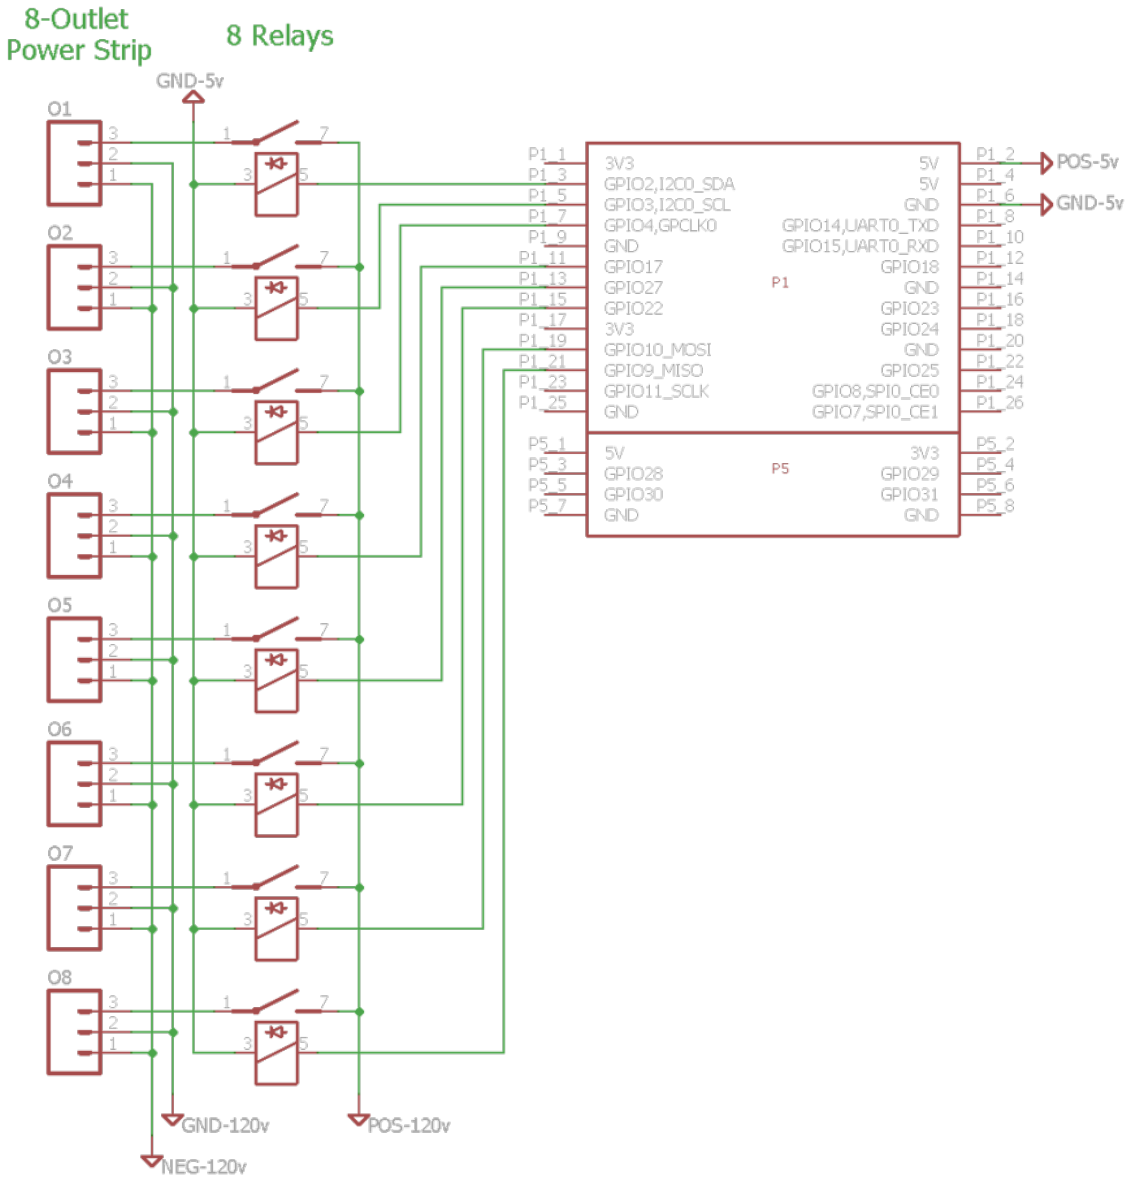
33
