演示文稿 Shiny Circos Help Manual
shinyCircos_Help_Manual
shinyCircos_Help_Manual
User Manual: Pdf
Open the PDF directly: View PDF ![]() .
.
Page Count: 78
- 幻灯片编号 1
- 幻灯片编号 2
- 幻灯片编号 3
- 幻灯片编号 4
- 幻灯片编号 5
- 幻灯片编号 6
- 幻灯片编号 7
- 幻灯片编号 8
- 幻灯片编号 9
- 幻灯片编号 10
- 幻灯片编号 11
- 幻灯片编号 12
- 幻灯片编号 13
- 幻灯片编号 14
- 幻灯片编号 15
- 幻灯片编号 16
- 幻灯片编号 17
- 幻灯片编号 18
- 幻灯片编号 19
- 幻灯片编号 20
- 幻灯片编号 21
- 幻灯片编号 22
- 幻灯片编号 23
- 幻灯片编号 24
- 幻灯片编号 25
- 幻灯片编号 26
- 幻灯片编号 27
- 幻灯片编号 28
- 幻灯片编号 29
- 幻灯片编号 30
- 幻灯片编号 31
- 幻灯片编号 32
- 幻灯片编号 33
- 幻灯片编号 34
- 幻灯片编号 35
- 幻灯片编号 36
- 幻灯片编号 37
- 幻灯片编号 38
- 幻灯片编号 39
- 幻灯片编号 40
- 幻灯片编号 41
- 幻灯片编号 42
- 幻灯片编号 43
- 幻灯片编号 44
- 幻灯片编号 45
- 幻灯片编号 46
- 幻灯片编号 47
- 幻灯片编号 48
- 幻灯片编号 49
- 幻灯片编号 50
- 幻灯片编号 51
- 幻灯片编号 52
- 幻灯片编号 53
- 幻灯片编号 54
- 幻灯片编号 55
- 幻灯片编号 56
- 幻灯片编号 57
- 幻灯片编号 58
- 幻灯片编号 59
- 幻灯片编号 60
- 幻灯片编号 61
- 幻灯片编号 62
- 幻灯片编号 63
- 幻灯片编号 64
- 幻灯片编号 65
- 幻灯片编号 66
- 幻灯片编号 67
- 幻灯片编号 68
- 幻灯片编号 69
- 幻灯片编号 70
- 幻灯片编号 71
- 幻灯片编号 72
- 幻灯片编号 73
- 幻灯片编号 74
- 幻灯片编号 75
- 幻灯片编号 76
- 幻灯片编号 77
- 幻灯片编号 78
shinyCircos
an R/Shiny application for interactive creation of
Circos plot

The source code of shinyCircos is deposited in
Github (https://github.com/venyao/shinyCircos).
shinyCircos is deployed at https://yimingyu.shinyapps.io/shinycircos/
and http://shinycircos.ncpgr.cn/. Users can use shinyCircos online by
accessing either of the two URLs.
Yiming Yu1,Yidan Ouyang1,*,Wen Yao1,2*
1National Key Laboratory of Crop Genetic Improvement, National Center of
Plant Gene Research (Wuhan), Huazhong Agricultural University, Wuhan
430070,China, 2College of Life Science and Technology, Henan Agricultural
University, Zhengzhou 450002,China.
Contact: yaowen@henau.edu.cn, diana1983941@mail.hzau.edu.cn
Users are encouraged to install and use shinyCircos on local personal computers.
Please check the help menu of the shinyCircos application or
https://github.com/venyao/shinyCircos for the installation of
shinyCircos on local computers.
1. Interface of shinyCircos
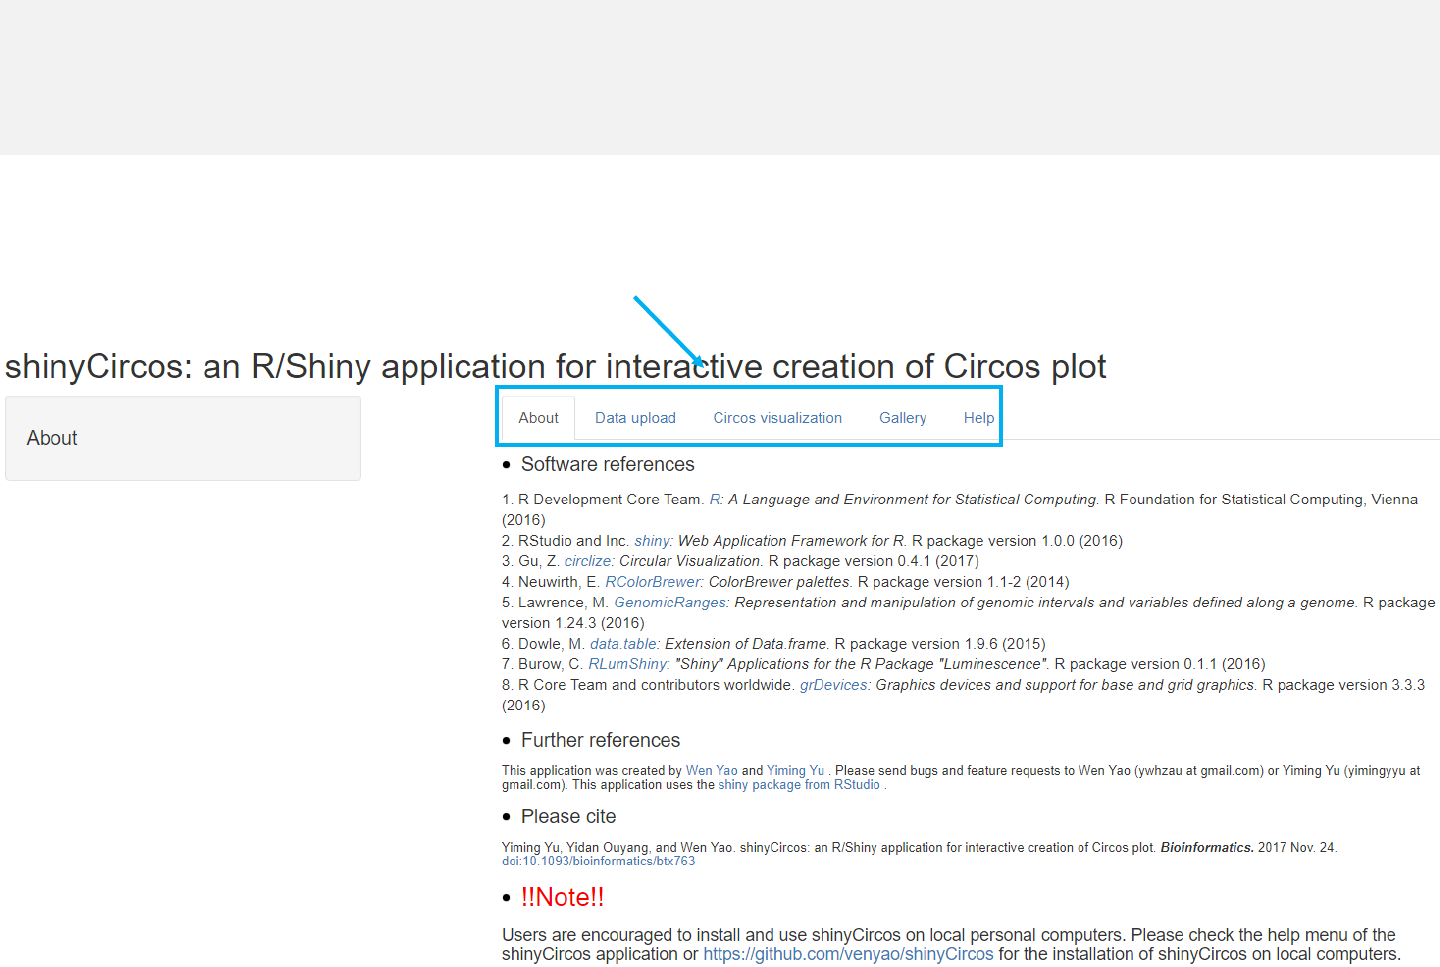
Menu in shinyCircos: About
-The shinyCircos application contains five menus, “About”, “Data upload”,
“Circos visualization”, “Gallery”and “Help”.
-The “About”menu lists the Rpackages used in shinyCircos.
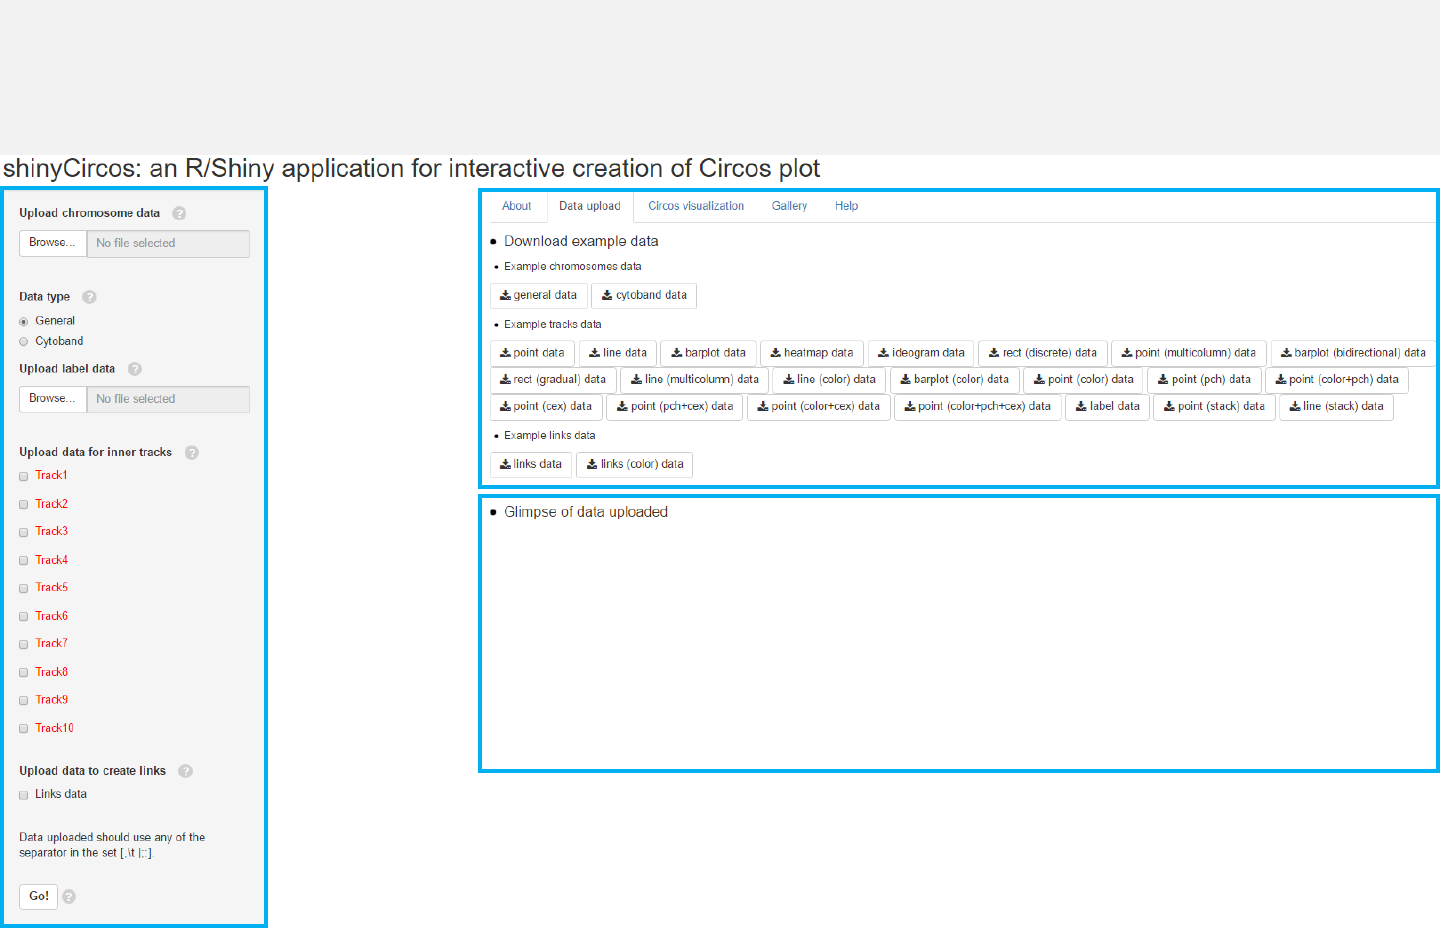
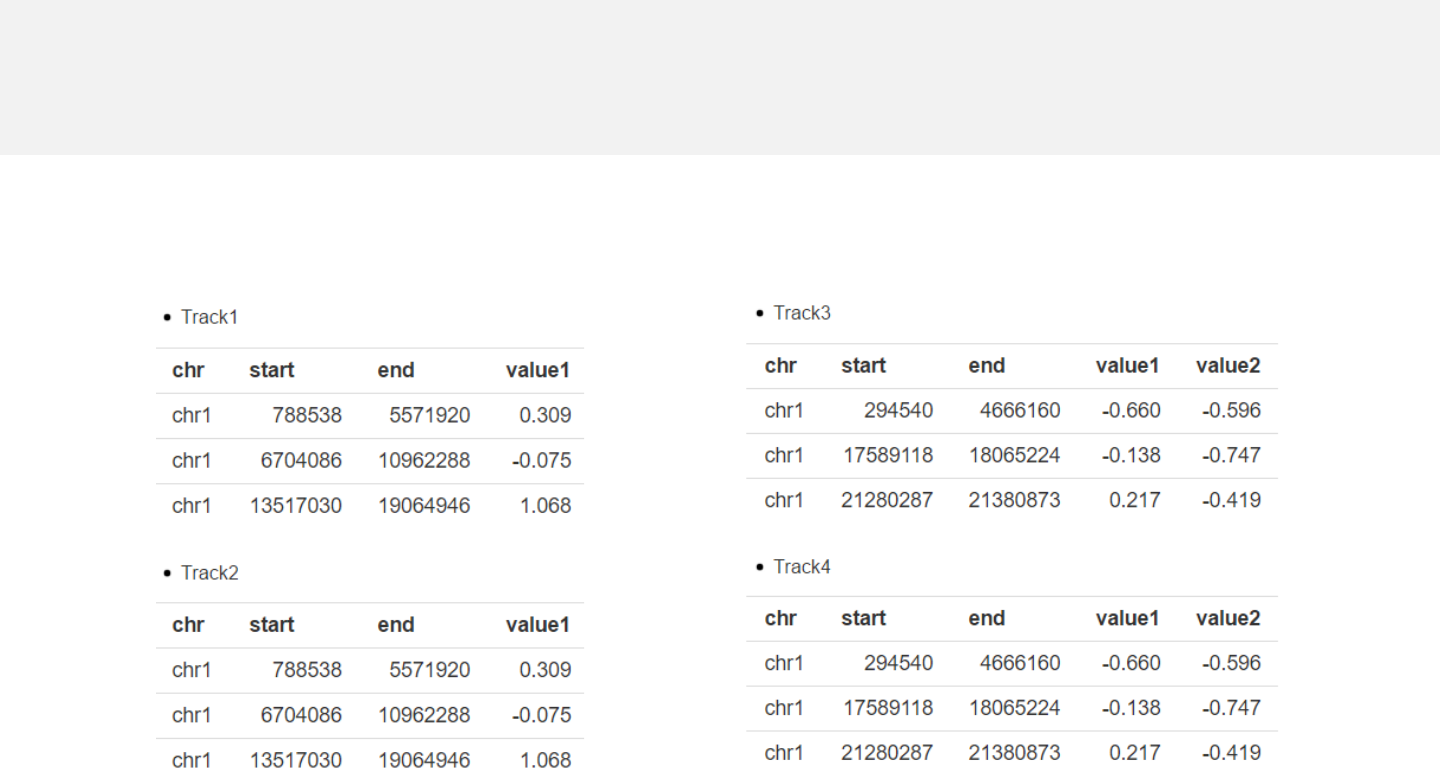
Upload data
Download
example data
View uploaded data
Menu in shinyCircos: Data upload
-The “Data upload”menu allows uploading of input data for Circos plots.
-Aglimpse of the uploaded data will be printed on this page.
-Example datasets could be downloaded from this menu.
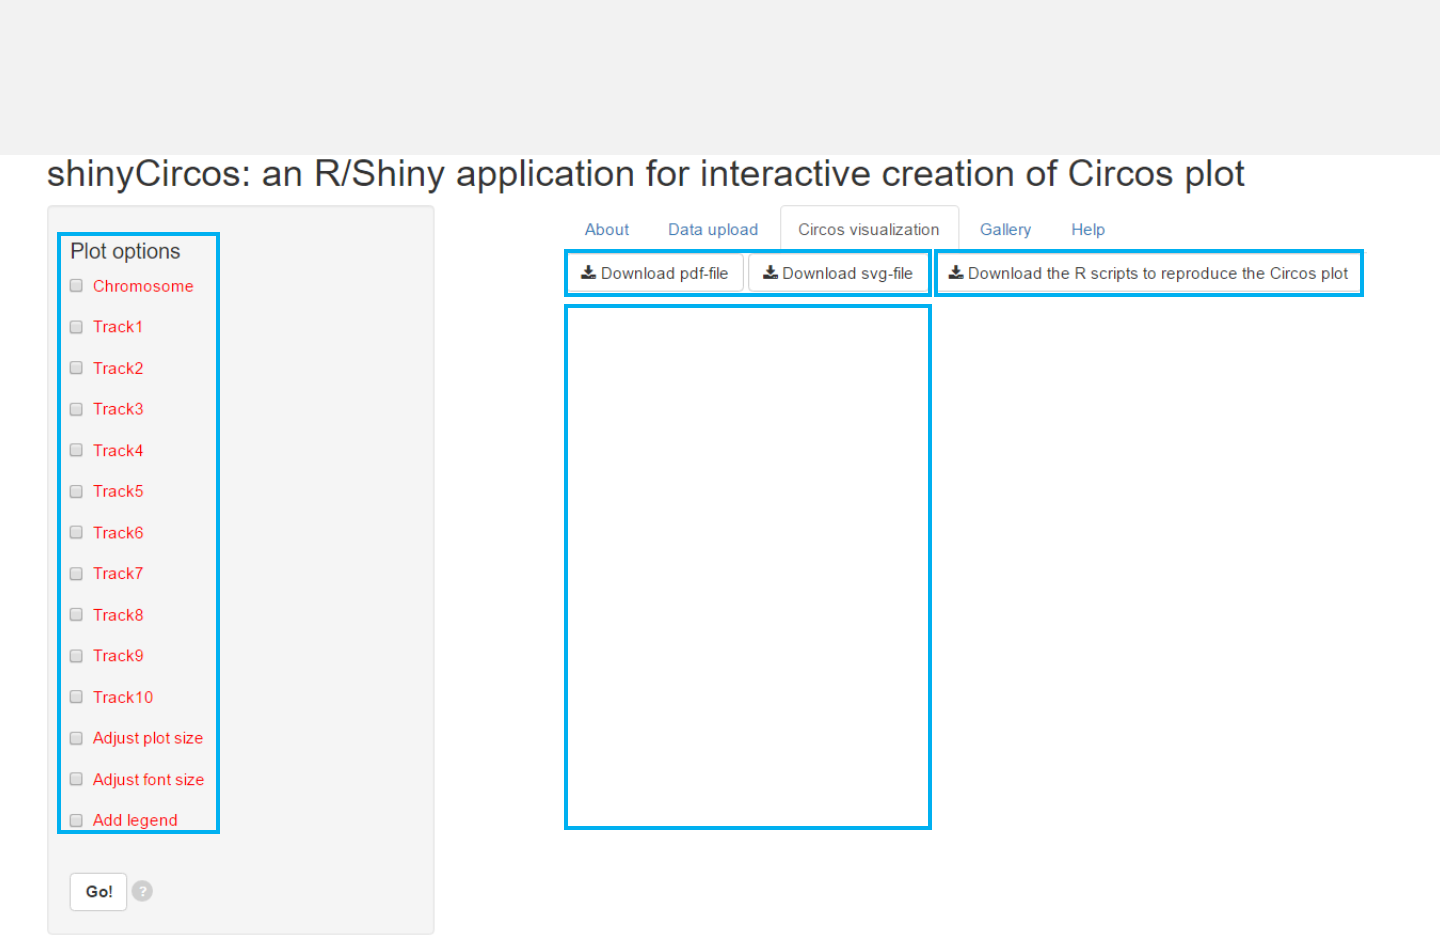
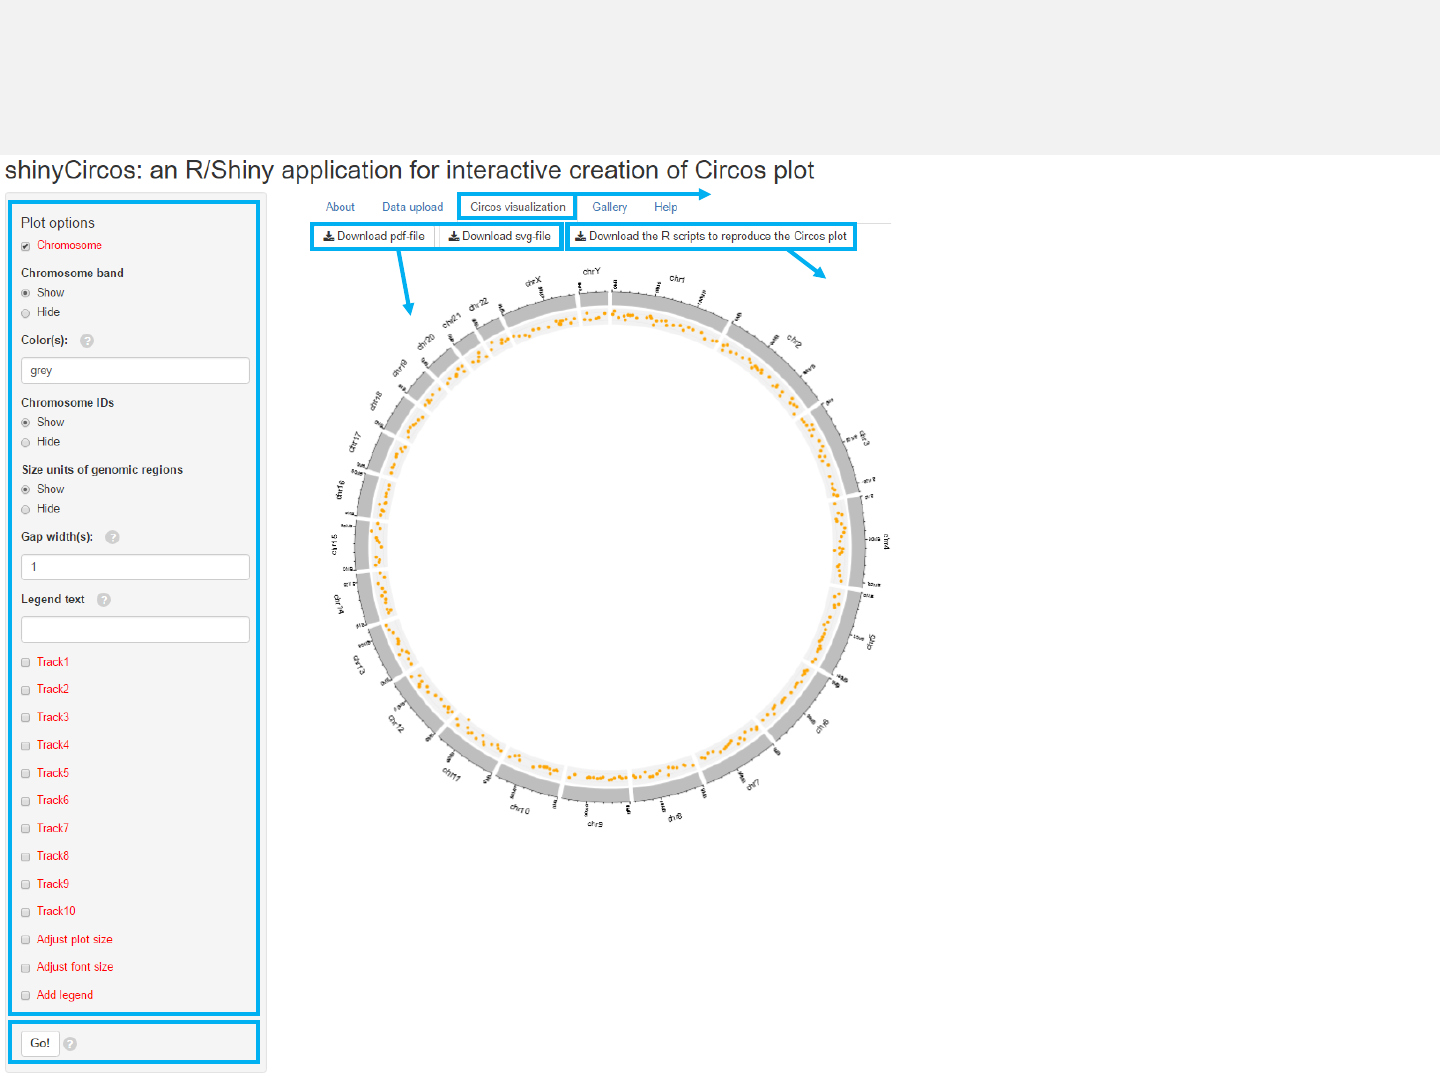
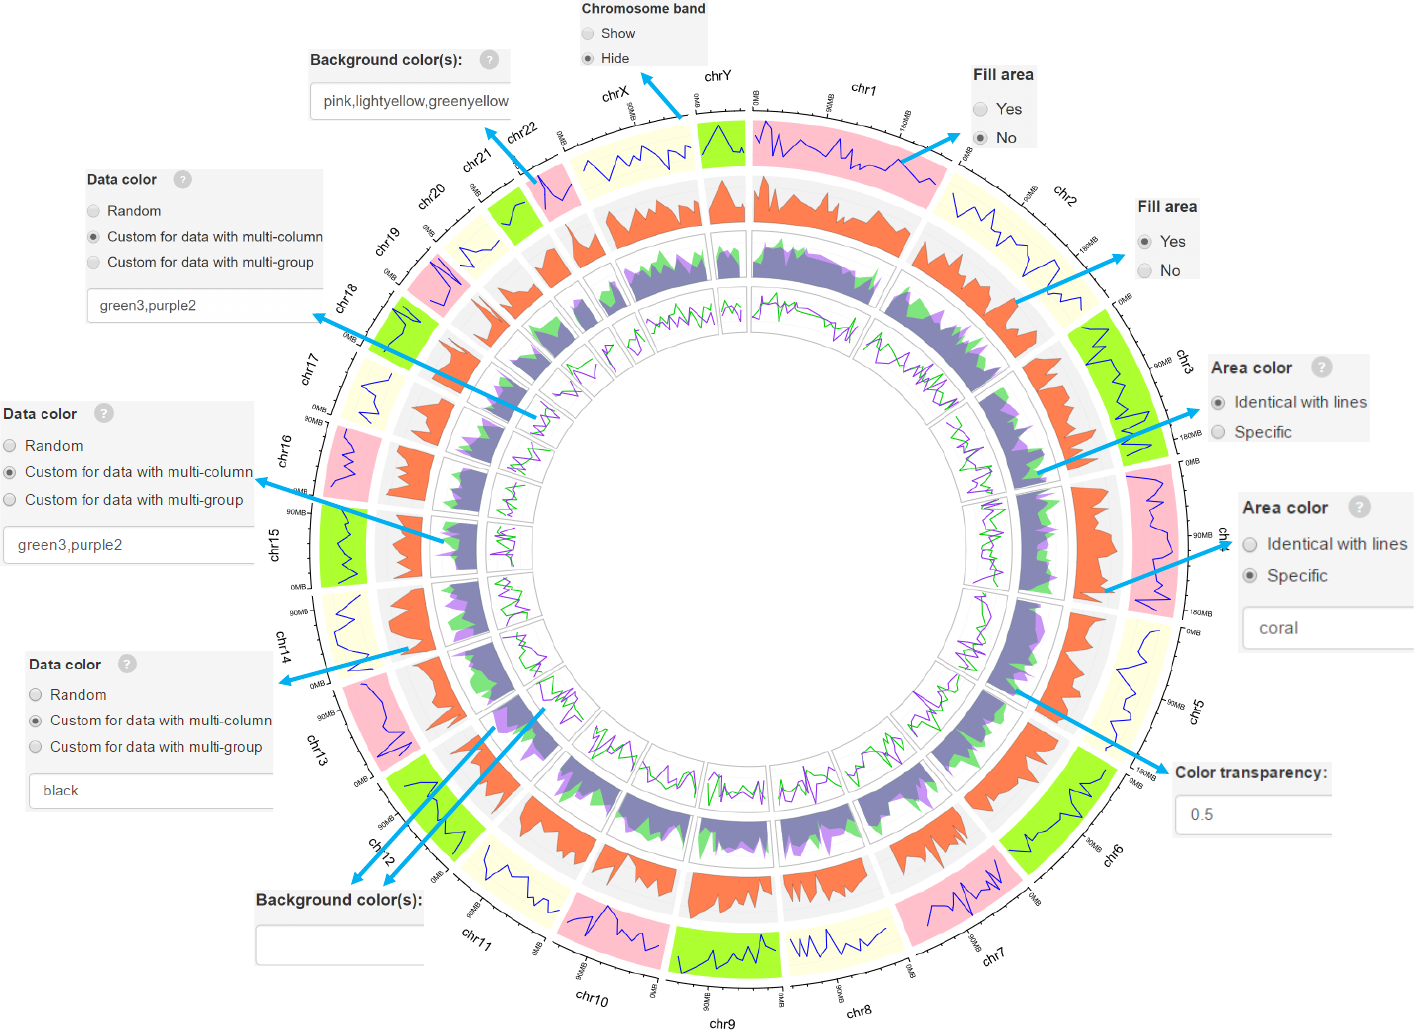
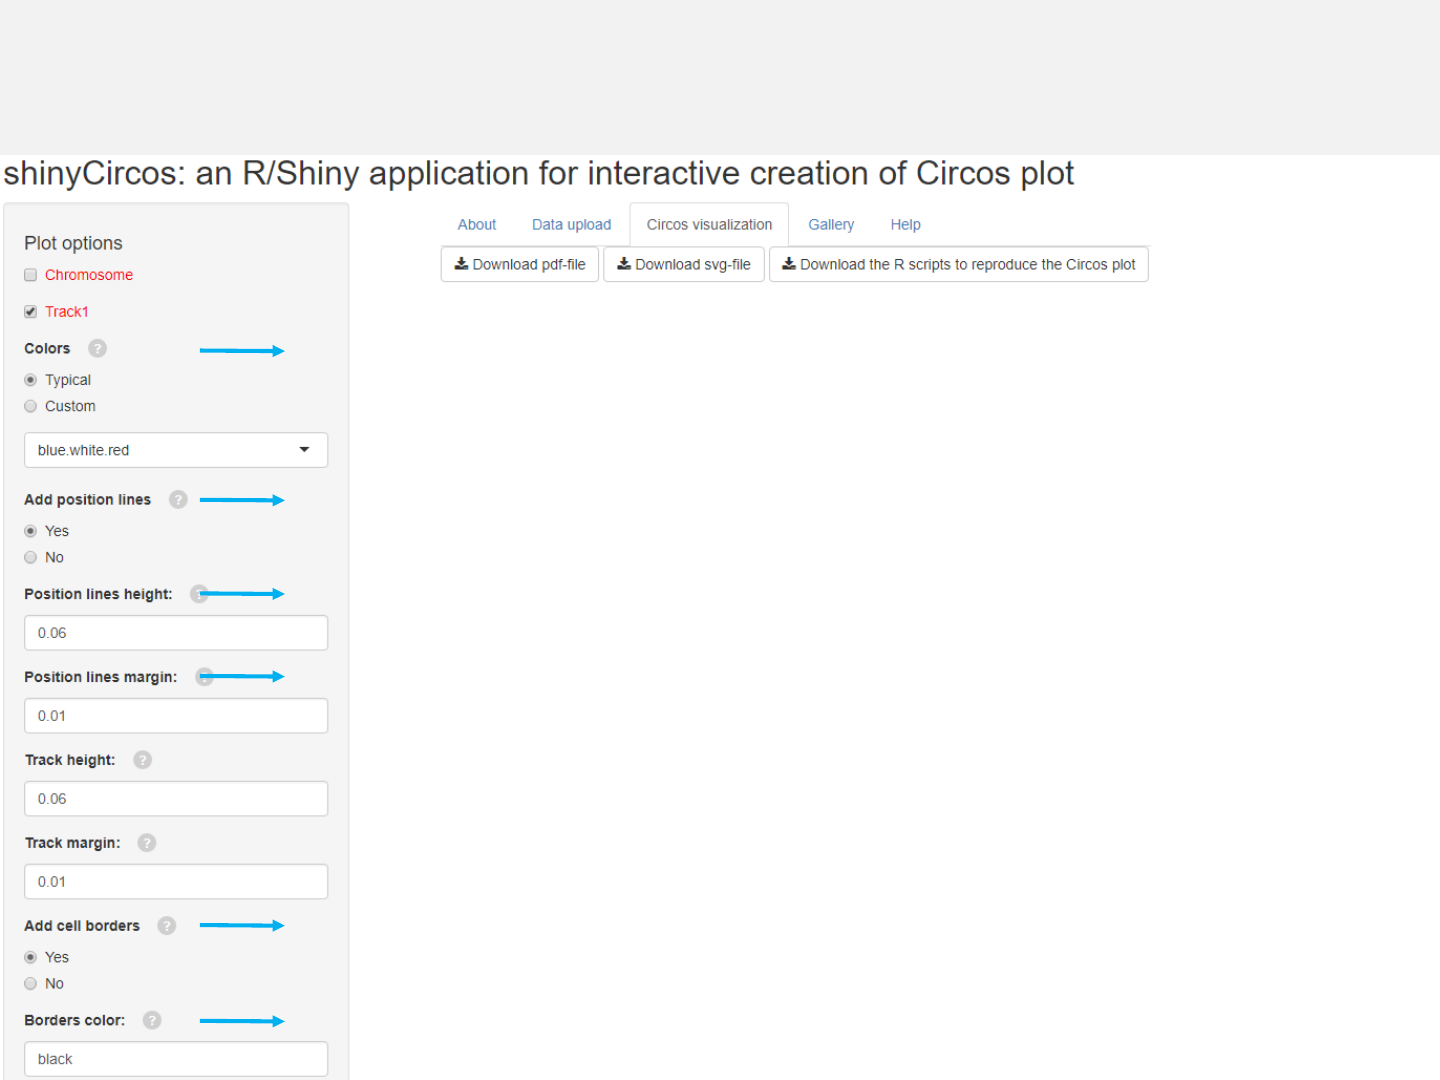
Menu in shinyCircos: Circos visualization
-After data uploading, the “Circos visualization”menu allows generation of Circos
plot.
-Various options are provided to tune the appearance of the Circos plot.
Download
figures
Tune
plot
options
Show Pictures
Download
scripts
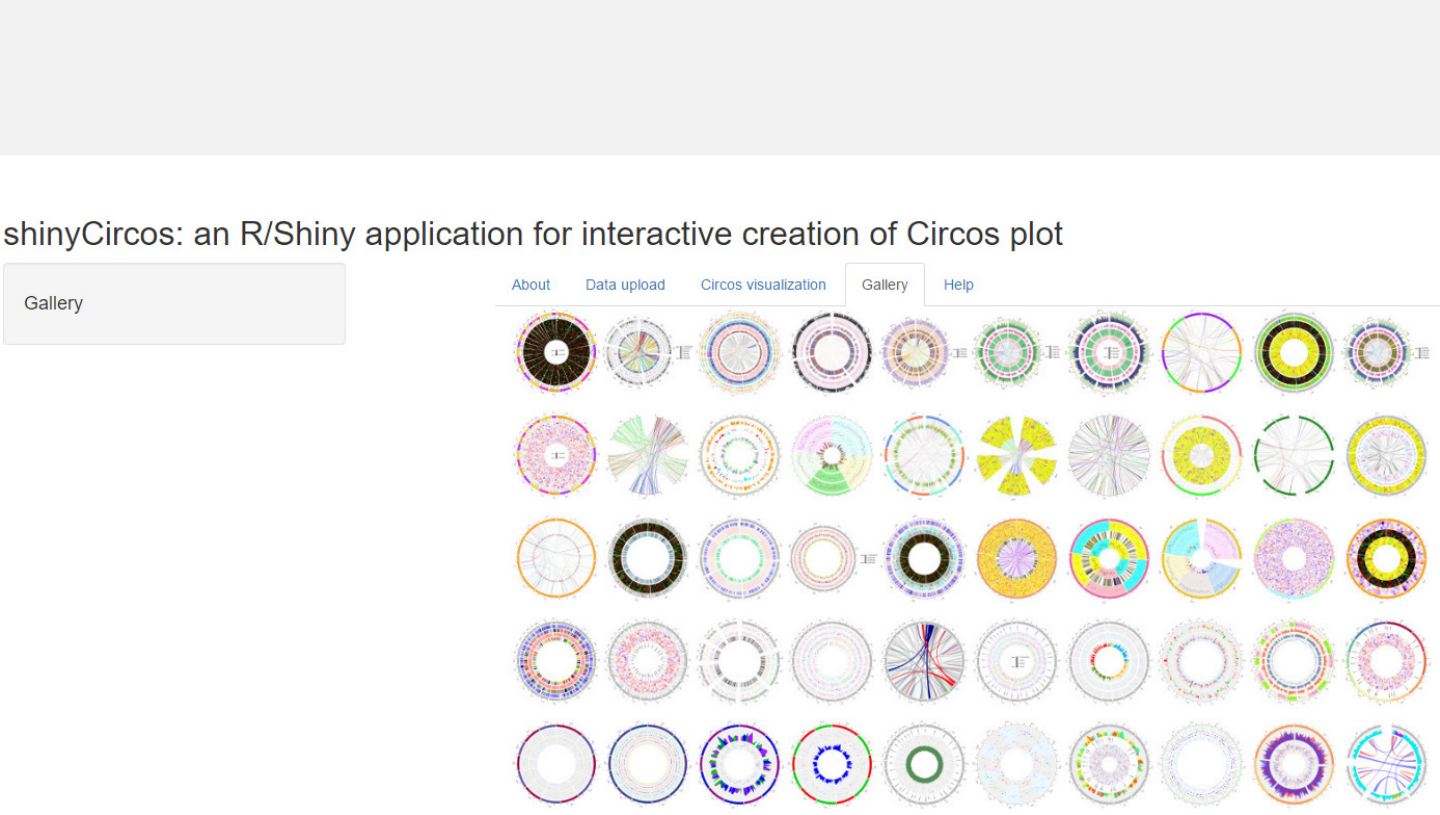
-Fifty example figures generated by shinyCircos are listed in the “Gallery”menu.
Menu in shinyCircos: Gallery
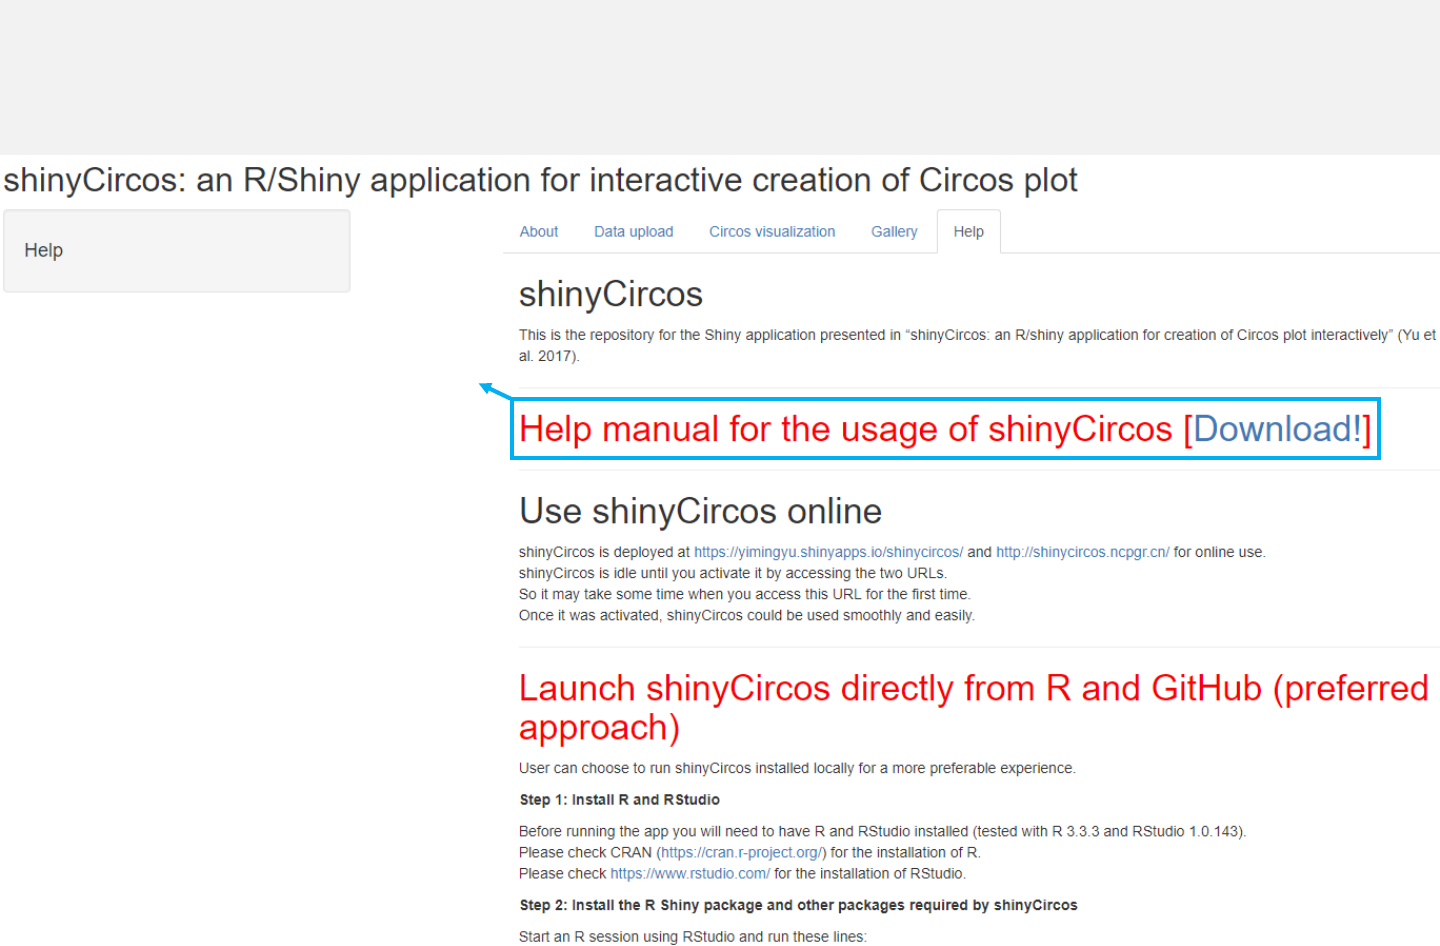
-Instructions for installation of shinyCircos on local computers or web servers
are shown in the “Help”menu.
Menu in shinyCircos: Help
Download this manual for
the usage of shinyCircos
2. Usage of shinyCircos
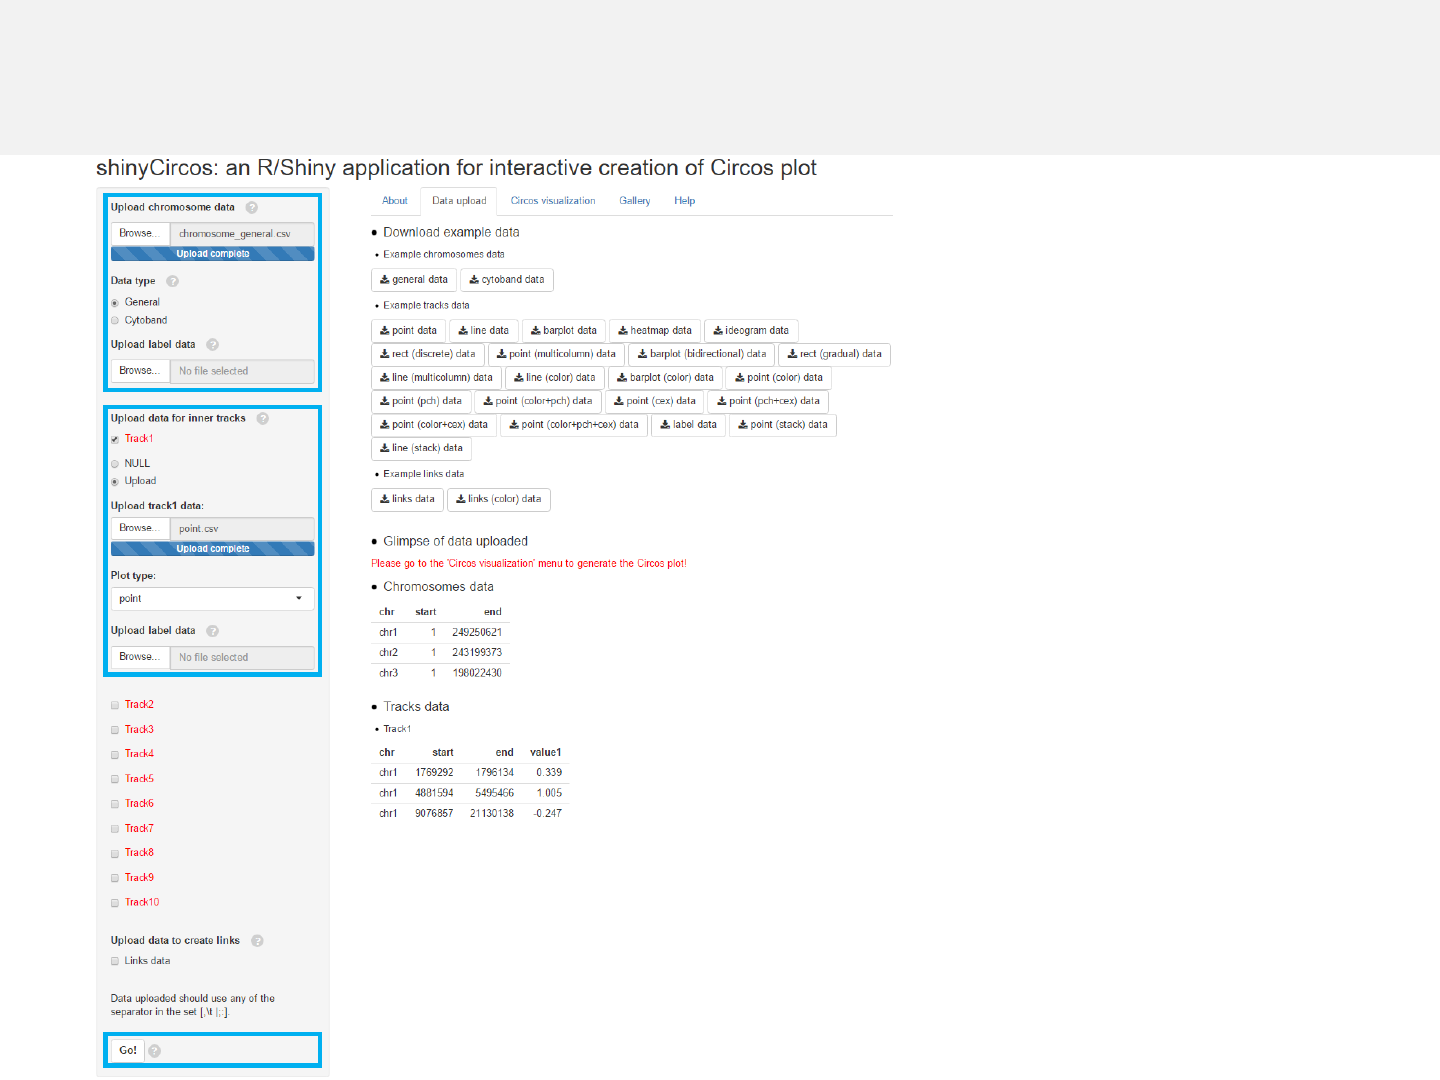
Step 1: Data uploading
1.1 Upload chromosome data
1.2 Upload track data
1.3 Complete uploading
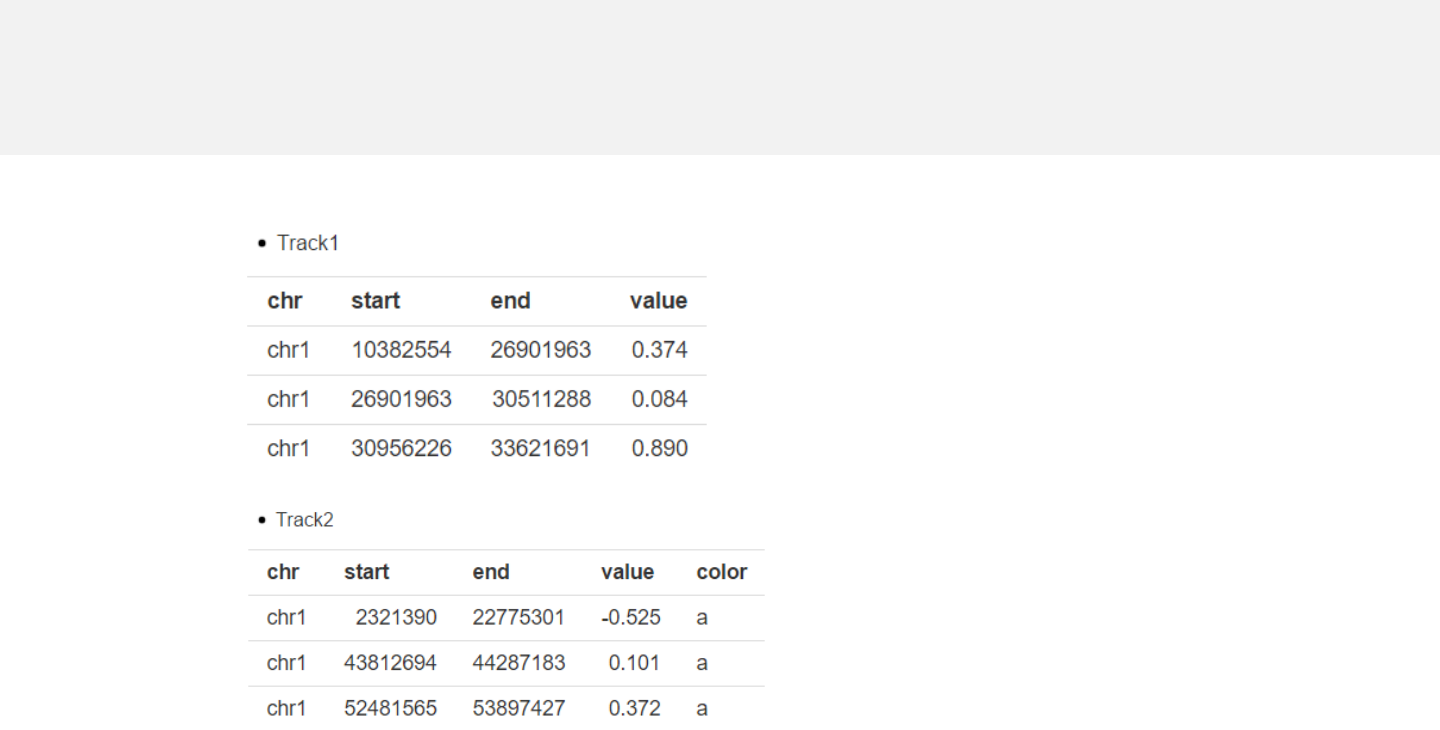
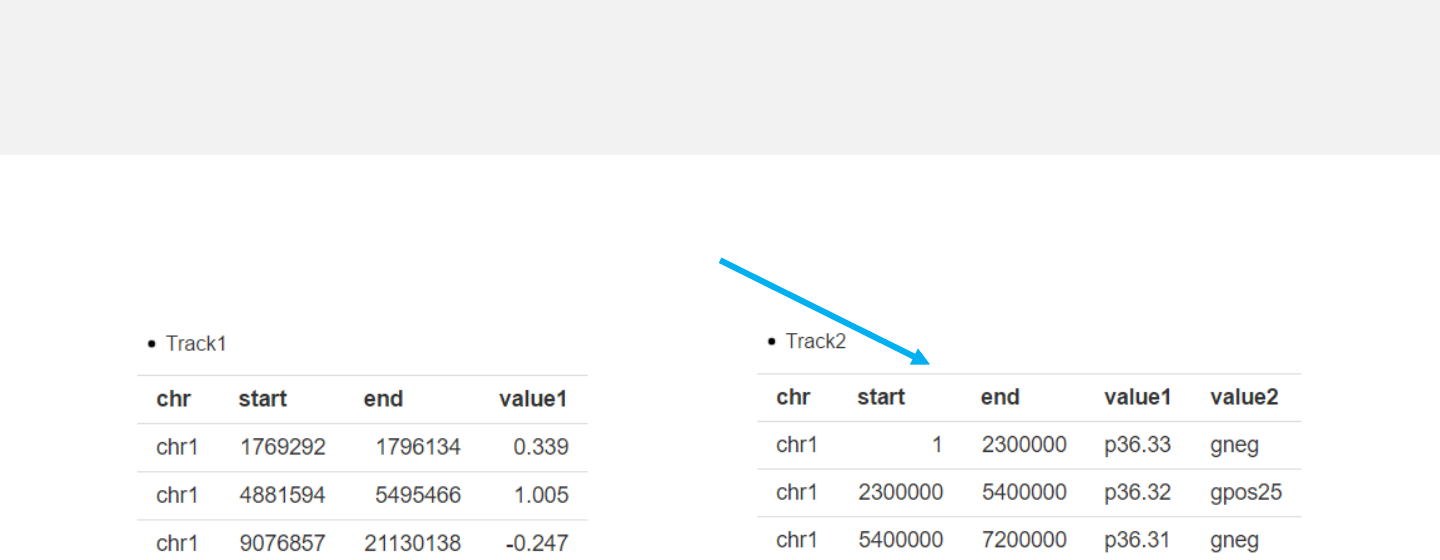
-Data from 0to 10 tracks can be uploaded.
-The first 3 columns of the uploaded data
should be the chromosome ID, the start
and end coordinates of genomic regions.
2.4 Download figures
2.1 Turn to “Circos visualization” menu
2.3 Make the plot
2.2 Tune plot options
2.5 Download scripts
Step 2: Circos visualization
-The chromosome data is compulsory and
defines the frame of a Circos plot.
-Please click the “Go!” button if any
options are modified.
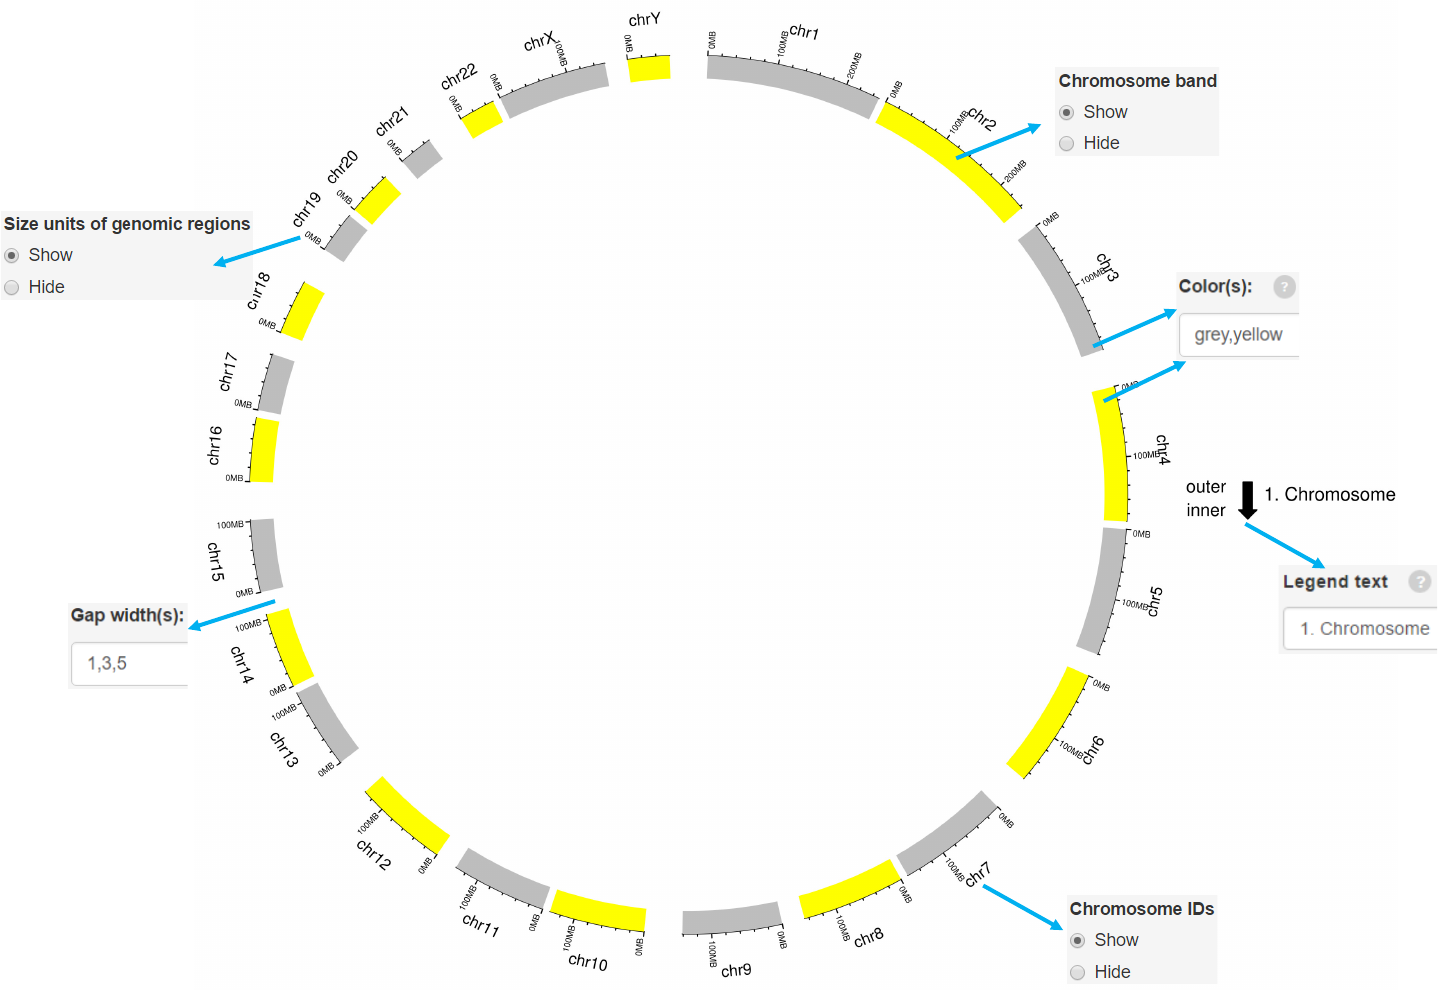
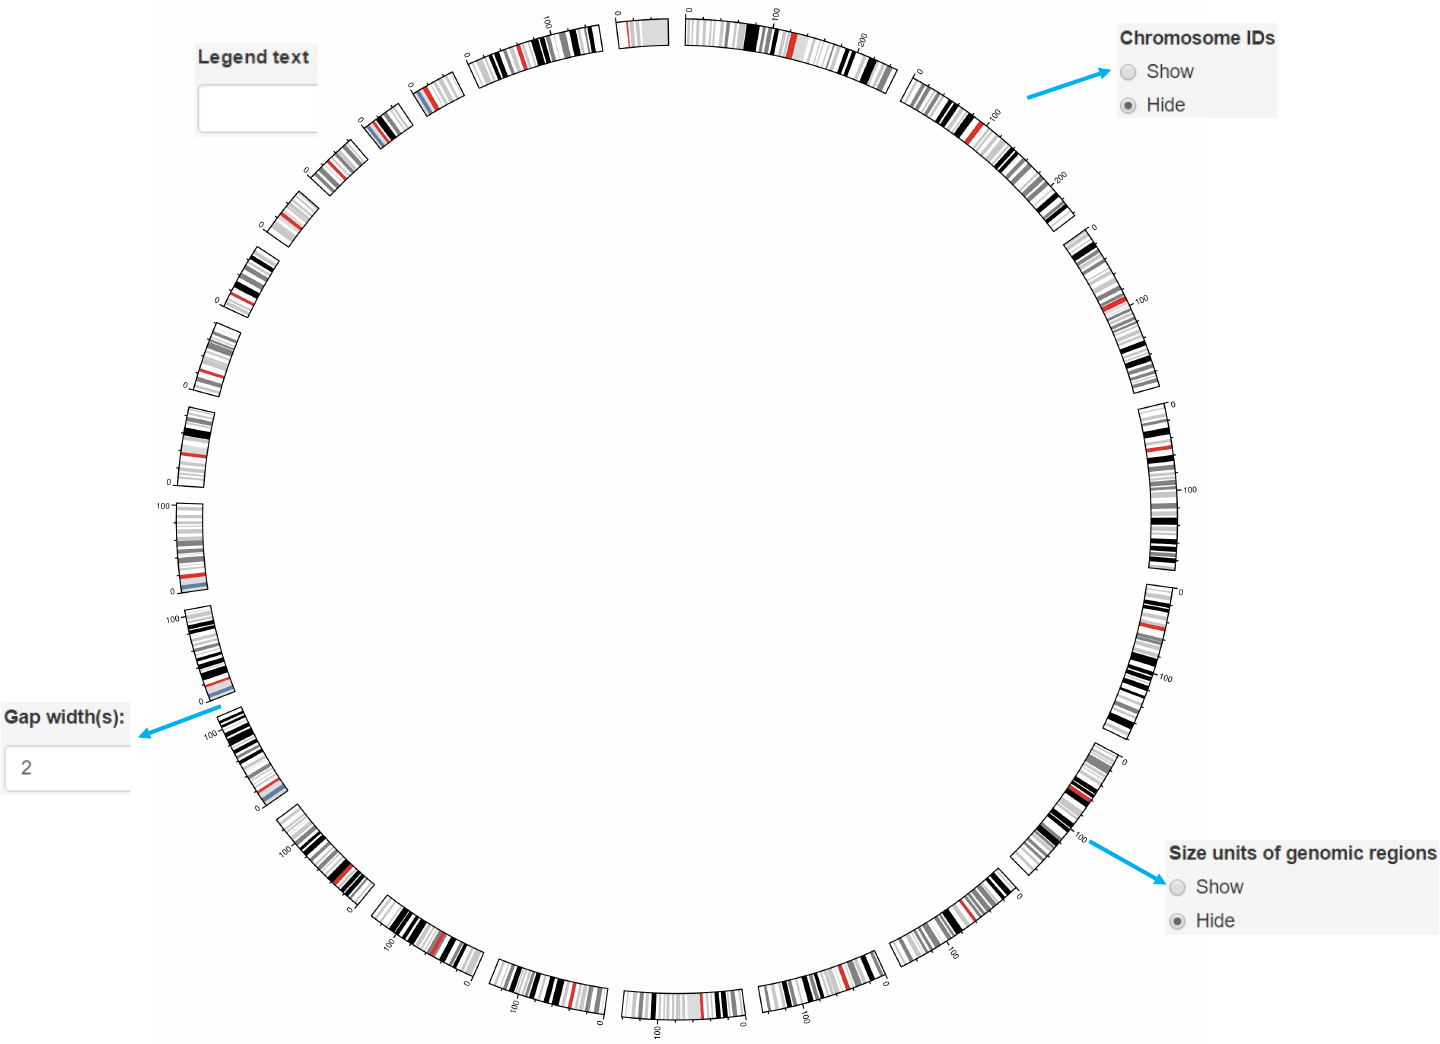
2.1 Plot chromosomes
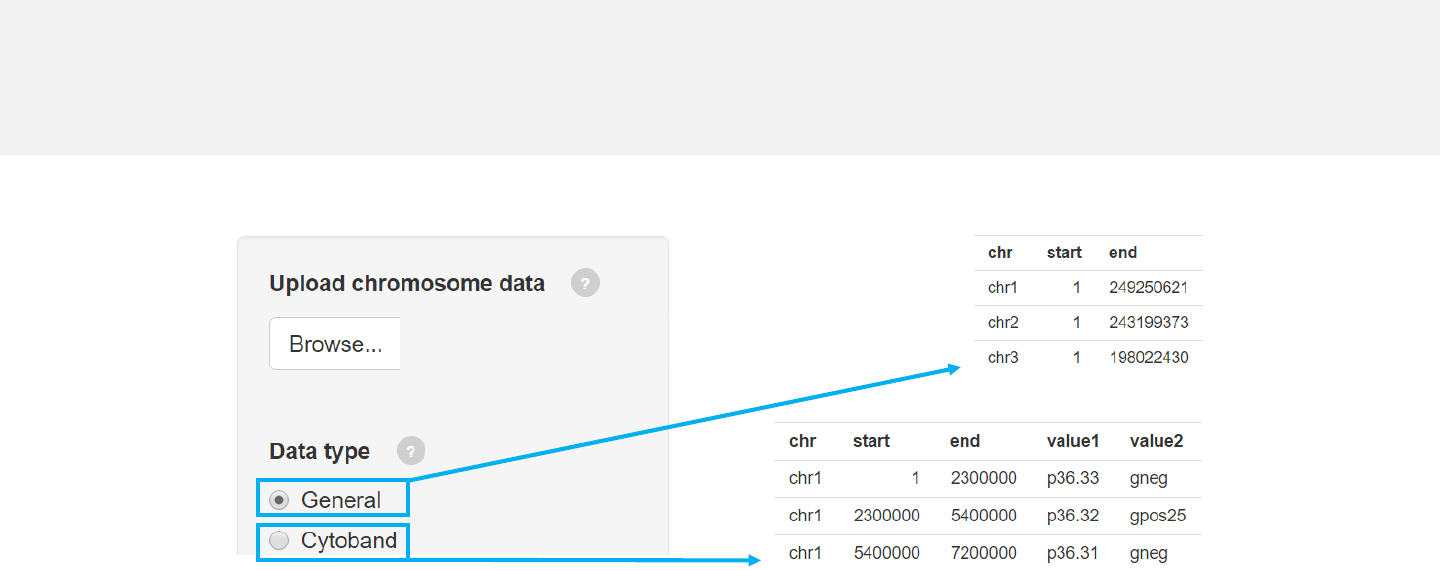
Upload chromosome data
-Use the “Data upload”menu for data input.
-Chromosome data can be either chromosome ideograms (“Cytoband”type, see
example data “chromosome_cytoband.csv” for detail) or simple definition of
chromosome lengths (“General”type, see example data “chromosome_general.csv”
for detail).
Click “Browse” to select file
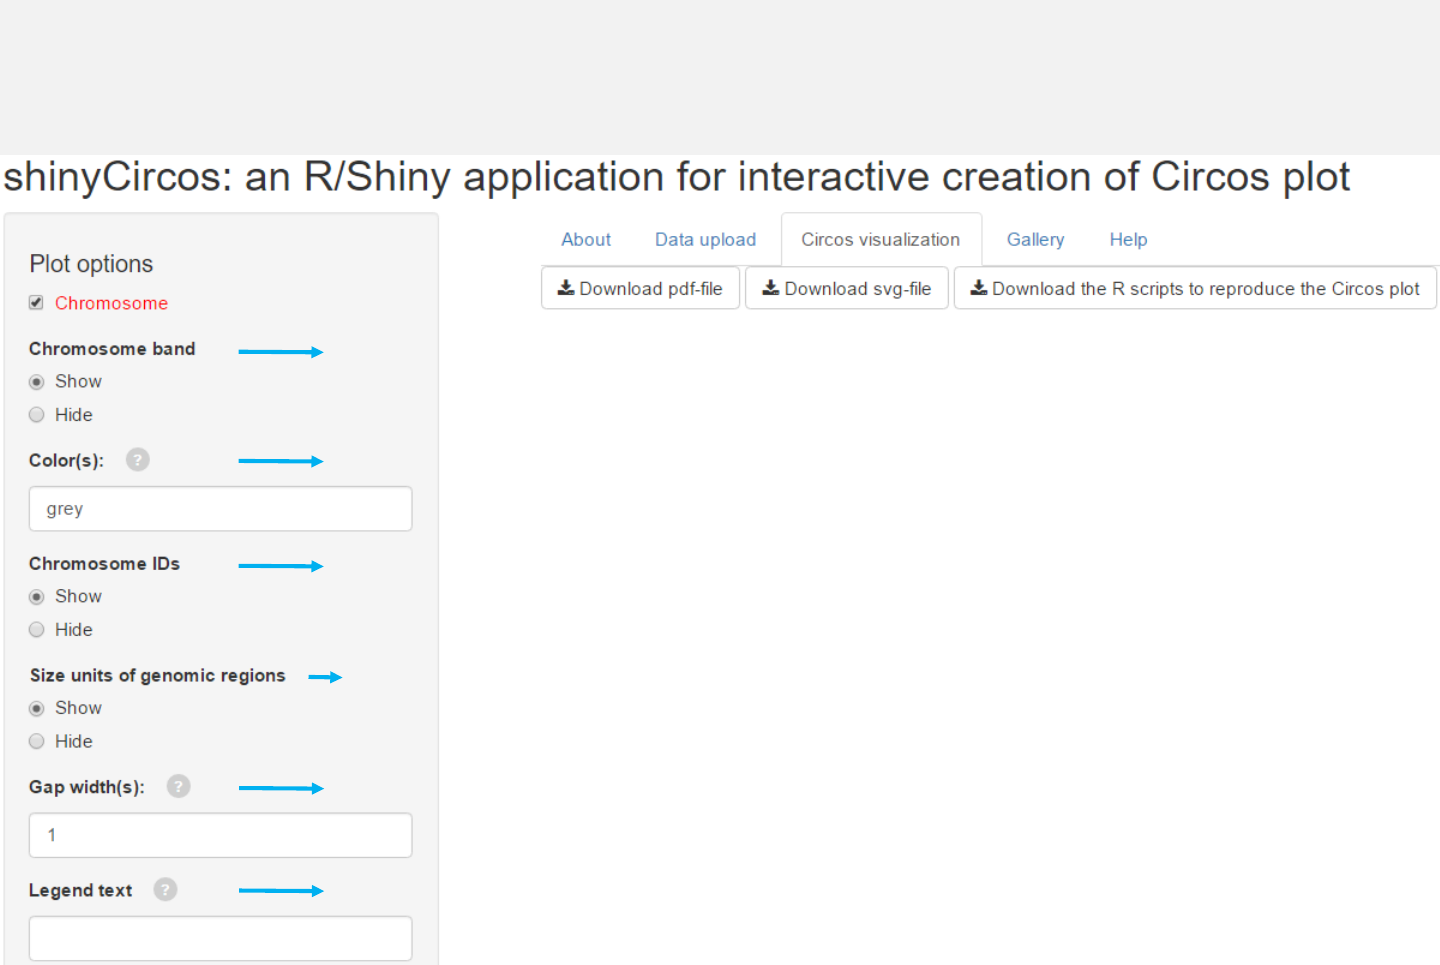
Options
Add color band for chromosomes.
Colors for chromosome/sector.
Add labels on the outermost circle.
Add size units of genomic regions on the chromosome axis.
Gap width between neighboring sectors.
The text to appear in the legend.
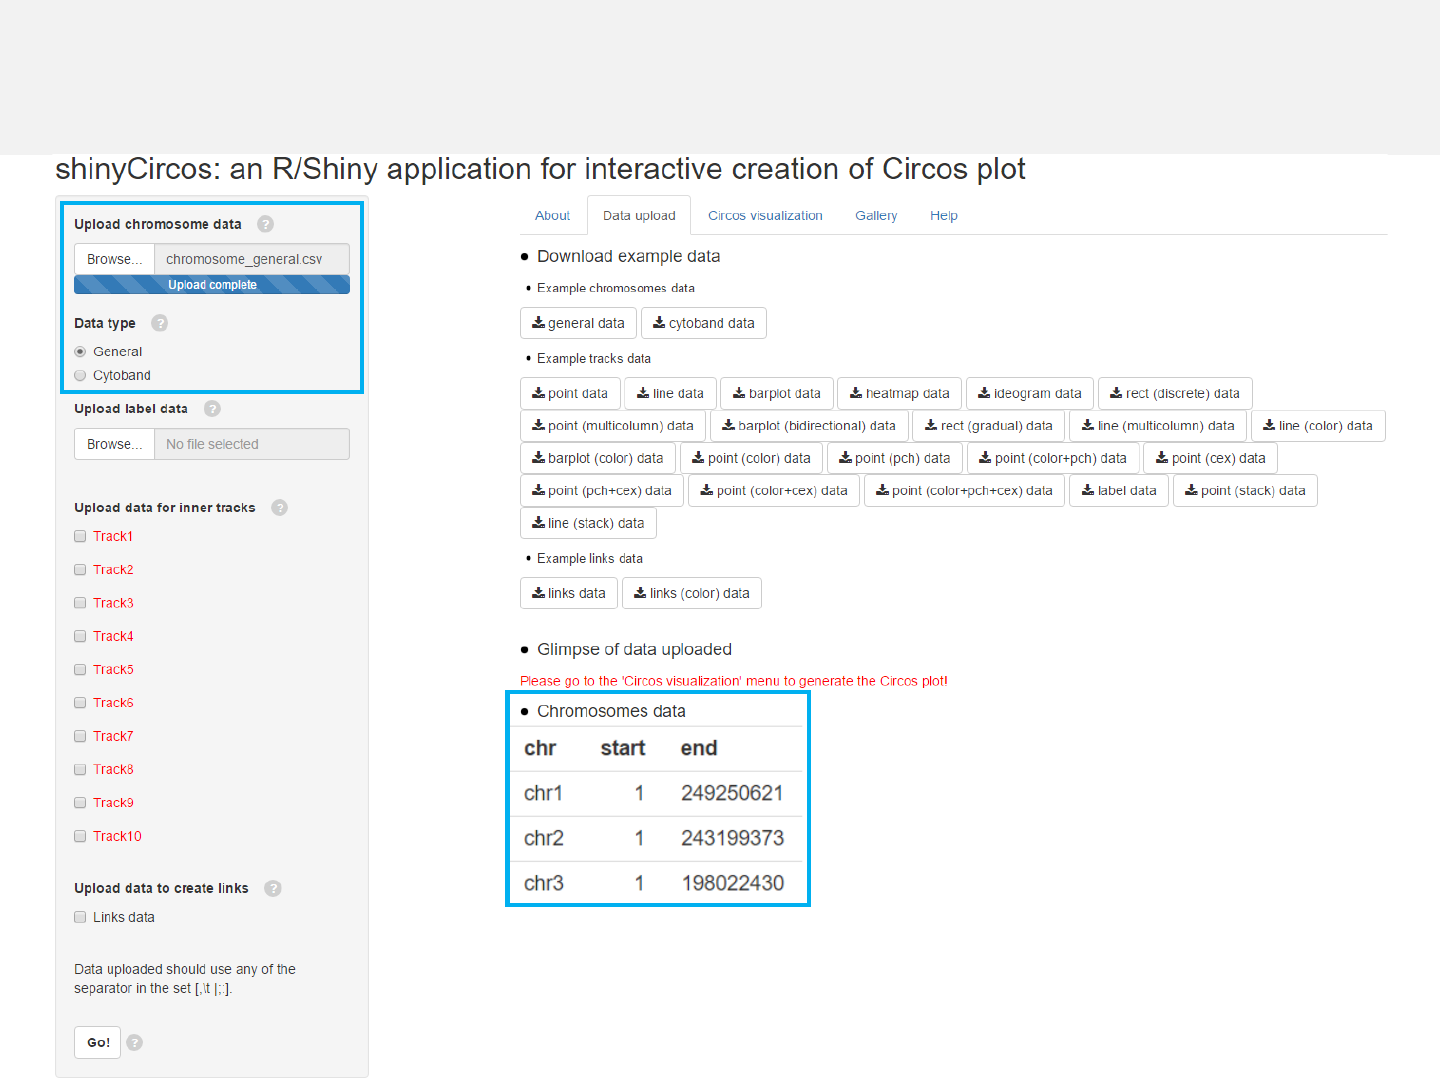
Example 1
Chromosome data: chromosome_general.csv
Data type: General
Data format
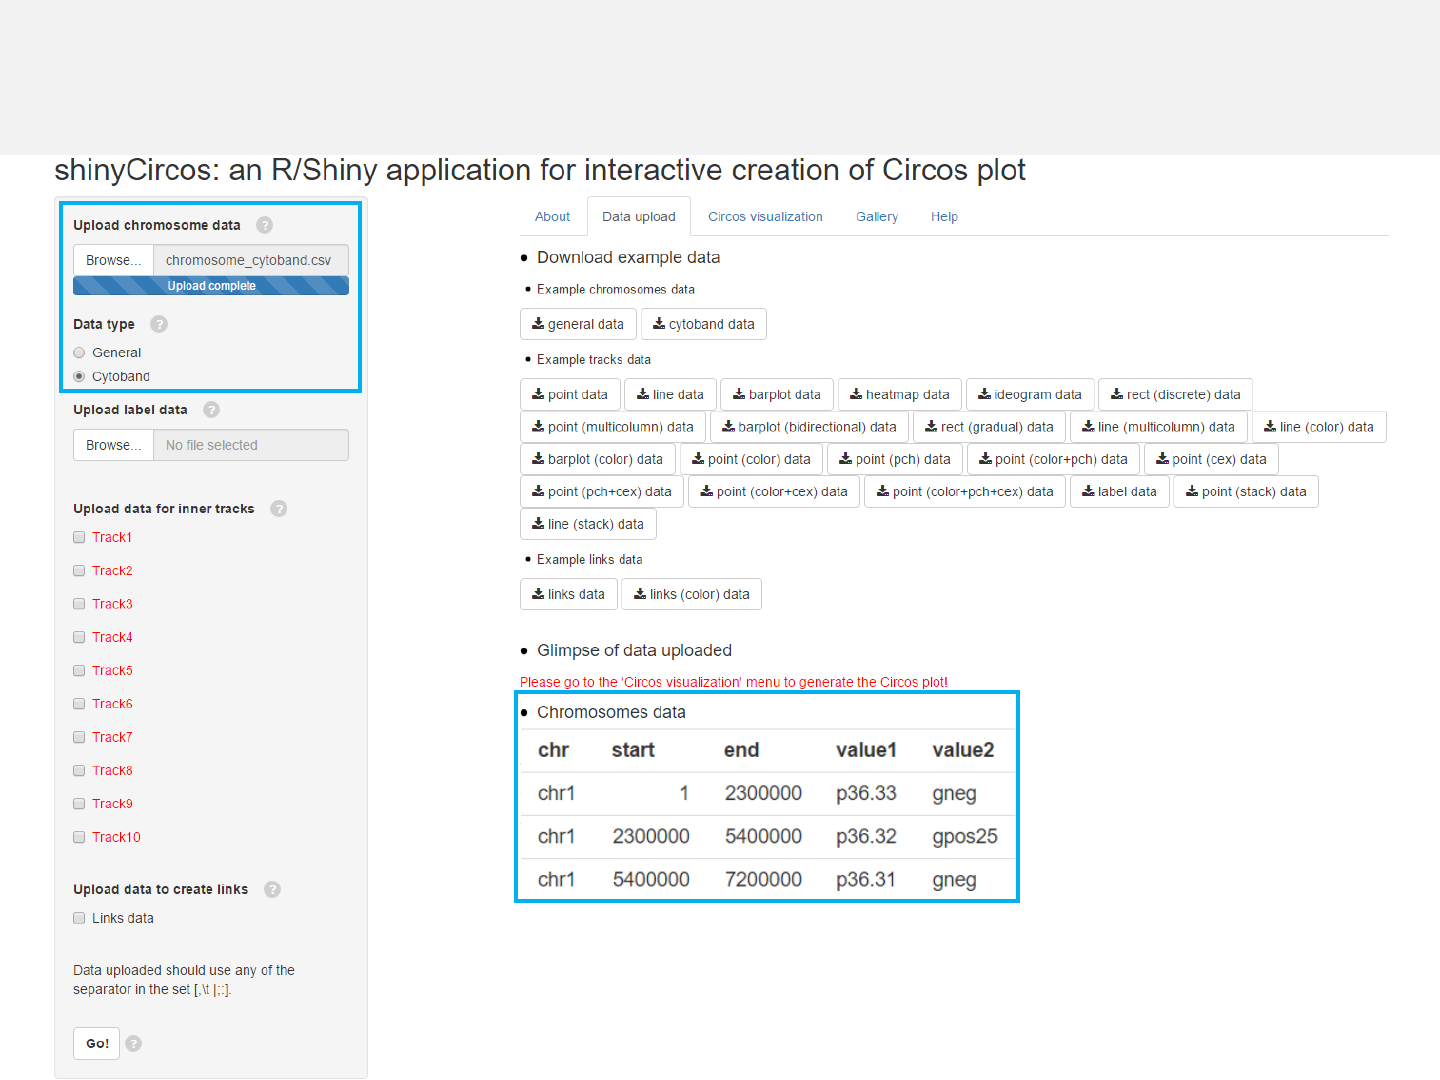
Example 2
Chromosome data: chromosome_cytoband.csv
Data type: Cytoband
Data format
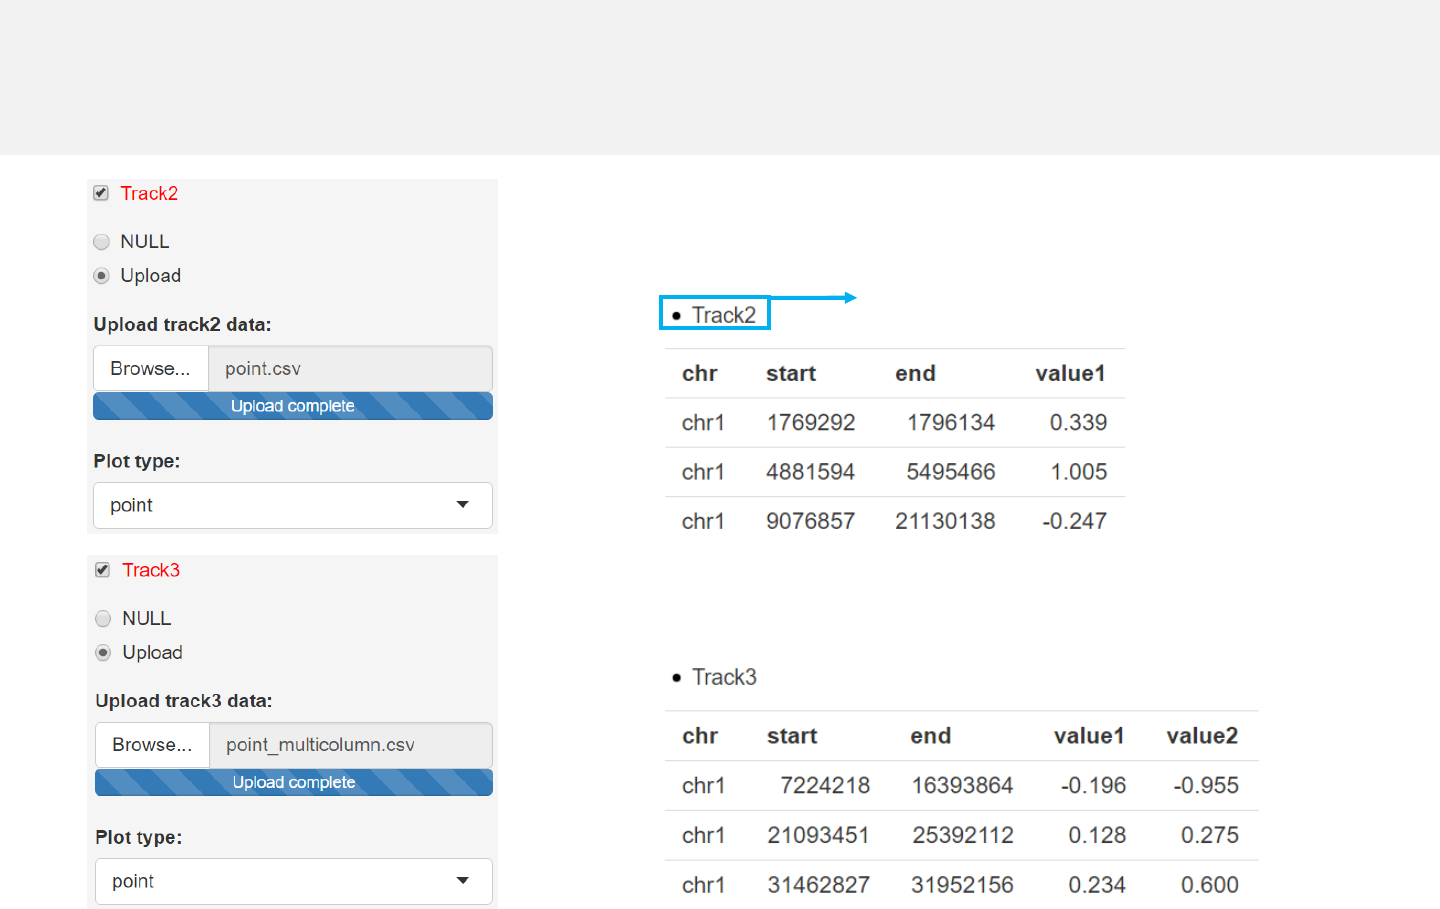
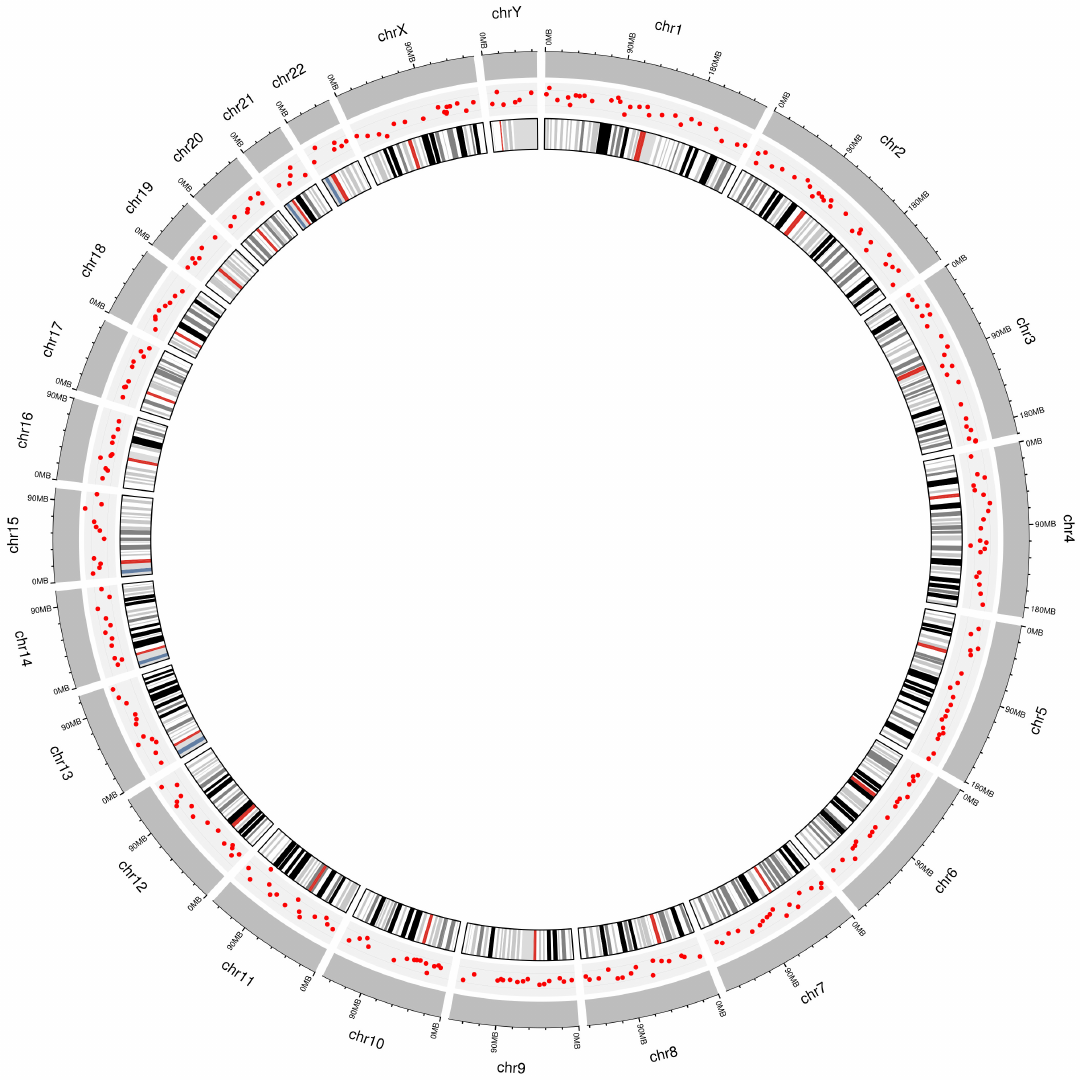
2.2 Plot points
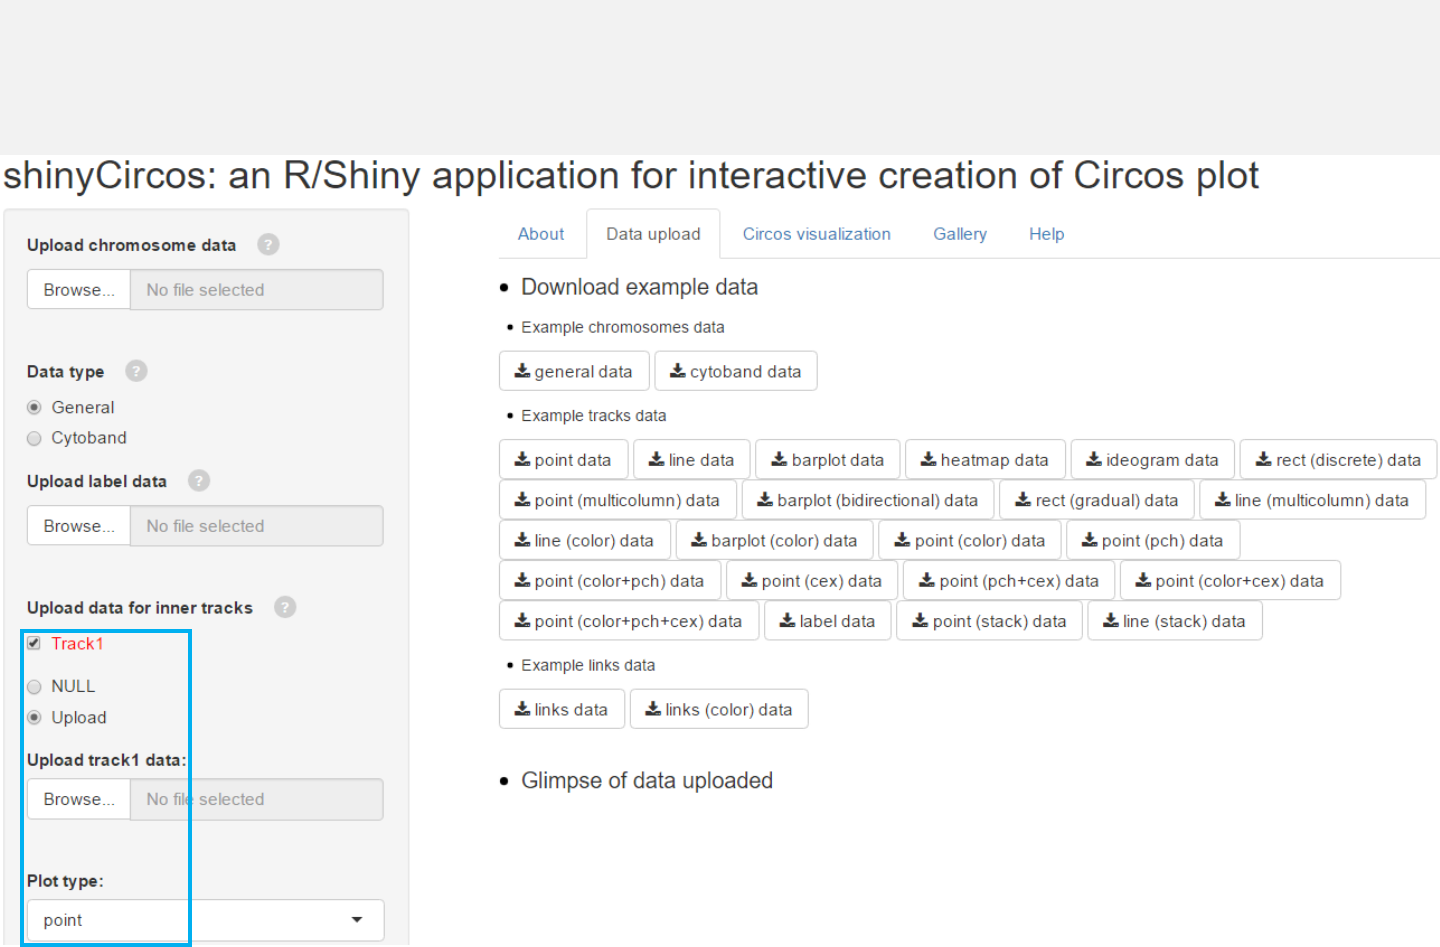
Upload point data
Select file
Select plot type “point”
Select “Upload”
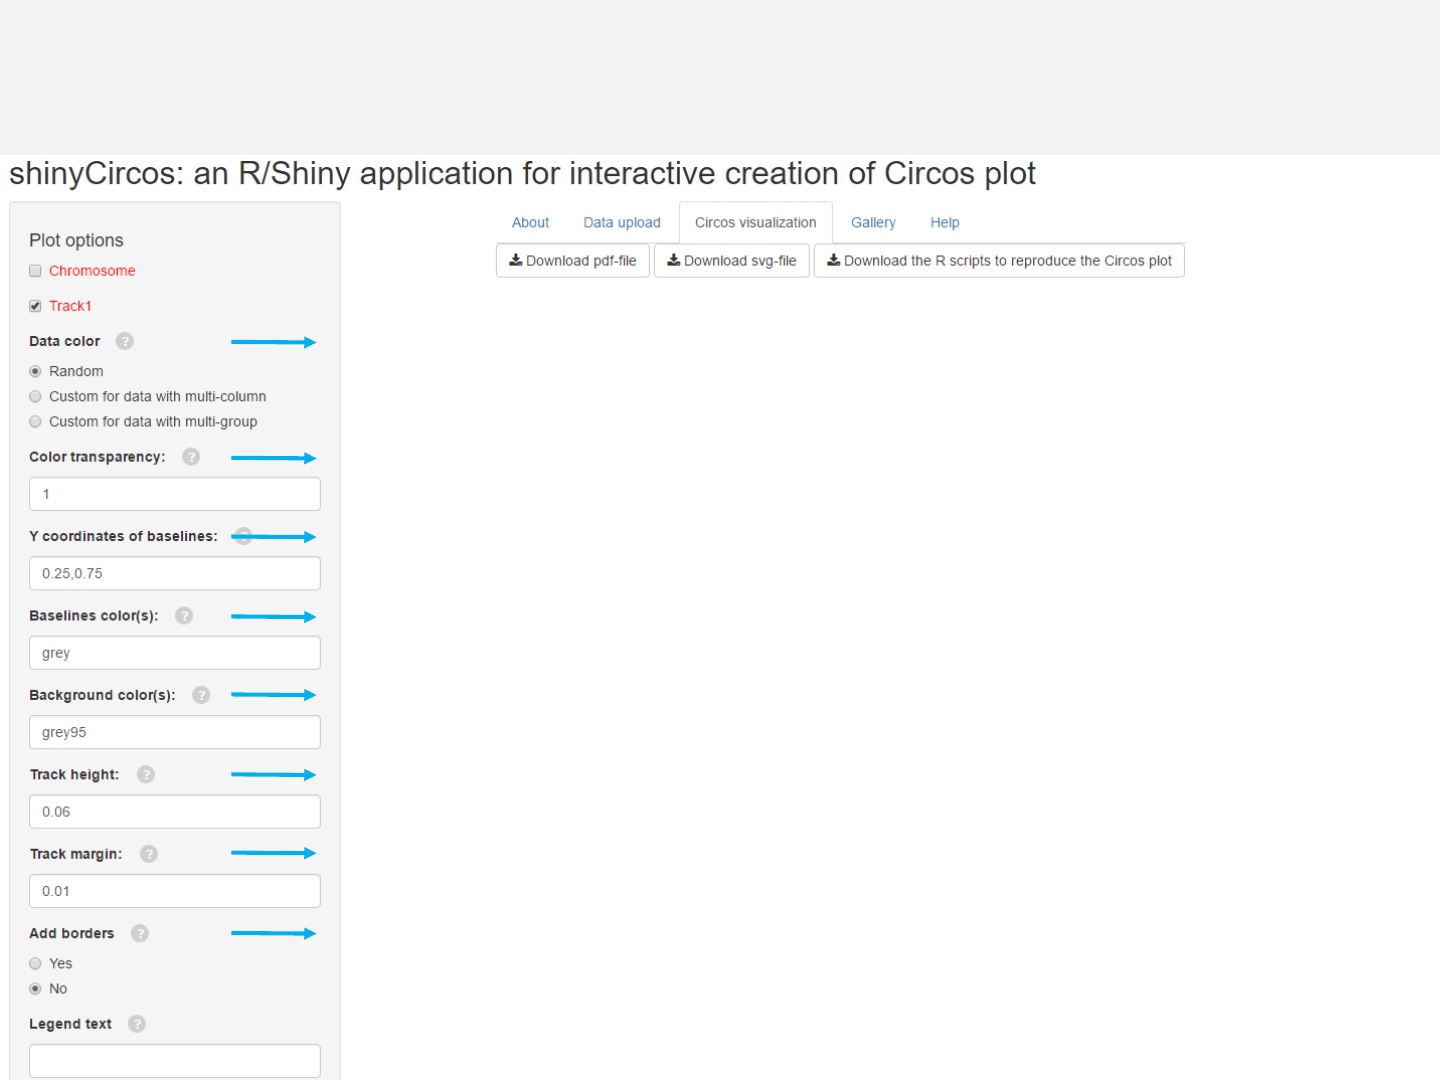
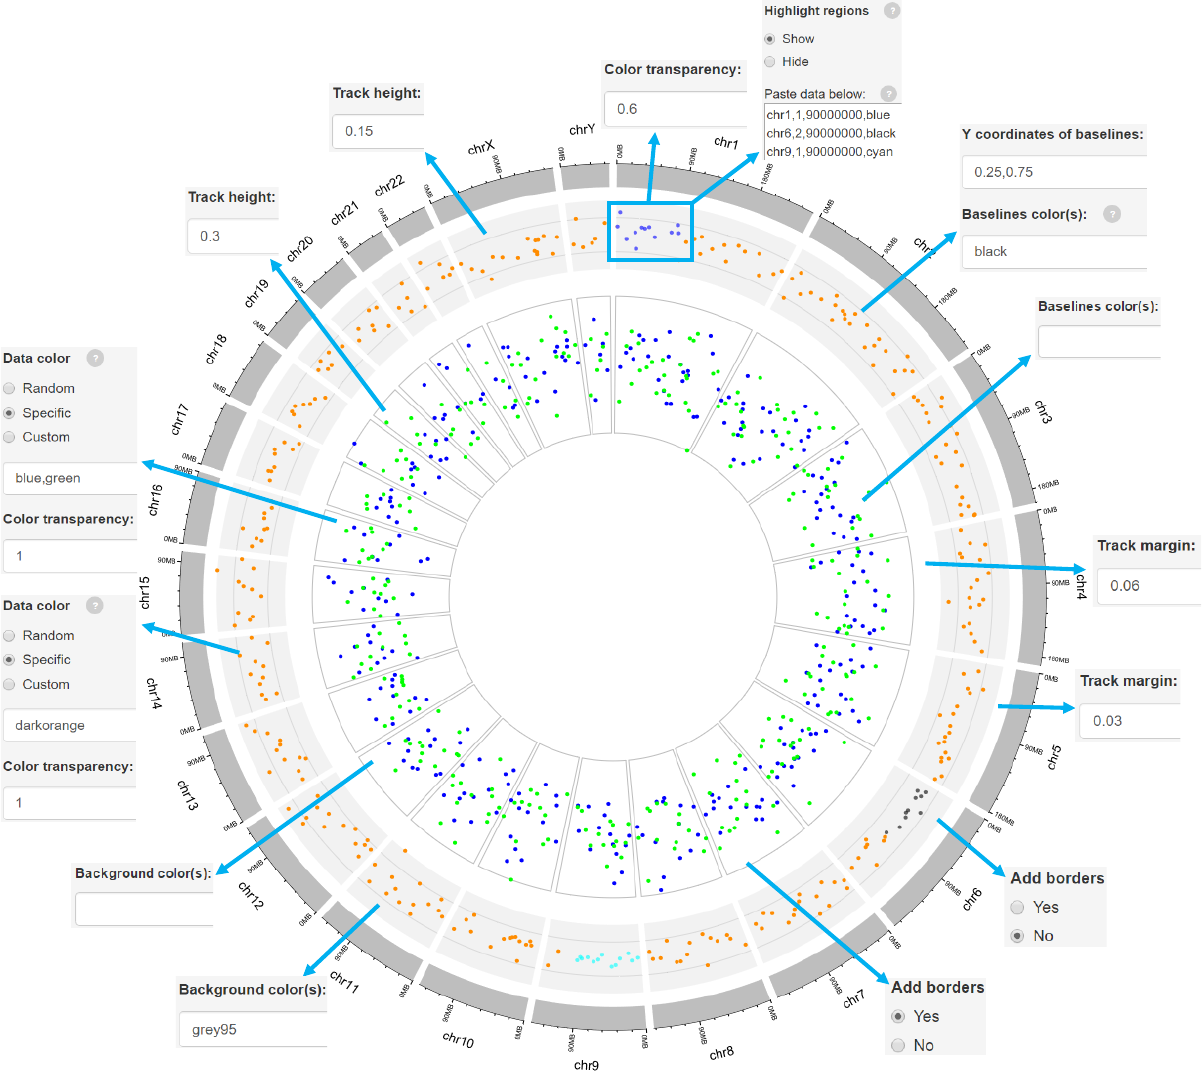
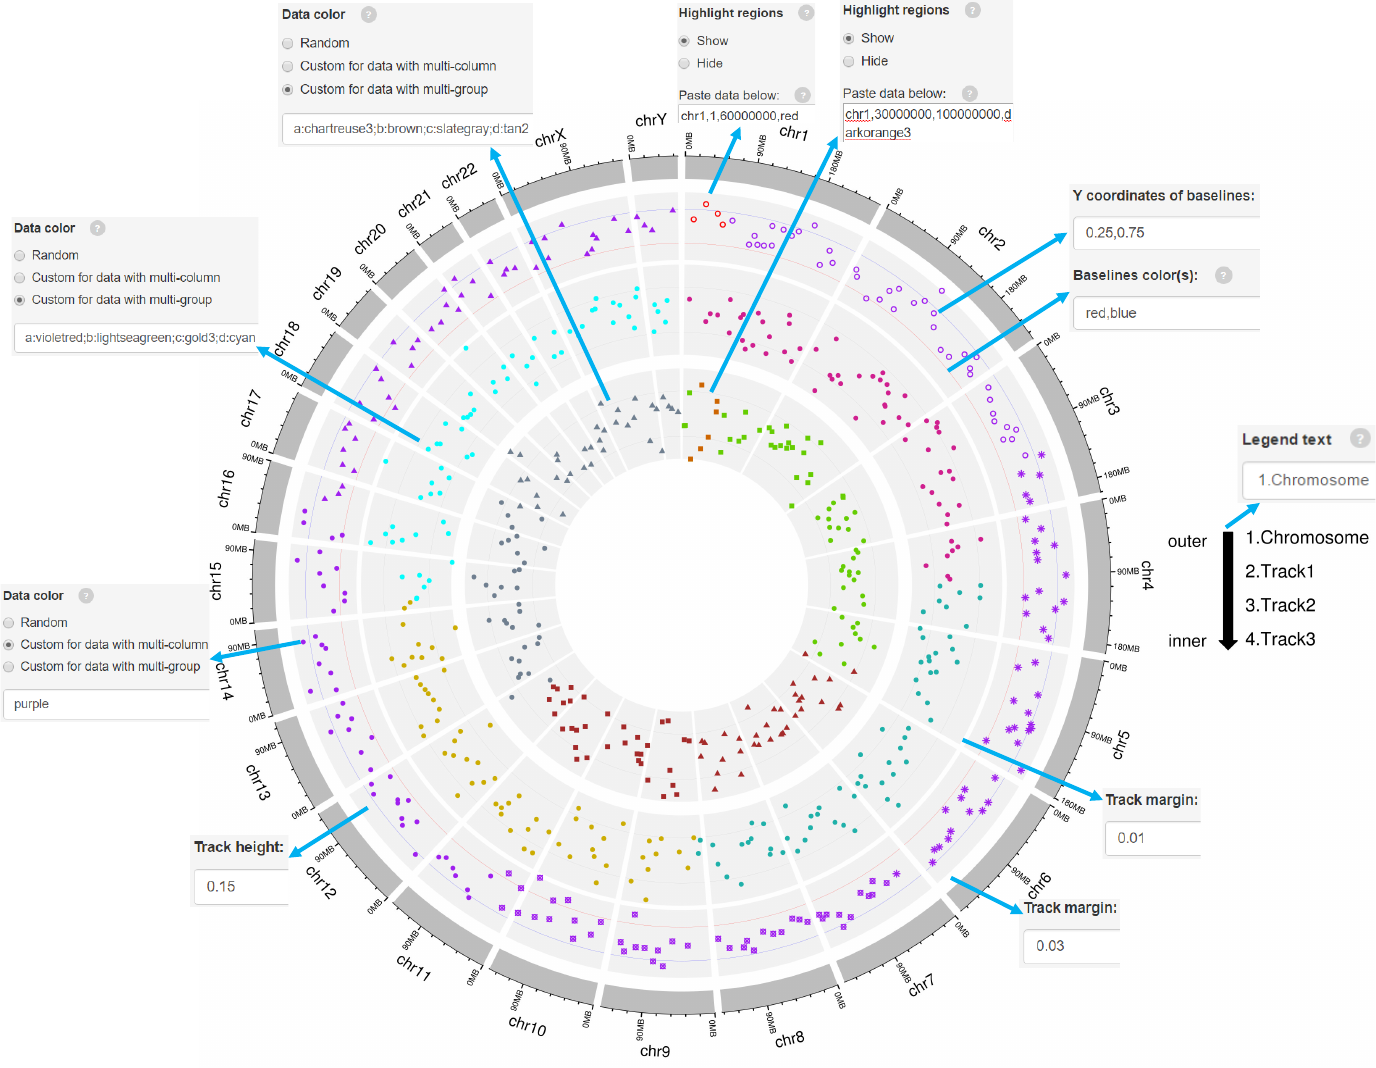
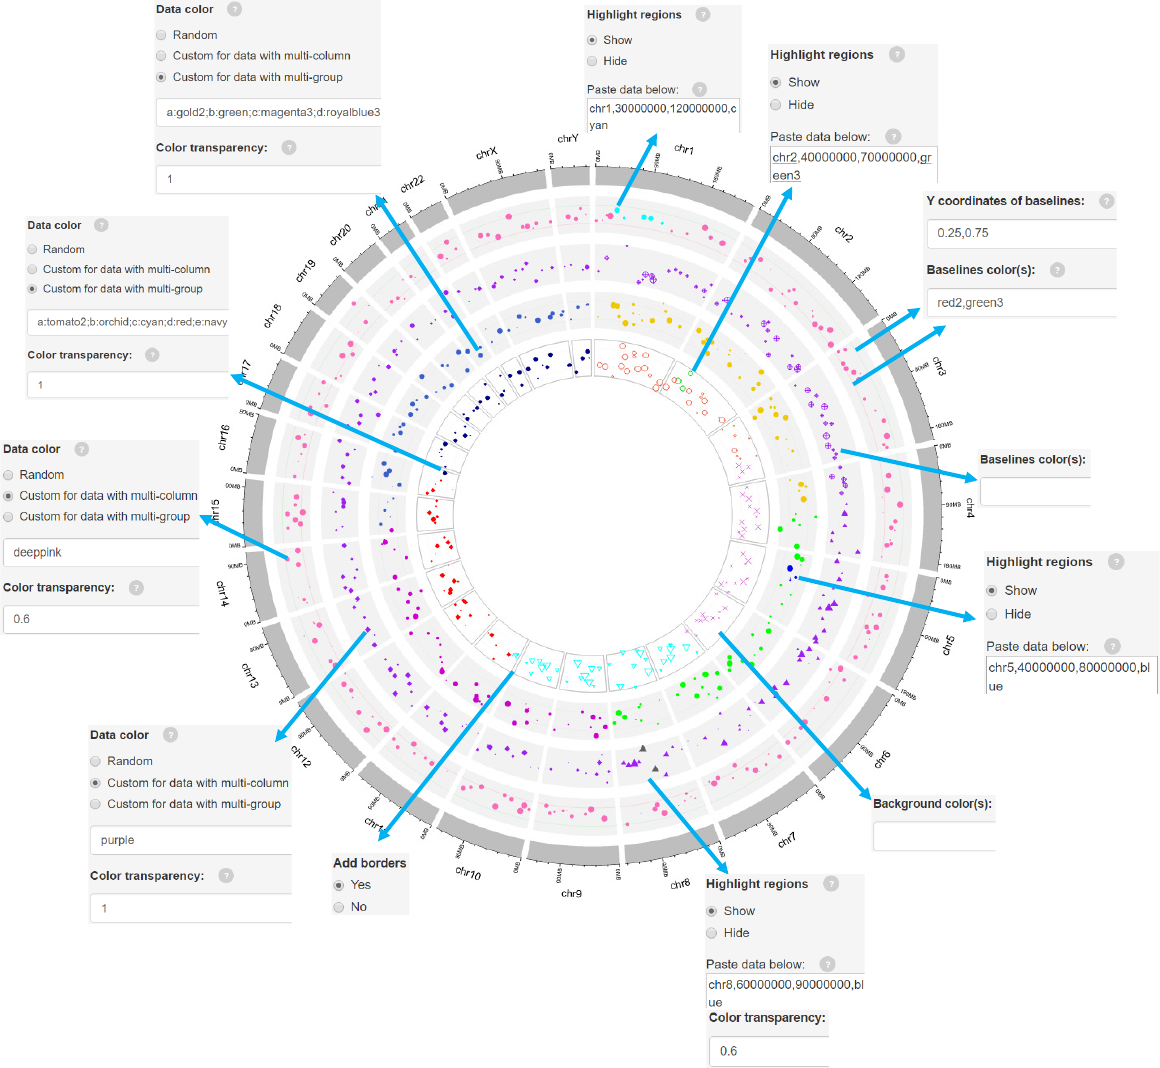
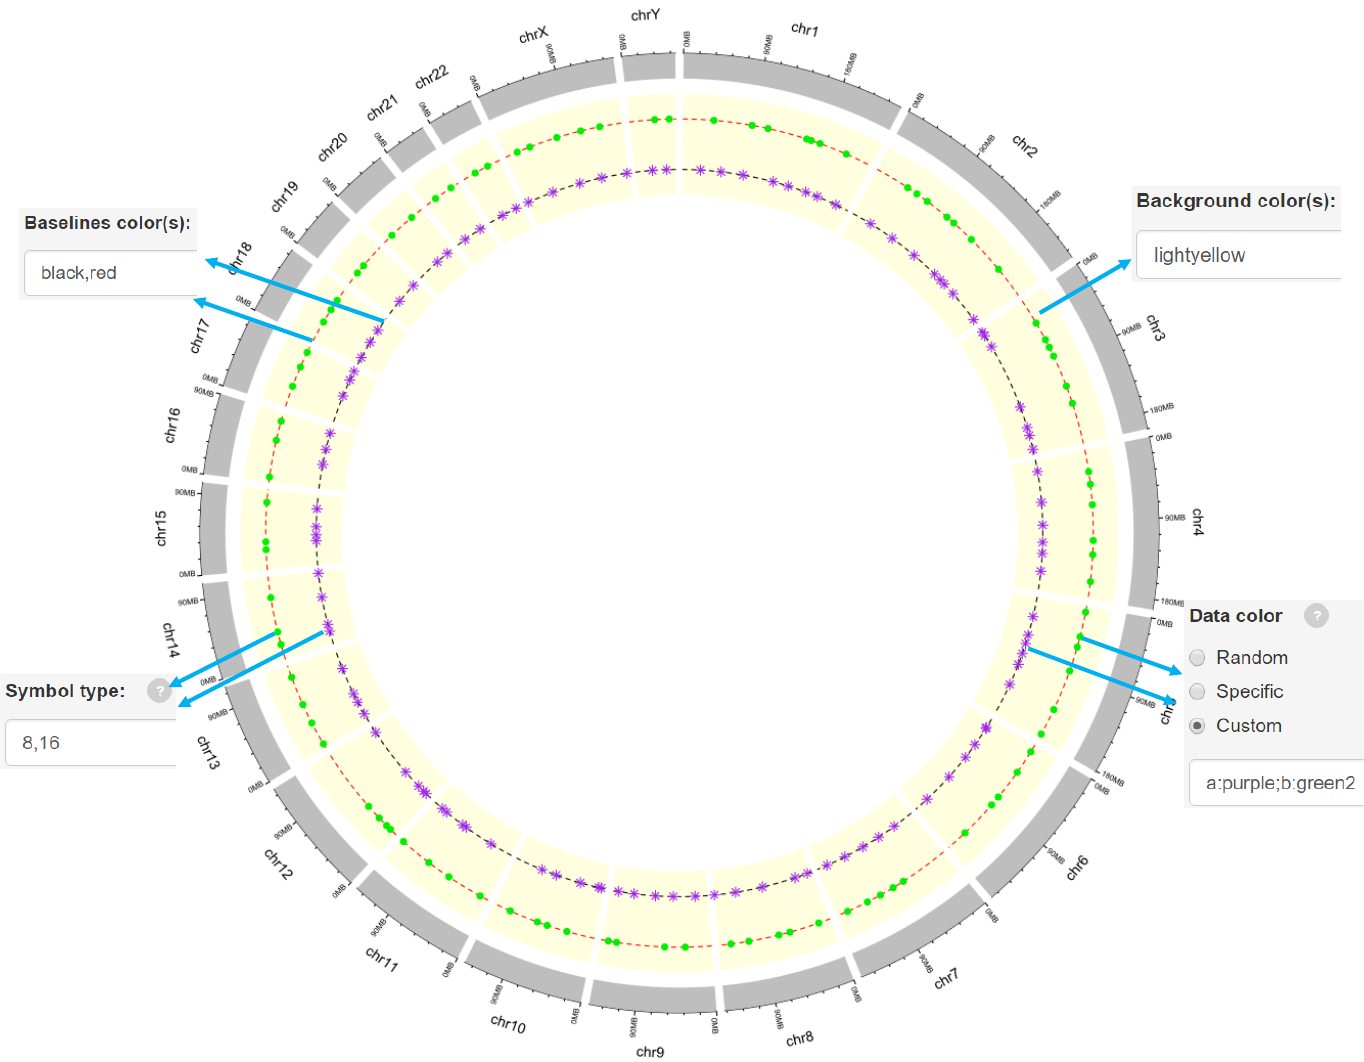
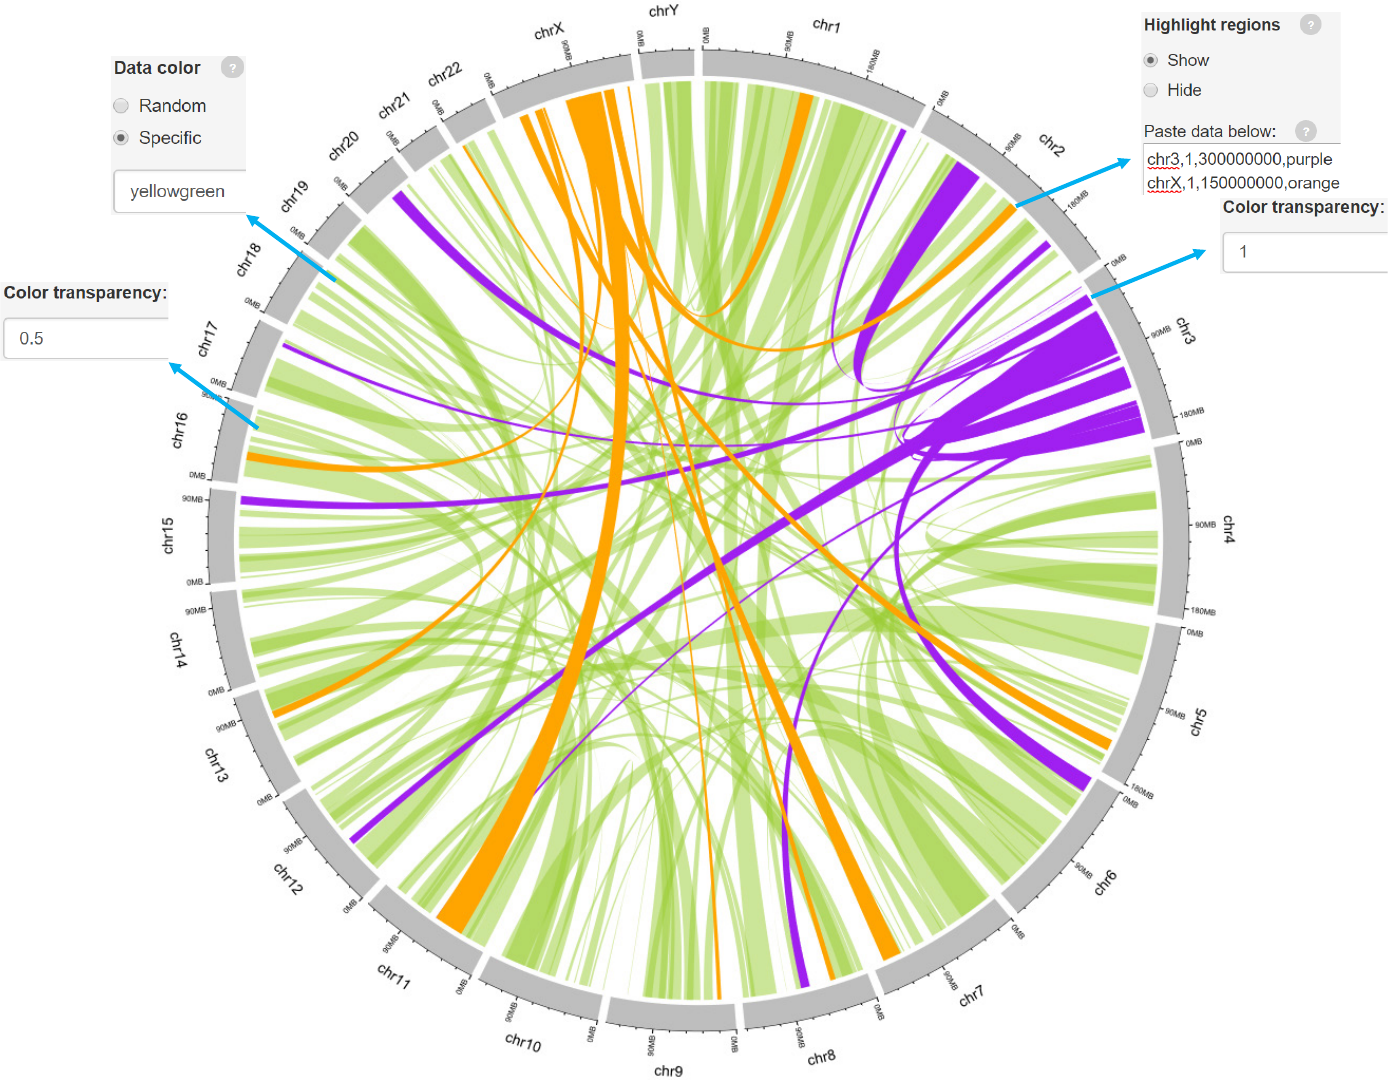
Options
The color used for data plotting can be randomly assigned by the application or
specified by the users.
Adecimal number in [0, 1] to adjust the color transparency.
Decimal numbers in [0, 1] to adjust the yaxis coordinates of baselines.
The color used for baselines.
The color for the background.
Height of the track.
Margin size of the track.
Add borders to the different chromosome sectors.
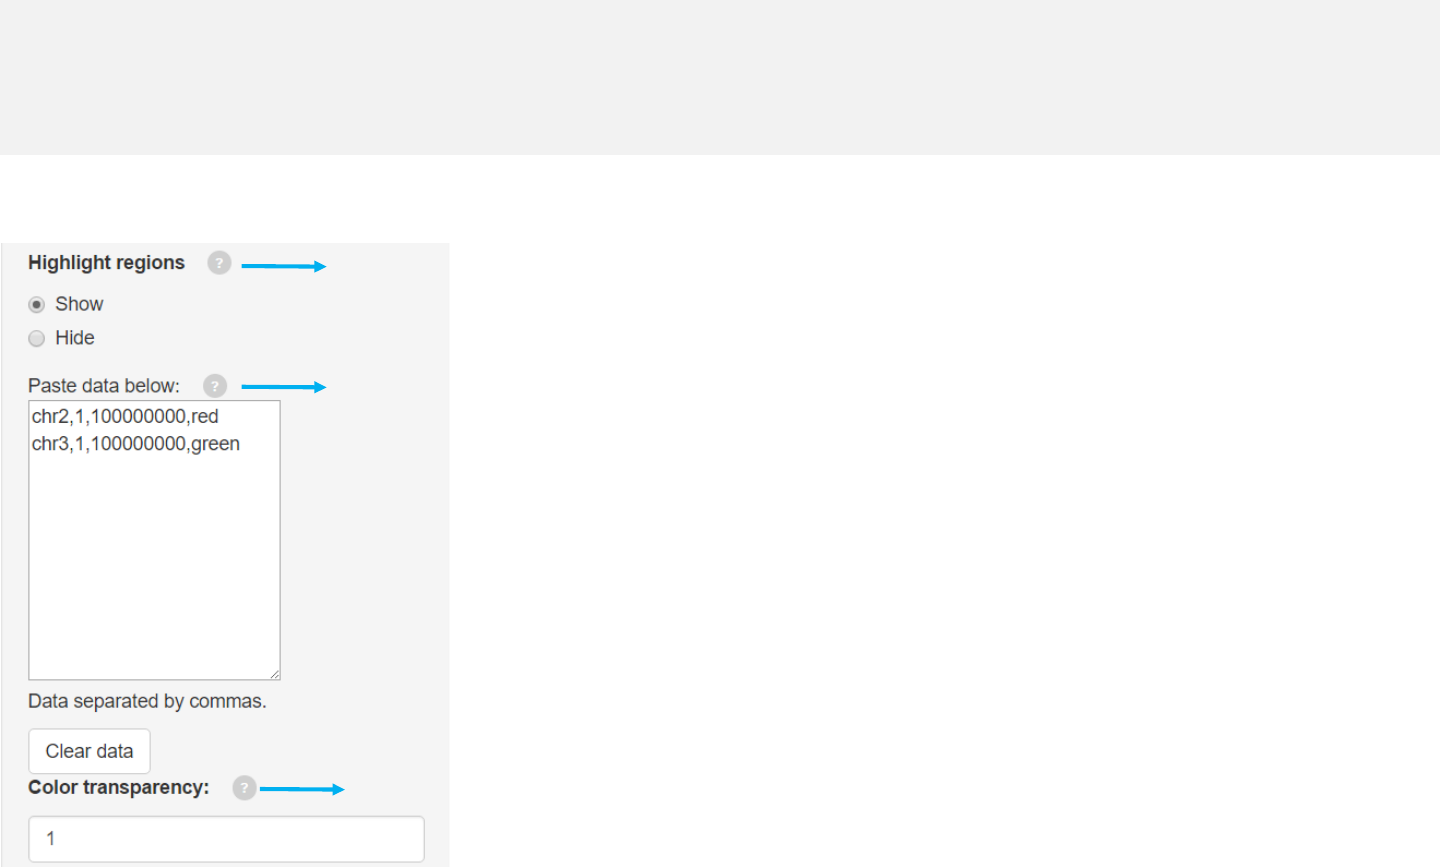
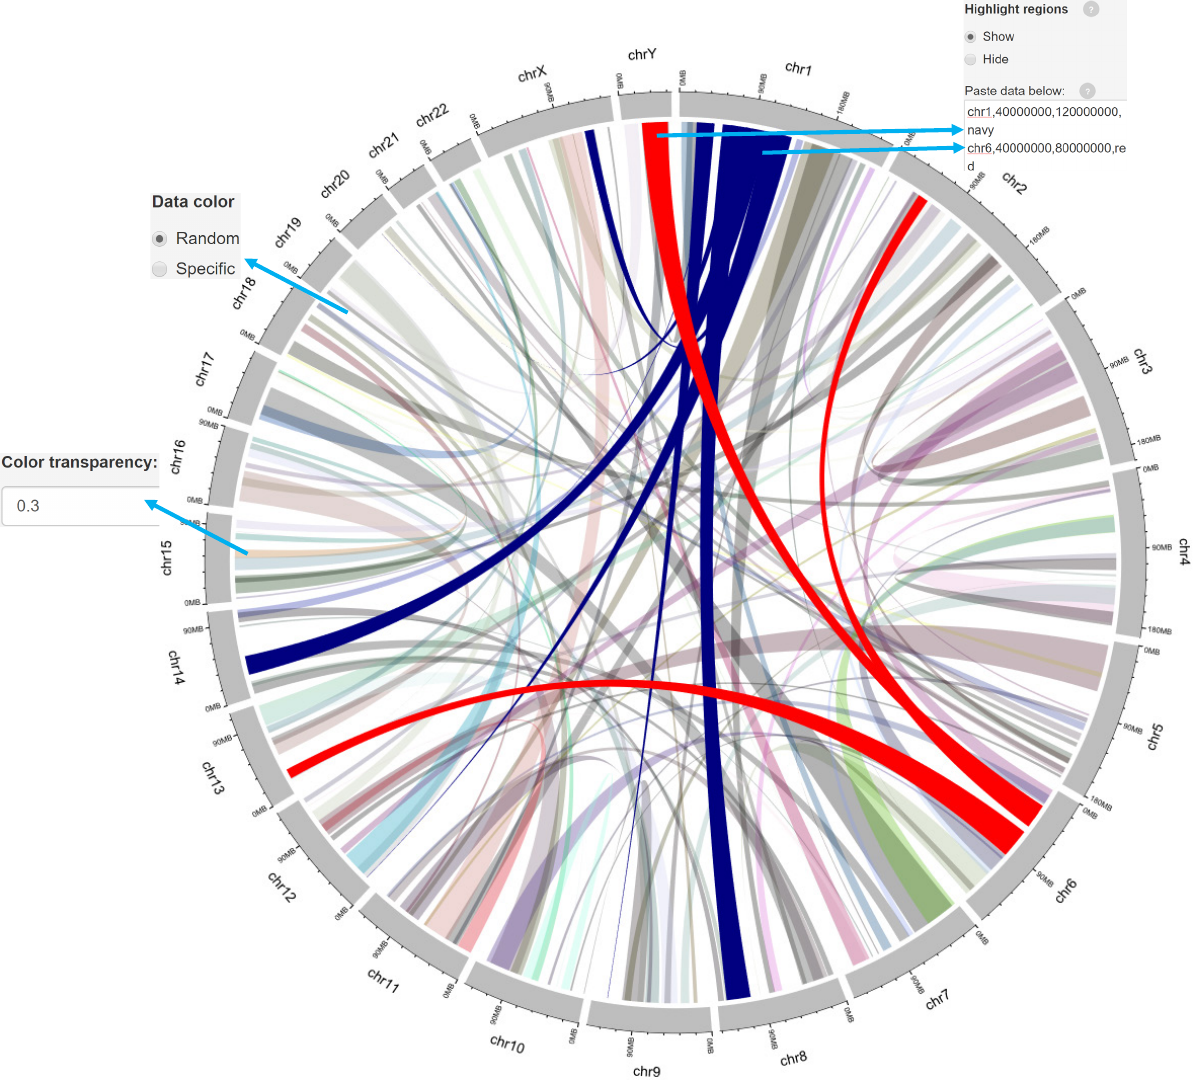
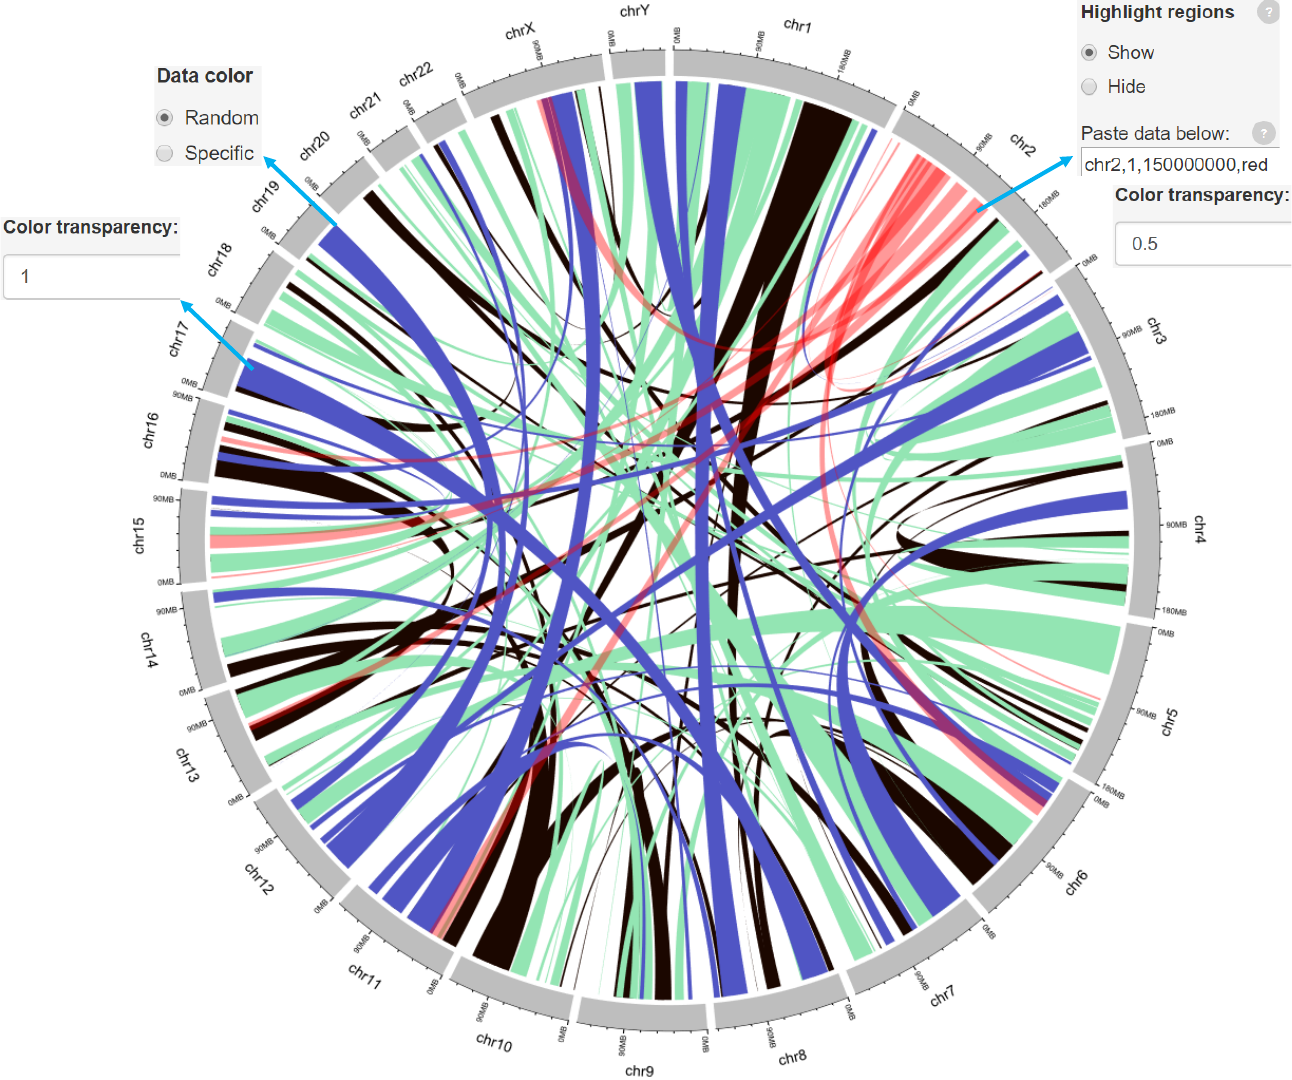
Options
Genomic regions can be highlighted with specified colors.
Each row should contain four components separated by commas including the
chromosome ID, start coordinate, end coordinate and the specified color.
Adecimal number in [0, 1] to adjust the color transparency for the highlighted
regions.
Example 1
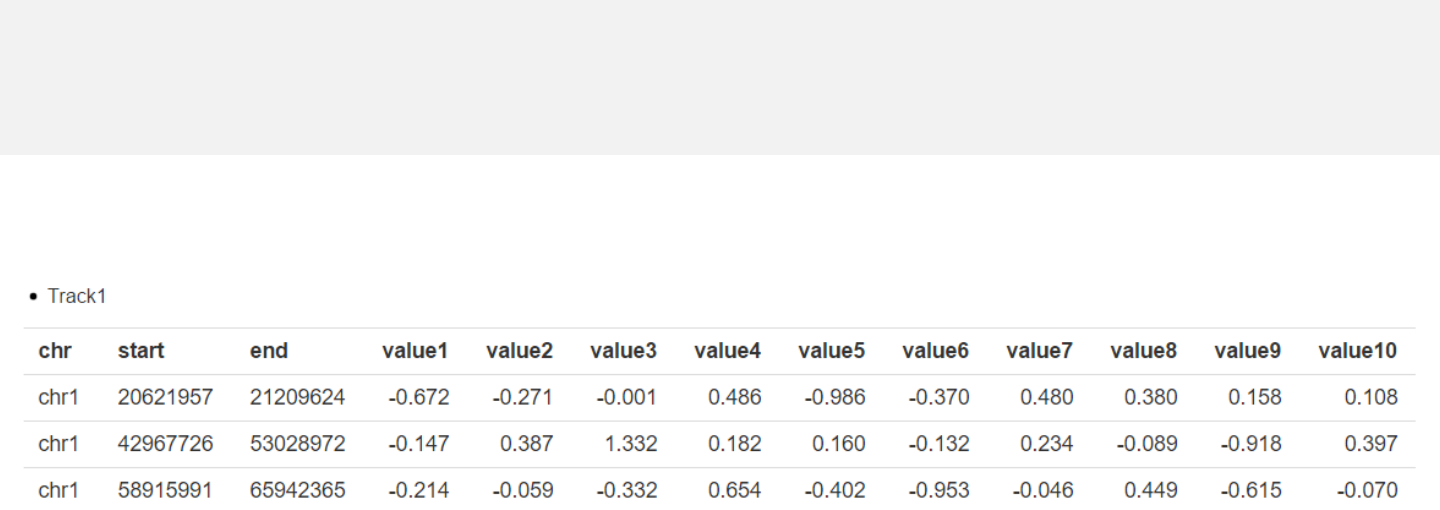
-Simplest data to plot point should contain at least 4 columns including the
chromosome ID, start coordinate, end coordinate and multiple columns of values.
Data format
Any track can be used
for data uploading.
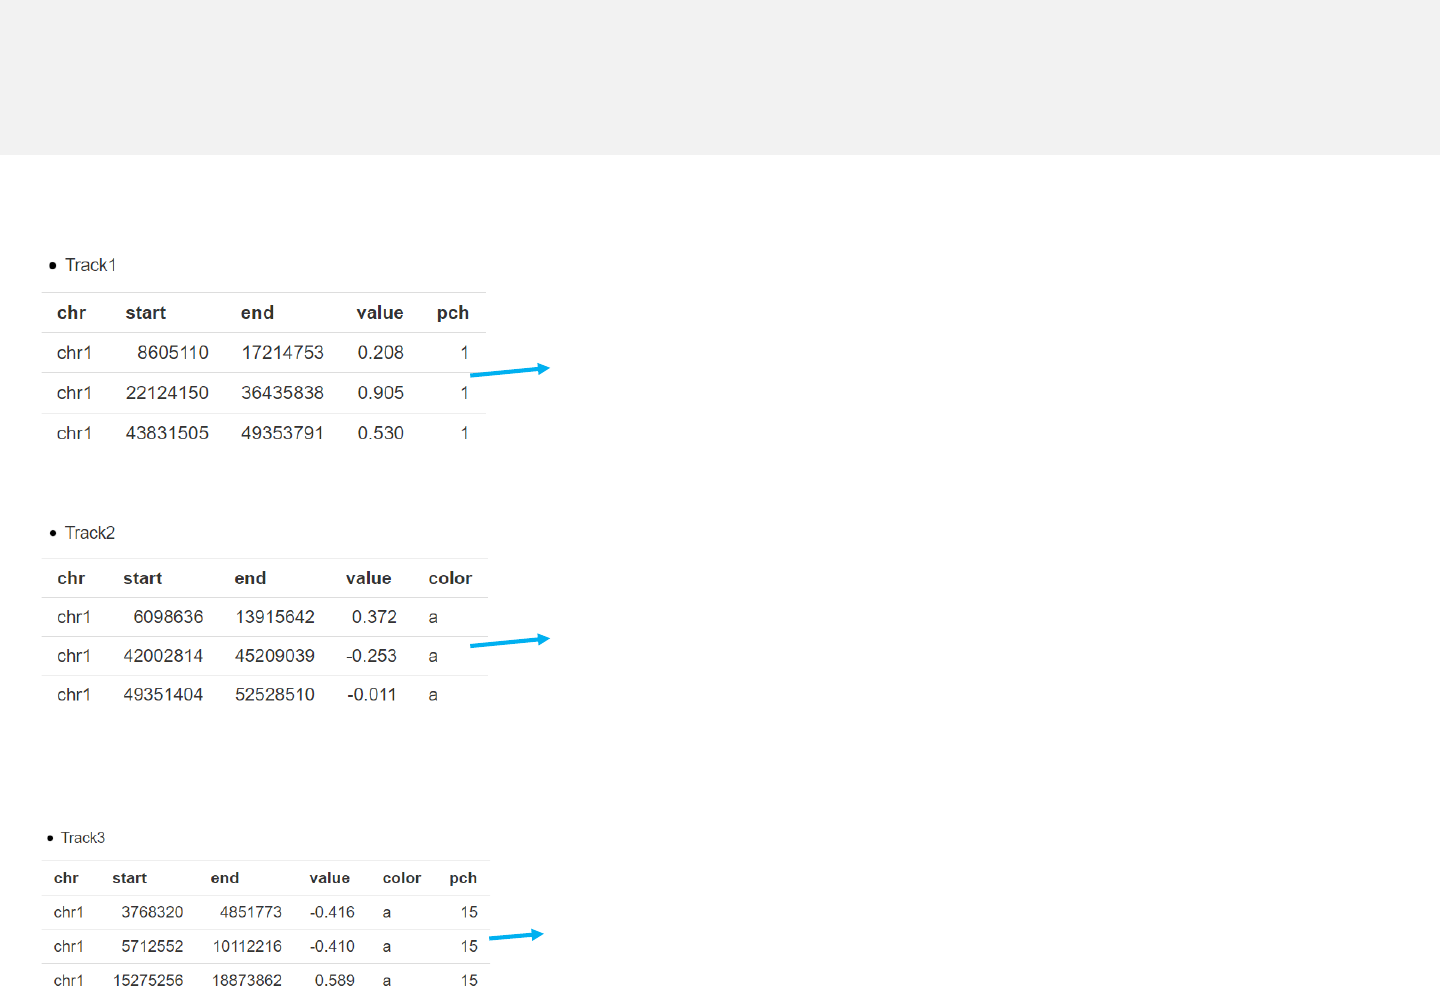
Example 2
point_pch.csv
point_color.csv
point_color_pch.csv
-The last column “pch’’ indicates
different point types for differing
data groups.
-The last column “color’’ indicates
different colors for differing data
groups.
-The last columns “color’’ and “pch”
represent different colors and
point types for different data
groups.
Data format
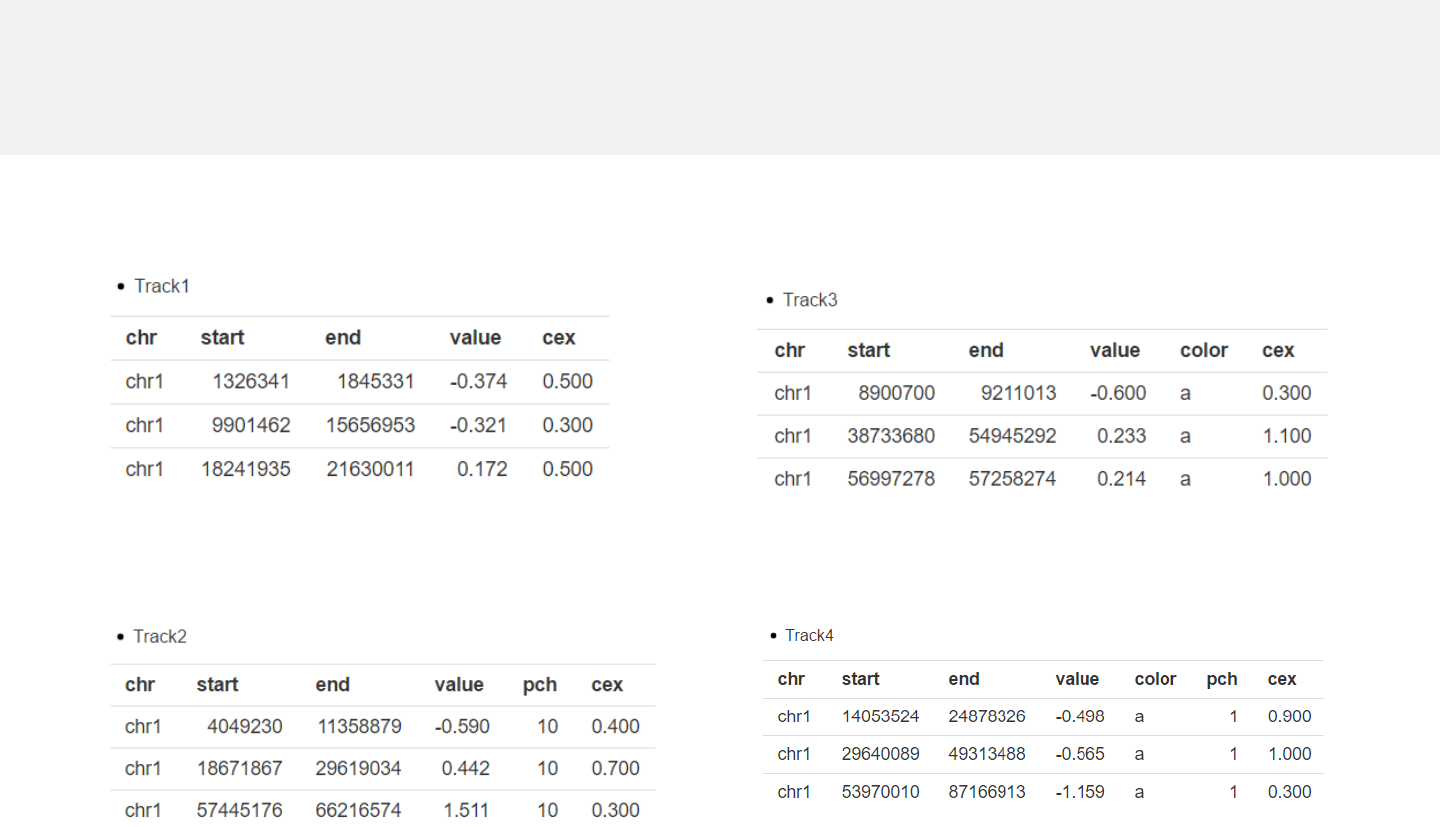
Example 3
-The “cex” column is a numeric vector represents different point size.
point_cex.csv
point_pch_cex.csv
point_color_cex.csv
point_color_pch_cex.csv
Data format
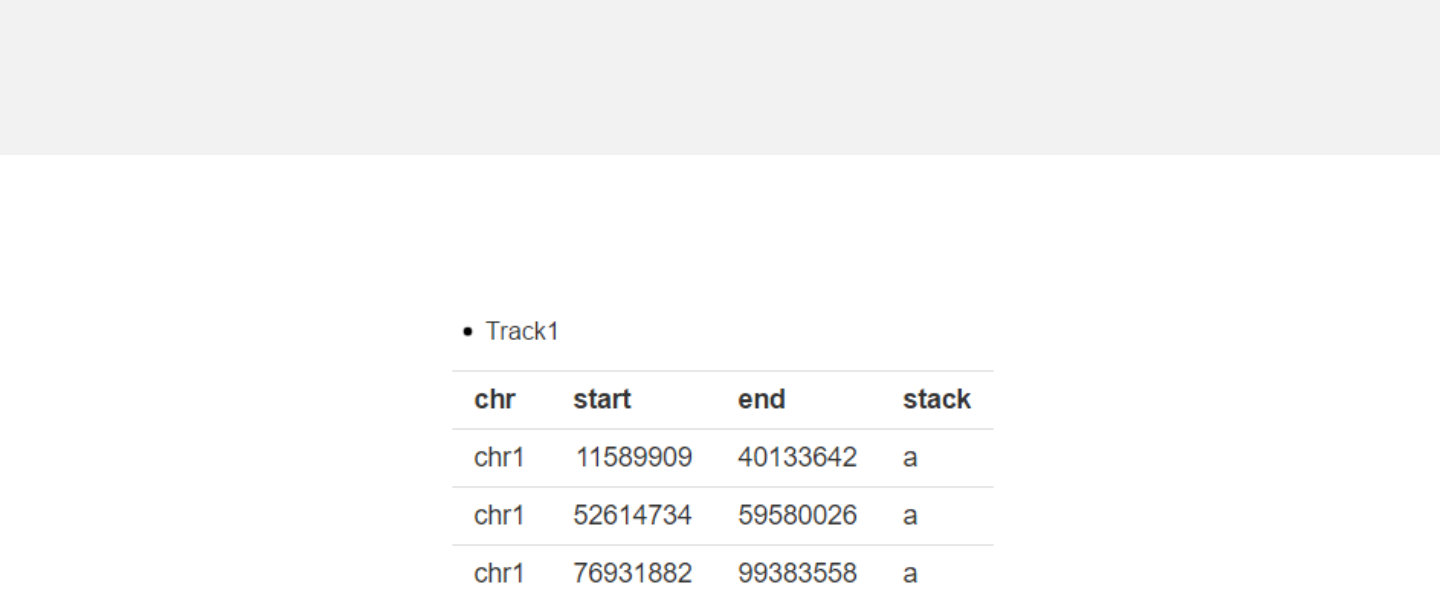
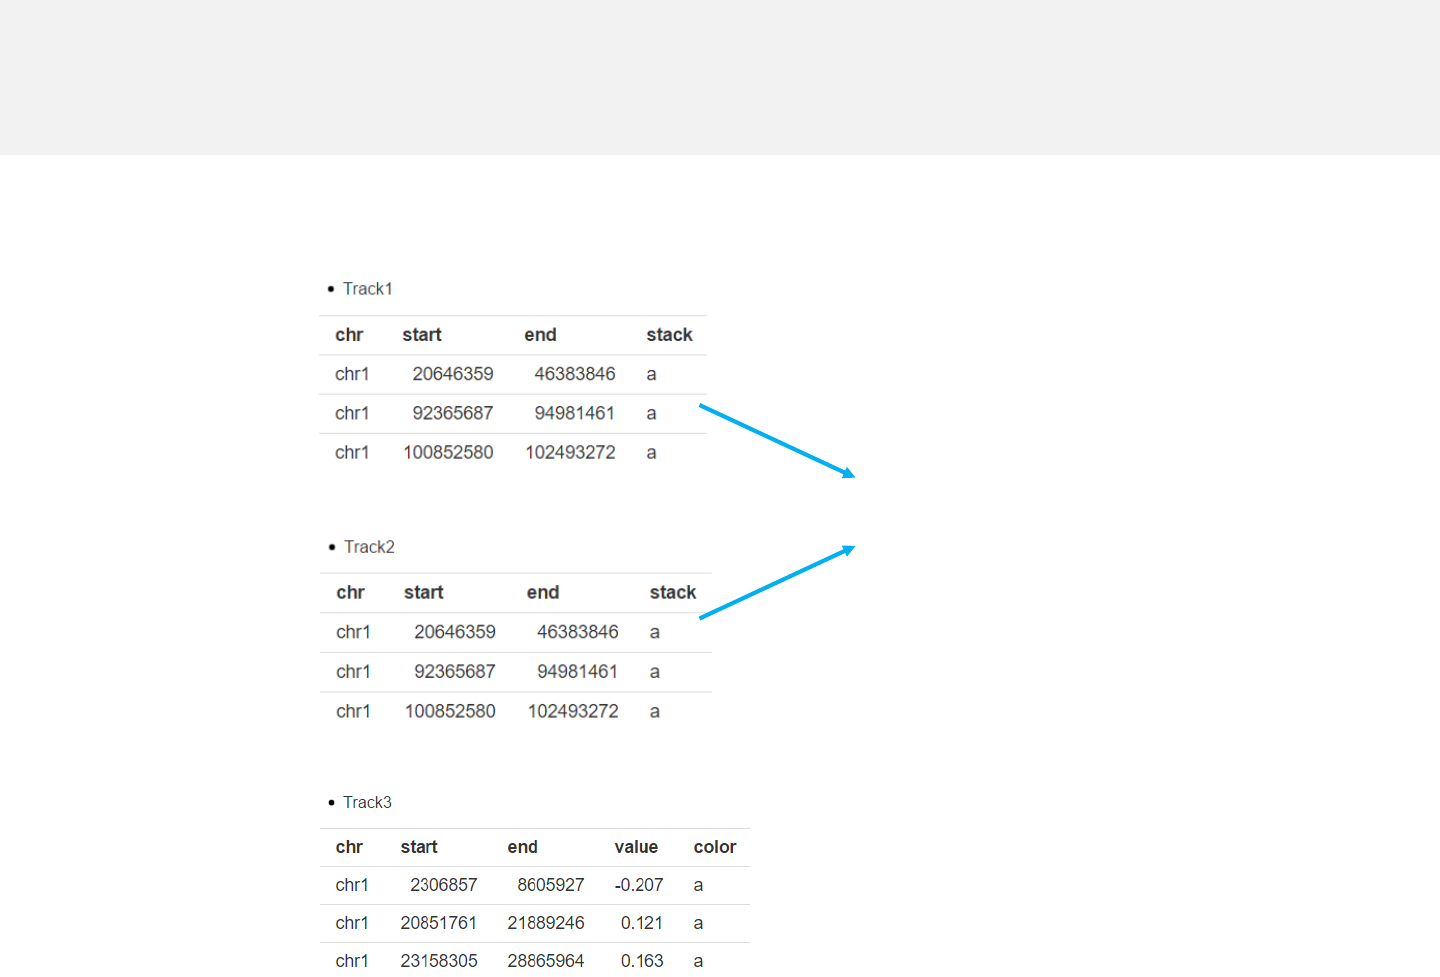
Example 4
stack_point.csv
-The last column “stack” is a numeric vector or acharacter vector.
-In stack mode, the y-axis is split into several bins with equal height and all data
points are put onto different “horizontal” bins based on the “stack” column.
Data format
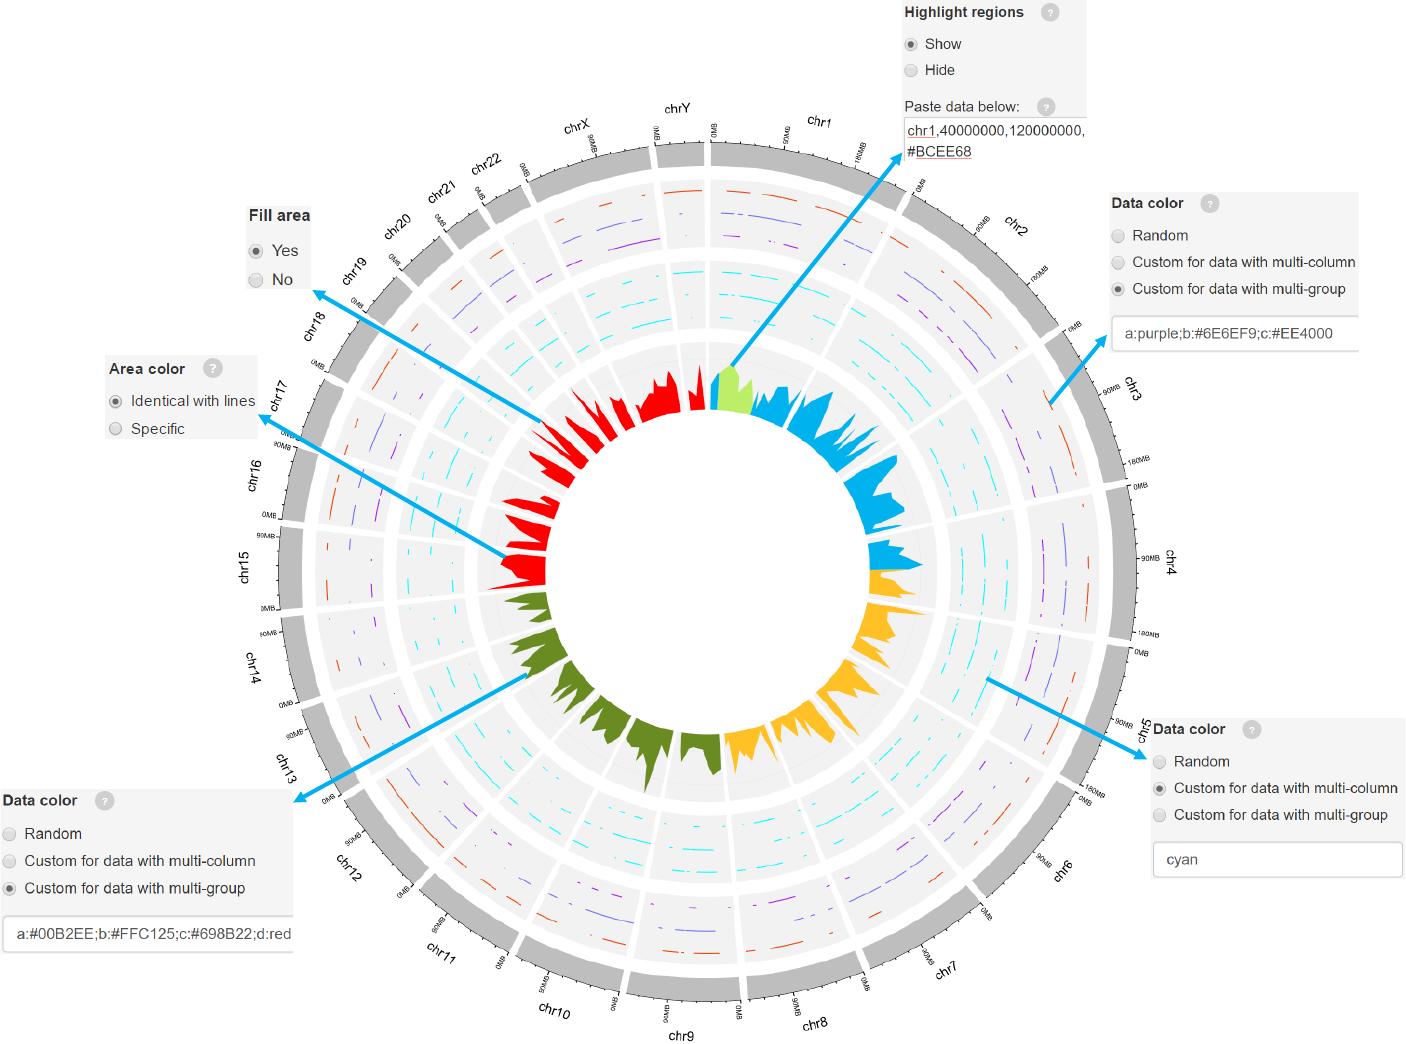
2.3 Plot lines
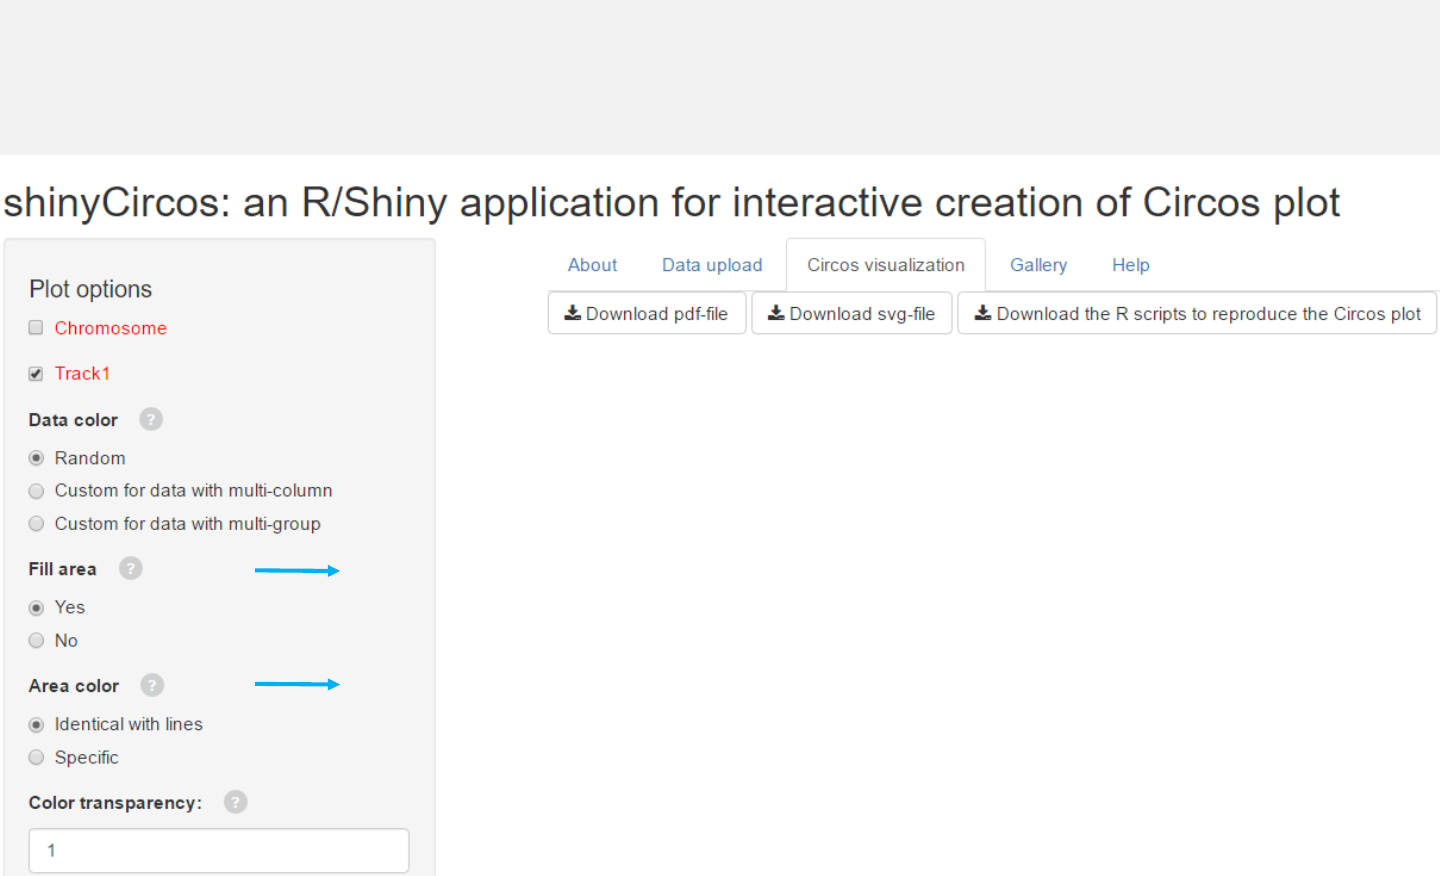
Fill the area below the lines.
Filled the area with color, which can be identical to line color
or specified by the user.
Options
-See section 2.2 for more plot options.
Example 1
line.csv line_multicolumn.csv
-Simplest data to plot line should contain at least 4 columns including the
chromosome ID, start coordinate, end coordinate and multiple columns of values.
Data format
Example 2
stack_line.csv
line_color.csv
Data format
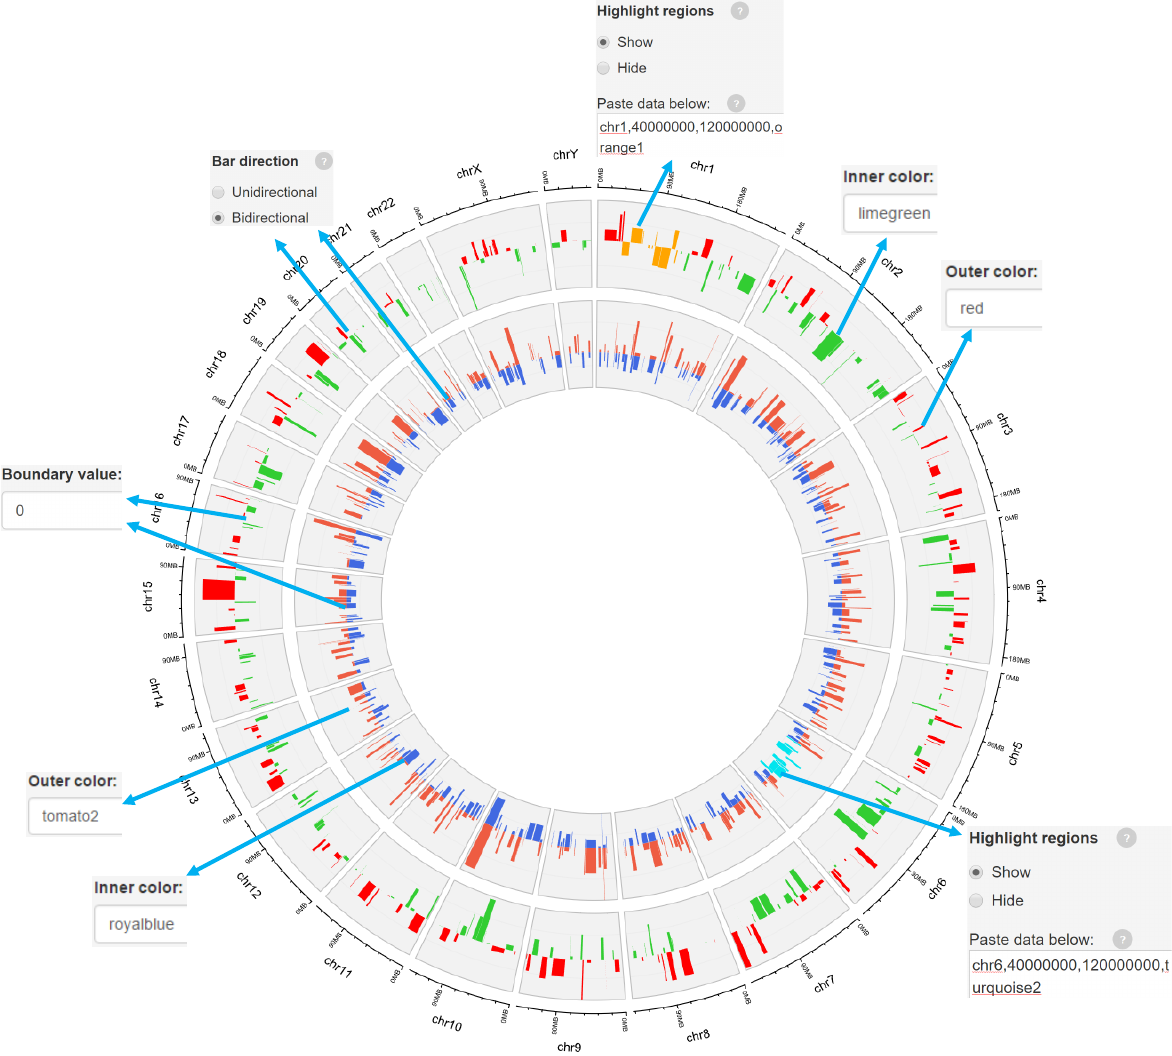
2.4 Plot bars
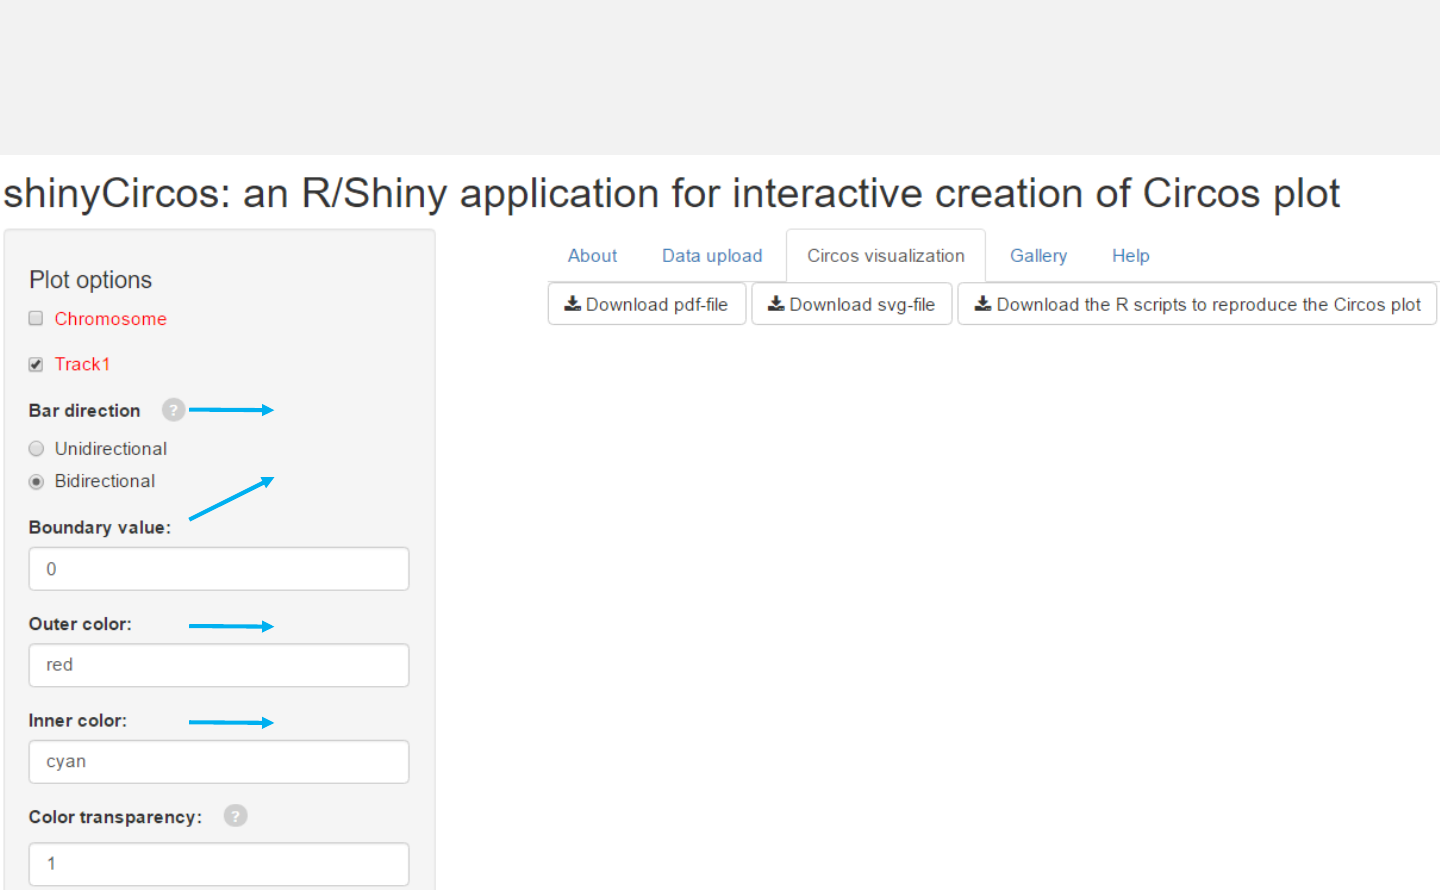
Options
Bars can be unidirectional or bidirectional. For bidirectional bars,
the 4th column with data values will be divided into two groups
based on the boundary value.
Color for the outer bars.
Color for the inner bars.
-See section 2.2 for more plot options.
Example 1
barplot.csv
barplot_color.csv
Data format
-Data for bar plot generally includes 4 columns.
-The 4th column is a numeric vector.
-A “color” column can be added to assign color to different bars.
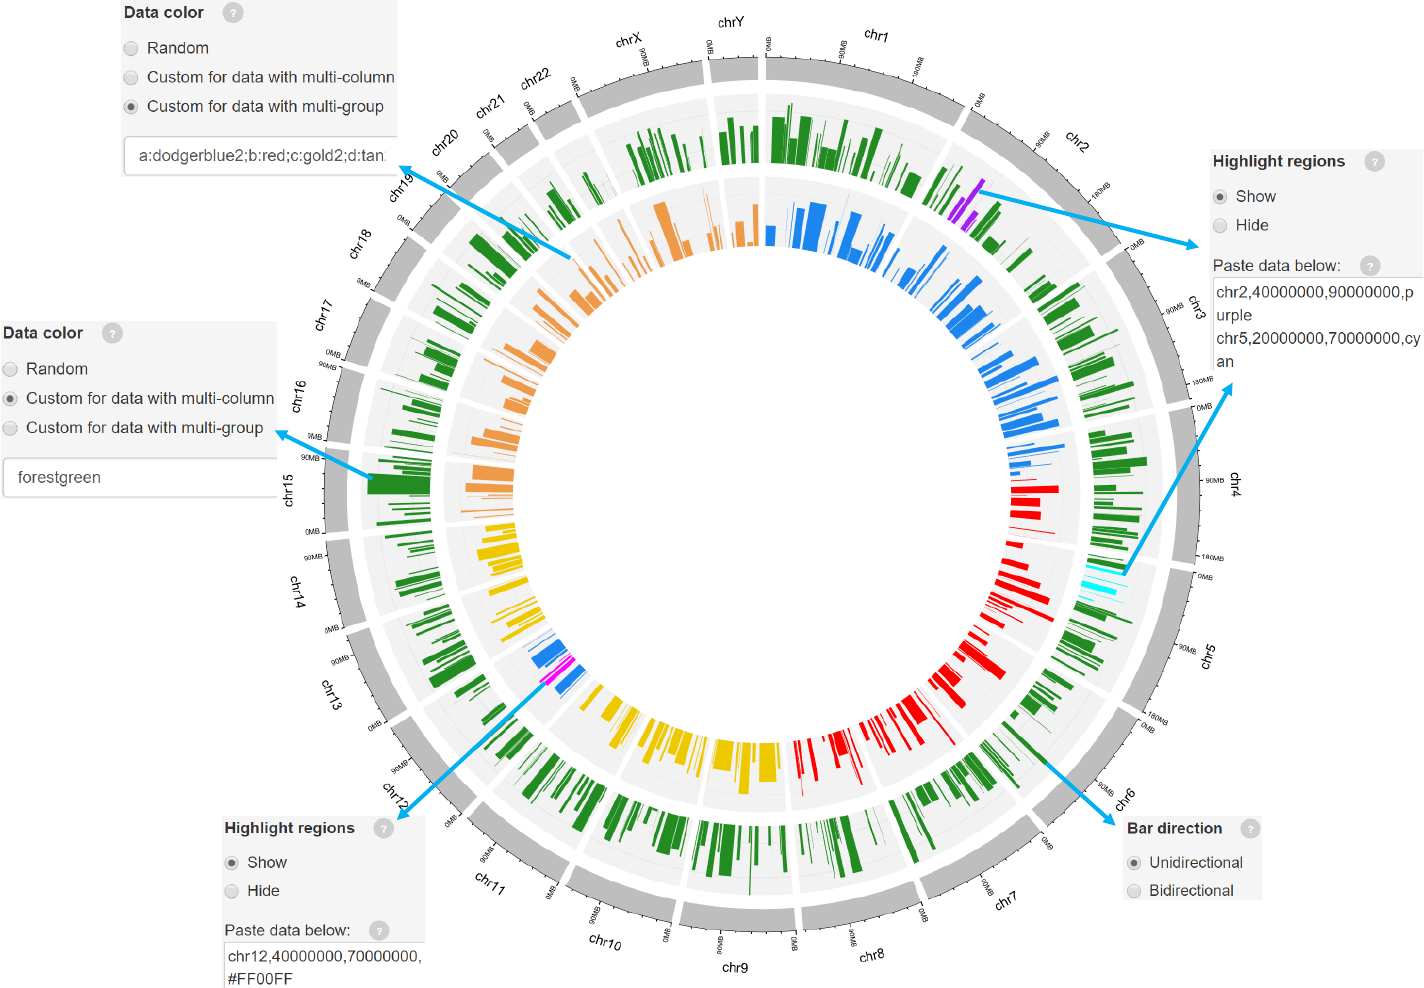
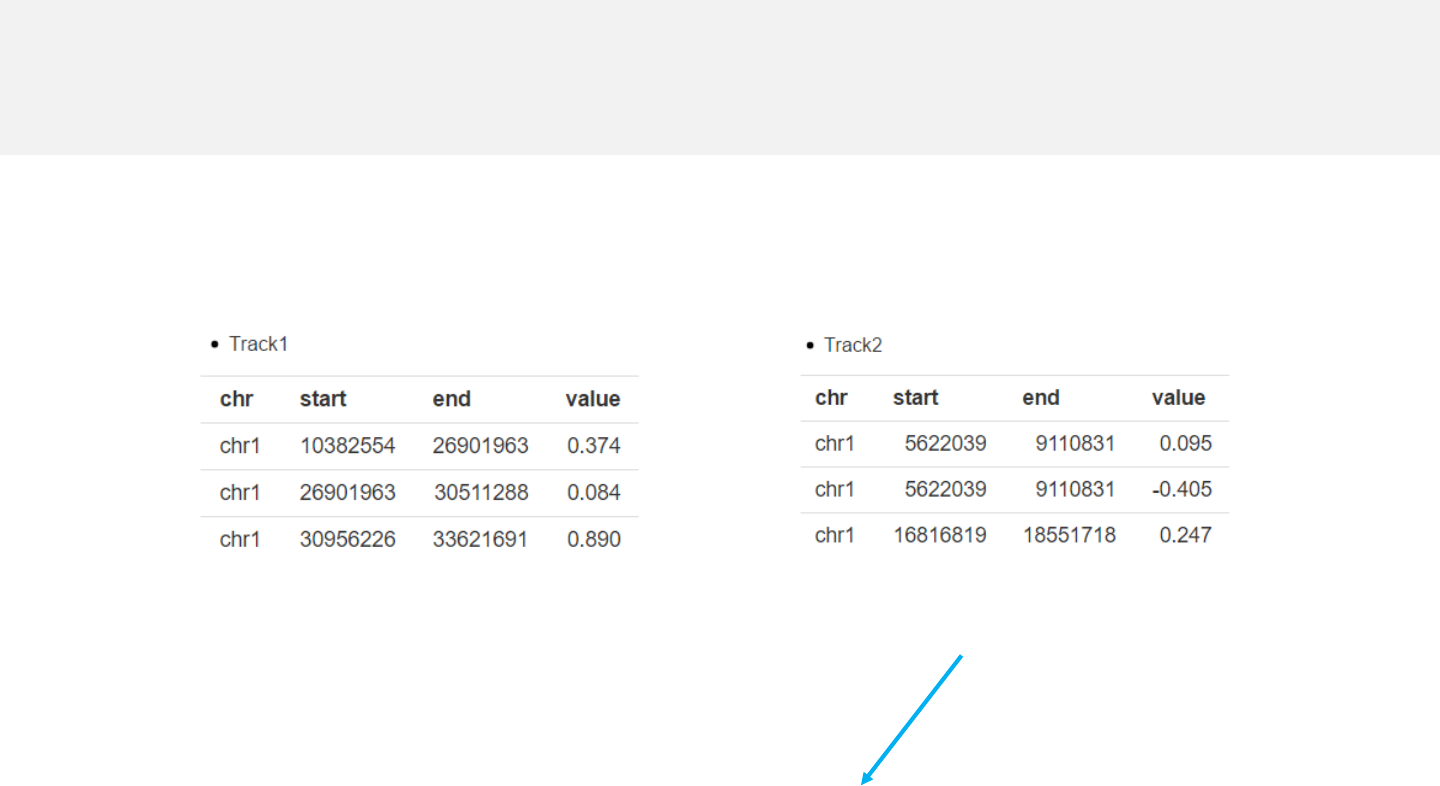
Example 2
-For bidirectional bars, each genomic region corresponds to one or two values.
barplot.csv barplot_bidirectional.csv
Data format
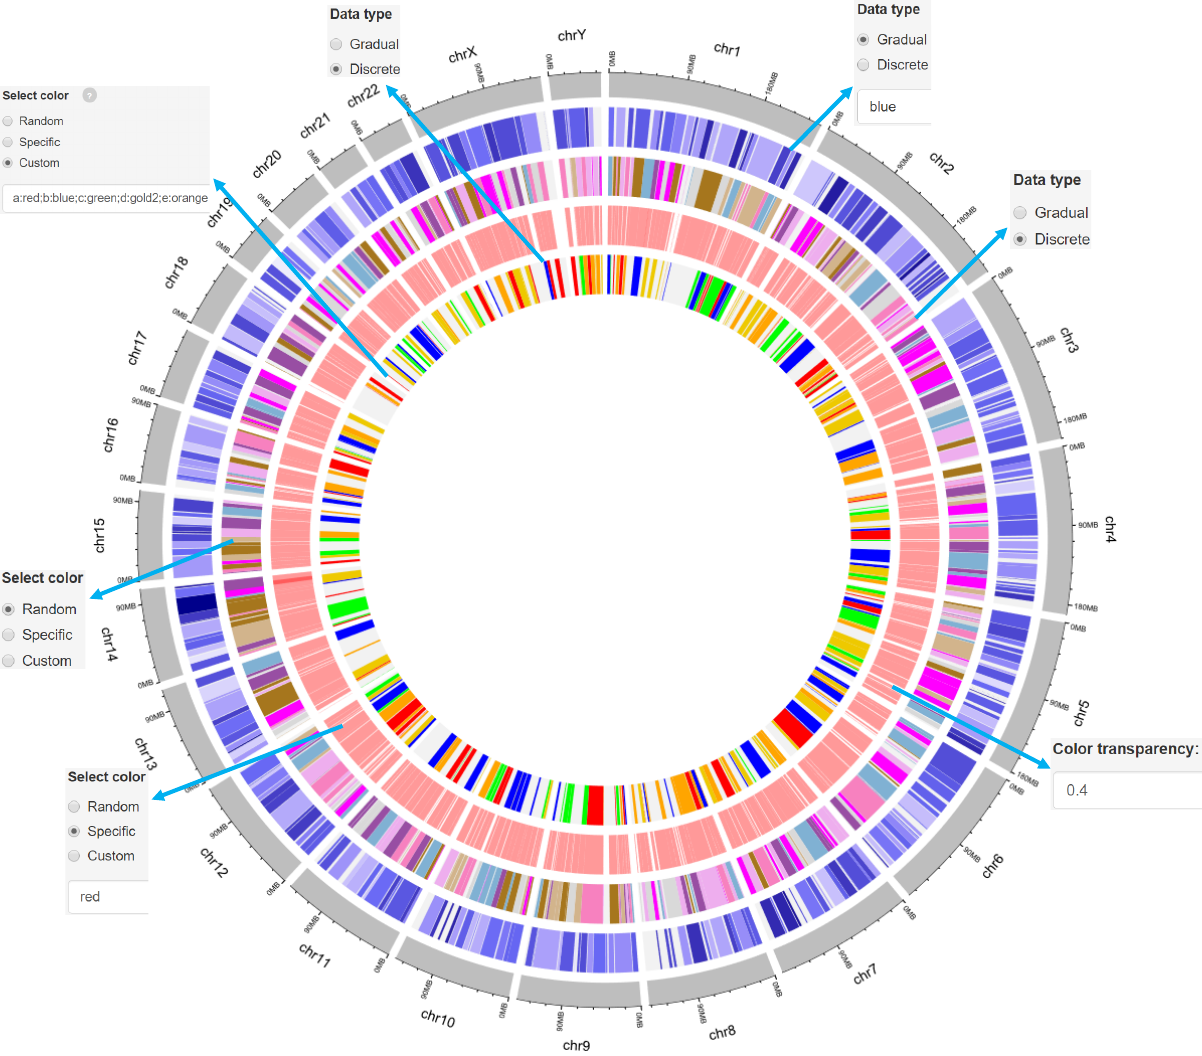
2.5 Plot rects
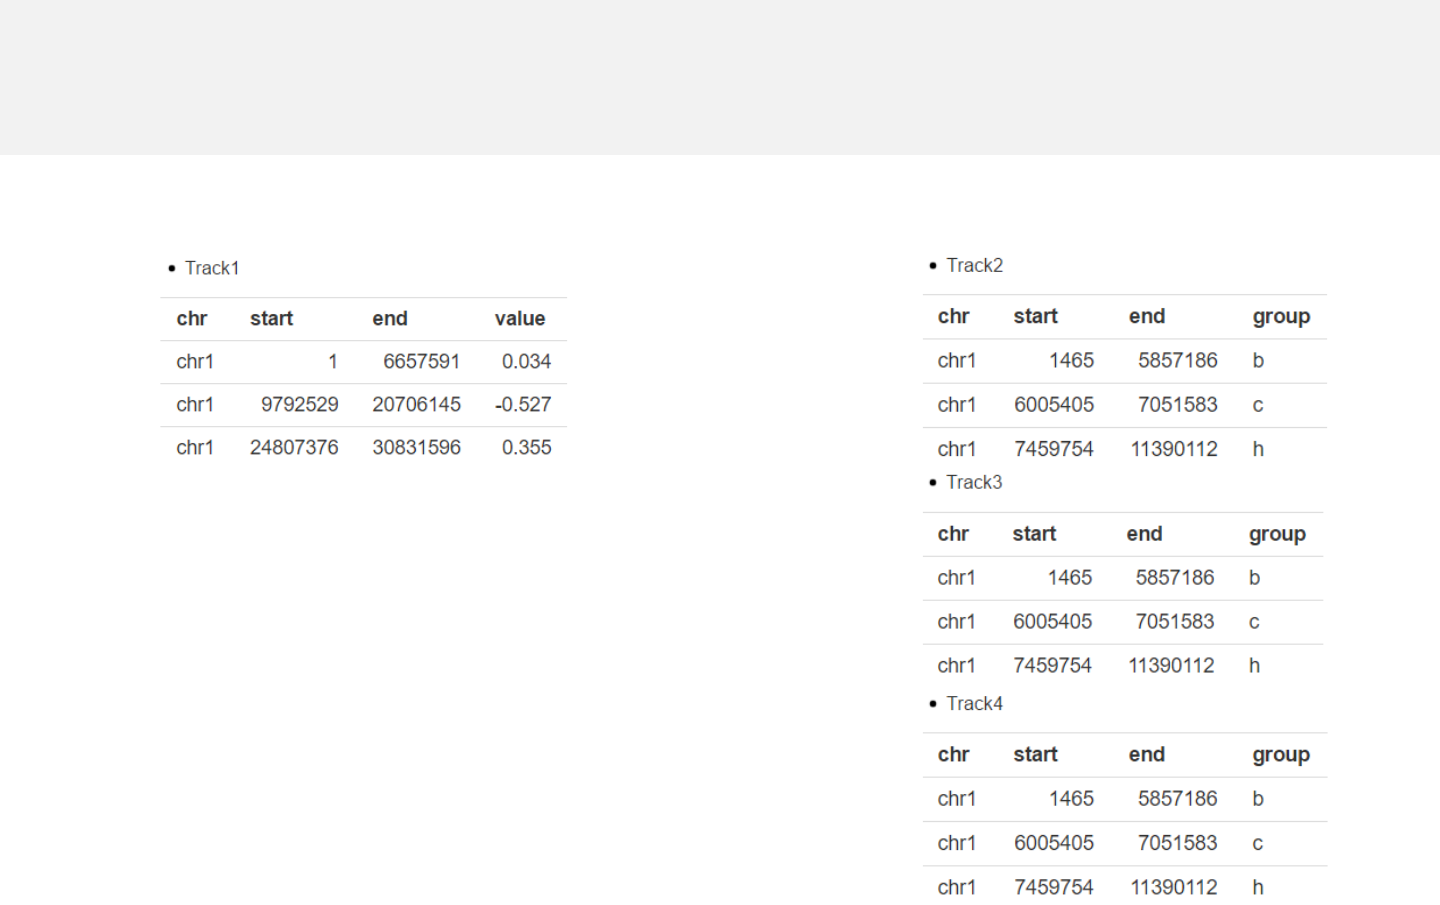
Upload rect data
rect_gradual.csv
rect_discrete.csv
Data format
-Data for rect plot generally includes four
columns.
-The last column should be a numeric vector
representing gradual values or acharacter
vector representing discrete variables.
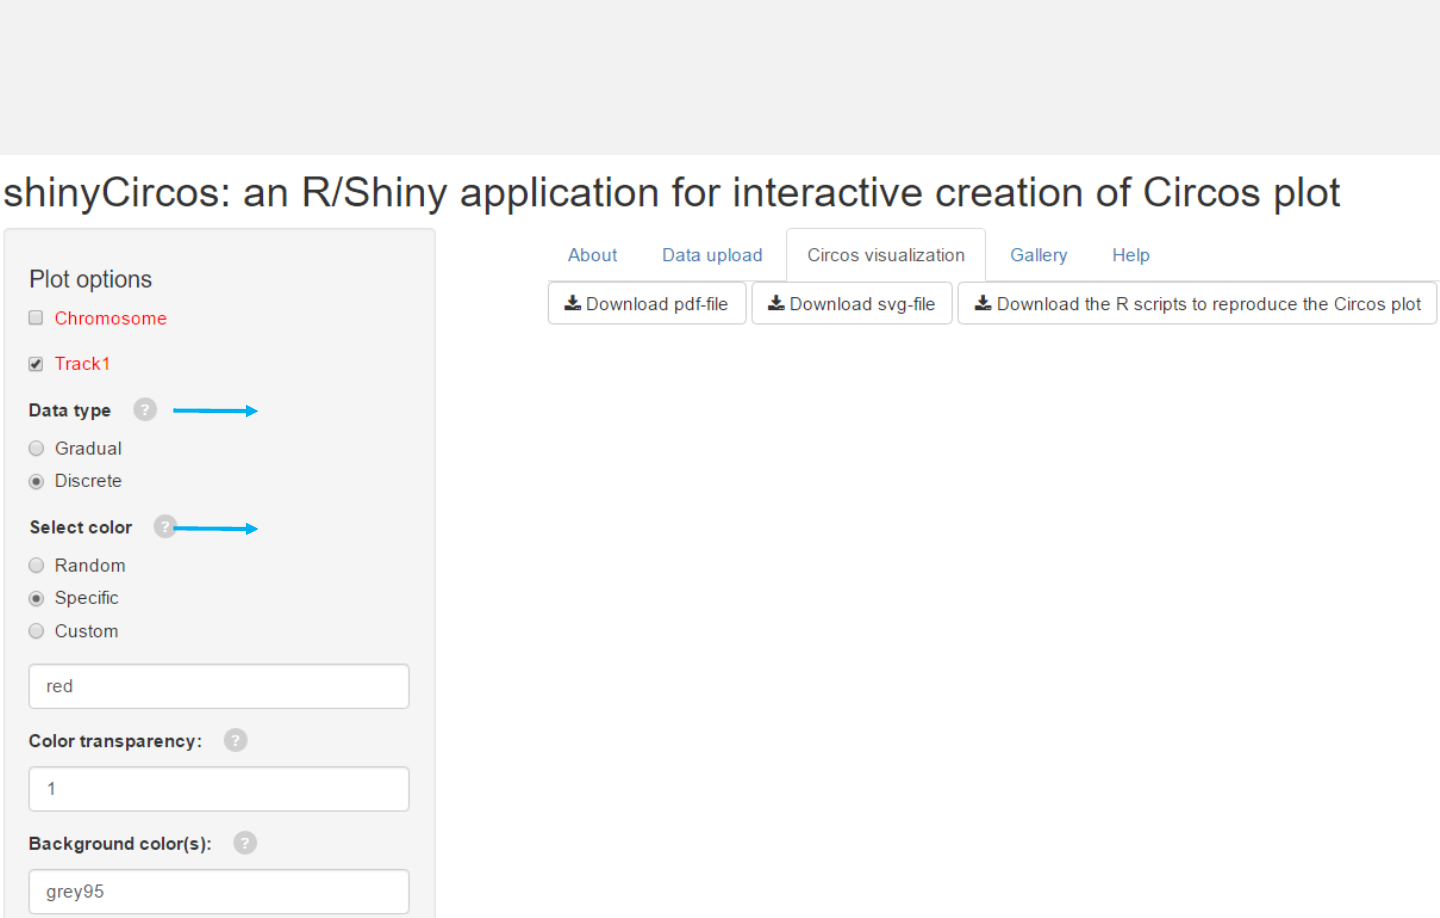
Options
The rects are filled with gradual or discrete colors.
The color used in data plotting can be randomly assigned by the
application or specified by the users.
-See section 2.2 for more plot options.
2.6 Plot heatmaps
Options
Colors used for the heatmap.
Add genomic position lines between tracks.
Height of the position lines.
Margin size of the position lines.
The color used for the borders of heatmap grids.
-See section 2.2 for more plot options.
Add borders to heatmap grids.
Upload heatmap data
-Apart from the first three columns, other columns are numeric vectors
representing different values.
heatmap.csv
Data format

2.7 Plot ideogram
Upload ideogram data
-Data to plot ideogram is the same as “chromosome_cytoband.csv”.
chromosome_ideogram.csv
point.csv
-Ideogram plot can be generated in any track.
Data format
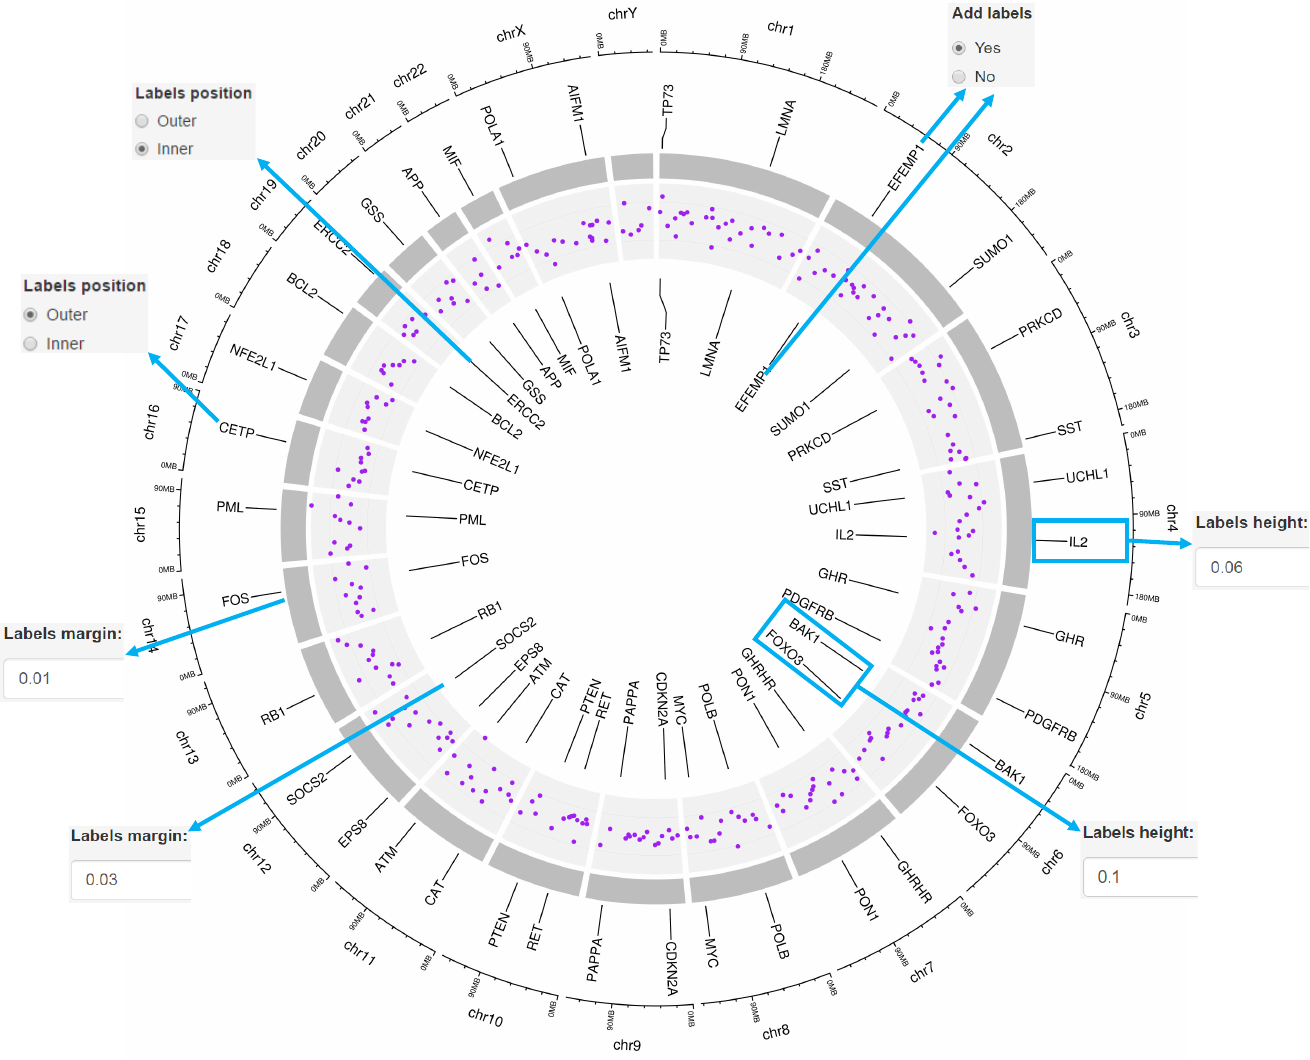
2.8 Plot labels
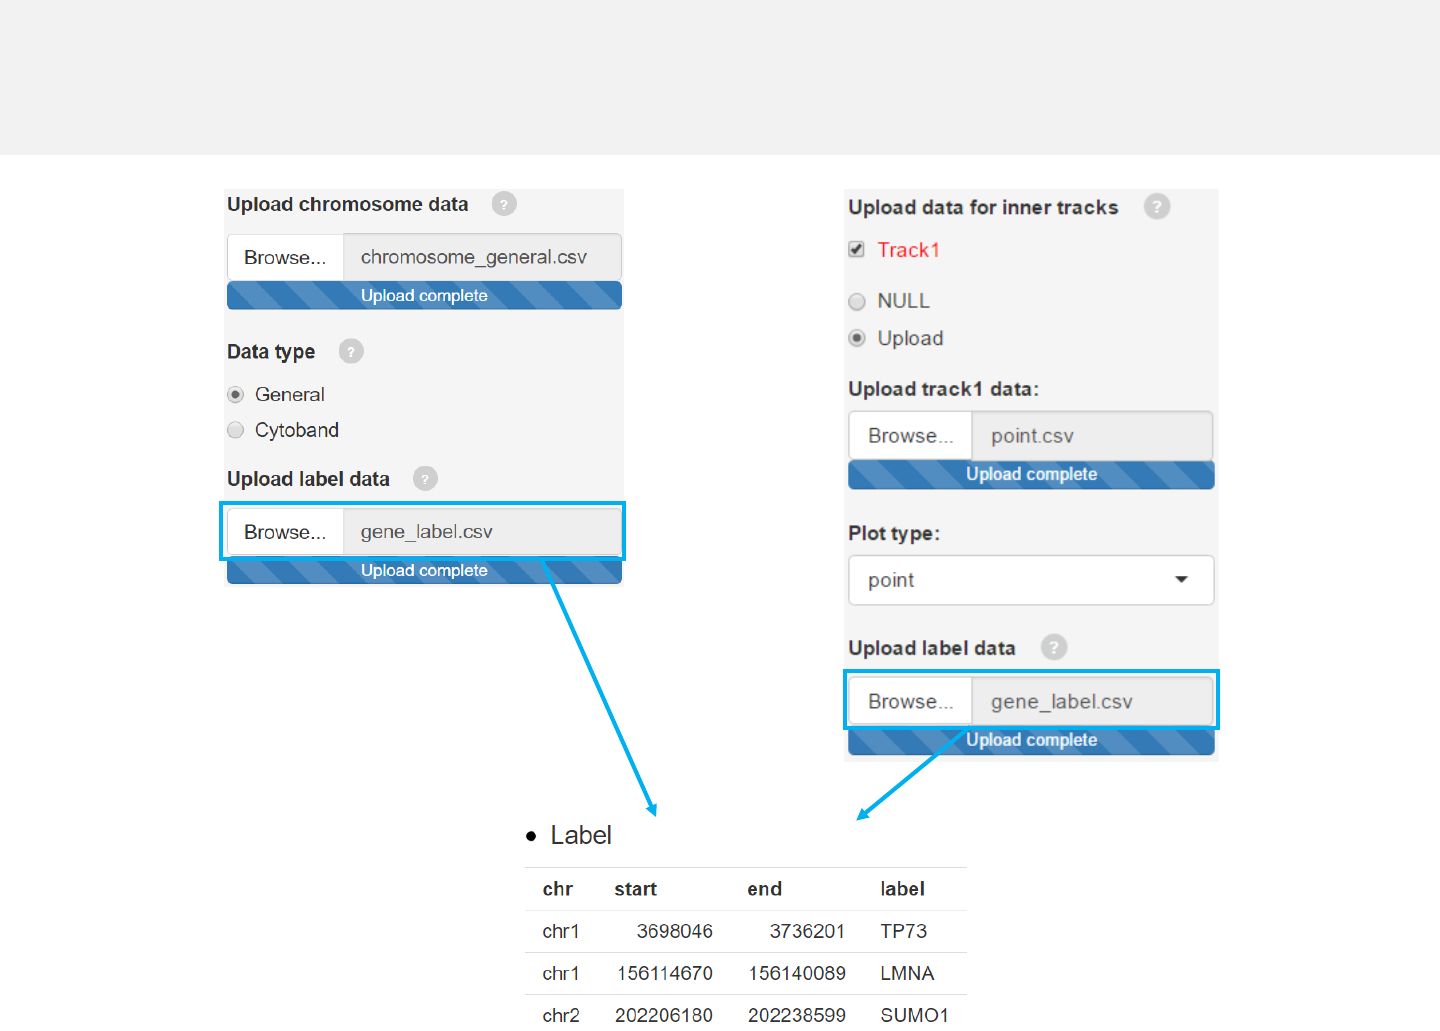
Upload label data
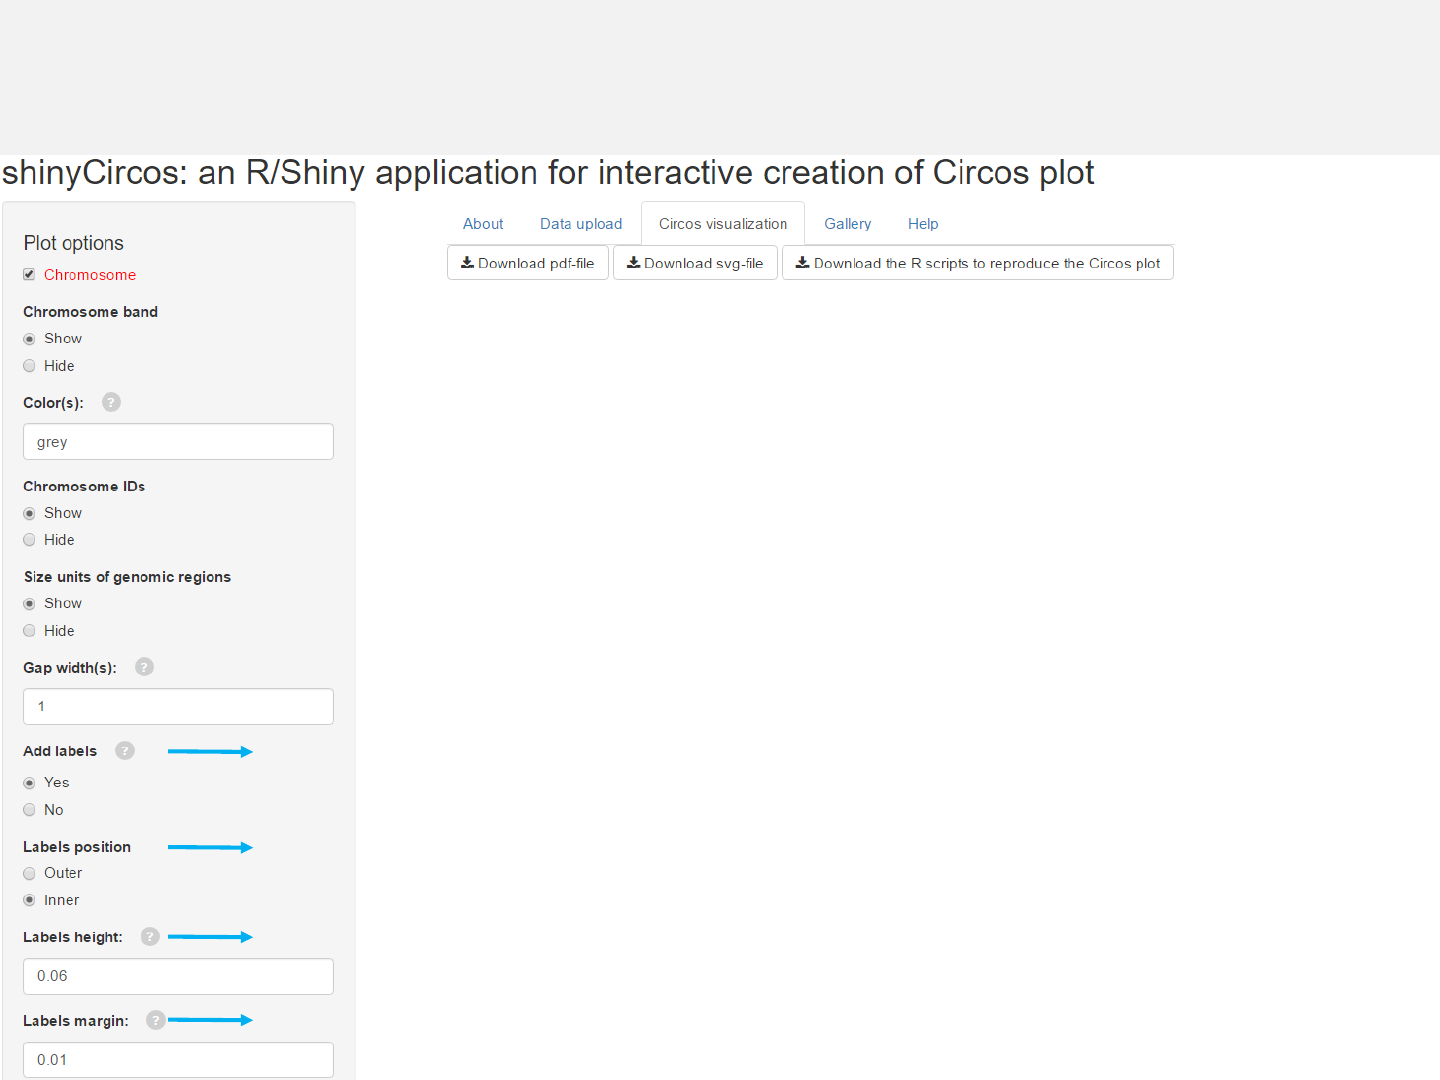
Options
Add labels to mark genes or genomic regions for this track using
data uploaded in the “Data upload” menu.
Specify labels positions relative to the track.
Height of the labels.
Margin size of the labels. -See section 2.2 for more plot options.
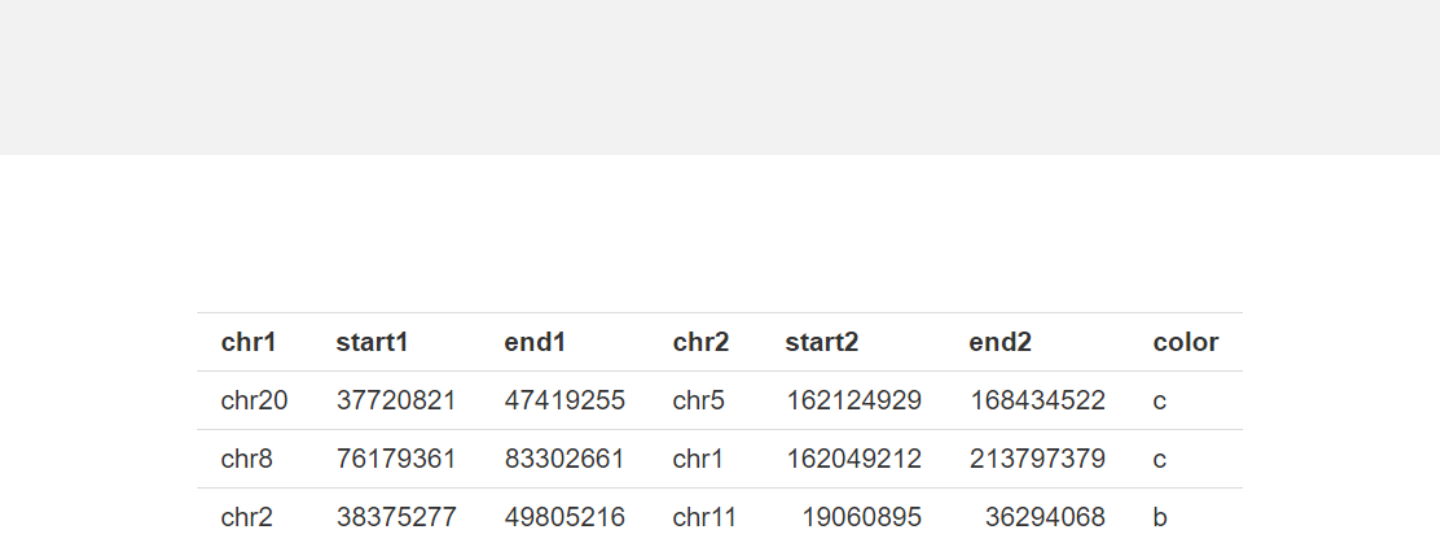
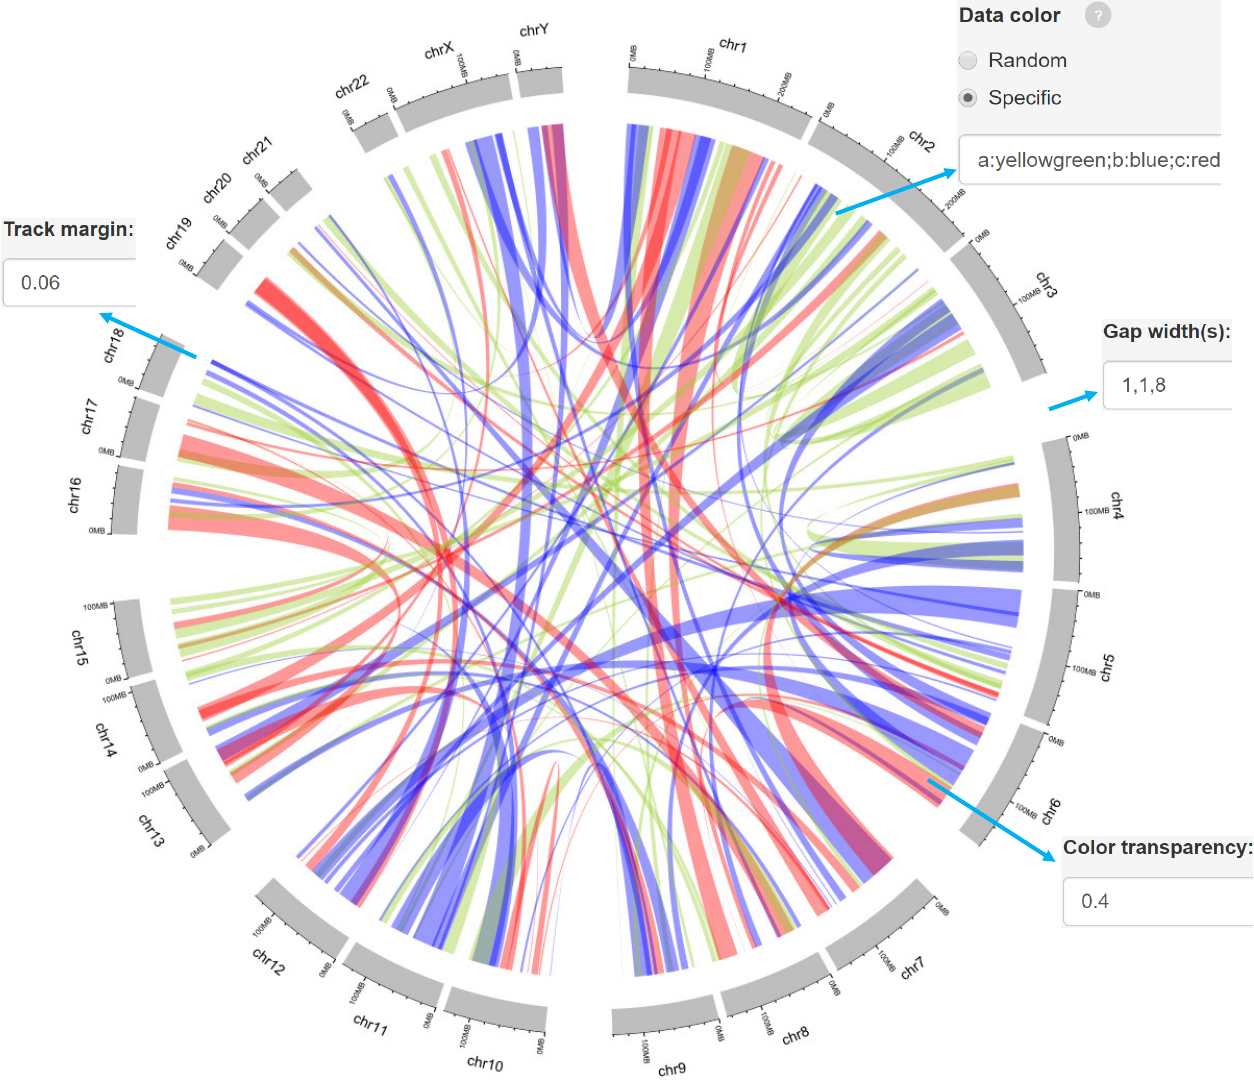
2.9 Plot links
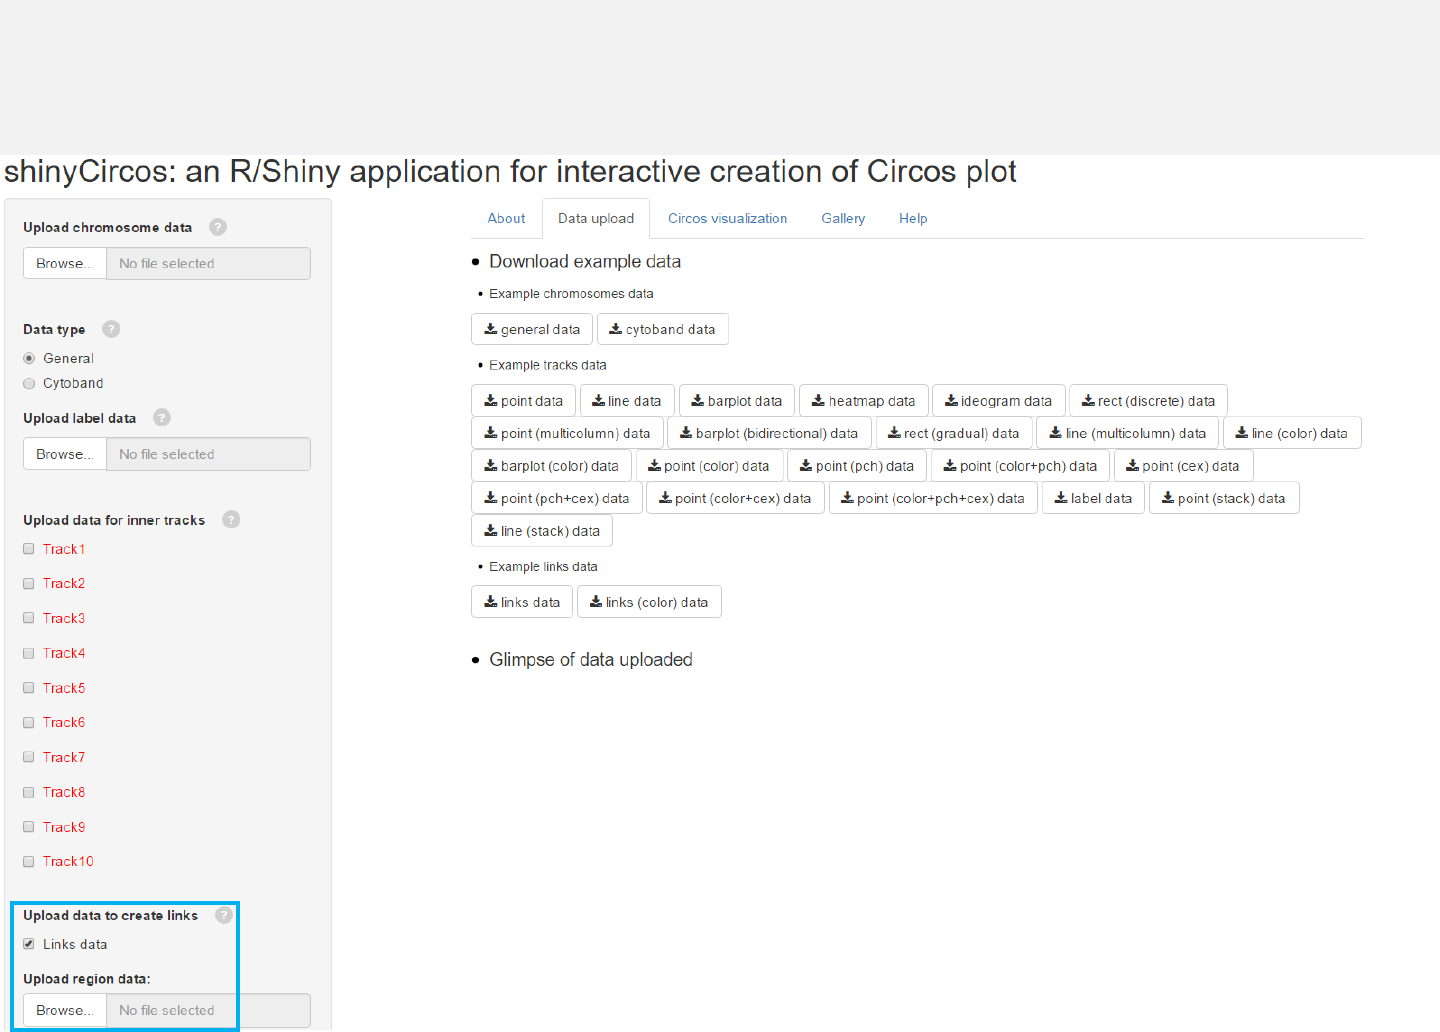
Upload links data
Data to plot links should include 6 or 7 columns.
Select “Links data” and upload file.
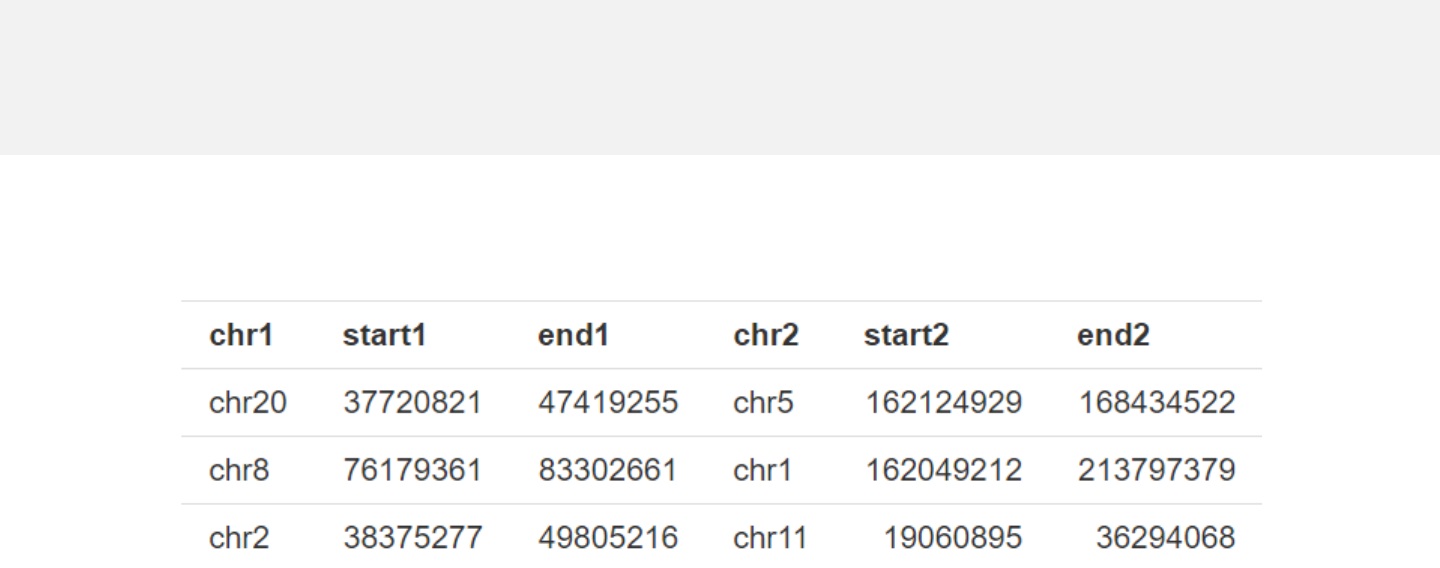
Example 1
-Data with 6 columns.
-Columns 1-3 and columns 4-6 represent the two ends of connectors respectively.
links.csv
Data format
Example 2
links_color.csv
Data format
-Data with 7 columns.
-A “color” column representing different groups of data with differing colors can
be added.
3. Other features
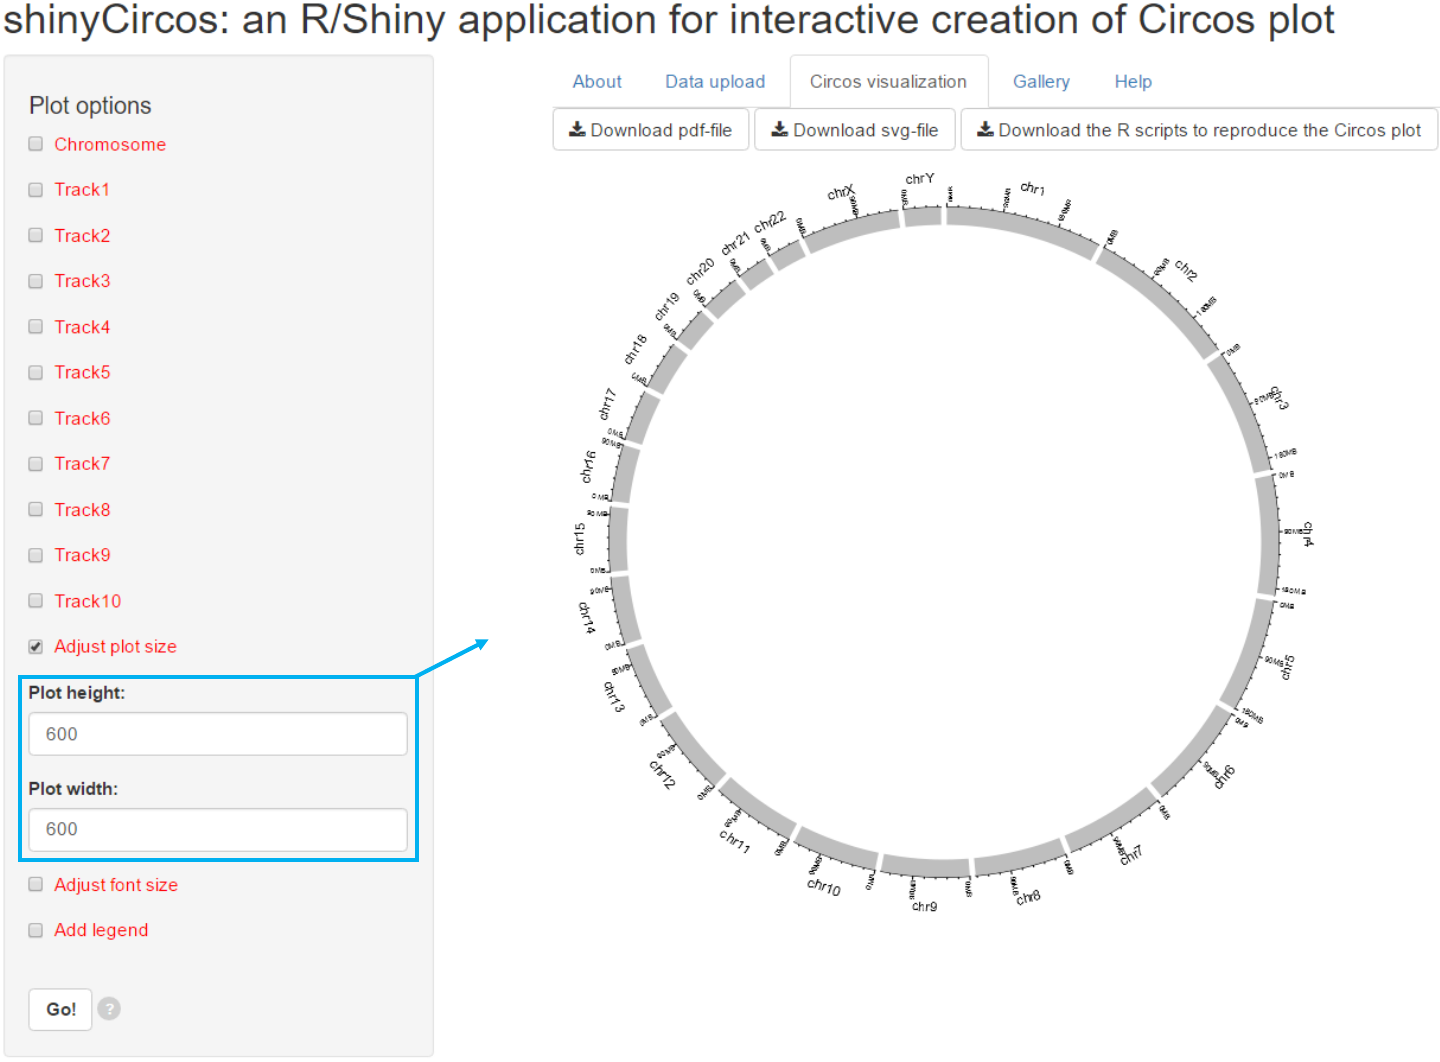
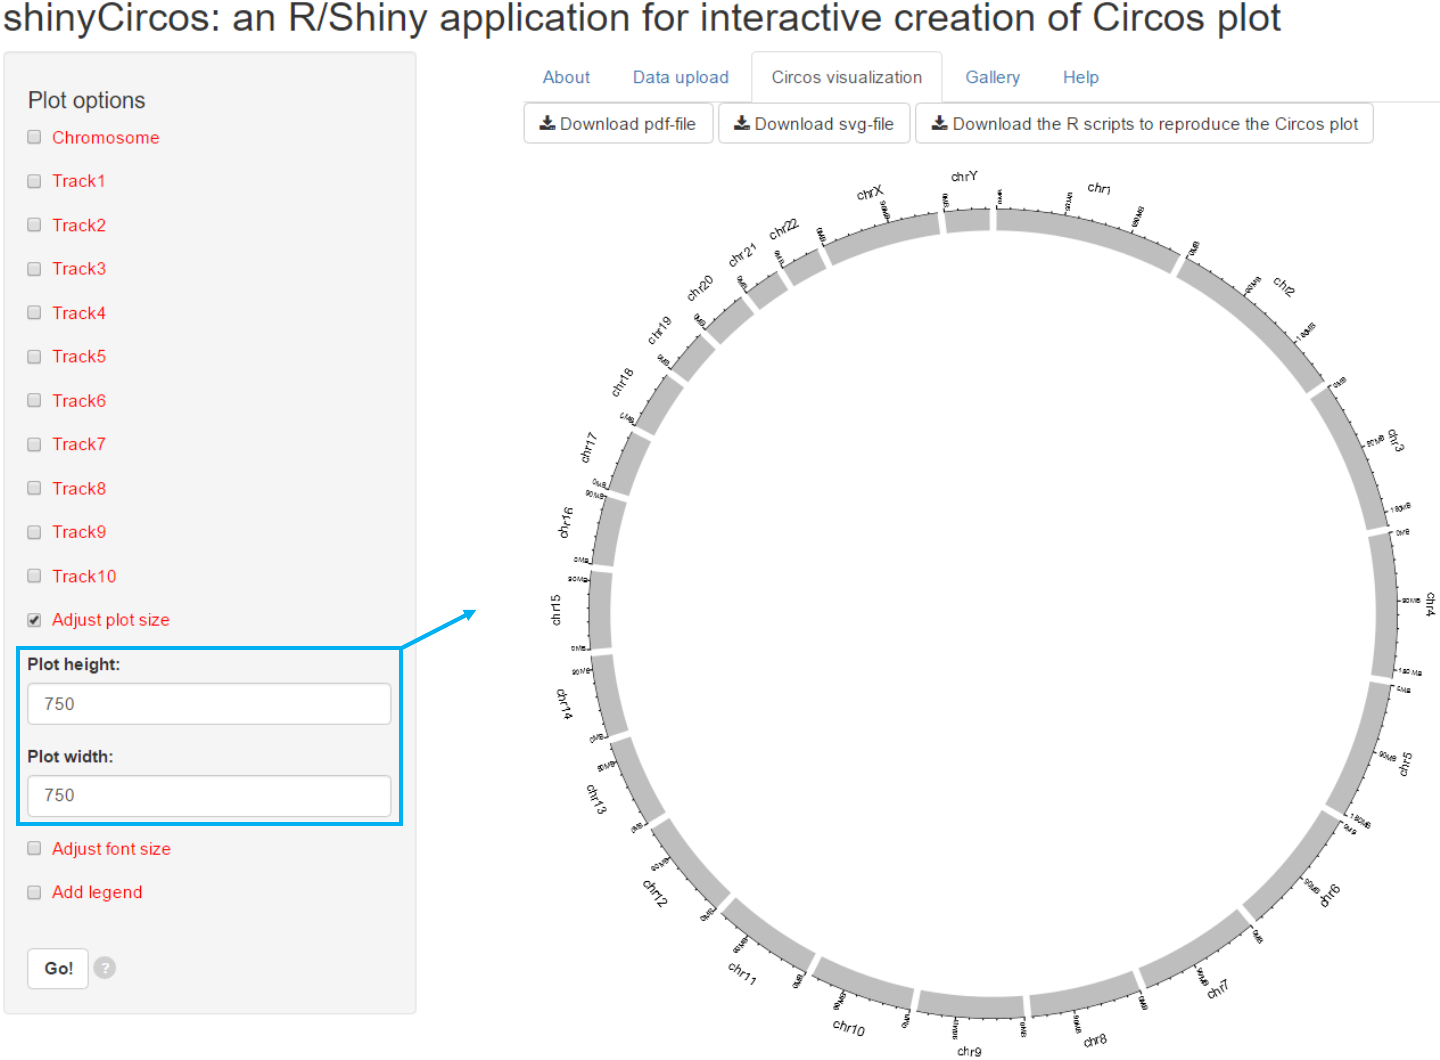
3.1 Figure size
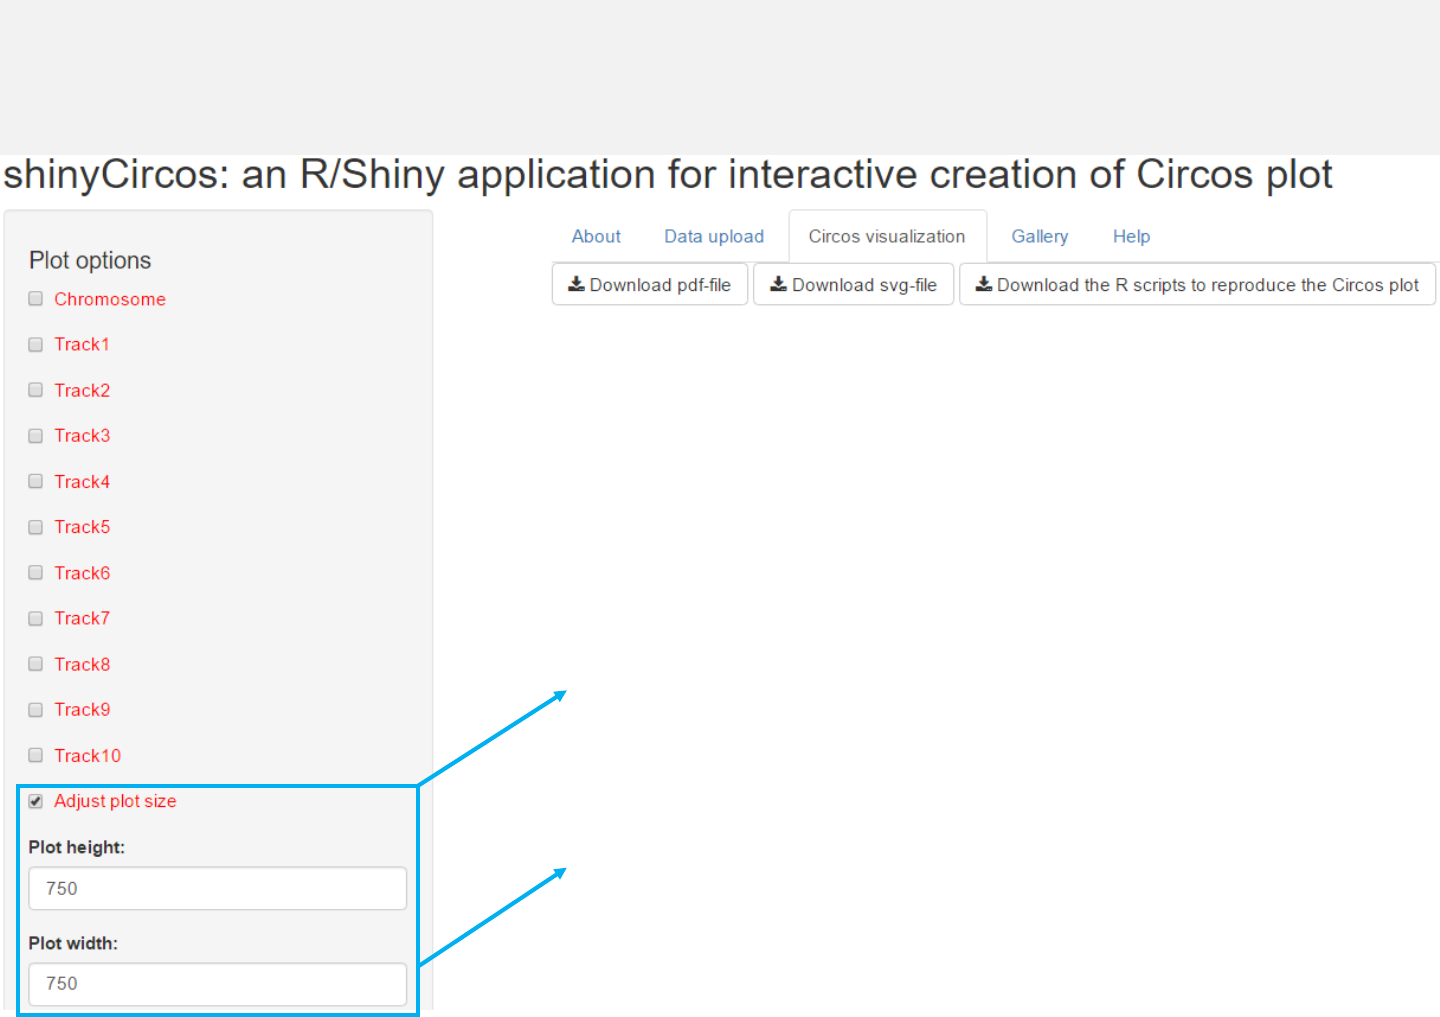
Options
Users can adjust the height and width
of the Circos plot.
The figure size in both the browser and the
download files would be affected.
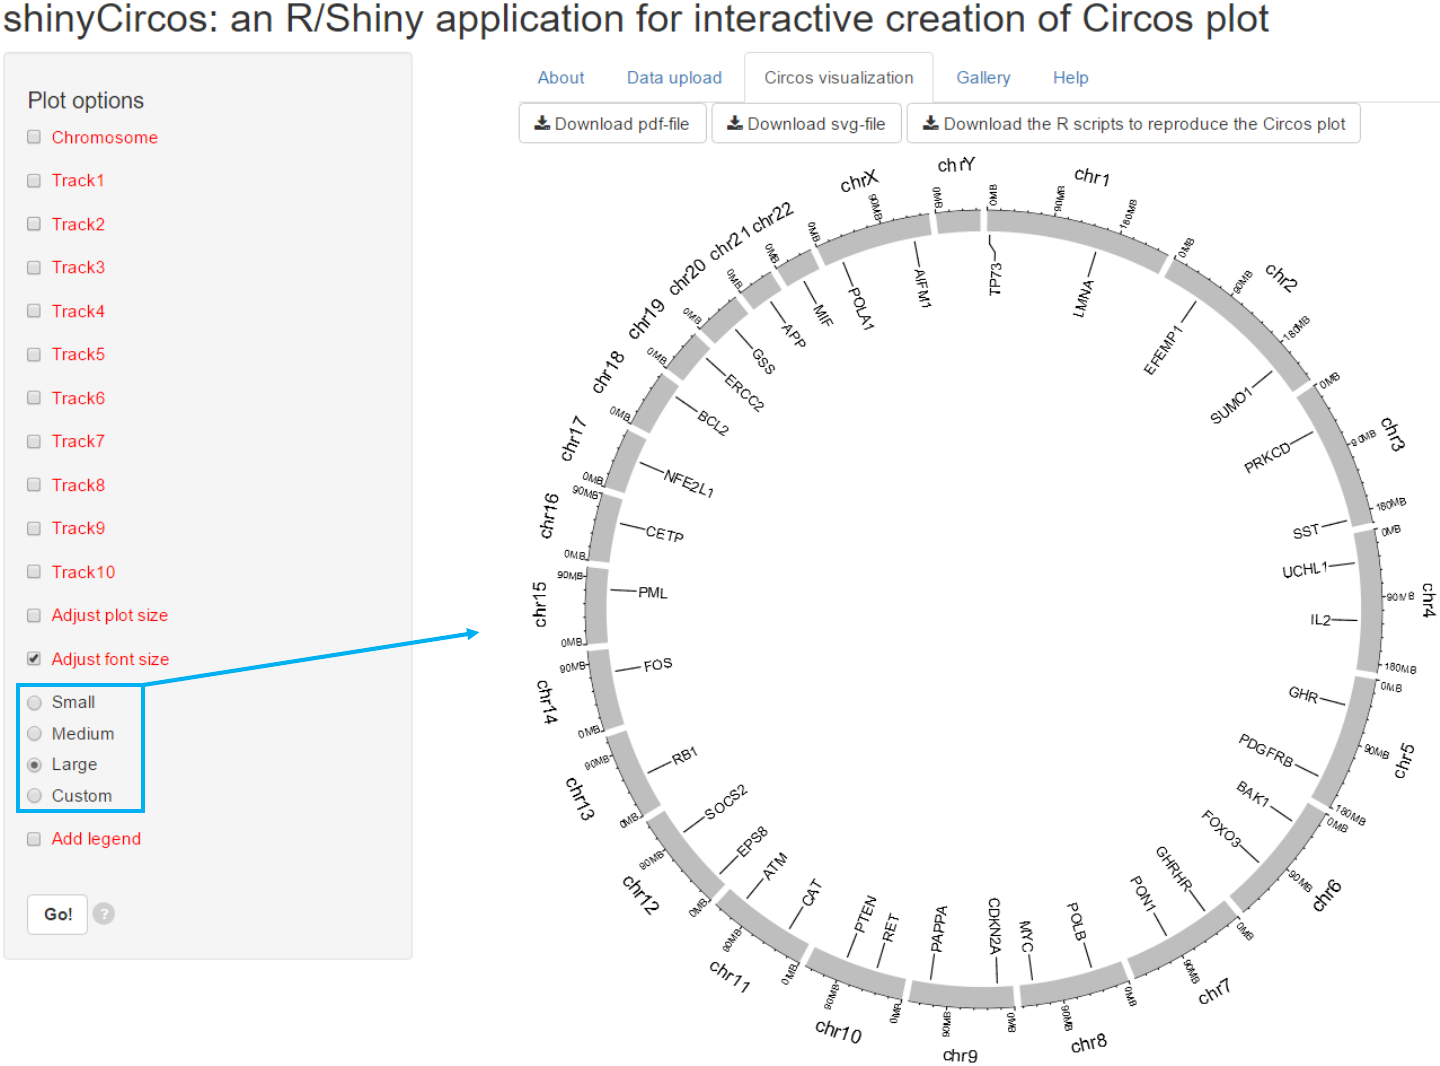
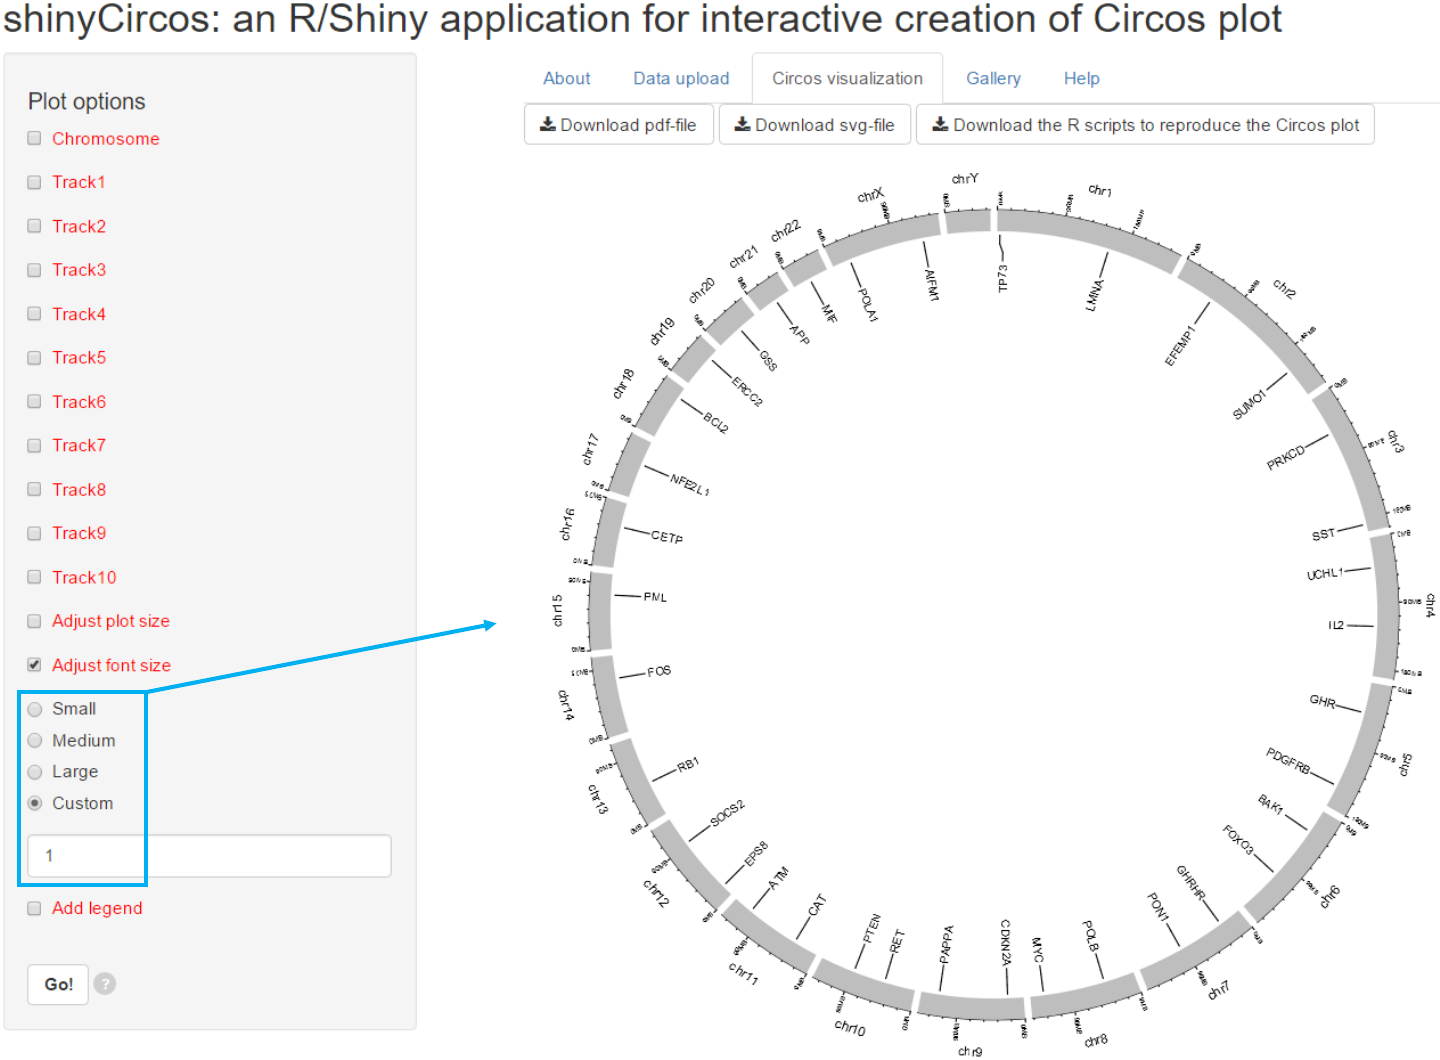
3.2 Font size
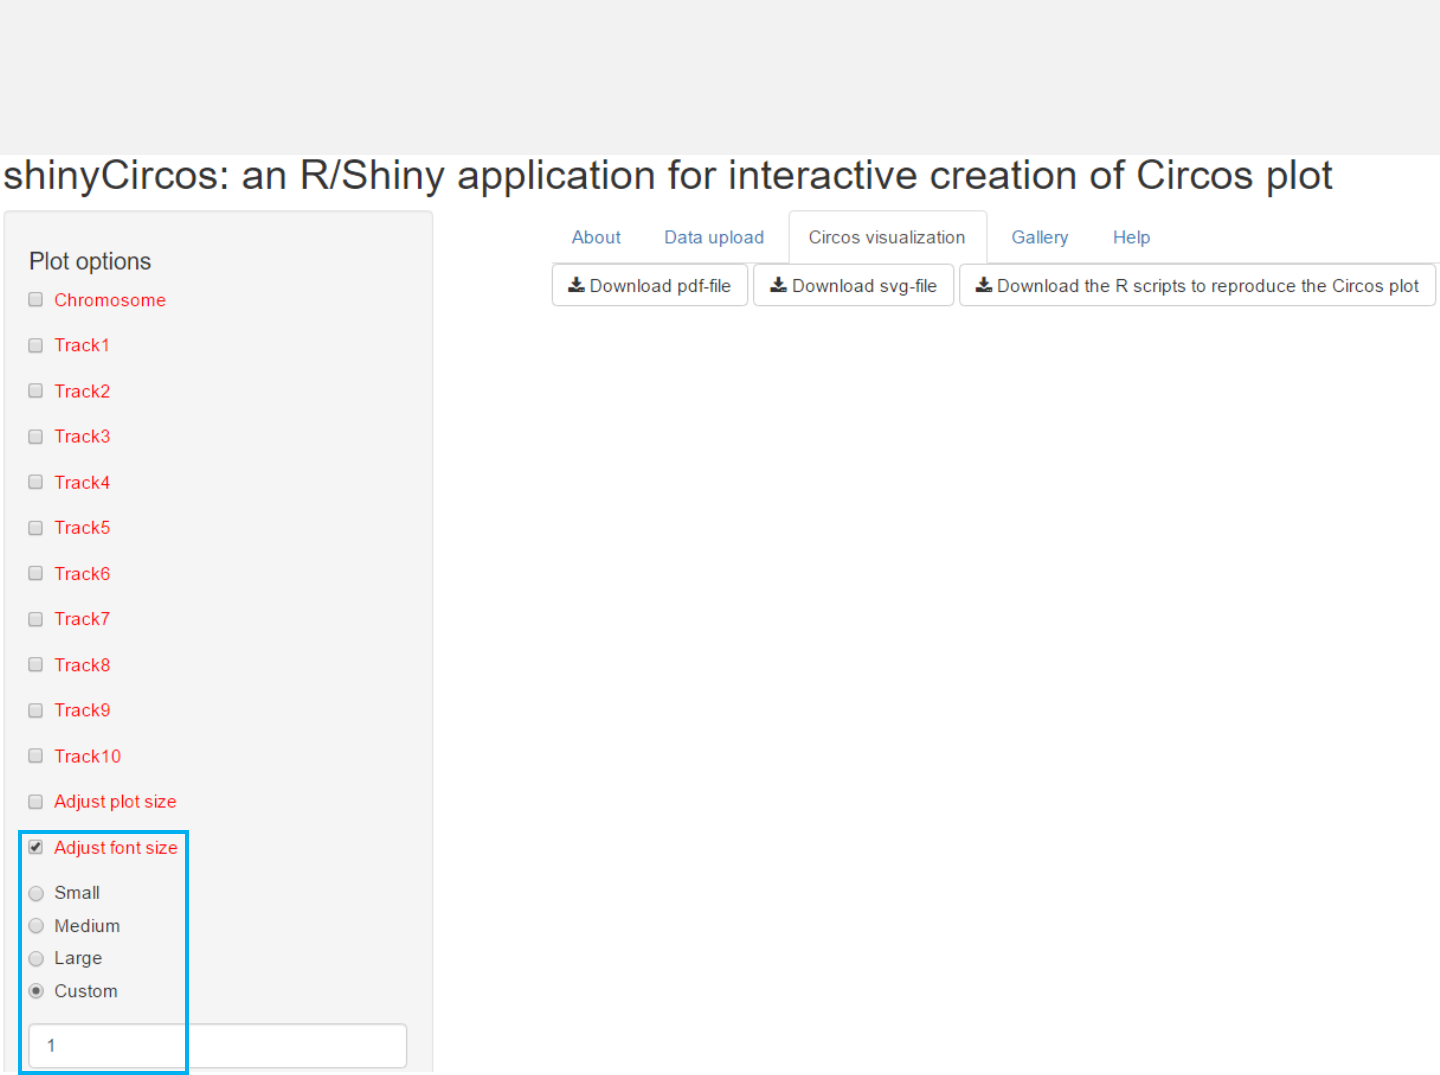
The font size can be ‘small’, ‘medium’, ‘large’ or specified by the user.
Options
3.3 Legend
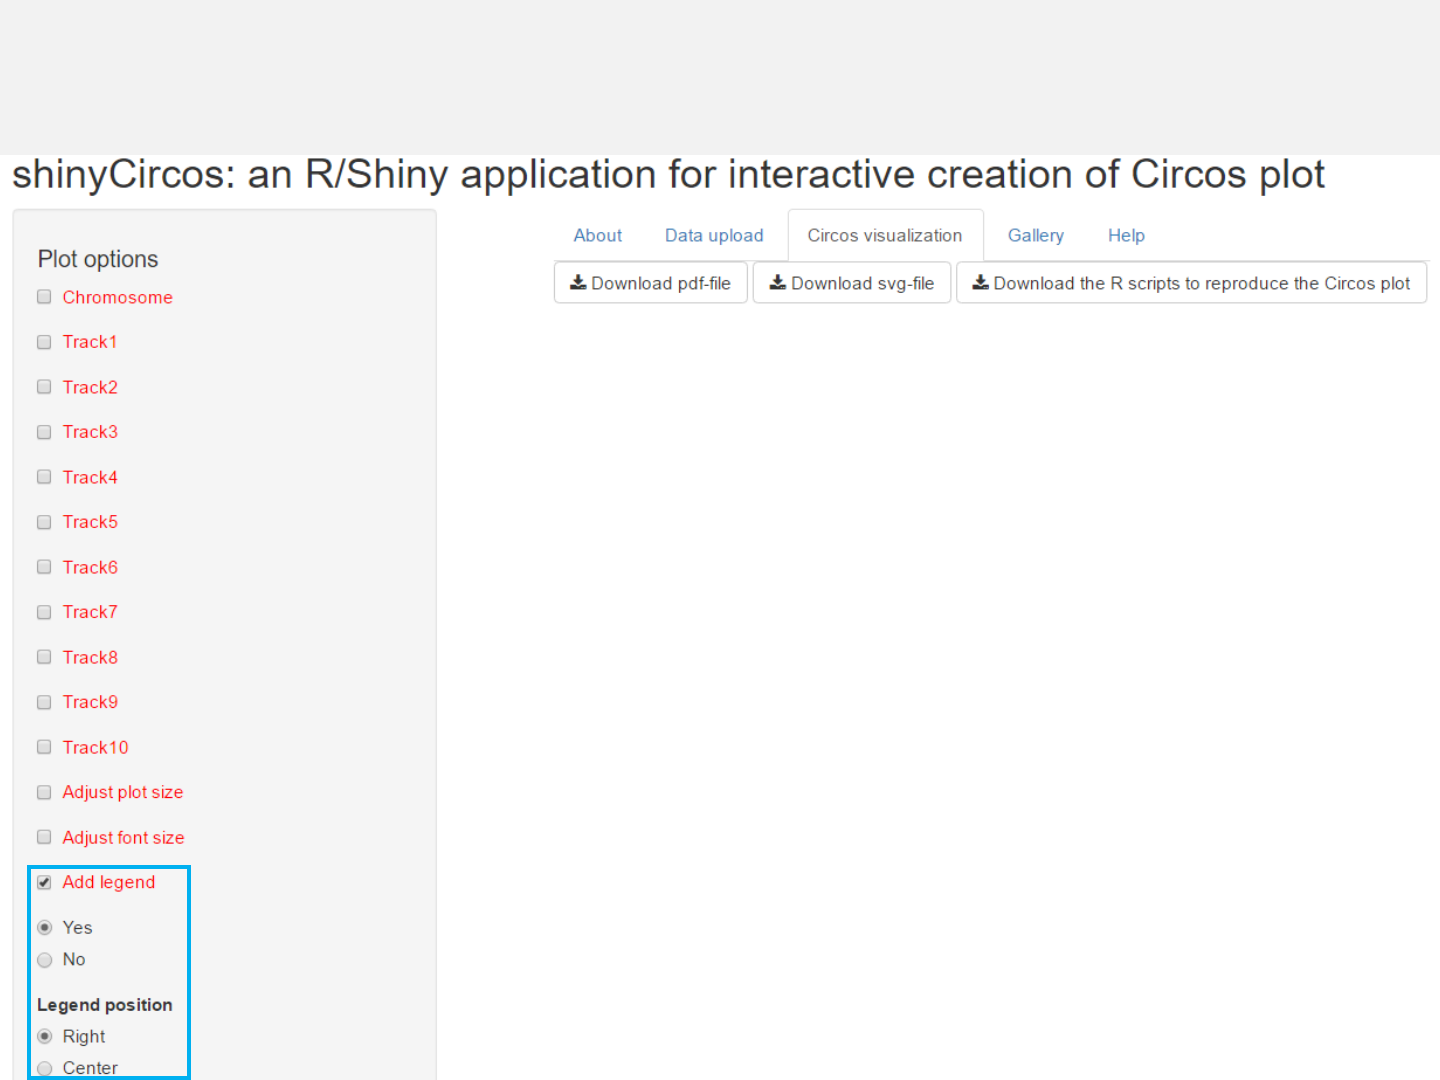
Options
Legend can be added at the right or the center of the Circos plot.
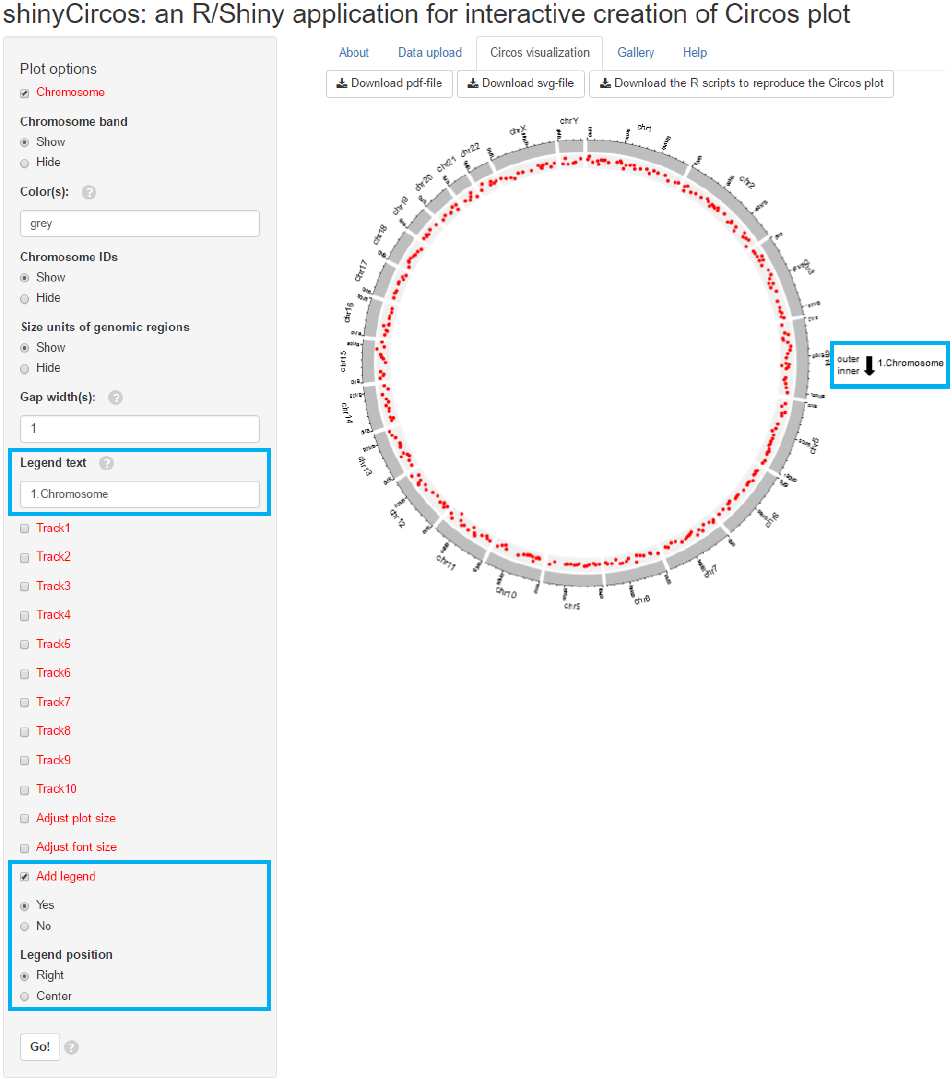
Input
legend text
Legend option
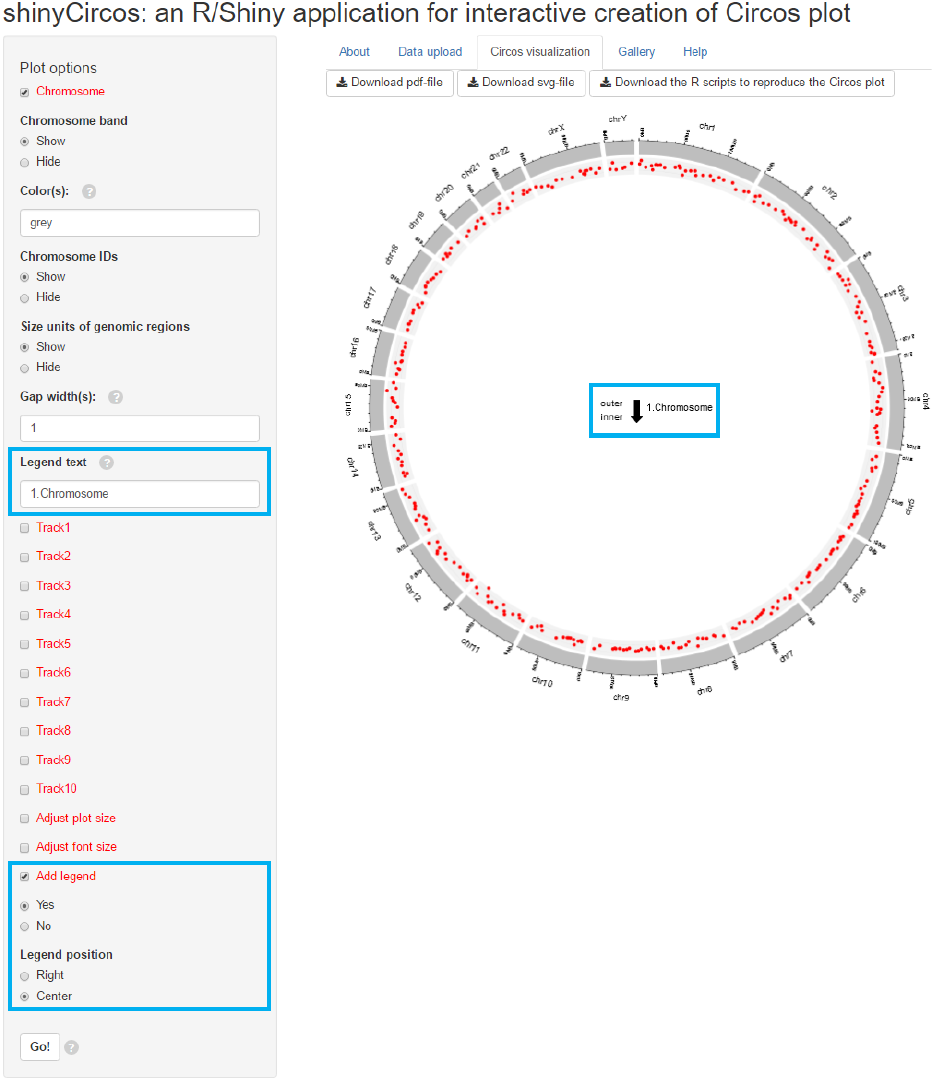
Input
legend text
Legend option
