Tutorial5 Instructions
User Manual: Pdf
Open the PDF directly: View PDF ![]() .
.
Page Count: 3
SPSS Tutorial 5: Power calculations
!
1. This tutorial will involve doing power calculations using G*Power (available for
free to download http://www.gpower.hhu.de/en.html).
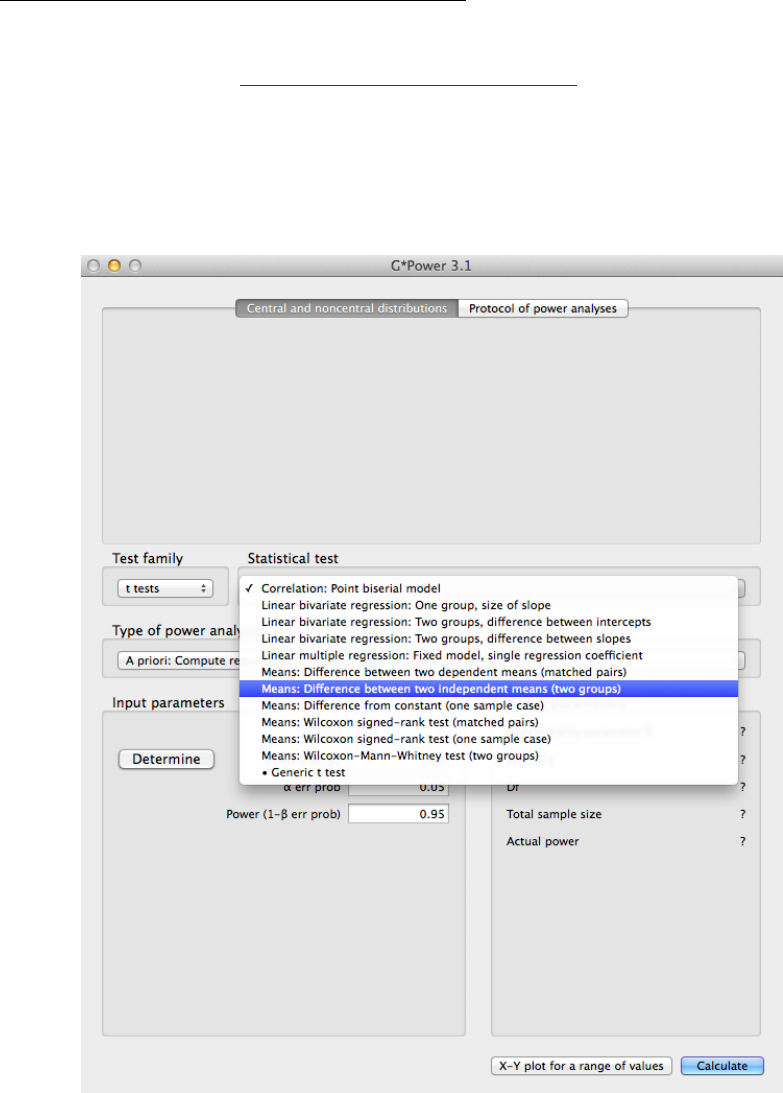
2. We’ll focus on doing a power/sample size calculation for the independent-
samples t-test. Open G*Power, and under “Test family”, make sure the “t tests”
option is chosen. Then under “Statistical test” make sure “Means: Difference
between two independent means (two groups)” is selected.
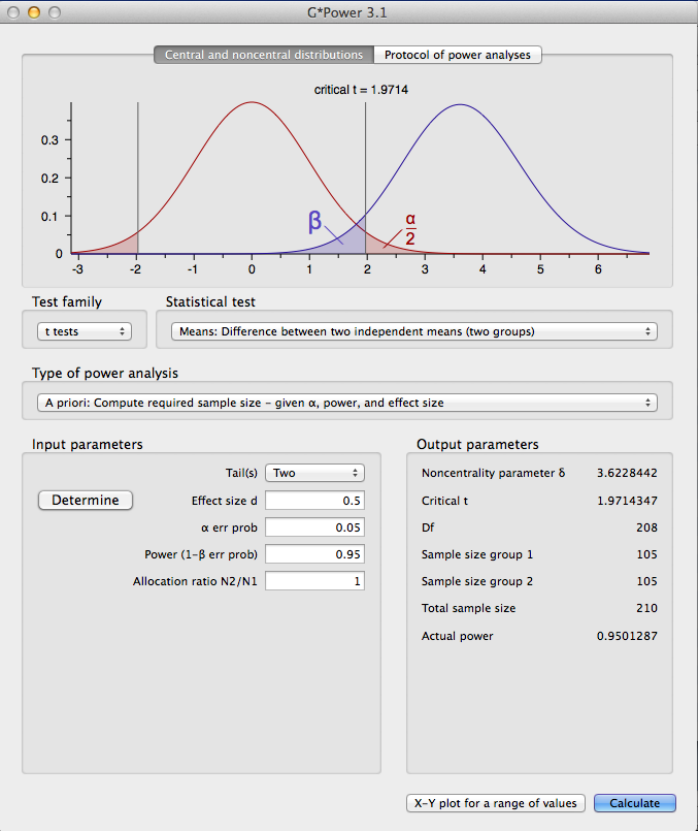
3. Next, adjust the input parameters. Choose a two-tailed test, and set the effect size
to 0.5, the alpha-error probability to 0.05, the power to 0.95, and the allocation
ratio to 1. Click on “Calculate” to get the required sample size in each group to
achieve the desired power. The distribution plot can be saved using File->Save
distributions plot.
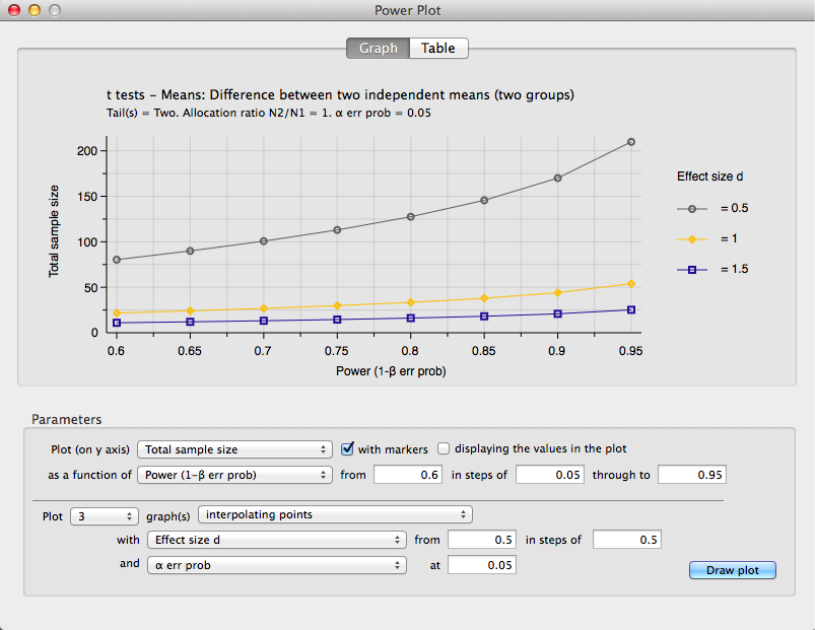
4. Finally, by clicking on “X-Y plot for a range of values”, a plot can be made
demonstrating the required sample size for different powers and different effect
sizes. Enter parameters as seen in the window below and click “Draw Plot” to
obtain the sample size vs. power plot for three different effect sizes. The plot can
be saved using File->Save X-Y Plot.
5. In the main window select “F tests” and “ANOVA: Fixed effects, omnibus, one-
way”. Play around with the parameters and see how they affect power in the one-
way ANOVA.