VRealize Operations Manager Customization And Administration Guide VRealize. 6.4 V Realize 64 Cust Admin
User Manual: Pdf vRealize Operations Manager - 6.4 - Customization and Administration Guide User Guide for VMware vRealize Software, Free Instruction Manual
Open the PDF directly: View PDF ![]() .
.
Page Count: 162 [warning: Documents this large are best viewed by clicking the View PDF Link!]
- vRealize Operations Manager Customization and Administration Guide
- Contents
- About Customization and Administration
- Configuring Users and Groups
- Customizing How vRealize Operations Manager Displays Your Data
- Using Dashboards
- Using Widgets
- Using Views
- Using Reports
- Customizing How vRealize Operations Manager Monitors Your Environment
- Defining Alerts in vRealize Operations Manager
- Object Relationship Hierarchies for Alert Definitions
- Alert Definition Best Practices
- Understanding Negative Symptoms for Alerts
- Create an Alert Definition for Department Objects
- Add Description and Base Object to Alert Definition
- Add a Virtual Machine CPU Usage Symptom to the Alert Definition
- Add a Host Memory Usage Symptom to the Alert Definition
- Add Recommendations to the Alert Definition
- Create a Custom Accounting Department Group
- Create a Policy for the Accounting Alert
- Configure Notifications for the Department Alert
- Create a Dashboard to Monitor Department Objects
- Defining Symptoms for Alerts
- Viewing Actions
- Defining Recommendations for Alert Definitions
- Creating and Managing Alert Notifications
- List of Outbound Plug-Ins
- Add Outbound Notification Plug-Ins
- Add a Standard Email Plug-In for Outbound Alerts
- Add a REST Plug-In for Outbound Alerts
- Add a Log File Plug-In for Outbound Alerts
- Add a Network Share Plug-In for vRealize Operations Manager Reports
- Add an SNMP Trap Plug-In for Outbound Alerts
- Add a Smarts Service Assurance Manager Notification Plug-In for Outbound Alerts
- Filtering Log File Outbound Messages With the TextFilter.xml File
- Configuring Notifications
- Defining Compliance Standards
- Operational Policies
- Managing and Administering Policies for vRealize Operations Manager
- Policy Decisions and Objectives
- Default Policy in vRealize Operations Manager
- Custom Policies
- Policies Provided with vRealize Operations Manager
- User Scenario: Create a Custom Operational Policy for a vSphere Production Environment
- User Scenario: Create an Operational Policy for Production vCenter Server Datastore Objects
- Create a Group Type for Your Datastore Objects
- Create an Object Group for Your Datastore Objects
- Create Your Policy and Select a Base Policy
- Override the Analysis Settings for the Datastore Objects
- Enable Disk Space Attributes for Datastore Objects
- Override Alert and Symptom Definitions for Datastore Objects
- Apply Your Datastore Policy to Your Datastore Objects Group
- Create a Dashboard for Disk Use of Your Datastore Objects
- Using the Monitoring Policy Workspace to Create and Modify Operational Policies
- Policy Workspace in vRealize Operations Manager
- Super Metrics in vRealize Operations Manager
- vSphere Predictive Distributed Resource Scheduler
- Configure vSphere Predictive DRS
- Customizing Icons
- Managing Objects in Your Environment
- Configuring Object Relationships
- Customizing How Endpoint Operations Management Monitors Operating Systems
- Modifying Global Settings
- Defining Alerts in vRealize Operations Manager
- Maintaining and Expanding vRealize Operations Manager
- Cluster and Node Maintenance
- Create a Support Bundle
- Passwords and Certificates
- How To Preserve Customized Content
- Backup and Restore
- OPS-CLI Command-Line Tool
- Index

vRealize Operations Manager
Customization and Administration
Guide
vRealize Operations Manager 6.4
vRealize Operations Manager Customization and Administration Guide
2 VMware, Inc.
You can find the most up-to-date technical documentation on the VMware Web site at:
hps://docs.vmware.com/
The VMware Web site also provides the latest product updates.
If you have comments about this documentation, submit your feedback to:
docfeedback@vmware.com
Copyright © 2017 VMware, Inc. All rights reserved. Copyright and trademark information.
VMware, Inc.
3401 Hillview Ave.
Palo Alto, CA 94304
www.vmware.com
Contents
About Customization and Administration 7
1Conguring Users and Groups in vRealize Operations Manager 9
Managing Users and Access Control in vRealize Operations Manager 10
Users of vRealize Operations Manager 10
Roles and Privileges in vRealize Operations Manager 13
User Scenario: Manage User Access Control 14
Congure a Single Sign-On Source in vRealize Operations Manager 17
Audit Users and the Environment in vRealize Operations Manager 20
Managing Custom Object Groups in VMware vRealize Operations Manager 21
User Scenario: Creating Custom Object Groups 22
Managing Application Groups 24
User Scenario: Adding an Application 24
2Customizing How vRealize Operations Manager Displays Your Data 27
Using Dashboards 27
User Scenario: Create and Congure Dashboards and Widgets 28
Dashboards 32
Predened Dashboards 33
Using Widgets 38
Widget Denitions List 39
Widget Interactions 41
Add a Resource Interaction XML File 41
Using Views 43
User Scenario: Create, Run, Export, and Import a vRealize Operations Manager View for
Tracking Virtual Machines 43
Views and Reports Ownership 45
Editing, Cloning, and Deleting a View 46
Using Reports 46
User Scenario: Handling Reports to Monitor Virtual Machines 46
3Customizing How vRealize Operations Manager Monitors Your Environment 51
Dening Alerts in vRealize Operations Manager 52
Object Relationship Hierarchies for Alert Denitions 53
Alert Denition Best Practices 53
Understanding Negative Symptoms for vRealize Operations Manager Alerts 54
Create an Alert Denition for Department Objects 55
Dening Symptoms for Alerts 65
Viewing Actions Available in vRealize Operations Manager 67
Dening Recommendations for Alert Denitions 68
Creating and Managing vRealize Operations Manager Alert Notications 68
VMware, Inc. 3
Dening Compliance Standards 79
vRealize Operations Manager Compliance for vSphere 6.0 Objects 80
User Scenario: Ensure Compliance of Your vSphere 6.0 Objects 81
User Scenario: Dene a Compliance Standard for Custom Standards 85
Operational Policies 87
Managing and Administering Policies for vRealize Operations Manager 88
Policy Decisions and Objectives 89
Default Policy in vRealize Operations Manager 90
Custom Policies 90
Policies Provided with vRealize Operations Manager 91
User Scenario: Create a Custom Operational Policy for a vSphere Production Environment 93
User Scenario: Create an Operational Policy for Production vCenter Server Datastore Objects 100
Using the Monitoring Policy Workspace to Create and Modify Operational Policies 108
Policy Workspace in vRealize Operations Manager 109
Super Metrics in vRealize Operations Manager 110
Super Metric Functions and Operators 110
Enhancing Your Super Metrics 113
User Scenario: Formulate and Apply Your Super Metric 114
Building a Super Metric Formula 117
Exporting a Super Metric 118
Importing a Super Metric 118
vSphere Predictive Distributed Resource Scheduler 119
Congure vSphere Predictive DRS 119
Customizing Icons 120
Customize an Object Type Icon 120
Customize an Adapter Type Icon 120
Managing Objects in Your Environment 121
Adding an Object to Your Environment 121
Creating and Assigning Tags 122
Conguring Object Relationships 125
Adding an Object Relationship 125
Customizing How Endpoint Operations Management Monitors Operating Systems 126
Conguring Remote Monitoring 126
Working with Agent Plug-ins 132
Conguring Agent Logging 133
Modifying Global Seings 136
List of Global Seings 137
4Maintaining and Expanding vRealize Operations Manager 139
vRealize Operations Manager Cluster and Node Maintenance 139
Create a vRealize Operations Manager Support Bundle 141
vRealize Operations Manager Passwords and Certicates 141
Change the vRealize Operations Manager Administrator Password 141
Reset the vRealize Operations Manager Administrator Password on vApp or Linux Clusters 142
Reset the vRealize Operations Manager Administrator Password on Windows Clusters 142
Generate a vRealize Operations Manager Passphrase 142
How To Preserve Customized Content 143
Backup and Restore 144
Backing Up and Restoring with vSphere Data Protection 144
vRealize Operations Manager Customization and Administration Guide
4 VMware, Inc.
Checking the Restore of vRealize Operations Manager Systems 147
Change the IP Address of Nodes After Restoring a Cluster on a Remote Host 148
Manual Backup Procedure Appears to Stall 149
5OPS-CLI Command-Line Tool 151
dashboard Command Operations 152
template Command Operations 152
supermetric Command Operations 153
aribute Command Operations 154
reskind Command Operations for Object Types 154
report Command Operations 154
view Command Operations 155
le Command Operations 155
Index 157
Contents
VMware, Inc. 5
vRealize Operations Manager Customization and Administration Guide
6 VMware, Inc.

About Customization and Administration
The VMware vRealize Operations Manager Customization and Administration Guide describes how to congure
and monitor your environment. It shows you how to connect vRealize Operations Manager to external data
sources and analyze the data collected from them, ensure that users and their supporting infrastructure are
in place, congure resources to determine the behavior of your objects, and format the content that appears
in vRealize Operations Manager.
To help you maintain and expand your vRealize Operations Manager installation, this information describes
how to manage nodes and clusters, congure NTP, view log les, create support bundles, and add a
maintenance schedule. It provides information about license keys and groups, and shows you how to
generate a passphrase, review the certicates used for authentication, run the describe process, and perform
advanced maintenance functions.
Intended Audience
This information is intended for vRealize Operations Manager administrators, virtual infrastructure
administrators, and operations engineers who install, congure, monitor, manage, and maintain the objects
in your environment.
VMware Technical Publications Glossary
VMware Technical Publications provides a glossary of terms that might be unfamiliar to you. For denitions
of terms as they are used in VMware technical documentation, go to
hp://www.vmware.com/support/pubs.
VMware, Inc. 7
vRealize Operations Manager Customization and Administration Guide
8 VMware, Inc.

Configuring Users and Groups in
vRealize Operations Manager 1
As a system administrator, you must ensure that users and their supporting infrastructure are in place. You
establish and maintain user access to your instance of vRealize Operations Manager, control user
preferences, and manage seings for the email server.
User Access Control
To ensure security of the objects in your vRealize Operations Manager instance, and the actions that a user
can perform to the objects and to the system, you manage all aspects of user access control .
vRealize Operations Manager assigns access permissions to users and user groups. Access privileges are
organized into roles. You control users and user groups access to objects in the system, by specifying the
privileges they can perform on selected objects. When you assign a role to a user, you are determining not
only what actions the user can perform in the system, but also the objects upon which he can perform those
actions. You can assign users a role that gives them complete access to all objects in the system.
Alternatively, you can assign users a role that gives them read-only privileges on virtual machines. Since
users and user groups can hold more than one role, the same user may have complete access to all the
virtual machines on one cluster, but read-only access to the virtual machines on another.
As a system administrator, you must prevent unauthorized users from accessing certain les in your
Windows-based environment. The %ALIVE_BASE%/user/conf directory contains password and other
sensitive information related to accessing your vRealize Operations Manager environment. Access this
directory, and assign access permissions accordingly to secure your environment.
User Preferences
To determine the display options for vRealize Operations Manager, such as colors for the display and health
chart, the number of metrics and groups to display, and whether to synchronize system time with the host
machine, you congure the user preferences on the top toolbar.
This chapter includes the following topics:
n“Managing Users and Access Control in vRealize Operations Manager,” on page 10
n“Managing Custom Object Groups in VMware vRealize Operations Manager,” on page 21
n“Managing Application Groups,” on page 24
VMware, Inc. 9
Managing Users and Access Control in vRealize Operations Manager
To ensure security of the objects in your vRealize Operations Manager instance, as a system administrator
you can manage all aspects of user access control. You create user accounts, assign each user to be a member
of one or more user groups, and assign roles to each user or user group to set their privileges.
Users must have privileges to access specic features in the vRealize Operations Manager user interface.
Access control is dened by assigning privileges to both users and objects. You can assign one or more roles
to users, and enable them to perform a range of dierent actions on the same types of objects. For example,
you can assign a user with the privileges to delete a virtual machine, and assign the same user with read-
only privileges for another virtual machine.
User Access Control
You can authenticate users in vRealize Operations Manager in several ways.
nCreate local user accounts in vRealize Operations Manager.
nUse VMware vCenter Server® users. After the vCenter Server is registered with
vRealize Operations Manager, congure the vCenter Server user options in the
vRealize Operations Manager global seings to enable a vCenter Server user to log in to
vRealize Operations Manager. When logged into vRealize Operations Manager, vCenter Server users
access objects according to their vCenter Server-assigned permissions.
nAdd an authentication source to authenticate imported users and user group information that resides
on another machine.
nUse LDAP to import users or user groups from an LDAP server. LDAP users can use their LDAP
credentials to log in to vRealize Operations Manager. For example, use Active Directory on a
Windows machine to log into vRealize Operations Manager through LDAP, by adding the Active
Directory server as an LDAP server.
nCreate a single sign-on source and import users and user groups from a single sign-on server.
Single sign-on users can use their single sign-on credentials to log in to
vRealize Operations Manager and vCenter Server. You can also use Active Directory through
single sign-on by conguring the Active Directory through single sign-on and adding the single
sign-on source to vRealize Operations Manager.
Users of vRealize Operations Manager
Each user has an account to authenticate them when they log in to vRealize Operations Manager.
The accounts of local users and LDAP users are visible in the vRealize Operations Manager user interface
when they are set up. The accounts of vCenter Server and single sign-on users only appear in the user
interface after a user logs in for the rst time. Each user can be assigned one or more roles, and can be an
authenticated member of one or more user groups.
Local Users in vRealize Operations Manager
When you create user accounts in a local vRealize Operations Manager instance,
vRealize Operations Manager stores the credentials for those accounts in its global database, and
authenticates the account user locally.
Each user account must have a unique identity, and can include any associated user preferences.
If you are logging in to vRealize Operations Manager as a local user, and on occasion receive an invalid
password message, try the following workaround. In the Login page, change the Authentication Source to
All vCenter Servers, change it back to Local Users, and log in again.
vRealize Operations Manager Customization and Administration Guide
10 VMware, Inc.
vCenter Server Users in vRealize Operations Manager
vRealize Operations Manager supports vCenter Server users. To log in to vRealize Operations Manager,
vCenter Server users must be valid users in vCenter Server.
Roles and Associations
A vCenter Server user must have either the vCenter Server Admin role or one of the
vRealize Operations Manager privileges, such as PowerUser which assigned at the root level in
vCenter Server, to log in to vRealize Operations Manager. vRealize Operations Manager uses only the
vCenter privileges, meaning the vRealize Operations Manager roles, at the root level, and applies them to all
the objects to which the user has access. After logging in, vCenter Server users can view all the objects in
vRealize Operations Manager that they can already view in vCenter Server.
Logging in to vCenter Server Instances and Accessing Objects
vCenter Server users can access either a single vCenter Server instance or multiple vCenter Server instances,
depending on the authentication source they select when they log in to vRealize Operations Manager.
nIf users select a single vCenter Server instance as the authentication source, they have permission to
access the objects in that vCenter Server instance. After the user has logged in, an account is created in
vRealize Operations Manager with the specic vCenter Server instance serving as the authentication
source.
nIf users select All vCenter Servers as the authentication source, and they have identical credentials for
each vCenter Server in the environment, they see all the objects in all the vCenter Server instances. Only
users that have been authenticated by all the vCenter Servers in the environment can log in. After a user
has logged in, an account is created in vRealize Operations Manager with all vCenter Server instances
serving as the authentication source.
vRealize Operations Manager does not support linked vCenter Server instances. Instead, you must
congure the vCenter Server adapter for each vCenter Server instance, and register each vCenter Server
instance to vRealize Operations Manager.
Only objects from a specic vCenter Server instance appear in vRealize Operations Manager. If a
vCenter Server instance has other linked vCenter Server instances, the data does not appear.
vCenter Server Roles and Privileges
You cannot view or edit vCenter Server roles or privileges in vRealize Operations Manager.
vRealize Operations Manager sends roles as privileges to vCenter Server as part of the vCenter Server
Global privilege group. A vCenter Server administrator must assign vRealize Operations Manager roles to
users in vCenter Server.
vRealize Operations Manager privileges in vCenter Server have the role appended to the name. For
example, vRealize Operations Manager ContentAdmin Role, or vRealize Operations Manager PowerUser
Role.
Read-Only Principal
A vCenter Server user is a read-only principal in vRealize Operations Manager, which means that you
cannot change the role, group, or objects associated with the role in vRealize Operations Manager. Instead,
you must change them in the vCenter Server instance. The role applied to the root folder applies to all the
objects in vCenter Server to which a user has privileges. vRealize Operations Manager does not apply
individual roles on objects. For example, if a user has the PowerUser role to access the vCenter Server root
folder, but has read-only access to a virtual machine, vRealize Operations Manager applies the PowerUser
role to the user to access the virtual machine.
Chapter 1 Configuring Users and Groups in vRealize Operations Manager
VMware, Inc. 11
Refreshing Permissions
When you change permissions for a vCenter Server user in vCenter Server, the user must log out and log
back in to vRealize Operations Manager to refresh the permissions and view the updated results in
vRealize Operations Manager. Alternatively, the user can wait for vRealize Operations Manager to refresh.
The permissions refresh at xed intervals, as dened in the $ALIVE_BASE/user/conf/auth.properties le.
The default refreshing interval is half an hour. If necessary, you can change this interval for all nodes in the
cluster.
Single Sign-On and vCenter Users
When vCenter Server users log into vRealize Operations Manager by way of single sign-on, they are
registered on the vRealize Operations Manager User Accounts page. If you delete the account of a
vCenter Server user that has logged into vRealize Operations Manager by way of single sign-on, or remove
the user from a single sign-on group, the user account entry still appears on the User Account page and you
must delete it manually.
Generating Reports
vCenter Server users cannot create or schedule reports in vRealize Operations Manager.
Backward Compatibility for vCenter Server Users in vRealize Operations Manager
vRealize Operations Manager provides backward compatibility for users of the earlier version of
vRealize Operations Manager, so that users of vCenter Server who have privileges in the earlier version in
vCenter Server can log in to vRealize Operations Manager.
When you register vRealize Operations Manager in vCenter Server, certain roles become available in
vCenter Server.
nThe Administrator account in the previous version of vRealize Operations Manager maps to the
PowerUser role.
nThe Operator account in the previous version of vRealize Operations Manager maps to the ReadOnly
role.
During registration, all roles in vRealize Operations Manager, except for vRealize Operations Manager
Administrator, Maintenance, and Migration, become available dynamically in vCenter Server.
Administrators in vCenter Server have all of the roles in vRealize Operations Manager that map during
registration, but these administrator accounts only receive a specic role on the root folder in vCenter Server
if it is specially assigned.
Registration of vRealize Operations Manager with vCenter Server is optional. If users choose not to register
vRealize Operations Manager with vCenter Server, a vCenter Server administrator can still use their user
name and password to log in to vRealize Operations Manager, but these users cannot use the vCenter Server
session ID to log in. In this case, typical vCenter Server users must have one or more
vRealize Operations Manager roles to log in to vRealize Operations Manager.
When multiple instances of vCenter Server are added to vRealize Operations Manager, user credentials
become valid for all of the vCenter Server instances. When a user logs in to vRealize Operations Manager, if
the user selects all vCenter Server options during login, vRealize Operations Manager requires that the
user's credentials are valid for all of the vCenter Server instances. If a user account is only valid for a single
vCenter Server instance, that user can select the vCenter Server instance from the login drop-down menu to
log in to vRealize Operations Manager.
vCenter Server users who log in to vRealize Operations Manager must have one or more of the following
roles in vCenter Server:
nvRealize Operations Content Admin Role
nvRealize Operations General User Role 1
vRealize Operations Manager Customization and Administration Guide
12 VMware, Inc.
nvRealize Operations General User Role 2
nvRealize Operations General User Role 3
nvRealize Operations General User Role 4
nvRealize Operations Power User Role
nvRealize Operations Power User without Remediation Actions Role
nvRealize Operations Read Only Role
For more information about vCenter Server users, groups, and roles, see the vCenter Server documentation.
External User Sources in vRealize Operations Manager
You can obtain user accounts from external sources so that you can use them in your
vRealize Operations Manager instance.
There are two types of external user identity sources:
nLightweight Directory Access Protocol (LDAP): Use the LDAP source if you want to use the Active
Directory or LDAP servers as authentication sources. The LDAP source does not support multi-
domains even when there is a two-way trust between Domain A and Domain B.
nSingle Sign-On (SSO): Use a single sign-on source to perform single sign-on with any application that
supports vCenter single sign-on, including vRealize Operations Manager. For example, you can install a
standalone vCenter Platform Services Controller (PSC) and use it to communicate with an Active
Directory server. Use a PSC if the Active Directory has a setup that is too complex for the simple LDAP
source in vRealize Operations Manager, or if the LDAP source is experiencing slow performance. If
your PSC is congured to use Active Directory with integrated Windows authentication mode, SSO
users can log in using Windows authentication.
Roles and Privileges in vRealize Operations Manager
vRealize Operations Manager provides several predened roles to assign privileges to users. You can also
create your own roles.
You must have privileges to access specic features in the vRealize Operations Manager user interface. The
roles associated with your user account determine the features you can access and the actions you can
perform.
Each predened role includes a set of privileges for users to perform create, read, update, or delete actions
on components such as dashboards, reports, administration, capacity, policies, problems, symptoms, alerts,
user account management, and adapters.
Administrator Includes privileges to all features, objects, and actions in
vRealize Operations Manager.
PowerUser Users have privileges to perform the actions of the Administrator role except
for privileges to user management and cluster management.
vRealize Operations Manager maps vCenter Server users to this role.
PowerUserMinusRemed
iation
Users have privileges to perform the actions of the Administrator role except
for privileges to user management, cluster management, and remediation
actions.
ContentAdmin Users can manage all content, including views, reports, dashboards, and
custom groups in vRealize Operations Manager.
AgentManager Users can deploy and congure Endpoint Operations Management agents.
Chapter 1 Configuring Users and Groups in vRealize Operations Manager
VMware, Inc. 13
GeneralUser-1 through
GeneralUser-4
These predened template roles are initially dened as ReadOnly roles.
vCenter Server administrators can congure these roles to create
combinations of roles to give users multiple types of privileges. Roles are
synchronized to vCenter Server once during registration.
ReadOnly Users have read-only access and can perform read operations, but cannot
perform write actions such as create, update, or delete.
User Scenario: Manage User Access Control
As a system administrator or virtual infrastructure administrator, you manage user access control in
vRealize Operations Manager so that you can ensure the security of your objects. Your company just hired a
new person, and you must create a user account and assign a role to the account so that the new user has
permission to access specic content and objects in vRealize Operations Manager.
In this scenario you will learn how to create user accounts and roles, and assign roles to the user accounts to
specify access privileges to views and objects. You will then demonstrate the intended behavior of the
permissions on these accounts.
You will create a new user account, named Tom User, and a new role that grants administrative access to
objects in the vRealize Operations Clusters. You will apply the new role to the user account.
Finally, you will import a user account from an external LDAP user database that resides on another
machine to vRealize Operations Manager, and assign a role to the imported user account to congure the
user's privileges.
Prerequisites
Verify that the following conditions are met:
nvRealize Operations Manager is installed and operating properly, and contains objects such as clusters,
hosts, and virtual machines.
nOne or more user groups are dened.
Procedure
1Create a New Role on page 14
You use roles to manage access control for user accounts in vRealize Operations Manager.
2Create a User Account on page 15
As an administrator you assign a unique user account to each user so that they can use
vRealize Operations Manager. While you set up the user account, you assign the privileges that
determine what activities the user can perform in the environment, and upon what objects.
3Import a User Account and Assign Permissions on page 16
You can import user accounts from external sources, such as an LDAP database on another machine,
or a single sign-on server, so that you can give permission to those users to access certain features and
objects in vRealize Operations Manager.
What to do next
Create a new role.
Create a New Role
You use roles to manage access control for user accounts in vRealize Operations Manager.
In this procedure, you will add a new role and assign administrative permissions to the role.
vRealize Operations Manager Customization and Administration Guide
14 VMware, Inc.

Prerequisites
Verify that you understand the context of this scenario. See “User Scenario: Manage User Access Control,”
on page 14.
Procedure
1 In vRealize Operations Manager, select Administration in the left pane and click Access Control.
2 Click the Roles tab.
3 Click the Add icon on the toolbar to create a new role.
The Create Role dialog box appears.
4 For the role name, type admin_cluster, then type a description and click OK.
The admin_cluster role appears in the list of roles.
5 Click the admin_cluster role.
6 In the Details grid below, on the Permissions pane, click the Edit icon.
The Assign Permissions to Role dialog box appears.
7 Select the Administrative Access - all permissions check box.
8 Click Update.
This action gives this role administrative access to all the features in the environment.
What to do next
Create a user account, and assign this role to the account.
Create a User Account
As an administrator you assign a unique user account to each user so that they can use
vRealize Operations Manager. While you set up the user account, you assign the privileges that determine
what activities the user can perform in the environment, and upon what objects.
In this procedure, you will create a user account, assign the admin_cluster role to the account, and associate
the objects that the user can access while assigned this role. You will assign access to objects in the vRealize
Operations Cluster. Then, you will test the user account to conrm that the user can access only the specied
objects.
Prerequisites
Create a new role. See “Create a New Role,” on page 14.
Procedure
1 In vRealize Operations Manager, select Administration in the left pane and click Access Control.
2 Click the User Accounts tab.
3 Click the Add icon to create a new user account, and provide the information for this account.
Option Description
User Name Type the user name to use to log in to vRealize Operations Manager.
Password Type a password for the user.
Confirm Password Type the password again to conrm it.
First Name Type the user's rst name. For this scenario, type Tom.
Last Name Type the user's last name. For this scenario, type User.
Email Address (Optional). Type the user's email address.
Chapter 1 Configuring Users and Groups in vRealize Operations Manager
VMware, Inc. 15

Option Description
Description (Optional). Type a description for this user.
Disable this user Do not select this check box, because you want the user to be active for this
scenario.
Require password change at next
login
Do not select this check box, because you do not need to change the user's
password for this scenario.
4 Click Next.
The list of user groups appears.
5 Select a user group to add the user account as a member of the group.
6 Click the Objects tab.
7 Select the admin_cluster role from the drop-down menu.
8 Select the Assign this role to the user check box.
9 In the Object Hierarchies list, select the vRealize Operations Cluster check box.
10 Click Finish.
You created a new user account for a user who can access all the vRealize Operations Cluster objects.
The new user now appears in the list of user accounts.
11 Log out of vRealize Operations Manager.
12 Log in to vRealize Operations Manager as Tom User, and verify that this user account can access all the
objects in the vRealize Operations Cluster hierarchy, but not other objects in the environment.
13 Log out of vRealize Operations Manager.
You used a specic role to assign permission to access all objects in the vRealize Operations Cluster to a user
account named Tom User.
What to do next
Import a user account from an external LDAP user database that resides on another machine, and assign
permissions to the user account.
Import a User Account and Assign Permissions
You can import user accounts from external sources, such as an LDAP database on another machine, or a
single sign-on server, so that you can give permission to those users to access certain features and objects in
vRealize Operations Manager.
Prerequisites
nCongure an authorization source. See the vRealize Operations Manager Information Center.
Procedure
1 Log out of vRealize Operations Manager, then log in as a system administrator.
2 In vRealize Operations Manager, select Administration, and click Access Control.
3 On the toolbar, click the Import Users icon.
vRealize Operations Manager Customization and Administration Guide
16 VMware, Inc.

4 Specify the options to import user accounts from an authorization source.
a On the Import Users page, from the Import From drop-down menu, select an authentication
source.
b In the Domain Name drop-down menu, type the domain name from which you want to import
users, and click Search.
c Select the users you want to import, and click Next.
d On the Groups tab, select the user group to which you want to add this user account.
e Click the Objects tab, select the admin_cluster role, and select the Assign this role to the user
check box.
f In the Object Hierarchies list, select the vRealize Operations Cluster check box, and click Finish.
5 Log out of vRealize Operations Manager.
6 Log in to vRealize Operations Manager as the imported user.
7 Verify that the imported user can access only the objects in the vRealize Operations Cluster.
You imported a user account from an external user database or server to vRealize Operations Manager, and
assigned a role and the objects the user can access while holding this role to the user.
You have nished this scenario.
Configure a Single Sign-On Source in vRealize Operations Manager
As a system administrator or virtual infrastructure administrator, you use single sign-on to enable SSO users
to log in securely to your vRealize Operations Manager environment.
After the single sign-on source is congured, users are redirected to an SSO identity source for
authentication. When logged in, users can access other vSphere components such as the vCenter Server
without having to log in again.
Create Single Sign-On Source and Import User Groups in vRealize Operations Manager
(hp://link.brightcove.com/services/player/bcpid2296383276001?bctid=ref:video_create_sso)
Prerequisites
nVerify that the server system time of the single sign-on source and vRealize Operations Manager are
synchronized. If you need to congure the Network Time Protocol (NTP), see “vRealize Operations
Manager Cluster and Node Maintenance,” on page 139.
nVerify that you have access to a Platform Services Controller through the vCenter Server. See the
VMware vSphere Information Center for more details.
Procedure
1 Log in to vRealize Operations Manager as an administrator.
2 Select Administration > Authentication Sources, and click the Add icon on the toolbar.
3 In the Add Source for User and Group Import dialog box, provide information for the single sign-on
source.
Option Action
Source Display Name Type a name for the import source.
Source Type Verify that SSO SAML is displayed.
Chapter 1 Configuring Users and Groups in vRealize Operations Manager
VMware, Inc. 17

Option Action
Host Enter the IP address or FQDN of the host machine where the single sign-
on server resides. If you enter the FQDN of the host machine, verify that
every non-remote collector node in the vRealize Operations Manager
cluster can resolve the single sign-on host FQDN.
Port Set the port to the single sign-on server listening port. By default, the port
is set to 443.
User Name Enter the user name that can log into the SSO server.
Password Enter the password.
Grant administrator role to
vRealize Operations Manager for
future configuration?
Select Yes so that the SSO source is reregistered automatically if you make
changes to the vRealize Operations Manager setup. If you select No, and
the vRealize Operations Manager setup is changed, single sign-on users
will not be able to log in until you manually reregister the single sign-on
source.
Automatically redirect to vRealize
Operations single sign-on URL?
Select Yes to direct users to the vCenter single-sign on log in page. If you
select No, users are not redirected to SSO for authentication. This option
can be changed in the vRealize Operations Manager Global Seings.
Import single sign-on user groups
after adding the current source?
Select Yes so that the wizard directs you to the Import User Groups page
when you have completed the SSO source setup. If you want to import
user accounts, or user groups at a later stage, select No.
Advanced options If your environment uses a load balancer, enter the IP address of the load
balancer.
4 Click Test to test the source connection, and then click OK.
The certicate details are displayed.
5 Select the Accept this check box, and click OK.
6 In the Import User Groups dialog box, import user accounts from an SSO server on another machine.
Option Action
Import From Select the single sign-on server you specied when you congured the
single sign-on source.
Domain Name Select the domain name from which you want to import user groups. If
Active Directory is congured as the integrated Windows Authentication
(WA) source in the Platform Services Controller (PSC), and you are
importing user groups from an Active Directory tree, verify that the
groups are not domain local groups. Domain local groups are only visible
within a single domain, unless the domain is the one in which the PSC is
congured. If Active Directory is congured as the LDAP source in the
PSC, you can only import universal groups and domain local groups if the
vCenter Server resides in the same domain.
Result Limit Enter the number of results that are displayed when the search is
conducted.
Search Prefix Enter a prex to use when searching for user groups.
7 In the list of user groups displayed, select at least one user group, and click Next.
8 In the Roles and Objects pane, select a role from the Select Role drop-down menu, and select the
Assign this role to the group check box.
9 Select the objects users of the group can access when holding this role.
To assign permissions so that users can access all the objects in vRealize Operations Manager, select the
Allow access to all objects in the system check box.
10 Click OK.
vRealize Operations Manager Customization and Administration Guide
18 VMware, Inc.
11 Familiarize yourself with single-sign on and conrm that you have congured the single sign-on source
correctly.
a Log out of vRealize Operations Manager.
b Log in to the vSphere Web Client as one of the users in the user group you imported from the
single sign-on server.
c In a new browser tab, enter the IP address of your vRealize Operations Manager environment.
d If the single sign-on server is congured correctly, you are logged in to
vRealize Operations Manager without having to enter your user credentials.
Edit a Single Sign-On Source
Edit a single sign-on source if you need to change the administrator credentials used to manage the single
sign-on source, or if you have changed the host of the source.
When you congure an SSO source, you specify either the IP address or the FQDN of the host machine
where the single sign-on server resides. If you want to congure a new host, that is, if the single sign-on
server resides on a dierent host machine than the one congured when the source was set up,
vRealize Operations Manager removes the current SSO source, and creates a new source. In this case, you
must reimport the users you want to associate with the new SSO source.
If you want to change the way the current host is identied in vRealize Operations Manager, for example,
change the IP address to the FQDN and the reverse, or update the IP address of the PSC if the IP address of
the congured PSC has changed, vRealize Operations Manager updates the current SSO source, and you are
not required to reimport users.
Procedure
1 Log in to vRealize Operations Manager as an administrator.
2 Select Administration, and then select Authentication Sources.
3 Select the single sign-on source and click the Edit icon.
4 Make changes to the single sign-on source, and click OK.
If you are conguring a new host, the New Single Sign-On Source Detected dialog box appears.
5 Enter the administrator credentials that were used to set up the single sign-on source, and click OK.
The current SSO source is removed, and a new one created.
6 Click OK to accept the certicate.
7 Import the users you want to associate with the SSO source.
Chapter 1 Configuring Users and Groups in vRealize Operations Manager
VMware, Inc. 19
Audit Users and the Environment in vRealize Operations Manager
At times you might need to provide documentation as evidence of the sequence of activities that took place
in your vRealize Operations Manager environment. Auditing allows you to view the users, objects, and
information that is collected. To meet audit requirements, such as for business critical applications that
contain sensitive data that must be protected, you can generate reports on the activities of your users, the
privileges assigned to users to access objects, and the counts of objects and applications in your
environment.
Auditing reports provide traceability of the objects and users in your environment.
User Activity Audit Run this report to understand the scope of user activities, such as logging in,
actions on clusters and nodes, changes to system passwords, activating
certicates, and logging out.
User Permissions Audit Generate this report to understand the scope of user accounts and their roles,
access groups, and access privileges.
System Audit Run this report to understand the scale of your environment. This report
displays the counts of congured and collecting objects, the types and counts
of adapters, congured and collecting metrics, super metrics, applications,
and existing virtual environment objects. This report can help you determine
whether the number of objects in your environment exceeds a supported
limit.
System Component
Audit
Run this report to display a version list of all the components in your
environment.
Reasons for Auditing Your Environment
Auditing in vRealize Operations Manager helps data center administrators in the following types of
situations.
nYou must track each conguration change to an authenticated user who initiated the change or
scheduled the job that performed the change. For example, after an adapter changes an object, which is
associated with a specic object identier at a specic time, the data center administrator can determine
the principal identier of the authenticated user who initiated the change.
nYou must track who made changes to your data center during a specic range of time, to determine
who changed what on a particular day. You can identify the principal identiers of authenticated users
who were logged in to vRealize Operations Manager and running jobs, and determine who initiated the
change.
nYou must determine which objects were aected by a particular user during a time specic range of
time.
nYou must correlate events that occurred in your data center, and view these events overlayed so that
you can visualize relationships and the cause of the events. Events can include login aempts, system
startup and shutdown, application failures, watchdog restarts, conguration changes of applications,
changes to security policy, requests, responses, and status of success.
nYou must validate that the components installed in your environment are running the latest version.
vRealize Operations Manager Customization and Administration Guide
20 VMware, Inc.

System Component Audit
A system component audit report provides a version list of every component installed in the system.
Where You Audit System Components
To audit system components, select Administration, click Audit, and click the System Component Audit
tab. A list of components installed in the environment appears on the page.
Table 1‑1. System Component Audit Actions
Option Description
Download Display the version information in a new browser window.
Managing Custom Object Groups in
VMware vRealize Operations Manager
A custom object group is a container that includes one or more objects. vRealize Operations Manager uses
custom groups to collect data from the objects in the group, and report on the data collected.
Why Use Custom Object Groups?
You use groups to categorize your objects and have vRealize Operations Manager collect data from the
groups of objects and display the results in dashboards and views according to the way you dene the data
to appear.
You can create static groups of objects, or dynamic groups with criteria that determines group membership
as vRealize Operations Manager discovers and collects data from new added to the environment.
vRealize Operations Manager provides commonly used object group types, such as World, Environment,
and Licensing. vRealize Operations Manager uses the object group types to categorize groups of objects. You
assign a group type to each group so that you can categorize and organize the groups of objects that you
create.
Types of Custom Object Groups
When you create custom groups, you can use rules to apply dynamic membership of objects to the group, or
you can manually add the objects to the group. When you add an adapter to vRealize Operations Manager,
the groups associated with the adapter become available in vRealize Operations Manager.
nDynamic group membership. To dynamically update the membership of objects in a group, dene rules
when you create a group. vRealize Operations Manager adds objects to the group based on the criteria
that you dene.
nMixed membership, which includes dynamic and manual.
nManual group membership. From the inventory of objects, you select objects to add as members to the
group.
nGroups associated with adapters. Each adapter manages the membership of the group. For example,
the vCenter Server adapter adds groups such as datastore, host, and network, for the container objects
in the vSphere inventory. To modify these groups, you must do so in the adapter.
Administrators of vRealize Operations Manager can set advanced permissions on custom groups. Users
who have privileges to create groups can create custom groups of objects and have
vRealize Operations Manager apply a policy to each group to collect data from the objects and report the
results in dashboards and views.
Chapter 1 Configuring Users and Groups in vRealize Operations Manager
VMware, Inc. 21
When you create a custom group, and assign a policy to the group, vRealize Operations Manager can use
the criteria dened in the applied policy to collect data from and analyze the objects in the group.
vRealize Operations Manager reports on the status, problems, and recommendations for those objects based
on the seings in the policy.
How Policies Help vRealize Operations Manager Report On Object Groups
vRealize Operations Manager analyzes the objects in the object group and reports on the workload, capacity,
stress, anomalies, and faults of the object group, among other aributes.
When you apply a policy to an object group, vRealize Operations Manager uses threshold seings, metrics,
super metrics, aributes, properties, alert denitions, and problem denitions that you enabled in the policy
to collect data from the objects in the group, and report the results in dashboards and views.
When you create a new object group, you have the option to apply a policy to the group.
nTo associate a policy with the custom object group, select the policy in the group creation wizard.
nTo not associate a specic policy with the object group, leave the policy selection blank. The custom
object group will be associated with the default policy. If the default policy changes, this object group
will be associated with the new default policy.
vRealize Operations Manager applies policies in priority order, as they appear on the Active Policies tab.
When you establish the priority for your policies, vRealize Operations Manager applies the congured
seings in the policies according to the policy rank order to analyze and report on your objects. To change
the priority of a policy, you click and drag a policy row. The default policy is always kept at the boom of
the priority list, and the remaining list of active policies starts at priority 1, which indicates the highest
priority policy. When you assign an object to be a member of multiple object groups, and you assign a
dierent policy to each object group, vRealize Operations Manager associates the highest ranking policy
with that object.
User Scenario: Creating Custom Object Groups
As a system administrator, you must monitor the capacity for your clusters, hosts, and virtual machines.
vRealize Operations Manager must monitor them at dierent service levels to ensure that these objects
adhere to the policies established for your IT department, and discover and monitor new objects added to
the environment. You will have vRealize Operations Manager apply policies to the object groups to analyze,
monitor, and report on the status of their capacity levels.
To have vRealize Operations Manager monitor the capacity levels for your objects to ensure that they adhere
to your policies for your service levels, you will categorize your objects into Platinum, Gold, and Silver
object groups to support the service tiers established.
You will create a group type, and create dynamic object groups for each service level. You will dene
membership criteria for each dynamic object group to have vRealize Operations Manager keep the
membership of objects current. For each dynamic object group, you will assign the group type, and add
criteria to maintain membership of your objects in the group. To associate a policy with the custom object
group, you can select the policy in the group creation wizard.
Prerequisites
nKnow the objects that exist in your environment, and the service levels that they support.
nUnderstand the policies required to monitor your objects.
nVerify that vRealize Operations Manager includes policies to monitor the capacity of your objects.
Procedure
1 To create a group type to identify service level monitoring, select Content and click Group Types.
vRealize Operations Manager Customization and Administration Guide
22 VMware, Inc.
2 On the Group Types toolbar, click the plus sign and type Service Level Capacity for the group type.
Your group type appears in the list.
3 Select Environment, and click Custom Groups.
A folder named Service Level Capacity appears in the list of custom groups in the navigation pane, and
the Environment Overview displays the Groups tab.
4 To create a new object group, click the plus sign on the Groups toolbar.
The New Group workspace appears where you dene the data and membership criteria for the
dynamic group.
a In the Name text box, type a meaningful name for the object group, such as Platinum_Objects.
b In the Group Type drop-down menu, select Service Level Capacity.
c (Optional) In the Policy drop-down menu, select your service level policy that has thresholds set to
monitor the capacity of your objects.
To associate a policy with the custom object group, select the policy in the group creation wizard.
To not associate a specic policy with the object group, leave the policy selection blank. The custom
object group will be associated with the default policy. If the default policy changes, this object
group will be associated with the new default policy.
d Select the Keep group membership up to date check box so that vRealize Operations Manager can
discover objects that meet the criteria, and add those objects to the group.
5Dene the membership for virtual machines in your new dynamic object group to monitor them as
platinum objects.
a From the Select Object drop-down menu, select vCenter Adapter, and select Virtual Machine.
b From the empty drop-down menu for the criteria, select Metrics.
c From the Pick a metric drop-down menu, select Disk Space and double-click Current Size.
d From the conditional value drop-down menu, select is less than.
e From the Metric value drop-down menu, type 10.
6Dene the membership for host systems in your new dynamic object group to monitor them as
platinum objects.
a Click Add another criteria set.
b From the Select Object drop-down menu, select vCenter Adapter, and select Host System.
c From the empty drop-down menu for the criteria, select Metrics.
d From the Pick a metric drop-down menu, select Disk Space and double-click Current Size.
e From the conditional value drop-down menu, select is less than.
f From the Metric value drop-down menu, type 100.
7Dene the membership for cluster compute resources in your new dynamic object group.
a Click Add another criteria set.
b From the Select Object drop-down menu, select vCenter Adapter, and select Cluster Compute
Resources.
c From the empty drop-down menu for the criteria, select Metrics.
d From the Pick a metric drop-down menu, select Disk Space and double-click capacityRemaining.
e From the conditional value drop-down menu, select is less than.
Chapter 1 Configuring Users and Groups in vRealize Operations Manager
VMware, Inc. 23
f From the Metric value drop-down menu, type 1000.
g Click Preview to determine whether objects already match this criteria.
8 Click OK to save your group.
When you save your new dynamic group, the group appears in the Service Level Capacity folder, and
in the list of groups on the Groups tab.
9 Wait ve minutes for vRealize Operations Manager to collect data from the objects in your
environment.
vRealize Operations Manager collects data from the cluster compute resources, host systems, and virtual
machines in your environment, according to the metrics that you dened in the group and the thresholds
dened in the policy that is applied to the group, and displays the results about your objects in dashboards
and views.
What to do next
To monitor the capacity levels for your platinum objects, create a dashboard, and add widgets to the
dashboard. See “Using Dashboards,” on page 27.
Managing Application Groups
An application is a container construct that represents a collection of interdependent hardware and software
components that deliver a specic capability to support your business. vRealize Operations Managerbuilds
an application to determine how your environment is aected when one or more components in an
application experiences problems, and to monitor the overall health and performance of the application.
Object membership in an application is not dynamic. To change the application, you manually modify the
objects in the container.
Reasons to Use Applications
vRealize Operations Manager collects data from components in the application and displays the results in a
summary dashboard for each application with a real-time analysis for any or all of the components. If a
component experiences problems, you can see where in the application the problems arise, and determine
how problems spread to other objects.
User Scenario: Adding an Application
As the system administrator of an online training system, you must monitor components in the Web,
application, and database tiers of your environment that can aect the performance of the system. You build
an application that groups related objects together in each tier. If a problem occurs with one of the objects, it
is reected in the application display and you can open a summary to investigate the source of the problem
further.
In your application, you add the DB-related objects that store data for the training system in a tier, Web-
related objects that run the user interface in a tier, and application-related objects that process the data for
the training system in a tier. The network tier might not be needed. Use this model to develop your
application.
Procedure
1 Click Environment in the left pane.
2 Click the Applications tab and click the plus sign.
3 Click Basic n-tier Web App and click OK.
The Application Management page that appears has two rows. Select objects from the boom row to
populate the tiers in the top row.
vRealize Operations Manager Customization and Administration Guide
24 VMware, Inc.
4 Type a meaningful name such as Online Training Application in the Application text box.
5 For each of the Web, application, and database tiers listed, add the objects to the Tier Objects section.
a Select a tier name. This is the tier that you populate.
b To the left of the object row, select object tags to lter for objects that have that tag value. Click the
tag name once to select the tag from the list and click the tag name again to deselect the tag from
the list. If you select multiple tags, objects displayed depend on the values that you select.
You can also search for the object by name.
c To the right of the object row, select the objects to add to the tier.
d Drag the objects to the Tier Objects section.
6 Click Save to save the application.
The new application appears in the list of applications on the Environment Overview Applications page. If
any of the components in any of the tiers develops a problem, the application displays a yellow or red
status.
What to do next
To investigate the source of the problem, click the application name and evaluate the object summary
information. See the vRealize Operations Manager User Guide.
Chapter 1 Configuring Users and Groups in vRealize Operations Manager
VMware, Inc. 25
vRealize Operations Manager Customization and Administration Guide
26 VMware, Inc.

Customizing How
vRealize Operations Manager
Displays Your Data 2
You format the content in vRealize Operations Manager to suit your information needs, using views,
reports, dashboards and widgets.
Views display data, based on an object type. You can select from various view types to see your data from a
dierent perspective. Views are reusable components that you can include in reports and dashboards.
Reports can contain predened or custom views and dashboards in a specied order. You build the reports
to represent objects and metrics in your environment. You can customize the report layout by adding a
cover page, a table of contents, and a footer. You can export the report in a PDF or CSV le format for further
reference.
You use dashboards to monitor the performance and state of objects in your virtual infrastructure. Widgets
are the building blocks of dashboards and display data about congured aributes, resources, аpplications,
or the overall processes in your environment. You can also incorporate views in dashboards using the
vRealize Operations Manager View Widget.
This chapter includes the following topics:
n“Using Dashboards,” on page 27
n“Using Widgets,” on page 38
n“Using Views,” on page 43
n“Using Reports,” on page 46
Using Dashboards
Dashboards present a visual overview of the performance and state of objects in your virtual infrastructure.
You use dashboards to determine the nature and timeframe of existing and potential issues with your
environment.
You start with several predened dashboards in vRealize Operations Manager. You can create additional
ones that meet your specic needs using widgets, views, badges, and lters to change the focus of the
information. You can clone and edit the predened dashboards or start from scratch. To display data that
shows dependencies, you can add widget interactions in dashboards. You can provide role-based access to
various dashboards for beer collaboration in teams.
Create Custom Dashboards (hp://link.brightcove.com/services/player/bcpid2296383276001?
bctid=ref:video_create_dashboards_vrom)
VMware, Inc. 27

User Scenario: Create and Configure Dashboards and Widgets
As a virtual infrastructure administrator, you monitor your vCenter Server environment to detect
problematic resources. You must identify the problems and take action.
Prerequisites
Verify that you have the necessary access rights to perform this task. Your vRealize Operations Manager
administrator can tell you which actions you can perform.
You will create a dashboard to monitor the overview status of vCenter Server instance objects. You will
create another dashboard to view detailed information about the objects. You will link the widgets on the
two dashboards and create a way to link the widgets from one dashboard to the other.
Procedure
1Create a Dashboard to View Object Status on page 28
To view the status of all objects of a vRealize Operations Manager instance, create a dashboard.
2Create a Detailed Object Status Dashboard on page 29
To see the issues that might cause problems for an object in a vRealize Operations Manager instance,
create a dashboard.
3Congure Dashboard Navigation on page 31
To link the widgets from one dashboard to another, you create dashboard navigations.
4Work with Dashboard Navigations on page 31
To verify that the dashboard navigation works as expected, you must test it.
Create a Dashboard to View Object Status
To view the status of all objects of a vRealize Operations Manager instance, create a dashboard.
Each widget in a dashboard has a specic conguration. For more information about the widgets, see
“Widget Denitions List,” on page 39.
Procedure
1 In the left pane of vRealize Operations Manager, click the Content icon and click Dashboards.
2 Click the Create Dashboard icon to create and congure a dashboard.
Option Description
Dashboard name Enter Environment Health.
Dashboard default Select whether this dashboard is the default for this
vRealize Operations Manager instance.
3 Click Widget List.
4 To locate the Environment Overview widget, use the Filter option in the widgets list.
5 Select the Environment Overview widget and drag it to the right panel.
The widget is added to the dashboard.
6 In the upper-right corner of the widget, click the pencil icon and congure the widget.
Option Action
Widget title Retain the default.
Refresh Content Select On. The widget refreshes its data depending on the refresh interval.
vRealize Operations Manager Customization and Administration Guide
28 VMware, Inc.
Option Action
Self Provider Select On.
nOn. You dene the objects for which data appears in the widget.
nO. You congure other widgets to provide the objects to the widget
using the dashboard widget interactions options.
Refresh interval value Retain the default
7 Click the tab.
8 In the Filter text box, enter vCenter Server.
The lter limits the list to only vCenter Server instances.
9 In the objects list, select a vCenter Server instance to monitor.
The Selected Object text eld shows the selected object.
10 Click Save.
11 In the widgets list, select the Health Chart widget and drag it to the left panel to add it to the
dashboard.
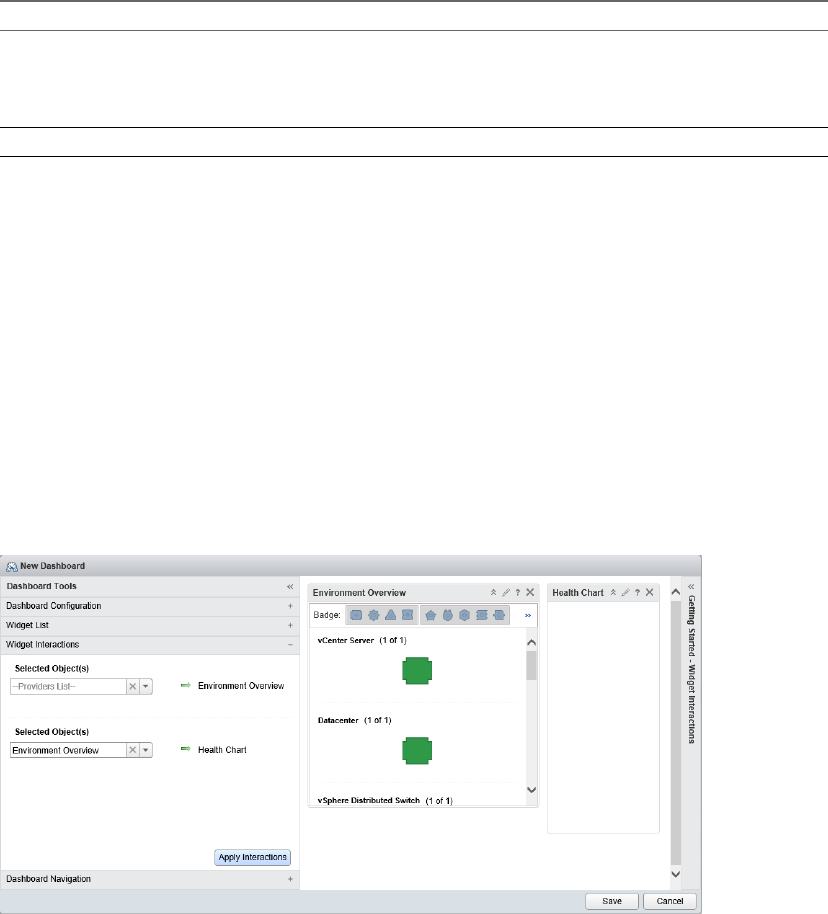
12 Click Widget Interactions.
13 From the Selected Object(s) drop-down menu next to Health Chart, select Environment Overview and
click Apply Interactions.
14 Click Save.
What to do next
Create a dashboard that shows the detailed status for a selected object. See “Create a Detailed Object Status
Dashboard,” on page 29.
Create a Detailed Object Status Dashboard
To see the issues that might cause problems for an object in a vRealize Operations Manager instance, create a
dashboard.
Each widget has a specic conguration. For more information about the widgets, see “Widget Denitions
List,” on page 39. For more information about widget interactions, see “Widget Interactions,” on page 41.
Prerequisites
Create a dashboard that shows the objects and their health status for a vCenter Server. See “Create a
Dashboard to View Object Status,” on page 28.
Chapter 2 Customizing How vRealize Operations Manager Displays Your Data
VMware, Inc. 29
Procedure
1 In the left pane of vRealize Operations Manager, click the Content icon and click Dashboards.
2 Click the Create Dashboard icon to create a dashboard and congure the dashboard.
Option Action
Dashboard name Enter Detailed Object Status.
Dashboard default Select whether this dashboard is the default for this
vRealize Operations Manager instance.
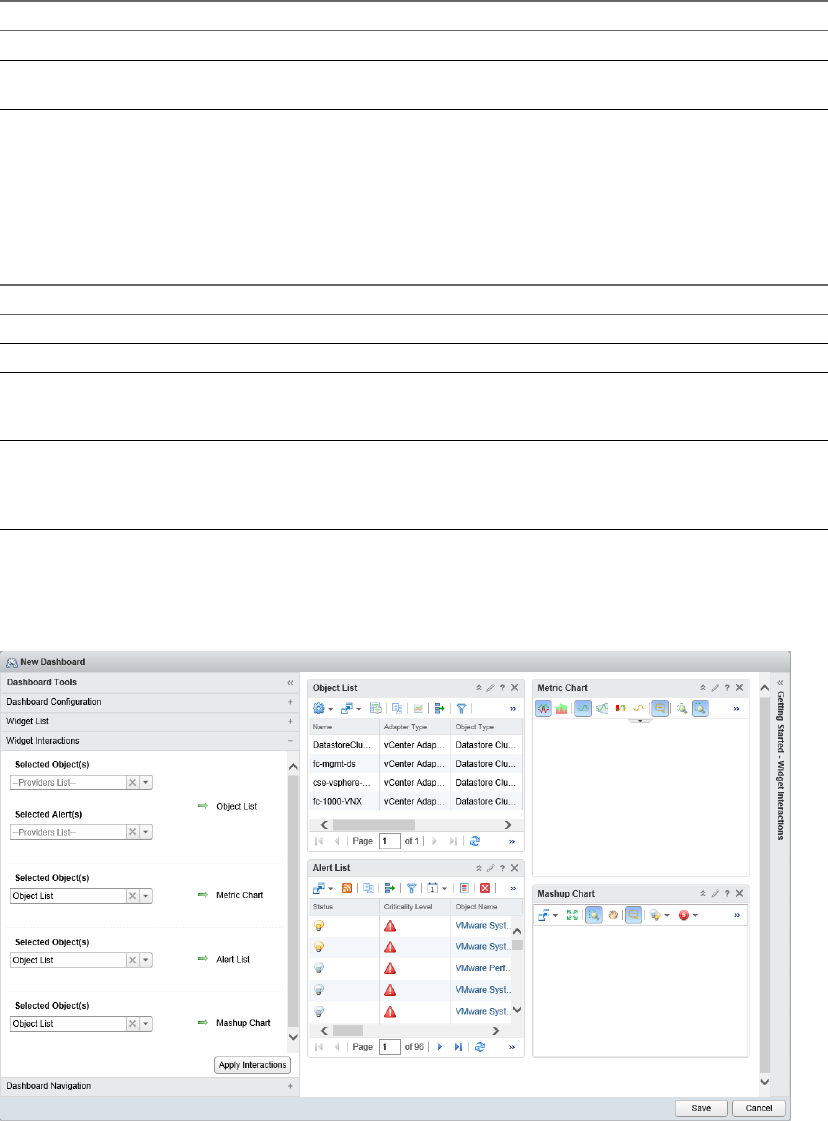
3 Click Widget List.
4 To locate specic widgets, use the Filter option in the widgets list.
5 Drag the widgets to the right panel.
The widgets are added to the dashboard.
Option Description
Object List Shows a list of all dened resources.
Metric Chart Shows a line chart with the recent performance of the selected metrics.
Alert List Shows a list of alerts for the objects that the widget is congured to
monitor. If no objects are congure, the list displays all alerts in your
environment.
Mashup Chart Brings together disparate pieces of information for a resource. It shows a
health chart, an anomaly count graph, and metric graphs for key
performance indicators (KPIs). This widget is typically used for a
container.
6 Click Widget Interactions.
7 From the Selected Object(s) drop-down menu next to the Metric Chart, Mashup Chart, and Alert List,
select Object List.
8 Click Apply Interactions.
9 Click Save.
vRealize Operations Manager Customization and Administration Guide
30 VMware, Inc.

What to do next
Create a dashboard to dashboard navigation. See “Congure Dashboard Navigation,” on page 31.
Configure Dashboard Navigation
To link the widgets from one dashboard to another, you create dashboard navigations.
You can use dashboard navigation to move from one dashboard to another, and to apply sections or context
from one dashboard to another. You can connect a widget to widgets on other dashboards to investigate
problems or beer analyze the provided information.
Prerequisites
nCreate a dashboard that shows the objects and their health status of a vCenter Server instance. See
“Create a Dashboard to View Object Status,” on page 28.
nCreate a dashboard that shows detailed status for a selected object. See “Create a Detailed Object Status
Dashboard,” on page 29.
Procedure
1 In the left pane of vRealize Operations Manager, click the Content icon and click Dashboards.
2 From the dashboards list, click the Environment Health dashboard and click the pencil icon.
3 Click Dashboard Navigation.
4 From the Environment Overview widget Destination Dashboard drop-down menu select the Detailed
Object Status dashboard.
5 From the Detailed Object Status dashboard widgets, select Metric Chart and Mashup Chart.
The Dashboard Navigation icon ( ) appears in the top menu of the Environment Overview widget
and leads to the Detailed Object Status dashboard. The Metric Chart and Mashup Chart update
depending on the selected object in the Environment Overview widget.
6 From the Health Chart widget Destination Dashboard drop-down menu select the Detailed Object
Status dashboard.
7 From the Detailed Object Status dashboard widgets, select All widgets.
The Dashboard Navigation icon ( ) appears in the top menu of the Health Chart widget and leads to
the Detailed Object Status dashboard. All the widgets update depending on the Health Chart widget.
8 Click Apply Navigations.
9 Click Save.
What to do next
Test the dashboard navigation. See “Work with Dashboard Navigations,” on page 31.
Work with Dashboard Navigations
To verify that the dashboard navigation works as expected, you must test it.
Prerequisites
Create a dashboard to dashboard navigation. See “Congure Dashboard Navigation,” on page 31.
Chapter 2 Customizing How vRealize Operations Manager Displays Your Data
VMware, Inc. 31

Procedure
1 On the vRealize Operations Manager home page, click the Dashboard List drop-down menu and click
the Environment Health dashboard.
The Dashboard List drop-down menu is a list that contains all dashboards that are visible on the home
page. You can use it for quick navigation through your dashboards.
2 On the Environment Overview widget, select the Workload badge.
The widget refreshes with the workload status of the objects in the vCenter Server instance.
3 From the Status menu on the right, deselect the green Good icon.
The widget lters and hides the objects whose workload status is Good.
4 In the widget main panel, select an object.
For example, a Resource Pool.
5 Click the Dashboard Navigation icon and click the Detailed Object Status dashboard.
The Detailed Object Status dashboard opens and the Metric Chart and Mashup Chart widget show
information about the selected object.
6 From the Dashboard List drop-down menu select the Environment Health dashboard.
7 On the Health Chart main panel, select an object line.
You set a context for the Dashboard Navigation option.
8 On the Health Chart widget, click the Dashboard Navigation icon and click the Detailed Object Status
dashboard.
The Detailed Object Status dashboard opens and all the widgets show information about the selected
object.
Dashboards
The Dashboard provides a quick overview of the performance and condition of your virtual infrastructure.
vRealize Operations Manager Home Page
vRealize Operations Manager collects performance data from monitored software and hardware resources
in your enterprise and provides predictive analysis and real-time information about problems. The data and
analysis are presented through alerts, in congurable dashboards, on predened pages, and in several
predened dashboards.
Table 2‑1. vRealize Operations Manager Home Page Menus
Menu Description
Dashboard List Lists all dashboards that are visible on the home page. You
can use this menu for a quick navigation through your
dashboards.
Actions Available dashboard actions, such as create, edit, delete,
and set as default. These actions are applied directly to the
dashboard that you are on.
vRealize Operations Manager Customization and Administration Guide
32 VMware, Inc.
Predefined Dashboards
vRealize Operations Manager 6.4 has predened dashboards that address several key questions including
how you can troubleshoot your VMs, the workload distribution of your hosts, clusters, and datastores, the
capacity of your data center, and information about the VMs.
You can access the predened dashboards from the Home page. Click Dashboard List > vSphere
Dashboards Library.
The following predened dashboards have been added in vRealize Operations Manager 6.4:
nGeing Started
nOperations Overview
nCapacity Overview
nTroubleshoot a VM
nVM Dashboards
nHeavy Hier VMs
nVM Conguration
nVM Usage
nInfrastructure Dashboards
nCluster Conguration
nCluster Performance
nDatastore Capacity
nDatastore Performance
nESXi Conguration
nNetwork Conguration
Getting Started Dashboard
The Geing Started dashboard lists all the predened dashboards for vRealize Operations Manager 6.4 in
one page. You can use this dashboard to understand key questions that each predened dashboard can help
you answer.
After you get familiar with the new predened dashboards, you can disable this dashboard by clicking
Actions > Remove Dashboard from Menu.
Operations Overview Dashboard
The Operations Overview dashboard provides an overview of the dierent data centers for which you are
responsible, and helps you to act on alerts to ensure that there are no underlying infrastructure problems.
You can use the dashboard widgets in several ways.
nUse the Inventory Summary widget to view a summary of the overall inventory of your environment.
nUse the Select a Datacenter widget to select the data center for which you want to view operational
information. You can use the lter to narrow your list based on several parameters. After you identify
the data center you want to view, select it. The dashboard is automatically populated with the relevant
data.
Chapter 2 Customizing How vRealize Operations Manager Displays Your Data
VMware, Inc. 33
nUse the Uptime of all Clusters widget to view the overall health of the clusters in the data center you
selected. The metric value is calculated based on the uptime of each ESXi host, when you take into
account one host as the HA host. If the number displayed is less than 100%, it means that at least two
hosts within the cluster were not operational for that period.
nUse the Alert Volume widget to view the breakdown of alert trends based on their criticality.
nYou can also view a list of 15 VMs that had the highest average CPU contention, the highest use of
memory, and the highest disk latency for the last 24 hours. To obtain specic data, you can manually set
the time to the time of the problem. To set the time, click the Edit Widget icon from title bar of the
widget and edit the Period Length drop-down menu.
Capacity Overview Dashboard
The Capacity Overview dashboard provides an overview of the capacity of the data centers in the
environment. You can navigate between the data centers and review the status of the objects to see if you
must rebalance the resource capacity among the data centers.
You can use the dashboard widgets in several ways.
nUse the Select an Environment widget to select a data center. You can use the lter to narrow your list
based on several parameters. After you identify the data center you want to view, select it. The
dashboard is populated with the relevant data.
nUse the Total Capacity widget to view the total physical capacity of the environment that includes
capacity assigned as High Availability (HA). The actual capacity is less than the total capacity displayed
when you consider HA and a buer.
nUse the Reclaimable Capacity widget to understand the amount of resources that can be freed up by
deleting the powered o VMs. You can reclaim capacity from idle VMs, active VMs, orphaned VMs,
and non-VMs. However, this widget highlights the capacity you can claim from powered o VMs.
Powered o machines are VMs that are in a powered o state for a minimum percentage in the
observation period. The default minimum percentage is 90% in the last 30 days. You can change this
seing in the policy.
nUse the Memory Capacity Utilization Trend widget to view the overall memory capacity trend. This
widget displays the total physical resources you have. The physical resources include a HA buer and a
utilization buer. This widget also displays the total memory you have allocated to VMs. If the number
is close to the total physical capacity, the VMs may contend for memory. Ensure that the contention
level is lower than what you promise to your customers. The chart also includes the actual utilization of
memory capacity. The actual utilization is based on the active memory and hence it tends to be lower, as
VMs do not normally access most of their RAM at any given moment.
nUse the CPU Capacity Utilization Trend widget to view the overall CPU capacity trend. This widget
displays the total physical resources you have. The physical resources include a HA buer and a
utilization buer, which reects the total capacity. This widget also displays the total CPU capacity you
have allocated to VMs. If the number is close to the total physical capacity, the VMs may contend for
CPU. Ensure that the contention level is lower than what you promise to your customers. The chart also
includes the actual utilization of CPU. The actual utilization is based on the CPU demand counter,
which takes into account the CPU used to perform I/O on behalf of the VM. The ESXi host performs
storage I/O and network I/O on behalf of the VM, and this may be performed on a core that is dierent
from the one on which the VM runs. As a result, CPU demand is a more accurate reection of the VM
CPU usage.
nUse the Disk Space Capacity Utilization Trend widget to view the amount of disk space allocated to a
VM and the amount that is actually used. This information is helpful when you plan for thin
provisioning.
nUse the Capacity Utilization Distribution - What is Over or Under Utilized widget to view if the objects
in the data center are overused or underused. You can then carry out suitable actions on objects that are
over used.
vRealize Operations Manager Customization and Administration Guide
34 VMware, Inc.
Troubleshoot a VM
Use the Troubleshoot a VM dashboard to troubleshoot performance problems of a single VM.
You can use the dashboard widgets in several ways.
nUse the Search for a VM to Troubleshoot widget to view all the VMs in the environment. You can select
the VM you want to troubleshoot. You can use the lter to narrow your list based on several
parameters, such as name, folder name, associated tag, host, or vCenter Server. After you identify the
VM you want to troubleshoot, select it. The dashboard is automatically populated with the relevant
data.
nUse the About a VM widget to understand the context of the VM. This widget also lends insights to
analyze the root cause of the problem or potential mitigations.
nUse the Are there Critical Alerts widget to view critical alerts. To see noncritical alerts, click the VM
object.
nUse the Related Objects widget to view the ESXi host where the VM is now running. This host might
not be the ESXi host where the VM was running in the past. You can view the remaining related objects
and see whether they might contribute to the problem.
nUse the Is the VMs Demand Spiking or Anomalous widget to identify spikes in the VM demand for any
of the resources such as CPU, memory, and network. Spikes in the demand might indicate an abnormal
behavior of the VM or that the VM is undersized. The memory utilization is based on the Guest OS
metric. It requires VMware Tools 10.0.0 or later and vSphere 6 Update 1 or later. If you do not have
these products, the metric remains blank.
nUse the Is the VM Facing Contention widget to identify whether the VM is facing contention. If the VM
is facing contention, the underlying infrastructure might not have enough resources to meet the needs
of the VM.
nUse the Does the Parent Cluster have Contention widget to view the trend for the maximum CPU
contention for a VM within the cluster. The trend might indicate a constant contention within the
cluster. If there is contention, you must troubleshoot the cluster as the problem is no longer with the
VM.
nUse the Does the Parent Datastore have Latency widget to help you correlate the latency at the
datastore level with the total latency of the VM. If the VM has latency spikes, but the datastore does not
have such spikes, it might indicate a problem with the VM. If the datastore faces latency as well, you
can troubleshoot to nd out why the datastore has these spikes.
nUse the Parent Host and Parent Cluster widgets to view the host and the cluster on which the VM
resides.
VM Dashboards
The VM Dashboards are a set of dashboards that provide insight into the conguration and behavior of
VMs.
Heavy Hitter VMs
The Heavy Hier VMs dashboard provides information about the VMs that generated the highest IOPS and
network throughput during the last week for a given cluster.
You can use the dashboard widgets in several ways.
nUse the Select a Cluster widget to select a cluster. You can use the lter to narrow your list based on
several parameters. After you identify the cluster you want to view, select it. The dashboard is
automatically populated with the relevant data.
nUse the Cluster IOPS and Cluster Network Throughput widgets to view the IOPS and network
throughput for the cluster.
Chapter 2 Customizing How vRealize Operations Manager Displays Your Data
VMware, Inc. 35
nUse the other widgets in the dashboard to view which VMs in the cluster generated the highest network
throughput and IOPS. You can compare the information for the VM with the results for the cluster and
correlate the trends. You can manually set the time to the time period for which you want to view data.
VM Configuration Dashboard
The VM Conguration dashboard highlights the list of VMs with anomalous conguration. You can view
VMs which have large snapshots that can be deleted. You can also view a list of orphaned VMs in the
environment that can be deleted.
You can use the dashboard widgets in several ways.
nUse the Large VMs widgets to view graphical representations of VMs that have a large CPU, RAM, and
disk space.
nView the VMs with limits, large snapshots, orphaned VMs, VMs with more than one NIC, and VMs
with a nonstandard operating system. These VMs have a performance impact on the rest of the VMs in
your environment even though they do not fully use their allocated resources.
You can customize the views in the widgets.
1 Click the Edit Widget icon from title bar of the widget. The Edit widget dialog box is displayed.
2 From the Views section, click the Edit View icon. The Edit View dialog box is displayed.
3 Click the Presentation option in the left pane and make the required modications.
VM Usage Dashboard
The VM Usage dashboard can be shared with the owner of the VM to help identify potential problems with
the VM. It captures basic data about the VM. As there is no infrastructure-related data that is displayed in
this dashboard, you can share the data in this dashboard with other teams without sharing infrastructure-
related metrics.
You can use the dashboard widgets in several ways.
nUse the Search for a VM to Report its Usage widget to select the VM you want to troubleshoot. You can
use the lter to narrow your list based on several parameters. After you identify the VM that you want
to view, select it. The dashboard is automatically populated with the relevant data.
nUse the About the VM widget to view the VM you selected and its details. You select the VM in the
Search for a VM to Report its Usage widget.
nUse the VM Utilization Trend: CPU, Memory, IOPS, Network widget to view information about the
usage and allocation trends for CPU demand, memory workload, disk commands per second, and the
network usage rate.
Infrastructure Dashboards
The Infrastructure Dashboards are a set of dashboards that provide insight into the conguration of clusters,
datastores, and ESXi hosts.
Cluster Configuration Dashboard
The Cluster Conguration dashboard displays inconsistencies in any of the clusters in your environment.
You can use the dashboard widgets in several ways.
nUse the Is vMotion Congured Among All Hosts widget to determine whether an inconsistency exists
between the vMotion and HA congurations in the cluster . All ESXi hosts in a cluster should have
consistent conguration. Consistent conguration of clusters makes operation easier and performance
predictable.
vRealize Operations Manager Customization and Administration Guide
36 VMware, Inc.
nUse the Host Count across Clusters widget to view all the clusters in your environment. If the clusters
have a consistent number of hosts, the boxes displayed are of equal size. This representation helps you
determine whether there is a large deviation among cluster sizes, whether there is a small cluster with
fewer than four hosts, or whether there is a large cluster. Operationally, keep your clusters consistent
and of moderate size.
nUse the Aributes of ESXi Hosts in the Selected Cluster widget to view the conguration details for the
hosts within a cluster.
nUse the All Clusters Properties widget to view the properties for all the clusters in the widget.
Cluster Performance Dashboard
The Cluster Performance dashboard allows you to identify which clusters have VMs that suer from
memory contention and CPU contention.
You can use the dashboard widgets in several ways.
nUse the Clusters dashboard to select the cluster for which you want to view performance details. You
can use the lter to narrow your list based on several parameters. After you identify the cluster you
want to view, select it. The dashboard is automatically populated with the relevant data.
nUse the Clusters Colored by Critical Alerts and Sized by Host Count widget to view only the critical
alerts.
nView the maximum and average CPU, memory disk, and disk latency for the VMs. If the VM faces
contention, it might mean that the underlying infrastructure does not have enough resources to meet
the needs of the VMs.
nView a list of 10 VMs that face CPU, memory, and disk latency contention. You can then troubleshoot
and take steps to resolve the problem.
Datastore Capacity Dashboard
The Datastore Capacity dashboard provides information that helps you understand whether you must
rebalance the capacity of the datastores in the environment.
You can use the dashboard widgets in several ways.
nUse the Datastore Size and Usage Distribution widget to nd out which datastores are overused and
which ones are underused. You can also nd out whether the datastores are of equal size. When you
select a datastore from this widget, the dashboard is automatically populated with the relevant data.
nUse the VMs in the Selected Datastore widget to view a list of VMs based on the datastore you select.
You can also view relevant details such as whether the VMs are powered on and the size of the
snapshot if any.
nUse the Usage Trend of Selected Datastore widget to nd out the trends in capacity used by a selected
datastore as against the total capacity available.
nUse the All Shared Datastores in the Environment widget to view a list of datastores that are shared in
your environment. The information displayed in this widget helps you make an informed decision
about whether you have to rebalance the capacity of the datastores based on usage.
Datastore Performance Dashboard
The Datastore Performance dashboard displays the datastores that have high latency and their
corresponding trend line.
You can use the dashboard widgets in several ways.
nUse the Select a Datastore widget to select the datastore for which you want to view performance
details. You can use the lter to narrow your list based on several parameters. After you identify the
datastore you want to view, select it. The dashboard is automatically populated with the relevant data.
Chapter 2 Customizing How vRealize Operations Manager Displays Your Data
VMware, Inc. 37

nUse the Current IOPS and Latency of the VMs in the selected Datastore widget to view the current IOPS
and latency of the VMs in the selected datastore.
nUse the Datastores with High Latency and Outstanding IOs widget to view those datastores with high
latency and outstanding disk I/O trends. Ideally, your datastores must not have outstanding disk I/O.
nUse the other widgets in the dashboard to view trends for the selected datastore regarding disk latency,
outstanding disk I/O, IOPS, and throughput.
nUse the Historical IOPS Trend for the selected VM widget and the Historical Latency Trend of the
selected VM widget to view the historical trend of IOPS and latency for a VM in the selected datastore.
From the Current IOPS and Latency of the VMs in the selected Datastore widget, select a VM to
populate the historical trends.
ESXi Configuration Dashboard
The ESXi Conguration dashboard provides conguration and distribution information of the ESXi hosts in
your environment. You can also nd out whether any of the hosts are congured with non-recommended
seings.
You can use the dashboard widgets in several ways.
nUse the widgets to determine the distribution of hardware models, BIOS versions, and ESXi versions in
your environment.
nUse the widgets to determine whether any of the hosts are congured with non-recommended seings
that include ESXi hosts in a disconnected state, ESXi hosts in maintenance mode, and hosts with a
network speed that is below 10 GB.
nUse the All ESXi Conguration widget to identify a mismatch in the host conguration.
Network Configuration Dashboard
The Network Conguration dashboard helps you nd out which ESXi hosts and VMs use a specic switch.
You can use the dashboard widgets in several ways.
nUse the Distributed Switches widget to select the switch for which you want to view details. You can
use the lter to narrow your list based on several parameters. After you identify the switch that you
want to view, select it. The dashboard is automatically populated with the relevant data.
nUse the Distributed Port Groups on the Switch widget to view the port groups on the switch, how many
ports each switch has, and the usage details.
nUse the ESXi Hosts/VMs Using the Selected Switch widgets to nd out which ESXi hosts and VMs use
the selected switch. You can also view conguration details about the ESXi hosts and VMs that use the
selected switch.
Using Widgets
Widgets are the panes on your dashboards. They show information about aributes, resources, applications,
or the overall processes in your environment.
You can congure widgets to reect your specic needs. The available conguration options vary depending
on the widget type. You must congure some of the widgets before they display any data. Many widgets
can provide or accept data from one or more widgets. You can use this feature to set the data from one
widget as lter and display related information on a single dashboard.
Congure Widgets (hp://link.brightcove.com/services/player/bcpid2296383276001?
bctid=ref:video_congure_widgets_vrom)
vRealize Operations Manager Customization and Administration Guide
38 VMware, Inc.

Widget Definitions List
A widget is a pane on a dashboard that contains information about congured aributes, resources,
applications, or the overall processes in your environment. Widgets can provide a holistic, end-to-end view
of the health of all of the objects and applications in your enterprise. If your user account has the necessary
access rights, you can add and remove widgets from your dashboards.
Table 2‑2. Summary of Widgets
Widget Name Description
Alert List Shows a list of alerts for the objects that the widget is congured to monitor. If no objects
are congure, the list displays all alerts in your environment.
Alert Volume Shows a trend report for the last seven days of alerts generated for the objects it is
congured to monitor.
Anomalies Shows a chart of the anomalies count for the past 6 hours.
Anomaly Breakdown Shows the likely root causes for symptoms for a selected resource.
Capacity Shows a chart of the Capacity values for a specic resources over the past 7 days.
Capacity Utilization Shows the capacity or workload utilization for objects so that you can identify problems
with capacity and workload. Indicates objects that are underutilized, optimal, and
overutilized, and indicates why they are constrained.
Container Details Shows the health and alert counts for each tier in a single selected container.
Container Object List Shows a list of all dened resources and object types.
Container Overview Shows the overall health and the health of each tier for one or more containers.
Current Policy Shows the highest priority policy applied to a custom group.
Data Collection Results Shows a list of all supported actions specic for a selected object.
Density Shows the density breakdown as charts for the past 7 days for a specic resource.
DRS Cluster Seings Shows the workload of the available clusters and the associated hosts.
Eciency Shows the status of the eciency-related alerts for the objects that it is congured to
monitor. Eciency is based on generated eciency alerts in your environment.
Environment Lists the number of resources by object or groups them by object type.
Environment Overview Shows the performance status of objects in your virtual environment and their
relationships. You can click an object to highlight its related objects and double-click an
object to view its Resource Detail page.
Environment Status Shows statistics for the overall monitored environment.
Faults Shows a list of availability and conguration issues for a selected resource.
Forensics Shows how often a metric had a particular value, as a percentage of all values, within a
given time period. It can also compare percentages for two time periods.
Geo Shows where your objects are located on a world map, if your conguration assigns
values to the Geo Location object tag.
Health Shows the status of the health-related alerts for the objects that it is congured to monitor.
Health is based on generated health alerts in your environment.
Health Chart Shows health information for selected resources, or all resources that have a selected tag.
Heat Map Shows a heat map with the performance information for a selected resource.
Mashup Chart Brings together disparate pieces of information for a resource. It shows a health chart, an
anomaly count graph, and metric graphs for key performance indicators (KPIs). This
widget is typically used for a container.
Metric Chart Shows a chart with the workload of the object over time based on the selected metrics.
Chapter 2 Customizing How vRealize Operations Manager Displays Your Data
VMware, Inc. 39

Table 2‑2. Summary of Widgets (Continued)
Widget Name Description
Metric Picker Shows a list of available metrics for a selected resource. It works with any widget that can
provide resource ID.
Object List Shows a list of all dened resources.
Object Relationship Shows the hierarchy tree for the selected object.
Object Relationship
(Advanced)
Shows the hierarchy tree for the selected objects. It provides advanced conguration
options.
Property List Shows the properties and their values of an object that you select.
Reclaimable Capacity Shows a percentage chart representing the amount of reclaimable capacity for a specic
resource that has consumers.
Recommended Actions Displays recommendations to solve problems in your vCenter Server instances. With
recommendations, you can run actions on your data centers, clusters, hosts, and virtual
machines.
Risk Shows the status of the risk-related alerts for the objects that it is congured to monitor.
Risk is based on generated risk alerts in your environment.
Rolling View Chart Cycles through selected metrics at an interval that you dene and shows one metric graph
at a time. Miniature graphs, which you can expand, appear for all selected metrics at the
boom of the widget.
Scoreboard Shows values for selected metrics, which are typically KPIs, with color coding for dened
value ranges.
Scoreboard Health Shows color-coded health or workload scores for selected resources.
Sparkline Chart Shows graphs that contain metrics for an object . If all of the metrics in the Sparkline Chart
widget are for an object that another widget provides, the object name appears at the top
right of the widget.
Stress Shows a weather map of the average stress over the past 6 weeks for a specic resource.
Tag Picker Lists all dened resource tags.
Text Display Reads text from a Web page or text le and shows the text in the user interface.
Time Remaining Shows a chart of the Time Remaining values for a specic resources over the past 7 days.
Top Alerts Lists the alerts most likely to negatively aect your environment based on the congured
alert type and objects.
Top-N Shows the top or boom N number metrics or resources in various categories, such as the
ve applications that have the best or worth health score.
Topology Graph Shows multiple levels of resources between nodes.
View Shows a dened view depending on the congured resource.
Weather Map Uses changing colors to show the behavior of a selected metric over time for multiple
resources.
Workload Shows workload information for a selected resource.
vRealize Operations Manager Customization and Administration Guide
40 VMware, Inc.
Widget Interactions
Widget interactions are the congured relationships between widgets in a dashboard where one widget
provides information to a receiving widget. When you are using a widget in the dashboard, you select data
on one widget to limit the data that appears in another widget, allowing you to focus on a smaller subset
data.
How Interactions Work
If you congured interactions between widget at the dashboard level, you can then select one or more
objects in the providing widget to lter the data that appears in the receiving widget, allowing you to focus
on data related to an object.
To use the interaction option between the widgets in a dashboard, you congure interactions at the
dashboard level. If you do not congure any interactions, the data that appears in the widgets is based on
how the widget is generally congured.
When you congure widget interaction, you specify the providing widget for the receiving widget. For
some widgets, you can dene two providing widgets, each of which can be used to lter data in the
receiving widget.
For example, if you congured the Object List widget to be a provider widget for the Top-N widget, you can
select one or more objects in the Object List widget and the Top-N displays data only for the selected objects.
For some widgets, you can dene more than one providing widget. For example, you can congure the
Metric Chart widget to receive data from a metrics provider widget and an objects providing widget. In
such case, the Metric Chart widget shows data for any object that you select in the two provider widgets.
Add a Resource Interaction XML File
A resource interaction le is a custom set of metrics that you want to display in widgets that support the
option. You can congure one or more les that dene dierent sets of metrics for particular object types so
that the supported widgets are populated based the congured metrics and selected object type.
The following widgets support the resource interaction mode:
nMetric Chart
nProperty List
nRolling View Chart
nScoreboard
nSparkline Chart
nTopology Graph
To use the metric conguration, which displays a set of metrics that you dened in an XML le, the
dashboard and widget conguration must meet the following criteria:
nThe dashboard Widget Interaction options are congured so that another widget provides objects to
the target widget. For example, an Object List widget provides the object interaction to a chart widget.
nThe widget Self Provider option is set to .
nThe custom XML le in the Metric drop-down menu is in the following directory and
has been imported into the global storage using the import command.
nvApp or Linux. The XML le is in /usr/lib/vmware-vcops/tools/opscli.
nWindows. The XML le is in C:\vmware\vcenter-operations\vmware-vcops\tools\opscli.
If you add an XML le and later modify it, the changes might not take eect.
Chapter 2 Customizing How vRealize Operations Manager Displays Your Data
VMware, Inc. 41

Prerequisites
nVerify that you have the necessary permissions to access the installed les for
vRealize Operations Manager and add les.
nCreate a new les based on the existing examples. Examples are available in the following location:
nvApp or Linux. The XML le is in /usr/lib/vmware-vcops/tomcat-web-app/webapps/vcops-web-
ent/WEB-INF/classes/resources/reskndmetrics.
nWindows. The XML le is in C:\vmware\vcenter-operations\vmware-vcops\tomcat-web-
app\webapps\vcops-web-ent\WEB-INF\classes\resources\reskndmetrics.
Procedure
1 Create an XML le that denes the set of metrics.
For example:
<?xml version="1.0" encoding="UTF-8" standalone="yes"?>
<AdapterKinds>
<AdapterKind adapterKindKey="VMWARE">
<ResourceKind resourceKindKey="HostSystem">
<Metric attrkey="sys:host/vim/vmvisor/slp|resourceMemOverhead_latest" />
<Metric attrkey="cpu|capacity_provisioned" />
<Metric attrkey="mem|host_contention" />
</ResourceKind>
</AdapterKind>
</AdapterKinds>
In this example, the displayed data for the host system based on the specied metrics.
2 Save the XML le in one of the following directories base on the operating system of your
vRealize Operations Manager instance.
Operating System File Location
vApp or Linux /usr/lib/vmware-vcops/tools/opscli
Windows C:\vmware\vcenter-operations\vmware-vcops\tools\opscli
3 Run the import command.
Operating System File Location
vApp or Linux ./ops-cli.py file import reskndmetric
YourCustomFilename.xml
Windows ops-cli.py file import reskndmetric YourCustomFilename.xml
The le is imported into global storage and is accessible from the supported widgets.
4 If you update an exisiting le and must re-import the le, append --force to the above import
command and run it.
For example, ./vcops-cli.py file import reskndmetric YourCustomFilename.xml --force.
What to do next
To verify that the XML le is imported, congure one of the supported widgets and ensure that the new le
appears in the drop-down menu.
vRealize Operations Manager Customization and Administration Guide
42 VMware, Inc.

Using Views
vRealize Operations Manager provides several types of views. Each type of view helps you to interpret
metrics, properties, policies of various monitored objects including alerts, symptoms, and so on, from a
dierent perspective. vRealize Operations Manager Views also show information that the adapters in your
environment provide.
You can congure vRealize Operations Manager views to show transformation, forecast, and trend
calculations.
nThe transformation type determines how the values are aggregated.
nThe trend option shows how the values tend to change, based on the historical, raw data. The trend
calculations depend on the transformation type and roll up interval.
nThe forecast option shows what the future values can be, based on the trend calculations of the
historical data.
Create Views (hp://link.brightcove.com/services/player/bcpid2296383276001?
bctid=ref:video_create_views_in_vrom)
You can use vRealize Operations Manager views in dierent areas of vRealize Operations Manager.
nTo manage all views, select Content > Views.
nTo see the data that a view provides for a specic object, navigate to that object, click the Details tab,
and click Views.
nTo see the data that a view provides in your dashboard, add the View widget to the dashboard.
nTo have a link to a view in the Further Analysis section, select the Further Analysis option on the view
workspace visibility step.
User Scenario: Create, Run, Export, and Import a vRealize Operations Manager
View for Tracking Virtual Machines
As a virtual infrastructure administrator, you use vRealize Operations Manager to monitor several
environments. You must know the number of virtual machines on each vCenter Server instance. You dene
a view to gather the information in a specic order and use it on all vRealize Operations Manager
environments.
Prerequisites
Verify that you have the necessary access rights to perform this task. Your vRealize Operations Manager
administrator can tell you which actions you can perform.
You will create a distribution view and run it on the main vRealize Operations Manager environment. You
will export the view and import it in another vRealize Operations Manager instance.
Procedure
1Create a vRealize Operations Manager View for Supervising Virtual Machines on page 44
To collect and display data about the number of virtual machines on a vCenter Server, you create a
custom view.
2Run a vRealize Operations Manager View on page 44
To verify the view and capture a snapshot of information at any point, you run the view for a specic
object.
3Export a vRealize Operations Manager View on page 45
To use a view in another vRealize Operations Manager, you export a content denition XML le.
Chapter 2 Customizing How vRealize Operations Manager Displays Your Data
VMware, Inc. 43
4Import a vRealize Operations Manager View on page 45
To use views from other vRealize Operations Manager environments, you import a content denition
XML le.
Create a vRealize Operations Manager View for Supervising Virtual Machines
To collect and display data about the number of virtual machines on a vCenter Server, you create a custom
view.
Procedure
1 In the left pane of vRealize Operations Manager, click the Content icon and click Views.
2 Click the plus sign to create a new view.
3 Enter Virtual Machines Distribution, the name for the view.
4 Enter a meaningful description for the view.
For example, A view showing the distribution of virtual machines per hosts.
5 Click Presentation and select the Distribution view type.
The view type is the way the information is displayed.
a From the Visualization drop-down menu, select Pie Chart.
b From the Distribution Type congurations, select Discrete distribution.
Leave Max number of buckets deselected because you do not know the number of hosts on each
vCenter Server instance. If you specify a number of buckets and the hosts are more than that
number, one of the slices shows unspecied information labeled Others.
6 Click Subjects to select the object type that applies to the view.
a From the drop-down menu, select Host System.
The Distribution view is visible at the object containers of the subjects that you specify during the
view conguration.
7 Click Data and in the lter text box enter Total Number of VMs.
8 Select Summary > Total Number of VMs and double-click to add the metric.
9 Retain the default metric congurations and click Save.
Run a vRealize Operations Manager View
To verify the view and capture a snapshot of information at any point, you run the view for a specic object.
Prerequisites
Verify that you have the necessary access rights to perform this task. Your vRealize Operations Manager
administrator can tell you which actions you can perform.
Procedure
1 In the left pane of vRealize Operations Manager, click the Environment icon.
2 Navigate to a vCenter Server instance and click the Details tab.
All listed views are applicable for the vCenter Server instance.
3 From the All Filters drop-down menu on the left, select Type > Distribution.
You lter the views list to show only distribution type views.
vRealize Operations Manager Customization and Administration Guide
44 VMware, Inc.

4 Navigate to and click the Virtual Machines Distribution view.
The boom pane shows the distribution view with information about this vCenter Server. Each slice
represents a host and the numbers on the far left show the number of virtual machines.
Export a vRealize Operations Manager View
To use a view in another vRealize Operations Manager, you export a content denition XML le.
If the exported view contains custom created metrics, such as what-if, supermetrics, or custom adapter
metrics, you must recreate them in the new environment.
Prerequisites
Verify that you have the necessary access rights to perform this task. Your vRealize Operations Manager
administrator can tell you which actions you can perform.
Procedure
1 In the left pane of vRealize Operations Manager, click the Content icon and click Views.
2 In the list of views, navigate to and click the Virtual Machines Distribution view .
3 Select All Actions > Export view.
4 Select a location on your local system to save the XML le and click Save.
Import a vRealize Operations Manager View
To use views from other vRealize Operations Manager environments, you import a content denition XML
le.
Prerequisites
Verify that you have the necessary access rights to perform this task. Your vRealize Operations Manager
administrator can tell you which actions you can perform.
Procedure
1 In the left pane of vRealize Operations Manager, click the Content icon and click Views.
2 Select All Actions > Import view.
3 Browse to select the Virtual Machines Distribution content denition XML le and click Import.
If the imported view contains custom created metrics, such as what-if, supermetrics, or custom adapter
metrics, you must recreate them in the new environment.
N The imported view overwrites if a view with the same name exists. All report templates that use
the existing view are updated with the imported view.
Views and Reports Ownership
Views, reports, templates, or schedules owner might change in time.
The default owner of all predened views and templates is System. If you edit them, you become the owner.
If you want to keep the original predened view or template, you have to clone it. After you clone it, you
become the owner of the clone.
The last user who edited a view, template, or schedule is the owner. For example, if you create a view you
are listed as its owner. If another user edits your view, that user becomes the owner listed in the Owner
column.
Chapter 2 Customizing How vRealize Operations Manager Displays Your Data
VMware, Inc. 45

The user who imports the view or template is its owner, even if the view is initially created by someone else.
For example, User 1 creates a template and exports it. User 2 imports it in back, the owner of the template
becomes User 2.
The user who generated the report is its owner, regardless of who owns the template. If a report is generated
from a schedule, the user who created the schedule is the owner of the generated report. For example, if
User 1 creates a template and User 2 creates a schedule for this template, the generated report owner is User
2.
Editing, Cloning, and Deleting a View
You can edit, clone, and delete a view. Before you do, familiarize yourself with the consequences of these
actions.
When you edit a view, all changes are applied to the report templates that contain it.
When you clone a view, the changes that you make to the clone do not aect the source view.
When you delete a view, it is removed from all the report templates that contain it.
Using Reports
A report is a scheduled snapshot of views and dashboards. You can create it to represent objects and
metrics. It can contain table of contents, cover page, and footer.
With the vRealize Operations Manager reporting functions, you can generate a report to capture details
related to current or predicted resource needs. You can download the report in a PDF or CSV le format for
future and oine needs.
Create Reports (hp://link.brightcove.com/services/player/bcpid2296383276001?
bctid=ref:video_reports_in_vrom)
User Scenario: Handling Reports to Monitor Virtual Machines
As a virtual infrastructure administrator, you use vRealize Operations Manager to monitor several
environments. You must present to your team a report with your corporate logo for all oversized and
stressed virtual machines, and their current and trend memory use. You use predened report templates to
gather and format the information in a specic order.
You will create a report template with predened views and dashboards. You will generate the report to test
the template and create a schedule for generating the report once every two weeks.
Prerequisites
Verify that you have the necessary access rights to perform this task. Your vRealize Operations Manager
administrator can tell you which actions you can perform.
Procedure
1Create a Report Template for Monitoring Virtual Machines on page 47
To monitor oversized and stressed virtual machines, and their memory use, you create a report
template.
2Generate a Report on page 48
To generate a report, you use the Virtual Machines Report template for a vCenter Server system that
shows information for oversized and stressed virtual machines, and their memory use.
3Download a Report on page 48
To verify that the information appears as expected you download the generated report from the
Virtual Machines Report template .
vRealize Operations Manager Customization and Administration Guide
46 VMware, Inc.

4Schedule a Report on page 49
To generate a report on a selected date, time, and recurrence you create a schedule for the Virtual
Machines Report template. You set the email options to send the generated report to your team.
Create a Report Template for Monitoring Virtual Machines
To monitor oversized and stressed virtual machines, and their memory use, you create a report template.
You create a report template with PDF and CSV output and add views, dashboards and layout options to it.
Prerequisites
nUnderstand the concept of vRealize Operations Manager views. See “Using Views,” on page 43.
nKnow the location of your corporate logo.
Procedure
1 In the left pane of vRealize Operations Manager, click the Content icon and click Reports.
2 On the Report Templates tab, click the plus sign to create a template.
3 Enter Virtual Machines Report, the name for the template.
4 Enter a meaningful description for the template.
For example, A template for oversized and stressed virtual machines, and their memory use.
5 Click Views and Dashboards. On the Data type drop-down menu leave Views selected.
The currently congured views are available in the list below the Data type drop-down menu. Views
present collected information for an object in a certain way depending on the view type.
6 In the search box, enter Virtual Machine.
The list is now limited to views where the name contains Virtual Machine.
7 Double-click the views to add them to the template.
Option Description
Virtual Machine Rightsizing CPU,
Memory, and Disk Space
Monitors oversized VMs
Virtual Machine Recommended CPU
and Memory Size
Monitors stressed VMs
The views appear in the main panel of the workspace with a preview of sample data.
8 In the search box, enter VM.
The list is now limited to views where the name contains VM.
9 Navigate to VMs Memory Usage (%) Distribution view, and double-click the view to add it to the
template.
The view appears in the main panel of the workspace with a preview of sample data.
10 (Optional) In the main panel of the workspace, drag the views up and down to reorder them.
11 From the Data type drop-down menu, select Dashboards.
The currently congured dashboards appear in the list below the Data type drop-down menu.
Dashboards give a visual overview of the performance and state of objects in your virtual
infrastructure.
Chapter 2 Customizing How vRealize Operations Manager Displays Your Data
VMware, Inc. 47
12 Double-click vSphere VMs Memory, vSphere VMs CPU, and vSphere VMs Disk and Network
dashboards to add them to the template.
The dashboards appear in the main panel of the workspace.
13 Click Formats and leave the PDF and CSV check boxes selected.
14 Click Layout Options and select the Cover Page and Footer check boxes.
The corresponding panes appear in the main panel of the workspace.
15 In the Cover Page panel, click Browse and navigate to an image on your computer.
The default report size is 8.5 inches by 11 inches. The image is resized to t the report front page.
The image uploads to a database. It is used for the cover page every time you generate a report from
this template.
16 Click Save.
Your report template is saved and listed on the Report Templates tab of the Content management tab.
What to do next
Generate and download the report to verify the output. See “Generate a Report,” on page 48
Generate a Report
To generate a report, you use the Virtual Machines Report template for a vCenter Server system that shows
information for oversized and stressed virtual machines, and their memory use.
Prerequisites
Create a report template. See “Create a Report Template for Monitoring Virtual Machines,” on page 47.
Procedure
1 In the left pane of vRealize Operations Manager, click the Environment icon.
2 Navigate to a vCenter Server system.
3 Click the Reports tab and click Report Templates.
The listed report templates are associated with the current object.
4 Navigate to the Virtual Machines Report template and click the Run Template icon.
The report is generated and listed on the Generated Reports tab.
What to do next
Download the generated report and verify the output. See “Download a Report,” on page 48.
Download a Report
To verify that the information appears as expected you download the generated report from the Virtual
Machines Report template .
Prerequisites
Generate a report from the Virtual Machines Report template. See “Generate a Report,” on page 48.
Procedure
1 In the left pane of vRealize Operations Manager, click the Environment icon.
2 Navigate to the object for which you want to download a report.
vRealize Operations Manager Customization and Administration Guide
48 VMware, Inc.

3 Click the Reports tab and click Generated Reports.
The listed reports are generated for the current object.
4Click the PDF ( ) and CSV ( ) icon to save the report in the relevant le format.
vRealize Operations Manager saves the report le to the location you selected.
What to do next
Schedule a report generation and set the email options, so your team will receive the report. See “Schedule a
Report,” on page 49.
Schedule a Report
To generate a report on a selected date, time, and recurrence you create a schedule for the Virtual Machines
Report template. You set the email options to send the generated report to your team.
The date range for the generated report is based on the time when vRealize Operations Manager generates
the report and not on the time when you schedule the report or when vRealize Operations Manager places
the report in the queue.
Prerequisites
nDownload the generated report to verify the output. See “Download a Report,” on page 48.
nTo enable sending email reports, you must have congured Outbound Alert Seings.
Procedure
1 In the left pane of vRealize Operations Manager, click the Environment icon.
2 Navigate to the object vCenter Server .
3 Click the Reports tab and click Report Templates.
4 Select the Virtual Machines Report template from the list.
5
Click the gear icon ( ) and select Schedule report.
6 Select the time zone, date, and hour to start the report generation.
vRealize Operations Manager generates the scheduled reports in sequential order. Generating a report
can take several hours. This process might delay the start time of a report when the previous report
takes an extended period of time.
7 From the Recurrence drop-down menu, select Weekly and set the report generation for every two
weeks on Monday.
8 Select the Email report check box to send an email with the generated report.
a In the Email addresses text box, enter the email addresses that must receive the report.
b Select an outbound rule.
An email is sent according to this schedule every time a report is generated.
9 Click Ok.
What to do next
You can edit, clone, and delete report templates. Before you do, familiarize yourself with the consequences
of these actions.
Chapter 2 Customizing How vRealize Operations Manager Displays Your Data
VMware, Inc. 49
When you edit a report template and delete it, all reports generated from the original and the edited
templates are deleted. When you clone a report template, the changes that you make to the clone do not
aect the source template. When you delete a report template, all generated reports are also deleted.
vRealize Operations Manager Customization and Administration Guide
50 VMware, Inc.

Customizing How
vRealize Operations Manager
Monitors Your Environment 3
Congure the resources that determine the behavior of the objects in your vRealize Operations Manager
environment.
Use alert and symptom denitions with actionable recommendations to generate alerts that keep you aware
of problems that occur on your objects. Use and customize operational policies to determine how
vRealize Operations Manager analyzes your objects and displays information about them, so that you are
notied when problems occur on those objects. Use super metrics, which combine metrics into formulas, to
collect combinations of data from your objects.
To identify objects and adapter types, customize icons. Add objects, and metadata about them, to manage
those objects when an adapter instance does not support the discovery of a particular object type. Congure
the global seings, which apply to all users, such as data retention and system timeout.
This chapter includes the following topics:
n“Dening Alerts in vRealize Operations Manager,” on page 52
n“Dening Compliance Standards,” on page 79
n“Operational Policies,” on page 87
n“Managing and Administering Policies for vRealize Operations Manager,” on page 88
n“Super Metrics in vRealize Operations Manager,” on page 110
n“vSphere Predictive Distributed Resource Scheduler,” on page 119
n“Congure vSphere Predictive DRS,” on page 119
n“Customizing Icons,” on page 120
n“Managing Objects in Your Environment,” on page 121
n“Conguring Object Relationships,” on page 125
n“Customizing How Endpoint Operations Management Monitors Operating Systems,” on page 126
n“Modifying Global Seings,” on page 136
VMware, Inc. 51

Defining Alerts in vRealize Operations Manager
An alert denition comprises one or more symptom denitions, and the alert denition is associated with a
set of recommendations and actions that help you resolve the problem. Alert denitions include triggering
symptom denitions and actionable recommendations. You create the alert denitions so that the generated
alerts tell you about problems in the monitored environment. You can then respond to the alerts with
eective solutions that are provided in the recommendations.
Predened alerts are provided in vRealize Operations Manager as part of your congured adapters. You can
add or modify alert denitions to reect the needs of your environment.
Create Alert Denitions for vRealize Operations Manager
(hp://link.brightcove.com/services/player/bcpid2296383276001?
bctid=ref:video_create_alerts_vrom)
Symptoms in Alert Definitions
Symptom denitions evaluate conditions in your environment that, if the conditions become true, trigger a
symptom and can result in a generated alert. You can add symptom denitions that are based on metrics or
super metrics, properties, message events, fault events, or metric events. You can create a symptom
denition as you create an alert denition or as an individual item in the appropriate symptom denition
list.
When you add a symptom denition to an alert denition, it becomes a part of a symptom set. A symptom
set is the combination of the dened symptom with the argument that determines when the symptom
condition becomes true.
A symptom set combines one or more symptom denitions by applying an Any or All condition, and allows
you to choose the presence or absence of a particular symptom. If the symptom set pertains to related
objects rather than to Self, you can apply a population clause to identify a percentage or a specic count of
related objects that exhibit the included symptom denitions.
An alert denition comprises one or more symptom sets. If an alert denition requires all of the symptom
sets to be triggered before generating an alert, and only one symptom set is triggered, an alert is not
generated. If the alert denition requires only one of several symptom sets to be triggered, then the alert is
generated even though the other symptom sets were not triggered.
Recommendations in Alert Definitions
Recommendations are the remediation options that you provide to your users to resolve the problems that
the generated alert indicates.
When you add an alert denition that indicates a problem with objects in your monitored environment, add
a relevant recommendation. Recommendations can be instructions to your users, links to other information
or instruction sources, or vRealize Operations Manager actions that run on the target systems.
Modifying Alert Definitions
If you modify the alert impact type of an alert denition, any alerts that are already generated will have the
previous impact level. Any new alerts will be at the new impact level. If you want to reset all the generated
alerts to the new level, cancel the old alerts. If they are generated after cancellation, they will have the new
impact level.
vRealize Operations Manager Customization and Administration Guide
52 VMware, Inc.
Object Relationship Hierarchies for Alert Definitions
Object relationship hierarchies determine how one object is related to another. When you create alert
denitions, you select the relationship to identify the symptom object with respect to the base object. These
relationships, for example, ancestor or descendant, produce results based on how the objects are placed in
the relationship hierarchy.
vCenter Server Relationship Hierarchies
Depending on the conguration of your vCenter Server instances, objects have the following possible
hierarchies, from higher to lower objects:
nDatacenter, Host, Virtual Machine, Datastore
nDatacenter, Cluster, Host, Virtual Machine, Datastore
nDatacenter, Host, Datastore
nDatacenter, Cluster, Host, Datastore
Alert Definition Best Practices
As you create alert denitions for your environment, apply consistent best practices so that you optimize
alert behavior for your monitored objects.
Alert Definitions Naming and Description
The alert denition name is the short name that appears in the following places:
nIn data grids when alerts are generated
nIn outbound alert notications, including the email notications that are sent when outbound alerts and
notications are congured in your environment
Ensure that you provide an informative name that clearly states the reported problem. Your users can
evaluate alerts based on the alert denition name.
The alert denition description is the text that appears in the alert denition details and the outbound alerts.
Ensure that you provide a useful description that helps your users understand the problem that generated
the alert.
Wait and Cancel Cycle
The wait cycle seing helps you adjust for sensitivity in your environment. The wait cycle for the alert
denition goes into eect after the wait cycle for the symptom denition results in a triggered symptom. In
most alert denitions you congure the sensitivity at the symptom level and congure the wait cycle of alert
denition to 1. This conguration ensures that the alert is immediately generated after all of the symptoms
are triggered at the desired symptom sensitivity level.
The cancel cycle seing helps you adjust for sensitivity in your environment. The cancel cycle for the alert
denition goes into aect after the cancel cycle for the symptom denition results in a cancelled symptom.
In most denitions you congure the sensitivity at the symptom level and congure the cancel cycle of alert
denition to 1. This conguration ensures that the alert is immediately cancelled after all of the symptoms
conditions disappear after the desired symptom cancel cycle.
Create Alert Definitions to Generate the Fewest Alerts
You can control the size of your alert list and make it easier to manage. When an alert is about a general
problem that can be triggered on a large number of objects, congure its denition so that the alert is
generated on a higher level object in the hierarchy rather than on individual objects.
Chapter 3 Customizing How vRealize Operations Manager Monitors Your Environment
VMware, Inc. 53
As you add symptoms to your alert denition, do not overcrowd a single alert denition with secondary
symptoms. Keep the combination of symptoms as simple and straightforward as possible.
You can also use a series of symptom denitions to describe incremental levels of concern. For example,
Volume nearing capacity limit might have a severity value of Warning while Volume reached capacity
limit might have a severity level of Critical. The rst symptom is not an immediate threat, but the second
one is an immediate threat. You can then include the Warning and Critical symptom denitions in a single
alert denition with an Any condition and set the alert criticality to be Symptom Based. These seings cause
the alert to be generated with the right criticality if either of the symptoms is triggered.
Avoid Overlapping and Gaps Between Alerts
Overlaps result in two or more alerts being generated for the same underlying condition. Gaps occur when
an unresolved alert with lower severity is canceled, but a related alert with a higher severity cannot be
triggered.
A gap occurs in a situation where the value is <=50% in one alert denition and >=75% in a second alert
denition. The gap occurs because when the percentage of volumes with high use falls between 50 percent
and 75 percent, the rst problem cancels but the second does not generate an alert. This situation is
problematic because no alert denitions are active to cover the gap.
Actionable Recommendations
If you provide text instructions to your users that help them resolve a problem identied by an alert
denition, precisely describe how the engineer or administrator should x the problem to resolve the alert.
To support the instructions, add a link to a wiki, runbook, or other sources of information, and add actions
that you run from vRealize Operations Manageron the target systems.
Understanding Negative Symptoms for vRealize Operations Manager Alerts
Alert symptoms are conditions that indicate problems in your environment. When you dene an alert, you
include symptoms that generate the alert when they become true in your environment. Negative symptoms
are based on the absence of the symptom condition. If the symptom is not true, the symptom is triggered.
To use the absence of the symptom condition in an alert denition, you negate the symptom in the symptom
set.
All dened symptoms have a congured criticality. However, if you negate a symptom in an alert denition,
it does not have an associated criticality when the alert is generated.
All symptom denitions have a congured criticality. If the symptom is triggered because the condition is
true, the symptom criticality will be the same as the congured criticality. However, if you negate a
symptom in an alert denition and the negation is true, it does not have an associated criticality.
When negative symptoms are triggered and an alert is generated, the eect on the criticality of the alert
depends on how the alert denition is congured.
The following table provides examples of the eect negative symptoms have on generated alerts.
vRealize Operations Manager Customization and Administration Guide
54 VMware, Inc.

Table 3‑1. Negative Symptoms Effect on Generated Alert Criticality
Alert Definition
Criticality
Negative Symptom
Configured Criticality
Standard Symptom Configured
Criticality
Alert Criticality When
Triggered
Warning One Critical Symptom One Immediate Symptom Warning. The alert
criticality is based on the
dened alert criticality.
Symptom Based One Critical Symptom One Warning Symptom Warning. The negative
symptom has no
associated criticality and
the criticality of the
standard symptom
determines the criticality
of the generated alert.
Symptom Based One Critical Symptom No standard symptom included Info. Because an alert
must have a criticality and
the negative alert does not
have an associated
criticality, the generated
alert has a criticality of
Info, which is the lowest
possible criticality level.
Create an Alert Definition for Department Objects
As a virtual infrastructure administrator, you are responsible for the virtual machines and hosts that the
accounting department uses. You can create alerts to manage the accounting department objects.
You received several complaints from your users about delays when they are using their accounting
applications. Using vRealize Operations Manager, you identied the problem as related to CPU allocations
and workloads. To beer manage the problem, you create an alert denition with tighter symptom
parameters so that you can track the alerts and identify problems before your users encounter further
problems.
Using this scenario, you create a monitoring system that monitors your accounting objects and provides
timely notications when problems occur.
Procedure
1Add Description and Base Object to Alert Denition on page 56
To create an alert to monitor the CPUs for the accounting department virtual machines and monitor
host memory for the hosts on which they operate, you begin by describing the alert.
2Add a Virtual Machine CPU Usage Symptom to the Alert Denition on page 57
To generate alerts related to CPU usage on your accounting virtual machines, you add symptoms to
your vRealize Operations Manager alert denition after you provide the basic descriptive information
for the alert. The rst symptom you add is related to CPU usage on virtual machines. You later use a
policy and group to apply alert to the accounting virtual machines.
3Add a Host Memory Usage Symptom to the Alert Denition on page 58
To generate alerts related to CPU usage on your accounting virtual machines, you add a second
symptom to your vRealize Operations Manager alert denition after you add the rst symptom. The
second symptom is related to host memory usage for the hosts on which the accounting virtual
machines operate.
4Add Recommendations to the Alert Denition on page 60
To resolve a generated alert for the accounting department's virtual machines, you provide
recommendations so that you or other engineers have the information you need to resolve the alert
before your users encounter performance problems.
Chapter 3 Customizing How vRealize Operations Manager Monitors Your Environment
VMware, Inc. 55
5Create a Custom Accounting Department Group on page 61
To manage, monitor, and apply policies to the accounting objects as a group, you create a custom
object group.
6Create a Policy for the Accounting Alert on page 62
To congure how vRealize Operations Manager evaluates the accounting alert denition in your
environment, you congure a policy that determines behavior so that you can apply the policy to an
object group. The policy limits the application of the alert denition to only the members of the
selected object group.
7Congure Notications for the Department Alert on page 63
To receive an email notication when the accounting alert is generated, rather than relying on your
ability to generally monitor the accounting department objects in vRealize Operations Manager, you
create notication rules.
8Create a Dashboard to Monitor Department Objects on page 64
To monitor all the alerts related to the accounting department object group, you create a dashboard
that includes the alert list and other widgets. The dashboard provides the alert data in a single location
for all related objects.
Add Description and Base Object to Alert Definition
To create an alert to monitor the CPUs for the accounting department virtual machines and monitor host
memory for the hosts on which they operate, you begin by describing the alert.
When you name the alert denition and dene alert impact information, you specify how the information
about the alert appears in vRealize Operations Manager. The base object is the object around which the alert
denition is created. The symptoms can be for the base object and for related objects.
Procedure
1 In the left pane of vRealize Operations Manager, click the Content icon.
2 Click Alert .
3 Click the plus sign to add a denition.
4 Type a name and description.
In this scenario, type Acct VM CPU early warning as the alert name, which is a quick overview of the
problem. The description, which is a detailed overview. should provide information that is as useful as
possible. When the alert is generated, this name and description appears in the alert list and in the
notication.
5 Click Base Object Type.
6 From the drop-down menu, expand vCenter Adapter and select Host System.
This alert is based on host systems because you want an alert that acts as an early warning to possible
CPU stress on the virtual machines used in the accounting department. By using host systems as the
based object type, you can respond to the alert symptom for the virtual machines with bulk actions
rather than responding to an alert for each virtual machine.
vRealize Operations Manager Customization and Administration Guide
56 VMware, Inc.
7 Click Alert Impact and congure the metadata for this alert denition.
a From the Impact drop-down menu, select Risk.
This alert indicates a potential problem and requires aention in the near future.
b From the Criticality drop-down menu, select Immediate.
As a Risk alert, which is indicative of a future problem, you still want to give it a high criticality so
that it is ranked for correct processing. Because it is designed as an early warning, this
conguration provides a built-in buer that makes it an immediate risk rather than a critical risk.
c From the Alert Type and Subtype drop-down menu, expand Virtualization/Hypervisor and select
Performance.
d To ensure that the alert is generated during the rst collection cycle after the symptoms become
true, set the Wait Cycle to 1.
e To ensure that the an alert is removed as soon as the symptoms are no longer triggered, set the
Cancel Cycle to 1.
The alert is canceled in the next collection cycle if the symptoms are no long true.
These alert impact options help you identify and prioritize alerts as they are generated.
You started an alert denition where you provided the name and description, selected host system as the
base object type, and dened the data that appears when the alert generated.
What to do next
Continue in the workspace, adding symptoms to your alert denition. See “Add a Virtual Machine CPU
Usage Symptom to the Alert Denition,” on page 57.
Add a Virtual Machine CPU Usage Symptom to the Alert Definition
To generate alerts related to CPU usage on your accounting virtual machines, you add symptoms to your
vRealize Operations Manager alert denition after you provide the basic descriptive information for the
alert. The rst symptom you add is related to CPU usage on virtual machines. You later use a policy and
group to apply alert to the accounting virtual machines.
This scenario has two symptoms, one for the accounting virtual machines and one to monitor the hosts on
which the virtual machines operate.
Prerequisites
Begin conguring the alert denition. See “Add Description and Base Object to Alert Denition,” on
page 56.
Procedure
1 In the Alert Denition Workspace window, after you congure the Name and Description, Base Object
Type, and Alert Impact, click Add Symptom and congure the symptoms.
2 Begin conguring the symptom set related to virtual machines CPU usage.
a From the On drop-down menu, select Child.
b From the Filter by Object Type drop-down menu, select Virtual Machine.
c From the Symptom Type drop-down menu, select Metric / Supermetric.
d Click the Add buon to open the Add Symptom Denition workspace window.
Chapter 3 Customizing How vRealize Operations Manager Monitors Your Environment
VMware, Inc. 57
3Congure the virtual machine CPU usage symptom in the Add Symptom Denition workspace
window.
a From the Base Object Type drop-down menu, expand vCenter Adapter and select Virtual
Machine.
The collected metrics for virtual machines appears in the list.
b In the metrics list Search text box, which searches the metric names, type usage.
c In the list, expand CPU and drag Usage (%) to the workspace on the right.
d From the threshold drop-down menu, select Dynamic Threshold.
Dynamic thresholds use vRealize Operations Manager analytics to identify the trend metric values
for objects.
e In the Symptom Name text box, type a name similar to VM CPU Usage above trend.
f From the criticality drop-down menu, select Warning.
g From the threshold drop-down menu, select Above Threshold.
h Leave the Wait Cycle and Cancel Cycle at the default values of 3.
This Wait Cycle seing requires the symptom condition to be true for 3 collection cycles before the
symptom is triggered. This wait avoids triggering the symptom when there is a short spike in CPU
usage.
i Click Save.
The dynamic symptom, which identies when the usage is above the tracked trend, is added to the
symptom list.
4 In the Alert Denition Workspace window, drag VM CPU Usage above trend from the symptom
denition list to the symptom workspace on the right.
The Child-Virtual Machine symptom set is added to the symptom workspace.
5 In the symptoms set, congure the triggering condition so that when the symptom is true on half of the
virtual machines in the group to which this alert denition is applied, the symptom set is true.
a From the value operator drop-down menu, select >.
b In the value text box, enter 50.
c From the value type drop-down menu, select Percent.
You dened the rst symptom set for the alert denition.
What to do next
Add the host memory usage symptom to the alert denition. See “Add a Host Memory Usage Symptom to
the Alert Denition,” on page 58.
Add a Host Memory Usage Symptom to the Alert Definition
To generate alerts related to CPU usage on your accounting virtual machines, you add a second symptom to
your vRealize Operations Manager alert denition after you add the rst symptom. The second symptom is
related to host memory usage for the hosts on which the accounting virtual machines operate.
Prerequisites
Add the virtual machine CPU usage symptom. See “Add a Virtual Machine CPU Usage Symptom to the
Alert Denition,” on page 57.
vRealize Operations Manager Customization and Administration Guide
58 VMware, Inc.
Procedure
1 In the Alert Denition Workspace window, after you congure the Name and Description, Base Object
Type, and Alert Impact, click Add Symptom .
2Congure the symptom related to host systems for the virtual machines.
a From the On drop-down menu, select Self.
b From the Symptom Type drop-down menu, select Metric / Supermetric.
c Click the Add buon to congure the new symptom.
3Congure the host system symptom in the Add Symptom Denition workspace window.
a From the Base Object Type drop-down menu, expand vCenter Adapters and select Host System.
b In the metrics list, expand Memory and drag Usage (%) to the workspace on the right.
c From the threshold drop-down menu, select Dynamic Threshold.
Dynamic thresholds use vRealize Operations Manager analytics to identify the trend metric values
for objects.
d In the Symptom Name text box, enter a name similar to
Host memory usage above trend.
e From the criticality drop-down menu, select Warning.
f From the threshold drop-down menu, select Above Threshold.
g Leave the Wait Cycle and Cancel Cycle at the default values of 3.
This Wait Cycle seing requires the symptom condition to be true for three collection cycles before
the symptom is triggered. This wait avoids triggering the symptom when a short spike occurs in
host memory usage.
h Click Save.
The dynamic symptom identies when the hosts on which the accounting virtual machines run are
operating above the tracked trend for memory usage.
The dynamic symptom is added to the symptom list.
4 In the Alert Denition Workspace window, drag Host memory usage above trend from the symptoms
list to the symptom workspace on the right.
The Self-Host System symptom set is added to the symptom workspace.
5 On the Self-Host System symptom set, from the value type drop-down menu for This Symptom set is
true when, select Any.
With this conguration, when any of the hosts running accounting virtual machines exhibit memory
usage that is above the analyzed trend, the symptom condition is true.
6 At the top of the symptom set list, from the Match {operator} of the following symptoms drop-down
menu, select Any.
With this conguration, if either of the two symptom sets, virtual machine CPU usage or the host
memory, are triggered, an alert is generated for the host.
You dened the second symptom set for the alert denition and congured how the two symptom sets are
evaluated to determine when the alert is generated.
What to do next
Add recommendations to your alert denition so that you and your engineers know how to resolve the alert
when it is generated. See “Add Recommendations to the Alert Denition,” on page 60.
Chapter 3 Customizing How vRealize Operations Manager Monitors Your Environment
VMware, Inc. 59
Add Recommendations to the Alert Definition
To resolve a generated alert for the accounting department's virtual machines, you provide
recommendations so that you or other engineers have the information you need to resolve the alert before
your users encounter performance problems.
As part of the alert denition, you add recommendations that include actions that you run from
vRealize Operations Manager and instructions for making changes in vCenter Server that resolve the
generated alert.
Prerequisites
Add symptoms to your alert denition. See “Add a Host Memory Usage Symptom to the Alert Denition,”
on page 58.
Procedure
1 In the Alert Denition Workspace window, after you congure the Name and Description, Base Object
Type, Alert Impact, and Add Symptom , click Add Recommendations and add the
recommended actions and instructions.
2 Click Add and select an action recommendation to resolve the virtual machine alerts.
a In the New Recommendation text box, enter a description of the action similar to
Add CPUs to virtual machines.
b From the Actions drop-down menu, select Set CPU Count for VM.
c Click Save.
3 Click Add and provide an instructive recommendation to resolve host memory problems similar to this
example.
If this host is part of a DRS cluster, check the DRS settings to verify that the load
balancing setting are configured correctly. If necessary, manually vMotion the virtual
machines.
4 Click Add and provide an instructive recommendation to resolve host memory alerts.
a Enter a description of the recommendation similar to this example.
If this is a standalone host, add more memory to the host.
b To make the URL a hyperlink in the instructions, copy the URL, for example,
hps://www.vmware.com/support/pubs/vsphere-esxi-vcenter-server-pubs.html, to your clipboard.
c Highlight the text in the text box and click Create a hyperlink.
d Paste the URL in the Create a hyperlink text box and click OK.
e Click Save.
5 In the Alert Denition Workspace, drag Add CPUs to virtual machines, If this host is part of a DRS
cluster, and the If this is a standalone host recommendations from the list to the recommendation
workspace in the order presented.
6 Click Save.
You provided the recommended actions and instructions to resolve the alert when it is generated. One of the
recommendations resolves the virtual machine CPU usage problem and the other resolves the host memory
problem.
vRealize Operations Manager Customization and Administration Guide
60 VMware, Inc.
What to do next
Create a group of objects to use to manage your accounting objects. See “Create a Custom Accounting
Department Group,” on page 61.
Create a Custom Accounting Department Group
To manage, monitor, and apply policies to the accounting objects as a group, you create a custom object
group.
Prerequisites
Verify that you completed the alert denition for this scenario. See “Add Recommendations to the Alert
Denition,” on page 60.
Procedure
1 In the left pane of vRealize Operations Manager, click the Environment icon.
2 Click the Groups tab.
3 Click New Group.
4 Type a name similar to Accounting VMs and Hosts.
5 From the Group Type drop-down menu, select Department.
6 From the Policy drop-down menu, select Default Policy.
When you create a policy, you apply the new policy to the accounting group.
7 In the Dene membership criteria area, from the Select the Object Type that matches the following
criteria drop-down menu, expand vCenter Adapter, select Host System, and congure the dynamic
group criteria.
a From the criteria drop-down menu, select Relationship.
b From the relationships options drop-down menu, select Parent of.
c From the operator drop-down menu, select contains.
d In the Object name text box, enter acct.
e From the navigation tree drop-down list, select vSphere Hosts and Clusters.
You created a dynamic group where host objects that are the host for virtual machines with acct in the
virtual machine name are included in the group. If a virtual machine with acct in the object name is
added or moved to a host, the host object is added to the group.
8 Click Preview in the lower-left corner of the workspace, and verify that the hosts on which your virtual
machines that include acct in the object name appear in the Preview Group window.
9 Click Close.
10 Click Add another criteria set.
A new criteria set is added with the OR operator between the two criteria sets.
11 From the Select the Object Type that matches the following criteria drop-down menu, expand
vCenter Adapter, select Virtual Machine, and congure the dynamic group criteria.
a From the criteria drop-down menu, select Properties.
b From the Pick a property drop-down menu, expand and double-click Name.
c From the operator drop-down menu, select contains.
d In the Property value text box, enter acct.
Chapter 3 Customizing How vRealize Operations Manager Monitors Your Environment
VMware, Inc. 61
You created a dynamic group where virtual machine objects with acct in the object name are included in
the group that depends on the presence of those virtual machines. If a virtual machine with acct in the
name is added to your environment, it is added to the group.
12 Click Preview in the lower-left corner of the workspace, and verify that the virtual machines with acct
in the object name are added to the list that also includes the host systems.
13 Click Close.
14 Click OK.
The Accounting VMs and Hosts group is added to the Groups list.
You created a dynamic object group that changes as virtual machines with acct in their names are added,
removed, and moved in your environment.
What to do next
Create a policy that determines how vRealize Operations Manager uses the alert denition to monitor your
environment. See “Create a Policy for the Accounting Alert,” on page 62.
Create a Policy for the Accounting Alert
To congure how vRealize Operations Manager evaluates the accounting alert denition in your
environment, you congure a policy that determines behavior so that you can apply the policy to an object
group. The policy limits the application of the alert denition to only the members of the selected object
group.
When an alert denition is created, it is added to the default policy and enabled, ensuring that any alert
denitions that you create are active in your environment. This alert denition is intended to meet the needs
of the accounting department, so you disable it in the default policy and create a new policy to govern how
the alert denition is evaluated in your environment, including which accounting virtual machines and
related hosts to monitor.
Prerequisites
nVerify that you completed the alert denition for this scenario. See “Add Recommendations to the Alert
Denition,” on page 60.
nVerify that you created a group of objects that you use to manage you accounting objects. See “Create a
Custom Accounting Department Group,” on page 61.
Procedure
1 In the left pane of vRealize Operations Manager, click the Administration icon.
2 Click Policies and click Policy Library.
3 Click Add New Policy.
4 Type a name similar to Accounting Objects Alerts Policy and provide a useful description similar to
the following example.
This policy is configured to generate alerts when
Accounting VMs and Hosts group objects are above trended
CPU or memory usage.
5 Click Select Base Policies and select Default Policy from the Start with drop-down menu.
vRealize Operations Manager Customization and Administration Guide
62 VMware, Inc.
6 On the left, click Customize Alert / Symptom and disable all the alert denitions except the
new Acct VM CPU early warning alert.
a In the Alert Denitions area, click Actions and select Select All.
The alerts on the current page are selected.
b Click Actions and select Disable.
The alerts indicate Disabled in the State column.
c Repeat the process on each page of the alerts list.
d Select Acct VM CPU early warning in the list, click Actions and select Enable.
The Acct VM CPU early warning alert is now enabled.
7 On the left, click Apply Policy to Groups and select Accounting VMs and Hosts.
8 Click Save.
You created a policy where the accounting alert denition exists in a custom policy that is applied only to
the virtual machines and hosts for the accounting department.
What to do next
Create an email notication so that you learn about alerts even you when you are not actively monitoring
vRealize Operations Manager. See “Congure Notications for the Department Alert,” on page 63.
Configure Notifications for the Department Alert
To receive an email notication when the accounting alert is generated, rather than relying on your ability to
generally monitor the accounting department objects in vRealize Operations Manager, you create
notication rules.
Creating an email notication when accounting alerts are triggered is an optional process, but it provides
you with the alert even when you are not currently working in vRealize Operations Manager.
Prerequisites
nVerify that you completed the alert denition for this scenario. See “Add Recommendations to the Alert
Denition,” on page 60.
nVerify that standard email outbound alerts are congured in your system. See “Add a Standard Email
Plug-In for vRealize Operations Manager Outbound Alerts,” on page 70.
Procedure
1 In the left pane of vRealize Operations Manager, click the Content icon.
2 Click and click the plus sign to add a notication rule.
3Congure the communication options.
a In the Name text box, type a name similar to Acct Dept VMs or Hosts Alerts.
b From the Select Plug-In Type drop-down menu, select StandardEmailPlugin.
c From the Select Instance drop-down menu, select the standard email instance that is congured to
send messages.
Chapter 3 Customizing How vRealize Operations Manager Monitors Your Environment
VMware, Inc. 63
d In the Recipients text box, type your email address and the addresses of other recipients
responsible for the accounting department alerts. Use a semicolon between recipients.
e Leave the Notify again text box blank.
If you do not provide a value, the email notice is sent only once. This alert is a Risk alert and is
intended as an early warning rather than requiring an immediate response.
You congured the name of the notication when it is sent to you and the method that is used to send
the message.
4 In the Filtering Criteria area, congure the accounting alert notication trigger.
a From the Trigger drop-down menu, select Alert .
b Click Click to select Alert .
c Select Acct VM CPU early warning and click Select.
5 Click Save.
You created a notication rule that sends you and your designated engineers an email message when this
alert is generated for your accounting department alert denition.
What to do next
Create a dashboard with alert-related widgets so that you can monitor alerts for the accounting object
group. See “Create a Dashboard to Monitor Department Objects,” on page 64.
Create a Dashboard to Monitor Department Objects
To monitor all the alerts related to the accounting department object group, you create a dashboard that
includes the alert list and other widgets. The dashboard provides the alert data in a single location for all
related objects.
Creating a dashboard to monitor the accounting virtual machines and related hosts is an optional process,
but it provides you with a focused view of the accounting object group alerts and objects.
Prerequisites
Create an object group for the accounting department virtual machines and related objects. See “Create a
Custom Accounting Department Group,” on page 61.
Procedure
1 In the left pane of vRealize Operations Manager, click the Content icon and click Dashboards.
2 Click Add.
3 In the Dashboard Conguration denition area, type a tab name similar to Accounting VMs and Hosts
and congure the layout options.
4 Click Widget List and drag the following widgets to the workspace.
nAlert List
n
nHealth
nRisk
nTop Alerts
vRealize Operations Manager Customization and Administration Guide
64 VMware, Inc.
nAlert Volume
The blank widgets are added to the workspace. To change the order in which they appear, you can drag
them to a dierent location in the workspace.
5 On the Alert List widget title bar, click Edit Widget and congure the seings.
a In the Title text box, change the title to Acct Dept Alert List.
b For the Refresh Content option, select On.
c Type Accounting in the Search text box and click Search.
The Accounting value corresponds to the name of the object group for the accounting department
virtual machines and related hosts.
d In the ltered resource list, select the Accounting VMs and Hosts group.
The Accounting VMs and Hosts group is identied in the Selected Resource text box.
e Click OK.
The Acct Dept Alert List is now congured to display alerts for the Accounting VMs and Hosts group
objects.
6 Click Widget Interactions and congure the following interactions.
a For Acct Dept Alert List, leave the selected resources blank.
b For Top Alerts, Health, Risk, Eciency, and Alert Volume select Acct Dept Alert List from the
Selected Resources drop-down menu.
c Click Apply Interactions.
With the widget interaction congured in this way, the select alert in the Acct Dept Alert List is the
source for the data in the other widgets. When you select an alert in the alert list, the Health, Risk, and
Eciency widgets display alerts for that object, Top Alerts displays the topic issues aecting the health
of the object, and Alert Volume displays an alert trend chart.
7 Click Save.
You created a dashboard that displays the alerts related to the accounting virtual machines and hosts group,
including the Risk alert you created.
Defining Symptoms for Alerts
Symptoms are conditions that indicate problems in your environment. You dene symptoms that you add
to alert denitions so that you know when a problem occurs with your monitored objects.
As data is collected from your monitored objects, the data is compared to the dened symptom condition. If
the condition is true, then the symptom is triggered.
You can dene symptoms based on metrics and super metrics, properties, message events, fault events, and
metric events.
Dened symptoms in your environment are managed in the Symptom Denitions. When the symptoms that
are added to an alert denition are triggered, they contribute to a generated alert. Symptoms that are not
added to an alert denition are still evaluated and if the condition is evaluated as true, appear on the Alert
Details Symptom tab on the Troubleshooting tab.
Define Symptoms to Cover All Possible Severities and Conditions
Use a series of symptoms to describe incremental levels of concern. For example, Volume nearing capacity
limit might have a severity value of Warning while Volume reached capacity limit might have a severity
level of Critical. The rst symptom is not an immediate threat. The second symptom is an immediate threat.
Chapter 3 Customizing How vRealize Operations Manager Monitors Your Environment
VMware, Inc. 65
About Metrics and Super Metrics Symptoms
Metric and super metric symptoms are based on the operational or performance values that
vRealize Operations Manager collects from target objects in your environment. You can congure the
symptoms to evaluate static thresholds or dynamic thresholds.
You dene symptoms based on metrics so that you can create alert denitions that let you know when the
performance of an object in your environment is adversely aected.
Static Thresholds
Metric symptoms that are based on a static threshold compare the currently collected metric value against
the xed value you congure in the symptom denition.
For example, you can congure a static metric symptom where, when the virtual machine CPU workload is
greater than 90, a critical symptom is triggered.
Dynamic Thresholds
Metric symptoms that are based on dynamic thresholds compare the currently collected metric value against
the trend identied by vRealize Operations Manager, evaluating whether the current value is above, below,
or generally outside the trend.
For example, you can congure a dynamic metric symptom where, when the virtual machine CPU
workload is above the trended normal value, a critical symptom is triggered.
Property Symptoms
Property symptoms are based on the conguration properties that vRealize Operations Manager collects
from the target objects in your environment.
You dene symptoms based on properties so that you can create alert denitions that let you know when
changes to properties on your monitored objects can aect the behavior of the objects in your environment.
Message Event Symptoms
Message event symptoms are based on events received as messages from a component of
vRealize Operations Manager or from an external monitored system through the system's REST API. You
dene symptoms based on message events to include in alert denitions that use these symptoms. When the
congured symptom condition is true, the symptom is triggered.
The adapters for the external monitored systems and the REST API are inbound channels for collecting
events from external sources. Adapters and the REST server both run in the vRealize Operations Manager
system. The external system sends the messages, and vRealize Operations Manager collects them.
You can create message event symptoms for the supported event types. The following list is of supported
event types with example events.
nSystem Performance Degradation. This message event type corresponds to the
EVENT_CLASS_SYSTEM and EVENT_SUBCLASS_PERFORM_DEGRADATION type and subtype in
the vRealize Operations Manager API SDK.
nChange. The VMware adapter sends a change event when the CPU limit for a virtual machine is
changed from unlimited to 2 GHz. You can create a symptom to detect CPU contention issues as a
result of this conguration change. This message event type corresponds to the
EVENT_CLASS_CHANGE and EVENT_SUBCLASS_CHANGE type and subtype in the
vRealize Operations Manager API SDK.
vRealize Operations Manager Customization and Administration Guide
66 VMware, Inc.
nEnvironment Down. The vRealize Operations Manager adapter sends an environment down event
when the collector component is not communicating with the other components. You can create a
symptom that is used for internal health monitoring. This message event type corresponds to the
EVENT_CLASS_ENVIRONMENT and EVENT_SUBCLASS_DOWN type and subtype in the
vRealize Operations Manager API SDK.
nNotication. This message event type corresponds to the EVENT_CLASS_NOTIFICATION and
EVENT_SUBCLASS_EXTEVENT type and subtype in the vRealize Operations Manager API SDK.
Fault Symptoms
Fault symptoms are based on events published by monitored systems. vRealize Operations Manager
correlates a subset of these events and delivers them as faults. Faults are intended to signify events in the
monitored systems that aect the availability of objects in your environment. You dene symptoms based
on faults to include in alert denitions that use these symptoms. When the congured symptom condition is
true, the symptom is triggered.
You can create fault symptoms for the supported published faults. Some object types have multiple fault
denitions from which to choose, while others have no fault denitions.
If the adapter published fault denitions for an object type, you can select one or more fault events for a
given fault while you dene the symptom. The symptom is triggered if the fault is active because of any of
the chosen events. If you do not select a fault event, the symptom is triggered if the fault is active because of
a fault event.
Metric Event Symptoms
Metric event symptoms are based on events communicated from a monitored system where the selected
metric violates a threshold in a specied manner. The external system manages the threshold, not
vRealize Operations Manager.
Metric event symptoms are based on conditions reported for selected metrics by an external monitored
system, as compared to metric symptoms, which are based on thresholds that vRealize Operations Manager
is actively monitoring.
The metric event thresholds, which determine whether the metric is above, below, equal to, or not equal to
the threshold set on the monitored system, represent the type and subtype combination that is specied in
the incoming metric event.
nAbove Threshold. Corresponds to type and subtype constants EVENT_CLASS_HT and
EVENT_SUBCLASS_ABOVE dened in the vRealize Operations Manager API SDK.
nBelow Threshold. Corresponds to type and subtype constants EVENT_CLASS_HT and
EVENT_SUBCLASS_BELOW dened in the vRealize Operations Manager API SDK.
nEqual Threshold. Corresponds to type and subtype constants EVENT_CLASS_HT and
EVENT_SUBCLASS_EQUAL dened in the vRealize Operations Manager API SDK.
nNot Equal Threshold. Corresponds to type and subtype constants EVENT_CLASS_HT and
EVENT_SUBCLASS_NOT_EQUAL dened in the vRealize Operations Manager API SDK.
Viewing Actions Available in vRealize Operations Manager
Actions are the ability to update objects or read data about objects in monitored systems, and are commonly
provided in vRealize Operations Manager as part of a solution. The actions added by solutions are available
from the object Actions menu, list and view menus, including some dashboard widgets, and can be added to
alert denition recommendations.
The possible actions include read actions and update actions.
The read actions retrieve data from the target objects.
Chapter 3 Customizing How vRealize Operations Manager Monitors Your Environment
VMware, Inc. 67
The update actions modies the target objects. For example, you can congure an alert denition to notify
you when a virtual machine is experiencing memory issues. Add an action in the recommendations that
runs the Set Memory for Virtual Machine action. This action increases the memory and resolves the likely
cause of the alert.
To see or use the actions for your vCenter Server objects, you must enable actions in the vCenter Adapter for
each monitored vCenter Server instance. Actions can only be viewed and accessed if you have the required
permissions.
Defining Recommendations for Alert Definitions
Recommendations are instructions to your users who are responsible for responding to alerts. You add
recommendations to vRealize Operations Manager alerts so that your users can maintain the objects in your
environment at the required levels of performance.
Recommendations provide your network engineers or virtual infrastructure administrators with
information to resolve alerts.
Depending on the knowledge level of your users, you can provide more or less information, including the
following options, in any combination.
nOne line of instruction.
nSteps to resolve the alert on the target object.
nHyperlink to a Web site, runbook, wiki, or other source.
nAction that makes a change on the target object.
When you dene an alert, provide as many relevant action recommendations as possible. If more than one
recommendation is available, arrange them in priority order so that the solution with the lowest eect and
highest eectiveness is listed rst. If no action recommendation is available, add text recommendations. Be
as precise as possible when describing what the administrator should do to x the alert.
Creating and Managing vRealize Operations Manager Alert Notifications
When alerts are generated in vRealize Operations Manager, they appear in the alert details and object
details, but you can also congure vRealize Operations Manager to send your alerts to outside applications
using one or more outbound alert options.
You congure notication options to specify which alerts are sent out for the Standard Email, REST, SNMP,
and Log File outbound alert plug-ins. For the other plug-in types, all the alerts are sent when the target
outbound alert plug-in is enabled.
The most common outbound alert plug-in is the Standard Email plug-in. You congure the Standard Email
plug-in to send notications to one or more users when an alert is generated that meets the criteria you
specify in the notication seings.
List of Outbound Plug-Ins in vRealize Operations Manager
vRealize Operations Manager provides outbound plug-ins. This list includes the name of the plug-in and
whether you can lter the outbound data based on your notication seings.
If the plug-in supports conguring notication rules, then you can lter the messages before they are sent to
the target system. If the plug-in does not support notications, all messages are sent to the target system,
and you can process them in that application.
If you installed other solutions that include other plug-in options, they appear as a plug-in option with the
other plug-ins.
Messages and alerts are sent only when the plug-in is enabled.
vRealize Operations Manager Customization and Administration Guide
68 VMware, Inc.

Table 3‑2. Notification Support for Outbound Plug-Ins
Outbound Plug-In Configure Notification Rules
Automated Action Plug-in No
The Automated Action plug-in is enabled by default. If automated actions stop working,
check the Automated Action plug-in and enable it if necessary. If you edit the Automated
Action plug-in, you only need to provide the instance name.
Log File Plug-In Yes
To lter the log le alerts, you can either congure the le named TextFilter.xml or
congure the notication rules.
Smarts SAM Notication
Plug-In
No
REST Notication Plug-In Yes
Network Share Plug-In No
Standard Email Plug-In Yes
SNMP Trap Plug-In Yes
Add Outbound Notification Plug-Ins in vRealize Operations Manager
You add outbound plug-in instances so that you can notify users about alerts or capture alert data outside of
vRealize Operations Manager.
You can congure one or more instances of the same plug-in type if you need to direct alert information to
multiple target systems.
The Automated Action plug-in is enabled by default. If automated actions stop working, check the
Automated Action plug-in and enable it if necessary. If you edit the Automated Action plug-in, you only
need to provide the instance name.
nAdd a Standard Email Plug-In for vRealize Operations Manager Outbound Alerts on page 70
You add a Standard Email Plug-In so that you can use Simple Mail Transfer Protocol (SMTP) to email
vRealize Operations Manager alert notications to your virtual infrastructure administrators, network
operations engineers, and other interested individuals.
nAdd a REST Plug-In for vRealize Operations Manager Outbound Alerts on page 71
You add a REST Plug-In so that you can send vRealize Operations Manager alerts to another REST-
enabled application where you built a REST Web service to accept these messages.
nAdd a Log File Plug-In for vRealize Operations Manager Outbound Alerts on page 73
You add a Log File plug-in when you want to congure vRealize Operations Manager to log alerts to a
le on each of your vRealize Operations Manager nodes. If you installed vRealize Operations Manager
as a multiple node cluster, each node processes and logs the alerts for the objects that it monitors. Each
node logs the alerts for the objects it processes.
nAdd a Network Share Plug-In for vRealize Operations Manager Reports on page 73
You add a Network Share plug-in when you want to congure vRealize Operations Manager to send
reports to a shared location.
nAdd an SNMP Trap Plug-In for vRealize Operations Manager Outbound Alerts on page 74
You add an SNMP Trap plug-in when you want to congure vRealize Operations Manager to log
alerts on an existing SNMP Trap server in your environment.
nAdd a Smarts Service Assurance Manager Notication Plug-In for vRealize Operations Manager
Outbound Alerts on page 75
You add a Smarts SAM Notication plug-in when you want to congure vRealize Operations Manager
to send alert notications to EMC Smarts Server Assurance Manager.
Chapter 3 Customizing How vRealize Operations Manager Monitors Your Environment
VMware, Inc. 69

Add a Standard Email Plug-In for vRealize Operations Manager Outbound Alerts
You add a Standard Email Plug-In so that you can use Simple Mail Transfer Protocol (SMTP) to email
vRealize Operations Manager alert notications to your virtual infrastructure administrators, network
operations engineers, and other interested individuals.
Prerequisites
Ensure that you have an email user account that you can use as the connection account for the alert
notications. If you choose to require authentication, you must also know the password for this account.
Procedure
1 In the left pane of vRealize Operations Manager, click the Administration icon.
2 Click Outbound and click the plus sign to add a plug-in.
3 From the Plug-In Type drop-down menu, select Standard Email Plugin.
The dialog box expands to include your SMTP seings.
4 Enter an Instance Name.
This is the name that identies this instance that you select when you later congure notication rules.
5Congure the SMTP options appropriate for your environment.
Option Description
Use Secure Connection Enables secure communication encryption using SSL/TLS. If you select this
option, you must select a method in the Secure Connection Type drop-
down menu.
Requires Authentication Enables authentication on the email user account that you use to congure
this SMTP instance. If you select this option, you must provide a password
for the user account.
SMTP Host URL or IP address of your email host server.
SMTP Port Default port SMTP uses to connect with the server.
Secure Connection Type Select either SSL/TLS as the communication encryption method used in
your environment from the drop-down menu. You must select a
connection type if you select Use Secure Connection.
User Name Email user account that is used to connect to the email server.
Password Password for the connection user account. A password is required if you
select Requires Authentication.
Sender Email Address Email address that appears on the notication message
Sender Name Displayed name for the sender email address.
6 Click Save.
7 To start the outbound alert service for this plug-in, select the instance in the list and click Enable on the
toolbar.
This instance of the standard email plug-in for outbound SMTP alerts is congured and running.
What to do next
Create notication rules that use the standard email plug-in to send a message to your users about alerts
requiring their aention. See “User Scenario: Create a vRealize Operations Manager Email Alert
Notication,” on page 77.
vRealize Operations Manager Customization and Administration Guide
70 VMware, Inc.
Add a REST Plug-In for vRealize Operations Manager Outbound Alerts
You add a REST Plug-In so that you can send vRealize Operations Manager alerts to another REST-enabled
application where you built a REST Web service to accept these messages.
The REST Plug-In supports enabling an integration, it does not provide an integration. Depending on your
target application, you might need an intermediary REST service or some other mechanism that will
correlate the alert and object identiers included in the REST alert output with the identiers in your target
application.
Determine which content type you are delivering to your target application. If you select application/json,
the body of the POST or PUT calls that are sent have the following format. Sample data is included.
{
"startDate":1369757346267,
"criticality":"ALERT_CRITICALITY_LEVEL_WARNING",
"Risk":4.0,
"resourceId":"sample-object-uuid",
"alertId":"sample-alert-uuid",
"status":"ACTIVE",
"subType":"ALERT_SUBTYPE_AVAILABILITY_PROBLEM",
"cancelDate":1369757346267,
"resourceKind":"sample-object-type",
"alertName":"Invalid IP Address for connected Leaf Switch",
"attributeKeyID":5325,
"Efficiency":1.0,
"adapterKind":"sample-adapter-type",
"Health":1.0,
"type":"ALERT_TYPE_APPLICATION_PROBLEM",
"resourceName":"sample-object-name",
"updateDate":1369757346267,
"info":"sample-info"
}
If you select application/xml, the body of the POST or PUT calls that are sent have the following format:
<alert>
<startDate>1369757346267</startDate>
<criticality>ALERT_CRITICALITY_LEVEL_WARNING</criticality>
<Risk>4.0</Risk>
<resourceId>sample-object-uuid</resourceId>
<alertId>sample-alert-uuid</alertId>
<status>ACTIVE</status>
<subType>ALERT_SUBTYPE_AVAILABILITY_PROBLEM</subType>
<cancelDate>1369757346267</cancelDate>
<resourceKind>sample-object-type</resourceKind>
<alertName>Invalid IP Address for connected Leaf Switch</alertName>
<attributeKeyId>5325</attributeKeyId>
<Efficiency>1.0</Efficiency>
<adapterKind>sample-adapter-type</adapterKind>
<Health>1.0</Health>
<type>ALERT_TYPE_APPLICATION_PROBLEM</type>
Chapter 3 Customizing How vRealize Operations Manager Monitors Your Environment
VMware, Inc. 71

<resourceName>sample-object-name</resourceName>
<updateDate>1369757346267</updateDate>
<info>sample-info</info>
</alert>
N If the alert is triggered by a non-metric violation, the attributeKeyID is omied from the REST
output and is not sent.
If the request is processed as POST, for either JSON or XML, the Web service returns an HTTP status code of
201, which indicates the alert was successfully created at the target. If the request is processed as PUT, the
HTTP status code of 202, which indicates the alert was successfully accepted at the target.
Prerequisites
Ensure that you know how and where the alerts sent using the REST plug-in are consumed and processed
in your environment, and that you have the appropriate connection information available.
Procedure
1 In the left pane of vRealize Operations Manager, click the Administration icon.
2 Click Outbound and click the plus sign to add a plug-in.
3 From the Plug-In Type drop-down menu, select Rest Plugin.
The dialog box expands to include your REST seings.
4 Enter an Instance Name.
This is the name that identies this instance that you select when you later congure notication rules.
5Congure the Rest options appropriate for your environment.
Option Description
URL URL to which you are sending the alerts. The URL must support HTTPS.
When an alert is sent to the REST Web server, the plug-in
appends /{alertID} to the POST or PUT call.
User Name User account on the target REST system.
Password User account password.
Content Type Specify the format for the alert output.
napplication/json. Alert data is transmied using JavaScript Object
Notation as human-readable text.
napplication/xml. Alert data is transmied using XML that is human-
readable and machine-readable content.
Certificate thumbprint Thumbprint for the public certicate for your HTTPS service.
Connection count Limits the number of simultaneous alerts that are sent to the target REST
server. Use this number to ensure that your REST server is not
overwhelmed with requests.
6 Click Save.
7 To start the outbound alert service for this plug-in, select the instance in the list and click Enable on the
toolbar.
This instance of the REST plug-in for outbound alerts is congured and running.
What to do next
Create notication rules that use the REST plug-in to send alerts to a REST-enabled application or service in
your environment. See “User Scenario: Create a vRealize Operations Manager REST Alert Notication,” on
page 78.
vRealize Operations Manager Customization and Administration Guide
72 VMware, Inc.
Add a Log File Plug-In for vRealize Operations Manager Outbound Alerts
You add a Log File plug-in when you want to congure vRealize Operations Manager to log alerts to a le
on each of your vRealize Operations Manager nodes. If you installed vRealize Operations Manager as a
multiple node cluster, each node processes and logs the alerts for the objects that it monitors. Each node logs
the alerts for the objects it processes.
All alerts are added to the log le. You can use other applications to lter and manage the logs.
Prerequisites
Ensure that you have write access to the le system path on the target vRealize Operations Manager nodes.
Procedure
1 In the left pane of vRealize Operations Manager, click the Administration icon.
2 Click Outbound and click the plus sign to add a plug-in.
3 From the Plug-In Type drop-down menu, select Log File.
The dialog box expands to include your log le seings.
4 In the Alert Output Folder text box, enter the folder name.
If the folder does not exist in the target location, the plug-in creates the folder in the target location. The
default target location is: /usr/lib/vmware-vcops/common/bin/.
5 Click Save.
6 To start the outbound alert service for this plug-in, select the instance in the list and click Enable on the
toolbar.
This instance of the log le plug-in is congured and running.
What to do next
When the plug-in is started, the alerts are logged in the le. Verify that the log les are created in the target
directory as the alerts are generated, updated, or canceled.
Add a Network Share Plug-In for vRealize Operations Manager Reports
You add a Network Share plug-in when you want to congure vRealize Operations Manager to send reports
to a shared location.
Prerequisites
Verify that you have read, write, and delete permissions to the network share location.
Procedure
1 In the left pane of vRealize Operations Manager, click the Administration icon.
2 Click Outbound and click the plus sign to add a plug-in.
3 From the Plug-In Type drop-down menu, select Network Share Plug-in.
The dialog box expands to include your plug-in instance seings.
4 Enter an Instance Name.
This is the name that identies this instance that you select when you later congure notication rules.
Chapter 3 Customizing How vRealize Operations Manager Monitors Your Environment
VMware, Inc. 73

5Congure the Network Share options appropriate for your environment.
Option Description
Domain Your shared network domain address.
User Name The domain user account that is used to connect to the network.
Password The password for the domain user account.
Network share root The path to the root folder where you want to save the reports. You can
specify subfolders for each report when you congure the schedule
publication.
You must enter an IP address. For example, \\IP_address\ShareRoot.
You can use the host name instead of the IP address if the host name is
resolved to an IPv4 when accessed from the vRealize Operations Manager
host.
N Verify that the root destination folder exists. If the folder is missing,
the Network Share plug-in logs an error after 5 unsuccessful aempts.
6 Click Test to verify the specied paths, credentials, and permissions.
The test might take up to a minute.
7 Click Save.
The outbound service for this plug-in starts automatically.
8 (Optional) To stop an outbound service, select an instance and click Disable on the toolbar.
This instance of the Network Share plug-in is congured and running.
What to do next
Create a report schedule and congure it to send reports to your shared folder.
Add an SNMP Trap Plug-In for vRealize Operations Manager Outbound Alerts
You add an SNMP Trap plug-in when you want to congure vRealize Operations Manager to log alerts on
an existing SNMP Trap server in your environment.
All ltering of the alerts that are sent as SNMP traps must occur on the destination host.
Prerequisites
Ensure that you have an SNMP Trap server congured in your environment, and that you know the IP
address or host name, port number, and community that it uses.
Procedure
1 In the left pane of vRealize Operations Manager, click the Administration icon.
2 Click Outbound and click the plus sign to add a plug-in.
3 From the Plug-In Type drop-down menu, select SNMP Trap.
The dialog box expands to include your SNMP trap seings.
4 Type an Instance Name.
vRealize Operations Manager Customization and Administration Guide
74 VMware, Inc.

5Congure the SNMP trap seings appropriate to your environment.
Option Description
Destination Host IP address or fully qualied domain name of the SNMP management
system to which you are sending alerts.
Port Port used to connect to the SNMP management system. Default port is 162.
Community Text string that allows access to the statistics. SNMP Community strings
are used only by devices that support SNMPv1 and SNMPv2c protocol.
6 Click Save.
7 To start the outbound alert service for this plug-in, select the instance in the list and click Enable on the
toolbar.
This instance of the SNMP Trap plug-in is congured and running.
What to do next
When the plug-in is started, the alerts are sent to the SNMP server. Verify that the server receives the SNMP
traps.
Add a Smarts Service Assurance Manager Notification Plug-In for vRealize Operations Manager
Outbound Alerts
You add a Smarts SAM Notication plug-in when you want to congure vRealize Operations Manager to
send alert notications to EMC Smarts Server Assurance Manager.
This outbound alert option is useful when you manage the same objects in Server Assurance Manager and
in vRealize Operations Manager, and you added the EMC Smarts management pack and congured the
solution in vRealize Operations Manager. Although you cannot lter the alerts sent to Service Assurance
Manager in vRealize Operations Manager, you can congure the Smarts plug-in to send the alerts to the
Smarts Open Integration server. You then congure the Open Integration server to lter the alerts from
vRealize Operations Manager, and send only those that pass the lter test to the Smarts Service Assurance
Manager service.
Prerequisites
nVerify that you congured the EMC Smarts solution. For documentation regarding EMC Smarts
integration, see hps://solutionexchange.vmware.com/store.
nEnsure that you have the EMC Smarts Broker and Server Assurance Manager instance host name or IP
address, user name, and password.
Procedure
1 In the left pane of vRealize Operations Manager, click the Administration icon.
2 Click Outbound and click the plus sign to add a plug-in.
3 From the Plug-In Type drop-down menu, select Smarts SAM .
The dialog box expands to include your Smarts seings.
4 Enter an Instance Name.
This is the name that identies this instance that you select when you later congure notication rules.
Chapter 3 Customizing How vRealize Operations Manager Monitors Your Environment
VMware, Inc. 75

5Congure the Smarts SAM notication seings appropriate for your environment.
Option Description
Broker Type the host name or IP address of the EMC Smarts Broker that manages
registry for the Server Assurance Manager instance to which you want the
notications sent.
Broker Username If the Smarts broker is congured as Secure Broker, type the user name for
the Broker account.
Broker Password If the Smarts broker is congured as Secure Broker, type the password for
the Broker user account.
SAM Server Type the host name or IP address of the Server Assurance Manager server
to which you are sending the notications.
User Name Type the user name for the Server Assurance Manager server instance. This
account must have read and write permissions for the notications on the
Smarts server as specied in the SAM Server.
Password Type the password for the Server Assurance Manager server account.
6 Click Save.
7 Modify the Smarts SAM plug-in properties le.
a Open the properties le at: /usr/lib/vmware-vcops/user/plugins/outbound/vcops-smartsalert-
plugin/conf/plugin.properties
b Add the following string to the properties le: #
sendByType=APPLICATION::AVAILABILITY,APPLICATION::PERFORMANCE,APPLICATION::CAPACITY,APPLI
CATION::COMPLIANCE,VIRTUALIZATION::AVAILABILITY,VIRTUALIZATION::PERFORMANCE,VIRTUALIZATIO
N::CAPACITY,VIRTUALIZATION::COMPLIANCE,HARDWARE::AVAILABILITY,HARDWARE::PERFORMANCE,HARDW
ARE::CAPACITY,HARDWARE::COMPLIANCE,STORAGE::AVAILABILITY,STORAGE::PERFORMANCE,STORAGE::CA
PACITY,STORAGE::COMPLIANCE,NETWORK::AVAILABILITY,NETWORK::PERFORMANCE,NETWORK::CAPACITY,N
ETWORK::COMPLIANCE
c Save the properties le.
8 To start the outbound alert service for this plug-in, select the instance in the list and click Enable on the
toolbar.
This instance of the Smarts SAM Notications plug-in is congured and running.
What to do next
In Smarts Service Assurance Manager, congure your Notication Log Console to lter the alerts from
vRealize Operations Manager. To congure the ltering for Service Assurance Manager, see the EMC Smarts
Service Assurance Manager documentation.
Filtering Log File Outbound Messages With the TextFilter.xml File
The log le outbound plug-in in vRealize Operations Manager captures alert data. To lter the log le data,
you can update the TextFilter.xml le to capture only the alerts meeting the lter criteria.
As a vRealize Operations Manager administrator, you want to lter the outbound alert log les based on the
alert type and the subtype.
The lters are congured in the TextFile.xml le. The le is in one of the following locations, depending on
your operating system:
nvApp or Linux. /usr/lib/vmware-vcops/user/plugins/outbound/vcops-textfile-plugin/conf
nWindows. C:\vmware\vcenter-operations\vmware-vcops\user\plugins\outbound\vcops-textfile-
plugin\conf
vRealize Operations Manager Customization and Administration Guide
76 VMware, Inc.
In the le, use the following format for the lter rule.
<FilterRule name="AlertType">
<AlertTypes>
<AlertType key="AlertType1:AlertSubType1 " />
<AlertType key="AlertType2:AlertSubType2 " />
</AlertTypes>
</FilterRule>
For example, the rule to lter based on the Application type and Availability subtype uses this format.
<FilterRule name="AlertType">
<AlertTypes>
<AlertType key="ALERT_TYPE_APPLICATION_PROBLEM:ALERT_SUBTYPE_AVAILABILITY_PROBLEM " />
</AlertTypes>
</FilterRule>
Configuring Notifications
Notications are alert notications that meet the lter criteria in the notication rules before they are sent
outside vRealize Operations Manager. You congure notication rules for the supported outbound alerts so
that you can lter the alerts that are sent to the selected external system.
You use the notications list to manage your rules. You then use the notication rules to limit the alerts that
are sent to the external system. To use notications, the supported outbound alert plug-ins must be added
and running.
With notication rules, you can limit the data that is sent to the following external systems.
nStandard Email. You can create multiple notication rules for various email recipients based on one or
more of the lter selections. If you add recipients but do not add lter selections, all the generated alerts
are sent to the recipients.
nREST. You can create a rule to limit alerts that are sent to the target REST system so that you do not
need to implement ltering on that target system.
nSNMP Trap. You can congure vRealize Operations Manager to log alerts on an existing SNMP Trap
server in your environment.
nLog File. You can congure vRealize Operations Manager to log alerts to a le on each of your
vRealize Operations Manager nodes.
User Scenario: Create a vRealize Operations Manager Email Alert Notification
As a virtual infrastructure administrator, you need vRealize Operations Manager to send email notications
to your advanced network engineers when critical alerts are generated for mmbhost object, the host for
many virtual machines that run transactional applications, where no one has yet taken ownership of the
alert.
Prerequisites
nEnsure that you have at least one alert denition for which you are sending a notication. For an
example of an alert denition, see “Create an Alert Denition for Department Objects,” on page 55.
nEnsure that at least one instance of the standard email plug-in is congured and running. See “Add a
Standard Email Plug-In for vRealize Operations Manager Outbound Alerts,” on page 70.
Procedure
1 In the left pane of vRealize Operations Manager, click the Content icon.
2 Click and click the plus sign to add a notication rule.
3 In the Name text box type a name similar to Unclaimed Critical Alerts for mmbhost.
Chapter 3 Customizing How vRealize Operations Manager Monitors Your Environment
VMware, Inc. 77
4 In the Method area, select Standard Email Plug-In from the drop-down menu, and select the
congured instance of the email plug-in.
5Congure the email options.
a In the Recipients text box, type the email addresses of the members of your advance engineering
team, separating the addresses with a semi-colon (;).
b To send a second notication if the alert is still active after a specied amount of time, type the
number of minutes in the Notify again text box.
c Type number of notications that are sent to users in the Max text box.
6Congure the scope of ltering criteria.
a From the Scope drop-down menu, select Object.
b Click Click to select Object and type the name of the object.
In this example, type mmbhost.
c Locate and select the object in the list, and click Select.
7Congure the Notication Trigger.
a From the Trigger drop-down menu, select Impact.
b From the adjacent drop-down menu, select Health.
8 In the Criticality area, click Critical.
9 Expand the Advanced Filters and from the Alert States drop-down menu, select Open.
The Open state indicates that no engineer or administrator has taken ownership of the alert.
10 Click Save.
You created a notication rule that sends an email message to the members of your advance network
engineering team when any critical alerts are generated for the mmbhost object and the alert is not claimed
by an engineer. This email reminds them to look at the alert, take ownership of it, and work to resolve the
triggering symptoms.
What to do next
Respond to alert email notications. See vRealize Operations Manager User Guide.
User Scenario: Create a vRealize Operations Manager REST Alert Notification
As a virtual infrastructure administrator, you need vRealize Operations Manager to send alerts in JSON or
XML to a REST-enabled application that has REST Web service that accepts these messages. You want only
alerts where the virtualization alerts that aect availability alert types go to this outside application. You can
then use the provided information to initiate a remediation process in that application to address the
problem indicated by the alert.
The notication conguration limits the alerts sent to the outbound alert instance to those matching the
notication criteria.
Prerequisites
nVerify that you have at least one alert denition for which you are sending a notication. For an
example of an alert denition, see “Create an Alert Denition for Department Objects,” on page 55.
nVerify that at least one instance of the REST plug-in is congured and running. See “Add a REST Plug-
In for vRealize Operations Manager Outbound Alerts,” on page 71.
vRealize Operations Manager Customization and Administration Guide
78 VMware, Inc.
Procedure
1 In the left pane of vRealize Operations Manager, click the Content icon.
2 Click and click the plus sign to add a notication rule.
3 In the Name text box type a name similar to Virtualization Alerts for Availability.
4 In the Method area, select REST Plug-In from the drop-down menu, and select the congured instance
of the email plug-in.
5Congure the Notication Trigger.
a From the Trigger drop-down menu, select Alert Type.
b Click Click to select Alert type/subtype and select Virtualization/Hypervisor Alerts Availability.
6 In the Criticality area, click Warning.
7 Expand the Advanced Filters and from the Alert Status drop-down menu, select New.
The New status indicates that the alert is new to the system and not updated.
8 Click Save.
You created a notication rule that sends the alert text to the target REST-enabled system. Only the alerts
where the congured alert impact is Virtualization/Hypervisor Availability and where the alert is
congured as a warning are sent to the target instance using the REST plug-in.
Defining Compliance Standards
Compliance is used to monitor the vCenter Server instances, hosts, virtual machines, distributed port
groups, and distributed switches in your environment to ensure that the seings on your objects meet the
dened standards. You can use vRealize Operations Manager alert denitions to create compliance
standards that notify you when an object does not comply with a required standard.
vRealize Operations Manager includes alerts for VMware vSphere Hardening Guide versions 6.0 and 5.5.
vRealize Operations Manager generates compliance alerts when symptoms trigger on your vCenter Server
instances, hosts, virtual machines, distributed port groups, and distributed switches.
To enforce compliance on virtual machines, vRealize Operations Manager includes several compliance risk
proles. You apply the risk proles to groups of virtual machines based on whether you must ensure a high,
medium, or low level of security in your environment.
nRisk Prole 1 includes all available compliance rules as symptoms, and enforces the highest level of
security for your virtual machines. This prole is enabled by default.
nRisk Prole 2 enforces a medium level of security for your environment, and includes fewer symptoms
than Risk Prole 1. This prole is disabled by default.
nRisk Prole 3 enforces a low level of security, and includes fewer symptoms than Risk Prole 2. This
prole is disabled by default.
All the compliance standards in vRealize Operations Manager, including any standards that you dene, are
based on alert denitions. The generated alerts and symptoms appear as violations to the compliance
standards on the Analysis > Compliance tab for a selected object.
You can nd the vSphere Hardening Guides at hp://www.vmware.com/security/hardening-guides.html.
Chapter 3 Customizing How vRealize Operations Manager Monitors Your Environment
VMware, Inc. 79

The following video is an example of how you can now ensure compliance of your VMware vSphere 6.0 and
5.5 objects, including your vCenter Server instances, ESXi hosts, virtual machines, distributed port groups,
and distributed virtual switches. The compliance alerts include denitions and symptoms, and are based on
the compliance rules in the vSphere Hardening Guides 6.0 and 5.5.
vRealize Operations Manager 6.3 Compliance for vSphere 6.0 Objects
(hp://link.brightcove.com/services/player/bcpid2296383276001?
bctid=ref:video_vrom6.3_compliance_vsphere6_objects)
vRealize Operations Manager Compliance for vSphere 6.0 Objects
To ensure compliance of your vSphere 6.0 and 5.5 objects, vRealize Operations Manager includes
compliance alerts for VMware vSphere Hardening Guide versions 6.0 and 5.5. These hardening guide alerts are
now based on object type.
When you customize a policy to enable the vSphere Hardening Guide alerts, you can enable vSphere 6.0 and
5.5 alerts for the following object types and versions:
nESXi host is violating vSphere Hardening Guide (5.5 and 6.0)
nvCenter Server is violating vSphere Hardening Guide (6.0)
nVirtual machine is violating Risk Prole 1 in vSphere Hardening Guide (5.5 and 6.0)
nVirtual machine is violating Risk Prole 2 in vSphere Hardening Guide (5.5 and 6.0)
nVirtual machine is violating Risk Prole 3 in vSphere Hardening Guide (5.5 and 6.0)
nvSphere Distributed Port Group is violating vSphere Hardening Guide (6.0)
nvSphere Distributed Virtual Switch is violating vSphere Hardening Guide (6.0)
By default, the alert named Virtual machine is violating Risk Profile 1 is the only active alert among
the risk proles. You can congure this prole later, and choose one of the other risk proles.
To determine whether an alert triggered against vSphere Hardening Guide 6.0 or 5.5, you must examine the
underlying symptoms. For example, for the alert named ESXi Host is violating vSphere Hardening Guide,
the following underlying symptoms for the alert include:
nESXi.set-account-lockout - The count failed login aempts before the account is locked out exceeded
maximum (vSphere Hardening Guide 6.0)
nDCUI service is running (vSphere Hardening Guide 5.5)
You can nd the vSphere Hardening Guides at hp://www.vmware.com/security/hardening-guides.html.
Reset Default Content to Ensure Current Compliance Standards for vSphere 6.0
and 5.5 Objects
Alert denitions and symptom denitions now include the compliance standards for both vSphere 6.0 and
5.5. When you upgrade your current version of vRealize Operations Manager, you must select the option to
overwrite alert denitions and symptom denitions.
If you do not overwrite your alert denitions and symptom denitions with the new content provided with
this release, some compliance rules will include the new alert and symptom denitions, while other
compliance rules will continue to use outdated alert and symptom denitions.
vRealize Operations Manager Customization and Administration Guide
80 VMware, Inc.
User Scenario: Ensure Compliance of Your vSphere 6.0 Objects
As the virtual infrastructure administrator for your company, you must ensure that your vSphere 6.0 objects
comply with the compliance rules in the vSphere Hardening Guide. You use the compliance alerts in
vRealize Operations Manager to monitor your objects for violations to your compliance standards. When a
compliance alert triggers on your vCenter Server instance, hosts, virtual machines, distributed port groups,
or distributed switches, you investigate the compliance violation. You must and resolve the violation so that
the violated object continues to meet industry security standards.
You manage and monitor the security of your production, test, and development environments. Your objects
consist of multiple vCenter Server instances, with hosts, virtual machines, distributed port groups, and
distributed switches in each instance.
Your CIO requires that you run SSH on all vCenter Server instances and host machines in your production
and test environments. You monitor all hosts to ensure that they comply with the SSH requirement. You
produce a compliance report each week to prove to your manager and the compliance team that your
objects comply with the implemented security standards.
To enforce and report on the compliance of your vSphere 6.0 objects, you enable the compliance rules in the
vSphere Hardening Guide. Then, you enable the appropriate alerts, and apply a risk prole to your virtual
machines. After vRealize Operations Manager collects the compliance data from your objects, you resolve
any rule violations that occurred, and create a report of the compliance results for your manager and the
compliance team.
The Alert denitions provided with vRealize Operations Manager are based on object types instead of the
specic versions of the hardening guides. To use these alerts, you no longer must create a custom group and
apply the policy to that group.
Some alert denitions are common between vSphere 6.0 and vSphere 5.5 objects.
vRealize Operations Manager checks vSphere 6.0 symptoms against 6.0 objects, 5.5 symptoms against 5.5
objects, and a combination of 6.0 and 5.5 symptoms against both versions of the objects.
Prerequisites
Verify that the current version of vRealize Operations Manager is installed and running.
Procedure
1 In vRealize Operations Manager, enable the compliance rules.
a Click Administration, and click Solutions.
b Click the VMware vSphere solution, and click .
c In the Manage Solution dialog box, click Monitoring Goals.
d Under Enable vSphere Hardening Guide Alerts, click Yes and click Save.
e When vRealize Operations Manager reports that the default policy is congured to collect
compliance data on your objects, click OK and click Close.
2 Enable the compliance alert denitions in the default policy.
a Click Policies > Policy Library.
b Click the Default Policy, and click Edit Selected Policy.
c In the Edit Monitoring Policy workspace on the left, click Alert / Symptom .
Chapter 3 Customizing How vRealize Operations Manager Monitors Your Environment
VMware, Inc. 81
d In the lter text box in the Alert Denitions pane, enter hardening.
Several alert denitions appear, which you use to enforce compliance on your objects. Each alert
displays the number of symptoms and the object type to which the alert applies. You can see the
alert denitions for risk proles 1, 2, and 3, which you use to ensure high, medium, or low security
on your virtual machines.
e Click the alert named vCenter is violating vSphere Hardening Guide.
f In the State column, click the down arrow, and select Local.
g To enable compliance alerts on your virtual machines, distributed port groups, and distributed
switches, enable the other alert denitions, and click Save.
3 View the symptom set in the alert denition for the ESXi host.
a Click Content > Alert .
b In the lter text box, enter hardening.
c Click the alert named vCenter is violating vSphere Hardening Guide.
d In the lower pane, locate the alert impact, criticality, and symptom set.
e Scroll through the symptom set and examine the symptoms, which can trigger an alert, for the host.
f Below the symptom set, examine the recommendation to x the problem if this alert triggers on
your host.
g Click the link to the VMware vSphere Hardening Guide.
The Web page opens to the list of VMware vSphere Security Hardening Guides at
hp://www.vmware.com/security/hardening-guides.html.
vRealize Operations Manager Customization and Administration Guide
82 VMware, Inc.
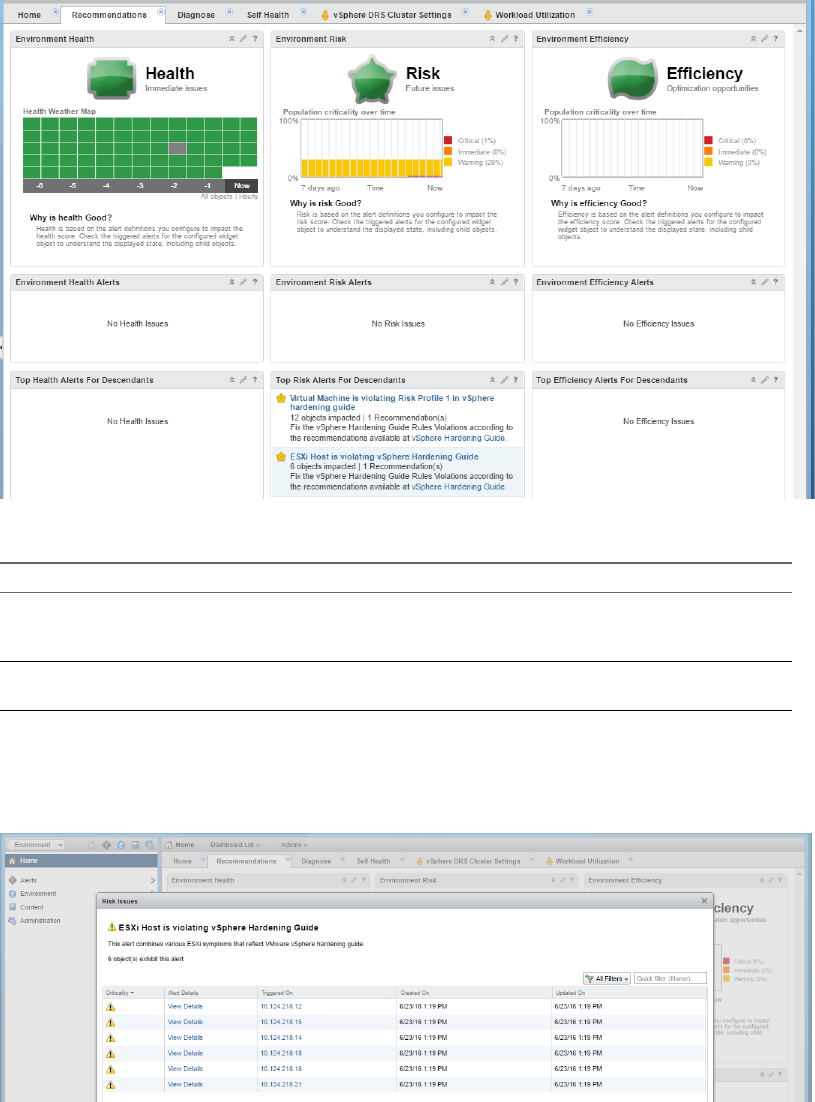
4 Focus in on the alerts for the host in your production vCenter Server instance.
a In the navigation pane, click Home and click the Recommendations tab.
b In the pane titled Top Risk Alerts for Descendants, you see that the following alerts triggered.
Compliance Alert Triggered How to Resolve the Alert
Virtual Machine is violating
Risk Profile 1 in vSphere
Hardening Guide
To resolve the alert on 12 of your virtual machines, click the link to the
vSphere Hardening Guide.
ESXi Host is violating
vSphere Hardening Guide
To resolve the alert on 6 of your hosts, click the link to the vSphere
Hardening Guide.
c Click the link in the compliance alert named ESXi Host is violating vSphere Hardening Guide.
d Examine the dialog box named Risk Issues, which displays the hosts that violated the rules in the
vSphere Hardening Guide.
Chapter 3 Customizing How vRealize Operations Manager Monitors Your Environment
VMware, Inc. 83
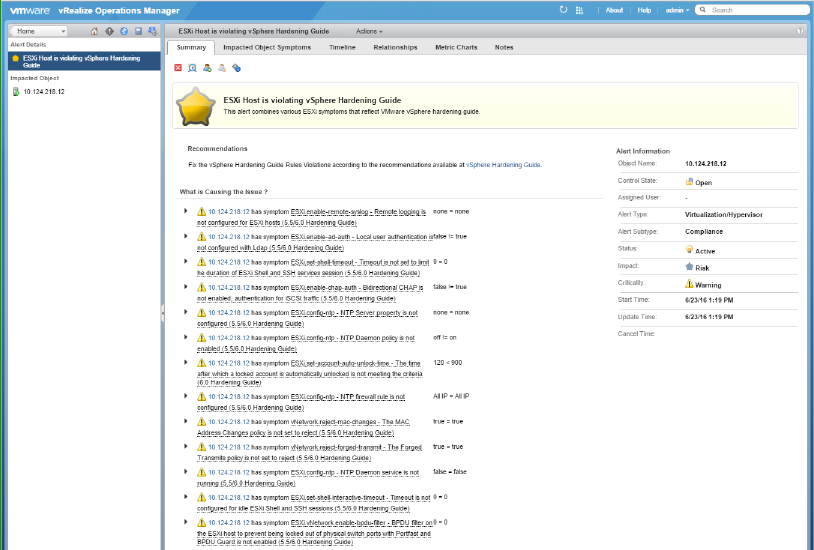
e For the rst host listed, click View Details, and examine the violations on the Summary tab.
f Examine the multiple compliance violations on the host, including SSH violations. By looking at
the description of the SSH rule violations, you see that the rule applies to both vSphere 6.0 and 5.5
objects.
5 To determine when the symptom for the SSH services triggered the compliance alert, click the down-
arrow next to the violated symptom. Then, use the vSphere Hardening Guide to resolve the alert.
6 Run a report for your compliance team.
a In the navigation pane on the left, click your host object.
b Click the Reports tab.
c In the lter text box, enter hardening.
The report named VMware vSphere Hardening Guide - Non-compliance Report appears.
d On the Report Templates tab, click Run Template, and wait for vRealize Operations Manager to
generate the report.
e Click Generated Reports.
The report appears, and provides PDF and CSV versions for you to download.
f In the Download column, click the PDF icon and examine the content in the report.
The non-compliance report appears for the host, and includes the date and time that you ran the
report. It also identies you as the user who ran the report. The report displays the noncompliant
rules that ran on the object and its descendants. In the report, you can see the criticality and status
of the alert, the object name, and the type on which the alert triggered.
g In the Download column, click the CSV icon, and examine the content of the spreadsheet.
The spreadsheet provides an easy way to see a summary of the results, and allows you to import
the data into another application.
vRealize Operations Manager Customization and Administration Guide
84 VMware, Inc.
You have ensured that the compliance rules, are enforced on the objects in your vCenter Server instances,
according to the VMware vSphere Hardening Guide.
What to do next
To examine the compliance alert denitions for your other objects, click Content > Alert .
User Scenario: Define a Compliance Standard for Custom Standards
As a virtual infrastructure administrator, you are responsible for the vCenter Server instances, hosts, virtual
machines, distributed port groups, and distributed switches in your environment. To ensure the compliance
of your vSphere objects, you create a compliance standard based on an alert denition.
In vRealize Operations Manager, you can congure an alert denition to use as a compliance standard. Any
alert denition that you congure with the subtype named Compliance appears on the Compliance tab.
When you create an alert denition as a compliance standard, you add all the relevant symptom denitions
to the alert denition. Each symptom is a rule in the compliance standards. For most alert denitions, you
must avoid adding too many symptoms to the alert denition.
vRealize Operations Manager includes alerts for VMware vSphere Hardening Guide versions 6.0 and 5.5.
You can nd the vSphere Hardening Guides at hp://www.vmware.com/security/hardening-guides.html.
In this scenario, the alert noties you when SSH is not running on the host.
Procedure
1Congure Basic Information for the Host Compliance Standard on page 85
To create an alert denition that is also a compliance standard, you rst congure the name, base
object type, and the alert impact.
2Add Symptoms to the Host Compliance Standard on page 86
You add symptoms and recommendations to the alert denition so that when the host system
compliance alert is generated, the symptoms appear as rules on the Compliance tab.
Configure Basic Information for the Host Compliance Standard
To create an alert denition that is also a compliance standard, you rst congure the name, base object
type, and the alert impact.
The name of the alert is the name of the standard on the Compliance tab.
Procedure
1 In the left pane of vRealize Operations Manager, click the Content icon.
2 Click Alert and click the plus sign to add a denition.
3 Type a name and description.
In this scenario, enter Organization Host Compliance Standards.
4 Click Base Object Type, expand vCenter Adapter in the drop-down menu, and select Host System.
5 Click Alert Impact and congure the metadata for this alert denition.
a From the Impact drop-down menu, select Risk.
b From the Criticality drop-down menu, select Symptom Based.
Chapter 3 Customizing How vRealize Operations Manager Monitors Your Environment
VMware, Inc. 85
c From the Alert Type and Subtype drop-down menu, expand Virtualization/Hypervisor and select
Compliance.
Any alert where you use the Compliance subtype is processed as a compliance standard.
dCongure the Wait Cycle and Cancel Cycle with a value of 1.
What to do next
Add the symptoms that act as the compliance rules. See “Add Symptoms to the Host Compliance Standard,”
on page 86.
Add Symptoms to the Host Compliance Standard
You add symptoms and recommendations to the alert denition so that when the host system compliance
alert is generated, the symptoms appear as rules on the Compliance tab.
Prerequisites
Congure the name, host object type, and alert impact seing for the alert so that it appears as a compliance
standard. See “Congure Basic Information for the Host Compliance Standard,” on page 85.
Procedure
1 In the Alert Denition Workspace window, click Add Symptom and add the SSH
symptom.
a From the Symptom Type drop-down menu, select Metric / Property.
b In the Symptom search text box, enter SSH.
c Drag the symptom named SSH service is running to the symptoms workspace.
If you add multiple symptoms for your own scenario, and you determine that the alert must trigger
when any of the symptoms occur, you would select Any from the drop-down menu named This
symptom set is true when.
2 In the workspace navigation pane, click Add Recommendations, and create a recommendation for the
standard.
a Click the plus sign to add a recommendation.
b Enter a name for the recommendation in the text box.
For example, enter Turn on the SSH service. If you have a local runbook, you can provide a link to
your local instructions.
c Click Save.
d Drag the recommendation to the workspace.
In your own scenario, you can create multiple recommendations for the standard.
3 Click Save.
If the symptom condition becomes true, the symptom is triggered and the compliance alert is generated for
the object. Because the alert denition includes the subtype named Compliance, the generated alert appears
as a compliance standard on the Compliance tab.
What to do next
Review the Compliance tab for standards that indicate that other objects are out of compliance, including
vCenter Server instances, virtual machines, distributed port groups, and distributed switches. See the
vRealize Operations Manager User Guide.
vRealize Operations Manager Customization and Administration Guide
86 VMware, Inc.

Operational Policies
Determine how to have vRealize Operations Manager monitor your objects, and how to notify you about
problems that occur with those objects.
vRealize Operations Manager Administrators assign policies to object groups and applications to support
Service Level Agreements (SLAs) and business priorities. When you use policies with object groups, you
ensure that the rules dened in the policies are quickly put into eect for the objects in your environment.
With policies, you can:
nEnable and disable alerts.
nControl data collections by persisting or not persisting metrics on the objects in your environment.
nCongure the product analytics and thresholds.
nMonitor objects and applications at dierent service levels.
nPrioritize policies so that the most important rules override the defaults.
nUnderstand the rules that aect the analytics.
nUnderstand which policies apply to object groups.
vRealize Operations Manager includes a library of built-in active policies that are already dened for your
use. vRealize Operations Manager applies these policies in priority order.
Create Operational Policies (hp://link.brightcove.com/services/player/bcpid2296383276001?
bctid=ref:video_create_policies_vrom)
When you apply a policy to an object group, vRealize Operations Manager collects data from the objects in
the object group based on the thresholds, metrics, super metrics, aributes, properties, alert denitions, and
problem denitions that are enabled in the policy.
The following examples of policies might exist for a typical IT environment.
nMaintenance: Optimized for ongoing monitoring, with no thresholds or alerts.
nCritical Production: Production environment ready, optimized for performance with sensitive alerting.
nImportant Production: Production environment ready, optimized for performance with medium
alerting.
nBatch Workloads: Optimized to process jobs.
nTest, Staging, and QA: Less critical seings, fewer alerts.
nDevelopment: Less critical seings, no alerts.
nLow Priority: Ensures ecient use of resources.
nDefault Policy: Default system seings.
Chapter 3 Customizing How vRealize Operations Manager Monitors Your Environment
VMware, Inc. 87

Managing and Administering Policies for
vRealize Operations Manager
A policy is a set of rules that you dene for vRealize Operations Manager to use to analyze and display
information about the objects in your environment. You can create, modify, and administer policies to
determine how vRealize Operations Manager displays data in dashboards, views, and reports.
How Policies Relate to Your Environment
vRealize Operations Manager policies support the operational decisions established for your IT
infrastructure and business units. With policies, you control what data vRealize Operations Manager collects
and reports on for specic objects in your environment. Each policy can inherit seings from other policies,
and you can customize and override various analysis seings, alert denitions, and symptom denitions for
specic object types, to support the service Level agreements and business priorities established for your
environment.
When you manage policies, you must understand the operational priorities for your environment, and the
tolerances for alerts and symptoms to meet the requirements for your business critical applications. Then,
you can congure the policies so that you apply the correct policy and threshold seings for your
production and test environments.
Policies dene the seings that vRealize Operations Manager applies to your objects when it collects data
from your environment. vRealize Operations Manager applies policies to newly discovered objects, such as
the objects in an object group. For example, you have an existing VMware adapter instance, and you apply a
specic policy to the group named World. When a user adds a new virtual machine to the vCenter Server
instance, the VMware adapter reports the virtual machine object to vRealize Operations Manager. The
VMware adapter applies the same policy to that object, because it is a member of the World object group.
To implement capacity policy seings, you must understand the requirements and tolerances for your
environment, such as CPU use. Then, you can congure your object groups and policies according to your
environment.
nFor a production environment policy, a good practice is to congure higher performance seings, and
to account for peak use times.
nFor a test environment policy, a good practice is to congure higher utilization seings.
vRealize Operations Manager applies policies in priority order, as they appear on the Active Policies tab.
When you establish the priority for your policies, vRealize Operations Manager applies the congured
seings in the policies according to the policy rank order to analyze and report on your objects. To change
the priority of a policy, you click and drag a policy row. The default policy is always kept at the boom of
the priority list, and the remaining list of active policies starts at priority 1, which indicates the highest
priority policy. When you assign an object to be a member of multiple object groups, and you assign a
dierent policy to each object group, vRealize Operations Manager associates the highest ranking policy
with that object.
Table 3‑3. Configurable Policy Rule Elements
Policy Rule Elements Thresholds, Settings, Definitions
Workload Enable or disable the demand for memory, CPU, and disk space. Enable or disable the rates
for network I/O and datastore I/O, and set the vSphere conguration limit. Congure
symptom thresholds for the Workload badge score.
Anomalies Congure symptom thresholds for the Anomalies badge score.
Faults Congure symptom thresholds for the Faults badge score.
vRealize Operations Manager Customization and Administration Guide
88 VMware, Inc.

Table 3‑3. Configurable Policy Rule Elements (Continued)
Policy Rule Elements Thresholds, Settings, Definitions
Capacity Remaining and
Time Remaining
Enable or disable the demand and allocation for memory, CPU, and disk space. Enable or
disable the rates for network I/O and datastore I/O, and set the vSphere conguration limit.
Account for peak times, account for commied projects, which aect the time remaining,
and set the provisioning time buer. Congure thresholds for the Capacity and Time
Remaining badge scores.
Stress Enable or disable the demand for memory and CPU. Enable or disable the rates for network
I/O and datastore I/O, and set the vSphere conguration limit. Congure symptom
thresholds for the stress badge score.
Reclaimable Capacity Set the recommended oversize percentage, and the idle and powered o time percentages.
Congure symptom thresholds for the Reclaimable Capacity badge score.
Density Congure symptom thresholds for the Density badge score.
Time Track the use of objects, and select the maintenance schedule.
Aributes An aribute is a collectible data component. You can enable or disable metric, property, and
super metric aributes for collection, and set aributes as key performance indicators (KPIs).
A KPI is the designation of an aribute that indicates that the aribute is important in your
own environment.
vRealize Operations Manager treats KPIs dierently from other aributes. Threshold
violations by a KPI generate dierent types of alerts from non-KPI aributes.
When a KPI violates a threshold, vRealize Operations Manager examines the events that
preceded the violation. If it nds enough related information, vRealize Operations Manager
captures the set of events that preceded the violation as a ngerprint. If it nds a similar
series of events in the future, it can issue a predictive alert warning that the KPI violation is
likely to occur.
Alert Denitions Enable or disable combinations of symptoms and recommendations to identify a condition
that classies as a problem.
Symptom Denitions Enable or disable test conditions on properties, metrics, or events.
Privileges To Create, Modify, and Prioritize Policies
You must have privileges to access specic features in the vRealize Operations Manager user interface. The
roles associated with your user account determine the features you can access and the actions you can
perform.
To set the policy priority, on the Active Policies tab, click the policy row and drag it to place it at the desired
priority in the list. The priority for the Default Policy is always designated with the leer D.
How Upgrades Affect Your Policies
If you upgrade vRealize Operations Manager from a previous version, you must analyze your existing
policies and modify the seings to optimize them for your current environment. If you apply the policies
used with a previous version of vRealize Operations Manager, the policy seings remain unaltered.
Policy Decisions and Objectives
Implementing policy decisions in vRealize Operations Manager is typically the responsibility of the
Infrastructure Administrator or the Virtual Infrastructure Administrator, but users who have privileges can
also create and modify policies.
You must be aware of the policies established to analyze and monitor the resources in your IT infrastructure.
nAs a Virtual Infrastructure Administrator who manages and troubleshoots an IT infrastructure, you
must understand how policies associated with objects aect the scores that appear in
vRealize Operations Manager, so that you can congure the approved policies based on your company
decisions and requirements.
Chapter 3 Customizing How vRealize Operations Manager Monitors Your Environment
VMware, Inc. 89
nIf you are a Network Operations engineer, you must understand how policies aect the data that
vRealize Operations Manager reports on objects, and which policies assigned to objects report alerts
and issues.
nIf you are the person whose role is to recommend an initial setup for policies, you typically edit and
congure the policies in vRealize Operations Manager.
nIf your primary role is to assess problems that occur in your environment, but you do not have the
responsibility to change the policies, you must still understand how the policies applied to objects aect
the data that appears in vRealize Operations Manager. For example, you might need to know which
policies apply to objects that are associated with particular alerts.
nIf you are a typical application user who receives reports from vRealize Operations Manager, you must
have a high-level understanding of the operational policies so that you can understand the reported
data values.
Default Policy in vRealize Operations Manager
The default policy is a set of rules that applies to the majority of your objects.
The Default policy appears on the Active Policies tab, and is marked with the leer D in the Priority
column. The Default policy can apply to any number of objects.
The Default policy always appears at the boom in the list of policies, even if that policy is not associated
with an object group. When an object group does not have a policy applied, vRealize Operations Manager
associates the Default policy with that group.
A policy can inherit the Default policy seings, and those seings can apply to various objects under several
conditions.
The policy that is set to Default always takes the lowest priority. If you aempt to set two policies as the
Default policy, the rst policy that you set to Default is initially set to the lowest priority. When you set the
second policy to Default, that policy then takes the lowest priority, and the earlier policy that you set to
Default is set to the second lowest priority.
You can use the Default policy as the base policy to create your own custom policy. You modify the default
policy seings to create a policy that meets your analysis and monitoring needs. When you start with the
Default policy, your new policy inherits all of the seings from the Default base policy. You can then
customize your new policy and override these seings.
The data adapters and solutions installed in vRealize Operations Manager provide a collective group of base
seings that apply to all objects. In the policy navigation tree on the Policy Library tab, these seings are
called Base Seings. The Default policy inherits all of the base seings by default.
Custom Policies
You can customize the default policy and base policies included with vRealize Operations Manager for your
own environment. You can then apply your custom policy to groups of objects, such as the objects in a
cluster, or virtual machines and hosts, or to a group that you create to include unique objects and specic
criteria.
You must be familiar with the policies so that you can understand the data that appears in the user interface,
because policies drive the results that appear in the vRealize Operations Manager dashboards, views, and
reports.
To determine how to customize operational policies and apply them to your environment, you must plan
ahead. For example:
nMust you track CPU allocation? If you overallocate CPU, what percentage must you apply to your
production and test objects?
nWill you overallocate memory or storage? If you use High Availability, what buers must you use?
vRealize Operations Manager Customization and Administration Guide
90 VMware, Inc.
nHow do you classify your logically dened workloads, such as production clusters, test or development
clusters, and clusters used for batch workloads? Or, do you include all clusters in a single workload?
nHow do you capture peak use times or spikes in system activity? In some cases, you might need to
reduce alerts so that they are meaningful when you apply policies.
When you have privileges applied to your user account through the roles assigned, you can create and
modify policies, and apply them to objects. For example:
nCreate a policy from an existing base policy, inherit the base policy seings, then override specic
seings to analyze and monitor your objects.
nUse policies to analyze and monitor vCenter Server objects and non-vCenter Server objects.
nSet custom thresholds for analysis seings on all object types to have vRealize Operations Manager
report on workload, anomalies, faults, capacity, stress, and so on.
nEnable specic aributes for collection, including metrics, properties, and super metrics.
nEnable or disable alert denitions and symptom denitions in your custom policy seings.
nApply the custom policy to object groups.
When you use an existing policy to create a custom policy, you override the policy seings to meet your own
needs. You set the allocation and demand, the overcommit ratios for CPU and memory, and the thresholds
for capacity risk and buers. To allocate and congure what your environment is actually using, you use the
allocation model and the demand model together. Depending on the type of environment you monitor, such
as a production environment versus a test or development environment, whether you over allocate at all
and by how much depends on the workloads and environment to which the policy applies. You might be
more conservative with the level of allocation in your test environment and less conservative in your
production environment.
vRealize Operations Manager applies policies in priority order, as they appear on the Active Policies tab.
When you establish the priority for your policies, vRealize Operations Manager applies the congured
seings in the policies according to the policy rank order to analyze and report on your objects. To change
the priority of a policy, you click and drag a policy row. The default policy is always kept at the boom of
the priority list, and the remaining list of active policies starts at priority 1, which indicates the highest
priority policy. When you assign an object to be a member of multiple object groups, and you assign a
dierent policy to each object group, vRealize Operations Manager associates the highest ranking policy
with that object.
Your policies are unique to your environment. Because policies direct vRealize Operations Manager to
monitor the objects in your environment, they are read-only and do not alter the state of your objects. For
this reason, you can override the policy seings to ne-tune them until vRealize Operations Manager
displays the results that are meaningful and that aect for your environment. For example, you can adjust
the capacity buer seings in your policy, and then view the data that appears in the dashboards to see the
eect of the policy seings.
Policies Provided with vRealize Operations Manager
vRealize Operations Manager includes sets of policies that you can use to monitor your environment, or as
the starting point to create your own policies.
Verify that you are familiar with the policies provided with vRealize Operations Manager so that you can
use them in your own environment, and to include seings in new policies that you create.
Where You Find the Policies Provided with vRealize Operations Manager Policies
Click Administration, click Policies, click the Policy Library tab. To see the policies provided with
vRealize Operations Manager, expand the Base Seings policy.
Chapter 3 Customizing How vRealize Operations Manager Monitors Your Environment
VMware, Inc. 91

Policies That vRealize Operations Manager Includes
All policies exist under the Base Seings, because the data adapters and solutions installed in your
vRealize Operations Manager instance provide a collective group of base seings that apply to all objects. In
the policy navigation tree on the Policy Library tab, these seings are called Base Seings.
The Base Seings policy is the umbrella policy for all other policies, and appears at the top of the policy list
in the policy library. All of the other policies reside under the Base Seings, because the data adapters and
solutions installed in your vRealize Operations Manager instance provide a collective group of base seings
that apply to all objects.
The Cong Wizard Based Policy set includes policies provided with vRealize Operations Manager that you
use for specic seings on objects to report on your objects. The Cong Wizard Based Policy set includes
several types of policies:
nCapacity Management policies for Network I/O and Storage I/O
nEciency alerts policies for infrastructure objects and virtual machines
nHealth alerts policies for infrastructure objects and virtual machines
nOvercommit policies for CPU and Memory
nRisk alerts policies for infrastructure objects and virtual machines
The Default Policy includes a set of rules that applies to the majority of your objects.
The VMware Management Policies set includes policies that you use for your type of environment, such as
production as opposed to test and development. These policies contain seings that monitor for peak
periods, batch and interactive workloads, and demand and allocation models. The VMware Management
Policies set provided with vRealize Operations Manager include the following policies:
Table 3‑4. Functions of VMware Management Policies
VMware Management Policy What it does
VMware Excludes over-sized analysis Does not calculate reclaimable capacity from oversized
virtual machines
VMware Optimized for 15-minute peak periods Congured to cause capacity alerts for workloads that
spike for 15 minutes.
VMware Optimized for 30-minute peak periods Congured to cause capacity alerts for workloads that
spike for 30 minutes.
VMware Policy for Batch workloads Optimized for batch workloads that run less than four
hours.
VMware Policy for Interactive workloads Congured to be sensitive toward interactive workloads,
such as a desktop or Web server, based on 15-minute peaks
with large buers.
VMware Production Policy (Demand only) Optimized for production loads, without using allocation
limits, to obtain the most capacity.
VMware Production Policy (with Allocation) Optimized for production loads that require the demand
and allocation capacity models.
VMware Production Policy (without Allocation) Optimized for production loads that require demand
capacity models, and provides the highest overcommit
without contention.
VMware Test and Dev Policy (without Allocation). Optimized for Dev and Test environments to maximize
capacity without causing signicant contention, because it
does not include capacity planning at the virtual machine
level.
vRealize Operations Manager Customization and Administration Guide
92 VMware, Inc.
User Scenario: Create a Custom Operational Policy for a vSphere Production
Environment
As a system administrator of vRealize Operations Manager, you are responsible for ensuring that the objects
in your vSphere environment conform to specic policies. You must ensure that your objects have enough
memory and CPU to support your Test, Development, and Production environments.
Large IT environments might include four to six production environments that are organized according to
object types, with a minor policy applied to each area. These large environments typically include a default
policy, a single production policy that applies to the entire environment, and individual policies for
dedicated areas.
You typically apply a default policy to most of the objects in your environment. To have
vRealize Operations Manager monitor and analyze dedicated groups of objects, you create a separate policy
for each object group, and make only minor changes in the seings for that policy. For example, you might
apply a default operational policy for all of the objects in your vSphere production environment, but you
also need to closely track the health and risk of virtual SQL Server instances, including their capacity levels.
To have vRealize Operations Manager analyze only the virtual SQL Server instances, and to monitor them,
you create a separate, dedicated policy and apply that policy to that group of objects. The seings in the
policy that you create to monitor the virtual SQL Server instances diers only slightly from the main
production policy.
This scenario shows you how to use multiple policies to analyze and monitor specic objects, so that you
can manage them to ensure continuous operation. In this scenario, your vSphere production environment is
one part of your overall production environment. You must create a custom operational policy to monitor
the virtual SQL Server objects in your vSphere production environment.
Prerequisites
nUnderstand the purpose of using a policy. See “Managing and Administering Policies for vRealize
Operations Manager,” on page 88.
nVerify that your vRealize Operations Manager instance is working properly.
nVerify that your vRealize Operations Manager instance includes the Default Policy and one or more
other policies. See “Default Policy in vRealize Operations Manager,” on page 90.
nUnderstand the sections and elements in the policy, such as the aributes, alert and symptom
denitions, and how the policy inherits seings from the base policies that you select. See “Policy
Workspace in vRealize Operations Manager,” on page 109.
nUnderstand the analysis seings in the policy, such as capacity remaining and stress on hosts and
virtual machines, and the actions used to override the seings inherited from the base policies. See the
vRealize Operations Manager Information Center.
Procedure
1Determine the vSphere Operational Requirements on page 94
You must continuously monitor the capacity levels of your virtual SQL Server machines, and have
vRealize Operations Manager notify you about any degradation in the performance of these objects.
You want vRealize Operations Manager to notify you 60 days before these objects begin to experience
problems with their capacity levels.
2Create a Policy to Meet vSphere Operational Needs on page 95
You will create an operational policy for your virtual SQL Server instances, where only these seings
dier from the main production policy. In this policy, you change the memory and CPU seings for
specic objects. You then congure vRealize Operations Manager to send alerts to you when the
performance degrades on your virtual SQL Servers.
Chapter 3 Customizing How vRealize Operations Manager Monitors Your Environment
VMware, Inc. 93
3Congure the Custom Policy Seings to Analyze and Report on vSphere Objects on page 97
You use dierent policy requirements for your Development, Test, and Production environments so
that you can congure the specic policy seings for vRealize Operations Manager to analyze and
report on your objects, including your virtual SQL Servers.
4Apply the Custom Policy to vSphere Object Groups on page 98
You create an object group type to categorize your virtual SQL Server machines. Then you create an
object group that contains your virtual SQL Server machines, and apply your custom policy to this
group of SQL Server virtual machine objects.
What to do next
After you nish this scenario, you must wait for vRealize Operations Manager to collect data from the
objects in your environment. When a violation of the policy thresholds occur, vRealize Operations Manager
sends an alert to notify you of the problem. If you continuously monitor the state of your objects, you are
always aware of the state of the objects in your environment, and do not need to wait for
vRealize Operations Manager to send alerts.
Create a custom dashboard so that you can monitor the virtual SQL Server objects and address problems
that occur. See “Using Dashboards,” on page 27.
Determine the vSphere Operational Requirements
You must continuously monitor the capacity levels of your virtual SQL Server machines, and have
vRealize Operations Manager notify you about any degradation in the performance of these objects. You
want vRealize Operations Manager to notify you 60 days before these objects begin to experience problems
with their capacity levels.
Your VP of Infrastructure has dened a default operational policy and a main production policy for all of
the objects in your production environment, and your IT Director has applied these policies to your
production environments. Although the main production policy handles the operational monitoring needs
for most of your objects, your manager requires that you be notied about any degradation in the
performance of your production virtual SQL Server machines. You have vRealize Operations Manager
continuously monitor the capacity levels of your virtual SQL Servers so that you can address problems that
occur. You have vRealize Operations Manager notify you 60 days before your virtual SQL Servers begin to
experience problems with their capacity levels.
Your IT department divided objects into dedicated groups that support the Development, Test, and
Production areas. You must use vRealize Operations Manager to continually track and assess the health and
risk of the objects in each of these areas.
In this scenario, you create an operational management policy to analyze, monitor, and troubleshoot your
objects. You then monitor the results in custom dashboards.
You must rst determine the vSphere operational requirements so that you can understand the analysis
seings required for your policy. You can then create a policy to monitor your virtual SQL Server objects,
and congure the custom policy to include minor dierences in the seings for the main production policy.
When you create the custom policy to analyze and monitor your virtual SQL Servers, you congure the
analysis seings so that vRealize Operations Manager analyzes specic objects and report the results in the
dashboards. You then apply the policy to groups of virtual SQL Server objects.
Prerequisites
Verify that the following conditions are met:
nYou understand the context of this scenario. See “User Scenario: Create a Custom Operational Policy for
a vSphere Production Environment,” on page 93.
nA default policy and a main production policy are in eect for all of the objects in your vSphere
production environment.
vRealize Operations Manager Customization and Administration Guide
94 VMware, Inc.
Procedure
1 Determine the operational requirements for your vSphere production environment.
In this scenario, the following requirements will be applied to the environment.
2 Develop a plan to create a custom operational policy that meets the requirements to analyze and
monitor the objects in your environment.
a Ensure that virtual SQL Servers continuously have adequate memory and CPU capacity.
b Ensure that you do not overcommit memory on your production virtual SQL Servers.
c Overcommit only a small percentage of the CPUs on your SQL Servers.
In this scenario, you set the value to 2. In some production environments, a typical value might be
4.
d Ensure that vRealize Operations Manager alerts you if the capacity of your virtual SQL Servers
drops below the dened thresholds.
e Set the Co-Stop value on your production virtual SQL Servers to an acceptable level so that the SQL
Servers do not experience delay because of CPU scheduling contention.
f Determine whether to overcommit compute resources for certain ratios.
After you plan the custom policy requirements, you can implement the policy.
What to do next
Create an operational policy for your virtual SQL Server instances.
Create a Policy to Meet vSphere Operational Needs
You will create an operational policy for your virtual SQL Server instances, where only these seings dier
from the main production policy. In this policy, you change the memory and CPU seings for specic
objects. You then congure vRealize Operations Manager to send alerts to you when the performance
degrades on your virtual SQL Servers.
In this procedure, you create a dedicated policy for a subset of virtual SQL Server objects, and change
seings for the memory and CPU capacity for your virtual SQL Server instances. At this point in the
scenario, your custom policy has only minor dierences from the production policy.
The dierence between the main production policy and your virtual SQL Server policy is in the
overcommitment of compute resources. For the SQL Server policy, you do not overcommit compute
resources. You have the SQL server policy inherit most of the seings from your overall production policy,
except that you change the capacity seings that apply directly to the virtual SQL servers.
After you apply the main production policy to your entire production environment, you create the
dedicated policy, have it inherit seings from the main policy, and make minor changes to seings in the
dedicated policy to adjust the capacity levels for your virtual SQL Servers.
To create this policy, you choose a cluster that contains the data center and the vCenter Server that will use
this policy. You make minor changes for all of the objects, including the cluster, data center, host system,
resource pools, and the virtual machine resource containers.
Prerequisites
Verify that the following conditions are met:
nYou know the vSphere operational requirements. See “Determine the vSphere Operational
Requirements,” on page 94.
nA default policy is in eect for your entire production environment of vSphere objects.
Chapter 3 Customizing How vRealize Operations Manager Monitors Your Environment
VMware, Inc. 95
Procedure
1 In vRealize Operations Manager, select Administration > Policies.
The Active Policies tab displays the current policies in eect.
2 Click the Policy Library tab, and click the plus sign to add a custom policy.
3 In the workspace navigation pane, click Started and dene the basic information for the policy.
a In the Name text box, enter vSphere Production Virtual SQL Servers.
b In the Description text box, enter Analyze capacity of virtual SQL Servers.
c To start with a base policy, select Default Policy from the Start with drop-down menu.
4 View the policy conguration seings.
a In the policy workspace, click Select Base Policies.
b To view the policy conguration for virtual machine objects, click the Show changes for drop-
down menu, click vCenter Adapter - Virtual Machine, and click the Show object type lter.
The Virtual Machine policy conguration appears in the right pane.
c To view the inherited seings, in the Policy Preview pane, click inherited from base
policy.
5 In the workspace navigation, click Analysis .
6 In the workspace navigation, add the following object types to the list so that you can change their
seings.
a Click the drop-down arrow, click vCenter Adapter - Cluster Compute Resource, and click the
lter.
b Click the drop-down arrow, click vCenter Adapter - Data Center, and click the lter.
c Click the drop-down arrow, click vCenter Adapter - Host System, and click the lter.
d Click the drop-down arrow, click vCenter Adapter - Resource Pool, and click the lter.
e Click the drop-down arrow, click vCenter Adapter - Virtual Machine, and click the lter.
The analysis seings for these object types appear in the right pane.
7 On the Cluster Compute Resource bar, click the double arrows to expand the list of analysis seings.
8 Locate Capacity Remaining Time Remaining and click the lock buon to enable changes.
9 In the resource table, set the overcommit for Memory Allocation value to 0 so that
vRealize Operations Manager does not overcommit these objects for your SQL Server policy.
10 In the resource table, set the overcommit ratio for CPU Allocation to 2 so that
vRealize Operations Manager overcommits a 2:1 ratio for CPU allocation on each SQL Server.
11 Repeat Step 7 through Step 10 for each object type that you added to the right pane.
12 Click Save.
You created a policy and made minor changes to seings so that vRealize Operations Manager can analyze
and report on your SQL Server objects.
What to do next
Congure the alert denitions and symptom denitions for your SQL Server policy. You will apply the
policy to your SQL Server object groups.
vRealize Operations Manager Customization and Administration Guide
96 VMware, Inc.
Configure the Custom Policy Settings to Analyze and Report on vSphere Objects
You use dierent policy requirements for your Development, Test, and Production environments so that you
can congure the specic policy seings for vRealize Operations Manager to analyze and report on your
objects, including your virtual SQL Servers.
This scenario presents several typical cases where you might be required to dierentiate between the policy
requirements for Development, Test, and Production environments.
nFor your Development and Test environments, you might not be concerned if the objects in these
environments experience network redundancy loss, but you do care when the objects fail. In this case,
you locate the Physical NIC link state alert denition, double-click the state, and set it to Disabled.
nFor a Test environment, you might not be concerned if your virtual machines demand more memory
and CPU capacity than what is actually congured, because workloads can vary in test environments.
nFor a Production environment, your virtual machines might require more memory than you have
congured, which might cause a problem with the performance and reliability of your production
environment.
In this procedure, you override the symptom denition threshold value for the Co-Stop performance of your
virtual machines.
Prerequisites
Verify that the following conditions are met:
nYou created a custom policy for your virtual SQL Servers. See “Create a Policy to Meet vSphere
Operational Needs,” on page 95.
nYou understand the Co-Stop CPU performance metric for virtual machines. This metric represents the
percentage of time that a virtual machine is ready to run, but experiences delay because of co-virtual
CPU scheduling contention. Co-Stop is one of several performance metrics for virtual machines that
also include Run, Wait, and Ready.
nThe alert denition named Virtual machine has high CPU contention caused by Co-Stop, exists.
nSymptom denitions exist to track the critical, immediate, and warning levels of CPU Co-Stop on the
virtual machines. For example, the critical level for virtual machine CPUs that experience contention
more than 15% of the time is set to 15% by default, as measured by the Co-Stop metric. The default
threshold level for Immediate is 10%, and for warning is 5%. However, in your production policy for
your production virtual machines, you manage the critical level at 3%.
Procedure
1 On the Policy Library tab, locate your vSphere Production Virtual SQL Servers policy, and click the
pencil to edit the policy.
The Edit Monitoring Policy workspace appears.
2 In the workspace, click Override Alert / Symptom .
3 On the Alert Denitions pane, enable the Co-Stop alert denition to notify you about high CPU
contention on your virtual machines.
a In the Object Type drop-down menu, select vCenter Adapter and Virtual Machine.
b In the Search text box, enter stop to display only the alert denitions that relate to the Co-Stop
performance metric for virtual machines.
c For the Alert denition named Virtual machine has high CPU contention caused by Co-Stop,
click the State drop-down menu and click Enabled.
Chapter 3 Customizing How vRealize Operations Manager Monitors Your Environment
VMware, Inc. 97
4 In the Symptom Denitions pane, modify the critical Co-Stop level for virtual machines so that
vRealize Operations Manager triggers an alert based on the threshold level dened for this symptom.
a In the Object Type drop-down menu, click vCenter Adapter and Virtual Machine.
b In the Search text box, enter stop to display the symptom denitions that apply to the Co-Stop
performance metric for virtual machines.
c For the symptom denition named Virtual Machine CPU Co-stop is at Critical level, click the
State drop-down menu and click Enabled.
d Click the Condition drop-down menu, and click Override.
For a production policy, a typical critical threshold value is >3. For a development or test
environment policy, a typical critical threshold value is >10.
e In the Override Symptom Denition Threshold dialog box, enter >3 to change the threshold value,
and click Apply.
5 Modify the immediate Co-Stop level for virtual machines.
a For the symptom denition named Virtual Machine CPU Co-stop is at Immediate level, click
the State drop-down menu and click Enabled.
b Click the Condition drop-down menu, and click Override.
c In the Override Symptom Denition Threshold dialog box, enter >2 to change the threshold value,
and click Apply.
6 Modify the warning Co-Stop level for virtual machines.
a For the symptom denition named Virtual Machine CPU Co-stop is at Warning level, click the
State drop-down menu and click Enabled.
b Click the Condition drop-down menu, and click Override.
c In the Override Symptom Denition Threshold dialog box, enter >1 to change the threshold value,
and click Apply.
7 Click Save to save your policy.
You changed the Co-Stop CPU performance metric for virtual machines to minimize the delay on your SQL
Server virtual machines because of CPU scheduling contention.
What to do next
Create a group type to use to categorize your group of virtual SQL Servers, create an object group that
contains your virtual SQL Servers, and apply the policy to your object group.
Apply the Custom Policy to vSphere Object Groups
You create an object group type to categorize your virtual SQL Server machines. Then you create an object
group that contains your virtual SQL Server machines, and apply your custom policy to this group of SQL
Server virtual machine objects.
To have vRealize Operations Manager analyze your SQL Server machines according to the performance
criteria in your custom policy, you must apply the custom policy to your group of SQL Server objects.
For this scenario, you create a static object group that contains your SQL Server virtual machines. In your
own environment, you might need to create a dynamic object group so that vRealize Operations Manager
discovers new SQL Server instances that become available to analyze and report on.
vRealize Operations Manager Customization and Administration Guide
98 VMware, Inc.
Prerequisites
You congured the custom policy seings for your virtual SQL Server machines. See “Congure the Custom
Policy Seings to Analyze and Report on vSphere Objects,” on page 97.
Procedure
1 To create a group type for your virtual SQL Servers, click Content in the left pane, and click Group
Types.
2 Click the plus sign to add a new object group type, and type vSphere Production Virtual Machines.
You use this group type to categorize your SQL Server virtual machines for analysis.
3 Click Environment in the left pane, and click Custom Groups.
A folder that corresponds to the group type that you just created appears in the list.
4 Click the folder named vSphere Production Virtual Machines, and click the plus sign to add a new
object group.
5 In the New Group dialog box, add your SQL Server virtual machines.
a In the Name text box, type vSphere Production SQL Server Virtual Machines.
b From the Group Type drop-down menu, select vSphere Production Virtual Machines.
c From the Policy drop-down menu, select vSphere Production Virtual SQL Servers.
d In the object type drop-down menu in the Dene Membership Criteria pane, expand vCenter
Adapter and click Virtual Machine.
6 Click OK to save your object group.
After vRealize Operations Manager collects data, the Groups tab displays the status for the health, risk,
and eciency of the virtual machines in the object group.
You created an object type and object group to have vRealize Operations Manager analyze and report on the
status of your SQL Server virtual machines.
What to do next
Create a custom dashboard so that you can view the status of your virtual SQL Servers and address
problems that occur. See “Using Dashboards,” on page 27.
Congure a modeling project that includes capacity planning scenarios for your production virtual SQL
Servers to have vRealize Operations Manager monitor the capacity trends on these objects and notify you 60
days before your virtual SQL Servers experience capacity problems. See the vRealize Operations Manager
Information Center.
Have vRealize Operations Manager report on the CPU use and memory use of your virtual machines on a
regular schedule, and send the reports to you.
Chapter 3 Customizing How vRealize Operations Manager Monitors Your Environment
VMware, Inc. 99
User Scenario: Create an Operational Policy for Production vCenter Server
Datastore Objects
As a Virtual Infrastructure Administrator, you manage the policies used for vRealize Operations Manager to
analyze objects in your environment, collect data from those objects, and display that data in dashboards,
views, and reports. Your IT sta added new datastore objects to your environment, and your responsibility
is to ensure that the new datastore objects adhere to the policy requirements from the VP of Infrastructure
for your test and production environments.
In this scenario, you create a policy to have vRealize Operations Manager monitor the disk space use of your
production datastore objects. You create a group type and custom object group for the datastore objects, and
apply your policy to your object group. After vRealize Operations Manager collects data from the datastore
objects in your environment according to the seings in your policy, you view the collected data and any
potential alerts in the dashboards to conrm whether the disk space use is in compliance for your datastore
objects.
Prerequisites
nUnderstand the purpose of using a policy. See “Managing and Administering Policies for vRealize
Operations Manager,” on page 88.
nVerify that your vRealize Operations Manager instance is working properly.
nVerify that one or more custom object groups and group types exist in your
vRealize Operations Manager instance. See “Managing Custom Object Groups in VMware vRealize
Operations Manager,” on page 21.
nVerify that your vRealize Operations Manager instance includes the default policy and one or more
other policies. See “Default Policy in vRealize Operations Manager,” on page 90.
nUnderstand the sections and elements in the default policy, such as the aributes, alert and symptom
denitions, and how the policy inherits seings from the base policies that you select. See “Policy
Workspace in vRealize Operations Manager,” on page 109.
nUnderstand the analysis seings in the default policy, such as capacity remaining and stress on hosts
and virtual machines, and the actions used to override the seings inherited from the base policies. See
the vRealize Operations Manager Information Center.
Procedure
1Create a Group Type for Your Datastore Objects on page 101
Create a group type so that you can categorize your Datastore objects.
2Create an Object Group for Your Datastore Objects on page 101
Create an object group to organize the Datastore objects in your environment as a single object group.
3Create Your Policy and Select a Base Policy on page 102
Create your policy, and select the base policies to use to override the seings for your new policy.
4Override the Analysis Seings for the Datastore Objects on page 103
Display and override the analysis seings for the Datastore objects that your new policy will monitor.
5Enable Disk Space Aributes for Datastore Objects on page 103
Enable the aributes for vRealize Operations Manager to monitor the disk space of your production
datastore objects.
6Override Alert and Symptom Denitions for Datastore Objects on page 104
Override the alert and symptom denitions for Datastore objects.
vRealize Operations Manager Customization and Administration Guide
100 VMware, Inc.
7Apply Your Datastore Policy to Your Datastore Objects Group on page 105
Apply the policy to your new group of Datastore objects to have vRealize Operations Manager
monitor them to ensure that the disk space levels of these objects adhere to the seings in your policies
to support the service level agreements and business priorities that are established for your
environment.
8Create a Dashboard for Disk Use of Your Datastore Objects on page 105
Create a dashboard so that you can monitor the disk use of your Datastore objects, and be alerted to
any potential problems.
You created a policy to apply to your new production Datastore objects so that you can have
vRealize Operations Manager monitor them to ensure that the disk space levels of these objects adhere to
the seings in your policies to support the service level agreements and business priorities that are
established for your environment. vRealize Operations Manager uses the seings in your new policy to
display the disk use for your Datastore objects in dashboards, views, and reports, and to enforce the service
levels during data collections.
What to do next
After you nish this scenario, you must wait for vRealize Operations Manager to collect data from the
objects in your environment. Then view the disk use of your Datastore objects.
Create a Group Type for Your Datastore Objects
Create a group type so that you can categorize your Datastore objects.
In this step, you create a group type so that you can apply it to the new custom object group that you will
create to organize your vCenter Server Datastore objects.
Prerequisites
Verify that you understand the context of this scenario. See “User Scenario: Create an Operational Policy for
Production vCenter Server Datastore Objects,” on page 100.
Procedure
1 In the navigation pane, click Content and click Group Types.
2 Click the plus sign to add a new group type, type Production_Datastores, and click OK.
The new group type appears in the list of group types.
What to do next
Create an object group so that you can organize the Datastore objects in your environment as a single object
group.
Create an Object Group for Your Datastore Objects
Create an object group to organize the Datastore objects in your environment as a single object group.
In this step, you create a new object group to organize your Datastore objects so that you can apply the
policy that you create to the object group.
Prerequisites
Create an object type. See “Create a Group Type for Your Datastore Objects,” on page 101.
Procedure
1 Select Environment, and click Custom Groups.
2 On the Groups tab, click the plus sign to add a new group, and enter a name for the object group.
Chapter 3 Customizing How vRealize Operations Manager Monitors Your Environment
VMware, Inc. 101
3 From the Group Type drop-down menu, select your new group type.
4 From the Policy drop-down menu, select the Default Policy for now.
To have vRealize Operations Manager identify new Datastore objects that are added to your
environment, you select the Keep group membership up to date check box to make this group
dynamic and keep it updated.
5 In the Dene membership criteria pane, select the vCenter Adapter > Datastore object type from the
drop-down menu.
6 Click in the Pick a property text box, and select Disk Space > Template > Virtual Machine used (GB).
7 In the adjacent text box, click the drop-down arrow and select is less than.
8 In the Property value text box, type 10.
vRealize Operations Manager uses this criteria to monitor Datastore objects in this group, and to report
when the Datastore objects have less than 10 GB of space remaining.
9 In the Objects to always include pane, select the object group that you created for your Datastore
objects, click Add to move the group to the selected pane, and select the object group check box.
In the Objects to always exclude pane, do not select objects to exclude.
10 Click OK to save your new group.
What to do next
Create your policy, and select the base policies to use to override the seings for your new policy.
Create Your Policy and Select a Base Policy
Create your policy, and select the base policies to use to override the seings for your new policy.
In this step, you create a policy for vRealize Operations Manager to analyze and monitor your Datastore
objects, and select the policies from which to inherit and override the seings for your new policy.
Prerequisites
Create a custom object group for your Datastore objects. See “Create an Object Group for Your Datastore
Objects,” on page 101.
Procedure
1 Access the Policies area to create your policy.
a Click Administration, and click Policies.
The Active Policies and Policy Library tabs appear.
b Click the Policy Library tab, and click the plus sign to add a policy.
c In the Geing Started policy workspace, enter a name and description for the policy.
d In the Start with area, select Default Policy to inherit seings from a base policy.
2 Select the base policies, object, and policy to use to override the seings for your new policy.
a In the policy workspace, click Select Base Policies.
b To view the current policy conguration for your Datastore objects, click the Show changes for
drop-down menu, click vCenter Adapter - Datastore, and click the Show object type lter.
The Datastore policy conguration appears in the right pane.
vRealize Operations Manager Customization and Administration Guide
102 VMware, Inc.
What to do next
Display and override the analysis seings for the Datastore objects that your new policy will monitor.
Override the Analysis Settings for the Datastore Objects
Display and override the analysis seings for the Datastore objects that your new policy will monitor.
In this step, you override the capacity remaining and time remaining seings for your new policy, and
override the capacity score symptom thresholds so that vRealize Operations Manager triggers an alert and
noties you of potential problems with the capacity of your Datastore objects.
Prerequisites
Create your policy and select the base policies to inherit and override the seings for your new policy. See
“Create Your Policy and Select a Base Policy,” on page 102.
Procedure
1 In the policy workspace, click Analysis .
2 Click the Show changes for drop-down menu, click vCenter Adapter - Datastore, and click the Show
object type lter.
The vCenter Adapter - Datastore object type appears in the Object types list, and the analysis seings
for Datastore objects appear in the right pane. The policy elements include thresholds and seings for
all of the analysis capabilities, such as Workload, Stress, Usable Capacity, and so on.
3 Click the policy element override buon for the Capacity Remaining and Time Remaining element to
turn on this policy element.
The buon changes to a check mark, and the policy element becomes active so that you can override the
seings.
4 Click and drag the seings on the Capacity Score Symptom Threshold slider to 10% for warning (red),
15% for caution (orange), and 20% for normal (green).
When these thresholds are violated for the Datastore objects in your environment,
vRealize Operations Manager triggers an alert and noties you of a potential problem with the capacity
of your Datastore objects.
5 Click the policy element override buon for the Usable Capacity element to turn on this policy element,
click the arrow to expand the policy element view, and select the Use High Availability (HA)
check box.
When you use High Availability, you ensure that vRealize Operations Manager provides enough
resources for your Datastore objects to handle throughput and potential loss of data.
What to do next
Enable the disk space aributes for datastore objects.
Enable Disk Space Attributes for Datastore Objects
Enable the aributes for vRealize Operations Manager to monitor the disk space of your production
datastore objects.
In this step, you enable vRealize Operations Manager to monitor and collect the disk space properties
aribute from the Datastore objects in your environment.
Prerequisites
Override the analysis seings for your Datastore objects. See “Override the Analysis Seings for the
Datastore Objects,” on page 103.
Chapter 3 Customizing How vRealize Operations Manager Monitors Your Environment
VMware, Inc. 103
Procedure
1 In the policy workspace, click Override .
2 From the Object Type drop-down menu, select vCenter Adapter > Datastore.
vRealize Operations Manager lters the list and displays only the aributes that apply to Datastore
objects.
3 Click the Type drop-down menu, select Property, and deselect the other aributes.
4 Enter space in the Search text box, and click the search buon.
vRealize Operations Manager lters the list and displays only the disk space properties associated with
Datastore objects.
5 For the Disk Space|Template|Virtual Machine used (GB) property aribute, click the State drop-
down menu, and click Local.
When this aribute is enabled in your local policy, vRealize Operations Manager collects this disk space
properties aribute from Datastore objects in your environment.
What to do next
Override the alert symptom denitions for Datastore objects.
Override Alert and Symptom Definitions for Datastore Objects
Override the alert and symptom denitions for Datastore objects.
In this step, you override the alert and symptom denitions so that vRealize Operations Manager uses
trigger an alert notication during data collections when the disk space for your Datastore objects begins to
run out.
Prerequisites
Enable vRealize Operations Manager to monitor and collect the disk space properties aribute from the
Datastore objects in your environment. See “Enable Disk Space Aributes for Datastore Objects,” on
page 103.
Procedure
1 In the policy workspace, click Alert / Symptom .
2 In the Alert Denitions pane, from the Object Type drop-down menu, select vCenter Adapter >
Datastore.
3 Enter space in the Search text box, and click the search buon.
4 For the alert denition named Datastore is running out of disk space, click the State drop-down
menu and click Local.
When this alert denition is enabled in your local policy, vRealize Operations Manager uses it to trigger
an alert notication during data collections when the disk space for your Datastore objects begins to run
out.
5 In the Symptom Denitions pane, from the Object Type drop-down menu, select vCenter Adapter >
Datastore.
6 Enter space in the Search text box, and click the search buon.
vRealize Operations Manager Customization and Administration Guide
104 VMware, Inc.

7 To enable the critical, immediate, and warning symptom denitions for the space use on datastore
objects, click Actions, and click Select All, then set the thresholds.
Table 3‑5. Symptom Definitions Threshold Settings
Selection Setting
Datastore space use reaching critical limit >90
Datastore space use reaching immediate limit >85
Datastore space use reaching warning limit >80
What to do next
Apply your policy to your Datastore objects.
Apply Your Datastore Policy to Your Datastore Objects Group
Apply the policy to your new group of Datastore objects to have vRealize Operations Manager monitor
them to ensure that the disk space levels of these objects adhere to the seings in your policies to support
the service level agreements and business priorities that are established for your environment.
In this step, you apply your new policy to production Datastore objects so that
vRealize Operations Manager monitors them to ensure adequate disk space levels of these objects.
Prerequisites
Override the alert and symptom denitions for Datastore objects. See “Override Alert and Symptom
Denitions for Datastore Objects,” on page 104.
Procedure
1 In the policy workspace, click Apply Policy to Groups, and select the new object group that you created
for your Datastore objects.
2 Click Save to save your new policy seings.
vRealize Operations Manager uses the seings in your new policy to display the disk use for your Datastore
objects in dashboards, views, and reports, and to enforce the service levels during data collections
What to do next
Create a new dashboard to view the disk use of your Datastore objects.
Create a Dashboard for Disk Use of Your Datastore Objects
Create a dashboard so that you can monitor the disk use of your Datastore objects, and be alerted to any
potential problems.
In this step, you create a new dashboard, add widgets to your new dashboard, and congure the widgets so
that you can monitor your production datastore objects.
Prerequisites
Apply the policy to your new group of Datastore objects. See “Apply Your Datastore Policy to Your
Datastore Objects Group,” on page 105.
Procedure
1 Click Home.
2 Click Actions > Create a Dashboard.
Chapter 3 Customizing How vRealize Operations Manager Monitors Your Environment
VMware, Inc. 105
3Congure your new dashboard.
a In the Dashboard Conguration pane of the New Dashboard workspace, enter the name
Production Datastores for the new dashboard.
b For Is default, select Yes.
4 Add widgets to your new dashboard.
a In the workspace, click Widget List.
b From the list of widgets, click the Object List widget, and drag it to the right pane.
c Click the Capacity widget, and drag it to the right pane.
d Click the Time Remaining widget, and drag it to the right pane.
e Click the Alert List widget, and drag it to the right pane.
5Congure the widget interactions.
a In the workspace, click Widget Interactions.
b For the Object List widget interactions, click the drop-down menu for the Selected Objects and
Selected Alerts, and clear the selections.
c For the Alert List widget interaction, click the drop-down and select Object List.
d For the Capacity widget interaction, click the drop-down and select Object List.
e For the Time Remaining widget interaction, click the drop-down and select Object List.
f Click Apply Interactions.
6Congure the Object List widget.
a On the Object List widget, click the pencil.
b For Refresh Content, select On.
c For Refresh Interval, click the arrows and select 30 seconds.
d For Mode, select Parent.
e For Auto Select First Row, select .
f In the lower pane, click the plus sign to expand the list of tags, expand Production Datastores,
select Production Datastores (n), and click OK.
The objects in your Production Datastores object group appears in the Object List widget.
7Congure the Capacity widget.
a On the Capacity widget, click the pencil.
b For Refresh Content, select On.
c For Refresh Interval, click the arrows and select 30 seconds.
d For Self Provider, select On.
e For Selected Object, in the Search text box, enter group, and select the Production Datastores group
from the list.
The Production Datastores group appears in the Selected Object text box.
f Click OK.
The Capacity widget displays a score and a graph to indicate the remaining compute objects as a
percentage of the total consumer capacity.
vRealize Operations Manager Customization and Administration Guide
106 VMware, Inc.
8Congure the Time Remaining widget.
a On the Time Remaining widget, click the pencil.
The Time Remaining widget displays the amount of time that remains until the object resources are
consumed.
b For Refresh Content, select On.
The Time Remaining widget displays the amount of time that remains until the object resources are
consumed.
c For Refresh Interval, click the arrows and select 30 seconds.
d For Self Provider, select On.
e For Selected Object, in the Search text box, enter group, and select the Production Datastores group
from the list.
The Production Datastores group appears in the Selected Object text box.
f Click OK.
The Time Remaining widget displays a score and a graph to indicate the amount of time that remains
until the object resources are consumed.
9Congure the Alert List widget.
a On the Alert List widget, click the pencil.
b For Refresh Content, select On.
c For Refresh Interval, click the arrows and select 30 seconds.
d For Selected Object, in the Search text box, enter group, and select the Production Datastores group
from the list.
The Production Datastores group appears in the Selected Object text box.
e In the lower pane, click the plus sign to expand the list of tags, expand Production Datastores,
select Production Datastores (n), and click OK.
The alert list widget displays the alerts that are congured for your objects. You created a dashboard to
monitor disk space of your production datastore objects. After vRealize Operations Manager analyzes
and collects data from the objects in your Production Datastores object group, you can view the results
in your new dashboard.
You created and applied a policy to your production datastore objects to have vRealize Operations Manager
monitor those objects during data collections so that you can monitor and enforce the service levels for your
environment. vRealize Operations Manager uses the seings in your new policy to display information
about the capacity, time remaining, and potential alerts for your Datastore objects. With your new policy in
place, you can ensure that the disk space levels for your production datastore objects adhere to the policies
established for your production environment.
Chapter 3 Customizing How vRealize Operations Manager Monitors Your Environment
VMware, Inc. 107

Using the Monitoring Policy Workspace to Create and Modify Operational
Policies
You can use the workow in the monitoring policy workspace to create local policies quickly, and update
the seings in existing policies. Select a base policy to use as the source for your local policy seings, and
modify the thresholds and seings used for analysis and collection of data from groups of objects in your
environment. A policy that has no local seings dened inherits the seings from its base policy to apply to
the associated object groups.
Customize Operational Policies (hp://link.brightcove.com/services/player/bcpid2296383276001?
bctid=ref:video_customize_policies_vrom)
Prerequisites
Verify that objects groups exist for vRealize Operations Manager to analyze and collect data, and if they do
not exist, create them. See “Managing Custom Object Groups in VMware vRealize Operations Manager,” on
page 21.
Procedure
1 Click Administration, and click Policies.
2 Click Policy Library, and click the plus sign to add a policy, or select the policy and click the pencil to
edit an existing policy.
You can add and edit policies on the Policy Library tab, and remove certain policies. You can use the
Base Seings policy or the Default Policy as the root policy for the seings in other policies that you
create. You can set any policy to be the default policy.
3 In the Geing Started workspace, assign a name and description to the policy.
Give the policy a meaningful name and description so that all users know the purpose of the policy.
4 Click Select Base Policies, and in the workspace, select one or more policies to use as a baseline to
dene the seings for your new local policy.
When you create a new policy, you can use any of the policies provided with
vRealize Operations Manager as a baseline source for your new policy seings.
5 Click Override Analysis , and in the workspace, lter the object types to customize your policy
for the objects to associate with this policy.
Filter the object types, and modify the seings for those object types so that
vRealize Operations Manager collects and displays the data that you expect in the dashboards and
views.
6 Click Override , and in the workspace, select the metric, property, or super metric aributes
to include in your policy.
vRealize Operations Manager collects data from the objects in your environment based on the metric,
property, or super metric aributes that you include in the policy.
7 Click Override Alert / Symptom , and in the workspace, enable or disable the alert
denitions and symptom denitions for your policy.
vRealize Operations Manager identies problems on objects in your environment and triggers alerts
when conditions occur that qualify as problems.
vRealize Operations Manager Customization and Administration Guide
108 VMware, Inc.

8 Click Apply Policy to Groups, and in the workspace, select one or more groups to which the policy
applies.
VMware vRealize Operations Manager monitors the objects according to the seings in the policy that
is applied to the object group, triggers alerts when thresholds are violated, and reports the results in the
dashboards, views, and reports. If you do not assign a policy to one or more object groups,
VMware vRealize Operations Manager does not assign the seings in that policy to any objects, and the
policy is not active. For an object group that dos not have a policy assigned,
VMware vRealize Operations Manager associates the object group with the Default Policy.
9 Click Save to retain the seings dened for your local policy.
What to do next
After vRealize Operations Manager analyzes and collects data from the objects in your environment, review
the data in the dashboards and views. If the data is not what you expected, edit your local policy to
customize and override the seings until the dashboards display the data that you need.
Policy Workspace in vRealize Operations Manager
The policy workspace allows you to quickly create and modify policies. To create a new policy, you can
inherit the seings from an existing policy, and you can modify the seings in existing policies if you have
adequate permissions. After you create a new policy, or edit an existing policy, you can apply the policy to
one or more groups of objects.
How the Policy Workspace Works
Every policy includes a set of packages, and uses the dened problems, symptoms, metrics, and properties
in those packages to apply to specic object groups in your environment. You can view details for the
seings inherited from the base policy, and display specic seings for certain object types. You can override
the seings of other policies, and include additional policy seings to apply to object types. For example, a
critical production policy includes seings to track use, available resources and the time remaining on them,
resource demands on the object group that determine how much stress is applied, and reclaimable capacity
amounts for CPU, disk I/O, and network I/O.
Use the Add and Edit options to create new policies and edit existing policies.
Customize Operational Policies (hp://link.brightcove.com/services/player/bcpid2296383276001?
bctid=ref:video_customize_policies_vrom)
Where You Create and Modify a Policy
To create and modify policies, click Administration, click Policies, click the Policy Library tab, and click the
plus sign to add a policy or click the pencil icon to edit a policy. The policy workspace is where you select
the base policies, and customize and override the seings for analysis, metrics, properties, alert denitions,
and symptom denitions. In this workspace, you can apply the policy to object groups.
To remove a policy from the list, select the policy and click the red X.
Policy Workspace Options
The policy workspace includes a step-by-step workow to create and edit a policy, and apply the policy to
custom object groups.
Chapter 3 Customizing How vRealize Operations Manager Monitors Your Environment
VMware, Inc. 109

Super Metrics in vRealize Operations Manager
The super metric is a mathematical formula that contains one or more metrics. It is a custom metric that you
design and is useful when you need to track combinations of metrics, either from a single object or from
multiple objects. If a single metric cannot tell you what you need to know about the behavior of your
environment, you can dene a super metric.
After you dene it, you assign the super metric to one or more object types. This action calculates the super
metric for the objects in that object type and simplies the metrics display. For example, if you dene a super
metric that calculates the average CPU usage on all virtual machines, and you assign the super metric to a
cluster, the average CPU usage on all virtual machines in that cluster is reported as a super metric for the
cluster.
When the super metric aribute is enabled in a policy, you can also collect super metrics from a group of
objects associated with a policy.
Super Metric Functions and Operators
vRealize Operations Manager includes functions and operators that you can use in super metric formulas.
The functions are either looping functions or single functions.
Looping Functions
Looping functions work on more than one value.
Table 3‑6. Looping Functions
Function Description
avg Average of the collected values.
combine Combines all of the values of the metrics of the included
objects in a single metric timeline.
count Number of values collected.
max Maximum value of the collected values.
min Minimum value of the collected values.
sum Total of the collected values.
Looping Function Arguments
The looping function returns an aribute or metric value for an object or object type. An aribute is
metadata that describes the metric for the adapter to collect from the object. A metric is an instance of an
aribute. The argument syntax denes the desired result.
For example, CPU usage is an aribute of a virtual machine object. If a virtual machine has multiple CPUs,
the CPU usage for each CPU is a metric instance. If a virtual machine has one CPU, then the function for the
aribute or the metric return the same result.
Table 3‑7. Looping Function Formats
Argument syntax example Description
funct(${this, metric =a|b:optional_instance|c}) Returns a single data point of a particular metric for the object to
which the super metric is assigned. This super metric does not take
values from the children or parents of the object.
funct(${this, aribute=a|b:optional_instance|c}) Returns a set of data points for aributes of the object to which the
super metric is assigned. This super metric does not take values
from the child or parent of the object.
vRealize Operations Manager Customization and Administration Guide
110 VMware, Inc.

Table 3‑7. Looping Function Formats (Continued)
Argument syntax example Description
funct(${adapterkind=adaptkind,
resourcekind=reskind, resourcename=resname,
identiers={id1=val1id2=val2,…}, metric=a|
b:instance|c})
Returns a single data point of a particular metric for the resname
specied in the argument. This super metric does not take values
from the children or parents of the object.
funct(${adapterkind=adaptkind,
resourcekind=reskind, resourcename=resname,
identiers={id1=val1, id2=val2,…}, aribute=a|
b:optional_instance|c})
Returns a set of data points. This function iterates aributes of the
resname specied in the argument. This super metric does not take
values from the child or parent of the object.
funct(${adapterkind=adaptkind,
resourcekind=reskind, depth=dep}, metric=a|
b:optional_instance|c})
Returns a set of data points. This function iterates metrics of the
reskind specied in the argument. This super metric takes values
from the child (depth > 0) or parent (depth < 0) objects, where depth
describes the object location in the relationship chain.
For example, a typical relationship chain includes a datacenter,
cluster, host, and virtual machines with the datacenter at the top
and the virtual machines at the boom. If the super metric is
assigned to the cluster and the function denition includes depth =
2, the super metric takes values from the virtual machines. If the
function denition include depth = -1, the super metric takes values
from the datacenter.
funct(${adapterkind=adaptkind,
resourcekind=reskind, depth=dep}, aribute=a|
b:optional_instance|c})
Returns a set of data points. This function iterates aributes of the
reskind specied in the argument. This super metric takes values
from the child (depth > 0) or parent (depth < 0) objects.
For example, avg(${adapterkind=VMWARE, resourcekind=VirtualMachine, attribute=cpu|usage_average,
depth=1}) averages the value of all metric instances with the cpu|usage_average aribute for all objects of
type VirtualMachine that the vCenter adapter nds. vRealize Operations Manager searches for objects one
level below the object type where you assign the super metric.
Single Functions
Single functions work on only a single value or a single pair of values.
Table 3‑8. Single Functions
Function Format Description
abs abs(x) Absolute value of x. x can be any oating point number.
acos acos(x) Arccosine of x.
asin asin(x) Arcsine of x.
atan atan(x) Arctangent of x.
ceil ceil(x) The smallest integer that is greater than or equal to x.
cos cos(x) Cosine of x.
cosh cosh(x) Hyperbolic cosine of x.
exp exp(x) e raised to the power of x.
oor oor(x) The largest integer that is less than or equal to x.
log log(x) Natural logarithm (base x) of x.
log10 log10(x) Common logarithm (base 10) of x.
pow pow(x,y) Raises x to the y power.
rand rand() Generates a pseudo random oating number greater than or equal to 0.0 and less
than 1.0.
sin sin(x) Sine of x.
Chapter 3 Customizing How vRealize Operations Manager Monitors Your Environment
VMware, Inc. 111

Table 3‑8. Single Functions (Continued)
Function Format Description
sinh sinh(x) Hyperbolic sine of x.
sqrt sqrt(x) Square root of x.
tan tan(x) Tangent of x.
tanh tanh(x) Hyperbolic tangent of x.
Operators
Operators are mathematical symbols to enclose or insert between functions.
Table 3‑9. Operators
Operators Description
+ Plus
- Subtract
* Multiply
/ Divide
% Modulo
== Equal
!= Not equal
< Less than
<= Less than, or equal
> Greater than
>= Greater than, or equal
|| Or
&& And
! Not
? : Ternary operator. If/then/else
For example:
conditional_expression ?
expression_if_condition_is_true :
expression_if_condition_is_false
For more information about ternary operators, see
“Enhancing Your Super Metrics,” on page 113.
( ) Parentheses
[ ] Use in an array of expressions
[x, y, z] An array containing x, y, z. For example, min([x, y, z])
vRealize Operations Manager Customization and Administration Guide
112 VMware, Inc.
Enhancing Your Super Metrics
vRealize Operations Manager enables you to enhance your super metric by using clauses and resource entry
aliasing.
Where Clause
The where clause checks whether a particular metric value should be used in the super metric. Use this
clause to point to a dierent metric of the same object, such as where = "metric_group|my_metric > 0.
For example:
count(${adaptertype = ExampleAdapter, objecttype = ExampleObject, metric = ExampleGroup|Rating,
depth=2, where = "==1"})
Resource Entry Aliasing
Resource entries are used to retrieve metric data from vRealize Operations Manager for super metric
computation. A resource entry is the part of an expression which starts with $ followed by a {..} block.
When computing a super metric, you may have to use the same resource entry multiple times. If you need to
make changes to your computation, the changes have to be made to each and every resource entry, which
may lead to errors. Use resource entry aliasing to rewrite the expression.
The following example, shows a resource entry that has been used twice.
(min(${adapterkind=VMWARE, resourcekind=HostSystem, attribute= cpu|demand|active_longterm_load,
depth=5, where=”>=0”}) + 0.0001)/(max(${adapterkind=VMWARE, resourcekind=HostSystem,
attribute=cpu|demand|active_longterm_load, depth=5, where=”>=0”}) + 0.0001)"
Using resource entry aliasing, you can write the expression like this. The output of both expressions are the
same.
(min(${adapterkind=VMWARE, resourcekind=HostSystem, attribute= cpu|demand|active_longterm_load,
depth=5, where=”>=0”} as cpuload) + 0.0001)/(max(cpuload) + 0.0001)"
Follow these guidelines when you use resource entry aliasing:
nTo create the alias, the resource entry should be followed by as and then alias:name. For example: ${…}
as alias_name.
nThe alias cannot contain the ()[]+-*/%|&!=<>,.?:$ special characters, and cannot start with a digit.
nAn alias name, like all names in super metric expressions, is case-insensitive.
nUse of an alias name is optional. You can dene the alias, and not use it in an expression.
nYou cannot specify the same alias name more than once. For example:
${resource1,…} as r1 + ${resource2,…} as R1.
nYou can specify multiple aliases for the same resource entry. For example: ${…} as a1 as a2.
Conditional Expression ?: Ternary Operators
You can use a ternary operator in an expression to execute conditional expressions.
For example: expression_condition ? expression_if_true : expression_if_false.
The result of the conditional expression is converted to a number. If the value is not 0 then the condition is
assumed as true.
For example: -0.7 ? 10 : 20 results in 10. 2 + 2 / 2 - 3 ? 4 + 5 / 6 : 7 + 8 results in 15 (7 + 8).
Chapter 3 Customizing How vRealize Operations Manager Monitors Your Environment
VMware, Inc. 113
Depending on the condition, either expression_if_true or expression_if_false is executed, but not both of
them. This enables you to write expressions such as,
${this, metric=cpu|demandmhz} as a != 0 ? 1/a : -1. A ternary operator can contain other operators in
all its expressions, including other ternary operators.
For example: !1 ? 2 ? 3 : 4 : 5 results in 5.
User Scenario: Formulate and Apply Your Super Metric
As the system administrator for a Web-based business, you want to improve the customer experience by
reducing the time it takes to check out with a purchase. To gauge system performance, you decide to create
a super metric that captures average CPU usage on your virtual machines that process transactions.
After you create your super metric, you assign it to the object type that contains the virtual machines to
monitor, and you analyze the results.
Procedure
1Design a Super Metric on page 114
Because super metric formulas can be complex, plan your super metric before you use the
vRealize Operations Manager user interface to create it. The key to creating a super metric that alerts
you to the expected behavior of your objects is knowing your own enterprise and your data.
2Add Your Super Metric on page 115
You add your super metric that captures the average CPU usage across all virtual machines. With a
super metric, you can conveniently track one value instead of several CPU usage metrics for multiple
virtual machines.
3Visualize Your Super Metric on page 115
To verify the super metric formula, display a graph that shows its value during a past time period.
4Associate Your Super Metric with an Object Type on page 116
When you assign your super metric to an object type, vRealize Operations Manager calculates the
super metrics for the target objects and displays it as a metric for the object type.
5Review Your Super Metric in Troubleshooting on page 117
After you assign your super metric to an object type, you can monitor it on the Troubleshooting tab of
the object type. Tracking a single super metric on one Troubleshooting tab is easier than tracking the
metrics of separate objects on several Troubleshooting tabs.
Design a Super Metric
Because super metric formulas can be complex, plan your super metric before you use the
vRealize Operations Manager user interface to create it. The key to creating a super metric that alerts you to
the expected behavior of your objects is knowing your own enterprise and your data.
Procedure
1 Determine the objects that are involved in the behavior to track.
When you dene the metrics to use, you can select either specic objects or object types. For example,
you can select the specic objects VM001 and VM002, or you can select the object type Virtual Machine.
2 Determine the metrics to include in the super metric.
If you are tracking the transfer of packets along a network, the metrics are packets in and packets out
because you are interested in the ratio of those metrics. In another common use of super metrics, the
metrics might be the average CPU usage or average memory usage of the object type that you select.
vRealize Operations Manager Customization and Administration Guide
114 VMware, Inc.
3 Decide how to combine or compare the metrics.
For example, to nd the ratio of packets in to packets out, you must divide the two metrics. If you are
tracking CPU usage for an object type, you might want to determine the average use, or you might want
to determine what the highest or lowest use is for any object of that type. In more complex scenarios,
you might need a formula that uses constants or trigonometric functions.
4 Decide where to assign the super metric.
You dene the objects to track in the super metric, then assign the super metric to the object type that
contains the objects being tracked. To monitor all the objects in a group, enable the super metric in the
policy, and apply the policy to the object group.
Add Your Super Metric
You add your super metric that captures the average CPU usage across all virtual machines. With a super
metric, you can conveniently track one value instead of several CPU usage metrics for multiple virtual
machines.
Prerequisites
nDesign your super metric formula. See “Design a Super Metric,” on page 114.
nBecome familiar with the user interface to build super metric formulas. See “Building a Super Metric
Formula,” on page 117.
Procedure
1 Select Content > Super Metrics and click the plus sign.
2 Enter a meaningful name for the super metric such as SM-AvgVMCPUUsage% in the Name text box.
3Dene the formula for the super metric.
Select each function or operator to use and the metrics or aribute kinds to use in each function or with
each operator.
a For Function, select avg.
b In the Operators eld, select the left parenthesis, then select the right parenthesis. Click between
the two parentheses to position your cursor in the formula.
c In the Adapter Type eld of the Object Types pane, select vCenter Adapter.
d From the list of object types that appear, select Virtual Machine.
e In the Aribute Kinds pane, expand the CPU category, scroll down and double-click the Usage (%)
metric .
The formula appears as a mathematical function with the format avg(${adapterkind=VMWARE,
resourcekind=VirtualMachine, attribute=cpu|usage_average, depth=1}). To view the formula in a
textual format, click the Show Formula Description icon. The formula appears as avg(VirtualMachine:
CPU|Usage).
If the formula syntax is wrong, an error message appears. For example, vRealize Operations Manager
veries that the number of opening and closing parentheses are the same and that single values and
arrays are not mixed. You must correct the formula before you can save the super metric.
Visualize Your Super Metric
To verify the super metric formula, display a graph that shows its value during a past time period.
Before you apply the super metric to an object type such as a host system, verify that it works for an object of
that type.
Chapter 3 Customizing How vRealize Operations Manager Monitors Your Environment
VMware, Inc. 115
Prerequisites
nDesign your super metric formula. See “Design a Super Metric,” on page 114.
nCreate your super metric. See “Add Your Super Metric,” on page 115.
Procedure
1 On the Manage Super Metric workspace, in the Adapter Type eld of the Object Types pane, select
vCenter Adapter.
2 From the list of object types that appear, select Host System.
3 In the toolbar above the formula, click the Visualize Super Metric icon.
4 In the Objects pane, double-click one of the host systems listed.
The metric graph replaces the Metrics and Aribute Types panes.
The metric graph shows the values of the metric collected for the host system. Verify that the graph shows
values over time. If the graph displays no values or zero values, the formula might contain an error.
Associate Your Super Metric with an Object Type
When you assign your super metric to an object type, vRealize Operations Manager calculates the super
metrics for the target objects and displays it as a metric for the object type.
You dened super metric SM-AvgVMCPUUsage% to calculate average CPU usage across all virtual machines.
The mathematical formula for the super metric is avg(${adapterkind=VMWARE,
resourcekind=VirtualMachine, attribute=cpu|usage_average, depth=1}). With depth=1, you assign the
super metric to an object type that is one level above virtual machines in the relationship chain so that the
super metric appears as a metric for that object type.
Prerequisites
nCreate or import your super metric. See “Add Your Super Metric,” on page 115.
nVisualize your super metric to verify that it works properly. See “Visualize Your Super Metric,” on
page 115.
Procedure
1 Select Content > Super Metrics and select the SM-AvgVMCPUUsage% super metric .
2 Click the Object Types tab and click the plus sign.
3 Under vCenter Adapter, select Host System and click Select.
The super metric calculates the average CPU usage across all virtual machines one level below the host.
The super metric is associated with a parent object type.
What to do next
In the Policies > Edit Policy > workspace, users must select and enable each super metric. See
“Custom Policies,” on page 90.
Wait at least one collection cycle for the super metric to start collecting and processing data. Then review
your super metric.
vRealize Operations Manager Customization and Administration Guide
116 VMware, Inc.

Review Your Super Metric in Troubleshooting
After you assign your super metric to an object type, you can monitor it on the Troubleshooting tab of the
object type. Tracking a single super metric on one Troubleshooting tab is easier than tracking the metrics of
separate objects on several Troubleshooting tabs.
The super metric SM-AvgVMCPUUsage% you dened to calculate average CPU usage across all virtual machines
is assigned to the Host System object type. After one collection cycle has completed, SM-AvgVMCPUUsage%
appears as a super metric on each host.
Prerequisites
nCreate or import your super metric. See “Add Your Super Metric,” on page 115.
nVisualize your super metric to verify that it works properly. See “Visualize Your Super Metric,” on
page 115.
nAssociate your super metric to a an object type. See “Associate Your Super Metric with an Object Type,”
on page 116.
Procedure
1 Select Environment > All Objects.
2 Under vCenter Adapter, expand Host System and select one of the objects.
3 On the Troubleshooting tab, select All Metrics.
4 Scroll down the metrics list to expand Super Metric and double-click SM-AvgVMCPUUsage% to view the
average CPU usage for all virtual machines that are children of the host you selected.
If the average CPU usage is low, system performance is good and your customers should not experience
long transaction processing times. You can continue monitoring the super metric for changes in average
CPU usage that might aect the customer experience. If the average CPU usage uctuates, enable the super
metric in a custom policy associated with the host objects to send an alert when the super metric value
reaches an unacceptable threshold.
Building a Super Metric Formula
A super metric formula can include one or more metric specications, super metric functions, arithmetic
operators such as the plus or minus sign, and constants. You can enter any number of constants as part of
the formula.
Procedure
uUse the correct procedures and rules to build a super metric formula in the
vRealize Operations Manager user interface.
Option Action
To use a function. Select it from the Function drop-down menu. Select the object or object
type, and metric or aribute type to use in its argument. The database IDs
of the object and metric appear in the formula line at the top of the
window.
To select an object and metric Click the object in the Objects pane and double-click the metric in the
Metrics pane.
Define a metric for the object to
which the super metric is assigned.
aClick the This Object icon or enter this on the formula line.
If the This Object icon is not selected, the super metric functions
display the object with a long description.
b In the Objects pane, click an object that contains the metric to use.
c In the Metrics pane, double-click the metric.
Chapter 3 Customizing How vRealize Operations Manager Monitors Your Environment
VMware, Inc. 117

Option Action
To select an object type and
attribute type as an argument for a
looping function.
Select an object type and double-click an aribute type. The database IDs
of the object type and aribute type appear in the formula line.
To shorten the Object Types list. Enter all or part of the adapter type in the Search text box and click the
arrow next to the text box.
To see the formula with object and
metric names instead of IDs.
Click the Show Formula Description icon in the area beneath the formula
line.
To select function names and
formats and arithmetic operators.
Either enter them directly on the formula line or select them from the
drop-down menus.
To use parentheses to specify the
order of operations in the formula.
Either enter them directly on the formula line or select them from the
Operators drop-down menu.
To clear the object or object types
selection.
Click the Refresh icon in the Objects or Object Types pane at any time.
Exporting a Super Metric
You can export a super metric from one vRealize Operations Manager instance and import it to another
vRealize Operations Manager instance. For example, after developing a super metric in a test environment,
you can export it to use in a production environment.
Prerequisites
Create a super metric. See “User Scenario: Formulate and Apply Your Super Metric,” on page 114.
Procedure
1 Select Content > Super Metrics.
2 Select the super metric to export and click the Export Selected Super Metric actions icon.
vRealize Operations Manager creates a super metric le, for example, SuperMetric.json.
3 Download the super metric le to your computer.
What to do next
Import the super metric le to another instance of vRealize Operations Manager. See “Importing a Super
Metric,” on page 118.
Importing a Super Metric
You can import a super metric that was exported from another instance of vRealize Operations Manager.
For example, after a super metric is developed and tested in a lab environment, you can import a super
metric to a production environment.
If the super metric to import contains a reference to an object that does not exist in the target instance, the
import fails. vRealize Operations Manager returns a brief error message and writes detailed information to
the log le.
Prerequisites
Export a super metric from another vRealize Operations Manager instance. See “Exporting a Super Metric,”
on page 118.
Procedure
1 Select Content > Super Metrics and click the Import Super Metric actions icon.
2 (Optional) If the target instance has a super metric with the same name as the super metric you are
importing, you can either overwrite the existing super metric or skip the import, which is the default.
vRealize Operations Manager Customization and Administration Guide
118 VMware, Inc.
3 Click Browse, select the super metric le to import, and click Open.
After the import is nished, the super metric is listed.
vSphere Predictive Distributed Resource Scheduler
vSphere Predictive DRS can proactively load balance a vCenter Server cluster to accommodate predictable
paerns in the cluster workload.
Whereas DRS performs load balancing of hosts within a cluster by considering the last ve minutes of
virtual machine demand, Predictive DRS acts based on data provided to it by vRealize Operations Manager.
vRealize Operations Manager monitors virtual machines running in a vCenter Server, analyzes longer-term
historical data, and provides forecast data about predictable paerns of resource usage to Predictive DRS.
Predictive DRS moves to balance resource usage among virtual machines based on these predictable
paerns
For instructions on conguring Predictive DRS, refer to “Congure vSphere Predictive DRS,” on page 119
Configure vSphere Predictive DRS
Predictive DRS provides metrics and data you can use to forecast virtual machine workload. It is enabled as
part of conguring a vCenter Server adapter instance. Currently Predictive DRS is congurable by users
only as true (on) or false (o).
vCenter Server allows only one active data provider of Predictive DRS statistics at any given time. If the
vCenter Server shuts down, it loses the conguration information for the data provider. If more than one
provider is enabled to provide data to a vCenter Server, when the vCenter Server restarts, the rst provider
to actually register with vCenter Server becomes the active provider.
Prerequisites
nPredictive DRS is supported in vCenter Server 6.5 and later versions.
nTo work properly, Predictive DRS must be congured and enabled in both
vRealize Operations Manager and vCenter Server.
nvRealize Operations Manager clocks and vCenter Server clocks must be synchronized.
nTo follow the procedure below, you must have the UI open to the screen for adding a vCenter Server
adapter instance. See the link in Step 1 below.
Procedure
1 Follow the instructions to add a vCenter Server adapter instance in vRealize Operations Manager. At
the Instance Seings screen, click Advanced .
For information about adding a vCenter adapter instance in vRealize Operations Manager, see the
vRealize Operations Manager Information Center.
2 In the Provide data to vSphere Predictive DRS drop-down menu, select True.
The vRealize Operations Manager adapter instance is now designated as a predictive data provider. It is
intended to send predictive data to vCenter Server. In the event that you have previously designated
another vCenter Server adapter instance as a data provider to a given vCenter Server, a dialog appears
stating that this vCenter Server is already receiving Predictive DRS data from another instance of
vRealize Operations Manager and asks you to click Yes or No.
3 Click Yes to stop the rst instance of vRealize Operations Managerfrom providing Predictive DRS data
and cause the current instance to start providing the data. Or click No to cause the rst instance of
vRealize Operations Manager to continue to provide the predictive data
Depending on your choice, you have either a previously existing or a brand new data provider
registered with the vCenter Server.
Chapter 3 Customizing How vRealize Operations Manager Monitors Your Environment
VMware, Inc. 119
Predictive DRS can now proactively load balance a vCenter Server cluster.
Customizing Icons
Every object or adapter in your environment has an icon representation. You can customize how the icon
appears.
vRealize Operations Manager assigns a default icon to each object type and adapter type . Taken collectively,
object types and adapter types are known as objects in your environment. Icons represent objects in the UI
and help you to identify the type of object. For example, in the Topology Graph widget on a dashboard,
labeled icons show how objects are connected to one other. You can quickly identify the type of object from
the icon.
If you want to dierentiate objects, you can change the icon. For example, a virtual machine icon is generic.
If you want to pictorially distinguish the data that a vSphere virtual machine provides from the data that a
Hypervisor virtual machine provides, you can assign a dierent icon to each.
Customize an Object Type Icon
You can use the default icons that vRealize Operations Manager provides, or you can upload your own
graphics le for an object type. When you change an icon, your changes take eect for all users.
Prerequisites
If you plan to use your own icon les, verify that each image is in PNG format and has the same height and
width. For best results, use a 256x256 pixel image size.
Procedure
1 Select Content > Icons > Object Type Icons.
2 Assign the Object Type icon.
a Select the object type in the list with the icon to change.
By default, object types for all adapter types are listed. To limit the selection to the object types that
are valid for a single adapter type, select the adapter type from the drop-down menu.
b Click the Upload icon.
c Browse to and select the le to use and click Done.
3 (Optional) To return to the default icon, select the object type and click the Assign Default Icons icon.
The original default icon appears.
Customize an Adapter Type Icon
You can use the default icons that vRealize Operations Manager provides, or you can upload your own
graphics le for an adapter type. When you change an icon, your changes take eect for all users.
Prerequisites
If you plan to use your own icon les, verify that each image is in PNG format and has the same height and
width. For best results, use a 256x256 pixel image size.
Procedure
1 Select Content > Icons > Adapter Type Icons.
vRealize Operations Manager Customization and Administration Guide
120 VMware, Inc.

2 Assign the Adapter Type icon.
a Select the adapter type in the list with the icon to change.
b Click the Upload icon.
c Browse to and select the le to use and click Done.
3 (Optional) To return to the default icon, select the adapter type and click the Assign Default Icons icon.
The original default icon appears.
Managing Objects in Your Environment
An object is the individual managed item in your environment for which vRealize Operations Manager
collects data, such as a router, switch, database, virtual machine, host, and vCenter Server instances.
vRealize Operations Manager requires specic information about each object. When you congure an
adapter instance, vRealize Operations Manager performs object discovery to start collecting data from the
objects with which the adapter communicates.
An object can be a single entity, such as a database, or a container that holds other objects. For example, if
you have multiple Web servers, you can dene a single object for each Web server and dene a separate
container object to hold all of the Web server objects. Groups and applications are types of containers.
You categorize your objects using tags, so that you can easily nd, group, or lter them later. A tag type can
have multiple tag values. You or vRealize Operations Manager assigns objects to tag values. When you select
a tag value, vRealize Operations Manager displays the objects associated with that tag. For example, if a tag
type is Lifecycle and tag values are Development, Test, Pre-production, and Production, you might assign
virtual machine objects VM1, VM2, or VM3 in your environment to one or more of these tag values,
depending on the virtual machine function.
Adding an Object to Your Environment
You might want to add an object by providing its information to vRealize Operations Manager. For example,
some solutions cannot discover all the objects that might be monitored. For these solutions, you must either
use manual discovery or manually add the object.
When you add an individual object, you provide specic information about it, including the kind of adapter
to use to make the connection and the connection method. For example, an SNMP adapter does not know
the location of the SNMP devices that you want to monitor. You can use manual discovery to perform a port
scan through an IP range. If port scans are not allowed on the network for security reasons, you must add
the devices manually.
Prerequisites
Verify that an adapter is present for the object you plan to add. See the vRealize Operations Manager vApp
Deployment and Conguration Guide.
Procedure
1 Select Administration > Inventory Explorer.
2 On the toolbar, click the plus sign.
3 Provide the required information.
Option Description
Display name Enter a name for the object. For example, enter SNMP-Switch1.
Description Enter any description. For example, enter
Switch monitored with SNMP adapter
Adapter type Select an adapter type. For example, select SNMP Adapter.
Chapter 3 Customizing How vRealize Operations Manager Monitors Your Environment
VMware, Inc. 121
Option Description
Adapter instance Select an adapter instance.
Object type Select an object type. For an SNMP adapter, select an MIB le.
vRealize Operations Manager uses the MIB le to determine what data is
available on the switch. When you select the object type, the dialog box
selections change to include information you provide so that
vRealize Operations Manager can nd and connect with the selected object
type.
Host IP address Enter the host IP. For example, enter the IP address of the switch.
Port number Accept the default port number or enter a new value. For the SNMP
adapter, this port is the SNMP management port number.
Credential Select the Credential, or click the plus sign to add new login credentials for
the object.
Collection interval Enter the collection interval, in minutes. For example, if you expect the
switch to generate performance data every 5 minutes, set the collection
interval to 5 minutes.
Dynamic Thresholding. Accept the default, Yes.
4 Click OK to add the object.
SNMP-Switch1 appears in the Inventory Explorer as an MIB object type for the SNMP adapter type.
What to do next
For each new object, vRealize Operations Manager assigns tag values for its collector and its object type.
Sometimes, you might want to assign other tags.
Creating and Assigning Tags
A large enterprise can have thousands of objects dened in vRealize Operations Manager. Creating object
tags and tag values makes it easier to nd objects and metrics in vRealize Operations Manager. With object
tags, you select the tag value assigned to an object and view the list of objects that are associated with that
tag value.
A tag is a type of information, such as Adapter Types. Adapter Types is a predened tag in
vRealize Operations Manager. Tag values are individual instances of that type of information. For example,
when vRealize Operations Manager discovers objects using the vCenter Adapter, it assigns all the objects to
the vCenter Adapter tag value under the Adapter Types tag.
You can assign any number of objects to each tag value, and you can assign a single object to tag values
under any number of tags. You typically look for an object by looking under its adapter type, its object type,
and possibly other tags.
If an object tag is locked, you cannot add objects to it. vRealize Operations Manager maintains locked object
tags.
nPredened Object Tags on page 123
vRealize Operations Manager includes several predened object tags. It creates values for most of
these tags and assigns objects to the values.
nAdd an Object Tag and Assign Objects to the Tag on page 124
An object tag is a type of information, and a tag value is an individual instance of that type of
information. If the predened object tags do not meet your needs, you can create your own object tags
to categorize and manage objects in your environment. For example, you can add a tag for cloud
objects and add tag values for dierent cloud names. Then you can assign objects to the cloud name.
nUse a Tag to Find an Object on page 124
The quickest way to nd an object in vRealize Operations Manager is to use tags. Using tags is more
ecient than searching through the entire object list.
vRealize Operations Manager Customization and Administration Guide
122 VMware, Inc.

Predefined Object Tags
vRealize Operations Manager includes several predened object tags. It creates values for most of these tags
and assigns objects to the values.
For example, when you add an object, vRealize Operations Manager assigns it to the tag value for the
collector it uses and the kind of object that it is. It creates tag values if they do not already exist.
If a predened tag has no values, there is no object of that tag type. For example, if no applications are
dened in your vRealize Operations Manager instance, the applications tag has no tag values.
Each tag value appears with the number of objects that have that tag. Tag values that have no objects appear
with the value zero. You cannot delete the predened tags or tag values that vRealize Operations Manager
creates.
Table 3‑10. Predefined Tags
Tag Description
Collectors (Full Set) Each dened collector is a tag value. Each object is assigned
to the tag value for the collector that it uses when you add
the object to vRealize Operations Manager. The default
collector is vRealize Operations Manager Collector-
vRealize.
Applications (Full Set) Each dened application is a tag value. When you add a
tier to an application, or an object to a tier in an application,
the tier is assigned to that tag value.
Maintenance Schedules (Full Set) Each dened maintenance schedule is a tag value, and
objects are assigned to the value when you give them a
schedule by adding or editing them.
Adapter Types Each adapter type is a tag value, and each object that uses
that adapter type is given the tag value.
Adapter Instances Each adapter instance is a tag value, and each object is
assigned the tag value for the adapter instance or instances
through which its metrics are collected.
Object Types Each type of object is a tag value, and each object is
assigned to the tag value for its type when you add the
object.
Recently Added Objects The last day, seven days, 10 days, and 30 days have tag
values. Objects have this tag value as long as the tag value
applies to them.
Object Statuses Tag value assigned to objects that are not receiving data.
Collection States Tag value assigned to indicate the object collection state,
such as collecting or not collecting.
Health Ranges Good (green), Warning (yellow), Immediate (orange),
Critical (red), and Unknown (blue) health statuses have tag
values. Each object is assigned the value for its current
health status.
Entire Enterprise The only tag value is Entire Enterprise Applications. This
tag value is assigned to each application.
Licensing Tag values are License Groups found under
Administration > Licensing. Objects are assigned to the
license groups during vRealize Operations Manager
installation.
Untag Drag an object to this tag to delete the tag assignment.
Chapter 3 Customizing How vRealize Operations Manager Monitors Your Environment
VMware, Inc. 123
Add an Object Tag and Assign Objects to the Tag
An object tag is a type of information, and a tag value is an individual instance of that type of information. If
the predened object tags do not meet your needs, you can create your own object tags to categorize and
manage objects in your environment. For example, you can add a tag for cloud objects and add tag values
for dierent cloud names. Then you can assign objects to the cloud name.
Prerequisites
Become familiar with the predened object tags.
Procedure
1 Select Administration > Inventory Explorer.
2 Click the Manage Tags icon above the list of tags.
3 Click the Add New Tag icon to add a new row and type the name of the tag in the row.
For example, type Cloud Objects and click Update.
4 With the new tag selected, click the Add New Tag Value icon to add a new row and type the name of
the value in the row.
For example, type Video Cloud and click Update.
5 Click OK to add the tag.
6 Click the tag to which you want to add objects to display the list of object tag values.
For example, click Cloud Objects to display the Video Cloud object tag value.
7 Drag objects from the list in the right pane of the Inventory Explorer onto the tag value name.
You can press Ctrl+click to select multiple individual objects or Shift+click to select a range of objects.
For example, if you want to assign datacenters that are connected through the vCenter Adapter, type
vCenter in the search lter and select the datacenter objects to add.
Use a Tag to Find an Object
The quickest way to nd an object in vRealize Operations Manager is to use tags. Using tags is more ecient
than searching through the entire object list.
Tag values that can also be tags are Applications and Object Types. For example, the Object Types tag has
values for each object that is in vRealize Operations Manager, such as Virtual Machine, which includes all
the virtual machine objects in your environment. Each of these virtual machines is also a tag value for the
Virtual Machine tag. You can expand the tag value list to select the value for which you want to see objects.
Procedure
1 Select Administration > Inventory Explorer.
2 In the tag list in the center pane, click a tag for an object with an assigned value.
When you click a tag, the list of values expands under the tag. The number of objects that is associated
with each value appears next to the tag value.
A plus sign next to a tag value indicates that the value is also a tag and that it contains other tag values.
You can click the plus sign to see the subvalues.
3 Select the tag value.
The objects that have that tag value appear in the pane on the right. If you select multiple tag values, the
objects in the list depend on the values that you select.
vRealize Operations Manager Customization and Administration Guide
124 VMware, Inc.
Tag Value Selection Objects Displayed
More than one value for the
same tag
The list includes objects that have either value. For example, if you select two values
of the Object Types tag, such as Datacenter and Host System, the list shows objects
that have either value.
Values for two or more
dierent tags
The list includes only objects that have all of the selected values. For example, if you
select two values of the Object Types tag, such as Datacenter and Host System, and
you also select an adapter instance such as vC-1 of the vCenter Adapter instance tag,
only Datacenter or Host System objects associated with vC-1 appear in the list.
Datacenter or Host System objects associated with other adapter instances do not
appear in the list, nor do objects that are not Datacenter or Host System objects.
4 Select the object from the list.
Configuring Object Relationships
vRealize Operations Manager shows the relationship between objects in your environment. Most
relationships are automatically formed when the objects are discovered by an installed adapter. In addition,
you can use vRealize Operations Manager to create relationships between objects that might not normally be
related.
Objects are related physically, logically, or structurally.
nPhysical relationships represent how objects connect in the physical world. For example, virtual
machines running on a host are physically related.
nLogical relationships represent business silos. For example, all the storage objects in an environment are
related to one another.
nStructural relationships represent a business value. For example, all the virtual machines that support a
database are structurally related.
Solutions use adapters to monitor the objects in your environment so that physical relationship changes are
reected in vRealize Operations Manager. To maintain logical or structural relationships, you can use
vRealize Operations Manager to dene the object relationships. When objects are related, a problem with
one object appears as an anomaly on related objects. So object relationships can help you to identify
problems in your environment quickly.
Adding an Object Relationship
Parent-child relationships normally occur between interrelated objects in your environment. For example, a
data center object for a vCenter Adapter instance might have datastore, cluster, and host system child
objects.
The most common object relationships gather similar objects into groups. When you dene a custom group
with parent objects, a summary of that group shows alerts for that object and for any of its descendants. You
can create relationships between objects that might not normally be related. For example, you might dene a
child object for an object in the group. You dene these types of relationships by conguring object
relationships.
Procedure
1 Select Administration > Object Relationships.
2 In the Parent Selection column, expand the object tag and select a tag value that contains the object to
act as the parent object.
The objects for the tag value appear in the top pane of the second column.
3 Select a parent object.
Current child objects appear in the boom pane of the second column.
Chapter 3 Customizing How vRealize Operations Manager Monitors Your Environment
VMware, Inc. 125

4 In the column to the right of the List column, expand the object tag and select a tag value that contains
the child object to relate to the parent.
5 (Optional) If the list of objects is long, lter the list to nd the child object or objects.
Option Action
Navigate the object tag list for an
object
Expand the object tag in the pane to the right of the List column and select
a tag value that contains the object. The objects for the tag value appear in
the List column. If you select more than one value for the same tag, the list
contains objects that have either value. If you select values for two or more
dierent tags, the list includes only objects that have all of the selected
values.
Search for an object by name If you know all or part of the object name, enter it in the Search text box
and press Enter.
6 To make an object a child object of the parent object, select the object from the list and drag it to the
parent object in the top pane of the second column, or click the Add All Objects To Parent icon to make
all of the listed objects children of the parent object.
You can use Ctrl+click to select multiple objects or Shift+click to select a range of objects.
Example: Custom Group with Child Objects
If you want vRealize Operations Manager to monitor objects in your environment to ensure that service
level capacity requirements for your IT department are met, you add the objects to a custom group, apply a
group policy, and dene criteria that aect the membership of objects in the group. If you want to monitor
the capacity of an object that does not aect the service level requirements, you can add the object as a child
of a parent object in the group. If a capacity problem exists for the child object, the summary of the group
shows an alert for the parent object.
Customizing How Endpoint Operations Management Monitors
Operating Systems
Endpoint Operations Management gathers operating system metrics through agent-based collections. In
addition to the features available after initial conguration of Endpoint Operations Management, you can
enable remote monitoring, enable or disable plug-ins for additional monitoring, and customize
Endpoint Operations Management logging.
Configuring Remote Monitoring
With remote monitoring you can monitor the state of an object from a remote location by conguring a
remote check.
You can congure remote monitoring using HTTP, ICMP TCP methods.
When you congure a remote HTTP, ICMP or TCP check, it is created as a child object of the tested object
that you are monitoring and of the monitoring agent.
If the object that you select to remotely monitor does not already have an alert congured, one is created
automatically in the format Remote check type failed on a object type. If the object has an existing alert,
that is used.
Configure Remote Monitoring of an Object
Use this procedure to congure remote monitoring of an object.
Conguration options are dened in “HTTP Conguration Options,” on page 127, “ICMP Conguration
Options,” on page 130and “TCP Conguration Options,” on page 131. You might need to refer to this
information when you are completing this procedure.
vRealize Operations Manager Customization and Administration Guide
126 VMware, Inc.

Procedure
1 In the vRealize Operations Manager user interface, select the remote object to monitor.
2 On the details page for the object, select Monitor this Object Remotely from the Actions menu.
3 In the Monitor Remote Object dialog, select the Endpoint Operations Management agent that will
remotely monitor the object from the Monitored From menu.
4 Select the method with which the remote object will be monitored from the Check Method menu.
The relevant parameters for the selected object type appear.
5 Enter values for all of the conguration options and click OK.
HTTP Configuration Options
Here are the options in the conguration schema for the HTTP resource.
For the HTTP resource, the netservices plug-in descriptor default values are:
nport: 80
nsslport: 443
HTTP Configuration Options
Table 3‑11. ssl Option
Option Information Value
Description Use ssl
Default false
Optional true
Type boolean
Notes N/A
Parent Schema ssl
Table 3‑12. hostname Option
Option Information Value
Description Hostname
Default localhost
Optional false
Type N/A
Notes The hostname of system that hosts the service to monitor.
For example: mysite.com
Parent Schema sockaddr
Table 3‑13. port Option
Option Information Value
Description Port
Default A default value for port is usually set for each type of
network service by properties in the netservices plug-in
descriptor.
Optional false
Type N/A
Chapter 3 Customizing How vRealize Operations Manager Monitors Your Environment
VMware, Inc. 127

Table 3‑13. port Option (Continued)
Option Information Value
Notes The port on which the service listens.
Parent Schema sockaddr
Table 3‑14. sotimeout Option
Option Information Value
Description Socket Timeout (in seconds)
Default 10
Optional true
Type int
Notes The maximum length of time the agent waits for a response
to a request to the remote service.
Parent Schema sockaddr
Table 3‑15. path Option
Option Information Value
Description Path
Default /
Optional false
Type N/A
Notes Enter a value to monitor a specic page or le on the site.
for example: /Support.html.
Parent Schema url
Table 3‑16. method Option
Option Information Value
Description Request Method
Default HEAD
Optional false
Type enum
Notes Method for checking availability.
Permied values: HEAD, GET
HEAD results in less network trac.
Use GET to return the body of the request response to
specify a paern to match in the response.
Parent Schema hp
Table 3‑17. hostheader Option
Option Information Value
Description Host Header
Default none
Optional true
Type N/A
vRealize Operations Manager Customization and Administration Guide
128 VMware, Inc.

Table 3‑17. hostheader Option (Continued)
Option Information Value
Notes Use this option to set a Host HTTP header in the request.
This is useful if you use name-based virtual hosting.
Specify the host name of the Vhost's host, for example,
blog.mypost.com.
Parent Schema hp
Table 3‑18. follow Option
Option Information Value
Description Follow Redirects
Default enabled
Optional true
Type boolean
Notes Enable if the HTTP request that is generated will be re-
directed. This is important, because an HTTP server returns
a dierent code for a redirect and
vRealize Operations Manager determines that the HTTP
service check is unavailable if it is a redirect, unless this
redirect conguration is set.
Parent Schema hp
Table 3‑19. pattern Option
Option Information Value
Description Response Match (substring or regex)
Default none
Optional true
Type N/A
Notes Specify a paern or substring for
vRealize Operations Manager to aempt to match against
the content in the HTTP response. This enables you to
check that in addition to being available, the resource is
serving the content you expect.
Parent Schema hp
Table 3‑20. proxy Option
Option Information Value
Description Proxy Connection
Default none
Optional true
Type N/A
Notes If the connection to the HTTP service goes through a proxy
server, supply the hostname and port for the proxy server.
For example, proxy.myco.com:3128.
Parent Schema hp
Chapter 3 Customizing How vRealize Operations Manager Monitors Your Environment
VMware, Inc. 129

Table 3‑21. requestparams Option
Option Information Value
Description Request arguments. For example, arg0=val0, arg1=val1,
and so on.
Default N/A
Optional true
Type string
Notes Request parameters added to the URL to be tested.
Parent Schema hp
Table 3‑22. Credential Option
Option Information Value
Description Username
Default N/A
Optional true
Type N/A
Notes Supply the user name if the target site is password-
protected.
Parent Schema credentials
ICMP Configuration Options
Here are the options in the conguration schema for the ICMP resource.
ICMP conguration is not supported in Windows environments. When aempting to run an ICMP check for
remote monitoring from an Agent running on a Windows platform, no data is returned.
Table 3‑23. hostname Option
Option Information Value
Description Hostname
Default localhost
Optional N/A
Type N/A
Notes The hostname of system that hosts the object to monitor.
For example: mysite.com
Parent Schema netservices plug-in descriptor
Table 3‑24. sotimeout Option
Option Information Value
Description Socket Timeout (in seconds)
Default 10
Optional N/A
Type int
vRealize Operations Manager Customization and Administration Guide
130 VMware, Inc.

Table 3‑24. sotimeout Option (Continued)
Option Information Value
Notes The maximum period of time the agent waits for a
response to a request to the remote service.
Parent Schema netservices plug-in descriptor
TCP Configuration Options
Here are the options in the conguration schema to enable TCP checking.
Table 3‑25. port Option
Option Information Value
Description Port
Default A default value for port is usually set for each type of
network service by properties in the netservices plug-in
descriptor.
Optional false
Type N/A
Notes The port on which the service listens.
Parent Schema sockaddr
Table 3‑26. hostname Option
Option Information Value
Description Hostname
Default localhost
Optional N/A
Type N/A
Notes The hostname of system that hosts the object to monitor.
For example: mysite.com
Parent Schema netservices plug-in descriptor
Make sure you use the IP address of the machine on which the remote check is to run, not the host name.
Table 3‑27. sotimeout Option
Option Information Value
Description Socket Timeout (in seconds)
Default 10
Optional N/A
Type int
Notes The maximum amount of time the agent waits for a
response to a request to the remote service.
Parent Schema netservices plug-in descriptor
Chapter 3 Customizing How vRealize Operations Manager Monitors Your Environment
VMware, Inc. 131
Working with Agent Plug-ins
Endpoint Operations Management agents include plug-ins that determine which objects to monitor, how
they should be monitored, which metrics to collect, and so on. Some plug-ins are included in the default
Endpoint Operations Managementagent installation, and other plug-ins might be added as part of any
management pack solution that you install to extend the vRealize Operations Manager monitoring process.
You can use the Plug-in tab in the Content view to disable or enable the agent plug-ins that are deployed in
your environment as part of a solution installation. For example, you might want to temporarily disable a
plug-in so that you can analyze the implication of that plug-in on a monitored virtual machine.
All the default plug-ins and the plug-ins that are deployed when you installed one or more solutions are
listed alphabetically on the tab.
You must have Manage Plug-ins permissions to enable and disable plug-ins.
When you disable a plug-in, it is removed from all the agents on which it has existed, and the agent no
longer collects the metrics and other data related to that plug-in. The plug-in is marked as disabled on the
vRealize Operations Manager server.
You cannot disable the default plug-ins that are installed during the vRealize Operations Manager
installation.
You use the action menu that appears when you click the gear wheel icon to disable or enable plug-ins.
Before you deploy a new version of a plug-in, you must implement a shut down method. If you do not
implement a shut down method, the existing plug-in version does not shut down so that a new instance is
created and allocated resources such as static threads are not released. Implement a shut down method for
these plug-ins.
nPlug-ins that use third-party libraries
nPlug-ins that use native libraries
nPlug-ins that use connection pools
nPlug-ins that might lock les, which cause issues on Windows operating systems
It is good practice that plug-ins do not use threads, third-party libraries, or static collection.
Configuring Plug-in Loading
At startup, an Endpoint Operations Management agent loads all the plug-ins in the
AgentHome/bundles/agent-x.y.z-nnnn/pdk/plugins directory. You can congure properties in the
agent.properties le to reduce an agent's memory footprint by conguring it to load only the plug-ins that
you use.
Plug-ins are deployed to all agents when a solution is installed. You might want to use the properties
described here in a situation in which you need to remove one or more plug-ins from a specic machine.
You can either specify a list of plug-ins to exclude, or congure a list of plug-ins to load.
plugins.exclude
Use this property to specify the plug-ins that the Endpoint Operations Management agent must not load at
startup.
You supply a comma-separated list of plugins to exclude. For example,
plugins.exclude=jboss,apache,mysql.
vRealize Operations Manager Customization and Administration Guide
132 VMware, Inc.
plugins.include
Use this property to specify the plug-ins that the Endpoint Operations Management agent must load at
startup.
You supply a comma-separated list of plugins to include. For example, plugins.include=weblogic,apache.
Understanding the Unsynchronized Agents Group
An unsynchronized agent is an agent that is not synchronized with the vRealize Operations Manager server
in terms of its plug-ins. The agent might be missing plug-ins that are registered on the server, include plug-
ins that are not registered on the server, or include plug-ins that have a dierent version to that registered
on the server.
Each agent must be synchronized with the vRealize Operations Manager server. During the time that an
agent is not synchronized with the server, it appears in the Unsynchronized Agents list. The list is located in
the vRealize Operations Manager user interface on the Groups tab in the Environment view.
The rst time an agent is started, a status message is sent to the server. The server compares the status sent
by the agent with that on the server. The server sends commands to the agent to synchronize, download or
delete plug-ins, as required by the dierences that it detects.
When a plug-in is deployed, disabled, or enabled as part of a management pack solution update, the
vRealize Operations Manager server detects that change and sends a new command to the agents so that
synchronization occurs.
Commonly, multiple agents are aected at the same time when a plug-in is deployed, disabled or enabled.
All agents have an equal need to be updated so, to avoid overloading the server and creating performance
issues that might occur if many agents were all synchronized at the same time, synchronization is
performed in batches and is staggered in one-minute periods. You will notice that the list of unsynchronized
agents decrements over time.
Configuring Agent Logging
You can congure the name, location, and logging level for Endpoint Operations Management agent logs.
You can also redirect system messages to the agent log, and congure the debug log level for an agent
subsystem.
Agent Log Files
The Endpoint Operations Management agent log les are stored in the AgentHome/log directory.
Agent log les include the following:
agent.log
agent.operations.log This log is applicable to Windows-based agents only.
This is an audit log that records the commands that were run on the agent,
together with the parameters that the agent used to action them.
wrapper.log The Java service wrapper-based agent launcher writes messages to the
wrapper.log le. For a non-JRE agent, this le is located in
agentHome/wrapper/sbin.
In the event that the value was changed ifr the agent.logDir property, the le
is also located in agentHome/wrapper/sbin.
Chapter 3 Customizing How vRealize Operations Manager Monitors Your Environment
VMware, Inc. 133
Configuring the Agent Log Name or Location
Use these properties to change the name or location of the agent log le.
agent.logDir
You can add this property to the agent.properties le to specify the directory where the
Endpoint Operations Management agent will write its log le. If you do not specify a fully qualied path,
agent.logDir is evaluated relative to the agent installation directory.
This property does not exist in the agent.properties le unless you explicitly add it. The default behavior is
equivalent to the agent.logDir=log seing, resulting in the agent log le being wrien to the AgentHome/log
directory.
To change the location for the agent log le, add agent.logDir to the agent.properties le and enter a path
relative to the agent installation directory, or a fully qualied path.
The name of the agent log le is congured with the agent.logFile property.
agent.logFile
This property species the path and name of the agent log le.
In the agent.properties le, the default seing for the agent.LogFile property is made up of a variable and
a string, agent.logFile=${agent.logDir}\agent.logDir.
nagent.logDir is a variable that supplies the value of an identically named agent property. By default, the
value of agent.logDir is log, interpreted relative to the agent installation directory.
nagent.log is the name for the agent log le.
By default, the agent log le is named agent.log and is wrien to the AgentHome/log directory.
To congure the agent to log to a dierent directory, you must explicitly add the agent.logDir property to
the agent.properties le.
Configuring the Agent Logging Level
Use this property to control the severity level of messages that the Endpoint Operations Management agent
writes to the agent log le.
agent.logLevel
This property species the level of detail of the messages that the Endpoint Operations Management agent
writes to the log le.
Seing the agent.logLevel property value to DEBUG level is not advised. This level of logging across all
subsystems imposes overhead, and can also cause the log le to roll over so frequently that log messages of
interest are lost. It is preferable to congure debug level logging only at the subsystem level.
The changes that you make to this property become eective approximately ve minutes after you save the
properties le. It is not necessary to restart the agent to initiate the change.
Redirecting System Messages to the Agent Log
You can use these properties to redirect system-generated messages to the
Endpoint Operations Management agent log le.
agent.logLevel.SystemErr
This property redirects System.err to agent.log. Commenting out this seing causes System.err to be
directed to agent.log.startup.
The default value is ERROR.
vRealize Operations Manager Customization and Administration Guide
134 VMware, Inc.
agent.logLevel.SystemOut
This property redirects System.out to agent.log. Commenting out this seing causes System.out to be
directed to agent.log.startup.
The default value is INFO.
Configuring the Debug Level for an Agent Subsystem
For troubleshooting purposes, you can increase the logging level for an individual agent subsystem.
To increase the logging level for an individual agent subsystem, uncomment the appropriate line in the
section of the agent.properties le that is labelled Agent Subsystems: Uncomment individual subsystems
to see debug messages.
Agent log4j Properties
This is the log4j properties in the agent.properties le.
log4j.rootLogger=${agent.logLevel}, R
log4j.appender.R.File=${agent.logFile}
log4j.appender.R.MaxBackupIndex=1
log4j.appender.R.MaxFileSize=5000KB
log4j.appender.R.layout.ConversionPattern=%d{dd-MM-yyyy HH:mm:ss,SSS z} %-5p [%t] [%c{1}@%L] %m%n
log4j.appender.R.layout=org.apache.log4j.PatternLayout
log4j.appender.R=org.apache.log4j.RollingFileAppender
##
## Disable overly verbose logging
##
log4j.logger.org.apache.http=ERROR
log4j.logger.org.springframework.web.client.RestTemplate=ERROR
log4j.logger.org.hyperic.hq.measurement.agent.server.SenderThread=INFO
log4j.logger.org.hyperic.hq.agent.server.AgentDListProvider=INFO
log4j.logger.org.hyperic.hq.agent.server.MeasurementSchedule=INFO
log4j.logger.org.hyperic.util.units=INFO
log4j.logger.org.hyperic.hq.product.pluginxml=INFO
# Only log errors from naming context
log4j.category.org.jnp.interfaces.NamingContext=ERROR
log4j.category.org.apache.axis=ERROR
#Agent Subsystems: Uncomment individual subsystems to see debug messages.
#-----------------------------------------------------------------------
#log4j.logger.org.hyperic.hq.autoinventory=DEBUG
#log4j.logger.org.hyperic.hq.livedata=DEBUG
#log4j.logger.org.hyperic.hq.measurement=DEBUG
#log4j.logger.org.hyperic.hq.control=DEBUG
#Agent Plugin Implementations
#log4j.logger.org.hyperic.hq.product=DEBUG
#Server Communication
#log4j.logger.org.hyperic.hq.bizapp.client.AgentCallbackClient=DEBUG
#Server Realtime commands dispatcher
#log4j.logger.org.hyperic.hq.agent.server.CommandDispatcher=DEBUG
Chapter 3 Customizing How vRealize Operations Manager Monitors Your Environment
VMware, Inc. 135
#Agent Configuration parser
#log4j.logger.org.hyperic.hq.agent.AgentConfig=DEBUG
#Agent plugins loader
#log4j.logger.org.hyperic.util.PluginLoader=DEBUG
#Agent Metrics Scheduler (Scheduling tasks definitions & executions)
#log4j.logger.org.hyperic.hq.agent.server.session.AgentSynchronizer.SchedulerThread=DEBUG
#Agent Plugin Managers
#log4j.logger.org.hyperic.hq.product.MeasurementPluginManager=DEBUG
#log4j.logger.org.hyperic.hq.product.AutoinventoryPluginManager=DEBUG
#log4j.logger.org.hyperic.hq.product.ConfigTrackPluginManager=DEBUG
#log4j.logger.org.hyperic.hq.product.LogTrackPluginManager=DEBUG
#log4j.logger.org.hyperic.hq.product.LiveDataPluginManager=DEBUG
#log4j.logger.org.hyperic.hq.product.ControlPluginManager=DEBUG
Modifying Global Settings
The global seings control the system seings for vRealize Operations Manager, including data retention
and system timeout seings. You can modify one or more of the seings to monitor your environment
beer. These seings aect all your users.
The global seings do not aect metric interactions, color indicators, or other object management behaviors.
These behaviors are congured in your policies.
Seings related to managing objects with vRealize Operations Manager are available on the Administration
> Inventory Explorer page.
You can view tooltips for each option in the Edit Global Seings dialog box.
Global Settings Best Practices
Most of the seings pertain to how long vRealize Operations Manager retains collected and process data.
The default values are common retention periods. You might need to adjust the time periods based on your
local policies or disk space.
vRealize Operations Manager Customization and Administration Guide
136 VMware, Inc.

List of Global Settings
The global seings determine how vRealize Operations Manager retains data, keeps connection sessions
open, and other seings. These are system seings that aect all users.
Table 3‑28. Global Setting Default Values and Descriptions
Setting
Default
Value Description
Action History 90 days Number of days to retain the recent task data for actions.
The data is purged from the system after the specied number
of days.
Deleted Objects 360 hours Number of hours to retain objects that are deleted from an
adapter data source or server before deleting them from
vRealize Operations Manager.
An object deleted from an adapter data source might be
identied by vRealize Operations Manager as not existing and
vRealize Operations Manager can no longer collect data about
the object. Whether vRealize Operations Manager identies
deleted objects as not existing depends the adapter. This feature
is not implemented in some adapters.
For example, if the retention time is 360 hour and a virtual
machine is deleted from a vCenter Server instance, the virtual
machine remains as an object in vRealize Operations Manager
for 15 days before it is deleted.
This seing applies to objects deleted from the data source or
server, not to any objects you delete from
vRealize Operations Manager on the Inventory Explorer page.
A value of -1 deletes objects immediately.
Deletion Schedule Interval 24 hours Determines the frequency to schedule deletion of resources.
This seing works with the Deleted Objects seing to remove
objects that no longer exist in the environment.
vRealize Operations Manager transparently marks objects for
removal that have not existed for the length of time specied
under Deleted Objects. vRealize Operations Manager then
removes the marked objects at the frequency specied under
Deletion Scheduling Interval.
Object History 300 days Number of days to retain the history of the object conguration,
relationship, and property data.
The conguration data is the collected data from the monitored
objects on which the metrics are based. The collected data
includes changes to the conguration of the object.
The data is purged from the system after the specied number
of days.
Session Timeout 30 minutes If your connection to vRealize Operations Manager is idle for
the specied amount of time, you are logged out of the
application.
You must provide credentials to log back in.
Symptoms/Alerts 90 days Number of days to retain canceled alerts and symptoms.
The alerts and symptoms can be canceled by the system or
canceled by a user.
Time Series Data 6 months Number of months that you want to retain the collected and
calculated metric data for the monitored objects.
If available disk space is less than 10%,
vRealize Operations Manager purges older data and might not
retain the full range specied.
Chapter 3 Customizing How vRealize Operations Manager Monitors Your Environment
VMware, Inc. 137

Table 3‑28. Global Setting Default Values and Descriptions (Continued)
Setting
Default
Value Description
Dynamic Threshold Calculation enabled Determines whether to calculate normal levels of threshold
violation for all objects.
If the seing is disabled, the following areas of
vRealize Operations Manager will not work or are not
displayed:
nAnomalies badge is not calculated
nAlert symptom denitions based on dynamic thresholds
will not work
nMetric charts that display normal behavior are not present
Disable this seing only if you have no alternative options for
managing resource constraints for your
vRealize Operations Manager system.
Capacity Calculation enabled Determines whether to calculate capacity metrics and badges
for all objects.
If the seing is disabled, the values for the following badges are
not calculated:
nCapacity Remaining
nTime Remaining
nStress
nReclaimable Capacity
nDensity
Allow vCenter Server users to log in Determine how users of vCenter Server log in to
vRealize Operations Manager.
nIn the vRealize Operations Manager user interface,
vCenter Server users can log in to individual vCenter Server
instances. Disabled by default.
nvCenter Server users can log in from vCenter Server clients.
Enabled by default.
nIn the vRealize Operations Manager user interface,
vCenter Server users can log in to all vCenter Server
instances. Enabled by default.
Customer Experience Improvement
Program
enabled Determines whether to participate in the Customer Experience
Improvement Program by having vRealize Operations Manager
send anonymous usage data to hps://vmware.com.
Automated Actions enabled or
disabled
Determines whether to allow vRealize Operations Manager to
automate actions. When an alert triggers, the alert provides
recommendations for remediation. You can automate an action
to remediate an alert when the recommendation is the rst
priority for that alert. You enable actionable alerts in your
policies.
vRealize Operations Manager Customization and Administration Guide
138 VMware, Inc.

Maintaining and Expanding
vRealize Operations Manager 4
vRealize Operations Manager provides features to help you perform maintenance, troubleshoot potential
issues, and optimize your work with vRealize Operations Manager.
The product includes cluster and node management options that let you work with the processing systems
at the heart of vRealize Operations Manager. When you need to troubleshoot the system, various logs collect
details related to how well vRealize Operations Manager is working and are available for bundling if
Technical Support needs to review them. You also have the ability to maintain passwords that control
operator access to the product, and authentication certicates that provide system-to-system security.
Some administration activities involve how vRealize Operations Manager monitors objects in the
environment. For example, maintenance mode seings prevent misleading data from appearing when
objects are oine or undergoing maintenance. Licensing activates vRealize Operations Manager monitoring
and solutions, and license groups organize objects for data collection under a particular license key. There
also are on-demand options to refresh installed adapter lists and gather information about adapter abilities,
and to recalculate dynamic thresholds so that vRealize Operations Manager captures the most recent data
for a particular metric.
When you are performing maintenance operations, it is good practice to stop the
Endpoint Operations Management agent and to restart it after the maintenance is complete to avoid
unnecessary system overhead.
This chapter includes the following topics:
n“vRealize Operations Manager Cluster and Node Maintenance,” on page 139
n“Create a vRealize Operations Manager Support Bundle,” on page 141
n“vRealize Operations Manager Passwords and Certicates,” on page 141
n“How To Preserve Customized Content,” on page 143
n“Backup and Restore,” on page 144
vRealize Operations Manager Cluster and Node Maintenance
You perform cluster and node maintenance procedures to help your vRealize Operations Manager perform
more eciently cluster and node maintenance involves activities such as changing the online or oine state
of the cluster or individual nodes, enabling or disabling high availability (HA), reviewing statistics related to
the installed adapters, and rebalancing the workload for beer performance.
You perform most vRealize Operations Manager cluster and node maintenance using the Cluster
Management page in the product interface, or the Cluster Status and Troubleshooting page in the
administration interface. The administration interface provides more options than the product interface.
VMware, Inc. 139

Table 4‑1. Cluster and Node Maintenance Procedures
Procedure Interface Description
Change Cluster Status Administration/Product You can change the status of a node to online or
oine.
In a high availability (HA) cluster, taking the
master or replica oine causes
vRealize Operations Manager to run from the
remaining node and for HA status to be degraded.
Any manual or system action that restarts the
cluster brings all vRealize Operations Manager
nodes online, including any nodes that you had
taken oine.
If you take a data node that is part of a multi-node
cluster oine and then bring it back online, the
Endpoint Operations Management adapter does
not automatically come back online. To bring the
Endpoint Operations Management adapter online,
select the Endpoint Operations Management
adapter in the Inventory Explorer and click the
Start Collector icon .
Enable or Disable High
Availability
Administration Enabling or disabling high availability requires the
cluster to have at least one Data node, with all
nodes online or all oine. You cannot us Remote
Collector nodes.
Disabling high availability removes the replica
node and restarts the
vRealize Operations Manager cluster.
After you disable high availability, the replica
node vRealize Operations Manager converts back
to a data node and restarts the cluster.
Generate Passphrase Administration You can generate a passphrase to use instead of
the administrator credentials to add a node to this
cluster.
The passphrase is only valid for a single use.
Remove a Node Administration When you remove a node, you lose data that the
node had collected unless you are running in high
availability (HA) mode. HA protects against the
removal or loss of one node.
You must not re-add nodes to
vRealize Operations Manager that you already
removed. If your environment requires more
nodes, add new nodes instead.
When you perform maintenance and migration
procedures, you should take the node oine, not
remove the node.
Congure NTP Product The nodes in vRealize Operations Manager cluster
synchronize with each other by standardizing on
the master node time or by synchronizing with an
external Network Time Protocol (NTP) source.
Rebalance the Cluster Product You can rebalance adapter, disk, memory, or
network load across vRealize Operations Manager
cluster nodes to increase the eciency of your
environment.
vRealize Operations Manager Customization and Administration Guide
140 VMware, Inc.

Create a vRealize Operations Manager Support Bundle
You create a vRealize Operations Manager support bundle to gather log and conguration les for analysis
when troubleshooting a vRealize Operations Manager issue.
When you create a support bundle, vRealize Operations Manager gathers les from cluster nodes into ZIP
les for convenience.
Procedure
1 In the left pane, click Administration.
2 Select Support > Support Bundles.
3 From the toolbar, click the buon to add a support bundle.
4 Select the option to create a light or full support bundle.
5 Select the cluster nodes that need to be evaluated for support.
Only logs from the selected nodes are included in the support bundle.
6 Click OK, and click OK to conrm support bundle creation.
Depending on the size of the logs and number of nodes, it might take time for
vRealize Operations Manager to create the support bundle.
What to do next
Use the toolbar to download the support bundle ZIP les for analysis. For security,
vRealize Operations Manager prompts you for credentials when you download a support bundle.
You can review the log les for error messages or, if you need troubleshooting assistance, send the
diagnostic data to VMware Technical Support. When you resolve or close the issue, use the toolbar to delete
the outdated support bundle to save disk space.
vRealize Operations Manager Passwords and Certificates
For secure vRealize Operations Manager operation, you might need to perform maintenance on passwords
or authentication certicates.
nPasswords are for user access to the product interfaces or to console sessions on cluster nodes.
nAuthentication certicates are for secure machine-to-machine communication within
vRealize Operations Manager itself or between vRealize Operations Manager and other systems.
Change the vRealize Operations Manager Administrator Password
You might need to change the vRealize Operations Manager administrator password as part of securing or
maintaining your deployment.
Procedure
1 In a Web browser, navigate to the vRealize Operations Manager administration interface at
hps://master-node-name-or-ip-address/admin.
2 Log in with the admin username and password for the master node.
3 In the upper right, click the admin drop-down menu, and click Change Administrator Password.
4 Enter the current password, and enter the new password twice to ensure its accuracy.
N You cannot change the administrator username of admin.
Chapter 4 Maintaining and Expanding vRealize Operations Manager
VMware, Inc. 141
5 Click OK.
Reset the vRealize Operations Manager Administrator Password on vApp or
Linux Clusters
If the admin account password is lost, you need to reset the password.
When the vRealize Operations Manager password for the built-in admin account is lost, follow these steps
to reset it on vApp or Linux clusters.
Prerequisites
This procedure requires root account credentials.
nIn vRealize Operations Manager vApp deployments, when you log in to the console of the virtual
application for the rst time, you are forced to set a root password.
nThe vRealize Operations Manager console root password can be dierent than the admin account
password that you set when conguring the vRealize Operations Manager master node.
Procedure
1 Log in to the master node command line console as root.
2 Enter the following command, and follow the prompts.
$VMWARE_PYTHON_BIN $VCOPS_BASE/../vmware-
vcopssuite/utilities/sliceConfiguration/bin/vcopsSetAdminPassword.py --reset
Reset the vRealize Operations Manager Administrator Password on Windows
Clusters
If the admin account password is lost, you need to reset the password.
When the vRealize Operations Manager password for the built-in admin account is lost, follow these steps
to reset it on Windows clusters.
Procedure
1 Open the command prompt using the Run as Administrator option.
2 Enter the following command, and follow the prompts.
%VMWARE_PYTHON_BIN% %VCOPS_BASE%\..\vmware-
vcopssuite\utilities\sliceConfiguration\bin\vcopsSetAdminPassword.py --reset
Generate a vRealize Operations Manager Passphrase
When users need to add a node to the vRealize Operations Manager cluster, you can generate a temporary
passphrase instead of giving them the master administrator login credentials, which might be a security
issue.
A temporary passphrase is good for one use only.
Prerequisites
Create and congure the master node.
Procedure
1 In a Web browser, navigate to the vRealize Operations Manager administration interface at
hps://master-node-name-or-ip-address/admin.
2 Log in with the admin username and password for the master node.
vRealize Operations Manager Customization and Administration Guide
142 VMware, Inc.
3 In the list of cluster nodes, select the master node.
4 From the toolbar above the list, click the option to generate a passphrase.
5 Enter a number of hours before the passphrase expires.
6 Click Generate.
A random alphanumeric string appears, which you can send to a user who needs to add a node.
What to do next
Have the user supply the passphrase when adding a node.
How To Preserve Customized Content
When you upgrade vRealize Operations Manager, it is important that you upgrade the current versions of
content types that allow you to alert on and monitor the objects in your environment. With upgraded alert
denitions, symptom denitions, and recommendations, you can alert on the various states of objects in
your environment and identify a wider range of problem types. With upgraded views, you can create
dashboards and reports to easily identify and report on problems in your environment.
You might need to perform certain steps before you upgrade the alert denitions, symptom denitions,
recommendations, and views in your vRealize Operations Manager environment.
nIf you customized any of the alert denitions, symptom denitions, recommendations, or views that
were provided with previous versions of vRealize Operations Manager, and you want to retain those
customized versions, perform the steps in this procedure.
nIf you did not customize any of the alert denitions, symptom denitions, recommendations, or views
that were provided with previous versions of vRealize Operations Manager, you do not need to back
them up rst. Instead, you can start the upgrade, and during the upgrade select the check box named
Reset out-of-the-box content.
Prerequisites
You previously customized versions of your alert denitions, symptom denitions, recommendations, or
views.
Procedure
1 Before you begin the upgrade to vRealize Operations Manager, back up the changes to your alert
denitions, symptom denitions, recommendations, and views by cloning them.
2 Start the upgrade of vRealize Operations Manager.
3 During the upgrade, select the check box named Reset out-of-the-box content.
After the upgrade completes, you have preserved your customized versions of alert denitions, symptom
denitions, recommendations, and views, and you have the current versions that were installed during the
upgrade.
What to do next
Review the changes in the upgraded alert denitions, symptom denitions, recommendations, and views.
Then, determine whether to keep your previously modied versions, or to use the upgraded versions.
Chapter 4 Maintaining and Expanding vRealize Operations Manager
VMware, Inc. 143

Backup and Restore
Backup and restore your vRealize Operations Manager system on a regular basis to avoid downtime and
data loss in case of a system failure. If your system does fail, you can restore the system to the last full or
incremental backup.
You can backup and restore vRealize Operations Manager single or multi-node clusters by using
vSphere Data Protection or other backup tools. You can perform full, dierential, and incremental backups
and restores of virtual machines.
To backup and restore vRealize Suite components by using vSphere Data Protection and NetBackup, see the
Backup and Restore section in the vRealize Suite Information Center.
N All nodes are backed up and restored at the same time. You cannot back up and restore individual
nodes.
Backing Up vRealize Operations Manager Systems
Be aware of these prerequisites when you back up vRealize Operations Manager systems by using
vSphere Data Protection.
n“Disable Quiescing,” on page 145.
nVerify that all nodes are powered on and are accessible while the backup is taking place.
Be aware of these guidelines when you back up vRealize Operations Manager systems by using any tool.
nUse a resolvable host name and a static IP address for all nodes.
nBack up the entire virtual machine. You must back up all VMDK les that are part of the virtual
appliance.
nDo not stop the cluster while performing the backup.
nDo not perform backup while dynamic threshold (DT) calculations are running because this might lead
to performance issues or loss of nodes.
You are not required to delete any snapshots, however, be aware that tools such as vSphere Data Protection
delete all existing snapshots at the time of backup.
Restoring vRealize Operations Manager Systems
Be aware of these prerequisites when restoring vRealize Operations Manager systems by using any tool.
nPower o the virtual machines in the multi-node cluster that you want to restore.
nBefore restoring to a dierent host, power o virtual machines at the original location, and then bring
up the environment on the new host to avoid hostname or IP conict. Verify that the datastore on the
new host has sucient capacity for the new cluster.
nVerify that all VMDK les have been assigned to the same datastore.
When you restore vRealize Operations Manager systems by using any tool, be aware that you need to reset
the root password after the restore completes.
Backing Up and Restoring with vSphere Data Protection
Use vSphere Data Protection to associate the back up of a vRealize Operations Manager multi-node cluster
with a backup schedule and retention policies. After backup, use vSphere Data Protection to restore a
vRealize Operations Manager multi-node cluster to its original location.
vRealize Operations Manager Customization and Administration Guide
144 VMware, Inc.
Disable Quiescing
Before you backup your vRealize Operations Manager multi-node cluster by using vSphere Data Protection,
disable quiescing of the le system.
Procedure
1 Log in to the ESXi host with an SSH session, and power o all nodes.
2 Navigate to the /vmfs/volumes/virtual_machine_datastore/ virtual_machine/ directory, and open the
virtual_machine.vmx le for editing.
3 Set the disk.EnableUUID parameter to false.
You may have to add the disk.EnableUUID parameter to the virtual_machine.vmx le.
4 Save and close the le.
5 Power on all nodes.
6 Open a console session to the virtual machine, and log in to each node.
7 Navigate to the /etc/vmware-tools directory, and open the tools.conf le for editing.
If you cannot locate the tools.conf le, run the vi tools.conf command to create a le.
8 Add these parameters to the le.
[vmbackup]
enableSyncDriver = false
This runs a synchronization operation before the snapshot, and does not run a freeze on the le system.
9 Save and close the le.
What to do next
Backup your vRealize Operations Manager multi-node cluster by using vSphere Data Protection.
Back Up vRealize Operations Manager By Using vSphere Data Protection
You can use vSphere Data Protection to associate the backup of a vRealize Operations Manager multi-node
cluster with a backup schedule and retention policies.
Be aware of these guidelines when you back up vRealize Operations Manager systems.
nUse a resolvable host name and a static IP address for all nodes.
nBack up the entire virtual machine. You must back up all VMDK les that are part of the virtual
appliance.
nDo not stop the cluster while performing the backup.
nDo not perform backup while dynamic threshold (DT) calculations are running because this might lead
to performance issues or loss of nodes.
You are not required to delete any snapshots, however, be aware that vSphere Data Protection deletes all
existing snapshots at the time of backup.
Prerequisites
n“Disable Quiescing,” on page 145.
nVerify that all nodes are powered on and are accessible while the backup is taking place.
nDeploy and congure the vSphere Data Protection appliance. See the vSphere Data Protection
Administration Guide.
Chapter 4 Maintaining and Expanding vRealize Operations Manager
VMware, Inc. 145
nVerify that the vSphere Data Protection appliance is installed on the vCenter Server instance where the
vRealize Operations Manager cluster is deployed.
nVerify that you have sucient disk space available for your vSphere Data Protection instance. This
depends on the size of the multi-node cluster that you want to back up.
nUse the vSphere Web Client to log in as an administrator to the vCenter Server instance that manages
your environment.
nIn the vSphere Web Client verify that the virtual machines have the latest version of VMware Tools
installed.
Procedure
1 In the left pane of the vSphere Web Client, select vSphere Data Protection.
2 Select the precongured vSphere Data Protection appliance and click Connect.
3 On the Started tab, select Create Backup Job.
4 Leave the Guest Images option selected, and click Next.
5 Leave the Full Images option selected, and click Next.
6 In the inventory tree select all the nodes of the cluster that you want to back up, and click Next.
7 Set a schedule for the backup job, and click Next.
8 Specify a retention policy for the backup job, and click Next.
9 Enter a name for the backup job, and click Next.
10 Review the summary information for the backup job and click Finish.
The newly created backup job is listed on the Backup tab. The backup runs automatically according to
the schedule you congured.
11 (Optional) To run the backup job manually at a later time.
a On the Backup tab, select the backup job.
b Click Backup Now, and select Backup all sources.
12 (Optional) On the Reports tab, select Job Details to verify that the backup job was completed.
What to do next
Restore a backed up system.
Restore vRealize Operations Manager By Using vSphere Data Protection
You can restore a backed up vRealize Operations Manager multi-node cluster to its original location by
using vSphere Data Protection.
Prerequisites
nPower o the virtual machines in the multi-node cluster that you want to restore.
nBefore restoring to a dierent host, power o virtual machines at the original location, and then bring
up the environment on the new host to avoid hostname or IP conict. Verify that the datastore on the
new host has sucient capacity for the new cluster.
nVerify that all VMDK les have been assigned to the same datastore.
nDeploy and congure the vSphere Data Protection appliance. See the vSphere Data Protection
Administration Guide.
nBack up the vRealize Operations Manager multi-node cluster.
vRealize Operations Manager Customization and Administration Guide
146 VMware, Inc.
nUse the vSphere Web Client to log in as an administrator to the vCenter Server instance that manages
your environment.
nIn the vSphere Web Client verify that the virtual machines have the latest VMware Tools installed.
Procedure
1 In the left pane of the vSphere Web Client, select vSphere Data Protection.
2 Select the precongured vSphere Data Protection appliance, and click Connect.
3 Click the Restore tab.
4 Select the rst virtual machine listed that is part of the cluster.
All performed backups for this virtual machine are displayed.
5 Select the backup from which you want to restore components.
6 Double-click the backup job, and select the components that you want to restore.
7 Click Restore to start the Restore backup wizard.
8 On the Select Backup page, verify that the backup is correct and click Next.
9 On the Set Restore Options page, leave the Restore to original location check box selected, and click
Next.
If you deselect the Restore to original location check box, you can select a dierent destination for the
restore. You might have to specify options such as the host name, network, datastore, and folder.
10 On the Ready to complete page, review the summary information for the restore request, and click
Finish.
11 Repeat steps 4 to 10 for the same backed up copies of all other virtual machines that are part of the
cluster.
12 Reset the root password.
13 To verify that the restore operation is successful, power on the virtual machines in the cluster and check
that all vRealize Operations Manager services are running.
What to do next
If you restored your system to a remote location, change the IP address to point the cluster to the new host.
Checking the Restore of vRealize Operations Manager Systems
After you have restored a vRealize Operations Manager system, verify that the system nodes are up and
running.
Procedure
1 Power on the master node for a simple cluster, and the master node and replica node for HA clusters.
2 Use SSH to log into the vRealize Operations Manager master node to check the
vRealize Operations Manager service status, and run service vmware-vcops status.
# service vmware-vcops status
Slice Online-true
admin Role Enabled-true
vRealize Operations vPostgres Replication Database is running (31810).
vRealize Operations Gemfire Locator is running (31893).
data Role Enabled-true
vRealize Operations vPostgres Database is running (32013).
vRealize Operations Cassandra Distributed Database is running (21062).
Chapter 4 Maintaining and Expanding vRealize Operations Manager
VMware, Inc. 147
vRealize Operations Analytics is running (32142).
vRealize Operations Collector is running (32225).
vRealize Operations API is running (32331).
ui Role Enabled-true
remote collector Role Enabled-false
3Conrm that the admin, data, and ui roles are running.
4 Verify that all the nodes in the cluster are up and collecting data. If you have an HA-enabled cluster,
verify that HA mode is enabled.
a In a Web browser, navigate to the vRealize Operations Manager administration interface at
hps://<Master_Node_IP>/admin/login.action.
b Log in with the admin username and password.
c Verify that each node is online.
d Click each node, and verify that the status of adapter instances is Data receiving.
e Verify that HA mode is enabled. If the cluster is running in degraded mode, restart the cluster.
Change the IP Address of Nodes After Restoring a Cluster on a Remote Host
After you have restored a vRealize Operations Manager cluster to a remote host, change the IP address of
the master nodes and data nodes to point to the new host.
Prerequisites
nVerify that the restore job has completed successfully.
nVerify that the datastore on the new host has sucient capacity for the new cluster.
Procedure
1 Shut down the vRealize Operations Manager cluster at the original location.
2 In the Virtual Appliance Management Interface (VAMI), access the machine from the vCenter console
and run the /opt/vmware/share/vami/vami_set_network eth0 STATICV4 new IP netmask gateway to
change the IP address for each node in the cluster.
For example:
/opt/vmware/share/vami/vami_set_network
eth0 STATICV4 10.145.152.170 255.255.252.0 10.145.155.253
3 After the command runs successfully, restart the network, reboot each node, and power on the remote
collector node.
4 Use SSH to access the master, data, and remote collector nodes, and run the
$VMWARE_PYTHON_BIN /usr/lib/vmware-
vcopssuite/utilities/sliceConfiguration/bin/vcopsConfigureRoles.py --action=bringSliceOffline
--offlineReason=restore cluster command to take the cluster oine.
5 Update the CaSA database with the new IP address rst on the master nodes, and then on the data
nodes.
a Run the vmware-casa stop command to stop the CaSA service.
b Open the /storage/db/casa/webapp/hsqldb/casa.db.script le for editing, and replace all
instances of the old IP address and with the new IP address.
c Run the vmware-casa start command to start the CaSA service.
vRealize Operations Manager Customization and Administration Guide
148 VMware, Inc.
6 In the following conguration les, use a text editor to replace all instances of the old IP address with
the new IP address.
n/usr/lib/vmware-vcopssuite/utilities/sliceConfiguration/data/roleState.properties.
n/usr/lib/vmware-vcops/user/conf/gemfire.properties.
n/usr/lib/vmware-vcops/user/conf/gemfire.locator.properties. This conguration le only runs
on the master node. Edit the locater parameter.
n/usr/lib/vmware-vcops/user/conf/gemfire.native.properties.
n/usr/lib/vmware-vcops/user/conf/persistence/persistence.properties.
7 Navigate to the /usr/lib/vmware-vcops/user/conf/cassandra/ directory, and edit the cassandra.yaml
le so that the seeds parameter points to the new IP address of the master node, and the
listen_address and broadcast_rpc_address point to the IP addresses of the data nodes.
8 Log in to the vRealize Operations Manager administration interface, and bring the cluster online.
Manual Backup Procedure Appears to Stall
When you run a backup job manually by using vSphere Data Protection, the progress of the job might reach
92% and stall. It appears as though the job has stopped running.
Problem
The task details in the Running tab of the Recent Tasks pane might show that the job has stopped running
when it reaches 92%. Often, the job might still be running in the background. The status of the backup job
can be veried in the vSphere Data Protection Appliance.
Solution
1 Use SSH to log in to vSphere Data Protection appliance.
2 Run mccli activity show to view a list of backup jobs and their status.
3 In the Client column, search for the ID of the backup job, and the corresponding virtual machines.
4 In the Status column, verify that the job is still running.
Chapter 4 Maintaining and Expanding vRealize Operations Manager
VMware, Inc. 149
vRealize Operations Manager Customization and Administration Guide
150 VMware, Inc.

OPS-CLI Command-Line Tool 5
The OPS-CLI tool is a Java application that you can use to manipulate the vRealize Operations Manager
database. It replaces the VCOPS-CLI andDBCLI tools.
The product includes the executable le in the tools directory or in <VCOPS_BASE>/tools/opscli/.
Operating System File Name
Linux ops-cli.sh
Windows ops-cli.bat
Python ops-cli.py
All OPS-CLI commands use the -h parameter for interactive and localized help.
When you add the control command to the post_install.sh script, it triggers the redescribe process after
an adapter is installed or upgraded.
control -h | redescribe --force
Supported Operations
The OPS-CLI tool supports the following database operations.
ndashboard Command Operations on page 152
You use the dashboard command to import, export, share, unshare, delete, reorder, show, hide, and set
the default summary for dashboards.
ntemplate Command Operations on page 152
You use the template command to import, export, share, unshare, delete, and reorder templates.
nsupermetric Command Operations on page 153
You use the supermetric command to import, export, congure, and delete super metrics.
naribute Command Operations on page 154
You use the attribute command to congure properties of a specic metric in one or more packages.
The metric is the object aribute.
nreskind Command Operations for Object Types on page 154
You use the reskind command to congure the default seings in your object type as dened by the
ResourceKind model element. The command sets the default aribute or supermetric package, enables
or disables dynamic thresholds, and enables or disables early warning smart alerts.
nreport Command Operations on page 154
You use the report command to import, export, congure, and delete super metrics.
VMware, Inc. 151

nview Command Operations on page 155
You use the view command to import, export, or delete view denitions.
nle Command Operations on page 155
You use the file command to import, export, list or delete database les. The command operates on
metric, text widget, and topology widget les.
dashboard Command Operations
You use the dashboard command to import, export, share, unshare, delete, reorder, show, hide, and set the
default summary for dashboards.
The dashboard command uses the following syntax.
dashboard -h | import|defsummary|export|share|unshare|delete|reorder|show|hide [parameters]
Table 5‑1. dashboard Command Options
Command
Name Description Syntax
dashboard
import
Import a dashboard from
a le and assign the
ownership to a user
account.
dashboard import -h | user-name|all|group:group_name input-
file [--force]
[--share all|group-name[{,group-
name}]] [--retry maxRetryMinutes]
[--set rank] [--default] [--create]
dashboard
export
Export an existing
dashboard to a le.
dashboard export -h | user-name dashboard-name [output-dir]
dashboard
defsummary
Import a dashboard from
a le and assign the
ownership to a user
account.
dashboard defsummary -h | input-file|default
--adapterKind adapterKind --
resourceKind resourceKind
dashboard
share
Share an existing
dashboard with one or
multiple user groups.
dashboard share -h | user-name dahsboard-name all|group-
name[{,group-name}]
dashboard
unshare
Stop sharing a dashboard
with specied groups.
dashboard unshare -h | user-name dashboard-name all|group-
name[{,group-name}]
dashboard
delete
Permanently delete a
dashboard.
dashboard delete -h | user-name|all|group:group_name
dashboard-name
dashboard
reorder
Set the order rank for a
dashboard, with an option
to make it the default.
dashboard reorder -h | user-name|all|group:group_name
dashboard-name
[--set rank] [--default]
dashboard
show
Show a dashboard. dashboard show -h | user-name|all|group:group_name
{,dashbaordname}|all
dashboard
hide
Hide a dashboard. dashboard hide -h | user-name|all|group:group_name
{,dashboardname}|all
template Command Operations
You use the template command to import, export, share, unshare, delete, and reorder templates.
The template command uses the following syntax.
template -h | import|export|share|unshare|delete|reorder [parameters]
vRealize Operations Manager Customization and Administration Guide
152 VMware, Inc.

Table 5‑2. template Command Operations
Command
Name Description Syntax
template
import
Import a
template from
a le.
template import -h | input-file
[--force] [--share all|group-name[{,group-
name}]]
[--retry maxRetryMinutes] [--set rank] [--
create]
template
export
Export an
existing
template to a
template le.
template export -h | template-name [output-dir]
template
share
Share an
existing
template with
one or multiple
user groups.
template share -h | template-name all|group-name[{,group-name}]
template
unshare
Stop sharing a
template with
specied
groups.
template unshare -h | template-name all|group-name[{,group-name}]
template
delete
Permanently
delete a
template.
template delete -h | template-name
template
reorder
Set the order
rank for a
template. The
order rank
controls the
order of
templates
created based
on shared
templates.
template reorder -h | template-name [--set rank]
supermetric Command Operations
You use the supermetric command to import, export, congure, and delete super metrics.
The supermetric command uses the following syntax.
supermetric -h | import|export|configure|delete [parameters]
Table 5‑3. supermetric Command Operations
Comman
d Name Description Syntax
supermet
ric
import
Import a super metric from a le
and assign the ownership to the
specied user account.
supermetric import -h | input-file
[--force] [--policies all|policy-
name[{,policy-name}]]
[--check (true|false)] [--retry
maxRetryMinutes] [--create]
supermet
ric export
Export an existing super metric to
a template le.
supermetric export -h | supermetric-name [output-dir]
Chapter 5 OPS-CLI Command-Line Tool
VMware, Inc. 153

Table 5‑3. supermetric Command Operations (Continued)
Comman
d Name Description Syntax
supermet
ric
congure
Congure properties of a super
metric in one or more super
metrics packages.
supermetric configure -h | supermetric-name
--policies all|policy-
name[{,policy-name}]]
--check (true|false) --ht
(true|false) --htcriticality level-name
--dtabove (true|false) --
dtbelow (true|false)
--thresholds threshold-
def[{,threshold-def}]
supermet
ric delete
Permanently delete a super
metric.
supermetric delete -h | supermetric-name
attribute Command Operations
You use the attribute command to congure properties of a specic metric in one or more packages. The
metric is the object aribute.
The attribute command uses the following syntax.
attribute configure -h | adapterkind-key:resourcekind-key attribute-key
--packages all|package-name[{,package-name}] --check (true|false)
--ht (true|false) --htcriticality level-name
--dtabove (true|false) --dtbelow (true|false)
--thresholds threshold-def[{,threshold-def}]
reskind Command Operations for Object Types
You use the reskind command to congure the default seings in your object type as dened by the
ResourceKind model element. The command sets the default aribute or supermetric package, enables or
disables dynamic thresholds, and enables or disables early warning smart alerts.
The reskind command uses the following syntax.
reskind configure -h | adapterkind-key:resourcekind-key
--package package-name --smpackage smpackagename
--dt (true|false) --smartalert (true|false)
report Command Operations
You use the report command to import, export, congure, and delete super metrics.
The report command uses the following syntax.
report -h | import|export|delete [parameters]
Table 5‑4. report Command Options
Command Name Description Syntax
report import Import a report denition
from a le.
report import -h | input-file [--force]
report export Export one or more report
denitions to a le.
report export -h | all|report-name[{,report-
name}] [output-dir]
report delete Permanently delete one or
more report denitions.
report delete -h | all|report-name[{,report-
name}]
vRealize Operations Manager Customization and Administration Guide
154 VMware, Inc.

view Command Operations
You use the view command to import, export, or delete view denitions.
The view command uses the following syntax.
view -h | import|export|delete [parameters]
Table 5‑5. view Command Operations
Command
Name Description Syntax
view import Import a view denition from a le. view import -h | input-file [--force]
view export Export one or more view denitions to
a le.
view export -h | all|view-name[{,view-name}]
[output-dir]
view delete Permanently delete one or more view
denitions.
view delete -h | all|view-name[{,view-name}]
file Command Operations
You use the file command to import, export, list or delete database les. The command operates on metric,
text widget, and topology widget les.
The file command uses the following syntax.
file -h | import|export|delete|list [parameters]
Table 5‑6. file Command Operations
Command Name Description Syntax
le import Import a metric or widget from a le. file import -h | reskndmetric|textwidget|
topowidget
input-file [--title
title] [--force]
le export Export one or more metrics or text widgets,
or export the toplogy widget to a le.
file export -h | reskndmetric|textwidget|
topowidget
all|title[{,title}]
[output-dir]
le delete Permanently delete a metric or a widget. file delete -h | reskndmetric|textwidget|
topowidget
all|title[{,title}]
le list List all metric or a widget les. file list -h | reskndmetric|textwidget|
topowidget
Chapter 5 OPS-CLI Command-Line Tool
VMware, Inc. 155
vRealize Operations Manager Customization and Administration Guide
156 VMware, Inc.
Index
A
access control
privileges 10
user scenario create role and user account 14
user scenario import user account 16
actions
alert definitions 67
overview list 67
adapters, icons 120
administer 7
administration
admin password 142
change admin password 141
policies 88
agents
configure logging 133
configure logging level 134
log files 133
logging 133
manage plug-ins 132
managing plug-ins 132
unsynchronized 133
alert
compliance 79
compliance standard 85
outbound alert plug-in 69–71, 73–75
outbound settings plug-ins 68
recommendations 68
alert symptom
fault 67
message event 66
metric 66
metric event 67
property 66
alert and symptom definitions, overwriting 80
alert definition
best practices 53
hierarchy 53
negative symptom 54
object hierarchy 53
alert definitions
alert 67
preserve customized content 143
alerts, for compliance 80
application, adding 24
application groups
environment overview 24
managing 24
apply policy to datastore objects 105
apply policy to vSphere object groups 98
associate super metric, object type 116
attribute command operations 154
audit
system 20
system component 21
use cases 20
user activity 20
user permissions 20
authentication sources, single sign-on 17
Automated Action plug-in 68
B
backup, with vSphere data protection 145
backup and restore
check the restore 147
general guidelines 144
backward compatibility for vCenter Server
Users 12
base settings 90
best practices
alert definition 53
recommendation 53
symptom 53
C
capacity overview dashboardpredefined
dashboard, capacity overview
dashboard 34
certificates 141
change IP address after a restore job 148
cluster configuration dashboardpredefined
dashboard, cluster configuration
dashboard 36
cluster performance dashboardpredefined
dashboard, cluster performance
dashboard 37
command operations
attribute 154
dashboard 152
file 155
report 154
reskind 154
VMware, Inc. 157
supermetric 153
template 152
view 155
compliance, alerts 80
compliance standard
alert 85
compliance subtype 85
negated symptom 86
recommendation 86
symptom 86
compliance for vSphere 6.0 objects 80
compliance of vSphere 6.0 objects 81
compliance risk profiles 79
configure dashboard navigation 31
configure policy settings to analyze and report on
vSphere objects 97
configuring users 9
create dashboard 28, 29
create report 47
create view 44
create a policy to meet vSphere operational
needs 95
create dashboard to view disk usage of
datastore objects 105
create new group type for policy 101
create new object group for policy 101
create new policy and select base policies 102
custom object groups 21
custom policies 90
custom groups 22
customize, icons 120
customize how resources behave 51
customized content 143
D
dashboard
configure 31
create 28, 29
definition 32
navigation 31
widgets 39
dashboard command operations 152
dashboards 27, 64
data retention 136
datastore capacity dashboardpredefined
dashboard, datastore capacity
dashboard 37
datastore performance dashboardpredefined
dashboard, datastore performance
dashboard 37
default content, resetting 80
default policy 90
disable quiescing 145
download report 48
DRS, vSphere Predictive 119
E
edit, global settings 136
email, notification 77
enable policy disk space attributes for datastore
objects 103
End Point Operations Management 126
Endpoint Operations Manager, agent log
files 133
environment overview, application groups 24
ESXi configuration dashboardpredefined
dashboard, ESXi configuration
dashboard 38
export, super metric 118
export view 45
external users 10
external sources for users 10
external user sources 13
F
fault symptom, alert 67
file command operations 155
filter, outbound alerts 76
formulate, super metric 114
G
getting started dashboard 33
global settings
edit 136
list 137
glossary 7
groups 21, 61, 87
H
heavy hitter VMs dashboardpredefined
dashboard, heavy hitter VMs
dashboard 35
hierarchy, objects 53
HTTP service, remote monitoring 126, 127
I
ICMP service, remote monitoring 126, 130
icons
customize 120
object type 120
import, super metric 118
import view 45
infrastructure dashboardpredefined dashboard,
infrastructure dashboard 36
intended audience 7
vRealize Operations Manager Customization and Administration Guide
158 VMware, Inc.
L
local users 10
log file, outbound alert plug-in 73
Log File plug-in 68
log files, Endpoint Operations Manager
agent 133
logging
agent log files 133
configure 133
configure agent log name 134
configure logging level 134
configure agent location name 134
configure debug level 135
redirect system messages 134
M
maintain 7
manage 7
manage user accounts 10
manual backup procedure stalls 149
message event symptom, alert 66
metric event symptom, alert 67
metric symptom, alert 66
monitor 7
N
negated symptom, compliance standard 86
negative symptom 54
network configuration dashboardpredefined
dashboard, network configuration
dashboard 38
network share, outbound report plug-in 73
Network Share plug-in 68
node,passphrase 142
nodes 139
notification
email 77
outbound alert 68, 77, 78
REST 78
notifications
outbound alert plug-ins 69–71, 73–75
outbound alerts 77
outbound plug-ins 68
O
object groups 21, 22, 87
object relationships 125
object tags
adding 124
predefined 123
object type
associate super metric 116
icons 120
objects
adding 121
assigning tags 122
configuring relationships 125
finding with tags 124
managing 121
parent-child relationships 125
operations for object type 154
operations overview dashboardpredefined
dashboard, operations overview
dashboard 33
ops-cli tool 151
outbound, settings 68
outbound alert
notification 68, 77, 78
settings 69–71, 73–75
outbound alert plug-in
log file 73
REST plug-in 71
Smarts Service Assurance Manager 75
SMTP 70
SNMP trap 74
standard email 70
outbound alerts
filter 76
notifications 77
outbound reports plug-in, network share 73
override policy alert and symptom definitions for
datastore objects 104
override policy analysis settings for datastore
objects 103
overview, super metric 110
overwriting alert and symptom definitions 80
owner
view 45
report 45
P
passphrase 142
passwords
admin 142
administrator account 141
pDRS 119
permissions 20
plug-in, outbound alert 68–71, 73–75
plug-ins
configure loading 132
excluding 132
including 132
synchronize with agent 133
policies
apply policy to vSphere object groups 98
custom 90
default 90
Index
VMware, Inc. 159
impact of upgrades 88
managing 88
objectives 89
privileges 88
responsibilities 89
user scenario to create an operational policy
for production datastore objects 100
user scenario to create policy for vSphere
production environment 93
workspace 109
policies provided 91
policies determine vSphere operational
requirements 94
policies,workspace 108
predefined dashboards 33
Predictive DRS 119
preserve customized content 143
privileges 10, 13
profiles for compliance risk 79
property symptom, alert 66
R
recommendation
best practices 53
compliance standard 86
recommendations
alerts 68
preserve customized content 143
remote monitoring
HTTP service 126, 127
ICMP service 126, 130
TCP service 126, 131
report
create 47
download 48
generate 48
introduction 46
owner 45
schedule 49
template
delete 49
edit 49
report command operations 154
reports 27
reset default content 80
Reset out-of-the-box content 143
reskind 154
reskind command operations 154
resource interaction mode, widget 41
resource behavior customize 51
ResourceKind 154
REST
notification 78
outbound alert plug-in 71
REST Notification plug-in 68
restore, with vSphere data protection 146
restore a system to a remote location 148
retention, data 136
review super metric, troubleshooting 117
risk profiles for compliance 79
roles 10, 13
run view 44
S
scenarios
create policy for vSphere production
environment 93
adding an application 24
create an operational policy for production
datastore objects 100
object groups 22
user access control create role and user
account 14
user access control import user account 16
schedule report 49
search for application 24
security,passphrase 142
settings, global 136
single sign-on 17
single sign-on source, edit a source 19
Smarts SAM Notification plug-in 68
Smarts Service Assurance Manager, outbound
alert plug-in 75
SMTP, outbound alert plug-in 70
SNMP trap, outbound alert plug-in 74
SNMP Trap plug-in 68
sources for external users 13
standard email, outbound alert plug-in 70
Standard Email plug-in 68
super metric
export 118
formulate 114
import 118
overview 110
visualize 115
super metric functions 110
super metric operators 113
super metrics
adding 115
formulas 117
preparing to create 114
supermetric command operations 153
support bundle 141
vRealize Operations Manager Customization and Administration Guide
160 VMware, Inc.
symptom
best practices 53
compliance standard 86
fault 67
message event 66
metric 66
metric event 67
negated 54
property 66
symptom definitions, preserve customized
content 143
symptoms 57, 58
system audit report 20
system component audit 21
system messages, redirect to agent log 134
T
tags, objects 122
TCP service, remote monitoring 126, 131
Technical Support 141
template command operations 152
tool, ops-cli 151
troubleshoot a VM dashboardpredefined
dashboard, troubleshoot a VM
dashboard 35
troubleshooting, review super metric 117
U
Unsynchronized Agents group 133
upgrade, Reset out-of-the-box content 143
upgrades, impact on policies 88
use cases, auditing 20
user access control, privileges 10
user preferences 9
user scenario
create a user account 15
dashboard 28
dashboard navigation 28
reports 46
views 43
vSphere 6.0 compliance 81
widget 28
user scenarios
access control 14
access control create role and user
account 14
access control import user account 16
create an operational policy for production
datastore objects 100
create policy for vSphere production
environment 93
users
accounts 10
external 10
external sources 13
local 10
privileges 10
roles 10
vCenter Server 10, 11
Users, backward compatibility 12
V
vCenter Server users 10, 11
vCenter Server Users, backward
compatibility 12
view
create 44
delete 46
edit 46
export 45
import 45
owner 45
run 44
view command operations 155
views, preserve customized content 143
visualize, super metric 115
VM configuration dashboardpredefined
dashboard, VM configuration
dashboard 36
VM dashboards 35
VM usage dashboardpredefined dashboard, VM
usage dashboard 36
vRealize Operations Manager
backup 144
backup and restore 144
licenses 139
maintenance 139
restore 144
troubleshooting 139
vSphere Predictive DRS 119
vSphere 6.0 compliance 81
vSphere 6.0 object compliance 80
vSphere data protection
backing up 145
backup and restore 144
restoring with 146
vSphere Hardening Guide 5.5 79, 85
vSphere Hardening Guide 6.0 79, 85
W
widget
interaction 41
resource interaction mode 41
widgets, configuring 38
work dashboard navigation 31
workspaces, policies 108, 109
Index
VMware, Inc. 161
vRealize Operations Manager Customization and Administration Guide
162 VMware, Inc.
