AWS X Ray Developer Guide Xray
User Manual: Pdf
Open the PDF directly: View PDF ![]() .
.
Page Count: 217 [warning: Documents this large are best viewed by clicking the View PDF Link!]
- AWS X-Ray
- Table of Contents
- What Is AWS X-Ray?
- AWS X-Ray Use Cases and Requirements
- Getting Started with AWS X-Ray
- AWS X-Ray Concepts
- AWS X-Ray Console
- AWS X-Ray API
- AWS X-Ray Permissions
- AWS X-Ray Sample Application
- Manually Instrumenting AWS SDK Clients
- Creating Additional Subsegments
- Recording Annotations, Metadata, and User IDs
- Instrumenting Outgoing HTTP Calls
- Instrumenting Calls to a PostgreSQL Database
- Instrumenting AWS Lambda Functions
- Instrumenting Amazon ECS Applications
- Instrumenting Startup Code
- Instrumenting Scripts
- Instrumenting a Web App Client
- Using Instrumented Clients in Worker Threads
- Deep Linking to the X-Ray Console
- AWS X-Ray Daemon
- Downloading the Daemon
- Verifying the Daemon Archive's Signature
- Running the Daemon
- Giving the Daemon Permission to Send Data to X-Ray
- X-Ray Daemon Logs
- Configuring the AWS X-Ray Daemon
- Running the X-Ray Daemon Locally
- Running the X-Ray Daemon on AWS Elastic Beanstalk
- Running the X-Ray Daemon on Amazon EC2
- Running the X-Ray Daemon on Amazon ECS
- AWS X-Ray SDK for Java
- Requirements
- Dependency Management
- Configuring the X-Ray SDK for Java
- Tracing Incoming Requests with the X-Ray SDK for Java
- Tracing AWS SDK Calls with the X-Ray SDK for Java
- Tracing Calls to Downstream HTTP Web Services with the X-Ray SDK for Java
- Tracing SQL Queries with the X-Ray SDK for Java
- Generating Custom Subsegments with the X-Ray SDK for Java
- Add Annotations and Metadata to Segments with the X-Ray SDK for Java
- Passing Segment Context between Threads in a Multithreaded Application
- AOP with Spring and the X-Ray SDK for Java
- AWS X-Ray SDK for Go
- Requirements
- Reference Documentation
- Configuring the X-Ray SDK for Go
- Instrumenting Incoming HTTP Requests with the X-Ray SDK for Go
- Tracing AWS SDK Calls with the X-Ray SDK for Go
- Tracing Calls to Downstream HTTP Web Services with the X-Ray SDK for Go
- Tracing SQL Queries with the X-Ray SDK for Go
- Generating Custom Subsegments with the X-Ray SDK for Go
- Add Annotations and Metadata to Segments with the X-Ray SDK for Go
- The X-Ray SDK for Node.js
- Requirements
- Dependency Management
- Configuring the X-Ray SDK for Node.js
- Tracing Incoming Requests with the X-Ray SDK for Node.js
- Tracing AWS SDK Calls with the X-Ray SDK for Node.js
- Tracing Calls to Downstream HTTP Web Services Using the X-Ray SDK for Node.js
- Tracing SQL Queries with the X-Ray SDK for Node.js
- Generating Custom Subsegments with the X-Ray SDK for Node.js
- Add Annotations and Metadata to Segments with the X-Ray SDK for Node.js
- AWS X-Ray SDK for Python
- Requirements
- Dependency Management
- Configuring the X-Ray SDK for Python
- Tracing Incoming Requests with the X-Ray SDK for Python Middleware
- Patching Libraries to Instrument Downstream Calls
- Tracing AWS SDK Calls with the X-Ray SDK for Python
- Tracing Calls to Downstream HTTP Web Services Using the X-Ray SDK for Python
- Generating Custom Subsegments with the X-Ray SDK for Python
- Add Annotations and Metadata to Segments with the X-Ray SDK for Python
- AWS X-Ray SDK for Ruby
- Requirements
- Configuring the X-Ray SDK for Ruby
- Tracing Incoming Requests with the X-Ray SDK for Ruby Middleware
- Patching Libraries to Instrument Downstream Calls
- Tracing AWS SDK Calls with the X-Ray SDK for Ruby
- Generating Custom Subsegments with the X-Ray SDK
- Add Annotations and Metadata to Segments with the X-Ray SDK for Ruby
- AWS X-Ray SDK for .NET
- Requirements
- Adding the X-Ray SDK for .NET to Your Application
- Configuring the X-Ray SDK for .NET
- Instrumenting Incoming HTTP Requests with the X-Ray SDK for .NET
- Instrumenting Downstream Calls to AWS Services
- Tracing Calls to Downstream HTTP Web Services with the X-Ray SDK for .NET
- Tracing SQL Queries with the X-Ray SDK for .NET
- Creating Additional Subsegments
- Add Annotations and Metadata to Segments with the X-Ray SDK for .NET
- Troubleshooting AWS X-Ray
- Integrating AWS X-Ray with Other AWS Services

AWS X-Ray
Developer Guide

AWS X-Ray Developer Guide
AWS X-Ray: Developer Guide
Copyright © 2018 Amazon Web Services, Inc. and/or its affiliates. All rights reserved.
Amazon's trademarks and trade dress may not be used in connection with any product or service that is not Amazon's, in any manner
that is likely to cause confusion among customers, or in any manner that disparages or discredits Amazon. All other trademarks not
owned by Amazon are the property of their respective owners, who may or may not be affiliated with, connected to, or sponsored by
Amazon.

AWS X-Ray Developer Guide
Table of Contents
What Is AWS X-Ray? ........................................................................................................................... 1
Use Cases .......................................................................................................................................... 3
Supported Languages and Frameworks ......................................................................................... 4
Supported AWS Services ............................................................................................................. 6
Code and Configuration Changes ................................................................................................. 6
Getting Started .................................................................................................................................. 8
Prerequisites .............................................................................................................................. 9
Deploy to Elastic Beanstalk and Generate Trace Data .................................................................... 10
View the Service Map in the X-Ray Console ................................................................................. 11
Configuration Amazon SNS Notifications ..................................................................................... 13
Explore the Sample Application ................................................................................................. 15
Clean Up ................................................................................................................................. 18
Next Steps ............................................................................................................................... 19
Concepts ......................................................................................................................................... 20
Segments ................................................................................................................................ 20
Subsegments ........................................................................................................................... 21
Service Graph .......................................................................................................................... 23
Traces ..................................................................................................................................... 24
Sampling ................................................................................................................................. 25
Tracing Header ......................................................................................................................... 25
Filter Expressions ..................................................................................................................... 25
Annotations and Metadata ........................................................................................................ 26
Errors, Faults, and Exceptions ..................................................................................................... 27
X-Ray Console .................................................................................................................................. 28
Viewing the Service Map ........................................................................................................... 28
Viewing Traces ......................................................................................................................... 31
Viewing Segment Details ........................................................................................................... 33
Viewing Subsegment Details ...................................................................................................... 35
Filter Expressions ..................................................................................................................... 37
Filter Expression Syntax .................................................................................................... 38
Boolean Keywords ............................................................................................................ 39
Number Keywords ............................................................................................................ 40
String Keywords ............................................................................................................... 40
Complex Keywords ........................................................................................................... 41
The ID Function ............................................................................................................... 42
Deep Linking ........................................................................................................................... 44
Traces ............................................................................................................................. 44
Filter Expressions ............................................................................................................. 44
Time Range ..................................................................................................................... 44
Region ............................................................................................................................ 45
Combined ........................................................................................................................ 45
Histograms .............................................................................................................................. 45
Encryption ............................................................................................................................... 47
X-Ray API ........................................................................................................................................ 49
Tutorial ................................................................................................................................... 49
Prerequisites .................................................................................................................... 49
Generate Trace Data ......................................................................................................... 50
Use the X-Ray API ............................................................................................................ 50
Cleanup ........................................................................................................................... 52
Sending Data ........................................................................................................................... 52
Generating Trace IDs ......................................................................................................... 54
Using PutTraceSegments ................................................................................................... 54
Sending Segment Documents to the X-Ray Daemon ............................................................. 55
Getting Data ............................................................................................................................ 56
iii

AWS X-Ray Developer Guide
Retrieving the Service Graph ............................................................................................. 56
Retrieving Traces .............................................................................................................. 56
Configuration ........................................................................................................................... 59
Segment Documents ................................................................................................................. 60
Segment Fields ................................................................................................................ 61
Subsegments ................................................................................................................... 62
HTTP Request Data .......................................................................................................... 65
Annotations ..................................................................................................................... 67
Metadata ......................................................................................................................... 68
AWS Resource Data .......................................................................................................... 69
Errors and Exceptions ....................................................................................................... 70
SQL Queries .................................................................................................................... 71
CloudTrail ................................................................................................................................ 72
Permissions ..................................................................................................................................... 74
IAM Managed Policies for X-Ray ................................................................................................. 74
Running Your Application Locally ............................................................................................... 75
Running Your Application in AWS ............................................................................................... 76
Sample Application ........................................................................................................................... 77
AWS SDK Clients ...................................................................................................................... 81
Custom Subsegments ............................................................................................................... 81
Annotations and Metadata ........................................................................................................ 82
HTTP Clients ............................................................................................................................ 83
SQL Clients .............................................................................................................................. 83
AWS Lambda Functions ............................................................................................................. 85
Random Name ................................................................................................................. 86
Worker ............................................................................................................................ 87
Amazon ECS ............................................................................................................................ 89
Startup Code ........................................................................................................................... 90
Scripts ..................................................................................................................................... 91
Client ...................................................................................................................................... 93
Worker Threads ........................................................................................................................ 96
Deep Linking ........................................................................................................................... 98
X-Ray Daemon ................................................................................................................................. 99
Downloading the Daemon ......................................................................................................... 99
Verifying the Daemon Archive's Signature ................................................................................... 99
Running the Daemon .............................................................................................................. 100
Giving the Daemon Permission to Send Data to X-Ray ................................................................. 101
X-Ray Daemon Logs ................................................................................................................ 101
Configuration ......................................................................................................................... 102
Using Command Line Options .......................................................................................... 102
Using a Configuration File ............................................................................................... 103
Run the Daemon Locally ......................................................................................................... 104
Running the X-Ray Daemon on Linux ................................................................................ 104
Running the X-Ray Daemon in a Docker Container .............................................................. 104
Running the X-Ray Daemon on Windows ........................................................................... 105
Running the X-Ray Daemon on OS X ................................................................................ 106
On Elastic Beanstalk ............................................................................................................... 106
Using the Elastic Beanstalk X-Ray Integration to Run the X-Ray Daemon ................................ 107
Downloading and Running the X-Ray Daemon Manually (Advanced) ...................................... 108
On Amazon EC2 ..................................................................................................................... 109
On Amazon ECS ..................................................................................................................... 110
Working with Java .......................................................................................................................... 113
Requirements ......................................................................................................................... 114
Dependency Management ....................................................................................................... 114
Configuration ......................................................................................................................... 116
Service Plugins ............................................................................................................... 116
Sampling Rules .............................................................................................................. 118
iv

AWS X-Ray Developer Guide
Logging ......................................................................................................................... 120
Environment Variables .................................................................................................... 120
System Properties ........................................................................................................... 120
Incoming Requests .................................................................................................................. 121
Adding a Tracing Filter to your Application (Tomcat) ........................................................... 122
Adding a Tracing Filter to your Application (Spring) ............................................................ 122
Configuring a Segment Naming Strategy ........................................................................... 122
AWS SDK Clients .................................................................................................................... 124
Outgoing HTTP Calls .............................................................................................................. 125
SQL Queries ........................................................................................................................... 126
Custom Subsegments .............................................................................................................. 128
Annotations and Metadata ...................................................................................................... 129
Recording Annotations with the X-Ray SDK for Java ............................................................ 130
Recording Metadata with the X-Ray SDK for Java ............................................................... 131
Recording User IDs with the X-Ray SDK for Java ................................................................. 132
Multithreading ....................................................................................................................... 133
AOP with Spring ..................................................................................................................... 133
Configuring Spring .......................................................................................................... 134
Annotating Your Code or Implementing an Interface ........................................................... 134
Activating X-Ray in Your Application ................................................................................. 134
Example ........................................................................................................................ 134
Working with Go ............................................................................................................................ 136
Requirements ......................................................................................................................... 137
Reference Documentation ........................................................................................................ 137
Configuration ......................................................................................................................... 137
Service Plugins ............................................................................................................... 137
Sampling Rules .............................................................................................................. 139
Logging ......................................................................................................................... 140
Environment Variables .................................................................................................... 140
Using Configure ............................................................................................................. 140
Incoming Requests .................................................................................................................. 141
Configuring a Segment Naming Strategy ........................................................................... 142
AWS SDK Clients .................................................................................................................... 143
Outgoing HTTP Calls .............................................................................................................. 144
SQL Queries ........................................................................................................................... 144
Custom Subsegments .............................................................................................................. 145
Annotations and Metadata ...................................................................................................... 145
Recording Annotations with the X-Ray SDK for Go .............................................................. 146
Recording Metadata with the X-Ray SDK for Go .................................................................. 146
Recording User IDs with the X-Ray SDK for Go ................................................................... 146
Working with Node.js ...................................................................................................................... 148
Requirements ......................................................................................................................... 149
Dependency Management ....................................................................................................... 149
Configuration ......................................................................................................................... 150
Service Plugins ............................................................................................................... 150
Sampling Rules .............................................................................................................. 151
Logging ......................................................................................................................... 152
X-Ray Daemon Address ................................................................................................... 152
Environment Variables .................................................................................................... 152
Incoming Requests .................................................................................................................. 153
Tracing Incoming Requests with Express ............................................................................ 153
Tracing Incoming Requests with Restify ............................................................................. 154
Configuring a Segment Naming Strategy ........................................................................... 154
AWS SDK Clients .................................................................................................................... 155
Outgoing HTTP Calls .............................................................................................................. 156
SQL Queries ........................................................................................................................... 157
Custom Subsegments .............................................................................................................. 158
v

AWS X-Ray Developer Guide
Annotations and Metadata ...................................................................................................... 159
Recording Annotations with the X-Ray SDK for Node.js ........................................................ 159
Recording Metadata with the X-Ray SDK for Node.js ........................................................... 160
Working with Python ...................................................................................................................... 162
Requirements ......................................................................................................................... 163
Dependency Management ....................................................................................................... 163
Configuration ......................................................................................................................... 164
Service Plugins ............................................................................................................... 164
Sampling Rules .............................................................................................................. 165
Logging ......................................................................................................................... 166
Recorder Configuration in Code ........................................................................................ 166
Recorder Configuration with Django ................................................................................. 167
Environment Variables .................................................................................................... 167
Incoming Requests .................................................................................................................. 168
Adding the Middleware to Your Application (Django) ........................................................... 169
Adding the Middleware to Your Application (Flask) ............................................................. 169
Instrumenting Python Code Manually ............................................................................... 169
Configuring a Segment Naming Strategy ........................................................................... 170
Patching Libraries ................................................................................................................... 171
Tracing Context for Asynchronous Work ............................................................................ 172
AWS SDK Clients .................................................................................................................... 172
Outgoing HTTP Calls .............................................................................................................. 173
Custom Subsegments .............................................................................................................. 174
Annotations and Metadata ...................................................................................................... 175
Recording Annotations with the X-Ray SDK for Python ........................................................ 176
Recording Metadata with the X-Ray SDK for Python ............................................................ 177
Recording User IDs with the X-Ray SDK for Python ............................................................. 177
Working with Ruby ......................................................................................................................... 179
Requirements ......................................................................................................................... 179
Configuration ......................................................................................................................... 180
Service Plugins ............................................................................................................... 180
Sampling Rules .............................................................................................................. 181
Logging ......................................................................................................................... 183
Recorder Configuration in Code ........................................................................................ 183
Recorder Configuration with Rails ..................................................................................... 183
Environment Variables .................................................................................................... 184
Incoming Requests .................................................................................................................. 184
Using the Rails Middleware .............................................................................................. 185
Instrumenting Code Manually .......................................................................................... 185
Configuring a Segment Naming Strategy ........................................................................... 186
Patching Libraries ................................................................................................................... 187
AWS SDK Clients .................................................................................................................... 187
Custom Subsegments .............................................................................................................. 188
Annotations and Metadata ...................................................................................................... 189
Recording Annotations with the X-Ray SDK for Ruby ........................................................... 189
Recording Metadata with the X-Ray SDK for Ruby .............................................................. 190
Recording User IDs with the X-Ray SDK for Ruby ................................................................ 190
Working with .NET .......................................................................................................................... 192
Requirements ......................................................................................................................... 193
Adding the X-Ray SDK for .NET to Your Application .................................................................... 193
Configuration ......................................................................................................................... 193
Plugins .......................................................................................................................... 194
Sampling Rules .............................................................................................................. 195
Logging (.NET) ............................................................................................................... 196
Logging (.NET Core) ........................................................................................................ 196
Environment Variables .................................................................................................... 197
Incoming Requests .................................................................................................................. 197
vi

AWS X-Ray Developer Guide
Instrumenting Incoming Requests (.NET) ........................................................................... 198
Instrumenting Incoming Requests (.NET Core) .................................................................... 198
Configuring a Segment Naming Strategy ........................................................................... 199
AWS SDK Clients .................................................................................................................... 200
Outgoing HTTP Calls .............................................................................................................. 201
SQL Queries ........................................................................................................................... 202
Custom Subsegments .............................................................................................................. 203
Annotations and Metadata ...................................................................................................... 204
Recording Annotations with the X-Ray SDK for .NET ........................................................... 204
Recording Metadata with the X-Ray SDK for .NET ............................................................... 205
Troubleshooting ............................................................................................................................. 206
X-Ray SDK for Java ................................................................................................................. 206
X-Ray SDK for Node.js ............................................................................................................. 206
The X-Ray daemon ................................................................................................................. 207
Working with Other Services ............................................................................................................ 208
Elastic Load Balancing ............................................................................................................. 208
Lambda ................................................................................................................................. 208
API Gateway .......................................................................................................................... 209
Amazon EC2 .......................................................................................................................... 210
Elastic Beanstalk ..................................................................................................................... 210
vii
AWS X-Ray Developer Guide
What Is AWS X-Ray?
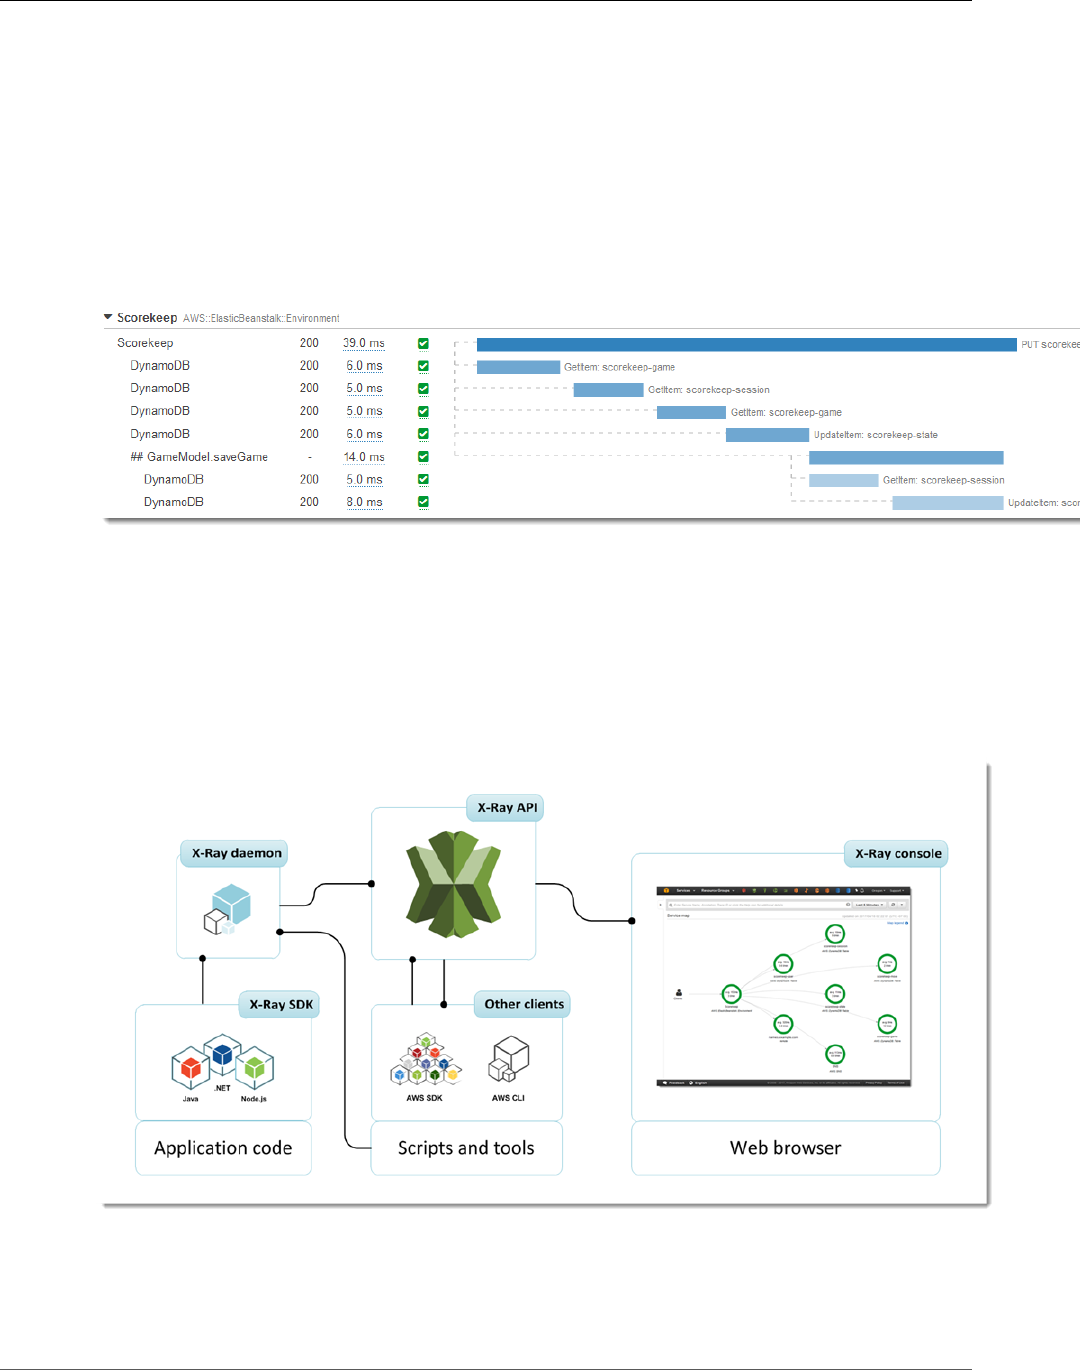
AWS X-Ray is a service that collects data about requests that your application serves, and provides
tools you can use to view, filter, and gain insights into that data to identify issues and opportunities
for optimization. For any traced request to your application, you can see detailed information not only
about the request and response, but also about calls that your application makes to downstream AWS
resources, microservices, databases and HTTP web APIs.
The X-Ray SDK provides:
•Interceptors to add to your code to trace incoming HTTP requests
•Client handlers to instrument AWS SDK clients that your application uses to call other AWS services
• An HTTP client to use to instrument calls to other internal and external HTTP web services
The SDK also supports instrumenting calls to SQL databases, automatic AWS SDK client instrumentation,
and other features.
Instead of sending trace data directly to X-Ray, the SDK sends JSON segment documents to a daemon
process listening for UDP traffic. The X-Ray daemon (p. 99) buffers segments in a queue and uploads
them to X-Ray in batches. The daemon is available for Linux, Windows, and macOS, and is included on
AWS Elastic Beanstalk and AWS Lambda platforms.
1
AWS X-Ray Developer Guide
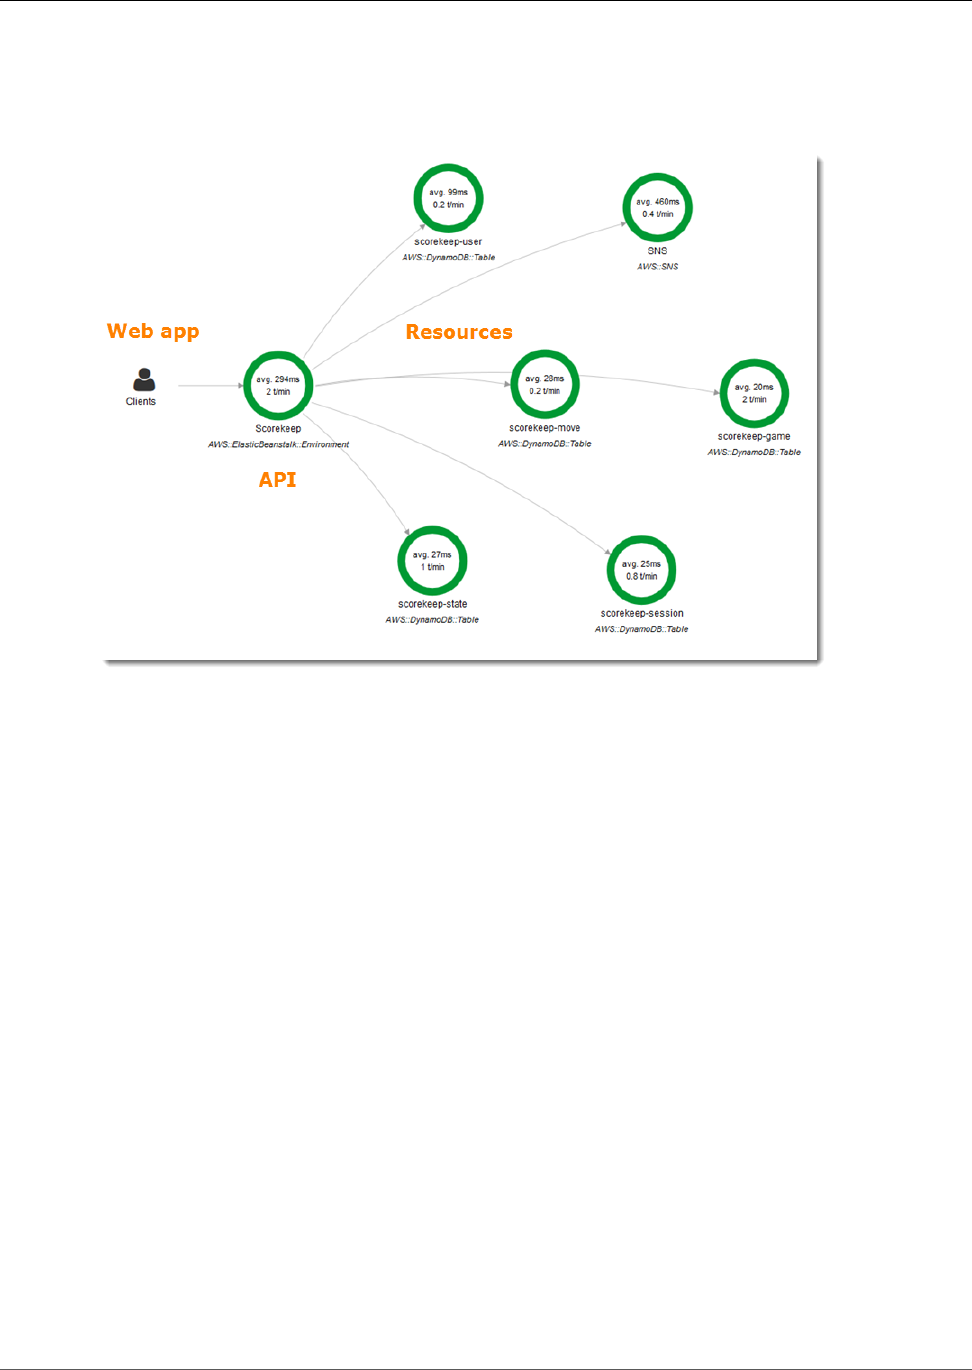
X-Ray uses trace data from the AWS resources that power your cloud applications to generate a detailed
service graph. The service graph shows the client, your front-end service, and backend services that your
front-end service calls to process requests and persist data. Use the service graph to identify bottlenecks,
latency spikes, and other issues to solve to improve the performance of your applications.
See the getting started tutorial (p. 8) to start using X-Ray in just a few minutes with an instrumented
sample application. Or keep reading (p. 3) to learn about the languages, frameworks, and services
that work with X-Ray.
2
AWS X-Ray Developer Guide
AWS X-Ray Use Cases and
Requirements
You can use the X-Ray SDK and AWS service integration to instrument requests to your applications that
are running locally or on AWS compute services such as Amazon EC2, Elastic Beanstalk, Amazon ECS and
AWS Lambda.
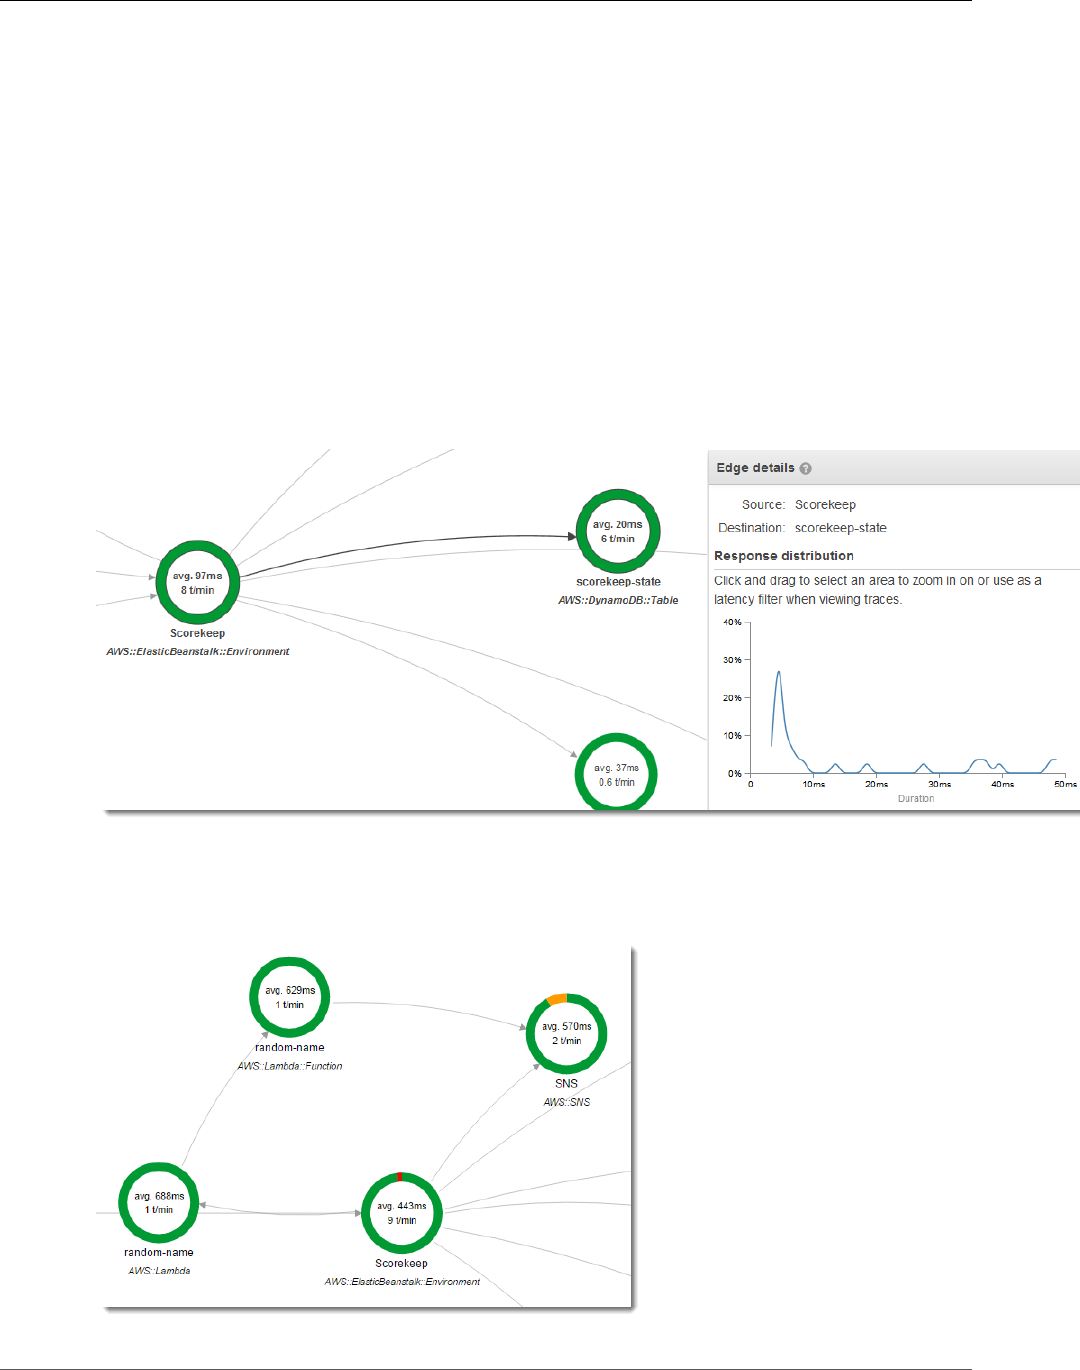
To instrument your application code, you use the X-Ray SDK. The SDK records data about incoming
and outgoing requests and sends it to the X-Ray daemon, which relays the data in batches to X-Ray. For
example, when your application calls DynamoDB to retrieve user information from a DynamoDB table,
the X-Ray SDK records data from both the client request and the downstream call to DynamoDB.
Other AWS services make it easier to instrument your application's components by integrating with X-
Ray. Service integration can include adding tracing headers to incoming requests, sending trace data to
X-Ray, or running the X-Ray daemon. For example, AWS Lambda can send trace data about requests to
your Lambda functions, and run the X-Ray daemon on workers to make it easier to use the X-Ray SDK.
3

AWS X-Ray Developer Guide
Supported Languages and Frameworks
Many instrumentation scenarios require only configuration changes. For example, you can instrument all
incoming HTTP requests and downstream calls to AWS services that your Java application makes. To do
this, you add the X-Ray SDK for Java's filter to your servlet configuration, and take the AWS SDK for Java
Instrumentor submodule as a build dependency. For advanced instrumentation, you can modify your
application code to customize and annotate the data that the SDK sends to X-Ray.
Sections
•Supported Languages and Frameworks (p. 4)
•Supported AWS Services (p. 6)
•Code and Configuration Changes (p. 6)
Supported Languages and Frameworks
AWS X-Ray provides tools and integration to support a variety of languages, frameworks, and platforms.
C#
On Windows Server, you can use the X-Ray SDK for .NET to instrument incoming requests, AWS SDK
clients, SQL clients, and HTTP clients. On AWS Lambda, you can use the Lambda X-Ray integration to
instrument incoming requests.
See AWS X-Ray SDK for .NET (p. 192) for more information.
•.NET on Windows Server – Add a message handler (p. 198) to your HTTP configuration to
instrument incoming requests.
•C# .NET Core on AWS Lambda – Enable X-Ray on your Lambda function configuration to instrument
incoming requests.
Go
In any Go application, you can use the X-Ray SDK for Go classes to instrument incoming requests,
AWS SDK clients, SQL clients, and HTTP clients. Automatic request instrumentation is available for
applications that use HTTP handlers.
On AWS Lambda, you can use the Lambda X-Ray integration to instrument incoming requests. Add the
X-Ray SDK for Go to your function for full instrumentation.
See AWS X-Ray SDK for Go (p. 136) for more information.
•Go web applications – Use the X-Ray SDK for Go HTTP handler (p. 141) to process incoming requests
on your routes.
•Go on AWS Lambda – Enable X-Ray on your Lambda function configuration to instrument incoming
requests. Add the X-Ray SDK for Go to instrument AWS SDK, HTTP, and SQL clients.
Java
In any Java application, you can use the X-Ray SDK for Java classes to instrument incoming requests,
AWS SDK clients, SQL clients, and HTTP clients. Automatic request instrumentation is available for
frameworks that support Java servlets. Automatic SDK instrumentation is available through the
Instrumentor submodule.
On AWS Lambda, you can use the Lambda X-Ray integration to instrument incoming requests. Add the
X-Ray SDK for Java to your function for full instrumentation.
See AWS X-Ray SDK for Java (p. 113) for more information.
4

AWS X-Ray Developer Guide
Supported Languages and Frameworks
•Tomcat – Add a servlet filter (p. 122) to your deployment descriptor (web.xml) to instrument
incoming requests.
•Spring Boot – Add a servlet filter (p. 122) to your WebConfig class to instrument incoming requests.
•Java on AWS Lambda – Enable X-Ray on your Lambda function to instrument incoming requests. Add
the X-Ray SDK for Java to instrument AWS SDK, HTTP, and SQL clients.
•Other frameworks – Add a servlet filter if your framework supports servlets, or manually create a
segment for each incoming request.
Node.js
In any Node.js application, you can use the X-Ray SDK for Node.js classes to instrument incoming
requests, AWS SDK clients, SQL clients, and HTTP clients. Automatic request instrumentation is available
for applications that use the Express and Restify frameworks.
On AWS Lambda, you can use the Lambda X-Ray integration to instrument incoming requests. Add the
X-Ray SDK for Node.js to your function for full instrumentation.
See The X-Ray SDK for Node.js (p. 148) for more information.
•Express or Restify – Use the X-Ray SDK for Node.js middleware (p. 153) to instrument incoming
requests.
•Node.js on AWS Lambda – Enable X-Ray on your Lambda function to instrument incoming requests.
Add the X-Ray SDK for Node.js to instrument AWS SDK, HTTP, and SQL clients
•Other frameworks – Manually create a segment for each incoming request.
Python
In any Python application, you can use the X-Ray SDK for Python classes to instrument incoming
requests, AWS SDK clients, SQL clients, and HTTP clients. Automatic request instrumentation is available
for applications that use the Django and Flask frameworks.
On AWS Lambda, you can use the Lambda X-Ray integration to instrument incoming requests. Add the
X-Ray SDK for Python to your function for full instrumentation.
See AWS X-Ray SDK for Python (p. 162) for more information.
•Django or Flask – Use the X-Ray SDK for Python middleware (p. 168) to instrument incoming
requests.
•Python on AWS Lambda – Enable X-Ray on your Lambda function configuration to instrument
incoming requests. Add the X-Ray SDK for Python to instrument AWS SDK, HTTP, and SQL clients.
•Other frameworks – Manually create a segment for each incoming request.
Ruby
In any Ruby application, you can use the X-Ray SDK for Ruby classes to instrument incoming requests,
AWS SDK clients, SQL clients, and HTTP clients. Automatic request instrumentation is available for
applications that use the Rails framework.
•Rails – Add the X-Ray SDK for Ruby gem and railtie to your gemfile, and configure the
recorder (p. 184) in an initializer to instrument incoming requests.
•Other frameworks – Manually create a segment (p. 185) for each incoming request.
If the X-Ray SDK isn't available for your language or platform, you can generate trace data manually and
send it to the X-Ray daemon, or directly to the X-Ray API (p. 49).
5

AWS X-Ray Developer Guide
Supported AWS Services
Supported AWS Services
Several AWS services provide X-Ray integration. Integrated services (p. 208) offer varying levels of
integration that can include sampling and adding headers to incoming requests, running the X-Ray
daemon, and automatically sending trace data to X-Ray.
•Active instrumentation – Samples and instruments incoming requests.
•Passive instrumentation – Instruments requests that have been sampled by another service.
•Request tracing – Adds a tracing header to all incoming requests and propagates it downstream.
•Tooling – Runs the AWS X-Ray daemon to receive segments from the X-Ray SDK.
Services with X-Ray integration include:
•AWS Lambda – Active and passive instrumentation of incoming requests on all runtimes. When you
enable instrumentation, AWS Lambda also runs the X-Ray daemon on Java and Node.js runtimes for
use with the X-Ray SDK. Learn more (p. 208).
•Amazon API Gateway – Request tracing. API Gateway passes the trace ID to AWS Lambda and adds it
to the request header for other downstream services. Learn more (p. 209).
•Elastic Load Balancing – Request tracing on application load balancers. The application load balancer
adds the trace ID to the request header before sending it to a target group. Learn more (p. 208).
•AWS Elastic Beanstalk – Tooling. Elastic Beanstalk includes the X-Ray daemon on the following
platforms:
•Java SE – 2.3.0 and newer configurations
•Tomcat – 2.4.0 and newer configurations
•Node.js – 3.2.0 and newer configurations
•Windows Server – All configurations other than Windows Server Core released since December 9th,
2016.
You can tell Elastic Beanstalk to run the daemon on these platforms in the Elastic Beanstalk console,
or by using the XRayEnabled option in the aws:elasticbeanstalk:xray namespace. Learn
more (p. 210).
Code and Configuration Changes
A large amount of tracing data can be generated without any functional changes to your code. Detailed
tracing of front-end and downstream calls requires only minimal changes to build and deploy-time
configuration.
Examples of Code and Configuration Changes
•AWS resource configuration – Change AWS resource settings to instrument requests to a Lambda
function. Run the X-Ray daemon on the instances in your Elastic Beanstalk environment by changing
an option setting.
•Build configuration – Take X-Ray SDK for Java submodules as a compile-time dependency to
instrument all downstream requests to AWS services, and to resources such as Amazon DynamoDB
tables, Amazon SQS queues, and Amazon S3 buckets.
•Application configuration – To instrument incoming HTTP requests, add a servlet filter to your Java
application, or use the X-Ray SDK for Node.js as middleware on your Express application. Change
sampling rules and enable plugins to instrument the Amazon EC2, Amazon ECS, and AWS Elastic
Beanstalk resources that run your application.
6

AWS X-Ray Developer Guide
Code and Configuration Changes
•Class or object configuration – To instrument outgoing HTTP calls in Java, import the X-Ray SDK for
Java version of HttpClientBuilder instead of the Apache.org version.
•Functional changes – Add a request handler to an AWS SDK client to instrument calls that it makes
to AWS services. Create subsegments to group downstream calls, and add debug information to
segments with annotations and metadata.
7
AWS X-Ray Developer Guide
Getting Started with AWS X-Ray
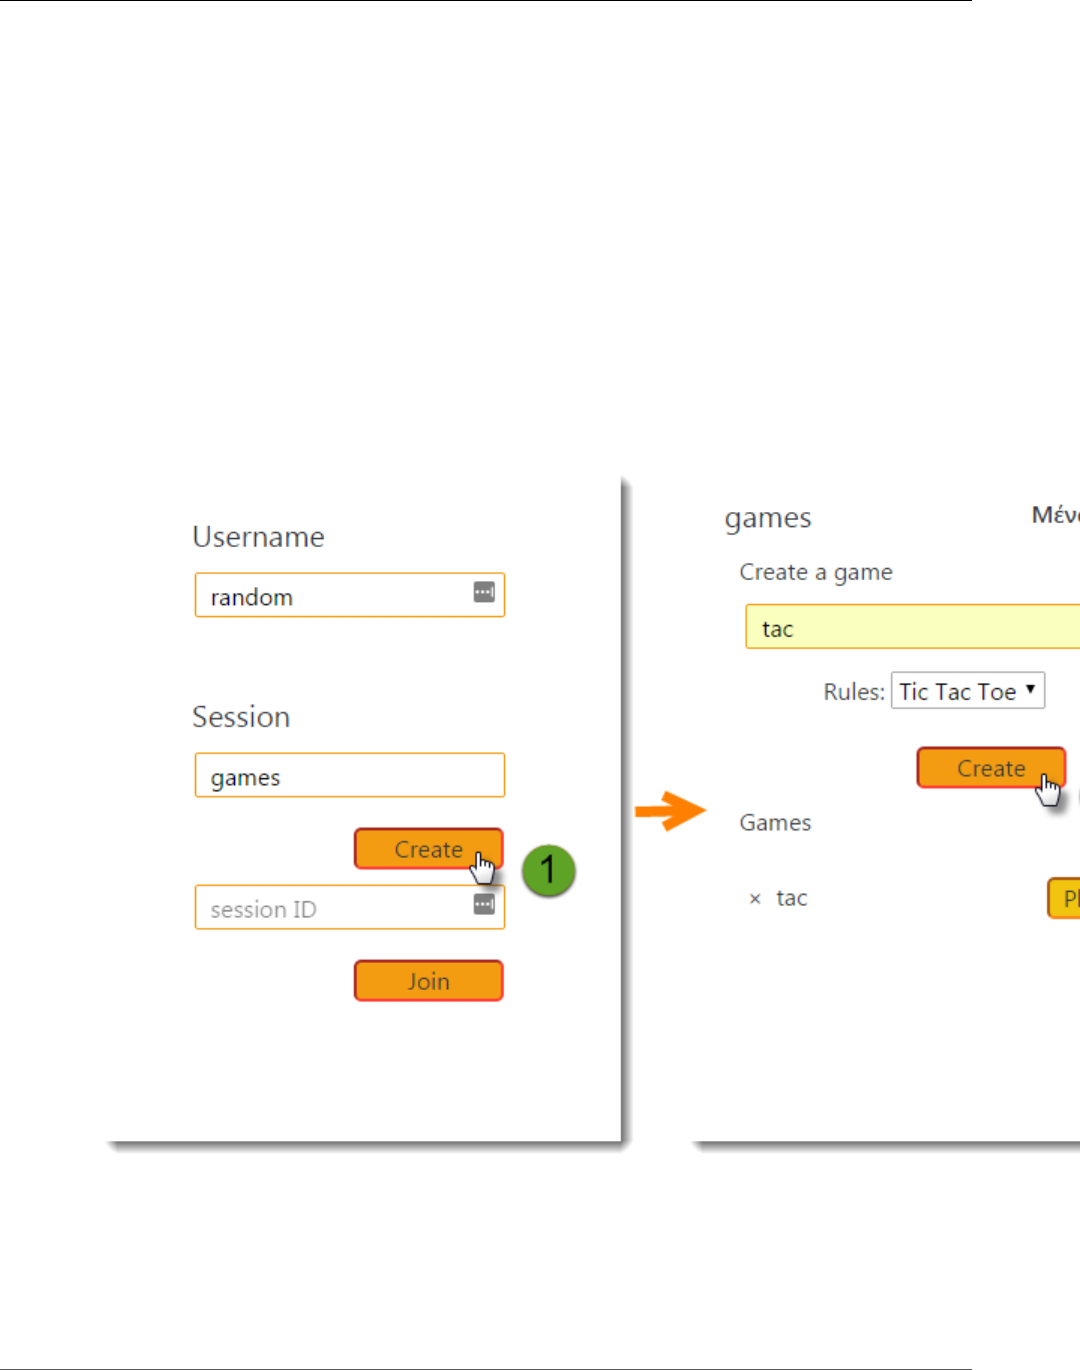
To get started with AWS X-Ray, launch a sample app in Elastic Beanstalk that is already
instrumented (p. 113) to generate trace data. In a few minutes, you can launch the sample app,
generate traffic, send segments to X-Ray, and view a service graph and traces in the AWS Management
Console.
This tutorial uses a sample Java application (p. 77) to generate segments and send them to X-Ray.
The application uses the Spring framework to implement a JSON web API and the AWS SDK for Java to
persist data to Amazon DynamoDB. A servlet filter in the application instruments all incoming requests
served by the application, and a request handler on the AWS SDK client instruments downstream calls to
DynamoDB.
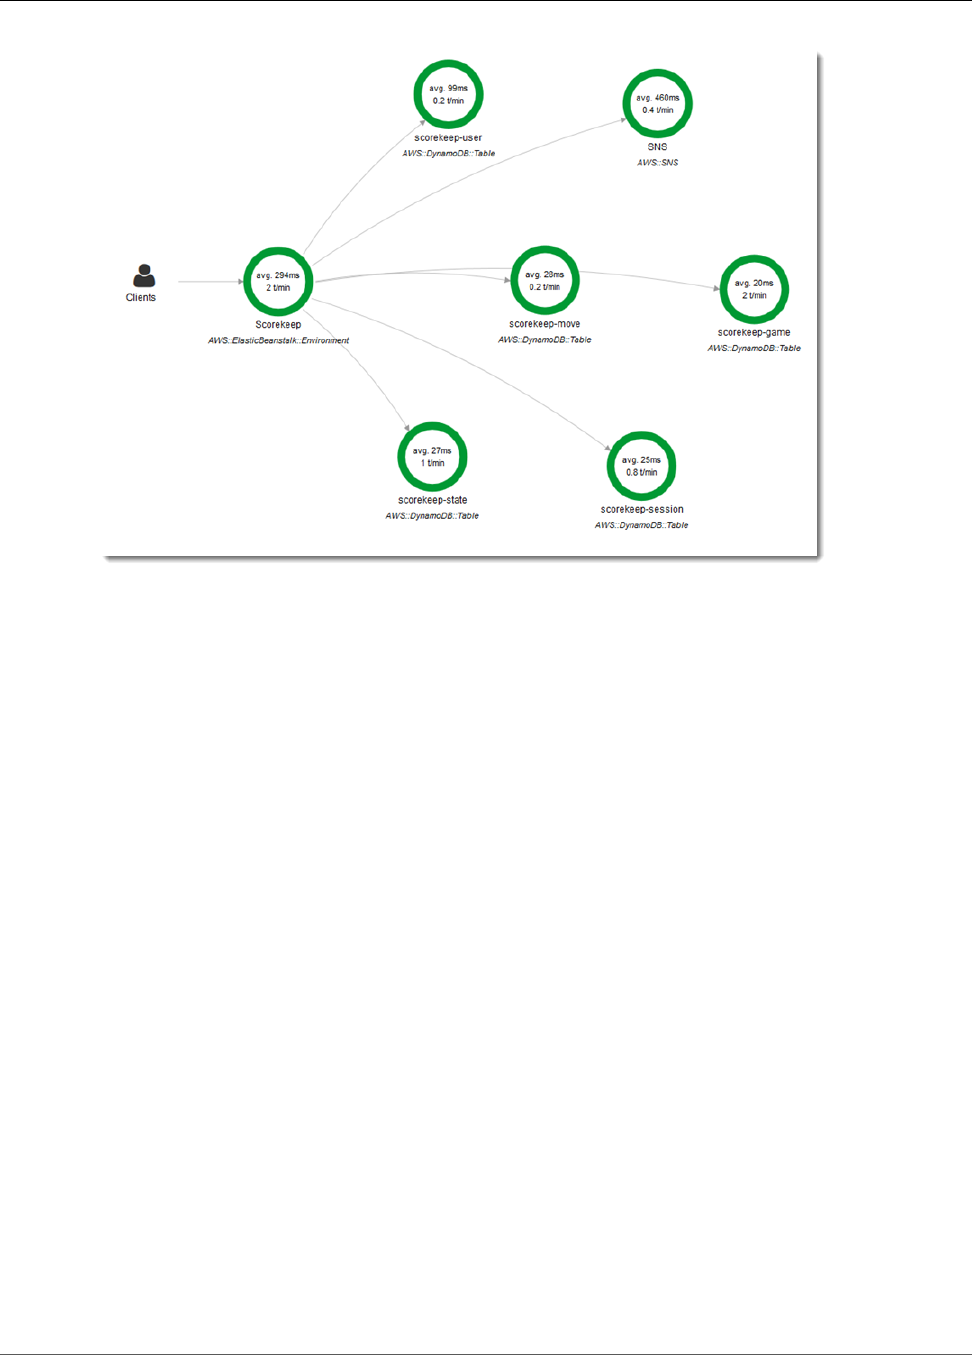
You use the X-Ray console to view the connections among client, server, and DynamoDB in a service
map. The service map is a visual representation of the services that make up your web application,
generated from the trace data that it generates by serving requests.
8
AWS X-Ray Developer Guide
Prerequisites
With the X-Ray SDK for Java, you can trace all of your application's primary and downstream AWS
resources by making two configuration changes:
• Add the X-Ray SDK for Java's tracing filter to your servlet configuration in a WebConfig class or
web.xml file.
• Take the X-Ray SDK for Java's submodules as build dependencies in your Maven or Gradle build
configuration.
You can also access the raw service map and trace data by using the AWS CLI to call the X-Ray API. The
service map and trace data are JSON that you can query to ensure that your application is sending data,
or to check specific fields as part of your test automation.
Sections
•Prerequisites (p. 9)
•Deploy to Elastic Beanstalk and Generate Trace Data (p. 10)
•View the Service Map in the X-Ray Console (p. 11)
•Configuration Amazon SNS Notifications (p. 13)
•Explore the Sample Application (p. 15)
•Clean Up (p. 18)
•Next Steps (p. 19)
Prerequisites
This tutorial uses Elastic Beanstalk to create and configure the resources that run the sample
application and X-Ray daemon. If you use an IAM user with limited permissions, add the Elastic
Beanstalk managed user policy to grant your IAM user permission to use Elastic Beanstalk, and the
AWSXrayReadOnlyAccess managed policy for permission to read the service map and traces in the X-
Ray console.
9

AWS X-Ray Developer Guide
Deploy to Elastic Beanstalk and Generate Trace Data
Create an Elastic Beanstalk environment for the sample application. If you haven't used Elastic Beanstalk
before, this will also create a service role and instance profile for your application.
To create an Elastic Beanstalk environment
1. Open the Elastic Beanstalk Management Console with this preconfigured
link: https://console.aws.amazon.com/elasticbeanstalk/#/newApplication?
applicationName=scorekeep&solutionStackName=Java
2. Choose Create application to create an application with an environment running the Java 8 SE
platform.
3. When your environment is ready, the console redirects you to the environment Dashboard.
4. Click the URL at the top of the page to open the site.
The instances in your environment need permission to send data to the AWS X-Ray service. Additionally,
the sample application uses Amazon S3 and DynamoDB. Modify the default Elastic Beanstalk instance
profile to include permissions to use these services.
To add X-Ray, Amazon S3 and DynamoDB permissions to your Elastic Beanstalk environment
1. Open the Elastic Beanstalk instance profile in the IAM console: aws-elasticbeanstalk-ec2-role.
2. Choose Attach Policy.
3. Attach AWSXrayFullAccess, AmazonS3FullAccess, and AmazonDynamoDBFullAccess to the role.
Deploy to Elastic Beanstalk and Generate Trace
Data
Deploy the sample application to your Elastic Beanstalk environment. The sample application uses Elastic
Beanstalk configuration files to configure the environment for use with X-Ray and create the DynamoDB
that it uses automatically.
To deploy the source code
1. Download the sample app: eb-java-scorekeep-xray-gettingstarted-v1.3.zip
2. Open the Elastic Beanstalk console.
3. Navigate to the management console for your environment.
4. Choose Upload and Deploy.
5. Upload eb-java-scorekeep-xray-gettingstarted-v1.3.zip, and then choose Deploy.
The sample application includes a front-end web app. Use the web app to generate traffic to the API and
send trace data to X-Ray.
To generate trace data
1. In the environment Dashboard, click the URL to open the web app.
2. Choose Create to create a user and session.
3. Type a game name, set the Rules to Tic Tac Toe, and then choose Create to create a game.
4. Choose Play to start the game.
5. Choose a tile to make a move and change the game state.
10
AWS X-Ray Developer Guide
View the Service Map in the X-Ray Console
Each of these steps generates HTTP requests to the API, and downstream calls to DynamoDB to read and
write user, session, game, move, and state data.
View the Service Map in the X-Ray Console
You can see the service map and traces generated by the sample application in the X-Ray console.
To use the X-Ray console
1. Open the service map page of the X-Ray console.
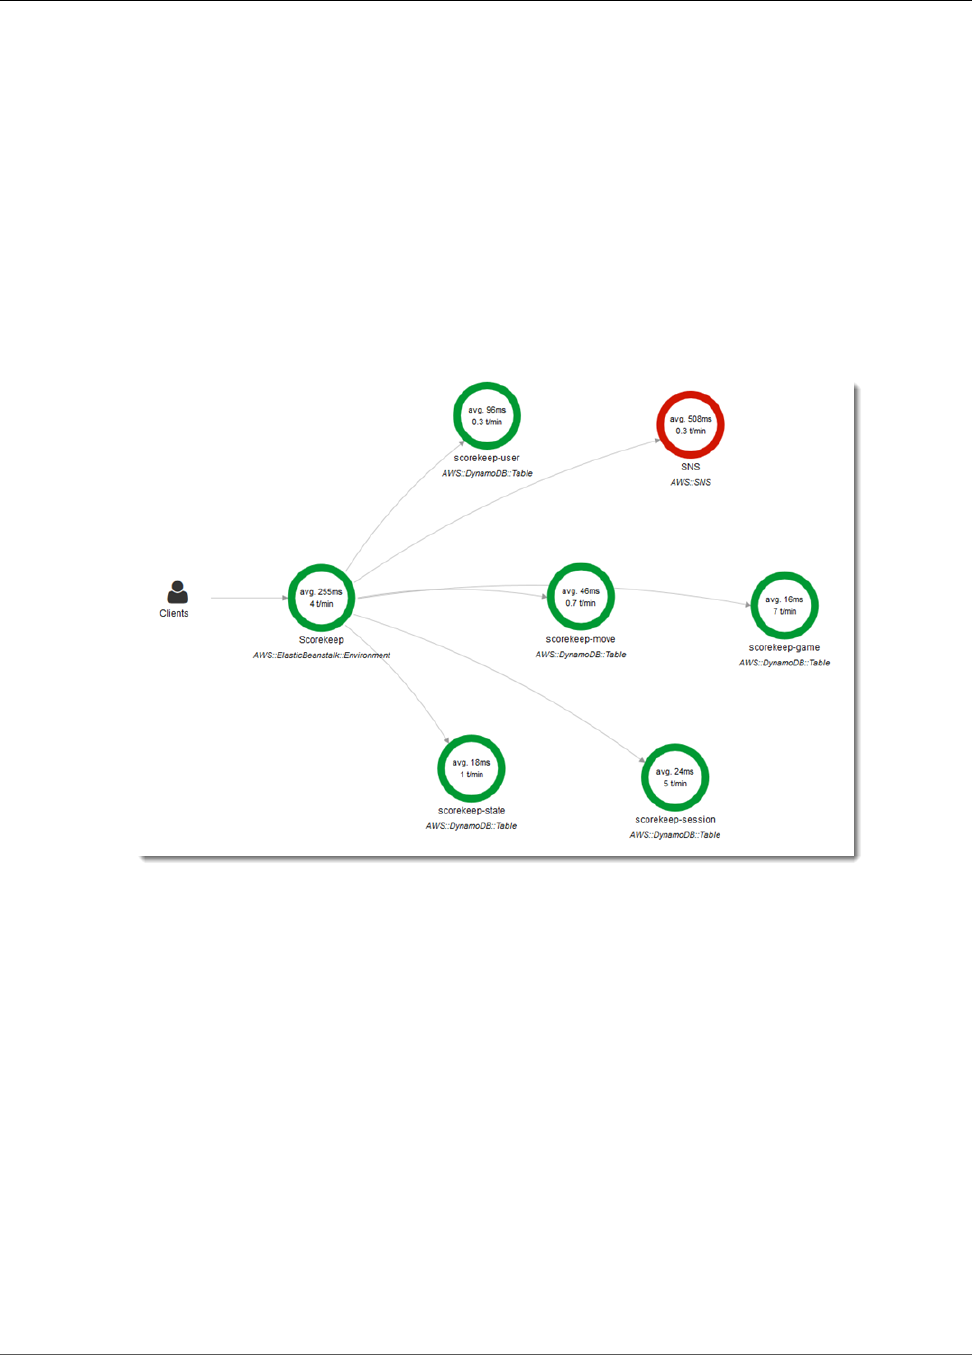
2. The console shows a representation of the service graph that X-Ray generates from the trace data
sent by the application.
The service map shows the web app client, the API running in Elastic Beanstalk, the DynamoDB
service, and each DynamoDB table that the application uses. Every request to the application, up to a
configurable maximum number of requests per second, is traced as it hits the API, generates requests to
downstream services, and completes.
You can choose any node in the service graph to view traces for requests that generated traffic to that
node. Currently, the Amazon SNS node is red. Drill down to find out why.
To find the cause of the error
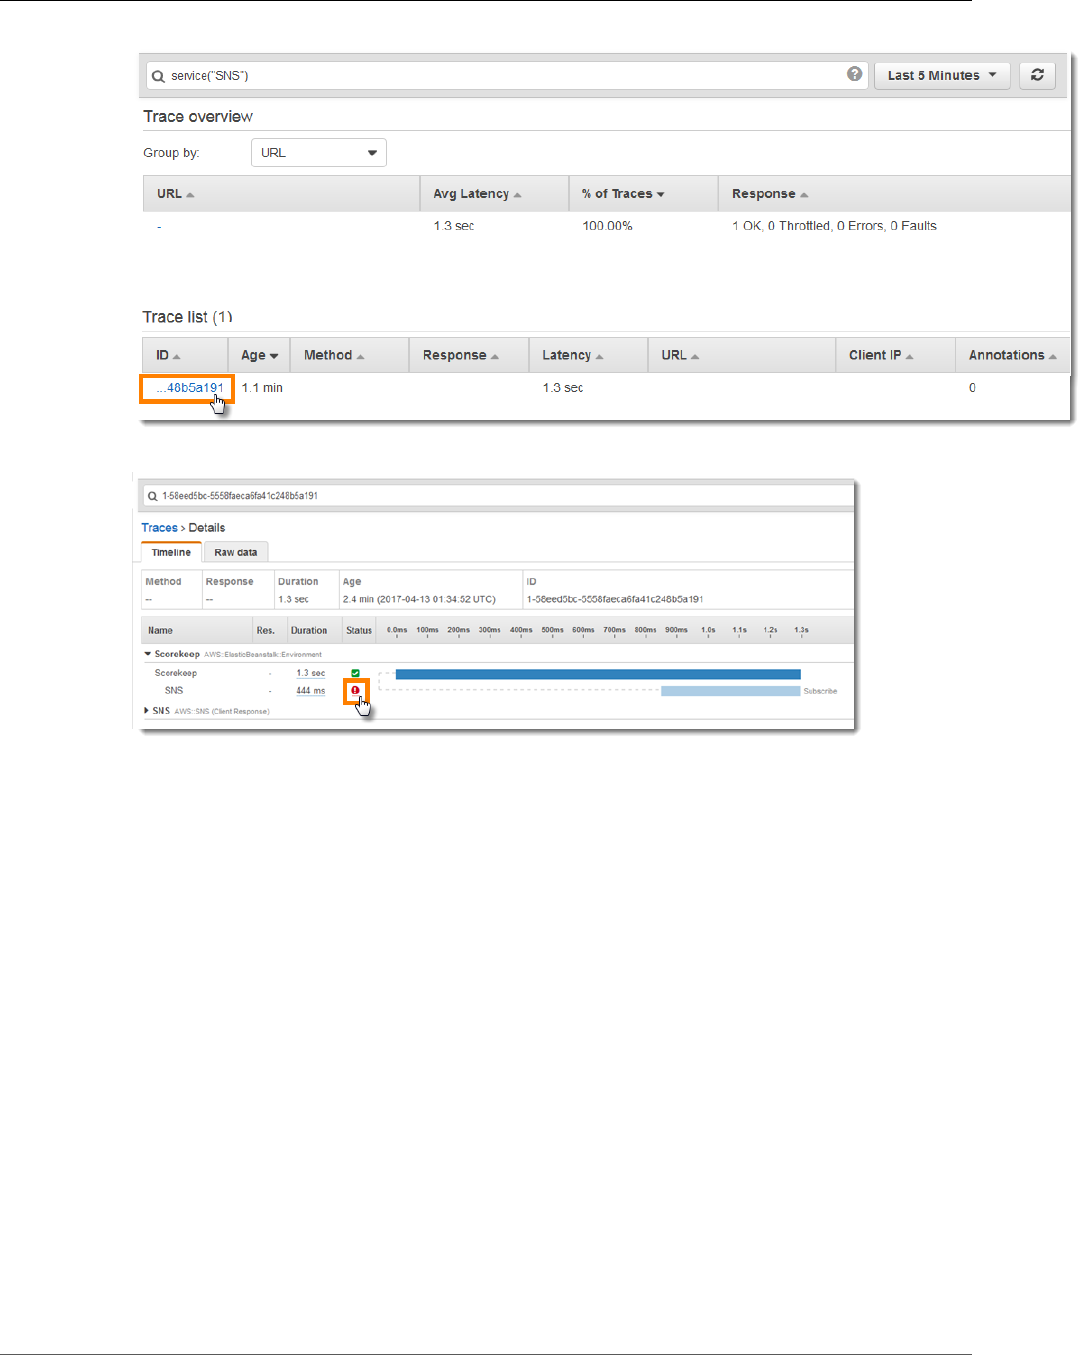
1. Choose the node named SNS.
2. Choose the trace from the Trace list. This trace doesn't have a method or URL because it was
recorded during startup instead of in response to an incoming request.
11
AWS X-Ray Developer Guide
View the Service Map in the X-Ray Console
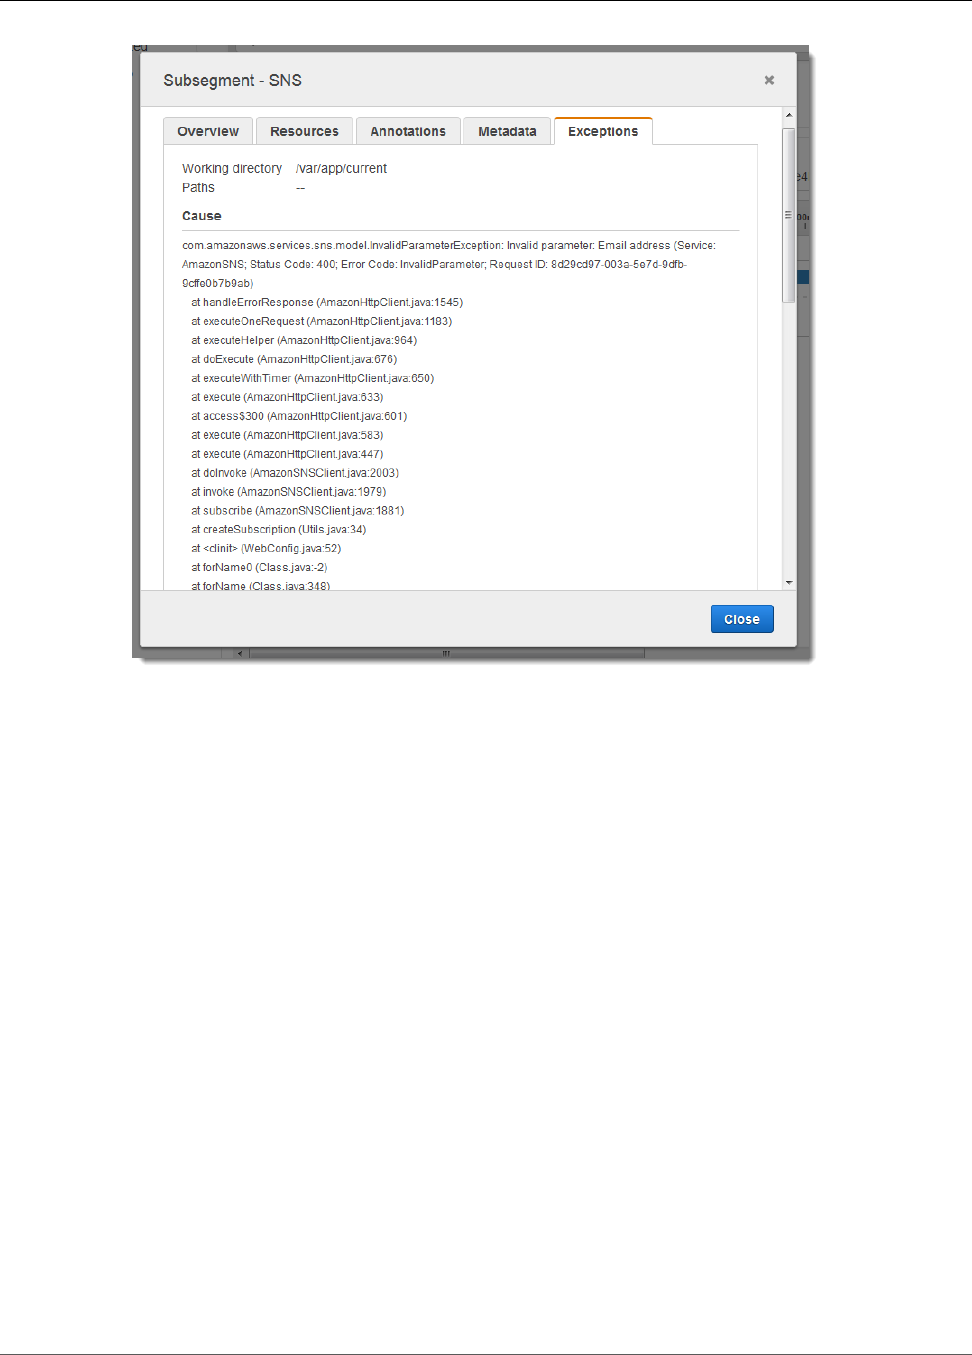
3. Choose the red status icon to open the Exceptions page for the SNS subsegment.
4. The X-Ray SDK automatically captures exceptions thrown by instrumented AWS SDK clients and
records the stack trace.
12
AWS X-Ray Developer Guide
Configuration Amazon SNS Notifications
The cause indicates that the email address provided in a call to createSubscription made in the
WebConfig class was invalid. Let's fix that.
Configuration Amazon SNS Notifications
Scorekeep uses Amazon SNS to send notifications when users complete a game. When the application
starts up, it tries to create a subscription for an email address defined in an environment variable.
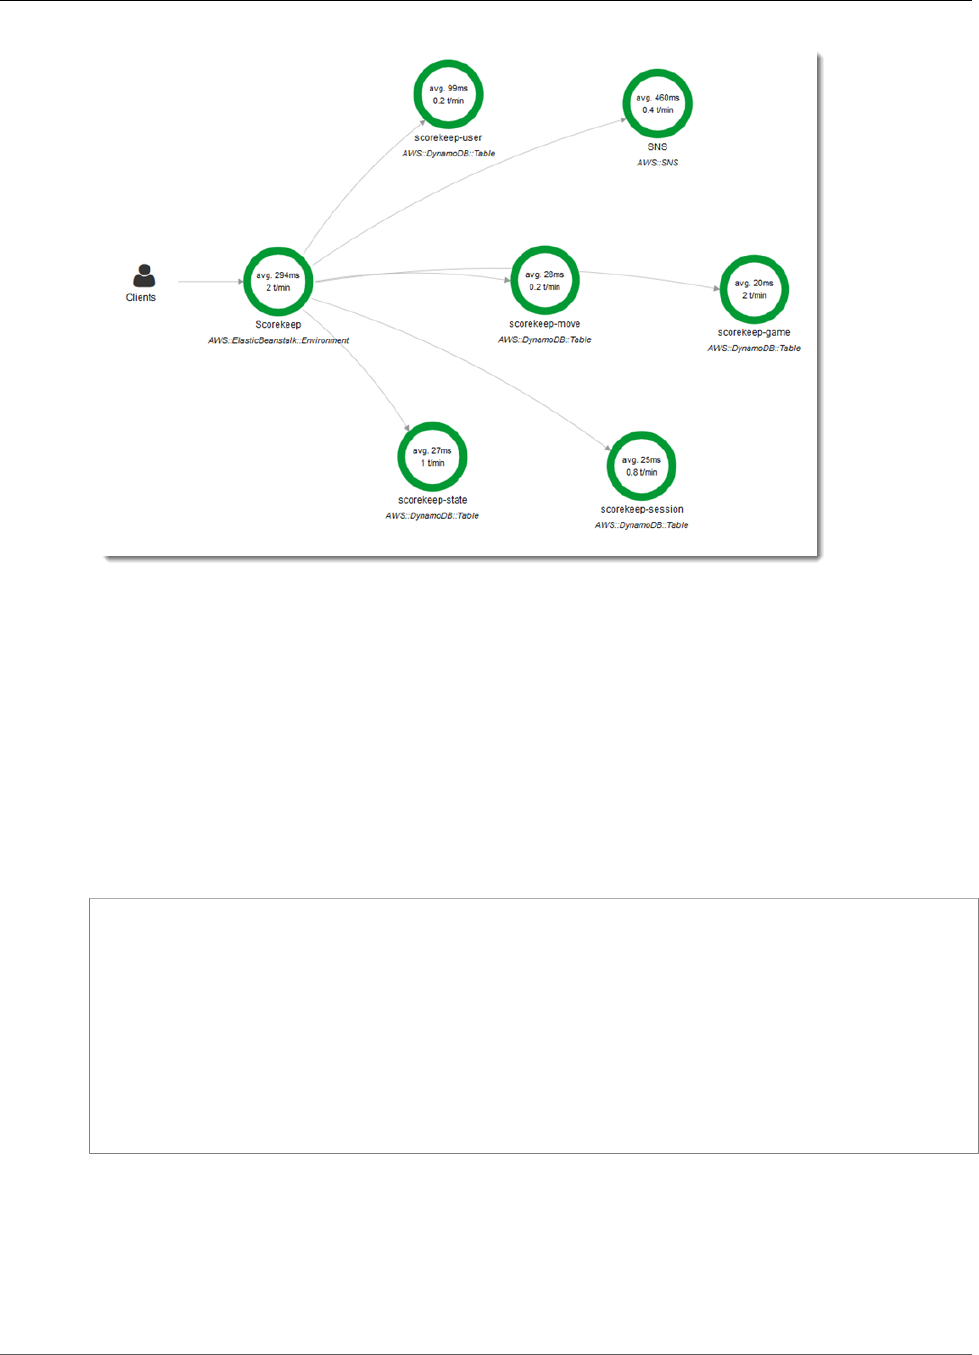
That call is currently failing, causing the Amazon SNS node in your service map to be red. Configure a
notification email in an environment variable to enable notifications and make the service map green.
To configure Amazon SNS notifications for Scorekeep
1. Open the Elastic Beanstalk console.
2. Navigate to the management console for your environment.
3. Choose Configuration.
4. Choose Software Configuration.
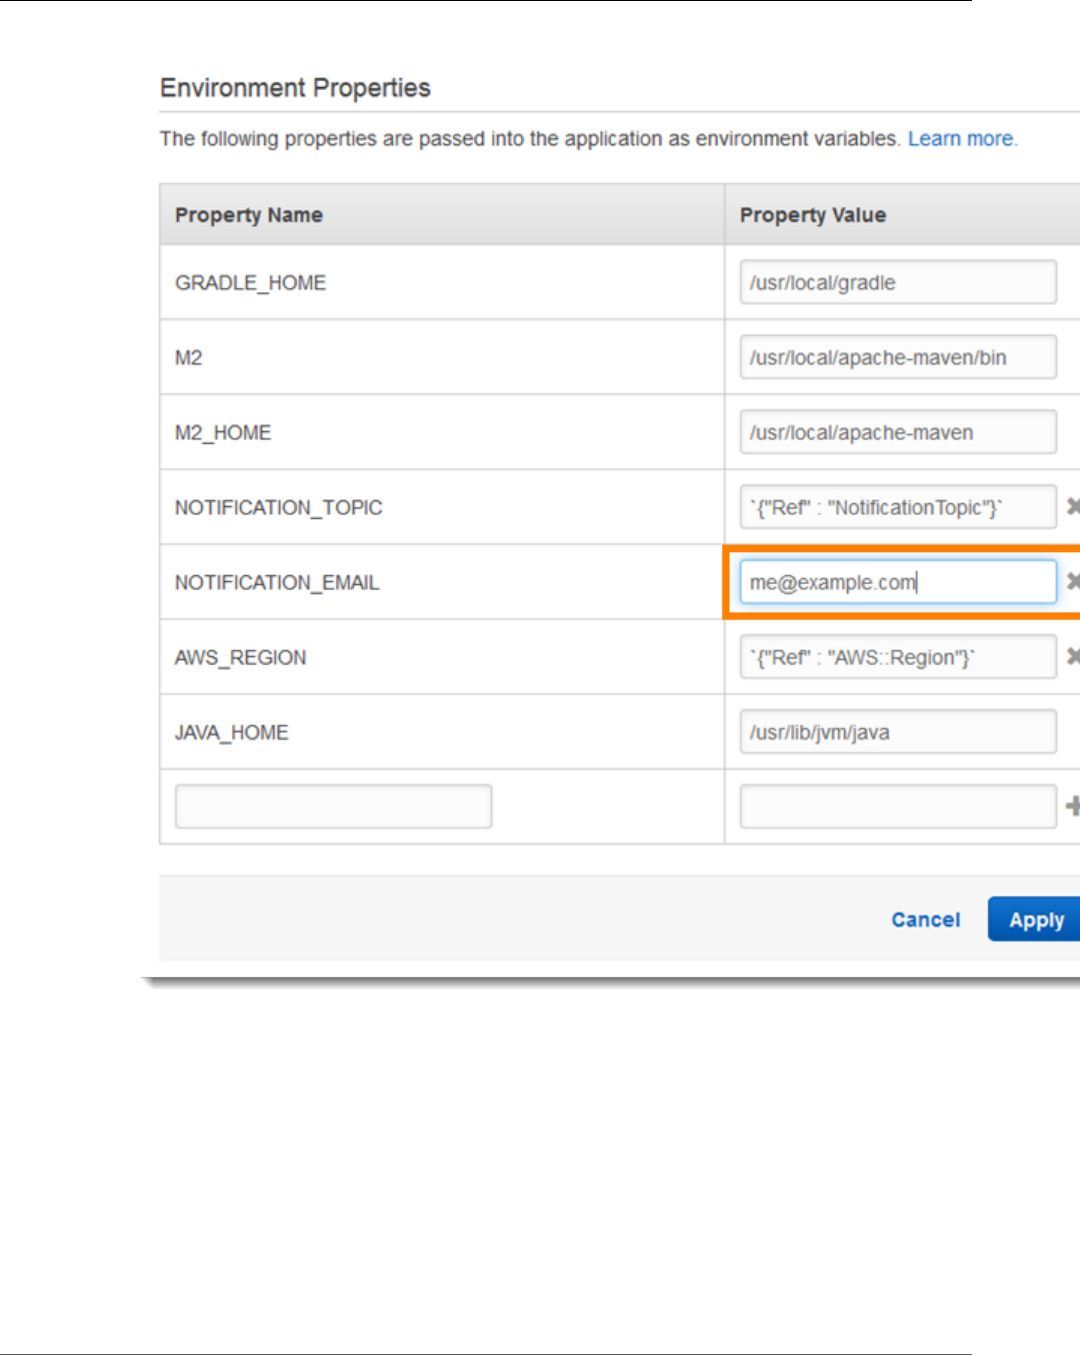
5. Under Environment Properties, replace the default value with your email address.
13
AWS X-Ray Developer Guide
Configuration Amazon SNS Notifications
Note
The default value uses an AWS CloudFormation function to retrieve a parameter stored in a
configuration file (a dummy value in this case).
6. Choose Apply.
When the update completes, Scorekeep restarts and creates a subscription to the SNS topic. Check your
email and confirm the subscription to see updates when you complete a game.
14
AWS X-Ray Developer Guide
Explore the Sample Application
Explore the Sample Application
The sample application is an HTTP web API in Java that is configured to use the X-Ray SDK for Java.
When you deploy the application to Elastic Beanstalk, it creates the DynamoDB tables, compiles the API
with Gradle, and configures the nginx proxy server to serve the web app statically at the root path. At the
same time, Elastic Beanstalk routes requests to paths starting with /api to the API.
To instrument incoming HTTP requests, the application adds the TracingFilter provided by the SDK.
Example src/main/java/scorekeep/WebConfig.java - Servlet Filter
import javax.servlet.Filter;
import com.amazonaws.xray.javax.servlet.AWSXRayServletFilter;
...
@Configuration
public class WebConfig {
@Bean
public Filter TracingFilter() {
return new AWSXRayServletFilter("Scorekeep");
}
...
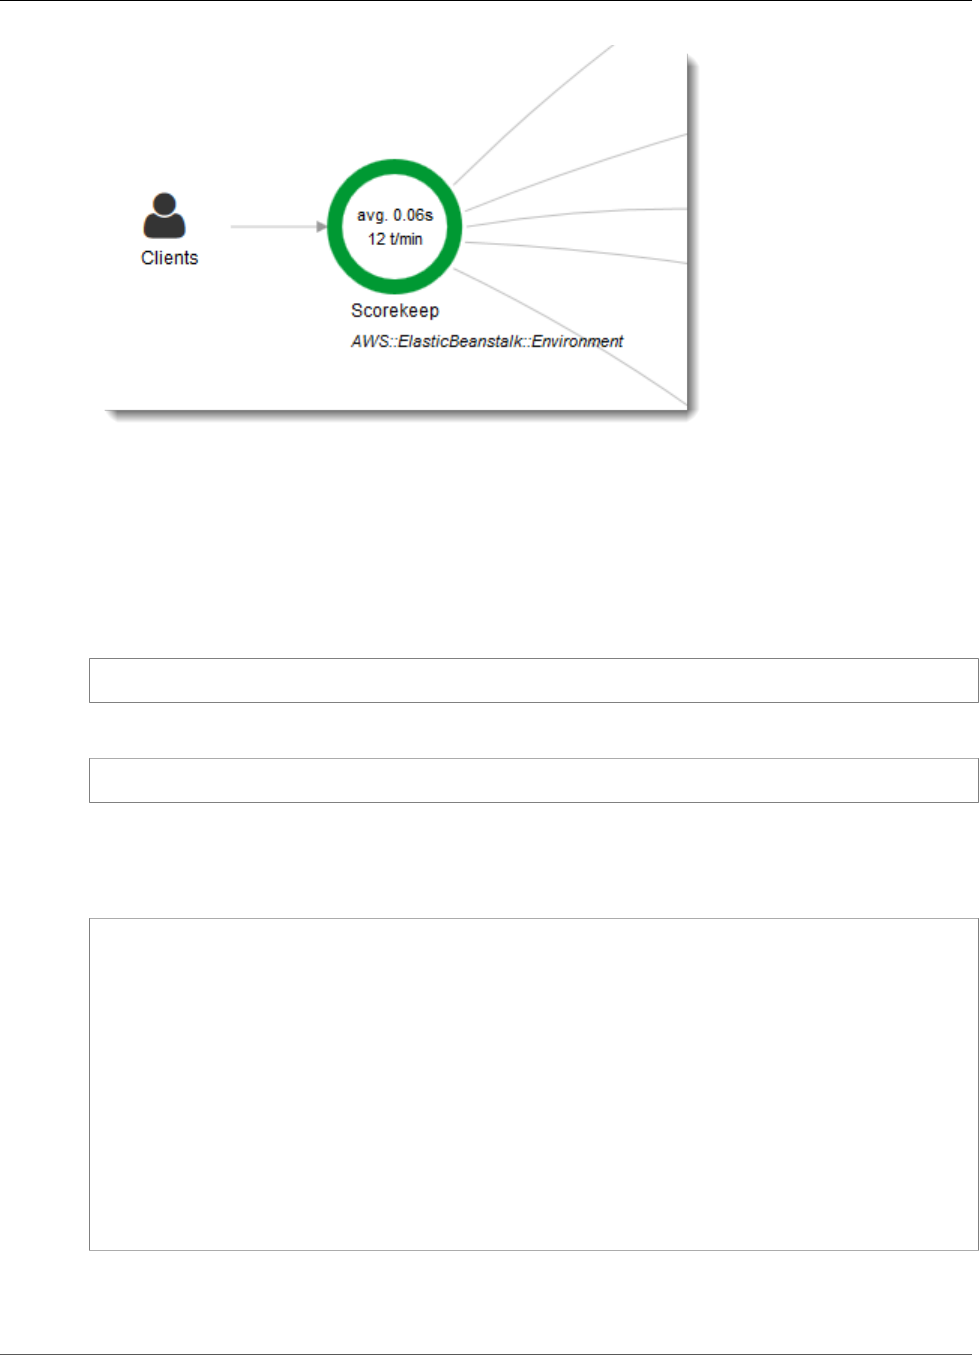
This filter sends trace data about all incoming requests that the application serves, including request
URL, method, response status, start time, and end time.
15
AWS X-Ray Developer Guide
Explore the Sample Application
The application also makes downstream calls to DynamoDB using the AWS SDK for Java. To instrument
these calls, the application simply takes the AWS SDK-related submodules as dependencies, and the X-
Ray SDK for Java automatically instruments all AWS SDK clients.
The application uses a Buildfile file to build the source code on-instance with Gradle and a
Procfile file to run the executable JAR that Gradle generates. Buildfile and Procfile support is a
feature of the Elastic Beanstalk Java SE platform.
Example Buildfile
build: gradle build
Example Procfile
web: java -Dserver.port=5000 -jar build/libs/scorekeep-api-1.0.0.jar
The build.gradle file downloads the SDK submodules from Maven during compilation by declaring
them as dependencies.
Example build.gradle -- Dependencies
...
dependencies {
compile("org.springframework.boot:spring-boot-starter-web")
testCompile('org.springframework.boot:spring-boot-starter-test')
compile('com.amazonaws:aws-java-sdk-dynamodb')
compile("com.amazonaws:aws-xray-recorder-sdk-core")
compile("com.amazonaws:aws-xray-recorder-sdk-aws-sdk")
compile("com.amazonaws:aws-xray-recorder-sdk-aws-sdk-instrumentor")
...
}
dependencyManagement {
imports {
mavenBom("com.amazonaws:aws-java-sdk-bom:1.11.67")
mavenBom("com.amazonaws:aws-xray-recorder-sdk-bom:1.3.1")
}
}
The core, AWS SDK, and AWS SDK Instrumentor submodules are all that's required to automatically
instrument any downstream calls made with the AWS SDK.
16

AWS X-Ray Developer Guide
Explore the Sample Application
To run the X-Ray daemon, the application uses another feature of Elastic Beanstalk, configuration files.
The configuration file tells Elastic Beanstalk to run the daemon and send its log on demand.
Example .ebextensions/xray.config
option_settings:
aws:elasticbeanstalk:xray:
XRayEnabled: true
files:
"/opt/elasticbeanstalk/tasks/taillogs.d/xray-daemon.conf" :
mode: "000644"
owner: root
group: root
content: |
/var/log/xray/xray.log
The X-Ray SDK for Java provides a class named AWSXRay that provides the global recorder, a
TracingHandler that you can use to instrument your code. You can configure the global recorder to
customize the AWSXRayServletFilter that creates segments for incoming HTTP calls. The sample
includes a static block in the WebConfig class that configures the global recorder with plugins and
sampling rules.
Example src/main/java/scorekeep/WebConfig.java - Recorder
import com.amazonaws.xray.AWSXRay;
import com.amazonaws.xray.AWSXRayRecorderBuilder;
import com.amazonaws.xray.plugins.EC2Plugin;
import com.amazonaws.xray.plugins.ElasticBeanstalkPlugin;
import com.amazonaws.xray.strategy.sampling.LocalizedSamplingStrategy;
@Configuration
public class WebConfig {
...
static {
AWSXRayRecorderBuilder builder = AWSXRayRecorderBuilder.standard().withPlugin(new
EC2Plugin()).withPlugin(new ElasticBeanstalkPlugin());
URL ruleFile = WebConfig.class.getResource("/sampling-rules.json");
builder.withSamplingStrategy(new LocalizedSamplingStrategy(ruleFile));
AWSXRay.setGlobalRecorder(builder.build());
}
}
This example uses the builder to load sampling rules from a file named sampling-rules.json.
Sampling rules determine the rate at which the SDK records segments for incoming requests.
Example src/main/java/resources/sampling-rules.json
{
"version": 1,
"rules": [
{
"description": "Resource creation.",
"service_name": "*",
"http_method": "POST",
"url_path": "/api/*",
"fixed_target": 1,
"rate": 1.0
},
17

AWS X-Ray Developer Guide
Clean Up
{
"description": "Session polling.",
"service_name": "*",
"http_method": "GET",
"url_path": "/api/session/*",
"fixed_target": 0,
"rate": 0.05
},
{
"description": "Game polling.",
"service_name": "*",
"http_method": "GET",
"url_path": "/api/game/*/*",
"fixed_target": 0,
"rate": 0.05
},
{
"description": "State polling.",
"service_name": "*",
"http_method": "GET",
"url_path": "/api/state/*/*/*",
"fixed_target": 0,
"rate": 0.05
}
],
"default": {
"fixed_target": 1,
"rate": 0.1
}
}
The sampling rules file defines four custom sampling rules and the default rule. For each incoming
request, the SDK evaluates the custom rules in the order in which they are defined. The SDK applies the
first rule that matches the request's method, path, and service name. For Scorekeep, the first rule catches
all POST requests (resource creation calls) by applying a fixed target of one request per second and a rate
of 1.0, or 100 percent of requests after the fixed target is satisfied.
The other three custom rules apply a five percent rate with no fixed target to session, game, and state
reads (GET requests). This minimizes the number of traces for periodic calls that the front end makes
automatically every few seconds to ensure the content is up to date. For all other requests, the file
defines a default rate of one request per second and a rate of 10 percent.
The sample application also shows how to use advanced features such as manual SDK client
instrumentation, creating additional subsegments, and outgoing HTTP calls. For more information, see
AWS X-Ray Sample Application (p. 77).
Clean Up
Terminate your Elastic Beanstalk environment to shut down the Amazon EC2 instances, DynamoDB
tables, and other resources.
To terminate your Elastic Beanstalk environment
1. Open the Elastic Beanstalk console.
2. Navigate to the management console for your environment.
3. Choose Actions.
4. Choose Terminate Environment.
5. Choose Terminate.
18

AWS X-Ray Developer Guide
Next Steps
Trace data is automatically deleted from X-Ray after 30 days.
Next Steps
Learn more about X-Ray in the next chapter, AWS X-Ray Concepts (p. 20).
To instrument your own app, learn more about the X-Ray SDK for Java or one of the other X-Ray SDKs:
•X-Ray SDK for Java – AWS X-Ray SDK for Java (p. 113)
•X-Ray SDK for Node.js – The X-Ray SDK for Node.js (p. 148)
•X-Ray SDK for .NET – AWS X-Ray SDK for .NET (p. 192)
To run the X-Ray daemon locally or on AWS, see AWS X-Ray Daemon (p. 99).
To contribute to the sample application on GitHub, see eb-java-scorekeep.
19

AWS X-Ray Developer Guide
Segments
AWS X-Ray Concepts
AWS X-Ray receives data from services as segments. X-Ray then groups segments that have a common
request into traces. X-Ray processes the traces to generate a service graph that provides a visual
representation of your application.
Concepts
•Segments (p. 20)
•Subsegments (p. 21)
•Service Graph (p. 23)
•Traces (p. 24)
•Sampling (p. 25)
•Tracing Header (p. 25)
•Filter Expressions (p. 25)
•Annotations and Metadata (p. 26)
•Errors, Faults, and Exceptions (p. 27)
Segments
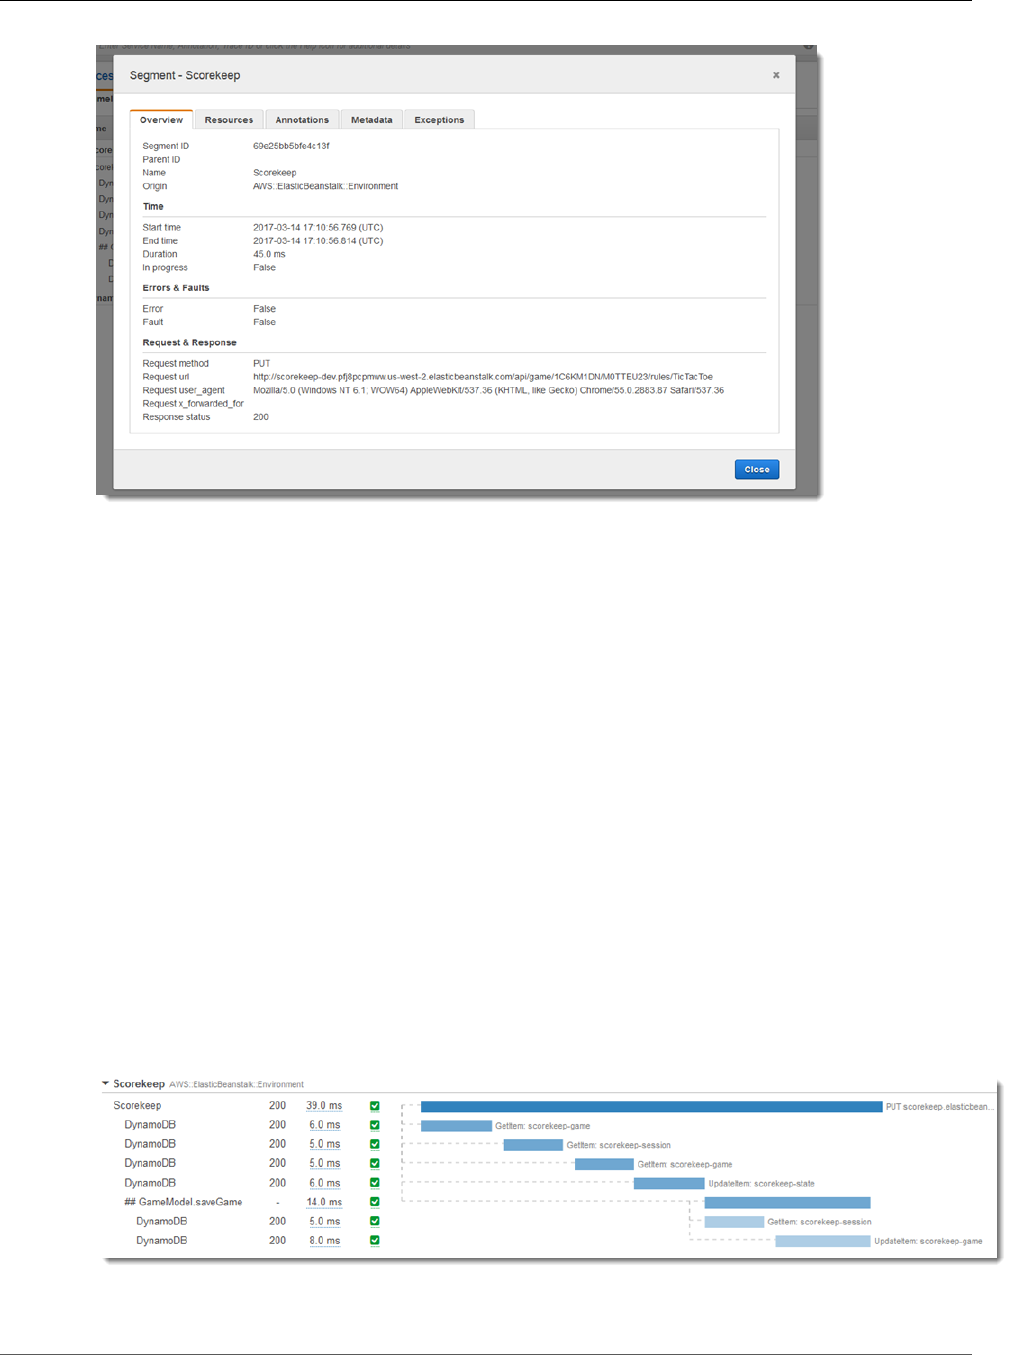
The compute resources running your application logic send data about their work as segments. A
segment provides the resource's name, details about the request, and details about the work done. For
example, when an HTTP request reaches your application, it can record the following data about:
•The host – hostname, alias or IP address
•The request – method, client address, path, user agent
•The response – status, content
•The work done – start and end times, subsegments
•Issues that occur – errors, faults and exceptions (p. 27), including automatic capture of exception
stacks.
20
AWS X-Ray Developer Guide
Subsegments
The X-Ray SDK gathers information from request and response headers, the code in your application, and
metadata about the AWS resources on which it runs. You choose the data to collect by modifying your
application configuration or code to instrument incoming requests, downstream requests, and AWS SDK
clients.
Forwarded Requests
If a load balancer or other intermediary forwards a request to your application, X-Ray takes the
client IP from the X-Forwarded-For header in the request instead of from the source IP in the
IP packet. The client IP that is recorded for a forwarded request can be forged, so it should not
be trusted.
You can use the X-Ray SDK to record additional information such as annotations and metadata. (p. 26)
For details about the structure and information that is recorded in segments and subsegments, see AWS
X-Ray Segment Documents (p. 60). Segment documents can be up to 64 kB in size.
Subsegments
A segment can break down the data about the work done into subsegments. Subsegments provide
more granular timing information and details about downstream calls that your application made to
fulfill the original request. A subsegment can contain additional details about a call to an AWS service,
an external HTTP API, or an SQL database. You can even define arbitrary subsegments to instrument
specific functions or lines of code in your application.
21
AWS X-Ray Developer Guide
Subsegments
For services that don't send their own segments, like Amazon DynamoDB, X-Ray uses subsegments to
generate inferred segments and downstream nodes on the service map. This lets you see all of your
downstream dependencies, even if they don't support tracing, or are external.
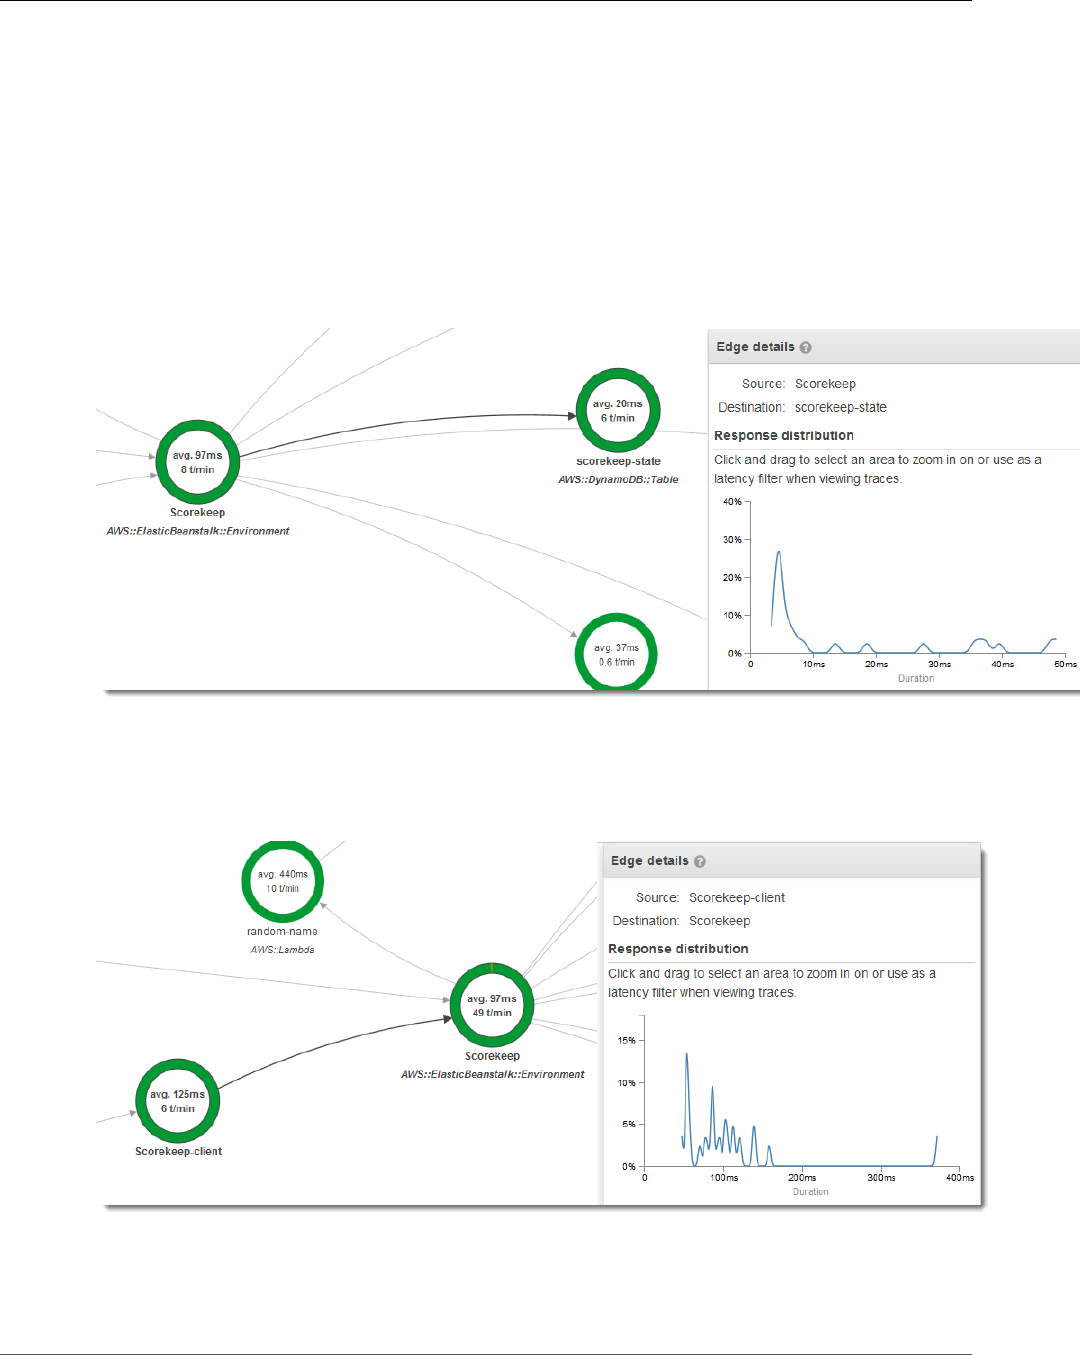
Subsegments represent your application's view of a downstream call as a client. If the downstream
service is also instrumented, the segment that it sends replaces the inferred segment generated from the
uptsream client's subsegment. The node on the service graph always uses information from the service's
segment, if it's available, while the edge between the two nodes uses the upstream service's subsegment.
For example, when you call DynamoDB with an instrumented AWS SDK client, the X-Ray SDK records a
subsegment for that call. DynamoDB doesn't send a segment, so the inferred segment in the trace, the
DynamoDB node on the service graph, and the edge between your service and DynamoDB all contain
information from the subsegment.
When you call another instrumented service with an instrumented application, the downstream service
sends its own segment to record its view of the same call that the upstream service recorded in a
subsegment. In the service graph, both services' nodes contain timing and error information from those
services' segments, while the edge between them contains information from the upstream service's
subsegment.
Both viewpoints are useful, as the downstream service records precisely when it started and ended work
on the request, and the upstream service records the round trip latency, including time that the request
spent traveling between the two services.
22
AWS X-Ray Developer Guide
Service Graph
Service Graph
X-Ray uses the data that your application sends to generate a service graph. Each AWS resource that
sends data to X-Ray appears as a service in the graph. Edges connect the services that work together
to serve requests. Edges connect clients to your application, and your application to the downstream
services and resources that it uses.
Service Names
A segment's name should match the domain name or logical name of the service that
generates the segment. However, this is not enforced. Any application that has permission to
PutTraceSegments can send segments with any name.
A service graph is a JSON document that contains information about the services and resources that
make up your application. The X-Ray console uses the service graph to generate a visualization or service
map.
For a distributed application, X-Ray combines nodes from all services that process requests with
the same trace ID into a single service graph. The first service that the request hits adds a tracing
header (p. 25) that is propagated between the front end and services that it calls.
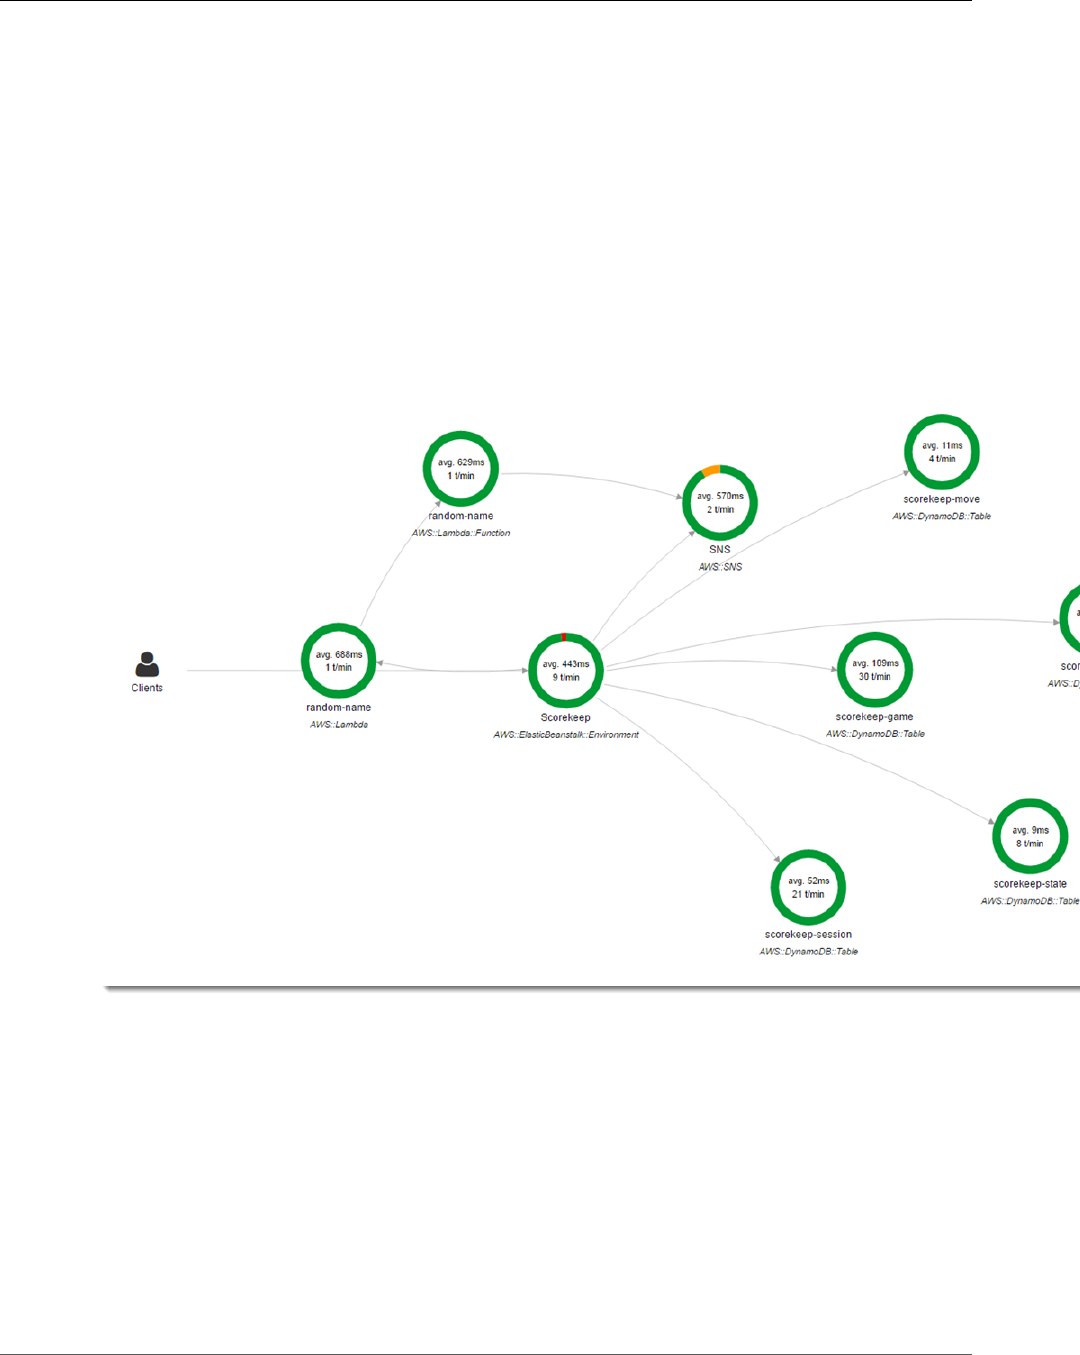
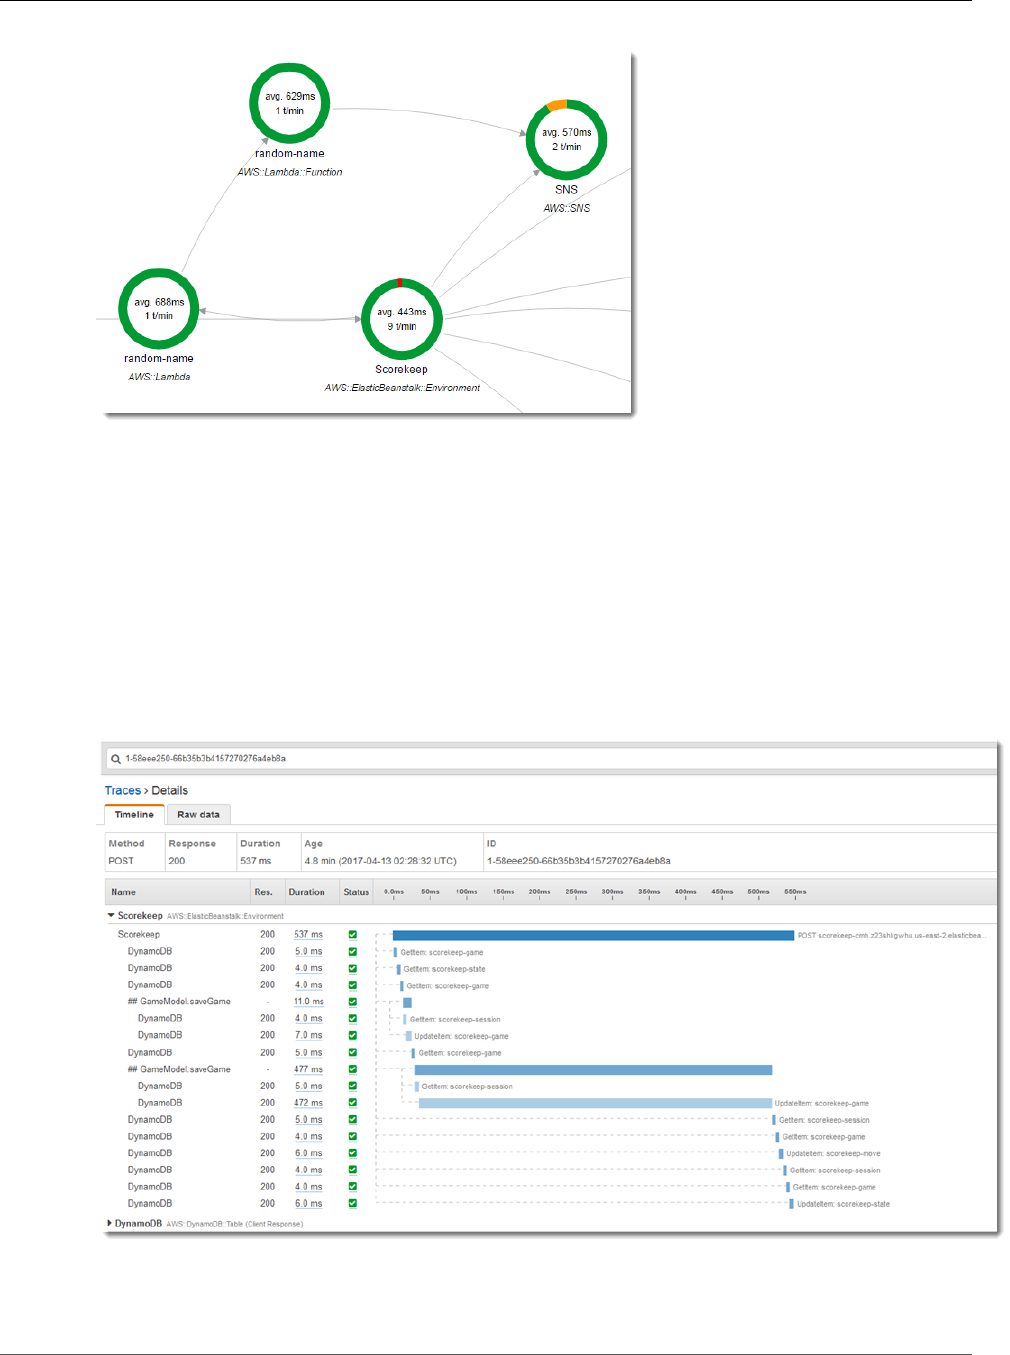
For example, Scorekeep (p. 77) runs a web API that calls a microservice (an AWS Lambda function)
to generate a random name by using a Node.js library. The X-Ray SDK for Java generates the trace ID
and includes it in calls to Lambda. Lambda sends tracing data and passes the trace ID to the function.
The X-Ray SDK for Node.js also uses the trace ID to send data. As a result, nodes for the API, the Lambda
service, and the Lambda function all appear as separate, but connected, nodes on the service map.
23
AWS X-Ray Developer Guide
Traces
Service graph data is retained for 30 days.
Traces
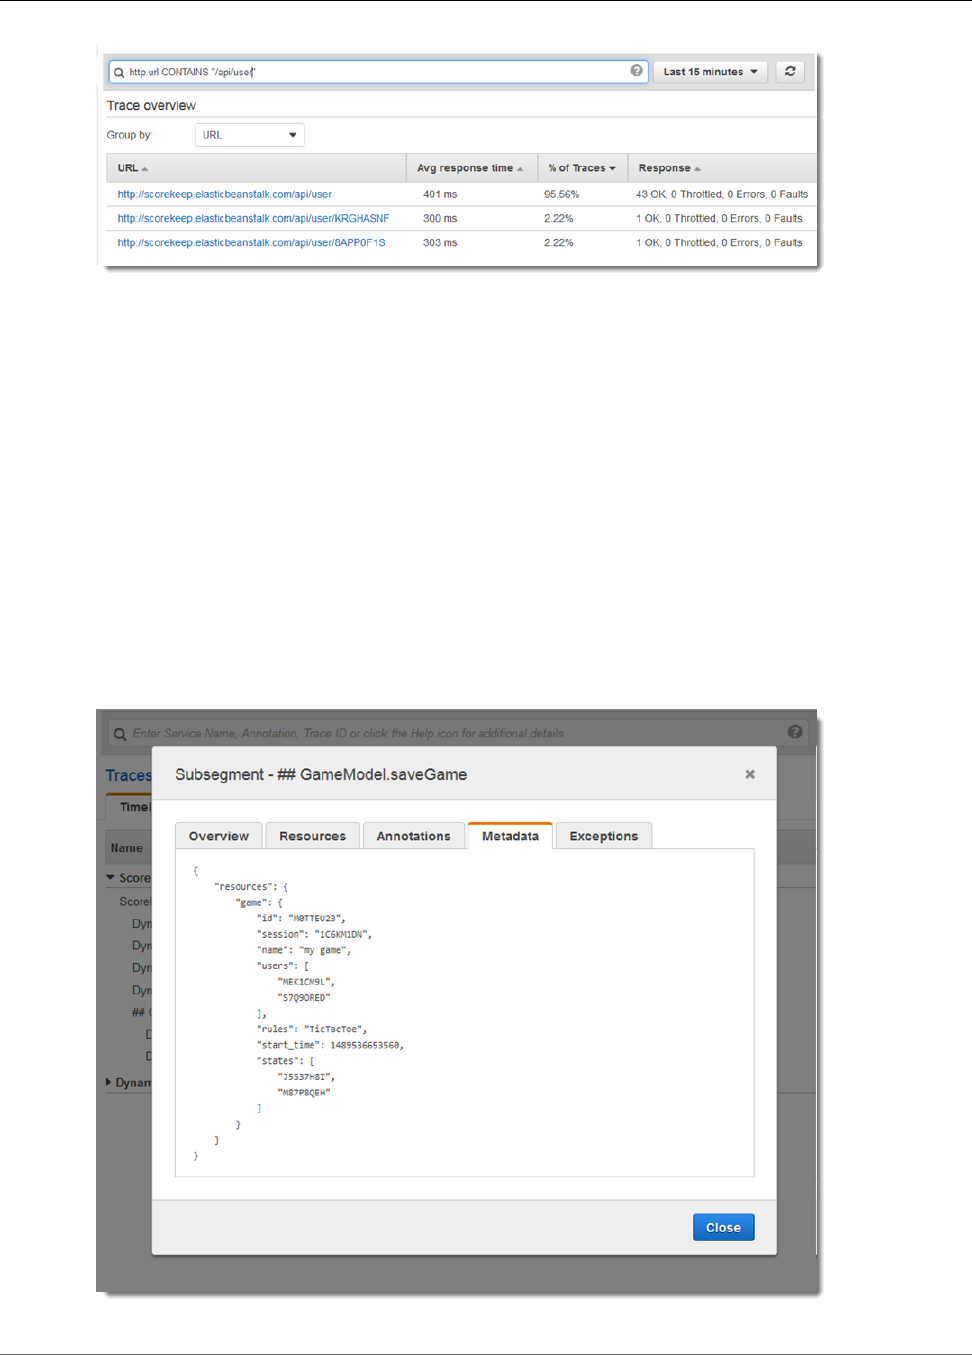
A trace ID tracks the path of a request through your application. A trace collects all the segments
generated by a single request. That request is typically an HTTP GET or POST request that travels
through a load balancer, hits your application code, and generates downstream calls to other AWS
services or external web APIs. The first supported service that the HTTP request interacts with adds a
trace ID header to the request, and propagates it downstream to track the latency, disposition, and other
request data.
Service graph data is retained for 30 days.
24

AWS X-Ray Developer Guide
Sampling
Sampling
To ensure efficient tracing and provide a representative sample of the requests that your application
serves, the X-Ray SDK applies a sampling algorithm to determine which requests get traced. By default,
the X-Ray SDK records the first request each second, and five percent of any additional requests.
To avoid incurring service charges when you are getting started, the default sampling rate is
conservative. You can configure the SDK to modify the default sampling rules and configure different
sampling rates for different routes that your application serves.
For example, you may want to disable sampling and trace all requests for calls that modify state or deal
with user accounts or transactions. For high volume read-only calls, like background polling, health
checks, or connection maintenance, you can sample at a low rate and still get enough data to see any
issues that arise.
Learn more about sampling configuration with a hands-on example in the Getting Started tutorial (p. 8).
Tracing Header
All requests are traced, up to a configurable minimum. After reaching that minimum, a percentage of
requests are traced to avoid unnecessary cost. The sampling decision and trace ID are added to HTTP
requests in tracing headers named X-Amzn-Trace-Id. The first X-Ray-integrated service that the
request hits adds a tracing header, which is read by the X-Ray SDK and included in the response.
Example Tracing header with root trace ID and sampling decision
X-Amzn-Trace-Id: Root=1-5759e988-bd862e3fe1be46a994272793;Sampled=1
Tracing Header Security
A tracing header can originate from the X-Ray SDK, an AWS service, or the client request. Your
application can remove X-Amzn-Trace-Id from incoming requests to avoid issues caused by
users adding trace IDs or sampling decisions to their requests.
The tracing header can also contain a parent segment ID if the request originated from an instrumented
application. For example, if your application calls a downstream HTTP web API with an instrumented
HTTP client, the X-Ray SDK adds the segment ID for the original request to the tracing header of the
downstream request. An instrumented application that serves the downstream request can record the
parent segment ID to connect the two requests.
Example Tracing header with root trace ID, parent segment ID and sampling decision
X-Amzn-Trace-Id: Root=1-5759e988-bd862e3fe1be46a994272793;Parent=53995c3f42cd8ad8;Sampled=1
Filter Expressions
Even with sampling, a complex application generates a lot of data. The AWS X-Ray console provides an
easy-to-navigate view of the service graph. It shows health and performance information that helps you
identify issues and opportunities for optimization in your application. For advanced tracing, you can drill
down to traces for individual requests, or use filter expressions to find traces related to specific paths or
users.
25
AWS X-Ray Developer Guide
Annotations and Metadata
Annotations and Metadata
When you instrument your application, the X-Ray SDK records information about incoming and outgoing
requests, the AWS resources used, and the application itself. You can add other information to the
segment document as annotations and metadata.
Annotations are simple key-value pairs that are indexed for use with filter expressions (p. 37). Use
annotations to record data that you want to use to group traces in the console, or when calling the
GetTraceSummaries API.
X-Ray indexes up to 50 annotations per trace.
Metadata are key-value pairs with values of any type, including objects and lists, but that are not
indexed. Use metadata to record data you want to store in the trace but don't need to use for searching
traces.
You can view annotations and metadata in the segment or subsegment details in the X-Ray console.
26

AWS X-Ray Developer Guide
Errors, Faults, and Exceptions
Errors, Faults, and Exceptions
X-Ray tracks errors that occur in your application code, and errors that are returned by downstream
services. Errors are categorized as follows.
•Error – Client errors (400 series errors)
•Fault – Server faults (500 series errors)
•Throttle – Throttling errors (429 Too Many Requests)
When an exception occurs while your application is serving an instrumented request, the X-Ray SDK
records details about the exception, including the stack trace, if available. You can view exceptions under
segment details (p. 33) in the X-Ray console.
27
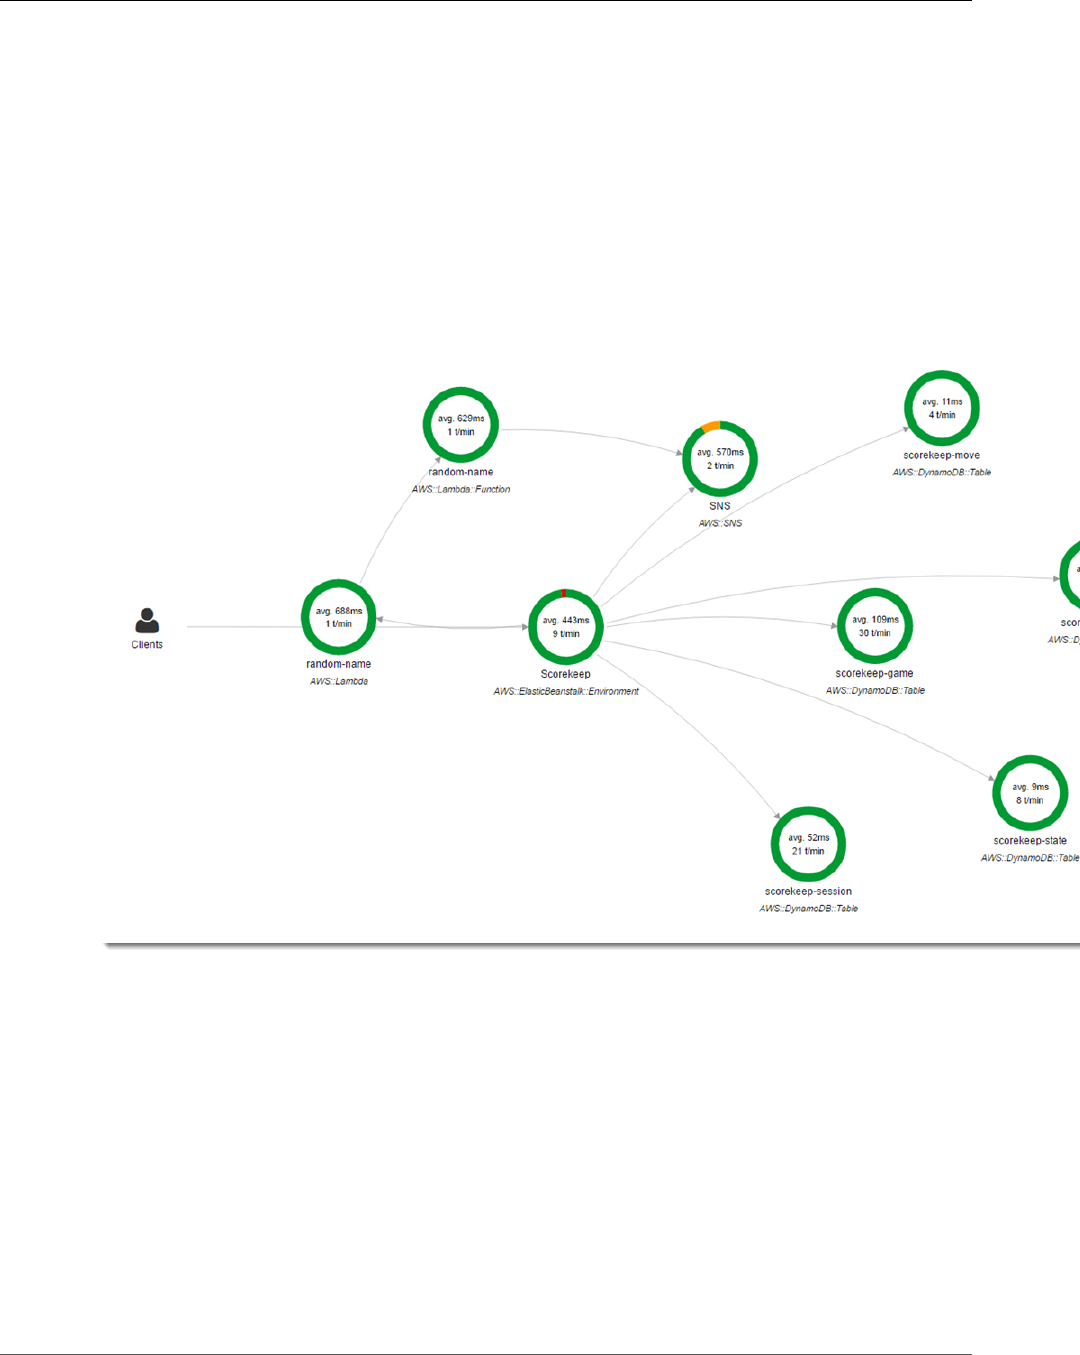
AWS X-Ray Developer Guide
Viewing the Service Map
AWS X-Ray Console
The AWS X-Ray console enables you to view service maps and traces for requests that your applications
serve.
The console's service map is a visual representation of the JSON service graph that X-Ray generates from
the trace data generated by your applications. The map consists of service nodes for each application
in your account that serves requests, upstream client nodes that represent the origins of the requests,
and downstream service nodes that represent web services and resources used by an application while
processing a request.
You can use filters to view a service map or traces for a specific request, service, connection between two
services (an edge), or requests that satisfy a condition. X-Ray provides a filter expression language for
filtering requests, services, and edges based on data in request headers, response status, and indexed
fields on the original segments.
Viewing the Service Map
View the service map in the X-Ray console to identify services where errors are occurring, connections
with high latency, or traces for requests that were unsuccessful.
To view the service map
1. Open the service map page of the X-Ray console.
28
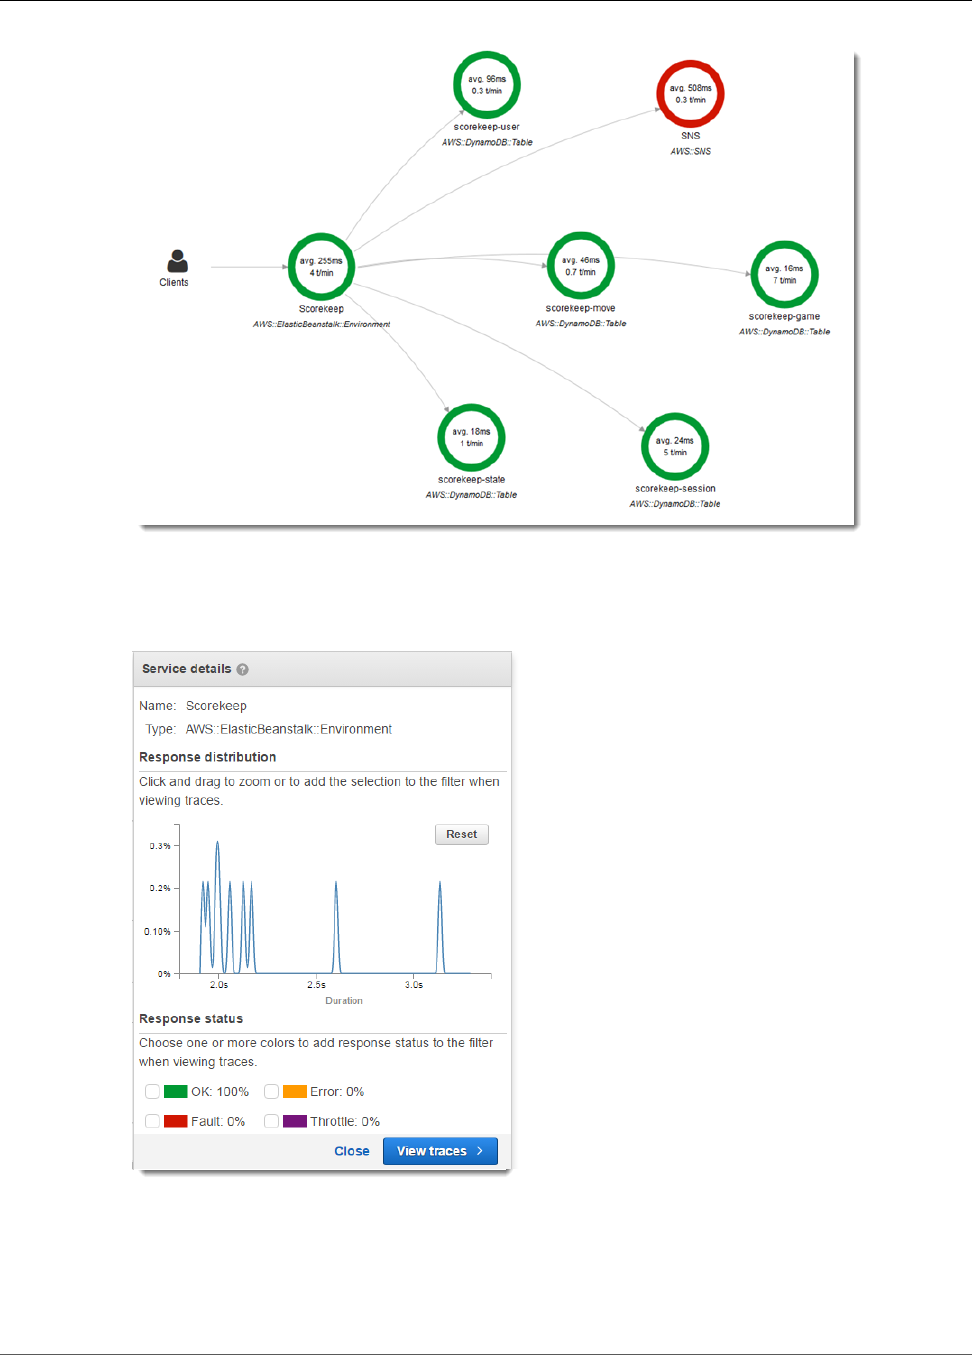
AWS X-Ray Developer Guide
Viewing the Service Map
2. Choose a service node to view requests for that node, or an edge between two nodes to view
requests that traveled that connection.
3. Use the histogram (p. 45) to filter traces by duration, and select status codes for which you want
to view traces. Then choose View traces to open the trace list with the filter expression applied.
The service map indicates the health of each node by coloring it based on the ratio of successful calls to
errors and faults:
•Green for successful calls
29
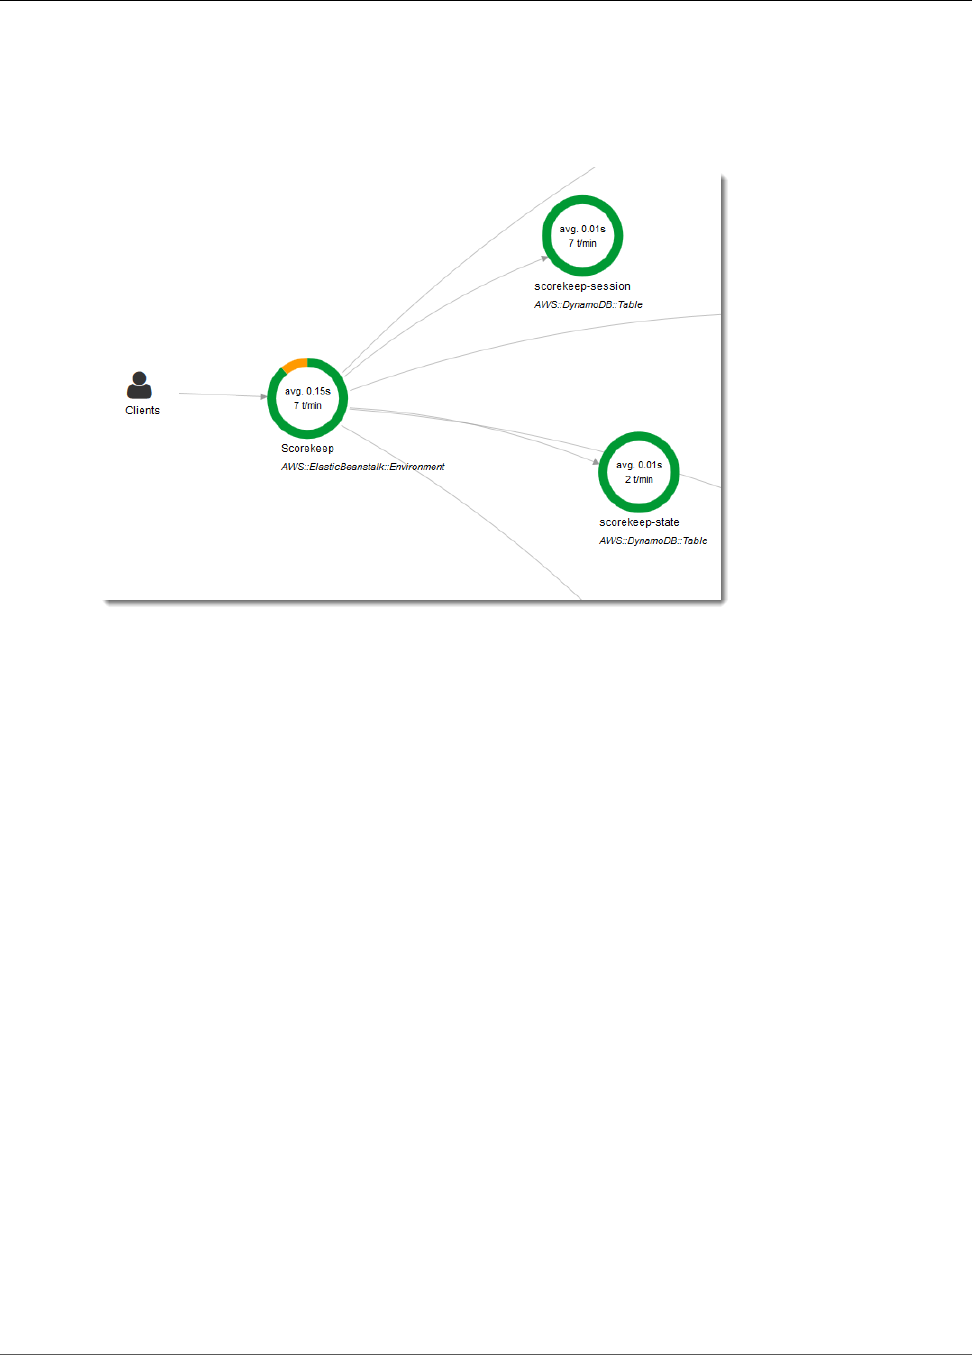
AWS X-Ray Developer Guide
Viewing the Service Map
•Red for server faults (500 series errors)
•Yellow for client errors (400 series errors)
•Purple for throttling errors (429 Too Many Requests)
In the center of each node, the console shows the average response time and number of traces that it
sent per minute during the chosen time range.
If your service map is large, the console defaults to a zoomed out view. Use the on-screen controls or
mouse to zoom in and out and move the image around.
30
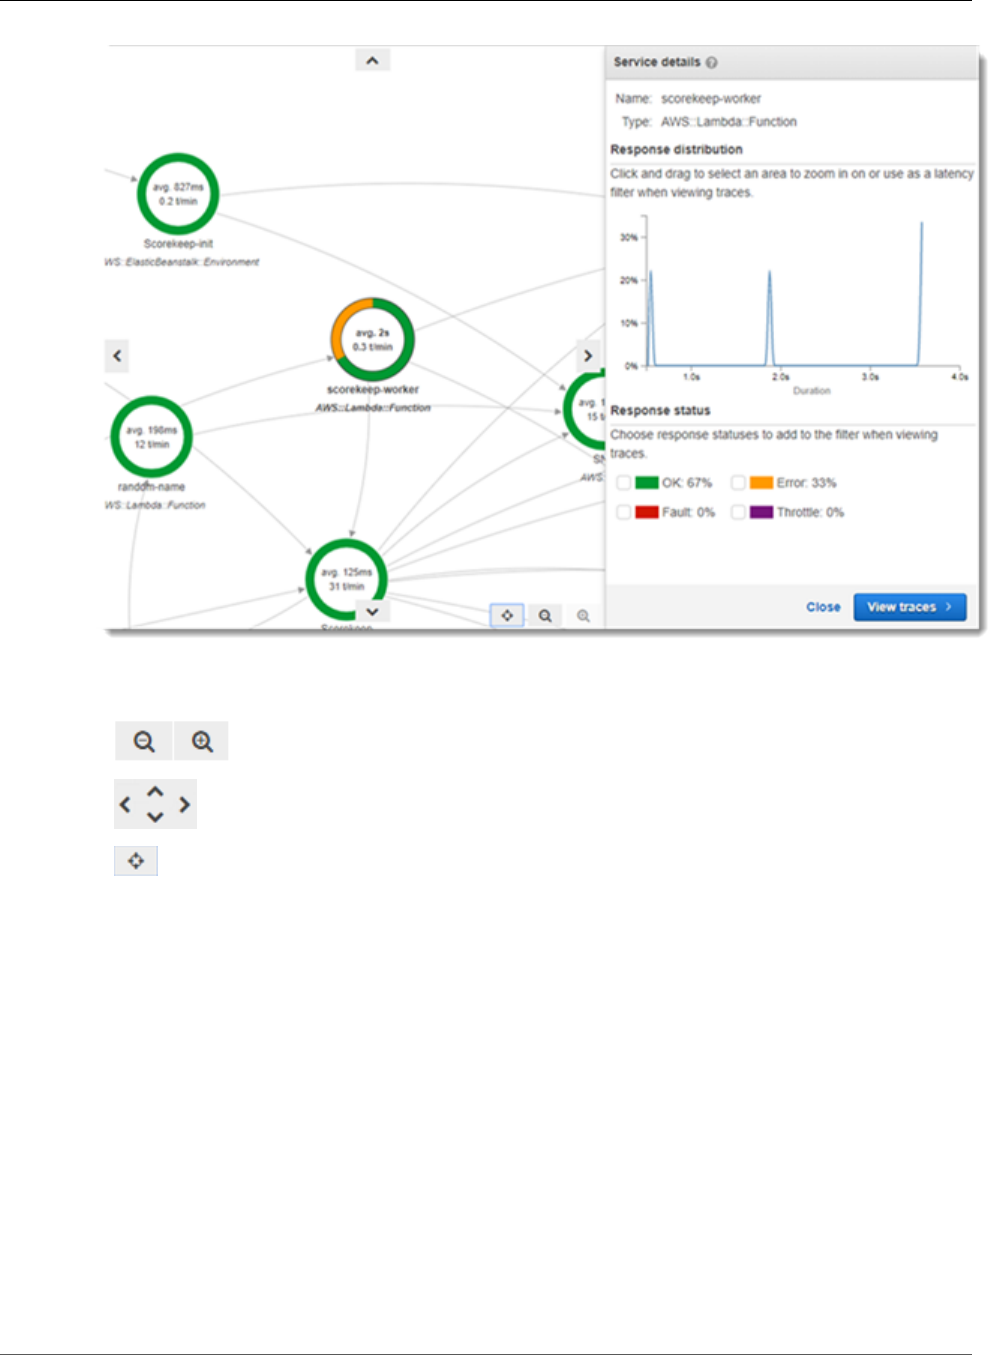
AWS X-Ray Developer Guide
Viewing Traces
Controls
•
– zoom in or out. You can also use the mouse wheel to zoom in and out.
•
– scroll the service map. Click and drag to scroll with the mouse.
• – frame the selected node or edge in the center of map.
Viewing Traces
Use the trace list in the X-Ray console to find traces by URL, response code, or other data from the trace
summary.
To use the trace list
1. Open the traces page of the X-Ray console.
31
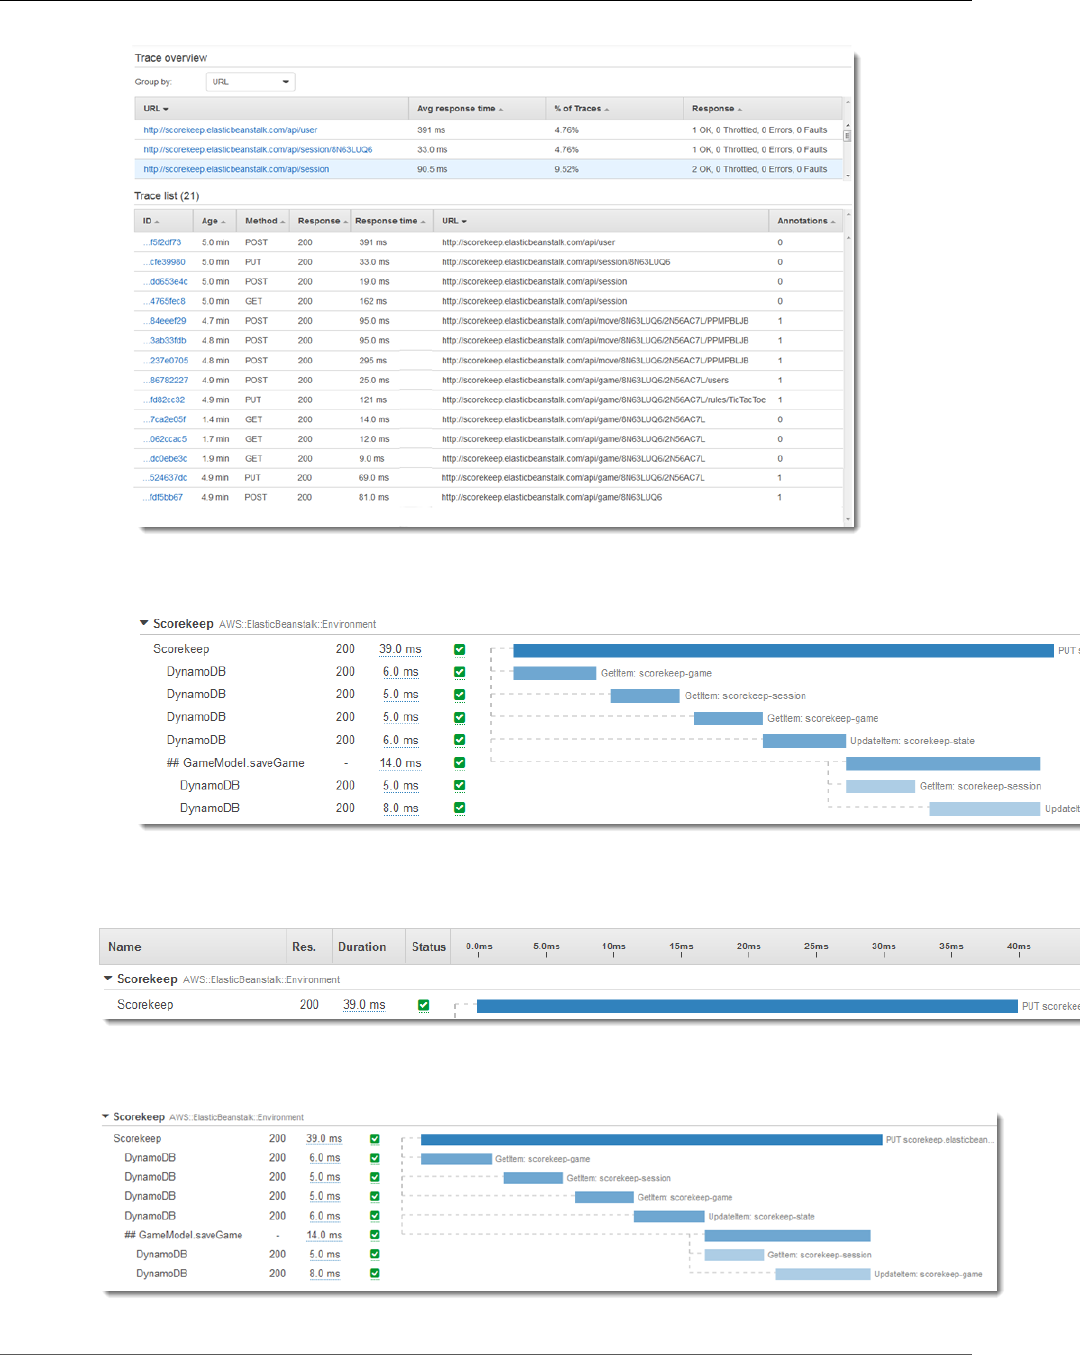
AWS X-Ray Developer Guide
Viewing Traces
2. Choose a URL to filter the trace list.
3. Choose a trace ID to view the timeline for a trace.
The timeline view shows a hierarchy of segments and subsegments. The first entry in the list is the
segment, which represents all data recorded by the service for a single request.
Below the segment are subsegments. This example shows subsegments recorded by instrumented
Amazon DynamoDB clients, and a custom subsegment.
32
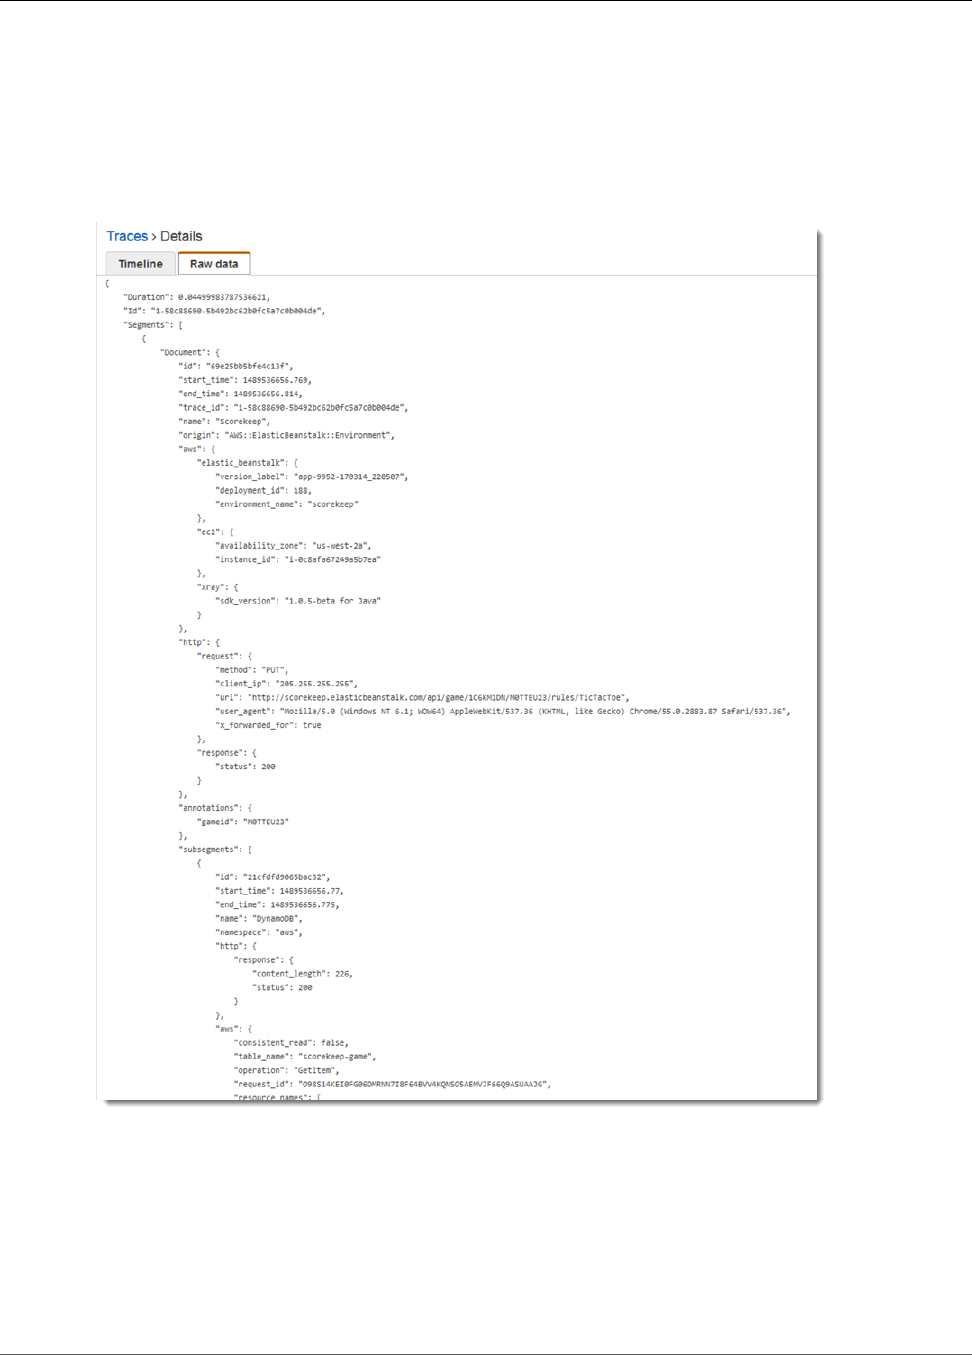
AWS X-Ray Developer Guide
Viewing Segment Details
The X-Ray SDK records subsegments automatically when you use an instrumented AWS SDK, HTTP, or
SQL client to make calls to external resources. You can also tell the SDK to record custom subsegments
for any function or block of code. Additional subsegments recorded while a custom subsegment is open
become children of the custom subsegment.
From the timeline view, you can also access the raw trace data that the console uses to generate the
timeline. Choose Raw data to see the JSON document that contains all the segments and subsegments
that make up the trace.
Viewing Segment Details
From the trace timeline, choose the name of a segment to view its details. The Overview shows
information about the request and response.
33
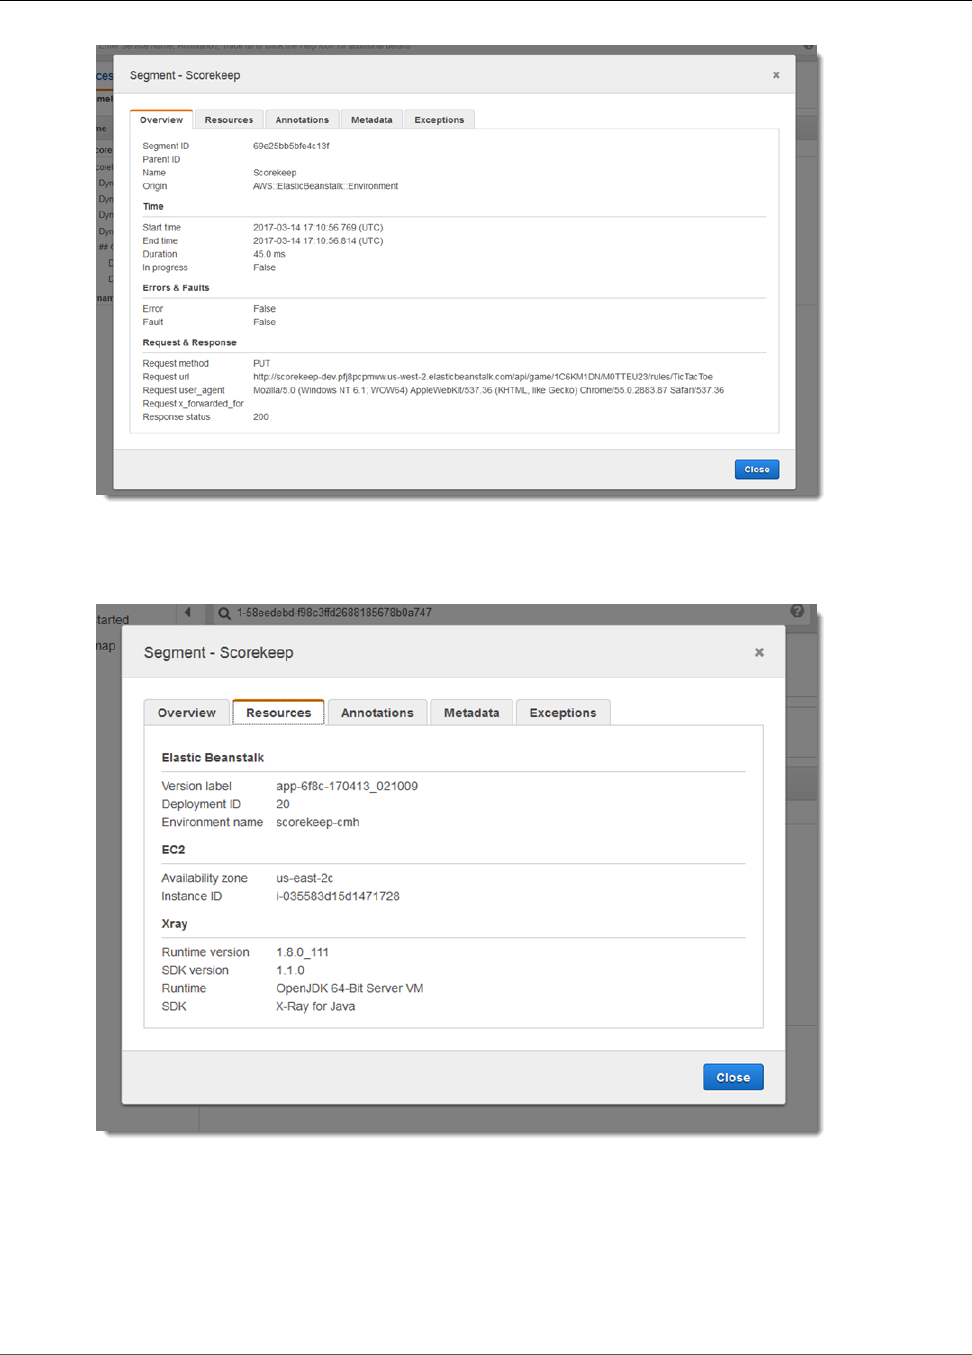
AWS X-Ray Developer Guide
Viewing Segment Details
The Resources tab for a segment shows information about the AWS resources running your application
and the X-Ray SDK. Use the Amazon EC2, AWS Elastic Beanstalk, or Amazon ECS plugin for the SDK to
record service-specific resource information.
The remaining tabs show Annotations, Metadata, and Exceptions recorded on the segment. Exceptions
are captured automatically when thrown from an instrumented request. Annotations and metadata
contain additional information that you record by using the methods provided by the SDK.
34
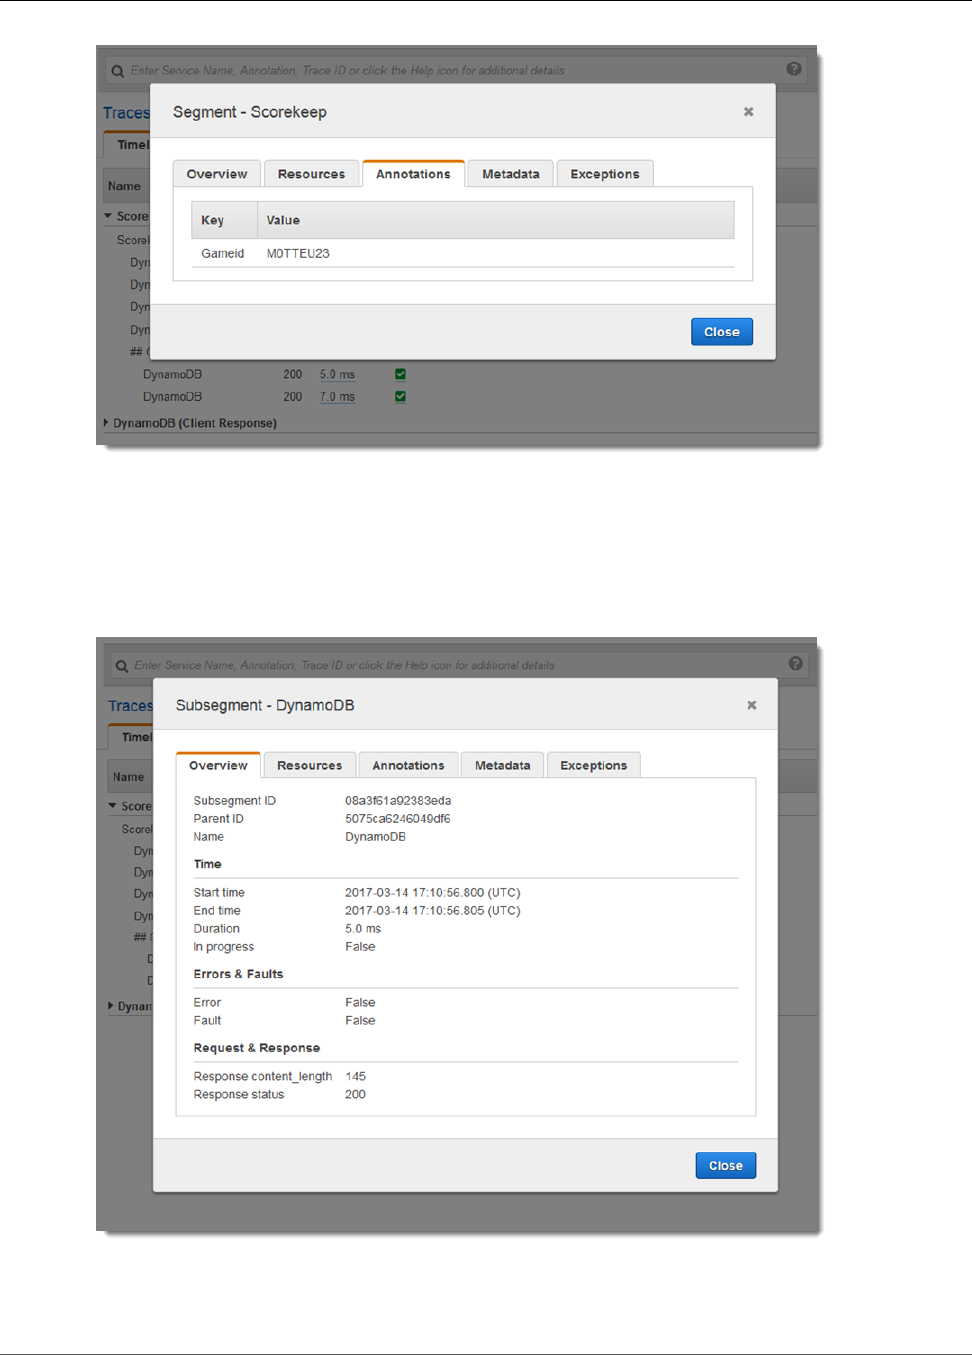
AWS X-Ray Developer Guide
Viewing Subsegment Details
Viewing Subsegment Details
From the trace timeline, choose the name of a segment to view its details. For subsegments generated
with instrumented clients, the Overview contains information about the request and response from your
application's point of view. This example shows a subsegment from an instrumented call to DynamoDB.
The Resources tab for subsegment showing details about the DynamoDB table, operation called, and
request ID.
35
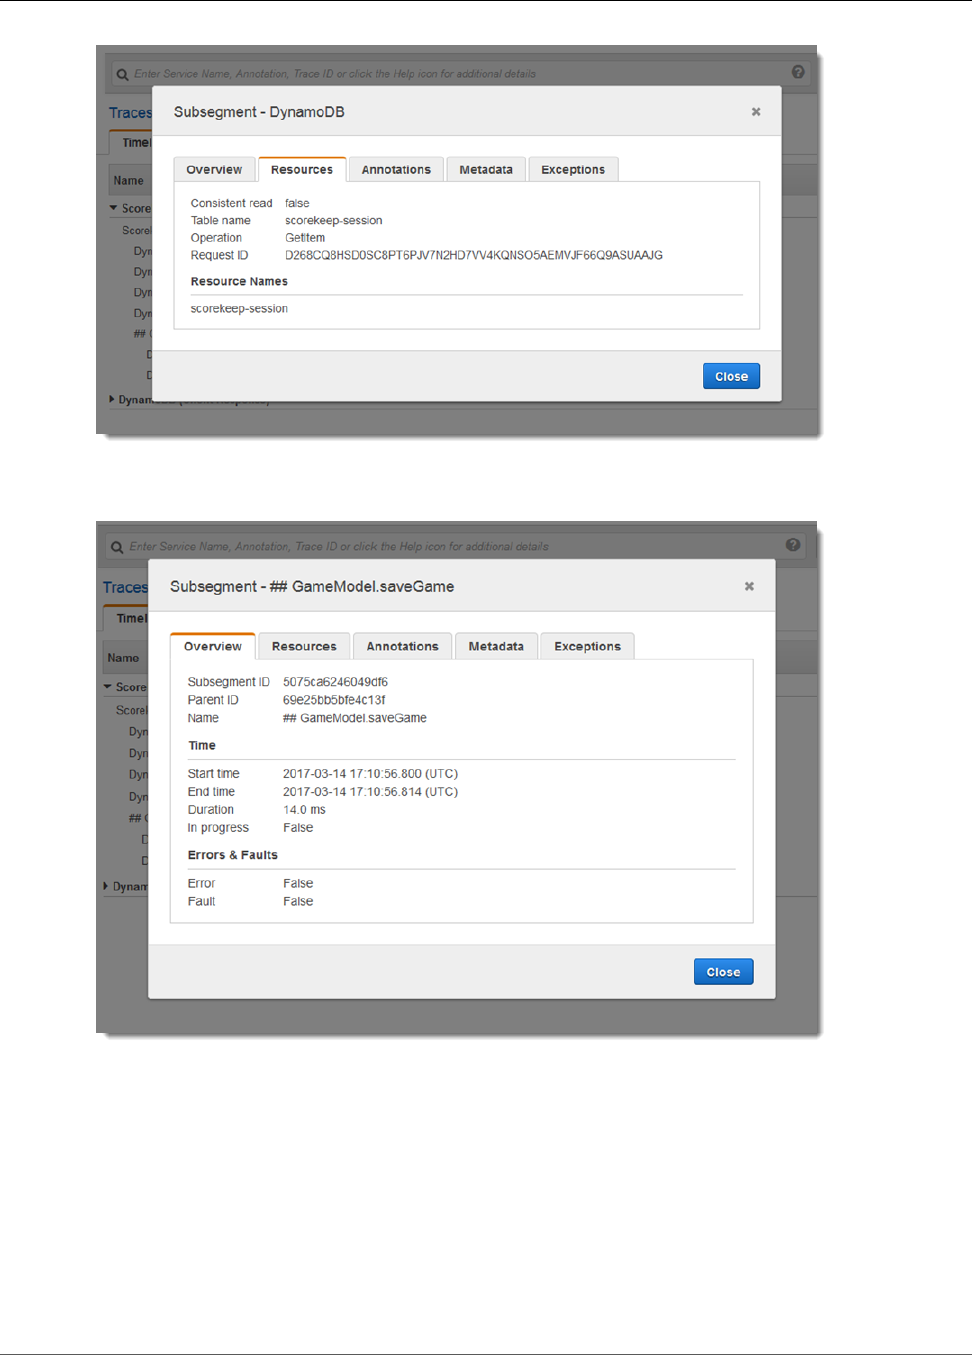
AWS X-Ray Developer Guide
Viewing Subsegment Details
For custom subsegments, the Overview shows the name of the subsegment, which you can set to specify
the area of the code or function that it records.
Use custom subsegments to organize subsegments from instrumented clients into groups. You can also
record metadata and annotations on subsegments, which can help you debug functions.
36
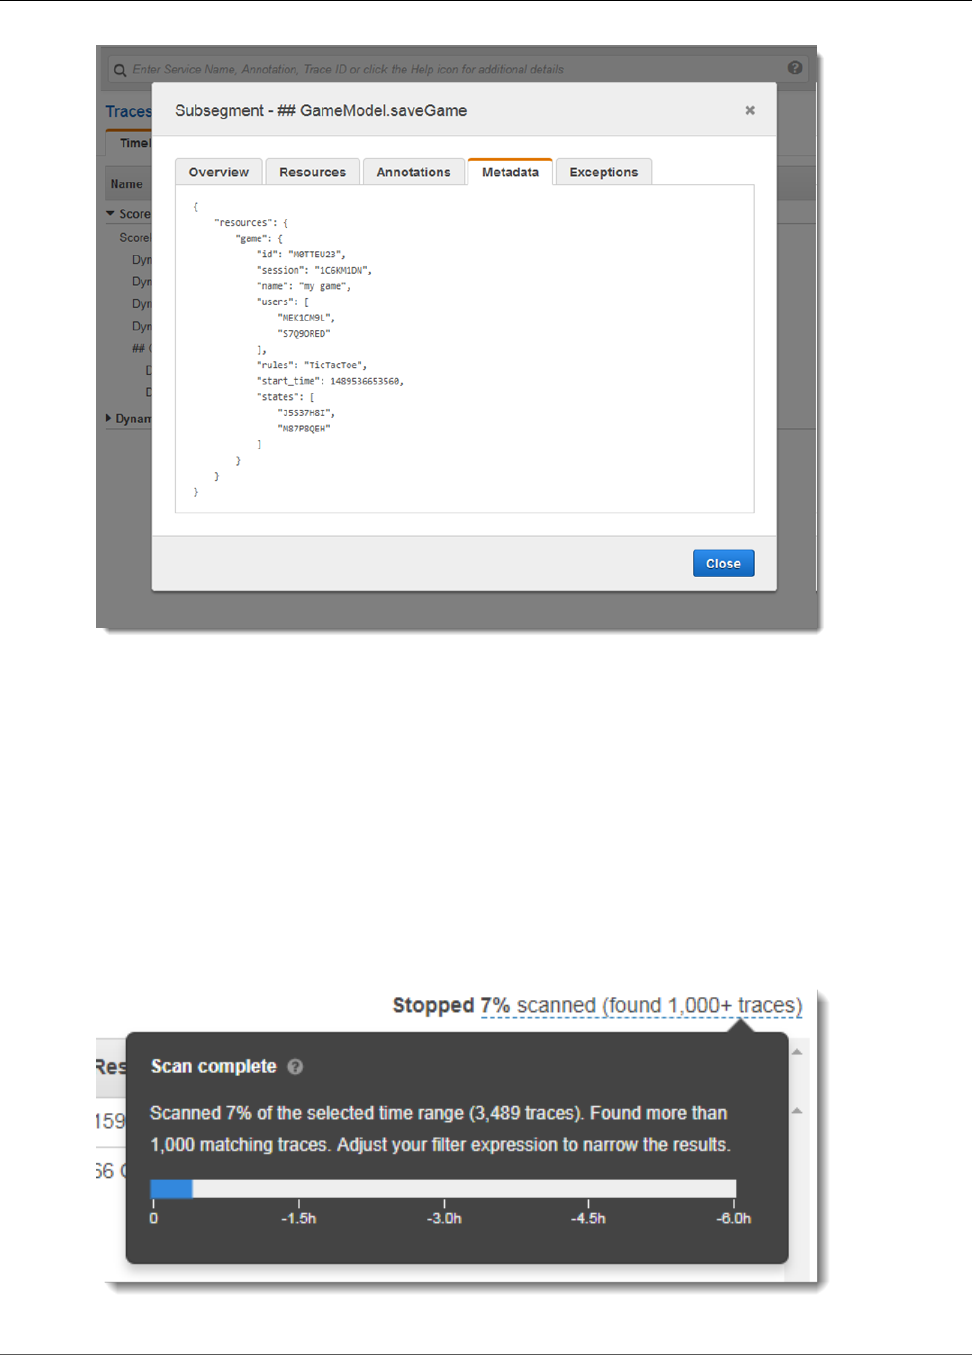
AWS X-Ray Developer Guide
Filter Expressions
In this example, the application records the state of each Game object that it saves to DynamoDB, simply
by passing the object into the putMetadata method on the subsegment. The X-Ray SDK serializes the
object into JSON and adds it to the segment document.
Searching for Traces in the AWS X-Ray Console
with Filter Expressions
When you choose a time period of traces to view in the X-Ray console, you might get more results than
the console can display. In the top-right corner, the console shows the number of traces that it scanned
and, whether there are more traces available. You can narrow the results to just the traces that you want
to find by using a filter expression.
37
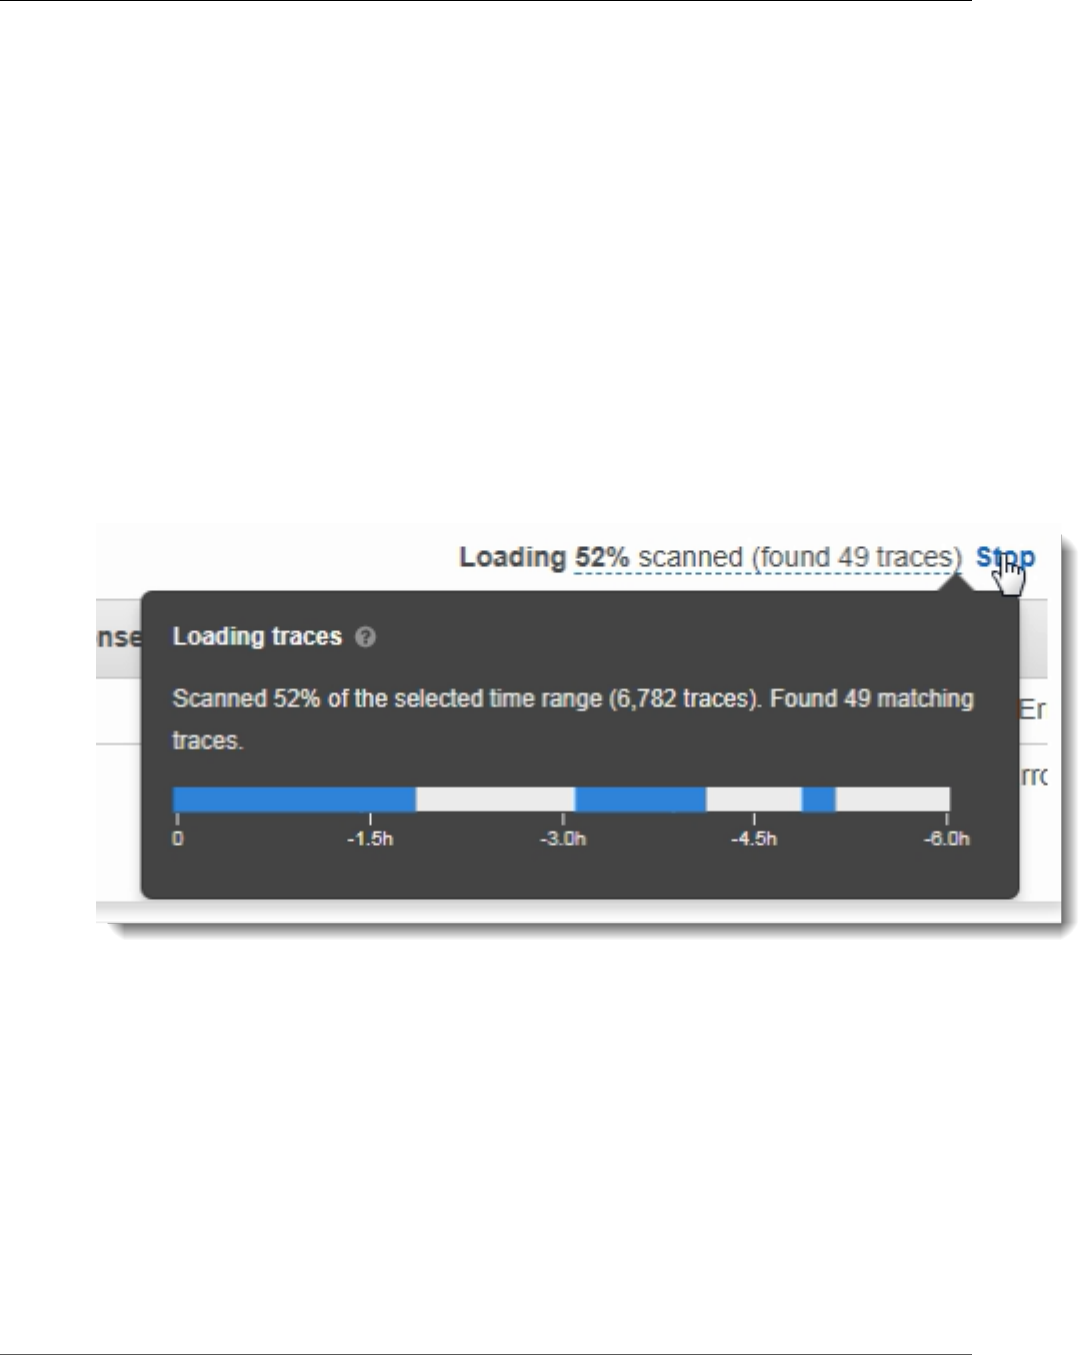
AWS X-Ray Developer Guide
Filter Expression Syntax
When you choose a node in the service map (p. 28), the console constructs a filter expression based
on the service name of the node, and the types of error present based on your selection. To find traces
that show performance issues or that relate to specific requests, you can adjust the expression provided
by the console, or create your own. If you add annotations with the X-Ray SDK, you can also filter based
on the presence of an annotation key or the value of a key.
Note
If you choose a relative time range in the service map, the console converts it to an absolute
start and end time when you choose a node. To ensure that the traces for the node appear in
the search results, and avoid scanning times when the node was not active, the time range only
includes times when the node sent traces. If you want to search relative to the current time, you
can switch back to a relative time range in the traces page and re-scan.
If there are still more results available than the console can show, the console shows you how many
traces matched and the number of traces scanned. The percentage shown is the percentage of the
selected time frame that was scanned. Narrow your filter expression further, or choose a shorter time
frame, to ensure that you see all matching traces represented in the results.
To get the freshest results first, the console starts scanning at the end of the time range and works
backwards. If there are a large number of traces, but few results, the console splits the time range into
chunks and scans them in parallel. The progress bar shows the parts of the time range that have been
scanned.
Sections
•Filter Expression Syntax (p. 38)
•Boolean Keywords (p. 39)
•Number Keywords (p. 40)
•String Keywords (p. 40)
•Complex Keywords (p. 41)
•The ID Function (p. 42)
Filter Expression Syntax
Filter expressions can contain a keyword, a unary or binary operator, and a value for comparison.
38
AWS X-Ray Developer Guide
Boolean Keywords
keyword operator value
Different operators are available for different types of keyword. For example, responsetime is a
number keyword and can be compared with operators related to numbers.
Example Requests where response time was more than 5 seconds
responsetime > 5
You can combine multiple expressions in a compound expression with the AND and OR operators.
Example Requests where the total duration was 5 to 8 seconds
duration >= 5 AND duration <= 8
Simple keywords and operators only find issues at the trace level. If an error occurs downstream, but is
handled by your application and not returned to the user, a search for error will not find it.
To find traces with downstream issues, you can use the complex keywords (p. 41) service() and
edge(). These keywords let you apply a filter expression to all downstream nodes, a single downstream
node, or an edge between two nodes. For even more granularity, you can filter services and edges by
type with the id() function (p. 42).
Boolean Keywords
Boolean keywords are either true or false. Use these keywords to find traces that resulted in errors.
Boolean Keywords
•ok – Response status code was 2XX Success.
•error – Response status code was 4XX Client Error.
•throttle – Response status code was 429 Too Many Requests.
•fault – Response status code was 5XX Server Error.
•partial – Request has incomplete segments.
Boolean operators find segments where the specified key is true or false.
Boolean Operators
• none – The expression is true if the keyword is true.
•! – The expression is true if the keyword is false.
•=,!= – Compare the value of the keyword to the string true or false. Acts the same as the other
operators but is more explicit.
Example Response status is 2XX OK
ok
Example Response status is not 2XX OK
!ok
39
AWS X-Ray Developer Guide
Number Keywords
Example Response status is not 2XX OK
ok = false
Number Keywords
Number keywords let you search for requests with a specific response time, duration, or response status.
Number Keywords
•responsetime – Time that the server took to send a response.
•duration – Total request duration, including all downstream calls.
•http.status – Response status code.
Number keywords use standard equality and comparison operators.
Number Operators
•=,!= – The keyword is equal to or not equal to a number value.
•<,<=, >,>= – The keyword is less than or greater than a number value.
Example Response status is not 200 OK
http.status != 200
Example Request where the total duration was 5 to 8 seconds
duration >= 5 AND duration <= 8
Example Requests that completed successfully in under 3 seconds, including all downstream
calls
ok !partial duration <3
String Keywords
String keywords let you find traces with specific text in the request headers, or user IDs.
String Keywords
•http.url – Request URL.
•http.method – Request method.
•http.useragent – Request user agent string.
•http.clientip – Requestor's IP address.
•user – Value of user field on any segment in the trace.
String operators find values that are equal to or contain specific text. Values must always be specified in
quotation marks.
40
AWS X-Ray Developer Guide
Complex Keywords
String Operators
•=,!= – The keyword is equal to or not equal to a number value.
•CONTAINS – The keyword contains a specific string.
•BEGINSWITH ,ENDSWITH – The keyword starts or ends with a specific string.
Example User filter
http.url CONTAINS "/api/game/"
To test if a field exists on a trace, regardless of its value, check to see if it contains the empty string.
Example User filter
Find all traces with user IDs.
user CONTAINS ""
Complex Keywords
Complex keywords let you find requests based on service name, edge name, or annotation value. For
services and edges, you can specify an additional filter expression that applies to the service or edge. For
annotations, you can filter on the value of an annotation with a specific key using boolean, number or
string operators.
Complex Keywords
•service(name) {filter} – Service with name name. Optional curly braces can contain a filter
expression that applies to segments created by the service.
•edge(name) {filter} – Connection between services source and destination. Optional curly
braces can contain a filter expression that applies to segments on this connection.
•annotation.key – Value of annotation with field key. The value of an annotation can be a boolean,
number, or string, so you can use any of those type's comparison operators. You cannot use this
keyword in combination with the service or edge keywords.
Use the service keyword to find traces for requests that hit a certain node on your service map.
Example Service filter
Requests that included a call to api.example.com with a fault (500 series error).
service("api.example.com") { fault }
You can exclude the service name to apply a filter expression to all nodes on your service map.
Example Service filter
Requests that caused a fault anywhere on your service map.
service() { fault }
41
AWS X-Ray Developer Guide
The ID Function
The edge keyword applies a filter expression to a connection between two nodes.
Example Edge filter
Request where the service api.example.com made a call to backend.example.com that failed with
an error.
edge("api.example.com", "backend.example.com") { error }
You can also use the ! operator with service and edge keywords to exclude a service or edge from the
results of another filter expression.
Example Service and request filter
Request where the URL begins with http://api.example.com/ and contains /v2/ but does not reach
a service named api.example.com.
http.url BEGINSWITH "http://api.example.com/" AND http.url CONTAINS "/v2/" AND !
service("api.example.com")
For annotations, use the comparison operators that correspond to the type of value.
Example Annotation with string value
Requests with an annotation named gameid with string value "817DL6VO".
annotation.gameid = "817DL6VO"
Example Annotation with number value
Requests with annotation age with numerical value greater than 29.
annotation.age > 29
The ID Function
When you provide a service name to the service or edge keywords, you get results for all nodes that
have that name. For more precise filtering, you can use the id function to specify a service type in
addition to a name to distinguish between nodes with the same name.
id(name: "service-name", type:"service::type")
You can use the id function in place of a service name in service and edge filters.
service(id(name: "service-name", type:"service::type")) { filter }
edge(id(name: "service-one", type:"service::type"), id(name: "service-two",
type:"service::type")) { filter }
For example, the Scorekeep sample application (p. 77) includes an AWS Lambda function named
random-name. This creates two nodes in the service map, one for the function invocation, and one for
the Lambda service.
42
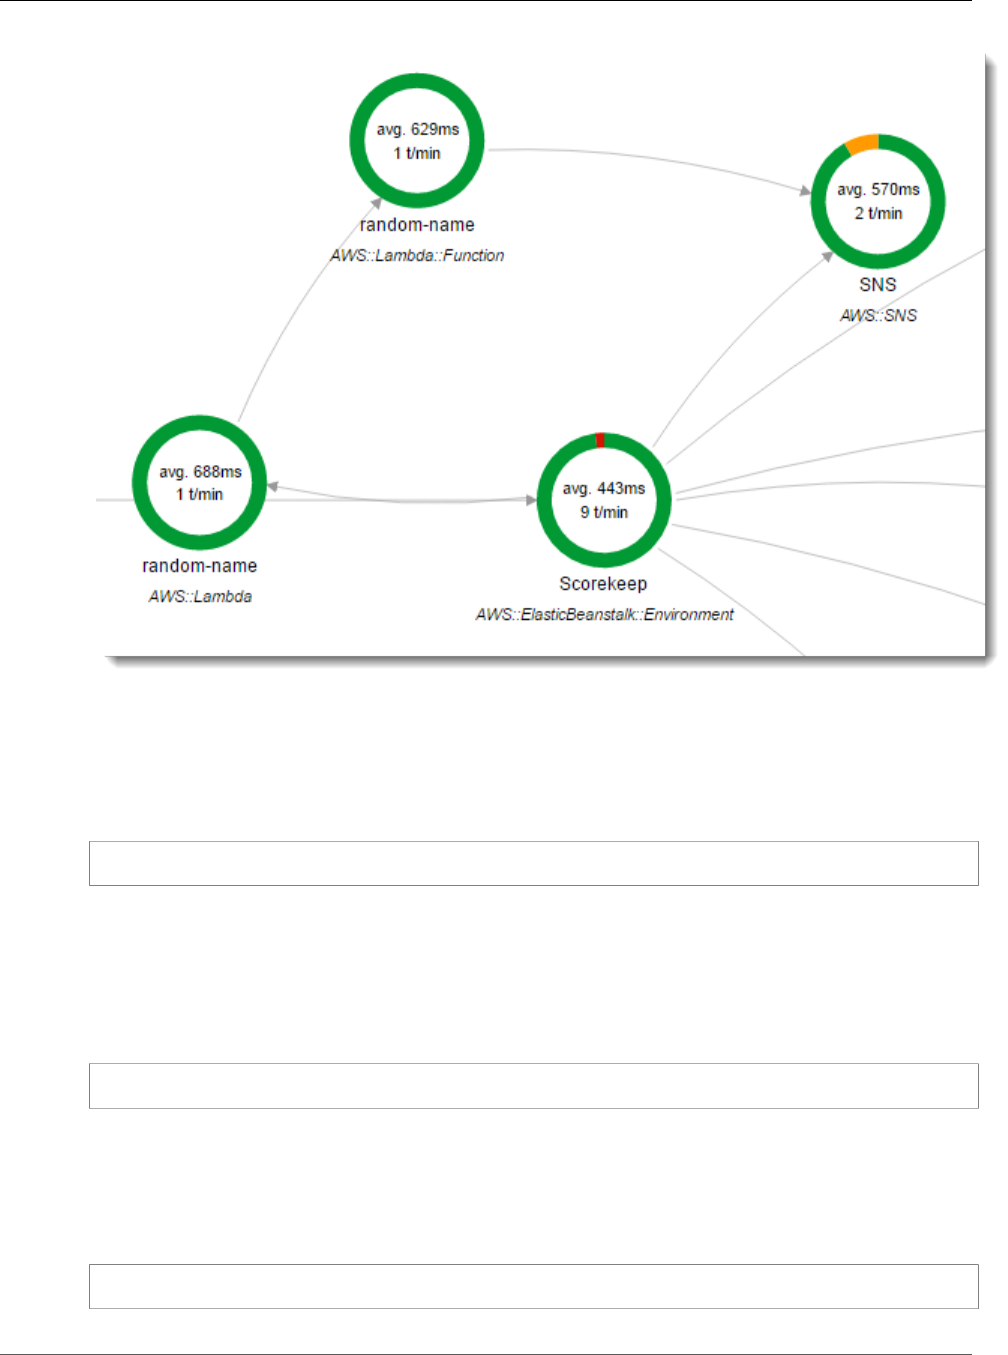
AWS X-Ray Developer Guide
The ID Function
The two nodes have the same name but different types. A standard service filter will find traces for both.
Example Service filter
Requests that include an error on any service named random-name.
service("random-name") { error }
Use the id function to narrow the search down to errors on the function itself, excluding errors from the
service.
Example Service filter with id function
Requests that include an error on a service named random-name with type AWS::Lambda::Function.
service(id(name: "random-name", type: "AWS::Lambda::Function")) { error }
You can also exclude the name entirely, to search for nodes by type.
Example Service filter with id() function
Requests that include an error on a service with type AWS::Lambda::Function.
service(id(type: "AWS::Lambda::Function")) { error }
43
AWS X-Ray Developer Guide
Deep Linking
Deep Linking
You can use routes and queries to deep link into specific traces, or filtered views of traces and the service
map.
Console Pages
• Welcome Page – xray/home#/welcome
• Getting Started – xray/home#/getting-started
• Service Map – xray/home#/service-map
• Traces – xray/home#/traces
Traces
You can generate links for timeline, raw, and map views of individual traces.
Trace timeline – xray/home#/traces/trace-id
Raw trace data – xray/home#/traces/trace-id/raw
Example Raw trace data
https://console.aws.amazon.com/xray/home#/traces/1-57f5498f-d91047849216d0f2ea3b6442/raw
Filter Expressions
Link to a filtered list of traces.
Filtered traces view – xray/home#/traces?filter=filter-expression
Example Filter expression
https://console.aws.amazon.com/xray/home#/traces?filter=service("api.amazon.com") { fault =
true OR responsetime > 2.5 } AND annotation.foo = "bar"
Example Filter expression (URL encoded)
https://console.aws.amazon.com/xray/home#/traces?filter=service(%22api.amazon.com%22)%20%7B
%20fault%20%3D%20true%20OR%20responsetime%20%3E%202.5%20%7D%20AND%20annotation.foo%20%3D
%20%22bar%22
For more information on filter expressions, see Searching for Traces in the AWS X-Ray Console with Filter
Expressions (p. 37).
Time Range
Specify a length of time or start and end time in ISO8601 format. Time ranges are in UTC and can be up
to 6 hours long.
Length of time – xray/home#/page?timeRange=range-in-minutes
Example Service map for the last hour
https://console.aws.amazon.com/xray/home#/service-map?timeRange=PT1H
44
AWS X-Ray Developer Guide
Region
Start and end time – xray/home#/page?timeRange=start~end
Example Time range accurate to seconds
https://console.aws.amazon.com/xray/home#/traces?
timeRange=2018-4-01T16:00:00~2018-4-01T22:00:00
Example Time range accurate to minutes
https://console.aws.amazon.com/xray/home#/traces?timeRange=2018-4-01T16:00~2018-4-01T22:00
Region
Specify a region to link to pages in that region. If you don't specify a region, the console redirects you to
the last visited region.
Region – xray/home?region=region#/page
Example Service map in Oregon (us-west-2)
https://console.aws.amazon.com/xray/home?region=us-west-2#/service-map
When you include a region with other query parameters, the region query goes before the hash, and the
X-Ray-specific queries go after the page name.
Example Service map for the last hour in Oregon (us-west-2)
https://console.aws.amazon.com/xray/home?region=us-west-2#/service-map?timeRange=PT1H
Combined
Example Recent traces with duration filter
https://console.aws.amazon.com/xray/home#/traces?timeRange=PT15M&filter=duration%20%3E%3D
%205%20AND%20duration%20%3C%3D%208
Output
• Page – Traces
• Time Range – Last 15 minutes
• Filter – duration >= 5 AND duration <= 8
Using Latency Histograms in the AWS X-Ray
Console
When you select a node or edge on an AWS X-Ray service map (p. 28), the X-Ray console shows a
latency distribution histogram. Latency is the amount of time between when a request starts and when
it completes. A histogram shows a distribution of latencies. It shows duration on the x-axis, and the
percentage of requests that match each duration on the y-axis.
45
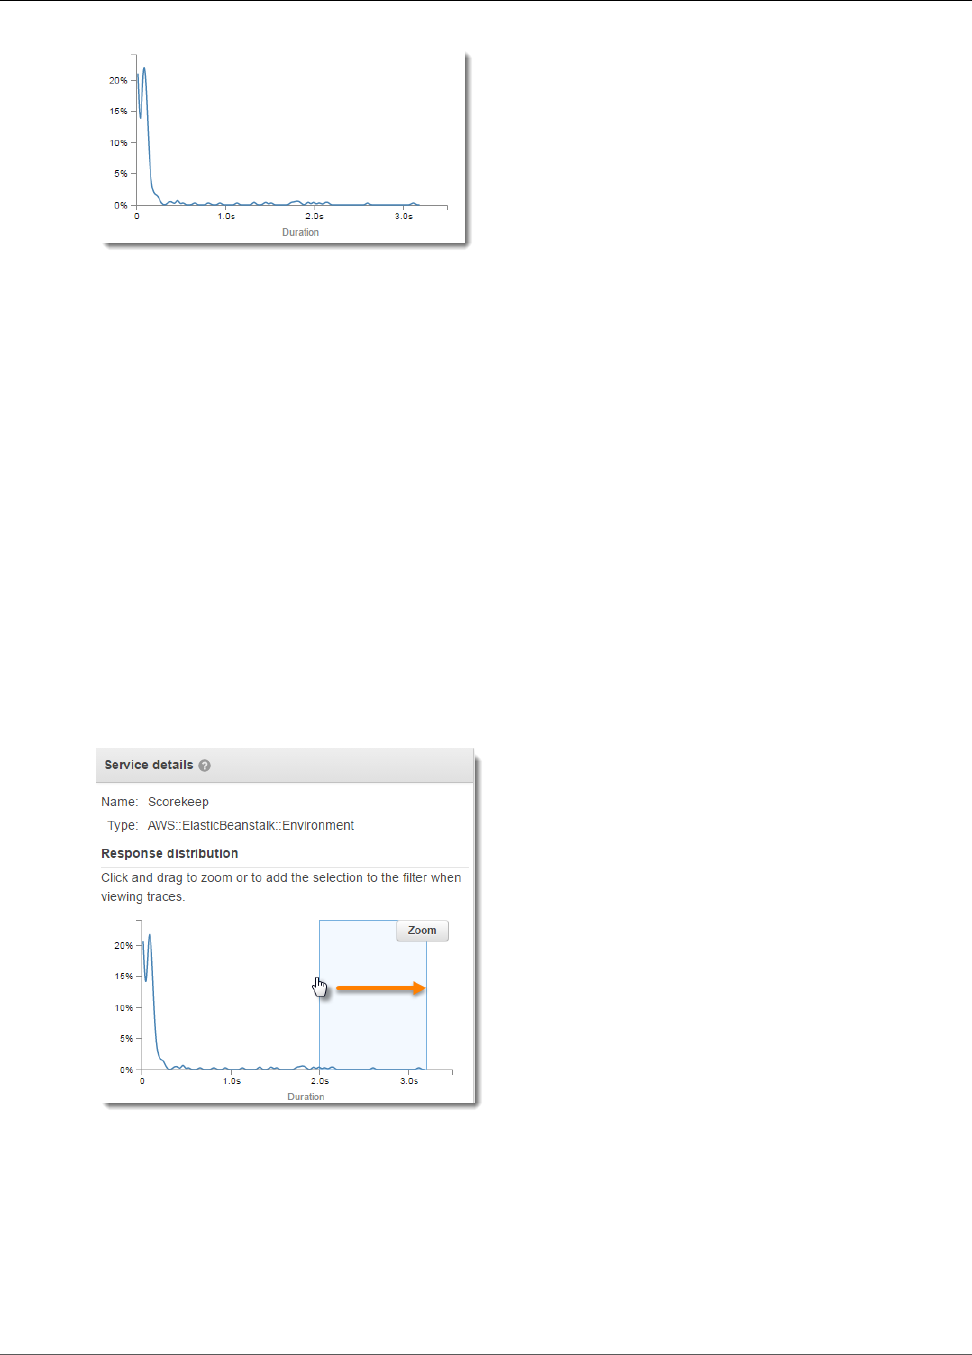
AWS X-Ray Developer Guide
Histograms
This histogram shows a service that completes most requests in less than 300 ms. A small percentage of
requests take up to 2 seconds, and a few outliers take more time.
Service histograms and edge histograms provide a visual representation of latency from the viewpoint of
a service or requester.
• Choose a service node by clicking the circle. X-Ray shows a histogram for requests served by the
service. The latencies are those recorded by the service, and do not include any network latency
between the service and the requester.
• Choose an edge by clicking the line or arrow tip of the edge between two services. X-Ray shows a
histogram for requests from the requester that were served by the downstream service. The latencies
are those recorded by the requester, and include latency in the network connection between the two
services.
To interpret the Service details panel histogram, you can look for values that differ the most from the
majority of values in the histogram. These outliers can be seen as peaks or spikes in the histogram, and
you can view the traces for a specific area to investigate what's going on.
To view traces filtered by latency, select a range on the histogram. Click where you want to start the
selection and drag from left to right to highlight a range of latencies to include in the trace filter.
After selecting a range, you can choose Zoom to view just that portion of the histogram and refine your
selection.
46
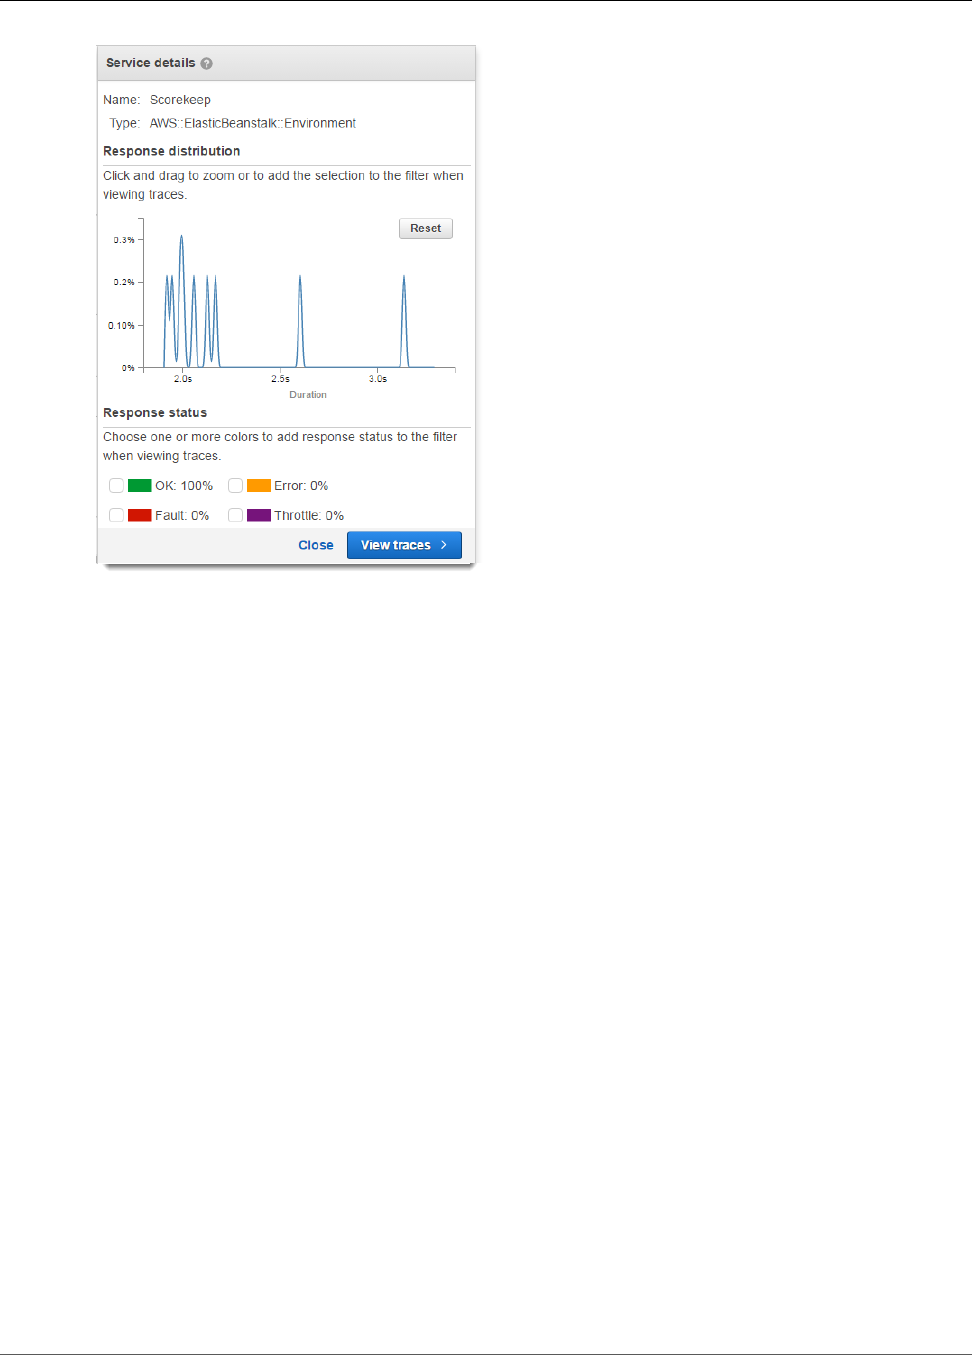
AWS X-Ray Developer Guide
Encryption
Once you have the focus set to the area you're interested in, choose View traces.
Configuring Encryption Settings in the AWS X-Ray
Console
AWS X-Ray always encrypts traces and related data at rest. If you need to audit and disable encryption
keys for compliance or internal requirements, you can configure X-Ray to use an AWS Key Management
Service (AWS KMS) customer master key (CMK) to encrypt data.
X-Ray provides an AWS managed CMK named aws/xray. Use this key if you just want to audit key usage
in AWS CloudTrail and don't need to manage the key itself. If you need to manage access to the key or
configure key rotation, you can create a customer managed CMK.
To configure X-Ray to use a CMK for encryption
1. Open the X-Ray console.
2. Choose Encryption.
3. Choose Use a customer master key.
4. Choose a key from the drop-down menu:
•aws/xray – Use the AWS managed CMK.
•key alias – Use a customer managed CMK in your account.
•Manually enter a key ARN – Use a customer managed CMK in a different account. Enter the full
Amazon Resource Name (ARN) of the key in the field that appears.
5. Choose Apply.
47

AWS X-Ray Developer Guide
Encryption
When you change encryption settings, X-Ray spends some time generating and propagating data keys.
While the new key is being processed, X-Ray may encrypt data with a combination of the new and old
settings. Existing data is not re-encrypted when you change encryption settings.
Note
AWS KMS charges when X-Ray uses a CMK to encrypt or decrypt trace data.
•Default encryption – Free.
•AWS managed CMK – Pay for key use.
•Customer managed CMK – Pay for key storage and use.
See AWS Key Management Service Pricing for details.
If X-Ray is unable to access your encryption key, it stops storing data. This can happen if your user loses
access to the CMK, or if you disable a key that's currently in use. When this happens, X-Ray shows a
notification in the navigation bar.
To configure encryption settings with the X-Ray API, see Configuring AWS X-Ray Encryption
Settings (p. 59).
48

AWS X-Ray Developer Guide
Tutorial
AWS X-Ray API
The X-Ray API provides access to all X-Ray functionality through the AWS SDK, AWS Command Line
Interface, or directly over HTTPS. The X-Ray API Reference documents input parameters each API action,
and the fields and data types that they return.
You can use the AWS SDK to develop programs that use the X-Ray API. The X-Ray console and X-Ray
daemon both use the AWS SDK to communicate with X-Ray. The AWS SDK for each language has a
reference document for classes and methods that map to X-Ray API actions and types.
AWS SDK References
•Java – AWS SDK for Java
•JavaScript – AWS SDK for JavaScript
•.NET – AWS SDK for .NET
•Ruby – AWS SDK for Ruby
•Go – AWS SDK for Go
•PHP – AWS SDK for PHP
•Python – AWS SDK for Python (Boto)
The AWS Command Line Interface is a command line tool that uses the SDK for Python to call AWS
APIs. When you are first learning an AWS API, the AWS CLI provides an easy way to explore the available
parameters and view the service output in JSON or text form.
See the AWS CLI Command Reference for details on aws xray subcommands.
Topics
•Using the AWS X-Ray API with the AWS CLI (p. 49)
•Sending Trace Data to AWS X-Ray (p. 52)
•Getting Data from AWS X-Ray (p. 56)
•Configuring AWS X-Ray Encryption Settings (p. 59)
•AWS X-Ray Segment Documents (p. 60)
•Logging X-Ray API Calls with AWS CloudTrail (p. 72)
Using the AWS X-Ray API with the AWS CLI
The AWS CLI lets your access the X-Ray service directly and use the same APIs that the X-Ray console
uses to retrieve the service graph and raw traces data. The sample application includes scripts that show
how to use these APIs with the AWS CLI.
Prerequisites
This tutorial uses the Scorekeep sample application and included scripts to generate tracing data and a
service map. Follow the instructions in the getting started tutorial (p. 8) to launch the application.
49
AWS X-Ray Developer Guide
Generate Trace Data
This tutorial uses the AWS CLI to show basic use of the X-Ray API. The AWS CLI, available for Windows,
Linux, and OS-X, provides command line access to the public APIs for all AWS services.
Scripts included to test the sample application uses cURL to send traffic to the API and jq to parse the
output. You can download the jq executable from stedolan.github.io, and the curl executable from
https://curl.haxx.se/download.html. Most Linux and OS X installations include cURL.
Generate Trace Data
The web app continues to generate traffic to the API every few seconds while the game is in-progress,
but only generates one type of request. Use the test-api.sh script to run end to end scenarios and
generate more diverse trace data while you test the API.
To use the test-api.sh script
1. Open the Elastic Beanstalk console.
2. Navigate to the management console for your environment.
3. Copy the environment URL from the page header.
4. Open bin/test-api.sh and replace the value for API with your environment's URL.
#!/bin/bash
API=scorekeep.9hbtbm23t2.us-west-2.elasticbeanstalk.com
5. Run the script to generate traffic to the API.
~/debugger-tutorial$ ./bin/test-api.sh
Creating users,
session,
game,
configuring game,
playing game,
ending game,
game complete.
{"id":"MTBP8BAS","session":"HUF6IT64","name":"tic-tac-toe-test","users":
["QFF3HBGM","KL6JR98D"],"rules":"102","startTime":1476314241,"endTime":1476314245,"states":
["JQVLEOM2","D67QLPIC","VF9BM9NC","OEAA6GK9","2A705O73","1U2LFTLJ","HUKIDD70","BAN1C8FI","G3UDJTUF","AB70HVEV"],"moves":
["BS8F8LQ","4MTTSPKP","463OETES","SVEBCL3N","N7CQ1GHP","O84ONEPD","EG4BPROQ","V4BLIDJ3","9RL3NPMV"]}
Use the X-Ray API
The AWS CLI provides commands for all of the API actions that X-Ray provides, including
GetServiceGraph and GetTraceSummaries. See the AWS X-Ray API Reference for more information
on all of the supported actions and the data types that they use.
Example bin/service-graph.sh
EPOCH=$(date +%s)
aws xray get-service-graph --start-time $(($EPOCH-600)) --end-time $EPOCH
The script retrieves a service graph for the last 10 minutes.
~/eb-java-scorekeep$ ./bin/service-graph.sh | less
{
"StartTime": 1479068648.0,
"Services": [
50
AWS X-Ray Developer Guide
Use the X-Ray API
{
"StartTime": 1479068648.0,
"ReferenceId": 0,
"State": "unknown",
"EndTime": 1479068651.0,
"Type": "client",
"Edges": [
{
"StartTime": 1479068648.0,
"ReferenceId": 1,
"SummaryStatistics": {
"ErrorStatistics": {
"ThrottleCount": 0,
"TotalCount": 0,
"OtherCount": 0
},
"FaultStatistics": {
"TotalCount": 0,
"OtherCount": 0
},
"TotalCount": 2,
"OkCount": 2,
"TotalResponseTime": 0.054000139236450195
},
"EndTime": 1479068651.0,
"Aliases": []
}
]
},
{
"StartTime": 1479068648.0,
"Names": [
"scorekeep.elasticbeanstalk.com"
],
"ReferenceId": 1,
"State": "active",
"EndTime": 1479068651.0,
"Root": true,
"Name": "scorekeep.elasticbeanstalk.com",
...
Example bin/trace-urls.sh
EPOCH=$(date +%s)
aws xray get-trace-summaries --start-time $(($EPOCH-120)) --end-time $(($EPOCH-60)) --query
'TraceSummaries[*].Http.HttpURL'
The script retrieves the URLs of traces generated between one and two minutes ago.
~/eb-java-scorekeep$ ./bin/trace-urls.sh
[
"http://scorekeep.elasticbeanstalk.com/api/game/6Q0UE1DG/5FGLM9U3/endtime/1479069438",
"http://scorekeep.elasticbeanstalk.com/api/session/KH4341QH",
"http://scorekeep.elasticbeanstalk.com/api/game/GLQBJ3K5/153AHDIA",
"http://scorekeep.elasticbeanstalk.com/api/game/VPDL672J/G2V41HM6/endtime/1479069466"
]
Example bin/full-traces.sh
EPOCH=$(date +%s)
TRACEIDS=$(aws xray get-trace-summaries --start-time $(($EPOCH-120)) --end-time
$(($EPOCH-60)) --query 'TraceSummaries[*].Id' --output text)
51

AWS X-Ray Developer Guide
Cleanup
aws xray batch-get-traces --trace-ids $TRACEIDS --query 'Traces[*]'
The script retrieves full traces generated between one and two minutes ago.
~/eb-java-scorekeep$ ./bin/full-traces.sh | less
[
{
"Segments": [
{
"Id": "3f212bc237bafd5d",
"Document": "{\"id\":\"3f212bc237bafd5d\",\"name\":\"DynamoDB\",
\"trace_id\":\"1-5828d9f2-a90669393f4343211bc1cf75\",\"start_time\":1.479072242459E9,
\"end_time\":1.479072242477E9,\"parent_id\":\"72a08dcf87991ca9\",\"http\":{\"response
\":{\"content_length\":60,\"status\":200}},\"inferred\":true,\"aws\":{\"consistent_read
\":false,\"table_name\":\"scorekeep-session-xray\",\"operation\":\"GetItem\",\"request_id
\":\"QAKE0S8DD0LJM245KAOPMA746BVV4KQNSO5AEMVJF66Q9ASUAAJG\",\"resource_names\":
[\"scorekeep-session-xray\"]},\"origin\":\"AWS::DynamoDB::Table\"}"
},
{
"Id": "309e355f1148347f",
"Document": "{\"id\":\"309e355f1148347f\",\"name\":\"DynamoDB\",
\"trace_id\":\"1-5828d9f2-a90669393f4343211bc1cf75\",\"start_time\":1.479072242477E9,
\"end_time\":1.479072242494E9,\"parent_id\":\"37f14ef837f00022\",\"http\":
{\"response\":{\"content_length\":606,\"status\":200}},\"inferred\":true,\"aws\":
{\"table_name\":\"scorekeep-game-xray\",\"operation\":\"UpdateItem\",\"request_id\":
\"388GEROC4PCA6D59ED3CTI5EEJVV4KQNSO5AEMVJF66Q9ASUAAJG\",\"resource_names\":[\"scorekeep-
game-xray\"]},\"origin\":\"AWS::DynamoDB::Table\"}"
}
],
"Id": "1-5828d9f2-a90669393f4343211bc1cf75",
"Duration": 0.05099987983703613
}
...
Cleanup
Terminate your Elastic Beanstalk environment to shut down the Amazon EC2 instances, DynamoDB
tables and other resources.
To terminate your Elastic Beanstalk environment
1. Open the Elastic Beanstalk console.
2. Navigate to the management console for your environment.
3. Choose Actions.
4. Choose Terminate Environment.
5. Choose Terminate.
Trace data is automatically deleted from X-Ray after 30 days.
Sending Trace Data to AWS X-Ray
You can send trace data to X-Ray in the form of segment documents. A segment document is a JSON
formatted string that contains information about the work that your application does in service of a
request. Your application can record data about the work that it does itself in segments, or work that
uses downstream services and resources in subsegments.
52

AWS X-Ray Developer Guide
Sending Data
Segments record information about the work that your application does. A segment, at a minimum,
records the time spent on a task, a name, and two IDs. The trace ID tracks the request as it travels
between services. The segment ID tracks the work done for the request by a single service.
Example Minimal complete segment
{
"name" : "Scorekeep",
"id" : "70de5b6f19ff9a0a",
"start_time" : 1.478293361271E9,
"trace_id" : "1-581cf771-a006649127e371903a2de979",
"end_time" : 1.478293361449E9
}
When a request is received, you can send an in-progress segment as a placeholder until the request is
completed.
Example In-progress segment
{
"name" : "Scorekeep",
"id" : "70de5b6f19ff9a0b",
"start_time" : 1.478293361271E9,
"trace_id" : "1-581cf771-a006649127e371903a2de979",
“in_progress”: true
}
You can send segments to X-Ray directly, with PutTraceSegments (p. 54), or through the X-Ray
daemon (p. 55).
Most applications call other services or access resources with the AWS SDK. Record information about
downstream calls in subsegments. X-Ray uses subsegments to identify downstream services that don't
send segments and create entries for them on the service graph.
A subsegment can be embedded in a full segment document, or sent separately. Send subsegments
separately to asynchronously trace downstream calls for long-running requests, or to avoid exceeding
the maximum segment document size (64 kB).
Example Subsegment
A subsegment has a type of subsegment and a parent_id that identifies the parent segment.
{
"name" : "www2.example.com",
"id" : "70de5b6f19ff9a0c",
"start_time" : 1.478293361271E9,
"trace_id" : "1-581cf771-a006649127e371903a2de979"
“end_time” : 1.478293361449E9,
“type” : “subsegment”,
“parent_id” : “70de5b6f19ff9a0b”
}
For more information on the fields and values that you can include in segments and subsegments, see
AWS X-Ray Segment Documents (p. 60).
Sections
•Generating Trace IDs (p. 54)
•Using PutTraceSegments (p. 54)
•Sending Segment Documents to the X-Ray Daemon (p. 55)
53
AWS X-Ray Developer Guide
Generating Trace IDs
Generating Trace IDs
To send data to X-Ray, you need to generate a unique trace ID for each request. Trace IDs must meet the
following requirements.
Trace ID Format
A trace_id consists of three numbers separated by hyphens. For example, 1-58406520-
a006649127e371903a2de979. This includes:
• The version number, that is, 1.
• The time of the original request, in Unix epoch time, in 8 hexadecimal digits.
For example, 10:00AM December 1st, 2016 PST in epoch time is 1480615200 seconds, or 58406520
in hexadecimal.
• A 96-bit identifier for the trace, globally unique, in 24 hexadecimal digits.
You can write a script to generate trace IDs for testing. Here are two examples.
Python
import time
import os
import binascii
START_TIME = time.time()
HEX=hex(int(START_TIME))[2:]
TRACE_ID="1-" + HEX + "-" + binascii.b2a_hex(os.urandom(12))
Bash
START_TIME=$(date +%s)
HEX_TIME=$(printf '%x\n' $START_TIME)
GUID=$(dd if=/dev/random bs=12 count=1 2>/dev/null | od -An -tx1 | tr -d ' \t\n')
TRACE_ID="1-$HEX_TIME-$GUID"
See the Scorekeep sample application for scripts that create trace IDs and send segments to the X-Ray
daemon.
• Python – xray_start.py
• Bash – xray_start.sh
Using PutTraceSegments
You can upload segment documents with the PutTraceSegments API. The API has a single parameter,
TraceSegmentDocuments, that takes a list of JSON segment documents.
With the AWS CLI, use the aws xray put-trace-segments command to send segment documents
directly to X-Ray.
$ DOC='{"trace_id": "1-5960082b-ab52431b496add878434aa25", "id": "6226467e3f845502",
"start_time": 1498082657.37518, "end_time": 1498082695.4042, "name":
"test.elasticbeanstalk.com"}'
$ aws xray put-trace-segments --trace-segment-documents $DOC
54
AWS X-Ray Developer Guide
Sending Segment Documents to the X-Ray Daemon
{
"UnprocessedTraceSegments": []
}
Note
Windows Command Processor and Windows PowerShell have different requirements for quoting
and escaping quotes in JSON strings. See Quoting Strings in the AWS CLI User Guide for details.
The output lists any segments that failed processing. For example, if the date in the trace ID is too far in
the past, you see an error like the following.
{
"UnprocessedTraceSegments": [
{
"ErrorCode": "InvalidTraceId",
"Message": "Invalid segment. ErrorCode: InvalidTraceId",
"Id": "6226467e3f845502"
}
]
}
You can pass multiple segment documents at the same time, separated by spaces.
$ aws xray put-trace-segments --trace-segment-documents $DOC1 $DOC2
Sending Segment Documents to the X-Ray Daemon
Instead of sending segment documents to the X-Ray API, you can send segments and subsegments to
the X-Ray daemon, which will buffer them and upload to the X-Ray API in batches. The X-Ray SDK sends
segment documents to the daemon to avoid making calls to AWS directly.
Note
See Running the X-Ray Daemon Locally (p. 104) for instructions on running the daemon.
Send the segment in JSON over UDP port 2000, prepended by the daemon header, {"format":
"json", "version": 1}\n
{"format": "json", "version": 1}\n{"trace_id": "1-5759e988-bd862e3fe1be46a994272793", "id":
"defdfd9912dc5a56", "start_time": 1461096053.37518, "end_time": 1461096053.4042, "name":
"test.elasticbeanstalk.com"}
On Linux, you can send segment documents to the daemon from a Bash terminal. Save the header and
segment document to a text file and pipe it to /dev/udp with cat.
$ cat segment.txt > /dev/udp/127.0.0.1/2000
Example segment.txt
{"format": "json", "version": 1}
{"trace_id": "1-594aed87-ad72e26896b3f9d3a27054bb", "id": "6226467e3f845502", "start_time":
1498082657.37518, "end_time": 1498082695.4042, "name": "test.elasticbeanstalk.com"}
Check the daemon log (p. 101) to verify that it sent the segment to X-Ray.
2017-07-07T01:57:24Z [Debug] processor: sending partial batch
55
AWS X-Ray Developer Guide
Getting Data
2017-07-07T01:57:24Z [Debug] processor: segment batch size: 1. capacity: 50
2017-07-07T01:57:24Z [Info] Successfully sent batch of 1 segments (0.020 seconds)
Getting Data from AWS X-Ray
AWS X-Ray processes the trace data that you send to it to generate full traces, trace summaries, and
service graphs in JSON. You can retrieve the generated data directly from the API with the AWS CLI.
Sections
•Retrieving the Service Graph (p. 56)
•Retrieving Traces (p. 56)
Retrieving the Service Graph
You can use the GetServiceGraph API to retrieve the JSON service graph. The API requires a start time
and end time, which you can calculate from a Linux terminal with the date command.
$ date +%s
1499394617
date +%s prints a date in seconds. Use this number as an end time and subtract time from it to get a
start time.
Example Script to retrieve a service graph for the last 10 minutes
EPOCH=$(date +%s)
aws xray get-service-graph --start-time $(($EPOCH-600)) --end-time $EPOCH
Retrieving Traces
You can use the GetTraceSummaries API to get a list of trace summaries. Trace summaries include
information that you can use to identify traces that you want to download in full, including annotations,
request and response information, and IDs.
Use the aws xray get-trace-summaries command to get a list of trace summaries. The following
commands get a list of trace summaries from between 1 and 2 minutes in the past.
$ EPOCH=$(date +%s)
$ aws xray get-trace-summaries --start-time $(($EPOCH-120)) --end-time $(($EPOCH-60))
{
"TraceSummaries": [
{
"HasError": false,
"Http": {
"HttpStatus": 200,
"ClientIp": "205.255.255.183",
"HttpURL": "http://scorekeep.elasticbeanstalk.com/api/session",
"UserAgent": "Mozilla/5.0 (Windows NT 6.1; Win64; x64) AppleWebKit/537.36
(KHTML, like Gecko) Chrome/59.0.3071.115 Safari/537.36",
"HttpMethod": "POST"
},
56

AWS X-Ray Developer Guide
Retrieving Traces
"Users": [],
"HasFault": false,
"Annotations": {},
"ResponseTime": 0.084,
"Duration": 0.084,
"Id": "1-59602606-a43a1ac52fc7ee0eea12a82c",
"HasThrottle": false
},
{
"HasError": false,
"Http": {
"HttpStatus": 200,
"ClientIp": "205.255.255.183",
"HttpURL": "http://scorekeep.elasticbeanstalk.com/api/user",
"UserAgent": "Mozilla/5.0 (Windows NT 6.1; Win64; x64) AppleWebKit/537.36
(KHTML, like Gecko) Chrome/59.0.3071.115 Safari/537.36",
"HttpMethod": "POST"
},
"Users": [
{
"UserName": "5M388M1E"
}
],
"HasFault": false,
"Annotations": {
"UserID": [
{
"AnnotationValue": {
"StringValue": "5M388M1E"
}
}
],
"Name": [
{
"AnnotationValue": {
"StringValue": "Ola"
}
}
]
},
"ResponseTime": 3.232,
"Duration": 3.232,
"Id": "1-59602603-23fc5b688855d396af79b496",
"HasThrottle": false
}
],
"ApproximateTime": 1499473304.0,
"TracesProcessedCount": 2
}
Use the trace ID from the output to retrieve a full trace with the BatchGetTraces API.
$ aws xray batch-get-traces --trace-ids 1-596025b4-7170afe49f7aa708b1dd4a6b
{
"Traces": [
{
"Duration": 3.232,
"Segments": [
{
"Document": "{\"id\":\"1fb07842d944e714\",\"name\":
\"random-name\",\"start_time\":1.499473411677E9,\"end_time\":1.499473414572E9,
\"parent_id\":\"0c544c1b1bbff948\",\"http\":{\"response\":{\"status\":200}},
\"aws\":{\"request_id\":\"ac086670-6373-11e7-a174-f31b3397f190\"},\"trace_id\":
57

AWS X-Ray Developer Guide
Retrieving Traces
\"1-59602603-23fc5b688855d396af79b496\",\"origin\":\"AWS::Lambda\",\"resource_arn\":
\"arn:aws:lambda:us-west-2:123456789012:function:random-name\"}",
"Id": "1fb07842d944e714"
},
{
"Document": "{\"id\":\"194fcc8747581230\",\"name\":\"Scorekeep
\",\"start_time\":1.499473411562E9,\"end_time\":1.499473414794E9,\"http\":{\"request
\":{\"url\":\"http://scorekeep.elasticbeanstalk.com/api/user\",\"method\":\"POST\",
\"user_agent\":\"Mozilla/5.0 (Windows NT 6.1; Win64; x64) AppleWebKit/537.36 (KHTML,
like Gecko) Chrome/59.0.3071.115 Safari/537.36\",\"client_ip\":\"205.251.233.183\"},
\"response\":{\"status\":200}},\"aws\":{\"elastic_beanstalk\":{\"version_label\":\"app-
abb9-170708_002045\",\"deployment_id\":406,\"environment_name\":\"scorekeep-dev\"},
\"ec2\":{\"availability_zone\":\"us-west-2c\",\"instance_id\":\"i-0cd9e448944061b4a
\"},\"xray\":{\"sdk_version\":\"1.1.2\",\"sdk\":\"X-Ray for Java\"}},\"service
\":{},\"trace_id\":\"1-59602603-23fc5b688855d396af79b496\",\"user\":\"5M388M1E
\",\"origin\":\"AWS::ElasticBeanstalk::Environment\",\"subsegments\":[{\"id\":
\"0c544c1b1bbff948\",\"name\":\"Lambda\",\"start_time\":1.499473411629E9,\"end_time
\":1.499473414572E9,\"http\":{\"response\":{\"status\":200,\"content_length\":14}},
\"aws\":{\"log_type\":\"None\",\"status_code\":200,\"function_name\":\"random-name
\",\"invocation_type\":\"RequestResponse\",\"operation\":\"Invoke\",\"request_id
\":\"ac086670-6373-11e7-a174-f31b3397f190\",\"resource_names\":[\"random-name\"]},
\"namespace\":\"aws\"},{\"id\":\"071684f2e555e571\",\"name\":\"## UserModel.saveUser
\",\"start_time\":1.499473414581E9,\"end_time\":1.499473414769E9,\"metadata\":{\"debug
\":{\"test\":\"Metadata string from UserModel.saveUser\"}},\"subsegments\":[{\"id\":
\"4cd3f10b76c624b4\",\"name\":\"DynamoDB\",\"start_time\":1.49947341469E9,\"end_time
\":1.499473414769E9,\"http\":{\"response\":{\"status\":200,\"content_length\":57}},
\"aws\":{\"table_name\":\"scorekeep-user\",\"operation\":\"UpdateItem\",\"request_id\":
\"MFQ8CGJ3JTDDVVVASUAAJGQ6NJ82F738BOB4KQNSO5AEMVJF66Q9\",\"resource_names\":[\"scorekeep-
user\"]},\"namespace\":\"aws\"}]}]}",
"Id": "194fcc8747581230"
},
{
"Document": "{\"id\":\"00f91aa01f4984fd\",\"name\":
\"random-name\",\"start_time\":1.49947341283E9,\"end_time\":1.49947341457E9,
\"parent_id\":\"1fb07842d944e714\",\"aws\":{\"function_arn\":\"arn:aws:lambda:us-
west-2:123456789012:function:random-name\",\"resource_names\":[\"random-name\"],
\"account_id\":\"123456789012\"},\"trace_id\":\"1-59602603-23fc5b688855d396af79b496\",
\"origin\":\"AWS::Lambda::Function\",\"subsegments\":[{\"id\":\"e6d2fe619f827804\",
\"name\":\"annotations\",\"start_time\":1.499473413012E9,\"end_time\":1.499473413069E9,
\"annotations\":{\"UserID\":\"5M388M1E\",\"Name\":\"Ola\"}},{\"id\":\"b29b548af4d54a0f
\",\"name\":\"SNS\",\"start_time\":1.499473413112E9,\"end_time\":1.499473414071E9,
\"http\":{\"response\":{\"status\":200}},\"aws\":{\"operation\":\"Publish\",\"region
\":\"us-west-2\",\"request_id\":\"a2137970-f6fc-5029-83e8-28aadeb99198\",\"retries
\":0,\"topic_arn\":\"arn:aws:sns:us-west-2:123456789012:awseb-e-ruag3jyweb-stack-
NotificationTopic-6B829NT9V5O9\"},\"namespace\":\"aws\"},{\"id\":\"2279c0030c955e52\",
\"name\":\"Initialization\",\"start_time\":1.499473412064E9,\"end_time\":1.499473412819E9,
\"aws\":{\"function_arn\":\"arn:aws:lambda:us-west-2:123456789012:function:random-name
\"}}]}",
"Id": "00f91aa01f4984fd"
},
{
"Document": "{\"id\":\"17ba309b32c7fbaf\",\"name\":
\"DynamoDB\",\"start_time\":1.49947341469E9,\"end_time\":1.499473414769E9,
\"parent_id\":\"4cd3f10b76c624b4\",\"inferred\":true,\"http\":{\"response
\":{\"status\":200,\"content_length\":57}},\"aws\":{\"table_name
\":\"scorekeep-user\",\"operation\":\"UpdateItem\",\"request_id\":
\"MFQ8CGJ3JTDDVVVASUAAJGQ6NJ82F738BOB4KQNSO5AEMVJF66Q9\",\"resource_names\":
[\"scorekeep-user\"]},\"trace_id\":\"1-59602603-23fc5b688855d396af79b496\",\"origin\":
\"AWS::DynamoDB::Table\"}",
"Id": "17ba309b32c7fbaf"
},
{
"Document": "{\"id\":\"1ee3c4a523f89ca5\",\"name\":\"SNS\",\"start_time
\":1.499473413112E9,\"end_time\":1.499473414071E9,\"parent_id\":\"b29b548af4d54a0f\",
\"inferred\":true,\"http\":{\"response\":{\"status\":200}},\"aws\":{\"operation\":\"Publish
\",\"region\":\"us-west-2\",\"request_id\":\"a2137970-f6fc-5029-83e8-28aadeb99198\",
58
AWS X-Ray Developer Guide
Configuration
\"retries\":0,\"topic_arn\":\"arn:aws:sns:us-west-2:123456789012:awseb-e-ruag3jyweb-stack-
NotificationTopic-6B829NT9V5O9\"},\"trace_id\":\"1-59602603-23fc5b688855d396af79b496\",
\"origin\":\"AWS::SNS\"}",
"Id": "1ee3c4a523f89ca5"
}
],
"Id": "1-59602603-23fc5b688855d396af79b496"
}
],
"UnprocessedTraceIds": []
}
The full trace includes a document for each segment, compiled from all of the segment documents
received with the same trace ID. These documents don't represent the data as it was sent to X-Ray by
your application. Instead, they represent the processed documents generated by the X-Ray service. X-
Ray creates the full trace document by compiling segment documents sent by your application, and
removing data that doesn't comply with the segment document schema (p. 60).
X-Ray also creates inferred segments for downstream calls to services that don't send segments
themselves. For example, when you call DynamoDB with an instrumented client, the X-Ray SDK records
a subsegment with details about the call from its point of view. However, DynamoDB doesn't send a
corresponding segment. X-Ray uses the information in the subsegment to create an inferred segment to
represent the DynamoDB resource in the service map, and adds it to the trace document.
To get multiple traces from the API, you need a list of trace IDs, which you can extract from the output of
get-trace-summaries with an AWS CLI query. Redirect the list to the intput of batch-get-traces
to get full traces for a specific time period.
Example Script to get full traces for a one minute period
EPOCH=$(date +%s)
TRACEIDS=$(aws xray get-trace-summaries --start-time $(($EPOCH-120)) --end-time
$(($EPOCH-60)) --query 'TraceSummaries[*].Id' --output text)
aws xray batch-get-traces --trace-ids $TRACEIDS --query 'Traces[*]'
Configuring AWS X-Ray Encryption Settings
AWS X-Ray provides APIs for configuring encryption settings (p. 47). Use PutEncryptionConfig to
specify a customer master key (CMK) to use for encryption.
$ aws xray put-encryption-config --type KMS --key-id alias/aws/xray
{
"EncryptionConfig": {
"KeyId": "arn:aws:kms:us-east-2:123456789012:key/c234g4e8-39e9-4gb0-84e2-
b0ea215cbba5",
"Status": "UPDATING",
"Type": "KMS"
}
}
For the key ID, you can use an alias (as shown in the example), a key ID, or an ARN.
Use GetEncryptionConfig to get the current configuration. When X-Ray finishes applying your
settings, the status changes from UPDATING to ACTIVE.
$ aws xray get-encryption-config
59

AWS X-Ray Developer Guide
Segment Documents
{
"EncryptionConfig": {
"KeyId": "arn:aws:kms:us-east-2:123456789012:key/c234g4e8-39e9-4gb0-84e2-
b0ea215cbba5",
"Status": "ACTIVE",
"Type": "KMS"
}
}
To stop using a CMK and use default encryption, set the encryption type to NONE.
$ aws xray put-encryption-config --type NONE
{
"EncryptionConfig": {
"Status": "UPDATING",
"Type": "NONE"
}
}
AWS X-Ray Segment Documents
A trace segment is a JSON representation of a request that your application serves. A trace segment
records information about the original request, information about the work that your application does
locally, and subsegments with information about downstream calls that your application makes to AWS
resources, HTTP APIs, and SQL databases.
A segment document conveys information about a segment to X-Ray. A segment document can be up
to 64 kB and contain a whole segment with subsegments, a fragment of a segment that indicates that a
request is in progress, or a single subsegment that is sent separately. You can send segment documents
directly to X-Ray by using the PutTraceSegments API.
X-Ray compiles and processes segment documents to generate queryable trace summaries and full
traces that you can access by using the GetTraceSummaries and BatchGetTraces APIs, respectively.
In addition to the segments and subsegments that you send to X-Ray, the service uses information
in subsegments to generate inferred segments and adds them to the full trace. Inferred segments
represent downstream services and resources in the service map.
X-Ray provides a JSON schema for segment documents. You can download the schema here: xray-
segmentdocument-schema-v1.0.0. The fields and objects listed in the schema are described in more
detail in the following sections.
A subset of segment fields are indexed by X-Ray for use with filter expressions. For example, if you
set the user field on a segment to a unique identifier, you can search for segments associated with
specific users in the X-Ray console or by using the GetTraceSummaries API. For more information, see
Searching for Traces in the AWS X-Ray Console with Filter Expressions (p. 37).
When you instrument your application with the X-Ray SDK, the SDK generates segment documents for
you. Instead of sending segment documents directly to X-Ray, the SDK transmits them over a local UDP
port to the X-Ray daemon (p. 99). For more information, see Sending Segment Documents to the X-
Ray Daemon (p. 55).
Sections
•Segment Fields (p. 61)
•Subsegments (p. 62)
•HTTP Request Data (p. 65)
60
AWS X-Ray Developer Guide
Segment Fields
•Annotations (p. 67)
•Metadata (p. 68)
•AWS Resource Data (p. 69)
•Errors and Exceptions (p. 70)
•SQL Queries (p. 71)
Segment Fields
A segment records tracing information about a request that your application serves. At a minimum, a
segment records the name, ID, start time, trace ID, and end time of the request.
Example Minimal Complete Segment
{
"name" : "example.com",
"id" : "70de5b6f19ff9a0a",
"start_time" : 1.478293361271E9,
"trace_id" : "1-581cf771-a006649127e371903a2de979",
"end_time" : 1.478293361449E9
}
The following fields are required, or conditionally required, for segments.
Note
Values must be strings (up to 250 characters) unless noted otherwise.
Required Segment Fields
•name – The logical name of the service that handled the request, up to 200 characters. For example,
your application's name or domain name. Names can contain Unicode letters, numbers, and
whitespace, and the following symbols: _, ., :, /, %, &, #, =, +, \, -, @
•id – A 64-bit identifier for the segment, unique among segments in the same trace, in 16 hexadecimal
digits.
•trace_id – A unique identifier that connects all segments and subsegments originating from a single
client request.
Trace ID Format
A trace_id consists of three numbers separated by hyphens. For example, 1-58406520-
a006649127e371903a2de979. This includes:
• The version number, that is, 1.
• The time of the original request, in Unix epoch time, in 8 hexadecimal digits.
For example, 10:00AM December 1st, 2016 PST in epoch time is 1480615200 seconds, or 58406520
in hexadecimal.
• A 96-bit identifier for the trace, globally unique, in 24 hexadecimal digits.
Trace ID Security
Trace IDs are visible in response headers (p. 25). Generate trace IDs with a secure random
algorithm to ensure that attackers cannot calculate future trace IDs and send requests with
those IDs to your application.
•start_time – number that is the time the segment was created, in floating point seconds in epoch
time. For example, 1480615200.010 or 1.480615200010E9. Use as many decimal places as you
need. Microsecond resolution is recommended when available.
61

AWS X-Ray Developer Guide
Subsegments
•end_time – number that is the time the segment was closed. For example, 1480615200.090 or
1.480615200090E9. Specify either an end_time or in_progress.
•in_progress – boolean, set to true instead of specifying an end_time to record that a segment is
started, but is not complete. Send an in-progress segment when your application receives a request
that will take a long time to serve, to trace the request receipt. When the response is sent, send the
complete segment to overwrite the in-progress segment. Only send one complete segment, and one
or zero in-progress segments, per request.
Service Names
A segment's name should match the domain name or logical name of the service that
generates the segment. However, this is not enforced. Any application that has permission to
PutTraceSegments can send segments with any name.
The following fields are optional for segments.
Optional Segment Fields
•service – An object with information about your application.
•version – A string that identifies the version of your application that served the request.
•user – A string that identifies the user who sent the request.
•origin – The type of AWS resource running your application.
Supported Values
•AWS::EC2::Instance – An Amazon EC2 instance.
•AWS::ECS::Container – An Amazon ECS container.
•AWS::ElasticBeanstalk::Environment – An Elastic Beanstalk environment.
When multiple values are applicable to your application, use the one that is most specific. For example,
a Multicontainer Docker Elastic Beanstalk environment runs your application on an Amazon ECS
container, which in turn runs on an Amazon EC2 instance. In this case you would set the origin to
AWS::ElasticBeanstalk::Environment as the environment is the parent of the other two
resources.
•parent_id – A subsegment ID you specify if the request originated from an instrumented application.
The X-Ray SDK adds the parent subsegment ID to the tracing header (p. 25) for downstream HTTP
calls.
•http – http (p. 65) objects with information about the original HTTP request.
•aws – aws (p. 69) object with information about the AWS resource on which your application served
the request.
•error, throttle, fault, and cause – error (p. 70) fields that indicate an error occurred and that
include information about the exception that caused the error.
•annotations – annotations (p. 67) object with key-value pairs that you want X-Ray to index for
search.
•metadata – metadata (p. 68) object with any additional data that you want to store in the
segment.
•subsegments – array of subsegment (p. 62) objects.
Subsegments
You can create subsegments to record calls to AWS services and resources that you make with the
AWS SDK, calls to internal or external HTTP web APIs, or SQL database queries. You can also create
subsegments to debug or annotate blocks of code in your application. Subsegments can contain other
62

AWS X-Ray Developer Guide
Subsegments
subsegments, so a custom subsegment that records metadata about an internal function call can contain
other custom subsegments and subsegments for downstream calls.
A subsegment records a downstream call from the point of view of the service that calls it. X-Ray uses
subsegments to identify downstream services that don't send segments and create entries for them on
the service graph.
A subsegment can be embedded in a full segment document or sent independently. Send subsegments
separately to asynchronously trace downstream calls for long-running requests, or to avoid exceeding
the maximum segment document size.
Example Segment with Embedded Subsegment
An independent subsegment has a type of subsegment and a parent_id that identifies the parent
segment.
{
"trace_id" : "1-5759e988-bd862e3fe1be46a994272793",
"id" : "defdfd9912dc5a56",
"start_time" : 1461096053.37518,
"end_time" : 1461096053.4042,
"name" : "www.example.com",
"http" : {
"request" : {
"url" : "https://www.example.com/health",
"method" : "GET",
"user_agent" : "Mozilla/5.0 (Macintosh; Intel Mac OS X 10_11_6) AppleWebKit/601.7.7",
"client_ip" : "11.0.3.111"
},
"response" : {
"status" : 200,
"content_length" : 86
}
},
"subsegments" : [
{
"id" : "53995c3f42cd8ad8",
"name" : "api.example.com",
"start_time" : 1461096053.37769,
"end_time" : 1461096053.40379,
"namespace" : "remote",
"http" : {
"request" : {
"url" : "https://api.example.com/health",
"method" : "POST",
"traced" : true
},
"response" : {
"status" : 200,
"content_length" : 861
}
}
}
]
}
For long-running requests, you can send an in-progress segment to notify X-Ray that the request was
received, and then send subsegments separately to trace them before completing the original request.
Example In-Progress Segment
{
63

AWS X-Ray Developer Guide
Subsegments
"name" : "example.com",
"id" : "70de5b6f19ff9a0b",
"start_time" : 1.478293361271E9,
"trace_id" : "1-581cf771-a006649127e371903a2de979",
"in_progress": true
}
Example Independent Subsegment
An independent subsegment has a type of subsegment, a trace_id, and a parent_id that identifies
the parent segment.
{
"name" : "api.example.com",
"id" : "53995c3f42cd8ad8",
"start_time" : 1.478293361271E9,
"end_time" : 1.478293361449E9,
"type" : "subsegment",
"trace_id" : "1-581cf771-a006649127e371903a2de979"
"parent_id" : "defdfd9912dc5a56",
"namespace" : "remote",
"http" : {
"request" : {
"url" : "https://api.example.com/health",
"method" : "POST",
"traced" : true
},
"response" : {
"status" : 200,
"content_length" : 861
}
}
}
When the request is complete, close the segment by resending it with an end_time. The complete
segment overwrites the in-progress segment.
You can also send subsegments separately for completed requests that triggered asynchronous
workflows. For example, a web API may return a OK 200 response immediately prior to starting the
work that the user requested. You can send a full segment to X-Ray as soon as the response is sent,
followed by subsegments for work completed later. As with segments, you can also send a subsegment
fragment to record that the subsegment has started, and then overwrite it with a full subsegment once
the downstream call is complete.
The following fields are required, or are conditionally required, for subsegments.
Note
Values are strings up to 250 characters unless noted otherwise.
Required Subsegment Fields
•id – A 64-bit identifier for the subsegment, unique among segments in the same trace, in 16
hexadecimal digits.
•name – The logical name of the subsegment. For downstream calls, name the subsegment after the
resource or service called. For custom subsegments, name the subsegment after the code that it
instruments (e.g., a function name).
•start_time – number that is the time the subsegment was created, in floating point seconds in
epoch time, accurate to milliseconds. For example, 1480615200.010 or 1.480615200010E9.
•end_time – number that is the time the subsegment was closed. For example, 1480615200.090 or
1.480615200090E9. Specify an end_time or in_progress.
64

AWS X-Ray Developer Guide
HTTP Request Data
•in_progress – boolean that is set to true instead of specifying an end_time to record that a
subsegment is started, but is not complete. Only send one complete subsegment, and one or zero in-
progress subsegments, per downstream request.
•trace_id – Trace ID of the subsegment's parent segment. Required only if sending a subsegment
separately.
Trace ID Format
A trace_id consists of three numbers separated by hyphens. For example, 1-58406520-
a006649127e371903a2de979. This includes:
• The version number, that is, 1.
• The time of the original request, in Unix epoch time, in 8 hexadecimal digits.
For example, 10:00AM December 1st, 2016 PST in epoch time is 1480615200 seconds, or 58406520
in hexadecimal.
• A 96-bit identifier for the trace, globally unique, in 24 hexadecimal digits.
•parent_id – Segment ID of the subsegment's parent segment. Required only if sending a subsegment
separately.
•type – subsegment. Required only if sending a subsegment separately.
The following fields are optional for subsegments.
Optional Subsegment Fields
•namespace – aws for AWS SDK calls; remote for other downstream calls.
•http – http (p. 65) object with information about an outgoing HTTP call.
•aws – aws (p. 69) object with information about the downstream AWS resource that your
application called.
•error, throttle, fault, and cause – error (p. 70) fields that indicate an error occurred and that
include information about the exception that caused the error.
•annotations – annotations (p. 67) object with key-value pairs that you want X-Ray to index for
search.
•metadata – metadata (p. 68) object with any additional data that you want to store in the
segment.
•subsegments – array of subsegment (p. 62) objects.
•precursor_ids – array of subsegment IDs that identifies subsegments with the same parent that
completed prior to this subsegment.
HTTP Request Data
Use an HTTP block to record details about an HTTP request that your application served (in a segment)
or that your application made to a downstream HTTP API (in a subsegment). Most of the fields in this
object map to information found in an HTTP request and response.
http
All fields are optional.
•request – Information about a request.
•method – The request method. For example, GET.
•url – The full URL of the request, compiled from the protocol, hostname, and path of the request.
65

AWS X-Ray Developer Guide
HTTP Request Data
•user_agent – The user agent string from the requester's client.
•client_ip – The IP address of the requester. Can be retrieved from the IP packet's Source
Address or, for forwarded requests, from an X-Forwarded-For header.
•x_forwarded_for – (segments only) boolean indicating that the client_ip was read from an X-
Forwarded-For header and is not reliable as it could have been forged.
•traced – (subsegments only) boolean indicating that the downstream call is to another traced
service. If this field is set to true, X-Ray considers the trace to be broken until the downstream
service uploads a segment with a parent_id that matches the id of the subsegment that contains
this block.
•response – Information about a response.
•status – number indicating the HTTP status of the response.
•content_length – number indicating the length of the response body in bytes.
When you instrument a call to a downstream web api, record a subsegment with information about the
HTTP request and response. X-Ray uses the subsegment to generate an inferred segment for the remote
API.
Example Segment for HTTP Call Served by an Application Running on Amazon EC2
{
"id": "6b55dcc497934f1a",
"start_time": 1484789387.126,
"end_time": 1484789387.535,
"trace_id": "1-5880168b-fd5158284b67678a3bb5a78c",
"name": "www.example.com",
"origin": "AWS::EC2::Instance",
"aws": {
"ec2": {
"availability_zone": "us-west-2c",
"instance_id": "i-0b5a4678fc325bg98"
},
"xray": {
"sdk_version": "1.3.1 for Java"
},
},
"http": {
"request": {
"method": "POST",
"client_ip": "78.255.233.48",
"url": "http://www.example.com/api/user",
"user_agent": "Mozilla/5.0 (Windows NT 6.1; WOW64; rv:45.0) Gecko/20100101
Firefox/45.0",
"x_forwarded_for": true
},
"response": {
"status": 200
}
}
Example Subsegment for a Downstream HTTP Call
{
"id": "004f72be19cddc2a",
"start_time": 1484786387.131,
"end_time": 1484786387.501,
"name": "names.example.com",
"namespace": "remote",
"http": {
66

AWS X-Ray Developer Guide
Annotations
"request": {
"method": "GET",
"url": "https://names.example.com/"
},
"response": {
"content_length": -1,
"status": 200
}
}
}
Example Inferred Segment for a Downstream HTTP Call
{
"id": "168416dc2ea97781",
"name": "names.example.com",
"trace_id": "1-5880168b-fd5153bb58284b67678aa78c",
"start_time": 1484786387.131,
"end_time": 1484786387.501,
"parent_id": "004f72be19cddc2a",
"http": {
"request": {
"method": "GET",
"url": "https://names.example.com/"
},
"response": {
"content_length": -1,
"status": 200
}
},
"inferred": true
}
Annotations
Segments and subsegments can include an annotations object containing one or more fields that X-
Ray indexes for use with filter expressions. Fields can have string, number, or Boolean values (no objects
or arrays).
Example Segment for HTTP Call with Annotations
{
"id": "6b55dcc497932f1a",
"start_time": 1484789187.126,
"end_time": 1484789187.535,
"trace_id": "1-5880168b-fd515828bs07678a3bb5a78c",
"name": "www.example.com",
"origin": "AWS::EC2::Instance",
"aws": {
"ec2": {
"availability_zone": "us-west-2c",
"instance_id": "i-0b5a4678fc325bg98"
},
"xray": {
"sdk_version": "1.3.1 for Java"
},
},
"annotations": {
"customer_category" : 124,
"zip_code" : 98101,
"country" : "United States",
67

AWS X-Ray Developer Guide
Metadata
"internal" : false
},
"http": {
"request": {
"method": "POST",
"client_ip": "78.255.233.48",
"url": "http://www.example.com/api/user",
"user_agent": "Mozilla/5.0 (Windows NT 6.1; WOW64; rv:45.0) Gecko/20100101
Firefox/45.0",
"x_forwarded_for": true
},
"response": {
"status": 200
}
}
Keys must be alphanumeric in order to work with filters. Underscore is allowed. Other symbols and
whitespace are not allowed.
Metadata
Segments and subsegments can include a metadata object containing one or more fields with values
of any type, including objects and arrays. X-Ray does not index metadata, and values can be any size,
as long as the segment document doesn't exceed the maximum size (64 kB). You can view metadata in
the full segment document returned by the BatchGetTraces API. Field keys (debug in the following
example) starting with AWS. are reserved for use by AWS-provided SDKs and clients.
Example Custom Subsegment with Metadata
{
"id": "0e58d2918e9038e8",
"start_time": 1484789387.502,
"end_time": 1484789387.534,
"name": "## UserModel.saveUser",
"metadata": {
"debug": {
"test": "Metadata string from UserModel.saveUser"
}
},
"subsegments": [
{
"id": "0f910026178b71eb",
"start_time": 1484789387.502,
"end_time": 1484789387.534,
"name": "DynamoDB",
"namespace": "aws",
"http": {
"response": {
"content_length": 58,
"status": 200
}
},
"aws": {
"table_name": "scorekeep-user",
"operation": "UpdateItem",
"request_id": "3AIENM5J4ELQ3SPODHKBIRVIC3VV4KQNSO5AEMVJF66Q9ASUAAJG",
"resource_names": [
"scorekeep-user"
]
}
}
]
68

AWS X-Ray Developer Guide
AWS Resource Data
}
AWS Resource Data
For segments, the aws object contains information about the resource on which your application
is running. Multiple fields can apply to a single resource. For example, an application running in a
multicontainer Docker environment on Elastic Beanstalk could have information about the Amazon EC2
instance, the Amazon ECS container running on the instance, and the Elastic Beanstalk environment
itself.
aws (Segments)
All fields are optional.
•account_id – If your application sends segments to a different AWS account, record the ID of the
account running your application.
•ecs – Information about an Amazon ECS container.
•container – The container ID of the container running your application.
•ec2 – Information about an EC2 instance.
•instance_id – The instance ID of the EC2 instance.
•availability_zone – The Availability Zone in which the instance is running.
Example AWS Block with Plugins
"aws": {
"elastic_beanstalk": {
"version_label": "app-5a56-170119_190650-stage-170119_190650",
"deployment_id": 32,
"environment_name": "scorekeep"
},
"ec2": {
"availability_zone": "us-west-2c",
"instance_id": "i-075ad396f12bc325a"
},
"xray": {
"sdk": "1.3.1 for Java"
}
}
•elastic_beanstalk – Information about an Elastic Beanstalk environment. You can find this
information in a file named /var/elasticbeanstalk/xray/environment.conf on the latest
Elastic Beanstalk platforms.
•environment_name – The name of the environment.
•version_label – The name of the application version that is currently deployed to the instance
that served the request.
•deployment_id – number indicating the ID of the last successful deployment to the instance that
served the request.
For subsegments, record information about the AWS services and resources that your application
accesses. X-Ray uses this information to create inferred segments that represent the downstream
services in your service map.
aws (Subsegments)
All fields are optional.
69

AWS X-Ray Developer Guide
Errors and Exceptions
•operation – The name of the API action invoked against an AWS service or resource.
•account_id – If your application accesses resources in a different account, or sends segments to
a different account, record the ID of the account that owns the AWS resource that your application
accessed.
•region – If the resource is in a region different from your application, record the region. For example,
us-west-2.
•request_id – Unique identifier for the request.
•queue_url – For operations on an Amazon SQS queue, the queue's URL.
•table_name – For operations on a DynamoDB table, the name of the table.
Example Subsegment for a Call to DynamoDB to Save an Item
{
"id": "24756640c0d0978a",
"start_time": 1.480305974194E9,
"end_time": 1.4803059742E9,
"name": "DynamoDB",
"namespace": "aws",
"http": {
"response": {
"content_length": 60,
"status": 200
}
},
"aws": {
"table_name": "scorekeep-user",
"operation": "UpdateItem",
"request_id": "UBQNSO5AEM8T4FDA4RQDEB94OVTDRVV4K4HIRGVJF66Q9ASUAAJG",
}
}
Errors and Exceptions
When an error occurs, you can record details about the error and exceptions that it generated. Record
errors in segments when your application returns an error to the user, and in subsegments when a
downstream call returns an error.
error types
Set one or more of the following fields to true to indicate that an error occurred. Multiple types can
apply if errors compound. For example, a 429 Too Many Requests error from a downstream call may
cause your application to return 500 Internal Server Error, in which case all three types would
apply.
•error – boolean indicating that a client error occurred (response status code was 4XX Client Error).
•throttle – boolean indicating that a request was throttled (response status code was 429 Too Many
Requests).
•fault – boolean indicating that a server error occurred (response status code was 5XX Server Error).
Indicate the cause of the error by including a cause object in the segment or subsegment.
cause
A cause can be either a 16 character exception ID or an object with the following fields:
•working_directory – The full path of the working directory when the exception occurred.
70

AWS X-Ray Developer Guide
SQL Queries
•paths – The array of paths to libraries or modules in use when the exception occurred.
•exceptions – The array of exception objects.
Include detailed information about the error in one or more exception objects.
exception
All fields are optional except id.
•id – A 64-bit identifier for the exception, unique among segments in the same trace, in 16
hexadecimal digits.
•message – The exception message.
•type – The exception type.
•remote – boolean indicating that the exception was caused by an error returned by a downstream
service.
•truncated – integer indicating the number of stack frames that are omitted from the stack.
•skipped – integer indicating the number of exceptions that were skipped between this exception and
its child, that is, the exception that it caused.
•cause – Exception ID of the exception's parent, that is, the exception that caused this exception.
•stack – array of stackFrame objects.
If available, record information about the call stack in stackFrame objects.
stackFrame
All fields are optional.
•path – The relative path to the file.
•line – The line in the file.
•label – The function or method name.
SQL Queries
You can create subsegments for queries that your application makes to an SQL database.
sql
All fields are optional.
•connection_string – For SQL Server or other database connections that don't use URL connection
strings, record the connection string, excluding passwords.
•url – For a database connection that uses a URL connection string, record the URL, excluding
passwords.
•sanitized_query – The database query, with any user provided values removed or replaced by a
placeholder.
•database_type – The name of the database engine.
•database_version – The version number of the database engine.
•driver_version – The name and version number of the database engine driver that your application
uses.
•user – The database username.
•preparation – call if the query used a PreparedCall; statement if the query used a
PreparedStatement.
71

AWS X-Ray Developer Guide
CloudTrail
Example Subsegment with an SQL Query
{
"id": "3fd8634e78ca9560",
"start_time": 1484872218.696,
"end_time": 1484872218.697,
"name": "ebdb@aawijb5u25wdoy.cpamxznpdoq8.us-west-2.rds.amazonaws.com",
"namespace": "remote",
"sql" : {
"url": "jdbc:postgresql://aawijb5u25wdoy.cpamxznpdoq8.us-west-2.rds.amazonaws.com:5432/
ebdb",
"preparation": "statement",
"database_type": "PostgreSQL",
"database_version": "9.5.4",
"driver_version": "PostgreSQL 9.4.1211.jre7",
"user" : "dbuser",
"sanitized_query" : "SELECT * FROM customers WHERE customer_id=?;"
}
}
Logging X-Ray API Calls with AWS CloudTrail
AWS X-Ray integrates with AWS CloudTrail to record API actions made by a user, a role, or an AWS service
in X-Ray. You can use CloudTrail to monitor X-Ray API requests in real time and store logs in Amazon
S3, Amazon CloudWatch Logs, and Amazon CloudWatch Events. X-Ray supports logging the following
actions as events in CloudTrail log files:
Supported API Actions
•PutEncryptionConfig – Management event (write)
•GetEncryptionConfig – Management event (read)
To create a trail
1. Open the Trails page of the CloudTrail console.
2. Choose Create trail.
3. Enter a trail name, and then choose the types of event to record.
•Management events – Record API actions that create, read, update, or delete AWS resources.
Records calls to all supported API actions for all AWS services.
•Data events – Record API actions that target specific resources, like Amazon S3 object reads or
AWS Lambda function invocations. You choose which buckets and functions to monitor.
4. Choose an Amazon S3 bucket and encryption settings.
5. Choose Create.
CloudTrail records API calls of the types you chose to log files in Amazon S3. A CloudTrail log is an
unordered array of events in JSON format. For each call to a supported API action, CloudTrail records
information about the request and the entity that made it. Log events include the action name,
parameters, the response from X-Ray, and details about the requester.
Example X-Ray GetEncryptionConfig log entry
{
"eventVersion"=>"1.05",
72

AWS X-Ray Developer Guide
CloudTrail
"userIdentity"=>{
"type"=>"AssumedRole",
"principalId"=>"AROAJVHBZWD3DN6CI2MHM:MyName",
"arn"=>"arn:aws:sts::123456789012:assumed-role/MyRole/MyName",
"accountId"=>"123456789012",
"accessKeyId"=>"AKIAIOSFODNN7EXAMPLE",
"sessionContext"=>{
"attributes"=>{
"mfaAuthenticated"=>"false",
"creationDate"=>"2018-4-01T00:24:36Z"
},
"sessionIssuer"=>{
"type"=>"Role",
"principalId"=>"AROAJVHBZWD3DN6CI2MHM",
"arn"=>"arn:aws:iam::123456789012:role/MyRole",
"accountId"=>"123456789012",
"userName"=>"MyRole"
}
}
},
"eventTime"=>"2018-4-01T00:24:36Z",
"eventSource"=>"xray.amazonaws.com",
"eventName"=>"GetEncryptionConfig",
"awsRegion"=>"us-east-2",
"sourceIPAddress"=>"33.255.33.255",
"userAgent"=>"aws-sdk-ruby2/2.11.19 ruby/2.3.1 x86_64-linux",
"requestParameters"=>nil,
"responseElements"=>nil,
"requestID"=>"3fda699a-32e7-4c20-37af-edc2be5acbdb",
"eventID"=>"039c3d45-6baa-11e3-2f3e-e5a036343c9f",
"eventType"=>"AwsApiCall",
"recipientAccountId"=>"123456789012"
}
The userIdentity element contains information about who generated the request. The identity
information helps you determine the following:
• Whether the request was made with root or IAM user credentials.
• Whether the request was made with temporary security credentials for a role or federated user.
• Whether the request was made by another AWS service.
To be notified when a new log file is available, configure CloudTrail to publish Amazon SNS notifications.
For more information, see Configuring Amazon SNS Notifications for CloudTrail.
You can also aggregate X-Ray log files from multiple AWS Regions and multiple AWS accounts into a
single Amazon S3 bucket. For more information, see Receiving CloudTrail Log Files from Multiple Regions
and Receiving CloudTrail Log Files from Multiple Accounts.
73

AWS X-Ray Developer Guide
IAM Managed Policies for X-Ray
AWS X-Ray Permissions
You can use AWS Identity and Access Management (IAM) to grant X-Ray permissions to users and
compute resources in your account. IAM controls access to the X-Ray service at the API level to enforce
permissions uniformly, regardless of which client (console, AWS SDK, AWS CLI) your users employ.
To use the X-Ray console (p. 28) to view service maps and segments, you only need read permissions. To
enable console access, add the AWSXrayReadOnlyAccess managed policy (p. 74) to your IAM user.
For local development and testing (p. 75), create an IAM user with read and write permissions.
Generate access keys for the user and store them in the standard AWS SDK location. You can use these
credentials with the X-Ray daemon, the AWS CLI, and the AWS SDK.
To deploy your instrumented app to AWS (p. 76), create an IAM role with write permissions and assign
it to the resources running your application.
Sections
•IAM Managed Policies for X-Ray (p. 74)
•Running Your Application Locally (p. 75)
•Running Your Application in AWS (p. 76)
IAM Managed Policies for X-Ray
To make granting permissions easy, IAM supports managed policies for each service. A service can
update these managed policies with new permissions when it releases new APIs. AWS X-Ray provides
managed policies (p. 74) for read only, write only, and read/write use cases.
•AWSXrayReadOnlyAccess – Read permissions for using the X-Ray console, AWS CLI, or AWS SDK to
get trace data and service maps from the X-Ray API.
{
"Version": "2012-10-17",
"Statement": [
{
"Effect": "Allow",
"Action": [
"xray:BatchGetTraces",
"xray:GetServiceGraph",
"xray:GetTraceGraph",
"xray:GetTraceSummaries"
],
"Resource": [
"*"
]
}
]
}
•AWSXrayWriteOnlyAccess – Write permissions for using the X-Ray daemon, AWS CLI, or AWS SDK
to upload segment documents and telemetry to the X-Ray API.
{
"Version": "2012-10-17",
74

AWS X-Ray Developer Guide
Running Your Application Locally
"Statement": [
{
"Effect": "Allow",
"Action": [
"xray:PutTraceSegments",
"xray:PutTelemetryRecords"
],
"Resource": [
"*"
]
}
]
}
•AWSXrayFullAccess – Read/write permissions.
{
"Version": "2012-10-17",
"Statement": [
{
"Effect": "Allow",
"Action": [
"xray:*"
],
"Resource": [
"*"
]
}
]
}
•AmazonS3ReadOnlyAccess – Permission for the user or resource to download the X-Ray daemon
from Amazon S3.
To add a managed policy to an IAM user, group, or role
1. Open the IAM console.
2. Open the role associated with your instance profile, an IAM user, or an IAM group.
3. Under Permissions, attach the managed policy.
Running Your Application Locally
Your instrumented application sends trace data to the X-Ray daemon. The daemon buffers segment
documents and uploads them to the X-Ray service in batches. The daemon needs write permissions to
upload trace data and telemetry to the X-Ray service.
When you run the daemon locally (p. 104), store your IAM user's access key and secret key in a file
named credentials in a folder named .aws in your user folder.
Example ~/.aws/credentials
[default]
aws_access_key_id=AKIAIOSFODNN7EXAMPLE
aws_secret_access_key=wJalrXUtnFEMI/K7MDENG/bPxRfiCYEXAMPLEKEY
If you already configured credentials for use with the AWS SDK or AWS CLI, the daemon can use those. If
multiple profiles are available, the daemon uses the default profile.
75

AWS X-Ray Developer Guide
Running Your Application in AWS
Running Your Application in AWS
When you run your application on AWS, use a role to grant permission to the Amazon EC2 instance or
Lambda function that runs the daemon.
•Amazon Elastic Compute Cloud – Create an IAM role and attach it to the EC2 instance as an instance
profile.
•Amazon Elastic Container Service – Create an IAM role and attach it to container instances as a
container instance IAM role.
•AWS Elastic Beanstalk – Elastic Beanstalk includes X-Ray permissions in its default instance profile.
You can use the default instance profile, or add write permissions to a custom instance profile.
•AWS Lambda – Add write permissions to your function's execution role.
To create a role for use with X-Ray
1. Open the IAM console.
2. Choose Roles.
3. Choose Create New Role.
4. For Role Name, type xray-application. Choose Next Step.
5. For Role Type, choose Amazon EC2.
6. Attach managed policies to give your application access to AWS services.
•AWSXrayWriteOnlyAccess – Gives the X-Ray daemon permission to upload trace data.
•AmazonS3ReadOnlyAccess (Amazon EC2 only) – Gives the instance permission to download the
X-Ray daemon from Amazon S3.
If your application uses the AWS SDK to access other services, add policies that grant access to those
services.
7. Choose Next Step.
8. Choose Create Role.
76
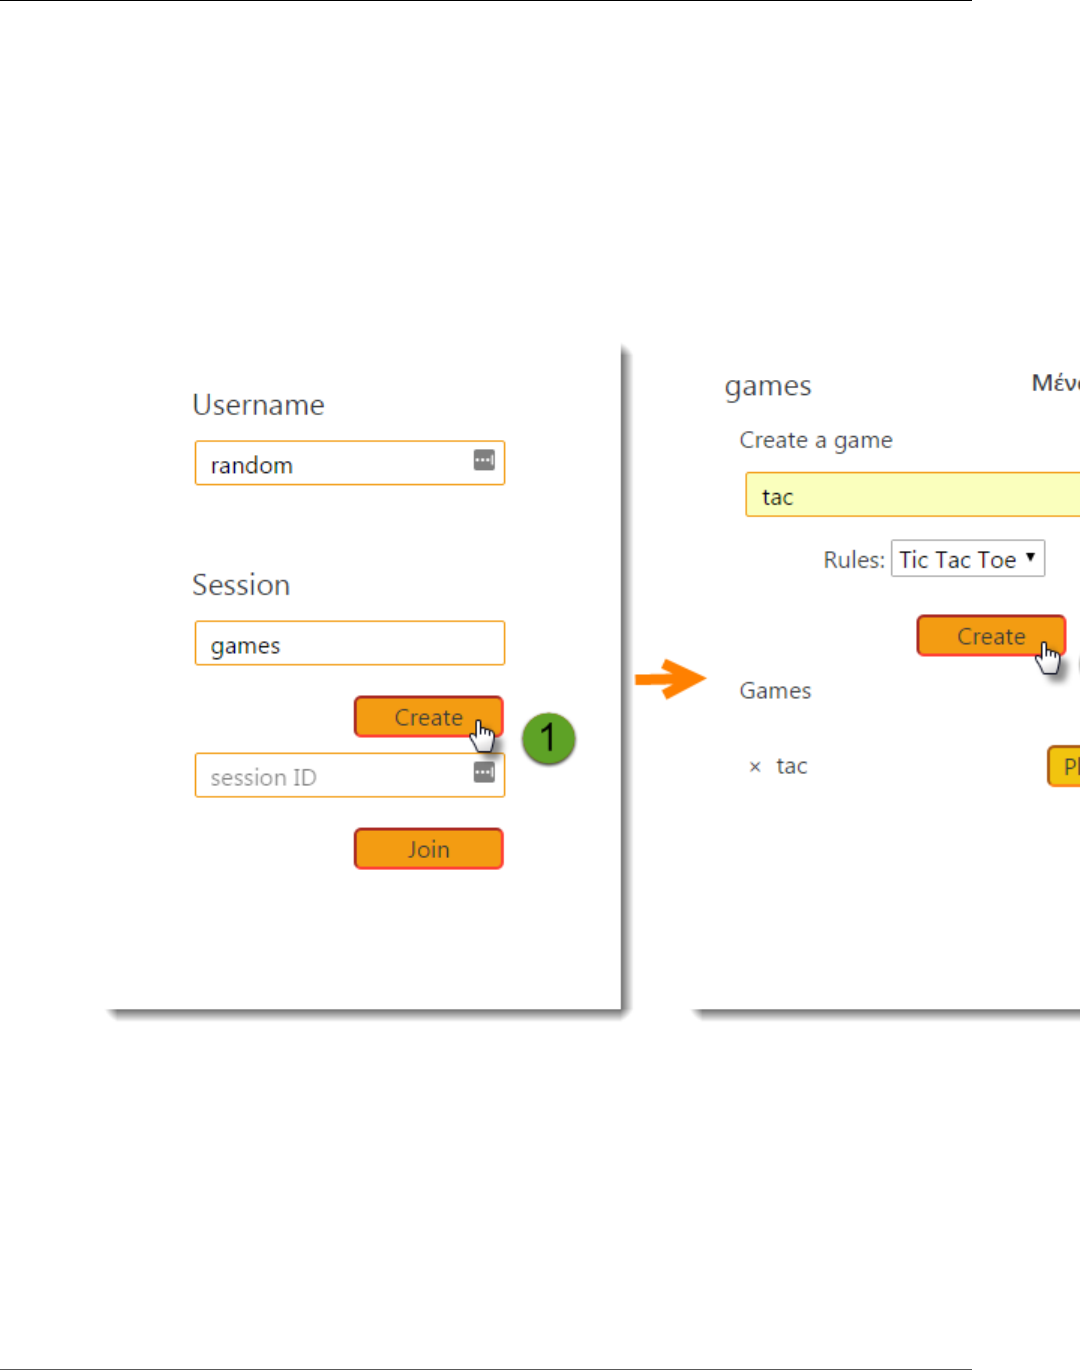
AWS X-Ray Developer Guide
AWS X-Ray Sample Application
The AWS X-Ray eb-java-scorekeep sample app, available on GitHub, shows the use of the AWS X-Ray SDK
to instrument incoming HTTP calls, DynamoDB SDK clients, and HTTP clients. The sample app uses AWS
Elastic Beanstalk features to create DynamoDB tables, compile Java code on instance, and run the X-Ray
daemon without any additional configuration.
The sample is an instrumented version of the Scorekeep project on AWSLabs. It includes a front-end web
app, the API that it calls, and the DynamoDB tables that it uses to store data. All the components are
hosted in an Elastic Beanstalk environment for portability and ease of deployment.
Basic instrumentation with filters (p. 121), plugins (p. 116), and instrumented AWS SDK
clients (p. 124) is shown in the project's xray-gettingstarted branch. This is the branch that you
deploy in the getting started tutorial (p. 8). Because this branch only includes the basics, you can diff it
against the master branch to quickly understand the basics.
77
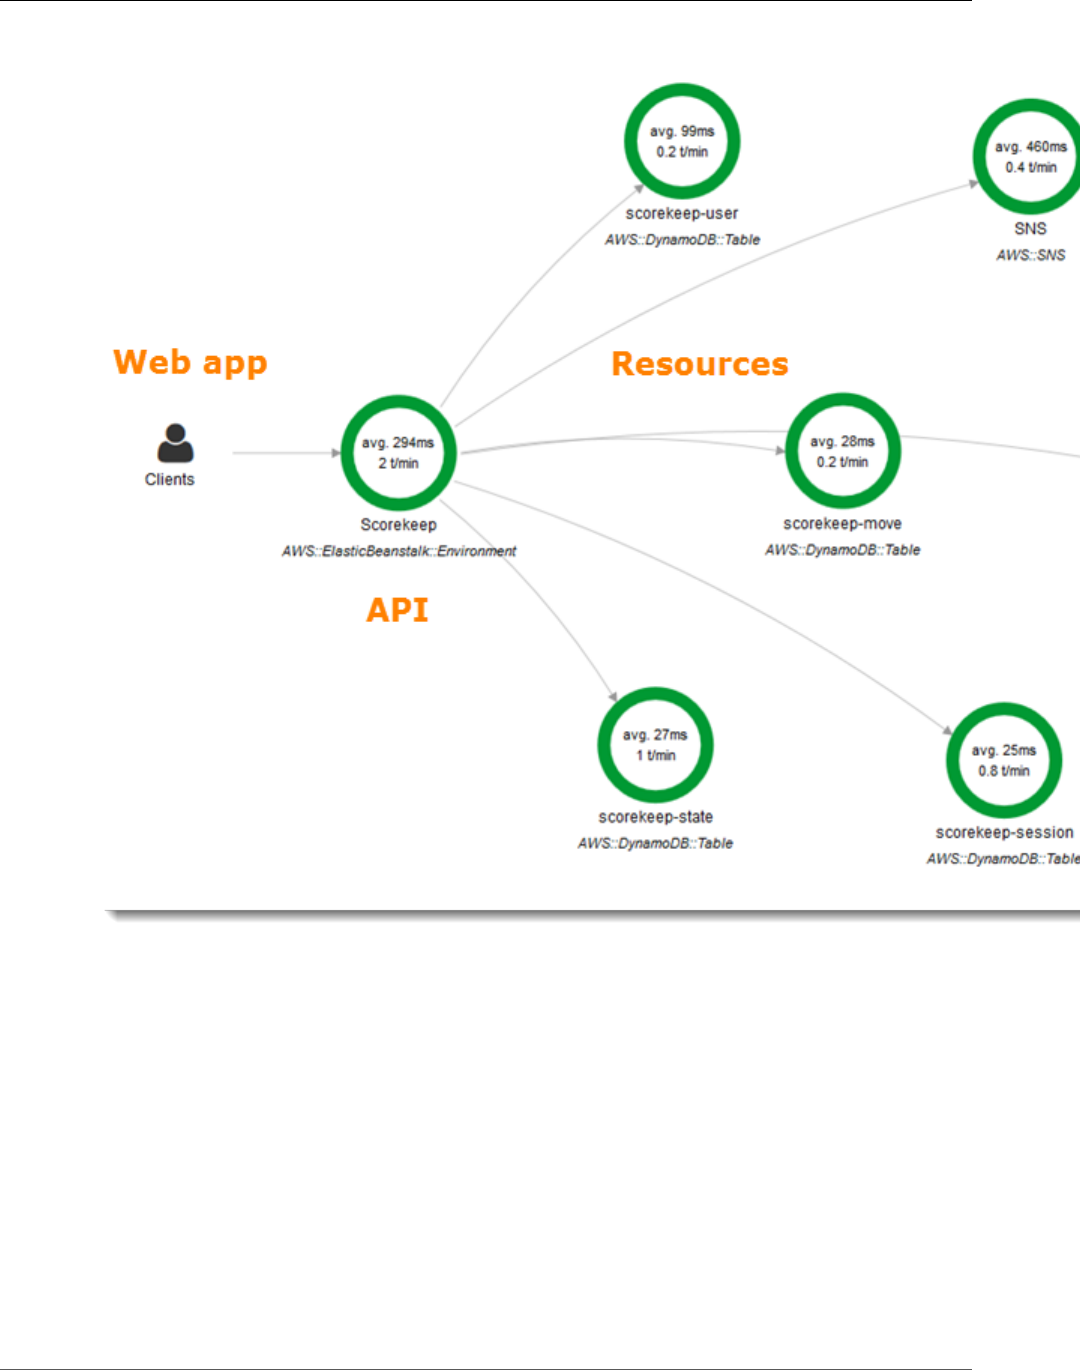
AWS X-Ray Developer Guide
The sample application shows basic instrumentation in these files:
•HTTP request filter – WebConfig.java
•AWS SDK client instrumentation – build.gradle
The xray branch of the application adds the use of HTTPClient (p. 125), Annotations (p. 129), SQL
queries (p. 126), custom subsegments (p. 128), an instrumented AWS Lambda (p. 208) function, and
instrumented initialization code and scripts (p. 90). This service map shows the xray branch running
without a connected SQL database:
78
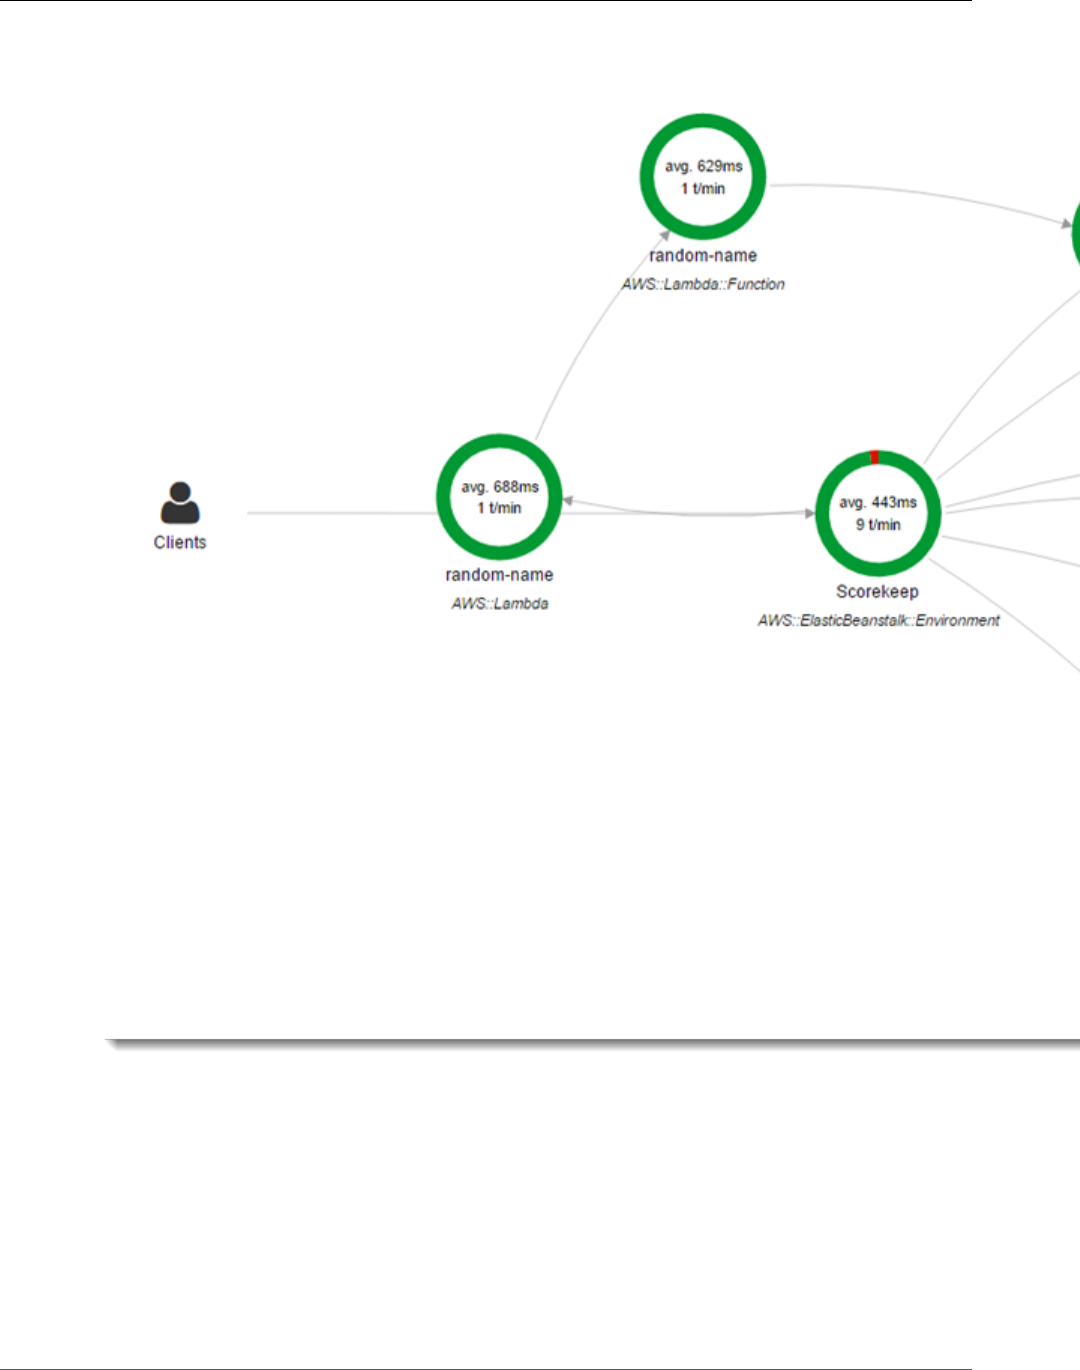
AWS X-Ray Developer Guide
To support user log-in and AWS SDK for JavaScript use in the browser, the xray-cognito branch
adds Amazon Cognito to support user authentication and authorization. With credentials retrieved
from Amazon Cognito, the web app also sends trace data to X-Ray to record request information from
the client's point of view. The browser client appears as its own node on the service map, and records
additional information, including the URL of the page that the user is viewing, and the user's ID.
Finally, the xray-worker branch adds an instrumented Python Lambda function that runs
independently, processing items from an Amazon SQS queue. Scorekeep adds an item to the queue each
time a game ends. The Lambda worker, triggered by CloudWatch Events, pulls items from the queue
every few minutes and processes them to store game records in Amazon S3 for analysis.
79
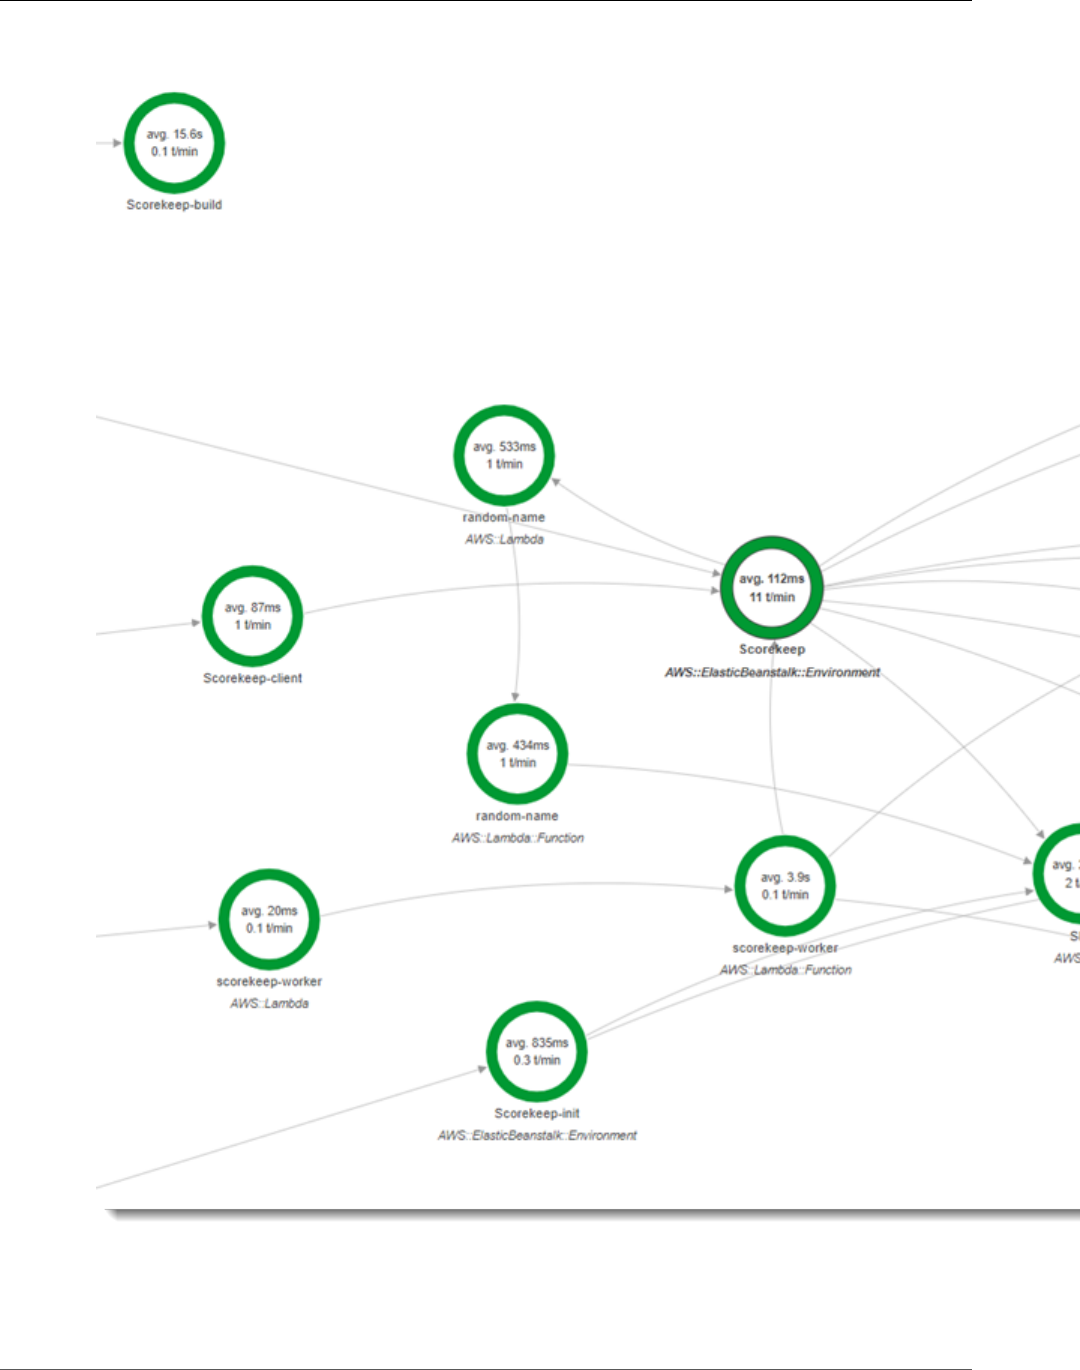
AWS X-Ray Developer Guide
With all features enabled, Scorekeep's service map looks like this:
For instructions on using the sample application with X-Ray, see the getting started tutorial (p. 8). In
addition to the basic use of the X-Ray SDK for Java discussed in the tutorial, the sample also shows how
to use the following features.
80

AWS X-Ray Developer Guide
AWS SDK Clients
Advanced Features
•Manually Instrumenting AWS SDK Clients (p. 81)
•Creating Additional Subsegments (p. 81)
•Recording Annotations, Metadata, and User IDs (p. 82)
•Instrumenting Outgoing HTTP Calls (p. 83)
•Instrumenting Calls to a PostgreSQL Database (p. 83)
•Instrumenting AWS Lambda Functions (p. 85)
•Instrumenting Amazon ECS Applications (p. 89)
•Instrumenting Startup Code (p. 90)
•Instrumenting Scripts (p. 91)
•Instrumenting a Web App Client (p. 93)
•Using Instrumented Clients in Worker Threads (p. 96)
•Deep Linking to the X-Ray Console (p. 98)
Manually Instrumenting AWS SDK Clients
The X-Ray SDK for Java automatically instruments all AWS SDK clients when you include the AWS SDK
Instrumentor submodule in your build dependencies (p. 114).
You can disable automatic client instrumentation by removing the Instrumentor submodule. This enables
you to instrument some clients manually while ignoring others, or use different tracing handlers on
different clients.
To illustrate support for instrumenting specific AWS SDK clients, the application passes a tracing handler
to AmazonDynamoDBClientBuilder as a request handler in the user, game, and session model. This
code change tells the SDK to instrument all calls to DynamoDB using those clients.
Example src/main/java/scorekeep/SessionModel.java – Manual AWS SDK Client
Instrumentation
import com.amazonaws.xray.AWSXRay;
import com.amazonaws.xray.handlers.TracingHandler;
public class SessionModel {
private AmazonDynamoDB client = AmazonDynamoDBClientBuilder.standard()
.withRegion(Constants.REGION)
.withRequestHandlers(new TracingHandler(AWSXRay.getGlobalRecorder()))
.build();
private DynamoDBMapper mapper = new DynamoDBMapper(client);
If you remove the AWS SDK Instrumentor submodule from project dependencies, only the manually
instrumented AWS SDK clients appear in the service map.
Creating Additional Subsegments
In the user model class, the application manually creates subsegments to group all downstream calls
made within the saveUser function and adds metadata.
Example src/main/java/scorekeep/UserModel.java - Custom Subsegments
import com.amazonaws.xray.AWSXRay;
81

AWS X-Ray Developer Guide
Annotations and Metadata
import com.amazonaws.xray.entities.Subsegment;
...
public void saveUser(User user) {
// Wrap in subsegment
Subsegment subsegment = AWSXRay.beginSubsegment("## UserModel.saveUser");
try {
mapper.save(user);
} catch (Exception e) {
subsegment.addException(e);
throw e;
} finally {
AWSXRay.endSubsegment();
}
}
Recording Annotations, Metadata, and User IDs
In the game model class, the application records Game objects in a metadata (p. 131) block each time
it saves a game in DynamoDB. Separately, the application records game IDs in annotations (p. 130) for
use with filter expressions (p. 37).
Example src/main/java/scorekeep/GameModel.java – Annotations and Metadata
import com.amazonaws.xray.AWSXRay;
import com.amazonaws.xray.entities.Segment;
import com.amazonaws.xray.entities.Subsegment;
...
public void saveGame(Game game) throws SessionNotFoundException {
// wrap in subsegment
Subsegment subsegment = AWSXRay.beginSubsegment("## GameModel.saveGame");
try {
// check session
String sessionId = game.getSession();
if (sessionModel.loadSession(sessionId) == null ) {
throw new SessionNotFoundException(sessionId);
}
Segment segment = AWSXRay.getCurrentSegment();
subsegment.putMetadata("resources", "game", game);
segment.putAnnotation("gameid", game.getId());
mapper.save(game);
} catch (Exception e) {
subsegment.addException(e);
throw e;
} finally {
AWSXRay.endSubsegment();
}
}
In the move controller, the application records user IDs (p. 132) with setUser. User IDs are recorded in
a separate field on segments and are indexed for use with search.
Example src/main/java/scorekeep/MoveController.java – User ID
import com.amazonaws.xray.AWSXRay;
...
@RequestMapping(value="/{userId}", method=RequestMethod.POST)
public Move newMove(@PathVariable String sessionId, @PathVariable String gameId,
@PathVariable String userId, @RequestBody String move) throws SessionNotFoundException,
GameNotFoundException, StateNotFoundException, RulesException {
AWSXRay.getCurrentSegment().setUser(userId);
82

AWS X-Ray Developer Guide
HTTP Clients
return moveFactory.newMove(sessionId, gameId, userId, move);
}
Instrumenting Outgoing HTTP Calls
The user factory class shows how the application uses the X-Ray SDK for Java's version of
HTTPClientBuilder to instrument outgoing HTTP calls.
Example src/main/java/scorekeep/UserFactory.java – HTTPClient Instrumentation
import com.amazonaws.xray.proxies.apache.http.HttpClientBuilder;
public String randomName() throws IOException {
CloseableHttpClient httpclient = HttpClientBuilder.create().build();
HttpGet httpGet = new HttpGet("http://uinames.com/api/");
CloseableHttpResponse response = httpclient.execute(httpGet);
try {
HttpEntity entity = response.getEntity();
InputStream inputStream = entity.getContent();
ObjectMapper mapper = new ObjectMapper();
Map<String, String> jsonMap = mapper.readValue(inputStream, Map.class);
String name = jsonMap.get("name");
EntityUtils.consume(entity);
return name;
} finally {
response.close();
}
}
If you currently use org.apache.http.impl.client.HttpClientBuilder,
you can simply swap out the import statement for that class with one for
com.amazonaws.xray.proxies.apache.http.HttpClientBuilder.
Instrumenting Calls to a PostgreSQL Database
The application-pgsql.properties file adds the X-Ray PostgreSQL tracing interceptor to the data
source created in RdsWebConfig.java.
Example application-pgsql.properties – PostgreSQL Database Instrumentation
spring.datasource.continue-on-error=true
spring.jpa.show-sql=false
spring.jpa.hibernate.ddl-auto=create-drop
spring.datasource.jdbc-interceptors=com.amazonaws.xray.sql.postgres.TracingInterceptor
spring.jpa.database-platform=org.hibernate.dialect.PostgreSQL94Dialect
Note
See Configuring Databases with Elastic Beanstalk in the AWS Elastic Beanstalk Developer Guide
for details on how to add a PostgreSQL database to the application environment.
The X-Ray demo page in the xray branch includes a demo that uses the instrumented data source to
generate traces that show information about the SQL queries that it generates. Navigate to the /#/xray
path in the running application or choose Powered by AWS X-Ray in the navigation bar to see the demo
page.
83
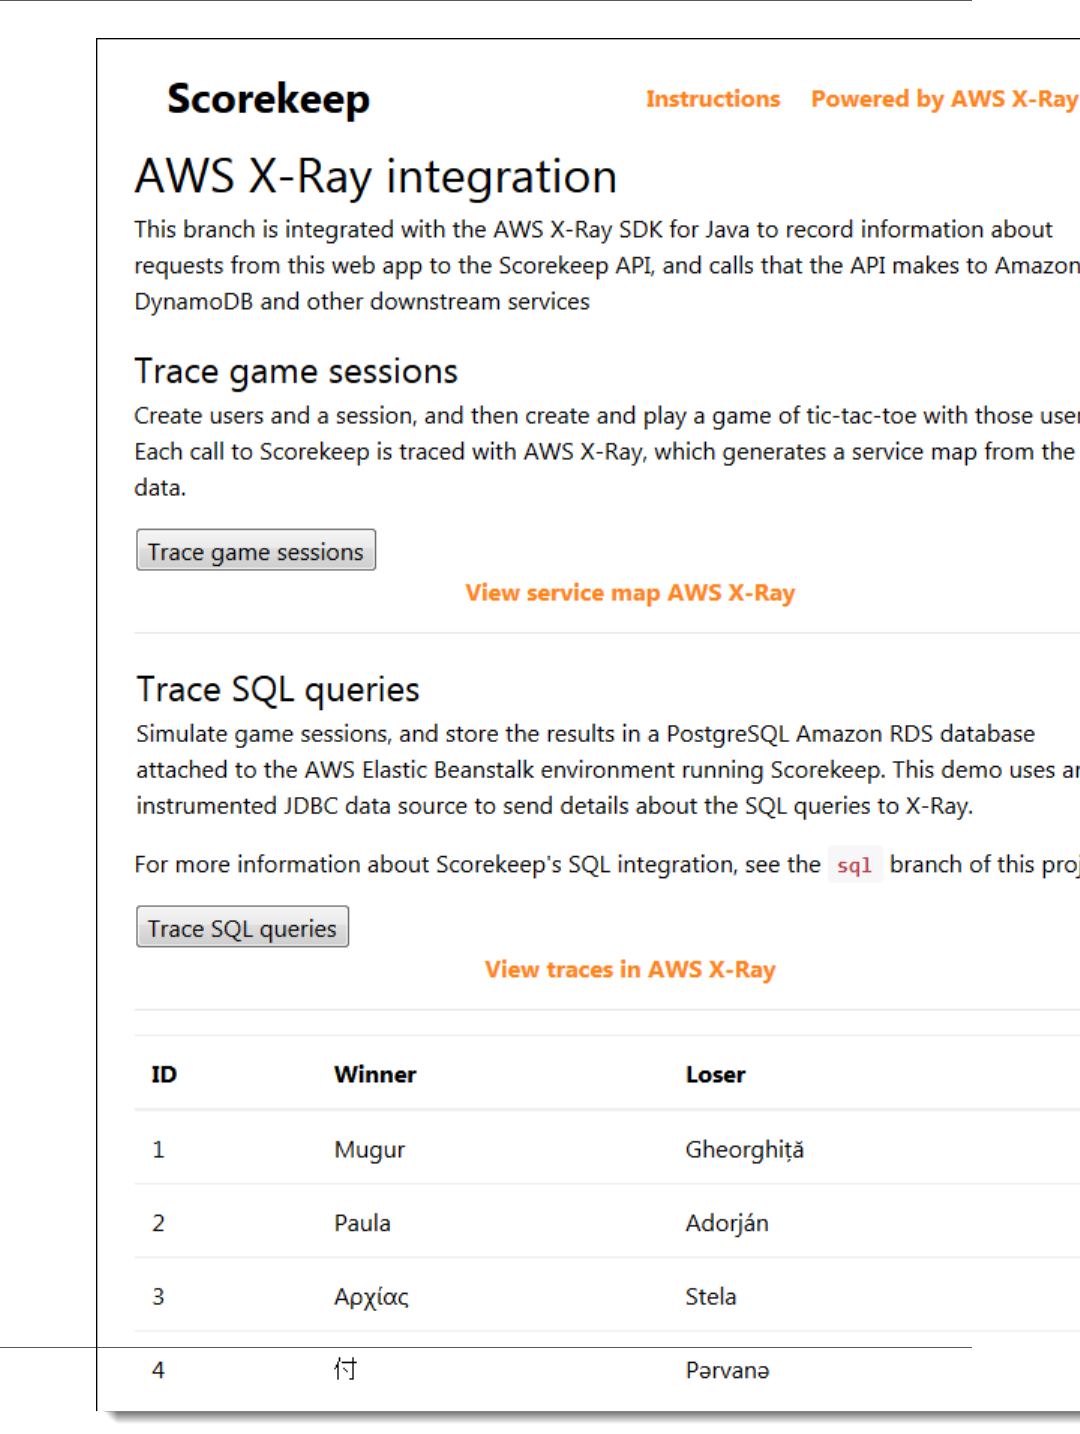
AWS X-Ray Developer Guide
SQL Clients
84
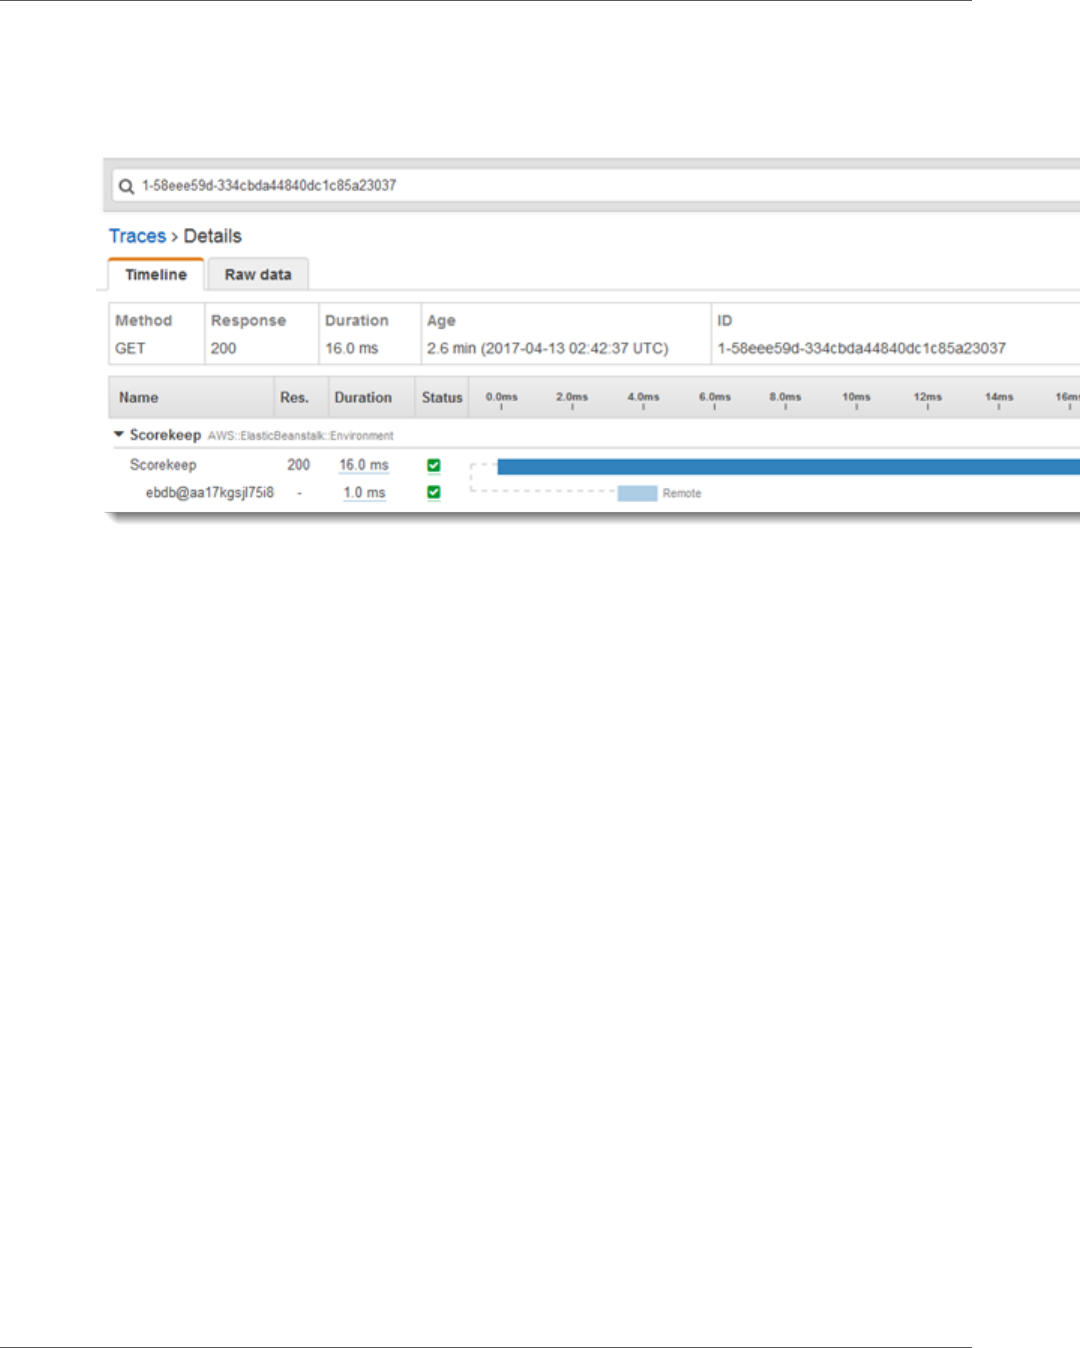
AWS X-Ray Developer Guide
AWS Lambda Functions
Choose Trace SQL queries to simulate game sessions and store the results in the attached database.
Then, choose View traces in AWS X-Ray to see a filtered list of traces that hit the API's /api/history
route.
Choose one of the traces from the list to see the timeline, including the SQL query.
Instrumenting AWS Lambda Functions
Scorekeep uses two AWS Lambda functions. The first is a Node.js function from the lambda branch
that generates random names for new users. When a user creates a session without entering a name,
the application calls a function named random-name with the AWS SDK for Java. The X-Ray SDK for
Java records information about the call to Lambda in a subsegment like any other call made with an
instrumented AWS SDK client.
Note
Running the random-name Lambda function requires the creation of additional resources
outside of the Elastic Beanstalk environment. See the readme for more information and
instructions: AWS Lambda Integration.
The second function, scorekeep-worker, is a Python function that runs independently of the
Scorekeep API. When a game ends, the API writes the session ID and game ID to an SQS queue. The
worker function reads items from the queue, and calls the Scorekeep API to construct complete records
of each game session for storage in Amazon S3.
Scorekeep includes AWS CloudFormation templates and scripts to create both functions. Because you
need to bundle the X-Ray SDK with the function code, the templates create the functions without any
code. When you deploy Scorekeep, a configuration file included in the .ebextensions folder creates
a source bundle that includes the SDK, and updates the function code and configuration with the AWS
Command Line Interface.
Functions
•Random Name (p. 86)
•Worker (p. 87)
85
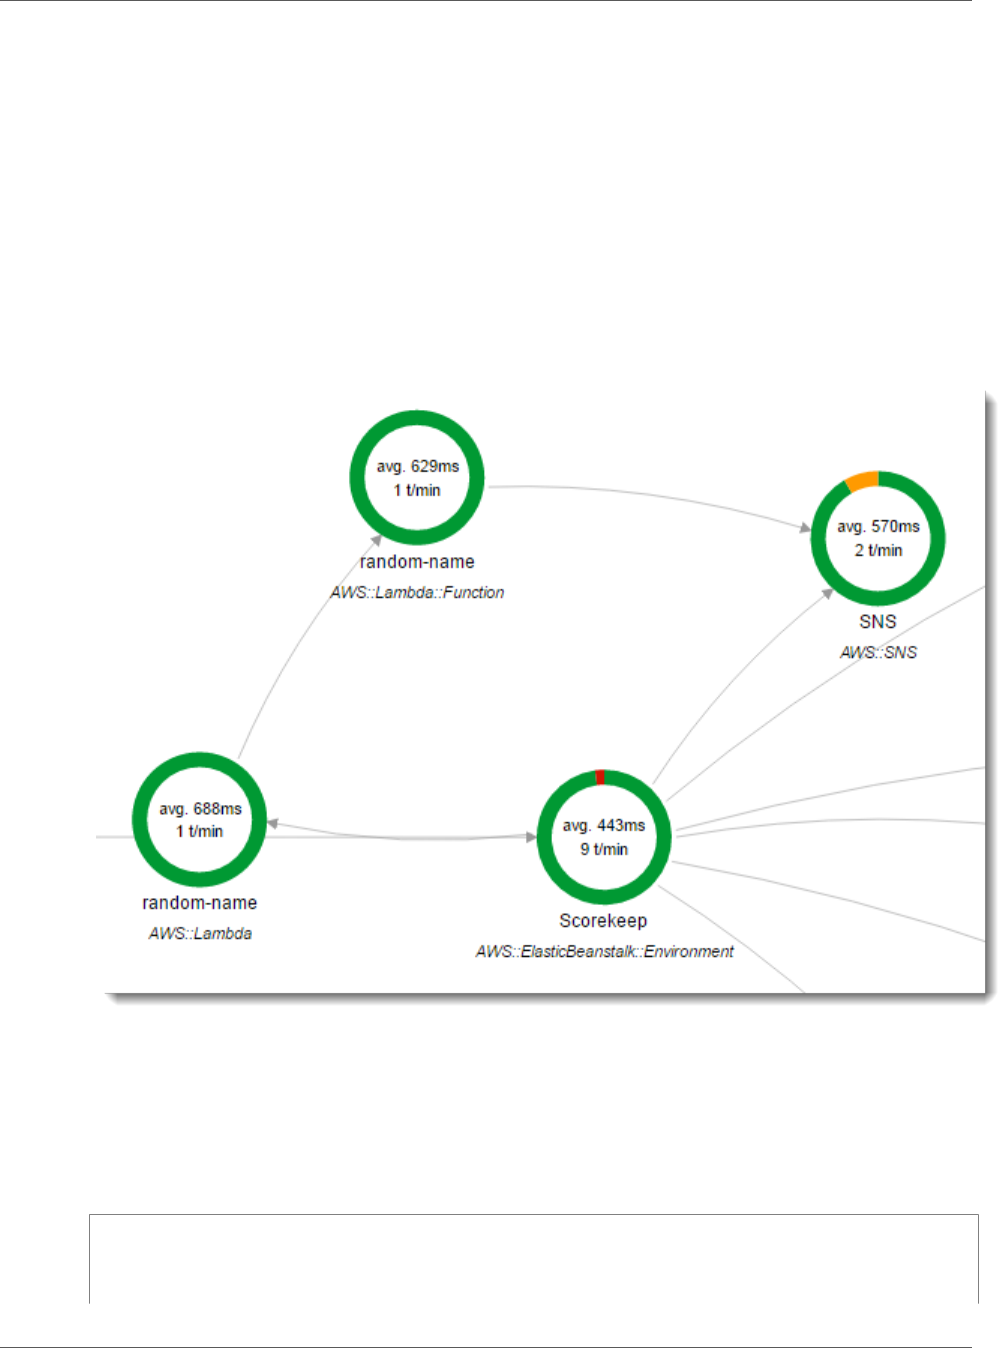
AWS X-Ray Developer Guide
Random Name
Random Name
Scorekeep calls the random name function when a user starts a game session without signing in
or specifying a user name. When Lambda processes the call to random-name, it reads the tracing
header (p. 25), which contains the trace ID and sampling decision written by the X-Ray SDK for Java.
For each sampled request, Lambda runs the X-Ray daemon and writes two segments. The first segment
records information about the call to Lambda that invokes the function. This segment contains the same
information as the subsegment recorded by Scorekeep, but from the Lambda point of view. The second
segment represents the work that the function does.
Lambda passes the function segment to the X-Ray SDK through the function context. When
you instrument a Lambda function, you don't use the SDK to create a segment for incoming
requests (p. 153). Lambda provides the segment, and you use the SDK to instrument clients and write
subsegments.
The random-name function is implemented in Node.js. It uses the SDK for JavaScript in Node.js to send
notifications with Amazon SNS, and the X-Ray SDK for Node.js to instrument the AWS SDK client. To
write annotations, the function creates a custom subsegment with AWSXRay.captureFunc, and writes
annotations in the instrumented function. In Lambda, you can't write annotations directly to the function
segment, only to a subsegment that you create.
Example _lambda/random-name/index.js -- Random Name Lambda Function
var AWSXRay = require('aws-xray-sdk-core');
var AWS = AWSXRay.captureAWS(require('aws-sdk'));
AWS.config.update({region: process.env.AWS_REGION});
86

AWS X-Ray Developer Guide
Worker
var Chance = require('chance');
var myFunction = function(event, context, callback) {
var sns = new AWS.SNS();
var chance = new Chance();
var userid = event.userid;
var name = chance.first();
AWSXRay.captureFunc('annotations', function(subsegment){
subsegment.addAnnotation('Name', name);
subsegment.addAnnotation('UserID', event.userid);
});
// Notify
var params = {
Message: 'Created randon name "' + name + '"" for user "' + userid + '".',
Subject: 'New user: ' + name,
TopicArn: process.env.TOPIC_ARN
};
sns.publish(params, function(err, data) {
if (err) {
console.log(err, err.stack);
callback(err);
}
else {
console.log(data);
callback(null, {"name": name});
}
});
};
exports.handler = myFunction;
This function is created automatically when you deploy the sample application to Elastic Beanstalk.
The xray branch includes a script to create a blank Lambda function. Configuration files in the
.ebextensions folder build the function package with npm install during deployment, and then
update the Lambda function with the AWS CLI.
Worker
The instrumented worker function is provided in its own branch, xray-worker, as it cannot run unless
you create the worker function and related resources first. See the branch readme for instructions.
The function is triggered by a bundled Amazon CloudWatch Events event every 5 minutes. When it runs,
the function pulls an item from an Amazon SQS queue that Scorekeep manages. Each message contains
information about a completed game.
The worker pulls the game record and documents from other tables that the game record references. For
example, the game record in DynamoDB includes a list of moves that were executed during the game.
The list does not contain the moves themselves, but rather IDs of moves that are stored in a separate
table.
Sessions, and states are stored as references as well. This keeps the entries in the game table from
being too large, but requires additional calls to get all of the information about the game. The worker
dereferences all of these entries and constructs a complete record of the game as a single document in
Amazon S3. When you want to do analytics on the data, you can run queries on it directly in Amazon S3
with Amazon Athena without running read-heavy data migrations to get your data out of DynamoDB.
87
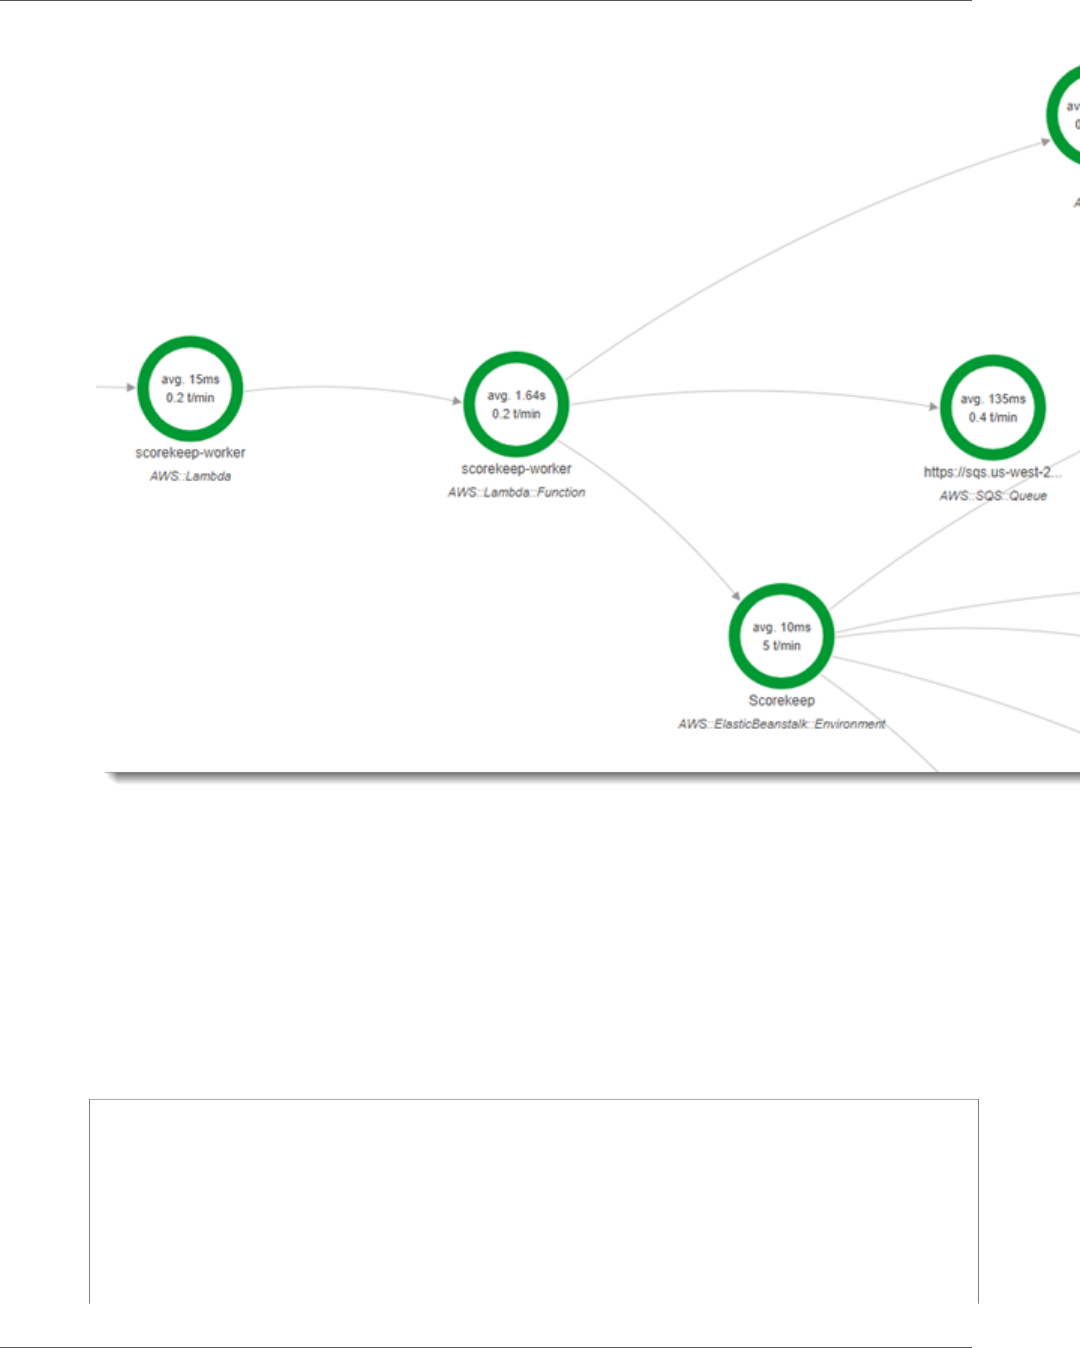
AWS X-Ray Developer Guide
Worker
The worker function has active tracing enabled in its configuration in AWS Lambda. Unlike the random
name function, the worker does not receive a request from an instrumented application, so AWS Lambda
doesn't receive a tracing header. With active tracing, Lambda creates the trace ID and makes sampling
decisions.
The X-Ray SDK for Python is just a few lines at the top of the function that import the SDK and run its
patch_all function to patch the AWS SDK for Python (Boto) and HTTclients that it uses to call Amazon
SQS and Amazon S3. When the worker calls the Scorekeep API, the SDK adds the tracing header (p. 25)
to the request to trace calls through the API.
Example _lambda/scorekeep-worker/scorekeep-worker.py -- Worker Lambda
Function
import os
import boto3
import json
import requests
import time
from aws_xray_sdk.core import xray_recorder
from aws_xray_sdk.core import patch_all
patch_all()
queue_url = os.environ['WORKER_QUEUE']
88

AWS X-Ray Developer Guide
Amazon ECS
def lambda_handler(event, context):
# Create SQS client
sqs = boto3.client('sqs')
s3client = boto3.client('s3')
# Receive message from SQS queue
response = sqs.receive_message(
QueueUrl=queue_url,
AttributeNames=[
'SentTimestamp'
],
MaxNumberOfMessages=1,
MessageAttributeNames=[
'All'
],
VisibilityTimeout=0,
WaitTimeSeconds=0
)
...
Instrumenting Amazon ECS Applications
In the xray-ecs branch, the Scorekeep sample application shows how to instrument an application
running in Amazon Elastic Container Service (Amazon ECS). The branch provides scripts and
configuration files for creating, uploading, and running Docker images in a Multicontainer Docker
environment in AWS Elastic Beanstalk.
The project includes three Dockerfiles that define container images for the API, front end, and X-Ray
daemon components.
•/Dockerfile – The Scorekeep API.
•/scorekeep-frontend/Dockerfile – The Angular web app client, and the nginx proxy that routes
incoming traffic.
•/xray-daemon/Dockerfile – The X-Ray daemon.
The X-Ray daemon Dockerfile creates an image based on Amazon Linux that runs the X-Ray daemon.
Example Dockerfile – Amazon Linux
FROM amazonlinux
RUN yum install -y unzip
RUN curl -o daemon.zip https://s3.dualstack.us-east-2.amazonaws.com/aws-xray-assets.us-
east-2/xray-daemon/aws-xray-daemon-linux-2.x.zip
RUN unzip daemon.zip && cp xray /usr/bin/xray
ENTRYPOINT ["/usr/bin/xray", "-b", "0.0.0.0:2000"]
EXPOSE 2000/udp
The makefile in the same directory defines commands for building the image, uploading it to Amazon
ECR, and running it locally (p. 104).
To run the containers on Amazon ECS, the branch includes a script to generate a Dockerrun.aws.json
file, which you can deploy to a multicontainer Docker environment in Elastic Beanstalk. The template
that the script uses shows how to write a task definition that configures networking between the
containers in Amazon ECS (p. 110).
89
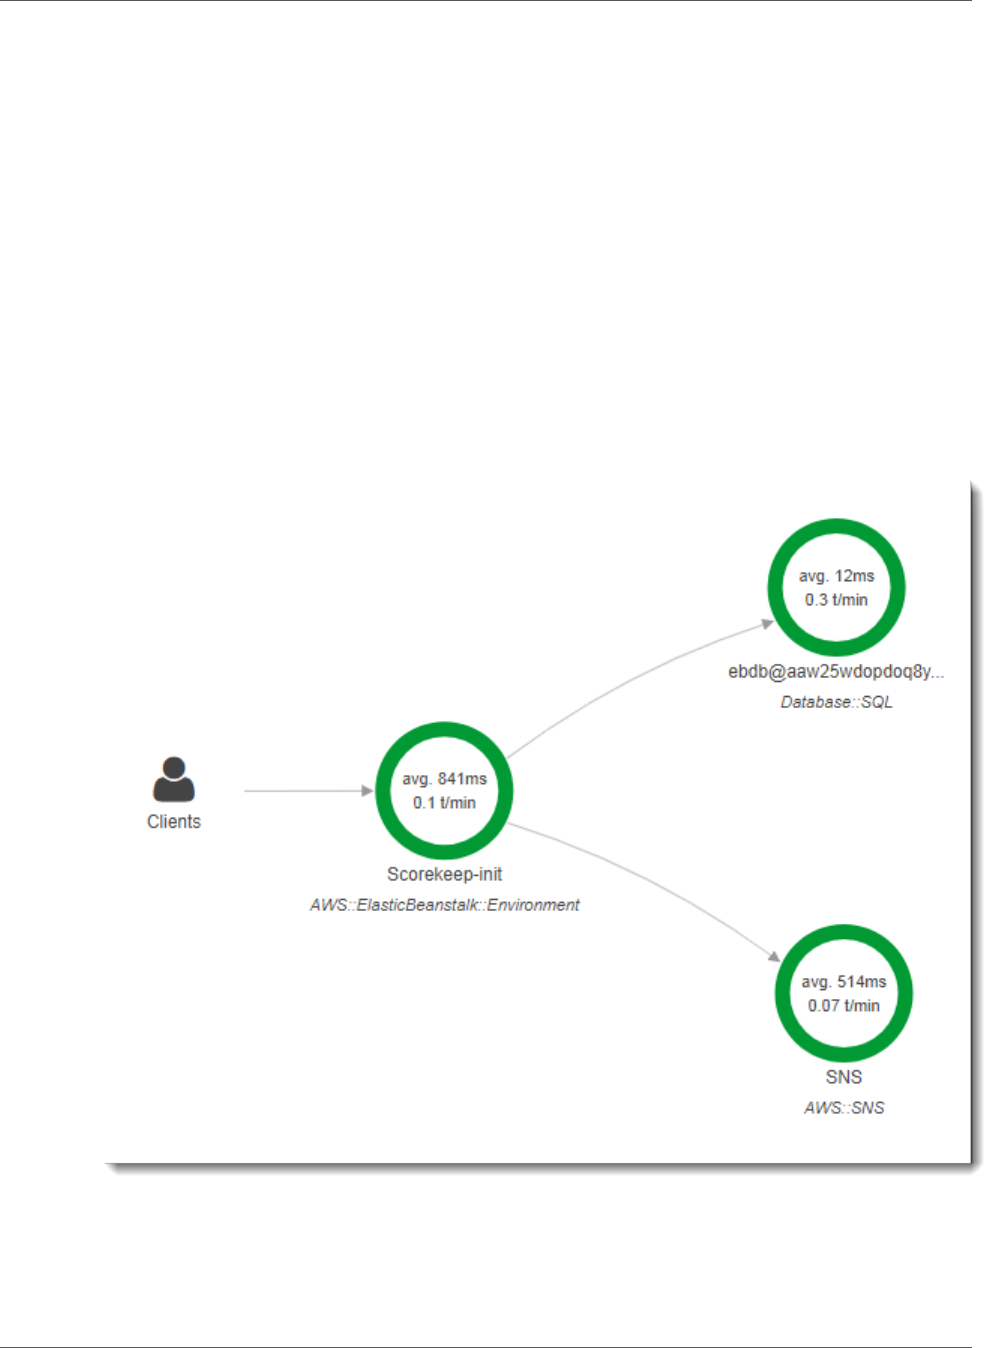
AWS X-Ray Developer Guide
Startup Code
Note
Dockerrun.aws.json is the Elastic Beanstalk version of an Amazon ECS task definition
file. If you don't want to use Elastic Beanstalk to create your Amazon ECS cluster, you can
modify the Dockerrun.aws.json file to run on Amazon ECS directly by removing the
AWSEBDockerrunVersion key from the file.
See the branch README for instructions on how to deploy Scorekeep to Amazon ECS.
Instrumenting Startup Code
The X-Ray SDK for Java automatically creates segments for incoming requests. As long as a request is
in scope, you can use instrumented clients and record subsegments without issue. If you try to use an
instrumented client in startup code, though, you'll get a SegmentNotFoundException.
Startup code runs outside of the standard request/response flow of a web application, so you need to
create segments manually to instrument it. Scorekeep shows the instrumentation of startup code in its
WebConfig files. Scorekeep calls an SQL database and Amazon SNS during startup.
The default WebConfig class creates an Amazon SNS subscription for notifications. To provide
a segment for the X-Ray SDK to write to when the Amazon SNS client is used, Scorekeep calls
beginSegment and endSegment on the global recorder.
90

AWS X-Ray Developer Guide
Scripts
Example src/main/java/scorekeep/WebConfig.java – Instrumented AWS SDK client in
startup code
AWSXRay.beginSegment("Scorekeep-init");
if ( System.getenv("NOTIFICATION_EMAIL") != null ){
try { Sns.createSubscription(); }
catch (Exception e ) {
logger.warn("Failed to create subscription for email "+
System.getenv("NOTIFICATION_EMAIL"));
}
}
AWSXRay.endSegment();
In RdsWebConfig, which Scorekeep uses when an Amazon RDS database is connected, the configuration
also creates a segment for the SQL client that Hibernate uses when it applies the database schema
during startup.
Example src/main/java/scorekeep/RdsWebConfig.java – Instrumented SQL database
client in startup code
@PostConstruct
public void schemaExport() {
EntityManagerFactoryImpl entityManagerFactoryImpl = (EntityManagerFactoryImpl)
localContainerEntityManagerFactoryBean.getNativeEntityManagerFactory();
SessionFactoryImplementor sessionFactoryImplementor =
entityManagerFactoryImpl.getSessionFactory();
StandardServiceRegistry standardServiceRegistry =
sessionFactoryImplementor.getSessionFactoryOptions().getServiceRegistry();
MetadataSources metadataSources = new MetadataSources(new
BootstrapServiceRegistryBuilder().build());
metadataSources.addAnnotatedClass(GameHistory.class);
MetadataImplementor metadataImplementor = (MetadataImplementor)
metadataSources.buildMetadata(standardServiceRegistry);
SchemaExport schemaExport = new SchemaExport(standardServiceRegistry,
metadataImplementor);
AWSXRay.beginSegment("Scorekeep-init");
schemaExport.create(true, true);
AWSXRay.endSegment();
}
SchemaExport runs automatically and uses an SQL client. Since the client is instrumented, Scorekeep
must override the default implementation and provide a segment for the SDK to use when the client is
invoked.
Instrumenting Scripts
You can also instrument code that isn't part of your application. When the X-Ray daemon is running,
it will relay any segments that it receives to X-Ray, even if they are not generated by the X-Ray SDK.
Scorekeep uses its own scripts to instrument the build that compiles the application during deployment.
Example bin/build.sh – Instrumented build script
SEGMENT=$(python bin/xray_start.py)
gradle build --quiet --stacktrace &> /var/log/gradle.log; GRADLE_RETURN=$?
if (( GRADLE_RETURN != 0 )); then
91
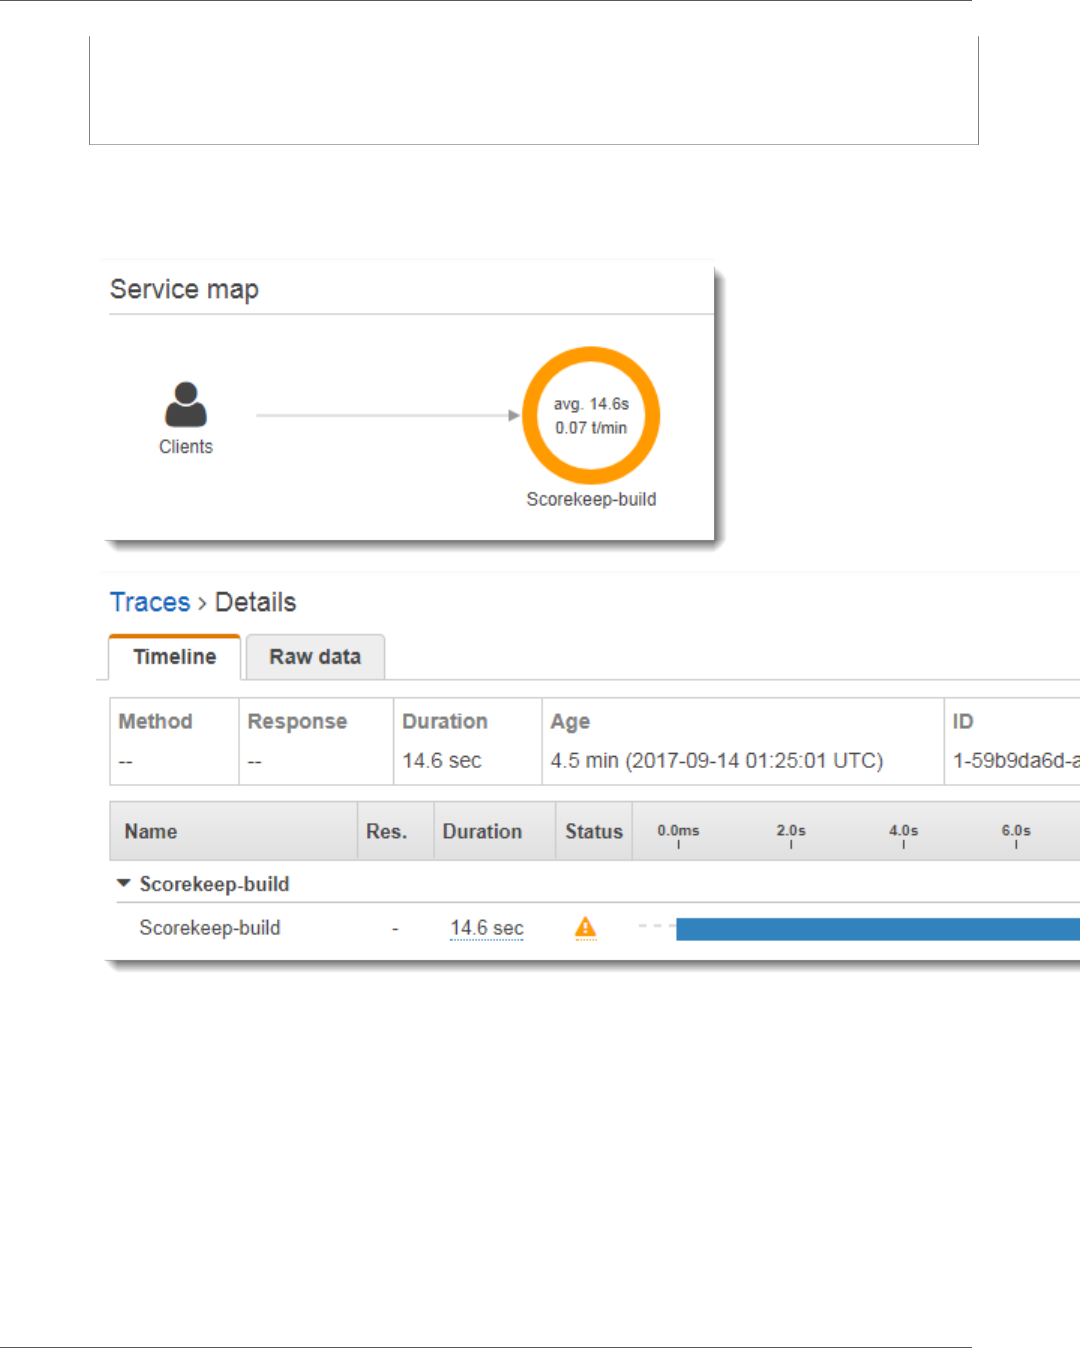
AWS X-Ray Developer Guide
Scripts
echo "Gradle failed with exit status $GRADLE_RETURN" >&2
python bin/xray_error.py "$SEGMENT" "$(cat /var/log/gradle.log)"
exit 1
fi
python bin/xray_success.py "$SEGMENT"
xray_start.py, xray_error.py and xray_success.py are simple Python scripts that construct
segment objects, convert them to JSON documents, and send them to the daemon over UDP. If the
Gradle build fails, you can find the error message by clicking on the scorekeep-build node in the X-Ray
console service map.
92
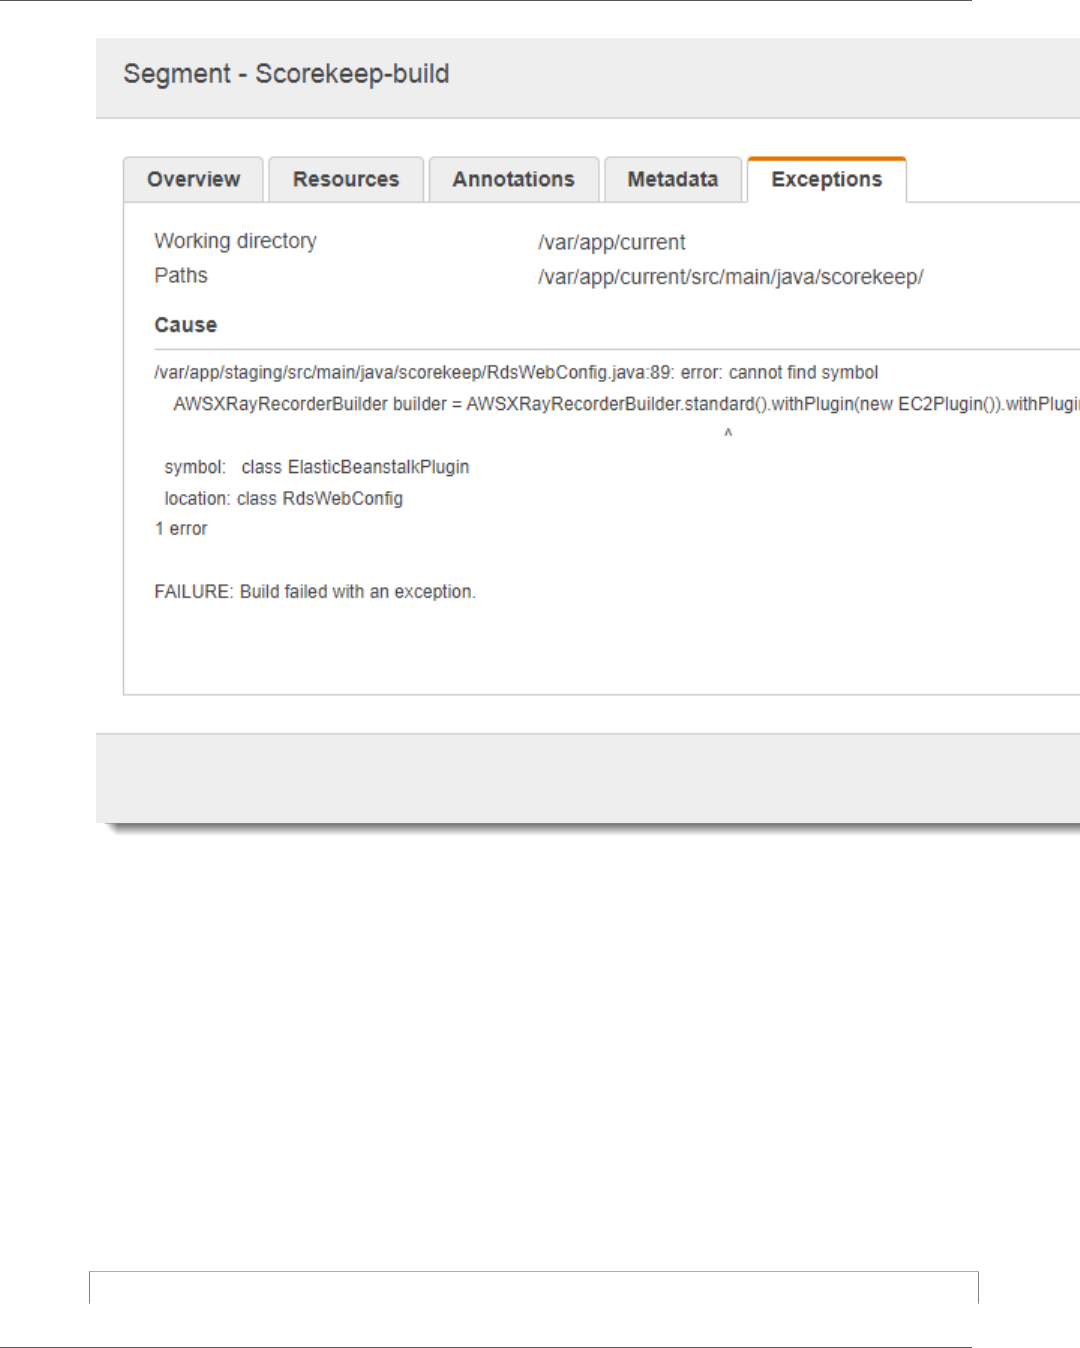
AWS X-Ray Developer Guide
Client
Instrumenting a Web App Client
In the xray-cognito branch, Scorekeep uses Amazon Cognito to enable users to create an account and
sign in with it to retrieve their user information from an Amazon Cognito user pool. When a user signs in,
Scorekeep uses an Amazon Cognito identity pool to get temporary AWS credentials for use with the AWS
SDK for JavaScript.
The identity pool is configured to let signed-in users write trace data to AWS X-Ray. The web app uses
these credentials to record the signed-in user's ID, the browser path, and the client's view of calls to the
Scorekeep API.
Most of the work is done in a service class named xray. This service class provides methods for
generating the required identifiers, creating in-progress segments, finalizing segments, and sending
segment documents to the X-Ray API.
Example public/xray.js – Record and upload segments
...
93

AWS X-Ray Developer Guide
Client
service.beginSegment = function() {
var segment = {};
var traceId = '1-' + service.getHexTime() + '-' + service.getHexId(24);
var id = service.getHexId(16);
var startTime = service.getEpochTime();
segment.trace_id = traceId;
segment.id = id;
segment.start_time = startTime;
segment.name = 'Scorekeep-client';
segment.in_progress = true;
segment.user = sessionStorage['userid'];
segment.http = {
request: {
url: window.location.href
}
};
var documents = [];
documents[0] = JSON.stringify(segment);
service.putDocuments(documents);
return segment;
}
service.endSegment = function(segment) {
var endTime = service.getEpochTime();
segment.end_time = endTime;
segment.in_progress = false;
var documents = [];
documents[0] = JSON.stringify(segment);
service.putDocuments(documents);
}
service.putDocuments = function(documents) {
var xray = new AWS.XRay();
var params = {
TraceSegmentDocuments: documents
};
xray.putTraceSegments(params, function(err, data) {
if (err) {
console.log(err, err.stack);
} else {
console.log(data);
}
})
}
These methods are called in header and transformResponse functions in the resource services that the
web app uses to call the Scorekeep API. To include the client segment in the same trace as the segment
that the API generates, the web app must include the trace ID and segment ID in a tracing header (p. 25)
(X-Amzn-Trace-Id) that the X-Ray SDK can read. When the instrumented Java application receives a
request with this header, the X-Ray SDK for Java uses the same trace ID and makes the segment from the
web app client the parent of its segment.
Example public/app/services.js – Recording segments for Angular resource calls and
writing tracing headers
var module = angular.module('scorekeep');
module.factory('SessionService', function($resource, api, XRay) {
return $resource(api + 'session/:id', { id: '@_id' }, {
segment: {},
get: {
94
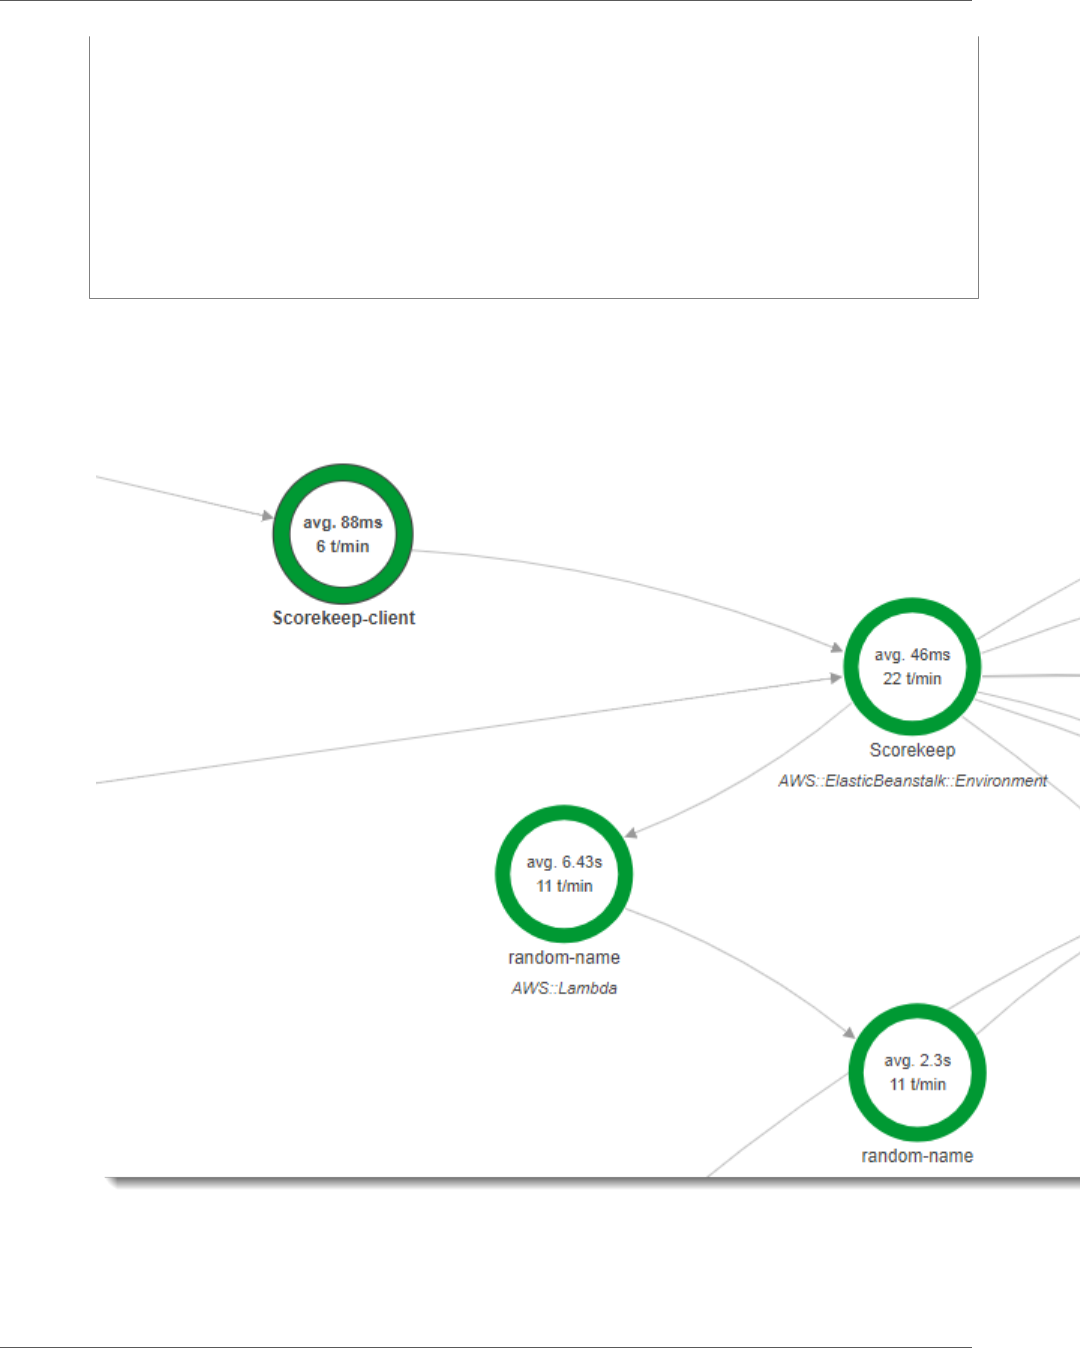
AWS X-Ray Developer Guide
Client
method: 'GET',
headers: {
'X-Amzn-Trace-Id': function(config) {
segment = XRay.beginSegment();
return XRay.getTraceHeader(segment);
}
},
transformResponse: function(data) {
XRay.endSegment(segment);
return angular.fromJson(data);
},
},
...
The resulting service map includes a node for the web app client.
Traces that include segments from the web app show the URL that the user sees in the browser (paths
starting with /#/). Without client instrumentation, you only get the URL of the API resource that the
web app calls (paths starting with /api/).
95
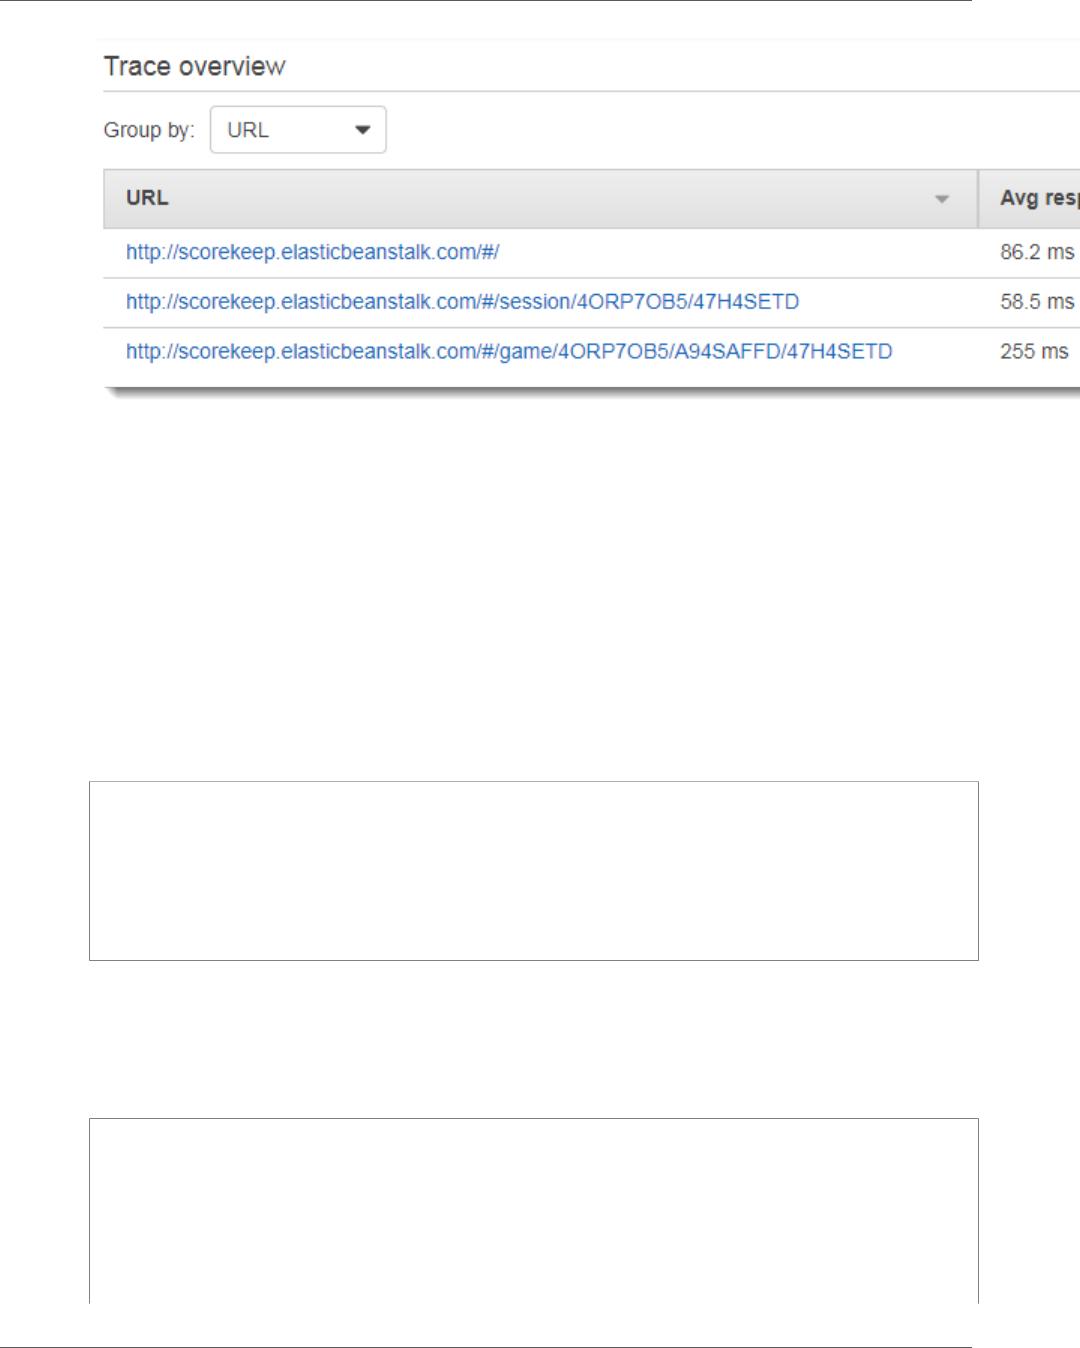
AWS X-Ray Developer Guide
Worker Threads
Using Instrumented Clients in Worker Threads
Scorekeep uses a worker thread to publish a notification to Amazon SNS when a user wins a game.
Publishing the notification takes longer than the rest of the request operations combined, and doesn't
affect the client or user. Therefore, performing the task asynchronously is a good way to improve
response time.
However, the X-Ray SDK for Java doesn't know which segment was active when the thread is created.
As a result, when you try to use the instrumented AWS SDK for Java client within the thread, it throws a
SegmentNotFoundException, crashing the thread.
Example web-1.error.log
Exception in thread "Thread-2" com.amazonaws.xray.exceptions.SegmentNotFoundException:
Failed to begin subsegment named 'AmazonSNS': segment cannot be found.
at sun.reflect.NativeConstructorAccessorImpl.newInstance0(Native Method)
at
sun.reflect.NativeConstructorAccessorImpl.newInstance(NativeConstructorAccessorImpl.java:62)
at
sun.reflect.DelegatingConstructorAccessorImpl.newInstance(DelegatingConstructorAccessorImpl.java:45)
...
To fix this, the application uses GetTraceEntity to get a reference to the segment in the main thread,
and SetTraceEntity to pass the segment back to the recorder in the worker thread.
Example src/main/java/scorekeep/MoveFactory.java – Passing trace context to a
worker thread
import com.amazonaws.xray.AWSXRay;
import com.amazonaws.xray.AWSXRayRecorder;
import com.amazonaws.xray.entities.Entity;
import com.amazonaws.xray.entities.Segment;
import com.amazonaws.xray.entities.Subsegment;
...
Entity segment = recorder.getTraceEntity();
Thread comm = new Thread() {
public void run() {
96
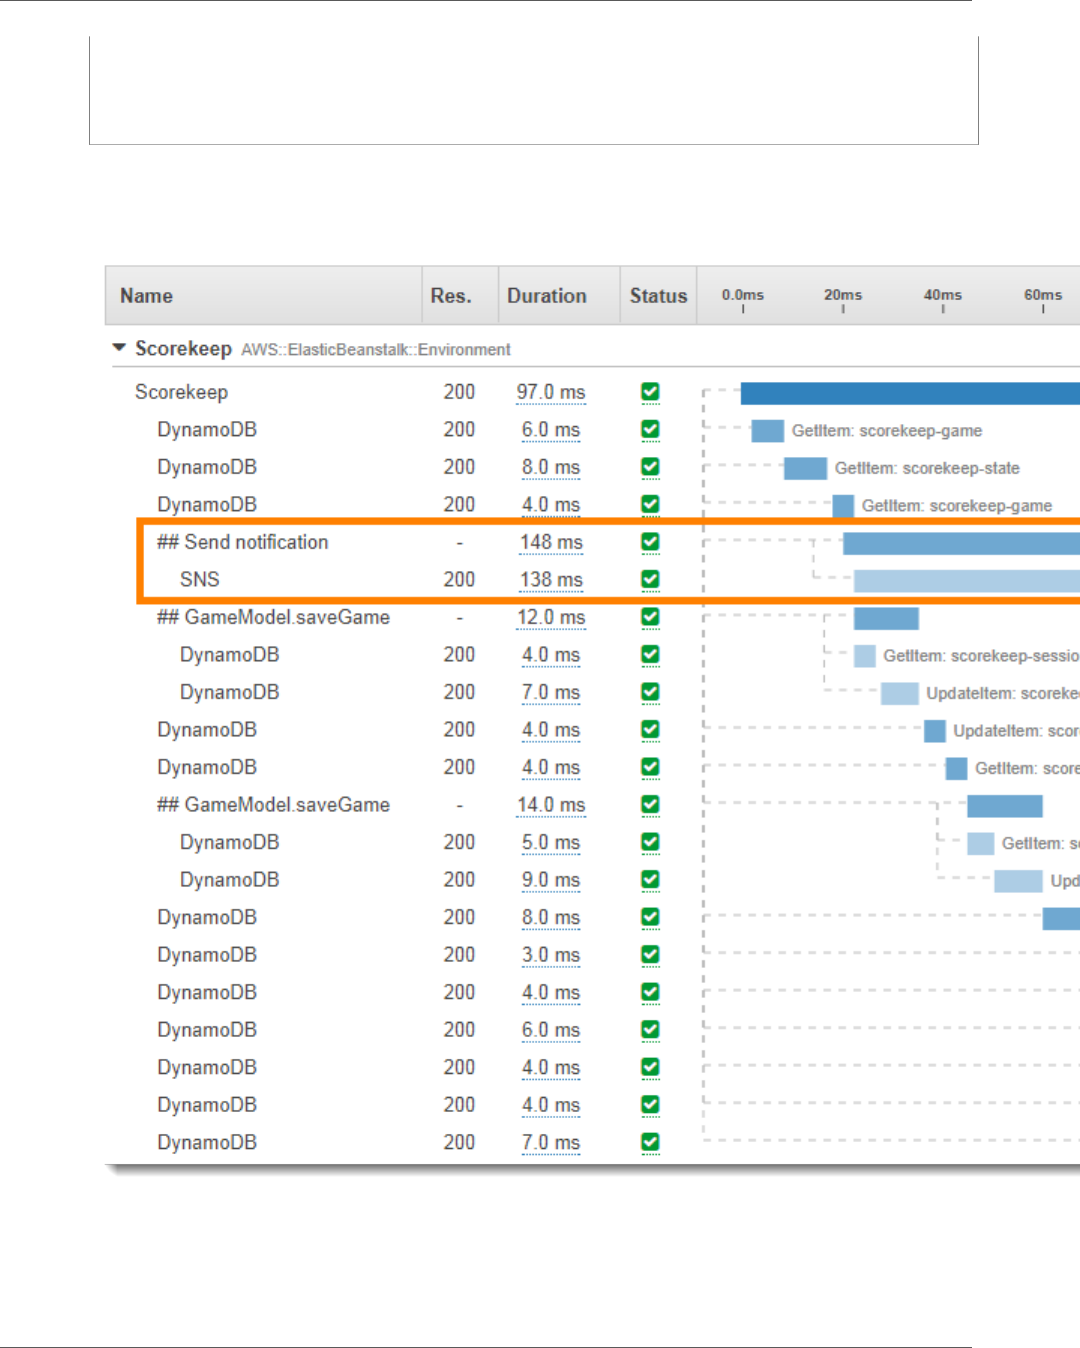
AWS X-Ray Developer Guide
Worker Threads
recorder.setTraceEntity(segment);
Subsegment subsegment = AWSXRay.beginSubsegment("## Send notification");
Sns.sendNotification("Scorekeep game completed", "Winner: " + userId);
AWSXRay.endSubsegment();
}
Because the request is now resolved before the call to Amazon SNS, the application creates a separate
subsegment for the thread. This prevents the X-Ray SDK from closing the segment before it records
the response from Amazon SNS. If no subsegment is open when Scorekeep resolved the request, the
response from Amazon SNS could be lost.
See Passing Segment Context between Threads in a Multithreaded Application (p. 133) for more
information about multithreading.
97

AWS X-Ray Developer Guide
Deep Linking
Deep Linking to the X-Ray Console
The session and game pages of the Scorekeep web app use deep linking to link to filtered trace lists and
service maps.
Example public/game.html – deep links
<div id="xray-link">
<p><a href="https://console.aws.amazon.com/xray/home#/traces?filter=http.url%20CONTAINS
%20%22{{ gameid }}%22&timeRange=PT1H" target="blank">View traces for this game</a></p>
<p><a href="https://console.aws.amazon.com/xray/home#/service-map&timeRange=PT1H"
target="blank">View service map</a></p>
</div>
See Deep Linking (p. 44) for details on how to construct deep links.
98

AWS X-Ray Developer Guide
Downloading the Daemon
AWS X-Ray Daemon
The AWS X-Ray daemon is a software application that listens for traffic on UDP port 2000, gathers raw
segment data, and relays it to the AWS X-Ray API. The daemon works in conjunction with the AWS X-Ray
SDKs and must be running so that data sent by the SDKs can reach the X-Ray service.
Note
The X-Ray daemon is an open source project. You can follow the project and submit issues and
pull requests on GitHub: github.com/aws/aws-xray-daemon
On AWS Lambda and AWS Elastic Beanstalk, use those services' integration with X-Ray to run the
daemon. Lambda runs the daemon automatically any time a function is invoked for a sampled request.
On Elastic Beanstalk, use the XRayEnabled configuration option (p. 106) to run the daemon on the
instances in your environment.
To run the X-Ray daemon locally, on-premises, or on other AWS services, download it from Amazon
S3 (p. 99), run it (p. 100), and then give it permission (p. 101) to upload segment documents to X-
Ray.
Downloading the Daemon
You can download the daemon from Amazon S3 to run it locally, or to install it on an Amazon EC2
instance on launch.
X-Ray daemon installers and executables
•Linux (executable) – aws-xray-daemon-linux-2.x.zip (sig)
•Linux (RPM installer) – aws-xray-daemon-2.x.rpm
•Linux (DEB installer) – aws-xray-daemon-2.x.deb
•OS X (executable) – aws-xray-daemon-macos-2.x.zip (sig)
•Windows (executable) – aws-xray-daemon-windows-process-2.x.zip (sig)
•Windows (service) – aws-xray-daemon-windows-service-2.x.zip (sig)
These links always point to the latest v2 release of the daemon. To download a specific release, replace
2.x with the version number. For example, 2.1.0.
X-Ray assets are replicated to buckets in every supported region. To use the bucket closest to you or your
AWS resources, replace the region in the above links with your region.
https://s3.dualstack.us-west-2.amazonaws.com/aws-xray-assets.us-west-2/xray-daemon/aws-
xray-daemon-2.x.rpm
Verifying the Daemon Archive's Signature
GPG signature files are included for daemon assets compressed in ZIP archives. The public key is here:
aws-xray.gpg.
99
AWS X-Ray Developer Guide
Running the Daemon
You can use the public key to verify that the daemon's ZIP archive is original and unmodified. First,
import the public key with GnuPG.
To import the public key
1. Download the public key.
$ BUCKETURL=https://s3.dualstack.us-east-2.amazonaws.com/aws-xray-assets.us-east-2
$ wget $BUCKETURL/xray-daemon/aws-xray.gpg
2. Import the public key into your keyring.
$ gpg --import aws-xray.gpg
gpg: /Users/me/.gnupg/trustdb.gpg: trustdb created
gpg: key 7BFE036BFE6157D3: public key "AWS X-Ray <aws-xray@amazon.com>" imported
gpg: Total number processed: 1
gpg: imported: 1
Use the imported key to verify the signature of the daemon's ZIP archive.
To verify an archive's signature
1. Download the archive and signature file.
$ BUCKETURL=https://s3.dualstack.us-east-2.amazonaws.com/aws-xray-assets.us-east-2
$ wget $BUCKETURL/xray-daemon/aws-xray-daemon-linux-2.0.0.zip
$ wget $BUCKETURL/xray-daemon/aws-xray-daemon-linux-2.0.0.zip.sig
2. Run gpg --verify to verify the signature.
$ gpg --verify aws-xray-daemon-linux-2.0.0.zip.sig aws-xray-daemon-linux-2.0.0.zip
gpg: Signature made Wed 19 Apr 2017 05:06:31 AM UTC using RSA key ID FE6157D3
gpg: Good signature from "AWS X-Ray <aws-xray@amazon.com>"
gpg: WARNING: This key is not certified with a trusted signature!
gpg: There is no indication that the signature belongs to the owner.
Primary key fingerprint: EA6D 9271 FBF3 6990 277F 4B87 7BFE 036B FE61 57D3
Note the warning about trust. A key is only trusted if you or someone you trust has signed it. This does
not mean that the signature is invalid, only that you have not verified the public key.
Running the Daemon
Run the daemon locally from the command line. Use the -o option to run in local mode, and -n to set
the region.
~/Downloads$ ./xray -o -n us-east-2
For detailed platform-specific instructions, see the following topics:
•Linux (local) – Running the X-Ray Daemon on Linux (p. 104)
•Windows (local) – Running the X-Ray Daemon on Windows (p. 105)
•Elastic Beanstalk – Running the X-Ray Daemon on AWS Elastic Beanstalk (p. 106)
•Amazon EC2 – Running the X-Ray Daemon on Amazon EC2 (p. 109)
100

AWS X-Ray Developer Guide
Giving the Daemon Permission to Send Data to X-Ray
•Amazon ECS – Running the X-Ray Daemon on Amazon ECS (p. 110)
You can customize the daemon's behavior further by using command line options or a configuration file.
See Configuring the AWS X-Ray Daemon (p. 102) for details.
Giving the Daemon Permission to Send Data to X-
Ray
The X-Ray daemon uses the AWS SDK to upload trace data to X-Ray, and it needs AWS credentials with
permission to do that.
On Amazon EC2, the daemon uses the instance's instance profile role automatically. Locally, save your
access keys to a file named credentials in your user directory under a folder named .aws.
Example ~/.aws/credentials
[default]
aws_access_key_id = AKIAIOSFODNN7EXAMPLE
aws_secret_access_key = wJalrXUtnFEMI/K7MDENG/bPxRfiCYEXAMPLEKEY
If you specify credentials in more than one location (credentials file, instance profile, or environment
variables), the SDK provider chain determines which credentials are used. For more information about
providing credentials to the SDK, see Specifying Credentials in the AWS SDK for Go Developer Guide.
The IAM role or user that the daemon's credentials belong to must have permission to write data to the
service on your behalf.
• To use the daemon on Amazon EC2, create a new instance profile role or add the managed policy to an
existing one.
• To use the daemon on Elastic Beanstalk, add the managed policy to the Elastic Beanstalk default
instance profile role.
• To run the daemon locally, create an IAM user and save its access keys on your computer.
For more information, see AWS X-Ray Permissions (p. 74).
X-Ray Daemon Logs
The daemon outputs information about its current configuration and segments that it sends to AWS X-
Ray.
2016-11-24T06:07:06Z [Info] Initializing AWS X-Ray daemon 2.1.0
2016-11-24T06:07:06Z [Info] Using memory limit of 49 MB
2016-11-24T06:07:06Z [Info] 313 segment buffers allocated
2016-11-24T06:07:08Z [Info] Successfully sent batch of 1 segments (0.123 seconds)
2016-11-24T06:07:09Z [Info] Successfully sent batch of 1 segments (0.006 seconds)
By default, the daemon outputs logs to STDOUT. If you run the daemon in the background, use the --
log-file command line option or a configuration file to set the log file path. You can also set the log
level and disable log rotation. See Configuring the AWS X-Ray Daemon (p. 102) for instructions.
101
AWS X-Ray Developer Guide
Configuration
On Elastic Beanstalk, the platform sets the location of the daemon logs. See Running the X-Ray Daemon
on AWS Elastic Beanstalk (p. 106) for details.
Configuring the AWS X-Ray Daemon
You can use command line options or a configuration file to customize the X-Ray daemon's behavior.
Most options are available using both methods, but some are only available in configuration files and
some only at the command line.
To get started, the only option that you need to know is -n or --region, which you use to set the
region that the daemon uses to send trace data to X-Ray.
~/xray-daemon$ ./xray -n us-east-2
If you are running the daemon locally, that is, not on Amazon EC2, you can add the -o option to skip
checking for instance profile credentials so the daemon will become ready more quickly.
~/xray-daemon$ ./xray -o -n us-east-2
The rest of the command line options let you configure logging, listen on a different port, limit the
amount of memory that the daemon can use, or assume a role to send trace data to a different account.
You can pass a configuration file to the daemon to access advanced configuration options and do things
like limit the number of concurrent calls to X-Ray, disable log rotation, and send traffic to a proxy.
Sections
•Using Command Line Options (p. 102)
•Using a Configuration File (p. 103)
Using Command Line Options
Pass these options to the daemon when you run it locally or with a user data script.
Command Line Options
•-b, --bind – Bind the daemon to a different port.
--bind "127.0.0.1:3000"
Default – 2000.
•-c, --config – Load a configuration file from the specified path.
--config "/home/ec2-user/xray-daemon.yaml"
•-f, --log-file – Output logs to the specified file path.
--log-file "/var/log/xray-daemon.log"
•-l, --log-level – Log level, from most verbose to least: dev, debug, info, warn, error, prod.
--log-level warn
102
AWS X-Ray Developer Guide
Using a Configuration File
Default – prod
•-m, --buffer-memory – Change the amount of memory in MB that buffers can use (minimum 3).
--buffer-memory 50
Default – 1% of available memory.
•-o, --local-mode – Don't check for EC2 instance metadata.
•-r, --role-arn – Assume the specified IAM role to upload segments to a different account.
--role-arn "arn:aws:iam::123456789012:role/xray-cross-account"
•-a, --resource-arn – Amazon Resource Name (ARN) of the AWS resource running the daemon.
•-n, --region – Send segments to X-Ray service in a specific region.
•-v, --version – Show AWS X-Ray daemon version.
•-h, --help – Show the help screen.
Using a Configuration File
You can also use a YAML format file to configure the daemon. Pass the configuration file to the daemon
by using the -c option.
~$ ./xray -c ~/xray-daemon.yaml
Configuration file options
•TotalBufferSizeMB – Maximum buffer size in MB (minimum 3). Choose 0 to use 1% of host
memory.
•Concurrency – Maximum number of concurrent calls to AWS X-Ray to upload segment documents.
•Region – Send segments to AWS X-Ray service in a specific region.
•Socket – Configure the daemon's binding.
•UDPAddress – Change the port on which the daemon listens.
•Logging – Configure logging behavior.
•LogRotation – Set to false to disable log rotation.
•LogLevel – Change the log level, from most verbose to least: dev, debug, info, warn, error,
prod (default).
•LogPath – Output logs to the specified file path.
•LocalMode – Set to true to skip checking for EC2 instance metadata.
•ResourceARN – Amazon Resource Name (ARN) of the AWS resource running the daemon.
•RoleARN – Assume the specified IAM role to upload segments to a different account.
•ProxyAddress – Upload segments to AWS X-Ray through a proxy.
•Endpoint – Change the X-Ray service endpoint to which the daemon sends segment documents.
•NoVerifySSL – Disable TLS certificate verification.
•Version – Daemon configuration file format version.
Example xray-daemon.yaml
This configuration file changes the daemon's listening port to 3000, turns off checks for instance
metadata, sets a role to use for uploading segments, and changes region and logging options.
103
AWS X-Ray Developer Guide
Run the Daemon Locally
Socket:
UDPAddress: "127.0.0.1:3000"
Region: "us-west-2"
Logging:
LogLevel: "warn"
LogPath: "/var/log/xray-daemon.log"
LocalMode: true
RoleARN: "arn:aws:iam::123456789012:role/xray-cross-account"
Version: 1
Running the X-Ray Daemon Locally
You can run the AWS X-Ray daemon locally on Linux, MacOS, Windows, or in a Docker container. Run the
daemon to relay trace date to X-Ray when you are developing and testing your instrumented application.
Download and extract the daemon by using the instructions here (p. 99).
When running locally, the daemon can read credentials from an AWS SDK credentials file (.aws/
credentials in your user directory) or from environment variables. For more information, see Giving
the Daemon Permission to Send Data to X-Ray (p. 101).
The daemon listens for UDP data on port 2000. You can change the port and other options by using
a configuration file and command line options. For more information, see Configuring the AWS X-Ray
Daemon (p. 102).
Running the X-Ray Daemon on Linux
You can run the daemon executable from the command line. Use the -o option to run in local mode, and
-n to set the region.
~/xray-daemon$ ./xray -o -n us-east-2
To run the daemon in the background, use &.
~/xray-daemon$ ./xray -o -n us-east-2 &
Terminate a daemon process running in the background with pkill.
~$ pkill xray
Running the X-Ray Daemon in a Docker Container
To run the daemon locally in a Docker container, save the following text to a file named Dockerfile.
Example Dockerfile – Amazon Linux
FROM amazonlinux
RUN yum install -y unzip
RUN curl -o daemon.zip https://s3.dualstack.us-east-2.amazonaws.com/aws-xray-assets.us-
east-2/xray-daemon/aws-xray-daemon-linux-2.x.zip
RUN unzip daemon.zip && cp xray /usr/bin/xray
ENTRYPOINT ["/usr/bin/xray", "-b", "0.0.0.0:2000"]
EXPOSE 2000/udp
104
AWS X-Ray Developer Guide
Running the X-Ray Daemon on Windows
Build the container image with docker build.
~/xray-daemon$ docker build -t xray-daemon .
Run the image in a container with docker run.
~/xray-daemon$ docker run \
--attach STDOUT \
-v ~/.aws/:/root/.aws/:ro \
--net=host \
-e AWS_REGION=us-east-2 \
--name xray-daemon \
-p 2000:2000/udp \
xray-daemon -o
This command uses the following options:
•--attach STDOUT – View output from the daemon in the terminal.
•-v ~/.aws/:/root/.aws/:ro – Give the container read-only access to the .aws directory to let it
read your AWS SDK credentials.
•AWS_REGION=us-east-2 – Set the AWS_REGION environment variable to tell the daemon which
region to use.
•--net=host – Attach the container to the host network. Containers on the host network can
communicate with each other without publishing ports.
•-p 2000:2000/udp – Map UDP port 2000 on your machine to the same port on the container. This is
not required for containers on the same network to communicate, but it does let you send segments to
the daemon from the command line (p. 55) or from an application not running in Docker.
•--name xray-daemon – Name the container xray-daemon instead of generating a random name.
•-o (after the image name) – Append the -o option to the entry point that runs the daemon within the
container. This option tells the daemon to run in local mode to prevent it from trying to read Amazon
EC2 instance metadata.
To stop the daemon, use docker stop. If you make changes to the Dockerfile and build a new
image, you need to delete the existing container before you can create another one with the same name.
Use docker rm to delete the container.
$ docker stop xray-daemon
$ docker rm xray-daemon
The Scorekeep sample application shows how to use the X-Ray daemon in a local Docker container. See
Instrumenting Amazon ECS Applications (p. 89) for details.
Running the X-Ray Daemon on Windows
You can run the daemon executable from the command line. Use the -o option to run in local mode, and
-n to set the region.
> .\xray_windows.exe -o -n us-east-2
Use a PowerShell script to create and run a service for the daemon.
Example PowerShell Script - Windows
if ( Get-Service "AWSXRayDaemon" -ErrorAction SilentlyContinue ){
105
AWS X-Ray Developer Guide
Running the X-Ray Daemon on OS X
sc.exe stop AWSXRayDaemon
sc.exe delete AWSXRayDaemon
}
if ( Get-Item -path aws-xray-daemon -ErrorAction SilentlyContinue ) {
Remove-Item -Recurse -Force aws-xray-daemon
}
$currentLocation = Get-Location
$zipFileName = "aws-xray-daemon-windows-service-2.x.zip"
$zipPath = "$currentLocation\$zipFileName"
$destPath = "$currentLocation\aws-xray-daemon"
$daemonPath = "$destPath\xray.exe"
$daemonLogPath = "C:\inetpub\wwwroot\xray-daemon.log"
$url = "https://s3.dualstack.us-west-2.amazonaws.com/aws-xray-assets.us-west-2/xray-daemon/
aws-xray-daemon-windows-service-2.x.zip"
Invoke-WebRequest -Uri $url -OutFile $zipPath
Add-Type -Assembly "System.IO.Compression.Filesystem"
[io.compression.zipfile]::ExtractToDirectory($zipPath, $destPath)
sc.exe create AWSXRayDaemon binPath= "$daemonPath -f $daemonLogPath"
sc.exe start AWSXRayDaemon
Running the X-Ray Daemon on OS X
You can run the daemon executable from the command line. Use the -o option to run in local mode, and
-n to set the region.
~/xray-daemon$ ./xray_mac -o -n us-east-2
To run the daemon in the background, use &.
~/xray-daemon$ ./xray_mac -o -n us-east-2 &
Use nohup to prevent the daemon from terminating when the terminal is closed.
~/xray-daemon$ nohup ./xray_mac &
Running the X-Ray Daemon on AWS Elastic
Beanstalk
To relay trace data from your application to AWS X-Ray, you can run the X-Ray daemon on your Elastic
Beanstalk environment's Amazon EC2 instances. For a list of supported platforms, see Configuring AWS
X-Ray Debugging in the AWS Elastic Beanstalk Developer Guide.
Note
The daemon uses your environment's instance profile for permissions. For instructions about
adding permissions to the Elastic Beanstalk instance profile, see Giving the Daemon Permission
to Send Data to X-Ray (p. 101).
Elastic Beanstalk platforms provide a configuration option that you can set to run the daemon
automatically. You can enable the daemon in a configuration file in your source code or by choosing
an option in the Elastic Beanstalk console. When you enable the configuration option, the daemon is
installed on the instance and runs as a service.
106

AWS X-Ray Developer Guide
Using the Elastic Beanstalk X-Ray
Integration to Run the X-Ray Daemon
The version included on Elastic Beanstalk platforms might not be the latest version. See the Supported
Platforms topic to find out the version of the daemon that is available for your platform configuration.
Elastic Beanstalk does not provide the X-Ray daemon on the Multicontainer Docker (Amazon ECS)
platform. The Scorekeep sample application shows how to use the X-Ray daemon on Amazon ECS with
Elastic Beanstalk. See Instrumenting Amazon ECS Applications (p. 89) for details.
Using the Elastic Beanstalk X-Ray Integration to Run
the X-Ray Daemon
Use the console to turn on X-Ray integration, or configure it in your application source code with a
configuration file.
To enable the X-Ray daemon in the Elastic Beanstalk console
1. Open the Elastic Beanstalk console.
2. Navigate to the management console for your environment.
3. Choose Configuration.
4. Choose Software Settings.
5. For X-Ray daemon, choose Enabled.
6. Choose Apply.
You can include a configuration file in your source code to make your configuration portable between
environments.
Example .ebextensions/xray-daemon.config
option_settings:
aws:elasticbeanstalk:xray:
XRayEnabled: true
Elastic Beanstalk passes a configuration file to the daemon and outputs logs to a standard location.
On Windows Server Platforms
•Configuration file – C:\Progam Files\Amazon\XRay\cfg.yaml
•Logs – c:\Program Files\Amazon\XRay\logs\xray-service.log
On Linux Platforms
•Configuration file – /etc/amazon/xray/cfg.yaml
•Logs – /var/log/xray/xray.log
Elastic Beanstalk provides tools for pulling instance logs from the AWS Management Console or
command line. You can tell Elastic Beanstalk to include the X-Ray daemon logs by adding a task with a
configuration file.
Example .ebextensions/xray-logs.config - Linux
files:
"/opt/elasticbeanstalk/tasks/taillogs.d/xray-daemon.conf" :
mode: "000644"
owner: root
107

AWS X-Ray Developer Guide
Downloading and Running the X-
Ray Daemon Manually (Advanced)
group: root
content: |
/var/log/xray/xray.log
Example .ebextensions/xray-logs.config - Windows Server
files:
"c:/Program Files/Amazon/ElasticBeanstalk/config/taillogs.d/xray-daemon.conf" :
mode: "000644"
owner: root
group: root
content: |
c:\Progam Files\Amazon\XRay\logs\xray-service.log
See Viewing Logs from Your Elastic Beanstalk Environment's Amazon EC2 Instances in the AWS Elastic
Beanstalk Developer Guide for more information.
Downloading and Running the X-Ray Daemon
Manually (Advanced)
If the X-Ray daemon isn't available for your platform configuration, you can download it from Amazon
S3 and run it with a configuration file.
Use an Elastic Beanstalk configuration file to download and run the daemon.
Example .ebextensions/xray.config - Linux
commands:
01-stop-tracing:
command: yum remove -y xray
ignoreErrors: true
02-copy-tracing:
command: curl https://s3.dualstack.us-east-2.amazonaws.com/aws-xray-assets.us-east-2/
xray-daemon/aws-xray-daemon-2.x.rpm -o /home/ec2-user/xray.rpm
03-start-tracing:
command: yum install -y /home/ec2-user/xray.rpm
files:
"/opt/elasticbeanstalk/tasks/taillogs.d/xray-daemon.conf" :
mode: "000644"
owner: root
group: root
content: |
/var/log/xray/xray.log
"/etc/amazon/xray/cfg.yaml" :
mode: "000644"
owner: root
group: root
content: |
Logging:
LogLevel: "debug"
Example .ebextensions/xray.config - Windows Server
container_commands:
01-execute-config-script:
command: Powershell.exe -ExecutionPolicy Bypass -File c:\\temp\\installDaemon.ps1
waitAfterCompletion: 0
108

AWS X-Ray Developer Guide
On Amazon EC2
files:
"c:/temp/installDaemon.ps1":
content: |
if ( Get-Service "AWSXRayDaemon" -ErrorAction SilentlyContinue ) {
sc.exe stop AWSXRayDaemon
sc.exe delete AWSXRayDaemon
}
$targetLocation = "C:\Program Files\Amazon\XRay"
if ((Test-Path $targetLocation) -eq 0) {
mkdir $targetLocation
}
$zipFileName = "aws-xray-daemon-windows-service-2.x.zip"
$zipPath = "$targetLocation\$zipFileName"
$destPath = "$targetLocation\aws-xray-daemon"
if ((Test-Path $destPath) -eq 1) {
Remove-Item -Recurse -Force $destPath
}
$daemonPath = "$destPath\xray.exe"
$daemonLogPath = "$targetLocation\xray-daemon.log"
$url = "https://s3.dualstack.us-west-2.amazonaws.com/aws-xray-assets.us-west-2/xray-
daemon/aws-xray-daemon-windows-service-2.x.zip"
Invoke-WebRequest -Uri $url -OutFile $zipPath
Add-Type -Assembly "System.IO.Compression.Filesystem"
[io.compression.zipfile]::ExtractToDirectory($zipPath, $destPath)
New-Service -Name "AWSXRayDaemon" -StartupType Automatic -BinaryPathName
"`"$daemonPath`" -f `"$daemonLogPath`""
sc.exe start AWSXRayDaemon
encoding: plain
"c:/Program Files/Amazon/ElasticBeanstalk/config/taillogs.d/xray-daemon.conf" :
mode: "000644"
owner: root
group: root
content: |
C:\Program Files\Amazon\XRay\xray-daemon.log
These examples also add the daemon's log file to the Elastic Beanstalk tail logs task, so that it's included
when you request logs with the console or Elastic Beanstalk Command Line Interface (EB CLI).
Running the X-Ray Daemon on Amazon EC2
You can run the X-Ray daemon on the following operating systems on Amazon EC2:
• Amazon Linux
• Ubuntu
• Windows Server (2012 R2 and newer)
Use an instance profile to grant the daemon permission to upload trace data to X-Ray. For more
information, see Giving the Daemon Permission to Send Data to X-Ray (p. 101).
Use a user data script to run the daemon automatically when you launch the instance.
Example User Data Script - Linux
#!/bin/bash
109

AWS X-Ray Developer Guide
On Amazon ECS
curl https://s3.dualstack.us-east-2.amazonaws.com/aws-xray-assets.us-east-2/xray-daemon/
aws-xray-daemon-2.x.rpm -o /home/ec2-user/xray.rpm
yum install -y /home/ec2-user/xray.rpm
Example User Data Script - Windows Server
<powershell>
if ( Get-Service "AWSXRayDaemon" -ErrorAction SilentlyContinue ) {
sc.exe stop AWSXRayDaemon
sc.exe delete AWSXRayDaemon
}
$targetLocation = "C:\Program Files\Amazon\XRay"
if ((Test-Path $targetLocation) -eq 0) {
mkdir $targetLocation
}
$zipFileName = "aws-xray-daemon-windows-service-2.x.zip"
$zipPath = "$targetLocation\$zipFileName"
$destPath = "$targetLocation\aws-xray-daemon"
if ((Test-Path $destPath) -eq 1) {
Remove-Item -Recurse -Force $destPath
}
$daemonPath = "$destPath\xray.exe"
$daemonLogPath = "$targetLocation\xray-daemon.log"
$url = "https://s3.dualstack.us-west-2.amazonaws.com/aws-xray-assets.us-west-2/xray-daemon/
aws-xray-daemon-windows-service-2.x.zip"
Invoke-WebRequest -Uri $url -OutFile $zipPath
Add-Type -Assembly "System.IO.Compression.Filesystem"
[io.compression.zipfile]::ExtractToDirectory($zipPath, $destPath)
New-Service -Name "AWSXRayDaemon" -StartupType Automatic -BinaryPathName "`"$daemonPath`" -
f `"$daemonLogPath`""
sc.exe start AWSXRayDaemon
</powershell>
Running the X-Ray Daemon on Amazon ECS
On Amazon ECS, create a Docker image that runs the X-Ray daemon, upload it to a Docker image
repository, and then deploy it to your Amazon ECS cluster. You can use port mappings and network
mode settings in your task definition file to allow your application to communicate with the daemon
container.
Note
The Scorekeep sample application shows how to use the X-Ray daemon on Amazon ECS. See
Instrumenting Amazon ECS Applications (p. 89) for details.
Add managed policies to your task role to grant the daemon permission to upload trace data to X-Ray.
For more information, see Giving the Daemon Permission to Send Data to X-Ray (p. 101).
Use one of the following Dockerfiles to create an image that runs the daemon.
Example Dockerfile – Amazon Linux
FROM amazonlinux
RUN yum install -y unzip
RUN curl -o daemon.zip https://s3.dualstack.us-east-2.amazonaws.com/aws-xray-assets.us-
east-2/xray-daemon/aws-xray-daemon-linux-2.x.zip
110

AWS X-Ray Developer Guide
On Amazon ECS
RUN unzip daemon.zip && cp xray /usr/bin/xray
ENTRYPOINT ["/usr/bin/xray", "-b", "0.0.0.0:2000"]
EXPOSE 2000/udp
Example Dockerfile – Ubuntu
For Debian derivatives, you also need to install certificate authority (CA) certificates to avoid issues when
downloading the installer.
FROM ubuntu:16.04
RUN apt-get update && apt-get install -y --force-yes --no-install-recommends apt-transport-
https curl ca-certificates wget && apt-get clean && apt-get autoremove && rm -rf /var/lib/
apt/lists/*
RUN wget https://s3.dualstack.us-east-2.amazonaws.com/aws-xray-assets.us-east-2/xray-
daemon/aws-xray-daemon-2.x.deb
RUN dpkg -i aws-xray-daemon-2.x.deb
CMD ["/usr/bin/xray", "--bind=0.0.0.0:2000"]
EXPOSE 2000/udp
In your task definition, the configuration depends on the networking mode that you use. Bridge
networking is the default and can be used in your default VPC. In a bridge network, publish UDP
port 2000, and create a link from your application container to the daemon container. Use the
AWS_XRAY_DAEMON_ADDRESS environment variable to tell the X-Ray SDK where to send traces.
Example Task definition
{
"name": "xray-daemon",
"image": "123456789012.dkr.ecr.us-east-2.amazonaws.com/xray-daemon",
"cpu": 32,
"memoryReservation": 256,
"portMappings" : [
{
"hostPort": 2000,
"containerPort": 2000,
"protocol": "udp"
}
],
},
{
"name": "scorekeep-api",
"image": "123456789012.dkr.ecr.us-east-2.amazonaws.com/scorekeep-api",
"cpu": 192,
"memoryReservation": 512,
"environment": [
{ "name" : "AWS_REGION", "value" : "us-east-2" },
{ "name" : "NOTIFICATION_TOPIC", "value" : "arn:aws:sns:us-
east-2:123456789012:scorekeep-notifications" },
{ "name" : "AWS_XRAY_DAEMON_ADDRESS", "value" : "xray-daemon:2000" }
],
"portMappings" : [
{
"hostPort": 5000,
"containerPort": 5000
}
],
"links": [
"xray-daemon"
]
}
111

AWS X-Ray Developer Guide
On Amazon ECS
If you run your cluster in the private subnet of a VPC, you can use the awsvpc network mode to attach
an elastic network interface (ENI) to your containers. This enables you to avoid using links. Omit the host
port in the port mappings, the link, and the AWS_XRAY_DAEMON_ADDRESS environment variable.
Example VPC task definition
{
"family": "scorekeep",
"networkMode":"awsvpc",
"containerDefinitions": [
{
"name": "xray-daemon",
"image": "123456789012.dkr.ecr.us-east-2.amazonaws.com/xray-daemon",
"cpu": 32,
"memoryReservation": 256,
"portMappings" : [
{
"containerPort": 2000,
"protocol": "udp"
}
]
}
{
"name": "scorekeep-api",
"image": "123456789012.dkr.ecr.us-east-2.amazonaws.com/scorekeep-api",
"cpu": 192,
"memoryReservation": 512,
"environment": [
{ "name" : "AWS_REGION", "value" : "us-east-2" },
{ "name" : "NOTIFICATION_TOPIC", "value" : "arn:aws:sns:us-
east-2:123456789012:scorekeep-notifications" }
],
"portMappings" : [
{
"containerPort": 5000
}
]
}
]
112

AWS X-Ray Developer Guide
AWS X-Ray SDK for Java
The X-Ray SDK for Java is a set of libraries for Java web applications that provide classes and methods
for generating and sending trace data to the X-Ray daemon. Trace data includes information about
incoming HTTP requests served by the application, and calls that the application makes to downstream
services using the AWS SDK, HTTP clients, or an SQL database connector. You can also create segments
manually and add debug information in annotations and metadata.
Note
The X-Ray SDK for Java is an open source project. You can follow the project and submit issues
and pull requests on GitHub: github.com/aws/aws-xray-sdk-java
Start by adding AWSXRayServletFilter as a servlet filter (p. 121) to trace incoming requests. A
servlet filter creates a segment (p. 20) While the segment is open you can use the SDK client's methods
to add information to the segment and create subsegments to trace downstream calls. The SDK also
automatically records exceptions that your application throws while the segment is open.
Starting in release 1.3, you can now instrument your application using aspect-oriented programming
(AOP) in Spring (p. 133). What this means is that you can instrument your application, while it is
running on AWS, without adding any code to your application's runtime.
Next, use the X-Ray SDK for Java to instrument your AWS SDK for Java clients by including the
SDK Instrumentor submodule (p. 114) in your build configuration. Whenever you make a call to a
downstream AWS service or resource with an instrumented client, the SDK records information about
the call in a subsegment. AWS services and the resources that you access within the services appear as
downstream nodes on the service map to help you identify errors and throttling issues on individual
connections.
If you don't want to instrument all downstream calls to AWS services, you can leave out the Instrumentor
submodule and choose which clients to instrument. Instrument individual clients by adding a
TracingHandler (p. 124) to an AWS SDK service client.
Other X-Ray SDK for Java submodules provide instrumentation for downstream calls to HTTP
web APIs and SQL databases. You can use the X-Ray SDK for Java's versions of HTTPClient and
HTTPClientBuilder (p. 125) in the Apache HTTP submodule to instrument Apache HTTP clients. To
instrument SQL queries, add the SDK's interceptor to your data source (p. 126).
Once you get going with the SDK, customize its behavior by configuring the recorder and servlet
filter (p. 116). You can add plugins to record data about the compute resources running your
application, customize sampling behavior by defining sampling rules, and set the log level to see more or
less information from the SDK in your application logs.
Record additional information about requests and the work that your application does in annotations
and metadata (p. 129). Annotations are simple key-value pairs that are indexed for use with filter
expressions (p. 37), so that you can search for traces that contain specific data. Metadata entries are less
restrictive and can record entire objects and arrays — anything that can be serialized into JSON.
Annotations and Metadata
Annotations and metadata are arbitrary text that you add to segments with the X-Ray SDK.
Annotations are indexed for use with filter expressions. Metadata are not indexed, but can be
viewed in the raw segment with the X-Ray console or API. Anyone that you grant read access to
X-Ray can view this data.
When you have a lot of instrumented clients in your code, a single request segment can contain a large
number of subsegments, one for each call made with an instrumented client. You can organize and
group subsegments by wrapping client calls in custom subsegments (p. 128). You can create a custom
subsegment for an entire function or any section of code, and record metadata and annotations on the
subsegment instead of writing everything on the parent segment.
113

AWS X-Ray Developer Guide
Requirements
You can download the X-Ray SDK for Java from Maven. The X-Ray SDK for Java is split into submodules
by use case, with a bill of materials for version management:
•aws-xray-recorder-sdk-core (required) – Basic functionality for creating segments and
transmitting segments. Includes AWSXRayServletFilter for instrumenting incoming requests.
•aws-xray-recorder-sdk-aws-sdk – Instruments calls to AWS services made with AWS SDK for
Java clients by adding a tracing client as a request handler.
•aws-xray-recorder-sdk-aws-sdk-instrumentor – With aws-xray-recorder-sdk-aws-sdk,
instruments all AWS SDK for Java clients automatically.
•aws-xray-recorder-sdk-apache-http – Instruments outbound HTTP calls made with Apache
HTTP clients.
•aws-xray-recorder-sdk-spring – Provides interceptors for Spring AOP Framework applications.
•aws-xray-recorder-sdk-sql-postgres – Instruments outbound calls to a PostgreSQL database
made with JDBC.
•aws-xray-recorder-sdk-sql-mysql – Instruments outbound calls to a MySQL database made
with JDBC.
•aws-xray-recorder-sdk-bom – Provides a bill of materials that you can use to specify the version
to use for all submodules.
If you use Maven or Gradle to build your application, add the X-Ray SDK for Java to your build
configuration (p. 114).
For reference documentation for of the SDK's classes and methods, see AWS X-Ray SDK for Java API
Reference.
Requirements
The X-Ray SDK for Java requires Java 8 or later, Servlet API 3, the AWS SDK, and Jackson.
The SDK depends on the following libraries at compile and runtime:
• AWS SDK for Java version 1.11.106 or later
• Servlet API 3.1.0
These dependencies are declared in the SDK's pom.xml file and are included automatically if you build
using Maven or Gradle.
If you use a library that is included in the X-Ray SDK for Java, you must use the included version. For
example, if you already depend on Jackson at runtime and include JARs in your deployment for that
dependency, you must remove those JARs because the SDK JAR includes its own versions of Jackson
libraries.
Dependency Management
The X-Ray SDK for Java is available from Maven:
•Group – com.amazonaws
•Bill of Materials – aws-xray-recorder-sdk-bom
•Version – 1.3.1
114

AWS X-Ray Developer Guide
Dependency Management
If you use Maven to build your application, add the SDK as a dependency in your pom.xml file.
Example pom.xml - dependencies
<dependencyManagement>
<dependencies>
<dependency>
<groupId>com.amazonaws</groupId>
<artifactId>aws-xray-recorder-sdk-bom</artifactId>
<version>1.3.1</version>
<type>pom</type>
<scope>import</scope>
</dependency>
</dependencies>
</dependencyManagement>
<dependencies>
<dependency>
<groupId>com.amazonaws</groupId>
<artifactId>aws-xray-recorder-sdk-core</artifactId>
</dependency>
<dependency>
<groupId>com.amazonaws</groupId>
<artifactId>aws-xray-recorder-sdk-apache-http</artifactId>
</dependency>
<dependency>
<groupId>com.amazonaws</groupId>
<artifactId>aws-xray-recorder-sdk-aws-sdk</artifactId>
</dependency>
<dependency>
<groupId>com.amazonaws</groupId>
<artifactId>aws-xray-recorder-sdk-aws-sdk-instrumentor</artifactId>
</dependency>
<dependency>
<groupId>com.amazonaws</groupId>
<artifactId>aws-xray-recorder-sdk-sql-postgres</artifactId>
</dependency>
<dependency>
<groupId>com.amazonaws</groupId>
<artifactId>aws-xray-recorder-sdk-sql-mysql</artifactId>
</dependency>
</dependencies>
For Gradle, add the SDK as a compile-time dependency in your build.gradle file.
Example build.gradle - dependencies
dependencies {
compile("org.springframework.boot:spring-boot-starter-web")
testCompile("org.springframework.boot:spring-boot-starter-test")
compile("com.amazonaws:aws-java-sdk-dynamodb")
compile("com.amazonaws:aws-xray-recorder-sdk-core")
compile("com.amazonaws:aws-xray-recorder-sdk-aws-sdk")
compile("com.amazonaws:aws-xray-recorder-sdk-aws-sdk-instrumentor")
compile("com.amazonaws:aws-xray-recorder-sdk-apache-http")
compile("com.amazonaws:aws-xray-recorder-sdk-sql-postgres")
compile("com.amazonaws:aws-xray-recorder-sdk-sql-mysql")
testCompile("junit:junit:4.11")
}
dependencyManagement {
imports {
mavenBom('com.amazonaws:aws-java-sdk-bom:1.11.39')
mavenBom('com.amazonaws:aws-xray-recorder-sdk-bom:1.3.1')
}
115

AWS X-Ray Developer Guide
Configuration
}
If you use Elastic Beanstalk to deploy your application, you can use Maven or Gradle to build on-
instance each time you deploy, instead of building and uploading a large archive that includes all of your
dependencies. See the sample application (p. 77) for an example that uses Gradle.
Configuring the X-Ray SDK for Java
The X-Ray SDK for Java provides a class named AWSXRay that provides the global recorder, a
TracingHandler that you can use to instrument your code. You can configure the global recorder to
customize the AWSXRayServletFilter that creates segments for incoming HTTP calls.
Sections
•Service Plugins (p. 116)
•Sampling Rules (p. 118)
•Logging (p. 120)
•Environment Variables (p. 120)
•System Properties (p. 120)
Service Plugins
Use plugins to record information about the service hosting your application.
Plugins
• Amazon EC2 – EC2Plugin adds the instance ID and Availability Zone.
• Elastic Beanstalk – ElasticBeanstalkPlugin adds the environment name, version label, and
deployment ID.
• Amazon ECS – ECSPlugin adds the container ID.
116
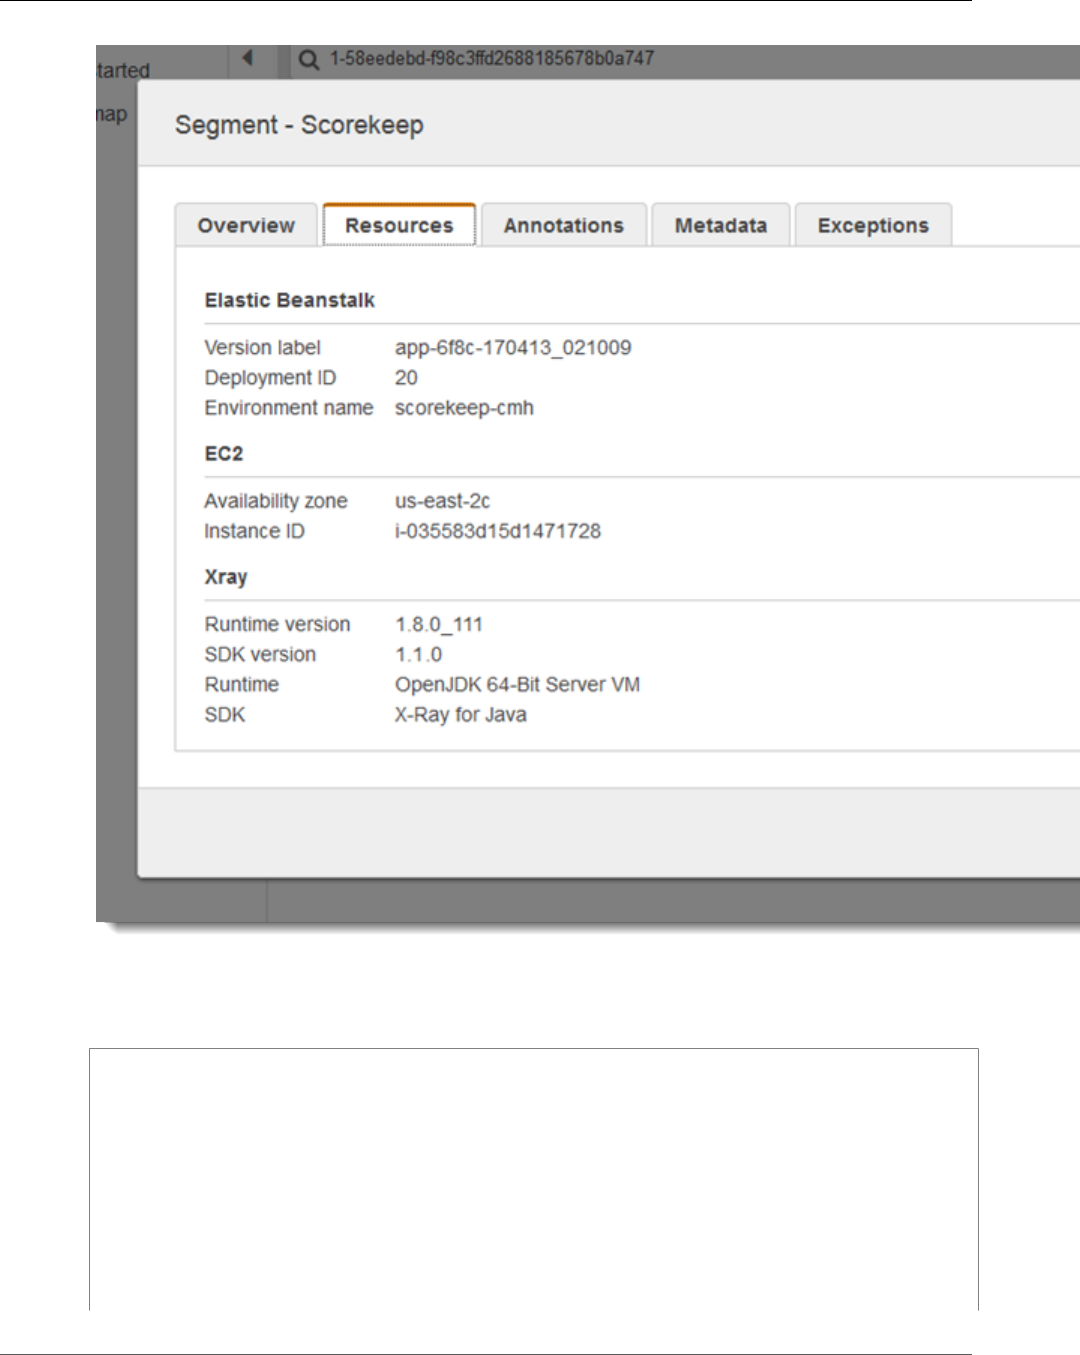
AWS X-Ray Developer Guide
Service Plugins
To use a plugin, call withPlugin on your AWSXRayRecorderBuilder.
Example src/main/java/scorekeep/WebConfig.java - Recorder
import com.amazonaws.xray.AWSXRay;
import com.amazonaws.xray.AWSXRayRecorderBuilder;
import com.amazonaws.xray.plugins.EC2Plugin;
import com.amazonaws.xray.plugins.ElasticBeanstalkPlugin;
import com.amazonaws.xray.strategy.sampling.LocalizedSamplingStrategy;
@Configuration
public class WebConfig {
...
static {
AWSXRayRecorderBuilder builder = AWSXRayRecorderBuilder.standard().withPlugin(new
EC2Plugin()).withPlugin(new ElasticBeanstalkPlugin());
117
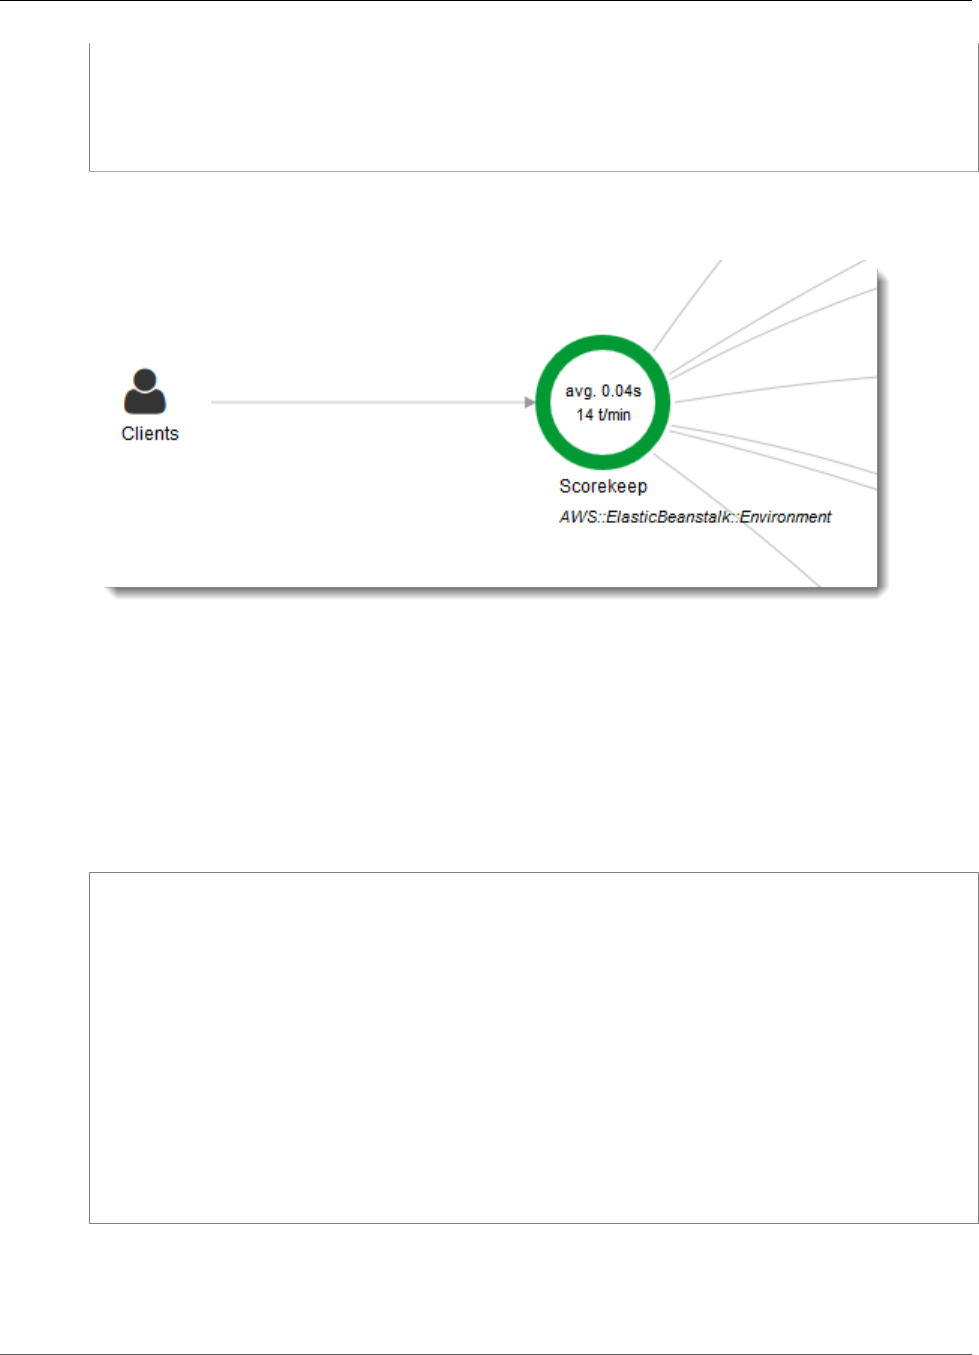
AWS X-Ray Developer Guide
Sampling Rules
URL ruleFile = WebConfig.class.getResource("/sampling-rules.json");
builder.withSamplingStrategy(new LocalizedSamplingStrategy(ruleFile));
AWSXRay.setGlobalRecorder(builder.build());
}
}
The SDK also uses plugin settings to set the origin field on the segment. This indicates the type of
AWS resource that runs your application. The resource type appears under your application's name in the
service map. For example, AWS::ElasticBeanstalk::Environment.
When you use multiple plugins, the SDK uses the plugin that was loaded last to determine the origin.
Sampling Rules
The SDK has a default sampling strategy that determines which requests get traced. By default, the SDK
traces the first request each second, and five percent of any additional requests. You can customize the
SDK's sampling behavior by applying rules you define in a local file.
Example sampling-rules.json
{
"version": 1,
"rules": [
{
"description": "Player moves.",
"service_name": "*",
"http_method": "*",
"url_path": "/api/move/*",
"fixed_target": 0,
"rate": 0.05
}
],
"default": {
"fixed_target": 1,
"rate": 0.1
}
}
This example defines one custom rule and a default rule. The custom rule applies a five-percent sampling
rate with no minimum number of requests to trace for paths under /api/move/. The default rule traces
the first request each second and 10 percent of additional requests.
118

AWS X-Ray Developer Guide
Sampling Rules
The SDK applies custom rules in the order in which they are defined. If a request matches multiple
custom rules, the SDK applies only the first rule.
On Lambda, you cannot modify the sampling rate. If your function is called by an instrumented service,
calls generated requests that were sampled by that service will be recorded by Lambda. If active tracing
is enabled and no tracing header is present, Lambda makes the sampling decision.
For Spring, configure the global recorder in a configuration class.
Example src/main/java/myapp/WebConfig.java - Recorder Configuration
import com.amazonaws.xray.AWSXRay;
import com.amazonaws.xray.AWSXRayRecorderBuilder;
import com.amazonaws.xray.javax.servlet.AWSXRayServletFilter;
import com.amazonaws.xray.plugins.EC2Plugin;
import com.amazonaws.xray.strategy.sampling.LocalizedSamplingStrategy;
@Configuration
public class WebConfig {
static {
AWSXRayRecorderBuilder builder = AWSXRayRecorderBuilder.standard().withPlugin(new
EC2Plugin());
URL ruleFile = WebConfig.class.getResource("file://sampling-rules.json");
builder.withSamplingStrategy(new LocalizedSamplingStrategy(ruleFile));
AWSXRay.setGlobalRecorder(builder.build());
}
For Tomcat, add a listener that extends ServletContextListener.
Example src/com/myapp/web/Startup.java
import com.amazonaws.xray.AWSXRay;
import com.amazonaws.xray.AWSXRayRecorderBuilder;
import com.amazonaws.xray.plugins.EC2Plugin;
import com.amazonaws.xray.strategy.sampling.LocalizedSamplingStrategy;
import java.net.URL;
import javax.servlet.ServletContextEvent;
import javax.servlet.ServletContextListener;
public class Startup implements ServletContextListener {
@Override
public void contextInitialized(ServletContextEvent event) {
AWSXRayRecorderBuilder builder = AWSXRayRecorderBuilder.standard().withPlugin(new
EC2Plugin());
URL ruleFile = Startup.class.getResource("/sampling-rules.json");
builder.withSamplingStrategy(new LocalizedSamplingStrategy(ruleFile));
AWSXRay.setGlobalRecorder(builder.build());
}
@Override
public void contextDestroyed(ServletContextEvent event) { }
}
Register the listener in the deployment descriptor.
119

AWS X-Ray Developer Guide
Logging
Example WEB-INF/web.xml
...
<listener>
<listener-class>com.myapp.web.Startup</listener-class>
</listener>
Logging
By default, the SDK outputs SEVERE level and ERROR level messages to your application logs. You can
enable debug-level logging on the SDK to output more detailed logs to your application log file.
Example application.properties
Set the logging level with the logging.level.com.amazonaws.xray property.
logging.level.com.amazonaws.xray = DEBUG
Use debug logs to identify issues, such as unclosed subsegments, when you generate subsegments
manually (p. 128).
Environment Variables
You can use environment variables to configure the X-Ray SDK for Java. The SDK supports the following
variables.
•AWS_XRAY_TRACING_NAME – Set a service name that the SDK uses for segments. Overrides the service
name that you set on the servlet filter's segment naming strategy (p. 122).
•AWS_XRAY_DAEMON_ADDRESS – Set the host and port of the X-Ray daemon listener. By default, the
SDK sends trace data to 127.0.0.1:2000. Use this variable if you have configured the daemon to
listen on a different port (p. 102) or if it is running on a different host.
•AWS_XRAY_CONTEXT_MISSING – Set to LOG_ERROR to avoid throwing exceptions when your
instrumented code attempts to record data when no segment is open.
Valid Values
•RUNTIME_ERROR – Throw a runtime exception (default).
•LOG_ERROR – Log an error and continue.
Errors related to missing segments or subsegments can occur when you attempt to use an
instrumented client in startup code that runs when no request is open, or in code that spawns a new
thread.
Environment variables override equivalent system properties (p. 120) and values set in code.
System Properties
You can use system properties as a JVM-specific alternative to environment variables (p. 120). The SDK
supports the following properties.
•com.amazonaws.xray.strategy.tracingName – Equivalent to AWS_XRAY_TRACING_NAME.
•com.amazonaws.xray.emitters.daemonAddress – Equivalent to AWS_XRAY_DAEMON_ADDRESS.
120

AWS X-Ray Developer Guide
Incoming Requests
•com.amazonaws.xray.strategy.contextMissingStrategy – Equivalent to
AWS_XRAY_CONTEXT_MISSING.
If both a system property and the equivalent environment variable are set, the environment variable
values is used. Either method overrides values set in code.
Tracing Incoming Requests with the X-Ray SDK for
Java
You can use the X-Ray SDK to trace incoming HTTP requests that your application serves on an EC2
instance in Amazon EC2, AWS Elastic Beanstalk, or Amazon ECS.
Use a Filter to instrument incoming HTTP requests. When you add the X-Ray servlet filter to your
application, the X-Ray SDK for Java creates a segment for each sampled request. This segment includes
timing, method, and disposition of the HTTP request. Additional instrumentation creates subsegments
on this segment.
Note
For AWS Lambda functions, Lambda creates a segment for each sampled request. See AWS
Lambda and AWS X-Ray (p. 208) for more information.
Each segment has a name that identifies your application in the service map. The segment can be named
statically, or you can configure the SDK to name it dynamically based on the host header in the incoming
request. Dynamic naming lets you group traces based on the domain name in the request, and apply a
default name if the name doesn't match an expected pattern (for example, if the host header is forged).
Forwarded Requests
If a load balancer or other intermediary forwards a request to your application, X-Ray takes the
client IP from the X-Forwarded-For header in the request instead of from the source IP in the
IP packet. The client IP that is recorded for a forwarded request can be forged, so it should not
be trusted.
When a request is forwarded, the SDK sets an additional field in the segment to indicate this. If the
segment contains the field x_forwarded_for set to true, the client IP was taken from the X-
Forwarded-For header in the HTTP request.
The message handler creates a segment for each incoming request with an http block that contains the
following information:
•HTTP method – GET, POST, PUT, DELETE, etc.
•Client address – The IP address of the client that sent the request.
•Response code – The HTTP response code for the completed request.
•Timing – The start time (when the request was received) and end time (when the response was sent).
•User agent — The user-agent from the request.
•Content length — The content-length from the response.
Sections
•Adding a Tracing Filter to your Application (Tomcat) (p. 122)
•Adding a Tracing Filter to your Application (Spring) (p. 122)
•Configuring a Segment Naming Strategy (p. 122)
121

AWS X-Ray Developer Guide
Adding a Tracing Filter to your Application (Tomcat)
Adding a Tracing Filter to your Application (Tomcat)
For Tomcat, add a <filter> to your project's web.xml file. Use the fixedName parameter to specify a
service name (p. 122) to apply to segments created for incoming requests.
Example WEB-INF/web.xml - Tomcat
<filter>
<filter-name>AWSXRayServletFilter</filter-name>
<filter-class>com.amazonaws.xray.javax.servlet.AWSXRayServletFilter</filter-class>
<init-param>
<param-name>fixedName</param-name>
<param-value>MyApp</param-value>
</init-param>
</filter>
<filter-mapping>
<filter-name>AWSXRayServletFilter</filter-name>
<url-pattern>*</url-pattern>
</filter-mapping>
Adding a Tracing Filter to your Application (Spring)
For Spring, add a Filter to your WebConfig class. Pass the segment name to the
AWSXRayServletFilter constructor as a string.
Example src/main/java/myapp/WebConfig.java - Spring
package myapp;
import org.springframework.context.annotation.Configuration;
import org.springframework.context.annotation.Bean;
import javax.servlet.Filter;
import com.amazonaws.xray.javax.servlet.AWSXRayServletFilter;
@Configuration
public class WebConfig {
@Bean
public Filter TracingFilter() {
return new AWSXRayServletFilter("Scorekeep");
}
}
Configuring a Segment Naming Strategy
AWS X-Ray uses a service name to identify your application and distinguish it from the other applications,
databases, external APIs, and AWS resources that your application uses. When the X-Ray SDK generates
segments for incoming requests, it records your application's service name in the segment's name
field (p. 61).
The X-Ray SDK can name segments after the hostname in the HTTP request header. However, this header
can be forged, which could result in unexpected nodes in your service map. To prevent the SDK from
naming segments incorrectly due to requests with forged host headers, you must specify a default name
for incoming requests.
If your application serves requests for multiple domains, you can configure the SDK to use a dynamic
naming strategy to reflect this in segment names. A dynamic naming strategy allows the SDK to use the
hostname for requests that match an expected pattern, and apply the default name to requests that
don't.
122

AWS X-Ray Developer Guide
Configuring a Segment Naming Strategy
For example, you might have a single application serving requests to three subdomains–
www.example.com, api.example.com, and static.example.com. You can use a dynamic naming
strategy with the pattern *.example.com to identify segments for each subdomain with a different
name, resulting in three service nodes on the service map. If your application receives requests with a
hostname that doesn't match the pattern, you will see a fourth node on the service map with a fallback
name that you specify.
To use the same name for all request segments, specify the name of your application when you initialize
the servlet filter, as shown in the previous section (p. 122). This has the same effect as creating a
FixedSegmentNamingStrategy and passing it to AWSXRayServletFilter constructor.
Note
You can override the default service name that you define in code with the
AWS_XRAY_TRACING_NAME environment variable (p. 120).
A dynamic naming strategy defines a pattern that hostnames should match, and a default name to use
if the hostname in the HTTP request does not match the pattern. To name segments dynamically in
Tomcat, use the dynamicNamingRecognizedHosts and dynamicNamingFallbackName to define the
pattern and default name, respectively.
Example WEB-INF/web.xml - Servlet Filter with Dynamic Naming
<filter>
<filter-name>AWSXRayServletFilter</filter-name>
<filter-class>com.amazonaws.xray.javax.servlet.AWSXRayServletFilter</filter-class>
<init-param>
<param-name>dynamicNamingRecognizedHosts</param-name>
<param-value>*.example.com</param-value>
</init-param>
<init-param>
<param-name>dynamicNamingFallbackName</param-name>
<param-value>MyApp</param-value>
</init-param>
</filter>
<filter-mapping>
<filter-name>AWSXRayServletFilter</filter-name>
<url-pattern>*</url-pattern>
</filter-mapping>
For Spring, create a DynamicSegmentNamingStrategy and pass it to the AWSXRayServletFilter
constructor.
Example src/main/java/myapp/WebConfig.java - Servlet Filter with Dynamic Naming
package myapp;
import org.springframework.context.annotation.Configuration;
import org.springframework.context.annotation.Bean;
import javax.servlet.Filter;
import com.amazonaws.xray.javax.servlet.AWSXRayServletFilter;
import com.amazonaws.xray.strategy.DynamicSegmentNamingStrategy;
@Configuration
public class WebConfig {
@Bean
public Filter TracingFilter() {
return new AWSXRayServletFilter(new DynamicSegmentNamingStrategy("MyApp",
"*.example.com"));
}
}
123

AWS X-Ray Developer Guide
AWS SDK Clients
Tracing AWS SDK Calls with the X-Ray SDK for Java
When your application makes calls to AWS services to store data, write to a queue, or send notifications,
the X-Ray SDK for Java tracks the calls downstream in subsegments (p. 128). Traced AWS services
and resources that you access within those services (for example, an Amazon S3 bucket or Amazon SQS
queue), appear as downstream nodes on the service map in the X-Ray console.
The X-Ray SDK for Java automatically instruments all AWS SDK clients when you include the aws-sdk
and aws-sdk-instrumentor submodules (p. 114) in your build. If you don't include the Instrumentor
submodule, you can choose to instrument some clients while excluding others.
To instrument individual clients, remove the aws-sdk-instrumentor submodule from your build and
add an XRayClient as a TracingHandler on your AWS SDK client using the service's client builder.
For example, to instrument an AmazonDynamoDB client, pass a tracing handler to
AmazonDynamoDBClientBuilder.
Example MyModel.java - DynamoDB Client
import com.amazonaws.xray.AWSXRay;
import com.amazonaws.xray.handlers.TracingHandler;
...
public class MyModel {
private AmazonDynamoDB client = AmazonDynamoDBClientBuilder.standard()
.withRegion(Regions.fromName(System.getenv("AWS_REGION")))
.withRequestHandlers(new TracingHandler(AWSXRay.getGlobalRecorder()))
.build();
...
For all services, you can see the name of the API called in the X-Ray console. For a subset of services, the
X-Ray SDK adds information to the segment to provide more granularity in the service map.
For example, when you make a call with an instrumented DynamoDB client, the SDK adds the table name
to the segment for calls that target a table. In the console, each table appears as a separate node in the
service map, with a generic DynamoDB node for calls that don't target a table.
Example Subsegment for a Call to DynamoDB to Save an Item
{
"id": "24756640c0d0978a",
"start_time": 1.480305974194E9,
"end_time": 1.4803059742E9,
"name": "DynamoDB",
"namespace": "aws",
"http": {
"response": {
"content_length": 60,
"status": 200
}
},
"aws": {
"table_name": "scorekeep-user",
"operation": "UpdateItem",
"request_id": "UBQNSO5AEM8T4FDA4RQDEB94OVTDRVV4K4HIRGVJF66Q9ASUAAJG",
}
}
When you access named resources, calls to the following services create additional nodes in the service
map. Calls that don't target specific resources create a generic node for the service.
124

AWS X-Ray Developer Guide
Outgoing HTTP Calls
•Amazon DynamoDB – Table name
•Amazon Simple Storage Service – Bucket and key name
•Amazon Simple Queue Service – Queue name
Tracing Calls to Downstream HTTP Web Services
with the X-Ray SDK for Java
When your application makes calls to microservices or public HTTP APIs, you can use the X-Ray SDK
for Java's version of HttpClient to instrument those calls and add the API to the service graph as a
downstream service.
The X-Ray SDK for Java includes DefaultHttpClient and HttpClientBuilder classes that can be
used in place of the Apache HttpComponents equivalents to instrument outgoing HTTP calls.
•com.amazonaws.xray.proxies.apache.http.DefaultHttpClient -
org.apache.http.impl.client.DefaultHttpClient
•com.amazonaws.xray.proxies.apache.http.HttpClientBuilder -
org.apache.http.impl.client.HttpClientBuilder
These libraries are in the aws-xray-recorder-sdk-apache-http (p. 113) submodule.
You can replace your existing import statements with the X-Ray equivalent to instrument all clients, or
use the fully qualified name when you initialize a client to instrument specific clients.
Example HttpClientBuilder
import com.fasterxml.jackson.databind.ObjectMapper;
import org.apache.http.HttpEntity;
import org.apache.http.client.methods.CloseableHttpResponse;
import org.apache.http.client.methods.HttpGet;
import org.apache.http.impl.client.CloseableHttpClient;
import org.apache.http.util.EntityUtils;
import com.amazonaws.xray.proxies.apache.http.HttpClientBuilder;
...
public String randomName() throws IOException {
CloseableHttpClient httpclient = HttpClientBuilder.create().build();
HttpGet httpGet = new HttpGet("http://names.example.com/api/");
CloseableHttpResponse response = httpclient.execute(httpGet);
try {
HttpEntity entity = response.getEntity();
InputStream inputStream = entity.getContent();
ObjectMapper mapper = new ObjectMapper();
Map<String, String> jsonMap = mapper.readValue(inputStream, Map.class);
String name = jsonMap.get("name");
EntityUtils.consume(entity);
return name;
} finally {
response.close();
}
}
When you instrument a call to a downstream web api, the X-Ray SDK for Java records a subsegment with
information about the HTTP request and response. X-Ray uses the subsegment to generate an inferred
segment for the remote API.
125

AWS X-Ray Developer Guide
SQL Queries
Example Subsegment for a Downstream HTTP Call
{
"id": "004f72be19cddc2a",
"start_time": 1484786387.131,
"end_time": 1484786387.501,
"name": "names.example.com",
"namespace": "remote",
"http": {
"request": {
"method": "GET",
"url": "https://names.example.com/"
},
"response": {
"content_length": -1,
"status": 200
}
}
}
Example Inferred Segment for a Downstream HTTP Call
{
"id": "168416dc2ea97781",
"name": "names.example.com",
"trace_id": "1-5880168b-fd5153bb58284b67678aa78c",
"start_time": 1484786387.131,
"end_time": 1484786387.501,
"parent_id": "004f72be19cddc2a",
"http": {
"request": {
"method": "GET",
"url": "https://names.example.com/"
},
"response": {
"content_length": -1,
"status": 200
}
},
"inferred": true
}
Tracing SQL Queries with the X-Ray SDK for Java
Instrument SQL database queries by adding the X-Ray SDK for Java JDBC interceptor to your data source
configuration.
•PostgreSQL – com.amazonaws.xray.sql.postgres.TracingInterceptor
•MySQL – com.amazonaws.xray.sql.mysql.TracingInterceptor
These interceptors are in the aws-xray-recorder-sql-postgres and aws-
xray-recorder-sql-mysql submodules (p. 113), respectively. They implement
org.apache.tomcat.jdbc.pool.JdbcInterceptor and are compatible with Tomcat connection
pools.
For Spring, add the interceptor in a properties file and build the data source with Spring Boot's
DataSourceBuilder.
126
AWS X-Ray Developer Guide
SQL Queries
Example src/main/java/resources/application.properties - PostgreSQL JDBC
Interceptor
spring.datasource.continue-on-error=true
spring.jpa.show-sql=false
spring.jpa.hibernate.ddl-auto=create-drop
spring.datasource.jdbc-interceptors=com.amazonaws.xray.sql.postgres.TracingInterceptor
spring.jpa.database-platform=org.hibernate.dialect.PostgreSQL94Dialect
Example src/main/java/myapp/WebConfig.java - Data Source
import org.springframework.boot.autoconfigure.EnableAutoConfiguration;
import org.springframework.boot.autoconfigure.jdbc.DataSourceBuilder;
import org.springframework.boot.context.properties.ConfigurationProperties;
import org.springframework.context.annotation.Bean;
import org.springframework.context.annotation.Configuration;
import org.springframework.data.jpa.repository.config.EnableJpaRepositories;
import javax.servlet.Filter;
import javax.sql.DataSource;
import java.net.URL;
@Configuration
@EnableAutoConfiguration
@EnableJpaRepositories("myapp")
public class RdsWebConfig {
@Bean
@ConfigurationProperties(prefix = "spring.datasource")
public DataSource dataSource() {
logger.info("Initializing PostgreSQL datasource");
return DataSourceBuilder.create()
.driverClassName("org.postgresql.Driver")
.url("jdbc:postgresql://" + System.getenv("RDS_HOSTNAME") + ":" +
System.getenv("RDS_PORT") + "/ebdb")
.username(System.getenv("RDS_USERNAME"))
.password(System.getenv("RDS_PASSWORD"))
.build();
}
...
}
For Tomcat, call setJdbcInterceptors on the JDBC data source with a reference to the X-Ray SDK for
Java class.
Example src/main/myapp/model.java - Data Source
import org.apache.tomcat.jdbc.pool.DataSource;
...
DataSource source = new DataSource();
source.setUrl(url);
source.setUsername(user);
source.setPassword(password);
source.setDriverClassName("com.mysql.jdbc.Driver");
source.setJdbcInterceptors("com.amazonaws.xray.sql.mysql.TracingInterceptor;");
The Tomcat JDBC Data Source library is included in the X-Ray SDK for Java, but you can declare it as a
provided dependency to document that you use it.
127

AWS X-Ray Developer Guide
Custom Subsegments
Example pom.xml - JDBC Data Source
<dependency>
<groupId>org.apache.tomcat</groupId>
<artifactId>tomcat-jdbc</artifactId>
<version>8.0.36</version>
<scope>provided</scope>
</dependency>
Generating Custom Subsegments with the X-Ray
SDK for Java
Subsegments extend a trace's segment (p. 20) with details about work done in order to serve a request.
Each time you make a call with an instrumented client, the X-Ray SDK records the information generated
in a subsegment. You can create additional subsegments to group other subsegments, to measure the
performance of a section of code, or to record annotations and metadata.
To manage subsegments, use the beginSubsegment and endSubsegment methods.
Example GameModel.java - Custom Subsegment
import com.amazonaws.xray.AWSXRay;
...
public void saveGame(Game game) throws SessionNotFoundException {
// wrap in subsegment
Subsegment subsegment = AWSXRay.beginSubsegment("Save Game");
try {
// check session
String sessionId = game.getSession();
if (sessionModel.loadSession(sessionId) == null ) {
throw new SessionNotFoundException(sessionId);
}
mapper.save(game);
} catch (Exception e) {
subsegment.addException(e);
throw e;
} finally {
AWSXRay.endSubsegment();
}
}
In this example, the code within the subsegment loads the game's session from DynamoDB with a
method on the session model, and uses the AWS SDK for Java's DynamoDB mapper to save the game.
Wrapping this code in a subsegment makes the calls DynamoDB children of the Save Game subsegment
in the trace view in the console.
128
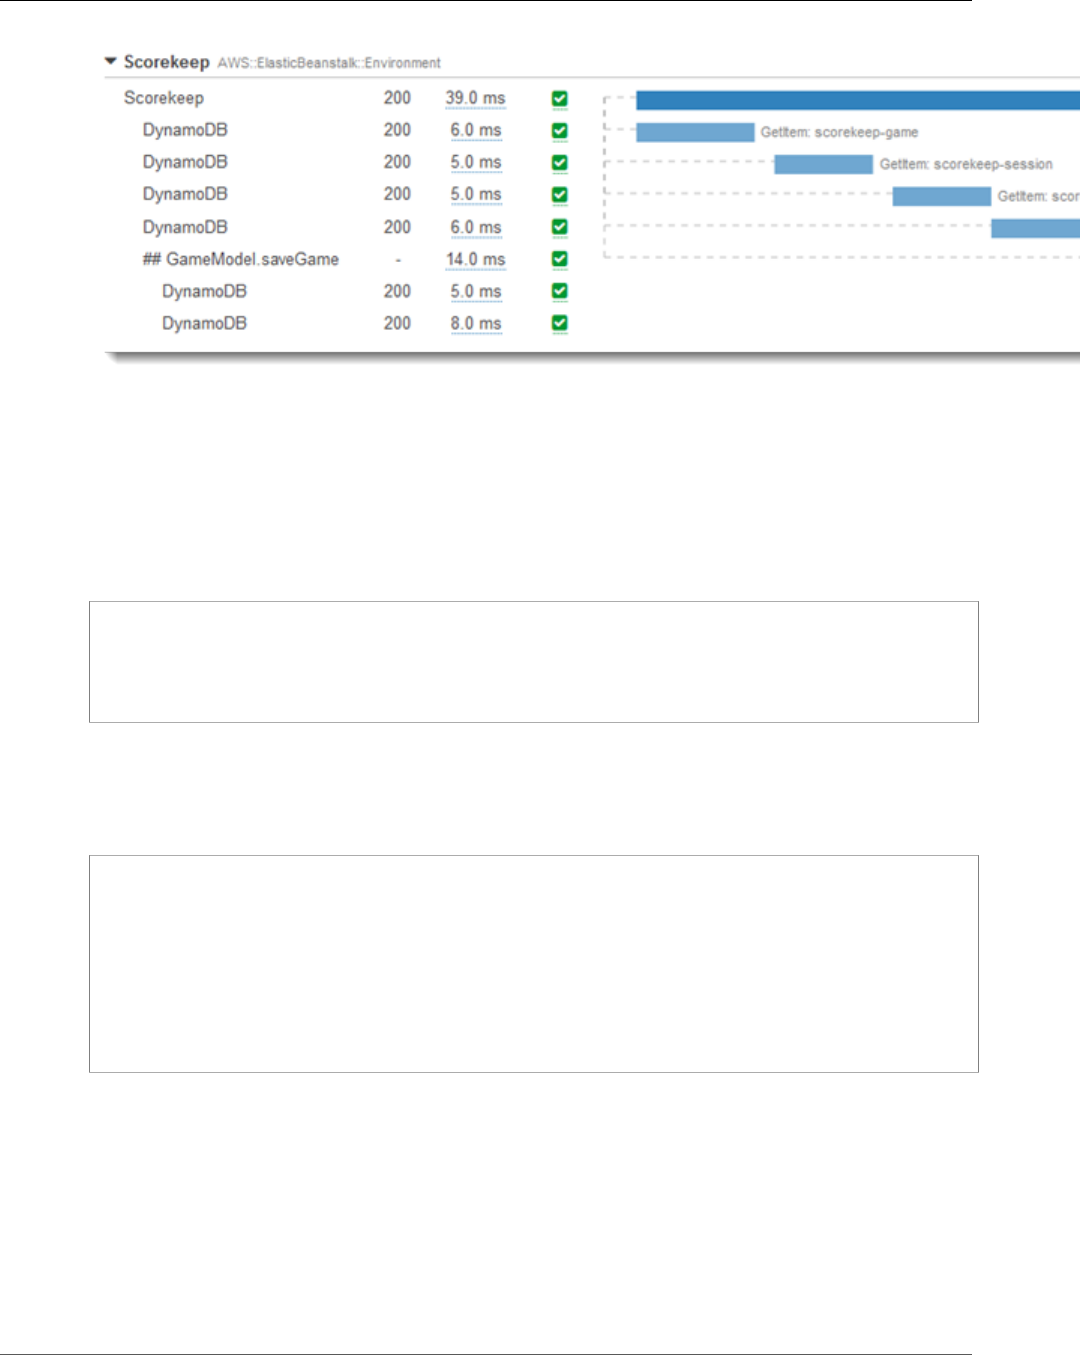
AWS X-Ray Developer Guide
Annotations and Metadata
If the code in your subsegment throws checked exceptions, wrap it in a try block and call
AWSXRay.endSubsegment() in a finally block to ensure that the subsegment is always closed. If a
subsegment is not closed, the parent segment cannot be completed and won't be sent to X-Ray.
For code that doesn't throw checked exceptions, you can pass the code to
AWSXRay.CreateSubsegment as a Lambda function.
Example Subsegment Lambda Function
import com.amazonaws.xray.AWSXRay;
AWSXRay.createSubsegment("getMovies", (subsegment) -> {
// function code
});
When you create a subsegment within a segment or another subsegment, the X-Ray SDK for Java
generates an ID for it and records the start time and end time.
Example Subsegment with Metadata
"subsegments": [{
"id": "6f1605cd8a07cb70",
"start_time": 1.480305974194E9,
"end_time": 1.4803059742E9,
"name": "Custom subsegment for UserModel.saveUser function",
"metadata": {
"debug": {
"test": "Metadata string from UserModel.saveUser"
}
},
Add Annotations and Metadata to Segments with
the X-Ray SDK for Java
You can record additional information about requests, the environment, or your application with
annotations and metadata. You can add annotations and metadata to the segments that the X-Ray SDK
creates, or to custom subsegments that you create.
129
AWS X-Ray Developer Guide
Recording Annotations with the X-Ray SDK for Java
Annotations are key-value pairs with string, number, or Boolean values. Annotations are indexed for use
with filter expressions (p. 37). Use annotations to record data that you want to use to group traces in the
console, or when calling the GetTraceSummaries API.
Metadata are key-value pairs that can have values of any type, including objects and lists, but are not
indexed for use with filter expressions. Use metadata to record additional data that you want stored in
the trace but don't need to use with search.
In addition to annotations and metadata, you can also record user ID strings (p. 132) on segments. User
IDs are recorded in a separate field on segments and are indexed for use with search.
Sections
•Recording Annotations with the X-Ray SDK for Java (p. 130)
•Recording Metadata with the X-Ray SDK for Java (p. 131)
•Recording User IDs with the X-Ray SDK for Java (p. 132)
Recording Annotations with the X-Ray SDK for Java
Use annotations to record information on segments or subsegments that you want indexed for search.
Annotation Requirements
•Keys – Up to 500 alphanumeric characters. No spaces or symbols except underscores.
•Values – Up to 1,000 Unicode characters.
•Entries – Up to 50 annotations per trace.
To record annotations
1. Get a reference to the current segment or subsegment from AWSXRay.
import com.amazonaws.xray.AWSXRay;
import com.amazonaws.xray.entities.Segment;
...
Segment document = AWSXRay.getCurrentSegment();
or
import com.amazonaws.xray.AWSXRay;
import com.amazonaws.xray.entities.Subsegment;
...
Subsegment document = AWSXRay.getCurrentSubsegment();
2. Call putAnnotation with a String key, and a Boolean, Number, or String value.
document.putAnnotation("mykey", "my value");
The SDK records annotations as key-value pairs in an annotations object in the segment document.
Calling putAnnotation twice with the same key overwrites previously recorded values on the same
segment or subsegment.
To find traces that have annotations with specific values, use the annotations.key keyword in a filter
expression (p. 37).
130
AWS X-Ray Developer Guide
Recording Metadata with the X-Ray SDK for Java
Example src/main/java/scorekeep/GameModel.java – Annotations and Metadata
import com.amazonaws.xray.AWSXRay;
import com.amazonaws.xray.entities.Segment;
import com.amazonaws.xray.entities.Subsegment;
...
public void saveGame(Game game) throws SessionNotFoundException {
// wrap in subsegment
Subsegment subsegment = AWSXRay.beginSubsegment("## GameModel.saveGame");
try {
// check session
String sessionId = game.getSession();
if (sessionModel.loadSession(sessionId) == null ) {
throw new SessionNotFoundException(sessionId);
}
Segment segment = AWSXRay.getCurrentSegment();
subsegment.putMetadata("resources", "game", game);
segment.putAnnotation("gameid", game.getId());
mapper.save(game);
} catch (Exception e) {
subsegment.addException(e);
throw e;
} finally {
AWSXRay.endSubsegment();
}
}
Recording Metadata with the X-Ray SDK for Java
Use metadata to record information on segments or subsegments that you don't need indexed for
search. Metadata values can be strings, numbers, Booleans, or any object that can be serialized into a
JSON object or array.
To record metadata
1. Get a reference to the current segment or subsegment from AWSXRay.
import com.amazonaws.xray.AWSXRay;
import com.amazonaws.xray.entities.Segment;
...
Segment document = AWSXRay.getCurrentSegment();
or
import com.amazonaws.xray.AWSXRay;
import com.amazonaws.xray.entities.Subsegment;
...
Subsegment document = AWSXRay.getCurrentSubsegment();
2. Call putMetadata with a String namespace, String key, and a Boolean, Number, String, or Object
value.
document.putMetadata("my namespace", "my key", "my value");
or
Call putMetadata with just a key and value.
131
AWS X-Ray Developer Guide
Recording User IDs with the X-Ray SDK for Java
document.putMetadata("my key", "my value");
If you don't specify a namespace, the SDK uses default. Calling putMetadata twice with the same key
overwrites previously recorded values on the same segment or subsegment.
Example src/main/java/scorekeep/GameModel.java – Annotations and Metadata
import com.amazonaws.xray.AWSXRay;
import com.amazonaws.xray.entities.Segment;
import com.amazonaws.xray.entities.Subsegment;
...
public void saveGame(Game game) throws SessionNotFoundException {
// wrap in subsegment
Subsegment subsegment = AWSXRay.beginSubsegment("## GameModel.saveGame");
try {
// check session
String sessionId = game.getSession();
if (sessionModel.loadSession(sessionId) == null ) {
throw new SessionNotFoundException(sessionId);
}
Segment segment = AWSXRay.getCurrentSegment();
subsegment.putMetadata("resources", "game", game);
segment.putAnnotation("gameid", game.getId());
mapper.save(game);
} catch (Exception e) {
subsegment.addException(e);
throw e;
} finally {
AWSXRay.endSubsegment();
}
}
Recording User IDs with the X-Ray SDK for Java
Record user IDs on request segments to identify the user who sent the request.
To record user IDs
1. Get a reference to the current segment from AWSXRay.
import com.amazonaws.xray.AWSXRay;
import com.amazonaws.xray.entities.Segment;
...
Segment document = AWSXRay.getCurrentSegment();
2. Call setUser with a String ID of the user who sent the request.
document.setUser("U12345");
You can call setUser in your controllers to record the user ID as soon as your application starts
processing a request. If you will only use the segment to set the user ID, you can chain the calls in a
single line.
Example src/main/java/scorekeep/MoveController.java – User ID
import com.amazonaws.xray.AWSXRay;
132

AWS X-Ray Developer Guide
Multithreading
...
@RequestMapping(value="/{userId}", method=RequestMethod.POST)
public Move newMove(@PathVariable String sessionId, @PathVariable String gameId,
@PathVariable String userId, @RequestBody String move) throws SessionNotFoundException,
GameNotFoundException, StateNotFoundException, RulesException {
AWSXRay.getCurrentSegment().setUser(userId);
return moveFactory.newMove(sessionId, gameId, userId, move);
}
To find traces for a user ID, use the user keyword in a filter expression (p. 37).
Passing Segment Context between Threads in a
Multithreaded Application
When you create a new thread in your application, the AWSXRayRecorder doesn't maintain a reference
to the current segment or subsegment Entity. If you use an instrumented client in the new thread, the
SDK tries to write to a segment that doesn't exist, causing a SegmentNotFoundException.
To avoid throwing exceptions during development, you can configure the recorder with a
ContextMissingStrategy that tells it to log an error instead. You can configure the strategy in code with
SetContextMissingStrategy, or configure equivalent options with an environment variable (p. 120) or
system property (p. 120).
One way to address the error is to use a new segment by calling beginSegment when you start the
thread and endSegment when you close it. This works if you are instrumenting code that doesn't run in
response to an HTTP request, like code that runs when your application starts.
If you use multiple threads to handle incoming requests, you can pass the current segment or
subsegment to the new thread and provide it to the global recorder. This ensures that the information
recorded within the new thread is associated with the same segment as the rest of the information
recorded about that request.
To pass trace context between threads, call GetTraceEntity on the global recorder to get a reference
to the current entity (segment or subsegment). Pass the entity to the new thread, and then call
SetTraceEntity to configure the global recorder to use it to record trace data within the thread.
See Using Instrumented Clients in Worker Threads (p. 96) for an example.
AOP with Spring and the X-Ray SDK for Java
This topic describes how to use the X-Ray SDK and the Spring Framework to instrument your application
without changing its core logic. This means that there is now a non-invasive way to instrument your
applications running remotely in AWS.
You must perform three tasks to enable this feature.
To enable AOP in Spring
1. Configure Spring (p. 134)
2. Annotate your code or implement an interface (p. 134)
3. Activate X-Ray in your application (p. 134)
133
AWS X-Ray Developer Guide
Configuring Spring
Configuring Spring
You can use Maven or Gradle to configure Spring to use AOP to instrument you application.
If you use Maven to build your application, add the following dependency in your pom.xml file.
<dependency>
<groupId>com.amazonaws</groupId>
<artifactId>aws-xray-recorder-sdk-spring</artifactId>
<version>1.3.1</version>
</dependency>
For Gradle, add the following dependency in your build.gradle file.
compile 'com.amazonaws:aws-xray-recorder-sdk-spring:1.3.1'
Annotating Your Code or Implementing an Interface
Your classes must either be annotated with the @XRayEnabled annotation, or implement the
XRayTraced interface. This tells the AOP system to wrap the functions of the affected class for X-Ray
instrumentation.
Activating X-Ray in Your Application
To activate X-Ray tracing in your application, your code must extend the abstract class
AbstractXRayInterceptor by overriding the following methods.
•generateMetadata—This function allows customization of the metadata attached to the current
function’s trace. By default, the class name of the executing function is recorded in the metadata. You
can add more data if you need additional insights.
•xrayEnabledClasses—This function is empty, and should remain so. It serves as the host for a
pointcut instructing the interceptor about which methods to wrap. Define the pointcut by specifying
which of the classes that are annotated with @XRayEnabled to trace. The following pointcut
statement tells the interceptor to wrap all controller beans annotated with the @XRayEnabled
annotation.
@Pointcut(“@within(com.amazonaws.xray.spring.aop.XRayEnabled) && bean(*Controller)”)
Example
The following code extends the abstract class AbstractXRayInterceptor.
@Aspect
@Component
public class XRayInspector extends AbstractXRayInterceptor {
@Override
protected Map<String, Map<String, Object>> generateMetadata(ProceedingJoinPoint
proceedingJoinPoint, Subsegment subsegment) throws Exception {
return super.generateMetadata(proceedingJoinPoint, subsegment);
}
@Override
@Pointcut("@within(com.amazonaws.xray.spring.aop.XRayEnabled) && bean(*Controller)")
public void xrayEnabledClasses() {}
134
AWS X-Ray Developer Guide
Example
}
The following code is a class that will be instrumented by X-Ray.
@Service
@XRayEnabled
public class MyServiceImpl implements MyService {
private final MyEntityRepository myEntityRepository;
@Autowired
public MyServiceImpl(MyEntityRepository myEntityRepository) {
this.myEntityRepository = myEntityRepository;
}
@Transactional(readOnly = true)
public List<MyEntity> getMyEntities(){
try(Stream<MyEntity> entityStream = this.myEntityRepository.streamAll()){
return entityStream.sorted().collect(Collectors.toList());
}
}
}
If you've configured your application correctly, you should see the complete call stack of the application,
from the controller down through the service calls, as shown in the following screen shot of the console.
135

AWS X-Ray Developer Guide
AWS X-Ray SDK for Go
The X-Ray SDK for Go is a set of libraries for Go applications that provide classes and methods for
generating and sending trace data to the X-Ray daemon. Trace data includes information about incoming
HTTP requests served by the application, and calls that the application makes to downstream services
using the AWS SDK, HTTP clients, or an SQL database connector. You can also create segments manually
and add debug information in annotations and metadata.
Download the SDK from its GitHub repository with go get:
$ go get -u github.com/aws/aws-xray-sdk-go/...
For web applications, start by using the xray.Handler function (p. 141) to trace incoming requests.
The message handler creates a segment (p. 20) for each traced request, and completes the segment
when the response is sent. While the segment is open you can use the SDK client's methods to
add information to the segment and create subsegments to trace downstream calls. The SDK also
automatically records exceptions that your application throws while the segment is open.
For Lambda functions called by an instrumented application or service, Lambda reads the tracing
header (p. 25) and traces sampled requests automatically. For other functions, you can configure
Lambda (p. 208) to sample and trace incoming requests. In either case, Lambda creates the segment
and provides it to the X-Ray SDK.
Note
On Lambda, the X-Ray SDK is optional. If you don't use it in your function, your service map
will still include a node for the Lambda service, and one for each Lambda function. By adding
the SDK, you can instrument your function code to add subsegments to the function segment
recorded by Lambda. See AWS Lambda and AWS X-Ray (p. 208) for more information.
Next, wrap your client with a call to the AWS function (p. 143). This step ensures that X-Ray instruments
calls to any client methods. You can also instrument calls to SQL databases (p. 144).
Once you get going with the SDK, customize its behavior by configuring the recorder and
middleware (p. 137). You can add plugins to record data about the compute resources running your
application, customize sampling behavior by defining sampling rules, and set the log level to see more or
less information from the SDK in your application logs.
Record additional information about requests and the work that your application does in annotations
and metadata (p. 145). Annotations are simple key-value pairs that are indexed for use with filter
expressions (p. 37), so that you can search for traces that contain specific data. Metadata entries are less
restrictive and can record entire objects and arrays — anything that can be serialized into JSON.
Annotations and Metadata
Annotations and metadata are arbitrary text that you add to segments with the X-Ray SDK.
Annotations are indexed for use with filter expressions. Metadata are not indexed, but can be
viewed in the raw segment with the X-Ray console or API. Anyone that you grant read access to
X-Ray can view this data.
When you have a lot of instrumented clients in your code, a single request segment can contain a large
number of subsegments, one for each call made with an instrumented client. You can organize and
group subsegments by wrapping client calls in custom subsegments (p. 145). You can create a custom
subsegment for an entire function or any section of code, and record metadata and annotations on the
subsegment instead of writing everything on the parent segment.
136

AWS X-Ray Developer Guide
Requirements
Requirements
The X-Ray SDK for Go requires Go 1.7 or later.
The SDK depends on the following libraries at compile and runtime:
• AWS SDK for Go version 1.10.0 or newer
These dependencies are declared in the SDK's README.md file.
Reference Documentation
Once you have downloaded the SDK, build and host the documentation locally to view it in a web
browser.
To view the reference documentation
1. Navigating to the $GOPATH/src/github.com/aws/aws-xray-sdk-go (Linux or Mac) directory or
the %GOPATH%\src\github.com\aws\aws-xray-sdk-go (Windows) folder
2. Run the godoc command.
$ godoc -http=:6060
3. Opening a browser at http://localhost:6060/pkg/github.com/aws/aws-xray-sdk-go/.
Configuring the X-Ray SDK for Go
You can specify the configuration for for X-Ray SDK for Go through environment variables, by calling
Configure with a Config object, or by assuming default values. Environment variables take precedence
over Config values, which take precedence over any default value.
Sections
•Service Plugins (p. 137)
•Sampling Rules (p. 139)
•Logging (p. 140)
•Environment Variables (p. 140)
•Using Configure (p. 140)
Service Plugins
Use plugins to record information about the service hosting your application.
Plugins
• Amazon EC2 – EC2Plugin adds the instance ID and Availability Zone.
• Elastic Beanstalk – ElasticBeanstalkPlugin adds the environment name, version label, and
deployment ID.
• Amazon ECS – ECSPlugin adds the container ID.
137
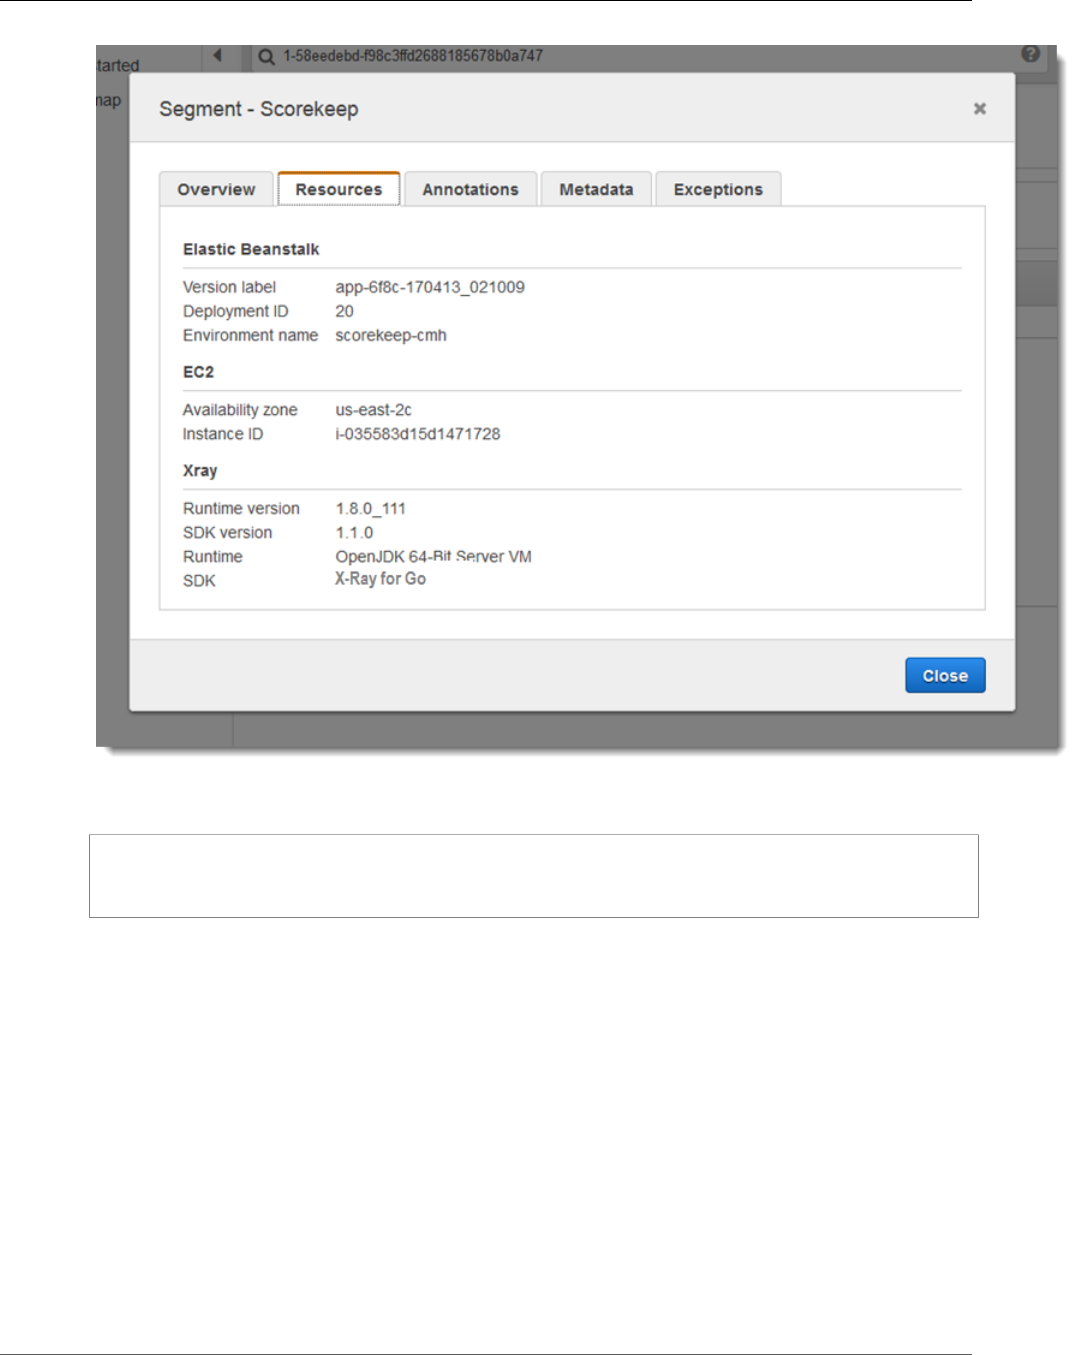
AWS X-Ray Developer Guide
Service Plugins
To use a plugin, import one of the following packages.
_ "github.com/aws/aws-xray-sdk-go/plugins/ec2"
_ "github.com/aws/aws-xray-sdk-go/plugins/ecs"
_ "github.com/aws/aws-xray-sdk-go/plugins/beanstalk"
The SDK also uses plugin settings to set the origin field on the segment. This indicates the type of
AWS resource that runs your application. The resource type appears under your application's name in the
service map. For example, AWS::ElasticBeanstalk::Environment.
138
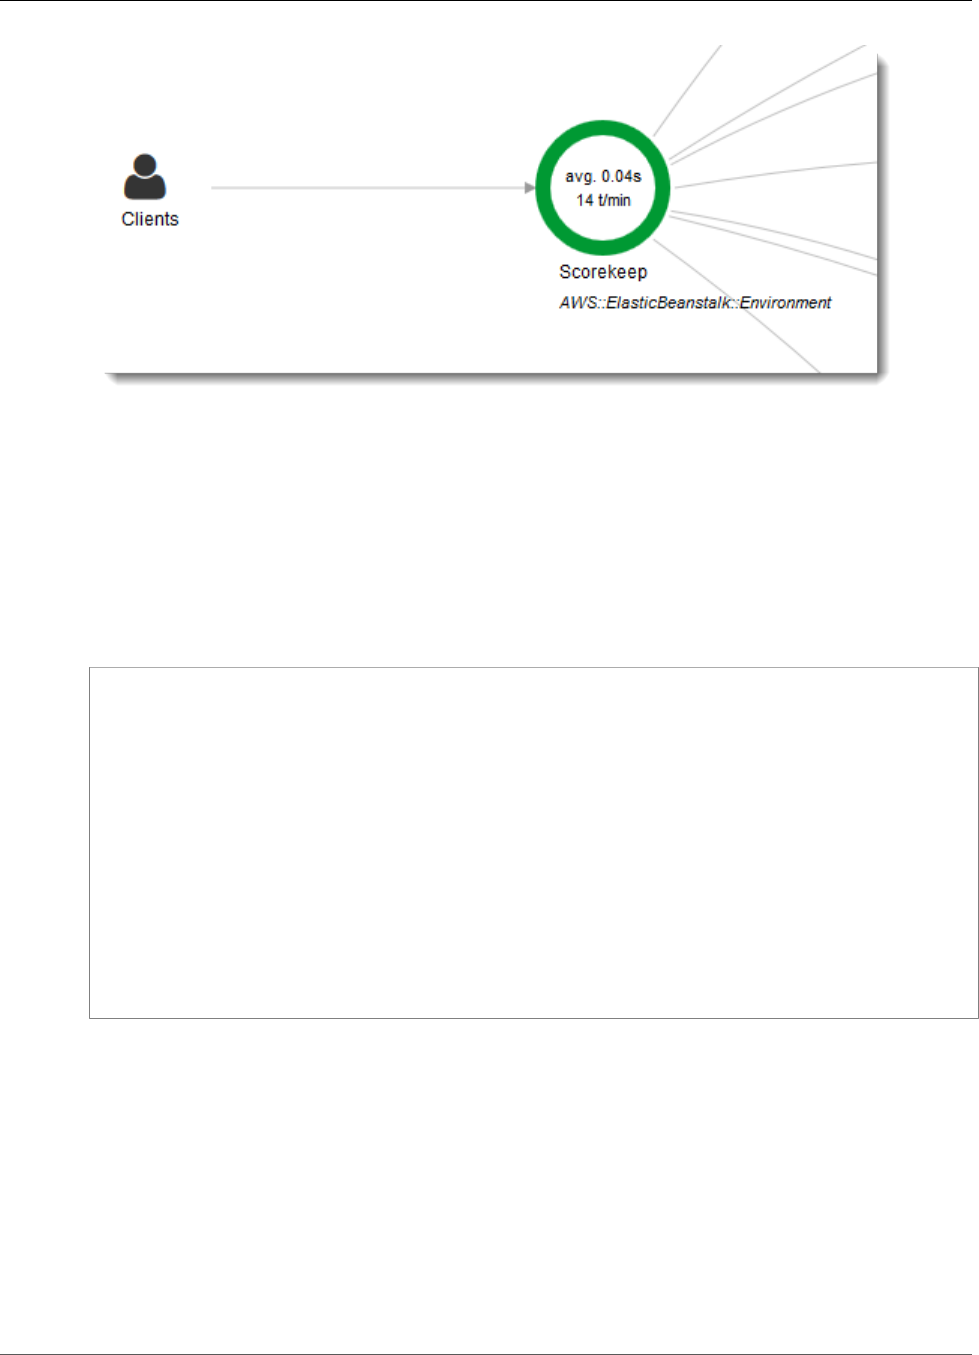
AWS X-Ray Developer Guide
Sampling Rules
When you use multiple plugins, the SDK uses the plugin that was loaded last to determine the origin.
Sampling Rules
The SDK has a default sampling strategy that determines which requests get traced. By default, the SDK
traces the first request each second, and five percent of any additional requests. You can customize the
SDK's sampling behavior by applying rules you define in a local file.
Example sampling-rules.json
{
"version": 1,
"rules": [
{
"description": "Player moves.",
"service_name": "*",
"http_method": "*",
"url_path": "/api/move/*",
"fixed_target": 0,
"rate": 0.05
}
],
"default": {
"fixed_target": 1,
"rate": 0.1
}
}
This example defines one custom rule and a default rule. The custom rule applies a five-percent sampling
rate with no minimum number of requests to trace for paths under /api/move/. The default rule traces
the first request each second and 10 percent of additional requests.
The SDK applies custom rules in the order in which they are defined. If a request matches multiple
custom rules, the SDK applies only the first rule.
On Lambda, you cannot modify the sampling rate. If your function is called by an instrumented service,
calls generated requests that were sampled by that service will be recorded by Lambda. If active tracing
is enabled and no tracing header is present, Lambda makes the sampling decision.
Once you've defined your rules, use xray.Configure to add them to your Go application.
139

AWS X-Ray Developer Guide
Logging
Example main.go – sampling rule configuration
func init() {
ss, err := sampling.NewLocalizedStrategyFromFilePath("conf/sampling.json")
if err != nil {
panic(err)
}
xray.Configure(xray.Config{
SamplingStrategy: ss,
})
}
Logging
You can change the log level and format with xray.Configure.
Example main.go
func main() {
http.Handle("/", xray.Handler(xray.NewFixedSegmentNamer("MyApp"), http.HandlerFunc(func(w
http.ResponseWriter, r *http.Request) {
xray.Configure(xray.Config{
LogLevel: "warn",
LogFormat: "[%Level] [%Time] %Msg%n"
})
w.Write([]byte("Hello!"))
})))
http.ListenAndServe(":8000", nil)
}
See Using Configure (p. 140) for more information.
Environment Variables
You can use environment variables to configure the X-Ray SDK for Go. The SDK supports the following
variables.
•AWS_XRAY_TRACING_NAME – Set the service name that the SDK uses for segments.
•AWS_XRAY_DAEMON_ADDRESS – Set the host and port of the X-Ray daemon listener. By default, the
SDK sends trace data to 127.0.0.1:2000. Use this variable if you have configured the daemon to
listen on a different port (p. 102) or if it is running on a different host.
Environment variables override equivalent values set in code.
Using Configure
You can also configure the X-Ray SDK for Go using the Configure method. Configure takes one
argument, a Config object, with the following, optional fields.
140

AWS X-Ray Developer Guide
Incoming Requests
DaemonAddr
This string specifies the host and port of the X-Ray daemon listener. If not specified, X-Ray uses the
value of the AWS_XRAY_DAEMON_ADDRESS environment variable. If that value is not set, it uses
"127.0.0.1:2000".
ServiceVersion
This string specifies the version of the service. If not specified, X-Ray uses the empty string ("").
SamplingStrategy
This SamplingStrategy object specifies which of your application calls are traced. If not specified,
X-Ray uses a LocalizedSamplingStrategy, which takes the strategy as defined in xray/
resources/DefaultSamplingRules.json.
StreamingStrategy
This StreamingStrategy object specifies whether to stream a segment when RequiresStreaming
returns true. If not specified, X-Ray uses a DefaultStreamingStrategy that streams a sampled
segment if the number of subsegments is greater than 20.
ExceptionFormattingStrategy
This ExceptionFormattingStrategy object specifies how you want to handle various exceptions.
If not specified, X-Ray uses a DefaultExceptionFormattingStrategy with an XrayError of
type error, the error message, and stack trace.
LogLevel
This string specifies the default logging level for your application. You can set this to "trace",
"debug", "info", "warn" or "error". If not specified, X-Ray uses "info".
LogFormat
This string specifies the format of the log messages. If not specified, X-Ray uses
"%Date(2006-01-02T15:04:05Z07:00) [%Level] %Msg%n".
Instrumenting Incoming HTTP Requests with the
X-Ray SDK for Go
You can use the X-Ray SDK to trace incoming HTTP requests that your application serves on an EC2
instance in Amazon EC2, AWS Elastic Beanstalk, or Amazon ECS.
Use xray.Handler to instrument incoming HTTP requests. The X-Ray SDK for Go implements the
standard Go library http.Handler interface in the xay.Handler class to intercept web requests.
The xay.Handler class wraps the provided http.Handler with xray.Capture using the request's
context, parsing the incoming headers, adding response headers if needed, and sets HTTP-specific trace
fields.
When you use this class to handle HTTP requests and responses, the X-Ray SDK for Go creates a segment
for each sampled request. This segment includes timing, method, and disposition of the HTTP request.
Additional instrumentation creates subsegments on this segment.
Note
For AWS Lambda functions, Lambda creates a segment for each sampled request. See AWS
Lambda and AWS X-Ray (p. 208) for more information.
The following example intercepts requests on port 8000 and returns "Hello!" as a response. It creates the
segment myApp and instruments calls through any application.
141

AWS X-Ray Developer Guide
Configuring a Segment Naming Strategy
Example main.go
func main() {
http.Handle("/", xray.Handler(xray.NewFixedSegmentNamer("MyApp"), http.HandlerFunc(func(w
http.ResponseWriter, r *http.Request) {
w.Write([]byte("Hello!"))
})))
http.ListenAndServe(":8000", nil)
}
Each segment has a name that identifies your application in the service map. The segment can be named
statically, or you can configure the SDK to name it dynamically based on the host header in the incoming
request. Dynamic naming lets you group traces based on the domain name in the request, and apply a
default name if the name doesn't match an expected pattern (for example, if the host header is forged).
Forwarded Requests
If a load balancer or other intermediary forwards a request to your application, X-Ray takes the
client IP from the X-Forwarded-For header in the request instead of from the source IP in the
IP packet. The client IP that is recorded for a forwarded request can be forged, so it should not
be trusted.
When a request is forwarded, the SDK sets an additional field in the segment to indicate this. If the
segment contains the field x_forwarded_for set to true, the client IP was taken from the X-
Forwarded-For header in the HTTP request.
The handler creates a segment for each incoming request with an http block that contains the following
information:
•HTTP method – GET, POST, PUT, DELETE, etc.
•Client address – The IP address of the client that sent the request.
•Response code – The HTTP response code for the completed request.
•Timing – The start time (when the request was received) and end time (when the response was sent).
•User agent — The user-agent from the request.
•Content length — The content-length from the response.
Configuring a Segment Naming Strategy
AWS X-Ray uses a service name to identify your application and distinguish it from the other applications,
databases, external APIs, and AWS resources that your application uses. When the X-Ray SDK generates
segments for incoming requests, it records your application's service name in the segment's name
field (p. 61).
The X-Ray SDK can name segments after the hostname in the HTTP request header. However, this header
can be forged, which could result in unexpected nodes in your service map. To prevent the SDK from
naming segments incorrectly due to requests with forged host headers, you must specify a default name
for incoming requests.
If your application serves requests for multiple domains, you can configure the SDK to use a dynamic
naming strategy to reflect this in segment names. A dynamic naming strategy allows the SDK to use the
hostname for requests that match an expected pattern, and apply the default name to requests that
don't.
For example, you might have a single application serving requests to three subdomains–
www.example.com, api.example.com, and static.example.com. You can use a dynamic naming
strategy with the pattern *.example.com to identify segments for each subdomain with a different
name, resulting in three service nodes on the service map. If your application receives requests with a
142
AWS X-Ray Developer Guide
AWS SDK Clients
hostname that doesn't match the pattern, you will see a fourth node on the service map with a fallback
name that you specify.
To use the same name for all request segments, specify the name of your application when you create
the handler, as shown in the previous section.
Note
You can override the default service name that you define in code with the
AWS_XRAY_TRACING_NAME environment variable (p. 140).
A dynamic naming strategy defines a pattern that hostnames should match, and a default name to use
if the hostname in the HTTP request doesn't match the pattern. To name segments dynamically, use
NewDynamicSegmentNamer to configure the default name and pattern to match.
Example main.go
If the hostname in the request matches the pattern *.example.com, use the hostname. Otherwise, use
MyApp.
func main() {
http.Handle("/", xray.Handler(xray.NewDynamicSegmentNamer("MyApp", "*.example.com"),
http.HandlerFunc(func(w http.ResponseWriter, r *http.Request) {
w.Write([]byte("Hello!"))
})))
http.ListenAndServe(":8000", nil)
}
Tracing AWS SDK Calls with the X-Ray SDK for Go
When your application makes calls to AWS services to store data, write to a queue, or send notifications,
the X-Ray SDK for Go tracks the calls downstream in subsegments (p. 145). Traced AWS services and
resources that you access within those services (for example, an Amazon S3 bucket or Amazon SQS
queue), appear as downstream nodes on the service map in the X-Ray console.
To trace AWS SDK clients, wrap the client object with the xray.AWS() call as shown in the following
example.
Example main.go
var dynamo *dynamodb.DynamoDB
func main() {
dynamo = dynamodb.New(session.Must(session.NewSession()))
xray.AWS(dynamo.Client)
}
Then, when you use the AWS SDK client, use the withContext version of the call method, and pass it
the context from the http.Request object passed to the handler (p. 141).
Example main.go – AWS SDK call
func listTablesWithContext(ctx context.Context) {
output := dynamo.ListTablesWithContext(ctx, &dynamodb.ListTablesInput{})
doSomething(output)
}
For all services, you can see the name of the API called in the X-Ray console. For a subset of services, the
X-Ray SDK adds information to the segment to provide more granularity in the service map.
143

AWS X-Ray Developer Guide
Outgoing HTTP Calls
For example, when you make a call with an instrumented DynamoDB client, the SDK adds the table name
to the segment for calls that target a table. In the console, each table appears as a separate node in the
service map, with a generic DynamoDB node for calls that don't target a table.
Example Subsegment for a Call to DynamoDB to Save an Item
{
"id": "24756640c0d0978a",
"start_time": 1.480305974194E9,
"end_time": 1.4803059742E9,
"name": "DynamoDB",
"namespace": "aws",
"http": {
"response": {
"content_length": 60,
"status": 200
}
},
"aws": {
"table_name": "scorekeep-user",
"operation": "UpdateItem",
"request_id": "UBQNSO5AEM8T4FDA4RQDEB94OVTDRVV4K4HIRGVJF66Q9ASUAAJG",
}
}
When you access named resources, calls to the following services create additional nodes in the service
map. Calls that don't target specific resources create a generic node for the service.
•Amazon DynamoDB – Table name
•Amazon Simple Storage Service – Bucket and key name
•Amazon Simple Queue Service – Queue name
Tracing Calls to Downstream HTTP Web Services
with the X-Ray SDK for Go
When your application makes calls to microservices or public HTTP APIs, you can use the xray.Client
to instrument those calls as subsegments of your Go application, as shown in the following example,
where http-client is an HTTP client.
Client creates a shallow copy of the provided http client, defaulting to http.DefaultClient, with
roundtripper wrapped with xray.RoundTripper.
Example main.go – HTTP client
myClient := xray.Client(http-client)
Tracing SQL Queries with the X-Ray SDK for Go
To trace SQL calls to PostgreSQL or MySQL, replacing sql.Open calls to xray.SQL, as shown in the
following example. Use URLs instead of configuration strings if possible.
Example main.go
func main() {
144
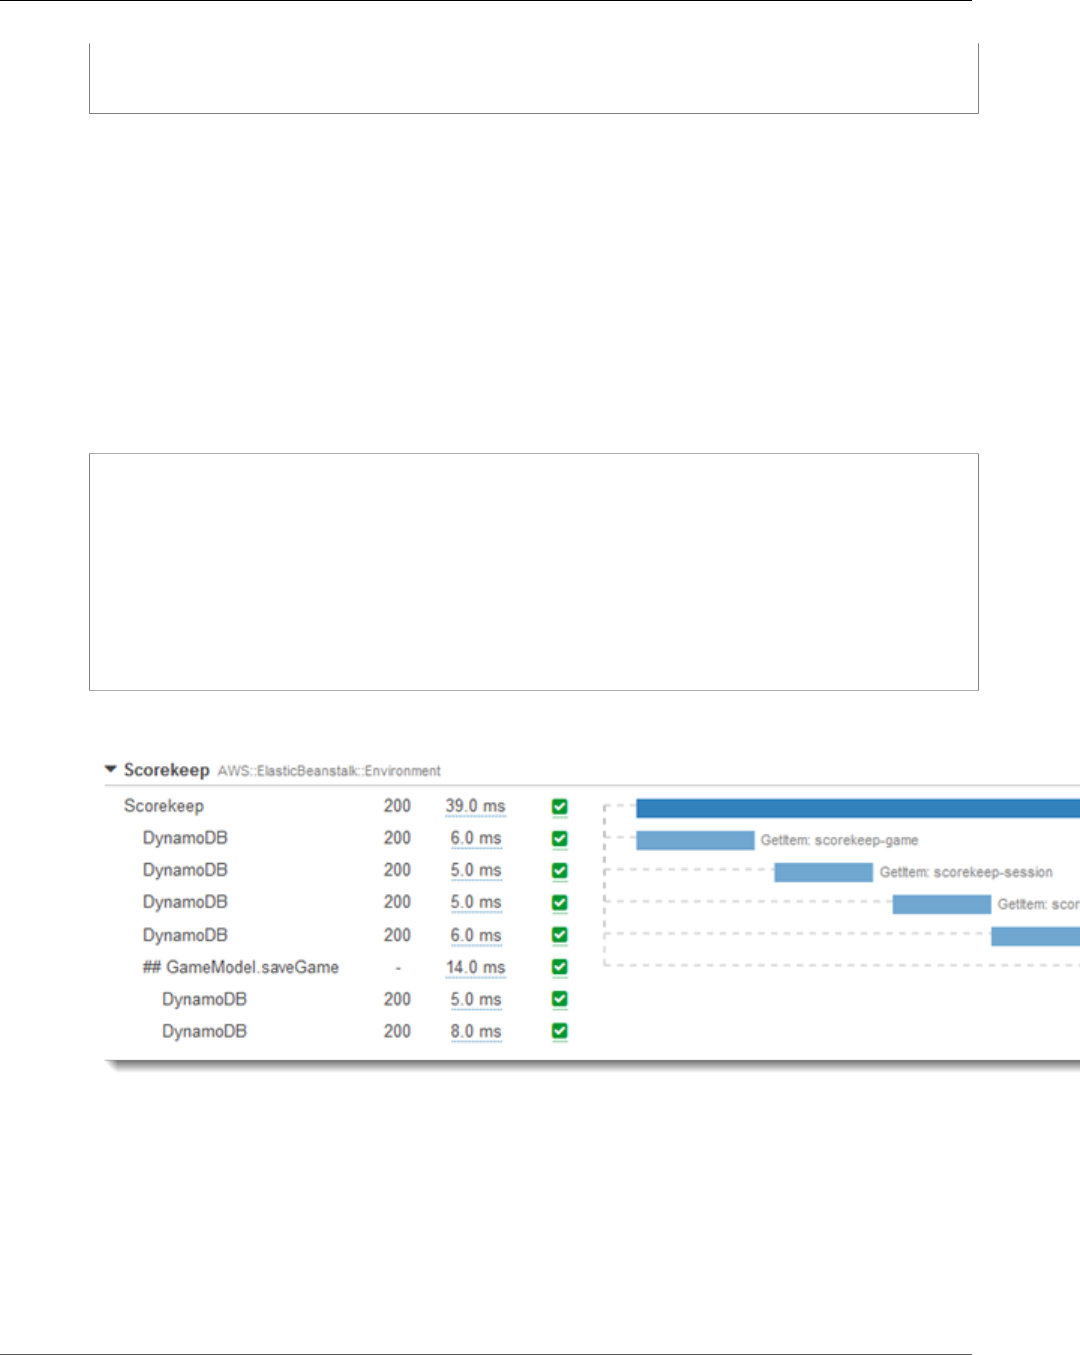
AWS X-Ray Developer Guide
Custom Subsegments
db := xray.SQL("postgres", "postgres://user:password@host:port/db")
row, _ := db.QueryRow("SELECT 1") // Use as normal
}
Generating Custom Subsegments with the X-Ray
SDK for Go
Subsegments extend a trace's segment (p. 20) with details about work done in order to serve a request.
Each time you make a call with an instrumented client, the X-Ray SDK records the information generated
in a subsegment. You can create additional subsegments to group other subsegments, to measure the
performance of a section of code, or to record annotations and metadata.
Use the Capture method to create a subsegment around a function.
Example main.go – custom subsegment
func criticalSection(ctx context.Context) {
//this is an example of a subsegment
xray.Capture(ctx, "GameModel.saveGame", func(ctx1 context.Context) error {
var err error
section.Lock()
result := someLockedResource.Go()
section.Unlock()
xray.AddMetadata(ctx1, "ResourceResult", result)
})
The following screenshot shows an example of how the saveGame subsegment might appear in traces
for the application Scorekeep.
Add Annotations and Metadata to Segments with
the X-Ray SDK for Go
You can record additional information about requests, the environment, or your application with
annotations and metadata. You can add annotations and metadata to the segments that the X-Ray SDK
creates, or to custom subsegments that you create.
145

AWS X-Ray Developer Guide
Recording Annotations with the X-Ray SDK for Go
Annotations are key-value pairs with string, number, or Boolean values. Annotations are indexed for use
with filter expressions (p. 37). Use annotations to record data that you want to use to group traces in the
console, or when calling the GetTraceSummaries API.
Metadata are key-value pairs that can have values of any type, including objects and lists, but are not
indexed for use with filter expressions. Use metadata to record additional data that you want stored in
the trace but don't need to use with search.
In addition to annotations and metadata, you can also record user ID strings (p. 146) on segments. User
IDs are recorded in a separate field on segments and are indexed for use with search.
Sections
•Recording Annotations with the X-Ray SDK for Go (p. 146)
•Recording Metadata with the X-Ray SDK for Go (p. 146)
•Recording User IDs with the X-Ray SDK for Go (p. 146)
Recording Annotations with the X-Ray SDK for Go
Use annotations to record information on segments that you want indexed for search.
Annotation Requirements
•Keys – Up to 500 alphanumeric characters. No spaces or symbols except underscores.
•Values – Up to 1,000 Unicode characters.
•Entries – Up to 50 annotations per trace.
To record annotations, call AddAnnotation with a string containing the metadata you want to associate
with the segment.
xray.AddAnnotation(context, "value", error)
The SDK records annotations as key-value pairs in an annotations object in the segment document.
Calling AddAnnotation twice with the same key overwrites previously recorded values on the same
segment.
To find traces that have annotations with specific values, use the annotations.key keyword in a filter
expression (p. 37).
Recording Metadata with the X-Ray SDK for Go
Use metadata to record information on segments that you don't need indexed for search.
To record metadata, call AddMetadata with a string containing the metadata you want to associate with
the segment.
xray.AddMetadata(context, "value", error)
Recording User IDs with the X-Ray SDK for Go
Record user IDs on request segments to identify the user who sent the request.
To record user IDs
1. Get a reference to the current segment from AWSXRay.
146

AWS X-Ray Developer Guide
Recording User IDs with the X-Ray SDK for Go
import (
"context"
"github.com/aws/aws-xray-sdk-go/xray"
)
mySegment := xray.GetSegment(context)
2. Call setUser with a String ID of the user who sent the request.
mySegment.User = "U12345"
To find traces for a user ID, use the user keyword in a filter expression (p. 37).
147

AWS X-Ray Developer Guide
The X-Ray SDK for Node.js
The X-Ray SDK for Node.js is a library for Express web applications and Node.js Lambda functions
that provides classes and methods for generating and sending trace data to the X-Ray daemon. Trace
data includes information about incoming HTTP requests served by the application, and calls that the
application makes to downstream services using the AWS SDK or HTTP clients.
Note
The X-Ray SDK for Node.js is an open source project. You can follow the project and submit
issues and pull requests on GitHub: github.com/aws/aws-xray-sdk-node
If you use Express, start by adding the SDK as middleware (p. 153) on your application server to trace
incoming requests. The middleware creates a segment (p. 20) for each traced request, and completes
the segment when the response is sent. While the segment is open you can use the SDK client's methods
to add information to the segment and create subsegments to trace downstream calls. The SDK also
automatically records exceptions that your application throws while the segment is open.
For Lambda functions called by an instrumented application or service, Lambda reads the tracing
header (p. 25) and traces sampled requests automatically. For other functions, you can configure
Lambda (p. 208) to sample and trace incoming requests. In either case, Lambda creates the segment
and provides it to the X-Ray SDK.
Note
On Lambda, the X-Ray SDK is optional. If you don't use it in your function, your service map
will still include a node for the Lambda service, and one for each Lambda function. By adding
the SDK, you can instrument your function code to add subsegments to the function segment
recorded by Lambda. See AWS Lambda and AWS X-Ray (p. 208) for more information.
Next, use the X-Ray SDK for Node.js to instrument your AWS SDK for JavaScript in Node.js
clients (p. 155). Whenever you make a call to a downstream AWS service or resource with an
instrumented client, the SDK records information about the call in a subsegment. AWS services and the
resources that you access within the services appear as downstream nodes on the service map to help
you identify errors and throttling issues on individual connections.
The X-Ray SDK for Node.js also provides instrumentation for downstream calls to HTTP web APIs and
SQL queries. Wrap your HTTP client in the SDK's capture method (p. 156) to record information about
outgoing HTTP calls. For SQL clients, use the capture method for your database type (p. 157).
The middleware applies sampling rules to incoming requests to determine which requests to trace.
You can configure the X-Ray SDK for Node.js (p. 150) to adjust the sampling behavior or to record
information about the AWS compute resources on which your application runs.
Record additional information about requests and the work that your application does in annotations
and metadata (p. 159). Annotations are simple key-value pairs that are indexed for use with filter
expressions (p. 37), so that you can search for traces that contain specific data. Metadata entries are less
restrictive and can record entire objects and arrays — anything that can be serialized into JSON.
Annotations and Metadata
Annotations and metadata are arbitrary text that you add to segments with the X-Ray SDK.
Annotations are indexed for use with filter expressions. Metadata are not indexed, but can be
viewed in the raw segment with the X-Ray console or API. Anyone that you grant read access to
X-Ray can view this data.
When you have a lot of instrumented clients in your code, a single request segment can contain a large
number of subsegments, one for each call made with an instrumented client. You can organize and
group subsegments by wrapping client calls in custom subsegments (p. 158). You can create a custom
148

AWS X-Ray Developer Guide
Requirements
subsegment for an entire function or any section of code, and record metadata and annotations on the
subsegment instead of writing everything on the parent segment.
For reference documentation about the SDK's classes and methods, see the AWS X-Ray SDK for Node.js
API Reference.
Requirements
The X-Ray SDK for Node.js requires Node.js and the following libraries:
•cls – 0.1.5
•continuation-local-storage – 3.2.0
•pkginfo – 0.4.0
•underscore – 1.8.3
The SDK pulls these libraries in when you install it with NPM.
To trace AWS SDK clients, the X-Ray SDK for Node.js requires a minimum version of the AWS SDK for
JavaScript in Node.js.
•aws-sdk – 2.7.15
Dependency Management
The X-Ray SDK for Node.js is available from NPM.
•Package – aws-xray-sdk
For local development, install the SDK in your project directory with npm.
~/nodejs-xray$ npm install aws-xray-sdk
nodejs-xray@0.0.0 ~/nodejs-xray
### aws-xray-sdk@1.2.0
### continuation-local-storage@3.2.0
# ### async-listener@0.6.3
# # ### shimmer@1.0.0
# ### emitter-listener@1.0.1
### moment@2.17.1
### pkginfo@0.4.0
### semver@5.3.0
### underscore@1.8.3
### winston@2.3.1
### async@1.0.0
### colors@1.0.3
### cycle@1.0.3
### eyes@0.1.8
### isstream@0.1.2
### stack-trace@0.0.9
Use the --save option to save the SDK as a dependency in your application's package.json.
~/nodejs-xray$ npm install aws-xray-sdk --save
nodejs-xray@0.0.0 ~/nodejs-xray
### aws-xray-sdk@1.2.0
149
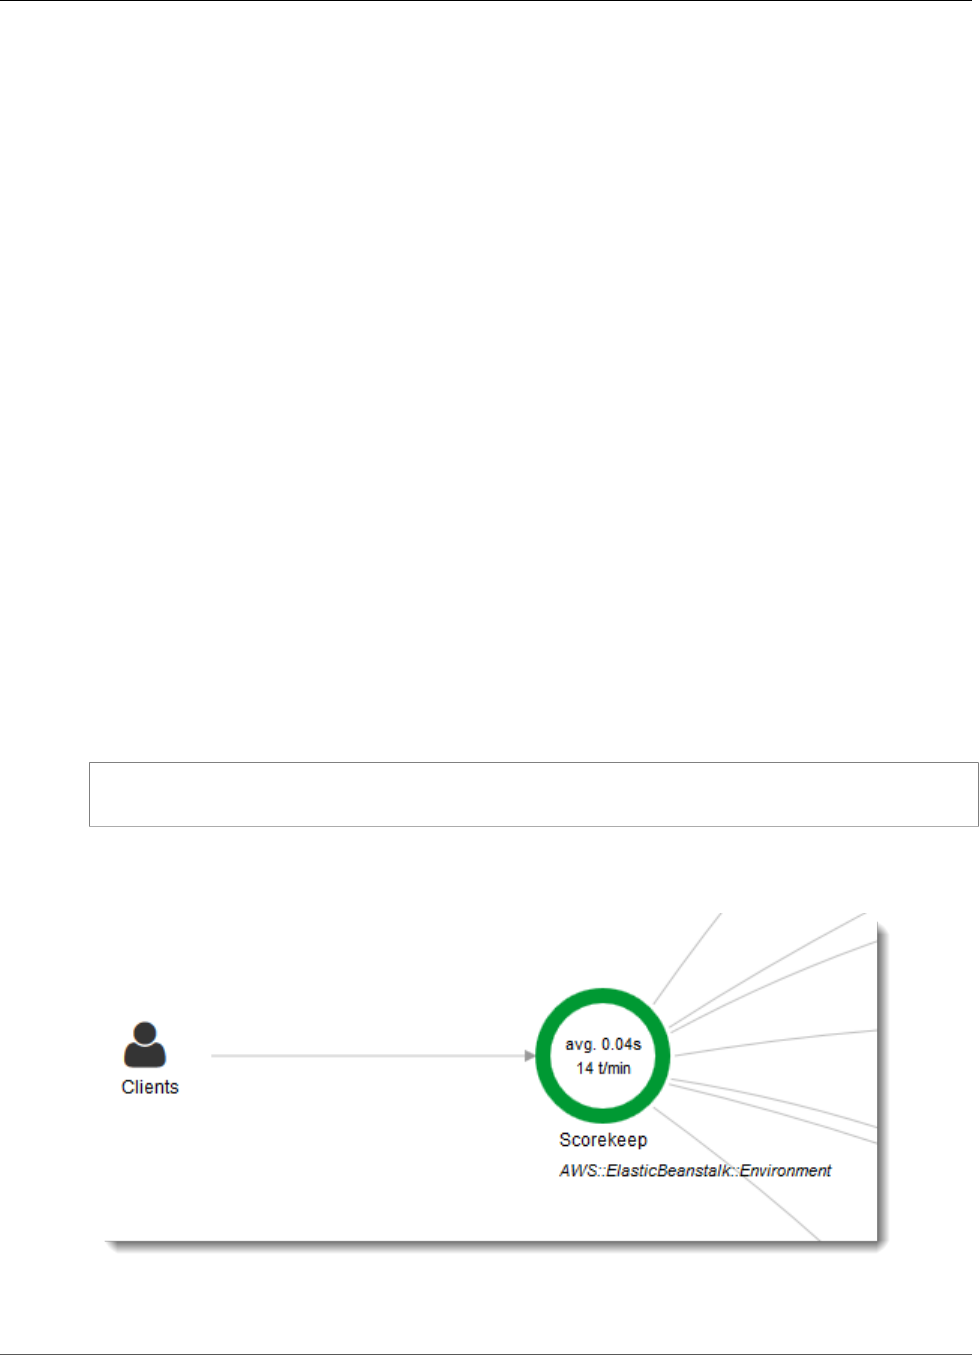
AWS X-Ray Developer Guide
Configuration
Configuring the X-Ray SDK for Node.js
You can configure the X-Ray SDK for Node.js with plugins to include information about the service that
your application runs on, modify the default sampling behavior, or add sampling rules that apply to
requests to specific paths.
Sections
•Service Plugins (p. 150)
•Sampling Rules (p. 151)
•Logging (p. 152)
•X-Ray Daemon Address (p. 152)
•Environment Variables (p. 152)
Service Plugins
Use plugins to record information about the service hosting your application.
Plugins
• Amazon EC2 – EC2Plugin adds the instance ID and Availability Zone.
• Elastic Beanstalk – ElasticBeanstalkPlugin adds the environment name, version label, and
deployment ID.
• Amazon ECS – ECSPlugin adds the container ID.
To use a plugin, configure the X-Ray SDK for Node.js client by using the config method.
Example app.js - Plugins
var AWSXRay = require('aws-xray-sdk');
AWSXRay.config([AWSXRay.plugins.EC2Plugin,AWSXRay.plugins.ElasticBeanstalkPlugin]);
The SDK also uses plugin settings to set the origin field on the segment. This indicates the type of
AWS resource that runs your application. The resource type appears under your application's name in the
service map. For example, AWS::ElasticBeanstalk::Environment.
When you use multiple plugins, the SDK uses the plugin that was loaded last to determine the origin.
150

AWS X-Ray Developer Guide
Sampling Rules
Sampling Rules
The SDK has a default sampling strategy that determines which requests get traced. By default, the SDK
traces the first request each second, and five percent of any additional requests. You can customize the
SDK's sampling behavior by applying rules you define in a local file.
Example sampling-rules.json
{
"version": 1,
"rules": [
{
"description": "Player moves.",
"service_name": "*",
"http_method": "*",
"url_path": "/api/move/*",
"fixed_target": 0,
"rate": 0.05
}
],
"default": {
"fixed_target": 1,
"rate": 0.1
}
}
This example defines one custom rule and a default rule. The custom rule applies a five-percent sampling
rate with no minimum number of requests to trace for paths under /api/move/. The default rule traces
the first request each second and 10 percent of additional requests.
The SDK applies custom rules in the order in which they are defined. If a request matches multiple
custom rules, the SDK applies only the first rule.
On Lambda, you cannot modify the sampling rate. If your function is called by an instrumented service,
calls generated requests that were sampled by that service will be recorded by Lambda. If active tracing
is enabled and no tracing header is present, Lambda makes the sampling decision.
Tell the X-Ray SDK for Node.js to load sampling rules from a file with setSamplingRules.
Example app.js - Sampling rules from a file
var AWSXRay = require('aws-xray-sdk');
AWSXRay.middleware.setSamplingRules('sampling-rules.json');
You can also define your rules in code and pass them to setSamplingRules as an object.
Example app.js - Sampling rules from an object
var AWSXRay = require('aws-xray-sdk');
var rules = {
"rules": [ { "description": "Player moves.", "service_name": "*", "http_method": "*",
"url_path": "/api/move/*", "fixed_target": 0, "rate": 0.05 } ],
"default": { "fixed_target": 1, "rate": 0.1 },
"version": 1
}
AWSXRay.middleware.setSamplingRules(rules);
151
AWS X-Ray Developer Guide
Logging
Logging
To log output from the SDK, call AWSXRay.setLogger(logger), where logger is an object that
provides standard logging methods (warn, info, etc.).
Example app.js - Logging with Winston
var AWSXRay = require('aws-xray-sdk');
var logger = require('winston');
AWSXRay.setLogger(logger);
AWSXRay.config([AWSXRay.plugins.EC2Plugin]);
Call setLogger before you run other configuration methods to ensure that you capture output from
those operations.
To configure the SDK to output logs to the console without using a logging library, use the
AWS_XRAY_DEBUG_MODE environment variable (p. 152).
X-Ray Daemon Address
If the X-Ray daemon listens on a port or host other than 127.0.0.1:2000, you can configure the X-Ray
SDK for Node.js to send trace data to a different UDP address.
AWSXRay.setDaemonAddress('host:port');
You can specify the host by name or by IPv4 address.
Example app.js - Daemon address
var AWSXRay = require('aws-xray-sdk');
AWSXRay.setDaemonAddress('daemonhost:8082');
You can also set the daemon address by using the AWS_XRAY_DAEMON_ADDRESS environment
variable (p. 152).
Environment Variables
You can use environment variables to configure the X-Ray SDK for Node.js. The SDK supports the
following variables.
•AWS_XRAY_TRACING_NAME – Set a service name that the SDK uses for segments. Overrides the
segment name that you set on the Express middleware (p. 153).
•AWS_XRAY_DAEMON_ADDRESS – Set the host and port of the X-Ray daemon listener. By default, the
SDK sends trace data to 127.0.0.1:2000. Use this variable if you have configured the daemon to
listen on a different port (p. 102) or if it is running on a different host.
•AWS_XRAY_CONTEXT_MISSING – Set to LOG_ERROR to avoid throwing exceptions when your
instrumented code attempts to record data when no segment is open.
Valid Values
•RUNTIME_ERROR – Throw a runtime exception (default).
•LOG_ERROR – Log an error and continue.
Errors related to missing segments or subsegments can occur when you attempt to use an
instrumented client in startup code that runs when no request is open, or in code that spawns a new
thread.
152

AWS X-Ray Developer Guide
Incoming Requests
•AWS_XRAY_DEBUG_MODE – Set to TRUE to configure the SDK to output logs to the console, instead of
configuring a logger (p. 152).
Tracing Incoming Requests with the X-Ray SDK for
Node.js
You can use the X-Ray SDK for Node.js to trace incoming HTTP requests that your Express and Restify
applications serve on an EC2 instance in Amazon EC2, AWS Elastic Beanstalk, or Amazon ECS.
The X-Ray SDK for Node.js provides middleware for applications that use the Express and Restify
frameworks. When you add the X-Ray middleware to your application, the X-Ray SDK for Node.js creates
a segment for each sampled request. This segment includes timing, method, and disposition of the HTTP
request. Additional instrumentation creates subsegments on this segment.
Note
For AWS Lambda functions, Lambda creates a segment for each sampled request. See AWS
Lambda and AWS X-Ray (p. 208) for more information.
Each segment has a name that identifies your application in the service map. The segment can be named
statically, or you can configure the SDK to name it dynamically based on the host header in the incoming
request. Dynamic naming lets you group traces based on the domain name in the request, and apply a
default name if the name doesn't match an expected pattern (for example, if the host header is forged).
Forwarded Requests
If a load balancer or other intermediary forwards a request to your application, X-Ray takes the
client IP from the X-Forwarded-For header in the request instead of from the source IP in the
IP packet. The client IP that is recorded for a forwarded request can be forged, so it should not
be trusted.
When a request is forwarded, the SDK sets an additional field in the segment to indicate this. If the
segment contains the field x_forwarded_for set to true, the client IP was taken from the X-
Forwarded-For header in the HTTP request.
The message handler creates a segment for each incoming request with an http block that contains the
following information:
•HTTP method – GET, POST, PUT, DELETE, etc.
•Client address – The IP address of the client that sent the request.
•Response code – The HTTP response code for the completed request.
•Timing – The start time (when the request was received) and end time (when the response was sent).
•User agent — The user-agent from the request.
•Content length — The content-length from the response.
Sections
•Tracing Incoming Requests with Express (p. 153)
•Tracing Incoming Requests with Restify (p. 154)
•Configuring a Segment Naming Strategy (p. 154)
Tracing Incoming Requests with Express
To use the Express middleware, initialize the SDK client and use the middleware returned by the
express.openSegment function before you define your routes.
153

AWS X-Ray Developer Guide
Tracing Incoming Requests with Restify
Example app.js - Express
var app = express();
var AWSXRay = require('aws-xray-sdk');
app.use(AWSXRay.express.openSegment('MyApp'));
app.get('/', function (req, res) {
res.render('index');
});
app.use(AWSXRay.express.closeSegment());
After you define your routes, use the output of express.closeSegment as shown to handle any errors
returned by the X-Ray SDK for Node.js.
Tracing Incoming Requests with Restify
To use the Restify middleware, initialize the SDK client and run enable. Pass it your Restify server and
segment name.
Example app.js - Restify
var AWSXRay = require('aws-xray-sdk');
var AWSXRayRestify = require('aws-xray-sdk-restify');
var restify = require('restify');
var server = restify.createServer();
AWSXRayRestify.enable(server, 'MyApp'));
server.get('/', function (req, res) {
res.render('index');
});
Configuring a Segment Naming Strategy
AWS X-Ray uses a service name to identify your application and distinguish it from the other applications,
databases, external APIs, and AWS resources that your application uses. When the X-Ray SDK generates
segments for incoming requests, it records your application's service name in the segment's name
field (p. 61).
The X-Ray SDK can name segments after the hostname in the HTTP request header. However, this header
can be forged, which could result in unexpected nodes in your service map. To prevent the SDK from
naming segments incorrectly due to requests with forged host headers, you must specify a default name
for incoming requests.
If your application serves requests for multiple domains, you can configure the SDK to use a dynamic
naming strategy to reflect this in segment names. A dynamic naming strategy allows the SDK to use the
hostname for requests that match an expected pattern, and apply the default name to requests that
don't.
For example, you might have a single application serving requests to three subdomains–
www.example.com, api.example.com, and static.example.com. You can use a dynamic naming
strategy with the pattern *.example.com to identify segments for each subdomain with a different
name, resulting in three service nodes on the service map. If your application receives requests with a
hostname that doesn't match the pattern, you will see a fourth node on the service map with a fallback
name that you specify.
154

AWS X-Ray Developer Guide
AWS SDK Clients
To use the same name for all request segments, specify the name of your application when you initialize
the middleware, as shown in the previous sections.
Note
You can override the default service name that you define in code with the
AWS_XRAY_TRACING_NAME environment variable (p. 152).
A dynamic naming strategy defines a pattern that hostnames should match, and a default name to use
if the hostname in the HTTP request does not match the pattern. To name segments dynamically, use
AWSXRay.middleware.enableDynamicNaming.
Example app.js - Dynamic Segment Names
If the hostname in the request matches the pattern *.example.com, use the hostname. Otherwise, use
MyApp.
var app = express();
var AWSXRay = require('aws-xray-sdk');
app.use(AWSXRay.express.openSegment('MyApp'));
AWSXRay.middleware.enableDynamicNaming('*.example.com');
app.get('/', function (req, res) {
res.render('index');
});
app.use(AWSXRay.express.closeSegment());
Tracing AWS SDK Calls with the X-Ray SDK for
Node.js
When your application makes calls to AWS services to store data, write to a queue, or send notifications,
the X-Ray SDK for Node.js tracks the calls downstream in subsegments (p. 158). Traced AWS services,
and resources that you access within those services (for example, an Amazon S3 bucket or Amazon SQS
queue), appear as downstream nodes on the service map in the X-Ray console.
You can instrument all AWS SDK clients by wrapping your aws-sdk require statement in a call to
AWSXRay.captureAWS.
Example app.js - AWS SDK Instrumentation
var AWS = AWSXRay.captureAWS(require('aws-sdk'));
To instrument individual clients, wrap your AWS SDK client in a call to AWSXRay.captureAWSClient.
For example, to instrument an AmazonDynamoDB client:
Example app.js - DynamoDB Client Instrumentation
var AWSXRay = require('aws-xray-sdk');
...
var ddb = AWSXRay.captureAWSClient(new AWS.DynamoDB());
For all services, you can see the name of the API called in the X-Ray console. For a subset of services, the
X-Ray SDK adds information to the segment to provide more granularity in the service map.
155

AWS X-Ray Developer Guide
Outgoing HTTP Calls
For example, when you make a call with an instrumented DynamoDB client, the SDK adds the table name
to the segment for calls that target a table. In the console, each table appears as a separate node in the
service map, with a generic DynamoDB node for calls that don't target a table.
Example Subsegment for a Call to DynamoDB to Save an Item
{
"id": "24756640c0d0978a",
"start_time": 1.480305974194E9,
"end_time": 1.4803059742E9,
"name": "DynamoDB",
"namespace": "aws",
"http": {
"response": {
"content_length": 60,
"status": 200
}
},
"aws": {
"table_name": "scorekeep-user",
"operation": "UpdateItem",
"request_id": "UBQNSO5AEM8T4FDA4RQDEB94OVTDRVV4K4HIRGVJF66Q9ASUAAJG",
}
}
When you access named resources, calls to the following services create additional nodes in the service
map. Calls that don't target specific resources create a generic node for the service.
•Amazon DynamoDB – Table name
•Amazon Simple Storage Service – Bucket and key name
•Amazon Simple Queue Service – Queue name
Tracing Calls to Downstream HTTP Web Services
Using the X-Ray SDK for Node.js
When your application makes calls to microservices or public HTTP APIs, you can use the X-Ray SDK for
Node.js client to instrument those calls and add the API to the service graph as a downstream service.
Pass your http or https client to the X-Ray SDK for Node.js captureHTTPs method to trace outgoing
calls.
Example app.js - HTTP Client
var AWSXRay = require('aws-xray-sdk');
var http = AWSXRay.captureHTTPs(require('http'));
To enable tracing on all HTTP clients, call captureHTTPsGlobal before you load http.
Example app.js - HTTP Client (Global)
var AWSXRay = require('aws-xray-sdk');
AWSXRay.captureHTTPsGlobal(require('http'));
var http = require('http');
156

AWS X-Ray Developer Guide
SQL Queries
When you instrument a call to a downstream web API, the X-Ray SDK for Node.js records a subsegment
that contains information about the HTTP request and response. X-Ray uses the subsegment to generate
an inferred segment for the remote API.
Example Subsegment for a Downstream HTTP Call
{
"id": "004f72be19cddc2a",
"start_time": 1484786387.131,
"end_time": 1484786387.501,
"name": "names.example.com",
"namespace": "remote",
"http": {
"request": {
"method": "GET",
"url": "https://names.example.com/"
},
"response": {
"content_length": -1,
"status": 200
}
}
}
Example Inferred Segment for a Downstream HTTP Call
{
"id": "168416dc2ea97781",
"name": "names.example.com",
"trace_id": "1-5880168b-fd5153bb58284b67678aa78c",
"start_time": 1484786387.131,
"end_time": 1484786387.501,
"parent_id": "004f72be19cddc2a",
"http": {
"request": {
"method": "GET",
"url": "https://names.example.com/"
},
"response": {
"content_length": -1,
"status": 200
}
},
"inferred": true
}
Tracing SQL Queries with the X-Ray SDK for
Node.js
Instrument SQL database queries by wrapping your SQL client in the corresponding X-Ray SDK for
Node.js client method.
•PostgreSQL – AWSXRay.capturePostgres()
var AWSXRay = require('aws-xray-sdk');
var pg = AWSXRay.capturePostgres(require('pg'));
var client = new pg.Client();
157

AWS X-Ray Developer Guide
Custom Subsegments
•MySQL – AWSXRay.captureMySQL()
var AWSXRay = require('aws-xray-sdk');
var mysql = AWSXRay.captureMySQL(require('mysql'));
...
var connection = mysql.createConnection(config);
When you use an instrumented client to make SQL queries, the X-Ray SDK for Node.js records
information about the connection and query in a subsegment.
Generating Custom Subsegments with the X-Ray
SDK for Node.js
Subsegments extend a trace's segment (p. 20) with details about work done in order to serve a request.
Each time you make a call with an instrumented client, the X-Ray SDK records the information generated
in a subsegment. You can create additional subsegments to group other subsegments, to measure the
performance of a section of code, or to record annotations and metadata.
To create a custom subsegment for a function that makes calls to downstream services, use the
captureAsyncFunc function.
Example app.js - Custom Subsegments
var AWSXRay = require('aws-xray-sdk');
app.use(AWSXRay.express.openSegment('MyApp'));
app.get('/', function (req, res) {
var host = 'api.example.com';
AWSXRay.captureAsyncFunc('send', function(subsegment) {
sendRequest(host, function() {
console.log('rendering!');
res.render('index');
subsegment.close();
});
});
});
app.use(AWSXRay.express.closeSegment());
function sendRequest(host, cb) {
var options = {
host: host,
path: '/',
};
var callback = function(response) {
var str = '';
response.on('data', function (chunk) {
str += chunk;
});
response.on('end', function () {
cb();
});
}
158

AWS X-Ray Developer Guide
Annotations and Metadata
http.request(options, callback).end();
};
In this example, the application creates a custom subsegment named send for calls to the sendRequest
function. captureAsyncFunc passes a subsegment that you must close within the callback function
when the asynchronous calls that it makes are complete.
For synchronous functions, you can use the captureFunc function, which closes the subsegment
automatically as soon as the function block finishes executing.
When you create a subsegment within a segment or another subsegment, the X-Ray SDK for Node.js
generates an ID for it and records the start time and end time.
Example Subsegment with Metadata
"subsegments": [{
"id": "6f1605cd8a07cb70",
"start_time": 1.480305974194E9,
"end_time": 1.4803059742E9,
"name": "Custom subsegment for UserModel.saveUser function",
"metadata": {
"debug": {
"test": "Metadata string from UserModel.saveUser"
}
},
Add Annotations and Metadata to Segments with
the X-Ray SDK for Node.js
You can record additional information about requests, the environment, or your application with
annotations and metadata. You can add annotations and metadata to the segments that the X-Ray SDK
creates, or to custom subsegments that you create.
Annotations are key-value pairs with string, number, or Boolean values. Annotations are indexed for use
with filter expressions (p. 37). Use annotations to record data that you want to use to group traces in the
console, or when calling the GetTraceSummaries API.
Metadata are key-value pairs that can have values of any type, including objects and lists, but are not
indexed for use with filter expressions. Use metadata to record additional data that you want stored in
the trace but don't need to use with search.
Sections
•Recording Annotations with the X-Ray SDK for Node.js (p. 159)
•Recording Metadata with the X-Ray SDK for Node.js (p. 160)
Recording Annotations with the X-Ray SDK for
Node.js
Use annotations to record information on segments or subsegments that you want indexed for search.
Annotation Requirements
•Keys – Up to 500 alphanumeric characters. No spaces or symbols except underscores.
159

AWS X-Ray Developer Guide
Recording Metadata with the X-Ray SDK for Node.js
•Values – Up to 1,000 Unicode characters.
•Entries – Up to 50 annotations per trace.
To record annotations
1. Get a reference to the current segment or subsegment.
var AWSXRay = require('aws-xray-sdk');
...
var document = AWSXRay.getSegment();
2. Call addAnnotation with a String key, and a Boolean, Number, or String value.
document.addAnnotation("mykey", "my value");
The SDK records annotations as key-value pairs in an annotations object in the segment document.
Calling addAnnotation twice with the same key overwrites previously recorded values on the same
segment or subsegment.
To find traces that have annotations with specific values, use the annotations.key keyword in a filter
expression (p. 37).
Example app.js - Annotations
var AWS = require('aws-sdk');
var AWSXRay = require('aws-xray-sdk');
var ddb = AWSXRay.captureAWSClient(new AWS.DynamoDB());
...
app.post('/signup', function(req, res) {
var item = {
'email': {'S': req.body.email},
'name': {'S': req.body.name},
'preview': {'S': req.body.previewAccess},
'theme': {'S': req.body.theme}
};
var seg = AWSXRay.getSegment();
seg.addAnnotation('theme', req.body.theme);
ddb.putItem({
'TableName': ddbTable,
'Item': item,
'Expected': { email: { Exists: false } }
}, function(err, data) {
...
Recording Metadata with the X-Ray SDK for Node.js
Use metadata to record information on segments or subsegments that you don't need indexed for
search. Metadata values can be strings, numbers, Booleans, or any other object that can be serialized into
a JSON object or array.
To record metadata
1. Get a reference to the current segment or subsegment.
var AWSXRay = require('aws-xray-sdk');
160

AWS X-Ray Developer Guide
Recording Metadata with the X-Ray SDK for Node.js
...
var document = AWSXRay.getSegment();
2. Call addMetadata with a string key, a Boolean, number, string, or object value, and a string
namespace.
document.addMetadata("my key", "my value", "my namespace");
or
Call addMetadata with just a key and value.
document.addMetadata("my key", "my value");
If you don't specify a namespace, the SDK uses default. Calling addMetadata twice with the same key
overwrites previously recorded values on the same segment or subsegment.
161

AWS X-Ray Developer Guide
AWS X-Ray SDK for Python
The X-Ray SDK for Python is a library for Python web applications that provides classes and methods for
generating and sending trace data to the X-Ray daemon. Trace data includes information about incoming
HTTP requests served by the application, and calls that the application makes to downstream services
using the AWS SDK, HTTP clients, or an SQL database connector. You can also create segments manually
and add debug information in annotations and metadata.
You can download the SDK with pip.
$ pip install aws-xray-sdk
Note
The X-Ray SDK for Python is an open source project. You can follow the project and submit
issues and pull requests on GitHub: github.com/aws/aws-xray-sdk-python
If you use Django or Flask, start by adding the SDK middleware to your application (p. 168) to trace
incoming requests. The middleware creates a segment (p. 20) for each traced request, and completes the
segment when the response is sent. While the segment is open, you can use the SDK client's methods
to add information to the segment and create subsegments to trace downstream calls. The SDK also
automatically records exceptions that your application throws while the segment is open. For other
applications, you can create segments manually (p. 169).
For Lambda functions called by an instrumented application or service, Lambda reads the tracing
header (p. 25) and traces sampled requests automatically. For other functions, you can configure
Lambda (p. 208) to sample and trace incoming requests. In either case, Lambda creates the segment
and provides it to the X-Ray SDK.
Note
On Lambda, the X-Ray SDK is optional. If you don't use it in your function, your service map
will still include a node for the Lambda service, and one for each Lambda function. By adding
the SDK, you can instrument your function code to add subsegments to the function segment
recorded by Lambda. See AWS Lambda and AWS X-Ray (p. 208) for more information.
See Worker (p. 87) for a example Python function instrumented in Lambda.
Next, use the X-Ray SDK for Python to instrument downstream calls by patching your application's
libraries (p. 171). The SDK supports the following libraries.
Supported Libraries
•botocore, boto3 – Instrument AWS SDK for Python (Boto) clients.
•pynamodb – Instrument PynamoDB's version of the Amazon DynamoDB client.
•aiobotocore, aioboto3 – Instrument asyncio-integrated versions of SDK for Python clients.
•requests, aiohttp – Instrument high-level HTTP clients.
•httplib, http.client – Instrument low-level HTTP clients and the higher level libraries that use
them.
•sqlite3 – Instrument SQLite clients.
•mysql-connector-python – Instrument MySQL clients.
Whenever your application makes calls to AWS, an SQL database, or other HTTP services, the SDK
records information about the call in a subsegment. AWS services and the resources that you access
within the services appear as downstream nodes on the service map to help you identify errors and
throttling issues on individual connections.
162

AWS X-Ray Developer Guide
Requirements
Once you get going with the SDK, customize its behavior by configuring the recorder and
middleware (p. 164). You can add plugins to record data about the compute resources running your
application, customize sampling behavior by defining sampling rules, and set the log level to see more or
less information from the SDK in your application logs.
Record additional information about requests and the work that your application does in annotations
and metadata (p. 175). Annotations are simple key-value pairs that are indexed for use with filter
expressions (p. 37), so that you can search for traces that contain specific data. Metadata entries are less
restrictive and can record entire objects and arrays — anything that can be serialized into JSON.
Annotations and Metadata
Annotations and metadata are arbitrary text that you add to segments with the X-Ray SDK.
Annotations are indexed for use with filter expressions. Metadata are not indexed, but can be
viewed in the raw segment with the X-Ray console or API. Anyone that you grant read access to
X-Ray can view this data.
When you have a lot of instrumented clients in your code, a single request segment can contain a large
number of subsegments, one for each call made with an instrumented client. You can organize and
group subsegments by wrapping client calls in custom subsegments (p. 174). You can create a custom
subsegment for an entire function or any section of code. You can then you can record metadata and
annotations on the subsegment instead of writing everything on the parent segment.
For reference documentation for the SDK's classes and methods, see the AWS X-Ray SDK for Python API
Reference.
Requirements
The X-Ray SDK for Python supports the following language and library versions.
•Python – 2.7, 3.4, and newer
•Django – 1.10 and newer
•Flask – 0.10 and newer
•aiohttp – 2.3.0 and newer
•AWS SDK for Python (Boto) – 1.4.0 and newer
•botocore – 1.5.0 and newer
Dependency Management
The X-Ray SDK for Python is available from pip.
•Package – aws-xray-sdk
Add the SDK as a dependency in your requirements.txt file.
Example requirements.txt
aws-xray-sdk==1.0
boto3==1.4.4
botocore==1.5.55
Django==1.11.3
If you use Elastic Beanstalk to deploy your application, Elastic Beanstalk installs all of the packages in
requirements.txt automatically.
163
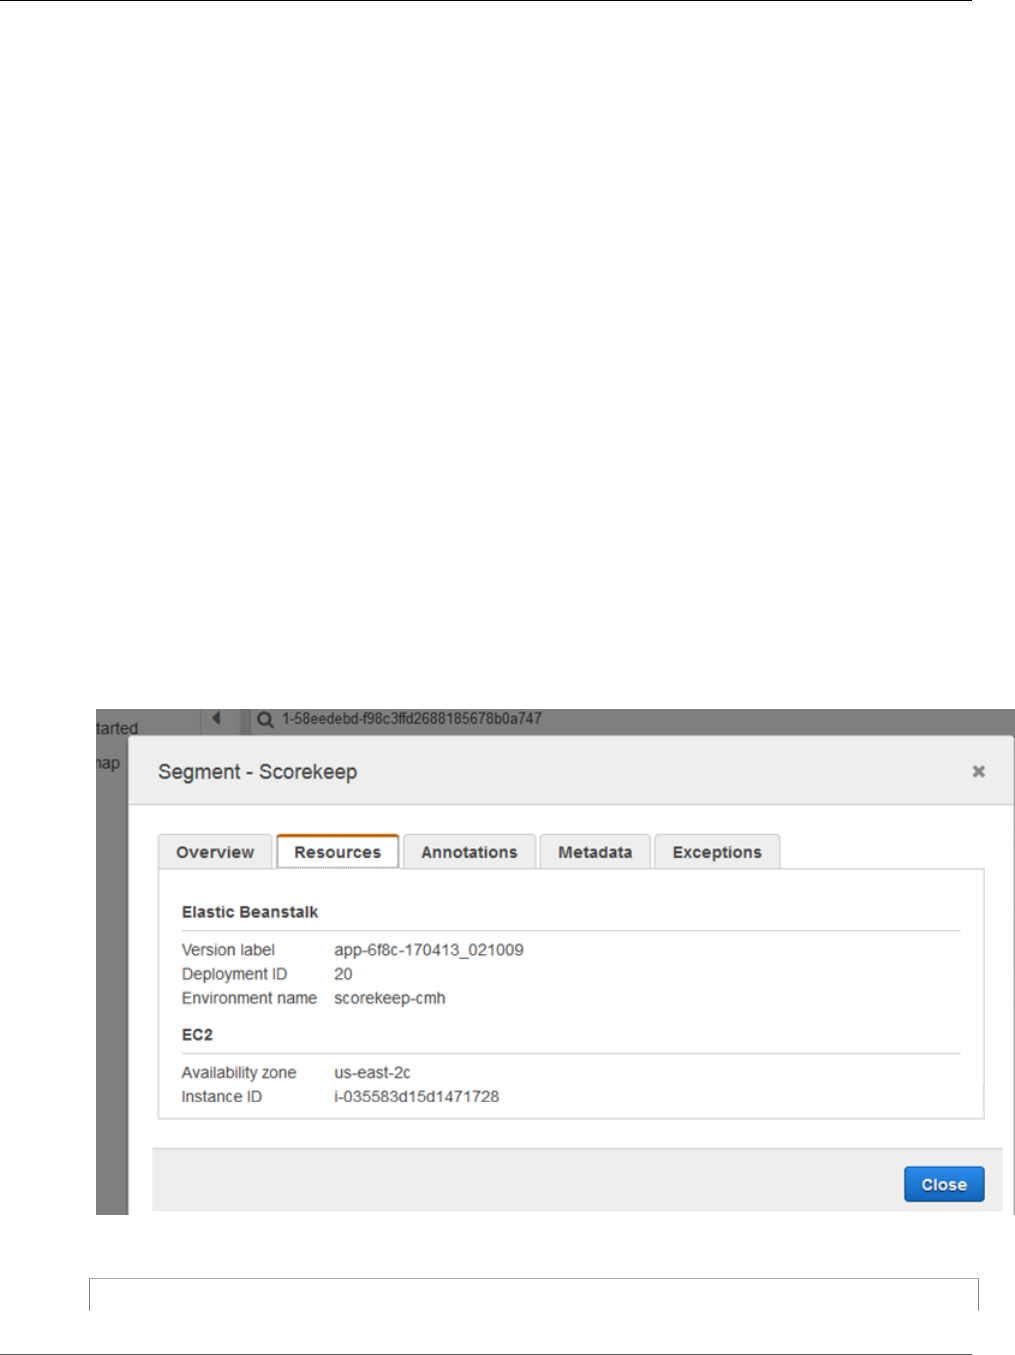
AWS X-Ray Developer Guide
Configuration
Configuring the X-Ray SDK for Python
The X-Ray SDK for Python has a class named xray_recorder that provides the global recorder. You can
configure the global recorder to customize the middleware that creates segments for incoming HTTP
calls.
Sections
•Service Plugins (p. 164)
•Sampling Rules (p. 165)
•Logging (p. 166)
•Recorder Configuration in Code (p. 166)
•Recorder Configuration with Django (p. 167)
•Environment Variables (p. 167)
Service Plugins
Use plugins to record information about the service hosting your application.
Plugins
• Amazon EC2 – EC2Plugin adds the instance ID and Availability Zone.
• Elastic Beanstalk – ElasticBeanstalkPlugin adds the environment name, version label, and
deployment ID.
• Amazon ECS – ECSPlugin adds the container ID.
To use a plugin, call configure on the xray_recorder.
from aws_xray_sdk.core import xray_recorder
164
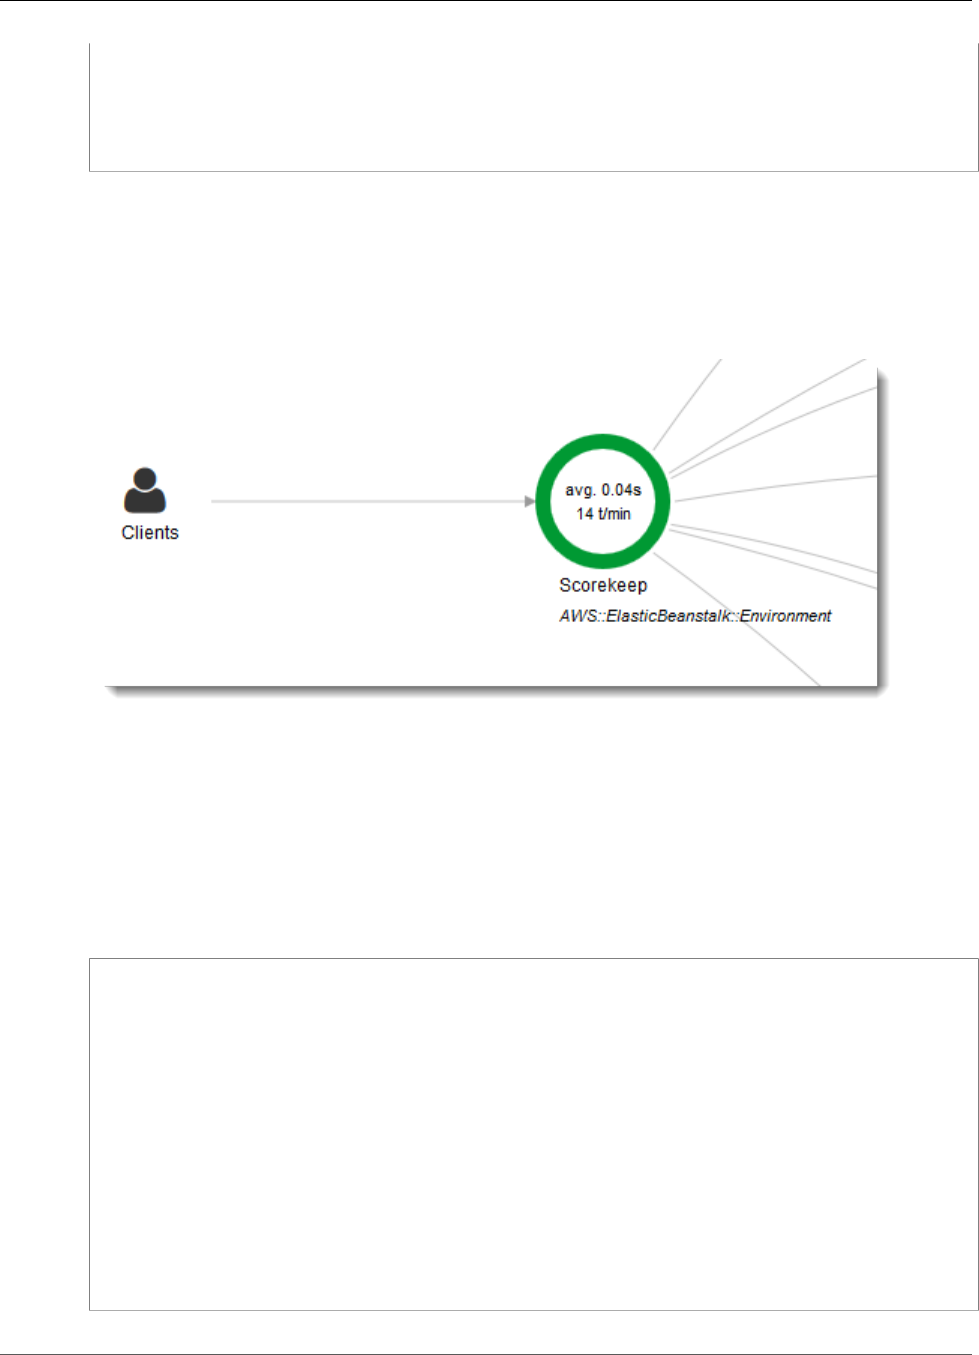
AWS X-Ray Developer Guide
Sampling Rules
from aws_xray_sdk.core import patch_all
xray_recorder.configure(aws_xray_tracing_name='My app')
plugins = ('ElasticBeanstalkPlugin', 'EC2Plugin')
xray_recorder.configure(plugins=plugins)
patch_all()
You can also use environment variables (p. 167), which take precedence over values set in code, to
configure the recorder.
Configure plugins before patching libraries (p. 164) to record downstream calls.
The SDK also uses plugin settings to set the origin field on the segment. This indicates the type of
AWS resource that runs your application. The resource type appears under your application's name in the
service map. For example, AWS::ElasticBeanstalk::Environment.
When you use multiple plugins, the SDK uses the plugin that was loaded last to determine the origin.
Sampling Rules
The SDK has a default sampling strategy that determines which requests get traced. By default, the SDK
traces the first request each second, and five percent of any additional requests. You can customize the
SDK's sampling behavior by applying rules you define in a local file.
Example sampling-rules.json
{
"version": 1,
"rules": [
{
"description": "Player moves.",
"service_name": "*",
"http_method": "*",
"url_path": "/api/move/*",
"fixed_target": 0,
"rate": 0.05
}
],
"default": {
"fixed_target": 1,
"rate": 0.1
}
}
165
AWS X-Ray Developer Guide
Logging
This example defines one custom rule and a default rule. The custom rule applies a five-percent sampling
rate with no minimum number of requests to trace for paths under /api/move/. The default rule traces
the first request each second and 10 percent of additional requests.
The SDK applies custom rules in the order in which they are defined. If a request matches multiple
custom rules, the SDK applies only the first rule.
On Lambda, you cannot modify the sampling rate. If your function is called by an instrumented service,
calls generated requests that were sampled by that service will be recorded by Lambda. If active tracing
is enabled and no tracing header is present, Lambda makes the sampling decision.
To configure sampling rules, call xray_recorder.configure, as shown in the following example,
where rules is either a dictionary of rules or the absolute path to a JSON file containing sampling rules.
xray_recorder.configure(sampling_rules=rules)
You can also configure the global recorder to disable sampling and instrument all incoming requests.
Example main.py – disable sampling
xray_recorder.configure(sampling=False)
Logging
The SDK uses Python’s built-in logging module. Get a reference to the logger for the aws_xray_sdk
class and call setLevel on it to configure the different log level for the library and the rest of your
application.
Example app.py – logging
logging.basicConfig(level='WARNING')
logging.getLogger('aws_xray_sdk').setLevel(logging.DEBUG)
Use debug logs to identify issues, such as unclosed subsegments, when you generate subsegments
manually (p. 174).
Recorder Configuration in Code
Additional settings are available from the configure method on xray_recorder.
•context_missing – Set to LOG_ERROR to avoid throwing exceptions when your instrumented code
attempts to record data when no segment is open.
•daemon_address – Set the host and port of the X-Ray daemon listener.
•service – Set a service name that the SDK uses for segments.
•plugins – Record information about your application's AWS resources.
•sampling – Set to False to disable sampling.
•sampling_rules – Set the path of the JSON file containing your sampling rules (p. 165).
Example main.py – disable context missing exceptions
from aws_xray_sdk.core import xray_recorder
xray_recorder.configure(context_missing='LOG_ERROR')
166
AWS X-Ray Developer Guide
Recorder Configuration with Django
Recorder Configuration with Django
If you use the Django framework, you can use the Django settings.py file to configure options on the
global recorder.
•AUTO_INSTRUMENT (Django only) – Record subsegments for built-in database and template rendering
operations.
•AWS_XRAY_CONTEXT_MISSING – Set to LOG_ERROR to avoid throwing exceptions when your
instrumented code attempts to record data when no segment is open.
•AWS_XRAY_DAEMON_ADDRESS – Set the host and port of the X-Ray daemon listener.
•AWS_XRAY_TRACING_NAME – Set a service name that the SDK uses for segments.
•PLUGINS – Record information about your application's AWS resources.
•SAMPLING – Set to False to disable sampling.
•SAMPLING_RULES – Set the path of the JSON file containing your sampling rules (p. 165).
To enable recorder configuration in settings.py, add the Django middleware to the list of installed
apps.
Example settings.py – installed apps
INSTALLED_APPS = [
...
'django.contrib.sessions',
'aws_xray_sdk.ext.django',
]
Configure the available settings in a list named XRAY_RECORDER.
Example settings.py – installed apps
XRAY_RECORDER = {
'AUTO_INSTRUMENT': True,
'AWS_XRAY_CONTEXT_MISSING': 'LOG_ERROR',
'AWS_XRAY_DAEMON_ADDRESS': '127.0.0.1:5000',
'AWS_XRAY_TRACING_NAME': 'My application',
'PLUGINS': ('ElasticBeanstalkPlugin', 'EC2Plugin', 'ECSPlugin'),
'SAMPLING': False,
}
Environment Variables
You can use environment variables to configure the X-Ray SDK for Python. The SDK supports the
following variables:
•AWS_XRAY_TRACING_NAME – Set a service name that the SDK uses for segments. Overrides the service
name that you set on the servlet filter's segment naming strategy (p. 170).
•AWS_XRAY_DAEMON_ADDRESS – Set the host and port of the X-Ray daemon listener. By default, the
SDK sends trace data to 127.0.0.1:2000. Use this variable if you have configured the daemon to
listen on a different port (p. 102) or if it is running on a different host.
•AWS_XRAY_CONTEXT_MISSING – Set to LOG_ERROR to avoid throwing exceptions when your
instrumented code attempts to record data when no segment is open.
Valid Values
•RUNTIME_ERROR – Throw a runtime exception (default).
167

AWS X-Ray Developer Guide
Incoming Requests
•LOG_ERROR – Log an error and continue.
Errors related to missing segments or subsegments can occur when you attempt to use an
instrumented client in startup code that runs when no request is open, or in code that spawns a new
thread.
Environment variables override values set in code.
Tracing Incoming Requests with the X-Ray SDK for
Python Middleware
If you use Django or Flask, use the Django middleware (p. 169) or Flask middleware (p. 169) to
instrument incoming HTTP requests. When you add the middleware to your application and configure
a segment name, the X-Ray SDK for Python creates a segment for each sampled request. This segment
includes timing, method, and disposition of the HTTP request. Additional instrumentation creates
subsegments on this segment.
Note
For AWS Lambda functions, Lambda creates a segment for each sampled request. See AWS
Lambda and AWS X-Ray (p. 208) for more information.
See Worker (p. 87) for a example Python function instrumented in Lambda.
For scripts or Python applications on other frameworks, you can create segments manually (p. 169).
Each segment has a name that identifies your application in the service map. The segment can be named
statically, or you can configure the SDK to name it dynamically based on the host header in the incoming
request. Dynamic naming lets you group traces based on the domain name in the request, and apply a
default name if the name doesn't match an expected pattern (for example, if the host header is forged).
Forwarded Requests
If a load balancer or other intermediary forwards a request to your application, X-Ray takes the
client IP from the X-Forwarded-For header in the request instead of from the source IP in the
IP packet. The client IP that is recorded for a forwarded request can be forged, so it should not
be trusted.
When a request is forwarded, the SDK sets an additional field in the segment to indicate this. If the
segment contains the field x_forwarded_for set to true, the client IP was taken from the X-
Forwarded-For header in the HTTP request.
The middleware creates a segment for each incoming request with an http block that contains the
following information:
•HTTP method – GET, POST, PUT, DELETE, etc.
•Client address – The IP address of the client that sent the request.
•Response code – The HTTP response code for the completed request.
•Timing – The start time (when the request was received) and end time (when the response was sent).
•User agent — The user-agent from the request.
•Content length — The content-length from the response.
Sections
•Adding the Middleware to Your Application (Django) (p. 169)
•Adding the Middleware to Your Application (Flask) (p. 169)
•Instrumenting Python Code Manually (p. 169)
168
AWS X-Ray Developer Guide
Adding the Middleware to Your Application (Django)
•Configuring a Segment Naming Strategy (p. 170)
Adding the Middleware to Your Application (Django)
Add the middleware to the MIDDLEWARE list in your settings.py file. The X-Ray middleware should be
the first line in your settings.py file to ensure that requests that fail in other middleware are recorded.
Example settings.py - X-Ray SDK for Python middleware
MIDDLEWARE = [
'aws_xray_sdk.ext.django.middleware.XRayMiddleware',
'django.middleware.security.SecurityMiddleware',
'django.contrib.sessions.middleware.SessionMiddleware',
'django.middleware.common.CommonMiddleware',
'django.middleware.csrf.CsrfViewMiddleware',
'django.contrib.auth.middleware.AuthenticationMiddleware',
'django.contrib.messages.middleware.MessageMiddleware',
'django.middleware.clickjacking.XFrameOptionsMiddleware'
]
Configure a segment name in your settings.py file (p. 167).
Example settings.py – segment name
XRAY_RECORDER = {,
'AWS_XRAY_TRACING_NAME': 'My application',
'PLUGINS': ('EC2Plugin'),
}
This tells the X-Ray recorder to trace requests served by your Django application with the default
sampling rate. You can configure the recorder your Django settings file (p. 167) to apply custom
sampling rules or change other settings.
Adding the Middleware to Your Application (Flask)
To instrument your Flask application, first configure a segment name on the xray_recorder. Then, use
the XRayMiddleware function to patch your Flask application in code.
Example app.py
from aws_xray_sdk.core import xray_recorder
from aws_xray_sdk.ext.flask.middleware import XRayMiddleware
app = Flask(__name__)
xray_recorder.configure(service='My application')
XRayMiddleware(app, xray_recorder)
This tells the X-Ray recorder to trace requests served by your Flask application with the default sampling
rate. You can configure the recorder in code (p. 166) to apply custom sampling rules or change other
settings.
Instrumenting Python Code Manually
If you don't use Django or Flask, you can create segments manually. You can create a segment for each
incoming request, or create segments around patched HTTP or AWS SDK clients to provide context for
the recorder to add subsegments.
169

AWS X-Ray Developer Guide
Configuring a Segment Naming Strategy
Example main.rb – manual instrumentation
from aws_xray_sdk.core import xray_recorder
# Start a segment
segment = xray_recorder.begin_segment('segment_name')
# Start a subsegment
subsegment = xray_recorder.begin_subsegment('subsegment_name')
# Add metadata and annotations
segment.put_metadata('key', dict, 'namespace')
subsegment.put_annotation('key', 'value')
# Close the subsegment and segment
xray_recorder.end_subsegment()
xray_recorder.end_segment()
Configuring a Segment Naming Strategy
AWS X-Ray uses a service name to identify your application and distinguish it from the other applications,
databases, external APIs, and AWS resources that your application uses. When the X-Ray SDK generates
segments for incoming requests, it records your application's service name in the segment's name
field (p. 61).
The X-Ray SDK can name segments after the hostname in the HTTP request header. However, this header
can be forged, which could result in unexpected nodes in your service map. To prevent the SDK from
naming segments incorrectly due to requests with forged host headers, you must specify a default name
for incoming requests.
If your application serves requests for multiple domains, you can configure the SDK to use a dynamic
naming strategy to reflect this in segment names. A dynamic naming strategy allows the SDK to use the
hostname for requests that match an expected pattern, and apply the default name to requests that
don't.
For example, you might have a single application serving requests to three subdomains–
www.example.com, api.example.com, and static.example.com. You can use a dynamic naming
strategy with the pattern *.example.com to identify segments for each subdomain with a different
name, resulting in three service nodes on the service map. If your application receives requests with a
hostname that doesn't match the pattern, you will see a fourth node on the service map with a fallback
name that you specify.
To use the same name for all request segments, specify the name of your application when you configure
the recorder, as shown in the previous sections (p. 169).
A dynamic naming strategy defines a pattern that hostnames should match, and a default name to use if
the hostname in the HTTP request doesn't match the pattern. To name segments dynamically in Django,
add the DYNAMIC_NAMING setting to your settings.py (p. 167) file.
Example settings.py – dynamic naming
XRAY_RECORDER = {
'AUTO_INSTRUMENT': True,
'AWS_XRAY_TRACING_NAME': 'My application',
'DYNAMIC_NAMING': '*.example.com',
'PLUGINS': ('ElasticBeanstalkPlugin', 'EC2Plugin'),
}
You can use '*' in the pattern to match any string, or '?' to match any single character. For Flask, configure
the recorder in code (p. 166).
170
AWS X-Ray Developer Guide
Patching Libraries
Example main.py – segment name
from aws_xray_sdk.core import xray_recorder
xray_recorder.configure(service='My application')
xray_recorder.configure(dynamic_naming='*.example.com')
Note
You can override the default service name that you define in code with the
AWS_XRAY_TRACING_NAME environment variable (p. 167).
Patching Libraries to Instrument Downstream Calls
To instrument downstream calls, use the X-Ray SDK for Python to patch the libraries that your
application uses. The X-Ray SDK for Python can patch the following libraries.
Supported Libraries
•botocore, boto3 – Instrument AWS SDK for Python (Boto) clients.
•pynamodb – Instrument PynamoDB's version of the Amazon DynamoDB client.
•aiobotocore, aioboto3 – Instrument asyncio-integrated versions of SDK for Python clients.
•requests, aiohttp – Instrument high-level HTTP clients.
•httplib, http.client – Instrument low-level HTTP clients and the higher level libraries that use
them.
•sqlite3 – Instrument SQLite clients.
•mysql-connector-python – Instrument MySQL clients.
When you use a patched library, the X-Ray SDK for Python creates a subsegment for the call and records
information from the request and response. A segment must be available for the SDK to create the
subsegment, either from the SDK middleware or from AWS Lambda.
Note
If you use SQLAlchemy ORM, you can instrument your SQL queries by importing the SDK's
version of SQLAlchemy's session and query classes. See Use SQLAlchemy ORM for instructions.
To patch all available libraries, use the patch_all function in aws_xray_sdk.core.
Example main.py – patch all supported libraries
import boto3
import botocore
import requests
import sqlite3
from aws_xray_sdk.core import xray_recorder
from aws_xray_sdk.core import patch_all
patch_all()
To patch individual libraries, call patch with a tuple of library names.
Example main.py – patch specific libraries
import boto3
import botocore
import requests
171

AWS X-Ray Developer Guide
Tracing Context for Asynchronous Work
import mysql-connector-python
from aws_xray_sdk.core import xray_recorder
from aws_xray_sdk.core import patch
libraries = ('botocore', 'mysql')
patch(libraries)
Note
In some cases, the key that you use to patch a library does not match the library name. Some
keys serve as aliases for one or more libraries.
Libraries Aliases
•httplib – httplib and http.client
•mysql – mysql-connector-python
Tracing Context for Asynchronous Work
For asyncio integrated libraries, or to create subsegments for asynchronous functions (p. 174), you
must also configure the X-Ray SDK for Python with an async context. Import the AsyncContext class
and pass an instance of it to the X-Ray recorder.
Example main.py – patch aioboto3
import asyncio
import aioboto3
import requests
from aws_xray_sdk.core.async_context import AsyncContext
from aws_xray_sdk.core import xray_recorder
xray_recorder.configure(service='my_service', context=AsyncContext())
from aws_xray_sdk.core import patch
libraries = ('aioboto3')
patch(libraries)
Tracing AWS SDK Calls with the X-Ray SDK for
Python
When your application makes calls to AWS services to store data, write to a queue, or send notifications,
the X-Ray SDK for Python tracks the calls downstream in subsegments (p. 174). Traced AWS services
and resources that you access within those services (for example, an Amazon S3 bucket or Amazon SQS
queue), appear as downstream nodes on the service map in the X-Ray console.
The X-Ray SDK for Python automatically instruments all AWS SDK clients when you patch the botocore
library (p. 171). You cannot instrument individual clients.
For all services, you can see the name of the API called in the X-Ray console. For a subset of services, the
X-Ray SDK adds information to the segment to provide more granularity in the service map.
For example, when you make a call with an instrumented DynamoDB client, the SDK adds the table name
to the segment for calls that target a table. In the console, each table appears as a separate node in the
service map, with a generic DynamoDB node for calls that don't target a table.
172

AWS X-Ray Developer Guide
Outgoing HTTP Calls
Example Subsegment for a Call to DynamoDB to Save an Item
{
"id": "24756640c0d0978a",
"start_time": 1.480305974194E9,
"end_time": 1.4803059742E9,
"name": "DynamoDB",
"namespace": "aws",
"http": {
"response": {
"content_length": 60,
"status": 200
}
},
"aws": {
"table_name": "scorekeep-user",
"operation": "UpdateItem",
"request_id": "UBQNSO5AEM8T4FDA4RQDEB94OVTDRVV4K4HIRGVJF66Q9ASUAAJG",
}
}
When you access named resources, calls to the following services create additional nodes in the service
map. Calls that don't target specific resources create a generic node for the service.
•Amazon DynamoDB – Table name
•Amazon Simple Storage Service – Bucket and key name
•Amazon Simple Queue Service – Queue name
Tracing Calls to Downstream HTTP Web Services
Using the X-Ray SDK for Python
When your application makes calls to microservices or public HTTP APIs, you can use the X-Ray SDK for
Python to instrument those calls and add the API to the service graph as a downstream service.
To instrument HTTP clients, patch the library (p. 171) that you use to make outgoing calls. If you use
requests or Python's built in HTTP client, that's all you need to do. For aiohttp, also configure the
recorder with an async context (p. 172).
If you use aiohttp 3's client API, you also need to configure the ClientSession's with an instance of
the tracing configuration provided by the SDK.
Example aiohttp 3 Client API
from aws_xray_sdk.ext.aiohttp.client import aws_xray_trace_config
async def foo():
trace_config = aws_xray_trace_config()
async with ClientSession(loop=loop, trace_configs=[trace_config]) as session:
async with session.get(url) as resp
await resp.read()
When you instrument a call to a downstream web API, the X-Ray SDK for Python records a subsegment
that contains information about the HTTP request and response. X-Ray uses the subsegment to generate
an inferred segment for the remote API.
173

AWS X-Ray Developer Guide
Custom Subsegments
Example Subsegment for a Downstream HTTP Call
{
"id": "004f72be19cddc2a",
"start_time": 1484786387.131,
"end_time": 1484786387.501,
"name": "names.example.com",
"namespace": "remote",
"http": {
"request": {
"method": "GET",
"url": "https://names.example.com/"
},
"response": {
"content_length": -1,
"status": 200
}
}
}
Example Inferred Segment for a Downstream HTTP Call
{
"id": "168416dc2ea97781",
"name": "names.example.com",
"trace_id": "1-5880168b-fd5153bb58284b67678aa78c",
"start_time": 1484786387.131,
"end_time": 1484786387.501,
"parent_id": "004f72be19cddc2a",
"http": {
"request": {
"method": "GET",
"url": "https://names.example.com/"
},
"response": {
"content_length": -1,
"status": 200
}
},
"inferred": true
}
Generating Custom Subsegments with the X-Ray
SDK for Python
Subsegments extend a trace's segment (p. 20) with details about work done in order to serve a request.
Each time you make a call with an instrumented client, the X-Ray SDK records the information generated
in a subsegment. You can create additional subsegments to group other subsegments, to measure the
performance of a section of code, or to record annotations and metadata.
To manage subsegments, use the begin_subsegment and end_subsegment methods.
Example main.py – custom subsegment
from aws_xray_sdk.core import xray_recorder
subsegment = xray_recorder.begin_subsegment('annotations')
174

AWS X-Ray Developer Guide
Annotations and Metadata
subsegment.put_annotation('id', 12345)
xray_recorder.end_subsegment()
To create a subsegment for a synchronous function, use the @xray_recorder.capture decorator. You
can pass a name for the subsegment to the capture function or leave it out to use the function name.
Example main.py – function subsegment
from aws_xray_sdk.core import xray_recorder
@xray_recorder.capture('## create_user')
def create_user():
...
For an asynchronous function, use the @xray_recorder.capture_async decorator, and pass an async
context to the recorder.
Example main.py – asynchronous function subsegment
from aws_xray_sdk.core.async_context import AsyncContext
from aws_xray_sdk.core import xray_recorder
xray_recorder.configure(service='my_service', context=AsyncContext())
@xray_recorder.capture_async('## create_user')
async def create_user():
...
async def main():
await myfunc()
When you create a subsegment within a segment or another subsegment, the X-Ray SDK for Python
generates an ID for it and records the start time and end time.
Example Subsegment with Metadata
"subsegments": [{
"id": "6f1605cd8a07cb70",
"start_time": 1.480305974194E9,
"end_time": 1.4803059742E9,
"name": "Custom subsegment for UserModel.saveUser function",
"metadata": {
"debug": {
"test": "Metadata string from UserModel.saveUser"
}
},
Add Annotations and Metadata to Segments with
the X-Ray SDK for Python
You can record additional information about requests, the environment, or your application with
annotations and metadata. You can add annotations and metadata to the segments that the X-Ray SDK
creates, or to custom subsegments that you create.
Annotations are key-value pairs with string, number, or Boolean values. Annotations are indexed for use
with filter expressions (p. 37). Use annotations to record data that you want to use to group traces in the
console, or when calling the GetTraceSummaries API.
175
AWS X-Ray Developer Guide
Recording Annotations with the X-Ray SDK for Python
Metadata are key-value pairs that can have values of any type, including objects and lists, but are not
indexed for use with filter expressions. Use metadata to record additional data that you want stored in
the trace but don't need to use with search.
In addition to annotations and metadata, you can also record user ID strings (p. 177) on segments. User
IDs are recorded in a separate field on segments and are indexed for use with search.
Sections
•Recording Annotations with the X-Ray SDK for Python (p. 176)
•Recording Metadata with the X-Ray SDK for Python (p. 177)
•Recording User IDs with the X-Ray SDK for Python (p. 177)
Recording Annotations with the X-Ray SDK for
Python
Use annotations to record information on segments or subsegments that you want indexed for search.
Annotation Requirements
•Keys – Up to 500 alphanumeric characters. No spaces or symbols except underscores.
•Values – Up to 1,000 Unicode characters.
•Entries – Up to 50 annotations per trace.
To record annotations
1. Get a reference to the current segment or subsegment from xray_recorder.
from aws_xray_sdk.core import xray_recorder
...
document = xray_recorder.current_segment()
or
from aws_xray_sdk.core import xray_recorder
...
document = xray_recorder.current_subsegment()
2. Call put_annotation with a String key, and a Boolean, Number, or String value.
document.put_annotation("mykey", "my value");
Alternatively, you can use the put_annotation method on the xray_recorder. This method records
annotations on the current subsegment or, if no subsegment is open, on the segment.
xray_recorder.put_annotation("mykey", "my value");
The SDK records annotations as key-value pairs in an annotations object in the segment document.
Calling put_annotation twice with the same key overwrites previously recorded values on the same
segment or subsegment.
To find traces that have annotations with specific values, use the annotations.key keyword in a filter
expression (p. 37).
176
AWS X-Ray Developer Guide
Recording Metadata with the X-Ray SDK for Python
Recording Metadata with the X-Ray SDK for Python
Use metadata to record information on segments or subsegments that you don't need indexed for
search. Metadata values can be strings, numbers, Booleans, or any object that can be serialized into a
JSON object or array.
To record metadata
1. Get a reference to the current segment or subsegment from xray_recorder.
from aws_xray_sdk.core import xray_recorder
...
document = xray_recorder.current_segment()
or
from aws_xray_sdk.core import xray_recorder
...
document = xray_recorder.current_subsegment()
2. Call put_metadata with a String key; a Boolean, Number, String, or Object value; and a String
namespace.
document.put_metadata("my key", "my value", "my namespace");
or
Call put_metadata with just a key and value.
document.put_metadata("my key", "my value");
Alternatively, you can use the put_metadata method on the xray_recorder. This method records
metadata on the current subsegment or, if no subsegment is open, on the segment.
xray_recorder.put_metadata("my key", "my value");
If you don't specify a namespace, the SDK uses default. Calling put_metadata twice with the same
key overwrites previously recorded values on the same segment or subsegment.
Recording User IDs with the X-Ray SDK for Python
Record user IDs on request segments to identify the user who sent the request.
To record user IDs
1. Get a reference to the current segment from xray_recorder.
from aws_xray_sdk.core import xray_recorder
...
document = xray_recorder.current_segment()
2. Call setUser with a String ID of the user who sent the request.
document.set_user("U12345");
177

AWS X-Ray Developer Guide
Requirements
AWS X-Ray SDK for Ruby
The X-Ray SDK is a library for Ruby web applications that provides classes and methods for generating
and sending trace data to the X-Ray daemon. Trace data includes information about incoming HTTP
requests served by the application, and calls that the application makes to downstream services using
the AWS SDK, HTTP clients, or an active record client. You can also create segments manually and add
debug information in annotations and metadata.
You can download the SDK by adding it to your gemfile and running bundle install.
Example Gemfile
gem 'aws-xray-sdk'
If you use Rails, start by adding the X-Ray SDK middleware (p. 184) to trace incoming requests. A
request filter creates a segment (p. 20). While the segment is open, you can use the SDK client's methods
to add information to the segment and create subsegments to trace downstream calls. The SDK also
automatically records exceptions that your application throws while the segment is open. For non-Rails
applications, you can create segments manually (p. 185).
Next, use the X-Ray SDK to instrument your AWS SDK for Ruby, HTTP, and SQL clients by configuring
the recorder (p. 187) to patch the associated libraries. Whenever you make a call to a downstream
AWS service or resource with an instrumented client, the SDK records information about the call in a
subsegment. AWS services and the resources that you access within the services appear as downstream
nodes on the service map to help you identify errors and throttling issues on individual connections.
Once you get going with the SDK, customize its behavior by configuring the recorder (p. 180). You can
add plugins to record data about the compute resources running your application, customize sampling
behavior by defining sampling rules, and provide a logger to see more or less information from the SDK
in your application logs.
Record additional information about requests and the work that your application does in annotations
and metadata (p. 189). Annotations are simple key-value pairs that are indexed for use with filter
expressions (p. 37), so that you can search for traces that contain specific data. Metadata entries are less
restrictive and can record entire objects and arrays — anything that can be serialized into JSON.
Annotations and Metadata
Annotations and metadata are arbitrary text that you add to segments with the X-Ray SDK.
Annotations are indexed for use with filter expressions. Metadata are not indexed, but can be
viewed in the raw segment with the X-Ray console or API. Anyone that you grant read access to
X-Ray can view this data.
When you have a lot of instrumented clients in your code, a single request segment can contain a large
number of subsegments, one for each call made with an instrumented client. You can organize and
group subsegments by wrapping client calls in custom subsegments (p. 188). You can create a custom
subsegment for an entire function or any section of code, and record metadata and annotations on the
subsegment instead of writing everything on the parent segment.
For reference documentation for the SDK's classes and methods, see the AWS X-Ray SDK for Ruby API
Reference.
Requirements
The X-Ray SDK requires Ruby 2.3 or later and is compatible with the following libraries:
179
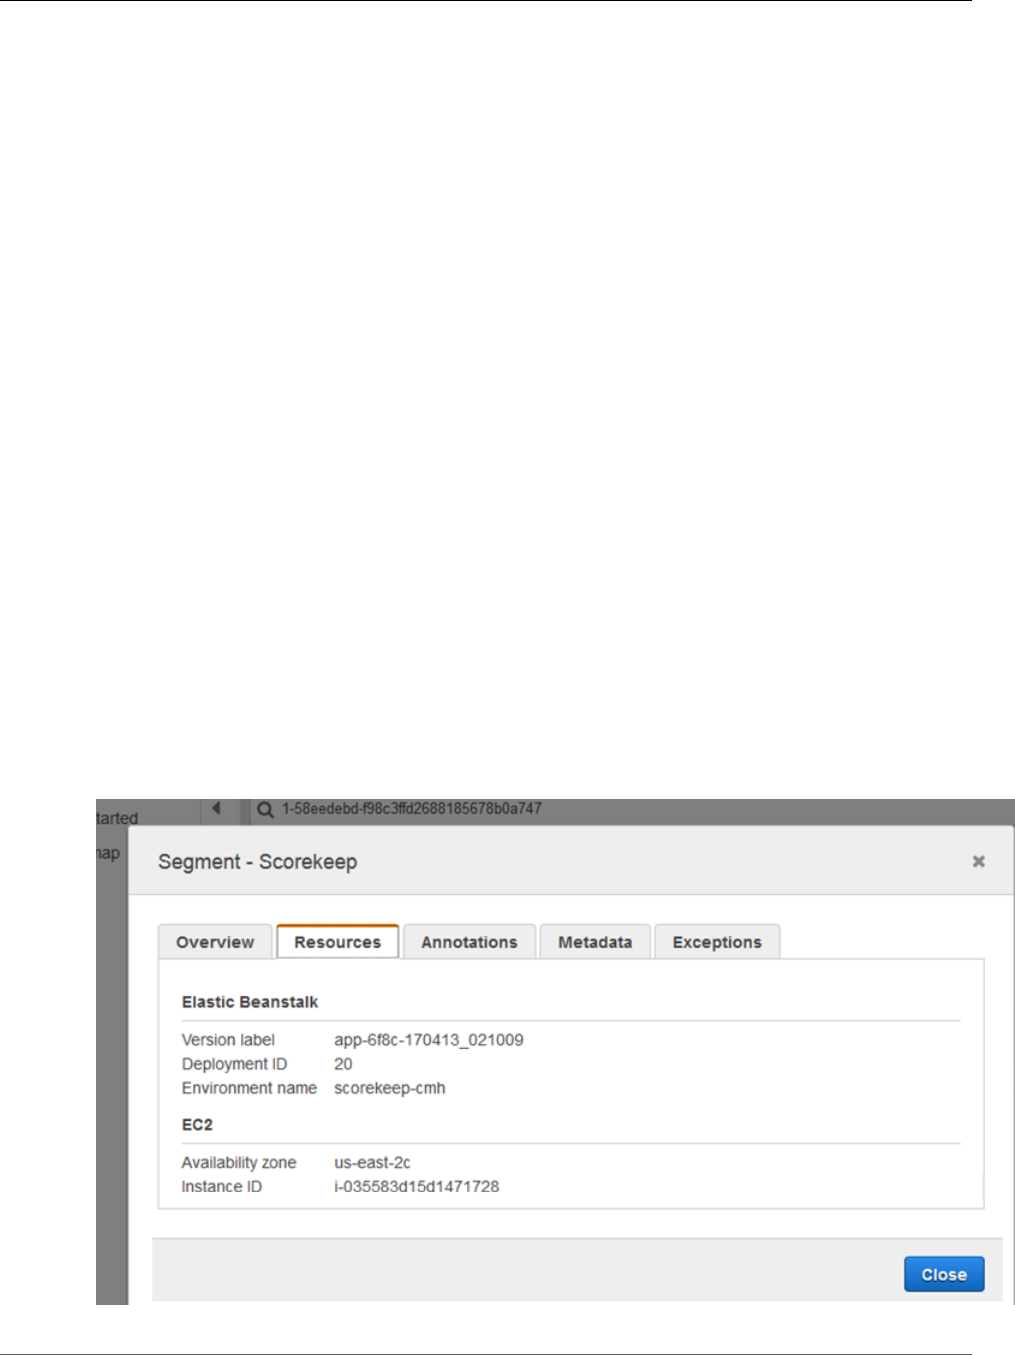
AWS X-Ray Developer Guide
Configuration
• AWS SDK for Ruby version 3.0 or later
• Rails version 5.1 or later
Configuring the X-Ray SDK for Ruby
The X-Ray SDK for Ruby has a class named XRay.recorder that provides the global recorder. You can
configure the global recorder to customize the middleware that creates segments for incoming HTTP
calls.
Sections
•Service Plugins (p. 180)
•Sampling Rules (p. 181)
•Logging (p. 183)
•Recorder Configuration in Code (p. 183)
•Recorder Configuration with Rails (p. 183)
•Environment Variables (p. 184)
Service Plugins
Use plugins to record information about the service hosting your application.
Plugins
• Amazon EC2 – ec2 adds the instance ID and Availability Zone.
• Elastic Beanstalk – elastic_beanstalk adds the environment name, version label, and deployment
ID.
• Amazon ECS – ecs adds the container ID.
180
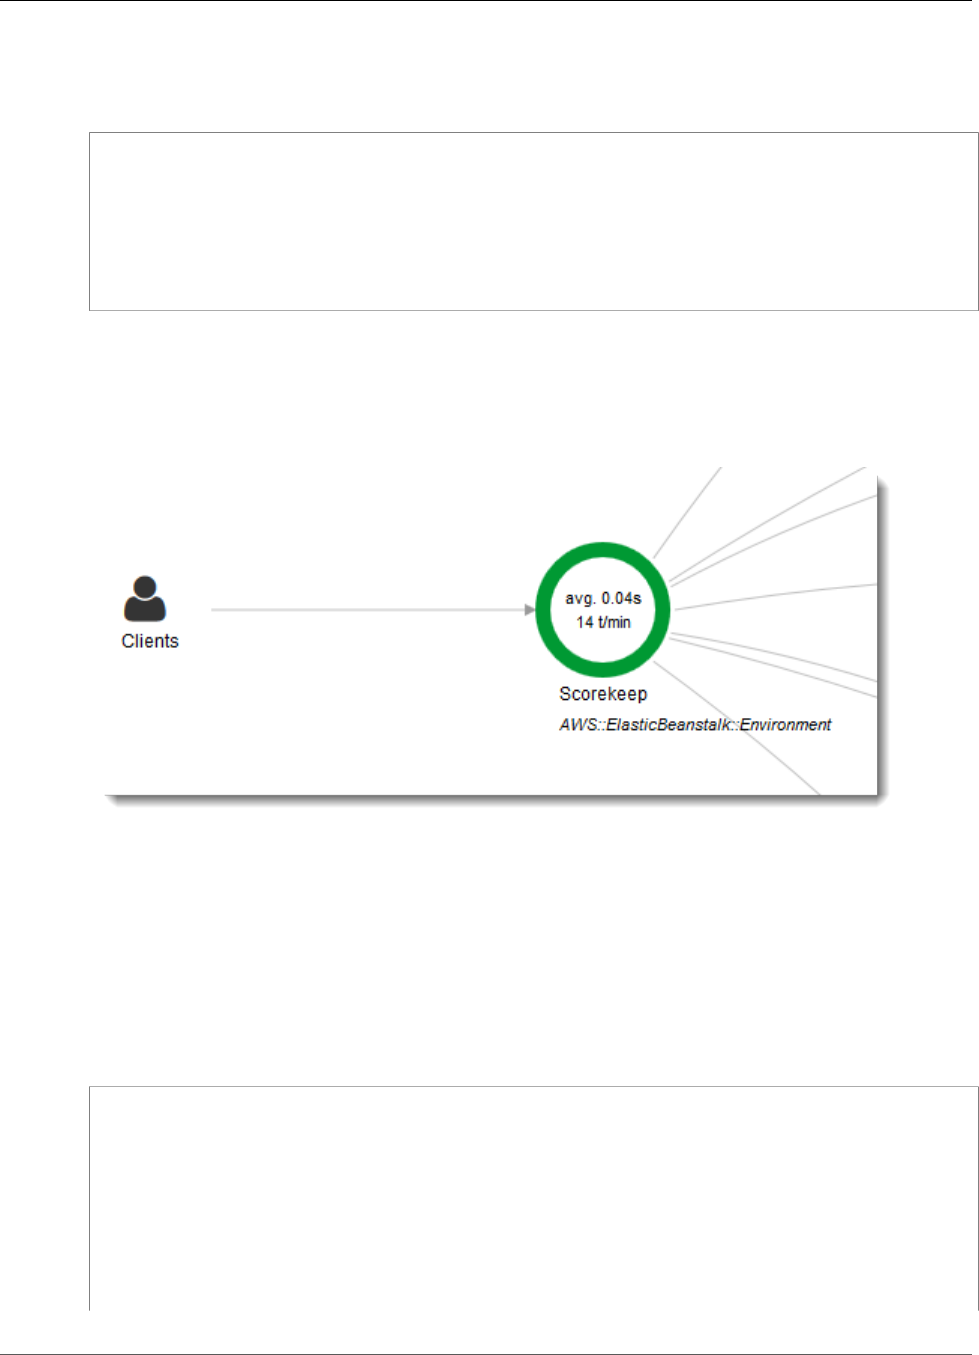
AWS X-Ray Developer Guide
Sampling Rules
To use plugins, specify it in the configuration object that you pass to the recorder.
Example main.rb – plugin configuration
my_plugins = %I[ec2 elastic_beanstalk]
config = {
plugins: my_plugins,
name: 'my app',
}
XRay.recorder.configure(config)
You can also use environment variables (p. 184), which take precedence over values set in code, to
configure the recorder.
The SDK also uses plugin settings to set the origin field on the segment. This indicates the type of
AWS resource that runs your application. The resource type appears under your application's name in the
service map. For example, AWS::ElasticBeanstalk::Environment.
When you use multiple plugins, the SDK uses the plugin that was loaded last to determine the origin.
Sampling Rules
The SDK has a default sampling strategy that determines which requests get traced. By default, the SDK
traces the first request each second, and five percent of any additional requests. You can customize the
SDK's sampling behavior by applying rules you define in a local file.
Example sampling-rules.json
{
"version": 1,
"rules": [
{
"description": "Player moves.",
"service_name": "*",
"http_method": "*",
"url_path": "/api/move/*",
"fixed_target": 0,
"rate": 0.05
}
181

AWS X-Ray Developer Guide
Sampling Rules
],
"default": {
"fixed_target": 1,
"rate": 0.1
}
}
This example defines one custom rule and a default rule. The custom rule applies a five-percent sampling
rate with no minimum number of requests to trace for paths under /api/move/. The default rule traces
the first request each second and 10 percent of additional requests.
The SDK applies custom rules in the order in which they are defined. If a request matches multiple
custom rules, the SDK applies only the first rule.
To configure sampling rules, define a hash for the document in the configuration object that you pass to
the recorder.
Example main.rb – sampling rule configuration
require 'aws-xray-sdk'
my_sampling_rules = {
version: 1,
default: {
fixed_target: 1,
rate: 0.1
}
}
config = {
sampling_rules: my_sampling_rules,
name: 'my app',
}
XRay.recorder.configure(config)
To store the sampling rules independently, define the hash in a separate file and require the file to pull it
into your application.
Example config/sampling-rules.rb
my_sampling_rules = {
version: 1,
default: {
fixed_target: 1,
rate: 0.1
}
}
Example main.rb – sampling rule from a file
require 'aws-xray-sdk'
require config/sampling-rules.rb
config = {
sampling_rules: my_sampling_rules,
name: 'my app',
}
XRay.recorder.configure(config)
You can also configure the global recorder to disable sampling and instrument all incoming requests.
182

AWS X-Ray Developer Guide
Logging
Example main.rb – disable sampling
require 'aws-xray-sdk'
config = {
sampling: false,
name: 'my app',
}
XRay.recorder.configure(config)
Logging
By default, the recorder outputs info-level events to $stdout. You can customize logging by defining a
logger in the configuration object that you pass to the recorder.
Example main.rb – logging
require 'aws-xray-sdk'
config = {
logger: my_logger,
name: 'my app',
}
XRay.recorder.configure(config)
Use debug logs to identify issues, such as unclosed subsegments, when you generate subsegments
manually (p. 188).
Recorder Configuration in Code
Additional settings are available from the configure method on XRay.recorder.
•context_missing – Set to LOG_ERROR to avoid throwing exceptions when your instrumented code
attempts to record data when no segment is open.
•daemon_address – Set the host and port of the X-Ray daemon listener.
•name – Set a service name that the SDK uses for segments.
•naming_pattern – Set a domain name pattern to use dynamic naming (p. 186).
•plugins – Record information about your application's AWS resources with plugins (p. 180).
•sampling – Set to false to disable sampling.
•sampling_rules – Set the hash containing your sampling rules (p. 181).
Example main.py – disable context missing exceptions
require 'aws-xray-sdk'
config = {
context_missing: LOG_ERROR
}
XRay.recorder.configure(config)
Recorder Configuration with Rails
If you use the Rails framework, you can configure options on the global recorder in a Ruby file under
app_root/initializers. The X-Ray SDK supports an additional configuration key for use with Rails.
183

AWS X-Ray Developer Guide
Environment Variables
•active_record – Set to true to record subsegments for Active Record database transactions.
Configure the available settings in a configuration object named Rails.application.config.xray.
Example config/initializers/aws_xray.rb
Rails.application.config.xray = {
name: 'my app',
patch: %I[net_http aws_sdk],
active_record: true
}
Environment Variables
You can use environment variables to configure the X-Ray SDK for Ruby. The SDK supports the following
variables:
•AWS_XRAY_TRACING_NAME – Set a service name that the SDK uses for segments. Overrides the service
name that you set on the servlet filter's segment naming strategy (p. 186).
•AWS_XRAY_DAEMON_ADDRESS – Set the host and port of the X-Ray daemon listener. By default, the
SDK sends trace data to 127.0.0.1:2000. Use this variable if you have configured the daemon to
listen on a different port (p. 102) or if it is running on a different host.
•AWS_XRAY_CONTEXT_MISSING – Set to LOG_ERROR to avoid throwing exceptions when your
instrumented code attempts to record data when no segment is open.
Valid Values
•RUNTIME_ERROR – Throw a runtime exception (default).
•LOG_ERROR – Log an error and continue.
Errors related to missing segments or subsegments can occur when you attempt to use an
instrumented client in startup code that runs when no request is open, or in code that spawns a new
thread.
Environment variables override values set in code.
Tracing Incoming Requests with the X-Ray SDK for
Ruby Middleware
You can use the X-Ray SDK to trace incoming HTTP requests that your application serves on an EC2
instance in Amazon EC2, AWS Elastic Beanstalk, or Amazon ECS.
If you use Rails, use the Rails middleware to instrument incoming HTTP requests. When you add the
middleware to your application and configure a segment name, the X-Ray SDK for Ruby creates a
segment for each sampled request. Any segments created by additional instrumentation become
subsegments of the request-level segment that provides information about the HTTP request and
response. This information includes timing, method, and disposition of the request.
Each segment has a name that identifies your application in the service map. The segment can be named
statically, or you can configure the SDK to name it dynamically based on the host header in the incoming
request. Dynamic naming lets you group traces based on the domain name in the request, and apply a
default name if the name doesn't match an expected pattern (for example, if the host header is forged).
184
AWS X-Ray Developer Guide
Using the Rails Middleware
Forwarded Requests
If a load balancer or other intermediary forwards a request to your application, X-Ray takes the
client IP from the X-Forwarded-For header in the request instead of from the source IP in the
IP packet. The client IP that is recorded for a forwarded request can be forged, so it should not
be trusted.
When a request is forwarded, the SDK sets an additional field in the segment to indicate this. If the
segment contains the field x_forwarded_for set to true, the client IP was taken from the X-
Forwarded-For header in the HTTP request.
The middleware creates a segment for each incoming request with an http block that contains the
following information:
•HTTP method – GET, POST, PUT, DELETE, etc.
•Client address – The IP address of the client that sent the request.
•Response code – The HTTP response code for the completed request.
•Timing – The start time (when the request was received) and end time (when the response was sent).
•User agent — The user-agent from the request.
•Content length — The content-length from the response.
Using the Rails Middleware
To use the middleware, update your gemfile to include the required railtie.
Example Gemfile - rails
gem 'aws-xray-sdk', require: ['aws-xray-sdk/facets/rails/railtie']
To use the middleware, you must also configure the recorder (p. 183) with a name that represents the
application in the service map.
Example config/initializers/aws_xray.rb
Rails.application.config.xray = {
name: 'my app'
}
Instrumenting Code Manually
If you don't use Rails, create segments manually. You can create a segment for each incoming request,
or create segments around patched HTTP or AWS SDK clients to provide context for the recorder to add
subsegments.
# Start a segment
segment = XRay.recorder.begin_segment 'my_service'
# Start a subsegment
subsegment = XRay.recorder.begin_subsegment 'outbound_call', namespace: 'remote'
# Add metadata or annotation here if necessary
my_annotations = {
k1: 'v1',
k2: 1024
}
185

AWS X-Ray Developer Guide
Configuring a Segment Naming Strategy
segment.annotations.update my_annotations
# Add metadata to default namespace
subsegment.metadata[:k1] = 'v1'
# Set user for the segment (subsegment is not supported)
segment.user = 'my_name'
# End segment/subsegment
XRay.recorder.end_subsegment
XRay.recorder.end_segment
Configuring a Segment Naming Strategy
AWS X-Ray uses a service name to identify your application and distinguish it from the other applications,
databases, external APIs, and AWS resources that your application uses. When the X-Ray SDK generates
segments for incoming requests, it records your application's service name in the segment's name
field (p. 61).
The X-Ray SDK can name segments after the hostname in the HTTP request header. However, this header
can be forged, which could result in unexpected nodes in your service map. To prevent the SDK from
naming segments incorrectly due to requests with forged host headers, you must specify a default name
for incoming requests.
If your application serves requests for multiple domains, you can configure the SDK to use a dynamic
naming strategy to reflect this in segment names. A dynamic naming strategy allows the SDK to use the
hostname for requests that match an expected pattern, and apply the default name to requests that
don't.
For example, you might have a single application serving requests to three subdomains–
www.example.com, api.example.com, and static.example.com. You can use a dynamic naming
strategy with the pattern *.example.com to identify segments for each subdomain with a different
name, resulting in three service nodes on the service map. If your application receives requests with a
hostname that doesn't match the pattern, you will see a fourth node on the service map with a fallback
name that you specify.
To use the same name for all request segments, specify the name of your application when you configure
the recorder, as shown in the previous sections (p. 185).
A dynamic naming strategy defines a pattern that hostnames should match, and a default name to use if
the hostname in the HTTP request doesn't match the pattern. To name segments dynamically, specify a
naming pattern in the config hash.
Example main.rb – dynamic naming
config = {
naming_pattern: '*mydomain*',
name: 'my app',
}
XRay.recorder.configure(config)
You can use '*' in the pattern to match any string, or '?' to match any single character.
Note
You can override the default service name that you define in code with the
AWS_XRAY_TRACING_NAME environment variable (p. 184).
186

AWS X-Ray Developer Guide
Patching Libraries
Patching Libraries to Instrument Downstream Calls
To instrument downstream calls, use the X-Ray SDK for Ruby to patch the libraries that your application
uses. The X-Ray SDK for Ruby can patch the following libraries.
Supported Libraries
•net/http – Instrument HTTP clients.
•aws-sdk – Instrument AWS SDK for Ruby clients.
When you use a patched library, the X-Ray SDK for Ruby creates a subsegment for the call and records
information from the request and response. A segment must be available for the SDK to create the
subsegment, either from the SDK middleware or a call to XRay.recorder.begin_segment.
To patch libraries, specify them in the configuration object that you pass to the X-Ray recorder.
Example main.rb – patch libraries
require 'aws-xray-sdk'
config = {
name: 'my app',
patch: %I[net_http aws_sdk]
}
XRay.recorder.configure(config)
Tracing AWS SDK Calls with the X-Ray SDK for
Ruby
When your application makes calls to AWS services to store data, write to a queue, or send notifications,
the X-Ray SDK for Ruby tracks the calls downstream in subsegments (p. 188). Traced AWS services
and resources that you access within those services (for example, an Amazon S3 bucket or Amazon SQS
queue), appear as downstream nodes on the service map in the X-Ray console.
The X-Ray SDK for Ruby automatically instruments all AWS SDK clients when you patch the aws-sdk
library (p. 187). You cannot instrument individual clients.
For all services, you can see the name of the API called in the X-Ray console. For a subset of services, the
X-Ray SDK adds information to the segment to provide more granularity in the service map.
For example, when you make a call with an instrumented DynamoDB client, the SDK adds the table name
to the segment for calls that target a table. In the console, each table appears as a separate node in the
service map, with a generic DynamoDB node for calls that don't target a table.
Example Subsegment for a Call to DynamoDB to Save an Item
{
"id": "24756640c0d0978a",
"start_time": 1.480305974194E9,
"end_time": 1.4803059742E9,
"name": "DynamoDB",
"namespace": "aws",
187
AWS X-Ray Developer Guide
Custom Subsegments
"http": {
"response": {
"content_length": 60,
"status": 200
}
},
"aws": {
"table_name": "scorekeep-user",
"operation": "UpdateItem",
"request_id": "UBQNSO5AEM8T4FDA4RQDEB94OVTDRVV4K4HIRGVJF66Q9ASUAAJG",
}
}
When you access named resources, calls to the following services create additional nodes in the service
map. Calls that don't target specific resources create a generic node for the service.
•Amazon DynamoDB – Table name
•Amazon Simple Storage Service – Bucket and key name
•Amazon Simple Queue Service – Queue name
Generating Custom Subsegments with the X-Ray
SDK
Subsegments extend a trace's segment (p. 20) with details about work done in order to serve a request.
Each time you make a call with an instrumented client, the X-Ray SDK records the information generated
in a subsegment. You can create additional subsegments to group other subsegments, to measure the
performance of a section of code, or to record annotations and metadata.
To manage subsegments, use the begin_subsegment and end_subsegment methods.
subsegment = XRay.recorder.begin_subsegment name: 'annotations', namespace: 'remote'
my_annotations = { id: 12345 }
subsegment.annotations.update my_annotations
XRay.recorder.end_subsegment
To create a subsegment for a function, wrap it in a call to XRay.recorder.capture.
XRay.recorder.capture('name_for_subsegment') do |subsegment|
resp = myfunc() # myfunc is your function
subsegment.annotations.update k1: 'v1'
resp
end
When you create a subsegment within a segment or another subsegment, the X-Ray SDK generates an ID
for it and records the start time and end time.
Example Subsegment with Metadata
"subsegments": [{
"id": "6f1605cd8a07cb70",
"start_time": 1.480305974194E9,
"end_time": 1.4803059742E9,
"name": "Custom subsegment for UserModel.saveUser function",
"metadata": {
"debug": {
188

AWS X-Ray Developer Guide
Annotations and Metadata
"test": "Metadata string from UserModel.saveUser"
}
},
Add Annotations and Metadata to Segments with
the X-Ray SDK for Ruby
You can record additional information about requests, the environment, or your application with
annotations and metadata. You can add annotations and metadata to the segments that the X-Ray SDK
creates, or to custom subsegments that you create.
Annotations are key-value pairs with string, number, or Boolean values. Annotations are indexed for use
with filter expressions (p. 37). Use annotations to record data that you want to use to group traces in the
console, or when calling the GetTraceSummaries API.
Metadata are key-value pairs that can have values of any type, including objects and lists, but are not
indexed for use with filter expressions. Use metadata to record additional data that you want stored in
the trace but don't need to use with search.
In addition to annotations and metadata, you can also record user ID strings (p. 190) on segments. User
IDs are recorded in a separate field on segments and are indexed for use with search.
Sections
•Recording Annotations with the X-Ray SDK for Ruby (p. 189)
•Recording Metadata with the X-Ray SDK for Ruby (p. 190)
•Recording User IDs with the X-Ray SDK for Ruby (p. 190)
Recording Annotations with the X-Ray SDK for Ruby
Use annotations to record information on segments or subsegments that you want indexed for search.
Annotation Requirements
•Keys – Up to 500 alphanumeric characters. No spaces or symbols except underscores.
•Values – Up to 1,000 Unicode characters.
•Entries – Up to 50 annotations per trace.
To record annotations
1. Get a reference to the current segment or subsegment from xray_recorder.
require 'aws-xray-sdk'
...
document = XRay.recorder.current_segment
or
require 'aws-xray-sdk'
...
document = XRay.recorder.current_subsegment
189
AWS X-Ray Developer Guide
Recording Metadata with the X-Ray SDK for Ruby
2. Call update with a hash value.
my_annotations = { id: 12345 }
document.annotations.update my_annotations
The SDK records annotations as key-value pairs in an annotations object in the segment document.
Calling add_annotations twice with the same key overwrites previously recorded values on the same
segment or subsegment.
To find traces that have annotations with specific values, use the annotations.key keyword in a filter
expression (p. 37).
Recording Metadata with the X-Ray SDK for Ruby
Use metadata to record information on segments or subsegments that you don't need indexed for
search. Metadata values can be strings, numbers, Booleans, or any object that can be serialized into a
JSON object or array.
To record metadata
1. Get a reference to the current segment or subsegment from xray_recorder.
require 'aws-xray-sdk'
...
document = XRay.recorder.current_segment
or
require 'aws-xray-sdk'
...
document = XRay.recorder.current_subsegment
2. Call metadata with a String key; a Boolean, Number, String, or Object value; and a String
namespace.
my_metadata = {
my_namespace: {
key: 'value'
}
}
subsegment.metadata my_metadata
Calling metadata twice with the same key overwrites previously recorded values on the same segment
or subsegment.
Recording User IDs with the X-Ray SDK for Ruby
Record user IDs on request segments to identify the user who sent the request.
To record user IDs
1. Get a reference to the current segment from xray_recorder.
require 'aws-xray-sdk'
190

AWS X-Ray Developer Guide
Recording User IDs with the X-Ray SDK for Ruby
...
document = XRay.recorder.current_segment
2. Set the user field on the segment to a String ID of the user who sent the request.
segment.user = 'U12345'
You can set the user in your controllers to record the user ID as soon as your application starts processing
a request.
To find traces for a user ID, use the user keyword in a filter expression (p. 37).
191

AWS X-Ray Developer Guide
AWS X-Ray SDK for .NET
The X-Ray SDK for .NET is a library for instrumenting C# .NET web applications, .NET Core web
applications, and .NET Core functions on AWS Lambda. It provides classes and methods for generating
and sending trace data to the X-Ray daemon (p. 99). This includes information about incoming requests
served by the application, and calls that the application makes to downstream AWS services, HTTP web
APIs, and SQL databases.
Note
The X-Ray SDK for .NET is an open source project. You can follow the project and submit issues
and pull requests on GitHub: github.com/aws/aws-xray-sdk-dotnet
For web applications, start by adding a message handler to your web configuration (p. 197) to
trace incoming requests. The message handler creates a segment (p. 20) for each traced request, and
completes the segment when the response is sent. While the segment is open you can use the SDK
client's methods to add information to the segment and create subsegments to trace downstream calls.
The SDK also automatically records exceptions that your application throws while the segment is open.
For Lambda functions called by an instrumented application or service, Lambda reads the tracing
header (p. 25) and traces sampled requests automatically. For other functions, you can configure
Lambda (p. 208) to sample and trace incoming requests. In either case, Lambda creates the segment
and provides it to the X-Ray SDK.
Note
On Lambda, the X-Ray SDK is optional. If you don't use it in your function, your service map
will still include a node for the Lambda service, and one for each Lambda function. By adding
the SDK, you can instrument your function code to add subsegments to the function segment
recorded by Lambda. See AWS Lambda and AWS X-Ray (p. 208) for more information.
Next, use the X-Ray SDK for .NET to instrument your AWS SDK for .NET clients (p. 200). Whenever
you make a call to a downstream AWS service or resource with an instrumented client, the SDK records
information about the call in a subsegment. AWS services and the resources that you access within the
services appear as downstream nodes on the service map to help you identify errors and throttling issues
on individual connections.
The X-Ray SDK for .NET also provides instrumentation for downstream calls to HTTP web
APIs (p. 201) and SQL databases (p. 202). The GetResponseTraced extension method for
System.Net.HttpWebRequest traces outgoing HTTP calls. You can use the X-Ray SDK for .NET's
version of SqlCommand to instrument SQL queries.
Once you get going with the SDK, customize its behavior by configuring the recorder and message
handler (p. 193). You can add plugins to record data about the compute resources running your
application, customize sampling behavior by defining sampling rules, and set the log level to see more or
less information from the SDK in your application logs.
Record additional information about requests and the work that your application does in annotations
and metadata (p. 204). Annotations are simple key-value pairs that are indexed for use with filter
expressions (p. 37), so that you can search for traces that contain specific data. Metadata entries are less
restrictive and can record entire objects and arrays — anything that can be serialized into JSON.
Annotations and Metadata
Annotations and metadata are arbitrary text that you add to segments with the X-Ray SDK.
Annotations are indexed for use with filter expressions. Metadata are not indexed, but can be
viewed in the raw segment with the X-Ray console or API. Anyone that you grant read access to
X-Ray can view this data.
192

AWS X-Ray Developer Guide
Requirements
When you have many instrumented clients in your code, a single request segment can contain a large
number of subsegments, one for each call made with an instrumented client. You can organize and
group subsegments by wrapping client calls in custom subsegments (p. 203). You can create a custom
subsegment for an entire function or any section of code, and record metadata and annotations on the
subsegment instead of writing everything on the parent segment.
For reference documentation about the SDK's classes and methods, see the following:
•AWS X-Ray SDK for .NET API Reference
•AWS X-Ray SDK for .NET Core API Reference
The same package supports both .NET and .NET Core, but the classes that are used vary. Examples in this
chapter link to the .NET API reference unless the class is specific to .NET Core.
Requirements
The X-Ray SDK for .NET requires the .NET framework and AWS SDK for .NET.
For .NET Core applications and functions, the SDK requires .NET Core 2.0 or later.
Adding the X-Ray SDK for .NET to Your Application
Use NuGet to add the X-Ray SDK for .NET to your application.
To install the X-Ray SDK for .NET with NuGet Package Manager in Visual Studio
1. Choose Tools, NuGet Package Manager, Manage NuGet Packages for Solution.
2. Search for AWSXRayRecorder.
3. Choose the package, and then choose Install.
Configuring the X-Ray SDK for .NET
You can configure the X-Ray SDK for .NET with plugins to include information about the service that your
application runs on, modify the default sampling behavior, or add sampling rules that apply to requests
to specific paths.
For .NET web applications, add keys to the appSettings section of your Web.config file.
Example Web.config
<configuration>
<appSettings>
<add key="AWSXRayPlugins" value="EC2Plugin"/>
<add key="SamplingRuleManifest" value="sampling-rules.json"/>
</appSettings>
</configuration>
For .NET Core, create a file named appsettings.json with a top-level key named XRay.
Example appsettings.json
{
193
AWS X-Ray Developer Guide
Plugins
"XRay": {
"AWSXRayPlugins": "EC2Plugin",
"SamplingRuleManifest": "sampling-rules.json"
}
}
Then, in your application code, build a configuration object and use it to initialize the X-Ray recorder. Do
this before you initialize the recorder (p. 198).
Example Program.cs – .NET Core Configuration
using Amazon.XRay.Recorder.Core;
...
AWSXRayRecorder.InitializeInstance(configuration);
If you are instrumenting a .NET Core web application, you can also pass the configuration object to the
UseXRay method when you configure the message handler (p. 198). For Lambda functions, use the
InitializeInstance method as shown above.
For more information on the .NET Core configuration API, see Configure an ASP.NET Core App on
docs.microsoft.com.
Sections
•Plugins (p. 194)
•Sampling Rules (p. 195)
•Logging (.NET) (p. 196)
•Logging (.NET Core) (p. 196)
•Environment Variables (p. 197)
Plugins
Use plugins to add data about the service that is hosting your application.
Plugins
• Amazon EC2 – EC2Plugin adds the instance ID and Availability Zone.
• Elastic Beanstalk – ElasticBeanstalkPlugin adds the environment name, version label, and
deployment ID.
• Amazon ECS – ECSPlugin adds the container ID.
To use a plugin, configure the X-Ray SDK for .NET client by adding the AWSXRayPlugins setting. If
multiple plugins apply to your application, specify all of them in the same setting, separated by commas.
Example Web.config - Plugins
<configuration>
<appSettings>
<add key="AWSXRayPlugins" value="EC2Plugin,ElasticBeanstalkPlugin"/>
</appSettings>
</configuration>
Example appsettings.json – Plugins
{
194

AWS X-Ray Developer Guide
Sampling Rules
"XRay": {
"AWSXRayPlugins": "EC2Plugin,ElasticBeanstalkPlugin"
}
}
Sampling Rules
The SDK has a default sampling strategy that determines which requests get traced. By default, the SDK
traces the first request each second, and five percent of any additional requests. You can customize the
SDK's sampling behavior by applying rules you define in a local file.
Example sampling-rules.json
{
"version": 1,
"rules": [
{
"description": "Player moves.",
"service_name": "*",
"http_method": "*",
"url_path": "/api/move/*",
"fixed_target": 0,
"rate": 0.05
}
],
"default": {
"fixed_target": 1,
"rate": 0.1
}
}
This example defines one custom rule and a default rule. The custom rule applies a five-percent sampling
rate with no minimum number of requests to trace for paths under /api/move/. The default rule traces
the first request each second and 10 percent of additional requests.
The SDK applies custom rules in the order in which they are defined. If a request matches multiple
custom rules, the SDK applies only the first rule.
On Lambda, you cannot modify the sampling rate. If your function is called by an instrumented service,
calls generated requests that were sampled by that service will be recorded by Lambda. If active tracing
is enabled and no tracing header is present, Lambda makes the sampling decision.
Tell the X-Ray SDK for .NET to load sampling rules from a file with the SamplingRuleManifest setting.
Example Web.config - Sampling Rules
<configuration>
<appSettings>
<add key="SamplingRuleManifest" value="sampling-rules.json"/>
</appSettings>
</configuration>
Example appsettings.json – Sampling Rules
{
"XRay": {
"SamplingRuleManifest": "sampling-rules.json"
}
}
195

AWS X-Ray Developer Guide
Logging (.NET)
Logging (.NET)
The X-Ray SDK for .NET uses the same logging mechanism as the AWS SDK for .NET. If you already
configured your application to log AWS SDK for .NET output, the same configuration applies to output
from the X-Ray SDK for .NET.
To configure logging, add a configuration section named aws to your App.config file or Web.config
file.
Example Web.config - Logging
...
<configuration>
<configSections>
<section name="aws" type="Amazon.AWSSection, AWSSDK.Core"/>
</configSections>
<aws>
<logging logTo="Log4Net"/>
</aws>
</configuration>
For more information, see Configuring Your AWS SDK for .NET Application in the AWS SDK for .NET
Developer Guide.
Logging (.NET Core)
For .NET Core applications, the X-Ray SDK supports the logging options in the AWS SDK for .NET
LoggingOptions enum. To configure logging, pass one of these options to the RegisterLogger
method.
AWSXRayRecorder.RegisterLogger(LoggingOptions.Console);
For example, to use log4net, create a configuration file that defines the logger, the output format, and
the file location.
Example log4net.config
<?xml version="1.0" encoding="utf-8" ?>
<log4net>
<appender name="FileAppender" type="log4net.Appender.FileAppender,log4net">
<file value="c:\logs\sdk-log.txt" />
<layout type="log4net.Layout.PatternLayout">
<conversionPattern value="%date [%thread] %level %logger - %message%newline" />
</layout>
</appender>
<logger name="Amazon">
<level value="DEBUG" />
<appender-ref ref="FileAppender" />
</logger>
</log4net>
Then, create the logger and apply the configuration in your program code.
Example Program.cs – Logging
using log4net;
using Amazon.XRay.Recorder.Core;
196

AWS X-Ray Developer Guide
Environment Variables
class Program
{
private static ILog log;
static Program()
{
var logRepository = LogManager.GetRepository(Assembly.GetEntryAssembly());
XmlConfigurator.Configure(logRepository, new FileInfo("log4net.config"));
log = LogManager.GetLogger(typeof(Program));
AWSXRayRecorder.RegisterLogger(LoggingOptions.Log4Net);
}
static void Main(string[] args)
{
...
}
}
For more information on configuring log4net, see Configuration on logging.apache.org.
Environment Variables
You can use environment variables to configure the X-Ray SDK for .NET. The SDK supports the following
variables.
•AWS_XRAY_TRACING_NAME – Set a service name that the SDK uses for segments. Overrides the service
name that you set on the servlet filter's segment naming strategy (p. 199).
•AWS_XRAY_DAEMON_ADDRESS – Set the host and port of the X-Ray daemon listener. By default, the
SDK sends trace data to 127.0.0.1:2000. Use this variable if you have configured the daemon to
listen on a different port (p. 102) or if it is running on a different host.
•AWS_XRAY_CONTEXT_MISSING – Set to LOG_ERROR to avoid throwing exceptions when your
instrumented code attempts to record data when no segment is open.
Valid Values
•RUNTIME_ERROR – Throw a runtime exception (default).
•LOG_ERROR – Log an error and continue.
Errors related to missing segments or subsegments can occur when you attempt to use an
instrumented client in startup code that runs when no request is open, or in code that spawns a new
thread.
Instrumenting Incoming HTTP Requests with the
X-Ray SDK for .NET
You can use the X-Ray SDK to trace incoming HTTP requests that your application serves on an EC2
instance in Amazon EC2, AWS Elastic Beanstalk, or Amazon ECS.
Use a message handler to instrument incoming HTTP requests. When you add the X-Ray message
handler to your application, the X-Ray SDK for .NET creates a segment for each sampled request. This
segment includes timing, method, and disposition of the HTTP request. Additional instrumentation
creates subsegments on this segment.
Note
For AWS Lambda functions, Lambda creates a segment for each sampled request. See AWS
Lambda and AWS X-Ray (p. 208) for more information.
Each segment has a name that identifies your application in the service map. The segment can be named
statically, or you can configure the SDK to name it dynamically based on the host header in the incoming
197

AWS X-Ray Developer Guide
Instrumenting Incoming Requests (.NET)
request. Dynamic naming lets you group traces based on the domain name in the request, and apply a
default name if the name doesn't match an expected pattern (for example, if the host header is forged).
Forwarded Requests
If a load balancer or other intermediary forwards a request to your application, X-Ray takes the
client IP from the X-Forwarded-For header in the request instead of from the source IP in the
IP packet. The client IP that is recorded for a forwarded request can be forged, so it should not
be trusted.
The message handler creates a segment for each incoming request with an http block that contains the
following information:
•HTTP method – GET, POST, PUT, DELETE, etc.
•Client address – The IP address of the client that sent the request.
•Response code – The HTTP response code for the completed request.
•Timing – The start time (when the request was received) and end time (when the response was sent).
•User agent — The user-agent from the request.
•Content length — The content-length from the response.
Sections
•Instrumenting Incoming Requests (.NET) (p. 198)
•Instrumenting Incoming Requests (.NET Core) (p. 198)
•Configuring a Segment Naming Strategy (p. 199)
Instrumenting Incoming Requests (.NET)
To instrument requests served by your application, call RegisterXRay in the Init method of your
global.asax file.
Example global.asax - Message Handler
using System.Web.Http;
using Amazon.XRay.Recorder.Handlers.AspNet;
namespace SampleEBWebApplication
{
public class MvcApplication : System.Web.HttpApplication
{
public override void Init()
{
base.Init();
AWSXRayASPNET.RegisterXRay(this, "MyApp");
}
}
}
Instrumenting Incoming Requests (.NET Core)
To instrument requests served by your application, call the UseExceptionHandler, UseXRay, and
UseStaticFiles methods in the Configure method of your Startup class.
Example Startup.cs
using Microsoft.AspNetCore.Builder;
198
AWS X-Ray Developer Guide
Configuring a Segment Naming Strategy
public void Configure(IApplicationBuilder app, IHostingEnvironment env)
{
app.UseExceptionHandler("/Error");
app.UseXRay("MyApp");
app.UseStaticFiles();
app.UseMVC();
}
Always call UseXRay after UseExceptionHandler to record exceptions. If you use other middleware,
enable it after you call UseXRay.
The UseXRay method can also take a configuration object (p. 193) as a second argument.
app.UseXRay("MyApp", configuration);
Configuring a Segment Naming Strategy
AWS X-Ray uses a service name to identify your application and distinguish it from the other applications,
databases, external APIs, and AWS resources that your application uses. When the X-Ray SDK generates
segments for incoming requests, it records your application's service name in the segment's name
field (p. 61).
The X-Ray SDK can name segments after the hostname in the HTTP request header. However, this header
can be forged, which could result in unexpected nodes in your service map. To prevent the SDK from
naming segments incorrectly due to requests with forged host headers, you must specify a default name
for incoming requests.
If your application serves requests for multiple domains, you can configure the SDK to use a dynamic
naming strategy to reflect this in segment names. A dynamic naming strategy allows the SDK to use the
hostname for requests that match an expected pattern, and apply the default name to requests that
don't.
For example, you might have a single application serving requests to three subdomains–
www.example.com, api.example.com, and static.example.com. You can use a dynamic naming
strategy with the pattern *.example.com to identify segments for each subdomain with a different
name, resulting in three service nodes on the service map. If your application receives requests with a
hostname that doesn't match the pattern, you will see a fourth node on the service map with a fallback
name that you specify.
To use the same name for all request segments, specify the name of your application when you initialize
the message handler, as shown in the previous section (p. 198). This has the same effect as creating a
FixedSegmentNamingStrategy and passing it to the RegisterXRay method.
AWSXRayASPNET.RegisterXRay(this, new FixedSegmentNamingStrategy("MyApp"));
Note
You can override the default service name that you define in code with the
AWS_XRAY_TRACING_NAME environment variable (p. 197).
A dynamic naming strategy defines a pattern that hostnames should match, and a default name to use if
the hostname in the HTTP request does not match the pattern. To name segments dynamically, create a
DynamicSegmentNamingStrategy and pass it to the RegisterXRay method.
AWSXRayASPNET.RegisterXRay(this, new DynamicSegmentNamingStrategy("MyApp",
"*.example.com"));
199

AWS X-Ray Developer Guide
AWS SDK Clients
Instrumenting Downstream Calls to AWS Services
You can instrument all of your AWS SDK for .NET clients by calling RegisterXRayForAllServices
before you create them.
Example SampleController.cs - DynamoDB Client Instrumentation
using Amazon;
using Amazon.Util;
using Amazon.DynamoDBv2;
using Amazon.DynamoDBv2.DocumentModel;
using Amazon.XRay.Recorder.Core;
using Amazon.XRay.Recorder.Handlers.AwsSdk;
namespace SampleEBWebApplication.Controllers
{
public class SampleController : ApiController
{
AWSSDKHandler.RegisterXRayForAllServices();
private static readonly Lazy<AmazonDynamoDBClient> LazyDdbClient = new
Lazy<AmazonDynamoDBClient>(() =>
{
var client = new AmazonDynamoDBClient(EC2InstanceMetadata.Region ??
RegionEndpoint.USEast1);
return client;
});
To instrument clients for some services and not others, call RegisterXRay instead of
RegisterXRayForAllServices. Replace the highlighted text with the name of the service's client
interface.
AWSSDKHandler.RegisterXRay<IAmazonDynamoDB>()
For all services, you can see the name of the API called in the X-Ray console. For a subset of services, the
X-Ray SDK adds information to the segment to provide more granularity in the service map.
For example, when you make a call with an instrumented DynamoDB client, the SDK adds the table name
to the segment for calls that target a table. In the console, each table appears as a separate node in the
service map, with a generic DynamoDB node for calls that don't target a table.
Example Subsegment for a Call to DynamoDB to Save an Item
{
"id": "24756640c0d0978a",
"start_time": 1.480305974194E9,
"end_time": 1.4803059742E9,
"name": "DynamoDB",
"namespace": "aws",
"http": {
"response": {
"content_length": 60,
"status": 200
}
},
"aws": {
"table_name": "scorekeep-user",
"operation": "UpdateItem",
"request_id": "UBQNSO5AEM8T4FDA4RQDEB94OVTDRVV4K4HIRGVJF66Q9ASUAAJG",
}
}
200
AWS X-Ray Developer Guide
Outgoing HTTP Calls
When you access named resources, calls to the following services create additional nodes in the service
map. Calls that don't target specific resources create a generic node for the service.
•Amazon DynamoDB – Table name
•Amazon Simple Storage Service – Bucket and key name
•Amazon Simple Queue Service – Queue name
Tracing Calls to Downstream HTTP Web Services
with the X-Ray SDK for .NET
When your application makes calls to microservices or public HTTP APIs, you can use the X-Ray SDK
for .NET's GetResponseTraced extension method for System.Net.HttpWebRequest to instrument
those calls and add the API to the service graph as a downstream service.
Example HttpWebRequest
using System.Net;
using Amazon.XRay.Recorder.Core;
using Amazon.XRay.Recorder.Handlers.System.Net;
private void MakeHttpRequest()
{
HttpWebRequest request = (HttpWebRequest)WebRequest.Create("http://names.example.com/
api");
request.GetResponseTraced();
}
For asynchronous calls, use GetAsyncResponseTraced.
request.GetAsyncResponseTraced();
If you use system.net.http.httpclient, use the HttpClientXRayTracingHandler delegating
handler to record calls.
Example HttpClient
using System.Net.Http;
using Amazon.XRay.Recorder.Core;
using Amazon.XRay.Recorder.Handlers.System.Net;
private void MakeHttpRequest()
{
var httpClient = new HttpClient(new HttpClientXRayTracingHandler(new
HttpClientHandler()));
httpClient.GetAsync(URL);
}
When you instrument a call to a downstream web API, the X-Ray SDK for .NET records a subsegment
with information about the HTTP request and response. X-Ray uses the subsegment to generate an
inferred segment for the API.
Example Subsegment for a Downstream HTTP Call
{
201

AWS X-Ray Developer Guide
SQL Queries
"id": "004f72be19cddc2a",
"start_time": 1484786387.131,
"end_time": 1484786387.501,
"name": "names.example.com",
"namespace": "remote",
"http": {
"request": {
"method": "GET",
"url": "https://names.example.com/"
},
"response": {
"content_length": -1,
"status": 200
}
}
}
Example Inferred Segment for a Downstream HTTP Call
{
"id": "168416dc2ea97781",
"name": "names.example.com",
"trace_id": "1-5880168b-fd5153bb58284b67678aa78c",
"start_time": 1484786387.131,
"end_time": 1484786387.501,
"parent_id": "004f72be19cddc2a",
"http": {
"request": {
"method": "GET",
"url": "https://names.example.com/"
},
"response": {
"content_length": -1,
"status": 200
}
},
"inferred": true
}
Tracing SQL Queries with the X-Ray SDK for .NET
The SDK provides a wrapper class for System.Data.SqlClient.SqlCommand named
TraceableSqlCommand that you can use in place of SqlCommand. Initialize an SQL command with the
X-Ray SDK for .NET's TraceableSqlCommand class.
Example Controller.cs - SQL Client Instrumentation
using Amazon;
using Amazon.Util;
using Amazon.XRay.Recorder.Core;
using Amazon.XRay.Recorder.Handlers.SqlServer;
private void QuerySql(int id)
{
var connectionString = ConfigurationManager.AppSettings["RDS_CONNECTION_STRING"];
using (var sqlConnection = new SqlConnection(connectionString))
using (var sqlCommand = new TraceableSqlCommand("SELECT " + id, sqlConnection))
{
sqlCommand.Connection.Open();
sqlCommand.ExecuteNonQuery();
202

AWS X-Ray Developer Guide
Custom Subsegments
}
}
You can also execute the query asynchronously with the ExecuteReaderAsync method.
Example Controller.cs - SQL Client Instrumentation (Asynchronous)
using Amazon;
using Amazon.Util;
using Amazon.XRay.Recorder.Core;
using Amazon.XRay.Recorder.Handlers.SqlServer;
private void QuerySql(int id)
{
var connectionString = ConfigurationManager.AppSettings["RDS_CONNECTION_STRING"];
using (var sqlConnection = new SqlConnection(connectionString))
using (var sqlCommand = new TraceableSqlCommand("SELECT " + id, sqlConnection))
{
await sqlCommand.ExecuteReaderAsync();
}
}
Creating Additional Subsegments
Subsegments extend a trace's segment (p. 20) with details about work done in order to serve a request.
Each time you make a call with an instrumented client, the X-Ray SDK records the information generated
in a subsegment. You can create additional subsegments to group other subsegments, to measure the
performance of a section of code, or to record annotations and metadata.
To manage subsegments, use the BeginSubsegment and EndSubsegment methods. Perform any work
in the subsegment in a try block and use AddException to trace exceptions. Call EndSubsegment in a
finally block to ensure that the subsegment is closed.
Example Controller.cs – Custom Subsegment
AWSXRayRecorder.Instance.BeginSubsegment("custom method");
try
{
DoWork();
}
catch (Exception e)
{
AWSXRayRecorder.Instance.AddException(e);
}
finally
{
AWSXRayRecorder.Instance.EndSubsegment();
}
When you create a subsegment within a segment or another subsegment, the X-Ray SDK for .NET
generates an ID for it and records the start time and end time.
Example Subsegment with Metadata
"subsegments": [{
"id": "6f1605cd8a07cb70",
"start_time": 1.480305974194E9,
"end_time": 1.4803059742E9,
203
AWS X-Ray Developer Guide
Annotations and Metadata
"name": "Custom subsegment for UserModel.saveUser function",
"metadata": {
"debug": {
"test": "Metadata string from UserModel.saveUser"
}
},
Add Annotations and Metadata to Segments with
the X-Ray SDK for .NET
You can record additional information about requests, the environment, or your application with
annotations and metadata. You can add annotations and metadata to the segments that the X-Ray SDK
creates, or to custom subsegments that you create.
Annotations are key-value pairs with string, number, or Boolean values. Annotations are indexed for use
with filter expressions (p. 37). Use annotations to record data that you want to use to group traces in the
console, or when calling the GetTraceSummaries API.
Metadata are key-value pairs that can have values of any type, including objects and lists, but are not
indexed for use with filter expressions. Use metadata to record additional data that you want stored in
the trace but don't need to use with search.
Sections
•Recording Annotations with the X-Ray SDK for .NET (p. 204)
•Recording Metadata with the X-Ray SDK for .NET (p. 205)
Recording Annotations with the X-Ray SDK for .NET
Use annotations to record information on segments or subsegments that you want indexed for search.
Annotation Requirements
•Keys – Up to 500 alphanumeric characters. No spaces or symbols except underscores.
•Values – Up to 1,000 Unicode characters.
•Entries – Up to 50 annotations per trace.
To record annotations
1. Get an instance of AWSXRayRecorder.
using Amazon.XRay.Recorder.Core;
...
AWSXRayRecorder recorder = AWSXRayRecorder.Instance;
2. Call addAnnotation with a String key and a Boolean, Int32, Int64, Double, or String value.
recorder.AddAnnotation("mykey", "my value");
The SDK records annotations as key-value pairs in an annotations object in the segment document.
Calling addAnnotation twice with the same key overwrites previously recorded values on the same
segment or subsegment.
204
AWS X-Ray Developer Guide
Recording Metadata with the X-Ray SDK for .NET
To find traces that have annotations with specific values, use the annotations.key keyword in a filter
expression (p. 37).
Recording Metadata with the X-Ray SDK for .NET
Use metadata to record information on segments or subsegments that you don't need indexed for
search. Metadata values can be Strings, Numbers, Booleans, or any other Object that can be serialized
into a JSON object or array.
To record metadata
1. Get an instance of AWSXRayRecorder.
using Amazon.XRay.Recorder.Core;
...
AWSXRayRecorder recorder = AWSXRayRecorder.Instance;
2. Call AddMetadata with a String namespace, String key, and an Object value.
segment.AddMetadata("my namespace", "my key", "my value");
or
Call putMetadata with just a key and value.
segment.AddMetadata("my key", "my value");
If you don't specify a namespace, the SDK uses default. Calling AddMetadata twice with the same key
overwrites previously recorded values on the same segment or subsegment.
205

AWS X-Ray Developer Guide
X-Ray SDK for Java
Troubleshooting AWS X-Ray
This topic lists common errors and issues that you might encounter when using the X-Ray API, console, or
SDKs. If you find an issue that is not listed here, you can use the Feedback button on this page to report
it.
Sections
•X-Ray SDK for Java (p. 206)
•X-Ray SDK for Node.js (p. 206)
•The X-Ray daemon (p. 207)
X-Ray SDK for Java
Error: Exception in thread "Thread-1" com.amazonaws.xray.exceptions.SegmentNotFoundException: Failed
to begin subsegment named 'AmazonSNS': segment cannot be found.
This error indicates that the X-Ray SDK attempted to record an outgoing call to AWS, but couldn't find an
open segment. This can occur in the following situations:
•A servlet filter is not configured – The X-Ray SDK creates segments for incoming requests with a filter
named AWSXRayServletFilter. Configure a servlet filter (p. 121) to instrument incoming requests.
•You're using instrumented clients outside of servlet code – If you use an instrumented client to
make calls in startup code or other code that doesn't run in response to an incoming request, you must
create a segment manually. See Instrumenting Startup Code (p. 90) for examples.
•You're using instrumented clients in worker threads – When you create a new thread, the X-
Ray recorder loses its reference to the open segment. You can use the getTraceEntity and
setTraceEntity methods to get a reference to the current segment or subsegment (Entity),
and pass it back to the recorder inside of the thread. See Using Instrumented Clients in Worker
Threads (p. 96) for an example.
X-Ray SDK for Node.js
Issue: CLS does not work with Sequelize
Pass the X-Ray SDK for Node.js namespace to Sequelize with the cls method.
var AWSXRay = require('aws-xray-sdk');
const Sequelize = require('sequelize');
Sequelize.cls = AWSXRay.getNamespace();
const sequelize = new Sequelize('database', 'username', 'password');
Issue: CLS does not work with Bluebird
Use cls-bluebird to get Bluebird working with CLS.
var AWSXRay = require('aws-xray-sdk');
var Promise = require('bluebird');
var clsBluebird = require('cls-bluebird');
clsBluebird(AWSXRay.getNamespace());
206

AWS X-Ray Developer Guide
The X-Ray daemon
The X-Ray daemon
Issue: The daemon is using the wrong credentials
The daemon uses the AWS SDK to load credentials. If you use multiple methods of providing credentials,
the method with the highest precedence is used. See Running the Daemon (p. 100) for more information.
207

AWS X-Ray Developer Guide
Elastic Load Balancing
Integrating AWS X-Ray with Other
AWS Services
Other AWS services provide integration with AWS X-Ray by adding a tracing header to requests, running
the X-Ray daemon, or making sampling decisions and uploading trace data to X-Ray.
Note
The X-Ray SDKs include plugins for additional integration with AWS services. For example, you
can use the X-Ray SDK for Java's Elastic Beanstalk plugin to add information about the Elastic
Beanstalk environment that runs your application including the environment name and ID.
Topics
•Elastic Load Balancing and AWS X-Ray (p. 208)
•AWS Lambda and AWS X-Ray (p. 208)
•Amazon API Gateway and AWS X-Ray (p. 209)
•Amazon Elastic Compute Cloud and AWS X-Ray (p. 210)
•AWS Elastic Beanstalk and AWS X-Ray (p. 210)
Elastic Load Balancing and AWS X-Ray
Elastic Load Balancing application load balancers add a trace ID to incoming HTTP requests in a header
named X-Amzn-Trace-Id.
X-Amzn-Trace-Id: Root=1-5759e988-bd862e3fe1be46a994272793
Trace ID Format
A trace_id consists of three numbers separated by hyphens. For example, 1-58406520-
a006649127e371903a2de979. This includes:
• The version number, that is, 1.
• The time of the original request, in Unix epoch time, in 8 hexadecimal digits.
For example, 10:00AM December 1st, 2016 PST in epoch time is 1480615200 seconds, or 58406520
in hexadecimal.
• A 96-bit identifier for the trace, globally unique, in 24 hexadecimal digits.
Load balancers do not send data to X-Ray, and do not appear as a node on your service map.
For more information, see Request Tracing for Your Application Load Balancer in the Elastic Load
Balancing Developer Guide.
AWS Lambda and AWS X-Ray
You can use AWS X-Ray to trace your AWS Lambda functions. Lambda runs the X-Ray daemon (p. 99) and
records a segment with details about the function invocation and execution. For further instrumentation,
208

AWS X-Ray Developer Guide
API Gateway
you can bundle the X-Ray SDK with your function to record outgoing calls and add annotations and
metadata.
If your Lambda function is called by another instrumented service, Lambda will trace requests that
have already been sampled without any additional configuration. The upstream service can be an
instrumented web application, another Lambda function.
If your Lambda function is invoked by a service that is not instrumented, or does not propagate the
tracing header from an upstream service, you can configure Lambda to sample and record invocations
with active tracing.
To configure X-Ray integration on an AWS Lambda function
1. Open the AWS Lambda console.
2. Choose your function.
3. Choose Configuration.
4. Under Debugging and error handling, choose Enable active tracing.
On runtimes with a corresponding X-Ray SDK, Lambda also runs the X-Ray daemon.
X-Ray SDKs on Lambda
•X-Ray SDK for Go – Go 1.7 and newer runtimes
•X-Ray SDK for Java – Java 8 runtime
•X-Ray SDK for Node.js – Node.js 4.3 and newer runtimes
•X-Ray SDK for Python – Python 2.7, Python 3.6, and newer runtimes
•X-Ray SDK for .NET – .NET Core 2.0 and newer runtimes
To use the X-Ray SDK on Lambda, bundle it with your function code each time you create a new
version. You can instrument your Lambda functions with the same methods that you use to instrument
applications running on other services. The primary difference is that you do not use the SDK to
instrument incoming requests, make sampling decisions, and create segments.
The other difference between instrumenting Lambda functions and web applications is that the segment
that Lambda creates and sends to X-Ray cannot be modified by your function code. You can create
subsegments and record annotations and metadata on them, but you can't add annotations and
metadata to the parent segment.
For more information, see Troubleshooting Lambda-based Applications in the AWS Lambda Developer
Guide.
Amazon API Gateway and AWS X-Ray
Amazon API Gateway gateways add a trace ID to incoming HTTP requests in a header named X-Amzn-
Trace-Id.
X-Amzn-Trace-Id: Root=1-5759e988-bd862e3fe1be46a994272793
Trace ID Format
A trace_id consists of three numbers separated by hyphens. For example, 1-58406520-
a006649127e371903a2de979. This includes:
209

AWS X-Ray Developer Guide
Amazon EC2
• The version number, that is, 1.
• The time of the original request, in Unix epoch time, in 8 hexadecimal digits.
For example, 10:00AM December 1st, 2016 PST in epoch time is 1480615200 seconds, or 58406520
in hexadecimal.
• A 96-bit identifier for the trace, globally unique, in 24 hexadecimal digits.
API Gateway does not propagate X-Ray trace ID and sampling headers, or send trace data to X-Ray. If
your gateway is downstream of other services in your application, traces will terminate at the gateway
and the request will continue with a different trace ID. Gateways do not appear as a node on your service
map.
Amazon Elastic Compute Cloud and AWS X-Ray
You can install and run the X-Ray daemon on an Amazon EC2 instance with a user data script. See
Running the X-Ray Daemon on Amazon EC2 (p. 109) for instructions.
Use an instance profile to grant the daemon permission to upload trace data to X-Ray. For more
information, see Giving the Daemon Permission to Send Data to X-Ray (p. 101).
AWS Elastic Beanstalk and AWS X-Ray
AWS Elastic Beanstalk platforms include the X-Ray daemon. You can run the daemon (p. 106) by setting
an option in the Elastic Beanstalk console or with a configuration file.
On the Java SE platform, you can use a Buildfile file to build your application with Maven or Gradle on-
instance. The X-Ray SDK for Java and AWS SDK for Java are available from Maven, so you can deploy only
your application code and build on-instance to avoid bundling and uploading all of your dependencies.
You can use Elastic Beanstalk environment properties to configure the X-Ray SDK. The method that
Elastic Beanstalk uses to pass environment properties to your application varies by platform. Use the X-
Ray SDK's environment variables or system properties depending on your platform.
•Node.js platform – Use environment variables (p. 152)
•Java SE platform – Use environment variables (p. 120)
•Tomcat platform – Use system properties (p. 120)
For more information, see Configuring AWS X-Ray Debugging in the AWS Elastic Beanstalk Developer
Guide.
210
