Philips 882446 User Manual Product Brochure Vereos The World's First And Only True Digital PET/CT System Ed2389b512114e209f2fa77c0145f267
DPC Technical Overview 452299118531_Vereos_DPC_Tech_Overview Vereos Digital PET CT Scanner
User Manual: Philips 882446 Product Brochure Philips Vereos The world's first and only true digital PET/CT system Digital PET/CT Philips - Vereos Digital PET/CT882446
Open the PDF directly: View PDF ![]() .
.
Page Count: 12
Philips proprietary Digital Photon Counting technology
Vereos PET/CT is the rst commercially available scanner to oer truly digital PET, resulting in
signicantly improved performance compared with an analog system.* Digital PET is made possible
through a number of advances, including proprietary digital photon counting (DPC), 1:1 (pronounced
“one-to-one”) coupling between the scintillator element and the light-sensing element, and faster
Time-of-Flight (TOF) technology.
Philips DPC technology was developed to overcome the limitations of conventional photomultiplier
technology. DPC in combination with 1:1 coupling and enhanced TOF allows the Vereos system to
oer approximately double the volumetric resolution, sensitivity gain, and accuracy of a comparable
analog system.*
Overcoming limitations of conventional PET
Key advances contribute to the high level of performance
of Vereos digital PET/CT:
1. Digital photon counting (DPC)
2. Detector tile design
3. DPC and 1:1 coupling
4. Factors inuencing performance specications
5. Timing resolution and TOF technology
6. Point spread function (PSF) technology
7. Technology pillars supporting improved performance
Vereos PET/CT specifications
Preliminary performance data, subject to change.
Number of detectors 23,040
System spatial resolution 4.1 mm
Eective system sensitivity** 22.0 kcps/MBq
Eective peak NECR** 650 kcps @ 50 kBq/mL
Maximum trues > 675 kcps
System timing resolution 325 ps
Quantitative accuracy ± 5%
* GEMINI TF
** Eective gain dened as a ratio between patient size (20 cm diameter used in these specications) and TOF localization accuracy.
Vereos PET/CT
Advanced Molecular
Imaging
Truly digital PET imaging
32
Digital photon counting (DPC)
At the heart of the digital PET system is Philips
proprietary digital photon counting (DPC) technology.
This was developed in order to overcome the limitations
of conventional photomultiplier technology.
During a PET scan, detectors need to be able to accurately
pick up and locate the pairs of high-energy photons that
are emitted when positrons, produced by the decay of the
radioactive tracer that is introduced into the body before
the scan, interact with electrons in the body. Scintillating
crystals are used to collect these pairs of high-energy
photons and convert them to visible light, which is then
picked up by a light sensor, with the output being an
electronic signal (ultimately used to construct the
resulting image).
Dierent types of light sensors have been developed
over the years: arrays of photomultiplier tubes
(PMTs), avalanche photodiodes (APDs), analog silicon
photomultipliers (SiPMs), and now – as used in the
Vereos PET/CT system – DPC technology.
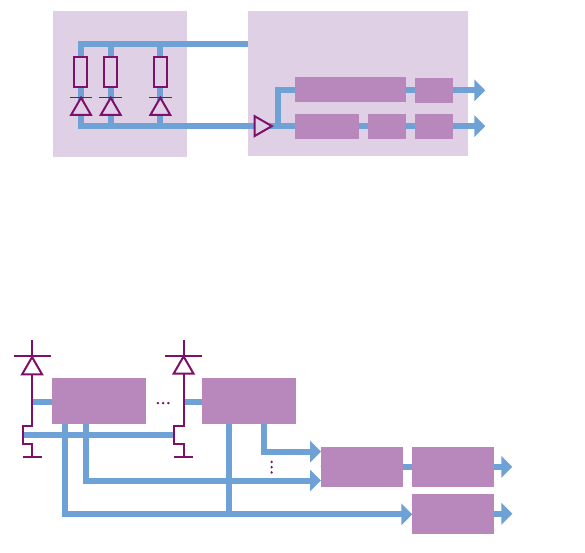
Figure 1 Processing of the analog signal in conventional analog
SiPMs. Reproduced from: Frach T, Prescher G, Degenhardt C.
Silicon photomultiplier technology goes fully digital. Electronic
Engineering Times Europe, January 2010.
Figure 2 Digital in/digital out photon counting in digital
SiPMs. Reproduced from: Frach T, Prescher G, Degenhardt C.
Silicon photomultiplier technology goes fully digital. Electronic
Engineering Times Europe, January 2010.
SiPM Vbias Readout ASIC
Shaper
Discriminator
ADC∫
TDC
Digital
Time
Energy
...
Vbias Vbias
Digital SiPM
Cell
electronics
Trigger
network
Recharge
Digital
Time
Energy
TDC
Photon
counter
Cell
electronics
The older technologies have limitations. PMTs are widely
used today, and were the foundation of PET imaging.
However, PMT design has reached its limits in counting
performance, due to the relatively large size of the device
and the timing resolution.
APDs have been used in PET systems for many years,
but although they have a higher sensitivity than PMTs,
APDs oer lower internal gain and no TOF capability.
Analog SiPMs use single photon avalanche diode
(SPAD) arrays. These are capable – as the name suggests –
of detecting single photons. However, when used in
conventional analog SiPMs, the pulses generated by
multiple photon detections (avalanche diode breakdowns)
are combined into an analog output signal that requires
extensive o-chip processing to produce a photon count
and time of arrival for the photon (see Figure 1). Also,
analog noise interferes with the signal, making it even
harder to exactly determine the number of photons
and the time of arrival.
32
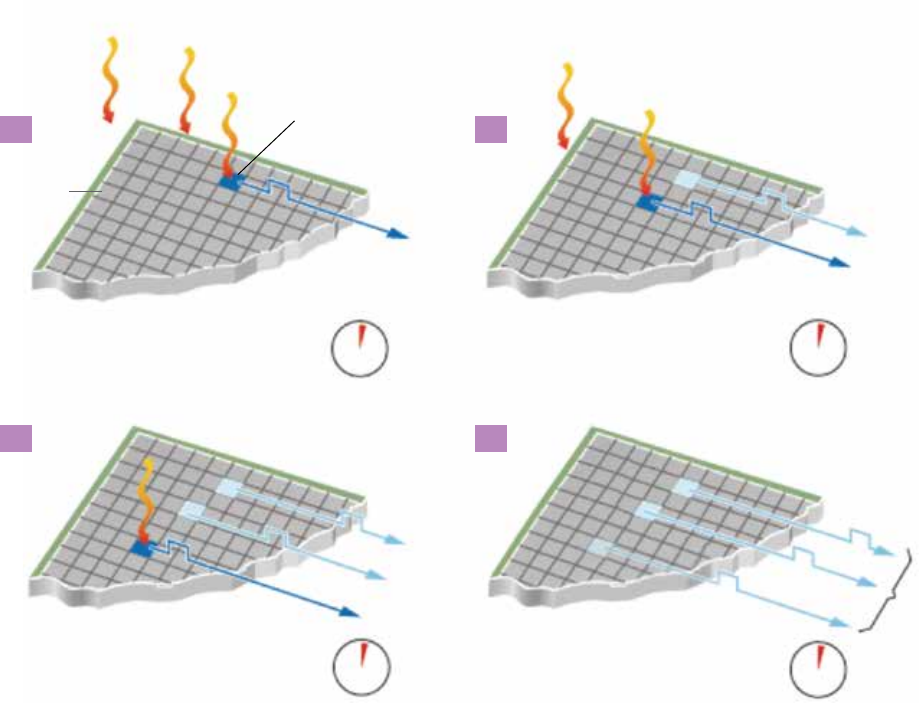
Figure 3 Digital photon counting in practice, showing the arrival and detection of individual photons,
and timing measurements.
Microcell
First photon
detected
002
001
0101101101
1 2
3 4
003
In contrast to analog SiPMs, the digital SiPMs seen in Philips
DPC technology enable the detection and counting of the
breakdown of individual SPADs on-chip. Light photons
produced by the scintillator are counted directly by the chip,
yielding a pure binary signal (0 or 1). This is achieved without
the need for amplication or o-chip analog-to-digital
processing of the signal (see Figure 2), minimizing
signal noise.
Conventional CMOS (complementary metal-oxide-
semiconductor) process technology is used to combine
SPADs and low-voltage CMOS logic on the same silicon
substrate. With both the sensor and the data processing
now on a single silicon chip, photon counting in ultra-low
light levels (down to single photons) is faster, more accurate,
and fully scalable.
In practice, how are the DPC measurements made?
During a scan, when the rst photon reaches a sensor the
integrated (on-chip) photon counter increases to 1, and the
integrated timer measures the arrival time of the rst photon
(Figure 3, top left). When the second and third photons
hit sensors, the photon counter increases to 2 and 3
respectively (Figure 3, top right and bottom left). At the end
of the desired length of the detection process, the values
of the photon counter and timer can be read (Figure 3,
bottom right).
Data acquisition is initiated by a trigger signal, generated
when the number of photons detected in a pixel becomes
higher than the congured trigger threshold.
54
Detector tile design
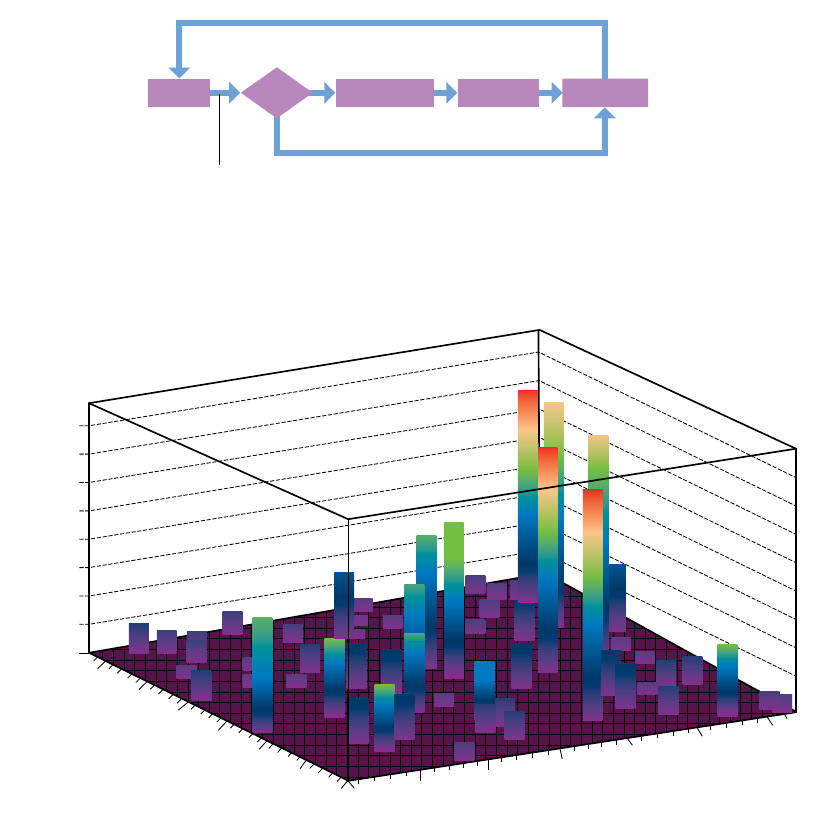
Figure 4 The data acquisition sequence within each die in a digital SiPM.
Figure 5 Dark counts of cells in a sub-pixel, at room temperature. Reproduced from Haemisch Y,
et al. Physics Procedia 2012;37:1546-60.
The DPC technology used in the Vereos system takes the
form of highly integrated arrays, or tiles, that contain more
than 200,000 cells, each of which is capable of detecting
a single photon.
Each tile consists of 16 independent die sensors, arranged
in a 4 x 4 matrix. Each die sensor consists of four pixels,
arranged in a 2 x 2 matrix. Each of these pixels contains
3,200 cells.
Each of the four pixels on a die has a photon count value.
Each die contains a pair of time-to-digital converters,
which generate a single timestamp for registered photon
detection events.
Ready Integration Readout RechargeValid?
(5-40) ns (0-20) µs 680 ns (5-80) ns
No
Yes
Trigger
(1st, 2nd, 3rd, 4th photon)
The generation of a trigger signal – when the number
of photons detected in a pixel becomes higher than the
congured threshold – prompts a timestamp to be saved,
and begins a validation process to detect a user-congured
number of further photons within a certain time. If this
validation threshold is exceeded, there is a subsequent
integration period before a readout process sends data
(four photon count values – one per pixel on the die –
and one timestamp per event) to a readout buer.
After readout, the cells are recharged so that the die
is ready for further data acquisition. Cells are also
recharged immediately if the original event is not validated.
Figure 4 shows the full data acquisition sequence, and the
timings involved.
0
5000
10000
15000
20000
25000
30000
35000
40000
0510
15
20 25 30
0
10
20
30
40
50
60
54
The design of the DPC technology allows every cell to
be individually activated or inactivated. This means that
background noise – the dark count rate – can be measured
and managed eectively.
By switching on and o each individual cell, in a fully
dark environment, a map of dark counts can be produced
automatically by the system (see Figure 5 for an example).
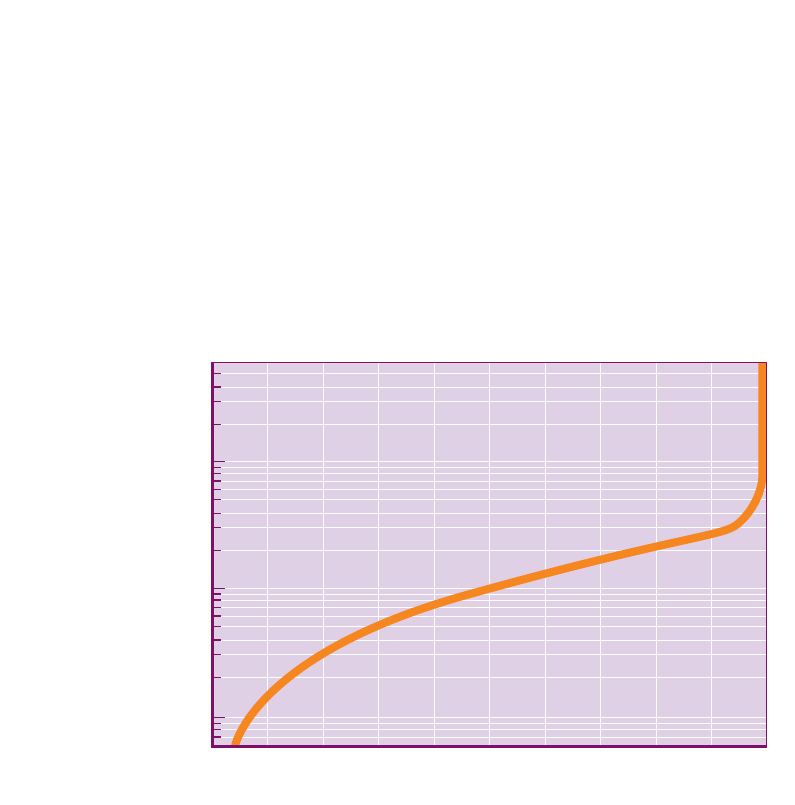
A cumulative logarithmic plot of dark counts (see Figure 6)
shows that the overall dark count rate is greatly reduced by
switching o the noisiest cells.
Figure 6 A cumulative logarithmic plot of dark count rate as a function
of the number of active cells. Reproduced from Haemisch Y, et al.
Physics Procedia 2012;37:1546-60.
The DPC technology is also much less sensitive to
temperature variations than conventional analog SiPMs.
In analog SiPMs, the temperature dependence of the
ionization coecients and holes in silicon leads to a
temperature-dependent drift in each sensor’s breakdown
voltage and a change in gain. In DPC technology, any shift
in breakdown voltage must exceed the threshold voltage
of the CMOS inverter before the count rate is aected since
the logic gate just looks for voltage above or below the
CMOS threshold, not the amount of charge.
The implications of DPC and 1:1 coupling will be discussed
in the next section.
0 10 20 30 40 50 60 70 80 90 100
Active cells [100%]
106
105
104
DCR [Hz]

76
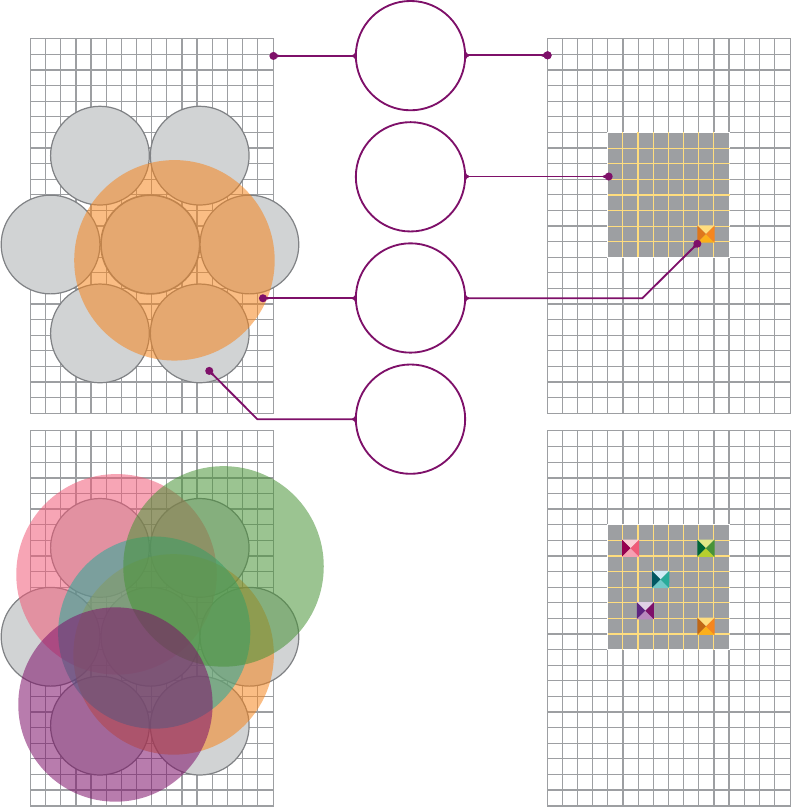
DPC and 1:1 coupling
In the detectors used in the Vereos PET/CT system, each
scintillator is connected to a single detector pixel. This is
called 1:1 coupling (see Figure 7).
The 1:1 coupling of scintillator crystals to detectors, coupled
with fast timing resolution, reduced pile-up eects, and
TOF benets, allows for a much higher count rate capability
compared to analog* systems.
The direct 1:1 coupling also results in an improved spatial
resolution. The nal spatial resolution of a PET image is the
result of multiple factors, some related to the annihilation
events and interactions (such as non-co-linearity of
annihilation photons, and the positron range), and others
related to the detection system (such as the scintillation
crystal size and crystal identication, or decoding). In the
Vereos system, with 1:1 coupling, the contribution of the
decoding is eliminated. A related improvement comes
from the elimination of distortions and edge eects in
the decoding. PMT-based detectors typically have worse
resolution directly underneath the tubes and at the edges
of the eld of view. With 1:1 coupling, the crystal identication
is uniform across the entire detector, resulting in a more
uniform image.
Because they are pixelated, the digital detectors in Vereos
also show a uniform response across their surface, and across
the entire eld of view. This is in contrast to analog PMT-
based systems that use Anger logic for crystal identication,
where the response varies across the detector and is worse
directly underneath the PMTs and at the edge of the eld of
view. 1:1 coupling eliminates this eect in Vereos.
Users will also benet from Vereos’ high peak true rate
(≥ 675 kcps), also known as the maximum true rate.
This is the maximum count rate of true coincidences, which
occurs at a certain level of activity, beyond which the system
is paralyzed. With Vereos, researchers can perform high
count rate studies, such as short-lived isotope dynamic and
bolus imaging, while maintaining sensitivity – important for
quantitative accuracy.
“
There is non-uniform behavior across PMT-based detector
modules that impacts image quality and quantitation.
With Philips digital photon counting technology, we deliver
uniformity throughout.
”
Chi-Hua Tung, Director
Advanced Molecular Imaging, Philips
76
Figure 7 Comparison of analog* and digital photon counting. A PMT covers multiple crystals
in the analog* system, while the digital system shows 1:1 coupling between scintillator crystals
and single photon counters.
*GEMINI TF
Analog* Digital 1:1 coupling
Scintillation
photon
Analog
PMT
DPC
tile
Crystal
array
98
Factors inuencing performance specications
A number of dierent factors inuence and enhance the
performance specications of the DPC technology used
in the Vereos system.
List mode-based TOF reconstruction
Vereos uses list mode TOF reconstruction. The list mode
reconstruction method does not require any binning of
the raw data. Event location and time of ight information
are retained without degradation from binning, providing
exceptional image quality and quantitation.
Energy resolution and spectrum/system
dead time
The 1:1 coupling and sharp detection pulses seen with the
DPC technology in Vereos eectively eliminates problems
caused by coincident event pile-ups and electronic drift
seen with analog systems. These problems can occur in
analog* systems if there is a high level of activity and two or
more events are detected almost simultaneously. In terms
of resolution and the energy spectrum, pulse pile-up and
drift cause good counts to be pushed out of the observed
energy window, in favor of scatter counts. In terms of system
dead time, the overlapping of the distributions for almost
simultaneous events means a loss of sensitivity and the
system will be partially dead at high count rates.
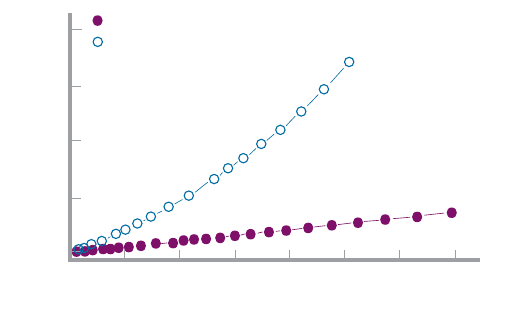
The benets of 1:1 coupling in terms of dead time are
further illustrated by a plot of dead time factors against
activity concentration for Vereos and an analog* system
(see Figure 8). Dead time factors are dened as the
inverse of the actual measured counts divided by the
expected counts. As Figure 8 indicates, at a clinical activity
concentration of 10 kBq/ml which is typical of most whole
body studies, Vereos has a deadtime factor of 1. In contrast,
we see a higher dead-time factor of 1.17 for the analog*
system. This eectively translates into an additional 17%
sensitivity gain for Vereos.
Sensitivity measurement
NEMA (National Electrical Manufacturers Association)
sensitivity is a measure of a system’s ability to convert
positron emissions to raw counts. However, this measure
was developed for analog systems and does not take into
account the quality of counts, such as the impact of TOF,
the spatial resolution, and the degradation with high
count rate (or dead time). Therefore, for superb sensitivity,
obtaining good counts is more important than obtaining
many mixed counts.
Digital PET oers real sensitivity gains, largely due to
the application of TOF. The eective sensitivity gain is
D/Δx, where D is the object diameter and Δx is position
uncertainty along the line of response, equal to the speed
of light (c) multiplied by time resolution divided by 2 (Δt/2).
Calculations for a range of object diameters show
a TOF gain with Vereos of 3.9 for an object with
a diameter of 20 cm, 5.8 for an object with a diameter
of 30 cm, and 7.7 for an object with a diameter of 40 cm –
objects approximately representing a brain, small body,
and large body respectively [Philips, data on le].
Reconstruction and noise
The process of reconstruction involves mathematically
estimating the original radioactivity distribution, based
on the collected dispersed data. This brings with it penalties
in terms of noise. However, Vereos’ 1:1 coupling of crystals
to sensors, better TOF resolution, and more uniform
detector response reduce the reconstruction noise.
Less noise translates into increased sensitivity.
* Ingenuity TF
Figure 8 Comparison of dead time correction factors
measured on Vereos digital PET and analog PET
(Ingenuity TF).
Vereos digital PET
Analog PET
0 10 20 30 40 50 60 70
Dead time correction factor
3.0
2.5
2.0
1.5
1.0
Calibration activity concentration (kBq/mL)
**Results are based on a uniform phantom (20 cm diameter and 30 cm long); Vereos results are preliminary and may be changed
Comparison of dead time factors**
98
Wi
th
o
ut
T
O
F
W
i
t
h TO
F
Annihilation
t1
t2-t1
t2
L
OR
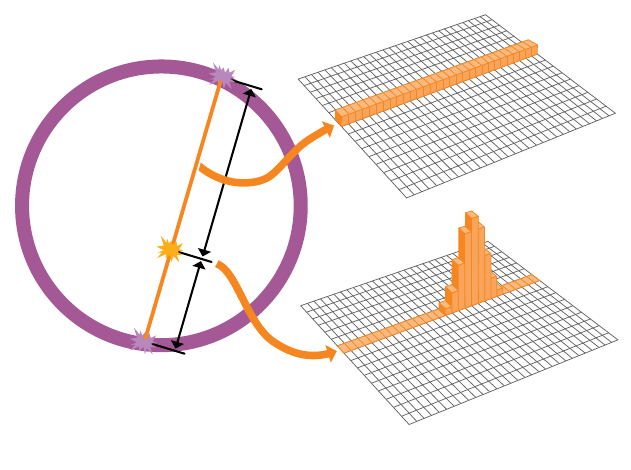
Timing resolution and TOF technology
In conventional non-TOF PET, the image reconstruction
process must assume that there is a uniform probability that
the annihilation event occurs at any one point along the line
of response (LOR). This major limitation has been overcome
by the development of TOF technology.
Vereos has a fast timing resolution of just 325 ps (currently
the fastest resolution on the market). This is the minimum
time interval between two photon events required for
them to be recorded as separate events. In systems with
fast timing resolution, TOF is able to be used to locate
each annihilation event on a specic part or segment of
the LOR. The dierence in ight time for the two photon
events is used to produce a more localized distribution of
probabilities (see Figure 9). For Vereos, the TOF localization
accuracy is 4.9 cm.
This has the eect of improving eective sensitivity and
image quality, and the speed of processing. With eective
sensitivity gain dened as D/Δx (where D is the object
diameter and Δx is position uncertainty along the LOR),
reducing the position uncertainty through the application
of TOF leads to a real sensitivity gain.
Calculated eective sensitivity gains for Vereos, due to
the benets of TOF technology, demonstrate greater gains
for larger diameter objects: 3.9 for a 20 cm diameter,
rising to 7.7 for a 40 cm diameter [Philips, data on le].
TOF may be particularly benecial in larger, heavier
patients, as increased levels of attenuation and scatter
in these patients would typically result in poor quality
PET images in the absence of TOF.1
1 El Fakhri G, et al. Improvement in lesion detection with whole-body oncologic time-of-ight PET. J Nucl Med. 2011;52:347-53.
Figure 9 How TOF technology can lead to improved
localization of the annihilation event along the LOR.
1110
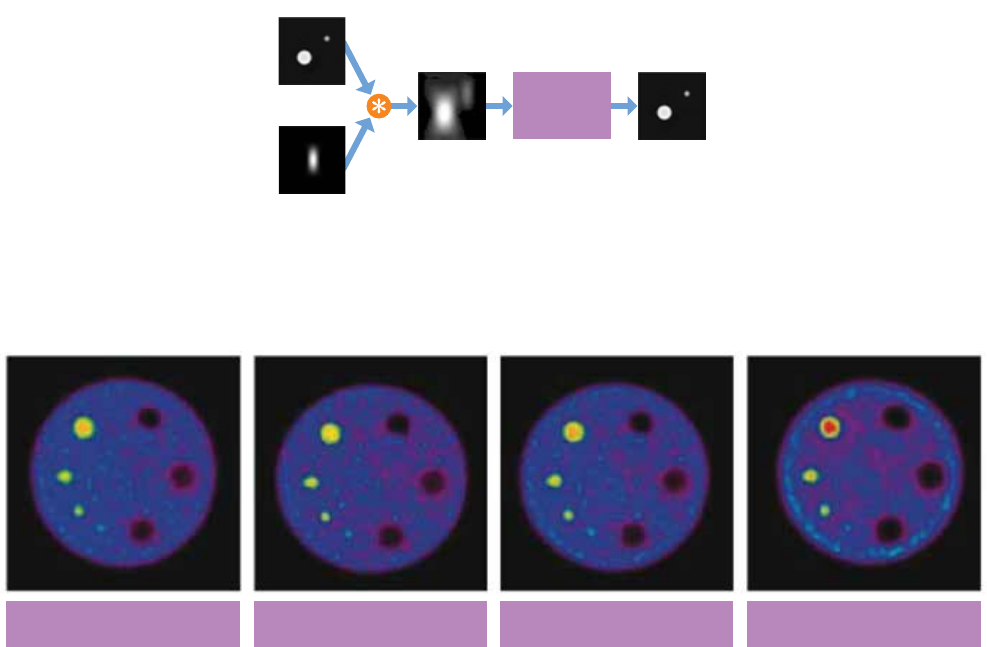
Point spread function (PSF) technology
Figure 10 Correcting for a system’s PSF provides superb
image clarity.
Vereos makes use of a point spread function (PSF)
algorithm to correct for partial-volume eects in PET
images. PET spatial resolution can be inuenced by
factors such as the positron range (which is radioisotope-
dependent), non-co-linearity of annihilation photons,
crystal/detector size, and reconstruction parameters such
as voxel dimensions and the use of post-lters.
PET scanner resolution can therefore be spatially variant,
resulting in blurred images if not corrected for. A system’s
PSF is determined by imaging point-sources at many
dierent locations within the scanner, producing a three-
dimensional PSF. Correcting for this PSF allows users to
retrieve images that closely match the true object scanned
(see Figure 10).
Experience with PSF correction in the analog Ingenuity TF
PET/CT system has demonstrated good improvement in
image resolution and quantication. The same method
is applied in Vereos. Overall, PSF needs to be used carefully,
as it can signicantly inuence quantitative accuracy.
Users can adjust two parameters: the number of iterations
and a regularization factor. Evaluations using phantoms
and clinical patients suggest that 1-2 PSF iterations is
sucient to recover resolution, with more iterations leading
only to increased noise in the nal image. Choosing PSF
regularization values similar to the resolution of the scanner
(in this case 6-8 mm for clinical images) provided good
resolution without excessive noise or quantication errors.
The eects of applying various values for iteration and
regularization in PSF correction can be seen in the following
images from a phantom study (Figure 11).
In addition, Vereos has the ability to reconstruct images
with a voxel size of 1 mm (for clinical brain images and
research-only 1 mm body images), which further minimizes
pixel sampling errors and improves image quality.
PSF
correction
Uncorrected
image
Object
System
PSF
Corrected
image
Figure 11 Transverse slices of 2 mm voxel ACR (American College of Radiology) phantom images, for various PSF
iterations and levels of regularization. Reproduced from Narayanan M, Perkins A. Resolution recovery in the Ingenuity TF
PET/CT. Data originally courtesy of the Hospital of the University of Pennsylvania.
No PSF 3 PSF iterations 1 PSF iteration
6 mm regularization
3 PSF iterations
20 mm regularization
1110
Technology pillars supporting improved performance
The Vereos system has approximately double the volumetric
resolution, sensitivity gain, and accuracy of a comparable
analog* system. These benets are gained through the
advantages oered by DPC technology, enhanced TOF,
and 1:1 coupling.
The improved volumetric resolution is largely due to
1:1 coupling. The overall resolution is typically expressed
as the full width at half maximum (FWHM), which has been
calculated as 69 mm3 for Vereos. The 1:1 coupling improves
overall volumetric resolution through the gains in spatial
resolution seen across the entire eld of view.
Most of the improved sensitivity gain seen with Vereos
is attributed to the application of TOF to more accurately
locate each annihilation event along the line of response
(LOR). The result is less dispersed data and improved
image contrast. The remaining improvement is provided
by reduced dead time.
Sensitivity gains have been measured for a range of object
sizes. For a typical patient body size (Δ30 cm), the Vereos
system showed a sensitivity gain of 5.8, compared with
a gain of 3.3 with the analog system* (both compared with
non-TOF). With the additional 20% to 25% sensitivity gain
due to less dead time, the overall clinical sensitivity gain
is about a factor of 2. Such improvements in sensitivity
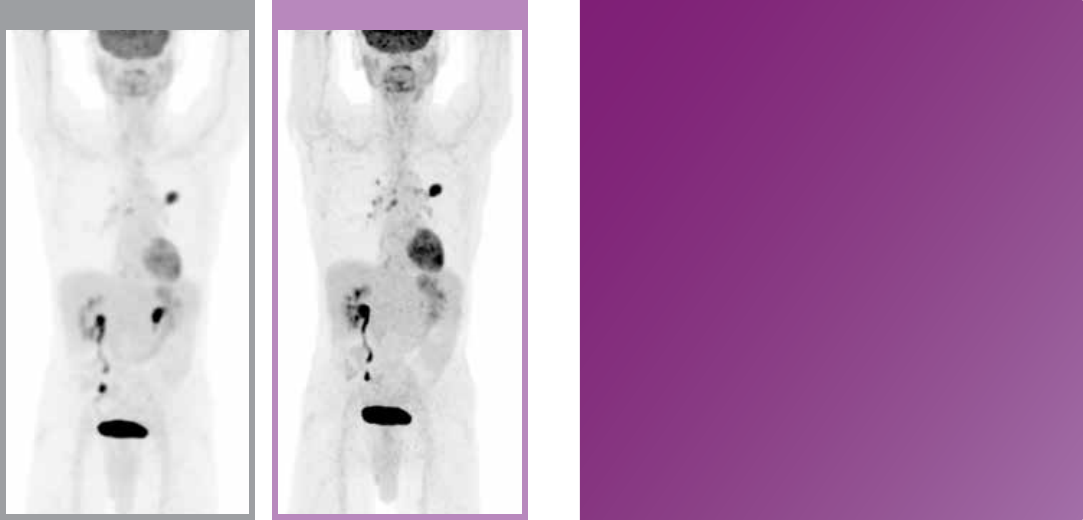
produce high quality images (see Figure 12).
Vereos has improved quantitative accuracy of +/- 5%
when compared to +/- 10% seen with the analog system.*
This improvement is primarily the result of the uniform
detector response enabled by 1:1 coupling and the enhanced
detector eciency normalization algorithm.
Figure 12 Sensitivity gain is approximately doubled with the
Vereos system compared with the analog GEMINI TF 16 system.
Analog PET scan* Digital PET scan
“
With 1:1 coupling, we get
not just more information
but enhanced information
and more certainty. We’re
better able to identify the
source of the annihilation
event, improving the
volumetric resolution.
”
Chuck Nortmann, Clinical Product Manager
Advanced Molecular Imaging, Philips
*GEMINI TF
Sample images acquired in a clinical study of the Vereos PET/CT system at University Hospitals Case Medical Center.
Investigational device limited by law to investigational use.

© 2016 Koninklijke Philips N.V. All rights are reserved.
Philips reserves the right to make changes in specifications and/or to discontinue any product
at any time without notice or obligation and will not be liable for any consequences resulting
from the use of this publication. Trademarks are the property of Koninklijke Philips N.V. or their
respective owners.
www.philips.com/VereosPETCT
Printed in The Netherlands.
4522 991 18531 * MAY 2016
