Philips Learn More EPIC Control Surface QG 20160511 V01
User Manual: Philips Learn more Ultrasound Education: Instructional Guides
Open the PDF directly: View PDF ![]() .
.
Page Count: 6
EPIQ Evoluon 2.0 IQ
Technology| 2D Imaging
QuickGuide
2D Opt
This opmizaon emphasizes the higher, lower, or mid-range
frequencies while imaging the enre bandwidth.
Note
Not all opons are available in every TSP.
In harmonic imaging, the leer H appears before the 2D Opt
selecon on the monitor and touchscreen:
• HRES
• HGEN
• HPEN
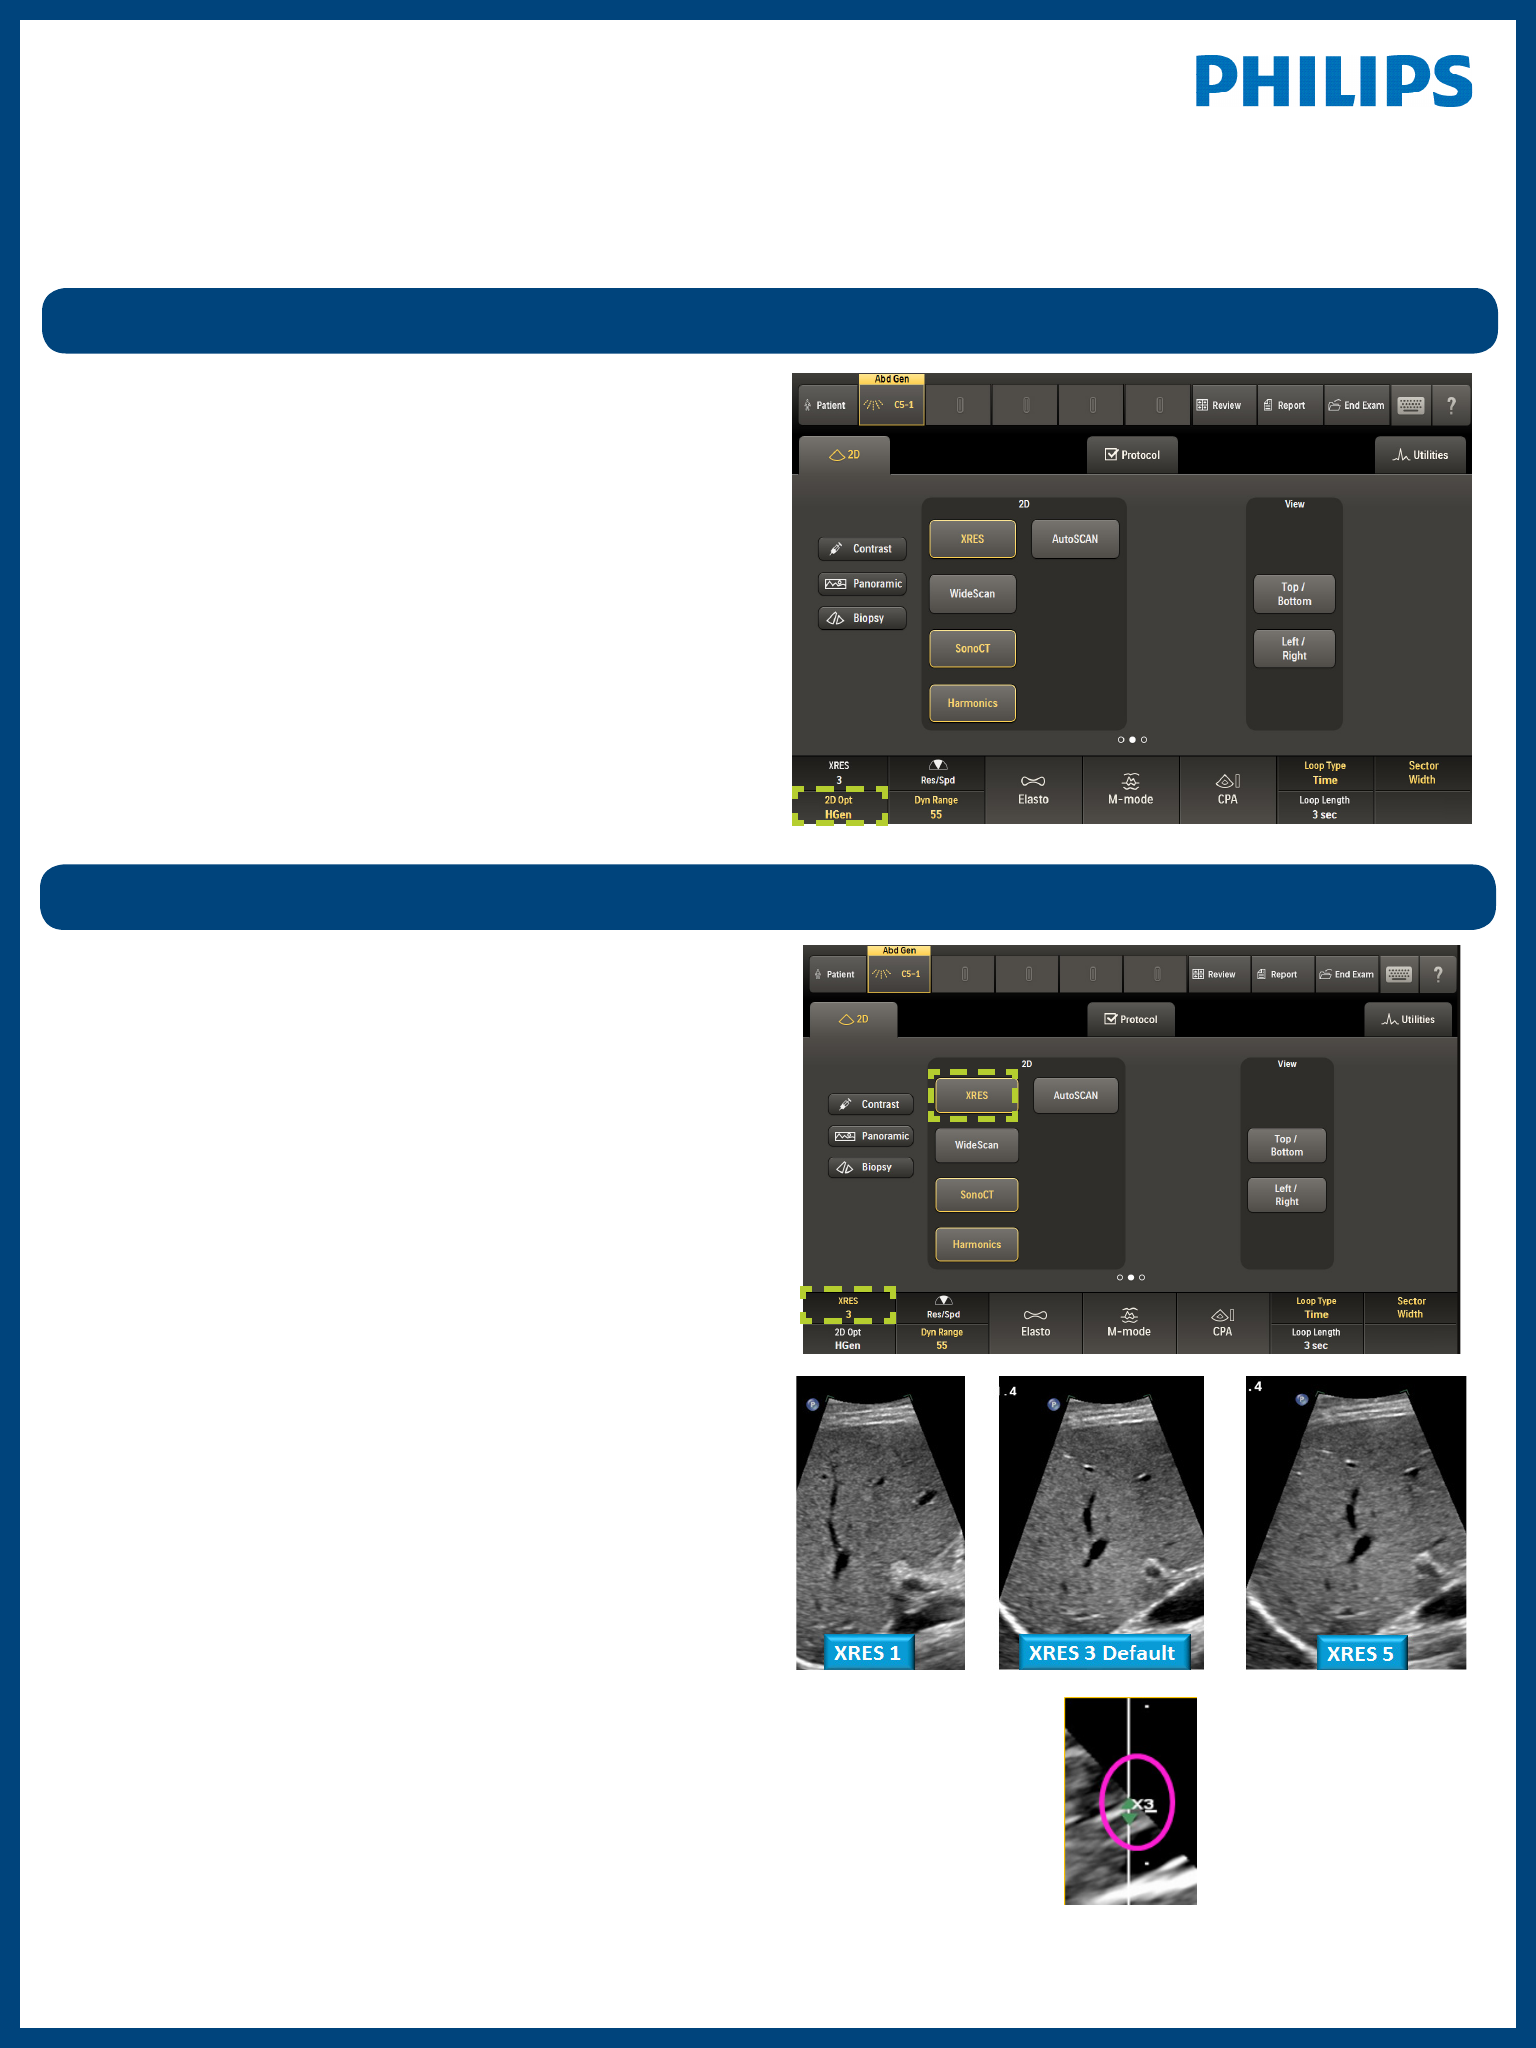
XRES
Up to 5 Variable XRES sengs are available on select
transducers and TSPs, 1=course, 5=smooth.
To acvate Variable XRES, press the associated rotary knob, and
then turn the rotary knob to the preferred seng.
XRES image processing reduces speckle noise arfacts and
improves image clarity and margin denion. Transducers and
TSPs with Variable XRES enabled have sengs that provide
smoother images as XRES level is increased.
Tip
Make user-dened TSPs that are customized for the customer.
The current variable XRES seng appears to the right of the
image if Variable XRES is available.
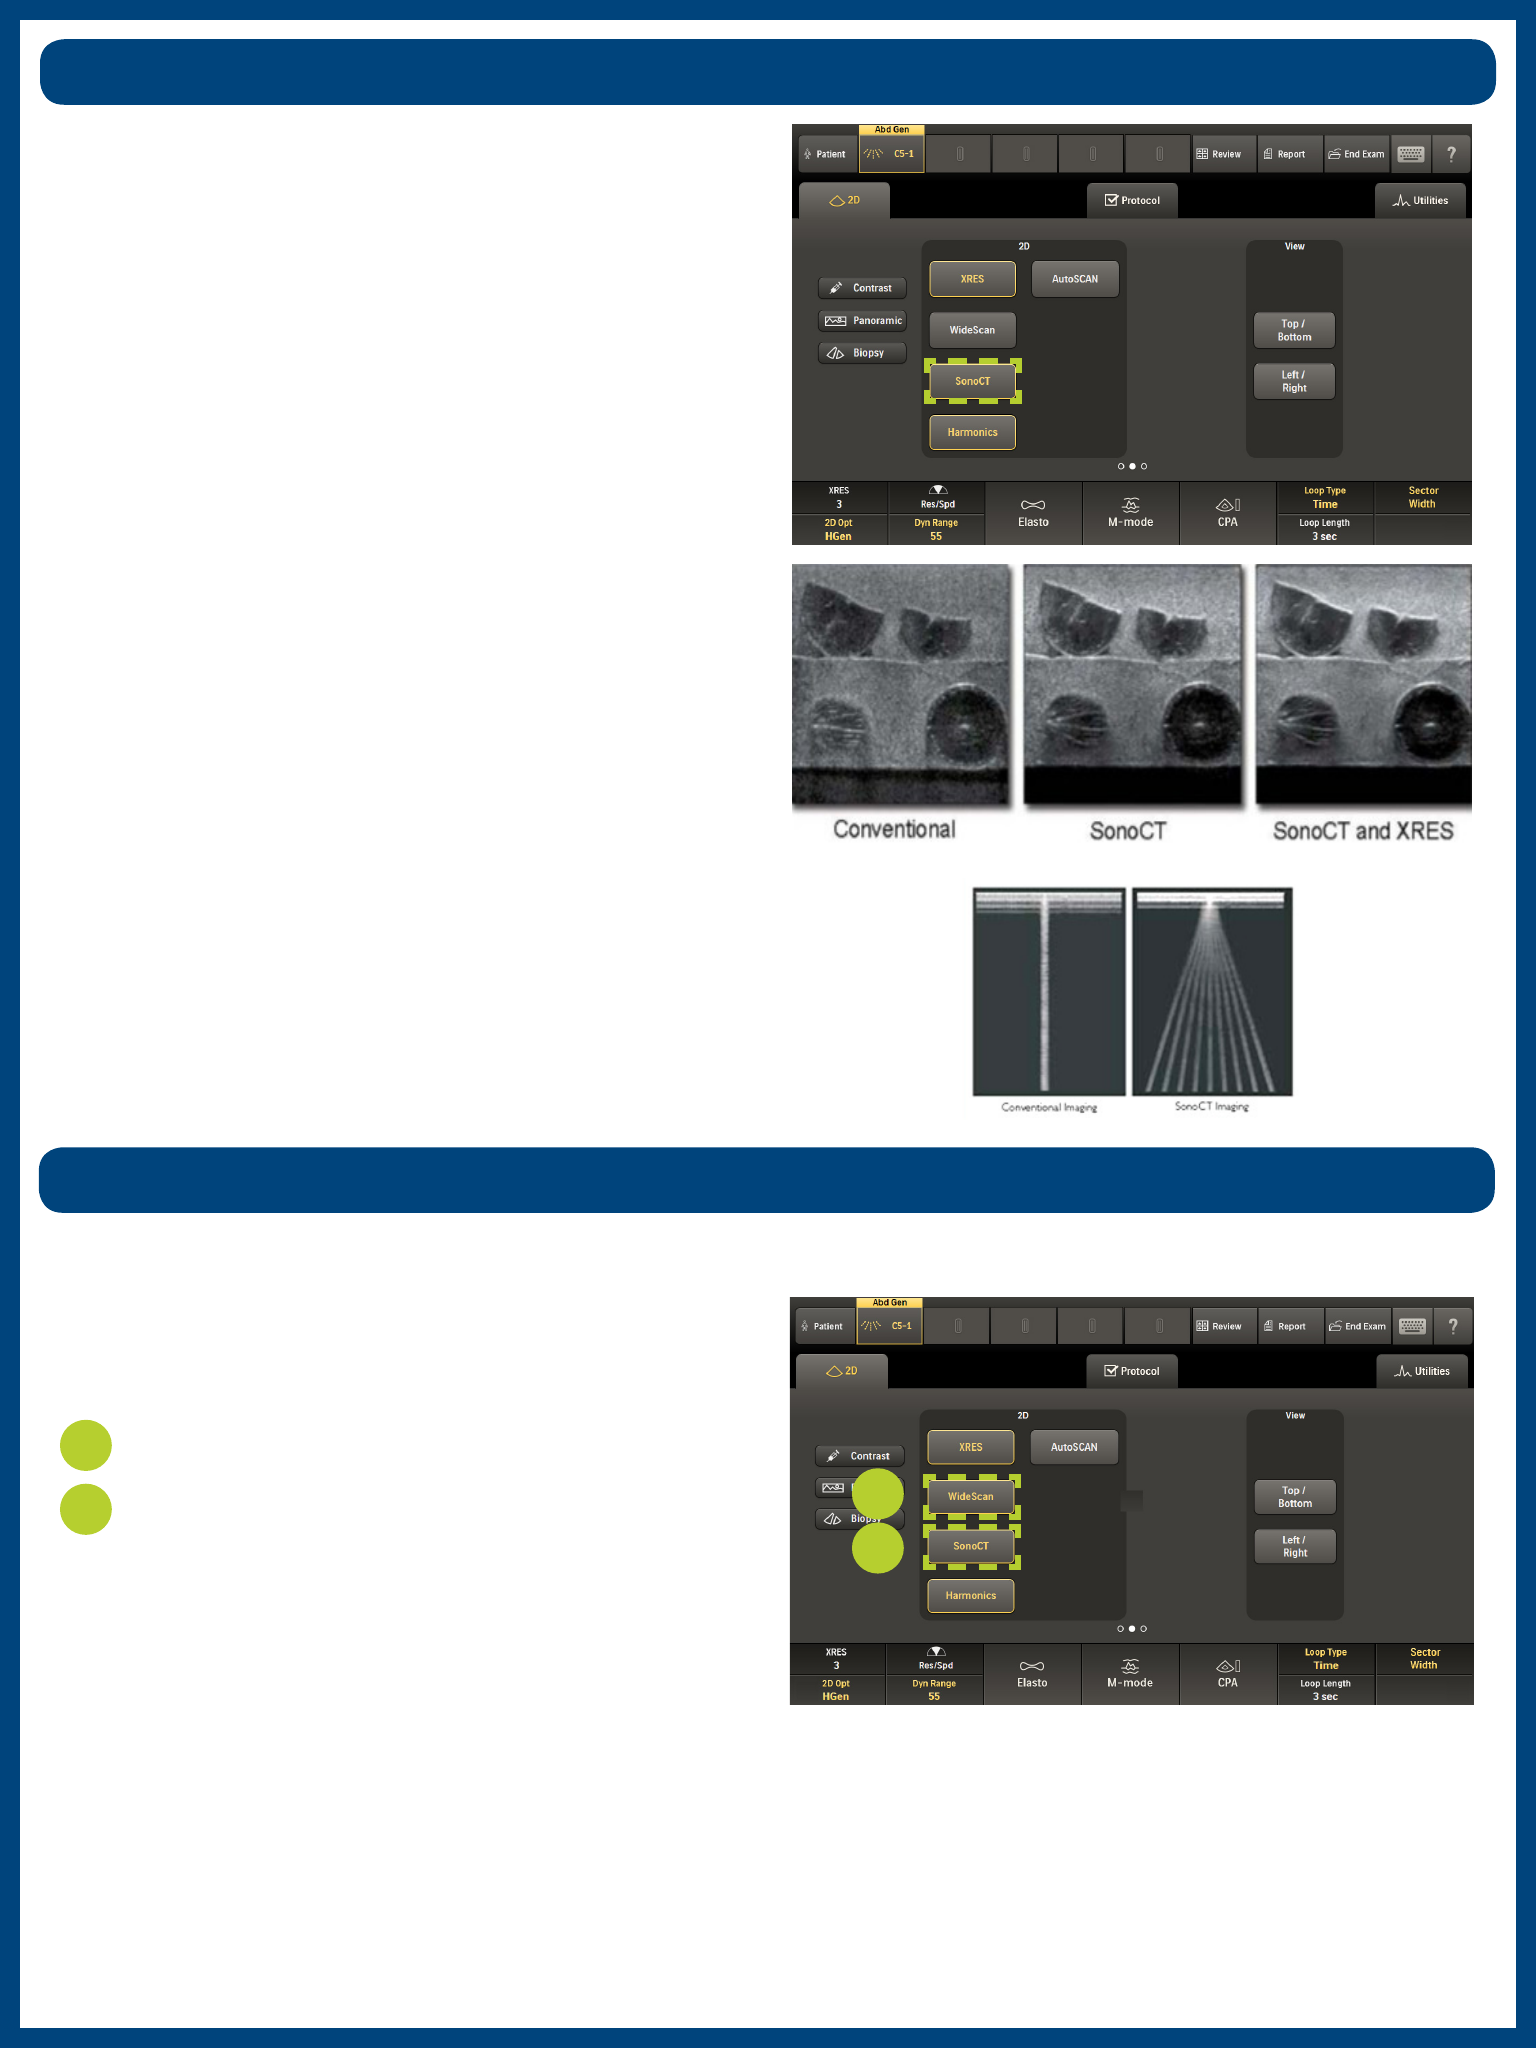
SonoCT
Real-me mulple lines-of-sight imaging increases ssue
informaon and improves display of curved and irregular
structures while reducing many angle-generated arfacts.
SonoCT provides:
• Increased margin denion
• Reduced angle-generated arfacts
• Virtual eliminaon of speckle noise
• Improved delineaon of curved structures
WideScan
2
1Press SonoCT.
Press WideScan.
• Provides a quanable image of structures larger than the
tradional eld of view.
• Demonstrates anatomic spaal relaonships.
• Allows for bi-direconal construcon of the panoramic
mosaic.
1
2
The muliple lines-of-sight acquired with SonoCT are clearly
demonstrated with a paper clip against the transducer lens cap.
Available on linear and curved arrays while in SonoCT mode.
Similar in appearance to trapezoidal imaging but not the same.
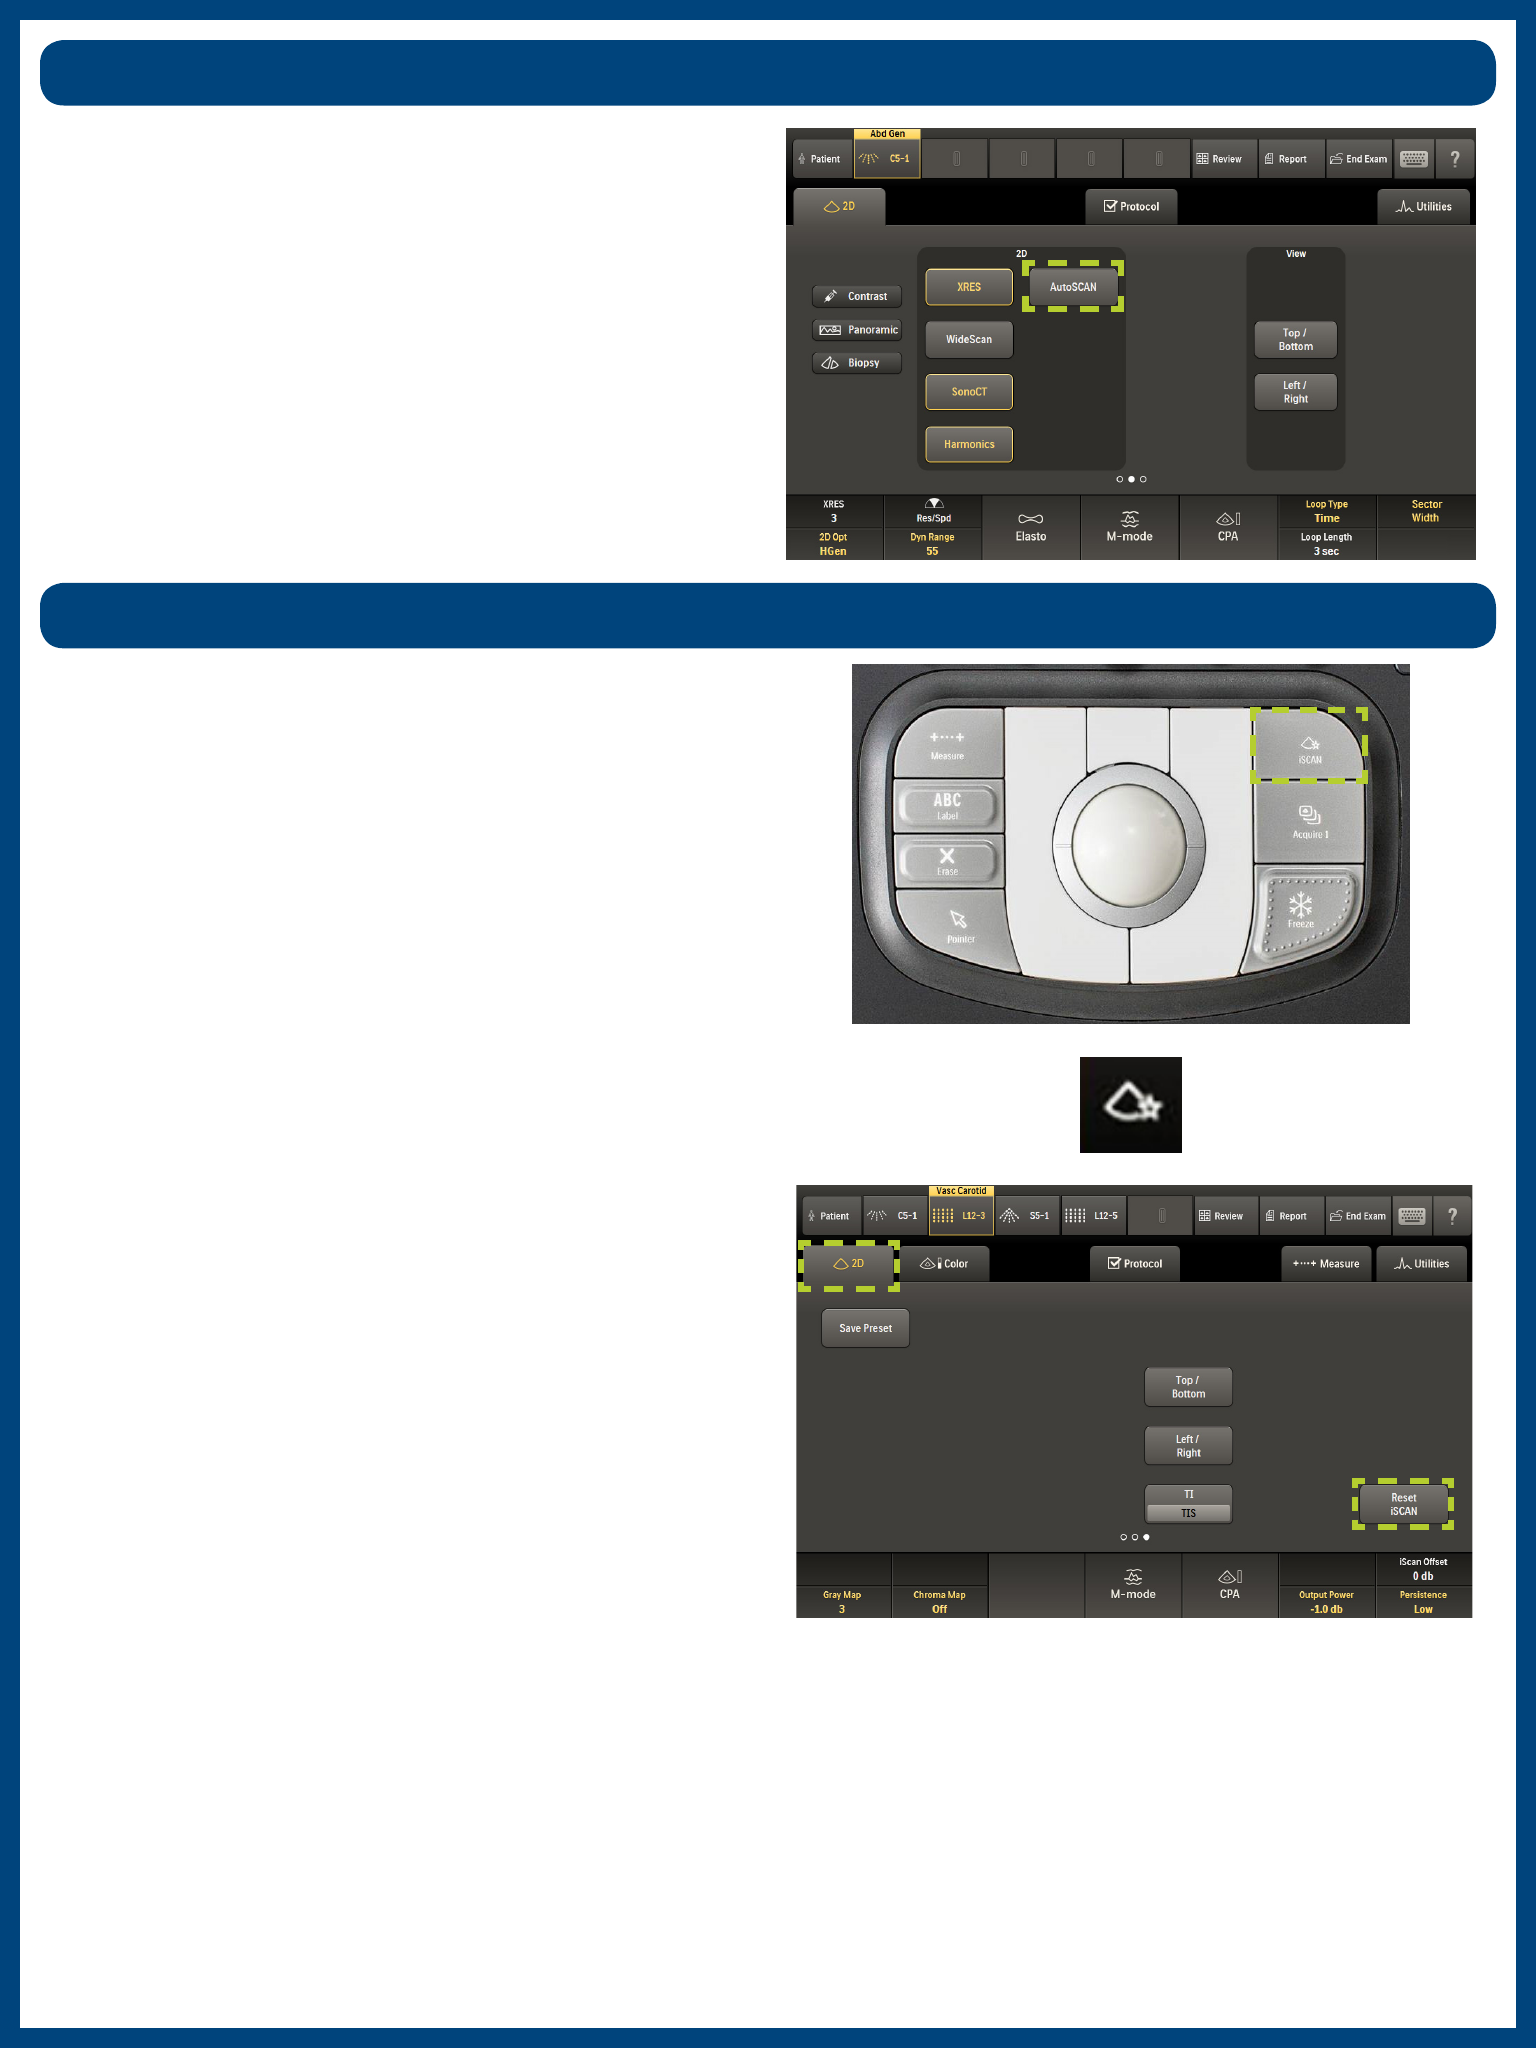
AutoSCAN
• Only available in 2D mode.
• Gain and TGC can also be manually adjusted when
AutoSCAN is on.
Press iSCAN to automacally adjust TGC, receiver gain,
compression maps, spectral Doppler PRF, and baseline during
real-me scanning.
AutoSCAN automacally and connuously opmizes 2D image
brightness at the default gain and TGC sengs.
iSCAN
• Evaluates grayscale distribuon to opmize TGC and 2D gain.
• The iSCAN icon appears in the boom le-hand corner of
the monitor when acvated. The iSCAN icon turns red for
three seconds to indicate the image has been opmized.
Tip
In 2D iSCAN opmizes system sengs based on the frame
acquired at the moment iSCAN is pressed. These sengs
remain unchanged unl pressing iSCAN again, touching Reset
iSCAN, or changing the associated controls manually.
Note
There is no visual indicator that AutoSCAN is on.
Tissue Harmonics
Tissue Harmonic imaging provides enhanced image contrast
resoluon and images with fewer arfacts, parcularly in cysc
structures.
• Reduces image arfacts and increases resoluon; the trade-
o is less penetraon.
• Does not impact frame rate.
• More clarity in acousc enhancement and shadowing.
Tip
Useful in dicult-to-image paents.
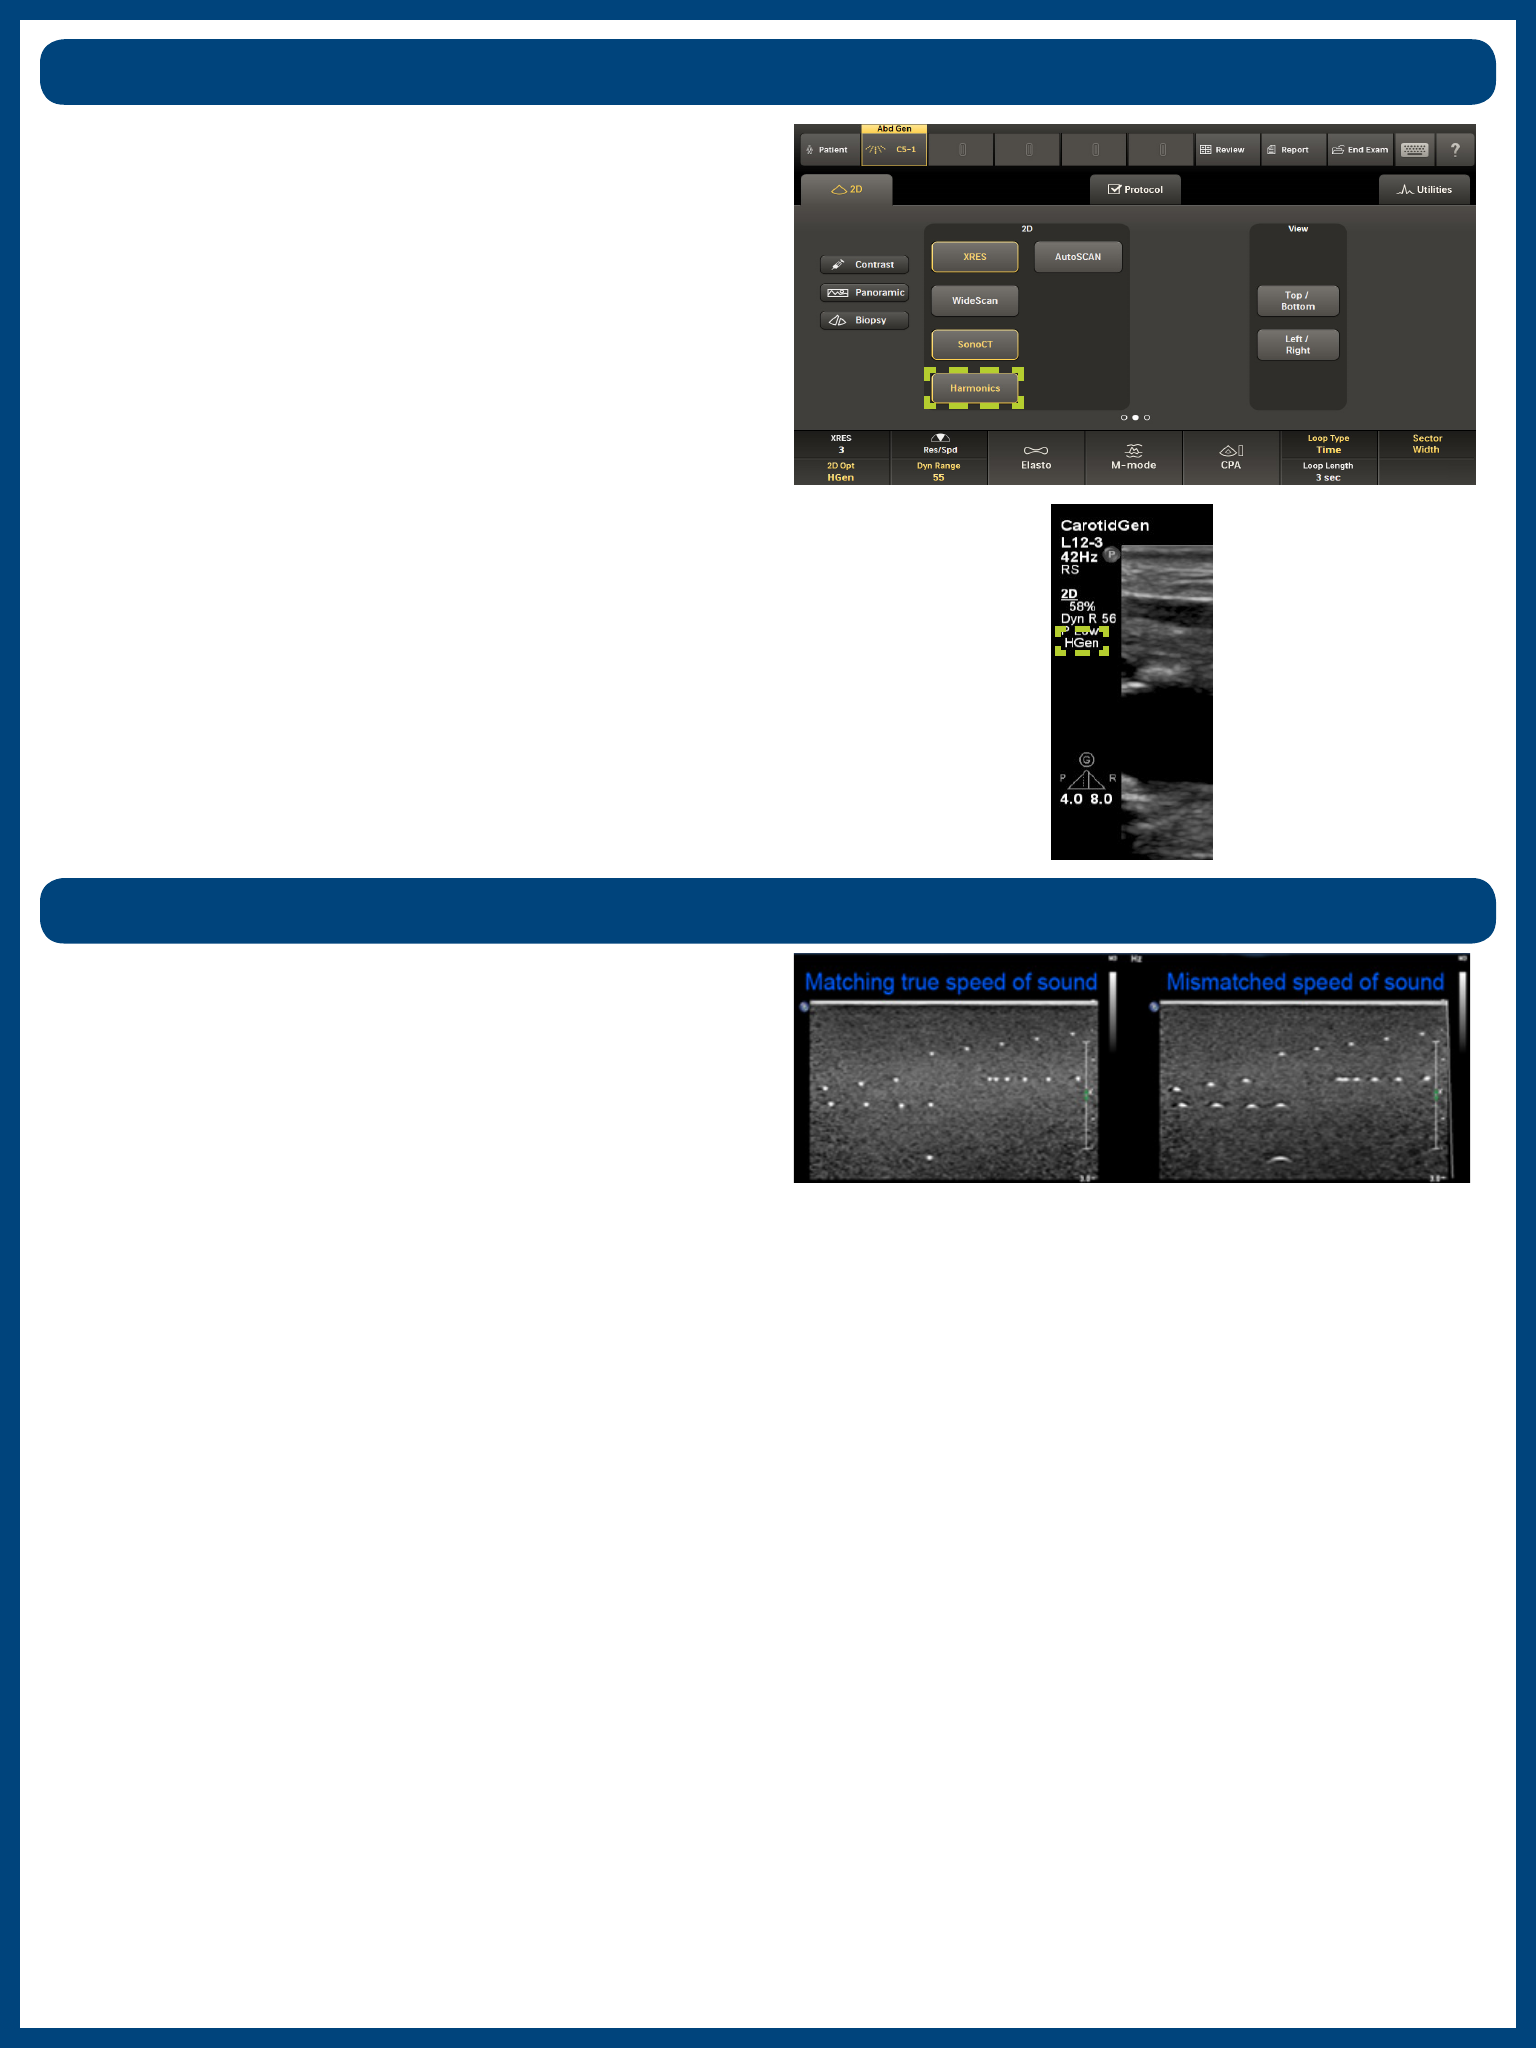
This user-selected speed of sound compensaon maintains
exceponal sharpness on fay and dense breast ssue.
Tissue Aberraon Correcon (TAC)
• Uses speed of sound correcon, applied to both transmit
and receive signals, throughout adipose ssue.
• SonoCT frames will be beer registered at the lower speed
of sound.
• Advanced XRES will not be eected by changing TAC because
Advanced XRES is a post-processing funcon.
• Reduces the eects of acousc beam distoron.
• Sharpens spaal resoluon.
• Improves ssue uniformity throughout the depth of view in
TDP.
Notes
• The C5-1 penetraon TSPs use TAC in the rst 3 cm of ssue.
The Advanced Breast TSP uses TAC throughout the image.
• Tissue with higher fat content causes in speed of sound
changes and reducon of overall image sharpness and
decreased ssue denion.
In Harmonic mode, the indicator appears to the upper right of
the image.
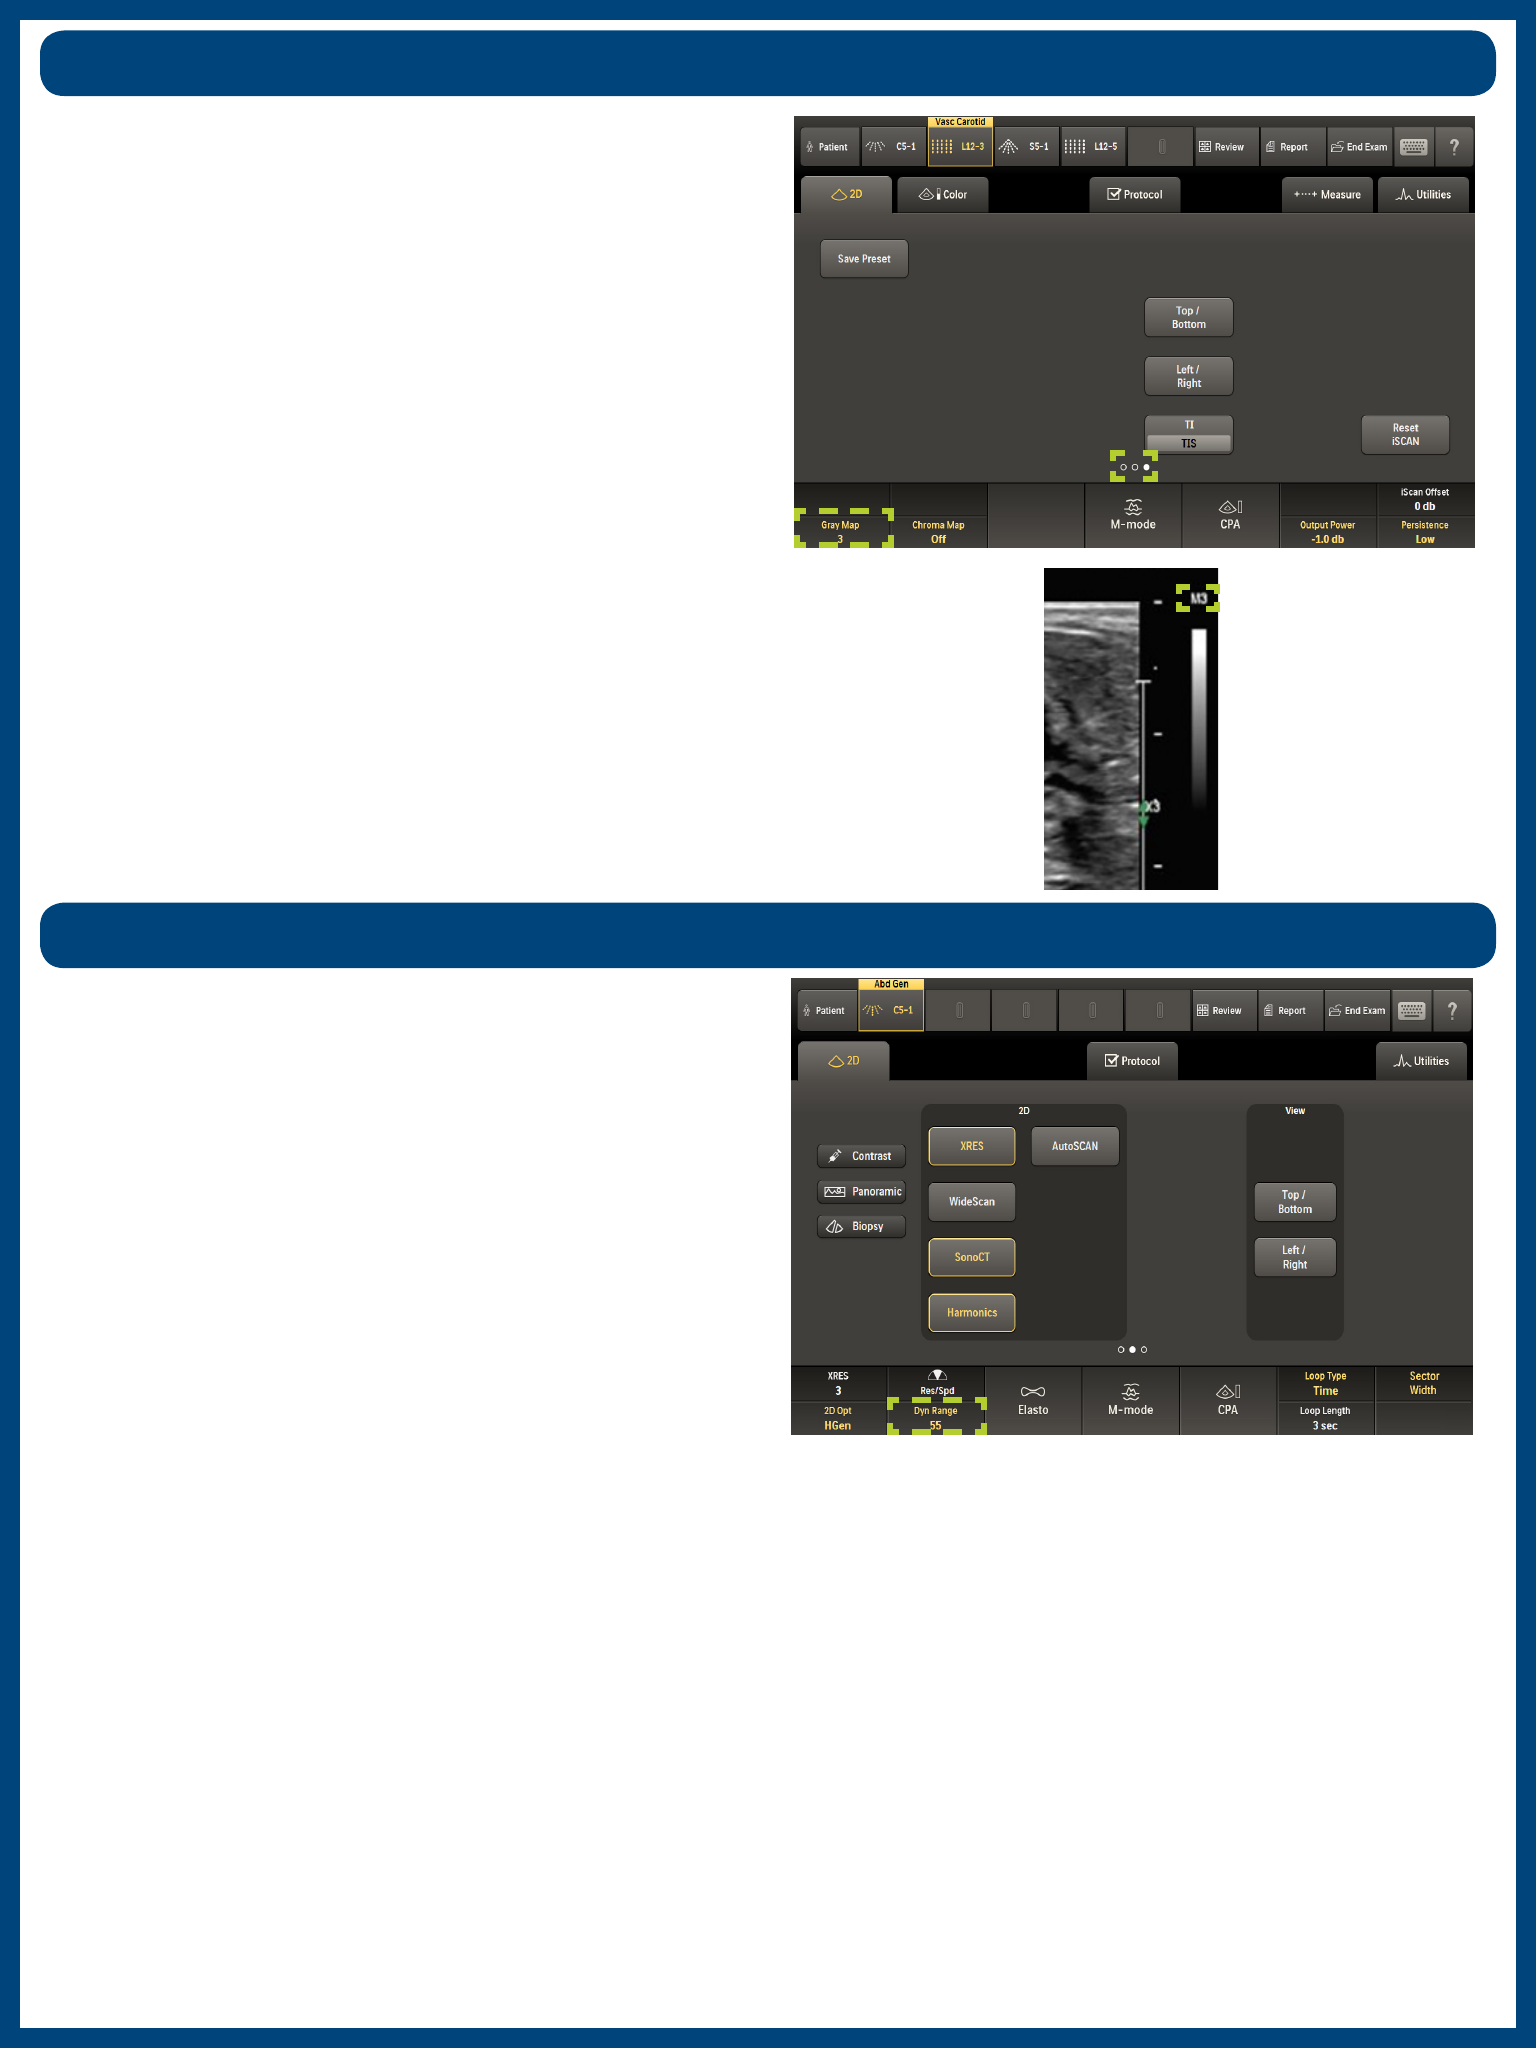
Gray Map
The Gray Map feature controls the levels of grays and whites in
the image.
• Gray Map selecons range from 1—5.
• This feature controls transions from “more whites” to
“aer whites.”
Note
This is also a post-processing feature.
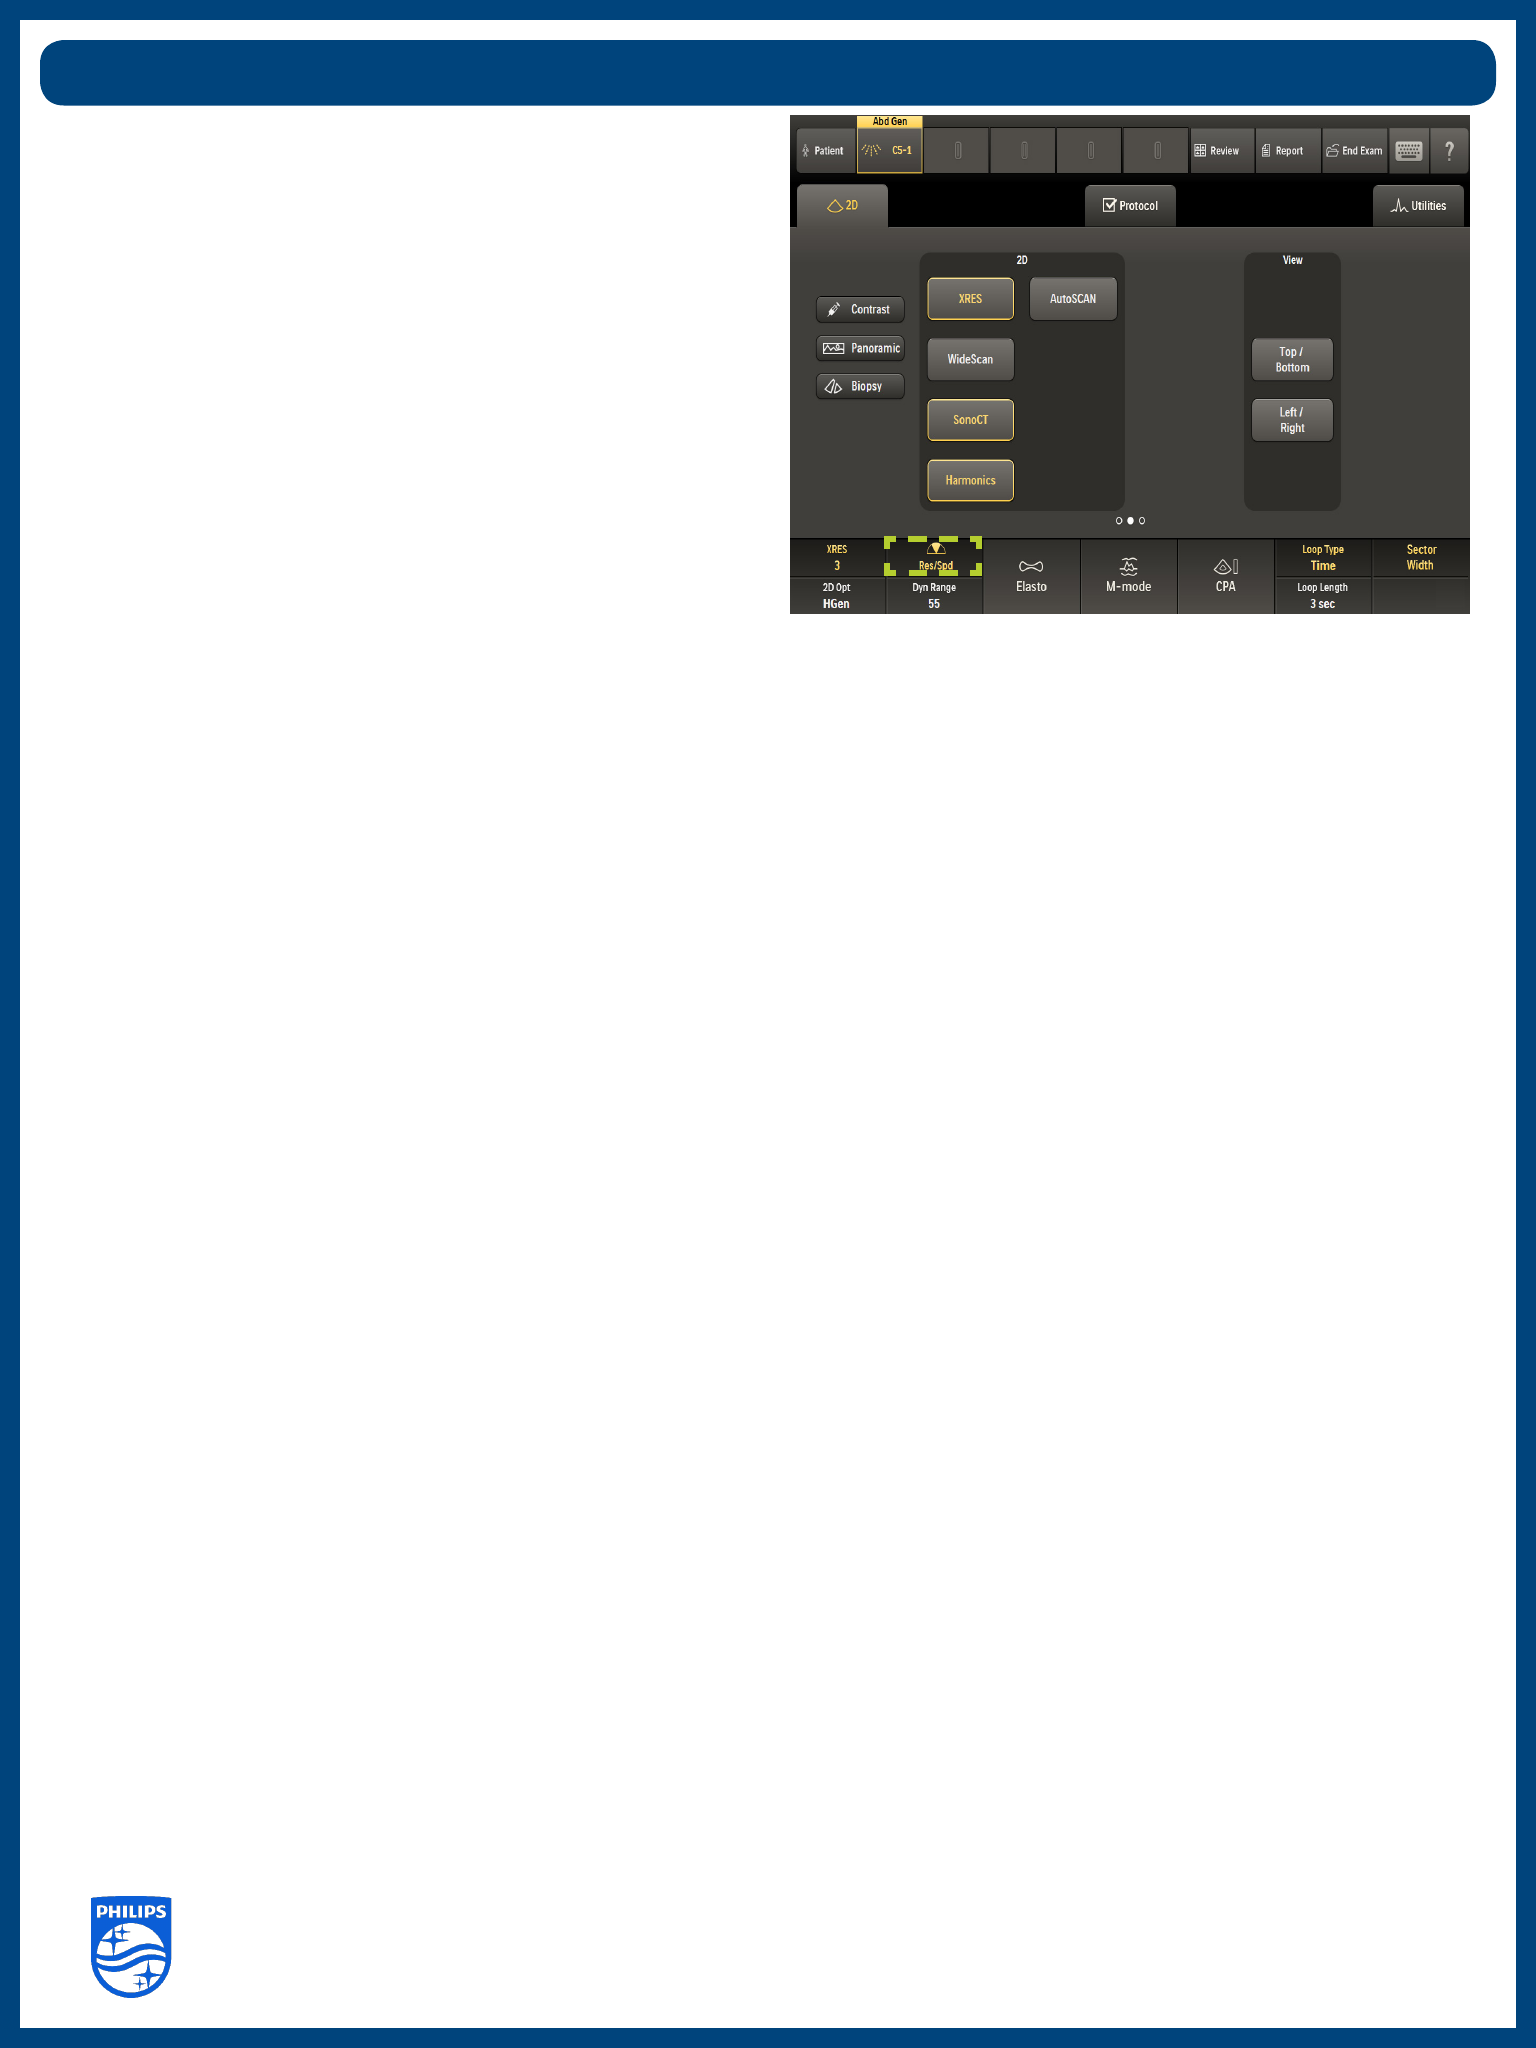
Dynamic Range
Press the rotary knob on the system control panel to switch
between Dynamic Range and DRS modes. When acvated, Dyn
Range is highlighted on the touchscreen.
Dynamic Range is the default opmizaon seng for imaging in
2D Opt, allowing for adjustments, adjusng up for more shades
of gray and down for fewer shades of gray.
Access Gray Map on the third page of the 2D touchscreen. To
change the Gray Map level, turn the rst rotary knob.
The Gray Map level also appears at the top of the grayscale bar
on the monitor screen.
EPIQ Evoluon 2.0 I.Q. Technology | 2D Imaging 2016/05/11
Philips Ultrasound
www.healthcare.philips.com/ultrasound
22100 Bothell-Evere Highway
Bothell, WA 98021-8431, USA
© Koninklijke Philips N.V. 2016. All rights are reserved. Printed in the USA.
Reproducon or transmission in whole or in part, in any form or by any means, electronic,
mechanical, or otherwise, is prohibited without the prior wrien consent of the copyright owner.
• DRS is a macro control that adjusts mulple parameters
simultaneously to opmize funcons such as:
– Line density
– Persistence
– Number of lines of sight (SonoCT)
• R1 is opmized for maximum image quality.
• RS provides the best overall choice of system sengs.
• S1 is opmized to improve speed.
Dynamic Resoluon System (DRS)
Note
Some system sengs, such as Persistence and SonoCT steering
angles, aect temporal response but not frame rate, therefore
frame rate (FR) annotaon may not change when adjusng DRS
to speed.
DRS provides one-buon temporal vs. spaal resoluon in 2D
and 3D modes.
