Philips Medical Alarms Mp20 30 Users Manual M80009001g
MP4050 to the manual a94b446f-887f-43c6-9d86-b6d5fa019865
2015-02-05
: Philips Philips-Philips-Medical-Alarms-Mp20-30-Users-Manual-382795 philips-philips-medical-alarms-mp20-30-users-manual-382795 philips pdf
Open the PDF directly: View PDF ![]() .
.
Page Count: 414 [warning: Documents this large are best viewed by clicking the View PDF Link!]
- Basic Operation
- What’s New?
- Alarms
- Patient Alarms and INOPs
- Managing Patients
- ECG, Arrhythmia, and ST Monitoring
- Monitoring Pulse Rate
- Monitoring Respiration Rate (Resp)
- Monitoring SpO2
- Monitoring NBP
- Monitoring Temperature
- Monitoring Invasive Pressure
- Monitoring Cardiac Output
- Monitoring Carbon Dioxide
- Monitoring Airway Flow, Volume and Pressure
- Monitoring tcGas
- Monitoring SvO2
- Monitoring EEG
- Monitoring BIS
- Trends
- Calculations
- High Resolution Trend Waves
- Event Surveillance
- Recording
- Printing Patient Reports
- Using the Drug Calculator
- VueLink Modules
- Using Timers
- Respiratory Loops
- Care and Cleaning
- Using the Batteries
- Maintenance and Troubleshooting
- Accessories
- Installation and Specifications
- Default Settings Appendix
- M8000-9001g_cover.pdf
Patient Monitoring
INSTRUCTIONS FOR USE
IntelliVue MP20/30, MP40/50 and MP60/70/80/90
IntelliVue Patient Monitor
MP20/30, MP40/50, MP60/70/80/90
Release D.0 with Software Revision D.00.xx

Part Number M8000-9001G
Printed in Germany 02/06
4512 610 13551
*M8000-9001G*

i
1Table Of Contents
M8000-9001G
1Basic Operation 1
Introducing the IntelliVue Family 1
IntelliVue MP20/MP30 2
MP20/MP30 Major Parts and Keys 3
IntelliVue MP40/MP50 4
MP40/MP50 Major Parts and Keys 4
IntelliVue MP60/MP70 5
MP60/MP70 Major Parts and Keys 6
IntelliVue MP80/MP90 6
MP80/MP90 Major Parts and Keys 7
D80 Intelligent Display 7
Remote Alarm Device 7
Docking Station 8
Related Products 8
Flexible Module Server (M8048A) 8
Measurement Modules 9
Multi-Measurement Server (M3001A) 10
Measurement Server Extensions 11
M3014A, M3015A and M3016A Capnography Extensions 12
M3012A Hemodynamic Measurement Server Extension 13
Operating and Navigating 14
Selecting Screen Elements 15
Using the Setup Menu 15
Using the Touchscreen 15
Disabling Touchscreen Operation 15
Using the SpeedPoint 16
Using the Navigation Point 17
Using a Mouse or Trackball 17
Using Keys 17
Permanent Keys 17
SmartKeys 18
Hardkeys 19
Pop-Up Keys 19
Using the On-Screen Keyboard 20
Using the On-Screen Calculator 20
Operating Modes 21
Standby Mode 21
Understanding Screens 22
Switching to a Different Screen 22
Changing a Screen’s Content 22
Using Additional Displays 23
Using the Visitor Screen 24

ii
Understanding Profiles 24
Swapping a Complete Profile 25
Swapping a Settings Block 26
Default Profile 26
Locked Profiles 26
Understanding Settings 26
Changing Measurement Settings 26
Switching a Measurement On and Off 27
Switching Numerics On and Off 27
Adjusting a Measurement Wave 27
Changing Wave Speeds 27
Changing the Wave Group Speed 27
Changing Wave Speed for a Channel 28
Freezing Waves 28
Freezing An Individual Wave 28
Freezing All Waves 28
Measuring Frozen Waves 28
Changing The Wave Speed 29
Updating The Frozen Wave 29
Releasing Frozen Waves 29
Using Labels 29
About Label Sets 29
Changing Measurement Labels (e.g. Pressure) 29
Resolving Label Conflicts 30
Changing Monitor Settings 31
Adjusting the Screen Brightness 31
Adjusting Touch Tone Volume 31
Setting the Date and Time 31
Checking Your Monitor Revision 32
Getting Started 32
Inspecting the Monitor 32
Switching On 32
Setting up the Measurement Servers and Modules 32
Starting Monitoring 33
Disconnecting from Power 33
Monitoring After a Power Failure 33
Networked Monitoring 33
Using Remote Applications 33
Remote Application Popup Keys 34
2What’s New? 35
What’s New in Release D.0? 35
What’s New in Release C.0? 36
What’s New in Release B.1? 37
What’s New in Release B.0? 38
What’s New in Release A.2? 39

iii
3Alarms 41
Visual Alarm Indicators 42
Audible Alarm Indicators 42
Alarm Tone Configuration 42
Traditional Audible Alarms (HP/Agilent/Philips/Carenet) 43
ISO/IEC Standard 9703-2 Audible Alarms 43
Changing the Alarm Tone Volume 43
Minimum Volume for No Central Monitoring INOP 43
Acknowledging Alarms 44
Acknowledging Disconnect INOPs 44
Alarm Reminder (ReAlarm) 44
Pausing or Switching Off Alarms 44
To Pause All Alarms 45
To Switch All Alarms Off 45
To Switch Individual Measurement Alarms On or Off 45
While Alarms are Paused or Off 45
Restarting Paused Alarms 46
Resetting Arrhythmia Alarm Timeouts 46
Extending the Alarm Pause Time 46
Alarm Limits 46
Viewing Individual Alarm Limits 46
Viewing All Alarm Limits 47
Changing Alarm Limits 48
About Automatic Alarm Limits (AutoLimits) 49
Documenting Alarm Limits 49
Reviewing Alarms 50
Alarm Messages Window 50
Review Alarms Window 50
Understanding Alarm Messages 51
Latching Alarms 51
Viewing the Alarm Latching Settings 51
Alarm Latching Behavior 52
Testing Alarms 52
Alarm Behavior at On/Off 52
4Patient Alarms and INOPs 53
Patient Alarm Messages 53
Technical Alarm Messages (INOPs) 59
5Managing Patients 77
Admitting a Patient 77
Patient Category and Paced Status 78
Admitting a Centrally-Monitored Patient 78
Quick Admitting a Patient 78
Editing Patient Information 79

iv
Discharging a Patient 79
Transferring Patients 80
Transferring a Centrally-Monitored Patient 80
Transferring a Patient with an MMS (no Central Station) 81
Data Upload from an MMS 81
Data Exchange Between Information Centers 82
Resolving Patient Information Mismatch 82
Manually Resolving Patient Mismatch 82
Patient Mismatch - If One Set of Patient Data is Correct 83
Patient Mismatch - If Neither Patient Data Set is Correct 83
Patient Mismatch - If Both Patient Data Sets Are Correct 84
Automatically Resolving Patient Mismatch 84
Care Groups 84
Understanding the Care Group Overview Bar 85
Viewing the My Care Group Window 86
Viewing the Other Bed Window 87
Other Bed Pop-Up Keys 88
Visual Alarm Status Information in the Other Bed Window 88
Care Group Alarms 88
Telemetry Data Overview 89
Unpairing a Telemetry Device 89
Telemetry Data Overview Screen Element 90
Silencing Telemetry Alarms from the Bedside 90
Suspending Telemetry Alarms 90
Using Standby 90
6ECG, Arrhythmia, and ST Monitoring 91
Skin Preparation for Electrode Placement 91
Connecting ECG Cables 91
Selecting the Primary and Secondary ECG Leads 92
Checking Paced Status 92
Understanding the ECG Display 93
Monitoring Paced Patients 93
Setting the Paced Status (Pace Pulse Rejection) 94
Avoiding Pace Pulse Repolarization Tails 94
Changing the Size of the ECG Wave 94
To Change the Size of an Individual ECG Wave 94
To Change the Size of all the ECG Waves 95
Changing the Volume of the QRS Tone 95
Changing the ECG Filter Settings 95
Choosing EASI or Standard Lead Placement 96
About ECG Leads 96
ECG Leads Monitored 96
Changing Lead Sets 96
ECG Lead Fallback 97
ECG Lead Placements 97

v
Standard 3-Lead Placement 98
Standard 5-Lead Placement 98
Chest Electrode Placement 99
10-Lead Placement 100
Conventional 12-Lead ECG 100
Modified 12-Lead ECG 101
Choosing Standard or Modified Electrode Placement 101
Labelling 12-Lead ECG Reports 101
Capture 12-Lead 102
EASI ECG Lead Placement 102
ECG, Arrhythmia, and ST Alarm Overview 104
Using ECG Alarms 105
Extreme Alarm Limits 105
ECG Alarms Off Disabled 105
HR Alarms When Arrhythmia Analysis is Switched Off 105
HR Alarms When Arrhythmia Analysis is Switched On 105
ECG Safety Information 105
About Arrhythmia Monitoring 107
Arrhythmia Options 107
Where Can I Find More Information? 107
Switching Arrhythmia Analysis On and Off 108
Choosing an ECG Lead for Arrhythmia Monitoring 108
Aberrantly-Conducted Beats 108
Atrial Fibrillation and Flutter 108
Intermittent Bundle Branch Block 109
Understanding the Arrhythmia Display 109
Viewing Arrhythmia Waves 109
Arrhythmia Beat Labels 109
Arrhythmia Status Messages 110
Rhythm Status Messages 110
Ectopic Status Messages 111
Arrhythmia Relearning 111
Initiating Arrhythmia Relearning Manually 111
Automatic Arrhythmia Relearn 112
Arrhythmia Relearn and Lead Fallback 112
Arrhythmia Alarms 112
Yellow Arrhythmia Alarms 113
Arrhythmia Alarms and Latching 113
Switching Individual Arrhythmia Alarms On and Off 113
Switching All Yellow Arrhythmia Alarms On or Off 113
Adjusting the Arrhythmia Alarm Limits 113
Arrhythmia Alarm Timeout Periods 113
What is a Timeout Period? 114
Resetting the Timeout Period 114
How are Yellow Arrhythmia Alarms Indicated? 114
Behavior of Unsilenced Arrhythmia Alarms 114

vi
Behavior of Silenced Arrhythmia Alarms 114
Arrhythmia Alarm Chaining 115
Understanding PVC-Related Alarms 116
About ST Monitoring 117
Switching ST On and Off 117
Selecting ST Leads for Analysis 117
Understanding the ST Display 118
Updating ST Baseline Snippets 119
Recording ST Segments 119
About the ST Measurement Points 120
Adjusting ST Measurement Points 120
ST Alarms 122
Single- or Multi-lead ST Alarming 122
Changing ST Alarm Limits 122
Viewing ST Maps 122
Current View 122
Tre n d Vi e w 123
Viewing an ST Map 124
Working in the ST Map Task Window 124
Switching Between ST Map Views 124
Displaying an ST Reference Baseline 125
Updating an ST Map Reference Baseline 125
Changing the Scale of the ST Map 125
Changing the Trending Interval 125
Printing an ST Map Report 125
7Monitoring Pulse Rate 127
Entering the Setup Pulse Menu 127
System Pulse Source 127
Switching Pulse On and Off 128
Using Pulse Alarms 128
Selecting the Active Alarm Source: HR or Pulse? 128
Alarm Source Selection Disabled 129
Changing HR/Pulse Alarm Limits 129
Extreme Alarm Limits 129
QRS Tone 129
8Monitoring Respiration Rate (Resp) 131
Lead Placement for Monitoring Resp 131
Optimizing Lead Placement for Resp 131
Cardiac Overlay 131
Lateral Chest Expansion 132
Abdominal Breathing 132
Understanding the Resp Display 132
Changing Resp Detection Modes 132
Auto Detection Mode 132

vii
Manual Detection Mode 133
Resp Detection Modes and Cardiac Overlay 133
Changing the Size of the Respiration Wave 133
Changing the Speed of the Respiration Wave 134
Using Resp Alarms 134
Changing the Apnea Alarm Delay 134
Resp Safety Information 134
9Monitoring SpO2137
SpO2 Sensors 137
Applying the Sensor 137
Connecting SpO2 Cables 138
Measuring SpO2138
Assessing a Suspicious SpO2 Reading 139
Understanding SpO2 Alarms 140
Alarm Delays 140
Adjusting the Alarm Limits 140
Adjusting the Desat Limit Alarm 140
Pleth Wave 140
Perfusion (Pleth) Indicator 141
Setting SpO2/Pleth as Pulse Source 141
Setting Up Tone Modulation 141
Setting the QRS Volume 141
Calculating SpO2 Difference 141
10 Monitoring NBP 143
Introducing the Oscillometric NBP Measurement 143
Measurement Limitations 144
Measurement Methods 144
Reference Method 144
Preparing to Measure NBP 144
Correcting the Measurement if Limb is not at Heart Level 145
Understanding the NBP Numerics 145
Starting and Stopping Measurements 146
Enabling Automatic Mode and Setting Repetition Time 146
Choosing the NBP Alarm Source 147
Assisting Venous Puncture 147
Calibrating NBP 147
11 Monitoring Temperature 149
Making a Temp Measurement 149
Selecting a Temperature for Monitoring 149
Extended Temperature Label Set 150
Calculating Temp Difference 150

viii
12 Monitoring Invasive Pressure 151
Setting up the Pressure Measurement 151
Selecting a Pressure for Monitoring 152
Extended Pressure Label Set 152
Zeroing the Pressure Transducer 152
Zeroing ICP (or IC1/IC2) 153
Determining a Pressure’s Most Recent Zero 153
Zeroing a Pressure Measurement 153
Using the Zero Hardkey 153
Zeroing All Pressures Simultaneously 153
Troubleshooting the Zero 154
Adjusting the Calibration Factor 154
Displaying a Mean Pressure Value Only 154
Changing the Pressure Wave Scale 154
Optimizing the Waveform 155
Non-Physiological Artifact Suppression 155
Choosing the Pressure Alarm Source 155
Calibrating Reusable Transducer CPJ840J6 156
Making the Pressure Calibration 156
Troubleshooting the Pressure Calibration 157
Calculating Cerebral Perfusion 157
Calculating Pulse Pressure Variation 157
Measuring Pulmonary Artery Wedge Pressure 158
Editing the Wedge 159
Identifying the Pressure Analog Output Connector 160
13 Monitoring Cardiac Output 161
Hemodynamic Parameters 162
Using the C.O. Procedure Window 163
Accessing the Setup C.O. and Setup CCO Menus 164
Entering the HemoCalc Window 164
Measuring C. O. Using the PiCCO Method 164
Measuring Continuous Cardiac Output 164
Measuring Systemic Vascular Resistance 164
Setting Up the PiCCO C.O. Measurement 165
Performing PiCCO C.O. Measurements 166
Editing PiCCO C.O. Measurements 166
Saving and Calibrating PiCCO C.O. Measurements 167
CCO Calibration Status Indicators 167
Measuring C.O. Using the Right Heart Thermodilution Method 168
Setting up RH C.O. Measurements 168
Ice-Bath Setup for RH Thermodilution C.O. Measurements 168
Setting the Computation Constant 169
Performing RH C.O. Measurements 169
Editing and Saving RH C.O. Measurements 169

ix
Documenting C.O. Measurements 169
C.O. Injectate Guidelines 170
Guidelines for Right Heart Thermodilution C.O. Injectate 170
Guidelines for PiCCO C.O. Injectate 170
Injectate Volume, Patient Weight and ETVI Values (PiCCO Only) 170
C.O./CCO Curve Alert Messages 171
C.O./CCO Prompt Messages 172
C.O./CCO Warning Messages 173
C.O./CCO Safety Information 173
14 Monitoring Carbon Dioxide 175
Using the Capnography Extension (M3014A) 176
Preparing to Measure Mainstream CO2176
Preparing to Measure Sidestream CO2177
Using the Sidestream Sensor Holder 178
Removing Exhaust Gases from the System 179
Using the Mainstream CO2 Extension (M3016A) 179
Preparing to Measure Mainstream CO2179
Checking Transducer Accuracy 179
Calibrating the Transducer 180
Attaching and Removing the CO2 Tra n s d u c e r 180
Using the Microstream CO2 Extension (M3015A) 181
Preparing to Measure Microstream CO2 181
Using Microstream Accessories 181
Using the FilterLine and Airway Adapter 182
Removing Exhaust Gases from the System 182
Suppressing Zero Calibration 183
Setting up Mainstream and Sidestream CO2183
Adjusting the CO2 Wave Scale 183
Setting up CO2 Corrections 183
Suppressing Sampling (not Mainstream CO2)184
Changing CO2 Alarms 184
Changing the Apnea Alarm Delay 184
Deriving Alarms From awRR 184
Changing awRR Alarm Limits 184
15 Monitoring Airway Flow, Volume and Pressure 187
Attaching the Flow Sensor 188
Zero Calibration 190
Automatic Purging 190
Adult Mode 191
Neonatal and Pediatric Modes 191
Manual Purging 191
Gas Compensation 191
Setting up Spirometry 192
Optimizing Scale Settings 192

x
Spirometry Values Window 192
Alarms and Alarm Limits 192
Changing the Apnea Alarm Delay 192
Automatic Alarm Suppression 193
Choosing Measured AWV Components 193
Setting the Gas Compensation Mode 193
Changing the Type of Balance Gas 193
Changing the Concentration of Inspired O2 and the Inspired Agents 193
Changing the Temperature of the Inspired Gas 194
16 Monitoring tcGas 195
Identifying tcGas Module Components 195
Setting the tcGas Sensor Temperature 196
Using the tcGas Site Timer 196
Setting the tcGas Site Timer 196
Restarting the tcGas SiteTimer 197
Disabling the tcGas Site Timer 197
Setting the tcGas Barometric Pressure 197
Remembraning the tcGas Transducer 197
New/Dried Out Transducers 198
Storing tcGas Transducers 198
Calibrating the tcGas Transducer 199
Calibration Failure 200
Troubleshooting tcGas Calibration 200
Applying the tcGas Transducer 201
Selecting the tcGas HeatPowerDisplay Mode 202
Zeroing the tcGas Relative Heat Power 202
Finishing tcGas Monitoring 202
TcGas Corrections 202
Temperature Correction for tcpCO2202
Metabolism Correction for tcpCO2202
17 Monitoring SvO2203
Preparing to Monitor SvO2204
Carrying out a Pre-insertion Calibration 204
Inserting the Catheter 205
Performing a Light Intensity Calibration 205
Performing In-Vivo Calibration 206
Setting Up the In-Vivo Calibration 206
Making the In-Vivo Calibration 206
Calculating Oxygen Extraction 206
18 Monitoring EEG 207
EEG Monitoring Setup 208
Using the EEG Impedance/Montage Window 208
Choosing an EEG Electrode Montage 209

xi
Changing the Impedance Limit 209
About Electrode-to-Skin Impedance 210
Impedance Indicators 210
About Compressed Spectral Arrays (CSA) 211
Changing CSA Settings 212
Changing EEG Settings 212
Switching EEG Numerics On and Off 212
Changing the Scale of the EEG Waves for Display 212
Changing Filter Frequencies 213
Changing the Speed of the EEG Wave 213
EEG Reports 213
EEG Safety Information 214
EEG and Electrical Interference 214
19 Monitoring BIS 215
BIS Monitoring Setup 216
Monitoring BIS Using the DSC and BIS Engine 216
Monitoring BIS using the BISx 217
Manufacturer’s Information 218
BIS Continuous Impedance Check 218
BIS Cyclic Impedance Check 218
Starting a Cyclic Impedance Check 218
Stopping a Cyclic Impedance Check 218
BIS Window 219
BIS Impedance Indicators 219
Changing the BIS Smoothing Rate 220
Switching BIS and Individual Numerics On and Off 220
Changing the Scale of the EEG Wave 220
Switching BIS Filters On or Off 220
BIS Safety Information 221
20 Trends 223
Viewing Trends 223
Viewing Graphic Trends 224
Viewing Vital Signs Trends 224
Tre n d s Pop - Up K e y s 225
Setting Up Trends 225
Making Segment Settings 226
Expanded View 226
Trend Scales for Segment Measurements 226
Optimum Scale 226
Tr e n d Gr o u p 2 2 6
No. of Segments 226
Tre n d Gro u p s 227
Tre n d In te r v a l 227
Tre n d Pri or i t y 227

xii
Trend Parameter Scales 227
Graphical Trend Presentation 228
Documenting Trends 228
Trends Databases 229
Aperiodic Trends Database 229
Trending Multiple-Value Measurements 229
Screen Trends 229
Setting the Screen Trend Time 230
Changing the Selection of Screen Trends Displayed 231
Activating the Cursor for Screen Trends 231
Changing the Screen Trend View 231
Tabular View 231
Horizon View 232
Setting the Horizon 232
Setting the Horizon Trend Scale 232
21 Calculations 233
Viewing Calculations 233
Calculations Windows 234
Calculations Pop-Up Keys 234
Reviewing Calculations 235
Performing Calculations 235
Entering Values for Calculations 236
Automatic Value Substitution 236
Automatic Unit Conversion 236
Manual Unit Conversion 236
BSA Formula 236
Documenting Calculations 237
22 High Resolution Trend Waves 239
Changing the Hi-Res Trend Waves Displayed 239
Hi-Res Trend Wave Scales 239
Hi-Res Trend Waves and OxyCRG 239
Printing Hi-Res Trend Wave Reports 240
Hi-Res Trend Wave Recordings 240
23 Event Surveillance 241
Levels of Event Surveillance 241
Event Groups 242
Event Episodes 242
Events Pop-Up Keys 243
Event Triggers 244
Event Retriggering 245
Event Notification 245
Setting Triggers for NER and Basic Event Surveillance 245
Setting Triggers and Notification for Advanced Event Surveillance 246

xiii
Triggering Events Manually 246
The Events Database 247
Viewing Events 247
Event Counter 247
Counting Combi-Events 248
Counting Neonatal Event Review (NER) Events 248
Event Summary Window 249
Event Review Window 249
Event Episode Window 250
Annotating Events 251
Documenting Events 251
Documenting Event Review 251
Documenting an Event Episode 252
Event Recordings 252
Event Review Recordings 252
Event Episode Recordings 253
Event Reports 253
Event Review Reports 254
Event Episode Reports 255
Event Summary Reports 255
24 Recording 257
Starting and Stopping Recordings 258
Quickstarting Recordings 258
Extending Recordings 259
Stopping Recordings 259
Recording Without a Template 259
Overview of Recording Types 259
All ECG Waves Recordings 260
Creating and Changing Recordings Templates 260
Changing ECG Wave Gain 261
Recording Priorities 262
Sample Recording Strip 262
Recording Strip Code 262
Recorded Waveforms 263
Maintaining Recording Strips 263
Reloading Paper 264
Recorder Status Messages 265
25 Printing Patient Reports 267
Starting Reports Printouts 267
Stopping Reports Printouts 268
Setting Up Reports 268
Setting Up ECG Reports 268
Setting Up Vital Signs and Graphic Trend Reports 269
Setting Up Auto Reports 269

xiv
Setting Up Individual Print Jobs 270
Checking Printer Settings 270
Printing a Test Report 271
Switching Printers On Or Off for Reports 271
Dashed Lines on Reports 271
Unavailable Printer: Re-routing Reports 271
Printer Status Messages 272
Sample Report Printouts 272
Alarm Limits Report 273
Realtime Report 274
Cardiac Output Report 275
ECG Reports 276
Other Reports 276
26 Using the Drug Calculator 277
Accessing the Drug Calculator 277
Performing Drug Calculations 278
About the Rule of Six 278
Performing Calculations for a Non-Specific Drug 278
Performing Calculations for a Specific Drug 279
Charting Infusion Progress 280
Using the Titration Table 280
Documenting Drug Calculations 280
27 VueLink Modules 281
Connecting an External Device 282
Changing VueLink Waves and Numerics Displayed 282
Viewing the VueLink Device Data Window 282
Using VueLink Screens 283
Switching VueLink On and Off 283
Alarms/INOPs From External Devices 283
Language Conflict with External Device Drivers 284
28 Using Timers 285
Viewing Timers 285
Notification 285
Timer Types 286
Timer Setup Pop-up Keys 286
Setting Up Timers 286
Timer Label 286
Run Time 287
Timer Counting Direction 287
Displaying Timers On The Main Screen 287
Main Screen Timer Pop-up Keys 288
Displaying A Clock On The Main Screen 288

xv
29 Respiratory Loops 289
Viewing Loops 289
Capturing and Deleting Loops 290
Showing/Hiding Loops 290
Changing Loops Display Size 291
Using the Loops Cursor 291
Changing Loops Type 291
Setting Up Source Device 291
Documenting Loops 292
30 Care and Cleaning 293
General Points 293
Cleaning 294
Disinfecting 294
Cleaning Monitoring Accessories 294
Sterilizing 295
Cleaning the Recorder Printhead (M1116B only) 295
Cleaning the Batteries and Battery Compartment 295
31 Using the Batteries 297
Battery Power Indicators 298
Battery LED 298
Battery Status on the Main Screen 298
Battery Status Window 300
Viewing Individual Battery Status 300
Recording Battery Status 300
Printing Battery Reports 300
Checking Battery Charge 300
Replacing Batteries 301
Optimizing Battery Performance 301
Display Brightness Setting 302
Charging Batteries 302
Conditioning Batteries 302
Unequally-Charged Batteries 302
Battery Safety Information 303
32 Maintenance and Troubleshooting 305
Inspecting the Equipment and Accessories 305
Inspecting the Cables and Cords 305
Maintenance Task and Test Schedule 306
Troubleshooting 307
Disposing of the Monitor 307
Disposing of Empty Calibration Gas Cylinders 307

xvi
33 Accessories 309
ECG/Resp Accessories 309
Tr u n k C a b l e s 309
3-Electrode Cable Sets 309
5-Electrode Cable Sets 310
10-Electrode Cable Sets 310
3-Electrode One Piece Cables 310
5-Electrode One Piece Cables 310
Set Combiners and Organizers 311
NBP Accessories 311
Adult/Pediatric Multi-Patient Comfort Cuffs and Disposable Cuffs 311
Reusable Cuff Kits 311
Adult/Pediatric Antimicrobial Coated Reusable cuffs 312
Adult/Pediatric Soft Single Patient Single-Hose Disposable Cuffs 312
Neonatal/Infant Cuffs (Disposable, non-sterile) 312
Invasive Pressure Accessories 313
SpO2 Accessories 313
Temperature Accessories 318
Cardiac Output (C.O.) Accessories 319
Mainstream CO2 Accessories (for M3014A) 320
Sidestream CO2 Accessories (for M3014A) 320
Mainstream CO2 Accessories (for M3016A) 320
Microstream CO2 Accessories 321
Spirometry Accessories 321
tcGas Accessories 322
EEG Accessories 322
BIS Accessories 322
BIS Sensors 323
Other BIS Accessories 323
SvO2 Accessories 323
Recorder Accessories 324
34 Installation and Specifications 325
Intended Use 325
Indication for Use 325
Manufacturer’s Information 326
BIS Manufacturer’s Information 326
Trademark Acknowledgement 327
Symbols 328
Installation Safety Information 329
Connectors 329
MP20/MP30 330
MP40/MP50 331
MP60/MP70 332
MP80/MP90 334

xvii
802.11 Bedside Adapter (Wireless Network Adapter) 335
Altitude Setting 336
Monitor Safety Specifications 336
Physical Specifications 337
Environmental Specifications 339
M4605A Battery Specifications 341
Monitor Performance Specifications 342
Measurement Specifications 348
ECG/Arrhythmia/ST 348
Respiration 350
SpO2350
NBP 352
Invasive Pressure and Pulse 354
Temp 355
CO2356
Interfering Gas and Vapor Effects On CO2 Measurement Values 359
Spirometry 359
Cardiac Output / Continuous Cardiac Output 361
tcGas 362
SvO2363
EEG 363
BIS 364
Safety and Performance Tests 365
Electromagnetic Compatibility (EMC) Specifications 365
Accessories Compliant with EMC Standards 365
Electromagnetic Emissions 365
Avoiding Electromagnetic Interference (Resp and BIS) 365
Electromagnetic Immunity 366
Recommended Separation Distance 366
Recommended separation distances from portable and mobile RF communication equipment367
Electrosurgery Interference/Defibrillation/Electrostatic Discharge 368
Fast Transients/Bursts 368
Restart time 368
35 Default Settings Appendix 369
Alarm Default Settings 370
ECG, Arrhythmia, and ST Default Settings 370
Pulse Default Settings 373
Respiration Default Settings 374
SpO2 Default Settings 374
NBP Default Settings 375
Temperature Default Settings 375
Invasive Pressure Default Settings 376
Cardiac Output Default Settings 377
CO2 Default Settings 378
Spirometry Default Settings 378


1
1
1Basic Operation
These Instructions for Use are for clinical professionals using the IntelliVue MP20/MP30 (M8001A/
M8002A), MP40/50 (M8003A/M8004A) and MP60/70/80/90 (M8005A/M8007A/M8008A/
M8010A) patient monitors. Unless otherwise specified, the information here is valid for all the above
IntelliVue patient monitors.
The basic operation section gives you an overview of the monitor and its functions. It tells you how to
perform tasks that are common to all measurements (such as entering data, switching a measurement
on and off, setting up and adjusting wave speeds, working with profiles). The alarms section gives an
overview of alarms. The remaining sections tell you how to perform individual measurements, and how
to care for and maintain the equipment.
Familiarize yourself with all instructions including warnings and cautions before starting to monitor
patients. Read and keep the Instructions for Use that come with any accessories, as these contain
important information about care and cleaning that is not repeated here.
This guide describes all features and options. Your monitor may not have all of them; they are not all
available in all geographies. Your monitor is highly configurable. What you see on the screen, how the
menus appear and so forth, depends on the way it has been tailored for your hospital and may not be
exactly as shown here.
In this guide:
•A warning alerts you to a potential serious outcome, adverse event or safety hazard. Failure to
observe a warning may result in death or serious injury to the user or patient.
•A caution alerts you to where special care is necessary for the safe and effective use of the product.
Failure to observe a caution may result in minor or moderate personal injury or damage to the
product or other property, and possibly in a remote risk of more serious injury.
•Monitor refers to the entire patient monitor. Display refers to the physical display unit. Display
Screen and Screen refer to everything you see on monitor’s display, such as measurements, alarms,
patient data and so forth.
Introducing the IntelliVue Family
The Philips IntelliVue family of patient monitors offers a monitoring solution optimized for the
surgical, cardiac, medical and neonatal care environments. Combining patient surveillance and data
management, it allows multi-measurement monitoring by linking separate modules with “plug-and-
play” convenience.
1 Basic Operation Introducing the IntelliVue Family
2
Your monitor stores data in trend, event, and calculation databases. You can see tabular trends (vital
signs) and document them on a local or remote printer. You can view measurement trend graphs, with
up to three measurements combined in each graph, to help you identify changes in the patient’s
physiological condition. You can view fast-changing measurement trends with beat to beat resolution
and see up to four high resolution trend segments. Event surveillance enhances documentation and
review of physiologically significant events by automatically detecting and storing up to 50 user-
defined clinical events over a 24 hour period.
There is a choice of monitor configurations, as explained below. All models can also use computer
devices such as a mouse, a trackball and a keyboard.
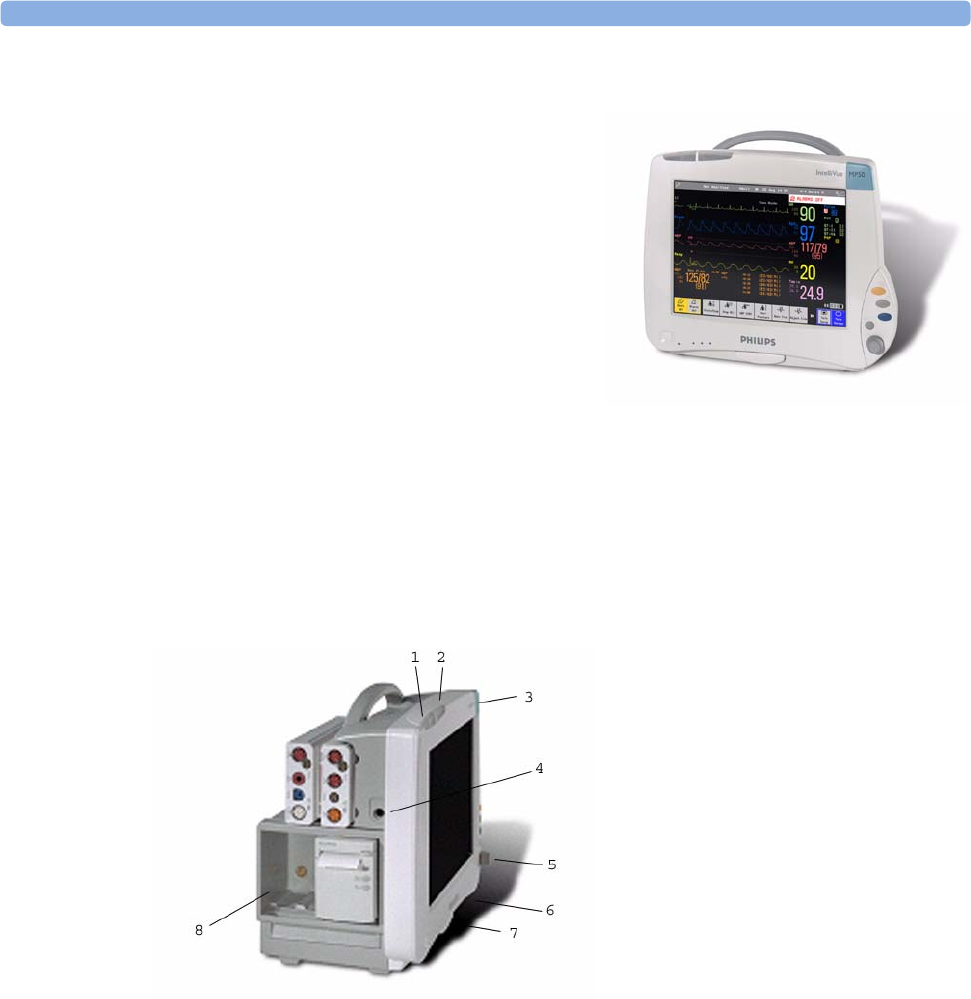
IntelliVue MP20/MP30
The IntelliVue MP20/MP30 (M8001A/M8002A)
patient monitor has a 10-inch TFT LCD flat panel
SVGA display. The standard input devices for the
MP30 are the Touchscreen and integrated navigation
point; the MP20 is supplied with an integrated
navigation point only. Up to six waves can be shown
on MP20/MP30 Screens (USA - up to four waves). 12
ECG traces can be shown on the 12-Lead ECG
Screen.
The MP20/MP30 can be connected to one Multi-
Measurement Server (MMS) and any one of the
measurement server extensions. There is an optional
built-in recorder. The Flexible Module Server
(M8048A) and all plug-in modules cannot be used
with the MP20/MP30. With an optional Interface
board Bispectral Index (BIS) monitoring is possible.
MP20Junior and MP20L are options of MP20
(M8001A) and are not referred to separately in these
Instructions for Use.
Introducing the IntelliVue Family 1 Basic Operation
3
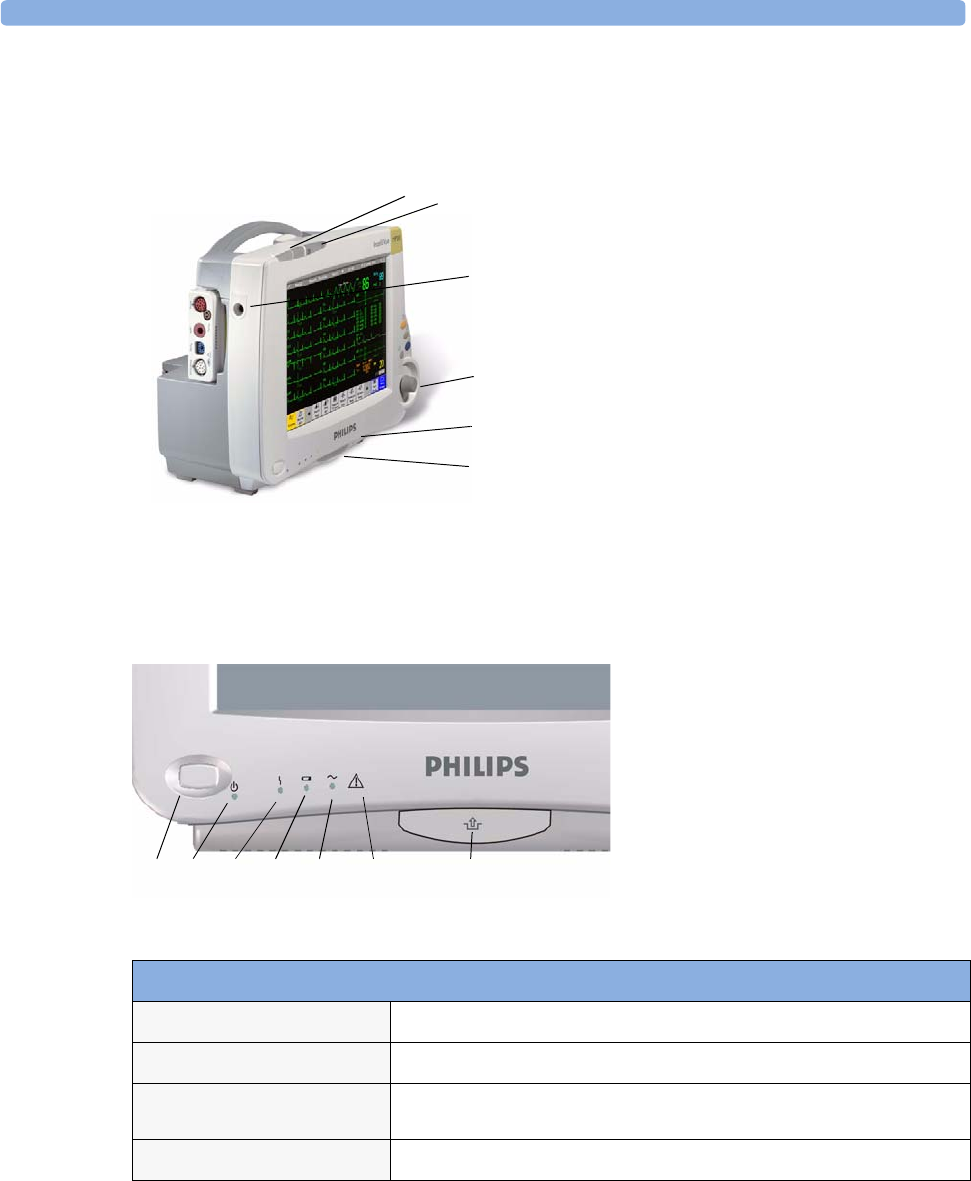
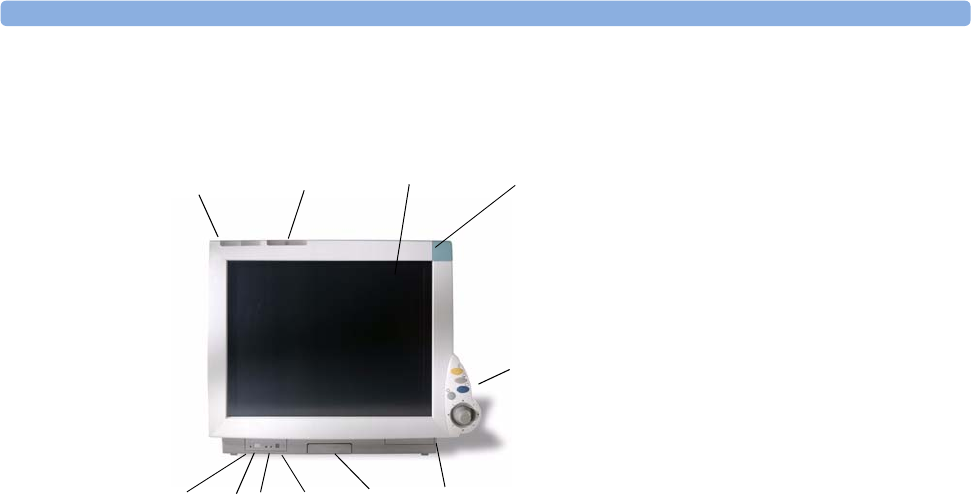
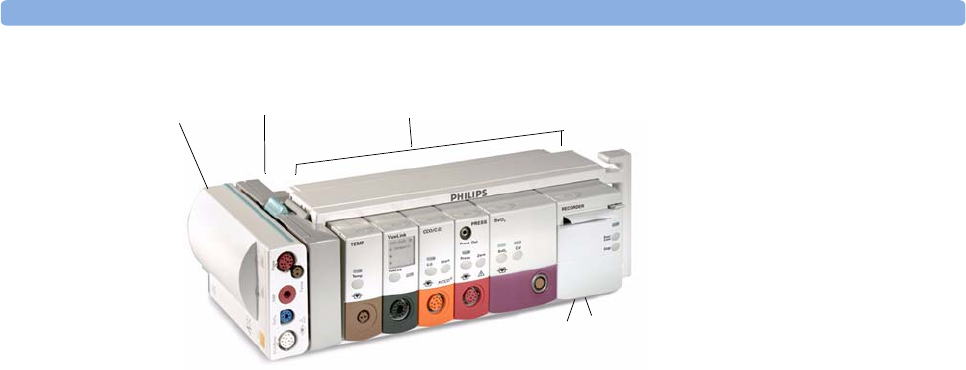
MP20/MP30 Major Parts and Keys
MP20/MP30 left side
1Color-coded alarm lamps
2Alarms off lamp
3Model indicator
4ECG out
5Navigation Point
6Part number and serial number
7Mounting quick-release lever
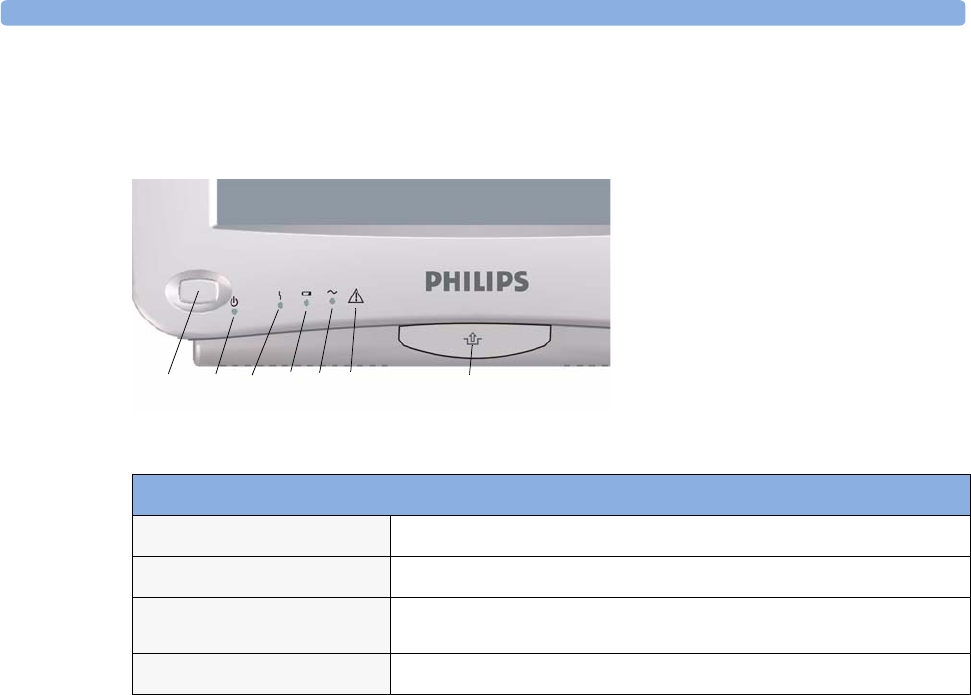
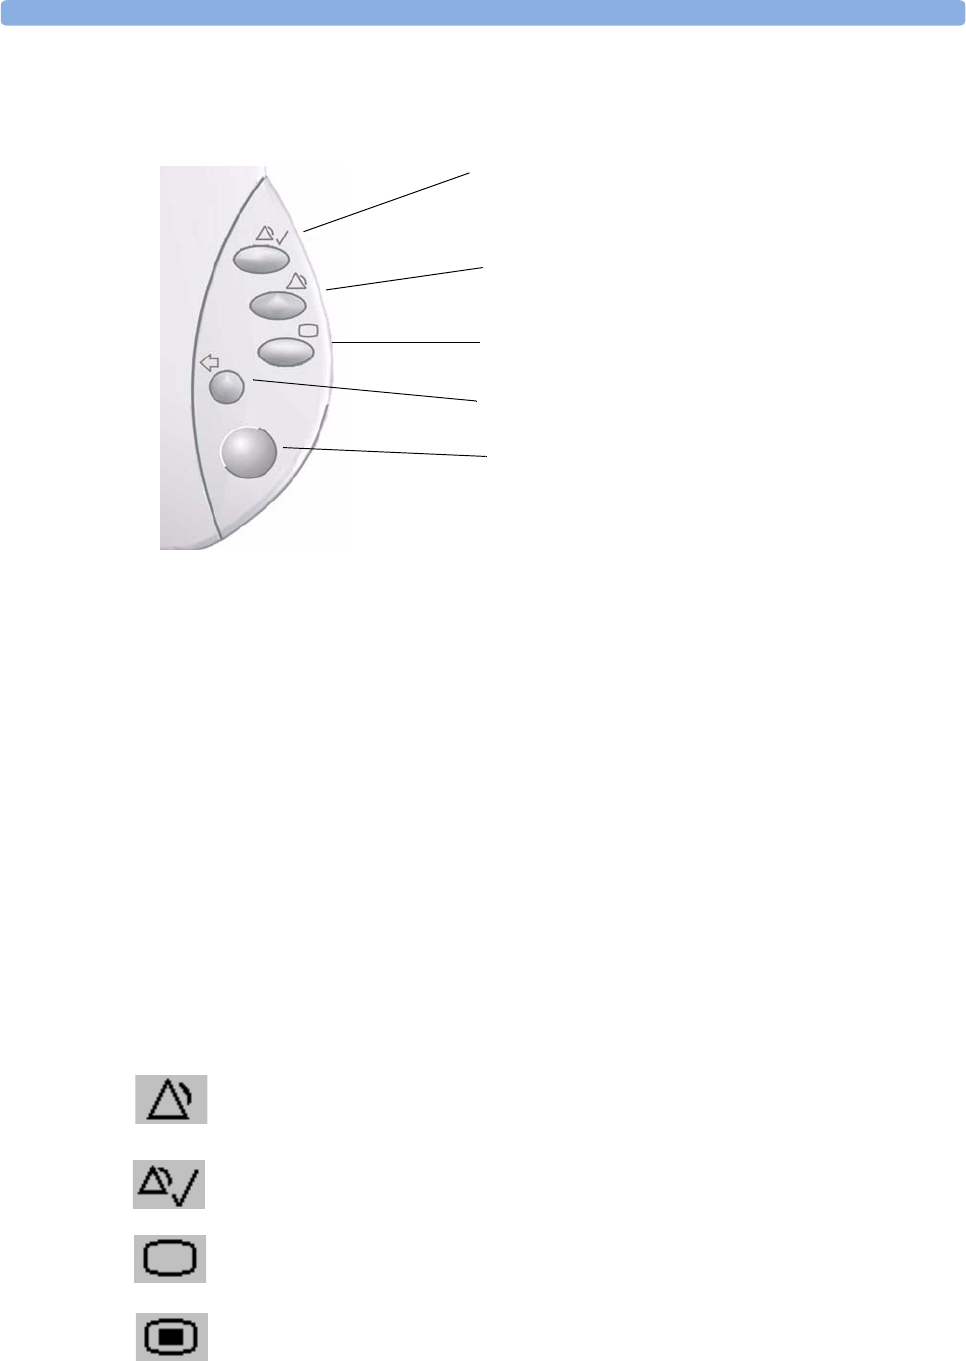
MP20/MP30 front panel
1On/Standby switch
2On/Standby LED
3Error LED
4Battery status LED
5AC power operation LED
6“read the documentation” symbol
7Mounting quick-release lever
MP20/MP30 LED Colors and their Meanings
On/Standby LED Green when monitor is switched on
Error LED Red if there is a problem with the monitor
Battery LED Green, yellow, and red.
See the section on Using the Batteries for details
AC Power LED Green while the monitor is connected to AC power (mains)
12
3
4
5
6
7
1
2
4
5
6
7
3
123 4 567
1 Basic Operation Introducing the IntelliVue Family
4
IntelliVue MP40/MP50
The IntelliVue MP40/MP50 (M8003A/M8004A)
patient monitor has a 12-inch TFT LCD flat panel
SVGA display. The standard input devices for the MP50
are the Touchscreen and integrated navigation point; the
MP40 is supplied with an integrated navigation point
only. Up to six waves can be shown on MP40/MP50
Screens, 12 ECG traces can be shown on the 12-Lead
ECG Screen.
The MP40/MP50 can be connected to one Multi-
Measurement Server (MMS) and any one of the
measurement server extensions. The IntelliVue family
plug-in measurement modules can be connected to its
four integrated plug-in module slots with plug-and-play convenience (the only exception is the SvO2
module, M1021A, which cannot be used with the MP40/MP50). The Flexible Module Server
(M8048A) cannot be used with the MP40/MP50.
MP40/MP50 Major Parts and Keys
MP40/MP50 left side
1Color-coded alarm lamps
2Alarms off lamp
3Model indicator
4ECG out
5Navigation Point
6Part number and serial number
7Mounting quick-release lever
8Plug-in module slots
Introducing the IntelliVue Family 1 Basic Operation
5
IntelliVue MP60/MP70
The IntelliVue MP60/MP70 (M8005A/M8007A) patient monitors integrate the display unit, with a
15” color LCD display, and the data processing unit into one. Up to eight waves can be shown on the
screens, as well as the 12-Lead ECG Screen. The MP60 uses the SpeedPoint as its primary input device
while the MP70 uses touch screen operation but may have an optional SpeedPoint.
The monitors can be connected to the Multi-Measurement Server (MMS) and any one of the
measurement server extensions, and to the Flexible Module Server (M8048A). The IntelliVue family
plug-in measurement modules can be connected to its FMS module slots with plug-and-play
convenience.
The MP60/MP70 has two integrated slots for plug-in modules. You can combine one each of the
following modules in these slots: Pressure, Temperature, C.O., SpO2 and VueLink. Two of the same
type of module cannot be used. You can also use the two-slot recorder module in the integrated slots.
MP40/MP50 front panel
1On/Standby switch
2On/Standby LED
3Error LED
4Battery status LED
5AC power operation LED
6“read the documentation” symbol
7Mounting quick-release lever
MP40/MP50 LED Colors and their Meanings
On/Standby LED Green when monitor is switched on
Error LED Red if there is a problem with the monitor
Battery LED Green, yellow, and red.
See the section on Using the Batteries for details
AC Power LED Green while the monitor is connected to AC power (mains)
132 456 7
1 Basic Operation Introducing the IntelliVue Family
6
MP60/MP70 Major Parts and Keys
IntelliVue MP80/MP90
Note: The MP80 monitor (M8008A) is not available in the USA.
The IntelliVue MP80/MP90 (M8008A/M8010A) patient monitors have the display and the
processing unit as separate components. They offer both touchscreen and the Remote SpeedPoint as
standard input devices. The MP80 can display up to 8 waves simultaneously and the MP90 up to 12
waves.
The monitors can be connected to the Multi-Measurement Server (MMS) and any one of the
measurement server extensions, and to the Flexible Module Server (M8048A). The IntelliVue family
plug-in measurement modules can be connected to its FMS module slots. The MP90 can be connected
to two Flexible Module Servers (FMS). The MP90 has the capability for two displays and can have a
third main display with the D80 Intelligent Display.
1 Color coded alarm lamps
2 Alarms Off lamp
3Display
4Model indicator
5 SpeedPoint (optional for MP70)
6 Part number and serial number
7 Mounting quick-release lever
8AC power LED
9Error LED
10 Power on/standby switch
11 Power on LED
1234
5
6
7
8
910
11
Introducing the IntelliVue Family 1 Basic Operation
7
MP80/MP90 Major Parts and Keys
D80 Intelligent Display
The D80 Intelligent Display can be used as a third main display with the MP90 monitor. You then
have three displays able to be configured individually and to be operated independently.
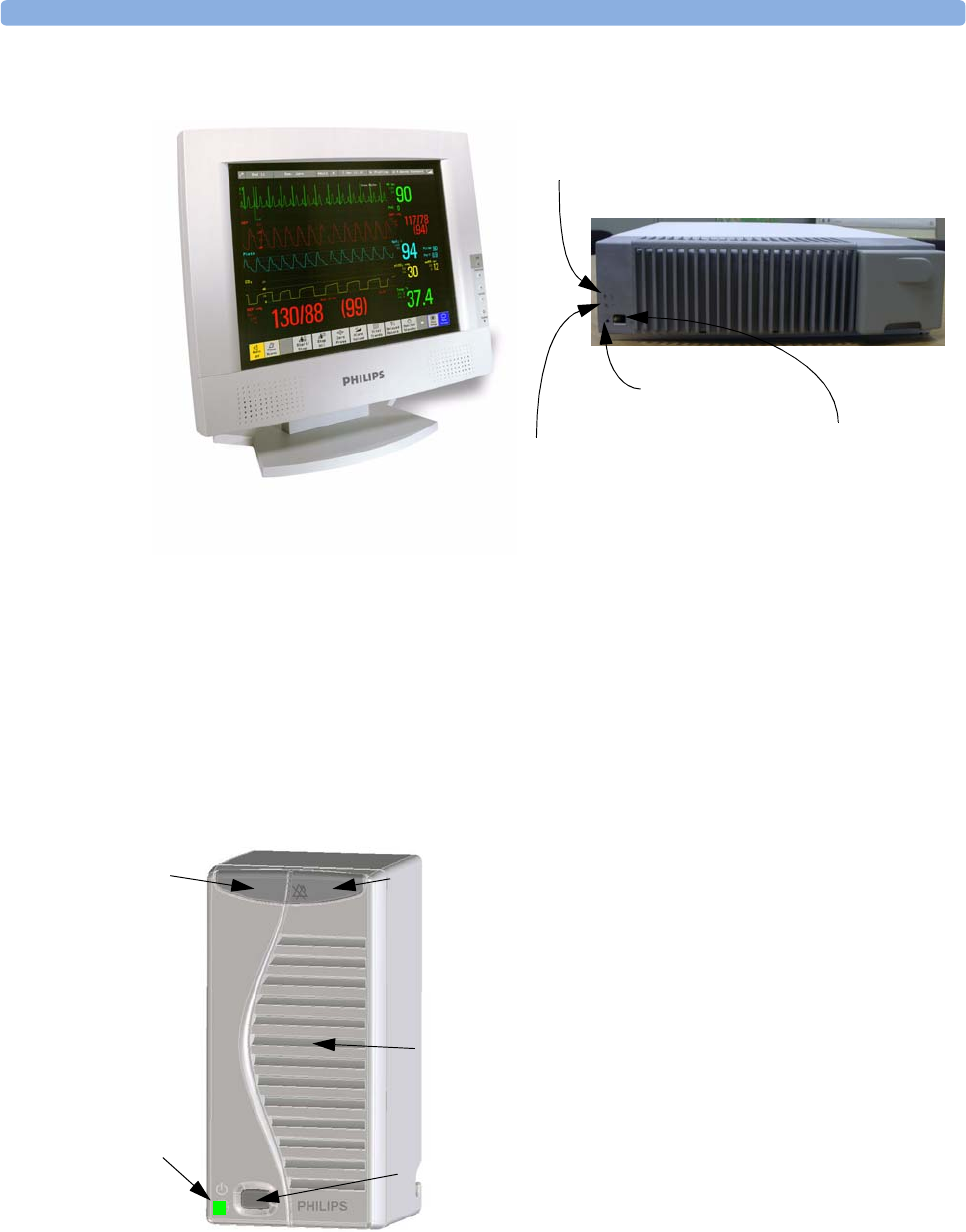
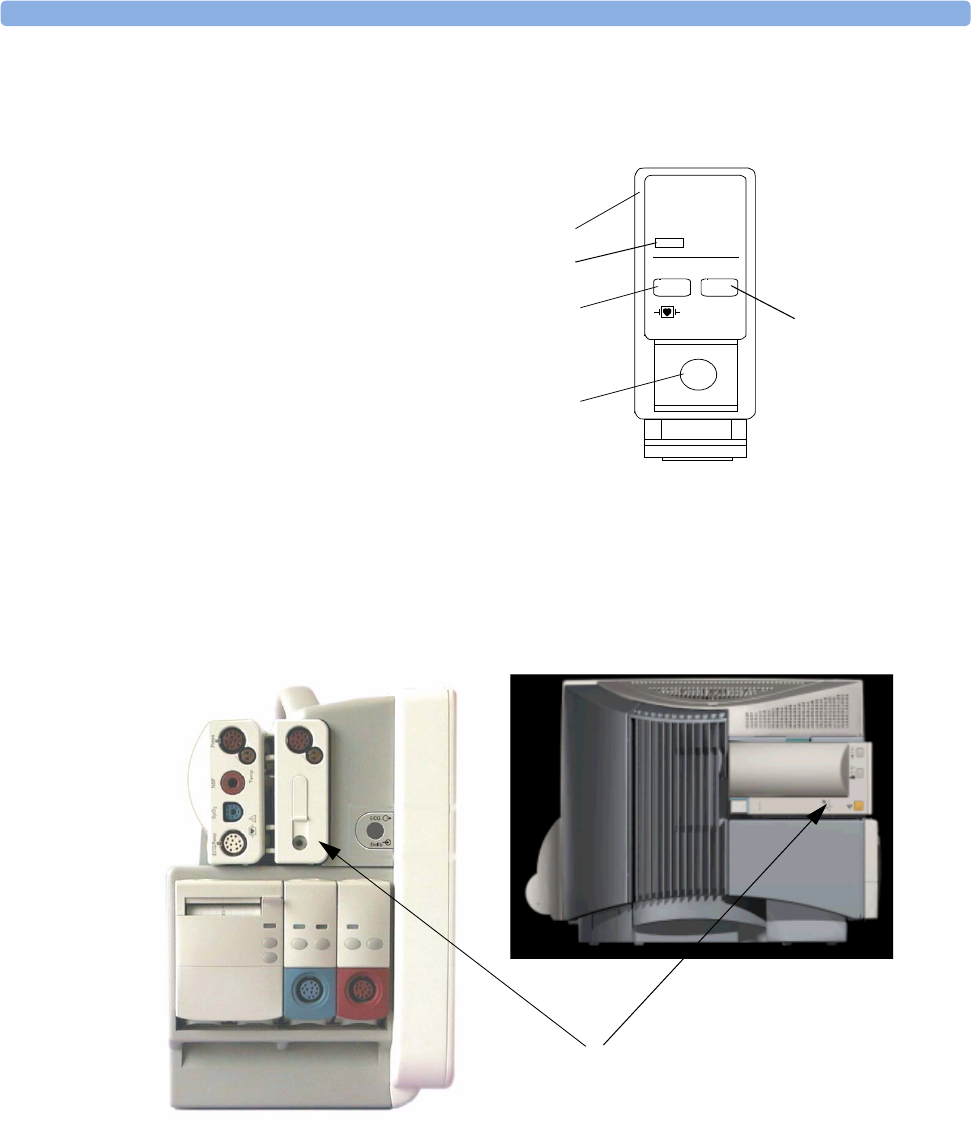
Remote Alarm Device
The Remote Alarm Device provides audio and visual indicators of alarms, in addition to those shown
on the display.
Power on Switch
AC Power LED
Error LED
Power on LED
Display Unit Processing Unit
1 Two color coded alarm lamps (right-hand lamp flashes
red or yellow for patient alarms, left-hand lamp flashes
light blue for INOPs)
2 Alarms off lamp - when illuminated it indicates that all
alarms are deactivated.
3 Speaker - for alarm tones, QRS tones and so forth
4 Monitor power on /standby switch. Press to switch
monitor on remotely. Press and hold for one second to
turn monitor off.
5 Power on LED - green when monitor is on
5
4
3
12
1 Basic Operation Related Products
8
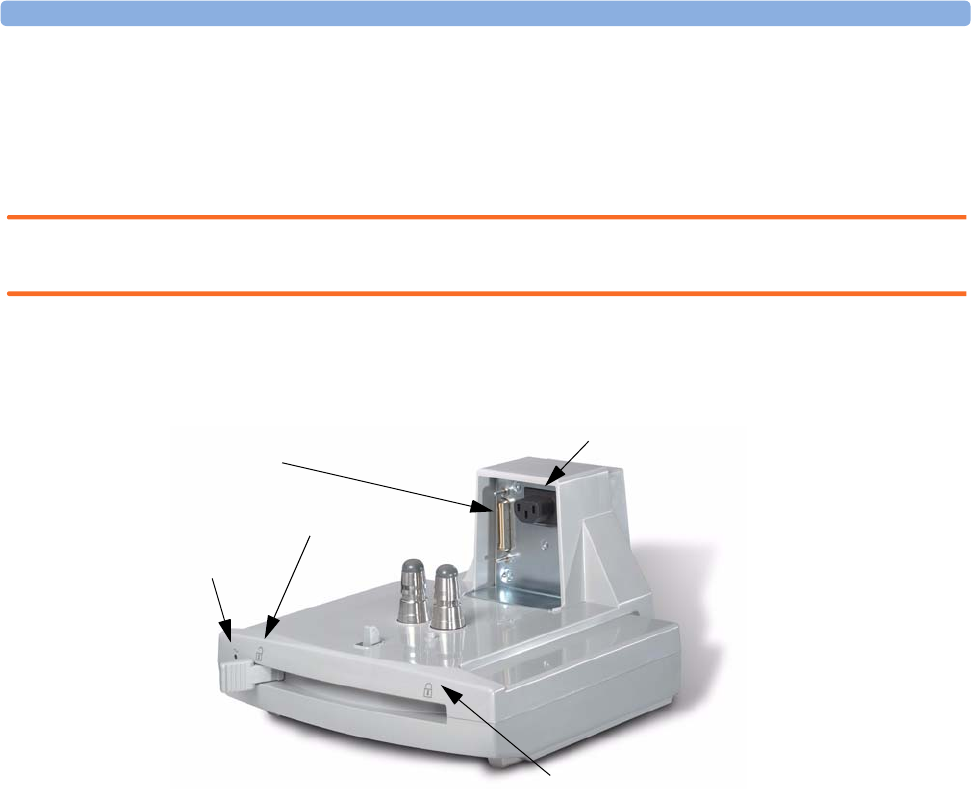
Docking Station
MP20/30/
40/50 only
The docking station provides quick mounting and connections in a one-step operation. By placing the
monitor on the docking station and closing the lever you can make the connection to power and to a
wired network, if present.
WARNING If the docking station is in a tilted position, you must hold the monitor in place while closing the
locking lever.
When using the monitor for transport directly after use on the docking station, insert the batteries
before placing the monitor on the docking station.
Related Products
Related products extend the measurement capabilities of your monitor. None of the related devices
have their own power on/standby switches. They take their power from the monitor, and switch on
automatically when you turn on the monitor. A green power-on LED indicates when they are drawing
power from the monitor. A permanently illuminated, or flashing, red LED indicates a problem with
the unit that requires the attention of qualified service personnel.
Flexible Module Server (M8048A)
MP60/70/80
/90 only
The flexible module server (FMS) lets you use up to eight plug-in physiological measurement modules.
With the MP60/70/80 you can connect only one FMS. With the MP90 (M8010A) you can connect
two FMSs to use up to 10 measurement modules. For individual modules, the maximum that can be
used simultaneously in an FMS is: five pressure modules, four temperature modules, four VueLink
modules.
Connect the FMS to the monitor via the measurement server link cable (MSL). Use the MSL
connector on the left-hand side to connect additional measurement servers. Use the connector on the
right to connect to the monitor.
Power On LED
Power Connector
Open Position
Locked Position
Data Connector
Related Products 1 Basic Operation
9
Measurement Modules
You can use up to eight measurement modules with the Flexible Module Server (M8048A), two
additional modules in the integrated module slots in the MP60/MP70, and up to four in the integrated
slots in the MP40/MP50. Available modules are:
• Invasive blood pressure (M1006B)
• Temperature (M1029A)
• Oxygen saturation of arterial blood (SpO2) (M1020B)
• Cardiac output (M1012A), and Continuous cardiac output with M1012A Option #C10
• Transcutaneous gas (M1018A)
• Mixed venous oxygen saturation - SvO2 (M1021A) MP60/70/80/90 monitor only
• Recorder (M1116B)
• VueLink device interface (M1032A)
• EEG (M1027A)
• Bispectral Index - BIS (M1034A)
• Spirometry (M1014A)
You can plug and unplug modules during monitoring. Insert the module until the lever on the module
clicks into place. Remove a module by pressing the lever upwards and pulling the module out.
Reconnecting a module to the same monitor restores its label and measurement settings, such as alarms
limits. If you connect it to a different monitor, the module remembers only its label.
The connector socket on the front of each module is the same color as the corresponding connector
plug on the transducer or patient cable.
Press the Setup key on the module’s front to display the measurement’s setup menu on the monitor
screen. When the setup menu is open, a light appears above the key. Some modules have a second key.
On the pressure module, for example, it initiates a zeroing procedure.
1Multi-Measurement
Server
2Measurement server
mount
3Flexible Module Server
4Power on LED
5Interruption indicator
123
45
1 Basic Operation Related Products
10
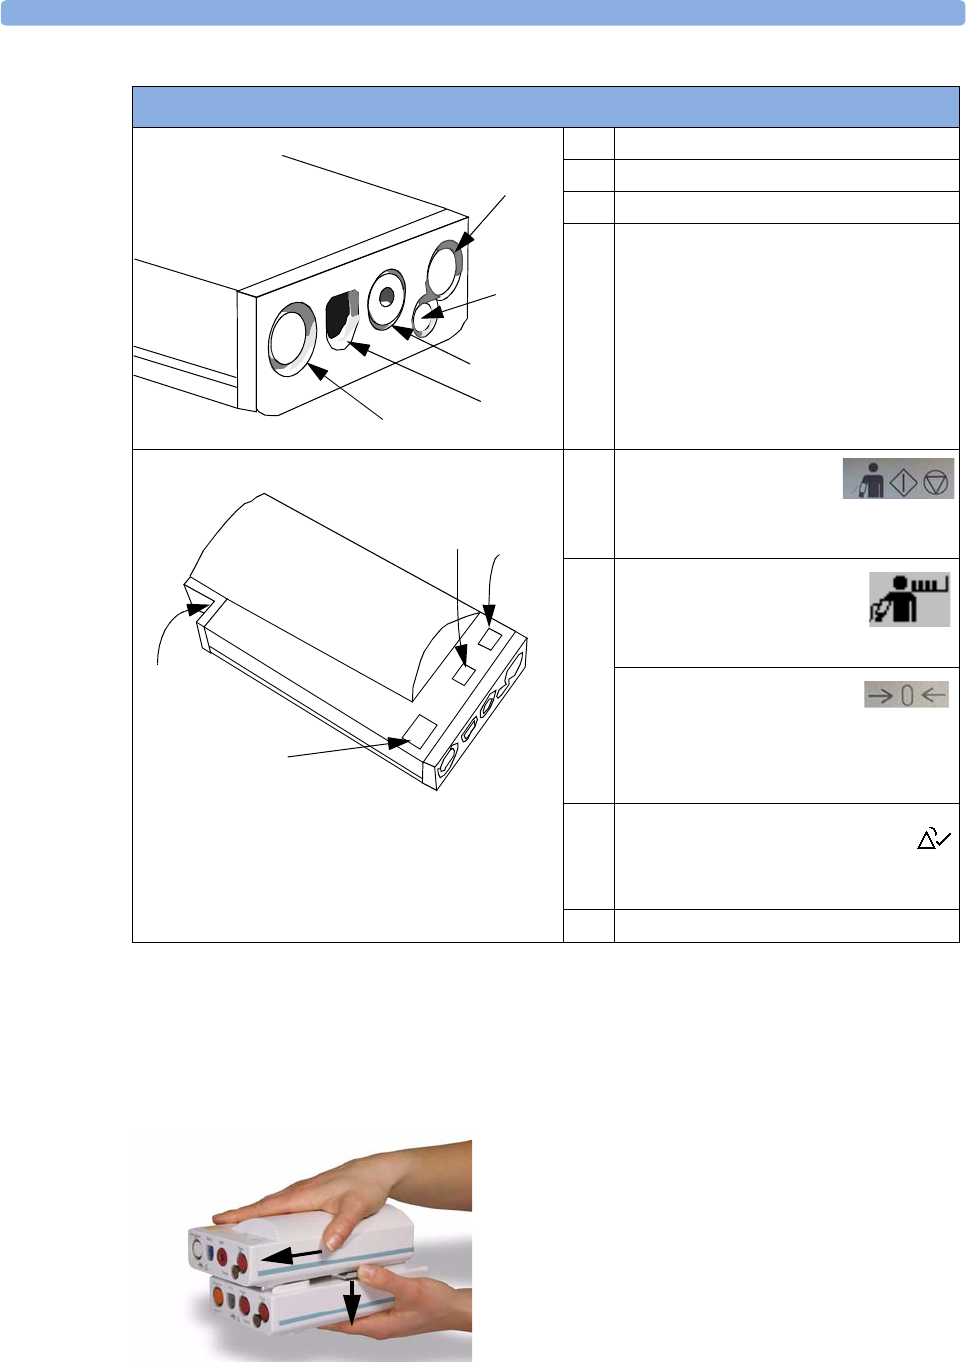
Multi-Measurement Server (M3001A)
The Multi-Measurement Server (MMS) can simultaneously monitor 3-, 5- or 10-lead ECG (including
arrhythmia and ST monitoring), respiration, SpO2, NBP and either invasive pressure or temperature.
Depending on the monitor model, you can connect it to the monitor via a cable or mount it either on
the left side of the FMS or on the back of the monitor, as shown here.
Example Module (Pressure)
1Module name
2Setup key LED
3 Setup key to enter setup menu of
measurement modules or VueLink
device data window
4 Connector socket for patient cable/
transducer
5 Second module-specific key, for
example Zero
80x80
1
2
3
4
5
PRESS
Press
MMS mounted on rear of MP40/MP50
(left) and MP60/MP70
Related Products 1 Basic Operation
11
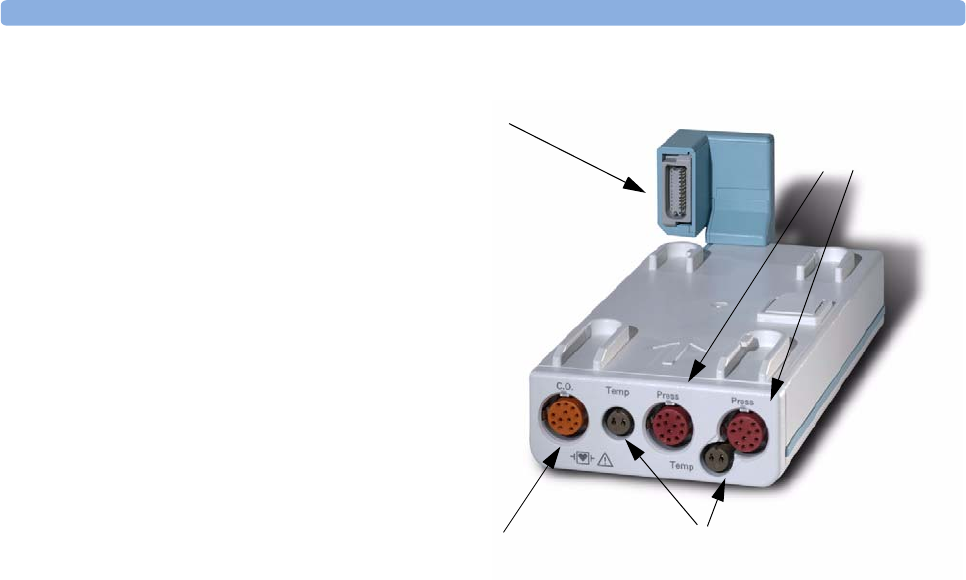
Measurement Server Extensions
The measurement server extensions connect to the MMS and use the MMS settings and power. Trend
data and measurement settings from the measurements in the extensions are stored in the measurement
server. To separate an extension from the MMS, press the release lever down, and push the server
forward.
M3001A Connectors and Symbols
1White ECG/Resp connector
2Blue SpO2 connector
3Red NBP connector
4 &
5
Combined pressure (red) and temperature
(brown) connector - connect either invasive
pressure transducer or temperature probe.
You might have a version of the MMS that
does not have this connector.
6
NBP Start/Stop key -
starts or stops NBP
measurements
7
NBP STAT key - starts NBP
STAT series of
measurements
OR
Zero key - initiates a zero procedure for the
connected pressure transducer when
pressed and held for a second
8
Silence: acknowledges all active
alarms by switching off audible
alarm indicators and lamps
9MSL cable connector to the monitor
1
2
3
4
5
9
7
6
8
3
1 Basic Operation Related Products
12
WARNING The measurement server extensions can only function when they are connected to a measurement
server. If the measurement server is removed during monitoring, the measurements from both the
measurement server and the measurement server extension are lost.
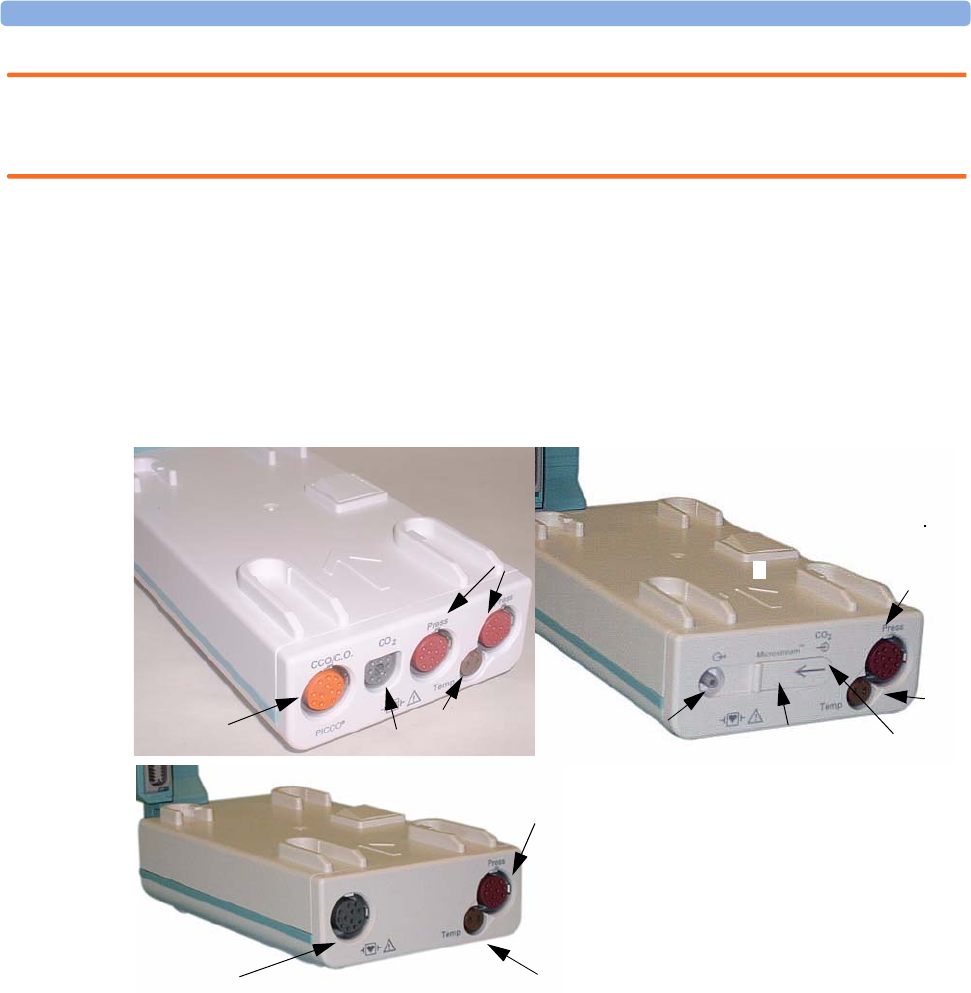
M3014A, M3015A and M3016A Capnography Extensions
The M3014A Capnography Extension adds mainstream capnography, and optionally one pressure
plus either a pressure or a temperature, Cardiac Output and Continuous Cardiac Output to the MMS.
The optional M3015A Microstream CO2 Extension adds microstream capnography and optionally
either pressure or temperature to the MMS. The optional M3016A Mainstream CO2 Extension adds
mainstream capnography and optionally either pressure or temperature to the MMS.
1Pressure connectors (red) 5Inlet
2Temperature connector (brown) 6Microstream connector CO2
3Mainstream connector CO2 (optional) 7Gas sample outlet
4Cardiac Output connector
M3014A Capnography M3015A Microstream
1
2
6
1
3275
4
1
2
M3016A Mainstream
Related Products 1 Basic Operation
13
M3012A Hemodynamic Measurement Server Extension
The M3012A Hemodynamic
Measurement Server Extension
(HMSE) can be connected to the
M3001A Multi-Measurement Server to
provide the following additional
measurements: Temperature, Pressure,
an additional Pressure or Temperature,
and C.O. and CCO measurements.
Temperature connectors (brown)
Cardiac Output (orange;
optional)
Pressure connectors
(red)
Connection to MMS
1 Basic Operation Operating and Navigating
14
Operating and Navigating
Everything you need to operate the monitor is contained on its screen. Almost every element on the
screen is interactive. Screen elements include measurement numerics, waveforms, screen keys,
information fields, alarms fields and menus.
The configurability of the monitor means that often you can access the same element in different ways.
For example, you might be able to access an item through its on-screen setup menu, via a hard key, or
via a SmartKey. These Instructions for Use always describe how to access items via an on-screen menu.
You may use whichever way you find most convenient.
1234567 8 9
12
14
15
18 16
17
ABP Zero done at 11 Nov 02 7:31 am
11
10
13
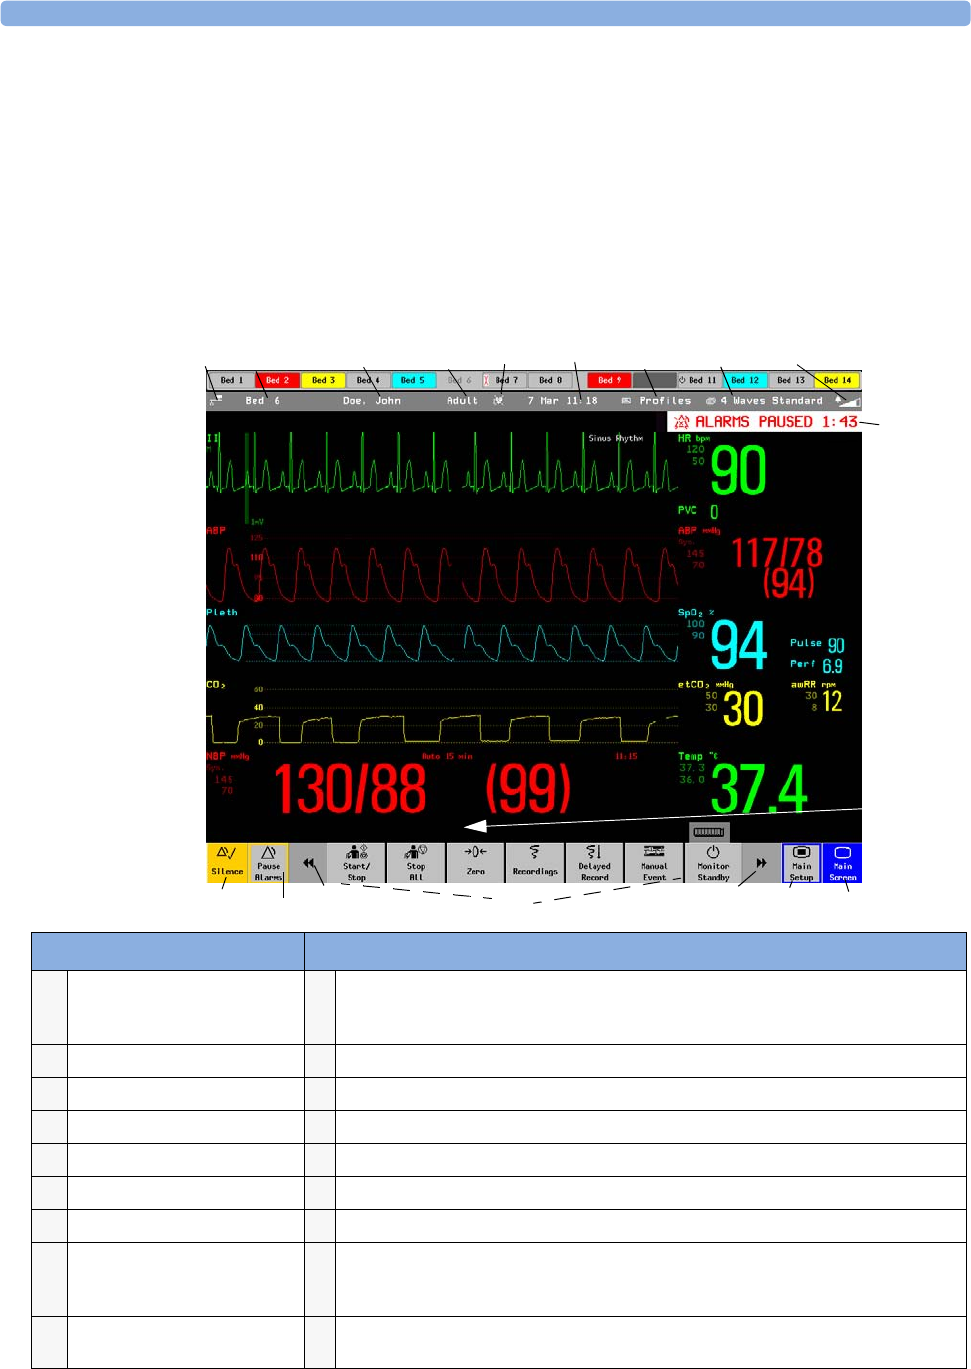
Monitor information line Other screen elements
1network connection indicator
(documented in Information
Center Instructions for Use)
10 alarm status area - shows active alarm messages
2bed label 11 status line - shows information messages and prompting you for action
3patient identification 12 close all open menus and windows and return to main screen
4patient category 13 enter Main Setup menu
5paced status 14 scroll right to display more SmartKeys
6date and time 15 SmartKeys - these change according to your monitor’s configuration
7access the profiles menu 16 scroll left to display more SmartKeys
8current screen name/enter
change screen menu
17 Pause Alarms - pauses alarm indicators. Pause duration depends on monitor
configuration. If pause duration is infinite, this key is labeled Alarms Off. Select again to
immediately re-enable alarm indicators.
9adjust alarm volume/level
indicator
18 Silence - acknowledges all active alarms by switching off audible alarm indicators and
lamps permanently or temporarily, if alarm reminder (ReAlarm) is configured on.
Operating and Navigating 1 Basic Operation
15
Selecting Screen Elements
Select a screen element to tell the monitor to carry out the actions linked to the element. For example,
select the Patient Identification element to call up the Patient Demographics window, or
select the HR numeric to call up the Setup ECG menu. Select the ECG wave segment to call up the
ECG lead menu.
Note that the space between each line of a menu may be configured to wide or narrow to facilitate your
most common method of operation, either touch, Speedpoint or navigation point, or mouse.
Using the Setup Menu
MP20/MP30/
MP40/MP50
Only
For the MP20/MP30 and MP40/MP50 monitors, the
elements at the top of the Screen are grouped together for
ease of navigation. Select any item at the top of the Screen
to open the Setup menu; scroll down the menu to
highlight the element you want then press the navigation
point to select the element.
Using the Touchscreen
Select screen elements by pressing them directly on the monitor’s screen.
Disabling Touchscreen Operation
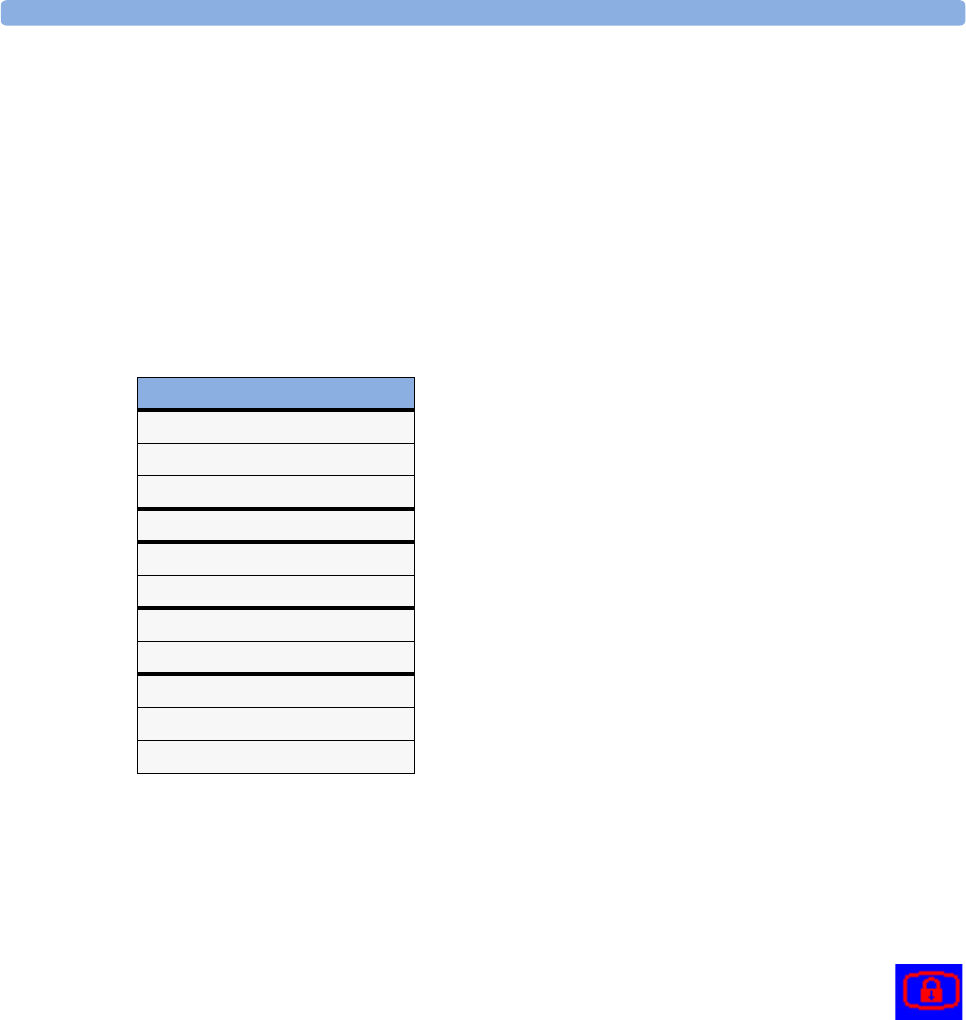
♦To temporarily disable touchscreen operation of the monitor, press and hold the Main
Screen permanent key. A padlock will appear on the Main Screen permanent key.
♦Press and hold the Main Screen permanent key again to re-enable the touchscreen operation.
Setup
Alarm Messages
Alarm Limits
Alarm Volume
My Care Group
Change Screens
Profiles
Admit/Dischrg
Paced No
Network
Bed Information
Date, Time
1 Basic Operation Operating and Navigating
16
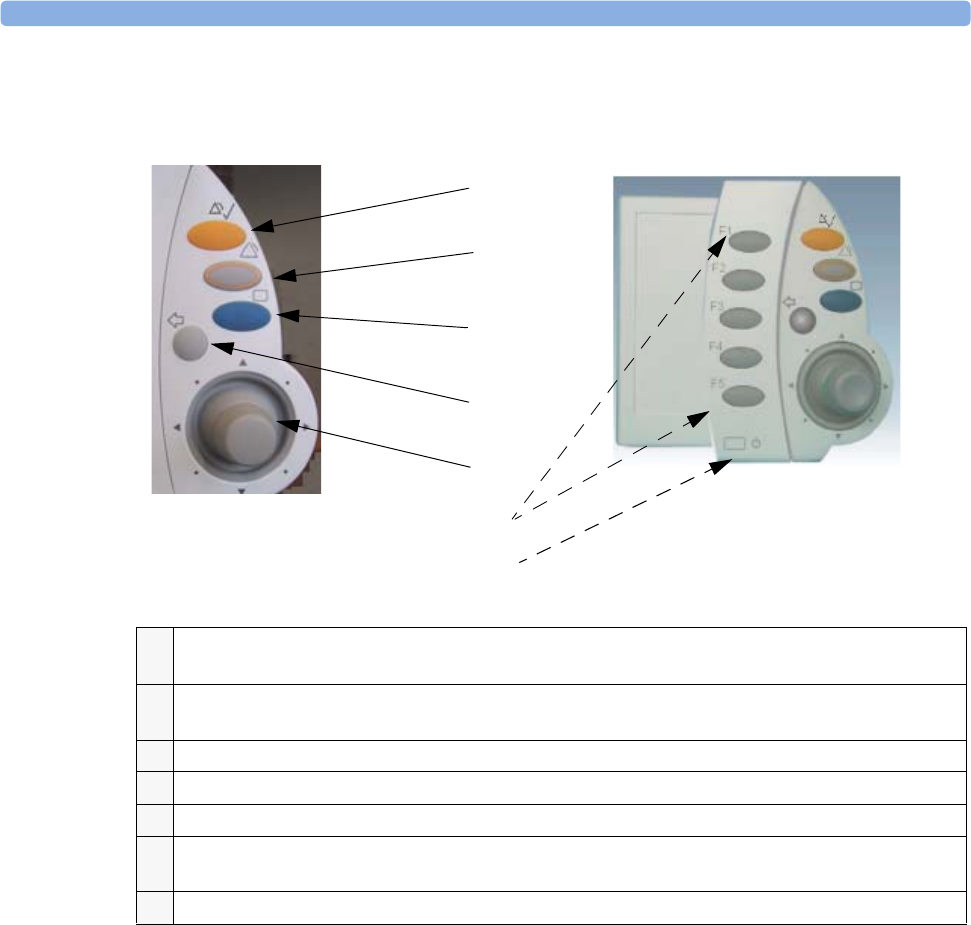
Using the SpeedPoint
Rotate the SpeedPoint knob left or right. With each click, the highlight jumps to the neighboring
screen element. Alternatively, tilt the knob to move it in the direction of a screen element. A cursor
moves across the screen, following the direction of the knob. Any screen element under the cursor is
highlighted. When you reach the screen element you want, press the knob to select the element.
Using the remote SpeedPoint, you can operate the monitor from a distant location such as at the foot
of the bed. The remote SpeedPoint can be used with all monitors.
1Silence - acknowledges all active alarms by switching off audible alarm indicators and lamps. Behavior
follows the Silence permanent key configuration.
2Alarms Off/Pause Alarms- pauses alarm indicators. Behavior follows the Pause Alarms permanent key
configuration.
3Main Screen - close all open menus and windows and return to the main screen.
4Back - go back one step to the previous menu.
5SpeedPoint knob - rotate and tilt to highlight elements. Press to select.
6Function keys on remote SpeedPoint - function identical to the first five SmartKeys configured for a
screen.
7On/standby key
1
2
3
4
5
6
integrated SpeedPoint
(MP60/MP70 only)
Remote SpeedPoint
(all monitors)
7
Operating and Navigating 1 Basic Operation
17
Using the Navigation Point
MP20/MP30/
MP40/MP50
Only
To use the navigation point, rotate it left or right. With each click, the highlight jumps to the
neighboring screen element. The element under the cursor is highlighted. When you reach the screen
element you want, press the knob to select the element.
Using a Mouse or Trackball
If you are using a mouse or trackball, select screen elements by clicking on them (press and release the
left mouse button). While you are moving the mouse, a cursor appears and a highlight shows your
current position.
Using Keys
The monitor has four different types of keys.
Permanent Keys
A permanent key is a graphical key that remains on the screen all the time to give you fast access to
functions.
1Silence - acknowledges all active alarms by
switching off audible alarm indicators and
lamps. Exact behavior depends on permanent
key configuration
2Alarms Off/Pause Alarms - pauses alarm
indicators. Exact behavior depends on Pause
Alarms permanent key configuration
3 Main Screen - closes all open menus and
windows and return to the main screen.
4Back - takes you back one step to the previous
menu.
5Navigation Point knob
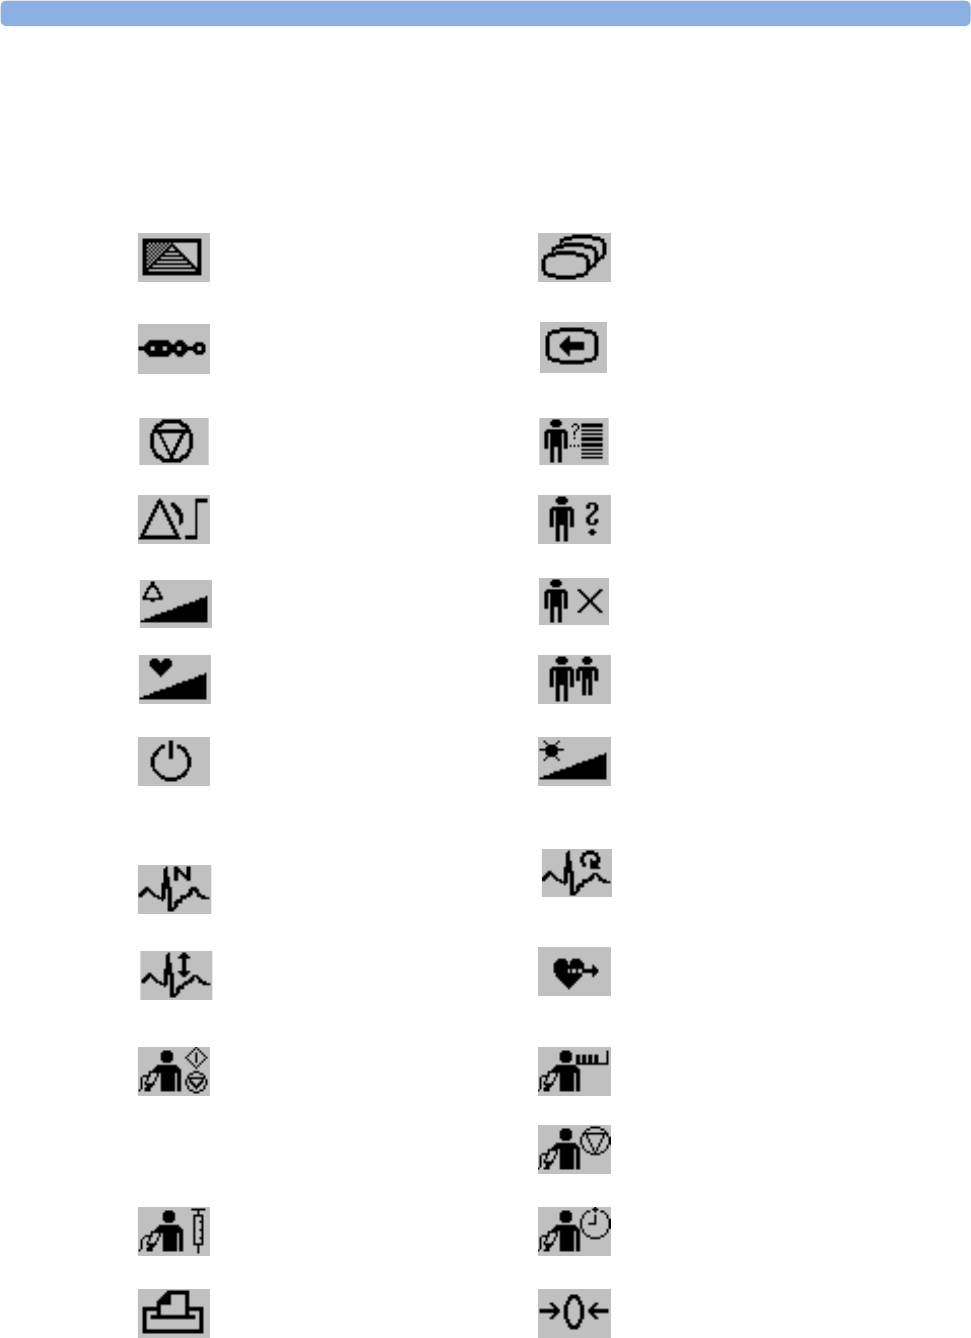
Pause Alarms - pauses alarm indicators. Pause duration depends on monitor
configuration. If pause duration is infinite, this key is labeled Alarms Off.
Select again to immediately re-enable alarm indicators.
Silence - acknowledges all active alarms by switching off audible alarm indicators and
lamps.
Main Screen - close all open menus and windows and return to the main screen.
Main Setup - enter main setup menu.
1 Basic Operation Operating and Navigating
18
SmartKeys
A SmartKey is a configurable graphical key, located at the bottom of the main screen. It gives you fast
access to functions. The selection of SmartKeys available on your monitor depends on your monitor
configuration and on the options purchased.
enter profile menu, or
revert to default profile
change Screen, or
revert to default screen
show BIS Sensor previous Screen
freeze waves quick admit a patient
set alarm limits enter patient identification menu to
admit/discharge/transfer
change alarm volume end case to discharge a patient
change QRS volume view information for patients in other
beds
enter standby mode - suspends patient
monitoring. All waves and numerics
disappear from the display. All settings
and patient data information are
retained.
change screen brightness (not for
independent displays)
review beat labels (annotate
arrhythmia wave) re-learn arrhythmia
change amplitude (size) of ECG wave enter cardiac output procedure
- start/stop manual NBP measurement
- start auto series
- stop current automatic measurement
within series
start NBP STAT measurement
stop automatic or STAT NBP
measurement and measurement series
start veni puncture (inflate cuff to
subdiastolic pressure)
set the NBP repeat time
access patient reports zero invasive pressure transducer
Operating and Navigating 1 Basic Operation
19
Hardkeys
A hardkey is a physical key on a monitoring device, such as the zero pressure key on the MMS or a
setup key on a module.
Pop-Up Keys
Pop-up keys are task-related graphical keys that appear automatically on the monitor screen when
required. For example, the confirm pop-up key appears only when you need to confirm a change.
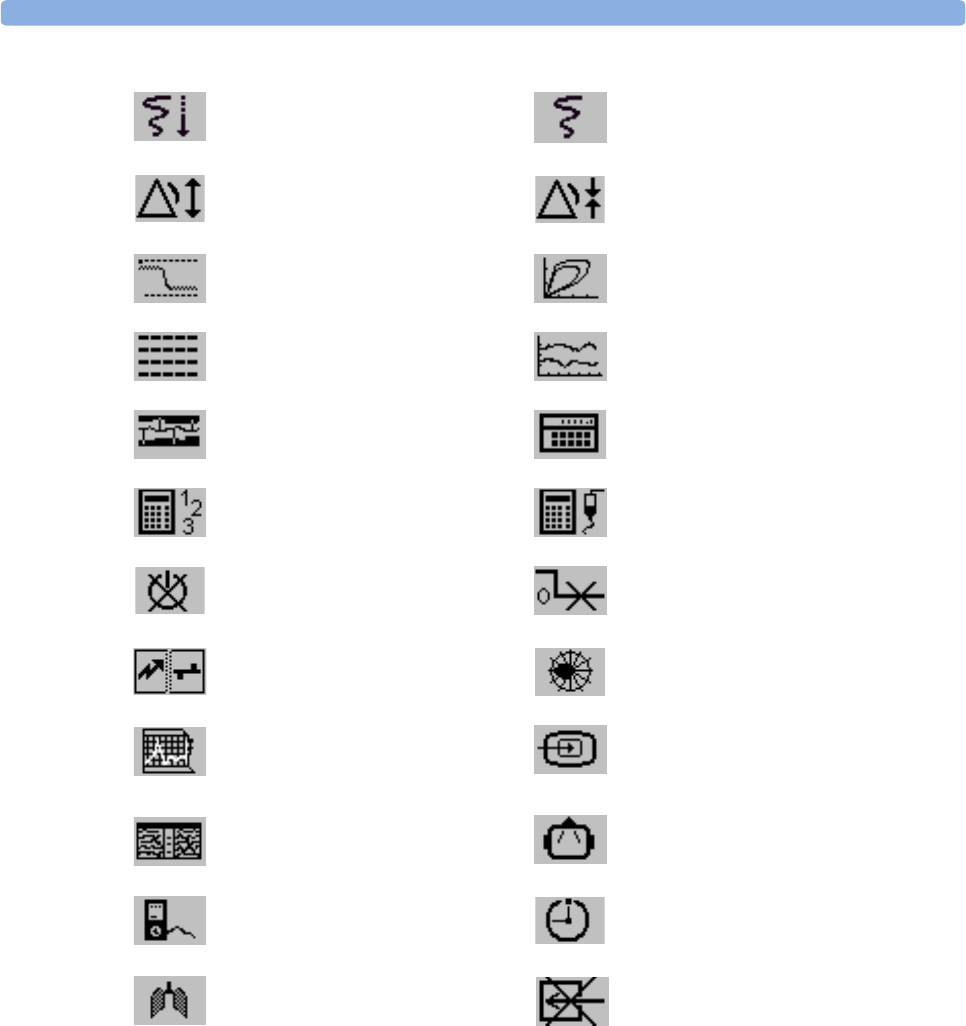
start a delayed recording Realtime Record SmartKey to access pop-
up recording keys
set wide automatic alarm limits set narrow automatic alarm limits
access wedge procedure window access the Loops window
review vital signs trend review graph trend
access event surveillance access calculations
access the calculator access the Drug Calculator
gas analyzer - exit standby mode suppress zero for all gas measurements
unpair equipment access ST Map application
start 12-Lead Capture (only available
if Information Center is connected)
access remote applications (if Application
Server is connected)
access EEG CSA access the EEG montage
display VueLink information access timers
access the spirometry data window switch CO2 pump off
1 Basic Operation Operating and Navigating
20
Using the On-Screen Keyboard
Use this as you would a conventional keyboard. Enter the information by selecting one character after
another. Use the Shift and capital Lock keys to access uppercase letters. Use the Back key to delete
single characters, or use the Clr key to delete entire entries. Select Enter to confirm what you have
entered and close the on-screen keyboard.
If a conventional keyboard is connected to the monitor, you can use this instead of or in combination
with the on-screen keyboard.
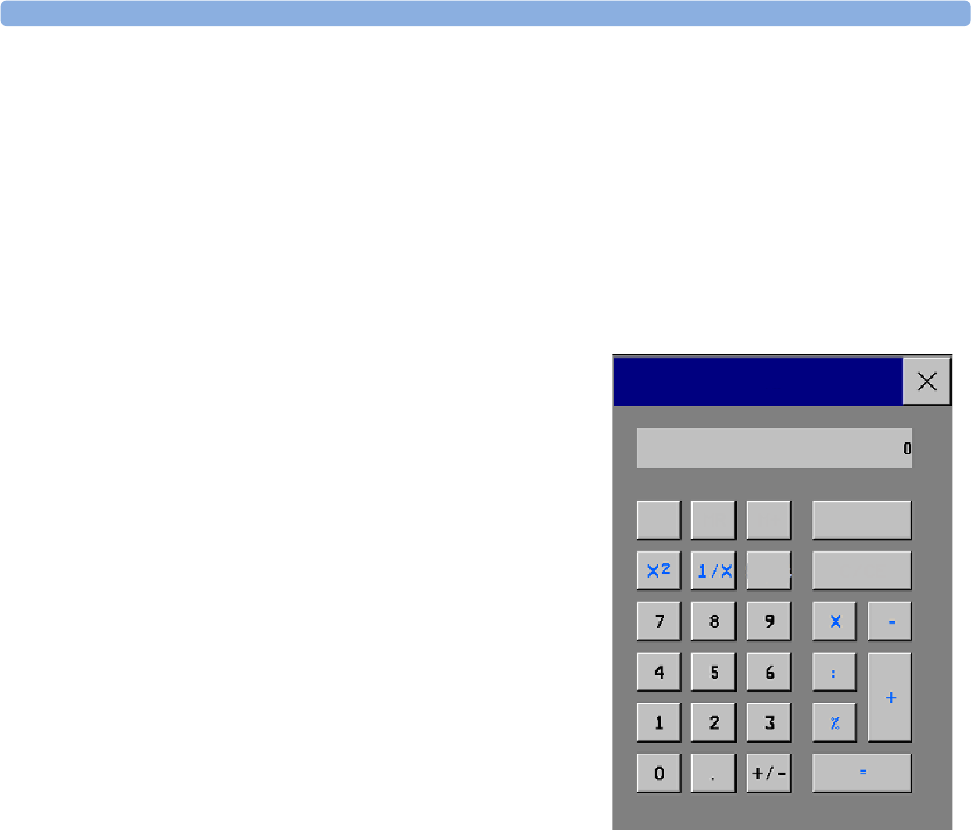
Using the On-Screen Calculator
You can use the on-screen calculator to perform any of
the standard operations for which you would normally
use a handheld calculator.
♦To access the on-screen calculator, select the
Calculator SmartKey, or select Main Setup
-> Calculations -> Calculator.
Calculator
MC MR M+ Back
√C/CE

Operating Modes 1 Basic Operation
21
Operating Modes
When you switch the monitor on, it starts up in monitoring mode. To change to a different mode:
1Select the Main Setup menu.
2Select Operating Modes and choose the mode you require.
Your monitor has four operating modes. Some are passcode protected.
•Monitoring Mode: This is the normal, every day working mode that you use for monitoring
patients. You can change elements such as alarm limits, patient category and so forth. When you
discharge the patient, these elements return to their default values. Changes can be stored
permanently only in Configuration Mode. You may see items, such as some menu options or the
altitude setting, that are visible but ‘grayed out’ so that you can neither select nor change them.
These are for your information and can be changed only in Configuration Mode.
•Demonstration Mode: Passcode protected, this is for demonstration purposes only. You must not
change into Demonstration Mode during monitoring. In Demonstration Mode, all stored trend
information is deleted from the monitor’s memory.
•Configuration Mode: Passcode protected, this mode is for personnel trained in configuration tasks.
These tasks are described in the Configuration Guide. During installation the monitor is configured
for use in your environment. This configuration defines the default settings you work with when
you switch on, the number of waves you see and so forth.
•Service Mode: Passcode protected, this is for trained service personnel.
When the monitor is in Demonstration Mode, Configuration Mode, or
Service Mode, this is indicated by a box with the mode name in the center
of the Screen and in the bottom right-hand corner. Select this field to
change to a different mode.
Standby Mode
Standby mode can be used when you want to temporarily interrupt monitoring.
To enter Standby mode,
♦select the Monitor Standby SmartKey or
♦select Main Setup, followed by Monitor Standby.
The monitor enters Standby mode automatically after the End Case function is used to discharge a
patient.
Standby suspends patient monitoring. All waves and numerics disappear from the display but all
settings and patient data information are retained. A special Standby screen is displayed. If a patient
location is entered at the Information Center, this will also be displayed on the Standby screen
(availability depends on Information Center revision).
To resume monitoring,
♦Select anything on the screen or press any key.
Config

1 Basic Operation Understanding Screens
22
Understanding Screens
Your monitor comes with a set of preconfigured Screens, optimized for common monitoring scenarios
such as OR adult, or ICU neonatal. A Screen defines the overall selection, size and position of waves,
numerics and SmartKeys on the monitor screen when you switch on. You can easily switch between
different Screens during monitoring. Screens do NOT affect alarm settings, patient category and so
forth.
When you switch from a complex to a less complex Screen layout, some measurements may not be
visible but are still monitored in the background. If you switch to a more complex Screen with, for
example, four invasive pressure waves but you have only two pressures connected to the monitor, the
“missing” two pressures are either left blank or the available space is filled by another measurement.
Switching to a Different Screen
1To switch to a different Screen, select the current Screen name in the monitor info line,
or select the Change Screen SmartKey.
2Choose the new Screen from the pop-up list.
Changing a Screen’s Content
If you do not want to change the entire Screen content, but only some parts of it, you can substitute
individual waves, numerics, high-res waves, or trends. Be aware that these changes cannot be stored
permanently in Monitoring Mode.
To change the selection of elements on a Screen,
1Select the element you want to change.
2From the menu that appears, select Change Wave, Change Numeric, or
Change HiResTrend, and then select the wave or numeric you want, or select the high-
resolution trend wave you want from the list of available waves.
If you do not see Change Numeric in the menu, this Screen may be configured to always
display the numeric beside its wave. Changing the wave will automatically change the numeric.
The changed Screen is shown with an asterisk in the monitor info line.
Using Additional Displays 1 Basic Operation
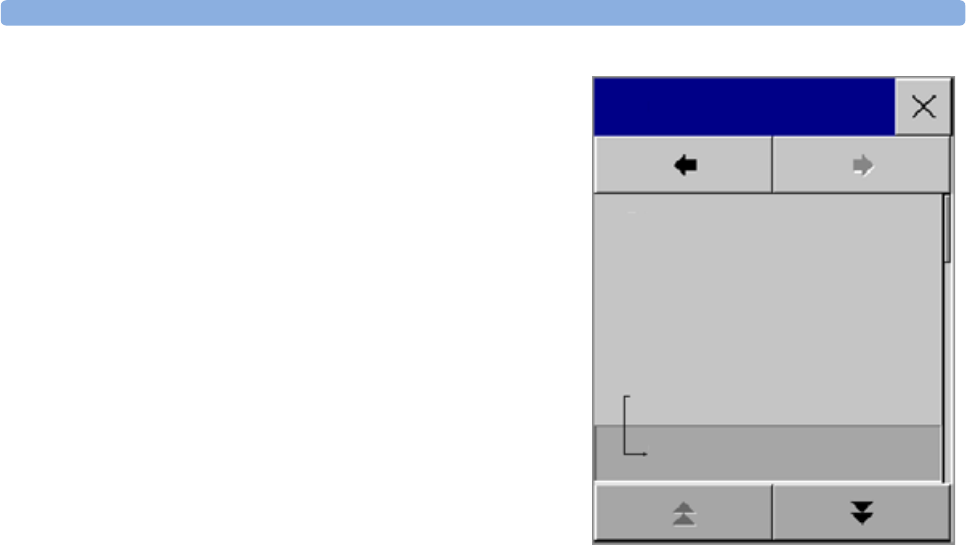
23
In the Change Screen menu, the changed Screen is
shown linked to the original Screen and marked with an
asterisk.
Up to three modified Screens can be accessed via the
Change Screen menu.
To recall Screens, either
♦select the name of the Screen in the
Change Screen menu
or
♦use the previous/next arrows at the top of the
Change Screen menu to move back and forth in the
Screen history. The ten most recently-used Screens
including up to three modified Screens can be
accessed.
After a patient discharge, the monitor’s default Screen is
shown. Modified Screens are still available in the
Change Screen menu.
If the monitor is switched off and then on again, modified Screens are erased from the monitor’s
memory and cannot be recalled. If a modified Screen was the last active Screen when the monitor was
switched off, it is retained (unless Automat. Default is configured to Yes).
Using Additional Displays
A second display, showing the same Screen as the main display, can be connected to any of the
monitors, for viewing only.
The MP90 can have two main displays and additionally, as a third main display, the D80 Intelligent
Display connected. All main displays can be configured and operated individually using standard input
devices.
For MP90 monitors with multiple displays and multiple input devices, the usage and behavior can be
configured according to specific requirements at installation (for example, use for two independent
operators or tracking of mouse input across two displays). For details refer to the Service Guide.
When two operators are using two displays, the scope of an action depends on the type of operation:
• Patient monitoring operations such as Silence or Pause alarms take effect for the monitor as a
whole, the results will be seen on both displays.
• Display operations such as the Main Screen key and Back hardkey will take effect only on the
display being operated.
If you are operating two displays with one remote SpeedPoint, to navigate from one display to another:
1Move the highlight to the Main Screen key and then turn one click further.
The highlighting moves to a special “jump” field at the edge of the Screen
2Press the knob on the SpeedPoint to confirm; the highlighting will automatically move to the other
display.
The content of each Screen can be changed individually as described in the previous section. If you are
operating two or three displays, you can choose Screens for all displays from one location:
Change Screen
6 Waves A
Split Screen A
Loops
Cardiac Output
Vital Signs A
Vital Signs A*

1 Basic Operation Understanding Profiles
24
1Select Profiles in the monitor info line of the first display,
2Select Display 1, Display 2, or Display 3 then select the Screen you want to display
on the that display from the list of available Screens.
When two displays are mounted next to each other or one above the other, a special Screen can be
assigned which spans across both displays. The Screen content for these Tall and Wide Screens can
then use the increased area available with two displays. These Screens appear in the Screen list with a
special Tall Screen or Wide Screen symbol.
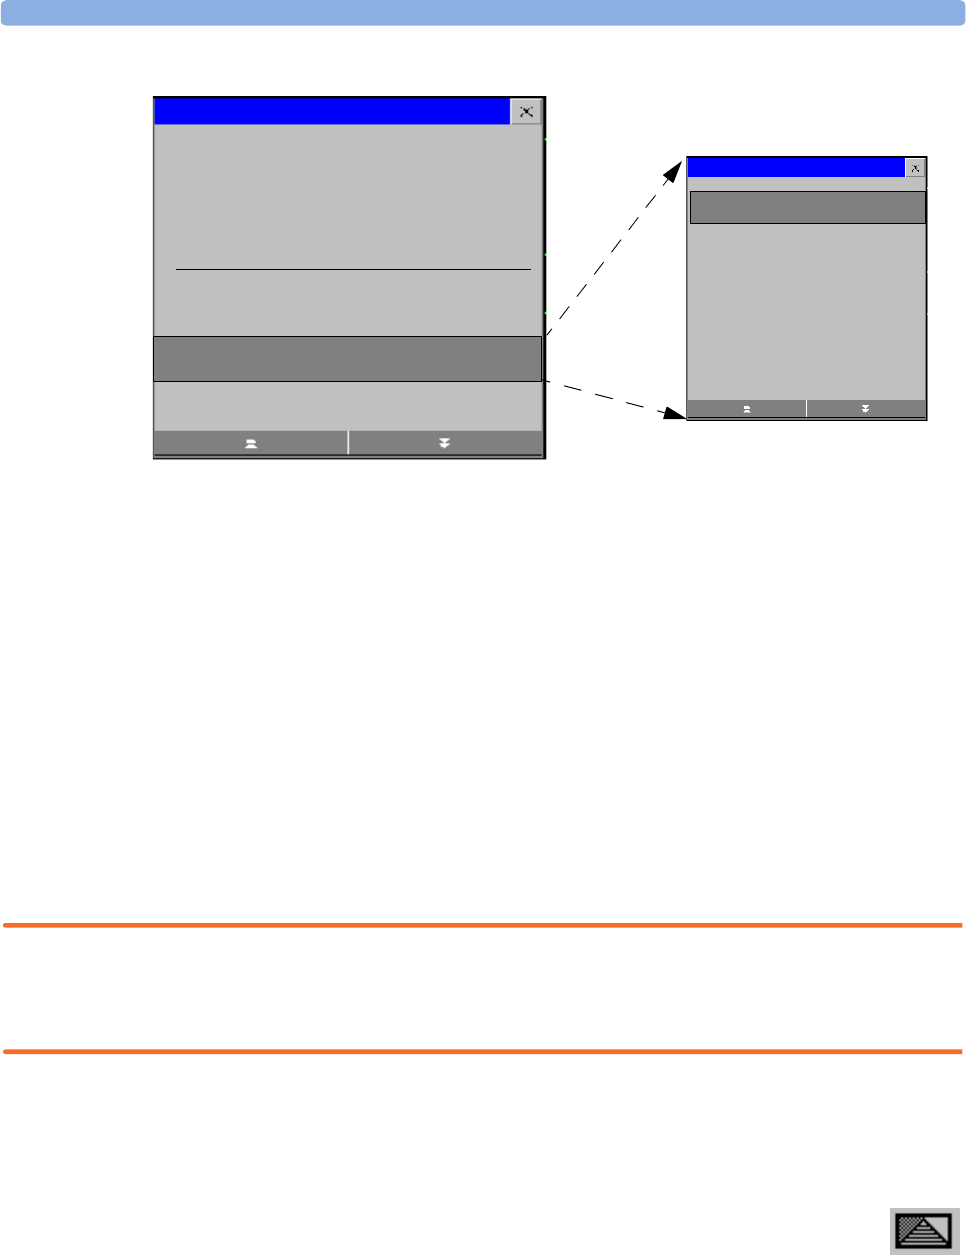
Certain windows (for example: cardiac output procedure) can only be shown on one display at a time.
If you try to open one of these windows when it is already shown on another display, you will see a
blank grey window with a cross through it.
Using the Visitor Screen
If a visitor Screen is configured for your monitor, you can use it to clear the screen of all waves and
numerics but continue to monitor the patient with active alarms and trend storage at the bedside and
Information Center. You can change the name of the visitor Screen in Configuration Mode.
♦To activate this Screen, select the Screen name in the monitor info line to open the Screen
menu, then select the name of the visitor Screen configured for your monitor from the list of
available Screens.
♦Select any element on the Screen to open the Screen menu and select a different Screen to show
waves and numerics again.
Understanding Profiles
Profiles are predefined monitor configurations. They let you change the configuration of the whole
monitor so you can adapt it to different monitoring situations. The changes that occur when you
change a complete profile are more far reaching than those made when you change a Screen. Screens
affect only what is shown on the display. Profiles affect all monitor and measurement settings.
The settings that are defined by Profiles are grouped into three categories. Each category offers a choice
of ‘settings blocks’ customized for specific monitoring situations. These categories are:
• Display (screens)
– Each profile can have a choice of many different predefined screens. If you are using a second
display, each display can have its own individual screen selection. When you change the profile,
the screen selection configured for the new profile becomes active.
• Measurement Settings
– Each profile can have a choice of different predefined measurement settings. These relate directly
to individual measurements, for example, measurement on/off, measurement color, alarms limits,
NBP alarm source, NBP repeat time, temperature unit (oF or oC) pressure unit (mmHg or kPa).
• Monitor Settings
– Each profile can have a choice of different predefined monitor settings. These relate to the
monitor as a whole; for example, display brightness, alarms off/paused, alarm volume, QRS tone
volume, tone modulation, prompt tone volume, wave speed, resp wave speed, pulse source.
Understanding Profiles 1 Basic Operation
25
You can change from one complete profile to another or swap individual settings blocks (display
screen/monitor settings/measurement settings) to change a subset of a profile. Changes you make to
any element within the settings blocks are not saved when you discharge the patient, unless you save
them in Configuration Mode.
You might find it helpful to think of the three categories in terms of a restaurant menu. The Screens
are like the first course, offering you a choice of “starters” (many different screen configurations from
which you can choose the one that best suits your requirements). The Monitor Settings category is like
the main course, offering a choice of different “main dishes” from which you can pick one. The
Measurement Settings are like the dessert course. From these you build your meal. You can choose one
from the “starters”, one from the main course, then one from the dessert or simply pick one or two
courses without having a full meal.
Depending on your monitor configuration, when you switch on or discharge a patient the monitor
either continues with the previous profile, or resets to the default profile configured for that monitor.
WARNING If you switch to a different profile, the patient category and paced status normally change to the setting
specified in the new profile. However some profiles may be setup to leave the patient category and
paced status unchanged. Always check the patient category, paced status, and all alarms and settings,
when you change profiles.
When you leave Demonstration Mode, the monitor uses the default profile.
Swapping a Complete Profile
1Select Profiles in the monitor info line, or select the Profiles SmartKey.
2In the Profiles menu, select Profile.
3Chose a profile from the pop-up list.
4Confirm your selection.
Profiles
Measurement B
Measurement C
Measurement D
Profiles Menu, showing current settings Available choices in measurement
menu
Profile : Profile A
Patient Category: Adult
Paced : No
Display : S-014
Monitor Settings: Monitor A
Meas Settings: Measurement A
Measurement A
1 Basic Operation Understanding Settings
26
Swapping a Settings Block
1Select Profiles in the monitor info line, or select the Profiles SmartKey.
2In the Profiles menu, select Display or Measmnt. Settings or
Monitor Settings to call up a list of the settings blocks in each category.
3Choose a settings block from the pop-up list.
4Confirm your selection.
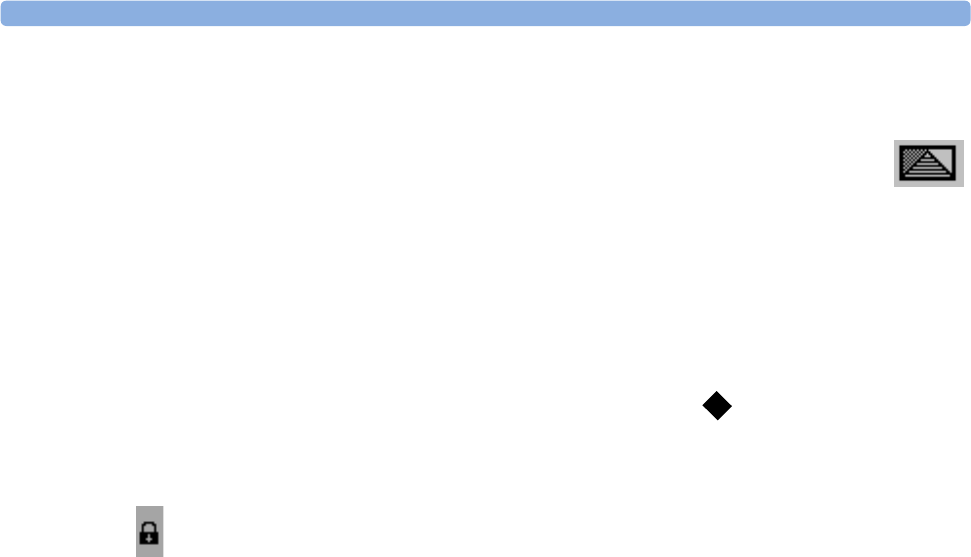
Default Profile
Your monitor has a default profile that it uses when you leave Demonstration, or Service modes, or
when you discharge a patient. This profile is indicated by a diamond .
Locked Profiles
Some profiles are locked, so that you cannot change them, even in Configuration Mode. These are
indicated by this lock symbol.
Understanding Settings
Each aspect of how the monitor works and looks is defined by a setting. There are a number of
different categories of settings, including,
Screen Settings, to define the selection and appearance of elements on each individual Screen
Measurement settings, to define settings unique to each measurement, for example, high and low
alarm limits
Monitor settings, including settings that affect more than one measurement or Screen and define
general aspects of how the monitor works, for example, alarm volume, reports and recordings, and
display brightness.
You must be aware that, although many settings can be changed in Monitoring Mode, permanent
changes to settings can only be done in the monitor’s Configuration Mode. All settings are reset to the
stored defaults:
• when you discharge a patient
•when you load a Profile
• when the monitor is switched off for more than one minute (if Automat. Default is set to
Yes).
Changing Measurement Settings
Each measurement has a setup menu in which you can adjust all of its settings. You can enter a setup
menu:
• via the measurement numeric - select the measurement numeric to enter its setup menu. For
example, to enter the Setup ECG menu, select the HR (heart rate) numeric.
• via the Setup hardkey (on plug-in modules) - press the Setup hardkey on the module front.

Changing Wave Speeds 1 Basic Operation
27
•via the Main Setup SmartKey - if you want to setup a measurement when the measurement is
switched off, use the Main Setup SmartKey and select Measurements. Then select the
measurement name from the popup list. With this SmartKey you can access any setup menu in the
monitor.
• via the Measurement Selection key.
This guide always describes the entry method using the setup menu. But you can use any method you
prefer.
Switching a Measurement On and Off
When a measurement is off, its waves and numerics are removed from the monitor’s screen. The
monitor stops data acquisition and alarming for this measurement. A measurement automatically
switches off if you disconnect its module or measurement server. If you disconnect a transducer, the
monitor replaces the measurement numeric with question marks.
1Enter the measurement’s setup menu and select the measurement.
2Select the measurement name to toggle between on and off. The screen display indicates the active
setting.
Switching Numerics On and Off
For some measurements, such as EEG, you can choose which numerics to view on the screen.
♦In the measurement’s setup menu, select the numeric name to toggle between on and off.
For example in the Setup EEG menu, select the EEG numeric name to toggle between on and
off.
Adjusting a Measurement Wave
♦To quickly adjust wave-related measurement settings (such as speed or size), select the
measurement wave itself. This displays the measurement Wave menu, which has only wave-
related measurement settings.
Changing Wave Speeds
Lowering the wave speed compresses the wave and lets you view a longer time period. Increasing the
speed expands the waveform, giving you a more detailed view.
The monitor distinguishes three groups of wave speed settings,
•RespiratorySpeed, for all respiratory waves: CO2, Resp. anesthetic agents and O2
•EEG Speed, for all EEG and BIS waves
•Global Speed, for all waves not included in the other two groups.
Changing the Wave Group Speed
The wave speed group setting defines the speed of all the waves in the group.
To change the wave speed of a wave speed group,
1Select Main Setup -> User Interface
2Select Global Speed, RespiratorySpeed, or EEG Speed as required

1 Basic Operation Freezing Waves
28
3Select a value from the list of available speeds.
Changing Wave Speed for a Channel
To change the wave speed of an individual wave channel,
1Enter the Wave menu for a measurement by selecting its wave.
2Select Change Speed.
3To set the speed to the wave group speed, select RespiratorySpeed, EEG Speed, or
Global Speed.
To set an individual channel speed, select a numeric value from the list of available speeds. This
overrides the wave group speed setting and set the speed for the individual wave channel on the
monitor Screen. The wave channel speed is independent of the wave (label) depicted in the
channel, if you change the wave, the new wave will retain the set channel speed.
Freezing Waves
You can freeze waves on the screen and measure parts of the wave using cursors. The waves are frozen
with a history of 20 seconds so that you can go back and measure what you have seen.
Freezing An Individual Wave
To freeze a wave,
1Enter the Wave menu for the measurement by selecting the wave on the screen.
2Select Freeze Wave.
The realtime wave is replaced with the frozen wave.
Freezing All Waves
To freeze all waves on the screen,
1Select the Freeze Waves SmartKey.
All realtime waves are replaced with frozen waves.
Measuring Frozen Waves
To measure a frozen wave,
1Select the frozen wave.
If you are using touch, this automatically positions the vertical cursor. The cursor can be
repositioned by touching the required point on the wave, or
2Using the Speedpoint or another pointing device or touch: use the right/left arrow keys to move
the vertical cursor.
The vertical cursor moves through the time axis and the current value is displayed next to the
cursor.
3Use the up/down arrow keys to activate and move the horizontal cursor.
The horizontal cursor measures the wave value, which is displayed above the cursor line.

Using Labels 1 Basic Operation
29
Changing The Wave Speed
Lowering the wave speed compresses the wave and lets you view a longer time period. Increasing the
speed expands the waveform, giving you a more detailed view.
To change the wave speed:
1Select the frozen wave.
2Select Change Speed.
3Select a speed from the list.
Updating The Frozen Wave
To update the wave, that is freeze the current wave:
1Select the frozen wave.
2Select Freeze Again.
Releasing Frozen Waves
To release frozen waves,
1Select a frozen wave.
2Select Unfreeze Waves.
All frozen waves are released.
Using Labels
You can measure multiple invasive pressures, temperatures, and SpO2 simultaneously. The monitor
uses labels to distinguish between them. The default settings defined in the profile (such as
measurement color, wave scale, and alarm settings) are stored within each label. When you assign a
label to a measurement, the monitor automatically applies these default settings to the measurement.
The labels assigned are used throughout the monitor, in reports, recordings, and in trends.
About Label Sets
Your monitor may be configured to use a Restricted or Full label set. The Full label set
provides extra labels for Pressure and Temp. See the sections in this Instructions for Use on Pressure
and Temp for more information.
If you connect a measurement server from a monitor using a Full label set to an IntelliVue monitor
using a Restricted label set or an M3/M4 monitor, any additional labels switch to labels available
in the target monitor. This may cause a label conflict with other monitored measurements.
Be aware that connecting a monitor using the Full label set to an Information Center with certain
software revisions may affect the availability of measurement information from the additional labels on
the Information Center. See the Information Center documentation and your monitor’s
Configuration Guide for information on label set compatibility.
Changing Measurement Labels (e.g. Pressure)
To change a measurement label of a measurement with multiple labels (invasive pressure, temperature,
or SpO2),
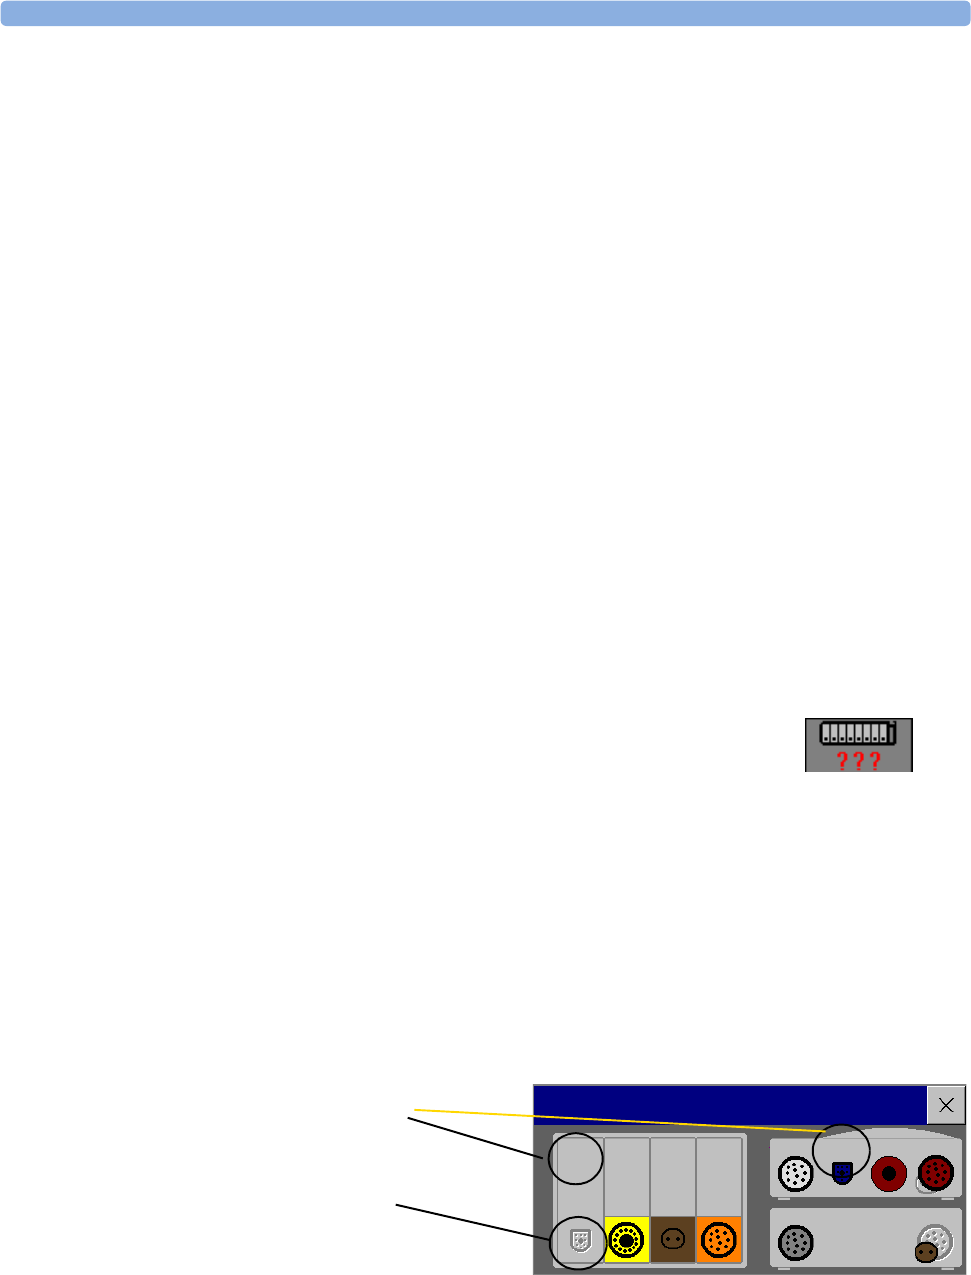
1 Basic Operation Using Labels
30
1Enter the Wave menu of the measurement.
2Select Label.
3Choose a label from the list.
The monitor automatically applies the scale, color, etc. settings stored in the Profile for the label you
select. You can change scale settings in Monitoring Mode, but color can only be changed in the
monitor’s Configuration Mode.
Any labels already being used in the monitor are shown “grayed-out” in the list and cannot be selected.
Give me an example Let’s imagine you used a Press module to monitor your previous patient’s CVP.
Now you want to use the same module to measure ABP with a new patient. You’ve set up your arterial
line. When you connect the pressure transducer to the module, the pressure shown on the screen still
uses the CVP color and wave scale and is labeled CVP. To rectify this, just change the pressure label to
ABP. Now the pressure has the correct color, the wave is shown in the correct scale, and the
appropriate alarm limits for ABP are active.
Resolving Label Conflicts
Each label must be unique, that is, it can only be assigned once. You cannot monitor two pressures
labelled “ICP” at the same time. If you need to use two identical pressures, you must assign different
labels to them, for example, P and ICP.
Measurement labels are stored in the measurement device (module or measurement server). If you try
to use two measurement devices that have identical labels, this causes a label conflict in the monitor.
Depending on your configuration, the monitor will either
• resolve the conflict automatically, by assigning a new, generic label
to the most recently connected conflicting label (e.g. a second FAP
label could be changed to ABP)
•display the Measurement Selection window automatically
for you to resolve the conflict
• take no action, you must enter the Measurement
Selection window and resolve the conflict
All the currently available measurement devices are depicted in the Measurement Selection
window. Any measurement labels causing a label conflict are shown in red. If a measurement device is
connected but currently unavailable, for example, because it was deactivated due to a label conflict, the
device is shown “grayed-out”.
To resolve a label conflict,
1Select the measurement selection key or select Main Setup -> Measurement Selection
to display the Measurement Selection window.
measurement selection key
with question marks
indicating a label conflict
Measurement Selection
SpO2 BIS SpO2
Tskin C.O. EcgRsp NBP ABP
CO2 Temp
Conflicting measurement
labels are shown in red
De-activated labels are
grayed-out

Changing Monitor Settings 1 Basic Operation
31
2Select the device whose label you want to correct.
3Use the measurement selection pop-up keys to resolve the conflict. Select either:
–Change Label to assign a different label to the conflicting label
–De-activate: to disable the conflicting device. It retains its label for future use but becomes
invisible to the monitor, as though it had been unplugged. When the device has been deactivated
the question marks under the measurement selection key will be replaced by XXX.
–Setup <Measurement label>: to enter the Setup menu for the measurement and change
the conflicting device’s label to a different label.
–Modify Driver (VueLink only) - change the VueLink device driver.
Changing Monitor Settings
♦To change monitor settings such as date and time, brightness, or QRS tone volume, select the
Main Setup SmartKey and then select the setting you want to change, or select User
Interface to enter a submenu where you can change user interface settings.
Adjusting the Screen Brightness
1Select the Brightness SmartKey.
2Select the appropriate setting for the screen brightness. 10 is the brightest, 1 is the least
bright.
Your monitor may be configured with a lower brightness for Standby mode and also (for battery
powered monitors) for transport to conserve battery power.These settings can only be changed in the
monitor’s Configuration Mode.
If you are using an MP80 or MP90 with an external display, the Brightness SmartKey does not
adjust the brightness of this display. See the instructions supplied with the external display for
instructions.
Adjusting Touch Tone Volume
The touch tone volume is the tone you hear when you select any field on the monitor screen. To adjust
the touch tone volume,
1In the Main Setup menu, select User Interface
2Select TouchToneVolume, then select the appropriate setting for the touch tone volume: 10 is
the loudest and 1 is the quietest. Selecting zero switches the touch tone volume off.
Setting the Date and Time
If your monitor is connected to an Information Center, the date and time are automatically taken from
this. Once it is set, the internal clock retains the setting even when you switch off the monitor.
WARNING Changing the date or time will affect the storage of trends and events.
1Select the Date, Time screen element from the monitor’s info line to enter the Date, Time
menu.

1 Basic Operation Checking Your Monitor Revision
32
2Select, in turn, the Year, Month, Day, Hour (in 24 hour format, only) and Minute as
necessary. Select the correct values from the pop-up list.
3Select Store Date, Time to change the date and time.
Checking Your Monitor Revision
1Select Main Setup -> Revision to open the Monitor Revision menu.
2Select the correct device from the device pop-up keys.
3From the Monitor Revision menu, select the monitor component for which you need
revision information.
Getting Started
Once you understand the basic operation principles, you can get ready for monitoring.
Inspecting the Monitor
WARNING If the monitor is mechanically damaged, or if it is not working properly, do not use it for any
monitoring procedure on a patient. Contact your service personnel.
1Before you start to make measurements, carry out the following checks on the monitor including
all connected Measurement Servers, modules, or measurement server extensions.
– Check for any mechanical damage.
– Check all the external cables, plug-ins and accessories.
2Plug the power cord into the AC power source. If you are using battery power, ensure that the
battery has sufficient power for monitoring. When you use a battery for the first time, you must
charge it, following the instructions given in the section on Charging Batteries.
3Check all the functions of the instrument that you need to monitor the patient, and ensure that the
instrument is in good working order.
Switching On
♦Press the on/off switch on the monitor for one second. The monitor performs a self test and is then
ready to use. If you see a message such as CO2 Sensor Warmup wait until it disappears before
starting monitoring that measurement. Connected devices usually take their power from the
monitor. External devices such as gas monitors and those connected via VueLink have their own
power switches.
CAUTION When using an MP90 monitor with a D80 Intelligent Display, always switch power on directly at the
MP90 or at a remote SpeedPoint or remote alarm device directly connected to the MP90.
Setting up the Measurement Servers and Modules
1Decide which measurements you want to make.

Disconnecting from Power 1 Basic Operation
33
2Connect the required modules, Measurement Servers, or measurement server extensions.
3Check that you have the correct patient cables and transducers plugged in. The connectors are
color-coded to the patient cables and transducers for easy identification.
Starting Monitoring
After you switch on the monitor,
1Admit your patient to the monitor.
2Check that the profile, alarm limits, alarm and QRS volumes, patient category and paced status
and so forth are appropriate for your patient. Change them if necessary.
3Refer to the appropriate measurement section for details of how to perform the measurements you
require.
Disconnecting from Power
The On/Standby switch does not disconnect the monitor from the ac power source. To disconnect,
unplug the power cable.
Monitoring After a Power Failure
If the monitor is without power for less than one minute, monitoring will resume with all active
settings unchanged. If the monitor is without power for more than one minute, the behavior depends
on your configuration. If Automat. Default is set to Yes, the default profile will be loaded
when power is restored. If Automat. Default is set to No, all active settings are retained, if power
is restored within 48 hours. The Automat. Default setting is made in Configuration Mode.
Networked Monitoring
If your monitor is connected to a network, a network symbol is displayed in the upper left corner next
to the bed label. To see details about the Care Group, the monitoring equipment, and technical
information about the network,
♦MP20/MP30/MP40/MP50 - select the monitor info line to enter the Setup menu, then select
Bed Information.
♦MP60/MP70/MP80/MP90 - in the monitor info line, select the bed label.
Be aware that some network-based functions may be limited for monitors on wireless networks in
comparison to those on wired networks.
Using Remote Applications
If your monitor is connected to a Philips Application Server, you can access applications hosted
remotely on the Application Server and display and operate them on the bedside monitor screen. The
Application Server provides portal technology to allow information access through a web browser,
terminal emulation, or served applications. The applications available depend on the Application
Server configuration: see the device documentation for details. A Remote Application window can also
be embedded in a monitoring Screen.
To display remote applications on the monitor,
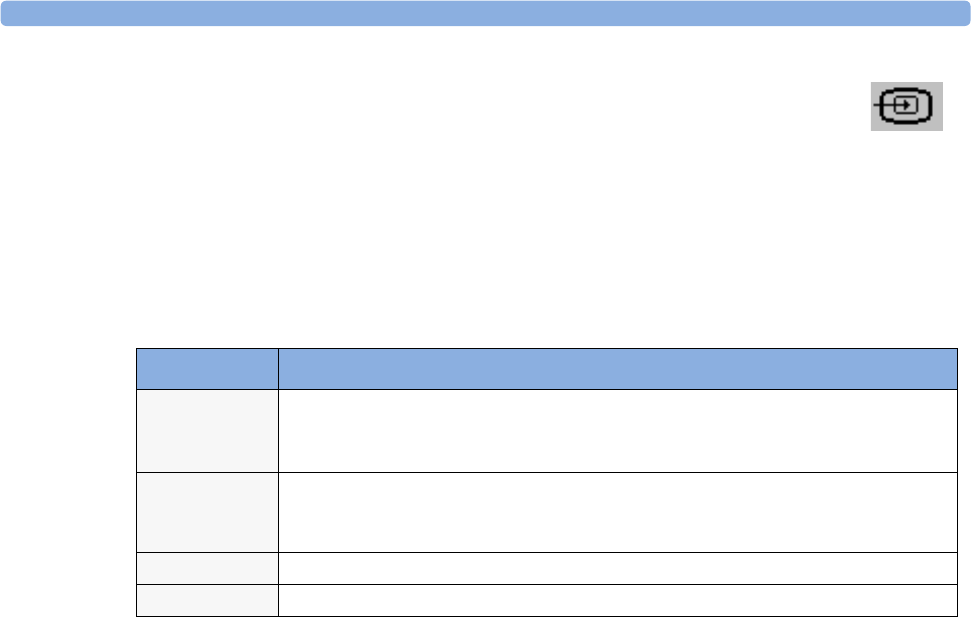
1 Basic Operation Using Remote Applications
34
1In the Main Setup menu, select Remote Applics, or select the
Remote Applications SmartKey.
2Select the required application from the pop-up list of available applications.
3Operate the application with your preferred monitor input device: touchscreen, SpeedPoint,
navigation point, keyboard or mouse.
Remote Application Popup Keys
The Remote Application window occupies a pre-defined area on the monitor Screen. The maximum
size of the area depends on the resolution of your display. If the pre-defined area for the Remote
Application covers the full monitor Screen (on independent second displays only), the pop-up keys are
not displayed. In this case a small window appears with two keys: one (with the Remote Application
symbol) to display the pop-up keys and another to move the small window if it is obstructing viewing.
If you change the monitor Screen while a Remote Application is running, and the pre-defined area on
the second Screen is smaller, the Remote Application cannot be shown at full size. You must select a
suitable monitor Screen to display the Remote Application again.
Pop-Up Keys Selecting this pop-up key lets you....
Minimize minimize the Remote Application window; the session continues running in the
background. Select the Remote Application symbol to show the window at full size
again.
Keyboard start a keyboard application to show a keyboard on the display. This key is not available
if the keyboard application is not installed or not supported on the Philips Application
Server.
Refresh update the content of the Remote Application window.
Close close the Remote Application session.

35
2
2What’s New?
This section lists the most important new features and improvements to the monitor and its user
interface introduced with each release. Further information is provided in other sections of this book.
You may not have all of these features, depending on the monitor configuration purchased by your
hospital.
What’s New in Release D.0?
M1014A Spirometry Module
The spirometry module produces a real time wave for flow, volume and pressure of respiratory gases
together with numerics for analysis of ventilatory mechanics. It is designed to be used in combination
with Philips-branded airway flow sensors and combined CO2/airway flow sensors.
M3014A Capnography Extension
The M3014A Capnography Extension offers an additional measurement method - sidestream CO2
with the M2741A sensor.
M8016A D80 Intelligent Display
The D80 Intelligent Display can be used as a third main display with the MP90 monitor. You then
have three displays able to be configured individually and to be operated independently.
IntelliVue 802.11 Bedside Adapter
The 802.11 Bedside Adapter is a wireless ethernet adapter which can be built in to the patient monitor
(option J35). It provides wireless connectivity to standard IEEE 802.11a/b/g wireless networks.
Improved Multiple Display Support
• Wide and Tall screen layouts are supported which allow screen content to be spread over two screens
next to each other (wide acreen) or one above the other (tall screen).
• An additional main display used for a surgeon can be configured not to show alarm information.
The permanent keys and SmartKeys can also be configured not to display.
• Input devices can be assigned to an operator, independent of physical connector location.
New SmartKeys
For the new spirometry module there is a SmartKey to provide direct access to the spirometry data
window. For microstream and sidestream CO2, sampling can now be suppressed directly with the
SmartKey CO2 Pump Off.

2What’s New? What’s New in Release C.0?
36
What’s New in Release C.0?
IntelliVue MP80
The MP80 patient monitor is a new addition to the IntelliVue patient monitor family. The
functionality is similar to that of the MP70 but with the flexibility of component modularity as in the
MP90.
M3014A Capnography Extension
The M3014A Capnography Extension offers a new measurement combination - mainstream CO2,
cardiac output, invasive pressure and invasive pressure/temperature.
M8045A Docking Station
The docking station provides quick mounting and connections for the MP20/MP30/MP40/MP50 in
a one-step operation. By placing the monitor on the docking station and closing the lever you can
make the connection to AC power and to a network, if present.
BIS Interface Board
This interface board allows use of Bispectral Index monitoring with the MP20 and MP30.
Timers Application
The new Timers application allows you to set timers to notify you when a specific time period has
expired. The timers can have varying characteristics and can be located on the Main screen for easy
viewing.
IntelliVue Instrument Telemetry (USA only)
Wireless network capabilities via the IntelliVue Instrument Telemetry network using a built-in
interface (MP20/MP30) or an external adapter (MP40/MP50).
Remote Applications
Remote applications can now be embedded in a monitoring Screen. The display colors for remote
applications have been enhanced.
Basic Operation
• Selection and order of SmartKeys can now be configured in the monitor’s Configuration mode.
• A new SmartKey exits Standby mode at the gas monitor.
• Direct operation of a second independent display with the MP90, using standard input devices.
• Networked monitors can now show Telemetry information for the “Own Bed” in an overview
window or embedded in a Screen.
• Overview bed information can be configured to display in the colors used at the Information Center
(with Information Center System G or higher).
• Support for Unit-based Care Group model for up to 64 beds (with Information Center System G or
higher).
• Battery status information on the main screen now includes estimated monitoring time available
during battery charging.
• Barcode reader support during patient admission.
• Direct entry to graphical trends when a limit alarm is selected in alarm review and to the event
episode window when an event alarm is selected.
• MP90: screen trends can now also be viewed on the second display.

What’s New in Release B.1? 2What’s New?
37
Trends
• In graphical trends, a segment menu allows direct adjustment of trend scales, automatic scale
optimization, expanded view for an individual segment.
• In graphical and horizon Screen Trends a cursor is available.
• In the Vital Signs window, the values can be shown with the parameter color.
Events
• Events can be configured to be signaled as alarms (advanced event surveillance only).
• Deviation triggers can be set which trigger an event when measured values change by a defined
amount over a set time (advanced event surveillance only).
• Up to six event groups can be active simultaneously (advanced event surveillance only).
Measurements
• Pulse Pressure Variation is a new derived measurement calculated from beat-to-beat arterial pressure
values.
• MAC value calculations
Applications
• Improved Drug Calculator meeting JCAHO requirements.
• The ST Map application shows ST changes over time in two multi-axis spider diagrams.
• Freeze and measure waves on the Main Screen.
What’s New in Release B.1?
IntelliVue MP20/MP30
The MP20/MP30 patient monitor is a new addition to the IntelliVue patient monitor family. It is
smaller and lighter than the MP40/MP50 monitors and can be powered by battery. It can be used with
the measurement server and server extensions and has a built-in recorder.
Basic Operation
• New Measurement Selection window makes it easier to resolve measurement label conflicts
• New Previous/Next Screen function provides access to the ten most recently modified Screens
• Wave speeds can now be set for individual wave channels
Trends
• Cursor in graphical trend window improves navigation in the trends database
• Vital Signs and Graphical Trend screen elements can be embedded on a Screen
• New band style format for displaying trends of measurements with multiple numerics
• Horizon trend is a new format for screen trends, showing the deviation from a stored baseline
• Aperiodic measurements now stored with a timestamp in Vital Signs
• New symbol representing NBP measurements in Graphical Trends
Measurements
• ST numerics in the Alarm Limits window can be shown and hidden

2What’s New? What’s New in Release B.0?
38
• ST Point can be set directly by selecting a numeric value
• New NBP countdown timer shows the time remaining until the next NBP measurement in a series
• Networked monitors can now show Other Bed information embedded on Screen
• Additional labels available for Pressure and Temp
• Additional options for SpO2, support for an extended list of accessories
• Suppress Zero function for Microstream CO2
Applications
• Drug Calculator can now be configured to include a list of commonly-used drugs
• Cursor in the Loops window improves navigation through the stored loops
• Volume-flow loops added to the list of respiratory loops types
• Loops Report for documentation of stored loops
• EEG CSA can now be called up and viewed in a window over the currently displayed Screen
What’s New in Release B.0?
IntelliVue MP40/MP50 The MP40/MP50 patient monitor is a new addition to the IntelliVue
patient monitor family. It uses the same measurement devices as the MP60/MP70/MP90 monitors
and shares the same technological platform and user interface, but is more compact in size and can be
operated by battery.
M3012A Measurement Server Extension The new Hemodynamic Measurement Server Extension
extends measurement capability by adding two additional pressures and Cardiac Output.
M1020B SpO2 Module New SpO2 measurement module, M1020B, enables dual SpO2
measurement without the need to use the VueLink module. Two options are available:
– Option A01 for use with Philips reusable and disposable sensors and Nellcor “R-Cal” disposable
sensors.
– Option A02 for use with Nellcor OxiMax sensors, including the MAX-FAST forehead sensor.
M1020B Option A02 for use with Nellcor OxiMax sensors may not be available in all countries.
PV Loops: compares graphic representations of airway waves to help detect changes in the patient
airway condition.
High-resolution waves per Screen: the number of high-resolution waves that can be shown on a
Screen is increased, limited only by the Axx Option purchased.
Alarms symbols: New alarm symbols are introduced, and “short” yellow alarms were renamed “one-
star” yellow alarms (yellow arrhythmia alarms).
Aperiodic measurements available as Screen Trends: patient trend information for NBP, C.O., C.I.,
and Wedge can now be permanently displayed on the Screen in tabular and graphical form.

What’s New in Release A.2? 2What’s New?
39
What’s New in Release A.2?
12-Lead ECG recordings: 12-Lead ECG waves and numerics can be sent to a connected recorder
High-Resolution Trend Report: high-resolution trend report can be sent to a connected printer
ST Snippets ST snippets, showing a one second wave segment for each measured ST lead, can be
permanently displayed on the Screen or called up as required.
EEG Wave Speed: new EEG-specific wave speeds have been added to the list of wave speeds available
Drug Calculator: this new feature helps you to calculate drug dosages for your patients
On-Screen Calculator: a mathematics calculator can be used on the Screen
Visitor Screen: this new Screen is designed to hide sensitive patient information from the Screen.
Monitoring and alarm generation function as usual.
Touch selection volume control: The volume of the audio prompt given when a screen element is
selected is now adjustable
VueLink interface: the VueLink on-screen appearance and controls are improved
M3001A: Trend upload from the Multi-Measurement Server (M3001A) improved
Screen Trends: lets you display patient trend information in graphic form permanently on the Screen
Alarm Limits Page: lets you view and control alarm settings for all measurements in one window
New Option for Event Surveillance: a new neonatal event review option #C04 is introduced
Second display To simultaneously show two different Screens, a second display can be connected to
the MP90. The second display is for viewing only.

2What’s New? What’s New in Release A.2?
40

41
3
3Alarms
The alarm information here applies to all measurements. Measurement-specific alarm information is
discussed in the sections on individual measurements.
The monitor has three alarm levels: red, yellow, and INOP.
Red and yellow alarms are patient alarms. A red alarm indicates a high priority patient alarm such as a
potentially life threatening situation (for example, asystole). A yellow alarm indicates a lower priority
patient alarm (for example, a respiration alarm limit violation). Yellow arrhythmia alarms are specific to
arrhythmia-related patient conditions (for example, ventricular bigeminy).
INOPs are technical alarms, they indicate that the monitor cannot measure or detect alarm conditions
reliably. If an INOP interrupts monitoring and alarm detection (for example, LEADS OFF), the
monitor places a question mark in place of the measurement numeric and an audible indicator tone
will be sounded. INOPs without this audible indicator indicate that there may a problem with the
reliability of the data, but that monitoring is not interrupted.
Alarms are indicated after the alarm delay time. This is made up of the system delay time plus the
trigger delay time for the individual measurement. See the specifications section for details.
If more than one alarm is active, the alarm messages are shown in the
alarm status area in succession. An arrow symbol next to the alarm
message informs you that more than one message is active.
The monitor sounds an audible indicator for the highest priority alarm. If more than one alarm
condition is active in the same measurement, the monitor announces the most severe. Your monitor
may be configured to increase alarm indicator volume automatically during the time when the alarm is
not acknowledged.
↑ ** HR HIGH

3Alarms Visual Alarm Indicators
42
Visual Alarm Indicators
Alarm message: An alarm message text appears in the alarm status area at the top of the screen
indicating the source of the alarm. If more than one measurement is in an alarm condition, the message
changes every two seconds, and has an arrow ( ) at the side. The background color of the alarm
message matches the alarm priority: red for red alarms, yellow for yellow alarms, and light blue for
INOPs. The asterisk symbols (*) beside the alarm message match the alarm priority: *** for red alarms,
** for yellow alarms, * for yellow arrhythmia alarms. INOPs are displayed without asterisks.
Depending on how your monitor is configured, it may display alarm limit violation messages
• in text form, for example “**SpO2 LOW” or
• in numeric form, for example “**SpO2 94<96”, where the first number shows the maximum
deviation from the alarm limit, and the second number shows the currently set limit.
Flashing numeric: The numeric of the measurement in alarm flashes.
Bright alarm limits: If the alarm was triggered by an alarm limit violation, the corresponding alarm
limit on the monitor screen is shown more brightly.
Alarm lamp: A lamp on the monitor’s front panel flashes. This has the same color as the alarm
priority.
Nurse call systems: Alarm conditions are indicated on any device connected to the nurse call relay, if
configured to do so.
Audible Alarm Indicators
The audible alarm indicators configured for your monitor depend on which alarm standard applies in
your hospital. Audible alarm indicator patterns are repeated until you acknowledge the alarm by
switching it off or pausing it. or until the alarm condition ceases (if audible alarm indication is set to
non-latching).
WARNING Do not rely exclusively on the audible alarm system for patient monitoring. Adjustment of alarm
volume to a low level or off during patient monitoring may result in patient danger. Remember that
the most reliable method of patient monitoring combines close personal surveillance with correct
operation of monitoring equipment.
Alarm Tone Configuration
The audible alarm indicators of your monitor are configurable. In the monitor’s Configuration Mode,
you can:
• increase the alarm volume of unacknowledged alarms at regular intervals
• change the interval between alarm sounds (ISO/IEC Standard 9703-2 alarms only)
• change the base volume of the red and yellow alarm tones and the INOP tones
• change the alarm sound to suit the different alarm standards valid in different countries.

Audible Alarm Indicators 3Alarms
43
Traditional Audible Alarms (HP/Agilent/Philips/Carenet)
• Red alarms: A high pitched sound is repeated once a second.
• Two-star yellow alarms: A lower pitched sound is repeated every two seconds.
• One-star yellow alarms (arrhythmia alarms): The audible indicator is the same as for yellow alarms,
but of shorter duration.
• INOPs: an INOP tone is repeated every two seconds.
ISO/IEC Standard 9703-2 Audible Alarms
• Red alarms: A high pitched tone is repeated five times, followed by a pause.
• Two-star yellow alarms: A lower pitched tone is repeated three times, followed by a pause.
• One-star yellow alarms (arrhythmia alarms): The audible indicator is the same as for yellow alarms,
but of shorter duration.
• INOPs: a lower pitched tone is repeated twice, followed by a pause.
Changing the Alarm Tone Volume
♦The alarm volume symbol at the top right of the monitor screen gives you an
indication of the current volume. To change the volume, select the volume symbol
and then select the required volume from the pop-up selection.
♦If you want to see a numerical indication of the current alarm volume on a scale
from zero to 10, select the Alarm Volume SmartKey. The volume scale pops up.
The current setting is indented. To change the setting, select the required number
on the scale. Any settings that are inactive (“grayed out”) have been disabled in the
monitor’s Configuration Mode.
When the alarm volume is set to zero (off), the alarm volume symbol reflects this. If you
switch the alarm volume off, you will not get any audible indication of alarm conditions.
Minimum Volume for No Central Monitoring INOP
If your monitor is connected to an Information Center, and the connection is interrupted, the INOP
message No Central Monit. will appear within 30 seconds, accompanied by an INOP tone. To
help ensure that this INOP, and any other active alarm, is not overlooked, the INOP and alarm tones
may be configured to have a minimum volume. In this case, INOP and alarm tones will sound even if
the monitor alarm volume is set to zero.
Alarm
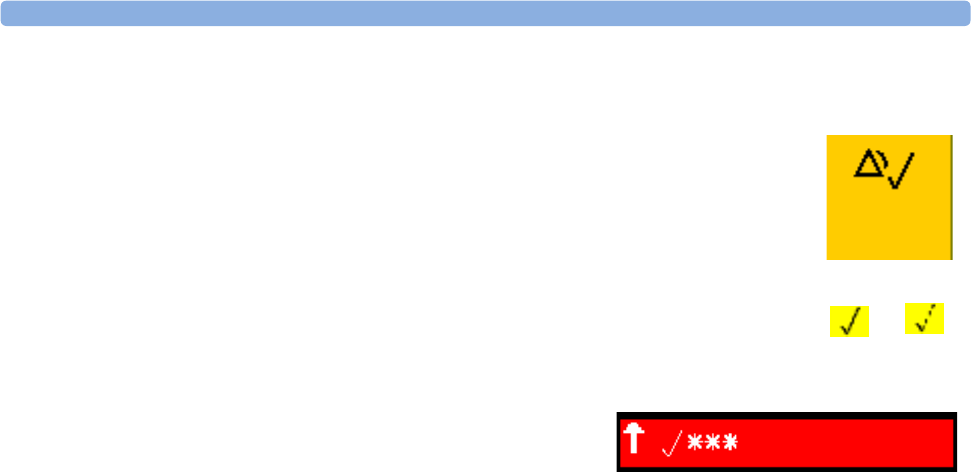
3Alarms Acknowledging Alarms
44
Acknowledging Alarms
To acknowledge all active alarms and INOPs, select the Silence permanent
key. This switches off the audible alarm indicators and alarm lamps. Alternatively,
you can acknowledge alarms by pressing the Silence hardkey on the MMS or
on the SpeedPoint. The hardkeys follow the behavior configured for the
permanent key.
A check mark beside the alarm message indicates that the alarm has been
acknowledged. If the monitor is configured to re-alarm, a dashed check mark will
be shown.
If the condition that triggered the alarm is still present
after the alarm has been acknowledged, the alarm message
stays on the screen with a check mark symbol beside it.
If the alarm condition is no longer present, all alarm indicators stop and the alarm is reset.
Switching off the alarms for the measurement in alarm, or switching off the measurement itself, also
stops alarm indication.
Acknowledging Disconnect INOPs
Acknowledging an INOP that results from a disconnected transducer switches off the associated
measurement. The only exception is ECG/Resp: acknowledging a disconnect INOP for ECG leads
does not switch off the ECG and Resp measurements. Acknowledging a disconnect INOP at the
Information Center switches off the audible INOP indicator but does not switch off the measurement.
Unplugging an MMS or a plug-in module automatically switches off its measurements.
Alarm Reminder (ReAlarm)
If Alarm Reminder is configured on for your monitor, you will get an audible reminder of alarm
conditions that remain active after you have acknowledged the alarm. This reminder may take the form
of a repetition of the alarm tone for a limited time, or an unlimited repetition of the alarm tone (this is
the same as a new alarm). There is no alarm reminder for INOPs.
In Configuration Mode, you can set the interval between silencing the alarm and sounding the
reminder tone to one, two, or three minutes.
Pausing or Switching Off Alarms
If you want to temporarily prevent alarms from sounding, for example while you are moving a patient,
you can pause alarms. Depending on your monitor configuration, alarms are paused for one, two, or
three minutes, or infinitely.
To view the alarm pause setting chosen for your unit,
1Select Main Setup -> Alarm Settings
2Check the Alarms Off setting.
This setting can only be changed in Configuration Mode.
Silence
APNEA
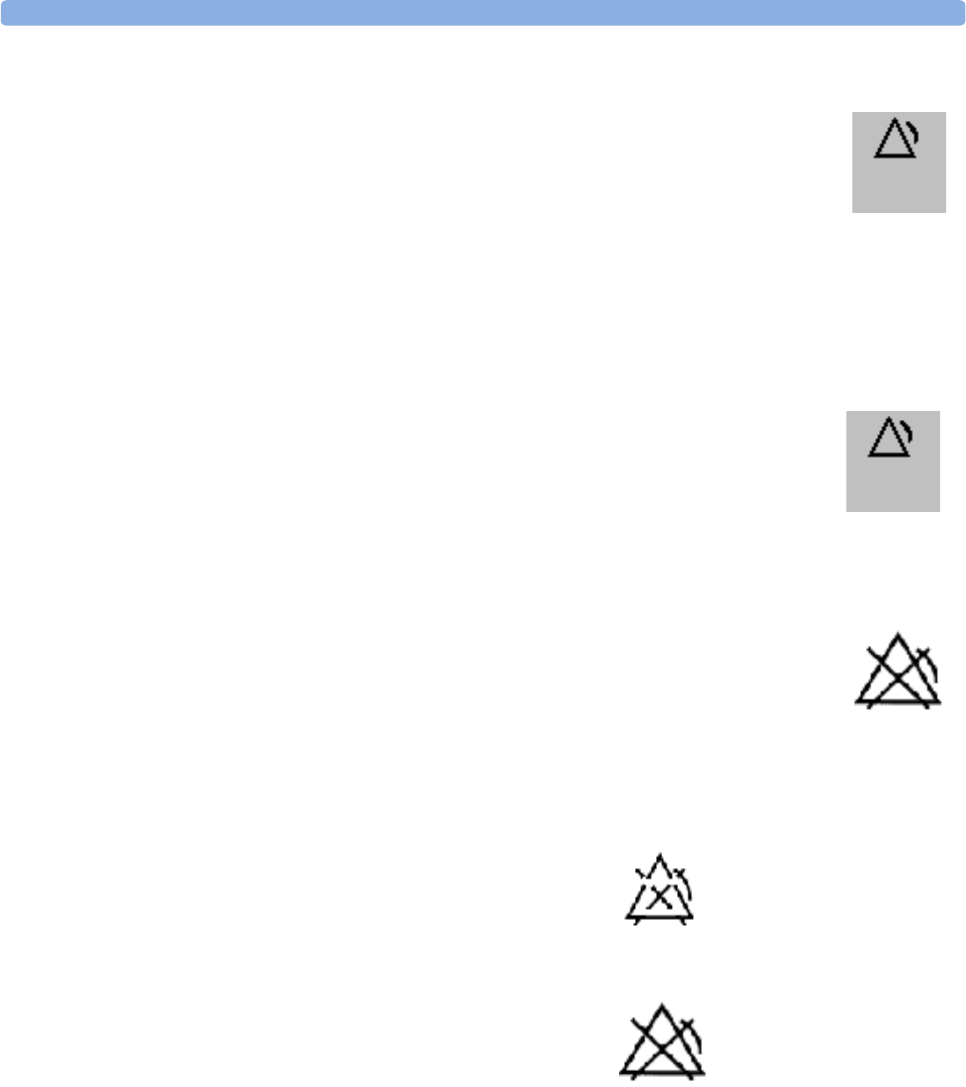
Pausing or Switching Off Alarms 3Alarms
45
To Pause All Alarms
♦Select the Pause Alarms permanent key. If your monitor is configured to
infinite pause time, the permanent key is labelled Alarms Off, and selecting it
switches alarms off.
♦Or press the Alarms hardkey on the SpeedPoint or Navigation Point. The hardkey
follows the behavior configured for the permanent key.
To Switch All Alarms Off
You can only switch alarms off permanently if your monitor is configured to allow infinite alarms
pause and the permanent key is labelled Alarms Off.
♦Select the Alarms Off permanent key.
♦Or press the Alarms hardkey on the SpeedPoint or Navigation Point. The
hardkey follows the behavior configured for the permanent key.
Pausing alarms infinitely is the same as switching them off.
To Switch Individual Measurement Alarms On or Off
1Select the measurement numeric to enter its setup menu.
2Select Alarms to toggle between On and Off.
The alarms off symbol is shown beside the measurement numeric.
While Alarms are Paused or Off
• The red Alarms Paused lamp on the monitor front panel is lit.
•In the alarm field, the monitor displays the message
Alarms Paused or Alarms Off, together with
the alarms paused symbol and the remaining pause
time in minutes and seconds, or alarms off symbol.
• No alarms are sounded and no alarm messages are
shown.
• INOP messages are shown but no INOP tones are
sounded.
The only exceptions are the INOPs Battery/Batteries Empty, Battery/
Batteries Malfunction, Batt 1/2 Missing, and NBP Cuff Overpressure.
These INOPs are sounded even if alarms are paused or off.
• The nurse call relay is not active.
If a disconnect INOP is present and alarms are paused or switched off, the measurement in question is
switched off.
Pause
Alarms
Alarms
Off
ALARMS PAUSED 1:28
ALARMS OFF

3Alarms Alarm Limits
46
Restarting Paused Alarms
♦To manually switch on alarm indication again after a pause, select the permanent key
Pause Alarms (or Alarms Off) again.
Alarm indication starts again automatically after the pause period expires. If the monitor is configured
to stay paused infinitely, you must select Alarms Off again to restart alarm indication.
Resetting Arrhythmia Alarm Timeouts
♦To reset the arrhythmia alarm timeout period, select the Alarms Off or Pause Alarms
permanent key and then reselect it.
Extending the Alarm Pause Time
If your monitor has extended alarm pause enabled, you can extend the alarm pause time. Use this to
prevent alarms being indicated, for example, while you are washing a patient or carrying out a
procedure. Only extend the alarm pause time when you are sure that clinical personnel are available to
monitor the patient’s condition closely.
To extend the alarm pause time to five or 10 minutes,
1Select one of the alarm fields. This calls up the Alarm Messages window.
2Select either the pop-up key Pause Al. 5 min or the pop-up key Pause Al. 10 min.
Each time you select one of these pop-up keys, the Alarm Pause Time is reset to five (or 10)
minutes.
Alarm Limits
The alarm limits you set determine the conditions that trigger yellow and red limit alarms. For some
measurements (for example, BIS and SpO2), where the value ranges from 100 to 0, setting the high
alarm limit to 100 switches the high alarm off, and setting the low alarm limit to 0 switches it off. In
these cases, the alarms off symbol is not displayed.
WARNING Be aware that the monitors in your care area may each have different alarm settings, to suit different
patients. Always check that the alarm settings are appropriate for your patient before you start
monitoring.
Viewing Individual Alarm Limits
You can usually see the alarm limits set for each measurement next to the
measurement numeric on the main screen.
If your monitor is not configured to show the alarm limits next to the numeric,
you can see them in the appropriate measurement setup menu. Select the
measurement numeric to enter the menu and check the limits.
85
120
50
HR
Alarm limits
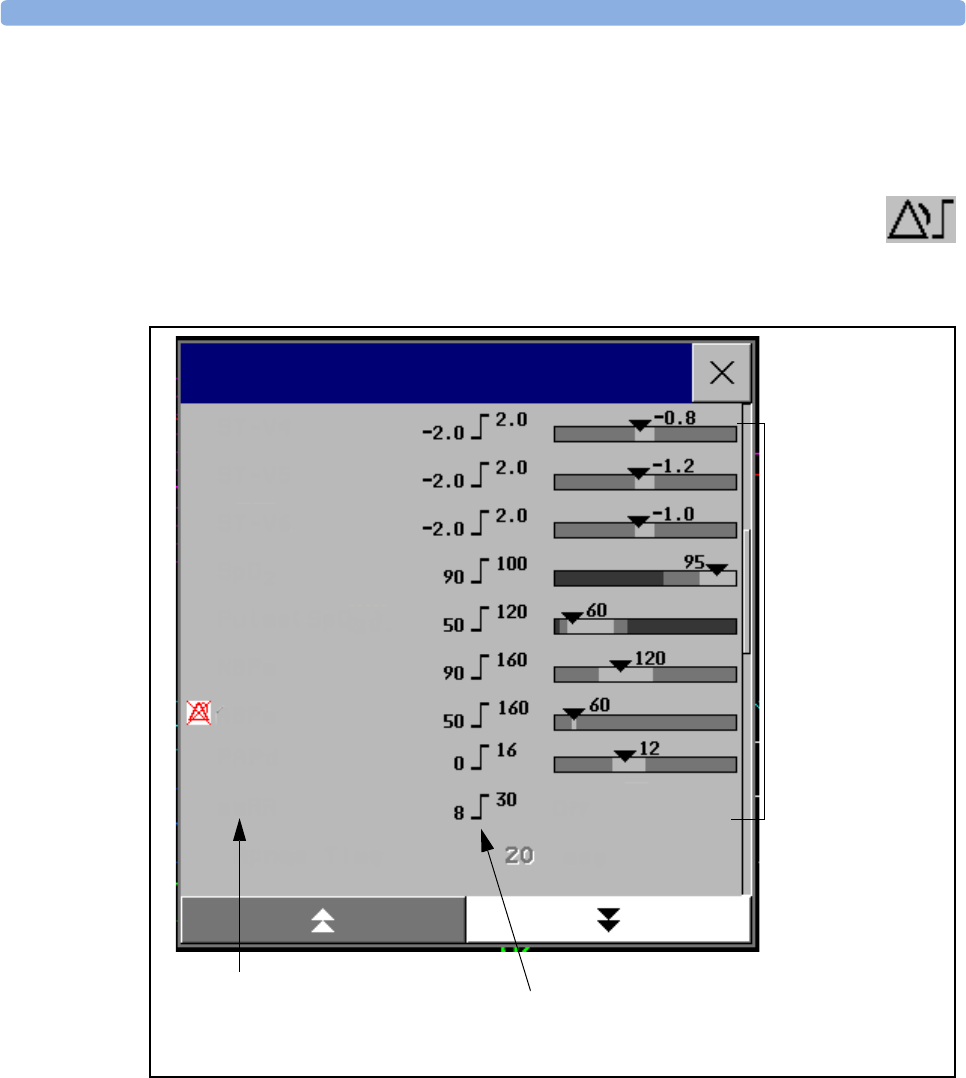
Alarm Limits 3Alarms
47
Viewing All Alarm Limits
The Alarm Limits overview window lists the currently set alarm limits for all measurements. If an
Apnea alarm delay time is set, this is also shown. The Alarms Off symbol is shown beside the
measurement label of any measurement whose alarm switched off.
To open the Alarm Limits window, either select any alarm field to open the Alarm
Messages window, then select the Alarm Limits pop-up key, or select the Alarm
Limits SmartKey, if configured.
♦Select Show ST Limits to expand the list of ST leads and view the currently set alarm limits.
Selecting Hide ST Limits hides the list again.
You can use the pop-up keys that open with the Alarm Limits window to perform common tasks:
–All Al. On/All Al. Off,
–All Lim. Narrow/All Lim. Wide to set narrow or wide alarm AutoLimits for all
measurements.
–Print Limits/Record Limits to print a list of all current alarm limit settings on a
connected printer or recorder.
Measurement labels, with alarms
off symbol where appropriate
Current alarm limits
Graphic view of current
yellow and red alarm
limits and currently
monitored measurement
value
Off indicates the
measurement is switched
off
Alarm Limits
ST-V4
ST-V5
ST-V6
SpO2
Pulse (SpO2)
ABPs
PAPd
awRR
NBPs
Apnea Time
Off
sec
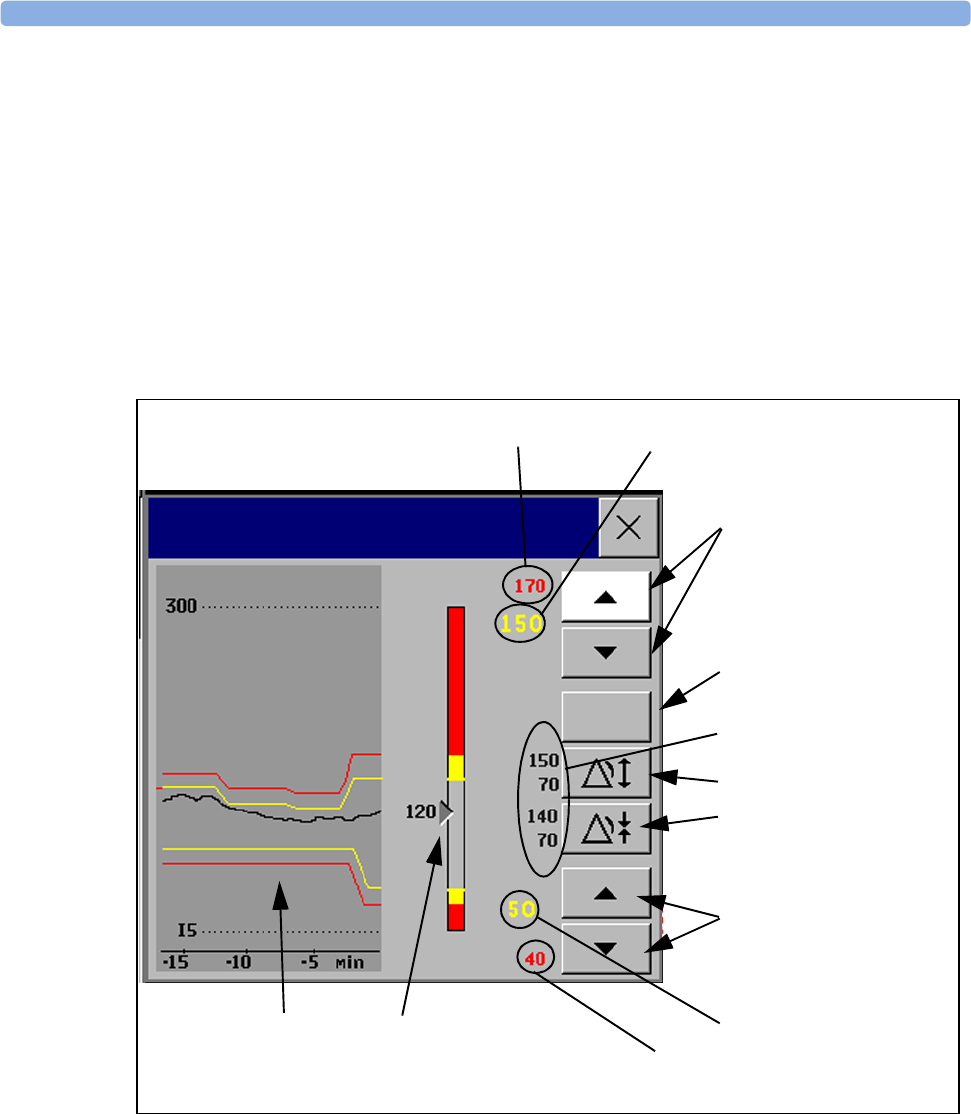
3Alarms Alarm Limits
48
These pop-up keys are not available in the window for changing individual alarm limits which you
access by selecting the measurement label in the Alarm Limits window.
Changing Alarm Limits
To change individual measurement alarm limits using the measurement’s Setup Menu,
1in the measurement’s setup menu, select the alarm limit you want to change. This calls up a list of
available values for the alarm limit.
2Select a value from the list to adjust the alarm limit.
Alternatively, you can use the keys in the measurement Change Limits window, which you access by
selecting the measurement label in the Alarm Limits window.
To change alarm limits,
1In the Change Limits window,
– if you are using touch, select the up or down arrow buttons to adjust the high and low alarm
limits as required.
– if you are using a SpeedPoint or Navigation Point, position the cursor in the high yellow alarm
field, then press the knob inwards. Rotate the knob to the left or right to adjust the limit. Press
the knob again to set the displayed limit.
2Repeat to set the low yellow alarm limit.
15-min trend, showing alarm
limits and monitored
measurement values
(MP40/50/60/70/90 only)
Preview Alarm AutoLimits for a
measurement before applying
Select to apply wide AutoLimits
Select to apply narrow
AutoLimits
High yellow alarm field
Low yellow alarm field
High red alarm (view only)
Up/down arrow keys for
changing high yellow alarm
limits
Alarms
On/Off
Alarms On/Off key - select to
toggle between alarms on or off
Low red alarm (view only)
Up/down arrow keys for
changing low yellow alarm limits
HR
Graphic view of alarm limits
with currently measured value

Alarm Limits 3Alarms
49
If you set the yellow alarm limit outside the red alarm limit, the monitor will automatically set the red
alarm to the yellow alarm limit.
When an ST measurement is in the Change Limits window there are also two pop-up keys
available labeled All ST Narrow/All ST Wide. With these keys you can set Auto Limits for all
ST Leads.
About Automatic Alarm Limits (AutoLimits)
The monitor can automatically set alarm limits suited to your individual patient, using the Automatic
Alarm Limits function. This tells the monitor to adapt the alarm limits of selected measurements to the
measured vital signs within a defined safe limit. The monitor calculates safe AutoLimits for each
patient based on the measured values from the last 12 seconds.
The defined safe limits never exceed the non-pathological range.
Limits Narrow sets limits close to the currently measured values for situations where it is critical
for you to be informed about small changes in your patient’s vital signs.
Limits Wide sets limits further away from the currently measured values for situations where small
changes are not so critical.
♦Use the keys in the Change Limits window to apply AutoLimits for individual measurements.
These keys are not available if AutoLimits have been disabled for the measurement in the monitor’s
Configuration Mode.
AutoLimits are not available for all measurements. The list of measurements for which AutoLimits can
be used is defined in the monitor’s Configuration mode.
Use the Change Limits window to check AutoLimits before you apply them to ensure that they are
appropriate for your individual patient and their clinical condition. Once applied, AutoLimits are
shown on the monitor screen just like manually-set alarm limits. If the AutoLimits are not appropriate
for your patient, you must set alarm limits manually. The limits remain unchanged until you set them
again or change them manually.
Documenting Alarm Limits
The alarm limits pop-up keys appear with the Alarm Limits and Change Limits windows.
♦Select the Print Limits pop-up key to print an overview of all alarm limits on a connected
printer.
♦Select the Record Limits pop-up key to send a recording of the alarm limits to a recorder.
High alarm limit, wide
High alarm limit, narrow
Low alarm limit, narrow
Low alarm limit, wide
Measurement value
Alarm
limits
Upper limit
clamps
Lower limit
clamps
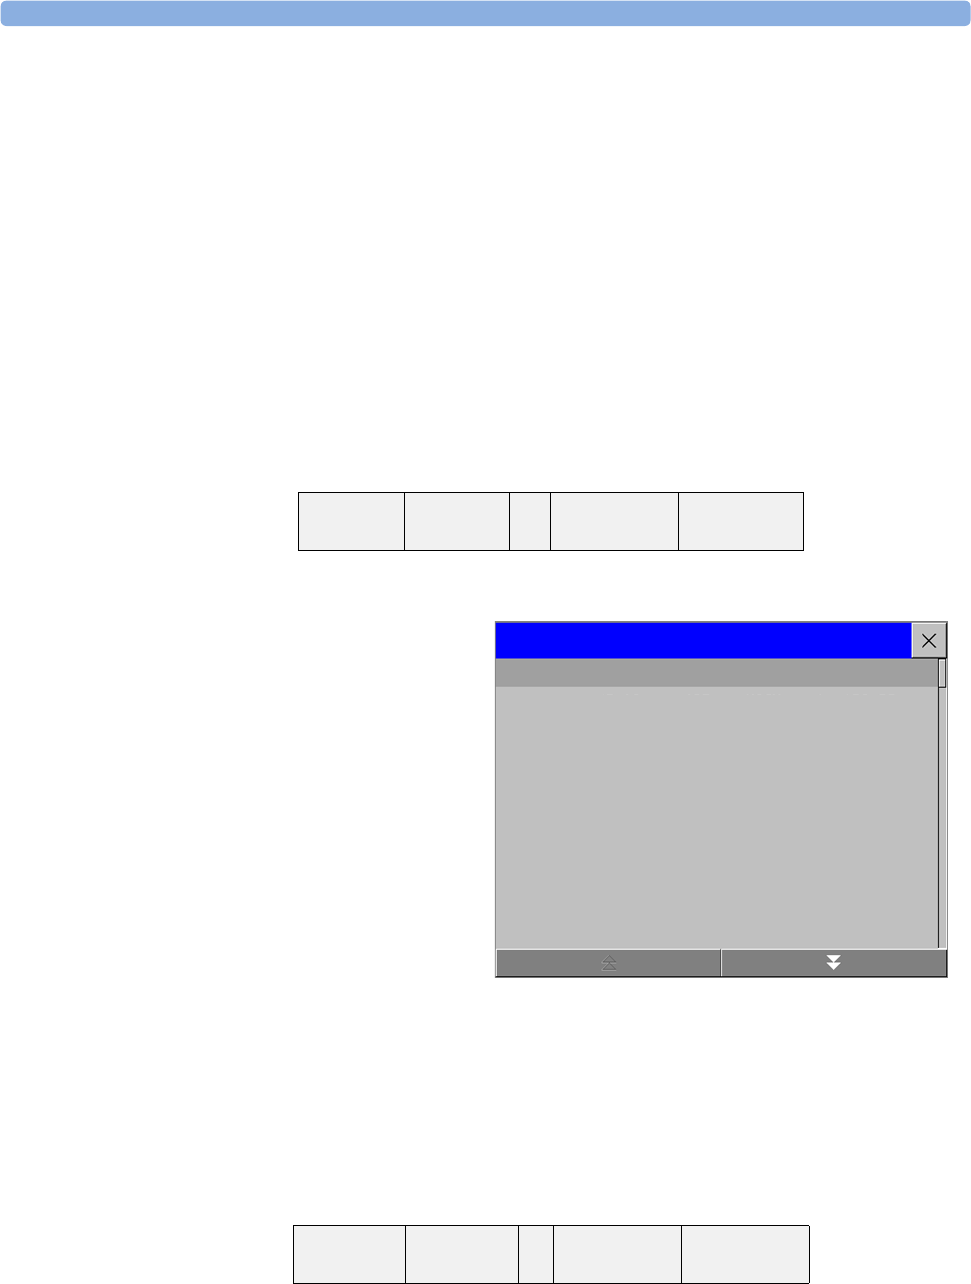
3Alarms Reviewing Alarms
50
Reviewing Alarms
To review the currently active alarms and INOPs, select any of the alarm status areas on the monitor
screen. The Alarm Messages window pops up. All alarms and INOPs are erased from the
monitor’s alarm history when you discharge a patient, or if you change to Demonstration Mode.
Alarm Messages Window
The Alarm Messages window shows all the currently active alarms and INOPs in chronological
order, beginning at the top with the most recent. INOPs are shown on the left hand side and patient
alarms are shown on the right hand side. Any active red alarms are shown first, followed by yellow
alarms. Acknowledged alarms or INOPs are shown with the check mark symbol.
The Alarm Messages window pop-up keys appear when the window is opened. If alarm pause
extension is disabled, the pause pop-up keys are inactive (“grayed-out”). Selecting the Review
Alarms pop-up key opens the Review Alarms window.
Review Alarms Window
The Review Alarms window
contains a list of up to 100 of the most
recent alarms and INOPs with date and
time information. If configured to do so,
each alarm is shown with the alarm limit
active when the alarm was triggered and
the maximum value measured beyond
this limit. The Review Alarms
window also shows any changes made to
the Alarms On/Off or Silence status.
If you select a high or low limit alarm in
the list, the Graphical Trends
window will open to provide further
data. If you select an alarm resulting
from an event alarm notification, the Event Episode window for that event will open. When you
close these windows you will return to the Review Alarms window.
The information in the Review Alarms window is deleted when a patient is discharged, when the
monitor is switched off for longer than one minute, and when you leave Demonstration Mode.
The Review Alarms window pop-up keys appear when the window is opened. If alarm pause
extension is disabled, the pause pop-up keys are inactive. Selecting the Active Alarms pop-up key
opens the Alarm Messages window.
Alarm
Limits
Review
Alarms
Pause Al.
5 Min.
Pause Al.
10 Min.
Alarm
Limits
Active
Alarms
Pause Al.
5 Min.
Pause Al.
10 Min.
5 Apr 16:55:18 ** ABPs HIGH (120 >95)
5 Apr 16:55:18 Alarms On
5 Apr 16:45:15 ** SpO2 NON-PULSAT.
5 Apr 16:44:57 Alarms Off
5 Apr 16:44:46 ** awRR LOW (14<15)
5 Apr 16:44:39 ** SpO2 LOW (95<99)
5 Apr 16:44:28 ** ABPs HIGH
5 Apr 16:55:18 *** Apnea
Review Alarms
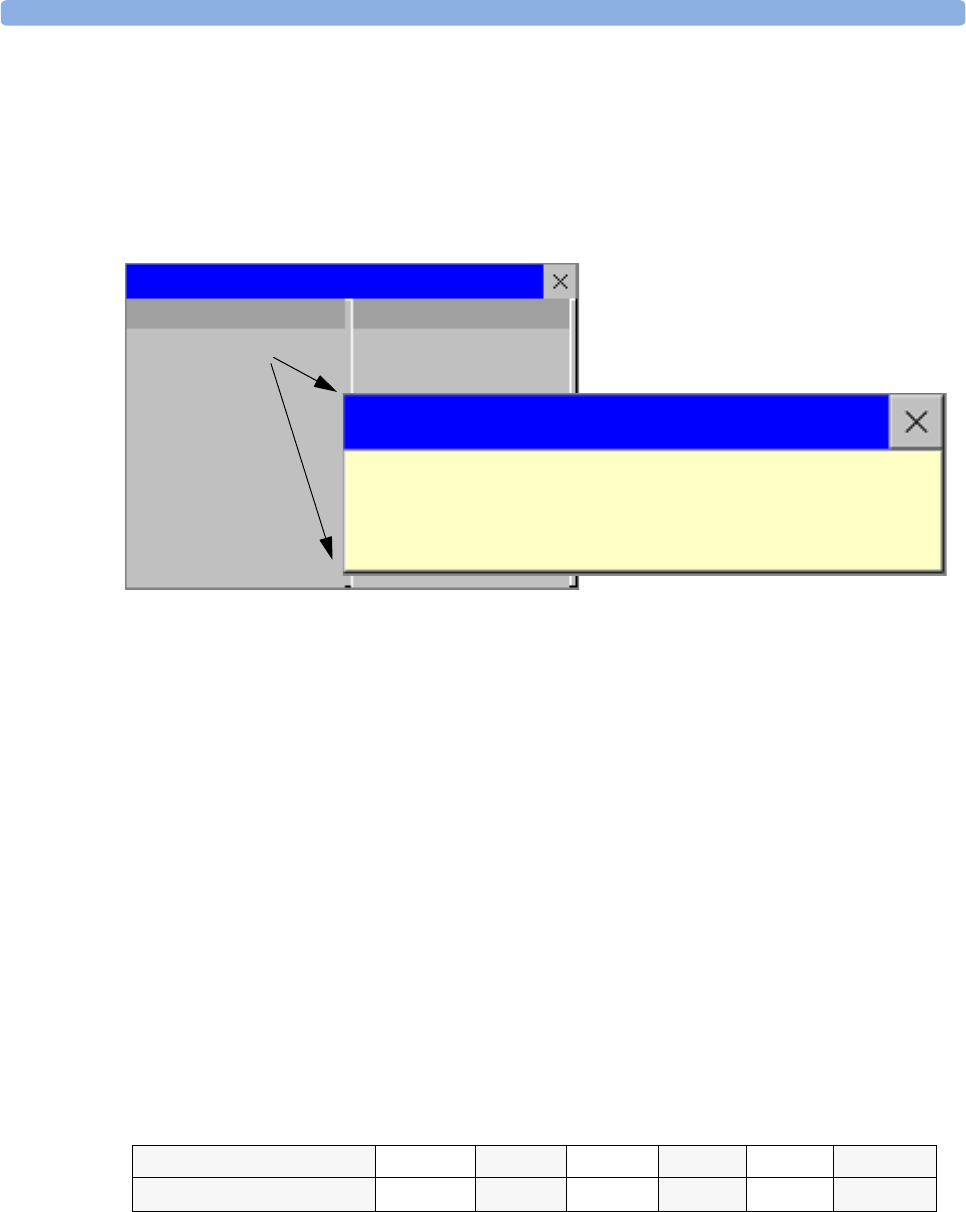
Understanding Alarm Messages 3Alarms
51
Understanding Alarm Messages
If you do not immediately understand an INOP or alarm message, refer to its help text.
♦In the Alarm Messages window, select the INOP message. This calls up a help window with
an explanation of the INOP message and, where appropriate, a suggested solution for the problem.
Latching Alarms
The alarm latching setting for your monitor defines how the alarm indicators behave when you do not
acknowledge them. When alarms are set to non-latching, their indicators end when the alarm
condition ends. Switching alarm latching on means that visual and/or audible alarm indications are still
displayed or announced by the monitor after the alarm condition ends. The indication lasts until you
acknowledge the alarm.
Viewing the Alarm Latching Settings
To see the alarm latching setting for your monitor
1In the monitor’s Main Setup menu, select Alarms.
2Select Alarm Settings, and see the Visual Latching and Audible Latching
settings.
This setting can only be changed in Configuration Mode. You should be aware of the settings chosen
for your unit. There are three possible choices each for visual and audible latching, Red, Red and
Yellow, and Off. These choices can be combined to give the following settings:
R = red alarms, Y = yellow alarms
The lead LL has become detached from the
patient or the lead set has been changed.
Attach the missing electrode or select <New
Lead Setup> to confirm the new lead set
Alarm Messages
Resp LEADS OFF
LL LEAD OFF
** awRR LOW
Visual Latching R&Y R&Y R&Y RROff
Audible latching R&Y ROffROffOff

3Alarms Testing Alarms
52
Alarm Latching Behavior
All INOPs except DISCONNECT and UNPLUGGED INOPs from measurement servers and modules
are non-latching. See “Yellow Arrhythmia Alarms” on page 113 for information on short yellow
arrhythmia alarms latching behavior.
Testing Alarms
When you switch the monitor on, a selftest is started. You must check that the alarms lamps light, one
after the other, and that you hear a single tone. This indicates that the visible and audible alarm
indicators are functioning correctly. For further testing of indidual measurement alarms, perform the
measurement on yourself (for example SpO2 or CO2) or use a simulator. Adjust alarm limits and check
that appropriate alarm behavior is observed.
Alarm Behavior at On/Off
When you switch alarms on, the settings defined in the currently active Profile are used.
If the monitor is switched off for longer than one minute and then switched on again, or after a loss of
power lasting longer than one minute, or when a patient is discharged, the monitor can be configured
to restore either the alarm settings from the monitor's configured default Profile, or the most recently
used alarm settings. After any of these situations, you should check that the alarm settings are
appropriate for your patient, and if necessary, select the correct Profile and patient category.
If power is lost for less than one minute, the alarm settings prior to the power loss are restored.
Red and Yellow Measurement
Alarms
Non-latching
alarms
Visual and audible
latching
Visual latching,
audible non-latching
Alarm has not been
acknowledged.
Alarm condition
still present.
Alarm tone on. Alarm lamp on. Alarm message. Flashing numerics.
Alarm condition
no longer present.
All audible and visual
alarm indicators
automatically stop.
Alarm tone on.
Alarm lamp on.
Alarm message.
Flashing numerics.
Alarm message. Flashing
numerics.
Audible alarm indicators
automatically stop.
Alarm has been
acknowledged.
Alarm condition
still present.
Audible alarm acknowledged. Alarm lamp off. Alarm message. Flashing
numerics. Audible alarm reminder (if configured).
Alarm condition
no longer present.
Audible and visual alarm indicators automatically stop.

53
4
4Patient Alarms and INOPs
This chapter lists patient alarms and technical alarms (INOPs) alphabetically, irrespective of their
priority. INOPs start on page 59.
For information on alarms and INOPs from the gas modules refer to your Gas Module Instructions for
Use.
Patient Alarm Messages
The measurement labels and abbreviations for pressure, temperature, SpO2, and anesthetic agent
alarms are explained in the individual chapters.
Some alarms may be shown at the Information Center in shortened form, when transferred through
IntelliVue Instrument Telemetry (USA only). These shortened alarm texts are included in the list and
identified with the note “at Information Center”.
Note that yellow arrhythmia alarms (“short yellow alarms”) may be shown with one or with two stars,
depending on your monitor configuration and the Information Center revision you are using.
Refer to your Gas Module Instructions for Use for patient alarms and INOPs from the gas modules.
Alarm Message From Condition Indication
***APNEA or
***APNEA xxx sec
CO2, Resp,
AGM
Respiration has stopped for longer than
the preset apnea time. “xxx” denotes the
Apnea duration.
numeric flashes, red alarm
lamp, alarm tone.
***ASYSTOLE ECG No QRS detected for a period greater
than the asystole threshold (in the
absence of Vfib or chaotic ECG).
numeric flashes, red alarm
lamp, alarm tone.
**awRR HIGH CO2, Resp,
AGM
The airway respiration rate has exceeded
the high alarm limit.
numeric flashes and high limit
is highlighted, yellow alarm
lamp, alarm tone.
**awRR LOW CO2, Resp,
AGM
The airway respiration rate has dropped
below the low alarm limit.
numeric flashes and low limit
is highlighted, yellow alarm
lamp, alarm tone.
**BIS HIGH BIS The Bispectral Index value has exceeded
the high alarm limit.
numeric flashes and high limit
is highlighted, yellow alarm
lamp, alarm tone.
**BIS LOW BIS The Bispectral Index value has dropped
below the low alarm limit.
numeric flashes and low limit
is highlighted, yellow alarm
lamp, alarm tone.

4 Patient Alarms and INOPs Patient Alarm Messages
54
***BRADY (Pulse)
or
***BRADY xxx<yyy
Press, SpO2The heart rate from the Pulse signal has
fallen below the bradycardia limit. xxx
denotes the lowest measured value; yyy
is the bradycardia limit.
numeric flashes and alarm
limit is highlighted, red alarm
lamp, alarm tone.
**CCO/CCI HIGH CCO Continuous Cardiac Output or CC
Index is above the high alarm limit.
numeric flashes and high alarm
limit is highlighted, yellow
alarm lamp, alarm tone.
**CCO/CCI LOW CCO Continuous Cardiac Output or CC
Index is below the low alarm limit.
numeric flashes and low alarm
limit is highlighted, yellow
alarm lamp, alarm tone.
**CPP HIGH CPP The CPP value has exceeded the high
alarm limit.
numeric flashes and high limit
is highlighted, yellow alarm
lamp, alarm tone
**CPP LOW CPP The CPP value has fallen below the low
alarm limit.
numeric flashes and low limit
is highlighted, yellow alarm
lamp, alarm tone.
***DESAT or
***DESAT xxx<yyy
SpO2The SpO2 value has fallen below the
desaturation alarm limit. xxx denotes
the lowest measured value, and yyy is
the desaturation limit.
numeric flashes, red alarm
lamp, alarm tone.
**et <Agent label>
HIGH
AGM The end tidal agent high alarm limit has
been exceeded.
numeric flashes and high limit
is highlighted, yellow alarm
lamp, alarm tone.
**et <Agent label>
LOW
AGM The end tidal agent value has fallen
below the low alarm limit.
numeric flashes and low alarm
limit is highlighted, yellow
alarm lamp, alarm tone.
**etCO2 HIGH CO2, Resp,
AGM
The end tidal CO2 high alarm limit has
been exceeded.
numeric flashes and high limit
is highlighted, yellow alarm
lamp, alarm tone.
**etCO2 LOW CO2, Resp,
AGM
The end tidal CO2 value has fallen
below the low alarm limit.
numeric flashes and low limit
is highlighted, yellow alarm
lamp, alarm tone.
**etO2 HIGH O2, AGM The end tidal O2 high alarm limit has
been exceeded.
numeric flashes and high limit
is highlighted, yellow alarm
lamp, alarm tone.
**etO2 LOW O2, AGM The end tidal O2 value has fallen below
the low alarm limit.
numeric flashes, and low limit
is highlighted, yellow alarm
lamp, alarm tone.
*/**/***
EVENT:<GRP>
Event
surveillance
An event has occurred and the event
notification is configured to alarm.
<GRP> is the event group
event group name flashes,
yellow or red alarm lamp and
alarm tone
*/**/*** EVENT
at Information center
Event
surveillance
An event has occurred and the event
notification is configured to alarm.
Check on the monitor for more details
on event group.
(on monitor) event group
name flashes, yellow or red
alarm lamp and alarm tone
***EXTREME BRADY ECG The bradycardia limit has been
exceeded.
numeric flashes and alarm
limit is highlighted, red alarm
lamp, alarm tone.
***EXTREME TACHY ECG The tachycardia limit has been
exceeded.
numeric flashes and alarm
limit is highlighted, red alarm
lamp, alarm tone.
Alarm Message From Condition Indication

Patient Alarm Messages 4 Patient Alarms and INOPs
55
**HR HIGH ECG The heart rate high alarm limit has been
exceeded.
numeric flashes and high limit
is highlighted, yellow alarm
lamp, alarm tone. The sound
switches off after 5 seconds if
Arrhythmia is On.
**HR LOW ECG The heart rate has fallen below the low
alarm limit.
numeric flashes and low limit
is highlighted, yellow alarm
lamp, alarm tone. The sound
switches off after 5 seconds if
Arrhythmia is On.
**imCO2 HIGH CO2, Resp,
AGM
The inspired minimum CO2 high alarm
limit has been exceeded.
numeric flashes and high limit
is highlighted, yellow alarm
lamp, alarm tone.
**in <Agent label>
HIGH
AGM The inspired agent high alarm limit has
been exceeded.
numeric flashes, high limit is
highlighted, yellow alarm
lamp, alarm tone.
**in <Agent label>
LOW
AGM The inspired agent value has fallen
below the AGT low alarm limit.
numeric flashes, low limit is
highlighted, yellow alarm
lamp, alarm tone.
**inN2O HIGH N2O, AGM The inspired N2O high alarm limit has
been exceeded.
numeric flashes, high limit is
highlighted, yellow alarm
lamp, alarm tone.
**inO2 HIGH O2, AGM The inspired O2 high alarm limit has
been exceeded.
numeric flashes, high limit is
highlighted, yellow alarm
lamp, alarm tone.
**inO2 LOW O2, AGM The inspired O2 value has fallen below
the low alarm limit.
numeric flashes, low limit is
highlighted, yellow alarm
lamp, alarm tone.
***inO2 LOW OXYGEN O2, AGM The inspired O2 value has fallen below
18 vol.%.
numeric flashes, low limit is
highlighted, red alarm lamp,
alarm tone.
*/**IRREGULAR HR ECG/
Arrhythmia
Consistently irregular heart rhythm. numeric flashes, yellow alarm
lamp, short yellow audible
alarm.
*/**MISSED BEAT ECG/
Arrhythmia
No beat detected for 1.75*R-R interval,
or if HR>120bpm no beat detected for
one second (non-paced patients only).
numeric flashes, yellow alarm
lamp, short yellow audible
alarm.
*/**MULTIFORM PVCs ECG/
Arrhythmia
Two differently shaped Vs detected,
each occurring at least twice within the
last 300 beats and at least once within
the last 60 beats.
numeric flashes, yellow alarm
lamp, short yellow audible
alarm.
**NBP HIGH NBP The measured NBP value is above the
high alarm limit.
s, d, or m after the label indicates
whether the systolic, diastolic or mean
pressure has crossed the limit.
numeric flashes and high limit
is highlighted, yellow alarm
lamp, alarm tone.
**NBP LOW NBP The measured NBP value is below the
low alarm limit.
s, d, or m after the label indicates
whether the systolic, diastolic or mean
pressure has crossed the limit.
numeric flashes and low limit
is highlighted, yellow alarm
lamp, alarm tone.
Alarm Message From Condition Indication

4 Patient Alarms and INOPs Patient Alarm Messages
56
*/**NON-SUSTAIN VT ECG/
Arrhythmia
A run of Vs having a ventricular HR>V-
Tach HR limit, but lasting for less than
the V-Tach Run limit has been detected.
numeric flashes, yellow alarm
lamp, short yellow audible
alarm.
*/**PACER NOT CAPT ECG/
Arrhythmia
(paced
patients only)
A missed beat with a pace pulse was
detected.
numeric flashes, yellow alarm
lamp, short yellow audible
alarm.
*/**PACER NT
PACING
ECG/
Arrhythmia
(paced
patients only)
A missed beat without a pace pulse was
detected.
numeric flashes, yellow alarm
lamp, short yellow audible
alarm.
*/**PAIR PVCs ECG/
Arrhythmia
A non-ventricular contraction, followed
by two ventricular contractions,
followed by a non-ventricular
contraction has been detected.
numeric flashes, yellow alarm
lamp, short yellow audible
alarm.
*/**PAUSE ECG/
Arrhythmia
No beat detected for a period greater
than the pause threshold.
numeric flashes, yellow alarm
lamp, short yellow audible
alarm.
***<Pressure>
DISCONNECT
PRESS The pressure is non-pulsatile and the
mean pressure is continuously less than
10mmHg (1.3kPa). This alarm occurs
only with arterial pressures (P, ABP,
ART, Ao, BAP, FAP, PAP, UAP).
numeric flashes, red alarm
lamp, alarm tone.
**<Pressure> HIGH PRESS The measured pressure value is above
the high alarm limit. s, d, or m after the
label indicates whether the systolic,
diastolic or mean pressure has crossed
the limit.
numeric flashes, high limit is
highlighted, yellow alarm
lamp, alarm tone.
**<Pressure> LOW PRESS The measured pressure value is below
the low alarm limit. s, d, or m after the
label indicates whether the systolic,
diastolic or mean pressure has crossed
the limit.
numeric flashes and low limit
is highlighted, yellow alarm
lamp, alarm tone.
**PULSE HIGH PRESS
SpO2
The pulse rate has exceeded the high
alarm limit.
numeric flashes and high limit
is highlighted, yellow alarm
lamp, alarm tone.
**PULSE LOW PRESS
SpO2
The pulse rate has dropped below the
low alarm limit.
numeric flashes and low limit
is highlighted, yellow alarm
lamp, alarm tone.
*/**PVCs/min HIGH ECG/
Arrhythmia
More premature ventricular
contractions have been detected in a
minute than the limit.
numeric flashes, yellow alarm
lamp, short yellow audible
alarm.
*/**R-ON-T PVCs ECG/
Arrhythmia
For HR <100, a PVC with R-R interval
< 1/3 the average interval followed by a
compensatory pause of 1.25 x average
R-R interval or two such Vs without
compensatory pause occurring within 5
minutes of each other. (When HR
>100, 1/3 R-R interval is too short for
detection.).
numeric flashes, yellow alarm
lamp, short yellow audible
alarm.
Alarm Message From Condition Indication

Patient Alarm Messages 4 Patient Alarms and INOPs
57
**RR HIGH RESP The respiration rate has exceeded the
high alarm limit.
numeric flashes and high limit
is highlighted, yellow alarm
lamp, alarm tone.
**RR LOW RESP The respiration rate has dropped below
the low alarm limit.
numeric flashes and low limit
is highlighted, yellow alarm
lamp, alarm tone.
*/**RUN PVCs HIGH ECG/
Arrhythmia
A run of PVCs greater than 2 was
detected.
numeric flashes, yellow alarm
lamp, short yellow audible
alarm.
**<SpO2 label>
HIGH
SpO2The arterial oxygen saturation has
exceeded the high alarm limit.
numeric flashes and high limit
is highlighted, yellow alarm
lamp, alarm tone.
**<SpO2 label> LOW SpO2The arterial oxygen saturation has fallen
below the low alarm limit.
numeric flashes and low limit
is highlighted, yellow alarm
lamp, alarm tone.
**ST<n> HIGH ECG/
Arrhythmia
The ST elevation in lead <n> is higher
than the limit.
numeric flashes and high alarm
limit is highlighted, yellow
alarm lamp, alarm tone.
**ST<n> LOW ECG/
Arrhythmia
The ST depression in lead <n> is lower
than the limit.
numeric flashes and low alarm
limit is highlighted, yellow
alarm lamp, alarm tone.
**ST MULTI <n>,<n> ECG/
Arrhythmia
The ST depression or elevation is
outside of the limit in two or more leads
<n> and <n>
numeric flashes, yellow alarm
lamp, alarm tone
**ST MULTI
at Information Center
ECG/
Arrhythmia
The ST depression or elevation is
outside of the limit in two or more
leads. Check on the monitor for more
details about which leads are affected.
(on monitor) numeric flashes,
yellow alarm lamp, alarm tone
**SvO2 HIGH SvO2The SvO2 value has exceeded the high
limit.
numeric flashes and high alarm
limit is highlighted, yellow
alarm lamp, alarm tone.
**SvO2 LOW SvO2The SvO2 value has fallen below the low
limit.
numeric flashes and low alarm
limit is highlighted, yellow
alarm lamp, alarm tone.
*/**SVT ECG/
Arrhythmia
A run of supraventricular beats greater
than the SVT run limit has been
detected and the HR has exceeded the
SVT HR limit.
numeric flashes, yellow alarm
lamp, alarm tone.
***TACHY (Pulse)
or
***TACHY xxx>yyy
Press, SpO2The heart rate from the Pulse signal has
exceeded the tachycardia limit. xxx
denotes the highest measured value; yyy
is the tachycardia limit.
numeric flashes, alarm limit is
highlighted, red alarm lamp,
alarm tone.
**Tblood HIGH C.O. The blood temperature value has
exceeded the high alarm limit.
numeric flashes, high alarm
limit is highlighted, yellow
alarm lamp, alarm tone.
**Tblood LOW C.O. The blood temperature value has fallen
below the low alarm limit.
numeric flashes, low alarm
limit is highlighted, yellow
alarm lamp, alarm tone.
**tcpO2 HIGH/
**tcpCO2 HIGH
tcGas The tcpO2 or tcpCO2 value has
exceeded the high alarm limit.
numeric flashes, high alarm
limit is highlighted, yellow
alarm lamp, alarm tone.
Alarm Message From Condition Indication

4 Patient Alarms and INOPs Patient Alarm Messages
58
**tcpO2 LOW/
**tcpCO2 LOW
tcGas The tcpO2 or tcpCO2 value has fallen
below the low alarm limit.
numeric flashes, low alarm
limit is highlighted, yellow
alarm lamp, alarm tone.
**<Temperature
label> HIGH
TEMP The temperature has exceeded the high
alarm limit.
numeric flashes and high limit
is highlighted, yellow alarm
lamp, alarm tone.
**<Temperature
label> LOW
TEMP The temperature has fallen below the
low alarm limit.
numeric flashes and low limit
is highlighted, yellow alarm
lamp, alarm tone.
*/**VENT BIGEMINY ECG/
Arrhythmia
A dominant rhythm of N, V, N, V (N =
supraventricular beat, V = ventricular
beat) was detected.
numeric flashes, yellow alarm
lamp, short yellow audible
alarm.
***VENT FIB/TACH ECG A fibrillatory waveform for 4
consecutive seconds was detected.
numeric flashes, red alarm
lamp, alarm tone.
*/**VENT RHYTHM ECG/
Arrhythmia
A dominant rhythm of adjacent Vs >
vent rhythm limit and ventricular HR <
VTach HR limit was detected.
numeric flashes, yellow alarm
lamp, short yellow audible
alarm.
*/**VENT TRIGEMINY ECG/
Arrhythmia
A dominant rhythm of N, N, V, N, N,
V (N = supraventricular beat, V =
ventricular beat) was detected.
numeric flashes, yellow alarm
lamp, short yellow audible
alarm.
***VTACH ECG,
Arrhythmia
Ventricular tachycardia has been
detected (Consecutive PVCs exceed V-
Tach Run limit and HR exceeds V-Tach
HR limit).
numeric flashes, yellow alarm
lamp, short yellow audible
alarm.
**/***VueLink
ALARM
at Information Center
VueLink A yellow (**) or red (***) patient alarm
is present on the VueLink module.
Check the monitor display for more
detailed alarm information.
(on monitor) yellow or red
alarm lamp, alarm tone
Alarm Message From Condition Indication

Technical Alarm Messages (INOPs) 4 Patient Alarms and INOPs
59
Technical Alarm Messages (INOPs)
The measurement labels and abbreviations for pressure, temperature, SpO2, anesthetic agent, and
VueLink INOP messages are explained in the individual chapters.
INOP Message, Indication Source What to do
ABP INOPS PRESS See <Pressure label> INOPS (under Pressure).
ALL ECG ALARMS OFF ECG/
Arrhythmia
All ECG alarms have been switched off, or the HR alarm
source is not ECG. To resume ECG alarm generation, switch
ECG alarms on or select ECG as the alarms source.
Ao INOPS PRESS See <Pressure label> INOPS (under Pressure).
ART INOPS PRESS See <Pressure label> INOPS (under Pressure).
AWF CHANGE SCALE Spirometry Airway flow signal exceeds range of selected scale. Adjust scale
to display complete wave.
AWP CHANGE SCALE Spirometry Airway pressure signal exceeds range of selected scale. Adjust
scale to display complete wave
AWV CHANGE SCALE Spirometry Airway volume signal exceeds range of selected scale. Adjust
scale to display complete wave.
Bad Serverlink
INOP tone
Monitor 1) An MMS with an incompatible software revision is
connected to the monitor. This combination does not allow
monitoring, OR
2) You cannot use this combination of monitor, MMS and
cable. Switch off the monitor and contact your service
personnel.
BAP INOPS PRESS See <Pressure label> INOPS (under Pressure).
BATTERIES EMPTY or BATT 1/
BATT 2 EMPTY
INOP tone, battery LED flashes
During this INOP, alarms cannot be
paused or switched off.
Batteries The estimated remaining battery-powered operating time of
the indicated battery or batteries is less than 10 minutes.
Replace the batteries immediately.
If the condition persists and the monitor is not connected to
mains power, this INOP is re-issued two minutes after you
acknowledge it.
BATTERIES INCOMPAT or BATT
1/BATT 2 INCOMPAT
INOP tone
Batteries The indicated battery or batteries cannot be used with this
monitor. Replace with the correct batteries (M4605A).
BATTERIES LOW or BATT 1/
BATT 2 LOW
INOP tone
Batteries The estimated battery-powered operating time remaining is less
than 20 minutes.
BATTERIES MALF or BATT 1/
BATT 2 MALFUNCTION
INOP tone, battery LED flashes
During this INOP, alarms cannot be
paused or switched off unless the
monitor is connected to mains power.
Batteries The monitor cannot determine the battery status. If this INOP
persists, replace the faulty battery or batteries. If the condition
persists and the monitor is not connected to mains power, this
INOP is re-issued two minutes after you acknowledge it.
Place the batteries in a different monitor or in a battery charger.
If the same INOP is shown, contact your service personnel.
BATT 1/BATT 2 MISSING
INOP tone.
During this INOP, alarms cannot be
paused or switched off.
Batteries The monitor requires two batteries but can detect only one
battery. Insert the missing battery immediately.

4 Patient Alarms and INOPs Technical Alarm Messages (INOPs)
60
BIS CABLE INCOMPAT
INOP tone.
BIS The semi-reusable sensor cable connected is unknown or not
supported by your software revision. Replace it with a Philips-
supported sensor cable.
BIS CABLE USAGE
INOP tone.
BIS The semi-reusable sensor cable has exceeded the maximum
number of uses. Replace the cable.
BIS DSC DISCONN
INOP tone
BIS DSC is not properly connected OR either DSC or BIS engine
may be faulty.
Make sure that the DSC is properly connected to the BIS
Engine. If INOP persists, replace DSC with a known good one
of the same type.
If INOP persists replace BIS engine.
Silencing this INOP switches the measurement off.
BIS DSC INCOMPT
INOP tone
BIS DSC is not supported by the BIS engine or new DSC
connected to an old BIS engine. A software upgrade may be
required. Contact your service personnel.
BIS DSC MALFUNC BIS Electrocautery used during self-test OR malfunction in the
DSC hardware.
Make sure not to use electrocautery during the self-test
procedure. Disconnect and reconnect the DSC to the BIS
engine. If the INOP persists, replace the DSC or contact your
service personnel.
BIS DSC UPDATE
INOP tone
BIS DSC update currently being carried out. This INOP will
disappear when the DSC update is finished. Do not disconnect
the DSC during the update. No action is needed.
BIS ELECTR. DISC
INOP tone.
BIS One or more electrodes are not connected to the semi-reusable
sensor cable. Check all electrode connections.
BIS ENGINE DISC.
INOP tone
BIS BIS engine not connected OR Module Cable defective.
Make sure that the Module Cable is properly connected. If
INOP persists, replace the Module Cable.
Silencing this INOP switches the measurement off.
BIS ENGINE INCOMPT
INOP tone
BIS BIS engine software is not supported. A software upgrade may
be required. Contact your service personnel.
MP20/30 - BIS engine not supported.
BIS ENGINE MALFUNC
INOP tone
BIS Malfunction in the BIS engine hardware. Disconnect and
reconnect the BIS engine. If the INOP persists, replace BIS
engine.
BIS EQUIP MALF
INOP tone
BIS There is a malfunction in the BIS hardware. Unplug and replug
the BIS module. If the INOP persists, contact your service
personnel.
BIS HIGH IMPEDANCE
INOP tone may sound
BIS Impedance of one or more electrode(s) is above the valid range,
most often caused by bad skin preparation. Check the sensor
montage and press the electrode pads firmly. If this INOP
persists, replace the sensor(s) in question using correct skin
preparation.
If INOP persists, contact your service personnel.
BIS IMPEDANCE CHCK
INOP tone may sound
BIS The Cyclic Impedance check is running. It will stop
automatically if all impedances are within the valid range. If
any electrodes do not pass the impedance test, check the sensor
montage and press the electrode pads firmly.
To manually stop the Cyclic Impedance Check, select
Cyclic Check Off in the Setup BIS menu.
INOP Message, Indication Source What to do

Technical Alarm Messages (INOPs) 4 Patient Alarms and INOPs
61
BIS ISOELECTRC EEG BIS No discernible EEG activity is detected for longer than one
minute.
Check the patient. Check that the electrodes are properly
connected.
BIS LEAD OFF
INOP tone may sound
BIS One or more electrodes have no skin contact and therefore
impedances cannot be measured. Check the sensor montage
and press the electrode pads firmly.
If this INOP persists, replace the sensor(s) in question, using
correct skin preparation.
BIS OVERCURRENT
INOP tone
BIS Unplug and replug the BIS module or, f or the MP20/MP30,
disconnect and reconnect the BISx from the Interface board. If
the INOP persists, contact your service personnel.
BIS SENSOR DISCONN
INOP tone
BIS The sensor is not properly connected to the patient interface
cable (PIC) and/or the PIC is not properly connected to the
DSC or BISx, or the sensor or PIC or DSC or BISx may be
faulty.
Check all the connections.
Disconnect and reconnect the sensor, PIC, DSC, BISx.
If the INOP persists, replace the sensor.
If the INOP persists, replace PIC. If INOP persists, contact
your service personnel.
Silencing this INOP switches the measurement off.
BIS SENSOR INCOMPAT
INOP tone
BIS Unsupported sensor connected or sensor type unknown or not
supported by your software revision. Replace the sensor, using
only Philips supported sensors.
BIS SENSOR MALFUNC
INOP tone
BIS Malfunction in the sensor hardware, most often caused by
liquids permeating into the connectors OR patient interface
cable (PIC) or DSC or BISx may be faulty.
Replace the sensor. Manually initiate a Cyclic Impedance
Check. Make sure all electrodes pass the test. Make sure that
the both sides of the PIC connector (between PIC and sensor)
are dry. If you are not sure that the connector is dry, replace the
PIC until it has dried. If this INOP persists, contact your
service personnel.
BIS SENSOR USAGE
INOP tone
BIS Excessive sensor usage. Replace sensor.
A Cyclic Impedance Check will start automatically.
BIS SQI < 15% (INOP tone)
OR
BIS SQI < 50% (no INOP tone)
BIS If the signal quality is below 50%, BIS numerics cannot be
reliably derived.
If the signal quality is below 15%, no BIS numerics can be
derived.
This may occur as a result of artifacts such as those generated
from motion or the presence of electrocautery devices. Make
sure the sensor is properly attached to the patient. Manually
initiate a Cyclic Impedance Check. Make sure all electrodes
pass the test. Make sure the patient is completely relaxed (even
small motions of the facial muscles affect the signal quality).
BIS UNPLUGGED
INOP tone
BIS Plug in the BIS module. Silencing this INOP switches off the
measurement.
BISx DISCONNECTED
INOP tone
BIS The BISx is not connected to the BIS module or the BIS
interface board. Silencing this INOP switches the measurement
off.
INOP Message, Indication Source What to do

4 Patient Alarms and INOPs Technical Alarm Messages (INOPs)
62
BISx INCOMPATIBLE
INOP tone
BIS The BISx software is not compatible with the BIS module or
with the MP20/MP30 monitor software. A software upgrade
may be required. Contact your service personnel.
BISx MALFUNCTION
INOP tone
BIS The BISx is faulty. Disconnect and reconnect it to the module
or BIS interface board. If the INOP persists, replace the BISx.
MP20/MP30 - Malfunction on interface board. If the INOP
persists, contact your service personnel.
CANNOT ANALYZE ECG ECG/
Arrhythmia
The arrhythmia algorithm cannot reliably analyze the ECG
data. Check the ECG signal quality of the selected primary and
secondary leads. If necessary, improve lead position or reduce
patient motion.
If you have arrhythmia analysis on, and you are not getting a
reliable HR because the signal is below a minimum amplitude,
unstable, or contains artifact, and you have tried to improve the
system performance by choosing another lead and changing
electrodes, you should consider turning arrhythmia analysis off.
CANNOT ANALYZE ST ST The ST algorithm cannot generate a valid ST value. Possible
causes are large variations in the measured ST values for
consecutive beats, or ventricular paced beats. Review the ECG
signal quality and the ST measurement points.
If the patient has a ventricular pacemaker, ST analysis is not
possible.
CCI NO BSA
CCI numeric unavailable
INOP tone
C.O. CCI cannot be calculated because the patient's body surface
area is unknown. Enter the patient weight and height to
provide the BSA for CCI calculation.
CCO BAD PRESS SIGN
numeric is replaced by -?-
INOP tone
C.O. The arterial pressure wave can currently not be used for pulse
contour calculation for CCO or CCI measurement. Possible
causes are air bubbles in the tubing or a physiological
condition, for example severe arrhythmia.
CCO NO <Pressure label>
numeric is replaced by -?-
INOP tone may sound
C.O. CCO/CCI cannot be calculated. Make sure that the pressure
chosen in the Setup CCO menu under CCO From
matches the pressure measured with the arterial catheter for
CCO measurement. A VueLink pressure cannot be used. Select
a n o t h e r p r e s s u r e l a b e l , e i t h e r A B P, A o , A R T, B A P, F A P, o r U A P.
CCO NO CALIBRATION
numeric is replaced by -?-
C.O. The CCO measurement is currently not calibrated.
CCO NO PRESS
at Information Center
C.O. CCO/CCI cannot be calculated. Make sure that the pressure
chosen in the Setup CCO menu under CCO From
matches the pressure measured with the arterial catheter for
CCO measurement. A VueLink pressure cannot be used. Select
a n o t h e r p r e s s u r e l a b e l , e i t h e r A B P, A o , A R T, B A P, F A P, o r U A P.
CCO NOT SUPPORTED
numeric is replaced by -?-
INOP tone
C.O. A catheter for transpulmonary C.O. measurements has been
unplugged and replaced with a Right Heart C.O. catheter, or
the measurement mode has been changed manually. Silencing
this INOP switches the measurement off.
CCO/CCI OVERRANGE
numeric is replaced by -?-
INOP tone
C.O. The measured CCO or CCI value is not within the specified
range for CCO/CCI measurement.
CCO <Pressure label>
INVALID
numeric is replaced by -?-
INOP tone may sound
C.O. The arterial pressure selected for pulse contour calculation for
CCO is available but currently invalid. Make sure the pressure
transducer is connected and the zero calibration is valid.
INOP Message, Indication Source What to do

Technical Alarm Messages (INOPs) 4 Patient Alarms and INOPs
63
CCO PRESS INVALID
at Information Center
C.O. The arterial pressure selected for pulse contour calculation for
CCO is available but currently invalid. Make sure the pressure
transducer is connected and the zero calibration is valid.
CCO PRESS OVERRANG
numeric is replaced by -?-
INOP tone
C.O. The mean value of the arterial pressure values used for pulse
contour calculation for CCO is below 0 mmHg or above 300
mmHg.
CCO PULSE OVERRANG
numeric is replaced by -?-
INOP tone
C.O. The pulse rate of the pressure used for pulse contour
calculation for CCO is below 30 bpm or above 240 bpm.
CCO/Tbl NO TRANSD
Numeric is replaced by -?-
INOP tone
C.O. No transducer attached to the module or catheter
disconnected.
CCO RECALIBRATE
numeric is replaced by -?-
C.O. The most recent CCO or CCI calibration was made over 8
hours ago. You should recalibrate CCO or CCI with
transpulmonary C.O. measurements at least every 8 hours or
when the hemodynamic condition of the patient has changed.
Charge BATT1/BATT2 now
INOP tone
Batteries Battery must be charged. Connect the monitor to mains power
or exchange the battery.
CHARGER MALFUNCT
INOP tone, battery LED may flash
Batteries There is a problem with the battery charger in the monitor.
Connect the monitor to mains power and contact your service
personnel.
Check Alarm Lamps
INOP tone.
Monitor Perform a visual check of the alarm lamp to establish whether
there is a problem. Contact your service personnel to check the
internal connections to the alarm lamps.
CHECK BATT TEMP
INOP tone
Battery The temperature of one or both batteries is too high. Check
that ventilation openings are not blocked and monitor is not
exposed to heat.
Check Flex Texts
INOP tone
Monitor Check the names of the monitor menus, for example the labels
for screens, profiles, event or trend group names, before you
resume monitoring. If they are unexpected, there may be a
problem with the monitor software. Contact your service
personnel.
CheckInternVoltage
at Information Center
Monitor Potential problem with alarm lamps, display or interfaces
detected. Contact your service personnel. This INOP will
appear on the monitor as Check Monitor Func.
Check Keyboard
INOP tone
Monitor Perform a visual and functional check of the keyboard. Contact
your service personnel.
Check Main Board 2
INOP tone.
Monitor There is a problem with the second main board in the monitor.
Contact your service personnel.
Check MCC Monitor The monitor cannot communicate with the D80 Intelligent
Display. Check the MSL coupling cable. The end with the grey
connector must be connected to the Intelligent Display.
Check Monitor Func
INOP tone.
Monitor Potential problem with alarm lamps, display or interfaces
detected. Contact your service personnel. This INOP may
appear on the Information Center as
CheckInternVoltage.
Check Monitor Temp
INOP tone
Monitor The temperature inside the monitor is too high. Check that the
monitor ventilation is not obstructed. If the situation
continues, contact your service personnel.
INOP Message, Indication Source What to do

4 Patient Alarms and INOPs Technical Alarm Messages (INOPs)
64
Check Mouse Device
INOP tone.
Monitor Perform a visual and functional check of the mouse input
device. Contact your service personnel.
Check MSL Voltage
INOP tone
Monitor/
Measuremt
Server
There is a problem with the voltage of the Measurement Server
Link (MSL). Contact your service personnel.
Check Network Conf
INOP tone
Monitor The monitor is receiving network topology information from
more than one source, e.g.the Database Server and an
Application Server. Contact your service personnel.
Check Nurse Relay
INOP tone
Monitor There is a problem with the connection to the nurse relay.
Contact your service personnel.
Check Screen Res
INOP tone
Monitor The Screen you have selected uses a resolution which is not
supported by the display. The monitor will show a generic
Screen instead until you select a different Screen.
Contact your service personnel if you want the Screen deleted
from the Profile(s) to avoid this in future.
Check Settings
INOP tone
Monitor If this INOP appears, check the monitor and patient settings
before you resume monitoring. If the settings are unexpected,
there may be a problem with the monitor software. Contact
your service personnel.
Check Speedpoint
INOP tone.
Monitor Perform a visual and functional check of the SpeedPoint input
device. Contact your service personnel.
Check Touch Input Monitor Perform a visual and functional check of the touch input
device. Contact your service personnel.
Check Waves
INOP tone
Monitor The options purchased with this monitor may not support the
number of waves required to show the selected Screen, so some
waves or high resolution trends are missing from the Screen.
Select a different Screen with fewer waves.
Contact your service personnel if you want the Screen deleted
from the Profile(s) to avoid this in future.
Chk IndepDsp Cable Monitor The monitor cannot communicate with the D80 Intelligent
Display. Check the MSL coupling cable. The end with the grey
connector must be connected to the Intelligent Display.
C LEAD OFF
HR Numeric is replaced by -?- for 10
seconds. INOP tone.
ECG The C electrode (AAMI: V electrode) has become detached
from the patient or the lead set has been changed. Reattach the
electrode or select New Lead Setup in the Setup ECG
menu to confirm the new lead set.
CO2 AUTO ZERO
Numeric is replaced by a - ? -
if the Autozero lasts >15 sec, INOP
tone sounds.
CO2The automatic zero calibration is in progress. This typically
takes 10 seconds. During this time the CO2 values may not be
updated, or they may be replaced by -?-. Wait until the zero
calibration is complete to resume monitoring.
CO2 CAL MODE
CO2 numeric displays current CO2
value for accuracy check
CO2Currently no calibration is running. Accuracy can be checked
by placing the transducer on the two cells of the calstick and
starting calibration. To start monitoring, leave Cal. Mode.
CO2 CAL RUNNING
Numeric is replaced by a - ? -
CO2Wait until calibration is finished.
CO2 CHANGE SCALE CO2The CO2 wave is clipped. Select a more appropriate wave scale
to display the whole wave.
CO2 CHECK ADAPTER
Numeric is replaced by a - ? -
INOP tone.
CO2Check that the sensor is connected to the airway adapter, clean
the airway adapter, if necessary. Perform a zero calibration. If
the INOP persists, contact your service personnel.
INOP Message, Indication Source What to do

Technical Alarm Messages (INOPs) 4 Patient Alarms and INOPs
65
CO2 CHECK CAL
Numeric is replaced by a - ? -
INOP tone.
CO2The CO2 value is outside the measurement range. Perform an
accuracy check for both calstick cells and, if necessary,
recalibrate the transducer.
C.O. EQUIP MALF
Numeric is replaced by a - ? -
INOP tone.
C.O. There is a problem with the C.O. hardware. Contact your
service personnel.
CO2 EQUIP MALF
Numeric is replaced by - ? -
INOP tone.
CO2The Measurement Server Extension is faulty. Unplug and
replug the Measurement Server with Extension. If you are using
the mainstream method, unplug and replug the transducer or
try another transducer. If the INOP persists, contact your
service personnel.
CO2 FAILED CAL
Numeric is replaced by -?-
INOP tone.
CO2Make sure that the Cal cell was changed between CAL1 and
CAL2. Repeat the calibration. If the INOP reappears, try
another transducer. If the INOP persists, contact your service
personnel.
CO2 NO SENSOR
Numeric is replaced by - ? -
INOP tone.
CO2There is no CO2 sensor connected. If you silence this INOP
the CO2 measurement will be switched off.
CO2 NO TRANSDUC
Numeric is replaced by - ? -
INOP tone.
CO2There is no CO2 transducer connected. If you replace the
transducer, the new transducer must be calibrated. If you
silence this INOP the CO2 measurement will be switched off.
CO2 NO TUBING
Numeric is replaced by - ? -
INOP tone.
CO2Either the FilterLine is disconnected, or an incorrect line is
attached. Check the connection. If necessary, connect another
Microstream Filterline (only Microstream accessories can be
used).
If you silence this INOP, the measurement will be switched off.
CO2 OCCLUSION
Numeric is replaced by a - ? -
INOP tone.
CO2The FilterLine or exhaust tube is blocked. Check the FilterLine
and exhaust tube, then disconnect and reconnect the
FilterLine. If the INOP persists, connect a new FilterLine.
CO2 OVERRANGE
Numeric is replaced by - ? -
INOP tone.
CO2The CO2 value is higher than the measurement range. If you
suspect a false high value, contact your service personnel.
CO2 PUMP OFF
Numeric is replaced by a - ? -.
CO2The pump has been switched off for fifteen minutes. To switch
it on again, select Pump On in the Setup CO2 menu.
CO2 PURGING
Numeric is replaced by a - ? -
INOP tone.
CO2The Filterline is being purged to remove an occlusion in the
line or airway adapter. If the occlusion is removed, the INOP
will disappear. If not, the INOP CO2 OCCLUSION is
displayed.
CO2 SENSOR WARMUP
Numeric is displayed with a - ? -
Microstream CO2: INOP tone.
Mainstream CO2: no INOP tone
CO2Wait until the sensor reaches operating temperature and the
INOP disappears.
C.O. UNPLUGGED
numeric is replaced by -?-
INOP tone.
C.O. Plug in the C.O. module. Silencing this INOP switches off the
measurement.
CO2 UPDATE FW
Numeric is replaced by a - ? -
INOP tone.
CO2The software in the Measurement Server Extension does not
match the software in the MMS. Contact your service
personnel.
CO2 WAIT CAL2
Numeric is replaced by a - ? -
CO2Calibration on the first calstick cell is complete. Place the
transducer on the other calstick cell and start the CAL2
calibration cycle.
INOP Message, Indication Source What to do

4 Patient Alarms and INOPs Technical Alarm Messages (INOPs)
66
CO2 ZERO FAILED
Numeric is replaced by a - ? -
INOP tone.
CO2An error occurred during the last zero calibration. Check the
airway adapter and clean, if necessary. Perform another zero
calibration. If the INOP persists, contact your service
personnel.
CO2 ZERO REQUIRED
Numeric is replaced by a - ? -
INOP tone
CO2Perform zero calibration for the CO2 sensor. If the INOP
persists, contact your service personnel.
CO2 ZERO RUNNING CO2Wait until zero calibration is finished.
CPP CHK SOURCES
Numeric is replaced by a - ? -
CPP Not all measurements or values required to perform the
calculation are available. Check the measurement sources.
CPP CHK UNITS
Numeric is replaced by a - ? -
CPP The monitor has detected a conflict in the units used for this
calculation. Check the unit settings.
CUFF NOT DEFLATED
Numeric is displayed with a - ? -
INOP tone.
During this INOP, alarms cannot be
paused or switched off.
NBP Remove the cuff from the patient. Make sure that the tubing is
not kinked or twisted and that the correct patient category is
selected. Try repeating the measurement.
You can silence the INOP, but the INOP message remains
visible until the next NBP measurement is started or the Stop
All SmartKey is selected.
[Adult or pediatric patients: The NBP cuff pressure has exceeded
15mmHg (2kPa) for more than 3 minutes.
Neonatal patients: The NBP cuff pressure has exceeded 5mmHg
(0.7kPa) for more than 90 seconds.]
CVP INOPS PRESS See <Pressure label> INOPS (under Pressure).
ECG EQUIP MALF
Numeric is displayed with a - ? -
INOP tone.
ECG Contact your service personnel.
The ECG hardware is faulty.
<ECG LEAD> LEAD OFF
Numeric is displayed with a - ? -
INOP tone.
ECG Not all the required leads for ECG monitoring are connected.
Check the ECG connections and make sure that the electrode
indicated by <ECG lead> [RA, LA, LL, RL, V or C] electrodes
is attached. In EASI mode, all 5 electrodes must be connected.
ECG EL. NOISY <ECG LEAD> ECG The ECG signal from the named ECG electrodes [RA, LA, LL,
RL, V (or C)] is noisy. Check the ECG connections and make
sure that the electrode indicated is attached.
ECG NOISY SIGN.
INOP tone.
ECG The ECG signal is too noisy. Check that the electrodes are
properly placed and have not dried out. Remove any possible
sources of signal noise (such as power cords) from the area
around the cable and the patient.
The ECG signal may be saturated or overloaded.
EcgOut EQUIP MALF
INOP tone
ECG Check that the ECG out cable is securely connected. Contact
your service personnel.
EEG EQUIP MALFUNC
INOP tone
EEG The EEG hardware is faulty. Contact your service personnel.
EEG IMPEDANCE HIGH or
EEG1 and/or EEG2 IMPED.
HIGH
EEG The signal electrode in one or both channels exceeds the user-
selected impedance limit, or the impedance of a single electrode
exceeds the limit. Check the impedance. If the impedance is
too high, reconnect the electrodes according to the EEG
monitoring setup guidelines.If the INOP persists, contact your
service personnel.
EEG<X> LEAD OFF <n>
[X = channel, n = electrode]
EEG Reconnect specified electrode.
INOP Message, Indication Source What to do

Technical Alarm Messages (INOPs) 4 Patient Alarms and INOPs
67
EEG<X> LEAD OFF
[X = channel]
at Information Center
EEG One or more electrodes are not connected. Check in the EEG
Impedance/Montage window on the monitor which
electrode(s) are affected and reconnect the electrodes.
EEG<X> LEADS OFF
[X = channel]
EEG Two or more electrodes are not connected. Check in the EEG
Impedance/Montage window which electrodes are
affected and reconnect the electrodes.
EEG LINE NOISE
EEG 1 or 2 LINE NOISE
EEG Excessive line noise has been detected in either channel EEG1
or EEG2, or in both EEG channels.
Keep all cables together and away from metallic bodies, other
cables & radiated fields.
EEG MUSCLE NOISE
EEG 1 or 2 MUSCLE NOISE
EEG Too much power above 30 Hz has been detected in channel
EEG1 or EEG2, or both.
Check the Electrode-to-Skin Impedance and reposition the
electrode away from possible muscle activity, if necessary.
EEG NO TRANSDUCER
INOP tone
EEG The trunk cable is disconnected from the EEG plug-in module.
Reconnect the trunk cable.Silencing this INOP switches the
measurement off.
EEG UNPLUGGED
INOP tone
EEG Plug in module. Silencing this INOP switches off the
measurement.
EEG OVERRANGE, or
EEG<X> OVERRANGE
EEG Input signal is too high in one or both channels. This is usually
caused by interfering signals such as line noise or electrosurgery.
X denotes the EEG channel.
FAP INOPS PRESS See <Pressure label> INOPS (under Pressure).
FMS UNPLUGGED
INOP tone.
FMS Make sure that the Flexible Module Server is connected to the
monitor. All FMS measurements are off while the FMS is
unplugged.
FMS UNSUPPORTED
INOP tone.
FMS The Flexible Module Server is not supported by your monitor.
Contact your service personnel.
IC1/IC2INOPS PRESS See <Pressure label> INOPS (under Pressure).
ICP INOPs PRESS See <Pressure label> INOPS (under Pressure).
Indep.Dsp Malfunc. Display A problem has occurred with the second main display. Contact
your service personnel.
Indep.Dsp NotSupp. Display The monitor does not support a second main display. The
monitor software is incompatible. Contact your service
personnel.
Intell.Dsp Malf.
INOP tone
Display There is a problem with the Intelligent Display. Check the
MSL coupling cable then contact your service personnel.
Intell.Dsp Missing Display The monitor has lost contact with the connected Intelligent
Display. Contact your service personnel.
Intell.Dsp Unsupp. Display The monitor does not support the connected Intelligent
Display. The monitor software is incompatible.
Internal.Comm.Malf
INOP tone
Monitor There is a problem with I2C Bus communication in the
monitor. Contact your service personnel.
LA LEAD OFF
Numeric is replaced by -?- for 10
seconds; INOP tone.
ECG The LA electrode has become detached from the patient or the
lead set has been changed. Reattach the electrode or select New
Lead Setup in the Setup ECG menu to confirm the
new lead set.
LAP INOPs PRESS See <Pressure label> INOPS (under Pressure).
INOP Message, Indication Source What to do

4 Patient Alarms and INOPs Technical Alarm Messages (INOPs)
68
LEADS OFF
Numeric is replaced by -?- for 10
seconds; INOP tone.
ECG Check that all of the required ECG leads are attached, and that
none of the electrodes have been displaced.
LL LEAD OFF
Numeric is replaced by -?- for 10
seconds; INOP tone.
ECG The LL electrode has become detached from the patient or the
lead set has been changed. Reattach the electrode or select New
Lead Setup in the Setup ECG menu to confirm the
new lead set.
MCC Reversed Monitor The MSL coupling cable is reversed. Connect the end with the
grey connector to the Intelligent Display.
MCC Unsupported Monitor An MSL coupling cable has been connected to a device which
does not support MSL coupling.
Measserv Unsupportd Monitor The measurement server is not supported by the monitor.
Contact your service personnel.
MMS UNPLUGGED
INOP tone.
MMS Make sure that the Multi-Measurement Server is connected to
the monitor. All MMS measurements are off while the MMS is
unplugged.
MMS UNSUPPORTED
INOP tone.
MMS The Multi-measurement Server is not supported by your
monitor. Contact your service personnel.
MSL Power High Monitor The power consumption of the devices connected to the
Measurement Server Link (MSL) cable is too high. If this
situation continues, the MSL will be switched off. Contact
your service personnel.
MSL Power Off
INOP tone.
Monitor The power consumption of the devices connected to the
Measurement Server Link (MSL) cable was too high for too
long and the MSL has been switched off. Contact your service
personnel.
MSL Power Overload
INOP tone.
Monitor The power consumption of the devices connected to the
Measurement Server Link (MSL) cable is much too high or
there has been a short circuit. The MSL has been switched off.
Contact your service personnel.
NBP CUFF OVERPRESS
Numeric displayed with -?- ; INOP
tone.
During this INOP, alarms cannot be
paused or switched off.
NBP The NBP cuff pressure exceeds the overpressure safety limits.
Remove the cuff from the patient. Make sure that the tubing is
not kinked or twisted and that the correct patient category is
selected. Try restarting the measurement.
You can silence this INOP, but the INOP message remains
visible until the next measurement is started or the Stop All
SmartKey is selected.
NBP EQUIP MALF
Numeric is replaced by -?-
INOP tone.
NBP Remove the cuff from the patient. The NBP hardware is faulty.
Contact your service personnel.
You can silence this INOP, but the INOP message remains
visible until the next measurement is started or the Stop All
SmartKey is selected.
INOP Message, Indication Source What to do

Technical Alarm Messages (INOPs) 4 Patient Alarms and INOPs
69
NBP INTERRUPTED
Numeric is replaced by -?-
INOP tone.
NBP Check the tubing and cuff for leakages or kinks. Check that
you are using the correct cuff size and placement, and that the
correct patient category is selected. Try restarting the
measurement.
If the INOP occurs repeatedly, contact your service personnel.
You can silence this INOP, but the INOP message remains
visible until the next measurement is started or the Stop All
SmartKey is selected.
This INOP arises when the measurement needed longer than
the maximum time for inflation, deflation or the total
measurement.
NBP MEASURE FAILED
Numeric may be displayed with a -?-
INOP tone.
NBP Check that you are using the correct cuff size and placement,
and that the correct patient category is selected. Try restarting
the measurement.
If numerics are displayed, the monitor is able to measure mean
only and the alarm source is set to S, D or S&D.
You can silence this INOP, but the INOP message remains
visible until the next measurement is started or the Stop All
SmartKey is selected.
Check the condition and suitability of the patient for NBP
monitoring. Use another cuff to continue measuring.
No Central Monit.
INOP tone
Monitor There is a problem with the communication to the network.
Central monitoring is currently not possible (no patient alarms
or information). Check the connection. Contact your service
personnel.
NO PPV FROM MeasSrv
at Information Center
MMS or
FMS
The measurement server does not supply a beat-to-beat arterial
pressure value. Contact your service personnel.
NO PPV FROM <Server> MMS or
FMS
The measurement server does not supply a beat-to-beat arterial
pressure value. Contact your service personnel.
P/P1/P2/P3/P4 INOPS PRESS See <Pressure label> INOPS (under Pressure).
PAP INOPS PRESS See <Pressure label> INOPS (under Pressure).
PPV BAD <Pressure Label>
SIGNAL
PRESS The arterial pressure source selected for PPV is not providing a
pulsatile signal.
PPV BAD SIGNAL
at Information Center
PRESS The arterial pressure source selected for PPV is not providing a
pulsatile signal.
PPV CHK SOURCES PRESS The arterial pressure source selected for PPV is unplugged or
switched off. When this INOP has displayed for 1 minute PPV
will be switched off.
<Pressure label> ARTIFACT
Numeric displayed with -?-
PRESS A non-physiological event is detected (for example, a flush or
blood sample). A resulting high limit alarm will be suppressed.
<Pressure label>
DEACTIVATED
INOP tone
PRESS A Pressure measurement label in the measurement server or
extension has been deactivated, either by connecting a Temp
transducer in the shared Press/Temp socket, or by deactivating
the label in the Measurement Selection window.
The measurement automatically disappears from the display.
To switch the measurement on again, either reconnect a
Pressure transducer or reactivate the measurement label in the
Measurement Selection window.
INOP Message, Indication Source What to do

4 Patient Alarms and INOPs Technical Alarm Messages (INOPs)
70
<Pressure label> EQUIP
MALF
Numeric displayed with -?-
INOP tone.
PRESS Contact your service personnel.
The pressure hardware is faulty.
<Pressure label> NO
TRANSDUCER
Numeric is replaced by -?-
INOP tone.
PRESS Make sure that the pressure transducer is connected to the
measurement server or module server.
If you silence this INOP, the measurement will be switched off.
<Pressure label> NOISY
SIGNAL
Pulse numeric is replaced by -?-
INOP tone.
PRESS This INOP can only arise when a pressure is selected as the
pulse source. It occurs when the pulse detector finds a pulse
rate above 350bpm. This is usually caused by movement
artifact or electrical interference.
<Pressure label> NON-
PULSATILE
Pulse numeric is replaced by -?-
INOP tone.
PRESS This INOP can only arise when a pressure is selected as the
pulse source. It occurs when the pulse rate being measured is
less than 25 beats per minute or the amplitude is less than three
mmHg.
Check the catheter and connections to the patient.
<Pressure label>
OVERRANGE
Numeric is replaced by -?-
INOP tone.
PRESS Make sure that the measurement has been properly prepared
and zeroed, and that the transducer is level with the heart. If
this INOP persists, try another transducer.
Possible causes are a measured pressure outside the allowed
pressure range, or a broken wire to the transducer.
<Pressure label> REDUCE
SIZE
PRESS Increase the scale for the pressure wave.
<Pressure label> TRANSDUC
MALF
Numeric is replaced by -?-
INOP tone.
PRESS Contact your service personnel.
The transducer is faulty.
<Pressure label>
UNPLUGGED
PRESS A Pressure measurement label has been deactivated, either by
unplugging a module, or by deactivating the label in the
Measurement Selection window.
The measurement automatically disappears from the display.
To switch the measurement on again, either replug the module
or reactivate the measurement label in the Measurement
Selection window.
<Pressure label>
ZERO+CHECK CAL
Numeric is replaced by -?-
PRESS Perform a zero and check the calibration of the transducer.
RA LEAD OFF
Numeric is replaced by -?-
INOP tone.
ECG The RA electrode has become detached from the patient or the
lead set has been changed. Reattach the electrode or select New
Lead Setup in the Setup ECG menu to confirm the
new lead set.
RAP INOPS PRESS See <Pressure label> INOPS (under Pressure).
Rem.Alarmdev.Malf
INOP tone
Monitor There is a problem with the connection to the remote alert
device. Contact your service personnel to check the remote
alert device and its connections.
RESP EQUIP MALF
Numeric is replaced by -?-
INOP tone.
RESP Contact your service personnel. The RESP hardware is faulty.
INOP Message, Indication Source What to do

Technical Alarm Messages (INOPs) 4 Patient Alarms and INOPs
71
RESP ERRATIC
Numeric is replaced by -?-
RESP The monitor has detected too many artifacts in the measured
Resp signal. Check that the RA and LL electrodes are correctly
attached and have not dried out.
RESP LEADS OFF
Numeric is replaced by -?-
INOP tone.
RESP Not all the required leads for Resp monitoring are attached.
Make sure that the RA and LL leads are attached.
RL LEAD OFF
Numeric is replaced by -?- for 10
seconds; INOP tone.
ECG The RL electrode has become detached from the patient or the
lead set has been changed. Reattach the electrode or select New
Lead Setup in the Setup ECG menu to confirm the
new lead set.
Settings Malfunc.
INOP tone.
Monitor The monitor cannot use the predefined settings for
monitoring. Contact your service personnel.
SOME ECG ALARMS OFF Arrhythmia This message appears (if configured to do so) when the on/off
settings of the yellow arrhythmia alarms differ from the current
Profile.
Speaker Malfunct.
INOP tone
Monitor Contact your service personnel to check the speaker and the
connection to the speaker.
SPIRO MALFUNCTION Spirometry Module failure detected. Contact your service personnel.
SPIRO INCOMPATIBLE Spirometry Module revision not compatible with the host monitor
software revision. Contact your service personnel.
SPIRO UPGRADE Spirometry The module is running a firmware upgrade. Wait until upgrade
is completed before resuming monitoring.
SPIRO CANNOT MEAS Spirometry Measurement is at its limit, e.g. ambient pressure out of range.
SPIRO PURGE FAILED Spirometry The purge operation could not be completed successfully.
Check for kinked sensor tubings, hard occlusions and make
sure that the pump is running and all valves are switching.
SPIRO UNKN. SENSOR Spirometry An unknown sensor ID code was detected. Use only the sensors
listed in the Accessories chapter.
SPIRO ALARMS SUPPR Spirometry Alarming is suppressed for the spirometry module.
SPIRO PURGING Spirometry A purge operation is in progress - no data update on the screen.
Wait until purge is complete.
SPIRO NO SENSOR Spirometry No sensor detected. Make sure the correct sensor is attached to
the breathing circuit.
SPIRO NO BREATH Spirometry No breath was detected for more than 25 seconds. Breath
derived numerics are not available.
SPIRO GAS COMPENS? Spirometry Gas compensation is set to “gas analyzer” but not all gases
necessary for compensation are measured by a gas monitor.
Some of the fall-back values provided by the user are used.
Measurement accuracy might be reduced.
SPIRO PATIENT CAT. Spirometry Mismatch of patient size configured in the host monitor and
sensor type plugged into the module. Check the instructions
on selecting the correct sensor in the Spirometry chapter.
∆SpO2 CHK SOURCES
Numeric is replaced by -?-
SpO2
Difference
Not all measurements or values required to perform the
calculation are available. Check measurement sources.
∆SpO2 CHK UNITS
Numeric is replaced by -?-
SpO2
Difference
The monitor has detected a conflict in the units used for this
calculation. Check the unit settings.
INOP Message, Indication Source What to do

4 Patient Alarms and INOPs Technical Alarm Messages (INOPs)
72
<SpO2 label> DEACTIVATED
INOP tone
SpO2You have connected a measurement server that uses a label the
monitor has already assigned to a different source. To activate
the new source, choose a new label in the Measurement
Selection window.
<SpO2 label> EQUIP MALF
Numeric is replaced by -?-
INOP tone.
SpO2The MMS is faulty. Unplug and replug the MMS. If the INOP
persists, contact your service personnel.
<SpO2 label> ERRATIC
Numeric is replaced by -?-
INOP tone.
SpO2Check the sensor placement. Try another adapter cable and
sensor. If the INOP persists, contact your service personnel.
<SpO2 label> EXTD. UPDATE
Label is displayed with a -?-
(questionable numeric)
SpO2The update period of displayed values is extended due to an
NBP measurement on the same limb or an excessively noisy
signal.
<SpO2 label> INTERFERNCE
Numeric is replaced by -?-
INOP tone.
SpO2There is too much interference, caused by a high level of
ambient light and/or electrical interference. Cover the sensor to
minimize ambient light. If the INOP persists, make sure that
the sensor cable is not damaged or positioned too close to
power cables.
<SpO2 label> LOW PERF
Label is displayed with a -?-
(questionable numeric)
SpO2Accuracy may be compromised due to very low perfusion.
Stimulate circulation at sensor site. If INOP persists, change
the measurement site.
<SpO2 label> NOISY SIGN.
Numeric is replaced by -?-
INOP tone.
SpO2Excessive patient movement or electrical interference is causing
irregular pulse patterns. Try to reduce patient movement or to
relieve the cable strain on the sensor.
<SpO2 label> NON-PULSAT.
Numeric is replaced by -?-
INOP tone.
SpO2Check the perfusion at measurement site. If necessary,
stimulate circulation or change measurement site. If the INOP
is due to NBP measurement on the same limb, wait until the
NBP measurement is finished.
<SpO2 label> NO SENSOR
Numeric is replaced by -?-
INOP tone.
SpO2Make sure the SpO2 sensor is connected. If the INOP persists,
try another adapter cable and sensor. If you silence this INOP,
the measurement will be switched off.
<SpO2 LABEL> POOR SIGNAL
Label is displayed with a - ? -
(questionable numeric)
SpO2The signal condition of the SpO2 measurement is poor and
measurement accuracy may be compromised.
<SpO2 LABEL> PULSE?
Numeric is replaced by -?-
INOP tone
SpO2The detectable pulsations of the SpO2 signal are outside the
specified pulse rate range.
<SpO2 LABEL> SEARCHING
Numeric unavailable
SpO2SpO2 is analyzing the patient signal to derive Pulse, SpO2 and
Perf values. Please wait until the search analysis is complete.
<SpO2 label> SENSOR MALF
Numeric is replaced by -?-
INOP tone.
SpO2The SpO2 sensor or adapter cable is faulty. Try another adapter
cable and sensor. If the INOP persists, contact your service
personnel.
<SpO2 LABEL> SENSOR OFF
Numeric is replaced by -?-
INOP tone
SpO2The SpO2 sensor is not properly applied to the patient. Apply
the sensor following the instructions supplied by the
manufacturer.
<SpO2 LABEL> UNKN.SENSOR
Numeric is replaced by a - ? -
SpO2The connected sensor or adapter cable is not supported by the
SpO2 measurement. Use only specified sensors and cables.
INOP Message, Indication Source What to do

Technical Alarm Messages (INOPs) 4 Patient Alarms and INOPs
73
<SpO2 LABEL> UPGRADE
Label is displayed with a -?-, numeric is
unavailable
SpO2The SpO2 measurement is currently in UPGRADE mode.
Monitoring is not possible in this mode.
Sp - vO2 CHK SOURCES
Numeric is replaced by -?-
Sp - vO2Not all measurements or values required to perform the
calculation are available. Check measurement sources.
Sp - vO2 CHK UNITS
Numeric is replaced by -?-
Sp - vO2The monitor has detected a conflict in the units used for this
calculation. Check the unit settings.
SvO2 CAL FAILED
SvO2 numeric is displayed with ?
SvO2The calibration failed. Check the catheter-to-Optical-Module
connection. Manually restart the calibration. Try another
catheter and Optical Module. If the catheter is already inserted,
perform an in-vivo calibration.
SvO2 CAL MODE
SvO2 numeric is replaced by -?-
SvO2Pre-insertion calibration is complete, but the catheter tip is still
inside the optical reference. The catheter is now ready for
insertion.
SvO2 CAL REQUIRED
SvO2 numeric is replaced by -?-.
INOP tone may sound
SvO2There is no valid calibration data in the Optical Module.
Perform either a pre-insertion or an in-vivo calibration.
SvO2 CONFIGURATION
SvO2 numeric is replaced by -?-.
INOP tone
SvO2The Optical Module has been configured to SaO2 Mode. Use
Change to SvO2 in the Setup SvO2 menu to
reconfigure to SvO2 Mode.
SvO2 CONNCT OPTMOD
SvO2 numeric is replaced by -?-.
INOP tone
SvO2The Optical Module was disconnected during data storage.
Reconnect the Optical Module for at least 20 seconds.
SvO2 EQUIP MALF
SvO2 numeric is replaced by -?-.
INOP tone
SvO2The SvO2 Module or Optical Module is faulty. Unplug and
replug the Optical Module and SvO2 module. Exchange the
modules. If the INOP persists, contact your service personnel.
SvO2 IN-VIVO CALIB
SvO2 numeric is replaced by -?-.
SvO2The in-vivo calibration is not yet complete. Lab values must be
stored to the Optical Module to complete the calibration.
Either continue with the next steps of the current calibration or
recall the previous calibration.
SvO2 LIGHT INTENS
SvO2 numeric is replaced by -?- or
numeric is displayed with ?
INOP tone with -?- display
SvO2The intensity changed considerably since the last light intensity
calibration. This may indicate that the catheter tip is positioned
against a blood vessel wall or that there is low blood flow.
Reposition the catheter and perform a light intensity
calibration.
SvO2 LOW LIGHT
SvO2 numeric is replaced by -?- or
numeric is displayed with ?
INOP tone may sound
SvO2The optical signal levels are too low. Check that the catheter is
either in the optical reference or inserted into the patient.
Check the catheter-to-Optical Module connection. If INOP
persists, try another catheter and Optical Module.
SvO2 NO OPTMOD
SvO2 numeric is replaced by -?-.
INOP tone
SvO2Connect the Optical Module. If the INOP persists, try another
Optical Module. Silencing this INOP switches the
measurement off.
SvO2 OPTMOD DEFECT SvO2The Optical Module memory is faulty, and calibration data
cannot be stored for transport or during power failure. If this
feature is needed, use another Optical Module.
SvO2 OPTMOD WARMUP
SvO2 numeric is displayed with ?
SvO2The Optical Module has not yet reached the operating
temperature. Wait a few minutes until warm-up is finished.
SvO2 PRE-INS CALIB
SvO2 numeric is replaced by -?-
INOP tone
SvO2The pre-insertion calibration is running. This typically takes
one minute. During this time SvO2 alarms are switched off.
Wait until the calibration is complete.
INOP Message, Indication Source What to do

4 Patient Alarms and INOPs Technical Alarm Messages (INOPs)
74
SvO2 UNABL TO MEAS
SvO2 numeric is replaced by -?-.
INOP tone
SvO2The signal is out of the normal range, and no SvO2 value can
be derived. Perform an in-vivo calibration. If the INOP
persists, try another Optical Module and catheter.
SvO2 UNPLUGGED
SvO2 numeric is replaced by -?-.
INOP tone
SvO2Measurement switched on and SvO2 module unplugged from
the rack.
The measurement automatically disappears from the display.
Silencing this INOP switches off the measurement.
SVR/SVRI CHK SOURCES
Numeric is replaced by -?-
SVR/SVRI Not all measurements or values required to perform the
calculation are available. Check measurement sources.
SVR/SVRI CHK UNITS
Numeric is replaced by -?-
SVR/SVRI The monitor has detected a conflict in the units used for this
calculation. Check the unit settings.
SVR/SVRI SET CVP USED
Numeric is replaced by -?-
SVR/SVRI A CVP value is required for this calculation, but is not
currently being measured. The monitor is using the CVP value
preset in the Setup SVR menu.
T/T1/T2/T3/T4 INOPs TEMP See <Temp label> INOPs (under Temp)
Tamb INOPs TEMP See <Temp label> INOPs (under Temp)
Tart INOPs TEMP See <Temp label> INOPs (under Temp)
Tblood NO TRANSDUC
Numeric is replaced by -?-
INOP tone
C.O. No transducer attached to the module or catheter
disconnected.
Tblood OVERRANGE
Numeric is replaced by -?-
C.O. Tblood out of range 17°C - 43°C.
Tcereb INOPS TEMP See <Temp label> INOPs (under Temp)
Tcore INOPs TEMP See <Temp label> INOPs (under Temp).
tcpO2 (or tcpCO2
or tcGas)
CAL FAILED
Numeric is replaced by -?-
INOP tone.
tcGas A calibration failed. Check the cal. unit, gas pressure, and
tubing connections, then restart the cal. If the cal. has failed
more than once, remembrane the transducer and restart the
calibration. If this INOP persists, contact your service
personnel.
tcpO2 (or tcpCO2
or tcGas)
CAL REQUIRD
Numeric is replaced by -?-
INOP tone.
tcGas Calibration is required before applying the transducer to the
patient.
Insert a membraned transducer into the cal. chamber on the
module, connect the cal. unit to the cal. chamber, open the gas
valve and start the calibration. If this INOP occurs during a
calibration, there may be a module or transducer malfunction:
contact your service personnel.
tcpO2 (or tcpCO2
or tcGas)
CAL RUNNING
Numeric displays first -?- , then
numeric is displayed with a ?
tcGas Wait until the tcpO2/tcpCO2 calibration is finished.
tcpO2 (or tcpCO2
or tcGas)
CHECK TIME
tcGas Site Timer due to time out in 15 minutes or less.
tcpO2 (or tcpCO2
or tcGas)
CHANGE SITE
If Heat Switch Off is configured to Yes,
numeric is replaced by -?-
INOP tone.
tcGas Site Timer has timed out. Change the application site to avoid
skin burns. To reset the Site Timer, either calibrate and change
the measurement site, or change the measurement site and reset
the Site Timer manually by selecting the appropriate site time
from the Setup TCGas menu.
INOP Message, Indication Source What to do

Technical Alarm Messages (INOPs) 4 Patient Alarms and INOPs
75
tcpO2 (or tcpCO2
or tcGas)
EQUIP MALF
Numeric is replaced by -?-
INOP tone.
tcGas There is a malfunction in the transducer or module. Connect
another transducer. If this INOP persists, contact your service
personnel.
tcpO2 (or tcpCO2
or tcGas)
NO TRANSDUC
Numeric is replaced by -?-
INOP tone.
tcGas No transducer is connected to the tcpO2/tcpCO2 module.
Silencing the alarm switches off the measurement.
tcpO2 (or tcpCO2
or tcGas)
STABILIZING
Numeric is displayed with a ?
tcGas The transducer has not yet reached the selected temperature
and/or skin hyperemization is not yet finished. This INOP will
disappear within three minutes.
tcpO2 (or tcpCO2
or tcGas)
UNPLUGGED
Numeric is replaced by -?-
INOP tone.
tcGas The measurement is switched on but the module is unplugged.
The measurement automatically disappears from the display.
Silencing this INOP switches off the measurement.
<∆Temp> CHK SOURCES
Numeric is replaced by -?-
TEMP
Difference
Not all measurements or values required to perform the
calculation are available. Check measurement sources.
<∆Temp> CHK UNITS
Numeric is replaced by -?-
TEMP
Difference
The monitor has detected a conflict in the units used for this
calculation. Check the unit settings.
<Temp label> DEACTIVATED
INOP tone
TEMP A Temp measurement label in the measurement server or
extension has been deactivated, either by connecting a Pressure
transducer in the shared Press/Temp socket, or by deactivating
the label in the Measurement Selection window.
The measurement automatically disappears from the display.
To switch the measurement on again, either reconnect a Temp
transducer or reactivate the measurement label in the
Measurement Selection window.
<Temp label> EQUIP MALF
Numeric is replaced by -?-
INOP tone.
TEMP Contact your service personnel.
The temperature hardware is faulty.
<Temp label> NO
TRANSDUCER
Numeric is replaced by -?-
INOP tone.
TEMP Make sure the TEMP probe is connected to the MMS or
module.
If you silence this INOP, the measurement will be switched off.
<Temp label> UNPLUGGED
INOP tone
TEMP A Temp measurement label has been deactivated, either by
unplugging a module, or by deactivating the label in the
Measurement Selection window.
The measurement automatically disappears from the display.
To switch the measurement on again, either replug the module
or reactivate the measurement label in the Measurement
Selection window.
<Temp label> OVERRANGE
Numeric is replaced by -?-
INOP tone.
TEMP Try changing the application site of the transducer.
[The temperature is less than -1°C, or greater than 45°C.]
Tesoph INOPS TEMP See <Temp label> INOPs (under Temp).
TimeExpired:<timer label>
INOP tone
Monitor The time has expired for the timer indicated in the INOP text.
Clearing the timer clears the INOP.
Tnaso INOPS TEMP See <Temp label> INOPs (under Temp).
Trect INOPS TEMP See <Temp label> INOPs (under Temp).
Tskin INOPS TEMP See <Temp label> INOPs (under Temp).
INOP Message, Indication Source What to do

4 Patient Alarms and INOPs Technical Alarm Messages (INOPs)
76
Ttymp INOPS TEMP See <Temp label> INOPs (under Temp)
Tven INOPS TEMP See <Temp label> INOPs (under Temp).
Tvesic INOPS TEMP See <Temp label> INOPs (under Temp)
UAP INOPS PRESS See <Pressure label> INOPS (under Pressure).
Unsupported LAN
INOP tone
Monitor There is a problem with the communication to the network
and central monitoring is currently not possible. Check the
connection.If the INOP persists, switch off the monitor and
contact your service personnel.
User I/F Malfunct.
INOP tone.
Monitor Perform a visual and functional check of all the monitor input
devices. Contact your service personnel.
UVP INOPS PRESS See <Pressure label> INOPS (under Pressure).
V LEAD OFF
Numeric is replaced by -?- for 10
seconds; INOP tone.
ECG The V electrode (IEC: C electrode) has become detached from
the patient or the lead set has been changed. Reattach the
electrode or select New Lead Setup in the Setup ECG
menu to confirm the new lead set.
<VueLink option> CHK
CABLE
INOP tone.
VueLink No cable or the wrong cable connected to the VueLink module,
or incorrect device selected. Silencing this INOP switches the
measurement off.
VueLink INOP abbreviations may differ slightly depending on
the device category.
<VueLink option> CHK
CONF.
INOP tone.
VueLink The wrong external device has been selected on the VueLink
module, or the external device has not been correctly setup, or
the wrong cable has been used to connect the device to the
VueLi nk module.
VueLink INOP abbreviations may differ slightly depending on
the device category.
<VueLink option> CHECK
SETUP
INOP tone.
VueLink No information was received from the external device. The
device may be switched off or disconnected.
VueLink INOP abbreviations may differ slightly depending on
the device category.
VueLnk EQUIP MALF
INOP tone.
VueLink Malfunction in the VueLink module. If this message appears
repeatedly, the module must be replaced. Contact your service
personnel.
VueLink INOP abbreviations may differ slightly depending on
the device category.
VueLnk NO CONFIG
INOP tone.
VueLink The VueLink module has not been configured during
installation. The installation process should be completed by
either your biomedical engineering department or the Philips
service engineer.
VueLink INOP abbreviations may differ slightly depending on
the device category.
VueLnk UNPLUGGED
INOP tone.
VueLink The VueLink module has been unplugged from the rack, or the
whole rack has been disconnected. The measurement
automatically disappears from the display. Silencing this INOP
switches off the measurement.
VueLink INOP abbreviations may differ slightly depending on
the device category.
INOP Message, Indication Source What to do

77
5
5Managing Patients
Use the Patient Demographics window and its associated pop-up keys to admit, discharge, and transfer
(ADT) patients.
All patient demographic and ADT information is shared between the patient monitor and the
Information Center, for example, patients admitted to the monitor are automatically admitted to a
connected Information Center.
Admitting a Patient
The monitor displays physiological data and stores it in the trends as soon as a patient is connected.
This lets you monitor a patient who is not yet admitted. It is however important to admit patients
properly so that you can identify your patient on recordings, reports, and networked devices.
During admission you enter data that the monitor needs for safe and accurate operation. For example,
the patient category setting determines the algorithm the monitor uses to process and calculate some
measurements, the safety limits that apply for some measurements, and the alarm limit ranges.
To admit a patient,
1Select the patient name field or select the
Admit/Dischrge SmartKey to open the
Patient Demographics window.
2Clear any previous patient data by selecting
the Dischrge Patient or End Case
pop-up key and then Confirm.
If you do not discharge the previous patient,
you will not be able to distinguish data from
the previous and current patients, for
example, in the trend database.
3Select Admit Patient.
4Enter the patient information: select each
field and use the on-screen keyboard or
choose from the pop-up list of alternatives to
input information. If a conventional
keyboard or a barcode scanner is connected to the monitor you can use this to enter patient
information.
–Last name: Enter the patient’s last name (family name), for example Smith.
Last Name
First Name
MRN
Patient Cat.
Paced
Height
Weight
BSA (D)
Date of Birth
Age
Gender
Notes (1):
Notes (2):
Adult
No
Patient Demographics

5 Managing Patients Quick Admitting a Patient
78
–First name: Enter the patient’s first name, for example Joseph.
–MRN: Enter the patient’s medical record number (MRN), for example 12345678.
–Patient Cat: Choose the patient category, either Adult, Pediatric, or Neonatal.
–Paced: Choose Yes or No (You must use “Yes” if your patient has a pacemaker).
–Height: Enter the patient’s height.
–Weight: Enter the patient’s weight.
–BSA: The monitor calculates the body surface area automatically.
–Date Of Birth: Enter the patient’s date of birth. Enter this in the form dd/mm/yyyy.
–Age: The monitor calculates the patient age automatically.
–Gender: Choose Male or Female.
–Notes: Enter any extra information about the patient or treatment.
5Select Confirm. The patient status changes to admitted.
Patient Category and Paced Status
The patient category setting determines the algorithm the monitor uses to process and calculate some
measurements, the safety limits that apply for some measurements, and the alarm limit ranges.
The paced setting determines whether the monitor shows pacemaker pulses or not. When Paced is
set to No, pace pulses are filtered and therefore do not show in the ECG wave.
WARNING Patient Category and Paced status will always contain a value, regardless of whether the
patient is fully admitted or not. If you do not specify settings for these fields, the monitor uses the
default settings from the current profile, which might not be correct for your patient.
Patient category Changing the patient category may change the arrhythmia and NBP alarm limits.
Always check alarm limits to make sure that they are appropriate for your patient.
Paced status For paced patients, you must set Paced to Yes. If it is incorrectly set to No, the monitor
could mistake a pace pulse for a QRS and fail to alarm during asystole.
Admitting a Centrally-Monitored Patient
You can admit a patient at either the bedside or the Information Center. When you admit a patient,
the patient’s name appears on the bedside monitor and the Information Center.
If you do not fill in all patient information required by the Information Center, the Information
Center may reject the admission. Complete all the required fields and try again to admit the patient.
Quick Admitting a Patient
Use Quick Admit only if you do not have the time or information to fully admit a patient. Complete
the rest of the patient demographic details later. If you do not, the patient name will not be written on
reports and on information stored in the database or sent to an Information Center.
1Select the Quick Admit SmartKey.
2Enter the required data (MRN or Last Name depending on configuration) with the keyboard or a
barcode scanner.

Editing Patient Information 5 Managing Patients
79
3Select Enter.
4In the confirmation window, select Confirm to discharge the previous patient (if confirmation is
configured).
5Check that patient category and paced status are correct for the new patient.
If the monitor is connected to an Information Center and only the MRN is entered, the patient name
is set to - - - . The patient name field on the monitor shows Not Admitted and the patient name
space on printed reports is blank. To fully admit this patient, select Admit Patient again and
complete all required fields.
Editing Patient Information
To edit the patient information after a patient has been admitted, select the patient name field on the
Main Screen to open the Patient Demographics window, and make the required changes.
Discharging a Patient
You should always perform a discharge even if your previous patient was not admitted. A discharge:
– clears the information in the Patient Demographics window
– erases all patient data (such as trend, event, and calculation data) from the monitor, measurement
servers and Information Center. This ensures that data from a previous patient are not mixed
with data from the new patient.
– resets patient category and paced settings to the settings defined in the default Profile
– resets all monitor and measurement settings as well as the active Screen to the settings defined in
the default Profile
– discharges the patient from the Information Center.
When a patient is discharged from the monitor or from an Information Center, all patient data is
deleted. Make sure that you have printed out any required reports before discharging. Check that a
functioning local or central printer is available before you use End Case.
To discharge a patient,
1Select the patient name field to display the Patient Demographics window and associated
pop-up keys.
2Select the pop-up key for either:
–End Case - to print any configured end case reports or vital signs recording, discharge the
patient and clear the patient database, then enter standby mode. If an End Case SmartKey is
configured for your monitor, you can also select this instead and then confirm.
To see which end case reports are set up for your monitor, select Main Setup -> Reports ->
Auto Reports. For each auto report, if End Case Report is set to On, this report will
be printed when you select End Case. See the section on AutoReports for information on
setting up end case reports.
–Dischrge Patient - to discharge the patient without printing any reports.

5 Managing Patients Transferring Patients
80
Transferring Patients
To save you from having to enter the same patient data multiple times and enable patient transfer
without loss of data, information can be shared between measurement servers, patient monitors, and
Information Centers.
– patient demographic information is shared between connected measurement servers, patient
monitors, and Information Centers
– measurement settings and calibration data can be uploaded from an MMS to a patient monitor, if
configured
– trend information can be uploaded from an MMS to a patient monitor, if configured.
Different sets of patient- and measurement-related data are stored in the monitor and the Multi-
Measurement Server. Understanding this will help you to understand what happens to patient data
when you transfer patients.
WARNING If the monitor is not battery-powered, you cannot monitor during transport.
Transferring a Centrally-Monitored Patient
Scenario: A centrally-monitored patient is moved to another monitoring location on the same
Information Center database server without interrupting the collection of patient trend information.
1Before you disconnect the MMS from the monitor, select the patient name in the monitor info line
to enter the Patient Demographics window, then select the Transfer pop-up key. If
the patient is not admitted or not monitored by an Information Center, the Transfer key is
inactive (“grayed-out”).
This step preserves the patient’s demographic data during the transfer.
2Remove the MMS and any connected extensions from the monitor.
3Connect the MMS to the transfer monitor and monitor your patient during the move.
Patient Information Stored in Monitor Stored in MMS and extensions
Patient demographics (name,
DOB, MRN)
yes yes
Monitor settings (alarm pause
time, alarm volume)
yes no
Measurement settings for all
measurements (alarm limits,
measurement on/off, etc.)
yes yes, for all MMS and extensions
measurements
Trend data yes, for all MMS and extensions
measurements (up to a maximum
of 16 or 32, depending on your
database configuration)
most recent 8 hours of
information, for all MMS and
extensions measurements
Calculation data (HemoCalc
data)
yes no
Events data yes no

Data Upload from an MMS 5 Managing Patients
81
4At the new location, connect the MMS to the monitor. If the monitor detects a patient conflict,
the patient selection window will be displayed.
5Select Continue MMS and Confirm your selection. This re-admits the patient from the
transfer list to the new monitor, completing the transfer. This will upload the patient
demographics, and, if configured, the measurement settings and trend data stored in the MMS to
the receiving monitor.
6Verify that the settings for patient category and paced mode are correct.
If you accidentally transfer a patient, use Re-admit to restore this patient’s data to the Information
Center. If you are not connected to the network, select Clear Transfer to leave transfer mode.The
patient data remains in the monitor.
Transferring a Patient with an MMS (no Central Station)
Scenario: A patient is moved to another monitoring location using a transport monitor and re-
admitted at the new monitor.
1Disconnect the MMS from the original monitor and silence the resulting MMS UNPLUGGED
INOP.
If you are sure that the patient will not be returning to this monitor, you should perform a
discharge or end-case. This prevents data from the next patient accidentally being mixed up with
your current patient’s data.
2Connect the MMS to the transport monitor and move the patient.
3At the new monitoring location, remove the MMS from the transport monitor and connect it to
the new monitor.
4If prompted, re-admit the patient to the new monitor: in the Patient Selection window,
select Continue MMS to retain the data in the MMS. This will upload the patient
demographics, and, if configured, the measurement settings and trend data stored in the MMS to
the monitor. Verify that the settings for patient category and paced mode are correct.
Data Upload from an MMS
The Multi-Measurement Server stores eight hours of patient trend data at one-minute resolution. It
also stores patient demographic information and the measurement settings and calibration data for the
measurements carried out by the MMS and any connected extensions. This data can be uploaded to an
IntelliVue patient monitor, if your monitor is configured to do so and if at least five minutes of trend
information is stored in the MMS.
Your monitor’s data upload settings are defined in Configuration Mode to suit your patient transfer
use model.
How data is uploaded to the host monitor depends on the configuration mode settings
MMS Trend Upload and MMS Settings Upload.
If there is a patient conflict and you select Continue Monitor, no data will be uploaded from the
MMS.

5 Managing Patients Data Exchange Between Information Centers
82
Data Exchange Between Information Centers
You can transfer demographic data and trend data from one IIC to another by selecting Transfer
on the patient monitor. Trend data is not shared between Information Centers and monitors.
Resolving Patient Information Mismatch
When you connect an MMS to a monitor, or a monitor to the network, the monitor compares patient
category, paced status, and a unique patient identification number that is internally stored in both the
MMS and the monitor. The monitor indicates a mismatch if the information is not identical.
Depending on your monitor’s configuration, this mismatch may be automatically resolved or you may
have to resolve it manually. If your monitor is configured to resolve mismatches automatically,
depending on the configuration, either the monitor or the Multi-Measurement Server data is
automatically retained.
WARNING USA only When a monitor is connected to an Information Center by the wireless IntelliVue
Instrument Telemetry interface, the patient data will automatically be merged in the case of a transfer.
This means there is no patient discharge at the monitor and settings and trend data will be retained.
You will see a message on the monitor and the Patient Demographics window will automatically
appear so that you can check the data and change it if necessary.
Manually Resolving Patient Mismatch
The patient mismatch is indicated by question marks (???) beside the questionable fields in the Monitor
Info Line and in the Patient Demographics window. The monitor displays a message such as
Different patients in Central and Monitor. The Patient Selection window
automatically opens so you can decide which patient data to use. You do not have to resolve the
mismatch immediately, however, the indicators remain until you do. There can be up to three columns
of data in the Patient Selection window if the patient is different in the Information Center,
monitor, and MMS.
After you resolve the mismatch, the monitor displays a confirmation window that explains the
consequences of your choice, telling you where the patient will be continued/discontinued. Confirm
your choice. The monitor automatically displays the Patient Demographics window after
confirmation. Verify that the settings shown are correct for the patient.
Gender, date of birth, height, weight, and nursing notes do not generate a mismatch. If these fields are
different on different devices, the monitor resolves them itself. For example, it may take date of birth
from the Information Center, whilst taking gender from the MMS. Always check the Patient
Demographics after combining patients, to ensure that you are satisfied with the results. Change them
if necessary.
WARNING After resolving a patient mismatch, check that the monitor settings (especially patient category, paced
status and alarm limits) are correct for the patient.
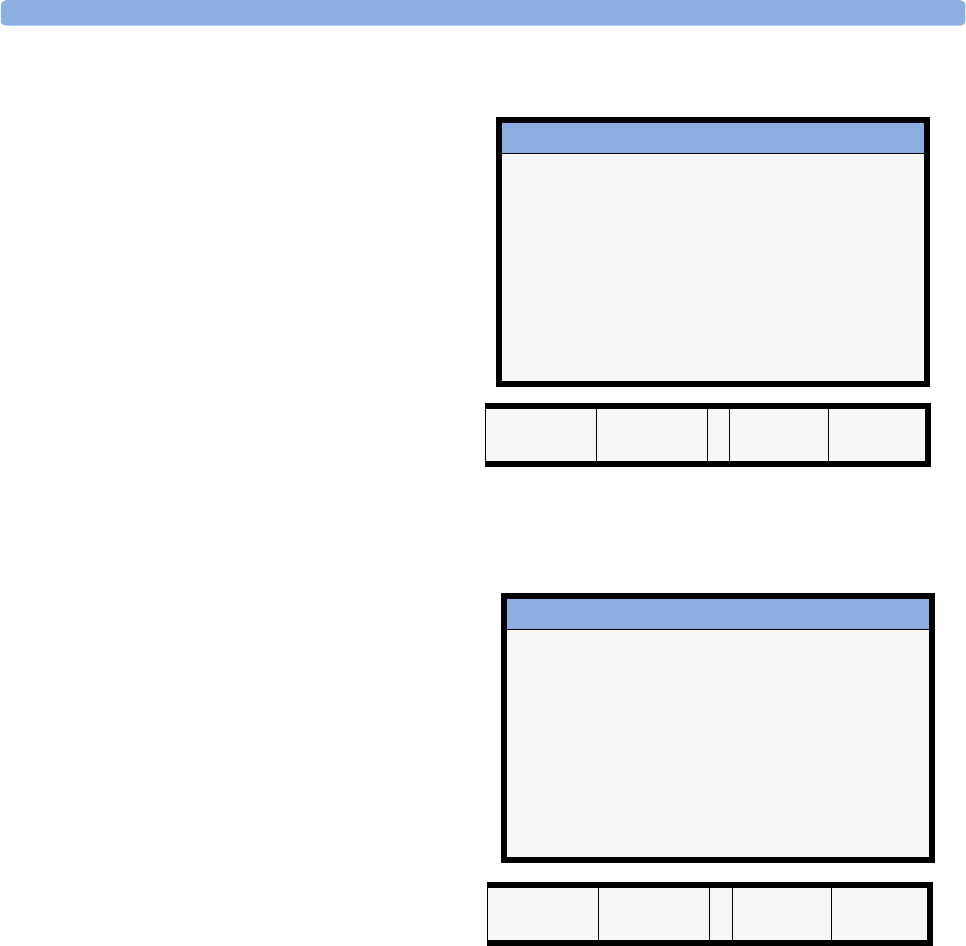
Resolving Patient Information Mismatch 5 Managing Patients
83
Patient Mismatch - If One Set of Patient Data is Correct
♦If there is a mismatch between an
Information Center and a monitor,
choose the data set you want to
continue using for this patient,
either:
Continue Central: to continue with
the patient demographics from the
Information Center, discharge the
patient in the monitor, and use the
default monitor profile.
Continue Monitor: to continue with
the patient in the monitor and
discharge the patient in the
Information Center, permanently
deleting all data in the Information
Center.
♦If there is a mismatch between a
monitor and a measurement server,
choose the data set you want to
continue using for this patient,
either:
Continue Monitor: to continue with
the patient demographics, trend
data, and settings in the monitor.
This discharges the patient in the
measurement server, and resets all
MMS settings to the defaults
currently active for the monitor.
Continue MMS: to upload the data
- patient demographics, trend data
(if configured), and measurement
settings (if configured) - stored in the MMS to the monitor. This clears all data in the monitor,
resets the monitor to the default Profile, and discharges the patient in the monitor.
Patient Mismatch - If Neither Patient Data Set is Correct
A patient mismatch where neither set of patient data is correct might occur if you connect a new MMS
to a monitor in order to prepare for a new patient, before you actually start measuring.
♦Select New Patient if you are sure that none of the information is correct. This discharges all
patients, erases all data in both the monitor and MMS, resets all settings to the default Profile, and
lets you admit a new patient.
Patient Selection
Central Monitor
Last name DOE MILLER
First name JOHN
MRN 1234HG9556
Patient Cat Adult Neo
Paced No Yes
Continue
Central
Continue
Monitor
New
Patient
Same
Patient
Patient Selection
Monitor MeasServ
Last name MILLER ADAMS
First name PETER
MRN
Patient Cat Neo Neo
Paced Yes No
Continue
Monitor
Continue
MMS
New
Patient
Same
Patient
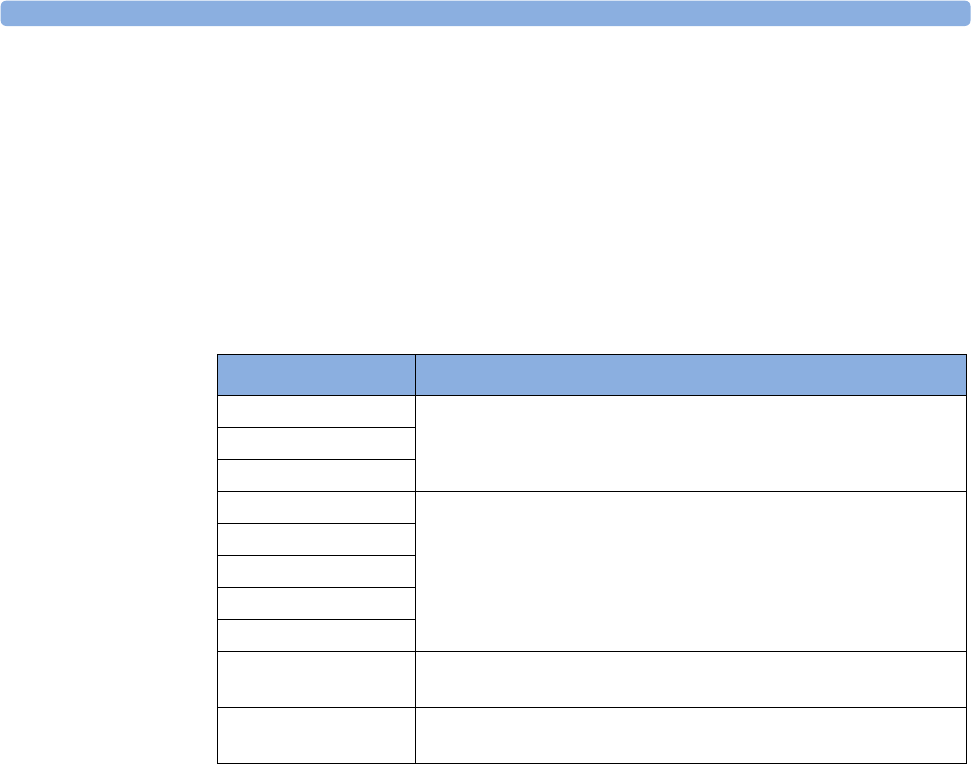
5 Managing Patients Care Groups
84
Patient Mismatch - If Both Patient Data Sets Are Correct
A patient mismatch where both sets of patient data are correct might occur if you admit a new patient
at the monitor (or Information Center) before the patient arrives at your unit and then connect the
MMS that was used during the patient transport to the monitor.
♦Select Same Patient if the patient information is different, but you are sure it is the same
patient. This merges the demographics and updates them in the Information Center, monitor, and
MMS, according to this table. Be aware that your monitor may be configured to merge trend data
from the MMS and the monitor, and to upload measurement settings from the MMS to the
monitor.
Automatically Resolving Patient Mismatch
Your monitor can be configured to automatically resolve mismatches in one of two ways.
• continue using the patient in the MMS, and delete the old data in the monitor. This is suitable for
transport monitors.
• continue with the patient in the monitor, and delete the data in the MMS.
Care Groups
If your monitor is connected to an Information Center, you can group bedside monitors into Care
Groups. This lets you:
• view information on the monitor screen from another bed in the same or in a different Care Group.
• be notified of yellow or red alarm conditions at the other beds in the Care Group.
• see the alarm status of all the beds in the Care Group on each monitor screen.
There are two main types of Care Groups:
• standard care group (Bed-based Care Group) - up to 12 patients monitored by up to 4
Information Centers
•unit group (Unit-based Care Group) - for a complete unit with up to 64 patients
monitored by up to 4 Information Centers
Patient Information This information is taken from...
Patient name the monitor, if the patient was admitted there. For centrally-admitted
patients, this information is taken from the Information Center.
MRN
Screen Notes
Patient Category the Multi-Measurement Server. if connected, otherwise the data is
taken from the monitor.
Date of Birth
Height
Weight
Gender
Paced Status Paced status is always set to Yes where there is a conflict in patient
information.
Trend data if there is newer trend data stored in the MMS, it is uploaded to the
monitor.
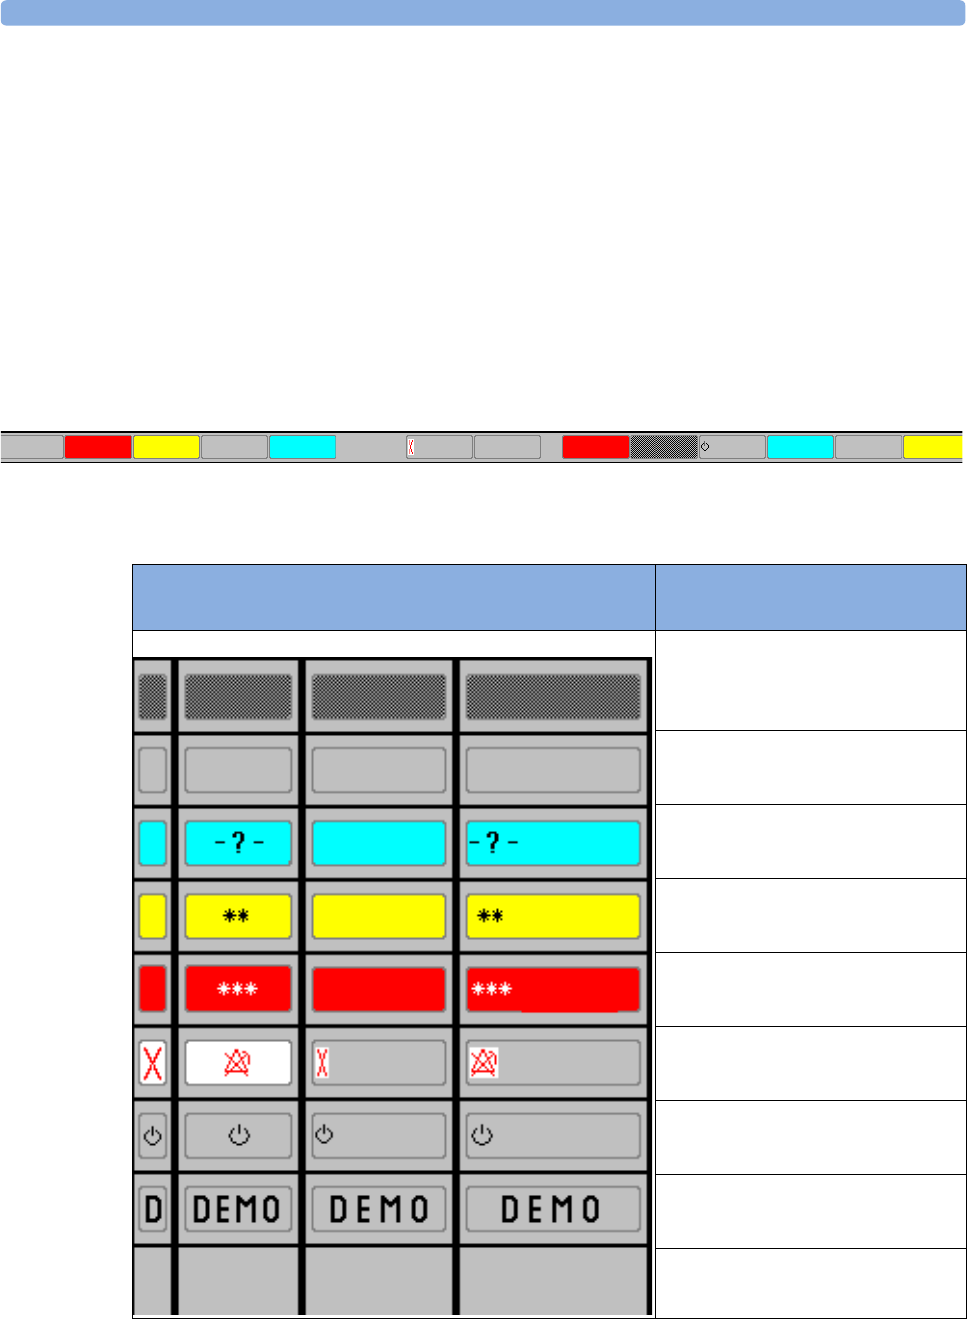
Care Groups 5 Managing Patients
85
Monitors must be assigned to these Care Groups at the Information Center. There is a third care group
which can be assigned locally at the bedside. This is the My Central care group which includes all beds
(up to 16) from the Information Center your bed is connected to. This care group setting is typically
used in facilities with only one Information center. The selection of beds is automatic and cannot be
changed.
The functions available with Care Groups depend on the Information Center revision your monitors
are connected to. See your Information Center Instructions for Use for further details.
Understanding the Care Group Overview Bar
The Care Group monitors’ status is shown in symbol form in the Care Group overview bar. Flashing
symbols indicate active alarms, symbols that are not flashing indicate alarms that have been
acknowledged. Selecting a bed symbol calls up the Other Patient window for that bed.
The Care Group overview bar must be configured to display on the monitor Screen. If it is not visible
on your monitor, select a Screen which has been configured to show the bar.
Bed 1 Bed 2 Bed 3 Bed 4 Bed 5 Bed 6 Bed 7 Bed 8 Bed 9 Bed11 Bed 12 Bed 13 Bed 14
Care Group Symbols (four alternative display possibilities
depending on space available)
No data from this bed
The alarms are on but there are no
currently active alarms at this monitor
The highest priority alarm at this
monitor is an INOP condition
The highest priority alarm at this
monitor is a yellow alarm
The highest priority alarm at this
monitor is a red alarm
The alarms at this monitor are
suspended
The monitor is in standby mode
The monitor is in Demonstration
mode
The current monitor
Bed 8 Bed 8
Bed 5 Bed 5
Bed 14 Bed 14
Bed 9 Bed 9
Bed 7 Bed 7
Bed 11 Bed 11
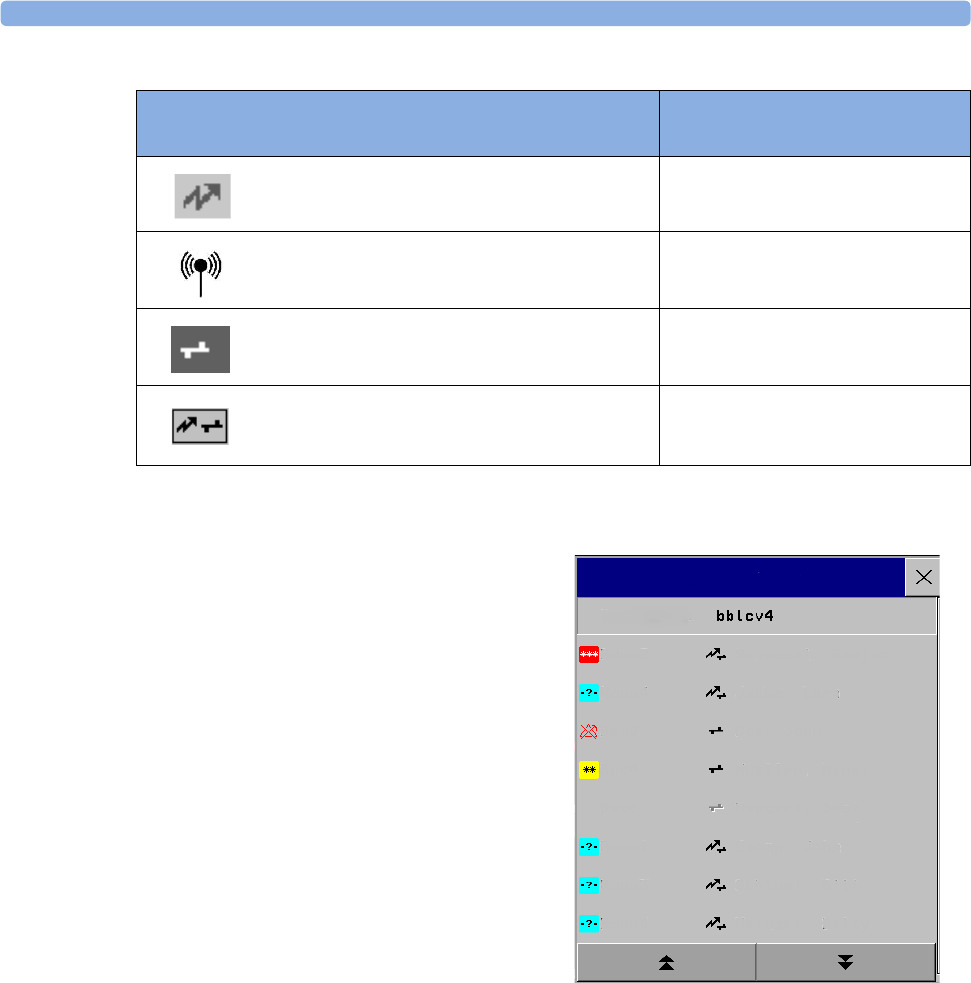
5 Managing Patients Care Groups
86
Viewing the My Care Group Window
This window shows the alarm status, bed name,
and patient name for every bed in the Care
Group.
The window for the Unit group (shown here)
shows first the beds of the Information Center
this bed is connected to. By selecting the
Information Center name you can display a list
of all Information Centers associated with the
Unit group, and select another Information
Center to view.
To enter the My Care Group window,
♦select the Other Patients SmartKey, if
configured, or
♦in the Main Setup menu, select My Care
Group.
Use the My Care Group pop-up keys to navigate
through the Care Groups:
My Unit lets you view a list of all the Information Centers in your Care Unit. Select an Information
Center to see a list of the monitors connected to it. Select any monitor to see the Other Patient
window for that bed.
Other Units lets you view a list of all the Care Units in your Care Domain. Select any Care Unit
to view a list of the Information Centers connected to it. Select an Information Center to see a list of
the monitors connected to it. Select any monitor to see the Other Patient window for that bed.
Alarming Beds lets you view a list of all beds in your care group with an unacknowledged
alarm. The beds are listed in order of alarm severity.
Care Group Symbols (used in the Care Group overview bar
and the My Care Group window)
This is a telemetry bed
This bed is on a wireless network
This bed is on a wired network
This is a “paired” bed, with a bedside
monitor and a telemetry transmitter
assigned.
Beds From:
Room 2
Room 4
Bed 2
Bed 4
Bed 8
Room 1
Room 3
Room 5
Smith, Mary
Jones, Paul
Murphy, Sarah
Miller, John
Baker, Jane
Green, Liza
Scott, James
Black, Harald
My Care Group
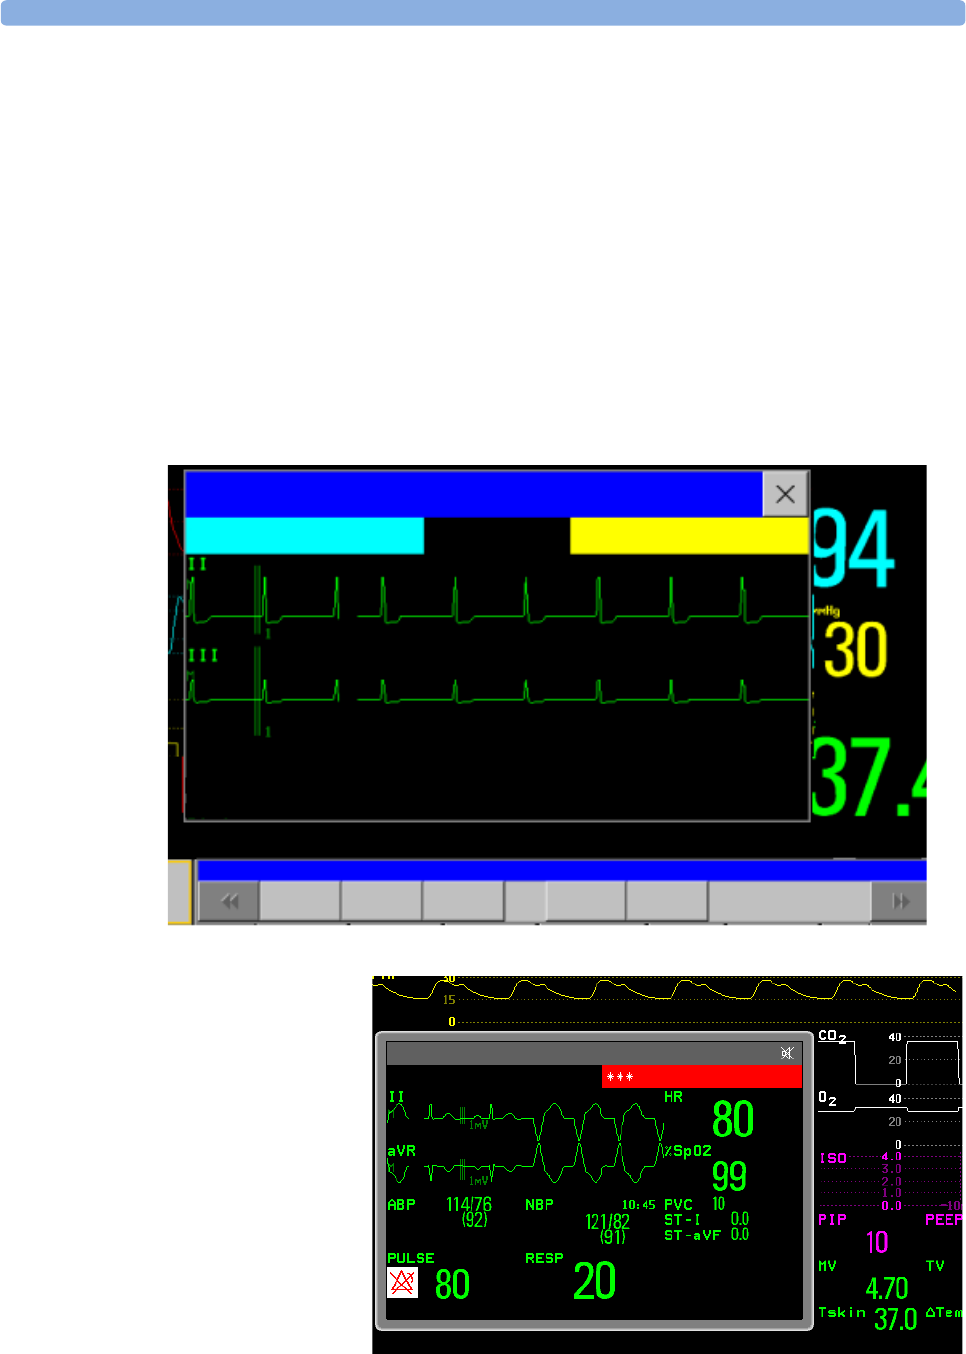
Care Groups 5 Managing Patients
87
Viewing the Other Bed Window
The Other Bed window lets you view a subset of the waveform and numeric information from another
bed on the same network. Waves and numeric information from another bed are delayed. If
configured, Other Bed information is displayed in color, using the colors defined by the Information
Center.
To open the Other Bed window,
♦MP60/MP70/MP80/MP90: select the required bed label or patient name in the Care Group
Overview Bar. If you are in a Unit Group with many beds, the My Care Group window may open
for you to select the bed.
MP20/MP30/MP40/MP50: select any field in the monitor info line to enter the Setup menu,
then select My CareGroup and select the required bed, or
♦Select the Other Patients SmartKey, if configured, and select the required bed.
The Other Bed window may be configured to display embedded in a specially designed Screen.
♦To d i s p l a y th e
embedded Other Bed
screen element, in the
Change Screen menu,
select a Screen designed
to show the Other Bed
information
permanently.
Note that a Screen with an
embedded Other Bed screen
element cannot be displayed
on the D80 Intelligent
Display.
Next
Wave More
Vitals Next
Bed My Care
Group
NO TRANSDUC ** HR HIGH
HR
Bed Label, Patient Name
110 99
SpO2
Silence
Bed
Bed Label Patient Name
VTACH

5 Managing Patients Care Groups
88
Note that changing the Screen may automatically change the bed shown in the other bed window. If
you switch to a different Screen, you should check if the correct other bed is displayed.
Other Bed Pop-Up Keys
Select the Other Patients SmartKey or the Other Bed window or embedded screen element to
access the associated pop-up keys:
Next Wave lets you view waveforms not currently shown in the other bed window.
More Vitals lets you view more numerics not currently shown in the other bed window.
Next Bed lets you view waveforms and numerics from the next available bed in the Care Group.
My Care Group lets you call up the Care Group window to select another bed.
Alarming Beds lets you view a list of all beds in your care group with an unacknowledged alarm.
The beds are listed in order of alarm severity.
Silence Bed lets you silence active alarms at the other bed. (Whether you see this key depends
on the revision and configuration of the Information Center your monitors are connected to.)
WARNING The Silence Bed pop-up key in the Other Bed window silences alarms at a remote bed. Be aware
that accidental use of this key could silence alarms for the wrong patient.
To silence own bed alarms use the Silence permanent key on screen or the Silence hardkey.
Visual Alarm Status Information in the Other Bed Window
• If individual alarms are switched off at the other bed, this is indicated by the crossed alarm symbol
beside the measurement numeric.
• If alarms are switched off at the other bed, the message Alarms Off is shown in the other bed
window.
• In the embedded Other Bed window, the crossed speaker symbol in the upper right hand indicates
that the volume of the audible alarm status change notification for the other beds in the care group
is set to zero at the overview monitor.
Care Group Alarms
Changes in the alarm status of beds in a Care Group are announced visually and audibly at all other
beds in the same Care Group. The visual and audible indicators used depend on the monitor and
Information Center configuration.
When an alarm is detected at another bed in the Care Group,
• the alarm status is shown in the Care Group overview bar as an icon.
• a message informing you about the care group alarm is shown in the monitor status line.
• if configured, the Other Bed window, the Alarming Beds window or the My Care Group window
may pop up on the Screen (if automatic alarm notification is enabled at the bedside monitor and at
the Information Center). The automatic alarm notification is suppressed when a window, menu or
pop-up keys are active.
• if configured, an audible status change notification is issued. The tone type and volume can be
configured.

Care Groups 5 Managing Patients
89
Automatic alarm notification can be switched off permanently in the monitor’s Configuration Mode
or at the Information Center. To temporarily disable and re-enable automatic alarm notification at the
bedside monitor, for example if you want to carry out a procedure, in Monitoring Mode:
1Select the network symbol on the monitor screen to call up the Network menu.
2Select Auto Window to toggle between the settings Enabled and Disabled.
This setting resets to the default at discharge and when the monitor is switched on. Always re-enable
the Auto Window as soon as possible.
Telemetry Data Overview
You can assign a monitor and a telemetry device to the same patient. This is called “pairing” and is
done at the Information Center. In paired mode, the telemetry data can be displayed as a permanent
overview session on the monitor. To do this, one of the available Screens must have the Telemetry
Data Overview screen element embedded. If configured, this Screen will automatically display when
the monitor is paired with a telemetry device at the Information Center. Be aware that the data from a
paired telemetry device is stored at the Information Center and not in the monitor.
Unpairing a Telemetry Device
To disconnect the patient from the telemetry device and reconnect them to the monitor
(for example, to see realtime waves),
♦select the Unpair Equipment SmartKey to have the Information Center receive
the ECG data from the monitor again. In this case data from the telemetry device will
no longer be monitored at the Information Center. (Behavior depends on the revision of your
Information Center.)
or
♦use the Unpair function at the Information Center. In this case you can decide whether the
Information Center will continue to monitor data from the telemetry device.
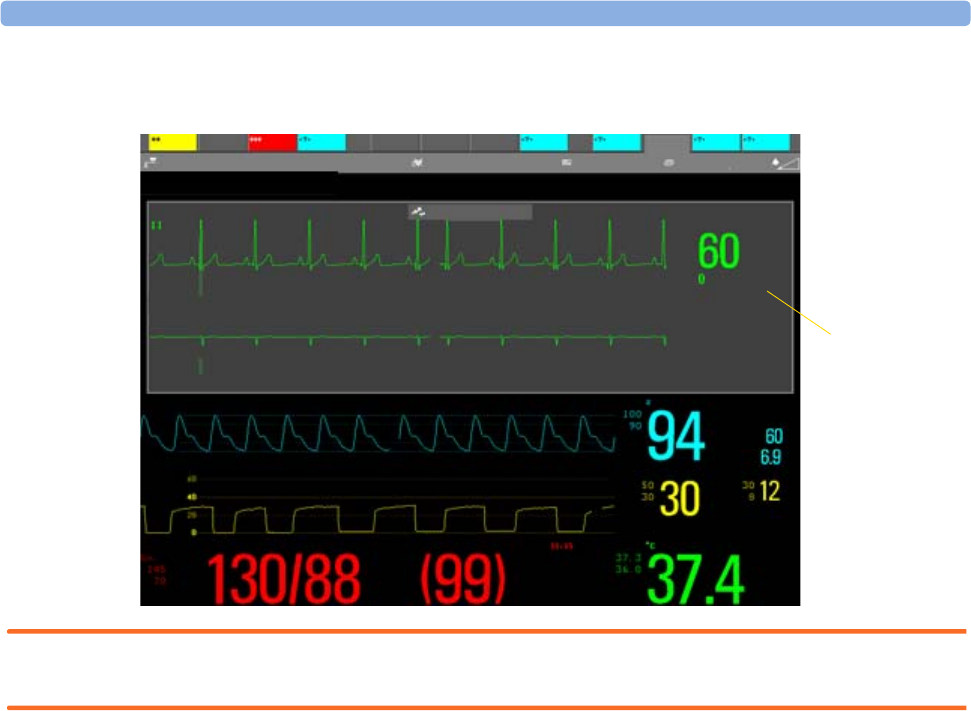
5 Managing Patients Care Groups
90
Telemetry Data Overview Screen Element
WARNING Waves and numeric information on the telemetry screen element are delayed for several seconds. If you
need realtime data, for example for defibrillation, always use the monitor ECG instead of telemetry.
Silencing Telemetry Alarms from the Bedside
When a telemetry device is paired with the monitor, an audible status change notification is issued for
new telemetry alarms. The volume can be configured.
If configured, alarms generated from a paired telemetry device can be silenced at the bedside.
To silence telemetry alarms from the bedside,
1select the telemetry screen element
2select the Silence Bed pop-up key
Depending on your configuration, the Silence Bed key may silence both telemetry alarms and
bedside alarms.
Suspending Telemetry Alarms
When you select Pause Alarms or Alarms Off at the monitor, the alarms are off or paused for
the bedside measurements.
Refer to the Information Center Instructions for Use for the Suspend/Pause alarms behavior of the
Information Center and telemetry device.
Using Standby
When you select Standby mode at the monitor, the bedside goes into Standby mode.
Refer to the Information Center Instructions for Use for the Standby behavior of the Information
Center and telemetry device.
Te l em e t r y
data overview
screen element
Bed1 Bed4 Bed5 Bed9 Room1
Bed7 Room3 Room1 Room4
TelemetryProfiles
23Feb 17:51Mayer, John AdultRoom3
Tele 3
NBP mmHg
HR
PVC
MCL 1mV
1mV Delayed
Pleth
CO2
Pulse
Perf
etCO2 mmHg
Temp
awRR rpm

91
6
6ECG, Arrhythmia, and ST
Monitoring
The electrocardiogram (ECG) measures the electrical activity of the heart and displays it on the
monitor as a waveform and a numeric. This section also tells you about arrhythmia monitoring (see
page 107) and ST monitoring (see page 117).
Skin Preparation for Electrode Placement
Good electrode-to-skin contact is important for a good ECG signal, as the skin is a poor conductor of
electricity.
1Select sites with intact skin, without impairment of any kind.
2Clip or shave hair from sites as necessary.
3Wash sites thoroughly with soap and water, leaving no soap residue.
We do not recommend using ether or pure alcohol, because this dries the skin and increases the
resistance.
4Dry skin thoroughly.
5Gently abrade the skin using ECG skin preparation paper to remove dead skin cells to improve the
conductivity of the electrode site.
Connecting ECG Cables
1Attach the clips or snaps to the electrodes before placing them. If you are not using pre-gelled
electrodes, apply electrode gel to the electrodes before placement.
2Place the electrodes on the patient according to the lead placement you have chosen.
3Attach the electrode cable to the patient cable.
4Plug the patient cable into the white ECG
connector on the measurement server. An ECG
waveform and numeric appears on the monitor
display.
ECG Connector
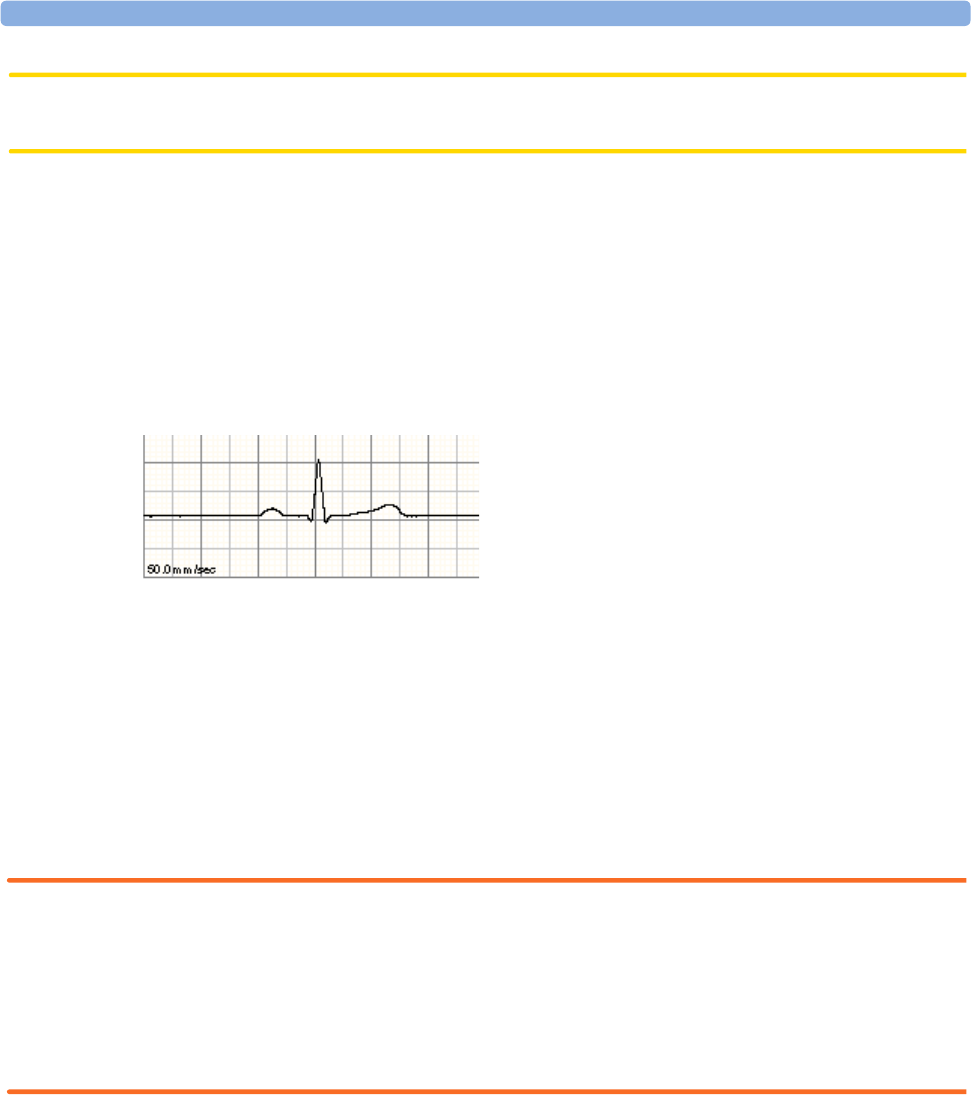
6 ECG, Arrhythmia, and ST Monitoring Selecting the Primary and Secondary ECG Leads
92
CAUTION To protect the monitor from damage during defibrillation, for accurate ECG information and to
protect against noise and other interference, use only ECG electrodes and cables specified by Philips.
Selecting the Primary and Secondary ECG Leads
The monitor uses the primary and secondary lead to compute HR and to analyze and detect cardiac
arrhythmias. They are also available for recordings and for display on the Information Center.
The secondary lead setting is used only if your monitor is configured for multi-lead (instead of single-
lead) arrhythmia analysis. It determines which additional lead will be used for arrhythmia analysis.
To select a lead as primary or secondary lead:
♦In the Setup ECG menu, select Primary Lead or Secondary Lead, then select the
appropriate lead. You can assign any available lead whether it is currently displayed or not.
Checking Paced Status
It is important to set the paced status correctly when you start monitoring ECG.
♦To change the paced status in the Setup ECG menu, select Paced, then select Yes or No.
WARNING Pace pulse rejection must be switched on for paced patients by setting “Paced” to Yes. Switching pace
pulse rejection off for paced patients may result in pace pulses being counted as regular QRS
complexes, which could prevent an asystole alarm from being detected. When changing profiles, and at
admission/discharge, always check that paced status is correct for the patient.
Some pace pulses can be difficult to reject. When this happens, the pulses are counted as a QRS
complex, and could result in an incorrect HR and failure to detect cardiac arrest or some arrhythmias.
Keep pacemaker patients under close observation.
You should choose a lead as primary or secondary lead
that has the following characteristics:
• the QRS should be either completely above or below
the baseline and it should not be biphasic
• the QRS should be tall and narrow
• the P-waves and T-waves should be less than 0.2 mV
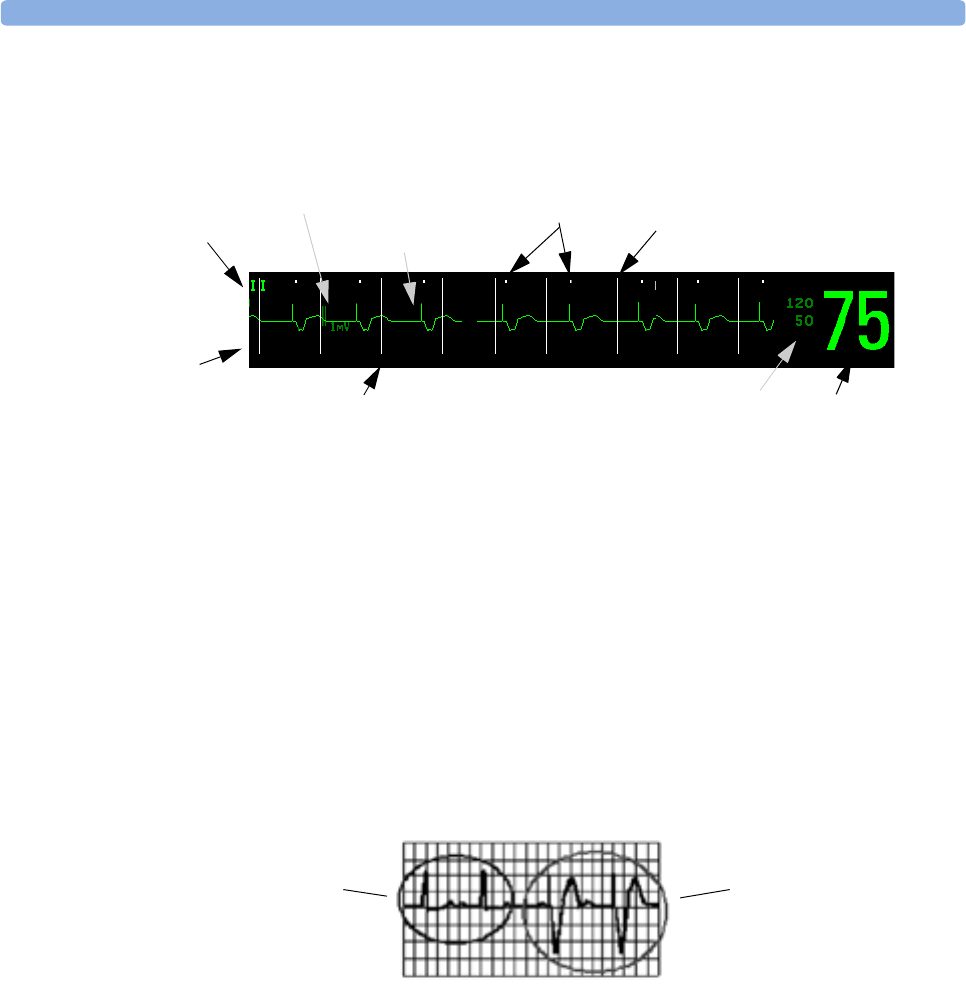
Understanding the ECG Display 6 ECG, Arrhythmia, and ST Monitoring
93
Understanding the ECG Display
Your display may be configured to look slightly different.
ECG numeric: This is derived from the monitored ECG.
Pace pulse markers: These are shown if the Paced status has been set to Yes and the patient has a
paced signal.
Defibrillator synchronization marks: If an HP/Agilent/Philips defibrillator is connected, the
synchronization marks (vertical lines on the ECG wave) are shown on the ECG wave.
ST numerics in ECG wave: ST numerics can be configured to show underneath the ECG wave on
the bottom left.
Monitoring Paced Patients
An ECG optimized for monitoring a paced patient should look like this:
You should choose a lead as primary or secondary lead that has these characteristics:
• the normal QRS should be either completely above or below the baseline and it should not be
biphasic. For paced patients, the QRS complexes should be at least twice the height of pace pulses.
• the QRS should be tall and narrow
• the P-waves and the T-waves should be less than 0.2 mV.
EASI
M
HR
Pace pulse marks
1 mV calibration bar
ECG Filter
label
Lead
label of
the
displayed
wave
Current heart rate alarm limits Current heart rate
Defibrillator synchronization marks
EASI lead placement label
Pacer spikes
Pace Pulses/Beats
Normal Beats
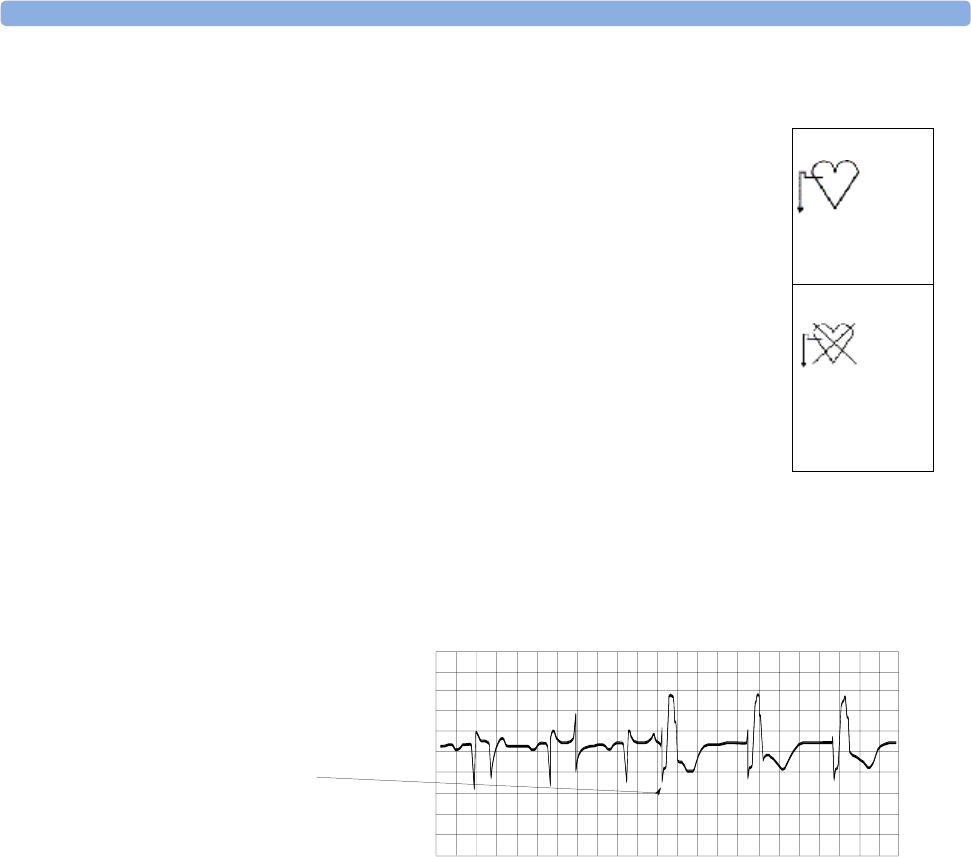
6 ECG, Arrhythmia, and ST Monitoring Changing the Size of the ECG Wave
94
Setting the Paced Status (Pace Pulse Rejection)
Avoiding Pace Pulse Repolarization Tails
Some unipolar pacemakers display pace pulses with repolarization tails. These tails may be counted as
QRSs in the event of cardiac arrest or other arrhythmias.
If you note a visible repolarization tail, choose a lead that decreases the size of the repolarization tail.
Changing the Size of the ECG Wave
If any of the displayed ECG waves is too small or clipped, you can change the size of one or all of the
ECG waves on the screen.
Changing the adjustment factor only changes the visual appearance of the ECG wave on the screen. It
does not affect the ECG signal analyzed by the monitor.
Comparing the wave size to the 1 mV calibration bar on the ECG wave segment can help you to get an
idea of the true ECG signal strength. If you choose a fixed adjustment factor, the 1 mV calibration bar
will be the same size for all the displayed ECG waves. If you choose AutoSize, the calibration bar may
be a different size for each wave.
To Change the Size of an Individual ECG Wave
1Select the wave segment you want to change. This calls up the lead menu for this segment.
2In the lead menu, select Size Up to increase wave size or Size Down to decrease the size.
Selecting AutoSize lets the monitor choose the optimal adjustment factor for all displayed ECG
waves.
♦In the Setup ECG menu, select Paced to toggle between Yes and No.
You can also change the paced status in the Patient Demographics window.
When Paced is set to Yes:
– Pace Pulse Rejection is switched on. This means that pacemaker pulses are
not counted as extra QRS complexes.
– pace pulse marks are shown on the ECG wave as a small dash
– the paced symbol is displayed on the main screen.
When Paced is set to No, pacer spikes are not shown in the ECG wave. Be
aware that switching pace pulse rejection off for paced patients may result in
pace pulses being counted as regular QRS complexes, which could prevent an
asystole alarm from being detected.
Paced
Non-Paced
Repolarization tail
(note width)

Changing the Volume of the QRS Tone 6 ECG, Arrhythmia, and ST Monitoring
95
To Change the Size of all the ECG Waves
To change the size of all the ECG waves on the screen by a fixed adjustment factor,
1In the Setup ECG Lead menu, select Adjust Size.
2Select the required adjustment factor from the line of pop-up keys.
–Size x0.5 to halve the wave size
–Size x1 to display the wave without zoom
–Size x2 to double the wave size
–Size x4: to multiply the wave size by four
–Previous Size: to return one step to the previous size
–Auto Size: to let the monitor choose the optimal adjustment factor for all the ECG waves.
Changing the Volume of the QRS Tone
The QRS tone is derived from either the HR or Pulse, depending on which is currently selected as the
alarm source. The QRS volume can be set from 0 to 10 (0 means off).
♦To change the QRS volume, in the Setup ECG menu select QRS Volume and then select the
appropriate volume from the pop-up list.
Changing the ECG Filter Settings
The ECG filter setting defines how ECG waves are smoothed. A letter indicating the filter type is
shown underneath the lead label on the monitor display. Filter settings do not affect ST measurement.
12-Lead ECG captures are analyzed in the PIC using the diagnostic filter and displayed on the
Information Center using the filter setting from the bedside monitor. Any changes you make to the
filter setting at the bedside monitor may take up to a minute to be reflected at a connected Information
Center. For this reason, you should wait one minute between changing the filter setting and sending a
12-lead capture to an Information Center.
♦To change the filter setting, in the Setup ECG menu, select Filter and then select the
appropriate setting.
–Monitor: Use under normal measurement conditions.
–Filter: The filter reduces interference to the signal. It should be used if the signal is distorted
by high frequency or low frequency interference. High frequency interference usually results in
large amplitude spikes making the ECG signal look irregular. Low frequency interference usually
leads to a wandering or rough baseline. In the operating room, the Filter reduces artifacts and
interference from electrosurgical units. Under normal measurement conditions, selecting
Filter may suppress the QRS complexes too much and thus interfere with the clinical
evaluation of the ECG displayed on the monitor. This does not affect the ECG analysis
performed by the monitor.
If AutoFilter is set to On in Configuration Mode, the filter setting will automatically be set to
Filter if electromagnetic interference is detected.

6 ECG, Arrhythmia, and ST Monitoring Choosing EASI or Standard Lead Placement
96
–Diag (Diagnostic): Use when diagnostic quality is required. The unfiltered ECG wave is
displayed so that changes such as R-wave notching or discrete elevation or depression of the ST
segments are visible.
The setting Diag selects the highest available ECG bandwidth which is 0.05 to 150 Hz for the
Adult and 0.5 to 150 Hz for the Pedi and Neo patient category. The term “diagnostic” relates
only to the ECG bandwidth requirements for diagnostic electrocardiographic devices as
outlined in the ANSI/AAMI standard EC11-1991.
Choosing EASI or Standard Lead Placement
If EASI™ monitoring is available on your monitor, you must enable either standard lead placement or
EASI lead placement.
♦In the Setup ECG menu, select Lead Placement and then Standard or EASI.
EASI is shown beside the 1mV calibration bar on the ECG wave on the display, and EASI is marked
on any recorder strips and printouts.
See the section on EASI ECG Lead Placement for electrode placement diagrams.
About ECG Leads
To make it possible to compare measured ECG signals, the electrodes (or lead sets) are placed in
standardized positions, forming so-called “leads.” To obtain ECG signals optimized for use in
diagnosis and patient management in different care environments, different lead sets in varying lead
placements can be used. You can use either standard lead placements or EASI lead placements with this
monitor.
When placing electrodes, choose a flat, non-muscular site where the signal will not be interfered with
by either movement or bones. Correct lead placement is always important for accurate diagnosis.
Especially in the precordial leads, which are close to the heart, QRS morphology can be greatly altered
if an electrode is moved away from its correct location.
ECG Leads Monitored
Changing Lead Sets
To change the ECG lead set,
1Remove the electrodes and then replace them as required.
2If the new lead set has more leads than the previous, the monitor automatically recognizes the new
lead placement. If the new lead set has fewer leads, then you must select New Lead Setup in the
Setup ECG menu. If you remove electrodes and do not select New Lead Setup, the monitor
If you are using these leads are available: Resp is measured
between electrodes:
a 3-electrode set I, II, III RA and LL
a 5-electrode set I, II, III, aVR, aVL, aVF, V and MCL RA and LL
a 10-electrode set I, II, III, aVR, aVL, aVF, V1, V2, V3, V4, V5, V6 RA and LL
an EASI 5-electrode set I, II, III, aVR, aVL, aVF, V1, V2, V3, V4, V5, V6 I and A

ECG Lead Fallback 6 ECG, Arrhythmia, and ST Monitoring
97
will issue a Lead Off INOP message. Select New Lead Setup and the INOP message will
disappear.
ECG Lead Fallback
If fallback is configured on and there is a leads off INOP in the primary lead (and in the secondary
lead, if you are using multi-lead monitoring) for longer than 10 seconds, and if another lead is
available, this available lead automatically becomes the primary lead. This is known as lead fallback.
When the Leads Off condition is corrected, the leads are automatically switched back.
This setting can only be changed in Configuration Mode.
ECG Lead Placements
The labels and colors of the ECG electrodes differ according to the standards that apply for your
hospital. The electrode placement illustrations in this chapter use the AAMI labels and colors.
Electrode labels Electrode colors
AAMI EASI IEC AAMI IEC
RA I RWhite Red
LA S LBlack Yellow
LL A FRed Green
RL N N Green Black
V E CBrown White
V1 C1 Brown/Red White/Red
V2 C2 Brown/Yellow White/Yellow
V3 C3 Brown/Green White/Green
V4 C4 Brown/Blue White/Brown
V5 C5 Brown/Orange White/Black
V6 C6 Brown/Violet White/Violet
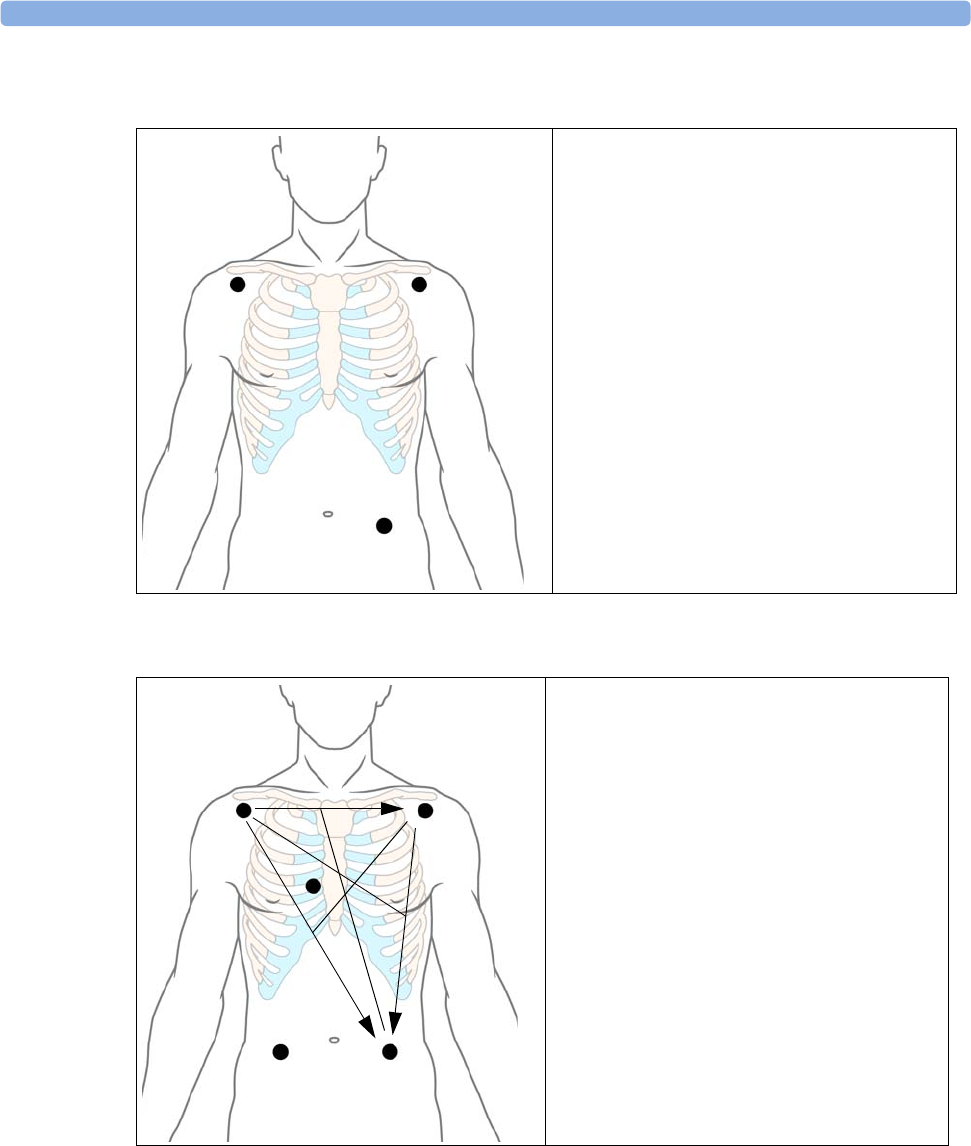
6 ECG, Arrhythmia, and ST Monitoring ECG Lead Placements
98
Standard 3-Lead Placement
Standard 5-Lead Placement
RA placement: directly below the clavicle and
near the right shoulder
LA placement: directly below the clavicle and
near the left shoulder
LL placement: on the left lower abdomen
RA LA
LL
RA placement: directly below the clavicle and
near the right shoulder
LA placement: directly below the clavicle and
near the left shoulder
RL placement: on the right lower abdomen
LL placement: on the left lower abdomen
V placement: on the chest, the position depends
on your required lead selection
LA
LL
RA
V
RL
I
III
II
aVR
aVL
aVF
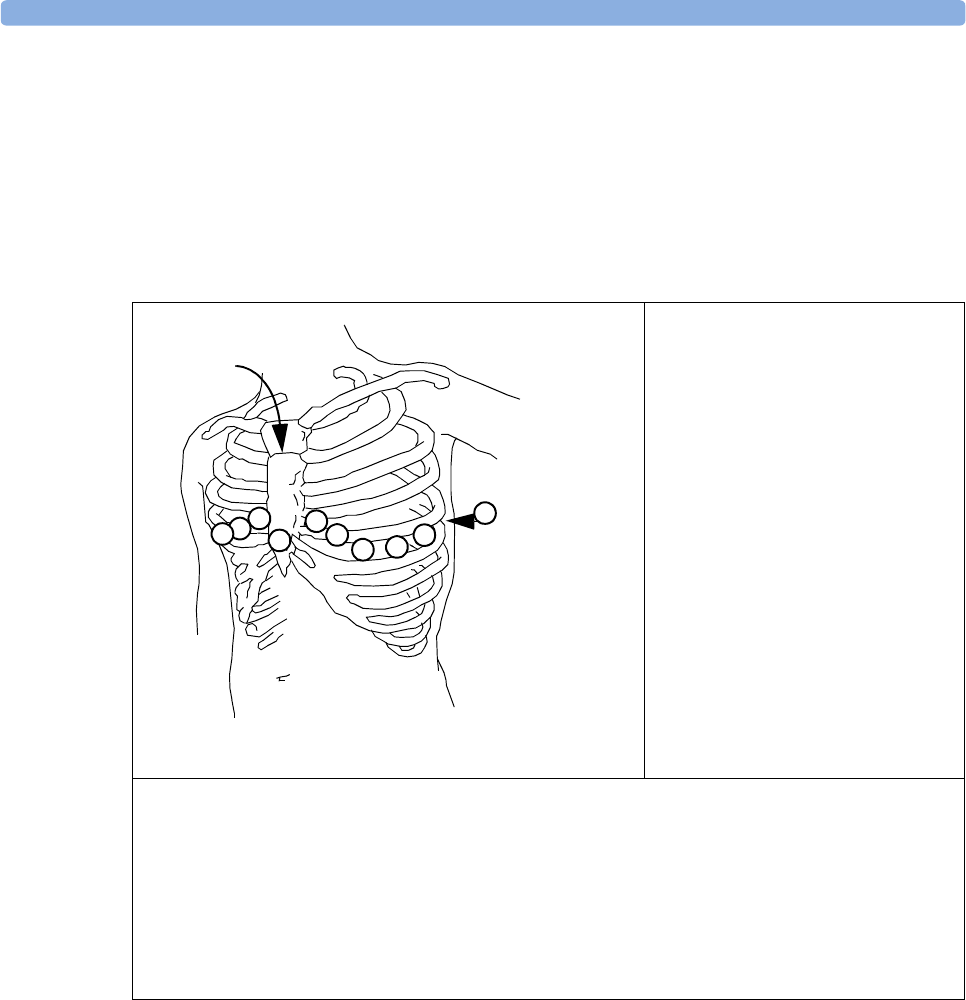
ECG Lead Placements 6 ECG, Arrhythmia, and ST Monitoring
99
Chest Electrode Placement
For accurate chest electrode placement and measurement, it is important to locate the fourth
intercostal space.
1Locate the second intercostal space by first palpating the Angle of Lewis (the little bony
protuberance where the body of the sternum joins the manubrium). This rise in the sternum is
where the second rib is attached, and the space just below this is the second intercostal space.
2Palpate and count down the chest until you locate the fourth intercostal space.
V1 placement: on the fourth
intercostal space at the right sternal
border
V2 placement: on the fourth
intercostal space at the left sternal
border
V3 placement: midway between the
V2 and V4 electrode positions
V4 placement: on the fifth
intercostal space at the left
midclavicular line
V5 placement: on the left anterior
axillary line, horizontal with the V4
electrode position
V6 placement: on the left midaxillary line, horizontal with the V4 electrode position
V3R to V6R placement: on the right side of the chest in positions corresponding to those on the left
VE placement: over the xiphoid process
V7 placement: on posterior chest at the left posterior axillary line in the fifth intercostal space
V7R placement: on posterior chest at the right posterior axillary line in the fifth intercostal space
VE
V1 V2 V3 V4 V5 V6
V7
V3R
V4R
2
3
4
Angle of
Lewis
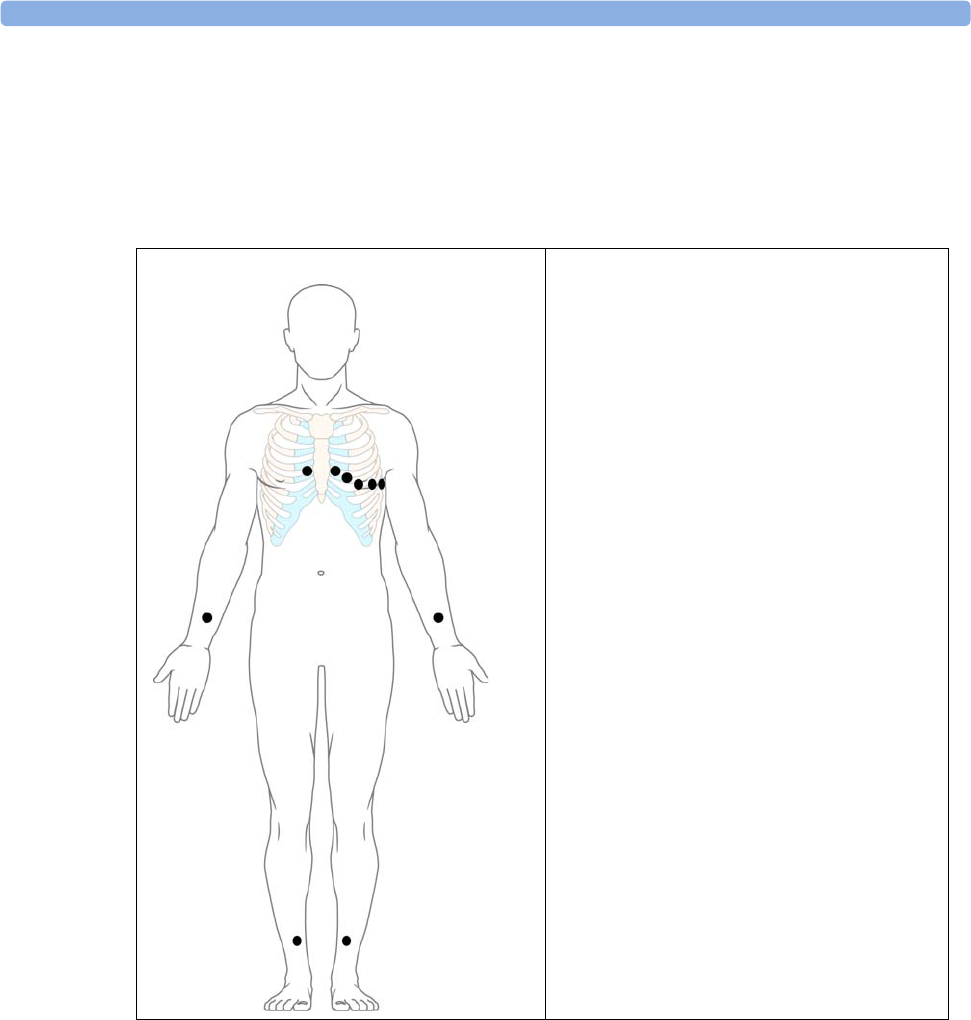
6 ECG, Arrhythmia, and ST Monitoring ECG Lead Placements
100
10-Lead Placement
When monitoring 12-leads of ECG, using a 10-Electrode Lead Placement, it is important to correctly
place electrodes and to label all 12-lead ECG reports with the correct lead placement.
Conventional 12-Lead ECG
In conventional 12-Lead ECG using 10
electrodes, an electrode is placed on the right
arm, left arm, right leg, and left leg. Six V-
electrodes are placed on the chest. The right leg
electrode is the reference electrode.
Limb electrodes:
– Place arm electrodes on the inside of each
arm, between the wrist and the elbow.
– Place leg electrodes inside of each calf,
between the knee and the ankle.
Chest electrodes:
V1 - on the 4th intercostal space at the right
sternal border
V2 - on the 4th intercostal space at the left
sternal border
V3 - midway between the V2 and V4 electrode
positions
V4 - on the 5th intercostal space at the left
midclavicular line
V5 - on the left anterior axillary line, horizontal
with the V4 electrode position
V6 - on the left midaxillary line, horizontal with
the V4 electrode position
RA
LA
V1 - V6
RL LL
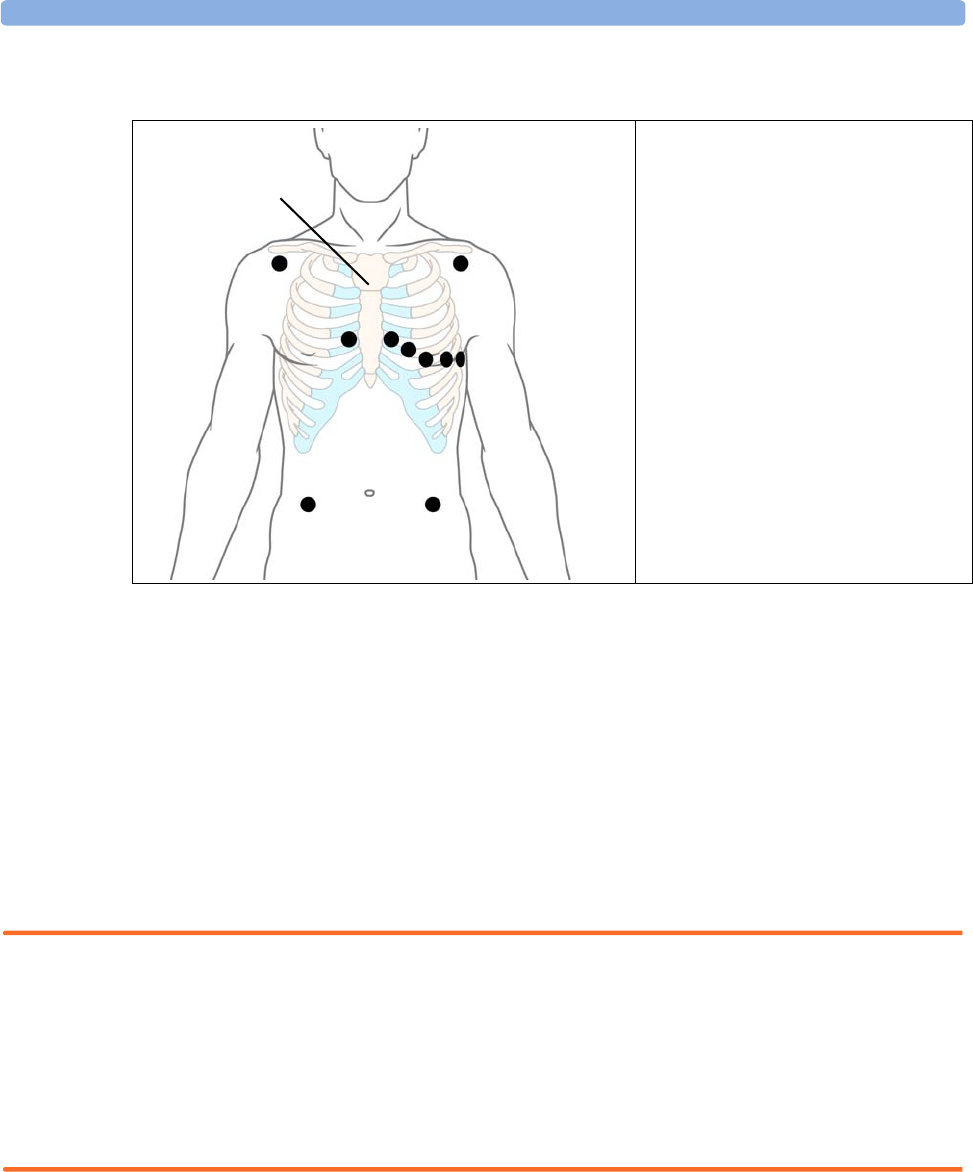
ECG Lead Placements 6 ECG, Arrhythmia, and ST Monitoring
101
Modified 12-Lead ECG
Choosing Standard or Modified Electrode Placement
If your institution uses modified 10 Lead ECG electrode placement (the Mason-Likar Lead System),
you must switch Mod. Lead Placment to On in the monitor. To do this,
♦in the Setup ECG menu, select Mod. LeadPlacement to toggle between On and Off.
–When Mod. Lead Placment is set to On, 12 Lead ECG Reports will be labelled 12 Lead
ECG Report (Mason-Likar), and captured 12-lead ECGs will be labelled Mason-
Likar to the right of the bandwidth annotation at the Information Center.
–When Mod. LeadPlacment is set to Off, 12 Lead ECG Reports will be labelled 12
Lead ECG Report, and captured 12-lead ECGs will not be annotated at the Information
Center.
WARNING Do not use ECG analysis interpretation statements and measurements for 12-lead ECGs obtained
using the modified (Mason-Likar) limb electrode placement.This may lead to misdiagnosis since the
modified (Mason-Likar) limb electrode placement does not look the same as the conventional 12-lead
ECG and may mask inferior infarction due to calculated axis, R, P and T wave magnitudes shifts and
ST slope.
Do not export 12-lead ECGs obtained using the modified (Mason-Likar) limb electrode placement.
Captured 12-Lead ECGs using the modified (Mason-Likar) limb electrode placement exported from
the Information Center are not annotated with the Mason-Likar label.
Labelling 12-Lead ECG Reports
To label 12-lead ECG monitor reports and Captured 12-lead ECGs reports:
♦In the Setup ECG menu, select Mod. LeadPlacement to toggle between On and Off.
When Mod LeadPlacement is set to On:
If your institution uses modified 10
Lead ECG electrode placement (the
Mason-Likar Lead System), place the
four limb electrodes close to the
shoulders and lower abdomen.
The six V electrodes are placed on the
chest in the same position as the
conventional 12-lead placement.
LA
LL
RA
RL
Angle of Lewis
V1 - V6

6 ECG, Arrhythmia, and ST Monitoring Capture 12-Lead
102
– 12 Lead ECG Reports will be labelled 12 Lead ECG Report (Mason-Likar).
– Captured 12-lead ECGs will be labelled Mason-Likar to the right of the bandwidth annotation at
the Information Center.
When Mod. LeadPlacement is set to Off,
– 12 Lead ECG Reports will be labelled 12 Lead ECG Report.
– Captured 12-lead ECGs will have no annotation next to the bandwidth annotation at the
Information Center.
Capture 12-Lead
If the monitor is connected to an Information Center via a wired network, the Capture 12-Lead
SmartKey may be configured to show on the screen. Selecting this exports 12-Lead ECG information
to the Information Center for analysis. For details see the Instructions for Use supplied with the
Information Center.
EASI ECG Lead Placement
Using a standard 5-electrode set in EASI lead placement you can monitor up to 12 standard ECG leads
simultaneously and continuously at the bedside. EASI provides a monitoring method for trending ST
segment changes that can provide an early indication of ischemia. EASI-derived 12-lead ECGs and
their measurements are approximations to conventional 12-lead ECGs. As the 12-lead ECG derived
with EASI is not exactly identical to the 12-lead conventional ECG obtained from an
electrocardiograph, it should not be used for diagnostic interpretations.
Respiratory monitoring is also possible with the EASI placement; respiration is measured between the I
and A electrodes.
Place the electrodes as accurately as possible to obtain the best quality EASI measurements.
When EASI lead placement is selected, EASI is shown beside the 1mV calibration bar on the ECG
wave on the display, and EASI is marked on any recorder strips and printouts.
EASI Monitoring During INOP Conditions If one of the derived EASI leads has an INOP
condition (for example, LEAD OFF), a flat line is displayed. After 10 seconds, the directly acquired
EASI AI, AS, or ES lead (depending on which is available) is displayed with the corresponding lead
label. This causes an arrhythmia relearn.
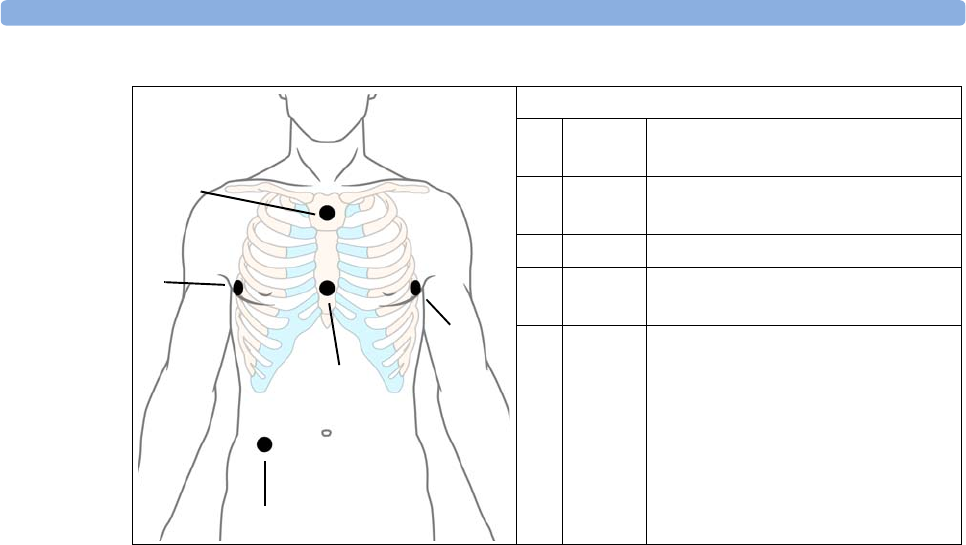
EASI ECG Lead Placement 6 ECG, Arrhythmia, and ST Monitoring
103
EASI Electrode Placement
1E (V) on the lower sternum at the level of
the fifth intercostal space
2A (LL) on the left midaxillary line at the
same level as the E electrode
3S (LA) on the upper sternum
4I (RA) on the right midaxillary line at the
same level as the E electrode
5Nreference electrode - can be anywhere,
usually below the sixth rib on the
right hip
1
2
3
4
5

6 ECG, Arrhythmia, and ST Monitoring ECG, Arrhythmia, and ST Alarm Overview
104
ECG, Arrhythmia, and ST Alarm Overview
The ECG, arrhythmia, and ST alarms available depend on which measurements are switched on, and
the arrhythmia option enabled for your monitor.
• Cardiotach alarms are available when HR is on and the active alarm source is ECG
• Basic arrhythmia alarms are available when Arrhythmia is switched on
• Advanced arrhythmia alarms are available when Arrhythmia is switched on and the Advanced
Arrhythmia option has been enabled for your monitor
• ST alarms are available when ST analysis is switched on and ST leads are selected for analysis.
Cardiotach Alarms Alarms with Basic
Arrhythmia Option
Alarms with Enhanced
Arrhythmia Option
ST Alarms
***Asystole
***Ventricular
Fibrillation/Tachycardia
***Extreme Bradycardia
***Extreme Tachycardia
**High heart rate
**Low heart rate
***Ventricular Tachycardia
**Pacer Not Capture
**Pacer Not Pacing
**Frequent PVCs (PVC >
limit/min)
**Supraventricular Tach
**Missed Beat
**Pause
**Irregular HR
**Ventricular Rhythm
**Run PVCs High
**Pair PVCs
**R-on-T PVCs
**Ventricular bigeminy
**Ventricular trigeminy
**Nonsustained V-Tach
**Multiform PVCs
**ST <Lead> High
**ST <Lead> Low

Using ECG Alarms 6 ECG, Arrhythmia, and ST Monitoring
105
Using ECG Alarms
ECG alarms can be switched on and off and the high and low alarm limits changed just like other
measurement alarms, as described in the Alarms section. Special alarm features which apply only to
ECG are described here.
Extreme Alarm Limits
The extreme rate alarms, Extreme Tachy and Extreme Brady, generated by the active alarm source,
either HR or Pulse, are set in Configuration Mode by adding a set value to the high and low alarm
limits. You need to know what value has been configured for your monitor. Changing the high and
low alarm limits automatically changes the extreme alarm limits within the allowed range.
♦To see the extreme rate alarms set for your monitor, in the Setup ECG menu, see the menu items
∆ExtrTachy and ∆ExtrBrady.
ECG Alarms Off Disabled
Be aware that your hospital department may have decided to disable the setting ECG Alarms Off in
the monitor’s Configuration Mode. In this case, HR alarms cannot be switched off in Monitoring
Mode. If you try to switch off the HR alarms, you will see the message To activate enter
Config and enable Alarms Off.
HR Alarms When Arrhythmia Analysis is Switched Off
When arrhythmia analysis is switched off, only these HR-related alarms will be detected:
• the asystole alarm
• the ventricular fibrillation/ventricular tachycardia alarm
• the extreme tachycardia/extreme bradycardia alarms
• the high heart rate/low heart rate alarms.
HR Alarms When Arrhythmia Analysis is Switched On
WARNING When arrhythmia analysis is on, all yellow alarms connected with ECG are short (one-star). This
means that the yellow alarm lamp and the tones are active for a configured number of seconds only,
after which the flashing numeric and the alarm message remain for up to three minutes. Alarm
reminders are not provided for yellow arrhythmia alarms. Red alarms behave as usual.
ECG Safety Information
CAUTION Interference from instruments near the patient and ESU interference can cause problems with the
ECG wave. See the monitor specifications for more information.

6 ECG, Arrhythmia, and ST Monitoring ECG Safety Information
106
WARNING Defibrillation and Electrosurgery: Do not touch the patient, or table, or instruments, during
defibrillation.
After defibrillation, the screen display recovers within 10 seconds if the correct electrodes are used and
applied in accordance with the manufacturers instructions.
According to AAMI specifications the peak of the synchronized defibrillator discharge should be
delivered within 60 ms of the peak of the R wave. The signal at the ECG output on the IntelliVue
patient monitors is delayed by a maximum of 30 ms. Your biomedical engineer should verify that your
ECG/Defibrillator combination does not exceed the recommended maximum delay of 60 ms.
When using electrosurgical (ES) equipment, never place ECG electrodes near to the grounding plate of
the ES device, as this can cause a lot of interference on the ECG signal.
General: When you are connecting the electrodes or the patient cable, make sure that the connectors
never come into contact with other conductive parts, or with earth. In particular, make sure that all of
the ECG electrodes are attached to the patient, to prevent them from contacting conductive parts or
earth.
During surgery: Use the appropriate orange electrode ECG safety cable for measuring ECG in the
operating room. These cables have extra circuitry to protect the patient from burns during cautery, and
they decrease electrical interference. These cables cannot be used for measuring respiration.
Pacemaker failure: During complete heart block or pacemaker failure to pace/capture, tall P-waves
(greater than 1/5 of the average R-wave height) may be erroneously counted by the monitor, resulting
in missed detection of cardiac arrest.
Patients exhibiting intrinsic rhythm: When monitoring paced patients who exhibit only intrinsic
rhythm, the monitor may erroneously count pace pulses as QRS complexes when the algorithm first
encounters them, resulting in missed detection of cardiac arrest.
The risk of missing cardiac arrest may be reduced by monitoring these patients with low heart rate limit
at or slightly above the basic/demand pacemaker rate. A low heart rate alarm alerts you when the
patient’s heart rate drops to a level where pacing is needed. Proper detection and classification of the
paced rhythm can then be determined.
Filtered ECG signal from external instruments: Instruments such as defibrillators or telemetry units
produce a filtered ECG signal. When this signal is used as an input to the bedside monitor, it is filtered
again. If this twice-filtered signal is passed to the arrhythmia algorithm, it may cause the algorithm to
fail to detect pace pulses, pacemaker non-capture, or asystole, thus compromising paced patient
monitoring performance.
External pacing electrodes: When a pacemaker with external pacing electrodes is being used on a
patient, arrhythmia monitoring is severely compromised due to the high energy level in the pacer pulse.
This may result in the arrhythmia algorithm’s failure to detect pacemaker noncapture or asystole.
Fusion beat pacemakers: Pacemakers that create fusion beats (pace pulse on top of the QRS complex)
cannot be detected by the monitor’s QRS detector.
Rate adaptive pacemakers: Implanted pacemakers which can adapt to the Minute Volume may
occasionally react on the Impedance measurement used by patient monitors for the determination of
the Resp value and execute pacing with the maximum programmed rate. Switching off the Resp
measurement can prevent this.

About Arrhythmia Monitoring 6 ECG, Arrhythmia, and ST Monitoring
107
About Arrhythmia Monitoring
Arrhythmia analysis provides information on your patient’s condition, including heart rate, PVC rate,
rhythm, and ectopics. The monitor uses the user-selected primary and secondary ECG leads for single-
lead or multi-lead arrhythmia analysis. During arrhythmia analysis, the monitor continuously
• optimizes ECG signal quality. This is important for arrhythmia analysis. The monitor continuously
filters the ECG signal to remove baseline wander, muscle artifact, and signal irregularities. Also, if
the Patient Paced status is set to Yes, pace pulses are filtered out to avoid processing them as QRS
beats.
• detects beats, for example, QRS complexes, identifying them for further analysis.
• measures signal features such as R-wave height, width, and timing.
• creates beat templates, and classifies and labels beats to aid in rhythm analysis and alarm detection.
• examines the ECG signal for ventricular fibrillation, asystole, and noise.
Arrhythmia Options
Your monitor has either the basic or the enhanced arrhythmia option. Both options provide rhythm
and ectopic status messages and beat labelling. The number of rhythms being classified, events being
detected, and alarms generated differs according to the option. The alarms available with the different
options are listed in the section “ECG, Arrhythmia, and ST Alarm Overview” on page 104, the rhythm
and ectopic messages detected are listed in “Arrhythmia Status Messages” on page 110.
Where Can I Find More Information?
See the Application Notes on ST and Arrhythmia supplied on your documentation CD-Rom for
detailed information on the arrhythmia algorithm and its clinical application.

6 ECG, Arrhythmia, and ST Monitoring Switching Arrhythmia Analysis On and Off
108
Switching Arrhythmia Analysis On and Off
1In the Setup Arrhythmia menu, select Arrhythmia to toggle between On and Off.
2Select the Confirm pop-up key which appears at the bottom of the screen.
Be aware that when arrhythmia analysis is switched off,
–the message Arrythmia OFF appears beside the ECG wave, if configured to do so
– only the HR-related alarms are detected (the asystole alarm, the ventricular fibrillation/ventricular
tachycardia alarm, the extreme tachycardia/extreme bradycardia alarms, the high heart rate/ low
heart rate alarms)
– HR High and HR Low alarms behave like normal yellow alarms, no timeout periods are active.
Choosing an ECG Lead for Arrhythmia Monitoring
It is important to select a suitable lead for arrhythmia monitoring.
Guidelines for non-paced patients are:
– QRS should be tall and narrow (recommended amplitude > 0.5 mV)
– R-Wave should be above or below the baseline (but not bi-phasic)
– T-wave should be smaller than 1/3 R-wave height
– the P-wave should be smaller than 1/5 R-wave height.
For paced patients, in addition to the above, the pace pulse should be:
– not wider than the normal QRS
– the QRS complexes should be at least twice the height of pace pulses
– large enough to be detected, with no re-polarization.
To prevent detection of P-waves or baseline noises as QRS complexes, the minimum detection level for
QRS complexes is set at 0.15 mV, according to AAMI-EC 13 specifications. Adjusting the ECG wave
size on the monitor display (gain adjustment) does not affect the ECG signal which is used for
arrhythmia analysis. If the ECG signal is too small, you may get false alarms for pause or asystole.
Aberrantly-Conducted Beats
As P-waves are not analyzed, it is difficult and sometimes impossible for the monitor to distinguish
between an aberrantly-conducted supraventricular beat and a ventricular beat. If the aberrant beat
resembles a ventricular beat, it is classified as ventricular. You should always select a lead where the
aberrantly-conducted beats have an R-wave that is as narrow as possible to minimize incorrect calls.
Ventricular beats should look different from these ‘normal beats’. Instead of trying to select two leads
with a narrow R-wave, it may be easier to just select one lead and use single lead arrhythmia
monitoring. Extra vigilance is required by the clinician for this type of patient.
Atrial Fibrillation and Flutter
Since P-waves are not analyzed, it is not possible to discriminate atrial rhythms. If there is constant
variance in the R-R interval, the rhythm is classified as Irregular. It is extremely important for accurate
analysis of the rhythm to have p-waves with an amplitude of less than 1/5 the height of the R-wave or
< 0.15 mV. If the p-waves are larger than this, they may be counted as QRS complexes.
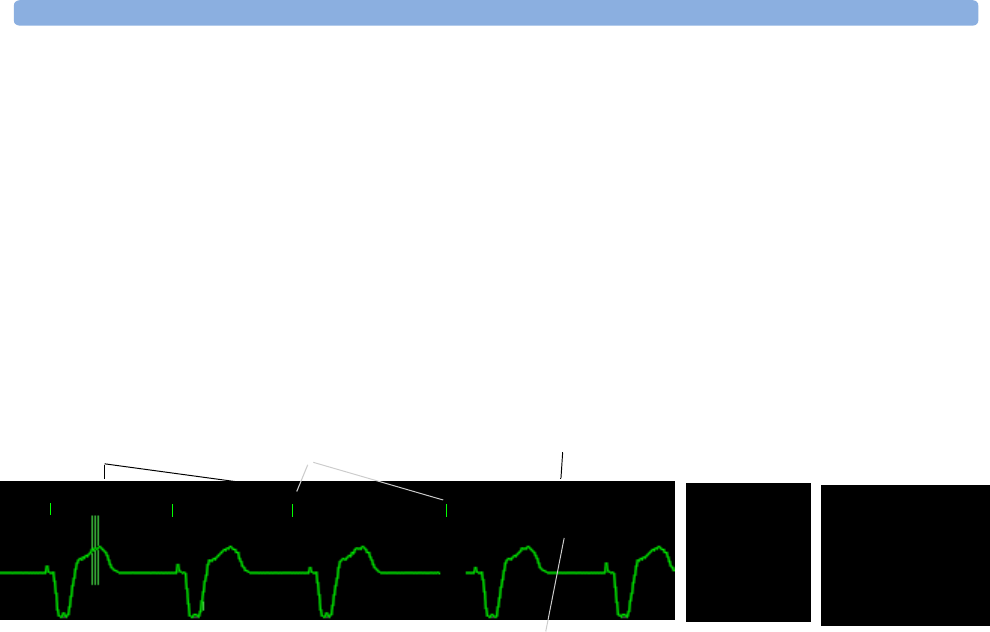
Understanding the Arrhythmia Display 6 ECG, Arrhythmia, and ST Monitoring
109
Intermittent Bundle Branch Block
Bundle branch and the other fascicular blocks create a challenge for the arrhythmia algorithm. If the
QRS during the block changes considerably from the learned normal, the blocked beat may be
incorrectly classified as ventricular, causing false PVC alarms. You should always select a lead where the
bundle branch block beats have an R-wave that is as narrow as possible to minimize incorrect calls.
Ventricular beats should look different from these ‘normal beats’. Instead of trying to select two leads
with a narrow R-wave, it may be easier to just select one lead and use single lead arrhythmia
monitoring. Extra vigilance is required by the clinician for this type of patient.
Understanding the Arrhythmia Display
Your monitor screen may look slightly different from the illustration.
Viewing Arrhythmia Waves
♦To review arrhythmia beat labels, in the Setup Arrhythmia menu, select Annotate Arrhy.
The wave showing the primary ECG lead will be delayed by six seconds and shown on a grey
background. Beat labels will be annotated above the ECG wave and Delayed will be written
beside it.
♦To return to the normal ECG primary lead display, select Annotate Arrhy again.
Arrhythmia Beat Labels
Arrhythmia beat labels tell you how the monitor is classifying beats.
N = Normal
V = Ventricular Ectopic
S = Supra-ventricular Premature
P = Paced
' = Pacer spike
L = Learning patient's ECG
A = Artifact (noisy episode)
? = Insufficient information to classify beats
I = Inoperative condition (e.g., LEADS OFF)
M = Pause or missed beat
PP P
Delayed 1mV
II
M
PVC Numeric HR Numeric
Delayed arrhythmia wave
Beat label Rhythm status message
Pair PVCs
Ectopic status message
Paced Rhythm
75
HR
2
PVC
Pace pulse marks

6 ECG, Arrhythmia, and ST Monitoring Understanding the Arrhythmia Display
110
Arrhythmia Status Messages
The monitor displays two types of status messages:
• Rhythm Status Messages -- to indicate the patient’s rhythm.
• Ectopic Status Messages -- to indicate the presence of ectopic beats.
These status messages are shown on the right hand side of the primary ECG wave. They are updated
every second, with the exception of the Sinus and Supraventricular (SV) rhythm messages.
The Sinus and SV rhythm messages are updated based on the current heart rate, taking into account
the patient category (adult, pediatric, or neonatal). For the message to change from one rhythm status
to another, the HR must be in the new range for five beats.
If you have basic arrhythmia capability, you will get only messages for the alarms provided with this
level.
Rhythm Status Messages
The label B or E indicates basic (B) or enhanced (E) arrhythmia capability.
Rhythm Status Message Description B or E
ASYSTOLE No QRS for 4 consecutive seconds in absence of vent fib or chaotic
signal
B, E
VENT FIB/TACH A fibrillatory wave for 4 consecutive seconds B, E
V-TACH A dominant rhythm of adjacent Vs and a HR > the V-Tach Heart
Rate Limit
B, E
SUST V-TACH Ventricular tachycardia rhythm for more than 15 seconds E
VENT RHYTHM A dominant rhythm of adjacent PVCs and a HR ≤ the V-Tach HR
Limit
E
VENT BIGEMINY A dominant rhythm of N, V, N, V E
VENT TRIGEMINY A dominant rhythm of N, N, V, N, N, V E
PACED RHYTHM A dominant rhythm of paced beats B, E
IRREGULAR HR Consistently irregular rhythm E
SINUS BRADY
SINUS RHYTHM
SINUS TACHY
A dominant rhythm of SV beats preceded by P-waves B, E
SV BRADY
SV RHYTHM
SV TACHY
A dominant rhythm of SV beats not preceded by P-waves B, E
UNKNOWN ECG
RHYTHM
Rhythm cannot be determined B, E
LEARNING ECG Algorithm is learning the ECG beat morphology B, E
LEARNING RHYTHM Algorithm is learning the rhythm of the classified beats B, E
CANNOT ANALYZE
ECG
ECG signal is predominantly invalid and therefore cannot be
analyzed
B, E

Arrhythmia Relearning 6 ECG, Arrhythmia, and ST Monitoring
111
Ectopic Status Messages
The label B or E indicates basic (B) or enhanced (E) arrhythmia capability.
Arrhythmia Relearning
During a learning phase:
• Alarm timeout periods are cleared
• Stored arrhythmia templates are cleared
•Asystole, Vfib, and HR alarms (when there are enough beats to compute the HR) are active. No other
alarms are active.
Initiating Arrhythmia Relearning Manually
1To initiate relearning manually, in the Setup Arrhythmia menu, select Relearn Arrhy.
– While the monitor is learning, the delayed arrhythmia wave displays the beat label L and the
rhythm status message LEARNING ECG.
– Next, the monitor determines the dominant rhythm. The beats are labeled N, and the rhythm
status message changes to LEARNING RHYTHM.
2After relearning is complete, you should check the delayed arrhythmia wave to ensure that the
algorithm is labeling the beats correctly.
3If beats are still not classified correctly, check that the ECG is optimized for arrhythmia
monitoring. You may need to select a different lead or change the electrodes or electrode positions
if there is excessive noise, unstable voltage, low amplitude, or large P- or T-waves.
Ectopic Status Message Explanation B or E
(No message displayed) No ectopic activity within the last minute
RUN PVCs More than 2 consecutive PVCs within the last minute E
PAIR PVCs Pair PVCs within the last minute E
PACER NOT CAPT Pause with pace pulse (paced patient only) within the last minute B, E
PACER NOT PACE Pause without pace pulse (paced patient only) within the last minute B, E
PAUSE No beat detected for 1.75 x average R-R interval for HR <120, or
No beat for 1 second with HR >120 (non-paced patient only), or
No beat detected for more than the set pause threshold.
E
R-ON-T PVCs R-ON-T detected within the last minute E
MULTIFORM PVCs Multiform PVCs detected within the last minute E
FREQUENT SVPBs SVPB count within last minute is greater than 5 E
SVPBs 1-5 SVPBs in the last minute with a sinus rhythm and no Vs E
SV BEATS SV count within last minute and rhythm status is PACED B, E
PACED BEATS Paced beat count within last minute and rhythm status is NOT
PACED
B, E

6 ECG, Arrhythmia, and ST Monitoring Arrhythmia Alarms
112
Automatic Arrhythmia Relearn
Arrhythmia relearning is initiated automatically whenever:
• ECG monitoring is switched on
• The ECG Lead or Lead Label is changed manually, or when fallback occurs
•A
Leads Off INOP condition (that has been active for > 60 seconds) ends.
If you are monitoring multi-lead arrhythmia and there is a change in one lead only, relearning happens
only in the affected lead. During this learning phase, the system will continue monitoring using the
other lead. Therefore, the delayed arrhythmia wave is not labeled L and there is no LEARNING ECG
rhythm status message. In addition, alarm timeout periods are maintained, stored arrhythmia
templates are maintained for the operative lead, and all alarms switched on are active.
Arrhythmia Relearn and Lead Fallback
Lead fallback triggers an automatic arrhythmia relearn.
WARNING If arrhythmia learning takes place during ventricular rhythm, the ectopics may be incorrectly learned as
the normal QRS complex. This may result in missed detection of subsequent events of V-Tach and V-
Fib.
For this reason you should:
• take care to initiate arrhythmia relearning only during periods of predominantly normal rhythm and
when the ECG signal is relatively noise-free
• be aware that arrhythmia relearning can happen automatically
• respond to any INOP messages (for example, if you are prompted to reconnect electrodes)
• be aware that a disconnected EASI electrode triggers an arrhythmia relearn on all leads
• always ensure that the arrhythmia algorithm is labeling beats correctly.
Arrhythmia Alarms
Arrhythmia alarms can be switched on and off and the settings changed just like other measurement
alarms, as described in the Alarms section. Special alarm features which apply only to arrhythmia are
described here.
The different alarms detected and generated by the monitor depend on the level of arrhythmia analysis
that is enabled. For a complete list of arrhythmia alarms and INOPs, see the Alarms chapter.
The monitor detects arrhythmia alarm conditions by comparing ECG data to a set of pre-defined
criteria. An alarm can be triggered by a rate exceeding a threshold (for example, HR >xx), an abnormal
rhythm (for example, Ventricular Bigeminy), or an ectopic event (for example, Pair PVCs).

Arrhythmia Alarms 6 ECG, Arrhythmia, and ST Monitoring
113
Yellow Arrhythmia Alarms
Yellow arrhythmia alarms are short yellow alarms specific to arrhythmia-related patient conditions.
Depending on your monitor and Information Center revision, they may be shown with one or two
stars.
WARNING When arrhythmia analysis is on, all yellow alarms connected with ECG are short (one-star). This
means that the yellow alarm lamp and the tones are active for a configured number of seconds only,
after which the blinking numeric and the alarm message remain for up to three minutes. Red alarms
behave as usual.
Arrhythmia Alarms and Latching
When using arrhythmia analysis, Visual Latching and Audible Latching should be on
for red alarms, or at least Visual Latching should be on. Because of the transient nature of
arrhythmia alarms, many arrhythmia conditions may go unnoticed if alarm latching is off. This setting
can only be changed in Configuration Mode.
Switching Individual Arrhythmia Alarms On and Off
Some arrhythmia alarms can be individually switched on or off. They are:
Pacer not capture, Pacer not pace, Non-Sustain VT, Vent Rhythm, Run PVCs, Pair PVCs, R-on-T
PVCs, V.Bigeminy, V.Trigeminy, Multif.PVCs, Pause, SVT, Irregular HR, Missed Beat, PVCs/min.
♦To switch individual alarms on or off, in the Setup Arrhythmia menu, select the alarm from
the list to toggle between On and Off. The monitor displays the INOP message SOME ECG
ALRMS OFF.
Switching All Yellow Arrhythmia Alarms On or Off
All yellow arrhythmia alarms can be switched on and off together. To do this,
♦In the Setup Arrhythmia menu, select All Yellow Off or All Yellow On.
Adjusting the Arrhythmia Alarm Limits
Some arrhythmia alarms have limits which can be individually adjusted. They are:
Vtach HR, Vtach Run, PVCs/min, Vent Rhythm, SVT HR, SVT Run, Asystole Thresh., Pause
Threshold.
1To adjust alarm limits, in the Setup Arrhythmia menu, select the alarm to be adjusted.
2Select the appropriate setting from the pop-up list.
Arrhythmia Alarm Timeout Periods
Normally, an arrhythmia alarm is announced when an alarm condition is detected. However, there are
certain situations that can inhibit the audible and visible indications of the alarm even though the
alarm condition was detected. These include:
• if a more serious alarm condition is active in the same chain
• if a timeout period is in effect for a particular alarm
• if a timeout period is in effect for a higher alarm in that chain.

6 ECG, Arrhythmia, and ST Monitoring Arrhythmia Alarms
114
What is a Timeout Period?
Timeout periods are automatically started when a yellow arrhythmia alarm is detected. During this
period, the same alarm condition will not generate another alarm. Alarm conditions further down the
same arrhythmia alarm chain will also not generate an alarm, but alarms further up the chain will: see
“Arrhythmia Alarm Chaining” on page 115).
This setting can only be changed in Configuration Mode.
♦To view the timeout period configured for your monitor, in the Setup Arrhythmia menu,
see the menu items TimeOut 1st and TimeOut 2nd.
♦To reset the timeout period, select the Alarms Off or Pause Alarms permanent key and
then reselect it.
Resetting the Timeout Period
Switching alarms off and then on again cancels all visual and audible indicators and resets the timeout
periods.
Silencing an alarm cancels all visual and audible indicators, if the alarm condition is no longer present.
How are Yellow Arrhythmia Alarms Indicated?
When a yellow arrhythmia alarm is generated, it triggers visual and audible indicators.
Behavior of Unsilenced Arrhythmia Alarms
Yellow arrhythmia alarms are always set to latch visually for three minutes.
Yellow arrhythmia alarms that have not been silenced behave as explained in this table:
Behavior of Silenced Arrhythmia Alarms
If you silence a yellow arrhythmia alarm and the alarm condition still exists, the visual indicators
continue until the condition stops. You will not get a realarm for the same condition or another
condition lower down on the same chain until the alarm condition has stopped and reoccurred, and
the timeout period has expired.
If you silence a yellow arrhythmia alarm and the alarm condition has stopped, the visual indicators
are immediately cleared. Silencing an alarm does not reset its time out period, so you will not get a
realarm for the same condition or lower on the chain until the time out expires.
Alarm condition Example Configured time
out period
Short yellow alarm
tone sounds ...
Alarm message
displayed ...
Single alarm instance Non-sustained
V-tach
All settings when alarm condition is
initially detected
for 3 minutes (latching
time)
Continuous alarm condition HR LOW All settings until the alarm condition
stops, plus a maximum of
3 minutes latching time
Same intermittent alarm
condition, occurring
frequently (more than once
per minute)
Pair of PVCs 2 minutes or less
3 minutes or more each time the alarm
condition is detected,
provided that the timeout
period has expired and the
alarm message has cleared
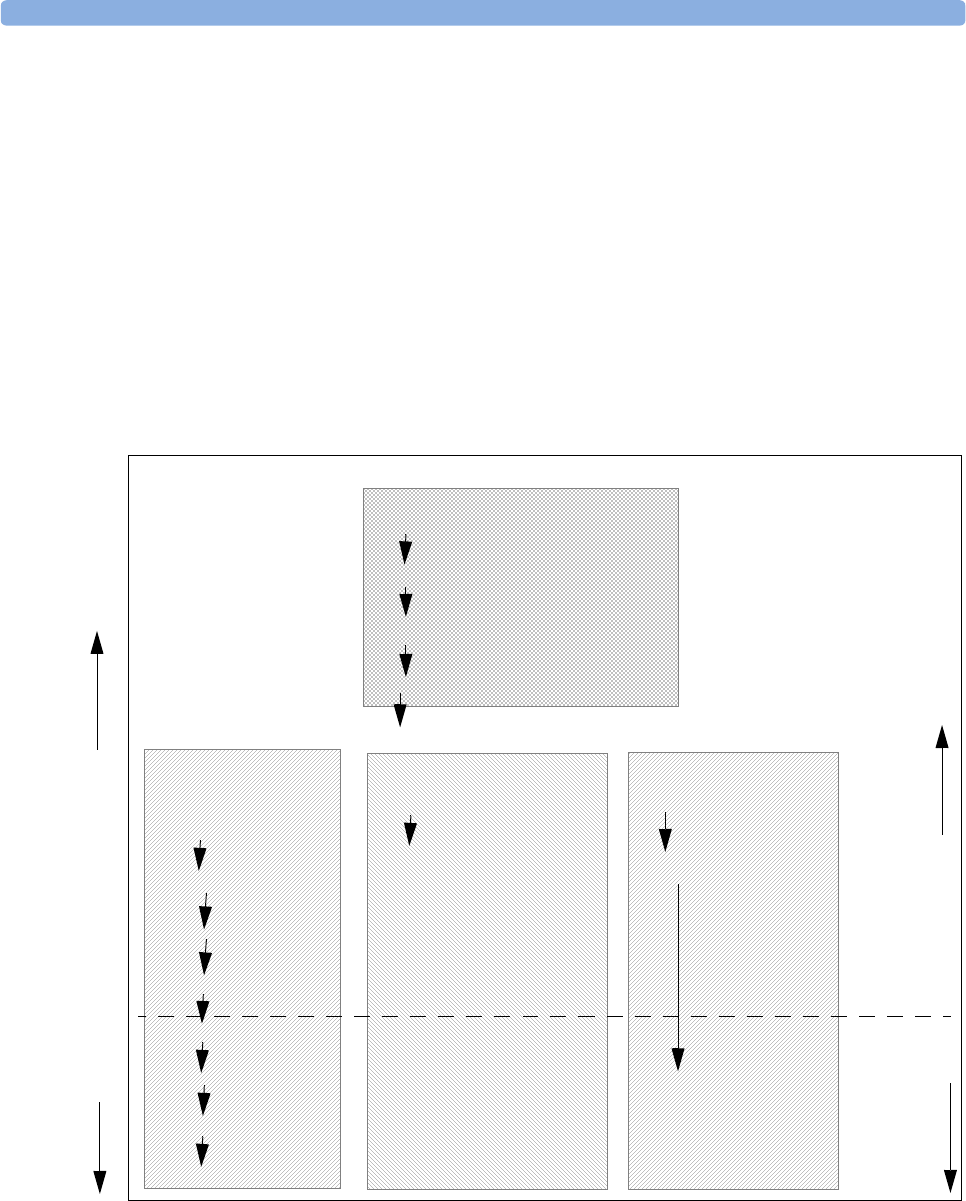
Arrhythmia Alarms 6 ECG, Arrhythmia, and ST Monitoring
115
Arrhythmia Alarm Chaining
When arrhythmia analysis is switched on, multiple alarm conditions may be present. Announcing all of
the detected alarm conditions would be confusing, and might hide a more serious condition. For this
reason, arrhythmia alarms are prioritized in three alarm “chains”: PVC Alarms; Beat Detection Alarms,
and Rate Alarms.
Only the highest priority alarm condition in each chain is announced. Lower priority alarms in the
same chain will not be announced while an alarm is active or during the configured timeout period. If
alarm conditions of equal severity from different chains are detected, the alarm condition that occurred
most recently is announced. The exception is Irregular HR, which only occurs if no other alarms are
occurring.
See “ECG, Arrhythmia, and ST Alarm Overview” on page 104 for information on which alarms are
included in the different arrhythmia options. See “Arrhythmia Alarm Timeout Periods” on page 113
for an explanation of how alarm timeouts work.
– If there is an active Vent Bigeminy alarm, a PVCs > xx/min will not be triggered because it is
lower on the same chain. However, a high HR alarm will become active because it is on a
different chain.
– Higher priority alarms supersede previous alarms. For example, if a Vent Trigeminy alarm is active
and a Pair PVCs occurs, the Pair alarm will be activated.
Red Arrhythmia Alarms
Asystole
Ven t Fib /Ta ch
V-Tach
Extreme Tachy/Extreme Brady
Yellow Arrhythmia Alarm s
PVC Alarms Chain Beat Detection Alarms Chain Rate Alarms Chain
Pacer Not Captured/
Pacer Not Pacing/
Missed Beat
HR High/ HR Low
PVCs > xx/min
Non-sustain VT/
Ven t R hyt hm
Run PVCs
R-on-T PVCs
Pause SVT
Multiform PVCs
Vent Bigeminy
Vent Trigeminy Irregular HR
(occurs only if no other
arrhythmia alarms are
present)
First level
timeout
period
(TimeOut
1st)
Second level
timeout
period
(TimeOut
2nd)
Pair PVCs
lower priority higher priority
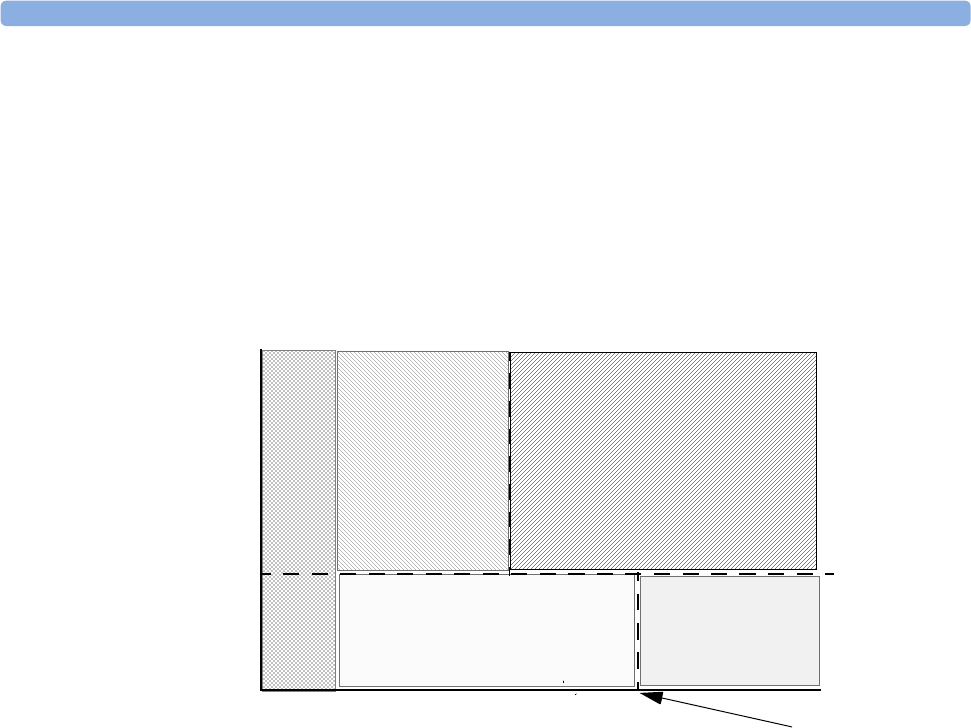
6 ECG, Arrhythmia, and ST Monitoring Arrhythmia Alarms
116
Understanding PVC-Related Alarms
PVC-related alarms are detected on the basis of the current ventricular heart rate and the number of
consecutive PVCs counted (referred to as PVC Runs). Changing one alarm limit automatically changes
linked alarm limits.
Example: This diagram illustrates the conditions under which PVC alarms would be generated if the
Vent Rhythm Run limit is set to 12, the V-Tach Run Limit is set to eight, and the V-Tach HR Limit
is set to 100.
You will see that
• if both the V-Tach Heart Rate Limit and the V-Tach Run Limit are exceeded, a red V-Tach alarm is
generated
• if the ventricular heart rate exceeds the V-Tach Heart Rate Limit but not the V-Tach Run Limit, a
yellow Non-Sustain VT alarm is generated.
Ventricular Heart Rate
Number of Consecutive PVCs (PVC Run)
**Pair
PVCs
PVC =
2
** Non-Sustain
VT
PVC Run < 8
HR > 100
***V-Tach
PVC Run ≥ 8
HR > 100
** Run PVCs
PVC Run > 2 but ≤ 12
HR ≤ 100
** Vent Rhythm
PVC Run > 12
HR ≤ 100
V-Tach
Heart Rate
Limit
V-Tach Run Limit
Ventricular Rhythm
Run Limit
1 2 3 4 5 6 7 8 9 10 11 12
100

About ST Monitoring 6 ECG, Arrhythmia, and ST Monitoring
117
About ST Monitoring
The monitor performs ST segment analysis on normal and atrially paced beats and calculates ST
segment elevations and depressions. This information can be displayed in the form of ST numerics and
snippets on the monitor.
All available leads can be monitored continuously. The ECG waveform does not need to be displayed
on the Screen for ST Segment analysis.
ST segment monitoring is intended for use with adult patients only and is not clinically validated for
use with neonatal and pediatric patients. For this reason, the recommended - and default - setting for
ST monitoring in neonatal and pediatric modes is ST Analysis: Off.
ST analysis is always performed using a dedicated filter which ensures diagnostic quality. If you are
monitoring ECG using an ECG filter mode other than Diagnostic, the ST segment of the ECG wave
may look different from the ST segment of the ST snippet for the same wave. For diagnostic evaluation
of the ST segment, always switch to Diagnostic filter mode or use the ST snippet.
WARNING Some clinical conditions may make it difficult to achieve reliable ST monitoring, for example:
• if you are unable to get a lead that is not noisy
• if arrhythmias such as atrial fib/flutter are present, which may cause an irregular baseline
• if the patient is continuously ventricularly paced
• if the patient has left bundle branch block.
You should consider switching ST monitoring off if these conditions are present.
This monitor provides ST level change information; the clinical significance of the ST level change
information should be determined by a physician.
Switching ST On and Off
♦To switch all ST monitoring on or off, in the Setup ST Analysis menu, select ST Analysis
to toggle between On and Off.
Selecting ST Leads for Analysis
♦To switch ST monitoring for individual leads on or off, in the Setup ST Analysis menu,
select Setup ST Leads. In the pop-up window, the leads in the left column under Choices
are the leads you can choose from, and the leads in the right-hand column Selected are the
leads chosen to be displayed. Select the ST leads on the left and use the arrow keys to move the
leads from one list to the other, then select Done to apply the changes.
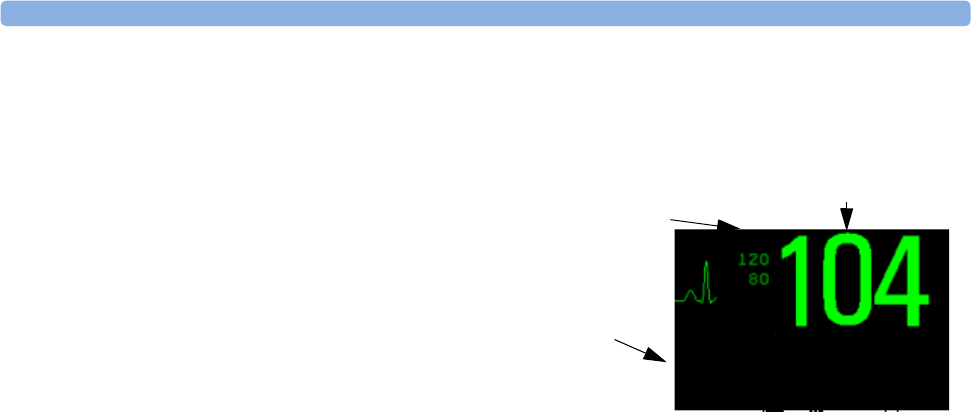
6 ECG, Arrhythmia, and ST Monitoring Understanding the ST Display
118
Understanding the ST Display
Your monitor screen may be configured to look slightly different from the illustrations.
ST Numerics Up to 12 ST numerics plus the
ST index can be displayed on the monitor
screen. They can be configured to show beside
the measurement numerics, beside the ECG
wave, or beside the ST snippet.
A positive ST value indicates ST segment
elevation; a negative value indicates depression.
ST numerics are displayed in the order in
which you select ST leads for analysis. If there
is additional space in the field assigned to ST numerics, the monitor will display extra numerics in the
order in which they appear in the Setup ST Analysis -> Setup ST Leads -> Choices
list. Any ST leads switched on for analysis that do not fit in the assigned numerics field are shown in
succession in place of the last ST numeric.
ST Index The ST index numeric (STindx) is the sum of the absolute values for the ST leads V2, V5,
aVF. Because it is based on absolute values, it is always a positive number. If you haven’t selected one of
the leads V2, V5, and aVF for ST analysis, the STindx numeric will display a question mark “?”.
♦To switch the ST index numeric on or off for display, in the Setup ST Analysis menu,
select ST-Index to toggle between On and Off.
ST Snippets ST snippets show a one second wave segment for each measured ST lead. The most
recent snippet is drawn in the same color as the ECG wave, usually green, superimposed over the
stored baseline snippet, drawn in a different color. The comparison shows any deviation in the
measurement since the baseline snippet was stored, for example as a result of a procedure carried out on
the patient.
The information is updated once per minute.
If you do not see ST snippets on the Screen, select the Screen name in the Monitor Info Line and select
a Screen configured to show snippets from the pop-up list of available Screens.
ST Baseline Window The ST Baseline Window shows an ST snippet drawn on a grid. The current
ST numeric and the ST numeric stored with the baseline are shown, as well as the difference between
these two numerics.
A “?” in front of the difference numeric indicates that the ST measurement points were adjusted since
the baseline snippet was stored.
The Baseline Window opens with the ST pop-up keys Update Baseline, Record ST,
Change ST Lead, Adjust ST Points, ST Map and arrow keys for scrolling through the
available leads.
♦To v ie w t h e ST Baseline window, select any snippet on the Screen.
ST-II 1.2
ST-V 2.5
ST-aVR -3.0
Current heart rate
ST numerics
Current HR
alarm limits
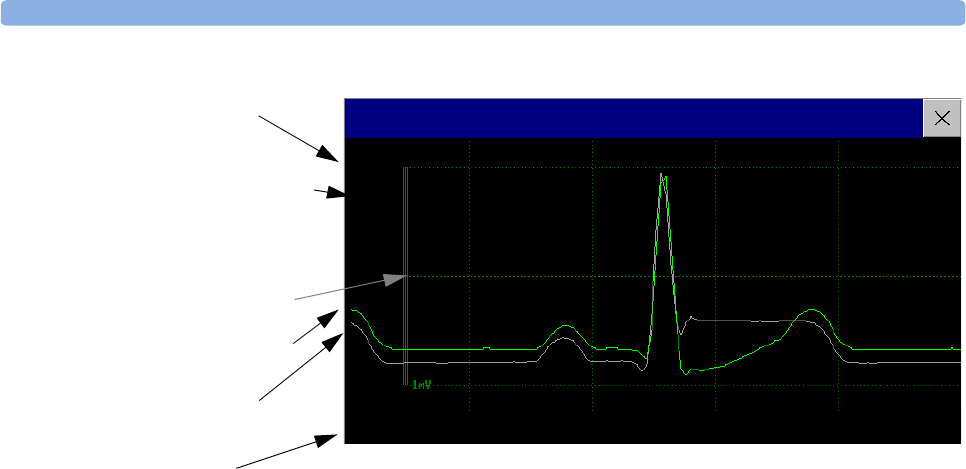
Updating ST Baseline Snippets 6 ECG, Arrhythmia, and ST Monitoring
119
Updating ST Baseline Snippets
ST analysis requires valid samples to measure and store a snippet. ST Snippets and ST values are
updated every minute. If there is artifact in the signal, it may take longer for an ST snippet and an ST
value to appear.
The first baseline is stored automatically after ST monitoring is started, or when a new patient is
admitted. To update ST baselines,
1Select an ST snippet to open the ST Baseline window.
2In the ST Baseline window, select Update Baseline to store all current snippets as
baselines. This deletes all previously-stored baselines.
Recording ST Segments
♦To record all currently available ST snippets and baselines, in the ST Baseline window, select
the pop-up key Record ST.
ST label and
numeric
ST Baseline stored at 14 Feb 03 9:38
Timestamp of most recently stored baseline snippet
ST Baseline
1mV calibration
bar
Current snippet
ST baseline
Baseline ST numeric
and difference since
baseline was stored
ST-II
-0.8
1.9
?-2.7
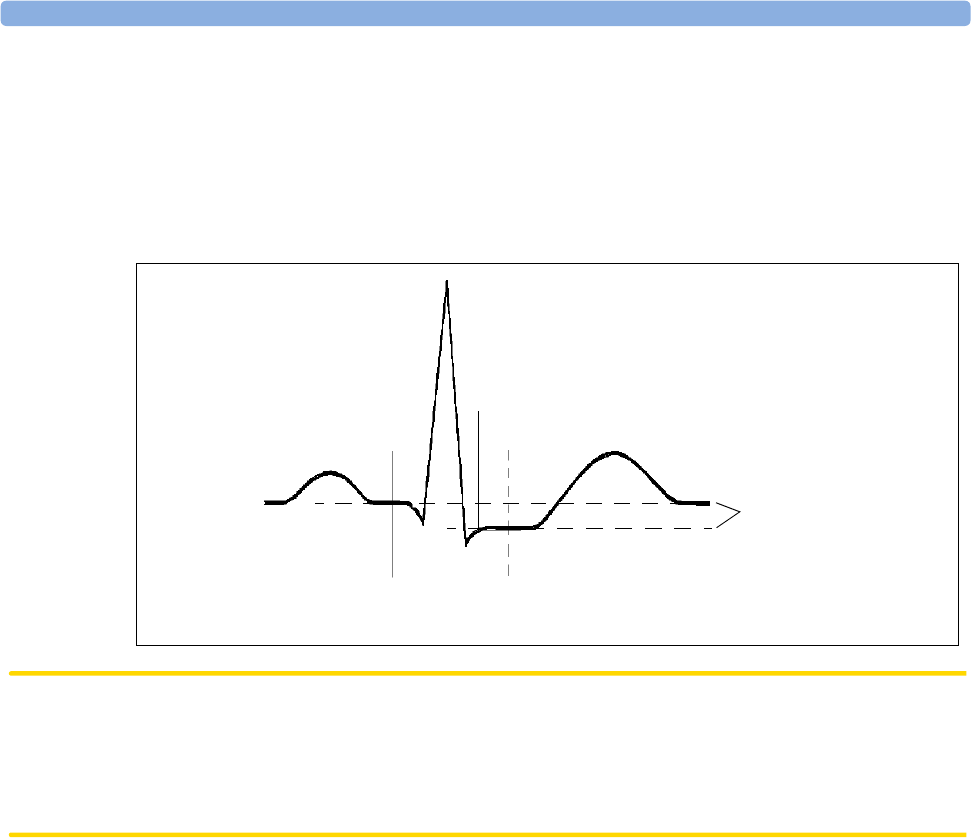
6 ECG, Arrhythmia, and ST Monitoring About the ST Measurement Points
120
About the ST Measurement Points
The ST value for each beat complex is the vertical difference between the ISO point and the ST point,
as shown in the diagram below. The isoelectric (ISO) point provides the baseline, the ST point is at the
midpoint of the ST segment. The J point is where the QRS complex changes its slope; as it is a fixed
distance away from the ST point, it can be useful to help you position the ST point correctly.
CAUTION The ST measurement points need to be adjusted when you start monitoring, and if the patient's heart
rate or ECG morphology changes significantly, as this may affect the size of the QT interval and thus
the placement of the ST point. Artifactual ST segment depression or elevation may occur if the
isoelectric point or the ST point is incorrectly set.
Always ensure that ST measurement points are appropriate for your patient.
Adjusting ST Measurement Points
Depending on your monitor’s configuration, the ST point can be positioned either
• relative to the J-point.
In the Adjust ST Points window, the pop-up keys ISO Point, J Point and ST Point are
visible and can be adjusted.
or
• directly. by selecting a numeric value for the ST point.
In the Adjust ST Points window, you can adjust the ISO and ST point.
The ST Uses setting can only be changed in Configuration Mode.
To adjust the ST measurement points,
1In the Setup ST Analysis menu, select Adjust ST Points to open the Adjust ST
Points window. Alternatively, you can use the Adjust ST Points pop-up key in the ST
Baseline window.
2Select a suitable ECG lead for ST measurement, with a visible J-point and a visible P wave. Use the
up and down arrow keys to scroll through the ST snippets for the other ECG leads.
J point, for example, 48 msec
R-wave peak at 0 msec
Isoelectric point set to -80 msec
Difference = ST value
ST measurement point, for example, J + 60 msec
T
P
QS
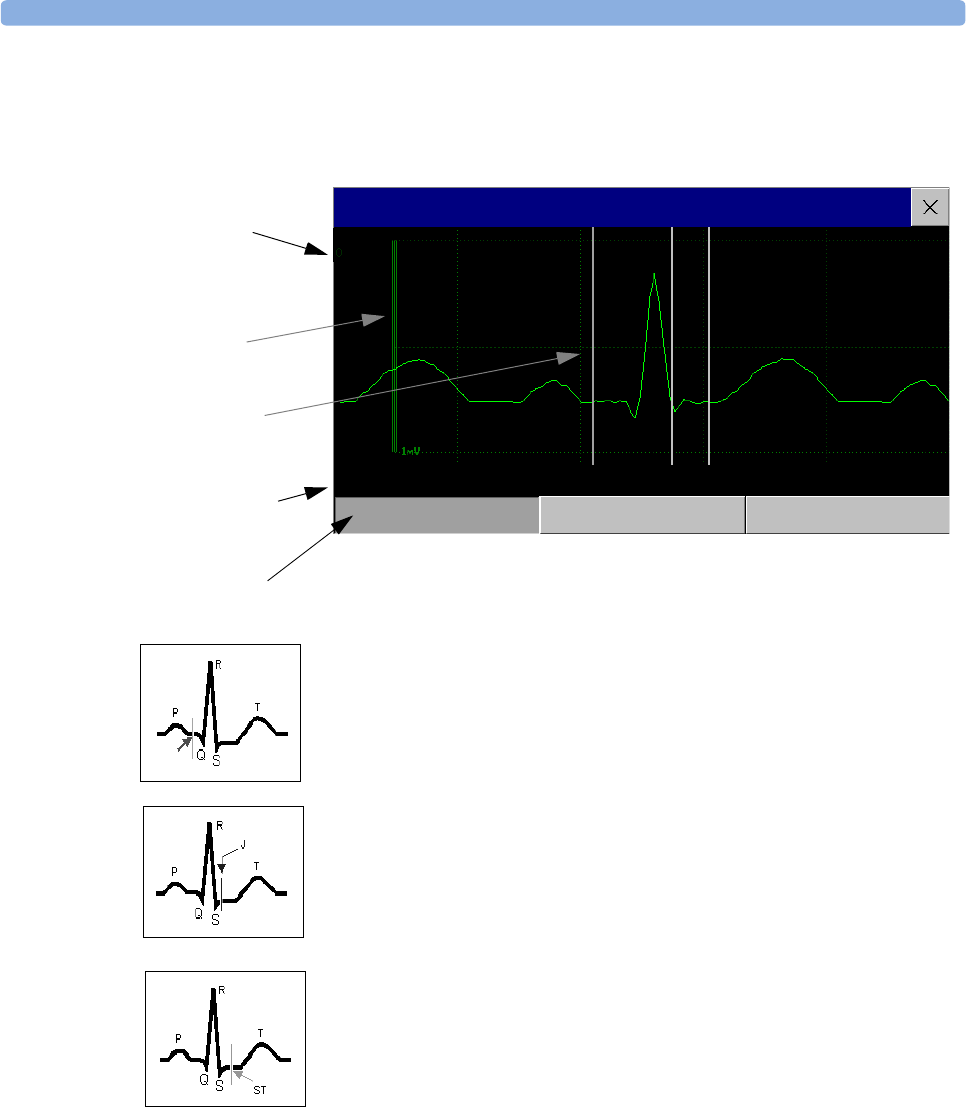
About the ST Measurement Points 6 ECG, Arrhythmia, and ST Monitoring
121
3Use the Select Point pop-up key to scroll through the points and activate the point you need
to adjust, then use the left and right arrow keys to move the measurement point. Each point is
highlighted while active.
The ISO-point cursor positions the isoelectric point relative to the R-wave
peak. The relation is shown beside the ISO-point in milliseconds. Position the
ISO-point in the middle of the flattest part of the baseline (between the P and
Q waves or in front of the P wave).
The J-point cursor positions the J-point relative to the R-wave peak. It helps
you to correctly position the ST-point. Position the J-point at the end of the
QRS complex and the beginning of the ST segment.
The J-point cursor is not available if your monitor is configured to let you set
the ST point directly.
To position the ST-point relative to the J-point:
select either J+60 or J+80. Select J Point and use the arrow keys
to move the J-Point and position the ST-point at the midpoint of the ST
segment.
To position the ST-point directly:
select ST Point and use the left and right arrow keys to position the ST
point at the midpoint of the ST segment.
4Select the Apply Changes pop-up key to activate the new ST measurement points and
recalculate all ST values.
The most recent ST Points adjustment time is displayed in the Adjust ST Points window.
This information is cleared when a patient is discharged or when a new Profile is loaded into the
monitor.
1mV
calibration
bar
Highlighted ST point
Timestamp of
most recent ST
point adjustment
ST-I
0.0
ST label and the ST
numeric that would
apply using the
current points
Adjust ST Points
ISO Point -80 J Point 48 ST Point J+60
ST Points adjusted at 04 Apr 03 11:38
Cursors for
adjusting ST
points
ISO

6 ECG, Arrhythmia, and ST Monitoring ST Alarms
122
5To update the ST snippet shown in the Adjust ST Points window, select the Update pop-up
key.
ST Alarms
ST alarms are yellow alarms. Each ST lead has its own alarm limit. ST alarms are triggered when an ST
value exceeds its alarm limit for more than one minute. Switching ST alarms off switches off alarms for
all ST leads.
If more than one ST measurement is in alarm, the monitor only displays the alarm message of the ST
lead which is currently furthest from its set alarm limits.
Single- or Multi-lead ST Alarming
Be aware that if multi-lead ST alarming is switched on, only alarms involving more than one ST lead
will be announced.
To choose individual or multi-lead ST alarming,
♦In the Setup ST Analysis menu, select ST Alarm Mode and select either Single ST or
Multi ST.
Changing ST Alarm Limits
The monitor can detect alarms on each ST lead separately, so you can set high and low ST alarm limits
individually for each ST lead. You can also set separate alarm limits for single-lead and multi-lead ST
monitoring. Set the high and low alarm limits based on your assessment of the patient's clinical
condition, unit protocols, physician orders or medication specified limits. A good guideline is + 1.0
mm or - 1.0 mm from the patients's ST, or follow your hospital protocol.
1In the Setup ST Analysis menu, select ST Alarm Mode and select Single ST or
Multi ST.
2Select the alarm to be adjusted.
3Select the appropriate setting.
Viewing ST Maps
The monitor can derive a multi-axis portrait (map) from the ST analysis to help you detect changes in
ST values. It displays two planes obtained from a multilead ECG in a multi-axis diagram, where each
axis represents a lead. The ST value at the J point is given. The position of the axes within the diagram
correspond to the placement of the ECG leads. Each ST value is assigned to either a limb lead, or to a
chest lead. Every axis shows the polarity of the lead it represents. By joining adjacent ST values, the
monitor obtains the ST map. The contour line, and the map shading, is shown in the same color as the
ECG parameter.
Current View
In current view, the monitor displays an ST map that corresponds to the current ST values. Three or
more leads per plane are necessary to display a map.
The left of the following diagram shows leads I, II, III, aVR, aVL, and aVF on the limb leads. On the
right, the V-leads (V1, V2, V3, V4, V5, and V6) are on the chest leads.
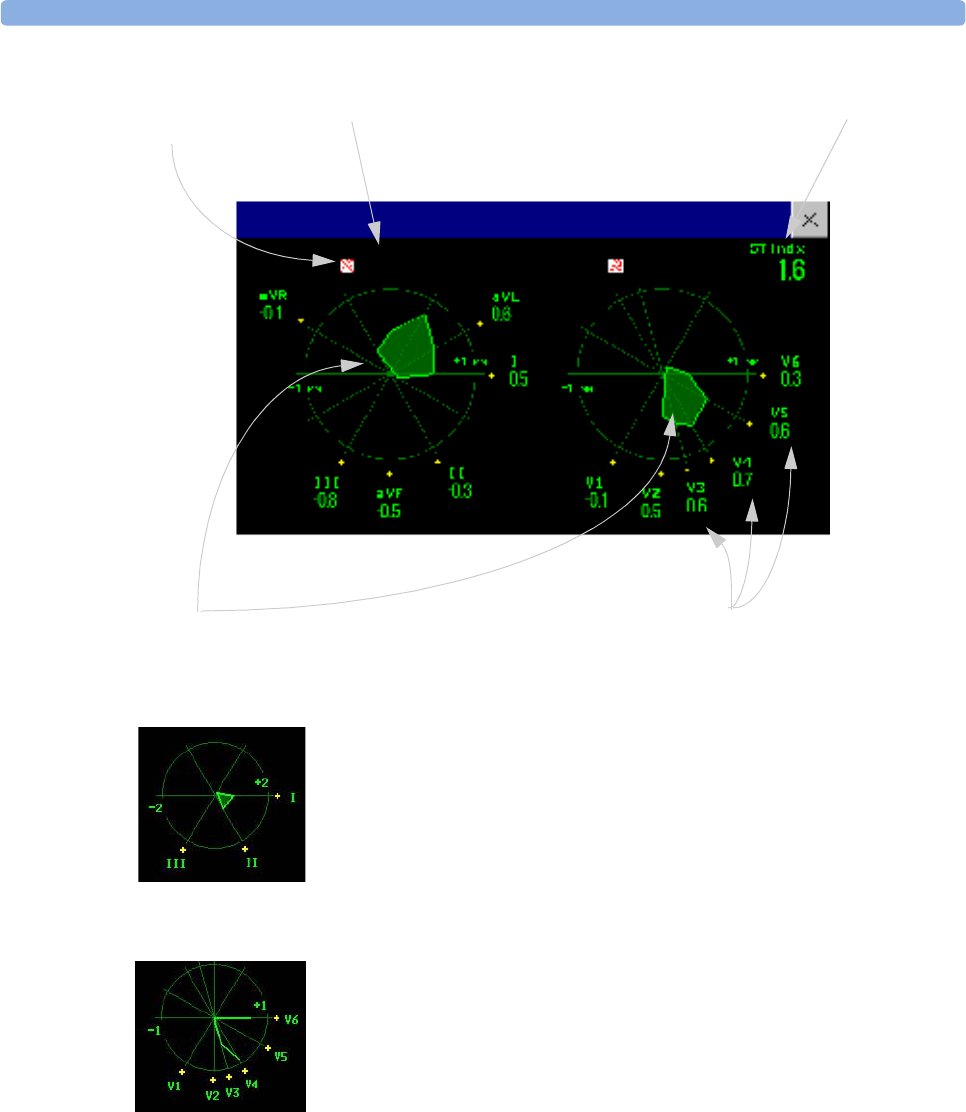
Viewing ST Maps 6 ECG, Arrhythmia, and ST Monitoring
123
If an ST lead is switched off, its axis is not shown in the map.
If a lead is in INOP (the value is being measured but is invalid or unavailable because, for example, the
corresponding ECG electrode is unplugged), the area formed by the remaining ST leads is left open.
Trend View
In trend view, you can see up to four trended ST maps, and the current ST map, simultaneously. You
can configure the time interval between trended samples. The most recent map is shown in the same
color as the parameter itself. Past values change from white through dark gray. In the diagram below,
the time interval between trends is 12 seconds. The first trended sample is white and is 12 seconds old.
The second trended sample corresponds to the ST values 24 seconds ago and so forth. The ST values
on the diagrams show the current ST values.
ST map
ST index (for EASI)12-Lead EASI indicator alarm status
indicator
EASI Limb leads EASI Chest Leads
ST label, value and polarity of
corresponding lead
ST Map (Current)
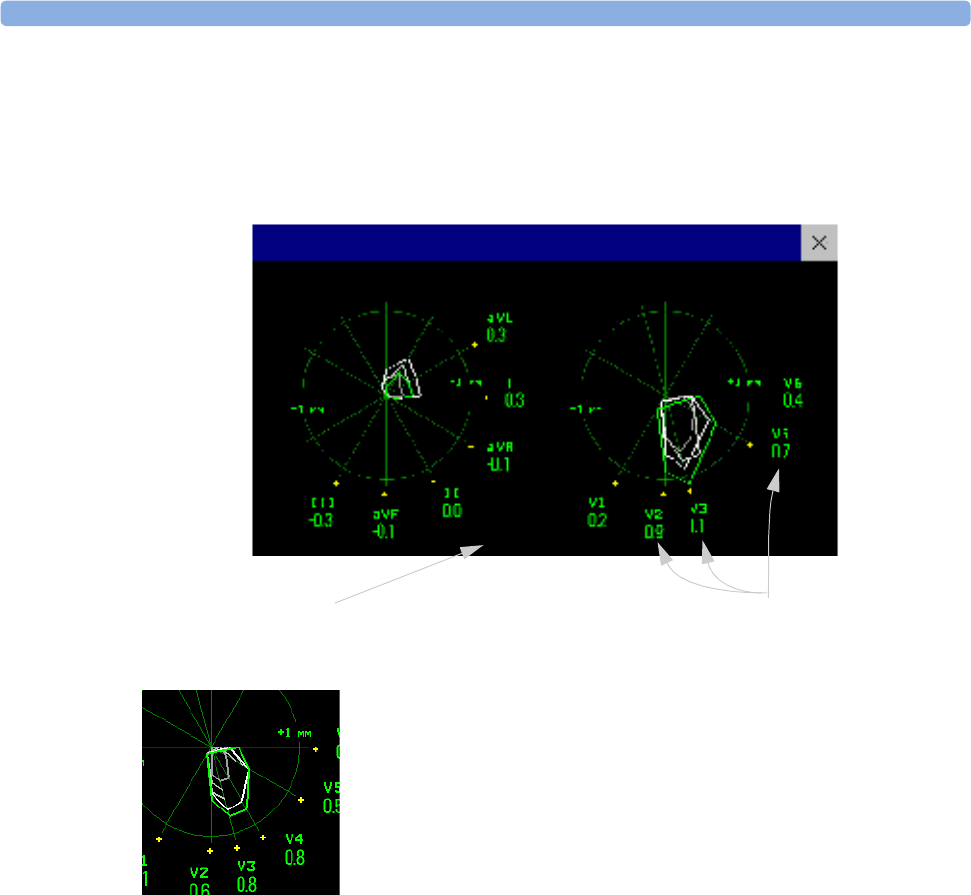
6 ECG, Arrhythmia, and ST Monitoring Viewing ST Maps
124
If a lead is turned off, its axis is no longer shown. This has no impact on the presentation of trended
values that were recorded while the lead was still on. In the diagram below, lead V4 was switched off 20
seconds ago. The current ST values and the first trended value reflect this change in the lead setup. All
other maps are displayed the way in which they were recorded.
Viewing an ST Map
To display an ST map,
♦In the Setup ST Analysis menu, select ST Map.
Working in the ST Map Task Window
You may need to activate the ST map task window to see all the data, and to access the pop-up keys.
Select the map view on screen to activate its task window. Once you activate it, you can perform the
tasks detailed here.
Switching Between ST Map Views
To switch between views,
♦Select Current View or Trend View to toggle between views.
If your trend view is empty, you need to adjust the priority of this measurement in the trending
priority list. See “Trend Priority” on page 227.
In this diagram, V4 was either temporarily switched off, or in INOP, for
around 30 seconds. No data was recorded. Consequently, the affected maps
are not closed.
Limb Leads Chest Leads
Interval
12 sec
current ST valuestrending interval
ST Map (Trend)

Viewing ST Maps 6 ECG, Arrhythmia, and ST Monitoring
125
Displaying an ST Reference Baseline
You can display an ST reference baseline for the current view, or for the trended view. The baseline is
shown in yellow. However, if the ECG color is yellow, the baseline is shown in green. Use this baseline
to detect ST changes. The baseline is derived automatically whenever the monitor relearns arrhythmia
and also on user request.
♦Select Show Baseline/Hide Baseline to toggle between baseline display on and off.
Updating an ST Map Reference Baseline
To update the baseline,
♦In the Setup ST Analysis menu, select ST Baseline -> Update baseline.
Changing the Scale of the ST Map
To change scale,
♦Select Size Up or Size Down to alter the size at which monitor displays the map.
Changing the Trending Interval
To determine how frequently the monitor displays a trended sample,
1In Trend view, select Select Interval.
2Select the required interval from the menu. The interval ranges between 12 seconds to 30 minutes.
Printing an ST Map Report
To print the most recently viewed (current or trend) window,
1Select Main Setup - > Reports.
2Select ST Map.
3Press Print.

6 ECG, Arrhythmia, and ST Monitoring Viewing ST Maps
126

127
7
7Monitoring Pulse Rate
The pulse numeric counts the arterial pulsations that result from the mechanical activity of the heart in
beats per minute (bpm). You can display a pulse from any measured SpO2 signal (pleth wave) or any
arterial pressure (ABP, ART, Ao, BAP, FAP, PAP, UAP, P: see the pressure section for an explanation
of the pressure labels). The displayed pulse numeric is labeled and color-coded to match its source
wave. If the pulse numeric is not displayed, see the Setup Pulse menu to check whether it is
switched on.
Entering the Setup Pulse Menu
If a pulse numeric is displayed on the screen, select it to enter the Setup Pulse (Pulse Source)
menu. If no pulse numeric is visible, in the Setup SpO2 menu or an Setup arterial pressure menu,
select Pulse (Pulse Source).
System Pulse Source
The currently active system pulse source is shown in the setup menus of the pulse source
measurements. The pulse rate chosen as system pulse:
• is monitored as system pulse and generates alarms when you select pulse as the active alarm source
• is sent via the network to the Information Center, if available
• is trended in the HighRes Trends and stored in the monitor’s databases.
To define which pulse rate is used as system pulse,
1In the Setup Pulse menu, select System Pulse.
2Select one of the SpO2 or arterial pressure labels from the pop-up list, or select Auto.
If you select Auto, the monitor automatically chooses a pulse rate to be used as system pulse. It
looks through the list from top to bottom and activates the first pulse rate that is switched on and
available.

7 Monitoring Pulse Rate Switching Pulse On and Off
128
Switching Pulse On and Off
To switch a particular pulse numeric on or off, enter the Setup Pulse menu via the measurement
setup menu or wave menu of the pulse source. For example, to switch an SpO2 pulse numeric on or
off,
1Enter the Setup Pulse menu by selecting the Pulse numeric or by selecting Pulse in the
Setup SpO2 menu.
2In the Setup Pulse menu, select Pulse (Pulse source) to toggle between On and
Off.
To switch the system pulse on or off, in any Setup Pulse (Pulse Source) menu, check
which measurement is currently selected as pulse source. Enter the Setup Pulse menu for this
pulse source and then switch off the pulse measurement as described.
Using Pulse Alarms
You can change pulse rate alarm limits in the Setup Pulse menu accessed via any Pulse source, or
in the Setup ECG menu. Changing the alarm limits for a specific Pulse numeric changes the alarm
limits for all pulse rate alarms and heart rate alarms.
Pulse alarms are only generated when the active alarm source is set to Pulse and a pulse source is set as
system pulse.
Selecting the Active Alarm Source: HR or Pulse?
In most cases the HR and Pulse numerics are identical. In order to avoid simultaneous alarms on HR
and Pulse, the monitor uses either HR or Pulse as its active alarm source. To change the alarm source,
select Alarm Source in the Setup ECG or Setup Pulse menu, then select either
•HR: if you want the HR to be the alarm source for HR/Pulse.
•Pulse: If you select Pulse as the active alarm source, the monitor will prompt you to confirm your
choice. Be aware that if you select Pulse as the alarm source, all arrhythmia and ECG HR alarms are
switched off.
•Auto: If the Alarm Source is set to Auto, the monitor will use the heart rate from the ECG
measurement as the alarm source whenever the ECG measurement is switched on and no ECG
LEADS OFF INOP is active.
The monitor will automatically switch to Pulse as the alarm source if:
– a Pulse source is switched on and available,
and
– the heart rate becomes unavailable and the ECG LEADS OFF inop is active.
The monitor then uses the pulse rate from the measurement currently selected as system pulse.
While Pulse is the alarm source, all arrhythmia and ECG HR alarms are switched off. If the HR
becomes available again, the monitor automatically uses this as alarm source.

Using Pulse Alarms 7 Monitoring Pulse Rate
129
WARNING Selecting Pulse as the active alarm source for HR/Pulse switches off the arrhythmia alarms listed in the
section “ECG, Arrhythmia, and ST Alarm Overview” on page 104, and the heart rate alarms. This is
indicated by the message All ECG Alarms Off (unless this has been configured off for your
monitor), and the crossed-out alarm symbol beside the ECG heart rate numeric.
High and low pulse rate and extreme bradycardia and extreme tachycardia alarms from pulse are active.
Alarm Source Selection Disabled
If Alarm Source Selection is disabled, you cannot change the alarm source. If you try to change the
source, the monitor displays the message To activate enter Config and enable
AlarmSourceSel. This setting can only be changed in Configuration Mode.
Changing HR/Pulse Alarm Limits
As Pulse and HR share the same high and low alarm limits, if you change the alarm limit in the
Setup Pulse menu, the high or low alarm limits for HR in the Setup ECG menu change
automatically, and vice versa. The only exceptions are caused by a low limit clamp for each
measurement: the lowest value for Pulse when derived from SpO2 is 30 bpm; for HR 15 bpm, and for
Pressure 25 bpm.
Extreme Alarm Limits
The extreme rate alarms, Extreme Tachy and Extreme Brady, generated by the active alarm source,
either HR or Pulse, are set in Configuration Mode by adding a set value to the high and low alarm
limits. You need to know what value has been configured for your monitor. Changing the high and
low alarm limits automatically changes the extreme alarm limits within the allowed range.
♦To see the values added to the high and low limit alarms to create the extreme rate alarms for your
monitor, in the Setup ECG menu, see the menu items ∆ExtrTachy and ∆ExtrBrady.
QRS Tone
The active alarm source is also used as a source for the QRS tone. You can change the tone volume in
the Setup SpO2 and Setup ECG menus and the QRS tone modulation in the Setup SpO2 menu.

7 Monitoring Pulse Rate Using Pulse Alarms
130

131
8
8Monitoring Respiration Rate
(Resp)
For the respiratory measurement (Resp), the monitor measures the thoracic impedance between two
ECG electrodes on the patient’s chest. Changes in the impedance due to thoracic movement produce
the Resp waveform on the monitor screen. The monitor counts the waveform cycles to calculate the
respiration rate (RR).
Lead Placement for Monitoring Resp
Correct patient skin preparation techniques for electrode placement are important for Resp
measurement: you will find this information in the chapter on ECG.
The Resp measurement uses the standard ECG cable sets and lead placements. You can use any of the
different types of ECG cable sets - 3-lead, 5-lead, or 10-lead, using either standard or EASI™
placement - to measure Resp, as long as you use ICU ECG cables.
The Resp signal is always measured between two of the ECG electrodes. If you are using standard ECG
electrode placement, Resp is measured between the RA and LL electrodes. If you are using EASI™
ECG electrode placement, Resp is measured between the I and A electrodes.
Optimizing Lead Placement for Resp
If you want to measure Resp and you are already measuring ECG, you may need to optimize
placement of the two electrodes between which Resp will be measured for some patients. Repositioning
ECG electrodes from standard positions, especially when you are using EASI™ ECG electrode
placement, results in changes in the ECG waveform and may influence ST and arrhythmia
interpretation.
Cardiac Overlay
Cardiac activity that affects the Resp waveform is called cardiac overlay. It happens when the Resp
electrodes pick up impedance changes caused by the rhythmic blood flow. Correct electrode placement
can help to reduce cardiac overlay: avoid the liver area and the ventricles of the heart in the line
between the respiratory electrodes. This is particularly important for neonates.
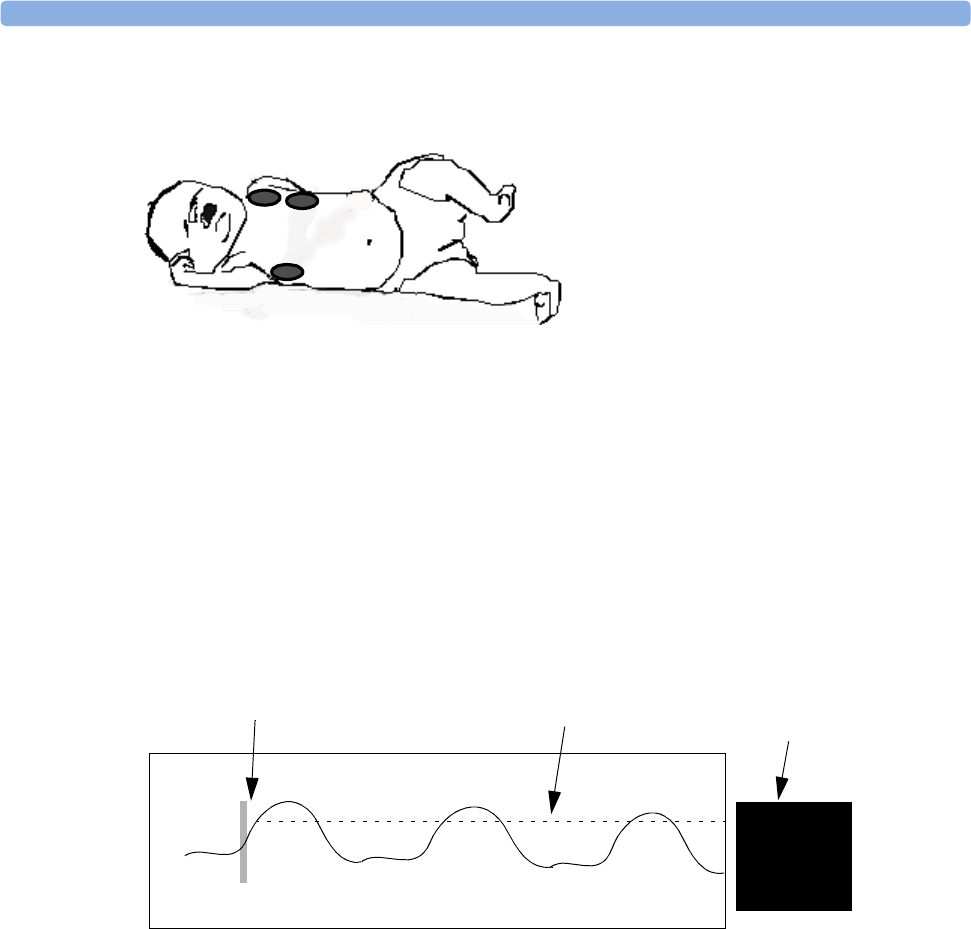
8 Monitoring Respiration Rate (Resp) Understanding the Resp Display
132
Lateral Chest Expansion
Abdominal Breathing
Some patients with restricted chest movement breathe mainly abdominally. In these cases, you may
need to place the left leg electrode on the left abdomen at the point of maximum abdominal expansion
to optimize the respiratory wave.
Understanding the Resp Display
The Resp measurement is displayed on the monitor as a continuous wave and a numeric respiration
rate. If the detected respiration rate is close to the heart rate, this is indicated by the text HR = RR next
to the respiration wave if you are in manual monitoring mode. Your monitor screen may look slightly
different from the illustration.
Changing Resp Detection Modes
The Resp detection level can be set either automatically or manually.
♦To change the resp detection mode, in the Setup Resp menu, select Auto/Manual to toggle
between the settings.
Auto Detection Mode
In Auto Detection Mode, the monitor adjusts the detection level automatically, depending on the wave
height and the presence of cardiac artifact. Note that in Auto Detection Mode,
• the detection level (a dotted line) is not displayed on the waveform,
Some patients, especially neonates, expand
their chests laterally. In these cases it is best
to place the two respiratory electrodes in the
right midaxillary and left lateral chest areas at
the patient’s maximum point of breathing
movement to optimize the respiratory wave.
Resp
1 Ohm
22
RR
Manually-set Resp detection level
1 Ohm calibration bar Resp numeric
and label

Changing the Size of the Respiration Wave 8 Monitoring Respiration Rate (Resp)
133
• the algorithm expects a heart rate and therefore needs at least 3 electrodes attached to the patient. If
you are monitoring respiration with only two electrodes, the detection algorithm becomes less
sensitive which may result in reduced breath detection performance.
Use Auto Detection Mode for situations where:
• the respiration rate is not close to the heart rate
• breathing is spontaneous, with or without continuous positive airway pressure (CPAP)
• patients are ventilated, except patients with Intermittent Mandatory Ventilation (IMV).
Manual Detection Mode
In Manual Detection Mode you must set the Resp detection level.
♦In the Setup Resp menu, select Manual Up or Manual Down. Use the dotted detection level
line in the Resp waveform to determine when the desired level is reached.
Once set, the detection level will not adapt automatically to different respiration depths. It is important
to remember that if the depth of breathing changes, you may need to change the detection level.
Use Manual Detection Mode for situations where:
• the respiration rate and the heart rate are close.
• patients have Intermittent Mandatory Ventilation.
• respiration is weak. Try repositioning the electrodes to improve the signal.
Resp Detection Modes and Cardiac Overlay
In Auto Detection Mode: If you are monitoring Resp and the ECG is switched off, the monitor
cannot compare the ECG and Resp rates to detect cardiac overlay. The respiration detection level is
automatically set higher to prevent the detection of cardiac overlay as respiration.
In Manual Detection Mode: Cardiac overlay can in certain situations trigger the respiration counter.
This may lead to a false indication of a high respiration rate or an undetected apnea condition. If you
suspect that cardiac overlay is being registered as breathing activity, raise the detection level above the
zone of cardiac overlay. If the Resp wave is so small that raising the detection level is not possible, you
may need to optimize the electrode placement as described in the section ”Lateral Chest Expansion”.
Changing the Size of the Respiration Wave
WARNING When monitoring in Manual Detection Mode, make sure to check the respiration detection level after
you have increased or decreased the size of the respiration wave.
♦In the Setup Resp menu, select Size Up to increase the size of the wave or Size Down to
decrease it.

8 Monitoring Respiration Rate (Resp) Changing the Speed of the Respiration Wave
134
Changing the Speed of the Respiration Wave
Resp waveforms are usually viewed at a slower speed than other waveforms. For this reason, the Resp
measurement has its own speed control and is not affected by the wave speed settings of the other
measurements.
♦Select the Resp wave to enter the Resp Wave menu, then select Change Speed. Choose the
required speed from the pop-up list. This defines the speed at which the wave is drawn across the
screen in millimeters per second (mm/s).
Using Resp Alarms
Resp alarms can be switched on and off and the high and low alarm limits can be changed just like
other measurement alarms, as described in the Alarms chapter.
Changing the Apnea Alarm Delay
The apnea alarm is a high priority red alarm used to detect apneas. The apnea alarm delay time defines
the time period between the point where the monitor cannot detect any respiration activity and the
indication of the apnea alarm.
1In the Setup Resp menu, select Apnea Time.
2Select the appropriate setting.
Resp Safety Information
WARNING Respiration detection level If you do not set the detection level for the respiration correctly in manual
detection mode, it may not be possible for the monitor to detect apnea. If you set the detection level
too low, the monitor is more likely to detect cardiac activity, and to falsely interpret cardiac activity as
respiratory activity in the case of apnea.
Apnea The respiration measurement does not recognize obstructive and mixed apneas — it only
indicates an alarm when a pre-adjusted time has elapsed since the last detected breath.
The safety and effectiveness of the respiration measurement method in the detection of apnea,
particularly the apnea of prematurity and apnea of infancy, has not been established.
Interference If operating under conditions according to the EMC Standard EN 60601-1-2 (Radiated
Immunity 3V/m), field strengths above 1V/m may cause erroneous measurements at various
frequencies. Therefore it is recommended to avoid the use of electrically radiating equipment in close
proximity to the respiration measurement unit.
Resp Accessories To monitor respiration, use only the non-OR ECG accessories listed in the Resp
section of the accessories chapter. You cannot measure respiration if you are using an orange OR ECG
cable set. This is because of the higher internal impedance of the OR cable set, required for use if
electro-surgery is being performed.

Resp Safety Information 8 Monitoring Respiration Rate (Resp)
135
Rate adaptive pacemakers: Implanted pacemakers which can adapt to the Minute Volume may
occasionally react on the Impedance measurement used by patient monitors for the determination of
the Resp value and execute pacing with the maximum programmed rate. Switching off the Resp
measurement can prevent this.

8 Monitoring Respiration Rate (Resp) Resp Safety Information
136

137
9
9Monitoring SpO2
Philips pulse oximetry uses a motion-tolerant signal processing algorithm, based on Fourier artefact
suppression technology (FAST). It provides four measurements:
• Oxygen saturation of arterial blood (SpO2) - percentage of oxygenated hemoglobin in relation to the
sum of oxyhemoglobin and deoxyhemoglobin (functional arterial oxygen saturation).
• Pleth waveform - visual indication of patient’s pulse.
• Pulse rate (derived from pleth wave) - detected pulsations per minute.
• Perfusion indicator - numerical value for the pulsatile portion of the measured signal caused by
arterial pulsation.
The monitors are also compatible with SpO2 technologies from other manufacturers. Please refer to the
instructions for use provided with these devices for further information.
SpO2 Sensors
Depending on the purchased SpO2 option, different sensors and adapter cables can be used. The
sensors for the different options are color-coded to match the connectors. See the section on
Accessories for a compatibility table.
Familiarize yourself with the instructions for use supplied with your sensor before using it. In
particular, check that the sensor being used is appropriate for your patient category and application
site.
CAUTION Do not use OxiCliq disposable sensors in a high humidity environment, such as in neonatal incubators
or in the presence of fluids, which may contaminate sensor and electrical connections causing
unreliable or intermittent measurements. Do not use disposable sensors on patients who have allergic
reactions to the adhesive. Always use the MAX-FAST forehead sensor with the foam headband
provided by Nellcor.
Applying the Sensor
1Follow the SpO2 sensor’s instructions for use, adhering to all warnings and cautions.
2Remove colored nail polish from the application site.
3Apply the sensor to the patient. The application site should match the sensor size so that the sensor
can neither fall off, nor apply excessive pressure. When using the M1195A Infant Finger Sensor,

9 Monitoring SpO2Connecting SpO2 Cables
138
select a finger or toe with a diameter of between 7 and 8 mm (0.27” and 0.31”). When applying a
M1193A neonatal sensor do not overtighten the strap.
4Check that the light emitter and the photodetector are directly opposite each other. All light from
the emitter must pass through the patient’s tissue.
WARNING Loose Sensor: If a sensor is too loose, it might compromise the optical alignment or fall off. If it is too
tight, for example because the application site is too large or becomes too large due to edema, excessive
pressure may be applied. This can result in venous congestion distal from the application site, leading
to interstitial edema, hypoxemia and tissue malnutrition. Skin irritations or lacerations may occur as a
result of the sensor being attached to one location for too long. To avoid skin irritations and
lacerations, periodically inspect the sensor application site and change the application site at least every
four hours.
Venous Pulsation: Do not apply sensor too tightly as this results in venous pulsation which may
severely obstruct circulation and lead to inaccurate measurements.
Ambient Temperature: Never apply an SpO2 sensor at ambient temperatures from above 37 oC
because this can cause severe burns after prolonged application.
Extremities to Avoid: Avoid placing the sensor on extremities with an arterial catheter, or intravascular
venous infusion line.
Connecting SpO2 Cables
♦Connect the sensor cable to the color-coded socket on the
measurement device (MMS or module). If you are using a
disposable sensor, plug the sensor into the adapter cable and connect
this to the measurement device. Connect reusable sensors directly to
the measurement device.
CAUTION Extension cables: Do not use more than one extension cable (M1941A). Do not use an extension cable
with Philips reusable sensors or adapter cables with part numbers ending in -L (indicates “long” cable
version).
Electrical Interference: Position the sensor cable and connector away from power cables, to avoid
electrical interference.
Humidity: For neonatal patients, make sure that all sensor connectors and adapter cable connectors are
outside the incubator. The humid atmosphere inside can cause inaccurate measurements.
Measuring SpO2
1Select the correct patient category setting (adult/pediatric and neonatal), as this is used to optimize
the calculation of the SpO2 and pulse numerics.
2During measurement, ensure that the application site:
– has a pulsatile flow, ideally with a perfusion indicator value above 1.0.
SpO2

Assessing a Suspicious SpO2 Reading 9Monitoring SpO
2
139
– has not changed in its thickness (for example, due to edema), causing an improper fit of the
sensor.
WARNING Inspect the application site every two to three hours to ensure skin quality and correct optical
alignment. If the skin quality changes, move the sensor to another site. Change the application site at
least every four hours.
Using an SpO2 sensor during MR imaging can cause severe burns. Minimize this risk by positioning
the cable so that no inductive loops are formed. If the sensor does not appear to be operating properly,
remove it immediately from the patient.
CAUTION Injected dyes such as methylene blue, or intravascular dyshemoglobins such as methemoglobin and
carboxyhemoglobin may lead to inaccurate measurements.
Interference can be caused by:
• High levels of ambient light. (Hint: cover application site with opaque material.)
• Electromagnetic interference.
• Excessive patient movement and vibration.
Assessing a Suspicious SpO2 Reading
Traditionally, pulse rate from SpO2 was compared with heart rate from ECG to confirm the validity of
the SpO2 reading. With newer algorithms, such as FAST-SpO2, this is no longer a valid criteria
because the correct calculation of SpO2 is not directly linked to the correct detection of each pulse.
When pulse rate is very low, or strong arrhythmia is present, the SpO2/Pleth pulse rate may differ from
the heart rate calculated from ECG but this does not indicate an inaccurate SpO2 value.
If you doubt the measured SpO2, use the pleth wave and perfusion indicator instead to assess the signal
quality.

9 Monitoring SpO2Understanding SpO2 Alarms
140
Understanding SpO2 Alarms
This refers to SpO2 specific alarms. See the Alarms section for general alarm information. SpO2 offers
high and low limit alarms, and a high priority desat alarm. You cannot set the low alarm limit below
the desat alarm limit.
CAUTION If you measure SpO2 on a limb that has an inflated NBP cuff, a non-pulsatile SpO2 INOP can occur.
If the monitor is configured to suppress this alarm there may be a delay of up to 60 seconds in
indicating critical patient status, such as sudden pulse loss or hypoxia.
Alarm Delays
There is a delay between a physiological event at the measurement site and the corresponding alarm at
the monitor. This delay has two components:
• The time between the occurrence of the physiological event and when this event is represented by
the displayed numerical values. This delay depends on the algorithmic processing and the
configured averaging time. The longer the averaging time configured, the longer the time needed
until the numerical values reflect the physiological event.
• The time between the displayed numerical values crossing an alarm limit and the alarm indication
on the monitor. This delay is the combination of the configured alarm delay time plus the general
system delay time (see “Monitor Performance Specifications” on page 342).
Adjusting the Alarm Limits
In the Setup SpO2 menu:
•Select
High Limit then choose the upper alarm limit.
•Select
Low Limit then choose the lower alarm limit.
WARNING High oxygen levels may predispose a premature infant to retrolental fibroplasia. If this is a
consideration do NOT set the high alarm limit to 100%, which is equivalent to switching the alarm
off. Transcutaneous pO2 monitoring is recommended for premature infants receiving supplemental
oxygen.
Adjusting the Desat Limit Alarm
The Desat alarm is a high priority (red) alarm notifying you of potentially life threatening drops in
oxygen saturation.
1In the Setup SpO2 menu, select Desat Limit.
2Adjust the limit.
Pleth Wave
The Pleth wave is autoscaled to maximum display size. It decreases only when the signal quality
becomes marginal. It is NOT directly proportional to the pulse volume. If you need an indication of
change in pulse volume, use the perfusion indicator.
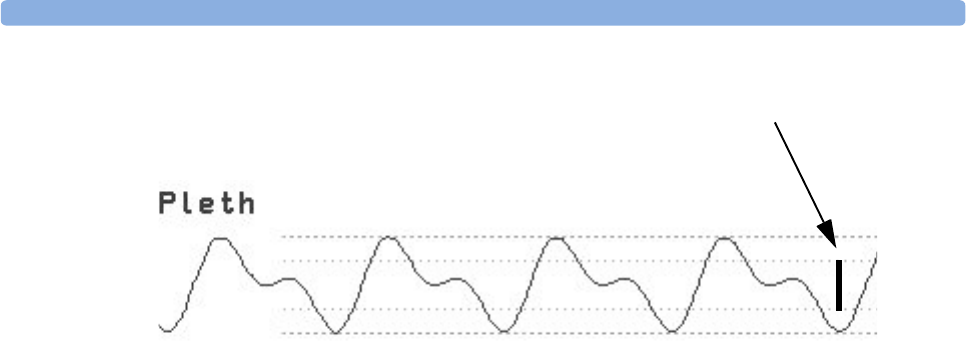
Perfusion (Pleth) Indicator 9Monitoring SpO
2
141
Perfusion (Pleth) Indicator
The perfusion indicator gives a numerical value for the pulsatile portion of the measured signal caused
by the pulsating arterial blood flow.
As pulse oximetry is based on the pulsatile nature of the signal, you can also use the perfusion indicator
as a quality indicator for the SpO2 measurement. Above 1 is optimal, between 0.3-1 is acceptable.
Below 0.3 is marginal; reposition the sensor or find a better site.
Setting SpO2/Pleth as Pulse Source
1In the Setup SpO2 menu, select Pulse (SpO2) to enter the Setup Pulse menu.
2In the Setup Pulse menu, select System Pulse and select SpO2 from the pop-up list.
Setting Up Tone Modulation
If tone modulation is on, the QRS tone pitch lowers when the SpO2 level drops. Remember, the QRS
tone is derived from either heart rate or pulse depending on which is currently selected as the active
alarm source.
♦In the Setup SpO2 menu, select Tone Modulation to toggle between Yes (for on) and No
(for off).
Tone modulation is licensed under US patent US 4,653,498 from Nellcor Puritan Bennett
Incorporated, a Tyco Healthcare company.
Setting the QRS Volume
♦In the Setup SpO2 menu, select QRS Volume and set the appropriate QRS tone volume.
Calculating SpO2 Difference
When a second SpO2 measurement is present (either through the SpO2 module or through VueLink),
the monitor displays both SpO2 values, and calculates the difference between them. The second value
is subtracted from the first.
minimum size for reliable SpO2 value

9 Monitoring SpO2Calculating SpO2 Difference
142
1From the Main Setup menu, select Measurements.
2From the ∆SpO2 Setup menu, select First SpO2.
3Choose the first measurement source.
4Select Second SpO2.
5Choose the second measurement source.

143
10
10Monitoring NBP
This monitor uses the oscillometric method for measuring NBP. In adult and pediatric mode, the
blood pressure measurements determined with this device comply with the American National
Standard for Electronic or Automated Sphygmomanometers (ANSI/AAMI SP10-1992) in relation to
mean error and standard deviation, when compared to intra-arterial or auscultatory measurements
(depending on the configuration) in a representative patient population. For the auscultatory reference,
the fifth Korotkoff sound was used to determine the diastolic pressure.
In neonatal mode, the blood pressure measurements determined with this device comply with the
American National Standard for Electronic or Automated Sphygmomanometers (ANSI/AAMI SP10-
1992) in relation to mean error and standard deviation, when compared to intra-arterial measurements
in a representative patient population.
The NBP measurement is suitable for use in the presence of electrosurgery and during the discharge of
a cardiac defibrillator according to IEC 601-2-30/EN 60601-2-30.
A physician must determine the clinical significance of the NBP information.
Introducing the Oscillometric NBP Measurement
Oscillometric devices measure the amplitude of pressure changes in the occluding cuff as the cuff
deflates from above systolic pressure. The amplitude suddenly increases as the pulse breaks through the
occlusion in the artery. As the cuff pressure decreases further, the pulsations increase in amplitude,
reach a maximum (which approximates to the mean pressure), and then diminish.
Studies show that, especially in critical cases (arrhythmia, vasoconstriction, hypertension, shock),
oscillometric devices are more accurate and consistent than devices using other noninvasive measuring
techniques.
WARNING Patient Category: Select the correct patient category setting for your patient. Do not apply the higher
adult inflation, overpressure limits and measurement duration to neonatal patients.
Intravenous infusion: Do not use the NBP cuff on a limb with an intravenous infusion or arterial
catheter in place. This could cause tissue damage around the catheter when the infusion is slowed or
blocked during cuff inflation.
Skin Damage: Do not measure NBP on patients with sickle-cell disease or any condition where skin
damage has occurred or is expected.
Unattended measurement: Use clinical judgement to decide whether to perform frequent unattended
blood pressure measurements on patients with severe blood clotting disorders because of the risk of
hematoma in the limb fitted with the cuff.

10 Monitoring NBP Preparing to Measure NBP
144
CAUTION If you spill liquid onto the equipment or accessories, particularly if there is a chance that it can get
inside the tubing or the MMS, contact your service personnel.
Measurement Limitations
Measurements are impossible with heart rate extremes of less than 40 bpm or greater than 300 bpm, or
if the patient is on a heart-lung machine.
The measurement may be inaccurate or impossible:
• if a regular arterial pressure pulse is hard to detect
• with cardiac arrhythmias
• with excessive and continuous patient movement such as shivering or convulsions
• with rapid blood pressure changes
• with severe shock or hypothermia that reduces blood flow to the peripheries
• with obesity, where a thick layer of fat surrounding a limb dampens the oscillations coming from the
artery
• on an edematous extremity.
Measurement Methods
There are three methods of measuring NBP:
•Manual - measurement on demand.
•Auto - continually repeated measurements (between one and 120 minute adjustable interval).
•STAT - rapid series of measurements over a five minute period, then the monitor returns to the
previous mode. Use only on supervised patients.
Reference Method
The NBP measurement reference method can be Auscultatory (manual cuff) or Invasive (intra-
arterial). For further information, see the Application Note on NBP supplied on the monitor
documentation CD-ROM.
In Adult and Pediatric mode to check the current setting, select Main Setup -> Measurements
-> NBP, and check whether the Reference setting is set to Auscultatory or Invasive. This
setting can only be changed in Configuration Mode.
In Neonatal mode, to comply with safety standards, invasive is always used as the reference method.
This setting cannot be changed and is not visible in any operating mode.
Preparing to Measure NBP
1Connect the cuff to the air tubing.
2Plug the air tubing into the red NBP connector. Avoid compression or restriction of pressure tubes.
Air must pass unrestricted through the tubing.
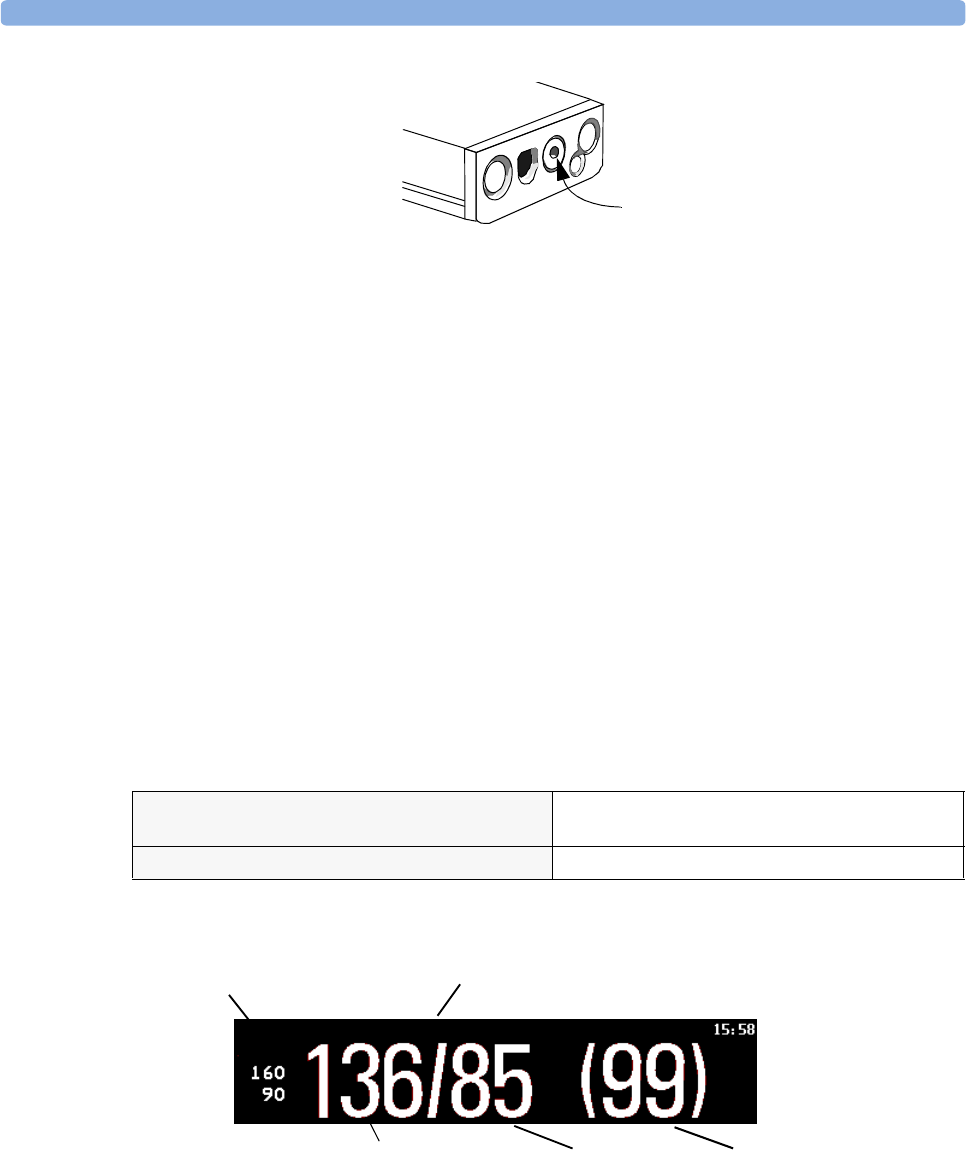
Preparing to Measure NBP 10 Monitoring NBP
145
3Make sure that you are using a Philips-approved correct sized cuff and that the bladder inside the
cover is not folded or twisted.
A wrong cuff size, and a folded or twisted bladder, can cause inaccurate measurements. The width
of the cuff should be in the range from 37% to 47% of the limb circumference. The inflatable part
of the cuff should be long enough to encircle at least 80% of the limb.
4Apply the cuff to a limb at the same level as the patient’s heart. If it is not, you must use the
measurement correction formula to correct the measurement.
The marking on the cuff must match the artery location. Do not wrap the cuff too tightly around
the limb. It may cause discoloration, and ischemia of the extremities. Inspect the application site
regularly to ensure skin quality and inspect the extremity of the cuffed limb for normal color,
warmth and sensitivity. If the skin quality changes, or if the extremity circulation is being affected,
move the cuff to another site or stop the blood pressure measurements immediately. Check more
frequently when making automatic or stat measurements.
Correcting the Measurement if Limb is not at Heart Level
To correct the measurement if the limb is not at heart level, to the displayed value
Understanding the NBP Numerics
Depending on the NBP numeric size, not all elements may be visible. Your monitor may be configured
to display only the systolic and diastolic values.
Alarm Sources if you have parallel alarm sources, the sources are displayed instead of the alarm limits.
NBP Timestamp depending on the configured NBP Time setting, the time shown beside the NBP
numeric can be:
NBP
add 0.75mmHg (0.10kPa) for each centimeter
higher or
deduct 0.75mmHg (0.10kPa) for each centimeter
lower or
add 1.9mmHg (0.25kPa) for each inch higher. deduct 1.9mmHg (0.25kPa) for each inch lower.
NBP mmHg 60min 17:15
Mean
120
90
Auto
Cuff 151
Auto
Sys.
Measurement Mode
Timestamp/
Timer
Mean pressure
Diastolic
Alarm limits
Alarm source
Systolic
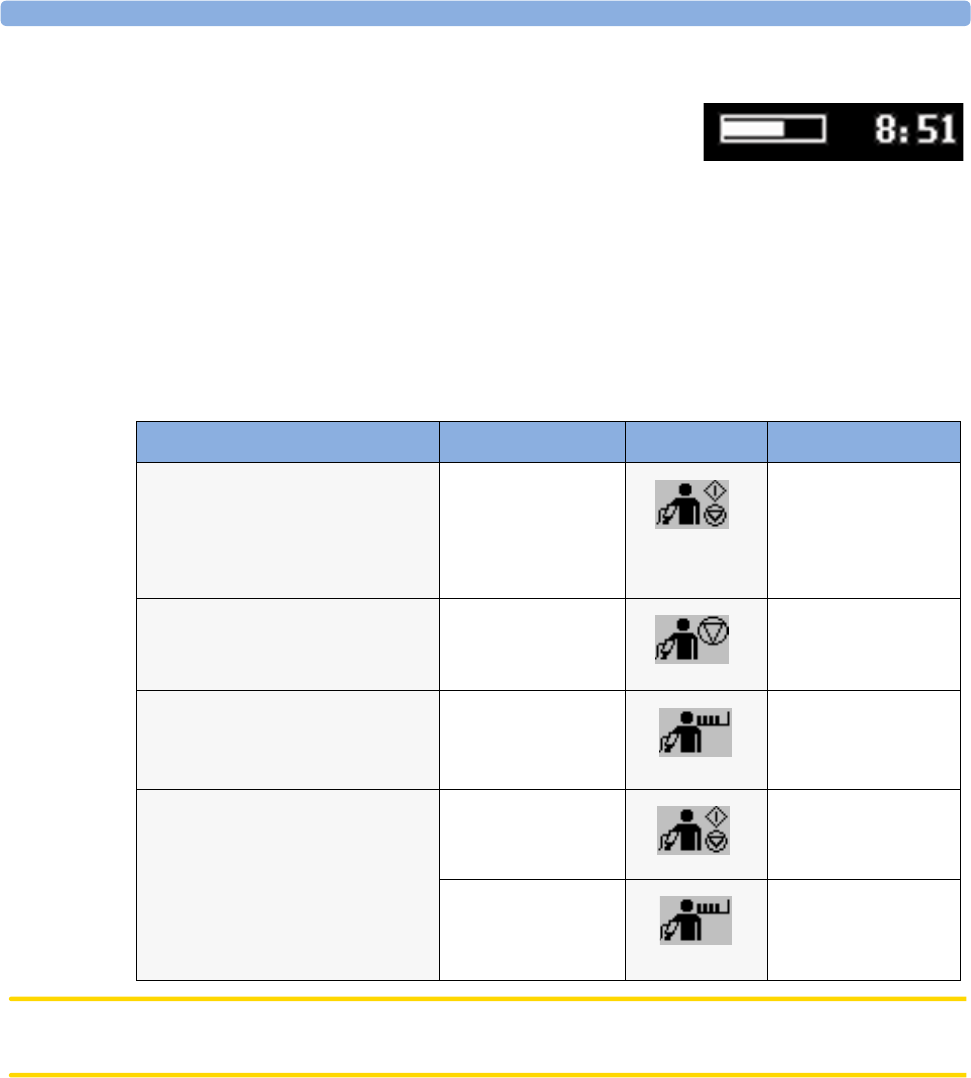
10 Monitoring NBP Starting and Stopping Measurements
146
–Meas Time: the time of the most recent NBP measurement, or
–Next Meas: the time until the next measurement in an
automatic series, displayed with a graphic representation of the
remaining time, as shown here.
During measurements the cuff pressure is displayed instead of the units and the repeat time. An early
systolic value gives you a preliminary indication of the systolic blood pressure during measurement.
Starting and Stopping Measurements
Use the Setup menu, SmartKeys or the MMS hardkey to start and stop measurements.
CAUTION Use clinical judgement to decide whether to perform repeated series of STAT measurements because of
the risk of purpura, ischemia and neuropathy in the limb with the cuff.
Enabling Automatic Mode and Setting Repetition
Time
1In the Setup NBP menu, select Auto/Man.
2Toggle between Auto/Man, if necessary, to pick the measurement method.
3If making an automatic measurement, select Repeat Time and set the time interval between two
measurements.
Action to be performed NBP Setup menu SmartKeys MMS hardkey
Start/Stop manual measurement
Start Auto series
Stop current automatic
measurement
Start/Stop Start/Stop
Stop Automatic, Manual or STAT
measurement AND series
Stop All ---
Start STAT measurement NBP STAT STAT (for MMS
without Pressure/Temp
measurement)
Stop current STAT measurement
and end series
Start/Stop Start/Stop
NBP STAT STAT (for MMS
without Pressure/Temp
measurement)
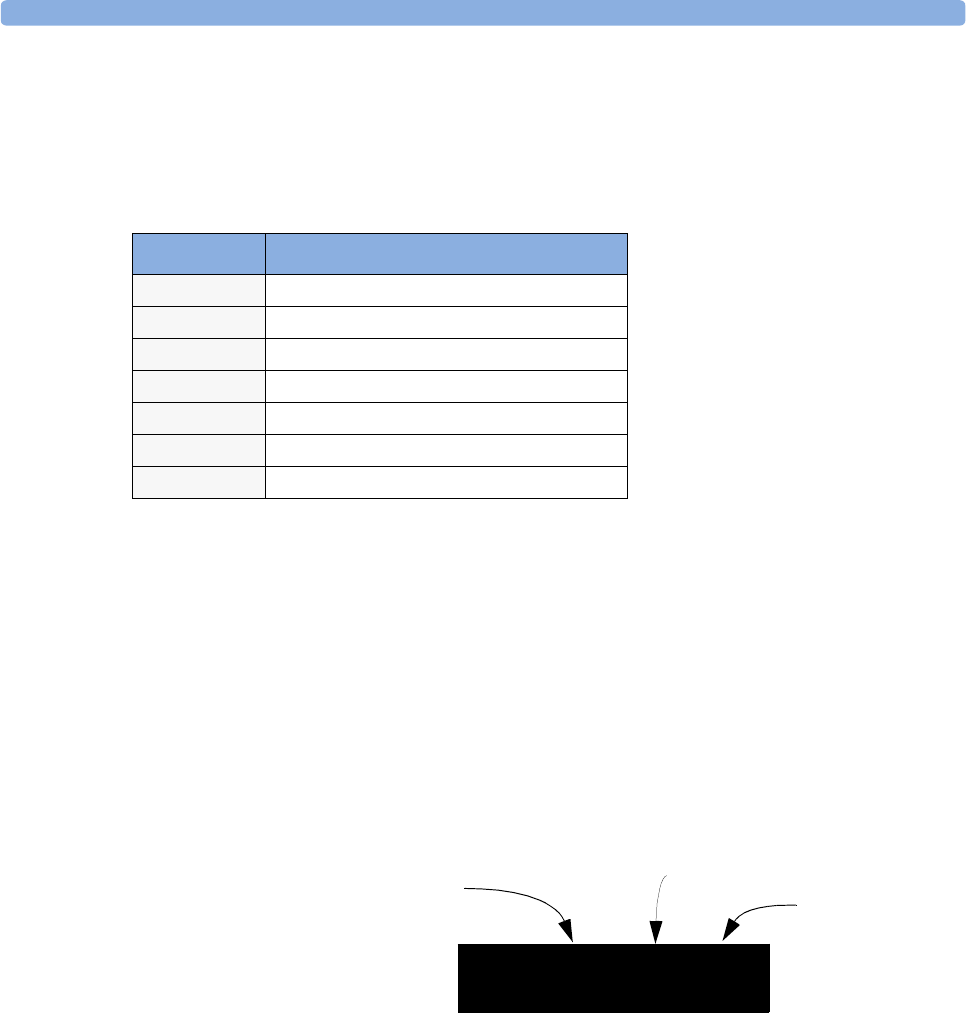
Choosing the NBP Alarm Source 10 Monitoring NBP
147
Choosing the NBP Alarm Source
You can monitor for alarm conditions in systolic, diastolic and mean pressure, either singly or in
parallel. Only one alarm is given, with the priority of mean, systolic, diastolic. In the Setup NBP
menu, select Alarms from and choose from:
Assisting Venous Puncture
You can use the NBP cuff to cause sub-diastolic pressure. The cuff deflates automatically after a set
time (adult/pediatric 170 seconds, neonatal 85 seconds) if you do not deflate it.
1In the NBP Setup menu select VeniPuncture.
2Puncture vein and draw blood sample.
3Reselect VeniPuncture to deflate the cuff.
During measurement, the NBP display shows the inflation pressure of the cuff and the remaining time
in venous puncture mode.
Calibrating NBP
NBP is not user-calibrated. Cuff-pressure transducers must be verified and calibrated, if necessary, at
least once every two years by a qualified service professional. See the Service Guide for details.
Menu option Pressure value monitored
Sys. systolic
Dia. diastolic
Mean mean
Sys&Dia systolic and diastolic in parallel
Dia&Mean diastolic and mean in parallel
Sys&Mean systolic and mean in parallel
S&D&M all three pressures in parallel
(60)
Cuff pressure
Venous puncture measurement mode
VP
NBP 01:45
Time left in venous
puncture mode

10 Monitoring NBP Calibrating NBP
148
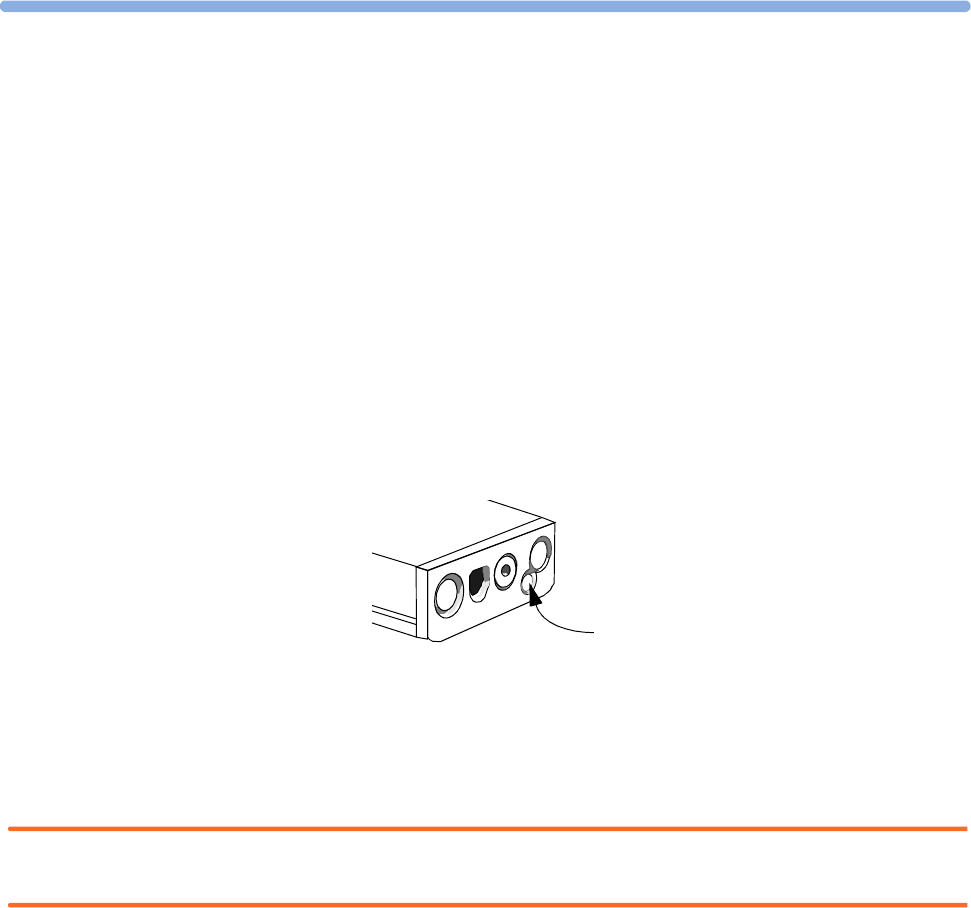
149
11
11Monitoring Temperature
You can measure temperature using the Multi-Measurement Server (MMS), one of the measurement
server extensions, or the temperature plug-in module. Temp measurement automatically switches on
when you connect a probe. You can switch the measurement off manually.
Making a Temp Measurement
1Select the correct type and size of probe for your patient.
2If you are using a disposable probe, connect the probe to the temperature cable.
3Plug the probe or temperature cable into the temperature connector socket.
4Apply the probe to the patient. You are advised to use a protective rubber cover on rectal probes.
5Select an appropriate temperature label.
6Check that the alarm settings (on or off, high and low limits) are appropriate for this patient and
this type of temperature measurement.
WARNING Make sure you set alarm limits for the correct label. The alarm limits you set are stored for that
particular label only. Changing the label may change the alarm limits.
Selecting a Temperature for Monitoring
Tell the monitor which temperature you want to monitor by selecting its temperature label. The label
is a unique identifier for each type of temperature. When you choose a label, the monitor uses that
label’s stored color and alarm settings.
1In the Setup <Temp> menu, select Label.
2Select the appropriate label from the list.
Temp connector socket
11 Monitoring Temperature Calculating Temp Difference
150
Extended Temperature Label Set
The following additional labels are available if Label Set is set to Full. This setting can only be
changed in Configuration Mode.
Note that if your monitor is connected to an Information Center, the additional labels in the extended
label set may not be correctly displayed. See the Configuration Guide for your monitor for more
information.
Calculating Temp Difference
The monitor can calculate and display the difference between two temperature values by subtracting
the second value from the first. The difference is labeled ∆Temp.
1In the Setup Main menu, select Measurements.
2In the Setup ∆Temp menu, select First Temp.
3Label the measurement source as appropriate.
4Select Second Temp.
5Label the measurement source as appropriate.
Temp non-specific temperature label. Trect rectal temperature
Tart arterial temperature Tskin skin tem pera t ure
Tcore core temperature Tven venous temperature
Tesoph esophageal temperature Tnaso nasopharyngeal temperature
T1, T2, T3, T4 Non-specific temperature labels
Tamb ambient temperature
Tcereb cerebral temperature
Ttymp tympanic temperature
Tvesic vesical temperature
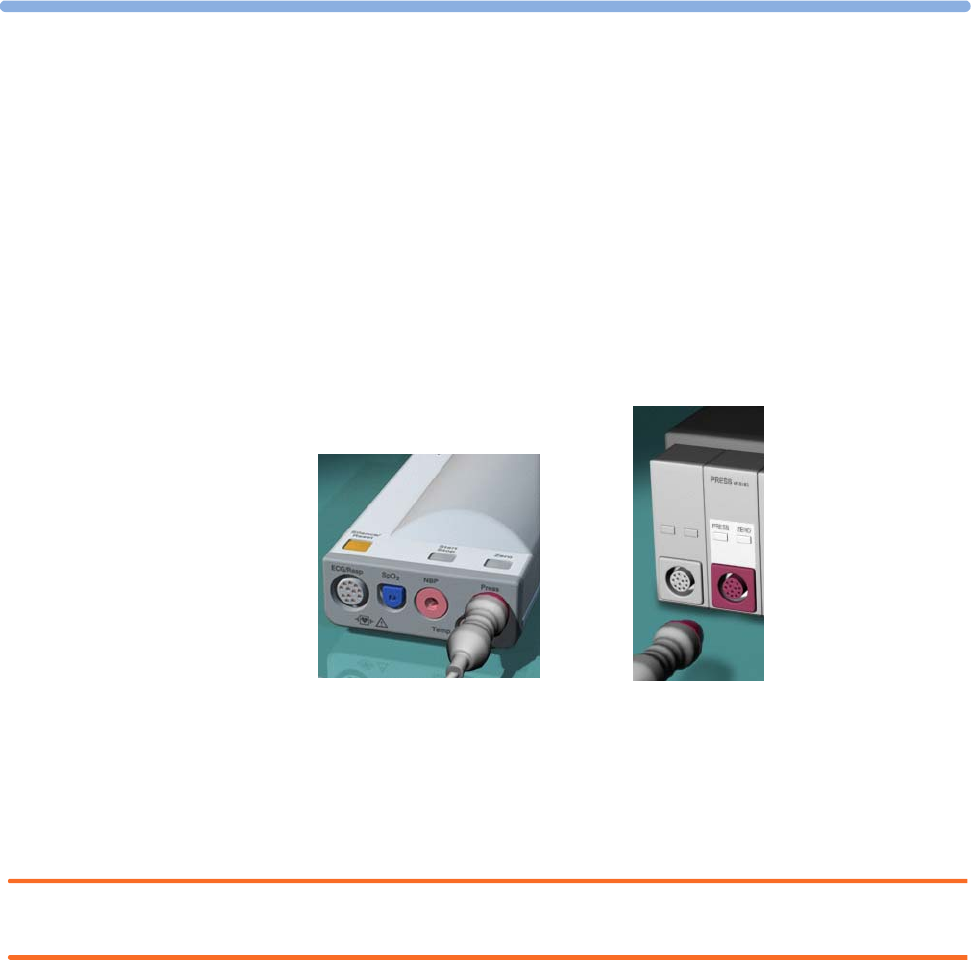
151
12
12Monitoring Invasive Pressure
You can measure pressure using the Multi-Measurement Server (MMS), one of the measurement
server extensions or the pressure plug-in module.
Setting up the Pressure Measurement
1Plug in the pressure cable.
2Prepare the flush solution.
3Flush the system to exhaust all air from the tubing. Ensure that the transducer and stopcocks are
free of air bubbles.
WARNING If air bubbles appear in the tubing system, flush the system with the infusion solution again. Air
bubbles may lead to a wrong pressure reading.
4Connect the pressure line to the patient catheter.
5If you are using an infusion pressure cuff with the pressure line, attach the pressure cuff to the fluid
to be infused. Inflate it according to your standard hospital procedure, then start the infusion.
6Position the transducer so that it is level with the heart, approximately at the level of the
midaxillary line.
MMS Module
12 Monitoring Invasive Pressure Zeroing the Pressure Transducer
152
WARNING If measuring intracranial pressure (ICP) with a sitting patient, level the transducer with the top of the
patient’s ear. Incorrect leveling may give incorrect values.
Selecting a Pressure for Monitoring
Tell the monitor which pressure you want to monitor by selecting its pressure label. The label is a
unique identifier for each type of pressure. When you chose a label, the monitor uses that label’s stored
color, wave scale and alarm settings.
1In the Setup <Press> menu, select Label.
2Select the appropriate label from the list.
Extended Pressure Label Set
The following additional labels are available if Label Set is set to Full. This setting can only be
changed in Configuration Mode.
Note that if your monitor is connected to an Information Center, the additional labels in the extended
label set may not be correctly displayed. See the Configuration Guide for your monitor for more
information.
Zeroing the Pressure Transducer
To avoid inaccurate pressure readings, the monitor requires a valid zero. Zero the transducer in
accordance with your hospital policy (at least once per day). You must perform a zero:
• when you use a new transducer or tubing
• every time you reconnect the transducer cable to the monitor
• if you think the monitor’s pressure readings are not correct.
Label Description Label Description
ABP Arterial blood pressure PNon-specific pressure label
ART Arterial blood pressure (alternative) PAP Pulmonary artery pressure
Ao Aortic pressure RAP Right atrial pressure
CVP Central venous pressure UAP Umbilical arterial pressure
ICP Intracranial pressure UVP Umbilical venous pressure
LAP Left atrial pressure
Label Description
BAP Brachial arterial pressure
FAP Femoral arterial pressure
IC1, IC2 Alternative intracranial pressures
P1, P2, P3, P4 Alternative non-specific pressure labels

Zeroing the Pressure Transducer 12 Monitoring Invasive Pressure
153
Zeroing ICP (or IC1/IC2)
Your hospital guidelines may require you to zero the ICP transducer less frequently than other
transducers, due to the need for aseptic conditions. When you zero an ICP transducer, the zero values
are automatically stored and you will not be prompted to repeat the zero procedure.
If you want to simultaneously zero all pressures except ICP, disconnect the ICP transducer from the
measurement server or module while zeroing. Reconnecting the transducer recalls the stored values.
WARNING If you select the label ICP (or IC1/IC2), the measurement device uses the most recently stored zero.
Therefore, make sure you zeroed the transducer correctly in accordance with the transducer
manufacturer’s instructions and your hospital policy. When you use a transducer that you cannot
rezero after placement, ensure that you keep the measuring device with the patient so that you are
certain you have the correct zero data for this patient.
Determining a Pressure’s Most Recent Zero
The monitor displays the most recent zero on the status line. If this has “timed-out” after you have
performed a zero, redisplay the information in the status line by entering the pressure’s setup menu.
Zeroing a Pressure Measurement
WARNING Invasive pressure alarms (and pulse alarms, if derived from invasive pressure) are temporarily
suppressed until 30 seconds after the transducer finishes zeroing.
1Turn off the stopcock to the patient.
2Vent the transducer to atmospheric pressure, to compensate for the static and atmospheric pressure
exerted on the transducer.
3In the setup menu for the pressure, select Zero <Press>.
4When you see the message <Press> zero done at <date and time> on the status line,
(for example, ABP zero done at 13 Mar 02 23.35) close the stopcock to atmospheric
pressure, and open the stopcock to the patient.
Using the Zero Hardkey
Pressing the Zero hardkey for two seconds on the M1006B Pressure module starts a zero for the
pressure currently measured with the module.
Pressing the Zero hardkey for two seconds on the M3001A Multi-Measurement Server zeros the
pressure being measured by the measurement server and the pressures from any connected
measurement extensions.
Zeroing All Pressures Simultaneously
WARNING Before zeroing all pressures, make sure that all pressure transducers are vented to atmospheric pressure.
12 Monitoring Invasive Pressure Adjusting the Calibration Factor
154
If you are measuring pressures with more than one measuring device, using the Zero SmartKey to
initiate the zeroing calls up a list of all active pressures. Select the pressure you want to zero or select
All Press to zero all pressures simultaneously.
Troubleshooting the Zero
The status line lists the probable cause of an unsuccessful zero:
Adjusting the Calibration Factor
Each time you use a reusable transducer, compare the calibration factor written on your transducer
with the calibration factor shown on the monitor. To ensure accurate measurement, they must be the
same.
1In the Setup <Press> menu, select Cal. Factor.
If the value here does not match that on the transducer, select the corresponding value from the
list now in accordance with your hospital’s procedure.
2To confirm you want to use the new calibration factor, select the Confirm popup.
Displaying a Mean Pressure Value Only
Use this when you want to see only the mean pressure.
♦In the pressure’s setup menu, select Mean Only. Toggle between On to display mean pressure
value only, and Off to display all pressure values (systolic, diastolic and mean).
Changing the Pressure Wave Scale
1Select the label of the pressure wave whose scale you want to set to enter the Setup menu.
2In the Setup <Press> menu, (for example ABP) select Scale.
Message Corrective Action
unable to zero -
equipment
malfunction
The hardware is faulty. Contact your service personnel.
unable to zero -
excessive offset
Make sure the transducer is vented to air and try again. If this fails, the hardware
may be faulty. Replace the adapter cable and try again. If it fails, replace the
transducer and try again. If it still fails, contact your service personnel.
unable to zero -
unstable signal
unable to zero -
no transducer
Make sure that the transducer is connected and try again. If this fails, exchange
the adapter cable and try again. If this fails, exchange the transducer.
unable to zero -
pulsatile
pressure
Make sure that the transducer is vented to air, not to the patient, and try again.
unable to zero -
timed out
Try pressing the Zero key again. If this fails, replace the transducer and adapter
cable and contact your service personnel.
switch <Press> on
first
Pressure measurement is switched off. To switch it on, in the Setup Pressure
menu, select the pressure’s label.
Optimizing the Waveform 12 Monitoring Invasive Pressure
155
3Select a value from the pop-up list:
– a positive value sets the top gridline. The bottom gridline is set at zero.
– a negative value sets the bottom gridline. The middle gridline is set at zero.
Optimizing the Waveform
♦In the Setup <Press> menu, select Optimum Scale to let the monitor select the best
minimum and maximum scales for the current wave.
Non-Physiological Artifact Suppression
Some clinical procedures may affect blood pressure, for example, a flush procedure or a blood sample.
Your monitor may be configured to suppress these non-physiological artifacts for a specified duration
(Artifact Suppression is configured to 30, 60, or 90 seconds). During artifact suppression,
the monitor shows the INOP message <Pressure label> ARTIFACT, and a question mark is
shown beside the pressure numerics. Pressure alarms and the Pulse Non-Pulsatile INOP are
suppressed during the configured period. The CPP high alarm is not suppressed.
Choosing the Pressure Alarm Source
WARNING Make sure you set alarm limits for the correct label. The alarm limits you set are stored for that
particular label only. Changing the label may change the alarm limits.
You can monitor for alarm conditions in systolic, diastolic and mean pressure, either singly or in
parallel. Only one alarm is given at a time, in this order of priority: mean, systolic, diastolic.
♦In the Setup <Press> menu, select Alarms from and choose the source.
♦Select and set the High Limit and Low Limit for the pressure(s) you have selected.
Menu option Pressure value monitored
Sys. systolic
Dia. diastolic
Mean mean
Sys&Dia systolic and diastolic in parallel
Dia&Mean diastolic and mean in parallel
Sys&Mean systolic and mean in parallel
Sys&Dia&Mean all three pressures in parallel
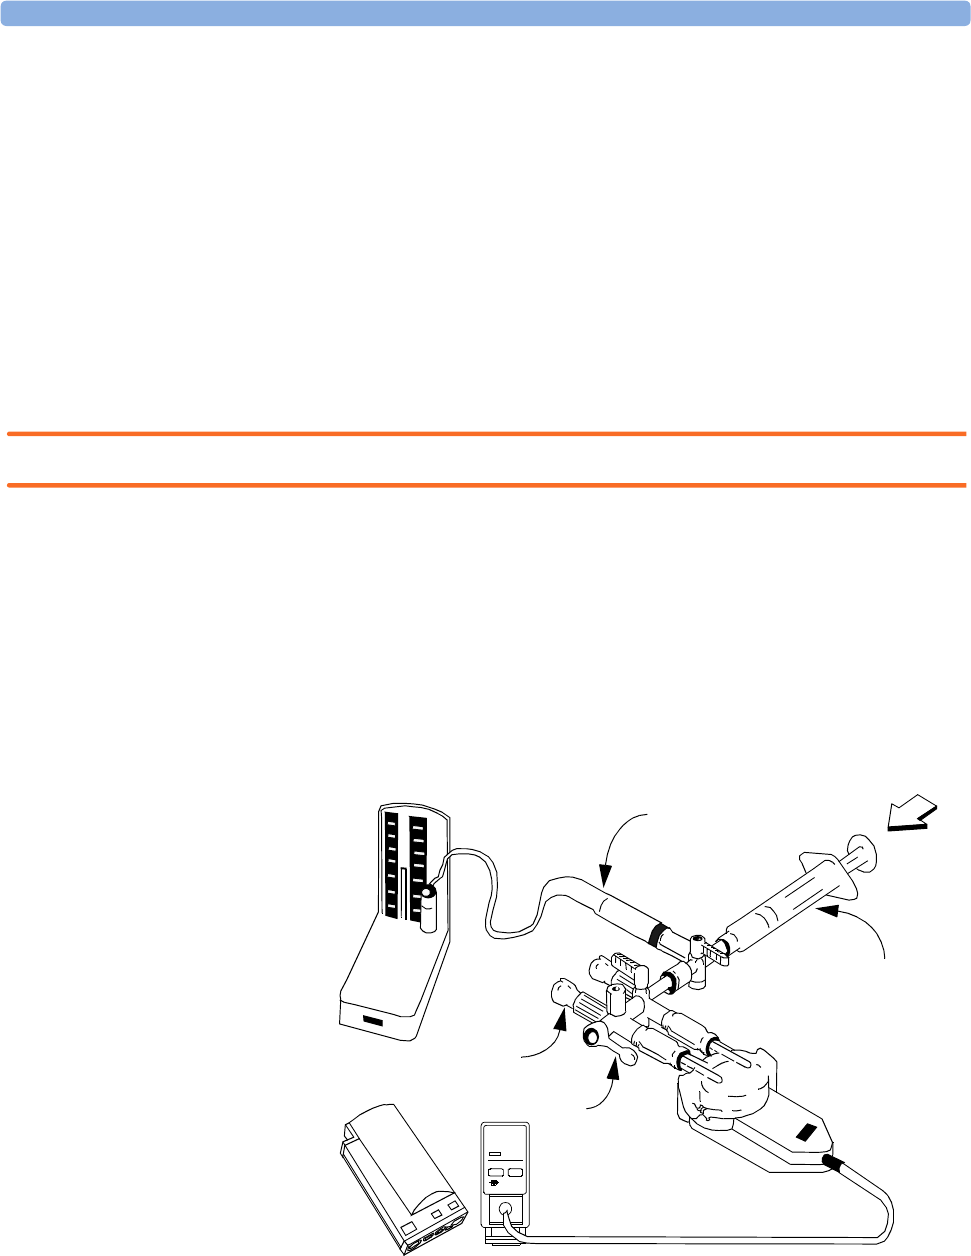
12 Monitoring Invasive Pressure Calibrating Reusable Transducer CPJ840J6
156
Calibrating Reusable Transducer CPJ840J6
Depending on your monitor’s configuration, you may be able to perform a calibration in monitoring
mode. Perform a mercury calibration when you use a new transducer, and at regular intervals according
to your hospital policy. You require:
• standard sphygmomanometer.
• sterile 10cc syringe with heparinised solution.
• 3-way stopcock.
• approximately 25cm of tubing.
Making the Pressure Calibration
WARNING Never perform the invasive pressure calibration while a patient is being monitored.
1Zero the transducer.
2Connect the syringe and manometer.
a. Attach the tubing to the manometer.
b. Connect the 3-way stopcock to the stopcock that is not connected to the patient catheter when
you measure a patient.
c. Attach the syringe to one port and the manometer tubing to the other port.
d. Open the port to the manometer.
3Move the syringe barrel in and raise the mercury to 200mmHg (30kPa). 200mmHg is the
recommended calibration pressure.
4In the Setup Pressure menu, select Cal. Press.
M1006A
12
PIN
PRESS
PRESS
T
ZERO
tubing to manometer
Syringe with
heparinised
solution
Off
Patient
connection
stoppered

Calculating Cerebral Perfusion 12 Monitoring Invasive Pressure
157
5Select the calibration pressure from the list, for example 200 mmHg.
6Select Confirm to recalculate the calibration factor using the applied pressure.
7When the monitor displays <Press> calibration done at <date and time>, remove
the manometer tubing, syringe and extra stopcock. We recommend you replace the transducer
dome and tubing with sterile ones.
8Label the transducer with the calibration factor shown in the Cal. Factor field in the pressure’s
setup menu.
9Reconnect the patient and start measuring again.
Troubleshooting the Pressure Calibration
The status line lists the probable cause of an unsuccessful calibration.
Calculating Cerebral Perfusion
The monitor can calculate the difference between mean arterial pressure and the intracranial pressure.
The difference is labeled CPP.
1In the Main Setup menu, select Measurements.
2In the Setup CPP menu, select ABP, ART, Ao, BAP or FAP as the arterial pressure source.
Calculating Pulse Pressure Variation
Note: The derived measurement Pulse Pressure Variation is not available in the USA.
Pulse Pressure Variation (PPV) is calculated from beat-to-beat arterial pressure values. Pulse pressure is
the difference between the systolic and the diastolic pressure values for a single beat. The average
variation in pulse pressure is calculated over periods of 32 seconds.
WARNING • This monitor can calculate PPV from beat-to-beat values of any arterial pulsatile pressure. The
circumstances under which the calculation of a PPV value is clinically meaningful, appropriate and
reliable must be determined by a physician.
Message Corrective Action
unable to calibrate -
equipment malfunction
Contact your service department. The pressure hardware is faulty.
unable to calibrate -
out of range
Make sure that you have selected the value for Cal. Press that
you are applying to the transducer, and repeat the calibration.
unable to calibrate - no
transducer
Make sure that the transducer is connected and try again.
unable to calibrate -
unstable signal
Make sure there are no disturbances to the transducer, and repeat
the calibration.
unable to calibrate -
perform zero first
No valid zero. Zero the transducer.

12 Monitoring Invasive Pressure Measuring Pulmonary Artery Wedge Pressure
158
• The clinical value of the derived PPV information must be determined by a physician. According to
recent scientific literature, the clinical relevance of PPV information is restricted to sedated patients
receiving controlled mechanical ventilation and mainly free from cardiac arrhythmia.
To select an arterial pressure as PPV source:
1In the Main Setup menu, select Measurements.
2In the Setup PPV menu, select ABP, ART, Ao, BAP, P or FAP as the arterial pressure source.
CAUTION Older measurement servers cannot supply a beat-to-beat arterial pressure value. In this case the
monitor shows a NO PPV FROM <Server> INOP.
At respiration rates below 8 rpm, PPV calculation may lead to inaccurate values.
Measuring Pulmonary Artery Wedge Pressure
Pulmonary Artery Wedge Pressure (PAWP) values, used to assess cardiac function, are affected by:
•Fluid status
• Myocardial contractility
• Valve and pulmonary circulation integrity
Obtain the measurement by introducing a balloon-tipped pulmonary artery flotation catheter into the
pulmonary artery. When the catheter is in one of the smaller pulmonary arteries, the inflated balloon
occludes the artery allowing the monitor to record changes in the intrathoraic pressures that occur
throughout the respiration cycle. The pulmonary wedge pressure is the left ventricular end diastolic
pressure (preload).
The most accurate PAWP values are obtained at the end of the respiration cycle when the intrathoraic
pressure is fairly constant. Use the ECG waveform to determine the waveform of the wedge pressure.
You can use the respiration waveform as a reference when assessing the PAWP waveform, to ensure
constant measurement timing relative to the respiratory cycle. The monitor displays the PAWP value
for up to 48 hours or until you admit a new patient.
WARNING The pressure receptor in the catheter records pressure changes that occur only in front of the
occlusion. Even though the catheter tip is in the pulmonary artery, the receptor records pressure
changes transmitted back through the pulmonary circulation from the left side of the heart.
While performing the wedge procedure, the monitor switches off the pressure alarms for pulmonary
artery pressure (PAP).
Due to a slight measurement delay, you should not use Microstream (sidestream) CO2 as a direct
reference for determining the end expiratory point in the pressure curve.
To start the Wedge procedure,
1In the Main Setup menu, select Wedge to display the wedge procedures window.
2Prepare and check the pressure line according to your hospital policy. If the PAP waveform scale is
set to Optimum prior to the wedge procedure, it is possible that after wedging the catheter, the
resulting pressure waveform will fall below the lower scale. In this case, the wedge waveform will

Editing the Wedge 12 Monitoring Invasive Pressure
159
not be displayed or recorded properly. To avoid this, switch out of optimum scale before
performing a wedge procedure.
3Use the Reference Wave 1 and 2 popup keys to select any ECG or respiratory wave as
reference waves.
4Select Wave Speed if you want to synchronize all displayed waves to your preferred speed.
5Inflate the balloon when the monitor prompts you: Ready for balloon inflation. The
waveform changes from the PAP to the PAWP wave. The measurement takes approximately 12
seconds. On completion, the monitor stores the PAWP waveform display and prompts you to
deflate the balloon. If the monitor cannot detect a wedging waveform you must use Store
Trace to store the wedge and two reference waves manually.
6Deflate the balloon when the monitor prompts you: Ready for balloon deflation and
verify that the waveform returns to pulmonary artery shape.
7If you need to start a new measurement, select Restart Wedge.
Editing the Wedge
1Select the Edit Wedge pop-up key to see the stored waveforms.
2The monitor displays a cursor in the waveform at the PAWP mean value. It also displays any
previously stored value and the time it was stored.
3Move the cursors up, down, right and left to set them on the correct wedge position.
4Select Store Wedge to store the PAWP value.
5Select Print Wedge to print the PAWP waveform and any reference waves or Record Wedge to
record them. While recording or printing, you cannot perform any more Wedge tasks.
WARNING Prolonged inflation can cause pulmonary hemorrhage, infarction or both. Inflate the balloon for the
minimum time necessary to get an accurate measurement.
If the pulmonary artery flotation catheter drifts into the wedge position without inflation of the balloon, the
pulmonary artery pressure waveform assumes a wedged appearance. Take appropriate action, in accordance
with standard procedures, to correct the situation.
If the PAWP (mean) is greater than the PAP (systolic), deflate the balloon and report the incident in
accordance with hospital policy, because the pulmonary artery could be accidently ruptured, and the wedge
value derived will not reflect the patient’s hemodynamic state, but will merely reflect the pressure in the
catheter or balloon.
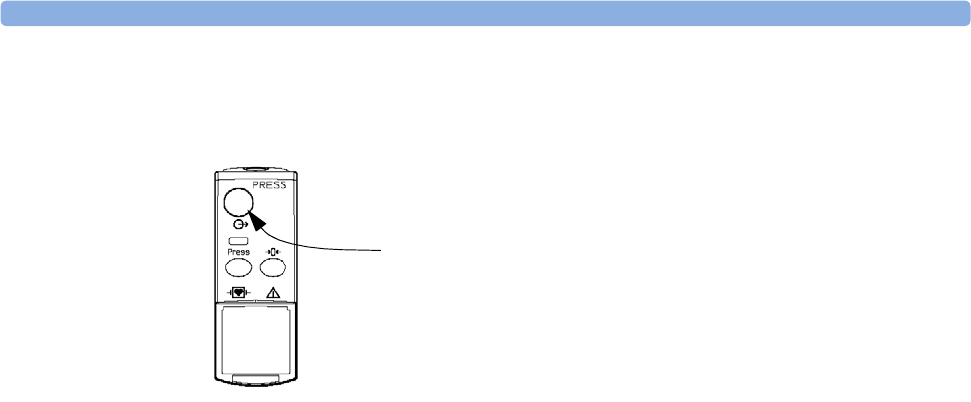
12 Monitoring Invasive Pressure Identifying the Pressure Analog Output Connector
160
Identifying the Pressure Analog Output Connector
analog output
(module M1006B,
option C01 only)

161
13
13Monitoring Cardiac Output
The Cardiac Output (C.O.) measurement invasively measures cardiac output and other hemodynamic
parameters using a technique called thermodilution. This can be used to determine the flow rate of a
system by introducing a cold solution into the system and measuring the resulting drop in temperature
at a downstream site. The temperature change is displayed as a curve in the C.O. procedure window,
and the monitor calculates the C.O. value from this curve. The C.O. value is inversely proportional to
the area under the curve. As cardiac output varies continuously, a series of measurements must be
carried out to achieve a reliable C.O. average value. Always use the average of multiple thermodilution
measurements for therapy decisions.
The measurements can be carried out using the right heart thermodilution method or the PiCCO
method (transpulmonary thermodilution).
• The right heart method is available with
– C.O. module M1012A, standard and option #C10
– M3012A Hemodynamic Measurement Server Extension, options #C05 and #C10
– M3014A Capnography Measurement Server Extension, option #C05 and #C10
• The PiCCO method is available with
– C.O. module M1012A, option #C10
– M3012A Hemodynamic Measurement Server Extension. option #C10
– M3014A Capnography Measurement Server Extension, option #C10
The PiCCO method additionally lets you measure Continuous Cardiac Output (CCO) by performing
pulse contour analysis on the blood pressure waveform.
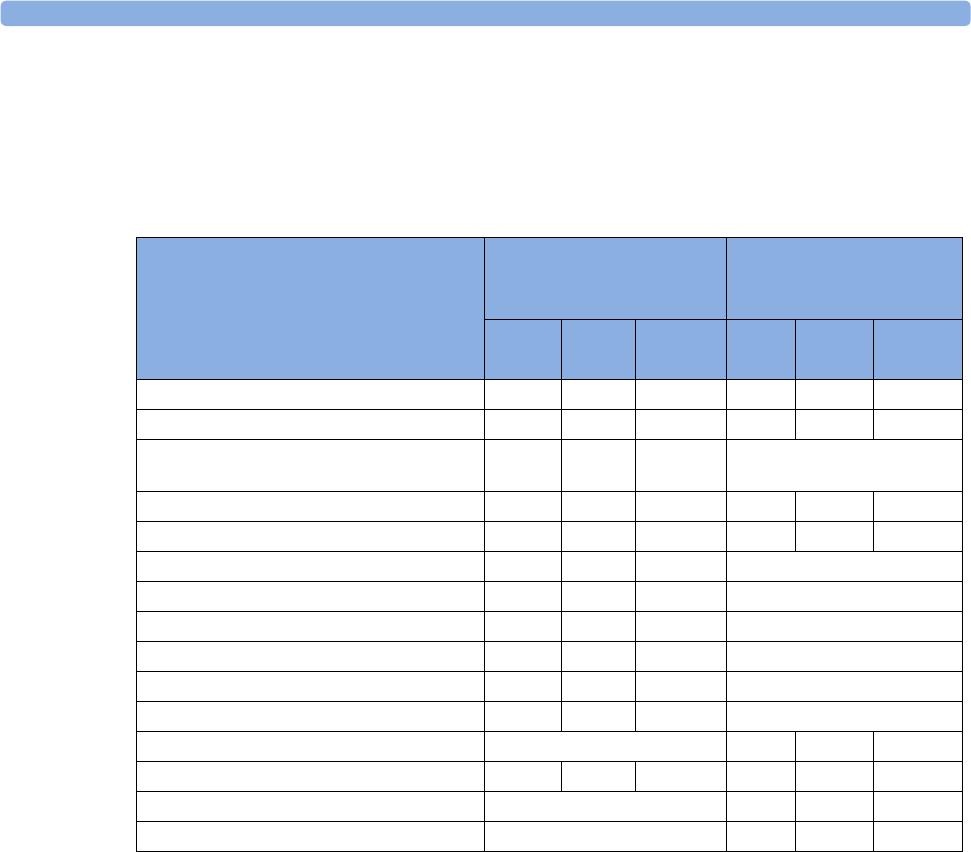
13 Monitoring Cardiac Output Hemodynamic Parameters
162
Hemodynamic Parameters
This table illustrates the hemodynamic parameters available with each method, whether they are
measured continuously, and whether they can be shown on the monitor’s resting display or in the
HemoCalc Window.
* currently not available in the U.S.A or in clinical environments under FDA control.
Measured and Calculated Hemodynamic
Parameters and Indexes
PiCCO Method
(Transpulmonary
Thermodilution) Right Heart Thermodilution
Continu
ous?
Resting
Display
HemoCalc
Window
Contin
uous?
Resting
Display
HemoCalc
Window
Blood Temperature (Tblood) Y Y N Y Y N
C.O./C.I.: Cardiac Output N Y Y N Y Y
CCO/CCI: Continuous Cardiac Output Y Y Y (in the
C.O. field)
Not available
SVR/SVRI: Systemic Vascular Resistance N and Y Y Y N N Y
SV/SI: Stroke Volume/SV Index N and Y Y Y N N Y
SVV: Stroke Volume Variation Y Y N Not available
*dPmax: Left Ventricular Contractility Index Y Y N Not available
CFI: Cardiac Function Index N Y N Not available
ITBV/ITBVI: Intrathoracic Blood Volume N Y Y Not available
*EVLW/EVLWI: Extravascular Lung Water N Y Y Not available
*GEDV/GEDVI: Global End-Diastolic Volume N Y Y Not available
PVR/PVRI: Pulmonary Vascular Resistance Not available N N Y
LCW/LCWI: Left Cardiac Work N N Y N N Y
RCW/RCWI: Right Cardiac Work Not available N N Y
RVSW/RVSWI: Right Ventricular Stroke Work Not available N N Y
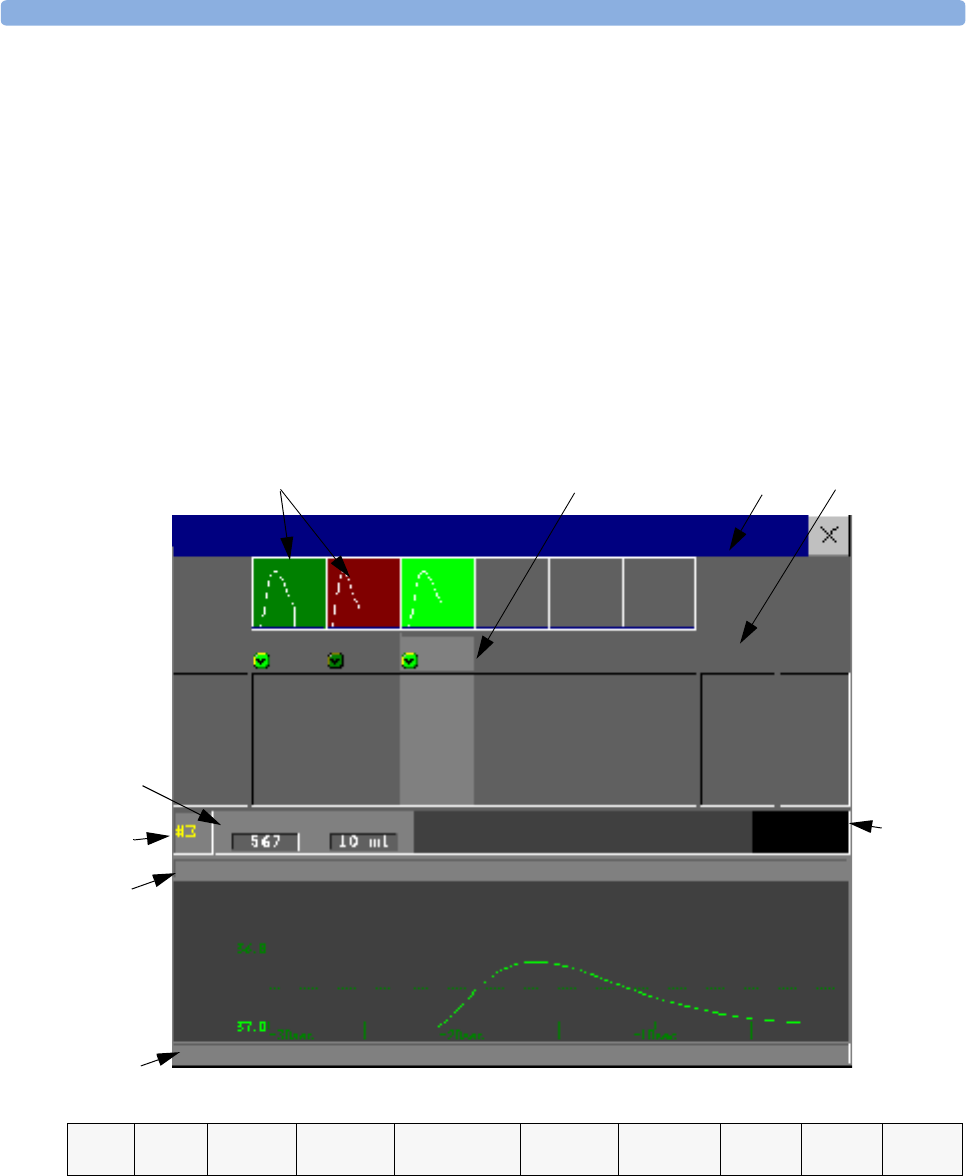
Using the C.O. Procedure Window 13 Monitoring Cardiac Output
163
Using the C.O. Procedure Window
The C.O. procedure window displays up to six trials (measurement curves) with the trial number and
the C.O. value under the thermodilution curve. When you open the window, a line of pop-up keys
automatically appears to let you carry out C.O.-related tasks. This example shows the procedure
window for the transpulmonary (PiCCO) Method. The window may be configured to look slightly
different on your monitor.
To open the C.O. procedure window,
♦Select Cardiac Output in the Setup C.O. or Setup CCO menu, or
♦Select the Cardiac Output SmartKey on the Screen, if configured, or
♦Press the START hardkey on the front of the C.O. plug-in module, if available, or
♦Press a remote start switch, if you are using one.
♦To change the measurement parameters shown in the results table of the C.O. procedure window,
select the Table Contents pop-up key and choose from the list of available parameters.
♦To view the currently-used temperature unit, see the “grayed-out” setting Temperature Unit
in the Setup C.O. menu. This setting can only be changed in Configuration Mode.
♦The Cardiac Output screen element may be configured to display permanently on a specially
designed Screen. Selecting the screen element opens the cardiac output pop-up keys.
Trial curves Trial curve scale Averaged values
Results table of current trial
Prompt
message field
Thermodilution
curve of current
trial
Curve alert
message field
Setup
information
Current trial
number
Continuously
measured
numeric
Cardiac Output (Transpulmonary)
CathCt InjVol
BSA 1.93
C.I. 4.40 C.O. 8.49
Average Unit
C.O.
CFI
C.I
ITBVI
ETVI
Tinj
InjVol
Tblood
Tblood 37.0
l/min
l/min/m2
ml/m2
oC
ml
#1
Cal
#3
Cal
#2
Cal
0.3oC
Trial
CCO-CAL
8.51
5.5
4.41
996
8.53
5.5
4.42
996
6.0
2.0
10
11.4
6.0
5.88
1225
5.0
2.0
10
8.49
5.5
4.40
998
6.1
2.0
10
Ready for new measurement
Start
C.O.
Stop
C.O.
Select
Trial
Accept/
Reject
Save C.O.&
Cal CCO
Print/
Record
Table
Contents
Hemo
Calc
Change
Scale
Setup
C.O.

13 Monitoring Cardiac Output Accessing the Setup C.O. and Setup CCO Menus
164
Accessing the Setup C.O. and Setup CCO Menus
C.O. settings can be changed in the Setup C.O. menu. To access this menu,
♦press the C.O. hard key on the C.O. module
♦select any of the discontinuous C.O. numerics (for example, C.O., C.I.) on the screen.
CCO/CCI settings can be changed in the Setup CCO menu. To access this menu,
♦select any of the continuously measured hemodynamic numerics (CCO, CCI.) on the screen.
Entering the HemoCalc Window
♦From the C.O. procedure window, select the pop-up key HemoCalc to open the HemoCalc
window.
Measuring C. O. Using the PiCCO Method
The PiCCO method combines transpulmonary thermodilution and pulse contour analysis on the
blood pressure waveform. A fluid with a known volume and temperature is injected into the right
atrium through a CVP catheter. The injectate bolus mixes with the blood in the heart and the change
in blood temperature is measured with a thermistor at the distal end of an arterial catheter placed in
one of the bigger systemic arteries, for example, the femoral or the axillary artery.
The PiCCO Method requires a pressure measurement made using either the M1006B Pressure
module, or a M3001A MMS, or a measurement server extension M3015A, M3014A, or M3012A. (A
VueLink pressure may not be used.) You will also need a conventional central venous (CVP) line and
an arterial catheter from Pulsion Medical Systems. You must use the approved catheters and puncture
locations.
Measuring Continuous Cardiac Output
Every time C.O. is measured with the PiCCO method, the monitor uses this C.O. value and the result
of the pulse contour analysis to calculate a patient-specific calibration factor. The monitor uses this
value to compute CCO and the other continuous hemodynamic parameters. CCO values are
calculated on a beat-to-beat basis and then averaged over a 12-second time frame. The calculated values
are displayed as numerics on the monitor screen.
Measuring Systemic Vascular Resistance
The monitor uses CCO, an arterial pressure, and CVP to calculate a continuous SVR value. If a
continuously measured CVP value is not available, the monitor uses a preset, static CVP value to
calculate the SVR (you will see the INOP message SVR SET CVP USED). If the BSA is available, the
monitor uses the CCI to calculate the SVRI.
SVR/SVRI settings can be changed in the Setup SVR/SVRI menu. To enter the menu, select ->
Main Setup -> Measurements -> SVR or SVRI.
To display a SVR/SVRI numeric on the Screen, select any numeric, then select Change Numeric
and select SVR or SVRI from the list of available numerics.
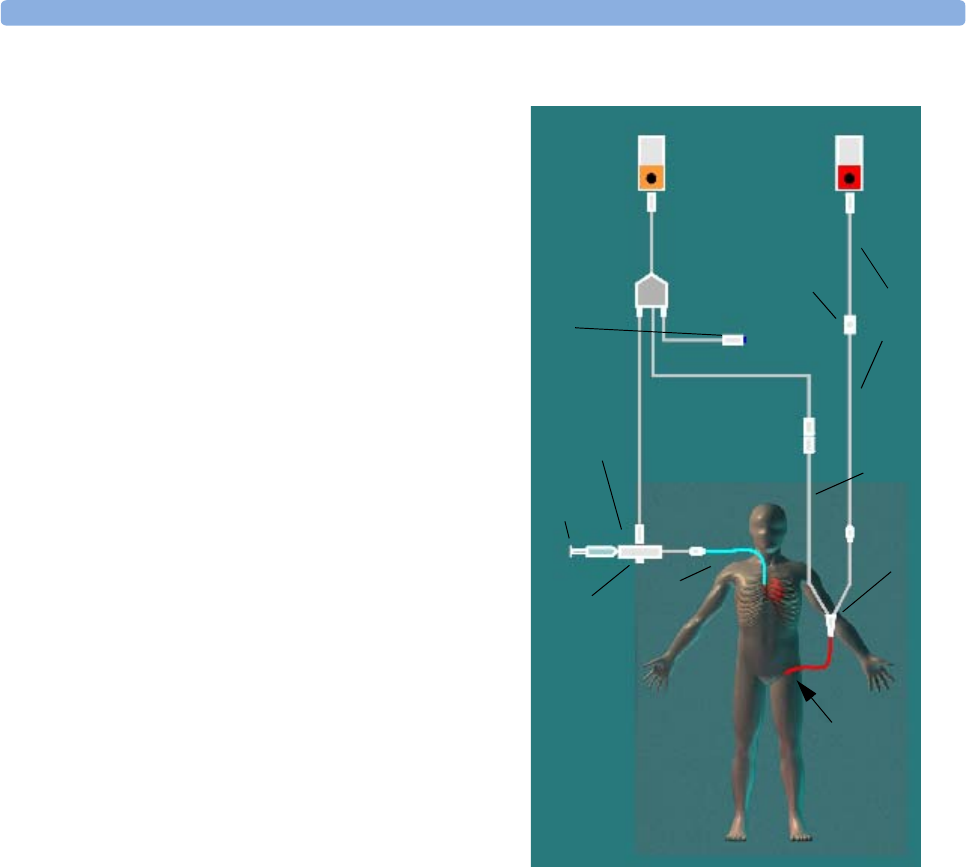
Measuring C. O. Using the PiCCO Method 13 Monitoring Cardiac Output
165
Setting Up the PiCCO C.O. Measurement
1Set up the arterial line using the arterial
catheter (transpulmonary catheter) and
the transducer kit from Pulsion Medical
Systems. It must be placed in one of the
bigger systemic arteries, for example, the
femoral or the axillary artery. You must
use the approved catheters and puncture
locations.
2Set up the central venous line.
3Connect the injectate temperature probe
housing to the venous line.
4Plug the C.O. interface cable into the
C.O. module or measurement server
extension and connect the following
devices to the C.O. interface cable:
– Injectate temperature probe
– Thermistor connector
– Remote start switch (if used).
Follow your hospital standards to avoid
unintentional extraction of the C.O.
catheter. Secure the cable using the
mounting clip shipped with each C.O.
interface cable. You may also find it
helpful to loop the C.O. interface cable,
tape the loop, and attach it to the
undersheet of the patient's bed using a
safety pin.
5If you are measuring CCO, set up the
pressure measurement now. The CCO measurement requires a minimally dampened invasive
pressure setup. You must ensure that there are no air bubbles in the pressure line or dome and use
only specified accessories.
6Check that the correct measurement method is selected.
If a catheter is already connected to the Cardiac Output Interface Cable, the monitor automatically
recognizes the method used. If not, in the Setup C.O. menu, select Method and then select
Transpulmonary.
7Check that the Tinj Probe Type setting in the Setup C.O. menu matches the type of
injectate temperature probe used. The probe type is usually printed on the plug of the probe.
To change the probe type, in the Setup C.O. menu, select Tinj Probe Type to call up a list
of available probes.
–23001: it is recommended to use this probe with cold injectate
–M1646: this probe can be used with room temperature injectate or with cold injectate.
C.O. Module Press Module
Pulsion
Pressure
Transducer
Pulsion Arterial
Catheter
Thermistor
Connection
Cable
Injectate
Temperature
Probe
C.O.
Interface
Cable
Injectate
Syringe
CVP
Line
Thermistor
Connection
Remote
Switch
Pressure
Adapter
Cable
Injectate
Temperatur
e Probe
Housing

13 Monitoring Cardiac Output Measuring C. O. Using the PiCCO Method
166
8Check that the correct arterial catheter constant is selected.
If the catheter is recognized by the monitor, the catheter constant is automatically displayed and
cannot be changed manually. If it is not recognized, in the C.O. procedure window, select CathCt
and use the pop-up keypad to enter the correct value. The catheter constant is usually written
either on the catheter or on the catheter packaging.
9Make sure that the injectate volume setting matches the injectate volume you will use. To change
the volume, in the C.O. procedure window, select InjVol and select the correct injectate volume
from the pop-up list.
If there is a problem with the volume or temperature you have chosen, the monitor will issue a curve
alert message to inform you of this.
10 If you are measuring CCO or CCI, check that the correct pressure source is selected in the
Setup CCO menu. The pressure label under CCO from must match the pressure measured with
the arterial catheter. To change the pressure source, select CCO from to call up a list of available
pressure labels and select the correct label.
11 If you are measuring CCO or CCI, verify that the correct alarm source is selected in the menu item
Alarms From. To change the alarm source, select Alarms From and choose either CCO or CCI.
Performing PiCCO C.O. Measurements
Always wait for the monitor to indicate readiness for the next step before proceeding.
If you are measuring CCO, all measurements should be conducted within 15 minutes. Older
measurements “expire” for CCO calibration.
1Enter the C.O. procedure window.
2When you see the message ...Ready for new measurement, start the measurement by
selecting the pop-up key Start C.O. or pressing the Start hardkey on the C.O. module, or
pressing the remote start switch.
3When you hear the ready tone and see the message ...Stable baseline, inject now!,
inject the solution into the CVP catheter.
At the end of the measurement the thermodilution curve, cardiac output, index values, ITBV and
EVLW values and any curve alerts are displayed and a message will appear “...Wait before
starting new measurement”.
4When you see the ...Ready for new measurement message, repeat the procedure until you
have completed the measurements you want to perform. You can perform a maximum of 6
measurements before editing. If you perform more than 6 measurements without rejecting any, the
oldest will automatically be deleted when a 7th curve is stored.
Editing PiCCO C.O. Measurements
It is important to identify and reject erroneous trials, as the monitor uses all the measurement trial
values you do not reject to calculate the averaged cardiac output.
1Review the trials. Irregular trials or trials marked with a “?” should be reviewed carefully. Consider
the similarity of the values and the shape of the C.O. curve. A normal C.O. curve has one smooth
peak and returns to the temperature baseline level after the peak.
2Reject unsatisfactory trials: use the Select Trial pop-up key to move between trials, then
select the Accept Reject pop-up key to accept or reject trials. If you are using a touch screen

Measuring C. O. Using the PiCCO Method 13 Monitoring Cardiac Output
167
you can accept or reject trials directly by tipping on the trial curve. Discard conspicuously different
values. The background of rejected trials is red and the background of accepted trials is green. The
monitor recalculates the average values after you reject or accept trials.
If all values are different from each other, there may be true hemodynamic instability caused, for
example, by severe cardiac arrhythmia.
Saving and Calibrating PiCCO C.O. Measurements
When you have finished editing the trials, you must save the results. This closes the measurement
series, sends the average C.O. numeric to be displayed on the main screen, and stores the averaged
values in the trends and calculations databases.
Before the monitor can calculate CCO, you must calibrate the measurement. You should also calibrate
CCO every eight hours, or if the hemodynamic condition of the patient changes consistently in the
same direction over 15 minutes, or if there are large or sudden changes in the patient’s condition.
The monitor only uses C.O. measurements from within the last 15 minutes for calibrating CCO.
To save and calibrate,
♦In the C.O. procedure window, select the pop-up key Save C.O. & Cal CCO to use the
averaged C.O. value to calibrate Continuous Cardiac Output (CCO).
Your monitor may be configured to have two separate pop-up keys, Save C.O. and Cal CCO,
instead of the combined Save C.O. & Cal CCO.
WARNING CCO calibration is patient-specific. When the C.O. module or measurement server extension is
plugged in after the patient has changed, make sure that the correct CCO calibration is used. When in
doubt perform a new CCO calibration first.
CCO Calibration Status Indicators
Each measurement trial is tagged with a calibration status indicator next to its trial number. Reflecting
the quality of the pressure signal during the thermodilution measurement, this tag indicates each trial’s
validity to be used in a CCO calibration.
For a trial to be eligible for calibration, the pressure signal must be continuously available and
undisturbed starting 30 seconds before the first C.O. measurement of the series. Do not zero the
pressure measurement, change the pressure label, or disturb the pressure signal in any other way during
this time.
CAL A pressure signal for CCO was available during the measurement (valid for calibration)
?CAL A disturbed pressure signal for CCO was available during the measurement (valid for
calibration)
N/A No adequate pressure signal for CCO was available during the measurement (no valid
calibration data)
EXP This trial is more than 15 minutes older than the most recent trial and has expired for CCO
calibration (no valid calibration data)
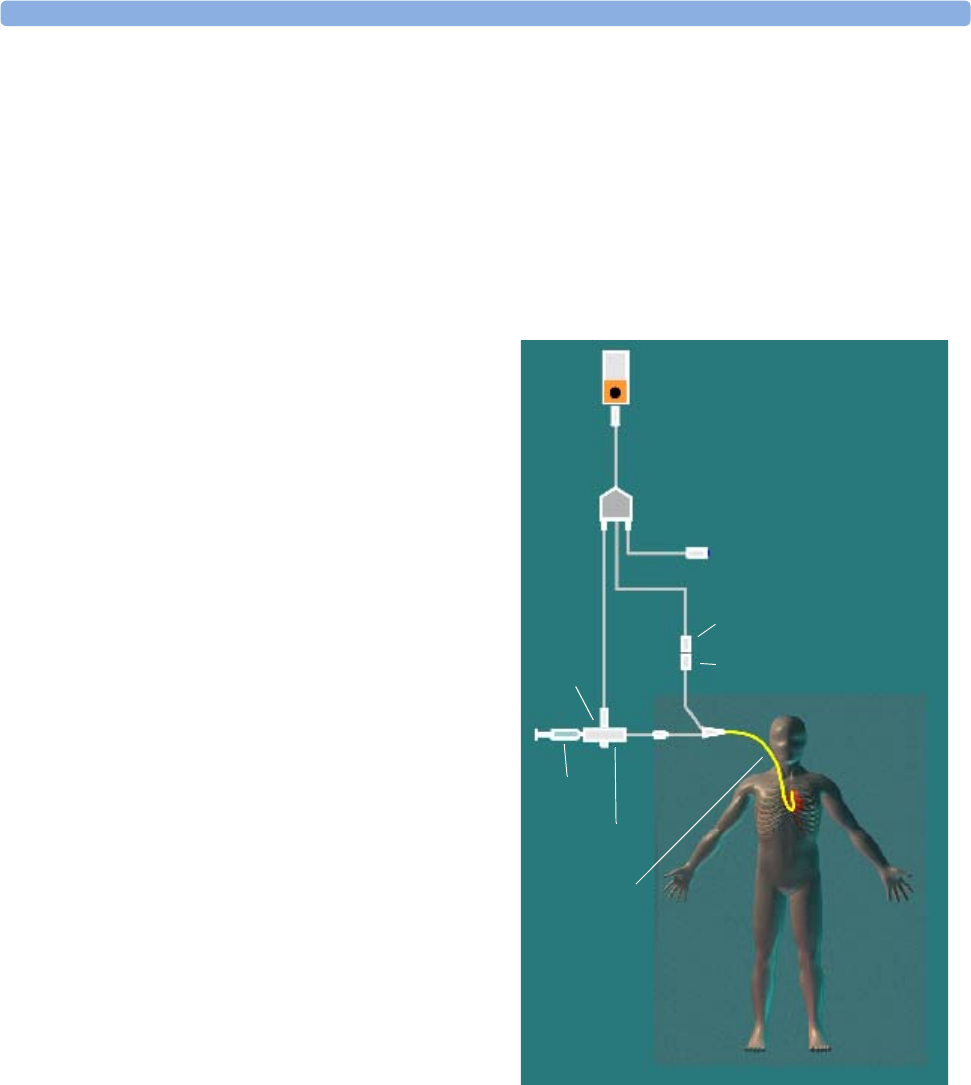
13 Monitoring Cardiac Output Measuring C.O. Using the Right Heart Thermodilution Method
168
Measuring C.O. Using the Right Heart
Thermodilution Method
In the right heart thermodilution method, a fluid of known volume and temperature is injected into
the right atrium through the proximal port of a pulmonary artery (PA) (Swan-Ganz) catheter. The
injectate bolus mixes with the blood in the right ventricle and the change in blood temperature is
measured with a thermistor at the distal end of the catheter in the pulmonary artery.
Setting up RH C.O. Measurements
1Set up the PA line using a PA catheter.
2Attach the injectate temperature probe
housing to the PA line.
3Plug the C.O. interface cable into the
C.O. module or measurement server
extension and connect the following
devices into the C.O. interface cable:
– injectate temperature probe
– remote start switch (if used).
Follow your hospital standards to avoid
unintentional extraction of the C.O.
catheter. Secure the cable using the
mounting clip shipped with each C.O.
interface cable. You may also find it
helpful to loop the C.O. interface cable,
tape the loop, and attach it to the
undersheet of the patient's bed using a
safety pin.
4Plug the thermistor connection cable of
the PA catheter into the thermistor
connector.
5Connect the injectate temperature probe
to the injectate temperature probe
housing.
6Check that the correct measurement
method is selected.
If a catheter is already connected to the Cardiac Output Interface Cable, the monitor automatically
recognizes the method used. If not, in the Setup C.O. menu, select Method and then select
Right Heart.
Ice-Bath Setup for RH Thermodilution C.O. Measurements
If you are using the flow-through method illustrated above, the injectate temperature is measured at
the time of injection by the temperature probe in the injectate temperature probe housing.
C.O. Module
C.O. Interface Cable
Remote Start Switch
Thermistor
Connector
Injectate
Temperature
Probe
Thermistor
Connection
Cable
PA Catheter
Injectate
Syringe
Injectate
Temperature
Probe Housing

Documenting C.O. Measurements 13 Monitoring Cardiac Output
169
If you are using the ice-bath setup, the injectate temperature probe and the injectate are both placed in
an ice-bath and the probe measures the temperature of the contents of the ice bucket.
Setting the Computation Constant
Check that the correct Computation Constant is entered in the C.O. procedure window. This can
be found in the documentation supplied with the catheter and is based on the injectate volume,
injectate temperature and catheter type. To change the value, in the C.O. procedure window, select
Computation Constant and use the pop-up keypad to enter the correct value.
Performing RH C.O. Measurements
1Enter the C.O. procedure window.
2When you see the message ...Ready for new measurement, select the pop-up key Start
C.O.
3When you hear a ready tone and see the message ...Inject now!, inject the solution into the
right atrial port of the Swan-Ganz catheter. The optimal injection rate is 2.5 ml/second.
At the end of the measurement the thermodilution curve, cardiac output, index values and curve
alerts (if necessary) are displayed and a message will appear ...Wait before starting new
measurement.
4When you see the ...Ready for new measurement message, repeat the procedure until you
have completed the measurements you want to perform. You can perform a maximum of six
measurements before editing. If you perform more than six measurements without rejecting any,
the oldest will automatically be deleted when a seventh curve is stored.
Editing and Saving RH C.O. Measurements
It is important to identify and reject erroneous measurements (called “trials”), as the monitor uses all
the measurement trial values you do not reject to calculate the averaged cardiac output.
1Review the trials. Irregular trials or trials marked with a “?” should be reviewed carefully. Consider
the similarity of the values and the shape of the C.O. curve. A normal C.O. curve has one smooth
peak and returns to the temperature baseline level after the peak.
2Reject unsatisfactory trials: use the Select Trial pop-up key to move between trials, then
select the Accept Reject pop-up key to accept or reject trials. If you are using a touch screen
you can accept or reject trials directly by tipping on the trial curve. Discard conspicuously different
values. The background of rejected trials is red and the background of accepted trials is green. The
monitor recalculates the average values after you reject or accept trials.
If all values are different from each other, there may be true hemodynamic instability caused, for
example, by severe cardiac arrhythmia.
3Save average C.O. values. To close a measurement series, you must save the average values by
selecting the pop-up key Save C.O. This sends the average C.O. numeric to be displayed on the
main screen, and stores the averaged values in the trends and calculations databases.
Documenting C.O. Measurements
You can document C.O. measurements on the default printer or recorder.
1In the C.O. procedure window, select the pop-up key Print/Record.

13 Monitoring Cardiac Output C.O. Injectate Guidelines
170
2From the pop-up list, choose:
–Print Results to print the contents of the C.O. procedure window
–Record Results to record the contents of the C.O. procedure window
–Record Trial to send an individual trial curve to the recorder.
C.O. Injectate Guidelines
The greater the injectate volume and the colder the temperature, the more accurate the measurement.
Reduced injectate volume or higher injectate temperature may reduce the specified accuracy.
For adult patients, to ensure the greatest measurement accuracy, use a cold injectate (< 8°C) of 10 ml
volume, if not contra-indicated by the patient's condition. Your choice of injectate volume should be
based on the injectate temperature and the patient’s cardiac output.
Guidelines for Right Heart Thermodilution C.O. Injectate
If you are using the right heart thermodilution method, the use of injectate with a temperature less
than 8°C lower than the blood temperature may cause incorrect values for the thermodilution.
Guidelines for PiCCO C.O. Injectate
If you are using the PiCCO method, the use of injectate with a temperature less than 12°C lower than
the blood temperature may cause incorrect values for the thermodilution and CCO calibration.
Injectate Volume, Patient Weight and ETVI Values (PiCCO Only)
When deciding on an injectate volume and temperature, you must consider your patient’s weight and
extra-vascular thermal volume index (ETVI).
High ETVI: The dilution of injectate is influenced by extravascular tissue and fluid. The accuracy of
the PiCCO method may be reduced in patients with high extra-vascular thermal volume index (ETVI)
values. Use the table below as a guide in selecting the correct injectate temperature. As shown in the
table, if your patient has an ETVI > 10, you must use cold injectate.
Weight: Use the table below as a guide in choosing an injectate volume appropriate for the patient
weight.
Patient Weight Cold Injectate Room Temperature Injectate
ETVI < 10 ETVI ≥ 10 ETVI < 10 ETVI ≥ 10
< 3 kg 2 ml 2 ml 3 ml Use cold injectate
< 10 kg 2 ml 3 ml 3 ml
< 25 kg 3 ml 5 ml 5 ml
< 50 kg 5 ml 10 ml 10 ml
< 100 kg 10 ml 15 ml 15 ml
≥ 100 kg 15 ml 20 ml 20 ml

C.O./CCO Curve Alert Messages 13 Monitoring Cardiac Output
171
C.O./CCO Curve Alert Messages
After each measurement trial, the monitor analyzes the thermodilution curve. If the curve appears
abnormal, a curve alert message appears in the C.O. procedure window. A question mark symbol (“?”)
may appear next to the cardiac output numeric if any of these messages appear. The curve alert
messages are not error messages and do not necessarily mean that the measured values are invalid.
C.O./CCO Curve Alert Messages Possible Causes
Tinj off scale The Tinjectate is out of the range -1°C and 30°C. Cool down or heat
up the injectate or change the injectate solution and repeat the
measurement.
Noisy Baseline A blood temperature baseline drift that could not be compensated
was detected during the C.O. measurement. Possible causes are:
- Interference may be caused by a ventilator.
- Interference may be caused by an infusion pump: infusions of
significant volume through the central line should be paused at least
30 seconds before the first thermodilution measurement in a series
and should not recommence until the measurement series is
completed.
- Do not administer injections through the central line during a
measurement series.
- Electrical devices in the vicinity can cause interference: check for
infusion pumps connected to the central catheter, cables parallel to
the thermodilution cable, electrocautery. Make sure all devices are
properly grounded.
- Wait until measurement results are displayed before moving the
patient or catheter.
- Close the stopcock to the injectate syringe after the injection.
- Do not rinse the catheter during measurement, to avoid
temperature fluctuations.
Temperature Baseline
Drift
May occur if patient is recovering from open heart surgery, or if
patient was cooled down for surgery and is in the process of regaining
normal body temperature when the measurement is made.
Small signal, more
indicator required
The peak of the transpulmonary thermodilution curve was below
0.1ºC. Increase injectate volume and/or lower injectate temperature.
Injectate Temperature
too High
The difference between the blood and injectate temperatures is too
small. The calculated value for C.O. may not be accurate.
High ETVI, use cold
injectate or greater
inj. volume
The ETVI value is too high. The accuracy of the transpulmonary
thermodilution measurement may be reduced. Increase injectate
volume and/or lower injectate temperature following the guidelines
given in the section “Guidelines for PiCCO C.O. Injectate” on
page 170.
Disturbed Injection The injection should be performed quickly and with a steady
pressure. Shaking, unsteady pressure, or injections that take longer
than six seconds may cause this message to appear; you should bear
this in mind if you are using a large injectate volume (> 10 ml).
13 Monitoring Cardiac Output C.O./CCO Prompt Messages
172
If you have followed all of these guidelines, your measurement values should be valid, even if you still
see a curve alert message. Ensure that at least three subsequent measurements within the current series
do no differ by more than 15%. If the difference exceeds 15%, use your clinical judgement to
determine the appropriate intervention.
C.O./CCO Prompt Messages
Prompt messages appear in the C.O. procedure window if a C.O. measurement trial must be
terminated.
Check Injectate
Temperature Probe Type
The recorded Tinj signal is uncharacteristic for the M1646 injectate
temperature probe. The probe may be defective or an incorrect probe
type may have been used.
Unsteady Baseline There is a noisy baseline, and thermal baseline drift.
Multiple Peaks Caused by faulty injection technique.
Abnormal Decay Time May be caused by low cardiac output. Calculated value for C.O. may
not be accurate.
Very Long Curve The decay time of the curve is longer than 15 seconds.
Very Short Curve Decay time of the curve is less than 0.5 seconds. If there is a noisy
baseline, part of the baseline may have been mistaken for a
thermodilution curve. Calculated value for C.O. may not be accurate.
Irregular Curve Any combination of curve alert messages.
Delayed Injection Injection is given more than 15 seconds after Start C.O. is
selected. Calculated value for C.O. may not be accurate.
C.O./CCO Curve Alert Messages Possible Causes
C.O./CCO Prompt Messages Possible Causes
Curve Below Baseline,
measurement terminated
May be caused by thermal baseline drift. No C.O. value
calculated.
Excessive Curve Height,
measurement terminated
The curve exceeds the upper limit. This may be caused by an
injectate that was too cold. No C.O. value calculated.
Unstable Baseline,
injection not recommended
The baseline is unstable. Wait until the baseline is stable before
injecting. If this does not occur within a reasonable time,
injection is possible but the accuracy of the measured values may
be reduced.
Excessive baseline drift,
don’t inject now
No measurement is possible. Measured values are incorrect.

C.O./CCO Warning Messages 13 Monitoring Cardiac Output
173
C.O./CCO Warning Messages
Warning messages contain important information about the C.O. measurement.
C.O./CCO Safety Information
WARNING Catheter constant: Make sure that the arterial catheter constant for the measurement is appropriate
to the catheter used.
Computation Constant: Make sure that the computation constant for the measurement is
appropriate to the injectate volume, injectate temperature and catheter type used.
IABP: Do not perform transpulmonary thermodilution measurements on patients undergoing IABP
treatment.
CCO accuracy: Accuracy of the CCO measurement and all the derived values may be influenced by
patients with valve diseases or artificial valves.
C.O. and MRI: Do not use the Cardiac Output Interface Cable in Magnetic Resonance Imaging
(MRI) Applications.
Aortic graft patients: Do not use an arterial catheter in the arteria femoralis when it is contra
indicated, for example, with patients who have an aortic graft.
C.O./CCO Warning Messages Possible Causes
Next measurement erases
older curve
Six curves are stored, this is the maximum possible. If another
measurement is stored, the oldest thermodilution curve will be erased.
Previous C.O. Setup Data
replaced
A C.O. module or measurement server extension has been plugged in
with different C.O. setup data from the previous data. The new C.O.
setup data is read from the new C.O. device, and replaces the current
data. The message disappears when the Start C.O. pop-up key is
pressed.
Verify the C.O. Setup
Data
A new transpulmonary thermodilution catheter has been connected to
the C.O. Interface Cable.
Check arterial pressure,
CCO cal currently not
possible
Poor or invalid pressure signal, for example if pressure was not zeroed.
Verify the Computation
Constant
A new catheter has been plugged in, or the computation constant has
been changed and Start C.O. has not been selected.
Previous Comp. Constant
replaced
A new C.O. module or measurement server extension with a different
computation constant from the current one has been connected. The
new computation constant is read from the new C.O. device, and
replaces the current one. The message disappears when Start
C.O.is selected.

13 Monitoring Cardiac Output C.O./CCO Safety Information
174
CAUTION During the cardiac output measurement procedure the blood temperature alarms are inactive. This is
indicated by a crossed-out alarm symbol next to the temperature numeric. Making alarms inactive
during this procedure prevents false alarms. The alarms are automatically reactivated when you have
completed the measurement procedure.

175
14
14Monitoring Carbon Dioxide
Use the CO2 measurement to monitor the patient’s respiratory status and to control patient
ventilation.
There are two methods for measuring carbon dioxide in the patient’s airway:
• Mainstream measurement uses a CO2 sensor attached to an airway adapter directly inserted into the
patient’s breathing system. This method is available with the M3014A Capnography Extension and
the M3016A Mainstream Extension to the M3001A Multi-Measurement Server.
• Sidestream measurement takes a sample of the respiratory gas with a constant sample flow from the
patient’s airway and analyzes it with a remote CO2 sensor built into the measurement system. Philips
offers the sidestream CO2 measurement in the M3014A Capnography Extension and the
Microstream method of sidestream CO2 measurement in the M3015A Microstream CO2
Measurement Extension.
In both cases, the measurement principle is infrared transmission, where the intensity of infrared light
passing the respiratory gas is measured with a photo detector. As some of the infrared light is absorbed
by the CO2 molecules, the amount of light passing the gas probe depends on the concentration of the
measured CO2.
When using a wet ventilator circuit, monitor mainstream CO2 if available, in preference to sidestream
CO2.
The partial pressure is calculated from the gas concentration by multiplying the concentration value
with the ambient pressure.
The measurement provides:
•a CO
2 waveform.
•an end tidal CO
2 (etCO2) value: the CO2 value measured at the end of the expiration phase.
• an inspired minimum CO2 (imCO2): the smallest value measured during inspiration.
• an airway respiration rate (awRR): the number of breaths per minute, calculated from the CO2
waveform.
Depending on the Max Hold setting configured for your monitor, the etCO2 numeric shows either
the highest CO2 value measured within the configured time period (Max Hold set to 10 sec or 20
sec) or the etCO2 numeric shows breath-to-breath value (Max Hold set to Off).
Refer to your Gas Module Instructions for Use, if you are using a Gas Module to monitor CO2.

14 Monitoring Carbon Dioxide Using the Capnography Extension (M3014A)
176
WARNING Correlation: The etCO2 readings do not always correlate closely with paCO2, especially in neonatal
patients and patients with pulmonary disease, pulmonary embolism or inappropriate ventilation.
Pharmaceuticals in aerosols: Do not measure CO2 in the presence of pharmaceuticals in aerosols.
Explosion Hazard: Do not use in the presence of flammable anesthetics, such as a flammable
anesthetic mixture with air, oxygen or nitrous oxide.Use of the devices in such an environment may
present an explosion hazard.
Failure of operation: if the measurement extension or a sensor fails to respond as described, do not use
it until the situation has been corrected by qualified personnel.
Low etCO2 values: Leakages in the breathing system or sampling system may cause the displayed
etCO2 values to be significantly too low. Always connect all components securely and check for leaks
according to standard clinical procedures. Displacement of the nasal or combined nasal oral cannulas
can cause lower than actual etCO2 readings. Even with combined nasal oral cannulas, the etCO2
readings may be slightly lower than actual in patients breathing through the mouth only.
Using the Capnography Extension (M3014A)
The M3014A Capnography Extension measures partial pressure of carbon dioxide in a patient’s
expired gas using the mainstream method or the sidestream method. The mainstream CO2
measurement can be used, with appropriate accessories, with intubated adult, pediatric and neonatal
patients. The sidestream CO2 measurement can be used, with appropriate accessories, with intubated
and nonintubated adult, pediatric and infant patients. With intubated patients, a sample of the
respiratory gas is drawn from the patient’s breathing circuit through an airway adapter and a gas
sampling tube. With non-intubated patients, the gas sample is drawn through a nasal or oral-nasal
cannula.
WARNING Altitude Setting: The monitor is not equipped with automatic barometric pressure compensation.
Before the CO2 measurement is used for the first time, the altitude must be set to the correct value. An
incorrect altitude setting will result in incorrect CO2 readings. The CO2 readings will typically deviate
5% for every 1000m difference.
Electrical Shock Hazard: Do not open the measurement extension. Contact with exposed electrical
components may cause electrical shock. Always turn off and remove power before cleaning the sensor
or measurement server. Do not use a damaged sensor or one with exposed electrical contacts. Refer
servicing to qualified service personnel.
CAUTION Use the M3014A measurement extension with Philips approved accessories only. Refer to the
instructions for use provided with the accessory.
Preparing to Measure Mainstream CO2
You must perform a zero as described in this procedure each time you use a new airway adapter.
1Attach the sensor connector to the CO2 connector on the measurement extension.
2Wait 2 minutes, allowing the sensor to reach its operating temperature and a stable thermal
condition.
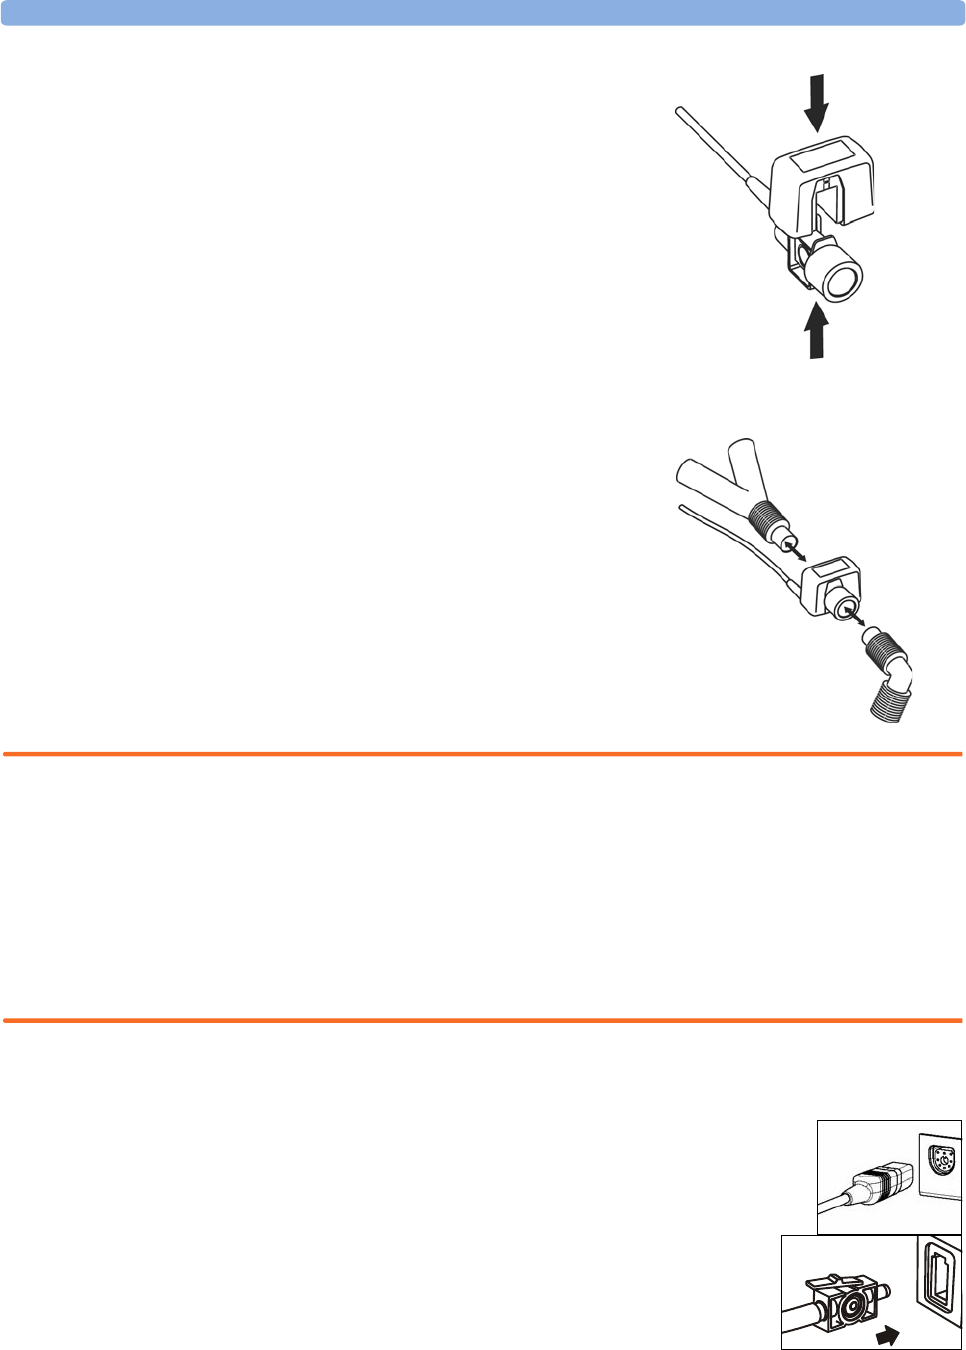
Using the Capnography Extension (M3014A) 14 Monitoring Carbon Dioxide
177
3Choose the appropriate airway adapter and connect it to
the sensor head. The airway adapter clicks into place when
seated correctly.
4To z e ro t h e s en s o r :
– expose the sensor to room air and keep it away from all
sources of CO2 including the ventilator, the patient’s
breath and your own.
– in the setup menu for the CO2, select Start Zero
Cal.
– When you see the message Zero done at <date
and time> on the status line, the zero calibration is finished and you can begin monitoring.
5Install the airway adapter at the proximal end of the circuit
between the elbow and the ventilator Y-section.
WARNING To prevent stress on the endotrachial tube, support the sensor and airway adapter.
Position sensor cables and tubing carefully to avoid entanglement or potential strangulation. Do not
apply excessive tension to any cable.
Replace the airway adapter, if excessive moisture or secretions are observed in the tubing or if the CO2
waveform changes unexpectedly without a change in patient status.
To avoid infection, use only sterilized, disinfected or disposable airway adapters.
Inspect the airway adapters prior to use. Do not use if airway adapter appears to have been damaged or
broken. Observe airway adapter color coding for patient population.
Preparing to Measure Sidestream CO2
1Plug the sensor cable into the monitor’s CO2 input connector. Allow the sensor
two minutes warm up time
2Connect the cannula, airway adapter, or sample line as appropriate, to the
sensor. It will click into place when seated correctly.
3To z e ro t h e s en s o r :
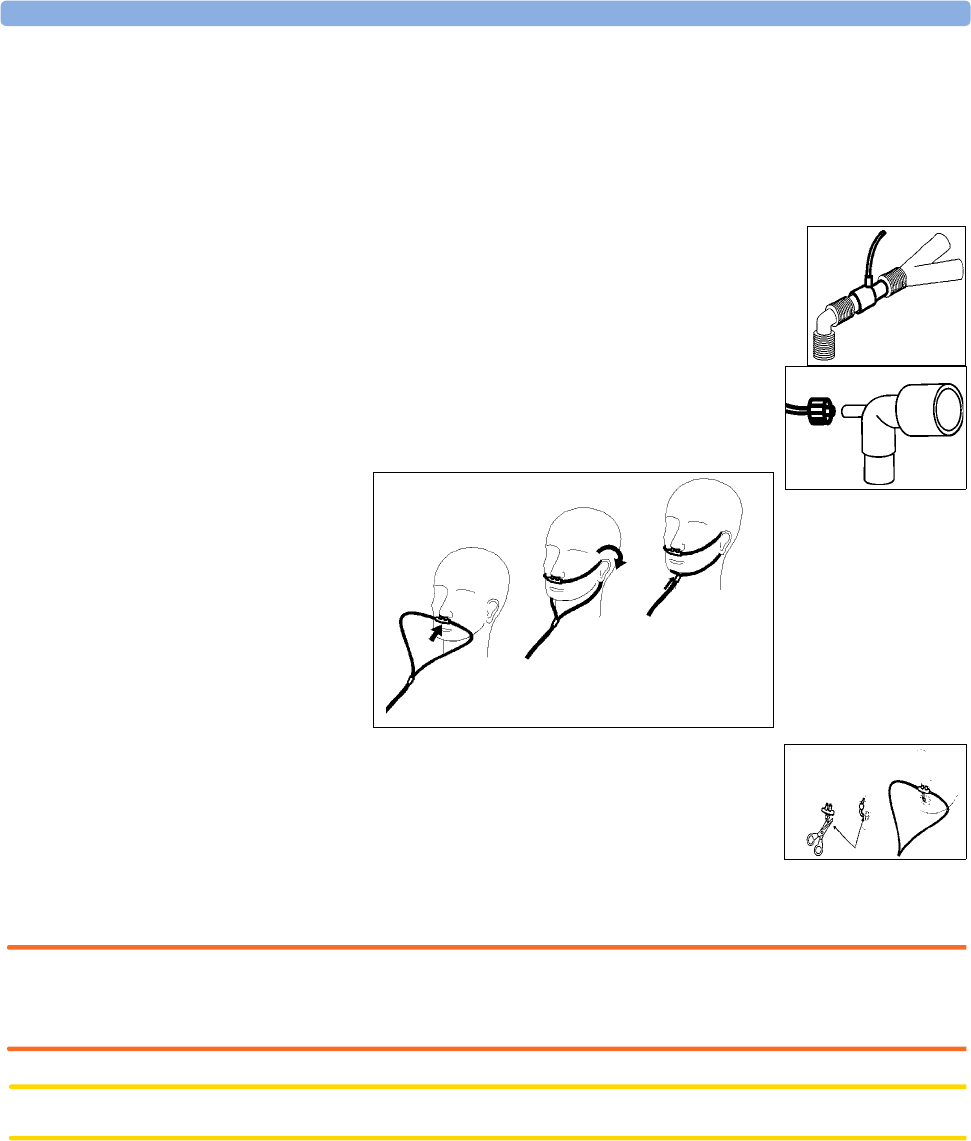
14 Monitoring Carbon Dioxide Using the Capnography Extension (M3014A)
178
– expose the sensor to room air and keep it away from all sources of CO2 including the ventilator,
the patient’s breath and your own.
– In the setup menu for the CO2, select Start Zero Cal.
– When you see the message Zero done at <date and time> on the status line, the zero
calibration is finished and you can begin monitoring.
4For intubated patients requiring an airway adapter: Install the airway adapter at
the proximal end of the circuit between the elbow and the ventilator Y-
section.
For intubated patients with an integrated airway adapter in the breathing
circuit.: Connect the male luer connector on the straight sample line to the
female port on the airway adapter.
For non-intubated patients: Place the nasal cannula onto the patient.
For patients prone to mouth breathing use an oral-nasal cannula. Trim the
oral sampling tip if necessary to fit the patient. It should extend down past the
teeth and be positioned in the mouth opening. Remove the cannula from the
patient if the tip needs to be trimmed.
For nasal or oral-nasal cannulas with oxygen delivery, place the cannula on the
patient as shown then attach the oxygen supply tubing to the oxygen delivery system and set the
prescribed oxygen flow.
WARNING Always connect the airway adapter to the sensor before inserting the airway adapter into the breathing
circuit. In reverse, always remove the airway adapter from the breathing circuit before removing the
sensor.
CAUTION Always disconnect the cannula, airway adapter or sample line from the sensor when not in use.
Using the Sidestream Sensor Holder
The holder delivered with the sensor can be used to clamp the sensor onto an IV pole or a shelf.
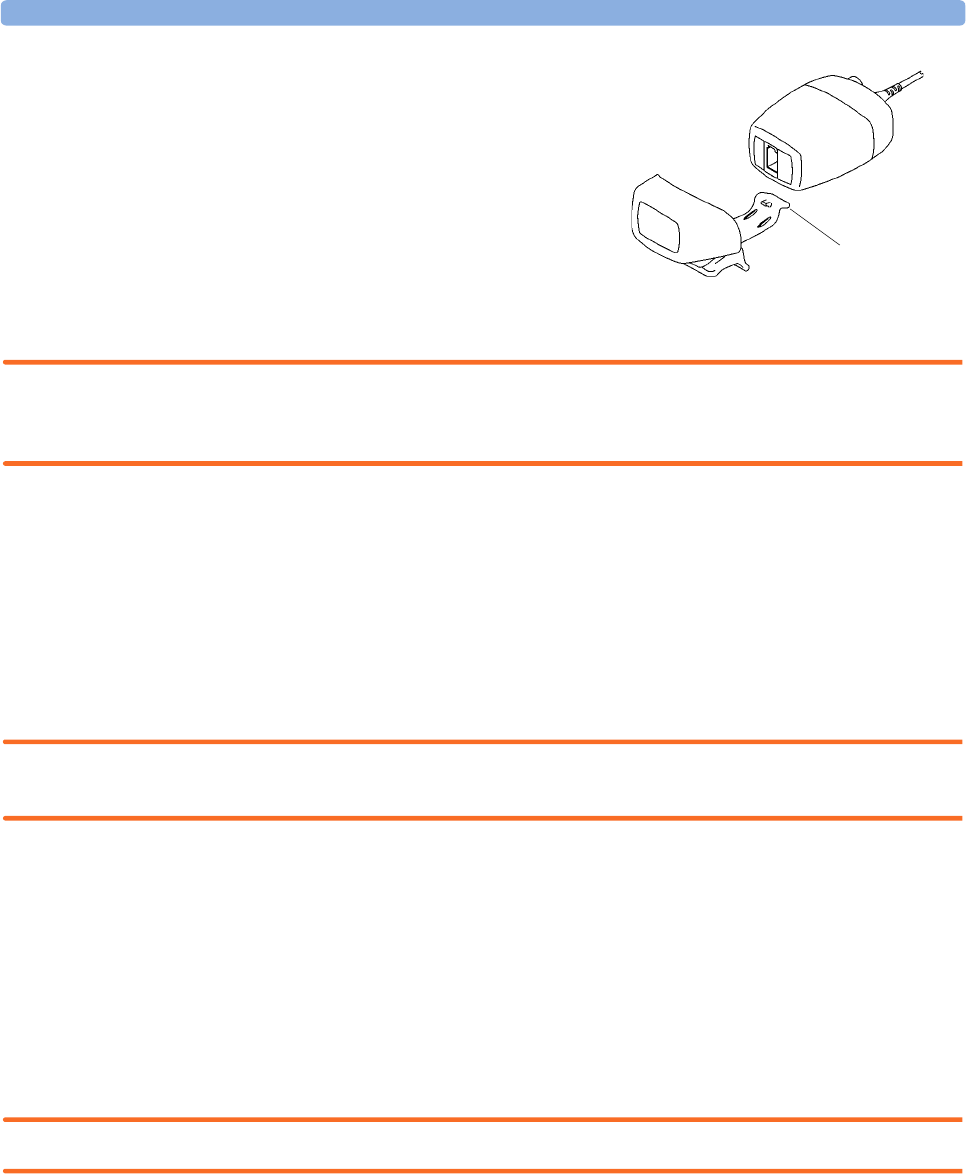
Using the Mainstream CO2 Extension (M3016A) 14 Monitoring Carbon Dioxide
179
1Push the sensor into the holder until it clicks into
position.
2Clamp the holder onto an IV pole, a shelf or
another appropriate location.
To remove the sensor from the holder, release the clip
and pull the sensor out of the holder.
Removing Exhaust Gases from the System
WARNING Anesthetics: When using the sidestream CO2 measurement on patients who are receiving or have
recently received anesthetics, connect the outlet to a scavenging system, or to the anesthesia machine/
ventilator, to avoid exposing medical staff to anesthetics.
Use an exhaust tube to remove the sample gas to a scavenging system. Attach it to the sidestream sensor
at the outlet connector.
Using the Mainstream CO2 Extension (M3016A)
The M3016A Measurement Server Extension measures partial pressure of carbon dioxide in a patient’s
expired gas using the mainstream method. When using the appropriate accessories you can use the
mainstream CO2 measurement with ventilated adults, pediatric and neonatal patients.
WARNING Infra-red radiation: Do not expose the airway adapter or M1460A transducer to infra-red radiation
during use. This may cause incorrect readings.
Preparing to Measure Mainstream CO2
1Attach the transducer connector to the CO2 connector on the measurement extension.
2Wait 20 minutes, allowing the transducer to reach its operating temperature and a stable thermal
condition.
3Perform an accuracy check and then, if necessary, calibrate the transducer.
Checking Transducer Accuracy
WARNING Check transducer accuracy at least once a week or if you doubt the CO2 readings.
1In Setup CO2 menu, select Cal. Mode to switch on calibration mode.
2Look at the calibration value displayed in the Setup CO2 menu next to Start Cal 1:. Is it
the same as the value on the calstick? If not, calibrate the transducer now.
3Place the transducer on the low cell of the calstick (labelled 0.0 mmHg or “ZERO”). The reading
on the screen should be zero within ±1 mmHg within one minute.
clip
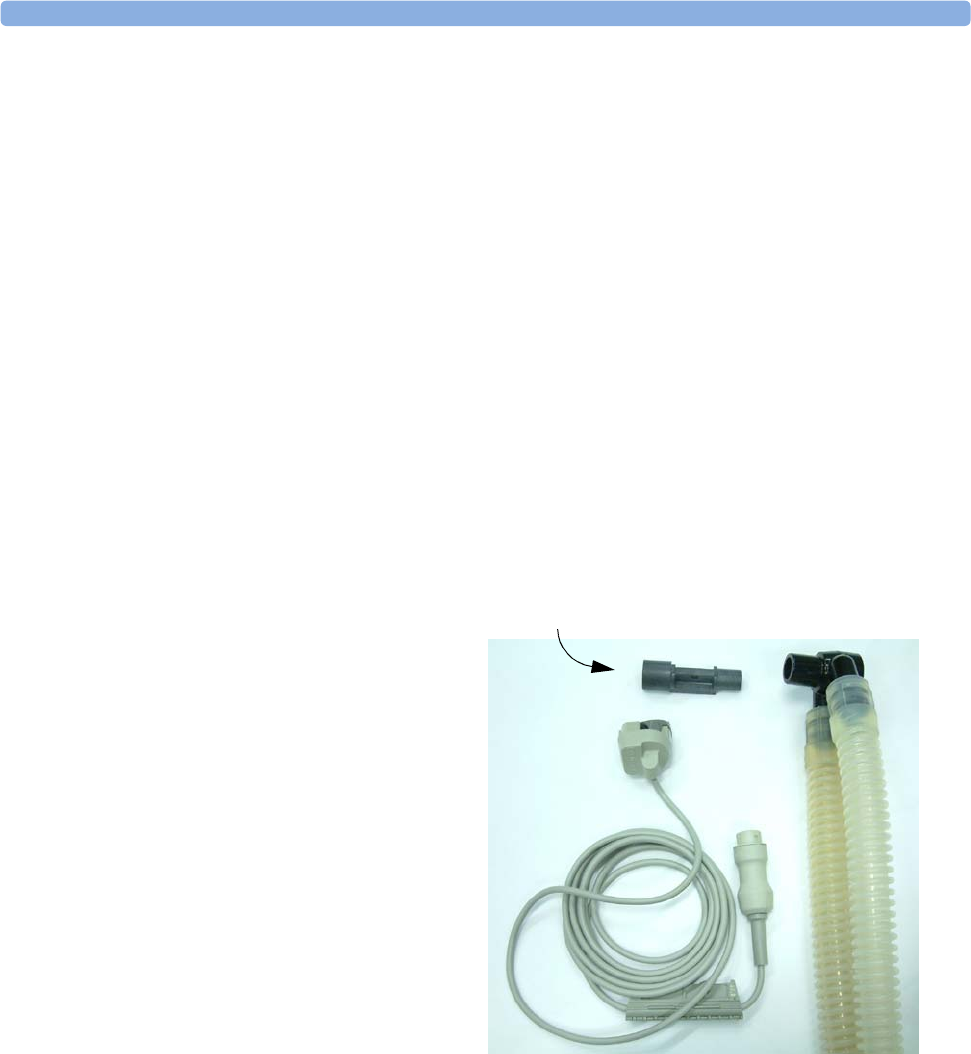
14 Monitoring Carbon Dioxide Using the Mainstream CO2 Extension (M3016A)
180
4Place the transducer on the high cell of the calstick. The reading on the screen should be within ±1
mmHg of the value on the calstick within one minute.
5If both readings are in range, you can leave calibration mode and begin monitoring. If either of the
readings is out of range, calibrate the transducer.
Calibrating the Transducer
1Check that the windows on the calstick are clean and clear.
2Place the transducer on one of the calstick cells and select Start Cal 1.
3Enter the calibration value printed on the calstick then press Confirm to start calibration.
4When the message CO2 CAL 1 calibration done - start CAL 2 calibration
appears, put the transducer on the other cell and select Start Cal 2 then press Confirm.
5When you see the message CO2 calibration completed. Leave calibration
mode., calibration is complete.
6Select Cal Mode to switch calibration mode off. You cannot monitor in calibration mode.
Attaching and Removing the CO2 Transducer
1Open the latch and place the
transducer onto the airway adapter.
Place the airway adapter in the
patient’s breathing circuit between
the endotracheal tube and the Y-
piece. You may see the CO2 SENSOR
WARM UP message until the
transducer reaches operating
temperature. Wait until this
disappears before starting the
measurement.
Airway Adapter
CO2 Tr a n s d u c e r
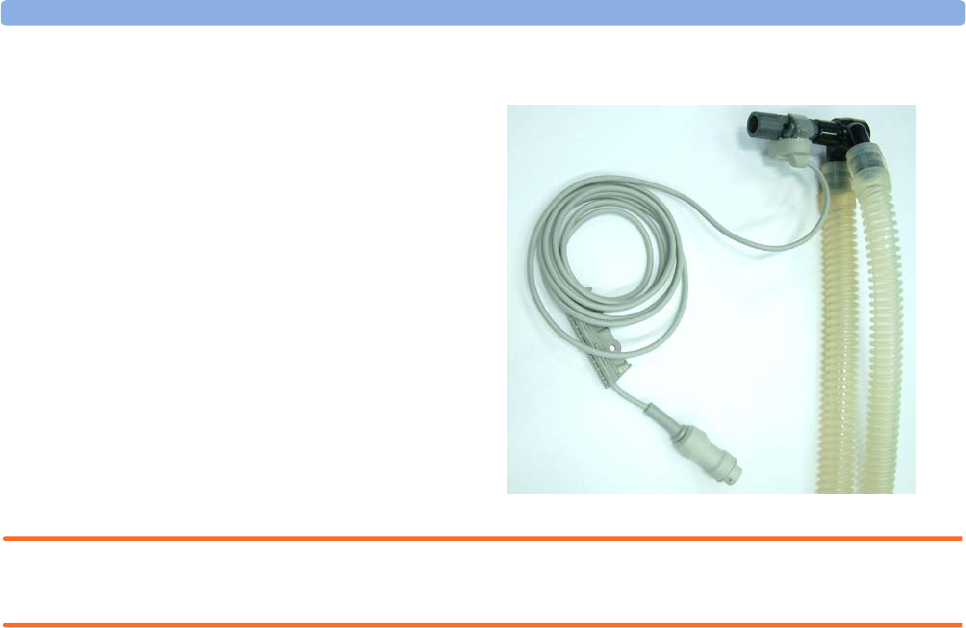
Using the Microstream CO2 Extension (M3015A) 14 Monitoring Carbon Dioxide
181
2To remove the transducer from the
airway adapter, open the latch and
pull out the airway adapter.
WARNING To prevent stress on the endotrachial tube, support the transducer and airway adapter.
To avoid infection, use only sterilized airway adapters.
Using the Microstream CO2 Extension (M3015A)
The M3015A Microstream CO2 Extension measures the partial pressure of carbon dioxide in a
patient’s expired gas using Microstream technology.
In intubated patients, a sample of the respiratory gas is drawn from the patient’s breathing circuit
through an airway adapter and a gas sampling tube. In non-intubated patients, the gas sample is drawn
through a nasal or oral-nasal cannula.
When using the appropriate accessories, you can use the Microstream CO2 measurement with adult,
pediatric, and neonatal patients.
The M3015A is equipped with an automatic barometric pressure compensation.
Preparing to Measure Microstream CO2
Use appropriate accessories for:
• the patient type (adult, pediatric or neonatal),
• the ventilation situation (including humidification)
• the duration - short term use, up to 24 hours (typically OR), or long term use (typically ICU).
All accessories are for single patient use only.
Using Microstream Accessories
M3015A can be operated with the special Microstream accessories only. Refer to the instructions for
use provided with the accessory.
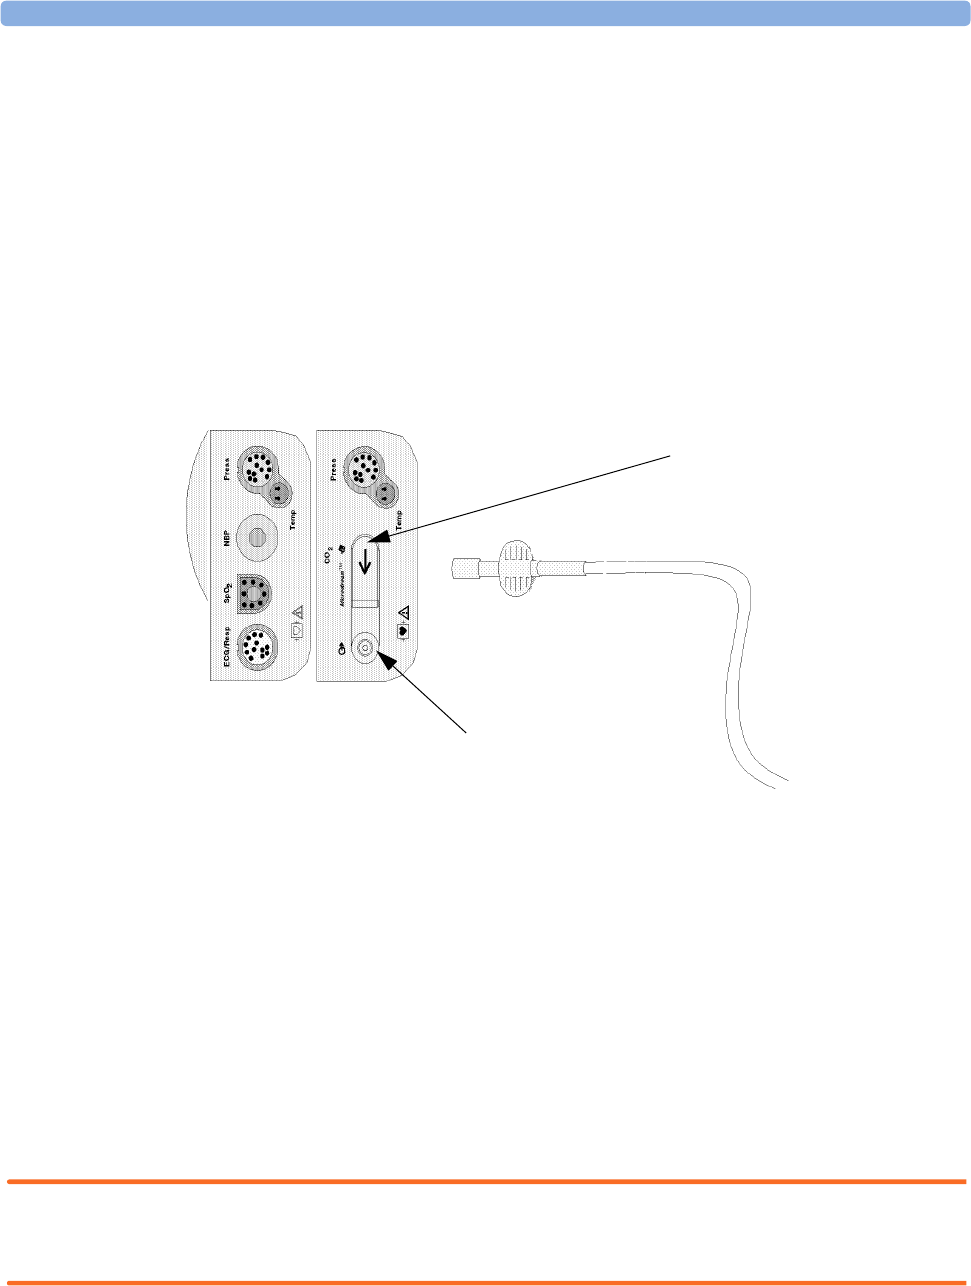
14 Monitoring Carbon Dioxide Using the Microstream CO2 Extension (M3015A)
182
For intubated patient with non-humidified ventilation, you can use a Microstream FilterLine set. For
humidified ventilation, use a FilterLine H Set.
For non-intubated patients, the gas sample is taken through a Nasal FilterLine, or a Smart CapnoLine
(which is a combined oral-nasal FilterLine). In parallel to the measurement of the CO2, oxygen (O2)
may be delivered to the patient to support gas exchange. This is done by using an O2/CO2 FilterLine,
or a Smart CapnoLine O2 (a combined oral-nasal O2/CO2 FilterLine).
Using the FilterLine and Airway Adapter
1Attach the female Luer connector to the CO2 inlet connector on the measurement extension by
pushing the socket cover down and screwing the connector into place.
2Check that the FilterLine is not kinked.
3Change the FilterLine if a “CO2 OCCLUSION” INOP appears on the monitor or if the readings
become extremely erratic.
Disconnect the FilterLine during suctioning and nebulizing therapies.
For best results change the FilterLines for non-humidified use (with orange connectors) after 24 hours
of continuous use and the FilterLines H, for humidified use, (with yellow connectors) after 72 hours of
continuous use.
CO2 values for non-intubated patients using Microstream accessories will always tend to be lower than
for intubated patients. If values appear extremely low, check whether the patient is breathing through
the mouth or whether one nostril is blocked
Removing Exhaust Gases from the System
WARNING Anesthetics: When using the Microstream CO2 measurement on patients who are receiving or have
recently received anesthetics, connect the outlet to a scavenging system, or to the anesthesia machine/
ventilator, to avoid exposing medical staff to anesthetics.
Use an exhaust tube to remove the sample gas to a scavenging system. Attach it to the Measurement
Server Extension at the outlet connector.
inlet connector cover
outlet connector

Setting up Mainstream and Sidestream CO214 Monitoring Carbon Dioxide
183
Suppressing Zero Calibration
To prevent an automatic zero calibration from being started in the next five minutes,
♦in the Setup CO2 menu, select No Zero for 5 Min, or select the Suppress CO2 Zero
SmartKey, if configured.
Selecting No Zero for 5 Min or selecting the Suppress CO2 Zero SmartKey again before the
timer has timed out resets the timer to five minutes, unless an AutoZero became due during the
previous suppression.
Setting up Mainstream and Sidestream CO2
These tasks are common to all CO2 measurements except where otherwise noted.
Adjusting the CO2 Wave Scale
1In the CO2 Wave menu or the Setup CO2 menu, select Scale.
2Choose a suitable scale range from the pop-up list.
Setting up CO2 Corrections
Temperature, water vapor in the patient’s breath, barometric pressure, and the proportions of O2, N2O
and Helium in the mixture all influence CO2 absorption. If values seem inaccurately high or low,
check that the monitor is using the appropriate corrections.
Correction
Altitude
(M3014A
only)
Altitude is set during installation. The monitor automatically applies an appropriate
correction.
O2
(M3014A
only)
In the Setup CO2 menu, select Oxygen Corr and select a value between 0% and
100%, the default value is 16%.
If the O2 correction is not available in the Setup CO2 menu, the CO2 measurement
in your Measurement Server Extension does not require O2 correction.
Humidity At installation, the monitor is configured to automatically apply either Body Temperature
Pressure Saturated (BTPS) or Standard Temperature Pressure Dry (STPD). To see
which, go to the Setup CO2 menu, and scroll down to look at HumidtyCorr.
N2O
(M3016A
mainstream
and M3015A
microstream
only)
In the Setup CO2 menu, select N2O Corr and turn on or off. If N2O is present in
the ventilation gas mixture, you must turn this on.
If the N2O correction is not available in the Setup CO2 menu, the CO2
measurement in your Measurement Server Extension does not require N2O correction
or it is setup with Gas Corr (see below).
Gas
(M3014A
only)
In the Setup CO2 menu, select Gas Corr and select Helium, N2O or turn off. If
Helium or N2O is present in the ventilation gas mixture, you must make the
appropriate selection.
If the Gas correction is not available in the Setup CO2 menu, the CO2 measurement
in your Measurement Server Extension does not require N2O or Helium correction or
the N2O correction is setup with N2O Corr (see above).

14 Monitoring Carbon Dioxide Setting up Mainstream and Sidestream CO2
184
Suppressing Sampling (not Mainstream CO2)
To temporarily stop sampling,
♦in the Setup CO2 menu, select Pump 15Min Off or use the CO2 Pump Off SmartKey if
available.
Selecting Pump 15Min Off again before fifteen minutes have passed resets the timer to fifteen
minutes.
To re-start the pump,
♦in the Setup CO2 menu, select Pump On.
Changing CO2 Alarms
This refers to CO2 specific alarms. See the Alarms section for general alarm information.
1In the Setup CO2 menu, select etCO2 High or imCO2 High and choose the upper alarm limit.
2Select etCO2 Low and choose the lower alarm limit.
Changing the Apnea Alarm Delay
This determines the time limit after which the monitor alarms if the patient stops breathing.
1In the Setup CO2 menu, select awRR.
2In Setup awRR menu, select Apnea Time.
3Choose the apnea alarm delay time.
WARNING Safety and effectiveness of the respiration measurement method in the detection of apnea, particularly
the apnea of prematurity and apnea of infancy, has not been established.
Prolonged delay: The selected apnea alarm delay may be prolonged by up to 17 seconds, if an apnea
occurs during the automatic zero process. This applies to the Microstream (M3015A) measurement
only.
Deriving Alarms From awRR
1In the Setup CO2 menu, select awRR.
2In the Setup awRR menu, select Alarms.
3Choose On to derive alarms from the airway respiration signal or Off to disable them.
Changing awRR Alarm Limits
1In the Setup CO2 menu, select awRR.
Agent
(M3014A
only)
In the Setup CO2 menu, select Agent Corr and select the concentration of the
anesthetic agent (between 0.0% and 20.0%). If an anesthetic agent is present in the
ventilation gas mixture, you must select the appropriate concentration.
Correction

Setting up Mainstream and Sidestream CO214 Monitoring Carbon Dioxide
185
2Select High Limit to set the upper alarm limit.
Select Low Limit to set the lower alarm limit.
3Select the appropriate setting.

14 Monitoring Carbon Dioxide Setting up Mainstream and Sidestream CO2
186

187
15
15Monitoring Airway Flow,
Volume and Pressure
The M1014A Spirometry Module is designed to be used in combination with Philips-branded airway
flow sensors and combined CO2/airway flow sensors. It produces a real time wave for flow, volume and
pressure of respiratory gases together with numerics for analysis of ventilatory mechanics.
The measurement provides:
• Airway flow, airway volume and airway pressure waveform.
•Numerics for:
– respiratory rate
–tidal volume
–minute volume
– PEEP (positive end-expiratory pressure)
– PIP (peak inspiration pressure)
– dynamic compliance
– airway resistance
• Numerics for: (only visible in Spirometry Values Window, no alarming, no trending)
– peak inspiratory flow
– peak expiratory flow
– negative inspiratory pressure
– mean airway pressure
–plateau pressure numeric
– I:E ratio
The measurement also provides pressure-volume loops, flow-volume loops and pressure-flow loops.
Please see the Respiratory Loops chapter for details on loops.
When using combined CO2/Flow sensors you can also perform mainstream capnography with
intubated adult, pediatric and neonatal patients. See the Measuring CO2 chapter for details on the CO2
measurement and the Accessories chapter for a list of compatible accessories.
WARNING Electrical Shock Hazard: Do not open the module. Contact with exposed electrical components may
cause electrical shock. Always turn off and remove power before cleaning the module. Refer servicing
to qualified service personnel.
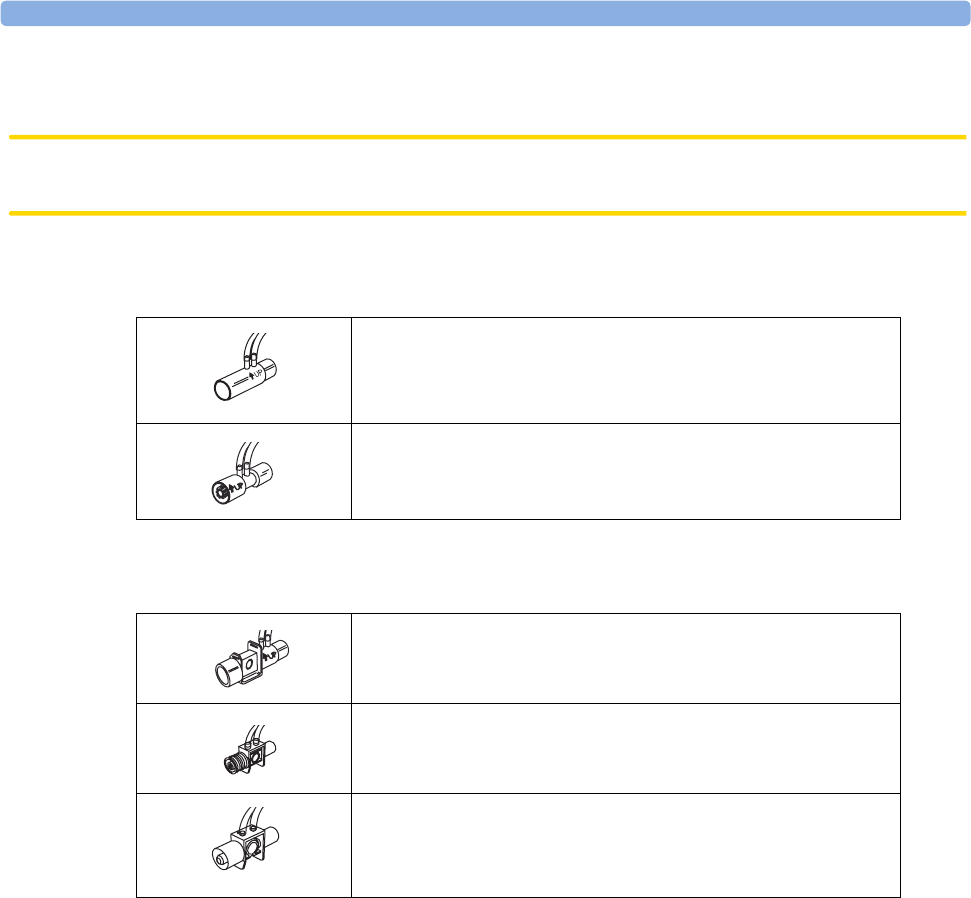
15 Monitoring Airway Flow, Volume and Pressure Attaching the Flow Sensor
188
Attaching the Flow Sensor
CAUTION Use the M1014A Spirometry Module with Philips approved accessories only. Refer to the instructions
for use provided with the accessory.
1Select the appropriate flow sensor. Make sure that you are using the correct sensor for the respective
patient category. Otherwise accuracy may be reduced.
You can also use combined CO2/flow sensors. Note that the M3014A Capnography Extension is
required to measure CO2.
2If you are using a combined CO2/Flow sensor, connect it to the CO2 sensor head first. The airway
adapter clicks into place when seated correctly.
3Click the connector into place in the flow sensor receptacle on the monitor before connecting to
the breathing circuit.
4Install the flow sensor or the combined CO2/Flow sensor at the proximal end of the breathing
circuit between the elbow and the ventilator Y-piece. Make sure that the spirometry sensor is in a
horizontal position with its tubing pointing upwards. The correct position is also indicated by an
arrow on some of the sensors. (Graphic shows combined CO2/Flow Sensors).
Pediatric/Adult Flow Sensor (M2785A). Color: clear
For intubated patients with endotracheal tube diameters >4 mm. Adds
approximately 6.5 cc of deadspace.
Infant/Neonatal Flow Sensor (M2786A) Color: violet
For intubated patients with endotracheal tube diameters ≤ 4 mm.
Adds less than 1 cc of deadspace.
Pediatric/Adult Combined CO2/Flow Sensor (M2781A). Color: clear
For intubated patients with endotracheal tube diameters >5.5 mm.
Adds 8 cc of deadspace.
Pediatric Combined CO2/Flow Sensor (M2783A): Color: green
For intubated patients with endotracheal tube diameters of 3.5 -
6 mm. Adds less than 4 cc of deadspace.
Infant/Neonatal Combined CO2/Flow Sensor (M2782A).
Color: violet
For intubated patients with endotracheal tube diameters of 2.5 -
4 mm. Adds less than 1 cc of deadspace.
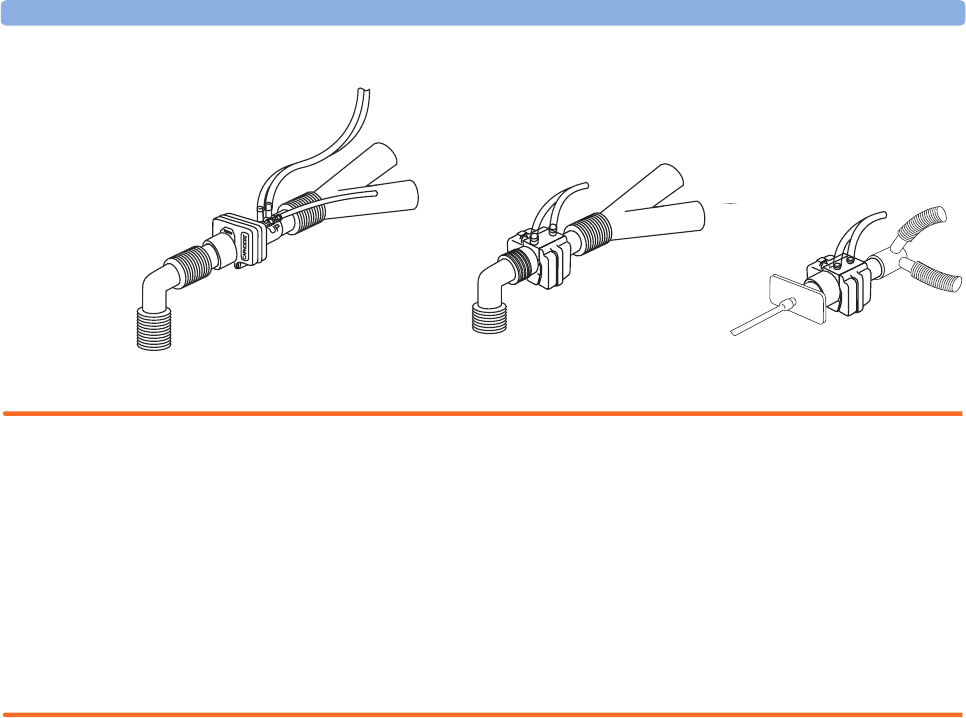
Attaching the Flow Sensor 15 Monitoring Airway Flow, Volume and Pressure
189
WARNING To prevent stress on the endotrachial tube, support the sensor and airway adapter.
Position sensor cables and tubing carefully to avoid entanglement or potential strangulation. Do not
apply excessive tension to any cable or tubing.
Replace the sensor, if excessive moisture or secretions are observed in the tubing and cannot be
removed by a purge cycle.
Reuse poses a patient hazard. Do not disassemble, clean, disinfect or sterilize the sensor.
A system leak may significantly affect readings of flow, volume, pressure and other respiratory
mechanics parameters.
Do not leave the sensor in the patient circuit when not connected to the monitor.
NOTE • Do NOT place the airway adapter between the endotrachial tube and the elbow (pediatric/adult
circuit), as this may allow patient secretions to block adapter windows.
• The striped tubing of the flow sensor should always be proximal to the patient.
• Position the airway adapter with the spirometry tubing pointing upwards.
• To prevent “rain-out” and moisture from draining into the airway adapter, do NOT place the airway
adapter in a gravity dependent position.
• Periodically check the flow sensor and tubing for excessive moisture or secretion build up. Perform a
purge cycle if droplets are visible within the sensor or tubing. Repeat if necessary. If purging does not
remove the droplets, replace the sensor.
• For routine performance of airway care, separate the system between the endotrachial tube and the
airway adapter (neonatal circuit), or between the endotracheal tube and elbow (pediatric/adult
circuit). Lavage and suctioning of the airway can then be performed without fluids and mucous
accumulating on the airway adapter windows.
• Measurement values provided by a ventilator may differ significantly from the values provided by
the spirometry module, due to different locations of the flow sensor.
• Incorrect entry of gas compensation parameters (i.e. temperature, gas composition) may reduce the
accuracy of the measured values.
Pediatric/adult sensor Pediatric sensor Infant/Neonatal sensor
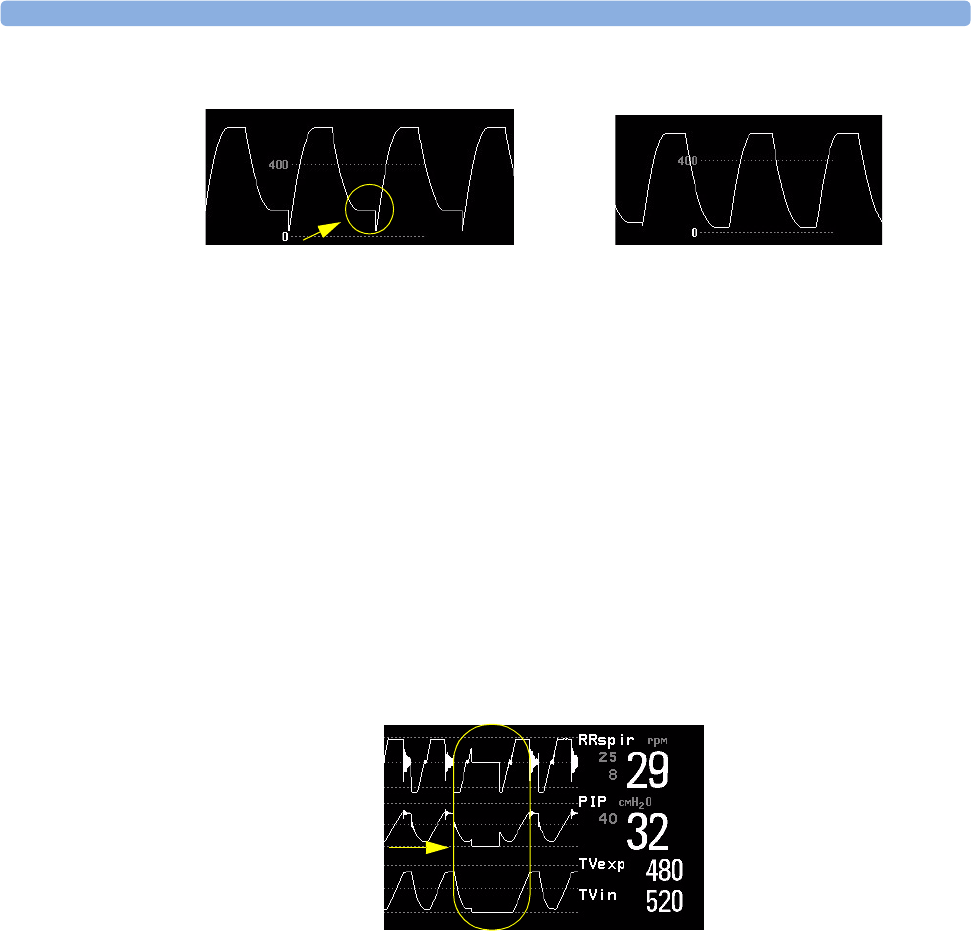
15 Monitoring Airway Flow, Volume and Pressure Zero Calibration
190
• A volume waveform as displayed below on the left may be an indicator of an air leak:
In general, if MVexp or TVexp are significantly smaller than MVin or TVin, the tubing should be
checked for leaks.
Zero Calibration
The zero calibration maintains the accuracy of the spirometry waves and numerics by regularly
compensating for drifts within the measurement section. It is performed automatically without user
interaction and takes about 2 seconds to complete. The automatic zero calibration is normally carried
out every ten minutes. During warm-up or when the ambient pressure changes, this interval may be
reduced to two minutes.
During the zero calibration the waveform is flat but the numerics remain on the screen. Typically, a
zero calibration is started at the beginning of a respiration cycle, therefore a waveform may begin
normally and then immediately become flat for the time of the zero calibration.
Automatic Purging
A double lumen connecting line (tubing) connects the flow sensors to the patient monitor. The
M1014A Spirometry Module includes an automatic and manual purge feature which provides a flush
of room air to keep the sensor tubing free from water condensation and patient secretions. This feature
is available for the adult, pediatric, and neonatal modes. The purge will begin with the exhalation
portion of the ventilator cycle.
NOTE • During the purge cycle the pump will be heard
• If the purge does not sufficiently clear the flow tubing lines, the flow sensor should be replaced
• With each purge cycle, a zero calibration is automatically performed
Abnormal waveform due to leak Normal waveform
Zero Calibration

Manual Purging 15 Monitoring Airway Flow, Volume and Pressure
191
Adult Mode
The system automatically purges the sensor tubing every ten minutes or less, depending on system
conditions. In adult mode, the system will purge both sides of the line, one at a time, during each
purge cycle. The higher the pressure, the more frequent the purging. This action anticipates increased
moisture migration into the sensor tubing due to the increase in circuit pressure.
Neonatal and Pediatric Modes
The automatic purge cycles used in the neonatal or pediatric mode is fixed at every three minutes
regardless of circuit pressure. Only one side of the sensor tubing will be purged during each purge
cycle.
Unlike the adult purge mode, the neonatal or pediatric purge mode does not use the full force of the
internal pump, but rather pressurizes an internal reservoir which is used for the purge. This minimizes
the pressure delivered to the ventilator circuit, but does deliver a sufficient pressure to purge the sensor
tubing.
Manual Purging
Occasionally, purging may be required in between the automatic purge cycles. The manual purge may
be used as often as needed. Check the orientation of the flow sensor if repeated manual purge cycles
become necessary.
To manually purge, press the Purge button on the module (marked by on international
versions of the module) or select Purge in the Setup Spirometry window to initiate a combined
purge and zero cycle.
Gas Compensation
Temperature and the proportions of individual gases influence the flow measurement. If values seem
inaccurately high or low, check that the monitor is using the appropriate gas compensation. Gas
compensation can be done using either manually entered gas concentrations or gas concentrations
from the gas analyzer.
NOTE If you unintentionally switch the gas compensation to the incorrect setting, the accuracy of the
measured flow and volume values may be significantly reduced. The tables below show examples of
incorrect gas compensation settings and the resulting inaccuracies:
Table 1 Incorrect Balance Gas Setting (N2O instead of N2)
N2O2N2OAgent Difference between measured
and actual values
Actual Gas Composition 60 40
Gas Compensation Setting 40 60 15%
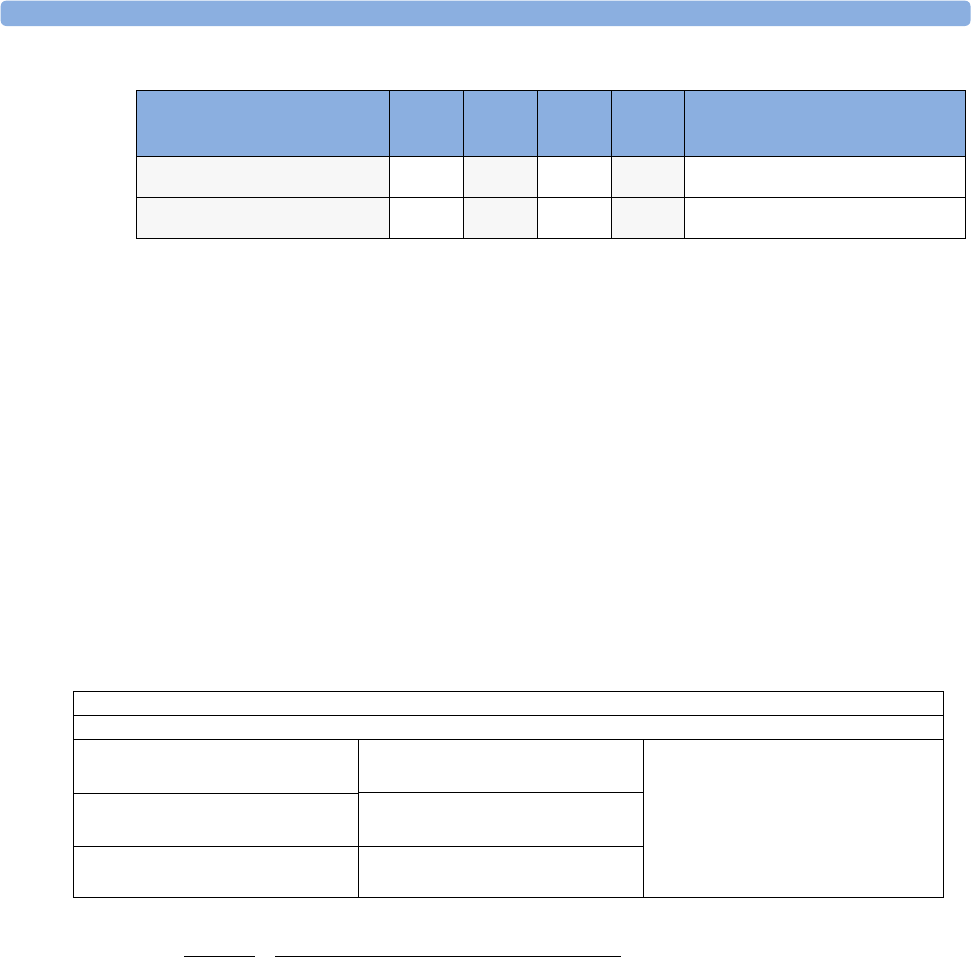
15 Monitoring Airway Flow, Volume and Pressure Setting up Spirometry
192
Table 2 Incorrect Agent Percentage Setting
Setting up Spirometry
The following settings can be accessed through the Setup Spirometry menu.
Optimizing Scale Settings
In the Setup Spirometry menu, select Optimize Scales.The scale settings for all three
spirometry waves (AWF, AWP, AWV) will be optimized.
Spirometry Values Window
You can view all spirometry measurement data in the spirometry data window. In the Setup
Spirometry menu, select Show All Values.
Figure 1 Example for Spirometry Values Window
Alarms and Alarm Limits
Alarms can be derived from PEEP, PIP, MV and RRspir. In the Setup Spirometry menu you
can set the alarm limits. Please refer to the Alarms chapter of this manual for details on alarm settings.
Changing the Apnea Alarm Delay
This determines the time limit after which the monitor alarms if the patient stops breathing.
1In the Setup Spirometry menu, select RRspir.
2In Setup RRspir menu, select Apnea Time.
3Choose the apnea alarm delay time.
N2O2N2OAgent Difference between measured
and actual values
Actual Gas Composition 55 40 5
Gas Compensation Setting 60 40 015%
Spirometry
Adult/Pedi Flow Sensor
RRspir 10 rpm MVexp 7.2 l/min PIP 31 cmH2O
I:E 1: 1.9 MVin 7.3 l/min PEEP 4 cmH2O
COMP 24 ml/cmH2O TVexp 720 ml MnAwP 17 cmH2O
Raw 4 cmH2O/l/s TVin 720 ml Pplat 30 cmH2O
PEF 8 l/min NgInsP -5 cmH2O
PIF 12 l/min

Setting up Spirometry 15 Monitoring Airway Flow, Volume and Pressure
193
WARNING Safety and effectiveness of the respiration measurement method in the detection of apnea, particularly
the apnea of prematurity and apnea of infancy, has not been established.
WARNING If an apnea occurs during a zero calibration, the time delay between the start of apnea and the
activation of the apnea alarm could be up to 10 seconds plus the configured apnea delay time.
Automatic Alarm Suppression
If the automatic alarm suppression is switched on, all spirometry alarms are suppressed until breathing
activity has been detected. This setting must be made in configuration mode.
Choosing Measured AWV Components
1In the Setup Spirometry menu, select AWV.
2Select MV to choose the measured components for Minute Volume
(inspiratory and/or expiratory or off).
Select TV to choose the measured components for Tidal Volume
(inspiratory and/or expiratory or off).
NOTE If MV and TV are set to off, there will be no alarming for these parameters.
Setting the Gas Compensation Mode
1In the Setup Spirometry menu, select Gas Compensation.
2Select Mode to choose the Gas Compensation mode:
–select
Manual for manually entered gas concentrations or
–select
Gas Analyzer for gas concentrations from the gas analyzer.
NOTE • Gas concentrations from the gas analyzer are only available for Philips gas analyzers, not for devices
connected via the Vuelink module.
• If gas concentrations from the gas analyzer are selected but not all data is available, the missing data
is taken from manually entered values. In case of invalid data or no data at all, the INOP message
SPIRO GAS COMPENS? is displayed.
Changing the Type of Balance Gas
1In the Setup Spirometry menu, select Gas Compensation.
2Select Balance Gas to change the type of balance gas.
3Select the appropriate setting (N2 or N2O).
Changing the Concentration of Inspired O2 and the Inspired Agents
1In the Setup Spirometry menu, select Gas Compensation.
2Select Inspired O2 to change the concentration of inspired O2.
Select Inspired Agent to change the concentration of the inspired agent(s).

15 Monitoring Airway Flow, Volume and Pressure Setting up Spirometry
194
3Select the appropriate setting.
Changing the Temperature of the Inspired Gas
Depending on the type of ventilator environment (e.g. if you are using a Heat Moisture Exchanger)
you may want to change the temperature setting of the inspired gas:
1In the Setup Spirometry menu, select Gas Compensation.
2Select Inspired Temp to change the temperature of the inspired gas.
3Select the appropriate temperature setting.
NOTE Changing the temperature setting unintentionally will result in approximately 3% reduced accuracy
per 10°C ( 18°F) temperature setting change.
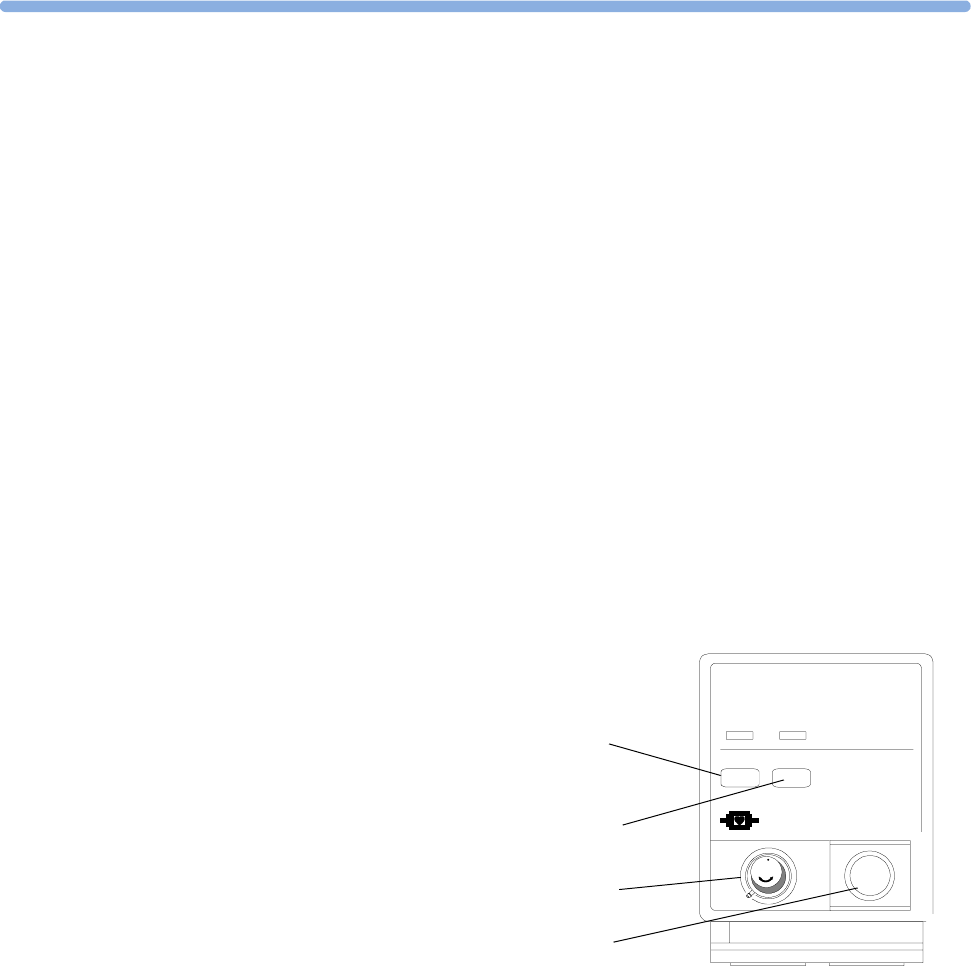
195
16
16Monitoring tcGas
The tcGas module measures the partial pressure of the oxygen and carbon dioxide that diffuses through
the skin, thereby providing a measure of these gases in the capillary blood.
The monitor’s settings for altitude and barometric pressure influence the measurement. The tcpO2/
tcpCO2 measurement is valid for an infant patient not under gas anesthesia. Anesthetic agents, such as
halothane, can cause incorrect or drifting readings.
Transcutaneous measurements cannot replace arterial blood gas monitoring. However, you can use
transcutaneous monitoring to reduce the frequency of arterial sampling. The values at tissue level will
not be the same as those measured arterially because the measurement is transcutaneous. They correlate
with (track closely) the arterial values. For example, a drop in transcutaneous values usually indicates a
corresponding drop in arterial values.
Transcutaneous values will not always correlate with blood samples taken from the capillary blood of
the heel (heelsticks or astrups).
Identifying tcGas Module Components
1 press to enter Setup tcGas menu
2 press to start calibration
3 calibration chamber
4 transducer connector
M1018A
80 x 70
1
2
3
4
tcGas
O2/CO2 CAL

16 Monitoring tcGas Setting the tcGas Sensor Temperature
196
Setting the tcGas Sensor Temperature
1In the Setup tcGas menu, select Transducer Temp.
2Choose a temperature value appropriate for your patient’s age, weight and physical condition in
accordance with your hospital policy.
Usually, a higher transducer temperature gives a better correlation and a quicker response time.
However, higher temperatures also increase the risk of skin burns. Most physicians prefer a
temperature between 42°C (107° F) and 44°C (111° F), and a site time of four hours or less.
Usually, the higher the transducer temperature, the less the site time should be. Whenever you
change the temperature setting, the monitor forces you to make a new calibration.
Using the tcGas Site Timer
Availability and behavior of the site timer depend on your monitor’s configuration.
WARNING Prolonged continuous monitoring may increase the risk of undesirable changes in skin characteristics,
such as irritation, reddening, blistering or burns. If the site timer is disabled, the transducer will heat
indefinitely while on a patient. Change the site regularly, in accordance with medical procedures in
your hospital.
Setting the tcGas Site Timer
The site timer helps reduce the risk of skin burn by ensuring that the transducer is used at one site for
no longer than a predefined period. It reminds you when this period expires.
1In the Setup tcGas menu, select Site Time.
2Choose the time you want the transducer to remain on the measurement site. The optimum time
depends on the transducer temperature and your patient’s skin sensitivity.
The site timer starts automatically when you remove the calibrated transducer from the calibration
chamber. If you return the transducer to the chamber and then remove it again, the site time continues
to count down the remaining time; it does not start a new time period. The time remaining before the
site timer expires appears in the status line which is visible as long as the Setup tcGas menu is
open. When the time expires, the monitor sounds a tone and a displays a change site INOP. The
monitor either switches off the transducer heating or continues monitoring, depending on its
configuration. Although you can reuse the transducer for up to two hours after the heating is switched
off, without making a new calibration, you are recommended to recalibrate before applying it to a
patient. After two hours without heat, you must recalibrate.
During the initial few minutes of use, the monitor eliminates false alarms by temporarily suppressing
tcGas alarms. It displays the “STABILIZING” INOP. After you apply the transducer to the skin, the
instrument reading slowly assumes a steady value. The reading stabilizes when the measurement site is
warm and local hyperemization is complete. This takes 10 to 20 minutes for the tcpO2 reading and
three to seven minutes for tcpCO2.

Setting the tcGas Barometric Pressure 16 Monitoring tcGas
197
Restarting the tcGas SiteTimer
To restart the site timer without recalibration (for example, after the site time has elapsed):
1In the Setup tcGas menu, select Site Time.
2Enter and confirm your desired time.
Disabling the tcGas Site Timer
Depending on your monitor’s configuration, you might be able to disable the site timer. Remember,
this means that the transducer heats indefinitely while on a patient.
1In Setup tcGas menu, select Site Timer and switch this to Disabled.
2Select the Confirm popup key.
Setting the tcGas Barometric Pressure
Altitude and barometric pressure affect tcGas values. The monitor derives barometric pressure from its
altitude setting. If you want to set the true barometric pressure you must do this before starting a
calibration - changes after calibration do not influence tcGas values. The monitor remembers this
pressure setting until you enter a new one.
1In the Setup tcGas menu, select AmbientPress.
2Enter the current barometric pressure reading indicated by your barometer.
3Select the Confirm popup key.
Remembraning the tcGas Transducer
CAUTION The tcGas transducer is thin and flexible. You must treat it with care. Avoid kinking, bending or
pulling the cable.
Remembrane the transducer if the electrolyte in your transducer has dried out or:
• if the transducer is new
• if you are using the transducer with a new patient
• if the membranes are damaged (scratched or wrinkled)
• after five days of continued use or 28 days of storage.

16 Monitoring tcGas Remembraning the tcGas Transducer
198
5Remove any surplus electrolyte solution on the outside of the membranes with a soft tissue.
6Make sure that the new membranes are secured by two O-rings on the transducer. If any air
bubbles are visible under the membranes, repeat this procedure - air bubbles will cause incorrect
readings.
7After 24 hours you can calibrate the transducer. You must remembrane all new and dried out
transducers twice before calibration.
New/Dried Out Transducers
Remembrane all new or dried out transducers twice before using. After the first remembraning, unplug
the transducer from the module and leave it for 24 hours with the cap on. Remembrane again before
calibrating.
Storing tcGas Transducers
If you need to store a sensor for more than 24 hours, protect it for up to 28 days by putting two drops
of electrolyte solution into the cap. Screw the cap on the sensor. Remembrane if it dries out or after 28
days.
1Unscrew the protection cap from the transducer and
hook the O-ring remover under both O-rings to remove
them.
2Remove both of the clear plastic membranes using your
fingers.
3Clean the transducer head, including the groove and
rim, with absorbent paper to remove all old electrolyte
(old electrolyte causes incorrect values) and apply
approximately two drops of electrolyte solution to the
transducer head.
4Press the transducer head downwards into an unused
membrane replacer until the replacer retracts as far as it
can and you hear a click. Discard used replacer.
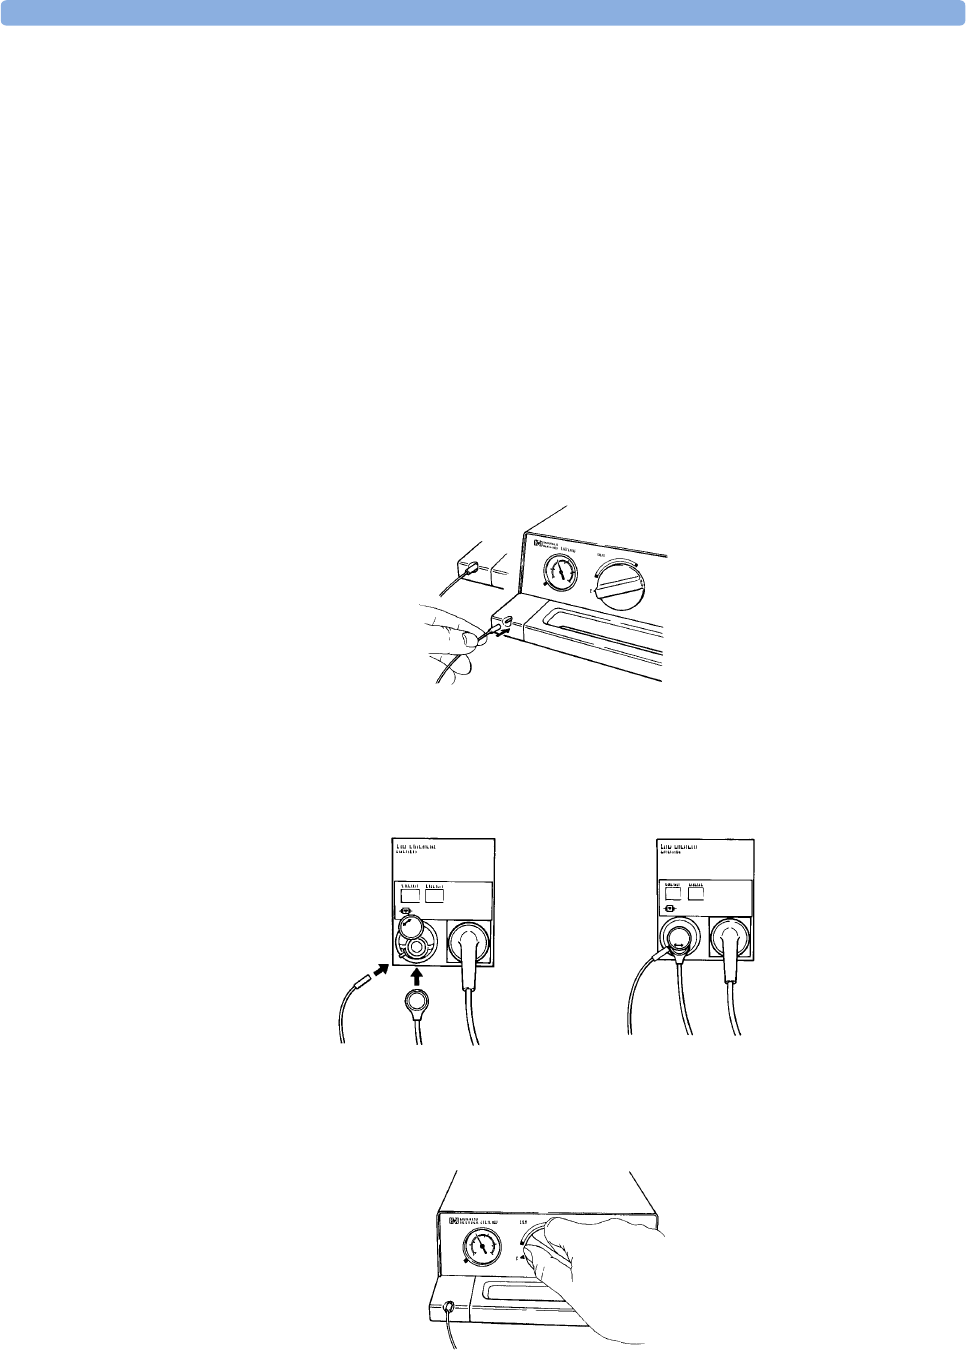
Calibrating the tcGas Transducer 16 Monitoring tcGas
199
Calibrating the tcGas Transducer
You can use either a Philips (15210B) or a Radiometer TCC3 calibration unit and a gas cylinder whose
pressure indicator is above the ‘out-of-gas’ zone (black on 15210B, red on TCC3). To maintain
accuracy, it is recommended to calibrate the transducer every four hours, even if the monitor does not
prompt you to do so. You MUST calibrate when:
• you remembrane the transducer
• you change the transducer heat setting
• you doubt the measurement accuracy
• you start a new monitoring period or use a new site
• the monitor displays the “calibration required” INOP message.
1Connect the calibration unit to the inlet on the side of the module’s calibration chamber using the
recommended gas tubing. Different tubing will cause inaccurate measurements.
2Plug the transducer cable into the module. Swing the calibration chamber cover open and insert
the transducer into the chamber. Close the cover to secure the transducer. Set the transducer
temperature at the monitor now.
3On the 15210B calibration unit, turn the timer control clockwise as far as you can. On the
Radiometer calibration unit, press the button with the green arrow once.

16 Monitoring tcGas Calibrating the tcGas Transducer
200
4Press CAL on the module until the light above the key comes on and wait (three - 20 minutes) for
the “calibration complete” message to appear on the monitor. Alternatively, in the Setup tcGas
menu, select Start Calibration. To save gas on 15210B, if the timer control dial is not in the
start position when the monitor displays the calibration complete message, turn the dial counter-
clockwise to the start position. For TCC3, if the green light is still flashing when INOP “tcGas
CalRunning” disappears, press the green arrow button again.
Calibration Failure
If calibration fails, the monitor displays “...tcGas transducer or Cal Unit malf” and the
CAL FAILED INOP for the measurement.
Troubleshooting tcGas Calibration
Perform each of the following steps, in order, until calibration is successful.
1Check the calibration unit, then recalibrate, remembering to turn on the gas supply on the
calibration unit. If the pressure indicator reading is in the out of gas zone, there is insufficient gas
in the cylinder. Connect the gas tubing firmly to the calibration unit and to the module’s
calibration chamber.
2If Step 1 fails, check whether you need to activate the transducer (necessary if the electrolyte has
dried out or if you have a new transducer). Remembrane the transducer, removing the old
membranes, and cleaning the transducer head thoroughly.
3Calibrate a second time.
4If Step 2 is unsuccessful, calibrate again. This calibration may be required to stabilize the
electrochemical system in the transducer.
5Only if the above steps are unsuccessful (you have activated and remembraned the transducer and
calibration has still failed twice), replace the transducer.
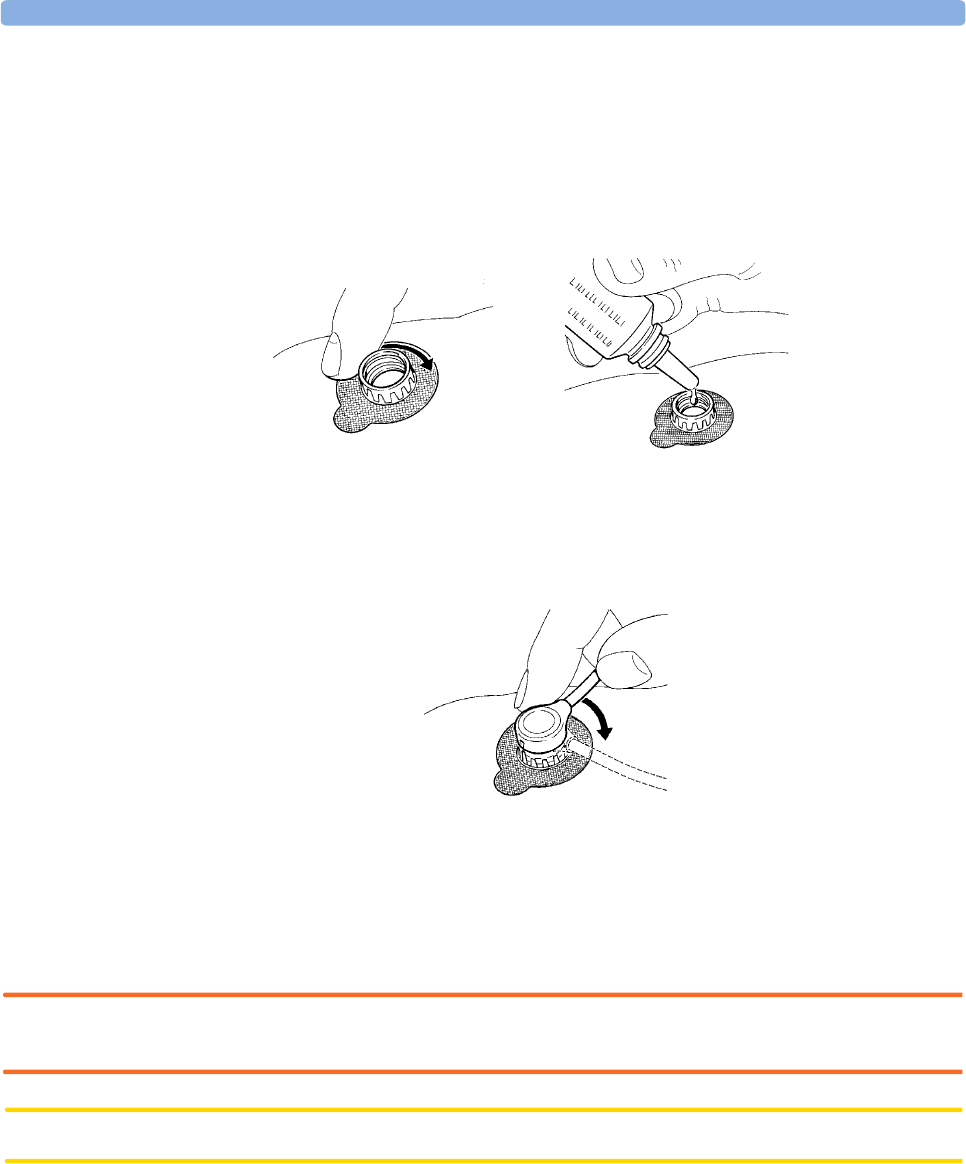
Applying the tcGas Transducer 16 Monitoring tcGas
201
Applying the tcGas Transducer
1Peel protection film from fixation ring. Using a finger, press the sticky side of the ring on to clean,
dry skin. Press around the outside to ensure a good seal. Apply three to five drops of contact fluid
in the ring’s center. Remove transducer from chamber.
2Align the arrow on the transducer with the tab on the ring and fasten by turning turn a quarter-
turn clockwise. Wait 10-20 minutes for readings to stabilize.
3Apply the transducer as soon as possible after you see the “...calibration complete” message. If you
wait longer than 30 minutes, the heat supply to the transducer switches off to prevent the
electrolyte from drying out and a new calibration is necessary.
Optimize the measurement by selecting a site with high capillary density and blood flow, thin
epidermis and no cardiovascular disorders. Most physicians use the abdomen, chest and back.
WARNING You must either remove the transducer before defibrillating, or remembrane and calibrate the
transducer after defibrillating.
CAUTION To avoid transducer damage, remove it from the patient during high frequency surgical procedures.

16 Monitoring tcGas Finishing tcGas Monitoring
202
Selecting the tcGas HeatPowerDisplay Mode
The heat power display gives an indication of the skin’s perfusion below the transducer and of the
transducer’s contact with the skin. If the transducer loses contact, the heat power value drops
significantly. When perfusion is poor you need less heat power to maintain the transducer temperature.
♦In the Setup tcGas menu, select HeatPowerDisplay to toggle between Relative and
Absolute. Choose Relative when the skin temperature is stable (the STABILIZING INOP
disappears). This indicates subsequent changes in the relative heat power (and therefore changes in
perfusion or transducer contact) since the last zeroing.
Zeroing the tcGas Relative Heat Power
When you start a calibration, the HeatPowerDisplay is set to Absolute. When you switch to
Relative, it automatically zeros. Zero again if you change application site.
Finishing tcGas Monitoring
♦Replace the transducer in the calibration chamber.
When changing the application site after a measuring period, some users leave the fixation rings in
position to allow them to quickly move the transducer from site to site. Always unscrew the transducer
from the fixation ring before removing the fixation ring from the skin.
TcGas Corrections
Transcutaneous pCO2 values tend to be higher than arterial values due to the metabolic processes of
the skin and the effect of heating on the blood under the transducer. Depending on your monitor’s
configuration, one or both of these corrections may automatically apply.
Temperature Correction for tcpCO2
The transducer temperature causes an increase in partial CO2 pressure. Your monitor may be
configured to correct this.
♦In the Setup tcpGas menu, look at the menu item CO2 Correction. If correction is enabled,
it is set to On.
Metabolism Correction for tcpCO2
CO2 production in the epidermis increases the CO2 value. Your monitor may be configured to
automatically deduct a metabolism factor (only applies when CO2 Correction is on).
♦In the Setup tcGas menu, look at the value shown for the menu item MetabolismFactor.
This is deducted from the CO2 value.

203
17
17Monitoring SvO2
MP60/70/
80/90
monitors
only
The SvO2 module measures the percentage of mixed venous oxygen saturation continuously and
invasively using the Hospira, Inc. (formerly Abbott Laboratories) OptiCath family of catheters routed
via the right side of the heart into the pulmonary artery. Can be used only with the MP60/MP70/
MP80/MP90 monitors.
WARNING Injected dyes, such as methylene blue, or intravascular dyshemoglobin may lead to inaccurate
measurements.
Do not monitor oxygen saturation during infusion of I.V. fat emulsion or other turbid substances
through the distal lumen of the OptiCath catheter. These liquids might temporarily modify the blood
scattering and absorption characteristics at the catheter tip. This interferes with the optical
measurement of oxygen saturation. After infusion is complete, you can again monitor oxygen
saturation accurately.
During injection of the bolus for thermodilution cardiac output measurements, the SvO2
measurement might be disturbed.
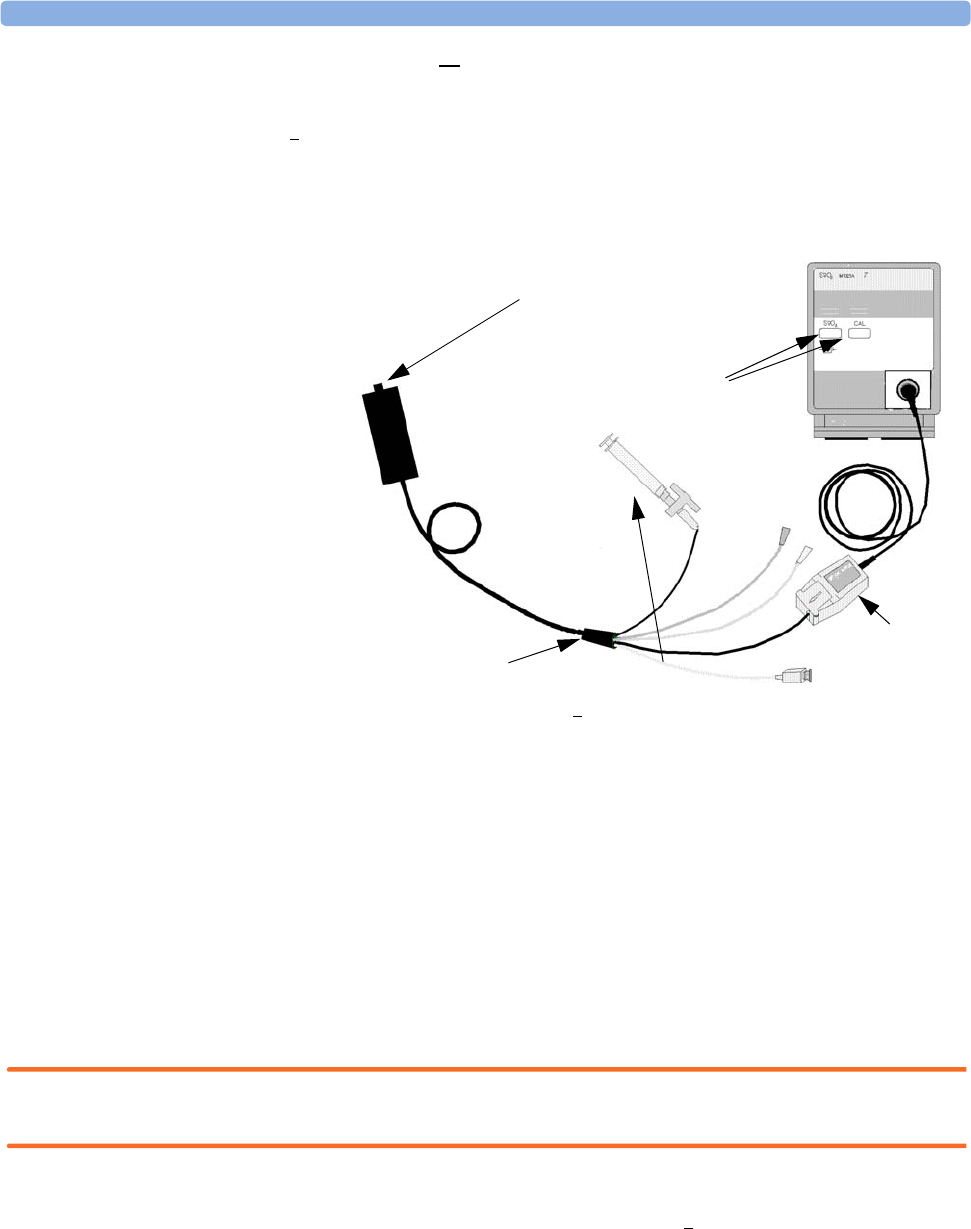
17 Monitoring SvO2Preparing to Monitor SvO2
204
Preparing to Monitor SvO2
In addition to an SvO2 module, you need a Hospira OptiCath catheter, and 50131 Optical Module.
Use only the Hospira accessories listed in the Accessories section.
Connect the optical module (Hospira 50131) to the SvO2 module. Allow the optical module to warm
up before you perform a calibration. Although the warm up message disappears from the screen after
one minute, Hospira recommends letting the optical module warm up for 15 minutes for best
accuracy. Please refer to the instructions for the optical module.
To avoid false alarms during the pre-insertion calibration and insertion of the catheter into the patient,
the monitor automatically suspends alarms during the pre-insertion calibration, for up to three minutes
after you remove the catheter tip from the optical reference. After light intensity calibration, or after
three minutes (whichever comes first), the monitor returns to the alarm state it was in prior to pre-
insertion calibration.
Carrying out a Pre-insertion Calibration
WARNING It is strongly recommended to carry out a pre-insertion calibration prior to all insertions. If this is not
possible, you must perform an in-vivo calibration after insertion.
Refer to the instructions for use that accompany the catheter. Do not use the catheter if the packaging
is damaged. If you have to disconnect the monitor from the patient (for example, when transferring the
patient from one location to another), you must disconnect at the SvO2 module. The catheter should
remain in the optical module, otherwise you need to recalibrate.
1Remove outer wrapping from catheter tray to uncover optical connector.
2Place the optical module on the catheter tray in the space provided and open the lid.
1optical module
2balloon
inflation
stopcock
3Hospira fiber
optic catheter
4optical
reference
5enter setup/
calibration
1
2
3
4
5

Inserting the Catheter 17 Monitoring SvO2
205
3Place the optical connector into the optical module (with the label “TOP” facing upwards) and
close the lid.
4In the Setup SvO2 menu, select Start Pre-InsCal. Ensure that the tip of the catheter is still
in the optical reference.
5Insert the catheter when you see the message SvO2 calibration completed - catheter
ready for insertion. If the calibration fails, repeat the calibration before inserting the
catheter. If it fails a second time, replace the optical module.
Inserting the Catheter
1Remove the inner cover of the catheter tray.
2Remove the catheter tip from the optical reference. Check the catheter's proper operation (for
example: the balloon tip).
3Prepare and insert the catheter in accordance with standard hospital practice.
The SvO2 catheter is thin and flexible, treat it carefully. Avoid kinking, bending or grasping the
catheter with forceps or a hemostat. Damage to the fiber results in low intensity light and sudden
decrease in intensity readings. Refer to the documentation provided with the fibre-optic catheter,
paying special attention to any precautions, warnings or contraindications.
Secure the optical module directly or in close proximity to the patient, to avoid placing excessive
tension on the catheter, which would result in movement of the catheter tip from the optimal position
in the patient. Position the optical module to avoid contact with liquids, because fluid entering the
catheter-optical module connection may impair light transmission.
If you place the catheter in the patient without performing the pre-insertion calibration, you must
perform an in-vivo calibration once the catheter is in place.
Performing a Light Intensity Calibration
Perform a light intensity calibration after the catheter is in its proper position. When the catheter is
positioned properly, the light intensity indicator must cover at least two small divisions above the
midpoint.
♦In the Setup SvO2 menu, select Start Light Cal.
Calibration is complete after a few seconds. If you doubt existing light intensity readings, recalibrate.
SvO2
80
60
67

17 Monitoring SvO2Performing In-Vivo Calibration
206
Performing In-Vivo Calibration
Perform an in-vivo calibration:
• if you place the catheter in a patient without performing a pre-insertion calibration.
• if the catheter was disconnected from the optical module.
• when the catheter has been in the patient for 24 hours.
• if any significant change in light intensity occurs that the monitor cannot correct automatically.
Setting Up the In-Vivo Calibration
Check for:
• proper positioning of the catheter in the patient.
• relatively stable oxygen saturation in patient.
• that the SvO2 light intensity indicator covers at least two divisions above the midpoint.
Making the In-Vivo Calibration
1Be prepared to draw a blood sample from the patient.
2In the Setup SvO2 menu, select Start In-VivoCal.
3To clear the distal lumen, draw off and discard at least 2 ml of blood before taking the sample.
4Draw a blood sample from the distal port of the catheter and flush the line according to standard
hospital practice.
5Obtain laboratory analysis of the sample using direct measurements.
6Compare the results with the stored calibration value displayed in the Setup SvO2 menu. If the
difference is less, or equal, to 4%, you can skip the next step.
7If there is a difference of more than 4% between the stored value and the laboratory value, select
CalibrationValue to adjust the stored value. Selecting Recall PreviousC recalls the
previously stored calibration value.
8Complete the calibration by selecting Store In-VivoCal (even if you did not adjust the
calibration value). This updates the data stored in the optical module.
Calculating Oxygen Extraction
Oxygen extraction is the difference between the measured SpO2 and SvO2 values. If you are
monitoring SpO2 and SvO2, the monitor can calculate this value and display it as a numeric.
♦To switch oxygen extraction calculation on or off, in the Setup Sp-vO2 menu, select Sp-vO2
and toggle between On and Off.
♦If more than one SpO2 value is available, you must choose which value is used in the calculation.
In the Setup Sp-vO2 menu, select SpO2 Source and select the required source.
If one of the calculation sources becomes unavailable, the monitor displays the INOP
Sp-vO2 CHK SOURCES for one minute. After this time, the calculation automatically switches off.
If the missing source becomes available again, the calculation automatically switches on again.

207
18
18Monitoring EEG
The Electroencephalograph (EEG) module monitors the patient’s cerebral function by measuring the
electrical activity of the brain. It provides the monitor with two channels of realtime EEG waves, EEG
trend information in the form of Compressed Spectral Arrays (CSA), and up to eight of the following
numerics:
Spectral Edge Frequency (SEF): The SEF is the frequency below which a defined percentage of the
Total Power lies. The percentage is set in Configuration Mode.
Mean Dominant Frequency (MDF): The MDF is the mean value of the frequency which dominates
the measured EEG.
Peak Power Frequency (PPF): The PPF is the frequency with the highest measured amplitude.
Tot a l Power (TP): The TP numeric indicates the power in the measured frequency band.
Percentage of total power in each frequency band:
–Alpha waves (8 to 13 Hz)
–Beta waves (13 to 30 Hz)
–Theta waves (4 to 8 Hz)
–Delta waves (0.5 to 4 Hz).
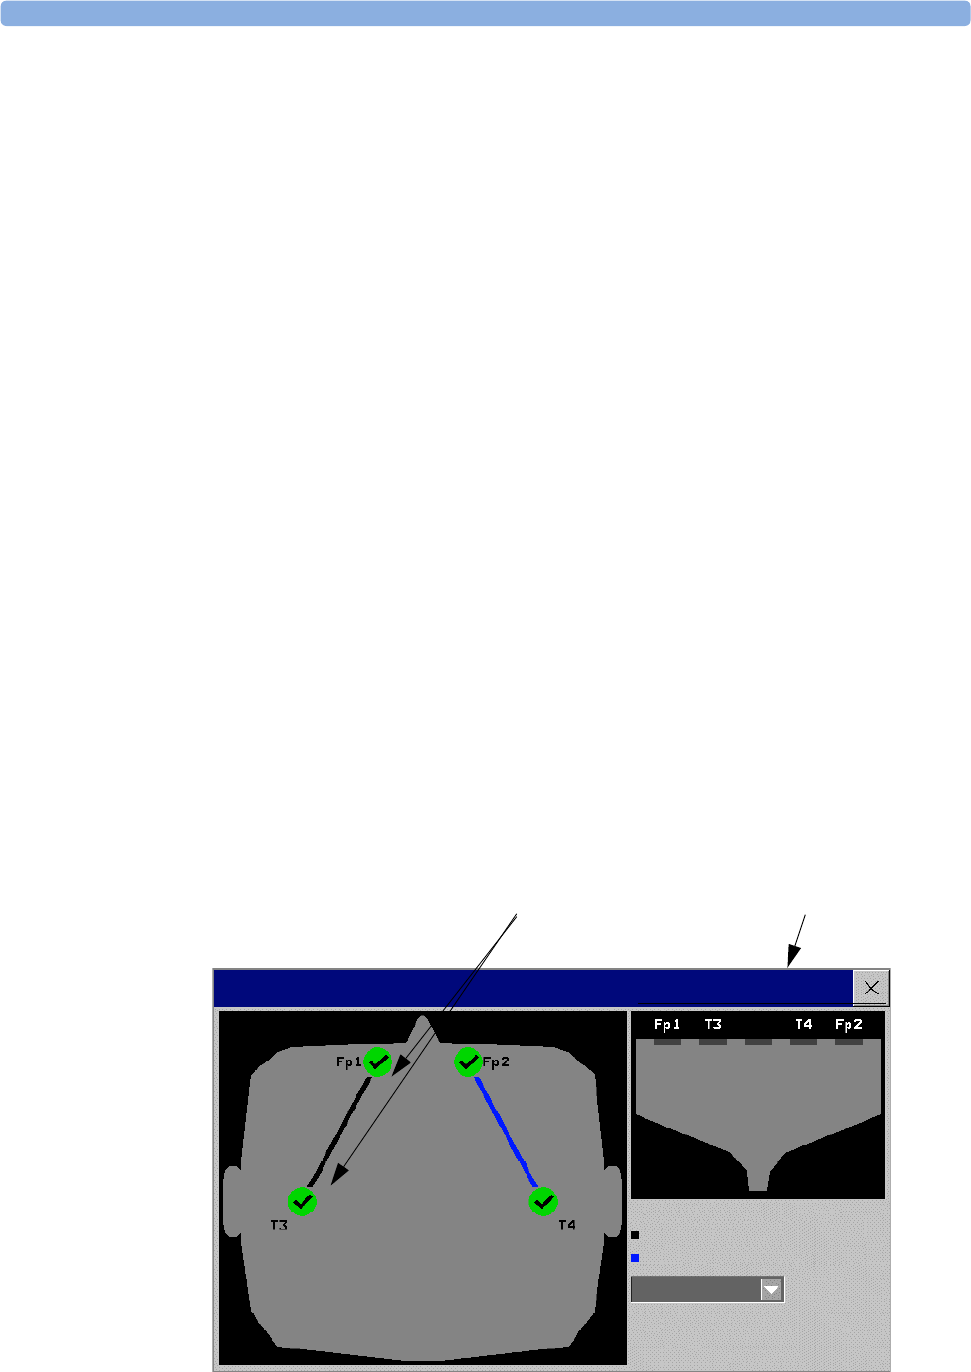
18 Monitoring EEG EEG Monitoring Setup
208
EEG Monitoring Setup
1Plug the trunk cable into the EEG module in the Flexible Module Server.
2Prepare the patient’s skin prior to placing the electrodes. Good electrode-to-skin contact is
important for a good EEG signal, as the skin is a poor conductor of electricity.
– Shave hair from sites, if necessary.
– Wash sites thoroughly with soap and water. We do not recommend using ether or pure alcohol,
because this dries the skin and increases the resistance.
– Use a skin preparation paste to remove skin cells and oil before placing the electrodes.
3Select the desired electrode montage in the Setup EEG menu or in the EEG Impedance/
Montage window.
4Attach the reference electrode first.
5Place the electrodes on the patient’s head according to the selected montage. Use electrode gel if
you are not using pre-gelled electrodes. Remember to select a site where the signal will not be
interfered with by muscle artifacts.
6Connect the electrode connector end to the trunk cable.
7Check the electrode-to-skin impedance in the EEG Impedance/Montage window.
8For good signal quality, keep all lead wires together and away from other electric devices and
metallic bodies.
Using the EEG Impedance/Montage Window
♦To open the window, in the Setup EEG menu, select Show Montage, or select the
EEG Montage SmartKey.
The window may be configured to look slightly different on your monitor.
ImpedanceLimit:5kOhm
Montage A
EEG 2: F4-P4
EEG 1: F3-P3
EEG Impedance/Montage
++
--
EEG 1 EEG 2
11 1 1
kOhm
Wiring and impedance values for the
selected montage
Electrode locations on the patient’s head. The symbols
represent the electrode-to-skin impedance.
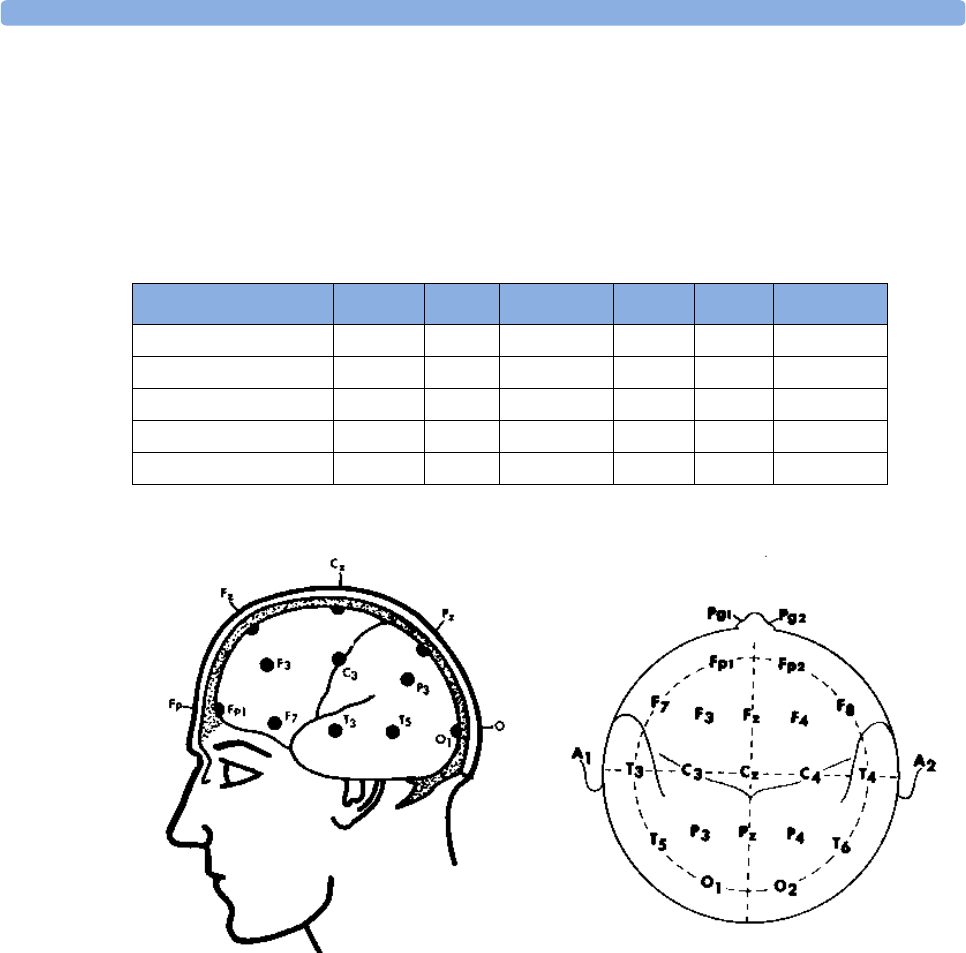
Using the EEG Impedance/Montage Window 18 Monitoring EEG
209
Choosing an EEG Electrode Montage
1To activate one of the five pre-configured electrode montages, select the arrow beside the label in
the EEG Impedance/Montage window and choose a montage from the list.
2Attach the electrodes as illustrated in the EEG Impedance/Montage window.
The five default electrode montage configurations can be modified and renamed in Configuration
Mode.
The electrode locations are labeled according to the international 10-20 electrode placement system.
Changing the Impedance Limit
The impedance limit can be set for all electrodes simultaneously in the Setup EEG menu, or in the
EEG Impedance/Montage window using the pop-up keys. If the limit is exceeded during
monitoring, an INOP will appear and the graphic impedance indicator will change.
To change the impedance limit, either
♦use the pop-up keys that appear with the EEG Impedance /Montage window, or
♦in the Setup EEG menu, select Impedance Limit to call up a list of selections between 1 and
30 kOhm, then select the required limit from this list.
Montage Name EEG1+ EEG1- Label1 EEG2+ EEG2- Label2
Mont.A Fp1 T3 Fp1-T3 Fp2 T4 Fp2-T4
Mont.B O1 T3 O1-T3 O2 T4 O2-T4
Mont.C F3 C3 F3-C3 F4 C4 F4-C4
Mont.D C3 P3 C3-P3 C4 P4 C4-P4
Mont.E Fp1 T5 Fp1-T5 Fp2 T6 Fp2-T6
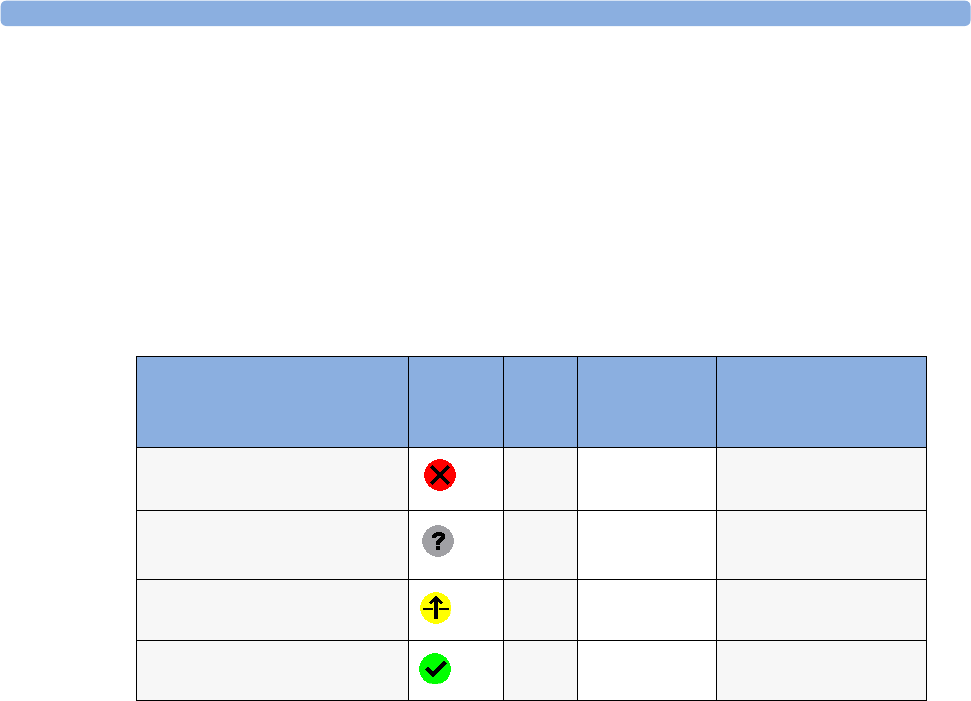
18 Monitoring EEG Using the EEG Impedance/Montage Window
210
About Electrode-to-Skin Impedance
Electrode-to-skin impedance is the main quality indicator for the measured EEG signal. During
normal EEG monitoring, electrode-to-skin impedance is measured continuously and disconnected
electrodes are detected. The impedance value for each single, independent signal electrode is displayed
in the EEG Impedance/Montage window. If the measured electrode-to skin impedance of one or
more electrodes is above the limit, an INOP will be issued.
For impedance measurement at least two electrodes, plus the reference electrode, must be connected.
Impedance Indicators
Electrode/Skin Impedance Symbol Color Displayed
Impedance
Value
Action
Electrode not connected red no value connect electrode
Noisy signal gray 60 kΩ (fixed) check electrode-to-skin
connections
Electrode connected, impedance
above limit
yellow measured value
(e.g 15 kΩ)
check limit, check
electrode-to-skin contact
Electrode connected, impedance
at or below limit
green measured value
(e.g. 3 kΩ) no action necessary
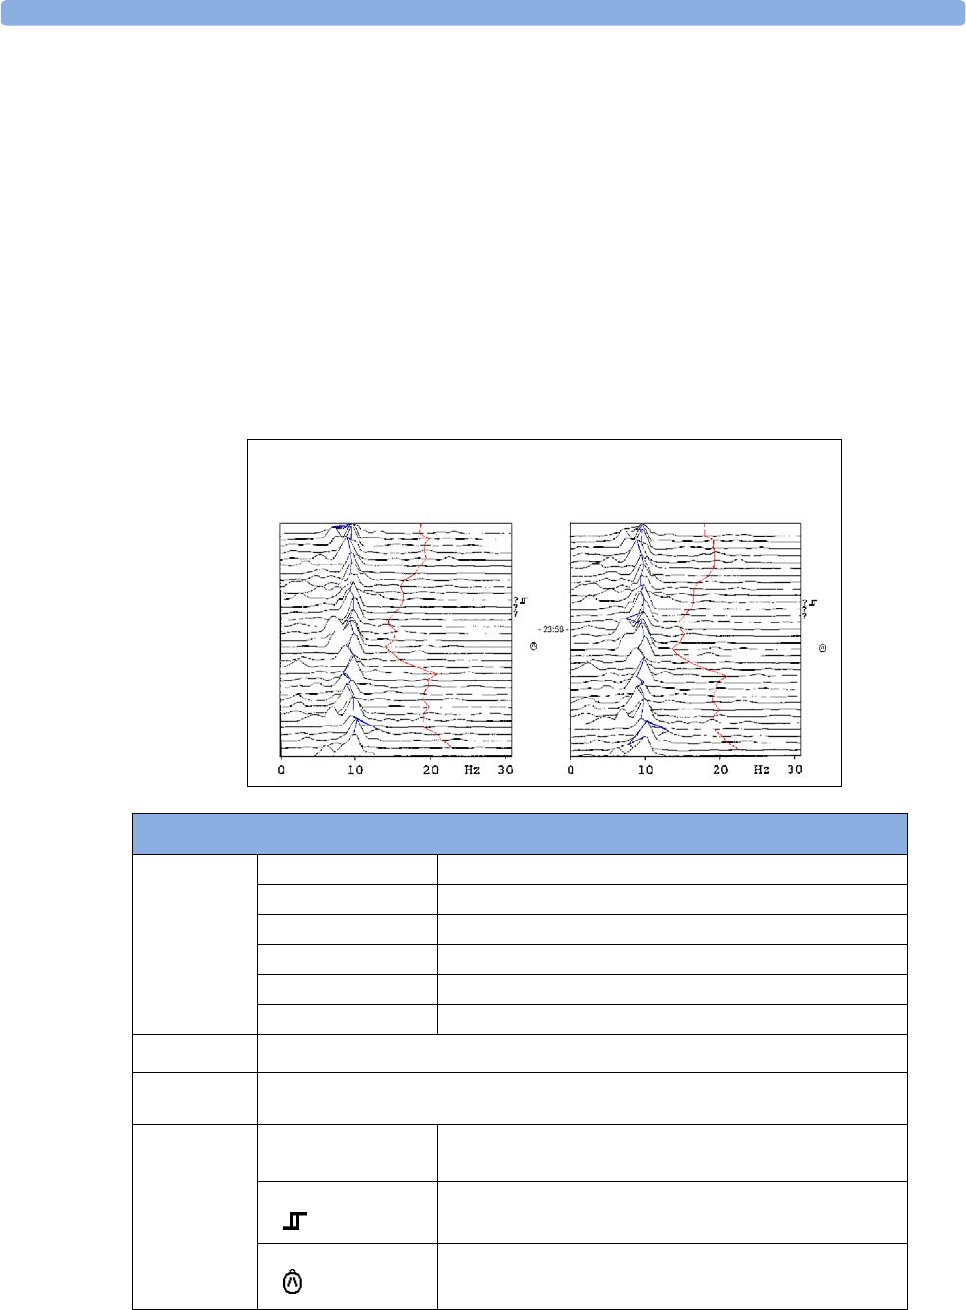
About Compressed Spectral Arrays (CSA) 18 Monitoring EEG
211
About Compressed Spectral Arrays (CSA)
The continuous EEG signal is sampled periodically and this value is stored in a frame. Each frame is
processed using Fast Fourier Transformation (FFT) to provide a frequency spectrum displayed as a
compressed spectral array (CSA).
The CSA window provides an overview of the patient’s EEG values over time. It may be configured to
look slightly different on your monitor.
♦To view the CSA window permanently embedded on a Screen, select a Screen configured to
display the CSA window.
♦To v ie w th e CSA window over the current Screen, select the EEG CSA SmartKey, if configured, or
select Setup EEG or Main Setup then Show CSA.
The CSA contains the following information
Status line Lead label for example, Fp1-T3, Fp2-T4
CSA label CSA1 or CSA2 according to EEG channel
Montage label for example, Montage A
Filter settings for example, 1-30 Hz
Buffer label and time the buffer and interval between spectral lines on the CSA
Current SEF Threshold can only be changed in Configuration Mode
Spectral lines The energy at each frequency is computed and displayed as a spectral line
Trendlines EEG values are sampled at configured time intervals and displayed as color-coded trendlines.
Trendlines are available for the three frequency numerics (SEF, PPF, MDF)
Annotations: INOP marker
Filter change marker
Montage change marker
Fp1-T3 Filter:0.5 - 30 Hz Montage: Montage A Fp2-T4
CSA1 Buffer: A (2 Sec) SEF (90%) PPF CSA2
?

18 Monitoring EEG Changing EEG Settings
212
Changing CSA Settings
When CSAs are shown embedded on the Main Screen, select the CSA to show the pop-up keys. When
the CSA is shown in a window over the current screen, the pop-up keys are always displayed.
Changing EEG Settings
Be aware that any changes made to EEG settings apply to both EEG channels.
Switching EEG Numerics On and Off
Each EEG numeric can be individually switched on or off in the Setup EEG menu.
1In the Setup EEG menu, select the numeric label.
2Select On/Off to toggle between the settings.
Changing the Scale of the EEG Waves for Display
This only changes the visual appearance of the wave. It does not affect the signal analyzed by the
monitor or printed in reports or recordings.
1In the Setup EEG menu, select Wave Scale to call up a list of wave scales.
2Select the required scale from this list.
Scaling information is displayed with each EEG wave.
•If
Show Gridlines is set to On in Configuration Mode, gridlines and the current wave scale
values are shown with the EEG wave.
•If
Show Gridlines is set to Off in Configuration Mode, the current wave scale is indicated by a
size bar beside the EEG wave.
Setup CSA This menu entry lets you
Buffer choose one of the three pre-configured buffers. A buffer defines the interval
between the spectral lines displayed in the CSA.
On/Off SEF/MDF/PPF switch the trendline of the specific numeric on or off

EEG Reports 18 Monitoring EEG
213
Changing Filter Frequencies
The low and high pass filters screen out undesirable interference from the raw EEG wave display. The
current EEG filter frequency settings are shown in the header of the CSA. Changing filter settings
affects the EEG wave and all the EEG numerics. Whenever the filter setting is changed, a filter change
marker appears next to the spectral lines.
To change the filter settings:
1In the Setup EEG menu, select Low Filter or High Filter to call up a list of available
frequencies.
2Select the required frequency from this list.
Changing the Speed of the EEG Wave
The EEG measurement has its own speed control and is not affected by the wave speed settings of the
other measurements.
♦In the Setup EEG menu, select Wave Speed. Choose the required speed from the pop-up list.
This defines the speed at which the wave is drawn across the screen in millimeters per second (mm/
s).
EEG Reports
The content of EEG Reports is always the same and does not need to be configured.
♦To print an EEG Report, in the Setup EEG menu, select Print Report.
Alternatively, you can select the CSA and use the Print Report pop-up key to start the report.
♦To modify the buffer and trendline settings on the CSA Report, in the Reports menu, select
CSA On EEG Rep.. If you do not change these settings, the monitor will use the default
settings SEF Trendlines: On, Buffer: C.
CSA on Report This menu entry lets you
Buffer choose one of the three pre-configured buffer times
Trend SEF/MDF/PPF switch the trendline of the specific numeric on or off

18 Monitoring EEG EEG Safety Information
214
EEG Safety Information
EEG Configuration and Monitor Upgrades The A.2 monitor release (software revision A.20.xx)
introduced a new feature that lets you rename EEG montages. It is not possible to clone EEG settings
between montages with different names, therefore all EEG settings are reset to factory defaults during
any upgrade/downgrade/cloning actions that mix releases/software revisions/configurations before A.2/
A.20.xx with subsequent versions. You must check that all EEG settings are correct before resuming
monitoring with a monitor that has been upgraded or cloned.
WARNING Do not touch the patient, or table, or instruments during defibrillation.
When connecting electrodes and/or patient cables, ensure that the EEG leads and connectors do not
come into contact with other conductive parts or earth.
High-frequency Surgery To reduce the hazard of burns in the high-frequency surgical neutral
electrode connection, the EEG electrodes should not be located between the surgical site and the
electro-surgical unit return electrode.
EEG and Electrical Interference
CAUTION Interference from a non-grounded instrument near the patient and electrosurgery interference can
cause problems with the waveform and the CSA.
Radiated field strengths above 1 V/m and patient signals ≤ 50 µV may cause noise on the EEG waves
at various frequencies. Therefore, it is recommended to avoid the use of electrical radiating equipment
in close proximity to the patient monitor. The noise does not influence the measurement accuracy.
Interference from ECG can be eliminated by adjusting the low filter settings.

215
19
19Monitoring BIS
Bispectral Index monitoring helps to monitor the level of consciousness of a patient under general
anesthesia or sedation in the OR and ICU. The BIS sensor is placed on the patient’s forehead to
capture electroencephalographic (EEG) signals from which several numerics are derived, including a
single BIS value representing the level of consciousness. See the chapter on Specifications for the BIS
intended use statement.
The BIS Module or BIS Interface board (for MP20/MP30) provides the monitor with an EEG wave
and the following numerics:
Bispectral Index (BIS). The BIS numeric reflects the patient’s level of consciousness. It ranges from
100 (fully awake) to 0 (suppression; no electrical brain activity).
Signal Quality Index (SQI). The SQI numeric reflects signal quality and provides information about
the reliability of the BIS, SEF, TP, SR, and Bursts numerics during the last minute.
It ranges from 0 to 100%:
SQI < 15%: the numerics cannot be derived
SQI 15% to 50%: the numerics cannot be reliably derived
SQI 50% to 100%: the numerics are reliable.
Electromyographic Activity (EMG). The EMG numeric reflects the electrical power of muscle
activity and high frequency artifacts.
EMG < 55 dB: this is an acceptable EMG
EMG ≤ 30 dB: this is an optimal EMG
(note that the minimum possible EMG is approximately 25 dB).
Suppression Ratio (SR). The SR is the percentage of time over the last 63-second period during
which the EEG is considered to be in a suppressed state.
Spectral Edge Frequency (SEF). The SEF is the frequency below which 95% of the Total Power is
measured.
Tot a l Power (TP). The TP numeric indicates the power in the frequency band 0.5 to 30 Hz. The
useful range is 30 - 100 dB.
Bursts (BISx module used with the Extend Sensor only) The Bursts numeric helps you quantify
suppression by measuring the number of EEG bursts per minute, where an EEG burst is defined as a
period of activity followed and preceded by inactivity (at least 0.5 second).
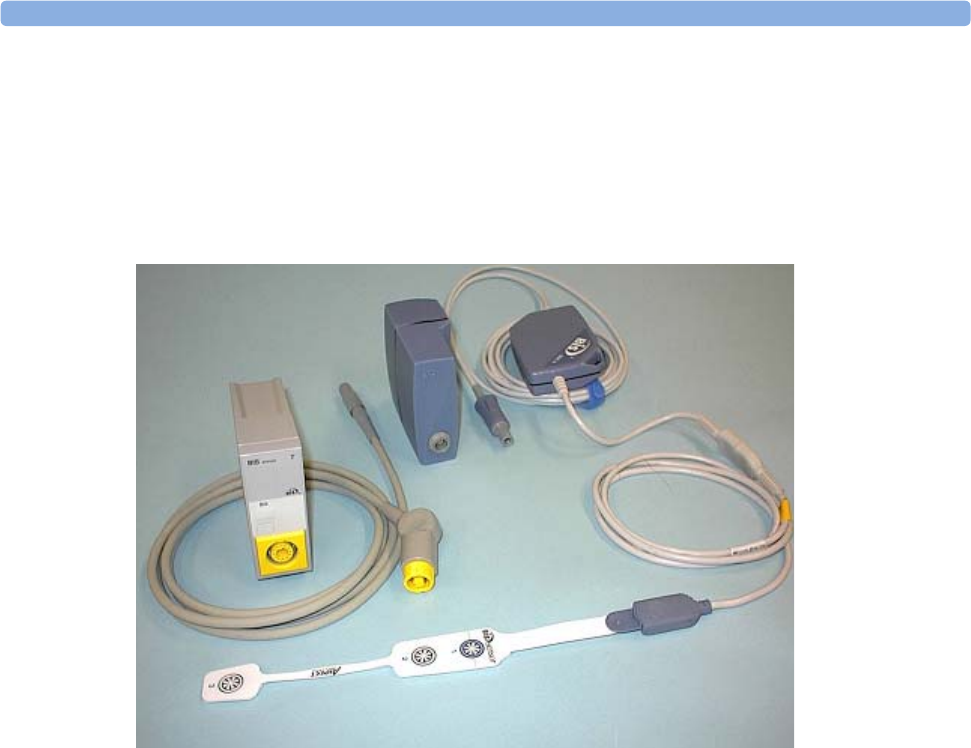
19 Monitoring BIS BIS Monitoring Setup
216
BIS Monitoring Setup
There are two BIS solutions available for use with the M1034A BIS module: using the DSC and BIS
engine or using the BISx.
Monitoring BIS Using the DSC and BIS Engine
1If you are monitoring BIS with the DSC and BIS engine,
a. Connect the BIS engine to the BIS module using the BIS Engine Cable.
b. Connect the digital signal converter (DSC) to the digital signal converter port on the front of
the BIS Engine. Use the attachment clip to secure the digital signal converter near, but not
above the patient’s head.
c. Attach the patient interface cable (PIC) to the digital signal converter (DSC).
2Attach the BIS sensor to the patient following the instructions supplied with the sensor.
Make sure that the patient’s skin is dry. Be aware that a wet sensor or a salt bridge may cause
erroneous BIS and impedance values.
A variety of sensors are available for use in the OR and ICU environments: see the chapter on
accessories for information.
3Connect the BIS sensor to the patient interface cable.
As soon as a valid sensor is detected, the impedances of all electrodes are measured automatically
and the results are shown in the BIS window.
Aspect BIS Sensor
Aspect
BIS Engine
185-0111
BIS
Module
Aspect Patient
Interface Cable
186-0131
Aspect
Digital Signal
Converter
185-0124
BIS
Engine
Cable
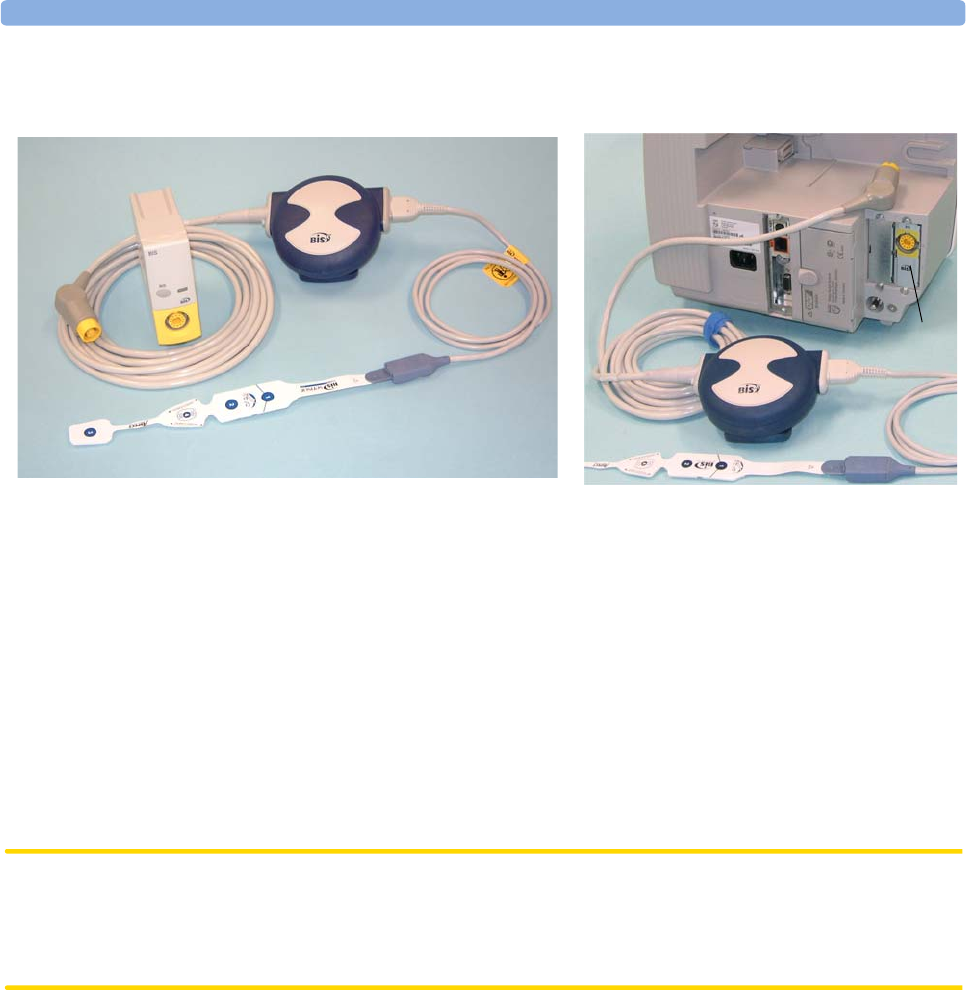
BIS Monitoring Setup 19 Monitoring BIS
217
Monitoring BIS using the BISx
1If you are monitoring BIS using the BISx,
a. Connect the BISx device to the BIS module or BIS Interface board connector (MP20/MP30)
b. Use the clip on the rear of the BISx device to affix it in a position convenient for your patient,
not above the patient’s head.
2Attach the BIS sensor/BIS electrodes to the patient following the instructions supplied with the
sensor.
Make sure that the patient’s skin is dry. Be aware that a wet sensor or a salt bridge may cause
erroneous BIS and impedance values.
A variety of sensors are available for use in the OR and ICU environments: see the chapter on
accessories for information.
CAUTION Ensure that the BISx does not come into prolonged contact with your patient’s skin, as it may generate
heat and cause discomfort.
The BISx may remain connected to a patient during defibrillation as long as the sensor is not located
between the defibrillator pads.
3With sensors for single-patient use:
a. Attach the patient interface cable (PIC) to the BISx device.
b. Connect the BIS sensor to the PIC.
With Semi Re-usable Sensors:
a. Attach the sensor cable to the BISx device.
b. Snap the sensor cable onto the electrodes.
As soon as a valid sensor is detected, the impedances of all electrodes are measured automatically
and the results are shown in the BIS window. The number of uses remaining for the semi re-usable
sensor is shown in the status line when the BIS window is open.
Aspect BIS Sensor
Aspect Patient
Interface Cable
186-0131
Aspect BISx
185-0145-PH
BIS Module
Aspect BIS Sensor
Aspect BISx
185-0145-PH
BIS Interface
Board

19 Monitoring BIS BIS Continuous Impedance Check
218
Manufacturer’s Information
BISx, the BIS Engine, the DSC, the Patient Interface Cable and the BIS Sensors are manufactured by
Aspect Medical Systems.
BIS Continuous Impedance Check
This checks:
• the combined impedance of the signal electrodes plus the reference electrode.
This is done continuously and does not affect the EEG wave. As long as the impedances are within
the valid range, there is no notification of this check or its results.
• the impedance of the ground electrode.
This is done every ten minutes and takes approximately 4 seconds. It causes an artifact in the EEG
wave, and the message Ground Check is shown on the monitor screen during the check. If the
ground electrode does not pass this check, another check is started. This continues until the ground
electrode passes the check.
If the Continuous Impedance Check interferes with other measurements, it can be switched off. To do
this:
1In the Setup BIS menu, select Cont.Imp.Check.
2Select On/Off to toggle between the settings.
CAUTION Switching the continuous impedance check off will disable automatic notification to the user of
impedance value changes, which may lead to incorrect BIS values. Therefore, this should only be done
if the check interferes with or disturbs other measurements.
When a Semi-reusable Sensor is in use the continuous impedance check cannot be switched off. If it is
switched off when the sensor is connected, it will automatically be switched on again.
BIS Cyclic Impedance Check
This measures the exact impedance of each individual electrode. It causes a disturbed EEG wave, and
the INOP BIS IMPEDANCE CHCK is shown on the monitor screen during the check.
Starting a Cyclic Impedance Check
The Cyclic Impedance Check is automatically started when a sensor is connected. To manually start a
Cyclic Impedance Check:
♦select Cyclic Check in the BIS Setup menu to toggle between On and Off, or
♦select Start Cyclic Check in the BIS window.
Stopping a Cyclic Impedance Check
The Cyclic Impedance Check stops automatically if the impedances of all electrodes are within the
valid range. To manually stop a Cyclic Impedance Check:
♦select Cyclic Check in the BIS Setup menu to toggle between On and Off, or
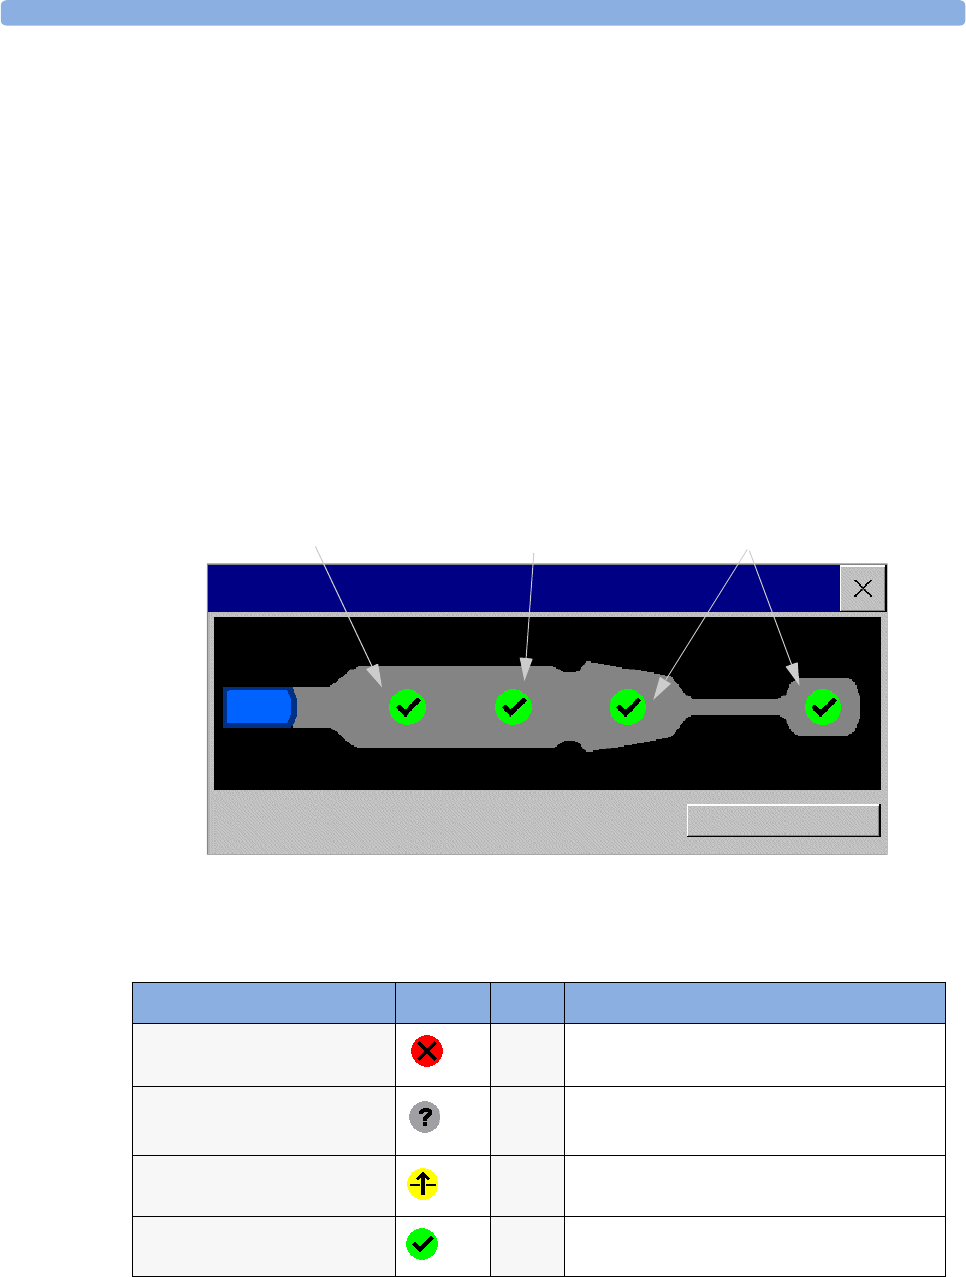
BIS Window 19 Monitoring BIS
219
♦select Stop Cyclic Check in the BIS Impedance Check Window.
If you stop a Cyclic Impedance Check before the ground electrode has passed, a ground electrode
impedance check will be started automatically. This cannot be switched off.
BIS Window
♦To open the BIS window, in the Setup BIS menu, select Show Sensor.
The window may look slightly different on your monitor. The graphic in the BIS Window
automatically adapts to show the type of sensor you are using, showing three or four electrodes as
required. Each symbol in the graphic represents an electrode and illustrates the most recently-measured
impedance status of the electrodes. Although BIS may still be measured when the electrode status is red
or yellow, for best performance, all electrodes should be green.
In addition, if the measured electrode-to skin impedance of any electrode or electrode combination is
above the limit, or if disconnected electrodes are detected, an INOP will be issued, either BIS HIGH
IMPEDANCE or BIS LEAD OFF.
BIS Impedance Indicators
Cyclic Check: 15 May 11:05 Start Cyclic Check
BIS - Quatro Sensor
Reference Electrode Ground Electrode Signal Electrode(s)
Time of the most recent cyclic check
Electrode-to-Skin Impedance Symbol Color Action
Electrode has no skin contact red Reconnect electrode, or check the sensor-to-
skin contact. If necessary, clean and dry skin.
To o m uc h s i g n a l n o i s e ,
impedance cannot be measured
gray Check sensor-to-skin contact. Press sensor more
firmly to skin. If necessary, clean and dry skin.
Impedance above limit yellow Check sensor-to-skin contact. Press sensor more
firmly to skin. If necessary, clean and dry skin.
Impedance within valid range green No action necessary

19 Monitoring BIS Changing the BIS Smoothing Rate
220
Changing the BIS Smoothing Rate
The smoothing rate defines how the monitor averages the BIS value.
♦To change the smoothing rate, in the Setup BIS menu, select BIS Smoothing Rate then
choose either:
– 15 seconds: this provides increased responsiveness to changes in the patient’s state.
– 30 seconds: this provides a smoother BIS trend with decreased variability and sensitivity to
artifacts.
Switching BIS and Individual Numerics On and Off
To switch the BIS measurement on or off:
♦In the Setup BIS menu, select BIS to toggle between On and Off.
To switch individual numerics provided by the BIS Module on or off:
♦In the Setup BIS menu, select SQI, TP, SEF, SR, EMG, or BURSTS to toggle between On and
Off.
Changing the Scale of the EEG Wave
Changing the scale only changes the visual appearance of the wave. It does not affect the signal
analyzed by the monitor or printed in reports or recordings.
The scale information shown depends on whether gridlines are switched on or off for display. This
setting can only be changed in Configuration Mode.
1In the Setup BIS menu, select Change Scale to call up a list of wave scales.
2Select the required scale from this list.
• When gridlines are switched off, you can choose from the available scale values: 50 µV, 1 0 0 µV,
200 µV, a n d 5 0 0 µV. Scaling information is displayed as a vertical bar on the EEG wave together
with its height equivalent in µV.
• When gridlines are switched on, scales are defined as a range, either ± 25 µV, ± 50 µV, ± 100 µV,
or ± 250 µV. Scaling information is shown in the form of gridlines.
Switching BIS Filters On or Off
The low and high pass filters screen out undesirable interference from the raw EEG wave display. The
notch filter removes line frequency interference. Filter settings affect the EEG wave and the SEF and
TP values, but they do not affect the BIS, EMG, SR, and SQI values.
The filter settings are set in Configuration Mode. You can switch all the filters on or off together in
Monitoring Mode.
1In the Setup BIS menu, select Filters.
2Select On/Off to toggle between all filters On or Off.

BIS Safety Information 19 Monitoring BIS
221
BIS Safety Information
For information on the use of BIS in specific monitoring situations and on pharmacological responses
to the anesthetic agents Nitrous Oxide (when used as the sole anesthetic agent), Ketamine, and
Etomidate, please contact Aspect Medical Systems to request a copy of their publication “A Clinician’s
Guide to the Bispectral Index®”.
Considerations for Use Due to limited clinical experience in the following applications, BIS values
should be interpreted cautiously in patients with known neurological disorders, those taking
psychoactive medications, and in children below the age of 1.
WARNING Conductive Parts The conductive parts of sensors and connectors should not contact other
conductive parts, including earth.
High-frequency Surgery To reduce the hazard of burns in the high-frequency surgical neutral
electrode connection, the BIS sensor should not be located between the surgical site and the electro-
surgical unit return electrode.
Defibrillation The BIS sensor must not be located between defibrillator pads when a defibrillator is
used on a patient connected to the patient monitor.
Securing Cables To minimize the risk of patient strangulation, the patient interface cable (PIC) must
be carefully placed and secured.
CAUTION Revisions The system will only function if all component revisions are compatible. Otherwise, an
incompatibility INOP is displayed.
If the DSC has an older software revision than the BIS Engine, the DSC will automatically be
upgraded by the BIS Engine. Do not disconnect the DSC from the BIS Engine, or disconnect the BIS
module from the monitor, or switch the monitor power off within the first ten seconds after
connection, as this will disrupt a possible software upgrade and cause damage to the DSC.
The BIS Interface board for the MP20/MP30 can only be used with BISx, not with the BIS engine. If
the BIS engine is connected to the MP20/MP30 a BIS ENGINE INCOMPT INOP will be issued.
Impedance Checks Impedance checks may influence data acquisition of other
electroencephalographic devices.

19 Monitoring BIS BIS Safety Information
222

223
20
20Trends
Trends are patient data collected over time and displayed in graphic or tabular form to give you a
picture of how your patient’s condition is developing. Trend information is stored in the trends
database for continuously-monitored measurements, such as ECG, as well as for aperiodically-
measured parameters, such as Cardiac Output.
Viewing Trends
Trend information can be viewed embedded as a screen element on specially-designed Screens, or you
can open a trend window over the current Screen.
♦To view trends embedded as a screen element, select the Screen name in the monitor info line to
enter the Change Screen menu, then select a Screen designed to show an embedded trend
window.
♦To open the tabular trends window over the current Screen, select the Vitals
Trend SmartKey.
♦To open the graphic trends window over the current Screen, select the Graph
Trends SmartKey.
The trend windows open displaying the most recent data and are updated as new data
is stored. A timescale along the bottom of the screen shows you where you are in the
trends database. The preview column on the right-hand side shows the latest available
measurement value. The preview column is updated every five minutes or whenever an
NBP or other aperiodic measurement is completed.
A question mark (?) beside a value means that the data may not be reliable, due perhaps to an INOP
condition in the measurement.
Your monitor screen may look slightly different to the examples shown here.
Vital
Graph
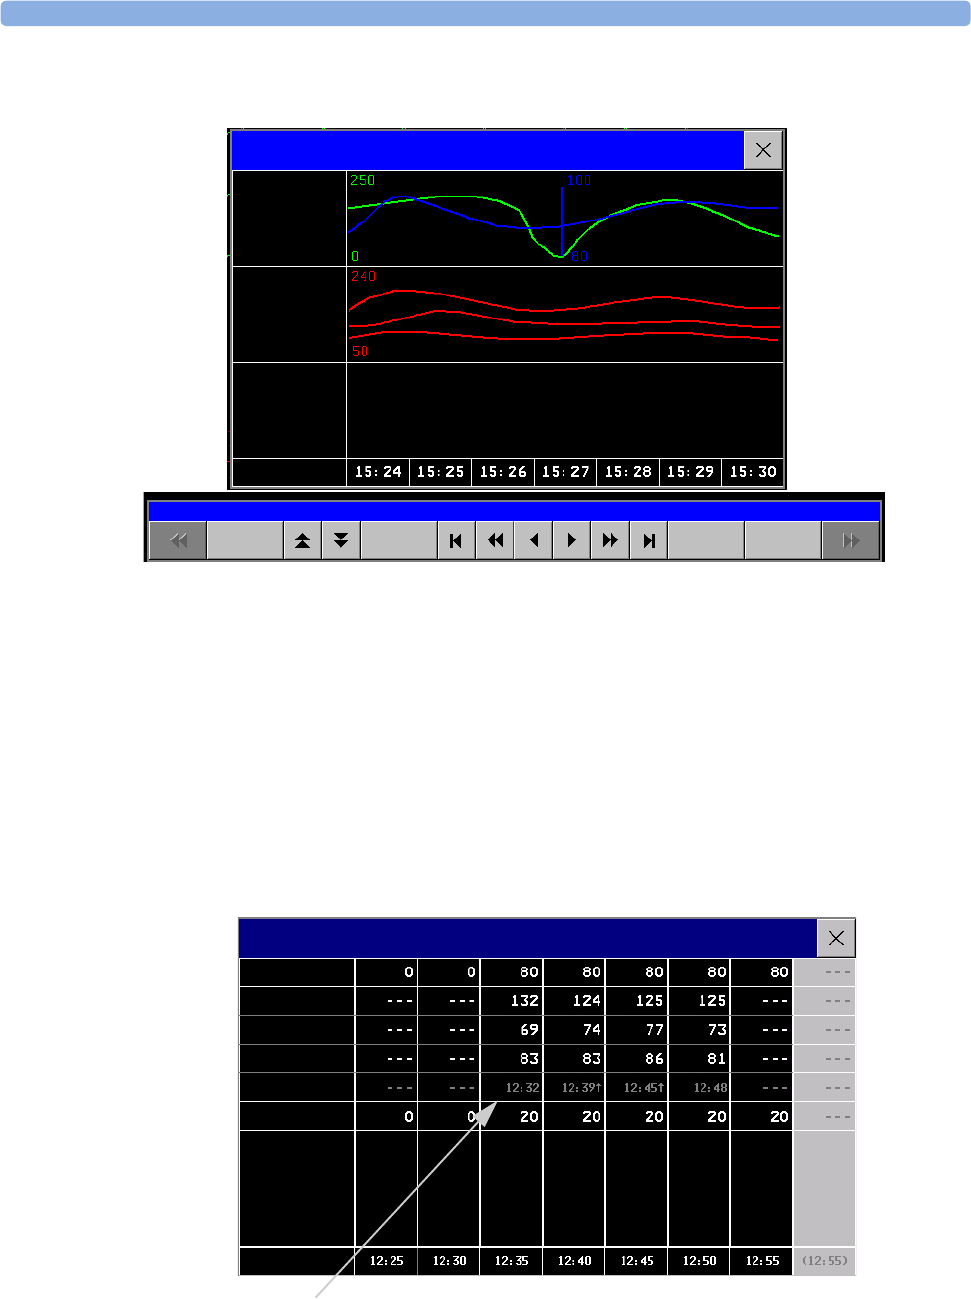
20 Trends Viewing Trends
224
Viewing Graphic Trends
A cursor spanning all measurements in the trend group helps you to navigate through the trends
database and shows you your current position in the database. When the cursor is moved across the
time line, the values measured at the cursor time are shown in the right hand column.
In graphical trends, aperiodic measurement trends are shown as an asterisk, NBP has a special symbol.
To use the trend cursor to navigate in time through the trends database,
1Select the graphical trend or the arrow pop-up keys to activate the cursor.
2Use the arrow pop-up keys to move the trend cursor backwards and forwards in time, or
3Place the cursor at a specific time by touching the graph.
Viewing Vital Signs Trends
Graphical Trends: All
Select
Group
Vital
Signs
Print
Select
Interva
Graphical Trends
HR
SpO2
ABP
9 Apr
Aperiodic values are shown with
a timestamp
Vital Signs: Standard
HR
NBPs
NBPd
NBPm
RR
20 Feb
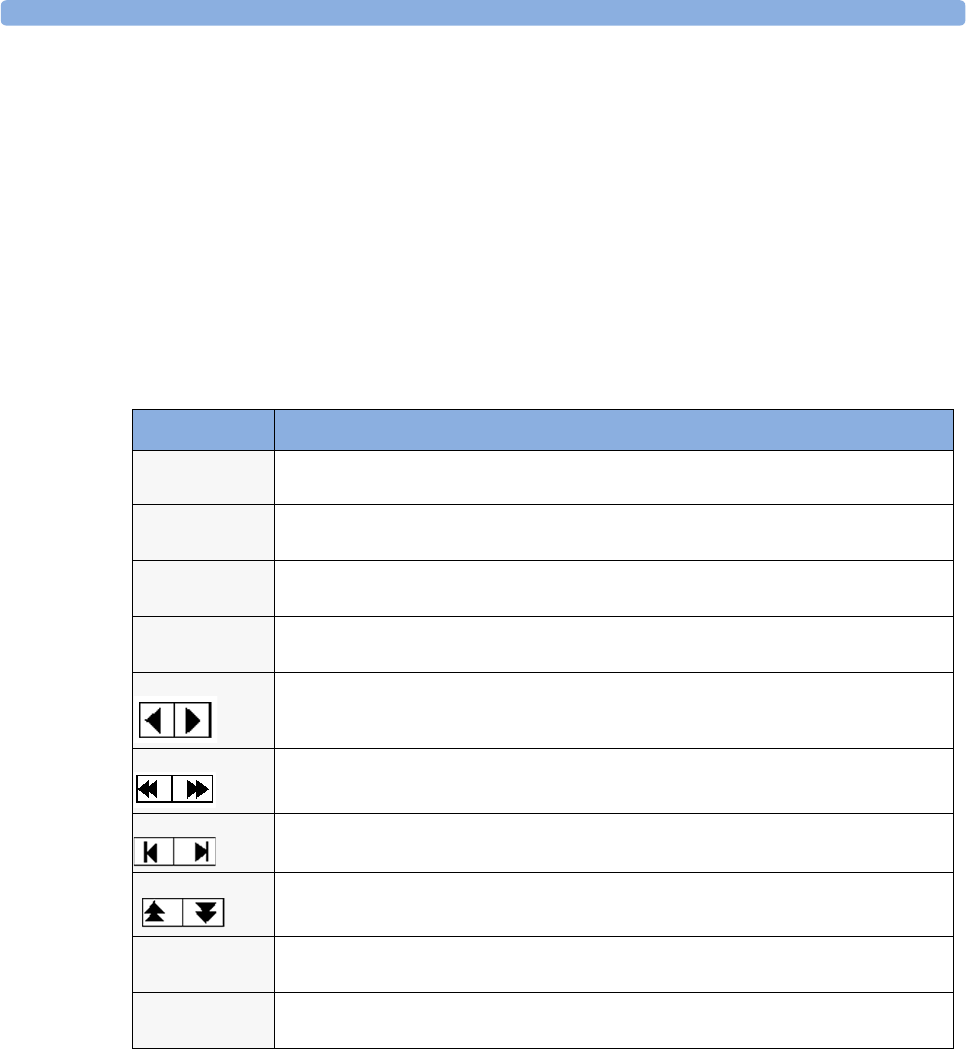
Setting Up Trends 20 Trends
225
The currently-selected column is highlighted. The values can be configured to display in the same
colors as the waves and numerics on the realtime display.
Any values available for display before the next scheduled update are shown in the right hand column,
with a timestamp in brackets
If more than one value is available for an aperiodic trend for a certain trend period, all measured values
are stored in the database and the value closest to the timestamp is shown in the Vital Signs display
marked with an arrow.
Trends Pop-Up Keys
When you open the trends window, a selection of pop-up keys appears to let you navigate through the
stored trend data and carry out trends-related tasks.
Setting Up Trends
Trends are set up in Configuration Mode. You can make temporary changes to trends settings such as
trend groups, priorities, or scales in Monitoring Mode. The general settings for all Trends are under
Main Setup -> Trends.
Settings for a single segment in graphical trends or for the corresponding trend group can be made
more easily in that segment menu.
Pop-Up Keys Selecting this pop-up key lets you....
Select
Group
see a pop-up list of trend groups and select a group for viewing.
Select
Interval
see a pop-up list of available data resolution settings and select the level of detail shown
in the trend view.
Print/
Record
print a tabular trends report or make a tabular trend recording of the data in the
current window. The report will use the current trend interval settings.
Print print a graphic trends report of the data in the current window. The report will use the
current trend interval settings.
move the cursor one step to the left or right to navigate through the trends database
timeline.
move the cursor one page to the left or right to navigate through the trends database
timeline.
jump to the beginning or the end of the trends database to see the most recent or oldest
trend information stored.
scroll up and down the screen to see measurement trends that do not fit in the current
view.
Vital
Signs
open the current trend view in tabular form. The displayed time period and resolution
stay the same.
Graph
Trends
open the current trend view in graphic form. The displayed time period and resolution
stay the same.

20 Trends Setting Up Trends
226
Making Segment Settings
The Graphical Trends window is divided into measurement segments, each of which has its own
settings.
To enter the segment menu,
♦select the left hand column of the segment, where the measurement label is displayed.
Expanded View
To expand the segment to fill the Graphical Trends window,
♦in the Segment menu, select Expand to have that segment enlarged to fill the window.
In the expanded view, you can also highlight a measurement to make it more easily visible (for example
when multiple ST trends are in one segment). To highlight a measurement,
♦in the Segment menu, select Highlight repeatedly until the highlight is on the required
measurement.
To return the segment to its original size,
♦in the Segment menu, select Expand again.
Trend Scales for Segment Measurements
To change the trend scales for a measurement in the current segment:
1In the segment menu, select the measurement label
2Select Upper to change the upper limit of the scale or Lower to change the lower limit of the
scale.
Optimum Scale
To have the monitor automatically select an optimum scale for viewing, based on current values,
♦in the Segment menu, select Optimum Scale.
This scale change is temporary. When the graphical trend window is closed the scale reverts back to the
setting in Parameter Scales.
To switch off automatic optimum scaling,
♦in the Segment menu, select Optimum Scale again.
Trend Group
To add or remove measurements for this trend group or change the order of the existing
measurements:
1In the Segment menu, select Change Group
2Use the Add, Change, Sort Up and Sort Down popup keys to change or re-order the group as
required.
No. of Segments
In an embedded graphical trend window, you can select the number of segments to be displayed in the
Segment menu:

Setting Up Trends 20 Trends
227
1In the Segment menu, select No. of Segments
2Select 1, 2, or 3 segments.
Trend Groups
The measurements grouped in trend groups define the trends displayed together in the Vital Signs or
Graphics Trends windows and printed in trends reports and recordings. The sequence of the
measurements in the group defines the order in which they are displayed. Measurements listed between
dotted line separators are displayed overlapping. The trend group All contains all available
measurements, you cannot change the order or selection of this group.
To change the selection of measurements in a trend group, either use the Change Group setting in
the Segment menu or:
1Select Main Setup -> Trends -> Trend Groups
2Select the Trend Group you want to change and use the pop-up keys to Add, Change, or Delete
the selection of measurements trended.
To temporarily change the order in which the measurements are displayed in a group,
1Select Main Setup -> Trends -> Trend Groups
2Select the Trend Group and then the measurement you want to move and use the Sort Up/Sort
Down pop-up keys.
Trend Interval
The trend interval defines the resolution of trend data shown on the Screen. High-resolution data is
especially suited for neonatal applications, where the clinical situation may change very quickly. In
adult monitoring, where the patient’s status typically changes more gradually, a longer trend may be
more informative.
To set the trend resolution, in the Vital Signs or Graphical Trends window,
♦Select the Select Interval pop-up key and then select the required interval from the list.
Trend Priority
The monitor stores trend information for all monitored measurements, if configured to do so. If your
configuration restricts the number of measurements trended, you must choose which measurements
will be included. A priority list is used to select the trended measurements.
To see the measurement priority list for trending,
1In the Main Setup menu, select Trends.
2Select Trend Priority.
To add measurements to the priority list,
1Select the pop-up key Add and choose from the pop-up list of available measurements.
2Use the Sort Up and Sort Down pop-up keys to change the priority order.
Trend Parameter Scales
Parameter scales define how the trend waveform will appear on the screen and in trend reports.
Separate scales can be set for adult, pediatric, and neonatal patient trends.
To change the trend parameter scales settings, either use the Scale setting in the Segment menu or:
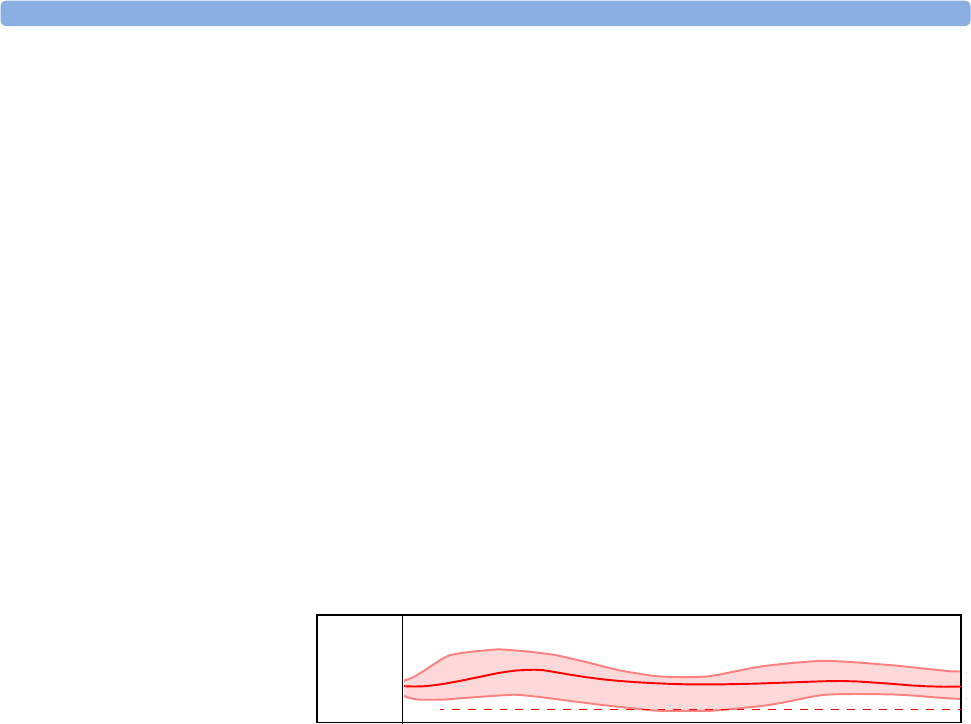
20 Trends Documenting Trends
228
1In the Main Setup menu, select Trends.
2Select Parameter Scales.
3Select the measurement or parameter you want to change from the list.
4Select the pop-up key Change to call up the Scale menu.
5In the Scale menu, select the parameter label you want to define settings for. Select Adult,
Pedi, and Neo and use the pop-up keypad to enter new upper and lower scale definitions.
Graphical Trend Presentation
Graphical trends and screen trends for measurements with compound values (for example ABP or
CO2) can be viewed in line or band form.
To change the presentation style,
1Select Main Setup -> Trends
2Select Global Style and choose
•Line to display the trends as a continuous line
•Band to fill the area between the trend lines, for example, between the systolic and diastolic
pressures, with color.
This sample ABP
trend shows the
continuously-
measured values for
the systolic, diastolic
and mean pressures
displayed in band
form.
Documenting Trends
To print a Vital Signs or Graphical Trends report,
♦in the Vital Signs or Graph Trends window, select the pop-up key Print to print a report
for the trend group currently on the monitor screen.
Reports include the most recent information in the trends database and extend backwards in time
according to the selected trend interval and your monitor’s configuration. Trends reports can be
printed on central or local printers.
To make a Vital Signs recording,
♦in the Vital Signs window, select the Print/Record pop-up key, then select the Record
Vitals pop-up key.
Vital Signs recordings print the trend data for the current group and trend period shown in the
Vital Signs window.
ABP
240
50
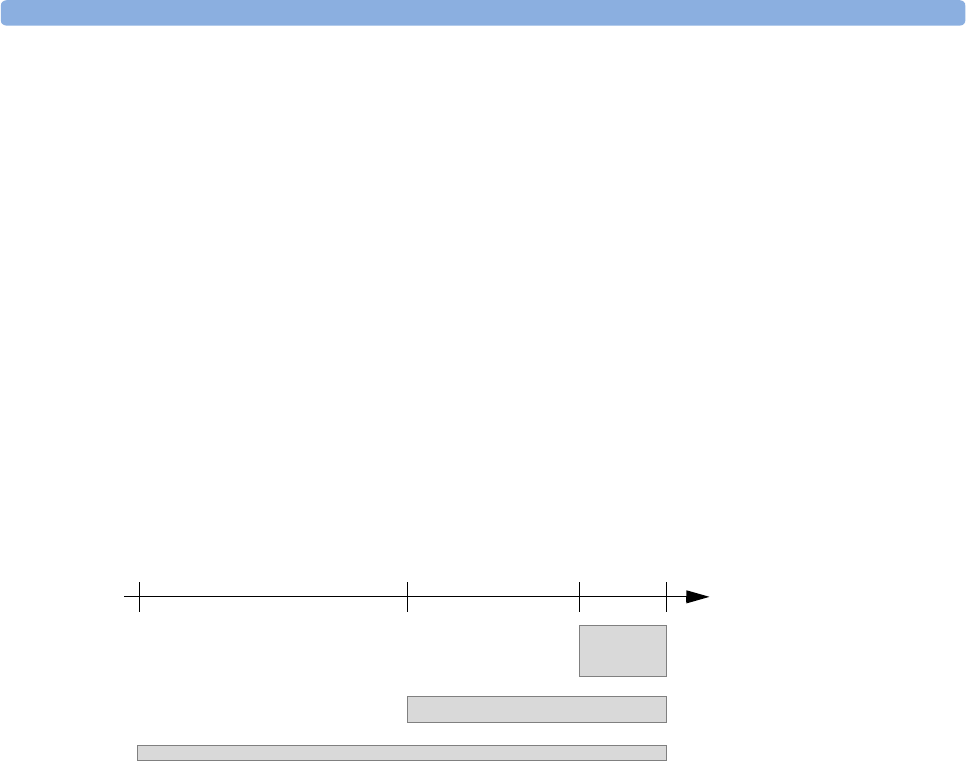
Trends Databases 20 Trends
229
Trends Databases
Depending on the purchased options and the monitor’s configuration, the trends databases store
information for up to 32 measurements for up to 72 hours.
The values in the trends database are stored as measured by the monitor, they are not averaged values.
The trend resolution defines how often a value is stored. In general, if more than one value is available
for storage in the trends database, the most recent value is used. Some values in the trends are marked
with arrows. This indicates that for this time period, more values were available and the most recent
one is shown.
Example database configuration In this example, we see that the monitor stores the most recent data
at the highest resolution, older data are stored at a lower resolution.
“4 hours @ 12 second resolution” means that the monitor stores trend data every 12 seconds, for the
most recent four hours.
Aperiodic Trends Database
Aperiodic trends do not count toward the maximum number of trends allowed by the trend
configuration. Trend data for aperiodic measurements is stored in a separate database and timestamped
with the measurement time.
Trending Multiple-Value Measurements
Some measurements generate multiple values, for example invasive pressure measurements can provide
systolic, diastolic, and mean values. These values are trended as separate measurements.
Screen Trends
Trends configured to display permanently on special monitor Screens are called screen trends. The
selection and number of measurement waves in the Screen Trend segment depends on your monitor
configuration. Screen trends are color-coded to match the measurement wave and numerics, and they
can be viewed in graphical, tabular, or horizon format.
If you do not see screen trends on the monitor Screen, select a different Screen, one that is configured
to show screen trends. Screen trends are only available on specially designed Screens.
- 48
hours
- 24
hours
- 4
hours now
time
4 hours @12 second resolution
24 hours @ 1 minute resolution
48 hours @ 5 minute resolution
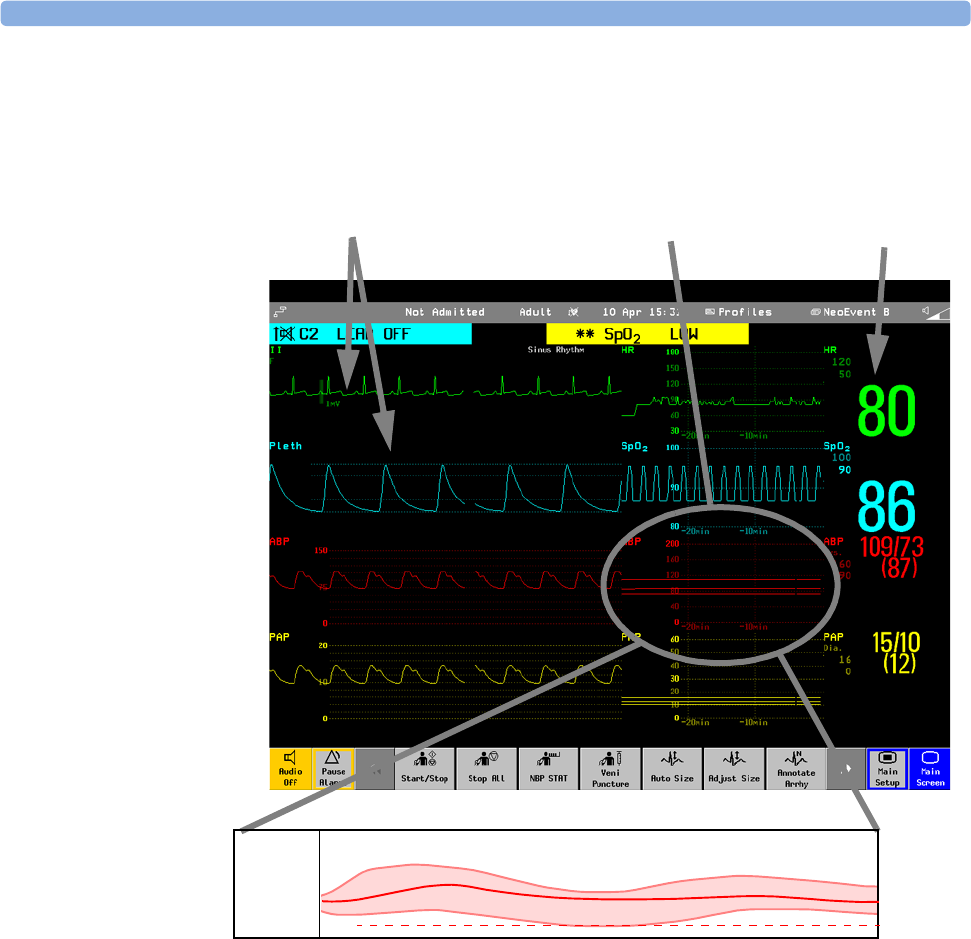
20 Trends Screen Trends
230
Screen Trend information is taken from the Trends database. If you do not see a Screen Trend for a
particular measurement on the Screen, check the trend priority list to ensure that this measurement is
being trended.
Setting the Screen Trend Time
To set the ScreenTrend Time for all graphical and horizon screen trends (“global” trend time),
1Select a screen trend then select Setup Trend, or select Main Setup -> Trends.
2Select ScreenTrend Time and select the required time: 30 minutes, one, two, four, eight, or
twelve hours.
This is now the Global screen trend time and defines the period of trend information shown for all
screen trends.
To set a different ScreenTrend Time for a screen trends or a group of aligned screen trends,
1Select a screen trend
2Select Change TrendTime
3Select the required trend time.
Selecting Global leaves the trend time set to the global screen trend time.
Measurement waves
or high-res trend
waves
Screen trends
Measurement
numerics
ABP
240
50

Screen Trends 20 Trends
231
Changing the Selection of Screen Trends Displayed
1Select the screen trend.
2Select Change Trend and select the required trend from the list of available trends.
Select Blank to remove the selected trend from the Screen.
If you do not see Change Trend in the screen trend menu, the trend is aligned to display with
the measurement wave. Changing the wave automatically changes the trend.
To display two or more screen trends overlapping,
1Select the screen trend to open the screen trend menu,
2Select Change Trend -> Add Trend and select a screen trend from the pop-up list.
Activating the Cursor for Screen Trends
To activate the cursor for Screen Trends:
1Select the screen trend.
2Select Activate Cursor
You can now use the arrow keys to move the cursor across the time line. The values measured at the
cursor time are shown next to the cursor.
To de-activate the cursor,
♦Select Main Screen.
Changing the Screen Trend View
♦To switch between tabular, graphic and horizon views, select the screen trend then select Change
View and select the required view.
Tabular View
Aperiodic measurements such as
NBP, C.O., C.I., and Wedge can be
viewed as a screen trend in tabular
form. The measured values and their
timestamps are shown, with the
measurement label.
The trend time for tabular screen trends depends on the space available on the Screen. Up to 30
measurements or 12 hours information can be shown.
16:30 120/80(95)
16:45 120/80(95)
17:00 120/80(95)
17:15 120/80(95)
17:30 120/80(95)
15:15 120/80(95)
15:30 120/80(95)
15:45 120/80(95)
16:00 120/80(95)
16:15 120/80(95)
NBP
mmHg
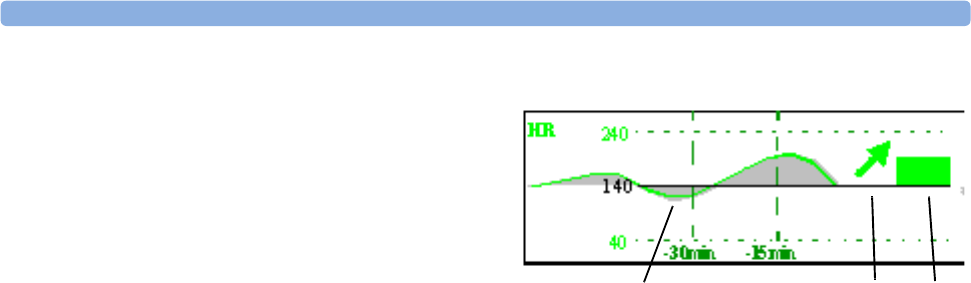
20 Trends Screen Trends
232
Horizon View
The horizon view presents trend information
superimposed over a defined baseline. This
helps you visualize changes in your patient’s
condition since the baseline was set.
The horizon view is made up of:
• a horizon, drawn in white, as a reference
point or baseline to help you visualize
changes in your patient’s condition. The
horizon can be set to represent your patient’s current condition, or a target condition.
• a graphical trend, displaying patient data for the set TrendTime (1).
• a trend indicator arrow, indicating how the patient trend has developed in the last ten minutes (2).
• a deviation bar, showing how the currently measured value deviates from the stored baseline (3). The
height of the deviation bar is an indication of the extent of the change in your patient’s condition
relative to the (horizon) baseline.
Your monitor may not be configured to show all three elements of the screen trend horizon view.
Setting the Horizon
The horizon is the reference value to which deviations in the measurements are compared.
1To set the baseline, select the horizon trend
2Select
–Auto All to reset the horizon for all horizon screen trends to the currently-measured values
–Auto Horizon to set the horizon for the selected horizon trend to the currently-measured value
–Set Horizon to set the horizon to a specific value from a pop-up list.
Setting the Horizon Trend Scale
The horizon trend scale is defined with respect to the horizon. If your horizon is set to 100 and you
select 20 as the horizon scale delta, the upper limit of the horizon scale will be 120 and lower limit 80.
To set the horizon trend scale delta,
1Select the horizon trend.
2Select Set Scale Delta and select a value to define the distance between the horizon and the
the upper and lower scale limits.
Be aware that changing the horizon trend scale can change the angle of the trend indicator, without the
patient’s condition having changed.
If a measurement exceeds the outer limits of the scale, the wave will be clipped and you must either
reset the horizon or the horizon trend scale to display the values outside the scale limits.
123

233
21
21Calculations
Calculations are patient data that is not directly measured but calculated by the monitor when you
provide it with the appropriate information.
Your monitor can perform the following hemodynamic, oxygenation, and ventilation calculations.
The hemodynamic calculations available depend on the Cardiac Output measurement method being
used and the regulatory standards that apply for your hospital: see the C.O. chapter for availability
details.
Viewing Calculations
♦Select the Calculations SmartKey to open the Calculations window.
♦Select the Calc Type field and select the required calculation type for display.
Hemodynamic Oxygenation Ventilation
Cardiac Index (C.I.)
Stroke Volume (SV)
Stroke Index (SI)
Systemic Vascular Resistance (SVR)
Systemic Vascular Resistance Index (SVRI)
Pulmonary Vascular Resistance (PVR)
Pulmonary Vascular Resistance Index (PVRI)
Left Cardiac Work (LCW)
Left Cardiac Work Index (LCWI)
Left Ventricular Stroke Work (LVSW)
Left Ventricular Stroke Work Index (LVSWI)
Right Cardiac Work (RCW)
Right Cardiac Work Index (RCWI)
Right Ventricular Stroke Work (RVSW)
Right Ventricular Stroke Work Index (RVSWI)
Extra Vascular Lung Water Index (EVLWI)
Intrathoracic Blood Volume Index (ITBVI)
Global End Diastolic Volume Index (GEDVI)
Arterial Oxygen Content (CaO2)
Venous Oxygen Content (CvO2)
Arteriovenous Oxygen Content
(avDO2)
Oxygen Availability Index (O2AVI)
Oxygen Consumption (VO2)
Oxygen Consumption Index
(VO2I)
Oxygen Extraction Ratio (O2ER)
Alveolar-Arterial Oxygen
Difference (AaDO2)
Percent Arteriovenous Shunt
(Qs/Qt)
Minute Volume (MINVOL)
Compliance (COMP)
Dead Space (Vd)
Dead Space/Tidal Volume
Ratio (Vd/TV)
Alveolar Ventilation
(ALVENT)
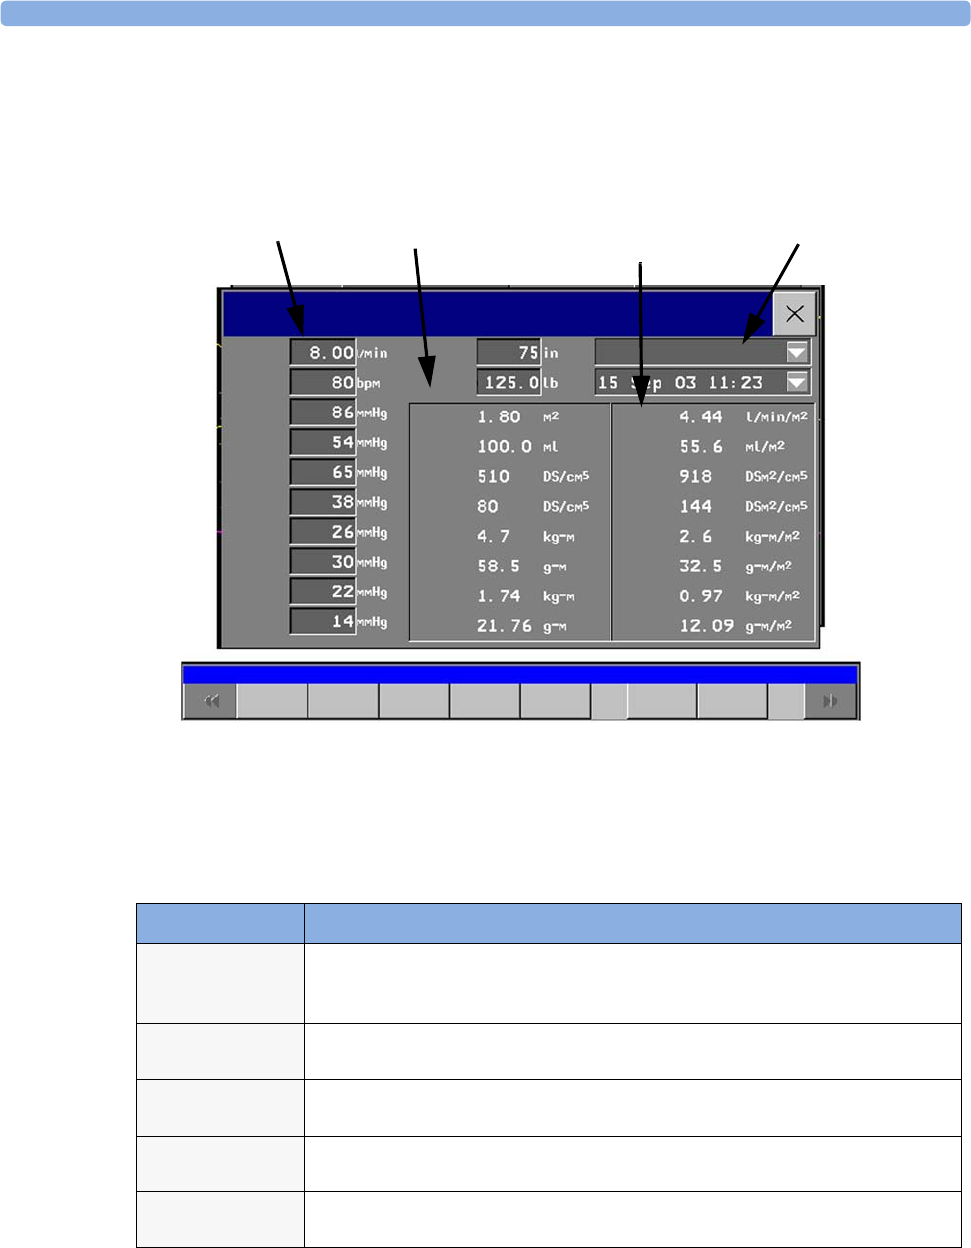
21 Calculations Viewing Calculations
234
Calculations Windows
This example calculations window shows the hemodynamic calculations window. The ventilation and
oxygenation windows are similar.
Calculations Pop-Up Keys
Depending on the calculations group you choose, a selection of pop-up keys will appear to let you
navigate through the stored events and carry out calculations-related tasks.
Calculations
Resample
Vitals
Cardiac
Output
Perform
Calc
C.O.
HR
ABPs
ABPd
ABPm
PAPs
PAPd
PAPm
PAWP
CVPm
Hemodynamic
Hemo
Review
On/Off
Ranges
On/Off
DateTime
Print/
Record
Calculations
Output
values
Calculations
input values
Indexed
calculation
values
Calculation type
BSA
SV
SVR
PVR
LCW
LVSW
RCW
RVSW
C.I.
SI
SVRI
PVRI
LCWI
LVSWI
RCWI
RVSWI
Pop-Up Keys Selecting this pop-up key lets you....
Resample
Vitals
tell the monitor to override the values in the calculations database and use the most
recent continuously monitored values. Resampling sets the calculation time to the
current time, and displays the corresponding values for the previous second.
Perform
Calc
perform the displayed calculation using the currently-input values and store the
calculation in the calculations database
Print/
Record
print or record the displayed calculation.
On/Off
DateTime
toggle between showing the date and time or the units for the calculation input
values.
On/Off
Ranges
toggle between showing the normal ranges or the units for the calculation output
values.

Reviewing Calculations 21 Calculations
235
Reviewing Calculations
♦To enter the calculations review window, select the Oxy Review, Ventil Review, or Hemo
Review pop-up key as required.
The review window lists all the input and output values for each measurement in the calculations
group. The timeline in the review window lists the times the calculations were performed.
♦To review individual calculations, select the calculation in the Calculation Review window and
then select the Original Calc pop-up key.
Performing Calculations
You must check that all input values are appropriate for your patient before performing calculations.
1Select the Calculations SmartKey to open the Calculations window.
2Select the Calc Type field and select the required calculation type for display.
3Check the calculation time in the Calc Time field.
When you enter the calculation window, this field will show either the current time or the time of
the most recent available C.O. measurement, depending on your monitor configuration.
– To choose a different calculation time, select the Calc Time field. This calls up a list showing
the timestamps of calculations performed earlier. Select a time from this list, or select
Select Time to enter a time of your choice.
– To enter the current time, select the Resample Vitals pop-up key. If you choose the current
time, the monitor will resample all the required values that are continuously monitored.
4Enter any values that must be entered or edited manually. Select the value field and then use the
pop-up keypad to enter the required values. Select Enter to confirm each entered value.
Manually-entered values are marked with an asterisk (*).
Cardiac
Output
access the C.O. procedure window.
Hemo
Review
open the hemodynamic calculations review window.
Vent
Review
open the ventilation calculations review window.
Oxygen
Review
open the oxygenation calculations review window.
Pop-Up Keys Selecting this pop-up key lets you....
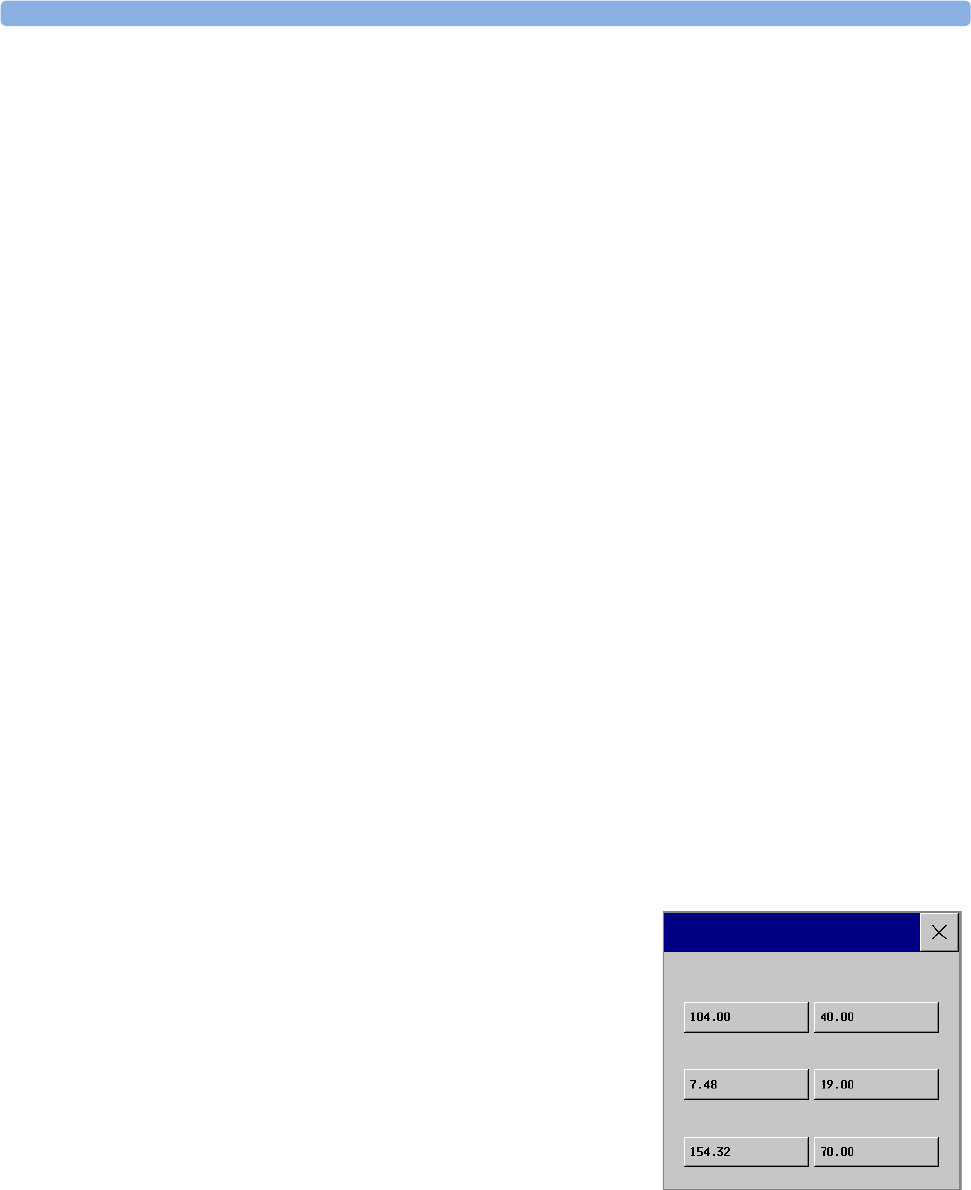
21 Calculations Entering Values for Calculations
236
Entering Values for Calculations
The monitor automatically enters any available values for calculations. For aperiodically-measured
values such as C.O., the monitor will re-use the most recent value in the calculation database until a
new value becomes available.
♦To enter calculations values manually or edit automatically-entered values, select the value field to
open the on-screen keyboard and use this to enter the correct value. Values edited manually are
marked with an asterisk symbol (*).
If you enter a value that has more decimal places than allowed for a particular input, the value you
enter will be rounded off after you select Enter. If you enter a value which cannot be stored, the
message Warning: Value out of range will appear. Enter a new value.
In hemodynamic calculations, if the systolic and diastolic pressures are manually entered, the mean
pressure is calculated and marked with an asterisk. The formula used to estimate the mean pressure is
[systolic + (diastolic x 2)] / 3.
Automatic Value Substitution
If the monitor cannot find a value required for calculation, it automatically tries to find an equivalent
source for this value. For example, if C.O. is required but unavailable, the monitor automatically looks
for CCO as a alternative source of C.O. values, or a alternative Pressure label may be used instead of
ABP. The label of the value in the Calculations window does not change. Substituted values are
marked with an asterisk (*).
Automatic Unit Conversion
The monitor needs consistent units for performing calculations. It automatically converts units where
necessary before it performs the calculation, for example, pressures sourced in kPa, cmH2O, or mbar
are automatically converted to mmHg, or to cmH2O for ventilation calculations.
Manual Unit Conversion
If you need to convert units for other purposes you can use the Unit Conversion window:
1Select Main Setup -> Calculations
2Select Unit Conversion.
3Select the field under the unit you know and use the on-
screen keypad to enter the known value. The converted
value automatically appears in the adjacent field.
BSA Formula
Your monitor provides both the Boyd and Dubois formulas for the calculation of body surface area
(BSA). For calculations, the monitor uses the setting defined in the Patient Demographics menu. All
calculation results that use BSA are indexed to the selected formula.
Unit Conversion
Fahrenheit Celsius
Pound Kilogram
Inch Centimeter
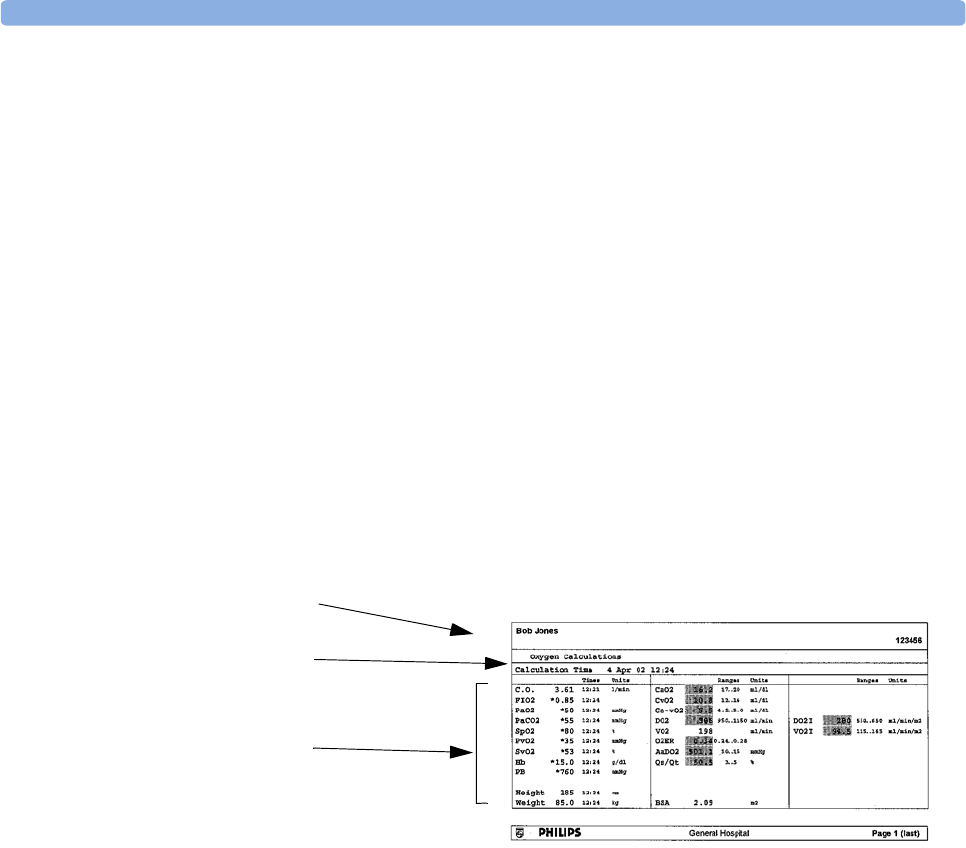
Documenting Calculations 21 Calculations
237
♦To check the current setting, select the patient name to enter the Patient Demographics menu.
BSA(B) indicates that the Boyd formula is used; BSA(D) indicates that the Dubois formula is
used.
Documenting Calculations
♦To send a Calculations recording to a connected recorder, in the Calculations window, select
the Print/Record pop-up key, then select the Record Calc pop-up key.
Calculations recordings print the patient demographic information and the content of the current
Calculations window on the recorder strip.
♦To print a report for the calculation group currently on the monitor screen, select the pop-up key
Print Calc. To print the Calculations Review window, select the pop-up key Print in the
Calculations Review window. All the calculations in the current group will be printed in the report.
Calculation Reports can be printed on central or local printers.
This example report shows the oxygen calculation group. Ventilation and hemodynamic calculation
reports are similar.
Patient information
Calculation group
Three columns of
calculations input and
output values, with
times, units and
ranges, where
appropriate

21 Calculations Documenting Calculations
238

239
22
22High Resolution Trend
Waves
High resolution (hi-res) trend waves provide information for fast-changing parameters at a glance.
They can help you to recognize trend patterns and to find interrelationships between measurements, by
comparing changes in your patient’s condition across different hi-res trend waves. This can aid in the
early detection of cardiorespiratory and hemodynamic problems.
The amount of data you can show on a screen depends on the display size and resolution: for example,
on an eight inch (20 cm) wave trace on your monitor screen, you can view approximately six minutes
of hi-res trend wave trace. The hi-res waves are drawn at a speed of 3 cm/minute.
The availability of hi-res trend waves depends on your monitor configuration and on the options
purchased for your monitor.
Changing the Hi-Res Trend Waves Displayed
♦To change the selection of hi-res trend waves on the Screen, select the hi-res trend wave and select
the required hi-res trend wave from the list of available measurements.
If there are no hi-res trend waves on the Screen, you must change to a Screen with hi-res trend waves.
Hi-Res Trend Wave Scales
High-resolution trend waves are either compressed realtime waves or fast numeric trends.
• Hi-res trend waves from compressed realtime waves include: Resp, CO2, A B P, P A P, C V P, I C P, AW P,
anesthetic agents.
• Hi-res trend waves from fast numeric trends include: btbHR, SpO2, tcpO2, tcpCO2, Pulse, Perf,
CPP, BIS, CCO, inO2, Delta SpO2.
Hi-res trend waves from waves use the wave scale as their display scale. Changing the wave scale
changes the hi-res trend wave scale.
Hi-res trend waves from numerics use a pre-defined display scale dependent on the patient category.
Hi-Res Trend Waves and OxyCRG
OxyCRG is a combination of three hi-res trend waves, btbHR, SpO2, and Resp, mainly used in
neonatal monitoring.
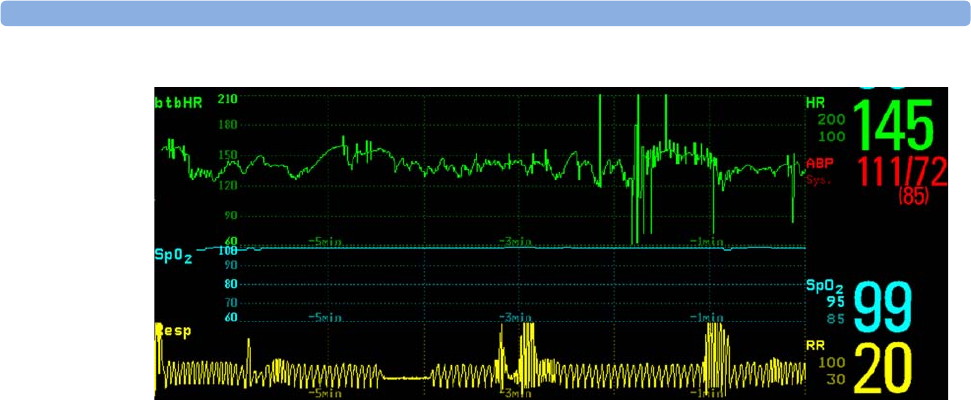
22 High Resolution Trend Waves Printing Hi-Res Trend Wave Reports
240
Printing Hi-Res Trend Wave Reports
To print hi-res trend waves on reports, you can choose to print either
• all VisibleWaves - prints all waves and hi-res trend waves currently displayed
•All Waves - prints realtime waves and hi-res trend waves for all currently-monitored
measurements
•HiRes Waves - prints hi-res trend waves for the currently-monitored measurements
•OxyCRG Waves - prints hi-res trend waves for btbHR, SpO2, and Resp.
For each hi-res trend wave, six minutes of measurement data will be printed.
See the section on Reports for more information on setting up reports.
Hi-Res Trend Wave Recordings
The selection of waves in hi-res trend wave recordings and the printing speed are defined by the pre-
configured HiResTrd recording template. See the section on Recordings for more information.
To start a hi-res trend waves recording,
1select the Realtime Record SmartKey, if configured, or select Main Setup ->
Recordings
2select the Start HiResTrd pop-up key.

241
23
23Event Surveillance
Events are electronic records of episodes in your patient’s condition. You can trigger them manually, or
set them to trigger automatically during pre-defined clinical situations. Depending on the level of event
surveillance available on your monitor, the information stored for each event episode can include:
• waveforms for up to four measurements of your choice (depending on episode type, see table on
page 243 for more details)
• numeric vital signs for all the measurements monitored
• any alarm conditions active when the event episode was triggered
• any annotations connected with the event.
You can navigate through the event database to view events retrospectively, and you can document
events on a recording or report marked with the patient name, bed label, and the data and time.
Levels of Event Surveillance
The appearance of the Events windows and menus and the settings you can select for events depends
on the event surveillance option purchased for your monitor: basic event surveillance, advanced event
surveillance, or neonatal event review. This table lists the differences between the options.
To determine which level of event surveillance your monitor has, select Main Setup ->
Event Surveill. -> Setup Events and select the trigger group to see the available event groups.
• if the only event group listed is NER, your monitor has the Neonatal Event Review option
• if there is one event group and it is not NER, your monitor has the Basic Event Surveillance option
• if you see six event groups, your monitor has the Advanced Event Surveillance option.
Event Functionality
Basic Event
Surveillance
Option C06
Advanced Event Surveillance
Option C07
Neonatal Event Review
(NER)
Option C04
Event groups 15 + NER NER
Measurements per group 34 3
Triggers per measurement 12 1
Trigger types Simple (“at least one”) Combined (“at least two”) Simple (“at least one”)
Annotation no yes no

23 Event Surveillance Event Groups
242
Event Groups
The event group
• monitors the patient’s signals to detect event triggers
• defines which waveforms are recorded in the event data.
In basic event surveillance only one event group can be active at a time, with Advanced Event
Surveillance all six groups can be active simultaneously. Active event groups monitor for event triggers.
Event groups are defined in Configuration Mode. In monitoring mode the groups can be adapted to
current conditions, for example episode types and threshold levels can be changed .
Event Episodes
When an event occurs, information for a
predefined duration is stored. This is the
event episode. It includes information
from a defined period before the trigger,
called the event pre-time. The episode
time after the event is called the event
post-time. If a further event occurs during
the event post-time it changes a single
event to a combined event (combi-event).
Manually-triggered event episodes
document patient information from the
time leading up to the event trigger; they
do not have a post-time.
Types of event episode
Average trend Average trend
High resolution trend
Snapshot events
High Resolution Trend
Event views
Graphic Event Review
window, graphic
Event Episode window
Summary view, graphic and
tabular
Event Review window, graphic
and tabular
Event Episode window
Graphic and tabular
Event Review window,
graphic and tabular
Event Episode window
Database capability
25 events for 24 hours 25 events for 24 hours
25 events for 8 hours
50 events for 8 hours
50 events for 24 hours
25 events for 24 hours
25 events for 8 hours
50 events for 8 hours
50 events for 24 hours
Event Notification no yes no
Event Functionality
Basic Event
Surveillance
Option C06
Advanced Event Surveillance
Option C07
Neonatal Event Review
(NER)
Option C04
Event pre-
time
Event post-time
Event trigger
Event Episode
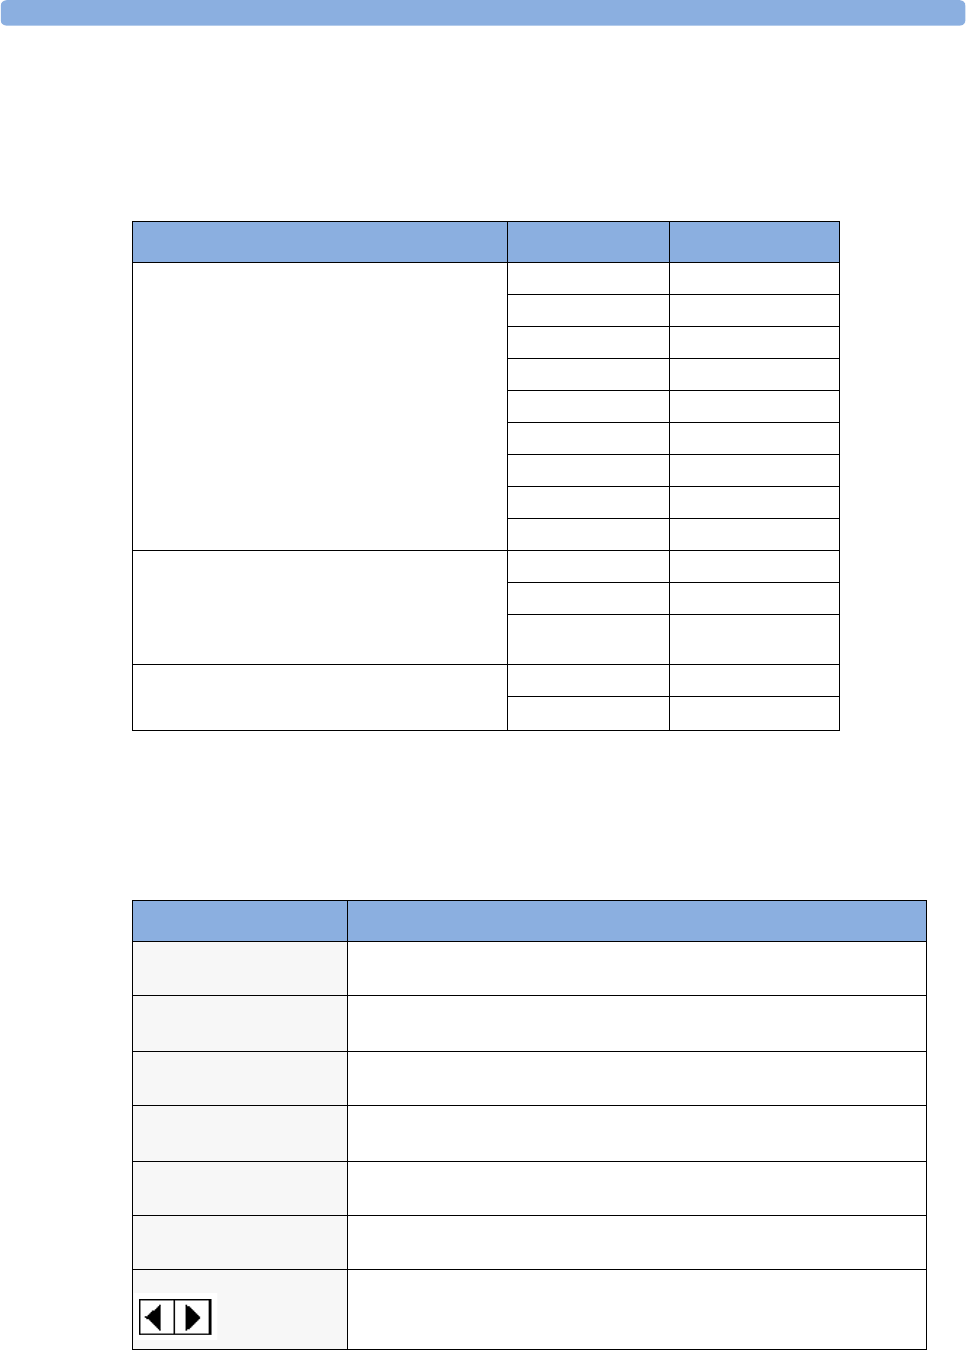
Events Pop-Up Keys 23 Event Surveillance
243
The episode type defines the level of detail captured in an event episode. The higher the data
resolution, the shorter the period that the monitor can store in its memory. High-resolution data is
suited for neonatal applications, where the clinical situation may change very quickly. In adult
monitoring, where the patient’s status typically changes more gradually, a longer trend may be more
informative.
Events Pop-Up Keys
Depending on the events view you choose, a selection of the events pop-up keys let you navigate
through the stored events and carry out events-related tasks.
Event Episode Types Pre-time Post-time
Average trend
20 minutes, five samples per minute
2 minutes 18 minutes
4 minutes 16 minutes
6 minutes 14 minutes
8 minutes 12 minutes
10 minutes 10 minutes
12 minutes 8 minutes
14 minutes 6 minutes
16 minutes 4 minutes
18 minutes 2 minutes
HiResTrnd
Four minutes, four samples per second.
Neonatal Event Review (NER) is a type of
HiResTrnd
1 minute 3 minutes
2 minutes 2 minutes
3 minutes 1 minute
Realtime Wave Snapshot
15 seconds
5 seconds 10 seconds
10 seconds 5 seconds
Pop-Up Keys Selecting this pop-up key lets you....
Event
Setup
open the Event Surveillance Setup menu.
Show
Episode
open the Event Episode window to review the selected event in
detail.
Show
Review
open the Event Review window.
Review
Group
choose a different event group for reviewing in the Event Review
window (Advanced Event Surveillance only).
Show
Summary
open the Event Summary window.
Manual
Event
start a manually-triggered event capture.
move the cursor left or right to the next event to navigate through the
events database. Placing the cursor over an event highlights it and shows
the event values for the selected event.
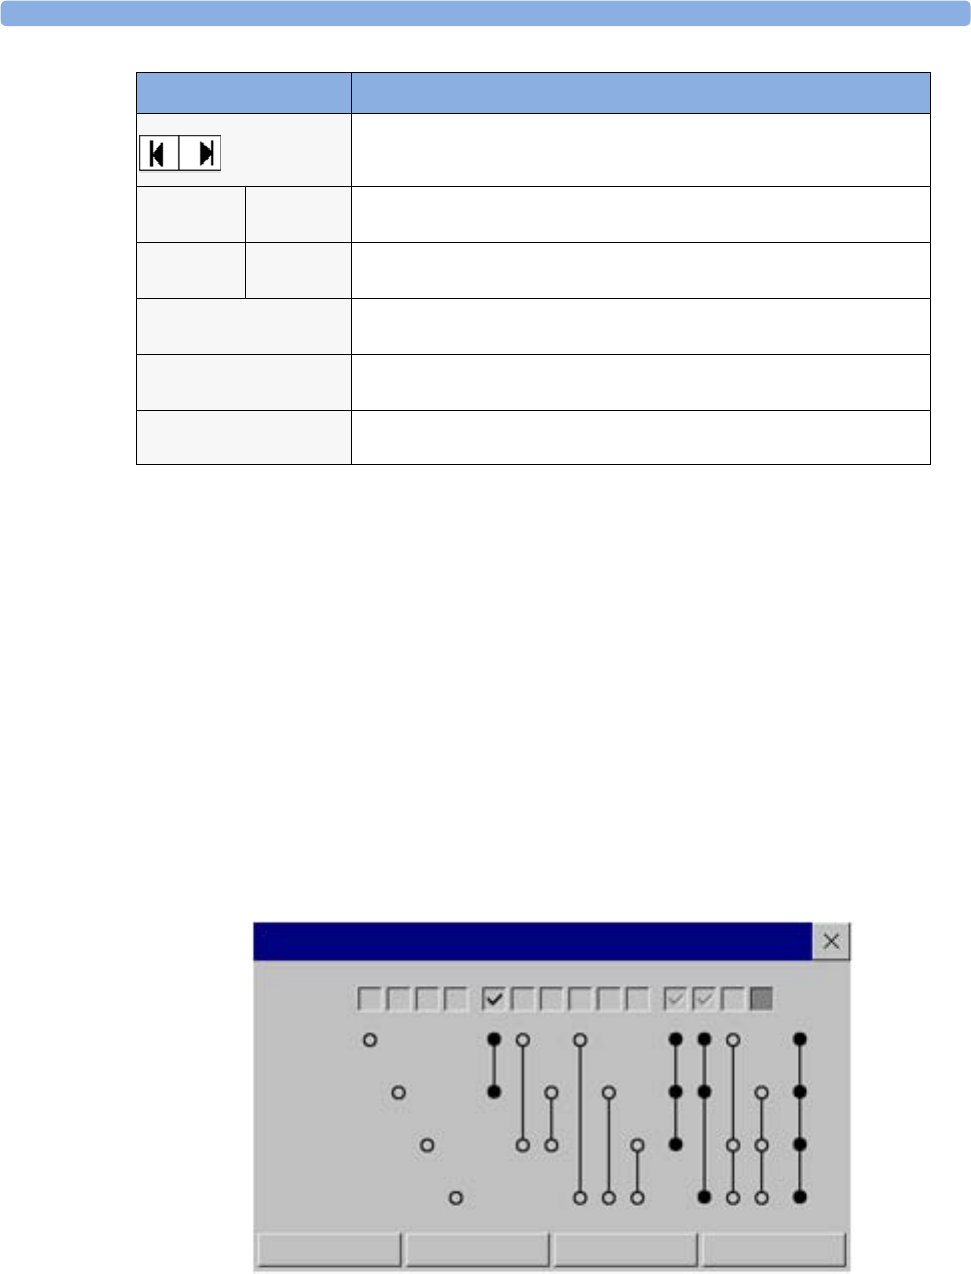
23 Event Surveillance Event Triggers
244
Event Triggers
You can trigger event capture manually, for example, if you want to record a patient’s condition before
a procedure. You can also set events to trigger automatically, when the patient’s values cross a
predefined threshold value, or when a particular measurement or procedure is carried out, for example,
when an NBP measurement or a Cardiac Output or Wedge procedure is carried out.
If more than one trigger is available for the measurements in the active event group, the trigger
condition may be AtLeast1Par, AtLeast2Par, AtLeast3Par,or All4Par. If the trigger is
AtLeast1Par (this is short for ‘at least one measurement parameter’), the monitor starts an event
capture if a trigger occurs in any of this event group’s measurements. If the trigger is AtLeast3Par,
the monitor captures events when three or more trigger thresholds from this event group’s
measurements are violated. With Enhanced Condition you can not only select a minimum
number of triggers to trigger an event but define which specific measurement triggers these must be.
For example, AtLeast2Par will cause an event to be captured if a trigger occurs in any two of this
event group’s measurements - with Enhanced Condition you can select that only when triggers are
in HR and SpO2 an event will be captured.
The trigger condition for event groups is set in the monitor’s Configuration Mode.
jump to the first or last event in the event database.
Vitals
View
Graphic
View
toggle between a tabular and graphic version of the Event Episode
window currently viewed.
Table
Review
Graphic
Review
toggle between a tabular and graphic version of the Event Review
window currently viewed.
Delete
Event
delete the currently-selected event from the database. The monitor asks
you to confirm this deletion. You cannot retrieve deleted events.
Select
Annot.
access the list of available annotations to add a nursing note for the
current event episode (Advanced Event Surveillance only).
Print/
Record
access the printing and recording pop-up keys to document events.
Pop-Up Keys Selecting this pop-up key lets you....
Enhanced TriggerCondition
HR (Pulse)
SpO2
Resp
ABP
Single Pair Triple All
At Least One Param At Least Two Param At Least Three Par All Four Parameter

Event Triggers 23 Event Surveillance
245
If you use alarm limits as event triggers, the event capture is triggered automatically when your
patient’s values violate set alarm limits, or when a specified alarm condition, such as apnea, occurs. No
events of this kind are triggered if alarms are switched off. Changing alarm limits changes the event
trigger definitions.
The asterisk symbols beside the trigger tell you about the alarm triggers:
*** indicates a high priority (red) alarm
** indicates a lower priority (yellow) alarm. This category includes short yellow arrhythmia alarms,
which may be configured to be shown as one star alarms (*) on your monitor.
Triggers without asterisk symbols are user-defined triggers.
If you set user-defined threshold triggers, you can define event triggers that are independent of alarm
limits. You must set a threshold value and a threshold time for the trigger. If you set the trigger
threshold time to 12 seconds, the monitor triggers an event if the threshold is violated for more than 12
seconds.
If you set On Measurement triggers, you can set aperiodic measurements (such as NBP) or
procedures (such as Cardiac Output) to trigger an event whenever they start.
If you set user-defined deviation triggers, you can define event triggers that are independent of
specific limits and based instead on deviations from the current values. You must set a deviation and a
period of time in which the deviation occurs. There are three types of deviation available: ANY
deviation, UP deviation where only changes in a positive direction are detected and DOWN
deviation where only changes in a negative direction are detected. The deviation can be defined
either in relative terms as a percentage, for example 10%, or as an absolute value, such as 10 bpm.
Event Retriggering
If a condition that triggered an event persists and the values remain beyond the trigger threshold, a new
event will not be triggered.
For a new event to be triggered by the same condition, the measured values for at least one of the
triggers must cross back into the normal range and then recross the trigger threshold.
Event Notification
(Advanced Event Surveillance Only). You can be notified when an event is detected. For each event
group you can define a type of notification depending on the severity of the event conditions. The
notification can be a status message with a prompt tone or a standard *, **, or *** alarm notification.
These event alarms are handled exactly like measurement alarms; they can be silenced and are also
suspended when all alarms are suspended. You should only use alarm notification for events which are
comparable in severity to standard measurement alarms to avoid potential confusion due to too many
alarms. Notification in the form of an alarm is not available when the trigger condition is At Least
One Param. Selecting None switches event notification off.
Setting the type of notification, or switching notification off, is done in Configuration Mode.
Setting Triggers for NER and Basic Event Surveillance
1Select Main Setup -> Event Surveill. -> Setup Events to enter the Event Setup
window.
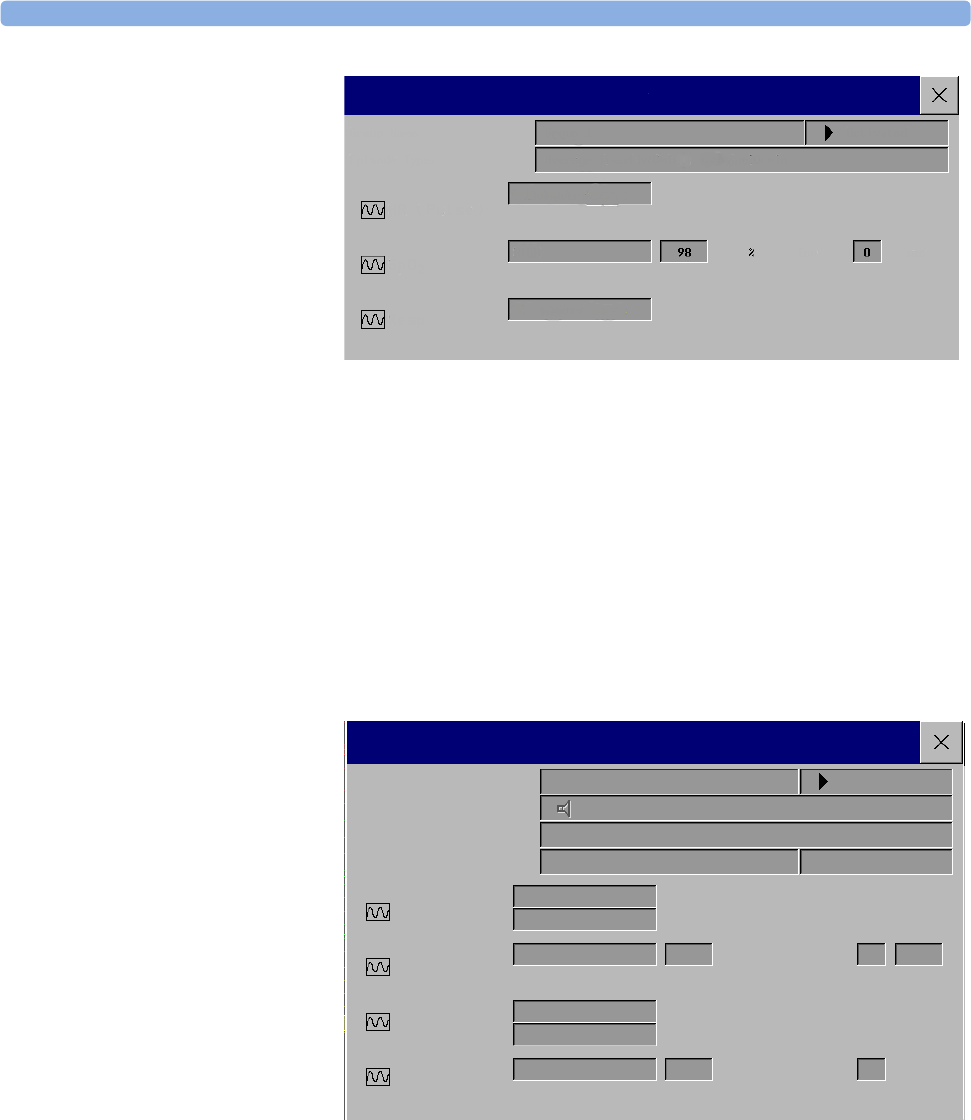
23 Event Surveillance Event Triggers
246
2Select the name of
the current episode
type to set the
episode pre/post
time.
3Set the event trigger
for each
measurement.
Select each trigger
name and select, if
available, either an
alarm trigger, or a
user-defined trigger from the pop-up trigger list. If you select a user-defined trigger, set the
required threshold level and delay time.
4Set the trigger status to Activated to start event triggering. If the status is Deactivated event
surveillance is effectively switched off.
5Select Confirm to confirm your changes.
Setting Triggers and Notification for Advanced Event Surveillance
1Select the group name to enter the Event Setup <Group Name> window.
2Set the trigger status to Activated, to have this event group trigger events, or Deactivated.
3Set the episode
type.
Select the name of
the current episode
type and select an
episode type from
the pop-up list. The
pre/post episode
time for the selected
episode type is
displayed.
4Set the trigger for
each measurement.
Select each trigger
name and select either an alarm trigger or a user-defined trigger from the pop-up trigger list. If you
select a user-defined trigger, set the required threshold level and delay time. If a deviation trigger is
configured, set the deviation and duration.
5Select Confirm to confirm your changes.
Triggering Events Manually
♦To manually trigger an event, select the SmartKey Manual Event and (for Advanced Event
Surveillance) select the group in which the event will be triggered.
Group Name:
Episode Type:
Group 1
Average Trend (20min): -10/+10 min
All ***/** Alarms
HIGH
All ***/** Alarms
HR (Pulse)
SpO2
Resp
Event Setup
Activated
for sec
10
Event Setup
Group Name:
Episode Type
Trigger Condition
Standard
Average Trend (20 min): -16 / +4 min
At least one param.
*** EXTREME TACHY
*** EXTREME BRADY
Any Deviation
HIGH
HR (Pulse)
SpO2
Resp
Notification Type:
Activated
within
ABP
Screen Prompt
sec
rpm sec
for
All ** HIGH ALARMS
All ** LOW ALARMS
Enhanced ...
%(dev)
35
10 10
35

The Events Database 23 Event Surveillance
247
For manually-triggered events. patient information for the time leading up to the trigger moment is
stored using the settings of the assigned event group.
The Events Database
The maximum number of events that can be stored in the event database depends on the database
configuration and the level of event surveillance used. The event database is set up in the monitor’s
Configuration Mode. Events are stored in the monitor’s event database for the configured lifetime,
either 8 hours or 24 hours. Deleted events cannot be retrieved. Events are automatically deleted when:
• their configured lifetime is over
• the storage capacity of the database is exceeded (storing a further event deletes the oldest event in the
memory)
• a patient is discharged.
As the event database is cleared when you discharge a patient, you should ensure that you have
documented any events you require for the patient records before you confirm the discharge.
Viewing Events
• To see a summary of all the events in every group in the event database, use the Event Summary
window.
• To review all the events in a particular event group, use the Event Review window.
• To review individual event episodes in detail, use the Event Episode window.
Event Counter
Vertical bars mark
events in the Event
Summary window.
The timeline shows
the position of the stored events in the event database. Selecting this view activates a cursor that lets
you navigate across the timeline and select individual events for review in the Episode Review
window. It also calls up the events pop-up keys.
The event counter counts the total number of events in the database. If more than one event group was
set to trigger events within the event history, the event counter also counts the event group totals.
To start viewing events, either:
♦in the Main Setup menu, select Event Surveillance and then select the event view
you require from the list, or
♦select the Event Surveillance SmartKey and then select the event view
you require from the list.
Event Counter Event Counter (Graphic)

23 Event Surveillance Viewing Events
248
Counting Combi-Events
If one or more events occur during the same Episode Time, the monitor combines them and displays
them as distinct events in one event episode, called a combi-event. The first event is the trigger event,
and the others are follow-up events. For example, if an apnea event is followed 40 seconds later by a
brady event, the brady event is not counted as a single event but as part of the apnea event.
Counting Neonatal Event Review (NER) Events
For neonatal events (NER, formerly “OxyCRG”), apnea events (A), bradycardia events (B), and
combinations of these events are counted and classified by the event counter in the Event Summary. If
they are associated with a Desaturation (D), this is also marked. Manual events (M) are counted
separately. In the example below, A(D):2(1) indicates that two apnea events occurred and one of
them was associated with a desaturation.
16 Stored Events: A(D):2(1) B(D):7(1) AB (D): 1(1) D:6 M:0
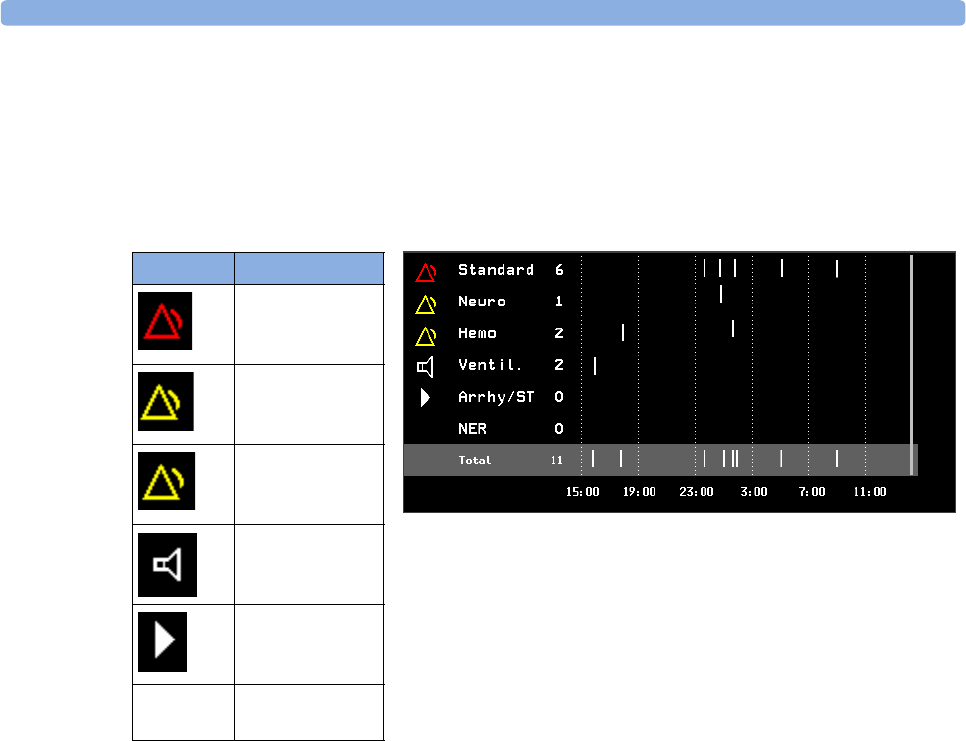
Viewing Events 23 Event Surveillance
249
Event Summary Window
(Advanced Event Surveillance only). The Event Summary window shows the number of stored events
in each event group and the total number of events in the database. Vertical bars mark events on a
timeline showing the position of the stored events in the event database. The symbol next to the group
name indicates the activation and notification status:
Selecting the Event Summary window calls up the events pop-up keys.
Parts of the Event Summary window can also be embedded in Screens so that they are always visible,
for example the Total row showing the total number of events with the bars on the timeline or the
column showing all the groups with the activation and notification status.
Event Review Window
♦To enter the Event Review window, select the graphic event summary, if available, or select the
events pop-up key Show Review.
♦When you open the Event Review window, it automatically shows the event group with the
most recent event. To view other event groups, select the pop-up key Review Group and select
the group from the list.
symbol meaning
group activated,
notification set to
***alarm
group activated,
notification set to
**alarm
group activated,
notification set to
*alarm
group activated,
notification set to
screen prompt
group is activated,
notification is
switched off
no symbol group not
activated
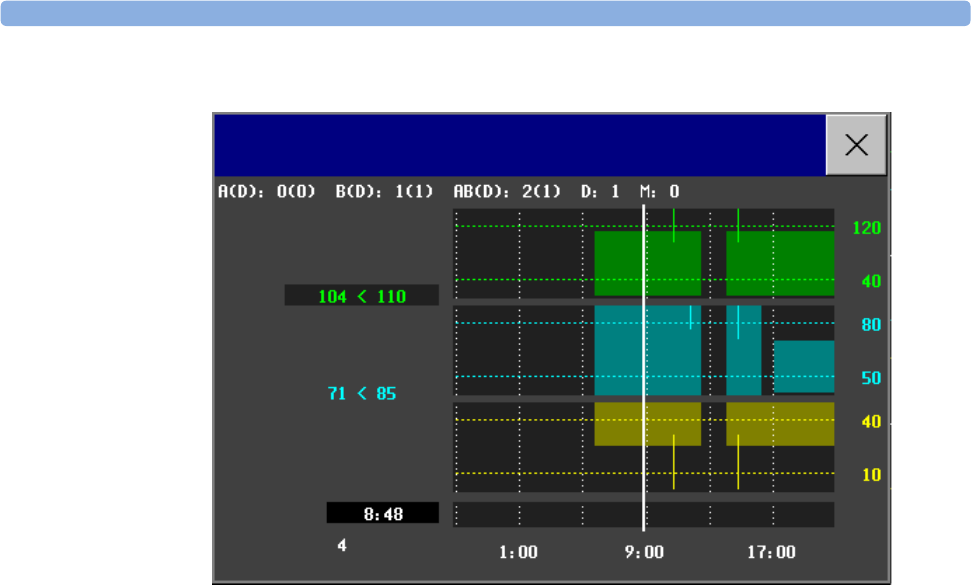
23 Event Surveillance Viewing Events
250
Event bars: Each event bar represents one event. The height indicates the event severity. Bars that
extend over more than one channel represent combi-events. Manually-captured events are marked with
a bar above the timeline instead of in the measurement channels.
Event values: Event information for the currently-selected event is shown on the left of the review
window. The trigger measurement is highlighted.
– If an alarm triggers the event, the monitor shows the alarm conditions that triggered the event.
– If the event trigger was user-defined, instead of an alarm condition the monitor shows for
example SpO2 94<96, where the second number is the current event trigger threshold and the
first number is the maximum deviation from the set limit.
Trig g e r t h res h o l d : The horizontal lines show the trigger thresholds. Gaps in the line indicate that the
trigger was inactive for a while, possibly because alarms were switched off or because there was an
INOP condition in the group measurements.
Timeline: The timeline at the bottom indicates the period currently stored in the event database.
Event Episode Window
♦To enter the Event Episode window, select the pop-up key Show Episode.
Depending on the event group settings, the Event Episode window shows either 20 minutes of
average trend event information, four minutes of high-resolution event information, or 15 seconds of
realtime wave information.
HR
Event Review
(Total: 4)
SpO2
Resp
Manual
Total
Brady
DESAT
APNEA
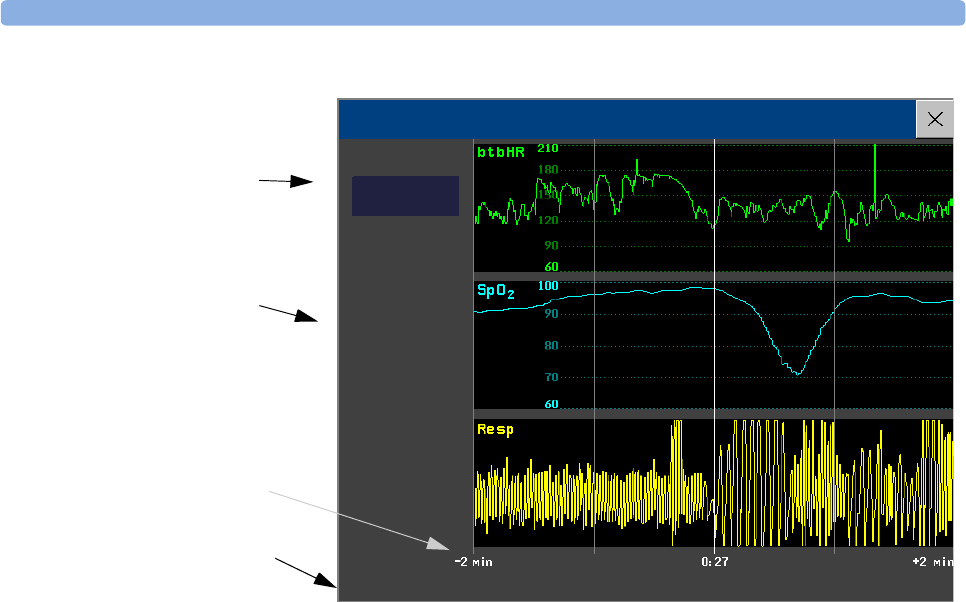
Annotating Events 23 Event Surveillance
251
The event values to the left of the measurement channels show the trigger threshold set and the
maximum amount by which this limit was exceeded. In this example, Brady 104<110 tells you that
104 was the lowest HR value measured during the event time and that the low HR trigger threshold
was set to 110 when the event was triggered. If the event was manually triggered, the event value boxes
display “manual”.
Annotating Events
1To annotate an event, in the Event Episode window, select the pop-up key
Select Annotation.
2Select the required annotation from the pop-up list of available annotations for the currently active
event group.
Up to 20 annotations can be configured to let you add commonly-used clinical notes to event episodes
for documentation purposes. To see the complete list of available annotations, in the Event Setup
menu, select Event Annotation.
Documenting Events
You can print a report or make a recording of the events history stored in the database or of individual
event episodes.
Documenting Event Review
1In the Event Review window, select the pop-up key Print/Record. This calls up the event
documentation pop-up keys.
Follow-on event
values
Trigger event values,
highlighted
Active event group
Timeline, showing
episode Pre/Post-
time
Event Episode
HR
Brady
104 < 110
SpO2
Desat
71 < 85
Resp
NER
7 Jul

23 Event Surveillance Documenting Events
252
2For a graphic Event Review recording, select the Record Graphic pop-up key.
For a tabular Event Review recording, select the Record Tabular pop-up key.
To print an Event Report, select the Print Review pop-up key.
Documenting an Event Episode
1In the Event Episode window, select the pop-up key Print/Record. This calls up the event
documentation pop-up keys.
2To m ak e an Event Episode recording, select the Record pop-up key.
To p r i n t a n Event Episode, select the Print Episode pop-up key.
Event Recordings
Event recordings can be sent to a locally-connected M1116B recorder module.
Event Review Recordings
Each event review
recording strip
begins with a
summary of the
events stored in
the event
database.
Recording strip
annotation is
explained in the
Recording
chapter.
In graphic event review recordings,
events are represented by bars, and each
event group is printed on a separate
channel.
The timeline reflects the period stored in
the database, either 24 hours (divided
into 4 hour sections) or 8 hours (divided
into one-hour sections).
90MIN Green, Sarah 37549201
23 Jan 02 10:43 ICU 37
Standar
d:
Combi:
0
Single:
2
Manual
: 1
(Total: 3)
Neuro:
Combi:
0
Single:
0
Manual
: 2
(Total: 2)
Hemo:
Combi:
0
Single:
0
Manual
: 2
(Total: 2)
Recording
strip
code
Event
group
s
Patient
information
and medical
record no.
Event types
Event
total per
event
group
Total
events in
database
Standa
rd
09:0 11:0 15:0 1
9
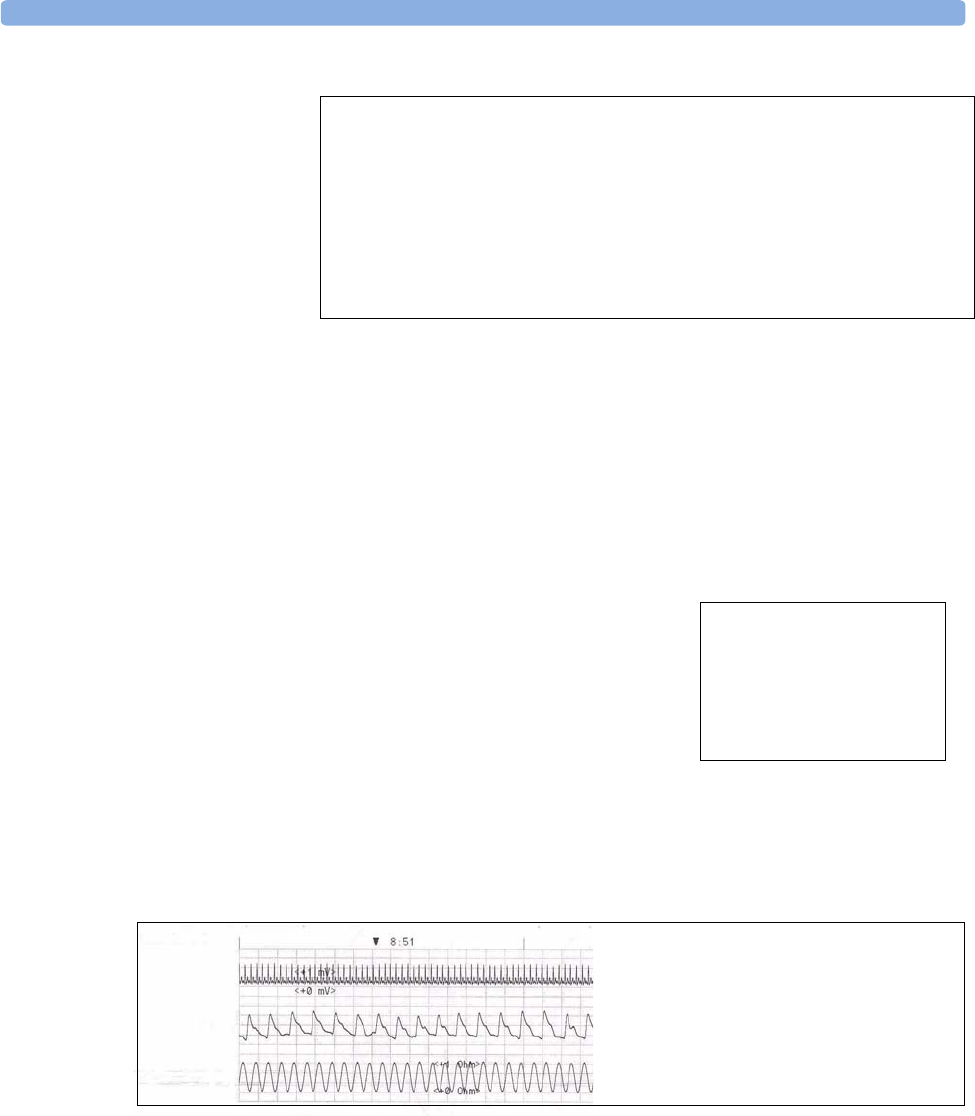
Documenting Events 23 Event Surveillance
253
Event Episode Recordings
3The third section shows the most important vital signs information, including numerics, active
alarms, and any annotations made on the event episode.
4The fourth section shows the numerics for all the currently monitored vital signs and any alarm
conditions or INOPs active at the time the event was triggered.
Event Reports
Event reports can be printed on A4 and letter size paper on a printer connected locally or centrally to
your monitor.
In tabular event
review recordings,
the events stored in
the event database
are shown in
chronological order,
with a number and
time-stamp.
The measurements in the event group are shown in the next columns, marked “Parameter 1, Parameter
2...”, along with the event values measured at the time of the event. For each event, the trigger values are
shown.
This section of the recording is A4 or letter size, so that it fits in a patient file.
# Time Group Parameter 1 Parameter
2
Parmeter 3
1 23 Jan 02
07:56
Neuro Resp BIS LOW
51<60
ABP
2 23 Jan 02
07:59
Stand
ard
HR(Pulse)
TACHY 201>180
ST-II SpO2
3 23 Jan 02
08 02
Neuro Resp HIGH
76 60
BIS ABP
Event episode recordings are divided into four sections.
1The first section shows the patient information and the event
group of the episode with the event values for the group
measurements. The trigger symbol marks the event trigger.
2The second section shows the waveforms recorded during the
episode. The trigger moment is marked with a triangle and
divides the episode into the pre/post time. Any calibration marks
and grid marks on the screen are automatically printed on the
recording.
If there are four measurements in the event group being recorded, two waveforms will be recorded in
two separate waveforms segments.
91MIN
Green, Sarah
37549201
23 Jan 02 10:43
ICU 3
Standard:HR(Pulse)
1.
HR 130
bpm
SPO2 98%
RR 80 rpm
No
interventi
on req.
**TACHY
**Resp
HIGH
**TACHY
**Resp
HIGH
HR 130 bpm
Pulse 130
bpm
6.25 -5 +10
II
Plet
Res
2. 3.
4
.
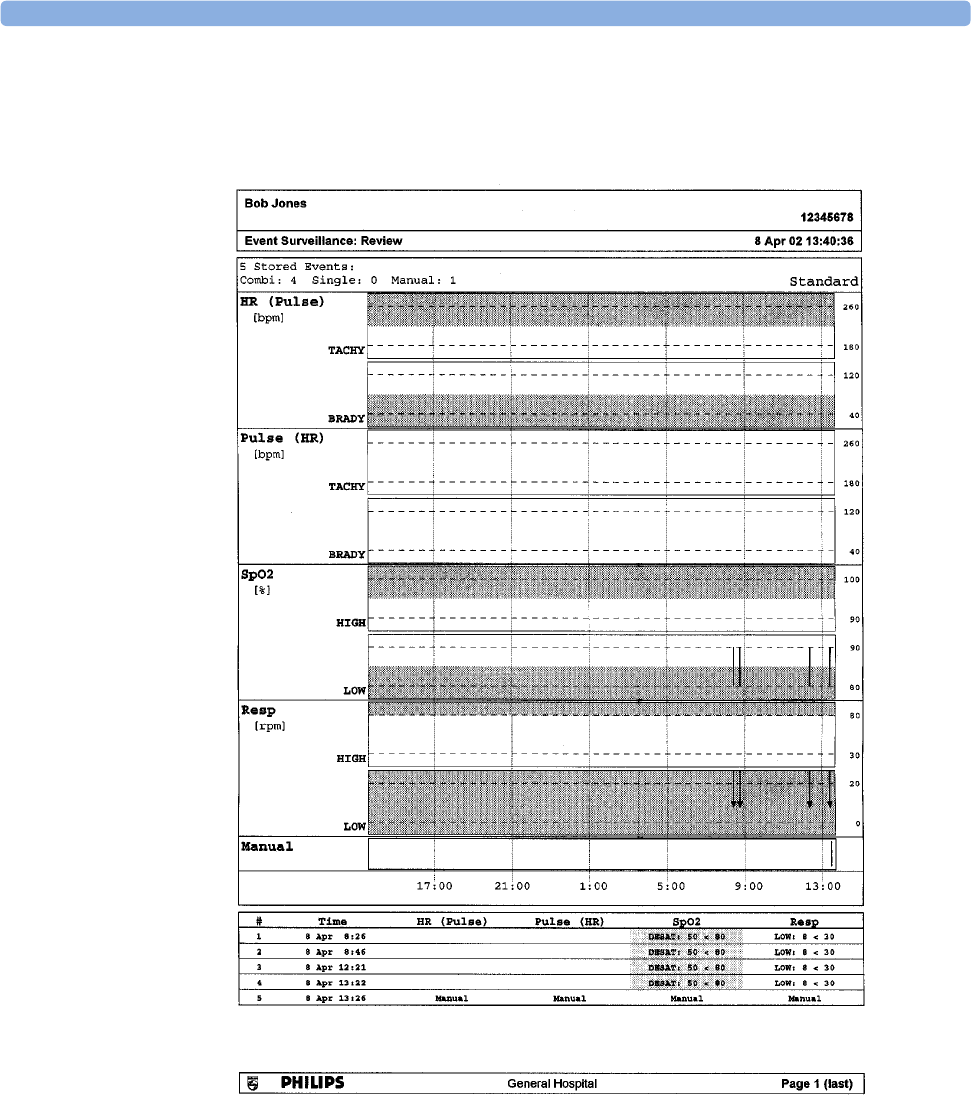
23 Event Surveillance Documenting Events
254
Event Review Reports
The event review report documents all the events stored in the event database for a selected group.
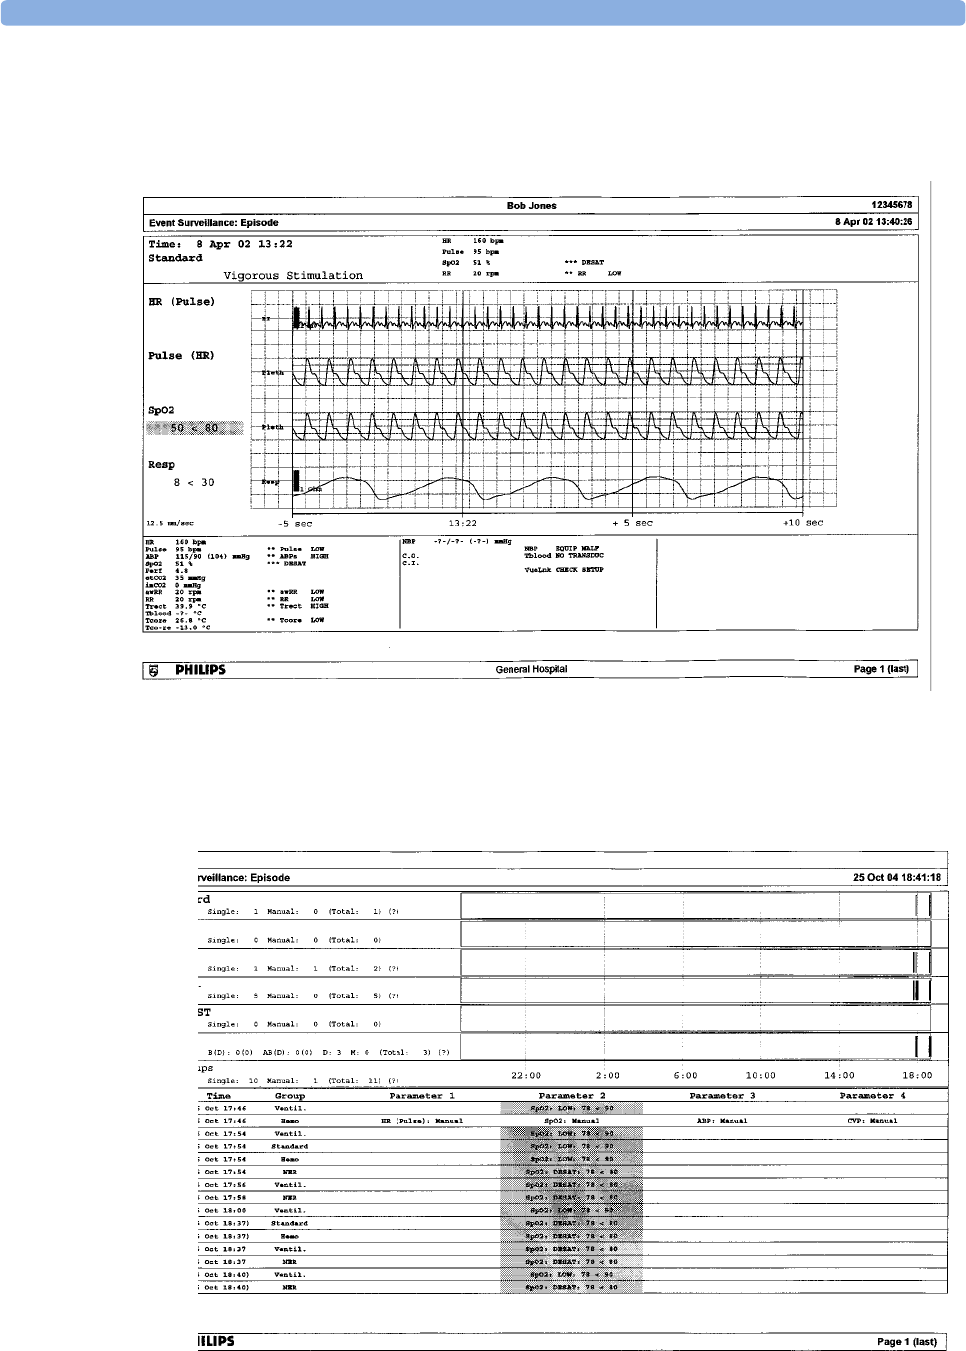
Documenting Events 23 Event Surveillance
255
Event Episode Reports
The event episode report documents the patient information from the currently-selected event. See the
section on event recordings for an explanation of the report elements.
Event Summary Reports
(Advanced Event Surveillance only). The event summary report shows a graphical view and a tabular
view of all events in the database for all groups.

23 Event Surveillance Documenting Events
256
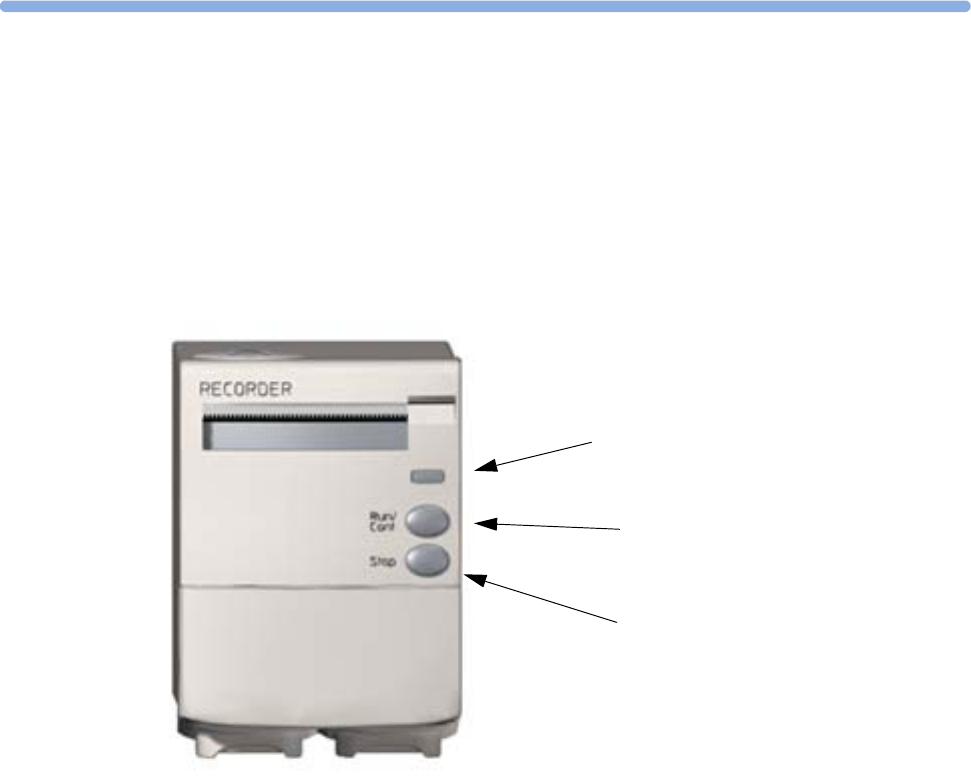
257
24
24 Recording
MP40/MP50/
MP60/MP70/
MP90
The M1116B plug-in recorder records numerics for all active measurements and up to three
waveforms. You can use it for local recording mounted either in the monitor’s FMS or in the integrated
module slots (MP40/MP50, MP60/MP70).
Continue LED
Flashes if a continuous recording is
ongoing
RUN/CONT key
Starts a delayed recording or makes
the current recording continuous
STOP key
Stops the current recording
M1116B Plug-in Recorder
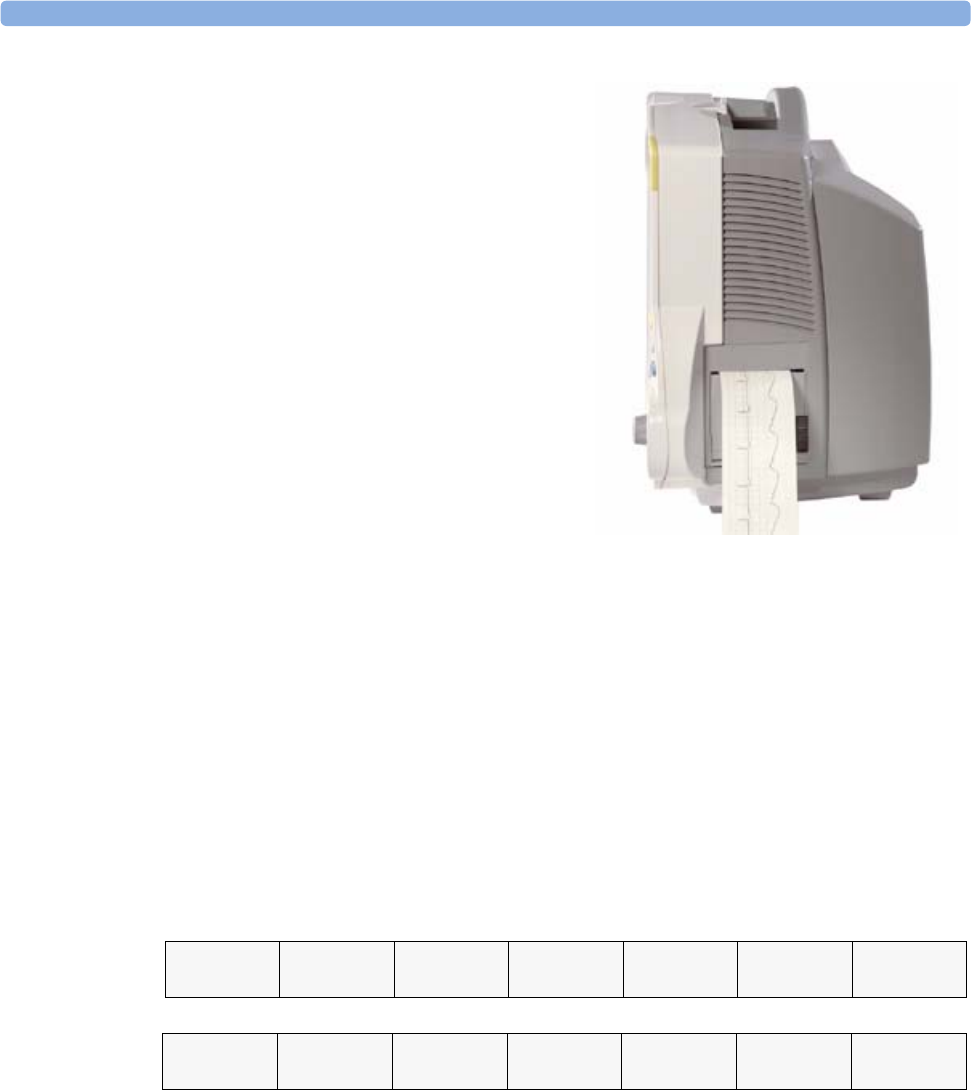
24 Recording Starting and Stopping Recordings
258
MP20/MP30
The integrated recorder records numerics for all
active measurements and up to three waveforms.
Central
Recording
For central recording from the bedside, your monitor must be connected via a network to an
Information Center. You can use either the M1116B recorder or the standalone M3160A 4-Channel
Recorder. Recordings made on the M3160A may look slightly different to those described here. See the
documentation supplied with the Information Center for information on the 4-Channel Recorder.
Starting and Stopping Recordings
The recordings pop-up keys let you start and stop recordings. Select the Recordings SmartKey to
call up the line of pop-up keys. Scroll right or left to see any pop-up keys not displayed.
The selection of pop-up keys available depends on the monitor and recorder model you are using.
Quickstarting Recordings
To quickstart any type of recording using a preconfigured recordings template,
♦Select the Recordings SmartKey and then select the pop-up key of the recording type you want
to start.
Alternatively, you can
♦Select the Main Setup SmartKey, select Recordings, then select the recording type.
MP20/MP30 Integrated Recorder
Delayed
Recordng
RT A
Recordng
RT B
Recordng
RT C
Recordng
Select
Waves
HiRes
Recordng
All ECG
Waves
Vital
Signs
Alarm
Limits
ST
Segments
Setup
Recordng
Stop all
Recordng

Overview of Recording Types 24 Recording
259
To quickstart a delayed recording,
♦Select the SmartKey Delayed Record to immediately start a delayed recording.
M1116B
only
♦You can also start a delayed recording by pressing the RUN/CONT key on the recorder module.
Extending Recordings
Timed (non-continuous) recordings stop when their runtime is over. Continuous recordings continue
until stopped manually or by an INOP condition.
♦To extend an ongoing recording by its runtime, reselect its Start pop-up key once.
♦To make an ongoing recording continuous, reselect its Start pop-up key twice within 5 seconds.
M1116B
only
♦You can also make an ongoing recording continuous by pressing the RUN/CONT key on the
recorder module.
Stopping Recordings
Recordings stop automatically when the preset runtime is over, when the recorder runs out of paper, or
when the recorder has an INOP condition.
♦To manually stop a recording, select the Recordings SmartKey and then select the pop-up key
Stop all Recordng.
M1116B
only
♦You can also stop a recording by pressing the STOP key on the recorder module.
Recording Without a Template
To record without a preconfigured template, selecting the waves you require,
1Select the Recordings SmartKey.
2Select the pop-up key Select Waves and use the pop-up keys to choose up to three
measurement waves to be printed on the recording. If you want fewer than three waves on the
recording, select the waves you want then select the Continue pop-up key.
3Select one of the recording speed pop-up keys to set the required recording speed.
4Select the Start pop-up key to start the recording.
Select Waves recordings use default values for any recorder settings not defined: runtime is
continuous, overlapping is set to non-overlapping.
Overview of Recording Types
This table details settings for local recordings, using either the integrated recorder or the M1116B. For
details on recordings made on the central recorder, see your Information Center Instructions for Use.

24 Recording All ECG Waves Recordings
260
All ECG Waves Recordings
An All ECG Waves recording shows a 4 second recording of each lead with a calibration bar
preceding each ECG lead. All available leads are recorded sequentially in the standardized lead order.
The recording is realtime, that is, the information recorded is not simultaneous.
Creating and Changing Recordings Templates
To save you defining recording settings each time you start a recording, you can create templates for
commonly-used types of recordings in the Setup Recording menu. You can create templates for
one delayed recording, one alarm recording, three realtime recordings, and one high resolution
recording. All ECG Waves recordings do not need to be configured, they always use the same
format.
Changing recordings templates changes the settings that will be used each time a recording of this
name is triggered.
1Select the Main Setup permanent key to call up the Main Setup menu.
2Select the item Recordings to enter the Setup Recordings menu.
Delayed Alarm Realtime (RT) All ECG Waves HiResTrnd
Procedure or
Context
Type of
recording
manual automatic,
triggered by
defined alarm
conditions
manual manual manual manual, use the
context
window’s pop-
up keys to start
Local or
Central
local and central local and central local and central local only local only local only
Information
recorded
from the start
trigger minus the
delay time
from the start
trigger minus the
delay time
from the start
trigger
from the start
trigger, in
realtime
from the start
trigger minus
delay time
defined by the
context
Number of
waves
up to 3 up to 3 up to 3 all ECG waves
currently
monitored and
available
up to 3 high-
resolution trends
(beat-to-beat)
waves
up to 3 waves,
or specific to
the context,
e.g. a C.O. trial
curve or a
wedge
procedure
Speed 50, 25, 12.5, 6.25,
2.5 mm/sec
50, 25, 12.5, 6.25,
2.5 mm/sec
50, 25, 12.5,
6.25, 2.5 mm/sec
25 mm/sec 1, 2, 2.5, 3, 6
cm/min
defined by the
context
Runtime 15, 20, 25, or 30
seconds
15, 20, 25, or 30
seconds
15 seconds or
continuously
4 seconds per
wave
10 minutes, or
continuously
defined by the
context
Stops automatically automatically automatically if
limited, manually
if continuous
automatically automatically if
limited, manually
if continuous
defined by the
context
Delay Time 10, 15 seconds 10, 15 seconds none none 6, 5, 4, 3, 2, 1
minutes
defined by the
context
Overlap up to 3 waves up to 3 waves up to 3 waves none up to 3 waves defined by the
context

Changing ECG Wave Gain 24 Recording
261
3Select the name of the template you want to create or change. Each recording name is linked to a
recording type, delayed, alarm, realtime, and high res trends. Recording names can be changed in
the monitor’s Configuration Mode.
4Design the template by selecting each menu item and entering the information for the template.
•Recorder: choose which recorder the recording will print to (Local, Central 2-Ch. or Central 4-
Ch.).
•Channels 1 - 4: choose which waveform to record in each channel. If the wave assigned to a
recording channel in a particular template is not available when a recording is triggered, the channel
is left blank on the recording strip. The pop-up list of available (currently monitored) waves differs
according to the recording type:
– Realtime, delayed and alarm recordings: the list shows all the currently available waves.
– High-resolution recordings: the list shows all the available high-resolution waves
In addition to the currently available waves, you can choose from several other settings which make
an automatic allocation when the recording starts:
–Alarm Par will always record the measurement in alarm in the chosen recorder channel
–Primary Lead will always record the current primary lead in the chosen recorder channel
–Secondary Lead will always record the current secondary lead in the chosen recorder
channel
–Agent will always record the currently selected anesthetic agent.
For high-resolution recordings only the Agent setting is available.
•Overlap: define whether the recorded waveforms will be printed overlapping or beside each other.
•Speed: choose the recording print speed.
•Delay Time: Delayed recordings start documenting on the recorder strip from a pre-set time
before the recording is started. This interval is called the “Delay Time” and can be set to 10 or 15
seconds. This setting can only be changed in Configuration Mode.
•Runtime: see how long this type of recording is configured to run. This setting can only be changed
in Configuration Mode. Continuous recordings run indefinitely.
•Central Config - if available, select this setting to use the recordings settings set for the
centrally-connected recorder.
Changing ECG Wave Gain
The ECG Gain setting in the General menu defines how every recorded ECG wave, irrespective of
template or recording type, will appear on the recorder strip. This does not affect the displayed ECG
wave, or printed ECG reports. To change the ECG gain setting for recordings,
1In the Setup Recording menu select General
2Select ECG Gain.
3Select the required setting:
–Auto: the wave recording will use the same scale as the ECG wave on the monitor screen
–5 mm/mV, 10 mm/mv, 20 mm/mV: the wave recording will use a scale of 5, 10, or 20
millimeters per millivolt.

24 Recording Recording Priorities
262
Recording Priorities
Manually-started recordings have priority over automatically-started recordings. If an
automatically-triggered alarm recording is running, and a realtime or delayed recording is manually
started, the alarm recording is stopped and the manually-requested recording is started.
More recent manually-started recordings have priority over older manually-started recordings. If a
manually-started recording is running, and another manually-started recording is triggered, then the
older recording is stopped and the more recent manually-started recording is started.
Alarm recordings are prioritized according to alarm priority. If an alarm recording triggered by a
yellow alarm is running and a new alarm recording is triggered by a red alarm, the yellow alarm
recording is stopped and the red alarm recording is started.
Sample Recording Strip
The information printed on the recording strip includes the patient name and MRN, bed number,
date and time of recording, recording speed, and recording code. Active alarm and INOP messages as
well as numerics for all currently monitored measurements are also printed.
Recording strip annotations are printed at the beginning of the recording strip and updated at regular
intervals, every 15 minutes for recordings made at speeds lower than 6.25 mm/s, and every 60 seconds
for recordings made at speeds greater or equal to 6.25 mm/s.
This sample recording strip shows a typical initial annotation:
Recording Strip Code
The recording strip code printed in the first line of the initial annotation has up to seven characters,
specifying recording type, operating mode, application area, patient category, and delay time, if
applicable.
90DIN 25 mm/sec
23 Jan 02 10:43 Bed 3
Green, Sarah 37549201
*** EXTREME BRADY
** ABPs HIGH
** PAPd HIGH
CCO NO CALIBRATION
SOME ECG ALARMS OFF
ABP REDUCE SIZE
HR 120 bpm
SPO2 95%
Pulse 120 bpm
PERF 10.0
ABP 120/70 (91) mmHg
PAP 28/15 /21) mmHg
NBP 120/80 (90) mmHg 23 Jan 02
10:31
C.O.
C.I.
CCO -?- l/min
CCI
etCO2 40 mmHg
imCO2 0 mmHg
awRR
RR 15 rpm
Tnaso 37.0×C
Tblood 37.0×C
SV 94 ml
SI 48 ml/m2
Recording
strip code
Patient
information
and medical
record no.
Alarms
and
INOPs
Recording speed Measurement numerics

Sample Recording Strip 24 Recording
263
Recorded Waveforms
A selection of up to three waveforms is recorded, marked with wave labels and wave scale information.
Wave scale information can be in the form of a calibration bar, like the 1 mV calibration bar for ECG,
or calibration steps before the waveform starts.
Maintaining Recording Strips
Recording ink sometimes fades when covered with transparent tape. Avoid covering any part of a
recording that is clinically relevant (annotation or waveforms) when taping a recording strip to a
patient record or other patient documentation.
Code Meaning
Recording type 90
8A
0B
91
Realtime
Delayed
Alarm
Context (Procedures)
Operating mode M
D
C
S
Monitoring
Demo
Configuration
Service
Application area I
O
C
N
ICU
OR
CCU
NICU
Patient category A
P
N
Adult
Pediatric
Neonatal
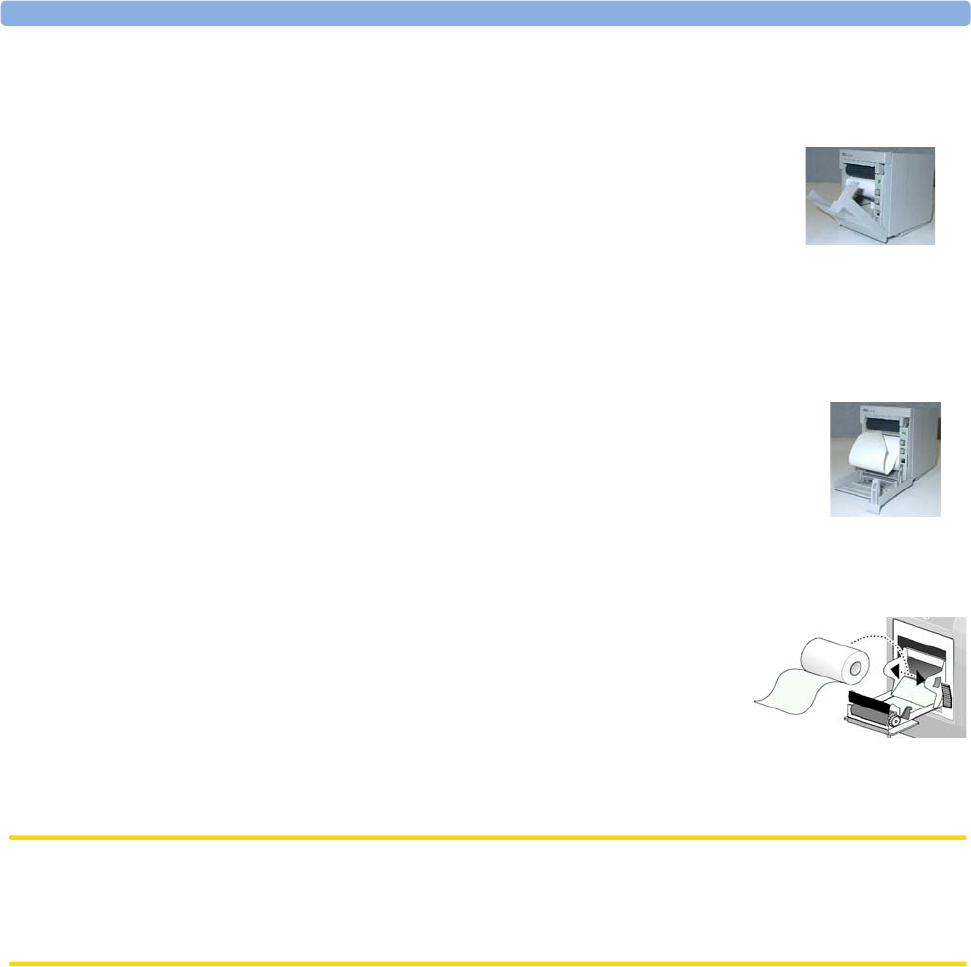
24 Recording Reloading Paper
264
Reloading Paper
M1116B
1Use the latch on the right side of the recorder door to pull the door open.
2Remove the empty core.
3Insert a new roll so that it fits snugly into its housing and the paper end is
feeding from the top.
4Pull out some paper and fold along the front edge at a 45° angle. This makes it easier to feed the
paper under the roller as shown.
5Feed the paper through and pull some paper out from the top of the roller.
6Close the recorder door.
7To test if paper is loaded correctly, start a recording. If no printing appears,
paper may be loaded backwards. Try reloading the paper.
MP20/MP30 1Use the latch on the right side of the recorder door to pull the door open.
2Remove the empty core.
3Insert a new roll and secure it in place on the paper holder. The paper
feeds from the bottom of the roll and over the top of the recorder door.
4With at least one inch of paper extending beyond the edge of the door,
swing the recorder door up and push it firmly closed.
5To test if paper is loaded correctly, start a recording. If no printing appears, paper may be loaded
backwards. Try reloading the paper.
CAUTION When the recorder is disabled (by removal from its slot, door open, or out of paper), any alarm
recordings will be sent to the central station recorder, if there is one. If no recorder is available, alarm
recordings may be lost during the time the recorder is disabled. The message no alarm recording
available will be displayed.
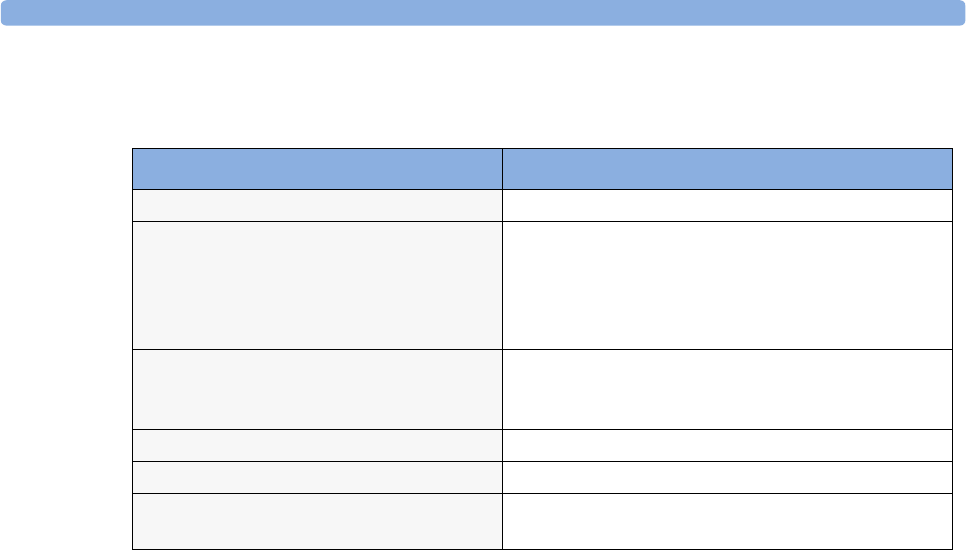
Recorder Status Messages 24 Recording
265
Recorder Status Messages
Recorder Status Messages Explanation
<Recording name> running The named recording is currently running.
No <recorder name> alarm
recording available
No alarm recording can be made on the selected recorder.
If available, try selecting another recorder. If a local
recorder was selected, the monitor will try to reroute the
recording. Recordings sent to a central recorder cannot
be rerouted. Alarm recordings may be lost.
No alarm recording available The selected recording cannot be made. Alarm
recordings will be lost.
Check that the recording has been correctly configured.
<Recorder name> out of paper The named recorder is out of paper.
<Recorder name> door open The door of the specified recorder is open.
<Recorder name> not supported The M1116A recorder is not supported. Connect a
M1116B plug-in recorder.

24 Recording Recorder Status Messages
266

267
25
25Printing Patient Reports
Starting Reports Printouts
Most patient reports can be printed by selecting Main Setup - > Reports (or the Reports
SmartKey) and then selecting the report name in the top half of the Reports menu. Report names
are shown only for reports that have been correctly set up.
Data from the time of the print request is printed, even if the print job is delayed in the printer queue.
Report types Report contents How to start printing reports
Vital Signs Report depends on selected trend group, data
resolution, and period.
In the Vital Signs window, select Print/Record,
then select Print
Graphic Trends Report In the Graphic Trends window, select Print
Events Reports Event Episode with up to 5 episodes In the Events window, select the pop-up key
Print/Record, then select the pop-up key
Print Review or Print Episode
Graphic or tabular Event Review
EEG Report EEG Waves, numerics, CSAs, montage
information and impedance values
In the Setup EEG menu, select Print Report
ECG Reports Depends on format selected Select the ECG Report SmartKeys, if configured
ST Map Report ST data in a transversal and/or horizontal
multiaxis diagram,
In the ST Map window, select Print.
Cardiac Output Report Trial curves and numerics In the Cardiac Output window, select the pop-
up key Print/Record
Wedge Report Wedge numerics and reference wave In the Wedge window, select the Print Wedge
pop-up key
Calculations Report Hemodynamic, Oxygenation, or
Ventilation Review
In the Calculations windows, select the
Print/Record pop-up key
Drug Calculator
Report
Titration Table In the Titration Table window, select the
Print Titr.Tbl pop-up key
Drip Table In the Drip Table window, select the Print
Drip Tbl pop-up key

25 Printing Patient Reports Stopping Reports Printouts
268
Stopping Reports Printouts
♦To stop Reports printing, in the Reports menu, select
–Stop Report to stop the current print job
–Stop All Reports to cancel all queued report printouts
–Scheduled Rep. to toggle to Off and switch off scheduled reports.
Setting Up Reports
ECG, Vital Signs, Graphic Trends, and Auto Reports settings must be defined in Configuration
Mode. As the content of context-linked reports, such as Cardiac Output, Calculations, and Wedge, is
defined by the content of the procedure window, these reports do not need to be set up.
The content you define in the individual Setup Reports menus will be used in all reports of this
type: for example, if you set a print speed of 50 mm/sec in the ECG Reports menu, every ECG report
will be printed at this speed, irrespective of format.
Setting Up ECG Reports
The settings you choose in the ECG Reports menu apply for all ECG reports printed. To set up
ECG Reports,
1Select Main Setup -> Reports -> ECG Reports. Note the report layout configured for
your monitor, either Internat. or Cabrera. This setting is inactive (“grayed-out”) in Monitoring Mode
and can only be changed in Configuration Mode.
2Select ECG Gain and set the required ECG Gain to define how ECG waves will appear on the
ECG report printouts.
3Select Speed and select the report print speed.
4Select Annotation and toggle to On if the printed ECG wave should be annotated with beat
labels or not. See the chapter on ECG for a list of beat labels. Pace pulse marks are automatically
printed beside the wave for paced patients.
Alarm Limits Report Graphic and numeric report of all
current alarm limits
In the Alarm Limits window, select Print
Limits
Realtime Reports,
including oxyCRG
Reports (Neonatal
Event Review)
patient data and numerics, and either:
all displayed waves OR all measured
waves OR all measured RT waves Or all
measured HiRes waves, OR oxyCRG
waves (RT waves: ECG Primary lead,
Pleth, Resp; HiRes waves: btbHR, HiRes
SpO2, HiRes Resp)
Select the Realtime Reports SmartKey, if
configured
Loops Report Individual Loops diagram with
timestamp, currently measured numerics
In the Loops window, select Print Loop
Battery Report Battery serial numbers, information on
the currently-measured and potential
charge status of the battery or batteries
In the Battery Status window, select Print
Status.
Report types Report contents How to start printing reports

Setting Up Reports 25 Printing Patient Reports
269
Setting Up Vital Signs and Graphic Trend Reports
The settings you choose in the Setup Vital Signs Report and Graphical Trend Report
menus apply for all Vital Signs and Graphic Trend reports printed.
To set up Vital Signs and Graphic Trend reports,
1Select Main Setup -> Reports -> Vital Signs Rep. or Graph Trend Rep.
2Select Trend Group and select the group you want to print on the report. The groups available
depend on your monitor’s trend configuration.
3Select Period and select the period of time for which trend data should be printed on the report. If
Automatic Period is configured to On, all trend data for the current patient will be printed,
irrespective which trend period is selected.
4Select Interval (Vital Signs Reports only) and select the resolution of the trend data printed on the
report,
Setting Up Auto Reports
Auto Reports print automatically when a specified trigger occurs. There are two types of Auto Reports:
Scheduled Reports, which print at predefined intervals, and End Case Reports, which print when a
patient is discharged using the End Case function. An Auto Report can be both a Scheduled Report
and an End Case report.
To set up Auto Reports,
1Select Main Setup -> Reports -> Auto Reports and select the Auto Report you want to set up (A, B,
C, or D).
2Select Report and assign a report type to the Auto Report.
3Select End Case Report and toggle to On if you want the selected report to print
automatically when you select End Case to discharge a patient.
Toggle End Case Report to Off if the report is a Scheduled Report only.
4Select Scheduled Rep. and toggle to On if you want the selected report to print at predefined
intervals, starting at a predefined time of day. The start time you set applies for every following day.
For example, if you set a start time of 07:00 and a repeat time of six hours, the first report will print
at 07:00 every day, the next at 13:00 and so on.
– To set the time of day at which you want the report to print every day: select Start Hour and
Start Minute and select the required time from the pop-up list
– To set the time interval in minutes between two scheduled reports: select Rep. Freq. (Hr)
and Rep. Freq. (Min) and select the time interval from the pop-up list.
If you are setting up an end case report, these settings will be inactive (“grayed-out”).
Toggle Scheduled Rep. to Off if the report is an End Case Report only.
5Repeat the procedure for all Auto Reports you want to set up.
All Auto Reports or Scheduled Reports set to On print automatically at the predefined trigger.
Be aware that the monitor’s memory for reports is limited. If the memory is full, Auto Reports cannot
be printed and the information may be lost.

25 Printing Patient Reports Setting Up Individual Print Jobs
270
Setting Up Individual Print Jobs
To adjust the appearance of individual print jobs, in the Reports menu,
1Select Main Setup -> Reports -> Setup Reports to enter the Setup Reports menu.
2Select Report and then select the report you want to set up.
3Select Report Type and then select the reports template you want the report selected in Step 2
to use. The selection of templates listed depends on the report type selected.
Each template includes patient demographic data, and each Realtime Report also includes alarm
and INOP information. In addition, the templates include:
Visible Waves: all waves currently visible, in the order they appear on the screen.
All Waves: all measured waves,
RT Waves: all currently measured realtime waves, according to the monitor’s priority list.
HiRes Waves: all measured HiRes waves
OxyCRG Waves: the OxyCRG/Neonatal Event Review waves.
Vital Signs: trend information in tabular form.
Graph Trend: trend information in graphic form.
ECG3X4, ECG6X2, ECG12X1, ECG4X2, ECG8X1, ECG12X1(2P): ECG reports.
EEG: EEG reports.
Episode: a single patient event episode.
Review: an overview of patient events
Alarm Limits: a list of all currently set alarm limits.
4Select Report Size to set choose the paper size to be used for the report: Unspecified to use
the default size for the template chosen, Universal, A4, Letter, LrgUniversal, A3, or
Ledger. The list of available sizes depends on the connected printers.
5Select Orientation to set the orientation of the report printout: Unspec. to use the default
size for the template chosen, Landscape or Portrait.
6Select Target Device choose which printer the print job will be sent to: Unspec. to use the
default printer, or the printer name defined at the Information Center or in the monitor’s
Configuration Mode (for example, Local 1).
Some settings may be inactive (“grayed-out”) in this menu for reports that can only be started in a
special window.
Checking Printer Settings
The printer settings for your monitor are defined in Configuration Mode. The printer settings Paper
Size, Resolution, Color Support, and Duplex Option for the active printer are visible but
inactive (“grayed-out”) in the Setup Printers menu.
Printer names for locally-connected printers can be defined in Configuration Mode. You can see
whether a specified printer is centrally or locally connected in the Setup Printers menu under
Port: Local <name> indicates locally-connected printers, Remote <name> indicates
centrally-connected printers.
♦To enter the Setup Printers menu, in the Reports menu, select Setup Printers.

Printing a Test Report 25 Printing Patient Reports
271
Printing a Test Report
A test report can be printed in Configuration mode, refer to the Service Guide for details.
Switching Printers On Or Off for Reports
You can enable or disable printer status to switch individual printers on or off for report printouts.
1In the Setup Printers menu, select Printer and then select the name of the device you want
to switch on or off for Reports printing from the pop-up list.
2Select Printer Status to toggle between the settings Enable and Disable. If you set this to
Disable, no reports will be printed to the named printer.
If the monitor detects that no printer of a particular type is available, the Enable/Disable
setting will automatically be set to Disable and “grayed out”.
Dashed Lines on Reports
If a section of a wave on a report is drawn with dashed lines, this tells
you that a setting that affects the appearance of the wave on the
screen was changed while the report was printing.
For example, if you change the wave scale while a report is printing,
the wave scale and wave size are changed immediately on the
monitor screen and on the report. To indicate that the scale
information printed at the beginning of the report no longer matches the currently used scale, the wave
will be printed using dashed lines, starting from the moment the change took place.
Some examples of settings that cause dashed lines in reports if changed during printing are: Filter
mode, ECG lead placement, wave scale, measurement unit, paced/non-paced setting, and
measurement mode. Note that as ECG waves are drawn with a fixed gain on reports (either 10 mm/
mV or 20 mm/mV), changing the ECG wave scale will not cause dashed-line reports.
To avoid dashed lines on reports, wait 15 seconds after changing a setting before you trigger a report.
Unavailable Printer: Re-routing Reports
If you send a report to be printed on a printer that is not available, for example, because it has run out
of paper, this print job is suspended and stored in the monitor’s memory.
If the target device of this print job was set to Unspecified, the monitor will periodically try to
resend the print job to the first printer listed in the Setup Printers menu under Printer that
is set to Enabled and that has paper of the correct size.
To allow the report to print, you must either solve the problem with the target printer, or re-route the
print job to another printer with paper of the correct size. To re-rout a print job,
♦Enable the new target printer by selecting it in the Setup Printers menu and toggling to
Enabled. As the monitor tries to send the report to the printers in the order they are listed, you
must make sure that all the printers above the new target printer are disabled.
If the target device of the print job was set to a specific printer, re-routing is not possible.

25 Printing Patient Reports Printer Status Messages
272
Printer Status Messages
Sample Report Printouts
Each report header contains the patient’s bed label, last name and first name, the patient ID, the date
and time, and the name of the report. The report footer contains the hospital label and page number,
and the last page contains a note to mark the report end.
The monitor may be configured to leave a space on the top left or right of the report printout to enable
you to stick a patient address label on it. This setting is called the Addressograph and it can only be
changed in the monitor’s Configuration Mode.
Printer Status Message Possible causes and suggested action
Print job could not
be queued
The printer queue is full and the monitor cannot accept another report
request. Wait until some more reports have been printed, then try again,
OR
A report has been triggered that uses a paper size unavailable with the
target printer. Try another printer, if available, or change the paper size of
the print request.
Cancelling all
print jobs
Stop All Reports has been selected in the Report menu, OR
The Operating Mode has been changed from Monitoring Mode to
Demonstration or Service Mode.
Cancelling N print
jobs due to patient
discharge
When a patient is discharged, all queued print jobs are cancelled. “N” is the
number of print jobs queued.
Printing failed: no
report configured
A report has been triggered which has not been correctly set up. Enter the
setup menu for the report type to set up the report.
Printer <Printer
name> unavailable -
job suspended
The chosen device is unavailable. Check that the printer is properly
connected and that paper is available. The requested report will start
printing when the printer becomes available.
Job on <Printer
name> failed
A report cannot be started on the requested printer.
Make sure the printer is plugged in, switched on, and has paper loaded. Try
another printer, if available. If this problem persists, call your service
personnel.
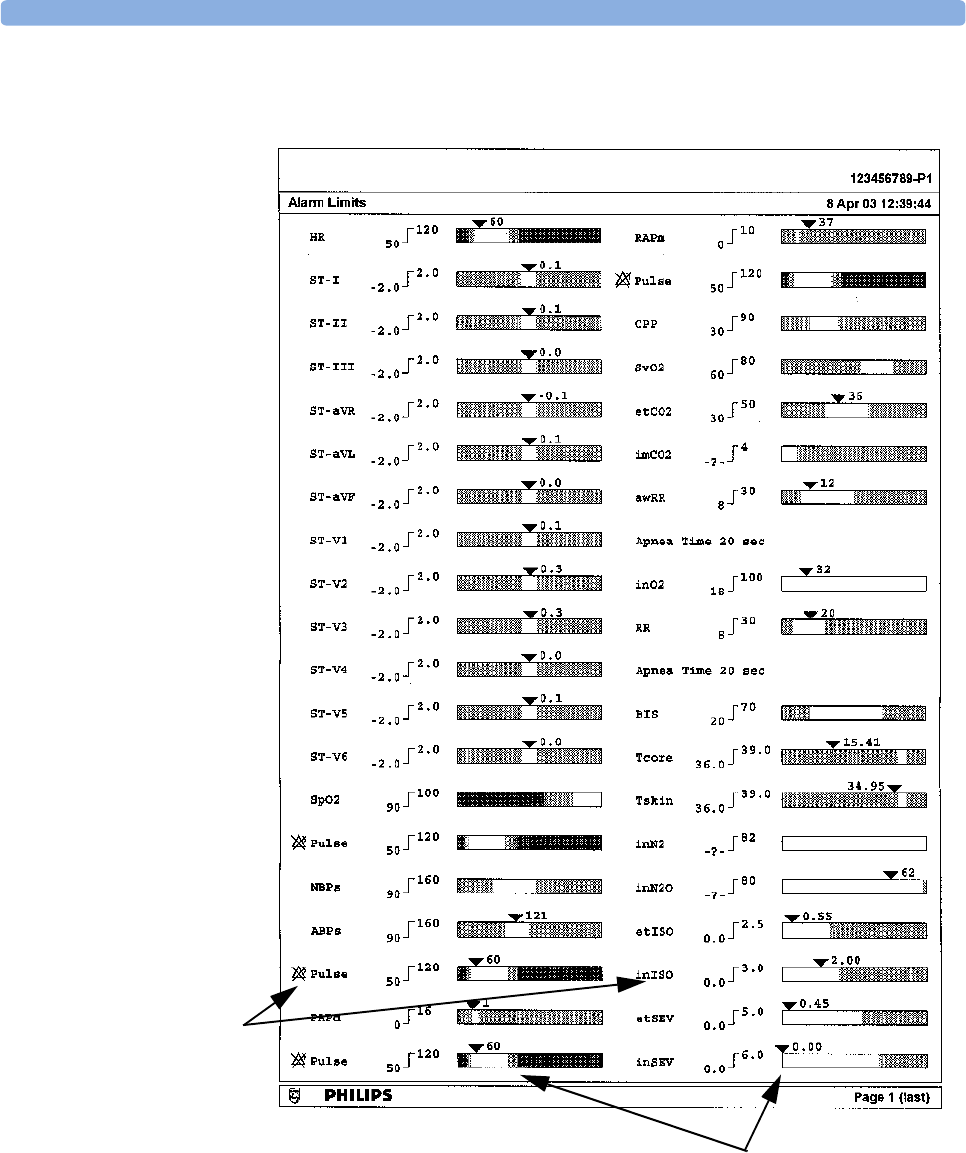
Sample Report Printouts 25 Printing Patient Reports
273
Alarm Limits Report
Graphic view of current alarm limits in
relation to currently monitored
measurement value
Measurement
labels, with
alarms off symbol
where alarms are
switched off
Patient Name
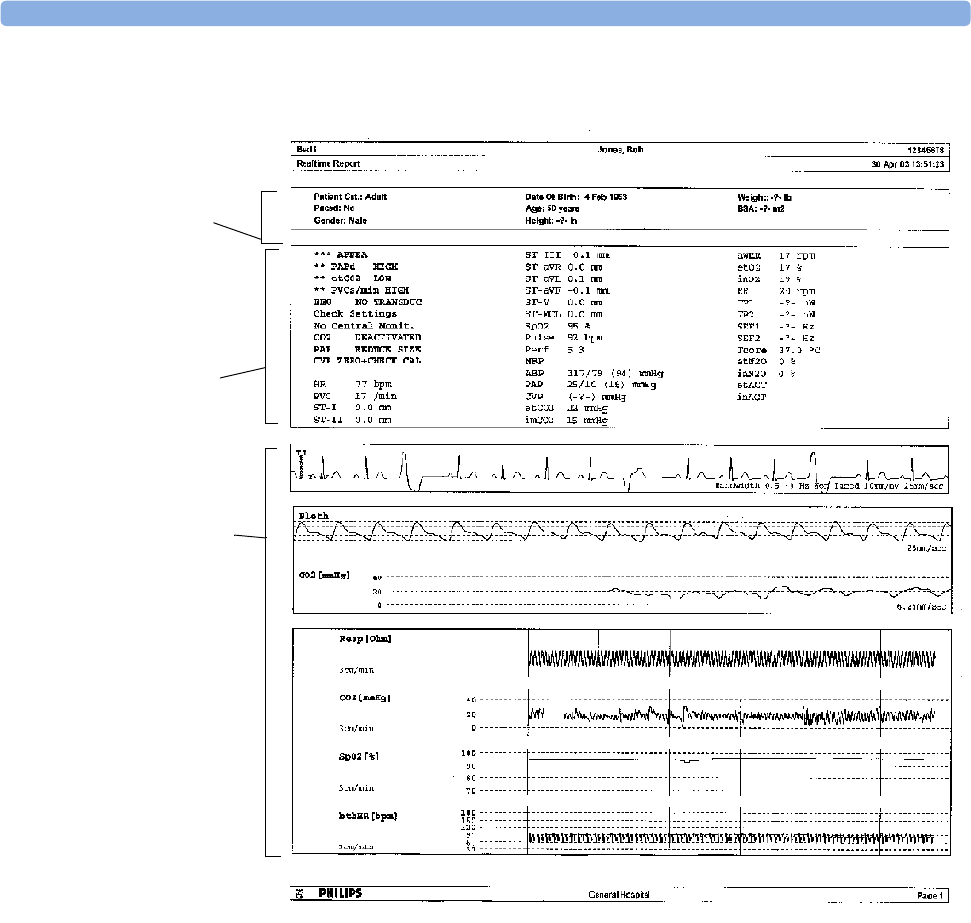
25 Printing Patient Reports Sample Report Printouts
274
Realtime Report
Patient
demographic
information,
time stamp
Active Alarms
and INOPs,
followed by
vital signs
Measurement
waves section,
including HiRes
waves
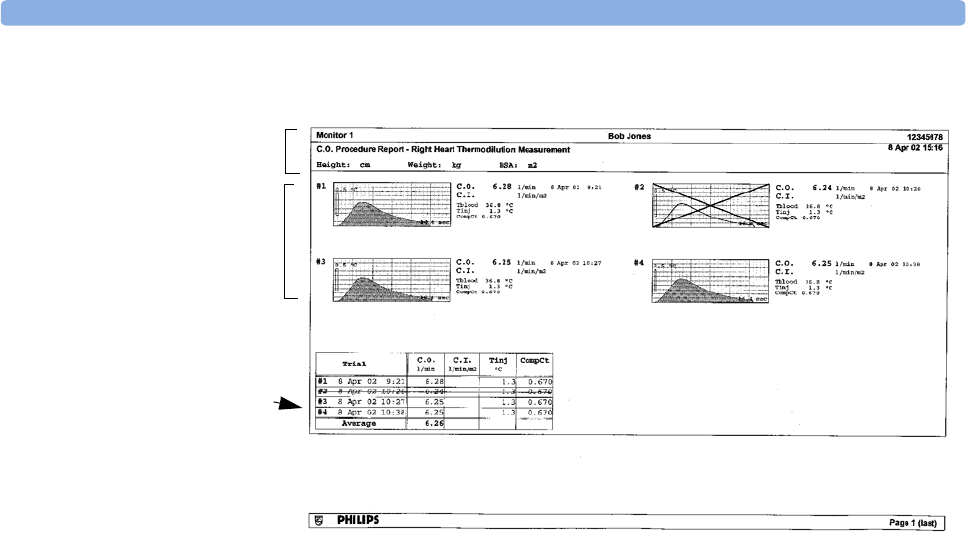
Sample Report Printouts 25 Printing Patient Reports
275
Cardiac Output Report
Numbered trial
curves
Trial information
in tabular form
Patient
information
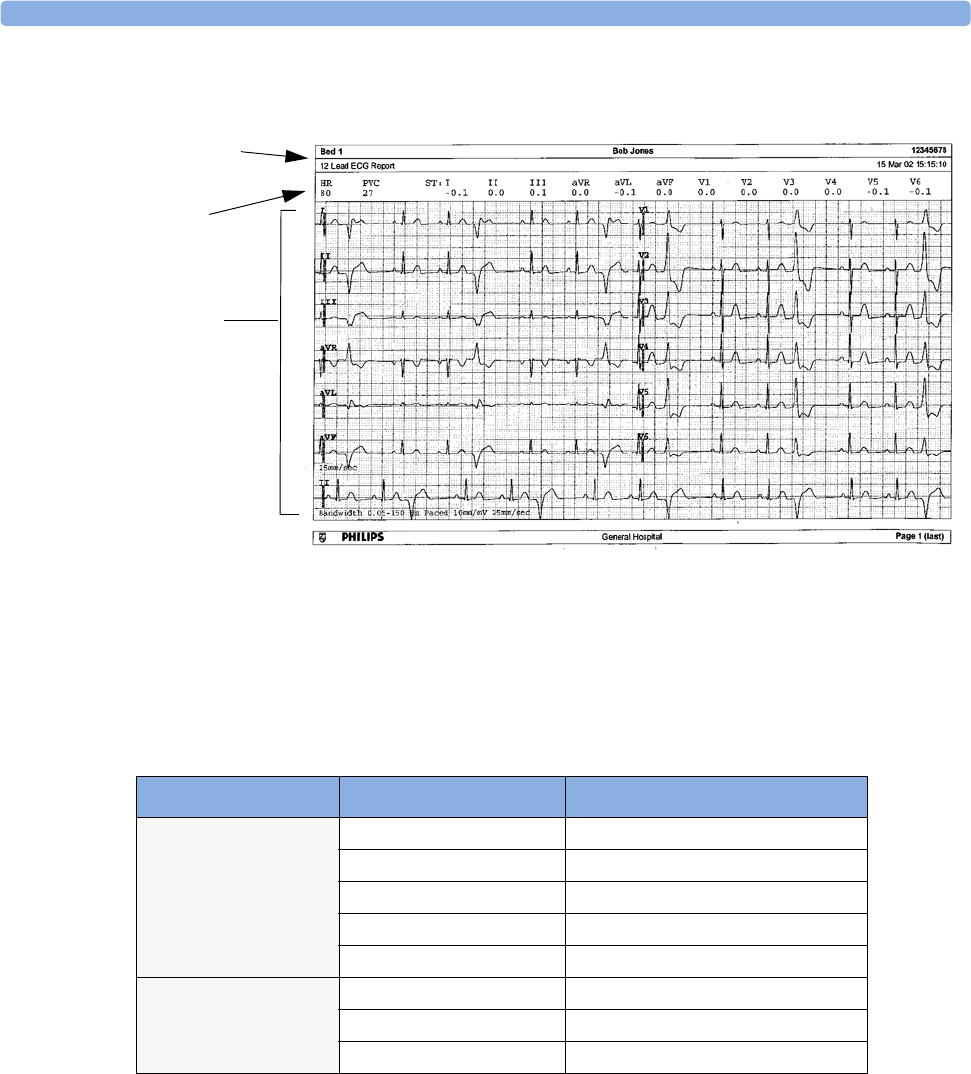
25 Printing Patient Reports Sample Report Printouts
276
ECG Reports
Below the header on ECG Reports, the numeric block shows the current HR, PVC, and ST values.
The wave area shows the printed waves for all available ECG leads. A 1 mV calibration bar is printed at
the beginning of each wave. With the 3X4, 6X2, and 2X4 formats, a rhythm stripe prints a longer
section of the ECG wave from the primary ECG lead for ECG rhythm evaluation. The ECG signal
bandwidth, the patient’s paced status, the ECG gain, and the print speed are printed at the bottom of
the wave area. Pace pulse marks are automatically printed beside the wave for paced patients. Beat
labels can be set to print on the rhythm stripe. The 12X1 (2P) format prints the report over two pages.
Other Reports
See the sections on Trends and Calculations and the chapter on Event Surveillance for other example
reports.
ECG Report type Available Formats Available Paper Sizes
12-Lead ECG 3X4 landscape A4, letter, A3, ledger
6X2 landscape A4, letter, A3, ledger
12X1 portrait A4 and letter only
12X1 landscape A4, letter, A3, ledger
12X1 (2P) landscape A4, letter (2 pages)
Multi-lead ECG 2X4 landscape A4, letter, A3, ledger
8X1 portrait A4 and letter only
8X1 landscape A4, letter, A3, ledger
Patient
information
Numeric
block
Wave area
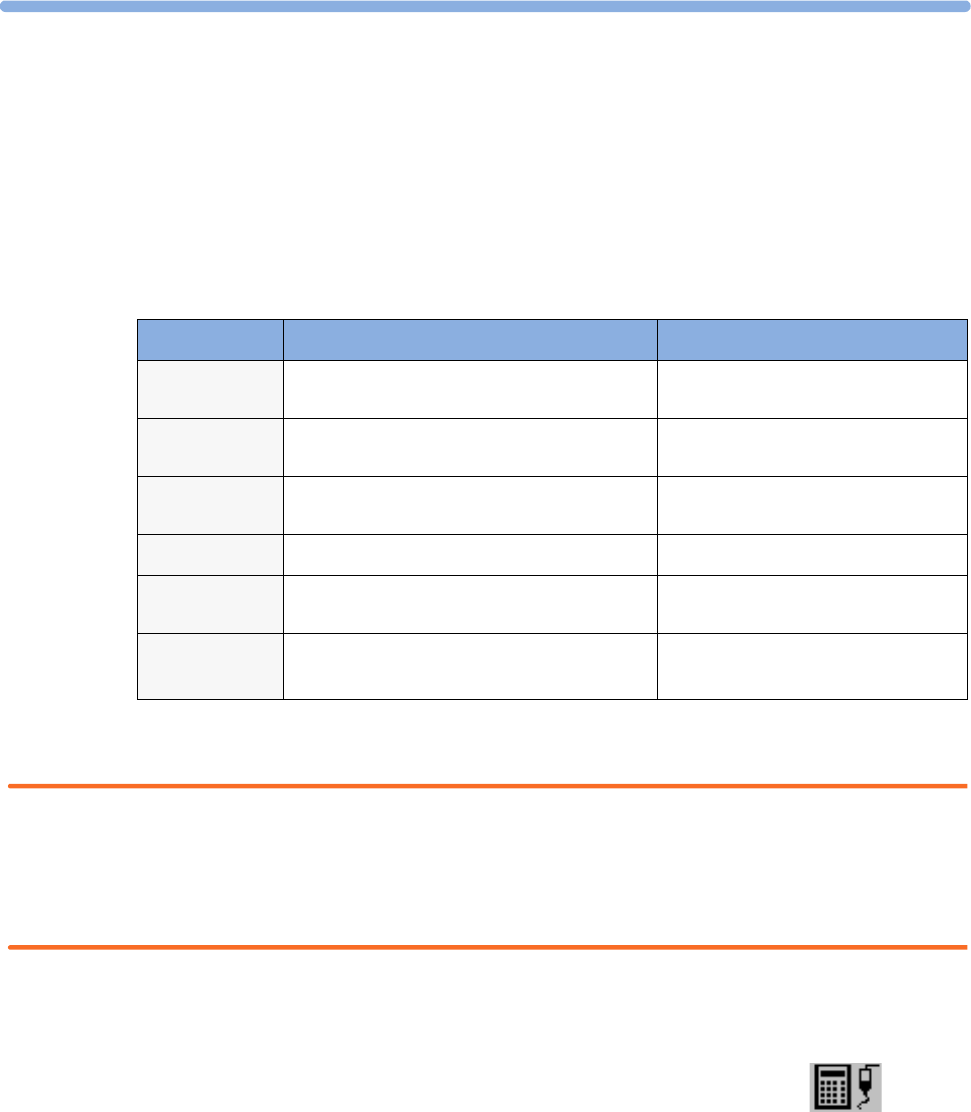
277
26
26Using the Drug Calculator
Drug mixtures for intravenous (IV) drug infusions combine information on drug dose, rate, amount,
volume, concentration, and standardized rate. The Drug Calculator helps you to manage infusions by
calculating one of these values at a time.
*Be aware that your hospital may use either ‘µg’ or ‘mcg’ as an abbreviation for microgram. These
abbreviations are equivalent.
WARNING Before you administer any drug, always check that the correct calculation units and patient category are
selected. Consult your pharmacy if you have questions.
Decisions on the choice and dosage of drugs administered to patients must always be made by the
physician in charge. The Drug Calculator performs calculations based on the values input during use,
it does not check the plausibility of the calculations performed.
Accessing the Drug Calculator
♦To access the Drug Calculator, select Main Setup -> Calculations ->
Drug Calculator, or select the Drug Calculator SmartKey, if
configured.
Term Definition Units
Dose total quantity of drug to be delivered to the
patient over time
amount units per time or per kg/
time, if the drug is weight-dependent
Rate volume of the mixture to be delivered to the
patient over time
ml/hour
Amount amount of drug to be added to diluent to
make up a mixture
ng, mcg*, mg, g, mUnit, Unit, where
g stands for gram
Volume quantity of mixture of diluent and drug ml
Concentration ratio of the amount of drug to the solution
volume
amount units per ml
Standardized
Rate
1ml volume of the mixture to be delivered to
the patient per hour
ml/hr
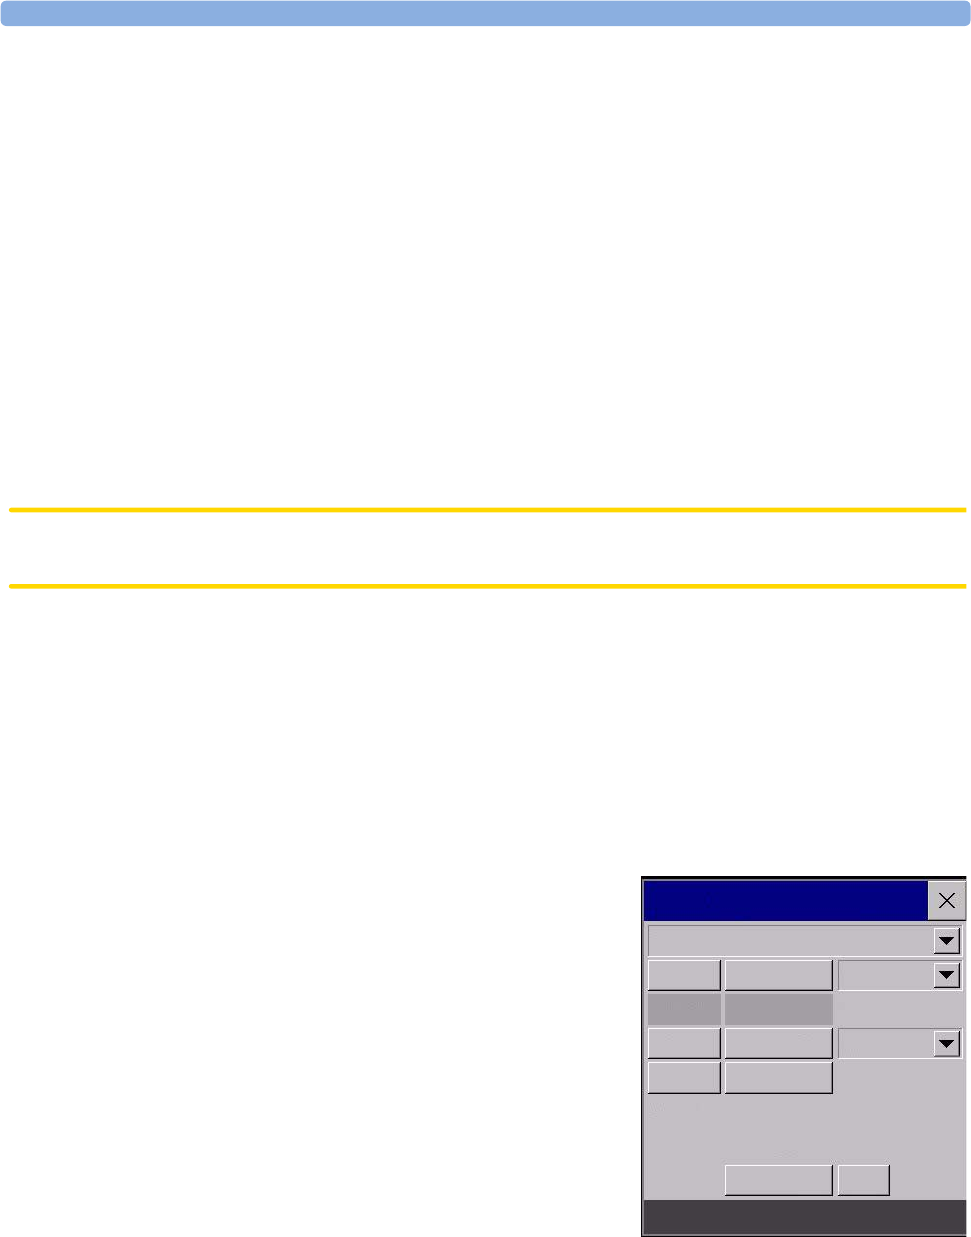
26 Using the Drug Calculator Performing Drug Calculations
278
Performing Drug Calculations
Using the service Support Tool, a list of drugs can be configured for the monitor containing pre-
defined dosage recommendations and unit settings. Selecting the arrow beside the drug name in the
Drug Calculator window opens a list of configured drugs. Contact your pharmacist if you have any
questions about the drugs in the list.
If Any Drug is the only entry in the list of drugs, no drugs have been preconfigured for your
monitor. Drug calculations can be performed for non-specific drugs.
You must have a Support Tool to add additional drugs to the Drug Calculator.
About the Rule of Six
If the Rule of Six has been enabled for use with individual drugs in your Drug Calculator, you can use
the formula in crisis situations to quickly calculate the amount of a drug needed to yield a target dose
for continuous infusion for neonatal or pediatric patients (the drug amount is given in “mg”, the
patient weight in “kg”). The Rule of Six can only be used with the dose unit mcg/kg/min.
CAUTION JCAHO recommends disabling the Rule of Six. The configuration is not JCAHO-compliant if Rule of
Six is enabled.
The Drug Calculator uses the following formula for Rule of Six calculations, based on the patient’s
weight:
• For a target dose of 0.1 mcg/kg/min, the Drug Calculator multiplies 0.6 x patient weight to
calculate the amount you need to add to the IV solution to equal a total of 100 ml.
• For a target dose of 1.0 mcg/kg/min, the Drug Calculator multiplies 6.0 x patient weight to
calculate the amount you need to add to the IV solution to equal a total of 100 ml.
Performing Calculations for a Non-Specific Drug
If a list of drugs has not been configured for your monitor,
you can use the Drug Calculator to calculate drug doses for a
single, generic drug called “Any Drug”. Selecting the arrow
beside the drug name in the Drug Calculator window shows
that are no other drugs configured.
1Enter three of these four values: dose, amount, volume,
and rate of the infusion solution.
To enter values, select the correct unit, then select each
value field and use the pop-up keypad to enter the correct
value.
2If you have chosen a weight-dependent dose unit, you
must enter the patient weight now or choose a different
unit.
If available, the patient weight from the Patient Demographic window is entered
automatically in the Drug Calculator window when the Drug Calculator is accessed. To change the
patient weight, select the Weight key then use the on-screen keypad to enter the correct value.
This will not change the patient weight stored in the patient demographic information.
Drug Calculator
ANY DRUG
Dose 2
Rate 480
Amount 25
Volume 100
mg/min
mg
ml
ml/hour
Concentr 0.25 mg/ml
1 ml/hr 0.004 mg/min
Weight 150 lb
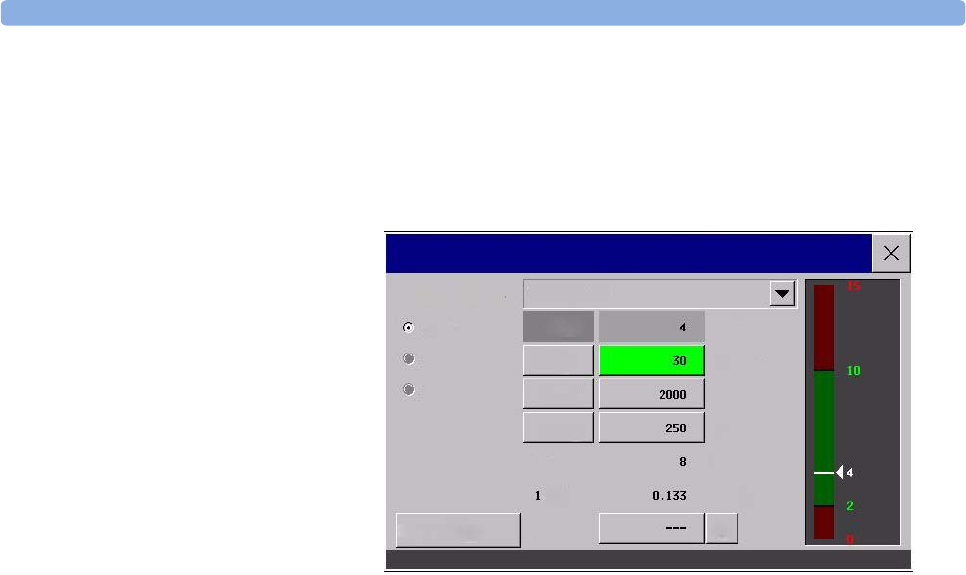
Performing Drug Calculations 26 Using the Drug Calculator
279
3When you have entered three values, the Drug Calculator automatically calculates the unknown
fourth value and shows it in the highlighted field. Standardized rate and concentration are also
calculated.
Performing Calculations for a Specific Drug
1Select the arrow beside
Any Drug, then select
the required drug from
the list of drugs.
This opens the
Drug Calculator
window for the selected
drug.
2Select the correct patient
category for your patient.
If you have a neonatal or
pediatric patient, the
Rule of Six choice
may be available. Select if required.
3Enter the patient weight, if necessary.
If available, the patient weight from the Patient Demographic window is entered
automatically in the Drug Calculator window. To change the patient weight, select the Weight
key then use the on-screen keypad to enter the correct value. This will not change the patient
weight stored in the patient demographic information. Select the weight unit shown to change
between lb and kg.
4When a specific drug is selected, the initial values for Dose, Amount and Volume are the
configured Start values for this drug. The Rate is then calculated. If other values are required you
can calculate any value by entering the remaining three values as described in ”Performing
Calculations for a Non-Specific Drug”.
The column on the right of the Drug Calculator window shows either drug dose or dosage rate,
whichever is the calculated value. The current calculated value is shown on a scale with the
recommended range in green. If the current calculated value lies outside the recommended range it is
shown in red.
If you have changed values in the Drug Calculator and you want to revert to the configured values,
select Reset Values key at any time.
Drug Calculator
Dose mg/min
mg
ml
ml/hour
Concentr.
ml/hr
Rate
Amount
Volume
Lidocaine
Adult
Pedi
Neo
Reset Values
Patient Category
mg/ml
mg/min
Weight lb
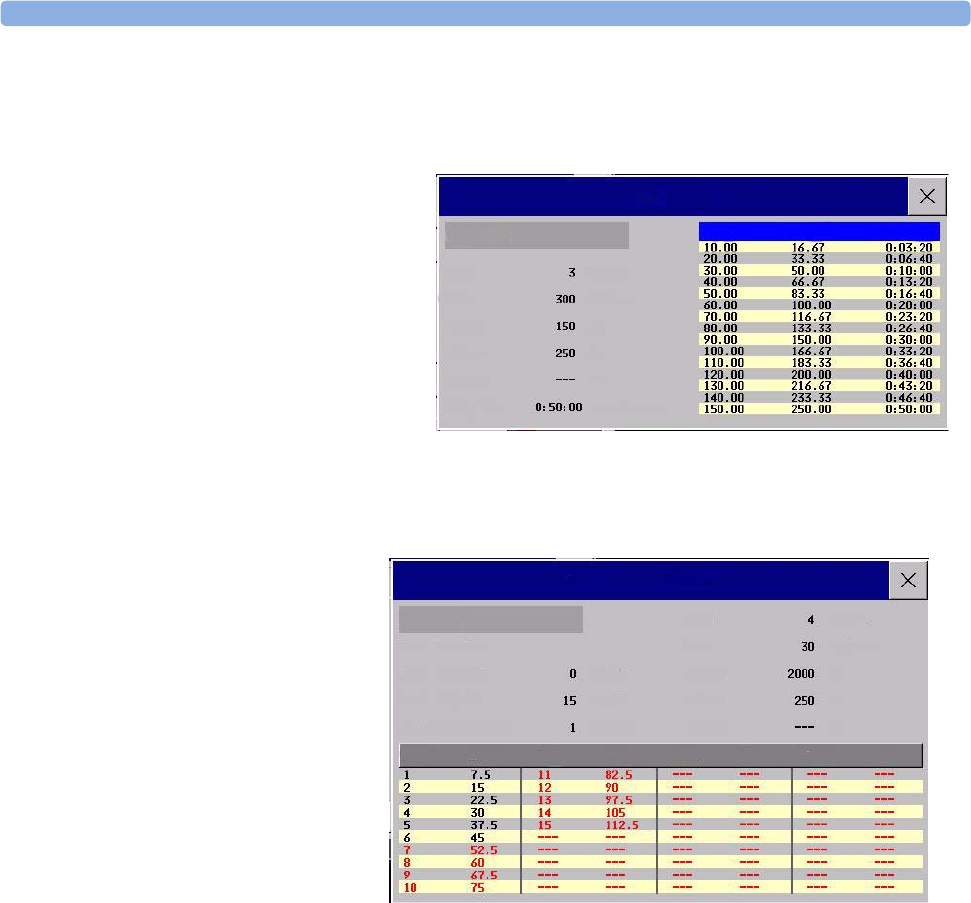
26 Using the Drug Calculator Charting Infusion Progress
280
Charting Infusion Progress
The Drip Table shows you at
a glance how much of the
infusion has been
administered to your patient
and how much time is left.
♦To see the Drip Table, in
the Drug Calculator
window, select the Drip
Table pop-up key.
If the DripTime exceeds 24
hours, the DripTime
timestamp shows - - :- - : - - .
Using the Titration Table
Use the Titration Table to see
at a glance what dose your
patient would receive of a
drug at different infusion
rates. By clicking on the title
row of the table you can
switch between the Dose
Increments and Rate
Increments view.
Values outside of the
recommended range are
shown in red.
To see the Titration Table,
♦in the Drug
Calculator window,
select the pop-up key
Titr.Table.
The Titration Table is configured with the service Support Tool.
Documenting Drug Calculations
♦In the Drug Calculator window, select the pop-up key Record DrugCalc to immediately start
a recording of the current drug calculation.
♦In the Titration Table window, select the pop-up key Print Titr. Tbl to print a report of
the current Titration Table.
♦In the Drip Table window, select the pop-up key Print Drip Tbl to print a report of the
current Drip Table.
Lidocaine
Drip Table
Amount Volume Drip Time
Dose mg/min
Rate ml/hour
Amount mg
Volume ml
Weight lb
DripTime hr:min:sec
Lidocaine
Titration Table
Rate
Dose
In increments of
mg/min
Rate
mg/min
AmountFrom a low of mcg
Volume
To a high of ml
Weight
Dose increments
lb
Dose Dose Dose Dose
Rate Rate Rate
mg/min
ml/hour
mg/min
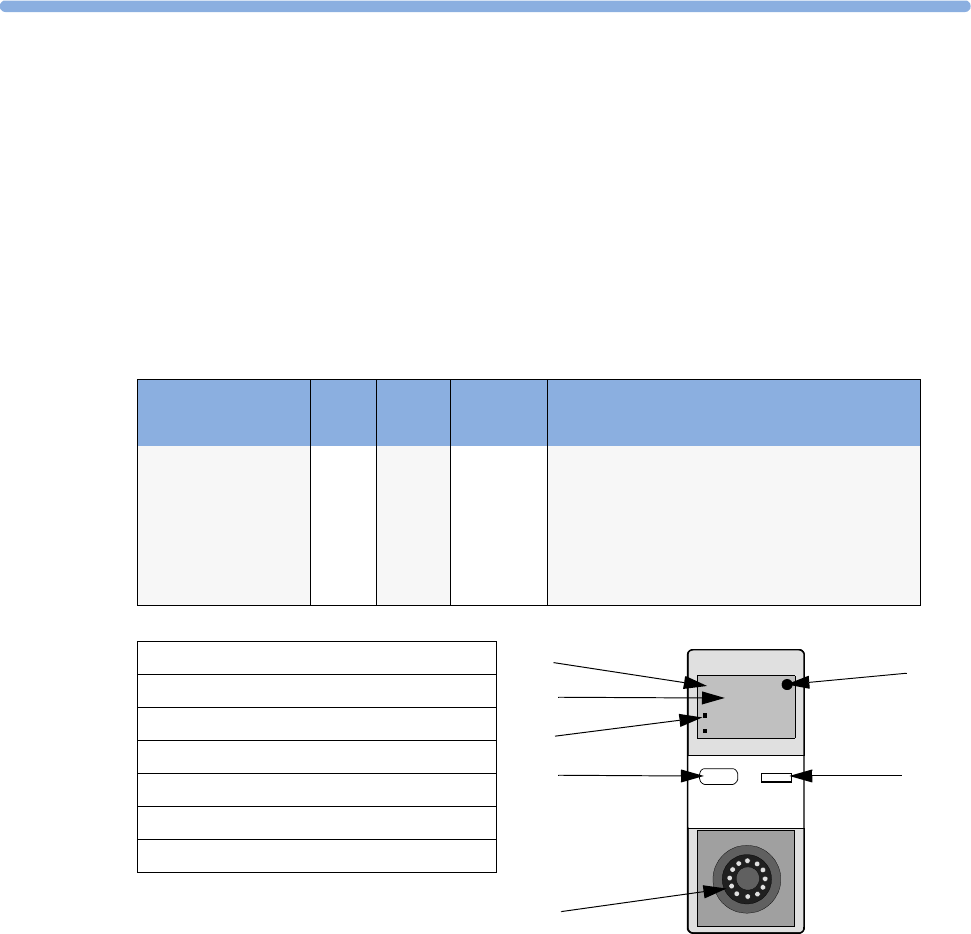
281
27
27VueLink Modules
A VueLink module transmits information from a connected external device to your monitor. Each
module can be connected to up to three external devices, and supports alarms from the external device.
Although the external device may transmit more information, the number of waves and numerics you
can view simultaneously on your monitor’s main screen depends on the module type. Type A modules
support one wave and two numerics, type B modules support two waves and six numerics.
The device labels (b) on the module indicate for which external devices the module is configured. The
selection LED (C) shows which device is currently active. The device label text may differ slightly from
the labels on the external devices.
See the documentation supplied with the VueLink module for a list of supported devices and
accessories, and for configuration information.
Module: Type Max
Wave
Max
numeric
External Devices
Auxiliary A 12 standalone measurement module
Ventilator B 26 ventilators
Gas Analyzer B 26 gas analyzers
Anesthesia Machine B 26 anesthesia machines
Auxiliary Plus B 26 external multi-measurement devices
a module name
b device label
c selection LED
d setup key
e external device cable connector
f setup indicator LED
g module type (A or B)
VENTILATOR
PB 7200a/ae
SIEMENS
60x145
VueLink M1032A T
VueLink
B
900C/D/E NEO
SIEMENS
900C/D/E AD
a
b
d
e
f
g
c

27 VueLink Modules Connecting an External Device
282
Connecting an External Device
1Insert the module into the FMS or integrated module slot.
2Check that the device selection LED (c) lights to show that it has correctly identified the external
device. If not, select Main Setup -> Measurements -> <VueLink Device Name> to
enter the setup menu for the connected device, headed Setup <VueLink Device Name>.
3In the device setup menu, select Device, select the correct device from the list, and confirm the
selection.
4Connect the external device to the module (e) and switch it on.
Once the VueLink device has been correctly connected, you can select the VueLink SmartKey and
then select the Setup VueLink pop-up key to access the Setup VueLink menu for the
connected device.
CAUTION Selecting the wrong device can cause unpredictable system behavior. Rectify this by switching off the
external device when it is safe to do so, and selecting the correct device.
Changing VueLink Waves and Numerics Displayed
To change the waves and numerics from the VueLink module displayed on the Screen,
1Select Main Setup -> Measurements -> <VueLink Device Name> to enter the setup
menu for the connected device, headed Setup <VueLink Device Name>.
2Select the item you want to change, then select the new item from the pop-up list,
or
Select Show Device Data to view the device data window.
3Close the setup menu. The monitor takes a few seconds to activate the change.
Viewing the VueLink Device Data Window
To view the VueLink device data window,
either
• select the setup hardkey on the VueLink
module or the VueLink SmartKey,
and then select the <Device Name>
pop-up key, or
•in the Setup <Device Name>
menu, select Show Device Data.
Selecting the device data window opens
the setup menu for the connected device.
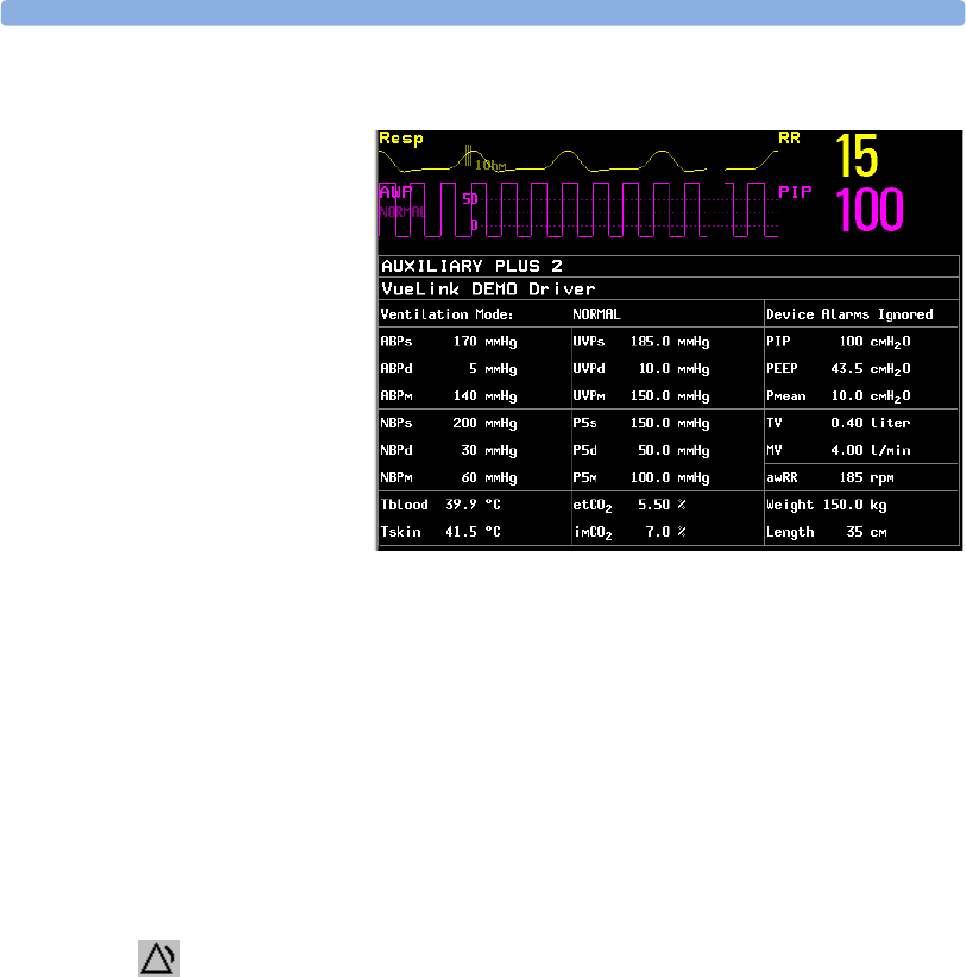
Using VueLink Screens 27 VueLink Modules
283
Using VueLink Screens
Your monitor may be
configured to show
VueLink device data
permanently on the
Screens.
Select the device data
window to display the
VueLink pop-up keys that
let you access the setup
menu and carry out
VueLink tasks.
Switching VueLink On and Off
♦To switch VueLink measurements on and off, in the Setup VueLink menu, select
Device Interface to toggle between the settings On and Off.
Alarms/INOPs From External Devices
The VueLink module itself generates INOPs, but does not generate alarms. If the external device’s
alarms are on, the module transmits these to the monitor. A message in the VueLink info window tells
you either Device Alarms Ignored or Device Alarms Accepted or No Alarms
Available. External device alarms status symbols precede some, but not all, measurement labels.
Alarms from external devices are:
• all transmitted to the monitor. For all numerics configured in the Setup VueLink menu, an
alarm condition is announced at the monitor. For one or more measurements not configured in the
Setup VueLink menu, an alarm is announced as a text message for the highest priority alarm.
Priority is determined at the external device.
•always non-latching on the monitor.
• announced as a flashing numeric while the alarm condition persists.
• announced audibly and visibly at the Information Center.
the monitor is configured to accept external device alarms,
but the alarms are switched off at the external device.
! alarms status of this external measurement is unknown

27 VueLink Modules Language Conflict with External Device Drivers
284
Language Conflict with External Device Drivers
You should avoid language conflicts between the VueLink module device driver and the monitor. Be
aware that if you connect a VueLink module with a different operating language to the monitor, the
monitor will show:
• measurement labels in the monitor language
• alarm and INOP texts in the VueLink module device driver language.

285
28
28Using Timers
With the Timers function you can set timers to notify you when a specific time period has expired.
CAUTION Do not use the timers to schedule critical patient-related tasks.
Viewing Timers
You can view currently active timers in the Timers window or directly on the Main Screen (if a timer
has been substituted for a numeric).
To open the Timers window:
♦Select the Timers SmartKey
or
♦Select Main Setup -> Timers
The maximum number of timers which can be active depends on your monitor model.
For each timer with a defined run time a progress bar is shown with the run time for that timer. Next
to the progress bar the elapsed time or the remaining time is shown, depending on whether the timer is
counting Up or Down. On the left, the label of the timer and a symbol indicating the type of expiry
notification is shown.
Notification
When any timer expires (except a No Limit timer), the color changes to red and a message appears in
the status line on the Main Screen. Be aware that if a timer has been configured to display in red, the
color will not change when the timer expires.
Additional notification is also available and can be pre-configured to:
Alarm An INOP alarm indicates the expiry of the timer
Sound A single tone indicates the expiry of the timer
No Sound No additional notification
This additional notification setting is made in the monitor’s Configuration Mode and is associated
with the timer label. The volume of the tone can also be set in Configuration Mode
28 Using Timers Timer Setup Pop-up Keys
286
Timer Types
There are four types of timer: Basic, Enhanced, Cyclic and No Limit. A Basic timer has
a single, defined run time and progress is shown in the progress bar. An Enhanced timer is like a
Basic timer but the progress bar shows progress beyond the end of the run time. A Cyclic timer
is like a Basic timer but restarts automatically when the run time is expired. A No Limit timer has
no run time or progress bar and shows the time elapsed since the timer was started.
The type of timer is set in the monitor’s Configuration Mode and is associated with the timer label.
Timer Setup Pop-up Keys
When you open the Timers window and select a timer, the Setup window opens and a selection of
pop-up keys appear to let you activate and control the timers.
Setting Up Timers
The additional notification setting is made in the monitor’s Configuration Mode and is associated with
the timer label. The timer type, display color of the timer and whether a window automatically pops up
on expiry are also settings made in Configuration Mode for each timer label.
The remaining timer settings can be made in Monitoring Mode. If you change settings when a timer is
running it will not be stopped. The timer will continue to count but the new settings will be applied.
To display the Setup window for a timer,
♦in the Timers window, select the required timer, or
♦select a timer on the Main Screen then select Setup Timers
Timer Label
You can select from a variety of specific labels, for example Tourniquet, Infusion, Documentation or
from four non-specific labels Timer A, B, C, D. When you assign a label to a timer, the monitor
automatically applies the associated configuration settings to this timer, but the timer continues
counting and is not reset.
To select a label, in the Timers window:
1Select the required timer to display the Setup window.
2Select Label.
3Select a specific or non-specific label from the list.
Pop-Up Keys Selecting this pop-up key lets you....
Start start the timer.
Stop stop the timer, allowing either restarting after a pause (Start key) or clearing
(Clear key).
Clear clear the timer, ending this timer episode.
Timers return to the timer window showing all active timers
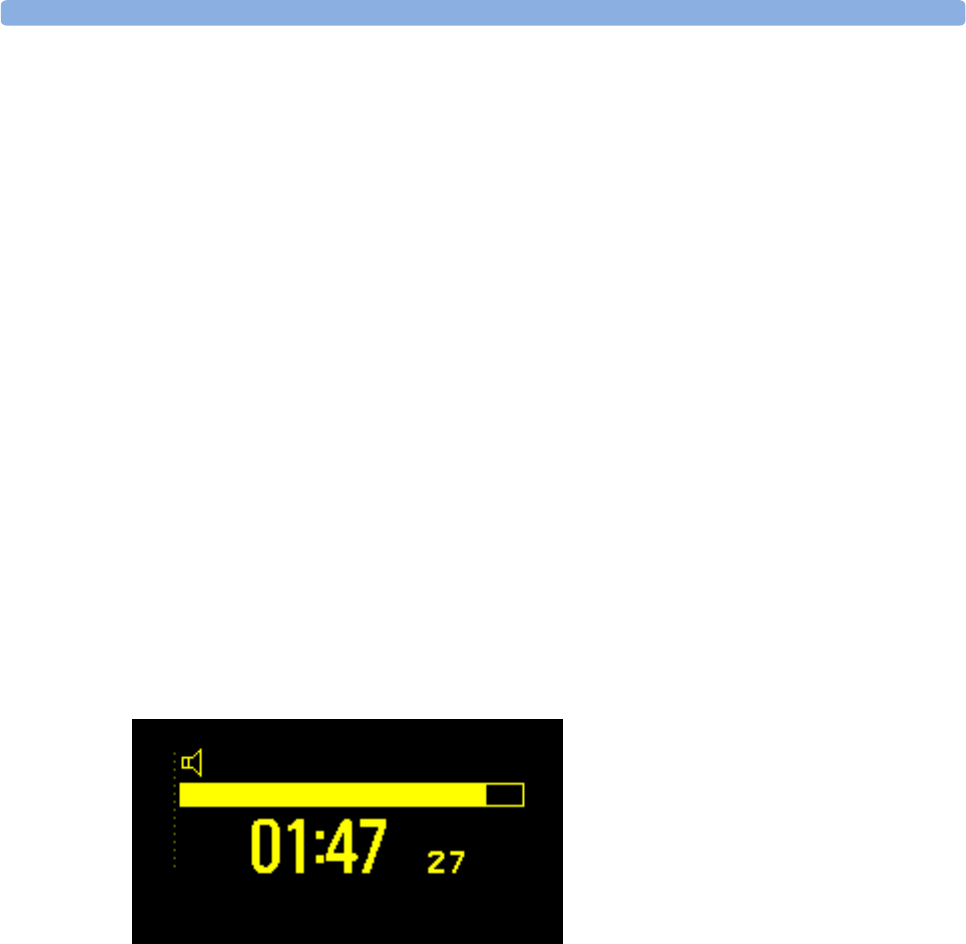
Displaying Timers On The Main Screen 28 Using Timers
287
Run Time
The run time can be set between 1 minute and 96 hours. No Limit timers have no run time.
To set the run time, in the Timers window:
1Select the required timer to display the Setup window.
2Select Run Time.
3Select a run time from the list.
Timer Counting Direction
Timers can count up or down, showing elapsed time or remaining time. No Limit timers
automatically count up.
To change the direction, in the Timers window:
1Select the required timer to display the Setup window.
2Select Direction to switch between Up and Down.
Displaying Timers On The Main Screen
If you want to have a timer displayed on the Main Screen, you can substitute it for a numeric which is
not directly associated with a wave. If limited space is available, some elements displayed in the
Timers window may not be displayed. The minimum information displayed is the label and the
elapsed or remaining time.
To display a timer on the Main Screen:
1Select the numeric you want to substitute.
2Select Change Numeric.
3Select Any Timer.
4Select the timer to be displayed.
TimerA
2 hrs

28 Using Timers Displaying A Clock On The Main Screen
288
Main Screen Timer Pop-up Keys
When you select a timer displayed on the Main Screen, additional pop-up keys become available:
Displaying A Clock On The Main Screen
In the same way that you can substitute a timer for a numeric, you can also substitute a larger clock
display for a numeric.
To display a clock on the Main Screen:
1Select the numeric you want to substitute.
2Select Change Numeric.
3Select Clock.
Pop-Up Keys Selecting this pop-up key lets you....
Setup
“Label”
enter the setup screen for the currently selected timer.
Change
Timer
select a different timer for display.

289
29
29Respiratory Loops
Using a VueLink module connected to a ventilator, you can measure and store graphic representations
of realtime respiratory loops. Respiratory loops can help you recognize changes in your patient’s lung
function , and they can also indicate a fault in the airway tubing (for example, if the respiratory loop
does not close).
You can measure:
• Pressure-volume loops
•Pressure-flow loops
•Volume-flow loops.
Note that you cannot store loops from different patients and different source devices in the same list as
they are patient and device specific.This prevents you from inadvertently comparing information from
different patients.
Viewing Loops
In the loops display, the current loop is drawn in white, and up to six stored loops are color-coded to
match their timestamps. The currently-used source device is shown in the window title.
To view respiratory loops permanently on your Screen,
♦select the current Screen name to open the Change Screen menu, then select a Screen
configured to display the loops screen element.
Select the loops screen element to access the loops pop-up keys.
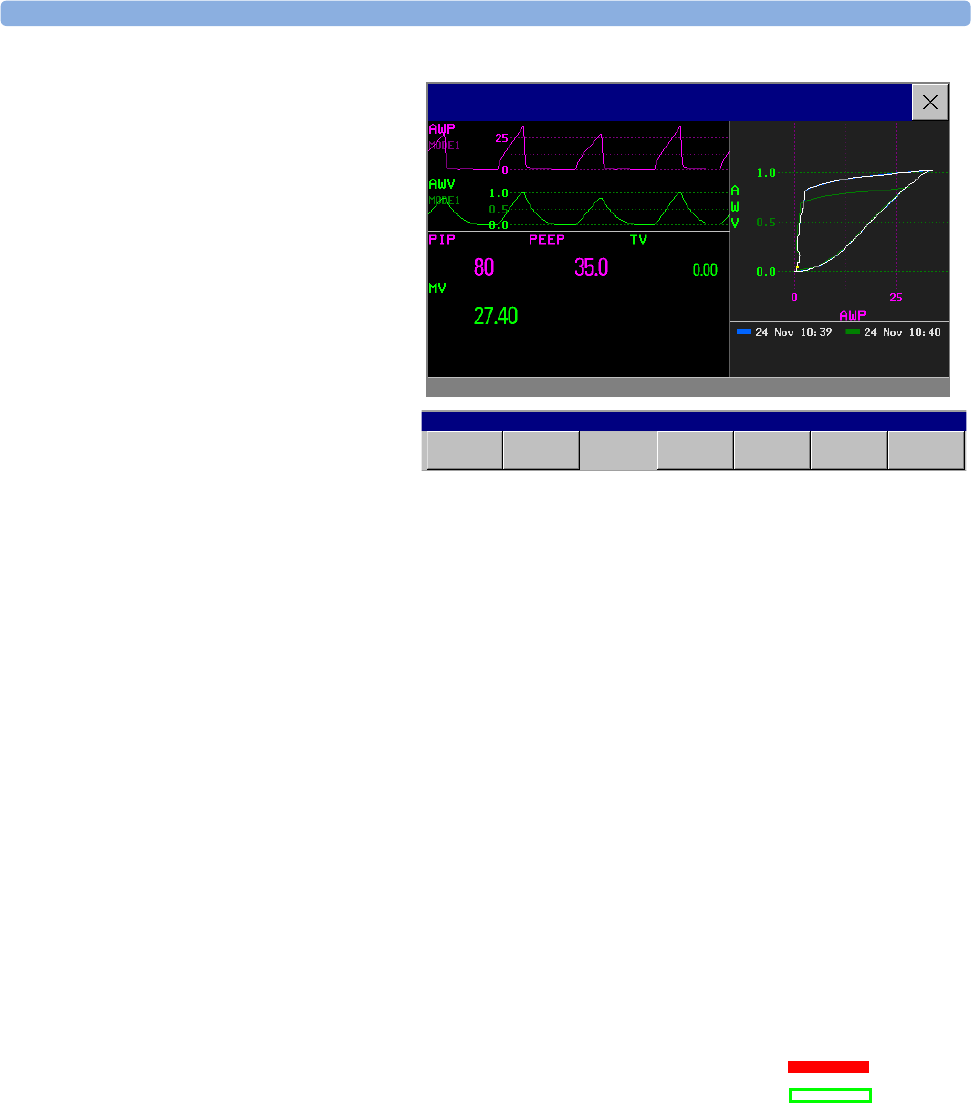
29 Respiratory Loops Capturing and Deleting Loops
290
To open the Loops window,
and its associated pop-up keys,
♦select Main Setup ->
Loops, or select the Loops
SmartKey, if configured.
In the Loops window, in
addition to the stored loops, three
realtime airway waves and six
available numerics from the
source device can be shown.
Capturing and Deleting Loops
Up to six loops of each kind can be stored for reference.
To capture the current Loop and display it in the Loops window,
♦select the Capture Loop pop-up key.
The monitor will prompt you to save the loop for reference, either in addition to or in place of
previously stored loops.
Status messages at the bottom of the window provide information on the loop capture process.
To delete Loops from the reference list,
♦Select the Select Loop pop-up key to view the list of stored loops and delete the loops from
the list.
Showing/Hiding Loops
Colored rectangles beside the loops timestamps and color-coded with the loops tell you whether each
loop is currently displayed or not:
– A filled-in rectangle marks loops currently shown in the Loops window
– A rectangle outline marks loops not currently shown.
Selecting the timestamp of the currently-displayed loop hides it and shows the next in the list; selecting
the timestamp of a currently hidden loop displays it.
Loop capture in progress......
Capture
Loop Select
Loop Select
Size
Print
Loop
Setup
Device
Loops: Ohmeda 7900
Loop
Type
Loops

Changing Loops Display Size 29 Respiratory Loops
291
Changing Loops Display Size
To change the loops display size, in the Loops window, select the pop-up key Select Size then
select
•Size x 0.5 to display loops at half the usual size
•Size x 1 to display loops at the usual size
•Size x 2 to display loops at twice the usual size
This does not affect the size of loops printed in reports.
Using the Loops Cursor
To view the coordinates for any point on a stored loop,
1Select the pop-up key Select Loop.
2Select the required loop from the list of available loops.
3Use the arrow pop-up keys to move the cursor around the loop. The values for both loop axes are
shown for every point on the loop.
Select the X at the top of the loop list to exit the cursor.
Changing Loops Type
To change the loop type, in the Loops window, select the Loop Type pop-up key (only available if
the source device delivers three waves), then select
•Press/Volume to display Pressure/Volume loops
•Flow/Volume to display Volume/Flow loops
•Press/Flow to display Pressure/Flow loops.
or, if the source device only delivers two waves,
1In the Loops window, select the Setup Device pop-up key to enter the
Setup <VueLink Device> menu.
2Select Wave 1 and select pressure, flow, or volume waves as required. Repeat for Wave 2.
Setting Up Source Device
The source device for the loops is indicated in the Loops window title.
♦Select the Setup Device pop-up key to view the settings of the current source device.
If the source device is changed, all reference loops from a previous device are cleared from the reference
list when the first loop from the new source device is captured. Reconnecting the previous device recalls
its reference list.
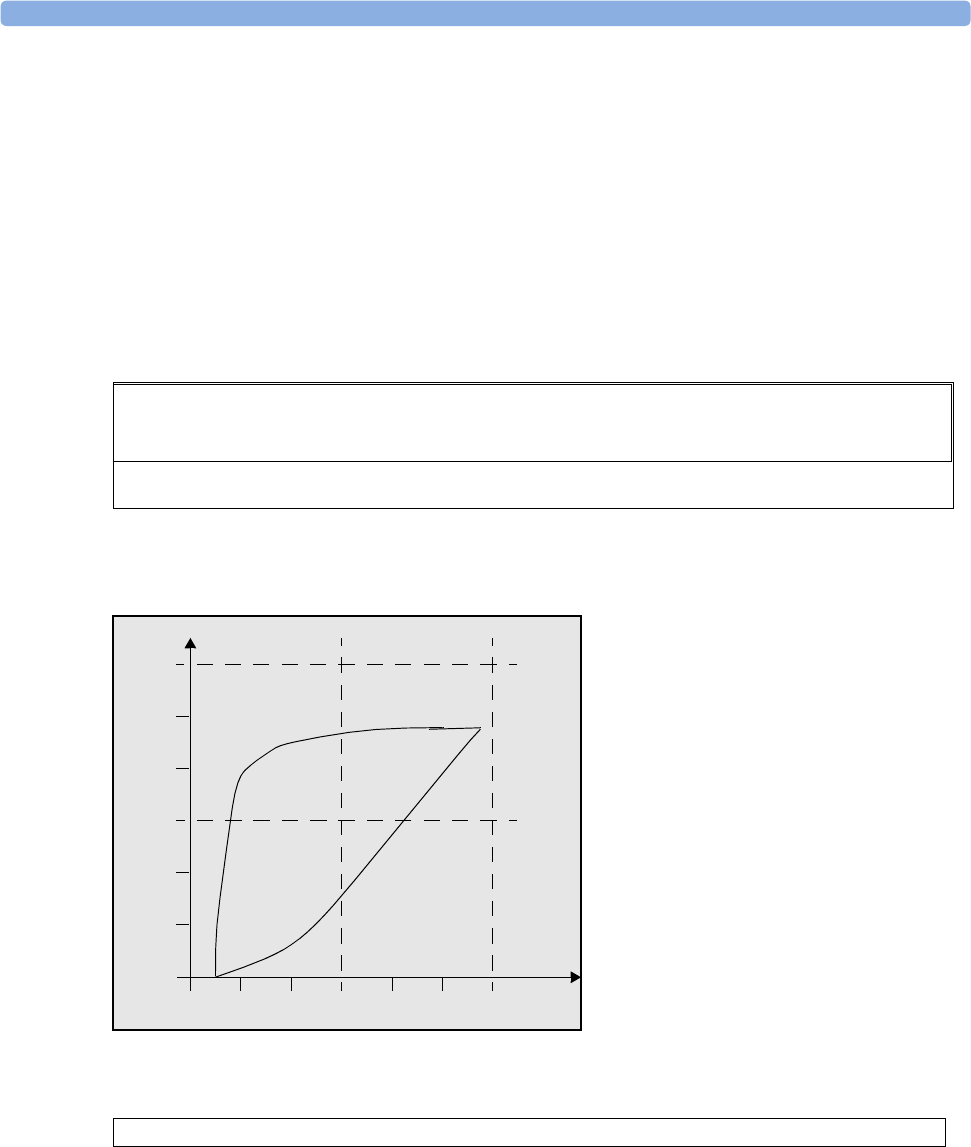
29 Respiratory Loops Documenting Loops
292
Documenting Loops
1In the Loops window, select the pop-up key Print Loop
2From the list of available loops, select an individual loop, or select Print All to print a report of all
For each loop, the report prints
• the currently-displayed loop, with the loop capture timestamp
• up to six realtime numerics provided by the loop source device
•SpO
2, etCO2, PO2, and PCO2 numerics from the patient monitor, if available.
AWP [mmHg]
0
0.0 50
1.0
2.0
A
W
V
[l]
TV 550 ml
MV 7.15 l/min
awRR 13 rpm
inO2 100 mmHg
etCO2 38 mmHg
imCO2 0.1 mmHg
SpO2 99 %
SpO2 l 98 %
SpO2 r 99 %
Philips Hospital Name Page number
Source Device
Loop Captured at 10 Jan 2004 13:10
Lastname, Firstname
Bed Label
Respiratory Loops Report 10 Jan 13:30

293
30
30Care and Cleaning
Use only the Philips-approved substances and methods listed in this chapter to clean or disinfect your
equipment. Warranty does not cover damage caused by using unapproved substances or methods.
Philips makes no claims regarding the efficacy of the listed chemicals or methods as a means for
controlling infection. Consult your hospital’s Infection Control Officer or Epidemiologist. For
comprehensive details on cleaning agents and their efficacy refer to “Guidelines for Prevention of
Transmission of Human Immunodeficiency Virus and Hepatitis B Virus to Health Care and Public-
Safety Workers” issued by the U.S. Department of Health and Human Services, Public Health Service,
Centers for Disease Control, Atlanta, Georgia, February 1989. See also any local policies that apply
within your hospital, and country.
General Points
Keep your monitor, modules, Multi-Measurement Server, measurement server extensions, Flexible
Module Server, cables and accessories free of dust and dirt. After cleaning and disinfection, check the
equipment carefully. Do not use if you see signs of deterioration or damage. If you need to return any
equipment to Philips, decontaminate it first.
Observe the following general precautions:
• Always dilute according to the manufacturer’s instructions or use lowest possible concentration.
• Do not allow liquid to enter the case.
• Do not immerse any part of the equipment in liquid.
• Do not pour liquid onto the system.
• Never use abrasive material (such as steel wool or silver polish).
• Never use bleach.
WARNING Do not operate any devices when they are wet. If you spill liquid on the equipment, battery, or
accessories, contact your service personnel or Philips service engineer.
The general care and cleaning information given here meets the requirements of Aspect Medical
Systems for their BIS measurement devices.
30 Care and Cleaning Cleaning
294
Cleaning
Clean with a lint-free cloth, moistened with warm water (40°C/104°F maximum) and soap, a diluted
non-caustic detergent, tenside, ammonia- or alcohol-based cleaning agent. Do not use strong solvents
such as acetone or trichloroethylene.
Take extra care when cleaning the screen of the monitor because it is more sensitive to rough cleaning
methods than the housing. Do not permit any liquid to enter the monitor case and avoid pouring it on
the monitor while cleaning. Do not allow water or cleaning solution to enter the connectors of the
Multi-Measurement Server, the measurement server extensions and measurement modules. Wipe
around, not over, connector sockets.
CAUTION To clean the touch-enabled display, disable the touch operation by switching off the monitor during
the cleaning procedure, or by selecting and holding the Main Screen key until the padlock symbol
appears on it, indicating that touch operation is disabled. Select and hold again to re-enable touch
operation. Unplug a mouse before cleaning it. Switch off the monitor to disable an attached
SpeedPoint Device before cleaning the device.
Recommended cleaning agents are:
Disinfecting
CAUTION Solutions: Do not mix disinfecting solutions (such as bleach and ammonia) as hazardous gases may
result.
Hospital policy: Disinfect the product as determined by your hospital’s policy, to avoid long term
damage to the product.
Clean equipment before disinfecting. Recommended disinfecting agents are:
Cleaning Monitoring Accessories
To clean, disinfect and sterilize reusable transducers, sensors, cables, leads, and so forth, refer to the
instructions delivered with the accessory.
Tensides (dishwasher detergents) Edisonite Schnellreiniger, Alconox
Ammonias Dilution of Ammonia <3%, Window cleaner
Alcohol Ethanol 70%, Isopropanol 70%, Window cleaner
Alcohol based Ethanol 70%, Isopropanol 70%, Cutasept, Hospisept, Kodan Tinktur
forte, Sagrosept, Spitacid, Sterilium fluid
(only Ethanol 70% and Isopropanol 70% are tested and qualified)
Aldehyde based Cidexactivated dialdehyde solution, Gigasept
(only Cidex is tested and qualified)
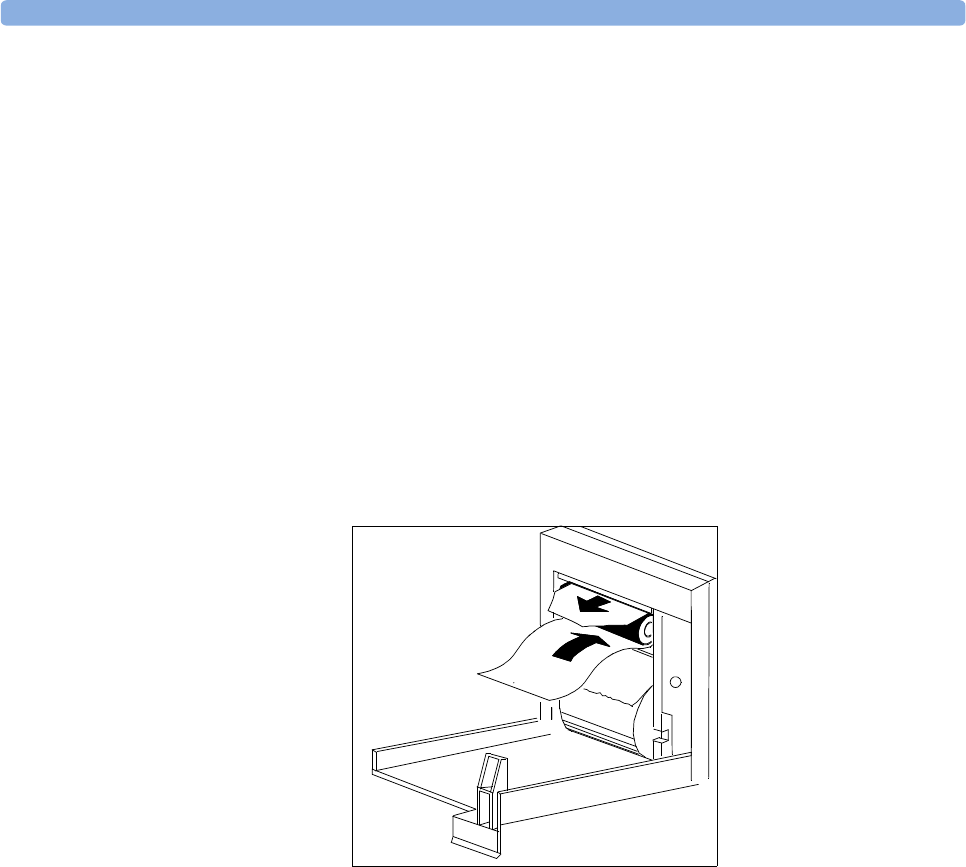
Sterilizing 30 Care and Cleaning
295
Sterilizing
Sterilization is not recommended for this monitor, related products, accessories or supplies unless
otherwise indicated in the Instructions for Use that accompany the accessories and supplies.
Cleaning the Recorder Printhead (M1116B only)
If you run recordings at low speed (1 or 2cm/min) for extended periods, deposits of paper debris may
collect on the print head making recordings unevenly fainter in horizontal stripes.
1Remove the recorder.
2Open the recorder door and un-thread the paper from behind the rubber roller.
3Tear off or roll up the excess paper into the roll chamber to get it out of your way.
4Thread the cloth cleaning strip instead of paper around the rubber roller until approximately two
inches of the strip come out from the top of the roller.
5Close the recorder door, aligning both ends of the strip over the top of the door.
6Holding the top end of the cleaning strip between your thumb and forefinger, pull the strip
through and out of the recorder.
7Open the door and ensure that the paper cavity is dust-free. Re-thread the paper and replace the
recorder.
Cleaning the Batteries and Battery Compartment
MP20/MP30
MP40/MP50
Only
Wipe with a lint-free cloth, moistened with warm water (40°C/104°F maximum) and soap. Do not use
strong solvents. Do not soak the battery.

30 Care and Cleaning Cleaning the Batteries and Battery Compartment
296
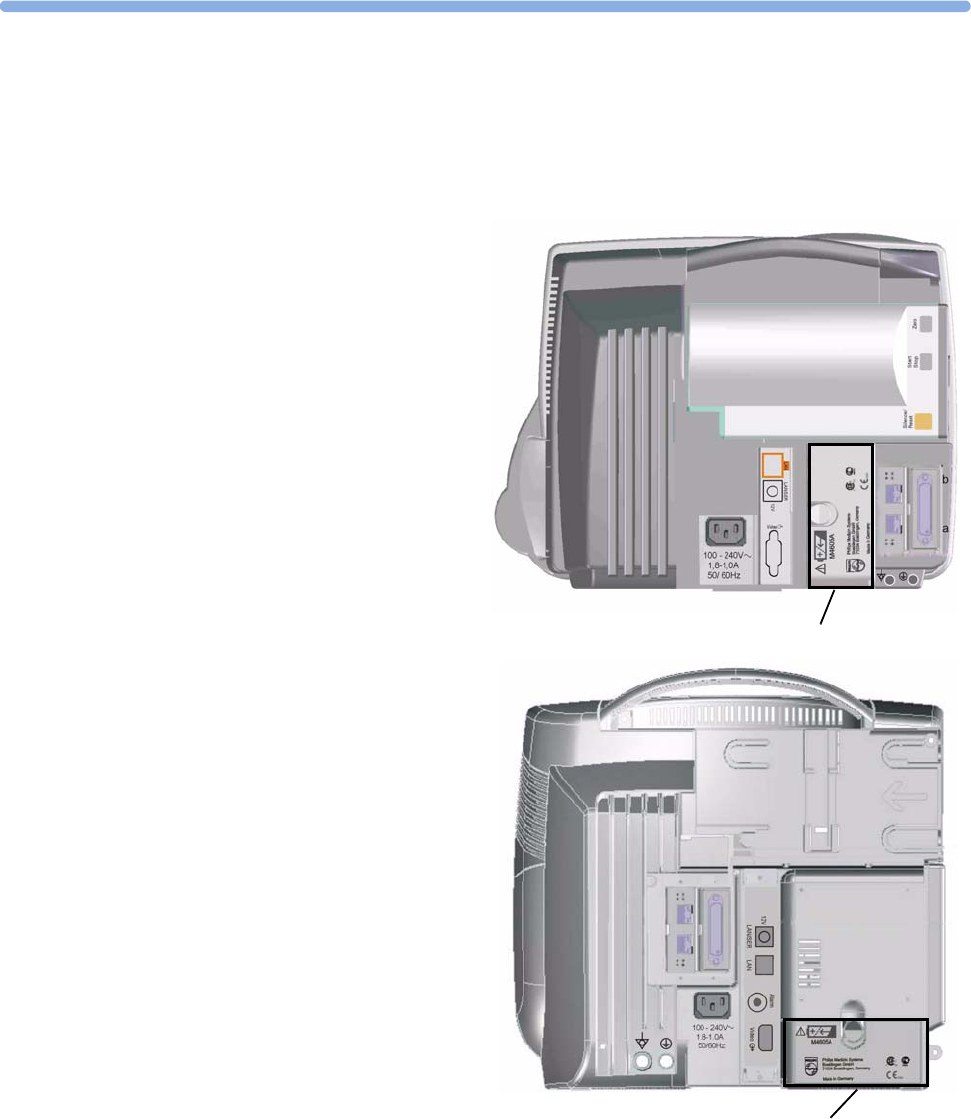
297
31
31Using the Batteries
IntelliVue
MP20/MP30/
MP40/MP50
only
MP20/MP30: one OR two Philips
M4605A rechargeable Lithium Ion
batteries must be inserted into the
battery compartment at the rear of the
monitor to use the MP20/MP30
monitor with battery power.
MP40/MP50: two Philips M4605A
rechargeable Lithium Ion batteries must
be inserted into the battery
compartment at the rear of the monitor
to use the MP40/MP50 monitor with
battery power.
Battery compartment
Battery compartment
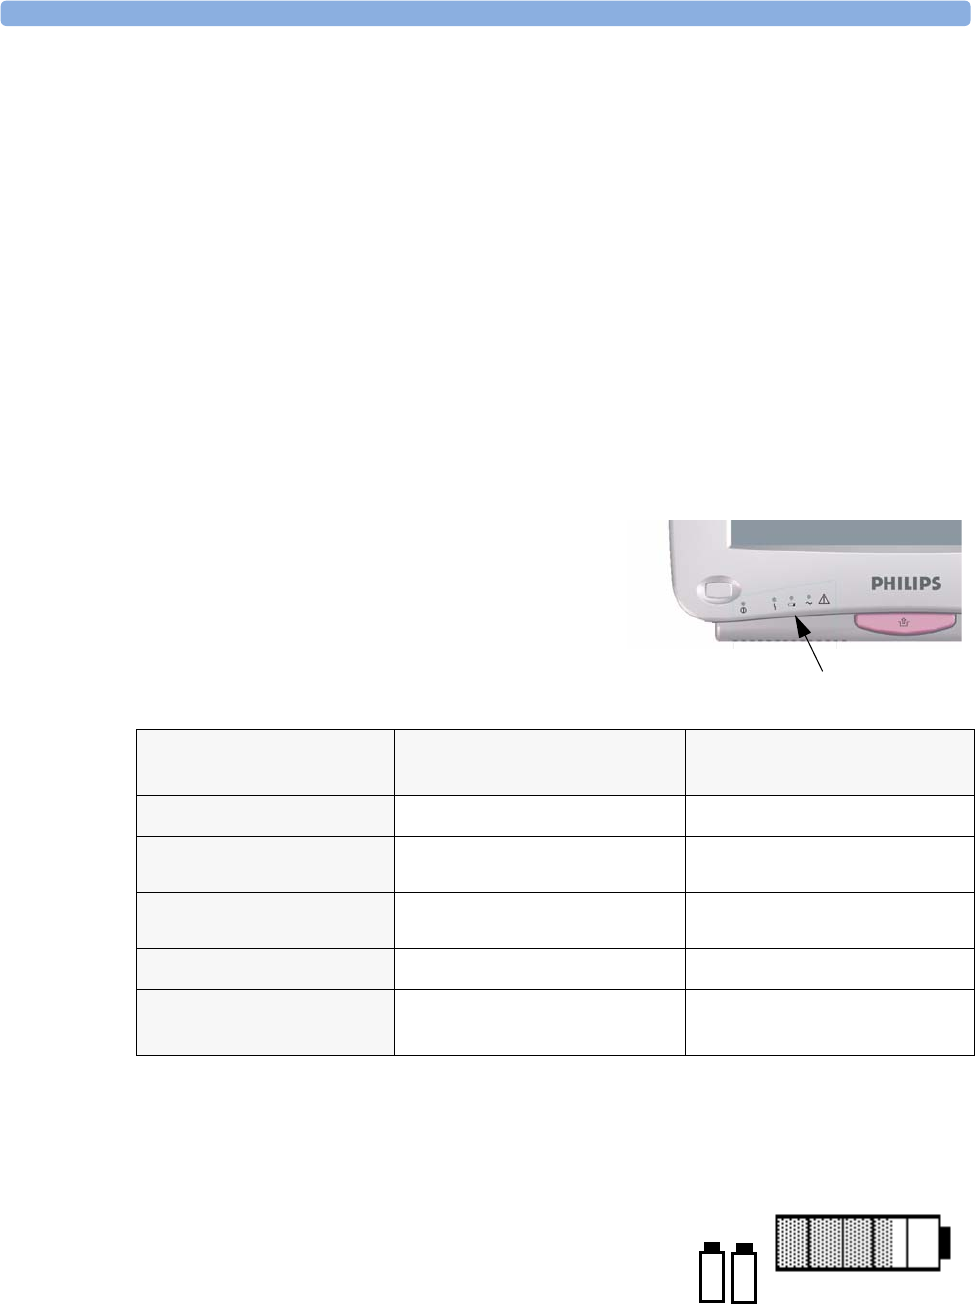
31 Using the Batteries Battery Power Indicators
298
The MP60/MP70/MP80/MP90 monitors cannot be powered by battery.
You can switch between battery-powered and mains-powered (AC) operation without interrupting
monitoring.
The batteries recharge automatically whenever the monitor is connected to mains power.
Battery operation may not be available in all geographies.
Battery Power Indicators
The battery LED and battery status information on the Main Screen, in combination with INOP
messages and prompts, help you keep track of the battery power status. The indicators always show the
remaining capacity in relation to the battery’s actual maximum capacity, which may lessen as the
battery ages. You can see the actual capacity in the Battery Status window.
When both batteries are empty the monitor switches off automatically.
Battery LED
The battery LED on the front panel of the
monitor is indicated by a battery symbol.
MP40/50
only
If only one battery is inserted during charging, the battery LED is yellow during charging and switches
off when the battery is charged.
Battery Status on the Main Screen
Battery status information can be configured to display
permanently on all Screens. It shows the status of each of the
batteries detected and the combined battery power remaining,
with an estimate of the monitoring time this represents.
Battery LED Colors If the monitor is connected to
mains power, this means
If the monitor is running on
battery power, this means
Green battery power is > 90%
Yellow batteries charging (battery power
<90%)
Red, flashing less than 10 minutes power
remaining
Red, flashes intermittently battery malfunction battery malfunction
Red, flashes once when on/
standby switch is pressed
not enough battery power left to
power monitor
Battery LED
12
3:40 hrs
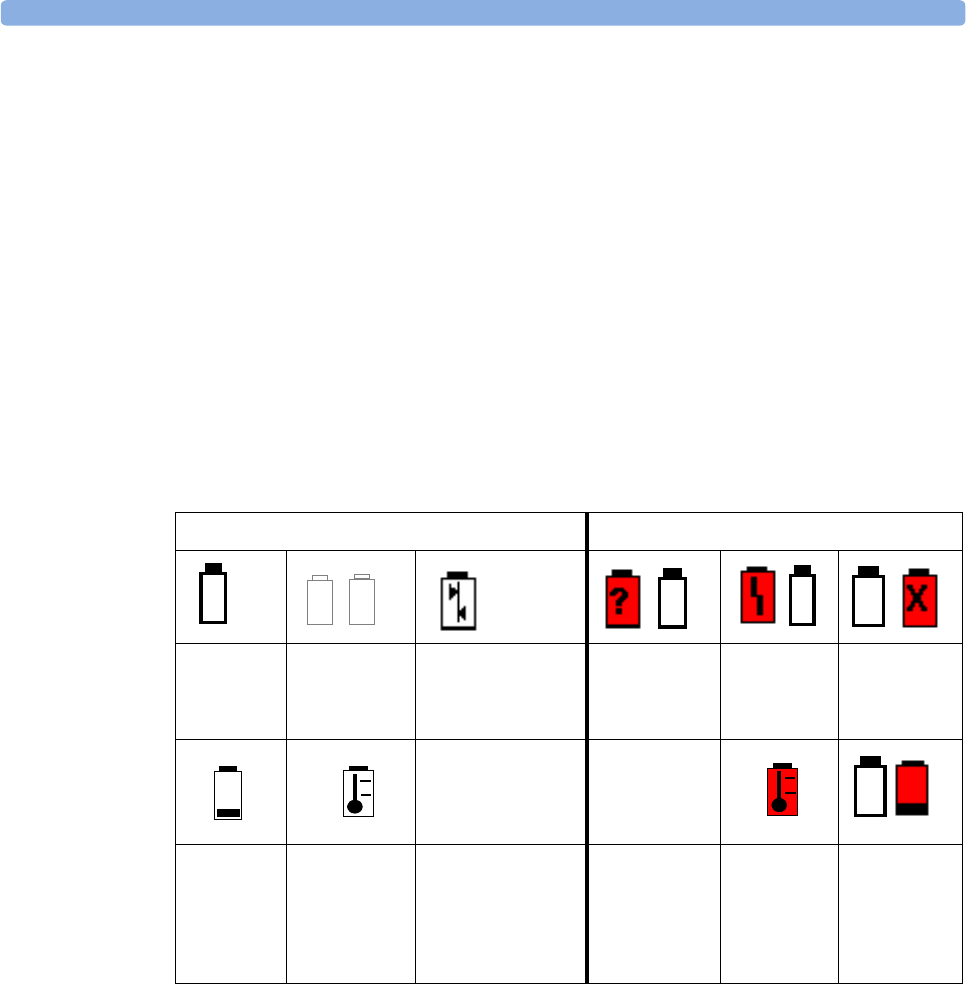
Battery Power Indicators 31 Using the Batteries
299
Battery status symbols: These symbols tell you the status of the batteries (see table below) and which
battery compartment they are in, either 1 or 2.
Battery power gauge: This shows the remaining battery power in the combined batteries. It is divided
into sections, each representing 20% of the total power. If three and a half sections are shaded, as in
this example, this indicates that 70% battery power remains. If no batteries are detected, the battery
gauge is grayed-out. If no data is available from the batteries, questions marks are shown in the gauge.
Monitoring Time Available: Below the battery power gauge a time is displayed. This is the estimated
monitoring time available with the current battery power. Note that this time fluctuates depending on
the system load (the display brightness and how many measurements and recordings you carry out),
the age of the battery, and the remaining capacity of the battery.
Battery malfunction symbols: If a problem is detected with a battery, these symbols alternate with
the symbol indicating the position of the battery affected. They may be accompanied by an INOP
message or by a battery status message in the monitor information line providing more details. Symbols
indicating critical situations are colored red.
If both batteries are malfunctioning or incompatible, the monitor will switch off automatically for
safety reasons, if it is not connected to AC power.
Battery status symbols Battery malfunction symbols
Battery 1 is
present
Battery
compartments
are empty
Battery requires
maintenance
Incompatible
battery
(Battery 1)
Battery
malfunction
(Battery 1)
Battery 2 is
missing, insert
battery (MP40/
50 only)
battery is
empty
battery not
charging as the
temperature is
above or below
the specified
range
(red) battery
temperature
too high
Battery 2 has no
power left
1
2
2
1
1

31 Using the Batteries Checking Battery Charge
300
Battery Status Window
♦To access the Battery
Status window and its
associated pop-up keys,
select the battery status
information on the
Screen, or select Main
Setup -> Battery.
Capacity, Remaining tells you how much power is left in each battery.
Capacity, Full Charge tells you how much power each battery can hold when fully charged.
Time To Empty tells you approximately how long you can continue to use the monitor with these
batteries. Note that this time fluctuates depending on the system load (the display brightness and how
many measurements and recordings you carry out), the age of the battery, and the remaining capacity
of the battery.
Time To Full is shown in place of Time To Empty if the monitor is connected to mains
power, and tells you how much time is left until the batteries are charged to 90%. When the batteries
are charging you can see how much monitoring time the current charging status represents under the
battery symbol.
Viewing Individual Battery Status
♦To view information for individual batteries, select the pop-up key Battery 1 or Battery 2.
Recording Battery Status
To print the information in the Battery Status window on a connected recorder,
1Select the battery status information on the Screen to open the Battery Status window
2Select the Record Status pop-up key.
Printing Battery Reports
To print the information in the Battery Status window on a connected printer,
1Select the battery status information on the Screen to open the Battery Status window
2Select the Print Status pop-up key.
Checking Battery Charge
♦To check the charge status of a battery in a monitor, see the battery power gauge on the Screen or
select Main Setup -> Battery to enter the Battery Status window.
♦To check the charge status of a battery that is not connected to a monitor or battery charger, press
the black dot marked “PUSH” on the labeled side of the battery. The remaining charge is indicated
by four LEDs on the electronic fuel gauge directly above the dot. Each LED represents 25% of
Battery Status
TimeToEmpty: 5hrs 10 min
Capacity
remaining
fullCharge
Batt 1 Batt 2
[mAh]
[mAh]
hrs
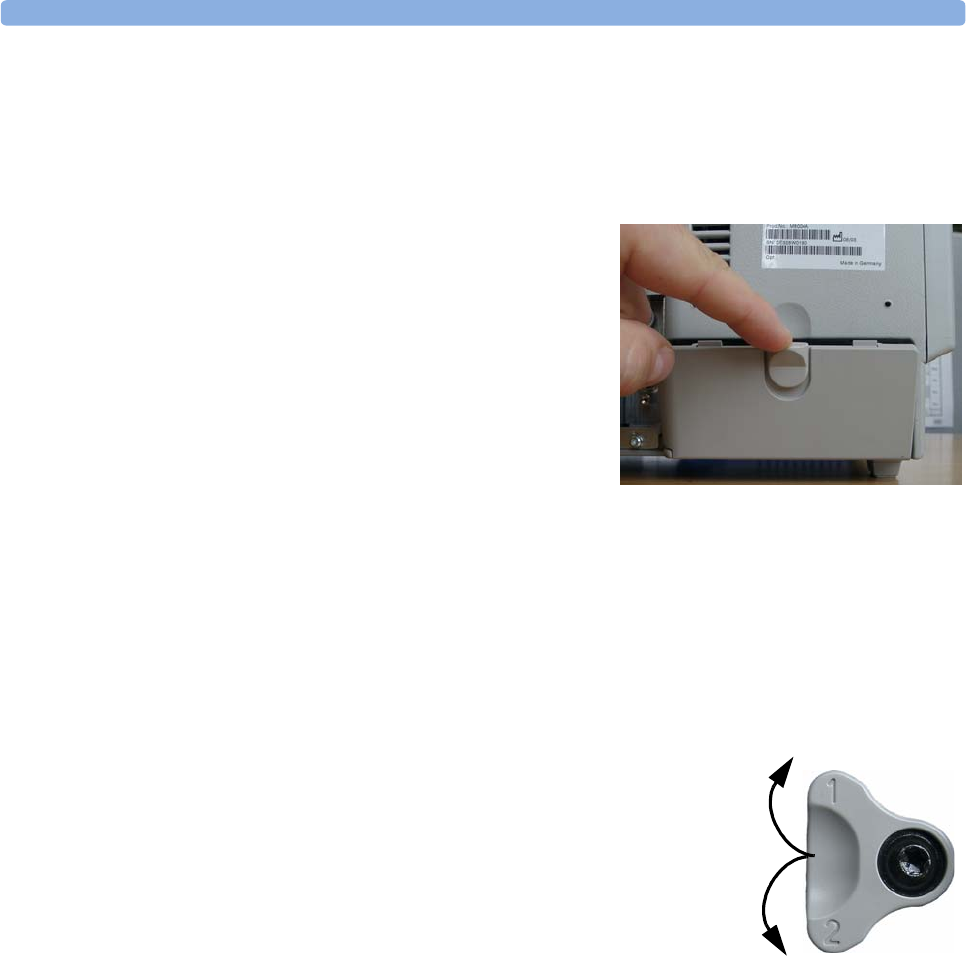
Replacing Batteries 31 Using the Batteries
301
charge. If all LEDs are lit, the battery is fully charged, if only one LED is lit, 25% or less charge is
left.
Replacing Batteries
MP40/MP50 You can replace batteries without switching off the monitor, if you replace them one at a time and if
the remaining battery has sufficient power. The Battery Missing INOP is suppressed for 30
seconds while you exchange each battery.
MP20/MP30 When using the monitor with only one battery, insert the new battery before removing the previous
battery, to avoid leaving the monitor without power.
To replace batteries,
1Press the battery compartment latch to open the battery compartment door.
2To replace battery 1, rotate the battery retainer until the battery can
be removed.
To replace battery 2, rotate the battery retainer until the battery can
be removed.
3Pull gently on the canvas strap to move the battery towards you, then
grasp the battery and pull it out fully.
4Slide the new battery into position, making sure that the positive and
negative poles are facing in the correct direction, as outlined on the inside of the battery
compartment door.
5Repeat with the second battery if required.
6Center the battery retainer and close the battery compartment door.
Optimizing Battery Performance
The performance of rechargeable batteries may deteriorate over time. Maintaining your batteries as
recommended here can help to slow down this process.

31 Using the Batteries Optimizing Battery Performance
302
Display Brightness Setting
♦In the Main Setup menu, select User Interface -> Brightness - > Optimum.
This selects a level of brightness suitable for most monitoring locations that uses less battery power
than brighter settings.
Satisfy yourself that this level of brightness is suitable for your monitoring location.
Note that your monitor may be configured to dim or brighten the display brightness automatically
when you disconnect from power, to suit the most common transport scenario
(“TransportBrightn” setting).
Charging Batteries
Batteries can be charged in monitors used to monitor patients. Charging is quicker in unused
monitors. Contact your local Philips representative for information on external battery chargers. Use
only Lithium Ion battery chargers approved by Philips.
1Insert the batteries into a monitor connected to mains power. The battery LED will light yellow to
indicate that charging is in process.
2Charge the battery until it is full, the battery LED is green, and the battery power gauge is fully
shaded.
Conditioning Batteries
CAUTION Do not use a monitor being used to monitor patients to condition batteries. The monitor switches off
automatically when the batteries are empty.
You must condition a battery when its “battery requires maintenance” symbol shows on the Screen. Do
not interrupt the charge or discharge cycle during conditioning. To condition a battery,
1Insert the battery into a monitor connected to mains power.
2Charge the battery until it is completely full. Open the Battery Status window and check
that the Batteries fully charged or Battery 1 / Battery 2 fully charged
message is displayed.
3Disconnect the monitor from mains power, and let the monitor run until the battery is empty and
the monitor switches itself off.
4Reconnect the monitor to mains power and charge the battery until it is full for use or charge to
50% for storage.
Contact your local Philips representative for information on external battery chargers/conditioners.
Use only Lithium Ion battery chargers approved by Philips.
Unequally-Charged Batteries
If two batteries in a monitor are unequally charged, the monitor can compensate by causing the fuller
battery to discharge faster. For this mechanism to work, the charge state of the two batteries should not
differ by more than 50%.

Battery Safety Information 31 Using the Batteries
303
Battery Safety Information
WARNING Use only Philips batteries part number M4605A. Use of a different battery may present a risk of fire or
explosion.
Do not open batteries, or dispose of them in fire, or cause them to short circuit. They may ignite,
explode, leak or heat up, causing personal injury.
Dispose of used batteries promptly and in an environmentally-responsible manner. Do not dispose of
the battery in normal waste containers. Consult your hospital administrator to find out about local
arrangements.
CAUTION Do not disassemble, heat above 100°C (212°F) or incinerate the batteries, to avoid the risk of fire and
burns. Keep batteries out of the reach of children and in their original package until you are ready to
use them.
If battery leakage should occur, use caution in removing the battery. Avoid contact with skin. Clean
the battery compartment according to the instructions.

31 Using the Batteries Battery Safety Information
304

305
32
32Maintenance and
Troubleshooting
WARNING Schedule: Failure on the part of the responsible individual hospital or institution employing the use of
this equipment to implement a satisfactory maintenance schedule may cause undue equipment failure
and possible health hazards.
Contact: If you discover a problem with any of the equipment, contact your service personnel, Philips,
or your authorized supplier.
Inspecting the Equipment and Accessories
You should perform a visual inspection before every use, and in accordance with your hospital’s policy.
With the monitor switched off:
1Examine unit exteriors for cleanliness and general physical condition. Make sure that the housings
are not cracked or broken, that everything is present, that there are no spilled liquids and that there
are no signs of abuse.
2If the MMS and Server Extensions are mounted on the monitor, make sure that they are locked
into place and do not slide out without releasing the locking mechanism.
3Inspect all accessories (cables, transducers, sensors and so forth). If any show signs of damage, do
not use.
4Switch the monitor on and make sure the backlight is bright enough. Check that screen is at its full
brightness. If the brightness is not adequate, contact your service personnel or your supplier.
Inspecting the Cables and Cords
1Examine all system cables, the power plug and cord for damage. Make sure that the prongs of the
plug do not move in the casing. If damaged, replace it with an appropriate Philips power cord.
2Inspect the Measurement Server Link cable and ensure that it makes good connection with the
MMS and the FMS. Make sure that there are no breaks in the insulation.
3If the MMS is not mounted directly on the monitor, inspect the cable connecting it to the
monitor. Make sure the connectors are properly engaged.
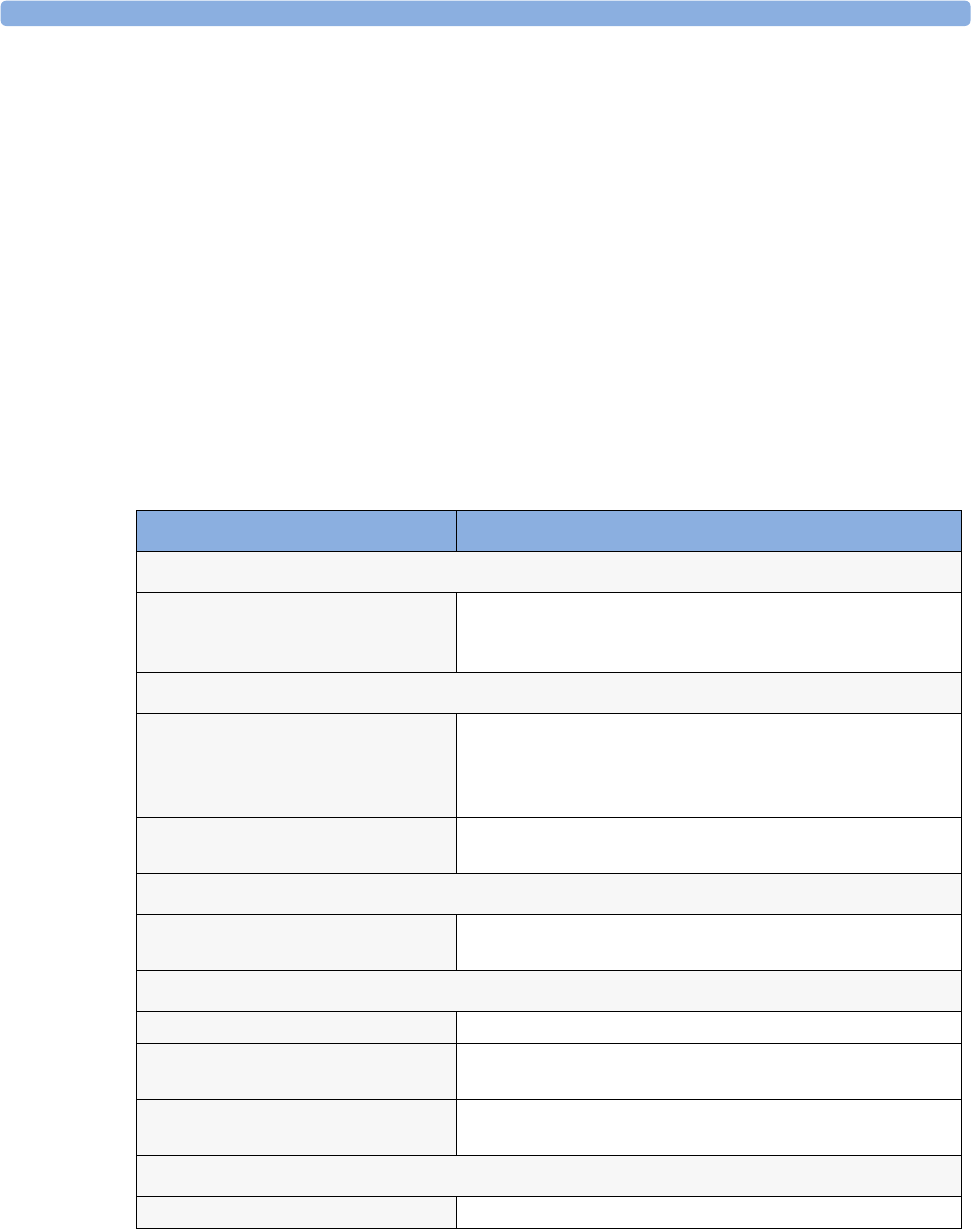
32 Maintenance and Troubleshooting Maintenance Task and Test Schedule
306
4Inspect the patient cables, leads and their strain reliefs for general condition. Make sure there are
no breaks in the insulation. Make sure that the connectors are properly engaged at each end to
prevent rotation or other strain.
5Apply the transducer or electrodes to the patient, and with the monitor switched on, flex the
patient cables near each end to make sure that there are no intermittent faults.
Maintenance Task and Test Schedule
The following tasks are for Philips-qualified service professionals only. All maintenance tasks and
performance tests are documented in detail in the service documentation supplied on the monitor
documentation CD.
Ensure that these tasks are carried out as indicated by the monitor’s maintenance schedule, or as
specified by local laws. Contact a Philips-qualified service provider if your monitor needs a safety or
performance test. Clean and disinfect equipment to decontaminate it before testing or maintaining it.
Maintenance and Test Schedule Frequency
Monitor Tests
Safety checks. Selected tests on the basis
of IEC 60601-1
At least once every two years, or as needed, after any repairs
where the power supply is removed or replaced, or if the
monitor has been dropped.
Monitor Maintenance
Check ECG synchronization of the
monitor and defibrillator (only if
hospital protocol requires use of
monitor during defibrillation)
At least once every two years, or as needed.
Replace backlight
(integrated displays only)
25,000 - 30,000 hours (about three years) of continuous usage,
or as needed.
Measurement Server and Module Tests
Performance assurance for all
measurements not listed below.
At least once every two years, or if you suspect the measurement
values are incorrect.
Measurement Server and Module Maintenance
NBP calibration At least once every two years, or as specified by local laws.
Microstream CO2 calibration and
performance test
At least once a year or after 4000 operating hours.
Mainstream and sidestream CO2
calibration check (M3014A)
At least once a year, or if you suspect the measurement values are
incorrect.
Battery Maintenance
Battery See the section on Maintaining Batteries

Troubleshooting 32 Maintenance and Troubleshooting
307
Troubleshooting
If you suspect a problem with an individual measurement, read the Instructions for Use and
doublecheck that you have set up the measurement correctly.
If you suspect an intermittent, system-wide problem call your service personnel. You may be asked for
information from the status log. To view the status log,
1In the Main Setup menu, select Revision.
2Select a pop-up key according to the status log you want to consult, for example, to check the
status log for the MMS, select the M3001A pop-up key.
3View the status log by selecting the Stat Log pop-up key.
Disposing of the Monitor
WARNING To avoid contaminating or infecting personnel, the environment or other equipment, make sure you
disinfect and decontaminate the monitor appropriately before disposing of it in accordance with your
country’s laws for equipment containing electrical and electronic parts. For disposal of parts and
accessories such as thermometers, where not otherwise specified, follow local regulations regarding
disposal of hospital waste.
You can disassemble the monitor, MMS, FMS and modules as described in the Service Guide.
– There is no metal molded into the plastic case, and there are no metal sprays on the plastic.
– All plastic parts with a weight greater than 10g (0.35 ounces) are marked with the ISO code for
identification.
– The sheet metal card cage uses only one kind of steel.
– The screen has a touch resistor laminate.
– You can recycle the paper Instructions for Use.
The battery can be easily removed (see “Replacing Batteries” on page 301), and can be returned, free of
charge, to the worldwide-recycling program run by the battery manufacturer (contact your local supplier).
Disposing of Empty Calibration Gas Cylinders
1Empty the cylinder completely by pushing in the pin of the regulator valve or by pulling out the
pin of the fill valve using a tire valve stem wrench or a pair of needle nose pliers.
2When the cylinder is empty, either remove the valve stem from the fill (or regulator) hole, or drill a
hole in the cylinder.
3Write “Empty” on the cylinder and dispose of it appropriately for scrap metal.
WARNING Ensure that the cylinder is completely empty before trying to remove the valve stem or drill a hole in
the cylinder.

32 Maintenance and Troubleshooting Disposing of Empty Calibration Gas Cylinders
308
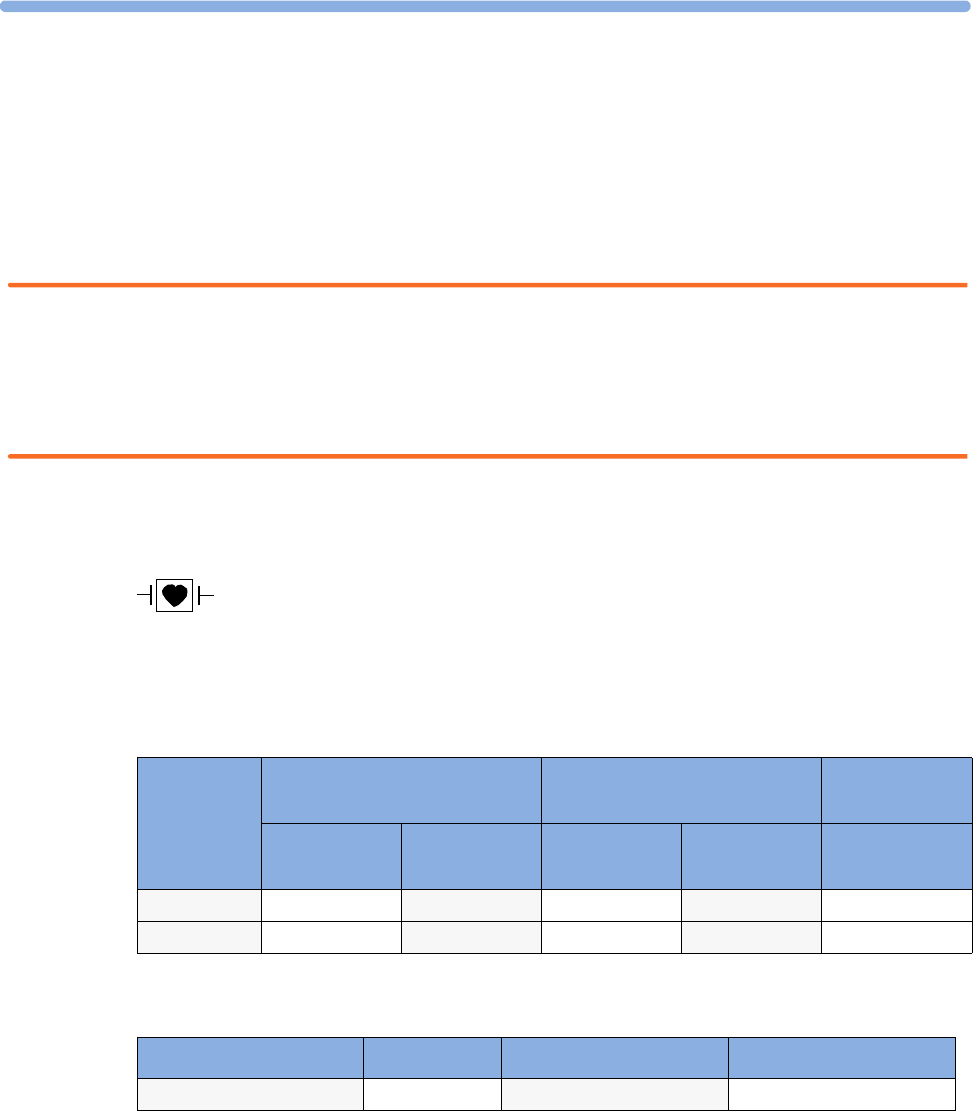
309
33
33Accessories
You can order parts and accessories from Philips supplies at www.medical.philips.com or consult your
local Philips representative for details.
WARNING Reuse: Never reuse disposable transducers, sensors, accessories and so forth that are intended for single
use, or single patient use only. Reuse may compromise device functionality and system performance
and cause a potential hazard.
Philips’ approval: Use only Philips-approved accessories.
Packaging: Do not use a sterilized accessory if its packaging is damaged.
ECG/Resp Accessories
This symbol indicates that the cables and accessories are designed to have special
protection against electric shocks (particularly regarding allowable leakage currents),
and are defibrillator proof.
Trunk Cables
3-Electrode Cable Sets
Length 3-Electrode Cable Set 5-Electrode Cable Set 10-Electrode
Cable set
AAMI
Part No.
IEC
Part No.
AAMI
Part No.
IEC
Part No.
AAMI/IEC
Part No.
0.9m M1540C M1550C M1560C M1570C n/a
2.7m M1500A M1510A M1520A M1530A M1949A
Description Length AAMI Part No. IEC Part No.
OR 1.0m M1601A M1611A
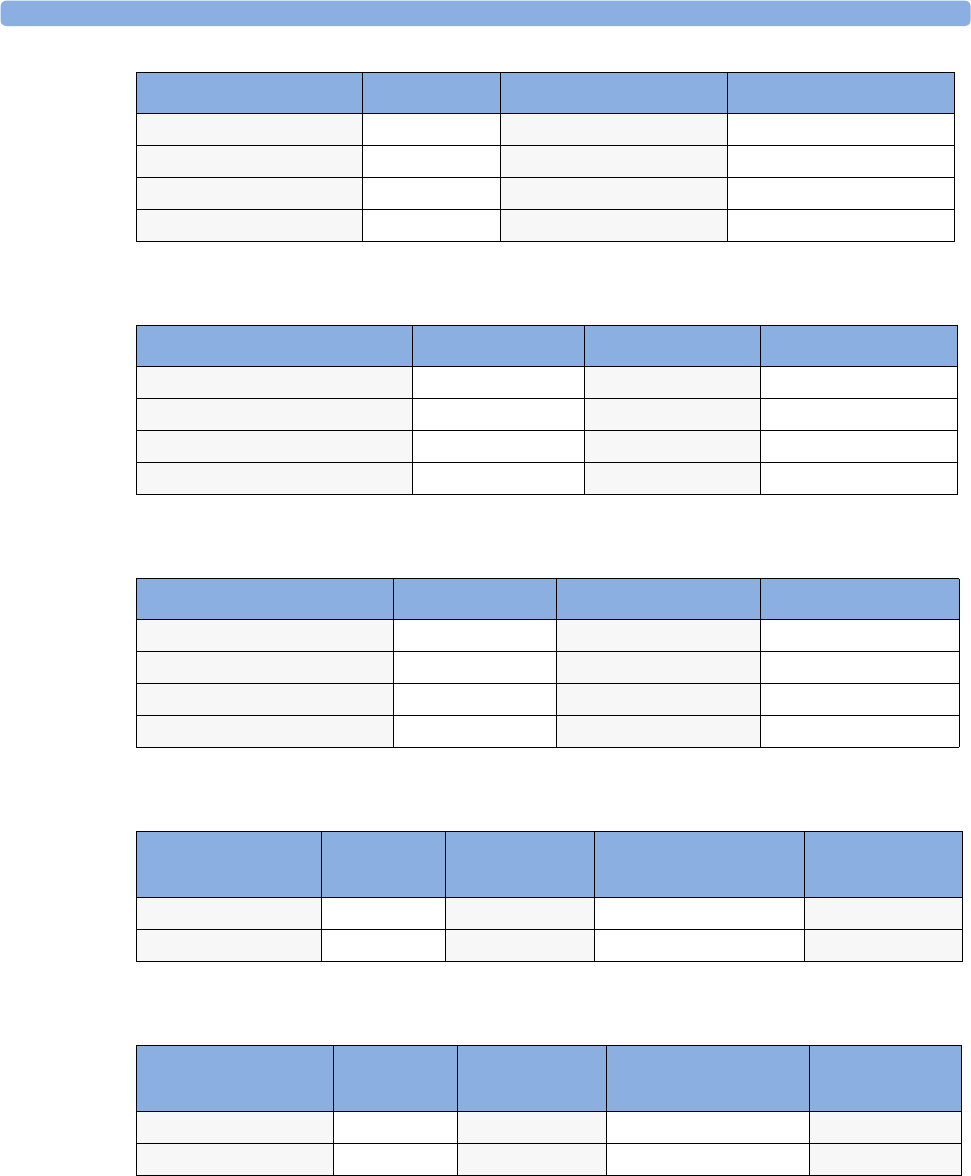
33 Accessories ECG/Resp Accessories
310
5-Electrode Cable Sets
10-Electrode Cable Sets
3-Electrode One Piece Cables
5-Electrode One Piece Cables
ICU Grabber shielded 1.0m M1603A M1613A
ICU snap shielded 1.0m M1605A M1615A
ICU Clip non-shielded 0.45m M1608A M1618A
ICU Clip non-shielded 0.7m M1609A M1619A
Description Length AAMI Part No. IEC Part No.
Description Length AAMI Part No. IEC Part No.
OR Grabber shielded 1.0m/1.6m M1621A M1631A
ICU Grabber shielded 1.0m/1.6m M1623A M1633A
ICU Snap shielded 1.0m/1.6m M1625A M1635A
ICU Clip non-shielded 0.7m/1.3m M1629A M1639A
Description Length AAMI Part No. IEC Part No.
OR Grabber - extremities 1.0m/1.6m M1973A M1974A
OR Grabber - chest 1.0m M1979A M1984A
ICU Extremities 1.0m/1.6m M1968A (grabber) M1971A (grabber)
ICU Chest 1.0m M1976A (grabber) M1978A (grabber)
AAMI 3-Electrode
One Piece Cables
Length AAMI
Part No.
IEC 3-electrode One
Piece Cables
IEC
Part No.
OR Grabber 1.9m M1970A OR Grabber M1980A
ICU Snap 1.9m M1972A ICU Grabber M1981A
AAMI 5-electrode
One Piece Cables
Length AAMI
Part No.
IEC 5-electrode One
Piece Cables
IEC
Part No.
OR Grabber 2.5m M1975A OR Grabber M1985A
ICU Snap 2.5m M1977A ICU Grabber M1986A
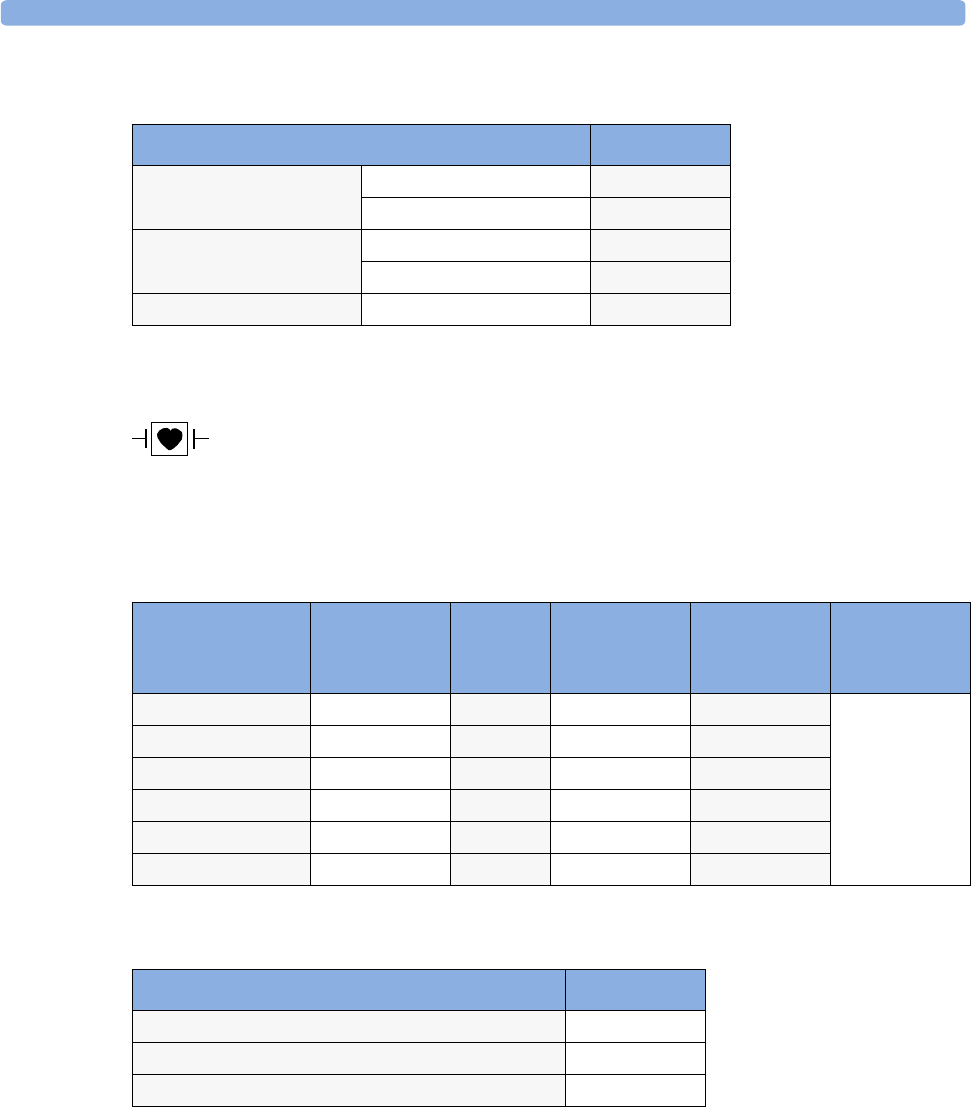
NBP Accessories 33 Accessories
311
Set Combiners and Organizers
NBP Accessories
These cuffs and tubings are designed to have special protection against electric shocks
(particularly regarding allowable leakage currents), and are defibrillator proof. You can
use them during electrosurgery.
Adult/Pediatric Multi-Patient Comfort Cuffs and Disposable Cuffs
Reusable Cuff Kits
Set combiners and organizers Part No.
Set combiner 3-electrode M1501A
5-electrode M1502A
Set organizer Shielded 3-electrode M1503A
Shielded 5-electrode M1504A
Bedsheet clip M1509A
Patient Category Limb
Circumference
Bladder
Width
Disposable
cuff
Part No.
Reusable cuff
Part No.
Tu b i n g
Adult (Thigh) 42 to 54 cm 20 cm M1879A M1576A M1598B (1.5m)
or
M1599B (3m)
Large Adult 34 to 43 cm 16 cm M1878A M1575A
Adult 27 to 35 cm 13 cm M1877A M1574A
Small Adult 20.5 to 28 cm 10.5 cm M1876A M1573A
Pediatric 14 to 21.5 cm 8 cm M1875A M1572A
Infant 10 to 15 cm 5.5 cm M1874A M1571A
Cuff Kits Part No.
Infant, pediatric, small adult, adult M1577A
Small adult, adult, large adult, thigh M1578A
Infant, pediatric, small adult, adult, large adult, thigh M1579A
33 Accessories NBP Accessories
312
Adult/Pediatric Antimicrobial Coated Reusable cuffs
Adult/Pediatric Soft Single Patient Single-Hose Disposable Cuffs
Neonatal/Infant Cuffs (Disposable, non-sterile)
Patient Category (color) Limb
Circumference
(cm)
Bladder Width Part No. Tu b i n g
Adult Thigh (grey) 45 - 56.5 21.0 cm M4559A M1598B
(1.5m) or
M1599B (3m)
Large Adult X-Long (burgundy) 35.5 - 46.0 17.0 cm M4558A
Large Adult (burgundy) 35.5 - 46.0 17.0 cm M4557A
Adult X-Long (navy blue) 27.5 - 36.5 13.5 cm M4556A
Adult (navy blue) 27.5 - 36.5 13.5 cm M4555A
Small Adult (royal blue) 20.5 - 28.5 10.6 cm M4554A
Pediatric (green) 13.8 - 21.5 8.0 cm M4553A
Infant (orange) 9 - 14.8 5.4 cm M4552A
Patient Category Limb Circumference
(cm)
Bladder
Width
Part No. Tu b i n g
Adult (Thigh) 45 - 56.5 cm 20.4 cm M4579A M1598B (1.5m)
or
M1599B (3m)
Large Adult X-Long 35.5 - 46 cm 16.4 cm M4578A
Large Adult 35.5 - 46 cm 16.4 cm M4577A
Adult X-Long 27.5 - 36.5 13.1 cm M4576A
Adult 27.5 - 36.5 cm 13.1 cm M4575A
Small Adult 20.5 - 28.5 cm 10.4 cm M4574A
Pediatric 15.0 - 21.5 cm 8.0 cm M4573A
Infant 9 - 15 cm 5.6 cm M4572A
Cuffs Limb Circumference
(cm)
Bladder Width Part No. Tu bi n g
Size 1 3.1 to 5.7 cm 2.2 cm M1866A M1596B (1.5m)
or
M1597B (3m)
Size 2 4.3 to 8.0 cm 2.8 cm M1868A
Size 3 5.8 to 10.9 cm 3.9 cm M1870A
Size 4 7.1 to 13.1 cm 4.7 cm M1872A
Invasive Pressure Accessories 33 Accessories
313
Invasive Pressure Accessories
These transducers and accessories are designed to have special protection against electric
shocks (particularly regarding allowable leakage currents), and are defibrillator proof.
If you are using the M3012A Hemodynamic Measurement Server Extension, and you
want to measure temperature and invasive pressure at the same time, we recommend
that you use the pressure transducer CPJ840J6, with a round module connector piece, and
not a transducer with a square connector. Pressure transducers with square connectors may
make it difficult to connect the adjacent Temperature connector at the same time.
SpO2 Accessories
This section lists accessories for use with Philips SpO2 technology. For accessory lists for other SpO2
technologies, refer to the instructions for use provided with these devices.
Some Nellcor sensors contain natural rubber latex which may cause allergic reactions. See the
Instructions for Use supplied with the sensors for more information. M1901B, M1902B, M1903B
and M1904B disposable sensors are not available in USA from Philips. Purchase Nellcor sensors and
adapter cables directly from Tyco Healthcare.
Do not use more than one extension cable with any sensors or adapter cables. Do not use an extension
cable with Philips reusable sensors or adapter cables with part numbers ending in -L (indicates “Long”
version).
All listed sensors operate without risk of exceeding 41oC on the skin if ambient temperature is below
37oC.
Transducer, accessories, sensor kits Part No
Reusable pressure transducer 5 µV/.V/mmHg sensitivity CPJ840J6
Sterile disposable pressure domes for CPJ840J6 (pack of 50) CPJ84022
Transducer holder for CPJ840J6 (pack of 4) CPJ84046
IV pole mount for CPJ840J6 CPJ84447
Single channel disposable sensor kit (20) - (EU/EFTA only) M1567A
Dual channel disposable sensor kit (20) (EU/EFTA only) M1568A
Transducer holder for M1567/8A (EU/EFTA only) M2271A
IV pole mount for M1567/8A (EU/EFTA only) M2272C
Adapter cable for disposable sensor kit 3,0m for M1567/8A M1634A
Pressure transducer kits
PiCCO monitoring kit, 30cm pressure line, includes PV4046 injectate temperature
sensor housing for M1646A
PV8103
PiCCO monitoring kit, 150cm pressure line, includes PV4046 injectate temperature
sensor housing for M1646A
PV8115
PiCCO monitoring kit, 150cm pressure line, includes PV4046 injectate temperature
sensor housing for M1646A and central venous pressure line
PV8115CVP
PULSION Pressure Interface Cable for disposable pressure transducer PMK 206
33 Accessories SpO2 Accessories
314
The M1020B SpO2 module with Option A02 may not be available in all countries. Some sensors may
not be available in all countries. Always use the MAX-FAST forehead sensor with the foam headband
provided by Nellcor.
Make sure that you use only the accessories that are specified for use with this device, otherwise patient
injury can result.
Option A01 is the Philips FAST-SpO2 version; Option A02 is the Nellcor OxiMax-compatible
version.
Product
Number
Description Compatible with: Comments
Opt. A01 Opt. A02
Philips reusable sensors.
M1191A Adult sensor (2m cable), for patients
over 50 kg. Any finger, except thumb.
yes no No adapter cable
required.
M1191AL M1191A with longer cable (3 m) yes no
M1192A Small adult, pediatric sensor (1.5m
cable) for patients between 15 kg and
50 kg. Any finger except thumb.
yes no
M1193A Neonatal sensor (1.5m cable) for
patients between 1kg and 4 kg. Hand
or foot.
yes no
M1194A Ear sensor (1.5m cable) for patients
more than 40 kg.
yes no
M1195A Infant sensor (1.5m cable) for patients
between 4kg and 15 kg. Any finger
except thumb.
yes no
M1191T Adult sensor (0.45m cable), for
patients over 50 kg. Any finger, except
thumb.
yes no Requires M1943
(1 m) or M1943AL
(3 m) adapter cable
M1192T Small adult, pediatric sensor (0.45m
cable) for patients between 15 kg and
50 kg. Any finger except thumb.
yes no
M1193T Neonatal sensor (0.9m cable) for
patients between 1kg and 4 kg. Hand
or foot.
yes no

SpO2 Accessories 33 Accessories
315
M1191ANL Special Edition (SE)
Adult sensor (3m cable), for patients
over 50 kg. Any finger, except thumb.
yes yes No adapter cable
required.
M1192AN Special Edition (SE)
Small adult, pediatric sensor (1.5m
cable) for patients between 15 kg and
50 kg. Any finger except thumb.
yes yes
M1193AN Special Edition (SE)
Neonatal sensor (1.5m cable) for
patients between 1kg and 4 kg. Hand
or foot.
yes yes
M1194AN Special Edition (SE)
Ear sensor (1.5m cable) for patients
more than 40 kg.
yes yes No adapter cable
required.
M1195AN Special Edition (SE)
Infant sensor (1.5m cable) for patients
between 4 kg and 15 kg. Any finger
except thumb.
yes yes
Philips disposable sensors. Not available in the USA.
M1904B Identical to OxiMax MAX-A yes yes Option A01: Use
adapter cable
M1943A or
M1943AL.
Option A02: Must
use adapter cable
M1943NL.
M1903B Identical to OxiMax MAX-P yes yes
M1902B Identical to OxiMax MAX-I yes yes
M1901B Identical to OxiMax MAX-N yes yes
Philips disposable sensors. Available worldwide.
M1131A Adult/Pediatric finger sensor, 0.45m
cable (patient size >20 kg)
yes no Use adapter cable
M1943A or
M1943AL.
M1132A Infant finger or toe sensor, 0.9m cable
(patient size 3 - 10 kg)
yes no Use adapter cable
M1943A or
M1943AL.
M1133A Adult/Infant/Neonatal, 0.9m cable
Foot or hand for neonates < 3 kg
Big toe or thumb for patients between
10kg and 20kg
Any finger except thumb for patients
> 40kg
yes no Use adapter cable
M1943A or
M1943AL.
Product
Number
Description Compatible with: Comments
Opt. A01 Opt. A02

33 Accessories SpO2 Accessories
316
NELLCOR disposable sensors (must be ordered from Nellcor)
OxiMax
MAX-A
Adult finger sensor (patient size >30
kg)
yes yes Option A01: Use
adapter cable
M1943A or
M1943AL.
Option A02: Must
use adapter cable
M1943NL.
OxiMax
MAX-AL
OxiMax MAX-A with long cable yes yes
OxiMax
MAX-P
Pediatric foot/hand sensor (patient
size 10-50 kg)
yes yes
OxiMax
MAX-I
Infant foot/hand sensor (patient size
3-20 kg)
yes yes
OxiMax
MAX-N
Adult finger or neonatal foot/hand
sensor (patient size >40 kg or <3 kg)
yes yes
MAX-FAST Forehead sensor no yes Must use
M1943NL adapter
cable.
OxiMax
MAX-R
Adult nasal sensor no yes
OxiMax SC-
A
Adult softcare sensor no yes
OxiMax SC-
NEO
Neonatal softcare sensor no yes
OxiMax SC-
PR
Preterm infant softcare sensor no yes
Oxisensor II
D-25
Adult sensor (patient size >30kg) yes no Must use M1943A
or M1943 AL
adapter cable
Oxisensor II
D-20
Pediatric sensor (patient size 10-50 kg) yes no
Oxisensor II
I-20
Infant sensor (patient size 3-20 kg) yes no
Oxisensor II
N-25
Neonatal sensor (patient size <3 kg or
>40 kg)
yes no
OxiCliq A See OxiMax MAX-A yes yes Option A01: Use
adapter cable
M1943A or
M1943AL together
with OC3 adapter
cable.
Option A02: Must
use adapter cables
M1943NL and
OC3 adapter cable.
OxiCliq P See OxiMax MAX-P yes yes
OxiCliq I See OxiMax MAX-I yes yes
OxiCliq N See OxiMax MAX-N yes yes
Product
Number
Description Compatible with: Comments
Opt. A01 Opt. A02
SpO2 Accessories 33 Accessories
317
Oxiband
OXI-A/N
Adult / neonatal sensor no yes Must use
M1943NL adapter
cable
Oxiband
OXI-P/I
Pediatric / infant sensor no yes
Durasensor
DS100A
Adult finger clip sensor no yes
Dura-Y D-YS Y-sensor no yes
Extension / Adapter Cables for Philips and Nellcor Sensors
M1941A Extension cable (2 m) yes yes For use with Philips
reusable sensors and
adapter cables.
M1943A Adapter cable (1.1 m cable) yes no Adapter cable for
Philips/Nellcor
disposable sensors.
M1943AL Adapter cable (3 m cable) yes no
M1943NL OxiMax adapter cable (3 m cable) no yes Adapter cable for
Philips disposable/
Nellcor disposable
and reusable
sensors.
OC 3 Adapter Cable for OxiCliq sensors yes yes Available from
Nellcor only.
Product
Number Description Compatible with: Philips Part
Number
Opt. A01 Opt. A02
MASIMO LNOP reusable sensors. Require AC-1 adapter cable
LNOP DC-I Adult Sensor yes no 989803140321
LNOP DC-IP Pediatric Sensor yes no 989803140331
LNOP-Y-I Reusable Multi-Site Sensor yes no n/a
LNOP TC-I Tip Clip reusable Sensor yes no 989803140341
MASIMO LNOP disposable sensors. Require AC-1 adapter cable
LNOP Adt Adult Sensor yes no 989803140231
LNOP Adtx Adult Sensor yes no n/a
LNOP Pdt Pediatric Adhesive Sensor yes no 989803140261
LNOP Pdtx Pediatric Sensor yes no n/a
LNOP INF-L Neo/Infant Adhesive Sensor yes no 989803140311
LNOP NEO-L Neo Adhesive Sensor yes no 989803140291
LNOP NEOPT-
L
Neo Pre-Term Sensitive Skin Adhesive
Sensors
yes no 989803140301
Adapter Cable for MASIMO sensors.
M1020-61101 AC-1 Adapter Cable for Masimo
Sensors (8-pin version)
yes no 451261000771
Product
Number
Description Compatible with: Comments
Opt. A01 Opt. A02

33 Accessories Temperature Accessories
318
The Philips M3001A option A01 Multi-Measurement server and the M1020B option
A01 SpO2 Module use Masimo certified pulse oximetry for reduced noise and low
perfusion performance with Masimo Sensors under the Masimo NR&LP protocol
available from Masimo.
Sensors for use with the Masimo SET SpO2 Module and orderable from Philips
Temperature Accessories
Sensors Philps Order No
LNOP Adult Adhesive Sensors (box of 20) 989803140231
Adult Sensor Sample Pack (4 sensors) 989803140241
Neo Sensor Sample Pack (4 sensors) 989803140251
Pediatric Adhesive Sensors (box of 20) 989803140261
LNOP Neonatal Adhesive Sensors (box of 20) 989803140271
Neo Pre-term Sensitive Skin Adhesive Sensors (box of 20) 989803140281
Neo Adhesive Sensors (box of 20) 989803140291
Neo Pre-term Sensitive Skin Adhesive Sensors (box of 20) 989803140301
Neo/Infant Adhesive Sensors (box of 20) 989803140311
DC-I Adult Reusable Sensor 989803140321
DCIP Pediatric Reusable Sensor 989803140331
LNOP TC-I Tip Clip Reusable Sensor 989803140341
Neo Sensitive Replacement Posey Wrap (12) 989803140351
Neo Replacement Tapes (100) 989803140361
Temperature Probes Part No. Minimum measurement time
for accurate readings
Reusable
General purpose probe 21075A 90 sec
Small flexible vinyl probe (Infant/Pediatric) 21076A 60 sec
Attachable surface probe 21078A 60 sec
Disposable
General purpose probe M1837A 90 sec
Skin probe 21091A 60 sec
Esophageal/Stethoscope Probe (12 French) 21093A 180 sec
Esophageal/Stethoscope Probe (French 18) 21094A 210 sec
Esophageal/Stethoscope Probe (French 24) 21095A 310 sec
Foley Catheter Probe (12 French) M2255A 180 sec
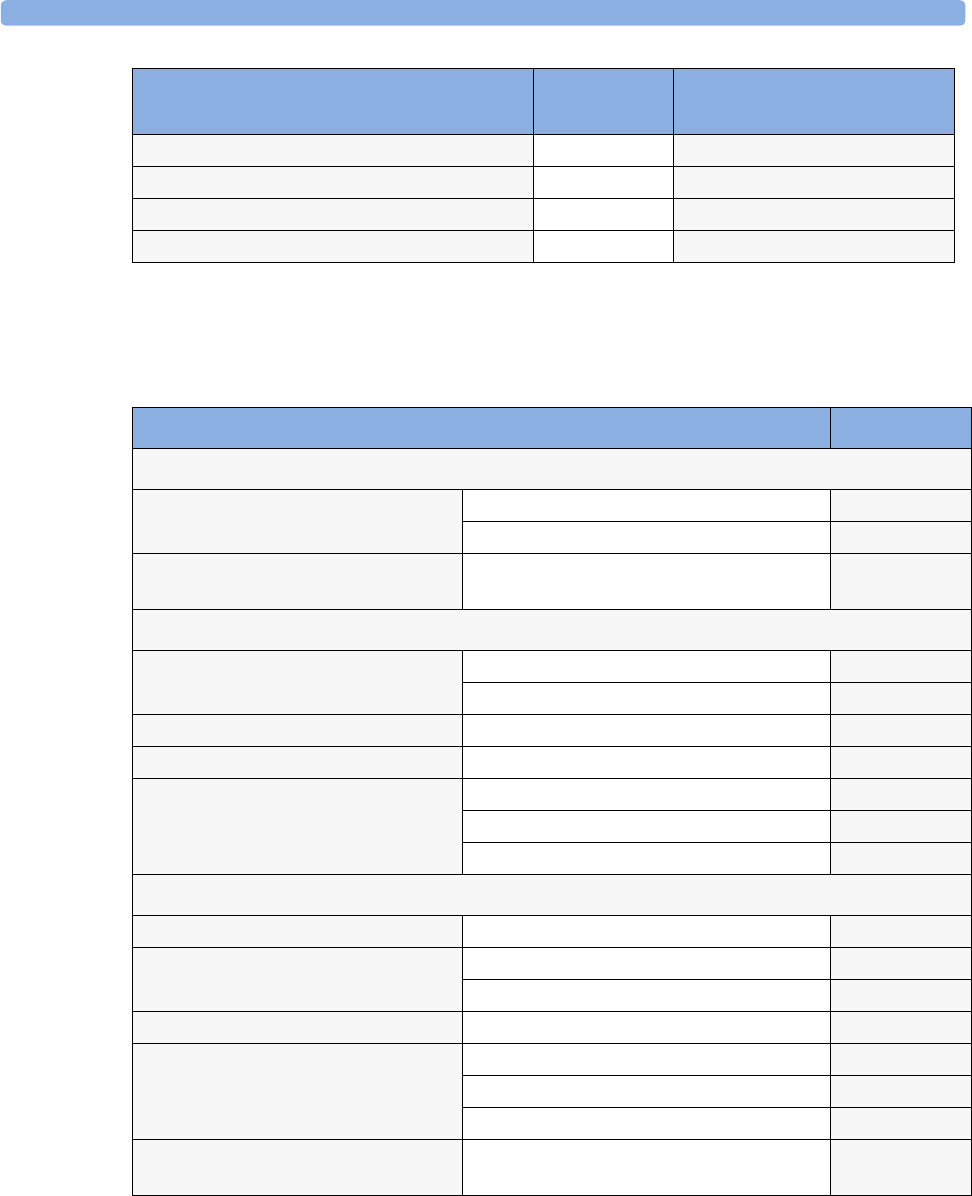
Cardiac Output (C.O.) Accessories 33 Accessories
319
Cardiac Output (C.O.) Accessories
See Pressure accessories for PULSION continuous cardiac output accessories.
Foley Catheter Probe (16 French) 21096A 180 sec
Foley Catheter Probe (18 French) 21097A 180 sec
Adapter cable 1.5m 21082B
Adapter cable 3.0m 21082A
Temperature Probes Part No. Minimum measurement time
for accurate readings
Description Part No
Accessories common to both methods
Accessories Set of ice buckets 14455A
Remote handswitch 15244A
PiCCO inline temperature probe for
warmer injectate
Latex free M1646A
Right Heart Thermodilution
C. O. Interface Cables 2.7 meter cable (right heart only) M1642A
2.4 m + 2.4 m cable M1643A
Right heart catheter for thermodilution (from Baxter) 831HF75
Baxter CO-set (only with HP 23001A/B) contact Baxter for information
Injectate Probes 2.4m injectate temp. probe (reusable) 23001A
0.5m injectate temp. probe (reusable) 23001B
Ice bath temp. probe (right heart only) 23002A
Transpulmonary Thermodilution
C. O. Interface Cables 2.4 m + 2.4 m cable M1643A
Injectate Probes 2.4m injectate temp. probe (reusable) 23001A
0.5m injectate temp. probe (reusable) 23001B
Baxter CO-set (only with HP 23001A/B) contact Baxter for information
Pressure Transducer Kits (PULSION) PV 8003 (30cm pressure line)
PV 8010 (100cm pressure line)
PV 8015 (150cm pressure line)
Pressure Interface Cable for disposable
pressure transducer
PULSION PMK 206

33 Accessories Mainstream CO2 Accessories (for M3014A)
320
Mainstream CO2 Accessories (for M3014A)
Sidestream CO2 Accessories (for M3014A)
Mainstream CO2 Accessories (for M3016A)
Description Part No.
CO2 Sensor M2501A
Adult/Pediatric Airway Adapter (reusable) M2513A
Infant Airway Adapter (reusable) M2516A
Adult Airway Adapter (single-patient use) M2533A
Infant Airway Adapter (single-patient use) M2536A
Description Part No.
CO2 Sensor M2741A
Nasal and Oral-Nasal Cannulas
CO2 Nasal Cannula, Adult M2744A
CO2 Nasal Cannula, Pediatric M2745A
CO2 Nasal Cannula, Infant M2746A
CO2 / O2 Nasal Cannula, Adult M2750A
CO2 / O2 Nasal Cannula, Pediatric M2751A
CO2 Oral-Nasal Cannula, Adult M2756A
CO2 Oral-Nasal Cannula, Pediatric M2757A
CO2 / O2 Oral-Nasal Cannula, Adult M2760A
CO2 / O2 Oral-Nasal Cannula, Pediatric M2761A
Airway Adapters
Airway Adapter Set, ET > 4.0 mm M2768A
Airway Adapter Set H, ET > 4.0 mm M2772A
Airway Adapter Set H, ET =< 4.0 mm M2773A
Straight Sample Lines
Straight Sample Line M2776A
Straight Sample Line H M2777A
Description Part No.
CO2 Sensor M1460A
Standard Airway Adapter (reusable) M1465A
Small Airway Adapter (reusable) 14363A
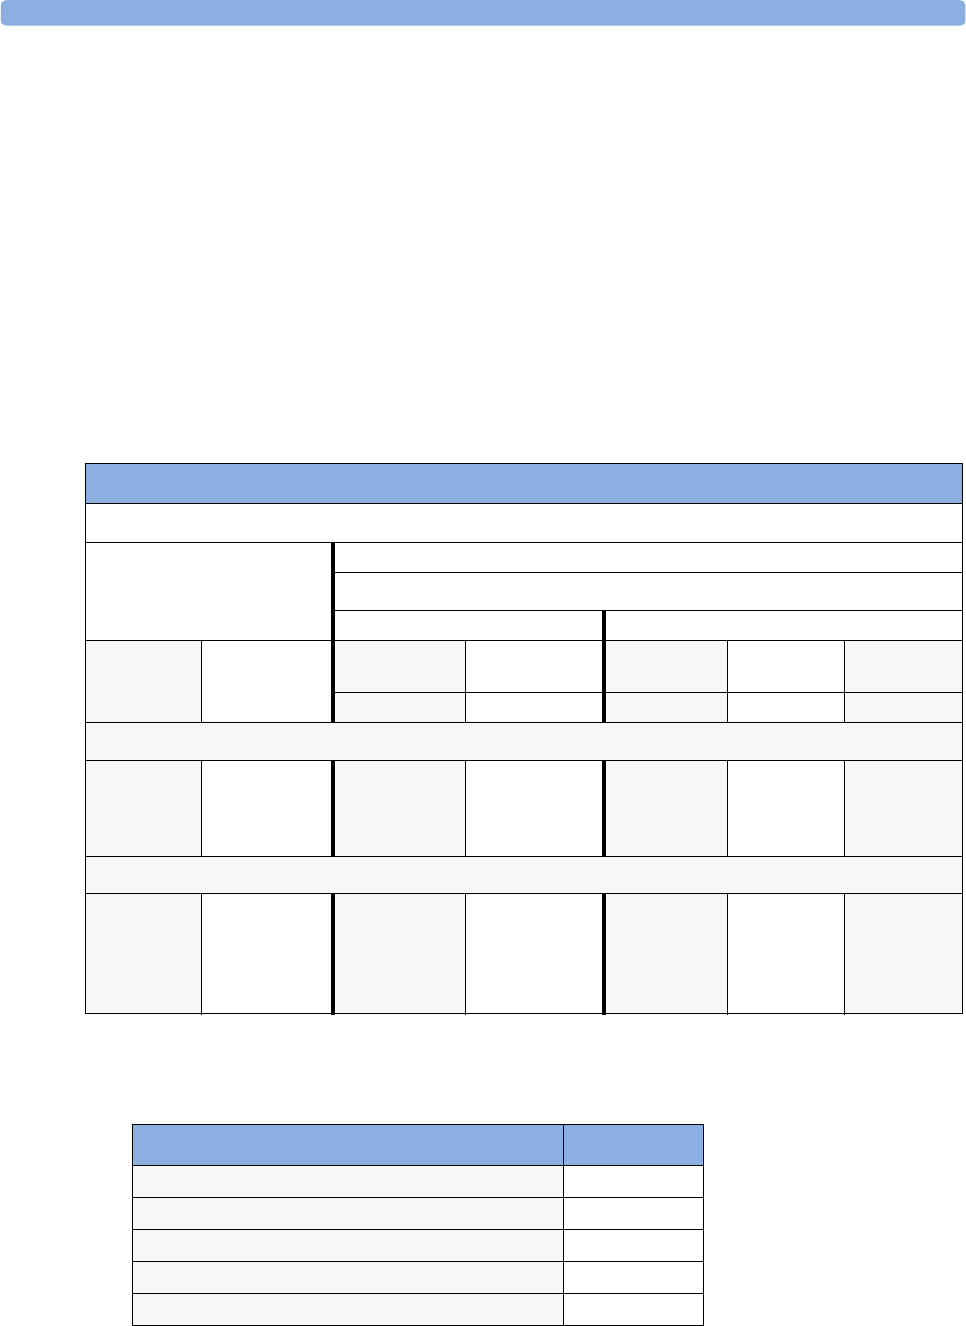
Microstream CO2 Accessories 33 Accessories
321
Microstream CO2 Accessories
• “FilterLine Set” is a combination of a FilterLine with an Airway Adapter.
• “H” in the accessory name indicates suitability for humidified ventilation and longer usage due to
the active removal of humidity from the sample line.
• “Smart CapnoLine” is a combined oral-nasal FilterLine.
•“Smart CapnoLine O
2” is a combined oral-nasal-O2-CO2 FilterLine.
• “NIV Line” is a nasal FilterLine suitable for mask ventilation (for example, C-PAP).
•“Single purpose” means CO
2 measurement only, “dual purpose” means CO2 measurement and O2
delivery.
• The accessories are supplied in packs of 25.
Spirometry Accessories
Microstream accessory selection flowchart
Is the patient intubated?
Yes No
Does the patient need oxygen?
Yes No
Short-term
(up to 6 hours)
Long-term
(up to 72 hours)
Short term
(up to 8 hours)
Long term
(up to 24 hours)
Long-term
(up to 24 hours)
Short term
(up to 8 hours)
Short term
(up to 8 hours)
Oral/Nasal Nasal Nasal Oral/Nasal Nasal
Key Applications
Critical Care OR, EMS, ED Procedural
Sedation, Critical
Care, EMS, ED
Critical Care,
Sleep Lab, Long-
term Pain
Management
Critical Care,
Sleep Lab
Procedural
Sedation,
Critical Care,
EMS, ED
EMS, ED
Philips part numbers (A = Adult, P= Pediatric, I = Infant, N = Neonate)
FilterLine Set:
A/P: M1920A
FilterLine H Set:
A/P: M1921A
I/N: M1923A
Smart
CapnoLine O2:
A: M2522A
P: M2520A
CapnoLine HO2:
A: M4680A
P: M4681A
CapnoLine H:
A: M4689A
P: M4690A
I/N: M4691A
Smart
CapnoLine:
A: M2526A
P: M2524A
NIV Line:
A: 4686A
P: M4687A
Description Part No.
Adult/Pediatric Flow Sensor M2785A
Neonatal Flow Sensor M2786A
Adult/Pediatric CO2/Flow Sensor M2781A
Neonatal CO2/Flow Sensor M2782A
Pediatric CO2/Flow Sensor M2783A
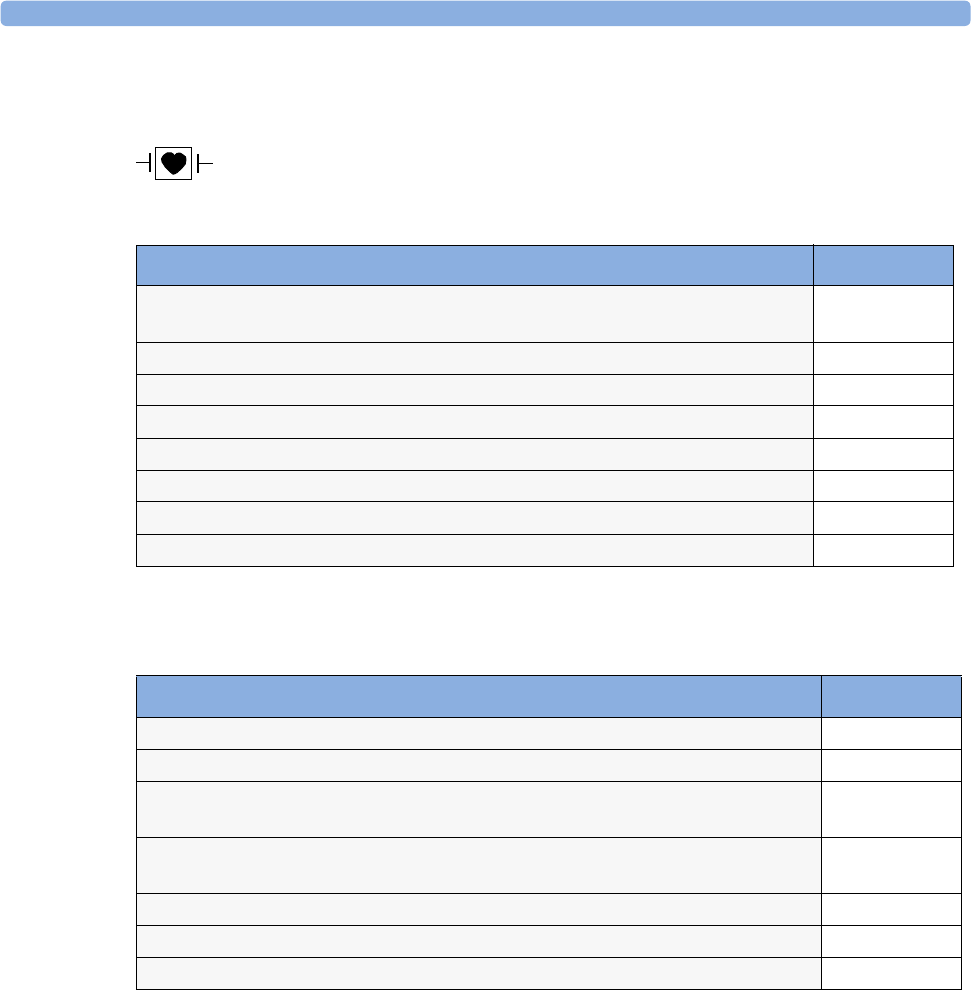
33 Accessories tcGas Accessories
322
tcGas Accessories
This symbol indicates that the specified transducer (but not its membranes) is designed
to have special protection against electric shocks (particularly regarding allowable
leakage currents), and is defibrillator proof.
EEG Accessories
BIS Accessories
Use only Aspect BIS sensors with the BIS module or BIS Interface board (MP20/MP30). The sensor is
a silver/silverchloride electrode array that uses Aspect’s patented ZipPrep technology and a proprietary
connector. The sensor/electrodes are for single patient use only. Check shelf-life before use.
The patient interface cable (Philips Ordering No. M1034-61630, Aspect Part No. 186-0131) has an
estimated lifetime of one year. Do not scrap it when disposing of the BIS sensor.
The sensor cable from the Semi-Reusable Sensor is re-usable but has a maximum number of uses, the
electrodes are single patient use only. The monitor displays how many uses remain for the sensor cable.
Description Part No.
12x tc Accessory Kit (O-ring remover, absorbent paper, electrolyte solution,
replacement membrane)
15209-60010
tc Application Kit (4x25 disposable fixation rings, 4x20ml contact fluid) 15209-60020
Calibration gas - 6 gas bottles 15210-60010
Calibration gas - 6 gas bottles (Europe and Japan only) 15210-64010
Replacement tubing (5 tubes) M2205A
tcpO2/CO2 transducer M1918A
Calibration unit 15210B
Radiometer TCC3 calibration unit (available from Radiometer) n/a
Description Part No.
Trunk Cable 2.7m M2268A
Trunk Cable, 1.0 m M2269A
Reusable 80-cm-long 5-lead cables with 10mm silver/silverchloride leadwired cup
electrodes (Adult)
M1931A
Reusable 80-cm-long 5-lead cables with 6mm silver/silverchloride leadwired cup
electrodes (Pediatric/Neonatal)
M1932A
Reusable 80 cm 5-lead cables with clip M1934A
Disposable EEG electrodes M1935A
EC2™ Electrode Cream (conductive paste) M1937A
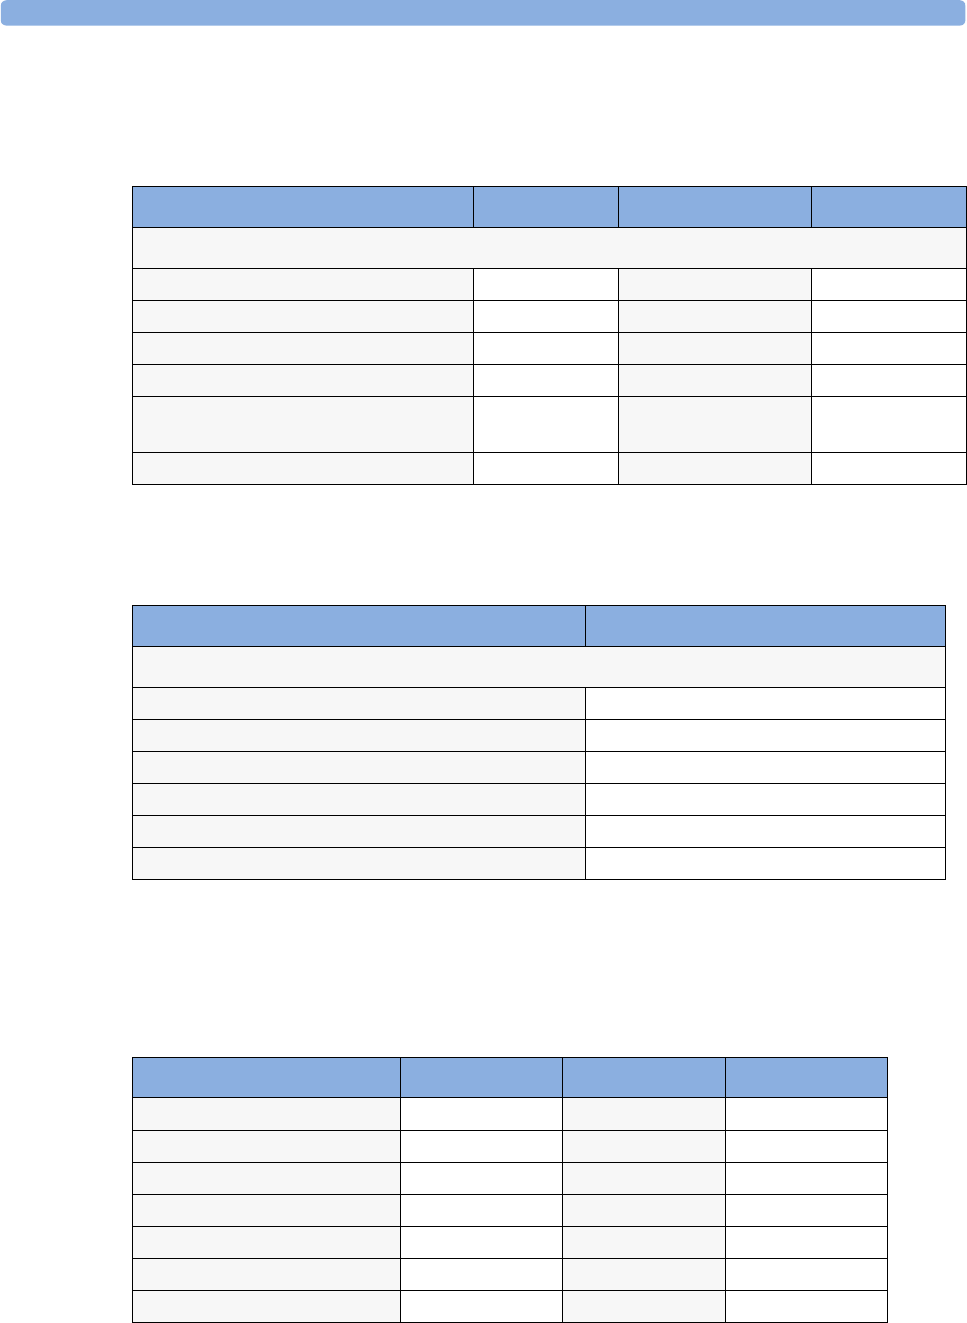
SvO2 Accessories 33 Accessories
323
BIS Sensors
To re-order sensors outside North America, contact your nearest Philips sales office and quote the
Philips ordering number. In North America, contact Aspect Medical Systems.
Other BIS Accessories
Order the following parts from your nearest Philips sales office and quote the Philips ordering number
SvO2 Accessories
Contact your local Hospira representative for information on accessories. They are not available from
Philips. Part numbers may vary according to country of purchase.
Description Pieces per pack Philips Ordering No Aspect Part No
BIS and BISx - compatible
BIS Sensor Quatro (formerly Sensor XP) 50 M1997A 186-0106
BIS Sensor Plus 50 M4546A 186-0076
BIS Sensor Pediatric 25 M1998A 186-0110
BIS Sensor Pediatric (4 electrode) 25 989803143581 186-0200
BIS Semi-reusable Sensor (not available in
USA, Japan)
100 M4615A 186-0164
BIS Sensor Extend 50 n/a 186-0160
Description Philips Ordering No
BIS M1034A only
BIS Engine Cable - Short (0.8 m) M1034-61610
BIS Engine Cable - Long (2.0 m) M1034-61620
PIC PLUS Cable M1034-61630
BIS Universal Clamp Mount M1180A #C32
BIS FMS Mount (Flexible Module Server) M1180A #C33
BIS Mount for MP40/MP50 M8003- 64011
Description Hospira Part No. French Size Length
Optical Module 50131
Pulmonary artery catheter 50324-05 7.5F 110cm
Pulmonary artery catheter 50355-03 5.5F 75cm
Pulmonary artery catheter 50328-05 8F 110cm
Intravascular catheters 50404-01 4F 40cm
Intravascular catheters 50405-01 4F 25cm
Intravascular catheters 50407-01 5.5F 40cm

33 Accessories Recorder Accessories
324
Recorder Accessories
Description Part No.
For M1116B recorder:
10 rolls of paper 40477A
80 rolls of paper 40477B
For integrated recorder (MP20/MP30):
10 rolls of paper M4816A
80 rolls of paper M4817A

325
34
34Installation and Specifications
The specifications in this section apply to the MP20, MP30, MP40, MP50, MP60, MP70, MP80 and
MP90 patient monitors, unless otherwise stated.
The monitors are not user installable. They must be installed by qualified service personnel.
Intended Use
The monitors are intended to be used for monitoring, recording, and alarming of multiple
physiological parameters of adults, pediatrics, and neonates in health care facilities. The devices are to
be used by trained health care professionals.
All the monitors are intended for use in health care facilities; the MP20/MP30/MP40/MP50 monitors
are additionally intended for use in transport situations within the hospital setting.
The monitors are only for use on one patient at a time. They are not intended for home use. Rx only:
U.S. Federal Law restricts this device to sale by or on the order of a physician. Not a therapeutic device.
The transcutaneous gas measurement (tcGas) is restricted to neonatal patients only.
ST segment monitoring is intended for use with adult patients only and is not clinically validated for
use with neonatal and pediatric patients.
The ECG measurement is intended to be used for diagnostic recording of rhythm and detailed
morphology of complex cardiac complexes (according to AAMI EC 11).
BIS is intended for use under the direct supervision of a licensed health care practitioner or by
personnel trained in its proper use. It is intended for use on adult and pediatric patients within a
hospital or medical facility providing patient care to monitor the state of the brain by data acquisition
of EEG signals. The BIS may be used as an aid in monitoring the effects of certain anesthetic agents.
Use of BIS monitoring to help guide anesthetic administration may be associated with the reduction of
the incidence of awareness with recall in adults during general anesthesia and sedation.
Indication for Use
The monitor is indicated for use by health care professionals whenever there is a need for monitoring
the physiological parameters of patients.

34 Installation and Specifications Manufacturer’s Information
326
Manufacturer’s Information
You can write to Philips at this address
Philips Medizin Systeme Boeblingen GmbH
Hewlett-Packard-Str. 2
71034 Boeblingen
Germany
Visit our website at: www.philips.com.
© Copyright 2002 - 2005. Koninklijke Philips Electronics N.V. All Rights Reserved.
BIS Manufacturer’s Information
BISx, the BIS engine, the DSC, the Patient Interface Cable and the BIS Sensor are manufactured by
Aspect Medical Systems:
Aspect Medical Systems, Inc
141 Needham St
Newton,
MA 02464
USA
1-617-559-7000
Free call:
1-888-BIS_INDEX
1-888-247-4633
Email: bis_info@aspectms.com
Web: www.aspectmedical.com
Address of the EU Authorized Representative:
Aspect Medical Systems International B.V.
Rijnzathe 7d2
3454 PV De Meern
The Netherlands
Phone: +31.30.662.9140
Email: amsint@aspectms.com

Manufacturer’s Information 34 Installation and Specifications
327
Trademark Acknowledgement
PiCCOΤΜ is a trademark of Pulsion Medical Systems AG.
Bispectral Index and BIS are trademarks of Aspect Medical Systems Inc, and are registered in the USA,
EU and other countries.
OxisensorΤΜ II, Oxi-CliqΤΜ, and OxiMaxΤΜ are trademarks of Tyco Healthcare Group LP, Nellcor
Puritan Bennett Division.
Microstream, FilterLine, and Smart CapnoLine are trademarks or registered trademarks of Oridion
Systems Ltd.
Citrix® and ICA® (Independent Computing Architecture) are registered trademarks of Citrix
Systems, Inc.
Masimo, Masimo SET, and LNOP are federally registered trademarks of the Masimo Corporation.
Other product and company names mentioned in this book may be trademarks of their respective
owners.
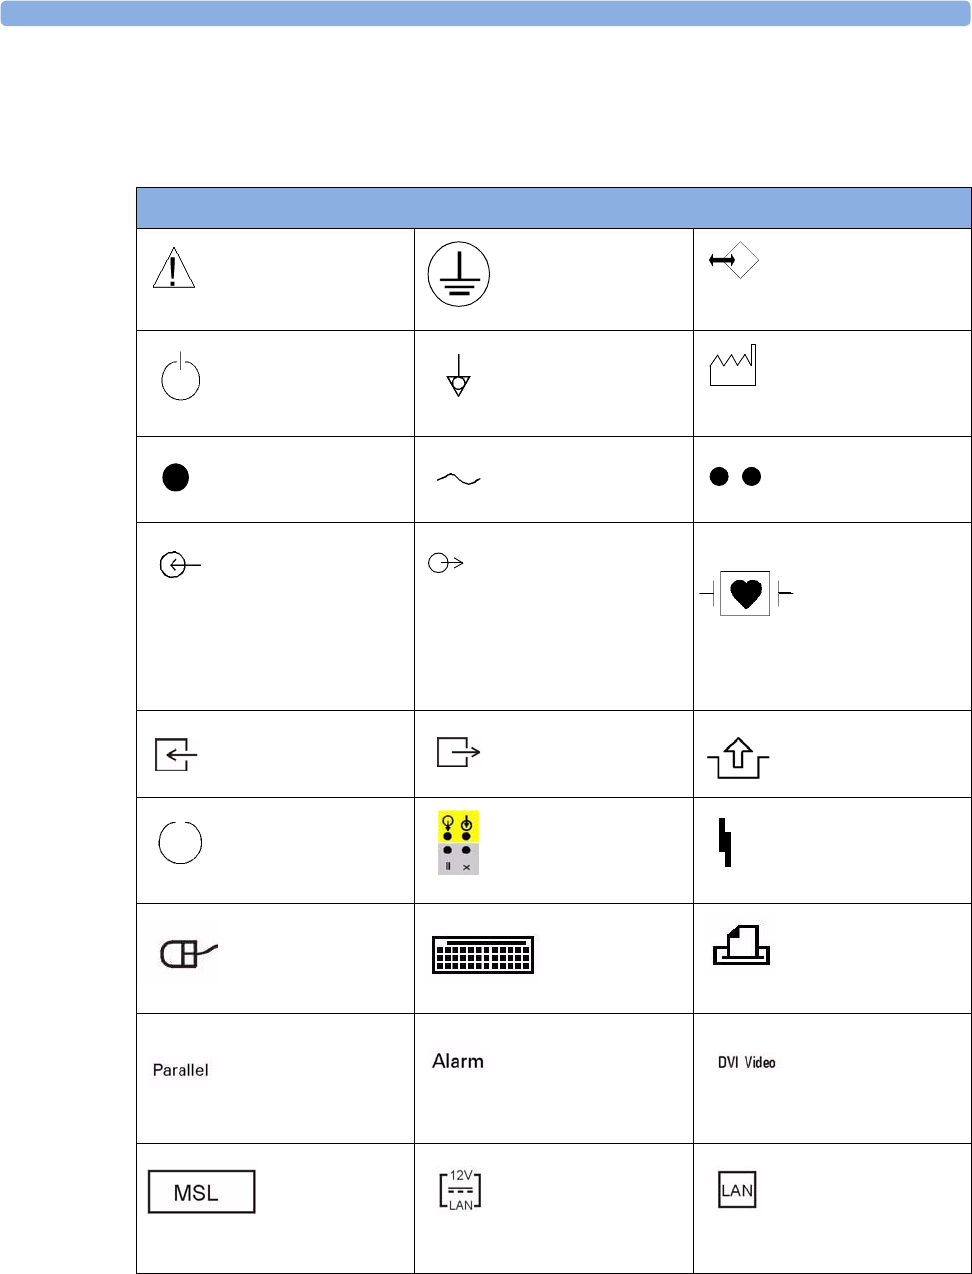
34 Installation and Specifications Symbols
328
Symbols
These symbols appear on the monitor and its associated equipment.
Symbols
Refer to accompanying
documents
Protective earth RS232 connector
Standby Equipotential
grounding
Identifies year
and month of
manufacture
Connection direction
indicator
Alternating current Connection direction
indicator
Electrical input
indicator
(On some older measurement
servers and extensions, and
modules, this symbol may indicate
the gas input.)
Electrical output
indicator
(On some older measurement
servers and extensions, and
modules, this symbol may indicate
the gas output.)
Connector has
special protection
against electric
shocks and is
defibrillator proof
Gas input indicator Gas output indicator Quick mount release
FMS Power On
Indicator - Ready for
operation
Serial/MIB connector Interruption indicator
Mouse connection
indicator
Keyboard
connection
indicator
Printer connection
indicator
Parallel interface
indicator for
connection to parallel
printer
Nurse call relay
connection indicator
Digital video device
connection indicator
for connection to
independent display
Measurement
server link
connection
indicator
12 Volt DC LAN
connection, for
connection to wireless
device
LAN connection
indicator for
connection to a wired
network
RS-232
2002-
06
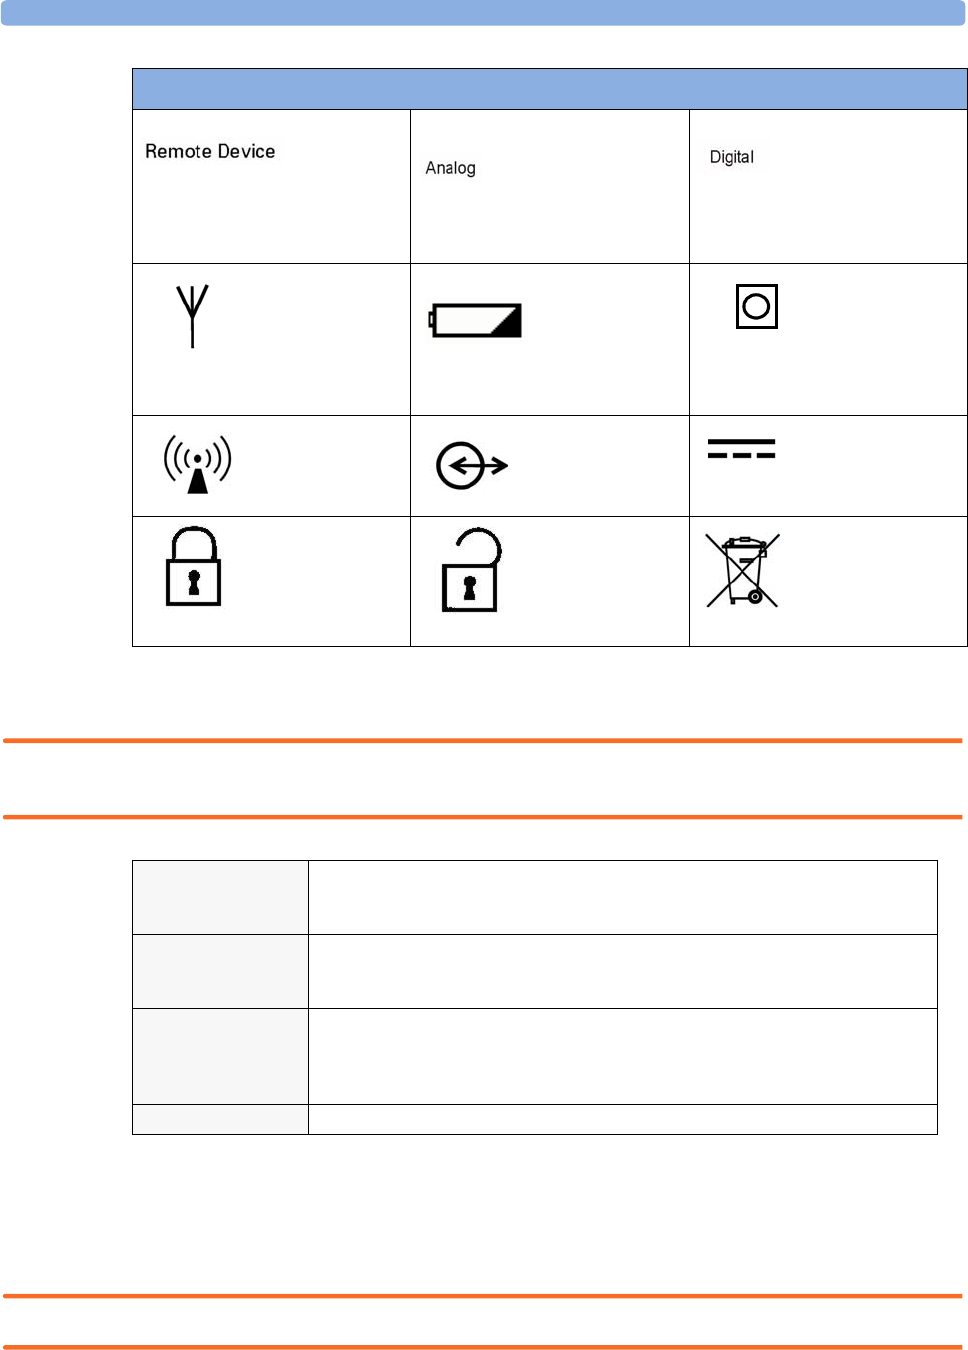
Installation Safety Information 34 Installation and Specifications
329
Installation Safety Information
WARNING If multiple instruments are connected to a patient, the sum of the leakage currents may exceed the
limits given in IEC/EN60601-1. Consult your service personnel.
Connectors
The actual placement of boards and configuration of connections for your monitor depends on how
your hardware has been configured. See the symbols table on page 328 to see which symbols are used
to mark the connections.
WARNING Connect only medical devices to the ECG output connector socket.
Philips
remote
device
(SpeedPoint or Alarm Device)
connection indicator
Analog interface
indicator for
connection to any
analog video display
Digital interface
indicator for
connection to any
digital video display
Antenna
connector
Battery symbol 12 Volt DC LAN
connection
indicator for
connection to
serial interface
Non-ionizing
radiation symbol
Data input/output
symbol
12 Volt DC
socket
Locked position Unlocked position
Always use separate
collection for waste
electrical and
electronic equipment (WEEE)
Symbols
LAN/SER
12V
12V
Grounding The monitors or the MP80/MP90 processing unit must be grounded during operation. If
a three-wire receptacle is not available, consult the hospital electrician. Never use a three-
wire to two-wire adapter.
Equipotential
Grounding
If the monitors or MP80/MP90 processing unit are used in internal examinations on the
heart or brain, ensure that the room incorporates an equipotential grounding system to
which the monitor and MP80/MP90 processing unit have separate connections.
Combining equipment Combinations of medical equipment with non-medical equipment must comply with
IEC 60601-1-1. Never use a multiple portable socket-outlet or extension cord when
combining equipment unless the socket outlet is supplied specifically for use with that
equipment.
Fusing The monitors use double pole/neutral fusing.
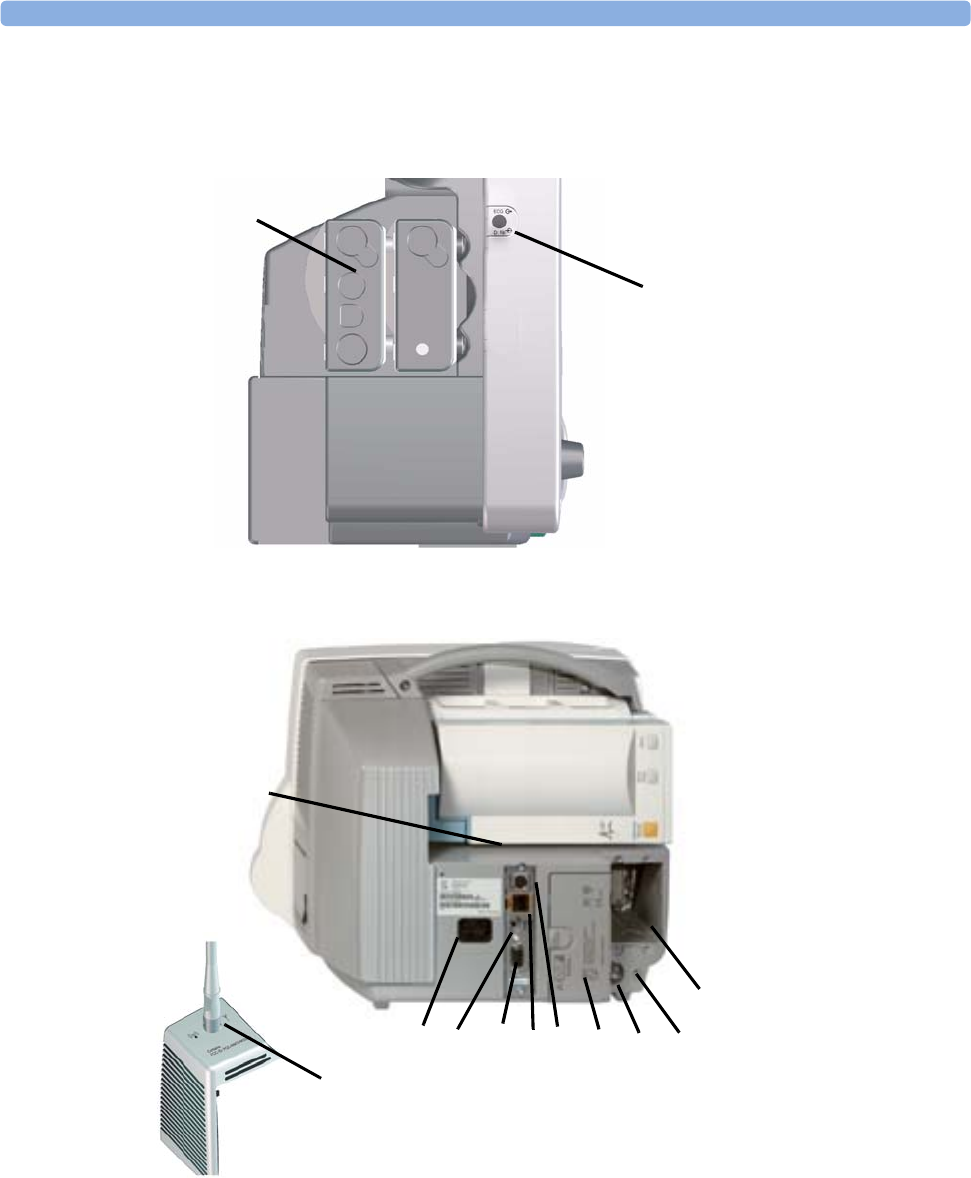
34 Installation and Specifications Installation Safety Information
330
MP20/MP30
MP20/MP30 Left side of monitor
1 MMS and one extension
2 ECG analog output/marker
input connector
MP20/MP30 Rear of monitor
1 Measurement Server
Link connector
2AC power inlet
3 Remote alarm
connector
4 Analog video out
connector
5Wired network
connector
6 Wireless network
connector
7Battery compartment
8Equipotential
grounding
9 Protective earth
10 Space for optional
interface boards, e.g.
serial/MIB (RS232)
connectors, or
optional parallel
printer connection
11 Side cover with
antenna for IntelliVue
Instrument Telemetry
Wireless Network
(USA only)
1
2
4
1
78
269
5
10
3
11
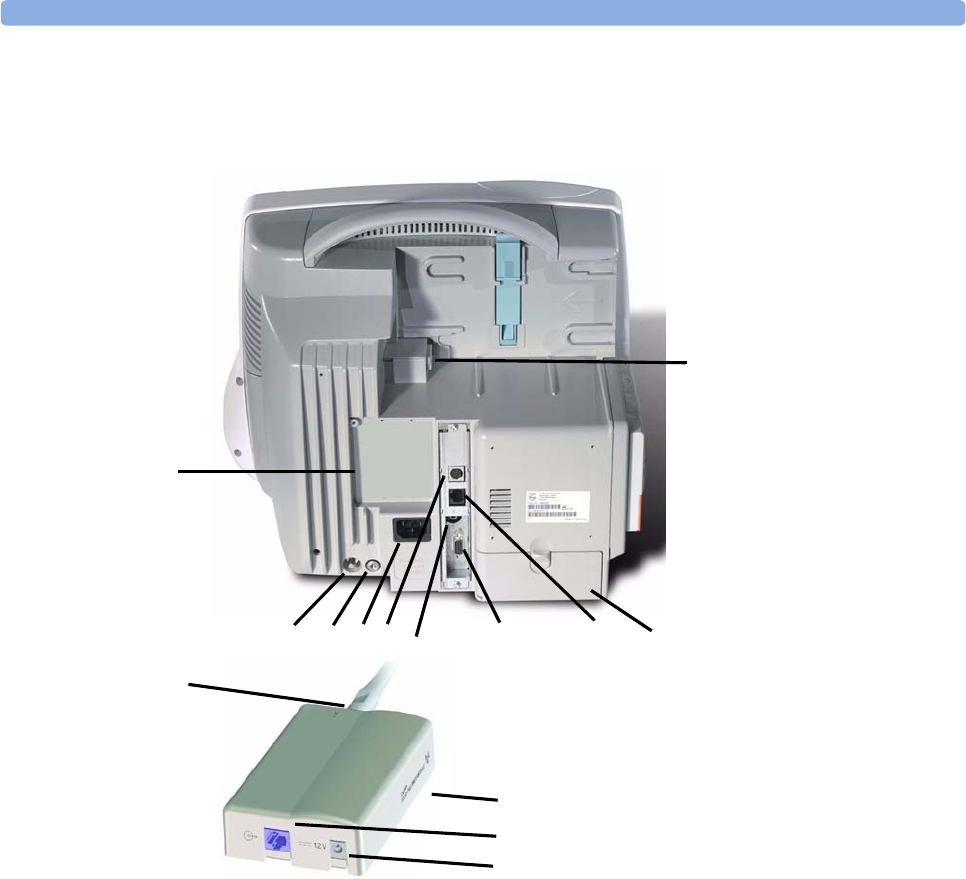
Installation Safety Information 34 Installation and Specifications
331
MP40/MP50
MP40/MP50 Rear of monitor
1 Space for optional
interface boards, e.g.
serial/MIB (RS232)
connectors, or
optional parallel
printer connection
2Equipotential
grounding
3 Protective earth
4AC power inlet
5 Wireless network
connector for use with
wireless LAN or
Instrument Telemetry
adapter
6 Remote alarm
connector
7 Analog video out
connector
8Wired network
connector
9Battery compartment
10 Measurement Server
Link connector
11 IntelliVue Instrument
Telemetry adapter
(USA only)
12 Monitor connector (to
5 above)
13 12V DC Power Inlet
(to 5 above)
14 Antenna connector
7
1
23456 9
10
8
11
12
13
14
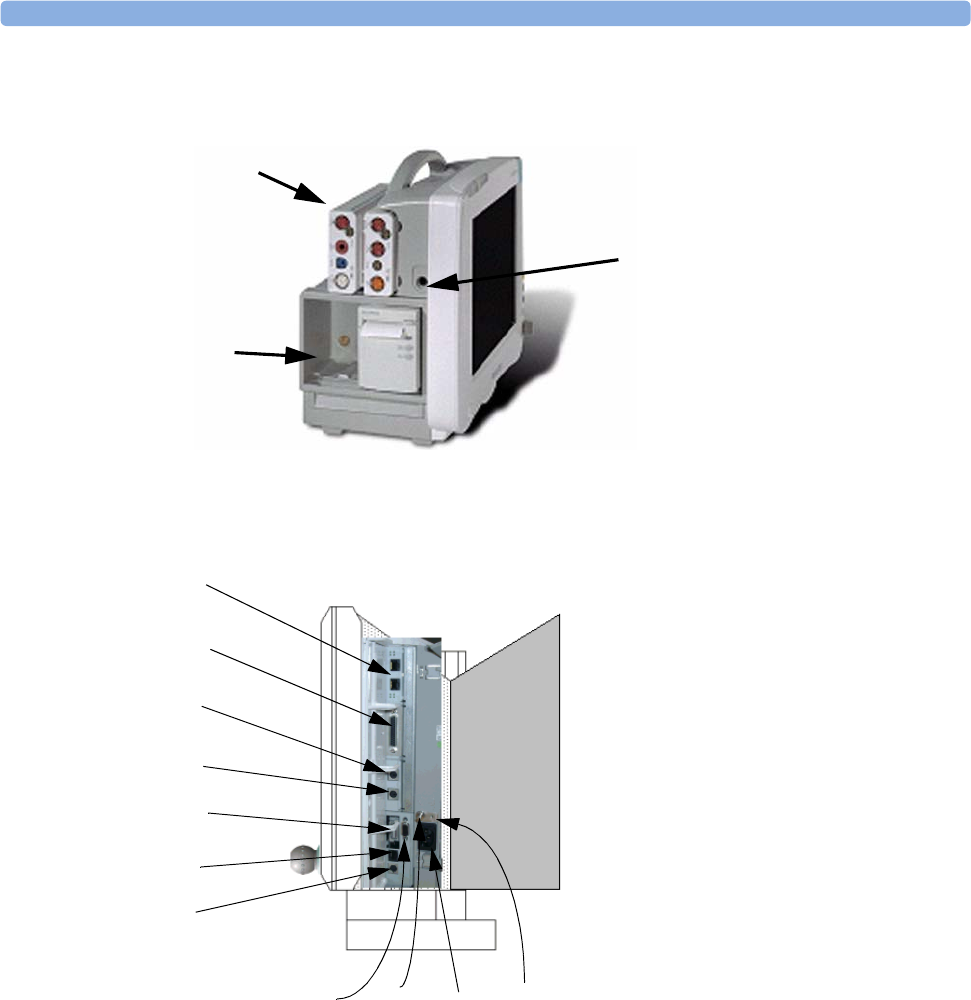
34 Installation and Specifications Installation Safety Information
332
MP60/MP70
MP40/MP50 Left side of monitor
1 MMS and one extension
2 Plug-in module slots
3 ECG analog output/marker
input connector
1
2
3
Right side of monitor (MP60/70)
1 Serial/MIB (RS232) connectors
(optional), type RJ45
2 Parallel printer connector
3 Keyboard connector
4Mouse/trackball connector
5 Main measurement server link (MSL)
6 Wired network connector
7 Wireless network connector
8 Analog video out connector
9 Equipotential ground connector
10 AC power input
11 Protective earth screw hole
3
2
1
4
5
6
7
8910 11
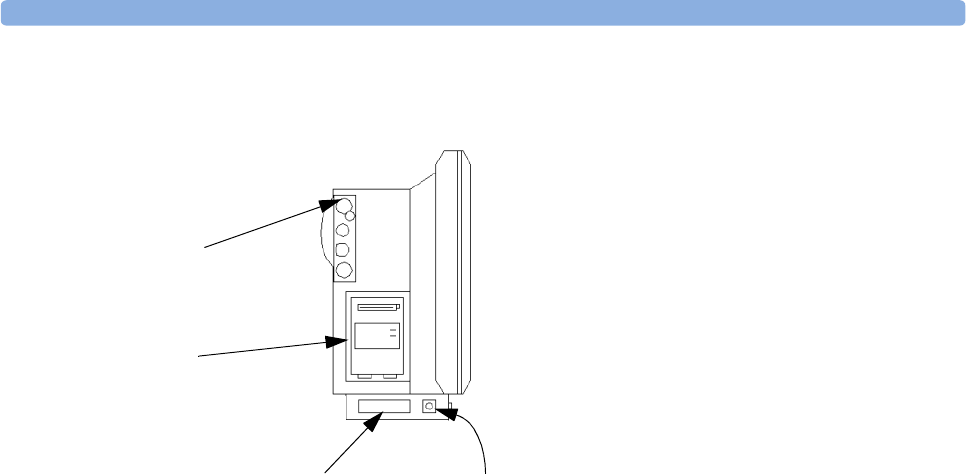
Installation Safety Information 34 Installation and Specifications
333
Left side of monitor (MP60/70)
1 MMS patient cable connectors
2 Slot for integrated recorder module or
measurement module
3 Additional measurement server link
(MSL) cable (alternative or additional to
MSL on right of monitor)
4 ECG analog output/marker input
connector
1
2
34
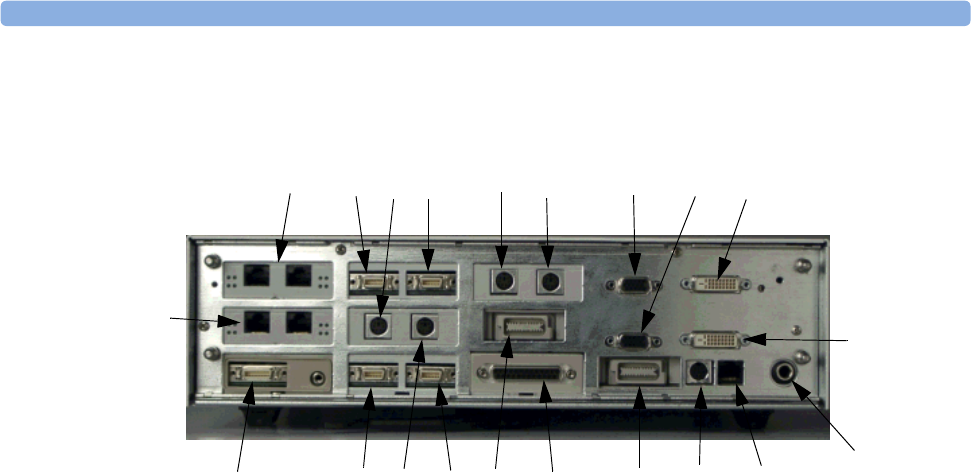
34 Installation and Specifications Installation Safety Information
334
MP80/MP90
MP80/MP90 (rear of processing unit) - MP80 does not have the top row of connectors
1 Serial/MIB (RS232) connectors, type RJ45 12 ECG analog output/marker input
2 Serial/MIB (RS232) connectors, type RJ45 13 Wired network connector
3 Independent display - remote alarm device connector 14 Wireless network connector
4 Keyboard connector 15 Primary measurement server link
5 Independent display - remote SpeedPoint connector 16 Parallel printer connector
6 Independent display - mouse/trackball connector 17 Additional measurement server link
7 Independent display - keyboard connector 18 Remote SpeedPoint connector
8 Independent display analog video out connector 19 Mouse/trackball connector
9 Primary display - analog video out connector 20 Remote alarm connector
10 Independent display - digital video out connector 21 Flexible nurse call interface
11 Primary display - digital video out connector
76542
1
21 20 19 17 16 15 14 12
11
18
10893
13
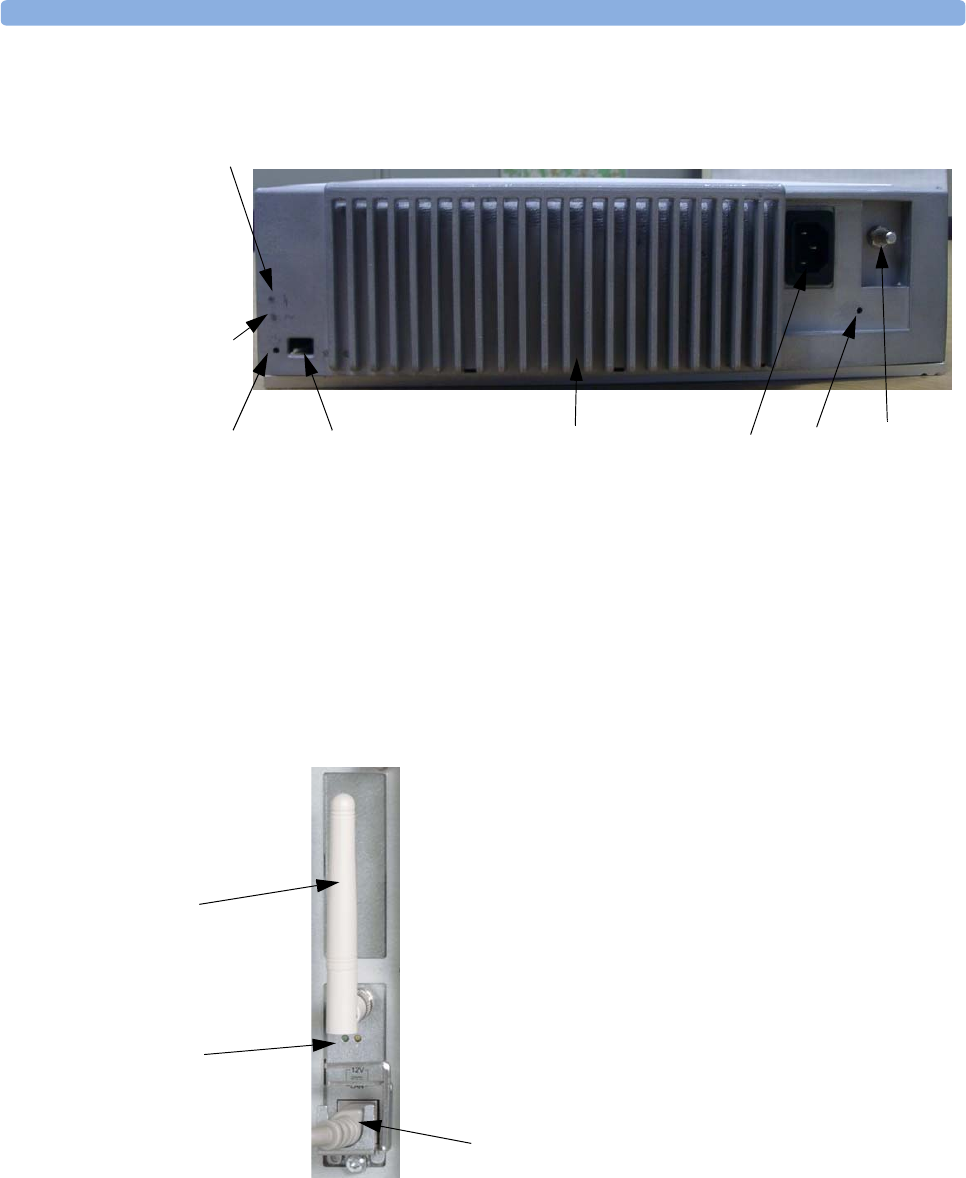
Installation Safety Information 34 Installation and Specifications
335
802.11 Bedside Adapter (Wireless Network Adapter)
MP80/MP90 (front of processing unit)
1 AC Power LED 5 Power supply
2 Error LED 6 AC power input
3 Power on LED 7 Protective earth screw hole
4 Power on switch 8 Equipotential grounding point
3876
45
1
2
802.11 Bedside Adapter (can be used with all monitors)
1 Antenna
2 LEDs - green and yellow LEDs light up
during startup while selftests are
performed. During normal operation the
green LED indicates whether Radio is
currently on or off; the yellow LED
remains off
3 Combined power/network cable
1
2
3

34 Installation and Specifications Altitude Setting
336
Altitude Setting
Altitude affects tcGas and CO2 measurements. The monitor must be configured at installation to the
correct altitude.
Monitor Safety Specifications
The monitors, together with the Multi-Measurement Server (M3001A), and the Flexible Module
Server (M8048A), all modules and measurement server extensions, comply with the Medical Device
Directive 93/42/EEC.
In addition, the product complies with:
IEC 60601-1:1988 + A1:1991 + A2:1995; EN60601-1:1990 + A1:1993 + A2:1995; UL 60601-
1:2003; UL 2601.1:1994; CAN/CSA C22.2#601.1-M90; JIS T 1001-1992; IEC 60601-1-1:2000;
EN 60601-1-1:2001; IEC 60601-1-2:2001; EN 60601-1-2:2001.
Classification (according to IEC 60601-1): Class 1, Type CF, Continuous Operation. The BIS
measurement uses a Type BF applied part.
The possibility of hazards arising from software errors was minimized in compliance with ISO
14971:2000, EN60601-1-4:1996 + A1:1999 and IEC 60601-1-4:1996 + A1:1999.
This ISM device complies with Canadian ICES-001. Cet appareil ISM est conforme a la norme NMB-
001 du Canada.
185-0145-PH Aspect BISx, 185-0111 Aspect BIS Engine and 185-0124 Aspect DSC comply with the
requirements of the Council Directive 93/42/EEC of 14 June 1993 (Medical Device Directive).
The MP20/30 including IntelliVue Instrument Telemetry and the MP40/50 with the IntelliVue
Instrument Telemetry adapter comply with part 15 of the FCC Rules. Operation is subject to the
condition that these devices do not cause harmful interference. Operation of this equipment requires
the prior coordination with a frequency coordinator designated by the FCC for the Wireless Medical
Telemetry Service.
IntelliVue 802.11 Bedside Adapter (Option J35 Wireless Network Adapter) - FCC and Industry
Canada Radio Compliance: This device complies with Part 15 of the FCC Rules and RSS-210 of
Industry Canada. Operation is subject to the following two conditions: (1) this device may not cause
harmful interference, and (2) this device must accept any interference received, including interference
that may cause undesired operation. Any changes or modifications to this equipment not expressly
approved by Philips Medical Systems may cause harmful radio frequency interference and void your
authority to operate this equipment.
The maximum antenna gain permitted (for devices in the 5250-5350 MHz and 5470-5725 MHz
bands) complies with the e.i.r.p. limits as stated in RSS-210.
The maximum antenna gain permitted (for devices in the 5725-5825 MHz band) complies with the
e.i.r.p. limits specified for point-to-point operation, as stated in RSS-210.
The device for the band 5150-5350 MHz is only for indoor usage to reduce potential for harmful
interference to co-channel mobile satellite systems.
0366
0123
Monitor Safety Specifications 34 Installation and Specifications
337
The OEM radio device used in this product is in compliance with the essential requirements and other
relevant provisions of Directive 1999/5/EC. This product is intended to be connected to the Publicly
Available Interfaces (PAI) and used throughout the EEA.
CAUTION High power radars are allocated as primary users (meaning they have priority) of 5250-5350 MHz and
5650-5850 MHz and these radars could cause interference and /or damage to LE-LAN devices.
IntelliVue 802.11 Bedside Adapter CE compliances:
This device is compliant to Council Directive 73/23/EEC (Low voltage directive) & 89/
336/EEC (EMC directive) & 1999/5/EC (Radio Equipment and Telecommunications
Terminal Equipment Directive)
The radio component contained in this device is compliant to Council Directive 1999/5/
EC (Radio Equipment and Telecommunications Terminal Equipment Directive)
WARNING To minimize the risk of causing severe burns during MR imaging, ensure that transducers, sensors and
cables are positioned so that no inductive loops are formed. If the measurement does not appear to be
operating properly, remove all transducers, sensors and cables immediately from the patient.
Physical Specifications
Product Max Weight W x H x D Comments
MP20/MP30 < 6 kg
< 13 lb
< 345 x 275 x 230 mm
13.6 x 11 x 9 in
including M3001A, recorder,
and battery, without options
MP40/MP50 < 8.6 kg
< 19 lb
< 365 x 330 x 217 mm
14 x 13 x 8.5 in
including M3001A, recorder,
and battery, without options
MP60/MP70
(with speedpoint)
MP70
(with touchscreen operation)
< 10 kg
< 22.05 lb
< 405 x 360 x 170 mm
15.95 x 14.17 x 6.69 in
without handle and speedpoint
device, without options
MP80/MP90/D80 < 10 kg
< 22.05 lb
342 x 108 x 505 mm
13.47 x 4.25 x 19.88 in
including AC cable, cable cover
and feet
M3001A
Multi-Measurement Server (MMS)
< 650g
< 1.4lb
188 x 96.5 x 51.5 mm
7.4 x 3.8 x 2 in
M3012A
Hemodynamic Measurement Server
Extension
< 550 g
1.2 lb
< 190 x 98 x 40 mm
< 7.5 x 4 x 1.6 in
M3014A
Measurement Server Extension -
Capnography
< 500 g
< 0.99 lb
< 190 x 98 x 40 mm
< 7.5 x 4 x 1.6 in
M3015A
Measurement Server Extension -
Microstream CO2
< 550 g
< 1.21 lb
< 190 x 98 x 40 mm
< 7.5 x 4 x 1.6 in

34 Installation and Specifications Monitor Safety Specifications
338
M3016A
Measurement Server Extension -
Mainstream CO2
< 450 g
< 0.99 lb
< 190 x 98 x 40 mm
< 7.5 x 4 x 1.6 in
M8048A
Flexible Module Server (FMS)
< 3500g
< 7.7lb
< 320 x 120 x 35 mm
12.6 x 4.7 x 5.3 in
without plug-in modules
M8045A
Docking Station
2700g
5.95lb
250 x 160 x 270 mm
9.8 x 6.3 x 10.6 in
dimensions without lever
M8025A
Remote Alarm Device
< 300 g
< 0.7 lb
62 x 125 x 63 mm
2.4 x 5 x 2.5 in
M8026A
Remote SpeedPoint
< 400 g
< 0.9 lb
103 x 139 x 63 mm
4 x 5.5 x 2.5 in
M8031A
XGA Touchscreen LCD Display
< 4.9 kg
< 10.8 lb
408 x 333 x 85 mm
16 x 13.1 x 3.4 in
with mounting bracket
M1006B
Invasive Press Module
190 g (6.7 oz)
Option #C01:
225 g (7.9 oz)
36 x 99.6 x 97.5 mm
1.4 x 3.9 x 3.8 in
M1029A
Tem p e r a tu re Modu l e
215 g (7.6 oz) 36 x 99.6 x 97.5 mm,
1.4 x 3.9 x 3.8 in
M1012A
Cardiac Output Module
225 g (7.9 oz.) 36 x 99.6 x 97.5 mm
1.4 x 3.9 x 3.8 in
M1014A
Spirometry Module
250 g (8.8 oz.) 36 x 99.6 x 97.5 mm
1.4 x 3.9 x 3.8 in3
M1018A
Transcutaneous Gas Module
350g (11.3oz) 72.5 x 99.6 x 97.5 mm,
2.9 x 3.9 x 3.8 in
M1020B
SpO2 Module
< 250 g
0.55 lb
36 x 99.6 x 97.5 mm
1.4 x 3.9 x 3.8 in
M1021A
Mixed Venous Oxygen Saturation
Module
460 g
(13.04 oz)
72.5 x 99.6 x 97.5 mm
2.9 x 3.9 x 3.8 in)
M1027A
Electroencephalograph Module
210 g (7.4 oz) 36 x 99.6 x 97.5 mm
1.4 x 3.9 x 3.8 in
M1034A
BIS Interface Module
215 g
7.6 oz
36 x 99.6 x 97.5 mm
1.4 x 3.9 x 3.8 in
without cables
BISx 450 gr
1 lb
102 x 38 mm
4 x 1.5 in
with PIC Plus Cable (1.22 m, 4
ft) and cable to BIS module
- DSC Digital Signal Converter 130 g (4.6 oz)
(without
cabling)
66 x 25 x 107 mm
2.6 x 1.0 x 4.25 in
with PIC Plus Cable (1.22 m, 4
ft)
- BIS Engine 170 g (6.0 oz) 43 x 93 x 95 mm
1.7 x 3.7 x 3.8 in
M1032A
Vuelink Module
240 g (8.4 oz) 36 x 99.6 x 97.5 mm
1.4 x 3.9 x 3.8 in
M1116B
Thermal Array Recorder Module
507.5 g
17.9 oz.
73 x 99.6 x 97 mm
2.9 x 3.6 x 3.9 in.
Product Max Weight W x H x D Comments
Monitor Safety Specifications 34 Installation and Specifications
339
Environmental Specifications
The monitor may not meet the performance specifications given here if stored or used outside the
specified temperature and humidity ranges.
When the monitor and related products have differing environmental specifications, the effective range
for the combined products is that range which is common to the specifications for all products.
Monitor MP40, MP50, MP60, MP70, MP80, MP90
Item Condition Range
Temperature Range Operating 0 to 35 °C (32 to 95 °F)
Non-operating -20 to 60 °C (-4 to 140 °F)
Battery storage -20 to 50 °C (-4 to 122 °F)
Monitor MP60, MP70 in conjunction with IntelliVue 802.11 Bedside Adapter (option #J35)
Temperature Range Operating 0 to 30 oC (32 to 86oF)
Monitor MP20, MP30
Item Condition Range
Temperature Range Operating 0 to 40 °C (32 to 104°F)
Operating when
charging battery or
when equipped with
IntelliVue Instrument
Telemetry
0 to 35 °C (32 to 95 °F)
Non-operating -20 to 60 °C (-4 to 140 °F)
Battery storage -20 to 50 °C (-4 to 122 °F)
Monitor MP20, MP30, MP40, MP50, MP60, MP70, MP80, MP90
Item Condition Range
Humidity Range Operating 20% to 85% Relative Humidity (RH) (non condensing)
Non-operating 5% to 85% Relative Humidity (RH)
Altitude Range Operating -500 m to 3000 m (10000 ft)
Non-operating -500 m to 12000 m (40000 ft)
34 Installation and Specifications Monitor Safety Specifications
340
Measurement Server M3001A, Measurement Server Extensions M3016A M3015A, M3014A,
M3012A, Measurement Modules, and Flexible Module Server M8048A
Item Condition Range
Temperature Range Operating 0 to 45 °C (32 to 113 °F)
Non-operating -40 to 70 °C (-40 to 158 °F)
Humidity Range Operating 95% Relative Humidity (RH) max. @ 40 °C (104 °F). M3015A
only non-condensing.
Non-operating 90% Relative Humidity (RH) max. @ 65 °C (150 °F)
Altitude Range Operating -500 m to 4600 m (-1600 to 15000 ft)
Non-operating -500 m to 15300 m (-1600 to 50000 ft)
D80 Intelligent Display
Item Condition Range
Temperature Range Operating 0 to 35 °C (32 to 95 °F)
Non-operating -20 to 60 °C (-4 to 140 °F)
Battery storage -20 to 50 °C (-4 to 122 °F)
Humidity Range Operating 20% to 85% Relative Humidity (RH) (non condensing)
Non-operating 5% to 85% Relative Humidity (RH)
Altitude Range Operating -500 m to 3000 m (10000 ft)
Non-operating -500 m to 12000 m (40000 ft)
Docking Station M8045A
Item Condition Range
Temperature Range Operating 0 to 40 °C (32 to 100 °F)
Non-operating -20 to 60 °C (-4 to 140 °F)
Humidity Range Operating 20% to 85% Relative Humidity (RH) (non condensing)
Non-operating 5% to 85% Relative Humidity (RH)
Altitude Range Operating -500 m to 3000 m (10000 ft)
Non-operating -500 m to 12000 m (40000 ft)
Thermal Array Recorder Module M1116B
Item Condition Range
Temperature Range Operating +5 to 45 °C (41 to 113°F)
Non-operating -10 to 70 °C (14 to 158 °F)
M4605A Battery Specifications 34 Installation and Specifications
341
M4605A Battery Specifications
MP20/MP30/
MP40/MP50
Only
Two batteries are required to operate the MP40/MP50 monitors. The MP20/MP30 monitors can
operate with one battery.
Humidity Range Operating 95% Relative Humidity (RH) max @ 40°C (104°F) (non
condensing)
Non-operating 95% Relative Humidity (RH) max @ 65°C (150°F) (non
condensing)
Altitude Range Operating up to 3048 m (10000 ft)
Non-operating up to 3048 m (10000 ft)
Remote SpeedPoint M8026A
Item Condition Range
Temperature range Operating 0 ... 55 °C (32 ...130 °F)
Storage -20 … 60 °C (-4 ... 140 °F)
Humidity range Operating 95 %RH max. at 40 °C (100 °F)
Storage 85 %RH max. at 50 °C (120 °F)
Altitude range Operating -500 … 4.600 m (-1600 ... 15000 ft)
Storage -500 … 13.100 m (-1600 ... 43000 ft)
Remote Alarm Device M8025A
Item Condition Range
Temperature range Operating 0 ... 55 °C (32 ...130 °F)
Storage -20 … 60 °C (-4 ... 140 °F)
Humidity range Operating 95 %RH max. at 40 °C (100 °F)
Storage 85 %RH max. at 50 °C (120 °F)
Altitude range Operating -500 … 4.600 m (-1600 ... 15000 ft)
Storage -500 … 13.100 m (-1600 ... 43000 ft)
Thermal Array Recorder Module M1116B
Item Condition Range
M4605A Battery Specifications
Physical Specifications
W x D x H 149 mm (5.866 in) x89 mm (3.504 in) x 19.8 mm (0.78 in)
Weight 490 g (1.08 lb) per battery
Performance Specifications
Nominal Voltage 10.8 Volt
Rated Capacity at discharge C/5 6000 mAh
Continuous Discharge Capability 6.5 A
Environmental Specifications
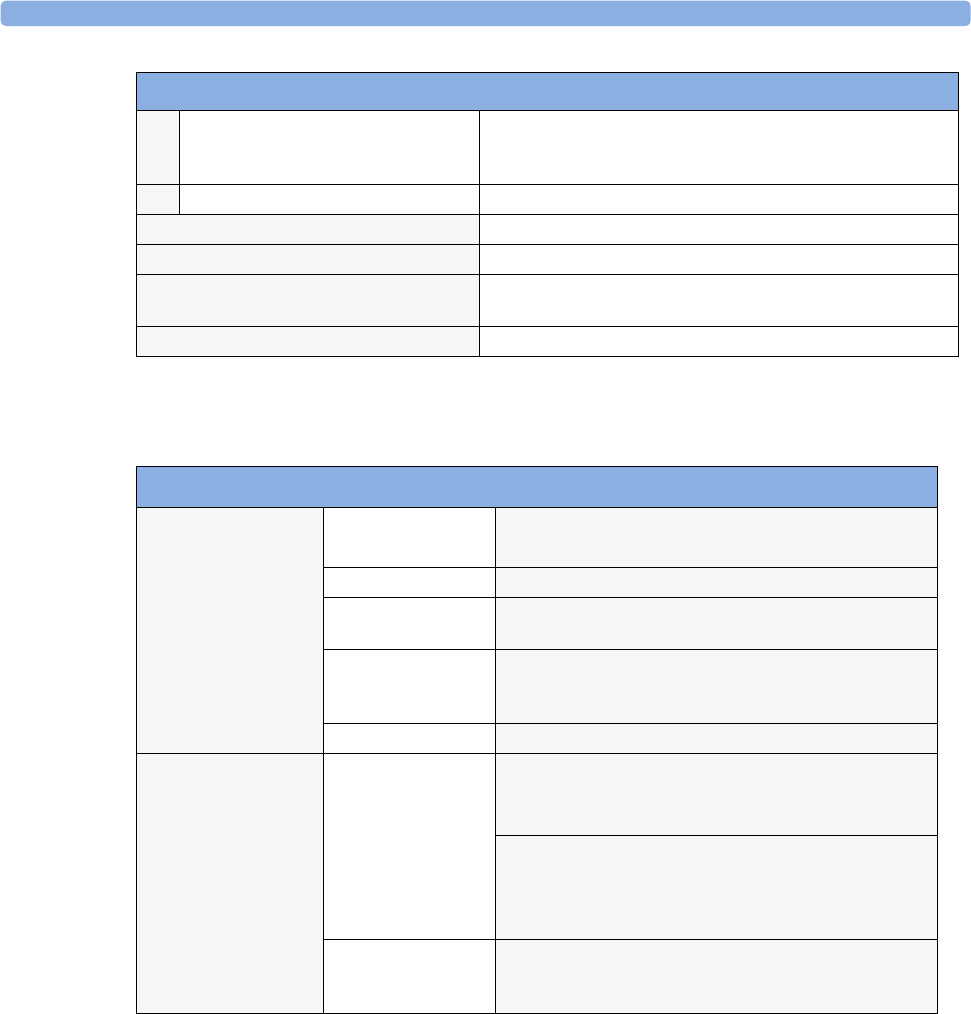
34 Installation and Specifications Monitor Performance Specifications
342
Monitor Performance Specifications
Temperature Range Discharge 0 to 50 °C (32 to 122 °F)
Charge 0 to 45 °C (32 to 113 °F)
Storage -20 to 60 °C (-4 to 140 °F)
Humidity Range 40% to 95% Relative Humidity (RH)
Battery Type Smart Battery 10.8V, 6000mAh, Lithium Ion
Safety complies with UL 1642 (UL Recognized) and IEC 61960-2:2001
Electromagnetic Compatibility (EMC) complies with the requirements for FCC Type B computing Device,
and EN 61000-4-2 and EN 61000-3
Communication Standard complies with the SMBus specification v1.1
M4605A Battery Specifications
MP20/30, MP40/50, MP60/70/80/90
Power Specifications Power consumption MP60/70/80/90: < 145 W
MP20/30, MP40/50: < 100 W
Line Voltage 100 to 240 V ~
MP60/MP70/MP80/
MP90 Current
1.6 to 0.7 A
MP20/MP30/MP40/
MP50
Current
1.8 to 1.0 A
Frequency 50/60 Hz ~
Battery Specifications
MP40/MP50
Operating Time
(with 2 new, fully
charged batteries)
Basic monitoring configuration: 5 hours
(Brightness set to Optimum, MMS connected, NBP
measurement every 15 minutes)
Extended monitoring configuration: 4 hours
(Brightness set to Optimum, MMS and measurement
server extension connected, NBP every 15 minutes, Recorder,
Pressure, Temperature modules connected)
Charge Time When monitor is off: 4 hours
When monitor is in use: 5 to 12 hours, depending on monitor
configuration

Monitor Performance Specifications 34 Installation and Specifications
343
Battery Specifications
MP20/MP30
Operating Time
(with 2 new, fully
charged batteries)
Basic monitoring configuration: 5 hours
(Brightness set to Optimum, MMS connected, NBP
measurement every 15 minutes)
Extended monitoring configuration: 4 hours
(Brightness set to Optimum, MMS and measurement
server extension connected, NBP every 15 minutes, Recorder,
every 15 minutes)
Operating Time
(with 1 new, fully
charged battery)
Basic monitoring configuration: 2.5 hours
(Brightness set to Optimum, MMS connected, NBP
measurement every 15 minutes)
Extended monitoring configuration: 2 hours
(Brightness set to Optimum, MMS and measurement
server extension connected, NBP every 15 minutes, Recorder,
every 15 minutes)
Charge Time When monitor is off: 4 hours
When monitor is in use: 5 to 12 hours, depending on monitor
configuration
Indicators Alarms Off red (crossed-out alarm symbol) LED
Alarms red/yellow/cyan LED
On/Standby green LED
AC Power green LED
Error red LED
Battery LED (MP20/
30/40/50 only)
red/yellow/green LED
Sounds Audible feedback for user input
Prompt tone
QRS tone, or SpO2 modulation tone
4 different alarm sounds
Remote tone for alarms on other beds in network
Tone for Timer expired
Tre n d s Resolution 12, 16, 24 or 32 numerics @ 12 sec, 1 minute, 5 minute
resolution
Information Multiple choices of number of numerics, resolution and
duration depending on trend option and application area.
For example:
neonatal extended 12 numerics, 24 hours @ 12 secs or 32
numerics 32 hours @ 1 minute
intensive care extended: 16 numerics 120 hours @ 5 minutes
anesthesia extended 32 numerics 9 hours @ 12 seconds
High-Res Trend Waves Measurements
available
HR, SpO2, Resp, tcpO2, Pulse, Perf, tcpO2, CO2, A B P, P A P,
CVP, ICP, CPP, BIS, CCO, AWP, Anesthetic Agents, Delta
SpO2, inO2
Resolution Measurement samples are taken at a resolution of four samples
per second
Update speed waves are drawn at a speed of 3 cm/minute
MP20/30, MP40/50, MP60/70/80/90
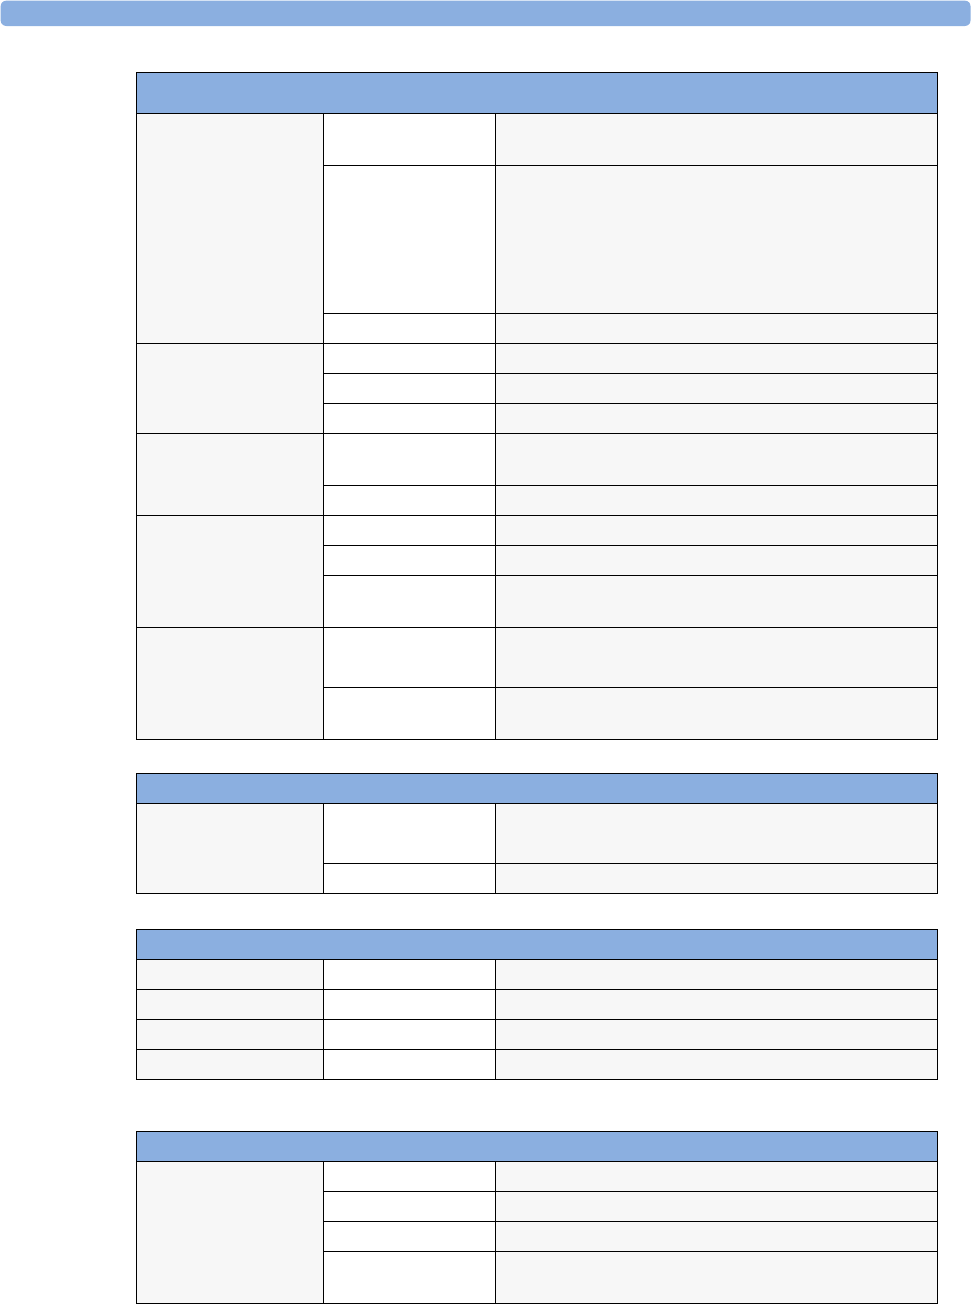
34 Installation and Specifications Monitor Performance Specifications
344
Events Information trigger condition and time, event classification and associated
detailed view of episode data
Episode data configurable (except MP20/30), either:
4 minutes of high resolution trend or
20 minutes of numerics trend @ 12 sec. resolution or
15 seconds of 4 waves @ 125 samples/sec. (Snapshot)
including all current numerics, alarms and inops
For MP20/30: 4 minutes of high resolution trend
Capacity (max) 25 or 50 events for either 8 or 24 hours
Alarm signal System delay less than 3 seconds
Pause duration 1,2,3 minutes or infinite, depending on configuration
Extended alarm pause 5 or 10 minutes
Review Alarms Information all alarms / inops, main alarms on/off, alarm silence and time
of occurrence
Capacity 100 items
Real Time Clock Range from: January 1, 1997, 00:00 to: December 31, 2080, 23:59
Accuracy < 2 seconds per day (typically)
Hold Time infinite if powered by AC; otherwise at least 48 hours (typical:
> 72 hours)
Buffered Memory Hold Time if powered by AC: infinite
without power: at least 48 hours (typical: > 72 hours)
Contents Active settings, trends, patient data, realtime reports, events,
review alarms
MMS M3001A Performance Specifications
Tre n d s Trend Data Buffered
Memory
if powered by monitor mains connection via MSL: infinite
without power applied: at least 6 hours
Contents trend data, patient identification and all active settings
D80 Intelligent Display Performance Specifications
Power Specifications Power consumption < 145 W
Line Voltage 100 to 240 V ~
Current 1.6 to 0.7 A
Frequency 50/60 Hz ~
Docking Station M8045A Performance Specifications
Power Line Voltage 100 - 240V
Frequency 50/60 Hz
Power Consumption negligible (for Power On LED)
Current to attached
patient monitor
max. 3.5 A
MP20/30, MP40/50, MP60/70/80/90

Monitor Performance Specifications 34 Installation and Specifications
345
Monitor Interface Specifications
Network Standard IEEE 802.3 10-Base-T
Connector RJ45 (8 pin)
Isolation 1.5 kV
Parallel Printer Port Standard IEEE 1284-I
Connector DB-25
Signals Level 1 and Level 2 (switchable)
Isolation 1.5 kV
Communication
Modes
Compatibility (for example Centronics), Nibble, ECP, EPP
Dual PS/2 Inputs Input Voltage 5V ±5%
Output Current 250mA (comb. max) to connected PS/2 devices
Dual MIB/RS232 Standard IEEE 1073-3.2-2000
Connectors RJ45 (8 pin)
Mode Software-controllable
BCC (RxD/TxD cross over) or
DCC (RxD/TxD straight through)
Power 5V +/- 5%, 100mA (max.)
Isolation 1.5kV
MIB-ready/RS-232
Interface
(not available in all
geographies)
Measurement data
exported to external
systems:
Numerics, alarms and INOPs, patient demographics, waves (up
to 7; maximum number depends on the sample rate of the
selected waves).
ECG Output/Marker Input (1/4” stereo phone jack with tip, ring, sleeve)
General Connector 1/4” phone each with tip, ring, sleeve
Isolation 500 V
ECG Output
(ring, tip)
Signal Gain 320 to 3200
Full Scale on Display 3.2Vpp
Gain Error <20%
Baseline Offset <150mV
Bandwidth 1 to 80Hz
Output Impedance ECG Output (ring): <2.2KΩ±20%
ECG Output/Marker Input (tip) <2.5kΩ ±20%
Signal delay ≤30ms
Marker Input
Requirements
(tip)
Signal Type 0 to -12V, negative edge pulse
Pulse Source
Impedance
<7kΩ
Pulse Fall Time <100µs
Pulse Duration >4ms
Flexible Nurse Call
Relay
Connector 20 pin MDR (Mini D-Ribbon), active open and closed contacts
3.5 mm phone jack, active closed contact only
Contact <= 100 mA, <= 24 V DC
Isolation 1.5 kV
Delay < (Configured Latency + 0.5 sec)

34 Installation and Specifications Monitor Performance Specifications
346
Wireless Network
Device Interface
Connector 8 pin Mini-DIN
Signals RD+/-, TD+/-: IEEE 802.3 10Base-T, PWR, GND
12.5 V ±20%, 3.5 W continuous
Remote Application
Support
Technology Citrix® and ICA® (Independent Computing Architecture)
client, Tunneling Control Engine (TCE)
Capabilities a monitor connected to a Philips Application Server can show a
Windows application on the monitor display. The application
can be controlled by the monitor user input devices.
Display Specifications
All displays Sweep Speeds 6.25, 12.5, 25 and 50 mm/s; additional EEG sweep speeds 15
mm/s, 30 mm/s with ±5% accuracy (guaranteed only for
integrated displays)
Integrated SVGA
Display, MP20/30
Resolution 800 x 600
Refresh frequency 60 Hz
Useful screen 211,2 x 158,4 mm
Pixel size 0.264 x 0.264 mm
Integrated SVGA
Display, MP40/50
Resolution 800 x 600
Refresh frequency 60 Hz
Useful screen 246 x 184.4 mm
Pixel size 0.3075 x 0.3075 mm
Integrated XGA Display,
MP60/70
Resolution 1024 x 768
Refresh frequency 60 Hz
Useful screen 304 x 228 mm (12 x 9 in)
Pixel size 0.297 x 0.297 mm
External XGA Display
(e.g. M8031B),
Resolution 1024 x 768
Refresh frequency 60 Hz or 75 Hz
Useful screen depends on size of display
Pixel size depends on size of display
External SXGA Display
(e.g. M8033C),
MP80, MP90, D80 only
Resolution 1280 x 1024 pixel
Refresh frequency 60 Hz
Useful screen depends on size of display
Pixel size depends on size of display
Video Interface MP20/
30, MP40/50, MP60/70
Specifications must be the same as the integrated display
Video Interface SVGA
MP20/MP30
Horizontal Frequency 37.9 kHz
Video Signals 0.7 Vpp @ 75 Ohm, HSYNC/VSYNC Signals TTL
Connector 15 pin D-SUB
Video Interface SVGA
MP40/MP50
Horizontal Frequency 37.5 kHz
Video Signals 0.7 Vpp @ 75 Ohm, HSYNC/VSYNC Signals TTL
Connector 15 pin D-SUB
Monitor Interface Specifications
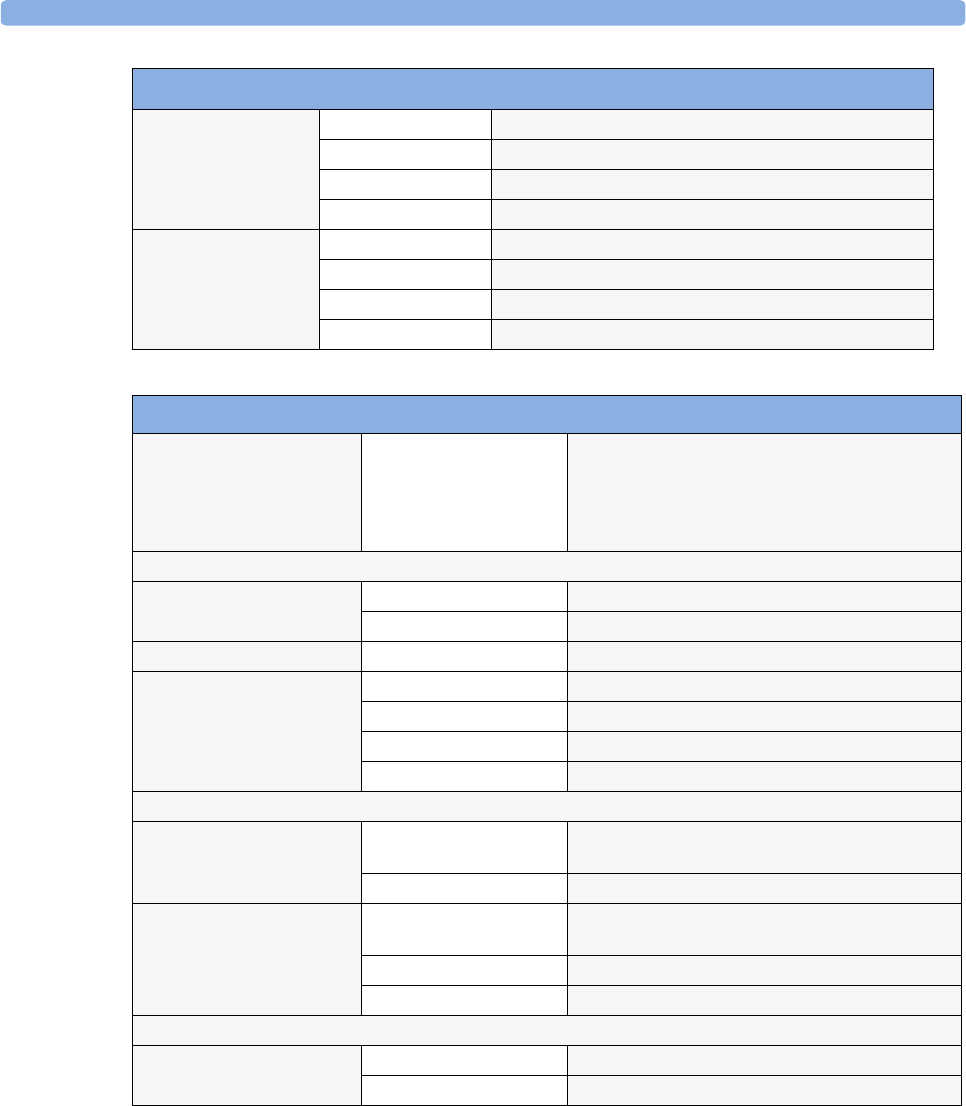
Monitor Performance Specifications 34 Installation and Specifications
347
Video Interface MP60/
MP70/MP80/MP90
SXGA (MP80, MP90,
D80 only), XGA
Horizontal Frequency 48.4 kHz or 60.0 kHz or 64.0 kHz
Video Signals 0.7 Vpp @ 75 Ohm, HSYNC/VSYNC Signals TTL
DDC Signals I2C compliant, 5V, 100 mA (max) (M8010 only)
Connector 15 pin D-SUB
Digital Video
MP80, MP90, D80
only
Video Signals Single Link TMDS
DDC Signals I2C compliant
DDC Power 5V, 100mA (max)
Connector DVI
Compatible Devices
Printers PCL5 capability required Examples:
HP Laserjet 1200 (monochrome)
HP Laserjet 2100 (monochrome)
HP DeskJet 2500 C+ (color)
Do not use printers that emulate PCL5
Displays (must be approved for medical use)
MP20/30/40/50/60/70/80/90,
D80
M1097A option A02 XGA color 15” LCD touchscreen
M8031B XGA color 15” LCD touchscreen
MP80, MP90, D80 M8033B/M8033C SXGA color 17” LCD touchscreen
Wireless Network Typ e Proxim Range LAN2 7920
Technology Frequency Hopping Spread Spectrum (FHSS)
Frequency Band 2.4 GHz ISM Band
Weight 300g max.
IntelliVue Instrument Telemetry Wireless Network (USA only, MP20/30/40/50 only)
Internal WMTS Adapter
(MP20/MP30)
Technology compatible with Philips Cellular Telemetry System
(CTS), cellular infrastructure
Frequency Band WMTS, 1395-1400 MHz and 1427-1432 MHz
External WMTS Adapter
M2638A
(MP40/MP50)
Technology compatible with Philips Cellular Telemetry System
(CTS), cellular infrastructure
Frequency Band WMTS, 1395-1400 MHz and 1427-1432 MHz
Weight 350g max.
IntelliVue 802.11 Bedside Adapter (Wireless Network Adapter)
Internal Wireless Adapter
Option J35
Technology IEEE 802.11a/b/g
Frequency Band 2.4 GHz and 5 GHz ISM Band
Display Specifications

34 Installation and Specifications Measurement Specifications
348
Measurement Specifications
See the Appendix on Default Settings for a list of the settings the monitor is initially shipped with.
ECG/Arrhythmia/ST
Complies with IEC 60601-2-25:1993 + A1:1999 /EN60601-2-25:1995 + A1:1999, IEC 60601-2-27/
EN60601-2-27:1994, IEC 60601-2-51:2003 /EN 60601-2-51:2003 and AAMI EC11/EC13:1991/
2002.
ECG/Arrhythmia/ST Performance Specifications
Cardiotach Range Adult/pedi: 15 to 300 bpm
Neo range: 15 to 350 bpm
Accuracy ±1% of range
Resolution 1 bpm
Sensitivity ≥200 µVpeak
PVC Rate Range 0 to 300 bpm
Resolution 1 bpm
ST Numeric Range -20 to +20 mm
Accuracy ±0.5 mm or 15%, whichever is greater
Resolution 0.1 mm
Sinus and SV Rhythm
Ranges
Brady Adult: 15 to 60 bpm
Pedi: 15 to 80 bpm
Neo: 15 to 90 bpm
Normal Adult:60 to 100 bpm
Pedi: 80 to 160 bpm
Neo: 90 to 180 bpm
Tachy Adult: > 100 bpm
Pedi: >160 bpm
Neo: >180 bpm
Bandwidth Diagnostic Mode Adult: 0.05 to 150Hz
Neo/pedi: 0.5 to 150Hz
Monitoring Mode Adult: 0.5 to 40Hz
Neo/pedi: 0.5 to 55Hz
Filter Mode Adult/neo/pedi: 0.5 to 20Hz
Differential Input Impedance >2MΩ RA-LL leads (Resp)
>5MΩ at all other leads (at 10Hz including patient cable)
Common Mode Rejection Ratio Diagnostic mode: >86 dB (with a 51 kΩ/47 nF imbalance).
Filter mode: >106 dB (with a 51 kΩ/47 nF imbalance).
Electrode Offset Potential Tolerance ±500mV
Auxiliary Current
(Leads off Detection)
Active electrode: <100 nA
Reference electrode: <900 nA
Input Signal Range ±5 mV
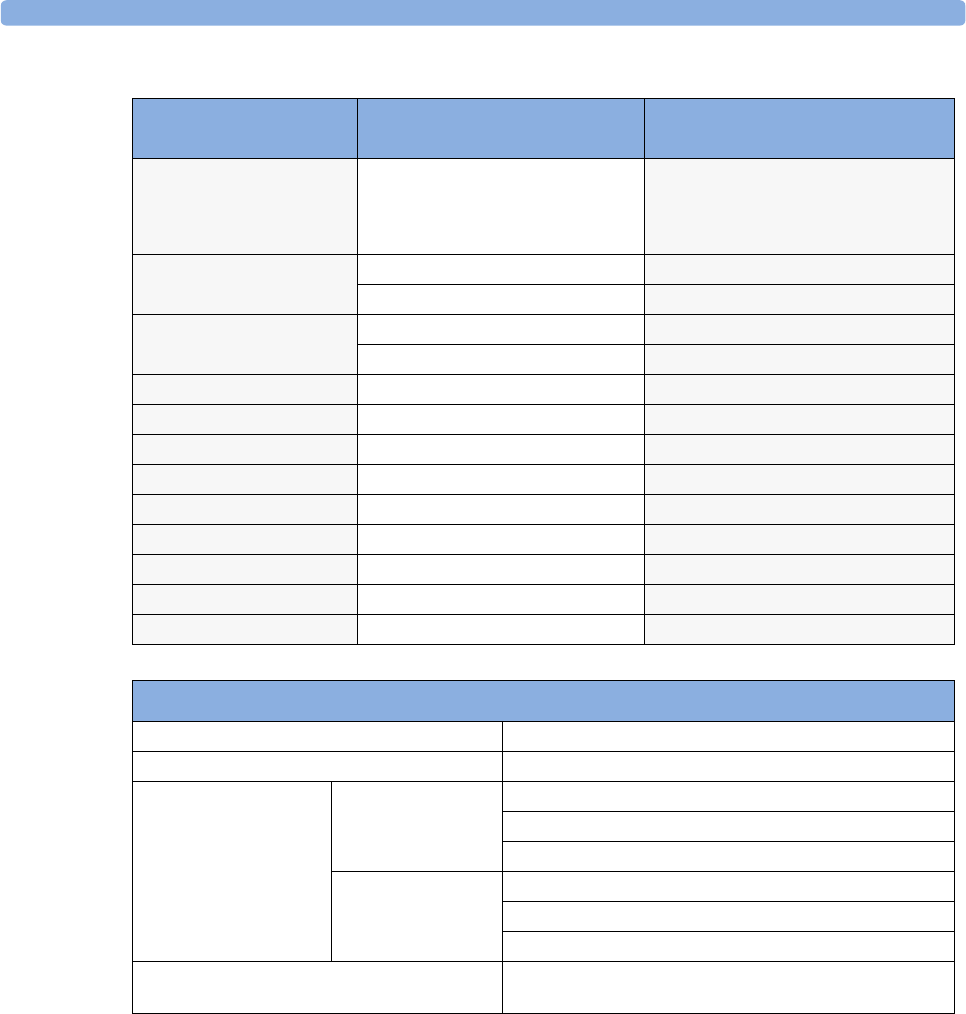
Measurement Specifications 34 Installation and Specifications
349
ECG/Arrhythmia/ST Alarm
Specifications Range Adjustment
HR 15 to 300 bpm
maximum delay: 10 seconds according
to AAMI EC 13-1992 standard
Adult:1 bpm steps (15 to 40 bpm)
5 bpm steps (40 to 300 bpm)
Pedi/Neo:1 bpm steps (15 to 50 bpm)
5 bpm steps (50 to 300 bpm)
Extreme Tachy Difference to high limit 0 to 50 bpm 5 bpm steps
Clamping at 150 to 300 bpm 5 bpm steps
Extreme Brady Difference to low limit 0 to 50 bpm 5 bpm steps
Clamping at 15 to 100 bpm 5 bpm steps
Run PVCs 2 PVCs Not adjustable by user
PVCs Rate 1 to 99 PVCs/minute 1 PVC
Vent Tach HR 20 to 300 bpm 5 bpm
Vent Tach Run 3 to 99 PVCs/minute 1 PVC
Vent Rhythm Run 2 to 99 PVCs/minute 1 PVC
SVT HR 120 to 300 bpm 5 bpm
SVT Run 3 to 99 SV beats 1 SV beat
ST High -19.8 to +20 mm 0.2 mm
ST Low -20 to +19.8 mm 0.2 mm
ECG/Arrhythmia/ST Supplemental Information as required by AAMI EC11/13
Respiration Excitation Waveform Sinusoidal signal, 260 µA, 39 kHz
Noise Suppression RL drive gain 44 dB max., max. voltage 1.8 Vrms
Time to Alarm for
Tachycardia
Vent Tachycardia
1mVpp,206 bpm
Gain 0.5, Range 6.5 to 8.4 seconds, Average 7.2 seconds
Gain 1.0 Range 6.1 to 6.9 seconds, Average 6.5 seconds
Gain 2.0, Range 5.9 to 6.7 seconds, Average 6.3 seconds
Vent Tachycardia
2 mVpp,195bpm
Gain 0.5, Range 5.4 to 6.2 seconds, Average 5.8 seconds
Gain 1.0, Range 5.7 to 6.5 seconds, Average 6.1 seconds
Gain 2.0, Range 5.3 to 6.1 seconds, Average 5.7 seconds
Tall T-Wave Rejection Capability Exceeds ANSI/AAMI EC 13 Sect. 3.1.2.1(c)
minimum recommended 1.2 mV T-Wave amplitude
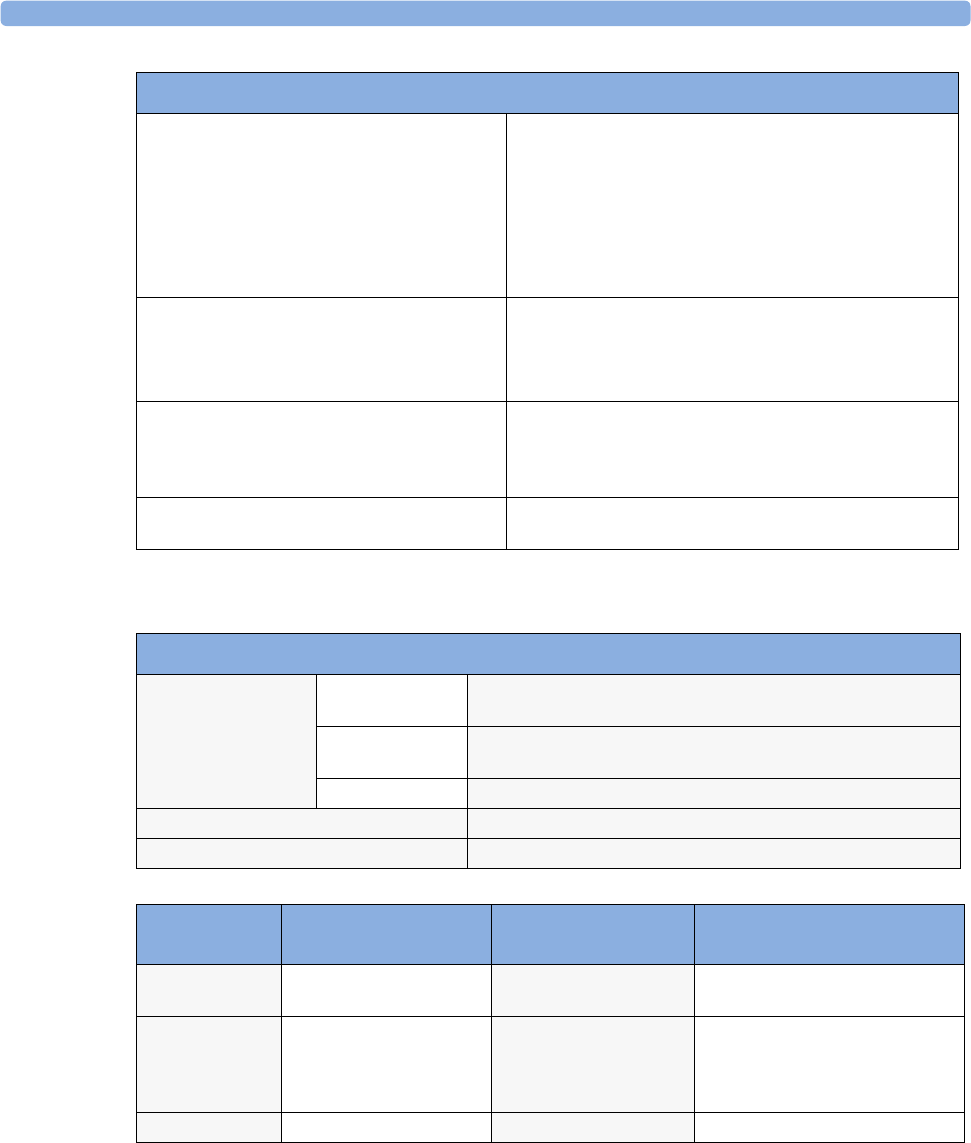
34 Installation and Specifications Measurement Specifications
350
Respiration
SpO2
Unless otherwise specified, this information is valid for SpO2 measured using the M3001A
measurement server and the M1020B measurement module.
Complies with EN ISO 9919:2005 (except alarm system; alarm system complies with IEC 60601-2-
49:2001).
Heart Rate Averaging Method Three different methods are used:
Normally, heart rate is computed by averaging the 12 most
recent RR intervals.
For runs of PVCs, up to 8 RR intervals are averaged to compute
the HR.
If each of 3 consecutive RR intervals is greater than 1200 ms
(that is, rate less than 50 bpm), then the 4 most recent RR
intervals are averaged to compute the HR.
Response Time of Heart Rate Meter to Change in
Heart Rate
HR change from 80 to 120 bpm:
Range: [6.4 to 7.2 seconds] Average: 6.8 seconds
HR change from 80 to 40 bpm:
Range: [5.6 to 6.4 sec] Average: 6.0 seconds
Heart Rate Meter Accuracy and Response to
Irregular Rhythm
Ventricular bigeminy: 80 bpm
Slow alternating ventricular bigeminy: 60 bpm
Rapid alternating ventricular bigeminy: 120 bpm
Bidirectional systoles: 90 bpm
Accuracy of Input Signal Reproduction Methods A and D were used to establish overall system error
and frequency response.
ECG/Arrhythmia/ST Supplemental Information as required by AAMI EC11/13
Respiration Performance Specifications
Respiration Rate Range Adult/pedi: 0 to 120 rpm
Neo: 0 to 170 rpm
Accuracy at 0 to 120 rpm ±1 rpm
at 120 to 170 rpm ±2 rpm
Resolution 1 rpm
Bandwidth 0.3 to 2.5Hz (–6dB)
Noise Less than 25mΩ (rms) referred to the input
Respiration Alarm
Specifications Range Adjustment Delay
High Adult/pedi: 10 to 100 rpm
Neo: 30 to 150 rpm
under 20 rpm: 1 rpm steps
over 20 rpm: 5 rpm steps
max. 14 seconds
Low Adult/pedi: 0 to 95 rpm
Neo: 0 to 145 rpm
under 20 rpm: 1 rpm steps
over 20 rpm: 5 rpm steps
for limits from 0 to 20 rpm: max. 4
seconds
for limits above 20 rpm: max. 14
seconds
Apnea Alarm 10 to 40 seconds 5 second steps

Measurement Specifications 34 Installation and Specifications
351
Measurement Validation: The SpO2 accuracy has been validated in human studies against arterial
blood sample reference measured with a CO-oximeter. Pulse oximeter measurements are statistically
distributed, only about two-thirds of the measurements can be expected to fall within the specified
accuracy compared to CO-oximeter measurements. Display Update Period: Typical: 2 seconds,
Maximum: 30 seconds. Max. with NBP INOP suppression on: 60 seconds.
SpO2 Performance Specifications
SpO2
The specified accuracy
is the root-mean-
square (RMS)
difference between the
measured values and
the reference values
Range 0 to 100%
Option #A01
Accuracy
Philips Reusable Sensors:
M1191A, M1191AL, M1192A, M1192AN = 2% (70% to 100%)
M1193A, M1194A, M1195A, = 3% (70% to 100%)
M1191T, M1192T, M1193T (Adult) = 3% (70% to 100%)
M1193T (Neonate) = 4% (70% to 100%)
Philips Disposable Sensors with M1943A(L):
M1132A, M1133A (adult/infant) = 2%
M1901B, M1902B, M1903B, M1904B, M1131A, M1133A (neonate)
= 3% (70% to 100%)
NellcorPB® Sensors with M1943A(L):
MAX-A, MAX-AL, MAX-P, MAX-I, MAX-N, D-25, D-20, I-20, N-
25, OxiCliq A, P, I, N = 3% (70% to 100%)
Masimo Sensors® with AC-1:
LNOP Adt, Adtx,Pdt, Pdtx, INF-L, DC-I, DC-IP, Y-I: 2% (70% to
100%)
LNOP NEO-L, NEOPT-L: 3% (70% to 100%)
LNOP TC-I: 3.5% (70% to 100%)
Option #A02
Accuracy
Philips Reusable Sensors
M1191ANL, M1192AN = 2% (70% to 100%)
M1193AN, M1194AN, M1195AN = 3% (70% to 100%)
Philips Disposable Sensors with M1943NL:
M1901B (Adult), M1902B, M1903B, M1904B = 2% (70% to 100%)
M1901B (Neonate) = 3%
NellcorPB® Sensors with M1943NL:
MAX-FAST, MAX-A, MAX-AL, MAX-P, MAX-I, MAX-N (Adult) =
2% (70 - 100%)
SC-A, OxiCliq A, P, I, N (Adult) = 2.5% (70 - 100%)
MAX-N (Neonate), Dura-Y D-YS (Infant to Adult), DS-
100A,Oxiband OXI-A/N (Adult), OXI-P/I = 3% (70 - 100%)
MAX-R, OxiCliq N (Neonate), SC-NEO (Neonate), SC-PR
(Neonate), Dura-Y D-YS with D-YSE or D-YSPD clip = 3.5% (70 -
100%)
Dura-Y D-YS (Neonate), Oxiband OXI-A/N (Neonate) = 4% (70 -
100%)
Resolution 1%
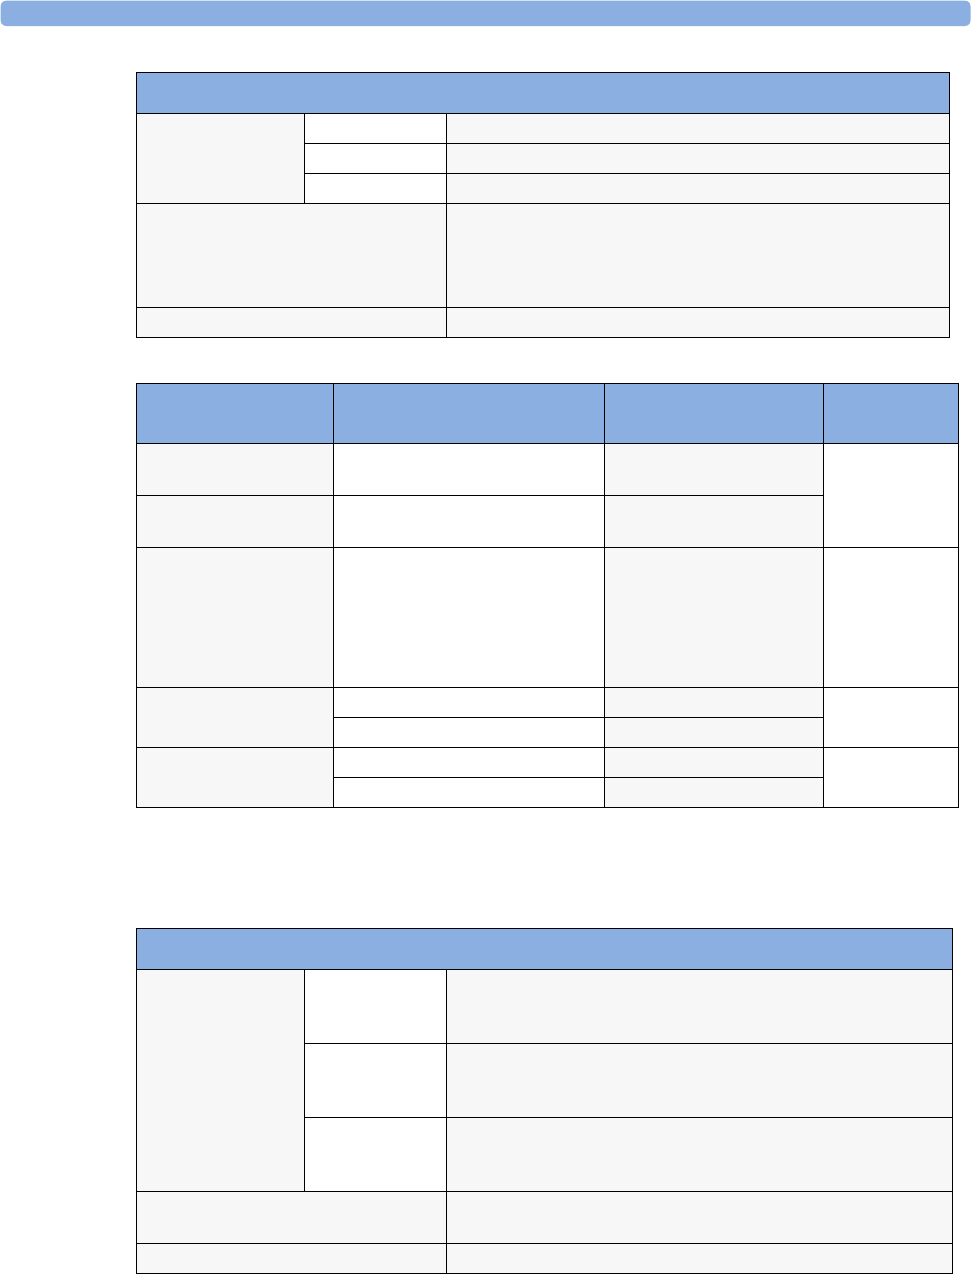
34 Installation and Specifications Measurement Specifications
352
NBP
Complies with IEC 60601-2-30:1999/EN60601-2-30:2000.
Pulse Range 30 to 300 bpm
Accuracy ±2% or 1 bpm, whichever is greater
Resolution 1 bpm
Sensors Wavelength range: 500 to 1000 nm
Emitted Light Energy: ≤ 15mW
Information about the wavelength range can be especially useful to
clinicians (for instance, when photodynamic therapy is performed)
Pulse Oximeter Calibration Range 70 - 100%
SpO2 Alarm
Specifications Range Adjustment Delay
SpO2Adult: 50 to 100%
Pedi/Neo: 30 to 100%
1% steps (0, 1, 2, 3,... 30)
+ 4 seconds
Desat Adult: 50 to Low alarm limit
Pedi/Neo: 30 to Low alarm limit
1% steps
Pulse 30 to 300 bpm Adult:
1 bpm steps (30 to 40 bpm)
5 bpm steps (40 to 300 bpm)
Pedi/Neo:
1 bpm steps (30 to 50 bpm)
5 bpm steps (50 to 300 bpm)
max. 14 seconds
Tachycardia Difference to high limit 0 to 50 bpm 5 bpm steps max. 14 seconds
Clamping at 150 to 300 bpm 5 bpm steps
Bradycardia Difference to low limit 0 to 50 bpm 5 bpm steps max. 14 seconds
Clamping at 30 to 100 bpm 5 bpm steps
SpO2 Performance Specifications
NBP Performance Specifications
Measurement Ranges Systolic Adult: 30 to 270 mmHg (4 to 36 kPa)
Pedi: 30 to 180 mmHg (4 to 24 kPa)
Neo: 30 to 130 mmHg (4 to 17 kPa)
Diastolic Adult: 10 to 245 mmHg (1.5 to 32 kPa)
Pedi: 10 to 150 mmHg (1.5 to 20 kPa)
Neo: 10 to 100 mmHg (1.5 to 13 kPa)
Mean Adult: 20 to 255 mmHg (2.5 to 34 kPa)
Pedi: 20 to 160 mmHg (2.5 to 21 kPa)
Neo: 20 to 120 mmHg (2.5 to 16 kPa)
Accuracy Max. Std. Deviation: 8 mmHg (1.1 kPa)
Max. Mean Error: ±5 mmHg (±0.7 kPa)
Heart Rate Range 40 to 300 bpm
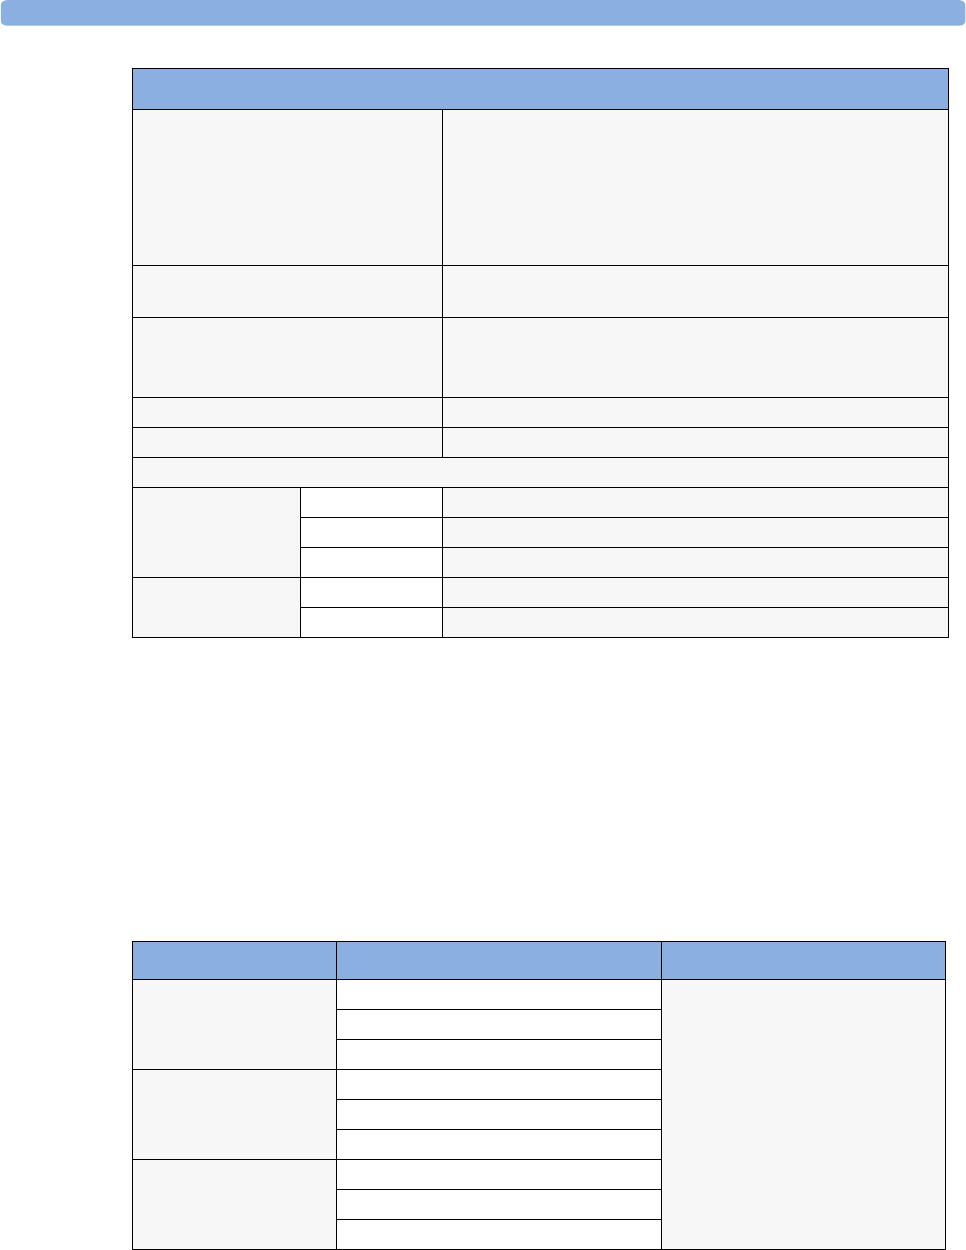
Measurement Specifications 34 Installation and Specifications
353
Measurement Validation: In adult and pediatric mode, the blood pressure measurements determined
with this device comply with the American National Standard for Electronic or Automated
Sphygmomanometers (ANSI/AAMI SP10 - 1992) in relation to mean error and standard deviation,
when compared to intra-arterial or auscultatory measurements (depending on the configuration) in a
representative patient population. For the auscultatory reference the 5th Korotkoff sound was used to
determine the diastolic pressure.
In neonatal mode, the blood pressure measurements determined with this device comply with the
American National Standard for Electronic or Automated Sphygmomanometers (ANSI/AAMI SP10 -
1992 and AAMI/ANSI SP10A -1996) in relation to mean error and standard deviation, when
compared to intra-arterial measurements in a representative patient population.
Measurement Time Typical at HR > 60bpm
Auto/manual: 30 seconds (adult)
25 seconds (neonatal)
Stat: 20 seconds
Maximum time: 180 seconds (adult/pediatric)
90 seconds (neonates)
Cuff Inflation Time Typical for normal adult cuff: Less than 10 seconds
Typical for neonatal cuff: Less than 2 seconds
Initial Cuff Inflation Pressure Adult: 165 ±15 mmHg
Pedi: 130 ±15 mmHg
Neo: 100 ±15 mmHg
Auto Mode Repetition Times 1, 2, 2.5, 3, 5, 10, 15, 20, 30, 45, 60 or 120 minutes
STAT Mode Cycle Time 5 minutes
Venipuncture Mode Inflation
Inflation Pressure Adult 20 to 120 mmHg (3 to 16 kPa)
Pediatric 20 to 80 mmHg (3 to 11 kPa)
Neonatal 20 to 50 mmHg (3 to 7 kPa)
Automatic deflation
after
Adult/pediatric 170 seconds
Neonatal 85 seconds
NBP Alarm Specifications Range Adjustment
Systolic Adult: 30 to 270 mmHg (4 to 36 kPa) 10 to 30 mmHg: 2 mmHg (0.5 kPa)
> 30 mmHg: 5 mmHg (1kPa)
Pedi: 30 to 180 mmHg (4 to 24 kPa)
Neo: 30 to 130 mmHg (4 to 17 kPa)
Diastolic Adult: 10 to 245 mmHg (1.5 to 32 kPa)
Pedi: 10 to 150 mmHg (1.5 to 20 kPa)
Neo: 10 to 100 mmHg (1.5 to 13 kPa)
Mean Adult: 20 to 255 mmHg (2.5 to 34 kPa)
Pedi: 20 to 160 mmHg (2.5 to 21 kPa)
Neo: 20 to 120 mmHg (2.5 to 16 kPa)
NBP Performance Specifications
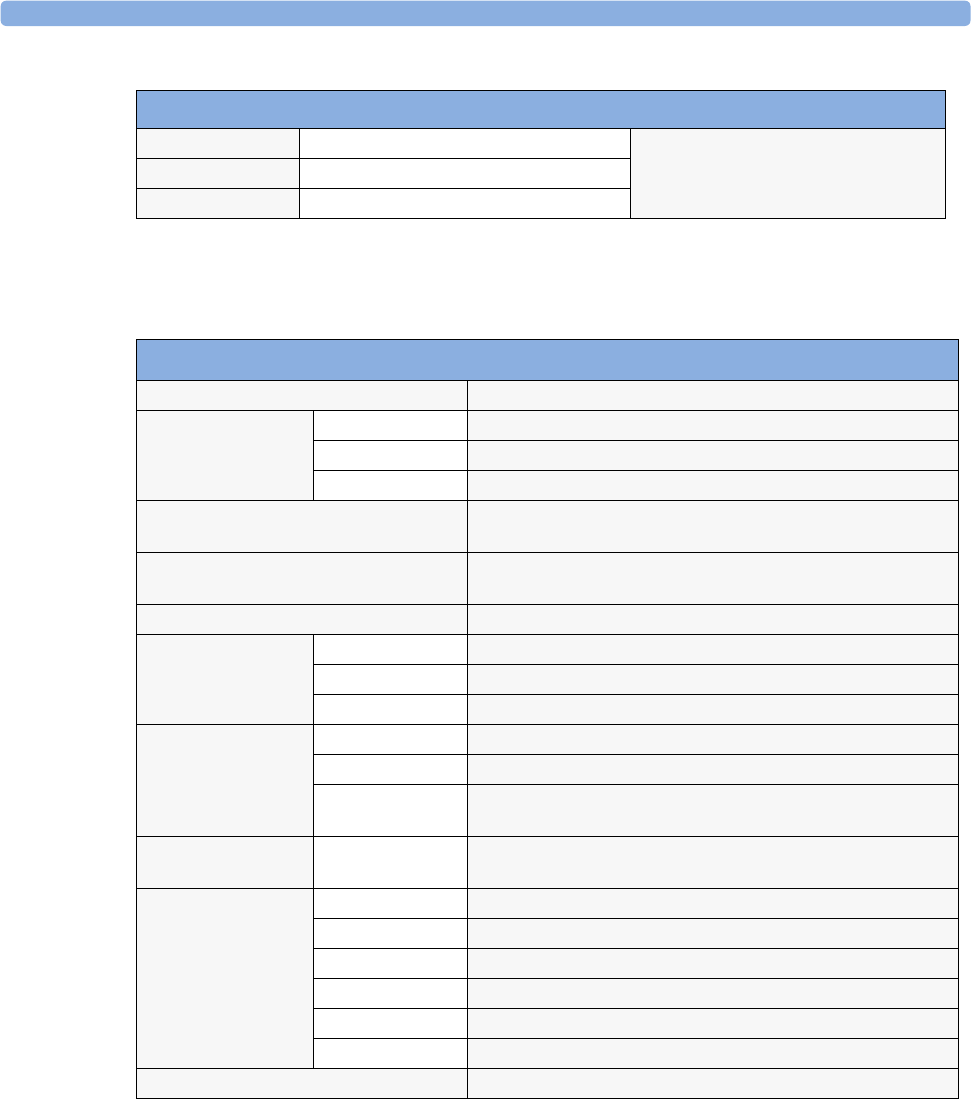
34 Installation and Specifications Measurement Specifications
354
Invasive Pressure and Pulse
Complies with IEC 60601-2-34:2000/EN60601-2-34:2000.
NBP Overpressure Settings
Adult > 300 mmHg (40 kPa) > 2 sec not user adjustable
Pedi > 300 mmHg (40 kPa) > 2 sec
Neo > 150 mmHg (20 kPa) > 2 sec
Invasive Pressure Performance Specifications
Measurement Range –40 to 360 mmHg
Pulse Rate Range 25 to 350 bpm
Accuracy ±1% Full Range
Resolution 1 bpm
Input Sensitivity Sensitivity:5µV/V/mmHg (37.5µV/V/kPa)
Adjustment range:±10%
Transducer Load Impedance:200 to 2000 Ω (resistive)
Output Impedance:≤3000 Ω (resistive)
Frequency Response dc to 12.5 Hz or 40 Hz
Zero Adjustment Range: ±200 mmHg (±26 kPa)
Accuracy ±1 mmHg (±0.1 kPa)
Drift Less than 0.1mmHg/°C (0.013 kPa/°C)
Gain Accuracy Accuracy ±1%
Drift Less than 0.05%/°C
Non linearity
and Hysteresis
Error of ≤ 0.4% FS (@CAL 200 mmHg)
Overall Accuracy (including
transducer)
± 4% of reading or ± 4 mmHg (± 0.5 kPa), whichever is greater
Analog Output
available only with
M1006B #C01 (@
CAL 200 mmHg)
Range -0.4 V to 3.6 V
Level 1 V / 100 mmHg
Accuracy ± 3% full scale
Offset ± 30 mV
Resolution 8 Bit (@ 5 V range)
Signal delay 20 ms
Volume displ acement of CPJ840J6 0.1 mm3 /100 mmHg
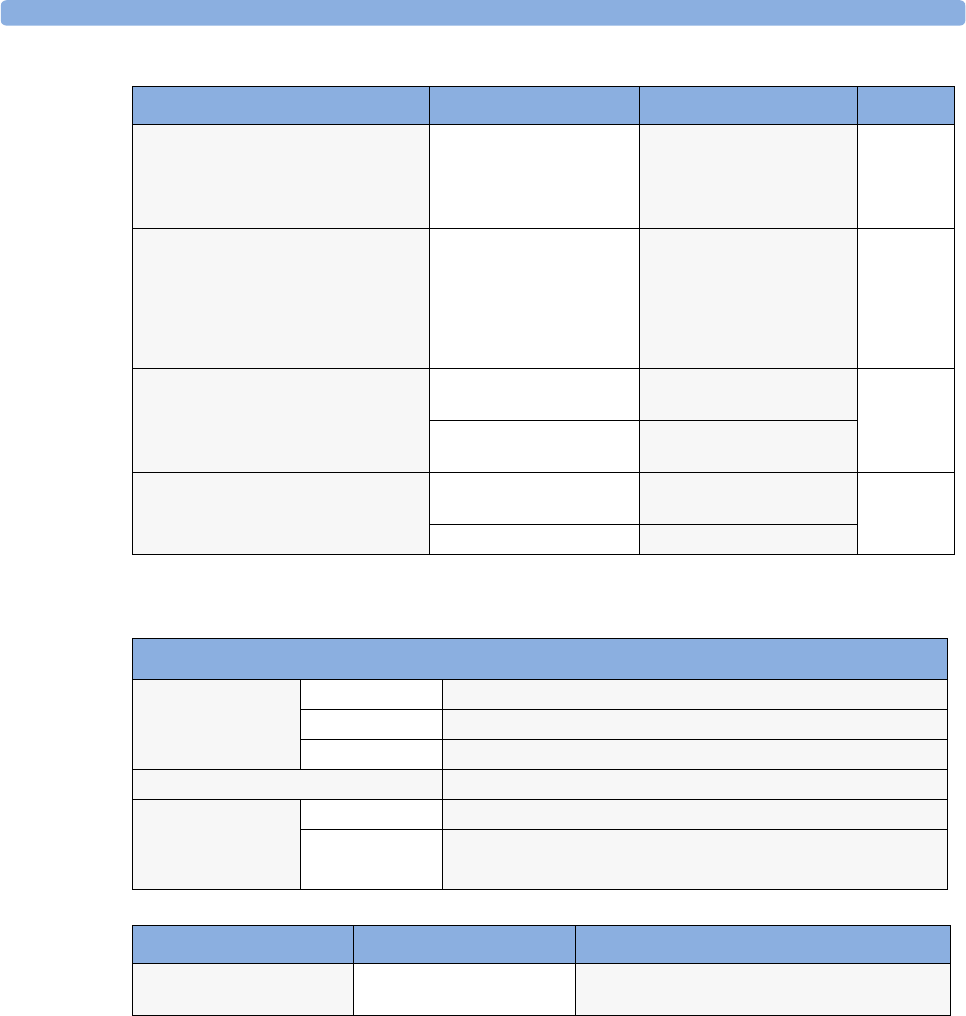
Measurement Specifications 34 Installation and Specifications
355
Temp
Invasive Pressure Alarm Specifications Range Adjustment Delay
Pressure –40 to 360 mmHg
(–5.0 to 48 kPa)
-40 to 30 mmHg
2 mmHg (0.5 kPa)
> 30 mmHg
5 mmHg (1 kPa)
max. 12
seconds
Pulse 25 to 300 bpm Adult:
1 bpm steps (25 to 40 bpm)
5 bpm steps (40 to 300 bpm)
Pedi/Neo:
1 bpm steps (25 to 50 bpm)
5 bpm steps (50 to 300 bpm)
Tachycardia Difference to high limit 0 to
50 bpm
5 bpm steps max. 14
seconds
Clamping at 150 to 300
bpm
5 bpm steps
Bradycardia Difference to low limit 0 to
50 bpm
5 bpm steps max. 14
seconds
Clamping at 25 to 100 bpm 5 bpm steps
Temp Performance Specifications
Temp Range –1 to 45 °C (30 to 113 °F)
Resolution 0.1 °C (32.2 °F)
Accuracy ±0.1 °C (±0.2 °F)
Average Time Constant Less than 10 seconds
Alarms Range –1 to 45 °C (30 to 113 °F)
Adjustment -1 to 35 °C (30 to 95 °F): 0.5 °C (1.0 °F) steps
35 to 45 °C (95 to 113 °F): 0.1 °C (0.2 °F) steps
Temp Alarm Specifications Range Adjustment
Temp Hi gh/ L ow Ala r m s
–1 to 45 ºC (30 to 113 ºF) -1 to 35 °C (30 to 95 °F), 0.5 °C (1.0 °F) steps
35 to 45 °C (95 to 113 °F), 0.1 °C (0.2 °F) steps
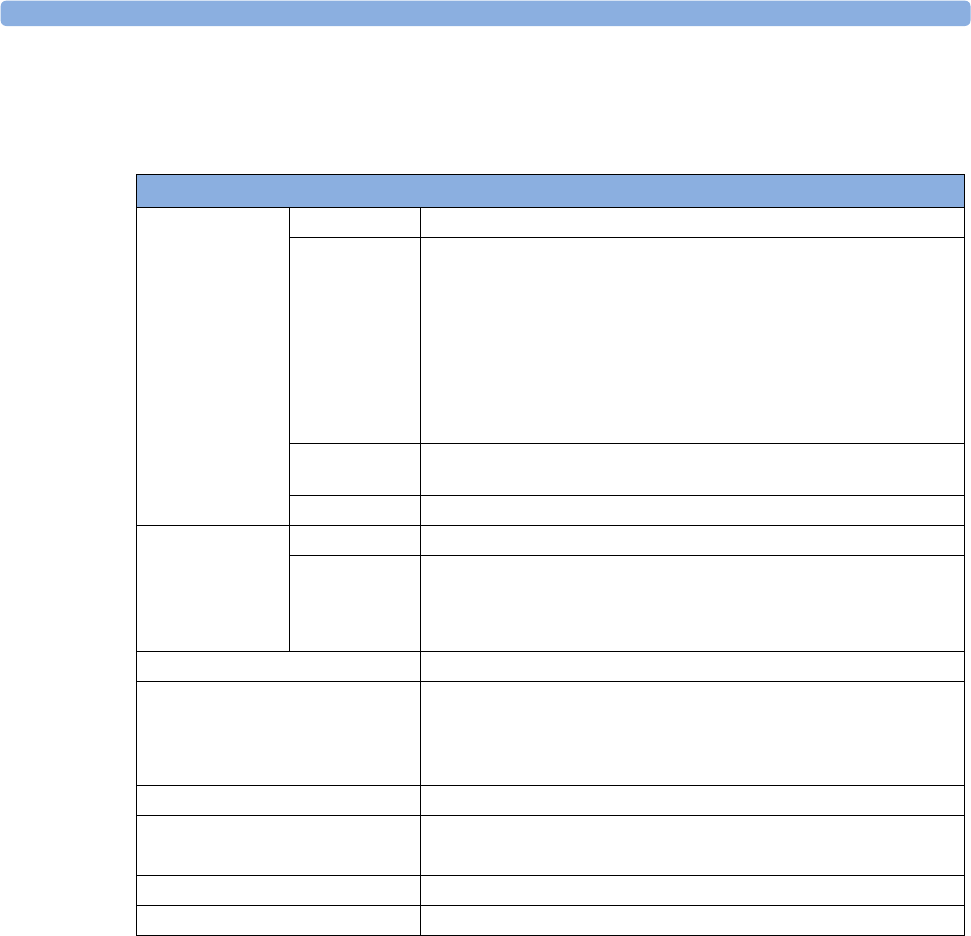
34 Installation and Specifications Measurement Specifications
356
CO2
The CO2 measurement in M3014A and M3015A complies with EN ISO 21647 (except alarm system;
alarm system complies with IEC 60601-2-49:2001)
Microstream CO2 Humidity Correction Factor
Either BTPS or STPD can be selected as the humidity correction factor for the Microstream CO2
readings. The formula for the correction calculation is:
PBTPS = (PSTPD . 0.94)
M3015A Microstream CO2 Performance Specifications
CO2Range 0 to 98mmHg (0 to 13 kPa), or 13% CO2, whichever is lower
Accuracy Up to 5 minutes during warmup: ±4 mmHg or 12%, whichever is greater
After 5 minutes warmup:
0 to 40 mmHg (0 to 5.3 kPa):±2.2 mmHg (±0.3 kPa)
Above 40 mmHg (5.3 kPa):±(5.5% + (0.08%/mmHg above 40 mmHg)) of
reading
These specifications are valid for 21% O2 and N2 balance, up to 35°C
ambient temperature, up to 60 rpm in adult mode and 100 rpm in neonatal
mode. Outside of these conditions the accuracy reaches at a minimum ±4
mmHg or ±12% of the reading, whichever is greater.
Resolution Numeric: 1.0 mmHg (0.1 kPa)
Wave: 0.1 mmHg (0.01 kPa)
Stability Included in Accuracy specifications
awRR Range 0 to 150 rpm
Accuracy 0 to 40 rpm: ±1 rpm
41 to 70 rpm: ±2 rpm
71 to 100 rpm: ±3 rpm
>100 rpm: ±5% of reading
Warm-up Time 20 minutes for full accuracy specification
Rise Time 190 ms for neonatal mode
(measured with FilterLine H for neonatal)
240 ms for adult mode
(measured with FilterLine H for adult)
Sample Flow Rate 50+15/-7.5 ml/minute
Gas Sampling Delay Time Typical:2.3 seconds
Maximum:3 seconds
Sound Pressure Acoustic noise: < 45 dBA
Total System Response Time The total system response time is the sum of the delay time and the rise time.
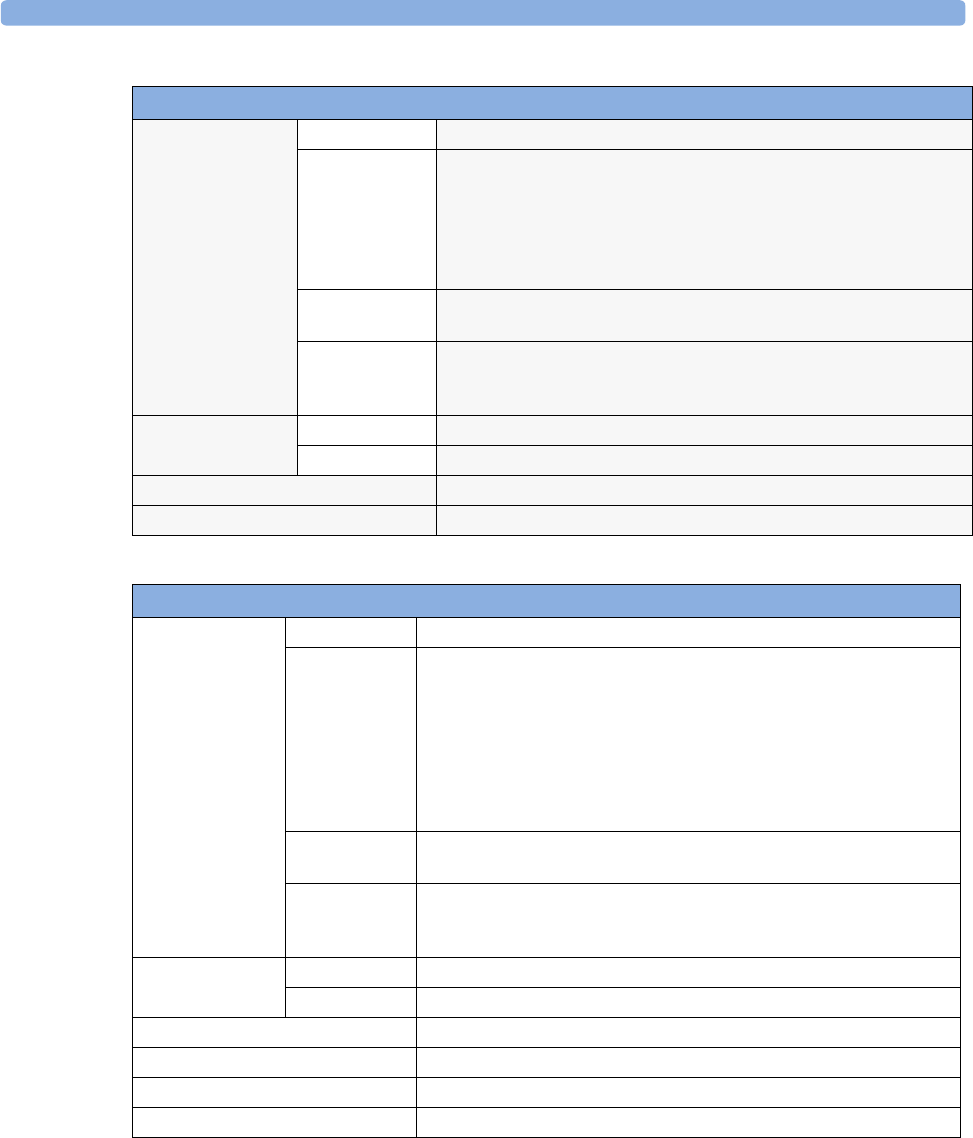
Measurement Specifications 34 Installation and Specifications
357
M3014A Mainstream and Sidestream CO2 Humidity Correction Factor
Either BTPS or STPD can be selected as the humidity correction factor for the Mainstream CO2
readings. The formula for the correction calculation is:
M3014A Mainstream CO2 Performance Specifications
CO2Range 0 to 150 mmHg (0 to 20.0 kPa)
Accuracy after 2 minutes warmup:
For values between 0 and 40 mmHg:±2.0 mmHg (±0.29 kPa)
For values from 41 to 70 mmHg: ±5% of reading
For values from 71 to 100 mmHg: ±8% of reading
The specifications are valid for standard gas mixtures, balance air, fully
hydrated at 35°C, Pabs = 760 mmHg, flow rate = 2 l/min.
Resolution Numeric: 1.0 mmHg (0.1 kPa)
Wave: 0.1 mmHg (0.01 kPa)
Stability:
Short term drift
Long term drift
±0.8 mmHg over four hours
Accuracy specification will be maintained over a 120 hour period
awRR Range 2 to 150 rpm
Accuracy ±1 rpm
Warm-up Time 2 minutes with CO2 transducer attached for full accuracy specification
Response Time Less than 60 ms (with adult or infant reusable or disposable adapter)
M3014A Sidestream CO2 Performance Specifications
CO2Range 0 to 150 mmHg (0 to 20.0 kPa)
Accuracy after 2 minutes warmup:
For values between 0 and 40 mmHg:±2.0 mmHg (±0.29 kPa)
For values from 41 to 70 mmHg: ±5% of reading
For values from 71 to 100 mmHg: ±8% of reading
For values from 101 to 150 mmHg: ±10% of reading
At respiration rates above 80 rpm, all ranges are ±12% of actual. The
specifications are valid for gas mixtures of CO2, balance N2, dry gas at
760 mmHg within specified operating temperature range.
Resolution Numeric: 1.0 mmHg (0.1 kPa)
Wave: 0.1 mmHg (0.01 kPa)
Stability:
Short term drift
Long term drift
±0.8 mmHg over four hours
Accuracy specification will be maintained over a 120 hour period
awRR Range 2 to 150 rpm
Accuracy ±1 rpm
Warm-up Time 2 minutes with CO2 sensor attached for full accuracy specification
Sample Flow Rate 50±10 ml/minute
Total System Response Time 3 seconds
Operating Temperature 0 to 40 °C (32 to 100 °F)
PSTPD PBTPS
=Pabs
Pabs PH2O
–
-----------------------------
⋅
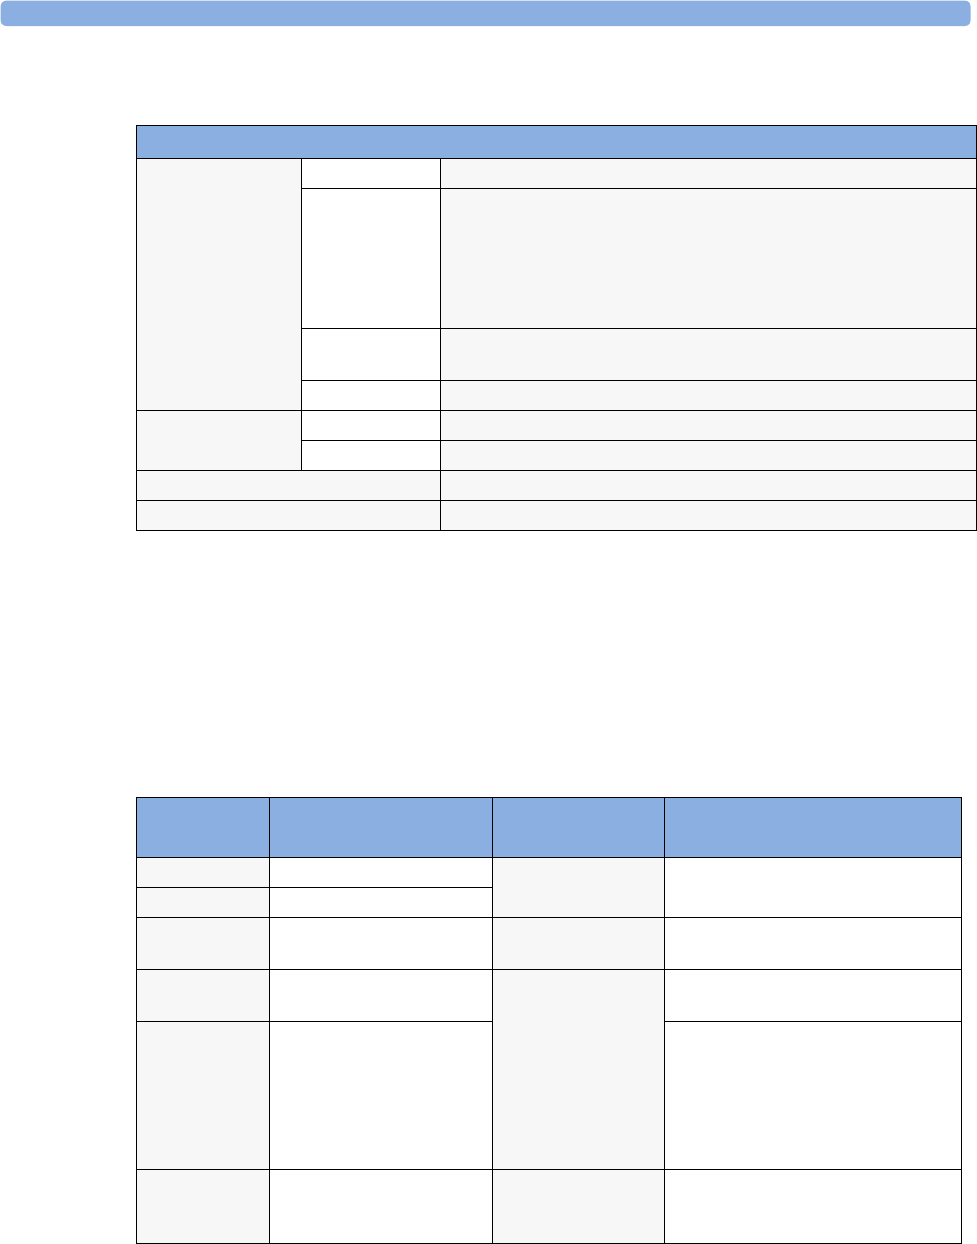
34 Installation and Specifications Measurement Specifications
358
Where p = partial pressure, Pabs = absolute pressure, and PH2O = 42 mmHg @35°C and 100% RH.
Mainstream CO2 Humidity Correction Factor
Either BTPS or STPD can be selected as the humidity correction factor for the Mainstream CO2
readings. The formula for the correction calculation is:
Where p = partial pressure, Pabs = absolute pressure, and PH2O = 47 mmHg @37°C and 100% RH.
M3016A Mainstream CO2 Performance Specifications
CO2Range –4 to 150 mmHg (-0.5 to 20.0 kPa)
Accuracy after 20 minutes warmup and calibration:
For values between 0 and 40 mmHg:±2.2 mmHg (±0.29 kPa)
For values between 40 and 76 mmHg:±5.5% of reading
The specifications are valid for 45% O2 and N2 or N2O balance. Outside
these conditions the accuracy reaches at a minimum the requirements of
EN864/ISO9918.
Resolution Numeric: 1.0 mmHg (0.1 kPa)
Wave: 0.1 mmHg (0.01 kPa)
Stability ±1.0 mmHg over a 7 day period
awRR Range 0 to 150 rpm
Accuracy ±2 rpm
Warm-up Time 20 minutes with CO2 transducer attached for full accuracy specification
Response Time Less than 125 ms (for step from 10% to 90%)
CO2 Alarm
Specifications Range Adjustment Delay
etCO2 High 20 to 95 mmHg (2 to 13 kPa) 1 mmHg (0.1 kPa) M3014A/M3016A: less than 14 seconds
M3015A: less than18 seconds.
etCO2 Low 10 to 90 mmHg (1 to 12 kPa)
imCO2 High 2 to 20 mmHg
(0.3 to 3.0 kPa)
steps of 1 mmHg (0.1
kPa)
M3014A/M3016A: less than 14 seconds
M3015A: less than18 seconds.
awRR High Adult/pedi: 10 to 100 rpm
Neo: 30 to 150 rpm
under 20 rpm: 1 rpm
steps
over 20 rpm:5 rpm
steps
M3014A/M3016A: less than 14 seconds
M3015A: less than18 seconds.
awRR Low Adult/pedi: 0 to 95 rpm
Neo: 0 to 145 rpm
M3015A:
settings < 20 rpm: less than 8 seconds
> 20 rpm: less than 18 seconds
M3014A/M3016A
settings < 20 rpm: less than 4seconds
> 20 rpm: less than 14 seconds
Apnea delay 10 to 40 seconds 5 second steps set apnea delay time + 4 seconds
(M3014A/M3016A) or 8 seconds
(M3015A)
PSTPD PBTPS
=Pabs
Pabs PH2O
–
-----------------------------
⋅
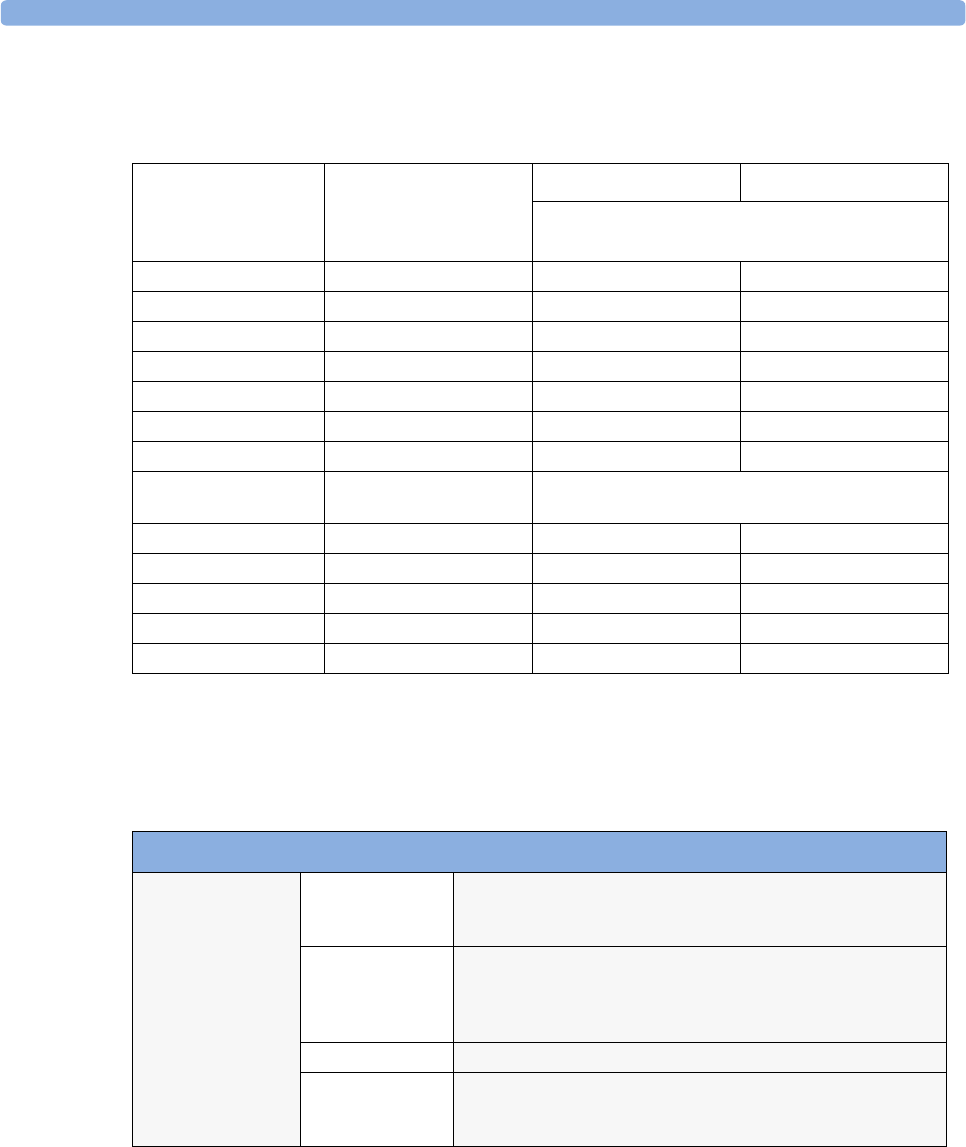
Measurement Specifications 34 Installation and Specifications
359
Interfering Gas and Vapor Effects On CO2 Measurement Values
The specified deviations for M3014A are valid when the appropriate corrections are switched on and
set correctly.
Spirometry
The following specifications apply for 760 mmHg ambient pressure and patient gas: room air at 35°,
unless otherwise noted
Gas or Vapor
Gas Level
(% volume fraction)
M3014A M3015A
Additional deviation due to gas interfence, measured at
0 - 40 mmHg CO2
Nitrous Oxide 60 ±1 mmHg ± 5%
Halothane 4 ±1 mmHg ± 5%
Enflurane 5 ±1 mmHg ± 5%
Isoflurane 5 ±1 mmHg ± 5%
Sevoflurane 5 ±1 mmHg ± 5%
Xenon 80 -5 mmHg ± 5%
Helium 50 ±1 mmHg ± 5%
Metered dose inhaler
propellants
- not specified for use
Desflurane 15 +3 mmHg ± 5%
Ethanol 0.1 ±1 mmHg ± 5%
Isopropanol 0.1 ±1 mmHg ± 5%
Acetone 0.1 ±1 mmHg ± 5%
Methane 1.0 ±1 mmHg ± 5%
Spirometry Performance Specifications
Flow Wave (AWF) Range ±25 l/min (neonatal)
±100 l/min (pediatric)
±180 l/min (adult)
Accuracy ±3% or
0.125 l/min (neonatal)
0.25 l/min (pediatric)
0.5 l/min (adult)
Scales ±10, ±20, ±40, ±60, ±80, ±100, ±120, ±150 l/min
Scale Default ±20 l/min (neonatal
±100 l/min (pediatric)
±150 l/min (adult)

34 Installation and Specifications Measurement Specifications
360
Volume Wave (AWV) Range 0 to 100 ml (neonatal
0 to 400 ml (pediatric)
0 to 3000 ml (adult)
Accuracy ±5% or
±3 ml (neonatal)
±12 ml (pediatric)
±90 ml (adult),
whichever is greater
Scales 50, 100, 200, 600, 800, 1000, 2000, 3000 ml
Scale Default 50 ml (neonatal
200 ml (pediatric)
800 ml (adult)
Pressure Wave (AWP) Range -20 to 120 cmH2O
Accuracy ±2% or ±0.5 cmH2O whichever is greater
Scales 10, 20, 40, 60, 80, 100, 120 cmH2O
Scale Default 20 l/min (neonatal
40 l/min (pediatric)
40 l/min (adult)
Respiration Rate
numeric (RRspir)
Range 2 to 120 breaths/min
Resolution 1 breath/min
Inspired Minute
Volume numeric
(MVin)
Range 0.01 to 5 l/min (neonatal)
0.06 to 30 l/min (pediatric)
0.4 to 60l/min (adult)
Resolution 0.01 l/min (neonatal/pediatric)
0.1 l/min (adult)
Expired Minute
Volume numeric
(MVexp)
Range 0.01 to 5 l/min (neonatal)
0.06 to 30 l/min (pediatric)
0.4 to 60l/min (adult)
Resolution 0.01 l/min (neonatal/pediatric)
0.1 l/min (adult)
Inspired Volume
numeric (TVin)
Range 5 to 100 ml (neonatal)
30 to 400 ml (pediatric)
200 to 3000 ml (adult)
Resolution 1 ml (neonatal/pediatric))
10 ml (adult)
Expired Volume
numeric (TVexp)
Range 5 to 100 ml (neonatal)
30 to 400 ml (pediatric)
200 to 3000 ml (adult)
Resolution 1 ml (neonatal/pediatric)
10 ml (adult)
Lung Compliance
numeric
Range 0 to 500 ml/cmH2O
Resolution 1 ml/cmH2O
Airway Resistance
numeric
Range 0 to 500 cmH2O/l/s (neonatal)
0 to 250 cmH2O/l/s (pediatric)
0 to 100 cmH2O/l/s (adult)
Resolution 1 cmH2O/l/s
Peak Inspiratory
Pressure numeric
(PIP)
Range 0 to +120 cmH2O
Resolution 1 cmH2O
Spirometry Performance Specifications
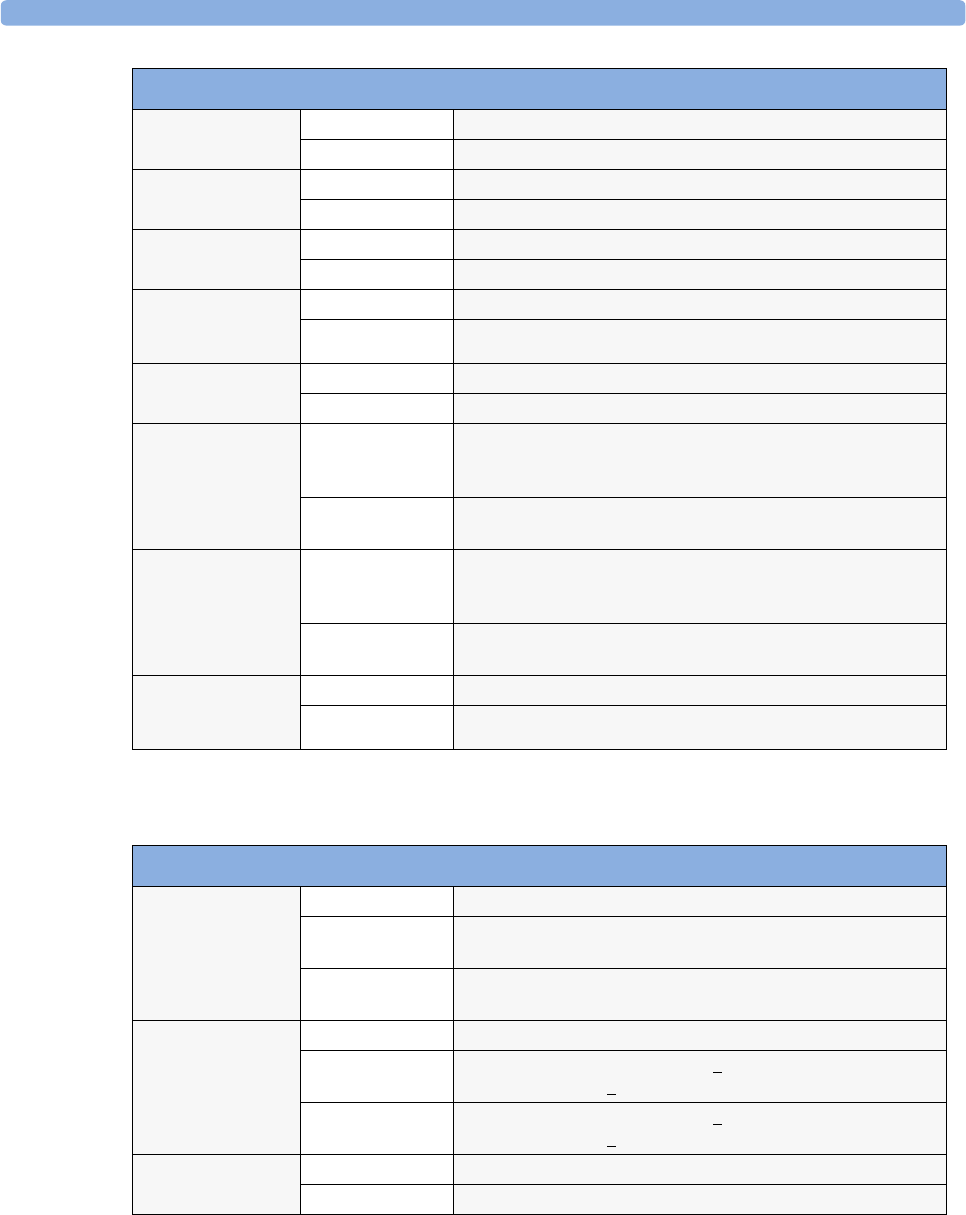
Measurement Specifications 34 Installation and Specifications
361
Cardiac Output / Continuous Cardiac Output
Negative Inspiratory
Pressure numeric
Range -20 to 0 cmH2O
Resolution 1 cmH2O
Mean Airway Pressure Range -20 to +120 cmH2O
Resolution 1 cmH2O
Plateau Pressure
numeric
Range 0 to +120 cmH2O
Resolution 1 cmH2O
Positive End-
Expiratory Pressure
numeric (PEEP)
Range 0 to 99 cmH2O
Resolution 1 cmH2O
Barometric Pressure
numeric (PB)
Range 400 to 800 mmHg
Resolution 1 mmHg
Peak Inspiratory Flow
numeric (PIF)
Range 0.1 to 25 l/min (neonatal)
1 to 100 l/min (pediatric)
2 to 180 l/min (adult)
Resolution 0.1 l/min (neonatal)
1 l/min (pediatric/adult)
Peak Expiratory Flow
numeric (PEF)
Range 0.1 to 25 l/min (neonatal)
1 to 100 l/min (pediatric)
2 to 180 l/min (adult)
Resolution 0.1 l/min (neonatal)
1 l/min (pediatric/adult)
Inspiration to
Expiration ratio
numeric (I:E)
Range 1: 0.2 ... 9.9
Resolution 0.1
Spirometry Performance Specifications
C.O./CCO Performance Specifications
C.O. (right heart) Range 0.1 to 20.0 l/min
Accuracy Instrument Specification (electrical):+ 3% or 0.1 l/min
System Specification:+ 5%.or 0.2 l/min
Repeatability Instrument Specification (electrical):+ 2% or 0.1 l/min
System Specification:+ 3%.or 0.1 l/min
C.O.
(transpulmonary)
Range 0.1 to 25.0 l/min
Accuracy Instrument Specification (electrical):+ 4% or 0.15 l/min
System Specification:+ 5% or 0.2 l/min
Repeatability Instrument Specification (electrical):+ 2% or 0.1 l/min
System Specification:+ 3% or 0.1 l/min
EVLW
not available in USA
Range 10 to 5000 ml
Standard Deviation 10% or 1 ml/kg
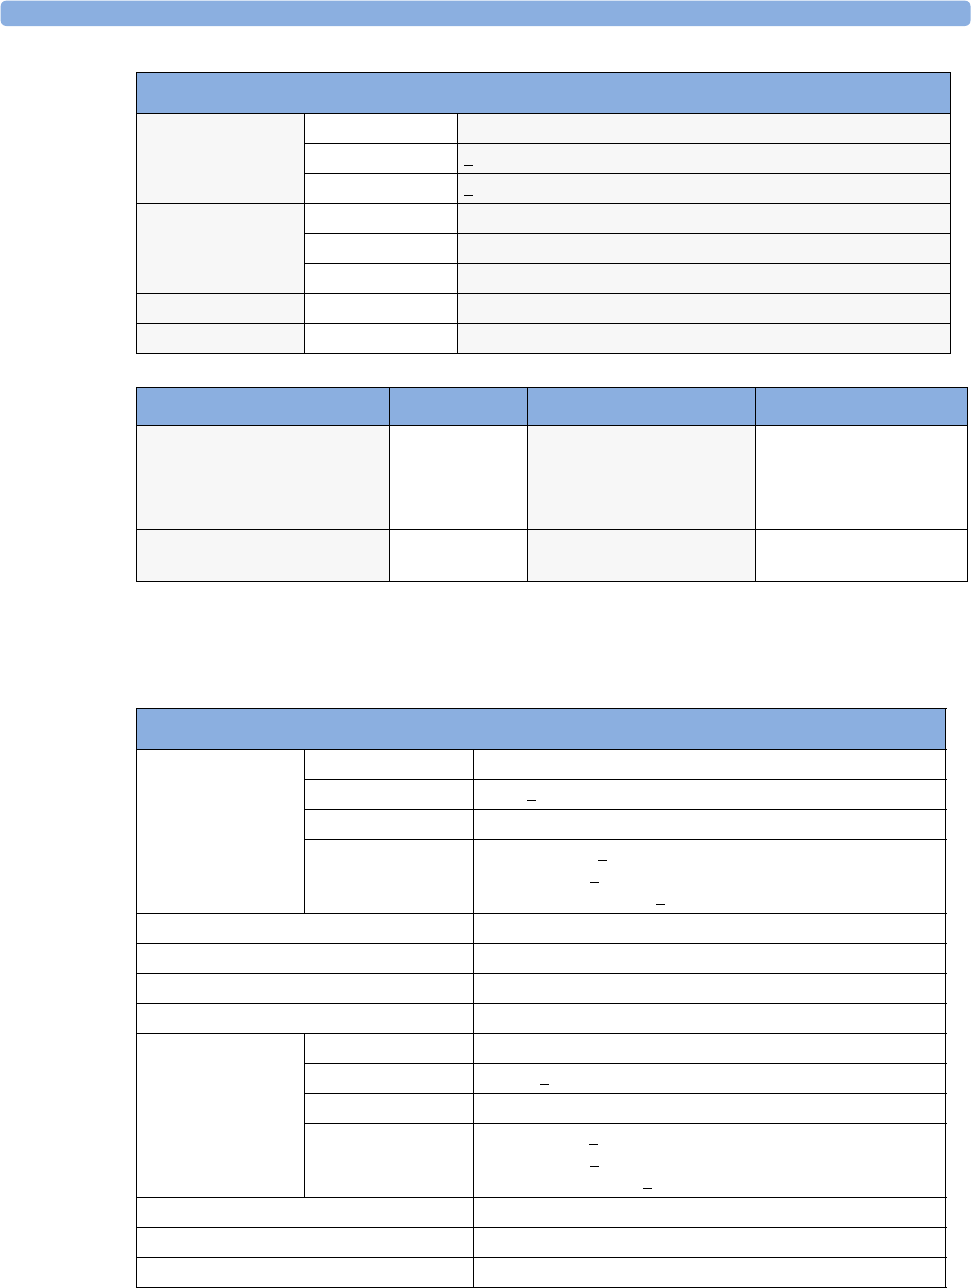
34 Installation and Specifications Measurement Specifications
362
tcGas
Complies with IEC 60601-2-23:1999/EN60601-2-23:2000.
ITBV Range 50 to 6000 ml
Accuracy + 10% or 30 ml
Repeatability + 5% or 20 ml
CCO Range 0.1 to 25.0 l/min
Standard Deviation 10% or 0.3 l/min
Display Update 2 seconds nominal
Blood Temperature Range 17,0 to 43°C (62,6 to 109,4°F)
Injectate Temperature Range -1 to 30°C
C.O./CCO Alarm Specifications Range Adjustment Delay
TBlood 17 to 43°C Steps of 0.5°C (17 to 35°C)
Steps of 0.1°C (35 to 43°C)
Steps of 1°F (63 to 95°C)
Steps of 0.2°F (95 to 109°C
10 seconds after the value
exceeds the set limit range
CCO 0.1 to 25.0 l/min 0.1 l/min (0.1 to10.0 l/min)
0.5 l/min (10.0 to 25.0 l/min)
10 seconds after the value
exceeds the set limit range
C.O./CCO Performance Specifications
tcGas Performance Specifications
tcpO2Range 0 to 750 mmHg (0 to 100 kPa)
Accuracy 0.5% (+ 1 digit)
Resolution 1 mmHg (0.1 kPa)
Overall Accuracy
(incl. transducer)
0 to 160 mmHg + 5 mmHg
0.0 to 21.3 kPa + 0.7 kPa
>160 mmHg (21.3 kPA) + 3% of reading
tcpO2 Temperature Drift < 0.1% / °C
tcpO2 Te s t Si g n a l 60 mmHg (8.0 kPa)
tcpO2 Drift, including transducer < 1 mmHg / h @ 10% O2
tcpO2 response time, including transducer < 30 s
tcpCO2Range 5 to 200 mmHg (0.7 to 26.7 kPa)
Accuracy 1.0% (1 + digit)
Resolution 1 mmHg (0.1 kPa)
Overall Accuracy
(incl. transducer)
0 to 76 mmHg + 5 mmHg
0.0 to 10.1 kPa + 0.7 kPa
>76 mmHg (10.1 kPa) + 10% of reading
tcpCO2 Temperature Drift < 0.1% / °C
tcpCO2 Test Signal 40 mmHg (5.3 kPa)
tcpCO2 Drift, including transducer < 1 mmHg / h @ 5% CO2
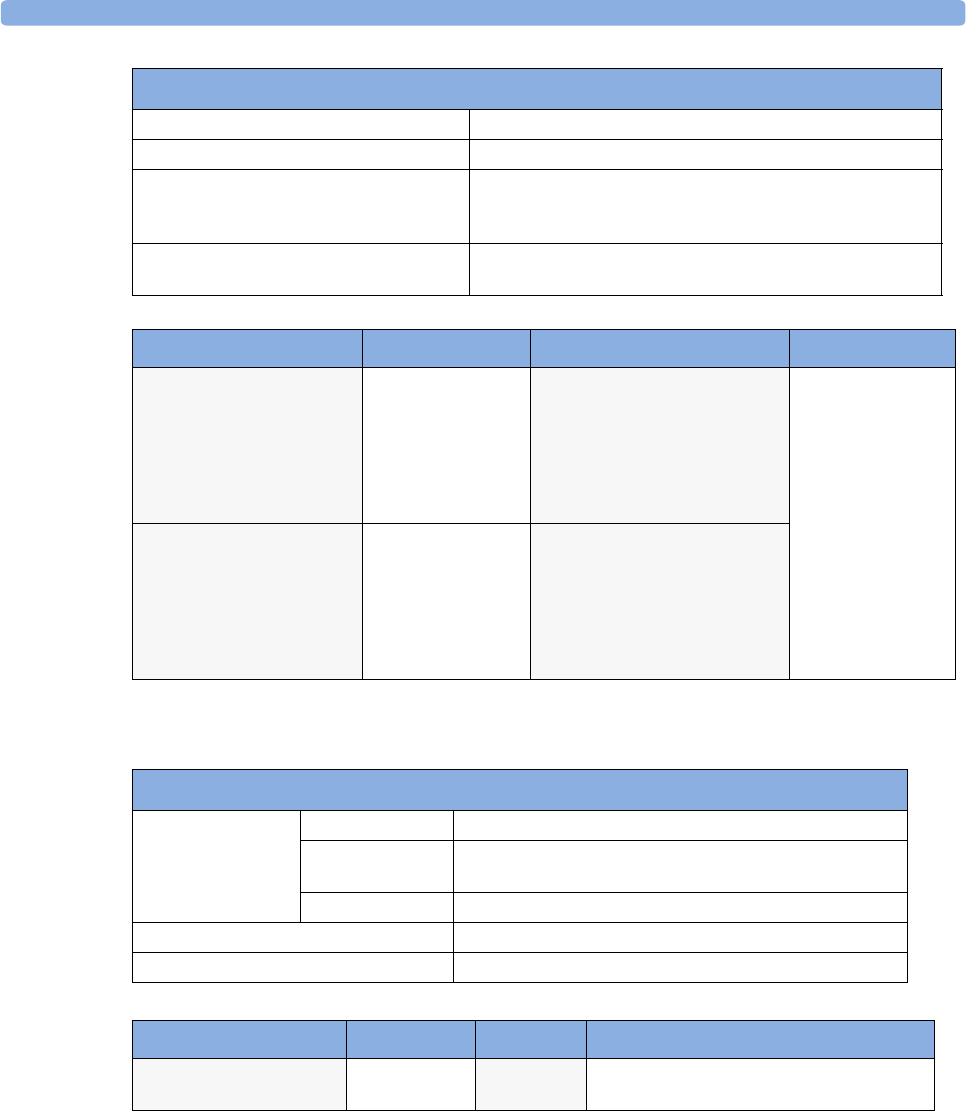
Measurement Specifications 34 Installation and Specifications
363
SvO2
EEG
Complies with IEC 60601-2-26:1994/EN60601-2-26:1994.
tcpCO2 response time, including transducer < 50 s
Warm-up Time < 3 minutes
Site Timer 0.5, 1, 1.5, 2, 2.5, 3, 4, 5, 6, 7, or 8 hours. Change Site alarm
when site time is expired and configurable automatic heating
switch-off
Transducer Heating Available Temperatures -
37.0°C, 41.0 to 45°C in steps of 0.5°C
tcGas Alarm Specifications Range Adjustment Alarm Delay
tcpO210 to 745 mmHg
1.0 to 99.5 kPa
10 to 30 mmHg: 1 mmHg
1.0 to 4.0 kPa: 0.1 kPa
32 to 100 mmHg: 2 mmHg
4.2 to 13 kPa: 0.2 kPa
105 to 745mmHg: 5 mmHg
13.5 to 99.5 kPa: 0.5 kPa
10 seconds after the
value exceeds the set
limit range.
tcpCO210 to 195 mmHg
1.0 to 26 kPa
10 to 30 mmHg: 1 mmHg
1.0 to 4.0 kPa: 0.1 kPa
32 to 100 mmHg: 2 mmHg
4.2 to 13 kPa: 0.2 kPa
105 to 195 mmHg: 5 mmHg
13.5 to 26 kPa: 0.5 kPa
tcGas Performance Specifications
SvO2 Performance Specifications
SvO2Range 10% to 100%
Accuracy ± 2 % (i.e. ± 2 units), 1 standard deviation over 40 % to 100 %
range.
Resolution 1%
Stability (system) Drift < 2% over 24 hours
Response Time (10 % to 90%) 5 seconds
SvO2 Alarm Specifications Range Adjustment Delay
SvO210% to 100% 1% max. 15+4 seconds after value goes beyond the
low/high alarm limit settings
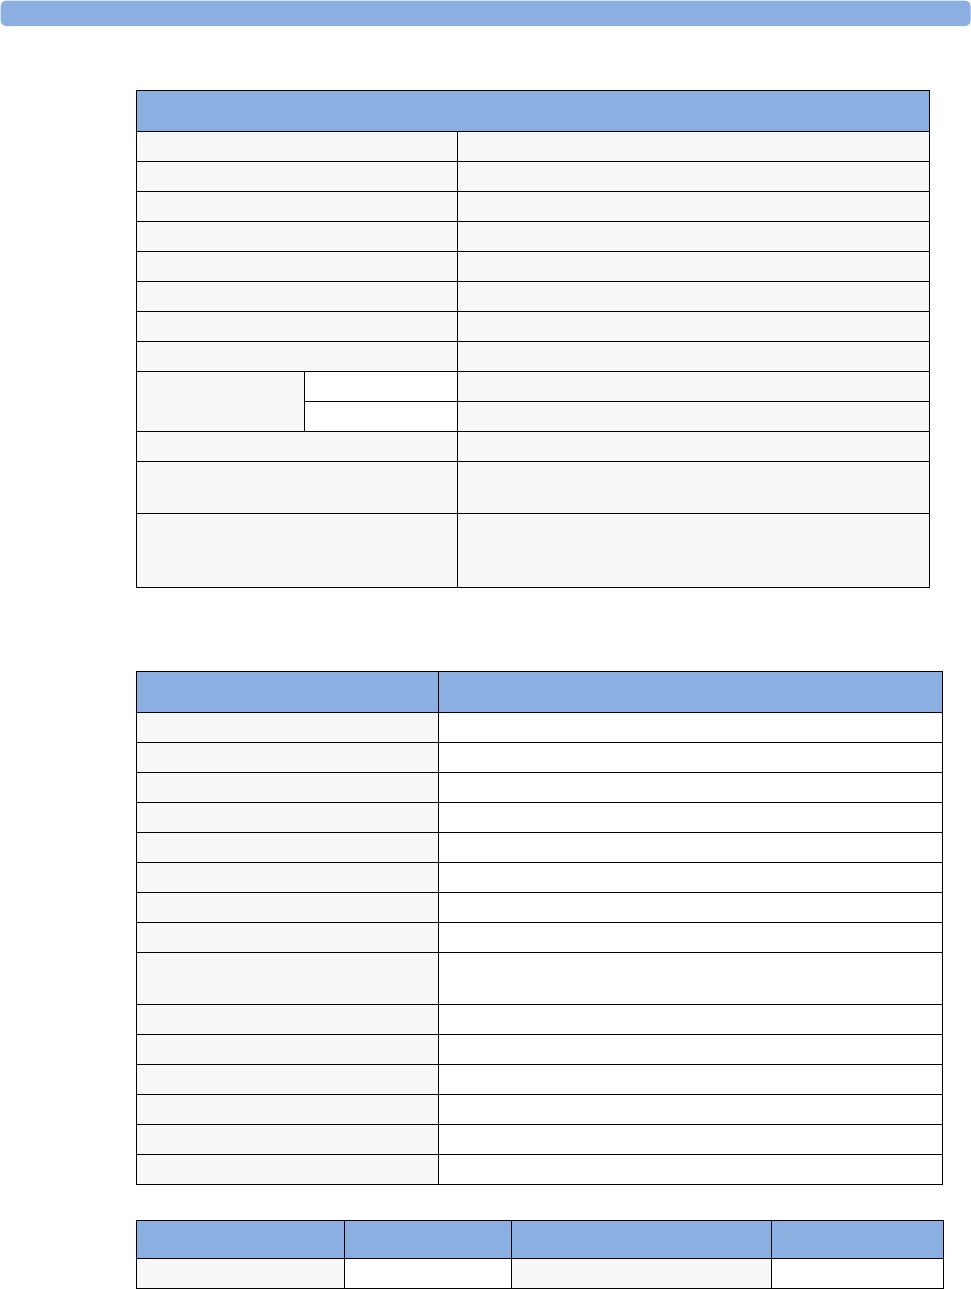
34 Installation and Specifications Measurement Specifications
364
BIS
EEG Performance Specifications
Leakage Current <=10 µA @ 110Vac
Input Signal Range 1 mVp-p
Differential Input Impedance >15 MΩ @ 10 Hz
Max. DC Input Offset Voltage ±320 mV
Input Protection Against defibrillation (5 kV) and electrosurgery
Common Mode Rejection >105 dB @ 5kΩ imbalance and 60 Hz
Noise <0.4 µVRMS (1 to 30 Hz)
Electromagnetic Susceptibility <10 µVp-p @ 3 V/m, 26-1000 MHz
Electrode Impedance
Measurement
Range 0 to 30 kΩ
Accuracy ±1 kΩ
Bandwidth 0.5 Hz to 50 Hz (–3 dB)
Low Filter Cut-Off Frequencies 0.5, 1.0, 2.0, and 5.0 Hz
(12 dB/octave)
High Filter Cut-Off Frequencies 15 Hz (65 dB/octave)
30 Hz (75 dB/octave)
50 Hz (85 dB/octave)
BIS Performance Specifications BIS, BISx M1034A, BIS Interface board for MP20/30
Bispectral Index (BIS) Range 0 - 100
Signal Quality Index (SQI) Range 0 - 100%
EMG Range 0 - 100dB
Suppression Ratio (SR) 0 - 100%
Spectral Edge Frequency (SEF) 0.5 - 30.0Hz
Total Power ( TP) 0 - 100 dB
Bursts (BISx only) 0 - 30/minute
Noise <0.3µV RMS (2.0µV peak-to-peak)
Wave Scale With gridlines on: ± 25µV, ± 50µV, ± 100µV, ± 250µV
With gridlines off: 50µV, 1 0 0 µV, 2 00 µV, 5 0 0 µV
Update Frequency (BIS Numeric) 2048 ms
Bandwidth 0.25 - 100Hz (-3dB)
High Pass Filters 0.25 Hz, 1 Hz, 2 Hz (-3dB)
Low Pass Filters 30 Hz, 50 Hz, 70 Hz, 100 Hz (-3dB)
Notch Filters (for line frequency) 50 Hz, 60 Hz
Impedance Measurement Range 0 to 999 kΩ
BIS Alarm Specifications Range Adjustment Alarm Delay
BIS High/Low Alarm 0 - 100 1 Max. 2 seconds
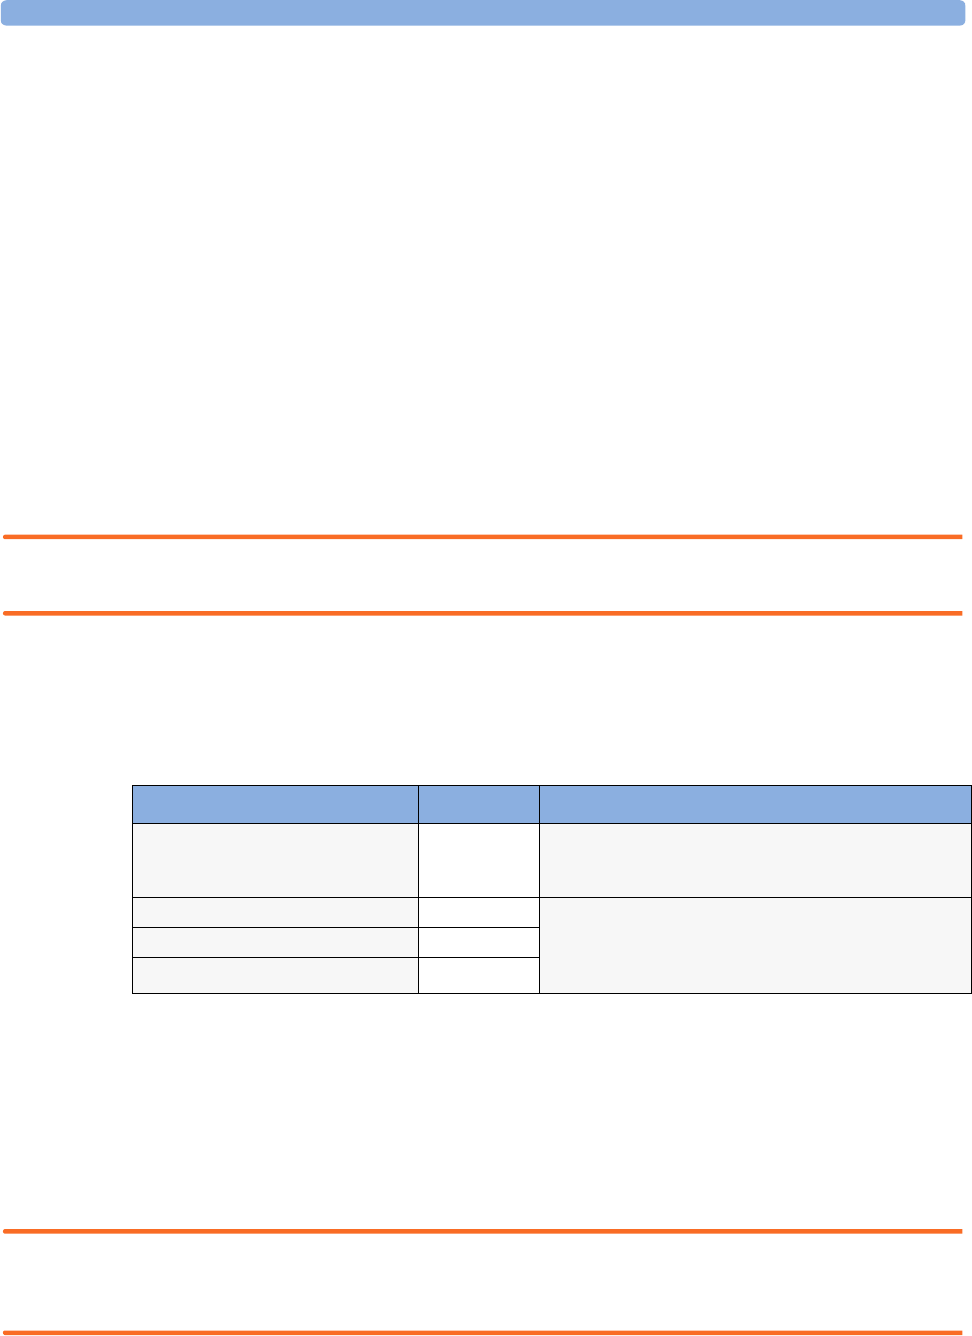
Safety and Performance Tests 34 Installation and Specifications
365
Safety and Performance Tests
You must observe any national regulations on the qualification of the testing personnel and suitable
measuring and testing facilities. See the maintenance section for a list of required tests. Safety and
performance tests, and what to do if the instrument does not meet these specifications are described in
the Installation and Service guide.
Electromagnetic Compatibility (EMC) Specifications
Take special precautions regarding electromagnetic compatibility (EMC) when using medical electrical
equipment. You must operate your monitoring equipment according to the EMC information
provided in this book. Portable and mobile radio frequency (RF) communications equipment can
affect medical electrical equipment.
Accessories Compliant with EMC Standards
All accessories listed in the accessories section comply, in combination with the IntelliVue patient
monitors, with the requirements of IEC 60601-1-2:2001.
WARNING Using accessories other than those specified may result in increased electromagnetic emission or
decreased electromagnetic immunity of the monitoring equipment.
Electromagnetic Emissions
The monitor is suitable for use in the electromagnetic environment specified in the table below. You
must ensure that it is used in such an environment
Avoiding Electromagnetic Interference (Resp and BIS)
The respiration (Resp) and BIS measurements are very sensitive measurements that measure very small
signals. Technological limitations don't allow higher immunity levels than 1V/m for radiated RF
electromagnetic fields and 1Vrms for conducted disturbances induced by RF fields. Electromagnetic
fields with field strengths above 1 V/m and conducted disturbances above 1Vrms may cause erroneous
measurements. Therefore Philips recommends that you avoid using electrically radiating equipment in
the close proximity of these measurements.
WARNING The monitor should not be used next to or stacked with other equipment. If you must stack the
monitor, you must check that normal operation is possible in the necessary configuration before you
start monitoring patients.
Emissions test Compliance Avoiding Electromagnetic Interference
Radio Frequency (RF) emissions Group 1 The monitor uses RF energy only for its internal function.
Therefore, its RF emissions are very low and are not likely to
cause any interference in nearby electronic equipment
RF emissions CISPR 11 Class A The monitor is suitable for use in all establishments other
than domestic and those directly connected to the public
low-voltage power supply network that supplies buildings
used for domestic purposes
Harmonic emissions IEC 61000-3-2 n/a
Voltage fluctuations IEC 61000-3-3 n/a

34 Installation and Specifications Safety and Performance Tests
366
Electromagnetic Immunity
The monitor is suitable for use in the specified electromagnetic environment. The user must ensure
that it is used in the appropriate environment as described below.
In this table, UT is the a.c. mains voltage prior to application of the test level.
Recommended Separation Distance
WARNING The monitor, equipped with a wireless network interface, intentionally receives RF electromagnetic
energy for the purpose of its operation. Therefore, other equipment may cause interference, even if that
other equipment complies with CISPR emission requirements.
In the following table, P is the maximum output power rating of the transmitter in watts (W)
according to the transmitter manufacturer and d is the recommended separation distance in metres
(m). The values given in brackets are for respiration and BIS.
Portable and mobile RF communications equipment should be used no closer to any part of the
monitor, including cables, than the recommended separation distance calculated from the equation
appropriate for the frequency of the transmitter.
Field strengths from fixed RF transmitters, as determined by an electromagnetic site survey, should be
less than the compliance level in each frequency range (over the frequency range 150 kHz to 80 MHz,
field strengths should be less than 1 V/m for respiration and BIS and 3 V/m for all other functions).
Immunity test
IEC 60601-1-2
test level Compliance level
Electromagnetic environment
guidance
Electrostatic
discharge (ESD)
IEC 61000-4-2
± 6 kV contact
± 8kV air
± 6 kV contact
± 8kV air
Floors should be wood, concrete, or
ceramic tile. If floors are covered
with synthetic material, the relative
humidity should be at least 30%.
Electrical fast
transient/burst
IEC 61000-4-4
± 2 kV for power supply lines
± 1 kV for input/output lines
± 2 kV for power supply
lines
± 1 kV for input/output lines
Mains power quality should be that
of a typical commercial and/or
hospital environment
Surge
IEC 61000-4-5
± 1 kV differential mode
± 2 kV common mode
± 1 kV differential mode
± 2 kV common mode
Mains power quality should be that
of a typical commercial and/or
hospital environment
Voltage dips,
short
interruptions
and voltage
variations on
power supply
input lines
IEC 61000-4-
11
<5% UT
(> 95% dip in UT) for 0.5
cycles
40% UT
(60% dip in UT) for 5 cycles
70% UT
(30% dip in UT) for 25 cycles
< 5% UT
(> 95% dip in UT) for 5 sec
<5% UT
(> 95% dip in UT) for 0.5
cycles
40% UT
(60% dip in UT) for 5 cycles
70% UT
(30% dip in UT) for 25
cycles
< 5% UT
(> 95% dip in UT) for 5 sec
Mains power quality should be that
of a typical commercial and/or
hospital environment. If the user of
the monitor requires continued
operation during power mains
interruptions, it is recommended
that the monitor is equipped with
an internal battery or is powered
from an uninterruptible power
supply.
Power frequency
(50/60 Hz)
magnetic field
IEC 61000-4-8
3 A/m 3 A/m Power frequency magnetic fields
should be a t levels characteristic of
a typical location in a typical
commercial and/or hospital
environment
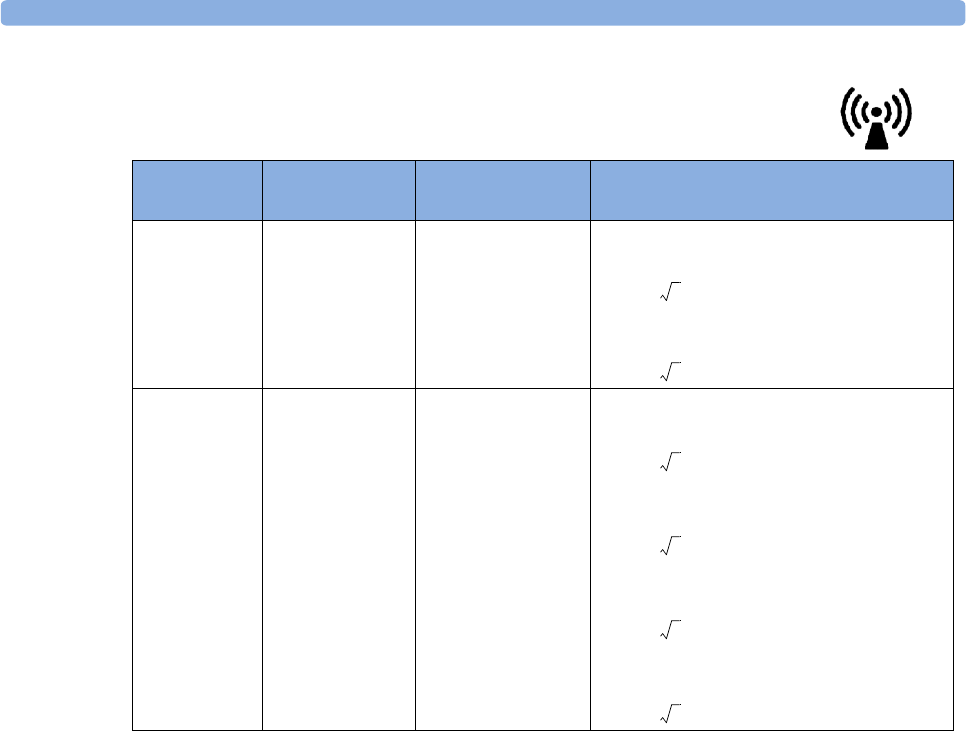
Safety and Performance Tests 34 Installation and Specifications
367
Interference may occur in the vicinity of equipment marked with this symbol:
Field strengths from fixed transmitters, such as base stations for radio (cellular, cordless) telephones and
land mobile radios, amateur radio, AM and FM radio broadcast and TV broadcast cannot be predicted
theoretically with accuracy. To assess the electromagnetic environment due to fixed RF transmitters, an
electromagnetic site survey should be considered. If the measured field strength in the location in
which the monitor is used exceeds the applicable RF compliance level above, the monitor should be
observed to verify normal operation. If abnormal performance is observed, additional measures may be
necessary, such as reorienting or relocating the monitor.
These guidelines may not apply in all situations. Electromagnetic propagation is affected by absorption
and reflection from structures, objects, and people.
Recommended separation distances from portable and mobile RF
communication equipment
The monitor is intended for use in an electromagnetic environment in which radiated RF disturbances
are controlled. The customer or user of the monitor can help prevent electromagnetic interference by
maintaining a minimum distance between portable and mobile RF communications equipment and
the monitor as recommended below, according to the maximum output power of the communications
equipment.
Immunity test
IEC 60601-1-2
test level Compliance level Electromagnetic environment guidance
Conducted RF
IEC 61000-4-6
3 VRMS
150 kHz to 80 MHz
3 VRMS
(1 VRMS for respiration
and BIS)
Recommended separation distance:
:
for respiration and BIS:
:
Radiated RF
IEC 61000-4-3
3 V/m
80 MHz to 2.5 GHz
3 V/m
(1 V/m for respiration
and BIS)
Recommended separation distance:
80 MHz to 800 MHz
80 MHz to 800 MHz for respiration and BIS
:
800 MHz to 2,5 GHz
800 MHz to 2,5 GHz for respiration and BIS
d
1.2 P=
d
3.5
P
=
d
1.2
P
=
d
3.5
P
=
d
2.3
P
=
d
7.0
P
=
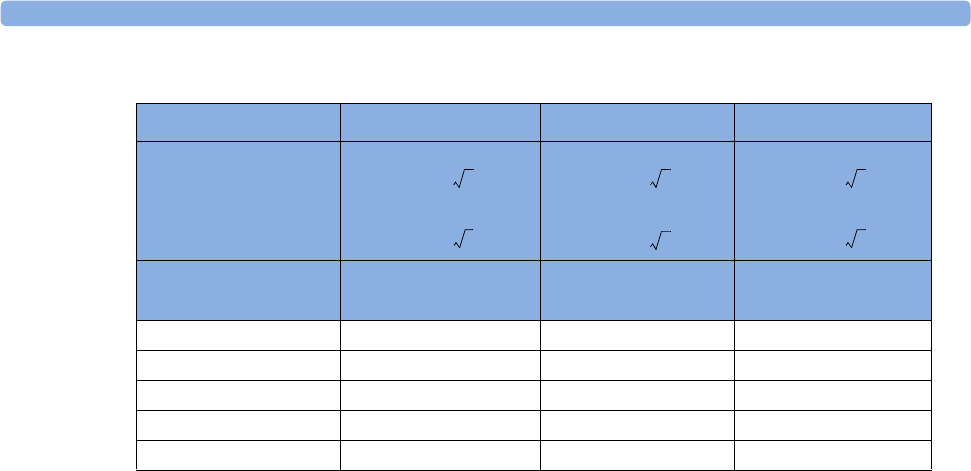
34 Installation and Specifications Safety and Performance Tests
368
Electrosurgery Interference/Defibrillation/Electrostatic Discharge
The equipment returns to the previous operating mode within 10 seconds without loss of any stored
data. Measurement accuracy may be temporarily decreased while performing electro-surgery or
defibrillation. This does not affect patient or equipment safety. Do not expose the equipment to x-ray
or strong magnetic fields (MRI).
Fast Transients/Bursts
The equipment will return to the previous operating mode within 10 seconds without loss of any
stored data (M1032 within 30 seconds). If any user interaction is required, the monitor indicates with
a technical alarm (INOP).
Restart time
After power interruption, an ECG wave will be shown on the display after 30 seconds maximum.
Frequency of transmitter 150 kHz to 80 MHz 150 kHz to 800 MHz 800 MHz to 2,5 GHz
Equation
for respiration and BIS: for respiration and BIS: for respiration and BIS:
Rated max. output power
of transmitter (W) Separation distance (m) Separation distance (m) Separation distance (m)
0.01 0.1 (0.4) 0.1 (0.4) 0.2 (0.7)
0.1 0.4 (1.1) 0.4 (1.1) 0.7 (2.2)
1 1.3 (3.5) 1.3 (3.5) 2.3 (7.0)
10 3.8 (11.1) 3.8 (11.1) 7.3 (22.1)
100 12.0 (35.0) 12.0 (35.0) 23.0 (70.0)
d1.2P=
d3.5p=
d1.2P=
d3.5P=
d2.3P=
d7.0P=

369
35
35Default Settings Appendix
This appendix documents the most important default settings of your monitor as it is delivered from
the factory. For a comprehensive list and explanation of default settings, see the Configuration Guide
supplied with your monitor. The monitor’s default settings can be permanently changed in
Configuration Mode.
Settings are only entered once per table row if they are the same for all patient categories.

35 Default Settings Appendix Alarm Default Settings
370
Alarm Default Settings
ECG, Arrhythmia, and ST Default Settings
Alarm Settings Factory Default H10 / H20 / H40 H30 (deviations from H10/20/40)
Alarm Volume 5
Alarms Off 3 min.
Pause Al. 5min Enabled
Pause Al. 10min Enabled
Auto Alarms Off Off
Alarm Off Reminder Off
Visual Latching Red & Yell Red Only
Audible Latching Red & Yell Off
Alarm Reminder On
Reminder Time 3 min
Alarm Sounds Traditional
Red Alarm Interval 10 sec
Yel. Al. Interval 20 sec
Alarm Low 4 2
Red Alarm Volume AlarmVol +2
Yell. Alarm Volume AlarmVol +0
Inop Volume AlarmVol +0
Auto Increase Vol. 2 Steps
Increase Vol Delay 20 sec
Keep Blinking No
Relay 1 Sensitiv. R & Y & I
Relay 2 Sensitiv. Red & Yell
Relay 3 Sensitiv. Red
Inop Relay Latency 5 sec
Yel. Relay Latency 2 sec
Alarm Text Standard
No Centr Mon Min Vol 4
ECG Settings
Factory defaults H10 / H20 / H40 H30 (deviations from H10/20/40)
Adult Pedi Neo Adult Pedi Neo
High Limit 120 bpm 160bpm 200 bpm
Low Limit 50 bpm 75 bpm 100 bpm
Alarms On
Alarm Source HR Auto
ECG On
QRS Volume 1

ECG, Arrhythmia, and ST Default Settings 35 Default Settings Appendix
371
Primary Lead II
Secondary Lead V
Analysis Mode Multi-lead
Lead Placement Standard
Mod. Lead Placment Off
Filter Monitor Filter
Speed 25mm/s
Auto Filter Off
Default ECG Size x1
Color Green
Asystole Thresh 4.0 sec 3.0 sec
∆ ExtrTachy 20 bpm
Tachy Clamp 200 bpm 220 bpm 240 bpm
∆ ExtrBrady 20 bpm
Brady Clamp 40 bpm 50 bpm 40 bpm 60 bpm 80 bpm
ALL ECG IN. On
Fallback On
Alarms Off Enabled
Alarm Source Sel. Enabled
ECG Settings
Factory defaults H10 / H20 / H40 H30 (deviations from H10/20/40)
Adult Pedi Neo Adult Pedi Neo

35 Default Settings Appendix ECG, Arrhythmia, and ST Default Settings
372
Arrhythmia Settings
Factory defaults H10 / H20 / H40 H30 (deviations from H10/20/40)
Adult Pedi Neo Adult Pedi Neo
Arrhythmia On Off Off
Pause Threshold 2.0 sec 1.5 sec
VTach HR 100 120 150
VTach Run 5
Vent Rhythm 14
SVT HR 180 200 210
SVT Run 5
PVCs/min 10 5 5
Non-Sustain On
Vent Rhythm On
Run PVCs On
Pair PVCs On Off
R-On-T PVCs On Off
V. Bi g e mi ny O n Off
V. Tri g e m i ny O n Off
PVCs/min On Off
Multif. PVCs On Off
Pacer N. Cap On
Pacer N. Pac On
Pause On Off
Missed Beat On Off
SVT On
IrregularHR On Off
TimeOut 1st 3 min
TimeOut 2nd 10 min
Arrhy Off Message Yes
SOME ECG IN On Off
Lead-independent ST Settings Factory Adult Factory Pedi Factory Neo
ST Alarm Mode Single ST
Alarms On
ST Analysis On Off
ST-Index On
ISO Point -80 ms
J Point 48 ms
ST Point J+60

Pulse Default Settings 35 Default Settings Appendix
373
Pulse Default Settings
Pulse alarms use the settings of the currently selected Pulse alarm source.
Lead I, II, III, V, aVR, aVL, aVF, V1-6,
MCL Settings Factory Adult Factory Pedi Factory Neo
ST(Label) On Off
For Alarm Mode = Single-ST
ST(Label) High +2.0 mm
ST(Label) Low -2.0 mm
For Alarm Mode = Multi-ST
ST(Label) High +1.0 mm
ST(Label) Low -1.0 mm
Pulse Settings
Factory defaults H10 / H20 / H40 H30 (deviations from H10/20/40)
Adult Pedi Neo Adult Pedi Neo
Alarm Source HR Auto
Pulse (Label) On
System Pulse SpO2 Auto
Alarms Off Enabled
Alarm Source Sel. Enabled
Pulse Alarm Settings
Factory defaults H10 / H20 / H40 H30 (deviations from H10/20/40)
Adult Pedi Neo Adult Pedi Neo
Pulse (SpO2) on
Pulse Alarms on
High Limit 120 bpm 160 bpm 200 bpm
Low Limit 50 bpm 75 bpm 100 bpm
∆ Extr Brady 20 bpm
Brady Clamp 40 bpm 40 bpm 50 bpm
∆ Extr Tachy 20 bpm
Tachy Clamp 200 bpm 220 bpm 240 bpm
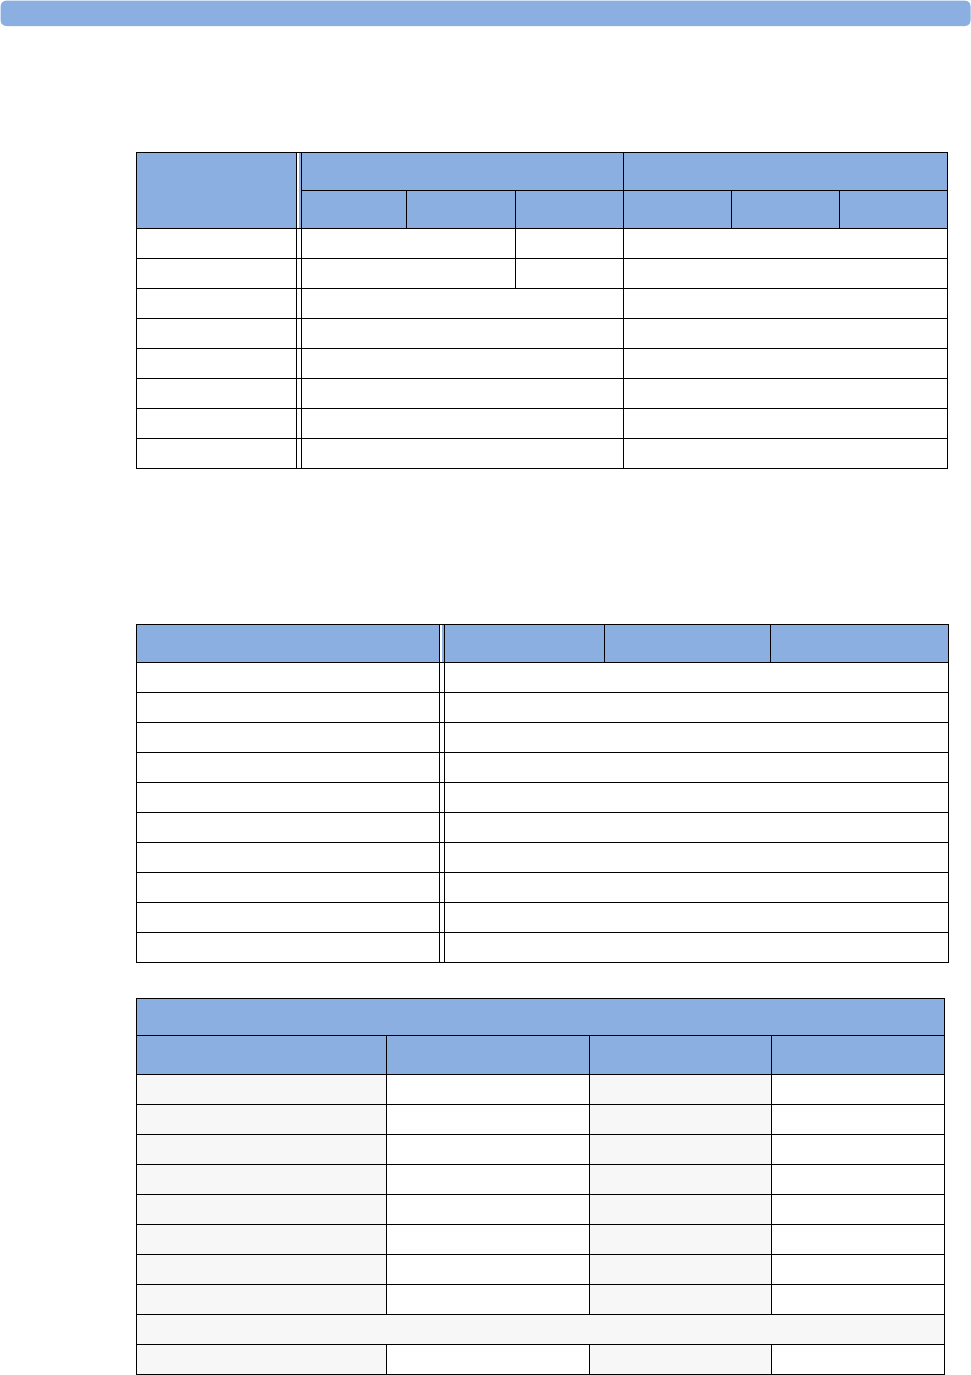
35 Default Settings Appendix Respiration Default Settings
374
Respiration Default Settings
SpO2 Default Settings
Respiration Settings
Factory defaults H10 / H20 / H40 H30 (deviations from H10/20/40)
Adult Pedi Neo Adult Pedi Neo
High Limit 30 rpm 100 rpm
Low Limit 8 rpm 30 rpm
Apnea Time 20 sec
Alarms On
Resp On Off
Auto/Manual Auto (Trigger Mode)
Resp Speed 6.25mm/s
Color Yellow White
SpO2 Settings Factory Adult Factory Pedi Factory Neo
Alarms On
QRS Volume 1
Ton e Modul at i on Yes
Ton e Mod. Ty pe Enh anc e d
Speed 25mm/s
Perfusion On
Average 10 sec
NBP Alarm Suppr. On
Extd. Auto OnOff Disabled
Color Cyan
SpO2 Alarm Default Settings
Setting adult pediatric neonatal
Desat Limit 80 80 80
Low Limit 90 90 85
High Limit 100 100 95
Desat delay 20 sec 20 sec 20 sec
High Alarm delay 10 sec 10 sec 10 sec
Low Alarm delay 10 sec 10 sec 10 sec
Parameter Alarms On/Off on on on
Label SpO2SpO2SpO2
Pulse Settings
Pulse (SpO2) On/Off on on on
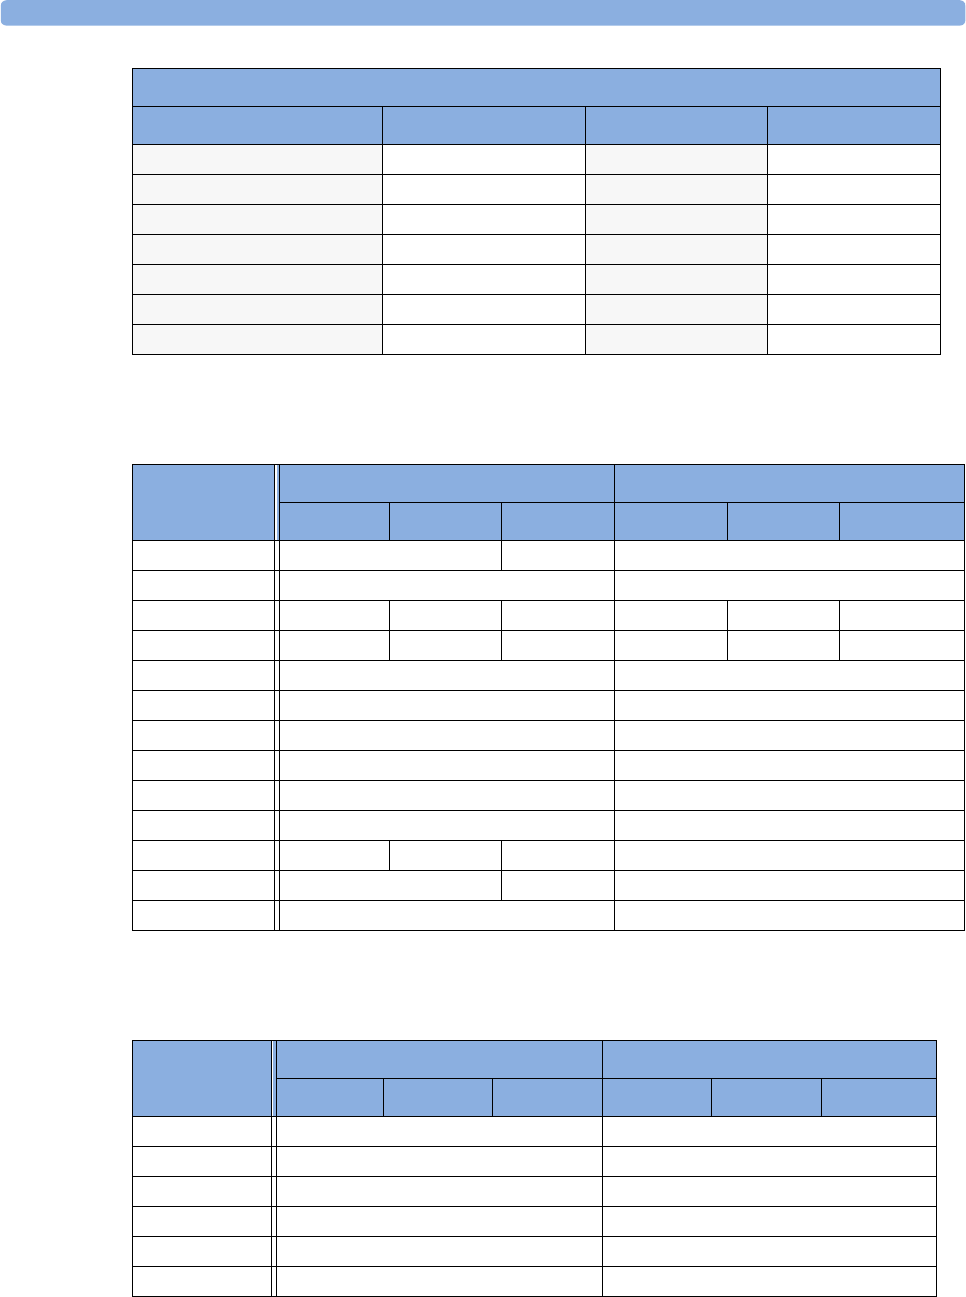
NBP Default Settings 35 Default Settings Appendix
375
NBP Default Settings
Temperature Default Settings
Pulse Alarms On/Off on on on
Pulse High Limit 120 bpm 160bpm 200 bpm
Pulse Low Limit 50 bpm 75 bpm 100 bpm
∆ Extr Brady 20 bpm 20 bpm 20 bpm
Brady Clamp 40 bpm 40 bpm 50 bpm
∆ ExtrTachy 20 bpm 20 bpm 20 bpm
Tachy Clamp 200 bpm 220 bpm 240 bpm
SpO2 Alarm Default Settings
Setting adult pediatric neonatal
NBP Settings
Factory defaults H10 / H20 / H40 H30 (deviations from H10/20/40)
Adult Pedi Neo Adult Pedi Neo
Auto/Manual Auto Manual
Alarms from Sys.
High Alarm Limit 160/ 90 (110) 120/ 70 (90) 90/ 60 (70) 180/ 90 (110)
Low Alarm Limit 90/ 50 (60) 70/ 40 (50) 40/ 20 (24) 70/ 50 (65)
Alarms On
NBP On
Repetition Time 15 min 3 min
Unit mmHg
Done Tone Off On
Start Time Synchronized NotSynchron.
VP Pressure 60 mmHg 40 mmHg 30 mmHg
Reference Auscultatory Invasive
Color Red Magenta
Temp Se t ti n gs
Factory defaults H10 / H20 / H40 H30 (deviations from H10/20/40)
Adult Pedi Neo Adult Pedi Neo
Low Limit 36 35
High Limit 39
Alarms On
Unit 0C
Range 35...43 30 ... 43
Color Green Light Green
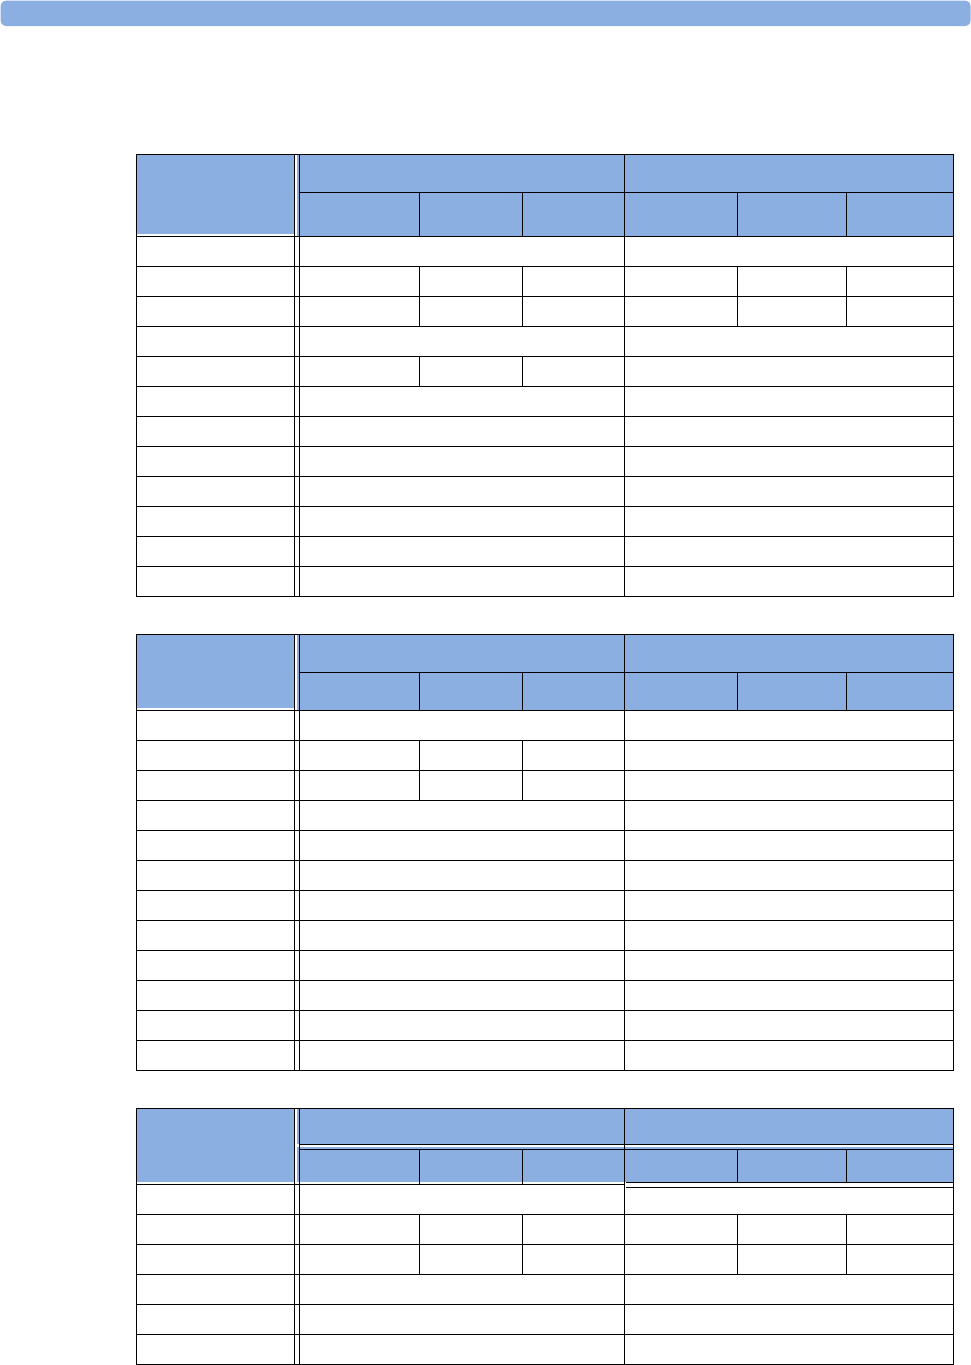
35 Default Settings Appendix Invasive Pressure Default Settings
376
Invasive Pressure Default Settings
ABP, ART, Ao, BAP,
FAP, P, P1, P2, P3,
P4, UAP Settings
Factory defaults H10 / H20 / H40 H30 (deviations from H10/20/40)
Adult Pedi Neo Adult Pedi Neo
Alarms from Sys.
High Limit 160/ 90 (110) 120/ 70 (90) 90/ 60 (70) 180/ 90 (110)
Low Limit 90/ 50 (70) 70/ 40 (50) 55/ 20 (35) 70/ 50 (70)
Alarms On
Scale 150 100 100
Speed 25mm/s
Mean Only No
Filter 12 Hz
Mercury Cal. Yes
Artifact Suppr. 60 sec
Unit mmHg
Color Red
C V P, R A P, L A P,
UVP Settings
Factory defaults H10 / H20 / H40 H30 (deviations from H10/20/40)
Adult Pedi Neo Adult Pedi Neo
Alarms from Mean
High Limit 14 / 6 (10) 10 / 2 (4) 10 / 2 (4)
Low Limit 6 / -4 (0) 2 / -4 (0) 2 / -4 (0)
Alarms On
Scale 30
Speed 25mm/s
Mean Only Yes
Filter 12 Hz
Mercury Cal. Yes
Artifact Suppr. 60 sec
Unit mmHg
Color Cyan Blue
Invasive Pressure
Settings
PAP Settings ICP, IC1, IC2 Settings
Factory Adult Factory Pedi Factory Neo Factory Adult Factory Pedi Factory Neo
Alarms from Dia. Mean
High Limit 35 / 16 (20) 60 / 4 (26) 60 / 4 (26) 14 / 6 (10) 10 / 2 (4) 10 / 2 (4)
Low Limit 10 / 0 (0) 24 / -4 (12) 24 / -4 (12) 6 / -4 (0) 2 / -4 (0) 2 / -4 (0)
Alarms On On
Scale 30 30
Speed 25mm/s 25mm/s
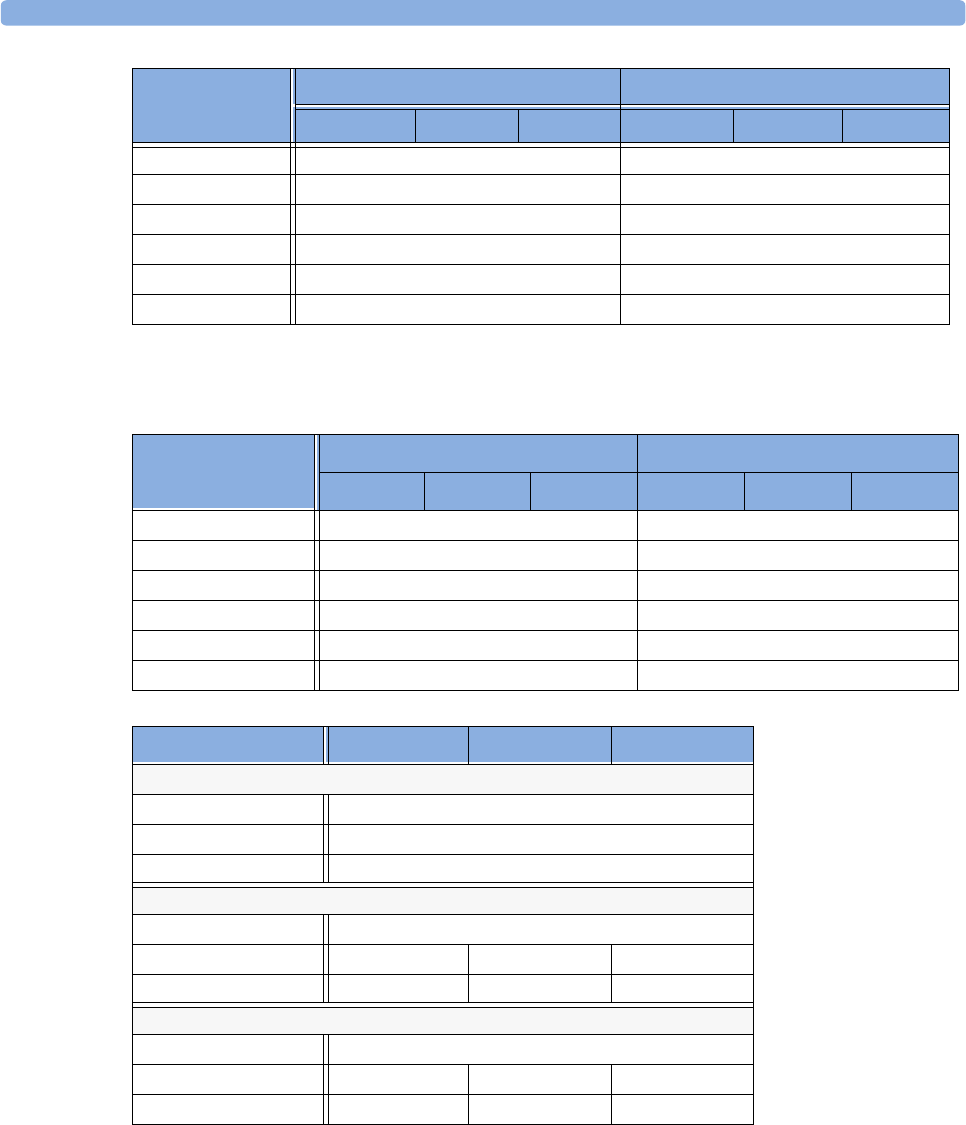
Cardiac Output Default Settings 35 Default Settings Appendix
377
Cardiac Output Default Settings
Mean Only No Yes
Filter 12 Hz 12 Hz
Mercury Cal. Yes Yes
Artifact Suppr. 60 sec 60 sec
Unit mmHg mmHg
Color Yellow Magenta
Invasive Pressure
Settings
PAP Settings ICP, IC1, IC2 Settings
Factory Adult Factory Pedi Factory Neo Factory Adult Factory Pedi Factory Neo
C.O. Settings
Factory defaults H10 / H20 / H40 H30 (deviations from H10/20/40)
Adult Pedi Neo Adult Pedi Neo
Auto-Calibration On
Tblood High Limit 39.0 ºC
Tblood Low Limit 36.0 ºC
Tblood Alarm On/Off On
Tem p e r a tu re Un it 0C
Color Green Yellow
CCO/CCI Settings Factory Adult Factory Pedi Factory Neo
Settings common to CCO and CCI
Alarms from CCO
CCO from ABP
Color Green
CCO
Alarms On
CCO High Limit 8.5 l/min 3.7 l/min 1.3 l/min
CCO Low Limit 4.0 l/min 2.6 l/min 0.3 l/min
CCI
Alarms On
CCI High Limit 4.3 l/min/m23.7 l/min/m25.2 l/min/m2
CCI Low Limit 2.0 l/min/m22.6 l/min/m21.2 l/min/m2

35 Default Settings Appendix CO2 Default Settings
378
CO2 Default Settings
Spirometry Default Settings
CO2 Settings
Factory defaults H10 / H20 / H40 H30 (deviations from H10/20/40)
Adult Pedi Neo Adult Pedi Neo
etCO2 low 30 25
etCO2 high 50 60
imCO2 high 4
CO2 Alarms on
Unit mmHg
Scale 40 mmHg 50
ImCO2on Off
N2O Corr (only
M3015A/
M3016A)
Off
Oxygen Corr (only
M3014A)
16%
Gas Corr (only
M3014A)
Off
Humidity Corr BTPS
Max Hold Off
AwRR On
AwRR Alarms On
AwRR high limit 30 100
AwRR low limit 8 30
Apnea time 20 secs
Color Yellow White
Spirometry
Settings Adult Pedi Neo
APNEA high limit 20 20 20
MVexp low limit 4.0 2.5 0.4
MVexp high limit 8.0 4.0 0.8
PIP high limit 40 25 20
PEEP low limit 0 0 0
PEEP high limit252525
RRspir low limit 8 8 30
RRSpir high limit303060
AWF scale ±150 l/min ±100 l/min ±20 l/min
AWV scale ±800 ml ±200 ml ±50 ml
AWP scale ±40 cmH2O±40 cmH2O±20 cmH2O

tcGas Default Settings 35 Default Settings Appendix
379
tcGas Default Settings
SvO2 Default Settings
tcGas Settings Factory Adult Factory Pedi Factory Neo
tcpO2 High 80 mmHg
tcpO2 Low 50 mmHg
tcpO2 Alarms On
tcpCO2 High 50 mmHg
tcpCO2 Low 30 mmHg
tcpCO2 Alarms On
Site Time 4.0 hours
Disable Timer Not Allowed
Heat Switch Off (i.e., after Site Timer
elapsed)
No
Tr a n s d u c e r Te m p. 4 3 . 0 ° C
CO2 Correction (Severinghaus) On
Metabolism Factor 8 mmHg
TcGas Unit mmHg
Tem p e r a tu re Un it 0C
tcpO2 Color Blue
tcpCO2 Color Green
SvO2 Settings Factory Adult Factory Pedi Factory Neo
Low Limit 60%
High Limit 80%
Alarms On
Light Intensity On
Color Yellow

35 Default Settings Appendix EEG Default Settings
380
EEG Default Settings
BIS Default Settings
EEG Settings Factory Adult Factory Pedi Factory Neo
TP, SEF On
M D F, P P F, D e l t a , T h e t a ,
Alpha, Beta
Off
SEF Threshold 90 %
Numeric Average 8 sec
Wave Scale 100uV (or +/- 50uV if Show Gridlines is configured to Yes)
Show Gridlines No
Low Filter 0.5 Hz
High Filter 30 Hz
Impedance Limit 5 kOhm
Smoothing CSA On
Color Yellow
BIS Settings
Factory defaults H10 / H20 / H40 H30 (deviations from H10/20/40)
Adult Pedi Neo Adult Pedi Neo
SQI On
EMG On
SR On
SEF Off
TP Off
Bursts On Off
Scale 100uV (or +/- 50uV if Show Gridlines
is configured to Yes)
Show Gridlines No
Filters On
Low Filter 2 Hz
High Filter 70 Hz
Notch Filter On
High Alarm Limit 70
Low Alarm Limit 20
Alarms On
Smoothing Rate 30 sec 15 sec
Color Yellow Magenta

VueLink Default Settings 35 Default Settings Appendix
381
VueLink Default Settings
Device Alarms Ignored
Color Green

35 Default Settings Appendix VueLink Default Settings
382

i
#
10-lead placement (ECG) 100
12-lead placement (ECG) 100
3-lead placement (ECG) 98
4-channel recorder 258
5-lead placement (ECG) 98
A
AAMI ECG lead labels 97
abdominal breathing
and Resp electrode placement 132
aberrantly conducted beats 108
AC power input 332
accessories
10-electrode cable sets 310
3-electrode cable sets 309
3-electrode one piece cables 310
5-electrode cable sets 310
5-electrode one piece cables 310
Aspect Medical Systems 322
C.O. 319
CO2 176, 181, 188
CO2 (mainstream) 320
CO2 (microstream) 321
ECG 309
EEG 322
Hospira Inc. 323
NBP
adult cuffs 312
comfort cuffs 311
disposable cuffs 311
multi-patient comfort cuff kits 311
neonatal/infant cuffs
(disposable) 312
reusable cuffs 311
single-hose disposable cuffs 312
Nellcor 313
pressure 313
Pulsion 313
recorder paper 324
resp 309
set combiners and organizers 311
SpO2 313
Nellcor adhesive sensors
(disposable) 313
Philips sensors (disposable) 313
Philips sensors (reusable) 313
SvO2 323
temperature 318
trunk cables 309
active alarms 41
address, Philips 326
addressograph (printer configuration
setting) 272
adjusting ST measurement points 120
adjusting wave scale (pressure) 154
adjusting wave size (CO2) 183, 192
admit
editing information 79
quick admit 78
admitting a patient 77
advanced event surveillance 241
airway adapter
CO2, microstream accessory 182
alarm latching 51, 52, 113
alarm limits
changing 48
checking 46
manually adjusting 48
narrow 49
report 273
setting 46
ST 122
switching auto limits on/off 49
using automatic limits 49
wide 49
window 47
alarm recording 259
choosing recorded measurements 261
alarm source selection, disabled 129
alarm status area 14
alarms
acknowledging 44
active 41
active SpO2 source 141
alphabetical listing 53
apnea delay 184, 192
apnea delay time (Resp) 134
arrhythmia 41
audible indicators 42
awrr limits 184
chaining 115
CO2 specific 184
CO2, apnea delay 184, 192
CO2, awRR 184
desat, SpO2 140
effect on pressure alarms during
zero 153
extending pause time 46
high priority 41
INOP 41
ISO/IEC standard 9703-2 43
limit, SpO2 352
NBP source 147
patient messages 53
pausing 44
physiological 53
pleth as source 141
red 41
reminder 44
restarting 46
reviewing 50
reviewing messages 50
reviewing window 50
selftest 52
silencing 44
SpO2 high and low limits 140
SpO2 specific 140
ST 122
suspended symbol 45
SvO2, behavior during
measurement 204
switching on and off 45
temperature 149
testing 52
tone configuration 42
traditional 43
visual indicators 42
volume, changing 43
VueLink and external devices 283
yellow 41
alphabetical listing of alarms 53
alternating current symbol 328
analog interface symbol 329
analog output
ECG 329
pressure 160
analog video out connector 332
annotating events 251
annotation
recording strip 262
apnea alarm delay
CO2 184, 192
apnea alarm delay time (RESP) 134
apnea alarms
and Resp detection modes 134
Application Server 33
arrhythmia
aberrantly conducted beats 108
analysis, how it works 107
atrial fibrillation and flutter 108
beat labels 109
initiating learning 111, 112
intermittent bundle branch block 109
learning during ventricular rhythm 112
levels of analysis 104, 107
monitoring non-paced patients 108
monitoring paced patients 108
options 107
relearning 111
relearning and lead fallback 112
status messages 110
switching on/off 108
understanding the display 109
arrhythmia alarms 41, 112
adjusting alarm limits 113
all yellow on/off 113
chaining 115
latching 113
multiple 115

ii
pvc-related alarms 116
short yellow 105
sinus and SV rhythm ranges 350, 352
switching on/off 113
timeout periods 113
yellow 113
arrhythmia monitoring
and defibrillation 106
arrhythmia options 104
arrhythmia relearning
with EASI INOP 102
arterial catheter constant (PiCCO) 166
arterial pressure source 157, 158
arterial pulsation 137
arterial values 195
artifact suppression (pressure) 155
Aspect Medical Systems Inc 327
atrial fibrillation and flutter 108
audlatching (arrhythmia alarms) 113
auto alarm limits
switching on/off 49
using 49
auto detection mode (Resp) 132
auto ECG wave gain (recordings) 261
auto window (care groups) 88
autofilter 95
automatic arrhythmia relearn 112
automatic default setting 26
automatic NBP
repeat time 146
autosize
ECG wave 94
average trend events 243
awRR alarm
limits 184
awRR alarms
CO2 184
B
backlight
maintenance interval 306
balloon inflation, wedge measurement 159
baseline
ST map, updating 125
ST, updating 119
basic arrhythmia option 104, 107
basic event surveillance 241
setup 245
battery
and display brightness 302
battery compartment location 297, 298
battery reports 300
battery status recording 300
battery status window 300
charge status 301
conditioning 302
conserving power 302
LED 298
malfunction symbols 298
power gauge 298
recharging 298
replacing 301
safety information 303
symbol 329
battery operation
MP20 MP30 297
MP40 MP50 297
beat labels
arrhythmia 109
BIS
BIS engine software revision 221
cables, securing 221
Continuous Impedance Check 218
Cyclic Impedance Check 218
filters 220
Ground Check 218
impedance indicators 219
monitoring 215
monitoring setup 216
numeric 215
numerics
on/off 220
safety information 221
smoothing rate
changing 220
updating software 221
window 219
Bispectral Index monitoring 215
blood pressure. See also NBP (non-invasive)
or PRESS (invasive)
Brightness SmartKey 31
brightness, adjusting 31
BSA formula (trends) 236
buffer (EEG) 211
buffer (EEG) on reports 213
buffer (EEG) on screen 212
bursts numeric (BIS) 215
C
C.I. 162
C.O. 161
accessories 319
calibrating measurements (PiCCO) 167
curve alert messages 171
documenting measurements 169
editing measurements (PiCCO) 166
editing measurements (RH
method) 169
flow-through method 168
hemocalc window 164
hemodynamic parameters available 162
injectate guidelines 170
PiCCO method 164
Procedure window 163
prompt messages 172
results table 163
right heart thermodilution method 168
saving measurements (PiCCO) 167
setup for PiCCO method 165
setup for RH method 168
setup menu 164
temperature unit 163
C.O. warning messages 173
C.O./CCO safety information 173
Calc Type 233
calculating
drug infusions 277
calculating cerebral perfusion 157
calculating oxygen extraction 206
calculating pulse pressure variation 157
calculating temperature difference 150
calculations 233
pop-up keys 234
calculations reports 237
calculations review 235
calculator 20
calibrating
CO2 transducer 180
tcGas transducer 199
calibrating C.O. measurements 167
calibration
interval, NBP 306
NBP 147
pressure 156
pressure transducer 156
SvO2 light intensity 205
SvO2 required equipment 203
SvO2, in-vivo 206
SvO2, pre-insertion 204
calibration status indicators (C.O) 167
capnography
mainstream 12
Microstream 12
capturing loops 290
carbon dioxide, see CO2 175, 187
cardiac output
how the measurement works 161
report 275
cardiac overlay
and Resp detection modes 133
when measuring Resp 131
cardiotach alarms 104
care groups
alarm notification 88

iii
other bed window 87
pop-up window 88
catheter
SvO2, insertion 205
catheter constant, setting (PiCCO) 166
catheter preparation
SvO2 204
cautions 1
CCO
calibration status indicators 167
choosing the correct pressure source 166
how the measurement works 161
PiCCO method 164
central recorder
choosing 261
cerebral perfusion 157
CFI 162
chaining 115
change screen menu 22
changing ECG lead sets 96
changing EEG wave scale 212
changing EEG wave speed 213
changing Resp detection mode 132
changing Resp wave size 133
changing Resp wave speed 134
changing screen content 22
changing screens 22
changing wave scale
EEG 220
channels
recorder 261
checking battery charge 301
checking paced status 92
cleaning
infection control 293
method 294
monitoring accessories 294
recommended substances 294
recorder printhead 295
CO2
airway adapter 182
alarms, apnea delay 184, 192
alarms, awRR 184
alarms, specific 184
awRR alarm limits 184
checking transducer accuracy 179
correction, humidity 183
correction, N2O 183
corrections 183, 192
FilterLine 182
mainstream accessories 176, 188
measuring mainstream 176, 179
measuring microstream 181
method, mainstream 175
method, microstream 175
method, sidestream 175
microstream accessories 181
microstream extension 181
removing exhaust gases 179, 182
transducer, calibrating 180
transducer, using 180
troubleshooting 183, 192
wave scale, adjusting 183, 192
CO2 (mainstream).
accessories 320
CO2 (microstream).
accessories 321
code
recording 262
combi-events 248
Compressed Spectral Arrays (CSA) 211
computation constant (RH) 169
conditioning batteries 302
configuration
drug calculator 278
trends database 229
configuration mode 21
conflict
label 29
connecting BIS accessories 216
connecting temperature probe 149
connection direction indicator symbol 328
connection direction symbol 328
connector
AC power input 332
additional MSL 333
analog video out 332
ECG analog (sync) output 330, 332, 333
equipotential ground 332
marker input 345
MMS patient cable 333
mouse 332
MSL 332
printer 332
protective earth 332
recorder module 333
trackball 332
wired network 332
wireless network 332
connectors 329
serial/MIB 330, 331, 332
continuous cardiac output 161
Continuous Impedance Check (BIS) 218
conventional 12-lead ECG 100
correcting the NBP measurement 145
counting events 247
CPAP (RESP) 133
CSA (Compressed Spectral Arrays) 211
cuff
pressure, NBP 146
selection, NBP 145
current view
ST map 122
curve alert messages (C.O.) 171
Cyclic Impedance Check (BIS) 218
D
damage
mechanical 32
database
events 247
database configuration
trends 229
date, setting 31
default profile 26
default settings 369
defibrillation
and arrhythmia monitoring 106
and ECG monitoring 106
and monitoring BIS 221
during EEG monitoring 214
synchronization marks 93
defibrillator input 345
defibrillator proof symbol 328
defibrillator synch
maintenance interval 306
delay time
recording 261
delayed recording 259
deleting events 247
demonstration mode 21
desat alarm, SpO2 140
detection modes (Resp) 132
device driver
language conflict with monitor 284
diagnostic (ECG filter setting) 96
digital interface symbol 329
digital video device connection symbol 328
disabling touch operation 15
discharging a patient 79
disconnect INOPs
silencing 44
disinfecting
infection control 293
recommended substances 294
display
arrhythmia 109
ECG 93
NBP 145
Resp 132
ST 118
using a second display 23
display brightness 302

iv
display settings 24
disposal
gas cylinder 307
parts and accessories 307
documenting events 251
dosemeter (drug calculator) 279
dPmax 162
drip table (drug calculator) 280
drug calculator 277
DSC (BIS)
software revision 221
dual SpO2 141
dual Temp measurement 150
dyshemoglobins
intravascular (SpO2) 139
E
early systolic blood pressure, NBP 146
EASI
activating 96
ECG monitoring 102
lead placement 102
EASI ECG lead labels 97
ECG 91
accessories 309
alarms off (Config Mode) 105
changing lead sets 96
choosing electrode sites 96
conventional 12-lead 100
external pacing electrodes 106
filter settings 95
fusion beat pacemakers 106
intrinsic rhythm 106
modified 12-lead 100
New Lead Setup 96
pacemaker failure 106
rate adaptive pacemakers 106
unfiltered 96
wave size 94
ECG analog (sync) output 330, 332, 333
ECG analog output 329
ECG cable
for operating room 106
ECG cables, connecting 91
ECG connector 91
ECG display 93
ECG electrode colors 97
ECG electrode placement
during electrosurgery 106
ECG gain
in recordings 261
in reports 268
ECG lead labels 97
ECG lead placement
choosing EASI/Standard 96
ECG leads monitored 96
ECG output 345
ECG report 276
lead layout 268
ECG safety information 105
ECG wave
autosize 94
calibration bar 94
ectopic status messages (arrhythmia
monitoring) 111
editing C.O. measurements (PiCCO
method) 166
editing C.O. measurements (RH method)
C.O.
saving measurements (RH
method) 169
EEG
accessories 322
monitor configuration and upgrade 214
EEG monitoring 207
buffer time 211
changing filter frequencies 213
changing wave scale 212
changing wave speed 213
choosing electrode montages 209
CSAs 211
electrical interference 214
electrode-to-skin impedance 210
gridlines 212
impedance quality indicators 210
Impedance/Montage Window 208
international 10-20 electrode placement
system 209
safety information 214
setting report buffer time 213
setting screen buffer time 212
setup 208
skin preparation 208
switching numerics on and off 212
EEG wave
changing scale 220
electrical input symbol 328
electrical interference
during EEG monitoring 214
electrical output symbol 328
electrode montage
EEG 209
electrode placement (ECG) 91
conventional 12-lead 100
modified 12-lead 100
electrode placement (Resp) 131
with abdominal breathing 132
with lateral chest expansion 132
electrode-to-skin impedance (BIS) 219
electrode-to-skin impedance (EEG) 210
electromyographic activity numeric
(BIS) 215
electrosurgery
and ECG 106
EMC interference
Resp 134
EMG numeric (BIS) 215
EMI filter for ECG 95
end case
discharging a patient 79
report, printing 79
end case reports
setup 269
enhanced arrhythmia option 104, 107
entering values
calculations 236
equipotential ground connector 332
equipotential grounding symbol 328
event
annotation 251
combi-events 248
counting oxyCRG/NER events 248
event counter 247
event episode 242
event episode recording 253
event episode types 243
event episode window 250
event post-time 242
event pre-time 242
event retriggering 245
event review recording 252
event review window 249
event summary view 249
event time 242
event triggers 244
event values 251
manual event triggers 246
recording 251
setting up NER 245
event database 247
event episode reports 270
event groups 242
event report 254
event review reports 270
event snapshots 243
event surveillance 241
options 241
events pop-up keys 243
EVLW/EVLWI 162
exclamation mark symbol 328
exhaust gases, removing 179, 182
extension cable for SpO2 138
external devices
alarms and INOPS 283
connecting to VueLink 281

v
connecting via VueLink 282
external pacing electrodes
and ECG monitoring 106
extreme bradycardia alarm 105, 129
extreme rate alarms 105, 129
extreme tachycardia alarm 105, 129
F
fallback (ECG) 97
FAST
Fourier artefact suppression
technology 137
filter (ECG filter setting) 95
filter (ECG) 95
filter frequencies (EEG) 213
FilterLine
CO2, microstream accessory 182
filters
BIS 220
flexible module server - see FMS 8
flushing invasive pressure accessories 151
FMS
connecting to monitor 8
modules 8
functional arterial oxygen saturation 137
fusion beat pacemakers
and ECG monitoring 106
G
gas cylinder
empty, disposing of 307
gas input symbol 328
gas output symbol 328
GEDV/GEDVI 162
getting started 32
global trend time 230
graphic trend
report 225
graphic trends 224
graphic trends report 228
gridlines (EEG) 212, 220
Ground Check (BIS) 218
H
hardkeys 19
help
INOPS 51
hemodynamic calculations 233
hemodynamic measurement server
extension 13
hemodynamic parameters 162
high filter (EEG) 213
high pass filter (BIS) 220
high resolution recording 259
high-res trend event episodes 243
high-res trend waves
about 239
OxyCRG 239
high-res waves
in reports 240
list of available measurements 343
recordings 240
HiResTrnd
see high-res trend 243
horizon trend
trend time 230
HR = RR (Resp) 132
HR alarms
when arrhythmia off 105
HR alarms off (Config Mode) 105
HR and pulse alarm source selection 129
HR from (heart rate source) 128
humidity correction
CO2 183
I
IEC ECG lead labels 97
impedance indicators (BIS) 219
impedance quality indicators 210
IMV (Resp) 133
independent display connection
symbol 328
infection control
cleaning 293
disinfecting 293
sterilizing 293
Information Center
central recording 258
transferring patients 80
injectate guidelines for C.O. 170
injectate volume setting (C.O.) 166
INOPs
from external devices 283
indicators 41
silencing 44
input
defibrillator 345
installation
connectors 329
Instructions for Use
intended audience 1
integrated module slots (MP40 50 60
70) 257
IntelliVue family 1
intermittent bundle branch block 109
intermittent mandatory ventilation
(Resp) 133
interruption symbol 328
intravascular dyshemoglobins (SpO2) 139
intrinsic rhythm 106
invasive pressure 151
in-vivo calibration, SvO2 206
ISO point (ST) 120
ITBV/ITBVI 162
J
J point (ST) 120
K
keyboard connection symbol 328
keys
hardkeys 19
permanent keys 17
pop-up 19
SmartKeys 18
L
label conflict resolution 29
labels
resolving conflict 30
language conflicts with device driver 284
latching
alarms 51
alarms, behavior 52
latching arrhythmia alarms 113
lateral chest expansion (neonates)
monitoring Resp 132
LCW/LCWI 162
lead fallback
and arrhythmia relearning 112
lead fallback (ECG) 97
lead labels (ECG) 97
lead placement
activating EASI/Standard 96
for Resp measurement 131
leads monitored (ECG) 96
Leads Off INOP (ECG) 97
LED
battery status 298
levels of arrhythmia analysis 107
levels of event surveillance 241
line frequency interference (BIS) 220
loops 289
capturing 290
loop size in window 291
loops report 292
source device 291
volume-flow 289
low filter (EEG) 213

vi
low pass filter (BIS) 220
LVCI 162
M
M1116B 257
M3160A recorder 258
main screen overview 14
mainstream
capnography 12
mainstream CO2
accessories 176, 188
measuring 176, 179
maintenance
cables 305
cords 305
measurements, schedule 306
microstream CO2, calibration 306
schedule 305
visual inspection 305
major parts and keys
MP20 MP30 3
MP40 MP50 4
malfunction symbols
battery 298
manual detection mode (Resp) 133
and apnea alarms 134
manually triggering events 246
manufacture date symbol 328
manufacturer’s information 326
map
ST 122
marker input connector 345
Mason-Likar lead system 100
max hold setting (CO2) 175
MDF (mean dominant frequency) 207
mean dominant frequency (MDF) 207
mean pressure calculation (trends) 236
measurement
adjusting a wave 27
preparation 32
setting up 26
switching on and off 27
wave speed, changing 27
measurement modules
setting up 32
measurement points, ST 120
measurement selection window 31
measurement server
ECG connector 91
measurement server extension
M3012A 13
M3015A 12
M3016A 12
measurement server link cable 8
measurement server link connection
symbol 328
measurement servers
setting up 32
measurement settings 24
mechanical damage 32
merging patient data 84
methemoglobin (SpO2) 139
MIB connector 330, 331, 332
Microstream capnography 12
microstream CO2 181
accessories 181
maintenance, calibration 306
measuring 181
minimize 34
mismatch
patient data, resolving 82
MMS
connecting to FMS 10
connecting to monitor 10
patient cable connector 333
using for patient transfer 81
modified 12-lead ECG 100
modified screen history 22
modifying
screens 22
module
connecting 9
reconnecting 9
removing 9
setup key 9
setup menu 9
tcGas 195
unplugging 9
VueLink 281
VueLink Type A and Type B 281
modules
setting up 32
monitor
inspecting before use 32
starting monitoring 33
switching on 32
monitor (ECG filter setting) 95
monitor defaults 369
monitor revision
how to find 32
monitor settings 24
changing 31
monitoring
preparation 32
monitoring BIS 215
monitoring EEG 207
monitoring mode 21
mouse
using 17
mouse connection symbol 328
mouse connector 332
MP20 2
MP20 Junior 2
MP20 MP30
major parts and keys 3
screen menus 15
MP30 2
MP40 4
MP40 MP50
major parts and keys 4
screen menus 15
MP50 4
MR imaging and the SpO2 transducer 139
MSL cable 8
MSL connector 332
MSL, additional connector 333
multi-lead ST alarming 122
multi-measurement server (MMS) 10
N
N2O correction
CO2 183
narrow alarm limits 49
navigating 14
mouse 17
permanent keys 17
SmartKeys 18
trackball 17
navigation point 17
NBP
adult cuffs 312
alarm source 147
ANSI/AAMI SP10-1992 143
automatic mode, enabling 146
calibrating 147
calibration interval 306
comfort cuff kits 311
comfort cuffs 311
cuff pressure 146
cuff, applying 145
cuff, selecting 145
cuff, tightness 145
disposable cuffs 311
how the measurement works 143
measurement correction 145
measurement limitations 144
measurement methods, auto 144
measurement methods, manual 144
measurement methods, stat 144
measurement, starting 146
measurement, stopping 146
neonatal cuffs (disposable) 312
numerics 145

vii
oscillometric method 143
pediatric cuffs 312
preparing to measure 144
repeat time 145
repeat time for automatic 146
repetition time, setting 146
reusable cuffs 311
single-hose disposable cuffs 312
site inspection 145
time of last measurement 145
units 145
venous puncture 147
neonatal event counting 248
neonates
Resp electrode placement 132
NER setup 245
network connection indicator 14
network connector, wired 332
network connector, wireless 332
networked monitoring 33
new features 35
non-invasive blood pressure. See NBP
non-paced patients
arrhythmia monitoring 108
notch filter (BIS) 220
numerics
explanation of NBP display 145
nurse call 45
nurse call relay connection symbol 328
O
on screen calculator 20
operating 14
mouse 17
permanent keys 17
SmartKeys, using 18
trackball 17
operating modes 21
configuration 21
demonstration 21
monitoring 21
passcode protection 21
service 21
operating room ECG cable 106
orange ECG cable 106
organizers 311
Oridion Systems Ltd 327
Original Calc pop-up key 235
oscillometric NBP measurement
method 143
other bed window 87
output
ECG 345
overlap
in recordings 261
overlapping screen trends 231
oxyCRG 239
event counting 248
OxyCRG event episodes 243
oxygen extraction 206
oxygenation calculations 233
P
pace pulse rejection (ECG)
about 92
switching on/off 94
paced patients
arrhythmia monitoring 108
repolarization tails 94
safety information 106
setting status 106
paced status
checking 92
pacemaker failure 106
paper
reloading (recorder) 264
paper size
for reports 270
parallel interface symbol 328
parallel printer connection symbol 328
parameter scales
trends 227
passcode protection 21
patient
admit 77
category, NBP 143
discharge 79
end case 79
patient alarm messages 53
patient demographics window 77
patient mismatch 82
patient reports
contents 272
patient trends
viewing 223
paused alarms 44
extending time 46
restarting 46
PAWP 158
peak power frequency (PPF) 207
performance specifications
pressure 348, 354
performance test 365
performing calculations 235
perfusion indicator 137, 138, 141
pf loops 289
Philips contact information 326
physiological alarms 41
PIC cable (BIS)
securing 221
PiCCO method
C.O. 164
CCO 164
setup 165
pleth alarm source 141
pleth wave 140
pleth waveform 137
plug-in recorder 257
pop-up keys 19
events 243
power
disconnecting from
mains power
disconnecting from 33
power on symbol 328
PPF (peak power frequency) 207
PPV 157
preparing skin
for ECG 91
pressure
alarms during zero 153
arterial source 157, 158
calibration pressure 156
cerebral perfusion, calculating 157
performance specifications 348, 354
wave scale 154
wave size 154
wedge 158
wedge, editing 159
zeroing the transducer 152
pressure accessories 313
pressure analog output 160
pressure artifact suppression 155
pressure of NBP cuff 146
pressure transducer
calibration 156
zeroing 153
pressure-flow loops 289
pressure-volume loops 289
previous screen 22
primary lead (ECG)
selecting 92
print job
suspended 271
printer
disabling 271
settings 270
status messages 272
unavailable 271
printer connection symbol 328
printer connector 332

viii
printing
C.O. measurements 169
calculations reports 237
event reports 251
ST map reports 125
status log 307
trends reports 228
wedge 159
priority list for trends 227
probes
disposable temperature 149
profiles 24
default profile 26
patient category 25
swapping 25
swapping setting block 26
prompt messages
C.O. 172
protective earth 332
protective earth symbol 328
pulse
alarms 128
system pulse source 127
pulse numerics for SpO2 138
pulse pressure variation 157
Pulsion Medical Systems AG 327
pv loops 289
PVC-related alarms 116
PVR/PVRI 162
Q
QRS tone 129
changing volume 31
QRS tone pitch, SpO2 141
QRS volume, changing 95
quick admit 78
quick mount release symbol 328
R
radiated field immunity
Resp 134
rate adaptive pacemakers
and ECG monitoring 106
ratemeter (drug calculator) 279
RCW/RCWI 162
realtime recording 259
realtime report 274
realtime reports
content 270
reconnecting a module 9
recorder 257
4-channel 258
cleaning the print head 295
paper accessories 324
recorder module connector 333
recorder status messages 265
recording
alarm 259
annotation 262
battery status 300
beat-to-beat 259
C.O. measurements 169
central 258
changing recording type 261
channels 261
choosing recorder 261
choosing recording speed 261
context 259
creating templates 260
delayed 259
drug calculations 280
ECG gain 261
extending 259
high resolution 259
local 257
preventing fading ink 263
procedure 259
realtime 259
recording strip 262
recording strip code 262
reloading paper 264
runtime 261
setting the runtime 261
setup menu 260
ST segments 119
starting and stopping 258
types 259
wave overlap 261
wave scale 261
waveforms recorded 263
wedge 159
with the plug-in recorder 257
recording delay time 261
recording events 251
reference waves, wedge measurement 158
refresh 34
rejecting pace pulses 92
related products
power-on LED 8
problem LED 8
switching on 8
relearning arrhythmia 111
reloading recorder paper 264
remembraning tcGas transducer 197
reminder, alarm 44
remote alarm device
alarms
remote device 7
remote applications
minimize 34
refresh 34
using 33
window size 34
remote SpeedPoint 16
removing a module 9
replacing batteries 301
repolarization tails 94
report
cardiac output 275
event review 254
reports
alarm limits 273
battery reports 300
calculations 237
choosing paper size 270
contents 272
drip table 280
drug calculator 280
ECG 276
end case 269
loops 292
patient trends 228
realtime report 274
re-routing 271
scheduled 269
setting up 268
ST map 125
stopping printouts 268
titration table 280
trends 225
re-routing reports 271
resampling vitals 234
resolution
trends 227
resolving patient mismatch 82
resp accessories 309
Resp alarms
apnea alarm delay time 134
Resp detection level
and apnea detection 134
Resp detection modes
and cardiac overlay 133
changing 132
Resp display 132
Resp monitoring
and cardiac overlay 131
Resp safety information 134
Resp wave
changing size 133
changing speed 134
respiratory loops
source device 291
restarting paused alarms 46
results table (C.O.) 163

ix
re-triggering events 245
retrolental fibroplasia (SpO2) 140
review
calculations 235
reviewing alarm messages 50
reviewing alarms 50
reviewing alarms window 50
RH method
computation constant 169
rhythm status messages (arrhythmia
monitoring) 110
right heart thermodilution method
(C.O.) 168
right heart thermodilution setup
(C.O.) 168
rs-232 interface symbol 328
rule of six 278
runtime
setting recording runtime 261
RVSW/RVSWI 162
S
safety
maintenance interval 306
monitor 336
safety information
batteries 303
BIS 221
C.O./CCO 173
ECG 105
Resp 134
safety test 365
same patient data merge 84
scale
ECG wave 94
Resp wave 133
scales
for trends waveforms 227
scheduled reports 269
screen
adjusting brightness 31
disabling touch operation 15
elements 15
using a second display 23
screen trend
trend time 230
screen trends 229
screens
changing 22
changing content 22
understanding 22
visitor screen 24
secondary lead (ECG)
selecting 92
SEF (spectral edge frequency) 207
SEF numeric (BIS) 215
on/off 220
selecting the primary lead (ECG) 92
selecting the secondary lead (ECG) 92
selftest
alarms 52
sensor
disposable SpO2 137
sensor temperature
tcGas 196
serial LAN interface 329
serial/MIB connector symbol 328
service mode 21
set combiners 311
setting the arterial catheter constant
(PiCCO) 166
setting the computation constant (RH) 169
setting up
trends 225
setting up reports 268
settings
about 26
default 369
measurement settings 26
monitor settings 26
screen settings 26
settings blocks 24
setup key, module 9
setup menu, module 9
setup menu, MP20 30 40 50 15
Setup Recording menu 260
short yellow alarms 105
signal quality index numeric (BIS) 215
signal quality of SpO2 139
sinus and SV rhythm ranges 350, 352
site timer
tcGas 196
skin preparation
ECG 91
EEG 208
SmartKeys 18
smoothing rate (BIS) 220
snapshots
events 243
source device
loops 291
specifications 325
arrhythmia 348
spectral edge frequency (SEF) 207
spectral edge frequency numeric (BIS) 215
speed
recording 261
wave speed, changing 27
SpeedPoint 16
SpeedPoint, remote 16
SpO2
accessories 313
active alarm source 141
alarms specific to 140
arterial pulsation 137
assessing suspicious reading 139
calculating difference between
values 141
connecting the cables 138
disposable sensors 137
dual SpO2 141
extension cable 138
FAST technology 137
Nellcor adhesive sensors
(disposable) 313
perfusion indicator 137, 138, 141
Philips sensors (disposable) 313
Philips sensors (reusable) 313
pleth as alarm source 141
pleth wave 140
pleth waveform 137
pulse numerics 138
QRS tone 141
signal quality 139
site inspection 139
site selection 137
tone modulation 141
SpO2 desat alarm 140
SpO2 limit alarms 140
Sp-vO2 206
SQI numeric
on/off 220
SQI numeric (BIS) 215
SR numeric (BIS) 215
on/off 220
ST
adjusting alarm limits 122
alarms 104, 122
baseline, updating 119
ensuring diagnostic quality 117
filtering 117
measurement points, adjusting
adjusting 120
multi-lead alarms 122
numerics in ECG wave 93
snippets 118
ST display 118
ST map
baseline, updating 125
current view 122
report, printing
printing
ST map report 125
scale, changing

x
scale
ST map 125
task window 124
trend view 123
trending interval, changing 125
trending priority 124
ST maps 122
ST point 120
standard 10-lead placement 100
standard 3-lead placement 98
standard 5-lead placement (ECG) 98
standardized rate 277
standby symbol 328
starting monitoring 33
status line 14
status log
printing 307
status messages
printer 272
recorder 265
status messages (arrhythmia) 110
ectopic 111
rhythm 110
sterilizing
infection control 293
stopping reports printouts 268
suppression ratio (BIS) 215
surgical ECG cable 106
suspended alarm 45
suspicious SpO2 reading 139
SV/SI 162
SvO2
accessories 323
alarms 204
calibration equipment 203
catheter insertion 205
catheter preparation 204
Hospira, accessories 203
in-vivo calibration 206
light intensity calibration 205
measurement principle 203
monitoring 204
SVR/SVRI 162
switching on
monitor 32
symbols 328
battery 298
synchronization marks (defibrillator) 93
system pulse 127
systolic blood pressure, NBP, early 146
T
tabular trends 224
Tamb 150
task window for ST map 124
Tcereb 150
tcGas 195
sensor temperature 196
transducer, calibrating 199
transducer, remembraning 197
tcGas site timer 196
technical alarms messages
see INOPs 59
temperature 149
accessories 318
alarm settings 149
connecting probe to monitor 149
difference, calculating 150
dual Temp measurement 150
extended label set 150
first 150
label 149
making a measurement 149
probe, disposable 149
probe, selecting 149
second 150
tcGas sensor 196
temperature probe
connecting 149
templates
creating for recordings 260
testing alarms 52
time, setting 31
Tinj Probe Type 165
titration table (drug calculator) 280
tone configuration, alarm 42
tone mod (SpO2) 141
tone modulation 141
total power (TP) 207
total power numeric (BIS) 215
touch tone volume 31
touchscreen 15
disabling 15
TP (total power) 207
TP numeric (BIS)
on/off 220
trackball connector 332
trackball, using 17
trademarks 327
transcutaneous gas measurements 195
transducer
CO2, accuracy 179
CO2, calibrating 180
pressure, zeroing 152
tcGas, calibrating 199
tcGas, remembraning 197
transferring centrally-monitored
patients 80
transferring patients with MMS 81
transport brightness setting 302
trend time 230
global 230
trend view
ST map 123
trending interval
ST map 125
trends
automatic unit conversion 236
automatic value substitution 236
database configuration 229
resolution 227
screen trends 229
setting parameter scales 227
setup 225
viewing 223
trends pop-up keys 225
trends priority list 227
ST map 124
trigger conditions
events 245
triggers
for events 244
troubleshooting
CO2 183, 192
trunk cables
accessories 309
Ttymp 150
Tvesic 150
Tyco Healthcare Group LP 327
U
unfiltered ECG signal 96
unplugging a module 9
upgrading
effect on EEG configuration 214
user interface settings
changing 31
V
V electrode placement (ECG) 99
venous puncture 147
ventilation calculations 233
viewing arrhythmia waves 109
viewing trends 223
visible waves report 270
visitor screen 24
vislatching (arrhythmia alarms) 113
vital signs
recording 225
report 225
vital signs report 228

xi
volume
alarm 43
touch tone volume 31
volume-flow loops 289
VueLink
alarm messages 283
device driver conflicts 284
language conflicts 284
module 281
module options 281
module setup 282
visible waves and numerics 281
W
warnings 1
wave
adjusting 27
changing speed 27
scale (CO2) 183, 192
scale (pressure) 154
size (CO2) 183, 192
size (pressure) 154
wave channel speed 28
wave group speed 27
wave scale (EEG)
changing 220
wave size
Resp 133
wave size (ECG)
changing 94
wave speed
eeg speed
wave speed
global speed 27
respiratory speed 27
wave speed (EEG) 213
wave speed (Resp) 134
wedge
balloon inflation 159
editing 159
printing 159
pulmonary artery 158
recording 159
reference waves 158
what’s new 35
wide alarms limits 49
wired network connection symbol 328
wireless device connection symbol 328
Y
yellow arrhythmia alarms 113
yellow arrhythmia alarms on/off 113
Z
zero
effect on pressure alarms 153
zeroing
pressure transducer 152

xii
