PowerOneData AMS-9000 AMS-9000 Hub User Manual
PowerOneData Inc. AMS-9000 Hub Users Manual
Contents
- 1. Users Manual
- 2. Starter Kit Information
Users Manual

AMS-9000
Advanced Metering System
Manual
March 14,
2006

SYSTEM OVERVIEW
Version 1.1 Preliminary 3/14/06 Page 2 of 36
REVISION HISTORY
VERSION DESCRIPTION DATE
1.0 Preliminary Release February 16, 2006
1.1 Added RF Exposure Information March 14, 2006

SYSTEM OVERVIEW
Version 1.1 Preliminary 3/14/06 Page 3 of 36
TABLE OF CONTENTS
CHAPTER 1...................................................................................................................................... 5
System Overview........................................................................................................................... 5
1.1 Introduction........................................................................................................................... 5
1.2. AMS-9000 System Architecture.......................................................................................... 7
1.3. Database System Architecture............................................................................................. 8
1.4. Configuring the Meters........................................................................................................ 9
1.5. Hardware Overview........................................................................................................... 10
CHAPTER 2.................................................................................................................................... 12
Cellular Modem Description......................................................................................................12
CHAPTER 3.................................................................................................................................... 13
Hub Installation .......................................................................................................................... 13
CHAPTER 4.................................................................................................................................... 14
Client Configuration................................................................................................................... 14
CHAPTER 5.................................................................................................................................... 15
Cluster Configuration................................................................................................................. 15
CHAPTER 6.................................................................................................................................... 16
Programmable Parameters........................................................................................................ 16
CHAPTER 7.................................................................................................................................... 17
Notes............................................................................................................................................. 17
Note 1: Rate Config: Byte Definition...................................................................................... 17
Note 2: Demand Config: Byte Definition................................................................................ 17
Note 3: Remote Disconnect/Connect Command Values......................................................... 17
Note 4: Link Definition Table Format..................................................................................... 18
Note 5: Custom LCD Message Table Format.......................................................................... 18
Note 6: Display Message Structures Format ........................................................................... 19
Note 7: Clear Registers Command .......................................................................................... 19
CHAPTER 8.................................................................................................................................... 20
TOU Data Structure ................................................................................................................... 20
8.1. Rate Schedules................................................................................................................... 20
8.2. Calendar Schedules: Total Bytes is 203(max)................................................................... 22
8.3. TOU_EVENT_CONFIG & DEMAND DURATION....................................................... 23
8.4. Byte Format ....................................................................................................................... 24

SYSTEM OVERVIEW
Version 1.1 Preliminary 3/14/06 Page 4 of 36
CHAPTER 9.................................................................................................................................... 25
Basic Operation........................................................................................................................... 25
9.1. Hub Field Installation and Power Up................................................................................. 25
9.2. Client Field Installation and Power Up.............................................................................. 26
9.3. Power Fail.......................................................................................................................... 27
9.4. Roll Call............................................................................................................................. 27
9.5. Standard Upload................................................................................................................. 28
9.6. General Meter Status Messages......................................................................................... 28
CHAPTER 10.................................................................................................................................. 30
LCD AMS-9000 Maintenance Display Status Codes............................................................... 30
10.1. Link Status Display Codes (3rd digit)............................................................................... 32
CHAPTER 11.................................................................................................................................. 33
Replacing a Meter....................................................................................................................... 33
11.1. Replacing a Hub Meter.................................................................................................... 33
11.2. Replacing a Client Meter ................................................................................................. 33
CHAPTER 12.................................................................................................................................. 34
Calibration................................................................................................................................... 34
CHAPTER 13.................................................................................................................................. 35
Zeroing the Meter....................................................................................................................... 35
APPENDIX...................................................................................................................................... 36
Regulatory Information.............................................................................................................. 36

SYSTEM OVERVIEW
Version 1.1 Preliminary 3/14/06 Page 5 of 36
CHAPTER 1
System Overview
1.1 Introduction
1.1.1. The AMS-9000, Advanced Metering System, is an under-glass, two-way,
battery-free electricity metering system that employs wireless communications
technologies to provide utilities with a cost-effective AMI alternative that is
feature rich and extremely simple to install and maintain.
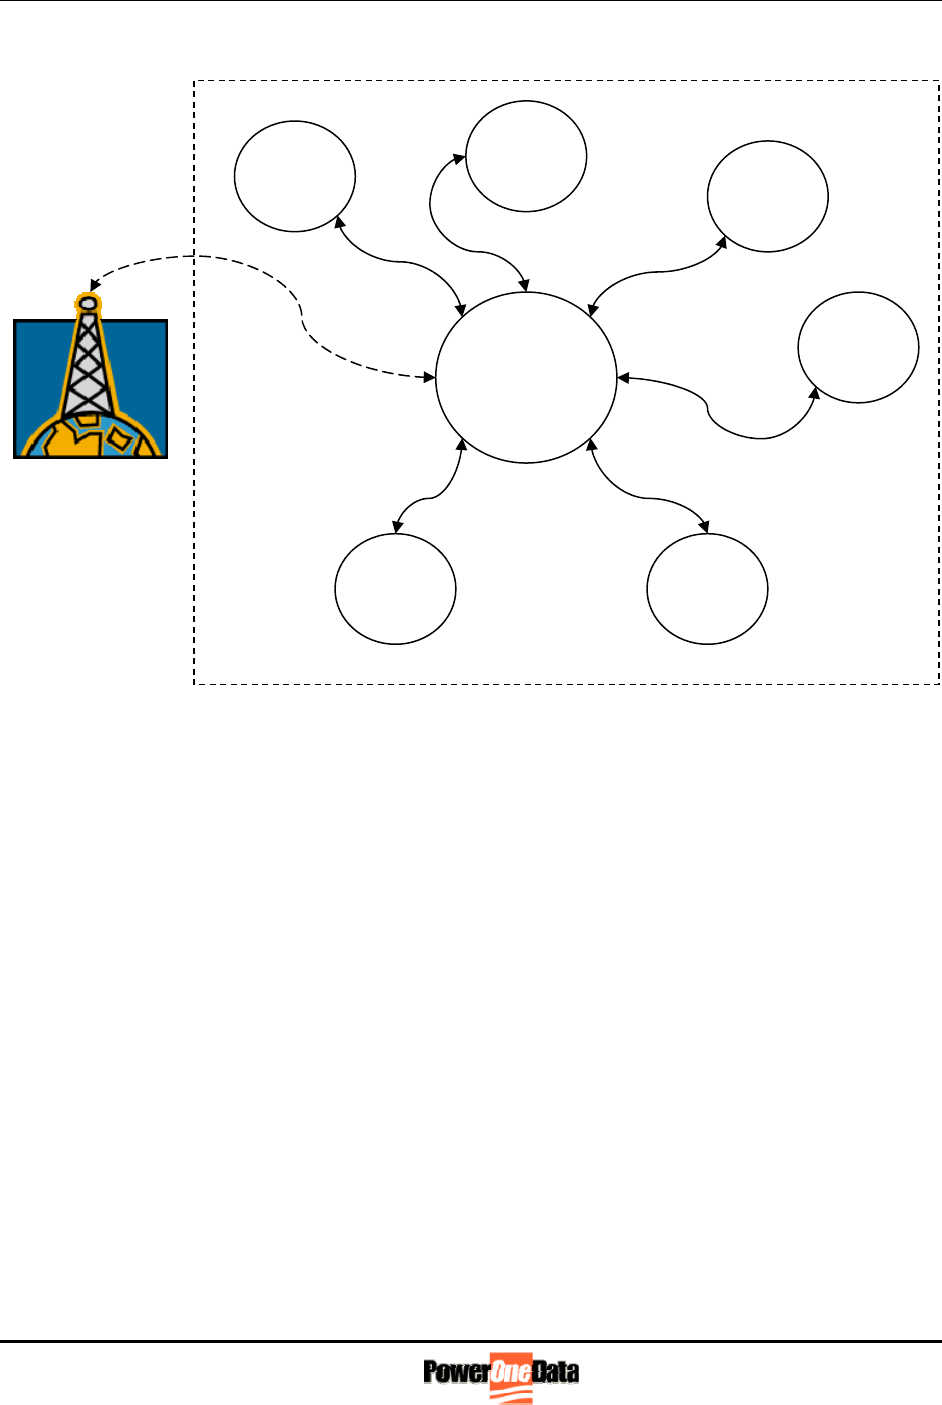
1.1.2. AMS-9000 Communications are organized in a star topology. Hub meters act as
an interface between large volumes of less expensive Client meters and the Host
system, and are fitted with cellular modems (GSM/GPRS) and 900MHz ISM band
radios. The more plentiful Client meters contain the 900MHz ISM band radio.
Multiple Client meters automatically associate themselves with a Hub meter into
groups known as “clusters”.
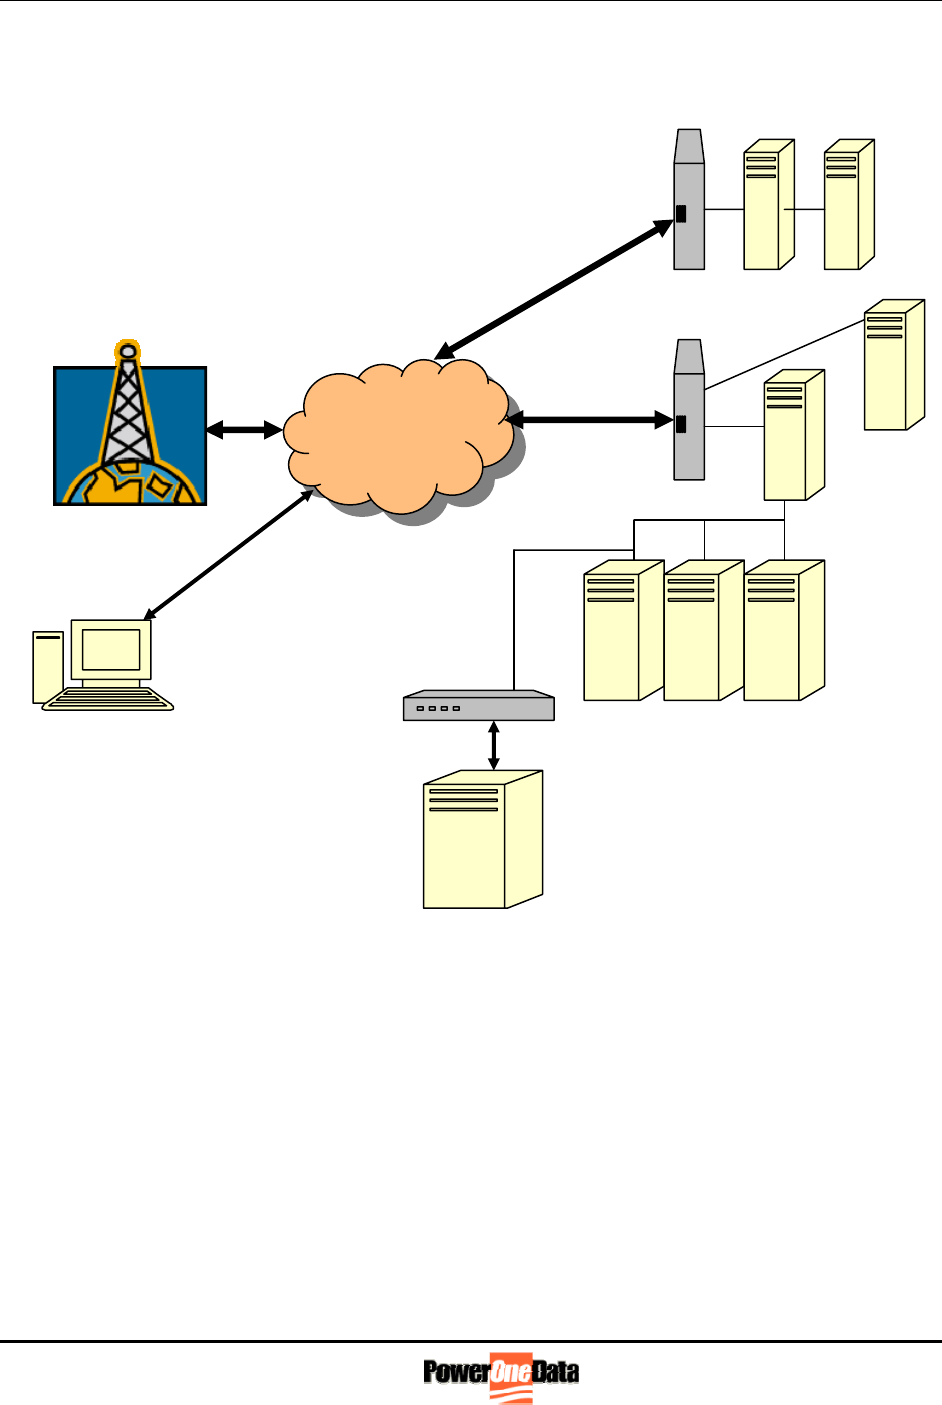
1.1.3. The system is further comprised of a remote database server (AMS-DB) running
Microsoft SQL Server connected to the Internet (or to the Utility and the cellular
phone provider) via secure connections. During standard (daily) uploads, and on
specific events, the cluster calls into the database server to report consumption
readings and any recordable events. The database will send any new information
and commands applicable back to the meters. Typical commands would include,
but not be limited to, synchronization of system time, and reset of one or more
Demand registers within a meter. The configuration of the meters is controlled by
the AMS-DB. Any new information can be sent to change rate plans or to switch
the available Whole House Disconnect Relay as necessary.
1.1.4. Each electricity meter in the AMS-9000 system is a full function
kWh/Demand/TOU billing quality meter. Interruptions to meter network
communication have no effect on individual meters’ ability to accurately perform
their metering billing functions. All meters have real time clocks whose power
supplies are maintained during power outages using super-capacitors. No
batteries are required to operate the system.
1.1.5. The meters are capable of recording kWh only in a flat rate plan or can be
configured to operate as Time-Of-Use meters. The configuration is kept within the
meter in non-volatile memory (FRAM - Ferroelectric Random Access Memory)
and new rate plans can be downloaded from the database server.
1.1.6. Every meter is capable of storing interval data (down to 15 minute intervals)
and internally maintains data for the last 35 days. In addition, each day at

SYSTEM OVERVIEW
Version 1.1 Preliminary 3/14/06 Page 6 of 36
midnight, the meter takes a snapshot of the active register values (i.e. Total kWh,
On Peak kWh, On Peak kW) and stores this information, along with a time/date
stamp in non-volatile memory.
1.1.7. At installation the Hub meters will be deployed first (typical ratio of one per 30
Client meters) and then the Client meters will be installed afterwards. When the
Hub is placed in the field it will power up and send a message to the database
indicating its condition and synchronize its real time clock with the server.
Subsequently, when Client meters are installed they search for all Hubs in range
over the 900MHz radio. Algorithms determine the Hub with the best signal and
once located the Client “joins” that cluster. When a Hub is found the Client will
immediately synchronize its real time clock with the Hub (note that the Hub had
previously synchronized its time with the database server). Once the Client has
joined the cluster its sends a Power Up Message to the Hub over the 900MHz link,
which it in turn relays to the Database server via the cellular interface. If the
Database has any new information for the Client meter it will be sent back via the
cellular modem to the Hub and then on the 900MHz link to the Client meter.
1.1.8. Every meter has its own unique serial number individually identifying it to the
database. It is this serial number that is used as the primary key to the database.
During the manufacturing process, when the PowerOneData circuit board
assembly is installed into the meter (solid state or electromechanical), the meter
serial number and the silicon serial number are recorded and entered into the
AMS-9000 database. When the meter is set in the field at a customer premise
the meter number is recorded against the premise number or physical address.
This information is then added to the database making the specific relationship
between silicon serial number, meter serial number and premise number
(address).
SYSTEM OVERVIEW
Version 1.1 Preliminary 3/14/06 Page 7 of 36
1.2. AMS-9000 System Architecture
Client
Meter
Client
Meter
Client
Meter
Client
Meter
Client
Meter Client
Meter
Hub
Meter
LAN +
WAN
Cellular Network
WAN 900MHz
LAN
SYSTEM OVERVIEW
Version 1.1 Preliminary 3/14/06 Page 8 of 36
1.3. Database System Architecture
Utility VPN
Consumer
Firewall
Data Center
Firewall
Internet
GSM/GPRS
Cellular System
Backup Server Portal Server

SYSTEM OVERVIEW
Version 1.1 Preliminary 3/14/06 Page 9 of 36
1.4. Configuring the Meters
1.4.1 The AMS-9000 system is designed such that minimal configuration is required
before the meters are set in the field. There is a default rate plan programmed
into the meters that can be changed at time of order. If the rate plan needs to be
changed once the meter has been installed in the field then this can be done by
instructing the database server that a particular meter/premise requires new
information. The database stores this information in a file on the database server
by silicon serial number. The next time that a communication is received from
that meter, the database will determine that new data is available for that
specific meter and send it over the communications link. The new rate plan
information is sent with an effective date. Just past midnight on that day the rate
plan will become active and the meter will change its accumulation processes to
follow the new rate plan. When the rate plan goes into effect the meter makes an
entry into its Event Log. The Event log is uploaded to the database server each
night during the standard upload process.

SYSTEM OVERVIEW
Version 1.1 Preliminary 3/14/06 Page 10 of 36
1.5. Hardware Overview
1.5.1 The AMS-9000 system board is essentially the same for the Hub and Client
meters. The foundation of the system is a 16-bit microcontroller running at
15MHz with up to 256kB of FLASH memory and up to 20kB of RAM. In
addition there is 16kB of EEPROM that is used for system configuration
information, consumption registers and up to 35 days of interval data. A real
time clock running from a 32kHz crystal synchronized to the database server is
backed up during power outages through the use of a super-capacitor. Time will
be maintained for up to 4 days during the absence of mains power
(resynchronization occurs at power up).
A liquid crystal display provides customer consumption and time/date
information on 0.6” high characters as well as diagnostics information during
communications operations by way of 3 small status digits. The contrast of the
display is maintained through changes in ambient temperature by the use of a
thermostat based temperature compensation circuit on the voltage bias of the
LCD.
The incoming 240VAC power is conditioned by the on-board power supply,
which smoothes and regulates the DC rail. The DC rail charges 2 super-
capacitors that provide power in the event of loss of line voltage. Adequate
energy is stored for up to 45 seconds of operation allowing a power fail message
to be sent to the database server.
Three serial communication interfaces are provided: the Cellular Modem
(WAN), the 900MHz (LAN) and a diagnostics/factory programming port. The
processor is capable of duplex communications in real time on the two main
communications ports.
Client meters only have the 900 MHz radio installed and are firmware
programmed as Clients. The Hub meters have, in addition to the 900 MHz
radio, a GSM/GPRS cellular modem and are firmware programmed as Hub
meters.
In the system that uses the Itron CENTRON metrology, the AMS-9000 board
simply snaps into the meter base clips (replacing any previously installed Itron
Register) and interfaces to the metrology board via the AMP edge connector.
No other connections are required.
Metrology Interface Signals
LINE 1, LINE 2 - AC Line Power (240V or 120V)
+2.5V, -2.5V - DC Power
CAL - Pulse for every 1WH of measured consumption
SIGN - Low for positive consumption, High for negative
SYNC - 60Hz reference signal

SYSTEM OVERVIEW
Version 1.1 Preliminary 3/14/06 Page 11 of 36
LINE 1 and LINE 2 are the 240VAC connections. -2.5V is interfaced to the
AMS-9000 system low voltage 0V. The SIGN signal indicates if the meter has
been installed upside down, that is, energy is not flowing in the expected
direction.
The CAL signal pulses once (10ms) for each 1 Wh of electricity consumption.
These pulses are accumulated by the AMS-9000 system to produce the register
values and the interval data.
Monitoring circuits are provided on the board such that the system can determine
of there has been a loss of line voltage. Also monitored is the 5V rail so that the
system does not attempt to operate with incorrect system voltages.
The microcontroller incorporates a hardware watchdog circuit that once activated
must be retriggered (by software) every 100ms or sooner or it will cause the
system to go through a full system reset. The feature has the effect of continually
monitoring operation of the embedded firmware. Should the program get “stuck”
at any point then the watchdog will time out, forcing the system to restart. Note
that the software is set up such that every 15 minutes all critical data is
stored to EEPROM and it is from here that system operations will be
restored after the reset condition.

MODEM DESCRIPTION
Version 1.1 Preliminary 3/14/06 Page 12 of 36
CHAPTER 2
Cellular Modem Description
The GSM/GPRS Modem is capable of establishing a TCP/IP connection to a remote computer.
Once this connection is established data can pass freely between the AMS-9000 Hub and the
remote Host computer. No external configuration is required for the modem.

HUB INSTALLATION
Version 1.1 Preliminary 3/14/06 Page 13 of 36
CHAPTER 3
Hub Installation
Hub meters can be installed in any suitable socket and there are no special requirements beyond
requiring that cellular GSM/GPRS signal is present at that location. Each hub is capable of
supporting up to maximum of 100 Client meters. However it is recommended that average
cluster sizes be of 30-40 meters and Hub meters be installed in sufficient numbers so that each
Client can “hear” at least two Hubs. The 900MHz radios have an average urban range of 600-
700ft. In areas such as apartment complexes, higher numbers of Clients can be operated on each
Hub due to the closer proximity of the meters to each other. In some cases a Hub meter may
have few or no Clients if the premise density is very low.
***As with any AMR system it is extremely import to
note the meter serial number that is placed on any given
residence or premise. The PowerOneData AMS-DB
database already has the relationship between meter
serial number and silicon serial number but has no idea
where the meter is installed. After the field installation
order is completed, the premise to meter number
relationship must be fed back to AMS-DB in order to
bill the correct electrical consumption to the
corresponding customer.
IMPORTANT

CLIENT CONFIGURATION
Version 1.1 Preliminary 3/14/06 Page 14 of 36
CHAPTER 4
Client Configuration
Client meters require no configuration before installation in the field.

CLUSTER CONFIGURATION
Version 1.1 Preliminary 3/14/06 Page 15 of 36
CHAPTER 5
Cluster Configuration
There are no settings that need to be made before meters are set in the field. Field deployment is
planned such that there is one Hub for every 30-40 meters. It is recommended that Hubs be
placed in accessible locations that are not unduly screened by porches or canopies if possible, as
this will give the system a longer range. Ideally the 600-700’ range will allow each Client to be
in range of at least two Hubs. With this arrangement, if a Client should lose communications
with its initial Hub, it will be able to find a new Hub during the daily Roll Call at 09:30pm.
Once a Client misses daily Roll Call, the Client meter will search for and join a second Hub that
is in range. The Client will remain part of this cluster until such times (if ever) that it misses roll
call again and seeks out a new Hub once more.
Each time a Client joins a cluster, information is sent to the AMS-DB updating the Client meter
record with its new associated Hub number.

PROGRAMMABLE PARAMETERS
Version 1.1 Preliminary 3/14/06 Page 16 of 36
CHAPTER 6
Programmable Parameters
Command Parameter Note
1 New interval value with Effective Date (H, C) Interval/D/M/Y
2 Time to call to Start Standard Upload (H)
4 Host IP 1 address, Port Number (H) Add – 4 Port - 2
5 Host IP 2 address, & Port Number (H) Add – 4 Port - 2
6 Generate new random Time to Call (H)
7 TOU Rates and Season Dates
8 TOU Schedule Effective Date D/M/Y/PlanID
9 Holiday Dates
10 Effective Date D/M/Y
11 Reset Configuration
14 Rate Configuration Flag See Note 1 Below
15 Billing Date D/M
16 Event Notification Flag
17 Demand Config/Demand Duration See Note 2 Below
18 DST (Effective month/date & enable / Disable)
19 GPRS Access Point Name
20 Demand Reset
21 Remote Disconnect See Note 3 Below
22 Cluster Channel
23 Cluster ID System ID, Cluster ID
24 Cluster Redistribution Enable/Hour/Minute
25 Public Link Parameters See Note 4 Below
26 Private Link Parameters See Note 4 Below
27 Roll Call Time Hour/Minute
28 Schedule Label
29 Custom LCD Message Table
30 Display Message Structures See Note 6 Below
31 Custom Display Message 1 Raw LCD Data
32 Custom Display Message 2 Raw LCD Data
33 Clear Registers Command See Note 7 Below
34 Trigger Standard Upload (Hub Only)
35 Premise ID Raw Format
36 Interval Data Upload Enable 0xff == Enable
0x00 == Disable
37 Meter ID (from faceplate) Raw Format
* - Time is in the format as sec:min:hour:date:month:year:day of week
** - 8 Seasons are possible. Each Season can have 4 rate schedules per day. Each rate Schedule
may have 50 bytes maximum, 48 bytes for data, one byte for season & rate schedule info and
another byte is for end of schedule info. For details refer to the following protocol...
*** - Holiday Dates indicates how many holidays per year & the date of each holiday

NOTES
Version 1.1 Preliminary 3/14/06 Page 17 of 36
CHAPTER 7
Notes
Note 1: Rate Config: Byte Definition
1 = Rate is used in the year
0 = Rate is not used in the year
Bit 0 = ON Peak (YEAR1)
Bit 1 = OFF Peak (YEAR1)
Bit 2 = SH1 Peak (YEAR1)
Bit 3 = SH2 Peak (YEAR1)
Bit 4 = ON Peak (YEAR2)
Bit 5 = OFF Peak (YEAR2)
Bit 6 = SH1 Peak (YEAR2)
Bit 7 = SH2 Peak (YEAR2)
Note 2: Demand Config: Byte Definition
Bit 0 = B
Bit 1 = M
Bit 2 = D
Bit 3 = X
Bit 4 = X
Bit 5 = X
Bit 6 = X
Bit 7 = X
D,M,B as defined previously
Note 3: Remote Disconnect/Connect Command Values
SCHEDULED_DISCONNECT_POWER 1
SCHEDULED_CONNECT_POWER 2
IMMEDIATE_DISCONNECT_POWER 3
IMMEDIATE_CONNECT_POWER 4
SCHEDULED_AUTO_CONNECT_POWER 5
IMMEDIATE_AUTO_CONNECT_POWER 6

NOTES
Version 1.1 Preliminary 3/14/06 Page 18 of 36
Note 4: Link Definition Table Format
Offset Definition
0 scenario retry interval (minutes between scenarios)
1 scenario retry range (possible deviation from interval)
2 socket retry limit (while connecting)
3 socket retry limit (after connection)
4 socket retry delay (seconds before retransmit)
5 socket auto ack delay (seconds from receive to auto-ack)
6 socket ack resend delay (seconds from receive to re-ack)
Note 5: Custom LCD Message Table Format
Message Number Type
00 Blank
01 Total
Message Number Type
02 On Peak
03 Off Peak
04 SH1
05 SH2
06 Total Demand
07 On Peak Demand
08 Off Peak Demand
09 SH1 Demand
10 SH2 Demand
11 Date
12 Time
13 Total Demand Time
14 On Peak Demand Time
15 Off Peak Demand Time
16 SH1 Demand Time
17 SH2 Demand Time
18 Schedule Label
19 All Segments On
20 Custom Display 1
21 Custom Display 2

NOTES
Version 1.1 Preliminary 3/14/06 Page 19 of 36
Note 6: Display Message Structures Format
20 Structures of 4 bytes each, with the following structure format:
Byte 1: Unit
00 = None
01 = kW
02 = kWh
03 = H
Byte 2: Parameter
00 = None
01 = Total
02 = On Peak
03 = Off Peak
04 = SH1
05 = SH2
Byte 3: Status MSB
Raw LCD data, most significant digit of two-digit display
Byte 4: Status LSB
Raw LCD data, least significant digit of two-digit display
Note 7: Clear Registers Command
Command Value
Clear all registers 0x10
Clear all registers except total 0x20
Do not clear registers 0x30

TOU DATA STRUCTURE
Version 1.1 Preliminary 3/14/06 Page 20 of 36
CHAPTER 8
TOU Data Structure
8.1. Rate Schedules
8.1.1. Data >>>>> N Bytes
Max of 200 bytes per season, if there are 4 day schedules possible per season
and each day schedule has 4 rate schedules in it. If this is the case, then the
following data bytes including End Of Schedule byte, will be given for each
day schedule. And for the next season, a new packet should be sent from HOST
/ PALM.
Data 1:
¾ Season & schedule info >>>>> 1 Byte
This Byte will have the information regarding which day
schedule it is and for which season. The bit format is as
Y ____ 0 - Current Year
1 - Next Year
SSS ____ 000 _ For Season1
001 _ For Season2
|
111 _ For Season8
RR ____ 00 _ Weekday Schedule
01 _ Saturday Schedule
10 _ Sunday Schedule
11 _ Holiday Schedule
D7 D6 D5 D4 D3 D2 D1 D0
0 0 Y S S S R R

TOU DATA STRUCTURE
Version 1.1 Preliminary 3/14/06 Page 21 of 36
Data 2:
¾ Rate Schedules >>>>> M Bytes
Four Time Frames are possible for each Rate Schedule and
there are Four rate schedules such as ON, OFF, SH1 and SH2.
Each Time Frame consists of a Start Time and the Rate Code. Each
of these time consumes 2 Bytes ( hh : mm ). The first time starts
with 00:00, followed by the Rate Code. This consumes 3 bytes and
if there is ‘n’ number of Rate schedules, then the total number of
bytes in the packet, will be n*3. After the final Rate schedule is
entered, end the message packet with the EOS. For example, if
there is 4 Time frames for a Rate Schedule, then the total number
of bytes in the packet will be ( 3*4*4 ) 48 bytes.
8.1.2. Rate Schedule Codes:
01 – ON time
02 – OFF time
03 – SH1 time
04 – SH2 time
The time should be entered in an increasing fashion. For example,
(the first time entry is always 00:00),
00:00 04, 09:00 01, 12:00 03, 17:00 02, 19:00 01 21:00 02
could be a possible entry. This implies that,
00:00 hours – 09:00 hours – SH2 Rate Schedule
09:00 hours – 12:00 hours – ON Rate Schedule
12:00 hours – 17:00 hours – SH1 Rate Schedule
17:00 hours – 19:00 hours – OFF Rate Schedule
19:00 hours – 21:00 hours – ON Rate Schedule
21:00 hours – 00:00 hours – OFF Rate Schedule
The start time of the next Rate Schedule is the end time of the
previous one.

TOU DATA STRUCTURE
Version 1.1 Preliminary 3/14/06 Page 22 of 36
¾ End Of Schedule >>>>> 1 Byte
May be 0xFF
¾ Checksum >>>>> 2 Bytes
CRC checksum.
8.2. Calendar Schedules: Total Bytes is 203(max)
8.2.1 There can be a maximum of Eight - season information. Season info will contain
information regarding the season starting dates. The start of one season specifies
the end of previous one.
8.2.2. Maximum of 22 Holidays are possible. The date, month and year of holidays are
given. Season & Holiday information for 2 years is given in a single
communication.
8.2.3. The Byte format is as,
¾ Date of Start of a Particular Season >>>>> N Bytes
The Date, at which a particular season begins, should be
given. All the Seasons begin at 00:00 Hrs of the specified date. A
date code consists of 3 Bytes as Year : Month : Date followed by
the Season Code. For 8 Seasons ( max ), the total bytes are 32.
Since there is 2 year’s info( Current year followed by the next year
) it occupies 67 bytes ( max ). Last 3 bytes have the end date of the
last season.
¾ End of Season ( EOS ) >>>>> 1 Byte
After all the entries for that year, are over, the Season
information should be terminated by this byte.
----- May be 0xFF -----
¾ Holiday Dates >>>>> M Bytes
The absolute date of a holiday is given. Max of 22 Holidays
are possible per year. Since a date code consumes 3 bytes ( year :
month : date ), for 22 days, and for 2 years it is 132 bytes.

TOU DATA STRUCTURE
Version 1.1 Preliminary 3/14/06 Page 23 of 36
¾ End of Holiday ( EOH ) >>>>> 1 Byte
After all the entries are over, the Holiday information
should be terminated by this byte.
----- May be 0xFF -----
¾ Checksum >>>>> 2 Bytes
CRC checksum.
The following example explains how the season info and holiday info are sent...
Consider, there are 8 seasons (4 seasons per year) and there are 4 holidays per year.
1. For 2001 & 2002
01:03:08 01 01:06:20 02 01:09:15 03 01:11:05 04 02:03:18 01 02:06:01 02 02:09:20 03
02:11:10 04 03:03:05 FF 01:01:01 01:07:04 01:11:24 01:12:25 02:01:01 02:07:04 02:11:22
02:12:25 FF CRC
And for 2002 & 2003, part of 2001 & 2002 season info is seen with the new dates for 2003.
This is to make easy the comparison for dates in the S/W. The Numbers in BOLD, are the
Season Codes and the EOS / EOH.
8.3. TOU_EVENT_CONFIG & DEMAND DURATION
8.3.1. The demand info contains the type of demand, whether a straight demand or a
rolling demand. Demand is nothing but the highest count in a particular time
frame. The maximum value in the ON TOU time is considered as ON PEAK
Demand, the maximum value in the OFF TOU time, is considered as OFF PEAK
Demand and so on. The maximum value, irrespective of time frame and day
schedules, in any day, is considered as TOTAL PEAK Demand.
8.3.2. All these values are stored in separate memory locations. This storage of values is
mainly used for Tariff calculations. This demand duration should be in multiple of
that corresponding TOU time frame. For Example, the time frame of ON time of a
particular day is 3.5 hours; the demand duration of ON peak demand should not
be greater than 3.5 hours and not in multiple of 1 hour. It should be 15 minutes or
30 minutes so that it will cover the entire 3.5 hours slot. And it should not be less
than the interval time.

TOU DATA STRUCTURE
Version 1.1 Preliminary 3/14/06 Page 24 of 36
8.4. Byte Format
¾ TOU_EVENT_CONFIG FLAG >>>>> 1 Byte
D7 D6 D5 D4 D3 D2 D1 D0
E D M B R R R R
EDMBRRRR – E -
D – If 0, Demand Calc OFF
If 1, Demand Calc ON
M - If 1, Demand is Moving (Rolling) Demand
B - If 1, Demand is Block Demand
RRRR – Indicates ON peak TOU Calc (LSB), OFF peak TOU Calc,
SH1 TOU Calc & SH2 TOU Calc (MSB). If 1, indicates
the presence.
¾ Demand Duration >>>>> 1 Byte
Gives the demand duration in minutes
¾ Checksum >>>>> 2 Bytes
CRC checksum.

BASIC OPERATION
Version 1.1 Preliminary 3/14/06 Page 25 of 36
CHAPTER 9
Basic Operation
9.1. Hub Field Installation and Power Up
9.1.1. Configuration
Hub meters are labeled HUB on the front panel.
Hub meters are shipped with a default TOU program (9-9 On Peak, M-F. Off Peak
Weekends) with 1hr block demand for On Peak periods. The meter self-selects its
900MHz Channel set and cluster ID. Similarly, there is no configuration required for
the GSM/GPRS WAN interface.
9.1.2. Installation
Remove existing meter from socket. Install AMS-9000 Hub meter. Unit will power
up going through the following sequence:
All segments on.
Display of Silicon ID – first 6 characters
Display of Silicon ID – final 6 characters
The unit will then start its normal message scroll on the main display:
Time – 11:15:43
Date - 072604
Rate Plan Indicator – ETC-1R
Total kWh – 000023kWh
Peak kWh – 000006kWh
Peak kW – 02.7kW
9.1.3. Hub Power Up Message To Host
Once the Hub meter has gone through its power-on reset process, it initiates a Power
Up Message scenario with the Host. A public link data connection is established
using the GSM/GPRS modem to the Host. In order for the Hub to open up a
communication socket on the Host AMRUDP program it must authenticate itself to
the Host. This security measure ensures that only valid connections can be established
with the Host computer. Once authenticated, the Hub sends its power up message that
contains the silicon ID of the Hub along with the time and date of the event. Also
included in this message is the 900 MHz RF channel information and cluster
identifier byte. Once this message has been accepted by the Host then the current
time is returned to the Hub meter. If there are no pending power up messages from
Clients in the cluster managed by the Hub then the public link connection is closed,
else the Client power up messages are passed onto the Host. This power up window
remains open for 20 seconds. After the power up window closes AMRUDP looks to
see if there is any new information pending for download for any member of the
cluster. If there is, then this is now done and once acknowledged, the public link
connection is closed.

BASIC OPERATION
Version 1.1 Preliminary 3/14/06 Page 26 of 36
9.1.4. 3 Digit Display
The 3 digit display in the lower left corner of the LCD has 2 modes:
Normal Mode – left 2 digits indicate the Register Number currently displayed. The 3
digit will display a “walking segment” that moves each time a consumption pulse is
received from the metrology board. Note that the display is only updated every
250ms.
STATUS Mode – when the Status indicator is lit then the 3 digit display indicated the
progress state of the communications link. Chapter 9 shows the meaning of the Status
digits.
Once a successful public link communications scenario has been completed the
display will read 6P≡ if the connection was successful or 6F≡ if a failure occurred.
During a successful communications setting with the Host the Hub meter will receive
the updated time from the Hosts clock.
9.2. Client Field Installation and Power Up
9.2.1 Configuration
Client meters are labeled CLIENT on the front panel. Client meters are shipped
with a default TOU program (9-9 On Peak, M-F. Off Peak Weekends with 1hr
block demand for On Peak periods). No other communications settings or
configuration is required.
9.2.2. First Time Field Power Up
When the Client meter powers up it will cycle through the same displays as the
Hub (see above). Almost immediately the Client meter will go into Hub Search
Mode. In this mode the Client meter will broadcast a “Seeking Hub” message
over the 900MHz RF link. If a Hub meter hears this message then it will respond
and the Client will join the Cluster managed by the Hub. During this exchange the
Hub will send the current time to the Client meter.
Once the Client has found a Hub it will then send a Power Up Message to the
Hub. When the Hub receives this message it will open up a Public connection
(through the GSM/GPRS modem) to the Host. Once the link is opened, the Power
Up message will be passed through to the Host. The successful receipt of the
message will be acknowledged by the Host to the Hub which will then pass the
acknowledgement on to the Client.
The Hub waits for any other power up messages to be received for a period of 30
seconds and passes on any that are received.
Once the 30 second window closes the Host downloads the current time to the
Hub which acknowledges receipt of the message. Then the Hub asks the Host
application if it has any new information for any members of the cluster (meter
configuration, demand reset etc.). If there is “New Info” available then this is
downloaded and passed on to the appropriate Client meter.
Once this process is complete the connection with the Host is terminated and the
Status display will show 9P≡ if the transactions were successful.

BASIC OPERATION
Version 1.1 Preliminary 3/14/06 Page 27 of 36
9.2.3. After First Time Field Power Up
After the initial field power up and Cluster configuration the Client meters expect
to be able to find the same Hub that they previously contacted. In this case the
Client will attempt to immediately send its Power Up Message to its last known
Hub. The Communications protocol at the low level will attempt to open up a
socket with the Hub. If the Hub is not busy it will acknowledge the
communication with a message that includes an ACK and the current time. The
Hub will then open up a connection to the Host on the public link and relay the
Power Up message to the Host.
If the Hub is busy communicating with another meter it will acknowledge the
transaction with a Not Ready message and will send back the current time. In this
case the Client will wait for 1 minute and then try again.
Should the Client meter be unable to contact its previous Hub after 6 tries then it
will enter Hub search mode as described in First Time Power Up Section 9.2.2.
9.3. Power Fail
9.3.1. The power fail scenario on a Hub can be initiated from its local power sense or it
could be initiated from a Client that has detected its own power failure. On the
Hub, the first step is to cancel any currently active communications scenario.
On the Client, if power fail is sensed, a short delay is started. If the Hub is also
failing, it will send out a broadcast to synchronize the Client responses. Each
Client is assigned a period to delay after receiving the request, and before
transmitting its response. However, if the Client does not receive a broadcast from
the Hub, it sends a broadcast to get the Hub to start a power fail scenario. The
Client will still respond to the Hub’s broadcast later.
After the Hub collects power fail statistics from the Clients, the information is
passed on to the Host system on the public link. Once the message is completed
the Hub will close the public link and wait either for power to be restored or until
power from the super-capacitors is exhausted, at which point the display is blank
and the processor is put into a reset state.
9.4. Roll Call
9.4.1. At 9:30pm each day the Hub will carry out a Roll call, attempting to connect to
each of the Clients that had previously registered with that Hub. The Hub sends
an “are you there” message to each Client in turn. If a response is received, the
Hub then moves on to the next Client in its Clients table. If no response is
received then the Hub will retry 5 more times at 6 second intervals. After the 6
tries that Client is removed from the Clients table. This process continues until
communications have been attempted with all Clients in the table.
All Clients expect to receive a Roll Call message by 9:45pm. If they do not
receive the message by this time then they will enter Hub Search Mode looking
for a replacement Hub. Once they find a Hub they will join that cluster. Clients
remain in Hub Search mode until a Hub is found.

BASIC OPERATION
Version 1.1 Preliminary 3/14/06 Page 28 of 36
9.5. Standard Upload
9.5.1. The standard upload process will be performed daily and this is controlled by the
Hub such that data is collected and uploaded to the Host in an orderly manner.
When the Hub reaches its scheduled ‘Time To Call’ it establishes a public link
connection with the Host. Once the link is established it sends any of its pending
packets to the Host. Normally there would be only one packet for the prior day.
However, if communications had failed in recent days there may be up to a
months worth of packets (31 days). The packet contains a sequence to notify the
Host how many more packets to expect from this meter. There is also a flag,
added by the Hub, which indicates if this is the last known meter in the cluster.
Once the packets for the Hub have been sent, the Hub establishes a private link
connection with the first Client in its membership table. The Hub forwards the
packets from the Client to the Host.
When the Client packets have been sent, the private connection is closed and the
Hub starts processing the next Client. After packets for all meters have been sent,
the Host may have download packets (new info) that are destined for the Hub
and/or Clients.
For each new info packet that is destined to a Client, the private link is opened
with that Client. The packet is delivered, and the connection is closed.
When no more packets are available from the Host, a terminate packet is sent
from the Host.
9.6. General Meter Status Messages
9.6.1. If an exceptional event occurs during the day on a meter, (Back Rotate, Hardware
Error), the Host is notified. When the Client needs to send a message to the Host, it
opens a private connection with the Hub. The Hub in turn opens a public link
connection with the Host and the packet is routed from the Client through the Hub to
the Host. If the packet is successfully received an ACK is sent back to the Client
through the Hub and the connection is closed. If the Host does not successfully
acknowledge the packet the Hub will try up to 5 more times to send the message to
the Host. If it is still unsuccessful it will close the Public link and send a status
message NACK to the Client.
These status messages are also considered as events and will be entered into the event
log and sent to the Host as part of the daily standard upload.

BASIC OPERATION
Version 1.1 Preliminary 3/14/06 Page 29 of 36
The recorded events are:
9.6.1.1 Time Change
• Old Time/Date, New Time/Date, Update Type (PU, STD Upload, Host
Query)
9.6.1.2 Demand Reset
• Time/Date, Demand Value prior to reset
9.6.1.3 Reverse Rotate
• Time/Date
9.6.1.4 New Schedule Implemented
• Records the Time and Date at which the new schedule went into effect and
also saves active Register Values as of midnight on the day prior to
activation.
9.6.1.5 Remote Disconnect
• Time/Date action occurred, Action type: On, Off or customer confirmation
for button press
9.6.1.6 Hardware Error
• Time/Date, Type code for problem

LCD AMS-9000 MAINTENANCE DISPLAY STATUS CODES
Version 1.1 Preliminary 3/14/06 Page 30 of 36
CHAPTER 10
LCD AMS-9000 Maintenance Display Status Codes
HUB METER CLIENT METER
0
000
010
020
030
040
050
060
070
080
090
STANDRAD UPLOAD
START_UP
OPEN_PUBLIC
OPEN_PRIVATE
SEND_STD_HUB
SEND_STD_CLIENT
SEND_CLIENT_REQUEST
SEND_CLIENT_DECREMENT
SEND_CLIENT_ALERT
CLOSE_PRIVATE
SHUT_DOWN
0
010
020
030
040
050
080
090
STANDARD UPLOAD
START_UP
OPEN_PUBLIC
OPEN_PRIVATE
SEND_STD_CLIENT
SEND_NACK
CLOSE_PRIVATE
SHUT_DOWN
1
101
111
121
131
141
151
161
171
181
191
POWER UP
START_UP
HUB_OPEN_PUBLIC
CLIENT_OPEN_PUBLIC
OPEN_PRIVATE
SEND_HUB
SEND_CLIENT
SEND_CLIENT_ACK
CLOSE_PRIVATE
SEND_COMPLETE
SHUT_DOWN
1
101
111
121
131
141
151
161
171
181
191
POWER UP
START_UP
HUB_OPEN_PUBLIC
CLIENT_OPEN_PUBLIC
OPEN_PRIVATE
SEND_HUB
SEND_CLIENT
SEND_CLIENT_ACK
CLOSE_PRIVATE
SEND_COMPLETE
SHUT_DOWN
2 BACK ROTATE 2 2 BACK ROTATE
3 WATCHDOG 3 3 WATCHDOG
4 SYSTEM ERROR 4 4 SYSTEM ERROR
5
50
51
52
53
54
55
RELAY STATUS
START_UP
OPEN_PUBLIC
SEND_HOST
SEND_CLIENT
SEND_CLIENT_ACK
SHUT_DOWN
5
50
51
52
53
54
55
RELAY STATUS
START_UP
OPEN_PRIVATE
SEND_HOST
SEND_CLIENT
SEND_CLIENT_ACK
SHUT_DOWN

LCD AMS-9000 MAINTENANCE DISPLAY STATUS CODES
Version 1.1 Preliminary 3/14/06 Page 31 of 36
HUB METER CLIENT METER
6
60
61
62
63
64
65
66
67
68
69
NEW INFORMATION MANAGER
OPEN_PRIVATE
RCVD_HOST
SEND_HOST_ACK
SEND_HOST_NACK
SEND_CLIENT_MESSAGE
SEND_CLIENT_ALERT
SEND_CLIENT_RESPONSE
SEND_DATA_RESPONSE
CLOSE_PRIVATE
SHUT_DOWN
6
60
61
67
68
69
NEW INFORMATION MANAGER
STARTUP
RCVD_HOST
SEND_DATA_RESPONSE
CLOSE_PRIVATE
SHUT_DOWN
7
70
71
72
73
74
75
76
77
POWER FAIL
START_UP
OPEN_PUBLIC
OPEN_PRIVATE
SEND_CLIENT_BROADCAST
CLOSE_PRIVATE
SEND_HOST_POWER_FAIL
SEND_CLIENT_MESSAGE
SHUT_DOWN
7
70
71
72
73
74
75
76
77
POWER FAIL
START_UP
OPEN_PUBLIC
OPEN_PRIVATE
SEND_CLIENT_BROADCAST
CLOSE_PRIVATE
SEND_HOST_POWER_FAIL
SEND_CLIENT_MESSAGE
SHUT_DOWN
8 ROLL CALL 8 ROLL CALL
9
90
91
92
93
94
95
96
97
99
CLUSTER MANAGER
START_UP
PRIVATE_REQUEST
PUBLIC_OPEN
PUBLIC_REQUEST
PUBLIC_RESPONSE
PRIVATE_RESPONSE
PRIVATE_CLOSE
PUBLIC_NEWINFO
SHUT_DOWN
9
90
91
92
93
94
95
96
97
98
99
CLUSTER MANAGER
START_UP
* BROADCAST_CHANNEL
* BROADCAST_OPEN
* BROADCAST_SEARCH
* BROADCAST_CLOSE
PRIVATE_OPEN
PRIVATE_REQUEST
PRIVATE_RESPONSE
PRIVATE_CLOSE
SHUT_DOWN
0 HOST_QUERY_SCENARIO_ID

LCD AMS-9000 MAINTENANCE DISPLAY STATUS CODES
Version 1.1 Preliminary 3/14/06 Page 32 of 36
10.1. Link Status Display Codes (3rd digit)
_ _ 0 LLCOMM_DISPLAY_STATUS_CLEAR
_ _ 1 LLCOMM_DISPLAY_STATUS_INIT_MODEM
_ _ 2 LLCOMM_DISPLAY_STATUS_GPRS_REGISTER
_ _ 3 LLCOMM_DISPLAY_STATUS_GPRS_CONNECT
_ _ 4 LLCOMM_DISPLAY_STATUS_PPP_ESTABLISH
_ _ 5 LLCOMM_DISPLAY_STATUS_UDP_ESTABLISH
_ _ 6 LLCOMM_DISPLAY_STATUS_AUTHENTICATE
_ _ 7 LLCOMM_DISPLAY_STATUS_LINK_UP
_ _ 8 LLCOMM_DISPLAY_STATUS_LINK_SHUT_DOWN
On a Hub meter, the link status codes relate to the public link connection.
On a Client meter, the link status codes refer to the private link connection
* During Client Configuration on the Client meter in the broadcast phase (codes 91 – 94), the third digit of the status code represents
the 900MHz hopping sequence (channel number).

REPLACING A METER
Version 1.1 Preliminary 3/14/06 Page 33 of 36
CHAPTER 11
Replacing a Meter
11.1. Replacing a Hub Meter
11.1.1 If a Hub meter needs to be replaced it can simply be removed from its socket and
replaced with another Hub. The replacement Hub can be installed and will send a
Power Up message to the host as described in Section 3 of System Overview.
When the Roll Call process is initiated at 9:30pm, no meters will be in the Hub’s
Clients table. At 9:45pm the Clients attached to the previous Hub will realize that
they have not heard from their Hub and enter Hub Search Mode as described in
Section 9.2.2 of Basic Operation.
11.2. Replacing a Client Meter
11.2.1. When a Client meter is replaced in the field the old meter is removed causing it to
send a Power Fail message to the Host.
The new Client meter is installed and it performs a Power Up sequence as
described in Section 9.2.2 of Basic Operation.

CALIBRATION
Version 1.1 Preliminary 3/14/06 Page 34 of 36
CHAPTER 12
Calibration
The Itron CENTRON metrology has no means to adjust the calibration.

ZEROING THE METER
Version 1.1 Preliminary 3/14/06 Page 35 of 36
CHAPTER 13
Zeroing the Meter
The AMS-9000 meter (Hub or Client) can be zeroed by briefly jumping J3, which is located
on the top left hand side above the LCD, with the meter powered up and operating.
AN INSULATED JUMPER MUST BE USED.
When the jumper is removed the system will reset and perform the initial startup display
sequence.
The meter will zero all active registers (TOTAL, ON PEAK, OFF PEAK, SH1, SH2 and all
associated Demand values).
CAUTION: HAZARDOUS VOLTAGES ARE
PRESENT ON THE CIRCUIT BOARD. EXTREME
CARE SHOULD BE EXERCISED WHEN
CARRYING OUT THIS PROCEDURE.
!

REGULATORY INFORMATION
Version 1.1 Preliminary 3/14/06 Page 36 of 36
APPENDIX
Regulatory Information
CAUTION:
The antenna(s) used for this transmitter must be installed to provide a separation distance of at least 25
cm from all persons and must not be co-located or operating in conjunction with any other antenna or
transmitter except as documented in the FCC application. This device has been approved for
simultaneous transmission of the collocated WLAN and Cellular/PCS transmitters. Users and installers
must be provided with antenna installation instructions and transmitter operating conditions for satisfying
RF exposure compliance.
!
NOTE:
This equipment has been tested and found to comply with the limits for a Class B digital device, pursuant
to Part 15 of the FCC Rules. These limits are designed to provide reasonable protection against harmful
interference in a residential installation. This equipment generates, uses and can radiate radio
frequency energy and, if not installed and used in accordance with the instructions, may cause harmful
interference to radio communications. However, there is no guarantee that interference will not occur in
a particular installation. If this equipment does cause harmful interference to radio or television
reception, which can be determined by turning the equipment off and on, the user is encouraged to try to
correct the interference by one or more of the following measures:
• Reorient or relocate the receiving antenna.
• Increase the separation between the equipment and receiver.
• Connect the equipment into an outlet on a circuit different from that to which the receiver is
connected.
• Consult the dealer or an experienced radio/TV technician for help.
IMPORTANT:
The AMS-9000 Advanced Metering System complies with Part 15 of the FCC Rules. Changes or
modifications not expressly approved by PowerOneData could void the user’s authority to operate the
e
q
ui
p
ment.
FCC ID: TRCAMS-9000
IC: 6190A-AMS-9000
This device complies with Part 15 of the FCC Rules. Operation is subject to the following two conditions:
(1) This device may not cause harmful interference, and (2) this device must accept any interference
received, including interference that may cause undesired operation.