SAM Electronics NG3028X25KW Marine Radar User Manual
SAM Electronics GmbH Marine Radar
UserManual.wiki
>
SAM Electronics
>
NG3028X25KW User Manual
users manual
Navigation menu
Upload a User Manual
Namespaces
Wiki Guide
HTML
PDF
Info
Views
User Manual
Discussion / Help
Navigation
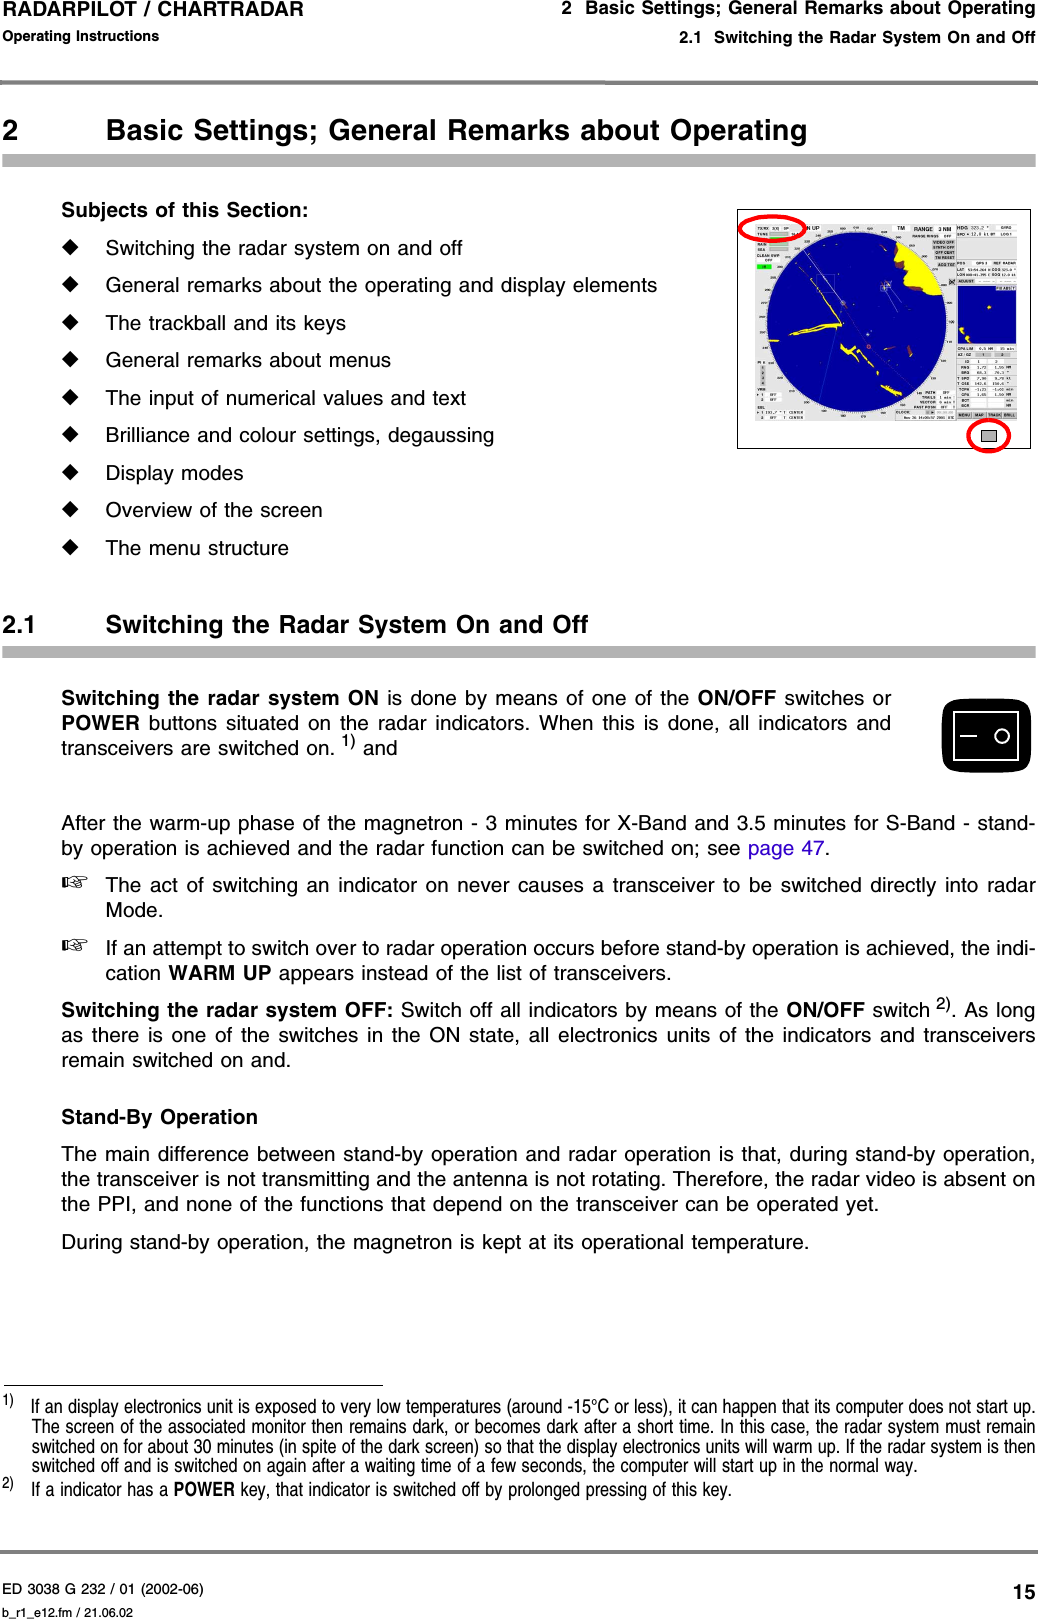
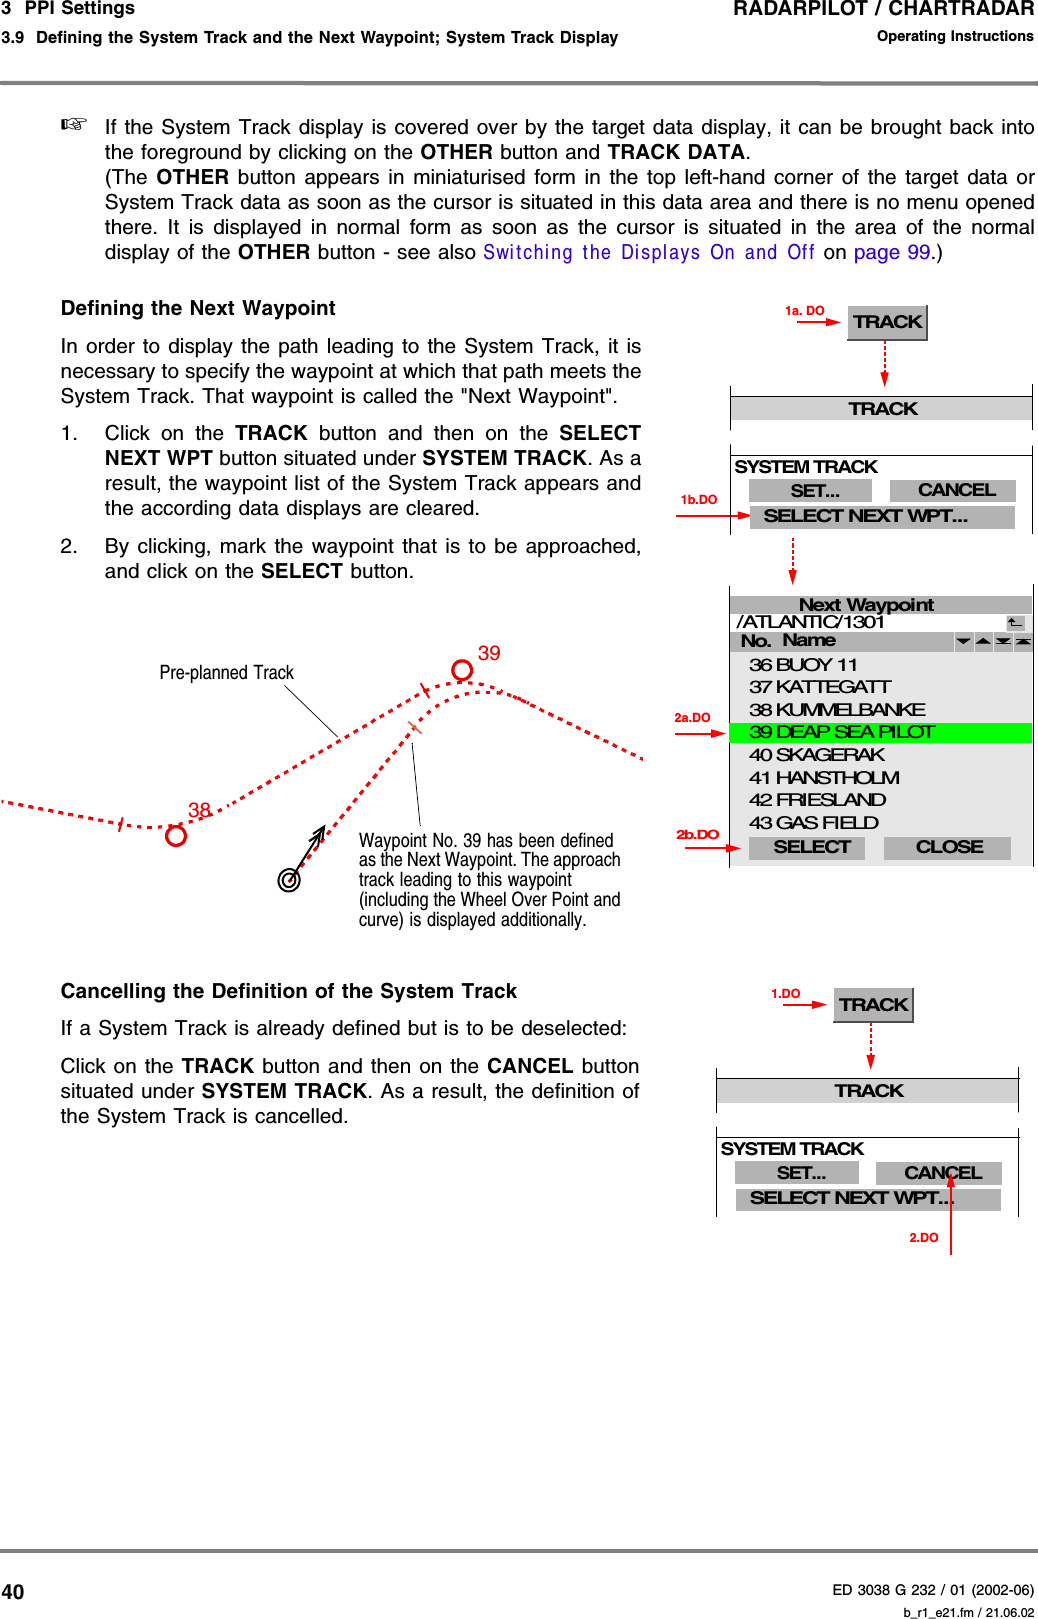
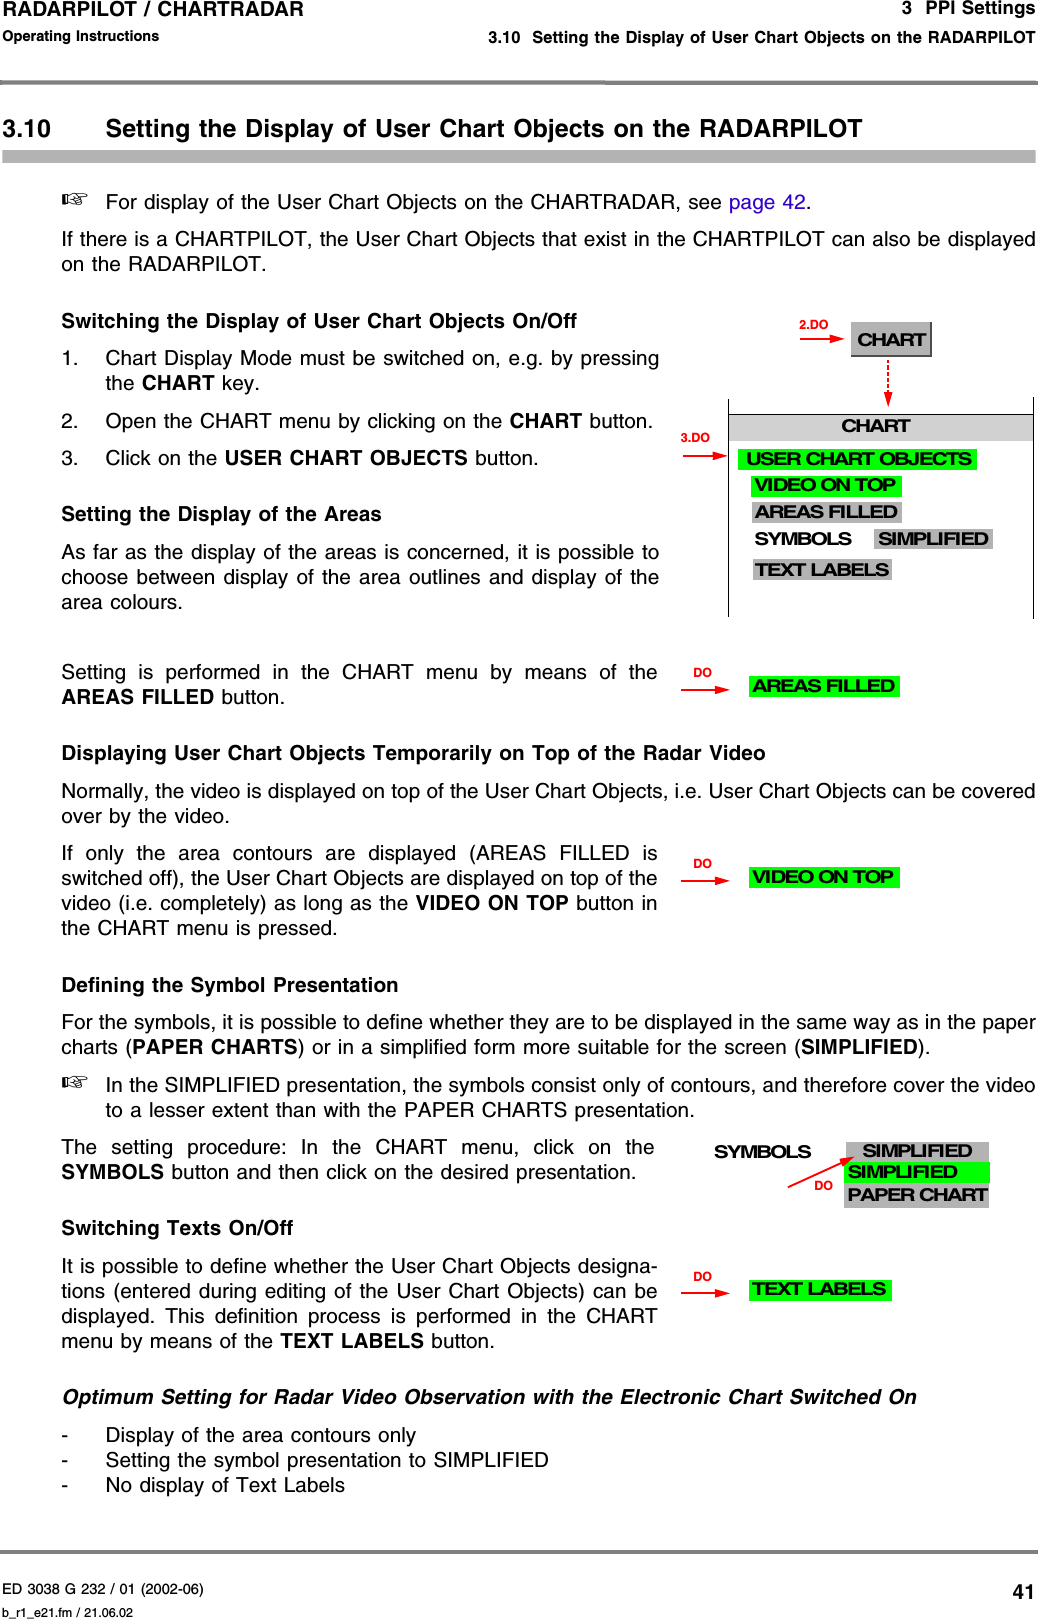
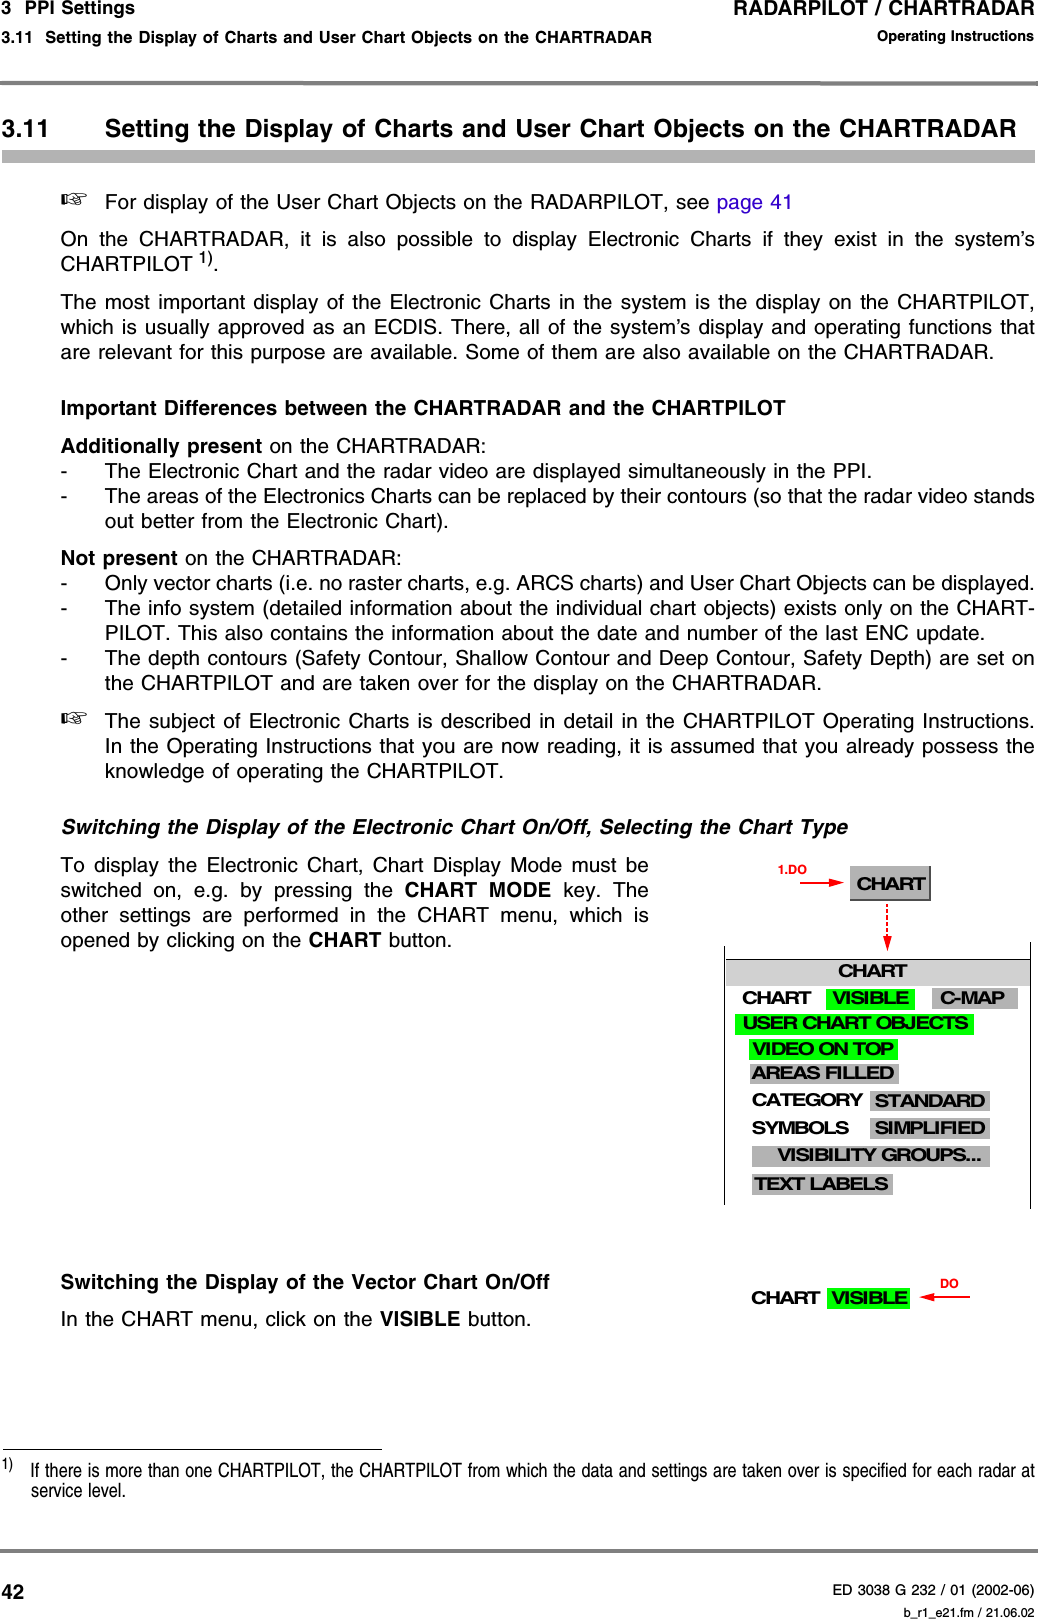
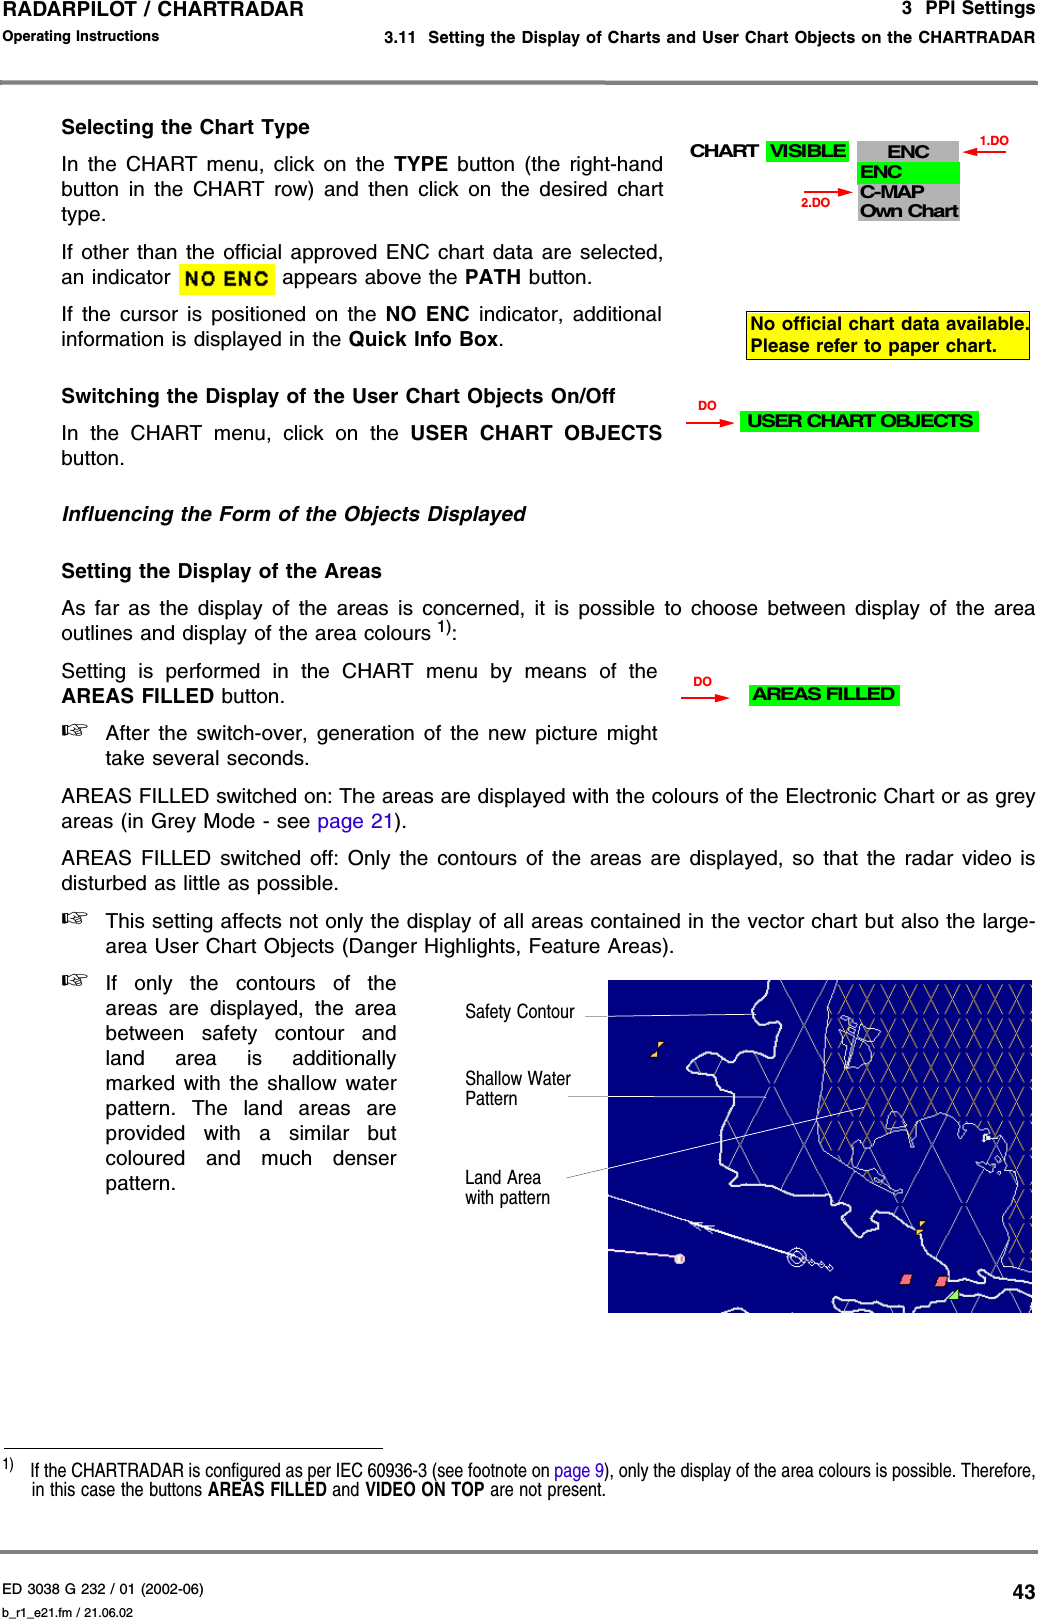
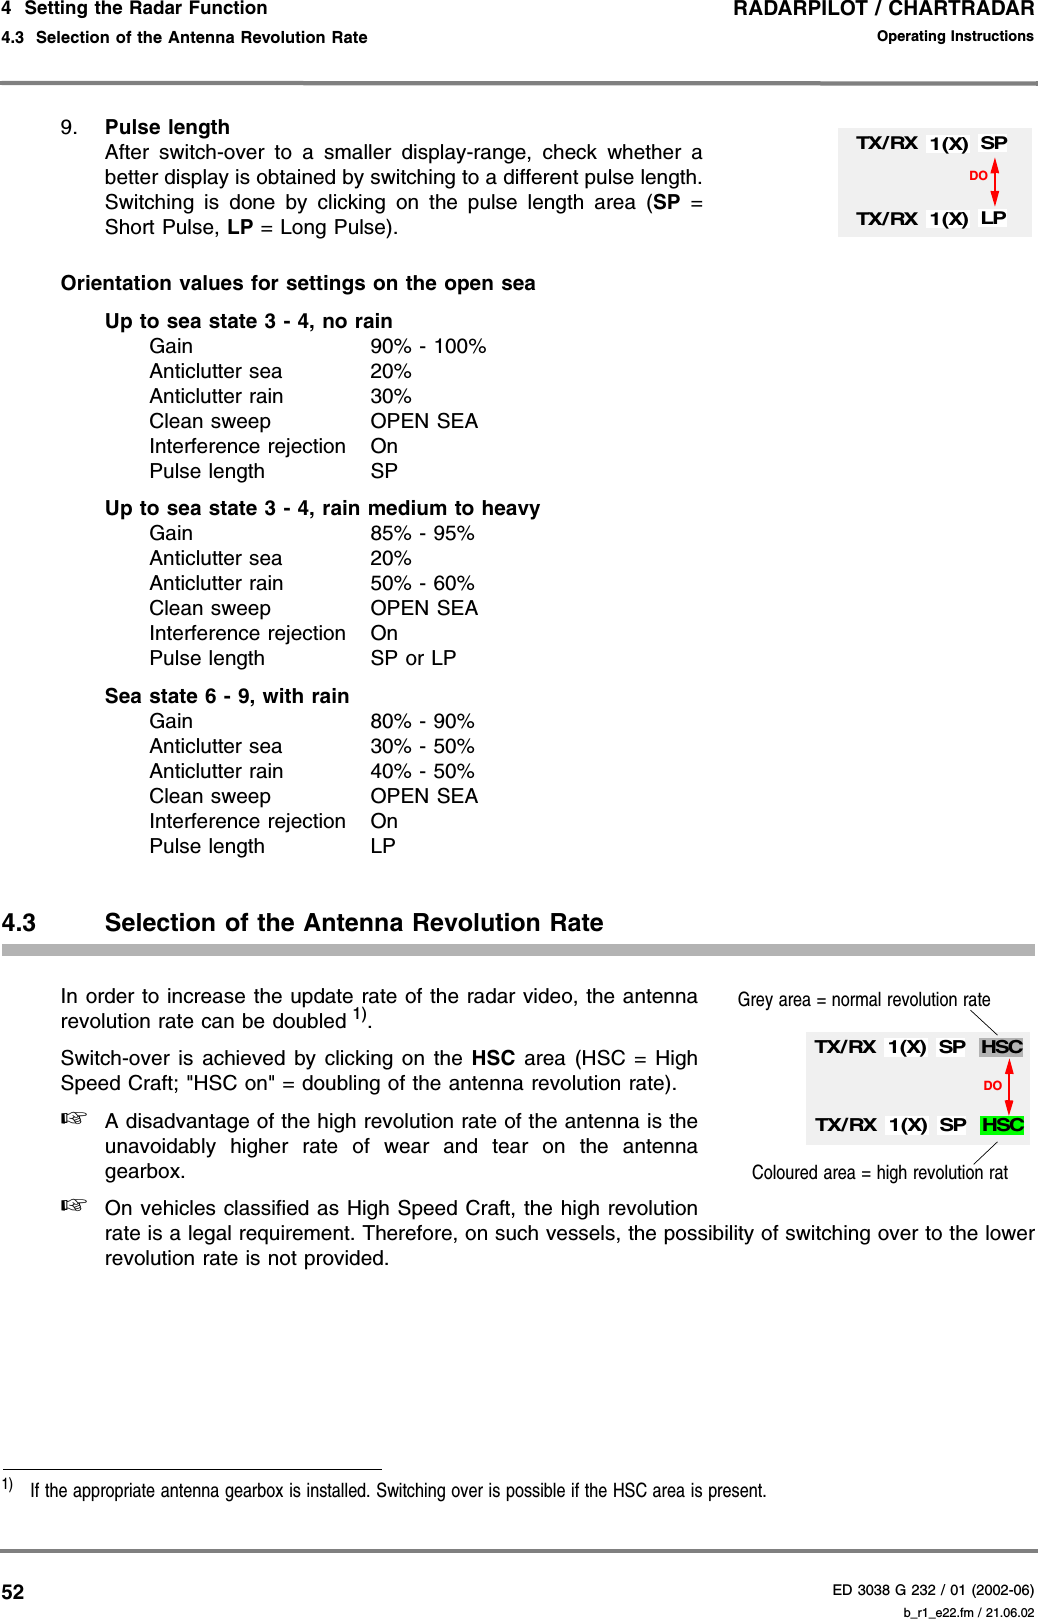
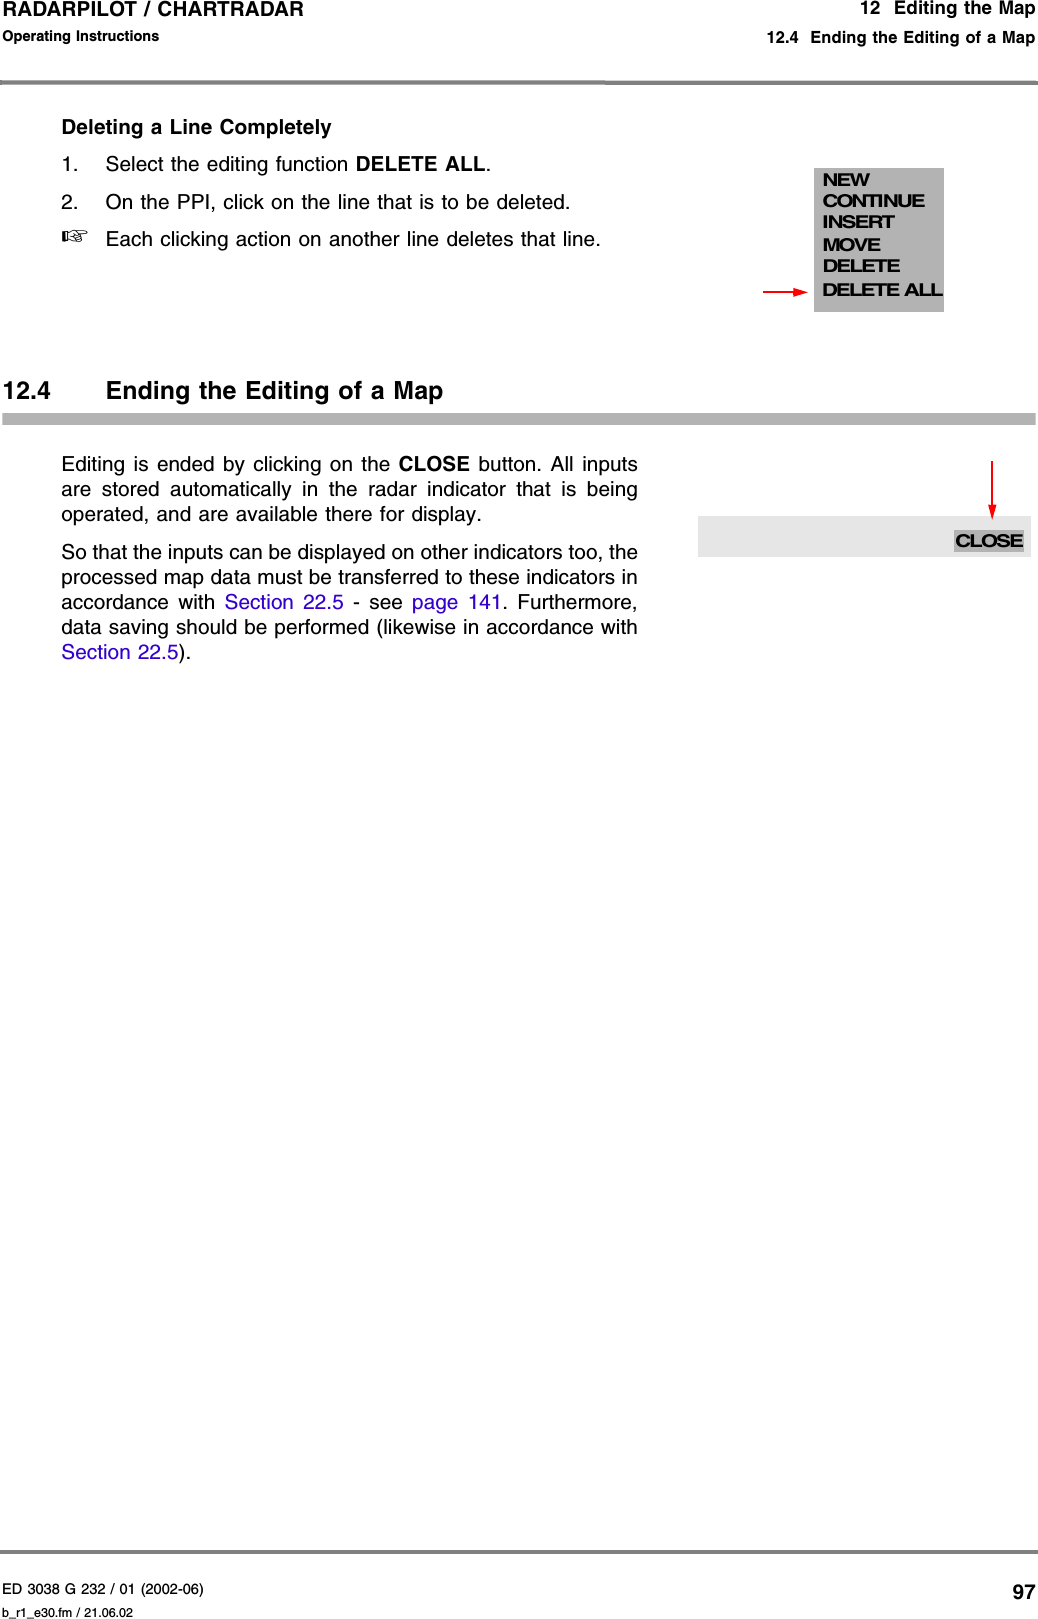
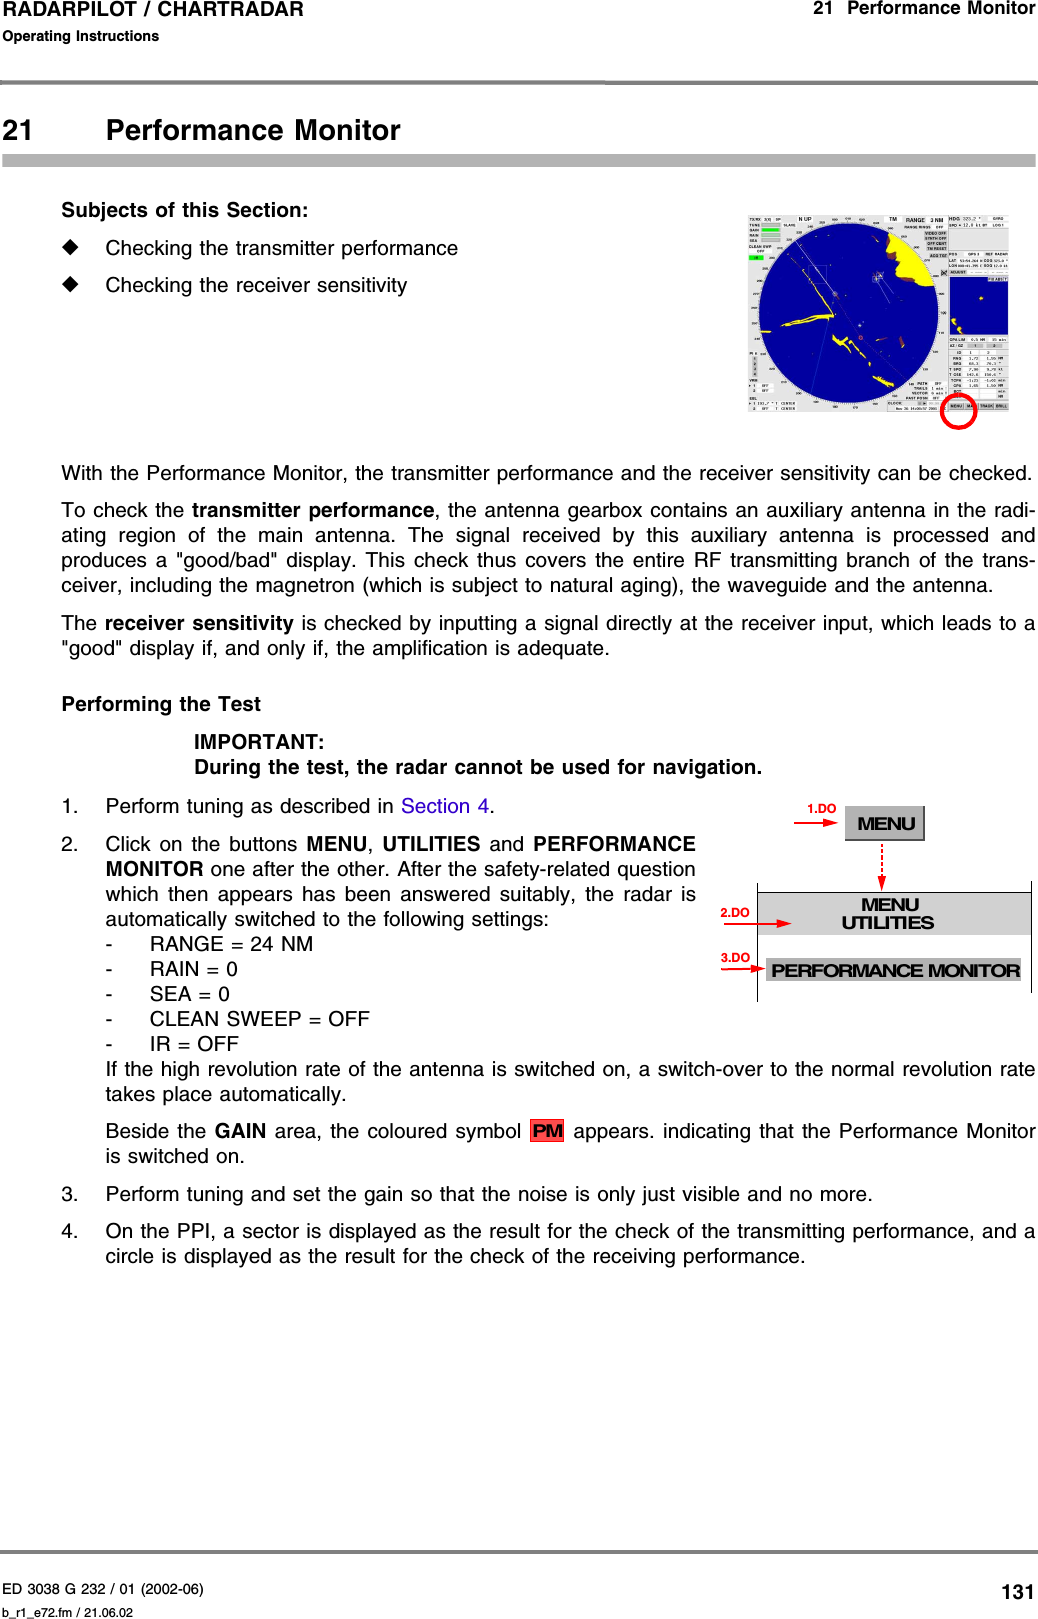
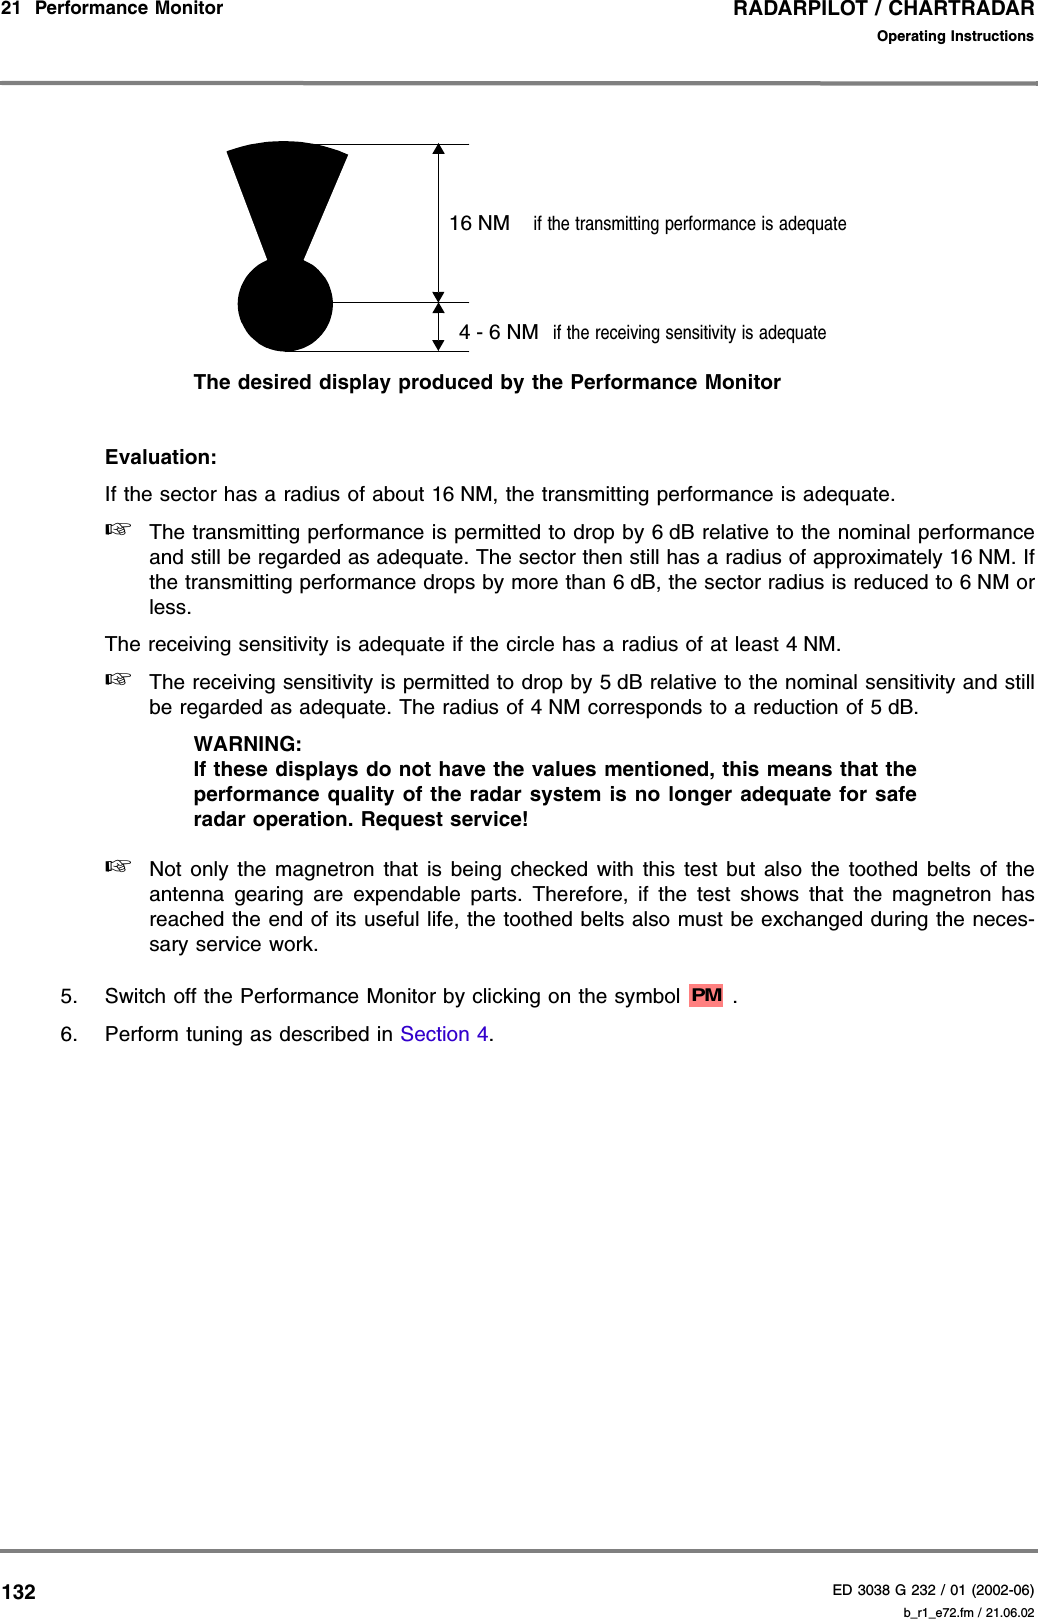
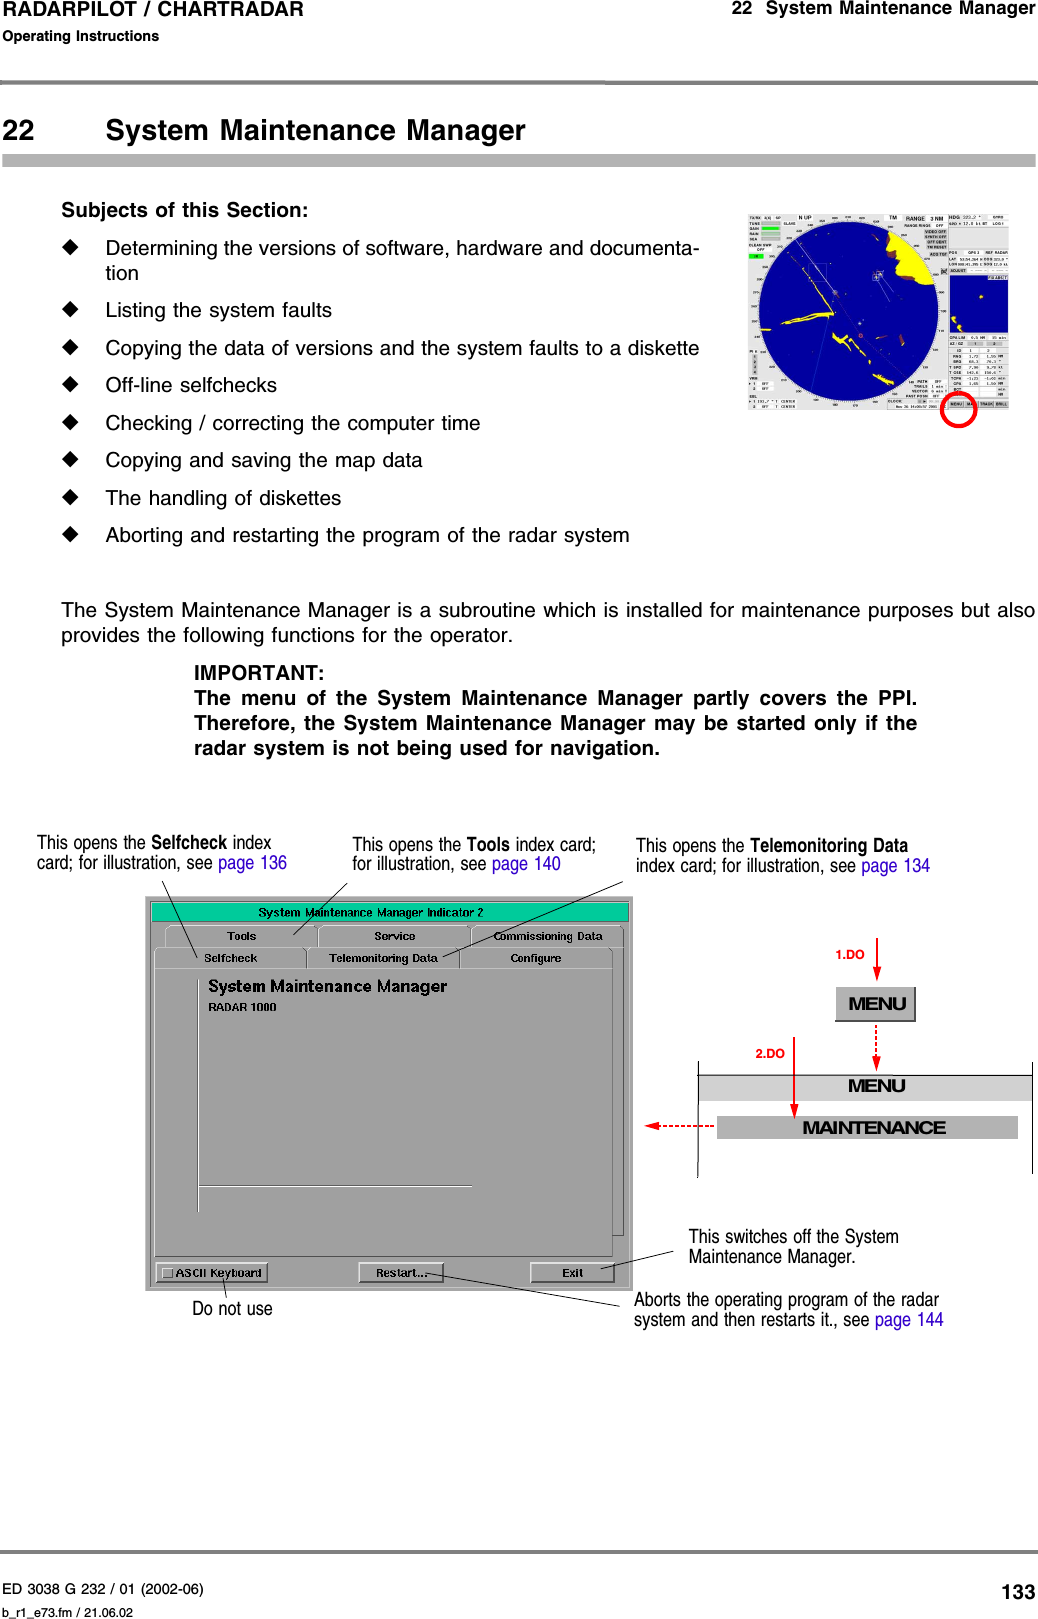
![ED 3038 G 232 / 01 (2002-06) Operating Instructions2 Basic Settings; General Remarks about Operating2.2 General Remarks about the Operating and Display Elementsb_r1_e12.fm / 21.06.0219RADARPILOT / CHARTRADAR Input of Geographical Coordinates1. Click on the numerical area; a virtual input-keyboard isopened.Here, the existing value appears on the display area of thekeyboard. Instead of the and buttons, the keyboardhas the buttons needed for the input of the relevant hemi-sphere.2. By the input of numerals, the existing value is overwritten, beginning at the most significant figure.3. With the "point" button, you go from the "degrees" part to the "minutes" part, from there to the "thou-sandths of a minute" part, and from there to the W/E, N/S input part.4. By clicking on the OK button, the value displayed is taken over and the keyboard disappears.Input of TextsIn some fields, a text line consisting of large and smallletters, numerals and punctuation marks can be entered.The process corresponds to new input of numbers - seeabove.The virtual keyboard which appears after the clicking ofthese fields is similar to the usual (English) computerkeyboard:- By means of the Caps button, a switch-over betweenlarge and small letters takes place.- By means of the Shift button, all characters areswitched over.- By means of the button, the character situated onthe right in the display field is deleted.- The input is completed by clicking on the OK button.Help FunctionAs soon as the cursor is situated on an area that can be operated,the function of the DO key and (if applicable) the function of theMORE key are displayed in the Quick Info Box at the bottom of thepicture if the Help function is switched on.Switching the Help Function On and Off Click on the MENU button, and then, in the USER SETTINGSmenu, click the HELP button.4 5 67 8 90 .OK1 2 3:008: 36. 437 WEW9 0 –6 7 83 4 5‘ 1 2 =o p [y u ie r tTab q w ]l ; ’h j kd f gCapsa sOK. /Spacen m ,c v bShiftz x\( ) _^ & *# $ %~ ! @ +O P {Y U IE R TTab Q W }L : "H J KD F GCapsA SOK> ?SpaceN M <C V BShiftZ X|DODOMENUMENUUSER SETTINGS1.DOHELP3.DO2.DO](https://usermanual.wiki/SAM-Electronics/NG3028X25KW/User-Guide-296342-Page-19.png)