Seba Dynatronic Mess und Ortungstechnik CPK3 Wireless charging system User Manual man correlux c 3 en 03 4 FCC
Seba Dynatronic Mess- und Ortungstechnik GmbH Wireless charging system man correlux c 3 en 03 4 FCC
User Manual
Consultation with SebaKMT
1
User Manual
Correlator
Correlux C-3
Issue: 3.2 (02/2016) - EN
Article number: 84416
Mess- und Ortungstechnik
Measuring and Locating Technologies
Elektrizitätsnetze
Power Networks
Kommunikationsnetze
Communication Networks
Rohrleitungsnetze
Water Networks
Abwassernetze
Sewer Systems
Leitungsortung
Line Locating

Consultation with SebaKMT
2
Consultation with SebaKMT
3
Consultation with SebaKMT
The present system manual has been designed as an operating guide and for
reference. It is meant to answer your questions and solve your problems in as fast and
easy a way as possible. Please start with referring to this manual should any trouble
occur.
In doing so, make use of the table of contents and read the relevant paragraph with
great attention. Furthermore, check all terminals and connections of the instruments
involved.
Should any question remain unanswered or should you need the help of an authorized
service station, please contact:
Seba Dynatronic
Mess- und Ortungstechnik GmbH
Hagenuk KMT
Kabelmesstechnik GmbH
Dr.-Herbert-Iann-Str. 6
D - 96148 Baunach
Phone: +49 / 9544 / 68 – 0
Fax: +49 / 9544 / 22 73
Röderaue 41
D - 01471 Radeburg / Dresden
Phone: +49 / 35208 / 84 – 0
Fax: +49 / 35208 / 84 249
E-Mail: sales@sebakmt.com
http://www.sebakmt.com
© SebaKMT
All rights reserved. No part of this handbook may be copied by photographic or other means unless SebaKMT
have before-hand declared their consent in writing. The content of this handbook is subject to change without
notice. SebaKMT cannot be made liable for technical or printing errors or shortcomings of this handbook.
SebaKMT also disclaims all responsibility for damage resulting directly or indirectly from the delivery, supply,
or use of this matter.

Terms of Warranty
4
Terms of Warranty
SebaKMT accept responsibility for a claim under warranty brought forward by a
customer for a product sold by SebaKMT under the terms stated below.
SebaKMT warrant that at the time of delivery SebaKMT products are free from
manufacturing or material defects which might considerably reduce their value or
usability. This warranty does not apply to faults in the software supplied. During the
period of warranty, SebaKMT agree to repair faulty parts or replace them with new parts
or parts as new (with the same usability and life as new parts) according to their choice.
This warranty does not cover wear parts, lamps, fuses, batteries and accumulators.
SebaKMT reject all further claims under warranty, in particular those from consequential
damage. Each component and product replaced in accordance with this warranty
becomes the property of SebaKMT.
All warranty claims versus SebaKMT are hereby limited to a period of 12 months from
the date of delivery. Each component supplied by SebaKMT within the context of
warranty will also be covered by this warranty for the remaining period of time but for 90
days at least.
Each measure to remedy a claim under warranty shall exclusively be carried out by
SebaKMT or an authorized service station.
This warranty does not apply to any fault or damage caused by exposing a product to
conditions not in accordance with this specification, by storing, transporting, or using it
improperly, or having it serviced or installed by a workshop not authorized by SebaKMT.
All responsibility is disclaimed for damage due to wear, will of God, or connection to
foreign components.
For damage resulting from a violation of their duty to repair or re-supply items,
SebaKMT can be made liable only in case of severe negligence or intention. Any liability
for slight negligence is disclaimed.
Since some states do not allow the exclusion or limitation of an implied warranty or of
consequential damage, the limitations of liability described above perhaps may not
apply to you.
For FCC:
- User Information acc. to FCC15.21:
Changes or modifications not expressly approved by the party responsible for
compliance could void the user's authority to operate the equipment.
- Part 15 Statement gem. FCC 15.19/RSS Gen Issue 3 Sect. 7.1.3
This device complies with Part 15 of the FCC Rules and with Industry Canada
license-exempt RSS standard(s). Operation is subject to the following two
conditions:
(1) this device may not cause harmful interference, and (2) this device must
accept any interference received, including interference that may cause
undesired operation

Terms of Warranty
5
Contents
Consultation with SebaKMT ........................................................................................... 3
Terms of Warranty ........................................................................................................... 4
1
Safety Instructions ........................................................................................... 9
1.1
General Safety Instructions and Warnings ......................................................... 9
1.2
General Notes .................................................................................................... 9
2
Frequently used menus ................................................................................. 11
2.1
Start menu ........................................................................................................ 11
2.2
Pipe data menu ................................................................................................ 13
2.3
Correlation menu .............................................................................................. 15
2.4
Correlation menu (Offline correlation) .............................................................. 17
2.5
Correlation analysis menu ................................................................................ 19
2.6
Frequency analysis menu ................................................................................ 21
2.7
Audio menu ...................................................................................................... 23
2.8
Audio menu (when ground microphone is connected) ..................................... 25
3
Technical description .................................................................................... 27
3.1
Function ............................................................................................................ 27
3.2
Features of the set ........................................................................................... 28
3.3
Communication of the components .................................................................. 29
3.4
Power supply .................................................................................................... 29
3.5
Scope of delivery .............................................................................................. 30
3.6
Technical data .................................................................................................. 31
4
The Power transmitters ................................................................................. 33
4.1
Function and Design ........................................................................................ 33
4.2
Identification number (ID) ................................................................................. 35
4.3
Power supply .................................................................................................... 35
4.4
Commissioning ................................................................................................. 36
4.5
Installation ........................................................................................................ 36
5
The Multi sensors ........................................................................................... 37
5.1
Design and function .......................................................................................... 37
5.2
Identification number (ID) ................................................................................. 37
5.3
Power supply .................................................................................................... 38
5.4
Switching ON/OFF ........................................................................................... 38
5.5
Installation ........................................................................................................ 39
5.6
Angle adapter ................................................................................................... 39
6
The Correlator ................................................................................................. 41
6.1
Design and function of the device .................................................................... 41

Terms of Warranty
6
6.2
Power supply .................................................................................................... 43
6.3
Design of the user interface ............................................................................. 44
6.4
Basics of operation ........................................................................................... 45
6.4.1
Input methods ................................................................................................... 45
6.4.2
Entering identification numbers ........................................................................ 45
6.4.3
Entering text ..................................................................................................... 46
6.4.4
Sorting devices in lists and tables .................................................................... 47
6.4.5
ESC pushbutton and "Back" button ................................................................. 47
6.5
Commissioning ................................................................................................. 48
6.5.1
Switch the Correlator ON/OFF ......................................................................... 48
6.5.2
Basic settings at initial start-up ......................................................................... 48
6.5.3
Change the language ....................................................................................... 49
6.5.4
Activate the display light ................................................................................... 49
6.5.5
Enable/Disable the touch screen (touch sensitivity) ........................................ 50
6.6
System settings ................................................................................................ 51
6.6.1
Basic settings ................................................................................................... 51
6.6.2
System info ....................................................................................................... 53
6.6.3
Saving the settings ........................................................................................... 53
6.7
Communication ................................................................................................ 54
6.7.1
Connection between the Correlator and the sensors ....................................... 54
6.7.2
Connection between the Correlator and the computer .................................... 54
6.8
Hardware reset ................................................................................................. 54
7
Sensor management ...................................................................................... 55
7.1
Introduction ....................................................................................................... 55
7.2
Access the sensor pool .................................................................................... 55
7.3
Register sensors .............................................................................................. 57
7.4
Replace / Delete sensors ................................................................................. 58
7.5
Additional functions .......................................................................................... 59
8
Online correlation ........................................................................................... 61
8.1
Measurement with 2 Power transmitters .......................................................... 61
8.2
Measurement with only 1 Power transmitter .................................................... 65
8.3
How to exchange A - B on the screen .............................................................. 67
9
Offline correlation (Multipoint measurement) ............................................. 69
10
GPS position data .......................................................................................... 77
10.1
Introduction ....................................................................................................... 77
10.2
Determine and save GPS coordinates ............................................................. 77
10.3
Distance measurement and navigation via GPS ............................................. 79
11
Real-time measurement ................................................................................. 81
12
Sound velocity measurement ....................................................................... 85
12.1
Velocity measurement in Online measurement mode ..................................... 85

Terms of Warranty
7
12.2
Velocity measurement in Offline measurement mode ..................................... 88
12.2.1
Introduction ....................................................................................................... 88
12.2.2
Procedure ......................................................................................................... 89
12.2.3
Notes and examples ......................................................................................... 91
13
Map function ................................................................................................... 93
14
Storage / Management of correlations (History) ......................................... 97
14.1
Storing a correlation ......................................................................................... 97
14.2
Managing stored correlations ........................................................................... 98
14.2.1
Call up and display a correlation ...................................................................... 98
14.2.2
Rename a correlation / Create a comment ...................................................... 99
15
Reset of correlation settings and data ....................................................... 101
16
Pinpointing .................................................................................................... 103
16.1
Introduction ..................................................................................................... 103
16.2
Pinpointing using the ground microphone ...................................................... 103
16.3
Pinpointing using Multi sens ors ...................................................................... 107
17
Query the status of a device ....................................................................... 111
18
Firmware update ........................................................................................... 113
18.1
How to update the Correlator ......................................................................... 113
18.2
How to update Power transmitters or Multi sensors ...................................... 115
18.2.1
Work step 1: Download and store the update-file .......................................... 115
18.2.2
Work step 2: Transfer and run the update-file................................................ 116
19
CorreluxView Software ................................................................................ 121
19.1
User interface ................................................................................................. 121
19.2
Basic settings ................................................................................................. 123
19.2.1
Storage location for application database ...................................................... 123
19.2.2
GPS receiver port ........................................................................................... 123
19.2.3
System of units ............................................................................................... 123
19.2.4
Logarithmic/linear display ............................................................................... 124
19.3
Creating, renaming and deleting directories .................................................. 124
19.4
Importing data ................................................................................................ 125
19.5
Editing a map ................................................................................................. 125
19.6
Correlation ...................................................................................................... 127
19.6.1
Perform / display correlation........................................................................... 127
19.6.2
Display / select audio blocks (Offline measurements only) ............................ 128
19.6.3
Calling up the correlation analysis menu ....................................................... 129
19.6.4
Selecting correlation method (Offline measurements only) ........................... 130

Terms of Warranty
8
Safety Instructions
9
1 Safety Instructions
1.1 General Safety Instructions and Warnings
•
Do not drop the device / the system’s components or subject it / them to
strong impacts or mechanical shocks.
•
The limits described under Technical Data may not be exceeded.
•
The device / system must be in a technically perfect condition for
measurement.
•
The indicated degree of protection can only be ensured if plugs or the
provided protection caps are put in all sockets of the device.
•
The plugs of the supplied connection cables are only compliant to the
indicated degree of protection as long as they are plugged in. Plugs
which are not connected or which are connected in a wrong way are not
protected from water and dust ingress.
•
If the O-ring seal of a socket is obviously damaged, it must be replaced
in order to ensure the total protection against water and dust ingress.
1.2 General Notes
This manual contains basic instructions for the commissioning and operation of the
device / system. For this reason, it is important to ensure that the manual is always
available to the authorised and trained operator. He needs to read the manual
thoroughly. The manufacturer is not liable for damage to material or humans due to non-
observance of the instructions and safety advices provided by this manual.
Locally applying regulations have to be observed!
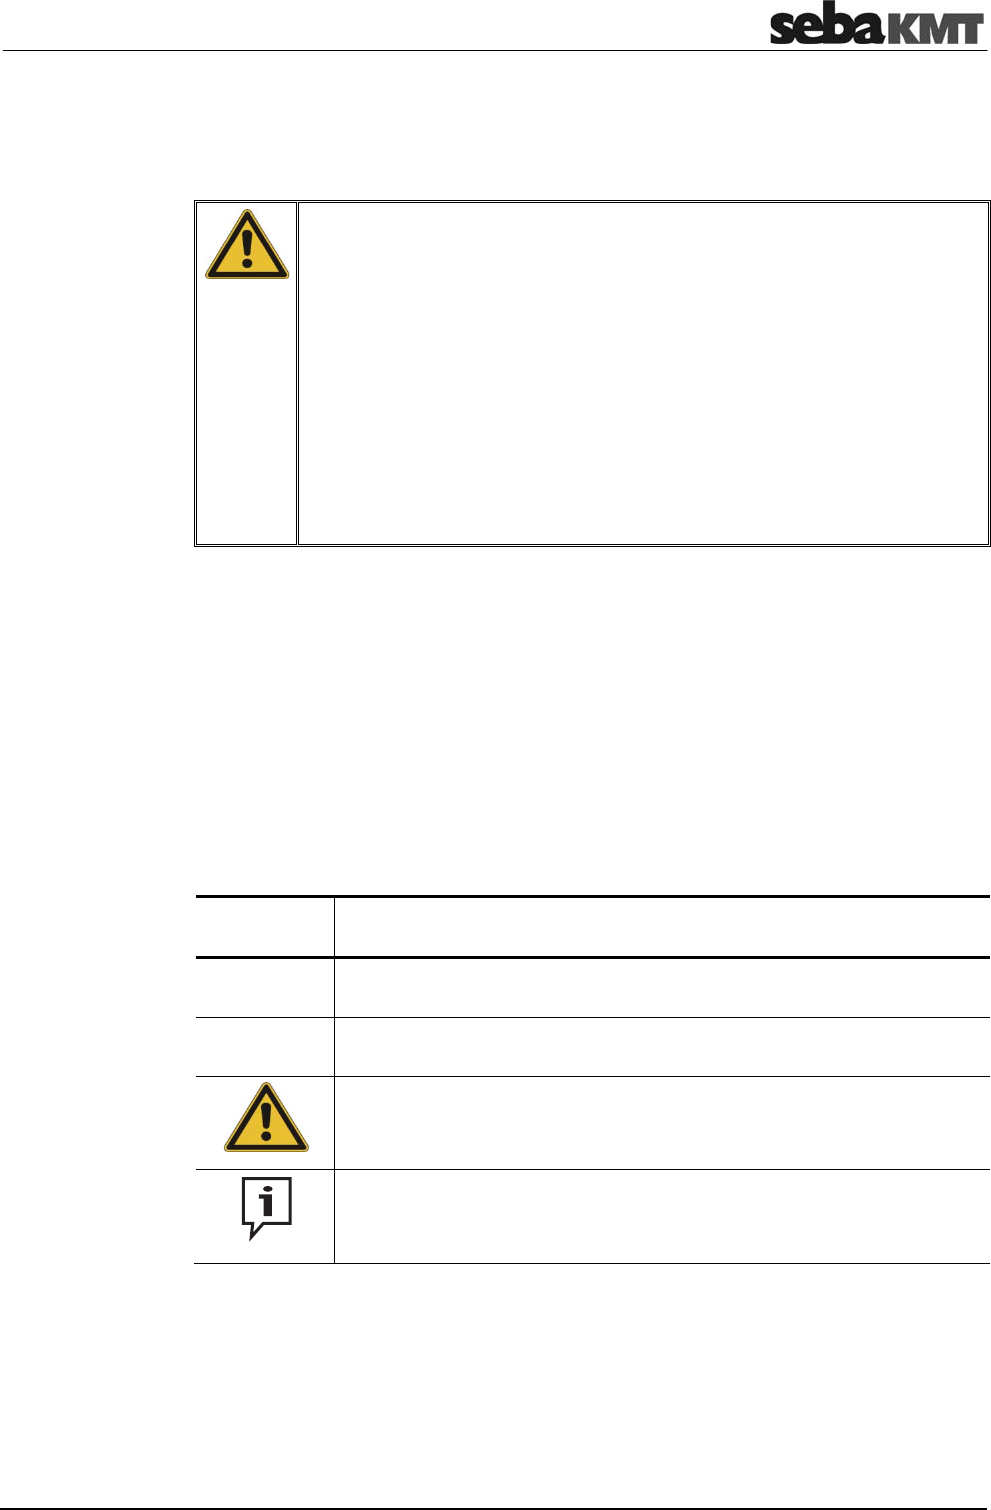
The following signal words and symbols are used in this manual and on the product
itself:
Signal word /
symbol
Description
CAUTION Indicates a potential hazard which may result in moderate or minor injury
if not avoided.
NOTICE Indicates a potential hazard which may result in material damage if not
avoided.
Serves to highlight warnings and safety instructions.
As a warning label on the product it is used to draw attention to potential
hazards which have to be avoided by reading the manual.
Serves to highlight important information and useful tips on the operation
of the device/system. Failure to observe may lead to unusable
measurement results.
Check the contents of the package for completeness and visible damage right after
receipt. In the case of visible damage, the device must under no circumstances be taken
into operation. If something is missing or damaged, please contact your local sales
representative.
It is important to observe the generally applicable regulations of the country in which the
device will be operated, as well as the current national accident prevention regulations
and internal company directives (work, operating and safety regulations).
Safety precautions
Labelling of safety
instructions
Check contents
Working with products
from SebaKMT

Safety Instructions
10
Use genuine accessories to ensure system safety and reliable operation. The use of
other parts is not permitted and invalidates the warranty.
Repair and maintenance work has to be carried out by SebaKMT or authorised service
partners using original spare parts only. SebaKMT recommends having the system
tested and maintained at a SebaKMT service centre once a year.
SebaKMT also offers its customers on-site service. Please contact your service centre if
needed.
The lithium batteries of the device are dangerous goods. The transport of the batteries
itselves and of devices which contain such batteries is subject to regulations based on
the UN Model Regulations “Transport of Dangerous Goods” (ST/SG/AC.10-1).
Please inform yourself about the transportation requirements and follow them when
shipping the device.
This device is designed for industrial use. When used at home it could cause
interference to other equipment, such as the radio or television.
The interference level from the line complies with the limit curve B (living area), the
radiation level complies with the limit curve A (industrial area) according to EN 55011.
Given that living areas are sufficiently far away from the planned area of operation
(industrial area), equipment in living areas will not be impaired.
Repair and
maintenance
Special transportation
requirements
Electromagnetic
radiation
Frequently used menus
11
2 Frequently used menus
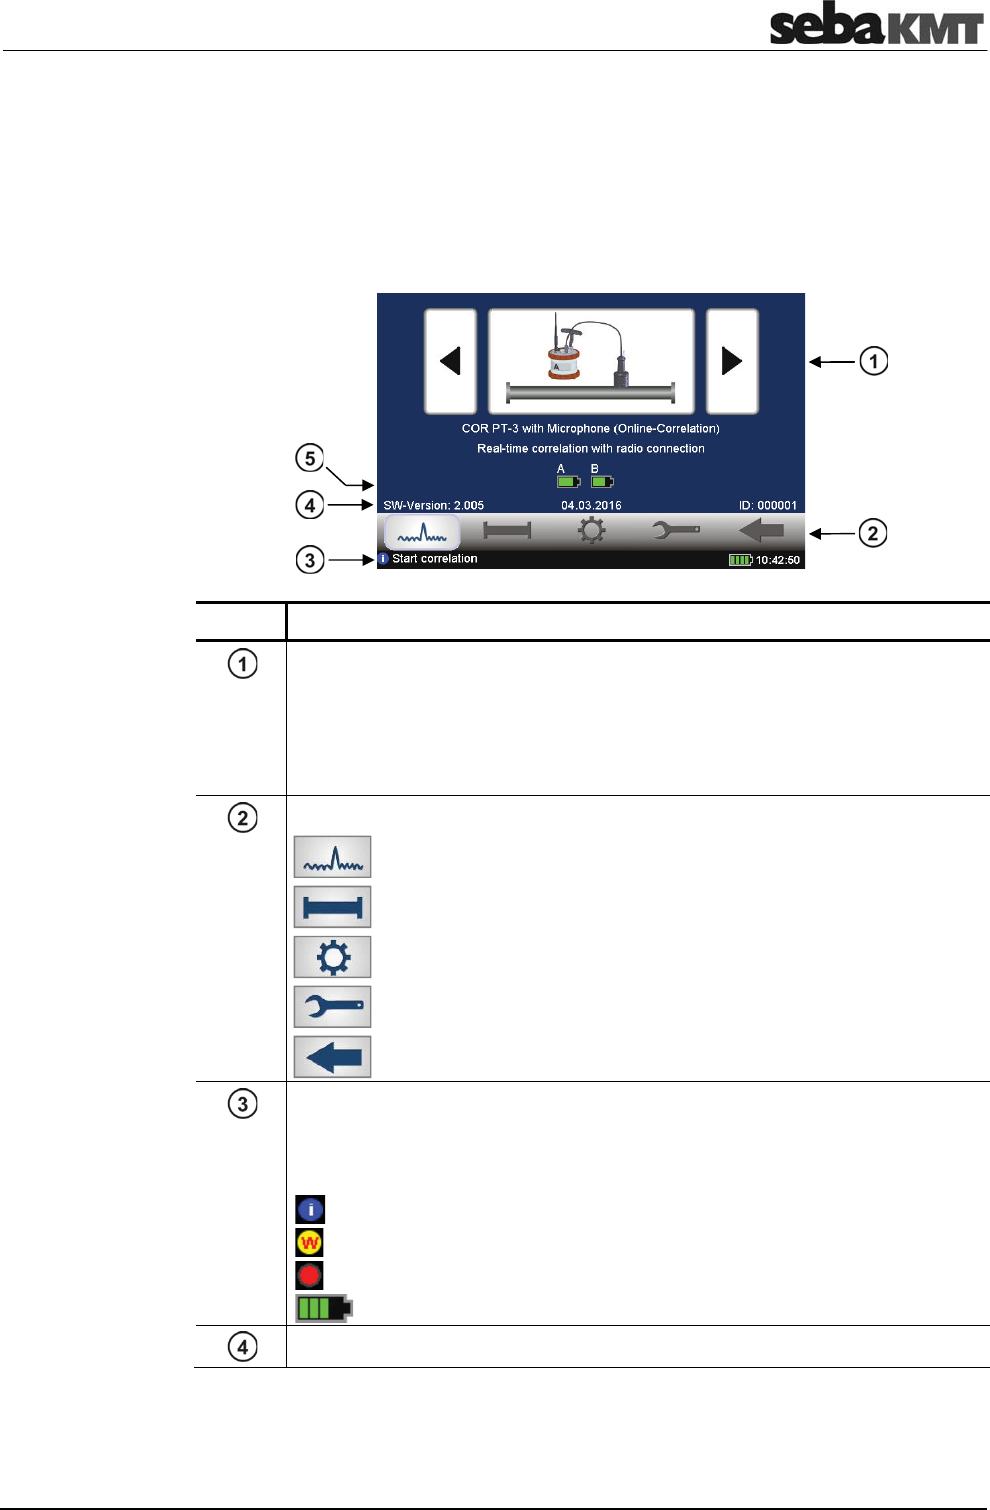
2.1 Start menu
The Start menu appears on the screen after the device has been switched on. In
addition, the ESC pushbutton takes you back directly to the Start menu from every
menu level.
Element Description
Measuring mode selection
Arrow buttons ... To go forward / backward through the available
measuring methods.
Large central button ... Opens the relevant measuring mode menu or starts
the correlation.
Main menu
Starts the Correlation
Opens the Pipe data menu
Opens the Tools menu
Opens the System settings menu
Goes Back to the previous menu
Info line
This line provides information on the display, comments and notes on how to
proceed. On the right, the Correlator's battery status and the time are
shown.
this symbol indicates info texts
this symbol indicates warnings
this symbol indicates that an Offline measurement is in progress
shows the Correlator battery level
Firmware version / Date / Identification number (ID) of the device
Frequently used menus
12
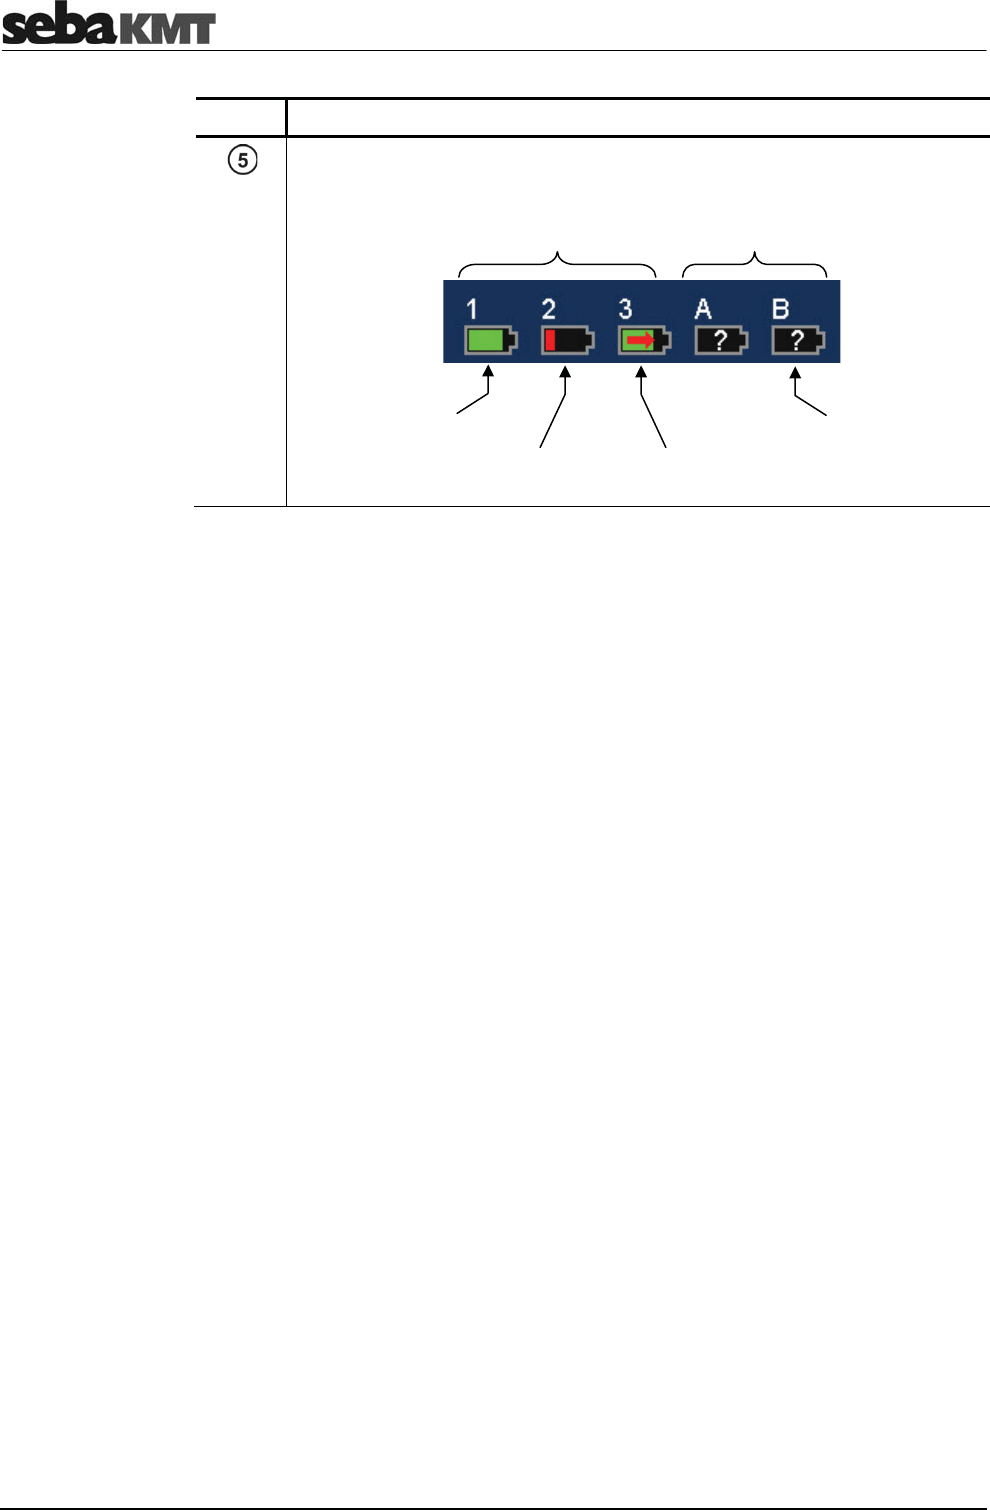
Element Description
Battery level of the received Power transmitters or Multi sensors.
Power transmitters
"A" and "B"
Multi sensors
No.1 to 3
Fully charged
Critical Charging
No information
available about the
status of the device
Frequently used menus
13
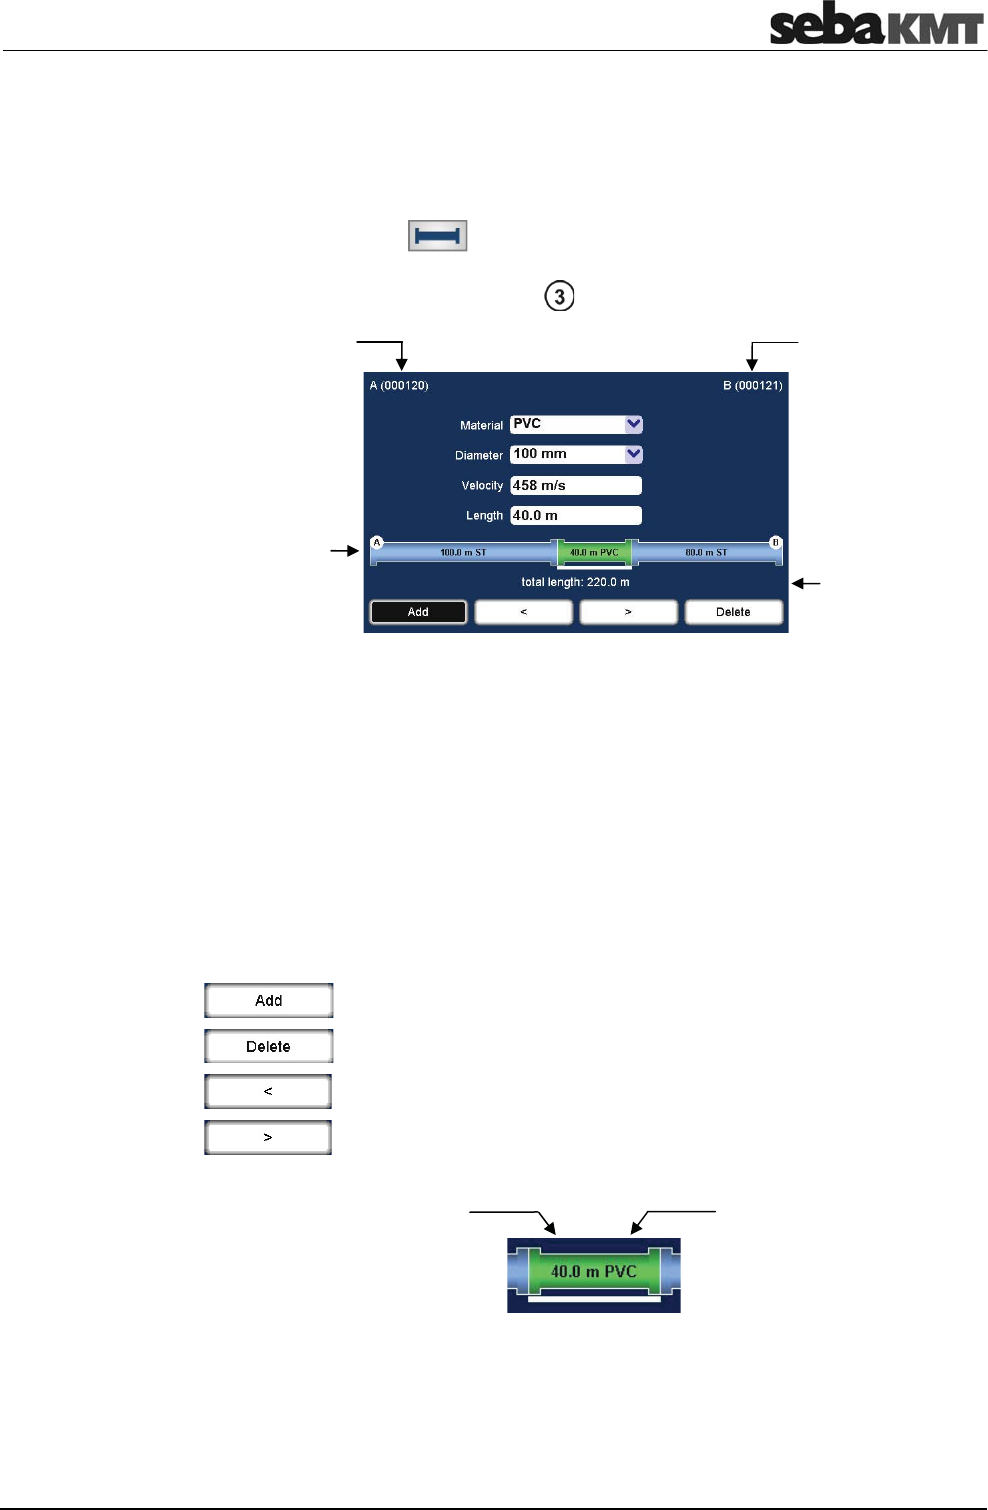
2.2 Pipe data menu
In the Pipe data menu the properties of the pipe can be specified.
The menu can be opened by:
•
tapping the button in the main menu
•
tapping the button between the two diagrams in the Correlation menu, representing
the pipe (see next section: button )
Material ... Select the pipe section's material.
Diameter ... Select the pipe section's diameter.
Velocity ... Input field for the pipe section's sound velocity.
The displayed value automatically adjusts to the selected pipe
material. The value can be entered manually when needed as well. To
do so, tap the field. A numeric keypad opens.
Length ... Input field for the pipe section's length.
Tap the field. A numeric keypad opens.
Use these buttons to divide the pipe line displayed in up to 12 sections.
Use these buttons to move from one pipe section to the next.
The selected pipe section is "highlighted" with a white bar. The pipe parameters in the
four input fields refer to this section.
Drop down lists
Input fields
Buttons
Pipe section
material
Len
g
ths of the
pipe section
ID of the sensor
at the first
measuring point
ID of the sensor
at the second
measuring point
Visual
illustration of
the
p
i
p
eline Totallength of
the
p
i
p
e between
the measuring
points

Frequently used menus
14
Frequently used menus
15
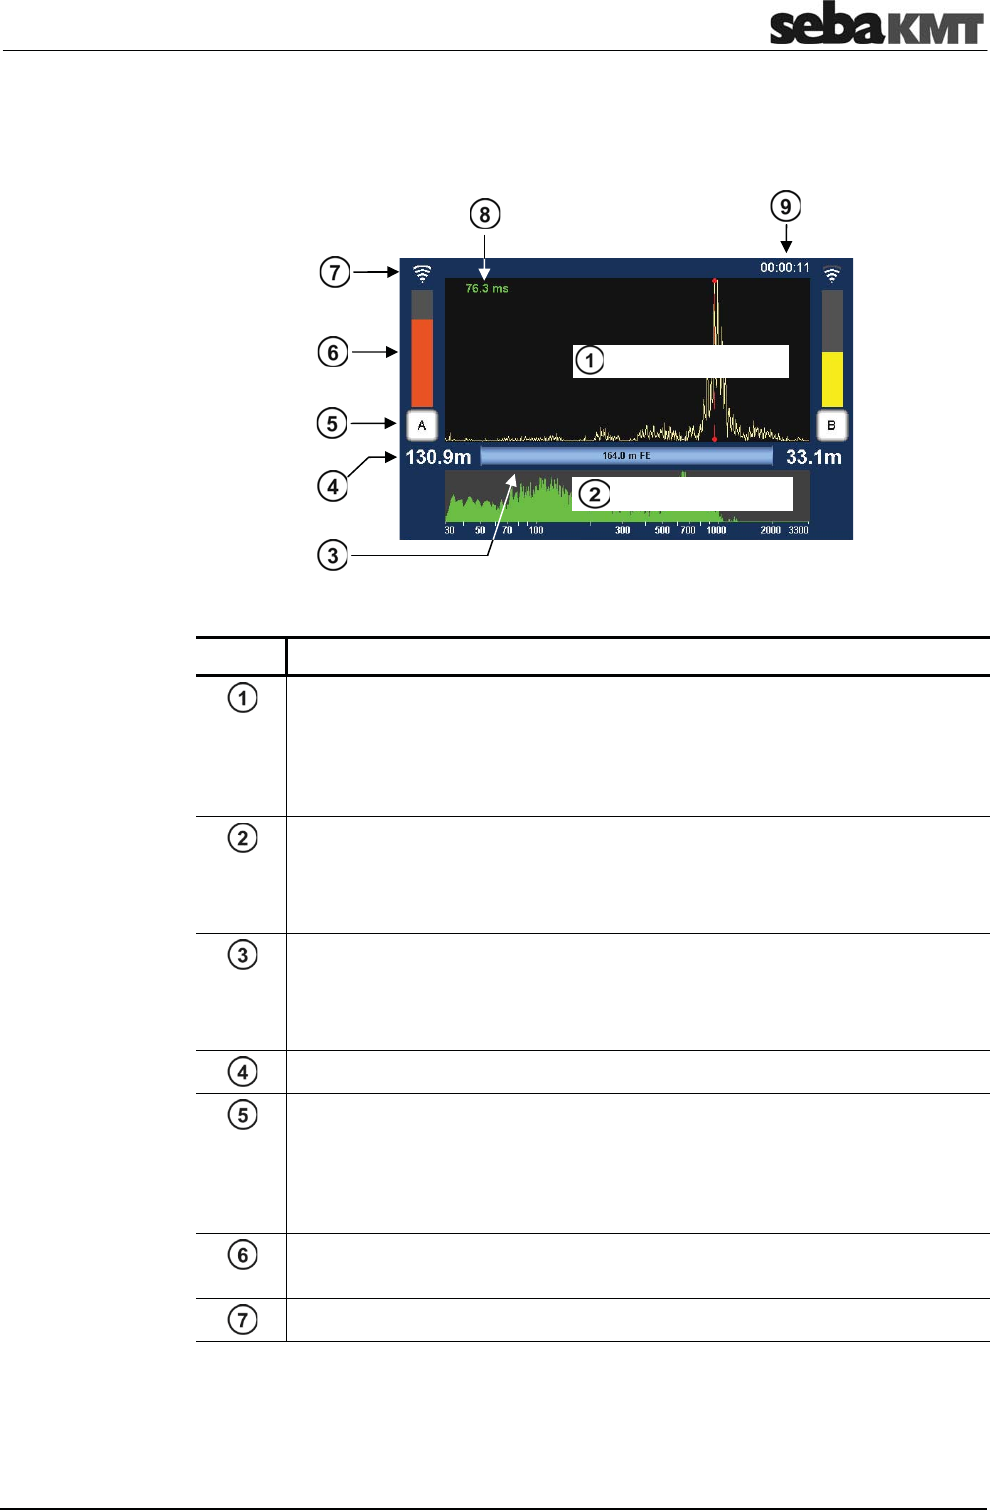
2.3 Correlation menu
After starting a correlation the result is displayed in the following view:
Element Description
Correlation curve
Result from comparing the recordings of the two sensors with regard to the
delay time of the signals.
Tap to open the Correlation analysis menu which provides a number of
analysis tools.
Coherence curve
Result from comparing the recordings of the two sensors with regard to the
frequency range of the recordings.
Tap to open the frequency filter settings menu.
Pipeline between A and B
The graphic illustrates the pipeline between the measuring points A and B
with all its sections.
Tap to open the Pipe data menu.
Distance from the measuring point to the leak
Measuring point A / B
Indicates whether the Power transmitter A or B is installed at this measuring
point.
Tap the button to open the Audio menu which can be used to listen to the leak
noise.
Noise level at the measuring point
The height of the bar reflects the noise level at the measuring point.
Quality of the radio link between transmitter and Correlator
(continued on next page)
Correlation curve
Coherence curve

Frequently used menus
16
Element Description
Lag value
Indicates the delay of the leak noise between the two sensors. The color of
the numbers shows how reliable the result of this correlation is:
green ... "good" correlation, reliable result
yellow ... correlation is not optimal
red ... "bad" correlation; no leak or unreliable result
negat. sign ... The leak is on the left from the center of the line.
posit. sign ... The leak is on the right from the center of the line.
Term of the correlation
Specifies how long the displayed correlation is already running.
Any interruption resets the counter to 00:00:00.
Frequently used menus
17
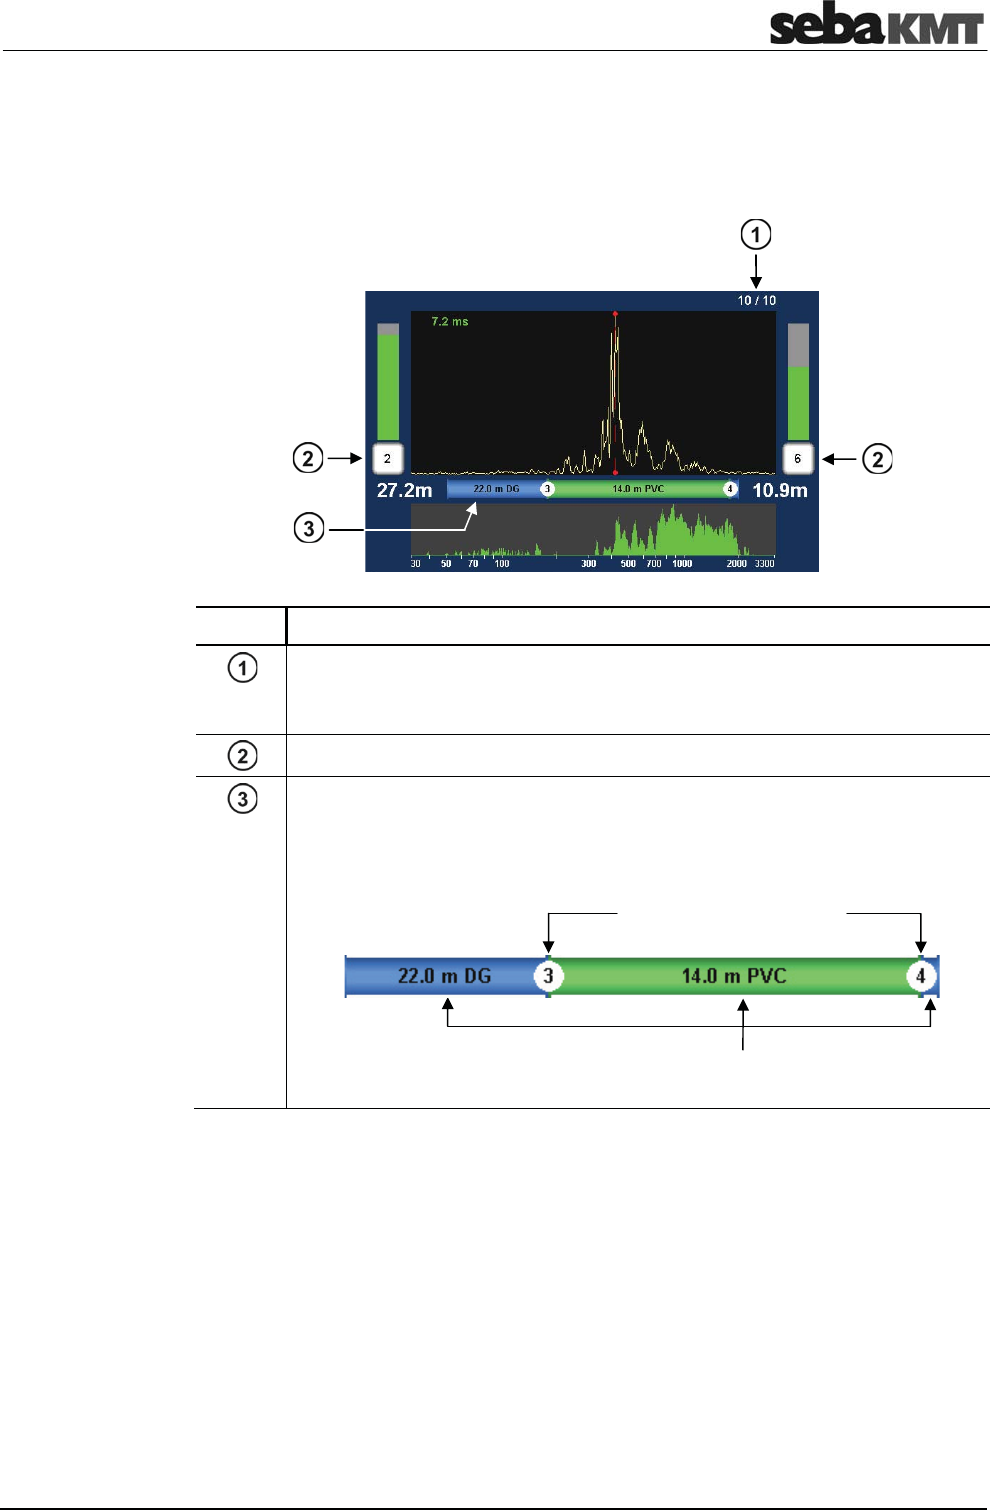
2.4 Correlation menu (Offline correlation)
In Offline measurement mode with Multi sensors, the Correlation menu differs in the
following aspects from the menu in Online measurement mode.
Element Description
Number of correlated audio blocks
The displayed curve is the result of an averaging from up to 10 single
correlations.
Number of the sensor at the measuring point
Pipeline between the measuring points
The graphic illustrates the pipeline between the measuring points.
Tap to open the Pipe data menu.
Pipeline sections
Installation points of
sensors No.3 and 4

Frequently used menus
18
Frequently used menus
19
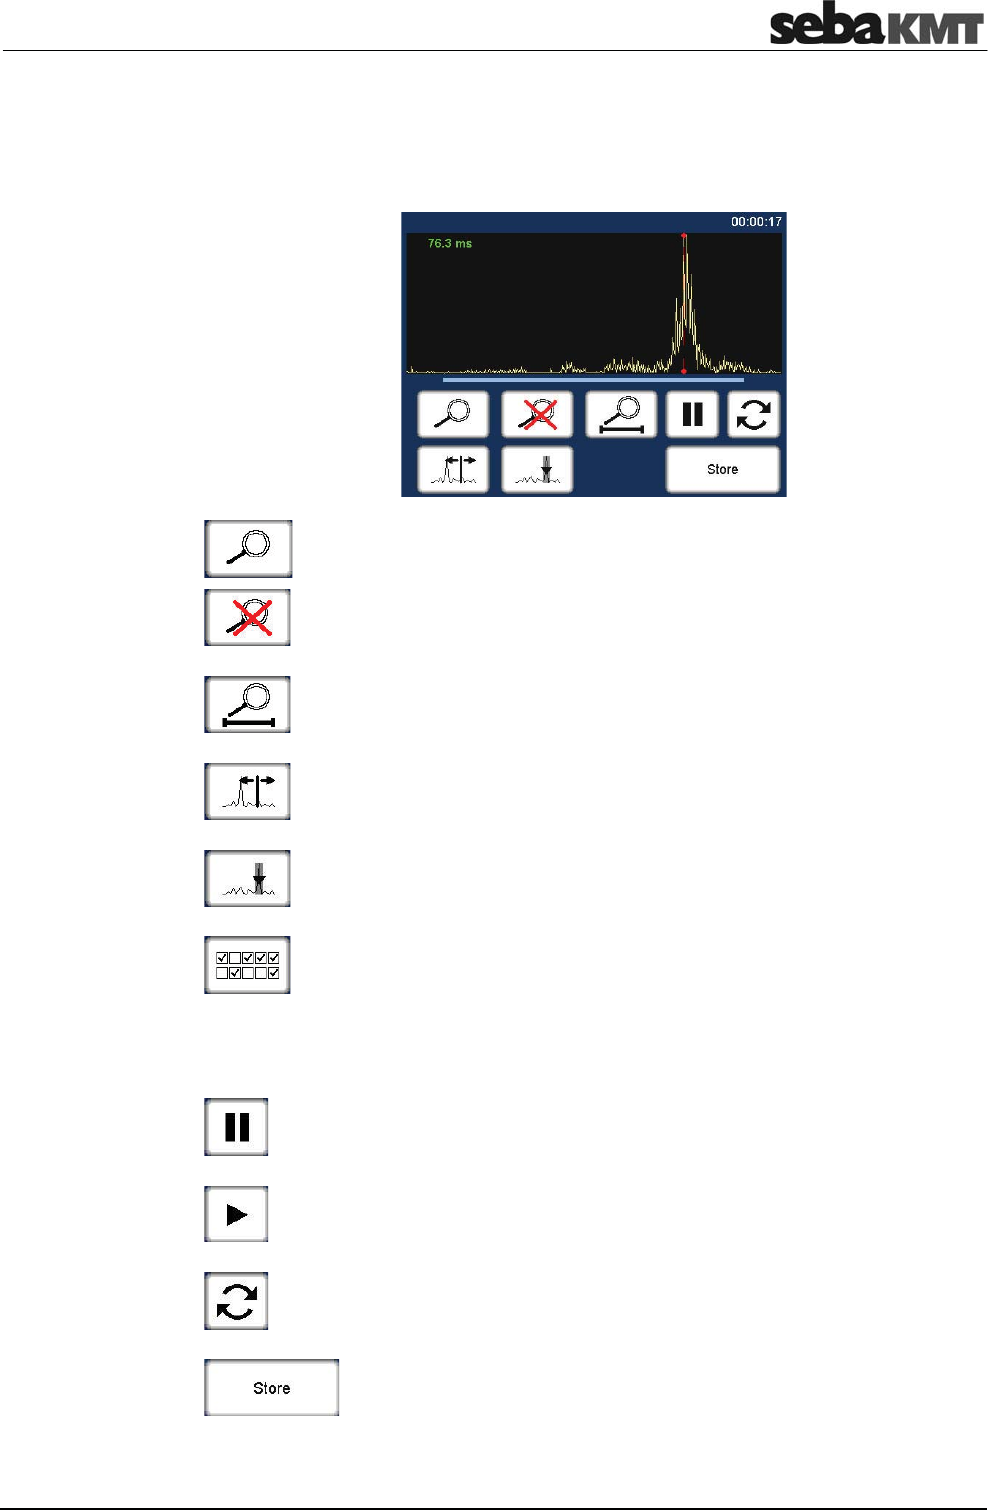
2.5 Correlation analysis menu
Tapping the Correlation curve always opens the following menu. This provides tools
for analyzing the correlation.
Zoom … to magnify a section of the curve
Tap the button, then mark the area to be magnified in the diagram.
Zoom-Reset … to reset the curve to its initial state
Magnification and suppression are abolished. The entire correlation curve
is displayed.
Zoom opt. ...magnifies length of the pipeline
Exactly the part of the correlation curve is shown, which refers to the pipe
between the two measuring points.
Move cursor … to read the lag value or the distance to the leak at any
point of the curve
Tap the button, then move the vertical red line in the diagram.
Suppress … to hide a section of the curve
Tap the button, then mark the area to be suppressed in the diagram,
i.e. tap and draw out the required range.
Suppress individual audio blocks (only Offline correlation)
Opens a menu showing the 10 single correlations of this pair of sensors.
"Bad" single-correlations can be 'deactivated' and, by this means,
excluded from the total-correlation.
Tap the buttons to remove/set the checkmark. Use the arrow button to
return back to the correlation analysis menu.
Pause
Interrupts the current correlation.
Continue
Continues the interrupted correlation, but does not reset the averaging
interval.
Refresh
Resets the averaging interval and restarts the correlation.
Store
Opens the Correlation management menu to store the displayed
correlation data in the Correlator's data base.

Frequently used menus
20
Frequently used menus
21
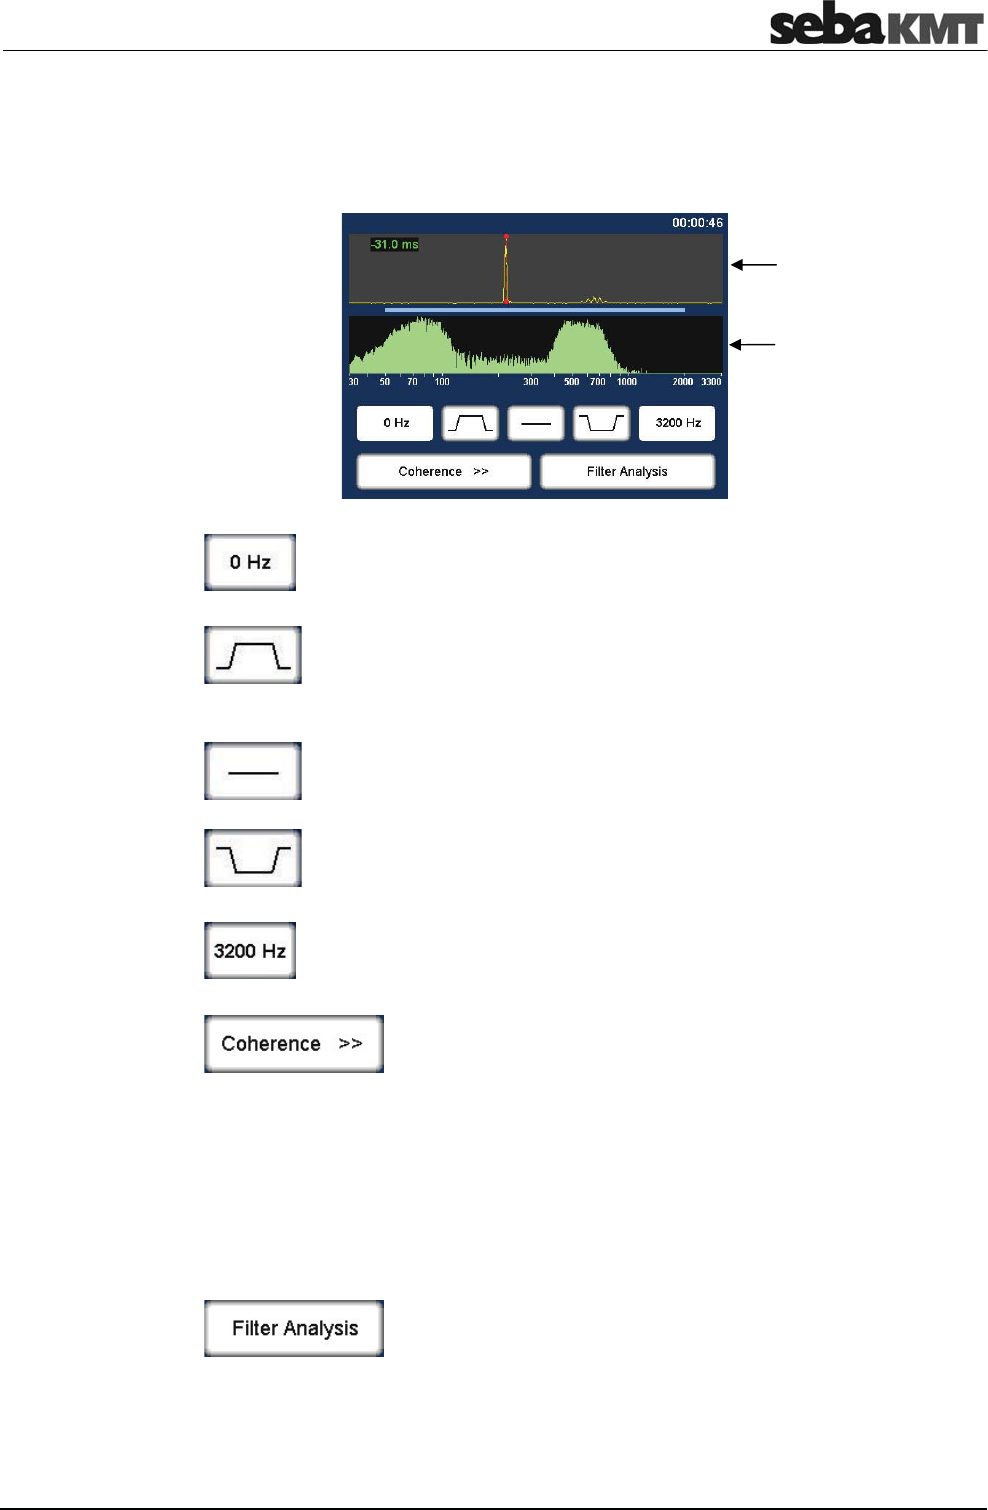
2.6 Frequency analysis menu
Tapping the Coherence curve always opens the following menu. This provides tools for
analyzing the frequency range.
Lower frequency limit
Shows the lower limit of the frequency range.
Tap the button to change the value.
Bandpass … to isolate a frequency range
Tap button. Then mark the required range in the frequency diagram.
The correlation is updated. The frequencies outside the selected range
are suppressed.
Filter reset
Tap the button to reset the frequency filter settings to the initial state.
Bandstop … to suppress a frequency range
Tap button. Then mark the required range in the frequency diagram.
The correlation is updated. The selected frequency range is suppressed.
Upper frequency limit
Shows the upper limit of the frequency range.
Tap the button to change the value.
Frequency spectrum
Allows to change between the following frequency diagram
options:
Coherence ... Coherence of the recordings of both sensors.
Spectrum L ... Frequency spectrum of the sensor on the left.
Spectrum R ... Frequency spectrum of the sensor on the right.
Spectrum L+R ... Frequency spectra of both sensors.
•
Orange curve … Sensor A
•
Yellow curve … Sensor B
Automatic search for filter
Provides 10 possible filter settings for selection
Coherence
curve
Correlation
curve

Frequently used menus
22
Frequently used menus
23
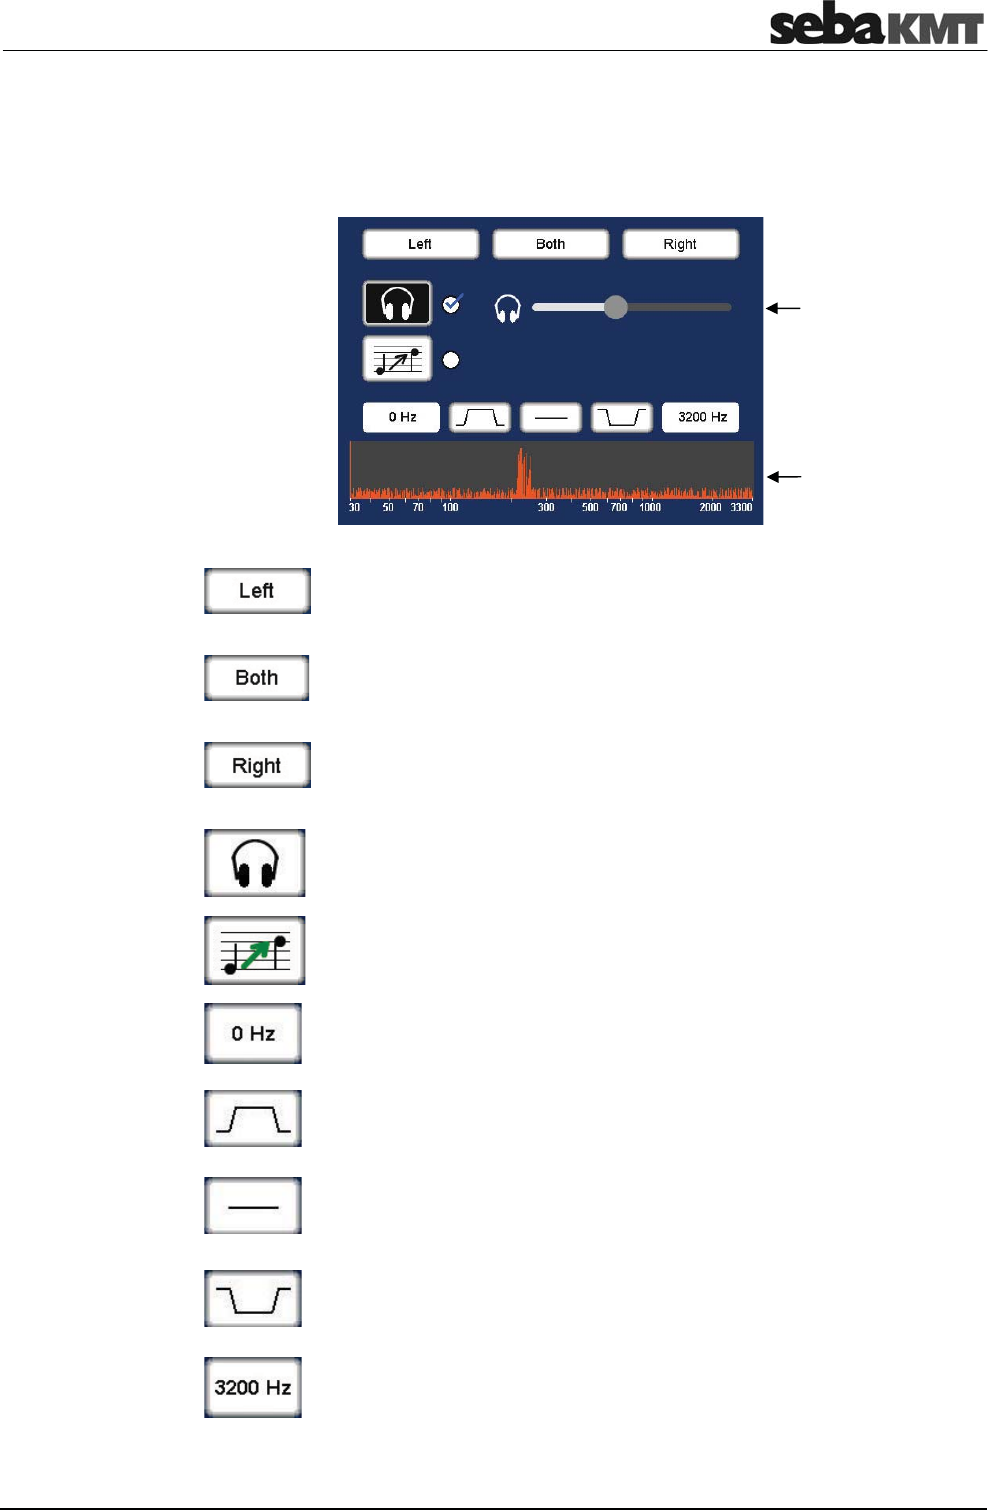
2.7 Audio menu
Tapping the buttons A / B / Sensor number in the Correlation menu opens the Audio
menu. It is used to listen to the leak noise via the supplied headphones.
Listen only to the left sensor
Only the noise recorded by the sensor on the left is reproduced.
Listen to both sensors
The combined noise of both sensors is reproduced.
Listen only to the right sensor
Only the noise recorded by the sensor on the right is reproduced.
Headphones ON / OFF
Button to enable/disable the connected headphones
Pitching function ON / OFF
This function lifts very low frequencies artificially up to a higher
frequency range to make them more audible to the user.
Audio filter: Lower limit
Shows the lower limit of the frequency range.
Tap the button to change the value.
Audio filter: Bandpass
Specify the frequency range to be reproduced. Frequencies outside this
range are suppressed.
Audio filter: Reset
Tap the button to reset the audio filter settings to the initial state.
Audio filter: Bandstop
Specify the frequency range to be suppressed, i.e.frequencies in this
range are suppressed.
Audio filter: Upper limit
Shows the upper limit of the frequency range.
Tap the button to change the value.
Headphone
volume
(slide control)
Frequency
curve

Frequently used menus
24
Frequently used menus
25
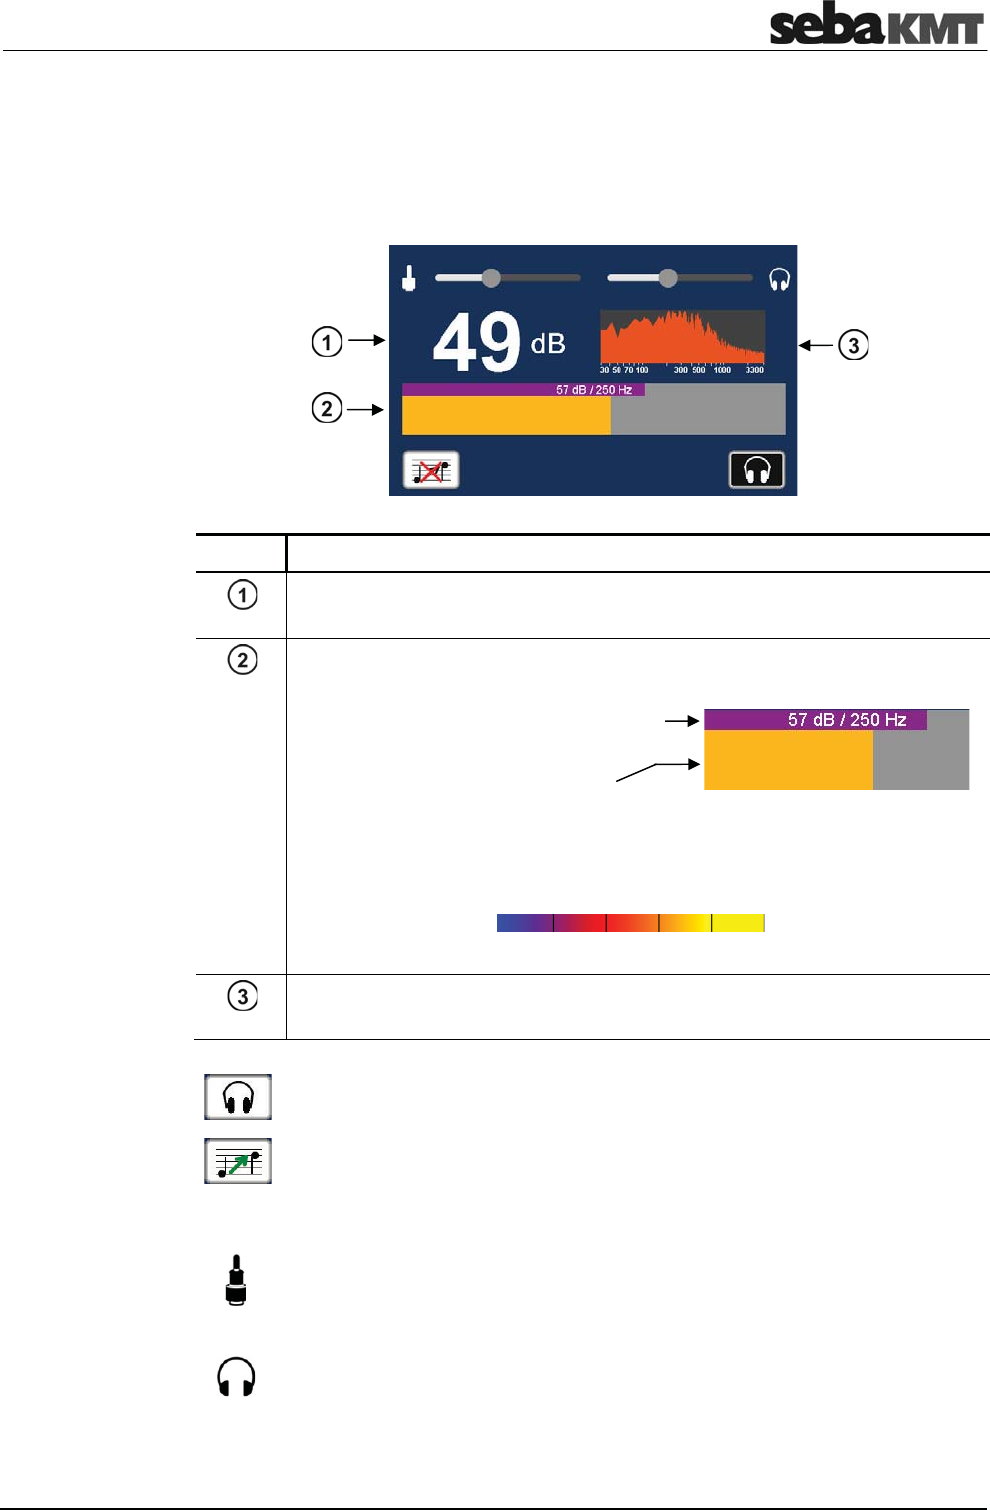
2.8 Audio menu (when ground microphone is connected)
A ground microphone can be connected to the Correlator. When you open the
Pinpointing function, at first this audio menu appears. It is used to listen to the leak noise
via the supplied headphones.
Element Description
Minimum value
lowest noise level of the measurement as a numeric value in dB
Bar graph display
The bar's height represents the noise level.
The bar's color illustrates the frequency of the noise.
blue yellow
0 Hz 3300 Hz
Frequency spectrum
Tap to open the menu for adjusting the frequency filter.
Headphones ON / OFF
Button to enable/disable the connected headphones
Pitching function ON / OFF
This function lifts very low frequencies artificially up to a higher frequency
range to make them more audible to the user.
Microphone gain
slide to the left ... reduces the gain
slide to the right ... increases the gain
Headphone volume
slide to the left ... lower
slide to the right ... louder
Indicators
Buttons
Slide controls
Narrow bar: Instantaneous value
(currently measured level and frequency)
Broad bar: Minimum value
(lowest level and frequency of measurement)

Frequently used menus
26
Technical description
27
3 Technical description
3.1 Function
The Correlux C-3 is a digital Correlator to locate leaks in drinking water pipes.
Pressurized water at the leak location creates a noise which travels out in all directions
of the pipe. This noise is recorded, amplified and sent wirelessly to the Correlator by two
sensors (piezo microphone, hydrophone) which are attached to the pipe (e.g. valve,
hydrants).
The Correlux C-3 compares both signals (correlation) and calculates the exact distance
to the leakage on the basis of the delay time of the signals, the sensor spacing and the
sound velocity in the pipe.
The Correlux C-3 is suitable for both immediate measurement ("Online measurement")
as well as time-delayed measurement ("Offline measurement").
Online measurement
In a so-called Online measurement, the noise recording and the correlation of the data
take place at the same time.
Step Description
1 Installing the Power transmitters "A" and "B" at two measuring points.
2 Noise recording, at the same time data transfer and live data correlation on the
Correlator.
Offline measurement
In a so-called Offline measurement, the correlation of the measured data takes place
only after the noise recording has been terminated.
Step Description
1 Programming the sensors (Multi sensors and Power transmitters)
2 Installing the Power transmitters and/or Multi sensors at up to 8 measuring points.
3 Noise recording, immediately or at a preset time (e.g. at night).
4 Collecting the sensors.
5 Reading and analyzing the measured data using the Correlator.
Pinpointing
To determine the exact location of the leak after the correlation, a pinpoint search can
be performed using the Multi sensors or the ground microphone connected to the
Correlator.
Technical description
28
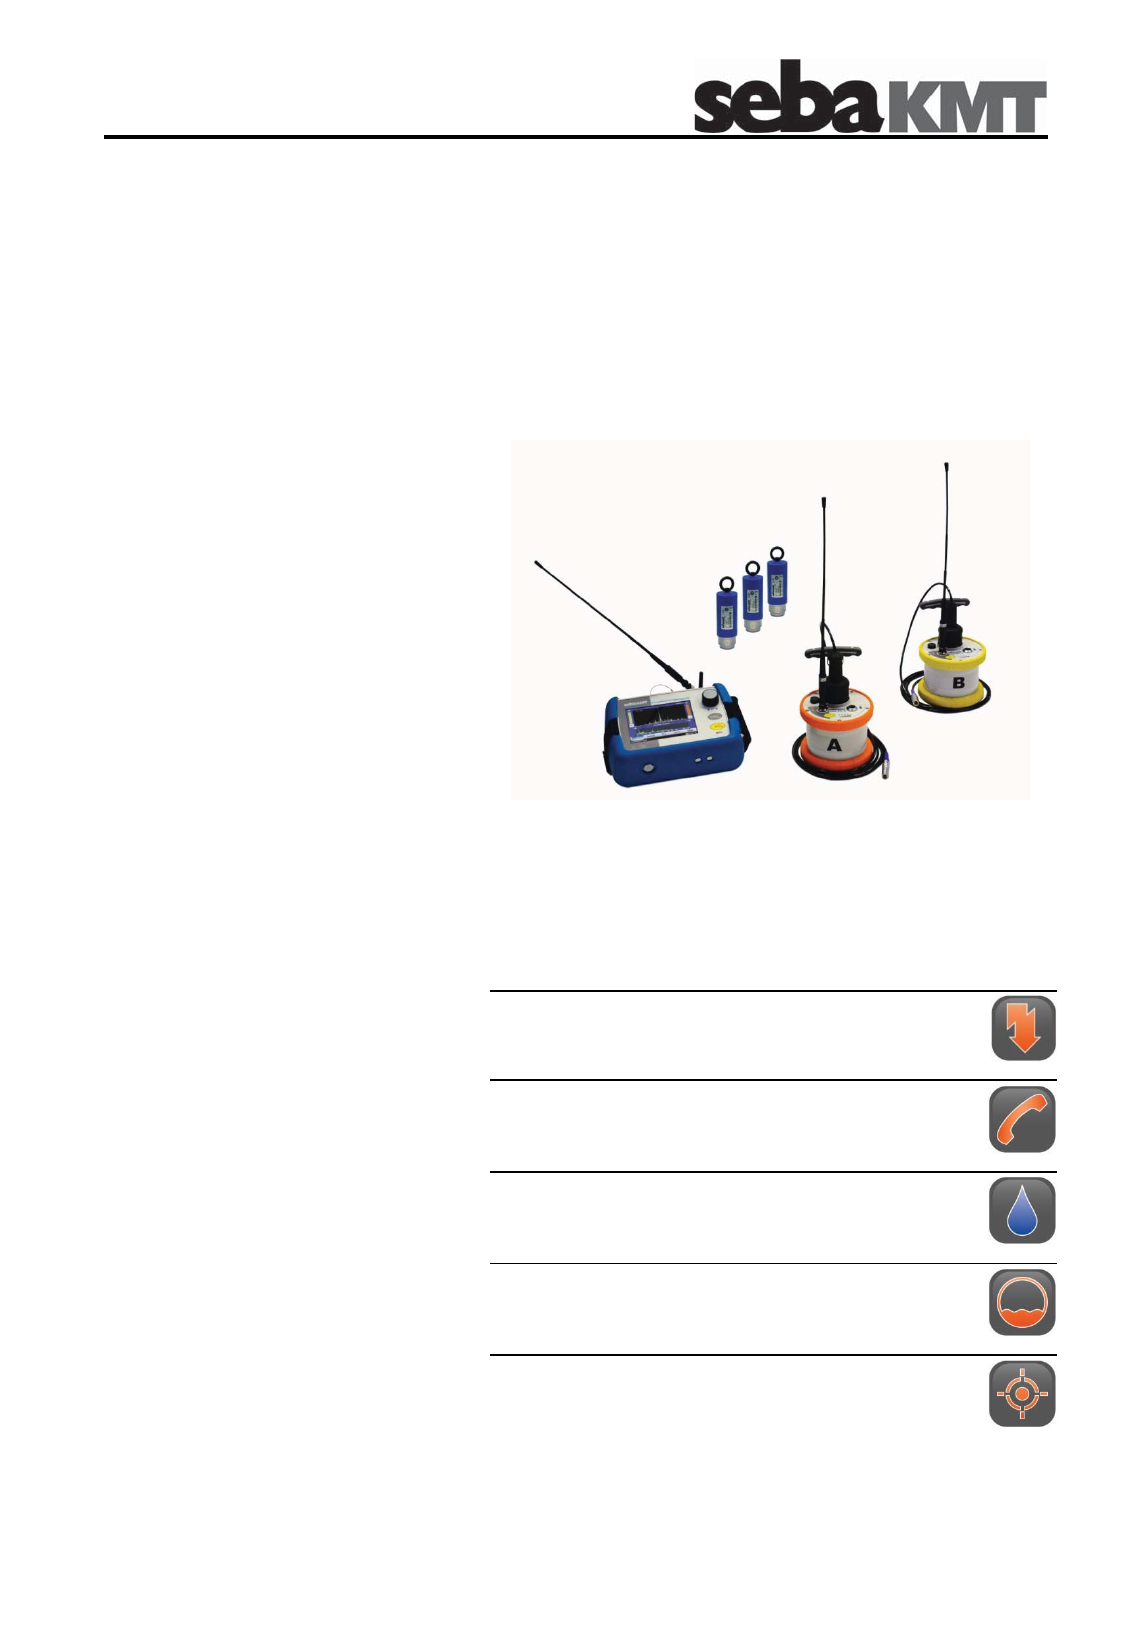
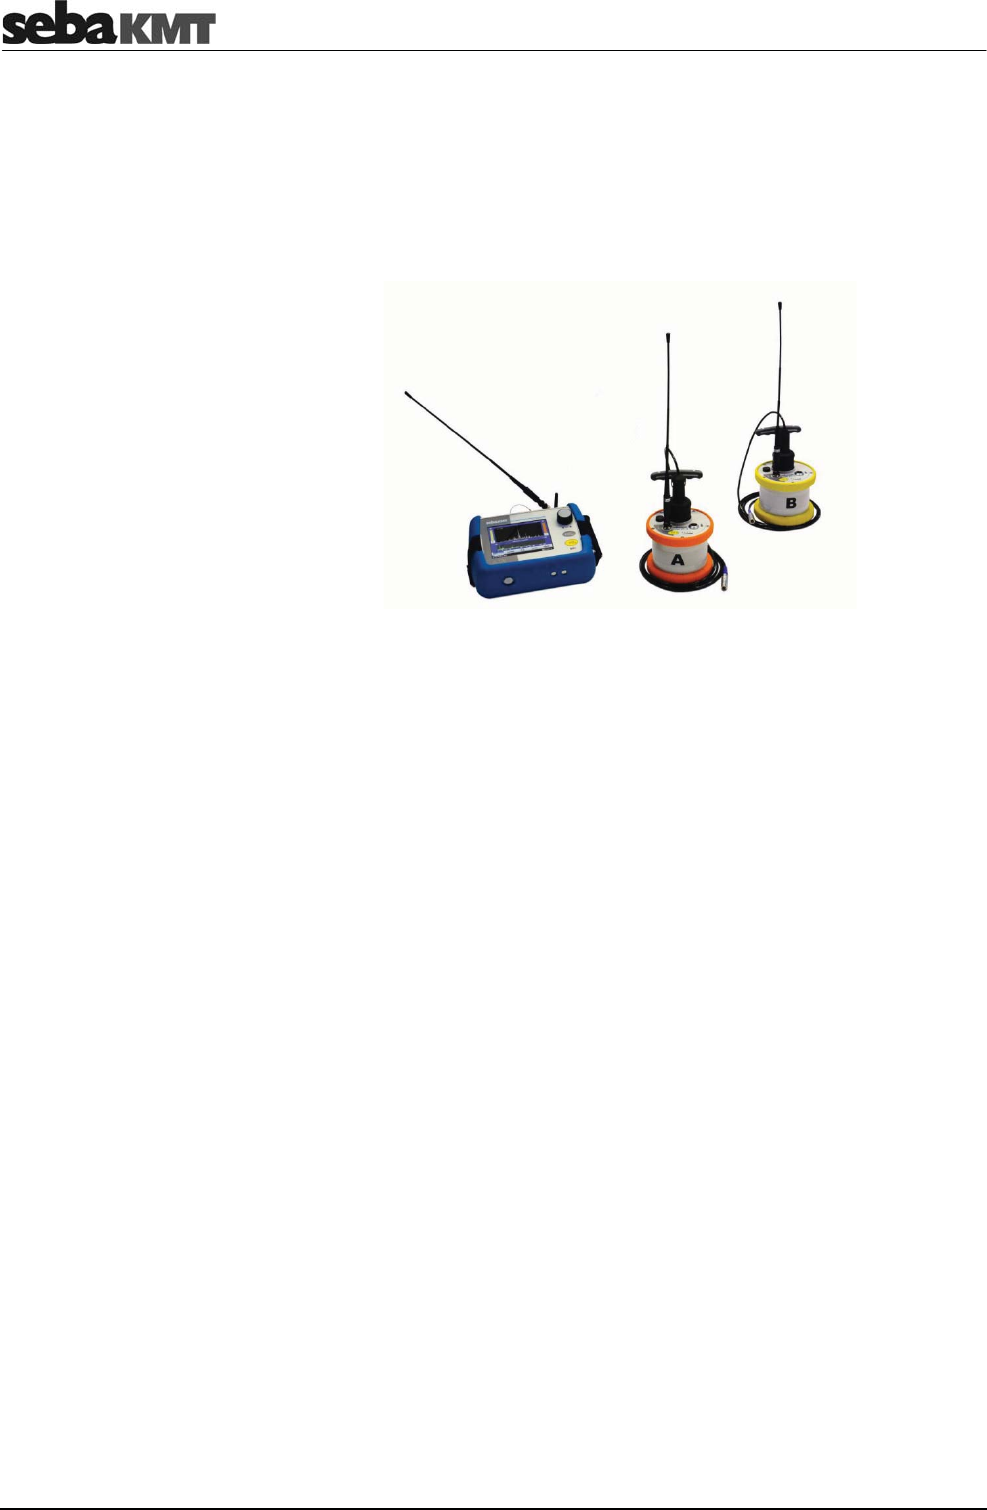
3.2 Features of the set
The Correlux C-3 set mainly comprises the following components:
•
Correlator
•
2 Power transmitters with microphone (Transmitter A / Transmitter B)
for recording the leak noise at two measuring points and sending the recorded data
to the Correlator
The set can be extended by the following components:
•
up to 8 multi sensors
for recording the leak noise of up to 8 measuring points at the same time followed
by an "Offline-correlation"
•
hydrophones
for recording the leak noise directly at the water column
•
a ground microphone
for pinpointing the leak after correlation
The Transport case offers space for the Correlator, 2 Power transmitters and
3 Multi sensors. The case is not only for storage and transportation purposes, but also
functions as a charging station for the devices.
Using the CorreluxView analysis software measurement data can be displayed and
processed on the computer. The software can be downloaded from the SebaKMT
Internet page:
www.sebakmt.com >> Information > User area > Software > Leak localization
Technical description
29
3.3 Communication of the components
The components of the system communicate with each other in the following ways:
Participating devices Communication channel
Correlator ļ Power transmitter Short range radio (digital or analogue)
Correlator ļ Multi sensors Short range radio (digital)
Correlator ļ Computer USB cable
Correlator ļ Ground microphone Connection cable
3.4 Power supply
The Correlator, the Power transmitters and the Multi sensors come with internal
rechargeable Li-Ion batteries.
The storage places of the individual devices in the transport case function as charging
stations. As soon as a device is placed in/on its station in the case, the device is
automatically charged, provided the case is connected to the mains.
The case can be connected via the connection socket and the supplied connection
cable to either a 12 V connector of a vehicle or to the mains
NOTE
When connected to the electrical system of a car, the transport case is
powered by the vehicle's battery, even while the vehicle is not in
operation. This could result in the complete discharge of the vehicle
battery.
When you park the car, disconnect the Correlux transport case from the
vehicle power supply.
NOTE
Use inductive charging units inside for COR PT-3 and COR MS-3 only!
NOTE
Close cover of transport case if it is raining!
You can find more information in the chapters which describe the individual devices.
Technical description
30
3.5 Scope of delivery
The basic set comprises the following devices and accessories:
Accessory Description Art.no.
COR C-3 Correlator 1006550
COR PT-3A Power transmitter A 1004779
COR PT-3B Power transmitter B 1004780
PAM CORR-2 2 x active universal microphone for PT-3 820019615
CPK 3-B Case for COR C-3 (Basis) 2007235
LG C-3 Charging unit for CPK 3/CMK 3 1006646
LK 13 Car charging adaptor, 3.5m 810000006
KR 22-5 Stereo headphones 810002087
VST T-1 2 x extension rod for PAM CORR-2 810000103
VK 77 Connection cable set Sebalog D (USB) 820012451
2 x nylon cord 3mm blue, 2m 304035025
CSW CorreluxView C-3 PC software 1006584
The following devices and accessories are available to extend the basic set.
Accessory Description Art.no.
COR MS-3 Multi sensor 1004815
CMK 3-8-MS Case for 8 Multi sensors COR MS-3 2005301
LOG TP Trivet adaptor for Sebalog Corr 128309877
LOG MWA Magnetic angled adaptor 118303355
Mounting set for COR MWA
(Screws for angled adapters) 2007393
Set of labels COR C-3 (1 - 8) 2007321
The PAM W-2 ground microphone set is available to extend the basic set. It consists of
the following parts:
Part Description Art.no.
PAM W-2 Windproof ground microphone 820013157
PAM W-2 D Trivet adapter for PAM W-2 820013234
VK 65 Connection cable 820000936
Carrying rod 210100071
VK 100 Connection cable 118302742
Article number of the complete set: 128310702
Standard accessory
Additional accessory
PAM W-2
ground microphone set
Technical description
31
3.6 Technical data
Correlux C-3 is specified by the following parameters:
Parameter Value
Indicators 5,7'' VGA color display
640 x 480 pixels
Entry Touch display,
Rotary encoder with enter function
Power supply Internal rechargeable Li-Ion battery,
12 V DC charging pins
Operating time min. 16 h
PC interface USB
Connections Sensor (microphone/hydrophone),
12 V DC / headphones (combined)
USB / GPS (combined)
External antenna 1 (digital radio)
External antenna 2 (analogue radio)
Dimensions 250 x 190 x 100 mm
Weight 1.9 kg
Degree of protection IP 65
Parameter Value
Sensor Piezo sensor with active amplifier (standard) /
hydrophone (optional)
Indicators I/O LED (device On/Off)
Radio LED (radio module On/Off))
Row of LEDs (battery status or measured noise level)
Operation On/Off pushbutton
Power supply Internal rechargeable Li-Ion battery,
inductive charging
Operating time min. 12 h
Connections Sensor (microphone/hydrophone),
Radio antenna
Dimensions (without
handle)
Ø 125 x 111 mm
Weight (without sensor) 0.9 kg
Degree of protection IP 65
Correlator
COR C-3
Power transmitter
COR PT-3A/B
Technical description
32
Parameter Value
Type Piezo sensor with magnetic adaptor
(to be connected to Power transmitter or Correlator)
Active amplification yes
Dimensions Ø 38 x 78 mm
Weight 0.4 kg
Degree of protection IP 68
Parameter Value
Type Wind shielded piezo sensor
(to be connected to Correlator)
Dimensions Ø 185 x 165 mm
Weight 4 kg
Parameter Value
Sensor Integrated piezo sensor with active amplifier
Adapter Magnetic adaptor
Indicators Status LED
Operation On/Off magnetic switch
Power supply Internal rechargeable Li-Ion battery,
inductive charging
Operating time min. 16 h
Dimensions Ø 45 x 115 mm
Weight 0.4 kg
Degree of protection IP 68
Sensor
PAM CORR-2
Ground microphone
PAM W-2
Multi sensor
COR MS-3
The Power transmitters
33
4 The Power transmitters
4.1 Function and Design
Each Power transmitter has an active amplifier for the microphone signal, a data
memory, a rechargeable Li-Ion battery, a digital radio module and an analogue radio
module with antenna inside.
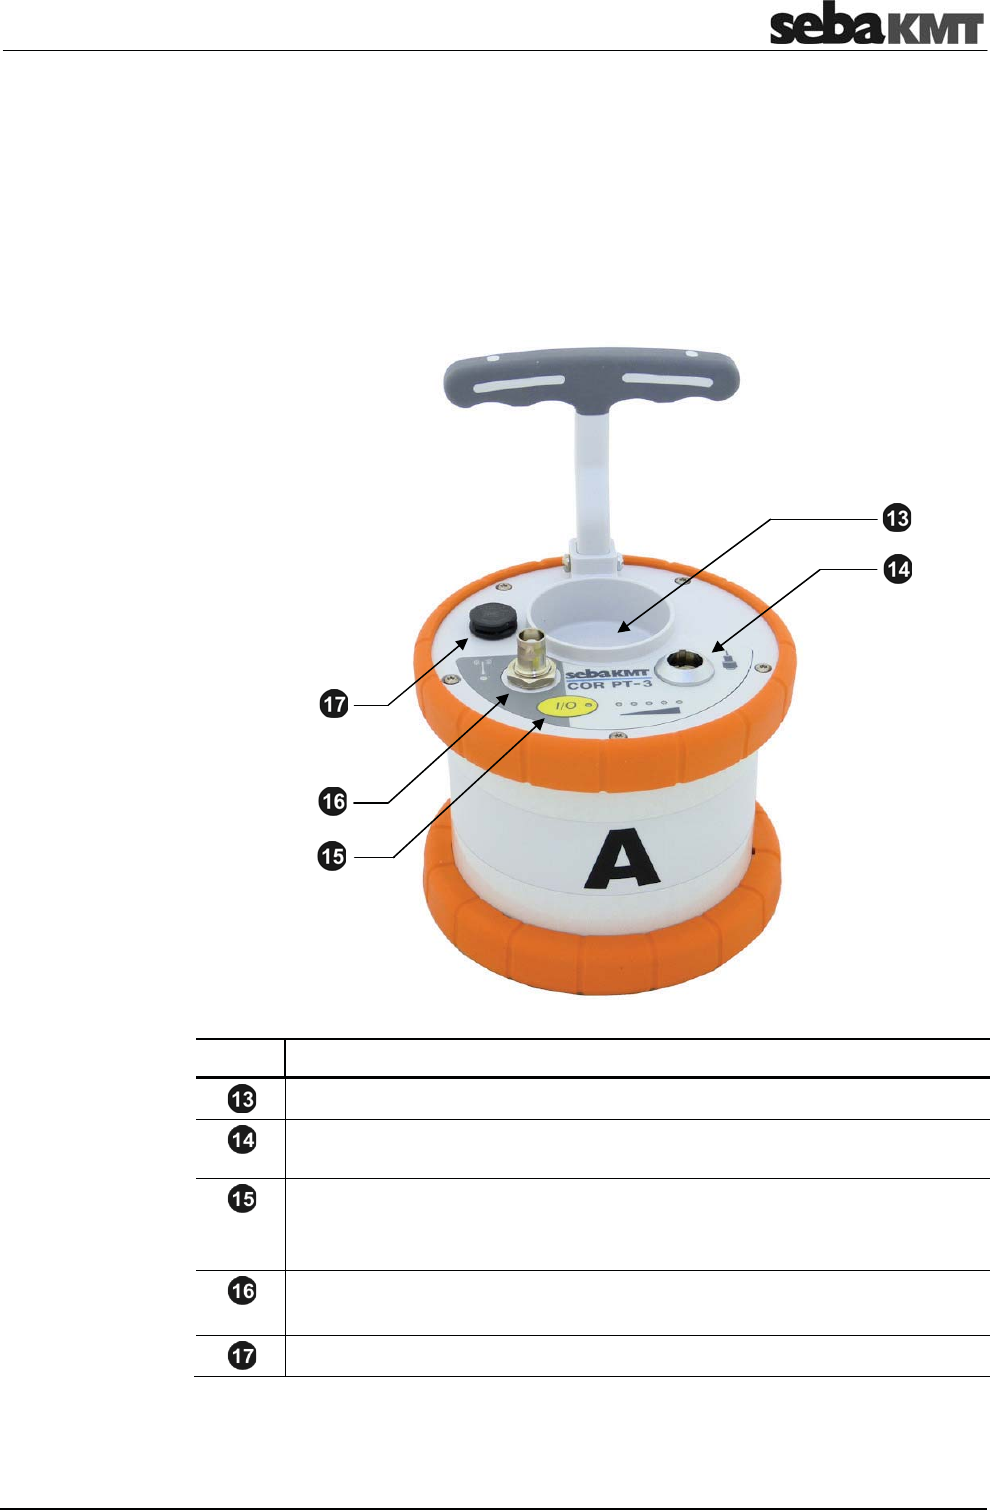
The sensors have the following external characteristics:
Element Description
Microphone storage place
Sensor socket
for connecting the microphone / hydrophone
I/O pushbutton
short pressing ... switches the device on
long pressing ... Switches the device off
Antenna socket
Antenna socket for connecting the analogue radio antenna
Ventilation/venting membrane
The Power transmitters
34
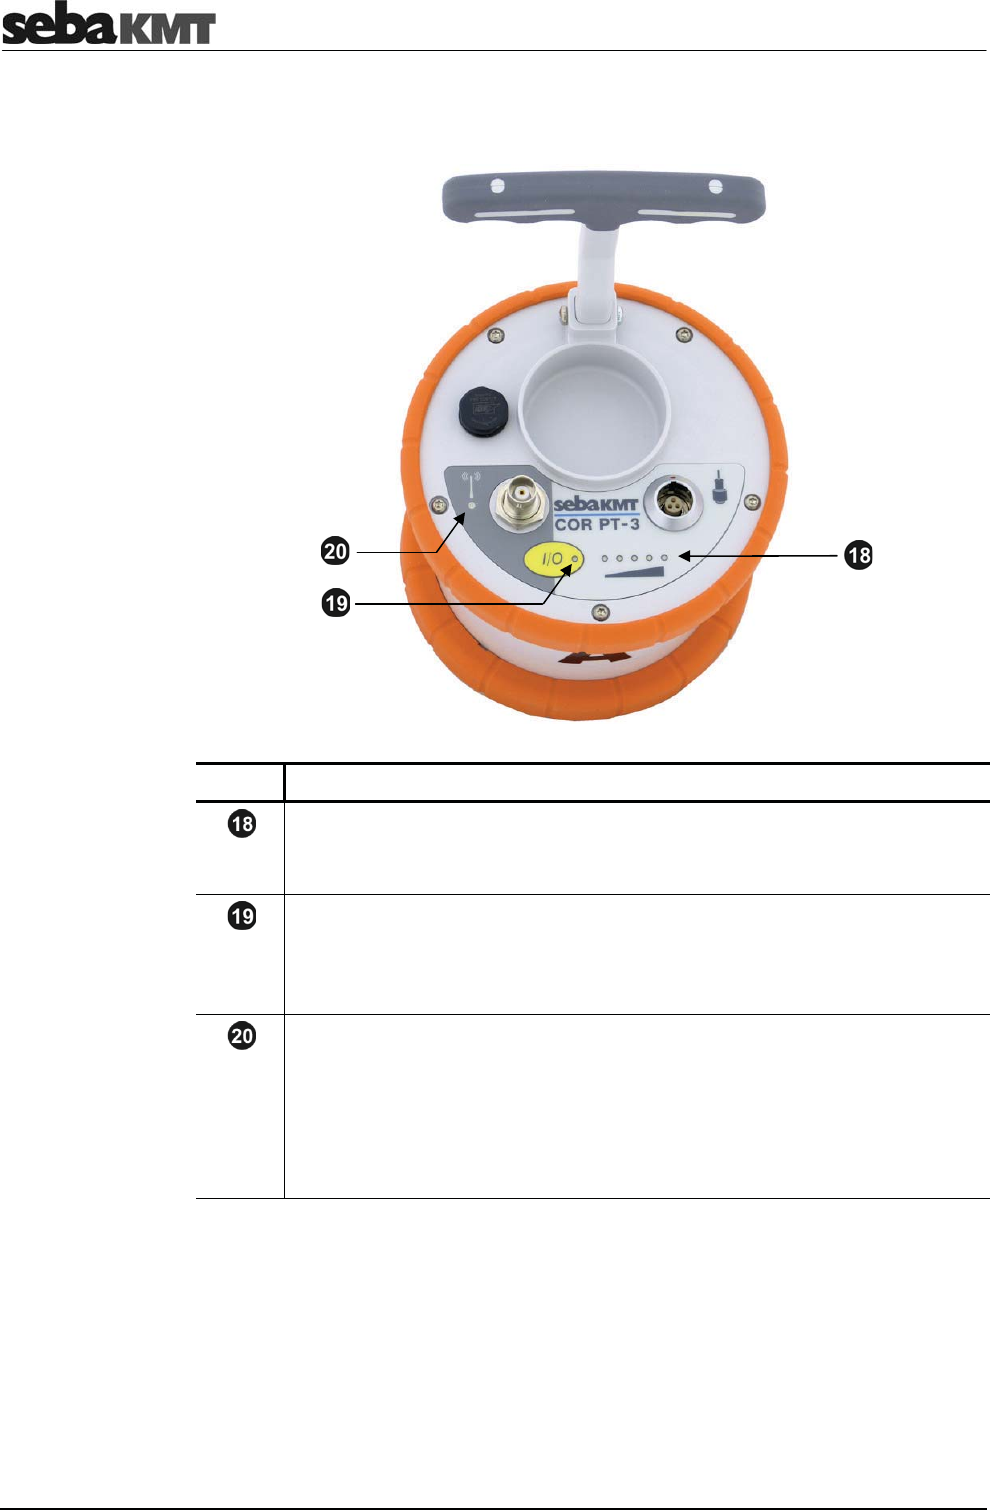
The Power transmitters have the following lights (LEDs):
Element Description
LED bar
lit green ... represents the current battery level
lit red ... represents the noise level
I/O LED
lit green ... the transmitter is switched on
flashing ... the device is charging
not lit ... the transmitter is switched off
Radio LED
lit red ... the transmitter is in "Active" mode,
noise measurement in progress,
measurement data is being sent to the Correlator
not lit ... the transmitter is in "Stand-by" mode,
no measurement in progress,
no radio traffic
Indicator lights
The Power transmitters
35
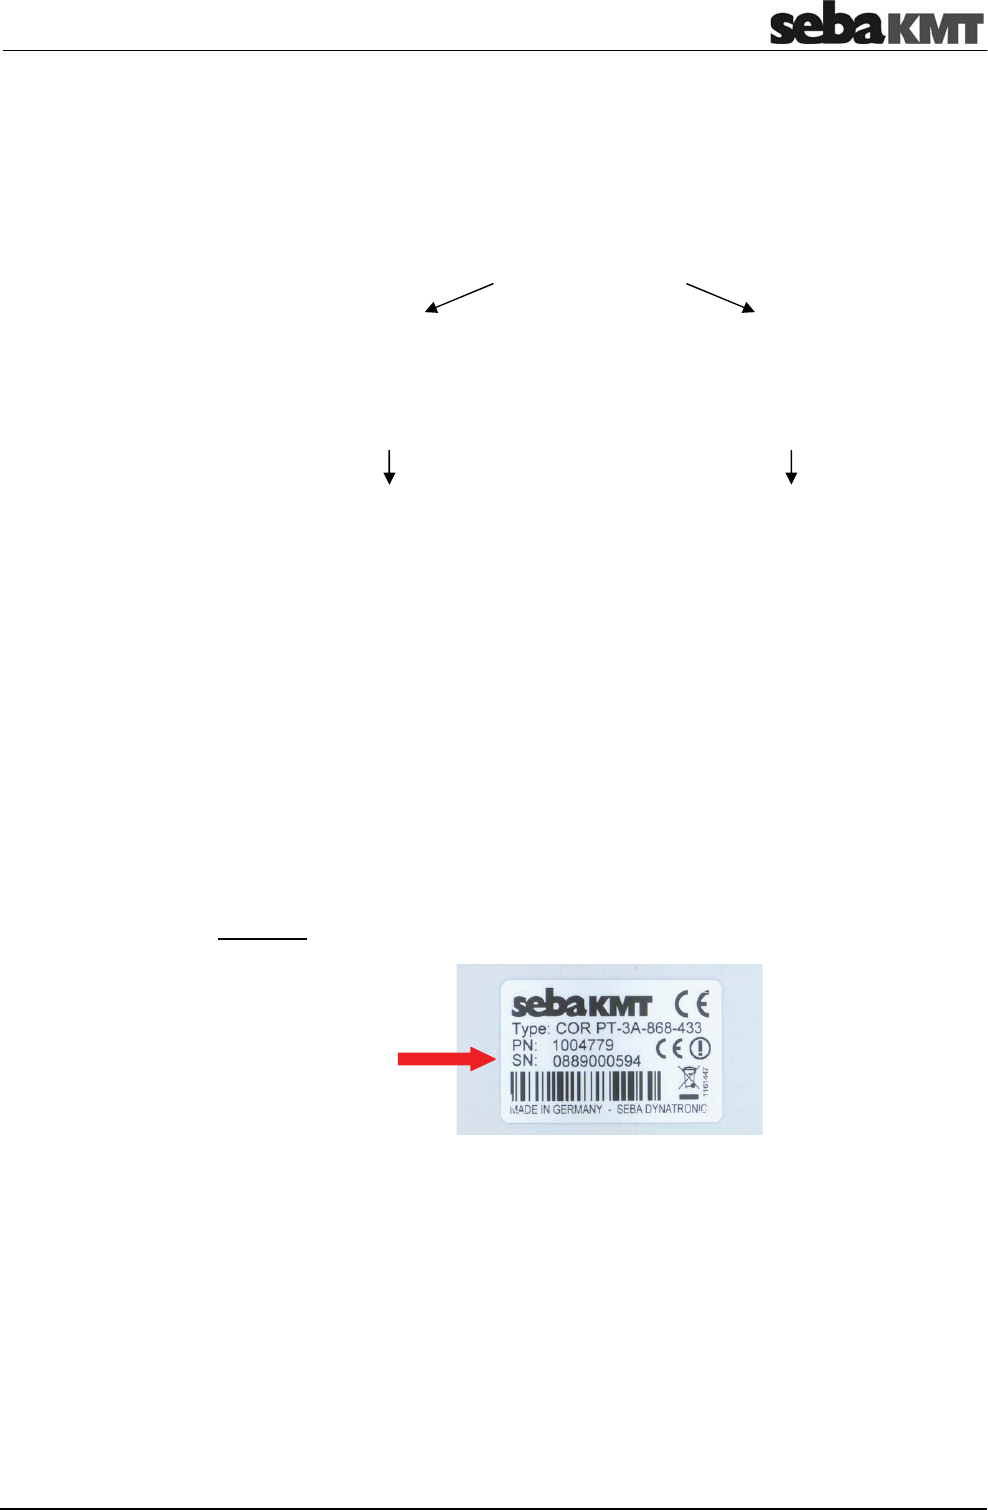
4.2 Identification number (ID)
Each Power transmitter has its own six-digit identification number (short: ID). Using this
ID the device can be managed and clearly identified in the Correlator, computer and
within the SebaKMT-Cloud.
The ID is deduced from the last six digits of the device's serial number (short: SN). You
find the serial number on the nameplate of the device.
When entering an ID on the Correlator or computer, the preceding zero digits can be
omitted.
4.3 Power supply
The Power transmitters are fitted with internal rechargeable Li-Ion batteries This can
power the device for approximately 12 hours.
In the Start menu of the Correlator two battery icons indicate the current battery status
of the Power transmitters.
On the Power transmitters, the current battery status is indicated by the LED bar
when it is green. If only one of five LEDs is lit, the device should be charged. Otherwise,
it switches itself off automatically.
Red light represents the recorded noise during the measurement and not the battery
status.
The Power transmitters are charged wirelessly in the transport case. The case must be
connected to a power supply. As soon as the Power transmitters are situated at their
storage places in the case, they are recharged inductively.
Charging takes approximately 12 hours. The I/O LED flashes when loading. The
LED bar indicates the progress of charging The I/O LED turns back to permanent
light as soon as the battery is full.
CAUTION
No objects must be put into empty charging stations.
Risk of fire!
The charging stations are for transport and charging of the devices only.
NOTE
Any repairs must be carried out by SebaKMT or an authorized service
partner.
Otherwise, the devices' resistance against water and dirt cannot be
guaranteed.
Do not open the device yourself. If you have problems with the battery,
please contact your SebaKMT service partner.
Battery level
Charging

The Power transmitters
36
4.4 Commissioning
To turn on, briefly press the I/O pushbutton . The I/O LED is lit green when the
device is turned on. To turn the device off, press the button until the LED goes out.
The microphone's storage place is fitted with a magnetic switch. As a result, the
Power transmitter "knows" whether the microphone is currently in use or not.
As long as the microphone rests in its storage place, the Power transmitter remains in
"Stand-by" mode. The internal analogue radio module stays off as no measuring data
needs to be transferred to the Correlator. This saves battery power.
As soon as the microphone is taken from the storage place, the Power transmitter
switches from "Stand-by" to "Active" mode. The radio module is activated. From now on,
the recorded data are directly sent to the Correlator. The row of LEDs switches from
green to red and represents the recorded noise level.
4.5 Installation
The sensors should be installed directly on the pipe but, however, you can also attach
them to valve rods or hydrants, for example, or any other position along the pipeline that
is easily accessible.
There must be the best possible contact between the sensor foot or the mounted
adapter (see below) and the pipe. If need be, clean the contact point thoroughly
(preferably with a wire brush).
In some situations it might be helpful to use one of the supplied magnetic angle
adapters.
Switching ON/OFF
Stand-by
The Multi sensors
37
5 The Multi sensors
5.1 Design and function
Each Multi sensor has a highly sensitive piezo microphone with active amplifier, a data
memory, a rechargeable Li-Ion battery and a radio module with antenna inside.
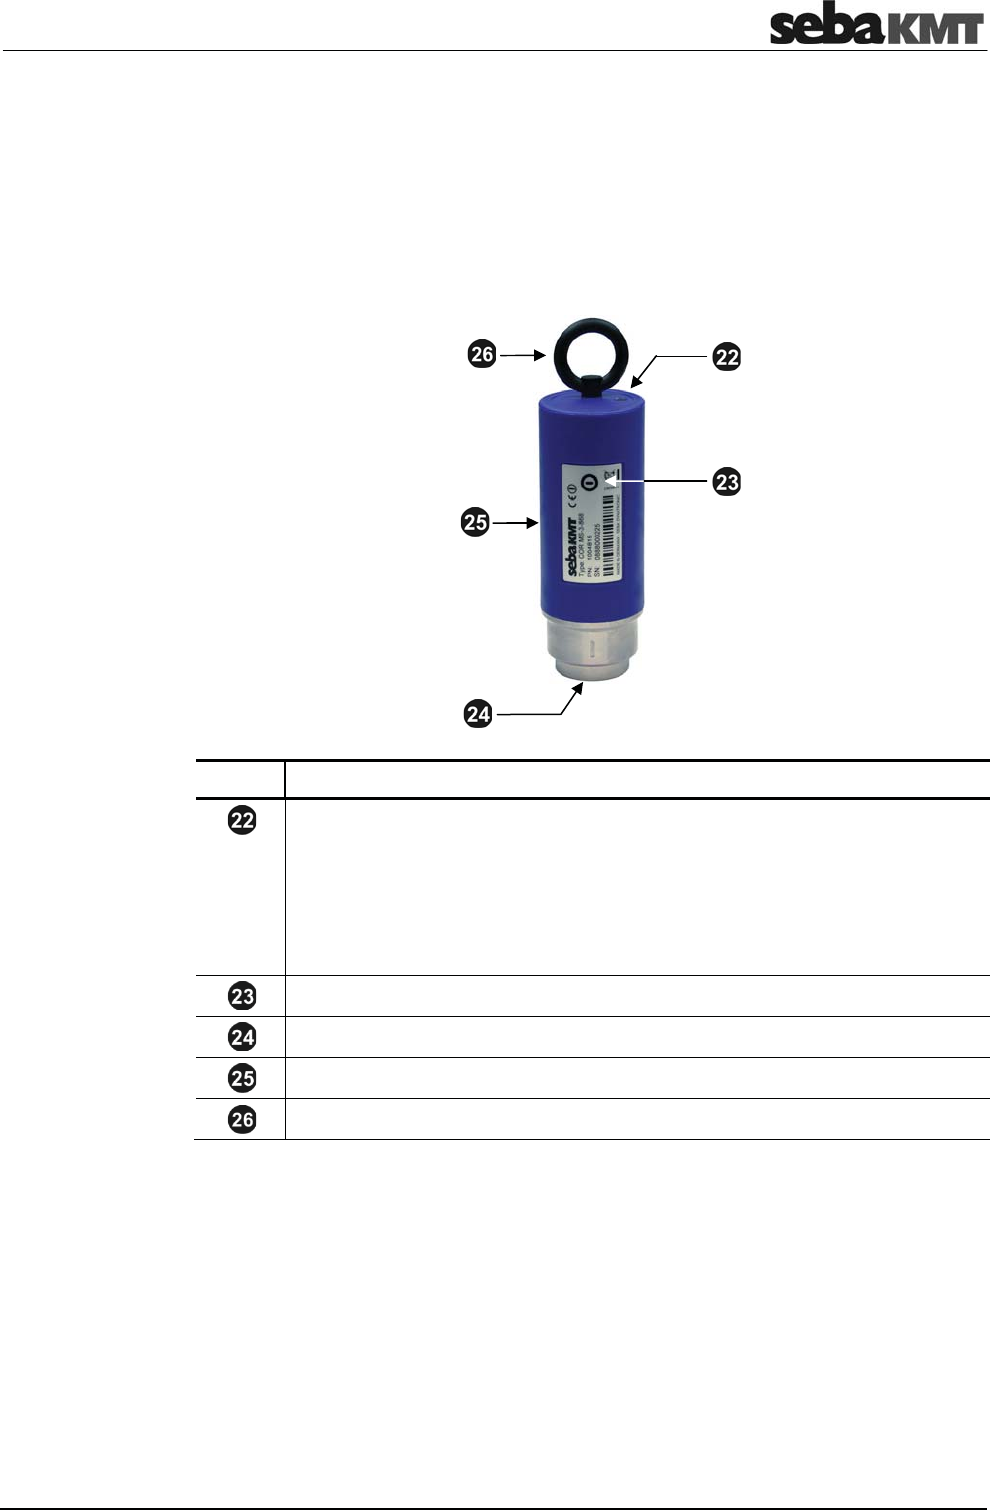
The sensors have the following external characteristics:
Element Description
Status LED
flashes green ... Battery OK
flashes yellow ... Battery critical
flashes red ... Device needs to be re-charged
flashes rapidly ... Device is charging
no light ... Device is turned off
ON/OFF contact area I/O
Magnetic foot (detachable)
Type plate
Carrying ring (detachable)
5.2 Identification number (ID)
Each Multi sensor has its own six-digit identification number (short: ID). Using this ID the
device in the Correlator and the CorreluxView PC software can be managed and clearly
identified.
The ID is deduced from the last six digits of the device's serial number (short: SN). You
find the serial number on the nameplate of the device.
When entering an ID on the Correlator or computer, the preceding zero zero digits can
be omitted (see page 45).
The Multi sensors
38
5.3 Power supply
The Multi sensors are fitted with internal rechargeable Li-Ion batteries This can power
the device for at least 16 hours.
In the Start menu of the Correlator up to eight battery icons can be seen. They indicate
the current battery status of the registered Multi sensors in reach. To know the exact
battery state of a Multi sensor, read the unit's configurations menu (see page 111). In
the line battery status the battery level of the sensor is shown as a percentage.
When the battery level of a Multi sensor falls below a certain threshold, the indicator
light of the device will flash red. The device must be charged. Otherwise, it switches
itself off automatically.
To charge the Power transmitters place them in the transport case. The case must be
connected to a power supply. As soon as the sensors are situated at their storage
places in the case, they are recharged inductively.
Charging takes approximately 6 hours. The units' indicator lights are rapidly flashing
during the charging process. The indicator lights turn to permanent green light as soon
as the battery is full.
CAUTION
No objects must be put into empty charging stations.
Risk of fire!
The charging stations are for transport and charging of the devices only.
NOTE
Any repairs must be carried out by an authorized service partner.
Otherwise, the devices' resistance against water and dirt cannot be
guaranteed.
Do not open the Multi sensors yourself. If you have problems with the
battery, please contact your SebaKMT service partner.
5.4 Switching ON/OFF
The Multi sensors have an internal magnetic switch.
To turn a Multi sensor on, briefly hold a magnet (e.g. the foot of another Multi sensor) in
front of the sensor's I/O area . The device turns on. The indicator light flashes
3 times.
To turn the device off, hold a magnet in front of the I/O area for approximately
2 seconds. The indicator light will flash 2 times before it goes out.
Battery level
Charging
The Multi sensors
39
5.5 Installation
The Multi sensors should be installed directly on the pipe However, you can also attach
them to valve rods or hydrants, for example, or any other position along the pipeline that
is easily accessible. Due to their powerful magnet, the sensors can also be attached
horizontally.
There must be the best possible contact between the sensor foot or the mounted
adapter (see below) and the pipe. If need be, clean the contact point thoroughly
(preferably with a wire brush).
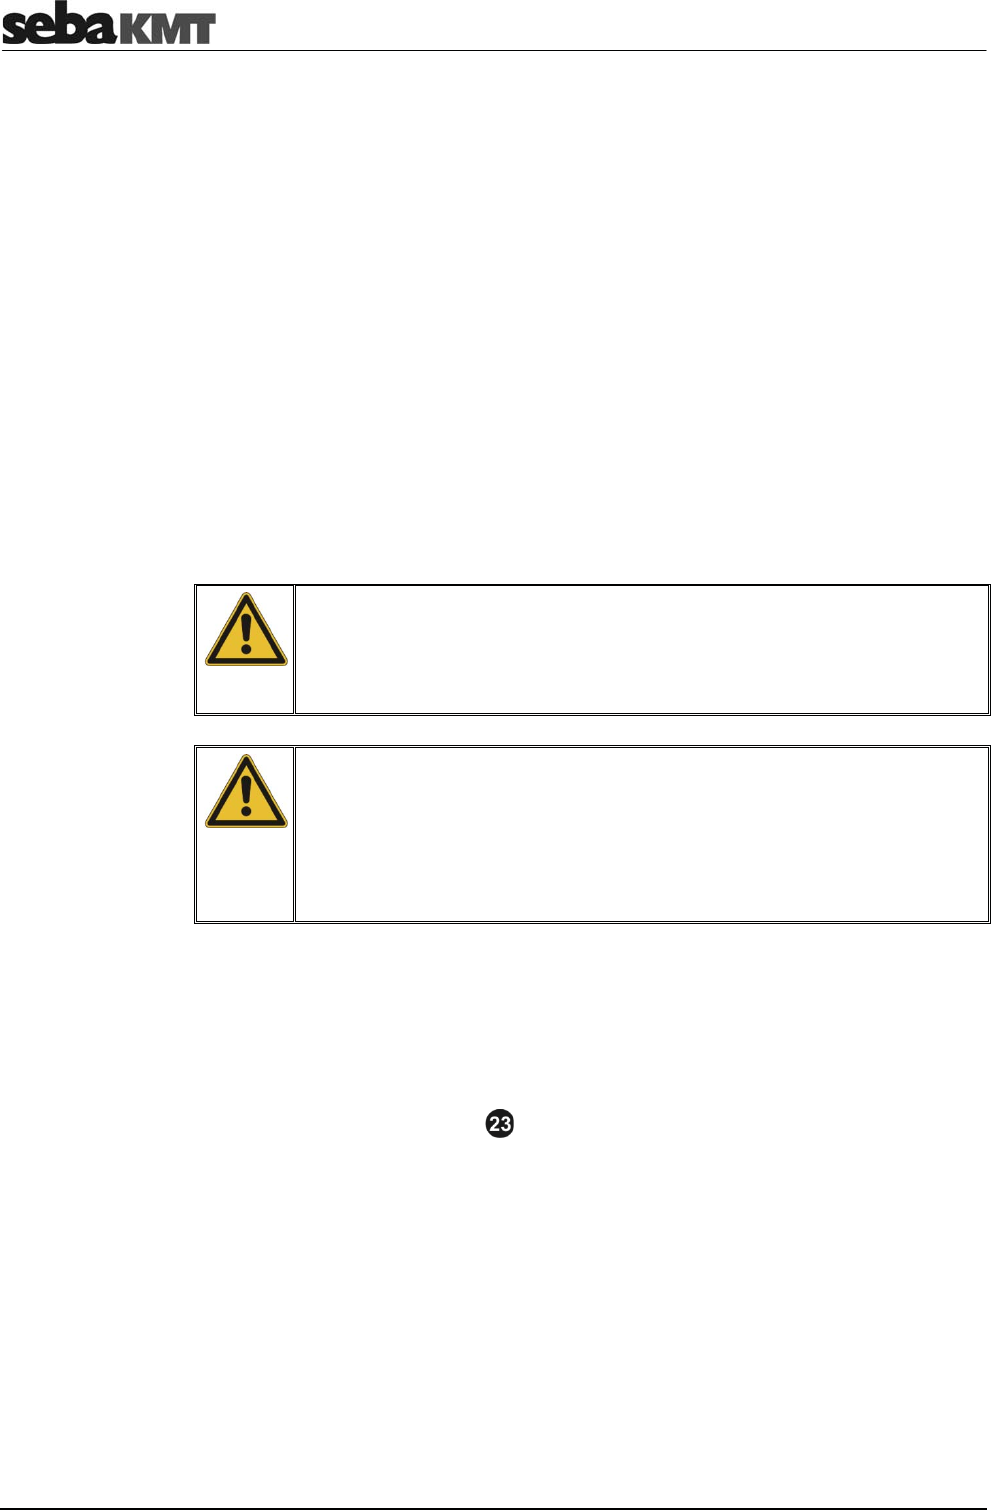
5.6 Angle adapter
In some situations, the Multi sensor cannot be attached directly to the desired
measurement point due to its size, e.g. in very narrow shafts or similar. In such cases, it
can be helpful to use one of the supplied angle adapters.
Thanks to its magnetic foot, the sensor is simply placed on the
adapter. Then, the magnetic adapter can be attached to the
pipe or fitting etc.
NOTE
The sensor's type plate and I/O area must face
away from the angle adapter - as can be seen on
the picture.
Otherwise, the magnet of the angle adapter would
turn off the Multi sensor unintentionally.
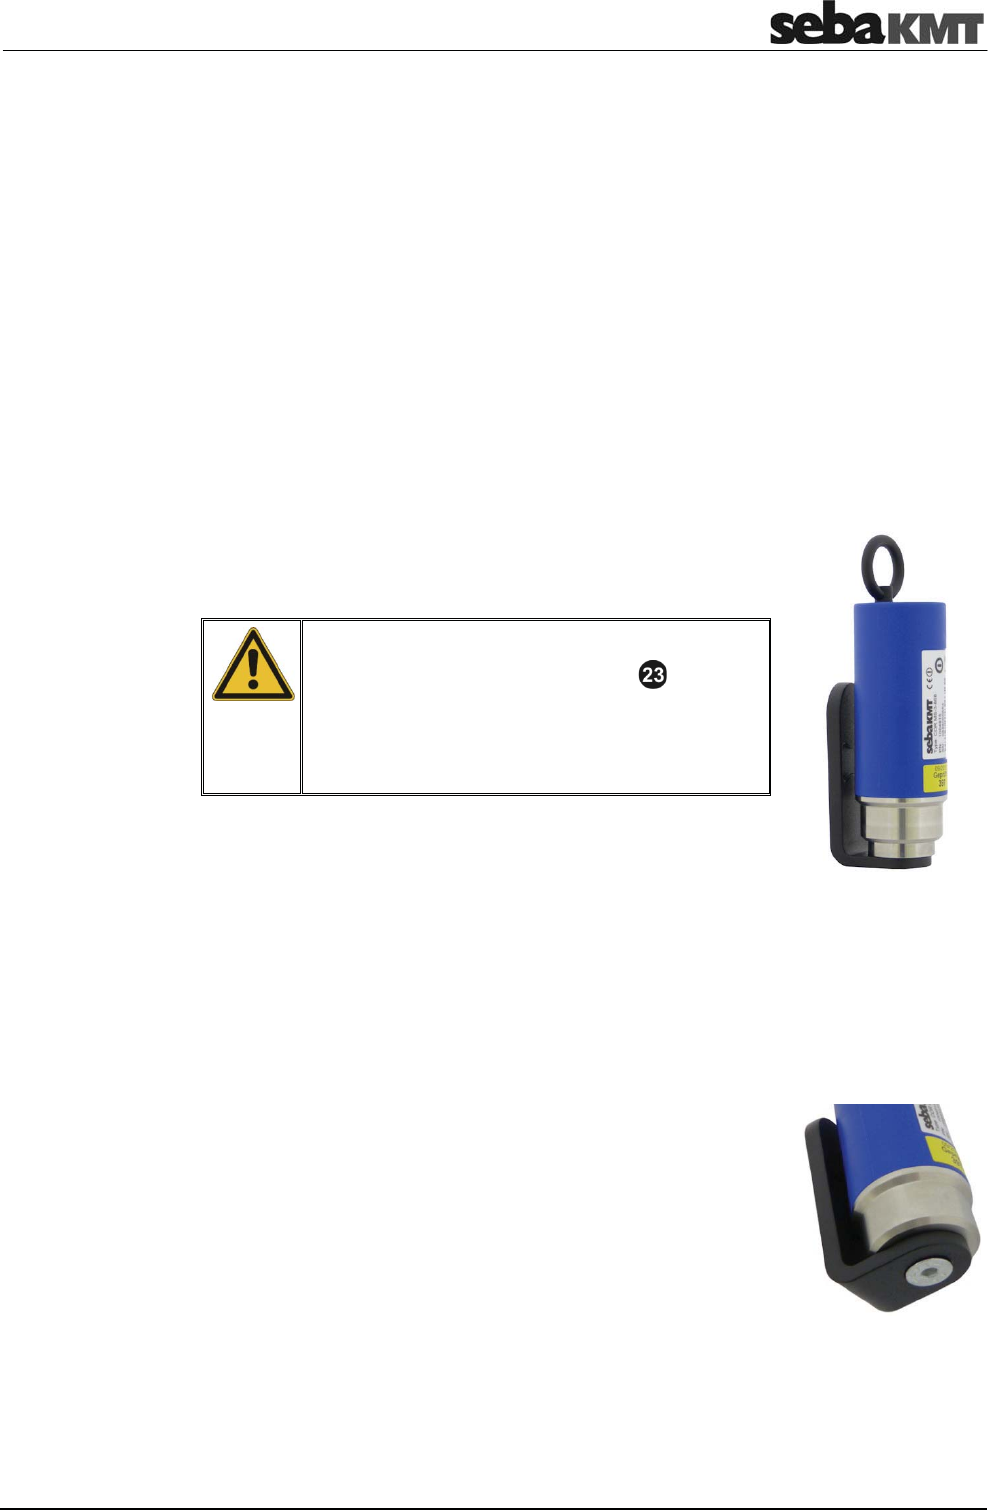
You can screw the angle adapter firmly to the sensor.
This can be useful as the holding strength between the angle adapter and the pipe in
general is higher than the holding strength between the angle adapter and the sensor.
When collecting the sensors, it may happen that you pull the sensor from the angle
without intention. The adapter then remains on the pipe and it could be difficult to
remove it.
Unscrew the magnetic foot from the sensor. Take one of the
supplied screws from the Correlux C-3 set to screw the angle
adapter on the sensor.
Make sure that the sensor's type plate does face away from the
angle adapter.
Magnetic connection
Screw connection

The Multi sensors
40
The Correlator
41
6 The Correlator
6.1 Design and function of the device
The COR C-3 Correlator is the central control unit for the Correlux C-3 system.
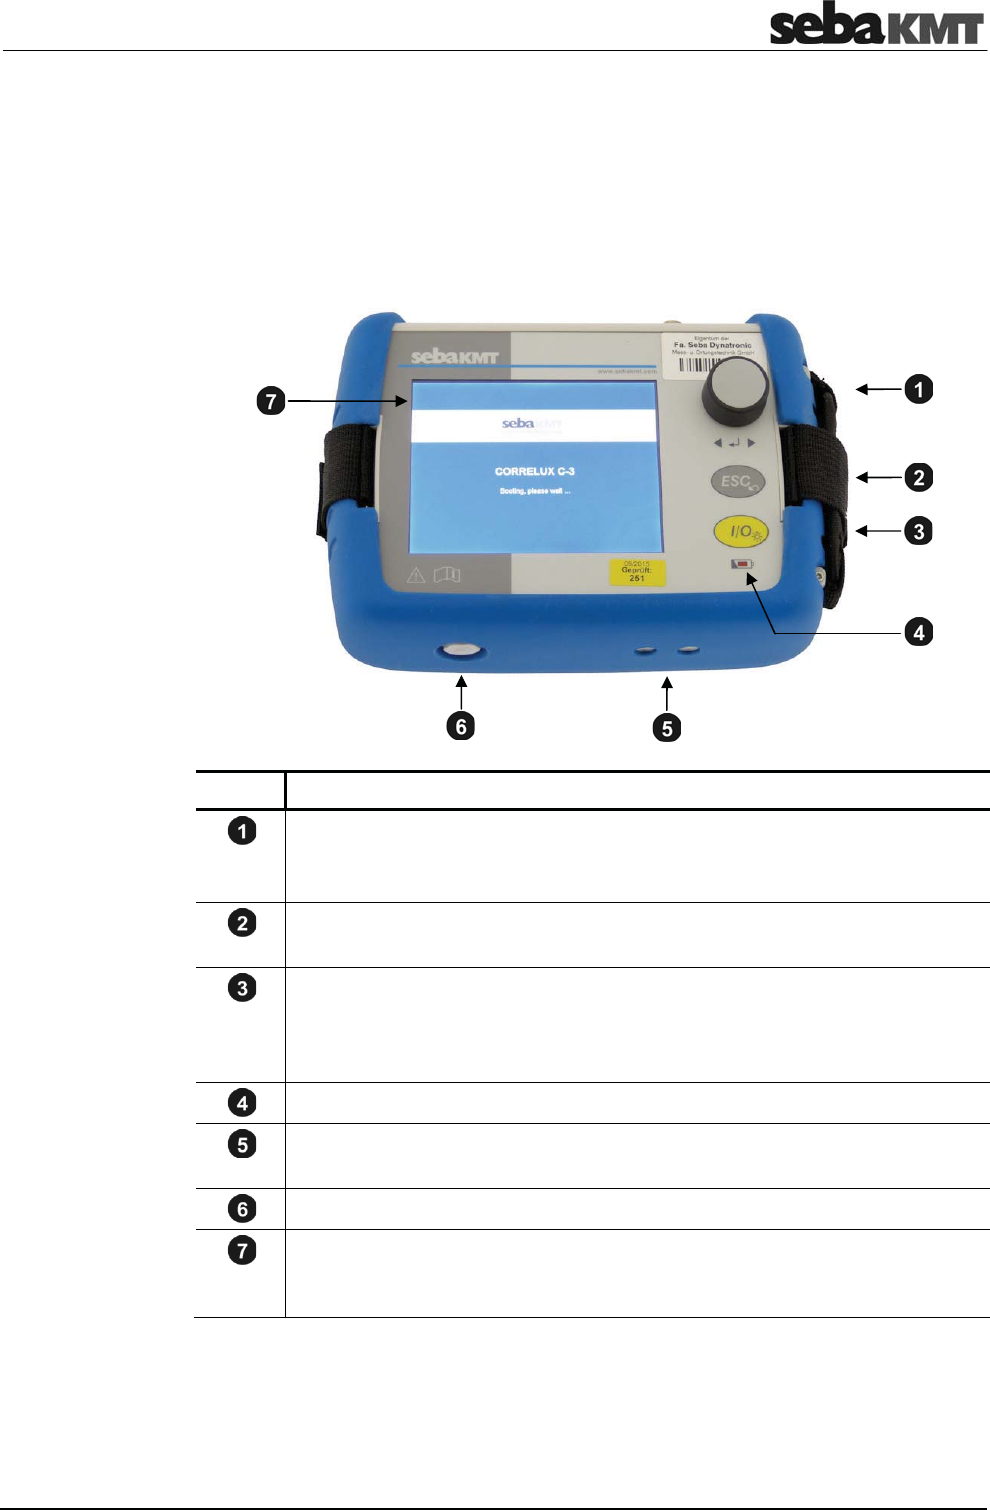
The device has the following control elements and external features:
Element Description
Rotary encoder
Turning ... Guides through the buttons and input fields displayed
Pressing ... Executes the selected button or enters the input field
ESC pushbutton
Exits the current menu and returns to the Start menu
I/O pushbutton
Short pressing ... Switches the device on or activates the back light for the
screen
Long pressing ... Switches the device off
Charging indicator light
Charging pins
To charge the device wirelessly in the transport case
Ventilation/venting membrane
Touch screen
(the Touch function can be enabled/disabled in the sytem settings (see
page 50))
The Correlator
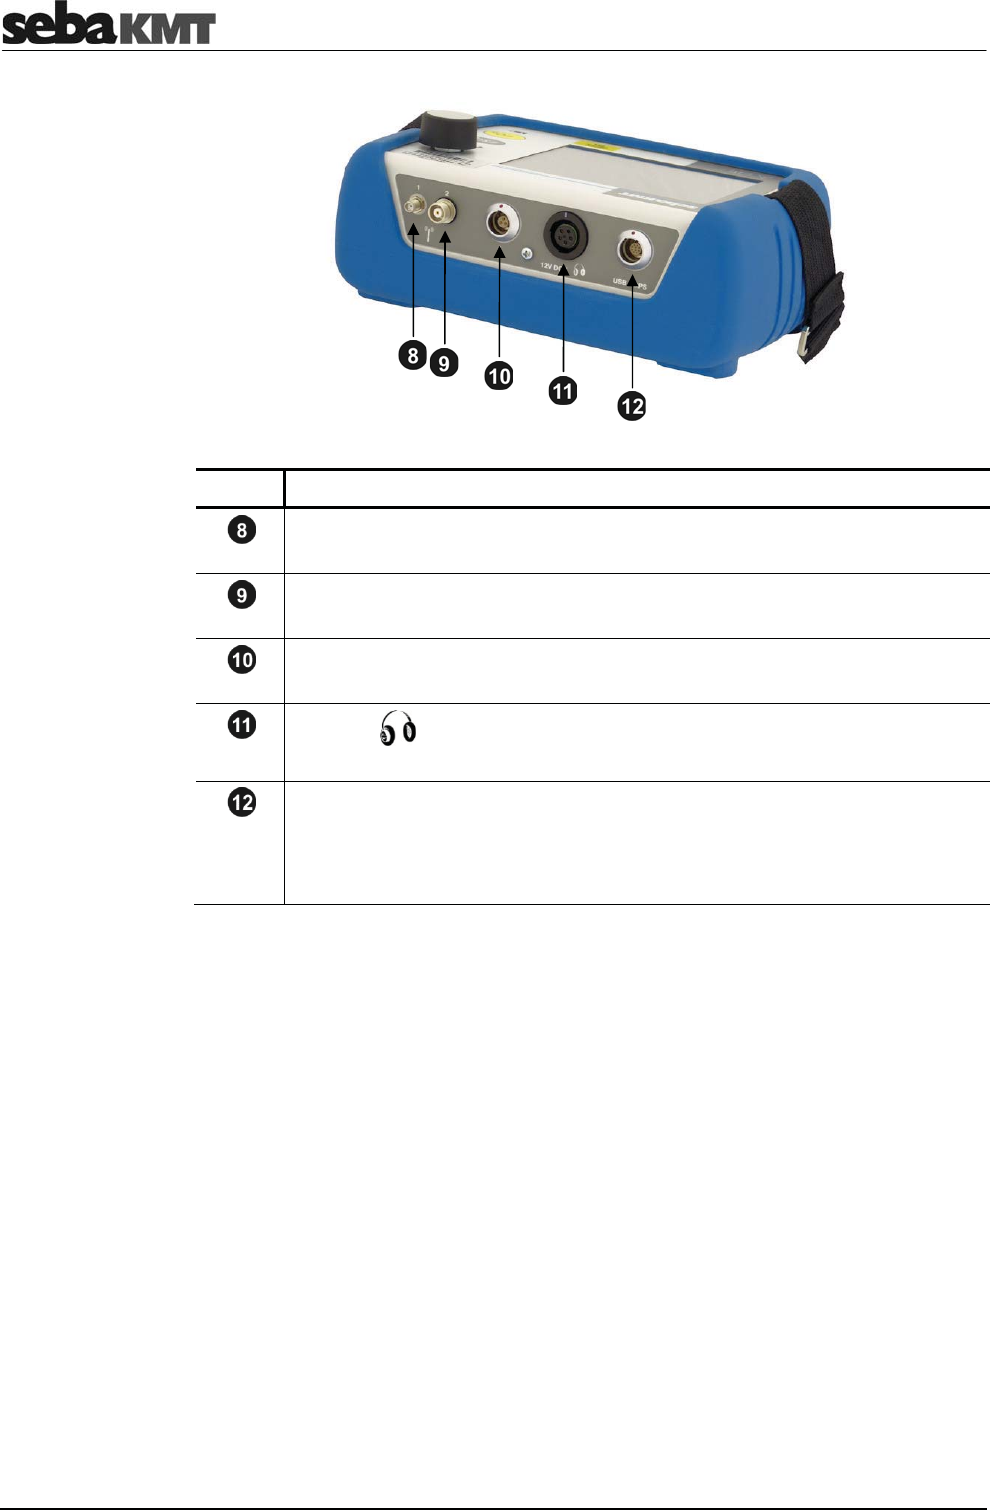
42
Element Description
Antenna 1 (digital radio)
Data transfer in Offline measurement mode
Antenna 2 (analogue radio)
Measurement data transfer in Online measurement mode
Microphone
Connection socket for ground microphone
12V DC /
Connection socket for headphones
USB / GPS
Combined connection socket for
•
USB cable
•
GPS receiver
The Correlator
43
6.2 Power supply
The Correlator is fitted with an internal rechargeable Li-ion battery. This can power the
devices for at least 16 hours. The battery’s present charge level is shown by the battery
symbol bottom right of the screen.
When the battery is low, a warning tone is heard and a warning message appears on
the screen. The device must be charged. Otherwise, it switches itself off automatically.
The Correlator is charged wirelessly in the C-3 transport case.
As soon as the device is situated at its storage place in the case, it is recharged via the
two pins , provided the case is connected to mains or a 12 Volt vehicle power
supply. The red indicator light is lit while the device is charging.
The Correlator is switched on during the entire charging process and can not be
deactivated. After the end of charging, the device remains switched on for the Auto-OFF
period specified in the system settings before it switches off.
Charging takes approximately 9 hours.
Heat is generated while charging. The charging station in the case therefore has a
temperature switch. The charger switches off automatically when it gets too warm inside
the case. It turns back on as soon as the degree of heat has fallen below a certain level.
NOTE
In order to prevent damage, observe the following precautions when
charging:
•
Use only the charging station in the transport case. Do not use other
chargers.
•
The ambient temperature should be between 10°C and 35°C
(50°F and 95°F).
•
To avoid heat accumulation, do not close the lid of the case at high
ambient temperatures during charging.
•
If you experience problems with the battery, please contact your
SebaKMT sales or service partner. Do not open the Correlator yourself.
Internal supply
Charging
The Correlator
44
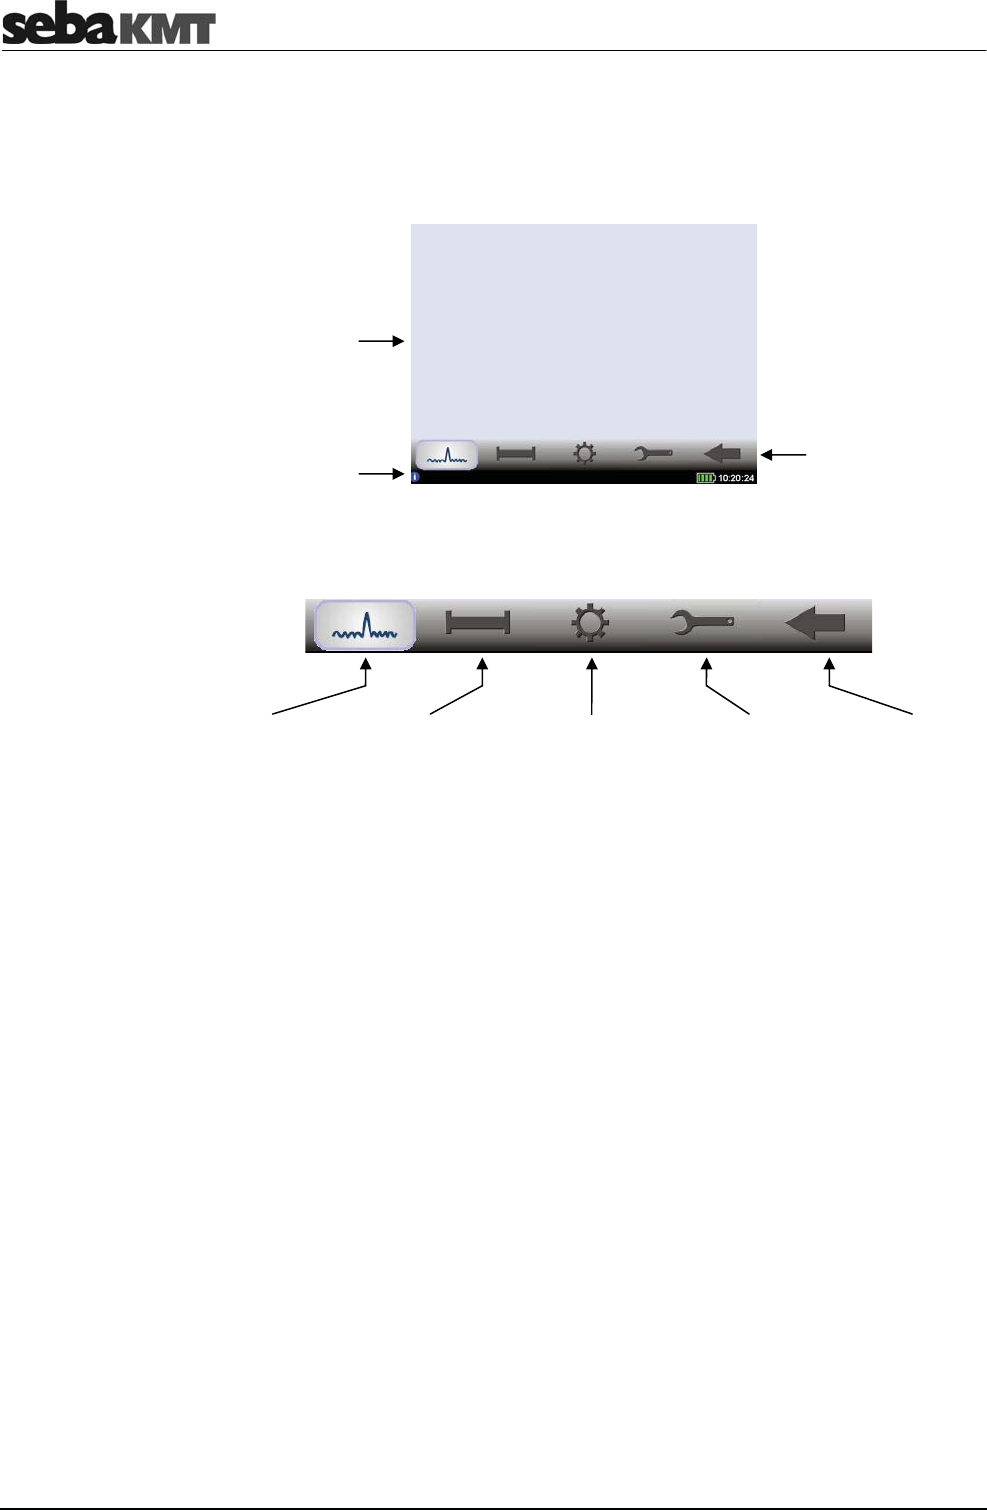
6.3 Design of the user interface
All the menu levels on the Correlator's user interface consist of a large display area, the
main menu and an info bar.
Using the buttons in the main menu you can access the individual functions of the
device.
The info bar provides the user with the following information (from left to right):
•
A help text with short explanations for the selected element (button / field / box) or
on how to proceed
•
The battery symbol indicates the charge level of the battery
•
The Correlator's internal time
Main menu
Info bar
Correlation
Quick start
to begin a
correlation
Pipe data
Menu to enter
pipe parameters
(length, material,
diameter etc.)
Measurement
functions
Functions to
arrange, perform
and analyze
measurements
Settings
Functions to
manage devices,
correlation data and
system settings
Back
Return
to previous
menu level
Dis
p
la
y
area
Info bar Main menu
Help text ++ Help text ++ Help text
The Correlator
45
6.4 Basics of operation
6.4.1 Input methods
Entries can be made directly on the screen or via the rotary encoder.
2 ways of entering data
Touch display Rotary encoder
The Correlator screen is touch-sensitive.
All entries can be made directly on the
screen.
The Correlator has a rotary encoder.
All entries can be made using the rotary
encoder.
The buttons or fields displayed
can be accessed or executed by tapping
with your finger.
Turn the rotary encoder to navigate
through the displayed buttons.
Press the encoder to access the selected
button (ENTER function).
You can always switch between operating via touch screen and operating via rotary
encoder.
6.4.2 Entering identification numbers
Various functions require the identification numbers (IDs) of the Power transmitters or
Multi sensors to be specified.
The ID is deduced from the last six digits of the device's serial number (short: SN). You
find the serial number on the nameplate of the relevant device.
Example:
Serial number (SN): 0888000225
Identification number (ID): 000225
Entry on Correlator / PC: 225
You can enter device IDs manually or you can use the "Automatic device detection".
Automatic detection means that once a device is activated its ID is immediately sent to
the Correlator. There, it is detected and displayed.
Introduction
The Correlator
46
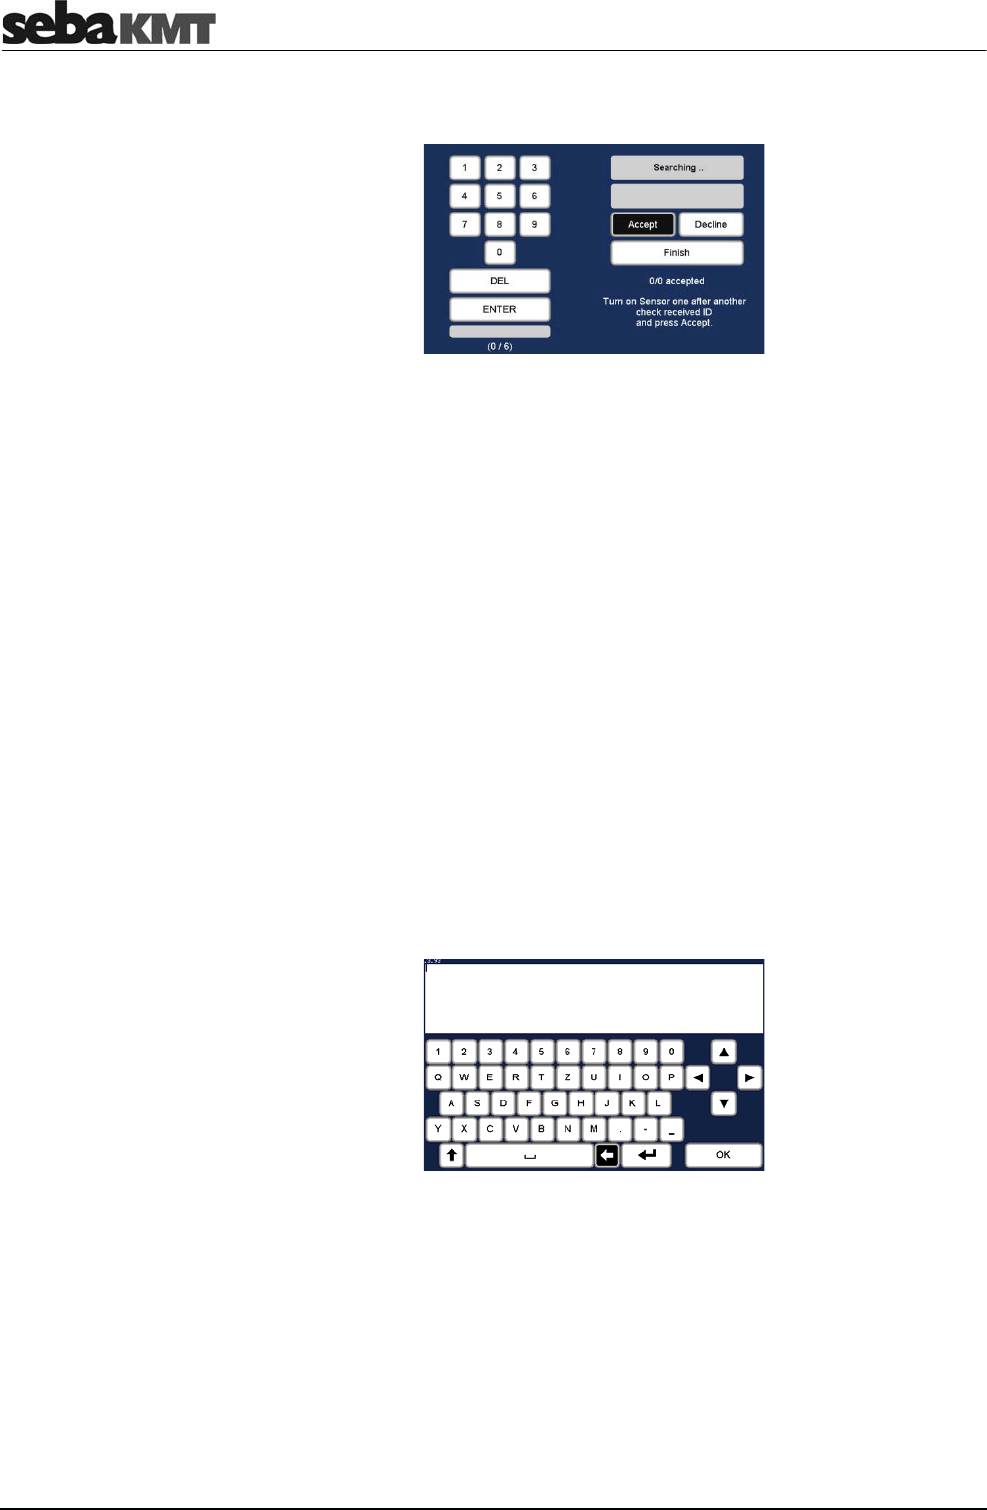
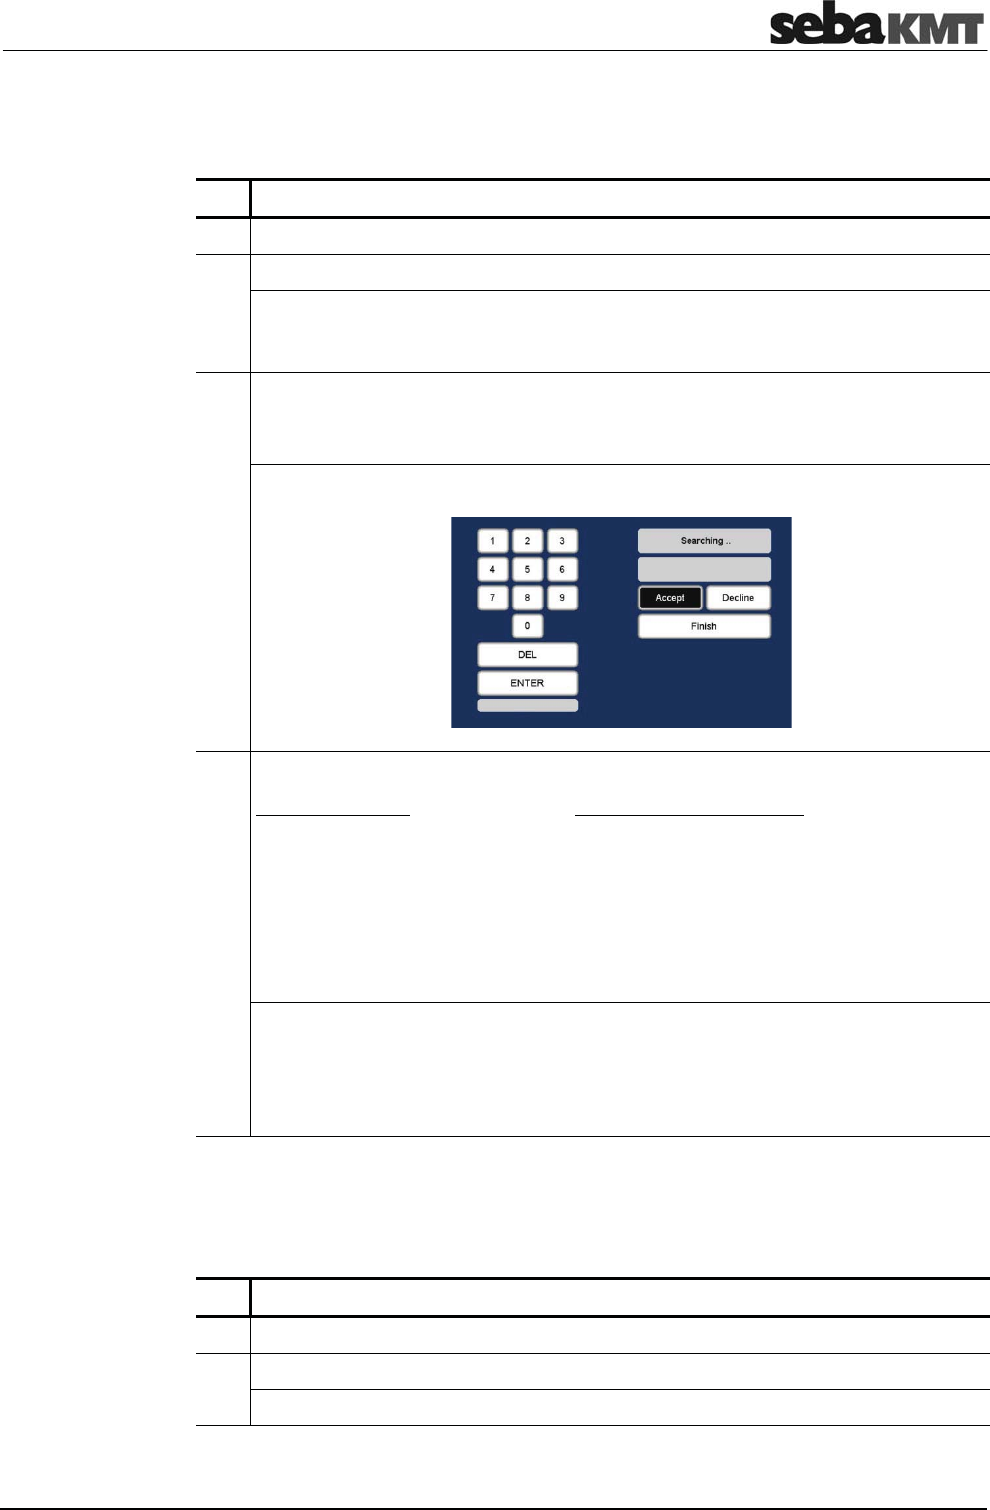
For entering a device ID the following screen view, or a similar one, opens:
DEL ... Deletes the last character
ENTER ... Confirms and completes the entry
Accept ... Accepts and enters the automatically detected ID
Decline ... Does not accept the automatically detected ID
Finish ... Completes the automatic detection
For the manual entry of IDs, use the number pad displayed. Confirm with the ENTER
button.
To the right of the number pad, there are fields and buttons for the automatic sensor
detection. The devices concerned must be close to the Correlator.
To register a Power transmitter, briefly press the I/O pushbutton of the device. To
register a Multi sensor, briefly move a magnet past the sensor's I/O area, so that the
LED lights up briefly. As a result, the device's ID is sent, detected by the Correlator and
displayed on the screen. Using the buttons the detected ID can be accepted or declined.
This way several device IDs can be added to the Correlator in quick succession.
6.4.3 Entering text
To enter comments or similar, a virtual keyboard appears on the screen. Enter the
required text and confirm with OK.
Manual entry
Automatic detection
The Correlator
47
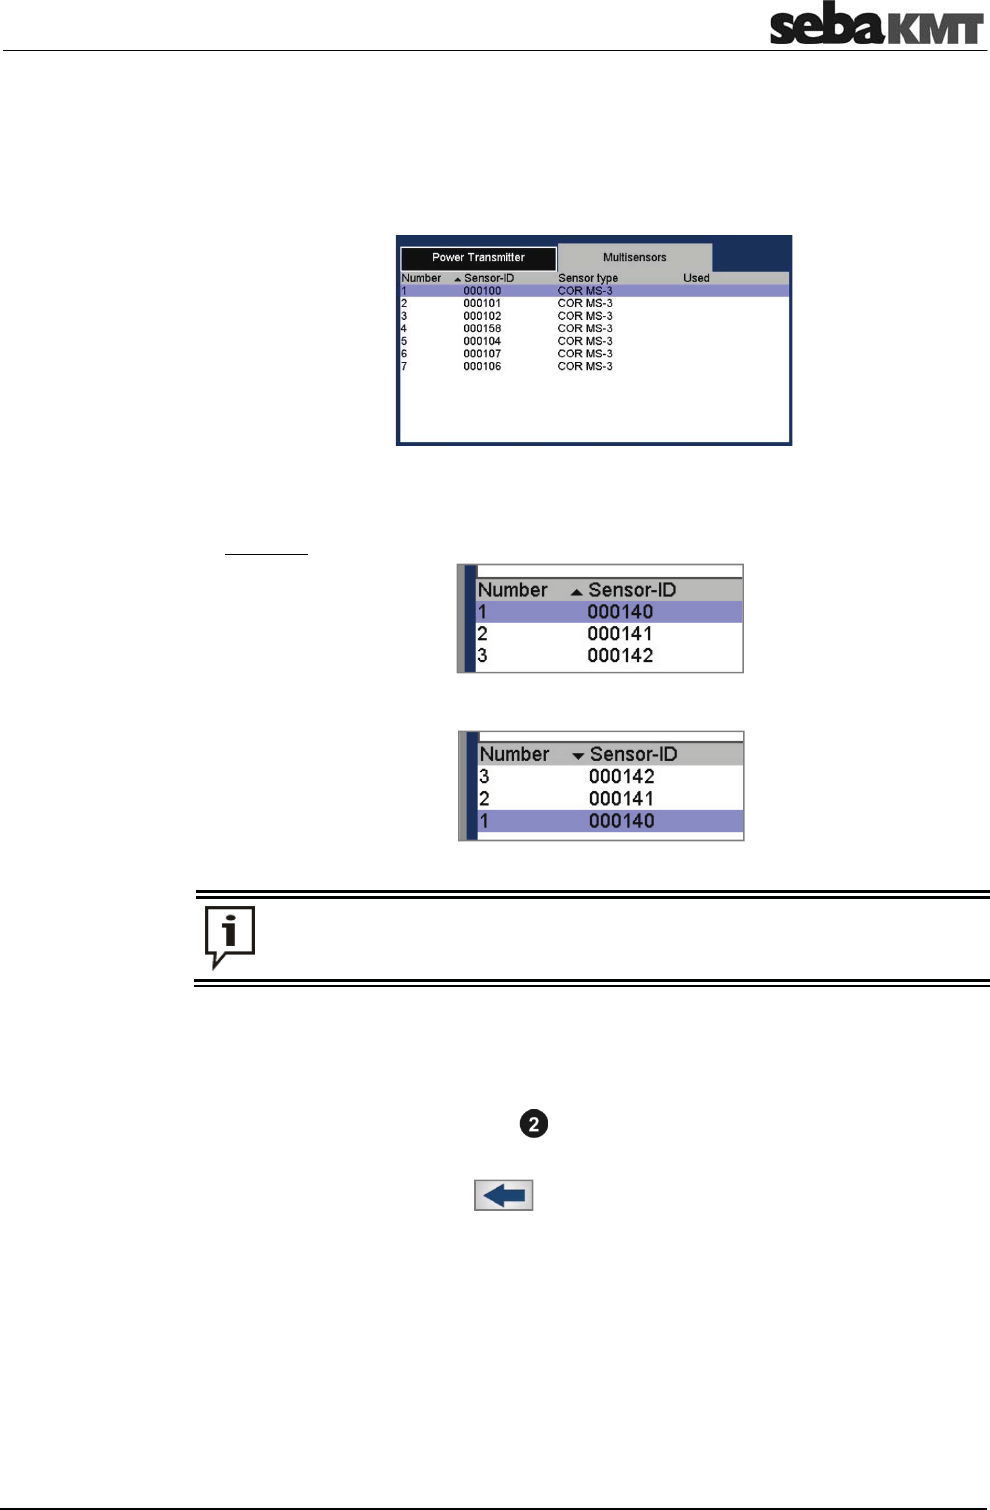
6.4.4 Sorting devices in lists and tables
In various menus, device IDs or other information are listed in a kind of table.
For example, the following picture shows the Correlator's sensor pool with all registered
Multi sensors listed.
If a black triangle can be seen in the header of a column, you have the option to change
the sort order (ascending / descending). Just tap the respective header.
Example: In the picture, a triangle can be seen in the Number header.
Tapping this header changes the sort order of the displayed devices from 1-3 to 3-1.
Changing the sort order is only possible via touch screen, not via the rotary
encoder.
6.4.5 ESC pushbutton and "Back" button
By pressing the ESC pushbutton of the Correlator you can cancel or end any
process. The button closes the displayed menu and opens the start menu.
You can use the Back button in the main menu to return to the previous menu
level.
The Correlator
48
6.5 Commissioning
6.5.1 Switch the Correlator ON/OFF
The Correlator is switched on with the I/O pushbutton . The device requires a few
seconds to boot. Then the Start menu appears on the screen. The device is now ready.
To switch the Correlator off, press the I/O pushbutton until the screen turns off
(approx. 2 seconds).
The Correlator automatically switches off if no entry is made within a specified time
period. This timespan can be configured in the system settings (see page 51).
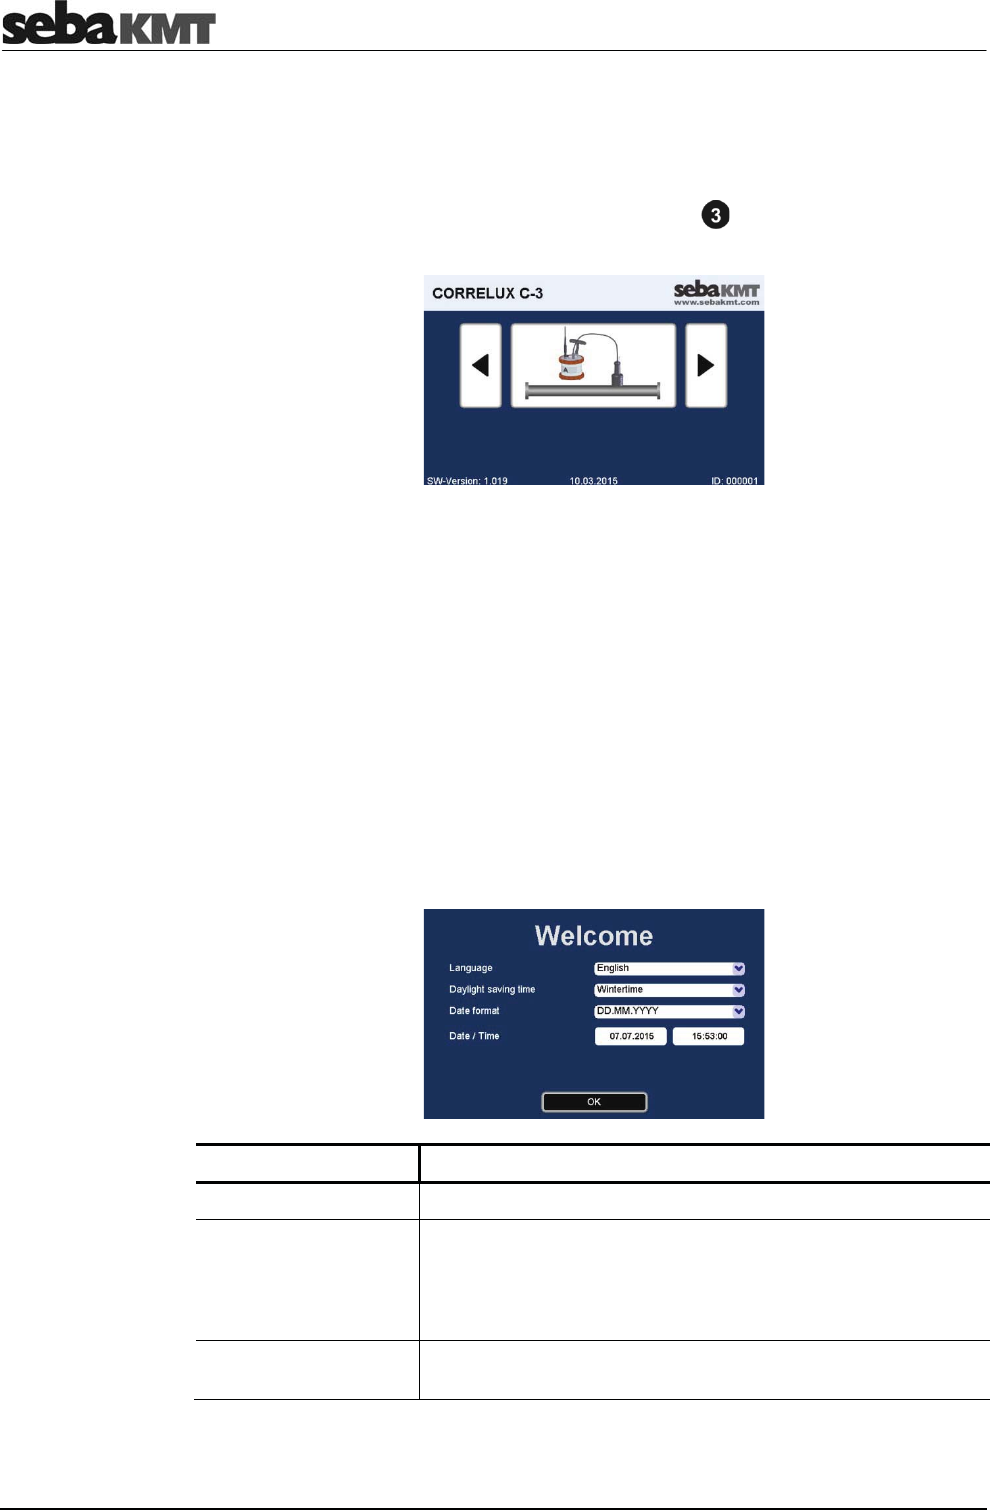
6.5.2 Basic settings at initial start-up
When the Correlator is switched on for the first time, two consecutive Welcome menus
appear on the screen. There, some basic system settings have to be made before the
Start menu can be entered.
Select your language in the first of the two menus. Use the first pull down list to do so.
The Correlator's operating language immediately adapts to your selection. After that,
enter the remaining requested details.
Line Description
Daylight saving time Select whether it is currently winter or summer time.
Date format Select the date format to be used by the Correlator.
DD
MM͒
YYYY
...
...
...
Day
Month
Year
Date / Time Enter the current date and time (hour:minute:second) for the
Correlator.
Confirm with OK. The menu is closed. The settings are accepted.
Switching ON
Switching OFF
Auto-OFF
Language,
date and time
The Correlator
49
You have the option to change these settings again in the Correlator's system settings
menu, at any time.
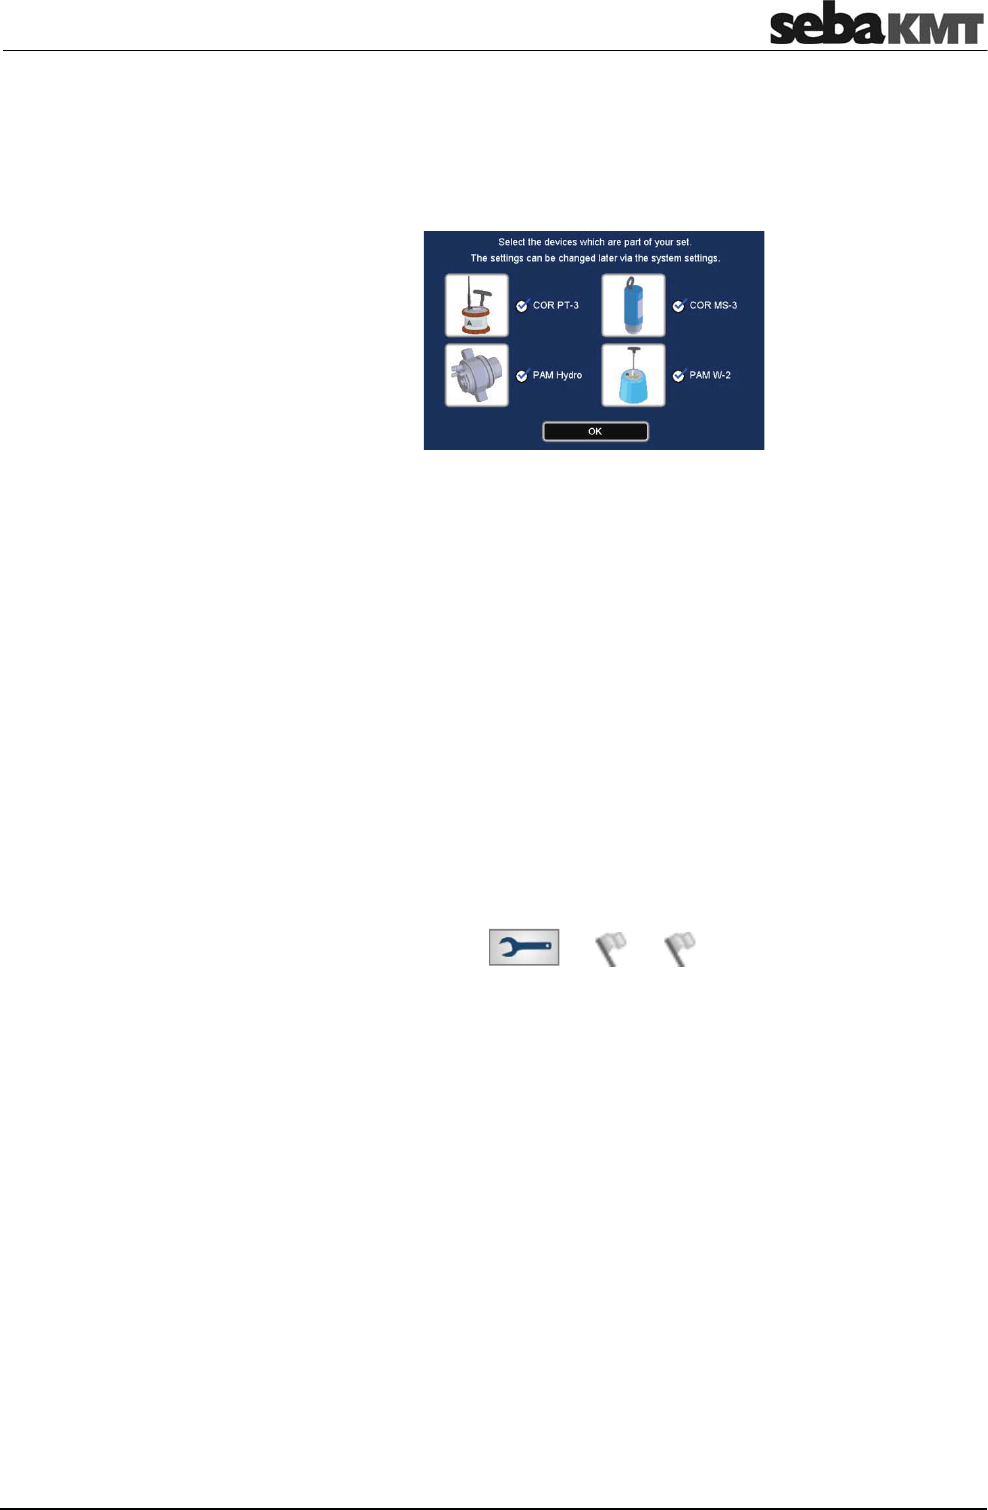
Specify in the next menu which devices are part of your Correlux C-3 set. Tick the
relevant checkbox/es.
The statements made here determine which measuring methods will be offered in the
Correlator's Start screen.
Example: If you select no checkbox except "COR PT-3", the Online measurement
method "COR PT-3 with microphone" will be the only available method in the Start
screen.
Confirm with OK. The menu is closed. The settings are accepted. The Start menu of the
Correlator appears.
You have the option to change these settings again in the Correlator's system settings
menu, at any time.
6.5.3 Change the language
The operating language can be changed in the system settings of the device.
If currently a foreign language is set, call the Start menu and follow these symbols:
Î
Î
Next to the second flag you find a pull-down list with all available languages.
6.5.4 Activate the display light
The display light is switched on once
•
the screen is touched (provided the touch function is not disabled)
•
the rotary encoder is turned
•
the I/O pushbutton is briefly pressed
The light remains on for a certain time period. The length of this period can be adjusted
in the system settings.
Devices of your set
The Correlator
50
6.5.5 Enable/Disable the touch screen (touch sensitivity)
The touch function of the screen can be disabled/enabled if needed. The screen will no
longer respond to tapping. The device can only be operated using the rotary encoder.
To enable/disable the touch function, proceed as follows:
Step Description
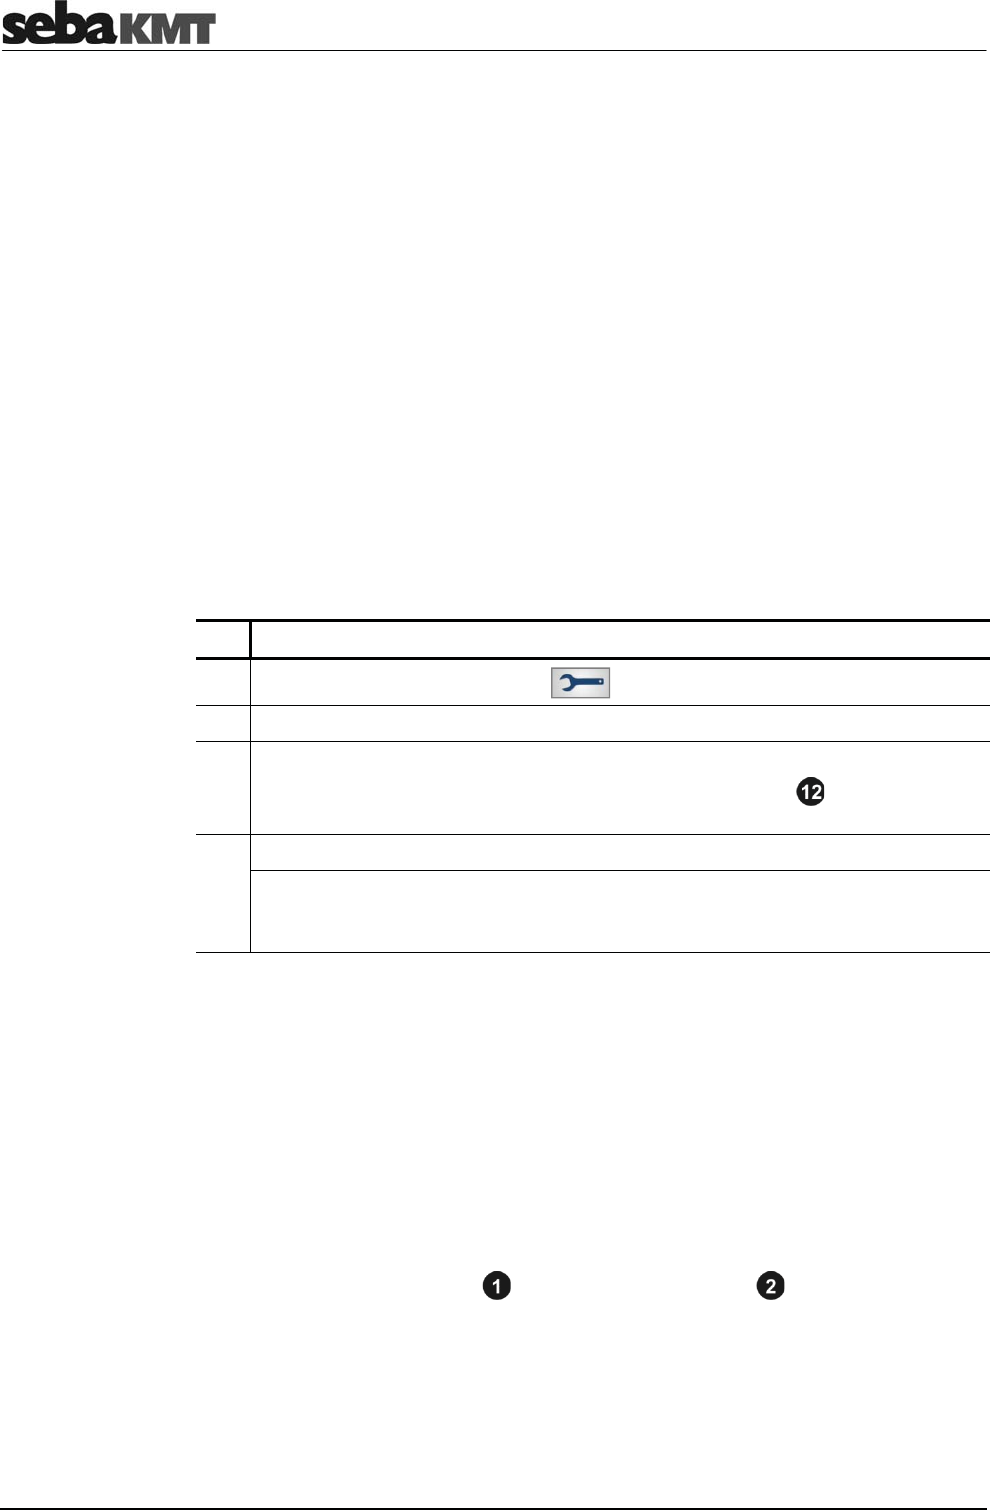
1 In the main menu, select the button .
2 In the displayed menu, select the System settings button.
Result: The system settings menu is opened.
Use the buttons Next and Previous to browse through the available settlings.
3 Look for the Touch option.
Enable/Disable the corresponding checkbox.
Enable/disable
touch function
The Correlator
51
6.6 System settings
By means of the System settings various device settings can be customized to the
needs of the user. Furthermore, the menu provides useful information on the status of
the device and the firmware used.
To access the System settings menu, proceed as follows:
Step Description
1 In the main menu, tap the button .
2 In the displayed menu, tap the System settings button.
Result: The system settings menu is opened.
Use the buttons Next and Previous to browse through the available settlings.
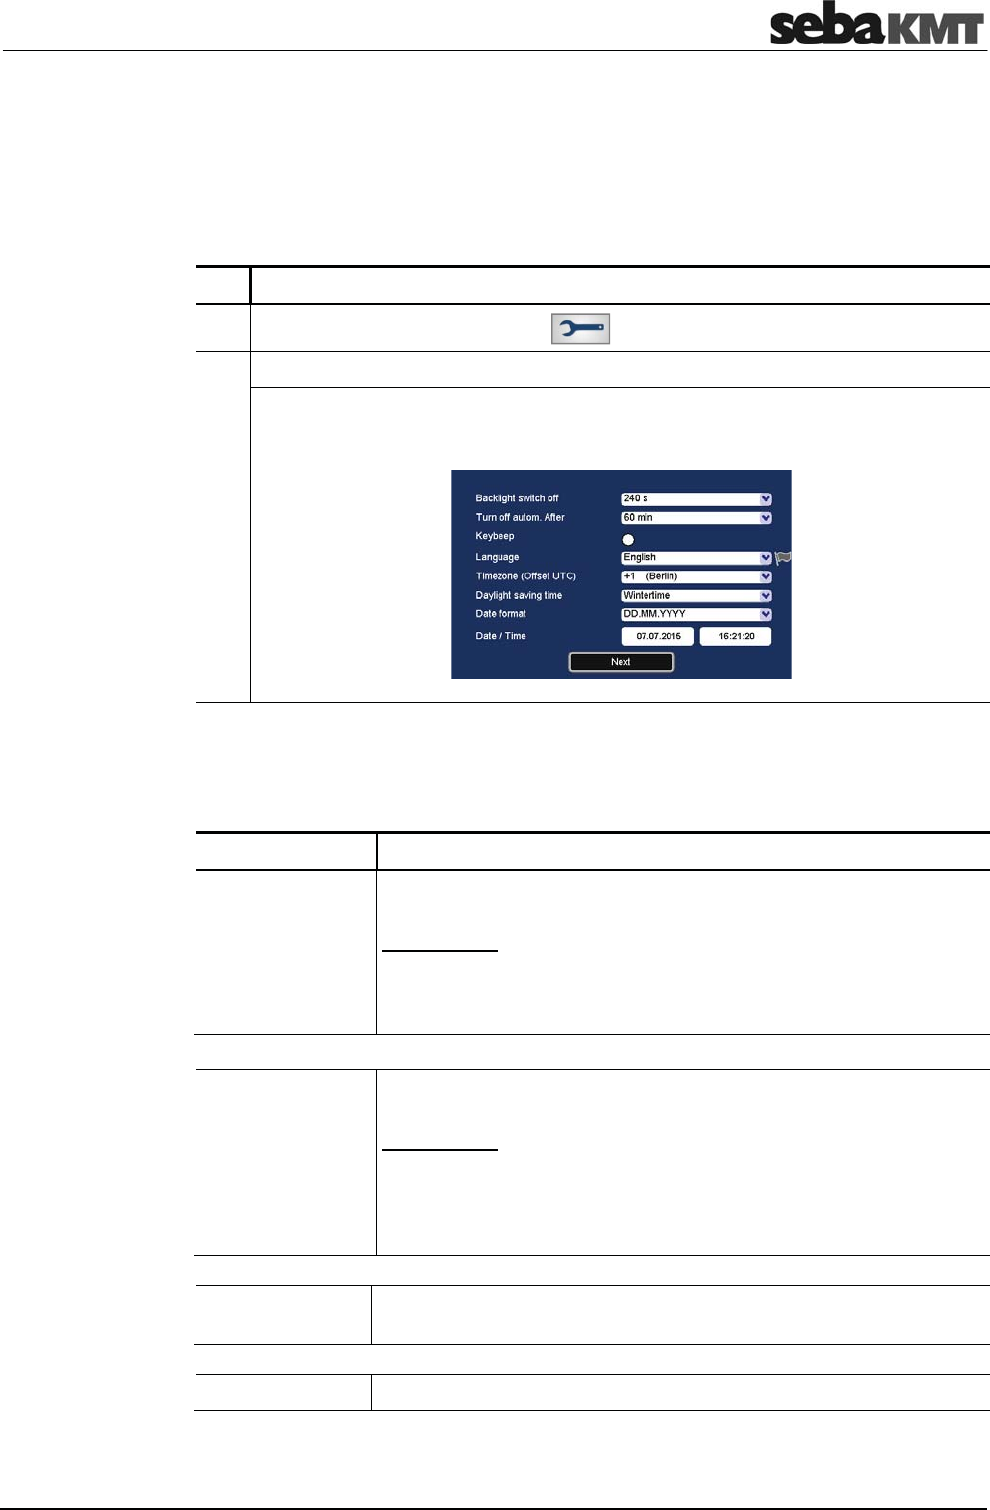
6.6.1 Basic settings
The following basic settings can be made
Line Description
Backlight switch
off
Select a period of time for the backlight until it is switched off
automatically.
Explanation: If no entry is made, the display light is switched off
automatically after a period of time. Specify the length of this period
here.
If you select never, the backlight will remain on permanently.
Turn off autom.
after
Select a period of time for the Correlator until it is switched off
automatically.
Explanation: If no entry is made, the device switches itself off
automatically after a period of time. Specify the length of this period
here.
If you select never, the Correlator will remain switched on
permanently.
Key beep Activate/deactivate the key tone that sounds when a button is
tapped or the rotary encoder is pressed.
Language Select your language.
Backlight
Auto-OFF
Key beep
Language
The Correlator
52
Timezone Select the time zone for where you are.
Daylight saving
time
Select whether it is currently winter or summer time.
Date format Select the date format to be used by the Correlator.
DD
MM
YYYY
...
...
...
Day
Month
Year
Date / Time Enter the current date and time (hour:minute:second) for the
Correlator.
Measurement
units
Select the system of units to be used by the Correlator.
Metric
Imperial ...
... Used in Europe and most countries around the world
Used in the US
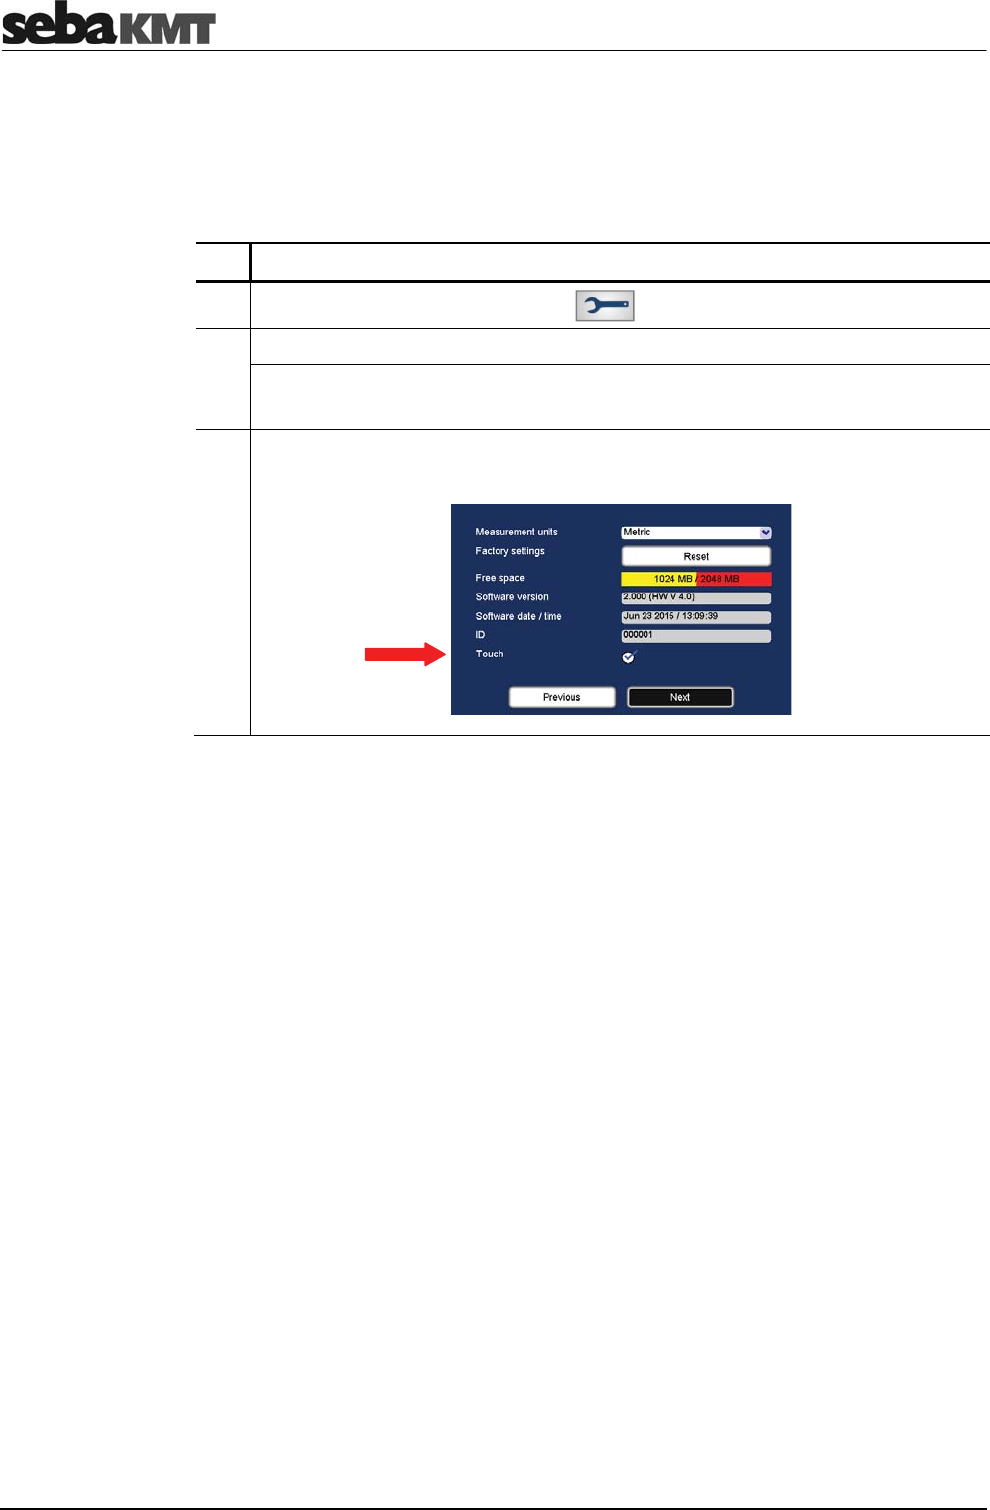
Factory settings Tap the Reset button if you want to reset all system settings to
factory defaults.
Touch Enable/Disable the touch function (touch sensitivity) of the screen.
If this function is disabled, the screen only works as a display. The
device can only be operated using the rotary encoder.
Averaging Select the averaging interval.
Explanation: When performing an Online measurement, the
calculation will automatically be restarted and the displayed
correlation curve will be updated at regular intervals. Here you set
the time interval
no averaging
20 s
unlimited
...
...
...
No averaging takes place.
Averaging of the correlation curve takes place in
a 20 seconds interval.
Averaging of the correlation curve takes place
with every new received measuring data
package.
Time and date
Format of units
Reset system settings
Touch screen ON/OFF
Averaging during
correlation
The Correlator
53
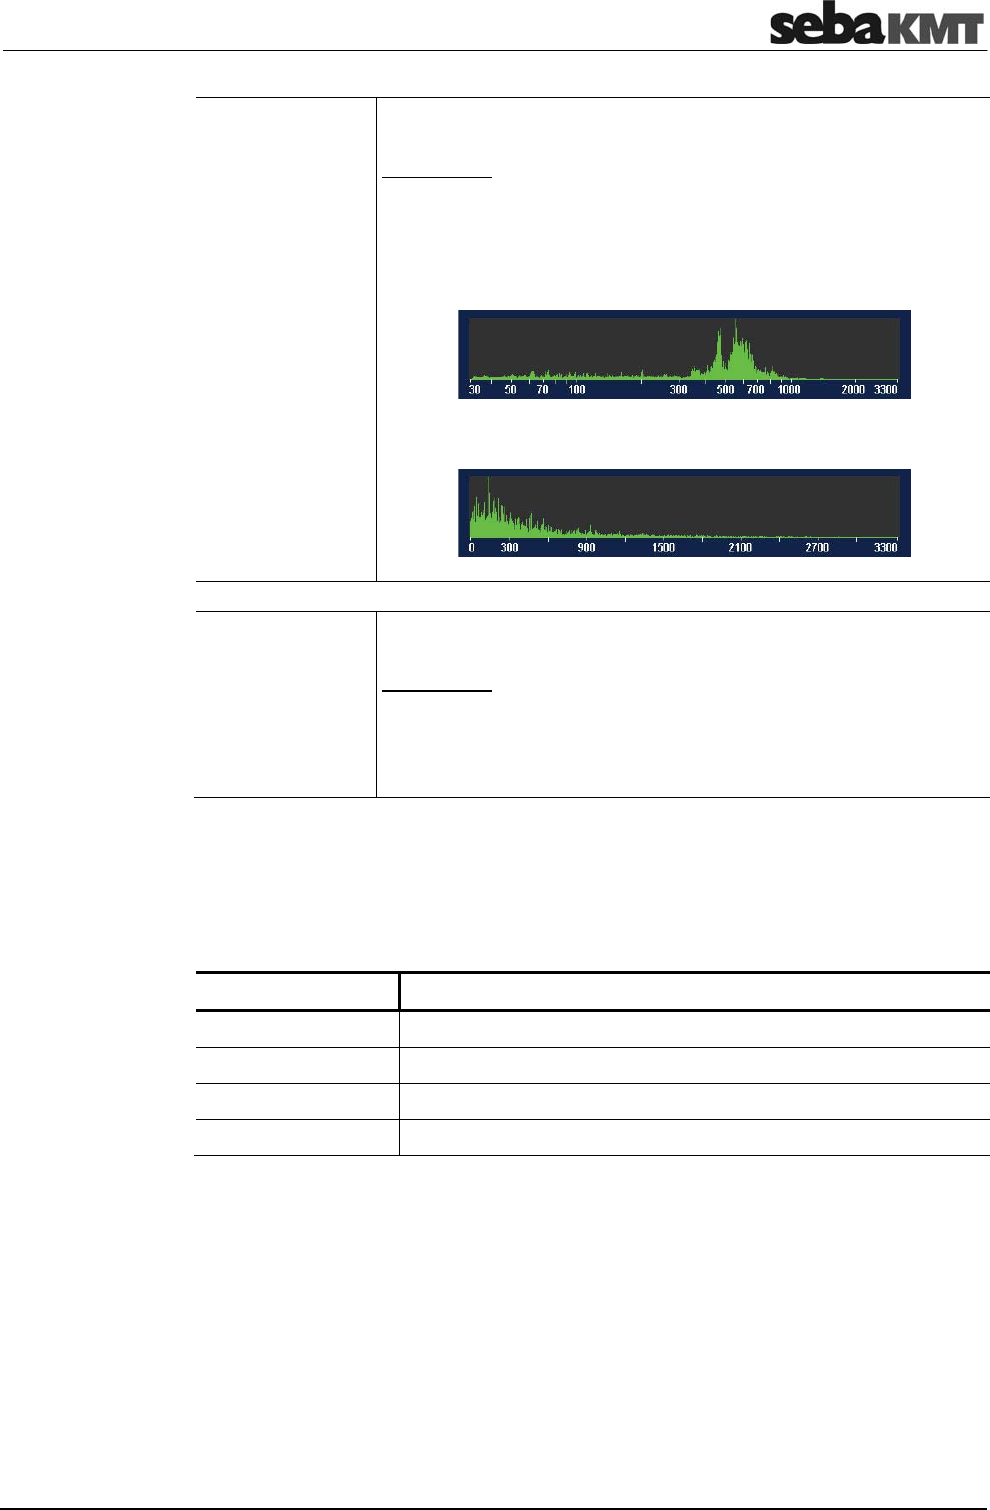
Frequency scale Select if the X-axis of the coherence diagram in the Correlation
menu shall ascend in a linear or logarithmic way.
Explanation: The frequency range of the Correlux C-3 system is
from 0 to 3300 Hz. Based on experience the frequency of leak
noise ranges from 0 to 1000 Hz. The logarithmic view results in a
wider display area for lower frequencies.
logarithmic:
linear:
Available quick
start buttons
Specify which devices are part of your Correlux C-3 set.
Enable/Disable the relevant checkbox/es.
Explanation: The statements made here determine which
measuring methods will be offered in the Correlator's Start screen.
Example: If you select no checkbox except "COR PT-3", the Online
measurement method "COR PT-3 with microphone" will be the only
available method on the Start screen.
6.6.2 System info
The System settings menu has the following information on the device and the
firmware currently in use:
Line Description
Free space The Correlator's free memory space in MB
Software Version Firmware version of the Correlator
Software date/time Date of the last firmware updates
ID Identification number of the Correlator
6.6.3 Saving the settings
When leaving the system settings menu all the settings are automatically saved and
accepted.
Frequency scale
linear / logarithmic
Available measuring
methods
in Start menu
The Correlator
54
6.7 Communication
6.7.1 Connection between the Correlator and the sensors
Short range radio is used for communication between the Correlator and the sensors
(Power transmitters and Multi sensors).
Analogue short range radio is used for Online measurements. Digital short range radio
is used for Offline measurements. Therefore, the Correlator is equipped with two radio
antennas.
Antenna 1 ... Digital radio
Antenna 2 ... Analogue radio
6.7.2 Connection between the Correlator and the computer
The included VK 77 connection cable is used to connect the Correlator to a PC/laptop.
This connection is needed for
•
correlation data transfer to the computer
•
firmware update file transfer to the Correlator
To connect the Correlator to a computer, proceed as follows:
Step Description
1 In the main menu, tap the button .
2 In the displayed menu, tap the Connect Correlator to PC button.
3 Establish the cable connection.
Connect the round plug of the cable to the USB/GPS socket of the Correlator.
Observe the markings on the plug and socket. You must feel the plug engage.
4 Tap the Connect button on the Correlator.
Result: The connection is established. The Correlator is automatically detected
by the computer as a mass storage device. As soon as the Connected message
on the Correlator’s screen appears, data can be transferred.
If no connection is made, check the cable connection again. If necessary, disconnect
the Correlator from the computer, restart it or perform a reset, and follow steps 1 to 4
once again.
To end the connection, select the Disconnect button on the Correlator. As soon as the
Disconnected message appears, the connection cable can be removed.
6.8 Hardware reset
If the Correlator stops responding to inputs (neither from touch screen nor from rotary
encoder or pushbuttons), a hardware reset can be performed.
Hold down the rotary encoder and the ESC pushbutton at the same time for
about one second. The Correlator restarts automatically. This usually rectifies the
malfunction.
If the device still malfunctions after resetting the device, try the following: Hold down the
rotary encoder and the ESC pushbutton at the same time for about 3 seconds. The
Correlator switches off. Wait about a minute before switching the Correlator back on.
The Correlator should now function correctly again.
Connecting
Disconnecting
Sensor management
55
7 Sensor management
7.1 Introduction
All Power transmitters and Multi sensors of your Correlux C-3 set have to be registered
in the Correlator.
Two Power transmitters and up to 8 Multi sensors can be registered. The units make up
the so-called "sensor-pool". The Correlator can only communicate with registered
devices.
7.2 Access the sensor pool
To access the sensor pool, proceed as follows:
Step Description
1 In the main menu, tap the button .
2 In the displayed menu, tap the Sensor management button.
Result: One additional menu appears, if the Correlator currently is in
Offline measurement mode. There, tap the Edit / Manage button.
Result: The Correlator's sensor pool appears.
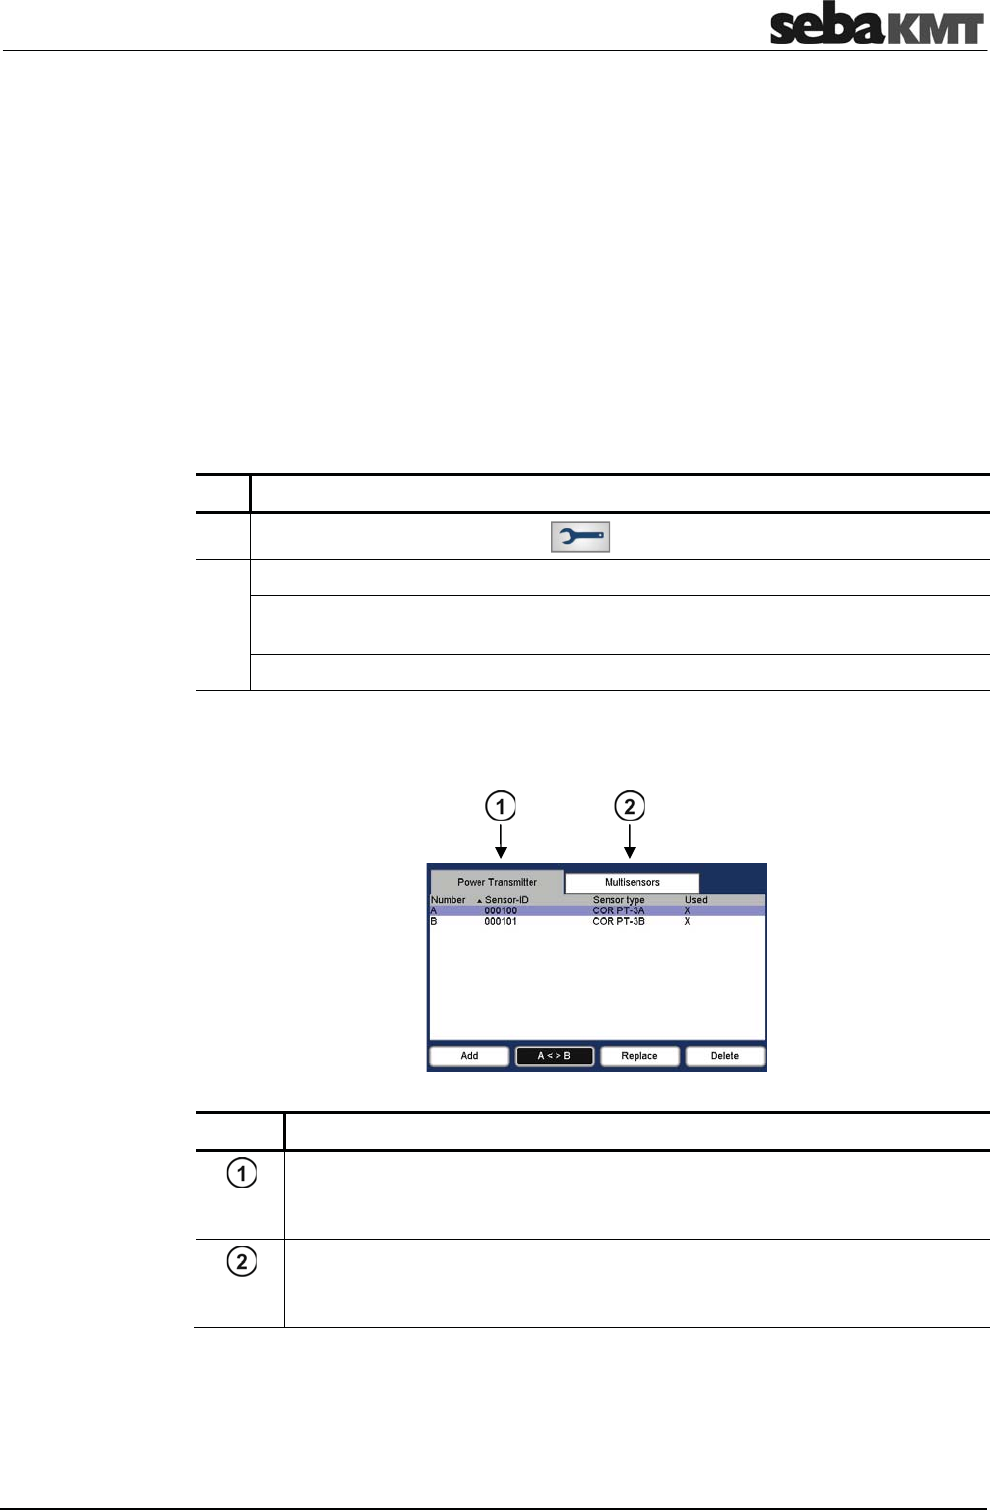
The sensor pool is divided into two sections:
Element Description
"Online" pool
Under the Power transmitter tab the two Power transmitters of your set are
managed which are used for Online correlations.
"Offline" pool
Under the Multi sensor tab the Multi sensors and Power transmitters are
managed which can be used for Offline correlations.
Indicators
Sensor management
56
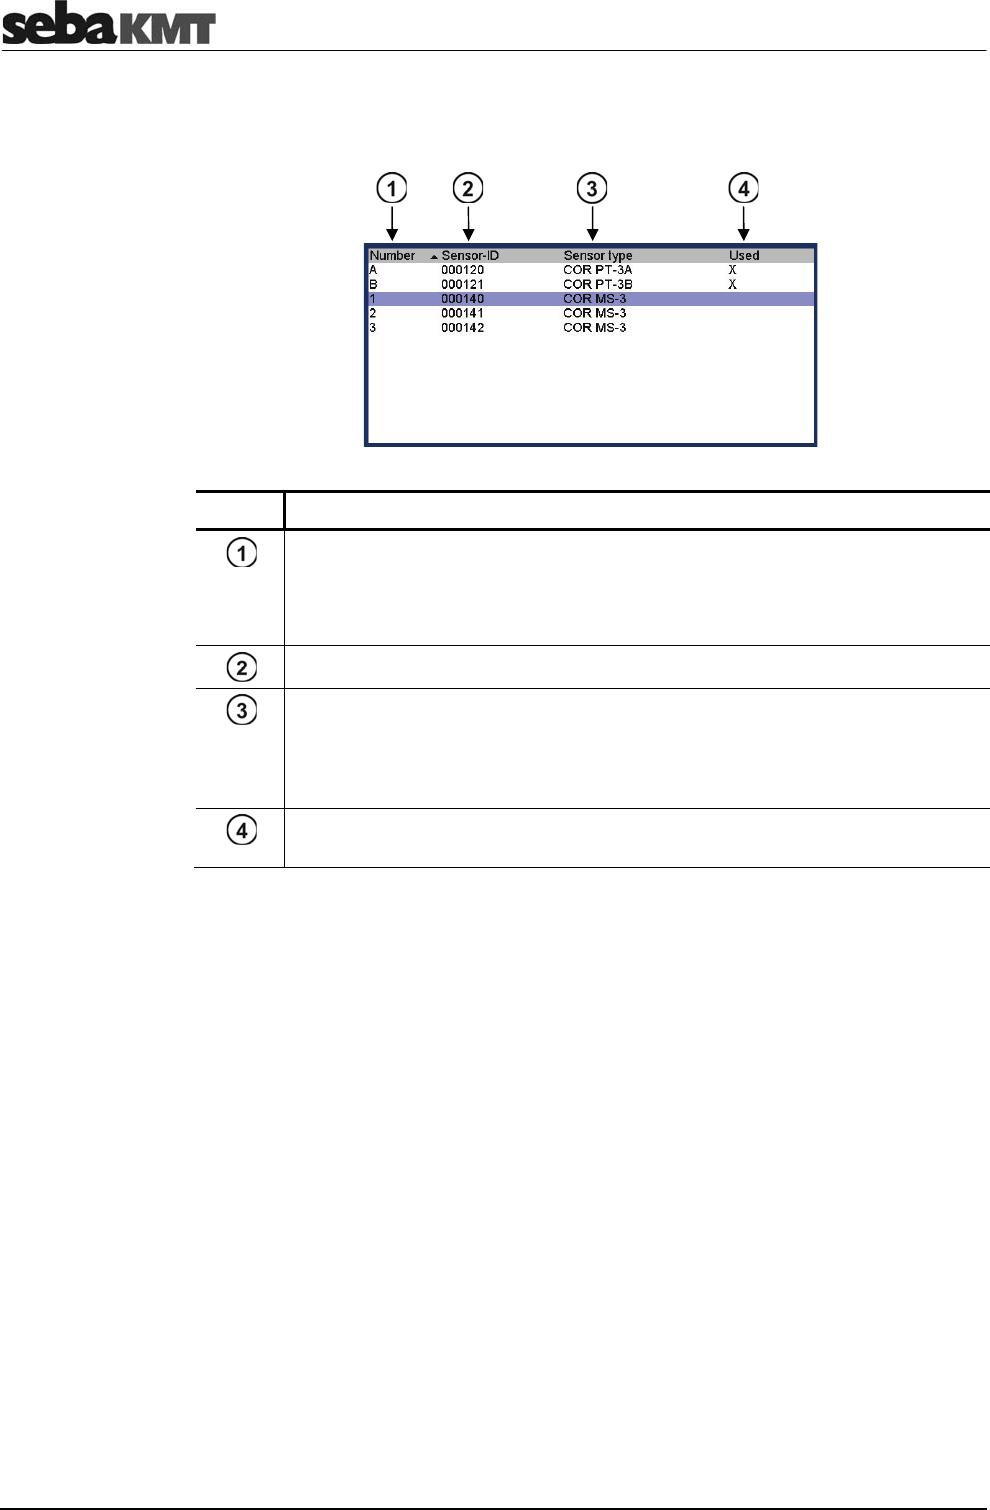
The registered sensors are listed respectively. The columns of the table have the
following definitions:
Element Description
Index / Number of the device
A / B ... indicates whether this is the Power transmitter A or B
1 - 8 ... shows the number of this Multi sensor which was assigned to the
device during the registration
Identification number of the device
Type designation of the device (as it is also found on the nameplate)
COR PT-3A ... Power transmitter "A"
COR PT-3B ... Power transmitter "B"
COR MS-3 ... Multi sensor
Sensors which are marked with an X have been used in the last
measurement.
Sensor management
57
7.3 Register sensors
To register a Power transmitter for Online measurements, proceed as follows:
Step Description
1 In the Sensor pool menu, select the Power transmitter tab.
2 Tap the Add button.
Result: A question appears on the screen. You must decide whether the
Power transmitter in question shall be added to the "Online pool" only or to both
the "Online pool" and "Offline pool" at the same time.
3 Use the buttons Yes or No to answer the question displayed.
No ... The device will only be added to the Online pool.
Yes ... The device will be added to both pools at the same time
Result: The menu for entering device IDs opens.
4 Enter the ID of the Power transmitter.
Via manual input:
•
Enter the ID.
•
Confirm with the ENTER
button.
Via „Automatic detection“:
•
Briefly contact the I/O field of the
Multi sensor with a magnet or press the
I/O button of the Power transmitter.
•
On the Correlator screen, confirm the ID
displayed with Accept.
•
Add another sensor or conclude by
tapping Finish.
Result: The display returns to the Sensor management menu.
The relevant device now appears in the list.
If the device could not be added, maybe there already exists a Power transmitter
of the same type (PT-A or PT-B) in the list. It is not possible to manage two PT-A
or two PT-B in the same list.
For Offline measurements, Multi sensors as well as Power transmitters can be used.
Therefore, the Offline pool can contain both types of sensors.
To register a sensor for Offline measurements, proceed as follows:
Step Description
1 In the Sensor management menu, select the Multi sensor tab.
2 Tap the Add button.
Result: The menu for entering device IDs opens.
(continued on next page)
Add sensors for
Online measurements
Add sensors for
Offline measurements.
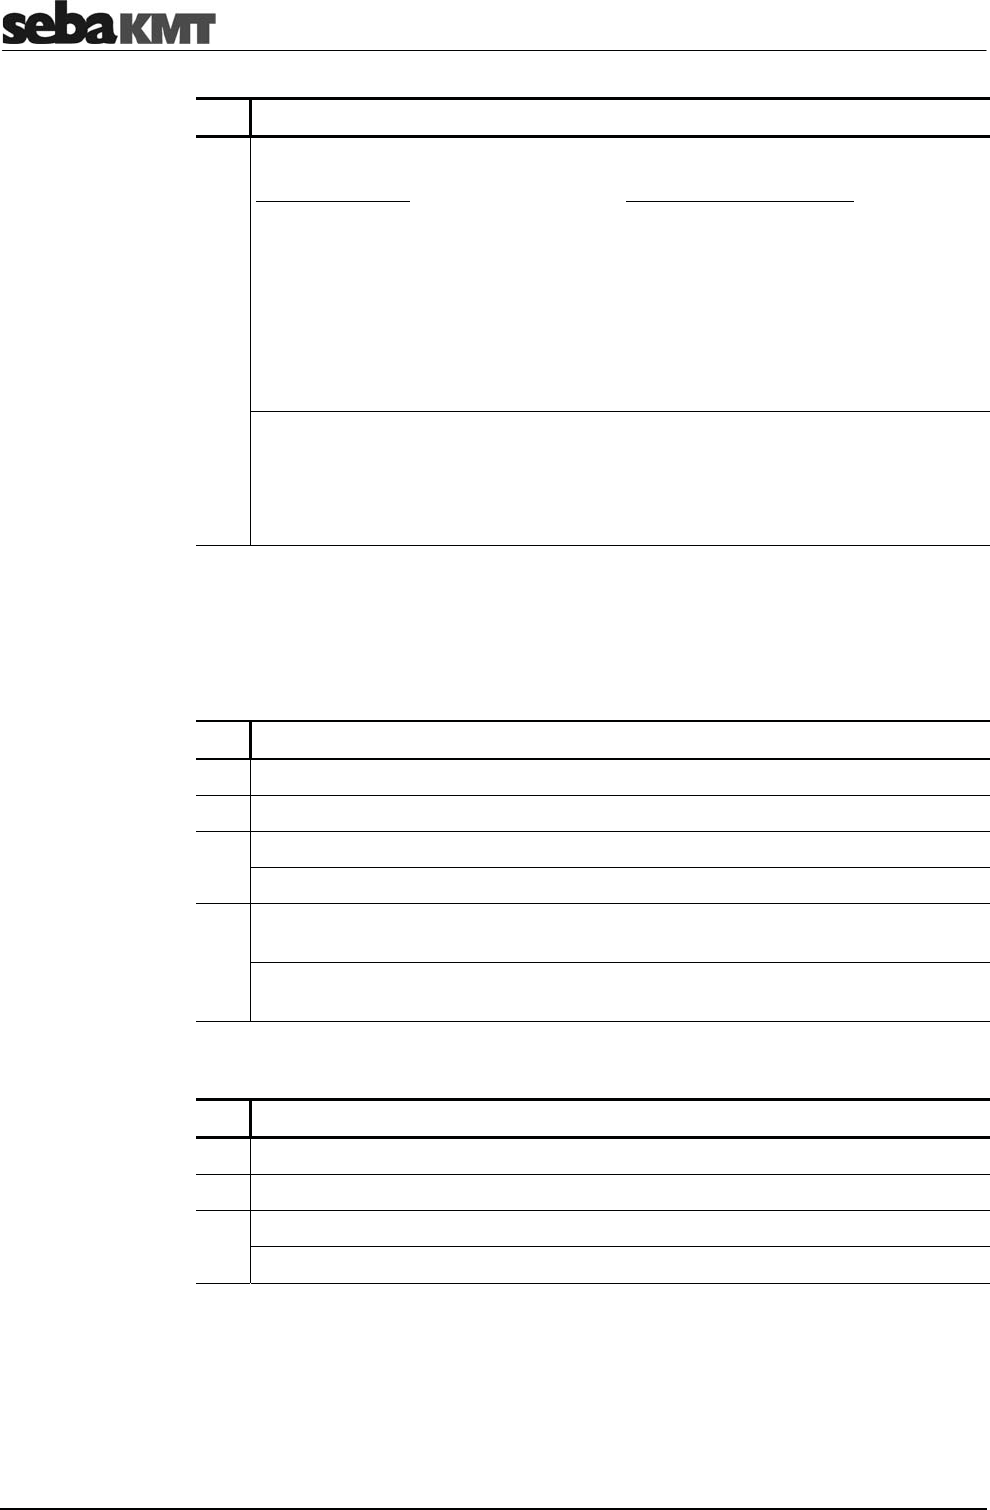
Sensor management
58
Step Description
3 Enter the identification number of the sensor in question.
Via manual input:
•
Enter the ID.
•
On the right, a drop-down list
appears. There, select whether the
device in question is a
Multi sensor (COR MS-3) or a
Power transmitter (COR PT-3).
•
Confirm with the ENTER button.
Via „Automatic detection“:
•
Briefly contact the I/O field of the
Multi sensor with a magnet or press
the I/O button of the
Power transmitter.
•
On the Correlator screen, confirm
the ID displayed with Accept.
•
Add another sensor or conclude
with Finish.
Result: The display returns to the Sensor management menu.
The relevant device now appears in the list.
Every Multi sensor receives a consecutive number from 1 to 8, according to the
registration order. This number is displayed in the first column of the table. The
number will be used in various functions of the Correlator to represent this sensor.
7.4 Replace / Delete sensors
You can remove a single sensor from the pool and replace it by a new sensor.
Proceed as follows:
Step Description
1 In the list, tap on the applicable sensor.
2 Tap the Replace button.
3 Answer the question displayed with Yes.
Result: The menu for entering device IDs opens.
4 Enter the identification number of the sensor which you want to add new to the
sensor pool. Use the key pad displayed or the "Automatic detection".
Result: The display returns to the Sensor management menu. The new sensor
now appears in the list. It takes over the number of the replaced sensor.
To remove a sensor from the pool, proceed as follows:
Step Description
1 In the list, tap on the applicable sensor.
2 Tap the Delete button.
3 Answer the question displayed with Yes.
Result: The sensor is removed from the list.
Replace a sensor
Delete a sensor
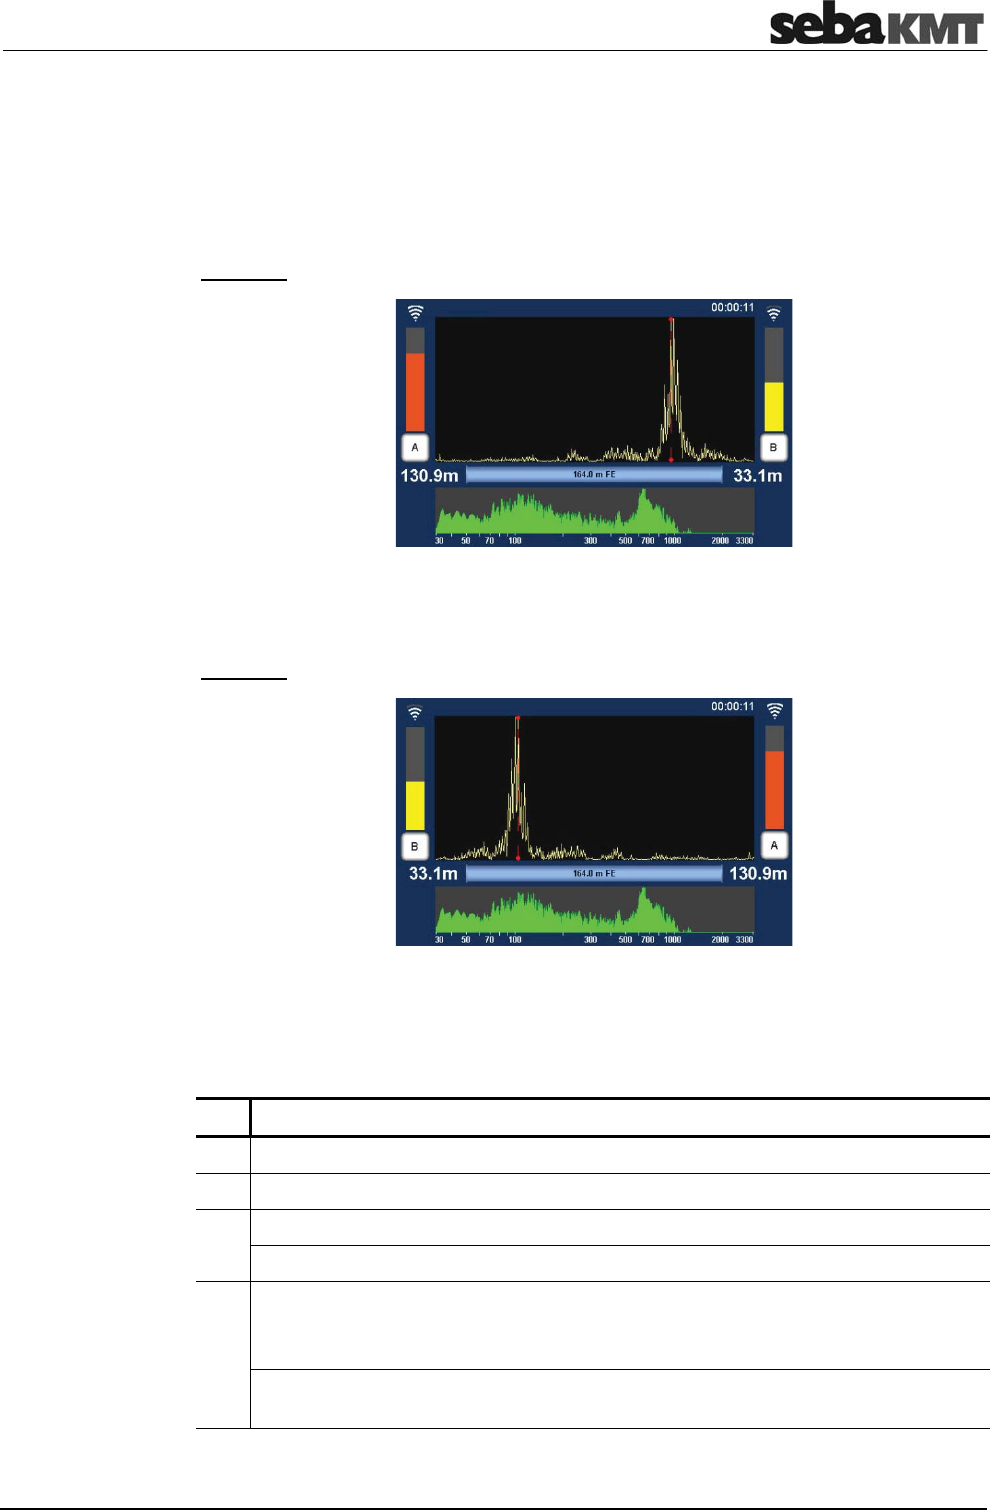
Sensor management
59
7.5 Additional functions
Using the A < > B button you can reverse the sorting order of the two
Power transmitters A and B in the Online pool. This step has an impact on the
Correlation menu which is shown on the screen when performing an
Online measurement.
Variant 1: Sorting order A ĺ B
In the Correlation menu, Power transmitter A appears on the left,
Transmitter B appears on the right.
Variant 2: Sorting order B ĺ A
In the Correlation menu, Power transmitter A appears on the right,
Transmitter B appears on the left.
You can change a Multi sensor's number in the sensor pool. Proceed as follows:
Step Description
1 In the list, tap on the applicable sensor.
2 Tap the Change number button.
3 Answer the question displayed with Yes.
Result: A key pad appears on the screen.
4 Enter the new number for this sensor. A number from 1 to 8 is possible. There
must not be two devices with the same number in the sensor pool.
Confirm with the ENTER button.
Result: The display returns to the sensor pool menu.
The relevant sensor is now shown with the new number in the list.
Change sorting order
of power transmitters
Change a sensor's
number

Sensor management
60
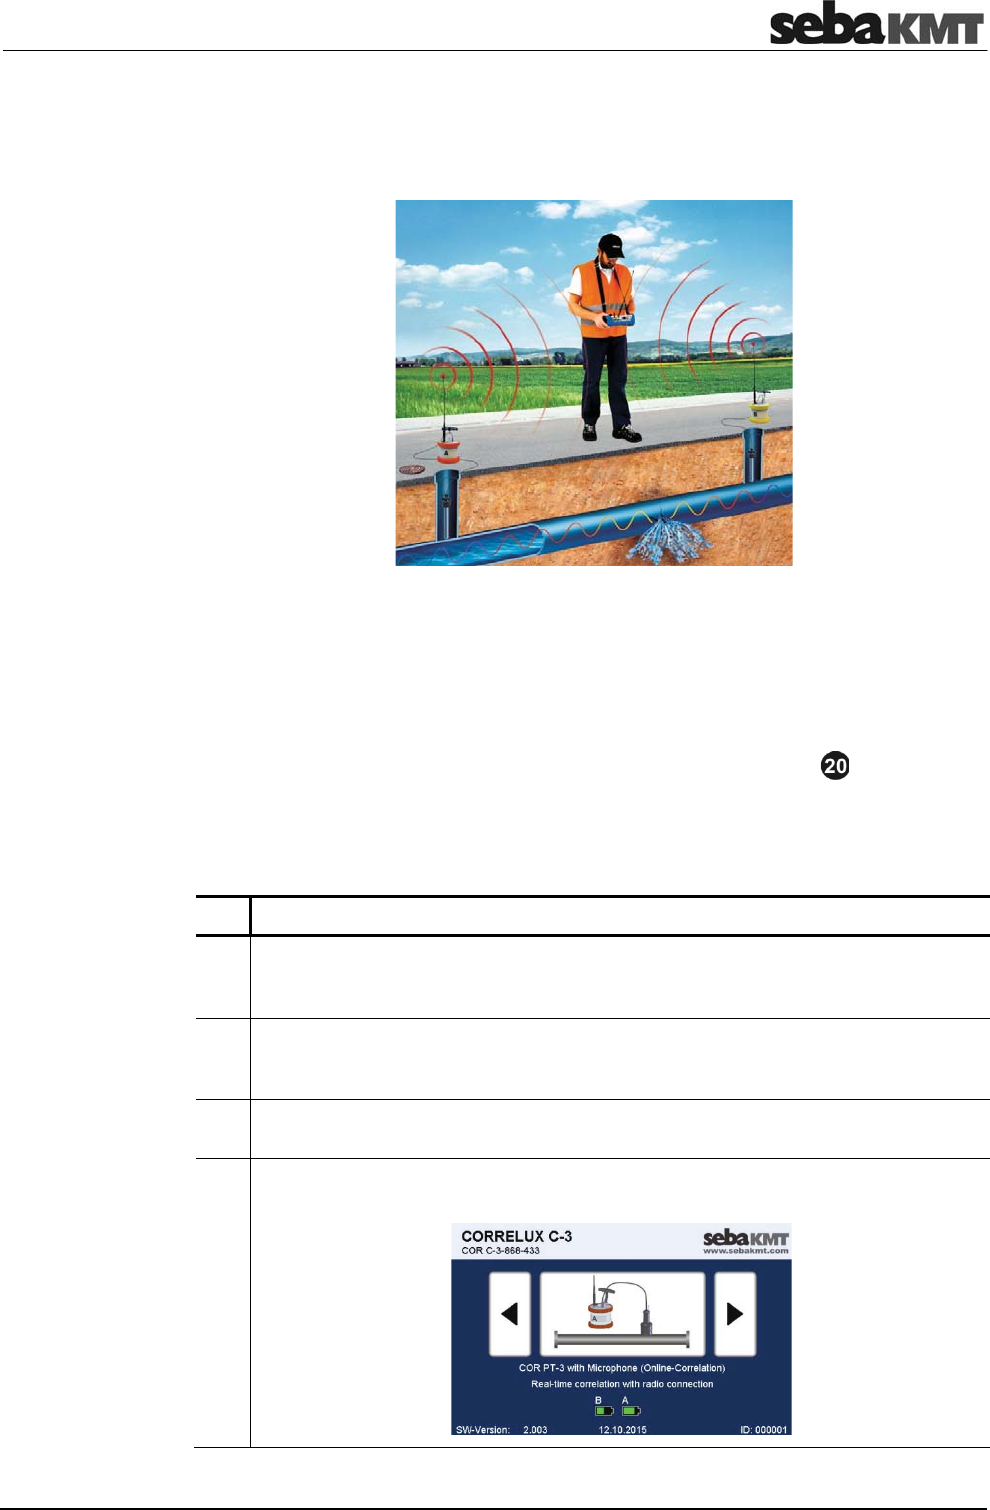
Online correlation
61
8 Online correlation
8.1 Measurement with 2 Power transmitters
The following requirements must be met or preparations must be made:
•
The batteries of the Power transmitters and the Correlator must be charged.
•
All radio antennas have to be properly connected to the Power transmitters and the
Correlator.
•
The microphones/hydrophones have to be properly connected to the Transmitters.
•
The radio of each Power transmitter should be tested. For this, take the
transmitter’s microphone from the storage place. The Radio LED must now be
lit. If not, put the microphone back to the storage place, switch the transmitter off
and on again and repeat the test.
Deploy the Power transmitters at the required measuring points and start the correlation.
Proceed as follows:
Step Description
1 Take the Power transmitter "A" (orange) and go to the first measuring point.
Attach the microphone to the pipe (or, alternatively, install the hydrophone).
Switch the Power transmitter on.
2 Take the Power transmitter "B" (yellow) and go to the first measuring point.
Attach the microphone to the pipe (or, alternatively, install the hydrophone).
Switch the Power transmitter on.
3 Take the Correlator and choose a position half way between the measuring
points. Switch the Correlator on.
4 In the Start menu, use the arrow buttons ŻŹ to choose the required Online
measuring mode (COR PT-3 with microphone or COR PT-3 with hydrophone.)
Checklist
prior to measurement
Start correlation
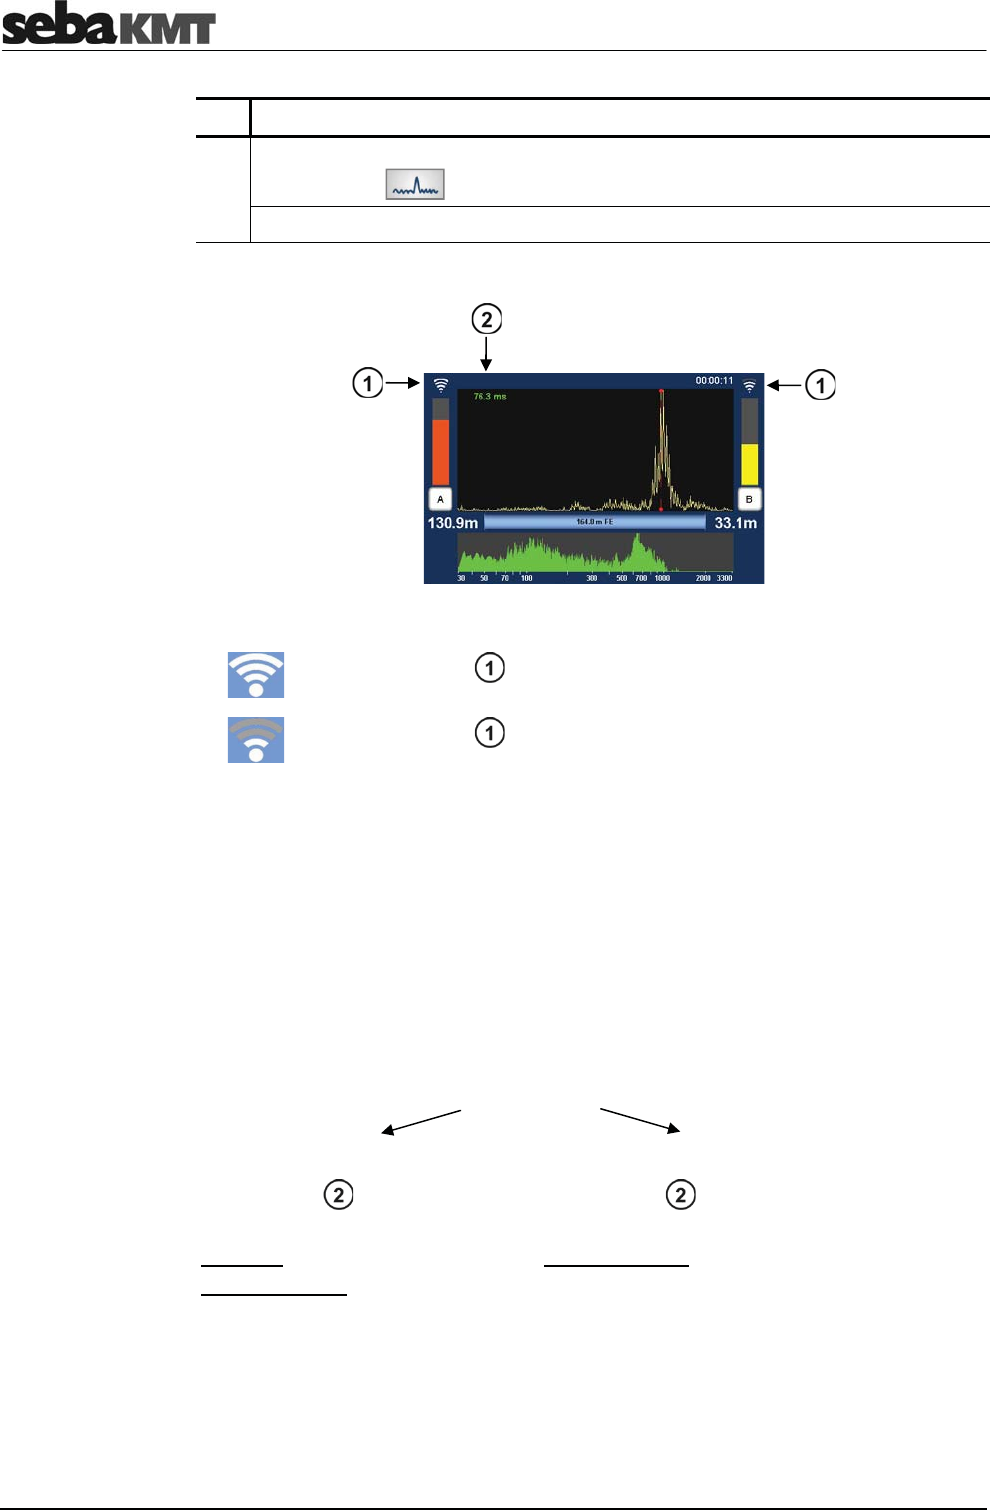
Online correlation
62
Step Description
5 To start the measurement, tap the large central button in the display area or
tap the button in the main menu.
Result: The correlation starts. The Correlation Analysis menu opens.
Rate the correlations. To do so answer the following questions.
Is the radio signal of both transmitters strong enough?
If the radio symbol shows a strong signal, the measurement can be
continued and a detailed analysis can be started.
If the radio symbol shows a weak signal, a continuous correlation will
be hardly or not possible.
The following actions may help:
•
Move closer to the Power transmitter in question.
•
Place the transmitter higher
(e.g. on a wall or on a traffic cone or similar).
•
If necessary, place the transmitter at an other measuring point.
•
If possible, there should be a direct line of sight connection between
Correlator and transmitter.
If still no connection can be made, conduct an Offline measurement instead
of the Online measurement.
Is the correlation result reliable?
The curve shows one clear peak;
the lag value is green or yellow
and does not fluctuate
The curve shows no clear peak;
the lag value is red and fluctuating
Meaning: The result is reasonable.
How to proceed: Continue the
measurement and start a detailed
analysis.
How to proceed: If you still suppose a leak to be
here, the following can help:
•
Access the system settings menu, adjust the
„Averaging“ to “unlimited” and restart the
correlation.
•
Conduct an Offline measurement (at night)
instead of the Online measurement.
Rate the correlation
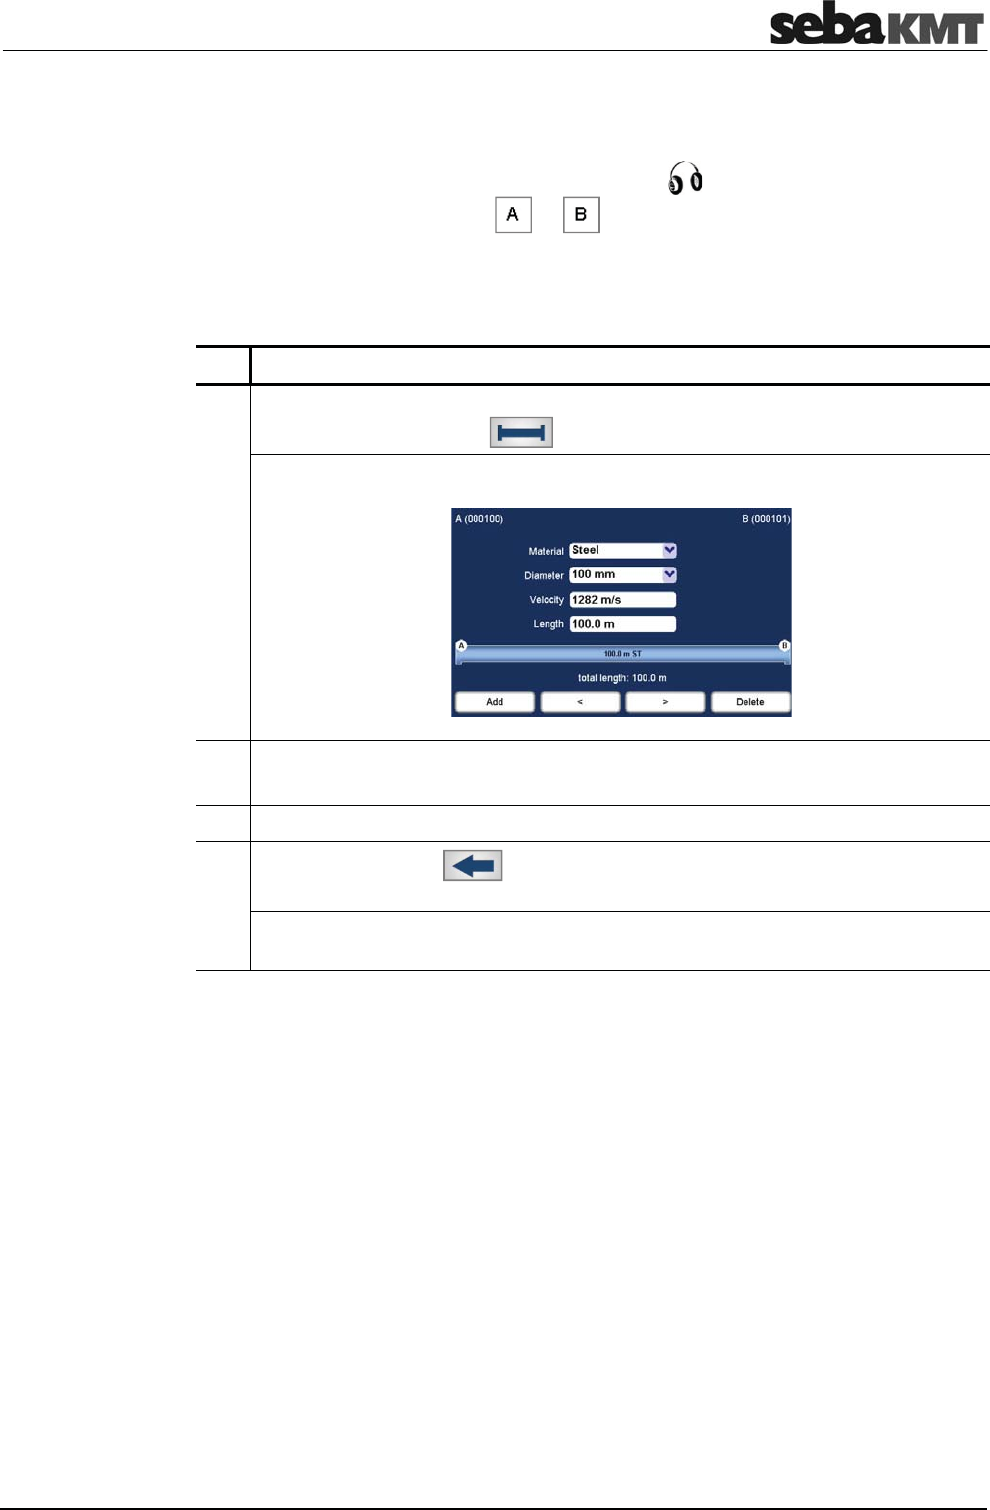
Online correlation
63
You have the option to listen to the sound in the pipe “live”, in order to judge whether a
leak noise or a background noise can be heard.
Connect the supplied headphones to the 12 V DC / socket of the Correlator. In the
Correlation menu, tap the button or to access the Audio menu (see chapter 2).
If you assess the correlation as "good", in the next step specify the properties of the pipe
in order to be able to calculate the distance to the leak.
Proceed as follows:
Step Description
1 In the Correlation menu, tap the button between the two diagrams representing
the pipe or use the button in the main menu.
Result: The Pipe data menu opens.
2 Reproduce the pipeline.
Use the Add and Delete buttons to divide the line into sections.
3 Enter the pipe data (material, diameter, length) for each section.
4 Use the Back button to return to the Correlation menu or the Start menu.
The entered pipe data are accepted
Result: In the Correlation menu, the distance from transmitter A or B to the leak
is displayed now.
Listen to leak noise
Enter pipe parameters
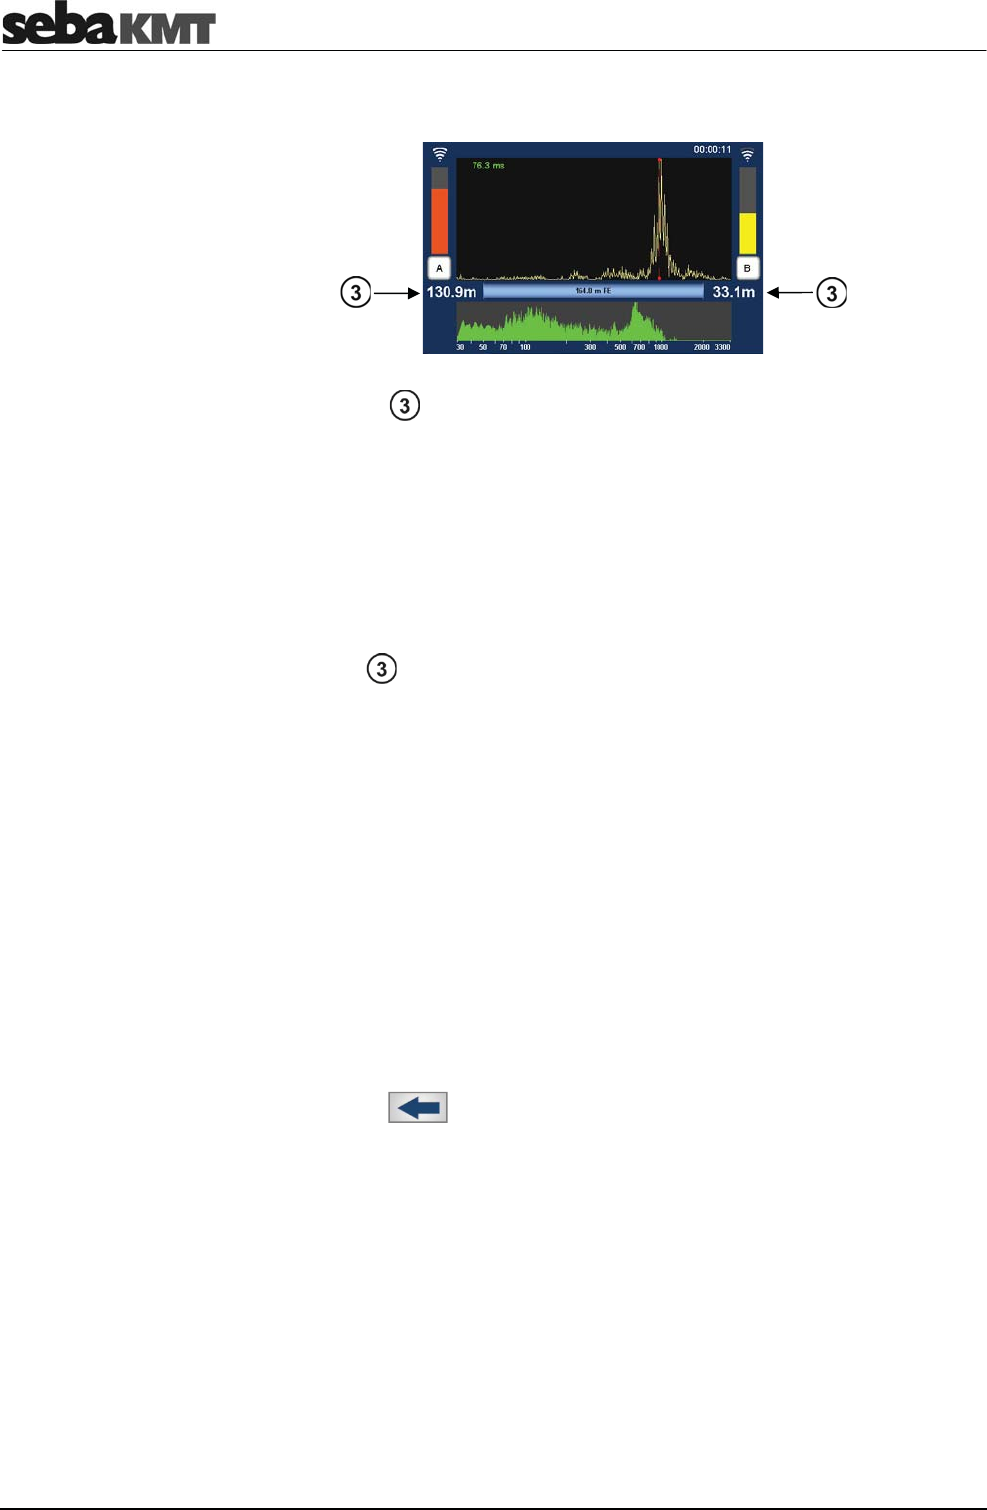
Online correlation
64
Use the following questions to assess whether the leak position seems plausible or not.
Is one of the values zero or close to zero?
If the answer is NO, the values seem plausible.
Continue the measurement and start a detailed analysis.
If the answer is YES, the leak is located precisely at the measuring point or outside the
correlated pipe section.
Cancel the measurement. Take the relevant transmitter and look for a new installation
point in order to enlarge the measuring length. Then start a new correlation.
Does each value show the half of the measuring length
If the answer is NO, the values seem plausible.
Continue the measurement and start a detailed analysis.
If the answer is YES, the leak is located precisely half way between the measuring
points or a measuring error has occurred (so called ‘center point correlation’).
Cancel the measurement. Take one of the transmitters and look for a new installation
point in order to enlarge the measuring length. Then start a new correlation.
Use the various tools to analyze the displayed correlation:
•
When you tap the displayed correlation curve, the Correlation analysis menu with
the relevant tools opens.
•
When you tap the displayed coherence curve, the Frequency analysis menu with
the relevant tools opens.
Use the Back button to return to the Correlation menu.
Some settings for calculating and presenting the correlation curve can be changed in
the in the System settings menu (see page 51).
Rate the leak position
Detailed analysis
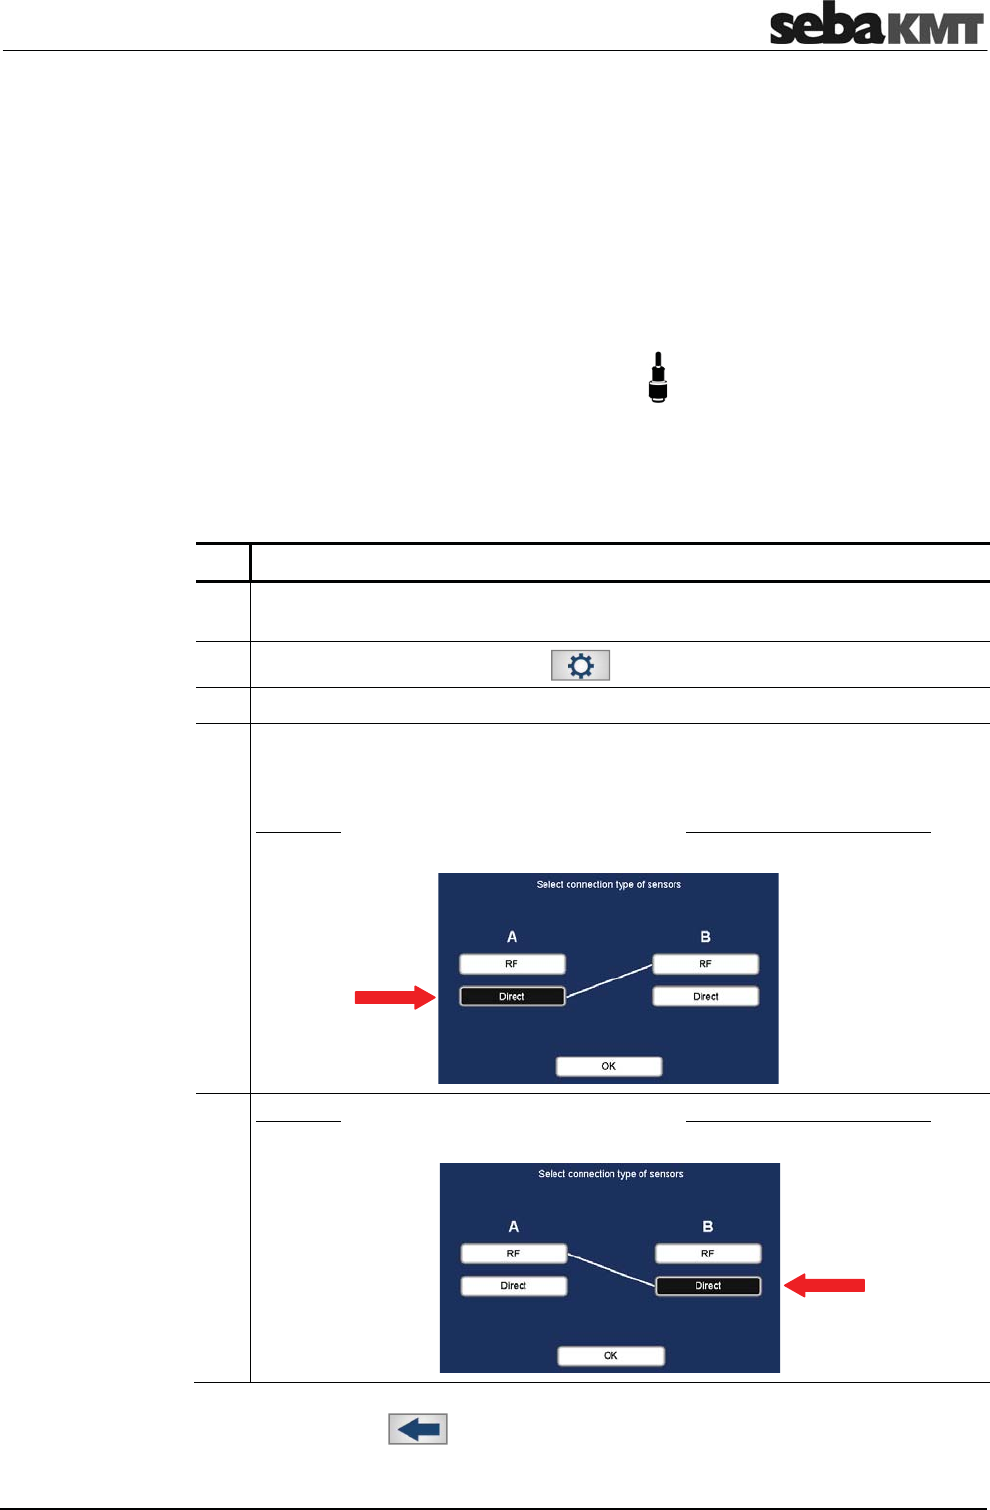
Online correlation
65
8.2 Measurement with only 1 Power transmitter
It is possible to replace one of the two Power transmitters by the Correlator. Thus, the
Correlator performs both, the function of a control unit and the function of a noise sensor
at the second measuring point.
This allows performing Online measurements even if one of the two Power transmitters
is not available or malfunctions.
The universal microphone PAM CORR-2 needs to be connected to the Correlator.
Simply use the microphone of the not used Power transmitter.
The Correlator's microphone socket has this icon:
Observe the markings on the plug and socket. You must feel the plug engage.
On the Correlator, it has to be specified which Power transmitter will be replaced at the
coming measurement.
Proceed as follows:
Step Description
1 In the Start menu, use the arrow buttons to choose an Online measuring mode,
e.g. "COR PT-3 with microphone".
2 In the main menu, tap the button .
3 In the displayed menu, tap the Sensor connection button.
4 In the menu displayed, specify which Power transmitter shall be replaced by the
Correlator at the next measurement.
Variant 1: The measurement shall be performed without Power transmitter A?
Then tap the Direct button beneath A and confirm with OK.
Variant 2: The measurement shall be performed without Power transmitter B?
Then tap the Direct button beneath Band confirm with OK.
Use the Back button or the ESC pushbutton to return to the Start menu.
Connect
the microphone
Configure the
Correlator
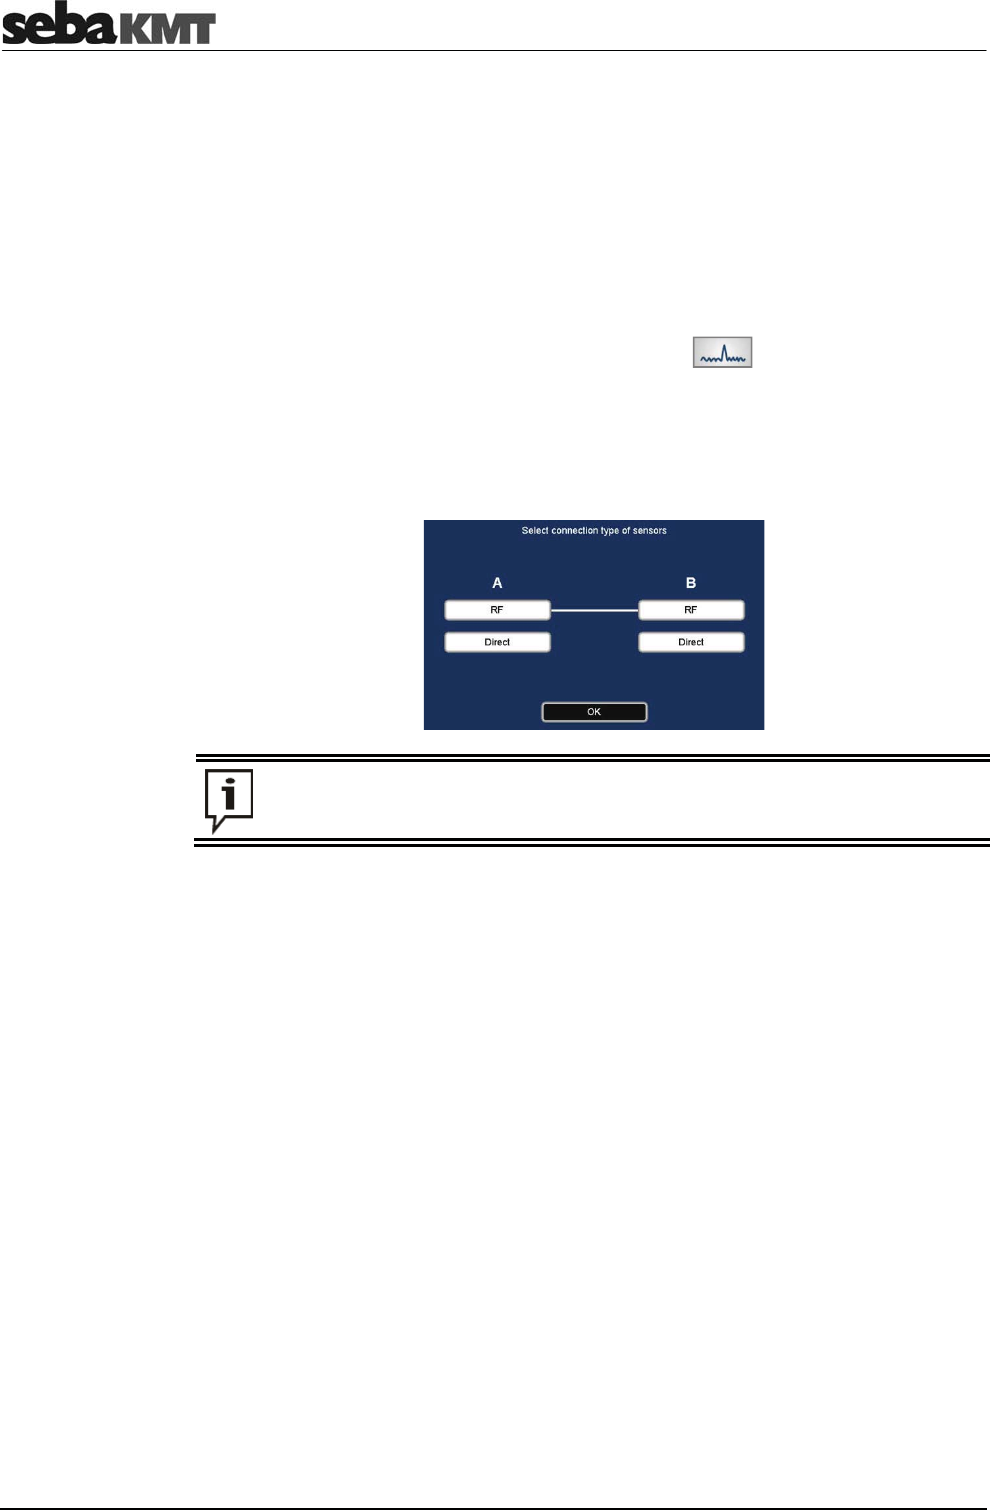
Online correlation
66
The changed setting is accepted and will become effective at the next measurement.
The setting will remain valid until it is changed again in the Sensor connection menu or
until the Reset last correlation data command in the System settings menu is used to
reset all measurement data (see page 101).
First, take the Power transmitter which shall be used, go to the first measuring position.
Attach the sensor to the pipe and turn the device on.
Then, take the Correlator and go to the second measuring position. Attach the sensor
which is connected to the Correlator to the pipe.
The measurement can now be started using the button in the main menu.
Before the next Online measurement with two Power transmitters can be performed, the
Sensor connection setting has to be reset.
For this, access the Sensor connection menu and tap the RF button beneath A as well
as the RF button beneath B and confirm by pressing OK.
If you use the Reset last correlation data command in the System settings
menu prior to a new correlation, the Sensor connection setting will be reset to
RF-RF at the same time.
Perform measurement
Reset the
"Sensor connection"
setting
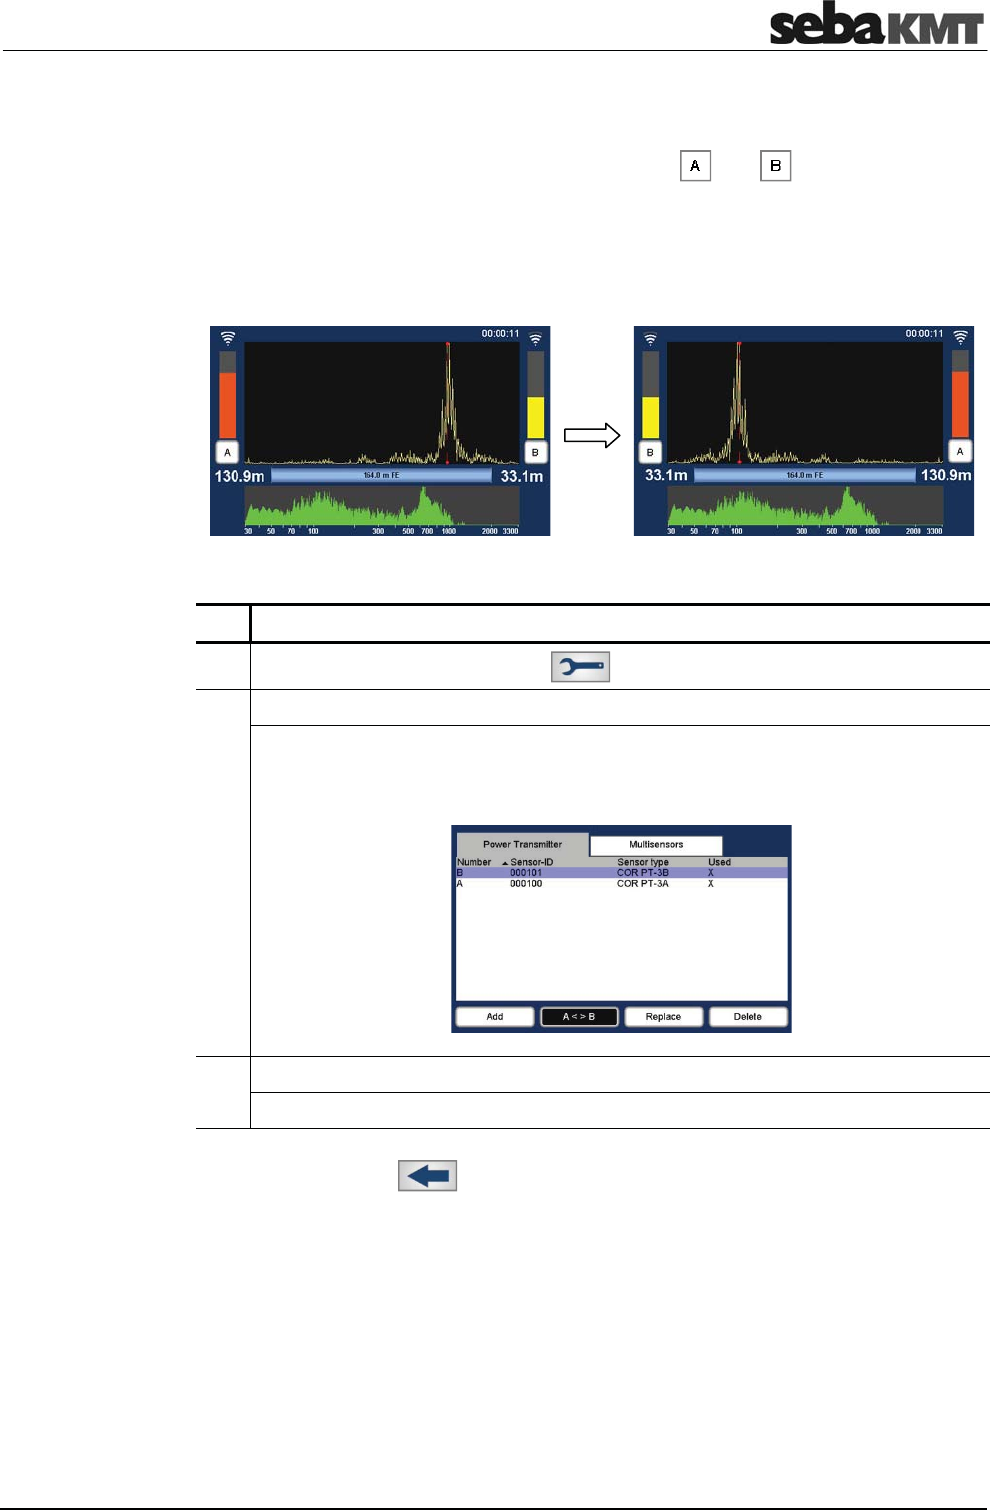
Online correlation
67
8.3 How to exchange A - B on the screen
In the Correlation menu, the Power transmitter icons and are positioned to the
left and right of the correlation curve. As standard, Power transmitter A is on the left,
Power transmitter B is on the right.
It is possible to exchange the two icons on the screen, when required. Then,
Power transmitter A will be on the right, Power transmitter B will be on the left.
To exchange the Power transmitter icons with each other, proceed as follows.
Step Description
1 In the main menu, tap the button .
2 In the displayed menu, tap the Sensor management button.
Result: The Sensor management menu opens. There, the list of
Power transmitters is shown. If this is not the case, tap the Power Transmitter
tab.
3 Tap the A < > B button.
Result: The sort order of the two Power transmitters in the list is reversed.
Use the Back button or the ESC pushbutton to leave the menu. The changed
setting is accepted and will become effective as soon as a new correlation is performed.
The setting will remain valid until it is changed again in the same way.
Procedure

Online correlation
68
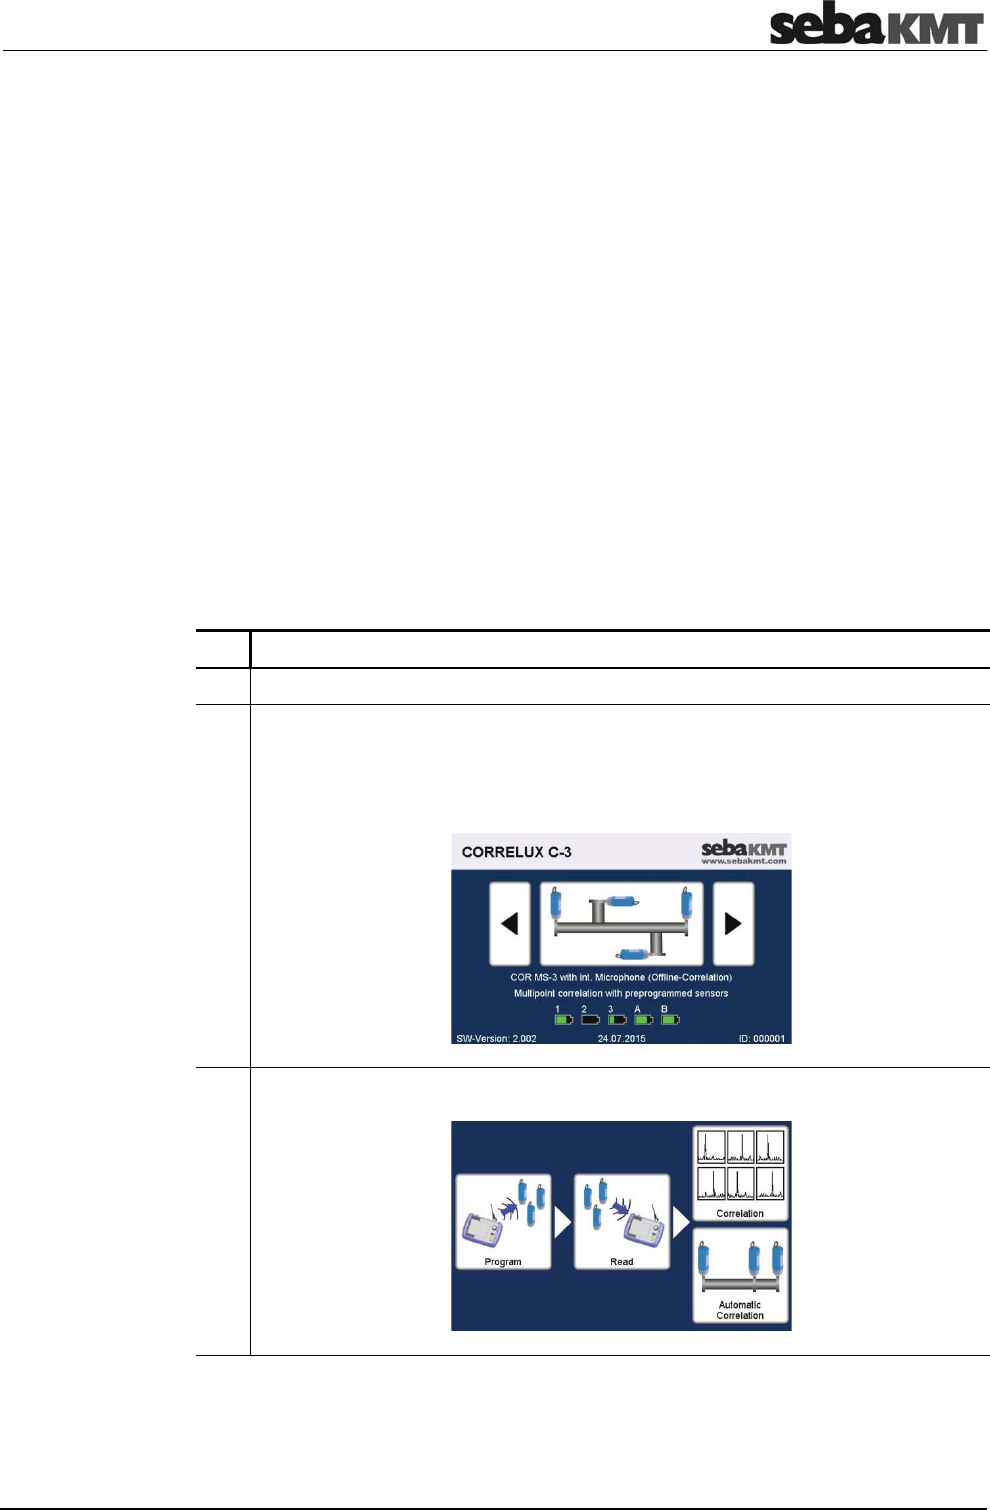
Offline correlation (Multipoint measurement)
69
9 Offline correlation (Multipoint measurement)
A group of 2 to 8 sensors is programmed for measurement and then deployed at the
measuring points. Multi sensors and/or Power transmitters can be used. The
measurement is carried out by all sensors simultaneously. During the measurement,
there is no contact between the sensors or between the sensors and the Correlator.
After the measurement, the sensors are collected and the recorded data is read, then
correlations can be carried out and displayed on the Correlator.
The following requirements must be met or preparations must be made:
•
A digital or printed pipe network plan of the relevant measuring area with all pipe
parameters is needed.
•
The batteries of the devices involved must be charged.
•
All sensors involved must be registered in the Correlator's Multisensor pool (also
called "Offline pool" (see page 55))
•
If Power transmitters will be used: The microphones must be properly connected.
•
All sensors must be received by the Correlator. (This is the case, when each battery
icon in the Correlator's Start menu shows the battery level of the relevant sensor. If
a question mark is shown, the corresponding sensor cannot be reached.)
Configure the sensors for the measurement:
Step Description
1 All sensors must be turned on.
2 In the Correlator's Start menu, select the required Offline measuring mode
("COR MS-3 with microphone" or "COR MS-3 with hydrophone").
Use the arrow buttons to choose the mode, then tap the large central button to
open it up.
3 In the displayed menu, tap the Program button.
(continued on next page)
Checklist
prior to measurement
Programming sensors
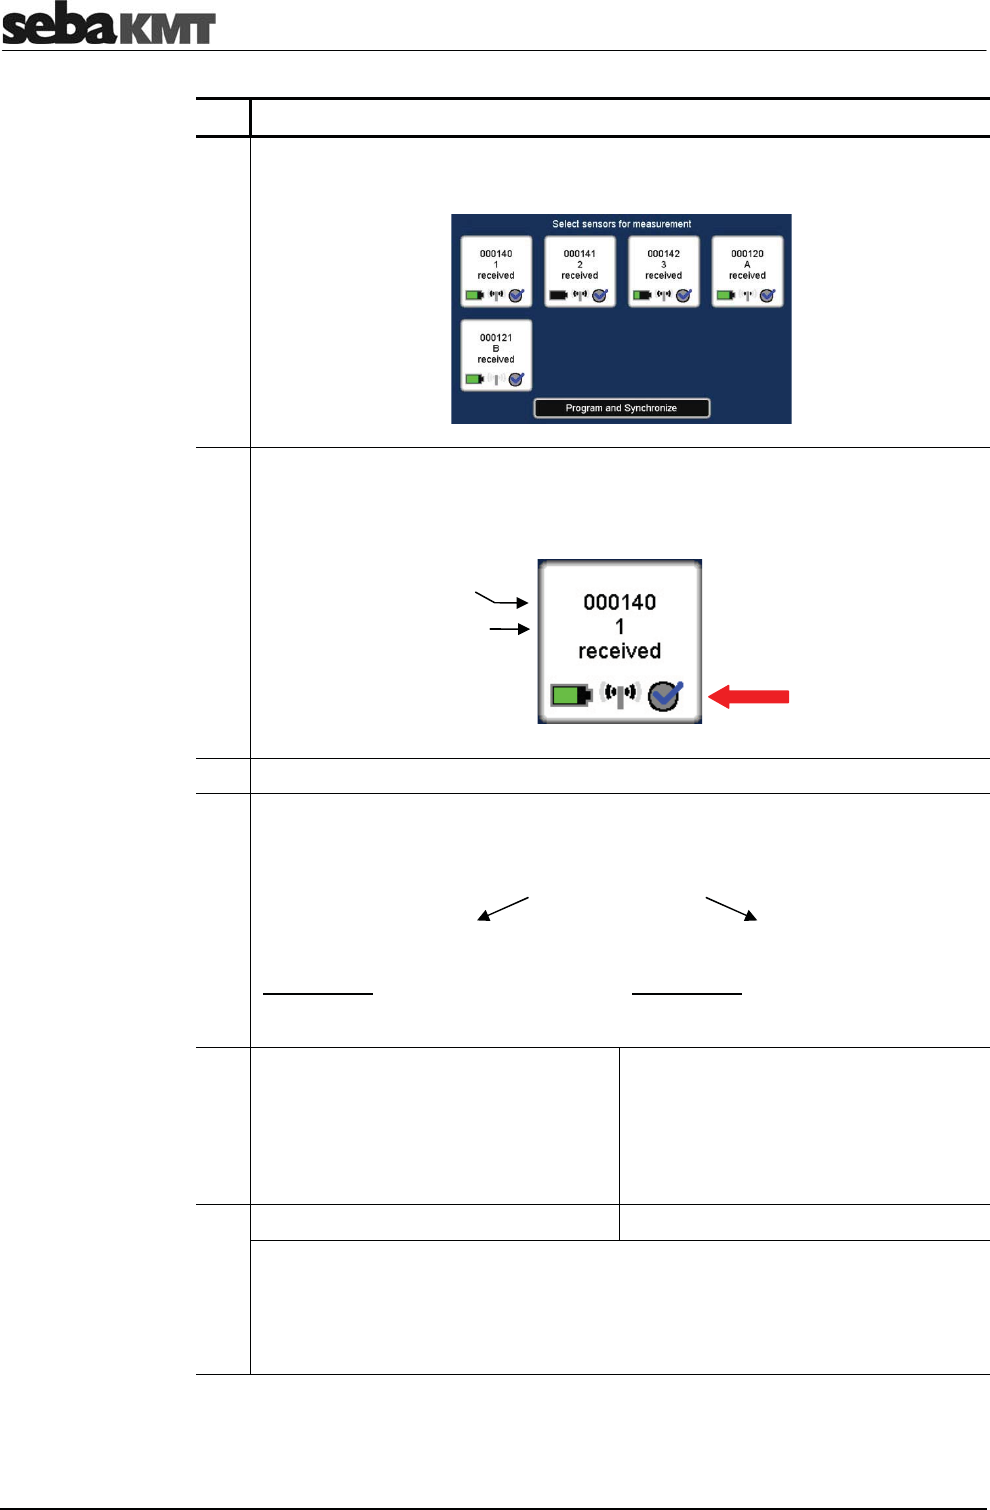
Offline correlation (Multipoint measurement)
70
Step Description
Result: In the displayed menu, up to 8 fields represent the sensors which are
registered in the Correlator's Multi sensor pool.
4 Select the sensors which shall be programmed. Tap the appropriate field to
enable/disable the checkbox.
Only "enabled" sensors will be part of the measurement.
5 Tap the Program and Synchronize button.
6 In the menu displayed, decide whether the measurement shall be carried out
immediately or at night.
Tap one of the two buttons:
Instantaneous measurement
(Explanation: measurement takes 2min
30sec and starts directly after the
sensors have been deployed)
Custom measurement
(Explanation: Start and end time of the
measurement are set by the user)
7 Use the Time offset field to specify the
period of time which it will take to deploy
the sensors at the individual measuring
points.
The entered time span will later be used
as a "countdown to measurement".
Use the Start of measurement field to
specify when the measurement shall
start.
Use the End of measurement field to
specify when the measurement shall be
finished.
8 Tap the OK button. Tap the OK button.
Result: The sensors are programmed and synchronized successively. The
Correlator successively establishes a connection to each sensor. The progress of
the operation is shown on the screen.
When the operation is completed, a countdown appears on the screen showing
the time remaining before the measurement starts.
Sensor ID
Sensor no.
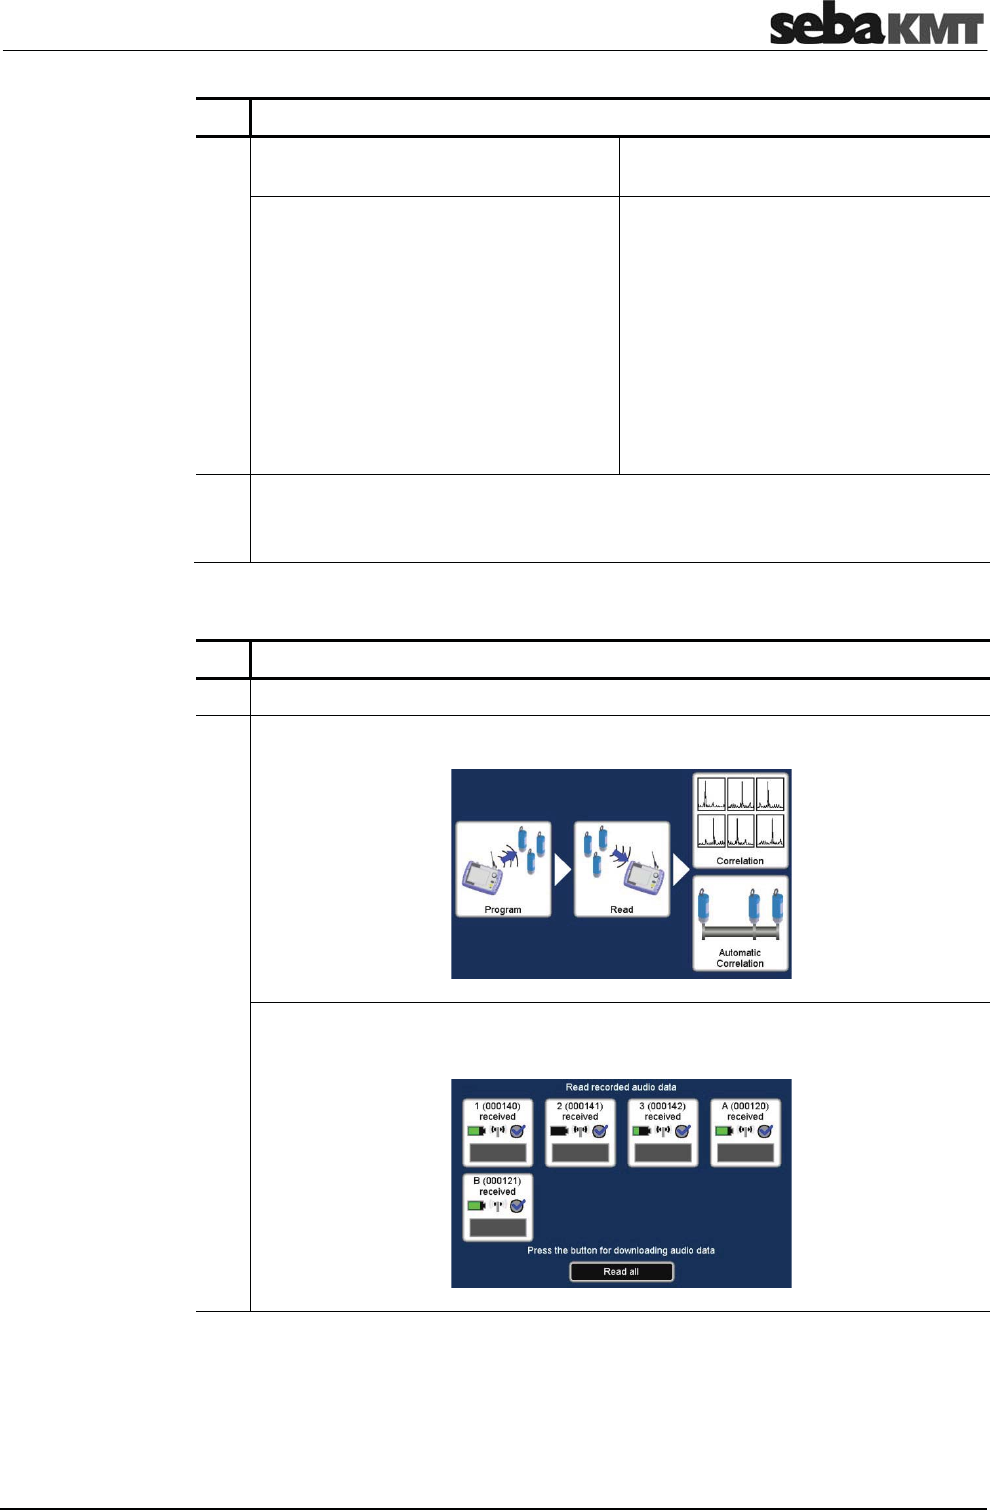
Offline correlation (Multipoint measurement)
71
Step Description
9 Deploy the sensors at the measuring
points. Deploy the sensors at the measuring
points.
Result: Once the countdown reached
zero, the sensors start measuring.
A new countdown of 2min 30sec is
displayed on the Correlator screen
representing the total time of the
measurement. During this time, the
sensors simultaneously record 10 audio
blocks, each of 3 seconds length. Once
the countdown reached zero, the
measurement is completed.
Result: The sensors start measuring at
the programmed time.
A new countdown is displayed on the
Correlator screen showing the time
remaining until the programmed end of
measurement.
During this time, the sensors
simultaneously record 10 audio blocks,
each of 3 seconds length. Once the
countdown reached zero, the
measurement is completed.
10 Once the measurement is completed, collect the sensors.
The sensors need to remain turned on. Otherwise the measurement data would
be lost.
To read the measuring data from the sensors, proceed as follows:
Step Description
1 In the Start menu, select the required Offline measuring mode.
2 In the displayed menu, tap the Read button.
Result: The Correlator successively contacts all sensors. Thereby, the devices
are synchronized. Then, the following menu appears:
(continued on next page)
Deploying sensors
Reading out data
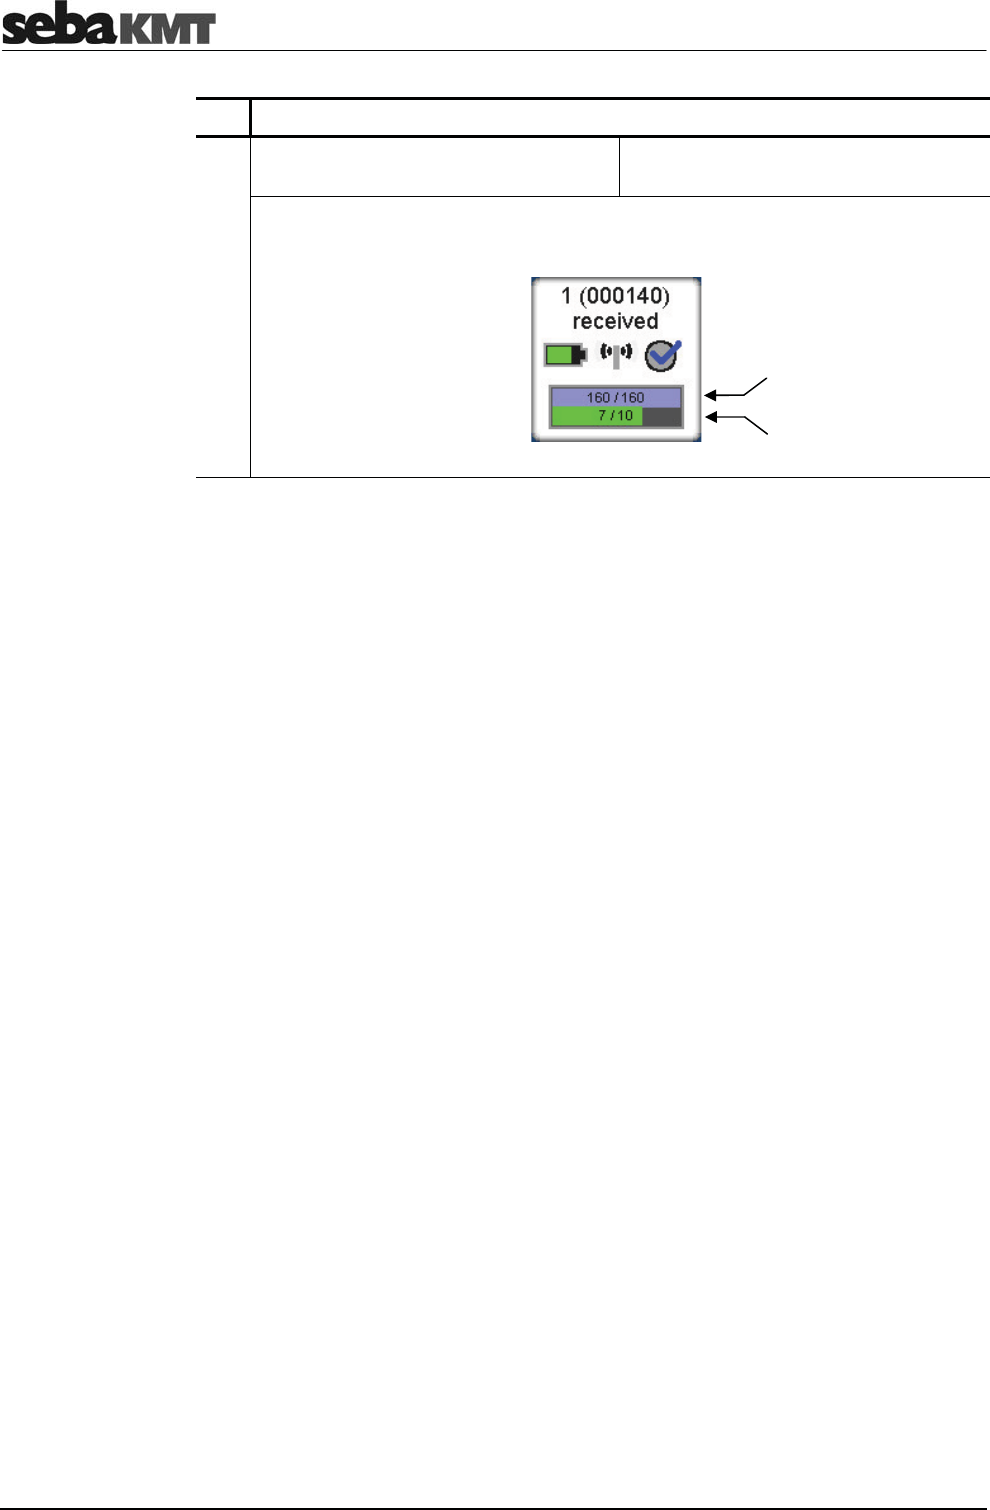
Offline correlation (Multipoint measurement)
72
Step Description
3 If you want to read the audio files of all
sensors, tap the Read all button. If you want to read just one sensor, tap
the field of the sensor in question.
Result: The audio files are successively transferred.
The progress of the operation is shown in the individual fields.
Use the ESC pushbutton to return to the Start menu.
Radio packages
received
Audio files
received
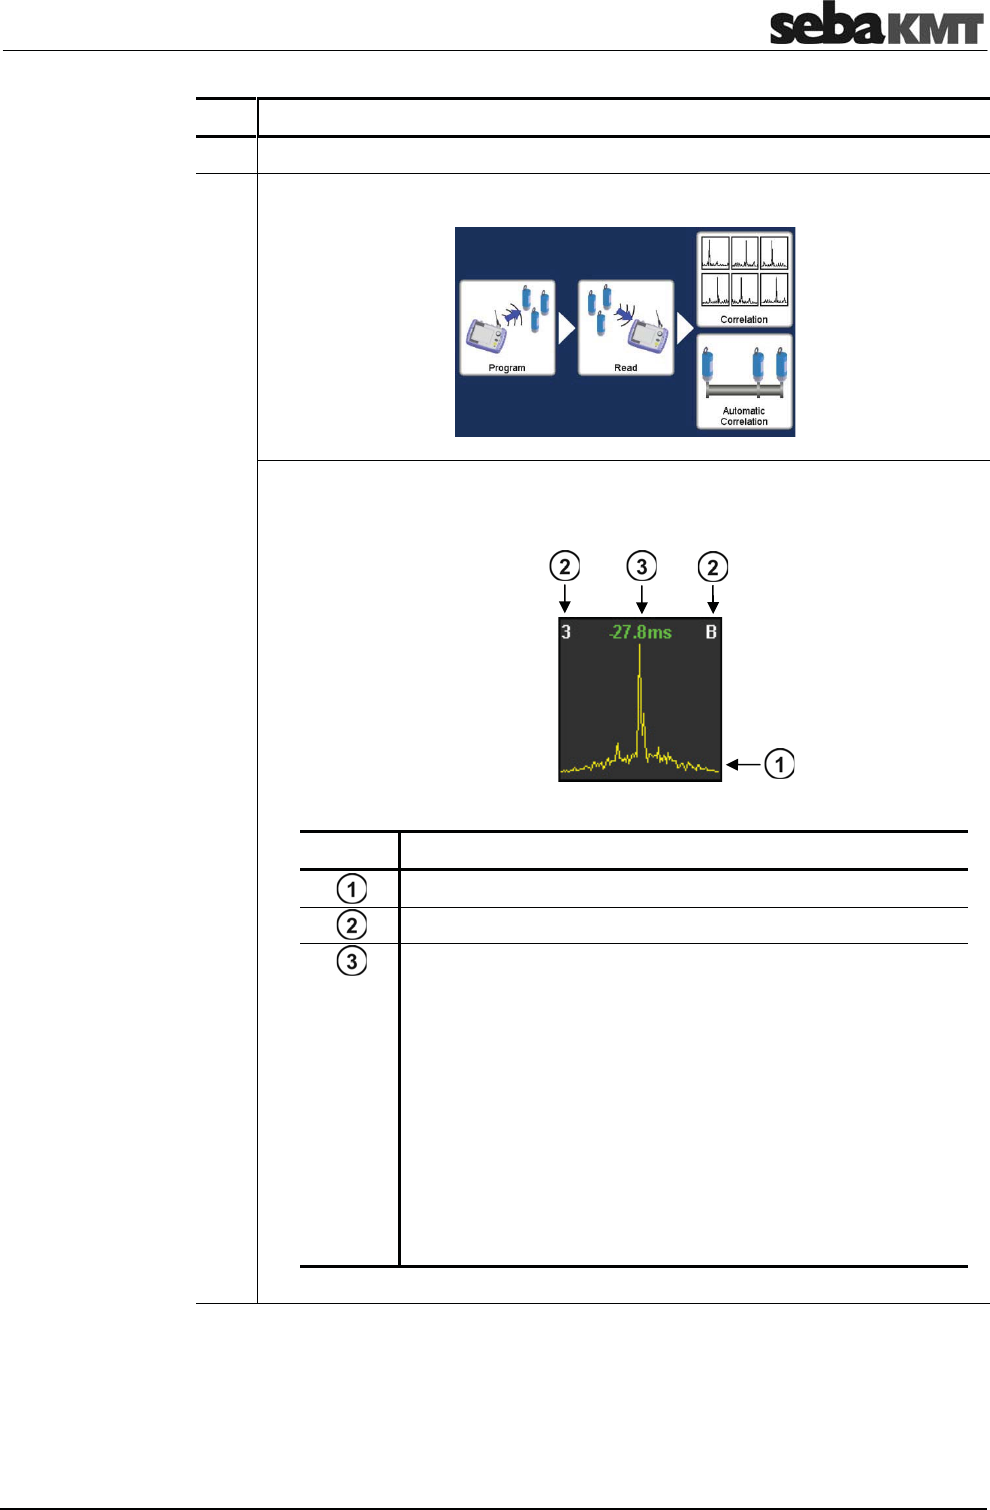
Offline correlation (Multipoint measurement)
73
Step Description
1 In the Start menu, select the required Offline measuring mode.
2 In the displayed menu, tap the Correlation button.
Result: A "Multi correlation" is carried out, which means that the values of all
sensors are correlated with each other. The process can take a few seconds.
Subse
q
uentl
y
, the correlation results for all sensor
p
airs are shown in thumbnails.
Element Description
Correlation curve
Sensor numbers of the two devices whose data are correlated.
Time distance from the middle of the pipe line to the leak.
The color of the numbers shows how reliable the result of this
correlation is:
green ... "good" correlation, reliable result
yellow ... correlation is not optimal
red ... bad correlation; no leak or no clear
localization possible
negat. value ... the leak is on the left from the center of the
line
posit. value ... the leak is on the right from the center of the
line
Perform correlation
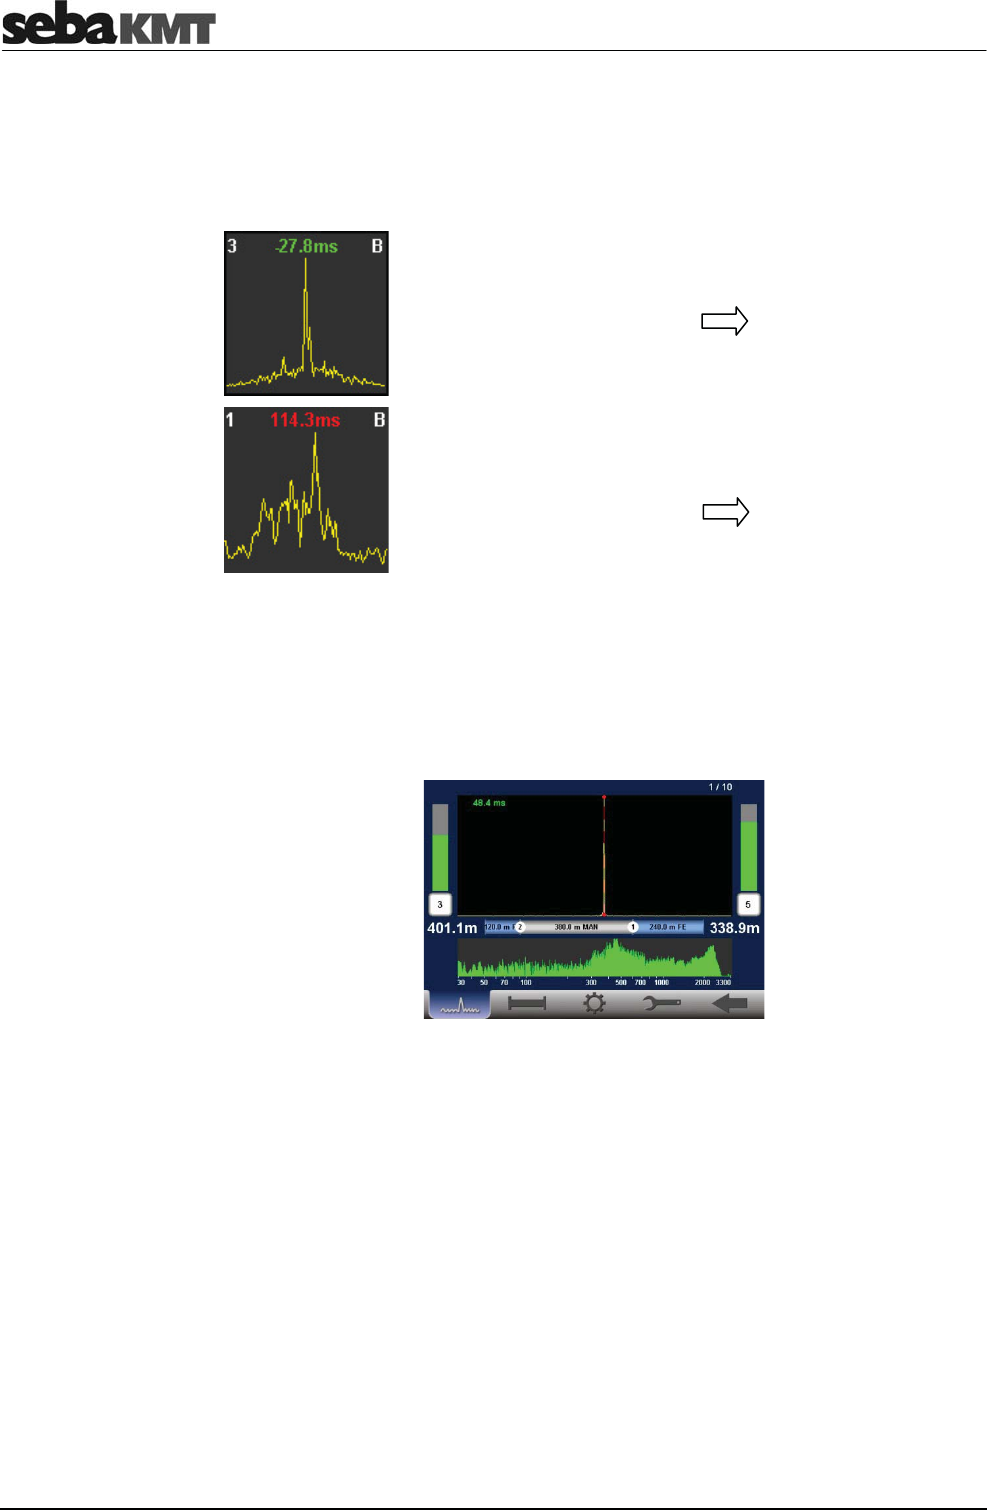
Offline correlation (Multipoint measurement)
74
The Multi correlation gives you an overview of the noise situation along the measured
pipeline. In the ideal case, the pipe sections where leaks are most likely can be
identified at a glance.
Rate the displayed correlations.
If the Multi correlation shows at least one "good correlation" with one clear peak, the
probability of a leak between the respective sensors is high.
Take a closer look at the good correlations. Tap the relevant thumbnail. The
Correlation menu for this sensor pair appears.
Rate correlations
"Bad correlation"
•
more than one peak
•
lag value is yellow or
red
•
lag value is zero or
nearly zero
No leak or no clear
localization possible
"Good correlation"
•
clear peak
•
lag value is green
•
lag value is not zero
Probability of a leak
is high
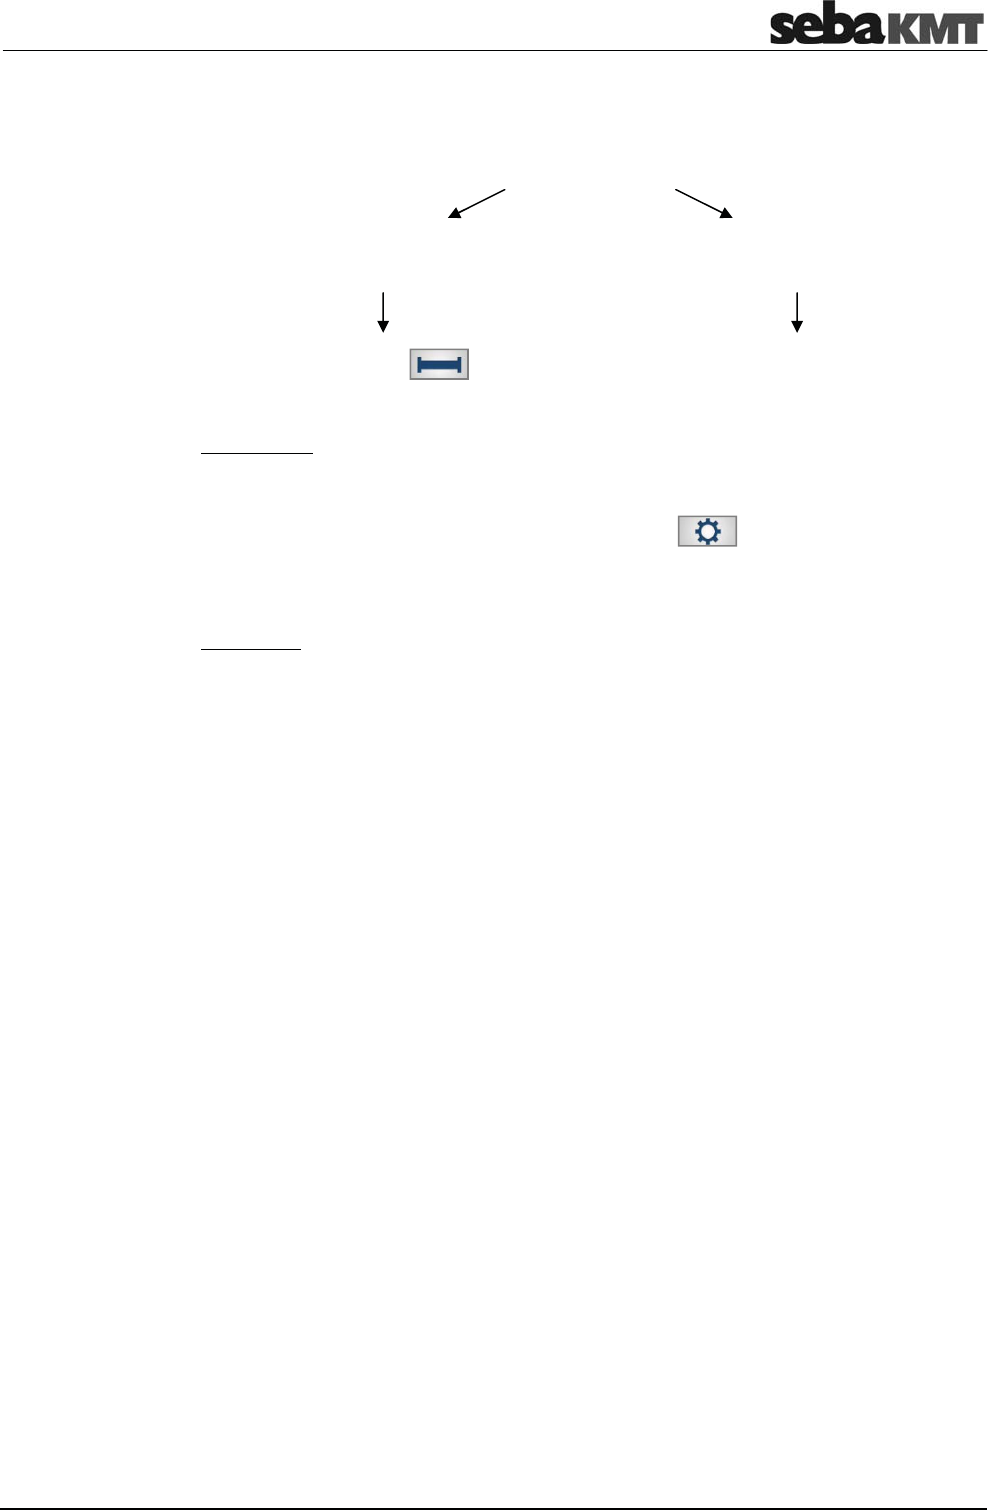
Offline correlation (Multipoint measurement)
75
To be able to calculate the distance to the leak, the properties of the pipe have to be
specified.
2 options
proceeding via
Pipe data menu
proceeding via
Map menu
You can tap the button to open
the Pipe data menu directly and enter
the pipe parameters there.
Prerequisite: The two measuring points
in question need to be connected directly
which means that there must be no other
sensor attached to the pipe between the
two points.
Otherwise, input errors may easily occur
which would lead to wrong correlation
results.
Alternative: It is highly recommended to
use the Map menu instead of the
Pipe data menu.
The Map menu offers a good overview of
the used sensors and the sections of the
pipe. The Map menu can not only be
used to specify the pipe parameters for
all pipe sections, but also to carry out
more correlations.
To access the Map menu, tap the
button , then tap the Map button
in the displayed menu.
You find detailed information about the
Map function in a separate section of this
manual (see page 93).
If there is no complete pipe data available, you have the option to switch now to the
"Velocity measurement" menu.
This menu is for:
•
Calculating the distance between a sensor and the leak, although material and
diameter of the pipe are unknown.
•
Calculating the sound velocity in the pipe. The value can then be adopted for further
correlations.
You find detailed information on how to use the Velocity measurement function in a
separate section in this manual (see page 88).
How to proceed
if there is pipe data
How to proceed
if there is no pipe data
available

Offline correlation (Multipoint measurement)
76
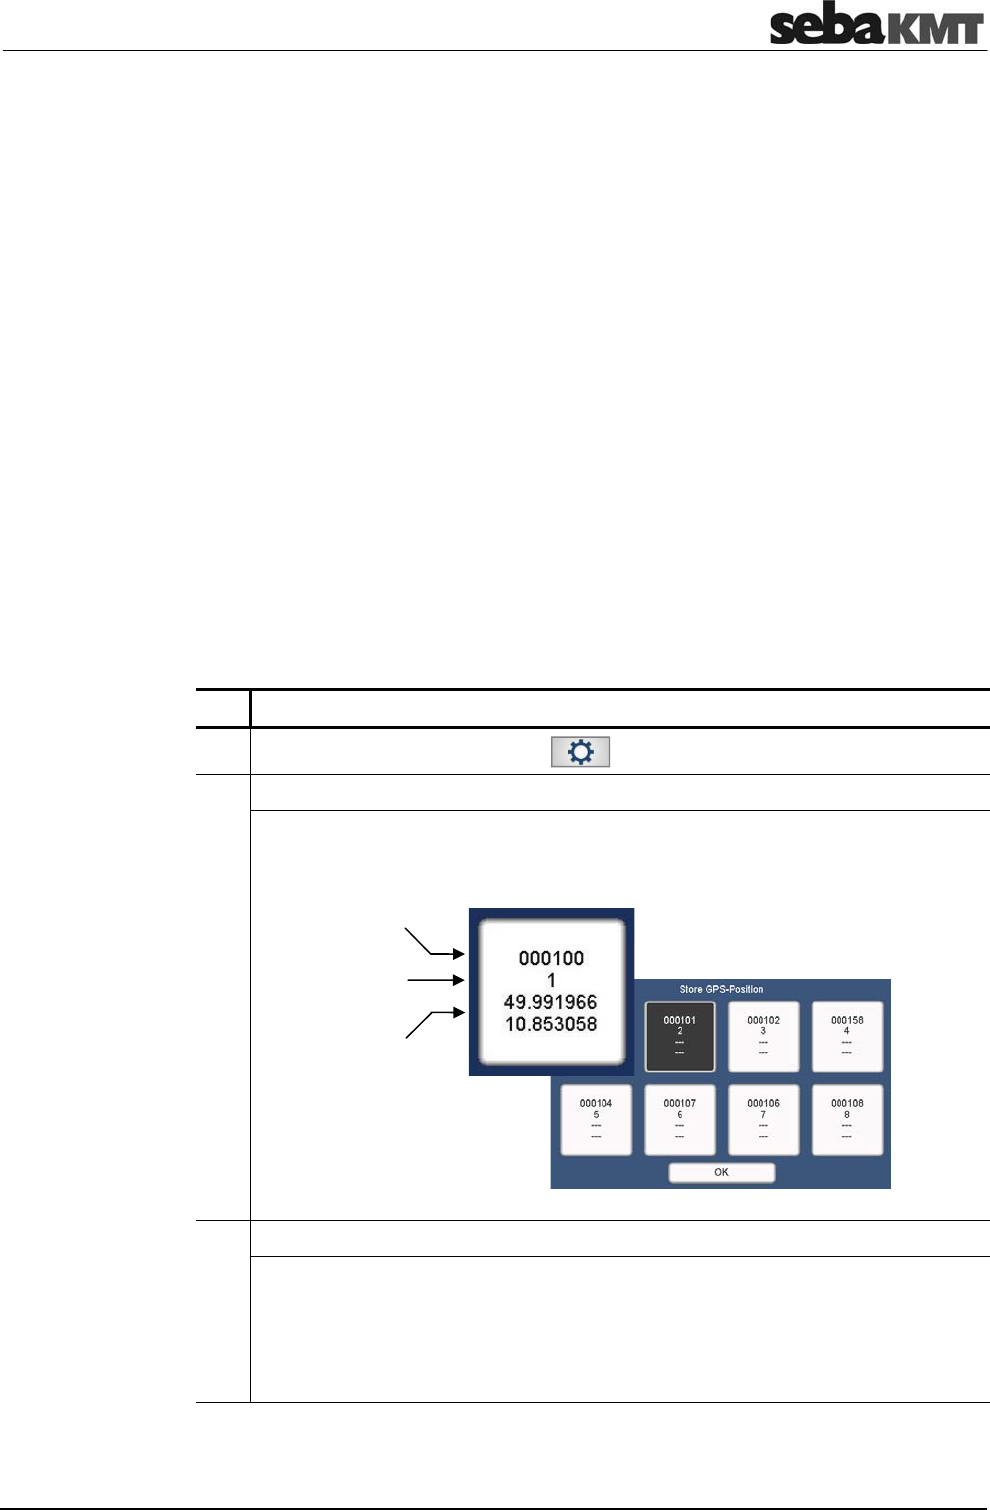
GPS position data
77
10 GPS position data
10.1 Introduction
You can use the Correlator to determine and store the GPS coordinates of the individual
measuring points.
GPS data facilitate the management and analysis of the measured data in the Offline
measurement. For some analysis capabilities GPS data are even a prerequisite.
The GPS receiver LOG GPS-3 has to be connected to the Correlator. The GPS receiver
is optionally available.
The GPS module is connected to Correlator using the USB / GPS socket. You must feel
the plug engage. The GPS module is powered by the Correlator. The device switches
on immediately after connection and is ready for operation. The status LED lights up.
The device immediately begins to search for GPS signals.
10.2 Determine and save GPS coordinates
To determine the GPS position for a sensor, you must take the Correlator and proceed
as close as possible to the installed device.
Subsequently, proceed as follows:
Step Description
1 In the main menu, tap the button .
2 In the displayed menu, tap the Store GPS position button.
Result: The following menu opens. Up to 8 fields represent the sensors which are
registered in the Correlator's Multisensor pool.
3 Tap the field of the sensor whose position is to be determined.
Result: The GPS menu opens. The GPS receiver is searching for available
satellites.
After a while, the current GPS time is displayed.
As soon as the position of the Correlator can be calculated, the current latitude
and longitude are specified.
(continued on next page)
Requirements
Sensor ID
Sensor no.
GPS
p
osition
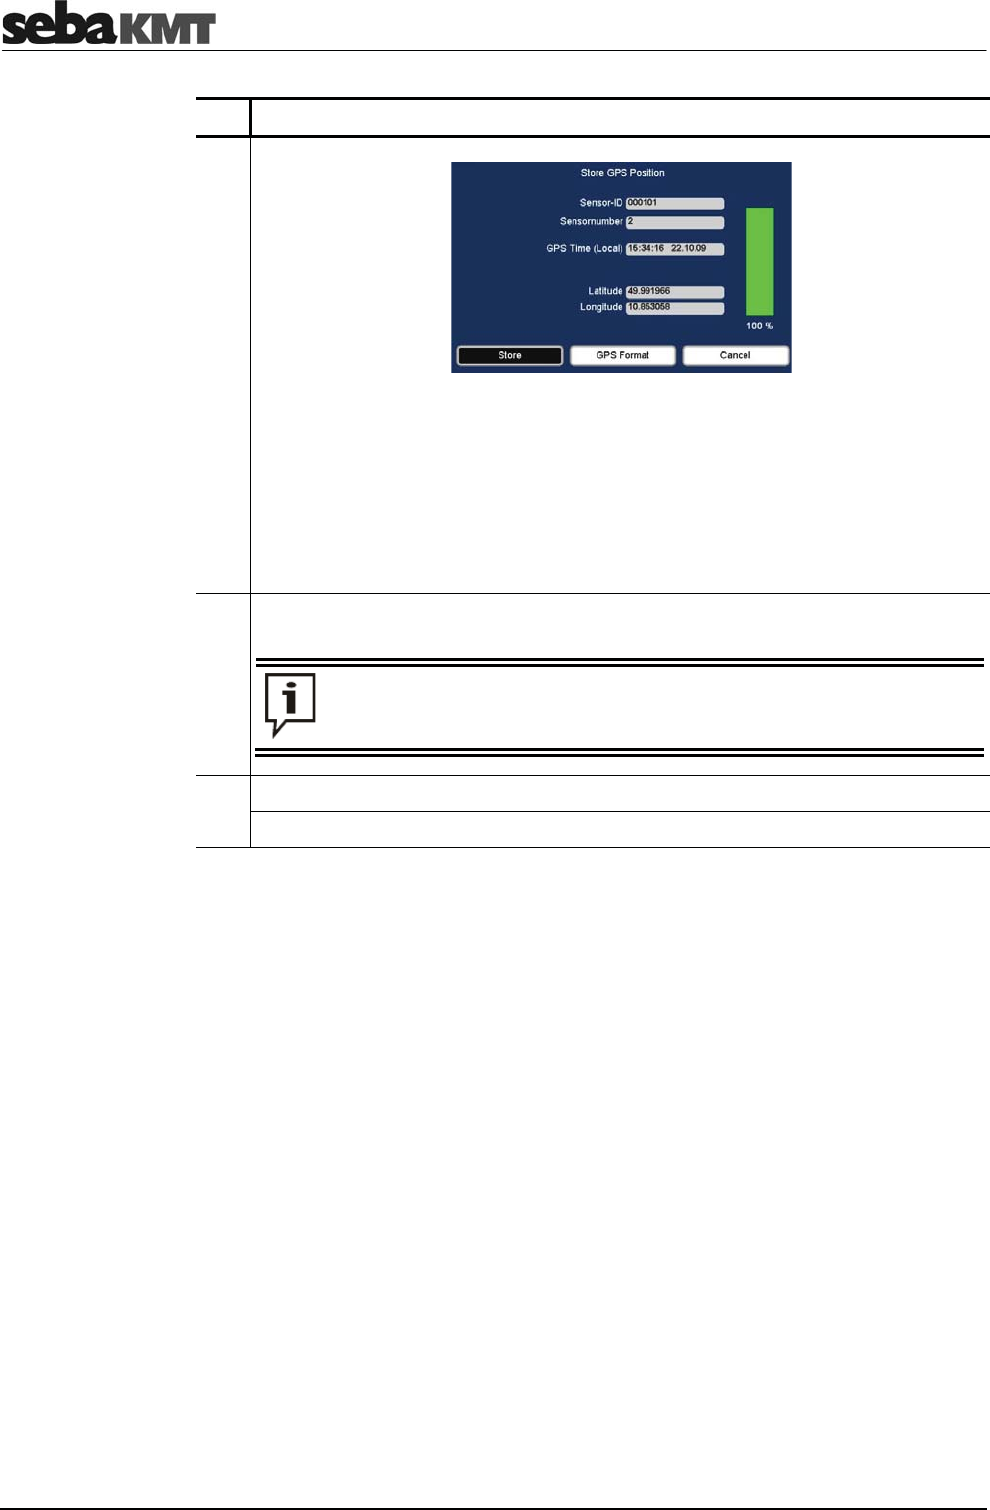
GPS position data
78
Step Description
You can change the GPS format for displaying the GPS position. Tap the
GPS format button to select one of the following formats:
•
Decimal degrees
•
Degrees, minutes
•
Degrees, minutes, seconds
The bar at the right of the screen indicates how high the accuracy is with which
the position can currently be determined.
4 Wait until the position has leveled out on a reliable value. The bar to the right
should show an accuracy of 100%.
The first time the position is determined after connecting the GPS module
may take a some time. The Correlator should not be moved during this
phase. It is best to put it down somewhere.
5 Tap the Store button.
Result: The coordinates are accepted. The display returns to the previous menu.
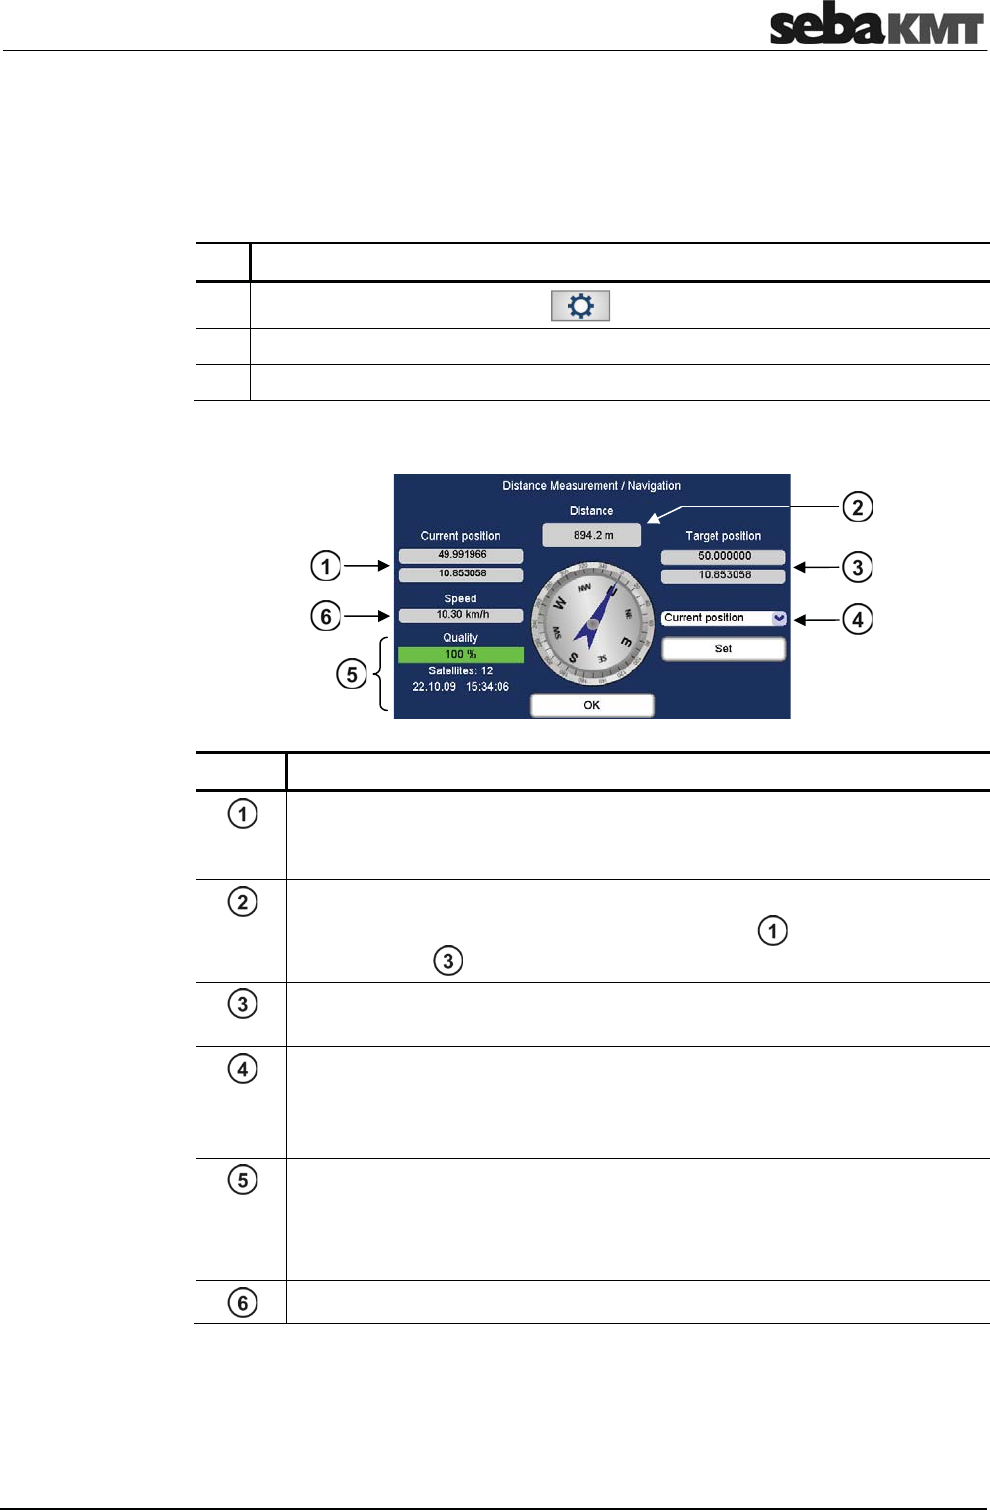
GPS position data
79
10.3 Distance measurement and navigation via GPS
You can use the GPS function of the Correlator to determine the distance between two
points. You can also use GPS navigation as a guide to find a stored GPS position.
To open the GPS menu, proceed as follows:
Step Description
1 In the main menu, tap the button .
2 In the displayed menu, tap the Tools button.
3 In the displayed menu, tap the Distance measurement / Navigation button.
The menu is structured as follows:
Element Description
Current position
Indicates the current position of the Correlator. Once the Correlator is moved,
the displayed value is adapted.
Distance
Indicates the linear distance between the Correlator and the
Target position .
Target position
Indicates the GPS position of the point, which was defined as Target position.
Sensor list
List of all sensors, i.e. measuring points, whose GPS coordinates have been
determined and stored. One of these sensor installation points can be
selected and specified as Target position.
top down:
•
Positioning accuracy for the Correlator position (in percent).
•
Number of available GPS satellites.
•
The current GPS date and GPS time.
Speed at which the Correlator is currently moved.
Access the menu
GPS position data
80
You can calculate the distance from your current position to a stored measuring point.
In the drop-down list , select the sensor which is installed at the relevant measuring
point.
The GPS coordinates of the measuring point are adopted and displayed as the new
"Target position". The distance information is updated and displays the distance
between the Correlator and the measuring point.
You can calculate the distance from your current position to any other location.
Proceed as follows:
Step Description
1 In the drop-down list , select Current position.
2 Tap the Set button.
Result: The GPS coordinates of your current location are adopted and displayed
as the new "Target position".
3 Take the Correlator and proceed to the desired other location.
Result: The distance information is updated and displays the distance from your
current to the previous location.
You can use the directional sign of the GPS menu to guide you to a measuring point.
Proceed as follows:
Step Description
1 In the drop-down list , select the sensor which is installed at the relevant
measuring point.
Result: The GPS coordinates of the measuring point are adopted and displayed
as the new "Target position".
2 Go into the direction the compass needle shows.
The target location is reached when the "Current position" coordinates match the
"Target position" coordinates.
The direction specified by the compass needle is reliable, as long as you
are in motion. Once you stand still at a place, the needle begins to rotate
and the direction shown is no longer reliable.
Distance from here
to a measuring point
Distance from here
to any location
Navigating
to a location
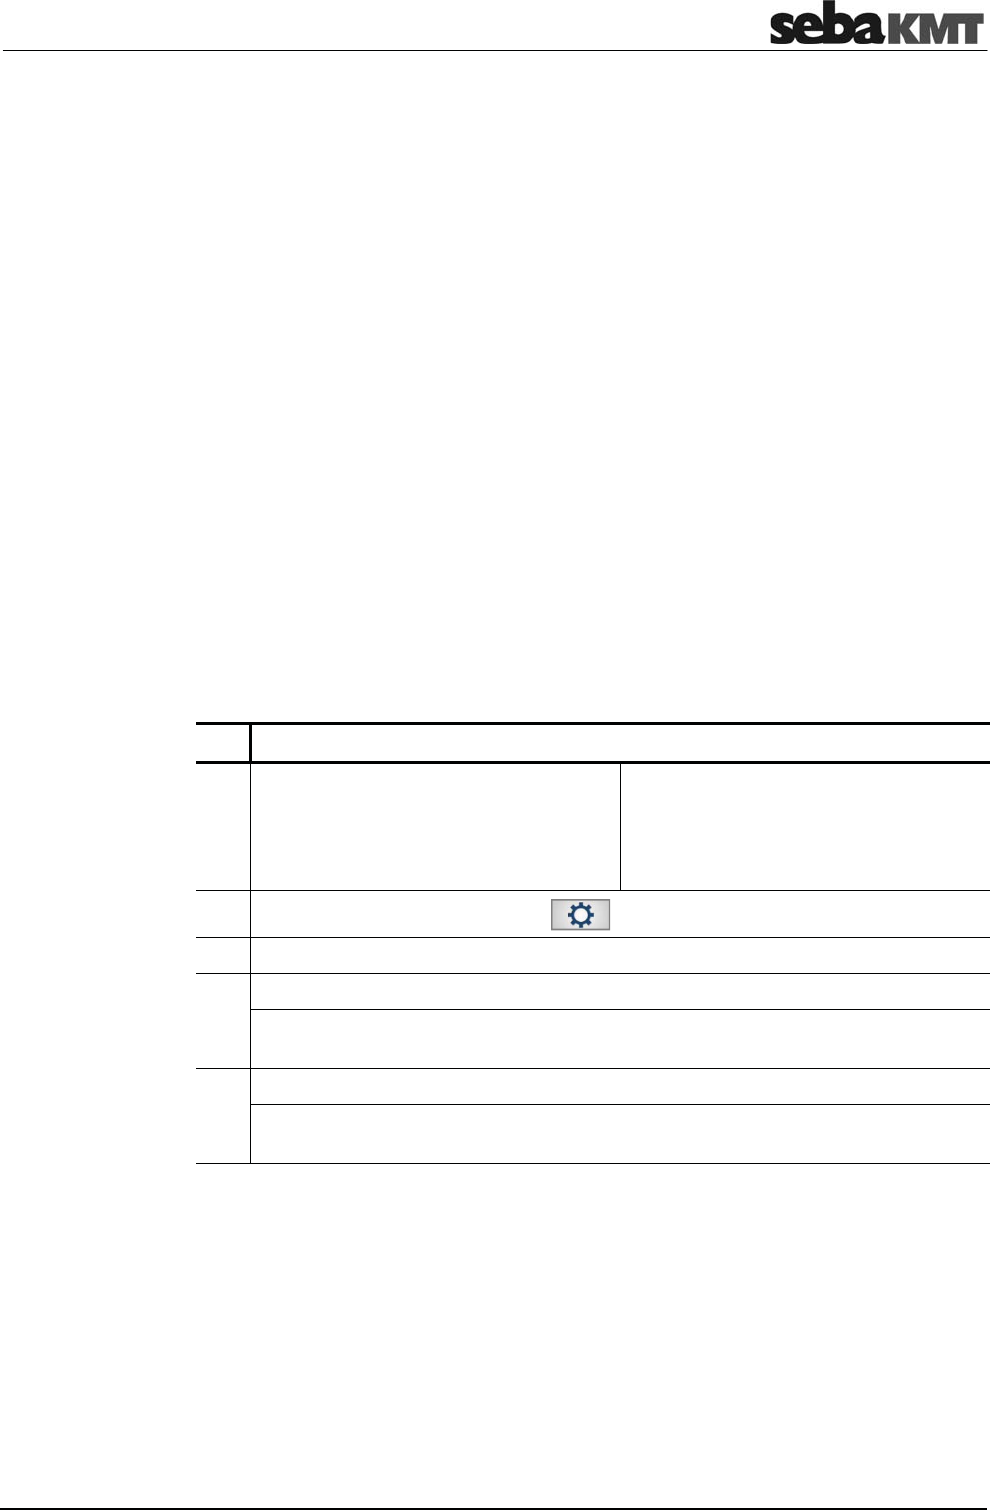
Real-time measurement
81
11 Real-time measurement
With a single sensor, you can perform a real-time measurement. By this means, you get
an idea about the current noise situation in the pipe.
The real-time measurement can be performed with a Power transmitter or with a
Multi sensor.
At the desired location, the sensor is attached to the pipe. Then, via the Correlator a
noise measurement is started. The measurement data are transferred from the sensor
to the Correlator and displayed there in real-time.
If a Power transmitter is used, you have the chance to listen to the recorded noise "live"
via headphones.
The following requirements must be met:
•
The relevant Power transmitter or Multi sensor must be registered to the Correlator.
•
The battery level of the sensor must be OK.
(Power transmitter: LED bar must show at least 2 green lights
Multi sensor: status LED must show green or yellow light)
•
The measuring point must be in the Correlator's radio range (max. 5 m).
•
If a Power transmitter will be used: Antenna and microphone must be properly
connected.
Switch the Power transmitter or Multi sensor on and attach the sensor to the pipe.
Subsequently, proceed as follows:
Step Description
1 If a Power transmitter is used,
use the arrow buttons in the Correlator's
Start menu to choose an
Online measuring mode
(e.g. "COR PT-3 with microphone").
If a Multi sensor is used,
use the arrow buttons in the Correlator's
Start menu to choose an
Offline measuring mode
(e.g. "COR MS-3 with microphone").
2 In the main menu, tap the button .
3 In the displayed menu, tap the Tools button.
4 In the displayed menu, tap the Real time measurement button.
Result: A new menu opens. The up to 8 fields displayed represent the
Power transmitters or Multi sensors registered in the Correlator's sensor pool.
5 In the display, tap on the device which you want to use for the measurement.
Result: The Real-time measurement menu opens. The measurement is started.
The progress of the measurement is shown on the screen.
Use the ESC pushbutton to finish the real-time measurement and to return to the Start
menu.
Requirements
Perform measurement
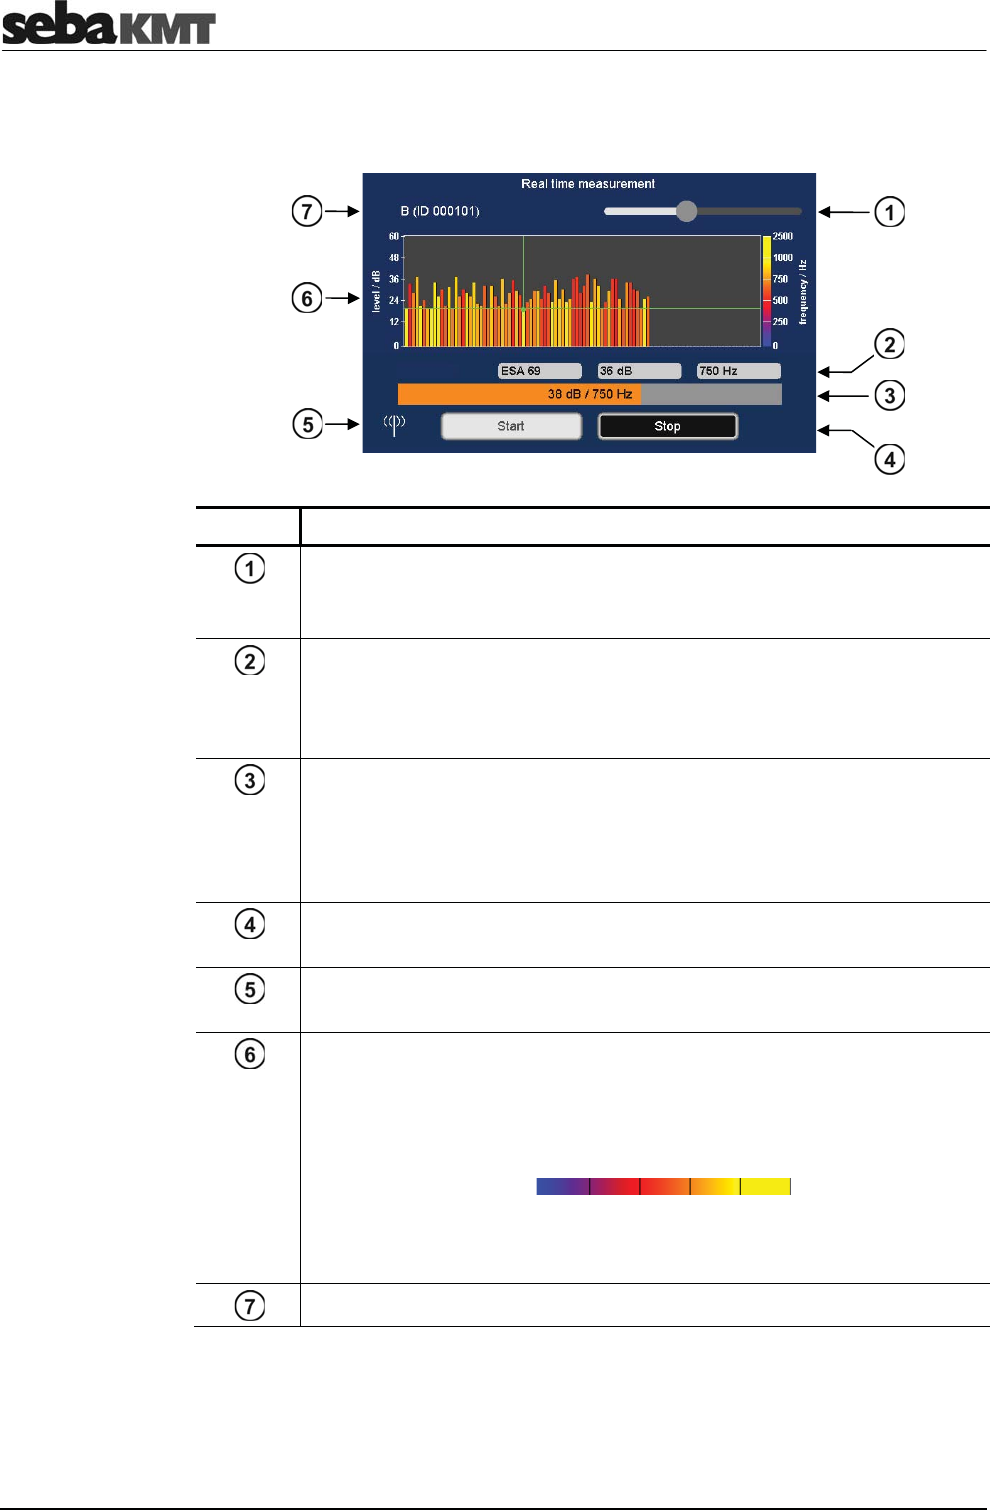
Real-time measurement
82
The course of the real-time measurement is shown on the Correlator's screen with a
running bar diagram.
Element Description
Headphone volume slide control
slide to the left ... lower
slide to the right ... louder
Minimum value
left-hand field ... ESA value of the quietest recording
center field ... noise level of the quietest recording (in dB)
right-hand field ... frequency of the quietest recording (in Hz)
Instantaneous value
noise level (in dB) and frequency (in Hz) of the current measuring value
shown as numeric values and as a bar graph
bar height ... noise level
bar color ... frequency
Start and Stop buttons
to cancel and continue the measurement
Antenna symbol
indicates that radio communication is in progress
Diagram
X-axis ... course of measurement over time
Y-axis ... noise level in dB
Each bar represents a single noise recording. The color of the bar shows the
approximate frequency of the noise:
blue yellow
0 Hz 3300 Hz
The point where the two green lines intersect marks the quietest recording in
the displayed measurement.
Number and ID of the sensor
View measurement
results

Real-time measurement
83
If a Power transmitter is used, you have the option to listen to the recorded noise "live"
via headphones.
Connect the supplied headphones to the 12 V DC / socket of the Correlator.
Observe the markings on the plug and socket.
The sound is reproduced as long as the measurement is in progress. To adjust the
headphone volume use the slide control top right of the screen.
If a Multi sensor is used, listening to the recorded noise is not possible. To save energy,
no audio files are transferred from the sensor to the Correlator.
Listening to the
noise „live“

Real-time measurement
84
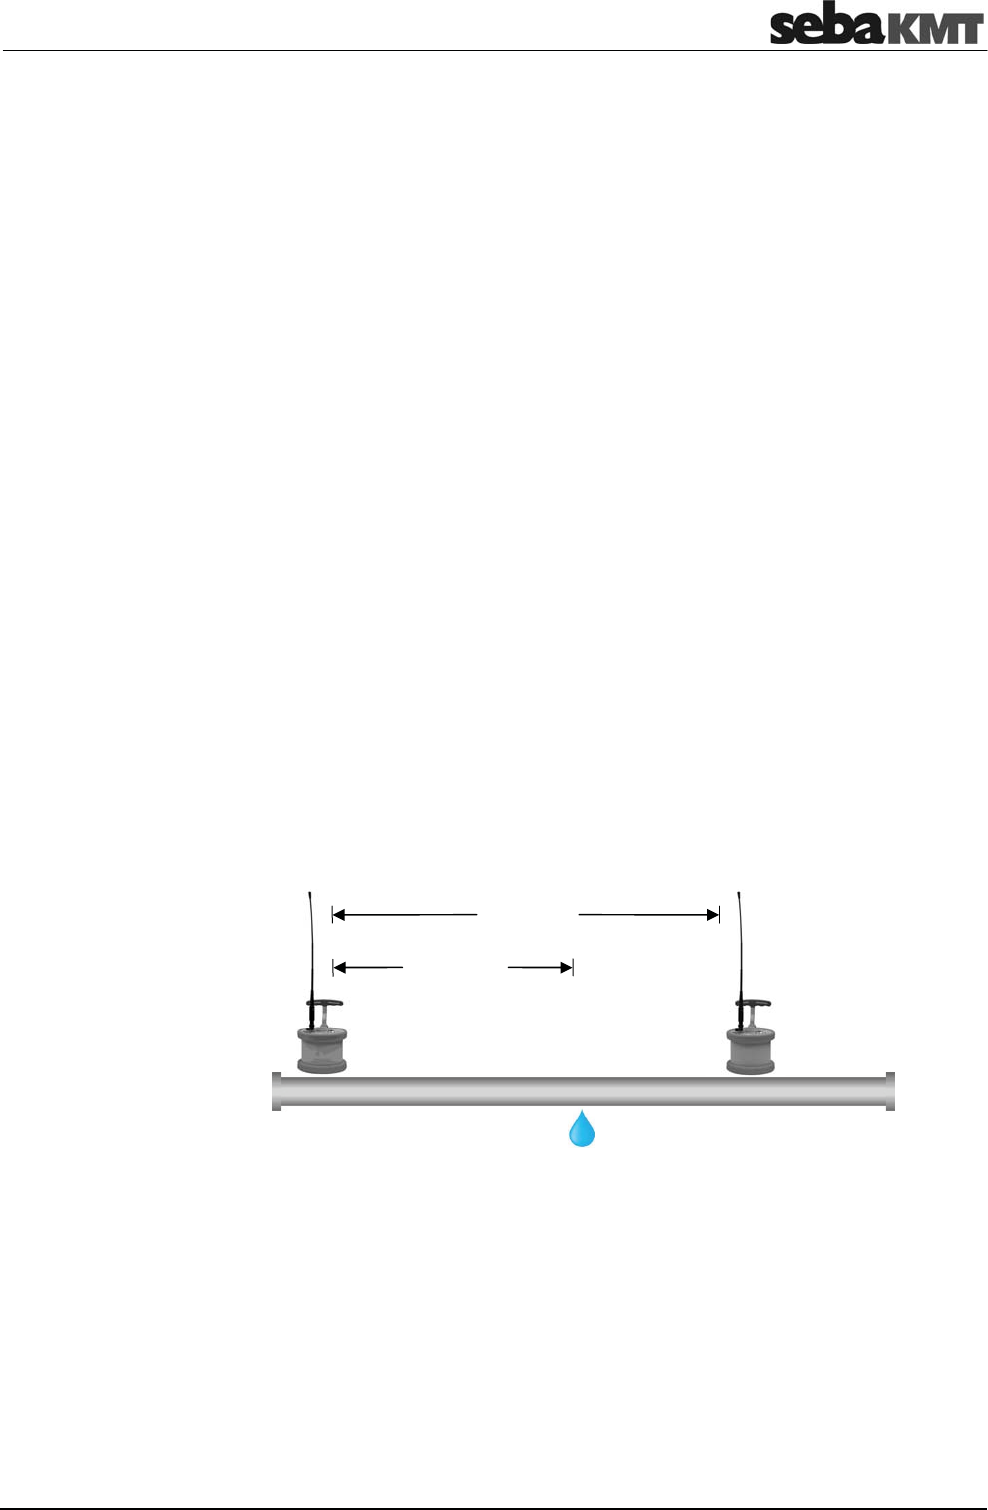
Sound velocity measurement
85
12 Sound velocity measurement
The Correlux C-3 system can be used to perform a sound velocity measurement in
order to determine the actual speed of sound in a pipe section.
This function is useful when no reliable information on the pipe material is available for a
pipe section or the entire measurement area. The calculated sound speed is then
accepted by the Correlator and used for the correlation.
The calculation of the speed of sound is possible in both the Online measurement as
well as the Offline measurement mode.
12.1 Velocity measurement in Online measurement mode
The Velocity measurement function compares the measuring values of the
Power transmitters while they are recording the noise from one specific source. The
sound velocity in the pipe is calculated using the sound delay.
There must be a source of noise on the pipe, which is clearly measurable for both
sensors. If such a noise source does not exist, it must be created artificially, for
example, by opening a fire hydrant.
The following conditions must be met in order to use the function:
•
Two Power transmitters (PT-A and PT-B) at two measuring points.
•
The distance between the measuring points must be known.
•
The noise must be clearly measurable for both sensors.
•
The source of noise may be inside or outside the measuring section.
•
The source of noise should not be half way between the measuring points.
•
If the source of noise is inside the measuring section, the distance from the first
measuring point to the sound source must be known.
Requirements
Source of noise
Distance
Distance
Measuring point 2 Measuring point 1
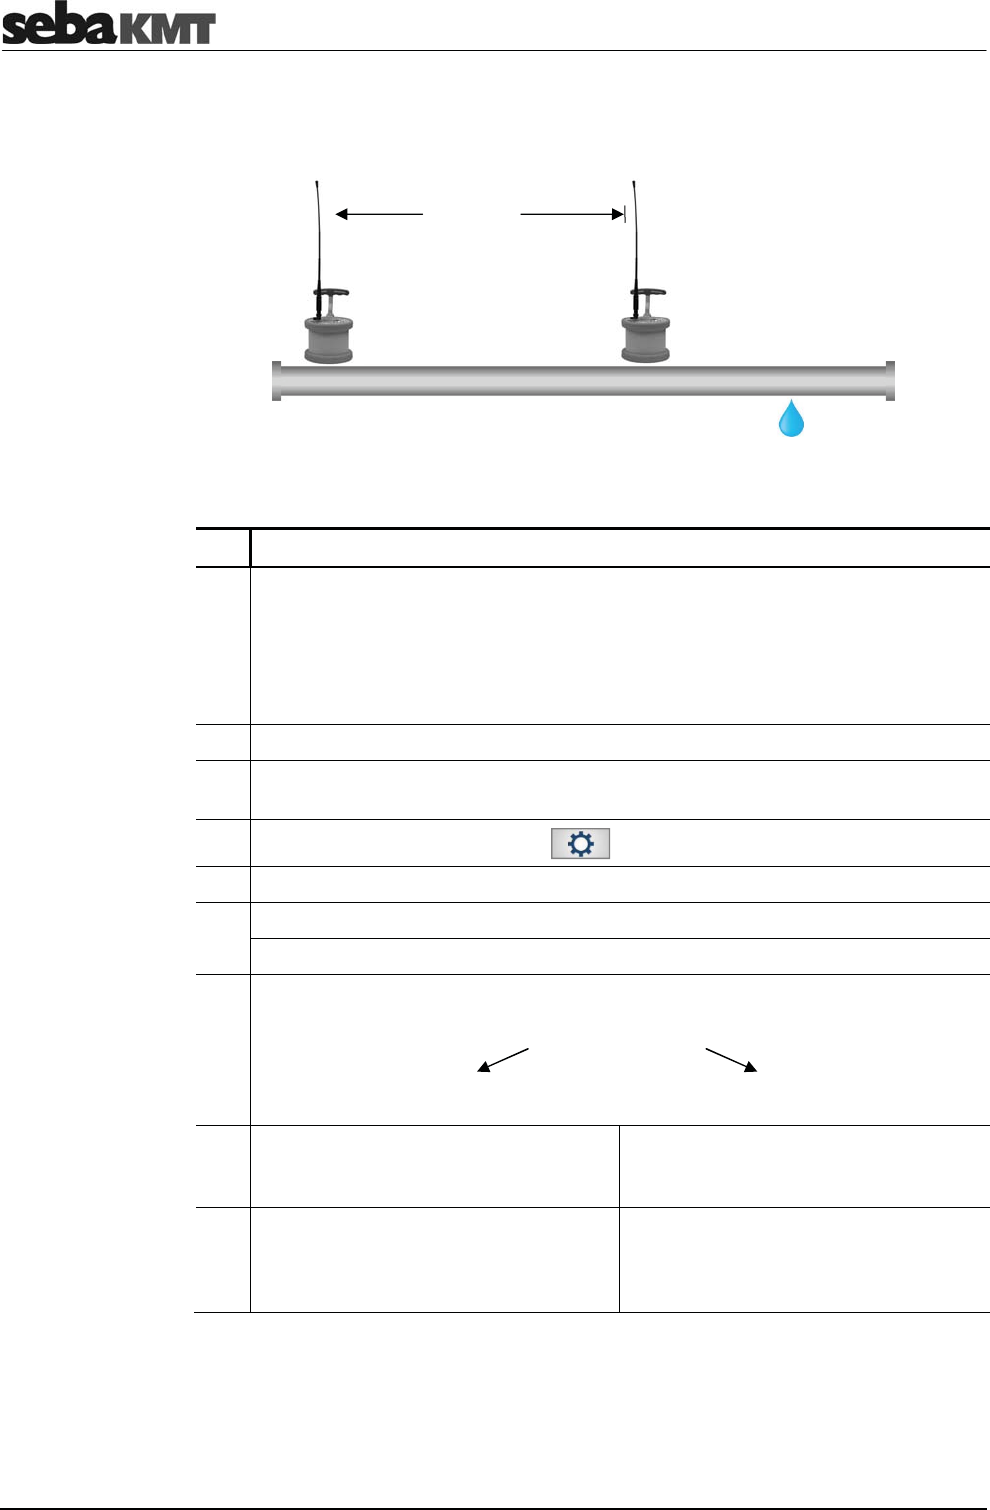
Sound velocity measurement
86
•
If the source of noise is outside the measuring section, the measuring points and
sound source must be arranged as shown on the following picture.
Proceed as follows:
Step Description
1 Position the Power Transmitters at both measuring points, attach the sensors
(Microphone / Hydrophone) to the pipe and switch the Power Transmitter on.
There must be radio contact between the Power transmitters and the Correlator.
(The two battery symbols in the Correlator’s Start screen can be seen. These
must show the battery level of the Power Transmitter. Question marks are shown
if the Power transmitters are not available.)
2 Make sure the required sound source does exist.
3 In the Correlator's Start menu, use the two arrow buttons to choose the required
Online measuring mode (e.g. "COR PT-3 with microphone").
4 In the main menu, tap the button .
5 In the displayed menu, tap the Tools button.
6 In the displayed menu, tap the Velocity measurement button.
Result: The corresponding menu opens.
7 Specify whether the source of noise is inside or outside the measuring section.
Tap the appropriate button:
Leak outside sensors Leak between sensors
8 Specify the length of the measuring
section. Tap the Distance between
sensors button.
Specify the length of the measuring
section. Tap the Distance between
sensors button.
9 Specify the distance from the first
measuring point to the sound source.
Tap the Distance from left sensor
button.
Procedure
Source of noise
Distance
Measuring point 2 Measuring point 1
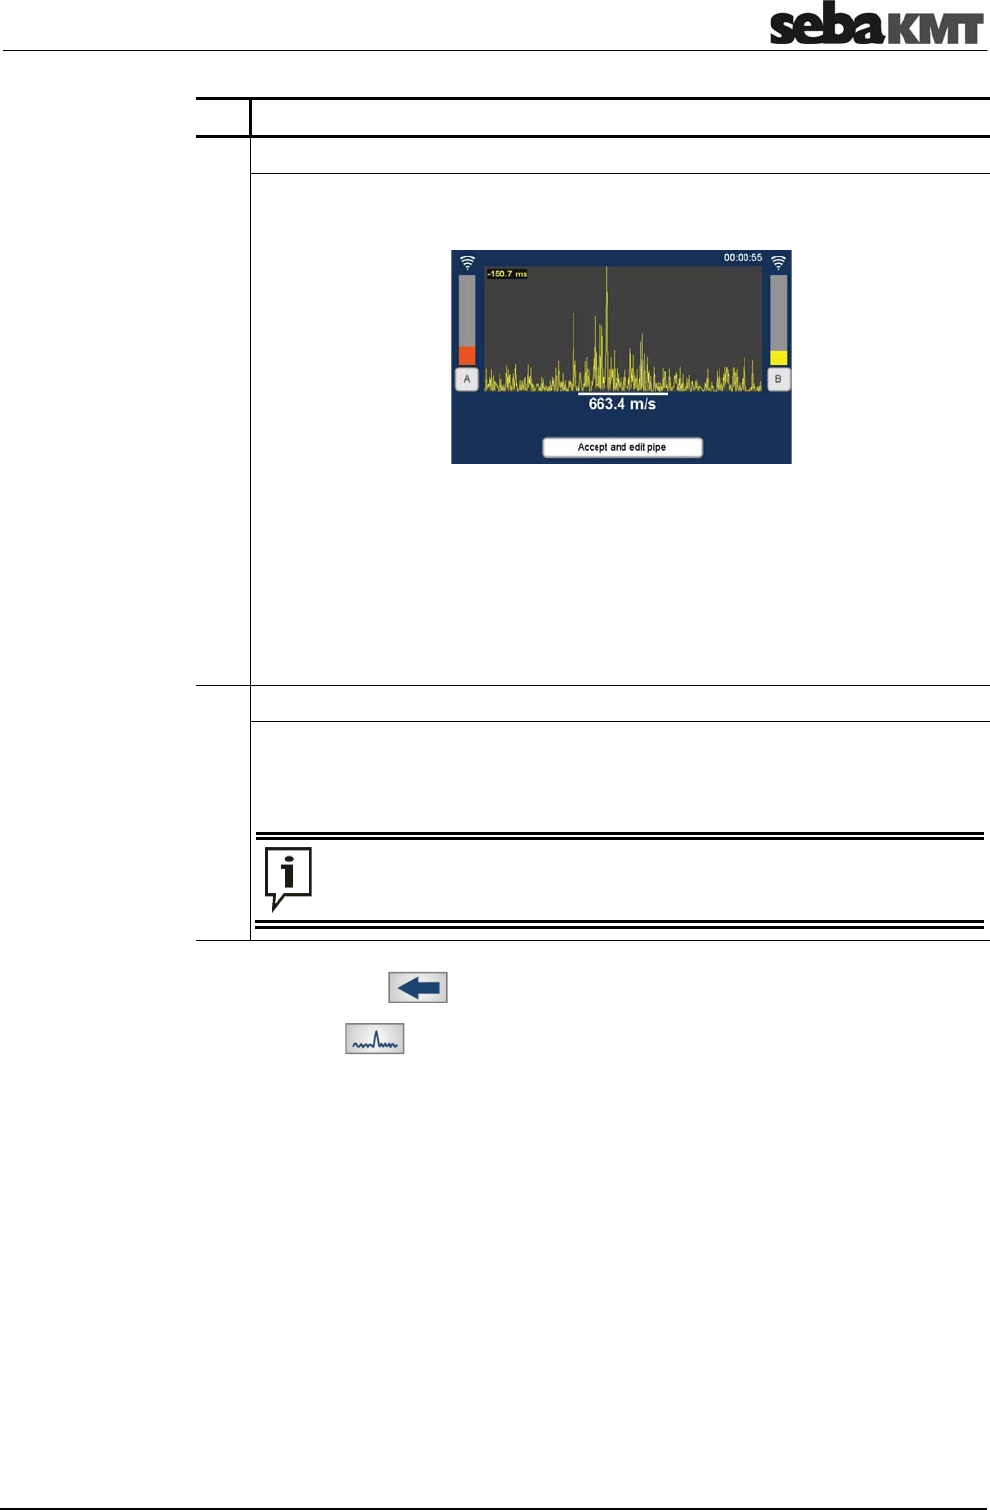
Sound velocity measurement
87
Step Description
10 Tap the OK button.
Result: The correlation starts. The sound velocity in the pipe is calculated and
displayed below the correlation curve.
The result is considered reliable if the following criteria are met:
•
The radio signal from both transmitters is good or excellent.
•
The lag value (top left of the diagram) is green and seems plausible.
•
The displayed sound velocity seems stable and plausible.
If no reliable result is shown, you can use the Cancel button to terminate the
measurement.
11 Tap the Accept and edit pipe button.
Result: The Pipe data menu opens.
There, for the Material and Diameter input fields, the “Manual” option is
automatically selected. The recently calculated sound velocity is accepted and
shown in the corresponding field.
Once the length of the pipe section is changed in this menu, the sound
velocity measurement must be performed again.
Use the Back button to return to the Start menu.
Use the button to start a new correlation between the Power transmitters. The
determined sound velocity will be used for the calculation. This applies until the pipe
parameters are changed in the Pipe data menu, or the entire correlation data are reset
in the system settings menu.
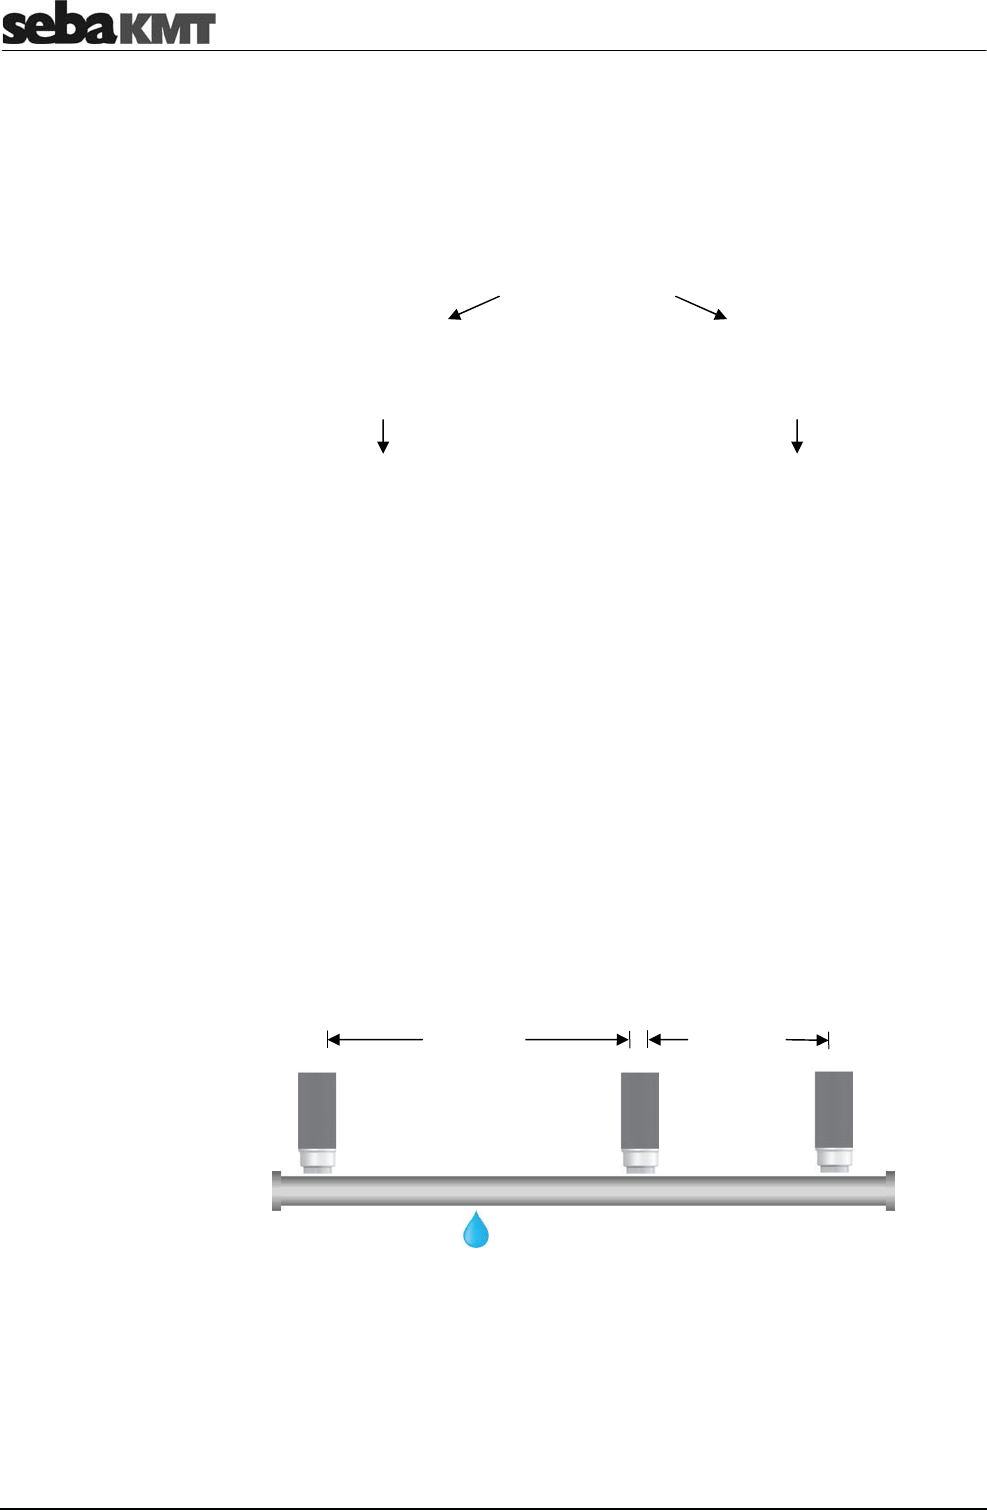
Sound velocity measurement
88
12.2 Velocity measurement in Offline measurement mode
12.2.1 Introduction
The Velocity measurement function compares the measuring values of three sensors
which have recorded a shared noise. As a result, the following applications are possible:
Application options
Determining the sound velocity
in the pipe
(for an unknown pipe material)
Determining the position of a leak
(despite unknown pipe material)
The actual sound velocity in the pipe is
calculated.
This value can then be adopted for the
pipe section being analyzed as a pipe
parameter.
The correlation curve will be updated on
this basis.
The distance from a certain measuring
point to the leak position is calculated.
The following conditions must be met in order to determine sound velocity or the leak
position:
•
A measurement (night or instantaneous measurement) with at least 3 sensors has
been performed.
•
The measured data has been read and saved with the Correlator.
•
Between the three considered sensors exists a clearly perceptible source of noise.
(The louder the noise, the lower are the negative effects of any potential
interference on the result of the sound velocity calculation).
•
The lengths of the pipe sections between the measuring points must be known.
•
The measuring points and sound source must be arranged as shown on the
following picture.
There must be one sensor „in front of“ the sound source (Position 1).
There must be two sensors “behind” the sound source (Positions 2 and 3).
Requirements
Source of noise
Distance
Position 2
Position 1 Position 3
Distance
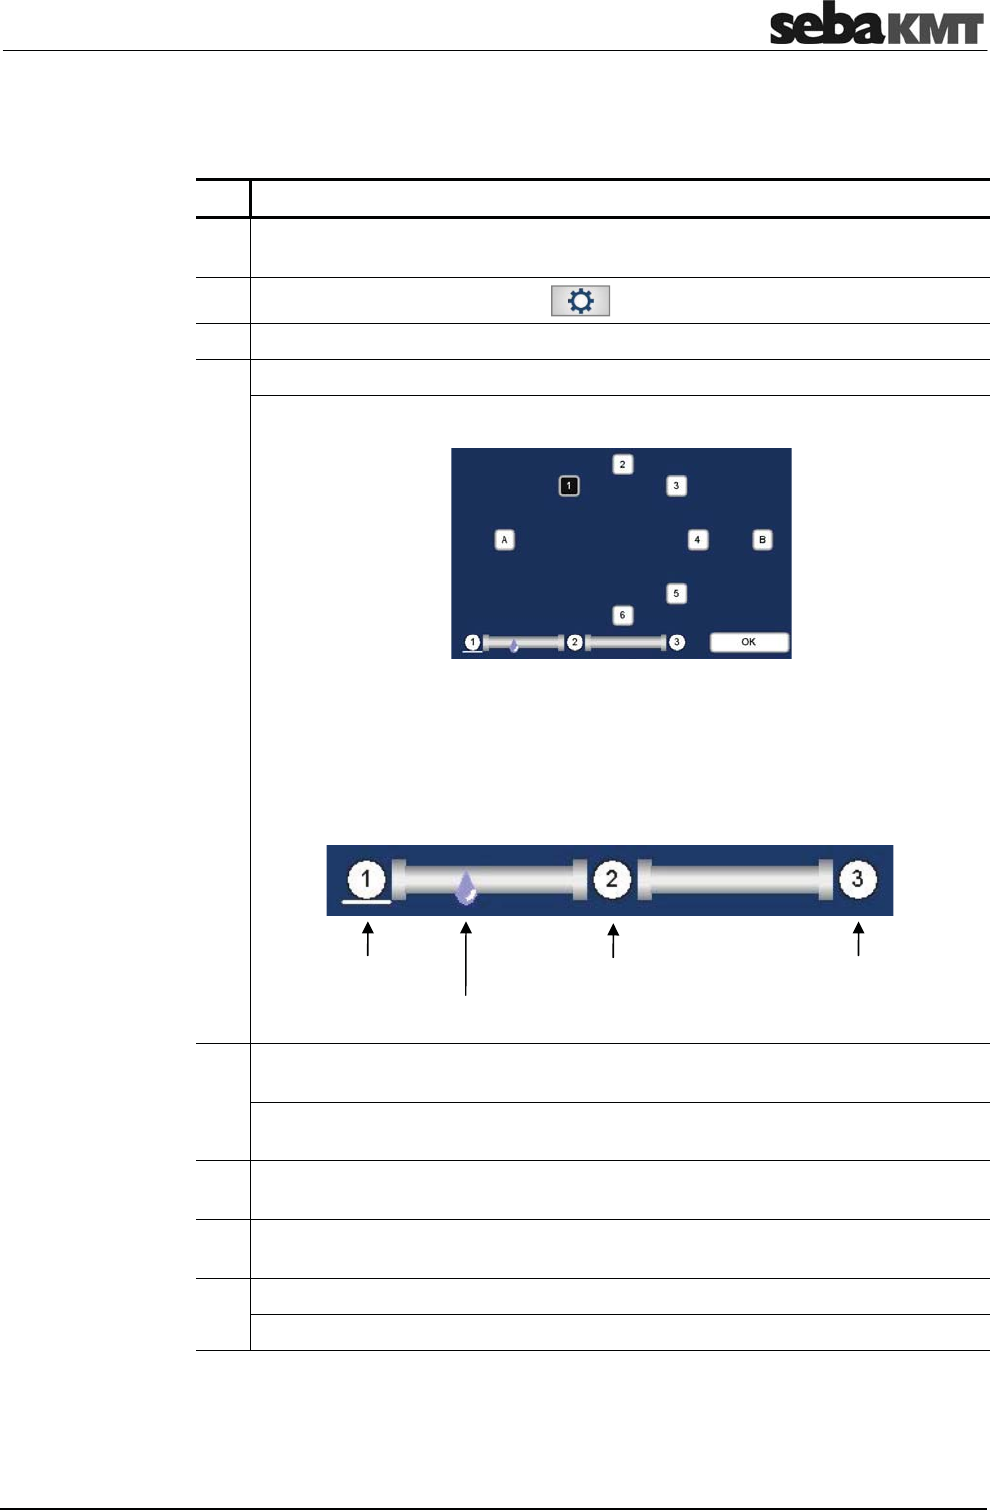
Sound velocity measurement
89
12.2.2 Procedure
To calculate the sound velocity in the pipe, proceed as follows:
Step Description
1 In the Correlator's Start menu, use the two arrow buttons to choose the required
Offline measuring mode (e.g. “COR MS-3 with microphone”).
2 In the main menu, tap the button .
3 In the displayed menu, tap the Tools button.
4 In the displayed menu, tap the Velocity measurement button.
Result: The following menu opens:
The square boxes represent the Multi sensors (1 to 8) or Power transmitters
(A and B) used in the measurement.
The scheme below illustrates how the sensors must be positioned in relation to
the source of noise. Take care to follow this scheme when selecting the three
sensors for the measurement. Otherwise the result of the calculation may be
wrong.
5 Select the sensor which represents Position 1 (sensor “in front of” the sound
source) by tapping the required box.
Result: The number of the selected sensor is shown at position 1. The white
highlighting switches to position 2.
6 Select the sensor which represents Position 2 (first sensor “behind” the sound
source).
7 Select the sensor which represents Position 3 (second sensor “behind” the sound
source).
8 Tap the OK button.
Result: The menu for calculating the speed of sound opens.
(continued on next page)
Position 1 Position 2 Position 3
Source of noise
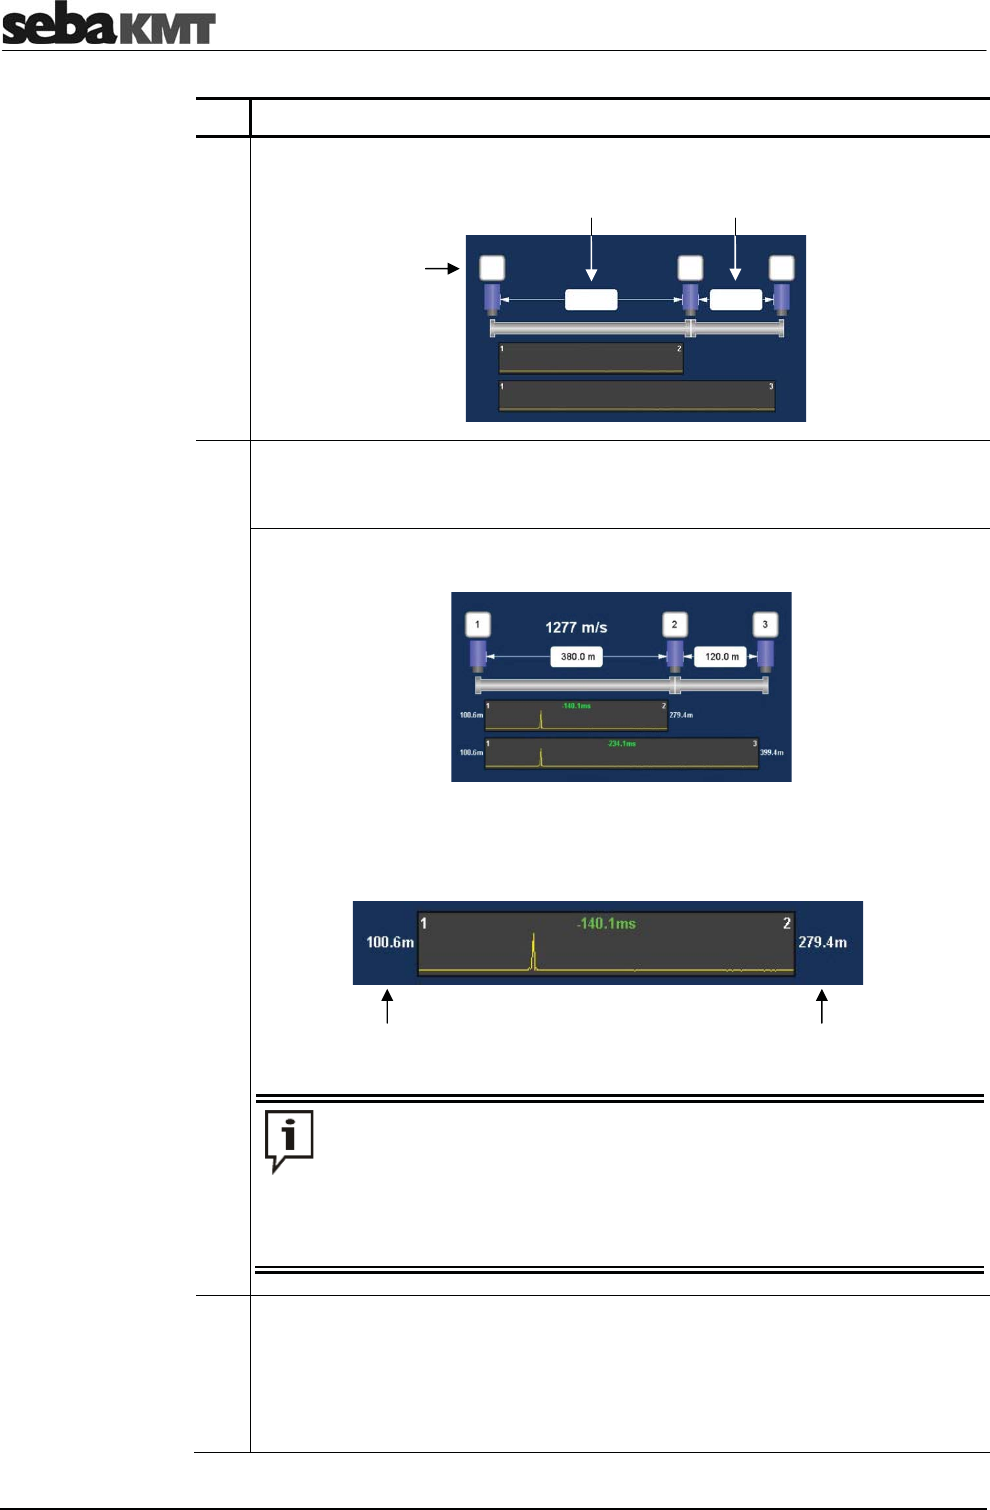
Sound velocity measurement
90
Step Description
9 Specify the pipe length from position 1 to 2 and from position 2 to 3.
For that, tap the input field between the relevant sensors. A numeric keypad is
displayed. Enter the pipe section length and confirm with ENTER.
Result: The sound velocity in the pipe is calculated immediately and displayed at
the top of the screen (here: 1277 m/s).
The upper diagram shows the correlation between position 1 and 2.
The lower diagram shows the correlation between position 2 and 3.
Next to the chart, you can read the distance from the respective measuring point
to the source of noise.
You have the option to replace one of the three sensors and repeat the
calculation.
Tap the sensor to be replaced. In the next menu, tap the required new
sensor, then tap OK. The sound velocity will be re-calculated and
displayed.
The next section offers an example.
10 Use the Accept button to accept the velocity value displayed as a pipe parameter
for the pipe section in question.
The correlation results are automatically updated in the background.
The display returns to the previous menu.
Use the Cancel button to cancel the velocity measurement and return to the
previous menu.
Distance from sensor No. 1
to the source of noise Distance from sensor No. 2
to the source of noise
Button:
Sensor No. at
position 1 / 2 / 3
Input field:
Pipe section length
from position 1 to 2
Input field:
Pipe section length
from position 2 to 3
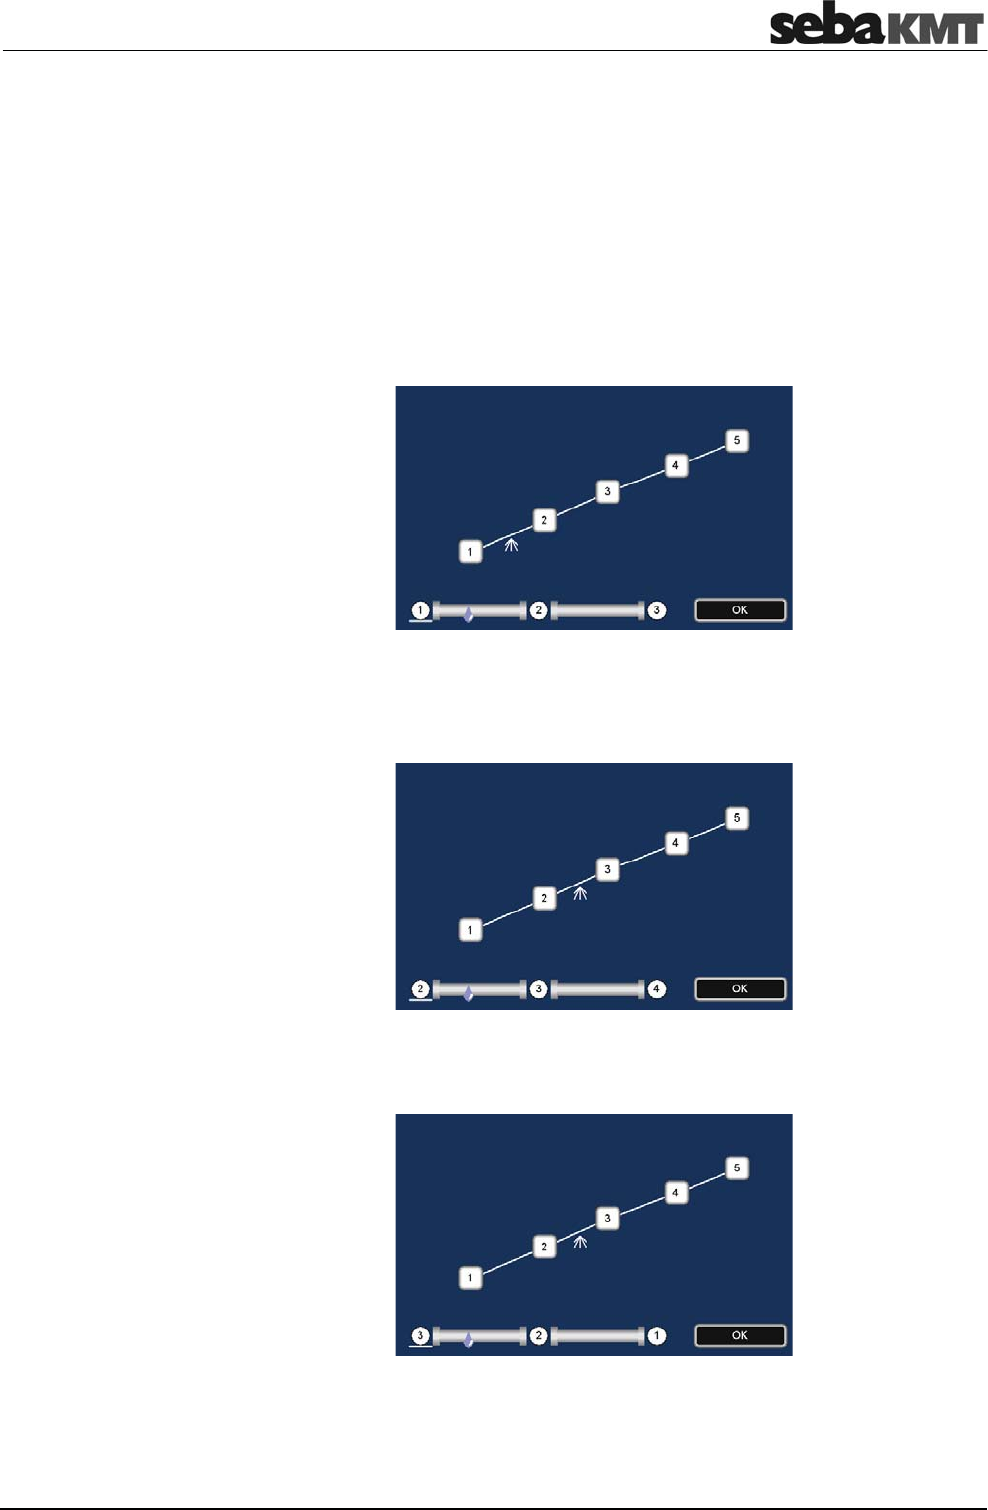
Sound velocity measurement
91
12.2.3 Notes and examples
Take care to follow this scheme at the bottom of the display area when selecting the
three sensors (see step 4). Otherwise the result of the calculation may be wrong.
There must be one sensor "in front" and two sensors "behind" the source of noise. The
sensors' numbers and their order on the pipe are of no importance in this process.
The source of noise is located between the sensors 1 and 2.
Entry on the Correlator: first, sensor 1 (in front of the sound source), then sensors 2 and
3 (behind the sound source).
The source of noise is located between the sensors 2 and 3.
Possible entry: first, sensor 2, then sensors 3 and 4.
Possible entry: first, sensor 3, then sensors 2 and 1.
Example 1:
Example 2:

Sound velocity measurement
92
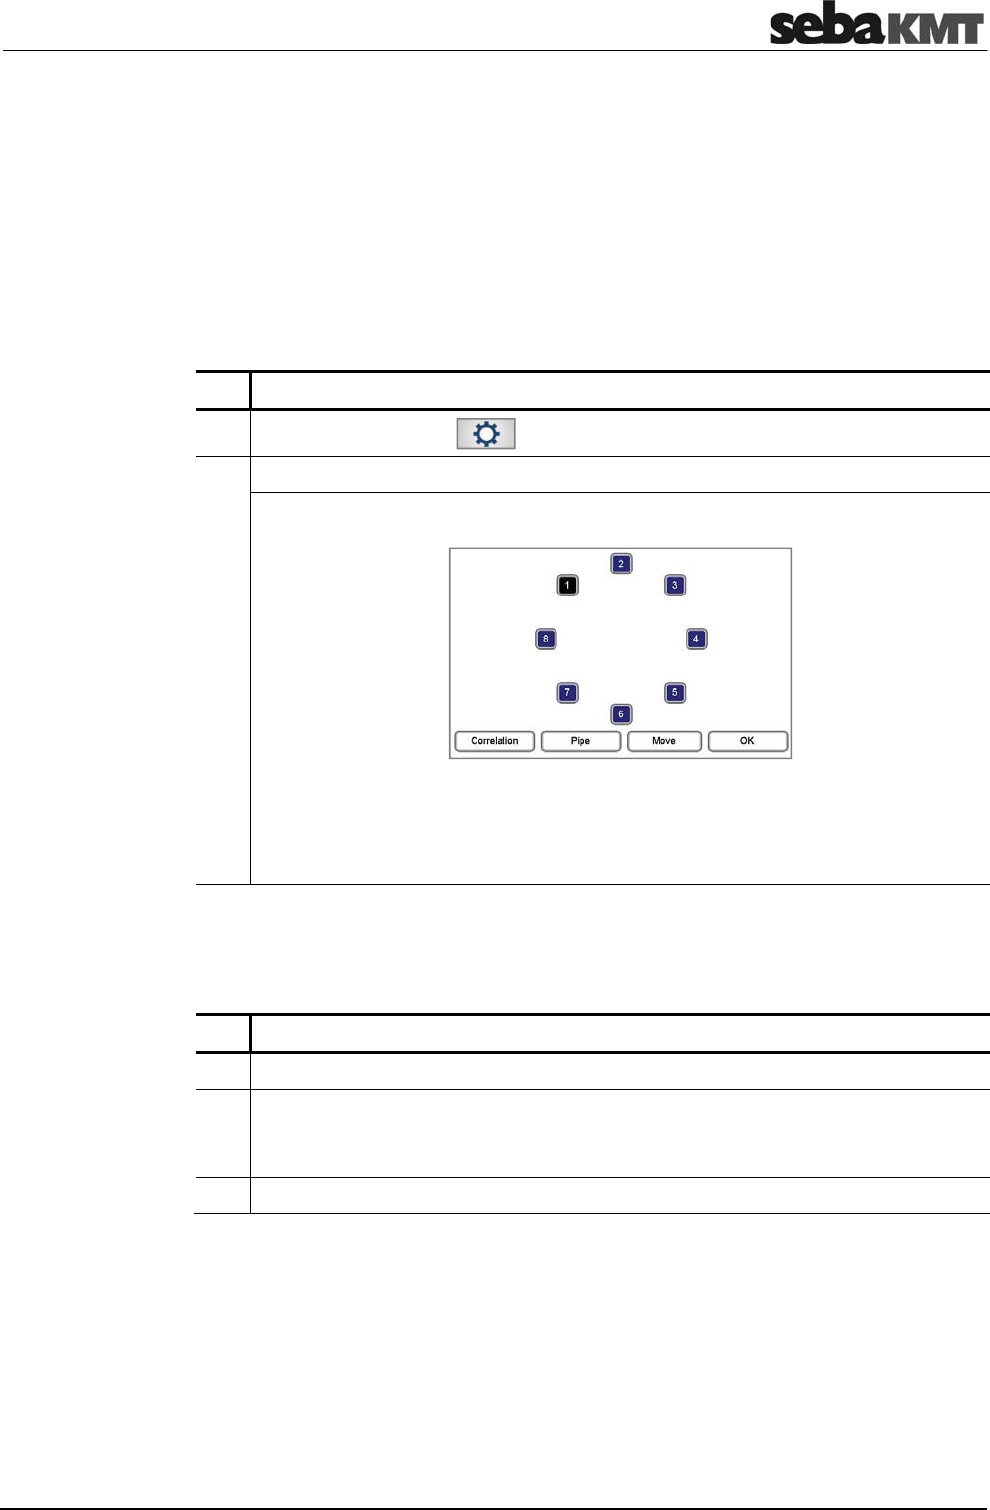
Map function
93
13 Map function
The Map function is a very clear and comfortable way to work with Offline Measurement
data.
The sensors used are shown as icons. Pipelines can be drawn between these icons and
the pipe parameters can be specified. In the Map menu, the existing pipe network can
be reproduced on the screen.
Then, the correlation can be accessed between any sensor pairs.
To access the Map menu, proceed as follows:
Step Description
1 In the main menu, tap the button .
2 In the displayed menu, tap the Map button.
Result: The following menu opens:
The square boxes represent the Multi sensors (1 to 8) or Power transmitters
(A + B) used in the measurement. The icons can be arranged realistically to each
other by hand or, if the GPS coordinates of the measuring points have been
determined and stored with the Correlator, at the touch of a button.
The sensor icons can be moved and repositioned on the screen. (Only possible via
touch screen, not possible via rotary encoder).
Proceed as follows:
Step Description
1 Tap the Move button.
2 Tap and move the sensor icons on the screen.
If GPS coordinates of the measuring points have been stored, you can use the
GPS button to arrange the sensor icons automatically.
3 Tap on Return to conclude the process.
Access the Map
Arrange sensor icons
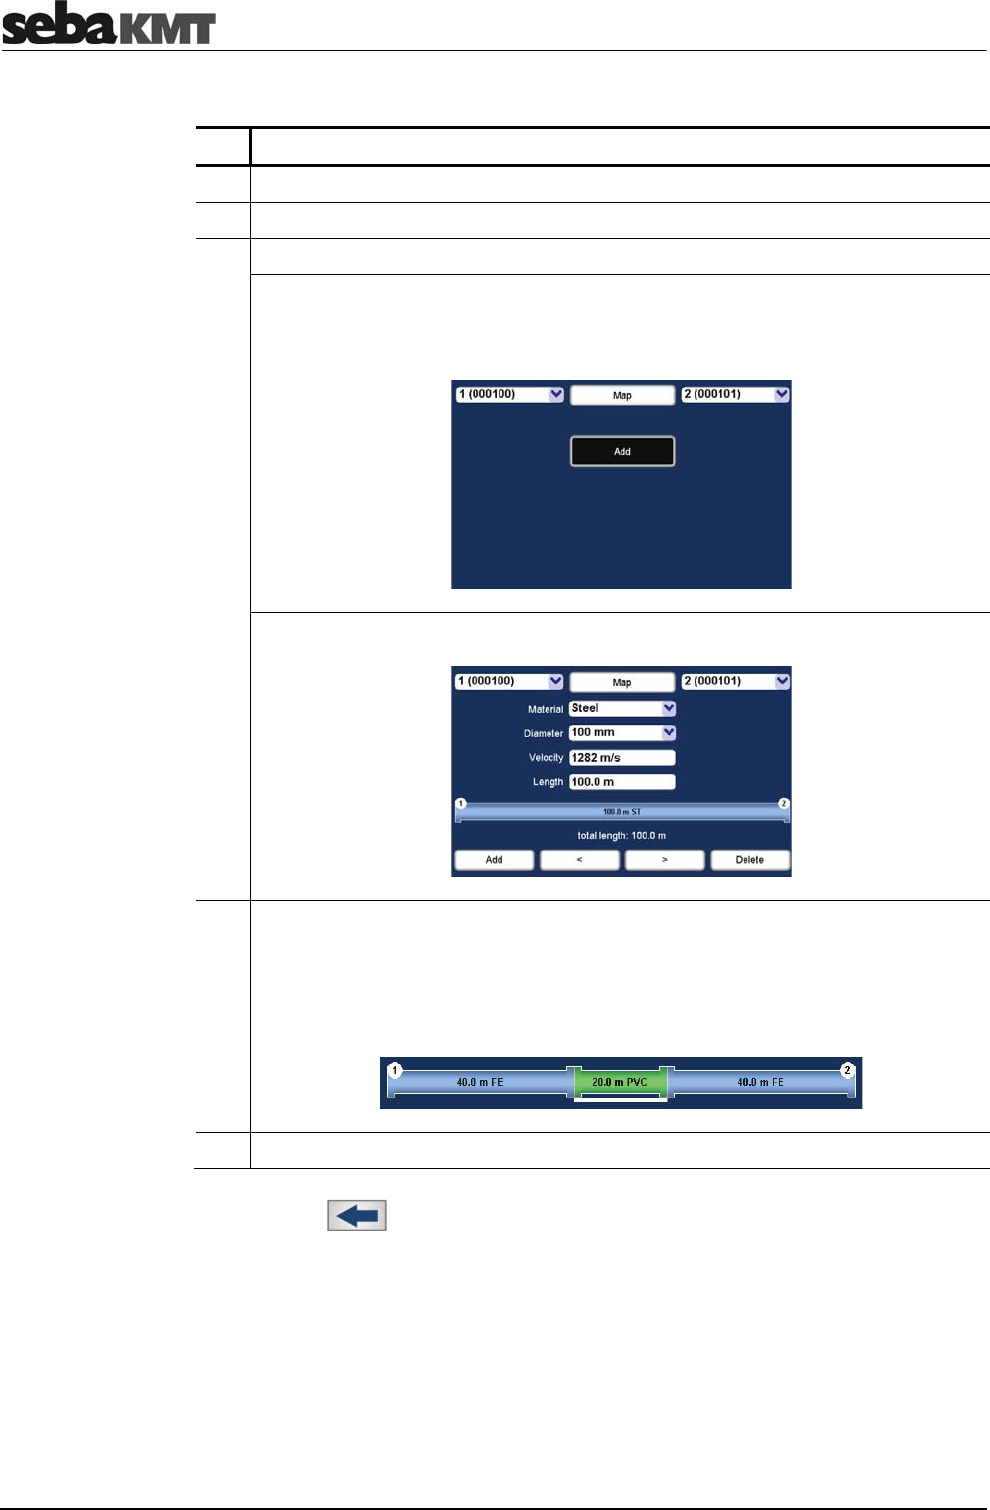
Map function
94
To draw, change or delete pipelines in the map, proceed as follows:
Step Description
1 Tap the sensor icon which represents the start point of the line.
2 Tap the sensor icon which represents the end point of the line.
3 Tap the Pipe button.
Result: If there is no line between the two sensors in question so far, first the
following screen appears.
Tap the Add button.
Result: The Pipe data menu opens.
5 You can divide the displayed pipeline into individual sections if the line between
the sensors is not consistently of the same material or diameter.
Use the buttons Add and Delete to create or remove pipe sections.
To select a section, tap directly on the relevant section in the graph or use the two
arrow keys. The currently selected section is underlined white.
6 Enter the pipe data (material, diameter, length) for each pipe section.
Use the Back button to return to the Map menu.
Draw pipelines
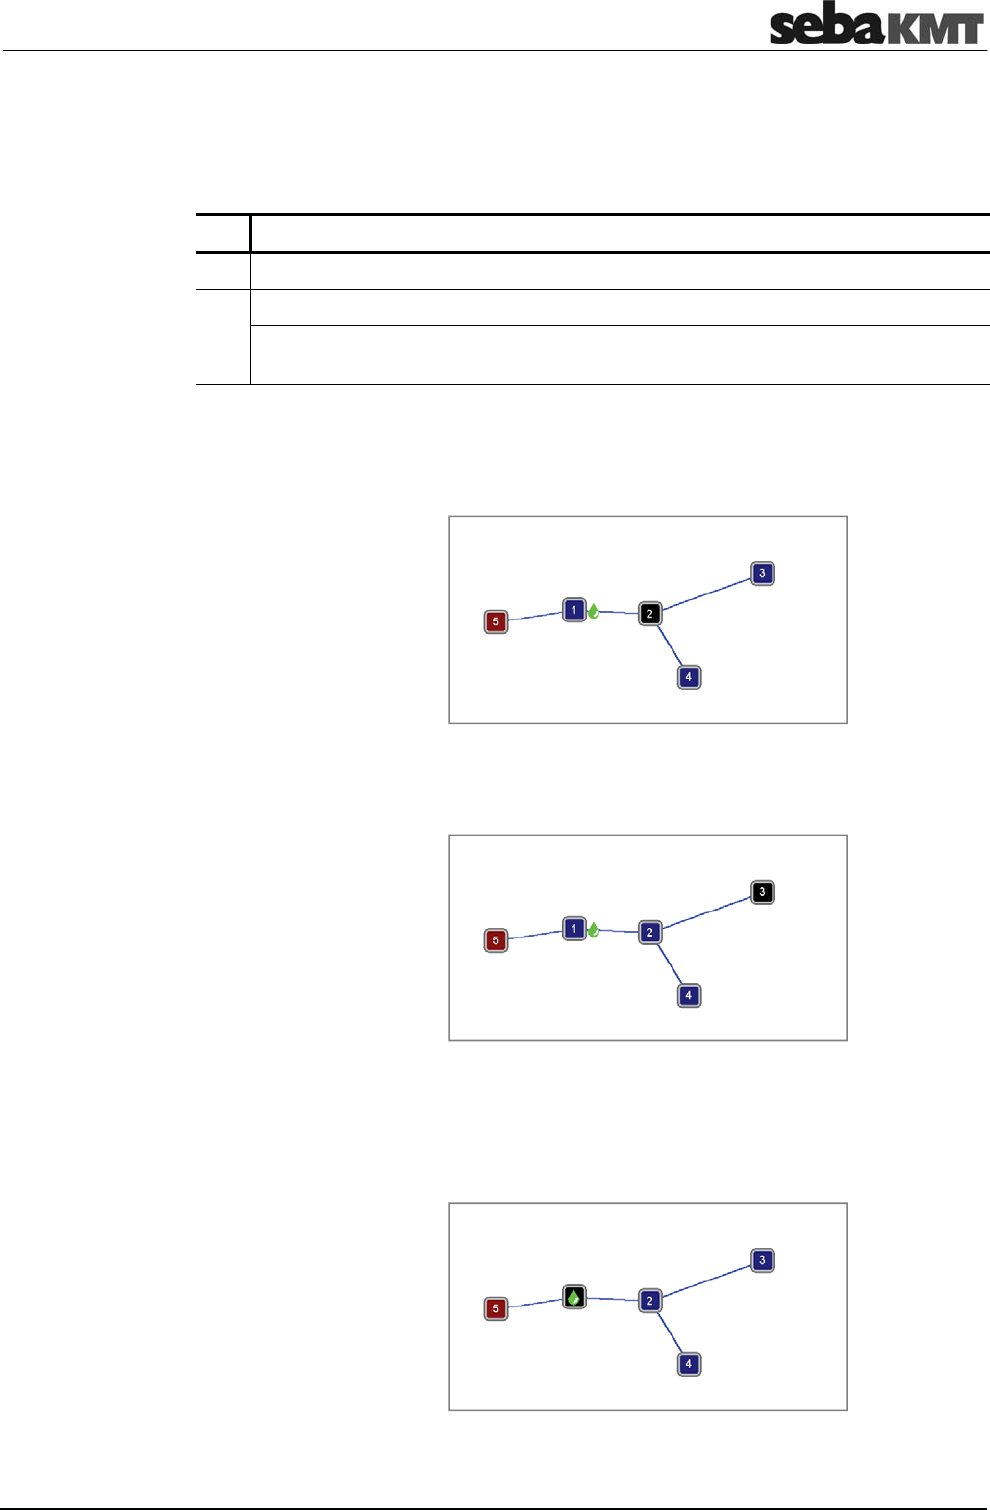
Map function
95
Once the pipe net in the map is created, the correlation calculations for all sensor pairs
are automatically updated in the background.
You can display the calculated leak between two sensors in the map. Proceed as
follows:
Step Description
1 Tap the first sensor.
2 Tap the second sensor.
Result: The leak position is marked on the map with a drop icon, provided the
correlation between the two sensors in question found a leak noise.
Example: The correlation of the line from sensor 5 to 2 results in a leak at the marked
position.
The correlation of the line from sensor 5 to 3 results in a leak at the very
same position.
The correlation of the line from sensor 5 to 1 shows the drop icon right at
sensor 1.
This indicates either that the leak is right at sensor 1 or that the leak is near
sensor 1 but outside the correlated pipeline section.
Show Leak
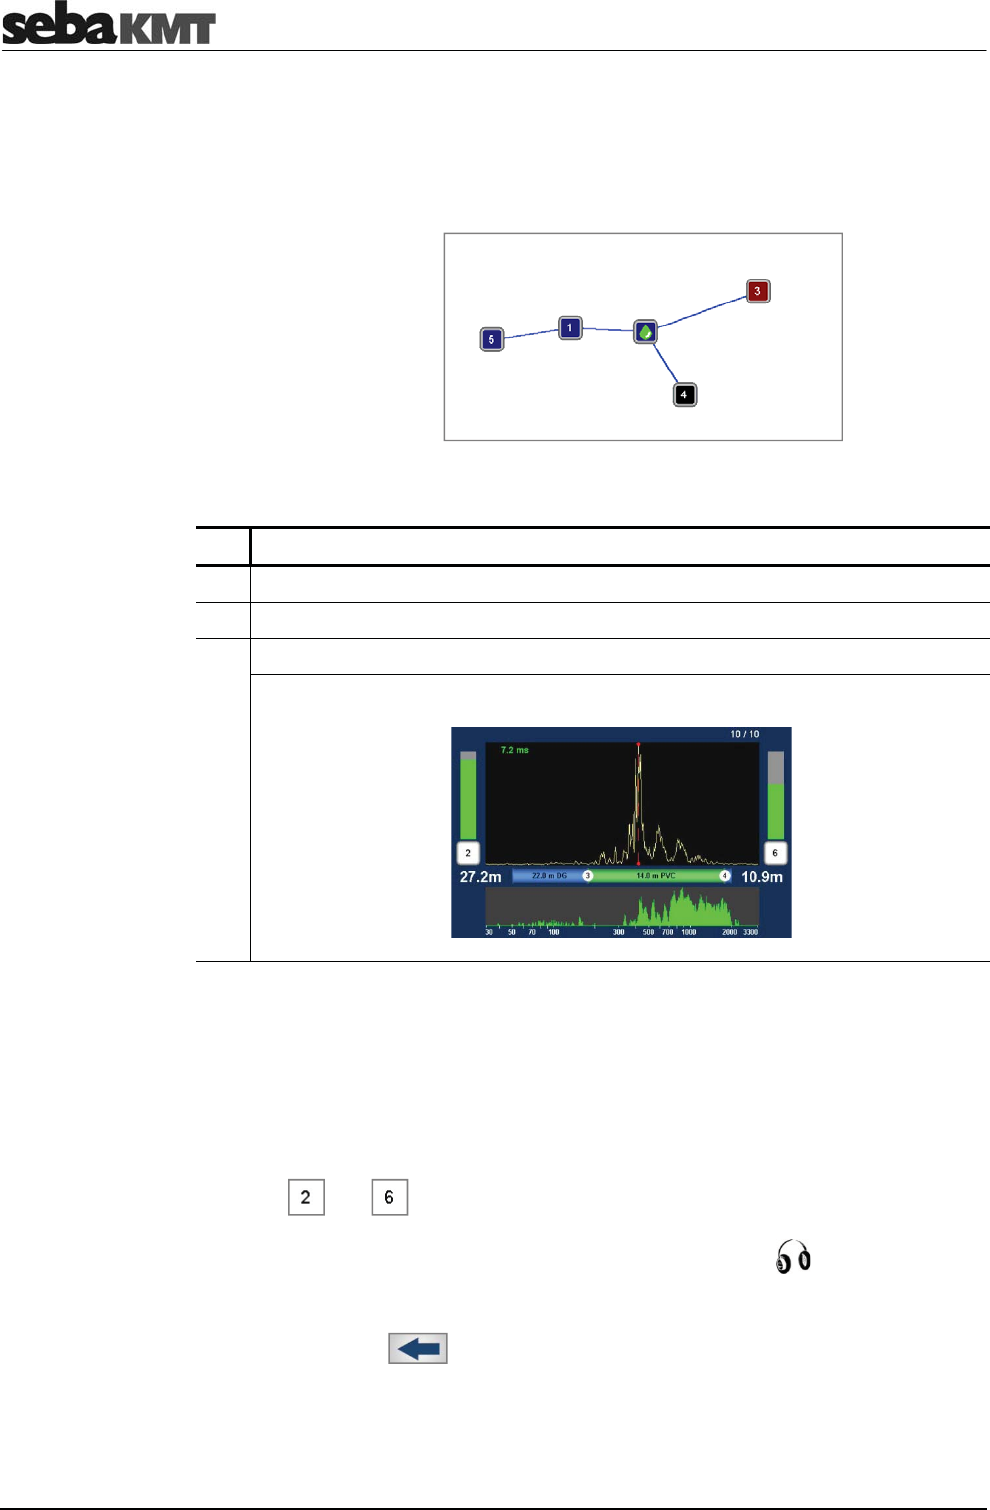
Map function
96
The correlation of the line from sensor 3 to 4 shows the drop icon right at
sensor 2.
This indicates either that the leak is right at sensor 2 or that the leak is near
sensor 2 but outside the correlated pipeline section.
To start the correlation between two sensors, proceed as follows:
Step Description
1 Tap the first sensor (start point of the pipeline section to be correlated).
2 Tap the second sensor (end point of the pipeline section to be correlated).
3 Tap the Correlation button.
Result: The Correlation menu opens. The correlation is displayed.
Use the various analysis tools:
•
When you tap the displayed correlation curve, the Correlation analysis menu with
the relevant tools opens.
•
When you tap the displayed coherence curve, the Frequency analysis menu
with the relevant tools opens.
•
When you tap the buttons that symbolize the sensors at the measuring points
(e.g. and ), the Audio menu opens which can be used to listen to the
stored leak noise.
For that, connect the supplied headphones to the 12 V DC / socket of the
Correlator.
Use the Back button to return to the previous menu.
Some settings for calculating and presenting the correlation curve can be changed in
the system settings menu.
Start correlation
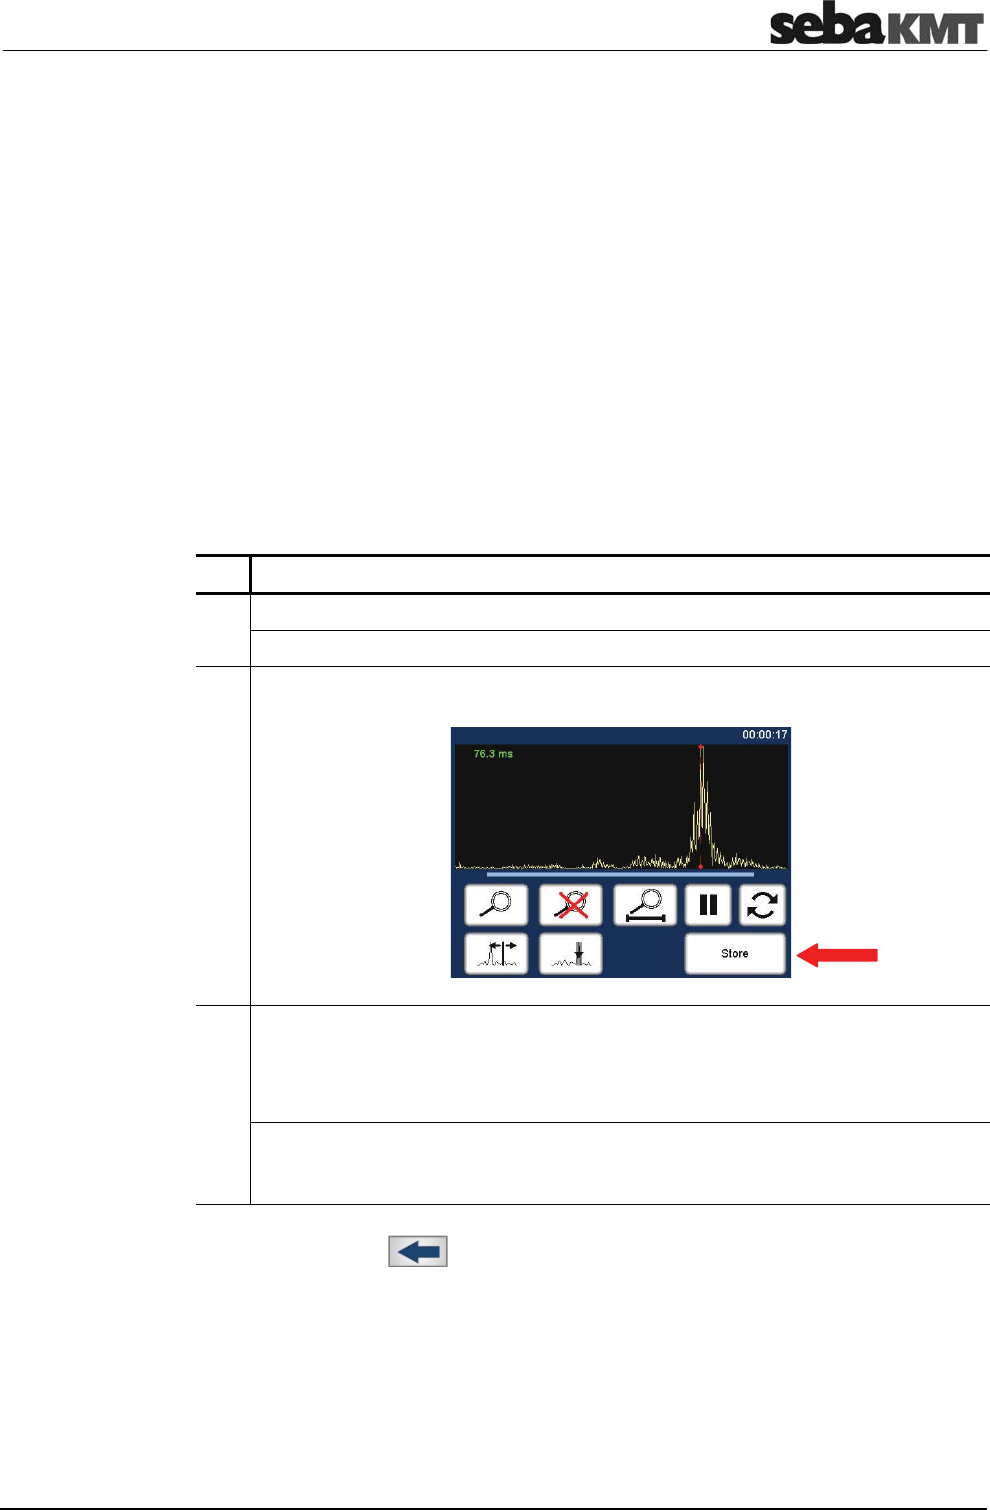
Storage / Management of correlations (History)
97
14 Storage / Management of correlations (History)
14.1 Storing a correlation
Every correlation can be saved permanently in the Correlator. This means that the
measurement data of the relevant correlation is written to the Correlator's internal data
base.
Saved correlations can be accessed, displayed and analyzed on the Correlator anytime.
Saved correlations can also be transferred to a computer and processed there using the
CorreluxView software.
If an Online correlation is not saved using the Store button, the corresponding
measurement data is lost once the correlation menu closes. However, the entered pipe
data and GPS coordinates are kept and preserved for the next correlation.
If an Offline correlation is not saved, the corresponding measurement data is lost as
soon as a new Offline measurement is performed.
To store the displayed correlation, proceed as follows:
Step Description
1 In the Correlation menu, tap on the correlation curve displayed.
Result: The Correlation Analysis menu opens.
2 Tap the Store button.
3 In the displayed menu, enter a name for this correlation.
If no entry is made, a name is automatically generated. The leading 8 digits
represent the date when the measurement has been performed.
To confirm, tap the ENTER button.
Result: The measurement data is stored in the Correlator. Subsequently, the
Correlation Management menu appears on the screen. There, all stored
correlations are listed.
Use the Back button or the ESCpushbutton to return to the Start menu.
Procedure
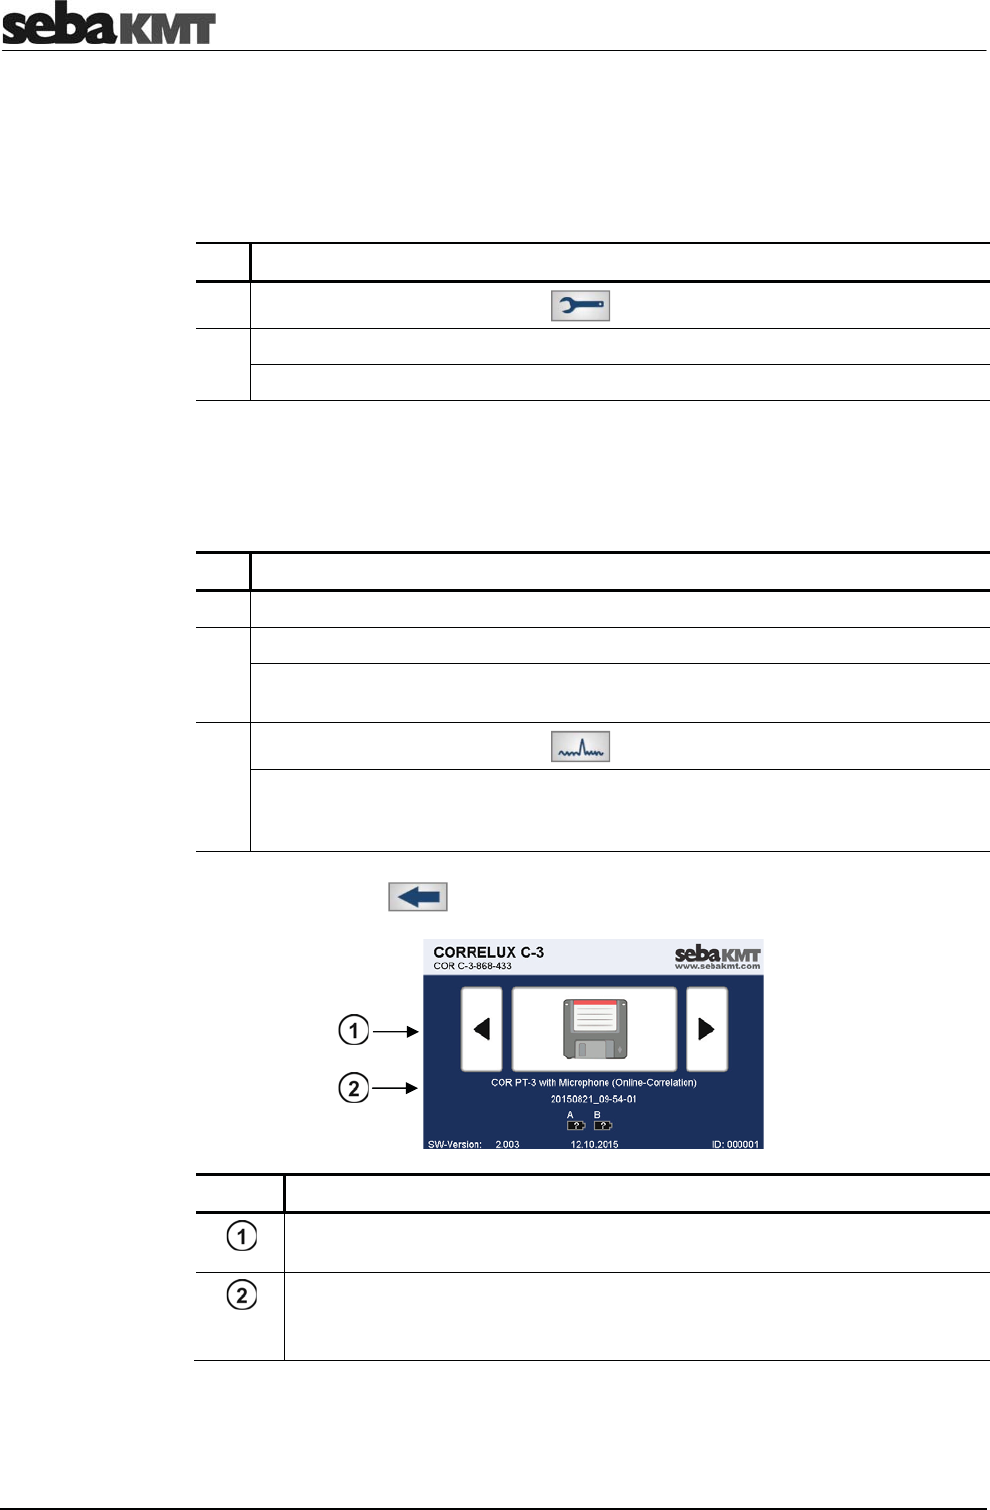
Storage / Management of correlations (History)
98
14.2 Managing stored correlations
In the Correlation Management menu the stored correlations are listed. There, the
corresponding measurement data sets can be called up or managed.
To access the menu, proceed as follows:
Step Description
1 In the main menu, tap the button .
2 In the displayed menu, tap the Correlation management button.
Result: The menu opens. The stored correlations are listed
14.2.1 Call up and display a correlation
To call up and display a stored correlation, proceed as follows:
Step Description
3 Select the desired correlation in the list.
4 Tap the Load button.
Result: The measurement data set in question is loaded into the Correlator's
memory (RAM).
5 In the main menu, tap the button .
Result: With the loaded measurement data, a correlation is performed. The
Correlation menu opens and the correlation curve is displayed. The known
analytical tools are available.
Use the Back button or the ESC pushbutton to return to the Start menu.
Element Description
The floppy disk icon indicates that the "History" mode is active. This means
that currently a stored correlation is loaded and ready to be displayed.
In the upper line can be read whether the loaded correlation is an Online
measurement or Offline measurement.
In the lower line the name of the correlation is shown.
If you tap the large button (floppy disk icon), the loaded correlation is displayed again.
Once you use the arrow buttons to set a measuring mode, the History mode is left and
the loaded measurement dataset is removed from the memory.
Call up a correlation
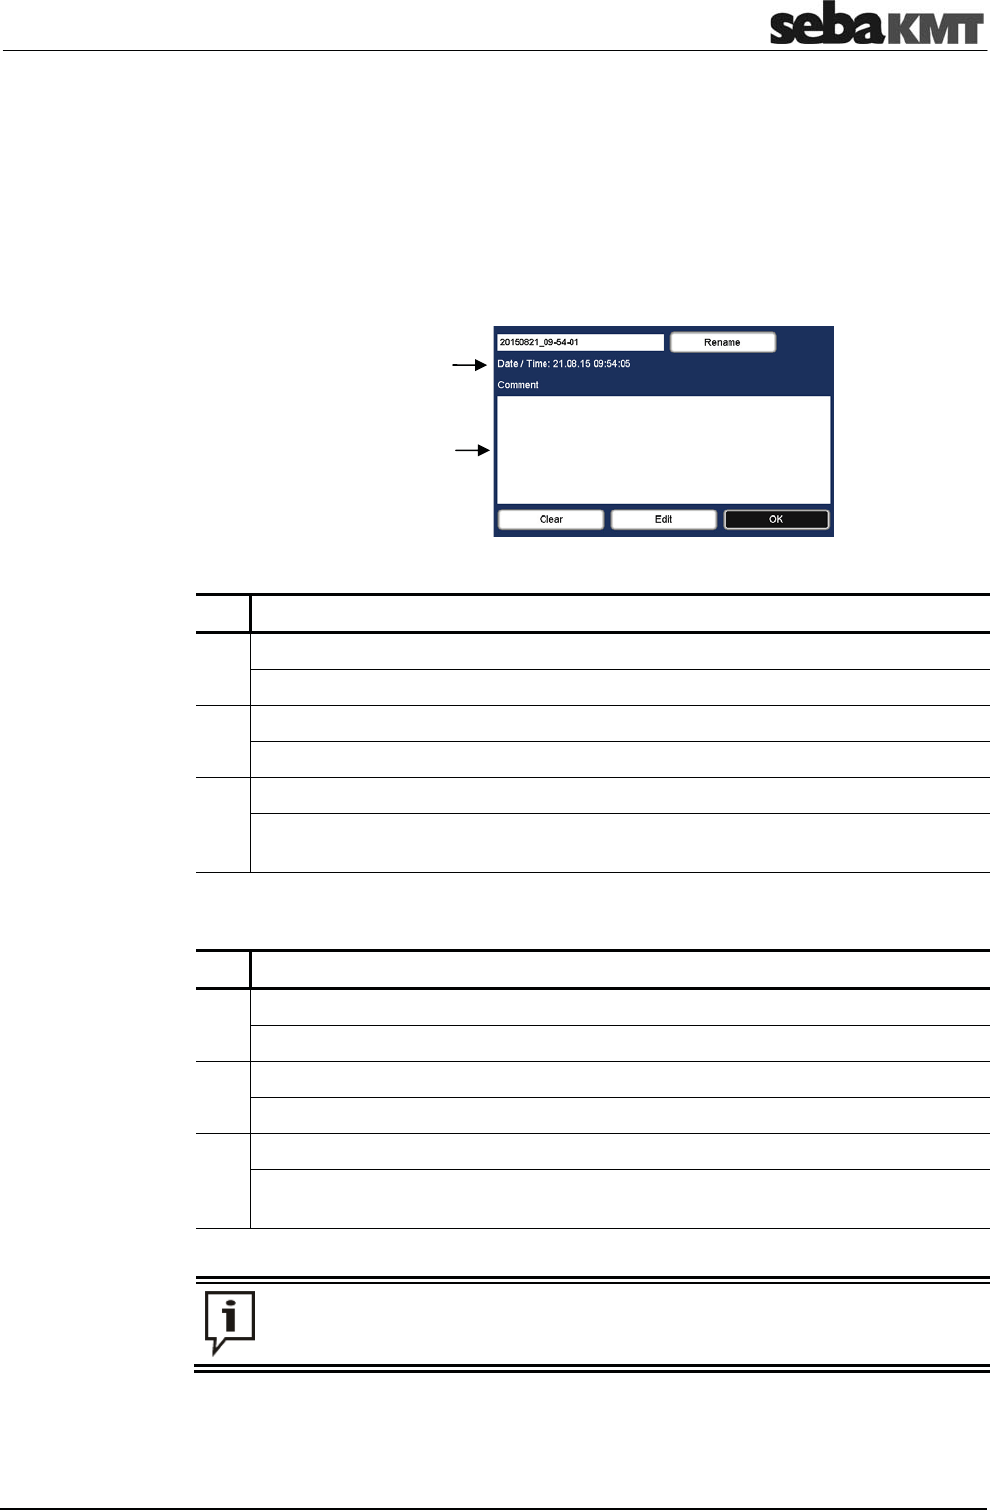
Storage / Management of correlations (History)
99
14.2.2 Rename a correlation / Create a comment
The name of a stored correlation can be changed.
Furthermore, you have the chance to add a "comment" to each correlation stored which
can be used to make useful annotation.
In the Correlation management menu, select the desired correlation and tap the Edit
button. The following menu opens:
To change the name of a stored correlation, proceed as follows:
Step Description
1 Tap the Rename button.
Result: A keyboard appears on the screen.
2 Enter the new name. To confirm, tap the ENTER button.
Result: The screen returns to the previous menu.
3 Tap the OK button.
Result: The screen returns to the Correlation management menu. The new name
for the correlation in question is accepted and displayed.
To create a comment or to change the comment text, proceed as follows:
Step Description
1 Tap the Edit button.
Result: A keyboard appears on the screen
2 Enter the desired text. To confirm, tap the OK button.
Result: The screen returns to the previous menu.
3 Tap the OK button.
Result: The screen returns to the Correlation management menu. The new
comment for the correlation in question is accepted and displayed.
Using the Clear button you can delete the entire comment displayed in one step.
Note that this step cannot be undone.
Access the menu
Rename a correlation
Create / edit a
comment
Date and time of the
measurement
Dis
p
la
y
area of the
comment

Storage / Management of correlations (History)
100
Reset of correlation settings and data
101
15 Reset of correlation settings and data
You can delete or reset all data and settings of the most recent correlation with a single
command.
This function is useful before a new measurement is prepared and performed. It ensures
that the new measurement is not affected by any analysis settings from previous
correlations.
This step has the following effects:
•
The Pipe data menu will be cleared, i.e. all pipe data will be deleted.
•
The GPS menu will be cleared, i.e. all GPS position data will be deleted.
•
The measurement values of the last correlation will be removed from the memory of
the Correlator. If the correlation has not been saved, the measurement data will be
lost.
•
All analysis tools in the Correlation Analysis menu (e.g. zoom, suppression) will be
reset to their initial state.
•
The frequency filters will be reset to the broadband setting.
To reset all measurement settings and data, proceed as follows:
Step Description
1 In the main menu, tap the button .
2 In the displayed menu, tap the Reset last correlation data button.
3 Answer the question displayed with Yes.
Effects
Procedure

Reset of correlation settings and data
102

Pinpointing
103
16 Pinpointing
16.1 Introduction
After a leakage has been identified and pre-located by a correlation, the Correlator can
be used to pinpoint the leak position.
In the area of the pre-located leak position, individual measurements are performed at a
number of measuring points along the probable pipe run. The noise levels recorded are
displayed on the Correlator. The closer a measuring point is to the leak, the louder the
recorded sound.
To determine the leak position accurately, a number of pinpointing runs are carried out
in succession. With each new run, a smaller distance between the measuring points is
chosen. This way, you will gradually approach the exact leak location.
The Correlux C-3 system allows two variants of how to conduct a pinpoint location:
2 options
Pinpoint location using the
ground microphone
Pinpoint location using
Multi sensors
The optional ground microphone is
connected to the Correlator.
Individual measurements are performed in
sequence along the pipe at a number of
measuring points.
The measured values are displayed "live"
on the screen of the Correlator.
You can listen to the recorded sound "live"
via headphones.
Up to 8 Multi sensors are placed at the
desired measurement points on the
ground. Actually, they are used as ground
microphones.
A measurement is performed by the
sensors.
The measured values are displayed "live"
on the screen of the Correlator.
16.2 Pinpointing using the ground microphone
The following preparation work is necessary if you want to perform a pinpoint location
using the optional ground microphone:
•
Connect the ground microphone PAM W2 to the Correlator using the supplied
VK 100 connection cable. Observe the markings on the plug and socket. You must
feel the plug engage.
The Correlator's microphone socket has this icon:
•
If you want to listen to the leak noise, connect the supplied headphones to the
Correlator. Use the 12 V DC / socket.
•
Have any object/s ready which can be used during the pinpoint location to mark the
position where the loudest sound will be measured.
Principle of the
pinpoint location
Options
Preparations
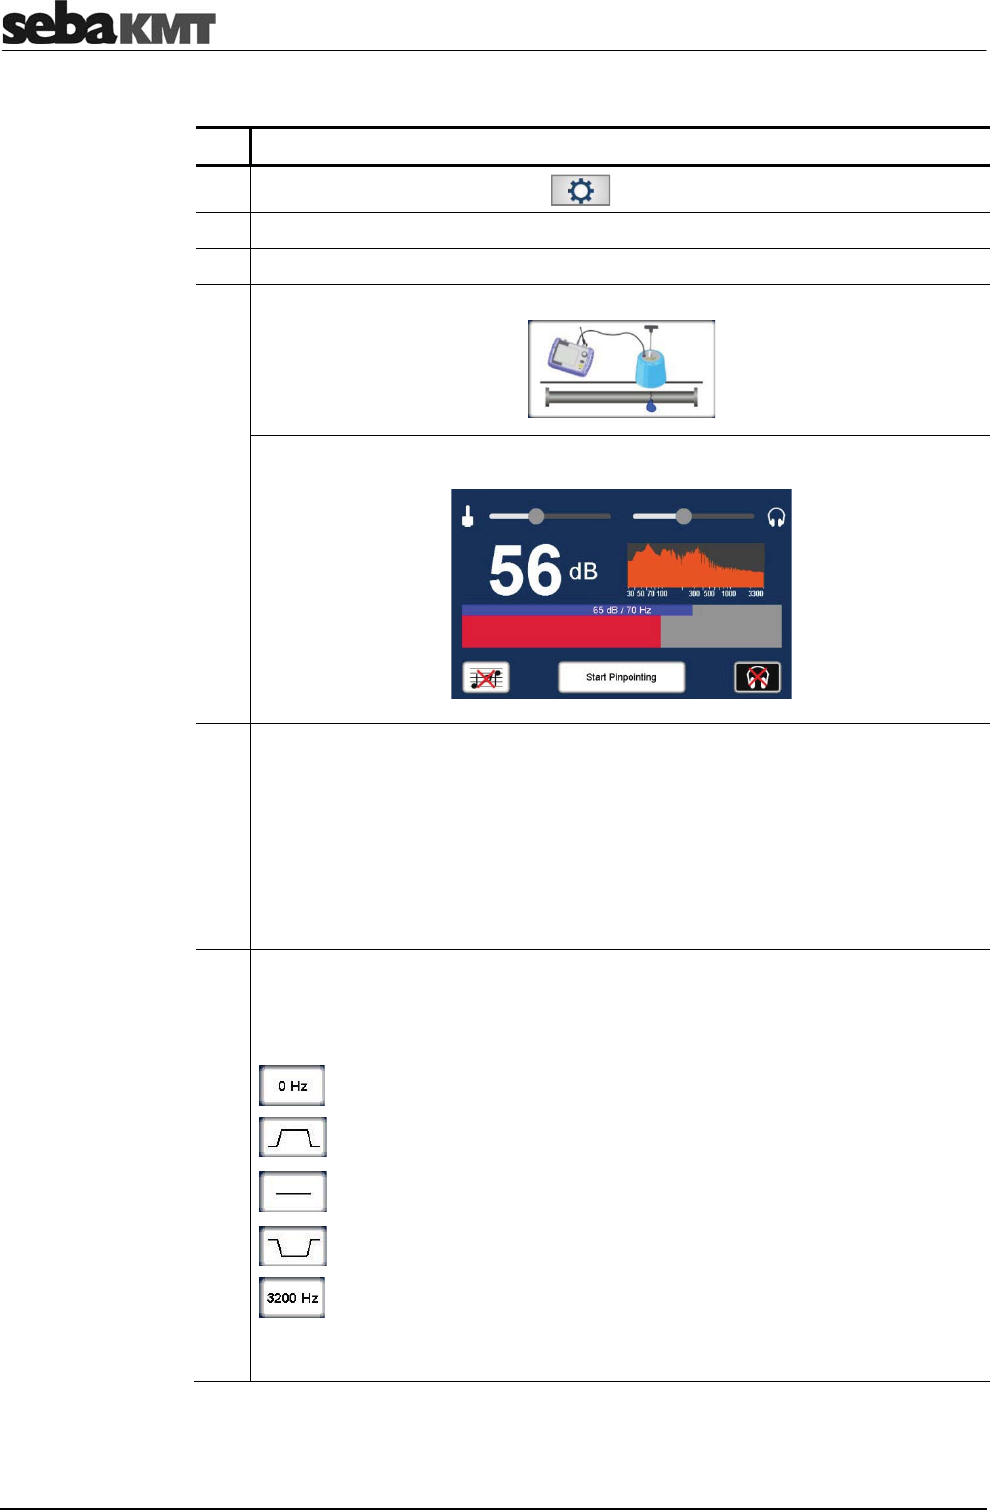
Pinpointing
104
Proceed as follows:
Step Description
1 In the main menu, tap the button .
2 In the displayed menu, tap the Tools button.
3 In the displayed menu, tap the Pinpointing button.
4 In the displayed menu, tap the upper button.
Result: The Audio menu for ground microphone use opens.
5 Adjust the microphone gain for the pinpoint location using the slider at the top
left of the screen.
slide to the left ... to reduce the gain
slide to the right ... to increase gain
Prior to the first pinpointing run, it is recommended to adjusted the microphone
gain in a way that the noise level bar on the screen is between 1/2 and 2/3 of it's
full scale.
This setting can be changed at any time.
6 Adjust the frequency filter for pinpointing.
For this, tap the frequency diagram on the screen. A new menu opens. Use the
buttons displayed to specify the frequency range to be regarded. The buttons are
known from the Audio menu (see page 23).
Button (on the left) to select the lower frequency limit
Bandpass: button to suppress frequencies outside the specified range.
Broad band: button to clear the current frequency filter and return to
Broad band setting
Bandstop: button to suppress the specified range
Button (on the right) to select the upper frequency limit
It is recommended to use the Broad band setting for the first pinpointing run. This
setting can be adjusted at any time later.
Procedure
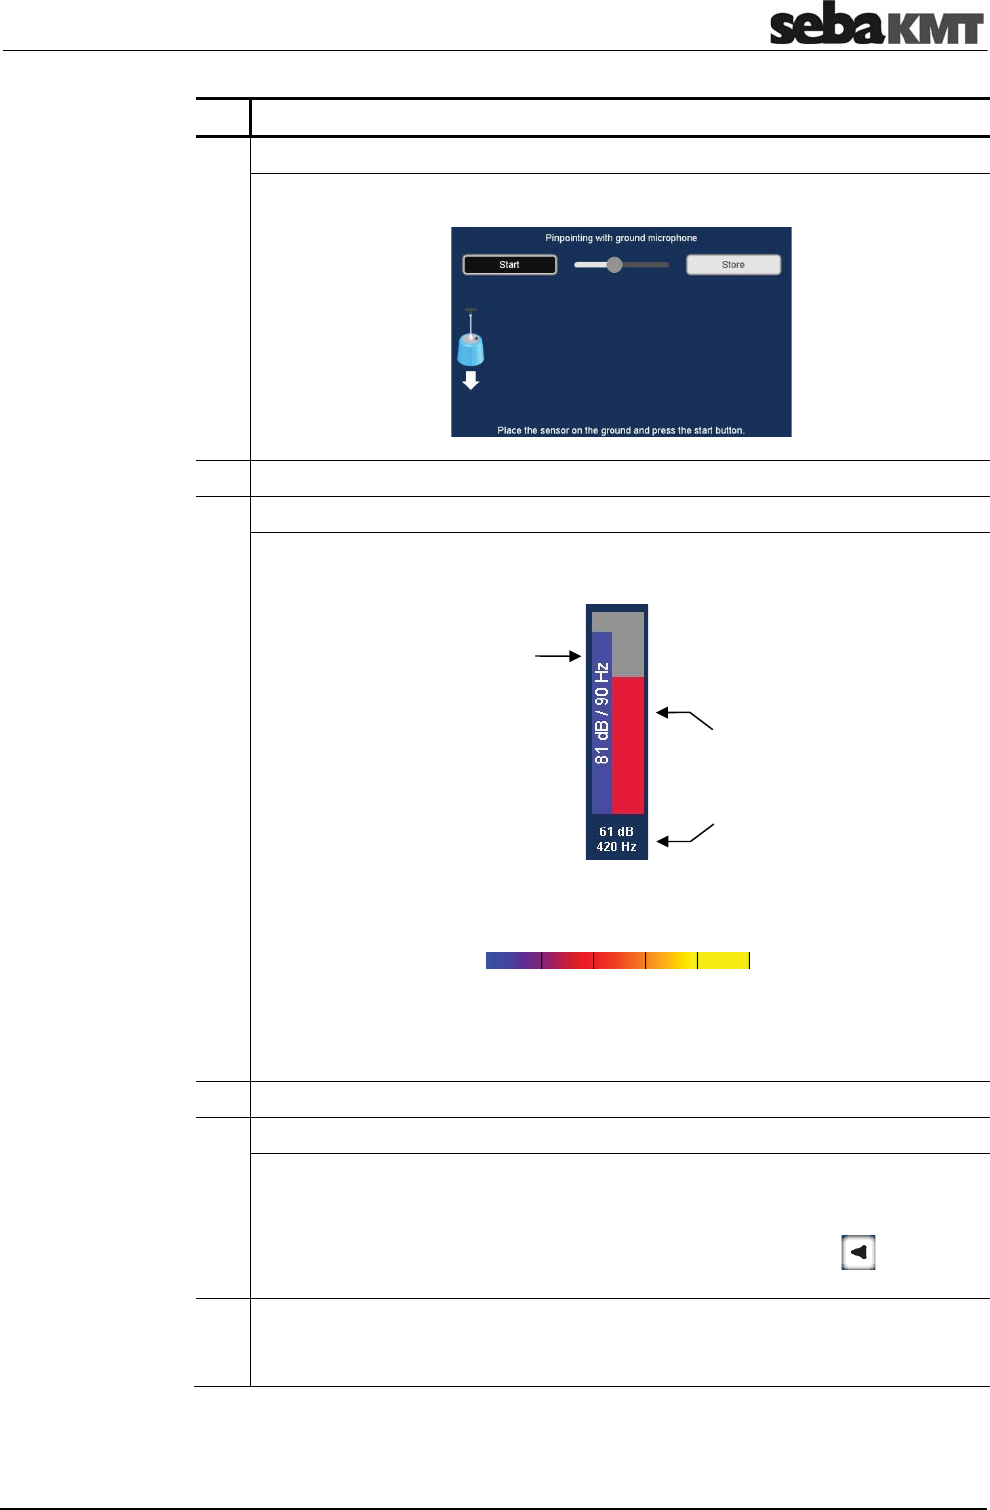
Pinpointing
105
Step Description
7 In the displayed menu, tap the Start Pinpointing button.
Result: The following menu opens:
8 Go to the first measuring position and put the microphone on the ground.
9 Tap the Start button.
Result: The measurement starts. The Current value and the Minimum value of
the measurement are displayed.
The bar's height represents the noise level.
The bar's color illustrates the frequency of the noise.
blue yellow
0 Hz 3300 Hz
If headphones are connected to the Correlator, you can listen to the leak noise.
The sound is continuously reproduced as long as the measurement is going on.
To adjust the headphone volume, use the slide control at the top of the screen.
10 Wait until the Minimum value has come to rest at a stable level.
11 Tap the Store button.
Result: The last displayed minimum value is "frozen" and displayed permanently.
The headphones are muted. The microphone icon on the screen moves to the
next measurement.
If necessary, you can delete the last result using the arrow button and repeat
the measurement.
12 Go to the next measuring position and perform another measurement. For this,
repeat the steps 6 to 9.
Perform further measurements in the same manner.
Instantaneous
value
(Current value)
Minimum value
(quietest recording
of measurement)
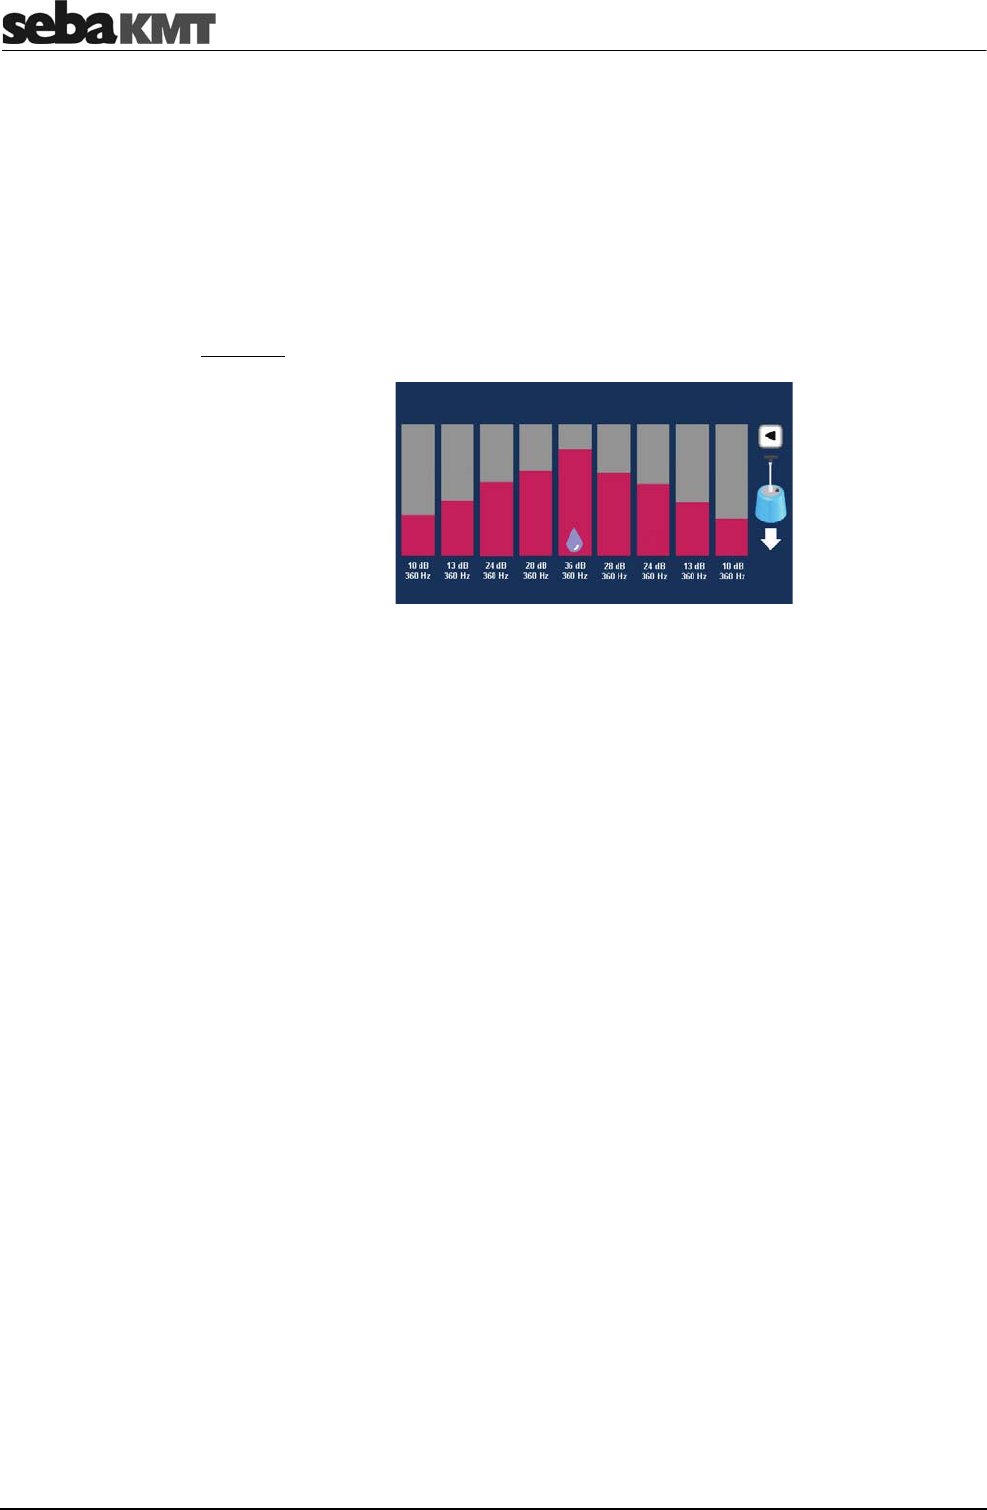
Pinpointing
106
Up to 10 measurement results can be displayed side by side. If more than 10
measurements are performed, always the oldest result (displayed on the very left) is
dropped out of the row in favor of the new result.
Ideally, the minimum value increases with every measurement as long as you move
toward the leak. The minimum value decreases again after you have passed the leak
position.
The drop symbol identifies the measurement with the highest minimum value.
This means that the leak noise at this measuring point is the loudest.
Example:
After the first pinpointing run is performed, you know the approximate location of the
leak. Furthermore you have an idea of the frequency spectrum and you are able to
assess whether the microphone gain needs to be changed or not.
Adjust the microphone gain
If the height of the level bars on the screen does only change very little from
measurement to measurement, you should increase the microphone gain (moving slide
control in the top left of the screen to the right).
If the height of the level bars does change much too much, you should reduce the
microphone gain (moving slide control in the top left of the screen to the left).
Adjust the Frequency filter
If the frequency values of the individual measurements share a common range, you can
change the frequency filter from the Broad band setting to this frequency range (see
step 6).
Perform further pinpointing runs
After the filter settings and microphone gain have been adjusted where necessary,
perform one more pinpointing run along the pipe in the area of the pre-located leak. This
time, choose a shorter distance between the measuring points.
Perform more pinpointing runs with increasingly smaller distances between the
measuring points.
The leak is considered reliably localized if multiple pinpointing runs show the leak at the
same position.
View
After the first
pinpointing run
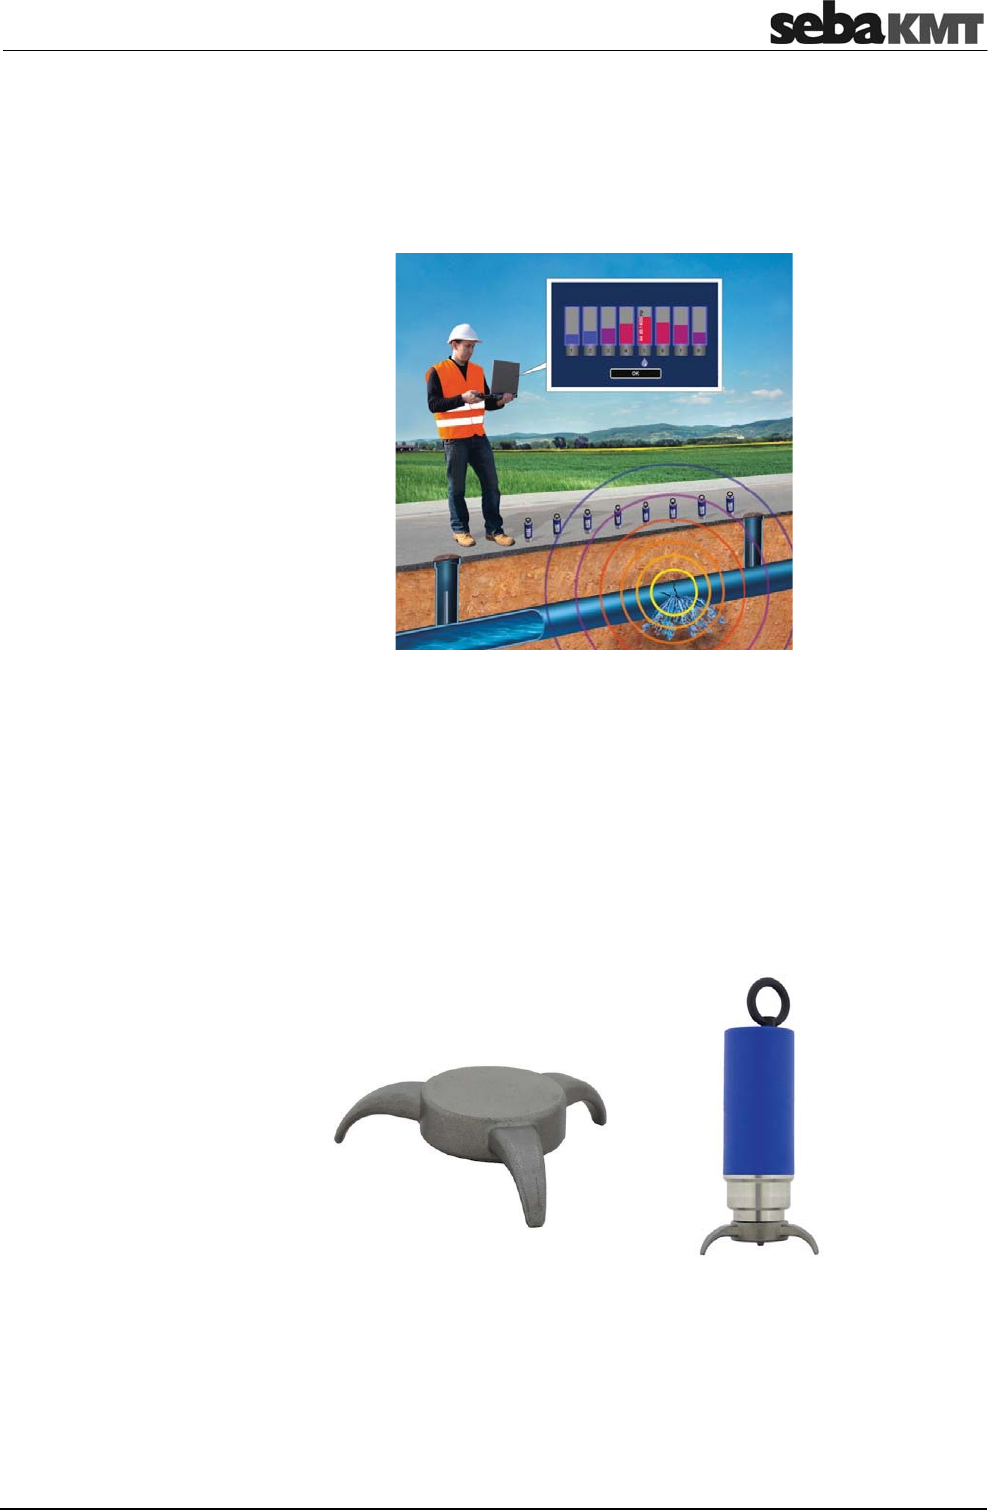
Pinpointing
107
16.3 Pinpointing using Multi sensors
In the area of the pre-located leak position, up to 8 sensors are placed on the ground
along the pipe. The devices record ground noise and send data to the Correlator.
Multi sensors as well as Power transmitters can be used.
The following requirements must be met:
•
All sensors to be used must be registered in the Correlator's Multi sensor pool (also
called "Offline pool" (see page 55)). This applies to both Multi sensors and
Power transmitters.
•
All measuring points must be within the Correlator's radio range.
Attach the supplied Trivet adaptors to the sensors in order to ensure safe standing and
best possible contact to the ground. Thanks to their magnetic foot, the sensors simply
have to be put on the trivets.
Switch the sensors on and put them on the ground, evenly spaced, along the pipe.
Requirements
Preparations
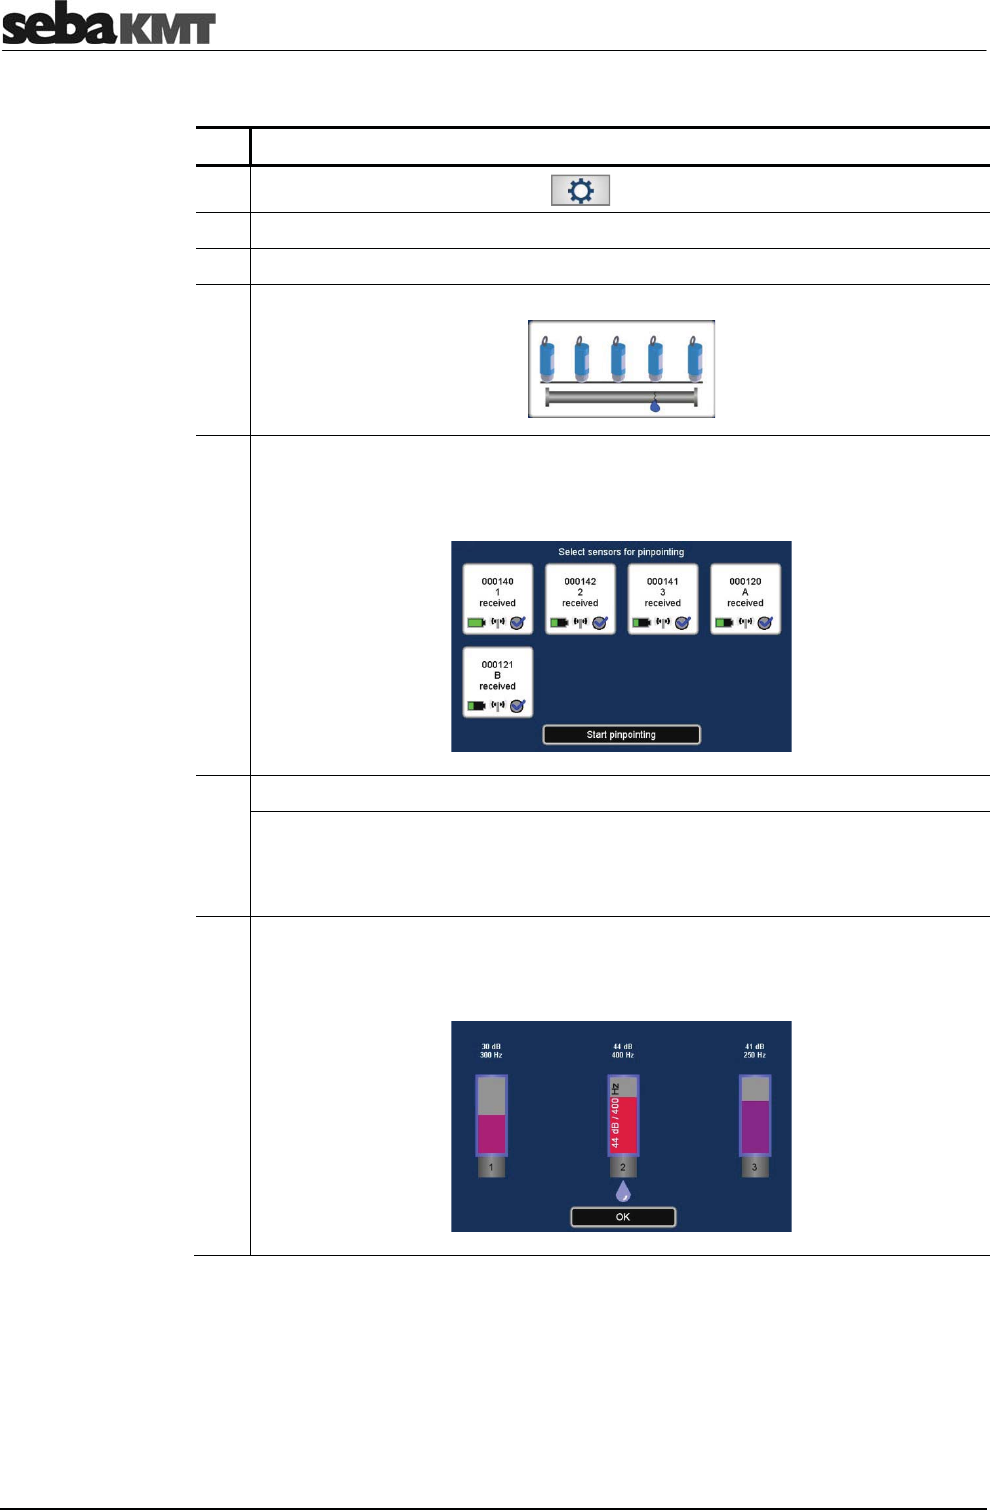
Pinpointing
108
Proceed as follows:
Step Description
1 In the main menu, tap the button .
2 In the displayed menu, tap the Tools button.
3 In the displayed menu, tap the Pinpointing button.
4 In the displayed menu, tap the lower button.
4 In the displayed menu, select the sensors that shall be used. Tap the appropriate
field to enable/disable the checkbox.
Only "enabled" sensors will be part of the measurement.
5 Tap the Start pinpointing button.
Result: A connection is established between the Correlator and the sensors. On
the screen, the pinpointing view appears (see below in the text).
The sensors start measuring. The measured values are periodically retrieved from
the individual sensors and displayed by the Correlator.
6 Wait until the displayed values have come to rest at a stable level.
The drop symbol identifies the measurement with the highest minimum value.
This means that the leak noise at this measuring point is the loudest.
Use the OK button to finish the pinpoint location.
Procedure
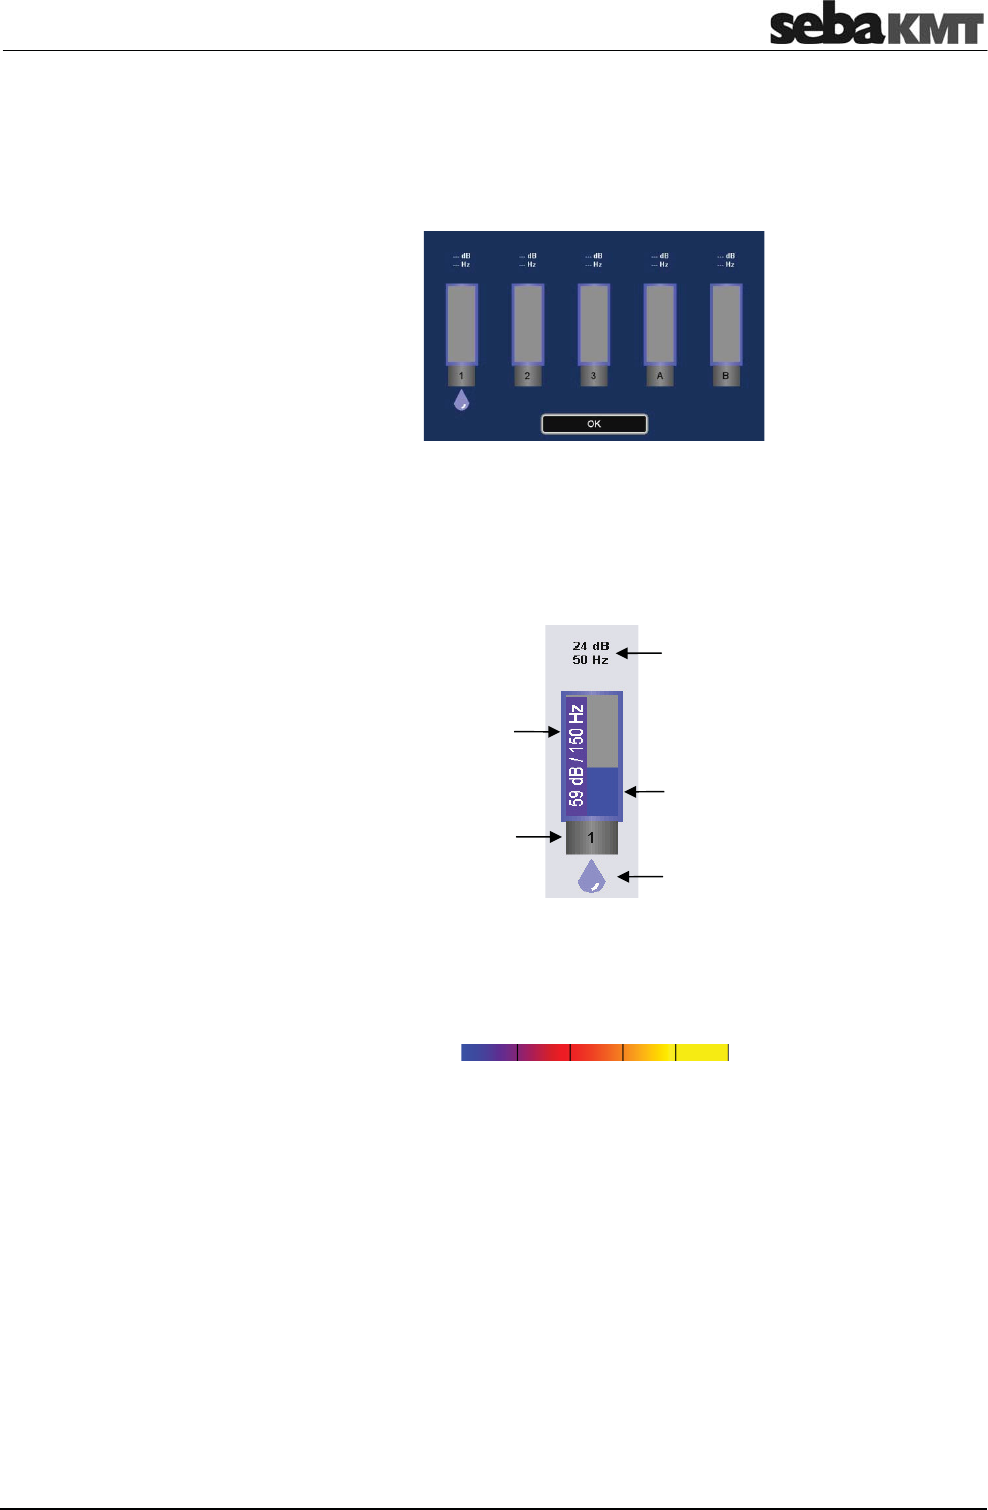
Pinpointing
109
On the screen, up to 8 Multi sensor graphics are shown which represent the sensors in
use. Inside the graphics, the measured values of the respective sensor are shown.
The order of the sensors on the screen does not reflect the actual position of the
sensors on site. The order on the screen is based on the sensor numbers (1-8 and A/B).
As long as the pinpoint location is in progress, in regular periods the currently measured
value of each sensor is retrieved by the Correlator and displayed. In addition, the lowest
measured value (Minimum value) of the current measurement is displayed for each
sensor.
The bar's height represents the noise level.
The bar's color illustrates the frequency of the noise.
blue yellow
0 Hz 3300 Hz
The drop symbol identifies the sensor which has the highest minimum value. This
means that the leak noise at this measuring point is the loudest.
View
Minimum value
(numerically)
Instantaneous value
(as a bar
g
ra
p
h and as
numeric values) Minimum value
(as a bar graph)
Number of Sensor
Drop symbol
(marks the location
of the leak)

Pinpointing
110
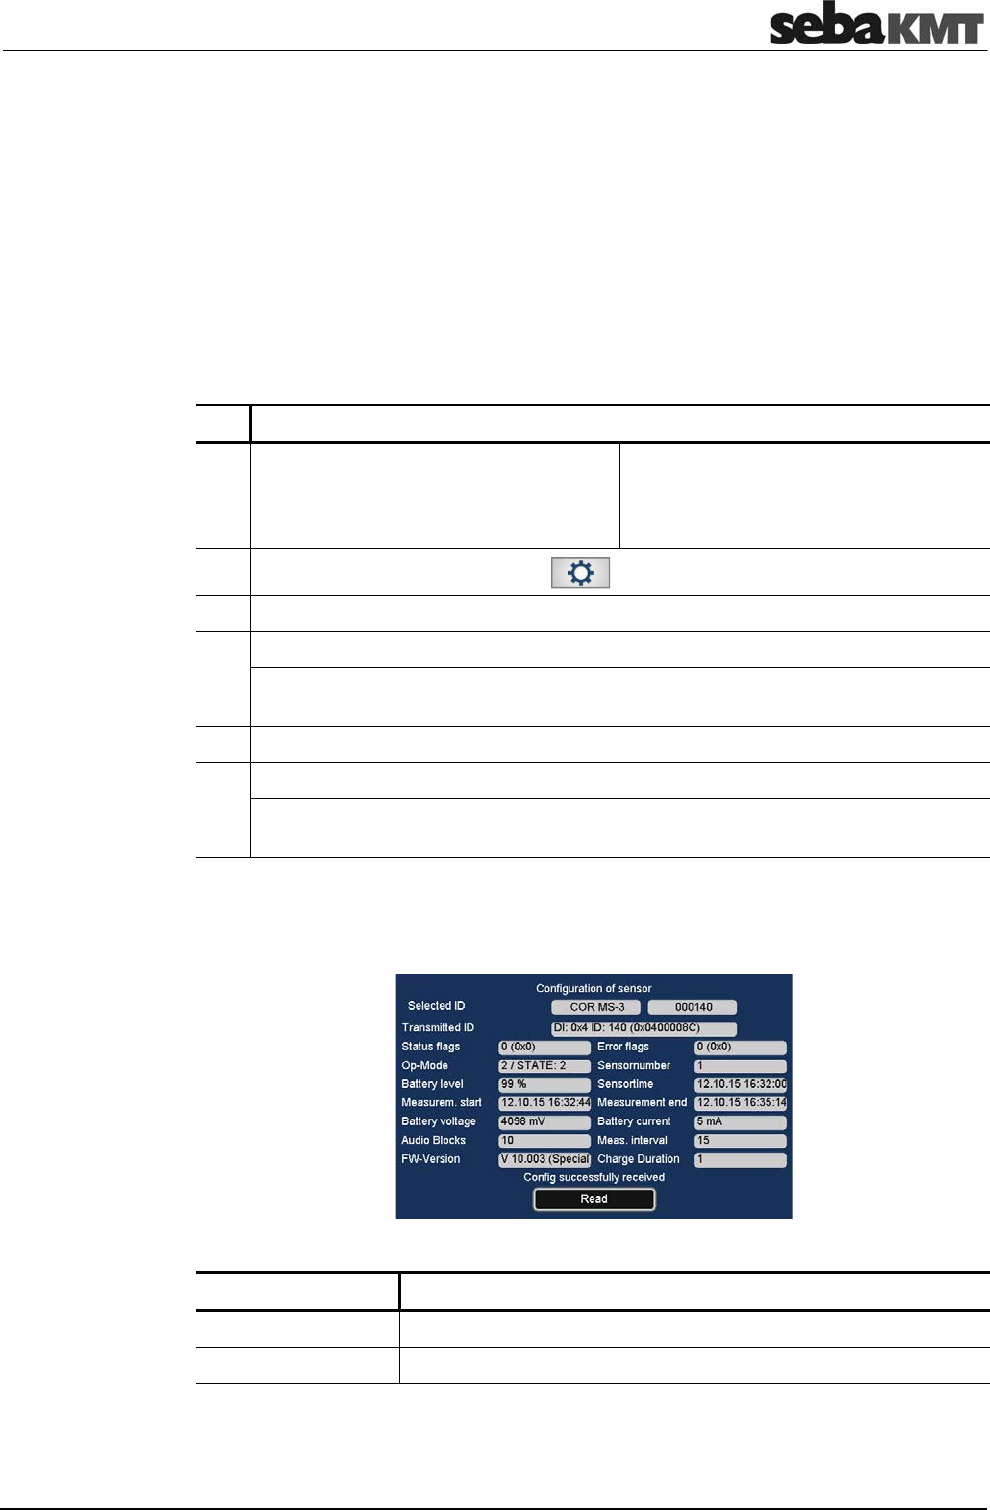
Query the status of a device
111
17 Query the status of a device
By means of the Read configuration function you have the possibility to obtain
information on the current configuration, the identity and the state of a Power transmitter
or Multi sensor. The information is retrieved from the relevant device using the
Correlator.
The following requirements must be met:
•
The relevant sensor must be switched on.
•
The sensor must be within the Correlator's radio range.
Proceed as follows:
Step Description
1 If you want to read a Power transmitter,
use the arrow buttons in the Start menu
to go to an Online measuring mode, e.g.
"COR PT-3 with microphone".
If you want to read a Multi sensor,
use the arrow buttons in the Start menu
to go to an Offline measuring mode, e.g.
"COR MS-3 with microphone".
2 In the main menu, tap the button .
3 In the displayed menu, tap the Tools button.
4 In the displayed menu, tap the Read configuration button.
Result: A new menu opens. The up to 8 fields displayed represent the
Power transmitters and Multi sensors registered in the Correlator's sensor pool.
5 Tap on the field of the sensor which you want to read.
6 In the displayed menu, tap the Read button.
Result: A connection is established between the Correlator and the device. After
transfer, the data is displayed on the screen.
The display shows a lot of information reflecting the status of the device. However,
much of the data is only relevant for SebaKMT service technicians in case of a problem.
The following information may be of interest to the user:
Line Description
Selected ID Type and identification number of the sensor
Sensor number Number of this sensor in the sensor pool
(continued on next page)
Requirements
Procedure
View

Query the status of a device
112
Line Description
Battery level Battery level of the sensor as a percentage
Sensor time Current time of the sensor if it is actually programmed for an
Offline measurement
Measurement start Programmed start time of the Offline measurement
Measurement end Programmed end time of the Offline measurement
Audio blocks Number of the stored recordings (audio blocks)
Meas. interval Time interval between the stored recordings
FW version Currently used firmware
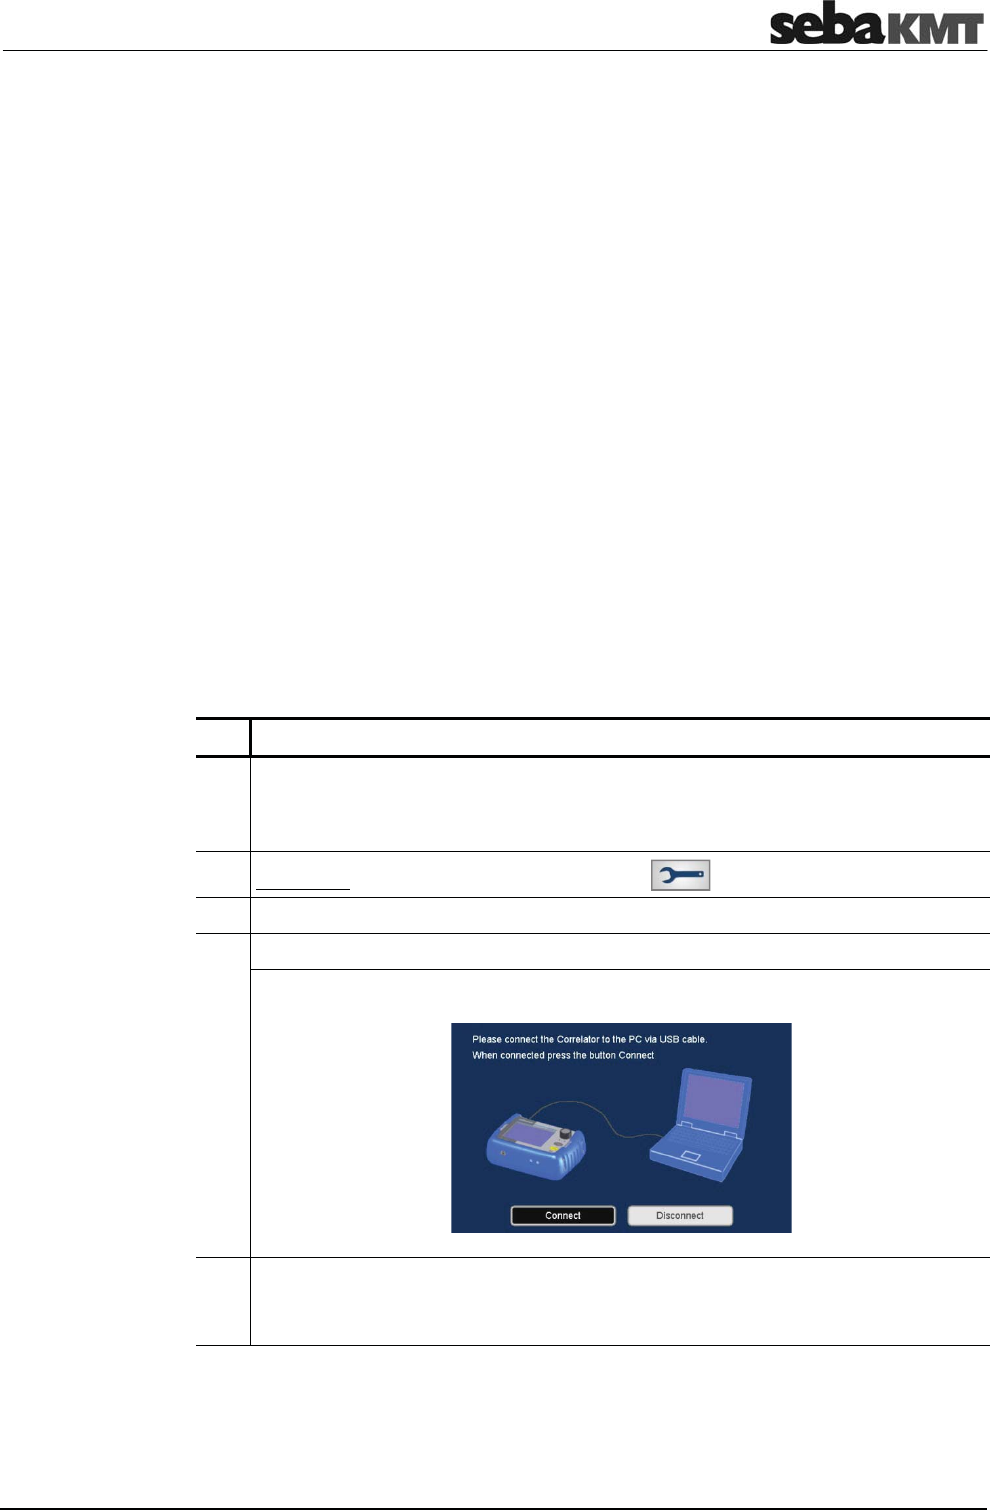
Firmware update
113
18 Firmware update
All devices of the Correlux C-3 system should be operated with the current firmware at
all times.
SebaKMT makes improved versions of the firmware available in the download area of
www.sebakmt.com on a regular basis.
18.1 How to update the Correlator
The version currently installed firmware is shown at the bottom left of the Start menu.
The version can also be found in the System settings menu. There, look for the
Software version line.
The following requirements must be met:
•
You need a computer with access to the Internet.
•
You need the supplied VK 77 connection cable.
•
The battery level of the Correlator must be OK. In case of doubt it should be
charged.
The firmware update has no impact on stored measuring data or personal settings. The
data will be retained.
To update the Correlator, proceed as follows:
Step Description
1 Visit the web-site www.sebakmt.com.
Access the Download area and look for the Correlator update-files.
Download the files to your computer and unzip them.
2 Correlator: In the main menu, tap the button .
3 In the displayed menu, tap Firmware update / Service button.
4 In the displayed menu, tap the Firmware update: Correlator button.
Result: The following menu opens:
5 Connect the Correlator to the computer. Use the supplied connection cable.
(Connect the round plug of the cable to the USB / GPS socket of the Correlator.
Observe the markings on the plug and socket. You must feel the plug engage.)
(continued on next page)
Version in use
Requirements
Stored data
Procedure
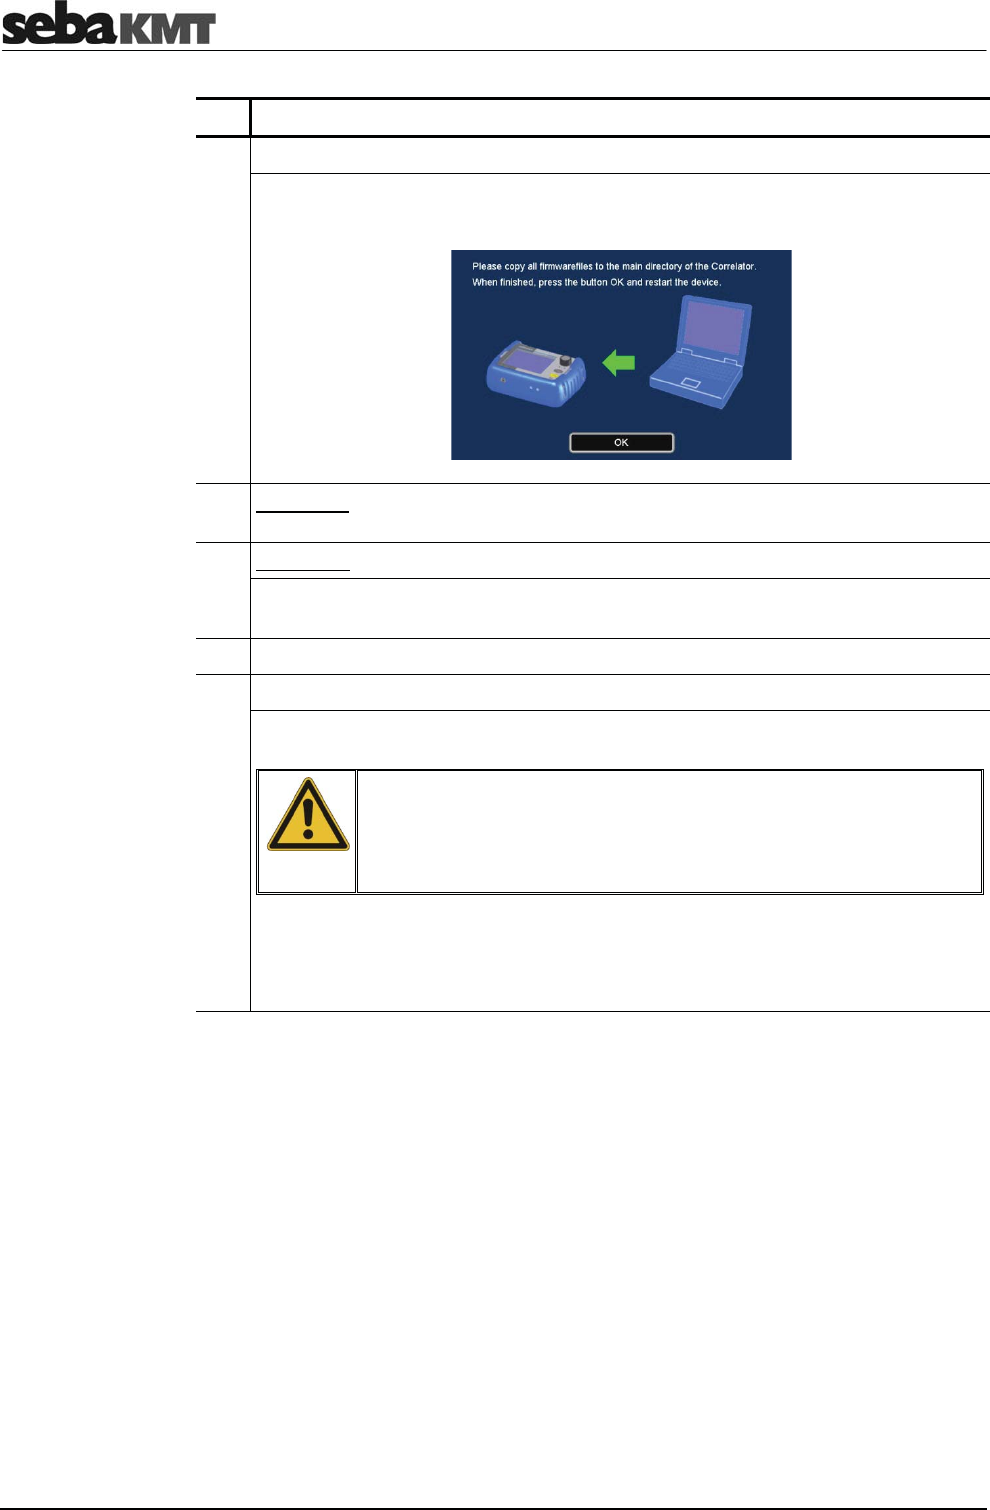
Firmware update
114
Step Description
6 In the displayed menu, tap the Connect button.
Result: The Correlator is automatically detected by the computer as a mass
storage device. The following menu opens:
7 Computer: Copy the firmware update-files (see step 1) to the root directory of the
Correlator. By that, the outdated firmware file must be overwritten there.
8 Correlator: Tap the OK button.
Result: The connection to the computer is disconnected. The connection cable
can be removed.
9 Switch the Correlator off.
10 Switch the Correlator on.
Result: The firmware update is performed. A bar on the screen shows the
progress of the process.
NOTE
The Correlator must not be operated while the update process is
in progress, i.e. as long as the bar is shown on the screen.
Doing so may cause irreparable damages.
As soon as the update process is finished the Start menu appears on the screen.
At the bottom left the new firmware version is displayed.
The device now is ready for use.
Firmware update
115
18.2 How to update Power transmitters or Multi sensors
If you want to determine which firmware version is currently installed on a device, you
can read the device's configuration (see page 111) using the Correlator. In the displayed
menu, look for the FW version line.
The following requirements must be met:
•
You need a computer with access to the Internet.
•
You need the supplied VK 77 connection cable.
•
The battery level of the devices involved must be OK.
(Power transmitter: at least 2 green lights in the LED bar
Multi sensor: LED shows green or yellow light)
First step, the relevant update-file has to be downloaded to the computer from the
SebaKMT web-site and, afterwards, transferred to the Correlator.
Second step, the update-file has to be transferred from the Correlator to the relevant
Power transmitter or Multi sensor, where it will be executed.
The following sections describe the steps in detail.
18.2.1 Work step 1: Download and store the update-file
Proceed as follows:
Step Description
1 Visit the web-site www.sebakmt.com.
Access the Download area and look for the relevant update-file.
Download the file to your computer and unzip it.
2 Correlator: In the main menu, tap the button .
3 Connect the Correlator to the computer. Use the supplied connection cable.
(Connect the round plug of the cable to the USB / GPS socket of the Correlator.
Observe the markings on the plug and socket. You must feel the plug engage.)
4 In the displayed menu, tap the Connect Correlator to PC button.
5 In the displayed menu, tap the Connect button.
Result: The connection is established. The message "Connected" appears on the
Correlator screen. The Correlator is automatically detected by the computer as a
mass storage device.
6 Computer: Copy the firmware update-file (see step 1) to the root directory of the
Correlator. By that, the outdated firmware file must be overwritten there.
7 Correlator: Tap the Disconnect button.
Result: The connection to the computer is disconnected. The connection cable
can be removed.
Version in use
Requirements
Procedure
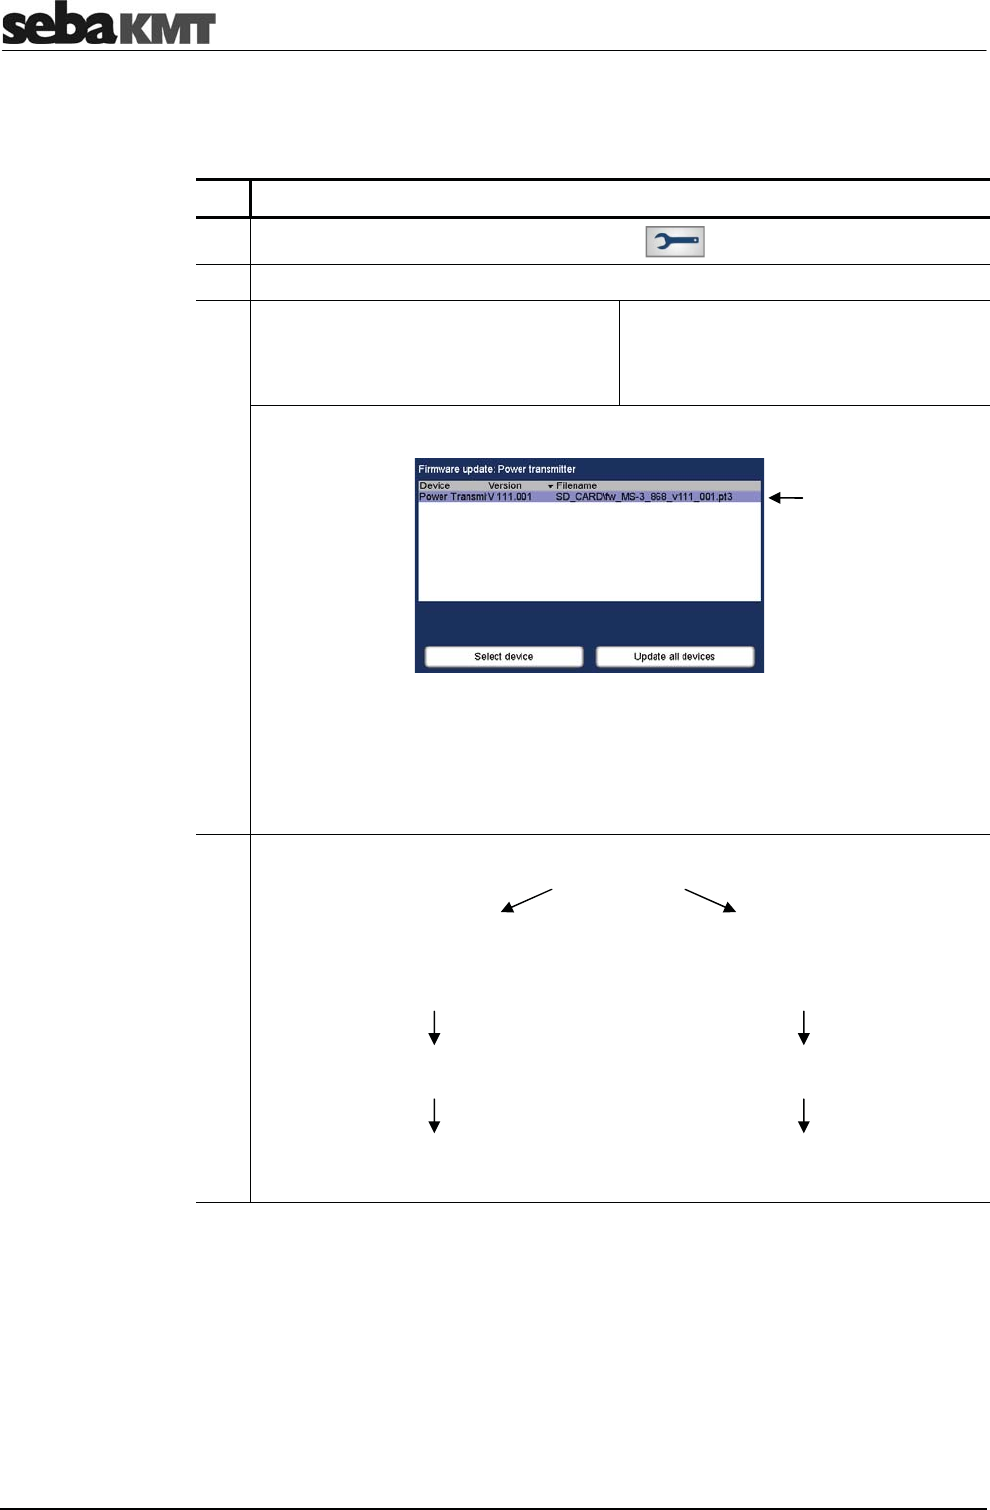
Firmware update
116
18.2.2 Work step 2: Transfer and run the update-file
Proceed as follows:
Step Description
1 In the Correlator main menu, tap the button .
2 In the displayed menu, tap the Firmware update / Service button.
3 In the displayed menu, tap the
Firmware update: Power transmitter
button if you want to update one or
more Power transmitters.
In the displayed menu, tap the
Firmware-Update: Multi sensor button
if you want to update one or more
Multi sensors.
Result: The following menu opens:
In the display area, the update-file is shown which is temporarily stored in the
Correlator root directory.
If more than one file is listed, select the required one.
If no file is displayed, there is no firmware update-file in the root directory. Perform
again "Work step 1" (see page 115) in order to download the relevant file.
4
2 options
Updating one individual
Power transmitter or one Multi sensor Updating all Power transmitters or
all Multi sensors which are registered to
the Correlator.
Tap the Select device button. Tap the Update all devices button
(for the next steps, go to the paragraph
"Updating a single device") (for the next steps, go to the paragraph
"Updating all devices")
update-file
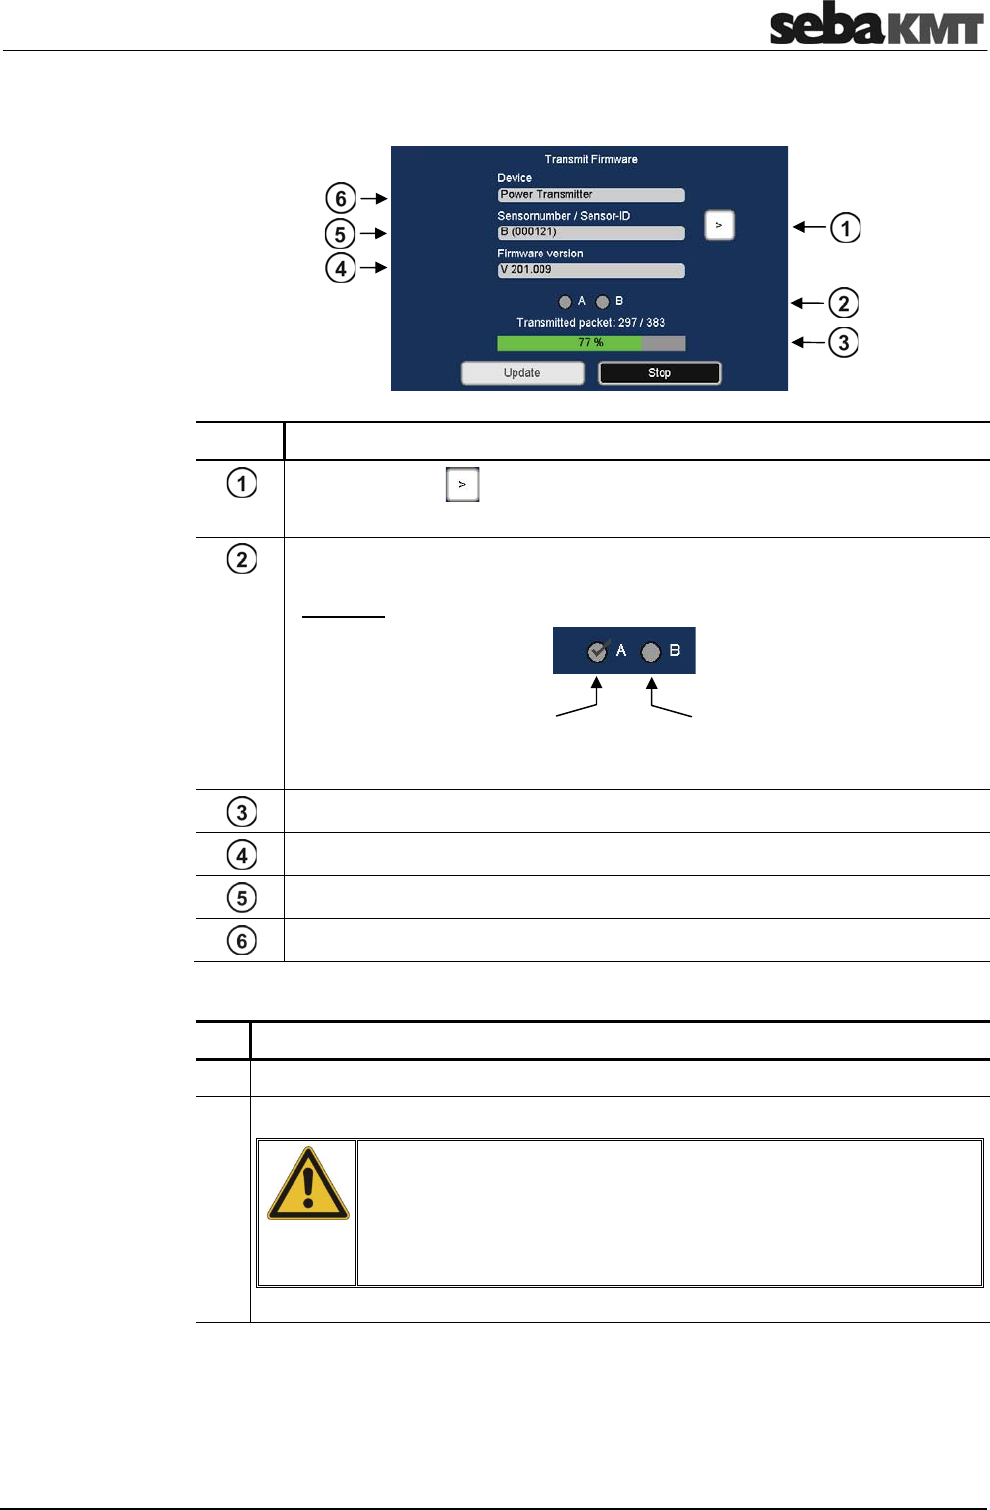
Firmware update
117
If you tapped on Update all devices, the following or a similar menu opens:
Element Description
Forward button
calls the next Power transmitter or Multi sensor from the sensor pool
The Checkboxes indicate which Power transmitter (A / B) or which
Multi sensors (1 - 8) are already updated.
Example:
Progress of the data transfer.
Version of the new firmware
Number and ID of the selected sensor
Sensor type
Proceed as follows:
Step Description
5 Switch on the device which is to be updated.
6 Tap the Update button.
NOTE
As long as the update process is in progress, no inputs or
actions must be made on the devices involved and the devices
must not be switched off.
Doing so may cause irreparable damages.
(continued on next page)
Updating all devices
Power transmitter "B"
is not yet updated
Power transmitter "A"
is updated
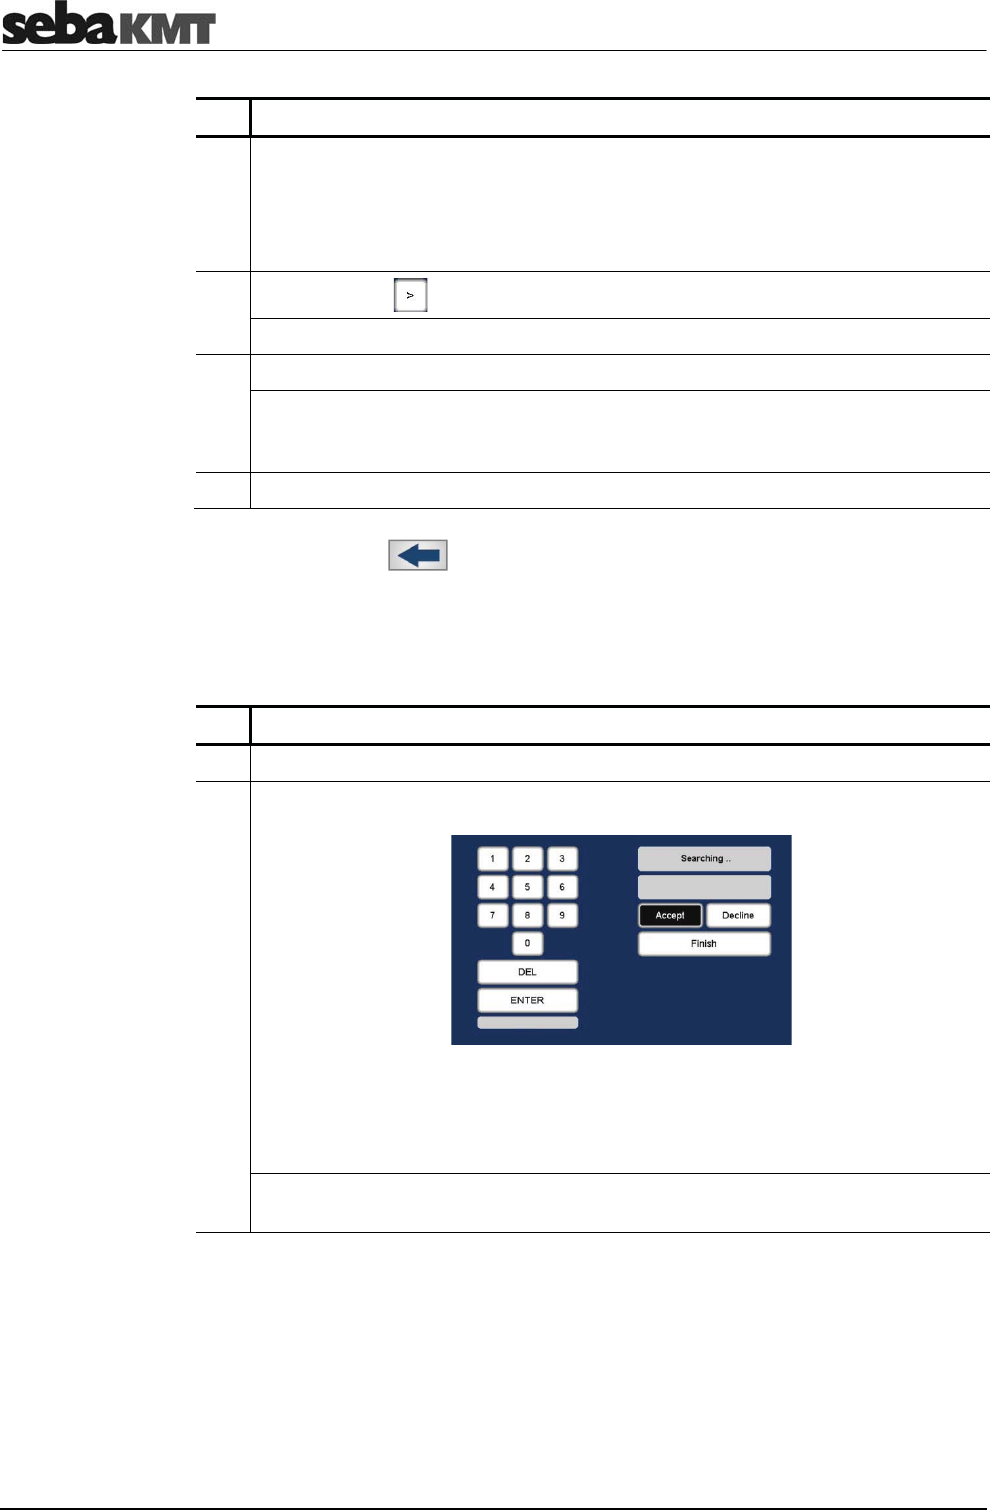
Firmware update
118
Step Description
Result: The update-file is transferred to the device in question. There, the new
firmware is installed and initialized. Subsequently, the device switches itself off
and on again.
A bar on the Correlator screen shows the progress of the process. Finally, the
message "Firmware successfully updated" appears.
7 Tap the button to call the next sensor from the sensor pool.
Result: The Number and the ID of this device are displayed.
8 Tap the Update button.
Result: The firmware is transferred and installed. The updated device switches
itself off and on again. After all, the message "Firmware successfully updated"
appears on the Correlator screen.
9 Tap the OKbutton to conclude the firmware update.
Use the Back button or the ESC pushbutton to return to the Start menu.
To check if a device really is operated with the new firmware read the configuration of
the device in question using the Correlator (see page 111). In the displayed menu,
check the FW version line.
If you tapped on Select device, proceed as follows:
Step Description
5 Switch on the device which is to be updated.
6 Enter the ID of this device.
(Manual entry: use the numeric keypad, confirm with ENTER button
Automatic detection: press the I/O pushbutton of the Power transmitter briefly or
contact the I/O field of the Multi sensor briefly using a magnet, confirm the ID
displayed with the Accept button)
Result: A new menu opens. Type and ID of the device and the new firmware
version are once again displayed.
Updating
a single device
Firmware update
119
Step Description
7 Tap the Update button.
NOTE
As long as the update process is in progress, no inputs or
actions must be made on the devices involved and the devices
must not be switched off.
Doing so may cause irreparable damages.
Result: The update-file is transferred to the device in question. There, the new
firmware is installed and initialized. Subsequently, the device switches itself off
and on again.
A bar on the Correlator screen shows the progress of the process. Finally, the
message "Firmware successfully updated" appears.
8 Tap the OK button to conclude the firmware update.
Use the Back button or the ESCpushbutton to return to the Start menu.
To check if a device really is operated with the new firmware read the configuration of
the device in question using the Correlator. In the displayed menu, check the
FW version line.

Firmware update
120
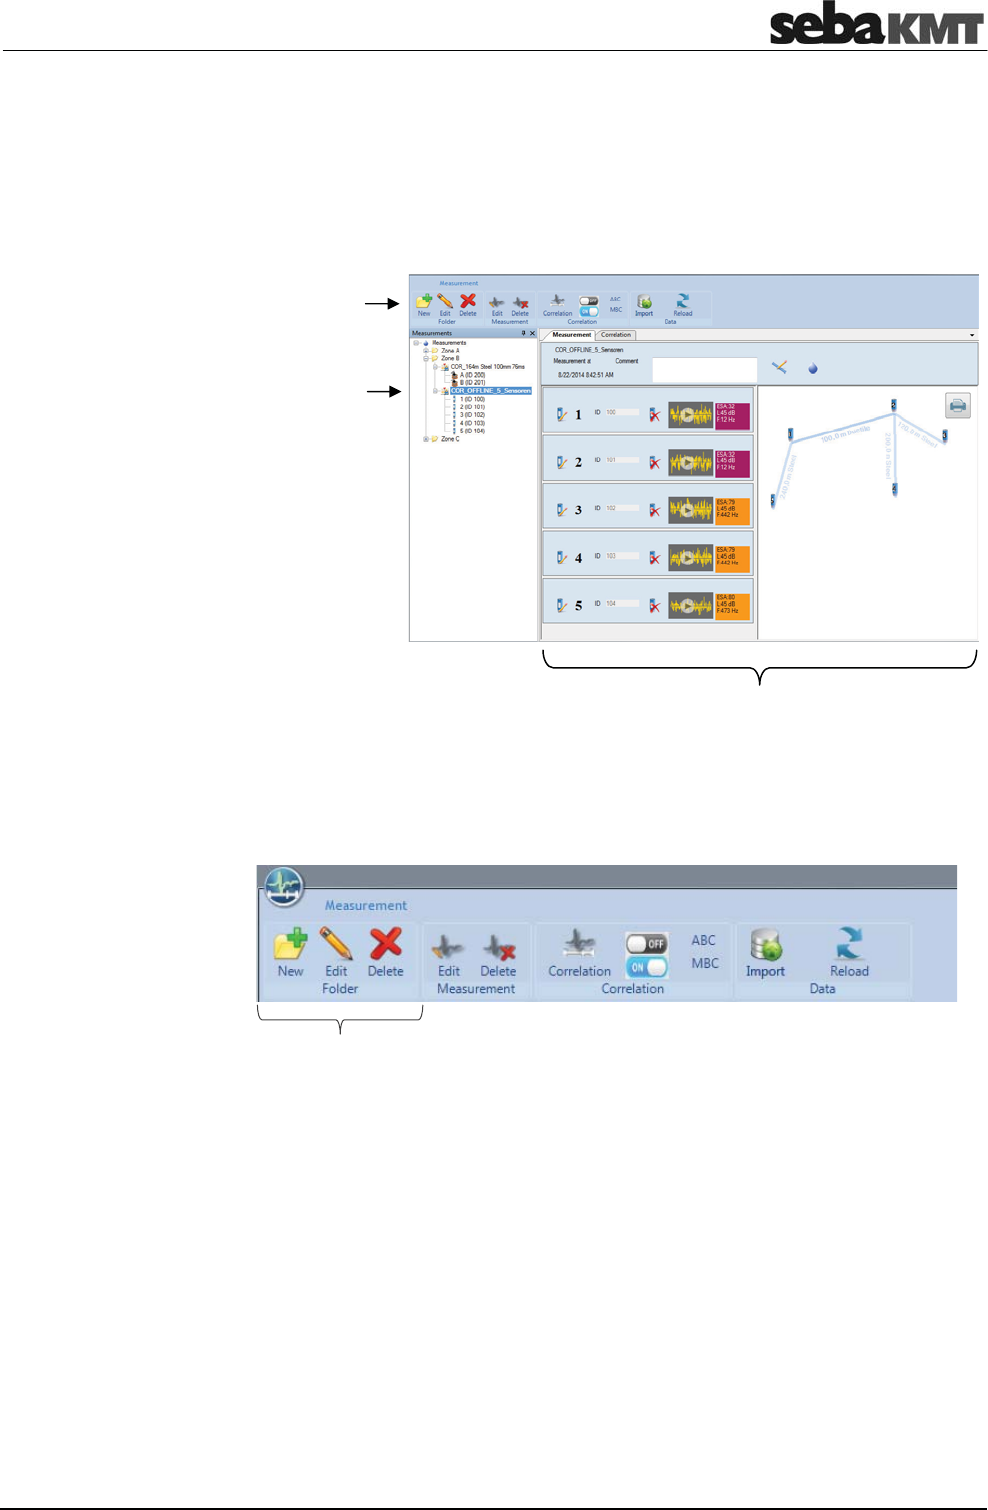
CorreluxView Software
121
19 CorreluxView Software
19.1 User interface
The CorreluxView screen is divided into three sections - menu bar, directory tree and
display area. This screen layout remains unchanged regardless of menu level.
The menu bar (ribbon) allows you to access any command or function.
Function keys are combined appropriately into different segments. The CorreluxView
symbol at the top left of the menu bar allows you to access system settings for the
application.
The directory structure (the so-called "directory tree") of the application's internal
database is displayed to the left of the screen. Users are free to create, edit and delete
directories and subdirectories in any way they wish.
Menu bar
Directory tree
Example: 'Folder' segment containing function buttons for managing
directories in the directory tree
Menu bar
Display area
Directory tree
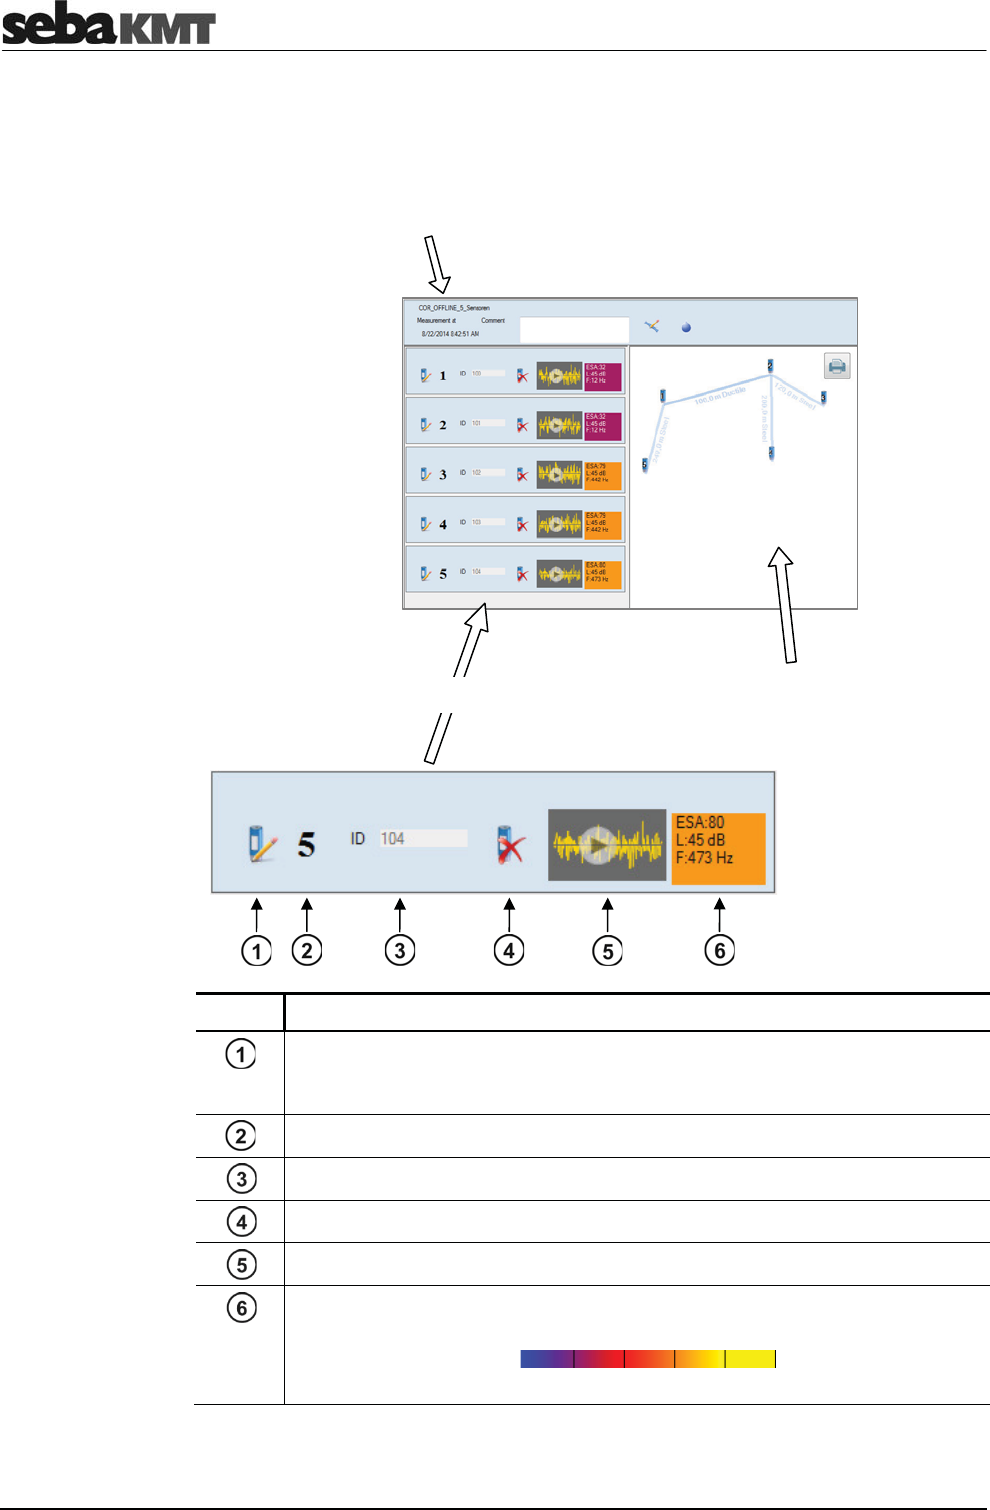
CorreluxView Software
122
The display area is divided into the following sections:
Element Description
Button to
•
edit the GPS data for this sensor
•
edit the comment text for this sensor
Sensor number
Identification number for this sensor
Button for deleting this sensor from the list
Button for listening to the quietest recording made by this sensor
Minimum value of this sensor (ESA value, level in dB, frequency in Hz).
The color of the field reflects the ESA value.
blue yellow
0 Hz 3300 Hz
Display area
Measurement information
(name of correlation, time of measurement,
measurement comments)
Map
(at the very top: function keys
for map management)
List of sensors in use
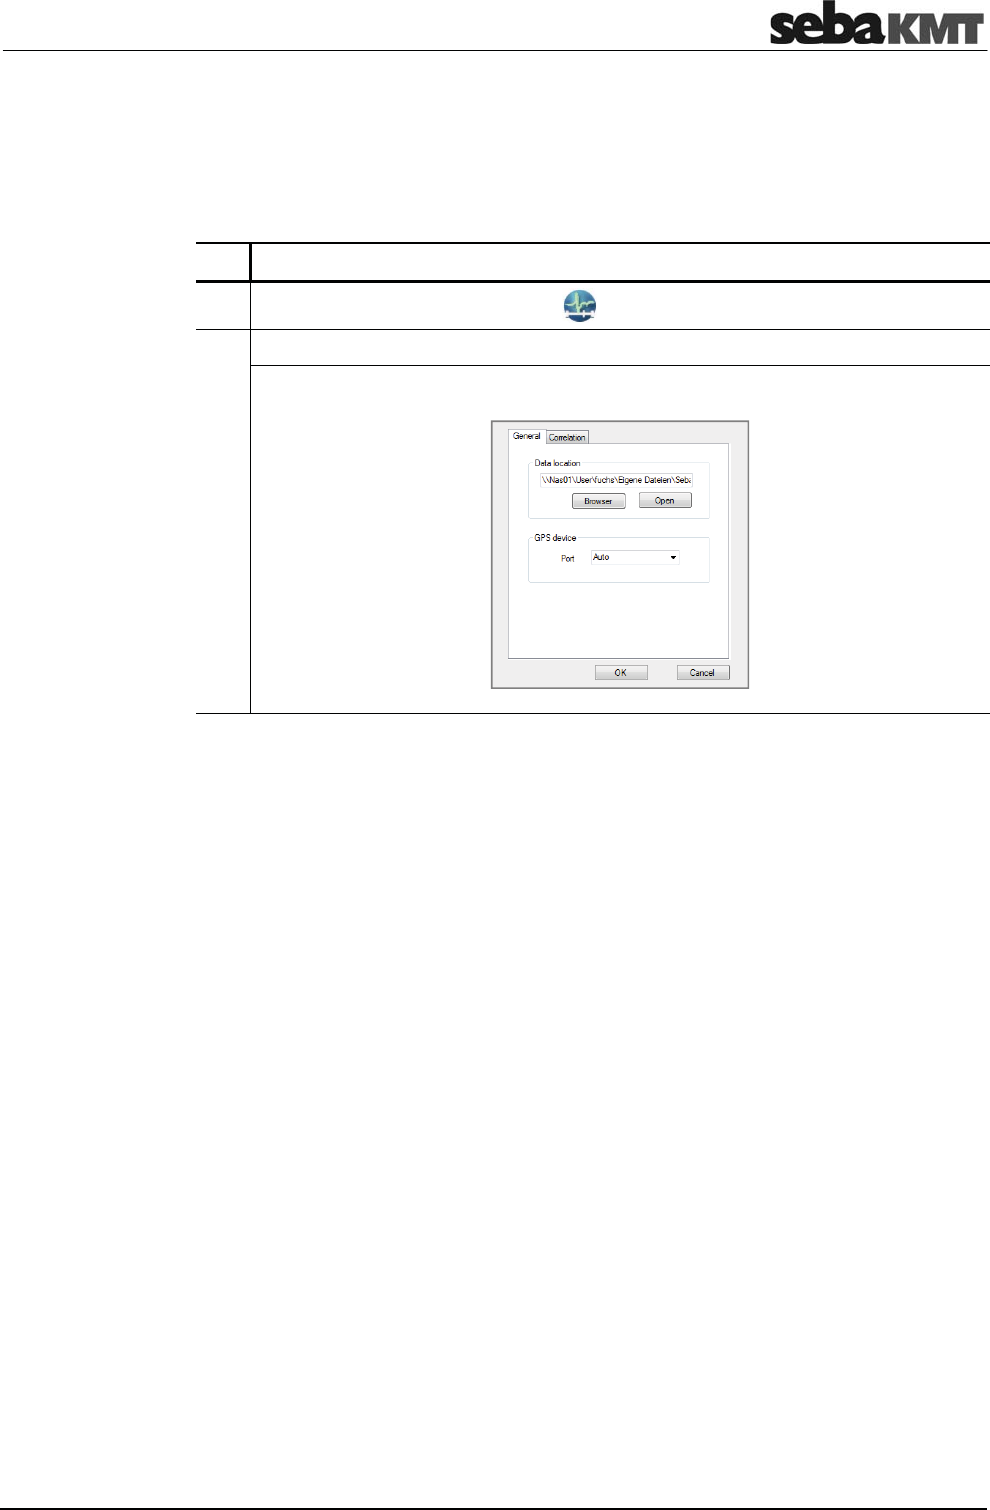
CorreluxView Software
123
19.2 Basic settings
You should always check basic CorreluxView software settings and adjust these if
necessary before using the application.
To open the system settings menu, proceed as follows:
Step Description
1 Click on the CorreluxView symbol at the top left of the menu bar.
2 Click on Settings in the context menu.
Result: The system settings menu opens.
19.2.1 Storage location for application database
In the Data location segment the storage location for the CorreluxView application
database is shown. This target directory was created upon initial installation of the
software. All measurement data sets that are imported to the CorreluxView application
by the Correlator are saved under this location.
You can use the Open button to open the directory.
You can use the Browse button to specify a new storage location. The application will
display a window allowing you to navigate to the new target directory for the application
database. When you are finished, click OK to confirm your change.
19.2.2 GPS receiver port
The CorreluxView application allows you to connect a GPS receiver to your computer so
you can use the software to specify GPS coordinates for sensors.
Use the drop-down menu in the GPS device segment to select the connection port for
your GPS receiver.
19.2.3 System of units
You can select whether Metric or Imperial (Anglo-American) units of measurement
are to be used in your CorreluxView application.
Open the Correlation tab. Use the drop-down menu in the Unit segment.
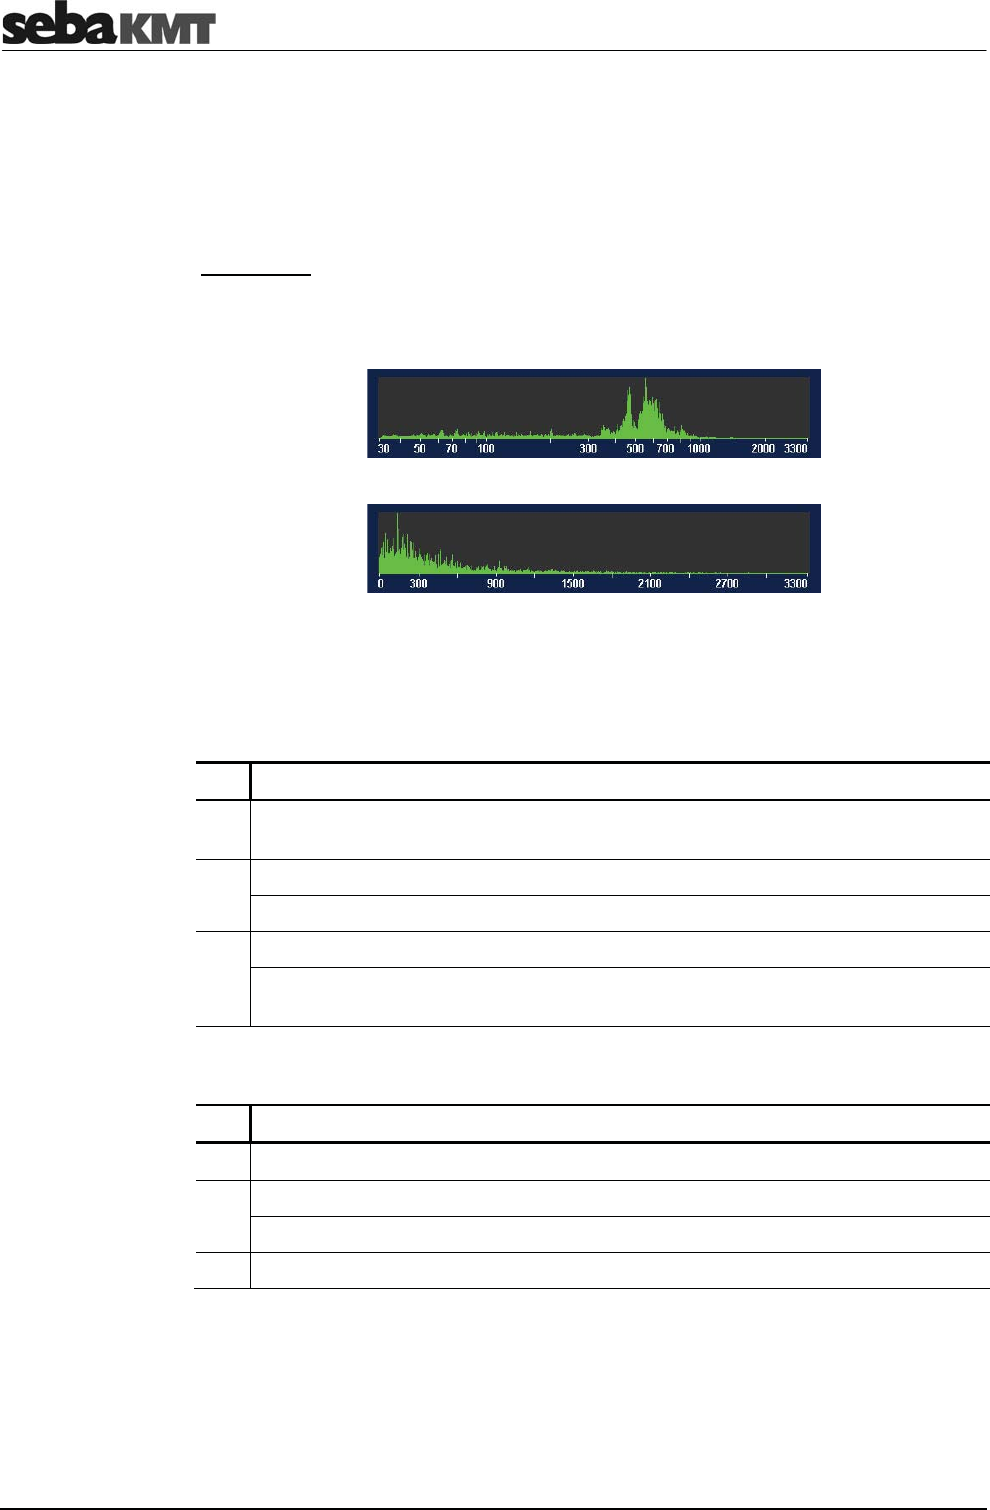
CorreluxView Software
124
19.2.4 Logarithmic or linear coherence display
In the Correlation menu a Coherence curve is shown. You can select whether the
frequency axis for the coherence curve should rise linearly or logarithmically.
Open the Correlation tab. Use the drop-down menu in the Coherence segment.
Explanation: The frequency range of the Correlux C-3 system is from 0 to 3300 Hz.
Experience shows that the frequency of leak noise ranges from 0 to 1000 Hz. The
logarithmic view results in a wider display area for these lower frequencies.
Logarithmic view:
Linear view:
19.3 Creating, renaming and deleting directories
To create a new directory in the directory tree, proceed as follows:
Step Description
1 In the directory tree, select the directory under which your new directory is to be
added as a subdirectory.
2 Click on New in the Folder segment.
Result: A new window opens.
3 Enter the name of your new directory, then click OK to confirm your input.
Result: The new directory has now been created in the database and appears in
the directory tree.
You may also change the name of an existing directory. Proceed as follows:
Step Description
1 Select the relevant directory in the directory tree.
2 Click on Edit in the Folder segment.
Result: A window opens.
3 Enter the new name for your directory, then click on OK to confirm your input
Creating a directory
Renaming a directory
CorreluxView Software
125
To remove a directory from the directory tree, proceed as follows:
Step Description
1 Select the relevant directory in the directory tree.
2 Click on Delete in the Folder segment.
3 Answer Yes to the delete confirmation prompt.
Result: The directory as well as all measurements stored under that directory are
deleted from the database.
19.4 Importing data
To import a measurement data set from the Correlator into the CorreluxView application,
proceed as follows:
Step Description
1 Connect the Correlator to your computer.
(First, establish the cable connection. Then go to the Correlator's main menu, click
on the button, then on Connect Correlator to PC, then on Connect.)
Result: Your computer will automatically recognize the Correlator as a data
storage device and display it under the name 'CORRELUX'.
2 Go to the CorreluxView directory tree and select the directory under which the
measurement is to be added. If necessary, first create a new directory.
3 Click on Import in the menu bar.
Result: A new window opens.
4 Navigate to the Correlator's root directory ('CORRELUX'). This directory will list a
set of subdirectories that contain all measurement data sets saved.
5 Select the measurement data set you want, then click on OK.
Result: The data import begins. The process may take a few seconds.
After the data transfer is complete, the measurement will appear in the directory
tree, and will also be opened for processing in the display area.
19.5 Editing a map
The Map section is intended to provide a realistic overview of the sensors and pipelines
in the measuring area.
The sensors used are shown as icons. Pipelines can be drawn between these icons and
the pipe parameters can be specified.
Provided that GPS data for the measuring points are known (i.e. the coordinates of the
measuring points have been determined and saved prior to measurement), the
CorreluxView application will automatically arrange the sensor icons in the map section
so that they correspond to reality.
Deleting a directory
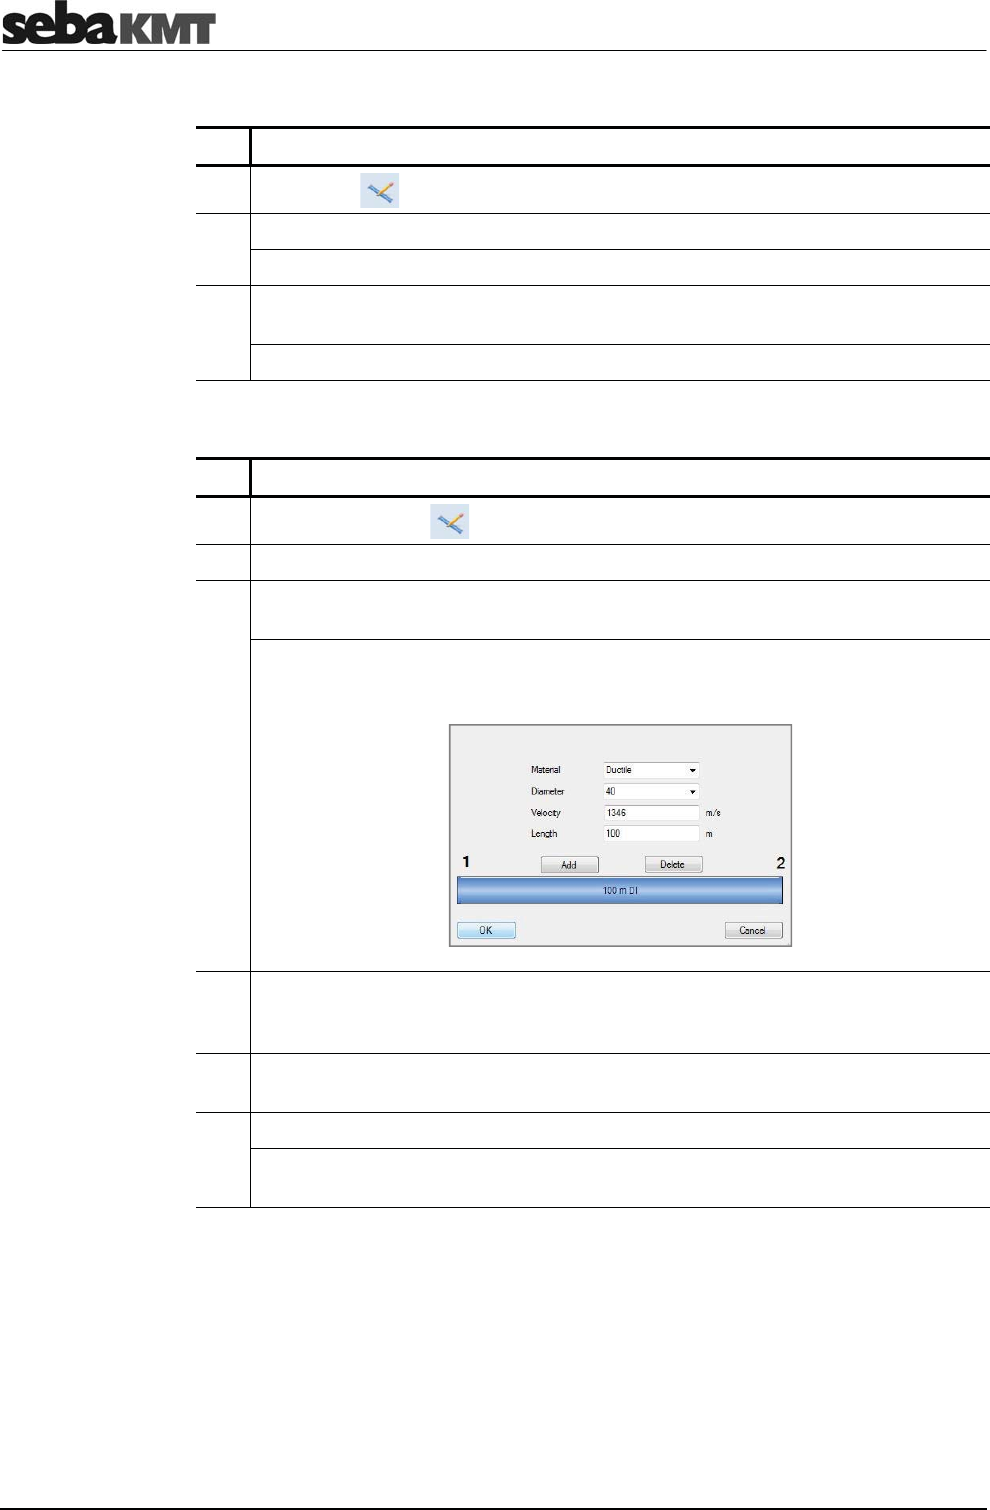
CorreluxView Software
126
To move and reposition sensor icons in the map section, proceed as follows:
Step Description
1 The button must be deactivated.
2 Click once on the sensor symbol you want to move.
Result: The symbol is now highlighted and "stuck" to your mouse cursor.
3 Move your mouse cursor to the new position for the symbol, then click your
mouse button again.
Result: The sensor now occupies the new position.
To draw in a new pipe section between two sensors, proceed as follows:
Step Description
1 Activate the button . It will appear highlighted.
2 In the map section, click on the first sensor (start of pipe section).
3 Move your mouse cursor to the second sensor (end of pipe section) and click on
it.
Result: A line will now connect the two sensor icons on the screen.
A window opens, allowing you to enter parameters for the new pipeline.
4 You can use the Add and Delete buttons to divide the displayed pipeline into
individual sections if the line between the sensors is not consistently of the same
material or does not have a consistent diameter.
5 Enter pipe data (material, diameter, length) for each pipe section.
To select a section, click directly on the relevant section in the graphic.
6 Click OK to confirm your input.
Result: The window will close, and the map section will now include the new
information you entered.
Go to the map section and double-click on a given pipeline to make changes to that
pipe's data or to the way you divided it into sections. The window for inputting pipe data
will open.
Arrange sensor icons
Draw pipelines
Edit a section /
change pipe data
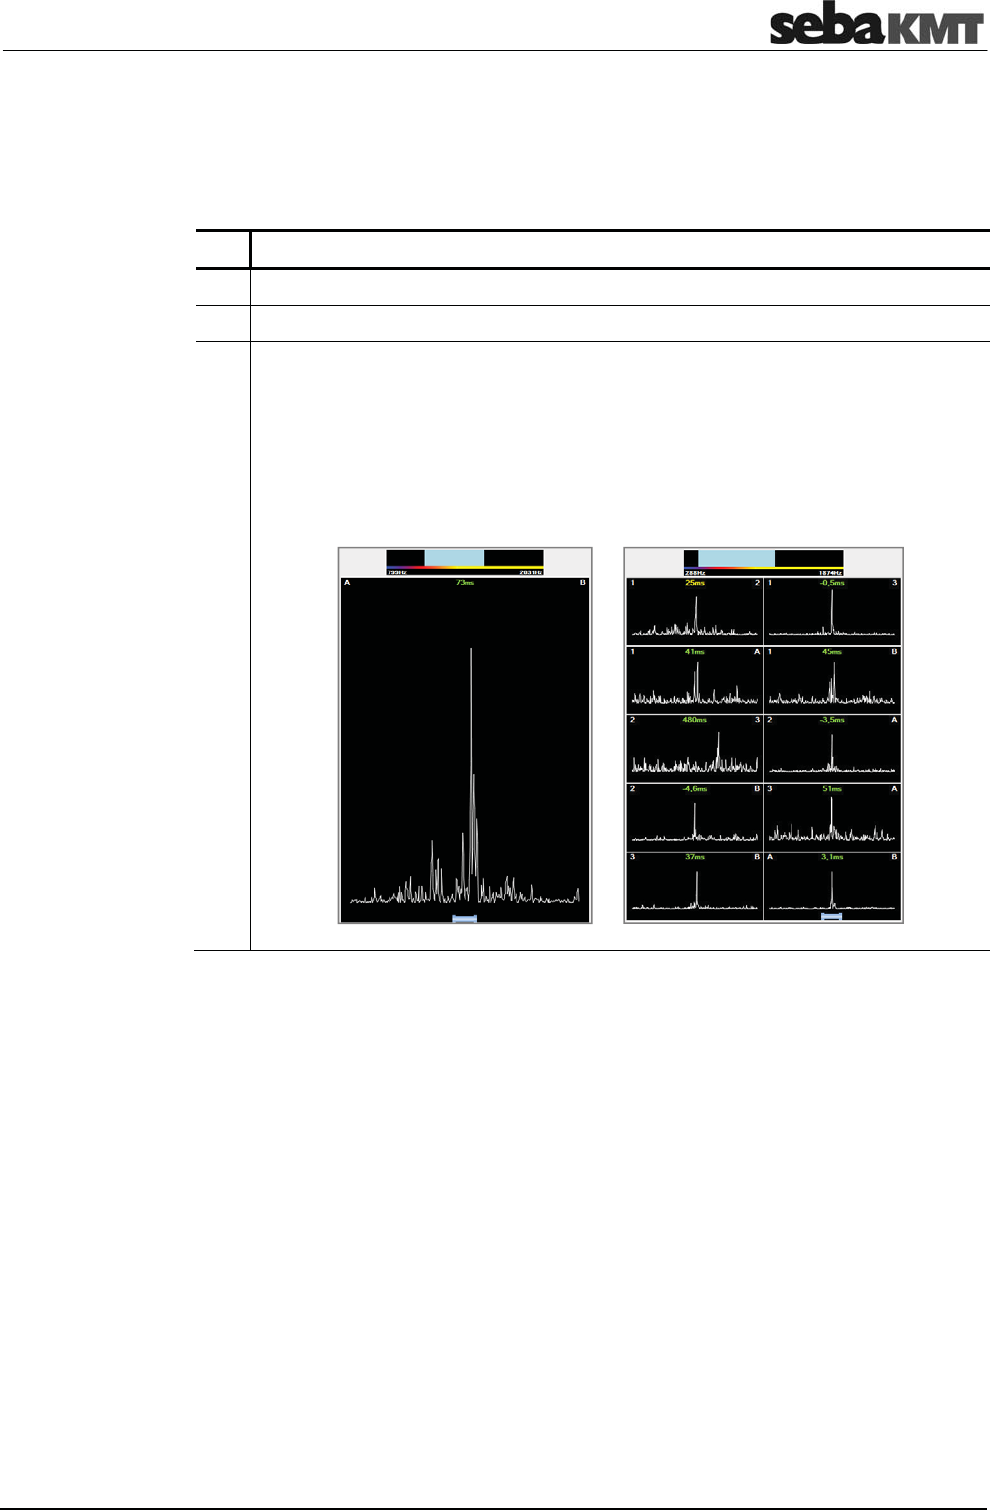
CorreluxView Software
127
19.6 Correlation
19.6.1 Perform and display a correlation
To display the correlation result for a measurement, proceed as follows:
Step Description
1 Select the relevant measurement in the directory tree.
2 Click on the Correlation button in the menu bar.
3 Result: In the case of Online measurements, a single window will appear and
display the correlation result as a curve (left graphic).
In the case of Offline measurements, the application will provide up to
28 miniature windows (thumbnails) to display the result of the multi-correlation
(right graphic).
You will probably already be familiar with these correlation diagrams from your
work with the Correlator.
The frequency diagram at the very top of the screen allows you to set a frequency filter
and to repeat the correlation.
First, go to the graphic and click on your desired lower frequency limit, keeping your
mouse key held down. Then move your mouse cursor to the right and let the key go
when you've reached your desired upper frequency limit. The correlation/multi-
correlation will update immediately, taking into consideration only the frequency range
marked in blue.
Using the Measurement tab at the top of the display area you can return to the view
that shows the sensor list and the map. Use the Correlation tab to call the correlation or
multicorrelation view again.
Set frequency filters
Change
display area view
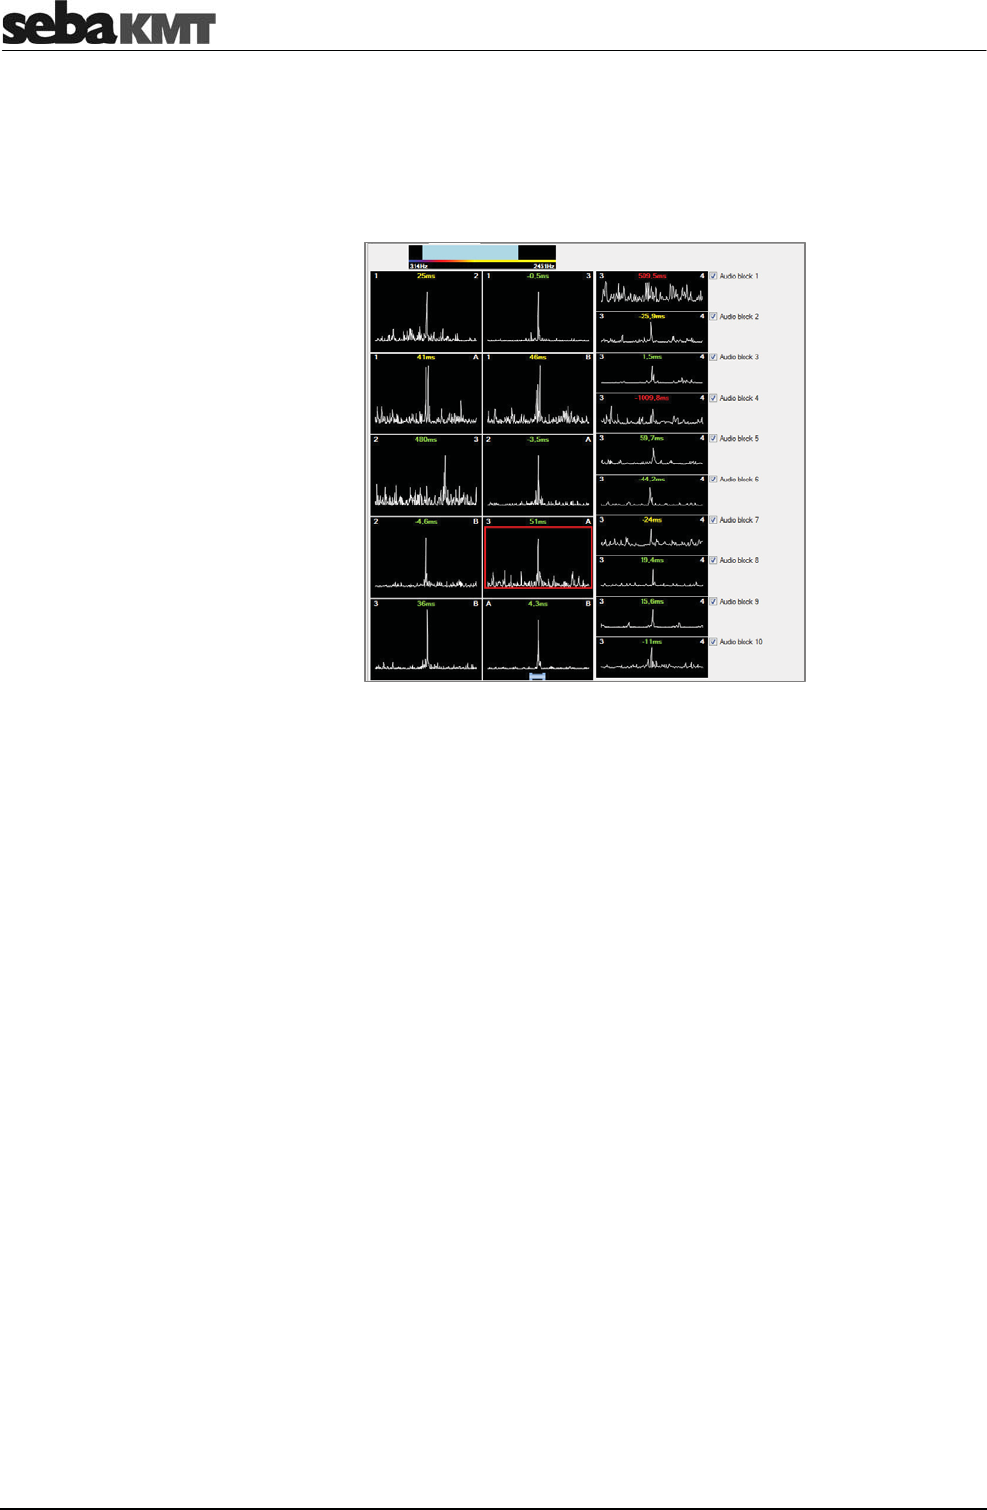
CorreluxView Software
128
19.6.2 Display and select audio blocks (Offline measurements only)
Once you click on the thumbnail of a sensor pair, 10 additional thumbnails will open at
the right of the screen, showing the individual correlations of the 10 audio blocks
recorded by these two sensors during measurement.
Using the 10 checkboxes on the right, you have the chance to exclude, from the overall
correlation, those individual audio block correlations which are "unusable".
To do this, just deactivate the checkbox next to the audio block in question.
The thumbnail of the sensor pair's overall correlation, highlighted by a red rectangular
frame, will be updated immediately.
The "disabled" audio block will be excluded from any correlation analysis until the
corresponding checkbox is ticked again.
Show audio blocks
Select audio blocks

CorreluxView Software
129
19.6.3 Call up the correlation analysis menu
Once you click twice on a correlation displayed by CorreluxView, the analysis menu
appears which can be used to more closely examine the correlation.
The menu which opens is very similar to the Correlator's Correlation menu.
Element Description
Correlation curve
with the Lag value top left whose color indicates the quality of the correlation
Coherence curve
Pipeline between A and B
Tapping the graphic opens the menu for entering pipe parameters.
Sensor number
Distance from sensor to leak
Comment field
for notes on this correlation
The buttons for analyzing correlation curve and coherence will probably also be familiar
to you from your work with the Correlator.
Zoom … To magnify a section of the correlation curve
Click on the button, then select the area in the diagram on which you want
to zoom.
Zoom opt. … Click on the button to toggle between the following two
displays:
•
Display of the entire correlation range
•
Display of only that portion of the correlation curve which refers to
the pipe section between the two measuring points
Peak suppression … To hide a section of the curve from view
Click on the button, then select the area in the diagram that you want to
suppress.
Reset … Sets all analysis tools as well as the correlation curve back to
their initial states.
Call up analysis menu
Design
Tools
Correlation
Coherence
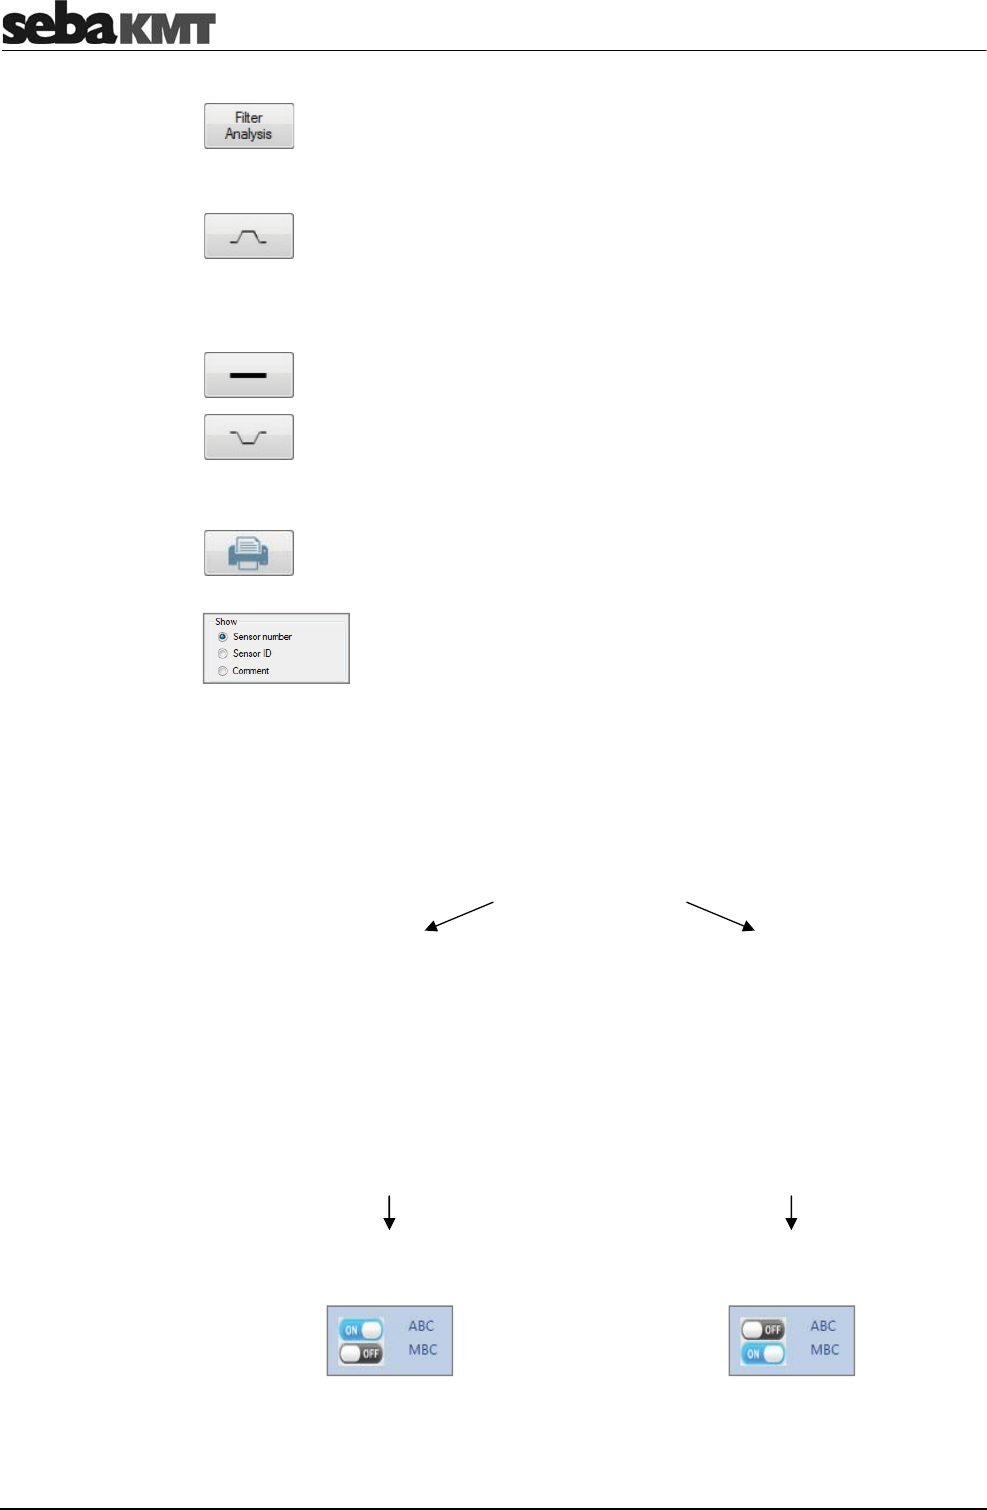
CorreluxView Software
130
Automatic search for filter … Provides 10 possible filter settings for
selection
Click on the button. The application will open a window which suggests 10
possible frequency filter settings, with the most sensible highlighted.
Bandpass … To delimit a frequency range
The button must first be activated. Then go to the coherence diagram and
select your desired frequency range.
The correlation is updated, suppressing those frequencies which fall
outside the range you selected.
Broadband … Resets the frequency filter
Bandstop … To suppress a frequency range.
The button must first be activated. Then go to the coherence diagram and
select your desired frequency range.
The correlation is updated, hiding the selected frequency range from view.
Print … Allows to print out the correlation and coherence curves that are
currently displayed. Clicking on the button will open the printer dialog
window.
Using the radio buttons in the Show segment bottom right, you can
select whether the two sensors (left and right of the correlation
curve) are described by their Sensor number, Identification number
or commentary.
19.6.4 Select a correlation method (Offline measurements only)
In the case of Offline measurements, one of the following two correlation methods for
the multi-correlation can be chosen:
Correlation methods
Averaged correlation
ABC
Minimum Block Correlation
MBC
The CorreluxView application calculates
an average over the 10 individual audio
block correlations carried out for a sensor
pair. This "averaged correlation" is
displayed in the sensor pair's thumbnail.
"Disabled" audio blocks are excluded from
the calculation.
The CorreluxView application selects the
quietest audio block out of the 10 individual
correlations for a sensor pair and displays
this in the sensor pair's thumbnail.
"Disabled" audio blocks are excluded from
the calculation.
In the menu bar, set the ABC slide control
to ON. In the menu bar, set the MBC slide control
to ON.

CorreluxView Software
131
Tento symbol indikuje, že výrobek nesoucí takovéto oznaþení nelze likvidovat spoleþnČ s bČžným domovním odpadem. Jelikož se jedná o produkt obchodovaný mezi
podnikatelskými subjekty (B2B), nelze jej likvidovat ani ve veĜejných sbČrných dvorech. Pokud se potĜebujete tohoto výrobku zbavit, obraĢte se na organizaci specializující
se na likvidaci starých elektrických spotĜebiþĤ v blízkosti svého pĤsobištČ.
Dit symbool duidt aan dat het product met dit symbool niet verwijderd mag worden als gewoon huishoudelijk afval. Dit is een product voor industrieel gebruik, wat betekent
dat het ook niet afgeleverd mag worden aan afvalcentra voor huishoudelijk afval. Als u dit product wilt verwijderen, gelieve dit op de juiste manier te doen en het naar een
nabij gelegen organisatie te brengen gespecialiseerd in de verwijdering van oud elektrisch materiaal.
This symbol indicates that the product which is marked in this way should not be disposed of as normal household waste. As it is a B2B product, it may also not be disposed
of at civic disposal centres. If you wish to dispose of this product, please do so properly by taking it to an organisation specialising in the disposal of old electrical equipment
near you.
Ɍɨɡɢ ɡɧɚɤ ɨɡɧɚɱɚɜɚ, ɱɟ ɩɪɨɞɭɤɬɴɬ, ɨɛɨɡɧɚɱɟɧ ɩɨ ɬɨɡɢ ɧɚɱɢɧ, ɧɟ ɬɪɹɛɜɚ ɞɚ ɫɟ ɢɡɯɜɴɪɥɹ ɤɚɬɨ ɛɢɬɨɜ ɨɬɩɚɞɴɤ. Ɍɴɣ ɤɚɬɨ ɟ B2B ɩɪɨɞɭɤɬ, ɧɟ ɛɢɜɚ ɞɚ ɫɟ ɢɡɯɴɪɥɹ ɢ ɜ
ɝɪɚɞɫɤɢ ɩɭɧɤɬɨɜɟ ɡɚ ɨɬɩɚɞɴɰɢ. Ⱥɤɨ ɠɟɥɚɟɬɟ ɞɚ ɢɡɜɴɪɥɢɬɟ ɩɪɨɞɭɤɬɚ, ɝɨ ɡɚɧɟɫɟɬɟ ɜ ɩɭɧɤɬ, ɫɩɟɰɢɚɥɢɡɢɪɚɧ ɜ ɢɡɯɜɴɪɥɹɧɟɬɨ ɧɚ ɫɬɚɪɨ ɟɥɟɤɬɪɢɱɟɫɤɨ ɨɛɨɪɭɞɜɚɧɟ.
Dette symbol viser, at det produkt, der er markeret på denne måde, ikke må kasseres som almindeligt husholdningsaffald. Eftersom det er et B2B produkt, må det heller ikke
bortskaffes på offentlige genbrugsstationer. Skal dette produkt kasseres, skal det gøres ordentligt ved at bringe det til en nærliggende organisation, der er specialiseret i at
bortskaffe gammelt el-udstyr.
Sellise sümboliga tähistatud toodet ei tohi käidelda tavalise olmejäätmena. Kuna tegemist on B2B-klassi kuuluva tootega, siis ei tohi seda viia kohalikku jäätmekäitluspunkti.
Kui soovite selle toote ära visata, siis viige see lähimasse vanade elektriseadmete käitlemisele spetsialiseerunud ettevõttesse.
Tällä merkinnällä ilmoitetaan, että kyseisellä merkinnällä varustettua tuotetta ei saa hävittää tavallisen kotitalousjätteen seassa. Koska kyseessä on yritysten välisen kaupan
tuote, sitä ei saa myöskään viedä kuluttajien käyttöön tarkoitettuihin keräyspisteisiin. Jos haluatte hävittää tämän tuotteen, ottakaa yhteys lähimpään vanhojen
sähkölaitteiden hävittämiseen erikoistuneeseen organisaatioon.
Ce symbole indique que le produit sur lequel il figure ne peut pas être éliminé comme un déchet ménager ordinaire. Comme il s’agit d’un produit B2B, il ne peut pas non plus
être déposé dans une déchetterie municipale. Pour éliminer ce produit, amenez-le à l’organisation spécialisée dans l’élimination d’anciens équipements électriques la plus
proche de chez vous.
Cuireann an siombail seo in iúl nár cheart an táirgeadh atá marcáilte sa tslí seo a dhiúscairt sa chóras fuíoll teaghlaigh. Os rud é gur táirgeadh ghnó le gnó (B2B) é, ní féidir
é a dhiúscairt ach oiread in ionaid dhiúscartha phobail. Más mian leat an táirgeadh seo a dhiúscairt, déan é a thógáil ag eagraíocht gar duit a sainfheidhmíonn i ndiúscairt
sean-fhearas leictrigh.
Dieses Symbol zeigt an, dass das damit gekennzeichnete Produkt nicht als normaler Haushaltsabfall entsorgt werden soll. Da es sich um ein B2B-Gerät handelt, darf es
auch nicht bei kommunalen Wertstoffhöfen abgegeben werden. Wenn Sie dieses Gerät entsorgen möchten, bringen Sie es bitte sachgemäß zu einem Entsorger für
Elektroaltgeräte in Ihrer Nähe.
ǹȣIJȩ IJȠ ıȪȝȕȠȜȠ ȣʌȠįİȚțȞȪİȚ ȩIJȚ IJȠ ʌȡȠȧȩȞ ʌȠȣ ijȑȡİȚ IJȘ ıȒȝĮȞıȘ ĮȣIJȒ įİȞ ʌȡȑʌİȚ ȞĮ ĮʌȠȡȡȓʌIJİIJĮȚ ȝĮȗȓ ȝİ IJĮ ȠȚțȚĮțȐ ĮʌȠȡȡȓȝĮIJĮ. ȀĮșȫȢ ʌȡȩțİȚIJĮȚ ȖȚĮ ʌȡȠȧȩȞ B2B, įİȞ
ʌȡȑʌİȚ ȞĮ ĮʌȠȡȡȓʌIJİIJĮȚ ıİ įȘȝȠIJȚțȐ ıȘȝİȓĮ ĮʌȩȡȡȚȥȘȢ. ǼȐȞ șȑȜİIJİ ȞĮ ĮʌȠȡȡȓȥİIJİ IJȠ ʌȡȠȧȩȞ ĮȣIJȩ, ʌĮȡĮțĮȜȠȪȝİ ȩʌȦȢ ȞĮ IJȠ ʌĮȡĮįȫıİIJİ ıİ ȝȓĮ ȣʌȘȡİıȓĮ ıȣȜȜȠȖȒȢ
ȘȜİțIJȡȚțȠȪ İȟȠʌȜȚıȝȠȪ IJȘȢ ʌİȡȚȠȤȒȢ ıĮȢ.
Ez a jelzés azt jelenti, hogy az ilyen jelzéssel ellátott terméket tilos a háztartási hulladékokkal együtt kidobni. Mivel ez vállalati felhasználású termék, tilos a lakosság
számára fenntartott hulladékgyĦjtĘkbe dobni.Ha a terméket ki szeretné dobni, akkor vigye azt el a lakóhelyéhez közel mĦködĘ, elhasznált elektromos berendezések
begyĦjtésével foglalkozó hulladékkezelĘ központhoz.
Questo simbolo indica che il prodotto non deve essere smaltito come un normale rifiuto domestico. In quanto prodotto B2B, può anche non essere smaltito in centri di
smaltimento cittadino. Se si desidera smaltire il prodotto, consegnarlo a un organismo specializzato in smaltimento di apparecchiature elettriche vecchie.
ŠƯ zƯme norƗda, ka iztrƗdƗjumu, uz kura tƗ atrodas, nedrƯkst izmest kopƗ ar parastiem mƗjsaimniecƯbas atkritumiem. TƗ kƗ tas ir izstrƗdƗjums, ko cits citam pƗrdod un lieto
tikai uzƼƝmumi, tad to nedrƯkst arƯ izmest atkritumos tƗdƗs izgƗztuvƝs un atkritumu savƗktuvƝs, kas paredzƝtas vietƝjiem iedzƯvotƗjiem. Ja bnjs vajadzƯgs šo izstrƗdƗjumu
izmest atkritumos, tad rƯkojieties pƝc noteikumiem un nogƗdƗjiet to tuvƗkajƗ vietƗ, kur Ưpaši nodarbojas ar vecu elektrisku ierƯþu savƗkšanu.
Šis simbolis rodo, kad juo paženklinto gaminio negalima išmesti kaip paprastǐ buitiniǐ atliekǐ. Kadangi tai B2B (verslas verslui) produktas, jo negalima atiduoti ir buitiniǐ
atliekǐ tvarkymo Ƴmonơms. Jei norite išmesti šƳ gaminƳ, atlikite tai tinkamai, atiduodami jƳ arti jnjsǐ esanþiai specializuotai senos elektrinơs Ƴrangos utilizavimo organizacijai.
Dan is-simbolu jindika li l-prodott li huwa mmarkat b’dan il-mod m’gƫandux jintrema bƫal skart normali tad-djar. Minƫabba li huwa prodott B2B , ma jistax jintrema wkoll
f’ƛentri ƛiviƛi gƫar-rimi ta’ l-iskart. Jekk tkun tixtieq tarmi dan il-prodott, jekk jogƫƥbok gƫamel dan kif suppost billi tieƫdu gƫand organizzazzjoni fil-qrib li tispeƛjalizza fir-rimi ta’
tagƫmir qadim ta’ l-elettriku.
Dette symbolet indikerer at produktet som er merket på denne måten ikke skal kastes som vanlig husholdningsavfall. Siden dette er et bedriftsprodukt, kan det heller ikke
kastes ved en vanlig miljøstasjon. Hvis du ønsker å kaste dette produktet, er den riktige måten å gi det til en organisasjon i nærheten som spesialiserer seg på kassering av
gammelt elektrisk utstyr.
Ten symbol oznacza, Īe produktu nim opatrzonego nie naleĪy usuwaü z typowymi odpadami z gospodarstwa domowego. Jest to produkt typu B2B, nie naleĪy go wiĊc
przekazywaü na komunalne składowiska odpadów. Aby we właĞciwy sposób usunąü ten produkt, naleĪy przekazaü go do najbliĪszej placówki specjalizującej siĊ w
usuwaniu starych urządzeĔ elektrycznych.
Este símbolo indica que o produto com esta marcação não deve ser deitado fora juntamente com o lixo doméstico normal. Como se trata de um produto B2B, também não
pode ser deitado fora em centros cívicos de recolha de lixo. Se quiser desfazer-se deste produto, faça-o correctamente entregando-o a uma organização especializada na
eliminação de equipamento eléctrico antigo, próxima de si.
Acest simbol indică faptul că produsul marcat în acest fel nu trebuie aruncat ca úi un gunoi menajer obiúnuit. Deoarece acesta este un produs B2B, el nu trebuie aruncat nici
la centrele de colectare urbane. Dacă vreĠi să aruncaĠi acest produs, vă rugăm s-o faceĠi într-un mod adecvat, ducând-ul la cea mai apropiată firmă specializată în colectarea
echipamentelor electrice uzate.
Tento symbol znamená, že takto oznaþený výrobok sa nesmie likvidovaĢ ako bežný komunálny odpad.Kećže sa jedná o výrobok triedy B2B, nesmie sa likvidovaĢ ani na
mestských skládkach odpadu. Ak chcete tento výrobok likvidovaĢ, odneste ho do najbližšej organizácie, ktorá sa špecializuje na likvidáciu starých elektrických zariadení.
Ta simbol pomeni, da izdelka, ki je z njim oznaþen, ne smete zavreþi kot obiþajne gospodinjske odpadke. Ker je to izdelek, namenjen za druge proizvajalce, ga ni dovoljeno
odlagati v centrih za civilno odlaganje odpadkov. ýe želite izdelek zavreþi, prosimo, da to storite v skladu s predpisi, tako da ga odpeljete v bližnjo organizacijo, ki je
specializirana za odlaganje stare elektriþne opreme.
Este símbolo indica que el producto así señalizado no debe desecharse como los residuos domésticos normales. Dado que es un producto de consumo profesional,
tampoco debe llevarse a centros de recogida selectiva municipales. Si desea desechar este producto, hágalo debidamente acudiendo a una organización de su zona que
esté especializada en el tratamiento de residuos de aparatos eléctricos usados.
Den här symbolen indikerar att produkten inte får blandas med normalt hushållsavfall då den är förbrukad. Eftersom produkten är en så kallad B2B-produkt är den inte
avsedd för privata konsumenter, den får således inte avfallshanteras på allmänna miljö- eller återvinningsstationer då den är förbrukad. Om ni vill avfallshantera den här
produkten på rätt sätt, ska ni lämna den till myndighet eller företag, specialiserad på avfallshantering av förbrukad elektrisk utrustning i ert närområde.