Snap on Diagnostics EEMS330 Display Unit User Manual VerusPro UserManual
Snap-on Diagnostics Display Unit VerusPro UserManual
UserManual.wiki
>
Snap on Diagnostics
>
EEMS330 User Manual
>
Users Manual-1
Contents
1.
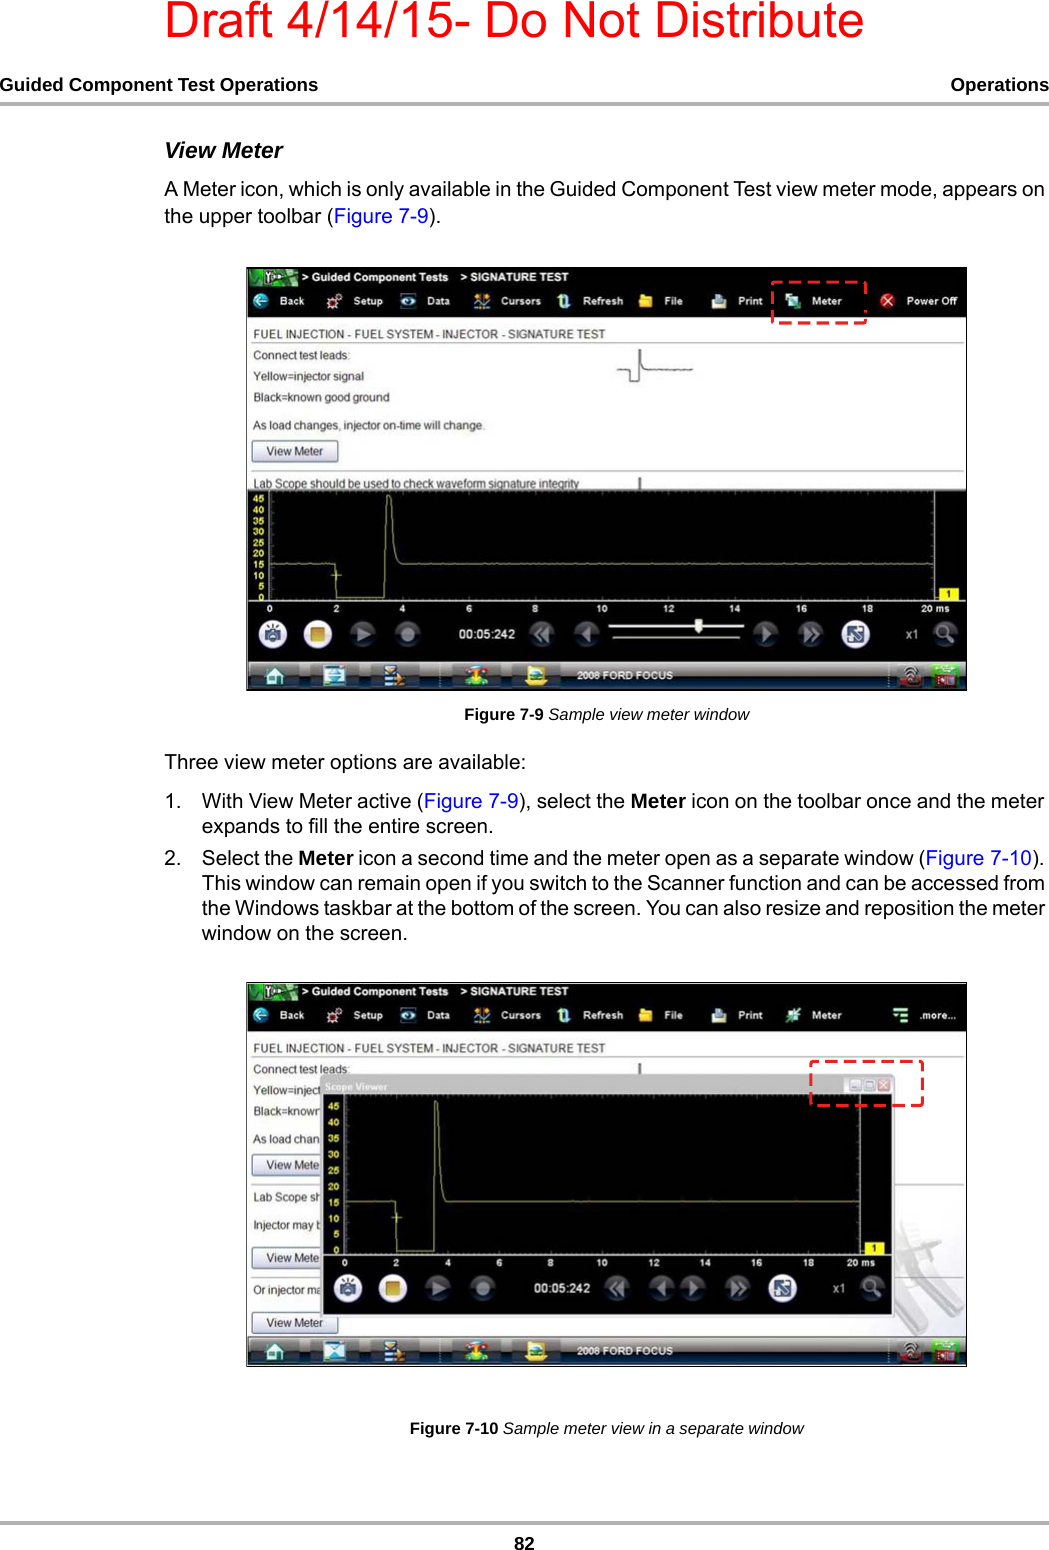
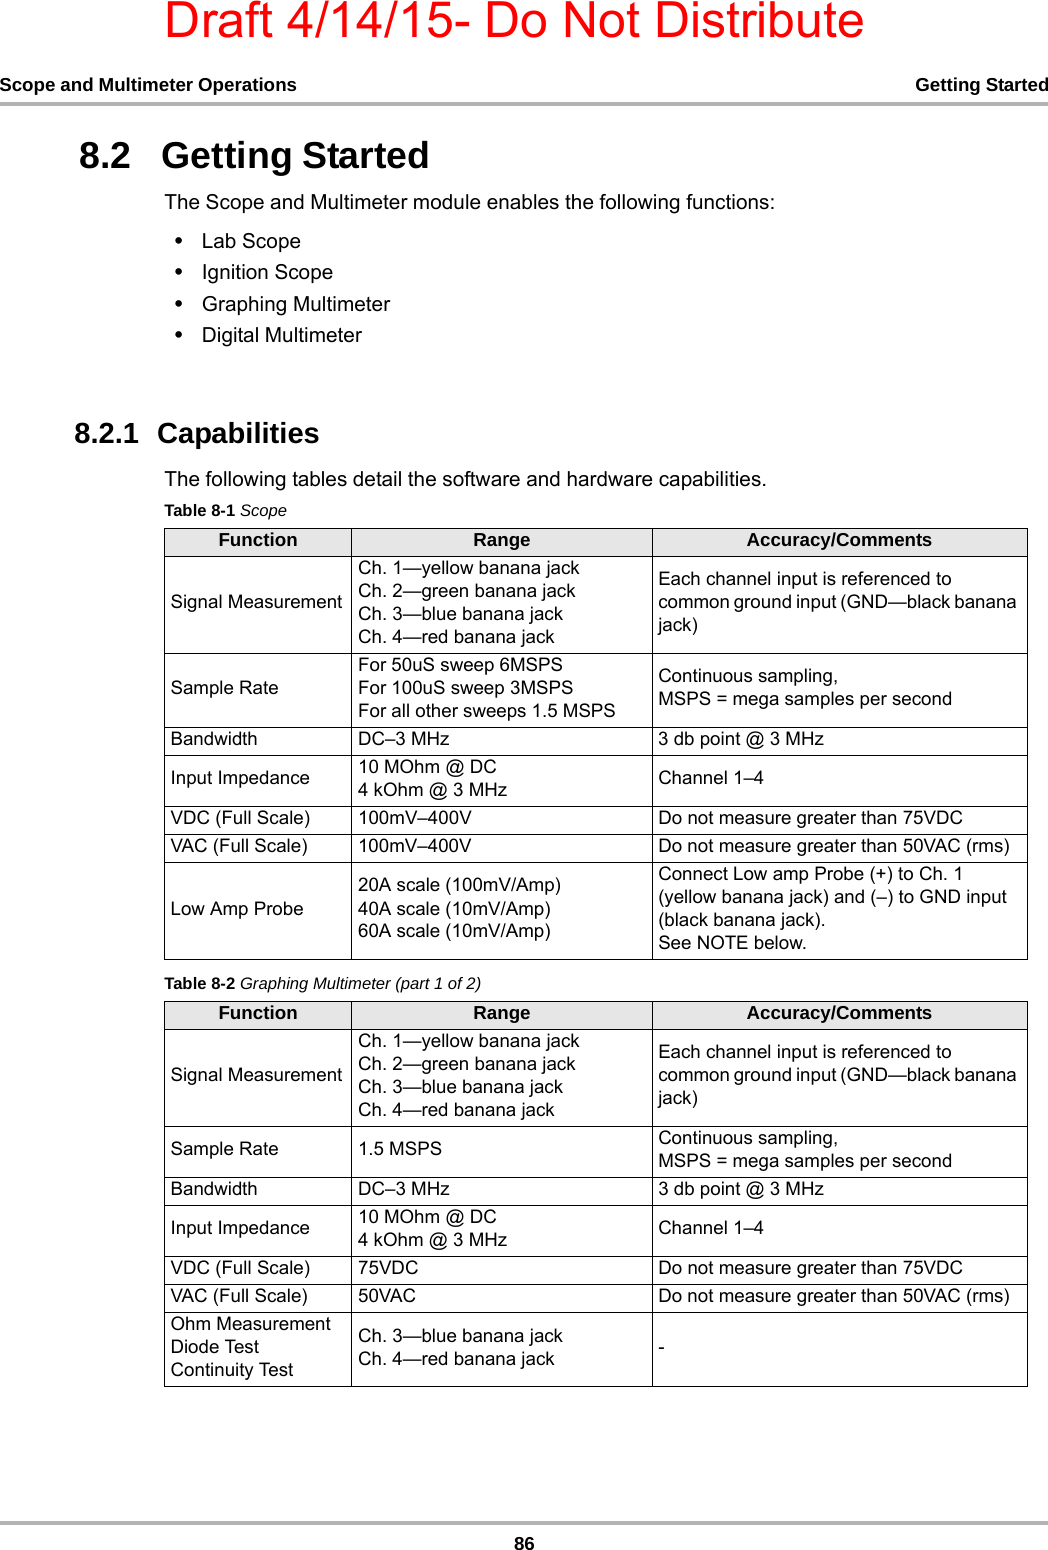
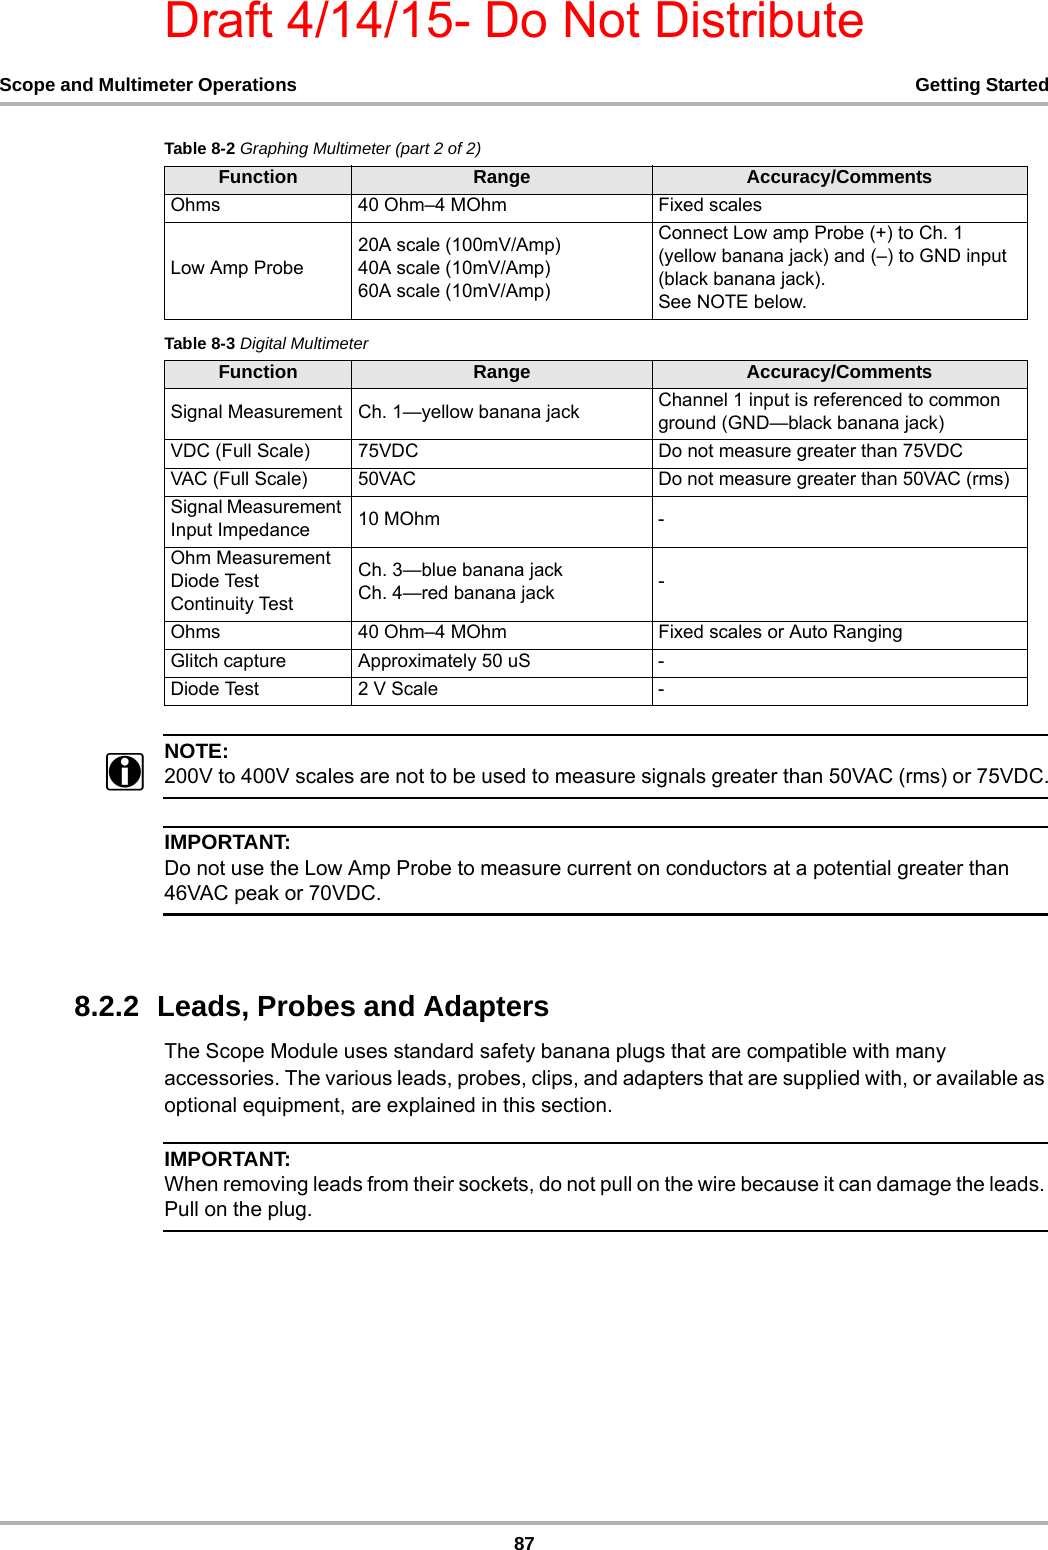
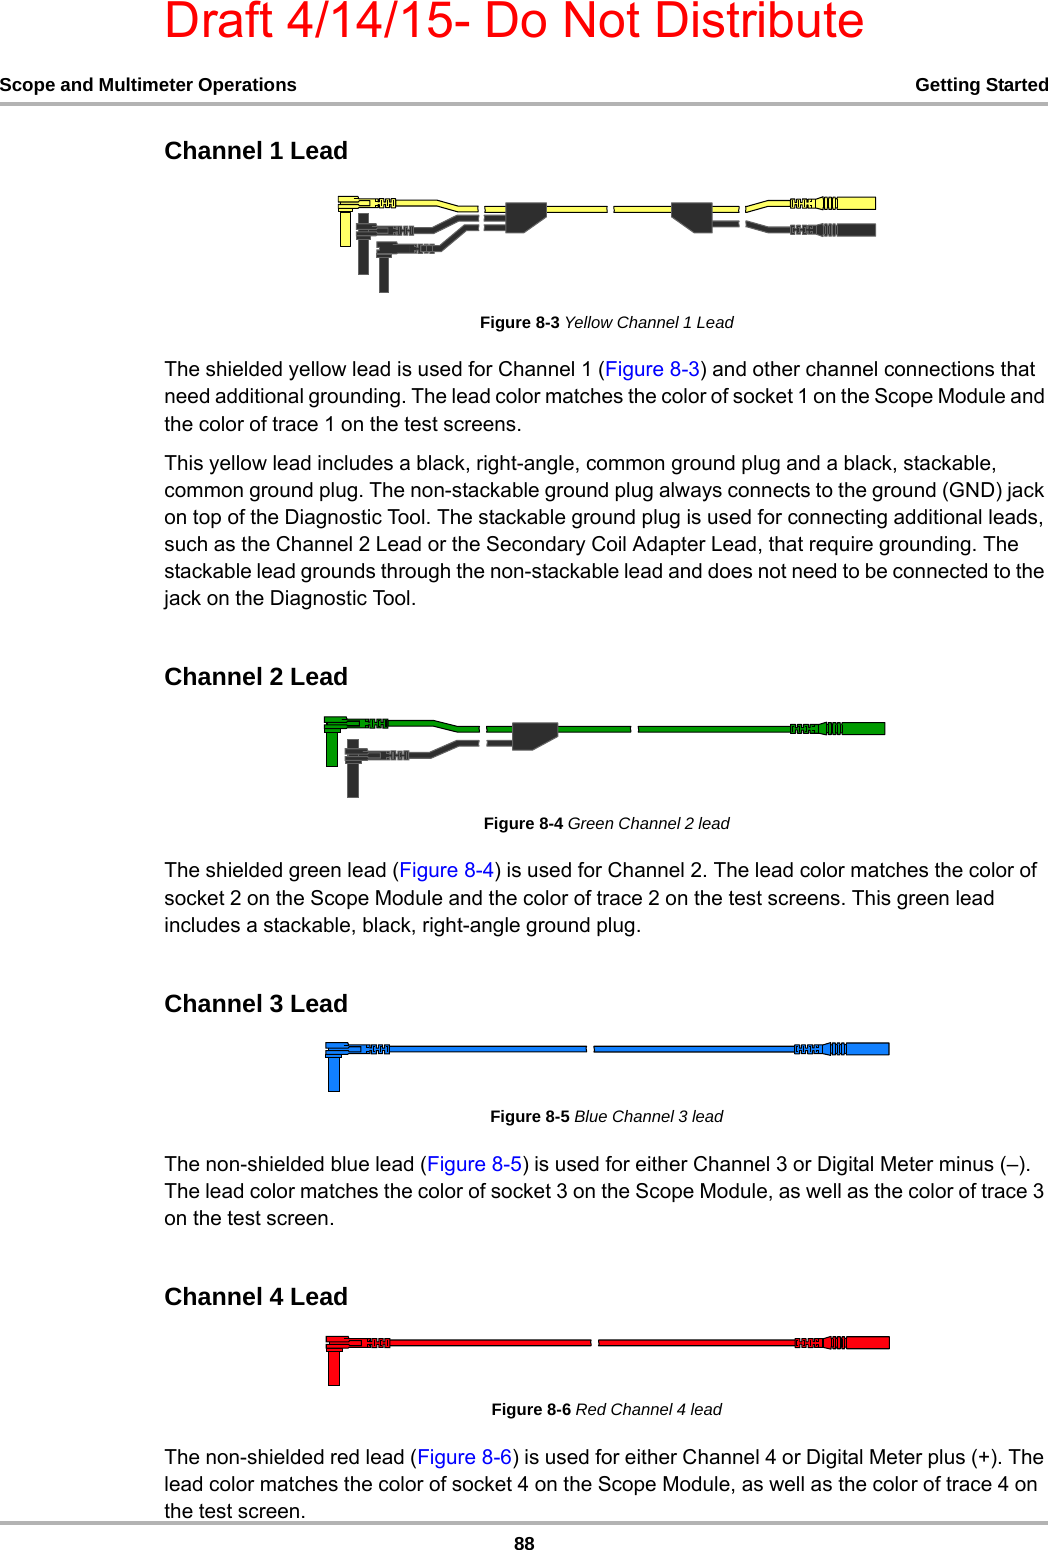
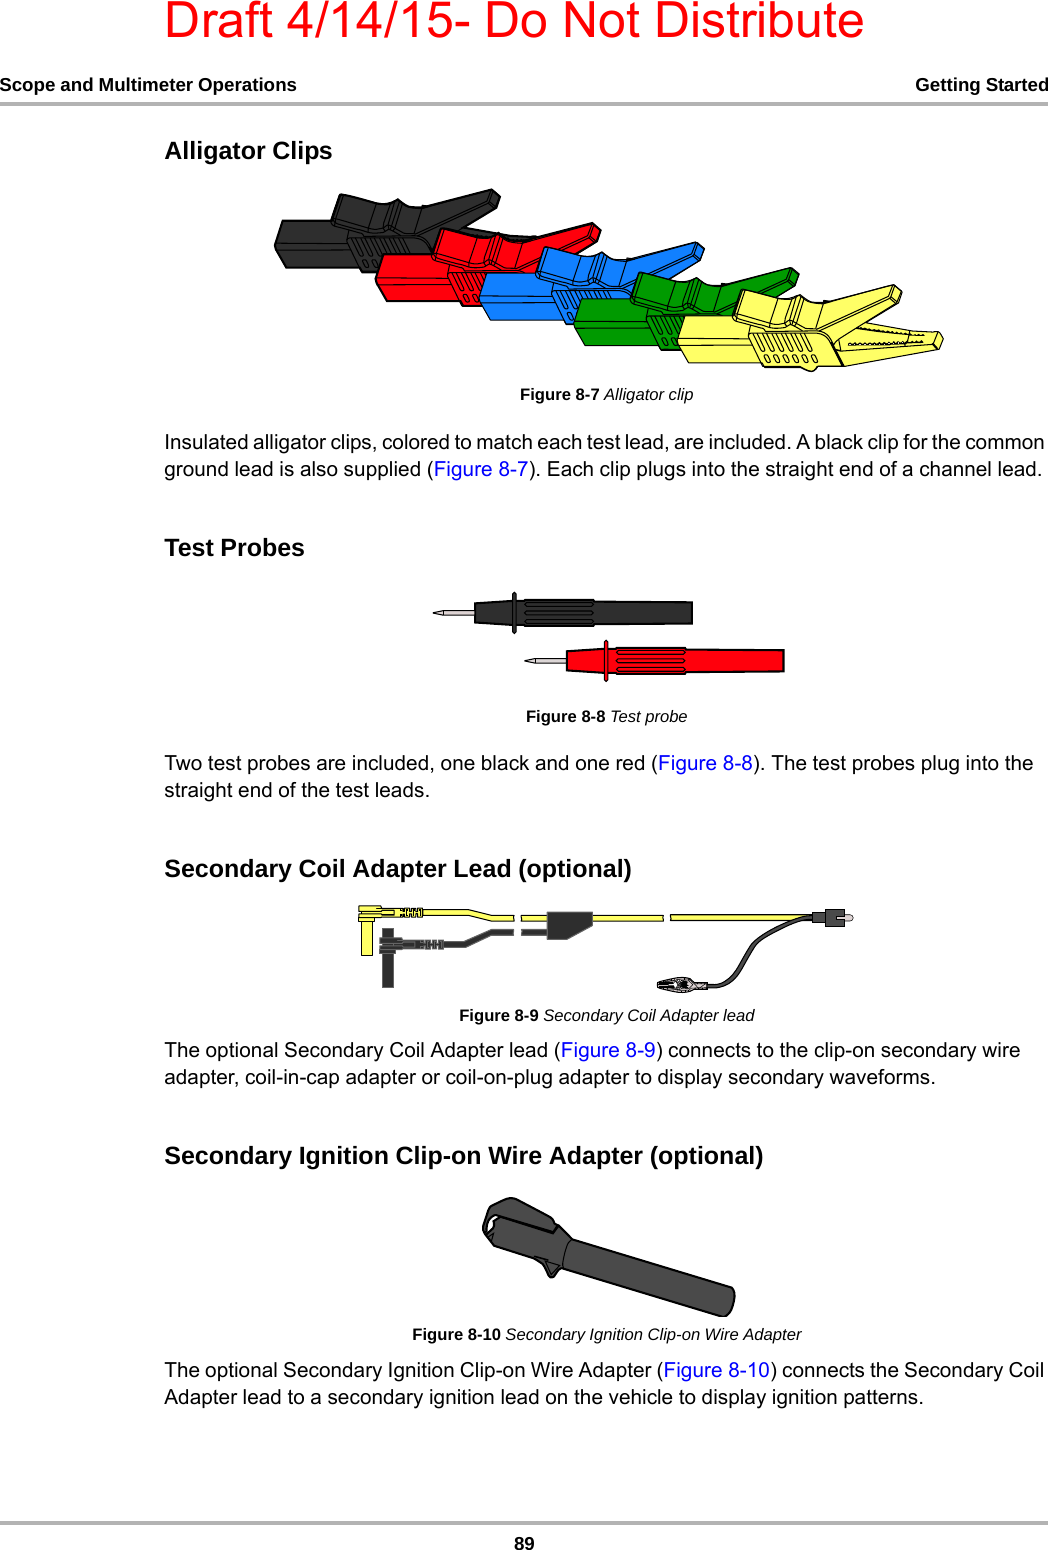
Users Manual-1
2.
Users Manual-2
Users Manual-1
Navigation menu
Upload a User Manual
Namespaces
Wiki Guide
HTML
PDF
Info
Views
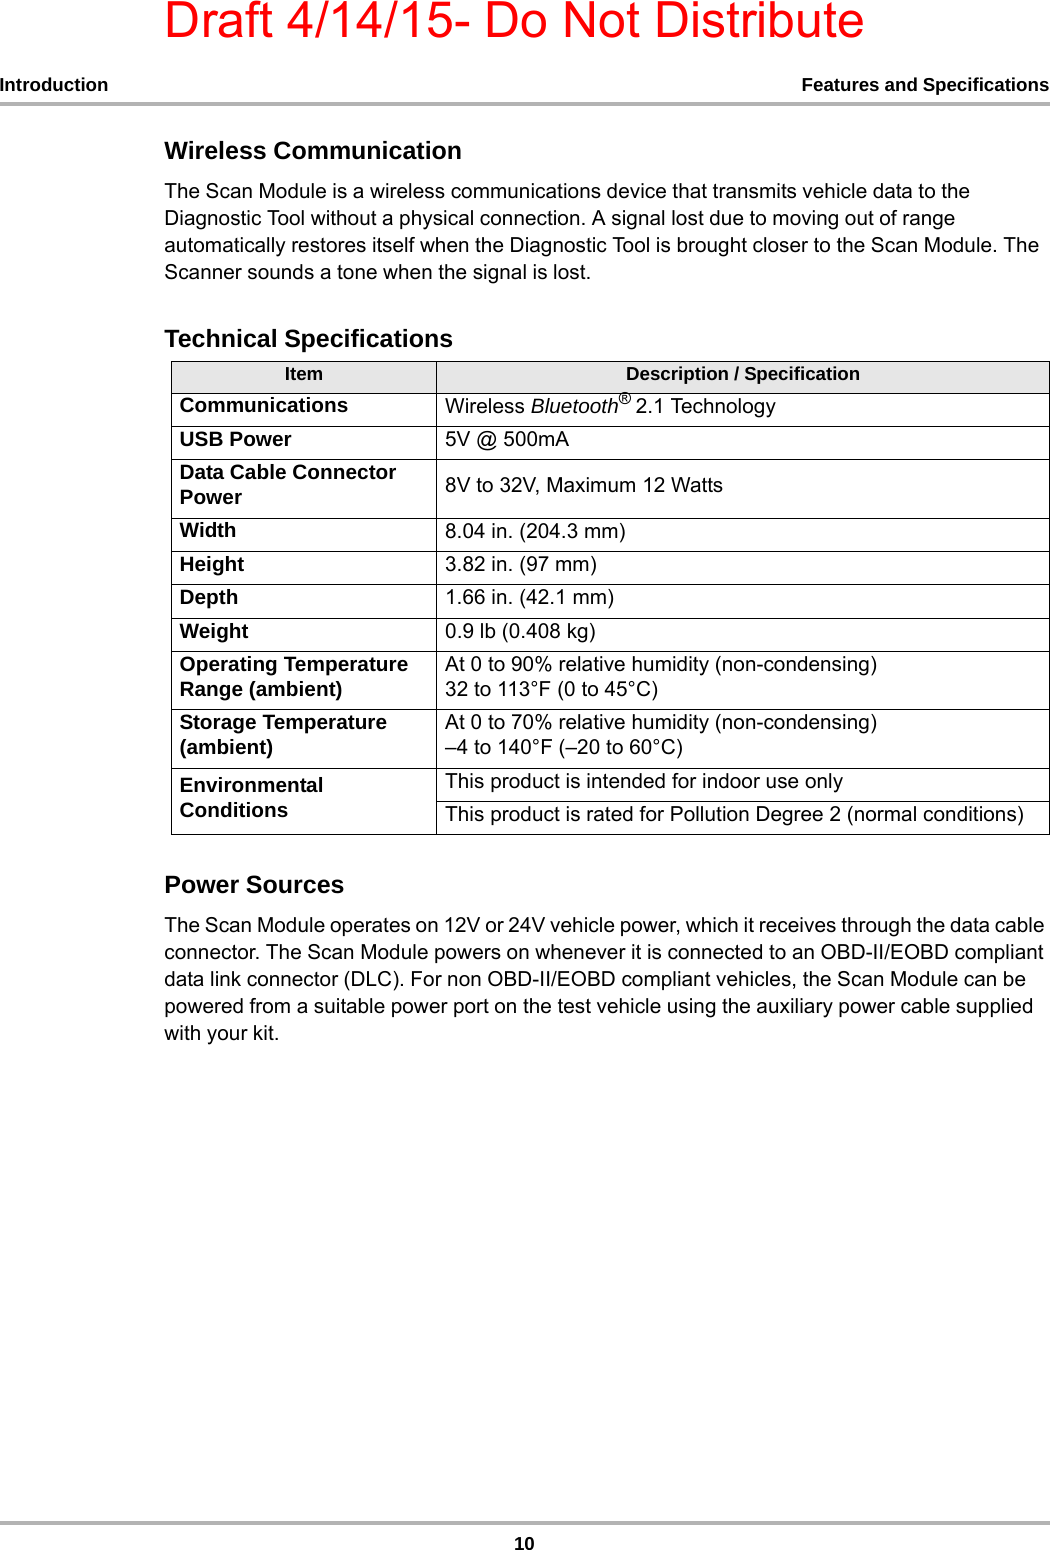
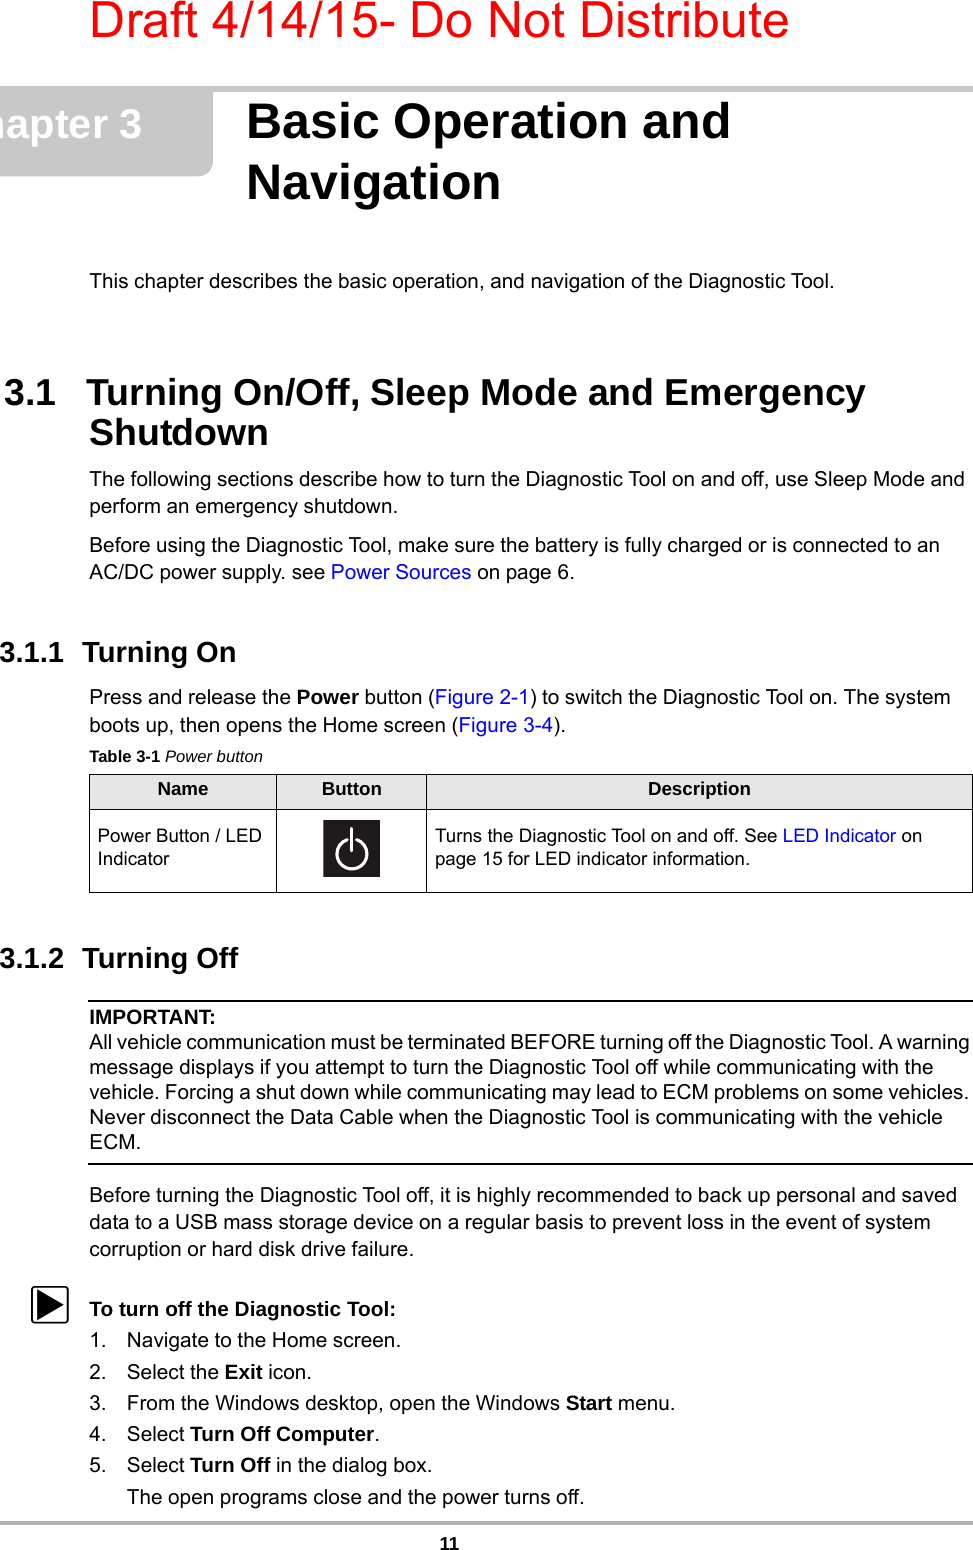
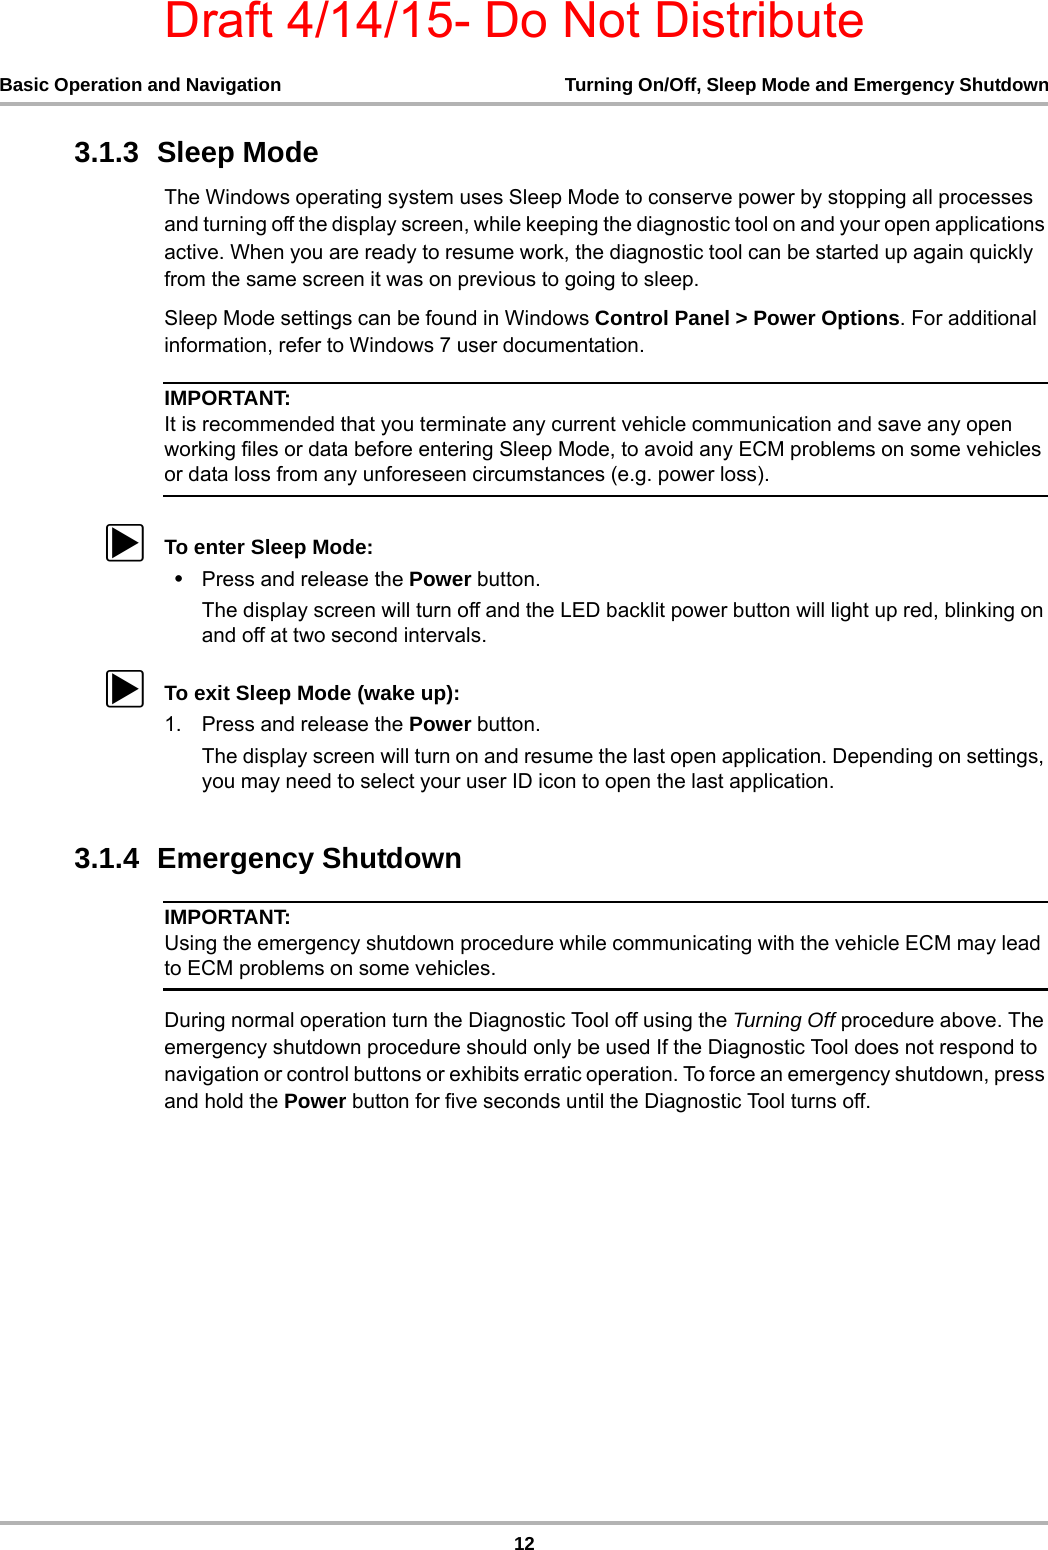
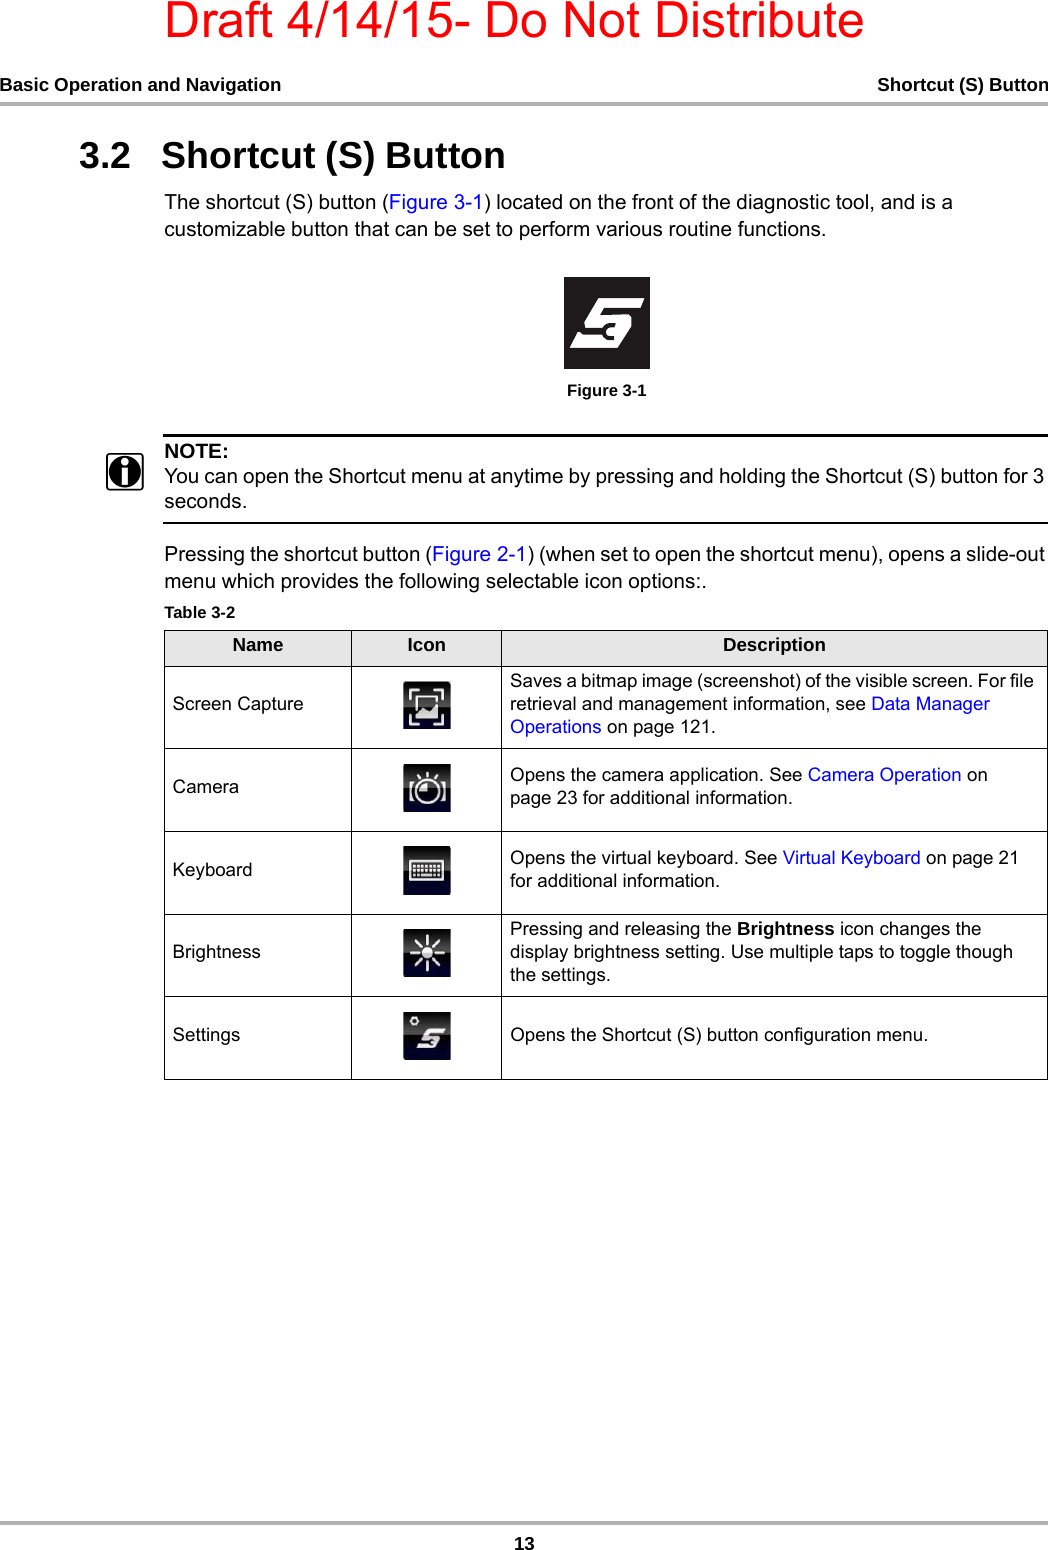
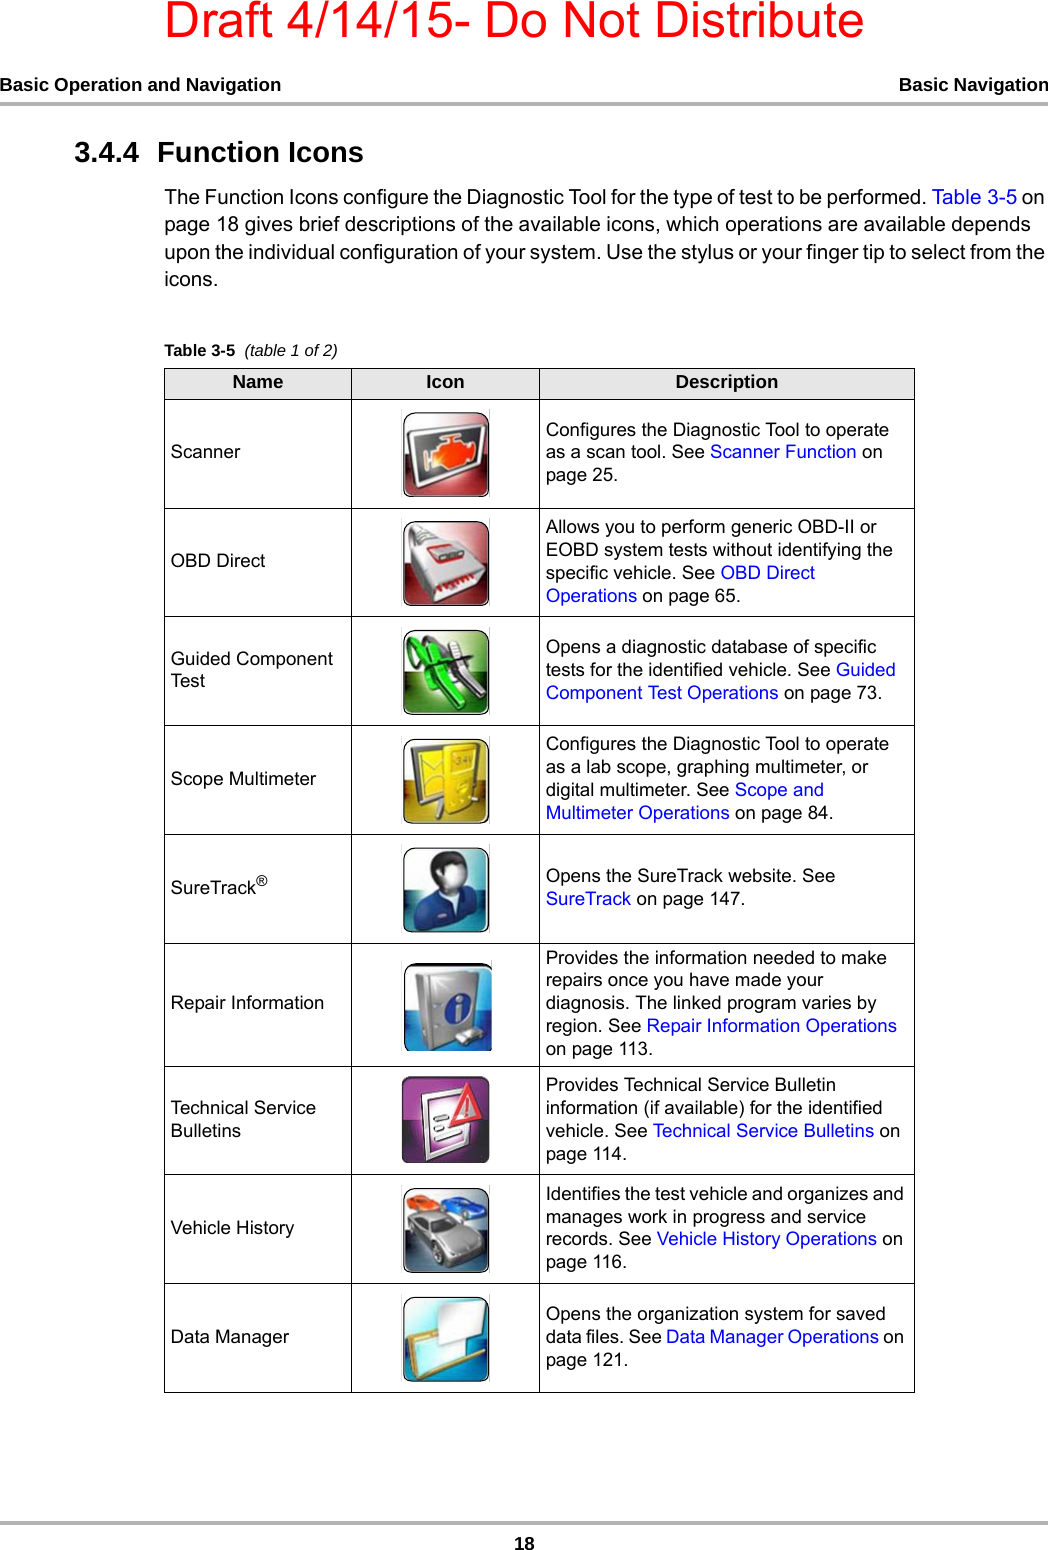
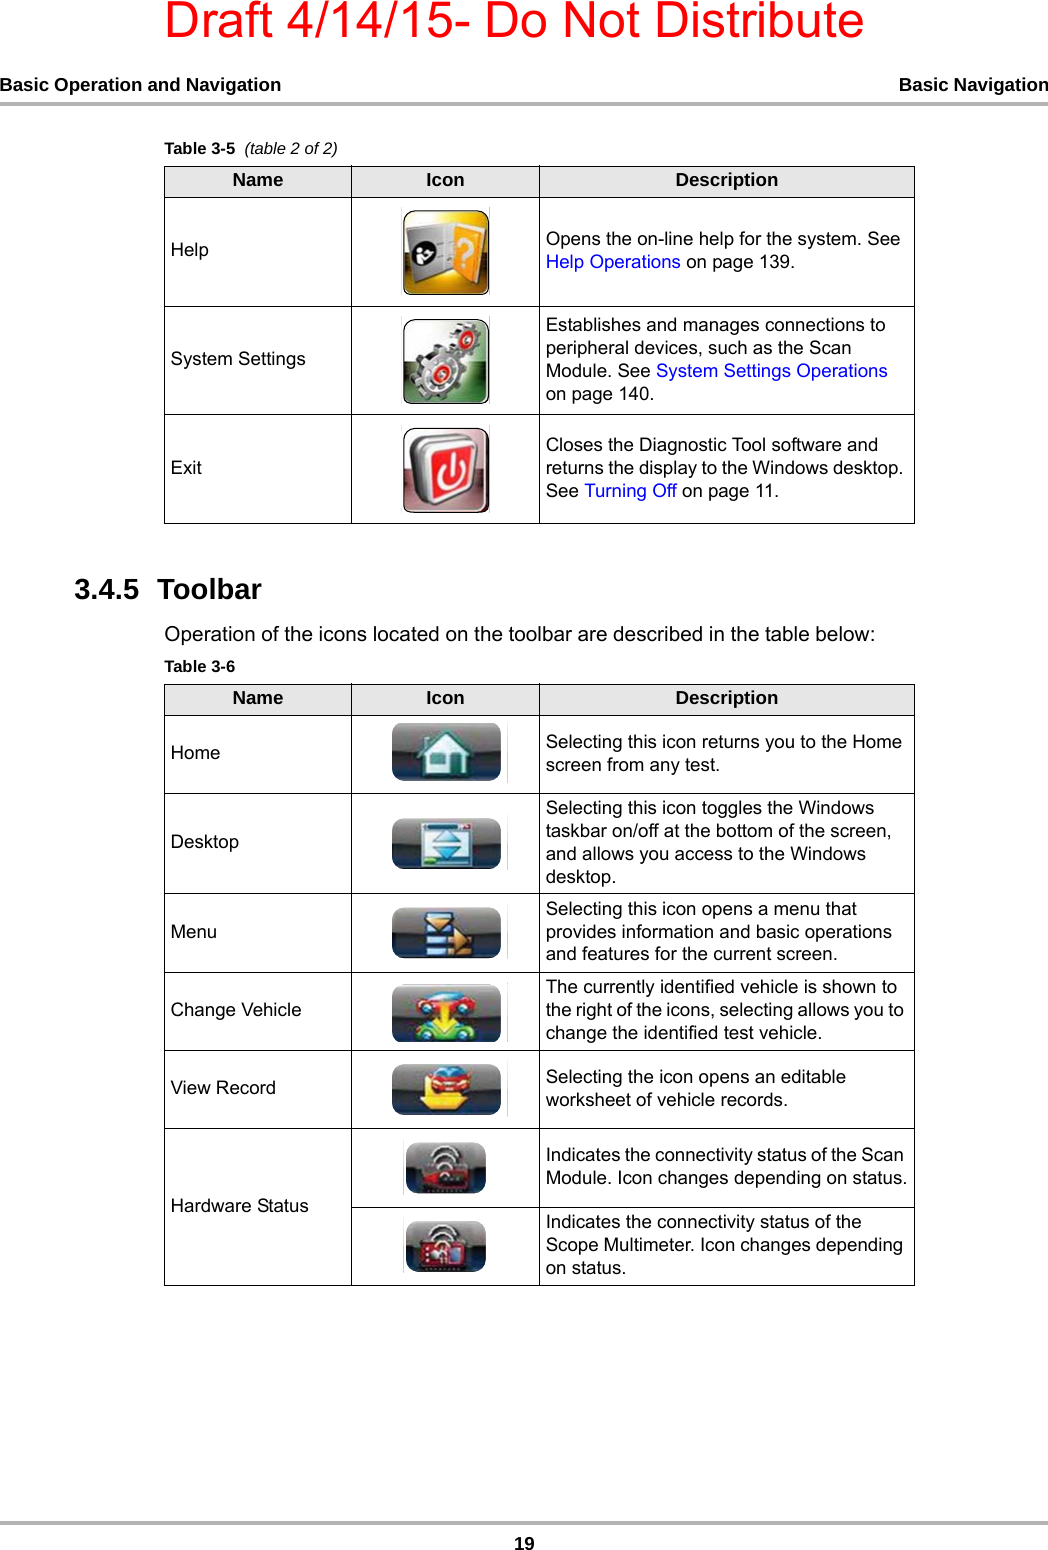
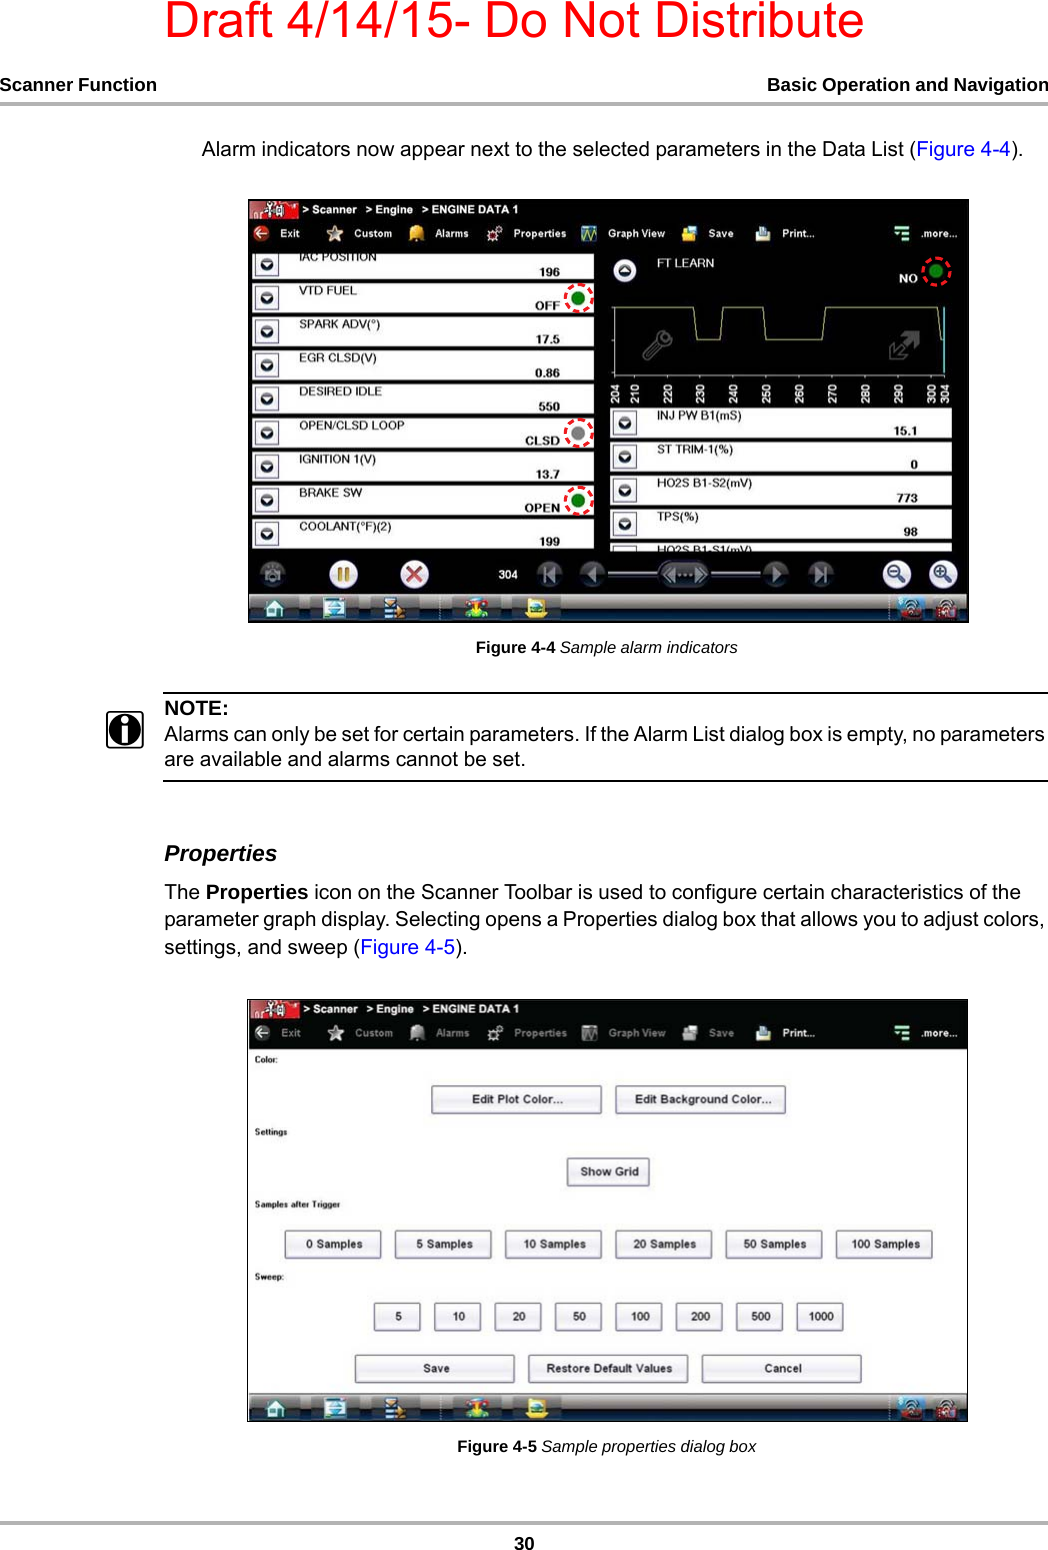
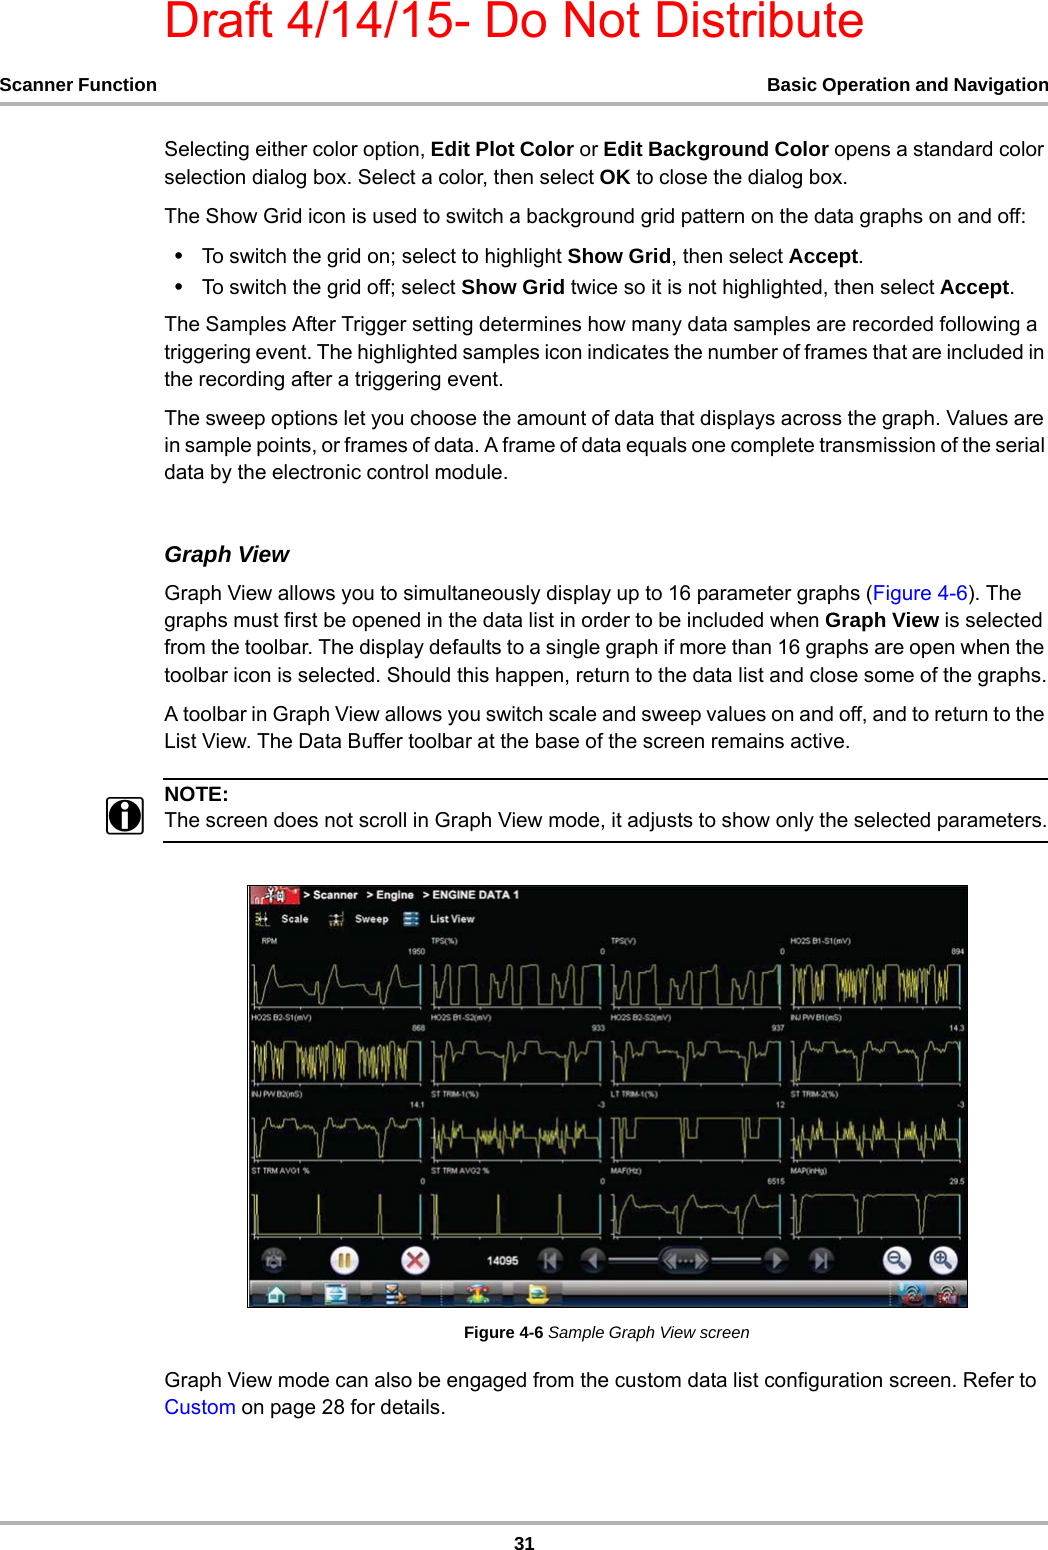
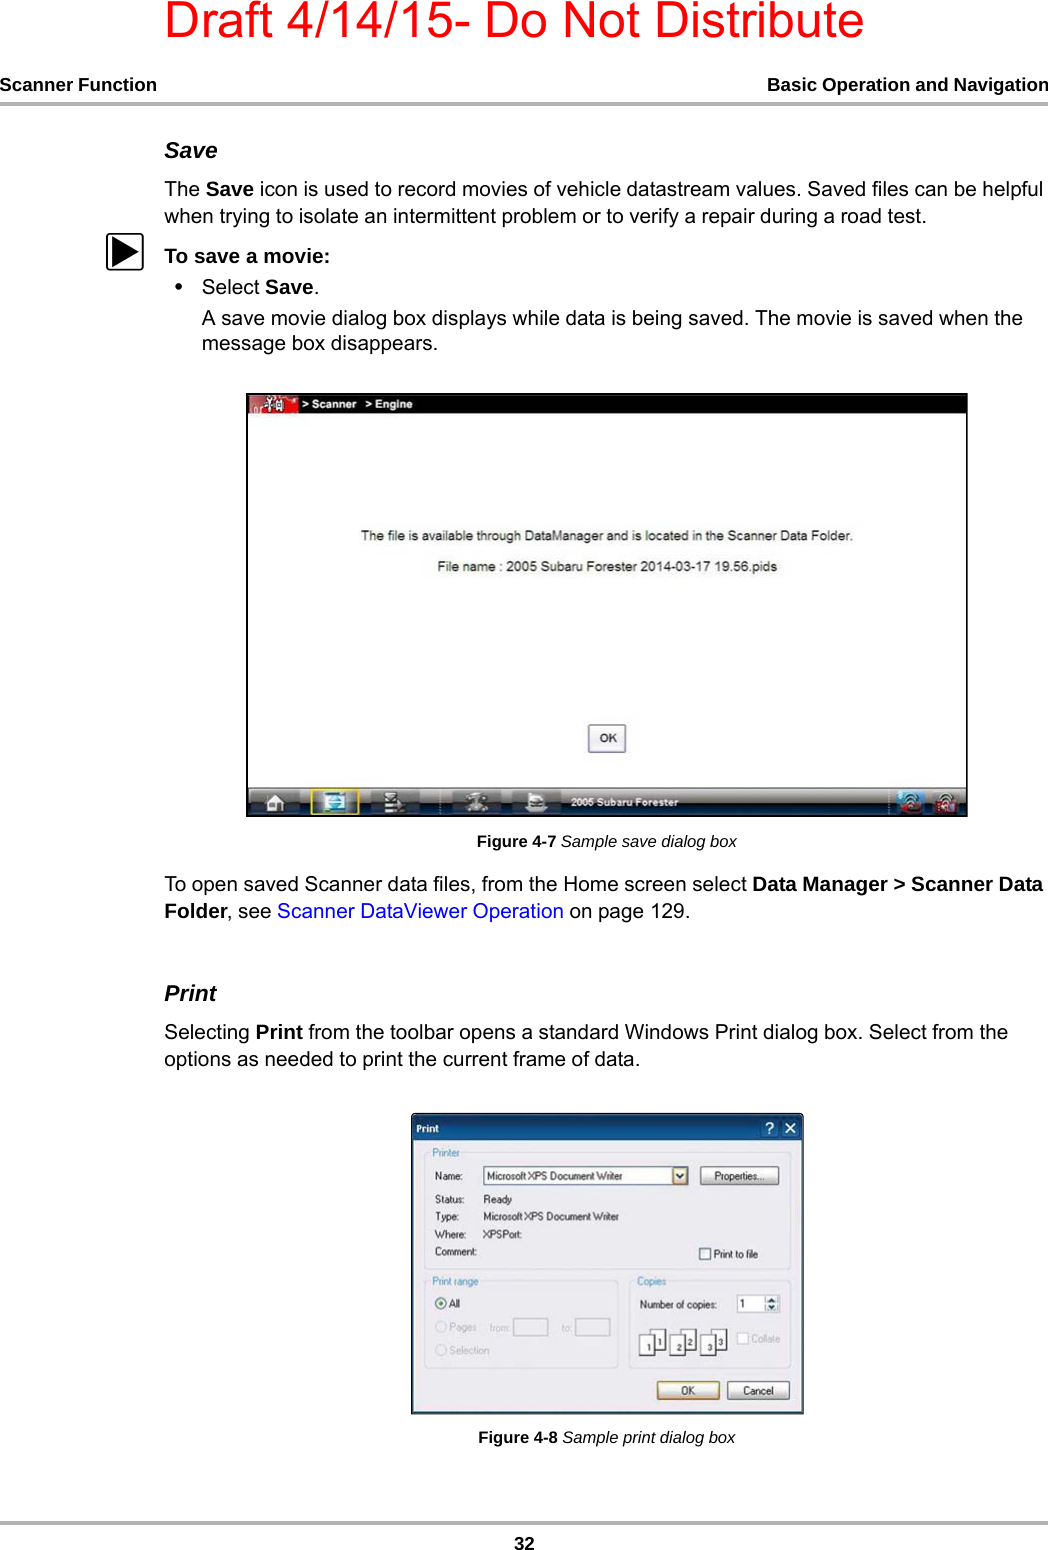
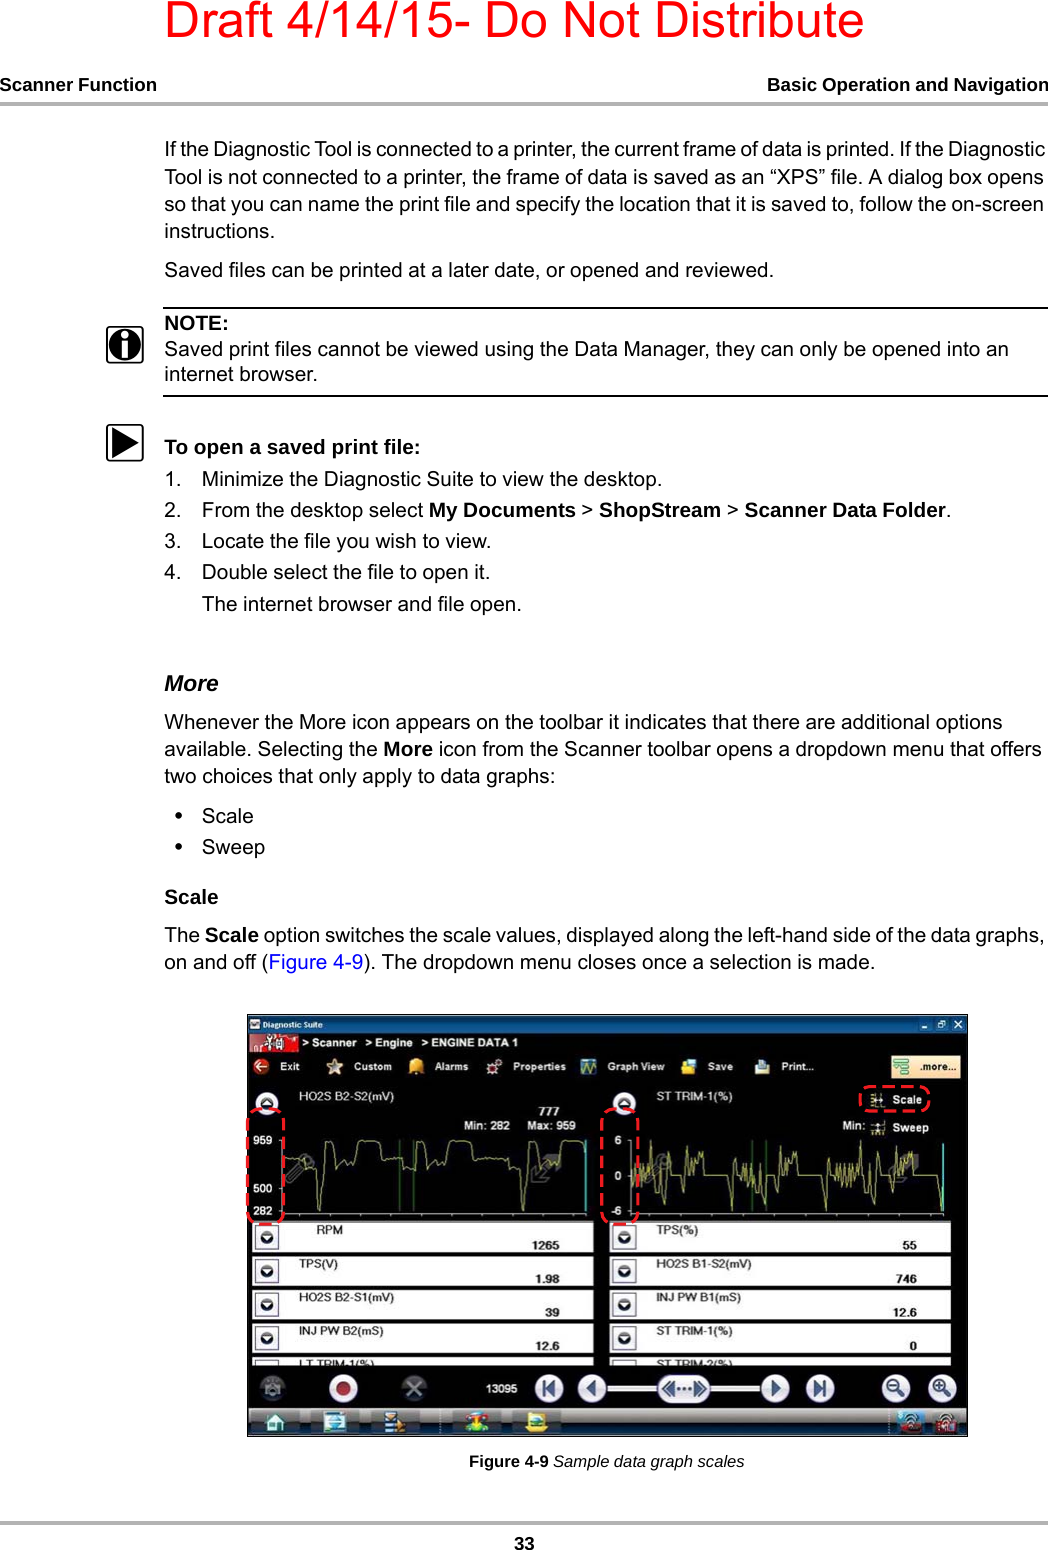
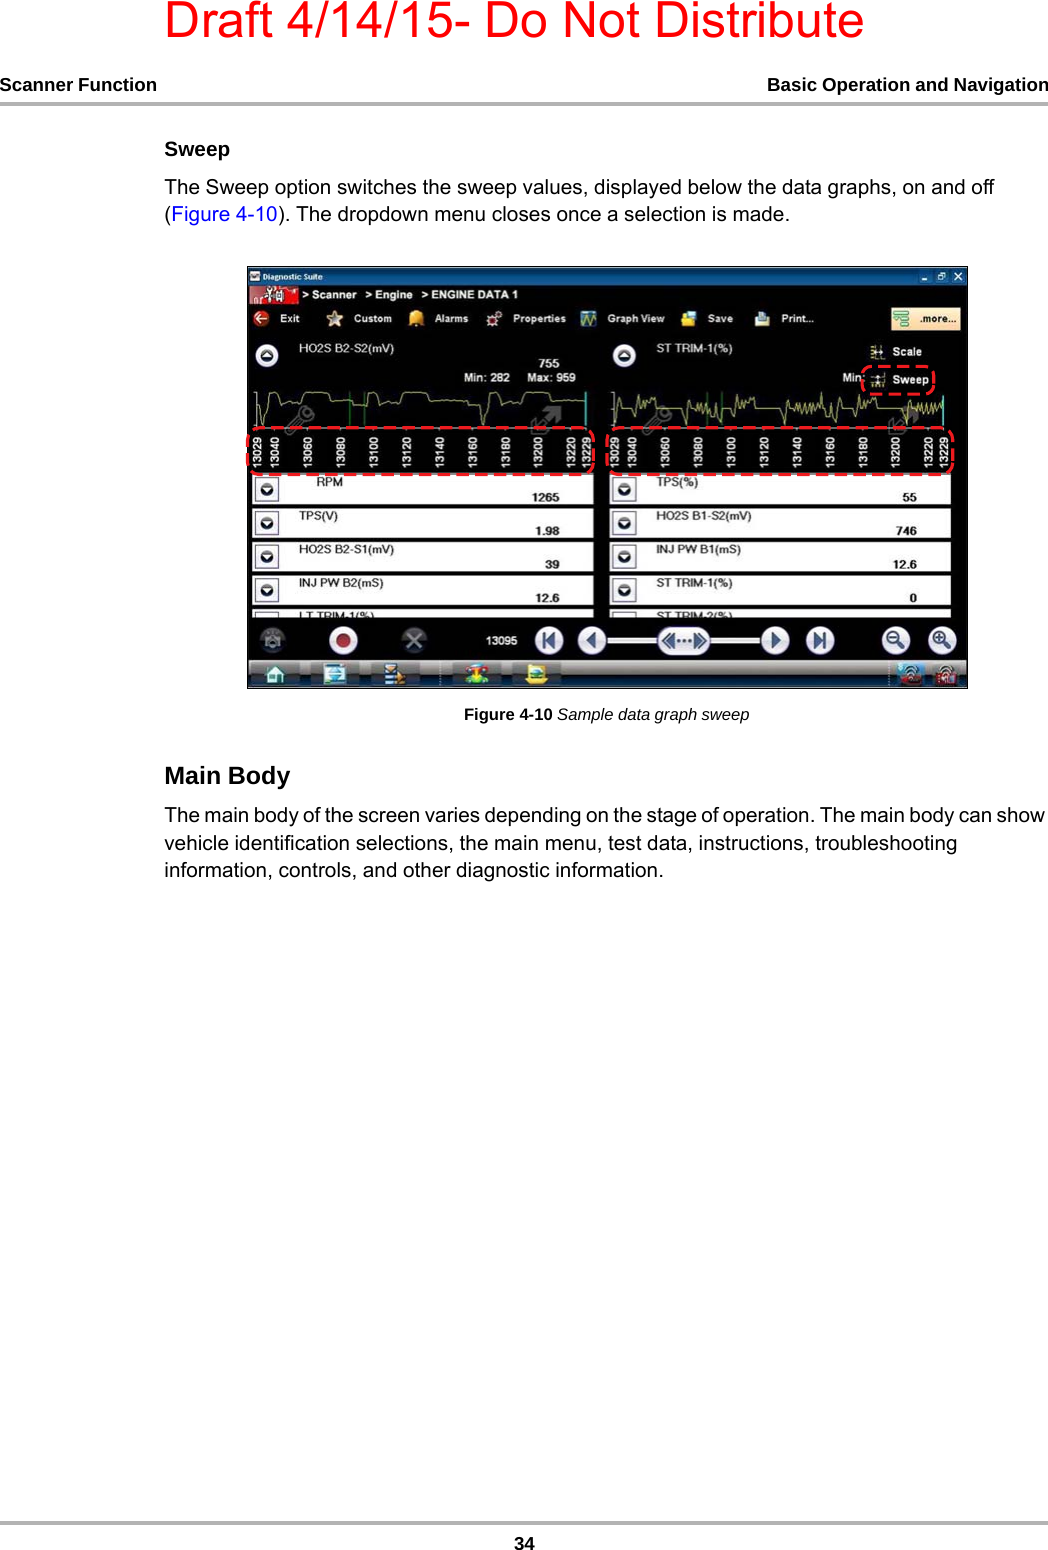
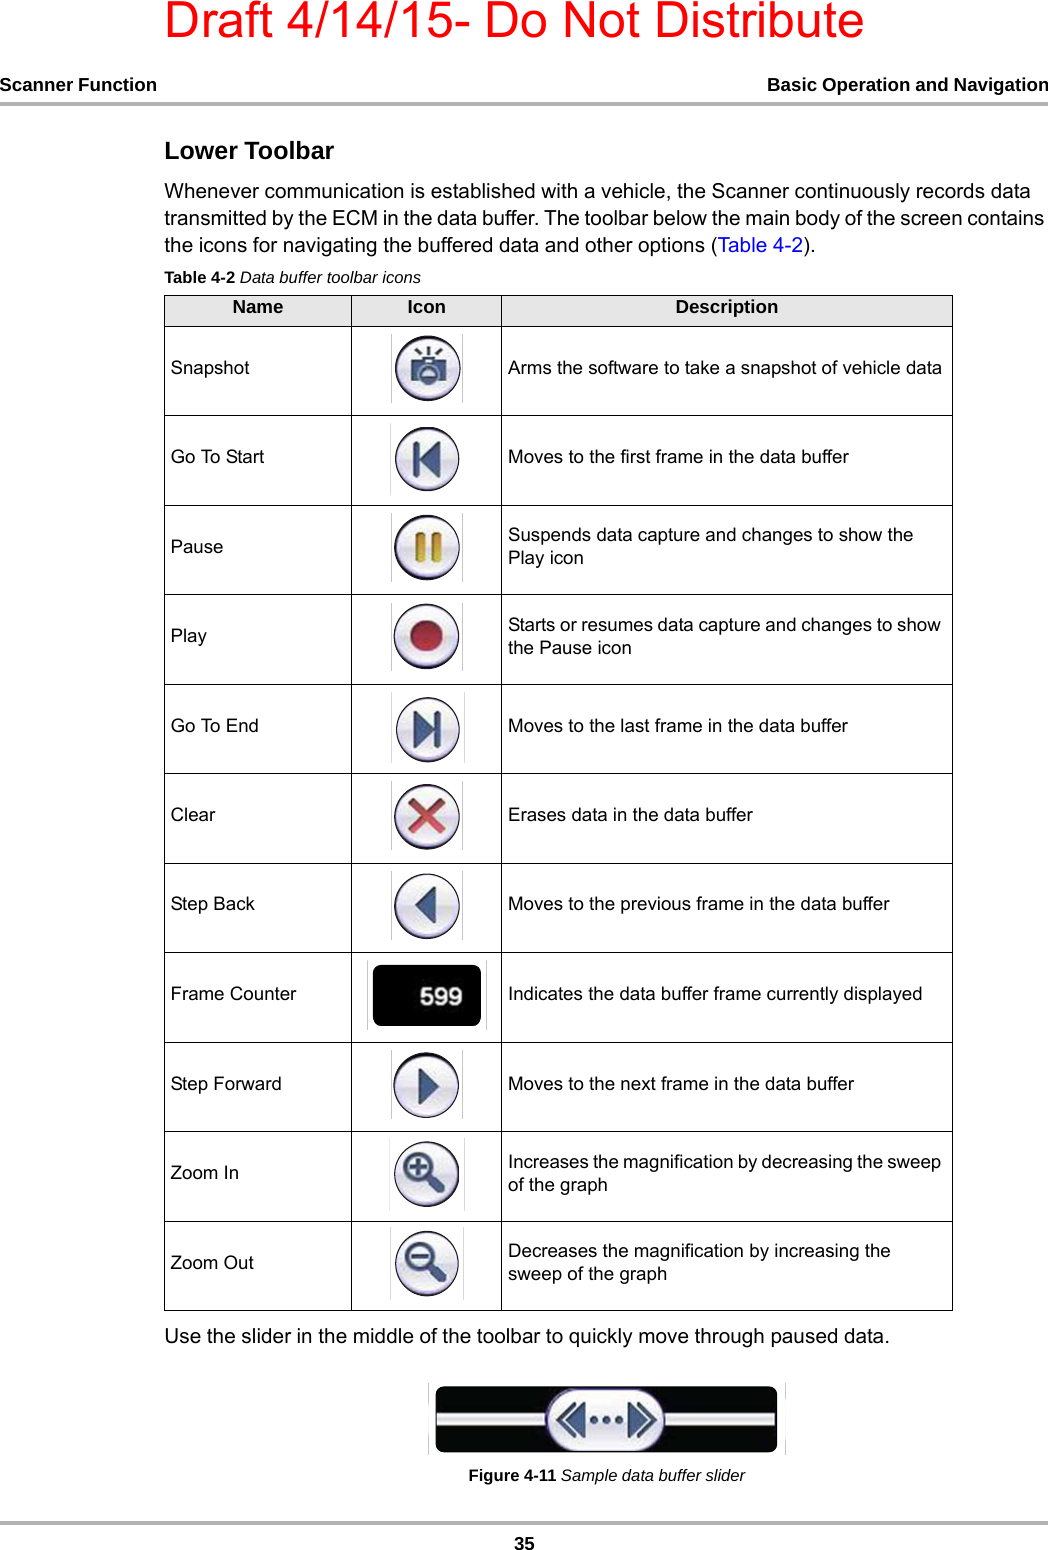
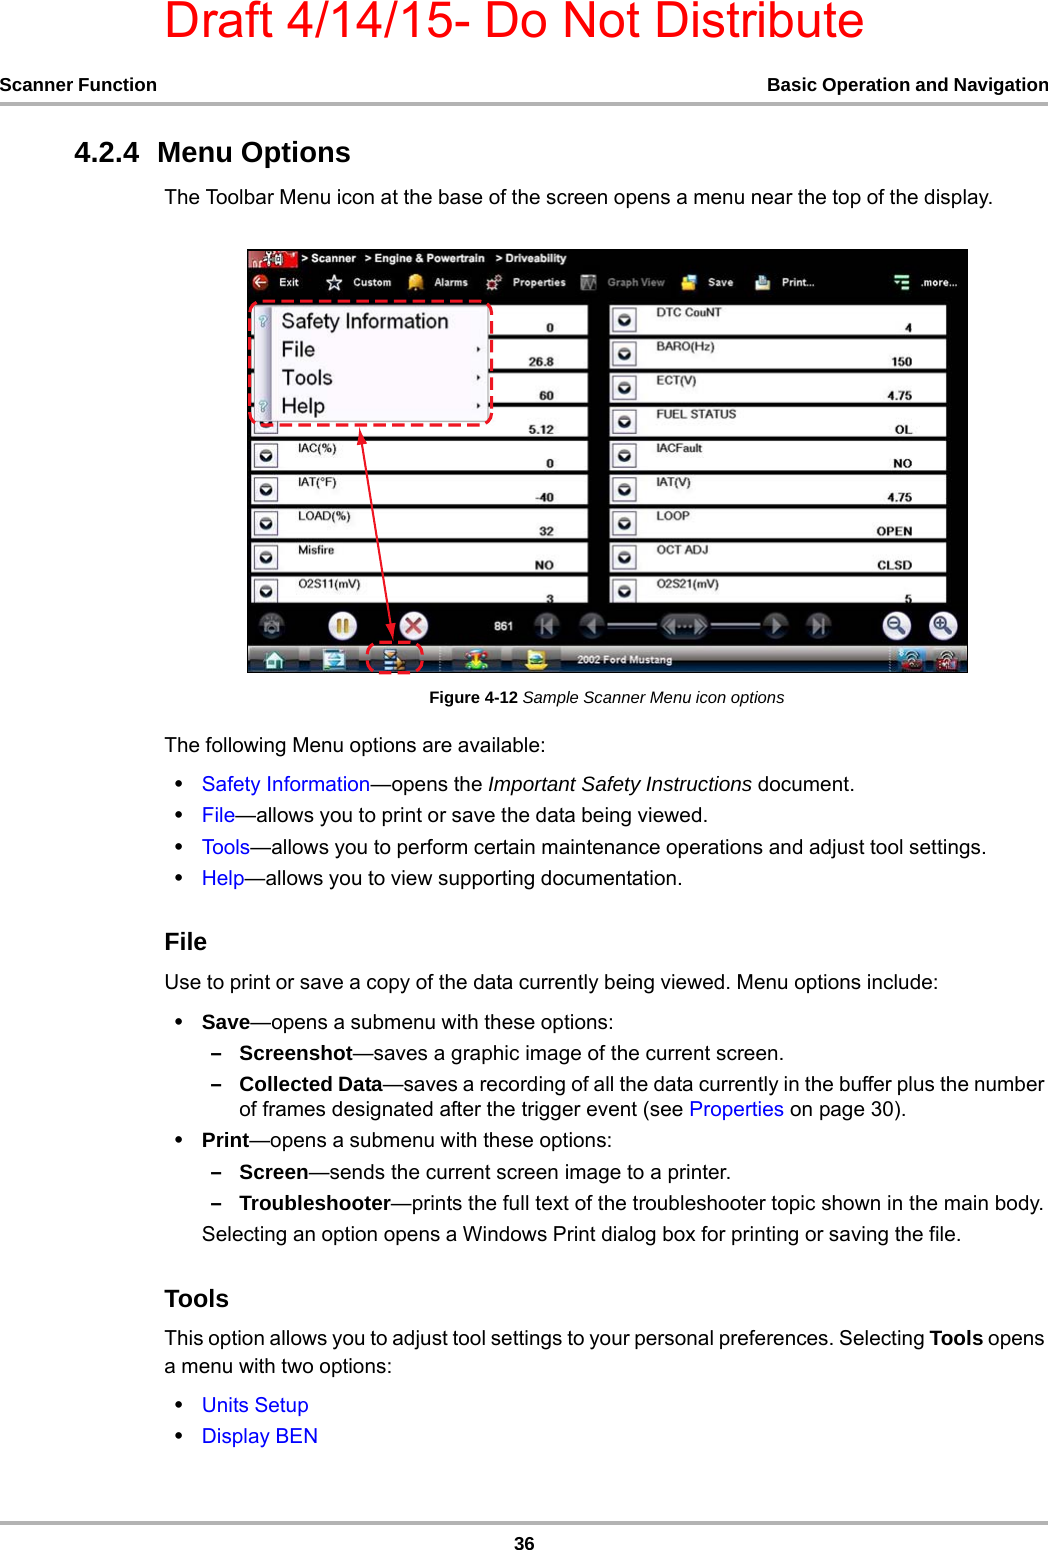
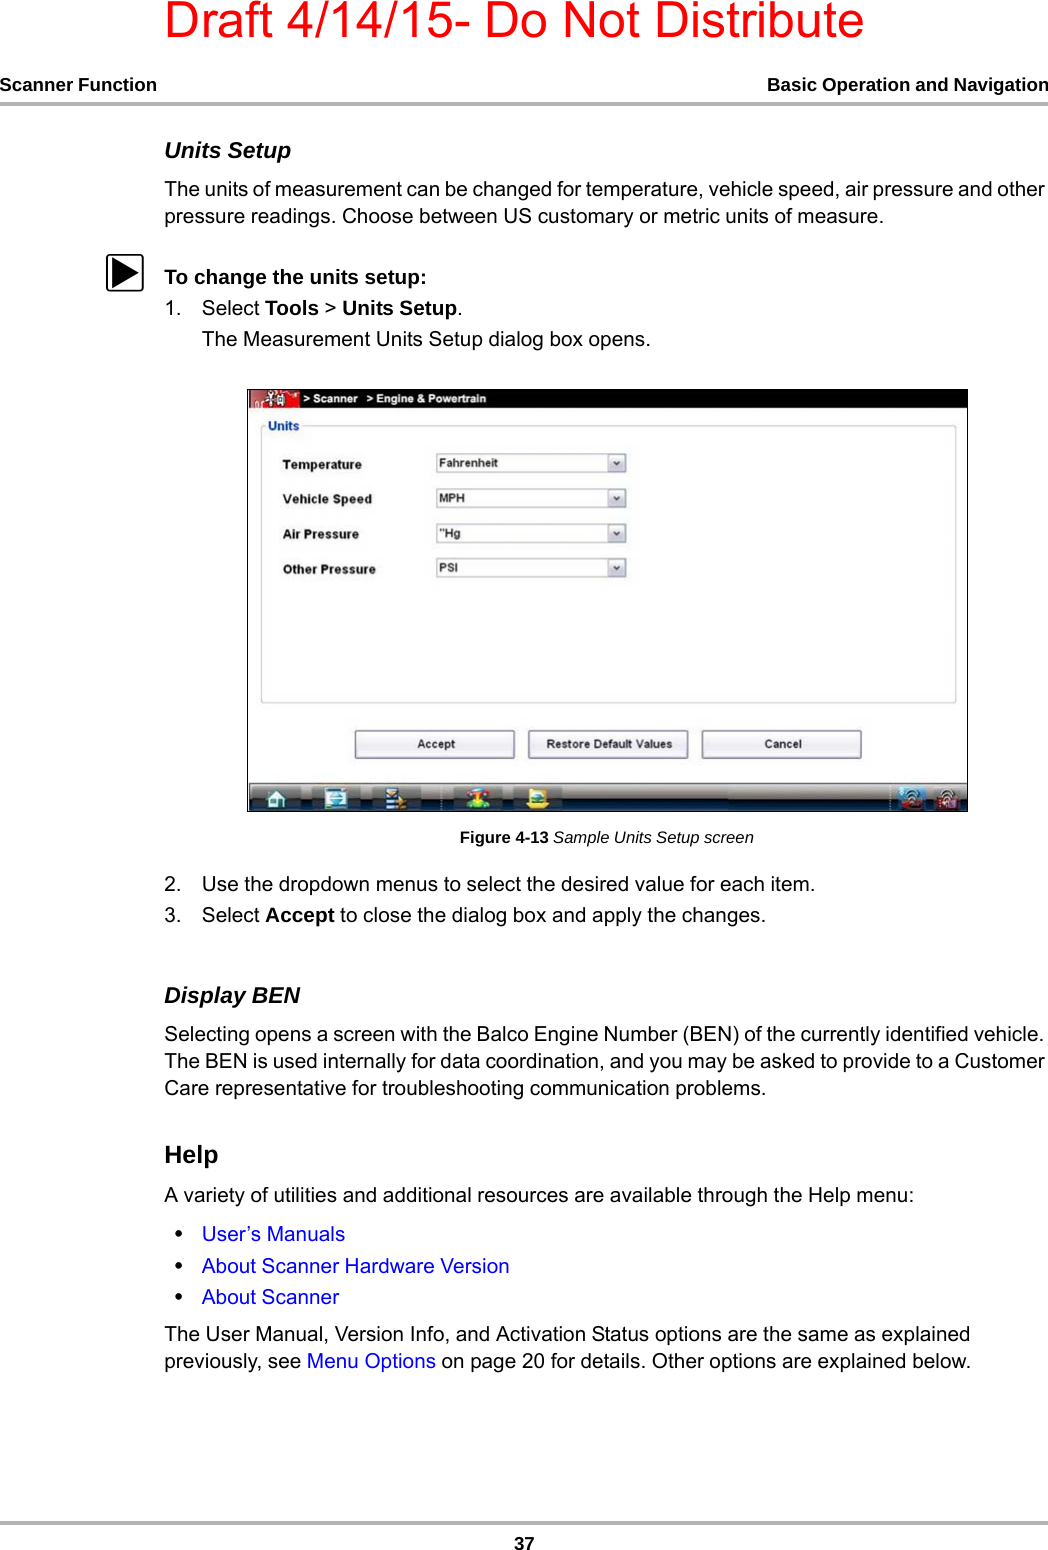
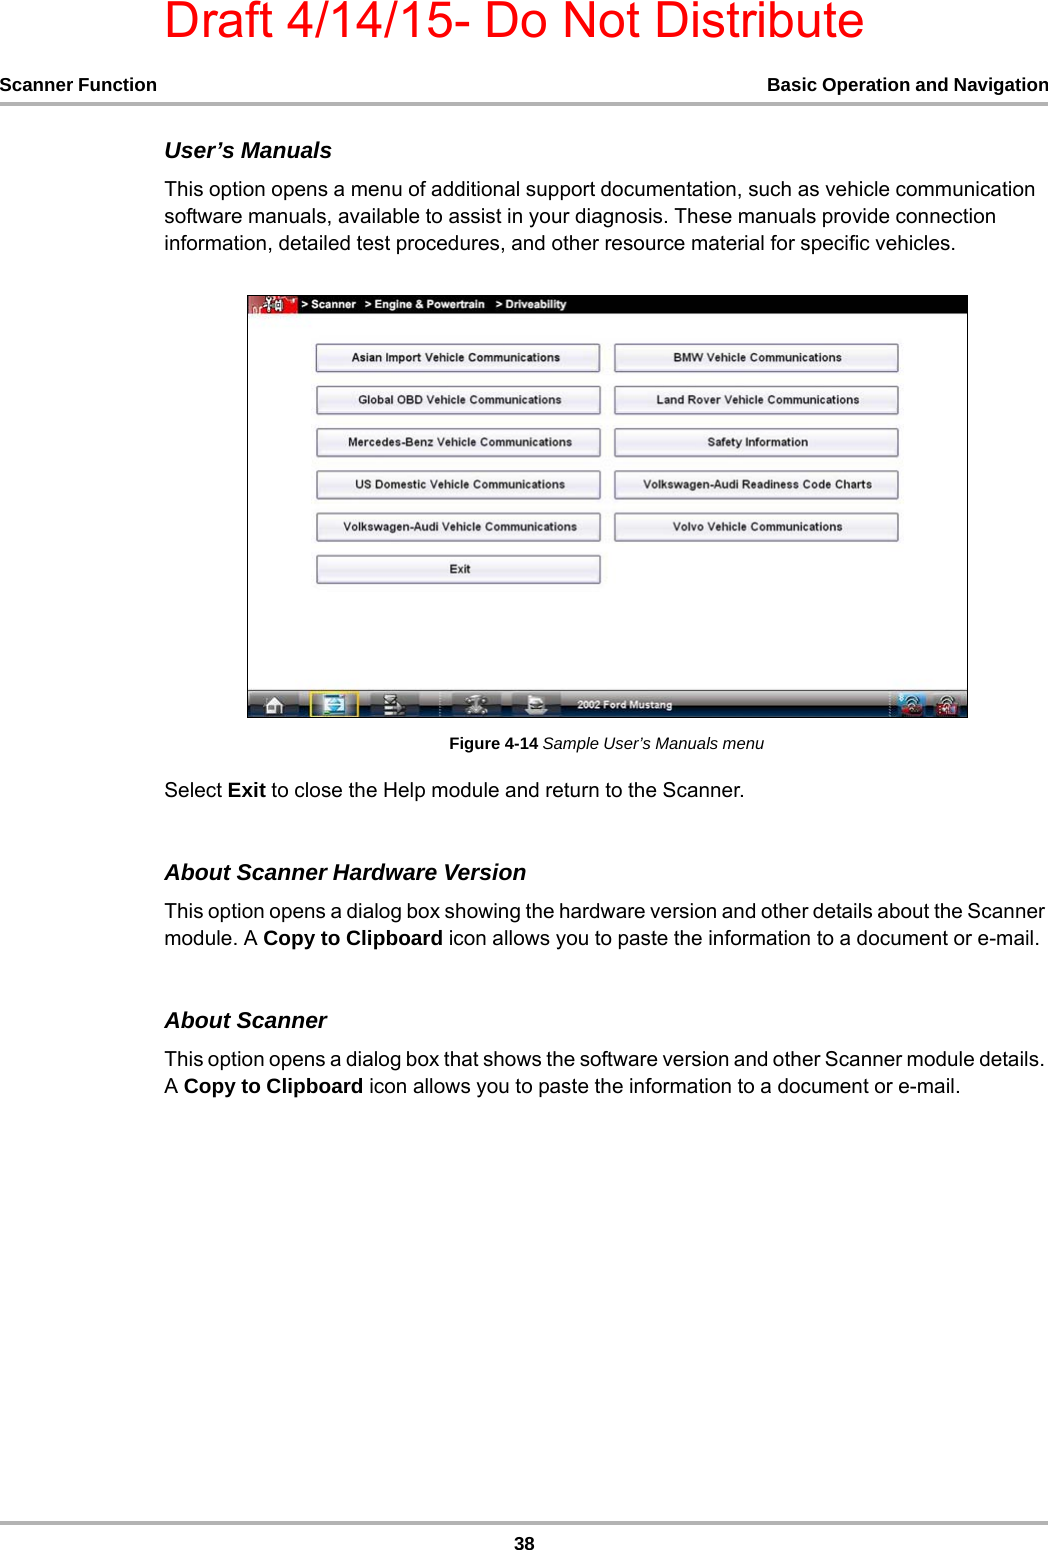
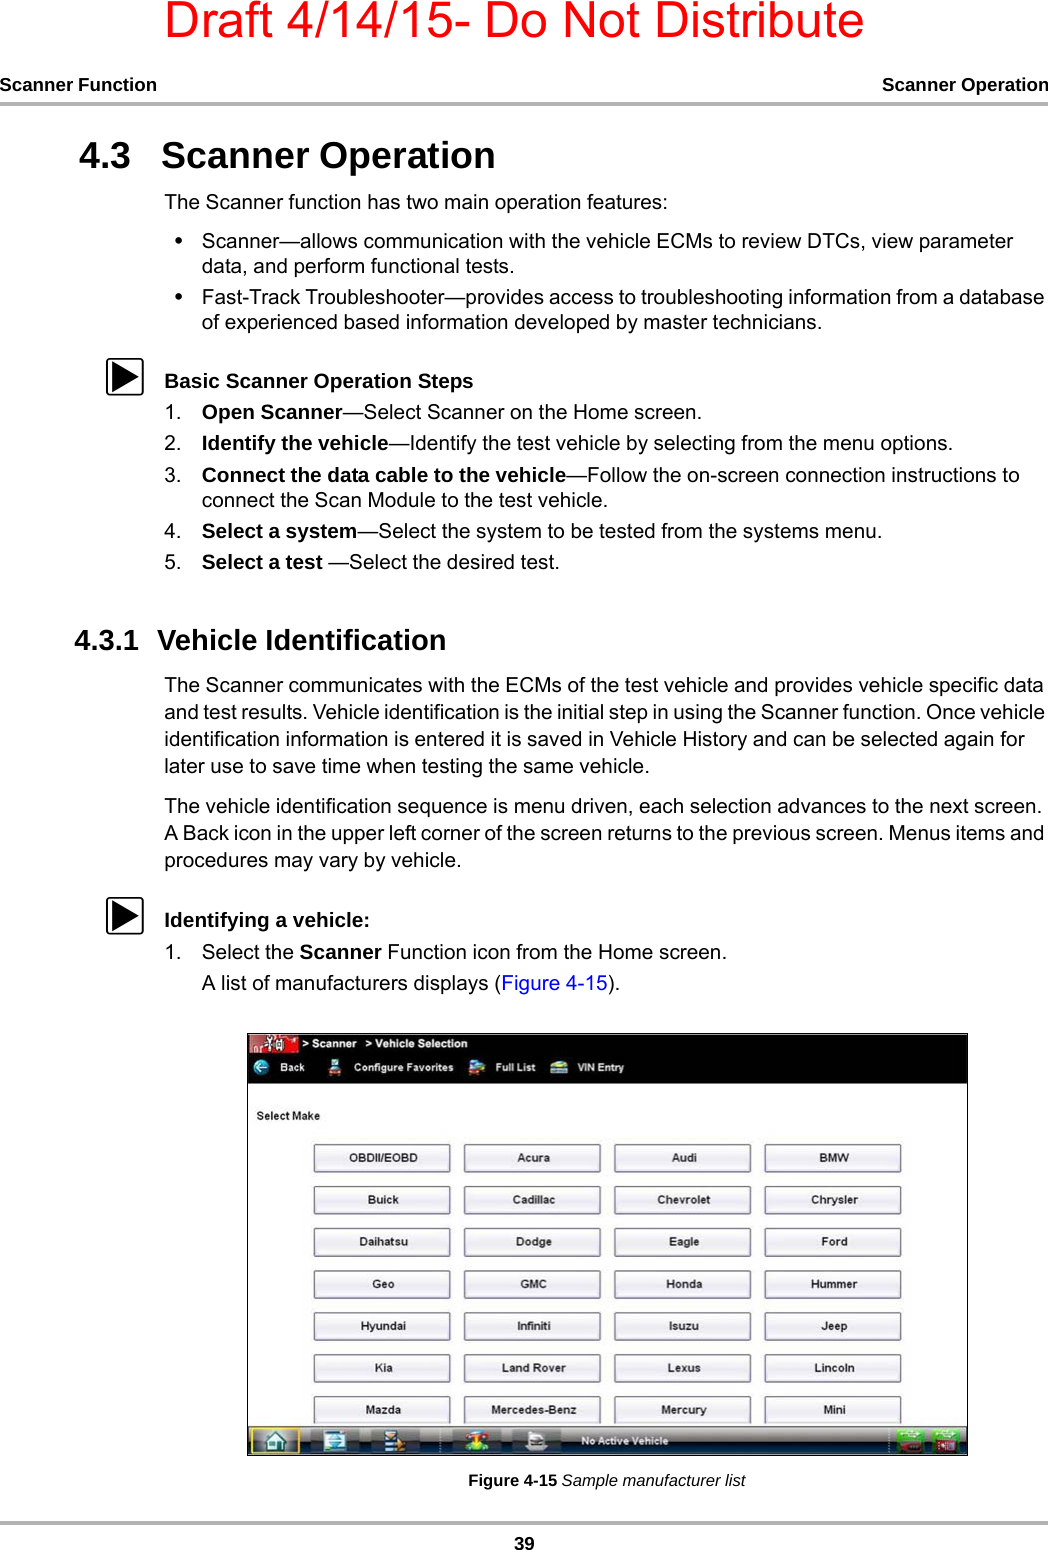
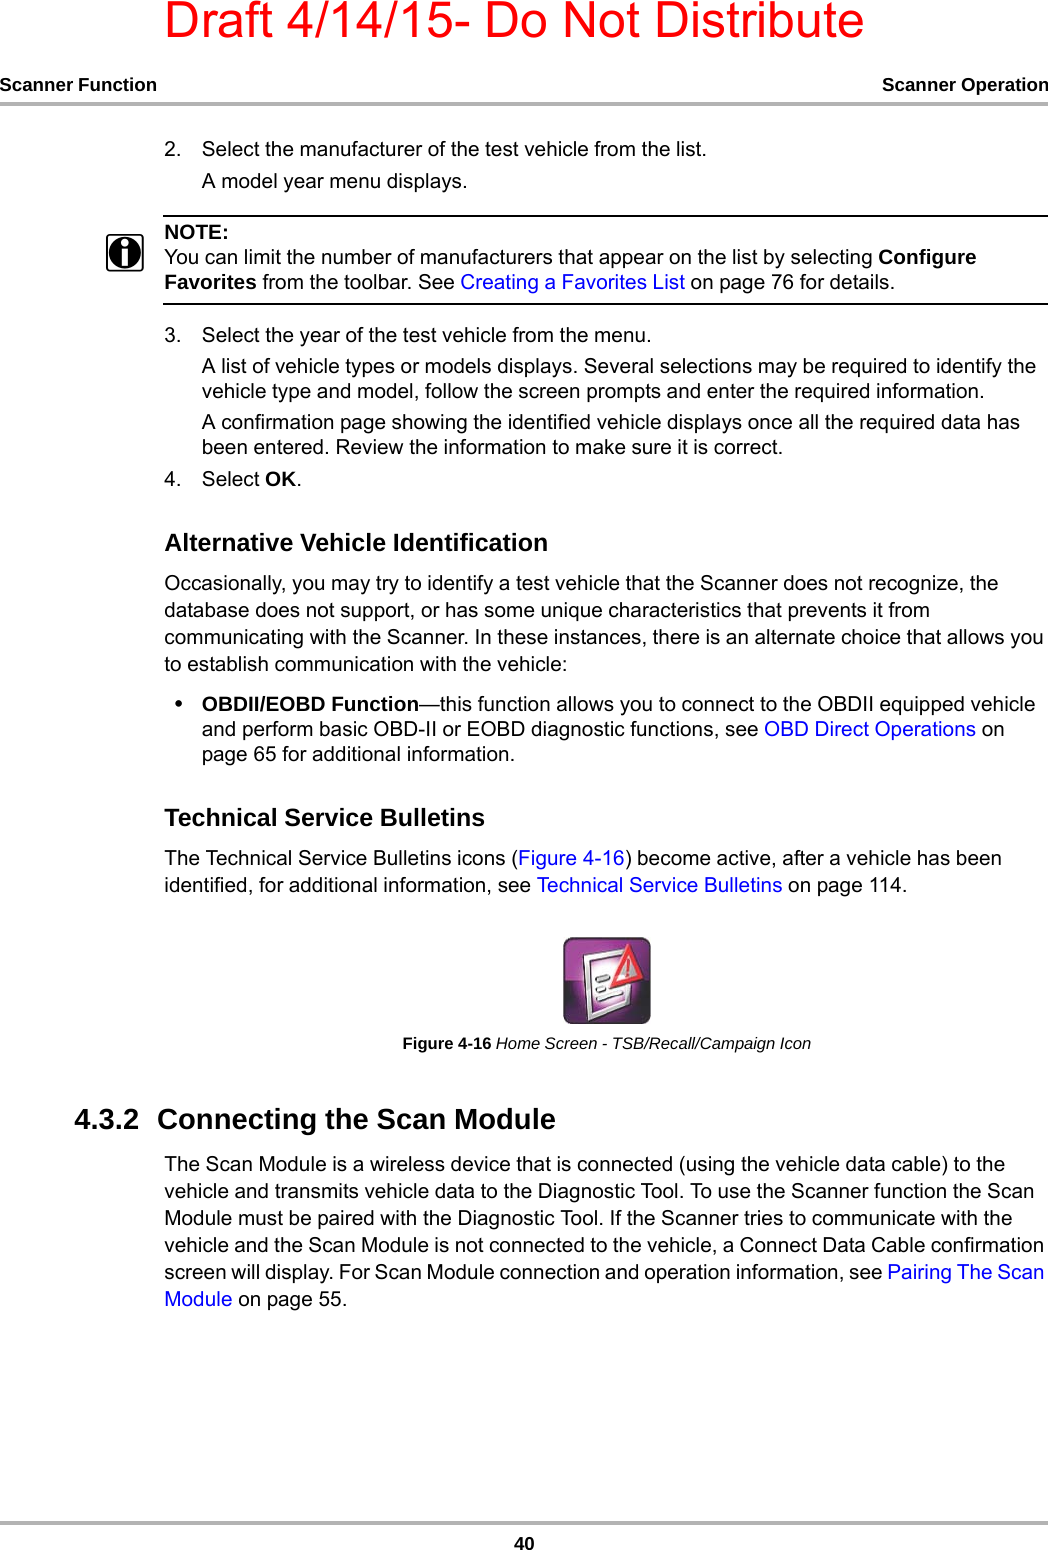
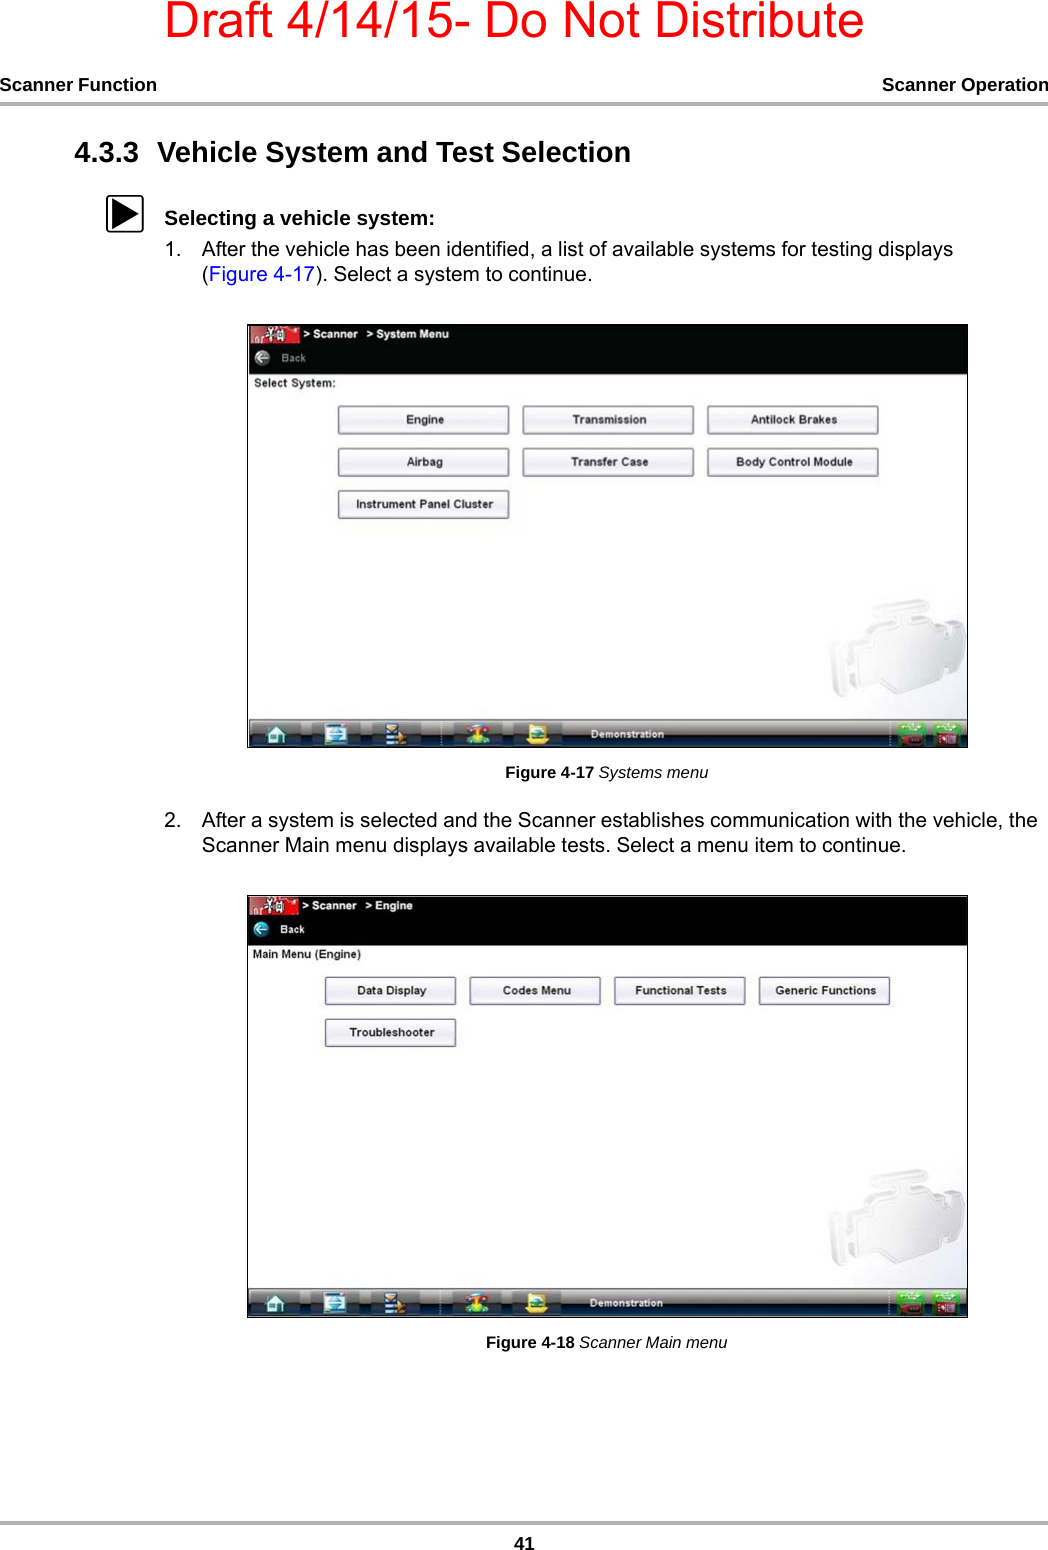
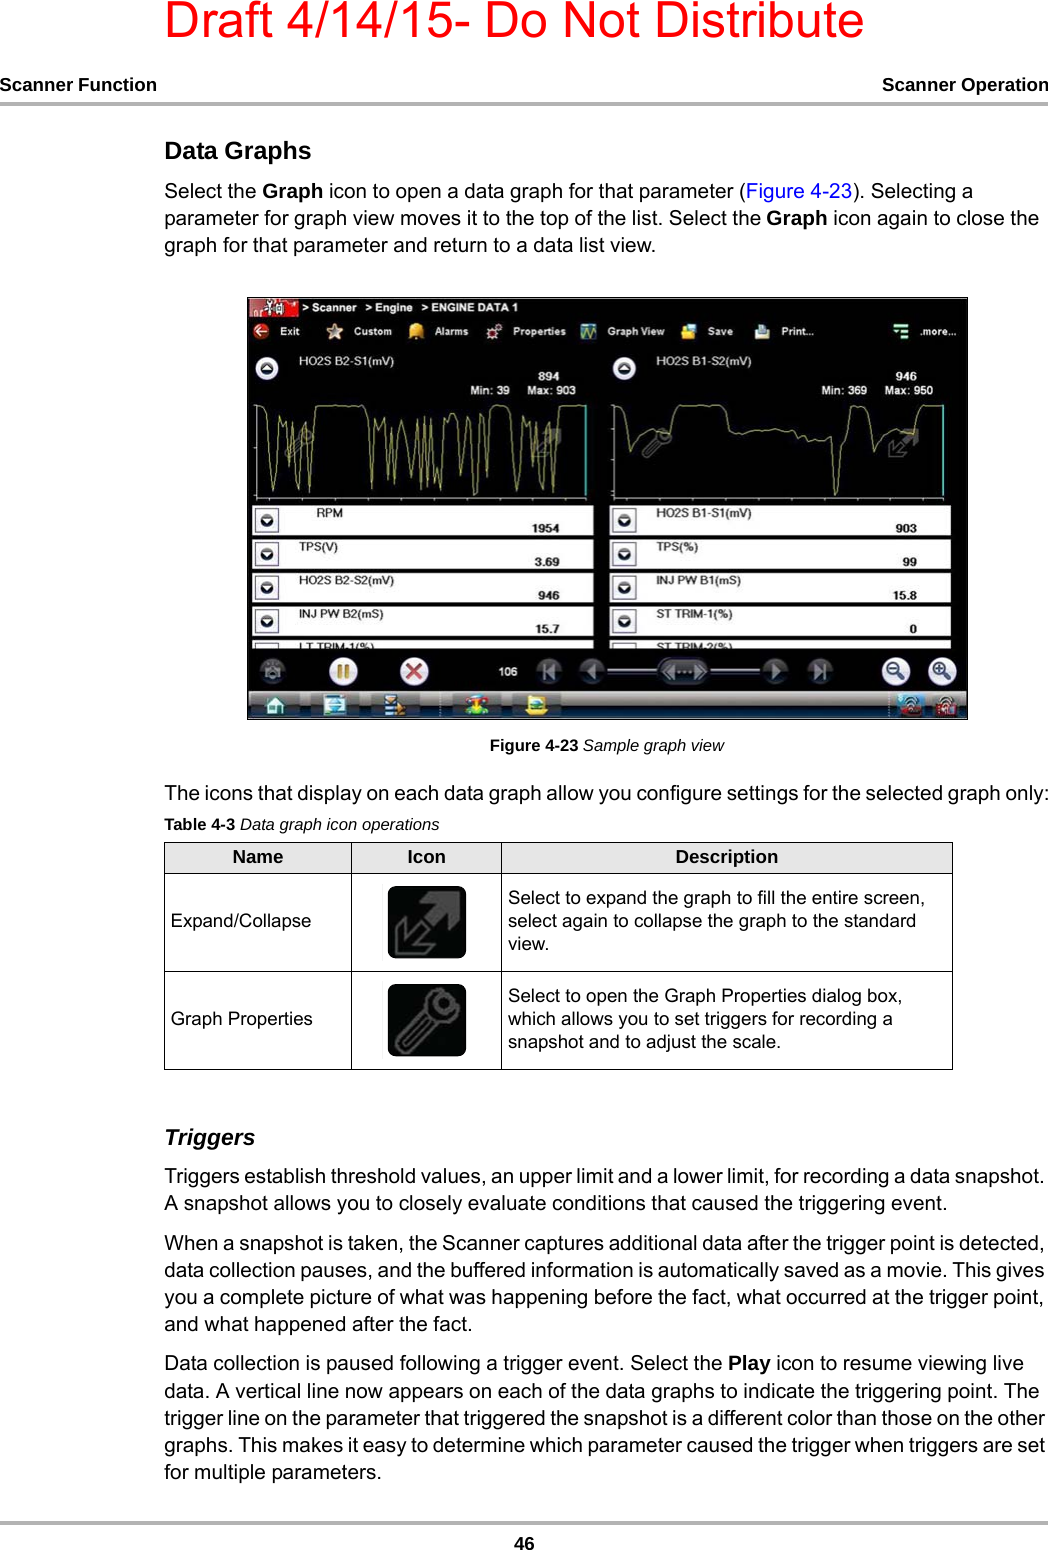
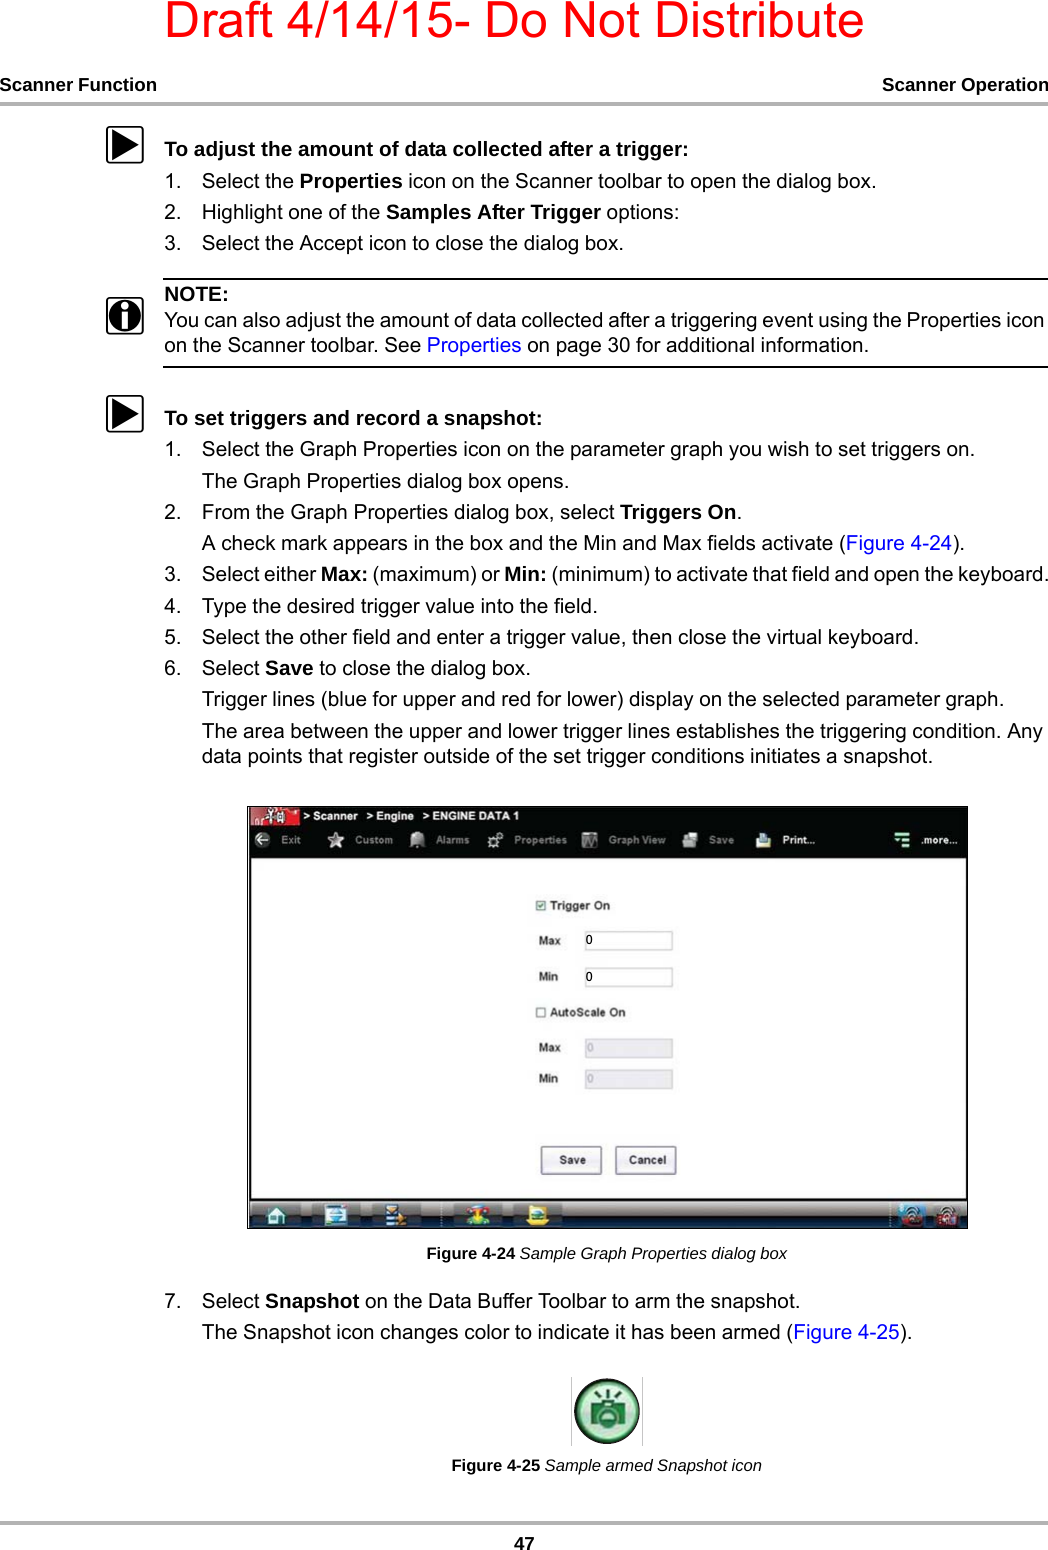
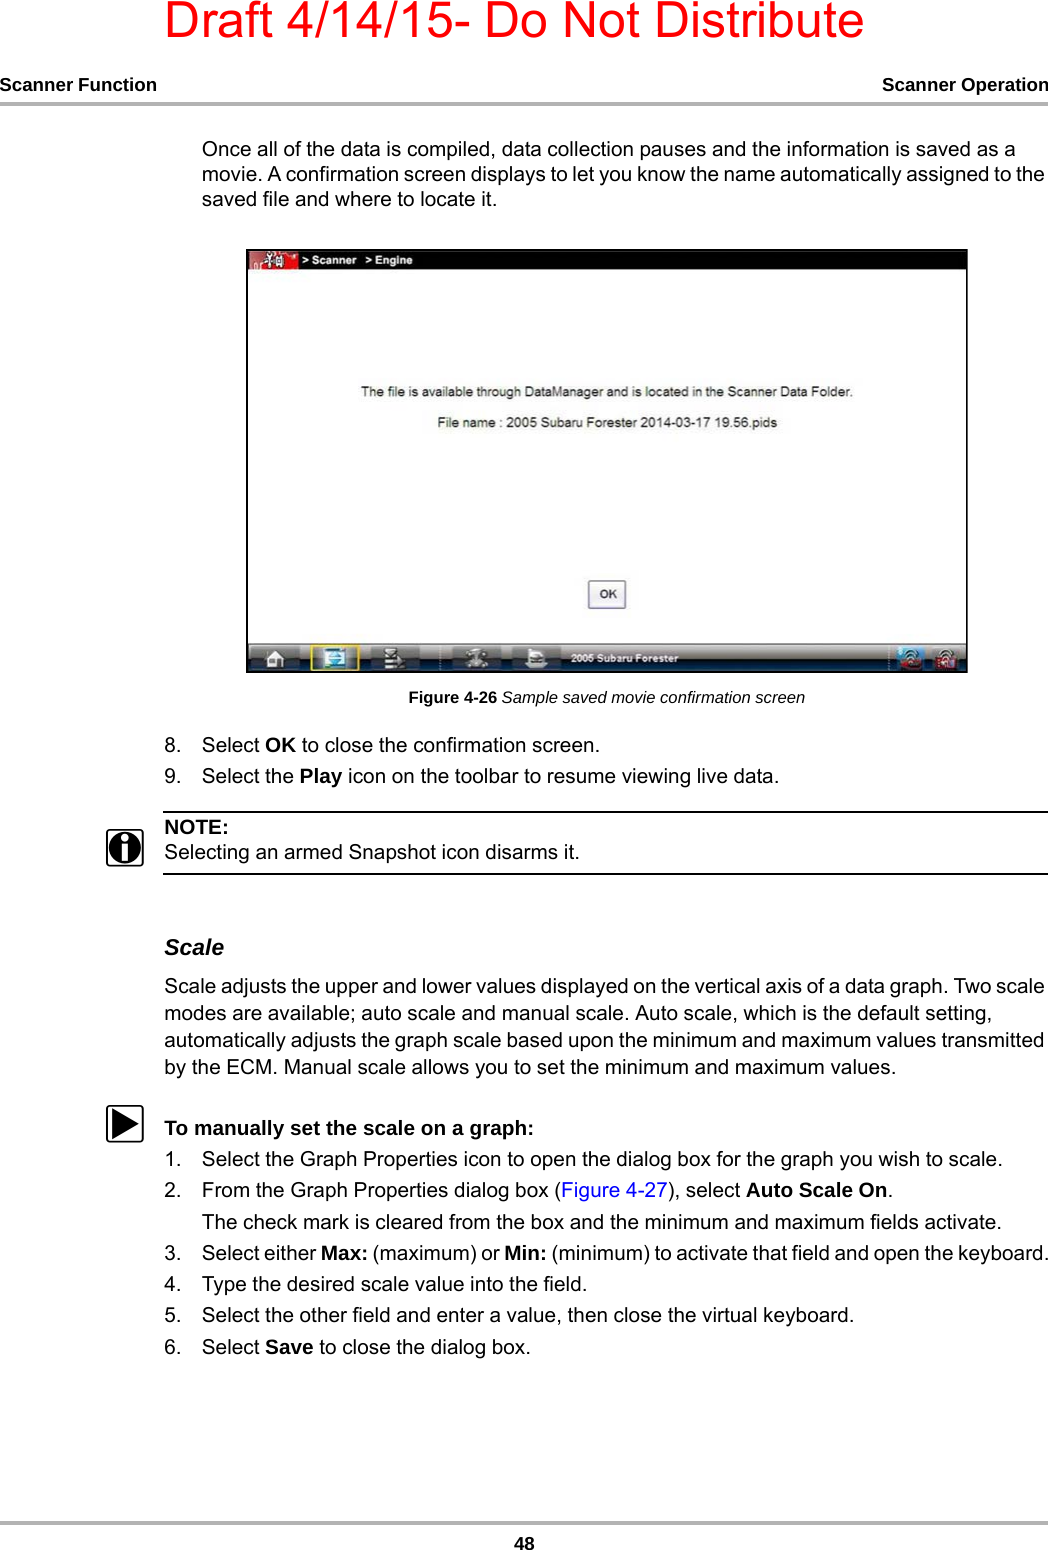
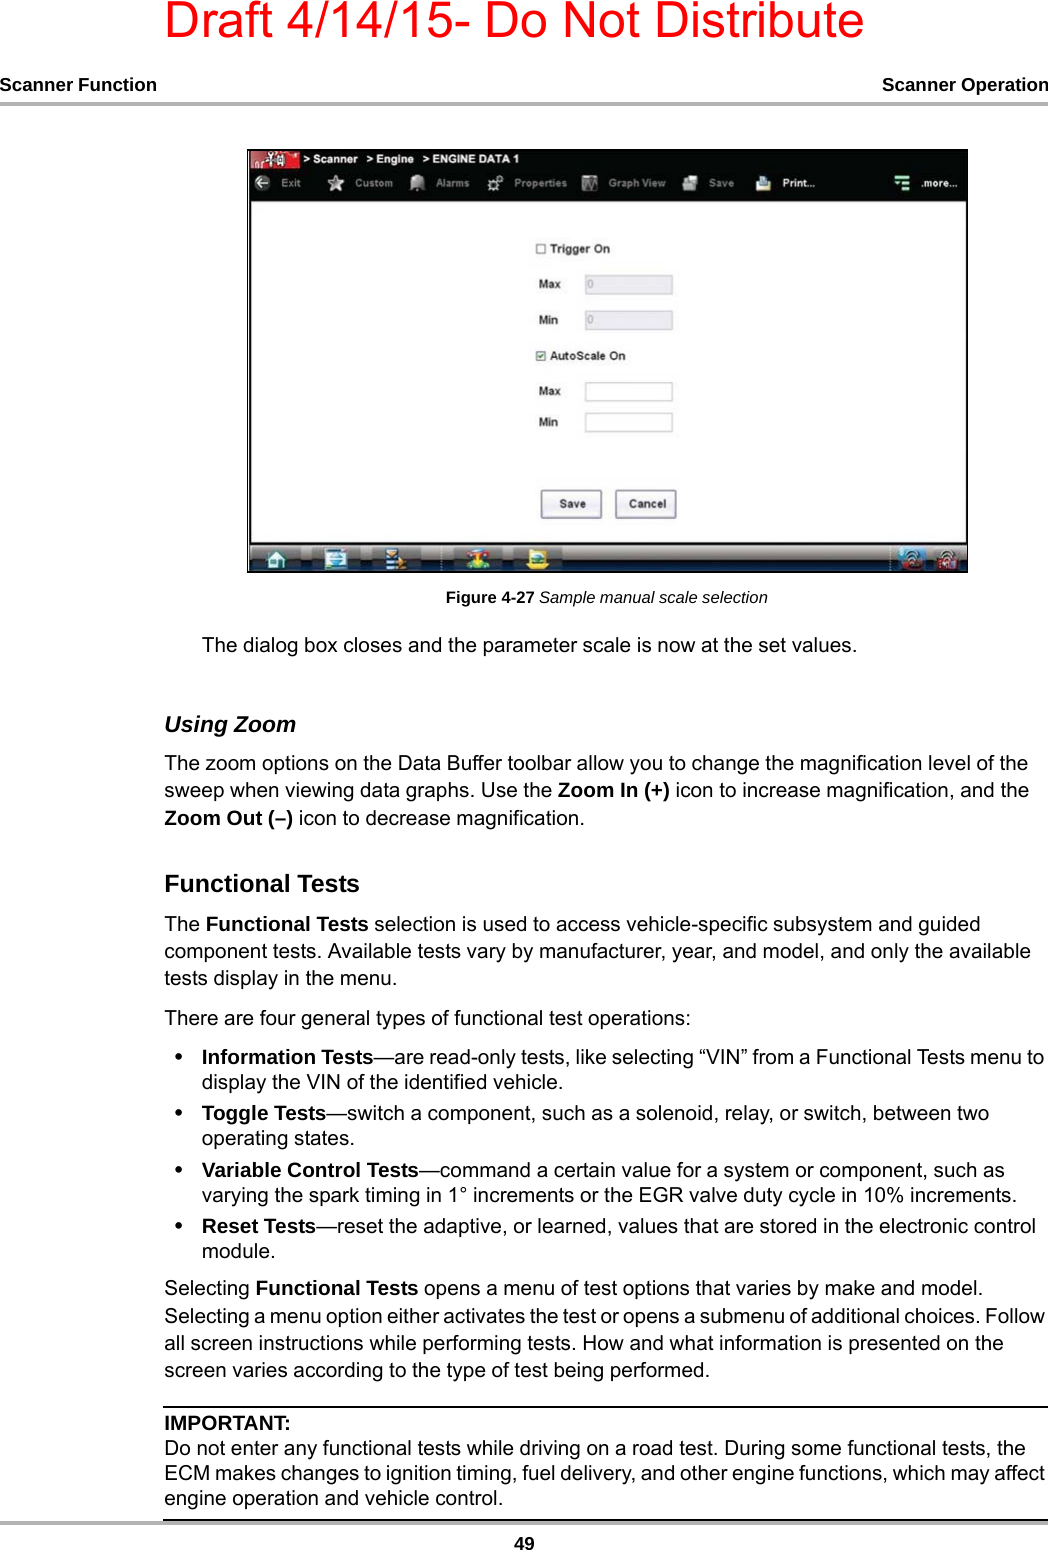
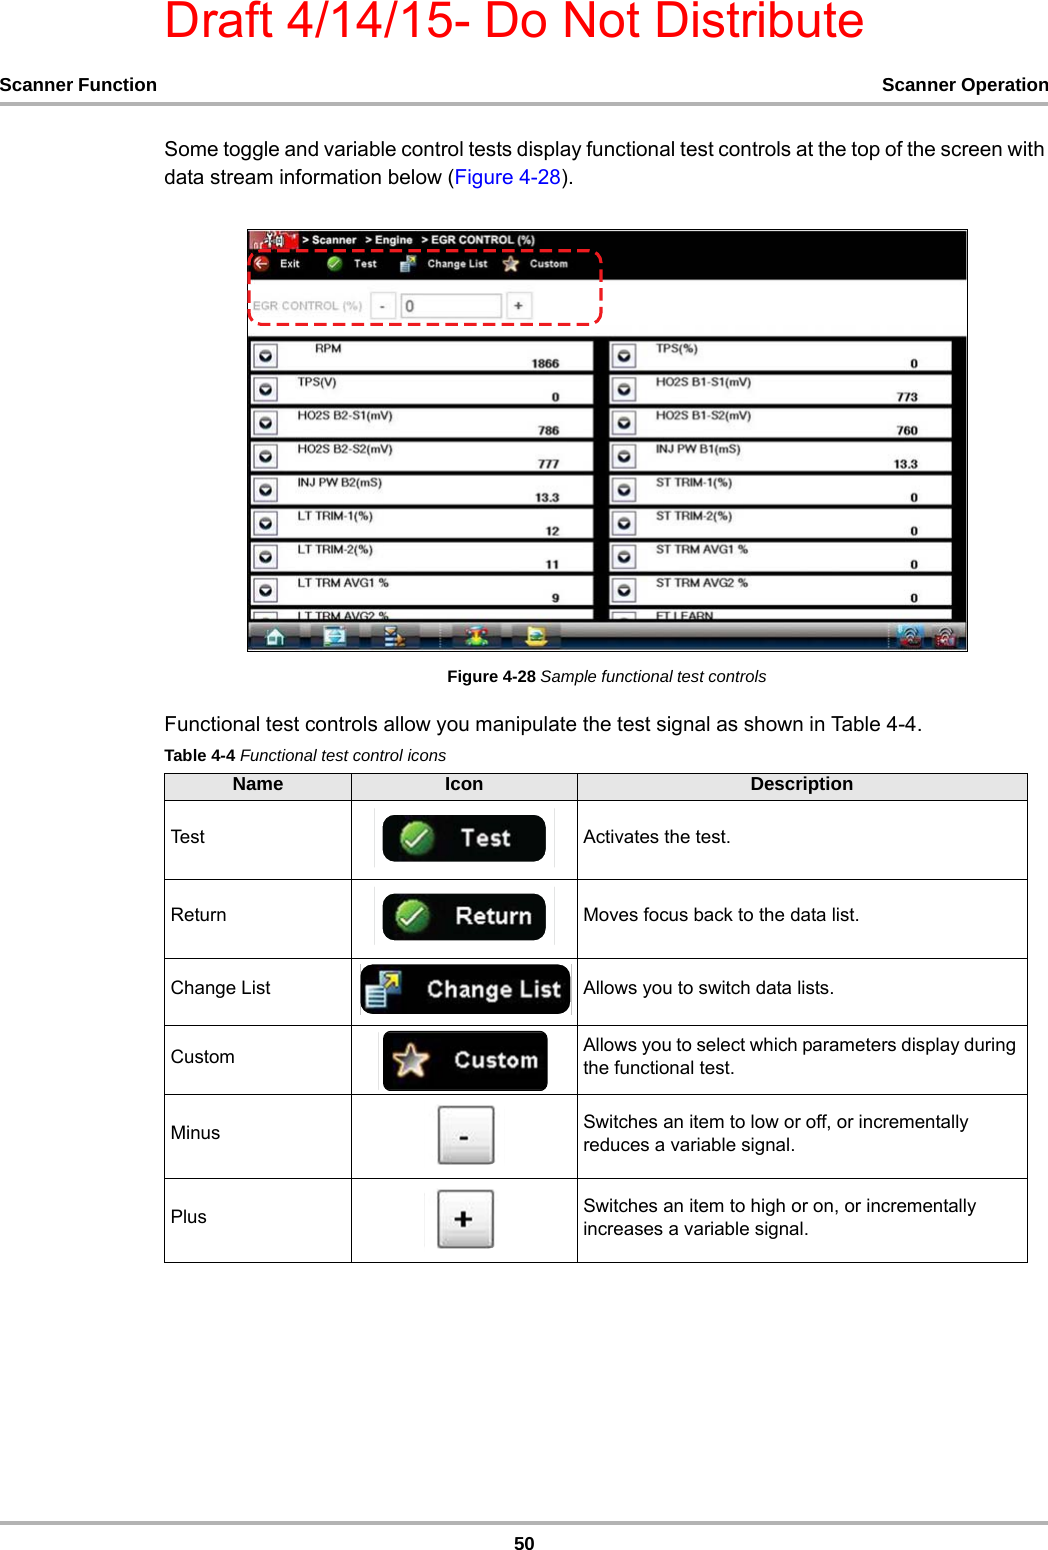
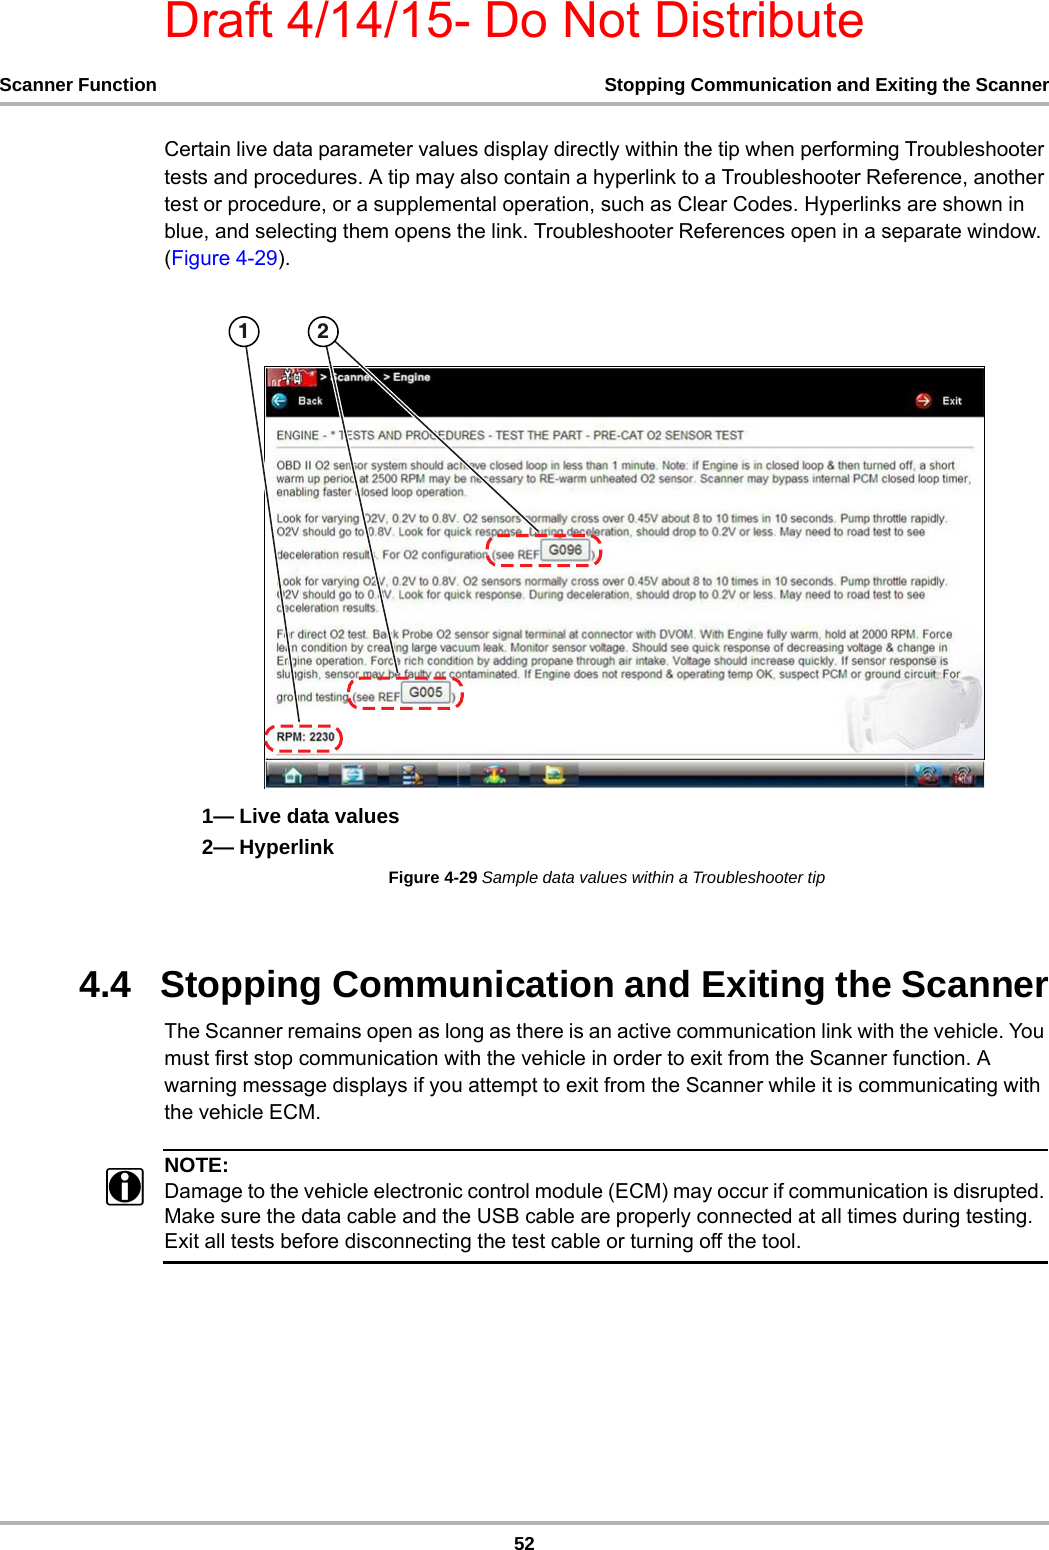
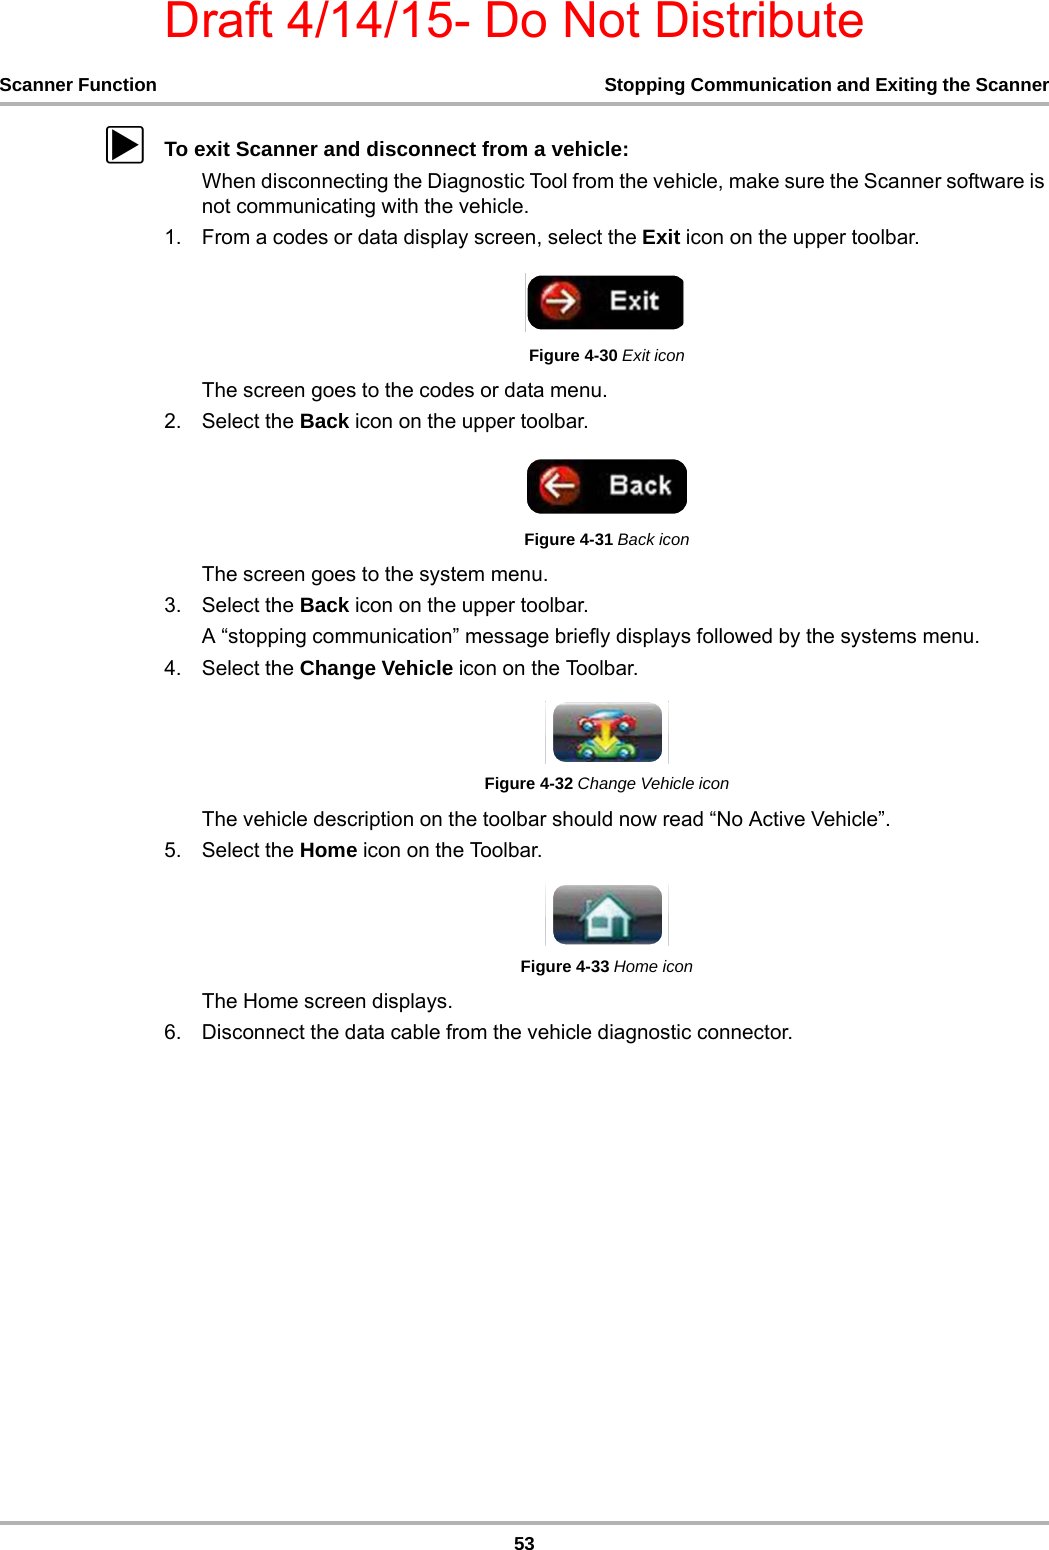
User Manual
Discussion / Help
Navigation