Snap on Diagnostics EEMS330E Display Unit User Manual VerusPro UserManual
Snap-on Diagnostics Display Unit VerusPro UserManual
Contents
- 1. Users Manual-1
- 2. Users Manual-2
Users Manual-2

Draft 4/14/15- Do Not Distribute
97
Scope and Multimeter Operations Operations
8.4 Operations
This section describes configuring the scope or meter and performing tests.
8.4.1 Starting the Scope and Multimeter
Use the following procedure to set up the scope multimeter for performing tests.
zTo start the scope multimeter:
1. Select the Scope Multimeter icon on the Home screen.
The Scope Multimeter main menu, a list of setup options, displays;
–Lab Scope
–Ignition Scope
–Graphing Meter
–Digital Multimeter
–Presets
2. Select from the menu options.
A submenu of scope or meter configuration displays, see below for additional information.
3. Select a configuration and the Scope Multimeter opens.
Presets
Presets are factory configured meter settings for common component tests. Selecting opens a list
of available setups. Selecting from the list opens the scope multimeter configured to perform the
selected test. In addition to the factory presets, you can create your own custom meter
configurations and save them as presets.
Lab Scope Options
The following options are available for testing:
•4 Channel Lab Scope
•Volts DC
•Low Amps (20)
•Low Amps (40)
•Low Amps (60)
•Ignition Probe
•100 PSI Vacuum
•100 PSI Pressure
•500 PSI Pressure
•5000 PSI Pressure

Draft 4/14/15- Do Not Distribute
98
Scope and Multimeter Operations Operations
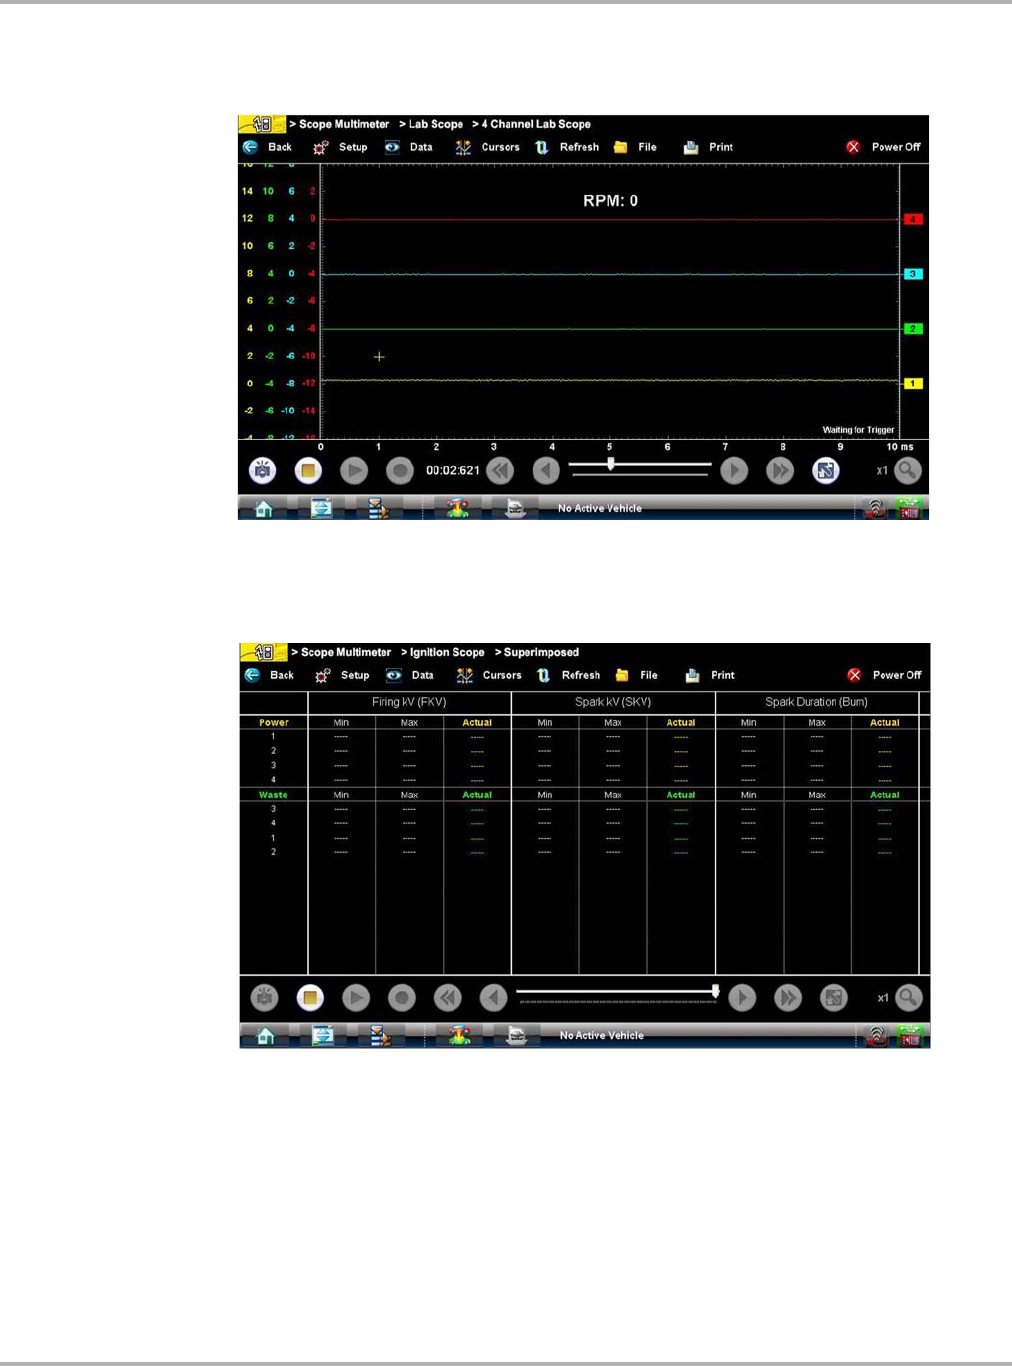
Ignition Scope Options
The following options are available for testing:
•Parade
•Cylinder
•Raster
•Superimposed
•Single Cylinder Ignition
Graphing Options
The following options are available for testing:
•4 Channel Graphing
•Volts DC
•Volts DC Average
•Volts AC RMS
•Ohms
•Frequency
•Pulse Width
•Injector Pulse Width
•Duty Cycle
•Low Amps (20)
•Low Amps (40)
•Low Amps (60)
•MC Dwell (60)
•MC Dwell (90)
•100 PSI Vacuum
•100 PSI Pressure
•500 PSI Pressure
•5000 PSI Pressure
Digital Multimeter Options
The following options are available for testing:
•Volts DC
•Volts DC Average
•Volts AC RMS
•Ohms
•Diode/Continuity
•Low Amps (20)
•Low Amps (40)
•Low Amps (60)
Draft 4/14/15- Do Not Distribute
99
Scope and Multimeter Operations Operations
8.4.2 Measurement Out of Range
A group of arrows display when a measurement is out of range for the scale selected:
•Arrows pointing UP—measurement over maximum range
•Arrows pointing DOWN—measurement under minimum range
Voltage measurements also display arrows in place of live values when the voltage exceeds the
input rating of the meter.
:$51 ,1*
Risk of electrical shock.
• Do not exceed voltage limits between inputs as indicated on the rating label.
• Use extreme caution when working with circuits that have greater than 40 volts AC or
24 volts DC.
Electrical shock can cause personal injury, equipment damage, or circuit damage.
IMPORTANT:
If arrows are displayed in the live voltage values, discontinue circuit testing.
Correct an out-of-range condition by selecting a scale setting appropriate for the signal being
sampled. See “Trace Controls” on page 99 for more information.
8.4.3 Scope and Multimeter Setup
The following sections explain how to adjust the scope and multimeter for the specific type of
signal being sampled. Most of these setup operations are available from the toolbar.
Trace Controls
The Trace controls are used to adjust individual characteristics of how the signal is sampled and
displayed for each of the four traces.
zTo adjust trace controls:
1. Select Setup from the Scope Multimeter toolbar.
The Scope Multimeter Preferences dialog box opens.
2. Select Traces to open the submenu.
3. Select the trace to be configured from the submenu.
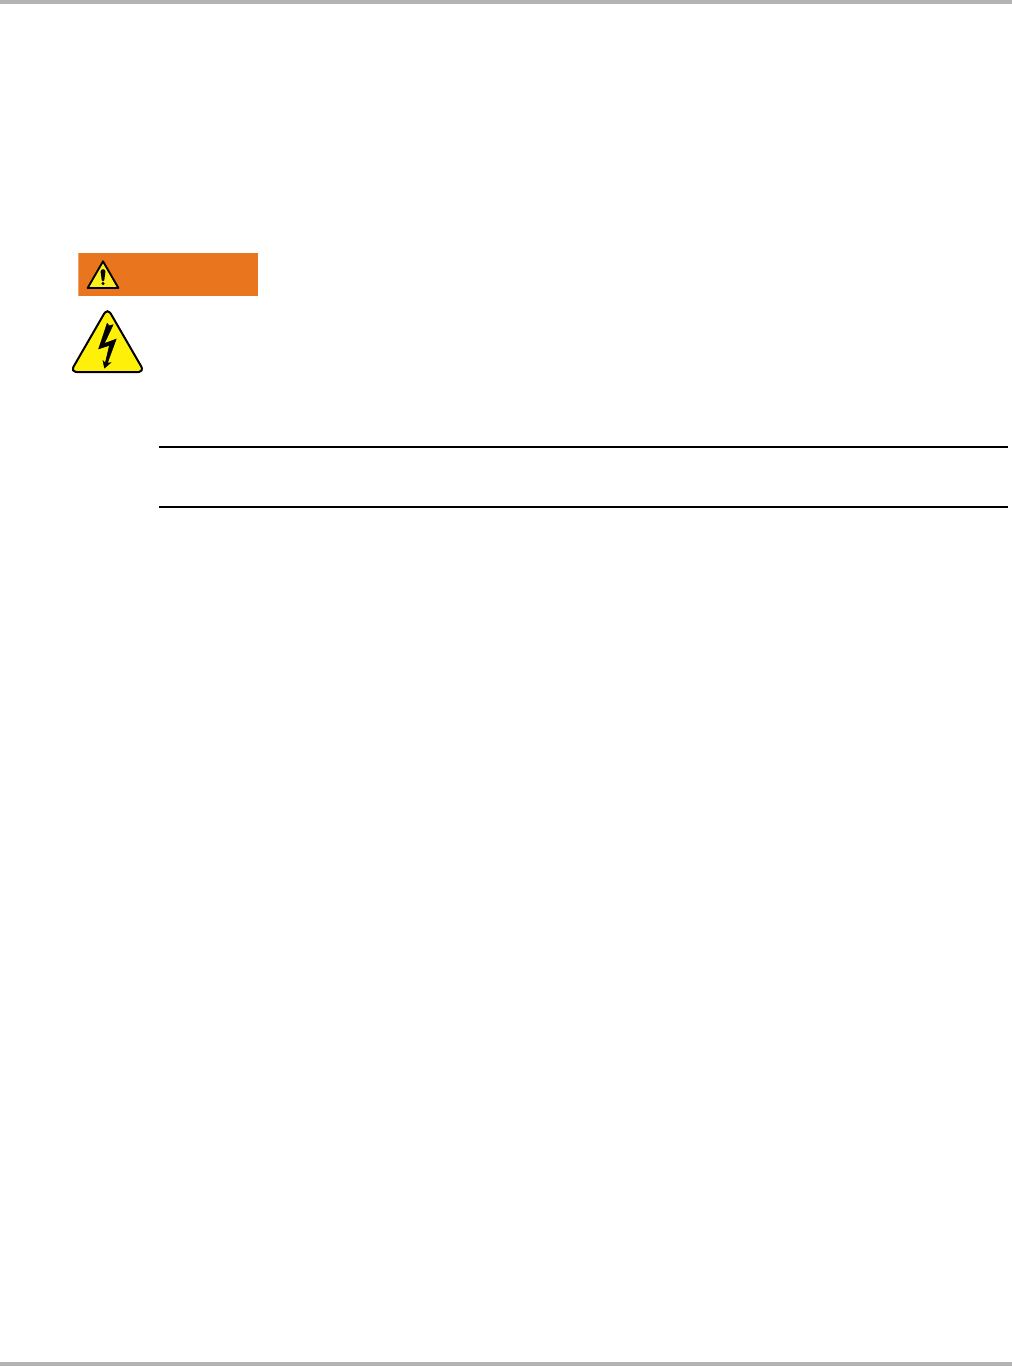
The traces dialog box displays (Figure 8-16).
Draft 4/14/15- Do Not Distribute
100
Scope and Multimeter Operations Operations
1— Trace tabs
2— Trace Probe icon
3— Trace Scale icon
4— Trace characteristics check boxes
5— Auto Find icon
6— Baseline position
7— Back icon
8— Exit icon
Figure 8-16 Traces dialog box
4. Select the Trace Probe icon to open the menu.
5. Highlight a probe on the list and select OK to close the window.
6. Select the Trace Scale icon to adjust the vertical scale of the display.
A dropdown menu opens. Menu options vary depending upon which test lead is selected.
7. Select a trace scale option, then close the window.
8. Select or deselect the trace characteristic items as needed:
–Displayed—this trace is on screen when checked, and not visible when not checked.
–Inverted—signal polarity is reversed when checked, normal when not checked.
–Coupling AC—check when sampling an AC signal, uncheck for DC signals.
–Peak Detect—use when trying to capture a fast event or signal glitch.
–Filter—use when radio frequency interference (RFI) may be disrupting the signal.
9. The scope samples the signal and internally calculates the best way to display it when Auto
Find is selected. A scale and the vertical position for the zero line of the trace that allows the
whole waveform to fit on the screen is established when Auto Find is selected. If Auto Find is
selected on the trigger channel, it also sets the trigger level halfway between the minimum and
maximum value of the sampled signal to provide a stable waveform.
10. The baseline position is the zero line of the trace, use the slider and arrows to adjust it.
11. Select Back to return to the Preferences dialog box, or select Exit to close the dialog box and
return to the scope.
Draft 4/14/15- Do Not Distribute
101
Scope and Multimeter Operations Operations
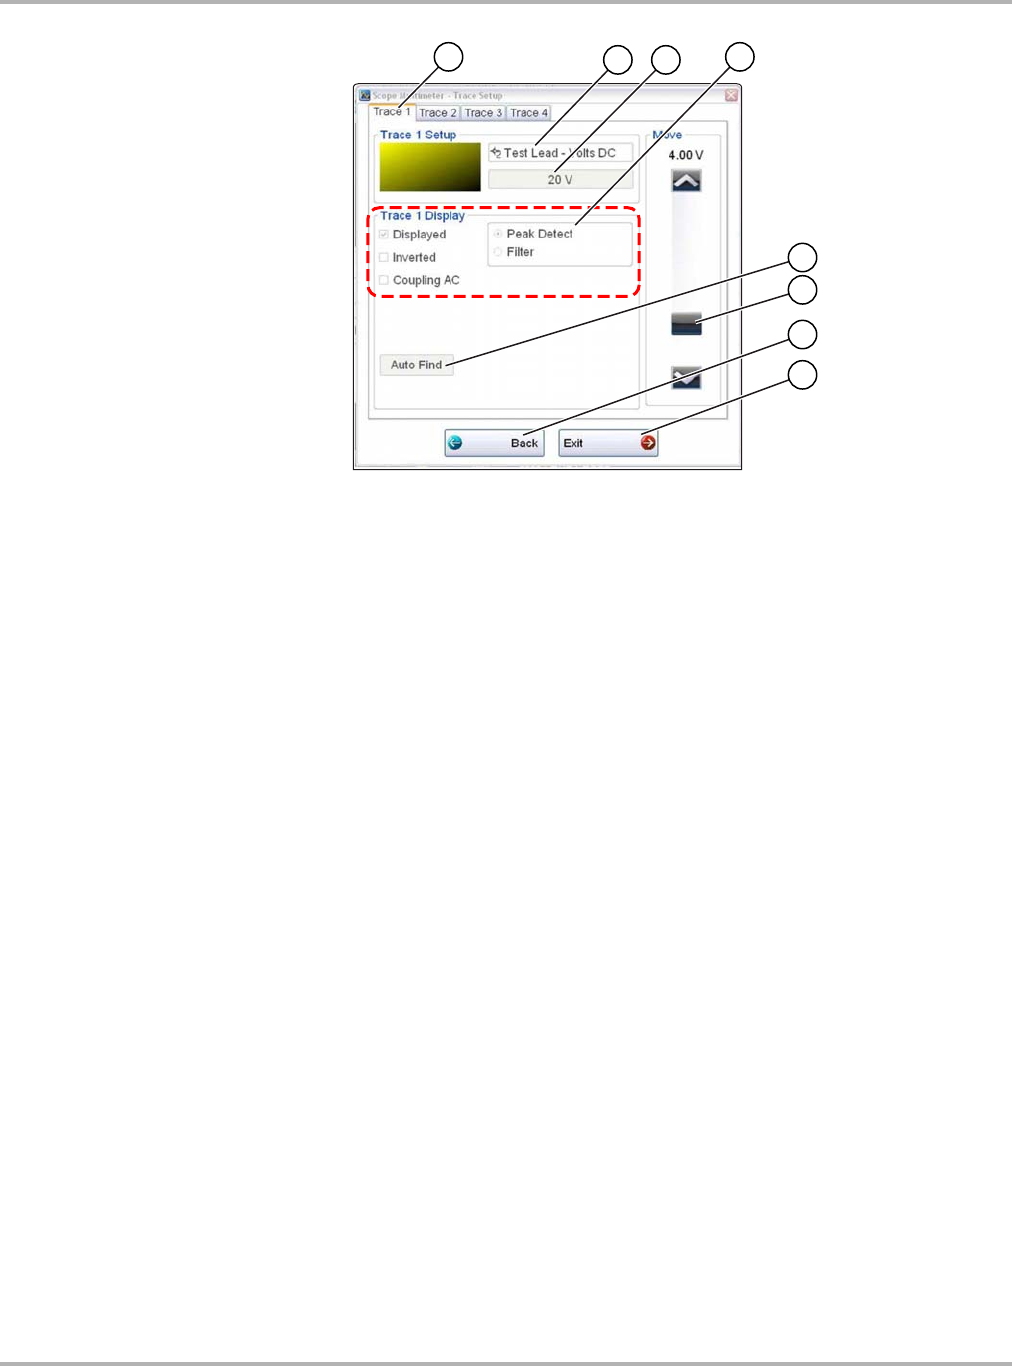
Sweep Controls
Sweep is the amount of time represented by the screen, or the horizontal scale of the display.
zTo adjust Sweep controls:
1. Select Setup from the Scope Multimeter toolbar.
The Scope Multimeter Preferences dialog box opens.
2. Select the Sweep icon to open the sweep dialog box (Figure 8-17)
Figure 8-17 Sample Sweep Setup dialog box
3. Choose an option from the list.
4. Select Back to return to the Preferences dialog box, or select Exit to close the dialog box and
return to the scope.
Draft 4/14/15- Do Not Distribute
102
Scope and Multimeter Operations Operations
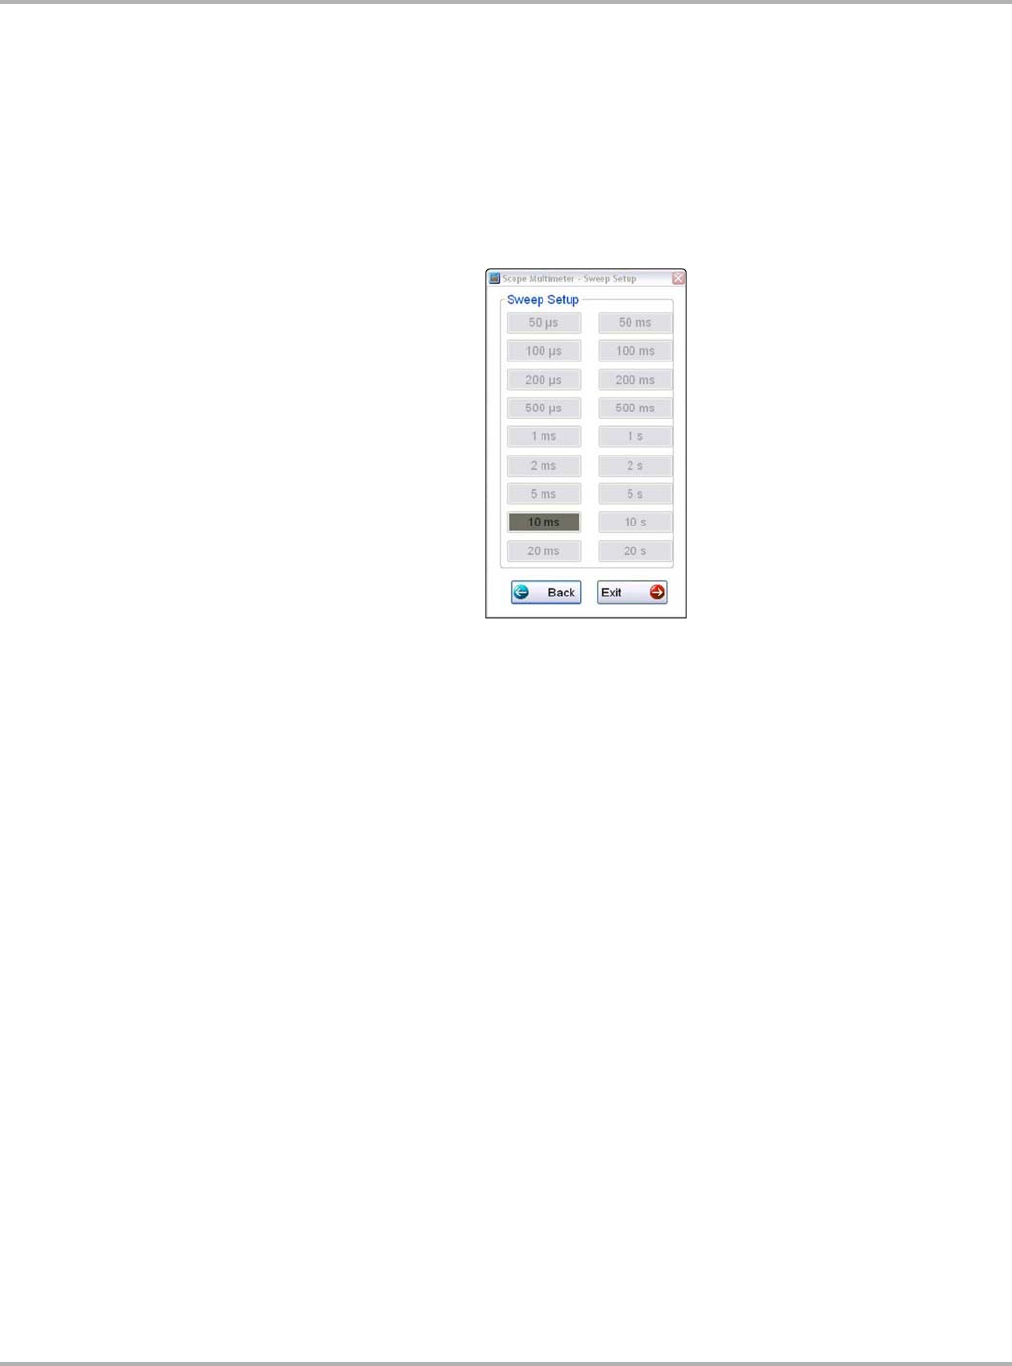
Trigger Controls
Triggering allows you to set the scope so that it only begins displaying a trace once predetermined
signal conditions, or triggers, are met. The trigger point is indicated by a plus sign (+) on the scope
grid. The plus sign can be dragged across the grid with the stylus to roughly position it. The trigger
controls allow you to precisely position the trigger.
zTo adjust trigger controls:
1. Select Setup from the Scope toolbar. The Scope Multimeter Preferences dialog box opens.
2. Select Trigger to open the Trigger Setup dialog box (Figure 8-18).
3. Use the dialog box controls to set the trigger.
4. Select OK to close the dialog box.
5. Select Back twice to close the Scope Multimeter Preferences dialog box.
1— Source—selects the triggering event:
- Trace 1—sets the trigger to channel 1.
- Trace 2—sets the trigger to channel 2.
- Trace 3—sets the trigger to channel 3.
- Trace 4—sets the trigger to channel 4.
- Cylinder—sets triggering to the firing of a cylinder detected by the optional RPM
Pickup or Secondary Ignition Adapter.
- None—switches triggering off.
2— Mode—sets the method of triggering:
- Auto (automatic)—if a trigger is found, the waveform displays. If a trigger is not found
after about a half second, the waveform and a “trigger not found” message displays.
- Manual—if a trigger is found, the waveform displays. If a trigger is not found nothing
displays (no waveform and no message).
3— Slope—sets triggering to the rising (top icon) or falling (lower icon) slope of the signal
waveform.
4— Vertical position—moves the trigger position up and down on the grid.
5— Horizontal position—moves the trigger timing left and right on the grid
Draft 4/14/15- Do Not Distribute
103
Scope and Multimeter Operations Operations
6— Select Back to return to the Preferences dialog box, or select Exit to close the dialog box
and return to the scope.
Figure 8-18 Trigger controls
View Controls
Use the view controls to set display attributes.
zTo adjust view controls:
1. Select Setup from the Scope Multimeter toolbar.
The Scope Multimeter Preferences dialog box opens.
2. Select View to open a submenu.
3. Select an option from the submenu dialog box. Option details are explained below.
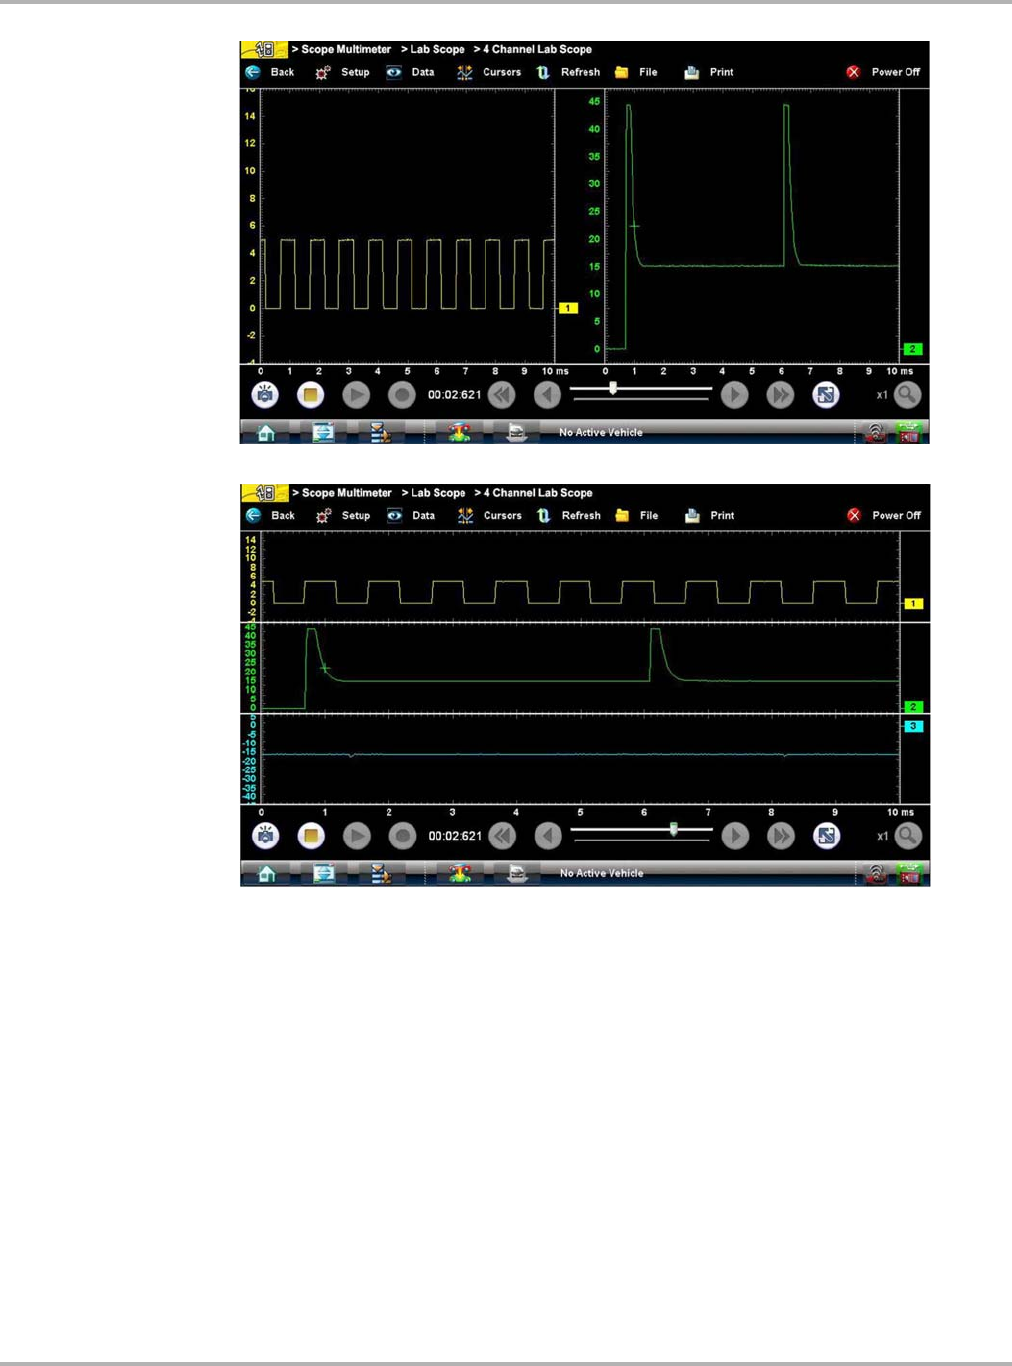
Four options are available on the submenu:
–Display—use to adjust what information displays and how it appears
–Layout—use to set how many traces display and how they display on the screen
–Units—use to adjust time and voltage interval settings
–Back— use to return to the Preferences dialog box, or select Exit to close the dialog box
and return to the scope.
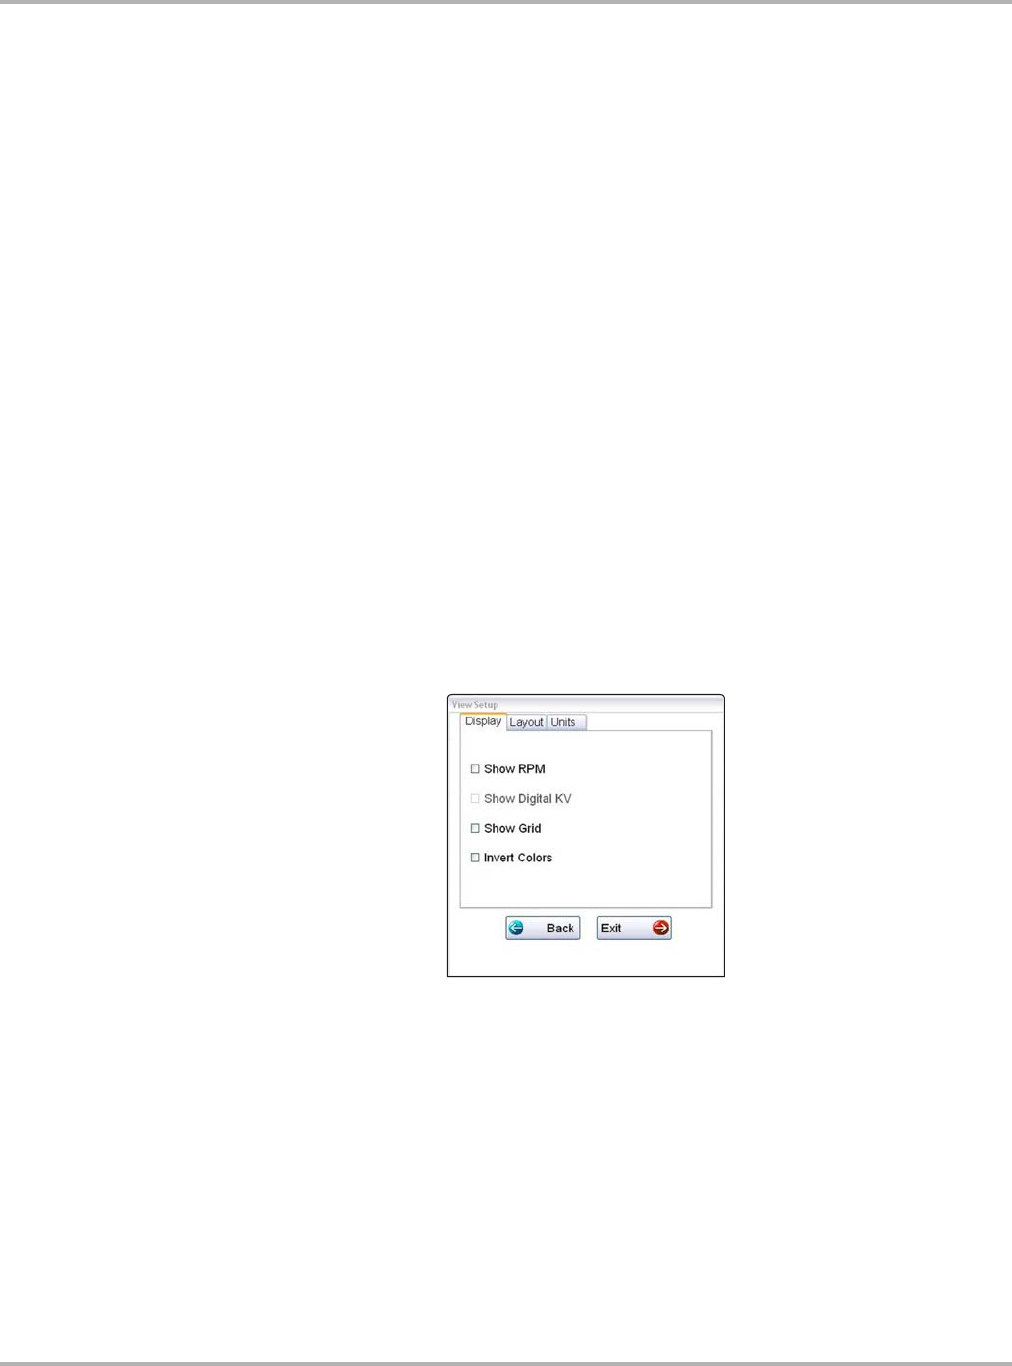
Display Settings
Selecting Display from the View submenu opens the Display dialog box (Figure 8-19).
Figure 8-19 Sample Display dialog box
Draft 4/14/15- Do Not Distribute
104
Scope and Multimeter Operations Operations
The following options are available from the Display dialog box:
•Show RPM—adds an engine speed field at the top of the screen (Figure 8-20).
Figure 8-20 Sample Show RPM selected
•Show Digital KV—available only in ignition scope, displays digital kilovolt readings, rather
than waveforms, on the screen (Figure 8-21).
Figure 8-21 Sample Show Digital KV selected
Draft 4/14/15- Do Not Distribute
105
Scope and Multimeter Operations Operations
•Show Grid—switches grid lines on the screen off and on (Figure 8-22).
Figure 8-22 Sample grid selected
•Invert Colors—switches the screen background to white.
Layout Settings
The selected radio knob on the Layout dialog box shows which setting is active. Use your finger
or the stylus to switch between settings:
•1 window—shows all traces on the same screen (Figure 8-22).
•2 windows—shows two separate traces in two ways: horizontal, one below another
(Figure 8-23) or vertical, side-by-side (Figure 8-24).
•3 windows—shows three traces, one below another, on the same screen (Figure 8-25).
•4 windows—shows four traces, one below another, on the same screen.
Figure 8-23 Sample 2 Windows horizontal display
Draft 4/14/15- Do Not Distribute
106
Scope and Multimeter Operations Operations
Figure 8-24 Sample 2 Windows vertical display
Figure 8-25 Sample 3 Windows display
Draft 4/14/15- Do Not Distribute
107
Scope and Multimeter Operations Operations
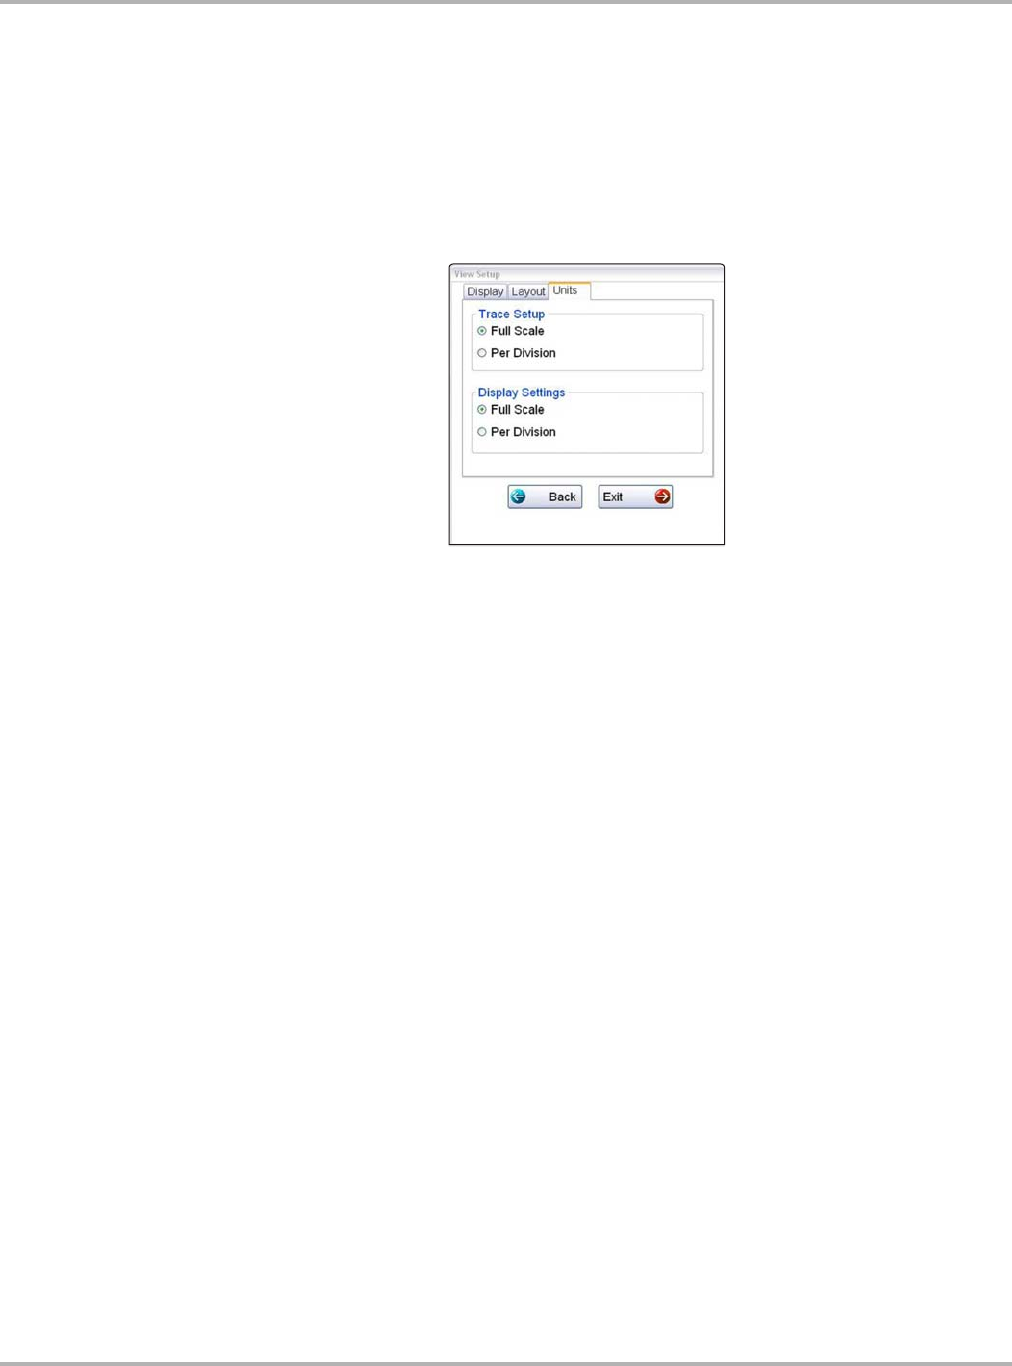
Unit Setup
The Unit Setup dialog box allows you to switch between Full Scale or Per Division settings for the
trace setup and the display settings. Selecting Full Scale configures the units to the full viewing
area of the screen, while Per Division adjusts the units to a single division (one tenth) of the
screen.
The selected radio knob on the Units dialog box shows which setting is active. Use your finger or
the stylus to switch between settings (Figure 8-26).
Figure 8-26 Sample View Units dialog box
Setup Controls
Basic tool settings are adjusted here.
zTo adjust setup controls:
1. Select Setup from the Scope Multimeter toolbar.
The Scope Multimeter Preferences dialog box opens
2. Select Setup from the dialog box.
A submenu of options displays:
–Back—use to return to the Preferences dialog box.
–Units—use to set how measurement values display, US standard or metric.
–Snapshot—use to adjust the percentage of data captured following a trigger event.
–Ignition—use to configure the ignition scope for the test vehicle.
Selecting from the submenu opens a dialog box for that item. Dialog box options for each item
are discussed in the following sections.
3. Make dialog box selections as needed.
4. Select Exit to close the dialog box and return to the scope.
Draft 4/14/15- Do Not Distribute
108
Scope and Multimeter Operations Operations
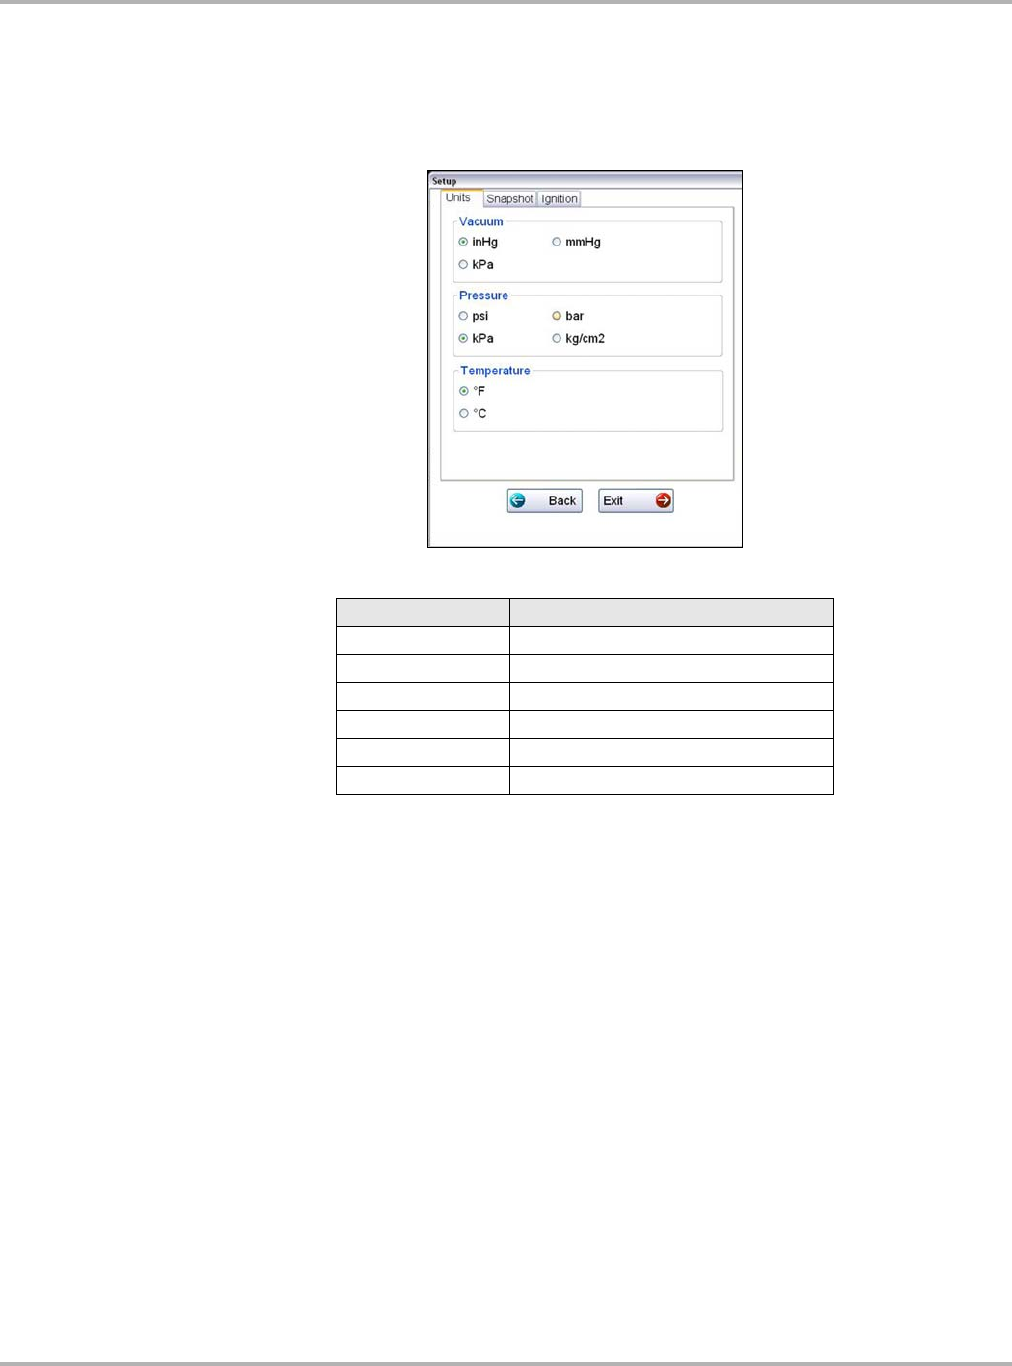
Units
Selecting Units opens the Setup dialog box. The units of measurement can be changed between
US customary or metric. The selected radio knobs on the Setup dialog box show which settings
are active (Figure 8-27).
Figure 8-27 Sample Setup Units dialog box
Abbreviation Description
bar bar
inHg inches of mercury
kg/cm2 kilograms per centimeter squared
kPa kilopascal
mmHg millimeters of mercury
psi pounds per square inch
Draft 4/14/15- Do Not Distribute
109
Scope and Multimeter Operations Operations
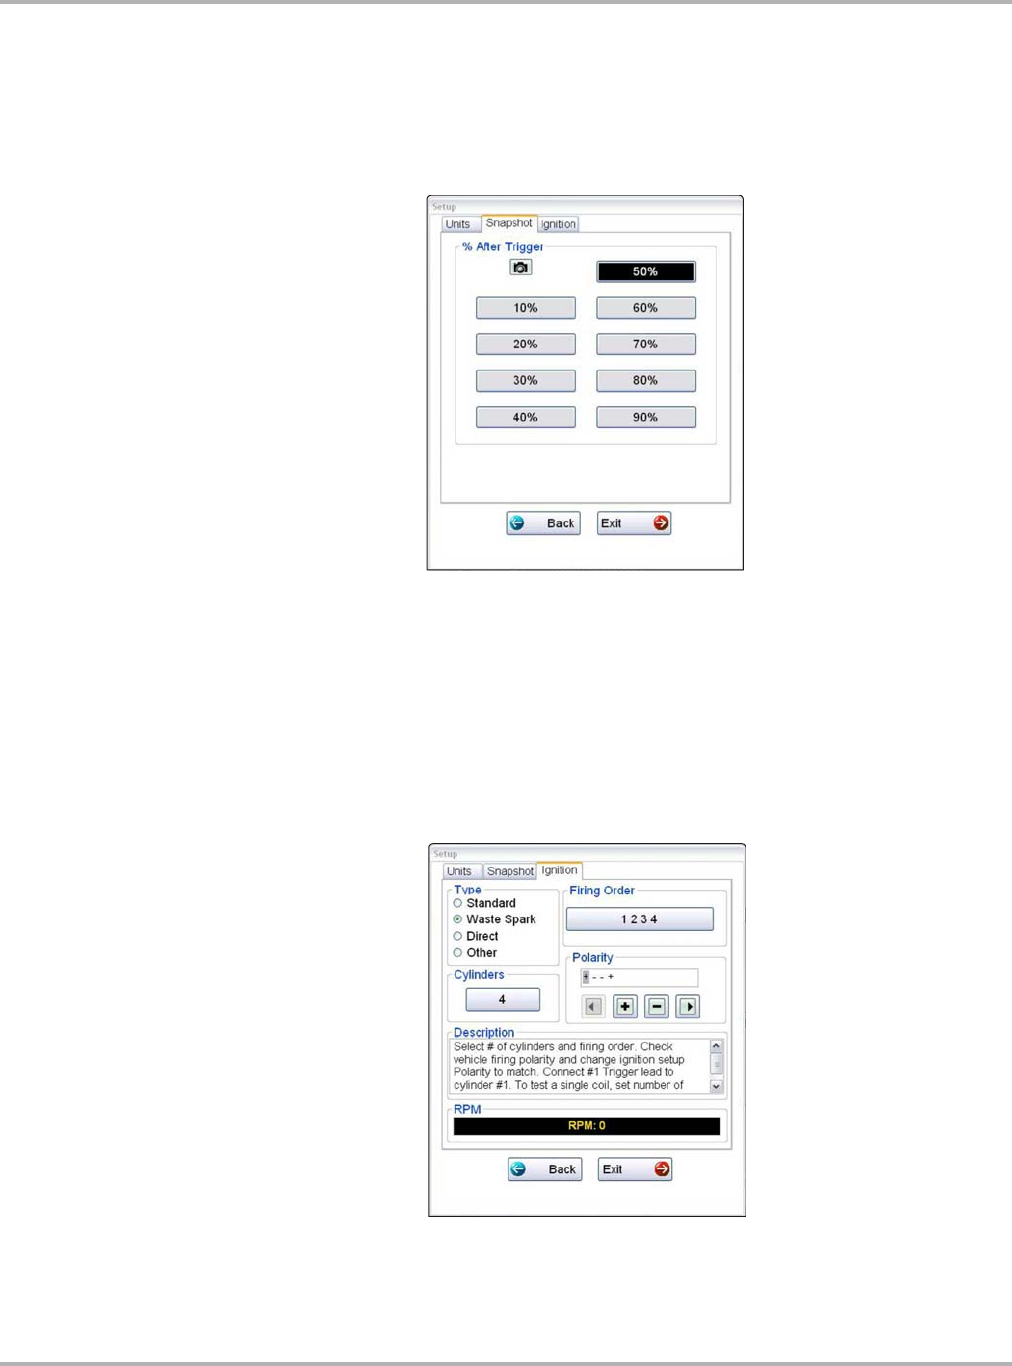
Snapshot
The Snapshot tab of the Setup dialog box opens a window that allows you to select how much
data is captured after a snapshot is triggered (Figure 8-28). Available selections, which range from
ten to ninety percent in ten-percent increments, are shown as icons with the current setting
highlighted. Select a icon, then select Back or Exit to close the dialog box.
Figure 8-28 Sample Snapshot dialog box
Refer to Trigger Controls on page 102 for information on how to setup a trigger.
Ignition
The Ignition tab of the Setup dialog box is used to configure the scope for displaying secondary
ignition patterns. There are two main selection fields (Type and Cylinders) and the fields vary
depending upon the type of ignition system selected in dialog box (Figure 8-29).
Figure 8-29 Sample Setup Ignition dialog box
Draft 4/14/15- Do Not Distribute
110
Scope and Multimeter Operations Operations
zTo setup Ignition tests
1. Select the Setup icon to open the Setup dialog box.
2. Select the Ignition tab of the dialog box.
3. Highlight the ignition system for the test vehicle in the “Type” field:
–Standard—use for systems with a distributor
–Waste Spark—use for coil pack systems that fire 2 plugs simultaneously
–Direct—use for coil-on-plug systems
–Other—use for systems that do not fit any of the above categories
4. Select the number of cylinders for the test vehicle in the “Cylinders” field.
Scroll through the list using the up and down arrows on either side of the number.
5. This step varies depending upon the type of ignition system:
–If testing a Standard system, select the Firing Order.
–If testing an Other system, select the RPM Factor.
Scroll through the list of available choices using the up and down arrows below the
displayed firing order or RPM factor.
6. This step also varies depending upon the type of ignition system:
–On a Standard or Direct system, choose between Coil and Plug for the Number 1 Trigger.
–On a waste Spark system, select the polarity of the firings using the +, –, and arrow icons.
7. Select Back to return to the Preferences dialog box, or select Exit to close the dialog box and
return to the scope.
Data
The Data icon on the toolbar switches the trace details information at the base of the screen
through three states as previously explained in Trace Details on page 94.
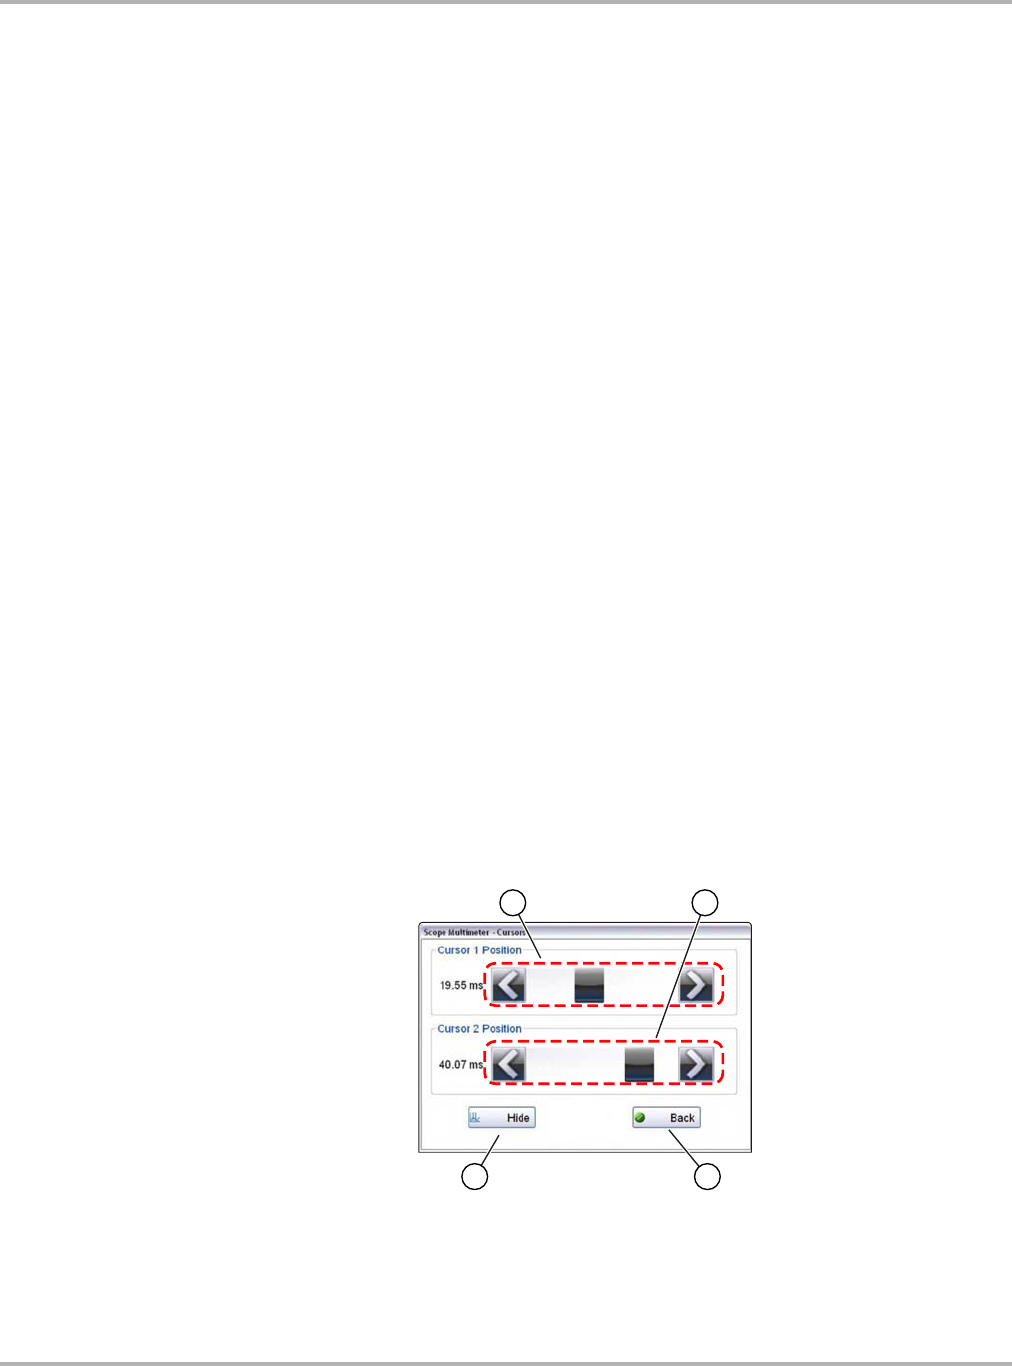
Cursor Controls
Select Cursors from the toolbar to open the Cursors dialog box (Figure 8-30).
1— Cursor 1 controls
2— Cursor 2 controls
3— Show or Hide icon
4— Back icon
Draft 4/14/15- Do Not Distribute
111
Scope and Multimeter Operations Operations
Figure 8-30 Cursor controls
Cursor 1, the top slider and arrows, is the left-hand cursor on the screen. Cursor 2, the lower set
of controls, is the right-hand cursor on the screen. Drag the slider or select the arrows to position
the cursors. Each tap of the stylus moves the cursor incrementally in the direction of the arrow.
Select Show to display the cursors (the icon changes to Hide).
Select Hide to conceal the cursors (the icon changes to Show).
Select Back to close the dialog box.
Refresh Controls
Selecting the Refresh icon from the Scope Multimeter Toolbar clears the minimum and maximum
digital values and updates the viewing screen.
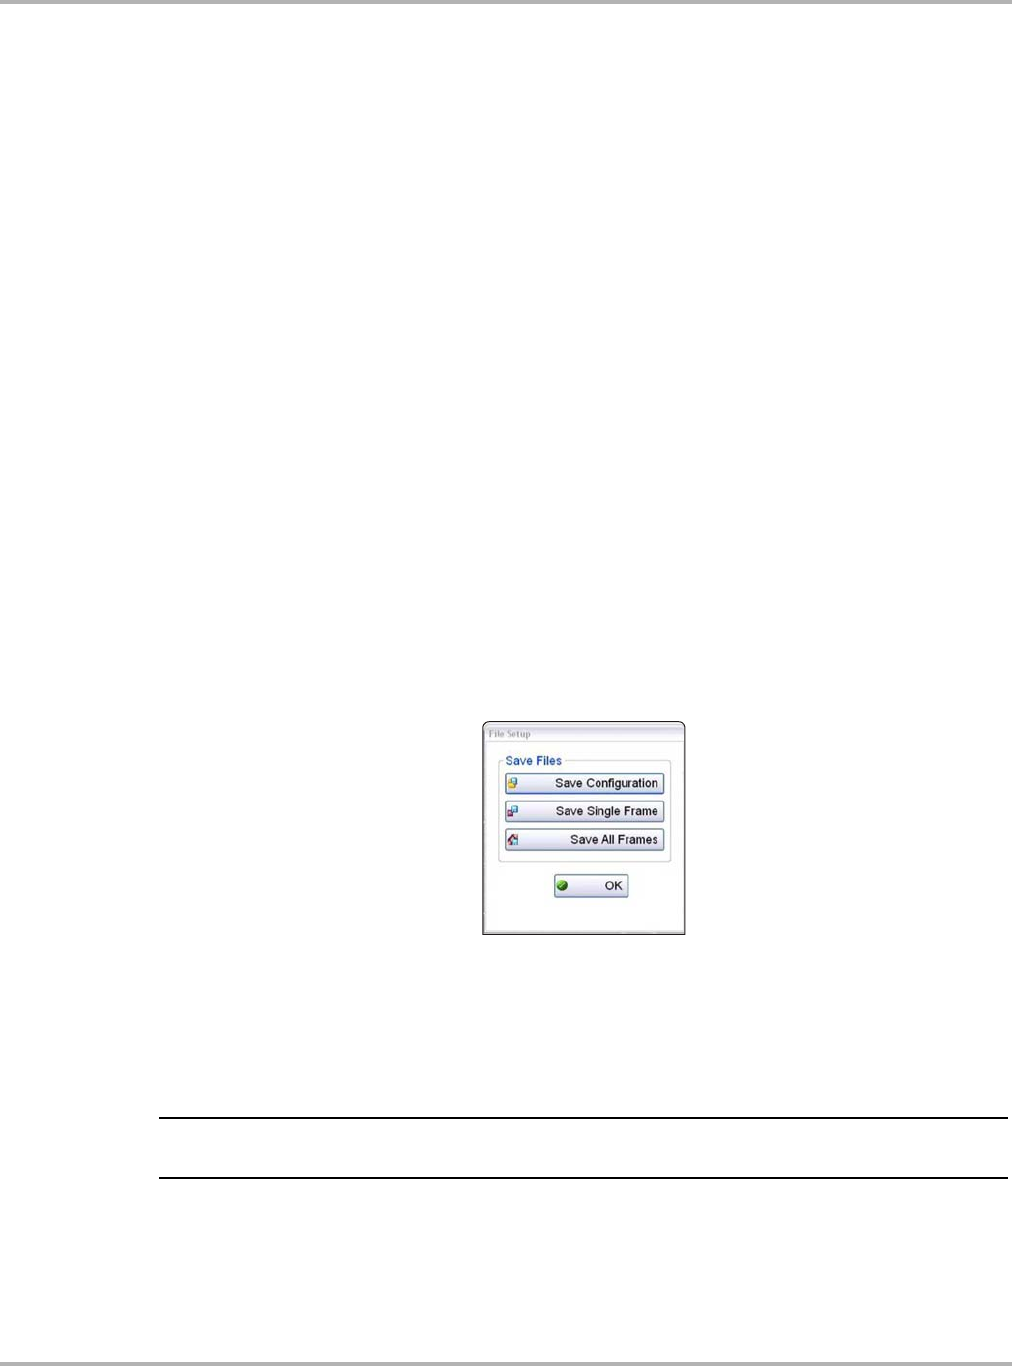
File Controls
Selecting File from the toolbar opens a dialog box with a menu of save options:
•Save Configuration—saves the current setup values as a preset.
•Save Single Frame—saves the data currently on the screen only.
•Save All Frames—saves the current screen plus all the data stored in the buffer.
zTo save a file or configuration:
1. Select File from the toolbar.
2. Select a save option from the dialog box.
Figure 8-31 Sample file setup dialog box
The Save As dialog box and the virtual keyboard open.
3. Use the keyboard to name the file to be saved, then either select the Save icon or select
return on the keyboard.
A configuration description dialog box opens.
NOTE:
iThe description entered here is what displays in the information panel of the Data Manager.
4. Use the keyboard to enter a description of the file to be saved.
5. Select the OK icon or select return on the keyboard.
6. Select OK to close the file setup dialog box.

Draft 4/14/15- Do Not Distribute
112
Scope and Multimeter Operations Operations
Once a configuration is saved, it becomes available as a preset. Files are saved to the Scope
Multimeter Data Folder and can be retrieved through the Data Manager.
Print Controls
Selecting Print from the toolbar opens a standard Windows Print dialog box set up to print the
current screen. A printer must be connected and setup on the Diagnostic Tool. If not, the “Add
Printer Wizard” opens and guides you through the procedure. Select from the menus as needed.

Draft 4/14/15- Do Not Distribute
113
Chapter 9 Repair Information Operations
After using the Scanner, Guided Component Test, and Scope Multimeter to diagnose and locate
the source of a problem, select Repair Information on the Home screen to link to resources that
help you fix the problem and get the vehicle back in service (Figure 9-1).
Figure 9-1 Sample Home screen Repair Information icon
ShopKey® Pro and ProDemand® subscriptions are available as an option for North America. An
internet connection is required. When installed, simply select the Repair Information icon on the
Home screen to start the program. Refer to the on-line help within the program for additional
information.
Draft 4/14/15- Do Not Distribute
114
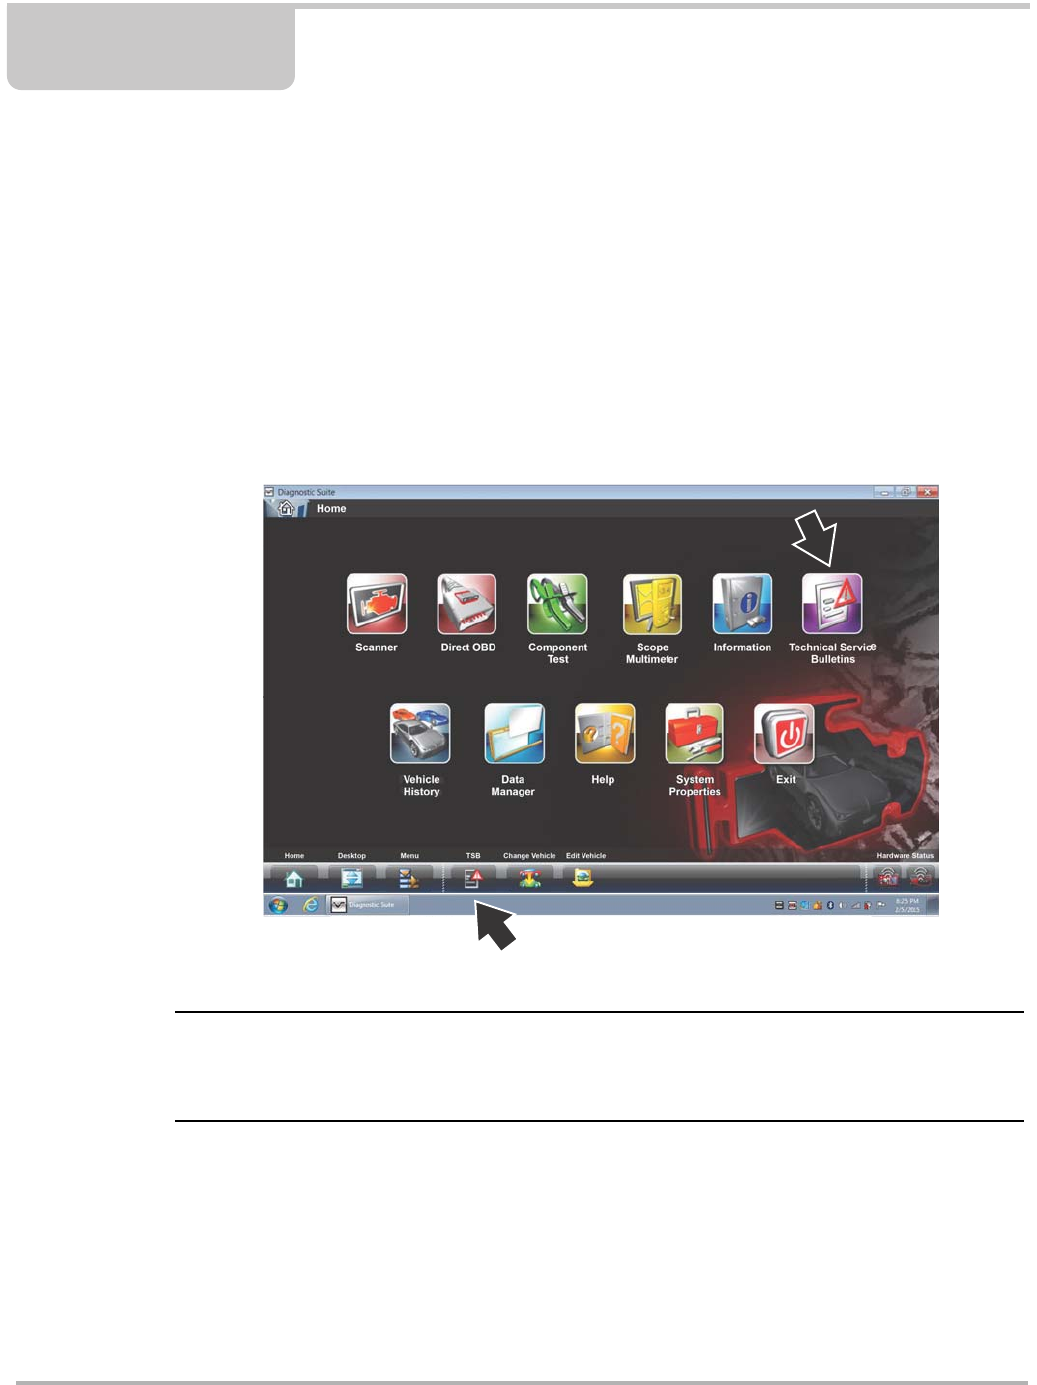
Chapter 10 Technical Service Bulletins
Selecting the Technical Service Bulletins (TSB) icons (Figure 10-1), provides the following
(if available) for the identified vehicle:
•Original Equipment Manufacturer (OEM) technical service bulletins and campaigns
•National Highway Traffic and Safety Administration (NHTSA) recalls
The Technical Service Bulletins icons become active after a vehicle has been identified, see
Vehicle Identification on page 39. The Technical Service Bulletins feature can be selected from
the:
•Home screen, or
•Toolbar
Figure 10-1 Technical Service Bulletins Icons
NOTE:
iThe Technical Service Bulletins feature is included with current Diagnostic Tool system software.
To use the Technical Service Bulletins feature you must have the current software upgrade
installed on your Diagnostic Tool.
Draft 4/14/15- Do Not Distribute
115
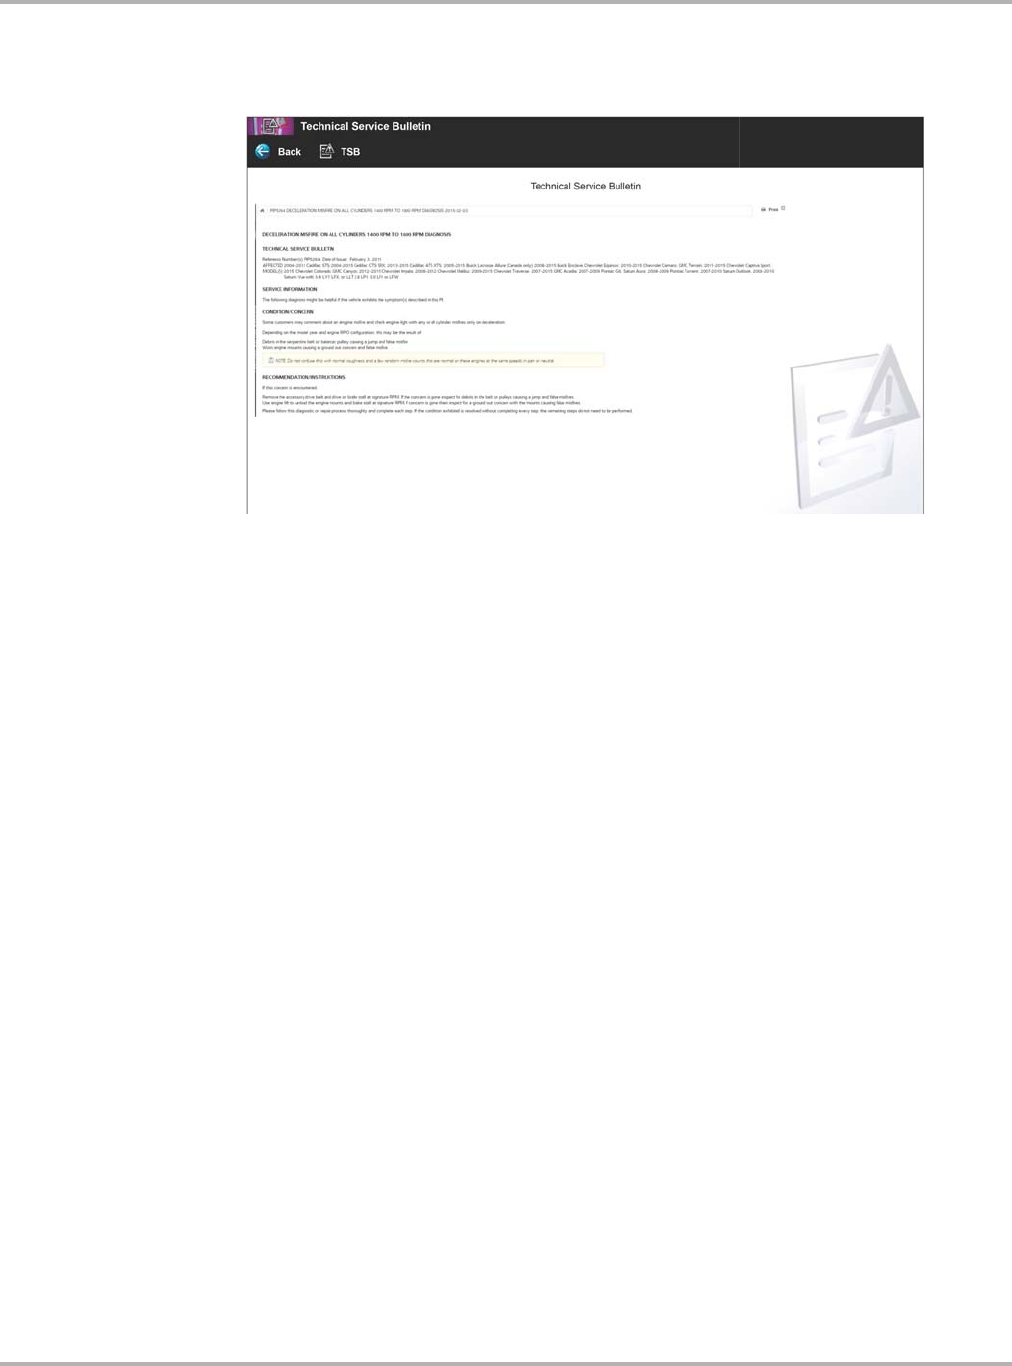
Technical Service Bulletins
Available Technical Service Bulletins are displayed in a listed order, select the desired file to
display the results (Figure 10-2).
Figure 10-2 Typical Technical Service Bulletin
Draft 4/14/15- Do Not Distribute
116
Chapter 11 Vehicle History Operations
Vehicle History refers to any work in progress, such as a repair order, estimate or invoice, that has
customer, vehicle, and repair information for a vehicle in your shop. The Vehicle History is the
starting point for using the Diagnostic Tool.
The Scanner and Guided Component Test software gets vehicle information from the Vehicle
History, and can only start after a Vehicle History is opened.
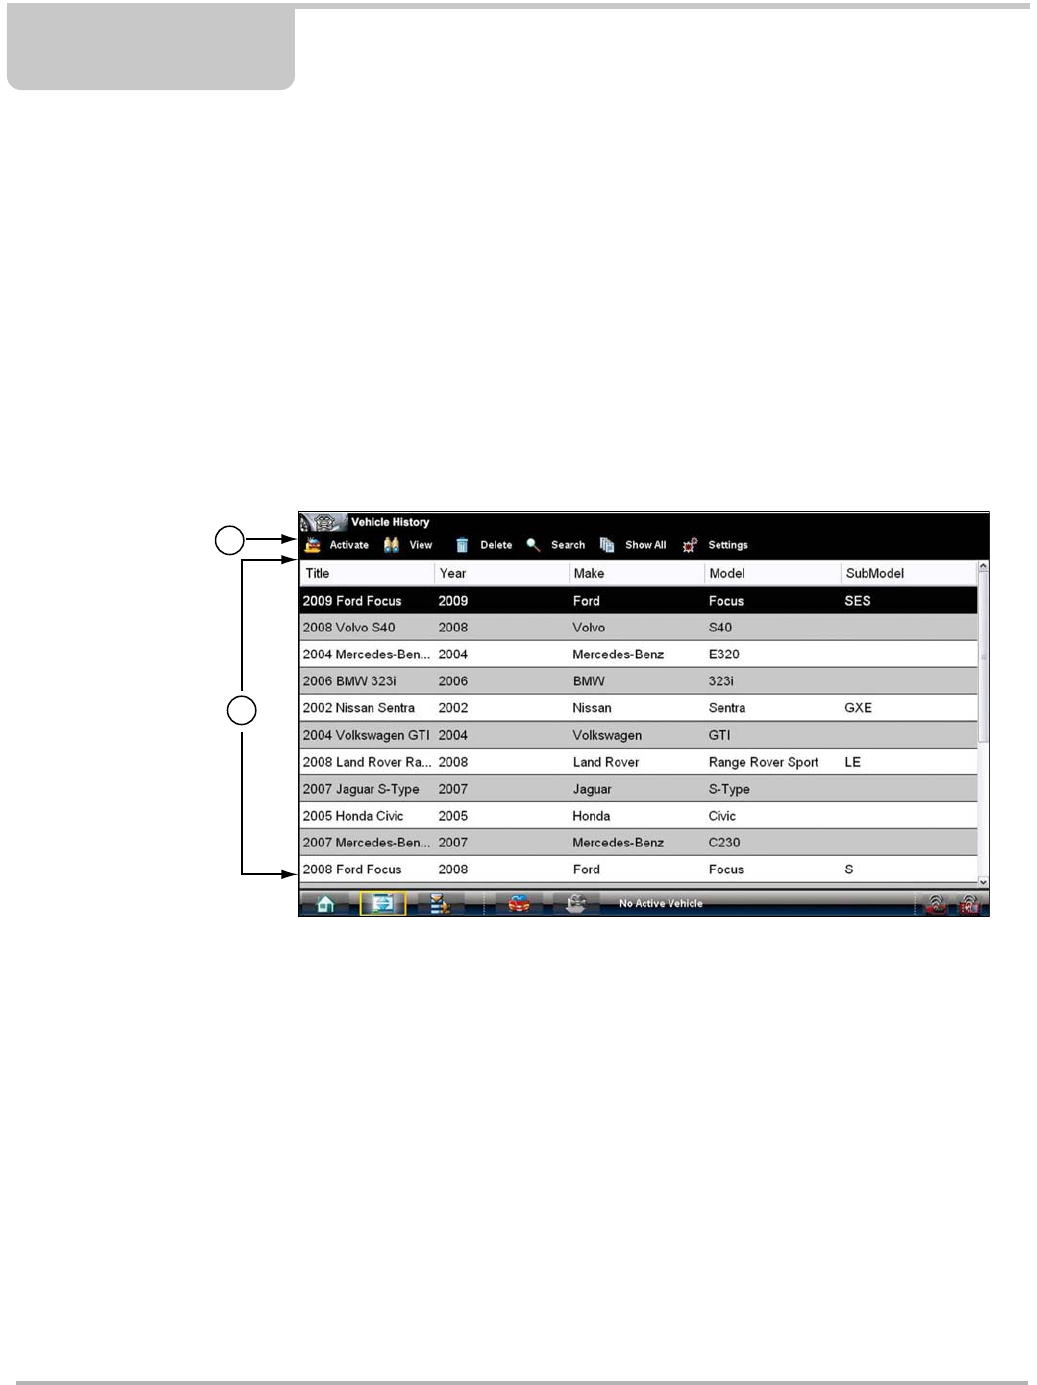
11.1 Screen Layout
There are two main parts to the Vehicle History screen:
1. Vehicle History Toolbar—lets you manage the vehicle data
2. Main Body—lists all open Vehicle History records
Figure 11-1 Sample Vehicle History screen
Draft 4/14/15- Do Not Distribute
117
Vehicle History Operations Screen Layout
11.1.1 Vehicle History Main Body
The main body of the screen lists all of the available Vehicle History items. By default, items are
shown in the order in which they are entered. However, you can resort them by any of the
categories shown as column headings. You can also resize the individual columns.
zTo sort Vehicle History items:
1. Select a category heading.
The listed items resort according to the selected category. A triangle appears alongside the
name of the column that was used for the sort.
2. Select the triangle in the heading to reverse the sort order.
zTo resize a Vehicle History column:
1. Select the line separating two columns.
A line with arrowheads appears to show the column is ready for resizing.
2. Drag the line left or right to increase or decrease the column width.
11.1.2 Vehicle History Toolbar
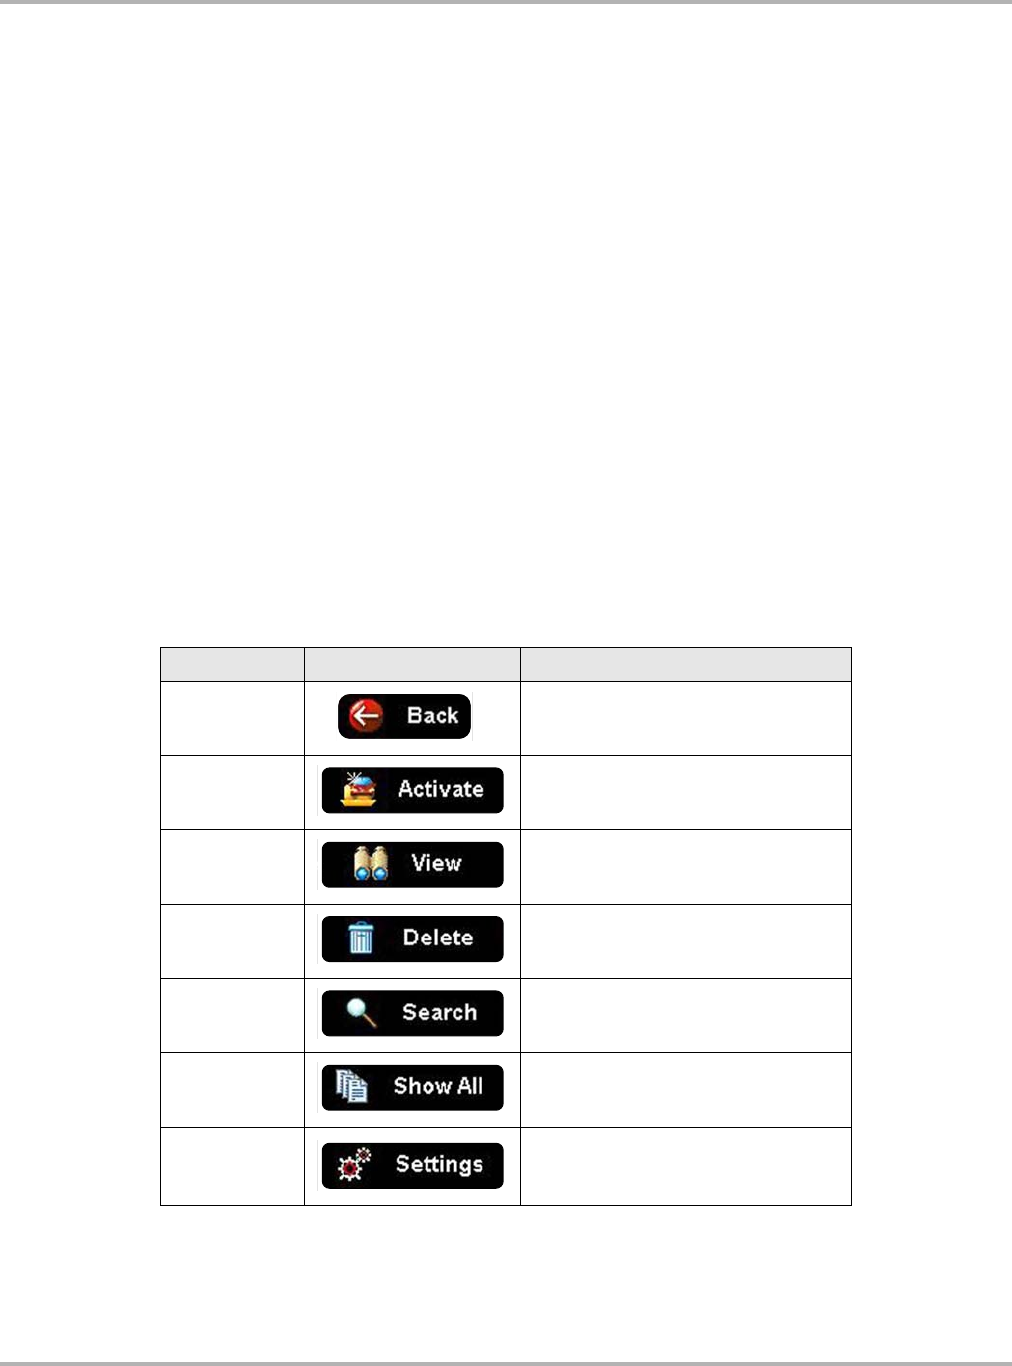
The table below gives brief descriptions of the control icons on the toolbar:
Table 11-1 Toolbar icons
Name Icon Description
Back Returns to the previously viewed
screen.
Activate Loads the highlighted vehicle history.
View Opens the worksheet for the currently
highlighted vehicle history.
Delete Erases the currently highlighted vehicle
history.
Search Opens a window that allows you to
locate a particular vehicle history.
Show All Available only after a search, use to
return to a complete Vehicle History list.
Settings
Opens a window that allows you to
configure which fields display on main
Vehicle History screen.
Draft 4/14/15- Do Not Distribute
118
Vehicle History Operations Screen Layout
Activate
Use this icon to load an existing vehicle history when servicing a vehicle that you have previously
worked on. The Diagnostic Tool uses the identification characteristics stored in the vehicle history
to load the correct database, so there is no need to identify the test vehicle.
zTo activate a vehicle:
1. Locate and highlight the desired Vehicle History in the main body of the screen.
2. Select Activate on the Vehicle History toolbar.
The Activate icon is removed from the toolbar once a vehicle has been selected.
3. Select the Home icon on the Toolbar.
The Home screen displays with the activated vehicle shown on the toolbar.
4. Select any Function icon on the Home screen to begin testing.
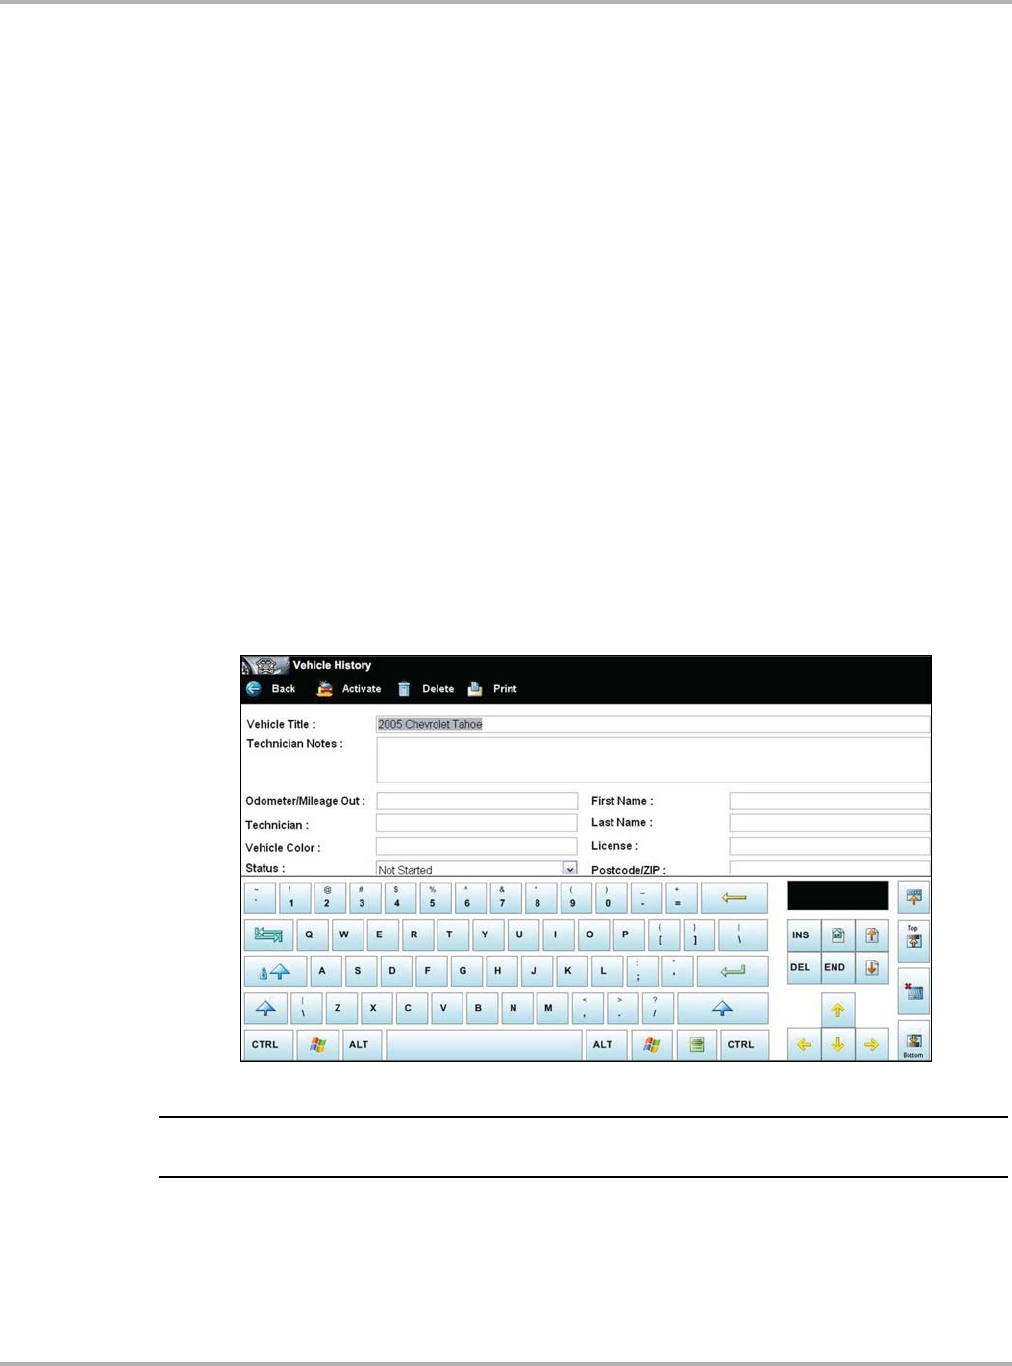
View
Use this selection to open, edit, add notes, and print the work sheet for an existing Vehicle History.
zTo modify an existing Vehicle History:
1. Highlight the Vehicle History be opened in the main body of the screen.
2. Select View on the Vehicle History toolbar.
The worksheet for the selected vehicle opens, and there are now Back and Save & Close
icons available on the toolbar.
Figure 11-2 Sample vehicle history worksheet
NOTE:
iThe virtual keyboard automatically opens the first time you select within one of the data fields.
3. Use the virtual keyboard to enter information in the data fields.
4. Select Save & Close on the toolbar to save the changes you made and return to the Vehicle
History screen.
Use the Back icon on the toolbar to return to the Vehicle History screen without saving the
changes you made.
Draft 4/14/15- Do Not Distribute
119
Vehicle History Operations Screen Layout
Delete
Use the Delete icon to remove unwanted items from the Vehicle History list. Simply highlight the
item to remove, then select Delete.
Search and Show All
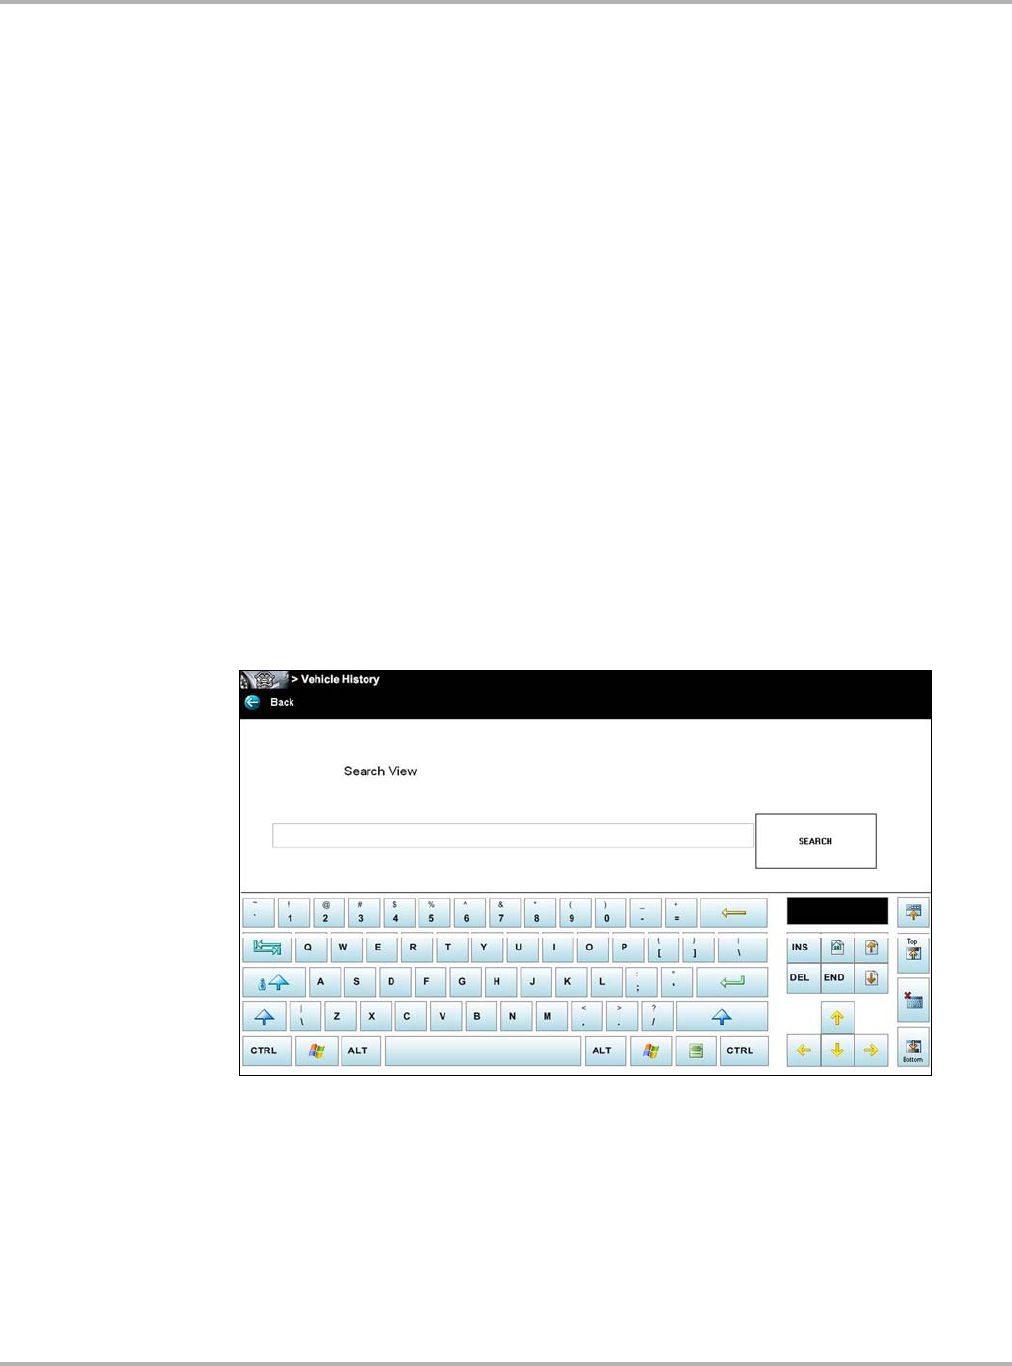
Selecting Search opens a dialog box that allows you to search Vehicle History items by category.
You can search for data in the following categories:
–Year
–Make
–Model
–Color
–Customer
–License
–State
–Technician
zTo search:
1. Select Search on the Vehicle History toolbar to open the search window.
2. Select within the text field of the search window to open the virtual keyboard (Figure 11-3).
Figure 11-3 Sample Search dialog box
3. Enter the search criteria using the keyboard. There is no need to identify the category, just
enter the search item.
4. Select Search twice. The first tap closes the keyboard, the second tap starts the search.
The display returns to the Vehicle History screen with only the records fitting the search
criteria showing.
5. Select Show All on the toolbar to restore the complete Vehicle History list.
Draft 4/14/15- Do Not Distribute
120
Vehicle History Operations Screen Layout
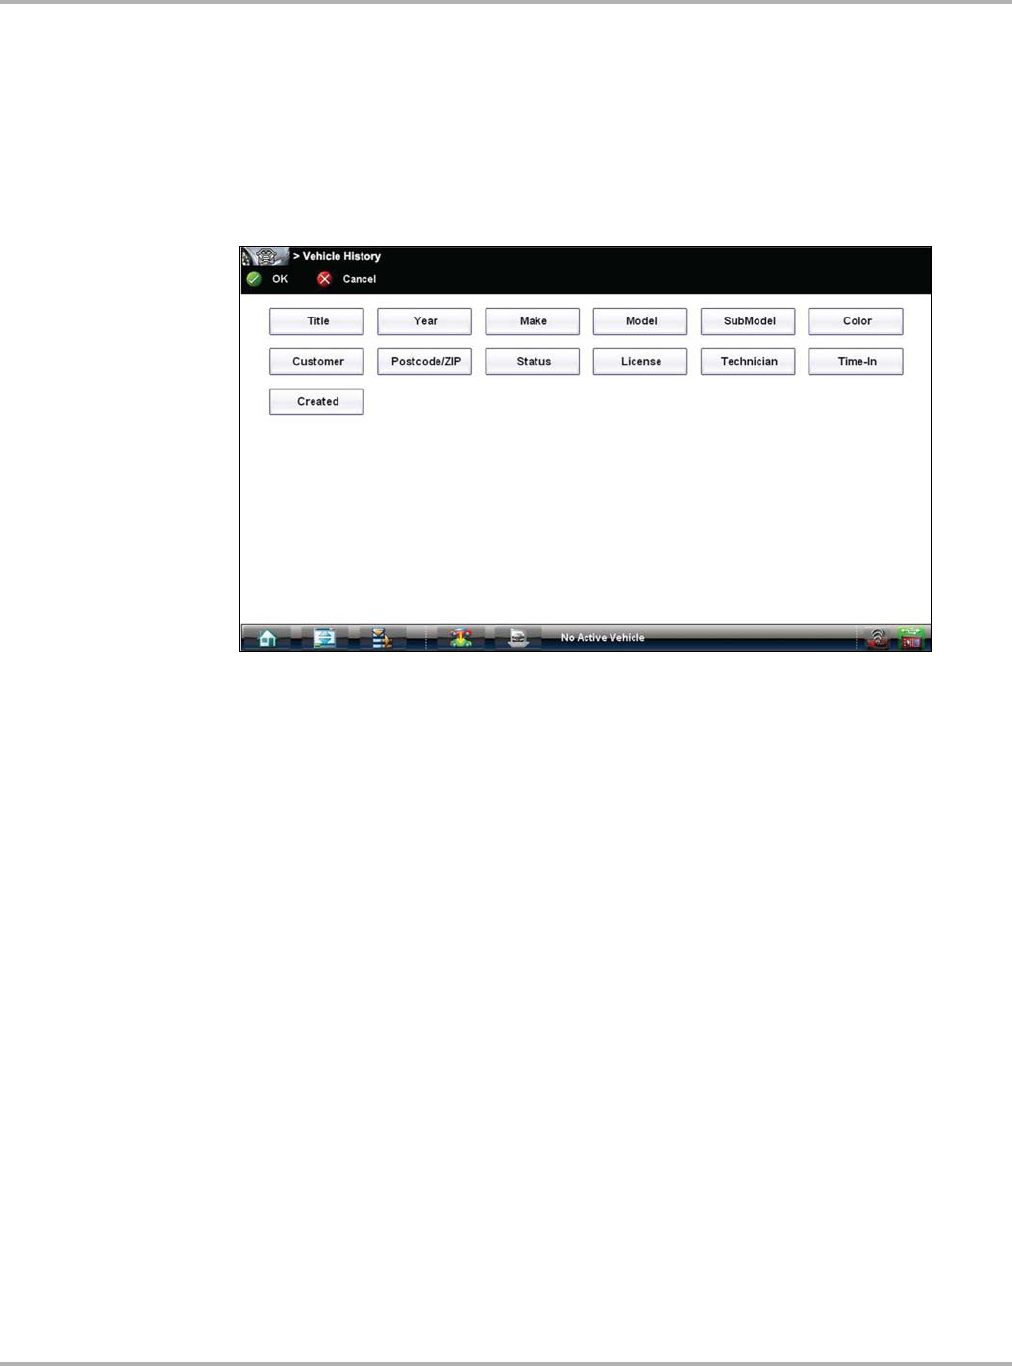
Settings
Use Settings to determine which categories of information display in the main body of the Vehicle
History screen. Selecting the Settings icon opens a dialog box.
zTo change Settings:
1. Select Settings on the Vehicle History toolbar to open the dialog box.
Figure 11-4 Sample Settings dialog box.
2. Select to highlight the categories that you do not want to display on the main screen,
remember:
–Items that are highlighted do not display
–Items that are not highlighted display
3. Select OK on the toolbar to implement the changes, select Cancel to disregard the changes.
The dialog box closes and the screen updates.
Draft 4/14/15- Do Not Distribute
121
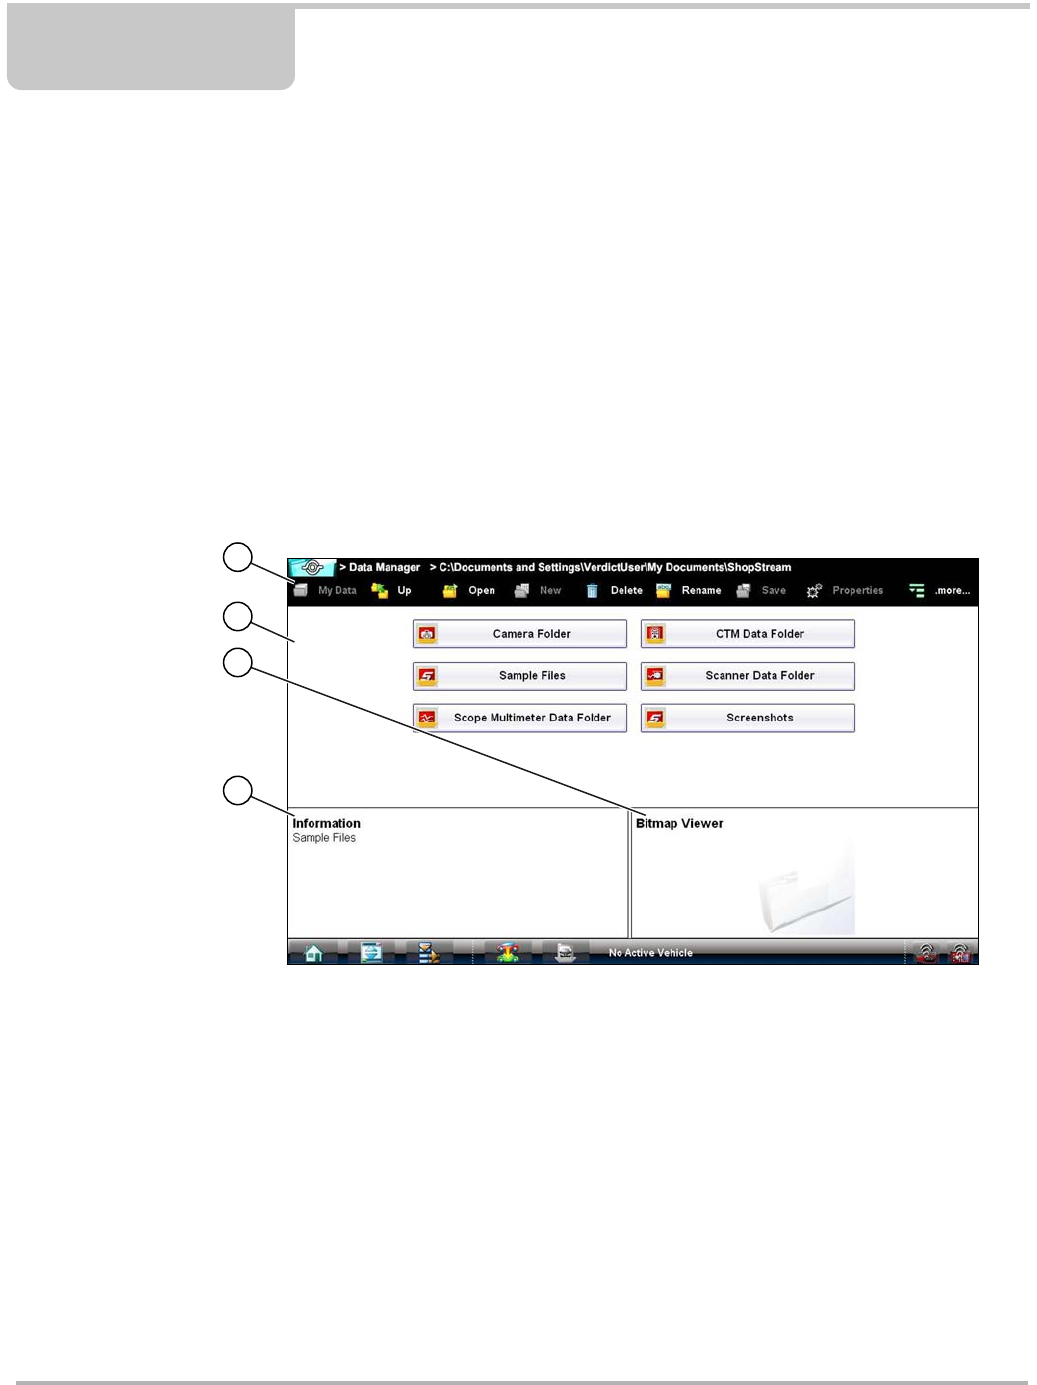
Chapter 12 Data Manager Operations
The Data Manager is used to store, sort, and review saved files. Most operations are controlled
through the toolbar.
12.1 Screen Layout
Select Data Manager on the Module toolbar to open the file system. Use the toolbar at the top of
the screen to navigate through the data. The folders panel below the toolbar displays the contents
of the Windows My Documents > ShopStream folder, which is the Data Manager main screen. The
information panel on the lower-left portion of the screen shows a summary of the saved file when
available, and the preview panel on the lower right displays an image if the selected file is a
graphic.
1— Data Manager Toolbar
2— Folders Panel
3— Preview Panel
4— Information Panel
Figure 12-1 Sample Data Manager main screen
The main screen includes folders for saved files from the various modules:
•Camera Folder—contains photographs taken with the built-in camera.
•CTM Data Folder—contains files saved while working in the Guided Component Test module.
•Sample Files—contains an assortment of example saved data files.
•Scanner Data Folder—contains files saved while working in the Scanner function. See
Scanner DataViewer Operation on page 129.
•Scope Multimeter Data Folder—contains files saved while working with the Scope Multimeter.
•Screenshots—contains images saved by pressing the Shortcut (S) button.
Draft 4/14/15- Do Not Distribute
122
Data Manager Operations Navigation
12.2 Navigation
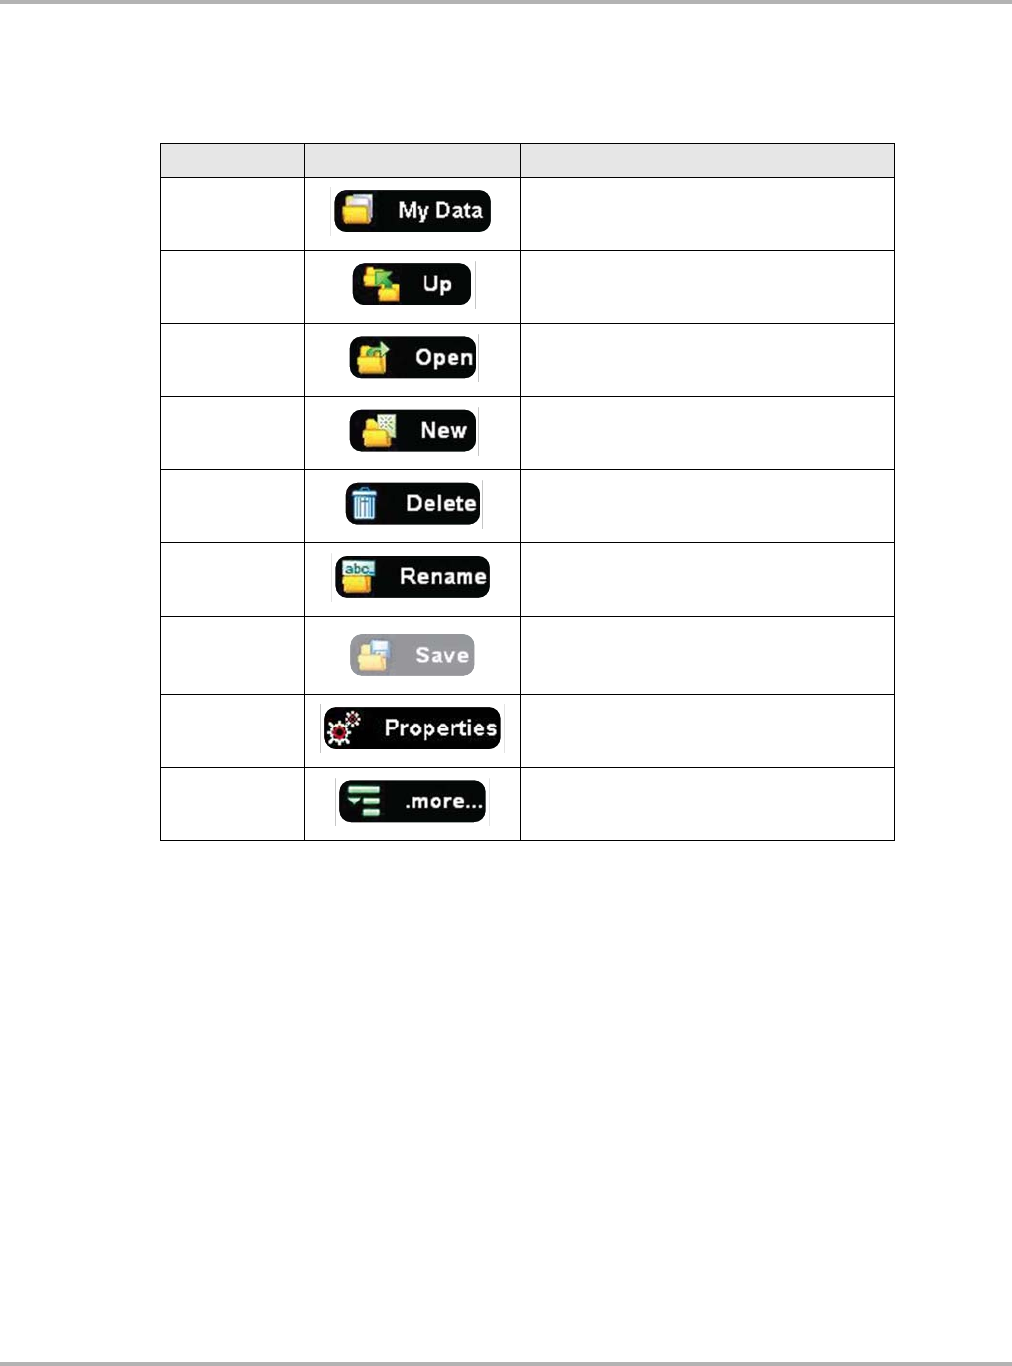
Use the toolbar icons as shown in the table below to navigate through the Data Manager:
12.3 Operations
Data Manager operations based on toolbar selections are explained in the following sections.
12.3.1 My Data
The My Data icon is a shortcut that quickly returns you to the main Data Manager screen. Select
the icon at any time to instantly return. Note the location of the page being viewed is shown near
the top of the screen just above the toolbar.
12.3.2 Up
This icon reflects the items shown in the folders panel of the screen up in the file structure one
level at a time. For example; one tap of the Up icon when viewing the contents of the Scanner Data
Table 12-1 Data Manager toolbar icons
Name Icon Description
My Data Returns to the Data Manager main screen.
Up Moves the items displayed in the folders
panel up one level in the file structure.
Open Opens the highlighted folder or file.
New Creates a new folder.
Delete Moves the highlighted file or folder to the
recycling bin.
Rename Opens a dialog box and the virtual keyboard
for renaming the selected file or folder.
Save
The Save function is not implemented at this
time. See Saving Files on page 138 for
information.
Properties Opens a dialog box and the virtual keyboard
for renaming the selected file or folder.
More Opens a menu of additional options.
Draft 4/14/15- Do Not Distribute
123
Data Manager Operations Operations
Folder returns you to the main screen. A second tap would display the contents of the “My
Documents” folder.
12.3.3 Open
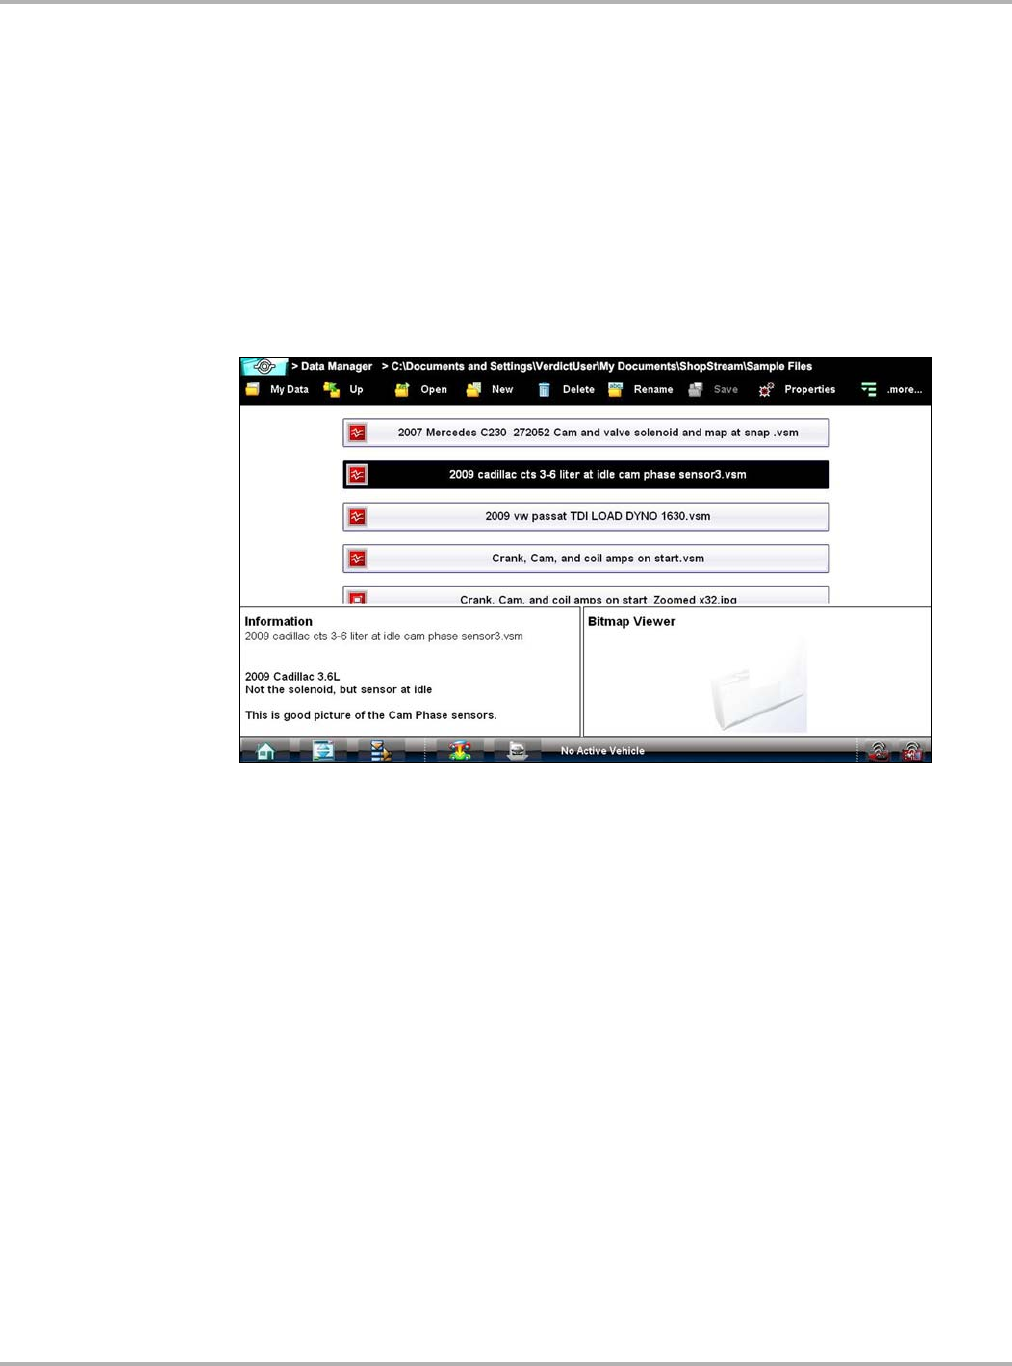
The Open icon is only active (displays in color) when an item in the folders panel is highlighted.
zTo open a folder:
1. Highlight the file to open in the folders panel.
2. Select the Open icon to load the highlighted file.
Figure 12-2 Sample open folder showing information
The screen advances and the contents of the open folder are shown in the folders panel.
Highlight an item in the folders panel and the information or preview displays, if available, in
the lower portion of the screen (Figure 12-2).
3. To exit the current folder:
–Select My Data on the toolbar to return to the main Data Manager screen.
–Select Up on the toolbar to return to the previous page.
Draft 4/14/15- Do Not Distribute
124
Data Manager Operations Operations
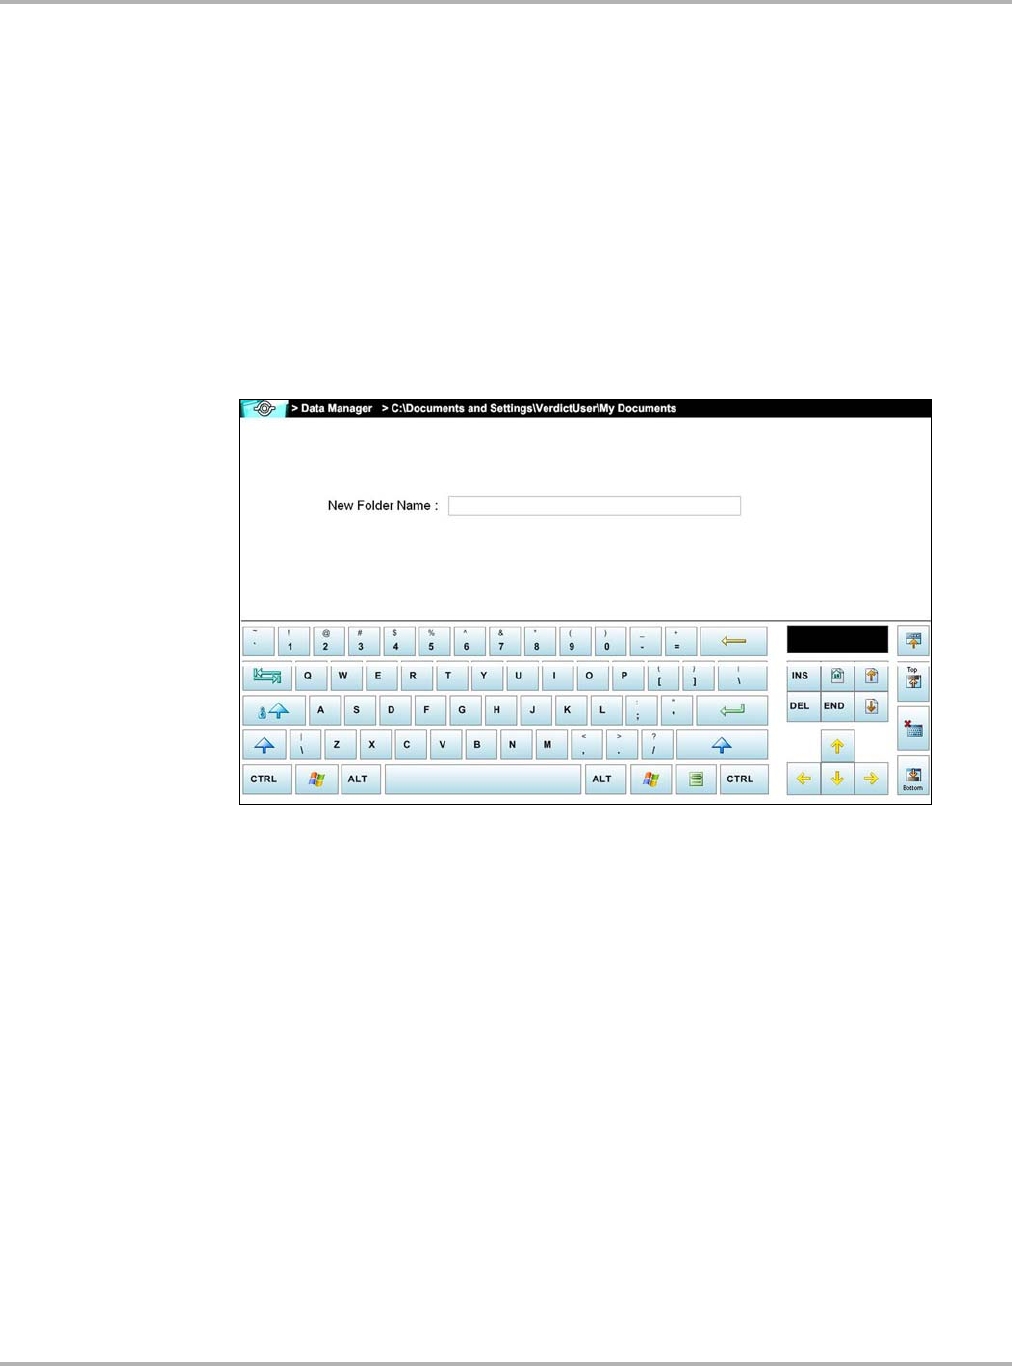
12.3.4 New
The New icon allows you to create a new folder. This option is only available when the icon
displays in color.
zTo create a new folder:
1. Select the New icon on the toolbar.
The New Folder Name dialog box opens (Figure 12-3).
2. Select the entry field on the dialog box to open the virtual keyboard.
3. Type a name for the new folder using the virtual keyboard.
4. Select the OK icon to create the new folder and return to the previous page. The Cancel icon
returns you to the previous page without creating a new folder.
Figure 12-3 Sample New Folder name dialog box
Draft 4/14/15- Do Not Distribute
125
Data Manager Operations Operations
12.3.5 Delete
The Delete icon moves folders or items within folders to the Recycling bin. A confirmation displays
when a file is selected for deletion. Select Yes to delete the file or Cancel to exit.
zTo delete an item:
1. Select to highlight the item or folder to be deleted.
2. Select the Delete icon on the toolbar.
A confirmation message displays (Figure 12-4).
Figure 12-4 Sample delete confirmation message
3. Select OK to delete the selected item and return to the previous page. The Cancel icon
returns you to the previous page without deleting the selected item.
Draft 4/14/15- Do Not Distribute
126
Data Manager Operations Operations
12.3.6 Rename
The Rename icon allows you to change the name of a folder or items within a folder.
zTo rename an item:
1. Highlight the item or folder to be renamed.
2. Select the Rename icon on the toolbar.
The New Name dialog box opens (Figure 12-3).
Figure 12-5 Sample new name dialog box
3. Select the entry field on the dialog box to open the virtual keyboard.
4. Type the new name into the entry field using the virtual keyboard.
5. Select the OK icon to change the name and return to the previous page. The Cancel icon
returns you to the previous page without changing the name.
Draft 4/14/15- Do Not Distribute
127
Data Manager Operations Operations
12.3.7 Properties
The Properties icon function allows you to change the name and assign identifying attributes to
saved Scope Multimeter files. Operation is similar to renaming a file as discussed above, except
there are additional fields for entering descriptive information.
zTo assign properties to an item:
1. Highlight the item or folder.
2. Select the Properties icon on the toolbar.
The Properties dialog box and the virtual keyboard open (Figure 12-3).
Figure 12-6 Sample Properties dialog box without the virtual keyboard
3. Type a new name into the field using the virtual keyboard if you want to rename the file.
4. Use either the virtual keyboard or the dropdown menus to fill in the Year, Make, Component,
and Condition fields.
5. Select the OK icon to change the name and return to the previous page. The Cancel icon
returns you to the previous page without changing the name.
12.3.8 More
Selecting the More icon opens a dropdown menu with two options:
•Shortcut—creates a shortcut to the highlighted item on the Data Manager main screen. A
confirmation message displays when this option is selected.
•Email—opens a new e-mail message with the selected file attached. The Diagnostic Tool
must have an active e-mail account to use this feature.
Draft 4/14/15- Do Not Distribute
128
Data Manager Operations Saved File Structure
12.4 Saved File Structure
The Diagnostic Suite automatically creates folders to manage saved files. Whenever 60 files are
saved into any of the Data Manager menu option folders, a new folder is created. Folders may
contain files for a day, week, month, or a year. An older folder, when available, goes to the next
higher level in the files structure menu (Figure 12-7).
Figure 12-7 Sample saved file folder structure
Draft 4/14/15- Do Not Distribute
129
Data Manager Operations Scanner DataViewer Operation
12.5 Scanner DataViewer Operation
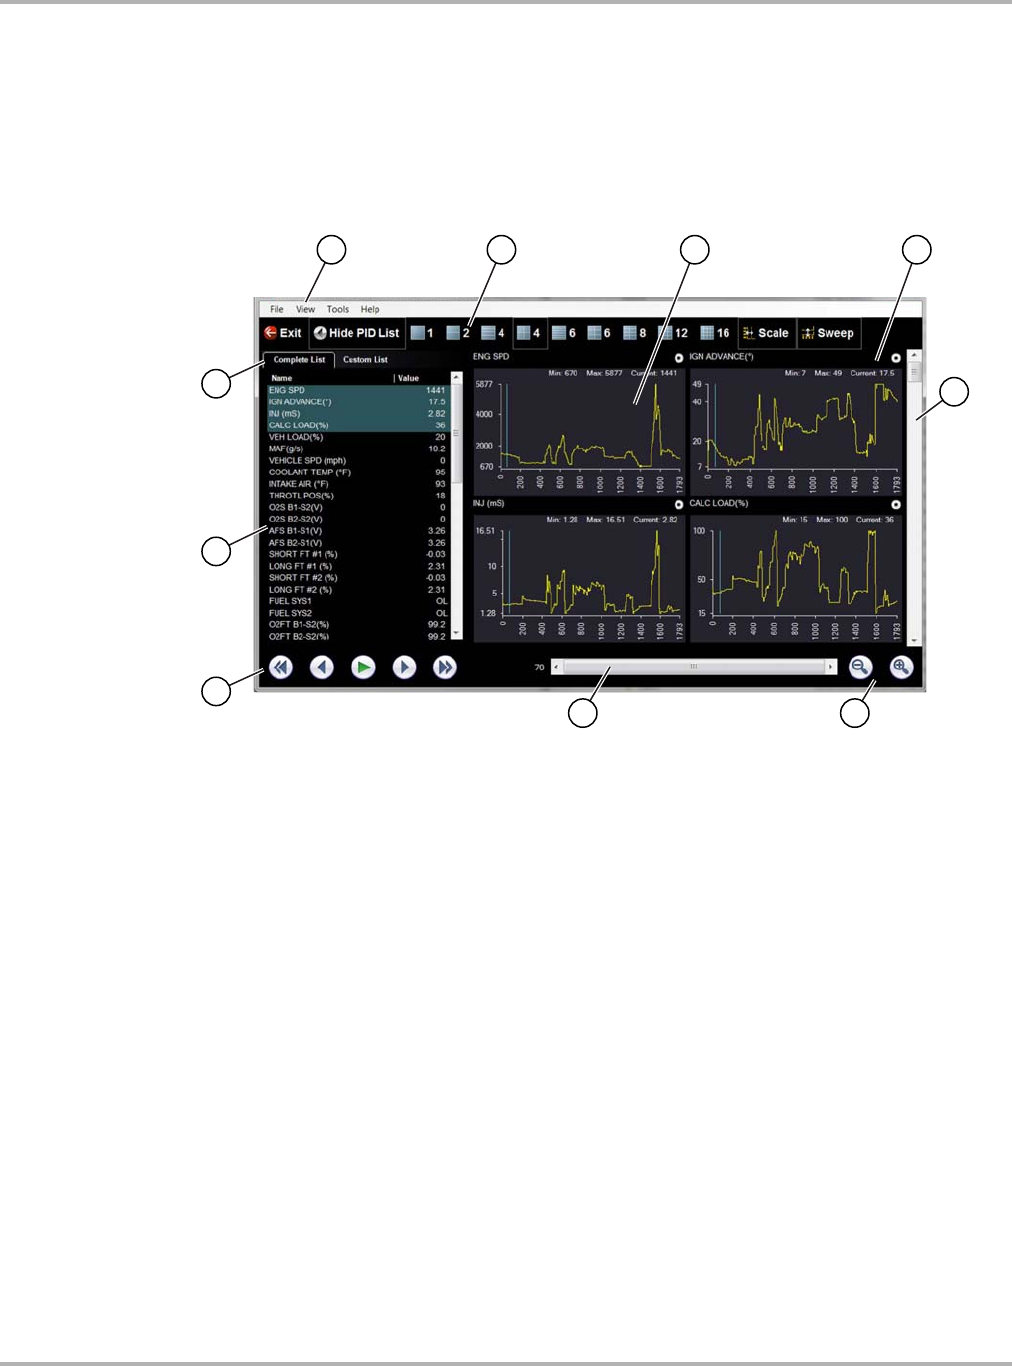
The Scanner DataViewer allows you to review saved scanner data files (Figure 12-8). To open
saved Scanner data files, select the Scanner Data Folder menu option from the Data Manager
main menu.
Scanner DataViewer - Opens .pids, .scm, .scs, .scp and .spm file extensions
1— Menu bar
2— Display toolbar
3— Graph display
4— Properties icon
5— Vertical Scroll bar
6— Zoom controls
7— Slider bar
8— Navigation toolbar
9— Parameter text list
10—Parameter configuration tabs
Figure 12-8 Scanner Data Viewer
Draft 4/14/15- Do Not Distribute
130
Data Manager Operations Scanner DataViewer Operation
12.5.1 Menu Bar
The menu bar at the top of the screen contains the File, View, Tools, and Help menus.
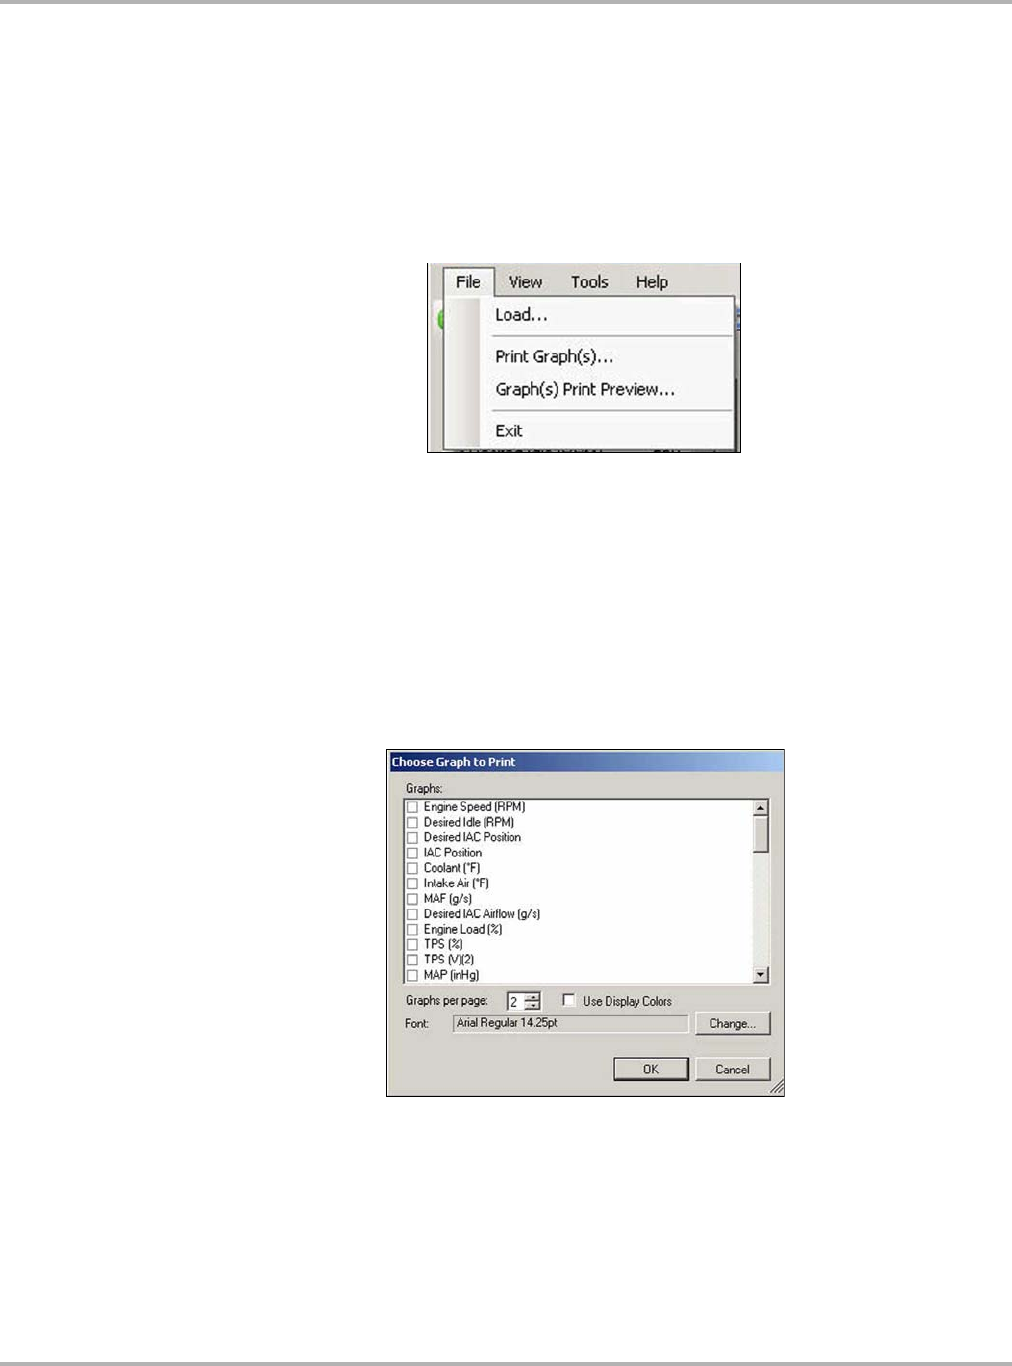
File Menu
The File menu offers the following selections (Figure 12-9):
Figure 12-9 Scanner DataViewer File menu
•Load—locate and open data files, launches a navigation window
•Print Graph(s)—print selected graphs
•Graph(s) Print Preview—preview graphs before printing
•Exit—closes Scanner DataViewer
When Print Graph(s) or Graph(s) Print Preview is selected, a dialog box opens that allows you to
choose which graphs to include, how many graphs appear on a page, and the text font
(Figure 12-10).
Figure 12-10 Choose Graphs dialog box
Draft 4/14/15- Do Not Distribute
131
Data Manager Operations Scanner DataViewer Operation
zTo print graphs:
1. Select the desired parameters. A checked box indicates the graph will be printed. Select again
to deselect the parameter.
2. Select Change to modify the font, this opens a standard Windows font dialog box.
–a. Modify the font as desired.
–b. Select OK to close the font dialog box.
3. Once all selections are made, select OK.
A print dialog box opens.
4. Select OK.
a. If Print Graph(s) was selected, the file is sent to the printer.
b. If Graph(s) Print Preview was selected, a preview window opens. Select the printer icon
(Figure 12-11) to send the file to the printer.
Figure 12-11 Print preview window
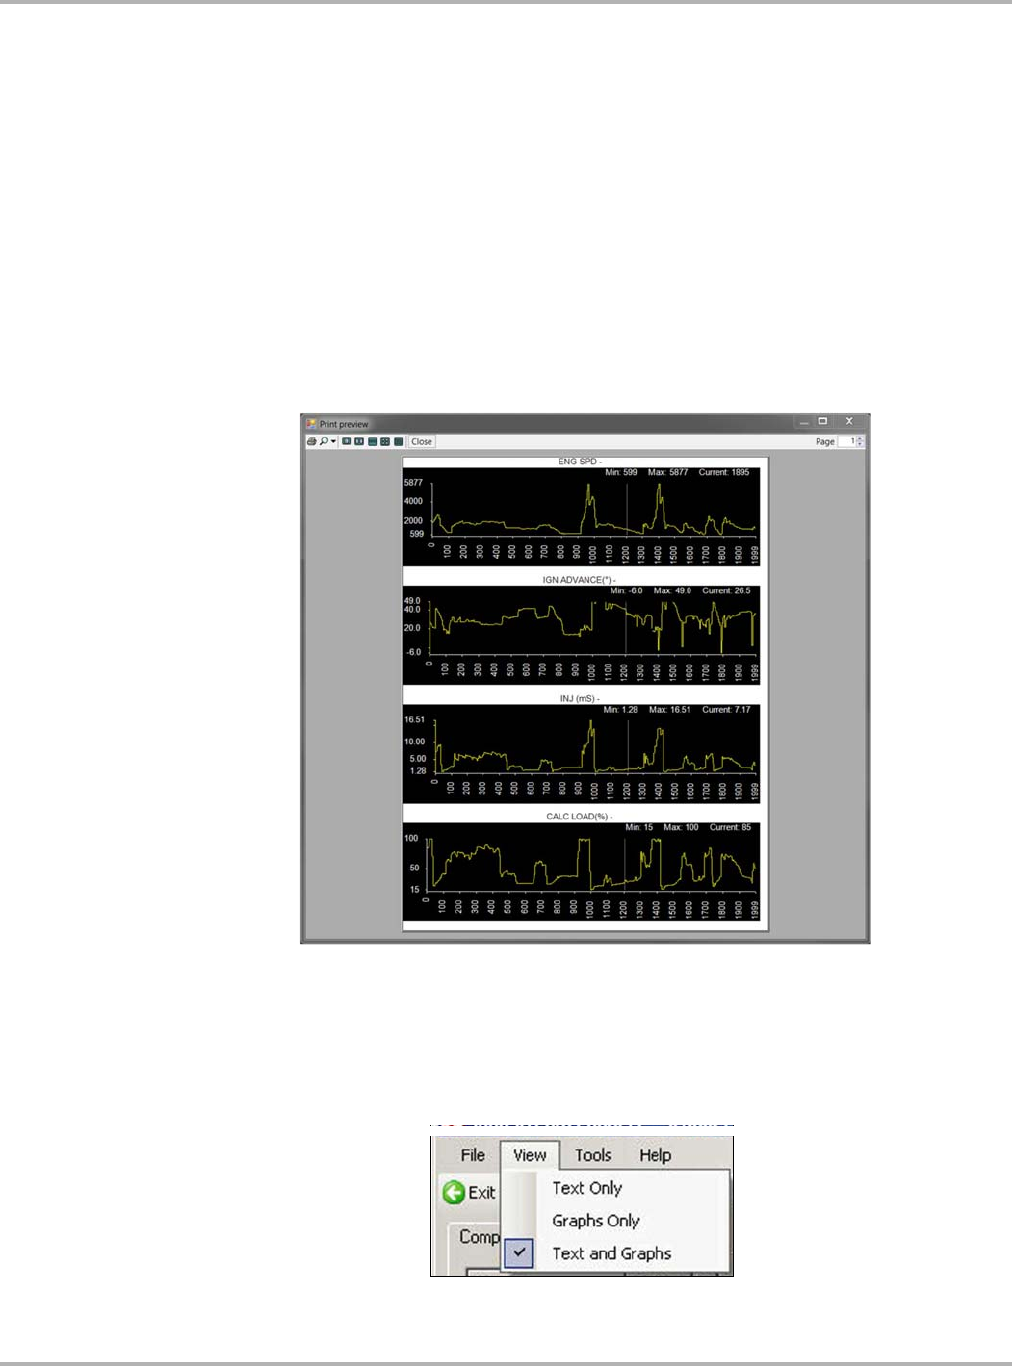
View Menu
The View menu allows you to change how data is displayed on the screen (Figure 12-12).
Figure 12-12 Scanner DataViewer View menu
Draft 4/14/15- Do Not Distribute
132
Data Manager Operations Scanner DataViewer Operation
Select from the following menu options:
•Text Only—shows all parameters and their values as text only
•Graphs Only—shows all parameters as graphs only
•Text and Graphs—shows all parameters and their values as text in the left panel of the
screen, and shows them as graphs in the right panel of the screen
Tools Menu
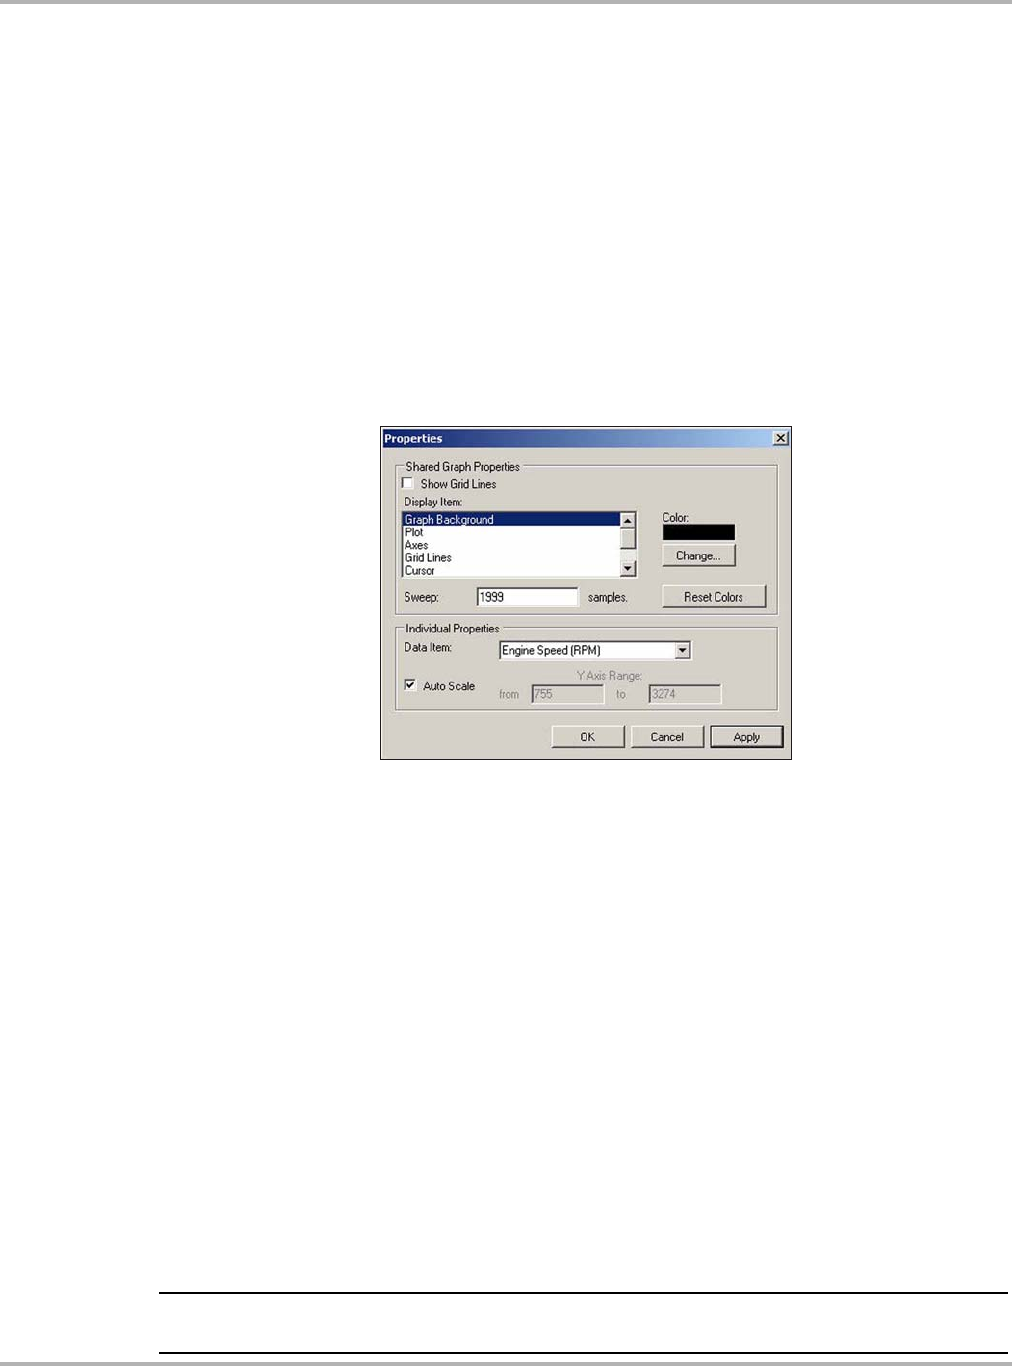
The Tools menu opens the Properties dialog box.
The Properties dialog box has two sections (Figure 12-13); Shared Graph Properties and
Individual Properties. Shared Graph Properties apply to all graphs and Individual Properties apply
to the selected graph only.
Figure 12-13 Properties dialog box
Properties dialog box selections include:
•Grid Lines—when selected, a line displays at each major division of the graphs.
•Display Item—use to view the display color of the listed items. Highlight an item and the
current color appears in the Color box.
•Change—use to change the color of the highlighted item, select to open a color palate.
•Sweep—use to adjust the number of data frames that appear on the screen (zoom in or out),
highlight and type in the desired number.
•Reset Colors—use to restore the default color settings.
•Data Item—use this pulldown menu to select individual graphs for modification.
•Auto Scale—minimum and maximum (Y axis) values automatically adjust to the signal when
the box is checked, uncheck the box if you want to custom set the values.
•Y Axis Range—use to type desired minimum (from) and maximum (to) values in the selection
boxes. This field is only active when Auto Scale is deselected.
•OK—applies the changes and closes the properties dialog box.
•Cancel—closes the properties dialog box without making changes.
•Apply—applies the changes and leaves the properties dialog box open.
NOTE:
iThe Properties icon on each graph also opens the Properties dialog box (Figure 12-8).
Draft 4/14/15- Do Not Distribute
133
Data Manager Operations Scanner DataViewer Operation
Help Menu
The Help menu provides Scanner Viewer software version information.
12.5.2 Display Toolbar
The Display toolbar provides the following controls (Figure 12-14).
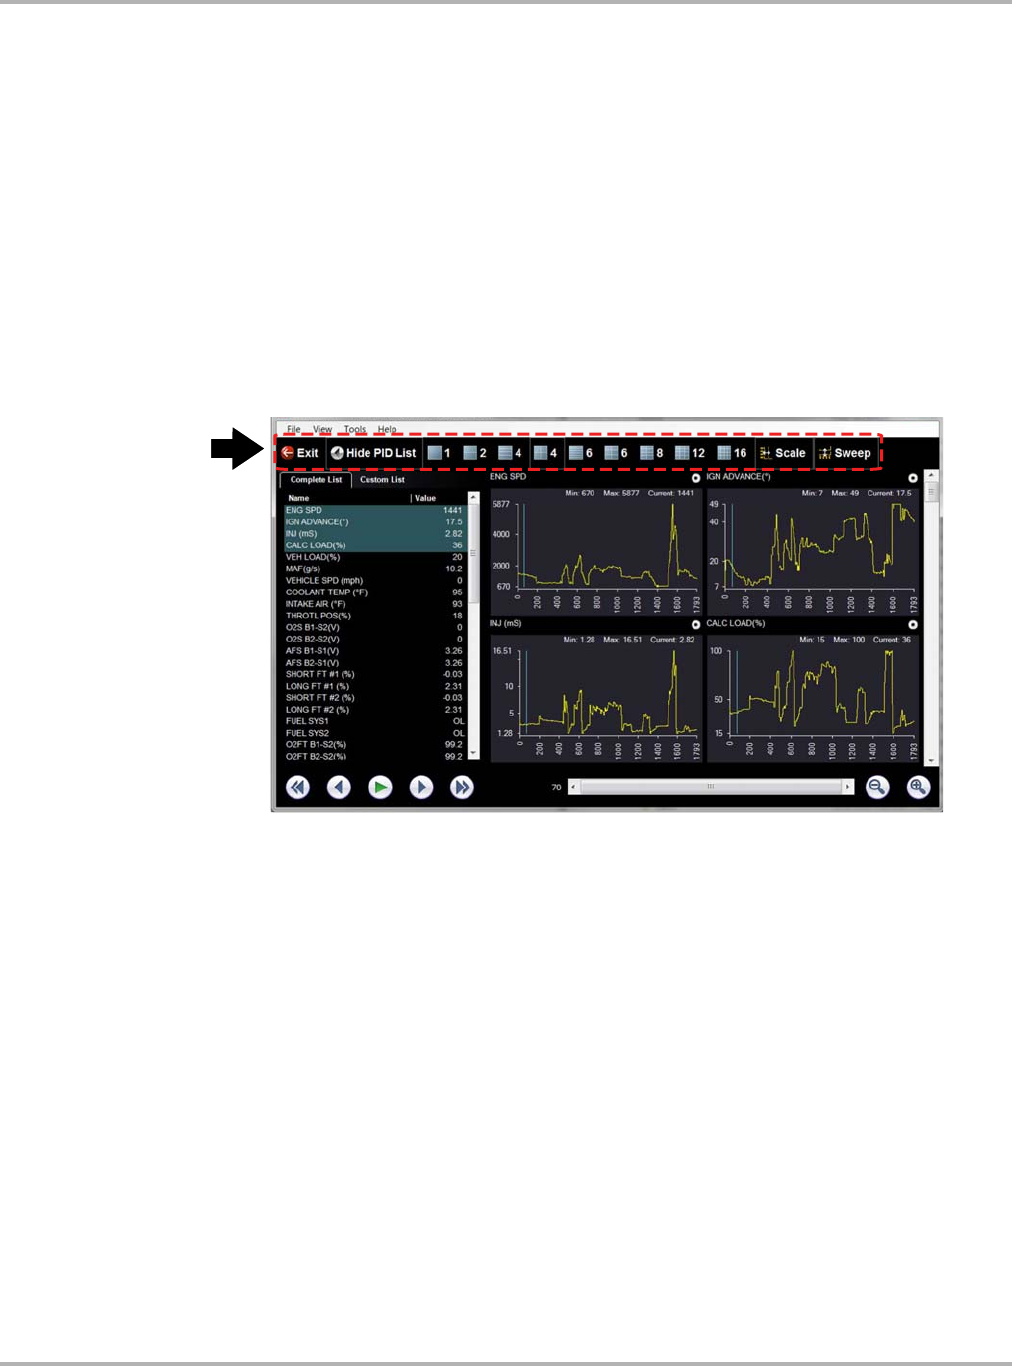
•Exit—closes Scanner DataViewer.
•Hide PID List—toggles display between parameter text and graph views.
•Display Views (1 to 16)—determines how many graphs display at a time.
•Scale—switches the scale values shown to the left of the graph off and on.
•Sweep—switches the sweep values shown below the graph off and on.
Figure 12-14 Display toolbar
Draft 4/14/15- Do Not Distribute
134
Data Manager Operations Scanner DataViewer Operation
12.5.3 Navigation Tools
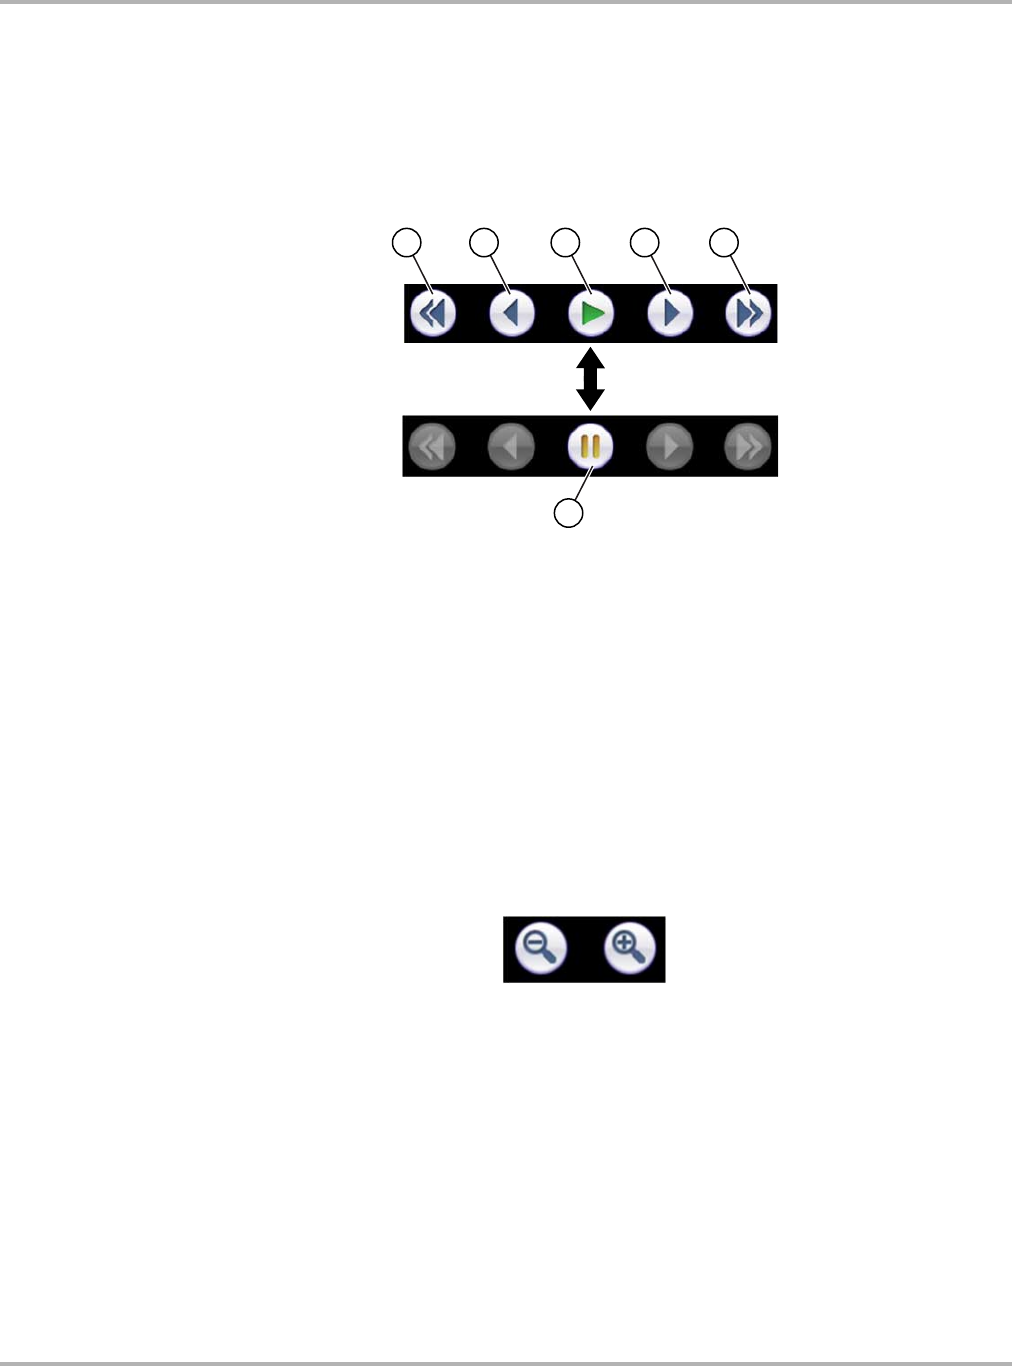
Playback Controls
The playback controls allow you to navigate through saved data (Figure 12-15).
1— Skip Back—Allows backward movement in multiple steps.
2— Step Back—Allows backward movement in singular steps.
3— Play—Select to play.
4— Step Forward—Allows forward movement in singular steps.
5— Skip Forward—Allows forward movement in multiple steps.
6— Pause—Select to pause playback.
Figure 12-15 Playback controls
Zoom Controls
The zoom controls allow you to incrementally increase or decrease the screen magnification
(Figure 12-16).
Figure 12-16 Zoom controls
Draft 4/14/15- Do Not Distribute
135
Data Manager Operations Scanner DataViewer Operation
Slider / Scroll Bars and Cursor
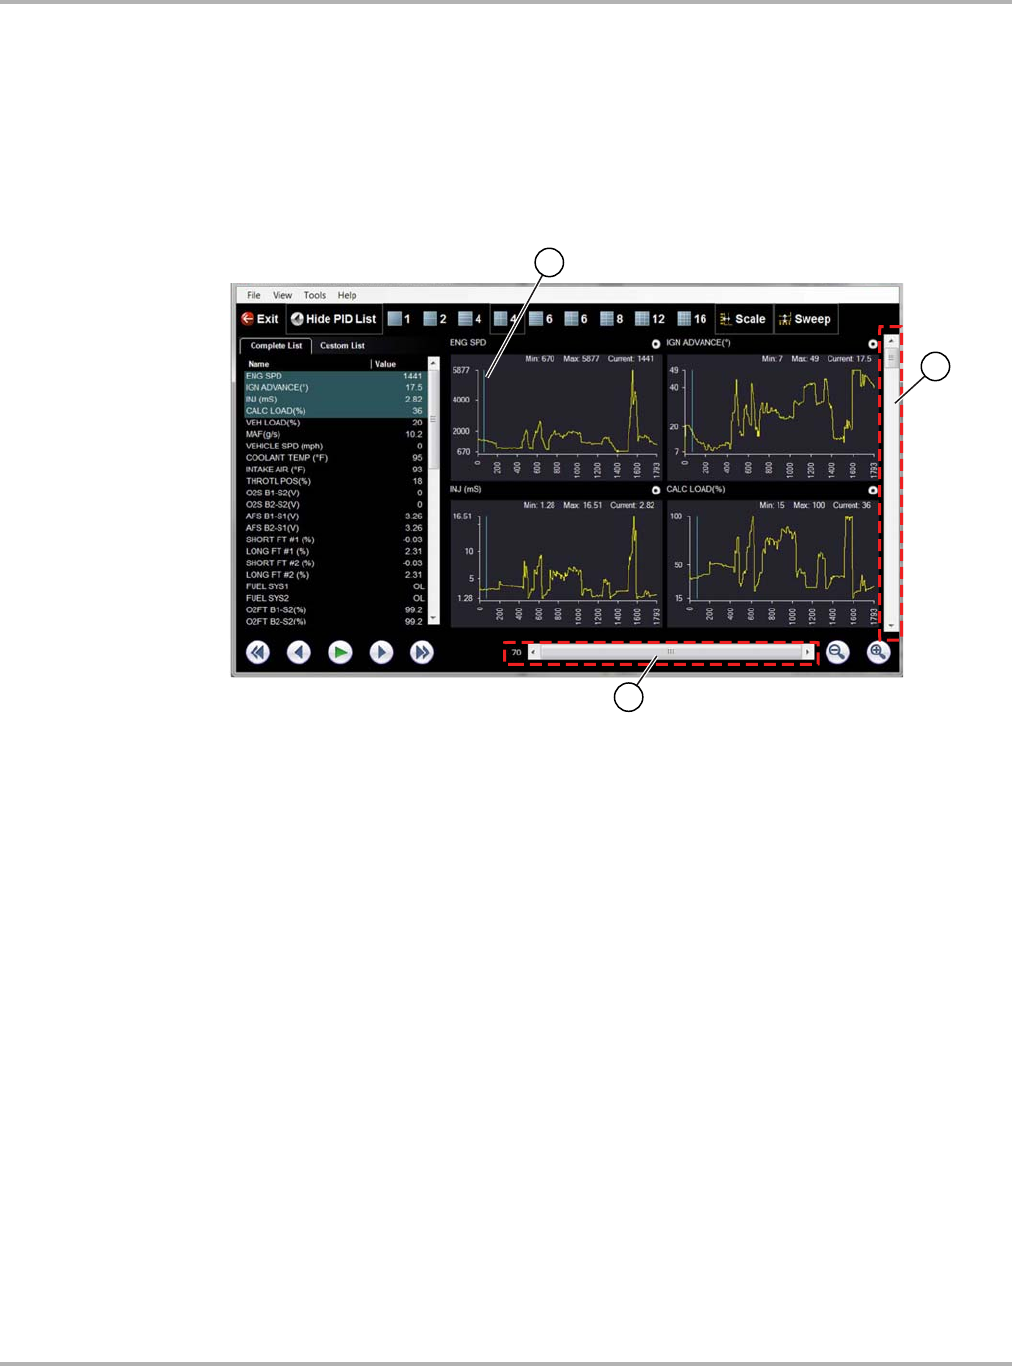
Use the slider bar to quickly navigate through the data (Figure 12-17). During playback the
number displayed on the left side of the slider bar indicates the current position of the cursor in the
data file. The cursor can be repositioned during playback or when paused, by selecting and
dragging.
Use the scroll bar (right side) to vertically scroll through the parameter list and graphs.
1— Cursor
2— Scroll bar
3— Slider bar
Figure 12-17
Draft 4/14/15- Do Not Distribute
136
Data Manager Operations Scanner DataViewer Operation
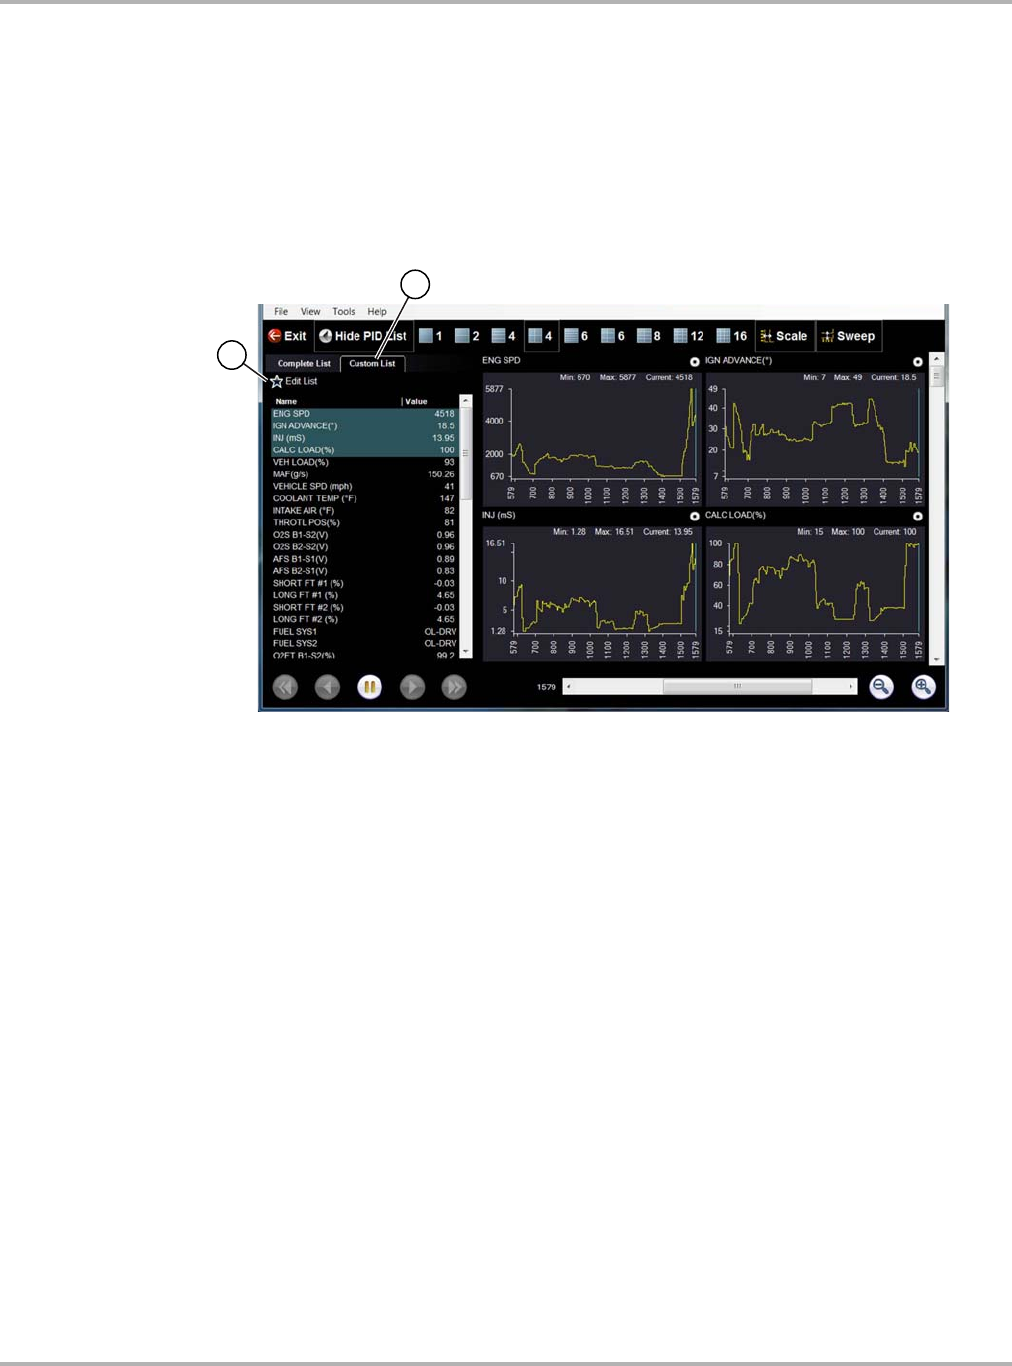
12.5.4 Customizing the Display
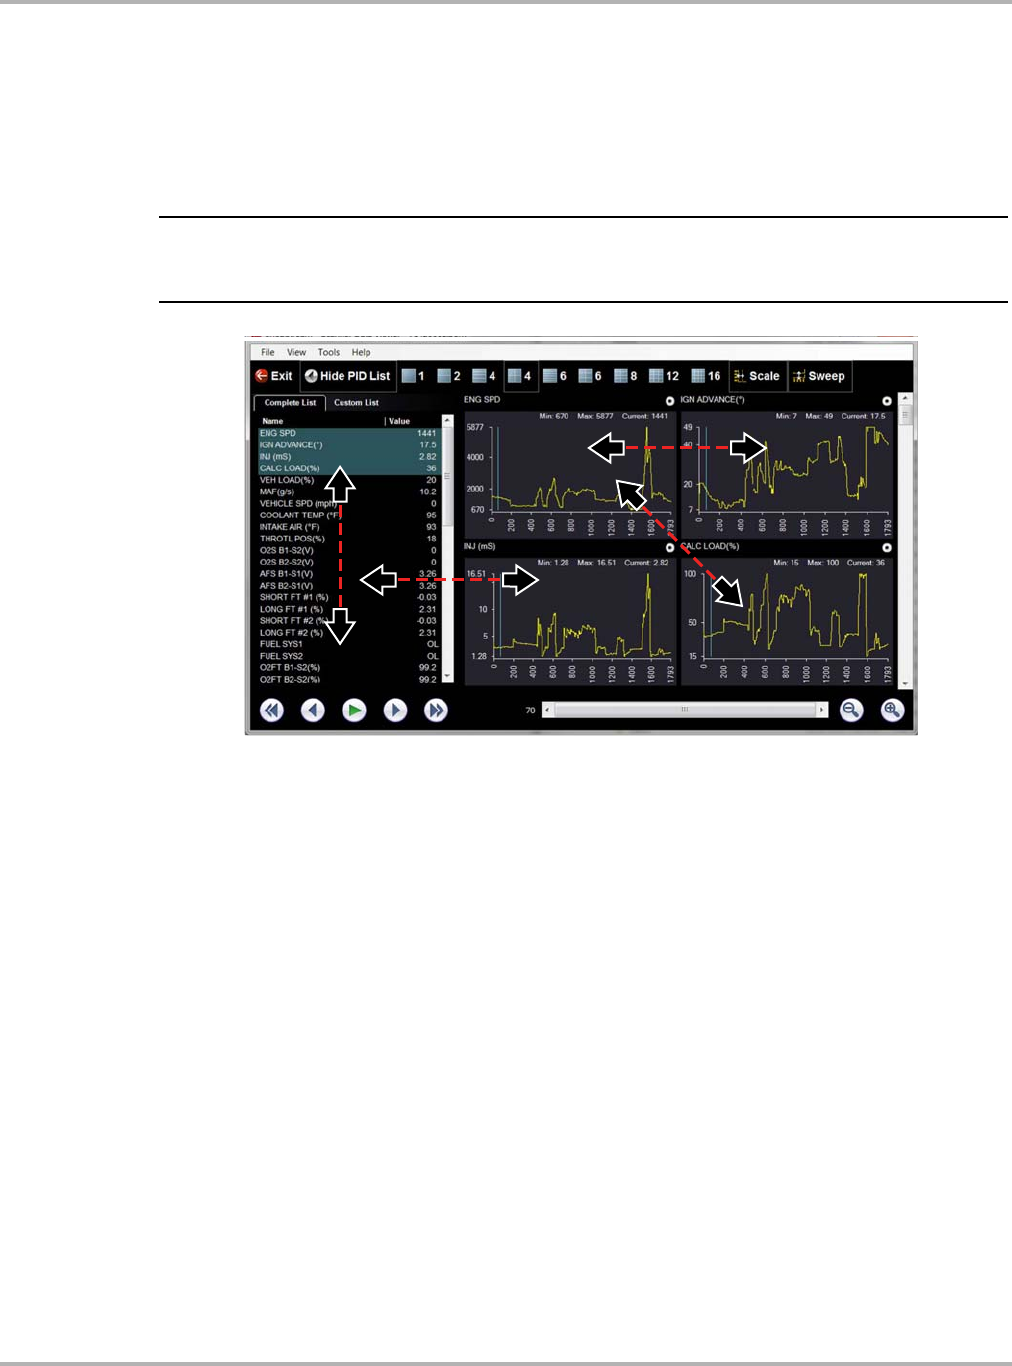
The parameter text list (left side) displays parameter names and current values.
The display can be customized by selecting and dragging parameters from the text list or graph
display to a different location in the text list or in the graph display (Figure 12-18). The highlighted
parameters in the text list indicate which parameters are displayed as graphs.
NOTE:
iThe parameter text list is sortable by name and value. Select Name or Value at the top of the list
to change the sorted view.
Figure 12-18
Draft 4/14/15- Do Not Distribute
137
Data Manager Operations Scanner DataViewer Operation
12.5.5 Customizing the Parameter List
1. The parameter configuration tabs allow you to choose between displaying all available
parameters (Complete List), or only those from a (Custom List) (Figure 12-19).
zTo customize the parameter list:
1. Select the Custom List tab (Figure 12-19).
2. Select Edit List in the custom window.
1— Edit List
2— Custom List tab
Figure 12-19
Draft 4/14/15- Do Not Distribute
138
Data Manager Operations Saving Files
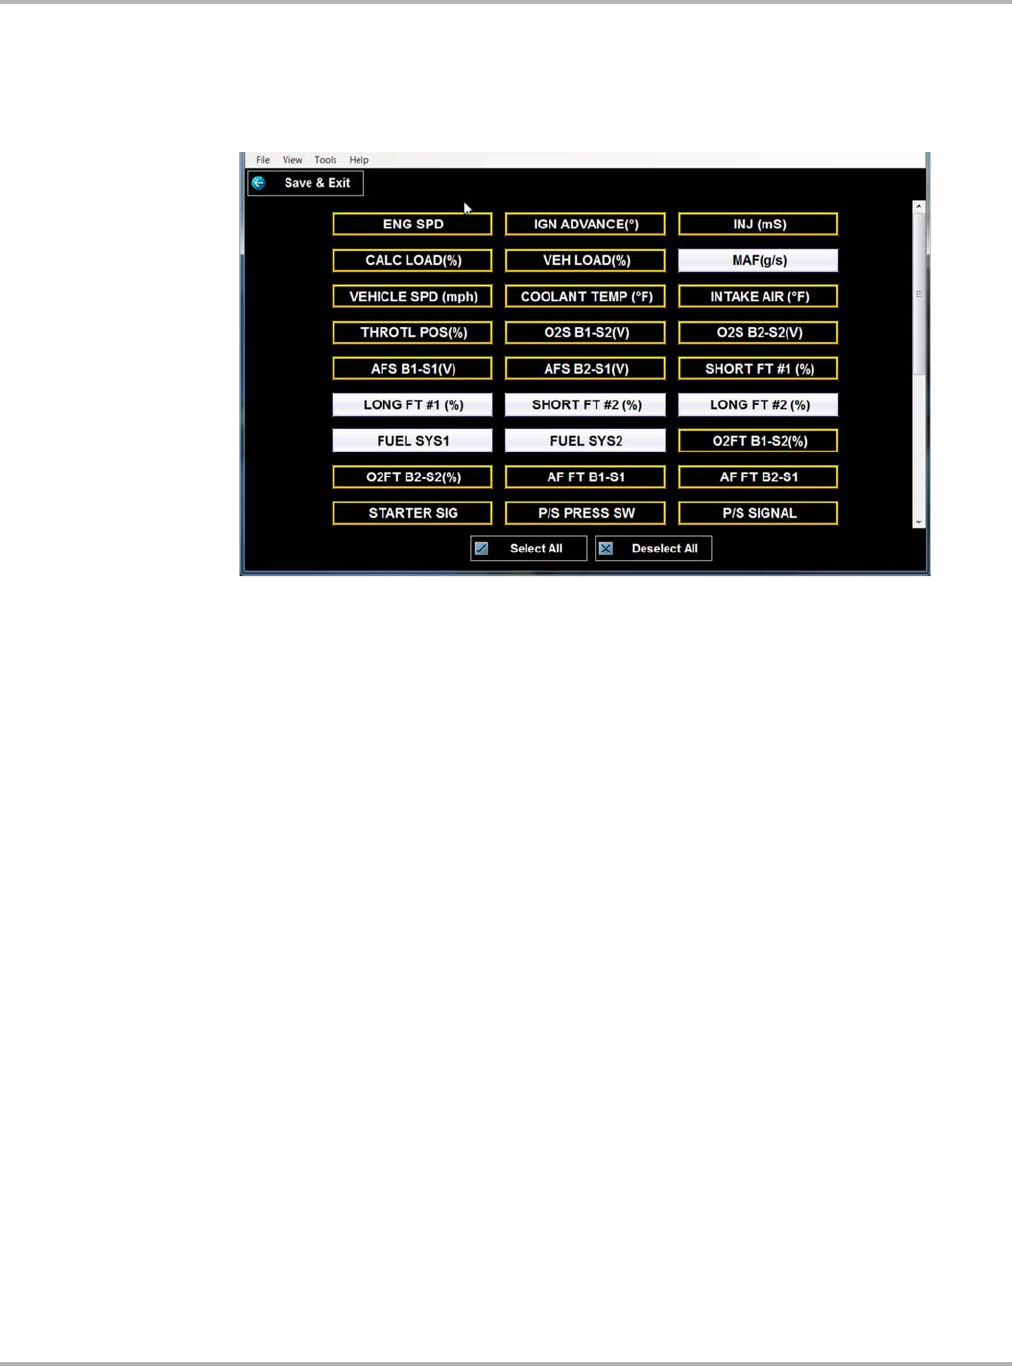
A list of available parameters displays (Figure 12-20).
3. Select the parameters to include in your custom list. Select All and Deselect All controls are
also available to assist in the selection process.
Figure 12-20 Creating a custom parameter list
4. Select Save & Exit to close the window.
Only the parameters selected in your custom list are displayed.
12.6 Saving Files
As mentioned in the beginning of this section, the data and image files in the Data Manager folders
are also accessible from the Windows My Documents > ShopStream folder. You may access,
copy or move the files you save in the ShopStream Diagnostic Suite program from the Windows
My Documents > ShopStream folder at anytime.
The files may also be transfered to portable USB drives and then transfered to your PC. All copy,
move and save functions are accomplished using standard Windows operations.
Camera images and screenshots are saved as JPEG files and are viewable on most PCs. Data
files are saved using propriety file extensions and are not viewable on a PC. An alternative viewing
method can be used to view select data files on a PC, see ShopStream Connect™ on page 138.
12.7 ShopStream Connect™
Data files saved on your Diagnostic Tool are designed and intended to be reviewed using the Data
Manager functions as described earlier in this section. An alternative method can be used to
review select data files on a PC using ShopStream Connect.
ShopStream Connect is PC-based program that allows you to manage and view data files on a
PC. ShopStream Connect is a free program available for download at:
http://diagnostics.snapon.com/ssc
See the ShopStream Connect user manual for basic installation and operational instructions.
Draft 4/14/15- Do Not Distribute
139
Chapter 13 Help Operations
Selecting Help from the Home screen opens this manual in a dedicated screen viewer. Navigate
through the file either by gesture scrolling on the touch screen, or with the scroll bar along the right
edge of the viewing screen. A left-to-right scroll bar appears at the bottom of the screen when
magnification is increased.
All listings in the Contents and Index are active links. Select an entry with the stylus to go directly
to that point of the document. Additional links within the text, shown in blue-colored type, also take
you to the referenced section of the manual.
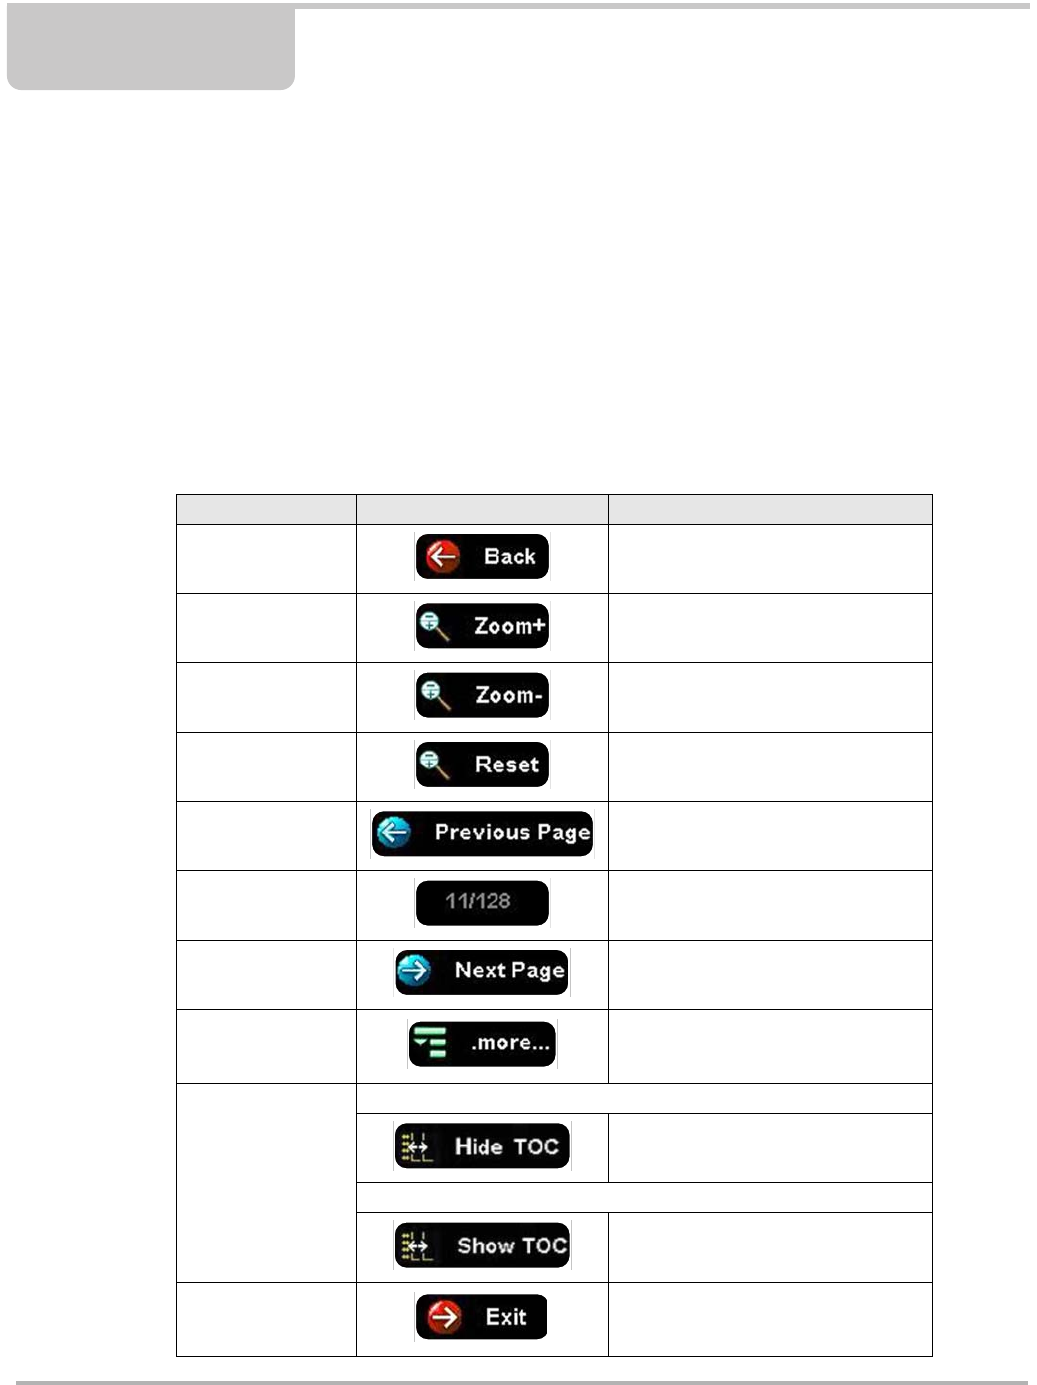
13.1 Using the Help Toolbar
A simple toolbar at the top of the screen is used to adjust screen magnification and to exit Help:
Table 13-1 Help toolbar icons
Name Icon Description
Back Closes the help file and returns you to
the previously viewed screen.
Zoom + Incrementally increases the screen
magnification.
Zoom – Incrementally decreases the screen
magnification.
Reset Restores the default screen
magnification.
Previous Page Moves back one page in the document.
Page Counter Shows the current page over the total
number of pages in the document.
Next Page Moves forward one page in the
document.
More
Opens a menu of the additional options
(Hide TOC or Show TOC) shown
below.
Hide TOC
Closes the contents and search column
so the document fills the screen.
Show TOC
Opens the contents and search column
if they have been hidden.
Exit
Closes the help file, and any other
open modules, and returns you to the
Home screen.
Draft 4/14/15- Do Not Distribute
140
Chapter 14 System Settings Operations
Selecting System Settings from the Home screen opens a menu with two options:
•Paired Devices - Paired Devices allows you to check the status and pair wireless devices to
the Diagnostic Tool.
•Shop Information - Shop Information allows you to create and edit a personalized header that
is included on printed documents.
14.1 Paired Devices
Wireless devices communicate with the Diagnostic Tool to allow you work and access data
remotely while working on a vehicle. Wireless devices such as the Scan Module and
M2 Scope/Meter need to be paired, or synchronized, the first time they are used together.
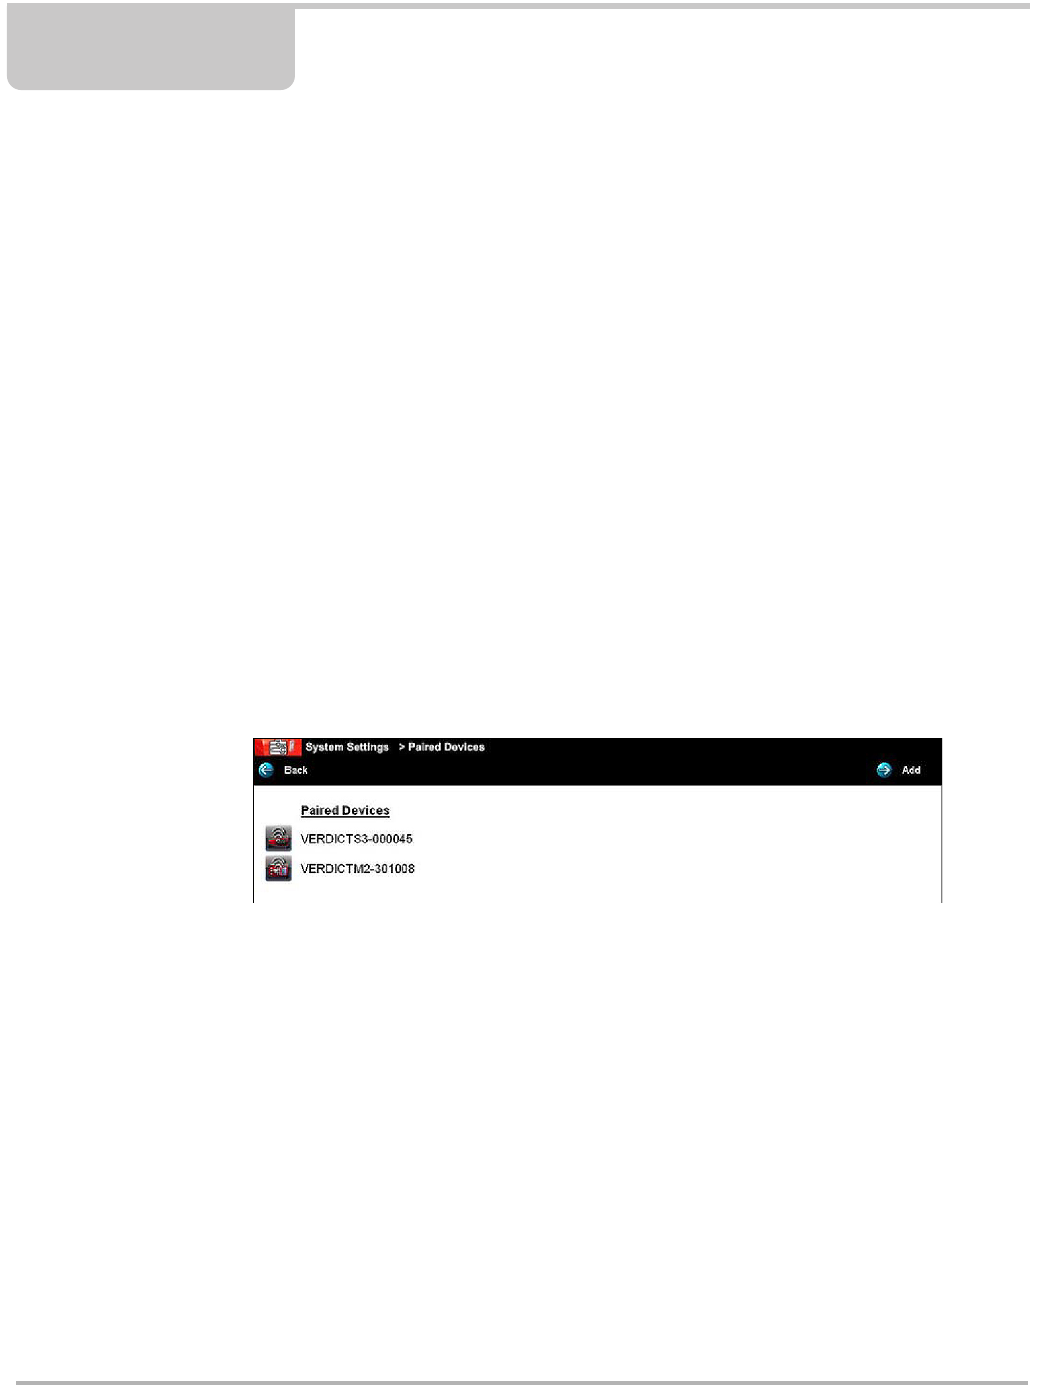
zTo check the devices paired to your Diagnostic Tool:
1. Select System Settings > Paired Devices.
The paired devices screen opens (Figure 14-1).
The Paired Devices screen lists all of the devices paired to the Diagnostic Tool, and also indicates
whether or not there is active communication occurring.
Figure 14-1 Typical Paired Devices screen
The Hardware Status indicators in the lower-right corner of the Home screen provide a quick
reference to wireless device operations. The background color of the status indicator icon
represents the condition of the wireless connectivity to that device. Icon status is shown in the
table below:
Draft 4/14/15- Do Not Distribute
141
System Settings Operations Paired Devices
14.1.1 Scan Module Pairing
For detailed information on the use and pairing of the Scan Module, see Scan Module Operation
on page 54.
14.1.2 Paring the M2 Scope/Meter
NOTE:
iThe M2 Scope/Meter is optional equipment for some Diagnostic Tools and may not be included
with your Diagnostic Tool kit. For detailed operation instructions, see the M2 Scope/Meter
instructions supplied with your M2 and/or Diagnostic Tool. M2 operation instructions can also be
found on our website, see the Contact Information section in the front of this manual for website
address information.
Pairing is the wireless connection (identification) process used to connect the M2 Scope/Meter to
your Diagnostic Tool. The M2 Scope/Meter needs to be paired (connected) to the Diagnostic Tool
for remote operation.
Hardware
Icon Background
Color Condition Action
Scan Module
Red Not Paired
Pair the Scan Module to the Diagnostic Tool.
See Pairing The Scan Module on page 55 for
instructions.
Grey Paired, but Not
Communicating
You may have moved out of range. Move the
Diagnostic Tool closer to the Scan Module to
reestablish communications. If connectivity is
not restored, perform the Recovery Procedure
on page 60.
Green Paired and
Communicating
Hardware status is good and Bluetooth should
be functional. Verify that the green Bluetooth
LED on the front of the Scan Module is flashing.
If there is no connectivity, perform the Recovery
Procedure on page 60.
M2 Scope/Meter
Red Not Paired
Pair the M2 to the Diagnostic Tool. See Paring
the M2 Scope/Meter on page 141 for
instructions.
Grey Paired, but Not
Communicating
You may have moved out of range. Move the
M2 closer to the Diagnostic Tool to reestablish
communications.
Green Paired, and
Communicating
Hardware status is good and Bluetooth is
communicating.
Draft 4/14/15- Do Not Distribute
142
System Settings Operations Paired Devices
The M2 Scope/Meter only needs to be paired once before it’s initial use. The connection
configuration should remain in memory for all future uses. If the connection configuration is
removed or lost the pairing procedure will need to be repeated.
Before pairing, make sure the M2 Scope/Meter and the Diagnostic Tool have fully charged
batteries, or are connected to their AC/DC power supplies. It is highly recommended that both
devices be powered by their respective AC/DC power supplies during the paring operation. The
two devices to be paired should also be in close proximity to each other, and in an area that is
relatively free of radio frequency interference.
NOTE:
iThe M2 Scope/Meter can only be paired with one Diagnostic Tool at a time.
zTo pair the M2 Scope/Meter with the Diagnostic Tool:
1. Turn on the Diagnostic Tool and M2 Scope/Meter.
2. Set the M2 Scope/Meter Rotary Switch to the oscilloscope position.
3. Press and hold the F1 key of the M2 Scope/Meter to open the alternate menu.
An alternate menu option for the F4 key is now displayed.
4. Press the F4 key (once) to enable Bluetooth Discovery. Enabling Bluetooth Discovery allows
the M2 Scope/Meter to be identified and paired to the Diagnostic Tool.
The F4 field on the screen switches to inverse video (white on black) when the Bluetooth
Discovery mode becomes enabled (Figure 14-2).
Figure 14-2 Bluetooth Discovery (shown enabled “on”)
&+ '& P6 7$872 7&+
9
9'LY
7
'
$I
' ' '
%JTQMBZ '
Draft 4/14/15- Do Not Distribute
143
System Settings Operations Paired Devices
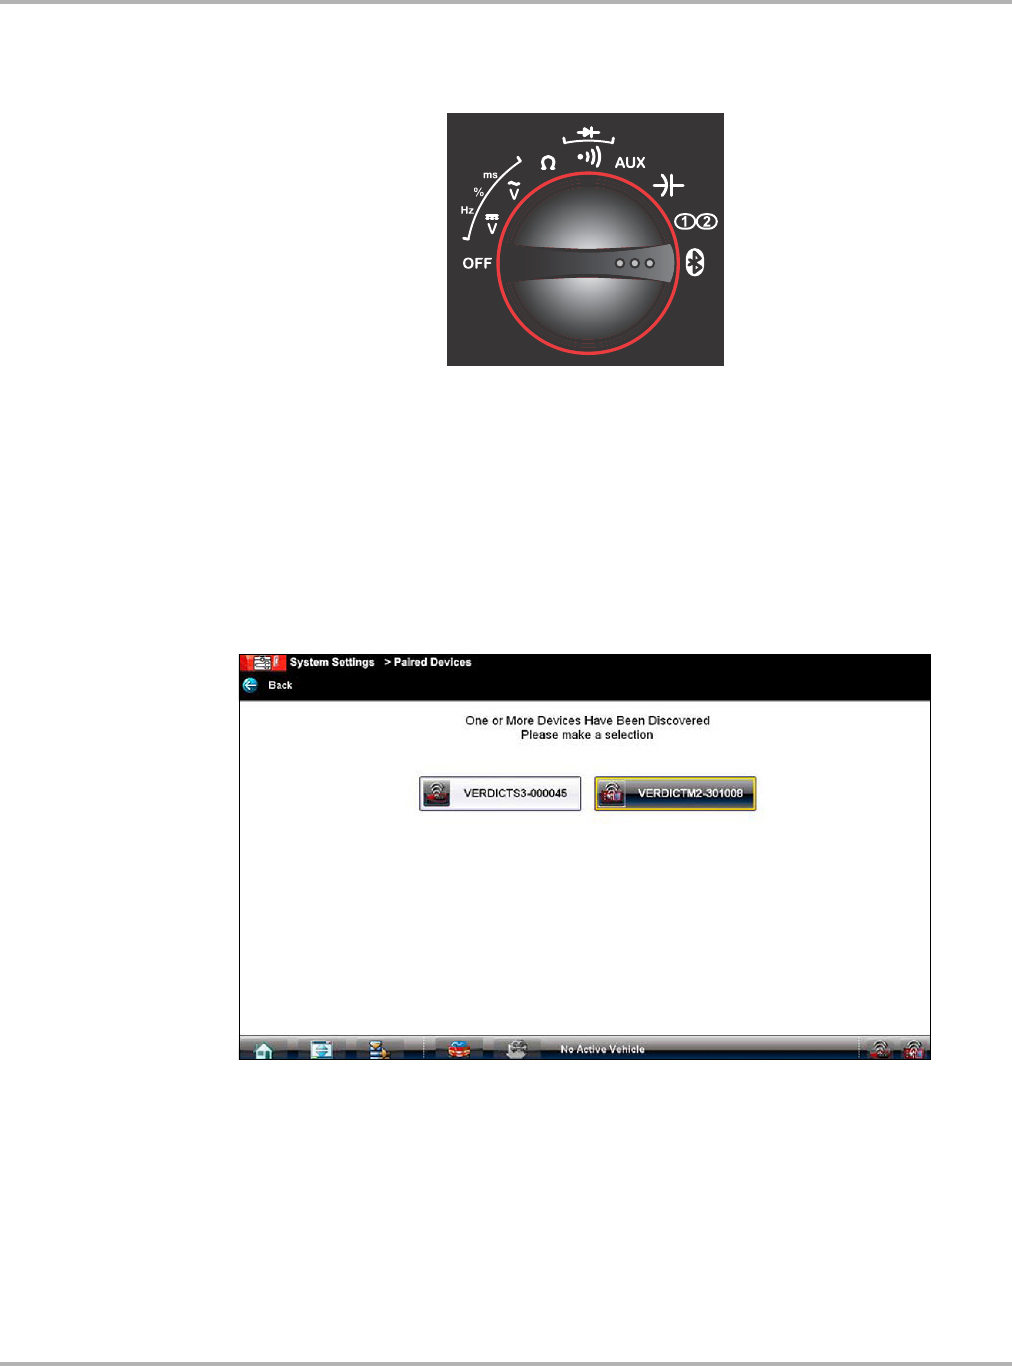
5. With Bluetooth Discovery enabled, turn the M2 Scope/Meter Rotary Switch to the Remote
Functions position (Figure 14-3).
Figure 14-3 Rotary switch Remote Functions setting
6. Select the System Settings icon on the Home screen of the Diagnostic Tool.
7. Select Paired Devices from the menu.
8. From the Paired Devices menu select Add from the toolbar.
9. When prompted select OK from the toolbar.
The Diagnostic Tool searches for compatible wireless devices, then displays the results. The
M2 Scope/Meter is typically listed as “VERDICT M2-” plus six digits of the unit’s serial number.
10. Select the M2 Scope/Meter from the search results list (Figure 14-4).
Figure 14-4 Typical Device selection
Draft 4/14/15- Do Not Distribute
144
System Settings Operations Paired Devices
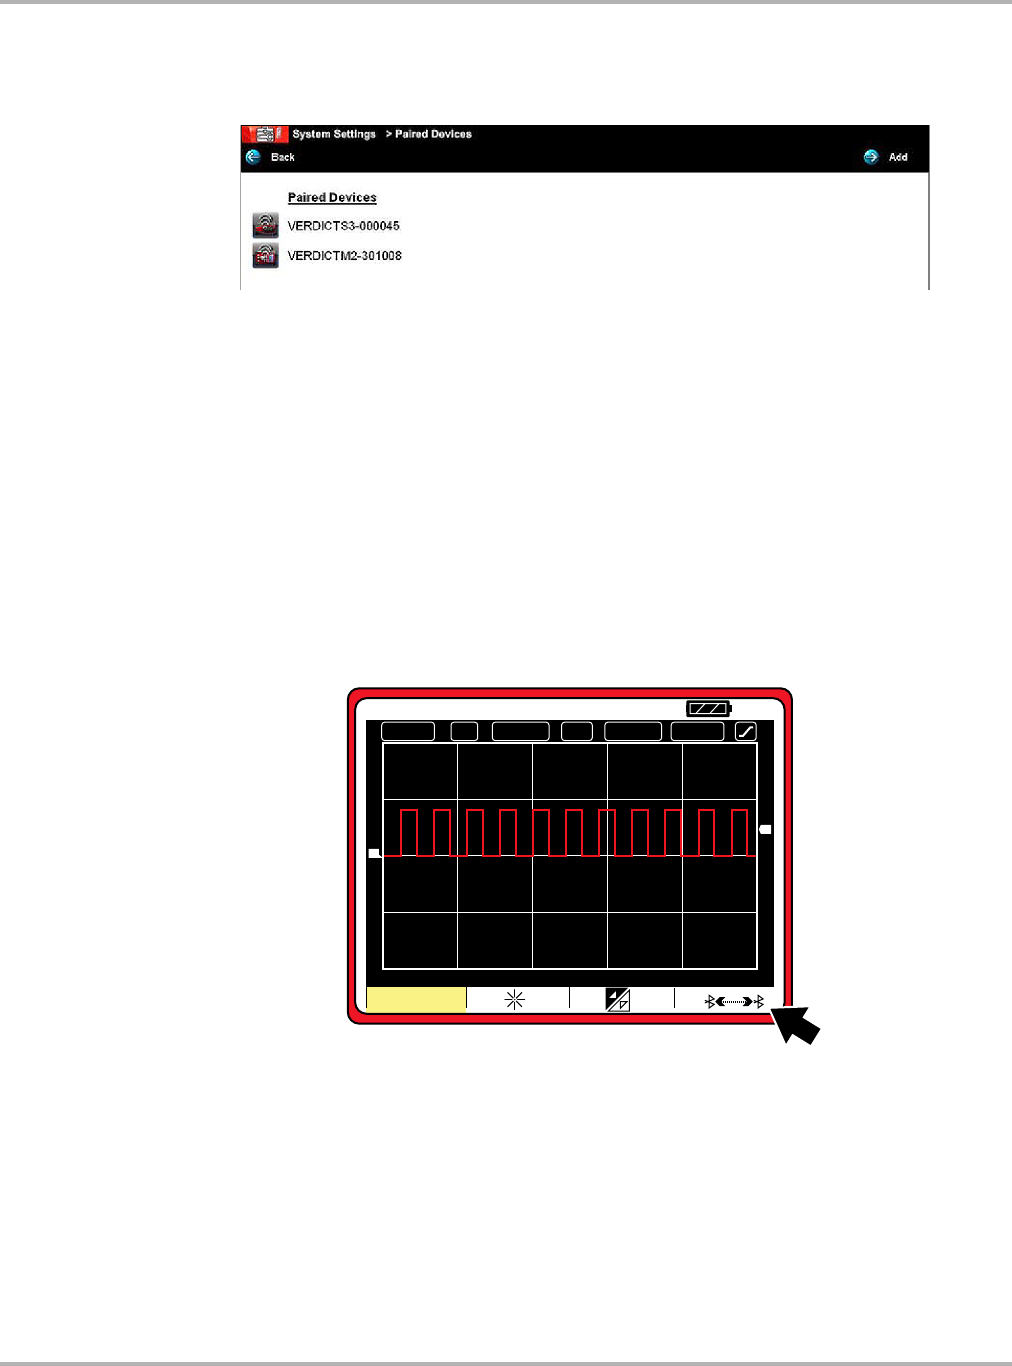
A “in progress” message displays during the pairing procedure, which takes several seconds.
The Paired Devices screen displays once the procedure completes (Figure 14-5).
Figure 14-5 Typical Paired Devices screen
11. Select the Home icon on the toolbar to return to the Home screen.M2 Scope/Meter
12. After the M2 Scope/Meter has been successfully paired, turn the M2 Scope/Meter Rotary
Switch to the oscilloscope position.
13. Press and hold the F1 key to open the alternate menu.
14. Press the F4 key (once) to turn off (disable) Bluetooth Discovery mode.
The F4 field on the screen switches to normal video (black on white) when the Bluetooth
Discovery mode is inactive (Figure 14-6).
Once the M2 Scope/Meter is initially paired with the Diagnostic Tool, additional pairing is not
necessary. Although the discovery mode has been disabled, the two-paired devices
automatically seek and find each other when they are both powered on. The M2 Scope/Meter
becomes “invisible” to other Bluetooth devices whenever Bluetooth Discovery is disabled.
Figure 14-6 Bluetooth Discovery (shown disabled “off”)
&+ '& P6 7$872 7&+
9
9'LY
7
'
$I
' ' '
%JTQMBZ '
'
Draft 4/14/15- Do Not Distribute
145
System Settings Operations Shop Information
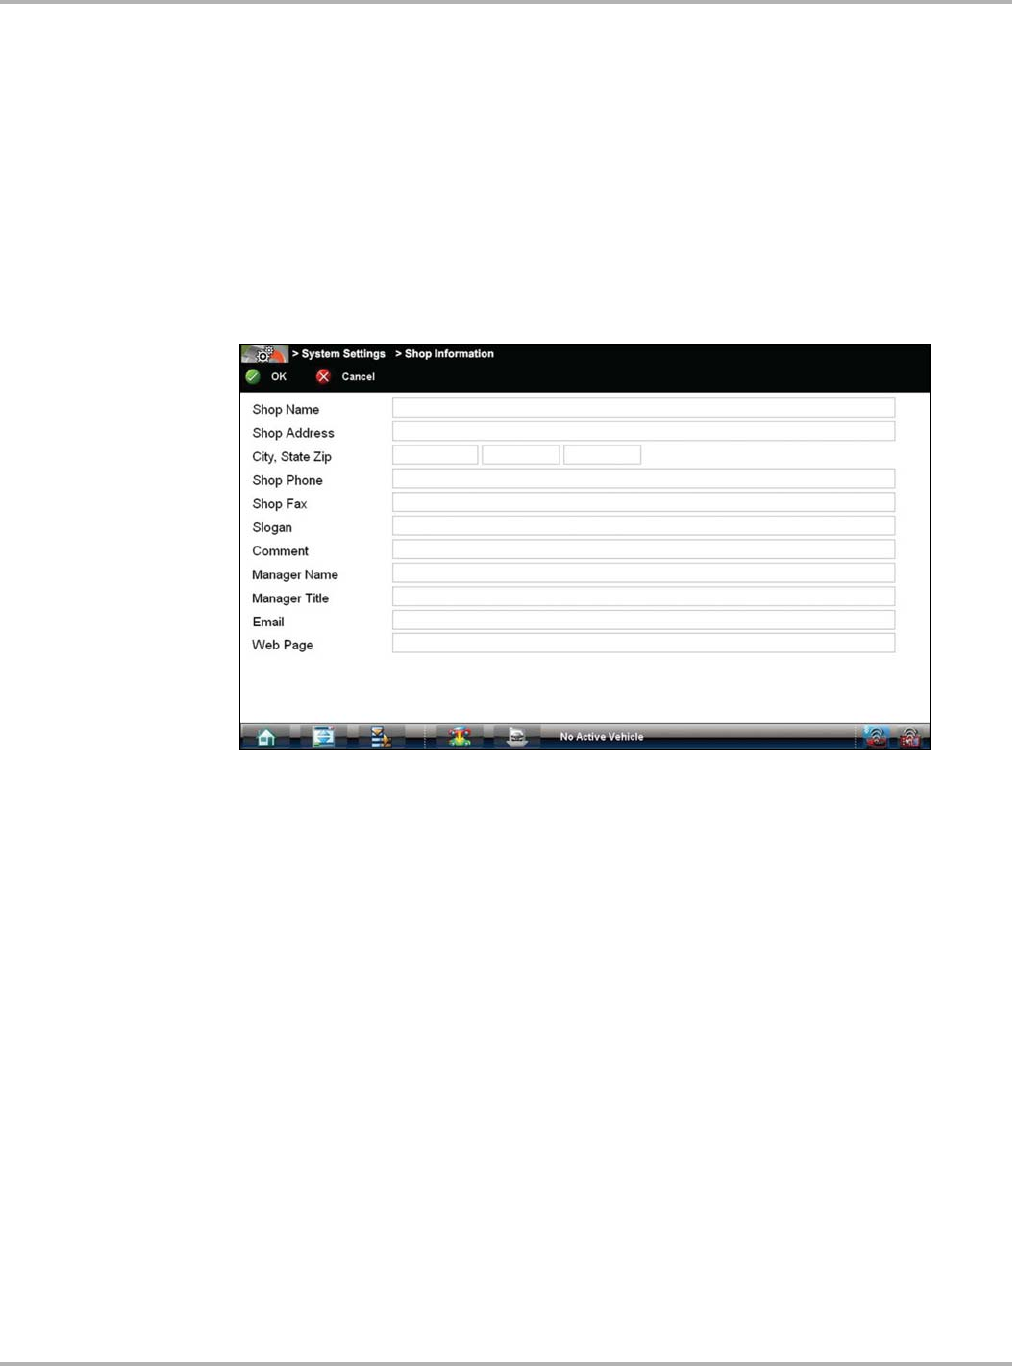
14.2 Shop Information
This option allows you to add personalized shop information that can be included on printed data
files. Selecting opens a form that can be filled in using the virtual keyboard. Select OK when the
form is complete and the information is saved.
zTo add Shop Information:
1. From the Home screen select System Settings.
2. From the System Settings menu select Shop Information.
The Shop Information dialog box opens (Figure 14-7).
Figure 14-7 Sample Shop Information dialog box
3. Select within any of the information fields and the virtual keyboard opens.
4. Use the virtual keyboard to fill in the Shop Information form.
As an alternative, you can connect a USB keyboard to a USB jack on the Diagnostic Tool and
use it to enter information into the form.
Draft 4/14/15- Do Not Distribute
146
System Settings Operations Shop Information
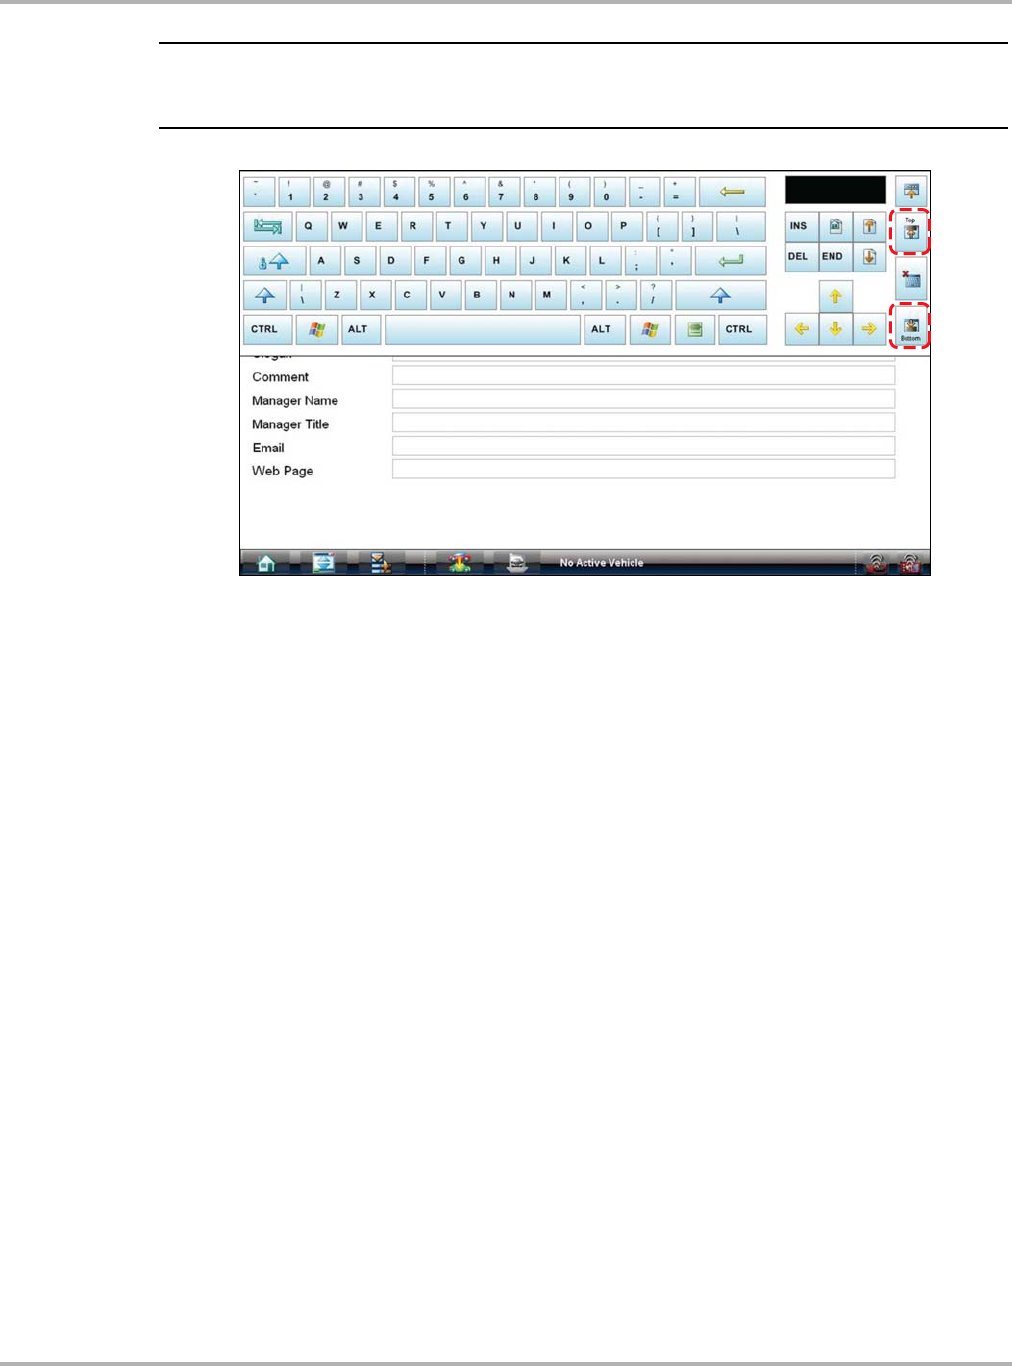
NOTE:
iThe screen does not scroll. Use the Top and Bottom icons on the right side of the virtual keyboard
relocate the keyboard on the screen so that you can complete the form (Figure 14-8).
Figure 14-8 Virtual keyboard Top and Bottom icons
5. Close the virtual keyboard and review the information once all the fields have been filled in.
6. Select OK from the toolbar to save the Shop Information, or Cancel to close the Shop
Information dialog box without saving.
The Shop Information screen closes and the screen returns to the System Settings menu.
Draft 4/14/15- Do Not Distribute
147
Chapter 15 SureTrack
Designed to help you improve diagnostic accuracy and reduce repair time, SureTrack is a
comprehensive source of expert knowledge for professional technicians, combining diagnostic
experience and detailed parts replacement records.
SureTrack offers this exclusive list of features:
•Access to multiple resources through a single intelligent lookup
•Verified parts replacement records shows which parts are most frequently replaced to
successfully complete repairs for symptoms, codes and vehicles similar to the one in your bay
•Real Fixes harvested from millions of successful repair orders.
•Guided Component Tests and waveform library gathered through on-vehicle tests for a
confident diagnosis
•OEM campaign alerts – never forget to check for TSBs and recalls again
•Up-to-the-minute intelligence based on vehicles in service bays nationwide
SureTrack can be accessed in multiple ways:
•While viewing DTCs in Scanner mode
•Selecting the SureTrack icon from the Home screen
•Opening the SureTrack website (askatech.com) using a web browser on your Diagnostic Tool
or a device with Internet access
15.1 SureTrack Authorization and Registration
SureTrack is included with current Diagnostic Tool system software. To use SureTrack you must
have the current software upgrade installed on your Diagnostic Tool.
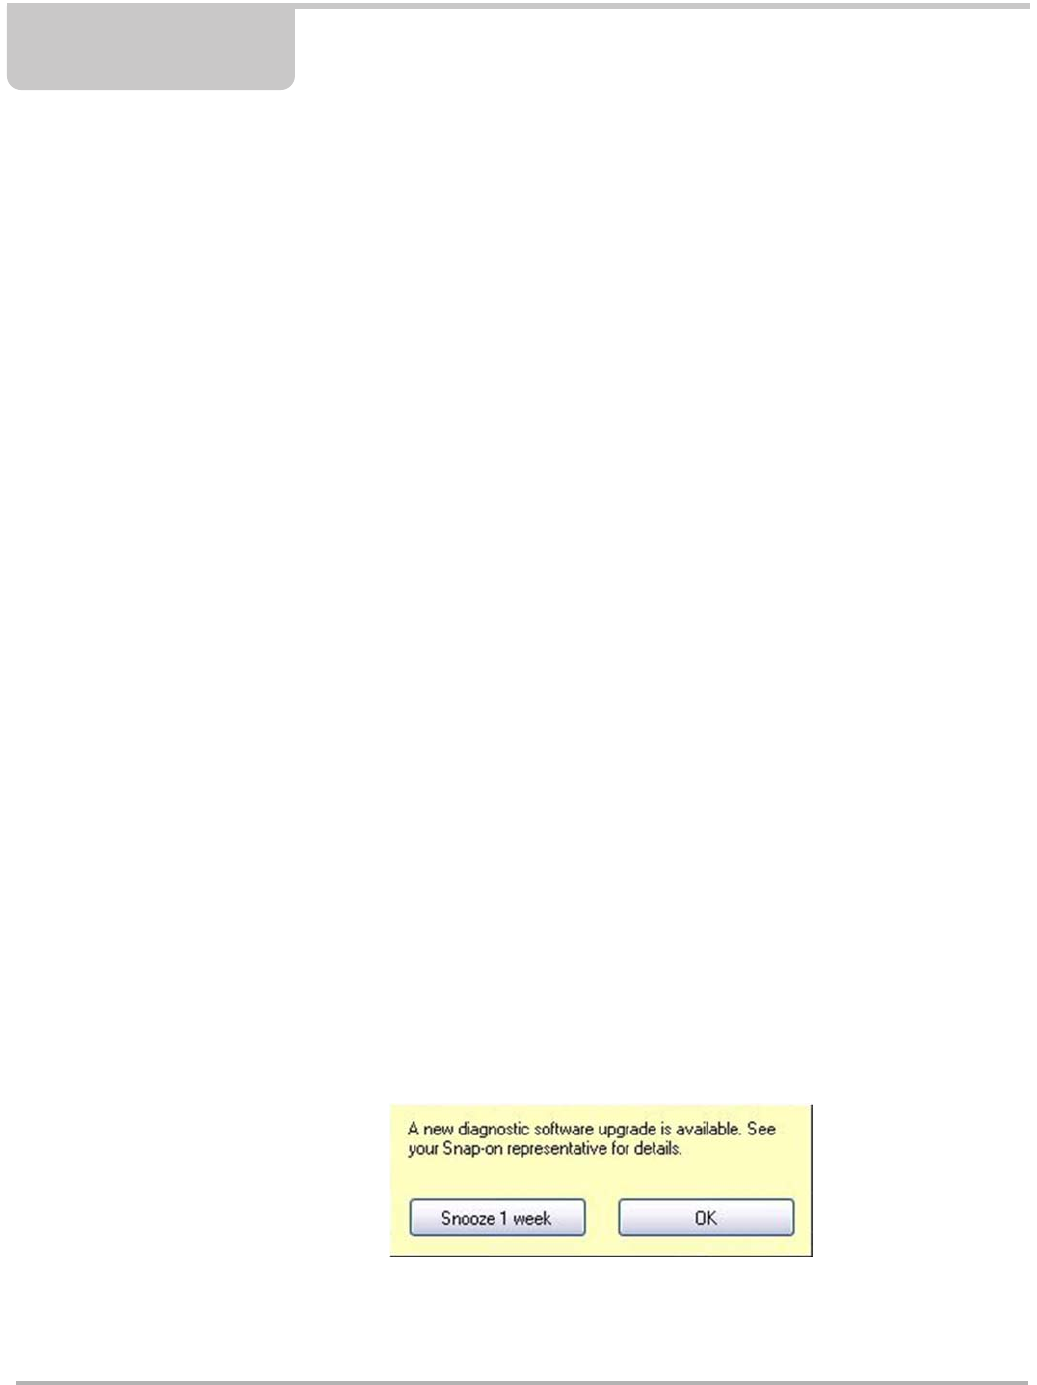
As a reminder to keep your software current and retain your access to SureTrack, software
upgrade reminder messages will display periodically when new software upgrades are available
(Figure 15-1). To purchase software upgrades or join the software subscription program, see your
Snap-on Representative.
Selecting OK will close the message box until the beginning of the next month when it will appear
to remind you again. Selecting Snooze 1 Week will close the message box for approximately one
week and then it will re-appear.
Figure 15-1 Software Upgrade Reminder Message
Draft 4/14/15- Do Not Distribute
148
SureTrack SureTrack Authorization and Registration
15.1.1 SureTrack Authorization Code
When you purchase a software upgrade from your Snap-on Representative, you will receive a
SureTrack authorization code. The authorization code is printed on your sales receipt.
Authorization codes are 12 digit alpha-numeric codes (e.g. 123ABCAP4-US).
NOTE:
iIf you are currently in the Software Subscription program, you will receive your SureTrack
authorization code by mail upon the new software upgrade release. Subscription software
upgrades are installed using the Subscription Upgrade Manager program installed on your
Diagnostic Tool.
Each time you purchase an a diagnostics software upgrade you will be provided a new SureTrack
authorization code. The authorization code will expire shortly after the release of the next
concurrent software upgrade. To log in with a new authorization code, see SureTrack Log In on
page 149.
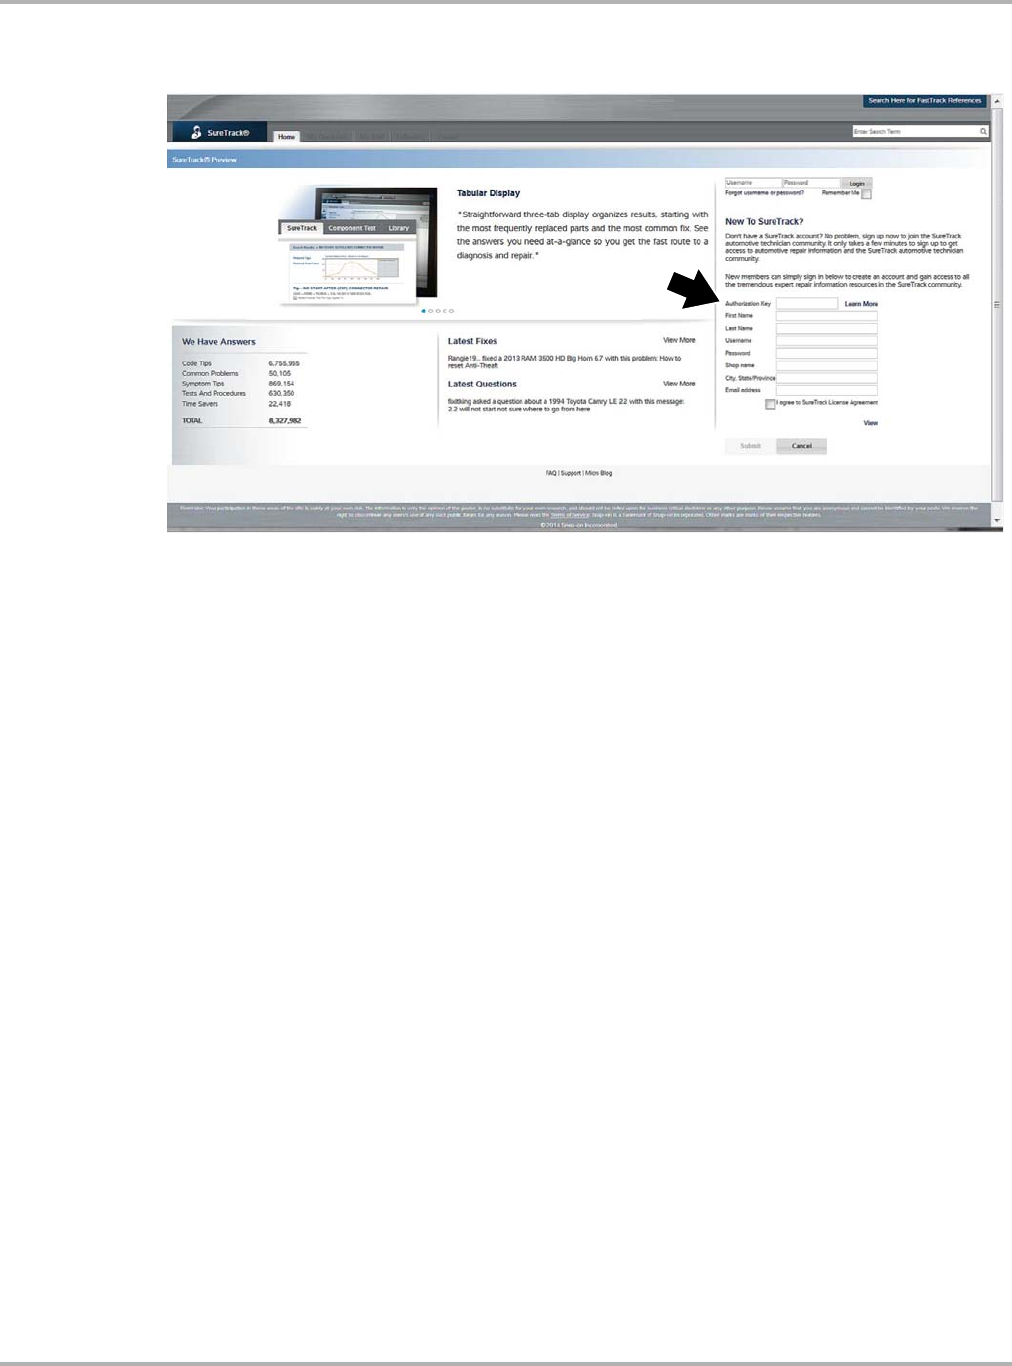
15.1.2 SureTrack Account Registration
If you are a new member (do not have an existing SureTrack account), you will need to complete
the online registration form before you can use SureTrack. Use the following procedure to register.
If you have an existing SureTrack account, see SureTrack Log In on page 149.
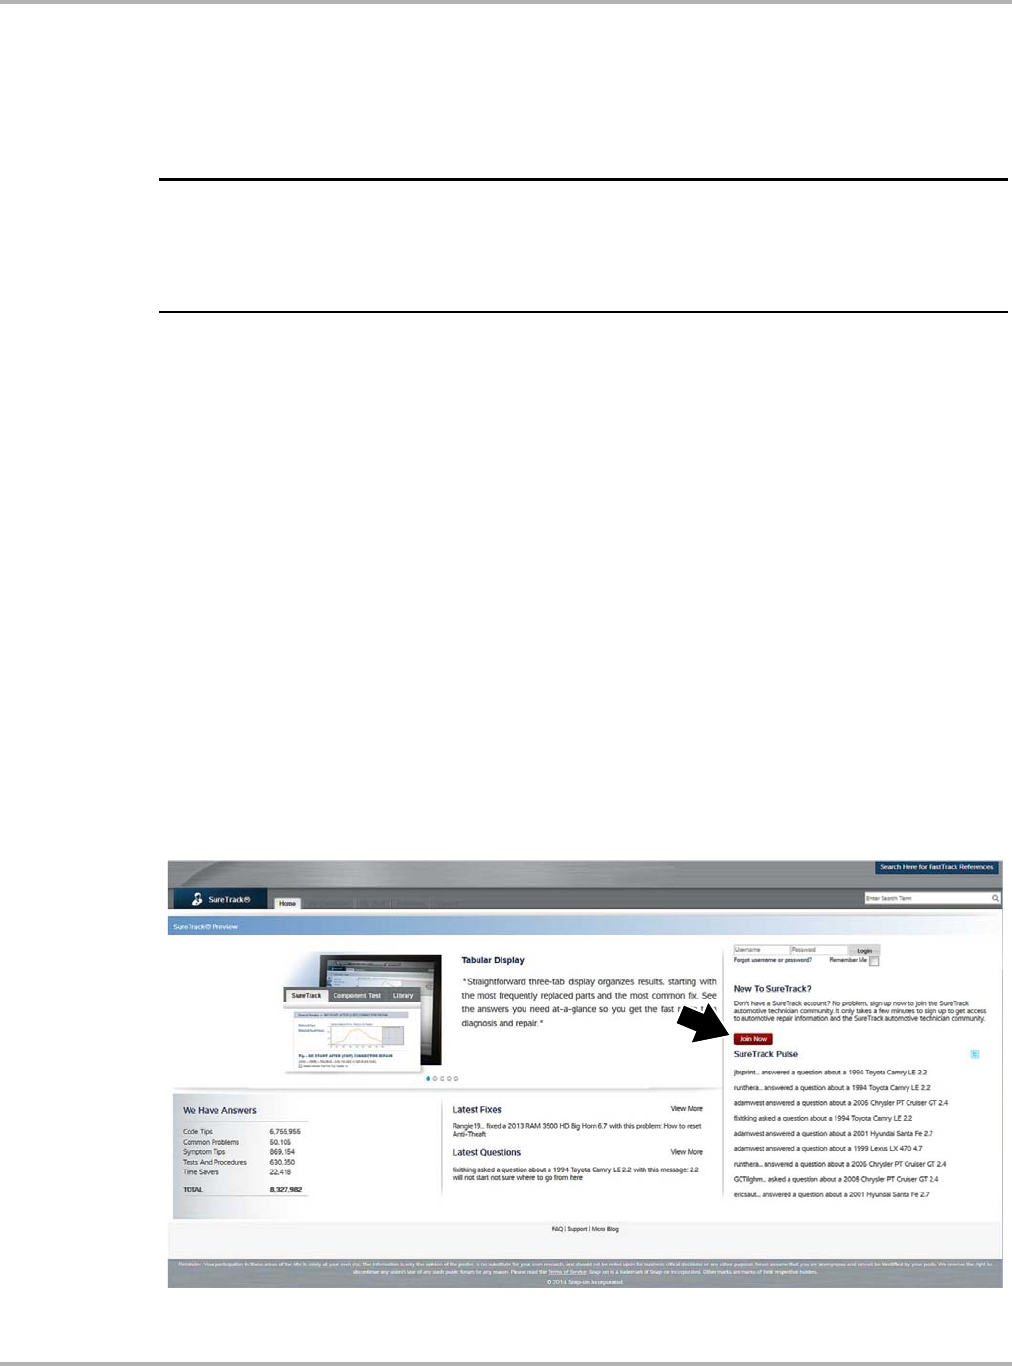
1. Navigate to the SureTrack website Login page, using one of the following procedures:
–Select the SureTrack icon from the Home screen of your Diagnostic Tool and enter your
vehicle information, or
–Open the SureTrack website using your web browser, see Using the SureTrack Website
on page 155.
2. From the SureTrack website Login page, select the Join Now icon (Figure 15-2) on the right
side of the screen to open the registration form (Figure 15-3).
Figure 15-2 SureTrack Website Login Page (Join Now icon)
Draft 4/14/15- Do Not Distribute
149
SureTrack SureTrack Log In
3. Enter your SureTrack authorization code (Figure 15-3).
Figure 15-3 SureTrack Website Registration Form
4. Enter your personal information and check the license agreement check box.
5. Select Submit.
Upon successful registration, you will be able to access SureTrack. For additional SureTrack
information, see the following sections: Using SureTrack in Scanner Mode on page 151, Starting
SureTrack from the Home Screen on page 154, and Using the SureTrack Website on page 155.
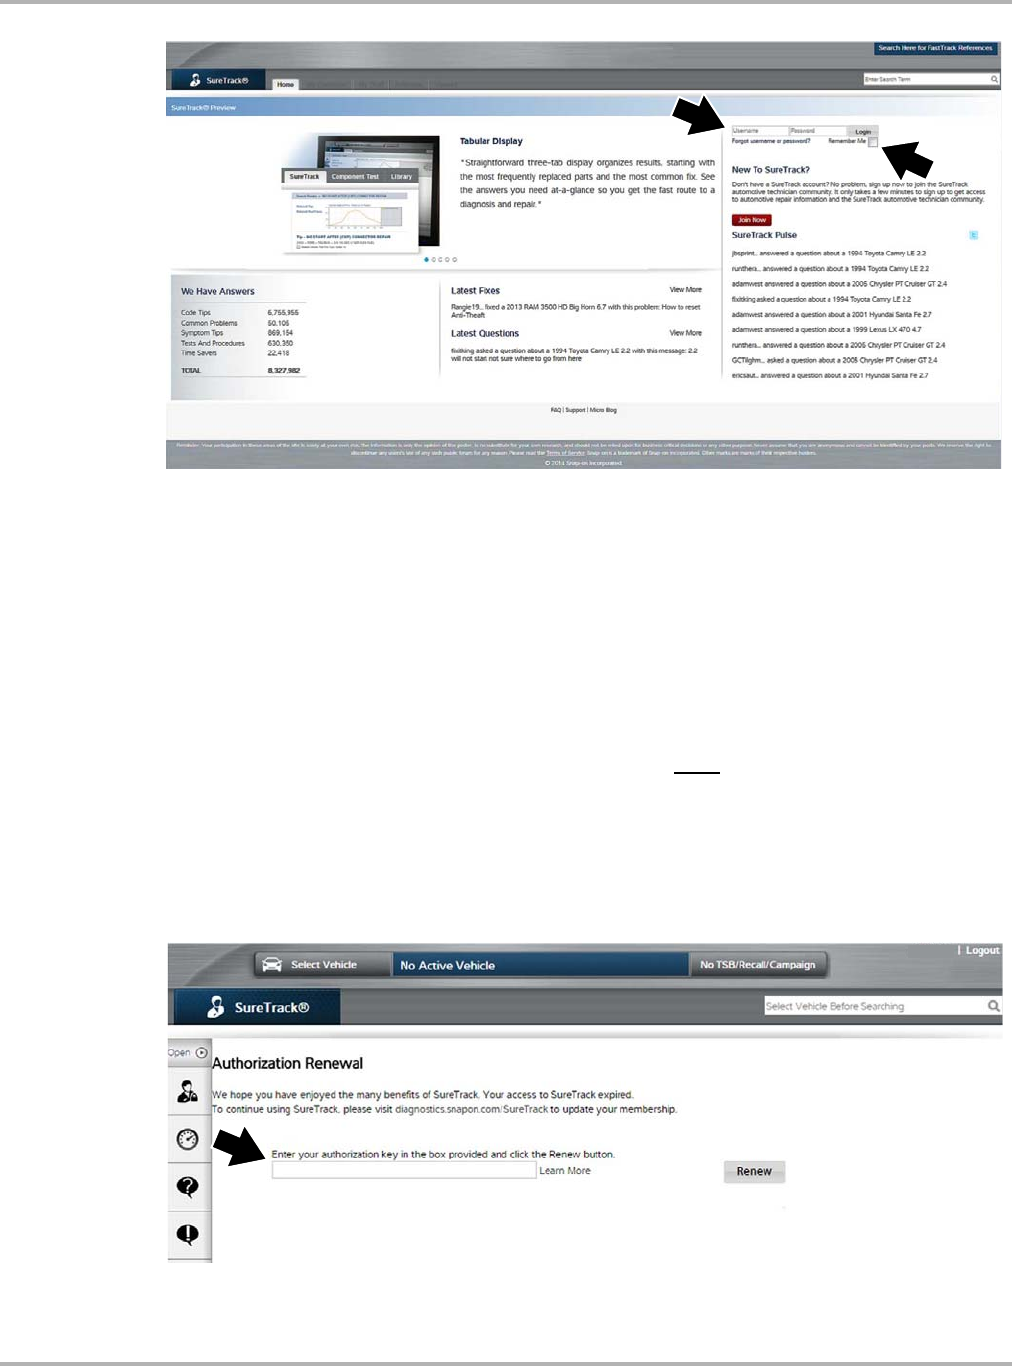
15.2 SureTrack Log In
Use the following procedure, if you already have an existing SureTrack account and need to:
•log in normally, or
•enter a new SureTrack authorization code to log in
If you do not have an existing SureTrack account, see SureTrack Authorization and Registration
on page 147 for log in instructions.
1. Navigate to the SureTrack website Login page, using one of the following procedures:
–Select the SureTrack icon from the Home screen of your Diagnostic Tool and enter your
vehicle information, or
–Open the SureTrack website using your web browser, see Using the SureTrack Website
on page 155.
2. From the SureTrack website Login page, enter your username and password (Figure 15-4).
3. (Optional) Select the Remember Me check box, to save your login information and stay
continually logged in to SureTrack (Figure 15-4).
Draft 4/14/15- Do Not Distribute
150
SureTrack SureTrack Log In
Figure 15-4 SureTrack Website Login Page (Login fields and Remember Me check box)
4. Select Login. One of two results can be expected.
•Upon successful log in, you will be able to access SureTrack. If you were not able to log in,
verify and re-enter your username and password.
•If your SureTrack authorization code has expired, you will be automatically redirected to the
SureTrack authorization renewal page (Figure 15-5), proceed to step 5.
For additional SureTrack information, see the following sections: Using SureTrack in Scanner
Mode on page 151, Starting SureTrack from the Home Screen on page 154, and Using the
SureTrack Website on page 155.
5. If you have purchased a software upgrade, enter your NEW SureTrack authorization code
(found on your sales receipt) (Figure 15-5).
–To use SureTrack you must have the current software upgrade installed on your
Diagnostic Tool. When you purchase a software upgrade from your Snap-on
Representative, you will receive a SureTrack authorization code.
6. Select Renew.
Figure 15-5 SureTrack Authorization Renewal Login Page
Draft 4/14/15- Do Not Distribute
151
SureTrack Using SureTrack in Scanner Mode
15.3 Using SureTrack in Scanner Mode
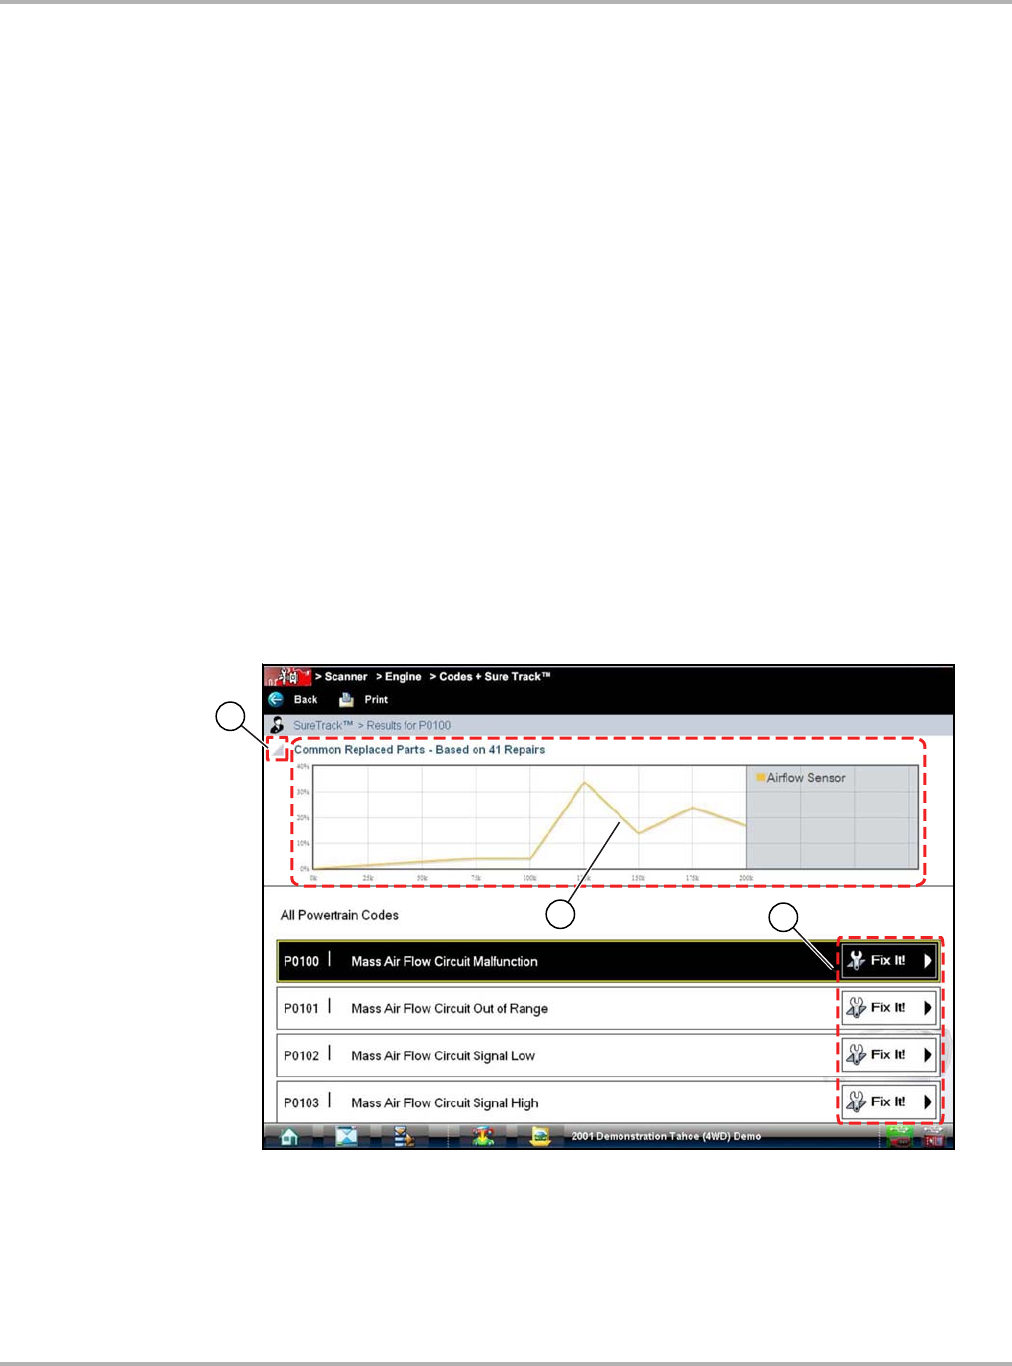
SureTrack repair information can be accessed while reviewing DTCs in Scanner Mode, to provide
you with diagnostic information specific to the DTC selected. Available DTCs are displayed in a list
that includes the DTC, a brief description, and a Fix It! icon (Figure 15-6).
Selecting the Fix It! icon provides the following SureTrack menu options:
•Common Replaced Parts Graph
•Dashboard Feature Information
Before using SureTrack, you must be logged in, see SureTrack Log In on page 149. If you are not
logged in to SureTrack, a message box will appear on the Display Codes screen (e.g.“SureTrack
Content May Be Available! Click here for more information.”). Selecting the message box will open
the SureTrack login page.
15.3.1 Common Replaced Parts Graph
The Common Replaced Parts graph (Figure 15-6) shows the percentage of verified fixes (using
the parts listed) derived from the total number of repairs by mileage. The example below indicates
that based on 41 repairs (intake airflow sensor replacement) involving vehicles with up to 200k
miles, approximately 33% of the repairs occurred at 125k miles. For additional information, see
“Common Replaced Parts Graph” on page 151.
Figure 15-6 Common Replaced Parts Graph
1— Common Replaced Part Graph icon—toggles Common Replaced Parts graph display
on/off.
2— Common Replaced Part Graph
3— Fix It! icon—opens Dashboard Feature Information
Draft 4/14/15- Do Not Distribute
152
SureTrack Using SureTrack in Scanner Mode
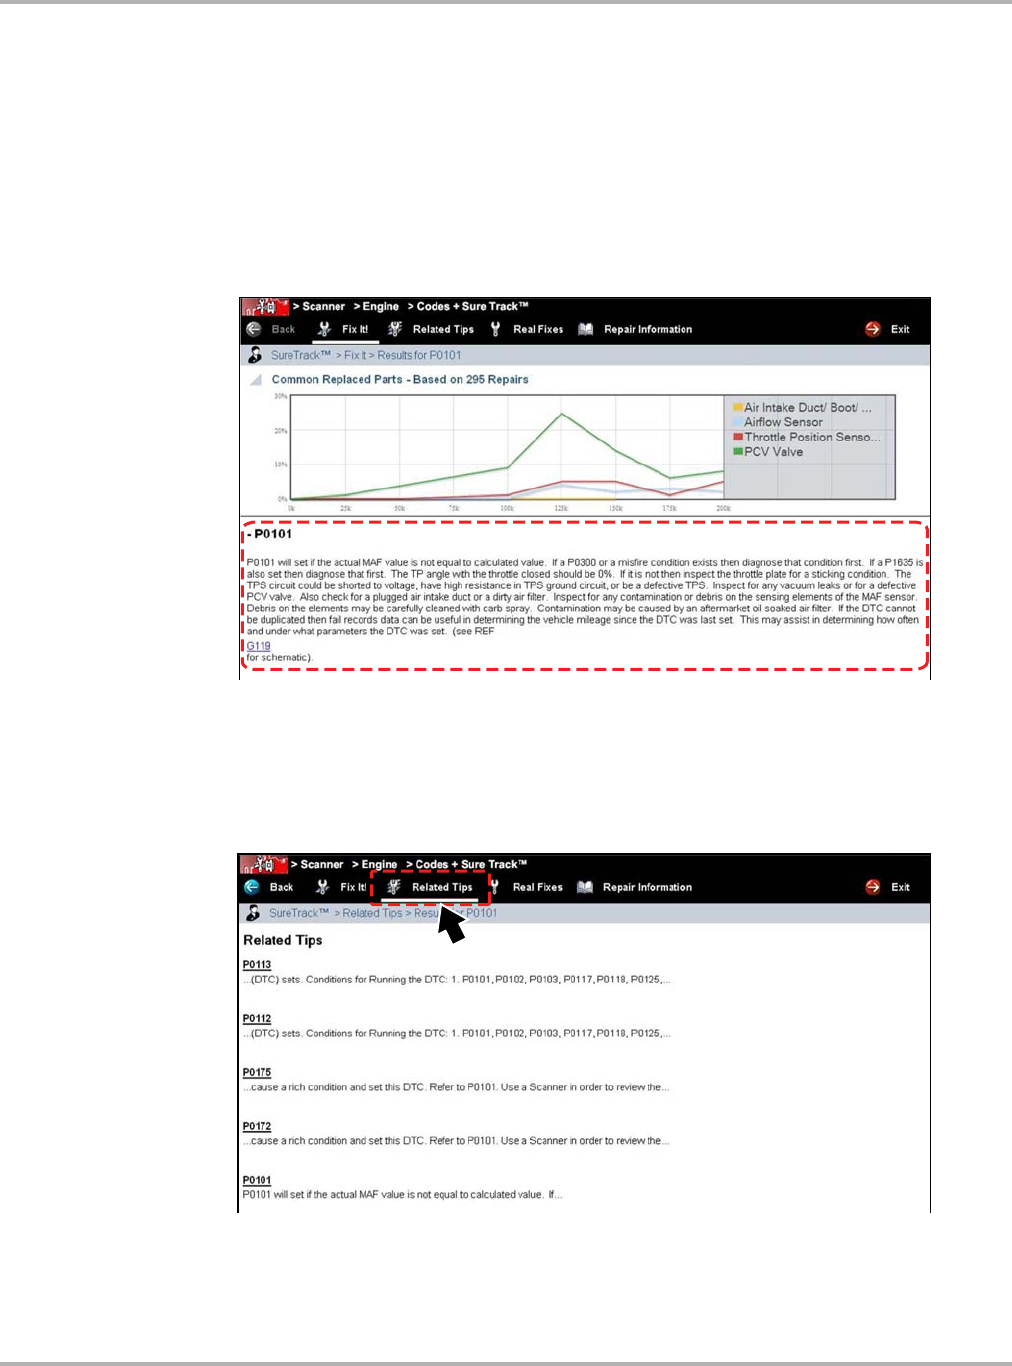
15.3.2 Dashboard Feature Information
Dashboard Feature Information includes:
•Detailed DTC Information
•Related Tips, Real Fixes and Repair Information
SureTrack will display detailed information about the current DTC describing code setting
conditions, possible symptoms, system operation and possible solutions (Figure 15-7). In
addition, other reference links may be provided such as schematics and illustrations.
Figure 15-7 “Fix It!” DTC Information
Menu options are also provided for the following:
Related Tips—opens a list of tips that may include information that is related to the current DTC
(Figure 15-8).
Figure 15-8 Related Tips Screen
Draft 4/14/15- Do Not Distribute
153
SureTrack Using SureTrack in Scanner Mode
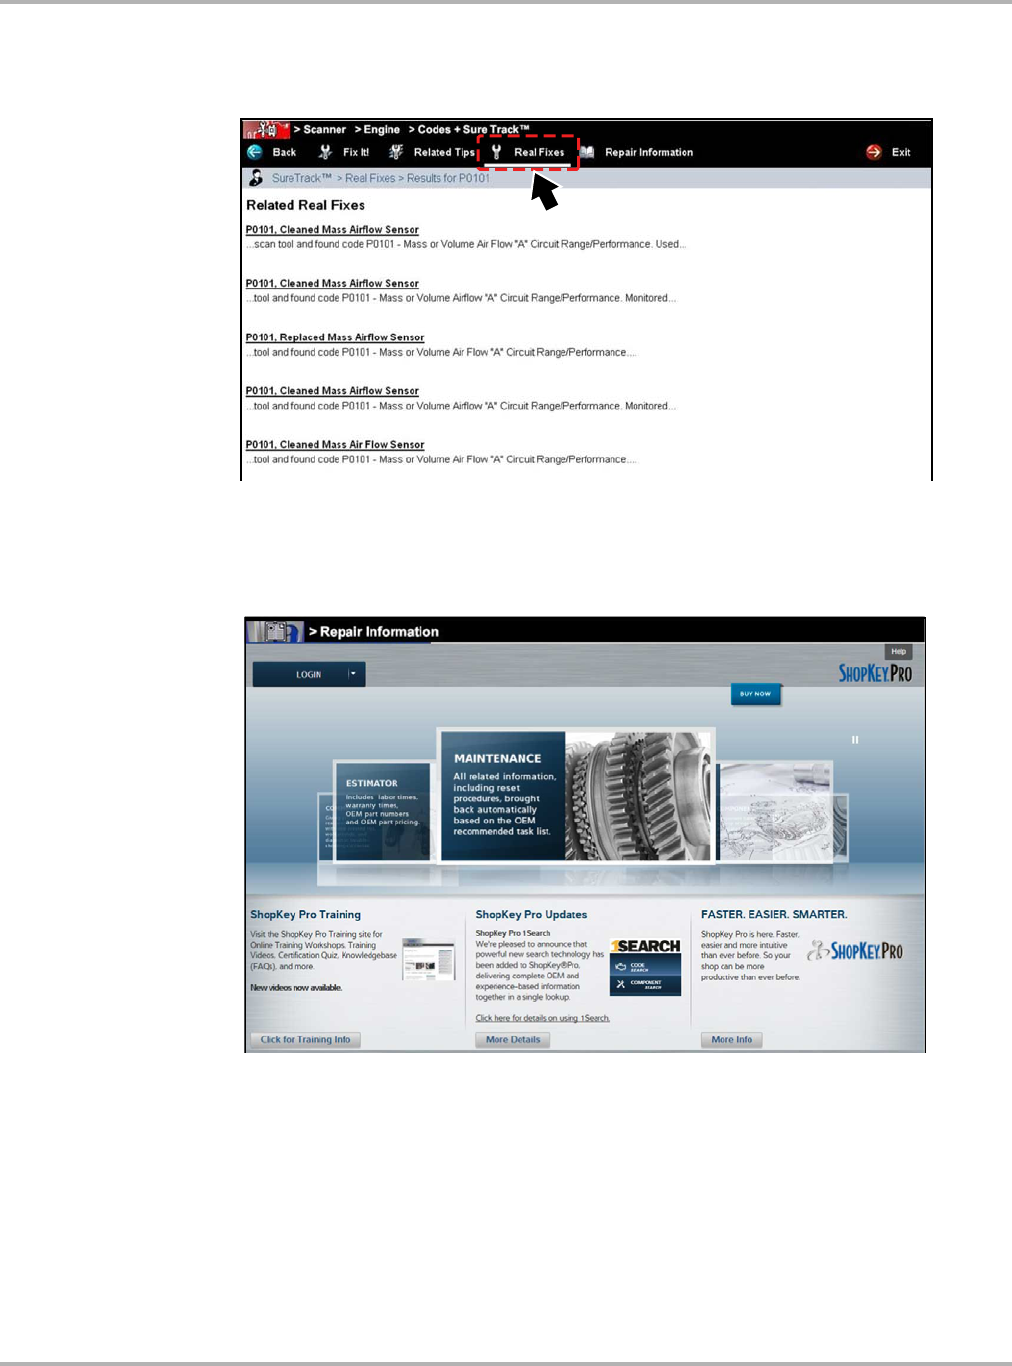
Real Fixes—opens a list of tips related to the current DTC that have been gathered from actual
shop repair orders and presented in a Complaint, Cause, Correction format (Figure 15-9).
Figure 15-9 Real Fixes Screen
Repair Information—opens the ShopKey Pro website, See “Repair Information Operations” on
page 113 for additional information (Figure 15-10).
Figure 15-10 ShopKey Pro Login Screen
Draft 4/14/15- Do Not Distribute
154
SureTrack Starting SureTrack from the Home Screen
15.4 Starting SureTrack from the Home Screen
Selecting the SureTrack icon from the Home screen, allows you to access SureTrack, without
connecting the scanner module to a vehicle. This allows you to quickly access SureTrack
diagnostic information at anytime. A vehicle must be identified to access SureTrack.
1. Select the SureTrack icon from the Home screen.
2. A vehicle identification sequence begins if there is no active vehicle. Follow the screen
prompts to select the year, make, model, submodel, engine, and system of the vehicle
(Figure 15-11).
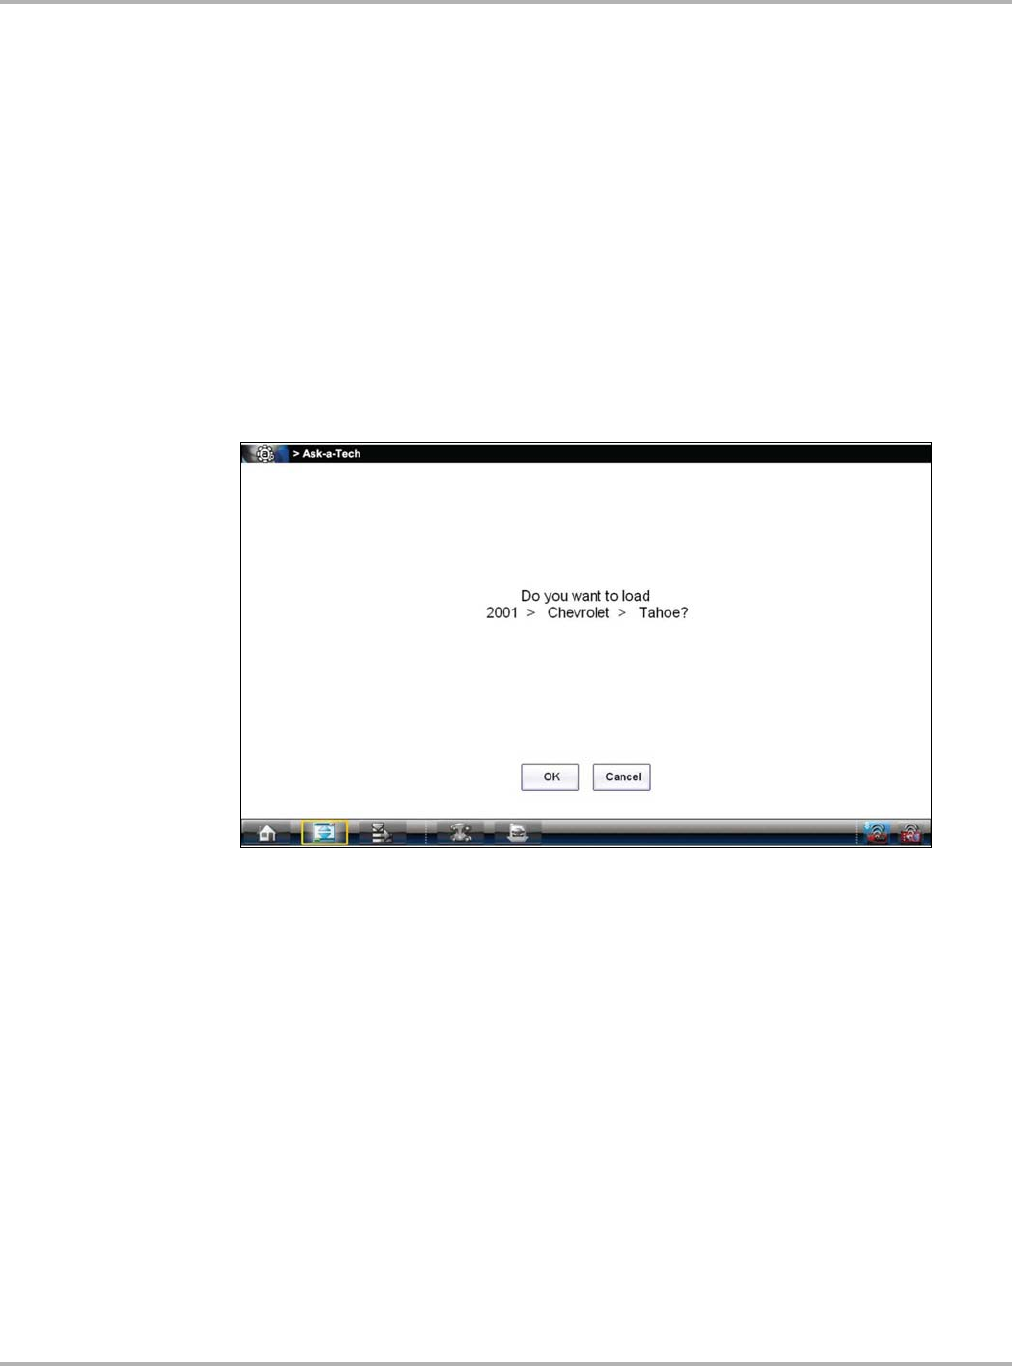
If an active vehicle is detected, a confirmation message will display providing the following
options.
a. Select OK to continue with the identified vehicle.
b. Select Cancel to identify a different vehicle.
Figure 15-11 Active Vehicle Confirmation Message
After the vehicle identification process is complete, the SureTrack website opens. See Using the
SureTrack Website on page 155 for additional information.
Before using SureTrack, you must be logged in, see SureTrack Log In on page 149.
Draft 4/14/15- Do Not Distribute
155
SureTrack Using the SureTrack Website
15.5 Using the SureTrack Website
The following section provides basic instructions and information for using the SureTrack website.
For additional information, see the FAQ page on the SureTrack website. The FAQ page link is
located on the bottom of the SureTrack Login page (Figure 15-12).
SureTrack website address: http://www.askatech.com
While operating the Diagnostic Tool the SureTrack website opens automatically when you are
directed to log in to SureTrack or can be opened by:
–Selecting the SureTrack icon on the Home screen and identifying a vehicle, see Starting
SureTrack from the Home Screen on page 154
or
–Using the web browser on your Diagnostic Tool or on a device with Internet access
Before using SureTrack, you must log in. For log in instructions, see SureTrack Log In on
page 149.
15.5.1 SureTrack Home Page
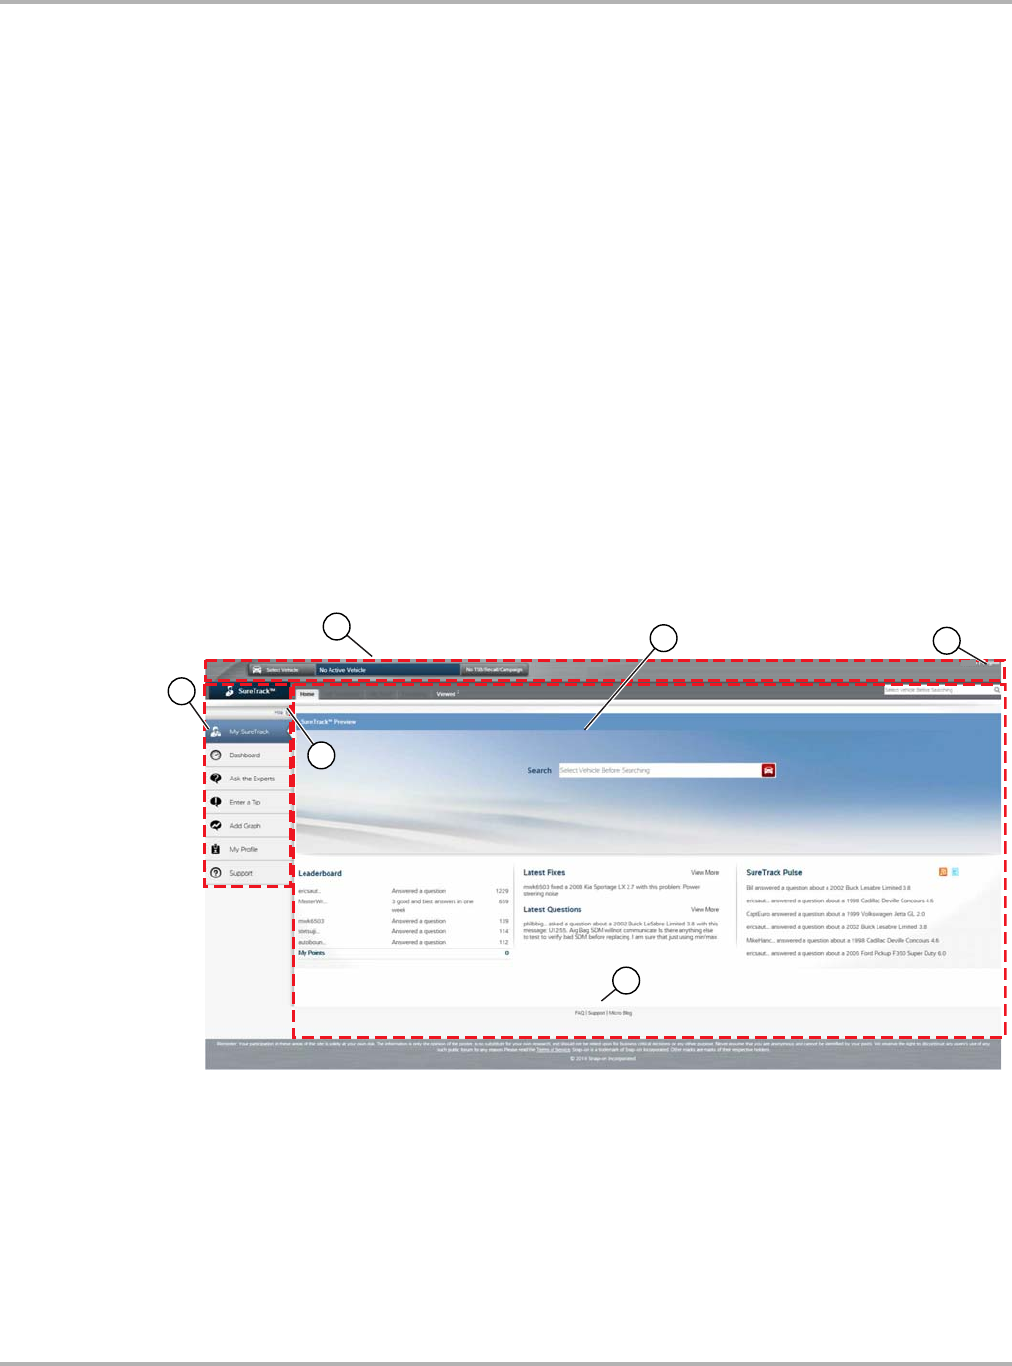
After you log in, the SureTrack website opens to the Home page (Figure 15-12):
Figure 15-12 SureTrack Home Page
1— Navigation Bar—located along the left-hand side of the page is used to access the main
functions of SureTrack.
2— Header Bar—located across the top of the page used to select vehicles and perform
keyword searches.
3— Main Screen—the center portion of the page presents content based on the vehicle
attributes and keywords selected.
4— Logout icon—select to log out of SureTrack
5— FAQ icon—select to open the frequently asked questions page
6— Hide/Show icon—toggles the Navigation Bar display between icon and text views.

Draft 4/14/15- Do Not Distribute
156
SureTrack Using the SureTrack Website
Main Screen
The Main screen is the active field that displays search results, SureTrack Tips, and other data
that is available for the vehicle. The display varies depending upon which Navigation Bar function
is active.
The Main screen also has tabs that allow you to switch between functions. Which tabs are
available depends upon which function is selected on the Navigation Bar.
Header Bar
The Header Bar consists of two rows of options that run across the top of the page. The upper row
may include:
•Select Vehicle/Change Vehicle icon
•Active vehicle description
•TSB/Recall/Campaign icon
The lower row may include a series of tabs that allow you to switch between functions, and a
search field for entering keywords to locate information. What is available from the tabs changes
depending upon which function is selected on the Navigation Bar.
Select Vehicle/Change Vehicle
The Select Vehicle/Change Vehicle icon is used to identify the active vehicle to SureTrack. Vehicle
attributes are selected from a sequence of option lists. Make a selection to advance through the
lists. Once an active vehicle is identified, search data is filtered so that only information that
applies to the identified vehicle is shown.
NOTE:
iTo ensure a more accurate search, it is recommended that you should make a complete vehicle
selection by choosing all of the attributes.
Select the Change Vehicle icon at any time to modify the attributes of the active vehicle. Select
from the list on the left-side of the screen to change individual attributes of the active vehicle. The
Clear All icon at the bottom of the list erases all of the vehicle attributes. Select Use This Vehicle
icon in the upper-right corner of the screen to implement changes once they are made.
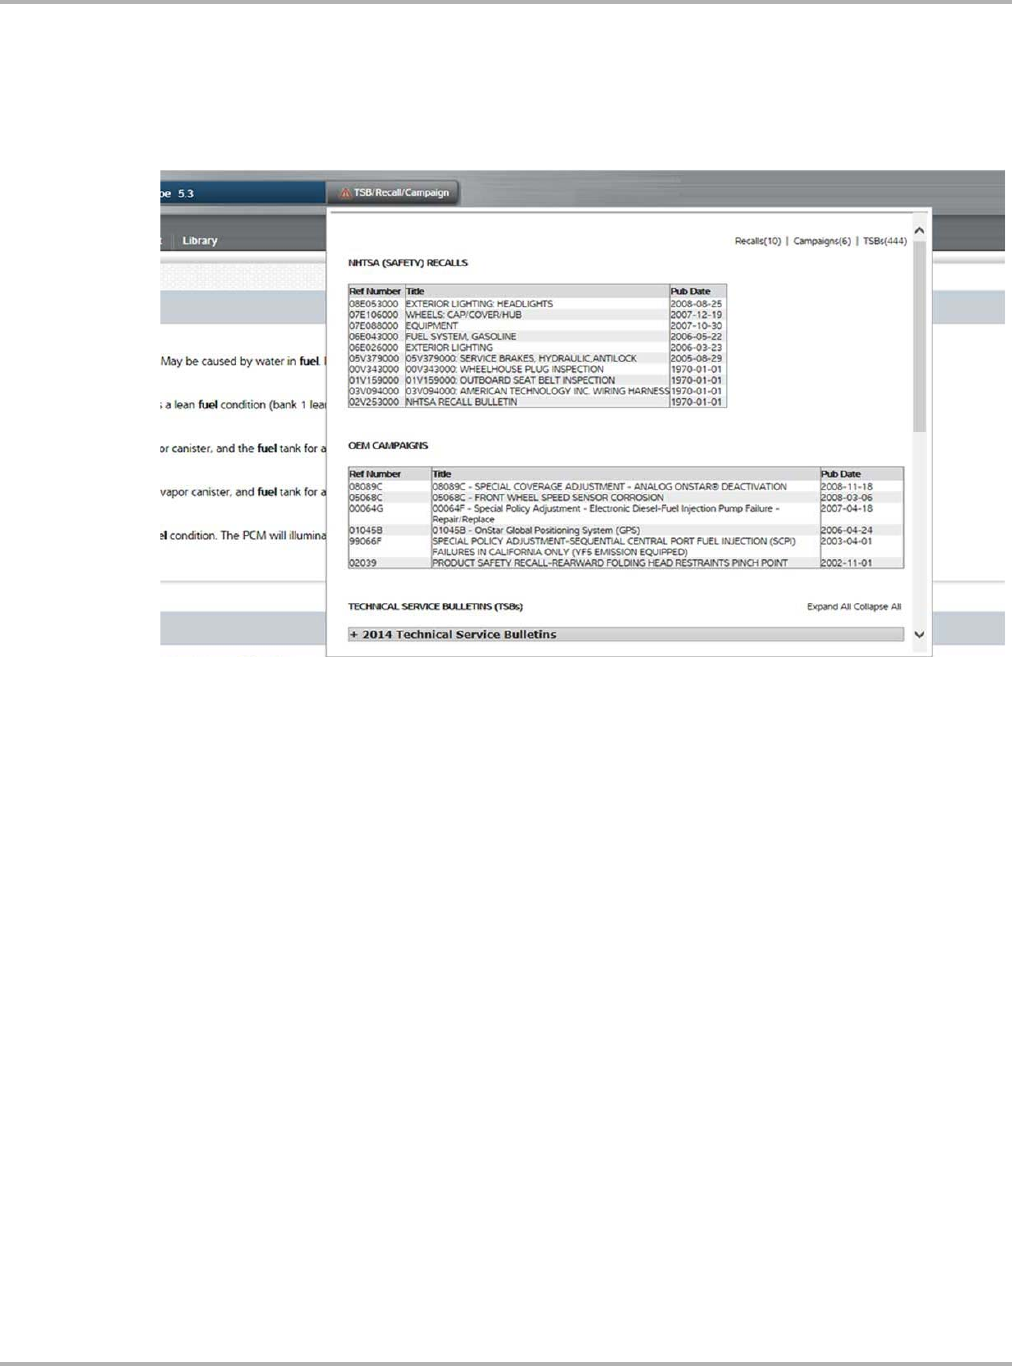
TSB/Recall/Campaign
Technical Service Bulletins from the original equipment manufacturer (OEM), recalls ordered by
the National Highway Traffic and Safety Administration (NHTSA), and campaigns from the OEM
that apply to the active vehicle are accessible from the TSB/Recall/Campaign icon. An icon
appears on the icon if any TSB, recall, or campaign information is available for the selected
vehicle (Figure 15-13).
Figure 15-13 Sample TSB/Recall/Campaign Icon
Draft 4/14/15- Do Not Distribute
157
SureTrack Using the SureTrack Website
Available items are listed in order; recalls first, followed by any campaigns, then service bulletins.
The most recent is at the top of the list when multiple documents are available (Figure 15-14).
Selecting a listed item opens the complete text of the recall or campaign. TSBs are grouped by
year, select the plus sign (+) alongside a year to expand the list.
Figure 15-14 TSB/Recall/Campaign Window
Select the Back icon on your web browser to close the TSB/Recall/Campaign window.
Navigation Bar
The icons on the Navigation are used to access the main SureTrack functions. Navigation Bar
options include:
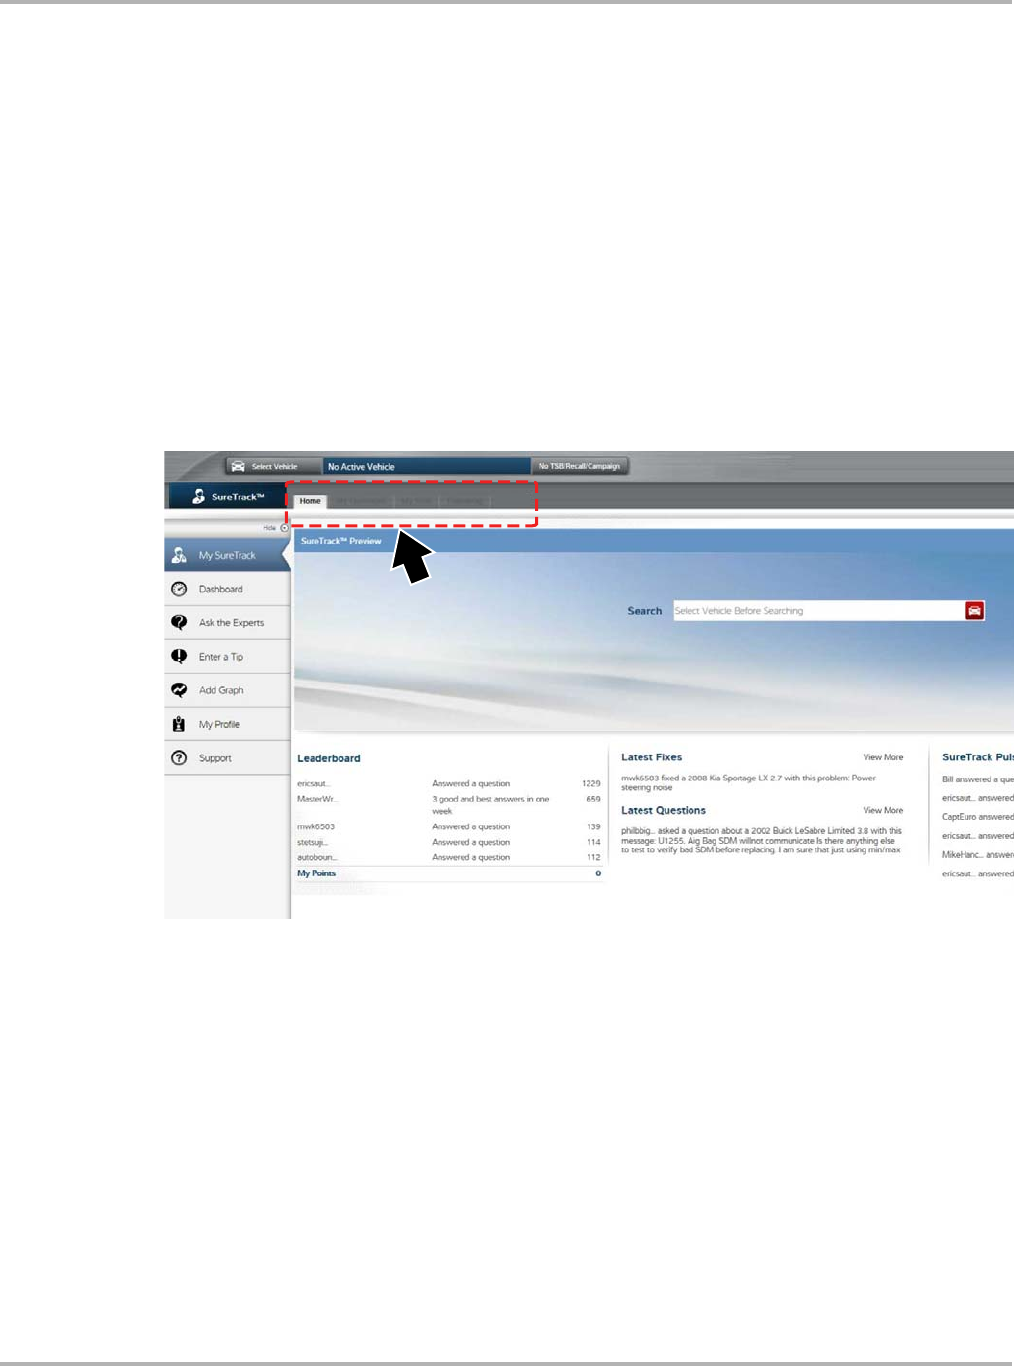
•My SureTrack—shows the latest questions and fixes, along with the SureTrack Pulse and
Leaderboard. See My SureTrack on page 158.
•Dashboard—shows the current search results for the active vehicle. See Dashboard on
page 159.
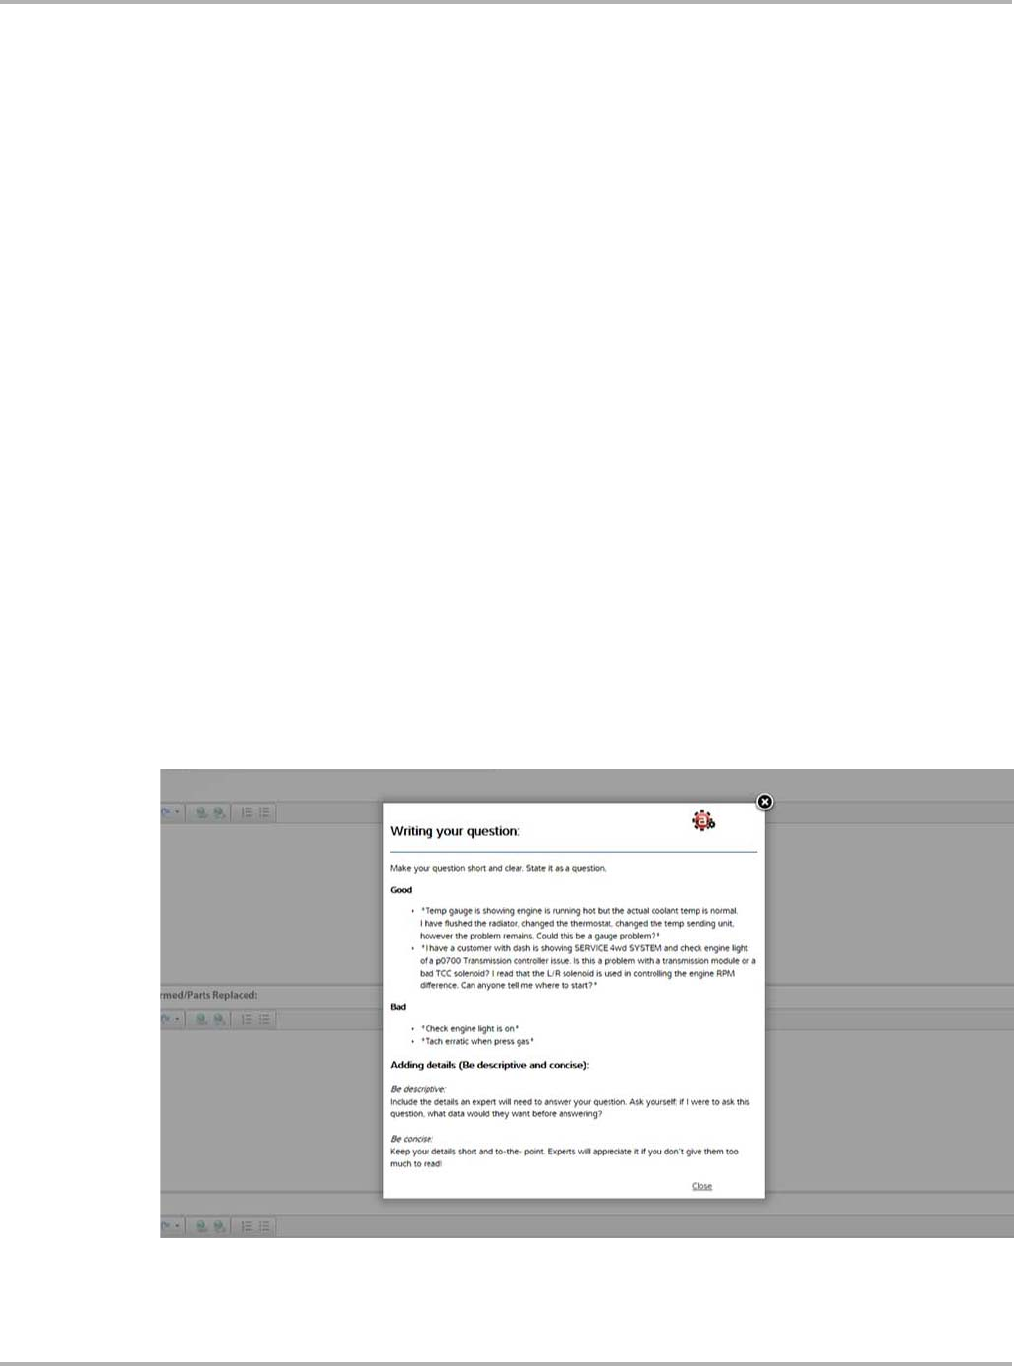
•Ask the Experts—use to post a question to the community. See Ask the Experts on
page 161.
•Enter a Tip—use to share your personal repair experience with the community. See Enter a
Tip on page 163.
•Add a Waveform or PID Graph—use to attach supporting images and files to an existing tip.
See Add Waveform/PID Graph on page 163.
•My Profile—allows you to customize how your profile appears to the community. See My
Profile on page 163.
•Support—opens a message box for contacting Customer Service by e-mail, a link to the
Frequently Asked Questions (FAQ) page, as well as a phone number for contacting the
Support Center. See Support on page 163.
Draft 4/14/15- Do Not Distribute
158
SureTrack Using the SureTrack Website
15.5.2 My SureTrack
Selecting My SureTrack opens your personal SureTrack page, which is also the page that
displays when you first login to SureTrack.
A search field is located on the Main screen and can be used to search for codes, symptoms and
tips, or other options by keyword.
Multiple options are available from the Header Bar tabs (Figure 15-15):
•Home—displays the SureTrack Leaderboard, links to Latest Fixes, Latest Questions,
SureTrack Pulse, and a search field.
•My Questions—opens a list with links to questions that you have posted to the community.
•My Stuff—opens a list of Tips that you have created.
•Following—opens a list with links to Tips and discussions you are actively participating in.
•Viewed—opens a list with links to Tips that you recently visited.
Figure 15-15 My SureTrack Page Tab Options
The following features, are also be available from the My SureTrack Main screen:
•Leaderboard, see Leaderboard on page 159.
•Latest Fixes and Questions—displays a list of the latest Questions and Fixes posted by
active Community members in chronological order
•SureTrack Pulse—displays a list of recent Questions and Fixes posted by active Community
members
'PMMPXJOH.Z4UVGG.Z2VFTUJPOT 7JFXFE

Draft 4/14/15- Do Not Distribute
159
SureTrack Using the SureTrack Website
Leaderboard
•The Leaderboard shows the top ranked SureTrack community members. Community
members are awarded points for answering questions, and those that gather the most points
show on the Leaderboard. For additional information on asking questions, see Ask the
Experts on page 161.
Leaderboard points are awarded as follows:
•1 point is awarded for answering a question.
•5 points are awarded if your answer is rated as a “Good Answer” by the SureTrack community
member who asked the question.
•10 points are awarded if your answer is rated as the “Best Answer” by the SureTrack
community member who asked the question.
Bonus points are awarded for:
•An extra 15 points every time three Best Answers are provided in the week.
•An extra 10 points for a combination of 3 Good Answers and Best Answers per week.
NOTE:
iAnswers can only be counted once for bonus points.
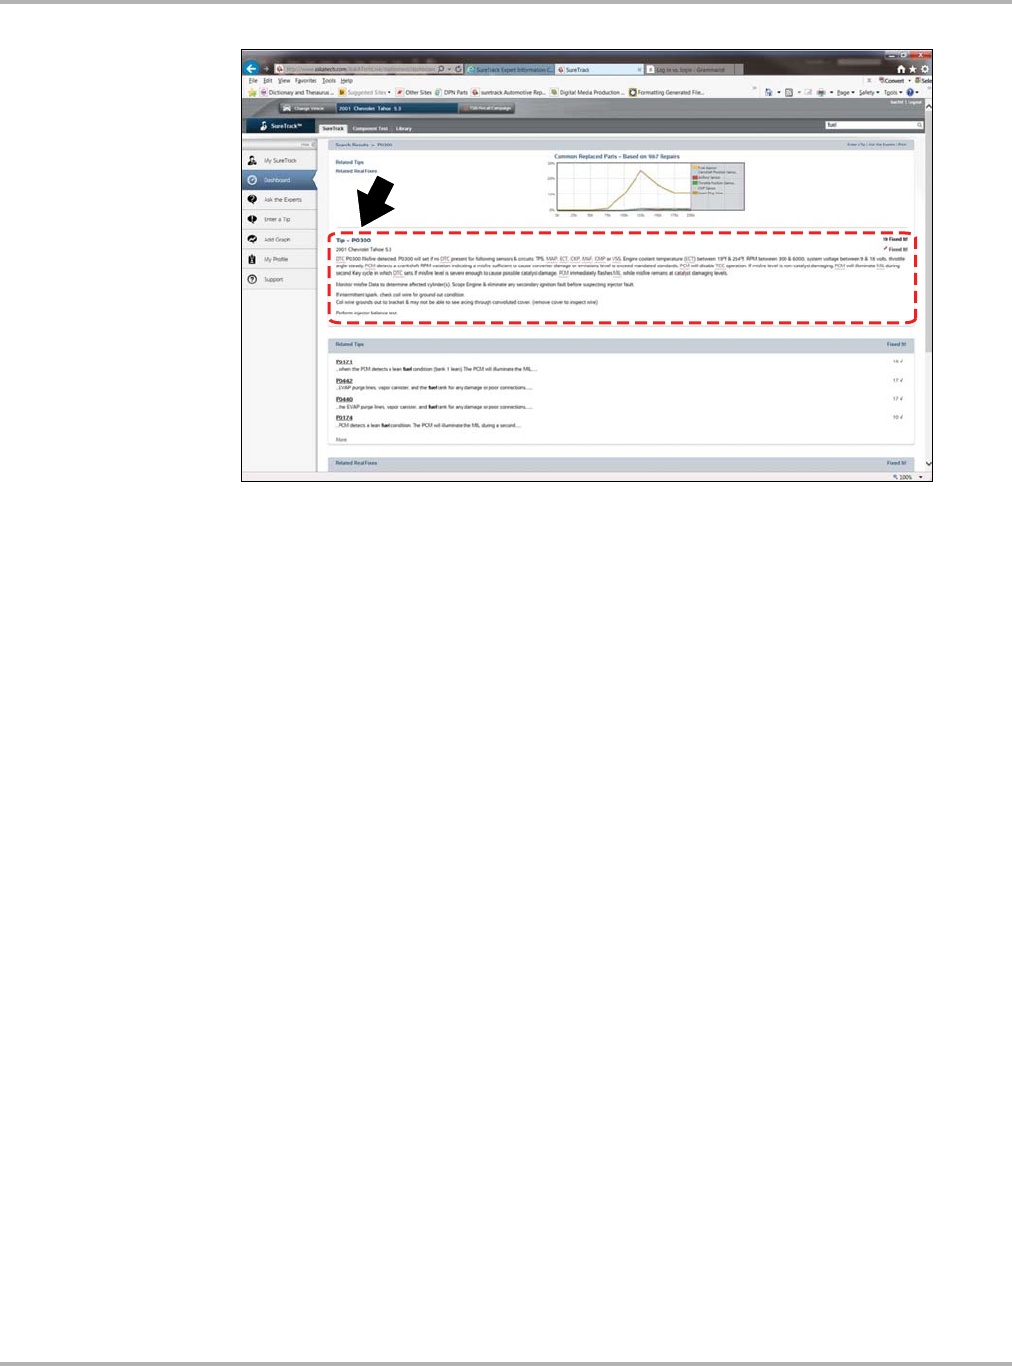
15.5.3 Dashboard
Selecting Dashboard displays search results for the active vehicle. Search results may be listed
in several categories (not all categories are available for all vehicles). Tabs across the top allow
you to select results by category (e.g. SureTrack, Component Test and Library).
SureTrack Tab
The SureTrack tab displays the following information:
•Tips—presents a list of Tips that directly correlate to your search criteria. Select a tip from the
list to open and review the complete Tip (Figure 15-16). For addition information, see “About
SureTrack Tips” on page 160.
Common Replaced Parts Graph—when a tip is selected the Common Replaced Parts graph
appears at the top the Dashboard page. The graph shows the frequency with which parts,
commonly related to the Tip, are replaced and at what vehicle mileage. The data in the
Common Replaced Parts graph is actual data extracted from millions of recorded repair
orders from shops all around the country. For additional information, see “Common Replaced
Parts Graph” on page 151.
Draft 4/14/15- Do Not Distribute
160
SureTrack Using the SureTrack Website
Figure 15-16 SureTrack Tip
•Related Tips—presents a list of Tips that may include information that pertains to your
search, even though they are not an exact match to your search criteria.
•Related Real Fixes—presents a list of successful repairs for problems similar to the one in
your search.
•Community—presents a list of Tips that have been gathered from actual shop repair orders
and are presented in an easy to understand Complaint, Cause, Correction format.
About SureTrack Tips
SureTrack Tips are concise and complete descriptions of a real fix for a particular vehicle repair
issue. A SureTrack Tip is a combination of proven fixes and vehicle specific data we have
collected and analyzed into an all-in-one information source to help you fix vehicle problems
quickly and easily (Figure 15-16).
On SureTrack you can search for Tips or enter your own Tip to help other community members
resolve vehicle issues. There are 3 types of SureTrack Tips:
•Snap-on Certified Tips—these proven tips have gone through rigorous review by experts.
•Real Fix Tips—these tips are gathered from actual shop repair orders and are presented in
an easy to understand Complaint, Cause, Correction format.
•SureTrack Community Tips—these are Tips that have been created by members of the
SureTrack community.
If you have a new fix to a specific problem, you can create a Tip to share this information with other
technicians. See “Enter a Tip” on page 163.
Draft 4/14/15- Do Not Distribute
161
SureTrack Using the SureTrack Website
Component Test Tab
The Component Test tab on the Dashboard page, provides specific component operational
information on how to locate the component on the vehicle, how to set up a meter to test the
component, the best place on the vehicle to connect the meter, component connector pin
assignments, and what readings you should expect to see.
Library Tab
The Library tab on the Dashboard page, provides data graphs and/or waveforms associated with
the selected Tip and vehicle. This is a comprehensive collection of test results gathered through
actual on-vehicle tests, so you know exactly what to look for when performing your own tests. Data
graphs and lab scope waveforms provide a point of reference to help you verify faulty parts.
15.5.4 Ask the Experts
Selecting Ask the Experts opens a series of text entry forms that allow you to ask a question to
the SureTrack community.
Questions and Answers
Asking Questions
SureTrack provides answers, but you must first ask a question in order to receive an answer.
Begin using SureTrack by asking a question of the Community. Select See Examples in the
upper-right portion of the screen to view samples of well written questions (Figure 15-17).
Figure 15-17 Example Question

Draft 4/14/15- Do Not Distribute
162
SureTrack Using the SureTrack Website
zTo ask a Question:
1. If not already done, select either Select Vehicle or Change Vehicle on the Header Bar and
enter the identifying attributes of the vehicle you would like to ask a question about.
2. Select Ask the Experts on the Navigation Bar along the left-side of the screen to open the
page.
3. Enter a Subject for the question (4 to 10 words).
4. Complete the form:
–Symptoms—this is where you describe how the vehicle is behaving.
–Diagnostics Steps Performed/Parts Replaced—include any previous diagnostic tests
that you performed, including the results of those tests. Also list any parts that were
replaced during previous diagnostic work.
–Your Question—compose a clear and concise question to ask the community. Be sure to
be descriptive and concise when asking your question. Select See Examples in the
upper-right corner of the page to review examples of how to construct a good question.
The Attach Files icon at the left-side bottom of the page allows you to include images or other
supporting data with your question. Select Attach Files and a selection window opens for
locating items on your computer and attaching them.
Use the Preview icon at the right-side bottom of the page to see how your question will be
presented to the community before you actually post it.
Use the Cancel icon at the right-side bottom of the page to delete your question.
Use the Submit icon at the right-side bottom of the page to ask your question.
Check the Follow box if you want to get e-mail notifications when other members edit or
comment on your question.
Closing a Question
Questions that you post to the community need to be closed once the vehicle repair issue has
been resolved. You are encouraged to document the fix, and an important part in doing so is to
provide information on what actually fixed the vehicle. This makes it possible for other SureTrack
community members to use the information as well. To close a question select the Close
Question icon on the right side of your question. Your question is now converted to a SureTrack
Community Tip. Unless you have already done so, you will be asked to award Best Answer and
Good Answer ratings to reward those community members that helped you as part of closing the
question. This awards Leaderboard points to those community members that assisted you.
Rating Answers
Rating answers is one way to give back to the SureTrack community. The member that originally
asked the question gets to select a Good Answer and a Best Answer from all the responses. The
community member that provided the Good Answer or Best Answer to a question is recognized for
their contribution.
About Good Answers and Best Answers:
•Only one answer can be rated Best Answer.
•More than one answer can be rated Good Answer.
•Only the SureTrack community member that asked the question can rate the answers.

Draft 4/14/15- Do Not Distribute
163
SureTrack Using the SureTrack Website
15.5.5 Enter a Tip
Selecting Enter a Tip opens a text entry form where you can enter you personal repair experience
to share with the community.
zTo create a new Tip:
1. Select either Select Vehicle or Change Vehicle from the Header Bar and enter all of the
identifying attributes of the vehicle you are writing the Tip about.
2. Select Enter a Tip from the Navigation Bar.
3. Enter your Tip Title in the Title field.
4. Compose your tip in the Content field. Include as much information as possible, while keeping
the information concise and to the point. A tip should provide accurate information that is easy
to read, understand, and follow.
5. Select Submit once you are satisfied with your Tip.
For additional information, see “About SureTrack Tips” on page 160.
15.5.6 Add Waveform/PID Graph
Selecting Add a Waveform/PIDGraph opens a data entry form that allows you to attach a file
sample of a graph or similar image. To submit the image you must complete all the required entries
including Title, File (attach) and the five drop-down list items in the Tags menu box. When you are
finished, select the Submit icon.
15.5.7 My Profile
Selecting My Profile opens your personal identification page. The Header Bar tabs allow you to
create your SureTrack identity, and to establish filters for the type of information that will be sent
to you:
•User Profile—information that you include here determines how you are presented to the
community.
•Vehicle Selection—use to set up a list of preferred vehicles. The preferred list limits the
choices that display on the “Select Vehicle” list to specific years, makes, and systems.
•Expert Subscriptions—allows you to share your knowledge by alerting you when there is a
question related to an indicated area of your expertise.
•Communication—use to configure what type of information from the community will be
e-mailed to you.
15.5.8 Support
Selecting Support opens a message box to report problems with the website and to make general
suggestions. The SureTrack customer support phone number is also listed.

Draft 4/14/15- Do Not Distribute
164
Chapter 16 ShopStream Update Tool
(SST)
The ShopStream Update Tool (SST) is a maintenance program that automatically keeps your
diagnostic software up-to-date.
The following terms are used in this section and throughout this manual as described below:
•Software Upgrade - a new diagnostic software version. Software upgrades include new and
enhanced coverage and features for subscribed Snap-on diagnostic tools.
•Software Update - a service release “update” for a existing diagnostic software version
For clarity, throughout this document the term “software update(s)” will be used to collectively
describe “software updates, upgrades and SST program updates” using the SST, except where
noted.
The ShopStream Update Tool program downloads and installs:
•Diagnostic software upgrades (subscribed tools only)
•Diagnostic software updates
•SST program updates
When connected to the Internet, the SST automatically checks for new software updates. This
automatic check also occurs every time the diagnostic tool is turned on. If a software update is
available, the SST will download it.
The SST is a low priority program that only downloads software updates when unused bandwidth
is available. If other programs are running that communicate over the Wi-Fi network, such as a
browser or instant messaging, the download may be temporarily suspended. This allows you to
continue normal diagnostic tool operation, without interruptions or loss of performance.
16.1 Basic Operation
The SST program is normally running in the Windows background and available from the
Windows taskbar notification area. The program can be accessed as follows:
•SST icon in the notification area - opens the SST program menu
•SST program selection from the Windows “All Programs” or “Startup” menus - starts
the SST program and adds the SST icon to the notification area
NOTE:
iIf necessary, select the expand arrow to see the SST icon in the notification area.
Draft 4/14/15- Do Not Distribute
165
ShopStream Update Tool (SST) Basic Operation
Figure 16-1 SST Icon in notification area
Selecting the SST icon from the notification area provides the following menu choices:
•Check for Updates - Allows you to manually check for software updates anytime. See
Manual Download on page 166.
•Show Progress - allows you to check the status of an active download
•Settings - provides SST program options:
–Turn on/off automatic software installation. Applies only for SST program updates. The
default setting is “on” (box checked).
–Set the hourly interval for the SST to check for software updates (choose number 2 to
168). Applies to SST program updates, and diagnostic tool software
upgrades/updates. The default interval is 4 hours.
Figure 16-2
•About - displays the SST program software version number
•Exit - closes the SST program
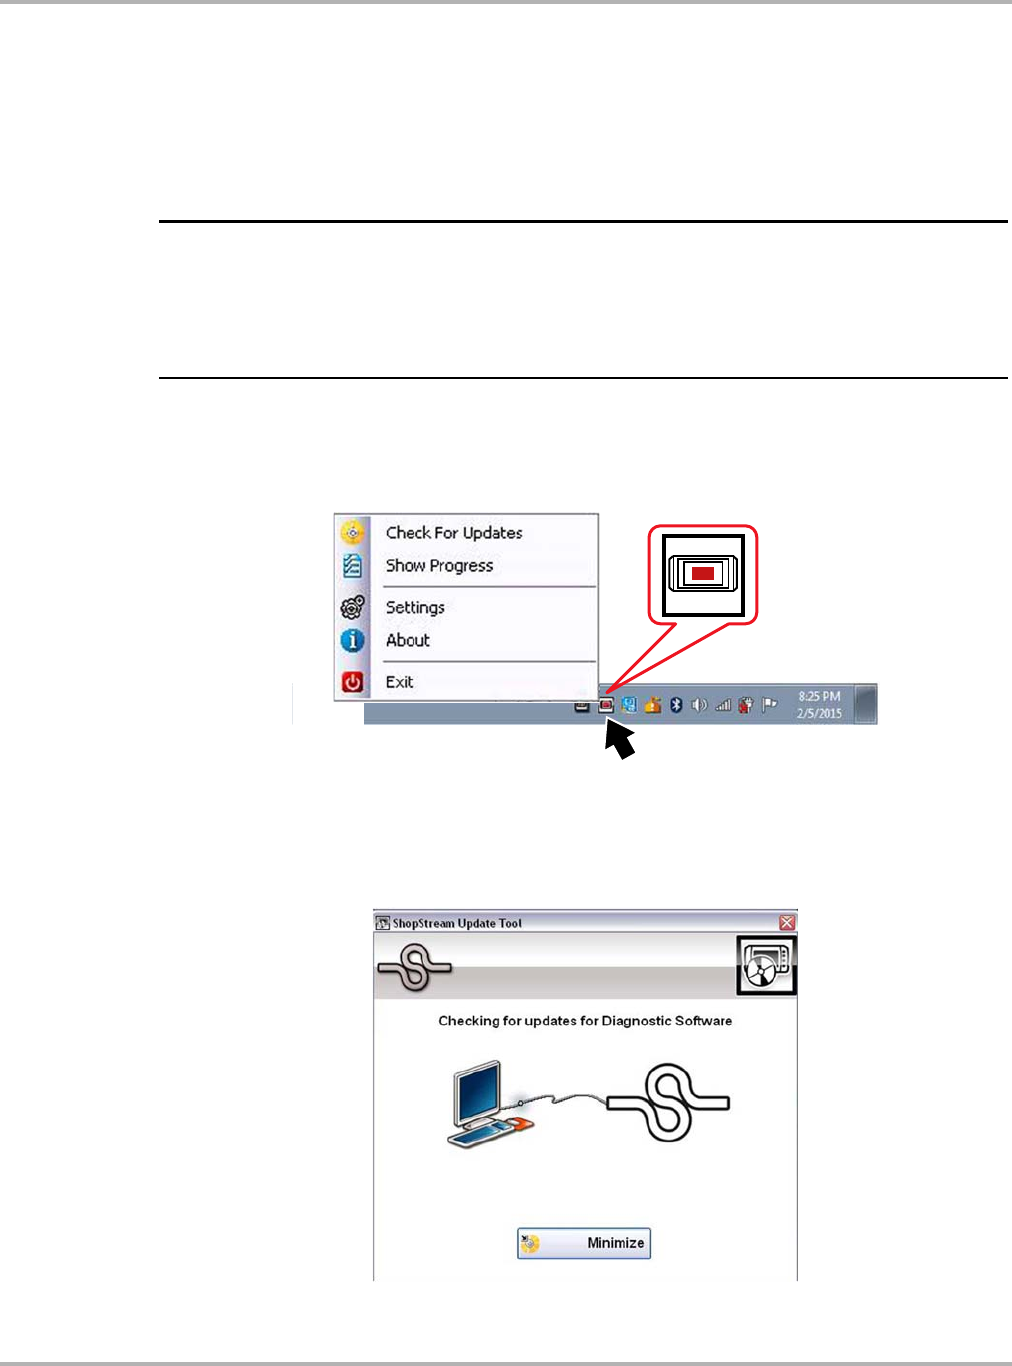
Draft 4/14/15- Do Not Distribute
166
ShopStream Update Tool (SST) Manual Download
16.2 Manual Download
This section describes the basic procedures for manually downloading software updates and
upgrades.
Normally, the SST will automatically detect and download software. If necessary, use the following
procedure to manually check for and download software.
NOTE:
iSoftware Subscription Customers Only - It is recommend that you download software
upgrades when not actively using the diagnostic tool. Download times will vary as they are
dependent on the file size of the upgrade (some upgrades may exceed 3Gb) and your connection
speed. It is suggested that you start the download at the end of your day and let it run overnight.
For software upgrade installation instructions, see Installing Software Upgrades on page 169.
zTo manually download software:
1. Select the SST icon in the Windows taskbar notification area to open the menu (Figure 16-3).
Figure 16-3 ShopStream Update Tool icon and menu
2. Select Check for Updates from the menu.
A series of message boxes will display as the SST searches for updates (Figure 16-4).
Figure 16-4 Typical - Checking for Updates message
Once the search is complete, one of two results are expected:
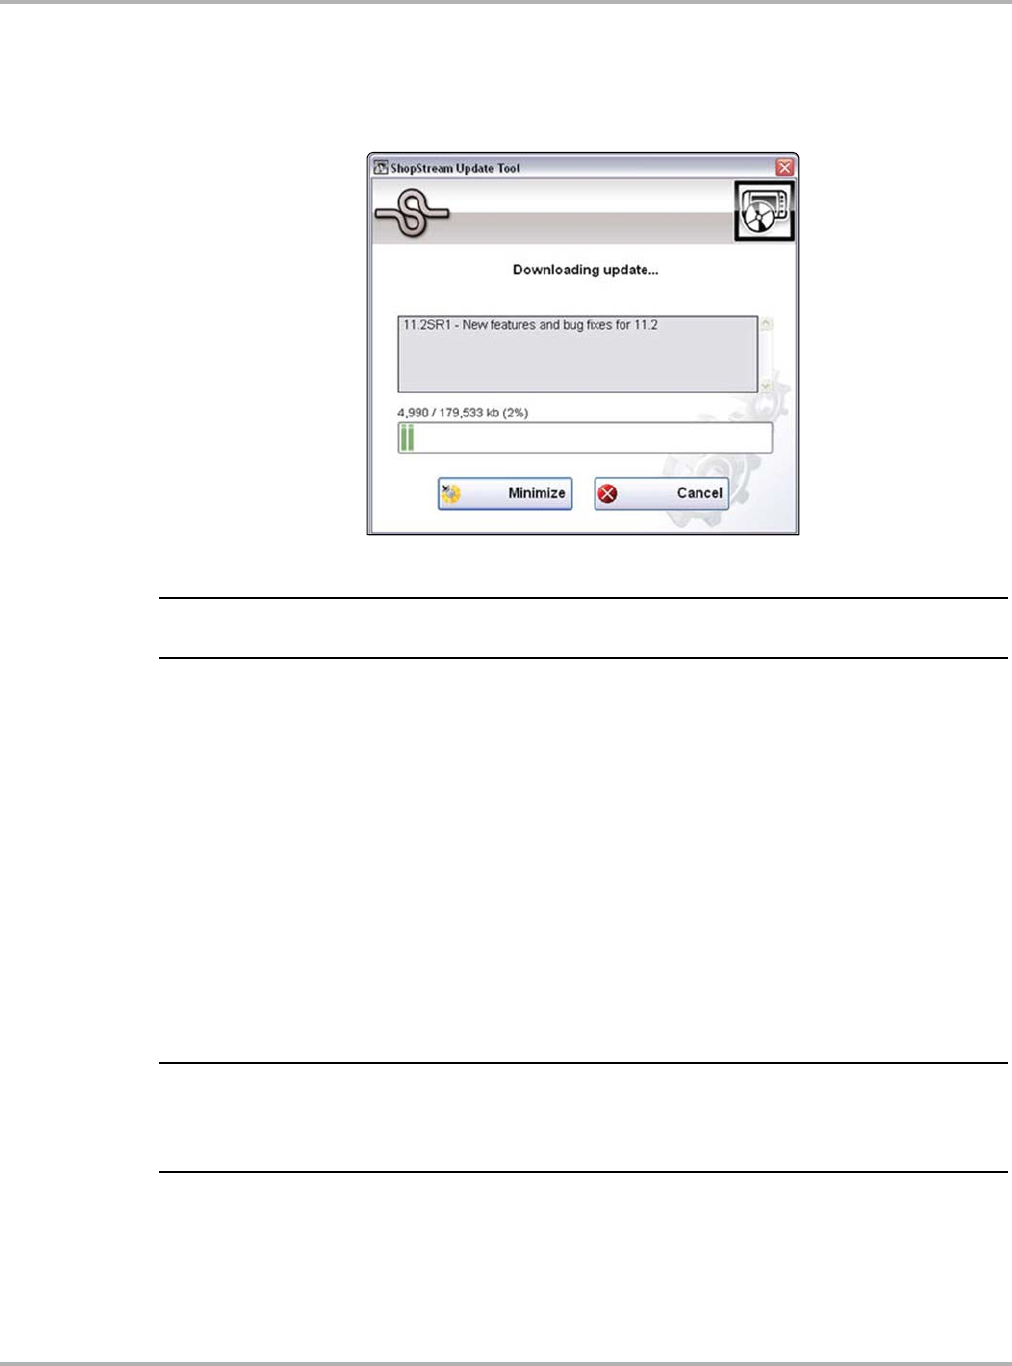
Draft 4/14/15- Do Not Distribute
167
ShopStream Update Tool (SST) Manual Download
–If no updates are found, the message box closes and a “No updates available” message
displays. Select the message to close it.
–If updates are found, they will automatically begin to download (Figure 16-5).
Figure 16-5 Typical - Downloading update window
NOTE:
iThe percentage status bar may not always be displayed while downloading (Figure 16-5).
3. During an active download, two options are available:
–Minimize—closes the message box. The download continues as a background task and
the diagnostic tool can be used normally. Select Show Progress from the SST icon menu
at any time to reopen the message box and check the status of the download.
–Cancel—stops and cancels the download and closes the message box. If you select
Cancel, and choose to re-start the download again, the download will start from the
beginning.
4. Once the download completes, it must be installed. See the applicable instructions for
Installing Software Updates on page 168 or Installing Software Upgrades on page 169.
For SST program updates (only) - if you have the Automatic Update setting ”on”, the update
will be installed automatically. See Automatic Update setting in Basic Operation on page 164
for additional information.
If you have the Automatic Update setting “off”, the SST program must be manually
installed. See Installing Software Updates on page 168.
NOTE:
iIf the Internet connection is interrupted during a download, the download is suspended and a
“network unavailable” message displays. The message disappears and the download resumes
automatically once the Internet connection is restored.
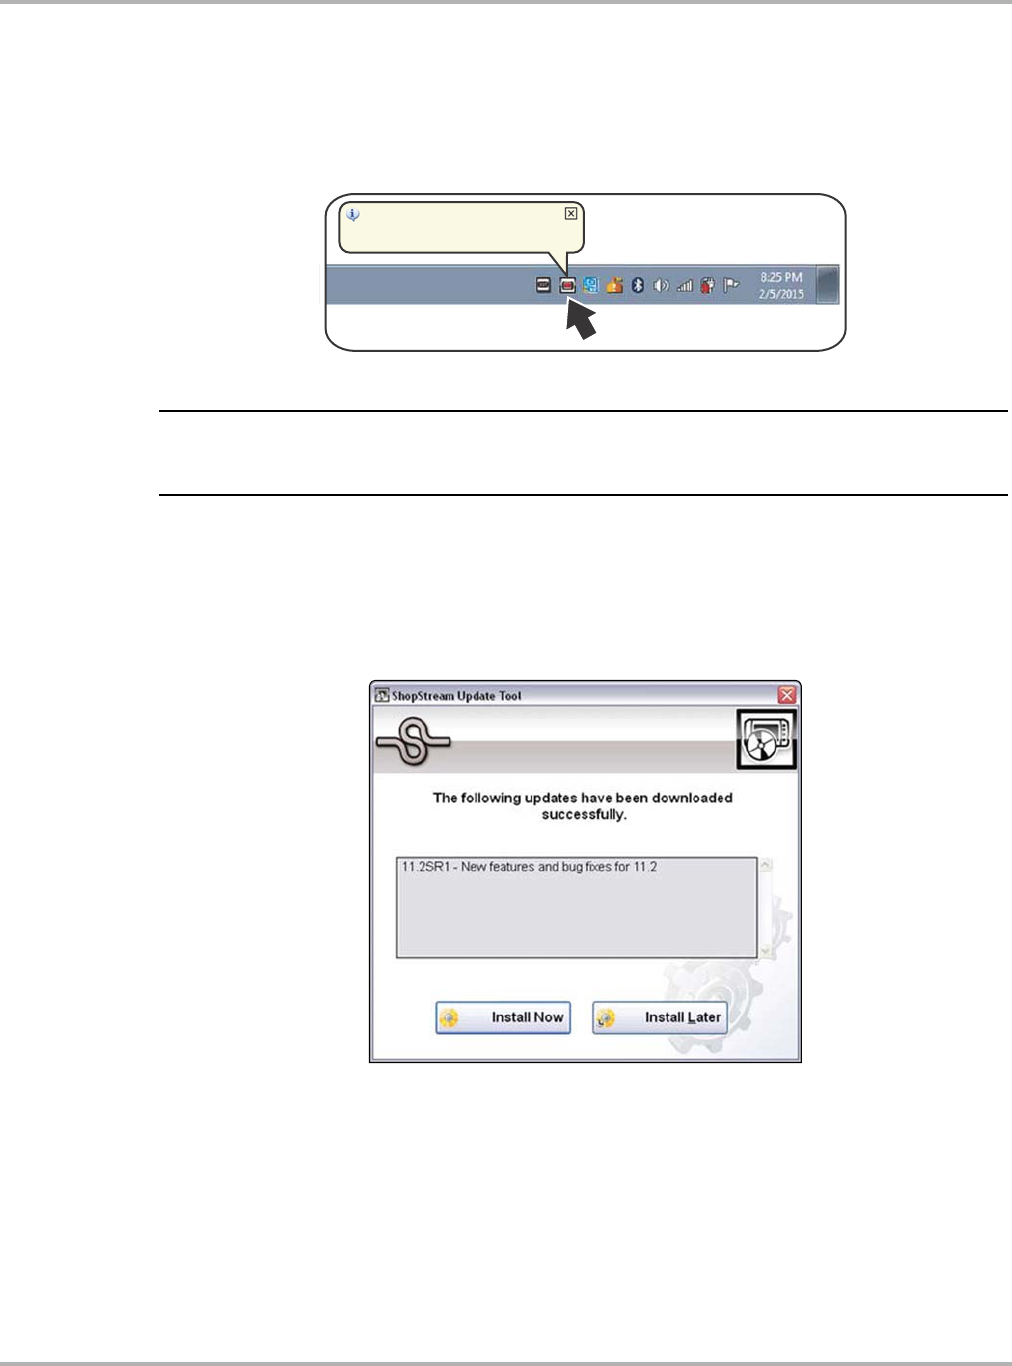
Draft 4/14/15- Do Not Distribute
168
ShopStream Update Tool (SST) Installing Software Updates
16.3 Installing Software Updates
When a software update is ready for installation, an installation update message will appear
(Figure 16-6). You can select the message or the SST icon from the Windows taskbar notification
area at anytime to start the software update installation process.
Figure 16-6 Typical update installation message
NOTE:
iBefore installing a software update, have your Scan Module and USB cable available. The
software update may include Scan Module firmware updates that need to be installed.
zTo install a software update:
1. Select the software update available message (Figure 16-6), or the SST icon from the
notification area.
A software update installation window will display (Figure 16-7).
Figure 16-7 Typical update installation window
2. Select an installation option to continue:
–Install Now—starts the software update installation. Proceed to step 3.
–Install Later—closes the message. The message will reappear at a later time as a
reminder.
4IPQ4USFBN6QEBUF5PPM
$SJUJDBMVQEBUFBWBJMBCMF$MJDLIFSFUPJOTUBMM
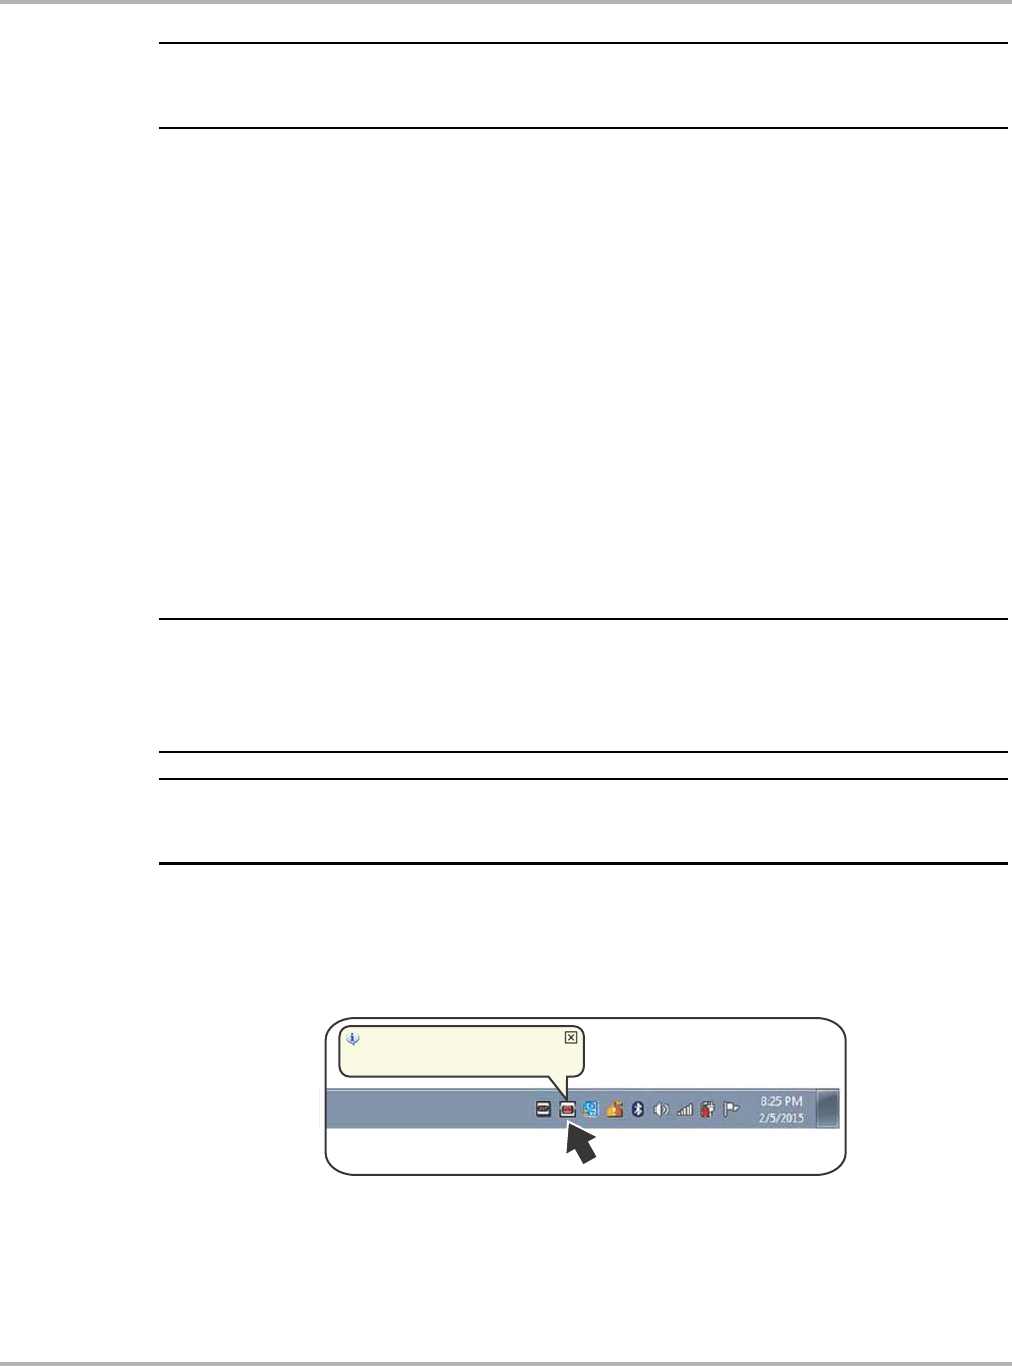
Draft 4/14/15- Do Not Distribute
169
ShopStream Update Tool (SST) Installing Software Upgrades
NOTE:
iIf Install Later is chosen, you can select the SST icon from the notification area to restart the
installation at anytime.
3. Close the ShopStream Diagnostic Suite application. The ShopStream Diagnostic Suite
should remain closed until the software installation has completed.
4. Follow the on-screen instructions to complete the installation.
5. After the installation is complete, open the ShopStream Diagnostic Suite application.
6. Select Scanner from the Home Screen. If a Scan Module firmware update has been received,
a “Scan Module firmware update” message will display. Proceed to Updating Scan Module
Firmware on page 62.
–If the Scanner opens normally and no update message is displayed, proceed to step 7.
7. Turn the diagnostic tool off, then turn it on (re-boot).
8. From the toolbar, select Menu > HELP > Version Info to confirm the new version number is
installed.
16.4 Installing Software Upgrades
This section is ONLY applicable if you are currently in the software subscription program.
NOTE:
iIt is recommended that you perform software upgrade installations Monday – Friday, during
business hours to ensure customer care representatives are available for support. The installation
will take approximately 30 minutes. If the installation is interrupted, Contact Snap-on Diagnostics
Customer Care for assistance. See the Snap-on contact information at the front of this manual.
NOTE:
iBefore installing a software upgrade, have your Scan Module and USB cable available. The
software upgrade may include firmware updates that need to be installed to the Scan Module.
zTo install a software upgrade:
1. Select the software upgrade available message (Figure 16-8), or the SST icon from the
Windows taskbar notification area.
Figure 16-8 Typical upgrade installation message
4IPQ4USFBN6QEBUF5PPM
$SJUJDBMVQEBUFBWBJMBCMF$MJDLIFSFUPJOTUBMM
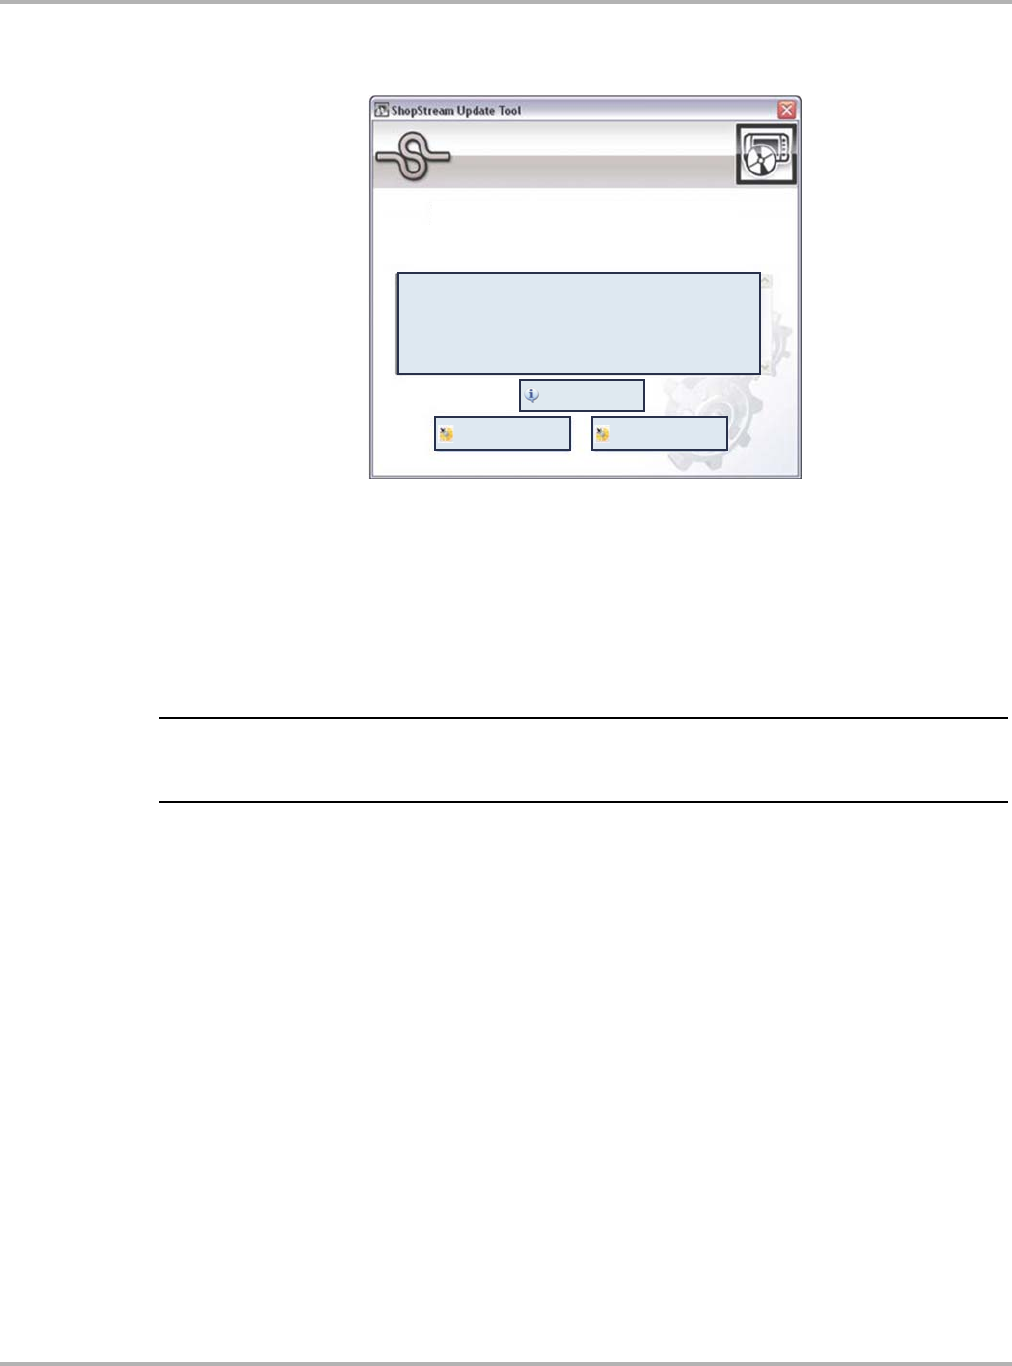
Draft 4/14/15- Do Not Distribute
170
ShopStream Update Tool (SST) Installing Software Upgrades
An upgrade installation window will display (Figure 16-9).
Figure 16-9 Typical upgrade installation window
2. Select an installation option to continue:
–Upgrade Detail—opens a PDF file describing the details of the software upgrade,
including any accessories that may be required.
–Install Now—starts the software upgrade installation. Proceed to step 3.
–Install Later—closes the upgrade message. The upgrade available message reappears
at a later time as a reminder.
NOTE:
iIf Install Later is chosen, you can select the SST icon from the notification area to restart the
installation at anytime.
3. Close the ShopStream Diagnostic Suite application. The ShopStream Diagnostic Suite
should remain closed until the software installation has completed.
4. Follow the on-screen instructions to complete the installation.
5. After the installation is complete, open the ShopStream Diagnostic Suite application.
6. Select Scanner from the Home Screen, if a Scan Module firmware update has been received,
a “Scan Module firmware update” message will display, proceed to Updating Scan Module
Firmware on page 62.
–If the Scanner opens normally and no update message is displayed, proceed to step 7.
7. Turn the diagnostic tool off, then turn it on (re-boot).
8. From the toolbar, select Menu > HELP > Version Info to confirm the new version number is
installed.
9. To activate your SureTrack access that comes with your new software upgrade, see
SureTrack on page 147.
#VOEMF7&3%*$5BOE7&364%JBHOPTUJD4PGUXBSF
5IFGPMMPXJOHVQEBUFIBTCFFOEPXOMPBEFETVDFTTGVMMZ
6QHSBEF%FUBJM
*OTUBMM/PX *OTUBMM-BUFS
Draft 4/14/15- Do Not Distribute
171
Chapter 17 Maintenance
This section describes typical maintenance and care procedures for your Diagnostic Tool and
components.
17.1 Diagnostic Tool
17.1.1 Cleaning
Periodically perform the following tasks to keep your Diagnostic Tool in proper working order:
•Check the housing, cables and connectors for dirt and damage before and after each use.
•At the end of each work day, wipe the Diagnostic Tool housing, cables and connectors clean
with a damp cloth.
IMPORTANT:
Do not use any abrasive cleansers or automotive chemicals on the Diagnostic Tool.
17.1.2 Cleaning the Touch Screen
The touch screen can be cleaned with a soft cloth and a mild window cleaner.
IMPORTANT:
Do not use any abrasive cleansers or automotive chemicals on the touch screen.
17.1.3 Battery Service
Follow all safety guidelines when handling the battery pack.
:$51 ,1*
Risk of electric shock.
• Prior to recycling the battery pack, protect exposed terminals with heavy insulating tape
to prevent shorting.
• Disconnect all test leads and turn Diagnostic Tools off before removing the battery
pack.
• Do not attempt to disassemble the battery or remove any component projecting from or
protecting the battery terminals.
• Do not expose the Diagnostic Tool or battery pack to rain, snow, or wet conditions.
• Do not short circuit the battery terminals.
Electric shock can cause injury.

Draft 4/14/15- Do Not Distribute
172
Maintenance Diagnostic Tool
:$51 ,1*
Risk of explosion.
• The Lithium battery is factory replaceable only, incorrect replacement or tampering with
the battery pack may cause an explosion.
Explosion can cause death or serious injury.
Battery Safety Guidelines
IMPORTANT:
The battery pack contains no user serviceable components. Tampering with the battery pack
terminals or housing will void the product warranty.
Keep the following in mind when using and handling the battery pack:
•Do not short circuit battery pack terminals.
•Do not immerse the Diagnostic Tool or battery pack in water, or allow water to enter the
Diagnostic Tool or battery pack.
•Do not crush, disassemble, or tamper with the battery pack.
•Do not heat the battery pack to over 100°C (212°F), or dispose of it in a fire.
•Do not expose the battery pack to excessive physical shock or vibration.
•Keep the battery pack out of reach of children.
•Do not use a battery pack that appears to have suffered abuse or damage.
•Charge the battery pack in the appropriate charger only.
•Do not use a battery charger that has been modified or damaged.
•Use the battery pack for the specified product only.
•Store the battery pack in a cool, dry, well ventilated area.
NOTE:
NOTE:
iThe battery pack should be used within a short period of time (about 30 days) after charging to
prevent loss of capacity due to self-discharging.
If long-term storage of the battery pack is necessary, it should be stored in a in a cool, dry, well
ventilated place with a 30 to 75 percent state of charge to prevent loss of characteristics.
To prolong the life of your battery, turn off the Diagnostic Tool when not in use. The Diagnostic Tool
has a built in charger that recharges the battery on demand whenever it is connected to a power
source.
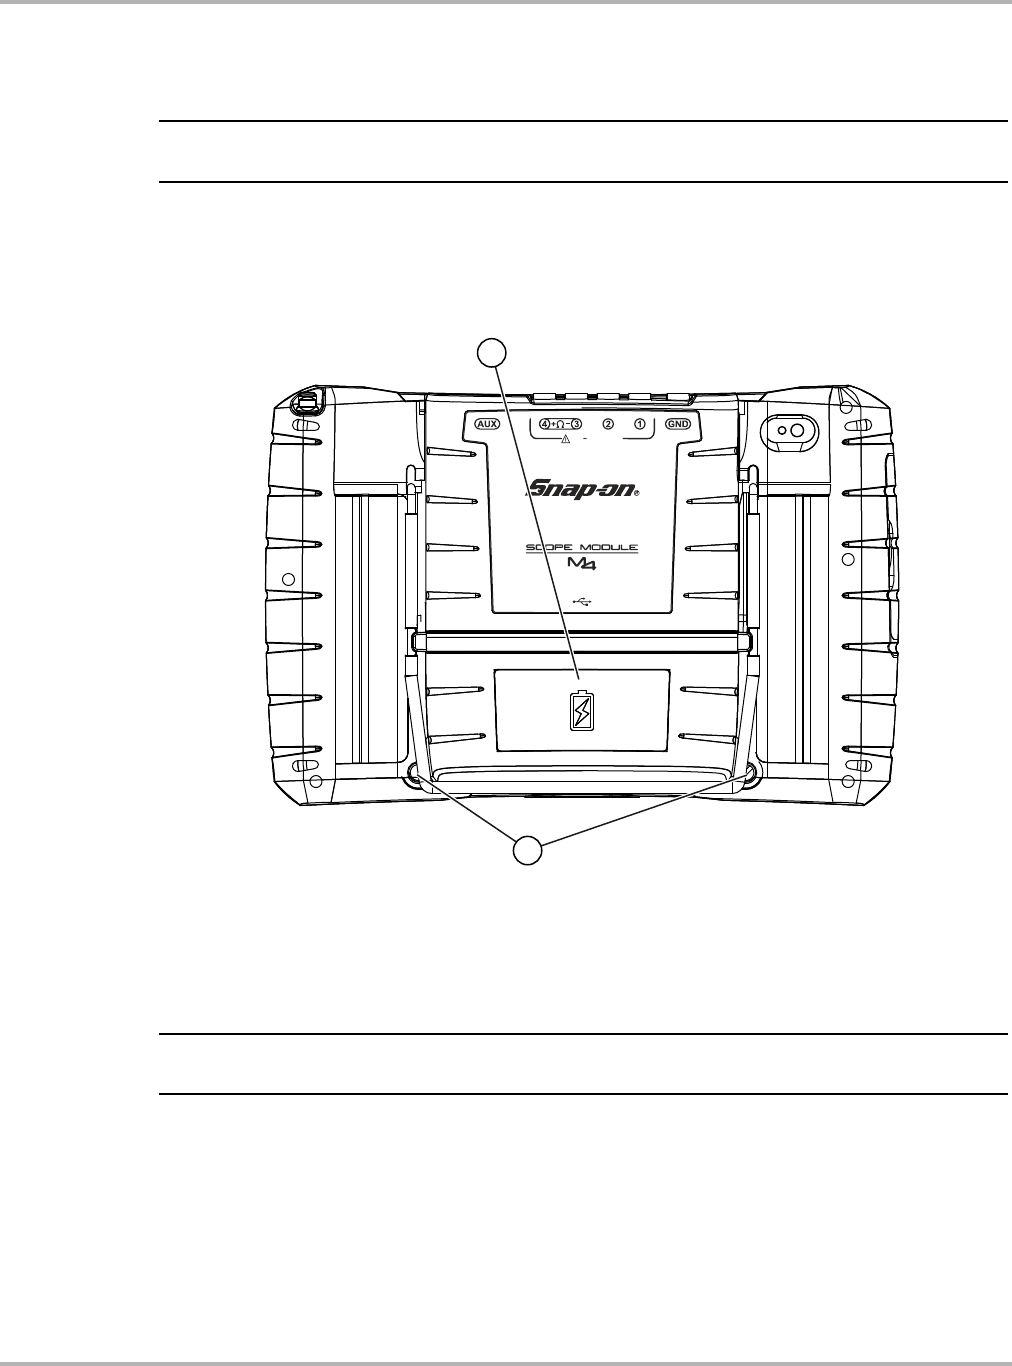
Draft 4/14/15- Do Not Distribute
173
Maintenance Diagnostic Tool
Replacing the Battery Pack
If the battery pack no longer holds a charge, contact your sales representative to order a new one.
IMPORTANT:
Replace the battery pack with original Snap-on replacement parts only.
zTo replace the battery pack:
1. Loosen the two battery pack screws.
2. Carefully raise the battery pack up and remove.
1— Battery Pack
2— Battery Pack Screws (2)
Figure 17-1 Battery pack location
3. Align the new battery pack into position, making sure it is fully seated.
NOTE:
NOTE:
iDo not overtighten the battery pack screws.
4. Tighten the two battery pack screws.
99 0$;
Draft 4/14/15- Do Not Distribute
174
Maintenance Diagnostic Tool
Disposing of the Battery Pack
Always dispose of a lithium-ion battery pack according to local regulations, which vary for different
countries and regions. The battery pack, while non-hazardous waste, does contain recyclable
materials. If shipping is required, ship the battery pack to a recyling facility in accordance with
local, national, and international regulations. For additional information contact:
•North America—Rechargeable Battery Recycling Corporation (RBRC) at http://www.rbrc.org
or http://www.call2recycle.org, or call 1(800) 822-8837 (USA)
Products bearing the WEEE logo (Figure 17-2) are subject to European Union regulations.
Figure 17-2 sample WEEE logo
NOTE:
NOTE:
iAlways dispose of materials according to local regulations.
Contact your sales representative for details.
17.1.4 Calibrating the Touch Screen
The touch screen can be calibrated for accuracy using the Windows Tablet PC Settings.
zTo calibrate the touch screen:
1. From the Windows menu select Start > Control Panel > Hardware and Sound >
Tablet PC Settings.
The Tablet PC Setting window is displayed (Figure 17-3).
Figure 17-3 Tablet PC Settings window

Draft 4/14/15- Do Not Distribute
175
Maintenance Diagnostic Tool
2. Select the display to be calibrated from the dropdown list. The default diagnostic tool display
is “CH7511B” (Figure 17-3).
NOTE:
NOTE:
iIf you are using an optional touch screen (e.g. using an external touch screen with a Tech Cart and
docking station), there will be an additional touch screen choice displayed.
3. Select Calibrate.
The Calibration screen is displayed (Figure 17-4).
4. Using the stylus, follow the screen prompts and tap on the center of the cross-hairs as they
appear at each corner on the screen (Figure 17-4).
NOTE:
NOTE:
iTo achieve the best results, it is recommended to use the capacitive stylus when performing the
touch screen calibration.
Figure 17-4 Calibrating the Touch Screen
5. Select OK to close the dialog boxes once the calibration is complete.
5PDBMJCSBUFUIFTDSFFOUBQUIFDSPTTIBJSFBDIUJNFUIBUJU
BQQFBSTPOUIFTDSFFO:PVDBOSJHIUDMJDLBOZXIFSFPOUIF
TDSFFOUPVOEPUIFMBTUQPJOUDBMJCSBUFEPSUPDBODFM
DBMJCSBUJOHBMUPHFUIFS
%POPUDIBOHFZPVSTDSFFOPSJFOUBUJPOVOUJMZPVIBWF
DPNQMFUFEUIFDBMJCSBUJPO
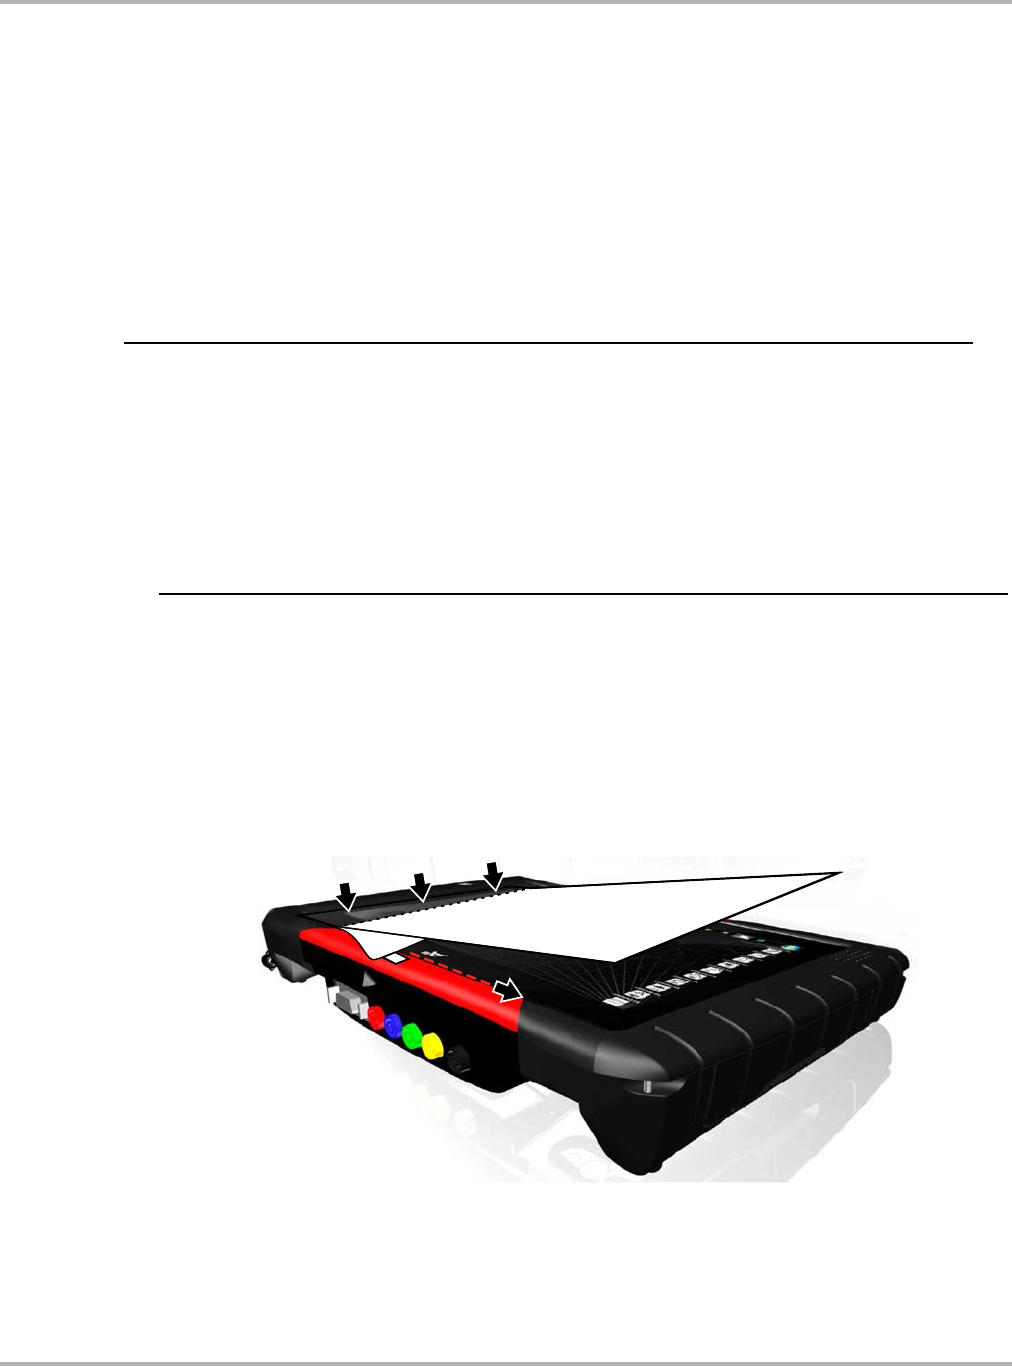
Draft 4/14/15- Do Not Distribute
176
Maintenance Diagnostic Tool
17.1.5 Screen Protector Installation
Touch screen protectors are available as optional equipment (contact your sales representative to
order). The following procedure describes typical installation procedures.
Items recommended for installation:
•Microfiber type cloth (lint-free)
•Flexible straight edged tool (e.g. small squeegee, plastic card)
•Cellophane tape
zTo install a screen protector:
Installation Tip(s):
iCleanliness is the most important factor during the installation of the screen protector. The
following tips are provided to assist in the installation:
○ Clean your hands thoroughly
○ Clean the touch screen thoroughly using a microfiber type cloth, removing all dirt, dust,
grease, fingerprints etc. See Cleaning the Touch Screen on page 171 for additional
information.
○ Work in a well lit area
○ Minimize dust; work in an area with minimal air movement, turn off fans or air conditioning etc.
1. Thoroughly clean and dry the touch screen. See Cleaning on page 171 for additional
information.
2. Peel the rear mask (Tab 1) approximately 1 in. (2.54 cm) away from one edge of the protector.
Do not remove the front mask (Tab 2) at this time.
3. Carefully align the exposed edge of the protector with the edge of the screen and lightly hold
the edge down to keep it in position (Figure 17-5). While holding the edge, slowly pull off the
rear mask and allow the protector to cling to the screen. Make any alignment adjustments as
needed during installation.
Figure 17-5 Removing rear mask (Tab 1) to apply protector
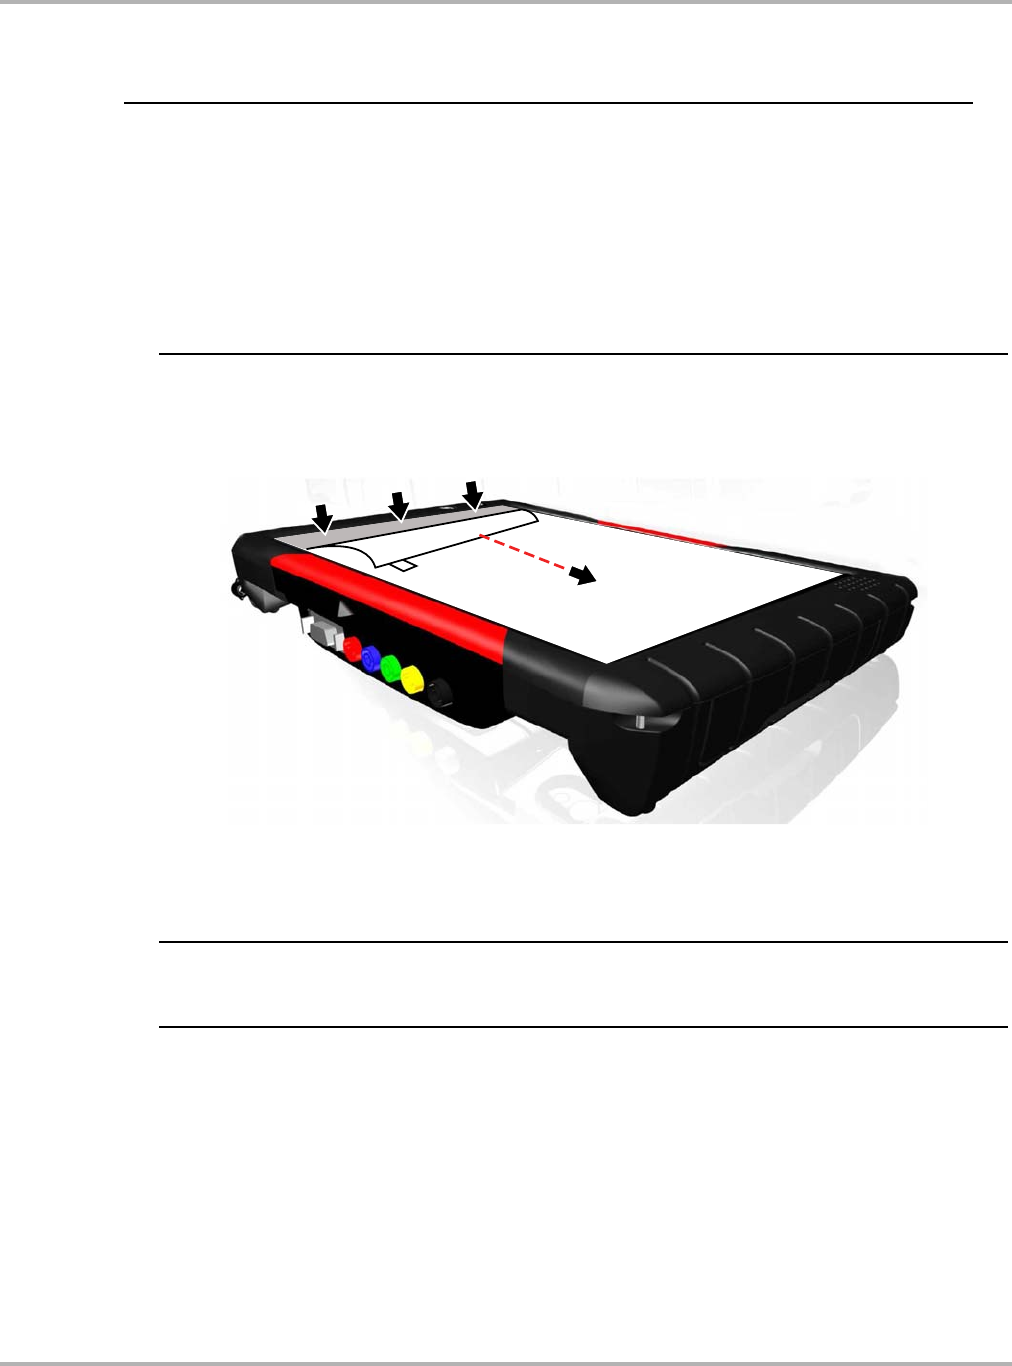
Draft 4/14/15- Do Not Distribute
177
Maintenance Diagnostic Tool
4. Once the protector is in place, use the microfiber cloth to work out any air bubbles. As an
alternative, a flexible straight edged tool can be used.
Installation Tip(s):
iTo remove air bubbles, slowly work from the inside towards the edges. If large air bubbles are
trapped, it may be easier to carefully peel back the protector and re-apply. If air bubbles are
persistent, it is an indication that the screen and/or protector are not clean.
If visible dust is noticed trapped under the protector, peel back the protector and use the adhesive
side of a small piece of cellophane tape to remove the dust.
To peel back the protector once it is in place, use a small piece of cellophane tape stuck to a corner
of the front mask to lift the edge.
5. Once the protector is in place and air bubbles are removed, slowly remove the front mask
(Tab 2) (Figure 17-6). Lightly hold the protector in place (under Tab 2), when you start to
remove the front mask.
Figure 17-6 Removing front mask (Tab 2)
6. To complete the application, wipe the protector (using microfiber cloth) evenly while applying
light pressure.
IMPORTANT:
If air bubbles appear at the edges, use the microfiber cloth or your finger to remove. Avoid using
any type of tool (e.g. small squeegee, plastic card, etc.) directly on the protector surface.

Draft 4/14/15- Do Not Distribute
178
Maintenance Diagnostic Tool
17.1.6 Stylus Tip Replacement
Periodically the capacitive stylus tip may need to be replaced. To remove the stylus tip, unthread
the tip counterclockwise. To install the new stylus tip, thread clockwise until seated.
Stylus tips are available as optional equipment (contact your sales representative to order).
IMPORTANT:
Do not overtighten the stylus tip.
Figure 17-7 Replacing stylus tip
17.1.7 Operating System Restore
Snap-on System Restore is a hard disk drive recovery program that allows you recover the hard
disk drive files in the event of a failure. Running the program replaces all of the C drive data with
the original factory data. Be aware, all new or modified files on the C drive will be lost.
zTo restore the operating system
1. Turn on the Diagnostic Tool.
2. Wait for the “Press the “S” button to run Snap-on System Restore.” message to display, then
Press the Shortcut (S) button.
A progress indicator displays while the program loads.
3. Select OK from the confirmation message.
A progress indicator displays while the files are being restored.
4. Select OK from the confirmation message.
The Diagnostic Tool shuts down, then reboots and the system recovery portion of the
operation begins. Follow any on-screen prompts.
The Diagnostic Tool shuts down and reboots a second time. When the Home screen displays,
the procedure is complete and the Diagnostic Tool is ready for use.

Draft 4/14/15- Do Not Distribute
179
Maintenance Scan Module
17.2 Scan Module
This section covers how to care for your Scan Module.
17.2.1 Cleaning and Inspecting the Scan Module
When using the Scan Module, make sure to do the following:
•Check the housing, wiring, and connectors for dirt and damage before and after each use.
•At the end of each work day, wipe the housing, wiring, and connectors clean with a slightly
damp cloth.
IMPORTANT:
Do not use any abrasive cleansers or automotive chemicals on the Scan Module.
17.2.2 Replacing the Protective Handgrip
The soft protective handgrip that covers the outer edges of the Scan Module is easily replaced
should it become worn or damaged. Contact your sales representative for replacement parts.
zTo replace the protective handgrip:
1. Disconnect the data cable, and any other cables, if attached to the Scan Module.
2. From the bottom of the Scan Module, gently lift up and out on one side of the handgrip to free
it from Scanner housing.
3. Repeat step 2 to loosen the other side of the handgrip.
4. Lift the handgrip off of the Scan Module housing.
NOTE:
NOTE:
iThe handgrip tapers toward the front of the Scan Module housing. Make sure the replacement
handgrip is correctly oriented before attempting to install it.
5. Fit the new handgrip over the top, data cable end, of the Scan Module housing.
6. With your fingers, work the new handgrip onto the Scan Module housing from top to bottom.
Make sure the tabs on the handgrip fit into the grooves on the housing.

Draft 4/14/15- Do Not Distribute
180
Index
Numerics
10-Minute Electronic Class 75
15-Minute Ignition Class 75
20-Minute current ramp classes 75
A
AC/DC power supply 6
actuator tests 42
Alarms 29
alligator clips 89
B
battery pack 6
disposal 174
handling 172
replacing 173
battery recycling 174
battery service 171
Bluetooth connectivity 58–62
bold text 1
C
cables 87–90
channel 1 88
channel 2 88
channel 3 88
channel 4 88
inductive RPM pickup 90
secondary coil adapter 89
secondary ignition clip-on wire adapter 89
capabilities, hardware 86
Clear Codes 42
clear codes 67
clearing codes 43
Codes Menu 42
codes. See diagnostic trouble codes (DTCs)
communication protocol 72
Component Information 79
component information 79–80
connecting to a vehicle 39, 83
Connector Information 72
D
Data display 42, 45
Data Manager 121–127
operations 123–127
properties 127
screen layout 121
toolbar 122
data parameters
displaying 42
delete 119
demonstration programs 25
Diagnostic 3
diagnostic connector 72
location 72
diagnostic trouble codes (DTCs) 42
digital meter 88
Display Device
battery replacement 171
connecting wireless devices 140, 144
introduction 3
specifications 5
docking cradle 6
DTC status 43
E
Emergency shutdown 12
F
Fast-Track Troubleshooter 70
Features & Benefits 74
following 11
Freeze Frame/Failure Records 43
functional tests 42, 49
G
Generic Functions 42, 51
Guided Component Test 73–83
custom configure 76
favorites 77
operations 79–83
performing tests 83
vehicle identification 73–78
guided component tests 49, 80–81
H
hardware overview 86
Help 139
How To... 75
I
identifying a test vehicle 39
Illustrated Terms and Definitions 75
inductive RPM pickup adapter 90
information tests 49

Draft 4/14/15- Do Not Distribute
181
Index M
M
Main Body 93
Making Selections 96
Scanner 26
manual conventions 1–2
Measurement Out of Range 99
Memory Resets 42
menu button 20
Messages
important 2
note 2
meter capabilities 86
Modules 18
N
No-Start Basics 75
O
O2 Sensor and Feedback System Analysis 75
OBD Diagnose 68–72
OBD Health Check 66–68
Operations
Guided Component Tests 80
operations
connecting to a vehicle 39
identifying a test vehicle 39
selecting a system to test 39
selecting tests 39
oxygen sensor tests 51
P
parameters. See data parameters
PIDs. See data parameters
Power Button LED 15
Power on 11, 13
power sources 6, 8, 10, 54
AC/DC power supply 6
Power User Tests. See tests
probe
test 89
procedures 2
ProDemand 113
Properties 30
R
readiness monitors 67
recording data 95
Repair Information 113
reset tests 49
S
Safety iii
Scale 33
Scan Module
introduction 9
specifications 8, 10
Troubleshooter 70
wireless communication 10, 40
Scanner
actuator tests 42
alarms 29
checking codes 66
cleaning 179
clear codes 42, 67
codes menu 42, 42–44
communication protocol 72
component tests 49
custom data list 28–29
data 45–49
demonstration program 25
disconnecting 53
exiting 52
functional tests 42, 49
generic functions 42, 51, 65
handgrip replacement 179
memory resets 42
OBDII testing 65
operations 25
pending codes 67
properties 30
readiness monitors 67
scale 33
screen 34
screen layout 27
screen messages 26
sweep 34
system selecting 39
system tests 42
toolbar 27, 30
trigger 47
Troubleshooter 42, 51
vehicle ID 39
wireless connection 55–56
Scope
record/playback controls 95
Scope Layout 91
Scope Multimeter
playback toolbar 95
scope multimeter toolbar 93
screen colors 31
screen main body 34
screen messages 26
search 119
secondary coil adapter 89
selecting a system to test 39
selecting tests 39
ShopKeyPro 113
Shortcut Button 13

Draft 4/14/15- Do Not Distribute
182
Index T
Shortcut button
Configuring 14
Sleep Mode 12
software
Troubleshooter 51
stand, the 6
subsystem tests 49
SureTrack 159
Sweep 34
symbols 1
System Settings 56, 140, 144
system tests 42, 49
T
Technical Service Bulletins 114
terminology 1
test leads 87–90
test probes 89
tests
actuator 42
component 49
functional 42, 49
Power User 74
selecting 39
subsystem 49
system 42, 49
tips 75
The 114
toggle tests 49
Toolbar 20–145
Vehicle History 117
toolbar
record/playback controls 95
Scanner 28
Tou ch 1 5, 16
Touch Screen 15
Touch screen calibration 171
Touch Screen Gestures 16
trigger
condition 47
Triggers
setting 47
trouble codes. See diagnostic trouble codes (DTCs)
Troubleshooter 42, 51, 70
Troubleshooter software. See software
U
Units Setup 108
V
variable control tests 49
Vehicle History 116–120
activate 118
delete 119
operations 118–120
screen layout 116
search 119
settings 120
toolbar 117
view 118
vehicle identification 116–117
Viewing component information 79
Virtual Keyboard 21
W
Wi-Fi 24
Windows Taskbar 21
wireless
pairing devices 56, 140, 144
wireless communication 10, 40, 54, 58
Wireless recovery 60
This equipment has been tested and found to comply with the limits for a Class
B digital device, pursuant to part 15 of the FCC rules. These limits are
designed to provide reasonable protection against harmful interference in a
residential installation. This equipment generates, uses and can radiate radio
frequency energy and, if not installed and used in accordance with the
instructions, may cause harmful interference to radio communications.
However, there is no guarantee that interference will not occur in a particular
installation. If this equipment does cause harmful interference to radio or
television reception, which can be determined by turning the equipment off and
on, the user is encouraged to try to correct the interference by one or more of
the following measures: -Reorient or relocate the receiving antenna. -Increase
the separation between the equipment and receiver. -Connect the equipment
into an outlet on a circuit different from that to which the receiver is connected.
-Consult the dealer or an experienced radio/TV technician for help.
You are cautioned that changes or modifications not expressly approved by
the party responsible for compliance could void your authority to operate the
equipment.
FCC RF Radiation Exposure Statement:
1. This Transmitter must not be co-located or operating in conjunction with any
other antenna or transmitter.
2. This equipment complies with FCC RF radiation exposure limits set forth for
an uncontrolled environment. This device was tested for typical lap held
operations with the device contacted directly to the human body to the back
side of the Display Unit. To maintain compliance with FCC RF exposure
compliance requirements, avoid direct contact to the transmitting antenna
during transmitting.