Snap on Diagnostics EEMS330E Display Unit User Manual VerusPro UserManual
Snap-on Diagnostics Display Unit VerusPro UserManual
Contents
- 1. Users Manual-1
- 2. Users Manual-2
Users Manual-1

Draft 4/14/15- Do Not Distribute
User Manual
ZEEMS330A Rev. A

Draft 4/14/15- Do Not Distribute
ii
Legal Information
Trademarks
Snap-on, ShopStream Connect, SureTrack, Fast-Track Troubleshooter, ProDemand, ShopKey Pro and VERUS are
trademarks registered in the United States and other countries of Snap-on Incorporated. All other marks are
trademarks or registered trademarks of their respective holders.
The Bluetooth word mark and logos are registered trademarks owned by Bluetooth SIG, Inc. and any use of such
marks by Snap-on Incorporated is under license.
Copyright Information
© 2015 Snap-on Incorporated. All rights reserved.
Disclaimer of Warranties and Limitation of Liabilities
All pictures and illustrations shown are for reference purposes only. All information, specifications and illustrations in
this manual are based on the latest information available at the time of printing and are subject to change without
notice. While the authors have taken due care in the preparation of this manual, nothing contained herein:
•Modifies or alters in any way the standard terms and conditions of the purchase, lease, or rental agreement
under the terms of which the equipment to which this manual relates was acquired.
•Increases in any way the liability to the customer or to third parties.
Snap-on® reserves the right to make changes at any time without notice.
IMPORTANT:
Before operating or maintaining this unit, please read this manual carefully paying extra attention to the safety
warnings and precautions.
Contact Information (North America)
Websites:
Snap-on Diagnostics and Information
•http://diagnostics.snapon.com
Software Subscription - Learn how to always have the latest diagnostic software on your Diagnostic Tool.
•http://diagnostics.snapon.com/theprogram
Training and Support (by platform) - Find product support information, and watch free instructional product
videos.
•http://diagnostics.snapon.com/FAQ.htm
Manuals / Technical Documentation - The information in this manual is periodically revised to ensure the latest
information is included. Download the latest version of this manual and other related technical documentation at :
•http://diagnostics.snapon.com/usermanuals
Forums and Training - Watch free instructional product videos. Connect with and share your Diagnostic Tool
questions, ideas and success stories :
•http://diagnostics.snapon.com/ForumsandTraining.htm
Phone / E-mail - Technical Assistance
1-800-424-7226 / diagnostics_support@snapon.com
For technical assistance in all other markets, contact your selling agent.
ZEEMS330A Rev. A 30-E-15 NA

Draft 4/14/15- Do Not Distribute
iii
Safety Information
READ ALL INSTRUCTIONS
For your own safety, the safety of others, and to prevent damage to the product and vehicles upon
which it is used, it is important that all instructions and safety messages in this manual and the
accompanying Important Safety Instructions manual be read and understood by all persons
operating, or coming into contact with the product, before operating. We suggest you store a copy
of each manual near the product in sight of the operator.
For your safety, read all instructions. Use your diagnostic tools only as described in the tool user’s
manual. Use only manufacturer recommended parts and accessories with your diagnostic tools.
This product is intended for use by properly trained and skilled professional automotive
technicians. The safety messages presented throughout this manual and the accompanying
Important Safety Instructions manual are reminders to the operator to exercise extreme care when
using this product.
There are many variations in procedures, techniques, tools, and parts for servicing vehicles, as
well as in the skill of the individual doing the work. Because of the vast number of test applications
and variations in the products that can be tested with this instrument, we cannot possibly
anticipate or provide advice or safety messages to cover every situation. It is the responsibility of
the automotive technician to be knowledgeable of the system being tested. It is essential to use
proper service methods and test procedures. It is important to perform tests in an appropriate and
acceptable manner that does not endanger your safety, the safety of others in the work area, the
equipment being used, or the vehicle being tested.
It is assumed that the operator has a thorough understanding of vehicle systems before using this
product. Understanding of these system principles and operating theories is necessary for
competent, safe and accurate use of this instrument.
Before using the equipment, always refer to and follow the safety messages and applicable test
procedures provided by the manufacturer of the vehicle or equipment being tested. Use the
product only as described in it’s user manual. Use only manufacturer recommended parts and
accessories with your product.
Read, understand and follow all safety messages and instructions in this manual, the
accompanying Important Safety Instructions manual, and on the test equipment.
Environmental Conditions:
•This product is intended for indoor use only
•This product is rated for Pollution Degree 2 (normal conditions)
Draft 4/14/15- Do Not Distribute
iv
Safety Information Safety Signal Words
Safety Signal Words
All safety messages contain a safety signal word that indicates the level of the hazard. An icon,
when present, gives a graphical description of the hazard. Safety Signal words are:
'$1*(5
Indicates an imminently hazardous situation which, if not avoided, will result in death or serious
injury to the operator or to bystanders.
:$51 ,1*
Indicates a potentially hazardous situation which, if not avoided, could result in death or serious
injury to the operator or to bystanders.
&$87,21
Indicates a potentially hazardous situation which, if not avoided, may result in moderate or minor
injury to the operator or to bystanders.
Safety Message Conventions
Safety messages are provided to help prevent personal injury and equipment damage. Safety
messages communicate the hazard, hazard avoidance and possible consequences using three
different type styles:
•Normal type states the hazard.
•Bold type states how to avoid the hazard.
•Italic type states the possible consequences of not avoiding the hazard.
An icon, when present, gives a graphical description of the potential hazard.
Safety Message Example
:$51 ,1*
Risk of unexpected vehicle movement.
•Block drive wheels before performing a test with engine running.
A moving vehicle can cause injury.
Important Safety Instructions
For a complete list of safety messages, refer to the accompanying Important Safety Instructions
manual.
SAVE THESE INSTRUCTIONS

Draft 4/14/15- Do Not Distribute
i
Contents
Safety Information..................................................................................................................... iii
Contents....................................................................................................................................... i
Chapter 1: Using This Manual................................................................................................... 1
Conventions.................................................................................................................................. 1
Bold Text................................................................................................................................ 1
Symbols ................................................................................................................................. 1
Terminology ........................................................................................................................... 1
Notes and Important Messages ............................................................................................. 2
Procedures............................................................................................................................. 2
Hyperlinks .............................................................................................................................. 2
Tool Help................................................................................................................................ 2
Chapter 2: Introduction.............................................................................................................. 3
Features and Specifications ........................................................................................................ 3
Diagnostic Tool ...................................................................................................................... 3
Scope Module ........................................................................................................................ 7
Scan Module (Wireless)......................................................................................................... 9
Chapter 3: Basic Operation and Navigation .......................................................................... 11
Turning On/Off, Sleep Mode and Emergency Shutdown ........................................................... 11
Turning On ........................................................................................................................... 11
Turning Off .......................................................................................................................... 11
Sleep Mode ......................................................................................................................... 12
Emergency Shutdown.......................................................................................................... 12
Shortcut (S) Button ..................................................................................................................... 13
Configure Shortcut (S) Button .............................................................................................. 14
Advanced (menu selection) ................................................................................................ 14
LED Indicator.............................................................................................................................. 15
Basic Navigation......................................................................................................................... 15
Touch Screen and Stylus..................................................................................................... 15
Starting the ShopStream Diagnostic Suite Program ............................................................ 17
Home Screen Layout ........................................................................................................... 17
Function Icons...................................................................................................................... 18
Toolbar................................................................................................................................. 19
Windows Taskbar ................................................................................................................ 21
Virtual Keyboard ......................................................................................................................... 21
Camera Operation ...................................................................................................................... 23
Operating the Camera ......................................................................................................... 23
Viewing Pictures .................................................................................................................. 24
Wi-Fi Setup................................................................................................................................. 24
Chapter 4: Scanner Function .................................................................................................. 25
Demonstration Program ............................................................................................................ 25
Basic Operation and Navigation ................................................................................................. 26

Draft 4/14/15- Do Not Distribute
ii
Contents
Screen Messages ................................................................................................................ 26
Making Selections ................................................................................................................ 26
Scanner Screen Layout ....................................................................................................... 27
Menu Options....................................................................................................................... 36
Scanner Operation ..................................................................................................................... 39
Vehicle Identification ............................................................................................................ 39
Connecting the Scan Module............................................................................................... 40
Vehicle System and Test Selection...................................................................................... 41
Stopping Communication and Exiting the Scanner .................................................................... 52
Chapter 5: Scan Module Operation ........................................................................................ 54
Overview..................................................................................................................................... 54
Pairing The Scan Module ........................................................................................................... 55
Checking Scan Module Paired Status ........................................................................................ 56
Data Cable Connection .............................................................................................................. 57
Troubleshooting.......................................................................................................................... 58
No Communication Message............................................................................................... 58
Signal Loss / Out of Range Alarm........................................................................................ 58
Checking Hardware Status .................................................................................................. 58
Recovery Procedure ............................................................................................................ 60
Updating Scan Module Firmware ............................................................................................... 62
Chapter 6: OBD Direct Operations.......................................................................................... 65
OBD Health Check ..................................................................................................................... 66
Global OBD II Code Check .................................................................................................. 66
Global OBD II Clear Codes.................................................................................................. 67
Readiness Monitors ............................................................................................................. 67
MIL Status............................................................................................................................ 68
OBD Diagnose............................................................................................................................ 68
Start Communication ........................................................................................................... 68
Connector Information ......................................................................................................... 72
Manual Protocol Selection ................................................................................................... 72
Chapter 7: Guided Component Test Operations................................................................... 73
Vehicle Identification................................................................................................................... 73
Menu Options, Guided Component Test.............................................................................. 74
Creating a Favorites List ...................................................................................................... 76
Identifying a Test Vehicle ..................................................................................................... 77
Operations .................................................................................................................................. 79
Component Information ....................................................................................................... 79
Tests .................................................................................................................................... 80
Chapter 8: Scope and Multimeter Operations ....................................................................... 84
Using the Scope Module Remotely ............................................................................................ 84
Getting Started ........................................................................................................................... 86
Capabilities .......................................................................................................................... 86
Leads, Probes and Adapters ............................................................................................... 87
Menu Options, Scope Multimeter......................................................................................... 90
Navigation................................................................................................................................... 91
Screen Layout...................................................................................................................... 91
Making Selections ................................................................................................................ 96

Draft 4/14/15- Do Not Distribute
iii
Contents
Operations .................................................................................................................................. 97
Starting the Scope and Multimeter....................................................................................... 97
Measurement Out of Range................................................................................................. 99
Scope and Multimeter Setup................................................................................................ 99
Chapter 9: Repair Information Operations........................................................................... 113
Chapter 10: Technical Service Bulletins .............................................................................. 114
Chapter 11: Vehicle History Operations............................................................................... 116
Screen Layout .......................................................................................................................... 116
Vehicle History Main Body ................................................................................................. 117
Vehicle History Toolbar ...................................................................................................... 117
Chapter 12: Data Manager Operations ................................................................................. 121
Screen Layout .......................................................................................................................... 121
Navigation................................................................................................................................. 122
Operations ................................................................................................................................ 122
My Data.............................................................................................................................. 122
Up ...................................................................................................................................... 122
Open .................................................................................................................................. 123
New.................................................................................................................................... 124
Delete................................................................................................................................. 125
Rename ............................................................................................................................. 126
Properties........................................................................................................................... 127
More................................................................................................................................... 127
Saved File Structure ................................................................................................................. 128
Scanner DataViewer Operation................................................................................................ 129
Menu Bar ........................................................................................................................... 130
Display Toolbar .................................................................................................................. 133
Navigation Tools ................................................................................................................ 134
Customizing the Display..................................................................................................... 136
Customizing the Parameter List ......................................................................................... 137
Saving Files ............................................................................................................................. 138
ShopStream Connect™ ........................................................................................................... 138
Chapter 13: Help Operations................................................................................................. 139
Using the Help Toolbar............................................................................................................. 139
Chapter 14: System Settings Operations............................................................................. 140
Paired Devices ......................................................................................................................... 140
Scan Module Pairing.......................................................................................................... 141
Paring the M2 Scope/Meter ............................................................................................... 141
Shop Information ...................................................................................................................... 145
Chapter 15: SureTrack ........................................................................................................... 147
SureTrack Authorization and Registration................................................................................ 147
SureTrack Authorization Code........................................................................................... 148
SureTrack Account Registration ........................................................................................ 148
SureTrack Log In ...................................................................................................................... 149
Using SureTrack in Scanner Mode........................................................................................... 151

Draft 4/14/15- Do Not Distribute
iv
Contents
Common Replaced Parts Graph ........................................................................................ 151
Dashboard Feature Information ......................................................................................... 152
Starting SureTrack from the Home Screen .............................................................................. 154
Using the SureTrack Website................................................................................................... 155
SureTrack Home Page ...................................................................................................... 155
My SureTrack..................................................................................................................... 158
Dashboard ......................................................................................................................... 159
Ask the Experts .................................................................................................................. 161
Enter a Tip ......................................................................................................................... 163
Add Waveform/PID Graph ................................................................................................. 163
My Profile ........................................................................................................................... 163
Support .............................................................................................................................. 163
Chapter 16: ShopStream Update Tool (SST) ....................................................................... 164
Basic Operation ........................................................................................................................ 164
Manual Download..................................................................................................................... 166
Installing Software Updates...................................................................................................... 168
Installing Software Upgrades.................................................................................................... 169
Chapter 17: Maintenance....................................................................................................... 171
Diagnostic Tool......................................................................................................................... 171
Cleaning............................................................................................................................. 171
Cleaning the Touch Screen ............................................................................................... 171
Battery Service................................................................................................................... 171
Calibrating the Touch Screen ............................................................................................ 174
Screen Protector Installation.............................................................................................. 176
Stylus Tip Replacement ..................................................................................................... 178
Operating System Restore................................................................................................. 178
Scan Module............................................................................................................................. 179
Cleaning and Inspecting the Scan Module ........................................................................ 179
Replacing the Protective Handgrip..................................................................................... 179
Index ........................................................................................................................................ 180

Draft 4/14/15- Do Not Distribute
1
Chapter 1 Using This Manual
This manual contains basic operating instructions and is structured in a manner to help you
become familiar with your Diagnostic Tool features and perform basic operations.
The illustrations in this manual are intended as reference only and may not depict actual screen
results, information, functions or standard equipment. Contact your sales representative for
availability of other functions and optional equipment.
1.1 Conventions
1.1.1 Bold Text
Bold emphasis is used in procedures to highlight selectable items such as buttons and menu
options.
Example:
•Select Functions.
1.1.2 Symbols
The “greater than” arrow (>) indicates an abbreviated set of selection instructions.
Example:
•Select Utilities > Tool Setup > Date.
The above statement abbreviates the following procedure:
1. Select the Utilities icon.
2. Select the Tool Setup submenu.
3. Highlight the Date option from the submenu.
1.1.3 Terminology
The term “select” describes tapping/touching an icon on the touch screen, or highlighting an icon
or menu choice and then selecting the confirmation menu choice such as Continue, Accept, OK,
Yes, or other similar choice.
Example:
•Select Reset.
The above statement abbreviates the following procedure:
1. Navigate to the Reset icon.
2. Select the Reset icon with your stylus.

Draft 4/14/15- Do Not Distribute
2
Using This Manual Conventions
1.1.4 Notes and Important Messages
The following messages are used.
Note
A note provides helpful information such as additional explanations, tips, and comments.
Example:
NOTE:
iFor additional information refer to...
Important
Important indicates a situation which, if not avoided, may result in damage to the test equipment
or vehicle.
Example:
IMPORTANT:
Disconnecting the USB cable during vehicle communication can cause damage to the ECM.
1.1.5 Procedures
An arrow icon indicates a procedure.
Example:
zTo change screen views:
1. Select View.
The dropdown menu displays.
2. Select an option from the menu.
The screen layout changes to the format you selected.
1.1.6 Hyperlinks
Hyperlinks, or links, that take you to other related articles, procedures, and illustrations are
available in electronic documents. Blue colored text indicates a selectable hyperlink.
Example:
IMPORTANT:
Read all applicable Safety Information before using this tool!
1.1.7 Tool Help
To display help topics for this tool, select a help option from the Help menu.
Draft 4/14/15- Do Not Distribute
3
Chapter 2 Introduction
This chapter introduces the basic features of the Diagnostic Tool, including the control buttons,
data ports, battery pack, and power sources. Your Diagnostic Tool is a specialized personal
automotive diagnostic solution that combines information with test instrumentation to help you
diagnose symptoms, codes, and complaints quickly and efficiently. There are three main
components to the system:
•Diagnostic Tool—central processor and monitor for the system
•Scope Module—device for sampling circuits and signals
•Scan Module—wireless device for accessing vehicle data
This manual describes the operation of these three devices and how they work together to deliver
diagnostic solutions.
2.1 Features and Specifications
2.1.1 Diagnostic Tool
1— Audio Speaker
2— Capacitive Touch Screen
3— Shortcut (S) Button (special functions)
4— Power Button (with backlit LED functions)
Figure 2-1 Front view
Draft 4/14/15- Do Not Distribute
4
Introduction Features and Specifications
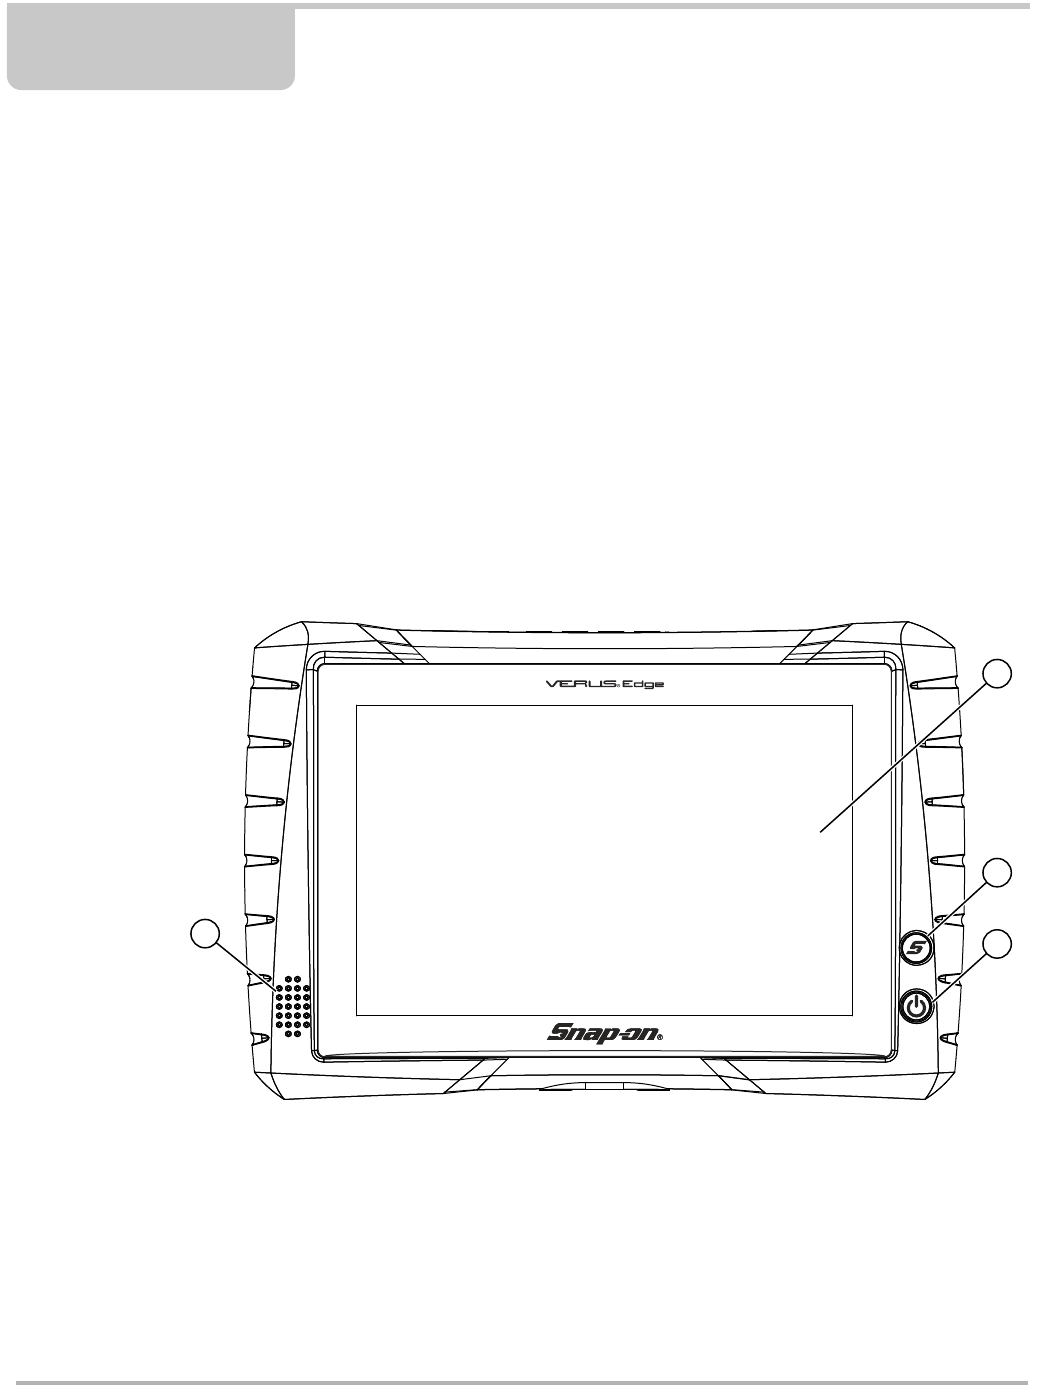
1— Stylus Storage
2— Scope Module M4 (removable)
3— Camera Lens
4— Communication and Power Jacks Cover
5— Head Phone Jack
6— Micro uSD Card Slot
7— USB (universal serial bus) Jacks (2)
8— DC Power Supply Input Jack
9— Docking Station Connector
10—Battery Pack
11—Collapsible Stand
Figure 2-2
99 0$;

Draft 4/14/15- Do Not Distribute
5
Introduction Features and Specifications
Technical Specifications
Item Description / Specification
Touch Screen Capacitive Touch Panel
Display 10.1 inch diagonal, TFT Color LCD
1280 x 800 resolution (WXGA)
Processor Intel Quad Core N2930, 1.8GHz
Operating System Microsoft® Windows® Embedded 7
Communications Wi-Fi standard (802.11 b/g/n)
Bluetooth® 2.1 Technology
Battery
Rechargeable Lithium Ion Smart Battery Pack, 11.1VDC
Approximate 5 hour run time
Approximate 3.5 hour charge time
Power Supply Supply Rating; 19 VDC, 3.4A
DC Operating Voltage 10 to 32 VDC
Width 12.4 in. (316 mm)
Height 8.23 in. (209 mm)
Depth 2.0 in. (51 mm)
Weight (including battery
pack without Scope
Multimeter Module) 3.80 lb (1.73 kg)
Weight (including battery
pack and Scope
Multimeter Module) 4.40 lb (2.00 kg)
Operating Temperature
Range (ambient) At 0 to 90% relative humidity (non-condensing)
32 to 113°F (0 to 45°C)
Storage Temperature
(ambient) At 0 to 70% relative humidity (non-condensing)
–4 to 140°F (–20 to 60°C)
Environmental
Conditions
This product is intended for indoor use only
This product is rated for Pollution Degree 2 (normal conditions)

Draft 4/14/15- Do Not Distribute
6
Introduction Features and Specifications
Built-in Stand
The built-in stand extends from the back of the Diagnostic Tool to allow hands-free viewing. The
stand clips into the Diagnostic Tool for storage and pivots out so the display is at a 45 degree angle
when in use.
Power Sources
Your Diagnostic Tool can receive power from any of the following sources:
•Internal Battery Pack
•AC/DC Power Supply
•Vehicle Power
•Docking Station (Optional)
Internal Battery Pack
The Diagnostic Tool can be powered from the internal rechargeable battery pack. A fully charged
standard battery pack provides sufficient power for about 5 hours of continuous operation. The
LED backlit power button indicates the battery status.
AC/DC Power Supply
The Diagnostic Tool can be powered from a standard AC outlet using the AC/DC power supply.
When connected to the Diagnostic Tool, the AC/DC power supply also recharges the internal
rechargeable battery pack.
Vehicle Power
The Diagnostic Tool can be powered from a standard 12VDC vehicle power port using the
Diagnostic Tool DC power port adapter. The DC power port adapter connects to the DC power
supply jack on the left side of the Diagnostic Tool.
Docking Station (Optional)
The Diagnostic Tool can be powered (when connected) by the optional docking station. When
connected to the docking station, the internal rechargeable battery pack is recharged. Contact
your sales representative for additional details.
Draft 4/14/15- Do Not Distribute
7
Introduction Features and Specifications
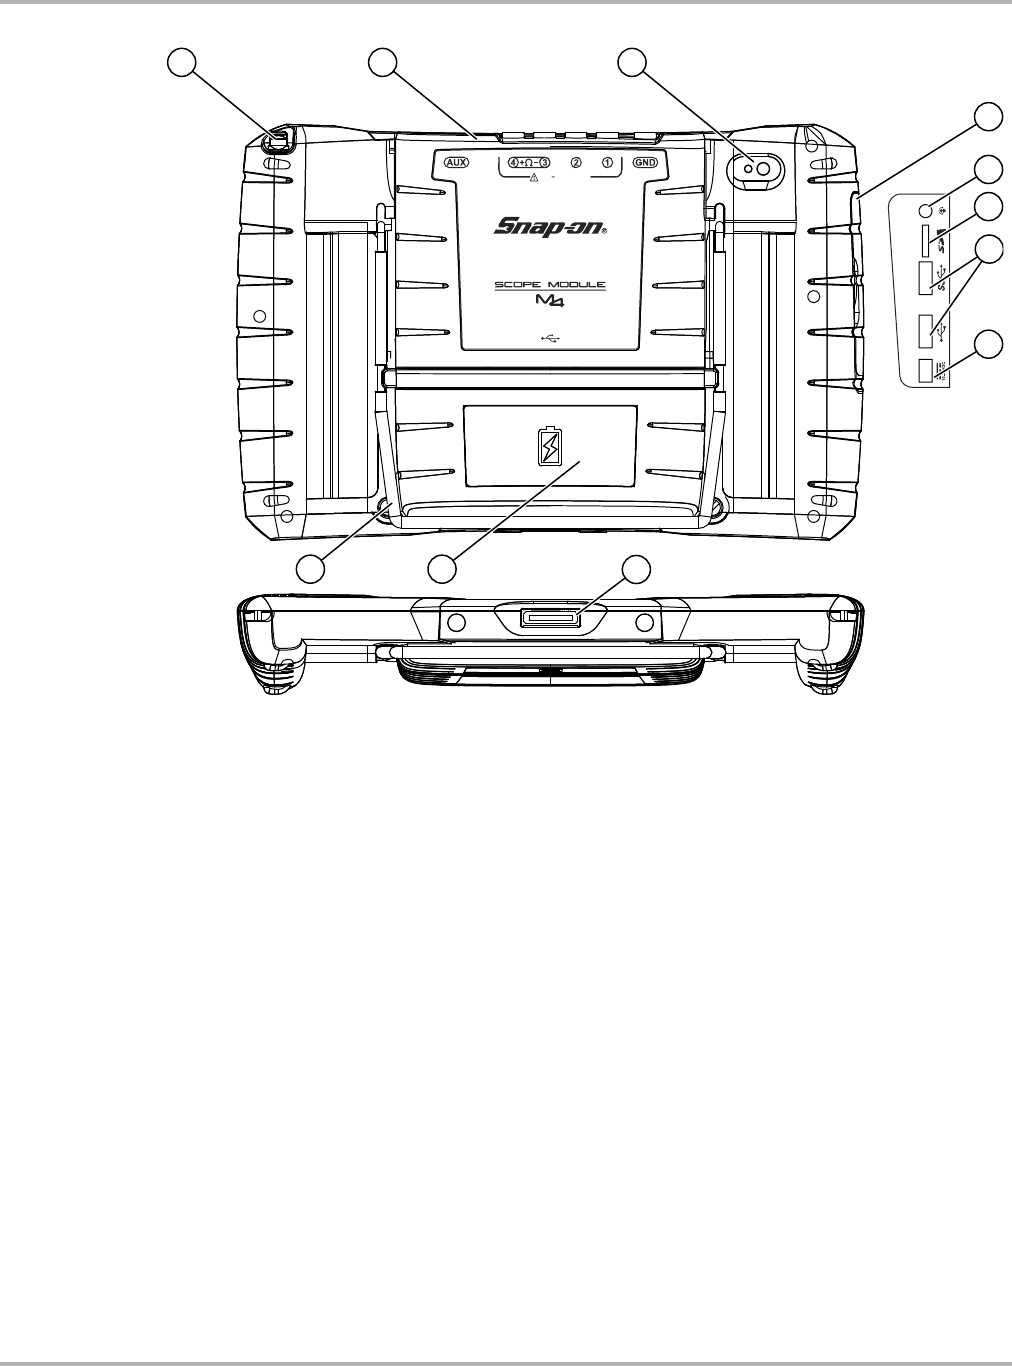
2.1.2 Scope Module
1— Auxiliary (DB9) Connector
2— Channel 4 Jack
3— Channel 3 Jack
4— Channel 2 Jack
5— Channel 1 Jack
6— Common (Ground) Jack
7— USB Jack (not shown - used for remote operation)
Figure 2-3 Scope Module, removed from Diagnostic Tool
99 0$;

Draft 4/14/15- Do Not Distribute
8
Introduction Features and Specifications
Remote Operation
If needed, the Scope Module (M4) can be removed from the Diagnostic Tool, then connected to
the Diagnostic Tool with a USB cable. This increases the range of mobility for the Diagnostic Tool
while monitoring signals on the test vehicle. Use the Type A/B USB cable, which is provided with
your kit, to make the connection. For additional information see, Using the Scope Module
Remotely on page 84.
Technical Specifications
Power Sources
The Scope Module operates on USB power (5V @ 500mA) supplied by the Diagnostic Tool.
Power is provided either through direct connection to the Diagnostic Tool, or through a USB cable
when the Scope Module is removed from the Diagnostic Tool.
Auxiliary Connector
The auxiliary connector is used for connection of the optional RPM inductive pickup and the
pressure traducer split lead adapter. For additional information contact your sales representative
and see, Using the Scope Module Remotely on page 84.
Item Description / Specification
USB Power 5V @ 500mA
Agency Approval -
Rating IEC 61010-1, UL Listed 61010-1 - Category 1
Width 6.3 in. (160 mm)
Height 4.6 in. (118 mm)
Depth 1.1 in. (28 mm)
Weight 0.62 lb (0.28 kg)
Operating Temperature
Range (ambient) At 0 to 90% relative humidity (non-condensing)
32 to 113°F (0 to 45°C)
Storage Temperature
(ambient) At 0 to 70% relative humidity (non-condensing)
–4 to 140°F (–20 to 60°C)
Environmental
Conditions
This product is intended for indoor use only
This product is rated for Pollution Degree 2 (normal conditions)
Draft 4/14/15- Do Not Distribute
9
Introduction Features and Specifications
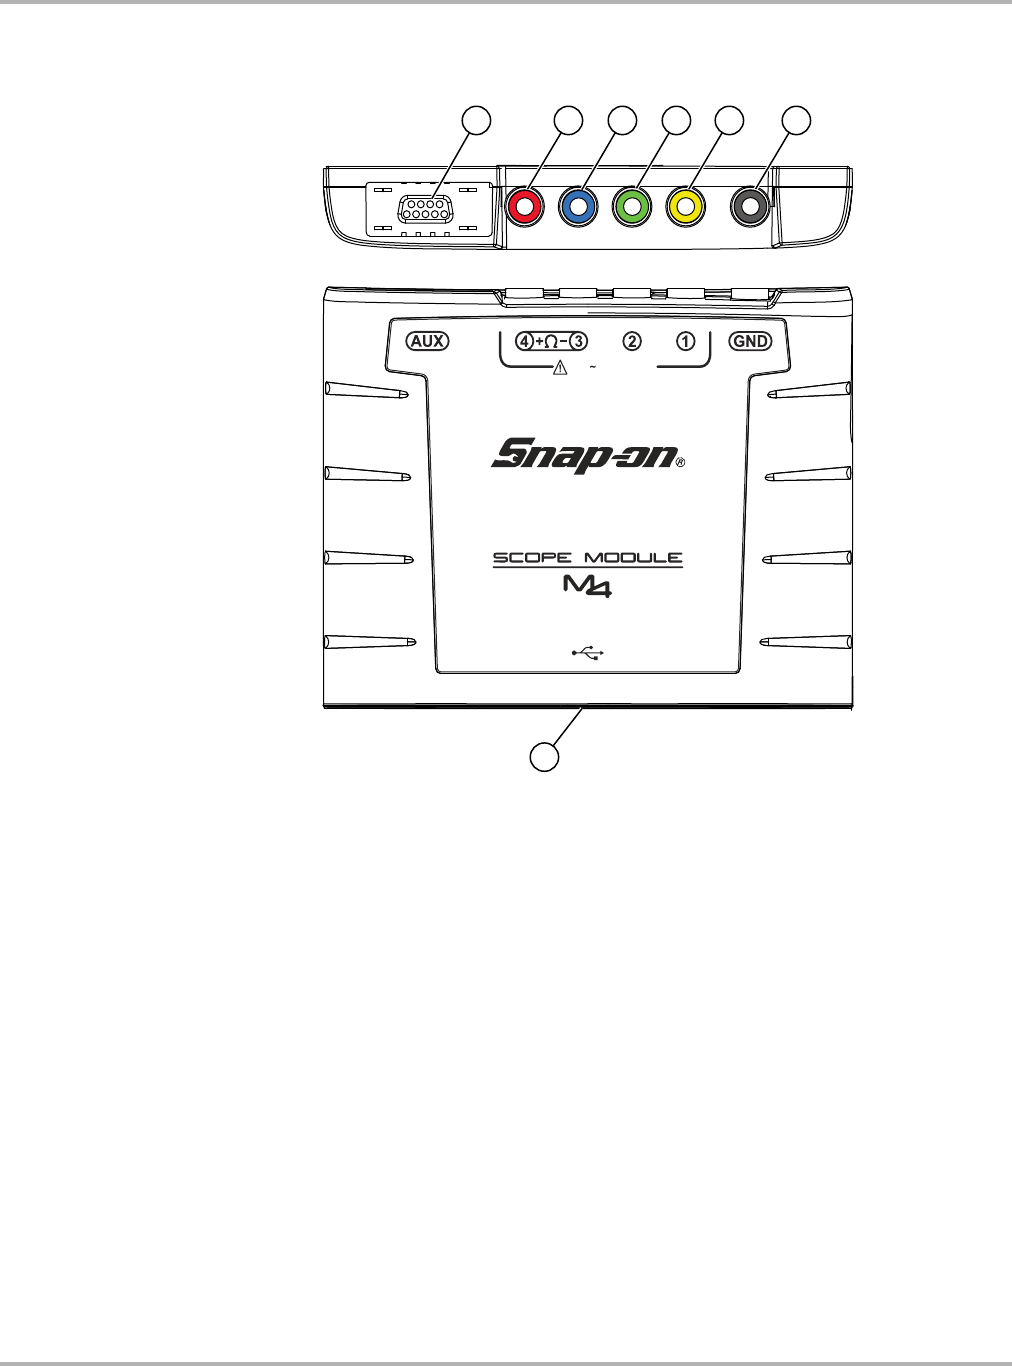
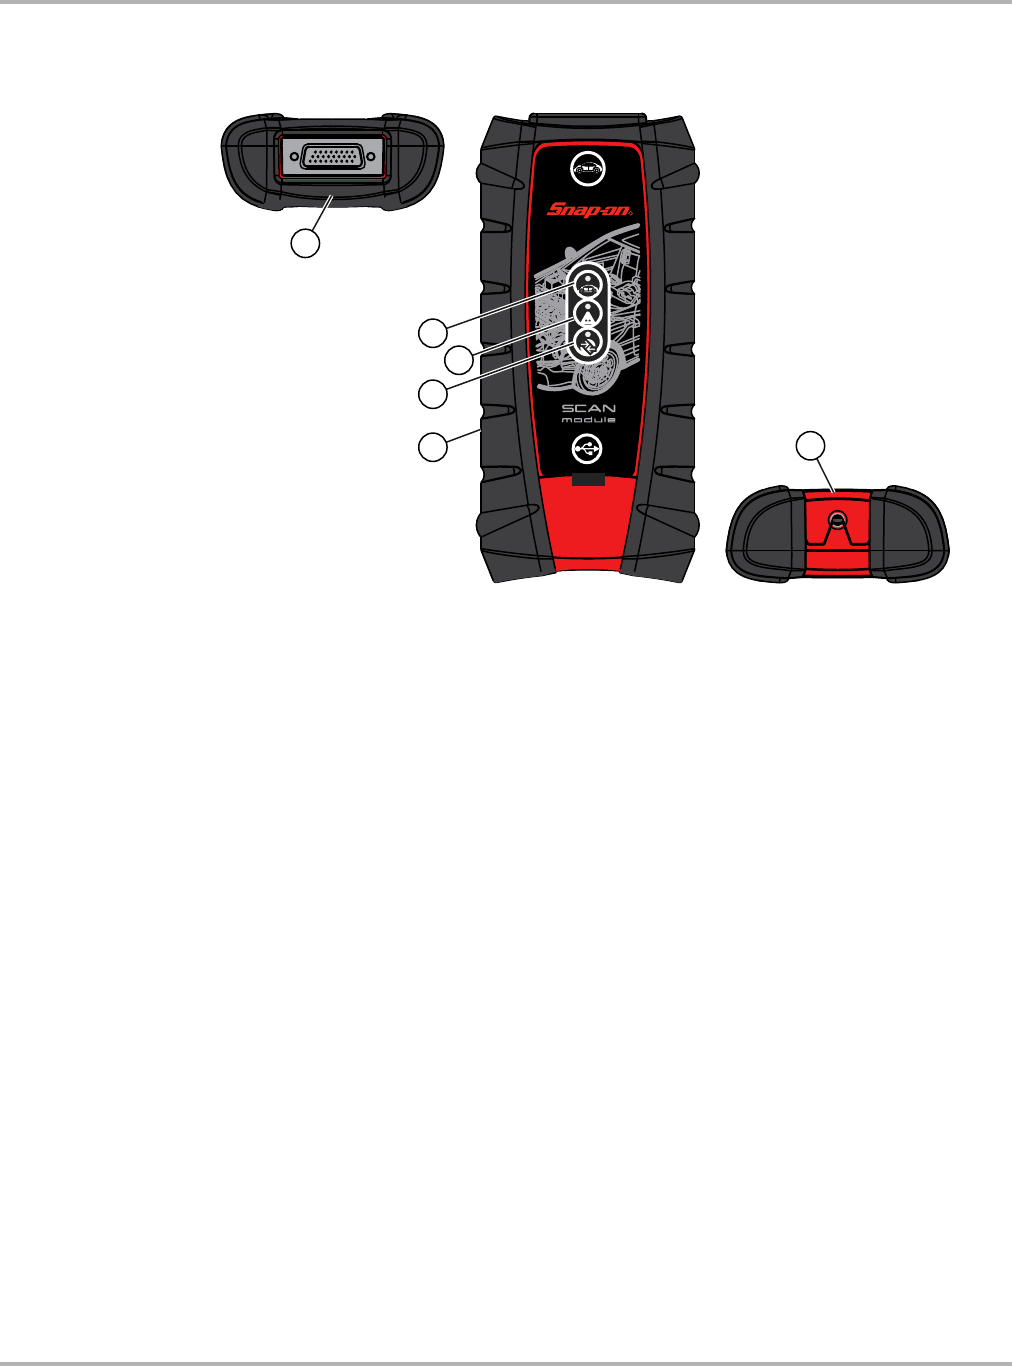
2.1.3 Scan Module (Wireless)
1— Data Cable Connector
2— Vehicle Power LED (green)
3— Communication Issue LED (red)
4— Bluetooth LED (green)
5— Memory Card Port (remove protective hand grip for access)
6— Universal Serial Bus (USB) Jack (remove protective hand grip for access)
Figure 2-4 Scan Module
($//%
5

Draft 4/14/15- Do Not Distribute
10
Introduction Features and Specifications
Wireless Communication
The Scan Module is a wireless communications device that transmits vehicle data to the
Diagnostic Tool without a physical connection. A signal lost due to moving out of range
automatically restores itself when the Diagnostic Tool is brought closer to the Scan Module. The
Scanner sounds a tone when the signal is lost.
Technical Specifications
Power Sources
The Scan Module operates on 12V or 24V vehicle power, which it receives through the data cable
connector. The Scan Module powers on whenever it is connected to an OBD-II/EOBD compliant
data link connector (DLC). For non OBD-II/EOBD compliant vehicles, the Scan Module can be
powered from a suitable power port on the test vehicle using the auxiliary power cable supplied
with your kit.
Item Description / Specification
Communications Wireless Bluetooth® 2.1 Technology
USB Power 5V @ 500mA
Data Cable Connector
Power 8V to 32V, Maximum 12 Watts
Width 8.04 in. (204.3 mm)
Height 3.82 in. (97 mm)
Depth 1.66 in. (42.1 mm)
Weight 0.9 lb (0.408 kg)
Operating Temperature
Range (ambient) At 0 to 90% relative humidity (non-condensing)
32 to 113°F (0 to 45°C)
Storage Temperature
(ambient) At 0 to 70% relative humidity (non-condensing)
–4 to 140°F (–20 to 60°C)
Environmental
Conditions
This product is intended for indoor use only
This product is rated for Pollution Degree 2 (normal conditions)
Draft 4/14/15- Do Not Distribute
11
Chapter 3 Basic Operation and
Navigation
This chapter describes the basic operation, and navigation of the Diagnostic Tool.
3.1 Turning On/Off, Sleep Mode and Emergency
Shutdown
The following sections describe how to turn the Diagnostic Tool on and off, use Sleep Mode and
perform an emergency shutdown.
Before using the Diagnostic Tool, make sure the battery is fully charged or is connected to an
AC/DC power supply. see Power Sources on page 6.
3.1.1 Turning On
Press and release the Power button (Figure 2-1) to switch the Diagnostic Tool on. The system
boots up, then opens the Home screen (Figure 3-4).
3.1.2 Turning Off
IMPORTANT:
All vehicle communication must be terminated BEFORE turning off the Diagnostic Tool. A warning
message displays if you attempt to turn the Diagnostic Tool off while communicating with the
vehicle. Forcing a shut down while communicating may lead to ECM problems on some vehicles.
Never disconnect the Data Cable when the Diagnostic Tool is communicating with the vehicle
ECM.
Before turning the Diagnostic Tool off, it is highly recommended to back up personal and saved
data to a USB mass storage device on a regular basis to prevent loss in the event of system
corruption or hard disk drive failure.
zTo turn off the Diagnostic Tool:
1. Navigate to the Home screen.
2. Select the Exit icon.
3. From the Windows desktop, open the Windows Start menu.
4. Select Turn Off Computer.
5. Select Turn Off in the dialog box.
The open programs close and the power turns off.
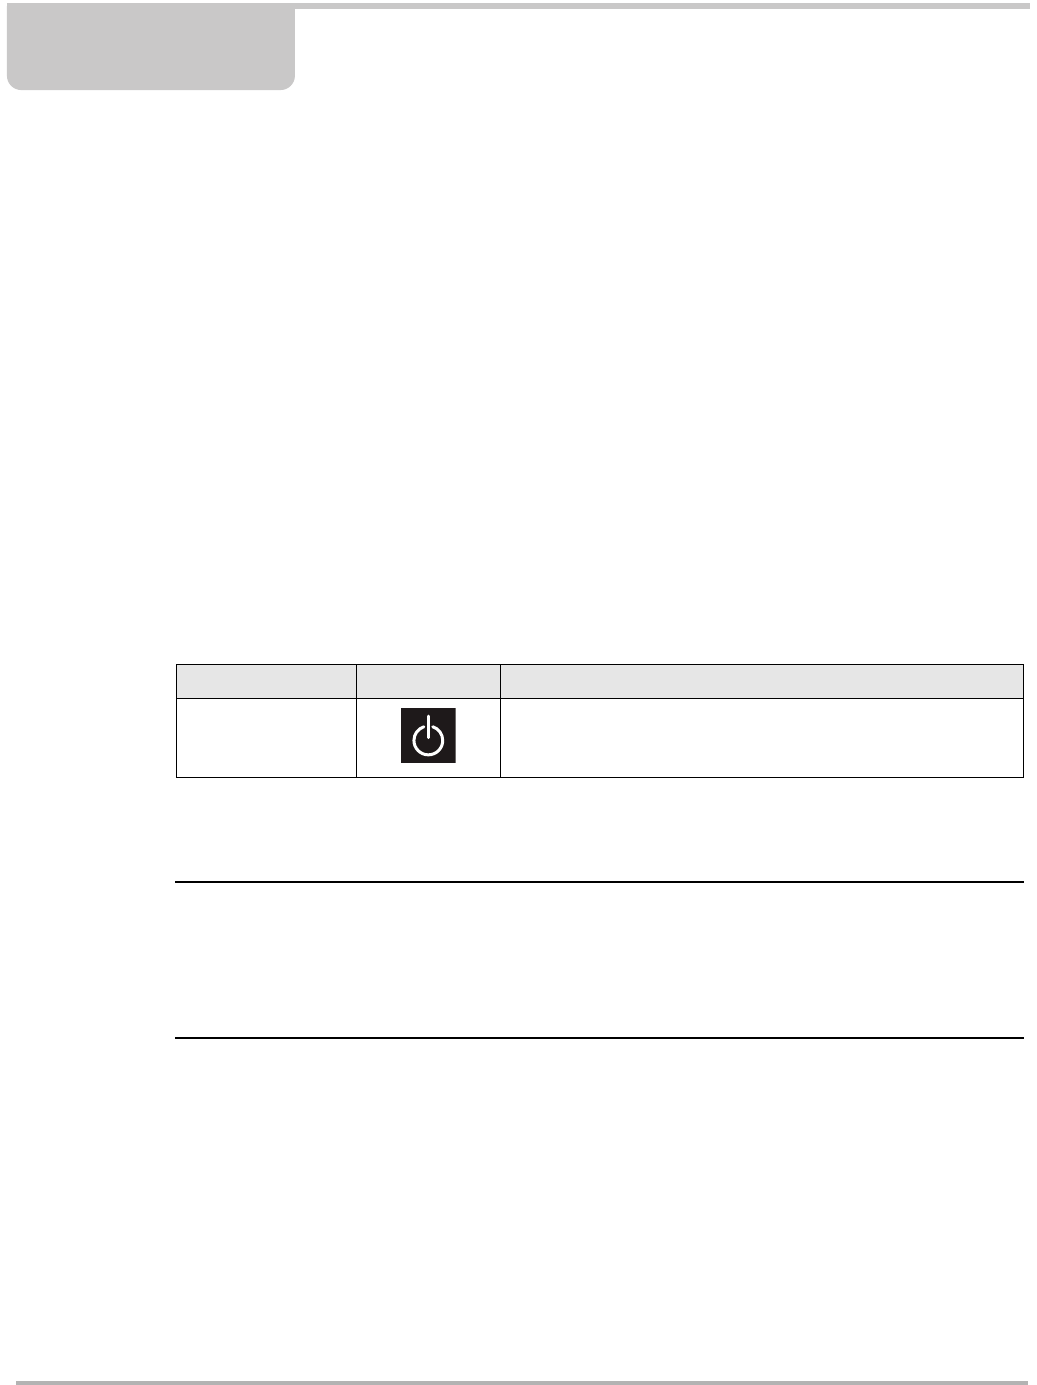
Table 3-1 Power button
Name Button Description
Power Button / LED
Indicator
Turns the Diagnostic Tool on and off. See LED Indicator on
page 15 for LED indicator information.

Draft 4/14/15- Do Not Distribute
12
Basic Operation and Navigation Turning On/Off, Sleep Mode and Emergency Shutdown
3.1.3 Sleep Mode
The Windows operating system uses Sleep Mode to conserve power by stopping all processes
and turning off the display screen, while keeping the diagnostic tool on and your open applications
active. When you are ready to resume work, the diagnostic tool can be started up again quickly
from the same screen it was on previous to going to sleep.
Sleep Mode settings can be found in Windows Control Panel > Power Options. For additional
information, refer to Windows 7 user documentation.
IMPORTANT:
It is recommended that you terminate any current vehicle communication and save any open
working files or data before entering Sleep Mode, to avoid any ECM problems on some vehicles
or data loss from any unforeseen circumstances (e.g. power loss).
zTo enter Sleep Mode:
•Press and release the Power button.
The display screen will turn off and the LED backlit power button will light up red, blinking on
and off at two second intervals.
zTo exit Sleep Mode (wake up):
1. Press and release the Power button.
The display screen will turn on and resume the last open application. Depending on settings,
you may need to select your user ID icon to open the last application.
3.1.4 Emergency Shutdown
IMPORTANT:
Using the emergency shutdown procedure while communicating with the vehicle ECM may lead
to ECM problems on some vehicles.
During normal operation turn the Diagnostic Tool off using the Turning Off procedure above. The
emergency shutdown procedure should only be used If the Diagnostic Tool does not respond to
navigation or control buttons or exhibits erratic operation. To force an emergency shutdown, press
and hold the Power button for five seconds until the Diagnostic Tool turns off.
Draft 4/14/15- Do Not Distribute
13
Basic Operation and Navigation Shortcut (S) Button
3.2 Shortcut (S) Button
The shortcut (S) button (Figure 3-1) located on the front of the diagnostic tool, and is a
customizable button that can be set to perform various routine functions.
Figure 3-1
NOTE:
iYou can open the Shortcut menu at anytime by pressing and holding the Shortcut (S) button for 3
seconds.
Pressing the shortcut button (Figure 2-1) (when set to open the shortcut menu), opens a slide-out
menu which provides the following selectable icon options:.
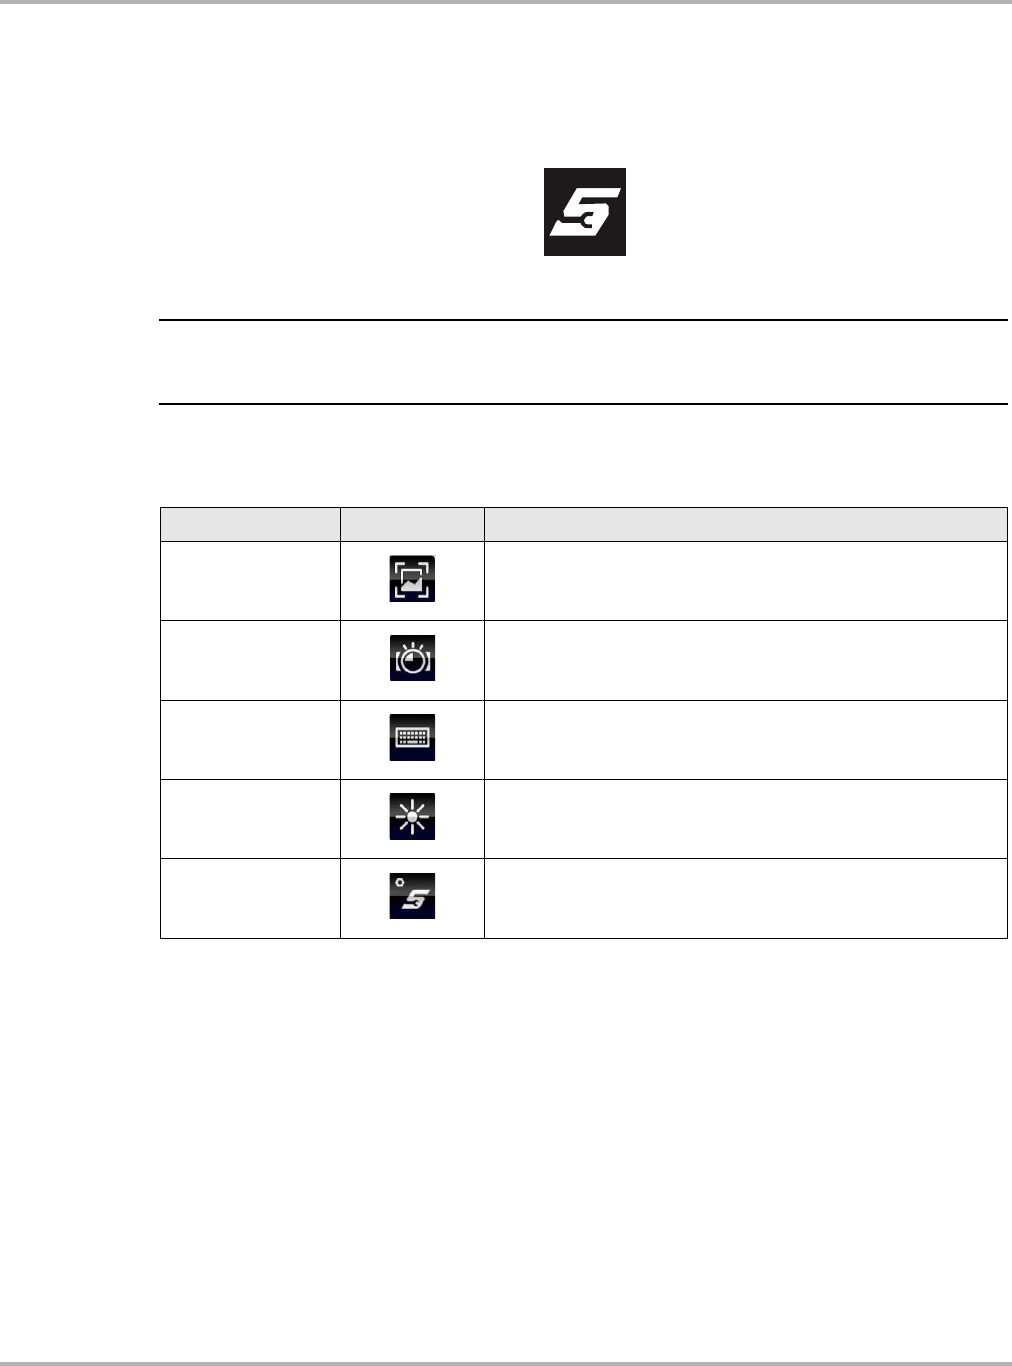
Table 3-2
Name Icon Description
Screen Capture
Saves a bitmap image (screenshot) of the visible screen. For file
retrieval and management information, see Data Manager
Operations on page 121.
Camera Opens the camera application. See Camera Operation on
page 23 for additional information.
Keyboard Opens the virtual keyboard. See Virtual Keyboard on page 21
for additional information.
Brightness
Pressing and releasing the Brightness icon changes the
display brightness setting. Use multiple taps to toggle though
the settings.
Settings Opens the Shortcut (S) button configuration menu.
Draft 4/14/15- Do Not Distribute
14
Basic Operation and Navigation Shortcut (S) Button
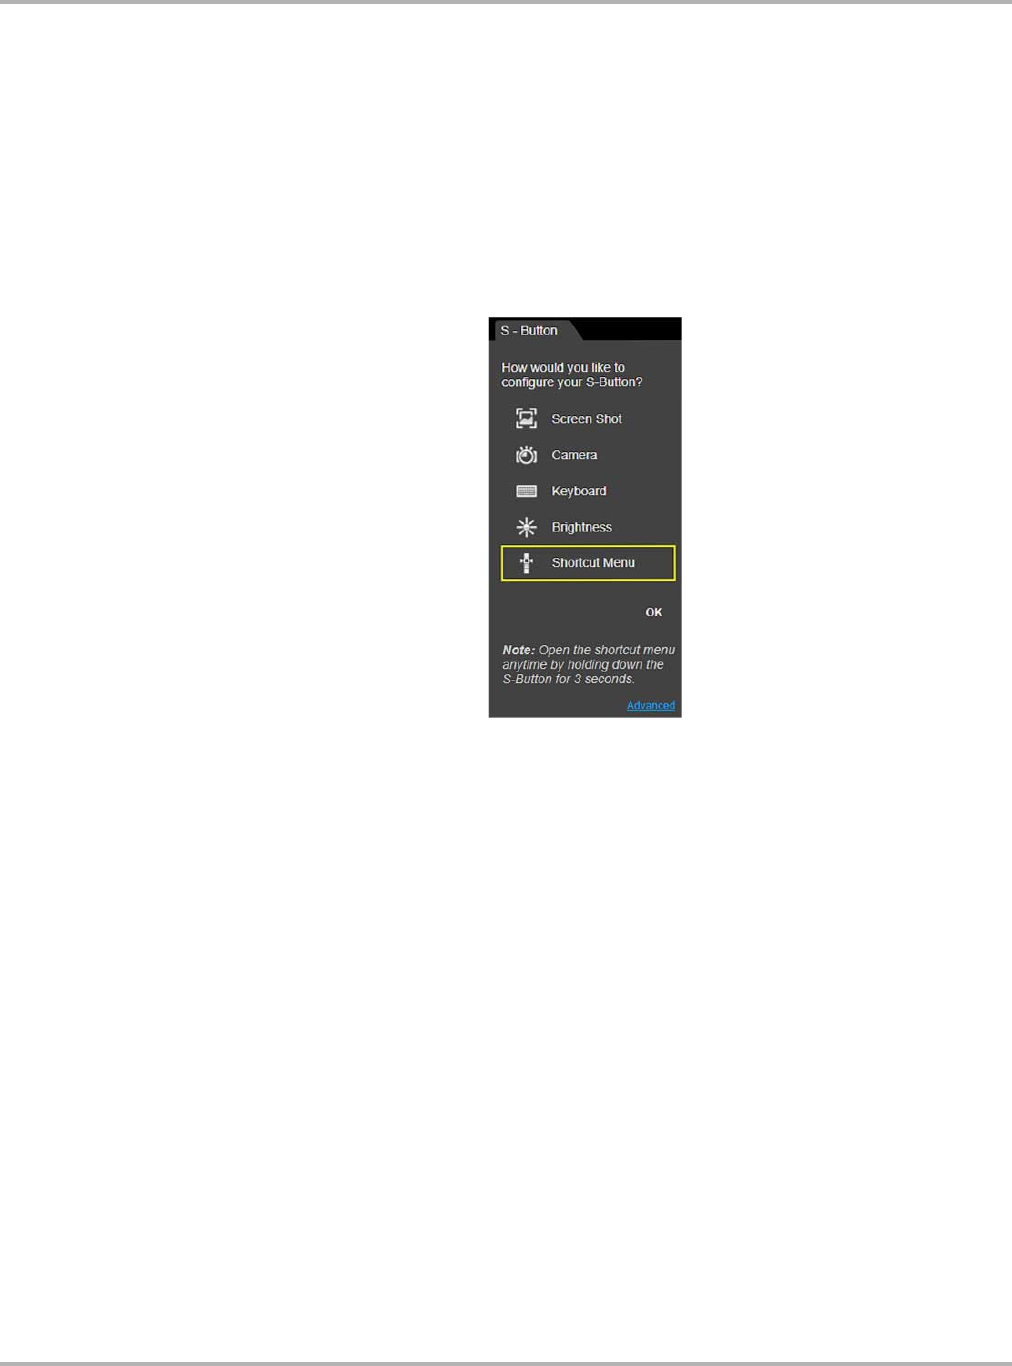
3.2.1 Configure Shortcut (S) Button
This feature allows you to change the function of the Shortcut (S) button.
zTo configure the Shortcut (S) button:
1. Press and release the Shortcut (S) button.
2. Select the Settings icon from the slide-out menu.
3. Choose the function you would like the Shortcut button to perform when pressed (Figure 3-2).
The current/active setting is indicated by a yellow highlight box.
Figure 3-2 Shortcut (S) button configuration menu
4. Select OK.
3.2.2 Advanced (menu selection)
The Advanced selection has no functionality under normal operating conditions, and should ONLY
be selected when directed to do so, by Snap-on customer service.
Selecting Advanced displays the advanced diagnostic system information screen. The system
state information and functions are ONLY used during system troubleshooting, when requested by
Snap-on customer service.

Draft 4/14/15- Do Not Distribute
15
Basic Operation and Navigation LED Indicator
3.3 LED Indicator
The power button is backlit by an light emitting diode (LED) (see Figure 2-1 on page 3 for
location). The LED is used to indicate battery/power status and sleep mode activation.
•Battery Status Indicator LED—three colors are used to show the battery and power status:
–Green indicates either a battery with a full or nearly full charge, or the Diagnostic Tool is
being powered by the AC/DC Power Supply.
–Orange indicates a battery that is charging.
–Red indicates a low battery (15% of capacity or less).
•Sleep Mode:
–A Red LED that blinks on and off at two second intervals indicates the Diagnostic Tool is
in Sleep Mode. See Sleep Mode on page 12 for additional information.
3.4 Basic Navigation
3.4.1 Touch Screen and Stylus
The capacitive touch screen is used to control almost all the operations of the Diagnostic Tool.
Simply touch the screen with your finger, or use the capacitive stylus to make a selection. The
capacitive touch screen also provides you with multi-touch gesture capabilities found on common
surface touch devices. Most operations are menu driven, which allows you to quickly locate the
test, procedure, or data that you need through a series of choices and questions. Detailed
descriptions of the menu structures are found in the chapters for the various functions.
For information on touch screen calibration, maintenance and stylus tip replacement:
Touch screen calibration - see Calibrating the Touch Screen on page 174
Touch screen maintenance - see Cleaning on page 171
Stylus tip replacement - see Stylus Tip Replacement on page 178
Table 3-3
Name Button
Power Button / LED Indicator

Draft 4/14/15- Do Not Distribute
16
Basic Operation and Navigation Basic Navigation
Touch Screen Gestures
This device uses common touch screen gesture motions (e.g. pinch-to-zoom, press and tap, pan
and swipe). The terms used to describe the various gestures may vary (industry wide), however
the general procedures and usage are similar for specific operations.
The information provided in the above table is not inclusive, may vary and is intended as a general
guide only. For additional information on Windows touch screen operations, see Windows 7 and
Windows “touch gesture” user documentation. Also refer to Pen and Touch settings in the
Windows Control Panel for additional information and settings.
Table 3-4
Common Gesture
Names General Procedure Common Usage
Tap
Tou c h
Select
Quickly tap a point (once), then
release.
Quickly tap a point (twice).
Make a selection (e.g. open application)
Insert a cursor in a text string
Open alternate menus.
Pinch open/close
Pinch-to-zoom
Zoom
Touch two points, then move your
fingers toward or away from each
other.
Zoom the display in or out, to make a
selection (e.g. image or picture) larger or
smaller.
Touch and hold
Select and hold
Tap and hold
Touch a point and maintain light
pressure.
Make a selection
Insert a cursor in a text string
Open alternate menus.
Touch and drag
Select and drag
Tap and drag
Pan
Touch a point, then while maintaining
light pressure, drag in the desired
direction.
Move onscreen controls (e.g. scrollbars
and slidebars)
Move windows
Select text
Swipe
Flick
In a quick and continuous motion,
select a point and quickly swipe in the
desired direction while lifting off the
screen.
Quickly scroll or move through content
Open alternate menus.
Press and tap
Select and tap
Touch a point, then while maintaining
light pressure, tap (in the same
general area) with another finger.
Open alternate menus (similar to right
click).
Draft 4/14/15- Do Not Distribute
17
Basic Operation and Navigation Basic Navigation
3.4.2 Starting the ShopStream Diagnostic Suite Program
The ShopStream Diagnostic Suite program is the main program which is used for all diagnostic
functions. The ShopStream Diagnostic Suite program is automatically started when the
Diagnostic Tool is turned on through the Windows “start up” folder function. After the program has
started, the ShopStream Diagnostic Suite Home Screen displays, see Home Screen Layout on
page 17. The application runs as a normal Windows program and it’s window can be minimized,
resized and closed like any other Windows program. To access the Windows desktop, minimize
the program window.
If the program is exited or closed, select the ShopStream Diagnostic Suite icon from the Windows
desktop to start the program.
Figure 3-3 ShopStream Diagnostic Suite desktop icon
NOTE:
iThe ShopStream Diagnostic Suite can also be started from the Windows Start menu.
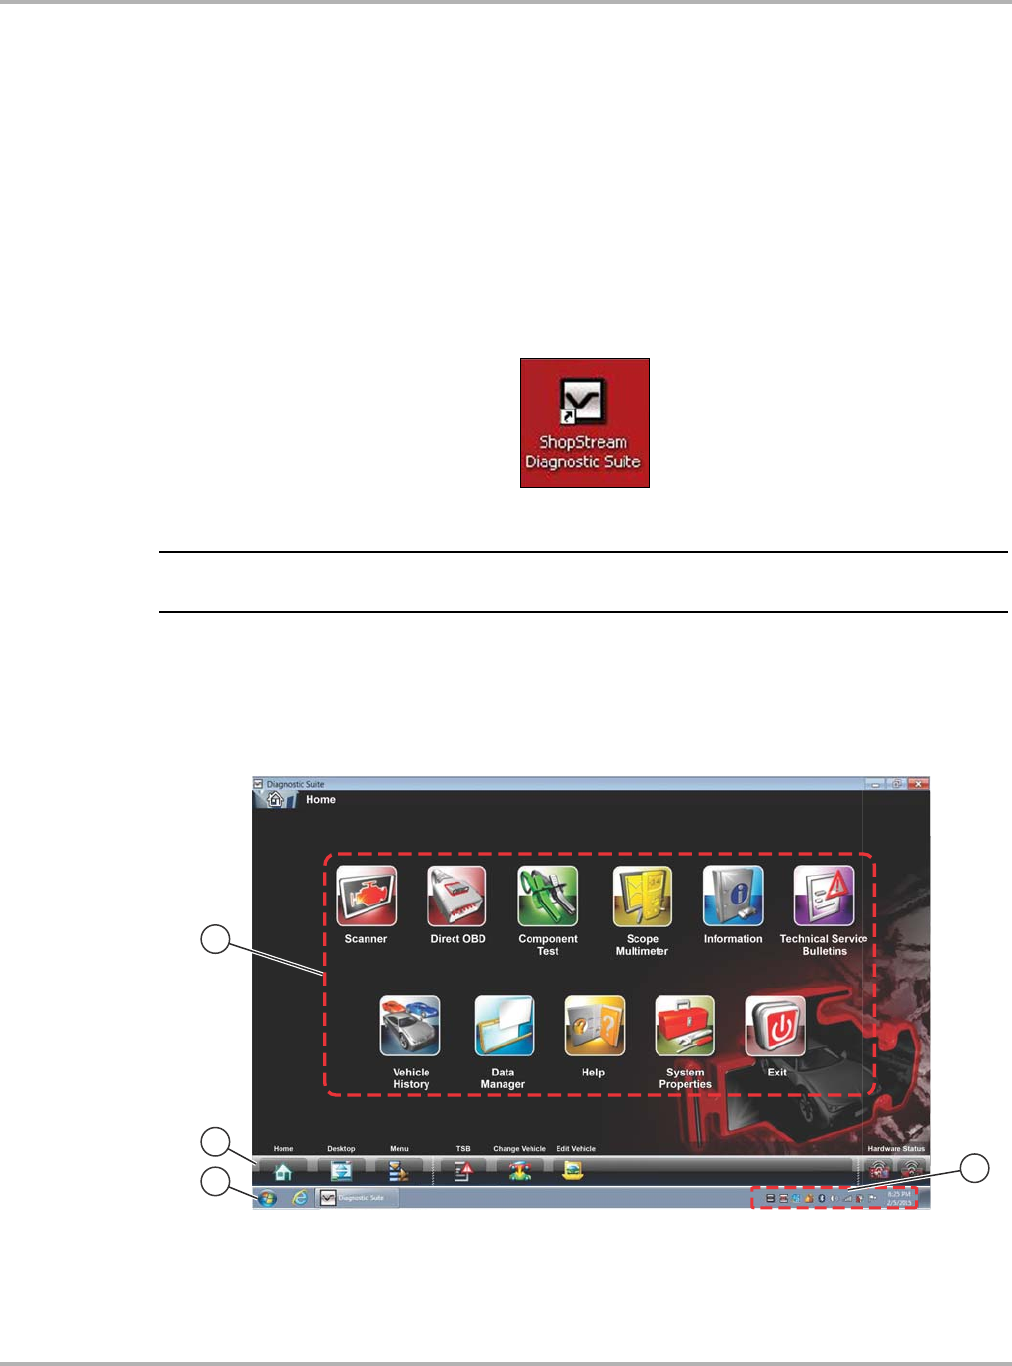
3.4.3 Home Screen Layout
The Home screen includes the diagnostic suite toolbar and the Windows taskbar. The Home
screen includes function icons, one for each of the primary Diagnostic Tool functions.
1. Function Icons
2. Toolbar
3. Windows Taskbar
4. Windows Taskbar Notification Area
Figure 3-4 Home screen
Draft 4/14/15- Do Not Distribute
18
Basic Operation and Navigation Basic Navigation
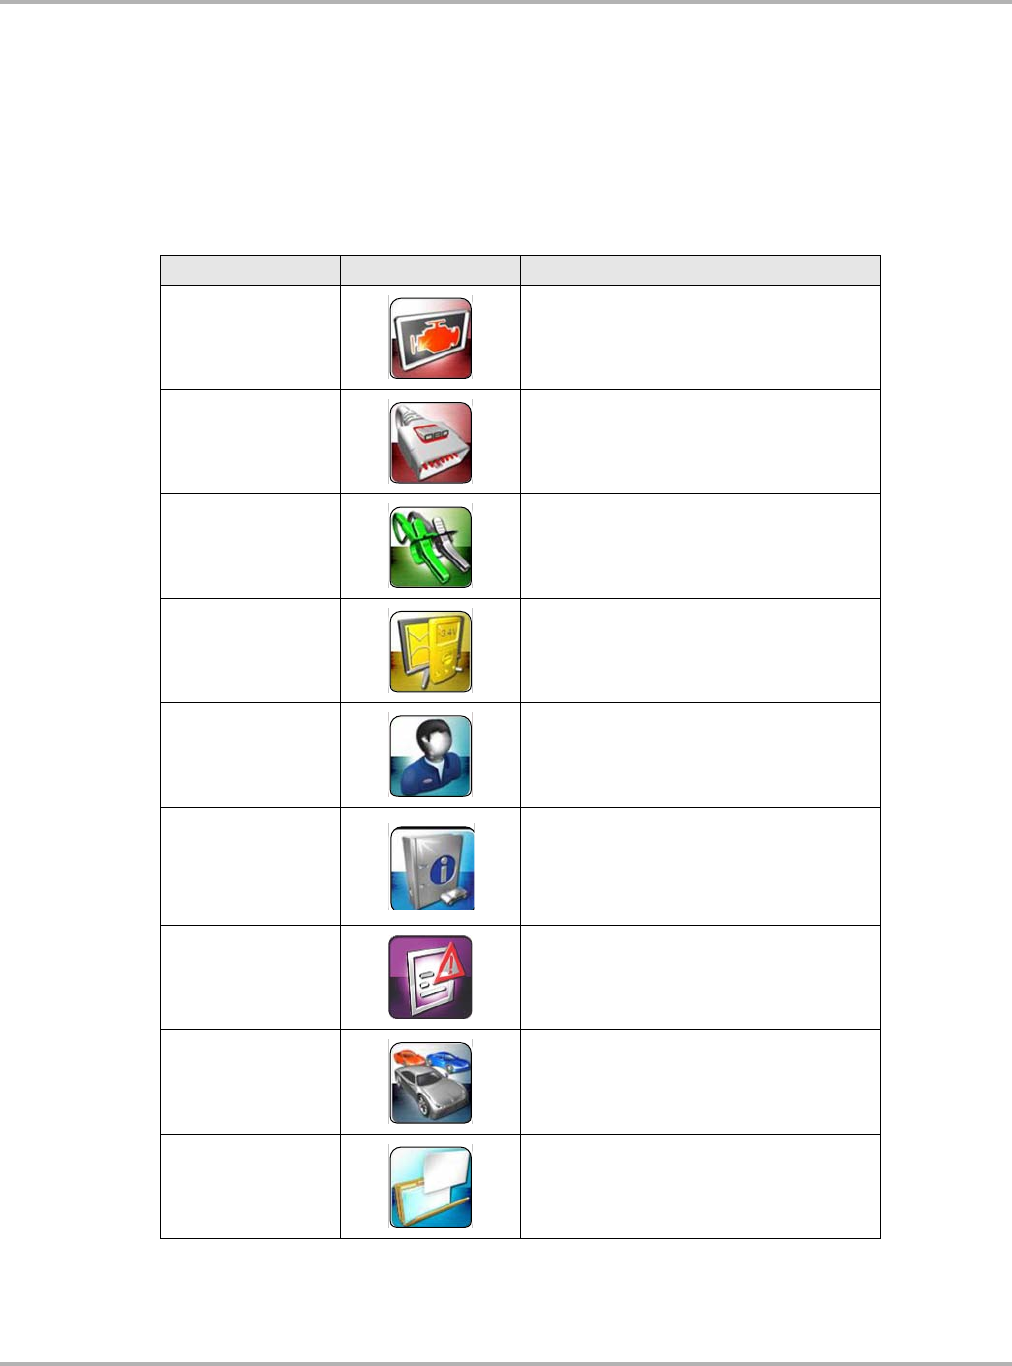
3.4.4 Function Icons
The Function Icons configure the Diagnostic Tool for the type of test to be performed. Table 3-5 on
page 18 gives brief descriptions of the available icons, which operations are available depends
upon the individual configuration of your system. Use the stylus or your finger tip to select from the
icons.
Table 3-5 (table 1 of 2)
Name Icon Description
Scanner
Configures the Diagnostic Tool to operate
as a scan tool. See Scanner Function on
page 25.
OBD Direct
Allows you to perform generic OBD-II or
EOBD system tests without identifying the
specific vehicle. See OBD Direct
Operations on page 65.
Guided Component
Test
Opens a diagnostic database of specific
tests for the identified vehicle. See Guided
Component Test Operations on page 73.
Scope Multimeter
Configures the Diagnostic Tool to operate
as a lab scope, graphing multimeter, or
digital multimeter. See Scope and
Multimeter Operations on page 84.
SureTrack®Opens the SureTrack website. See
SureTrack on page 147.
Repair Information
Provides the information needed to make
repairs once you have made your
diagnosis. The linked program varies by
region. See Repair Information Operations
on page 113.
Technical Service
Bulletins
Provides Technical Service Bulletin
information (if available) for the identified
vehicle. See Technical Service Bulletins on
page 114.
Vehicle History
Identifies the test vehicle and organizes and
manages work in progress and service
records. See Vehicle History Operations on
page 116.
Data Manager
Opens the organization system for saved
data files. See Data Manager Operations on
page 121.
Draft 4/14/15- Do Not Distribute
19
Basic Operation and Navigation Basic Navigation
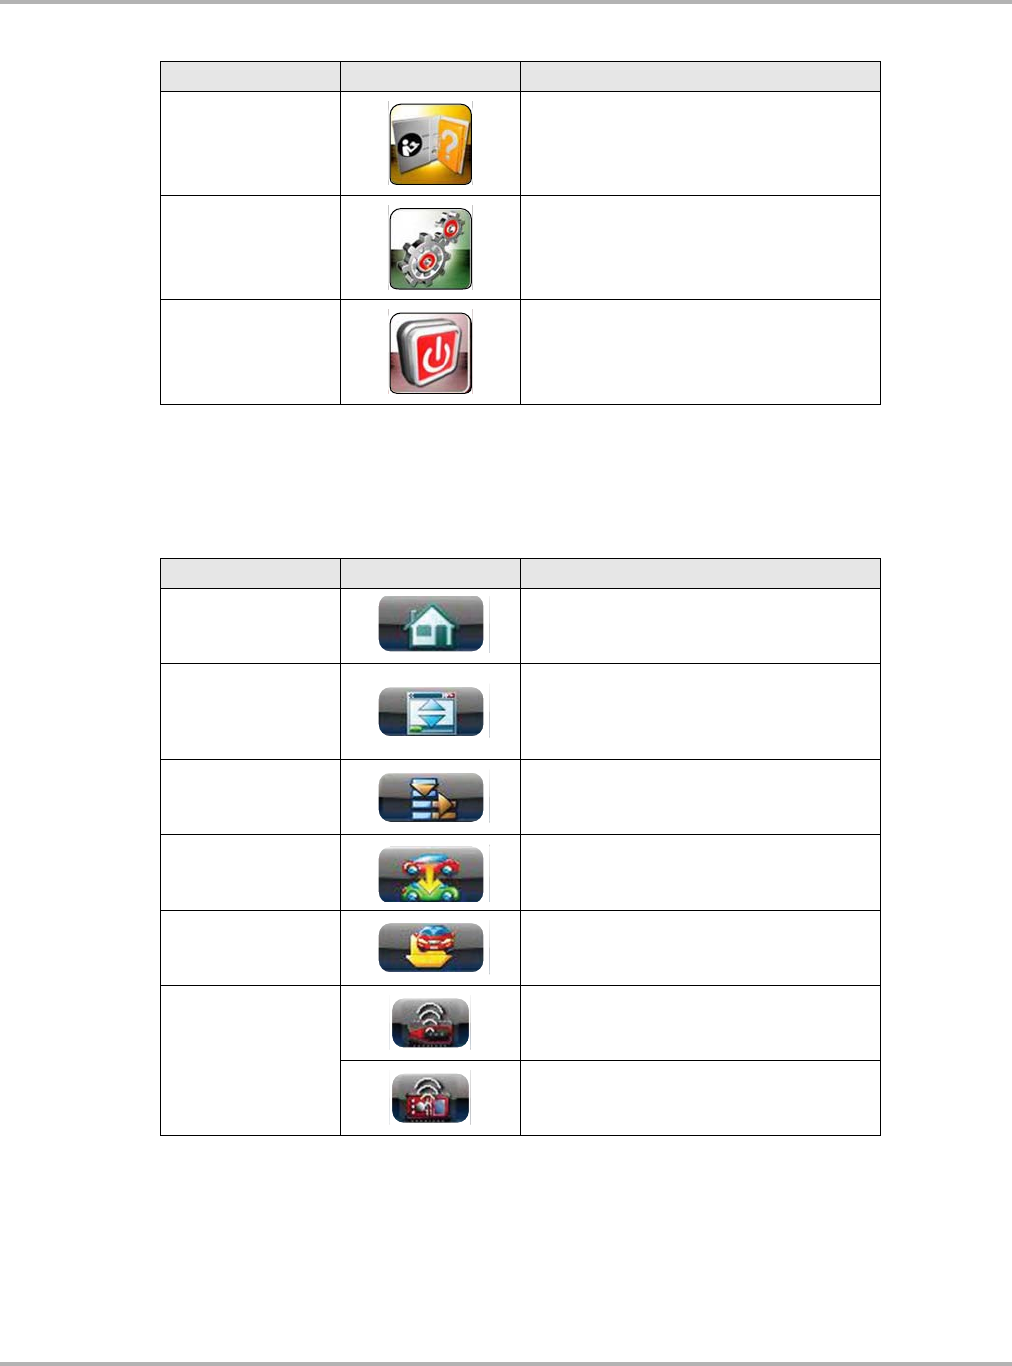
3.4.5 Toolbar
Operation of the icons located on the toolbar are described in the table below:
Help Opens the on-line help for the system. See
Help Operations on page 139.
System Settings
Establishes and manages connections to
peripheral devices, such as the Scan
Module. See System Settings Operations
on page 140.
Exit
Closes the Diagnostic Tool software and
returns the display to the Windows desktop.
See Turning Off on page 11.
Table 3-5 (table 2 of 2)
Name Icon Description
Table 3-6
Name Icon Description
Home Selecting this icon returns you to the Home
screen from any test.
Desktop
Selecting this icon toggles the Windows
taskbar on/off at the bottom of the screen,
and allows you access to the Windows
desktop.
Menu
Selecting this icon opens a menu that
provides information and basic operations
and features for the current screen.
Change Vehicle
The currently identified vehicle is shown to
the right of the icons, selecting allows you to
change the identified test vehicle.
View Record Selecting the icon opens an editable
worksheet of vehicle records.
Hardware Status
Indicates the connectivity status of the Scan
Module. Icon changes depending on status.
Indicates the connectivity status of the
Scope Multimeter. Icon changes depending
on status.

Draft 4/14/15- Do Not Distribute
20
Basic Operation and Navigation Basic Navigation
Menu Options
The Menu icon on the Toolbar at the base of the display screen opens a list of basic operations
and features. The list of options varies depending upon which module, or tool function, is active.
Selecting a menu item opens a submenu of choices, and some submenus also open an additional
menu. A right arrowhead () indicates additional choices are available. Touch an item to select
it. The following Menu options are available from the Home Screen:
•Safety Information—opens the Important Safety Instructions document.
•Help—allows you to view supporting documentation, selecting opens a submenu.
Safety Information
Selecting Safety Information opens a PDF copy of the Important Safety Instructions that are
included in your Diagnostic Tool kit. The Important Safety Instructions document should be read
and understood prior to using the Diagnostic Tool.
Help
A variety of utilities and additional resources are available through the Help menu. Basic menu
options, which are available for all modules, include:
•User Manual
•Version Info
•Activation Status
User Manual
This option opens this document, which provides overall navigation and operation information for
the Diagnostic Tool.
Version Info
This option opens a window showing the version of the software and a copy of the Software
License Agreement. Select OK to close the window.
Activation Status
This option opens a dialog box with version and licensing details for the system, and activation
status for the Diagnostic Tool and all other modules.

Draft 4/14/15- Do Not Distribute
21
Basic Operation and Navigation Virtual Keyboard
3.4.6 Windows Taskbar
The standard Windows taskbar displays program icons that are currently running or that you have
pinned to the taskbar for quick access. Refer to Microsoft Windows 7 user documentation for
additional information.
Windows Taskbar Notification Area
The notification area contains icons that provide active status and notifications of selected
programs. The notification area may contain standard Windows application icons (e.g. Wireless
Network Connection Status, Audio volume, etc) and specialized application icons designed for
use only on this Diagnostic Tool (e.g. ShopStream Update Tool and Virtual Keyboard). Refer to
Windows 7 user documentation for additional information for Windows applications. For additional
information on the ShopStream Update Tool and Virtual Keyboard, see:
ShopStream Update Tool - ShopStream Update Tool (SST) on page 164
Virtual Keyboard - Virtual Keyboard on page 21
3.5 Virtual Keyboard
The Virtual Keyboard allows you to type characters and key in information to complete form and
data entry fields, similar to a physical keyboard.
The Virtual Keyboard is normally running in the Windows background and can be opened in the
following ways:
•Shortcut (S) button - choose the Keyboard icon from the Shortcut (S) button menu
•Windows notification area - choose the Virtual Keyboard icon in the Windows notification
area
Menu options include:
-Hide Virtual Keyboard - minimizes the keyboard
-Close Virtual Keyboard - closes the Virtual Keyboard program
-Show Virtual Keyboard - displays the keyboard
-Settings - opens the Virtual Keyboard settings window (Figure 3-7)
-About - displays the Virtual Keyboard program software version number
•Windows “All Programs” or “Startup” menus - choosing the Virtual Keyboard application
from the Windows menus, opens the Virtual Keyboard and adds the Virtual Keyboard icon to
the notification area
NOTE:
iAs an alternative, you can connect a USB keyboard to the Diagnostic Tool and use it to key in
information.
Draft 4/14/15- Do Not Distribute
22
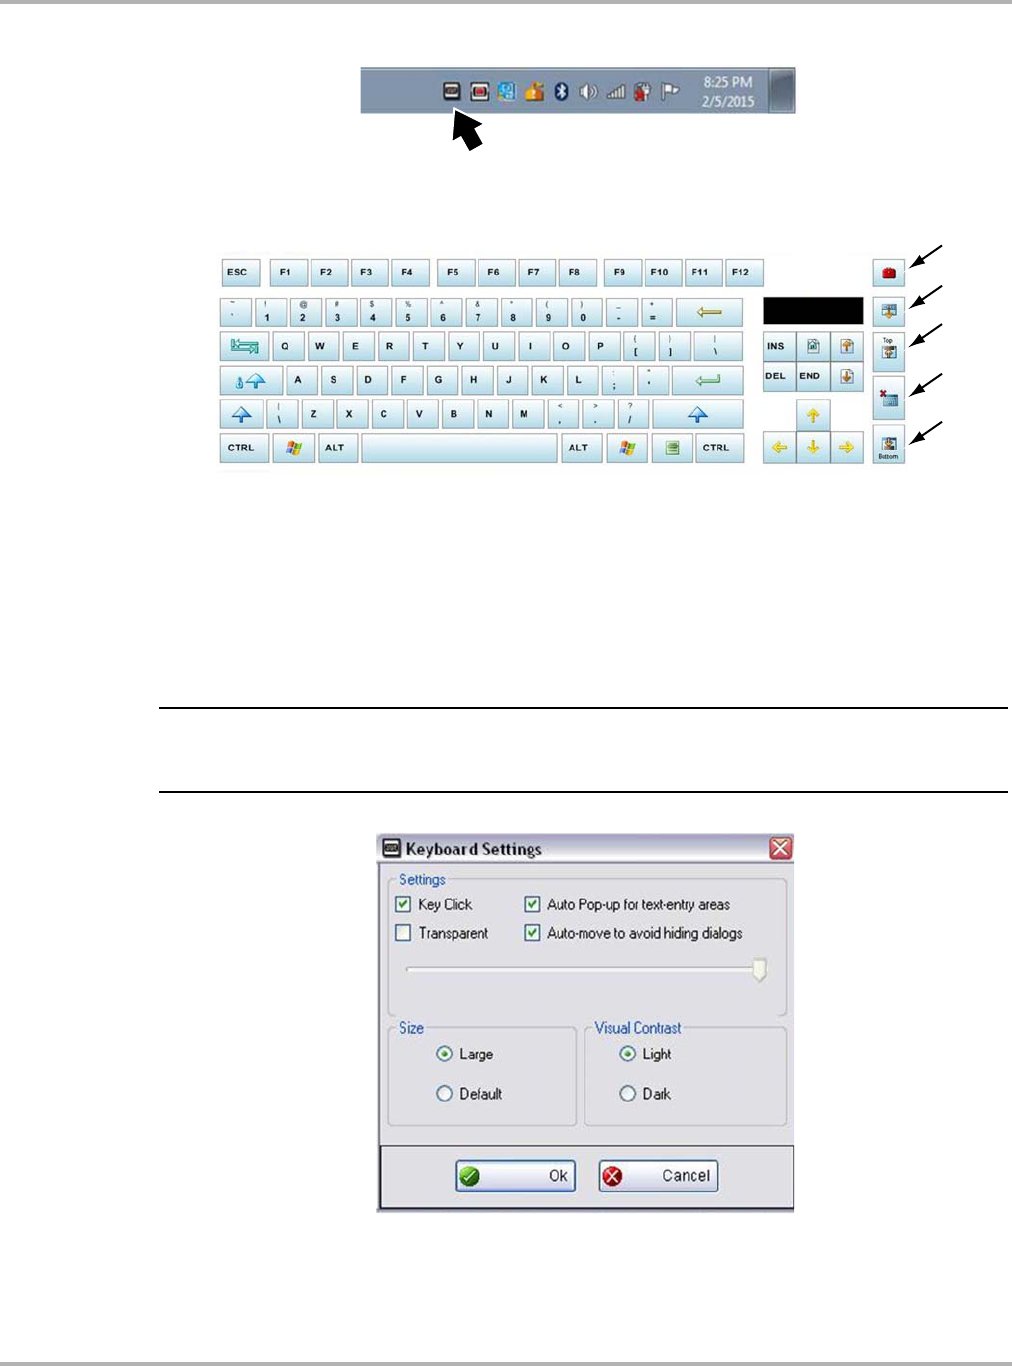
Basic Operation and Navigation Virtual Keyboard
Figure 3-5 Virtual Keyboard notification area icon
1. Settings icon - opens the Virtual Keyboard settings window (Figure 3-7)
2. Expand icon - expands the Virtual Keyboard to full display (press again to return to
standard display)
3. Top - moves the keyboard to top of screen
4. Close - closes the keyboard
5. Bottom - moves the keyboard to bottom of screen
Figure 3-6 Virtual Keyboard (shown expanded)
NOTE:
iThe Virtual Keyboard can be set to open automatically, when a data field or form is selected in
certain applications. See the Settings window (Figure 3-7) for selection options.
Figure 3-7 Virtual Keyboard settings window
Draft 4/14/15- Do Not Distribute
23
Basic Operation and Navigation Camera Operation
3.6 Camera Operation
3.6.1 Operating the Camera
Selecting Camera from the shortcut (S) button menu opens the camera application. The touch
screen becomes the view finder and is also used for reviewing photographs that are taken. Icons
on the touch screen are used to operate the camera. The icons change depending on which
camera function is active:
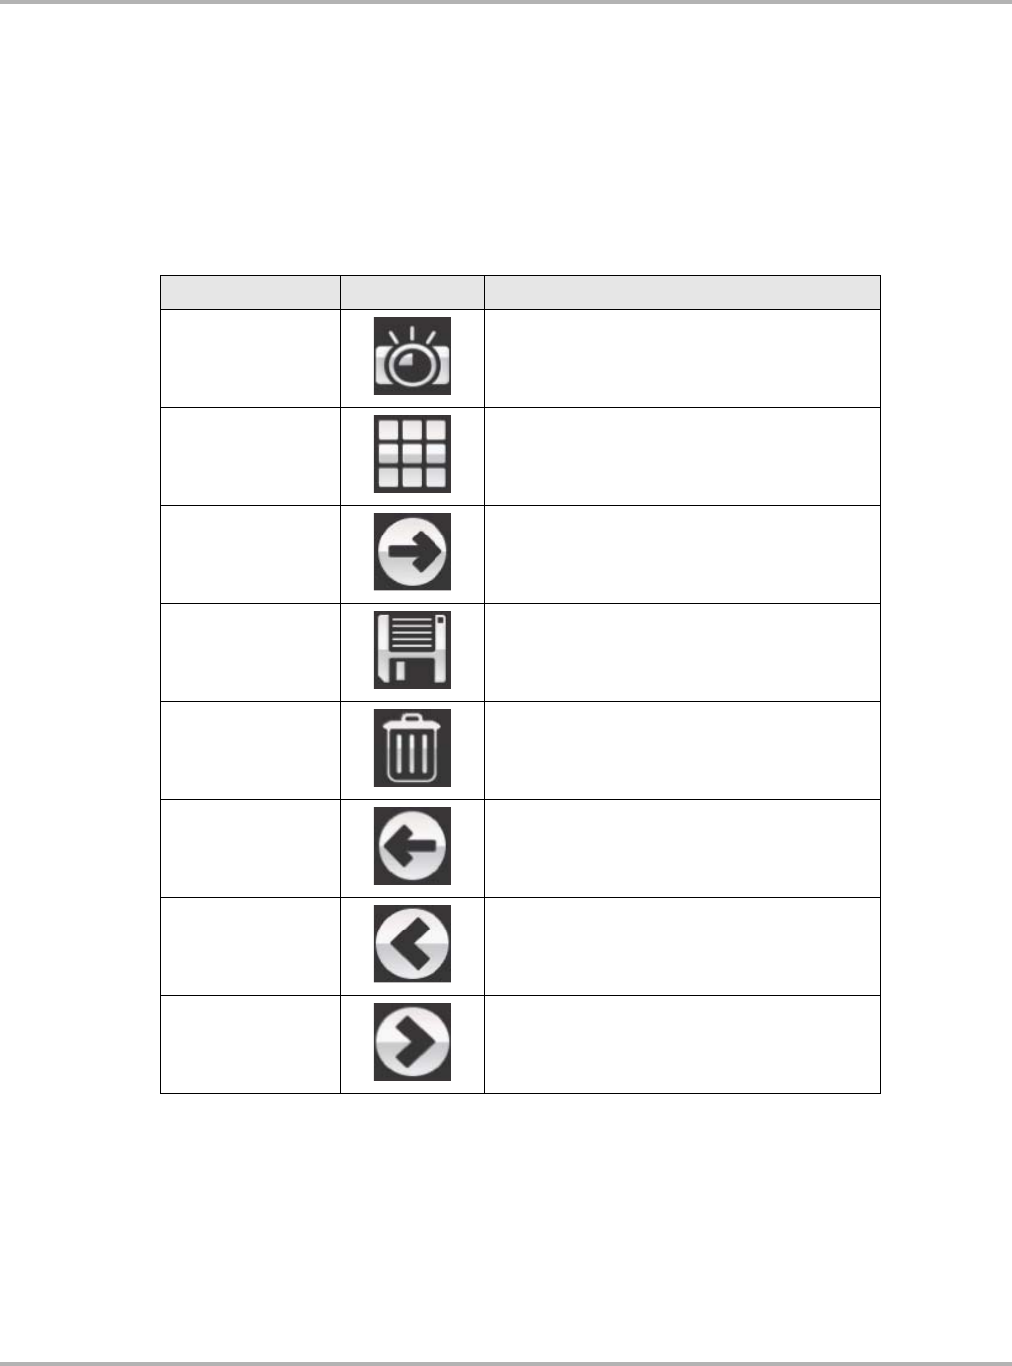
Table 3-7 Camera icons
Name Icon Description
Photo
Acts as a shutter to take a photograph of what is
visible in the view finder, which is the left-hand
portion of the screen.
Gallery Opens a thumbnail gallery of recently taken
pictures.
Exit Closes the camera application and returns to
the previous screen.
Save
Displays after a picture is taken. Selecting
saves the photograph and returns to the view
finder.
Delete
Displays after a picture is taken and in Gallery
mode. Selecting discards the photograph and
returns to the previous screen.
Back Displays in Gallery mode. Selecting returns to
the previously viewed screen.
Previous Displays in Gallery mode. Selecting opens the
picture prior to the current image in the gallery.
Next Displays in Gallery mode. Selecting opens the
picture after the current image in the gallery.

Draft 4/14/15- Do Not Distribute
24
Basic Operation and Navigation Wi-Fi Setup
zTaking pictures:
1. Press the Shortcut (S) Button and choose Camera from the menu.
2. Focus the image to be captured in the view finder.
3. Press the Photo icon.
The view finder now shows the captured picture.
4. Select Save to save the image, or Delete to delete it.
5. Select Exit from the live view to close the camera application.
3.6.2 Viewing Pictures
Photographs are stored on the hard drive and can be retrieved two ways:
From the Diagnostic Suite; select Data Manager from the Home screen, then open the Camera
Folder.
From the desktop; select My Documents > ShopStream > Camera Folder.
3.7 Wi-Fi Setup
Certain applications in the ShopStream Diagnostic Suite require wireless Internet connection. The
wireless network connection status icon is typically available from the Windows taskbar
notification area and can be used to access the wireless network connection setup. Refer to
Windows user documentation for wireless network setup instructions.
Draft 4/14/15- Do Not Distribute
25
Chapter 4 Scanner Function
The Scanner function allows your Diagnostic Tool to communicate with the electronic control
modules (ECMs ) of the vehicle being serviced. This allows you to perform tests, view diagnostic
trouble codes (DTCs), and view live data parameters from various vehicle systems such as the
engine, transmission, antilock brake system (ABS) and more.
4.1 Demonstration Program
A Scanner demonstration program is provided to help you to become familiar with Scanner
operations, without connecting to a vehicle. Sample data and test results are provided to help you
learn the menus and basic operations.
IMPORTANT:
Do not connect the Scan Module to a vehicle while using the Demonstration mode.
zUsing the demonstration program:
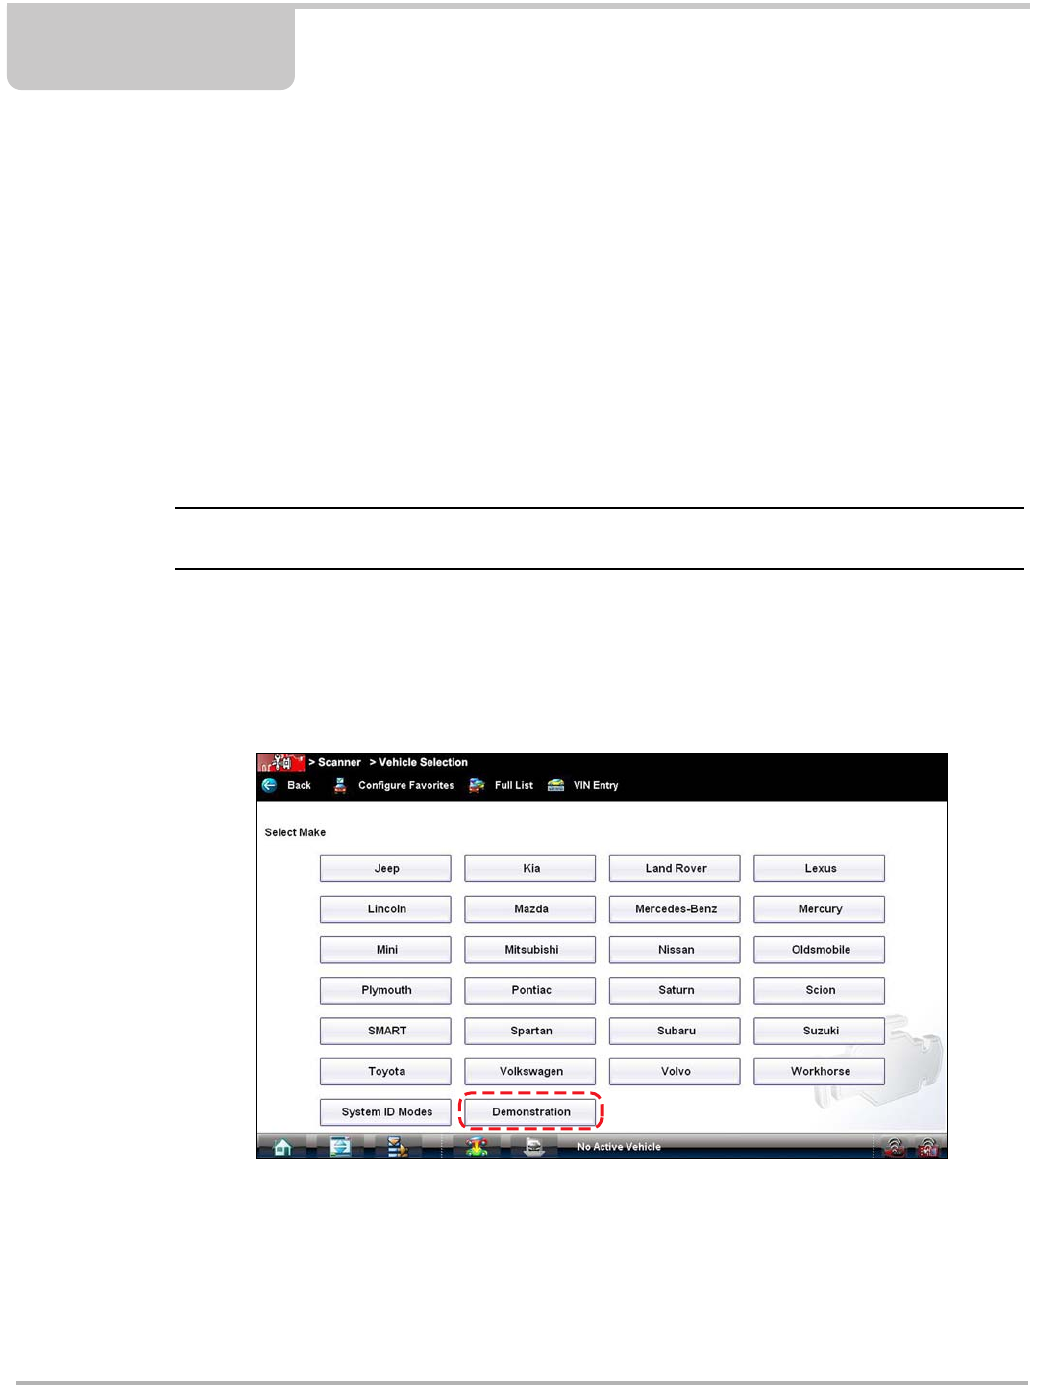
1. From the Home screen, select the Scanner icon to open the manufacturer menu.
The manufacturer menu includes all makes for which Scanner information is available. There
is also a Demonstration icon included in the list.
Figure 4-1 Sample demonstration selection

Draft 4/14/15- Do Not Distribute
26
Scanner Function Basic Operation and Navigation
2. Select the Demonstration icon.
A menu of demonstration choices now displays:
–US Domestic—contains actual data captured while driving a 2001 Chevrolet Tahoe. Look
for the throttle position (TP) sensor dropout while analyzing the data in Graphing mode.
–OBD Training Mode—provides simulated data for an OBD-II/EOBD vehicle that allows
you to access any of the standard functions.
3. Select either option and a confirmation message displays.
4. Select OK to load the selected database.
5. Follow the on-screen instructions and select as needed until the Systems menu displays.
6. Select from any of the systems listed, then select from the submenus.
4.2 Basic Operation and Navigation
This section describes the basic menus, controls and navigation of the Scanner function and
select scanner tests.
4.2.1 Screen Messages
Screen messages appear when additional input is needed before proceeding. There are three
types of on-screen messages; confirmations, warnings, and errors.
•Confirmation Messages - Confirmation messages inform you when you are about to perform
an action that cannot be reversed or when an action has been initiated and your confirmation
is needed to continue. When a user-response is not required to continue, the message
displays briefly before automatically disappearing.
•Warning Messages - Warning messages inform you when completing the selected action
may result in an irreversible change or loss of data.
•Error Messages - Error messages inform you when a system or procedural error has
occurred. Examples of possible errors include a disconnected cable or a peripheral, such as
a printer, is powered off.
4.2.2 Making Selections
The Scanner interface is a menu driven program that presents a series of choices one at a time.
As you select from a menu, the next menu in the series displays. Each selection narrows the focus
and leads to the desired test. Use your fingertip or the stylus to make menu selections.

Draft 4/14/15- Do Not Distribute
27
Scanner Function Basic Operation and Navigation
4.2.3 Scanner Screen Layout
The Scanner screens typically include three sections (Figure 4-2):
1— Scanner Toolbar
2— Main Body
3— Lower Toolbar
Figure 4-2 Scanner screen layout
Scanner Toolbar
The Scanner toolbar contains a number of icons that allow you to configure the displayed data and
to exit. The table below provides a brief explanation of the Scanner toolbar icon operations:
Table 4-1 Scanner toolbar icons (sheet 1 of 2)
Name Icon Description
Exit Closes the current test and returns you
to the menu.
Back When available, returns to the
previously viewed screen.
Custom Allows you to select which parameters
are displayed on the screen.
Alarms
Allows you to set an alarm on certain
data parameters when the signal goes
above or below the alarm setting.
Properties
Allows you to adjust the display
characteristics for all of the data
screens.
Graph View Allows you to simultaneously view up
to 16 data graphs at a time.
Draft 4/14/15- Do Not Distribute
28
Scanner Function Basic Operation and Navigation
The Scanner toolbar is used to configure certain aspects of the displayed data and to exit. The
following sections explain how to use the toolbar.
Custom
The Custom icon on the Scanner Toolbar is used to determine which specific parameters display.
Minimizing the number of parameters on the data list allows you to focus on any suspicious or
symptom-specific data parameters. You can add or remove most parameters from the list. Any
parameter that has a lock icon next to it cannot be removed from the list.
IMPORTANT:
Limiting the number of parameters that display allows for a faster refresh rate of the data. A
smaller data lists also reduces the amount of memory used for saved files.
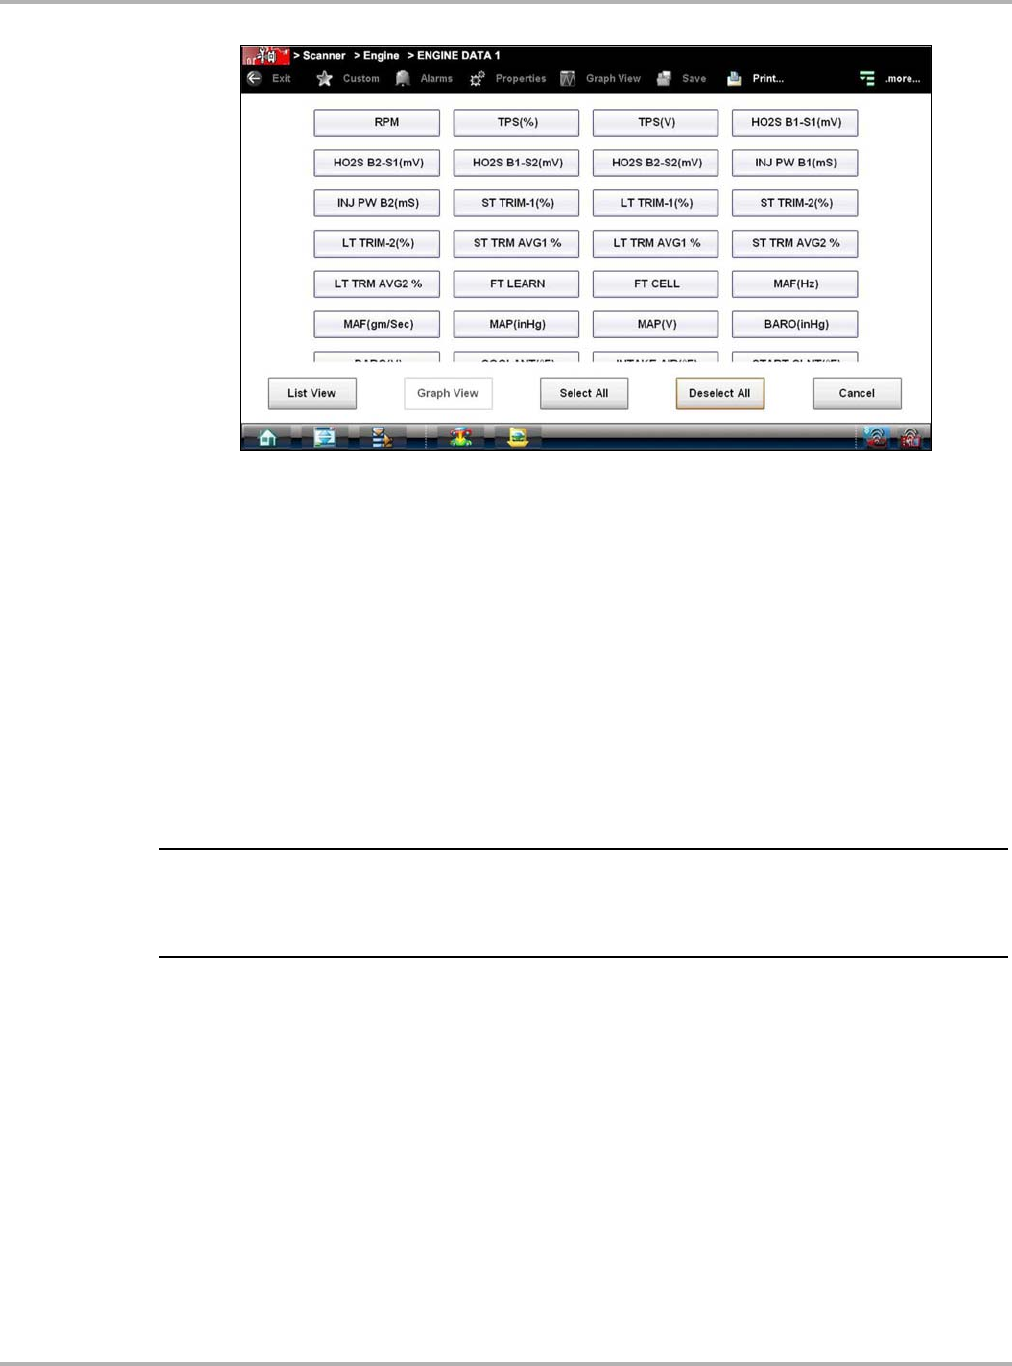
zTo create a custom data list:
1. Select Custom on the Scanner Toolbar.
The parameter selection dialog box with all of the parameters selected opens (Figure 4-3).
2. Select the Deselect All icon to clear the highlights from the screen.
3. Create a custom data list by selecting the parameters to be included. Highlighting indicates a
parameter that displays, parameters that are not highlighted do not display.
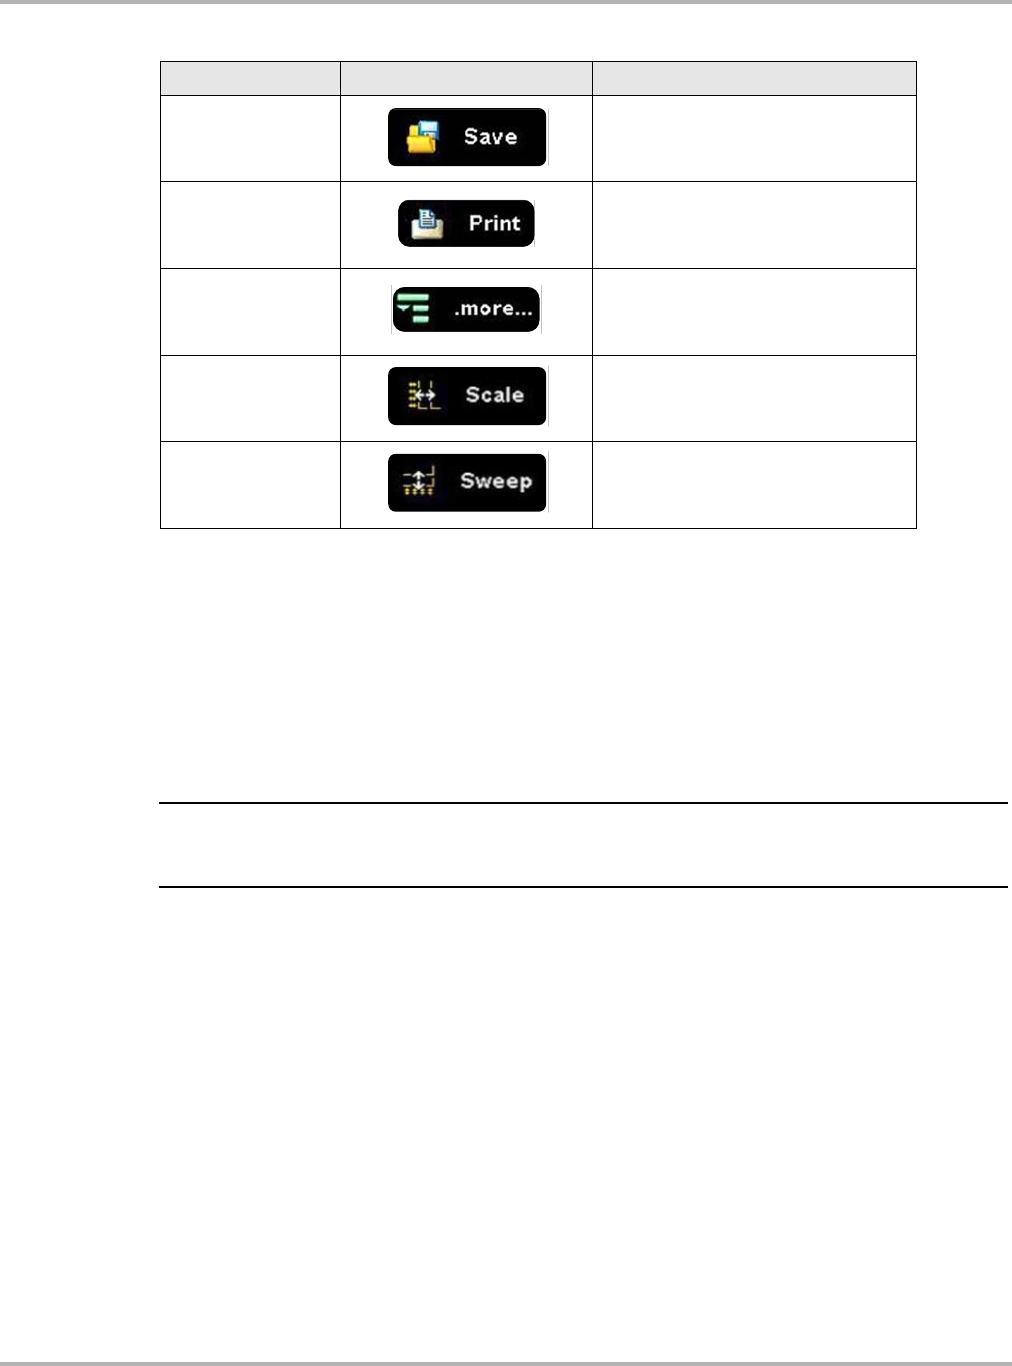
Save
Saves a copy of the current frame of
data that can be viewed using Data
Manager.
Print
Opens a standard Windows Print
dialog box for saving a print copy of the
current frame of data.
More Opens a dropdown menu of the
additional options shown below.
Scale
Switches the scale values, displayed
along the left-hand side of the graphs,
on and off.
Sweep Switches the sweep values, displayed
at the base of the graphs, on and off.
Table 4-1 Scanner toolbar icons (sheet 2 of 2)
Name Icon Description
Draft 4/14/15- Do Not Distribute
29
Scanner Function Basic Operation and Navigation
Figure 4-3 Sample custom configuration screen
Keep the following in mind when configuring a custom data list:
–Gesture scroll if the list of parameters is longer than what is shown on the screen.
–Use the Select All icon to display the complete list.
–Use the Deselect All icon to remove all the currently selected parameters from the list.
–Select individual parameters to highlight and include them in the list.
–Select individual highlighted parameters to remove them from the list.
–Use the Cancel icon to return to the data display.
4. Once all desired parameters have been selected, return to the data list:
–Use the List View icon to return to a data screen in PID List format.
–Use the Graph View icon to return to a data screen in Graph View format, see Graph View
on page 31 for details.
NOTE:
iGraph View is only available when 16 or fewer parameters (the number that can display on a
single screen) were selected for the custom list. Make sure that no more than 16 parameters are
highlighted if the screen displays a single graph when the Graph View icon is selected.
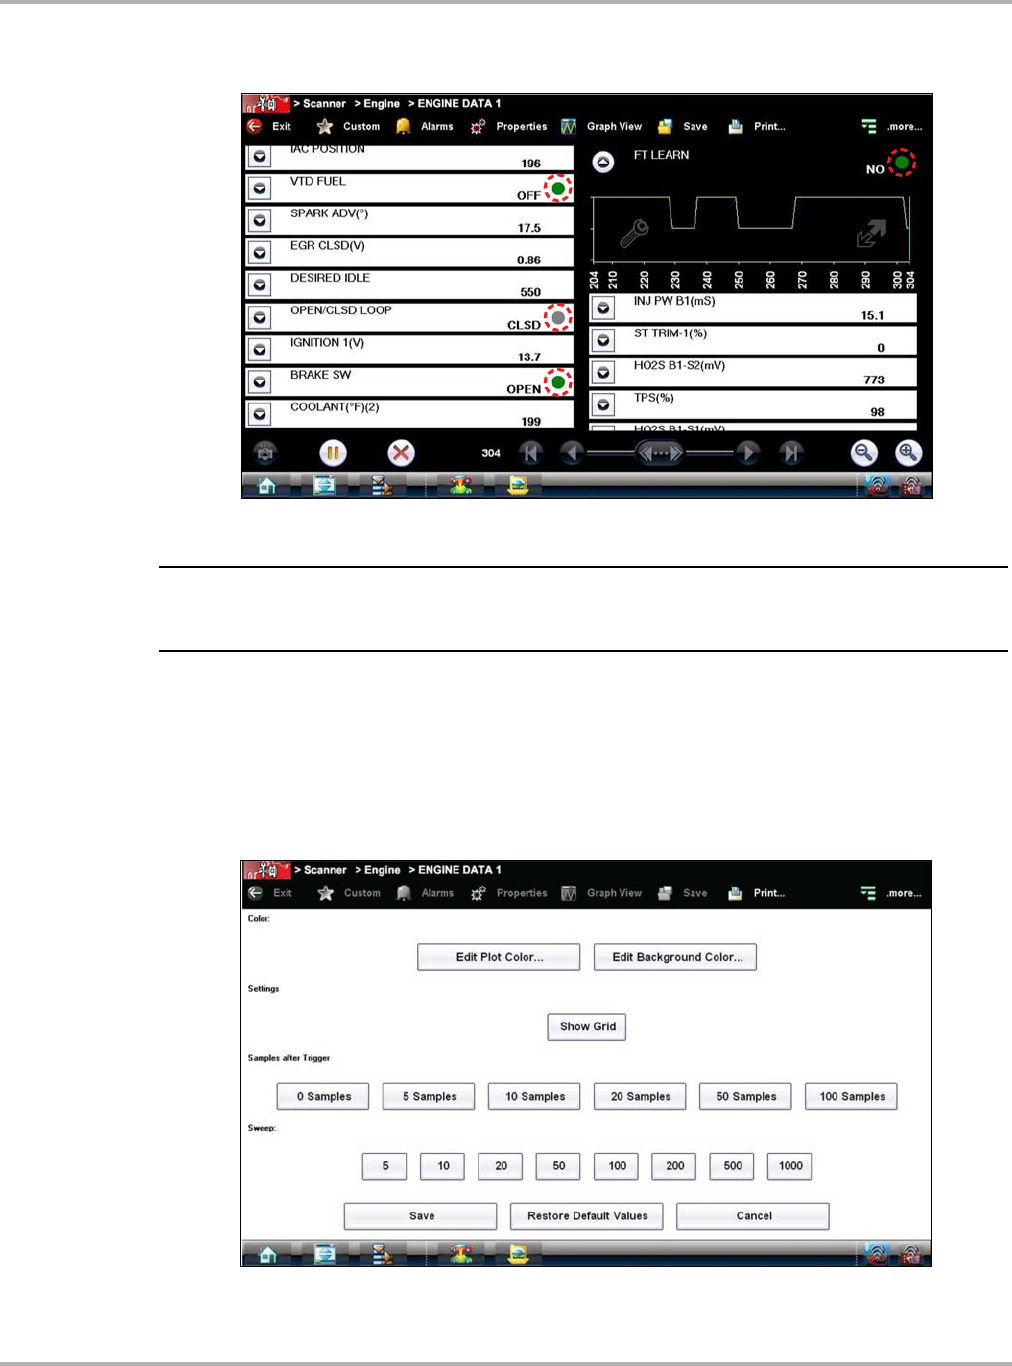
Alarms
Alarms are visual indicators alongside a parameter in the data display list that change color to
show the signal status. A green alarm indicates on, a gray alarm indicates off. Only digital
parameters, those with a range limited to two states, can have alarms. Parameters with
continuous ranges, such as variable voltage and pressure values, cannot have alarms. The alarm
indicator assignments remain as selected until you exit the data list:
zTo configure alarm settings:
1. Select the Alarms icon on the Scanner Toolbar.
The Alarm List dialog box opens.
2. Check the parameters that you want to show alarms.
3. Select Save.
Draft 4/14/15- Do Not Distribute
30
Scanner Function Basic Operation and Navigation
Alarm indicators now appear next to the selected parameters in the Data List (Figure 4-4).
Figure 4-4 Sample alarm indicators
NOTE:
iAlarms can only be set for certain parameters. If the Alarm List dialog box is empty, no parameters
are available and alarms cannot be set.
Properties
The Properties icon on the Scanner Toolbar is used to configure certain characteristics of the
parameter graph display. Selecting opens a Properties dialog box that allows you to adjust colors,
settings, and sweep (Figure 4-5).
Figure 4-5 Sample properties dialog box

Draft 4/14/15- Do Not Distribute
31
Scanner Function Basic Operation and Navigation
Selecting either color option, Edit Plot Color or Edit Background Color opens a standard color
selection dialog box. Select a color, then select OK to close the dialog box.
The Show Grid icon is used to switch a background grid pattern on the data graphs on and off:
•To switch the grid on; select to highlight Show Grid, then select Accept.
•To switch the grid off; select Show Grid twice so it is not highlighted, then select Accept.
The Samples After Trigger setting determines how many data samples are recorded following a
triggering event. The highlighted samples icon indicates the number of frames that are included in
the recording after a triggering event.
The sweep options let you choose the amount of data that displays across the graph. Values are
in sample points, or frames of data. A frame of data equals one complete transmission of the serial
data by the electronic control module.
Graph View
Graph View allows you to simultaneously display up to 16 parameter graphs (Figure 4-6). The
graphs must first be opened in the data list in order to be included when Graph View is selected
from the toolbar. The display defaults to a single graph if more than 16 graphs are open when the
toolbar icon is selected. Should this happen, return to the data list and close some of the graphs.
A toolbar in Graph View allows you switch scale and sweep values on and off, and to return to the
List View. The Data Buffer toolbar at the base of the screen remains active.
NOTE:
iThe screen does not scroll in Graph View mode, it adjusts to show only the selected parameters.
Figure 4-6 Sample Graph View screen
Graph View mode can also be engaged from the custom data list configuration screen. Refer to
Custom on page 28 for details.

Draft 4/14/15- Do Not Distribute
32
Scanner Function Basic Operation and Navigation
Save
The Save icon is used to record movies of vehicle datastream values. Saved files can be helpful
when trying to isolate an intermittent problem or to verify a repair during a road test.
zTo save a movie:
•Select Save.
A save movie dialog box displays while data is being saved. The movie is saved when the
message box disappears.
Figure 4-7 Sample save dialog box
To open saved Scanner data files, from the Home screen select Data Manager > Scanner Data
Folder, see Scanner DataViewer Operation on page 129.
Print
Selecting Print from the toolbar opens a standard Windows Print dialog box. Select from the
options as needed to print the current frame of data.
Figure 4-8 Sample print dialog box
Draft 4/14/15- Do Not Distribute
33
Scanner Function Basic Operation and Navigation
If the Diagnostic Tool is connected to a printer, the current frame of data is printed. If the Diagnostic
Tool is not connected to a printer, the frame of data is saved as an “XPS” file. A dialog box opens
so that you can name the print file and specify the location that it is saved to, follow the on-screen
instructions.
Saved files can be printed at a later date, or opened and reviewed.
NOTE:
iSaved print files cannot be viewed using the Data Manager, they can only be opened into an
internet browser.
zTo open a saved print file:
1. Minimize the Diagnostic Suite to view the desktop.
2. From the desktop select My Documents > ShopStream > Scanner Data Folder.
3. Locate the file you wish to view.
4. Double select the file to open it.
The internet browser and file open.
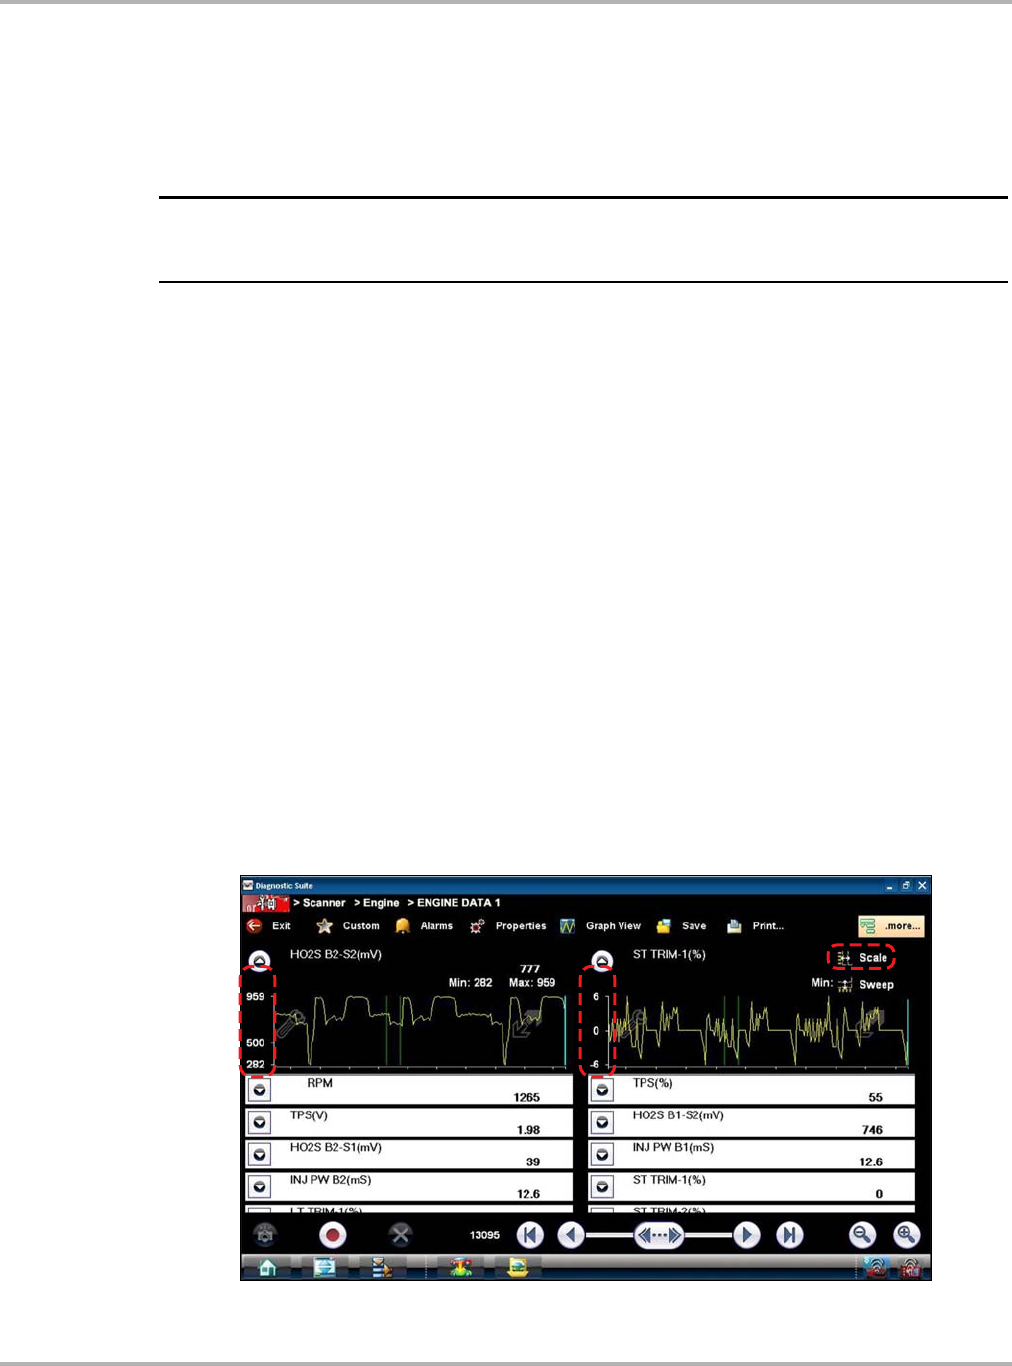
More
Whenever the More icon appears on the toolbar it indicates that there are additional options
available. Selecting the More icon from the Scanner toolbar opens a dropdown menu that offers
two choices that only apply to data graphs:
•Scale
•Sweep
Scale
The Scale option switches the scale values, displayed along the left-hand side of the data graphs,
on and off (Figure 4-9). The dropdown menu closes once a selection is made.
Figure 4-9 Sample data graph scales
Draft 4/14/15- Do Not Distribute
34
Scanner Function Basic Operation and Navigation
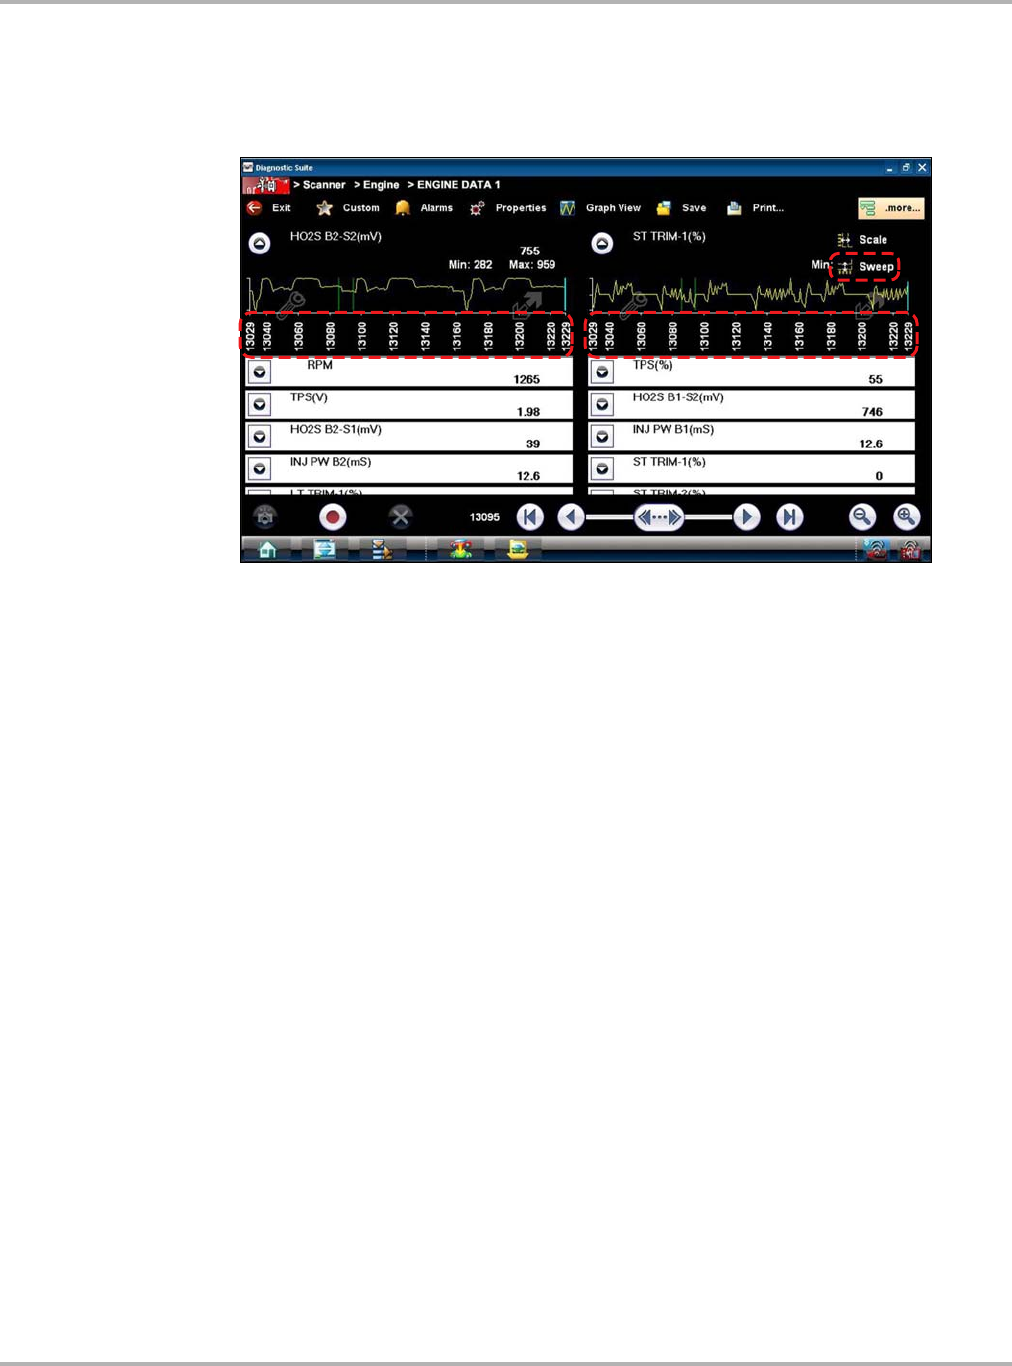
Sweep
The Sweep option switches the sweep values, displayed below the data graphs, on and off
(Figure 4-10). The dropdown menu closes once a selection is made.
Figure 4-10 Sample data graph sweep
Main Body
The main body of the screen varies depending on the stage of operation. The main body can show
vehicle identification selections, the main menu, test data, instructions, troubleshooting
information, controls, and other diagnostic information.
Draft 4/14/15- Do Not Distribute
35
Scanner Function Basic Operation and Navigation
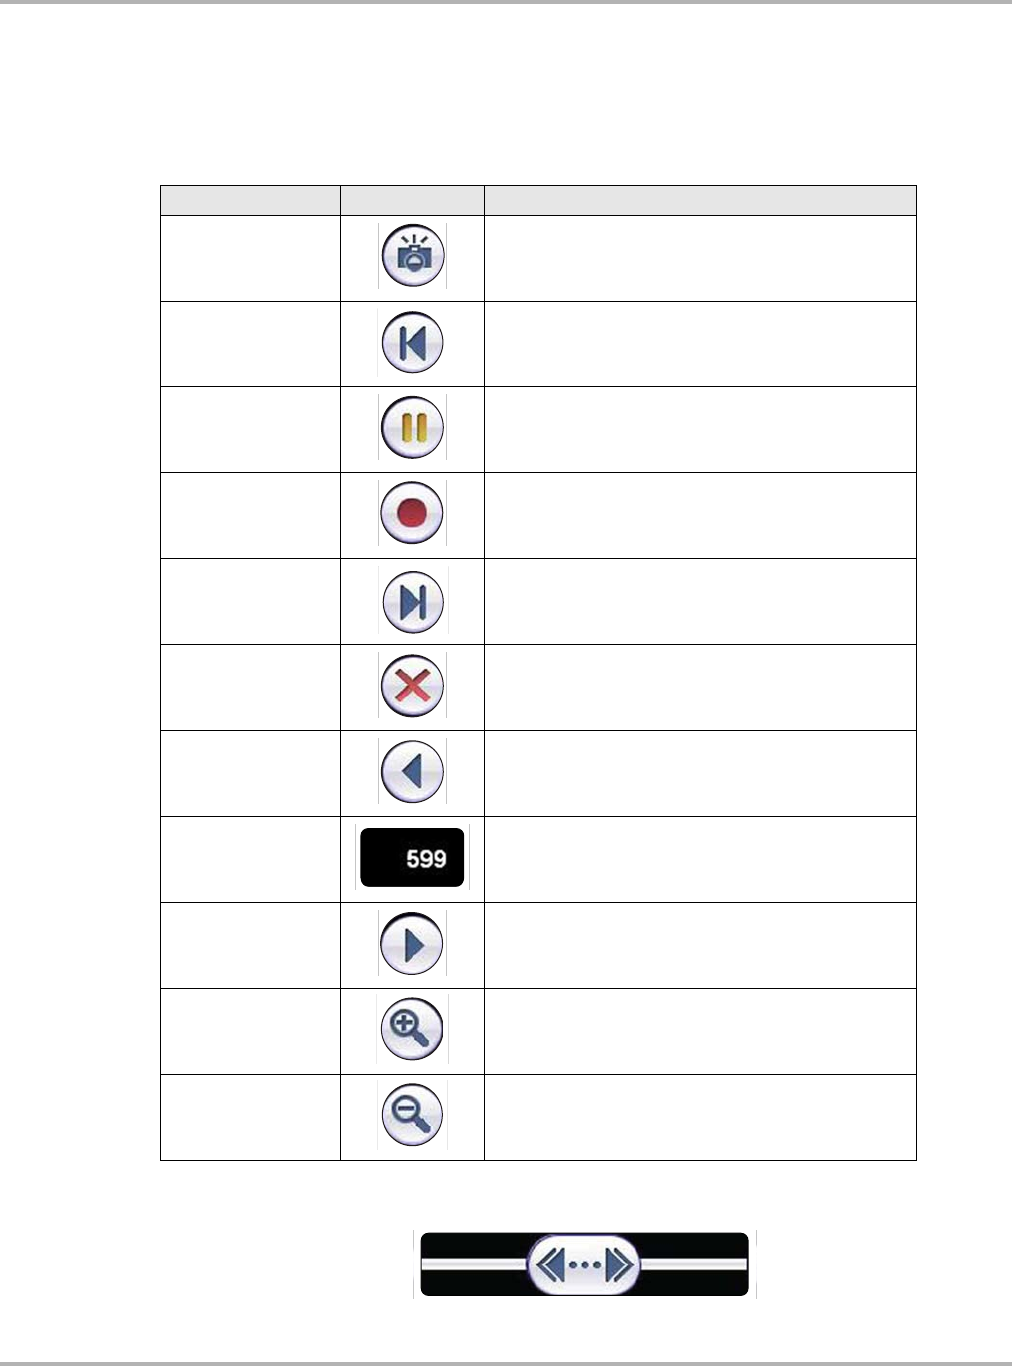
Lower Toolbar
Whenever communication is established with a vehicle, the Scanner continuously records data
transmitted by the ECM in the data buffer. The toolbar below the main body of the screen contains
the icons for navigating the buffered data and other options (Tab le 4- 2).
Use the slider in the middle of the toolbar to quickly move through paused data.
Figure 4-11 Sample data buffer slider
Table 4-2 Data buffer toolbar icons
Name Icon Description
Snapshot Arms the software to take a snapshot of vehicle data
Go To Start Moves to the first frame in the data buffer
Pause Suspends data capture and changes to show the
Play icon
Play Starts or resumes data capture and changes to show
the Pause icon
Go To End Moves to the last frame in the data buffer
Clear Erases data in the data buffer
Step Back Moves to the previous frame in the data buffer
Frame Counter Indicates the data buffer frame currently displayed
Step Forward Moves to the next frame in the data buffer
Zoom In Increases the magnification by decreasing the sweep
of the graph
Zoom Out Decreases the magnification by increasing the
sweep of the graph
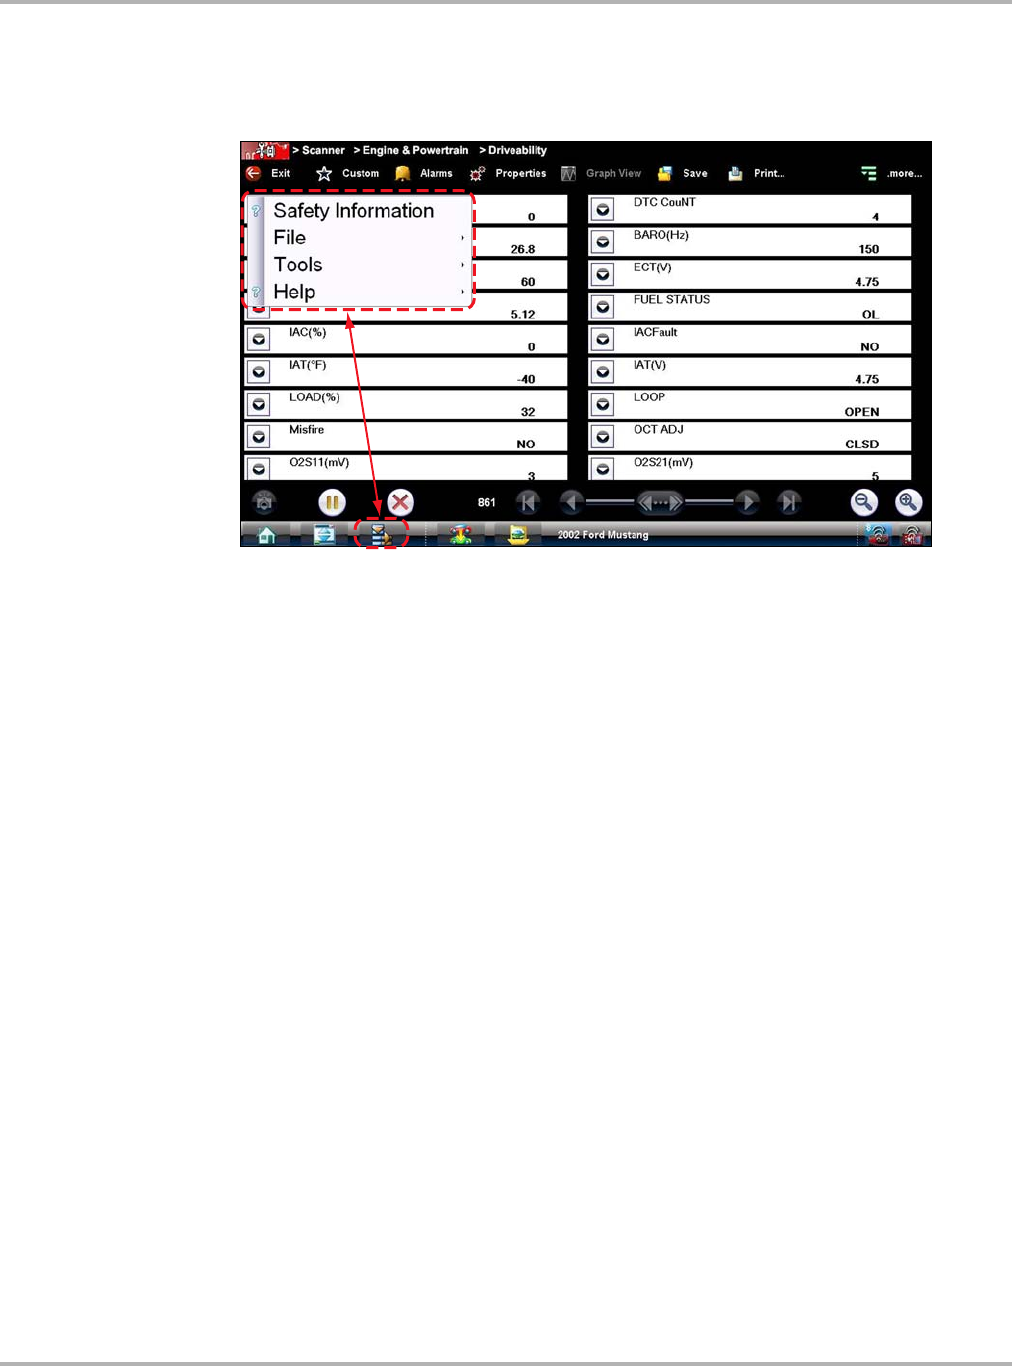
Draft 4/14/15- Do Not Distribute
36
Scanner Function Basic Operation and Navigation
4.2.4 Menu Options
The Toolbar Menu icon at the base of the screen opens a menu near the top of the display.
Figure 4-12 Sample Scanner Menu icon options
The following Menu options are available:
•Safety Information—opens the Important Safety Instructions document.
•File—allows you to print or save the data being viewed.
•Tool s —allows you to perform certain maintenance operations and adjust tool settings.
•Help—allows you to view supporting documentation.
File
Use to print or save a copy of the data currently being viewed. Menu options include:
•Save—opens a submenu with these options:
–Screenshot—saves a graphic image of the current screen.
–Collected Data—saves a recording of all the data currently in the buffer plus the number
of frames designated after the trigger event (see Properties on page 30).
•Print—opens a submenu with these options:
–Screen—sends the current screen image to a printer.
–Troubleshooter—prints the full text of the troubleshooter topic shown in the main body.
Selecting an option opens a Windows Print dialog box for printing or saving the file.
Tools
This option allows you to adjust tool settings to your personal preferences. Selecting Tools opens
a menu with two options:
•Units Setup
•Display BEN
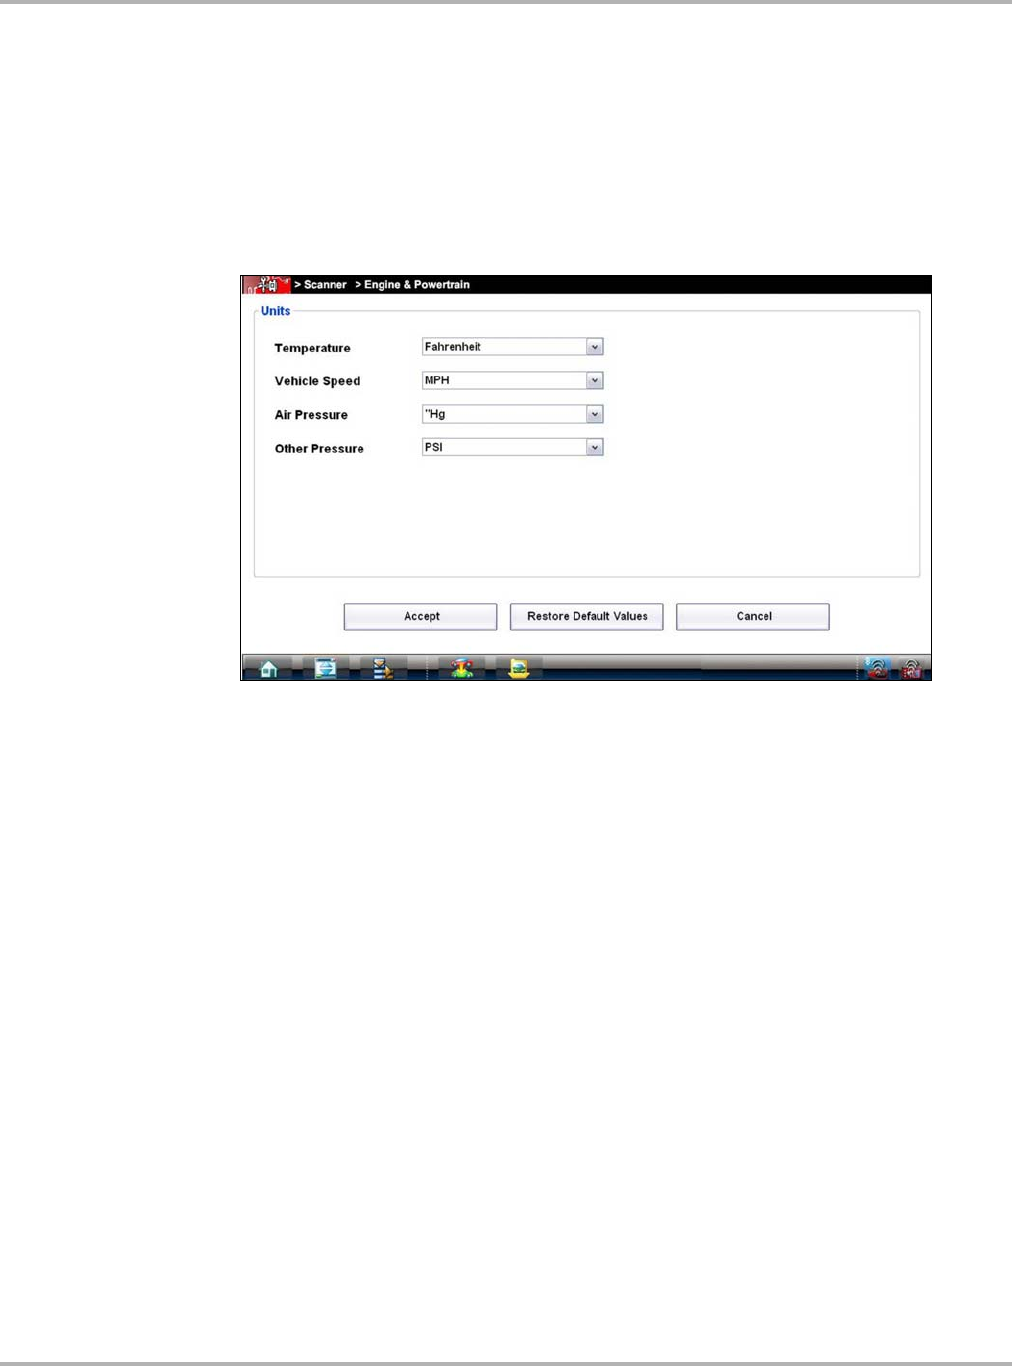
Draft 4/14/15- Do Not Distribute
37
Scanner Function Basic Operation and Navigation
Units Setup
The units of measurement can be changed for temperature, vehicle speed, air pressure and other
pressure readings. Choose between US customary or metric units of measure.
zTo change the units setup:
1. Select Tools > Units Setup.
The Measurement Units Setup dialog box opens.
Figure 4-13 Sample Units Setup screen
2. Use the dropdown menus to select the desired value for each item.
3. Select Accept to close the dialog box and apply the changes.
Display BEN
Selecting opens a screen with the Balco Engine Number (BEN) of the currently identified vehicle.
The BEN is used internally for data coordination, and you may be asked to provide to a Customer
Care representative for troubleshooting communication problems.
Help
A variety of utilities and additional resources are available through the Help menu:
•User’s Manuals
•About Scanner Hardware Version
•About Scanner
The User Manual, Version Info, and Activation Status options are the same as explained
previously, see Menu Options on page 20 for details. Other options are explained below.
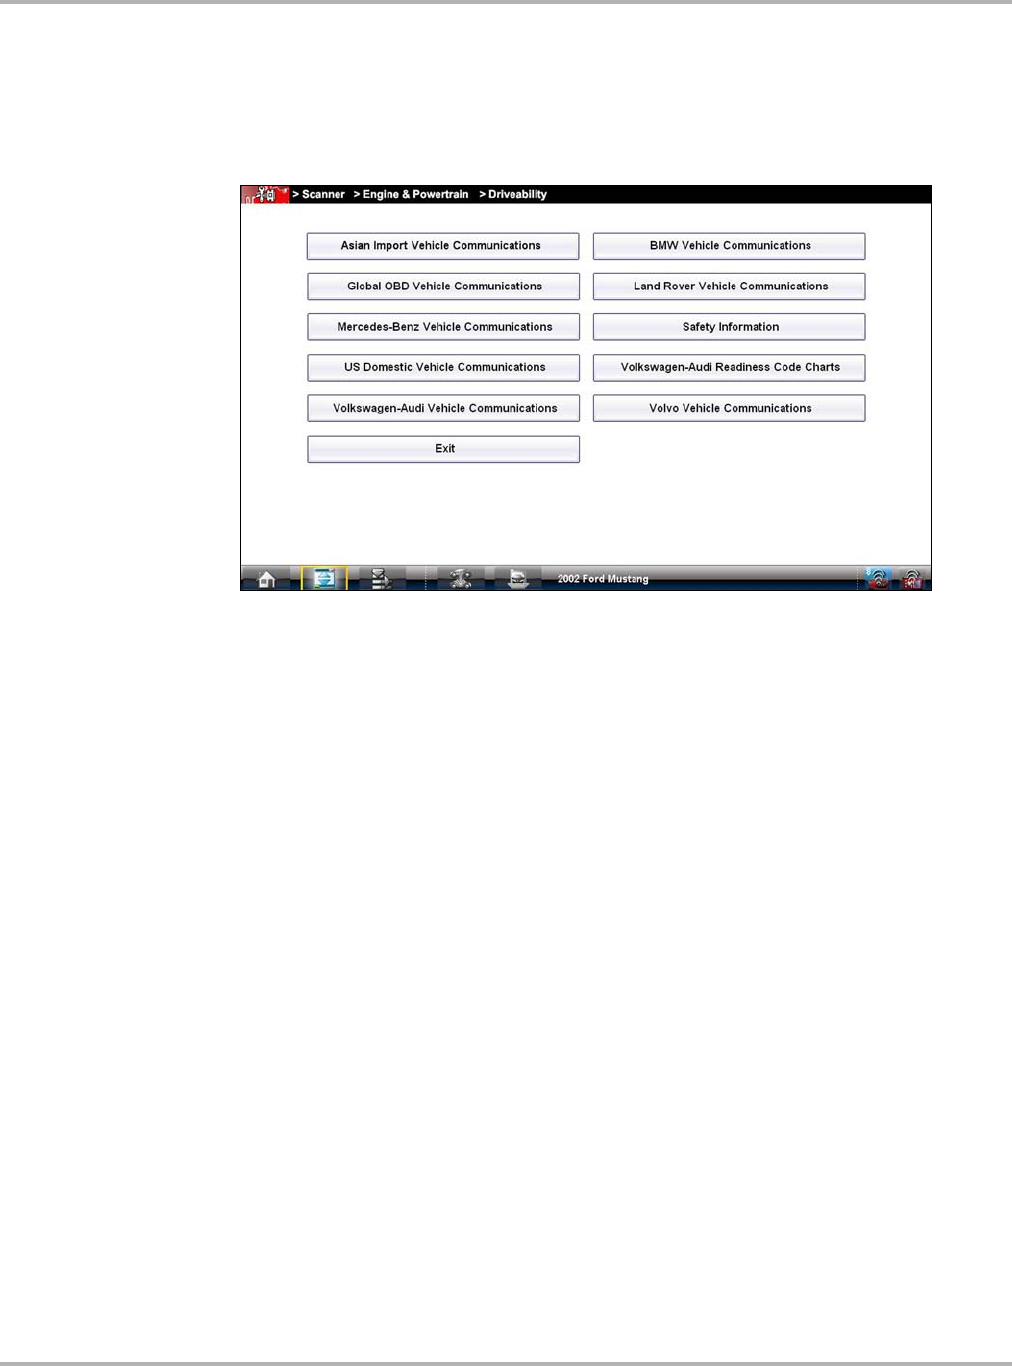
Draft 4/14/15- Do Not Distribute
38
Scanner Function Basic Operation and Navigation
User’s Manuals
This option opens a menu of additional support documentation, such as vehicle communication
software manuals, available to assist in your diagnosis. These manuals provide connection
information, detailed test procedures, and other resource material for specific vehicles.
Figure 4-14 Sample User’s Manuals menu
Select Exit to close the Help module and return to the Scanner.
About Scanner Hardware Version
This option opens a dialog box showing the hardware version and other details about the Scanner
module. A Copy to Clipboard icon allows you to paste the information to a document or e-mail.
About Scanner
This option opens a dialog box that shows the software version and other Scanner module details.
A Copy to Clipboard icon allows you to paste the information to a document or e-mail.
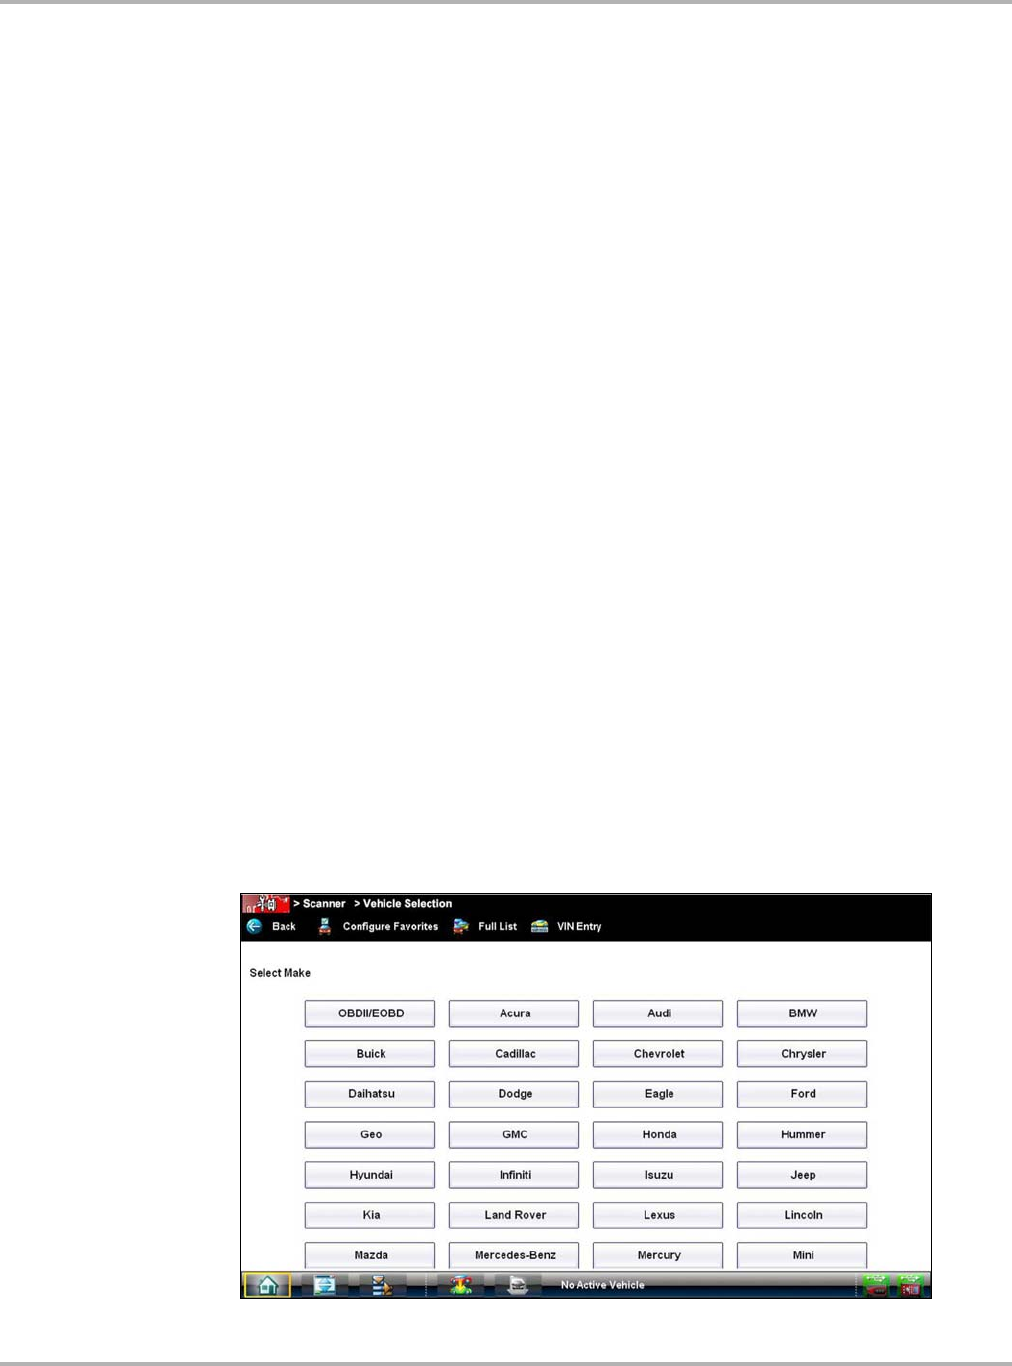
Draft 4/14/15- Do Not Distribute
39
Scanner Function Scanner Operation
4.3 Scanner Operation
The Scanner function has two main operation features:
•Scanner—allows communication with the vehicle ECMs to review DTCs, view parameter
data, and perform functional tests.
•Fast-Track Troubleshooter—provides access to troubleshooting information from a database
of experienced based information developed by master technicians.
zBasic Scanner Operation Steps
1. Open Scanner—Select Scanner on the Home screen.
2. Identify the vehicle—Identify the test vehicle by selecting from the menu options.
3. Connect the data cable to the vehicle—Follow the on-screen connection instructions to
connect the Scan Module to the test vehicle.
4. Select a system—Select the system to be tested from the systems menu.
5. Select a test —Select the desired test.
4.3.1 Vehicle Identification
The Scanner communicates with the ECMs of the test vehicle and provides vehicle specific data
and test results. Vehicle identification is the initial step in using the Scanner function. Once vehicle
identification information is entered it is saved in Vehicle History and can be selected again for
later use to save time when testing the same vehicle.
The vehicle identification sequence is menu driven, each selection advances to the next screen.
A Back icon in the upper left corner of the screen returns to the previous screen. Menus items and
procedures may vary by vehicle.
zIdentifying a vehicle:
1. Select the Scanner Function icon from the Home screen.
A list of manufacturers displays (Figure 4-15).
Figure 4-15 Sample manufacturer list

Draft 4/14/15- Do Not Distribute
40
Scanner Function Scanner Operation
2. Select the manufacturer of the test vehicle from the list.
A model year menu displays.
NOTE:
iYou can limit the number of manufacturers that appear on the list by selecting Configure
Favorites from the toolbar. See Creating a Favorites List on page 76 for details.
3. Select the year of the test vehicle from the menu.
A list of vehicle types or models displays. Several selections may be required to identify the
vehicle type and model, follow the screen prompts and enter the required information.
A confirmation page showing the identified vehicle displays once all the required data has
been entered. Review the information to make sure it is correct.
4. Select OK.
Alternative Vehicle Identification
Occasionally, you may try to identify a test vehicle that the Scanner does not recognize, the
database does not support, or has some unique characteristics that prevents it from
communicating with the Scanner. In these instances, there is an alternate choice that allows you
to establish communication with the vehicle:
•OBDII/EOBD Function—this function allows you to connect to the OBDII equipped vehicle
and perform basic OBD-II or EOBD diagnostic functions, see OBD Direct Operations on
page 65 for additional information.
Technical Service Bulletins
The Technical Service Bulletins icons (Figure 4-16) become active, after a vehicle has been
identified, for additional information, see Technical Service Bulletins on page 114.
Figure 4-16 Home Screen - TSB/Recall/Campaign Icon
4.3.2 Connecting the Scan Module
The Scan Module is a wireless device that is connected (using the vehicle data cable) to the
vehicle and transmits vehicle data to the Diagnostic Tool. To use the Scanner function the Scan
Module must be paired with the Diagnostic Tool. If the Scanner tries to communicate with the
vehicle and the Scan Module is not connected to the vehicle, a Connect Data Cable confirmation
screen will display. For Scan Module connection and operation information, see Pairing The Scan
Module on page 55.
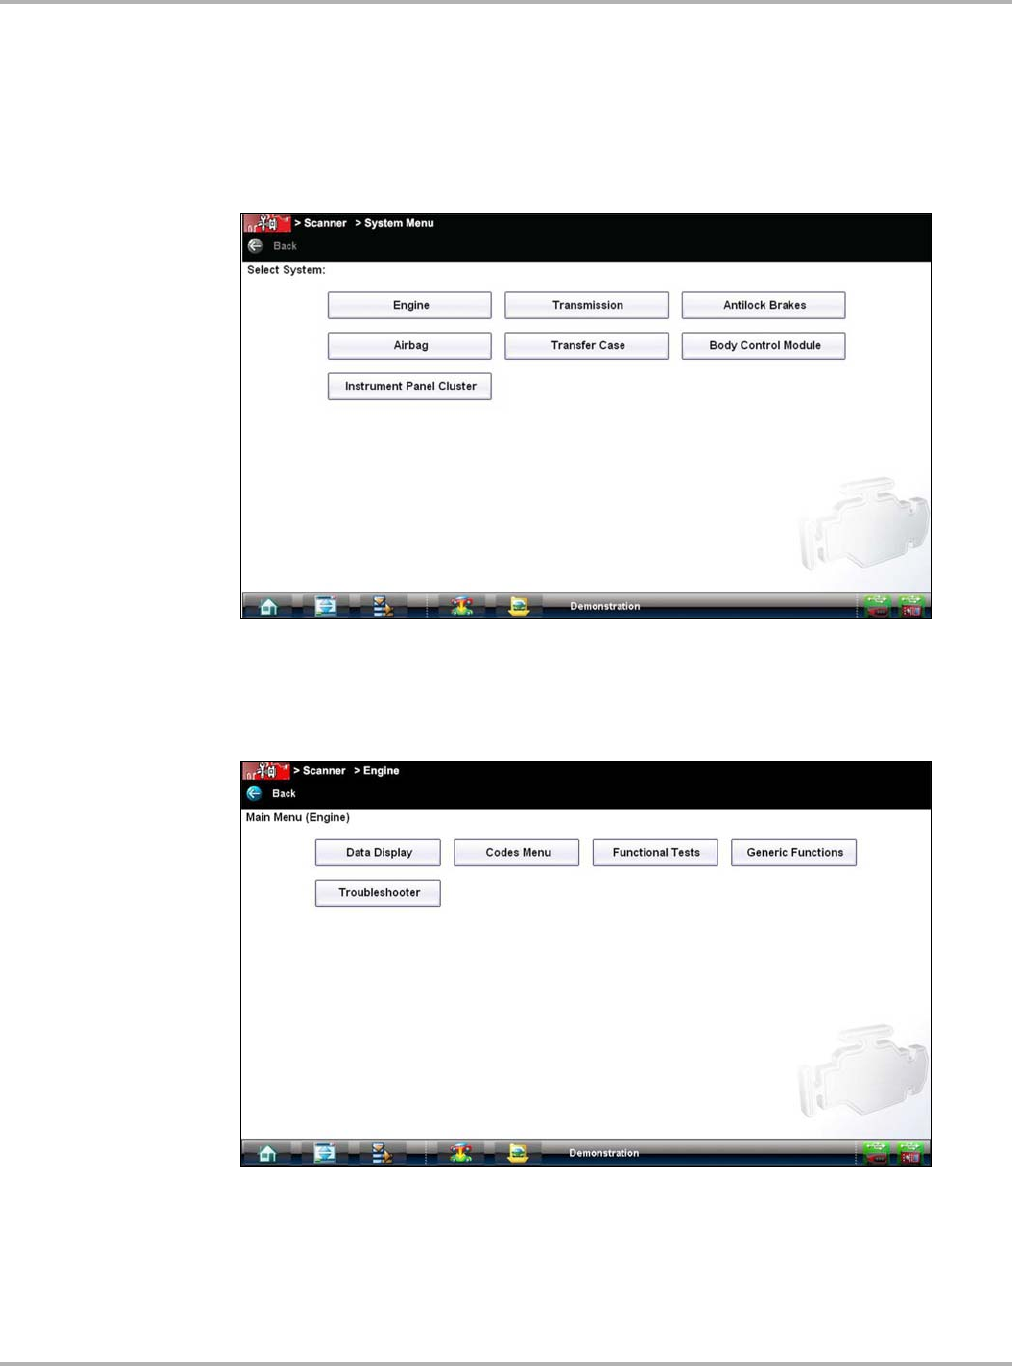
Draft 4/14/15- Do Not Distribute
41
Scanner Function Scanner Operation
4.3.3 Vehicle System and Test Selection
zSelecting a vehicle system:
1. After the vehicle has been identified, a list of available systems for testing displays
(Figure 4-17). Select a system to continue.
Figure 4-17 Systems menu
2. After a system is selected and the Scanner establishes communication with the vehicle, the
Scanner Main menu displays available tests. Select a menu item to continue.
Figure 4-18 Scanner Main menu

Draft 4/14/15- Do Not Distribute
42
Scanner Function Scanner Operation
Main menu options vary slightly by year, make, and model. The main menu may include:
•Data Display— displays data parameter information from the vehicle electronic control
module (ECM). Selecting may open a submenu of viewing options.
•Codes Menu—displays diagnostic trouble code (DTC) records from the vehicle electronic
control module. Selecting may open a submenu of viewing options.
•Clear Codes—erases DTC records and other data from the ECM. This selection is found on
a Codes submenu for some models.
•Functional Tests—provides specific subsystem and Guided Component Tests. The tests
vary depending on the manufacturer and model.
•Actuator Tests—similar to functional tests, checks the operation of certain actuators, such as
solenoid valves and relays.
•Memory Resets—allows you to reprogram adaptive values for certain components after
making repairs. Selecting opens a submenu. These options are found on the Functional Tests
Menu for some models.
•System Tests—provides specific subsystem testing. Performing these tests is similar to
functional tests.
•Generic Functions—lets you access certain available Generic OBD II functions from a
proprietary menu (1996 and newer vehicles only).
•Troubleshooter—provides step-by-step procedures, integrating parameter data and
retrieving trouble codes when appropriate, for specific symptoms of the identified vehicle.
Codes Menu
This selection may appear as Codes, Codes Menu, Codes Only, Codes (No Data), or something
similar on the menu. Selecting opens a list of data parameter viewing options that may include:
Display Codes
Selecting opens either a list of diagnostic trouble codes (DTCs) stored in the selected electronic
control module (ECM), or a submenu of DTC viewing options. Submenu options may include:
•Trouble Code Information—opens a list of codes in ECM memory.
•History Codes—opens a list of codes whose symptoms are not currently present. History
codes indicate an intermittently occurring problem.
•Failed This Ignition—opens a list of codes that set during the current ignition cycle.
•MIL SVS or Message Requested—displays ECM requests to light the malfunction indicator
lamp (MIL) or service vehicle soon (SVS) lamp, or display a driver information alert.
•Last Test Failed—displays a complete list of failed tests.
•Test Failed Since Code Cleared—displays a list of tests that failed since the last time codes
were cleared from ECM memory.
If SureTrack® (optional) is active and data is available for a selected DTC, additional
troubleshooting information from SureTrack (e.g. Common Replaced Parts data (Figure 4-19),
Real Fix and Related Fixes) will also be available. For additional information about using
SureTrack, see SureTrack on page 147.
A code list includes the DTC, a brief description, and a SureTrack Fix It! icon that opens a
submenu allowing you additional information about the DTC (Figure 4-19).
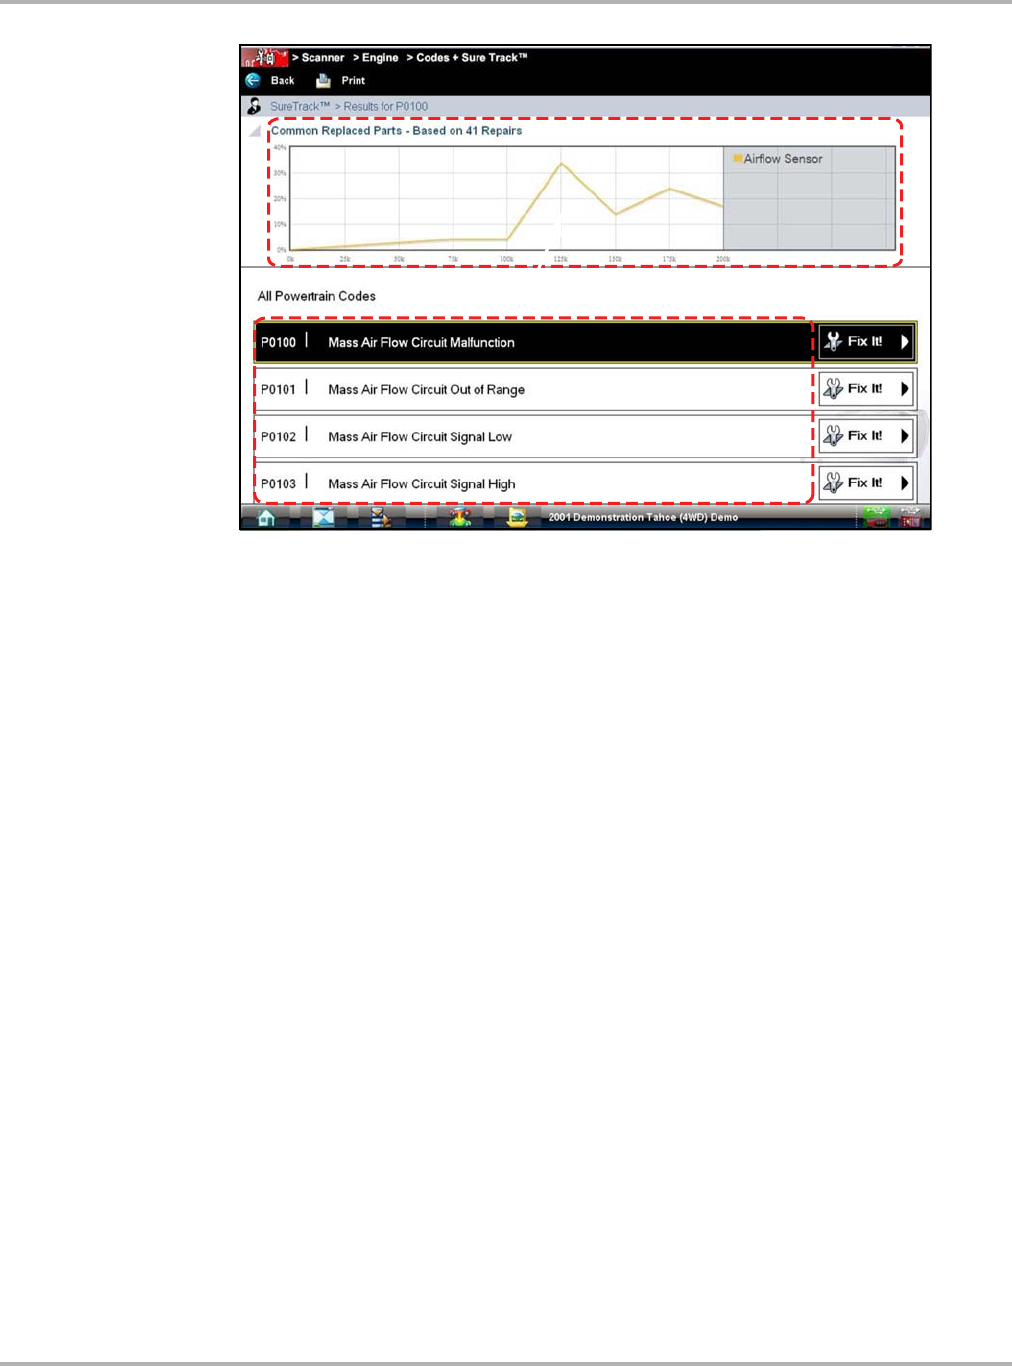
Draft 4/14/15- Do Not Distribute
43
Scanner Function Scanner Operation
Figure 4-19 Sample code list and SureTrack information
Clear Codes
The Scanner clears trouble codes from the ECM memory on some vehicles. If this function is not
available on the test vehicle, Clear Codes does not appear as a menu option.
zTo clear codes:
1. Select Clear Codes from the Codes Menu.
A confirmation message displays.
2. Make sure any conditions shown on the confirmation message are met, then select Yes.
A “codes cleared” message displays once the operation is complete.
3. Select Continue to return to the Codes Menu.
Freeze Frame/Failure Records
This selection displays the DTC that was set, along with corresponding data, when the ECM
commanded the malfunction indicator lamp (MIL) to turn on.
DTC Status
This selection allows you to view the records of a particular DTC.
zTo check DTC status
1. Select DTC Status from the Codes Menu.
The DTC Status entry field displays and the virtual keyboard opens (Figure 4-20).
2. Use the virtual keyboard to enter the characters of the DTC.
3. Select the virtual keyboard Backspace icon if needed to erase a character.
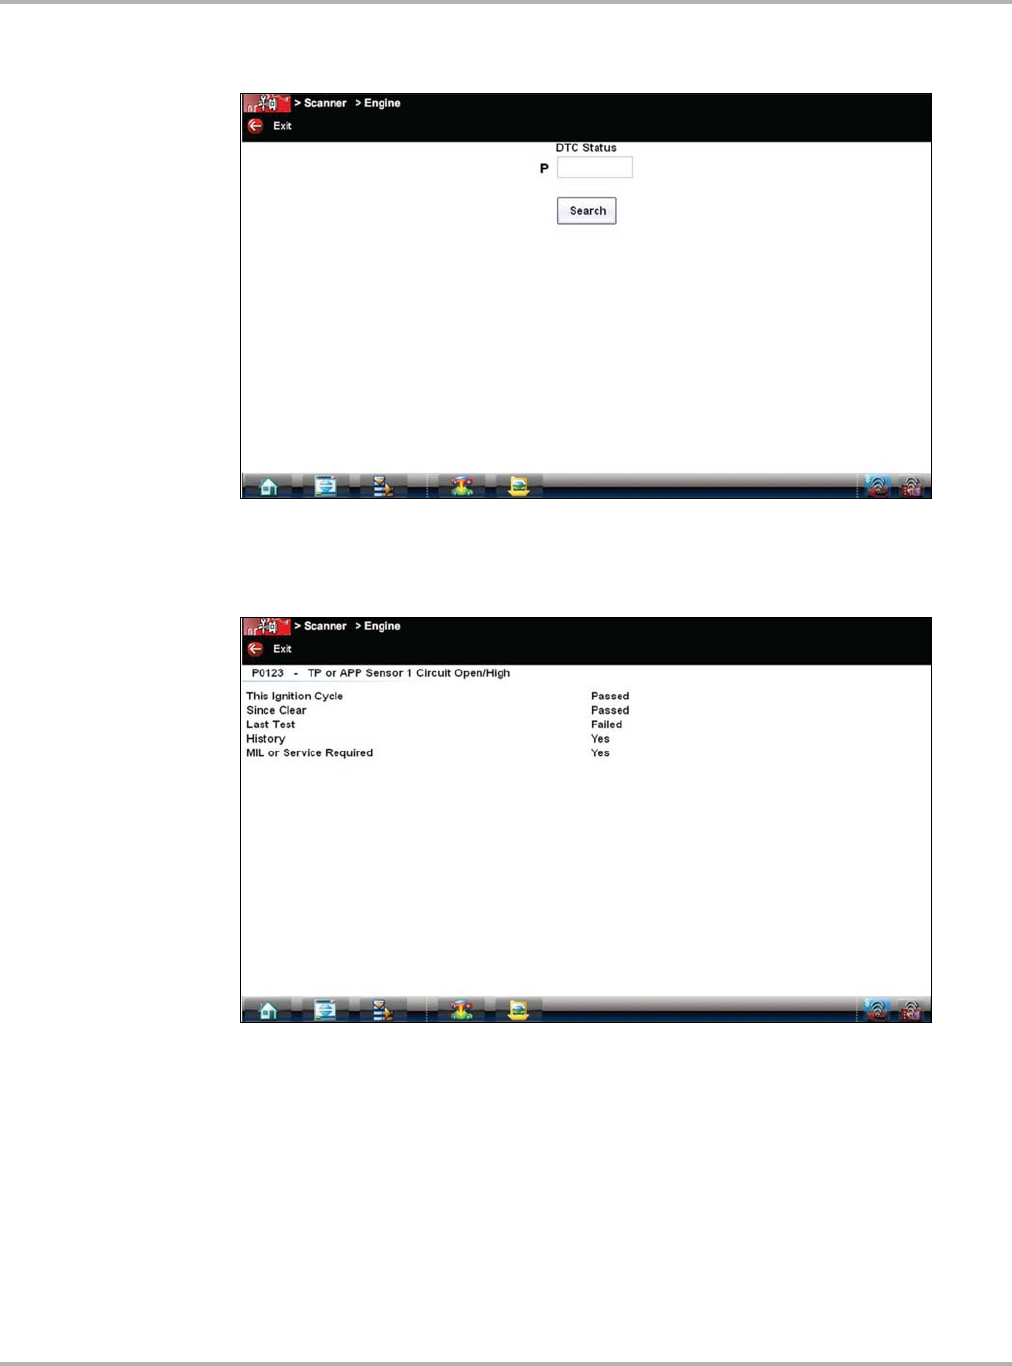
Draft 4/14/15- Do Not Distribute
44
Scanner Function Scanner Operation
4. Select the virtual keyboard Return key once all the code characters are entered.
Figure 4-20 Sample DTC Status entry field
The DTC status report displays (Figure 4-21).
Figure 4-21 Sample DTC status report
5. Select Exit to return to the DTC status entry screen.
6. Select Exit again to return to the Codes menu.

Draft 4/14/15- Do Not Distribute
45
Scanner Function Scanner Operation
Data Display
Depending upon the test vehicle, this selection may appear as Data, Data Display, Data Only,
Data (No Codes), or something similar. All are similar. Selecting has one of the following results:
•A submenu of data viewing choices displays.
•Vehicle data displays.
A submenu displays when more than one data viewing mode is available on the identified vehicle.
On some models, the engine must be started or cranked before data can be displayed. For these
models, a “Waiting to Communicate” message displays if the engine was not cranked or started.
Data Screens
When a Data selection is made, the screen displays the data list for the selected module.The
items available for any electronic control module vary from one vehicle to another.
Data is presented in a 2-column format. An abbreviated parameter name is at the left of each
column and its value is at the right edge of the column. Parameters display in the order that they
are transmitted by the ECM, so expect variation between vehicles.
Gesture scrolling allows you to quickly move through the data list. Simply touch the screen and
drag your finger up or down to reposition the parameters being displayed. Position bars
momentarily appear to the right of each column to indicate the position of the current screen in
relation to the entire list as you scroll. Each column of parameters scrolls independently of the
other column. Figure 4-22 shows a typical data screen.
1— Graph icon
2— Parameter name
3— Parameter value
Figure 4-22 Sample data screen
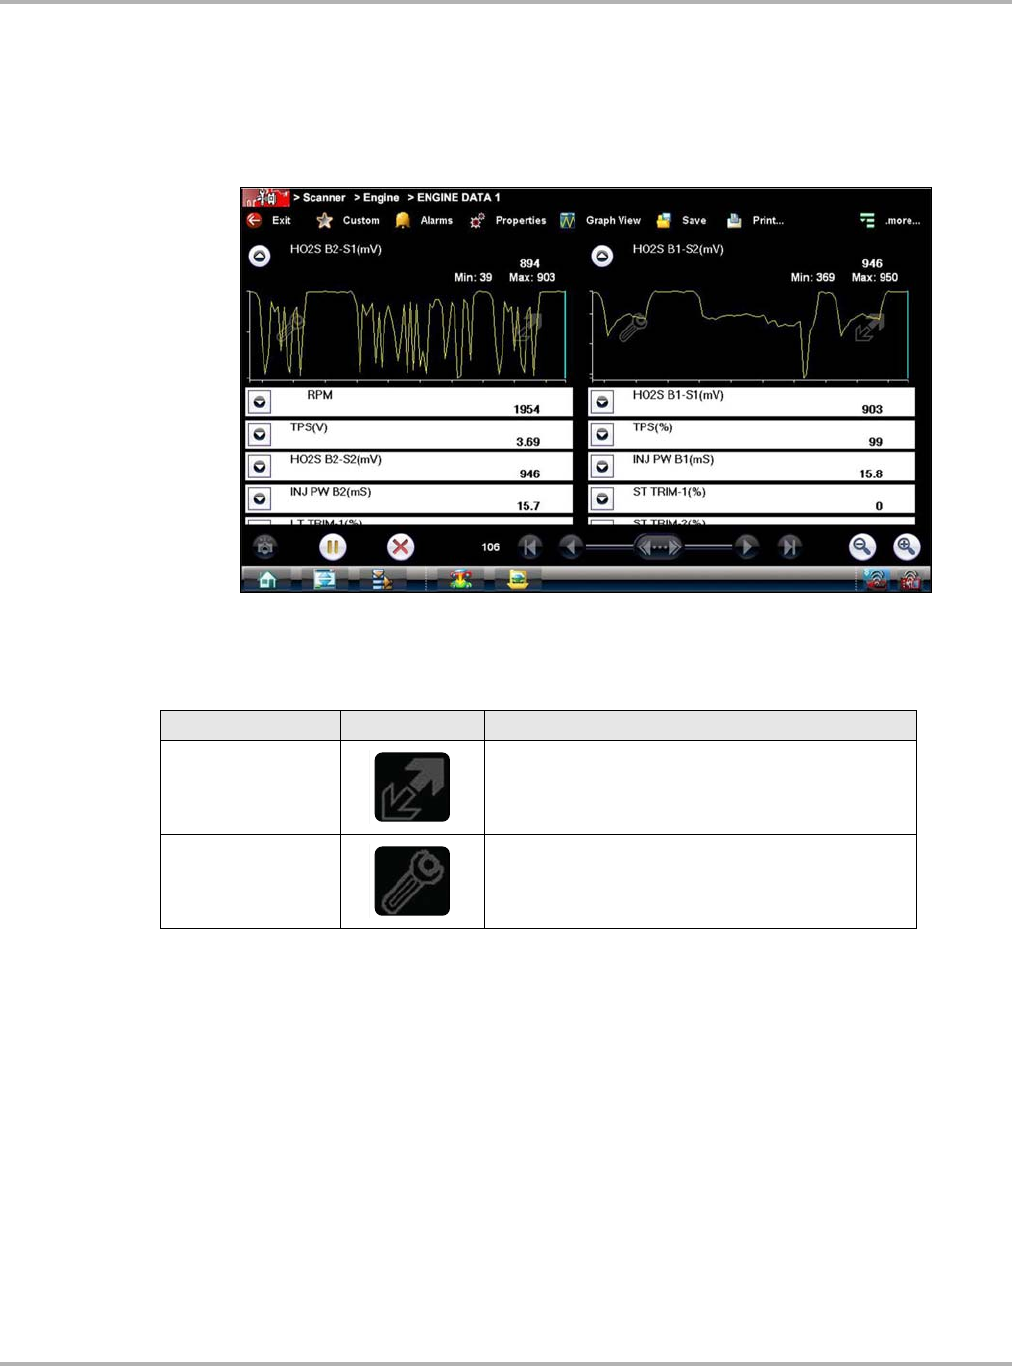
Draft 4/14/15- Do Not Distribute
46
Scanner Function Scanner Operation
Data Graphs
Select the Graph icon to open a data graph for that parameter (Figure 4-23). Selecting a
parameter for graph view moves it to the top of the list. Select the Graph icon again to close the
graph for that parameter and return to a data list view.
Figure 4-23 Sample graph view
The icons that display on each data graph allow you configure settings for the selected graph only:
Triggers
Triggers establish threshold values, an upper limit and a lower limit, for recording a data snapshot.
A snapshot allows you to closely evaluate conditions that caused the triggering event.
When a snapshot is taken, the Scanner captures additional data after the trigger point is detected,
data collection pauses, and the buffered information is automatically saved as a movie. This gives
you a complete picture of what was happening before the fact, what occurred at the trigger point,
and what happened after the fact.
Data collection is paused following a trigger event. Select the Play icon to resume viewing live
data. A vertical line now appears on each of the data graphs to indicate the triggering point. The
trigger line on the parameter that triggered the snapshot is a different color than those on the other
graphs. This makes it easy to determine which parameter caused the trigger when triggers are set
for multiple parameters.
Table 4-3 Data graph icon operations
Name Icon Description
Expand/Collapse
Select to expand the graph to fill the entire screen,
select again to collapse the graph to the standard
view.
Graph Properties
Select to open the Graph Properties dialog box,
which allows you to set triggers for recording a
snapshot and to adjust the scale.
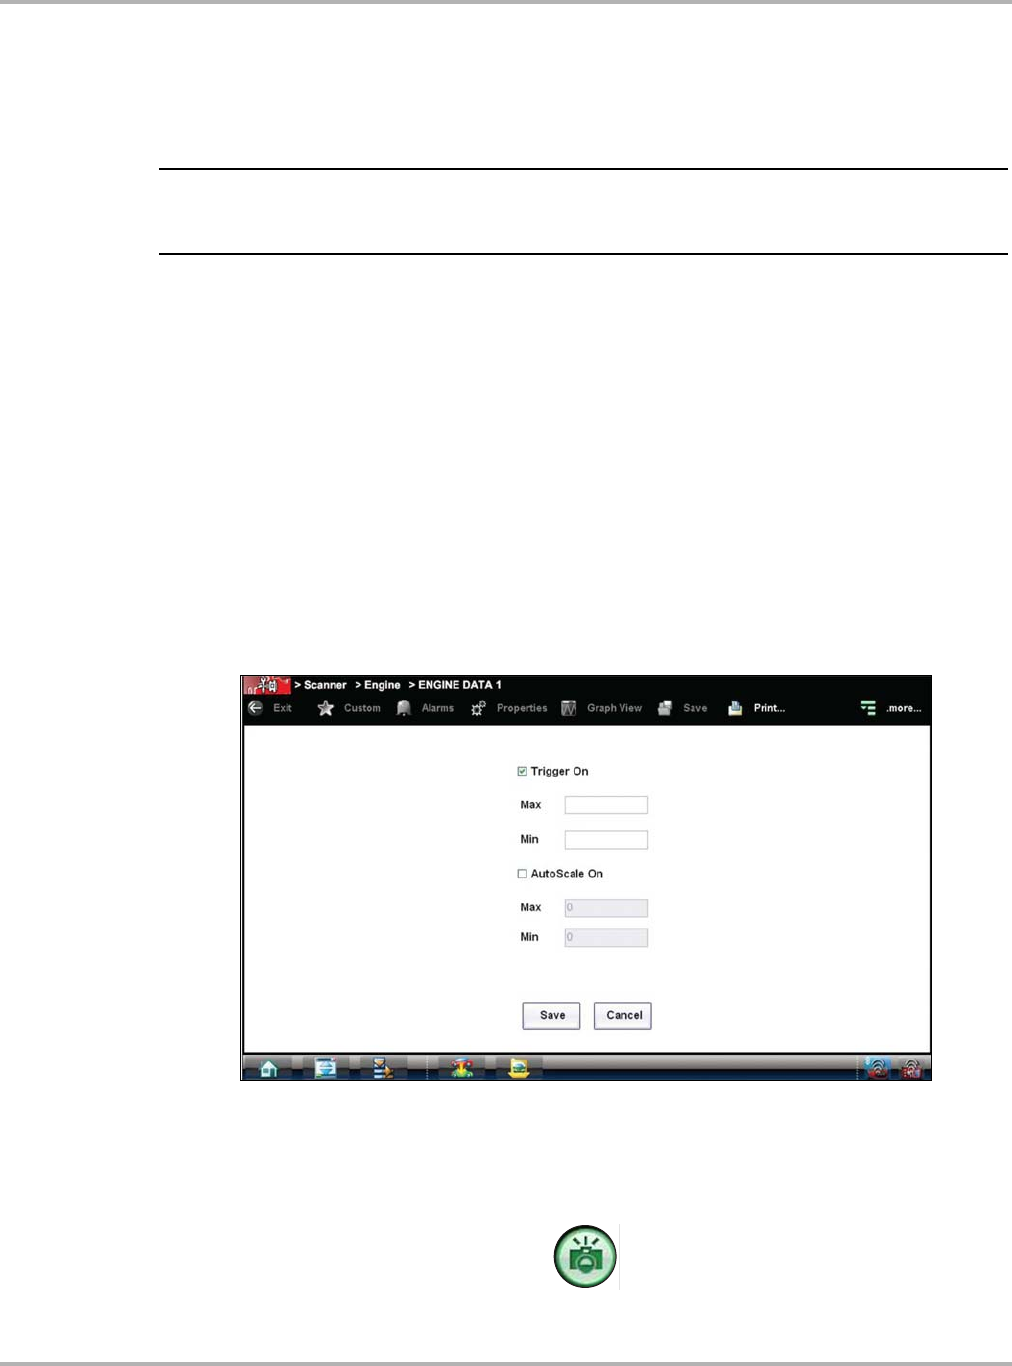
Draft 4/14/15- Do Not Distribute
47
Scanner Function Scanner Operation
zTo adjust the amount of data collected after a trigger:
1. Select the Properties icon on the Scanner toolbar to open the dialog box.
2. Highlight one of the Samples After Trigger options:
3. Select the Accept icon to close the dialog box.
NOTE:
iYou can also adjust the amount of data collected after a triggering event using the Properties icon
on the Scanner toolbar. See Properties on page 30 for additional information.
zTo set triggers and record a snapshot:
1. Select the Graph Properties icon on the parameter graph you wish to set triggers on.
The Graph Properties dialog box opens.
2. From the Graph Properties dialog box, select Triggers On.
A check mark appears in the box and the Min and Max fields activate (Figure 4-24).
3. Select either Max: (maximum) or Min: (minimum) to activate that field and open the keyboard.
4. Type the desired trigger value into the field.
5. Select the other field and enter a trigger value, then close the virtual keyboard.
6. Select Save to close the dialog box.
Trigger lines (blue for upper and red for lower) display on the selected parameter graph.
The area between the upper and lower trigger lines establishes the triggering condition. Any
data points that register outside of the set trigger conditions initiates a snapshot.
Figure 4-24 Sample Graph Properties dialog box
7. Select Snapshot on the Data Buffer Toolbar to arm the snapshot.
The Snapshot icon changes color to indicate it has been armed (Figure 4-25).
Figure 4-25 Sample armed Snapshot icon
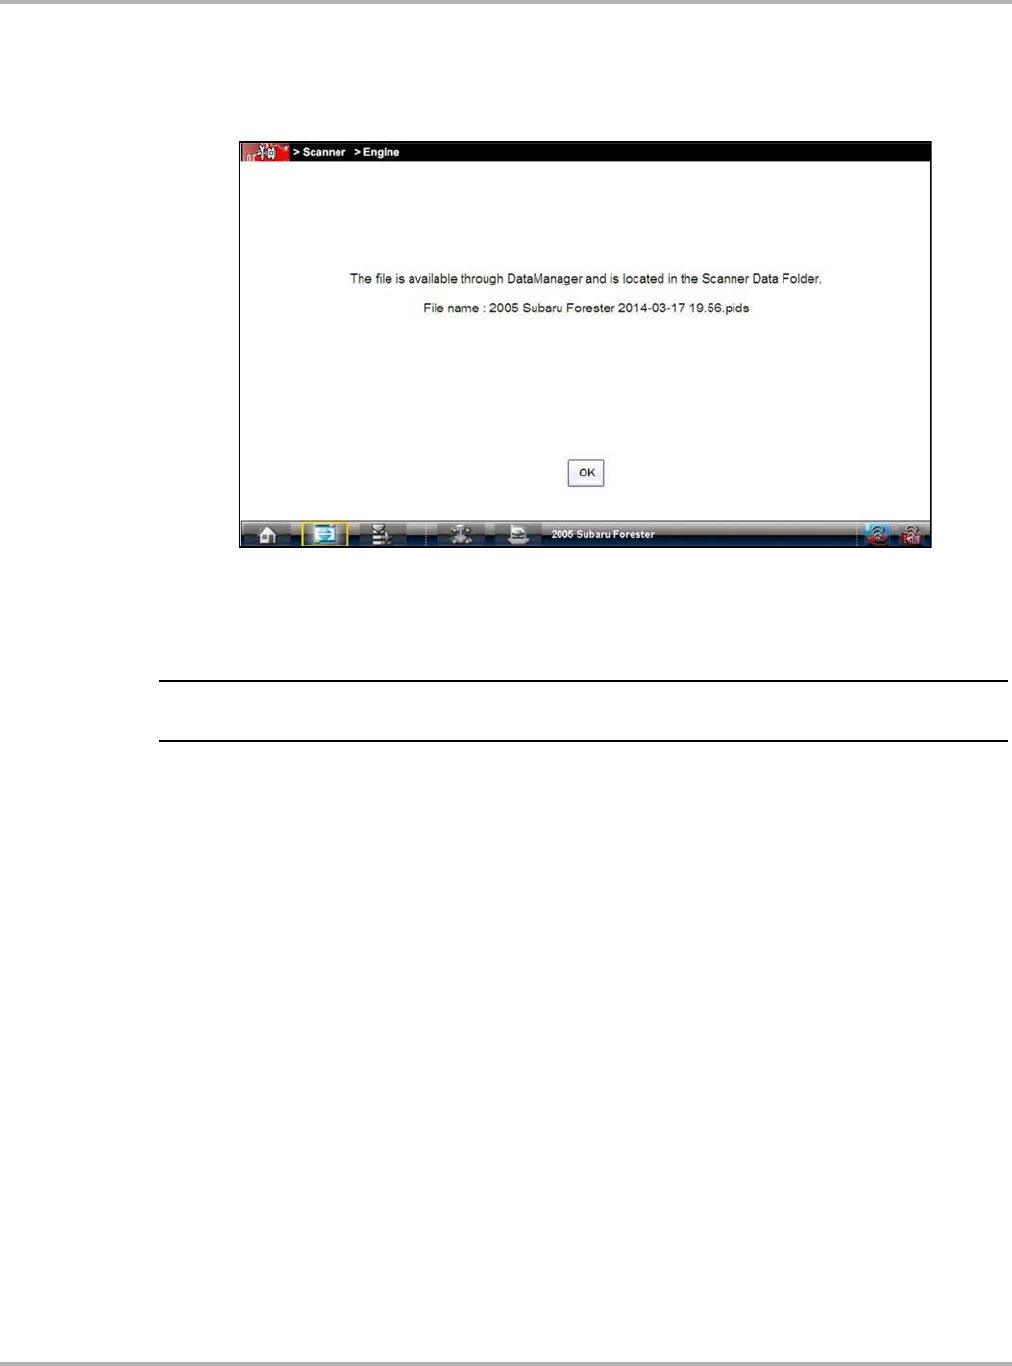
Draft 4/14/15- Do Not Distribute
48
Scanner Function Scanner Operation
Once all of the data is compiled, data collection pauses and the information is saved as a
movie. A confirmation screen displays to let you know the name automatically assigned to the
saved file and where to locate it.
Figure 4-26 Sample saved movie confirmation screen
8. Select OK to close the confirmation screen.
9. Select the Play icon on the toolbar to resume viewing live data.
NOTE:
iSelecting an armed Snapshot icon disarms it.
Scale
Scale adjusts the upper and lower values displayed on the vertical axis of a data graph. Two scale
modes are available; auto scale and manual scale. Auto scale, which is the default setting,
automatically adjusts the graph scale based upon the minimum and maximum values transmitted
by the ECM. Manual scale allows you to set the minimum and maximum values.
zTo manually set the scale on a graph:
1. Select the Graph Properties icon to open the dialog box for the graph you wish to scale.
2. From the Graph Properties dialog box (Figure 4-27), select Auto Scale On.
The check mark is cleared from the box and the minimum and maximum fields activate.
3. Select either Max: (maximum) or Min: (minimum) to activate that field and open the keyboard.
4. Type the desired scale value into the field.
5. Select the other field and enter a value, then close the virtual keyboard.
6. Select Save to close the dialog box.
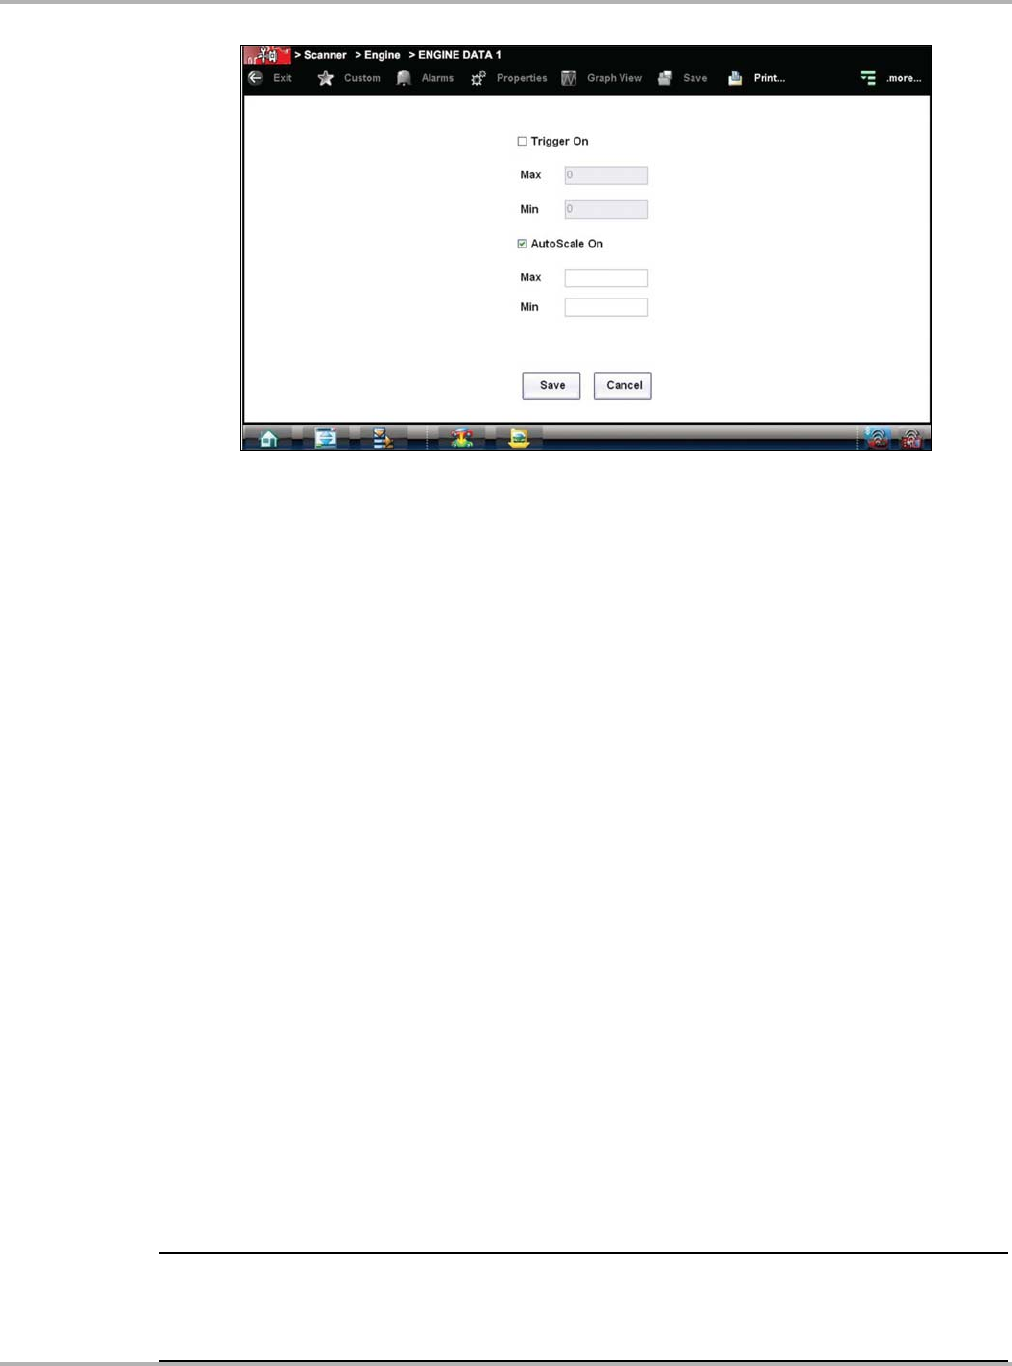
Draft 4/14/15- Do Not Distribute
49
Scanner Function Scanner Operation
Figure 4-27 Sample manual scale selection
The dialog box closes and the parameter scale is now at the set values.
Using Zoom
The zoom options on the Data Buffer toolbar allow you to change the magnification level of the
sweep when viewing data graphs. Use the Zoom In (+) icon to increase magnification, and the
Zoom Out (–) icon to decrease magnification.
Functional Tests
The Functional Tests selection is used to access vehicle-specific subsystem and guided
component tests. Available tests vary by manufacturer, year, and model, and only the available
tests display in the menu.
There are four general types of functional test operations:
•Information Tests—are read-only tests, like selecting “VIN” from a Functional Tests menu to
display the VIN of the identified vehicle.
•Toggle Tests—switch a component, such as a solenoid, relay, or switch, between two
operating states.
•Variable Control Tests—command a certain value for a system or component, such as
varying the spark timing in 1° increments or the EGR valve duty cycle in 10% increments.
•Reset Tests—reset the adaptive, or learned, values that are stored in the electronic control
module.
Selecting Functional Tests opens a menu of test options that varies by make and model.
Selecting a menu option either activates the test or opens a submenu of additional choices. Follow
all screen instructions while performing tests. How and what information is presented on the
screen varies according to the type of test being performed.
IMPORTANT:
Do not enter any functional tests while driving on a road test. During some functional tests, the
ECM makes changes to ignition timing, fuel delivery, and other engine functions, which may affect
engine operation and vehicle control.
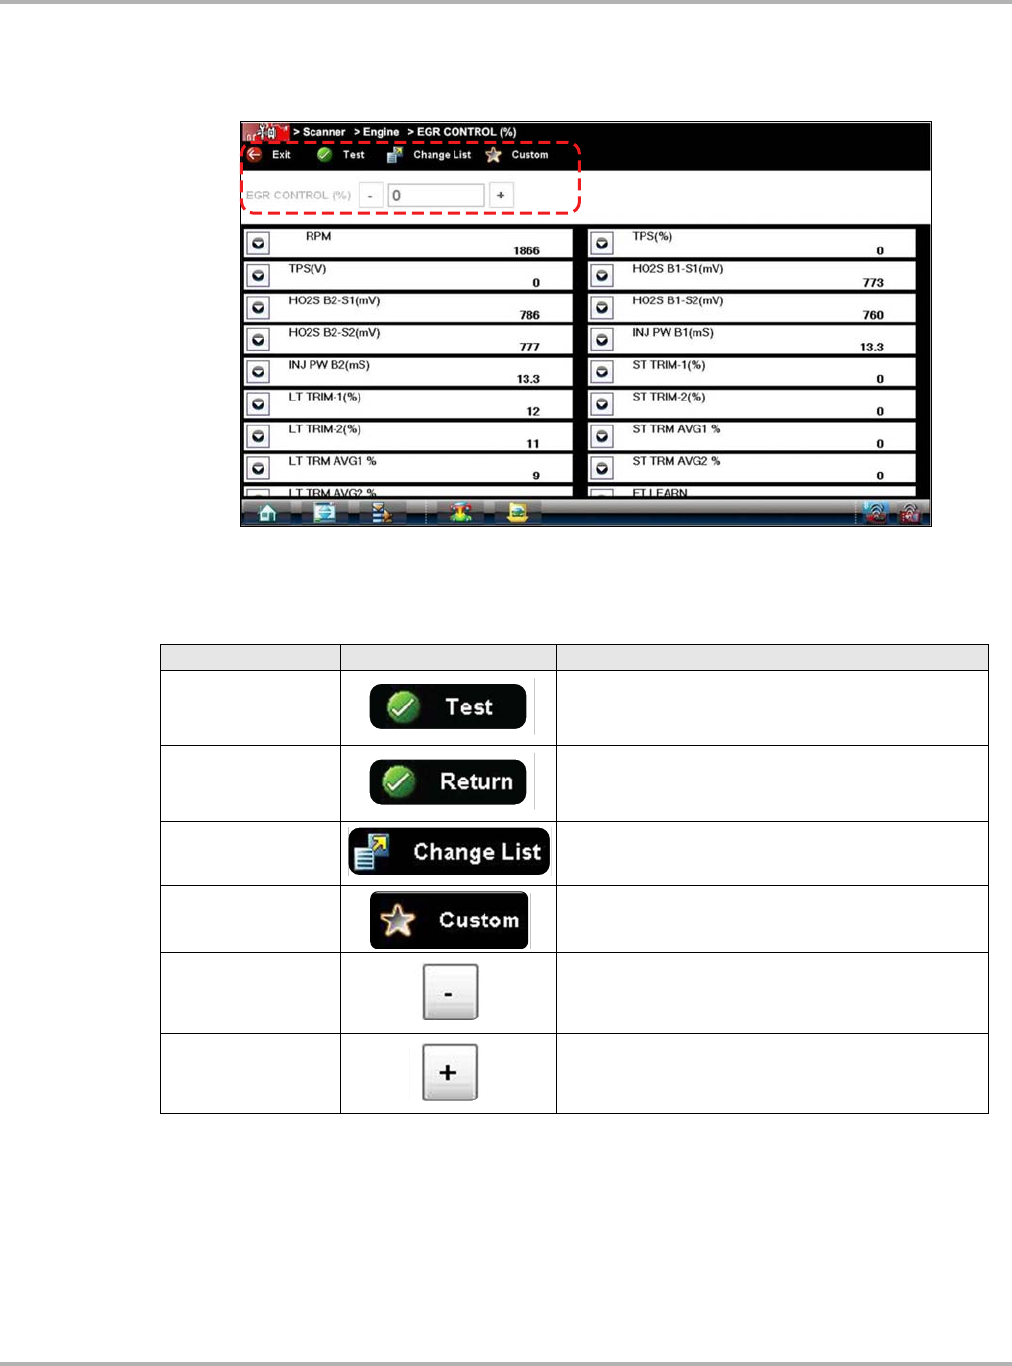
Draft 4/14/15- Do Not Distribute
50
Scanner Function Scanner Operation
Some toggle and variable control tests display functional test controls at the top of the screen with
data stream information below (Figure 4-28).
Figure 4-28 Sample functional test controls
Functional test controls allow you manipulate the test signal as shown in Table 4-4.
Table 4-4 Functional test control icons
Name Icon Description
Test Activates the test.
Return Moves focus back to the data list.
Change List Allows you to switch data lists.
Custom Allows you to select which parameters display during
the functional test.
Minus Switches an item to low or off, or incrementally
reduces a variable signal.
Plus Switches an item to high or on, or incrementally
increases a variable signal.

Draft 4/14/15- Do Not Distribute
51
Scanner Function Scanner Operation
Generic Functions
The Generic Functions selection opens a menu of available OBD-II/EOBD functions on 1996
and newer vehicles. For additional information on generic functions refer to the Global OBD
Vehicle Communications Software Manual. Menu options typically include:
•MIL Status - displays the ID and status of the Malfunction Indicator Lamp (MIL)
•Fast Track® Troubleshooter - displays a menu of available experience-based tests and tips
•Readiness Monitors—displays the status of the OBD-II/EOBD required monitors
•($01) Display Current Data - displays a screen containing Generic OBD PID data
•($02) Freeze Frame—displays data stored in ECM memory when a DTC is set
•($05) Oxygen Sensor Monitoring—displays on-board oxygen sensor monitoring test results
•($06) On-Board Monitored Systems—displays the status of system monitors
•($08) Request Control of On-Board System—establishes bidirectional ECM communication
•($09) Calibration Identification—displays the ECM calibration identification numbers
•($09) Calibration Verification Number—displays the ECM calibration
•($09) In-Use Performance Tracking—displays a monitoring conditions report
•($09) Vehicle Identification Number—displays the VIN
•($0A) Emissions Related Fault with Permanent Status—displays a record of permanent codes
Troubleshooter
Fast-Track® Troubleshooter is a database of experience-based information of validated
real-world repair strategies that have been compiled by top-notch technicians. Troubleshooter
simplifies the diagnosis process, as it contains information on virtually all common diagnostic
trouble code (DTC) problems and driveability symptoms.
Troubleshooter information is organized into a series of diagnostic tips that are designed to quickly
lead you to the root cause of a particular problem. The tips are vehicle-specific, which means only
tips that relate to the identified vehicle are presented. Selecting opens a menu that may include:
•Code Tips—provides detailed information on setting conditions, testing, and interpreting test
results for specific codes.
•Symptom Tips—provides diagnostic tests and procedures based on vehicle operation.
•Time Savers—provides supplemental information, such as firing order and #1 cylinder
location, that may be needed to make a diagnosis.
•Common Problems—provides advice and remedies for certain “pattern failures” that have
been experienced on vehicles of the same model.
•Tests and Procedures—explains how to perform certain tests on the specific test vehicle.
Some tips provide specifications and installation information as well.
•Fast-Track Data Scan (Normal Values)—contains information and guidelines on how to
validate data readings for certain sensors and actuators, live data values are provided.
NOTE:
iTroubleshooter appears in a Scanner menu only if tips are available for the system selected on the
identified vehicle.
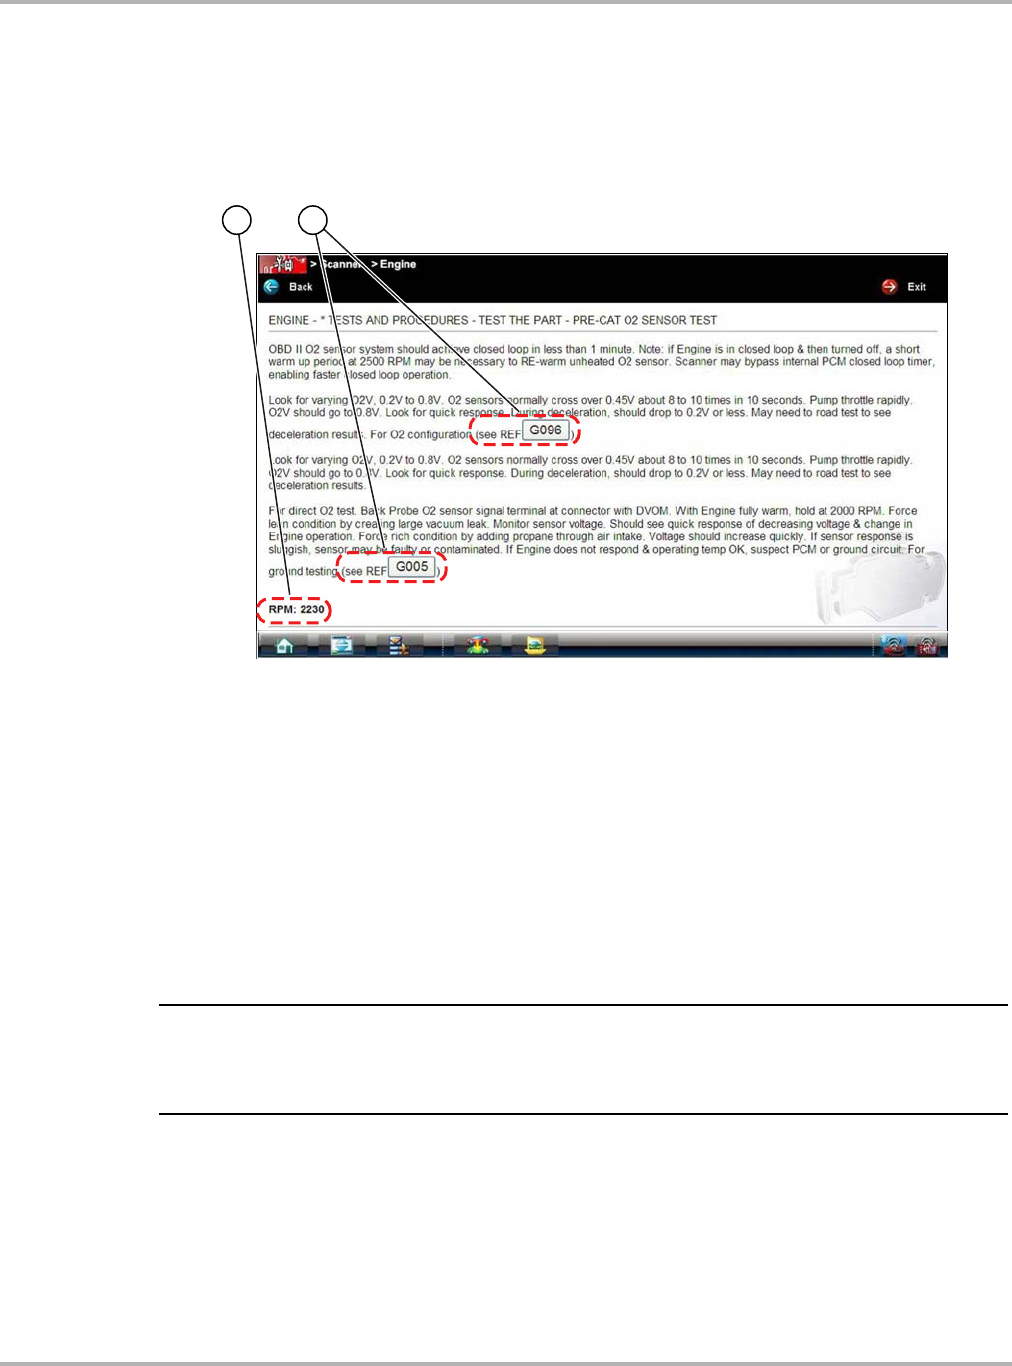
Draft 4/14/15- Do Not Distribute
52
Scanner Function Stopping Communication and Exiting the Scanner
Certain live data parameter values display directly within the tip when performing Troubleshooter
tests and procedures. A tip may also contain a hyperlink to a Troubleshooter Reference, another
test or procedure, or a supplemental operation, such as Clear Codes. Hyperlinks are shown in
blue, and selecting them opens the link. Troubleshooter References open in a separate window.
(Figure 4-29).
1— Live data values
2— Hyperlink
Figure 4-29 Sample data values within a Troubleshooter tip
4.4 Stopping Communication and Exiting the Scanner
The Scanner remains open as long as there is an active communication link with the vehicle. You
must first stop communication with the vehicle in order to exit from the Scanner function. A
warning message displays if you attempt to exit from the Scanner while it is communicating with
the vehicle ECM.
NOTE:
iDamage to the vehicle electronic control module (ECM) may occur if communication is disrupted.
Make sure the data cable and the USB cable are properly connected at all times during testing.
Exit all tests before disconnecting the test cable or turning off the tool.
Draft 4/14/15- Do Not Distribute
53
Scanner Function Stopping Communication and Exiting the Scanner
zTo exit Scanner and disconnect from a vehicle:
When disconnecting the Diagnostic Tool from the vehicle, make sure the Scanner software is
not communicating with the vehicle.
1. From a codes or data display screen, select the Exit icon on the upper toolbar.
Figure 4-30 Exit icon
The screen goes to the codes or data menu.
2. Select the Back icon on the upper toolbar.
Figure 4-31 Back icon
The screen goes to the system menu.
3. Select the Back icon on the upper toolbar.
A “stopping communication” message briefly displays followed by the systems menu.
4. Select the Change Vehicle icon on the Toolbar.
Figure 4-32 Change Vehicle icon
The vehicle description on the toolbar should now read “No Active Vehicle”.
5. Select the Home icon on the Toolbar.
Figure 4-33 Home icon
The Home screen displays.
6. Disconnect the data cable from the vehicle diagnostic connector.

Draft 4/14/15- Do Not Distribute
54
Chapter 5 Scan Module Operation
This chapter describes the connection, operation, troubleshooting and updating of the Scan
Module.
5.1 Overview
The Scan Module is a wireless device that is connected to the vehicle and transmits vehicle data
to the Diagnostic Tool.
The Scan Module operates on 12 or 24VDC vehicle power, supplied through the vehicle’s data link
connector (DLC).
1— Data Cable Connector
2— Vehicle Power LED (green)
3— Communication Issue LED (red)
4— Bluetooth LED (green)
5— Memory Card Port (remove protective hand grip for access)
6— Universal Serial Bus (USB) Jack (remove protective hand grip for access)
Figure 5-1 Scan Module
($//%
5
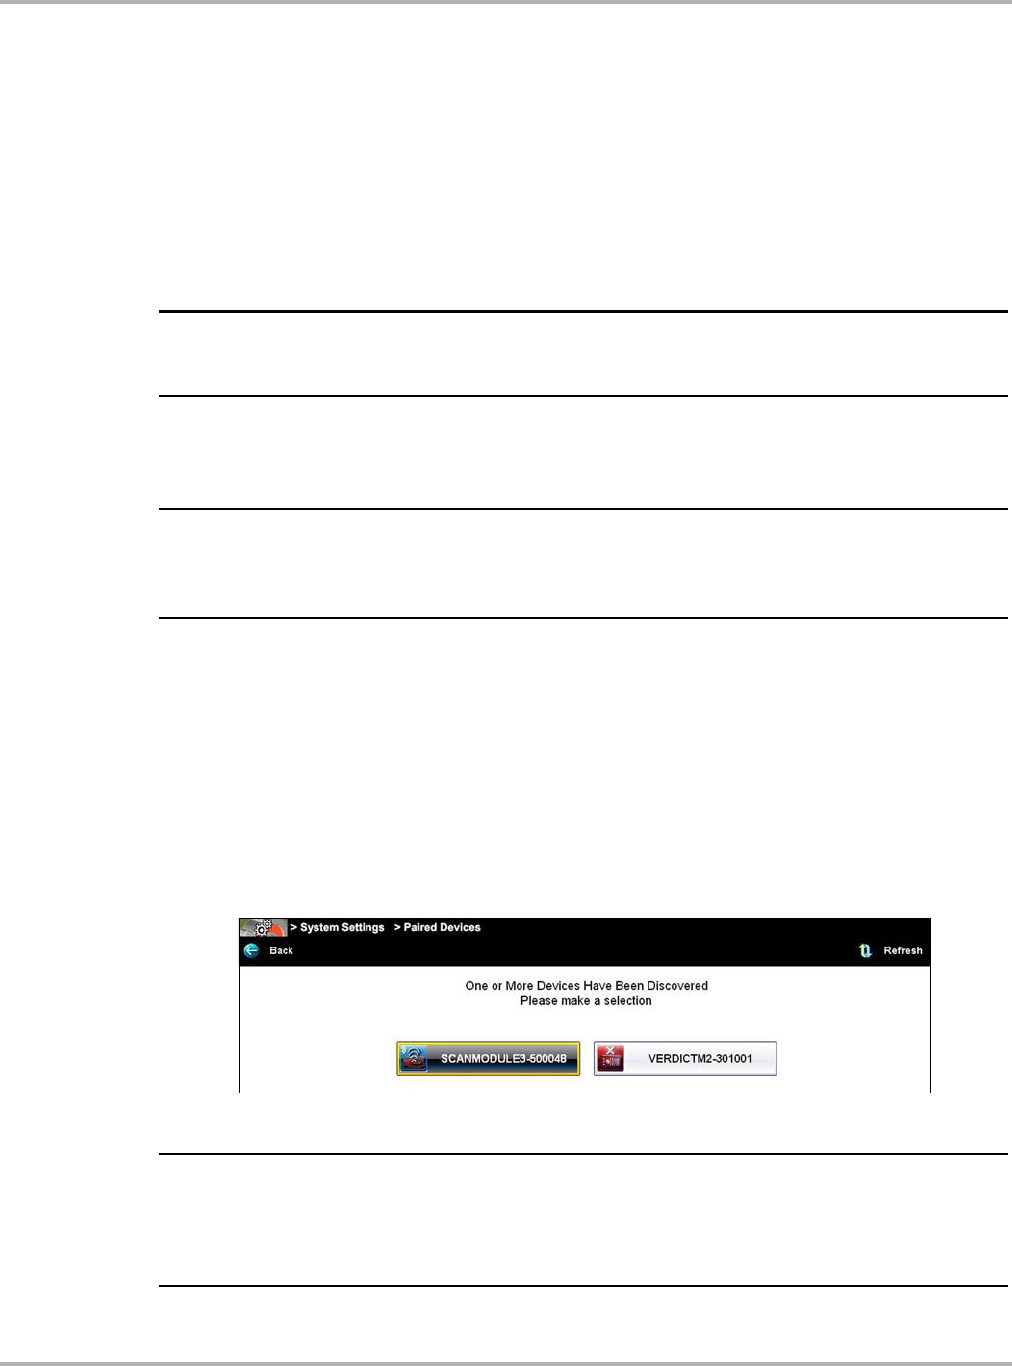
Draft 4/14/15- Do Not Distribute
55
Scan Module Operation Pairing The Scan Module
5.2 Pairing The Scan Module
To use the Scan Module with the Scanner or OBD-II/EOBD functions, it must first be paired with
the Diagnostic Tool.
Pairing is the wireless connection (identification) process used to connect the Scan Module to
your Diagnostic Tool.
The Scan Module only needs to be paired once before it’s initial use. The connection configuration
should remain in memory for all future uses, unless the connection configuration is removed or
lost.
NOTE:
iWireless devices shown in this section are used as reference. Not all devices shown may be
applicable to your Diagnostic Tool.
zTo pair the Scan Module with the Diagnostic Tool:
1. Turn on the Diagnostic Tool.
IMPORTANT:
The Scan Module needs to be powered on during the pairing process. Connect the Scan Module
to a vehicle or to the Diagnostic Tool using the USB cable. Make sure the Diagnostic Tool has a
charged battery or is connected to the AC/DC power supply.
2. Connect the 26-pin end of the data cable to the Scan Module data cable connector.
3. Connect the 16-pin end of the data cable to a vehicle data link connector (DLC).
The green LED on the Scan Module is illuminated when power is being supplied to the Scan
Module. For additional information on the Data Cable, see Data Cable Connection on
page 57.
4. From the Diagnostic Tool select System Settings > Paired Devices.
5. Select Add from the toolbar, then OK when prompted.
The Diagnostic Tool searches for compatible wireless devices, then displays the results.
(Figure 5-2).
Figure 5-2 Sample Scan Module selection
NOTE:
iSearch results include all compatible wireless devices detected, and may include multiple Scan
Modules if you are in a shop environment where more than one unit is powered on. Available
module listings include a partial serial number. Make sure the screen listing matches the last six
digits of the serial number of your Scan Module before continuing.
6. Select the Scan Module you wish to connect from the results list.
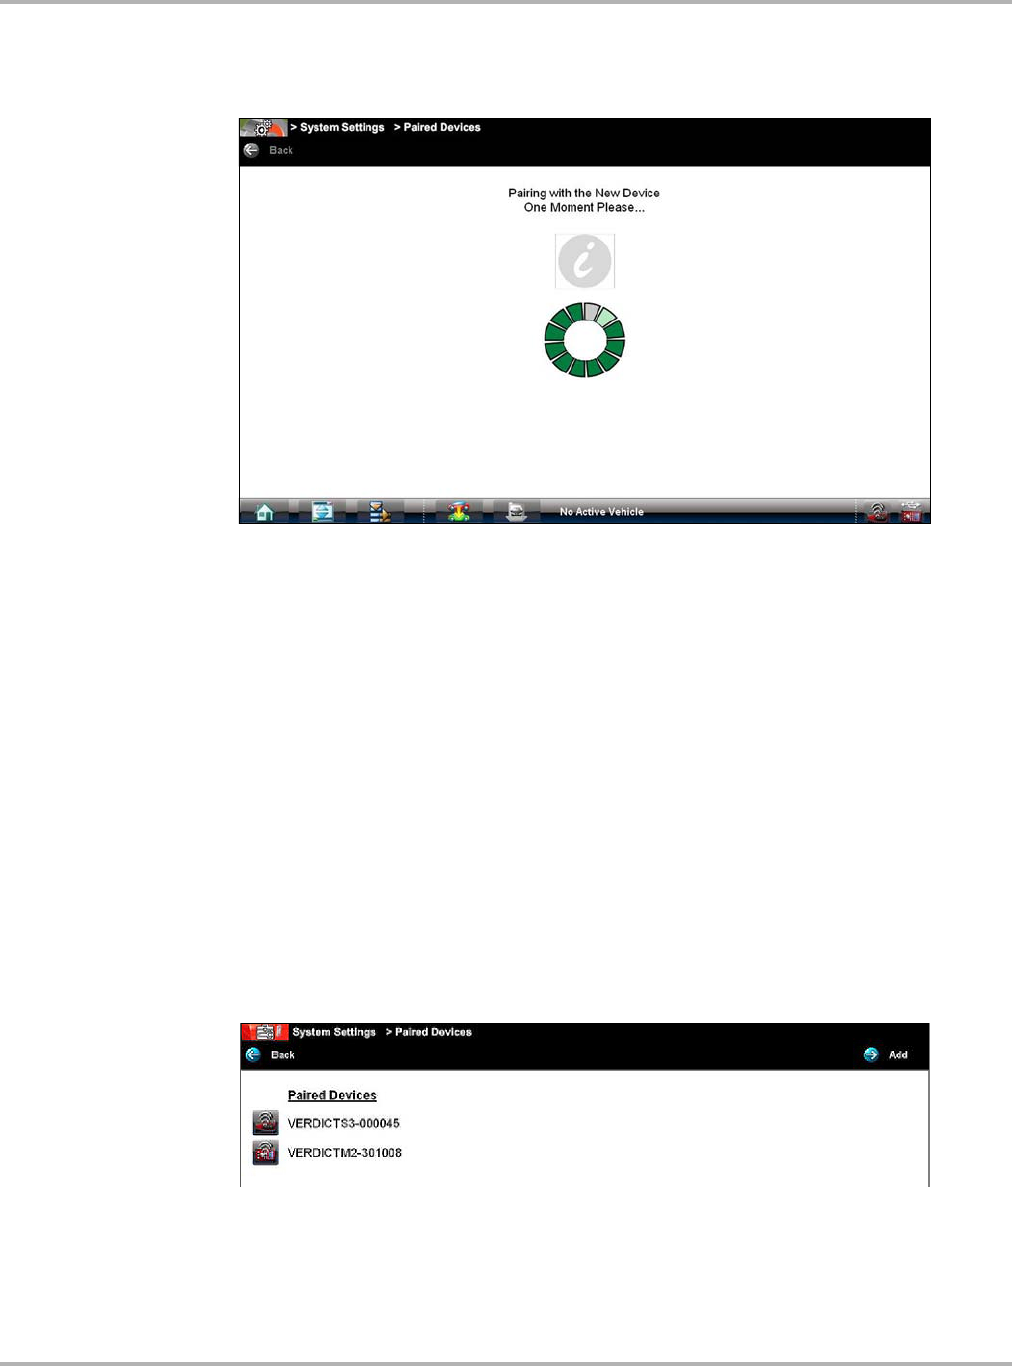
Draft 4/14/15- Do Not Distribute
56
Scan Module Operation Checking Scan Module Paired Status
A search in progress message displays during the pairing procedure (Figure 5-3), the Paired
Devices screen (Figure 5-4) displays once the procedure completes.
Figure 5-3 Sample pairing in progress message
7. Select the Home icon on the Toolbar.
8. Disconnect the data cable from the vehicle.
The Scan Module and Diagnostic Tool are now paired for wireless communication and should
automatically recognize each other when both are powered up.
5.3 Checking Scan Module Paired Status
zTo check if the Scan Module is paired to your Diagnostic Tool:
1. Select System Settings > Paired Devices.
The paired devices screen opens (Figure 5-4).
The Paired Devices screen lists all of the devices paired to the Diagnostic Tool, and also indicates
whether or not there is active communication occurring.
Figure 5-4 Typical Paired Devices screen
2. Verify the Scan Module is in the list of paired devices.
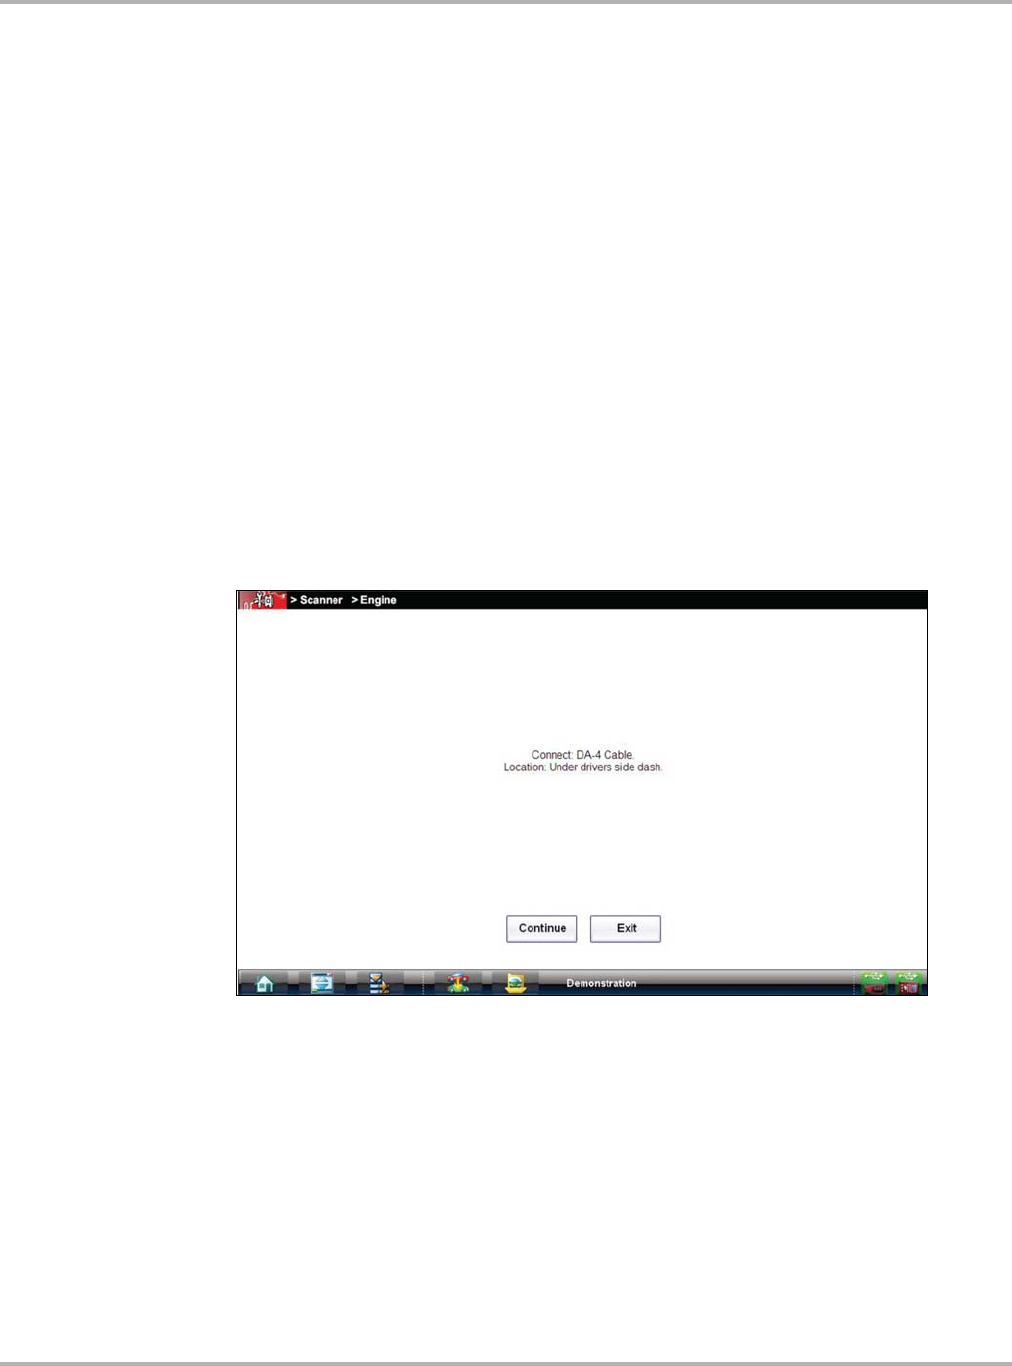
Draft 4/14/15- Do Not Distribute
57
Scan Module Operation Data Cable Connection
5.4 Data Cable Connection
To use the Scan Module for Scanner and OBD-II/EOBD testing, it must first be connected to the
vehicle’s data link connector (DLC).
Depending on the vehicle, the supplied DA-4 data cable may be used alone or may require
optional adapters.
•All OBD-II/EOBD compliant vehicles - Use the supplied DA-4 data cable. The 26-pin end of
the cable attaches to the data cable connector on the Scan Module. The16-pin end connects
to the vehicle DLC. The cable connectors are secured with captive screws.
•All non-OBD-II/EOBD (OBD-I) compliant vehicles - Use the supplied DA-4 data cable with
the optional DA-5 adapter and a manufacturer specific adapter. The 26-pin end of the cable
attaches to the data cable connector on the Scan Module. The16-pin end connects to the DA-
5 adapter, the DA-5 adapter connects to the manufacturer specific adapter and then connects
to the vehicle DLC. The cable connectors are secured with captive screws.
While using the Scanner and OBD-II/EOBD functions, on-screen cable and adapter connection
instructions are provided. The instructions may also include the location of the vehicle DLC
(Figure 5-5). If required, additional connection information can be found in the appropriate vehicle
communication software manual for the vehicle. Vehicle communication software manuals are
available online, see the website information at the front of this manual.
Figure 5-5 Vehicle connection data cable message
For data cable vehicle power connection information, see Power Sources on page 10.
zTo connect the data cable to the vehicle:
1. While using the Scanner or OBD-II/EOBD function, follow the on-screen instructions for
connecting the cable and/or any adapters required to the vehicle (Figure 5-5).
2. Select Continue once the data cable is connected to the vehicle.

Draft 4/14/15- Do Not Distribute
58
Scan Module Operation Troubleshooting
5.5 Troubleshooting
The Scan Module is a wireless communications device that uses Bluetooth technology to transmit
vehicle data to the Diagnostic Tool without a physical connection. The working range of the
transmitter is about 30 feet (9.14 m). Scan Module operations can be impacted when signal
interference, or some other condition, disrupts or impairs the wireless communication network.
These interruptions are usually temporary and easily repaired.
Indicators of wireless communication interference include:
•Slow Scan Module response accompanied by “Error 101” message.
•Slow Scan Module response accompanied by “Error 404” message.
•“Error Occurred” Message when trying to use the Scan Module.
•“Error Occurred” Message after 20 or more minutes sitting idle, particularly if the devices have
been stationary.
5.5.1 No Communication Message
If the Scan Module is paired to the Diagnostic Tool and tries to communicate with the vehicle and
the Scan Module is not connected to the vehicle, a “Connect Data Cable” or “no communication”
message displays.
A signal lost due to moving out of range automatically restores itself when the Diagnostic Tool is
brought closer to the Scan Module. The Scanner sounds a tone when the signal is lost.
The following conditions cause a “no communication” message to display:
•The Scanner is unable to establish a communication link with the vehicle.
•You selected a system for testing that the vehicle is not equipped with (such as ABS).
•There is a loose connection.
•There is a blown vehicle fuse.
•There is a wiring fault on the vehicle, or in the data cable or adapter.
•There is a circuit fault in the data cable, Personality Key, or adapter.
•Incorrect vehicle identification was entered.
Refer to the Vehicle Communication Software manuals for manufacturer-specific troubleshooting
information.
5.5.2 Signal Loss / Out of Range Alarm
A signal lost due to moving the Diagnostic Tool out of range of the Scan Module will automatically
restore itself when the Diagnostic Tool is brought closer to the Scan Module. The Scan Module will
sound an audible tone when the signal is lost.
5.5.3 Checking Hardware Status
Verifying the Hardware Status is always the first step in troubleshooting a wireless connection
issue.
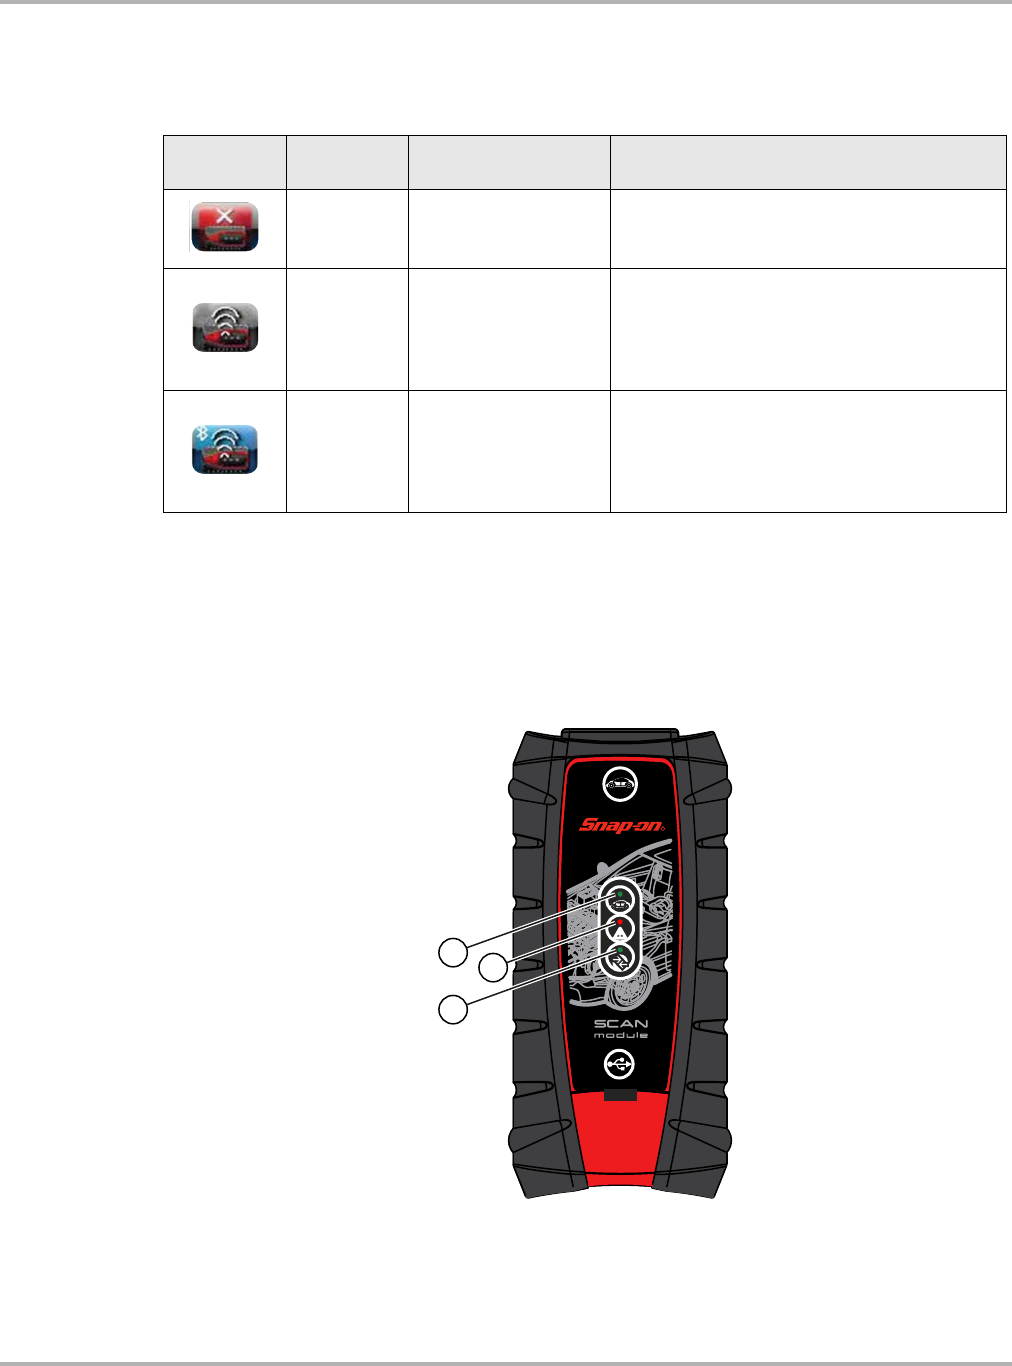
Draft 4/14/15- Do Not Distribute
59
Scan Module Operation Troubleshooting
The Hardware Status indicators in the lower-right corner of the Home screen provide a quick
reference to wireless operations. The background color of the status indicator icon represents the
condition of the wireless connectivity to that device. Icon status is shown in the table below:
The three light emitting diodes (LEDs) on the faceplate of the Scan Module let you know at a
glance whether or not there is an active connection between the two modules. The two green
LEDs (Vehicle Power and Bluetooth) both flash on and off when the Scan Module and Diagnostic
Tool are actively communicating through a wireless connection. The red Communication LED
flashes on and off when the Scan Module is performing an internal self test, and is illuminated
continuously if a failure is detected (Figure 5-6).
1— Vehicle Power—green LED, flashes during wireless communications
2— Communication—red LED, illuminates if there is a communications failure
3— Bluetooth—green LED, flashes during wireless communications
Figure 5-6 Scan Module LEDs
Hardware
Icon Background
Color Condition Action
Red Not Paired
Pair the Scan Module to the Diagnostic Tool.
See Scan Module Pairing on page 141 for
instructions.
Grey Paired, but Not
Communicating
You may have moved out of range. Move the
Diagnostic Tool closer to the Scan Module to
reestablish communications. If connectivity is
not restored, perform the Recovery
Procedure on page 60.
Blue Paired and
Communicating
Hardware status is good and Bluetooth should
be functional. Verify that the green Bluetooth
LED on the front of the Scan Module is flashing.
If there is no connectivity, perform the
Recovery Procedure on page 60.
($//%
5

Draft 4/14/15- Do Not Distribute
60
Scan Module Operation Troubleshooting
Each LED can be in one of three states; off, lit solid, or flashing. Interpret as follows:
•Vehicle Power
–Off, vehicle power is not being supplied to the Scan Module through the data cable
–On Solid, the Scan Module is being powered by the vehicle, but not communicating with
the Diagnostic Tool.
–Flashing, the Scan Module is being powered by the vehicle and is communicating with the
Diagnostic Tool.
•Communication
–Off, normal state, no errors detected.
–On Solid, communications error detected.
–Flashing, internal self-test in process, will go out once the test completes.
•Bluetooth
–Off, there is no connection between the Scan Module and Diagnostic Tool.
–On Solid, the Scan Module and Diagnostic Tool are communicating through a solid
(USB cable) connection.
–Flashing, the Scan Module and Diagnostic Tool are communicating through a wireless
connection.
5.5.4 Recovery Procedure
This is a quick and easy method that reestablishes connectivity between the Diagnostic Tool and
the Scan Module in most instances. If bluetooth connectivity remains unavailable following
recovery, use one of the alternate procedures to restart the system.
NOTE:
iThis product is intended to be used by professional technicians in a garage environment.
Electrostatic discharges may happen occasionally and cause a loss of communication. To restore
communication disconnect and reconnect the communication cables and follow screen prompts.
zTo recover wireless connectivity:
1. Disconnect the Scan Module from the vehicle.
2. Navigate to the Home Screen on the Diagnostic Tool.
3. Select Exit to close the ShopStream Diagnostic Suite.
4. Connect the Scan Module to the vehicle.
5. Select the ShopStream Diagnostic Suite icon on the desktop.
Figure 5-7 Sample ShopStream Diagnostic Suite desktop icon
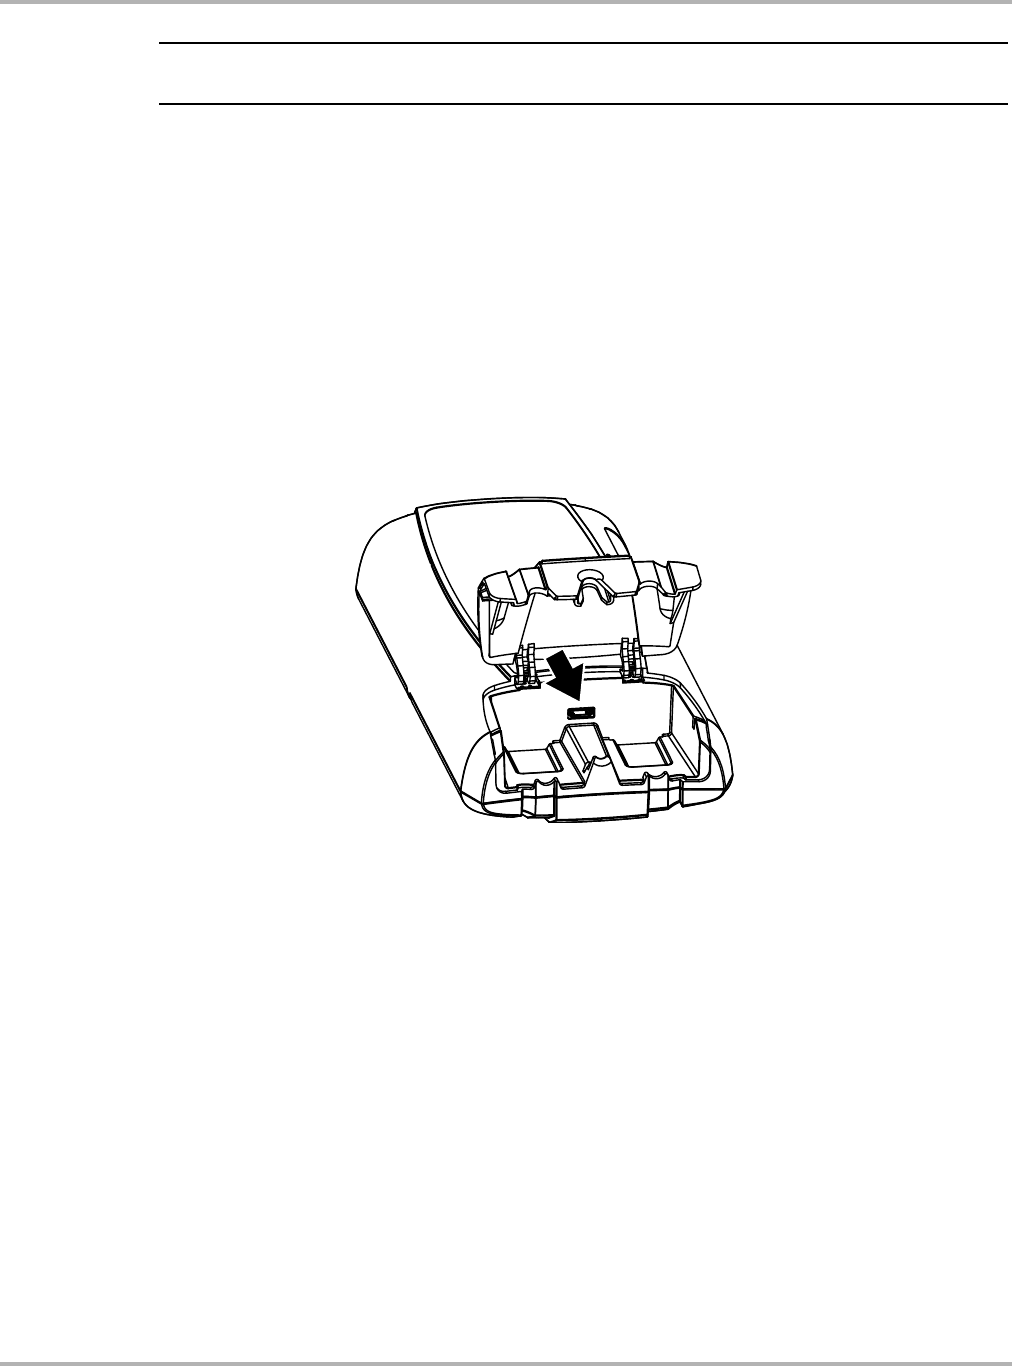
Draft 4/14/15- Do Not Distribute
61
Scan Module Operation Troubleshooting
NOTE:
iThe ShopStream Diagnostic Suite can also be started from the Windows Start menu.
Alternate Recovery Procedures
Use these methods as an option to the Recovery Procedure, or when recovery fails to restore the
wireless connection.
USB Procedure
This method establishes a “hard-wired” USB cable connection between the modules.
zTo create a USB connection:
1. Carefully slip the ends of the handgrip off of the sides of the Scan Module housing.
2. Lift open the hinged cover on the base of the Scan Module.
Figure 5-8 Scan Module USB jack, handgrip removed
3. Plug the small end of the USB cable into the USB jack on the Scan Module.
4. Plug the large end of the USB cable into a USB jack on the Diagnostic Tool.
Scanner functionality should be restored immediately once the USB connection is complete.
If not, suspect a hardware failure. The Diagnostic Tool and Scan Module are both fully
functional, so you can complete your testing with the USB connection intact.
ShopStream Diagnostic Suite Restart Procedure
This method, which closes and restarts the ShopStream Diagnostic Suite software, takes about
two minutes to complete.
zTo restart the ShopStream Diagnostic Suite:
1. Navigate to the Home Screen on the Diagnostic Tool.
2. Select Exit to close the ShopStream Diagnostic Suite.
3. Wait for the Scan Module Communication LED to stop flashing.
4. Select the ShopStream Diagnostic Suite icon on the desktop.
The ShopStream Diagnostic Suite should open with connectivity restored.
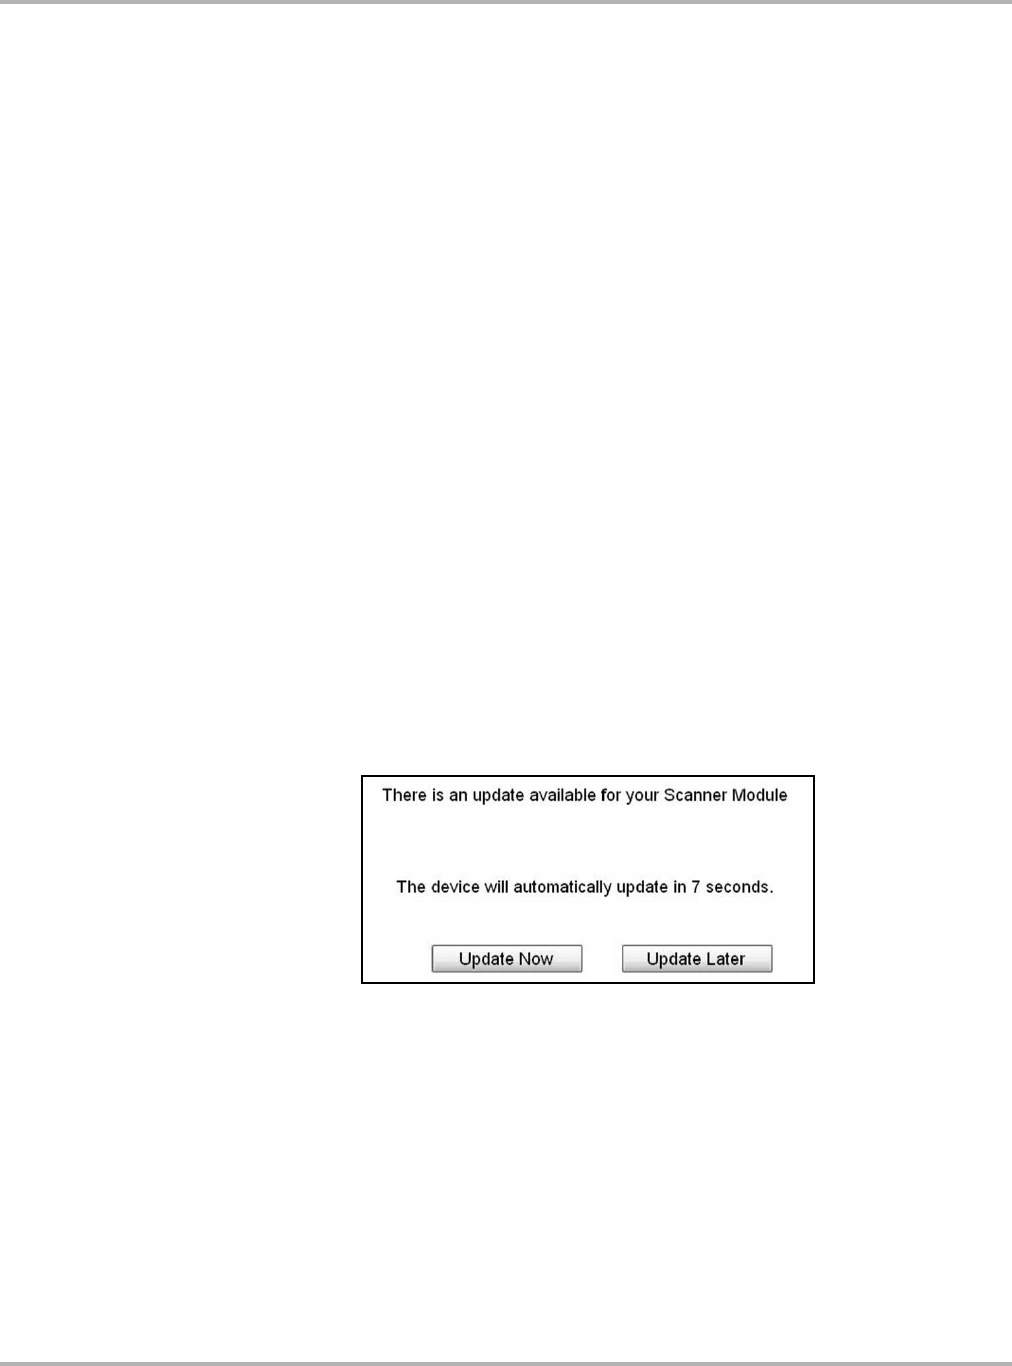
Draft 4/14/15- Do Not Distribute
62
Scan Module Operation Updating Scan Module Firmware
Windows Reboot Procedure
This method, which completely shuts down the Diagnostic Tool, takes several minutes to
complete.
zTo reboot the Diagnostic Tool:
1. Disconnect the Scan Module from the vehicle.
2. Navigate to the Home Screen on the Diagnostic Tool.
3. Select Exit to close the ShopStream Diagnostic Suite.
4. Select Start in the lower-left corner of the screen to open the menu.
5. Select Turn Off Computer from the menu.
6. Select Turn Off when the Confirmation window opens.
7. Wait for the tool to completely turn off, then press the Power button to restart the Diagnostic
Tool .
8. Connect the Scan Module to the vehicle once the ShopStream Diagnostic Suite opens.
5.6 Updating Scan Module Firmware
The internal programming (firmware) of the Scan Module, may require periodic updates. Firmware
updates increase the Scan Module’s diagnostic capabilities, typically by adding support for new
tests, vehicles and enhanced applications to the vehicle databases.
Scan Module firmware updates (when available) are delivered with diagnostic software updates/
upgrades. Upon starting the Scanner function, initially after a software update or upgrade has
been installed, a message may be displayed to inform you an update is available (Figure 5-9).
Figure 5-9 Scan Module update available message
The firmware update process, as explained in the following procedure, begins automatically after
ten seconds unless Update Now or Update Later is selected. Selecting Update Now begins the
process immediately. Update Later defers the operation, closes the message, and starts the
Scanner function. If you choose not to perform the update, it will not affect Diagnostic Tool
operation, however you will not benefit from the additional features available in the update.
Selecting Details in the upper-right corner opens a list of what is included in the update.
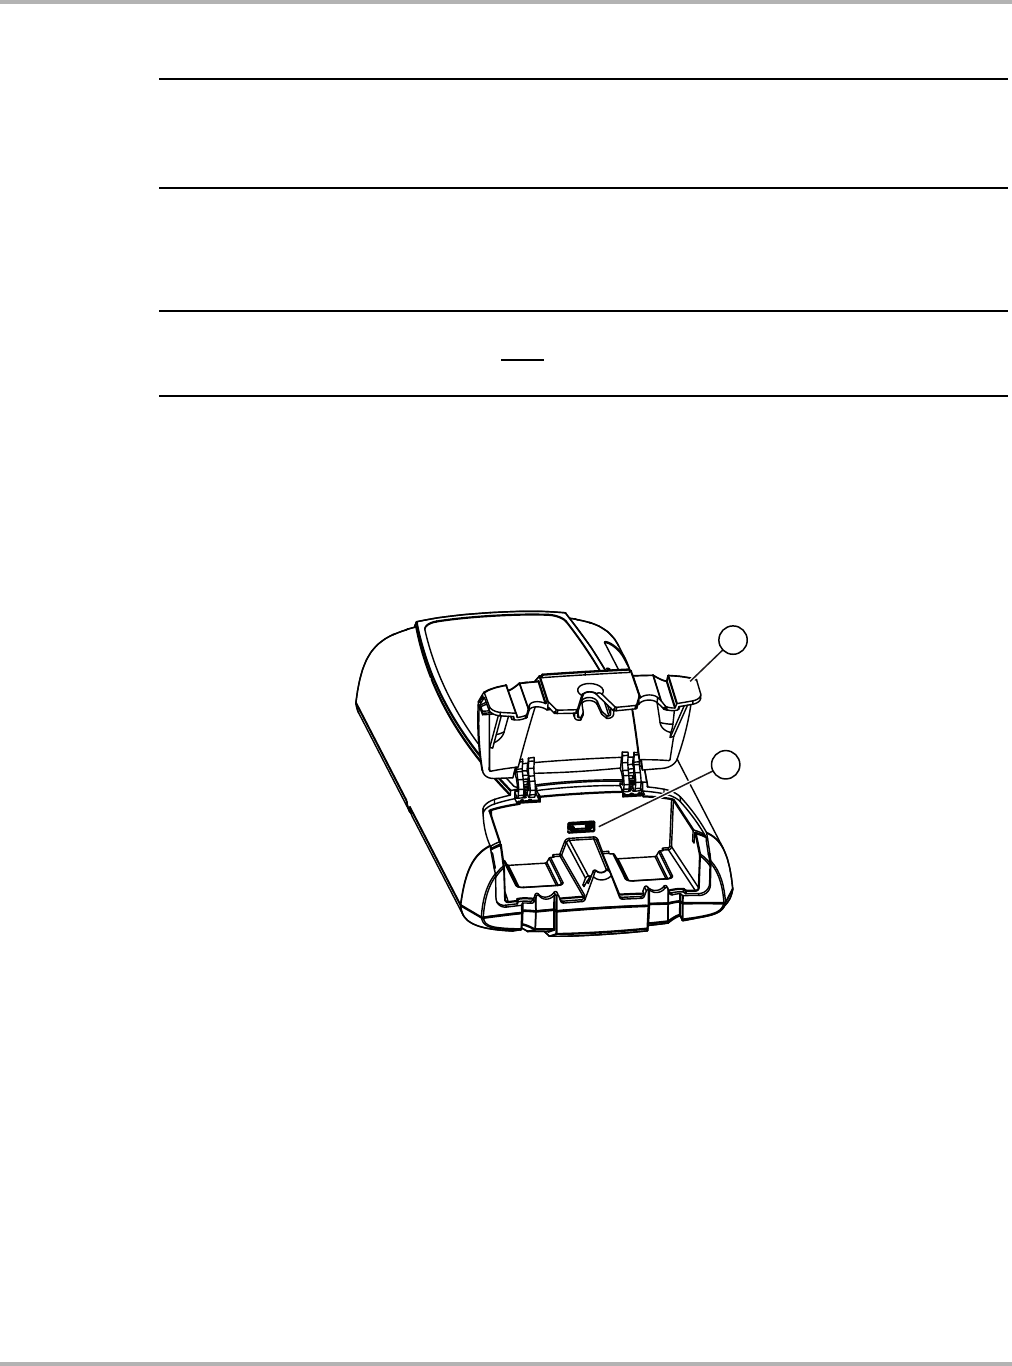
Draft 4/14/15- Do Not Distribute
63
Scan Module Operation Updating Scan Module Firmware
zUpdating Scan Module firmware:
IMPORTANT:
The Diagnostic Tool must be connected and powered by the AC/DC power supply during the Scan
Module firmware update process. Damage can occur to the Scan Module if the Diagnostic Tool
power is turned off or the power supply is disconnected during the firmware update process.
1. Connect the AC/DC power supply to the Diagnostic Tool.
2. Turn on the Diagnostic Tool.
3. Connect the Scan Module to the Diagnostic Tool as follows (Figure 5-10):
NOTE:
iThe Scan Module and Diagnostic Tool must be connected with the USB cable during the update
process. The Scan Module DLC must be disconnected from a vehicle during the update process.
a. From the bottom of the Scan Module, gently lift up and out on the sides of the handgrip to
free it from housing.
b. Open the hinged cover on the base of the Scan Module to expose the USB jack.
c. Plug the small end of the USB cable into the USB jack on the Scan Module.
d. Plug the large end of the USB cable into one of the USB jacks on the side of the
Diagnostic Tool.
1— Hinged cover
2— USB jack
Figure 5-10 Scan Module USB jack
4. Select Scanner from the Diagnostic Tool Home screen.
5. Select OK when the update available message displays (Figure 5-9).
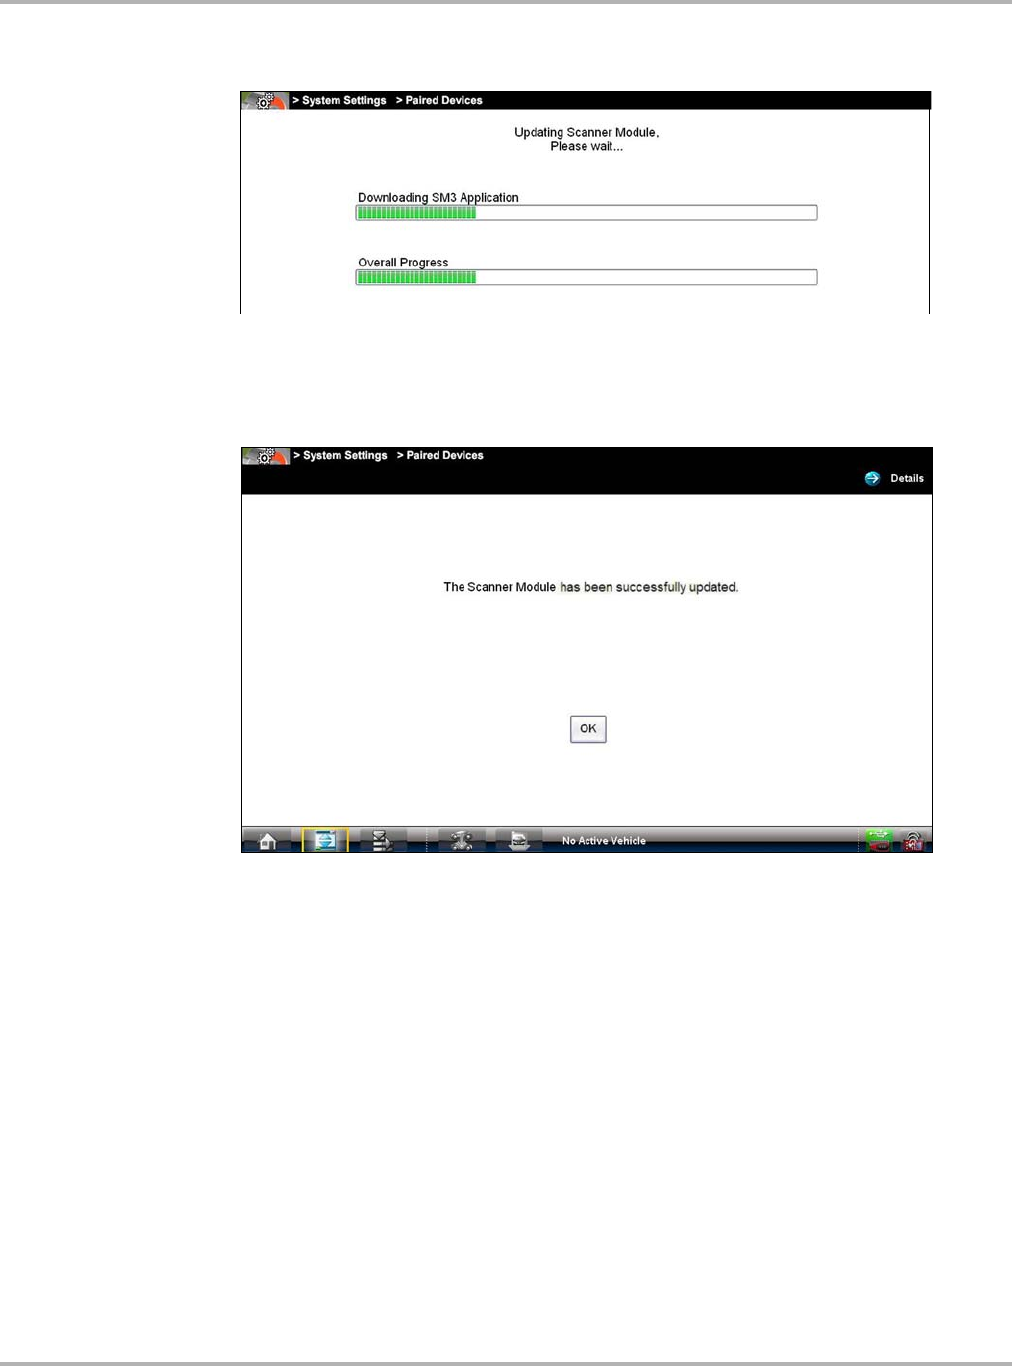
Draft 4/14/15- Do Not Distribute
64
Scan Module Operation Updating Scan Module Firmware
The update begins and installation progress is tracked on the screen (Figure 5-11).
Figure 5-11 Sample update in progress screen
A “successfully updated” message displays once the installation process is complete
(Figure 5-12).
Figure 5-12 Sample firmware update complete message
6. Select OK to close the message and return to Scanner operations.
The Scan Module, now has the latest firmware update, is ready to use.
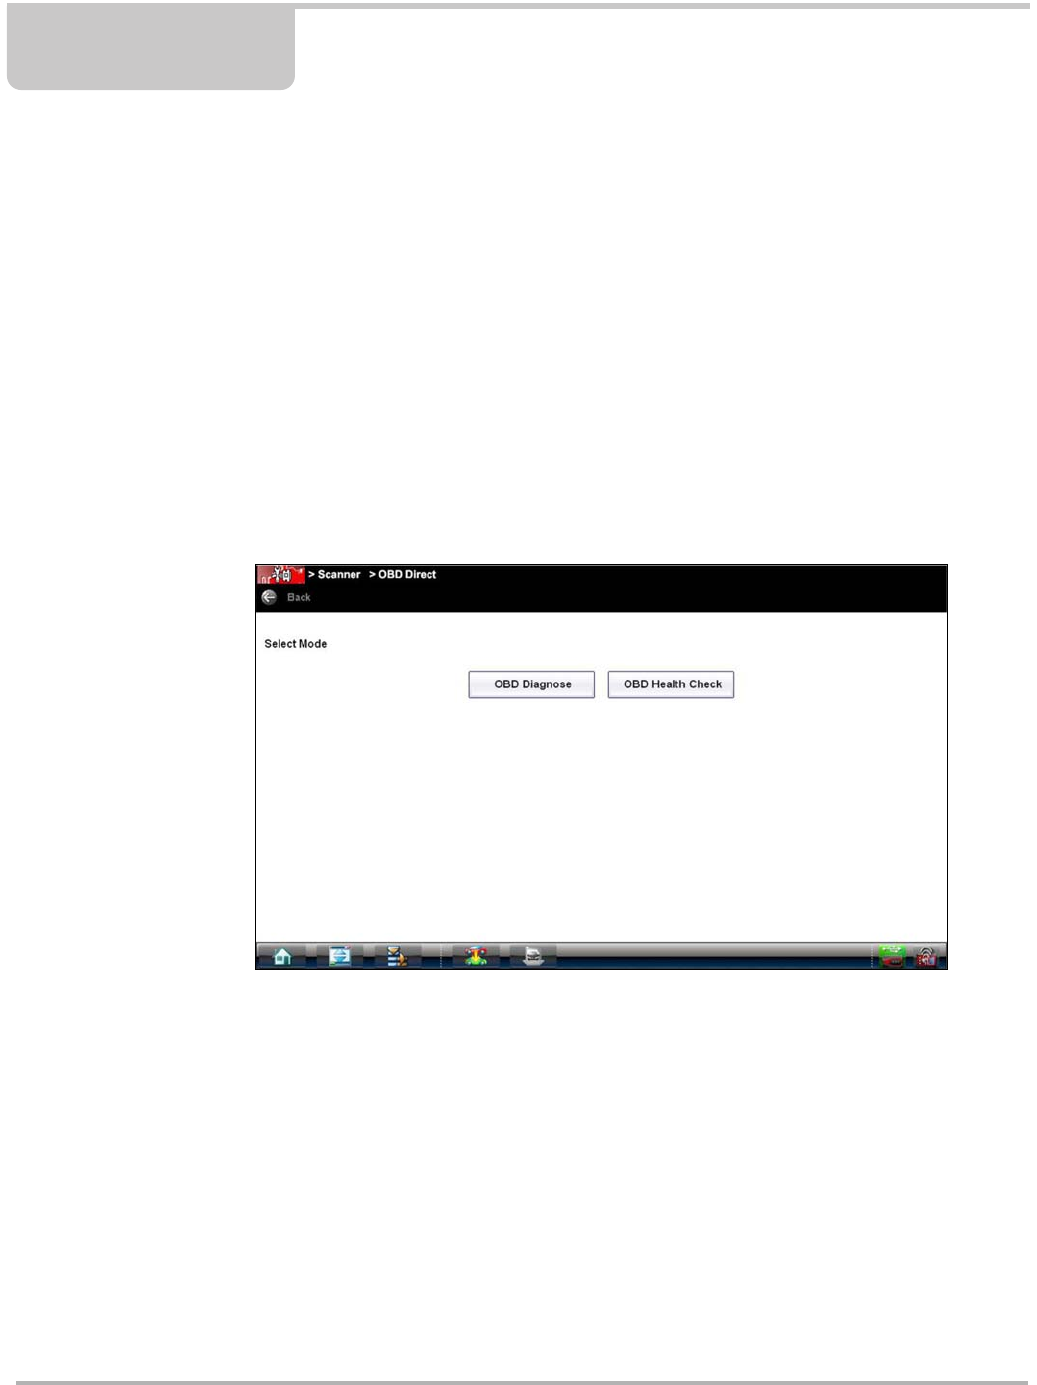
Draft 4/14/15- Do Not Distribute
65
Chapter 6 OBD Direct Operations
This Home screen option allows you to access Generic OBD-II/EOBD Scanner tests without
completing a vehicle identification. OBD Direct presents a quick way to check for diagnostic
trouble codes (DTCs), isolate the cause of an illuminated malfunction indicator lamp (MIL), check
monitor status prior to emissions certification testing, verify repairs, and perform a number of other
services that are emissions-related. This mode is also used for testing OBD-II/EOBD compliant
vehicles that are not included in the Scanner databases.
OBD Direct is a Scanner function, and the Scan Module must be connected to the test vehicle and
communicating with the Diagnostic Tool. This function only provides generic OBD-II/EOBD
information. To access enhanced OBD-II/EOBD functions, select Scanner from the Home screen.
Options for the Menu icon on the Toolbar at the base of the screen are the same as those available
for the Scanner module. Refer to Menu Options on page 36 for details.
Selecting OBD Direct on the Home screen opens a menu with two options (Figure 6-1):
Figure 6-1 Sample OBD Direct main menu
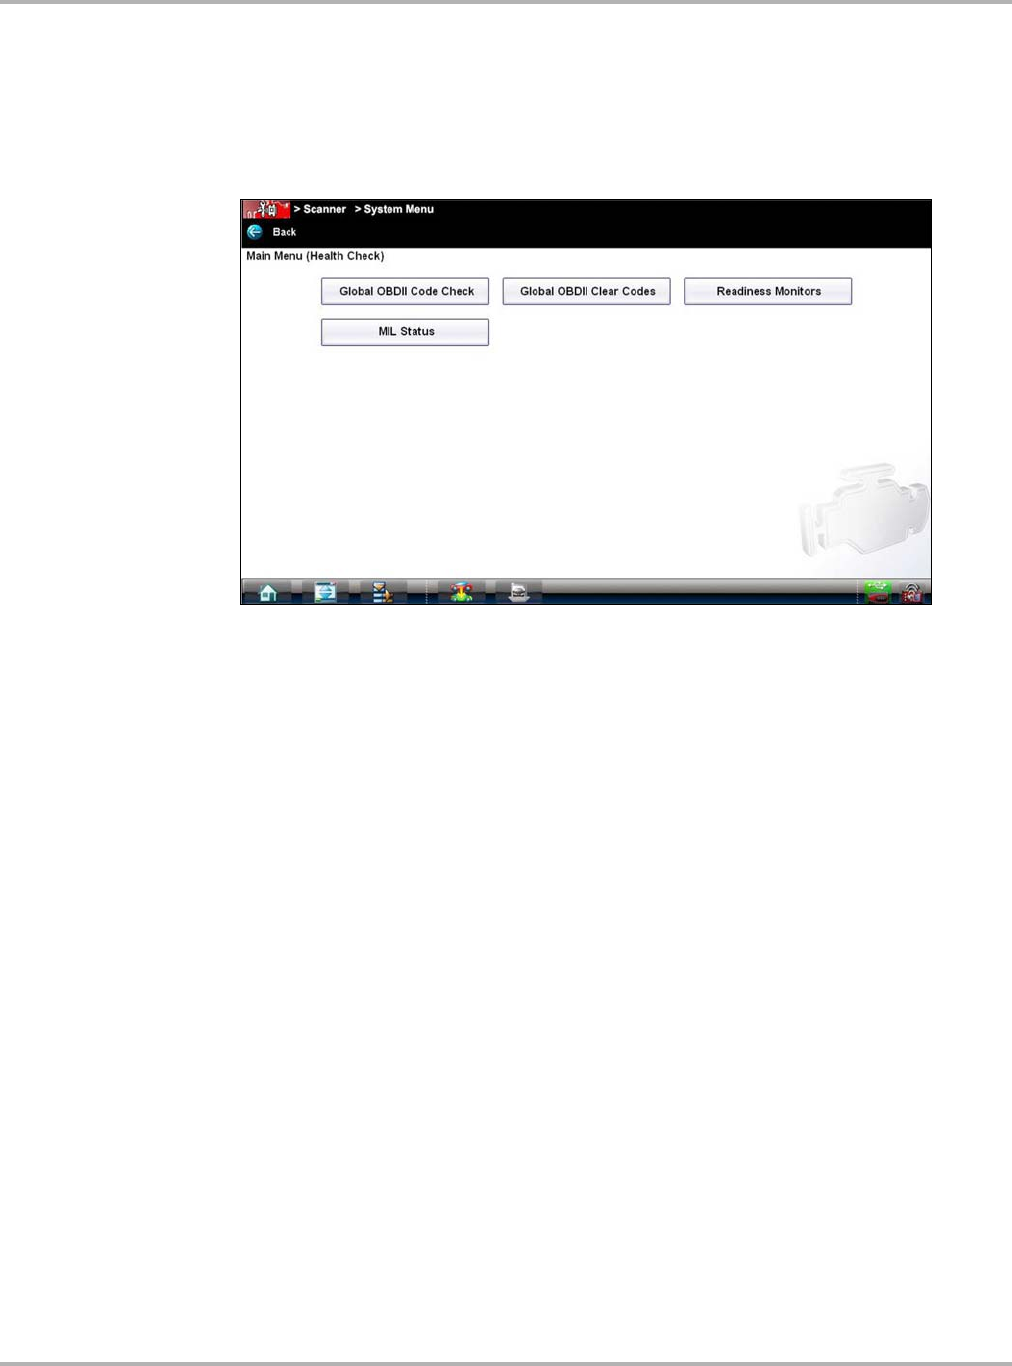
Draft 4/14/15- Do Not Distribute
66
OBD Direct Operations OBD Health Check
6.1 OBD Health Check
The OBD Health Check offers a way to quickly check for and clear generic diagnostic trouble
codes (DTCs) and to check readiness monitors. Selecting OBD Health Check opens a submenu
of options (Figure 6-2).
Figure 6-2 Sample OBD Health Check menu
6.1.1 Global OBD II Code Check
This option displays any stored emission related generic DTCs reported by the ECM. Selecting
opens a submenu with two choices: Codes and Pending Codes.
Select an option to display the code list. Refer to Codes Menu on page 42 and the Global OBD
Vehicle Communication Software Manual for additional information.
Codes
Codes displays a list of current emission related DTCs. OBD-II/EOBD Codes have a priority
according to their emission severity, with higher priority codes overwriting lower priority codes.
The priority of the code determines the illumination of the MIL and the code erase procedure.
Manufacturers rank codes differently, so expect to see differences between makes.
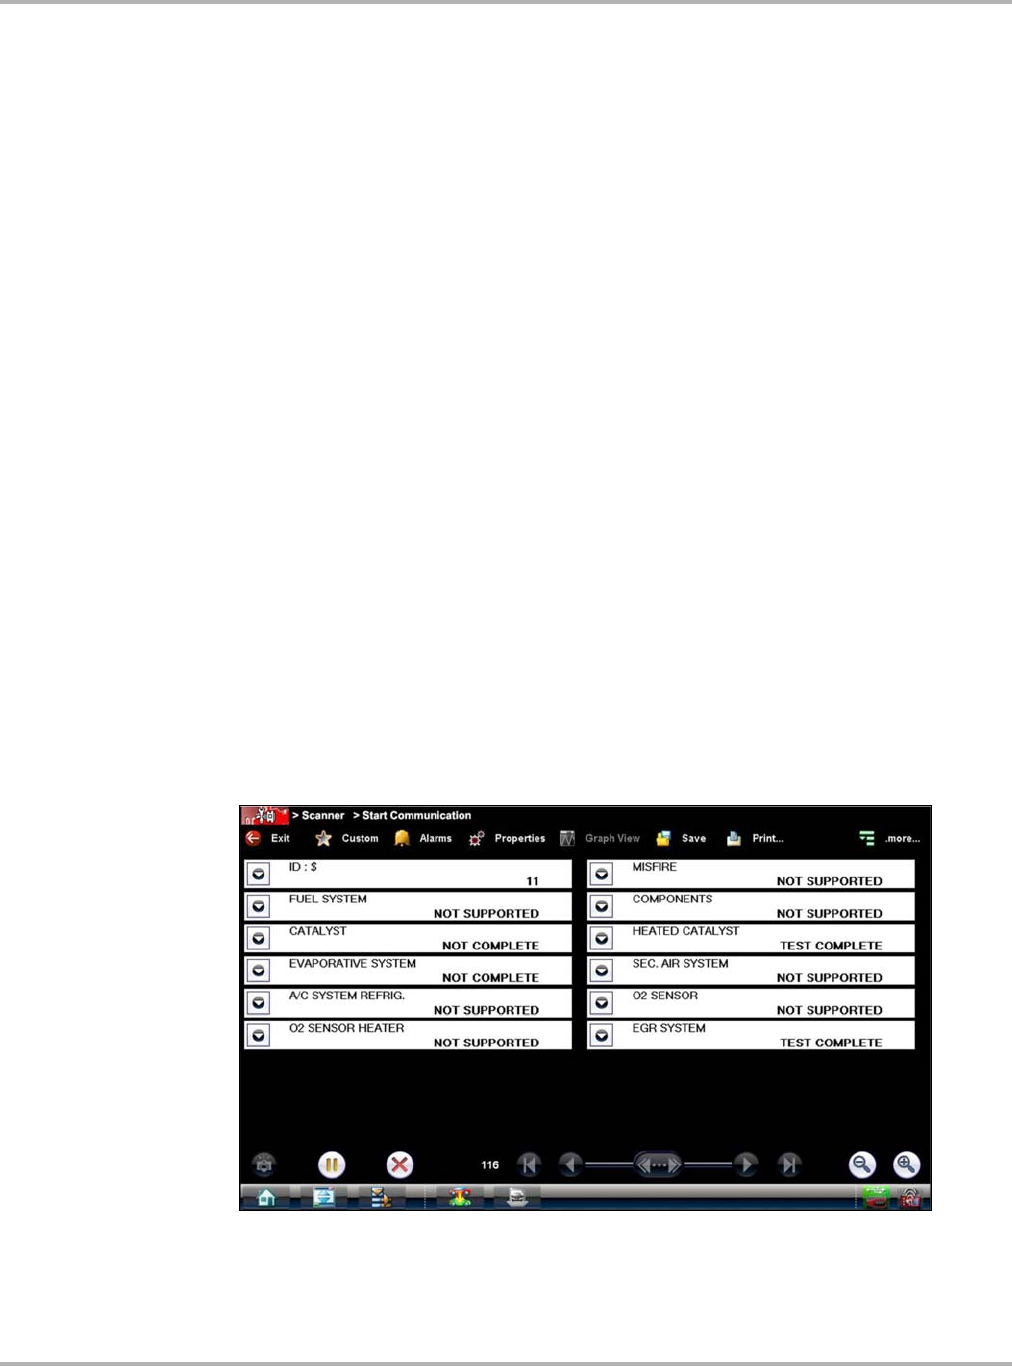
Draft 4/14/15- Do Not Distribute
67
OBD Direct Operations OBD Health Check
Pending Codes
The purpose of this service is to enable the scan tool to obtain “pending” or maturing diagnostic
trouble codes. These are codes whose setting conditions were met during the last drive cycle, but
need to be met on two or more consecutive drive cycles before the DTC actually sets.
The intended use of this service is to assist the service technician after a vehicle repair and after
clearing diagnostic information, by reporting test results after a single driving cycle.
•If a test failed during the driving cycle, the DTC associated with that test is reported. If the
pending fault does not occur again within 40 to 80 warm-up cycles, the fault is automatically
cleared from memory.
•Test results reported by this service do not necessarily indicate a faulty component or system.
If test results indicate another failure after additional driving, then a DTC is set to indicate a
faulty component or system, and the MIL is illuminated.
6.1.2 Global OBD II Clear Codes
This option is used to clear all emission related diagnostic data such as, DTC records, freeze
frame data, and test results, from ECM memory. Although OBD Direct only displays generic
OBD-II data, clearing codes erases all of the stored data including any enhanced codes.
A confirmation screen displays when the clear codes option is selected to prevent accidental loss
of data. Select Yes on the confirmation screen to continue. Refer to Codes Menu on page 42 and
the Global OBD Vehicle Communication Software Manual for additional information.
6.1.3 Readiness Monitors
Use this menu option to check the readiness of the monitoring system. An OBD-II/EOBD system
checks the status of emission-related subsystems by running continuous or periodic tests. Test
results are shown in the data viewer (Figure 6-3).
Figure 6-3 Sample readiness monitor test report
Gesture sweep to view the entire list of Readiness Monitors to ensure that all tests are complete.
It is possible to print the readiness test status or save it as part of a Vehicle history.
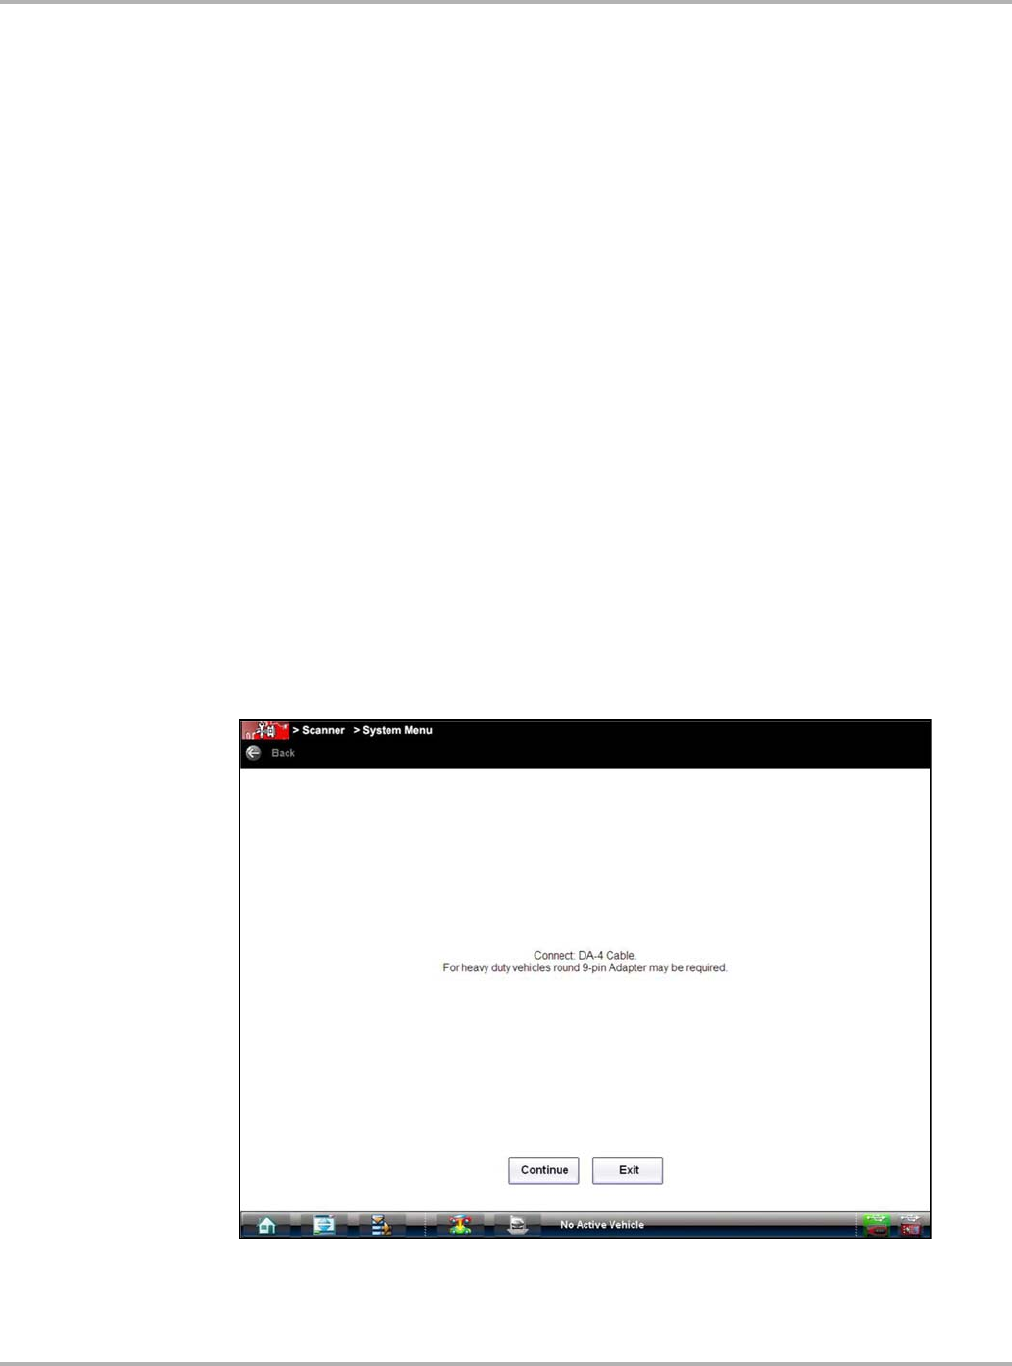
Draft 4/14/15- Do Not Distribute
68
OBD Direct Operations OBD Diagnose
6.1.4 MIL Status
This item is used to check the current condition of the malfunction indicator lamp (MIL). Additional
information, such as which ECM commanded the MIL on and the distance driven while the MIL is
on (if supported), can also be displayed. It is also possible to print the MIL Status.
6.2 OBD Diagnose
Selecting OBD Diagnose opens a menu with the following options:
•Start Communication—begins the test session
•Connector Information—provides data link connector (DLC) location details for most models
•Manual Protocol Selection—allows you to select which protocol to use
6.2.1 Start Communication
Use the following procedure to conduct an OBD Direct test session:
zTo perform an OBD Direct Test:
1. Select Start Communications from the OBD Direct menu.
A generic connection message will display (Figure 6-4), connect the Scan Module to the
test vehicle as instructed.
Figure 6-4 Sample generic connection message
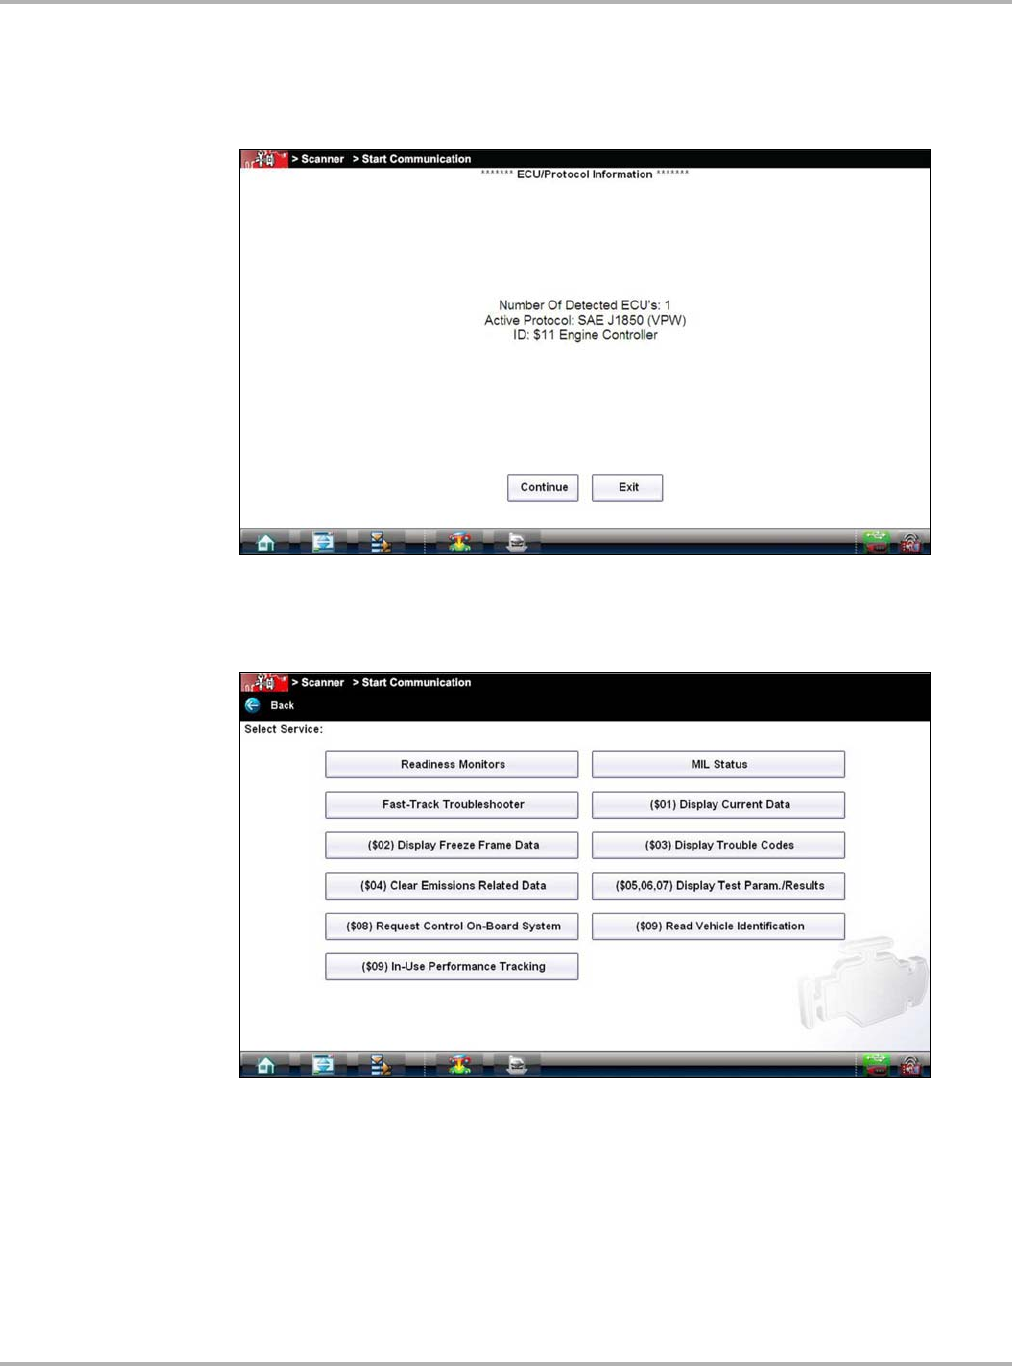
Draft 4/14/15- Do Not Distribute
69
OBD Direct Operations OBD Diagnose
2. Select Continue.
A communications message that shows how many ECMs were detected, which ECM is
communicating, and which communication protocol is being used displays (Figure 6-5).
Figure 6-5 Sample communication message
3. Select Continue and a menu of available tests displays (Figure 6-6).
Figure 6-6 Sample Start Communication menu
4. Select a test to continue.

Draft 4/14/15- Do Not Distribute
70
OBD Direct Operations OBD Diagnose
Readiness Monitors
Use this menu item to check the status of the monitored system. If a monitored system is not
supported, it is not displayed. Scroll, if needed, to view the entire list of monitors. Selecting
Readiness Monitors opens a submenu with two choices:
•Monitors Complete Since DTC Cleared—displays the results of all monitor tests that have
run since the last time the electronic control module (ECM) memory was cleared.
•Monitors Complete This Cycle—displays only the results of monitor tests that ran during the
current drive cycle, they reset when the ignition is switched off.
MIL Status
This item is used to check the current condition of the malfunction indicator lamp (MIL). Additional
information, such as which ECM commanded the MIL on and also the distance traveled while the
MIL is on (if supported), can also be displayed. It is also possible to print the MIL Status.
Fast-Track Troubleshooter
Fast-Track® Troubleshooter is a database of experience-based information of validated
real-world repair strategies that have been compiled by top-notch technicians since 1988. The
Troubleshooter system simplifies the diagnosis process, as it contains information on virtually all
common diagnostic trouble code (DTC) problems and driveability symptoms for most vehicles
covered by the vehicle communication software.
($01) Display Current Data
Use this item to display the current emission related data from the selected electronic control
module (ECM) of the vehicle. Displayed data includes analog inputs and outputs, digital inputs and
outputs, and system status information broadcast on the vehicle data stream. OBD Direct data
displays similar to Scanner data, refer to Data Display on page 45 for details.
($02) Display Freeze Frame Data
This item is used to display freeze fame data for any stored emission related diagnostic trouble
codes (DTC). In most cases the stored frame is the last DTC that occurred. Certain DTCs, those
that have a greater impact on vehicle emission, have a higher priority. In these cases, the highest
priority DTC is the one for which the freeze frame records are retained.
Freeze frame data includes a “snapshot” of critical parameter values at the time the DTC set.
($03) Display Trouble Codes
This option displays any stored emission related DTCs reported by the various ECMs. The OBD
Direct code report is similar to a Scanner module code report, and includes the Fix It icon with
hyperlinks to SureTrack and Repair Information details. See Display Codes on page 42 for
additional information.

Draft 4/14/15- Do Not Distribute
71
OBD Direct Operations OBD Diagnose
($04) Clear Emissions Related Data
This item is used to clear all emission related diagnostic data such as, DTCs, freeze frame data,
and test results from the memory of the selected ECM.
($05, 06, 07) Display Test param./Results
This option opens a submenu of test parameters and test results from various sensors, monitor
test results, and a record of DTCs detected during the last drive cycle. The menu includes:
•Oxygen Sensor Monitoring ($05)
•On-Board Monitored Systems ($06)
•DTCs Detected During Last Drive ($07)
($08) Request Control of On-board System
This service enables bidirectional control of the ECM so that the Scanner is able to transmit
control commands to operate the vehicle system. This function is useful in determining how well
the ECM responds to a command.
Available options vary by make, model, and year of the test vehicle. Select a test and follow the
on-screen instructions.
($09) Read Vehicle Identification
This selection displays the vehicle identification number (VIN), the calibration identification, and
the calibration verification number (CVN) of the test vehicle.
($09) In-use Performance Tracking
This selection displays the “In-use Performance Tracking” of monitored data. It is basically a
record of the number of times each of the monitor tests have been completed.
($0A) Emission Related DTC with Permanent Status
This service displays a record of any “permanent” codes on late-model vehicles if the vehicle
supports Service $0A. A permanent status DTC is one that was severe enough to illuminate the
MIL at some point, but the MIL may not be on at the present time.
Whether the MIL was switched off by clearing codes or because the setting conditions did not
repeat after a specified number of drive cycles, a record of the DTC is retained by the ECM.
Permanent status codes automatically clear after repairs have been made and the related system
monitor runs successfully.
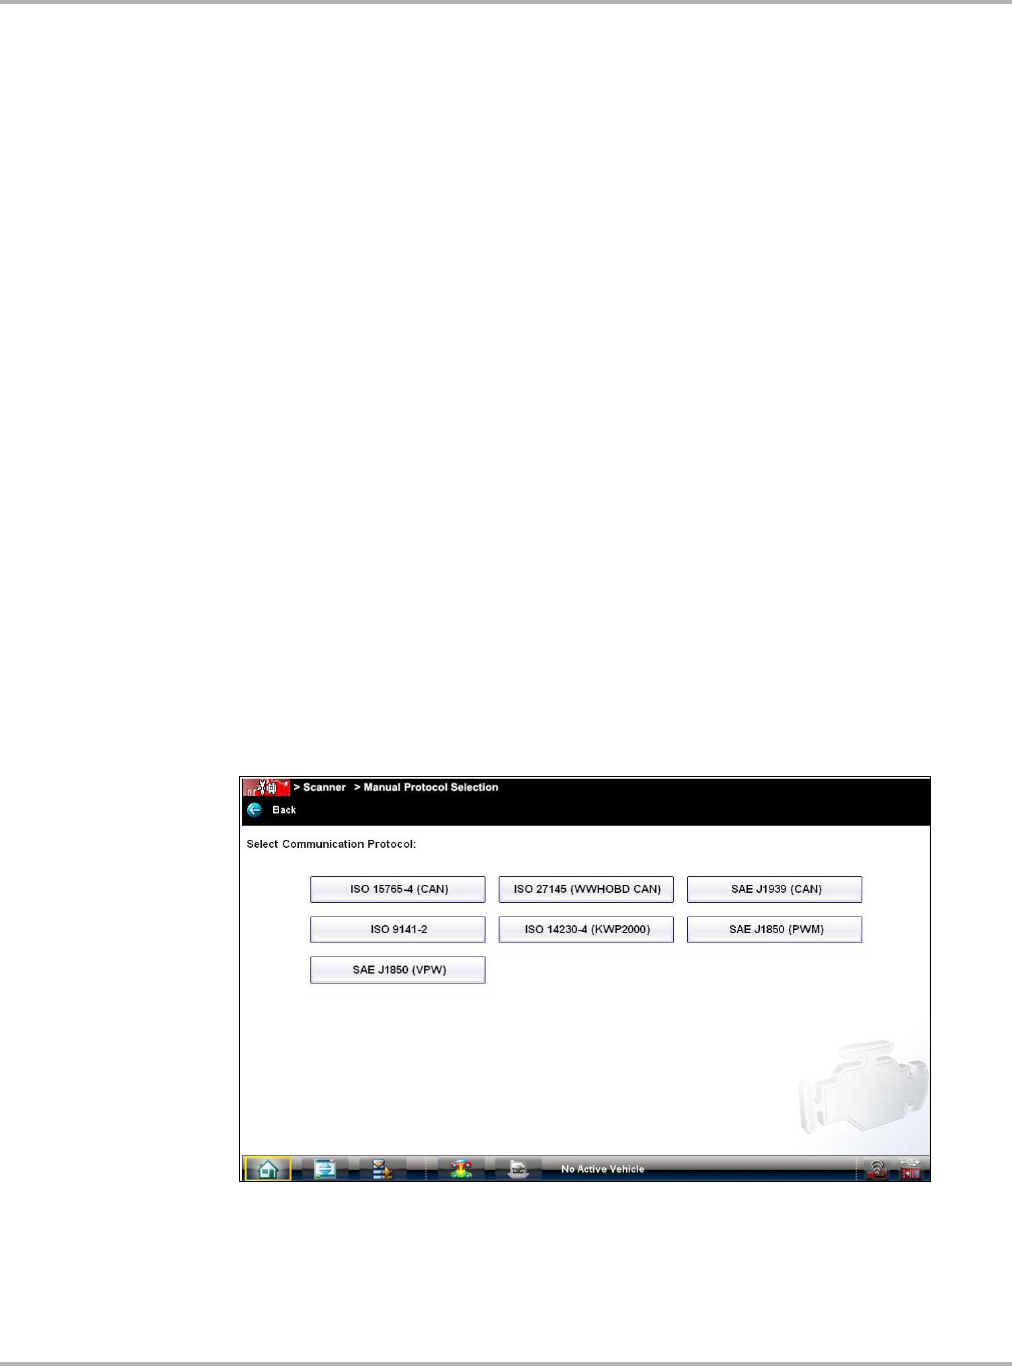
Draft 4/14/15- Do Not Distribute
72
OBD Direct Operations OBD Diagnose
6.2.2 Connector Information
This option opens a database of vehicle diagnostic connector locations that includes most makes
and models.
zTo locate a vehicle diagnostic connector:
1. Select Connector Information from the System menu.
2. Select a manufacturer from the list presented.
3. Select a model from the list presented.
Instructions for which, if any, cable adapter or pin to use displays.
4. Select Continue.
Information on where to locate the vehicle diagnostic connector displays.
5. Select Continue to return to the System menu.
6.2.3 Manual Protocol Selection
A communication protocol is a standardized way of data communication between an ECM and a
scan tool. Global OBD may use several different communication protocols. The scan tool
automatically connects to an available protocol, which displays on the connection message
(Figure 6-5). Some vehicles communicate on more than one protocol. Use the Manual Protocol
Selection option to switch to a different protocol.
Select Manual Protocol Selection and message displays advising you to make sure you know
the correct protocol for the test vehicle. An incorrect selection may activate warning lamps and set
CAN related faults on the vehicle. Select OK and a menu of options displays (Figure 6-7).
Figure 6-7 Sample communication protocol menu
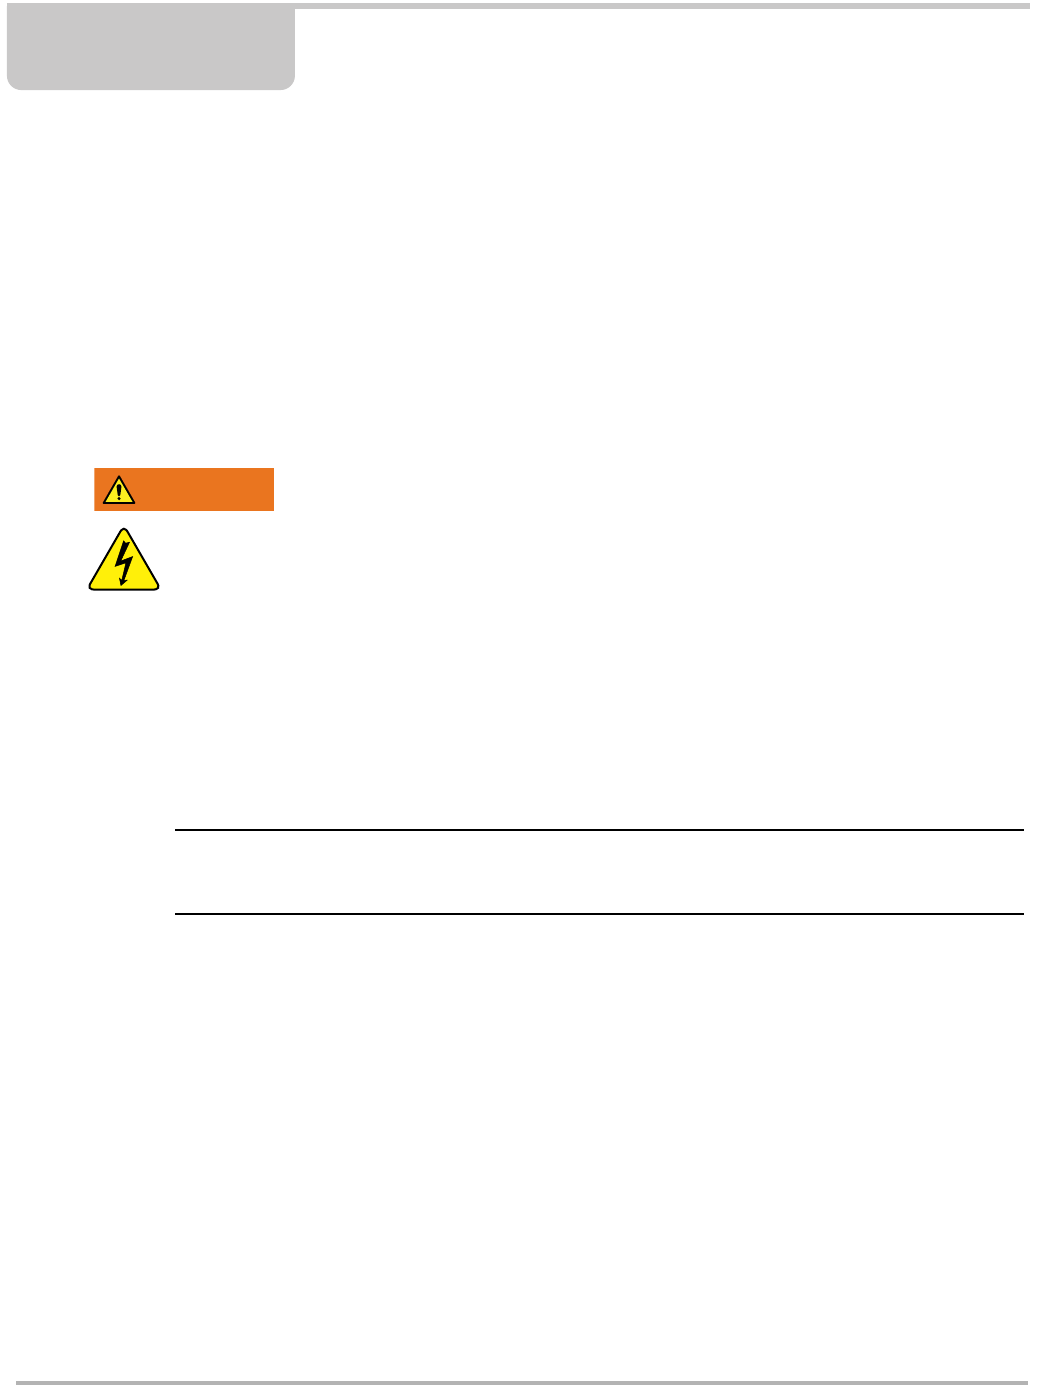
Draft 4/14/15- Do Not Distribute
73
Chapter 7 Guided Component Test
Operations
The Guided Component Test software is a component-testing powerhouse, providing you with a
robust diagnostic database for use with scopes and meters. It is like having access to a complete
library of shop manuals for testing engine-management components, transmission sensors and
components, and ABS systems.
Guided Component Test helps you with everything from selecting the appropriate test for a
specific component to showing the hook-up location and correct pin configuration. This software
thoroughly guides and instructs you on proper testing procedures and offers tips from the internal
troubleshooter database. The Guided Component Test procedures, tips, and meter settings
reduce your overall set-up and diagnostic testing time. Vehicle-specific Guided Component Tests
are provided for engine, transmission, ABS, charging, transfer case and suspension systems.
:$51 ,1*
Risk of electrical shock.
•Read the Important Safety Instructions document provided separately for messages on
the safe use of this product.
• This product is intended for Measurement Category I (for example, automotive 12V
systems), do not use this product for Measurement Categories II, III, and IV.
• Measurement Category I is for performing measurements on circuits not directly
connected to MAINS or MAINS circuits (an example of a MAINS circuit is 120V AC or
240V AC household or industrial electricity), do not connect this product to MAINS or
MAINS circuits.
• Do not apply the Black Ground Lead to test points other than ground/system return/
vehicle chassis.
Electrical shock can cause personal injury, equipment damage, or circuit damage.
IMPORTANT:
Maximum rated transient over voltage impulse is 500 volts, do not exceed the rated
transient over voltage.
7.1 Vehicle Identification
The Guided Component Test information presented is specific to the vehicle being tested.
Therefore, certain attributes of the test vehicle must be entered into the Diagnostic Tool so that the
correct data can be retrieved. Vehicle identification information is carried over if you enter the
Guided Component Test module either from the Scanner function or from one of the records
stored in the Vehicle History module. However, you may need to enter additional attributes in
some instances.
The vehicle identification sequence is menu driven, you simply follow the screen prompts and
make a series of choices. Each selection you make advances you to the next screen.

Draft 4/14/15- Do Not Distribute
74
Guided Component Test Operations Vehicle Identification
7.1.1 Menu Options, Guided Component Test
Selecting the Toolbar Menu icon at the base of the screen offers the following options:
•Safety Information—opens the Important Safety Instructions document. See Safety
Information on page iii for additional information.
•File—allows you to print, save and set page settings of the data being viewed.
•Top Level Menus—allows you to access supplemental information and training programs.
•Help—allows you to view supporting documentation. See Help Operations on page 139 for
additional information.
File
Selecting File opens a menu of print options:
•Print Article—selecting has one of two results:
–If a printer is connected, the file is sent to the printer.
–If a printer is not connected, the article is saved as a (.xps) file, which can be retrieved,
moved, or copied and printed at a later time.
•Print Preview—opens a representation of what the printed file will look like.
•Page Setup—allows you to adjust margins and paper orientation.
Top Level Menus
Selecting Top Level Menus opens a list of the following options:
•Features Benefits
•How To
•Power User Tests
•Snap-on Automotive Theory
Features Benefits
Selecting Features Benefits opens a menu page that includes:
•5-Minute Walk Thru With Demo Board—explains how to use the optional demonstration
board to generate sample signals.
•Features & Benefits—provides descriptions and a brief overview of meter functions.
•Accessories—opens a menu of optional equipment available.
•Product Description—provides descriptions and a brief overview of meter operations.
The demonstration board not only helps you learn how to use the Guided Component Test
software, it allows you to hone your skills and diagnostic technique without an actual test vehicle.
Power User Tests
The Power User Tests option gives you quick access to a pre-configured meter for conducting a
number of control system tests. Tests are available with or without on-screen help. Help typically
provides a description of the test along with expected results and a link to the pre-set meter.

Draft 4/14/15- Do Not Distribute
75
Guided Component Test Operations Vehicle Identification
How To
The How To option provides a list of available on-screen instructions for performing tasks. Scroll
to view the entire list. Typical topics include:
•10-Minute Electronic Classes—provides brief instruction in basic electronics and circuit
connections.
•15-Minute Ignition Classes—provides an introduction to basic ignition testing.
•Illustrated Terms & Definitions—provides definitions of terms, drawings and tips associated
with Guided Component Testing.
•No-start Basics—provides a guideline for diagnosing a no-start condition.
•O2 Sensor & Feedback System Analysis—displays the Guided Component Test meter in
the “live” graphing mode with O2S test tips to help you understand the fundamental concepts
of O2S diagnostics.
•Test Tips—gives on-screen instructions for performing specific Guided Component Tests
along with drawings and tips.
•20-Minute Current Ramp Classes—provides an introduction to current ramp testing.
•Minute Current Ramp Classes—provides an introduction to current ramp testing.
•Theory And Operation—provides basic theory and operation information for related
components.
Snap-on Automotive Theory
Selecting the Snap-on Automotive Theory option provides you basic operation, theory and
testing information on various systems such as:
•Air Conditioning
•Diesel Particulate Filters
•High-Intensity Discharge Headlights
•Supplemental Restraint Systems
•Diagnosing Battery Draws
•Electronic Parking Assistance Class
•LIN-Bus
•Tire Pressure Monitoring
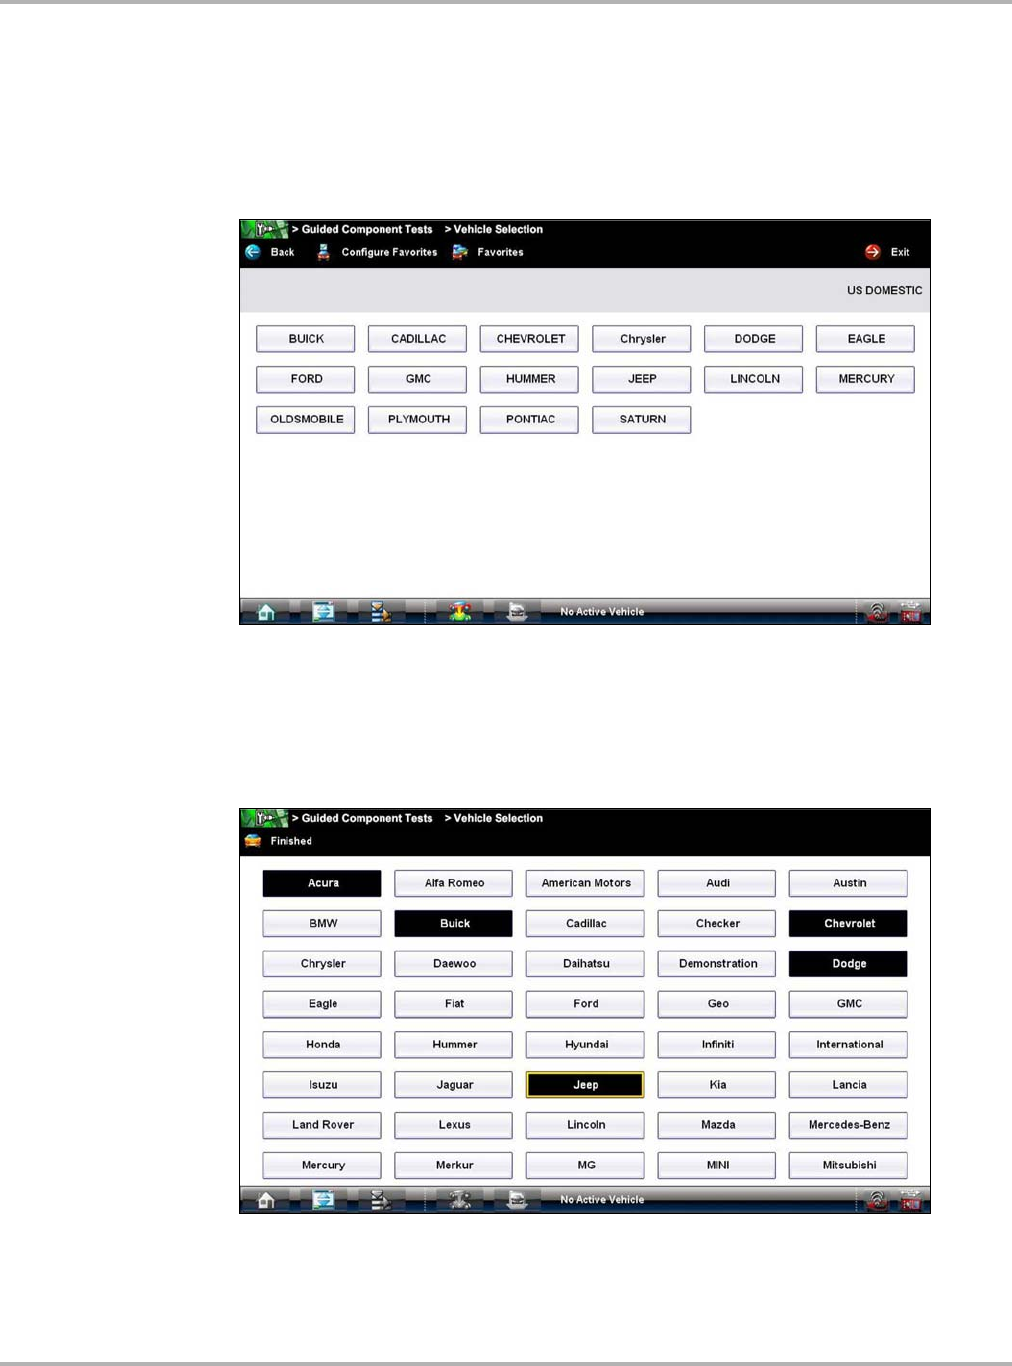
Draft 4/14/15- Do Not Distribute
76
Guided Component Test Operations Vehicle Identification
7.1.2 Creating a Favorites List
Once a Guided Component Test database is loaded, a list of manufacturers displays. This list is
often long and includes makes that are not frequently used. A toolbar at the top of the screen
allows you to custom configure the manufacturer list to display only the makes you frequently
service.
Figure 7-1 Sample manufacturer list
zTo configure a favorites list:
1. Select Configure Favorites on the toolbar.
A list of selectable manufacturers displays.
Figure 7-2 Sample Configure Favorites screen
2. Select each manufacturer you want to include, selected manufactures are highlighted.
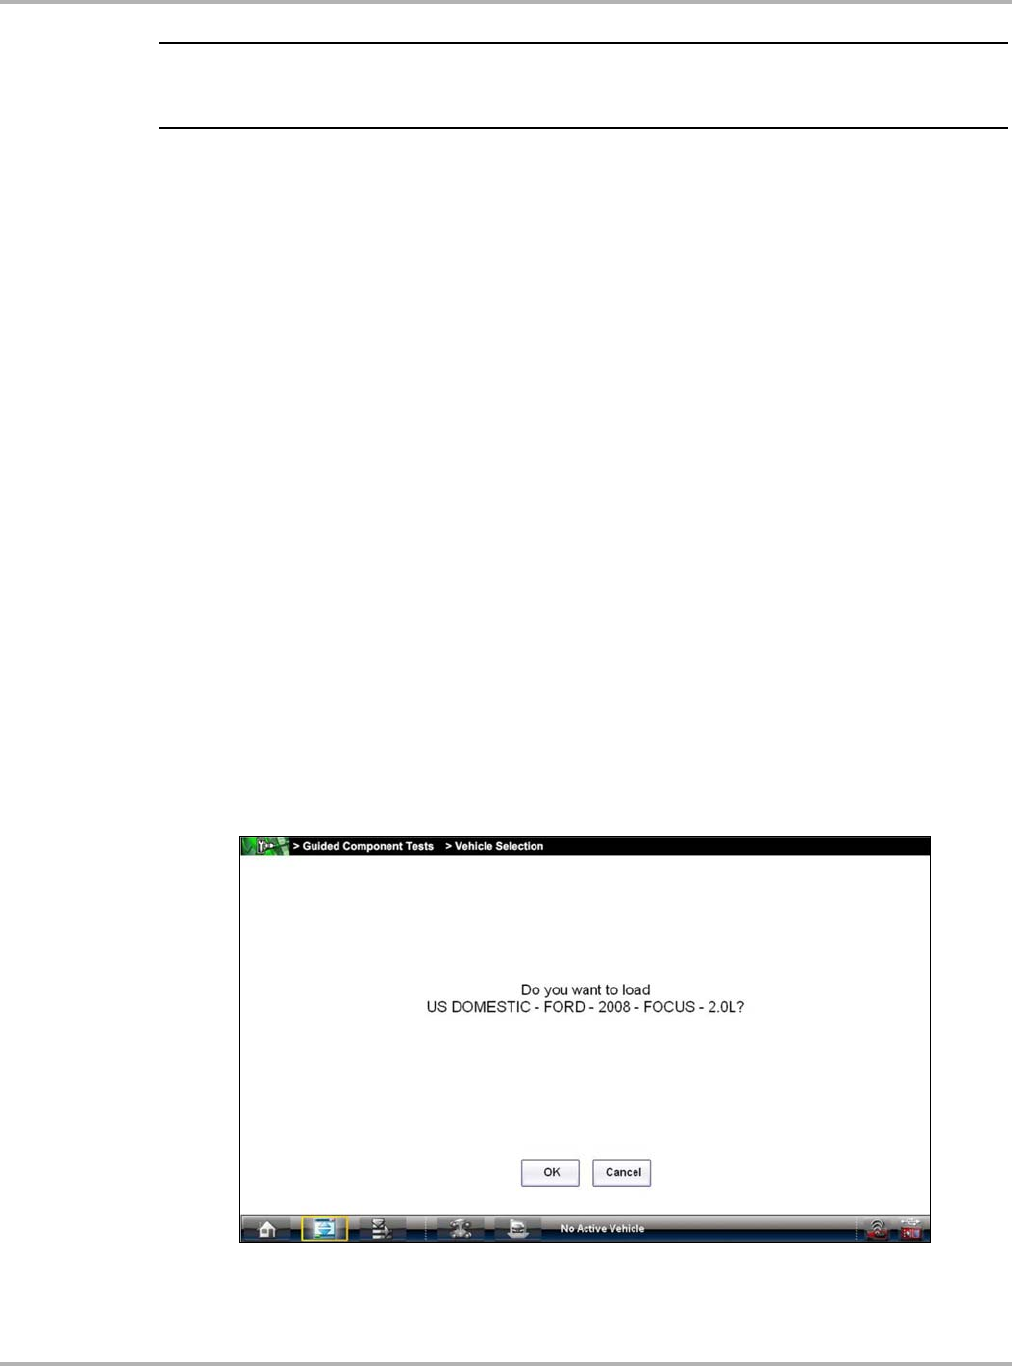
Draft 4/14/15- Do Not Distribute
77
Guided Component Test Operations Vehicle Identification
NOTE:
iManufacturers appear on the favorites list in the order in which they are selected. Therefore, if you
select the makes you work on most frequently first, they will appear at the top of the list.
3. Select Finished on the toolbar once your selections have been made.
The screen returns to the manufacturer list, but only the makes you selected display. Note the
“Favorites” toolbar selection now reads “Full list”.
4. Select Full List on the toolbar to view the complete list of manufacturers.
5. Select Back on the toolbar at any time to return to the previous screen.
Your favorites list is what will display whenever a Guided Component Test database is started in
the future. The list can be modified at any time by selecting Configure Favorites from the toolbar.
7.1.3 Identifying a Test Vehicle
Exact procedures to identify the test vehicle may vary somewhat by vehicle and market. The
following procedure, which identifies a 2008 Ford Focus for testing the fuel injection system, is
typical of what to expect.
zTo identify a vehicle for Guided Component Test:
1. Select the Guided Component Test Function icon from the Home screen.
2. Select which database to load for the test vehicle if requested (optional).
After the database loads, a list of manufacturers displays.
3. Select FORD and a model year menu displays.
4. Select 2008 from the year menu and a list of available models displays.
5. Select FOCUS from the model list and a list of available engines displays.
6. Select 2.0L from the engine list and a confirmation dialog box displays (Figure 7-3).
Figure 7-3 Sample confirmation dialog box
7. From the confirmation dialog box, select OK to continue, or Cancel to return to the engine list.
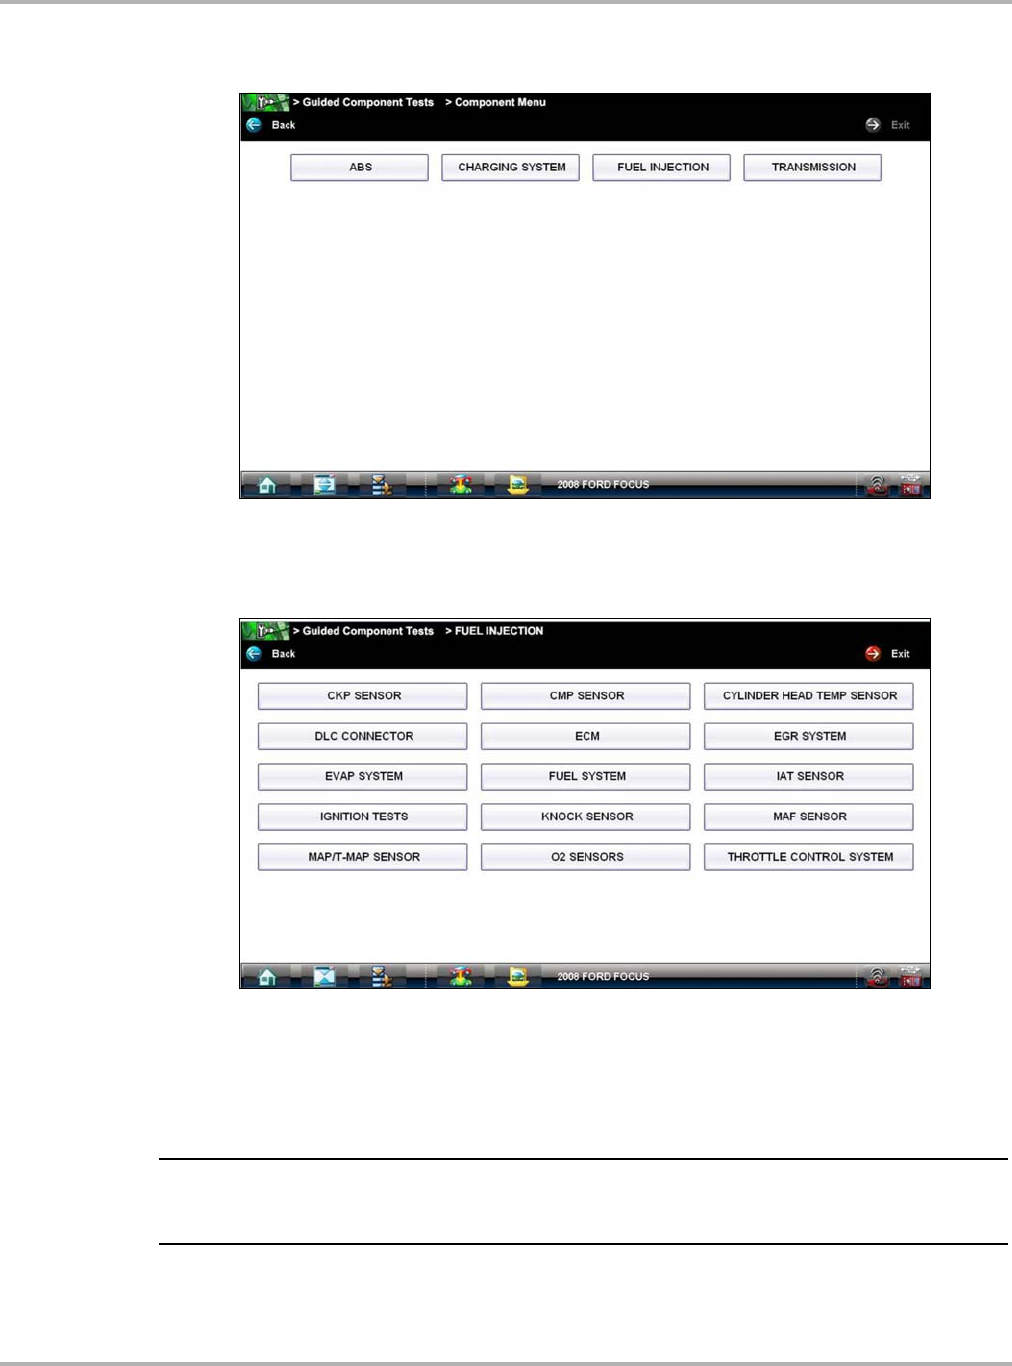
Draft 4/14/15- Do Not Distribute
78
Guided Component Test Operations Vehicle Identification
A list of tests available for the identified vehicle displays (Figure 7-4).
Figure 7-4 Sample available tests list
8. Select FUEL INJECTION and a fuel injection component test menu displays (Figure 7-5).
Figure 7-5 Sample available component tests list
9. Select a test to continue.
The identification sequence is now complete, refer to the Operations section that follows for
details on how to navigate through the Guided Component Test information and perform tests.
NOTE:
iIf you return to the Home screen and select Scanner or Vehicle History the vehicle identification
entered here is carried over. However, additional information may be needed by some modules.
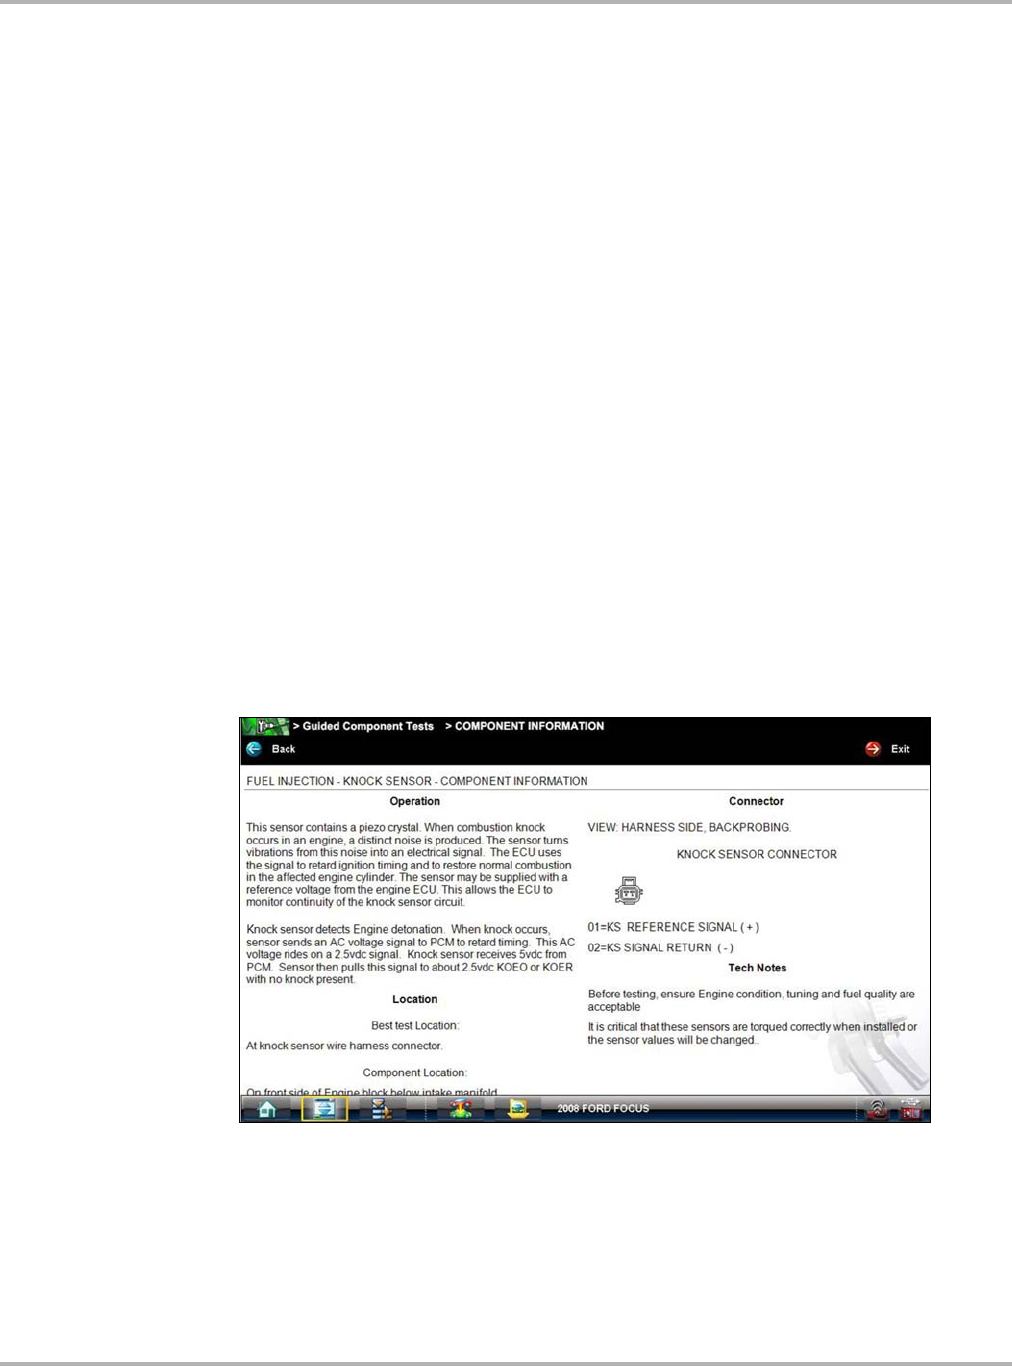
Draft 4/14/15- Do Not Distribute
79
Guided Component Test Operations Operations
7.2 Operations
The Guided Component Test software provides vehicle specific Guided Component Test
procedures and information that aid in setting up scopes and meters. Once a test vehicle is
identified, you can select a Guided Component Test from the list of available tests. For most
selections two main choices are available on the component menu:
1. COMPONENT INFORMATION—provides information on the selected component and
connector pin details that assists you in understanding the components prior to diagnosis.
2. TESTS—provides a pre-configured list of tests, guides you through performing the tests, and
offers tips and resources to reduce setup and testing time.
7.2.1 Component Information
Component Information provides details on specific vehicle components to provide a better
understanding of the components prior to diagnosis.
The Component Information screens contain information to assist you with testing. The screens
are divided in sections to help quickly guide you to the correct information (Figure 7-6):
•Operation—provides a general description of normal component operation.
•Connector—displays the component connector and lists pin assignments.
•Location—identifies the component location and the best place for testing it.
•Tech note—provides Guided Component Test-related tips (for example, common failures or
faults) as well as update or recall information.
Figure 7-6 Sample Component Information screen
zTo view component information:
1. Select a component from the tests list.
2. Select COMPONENT INFORMATION from the component menu.
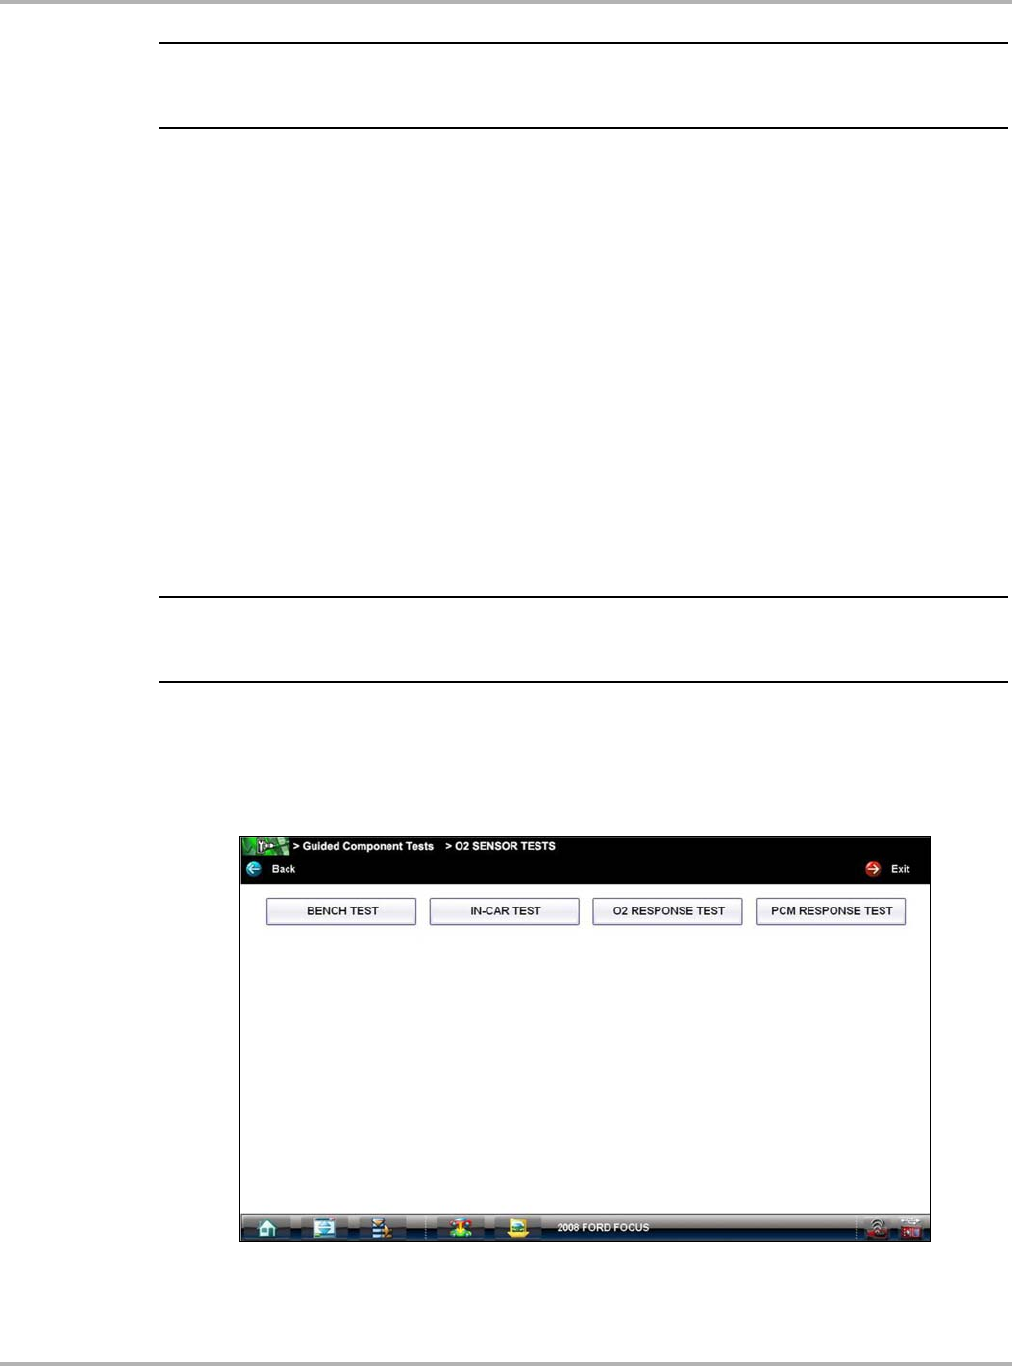
Draft 4/14/15- Do Not Distribute
80
Guided Component Test Operations Operations
NOTE:
iAn additional selection, such as front or rear for an oxygen sensor (O2S), may be required before
advancing to the component information screen.
The component information screen displays (Figure 7-6).
3. Always Gesture sweep to view any additional information below what is visible.
4. Select Back at any time to return to the previous screen.
7.2.2 Tests
The Tests section guides you through the process of performing tests on a specific component. It
also provides specifications, tips on how and where to connect the test meter leads, and also
automatically configures the multimeter or lab scope to perform the selected test.
Once a test vehicle is identified, you can select a component from the available tests list.
zTo select a test:
1. Select a component from the list.
2. Select TEST to open the list.
NOTE:
iMore than one selection is available in some instances. For example, select Ignition Tests and a
menu offering Primary Tests and Secondary Tests displays.
The list shows all of the tests available for the selected component, choices vary by make,
model, and year.
Selecting opens an additional submenu similar to the one shown in Figure 7-7 when more
than one option is available.
Figure 7-7 Sample O2S voltage test submenu
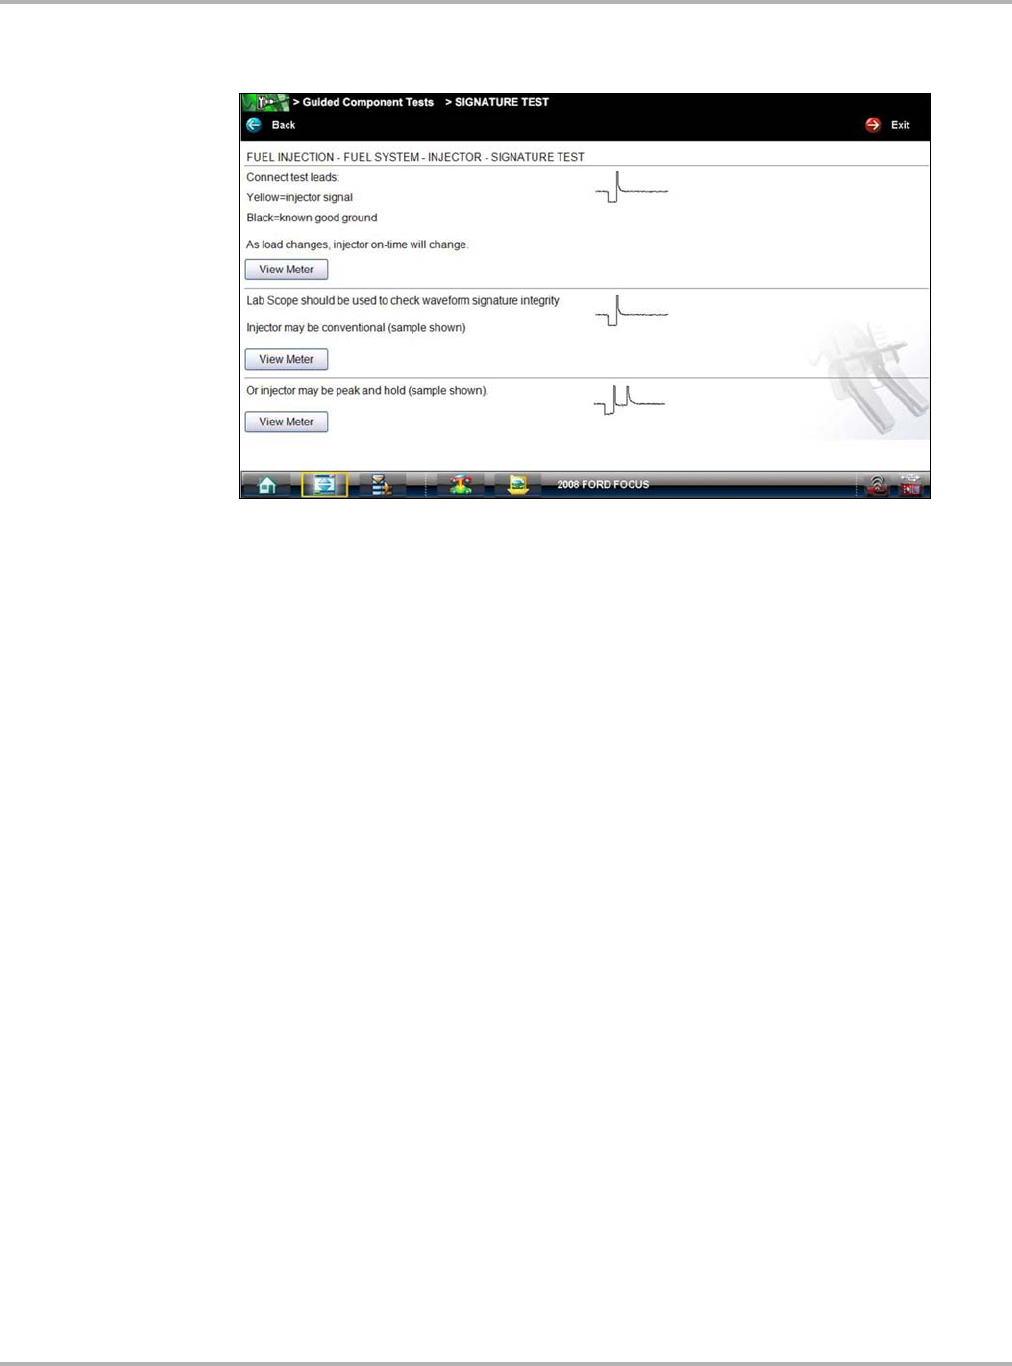
Draft 4/14/15- Do Not Distribute
81
Guided Component Test Operations Operations
3. Select a test option and the test screen displays (Figure 7-8).
Figure 7-8 Sample Test screen
4. Gesture sweep to view any additional information.
5. Select Back at any time to return to the previous screen, or select Exit to return to the main
component menu.
Hyperlinks
Guided component test screens contain hyperlinks that can either take you to another page
containing additional information or open an additional window on top of the current screen.
Hyperlinks display as icons. Common hyperlinks are:
–View Meter—opens a live meter set up to perform the test in the lower portion of the
screen (Figure 7-9). Once the meter view is open, the Guided Component Test toolbar at
the top of the screen is replaced by the Scope Multimeter toolbar, which allows you to
make adjustments to the settings. See Scope Multimeter Toolbar on page 93 for details.
–Show More Information—advances to a new screen with more detailed information
about a particular test, select Back to return to the test screen.
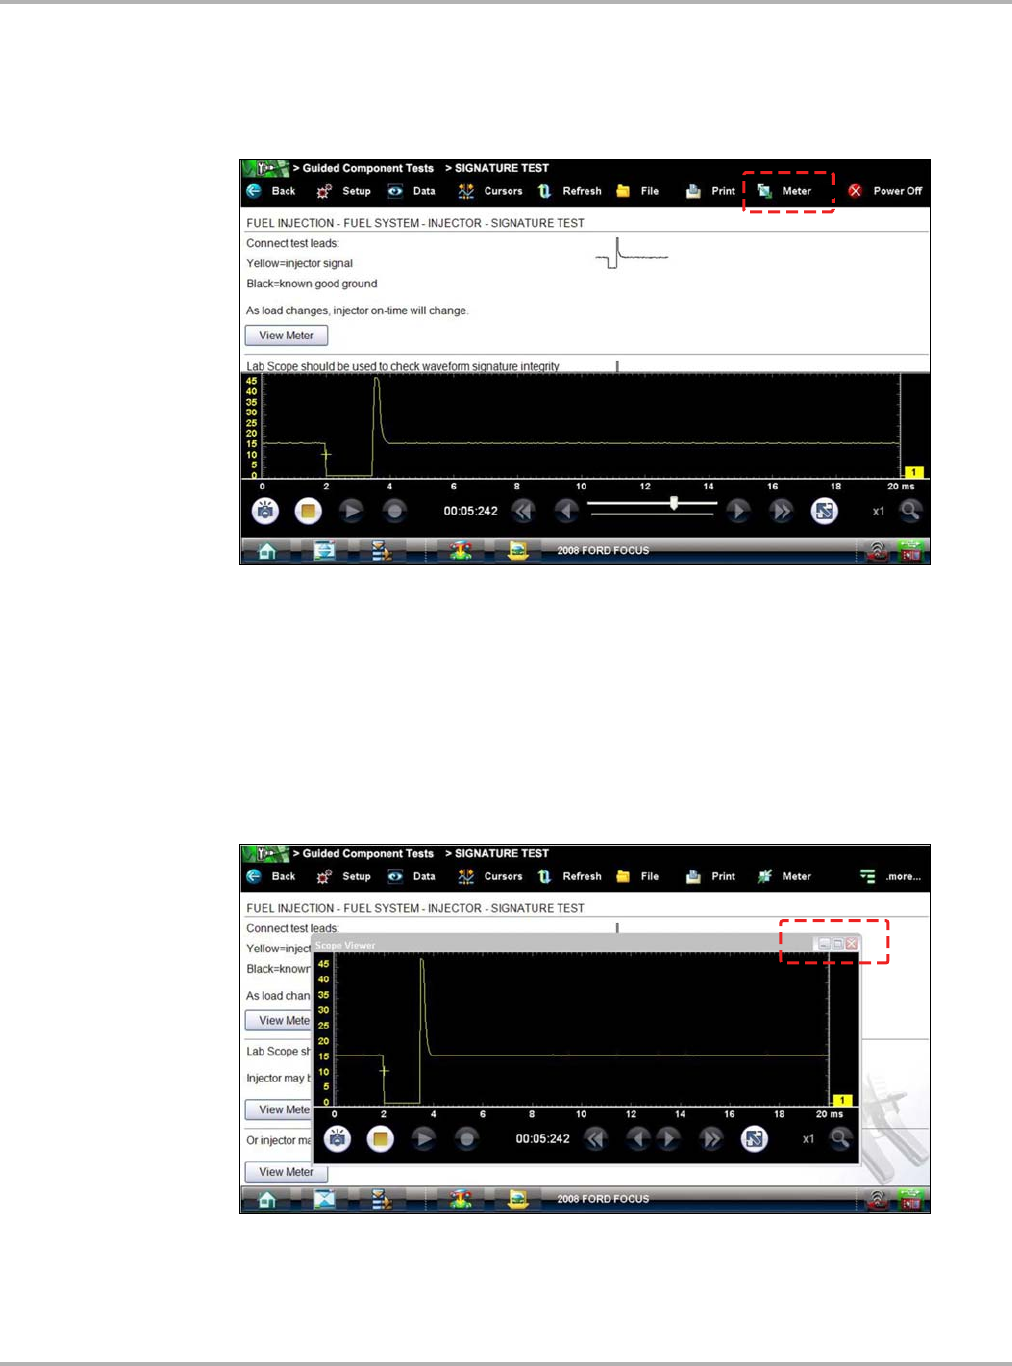
Draft 4/14/15- Do Not Distribute
82
Guided Component Test Operations Operations
View Meter
A Meter icon, which is only available in the Guided Component Test view meter mode, appears on
the upper toolbar (Figure 7-9).
Figure 7-9 Sample view meter window
Three view meter options are available:
1. With View Meter active (Figure 7-9), select the Meter icon on the toolbar once and the meter
expands to fill the entire screen.
2. Select the Meter icon a second time and the meter open as a separate window (Figure 7-10).
This window can remain open if you switch to the Scanner function and can be accessed from
the Windows taskbar at the bottom of the screen. You can also resize and reposition the meter
window on the screen.
Figure 7-10 Sample meter view in a separate window

Draft 4/14/15- Do Not Distribute
83
Guided Component Test Operations Operations
Selecting the Close icon (red box with an X) when viewing the meter in a separate window
closes the meter and returns you to the Guided Component Test screen.
3. Select the Meter icon a third time to close the separate window and return to the standard
meter view as shown in Figure 7-9.
Select Exit from the toolbar to close meter view and return to the Guided Component Test
screen.
Connecting to a Test Vehicle
Before performing a test, you must connect the meter test leads to the vehicle. Certain Guided
Component Tests require the use of specific leads. Information on specific leads and other
connecting information displays on the initial test screen. Follow the on-screen connection
instructions in the test procedure to connect the test leads.
Performing a Test
Once you connect the test leads to the vehicle, you can proceed with testing.
zTo perform Guided Component Tests:
1. Follow the instructions displayed in the test procedure section.
2. Gesture sweep to view all of the instructions and follow the on-screen procedures.
3. Select the View Meter hyperlink to display test results.
4. Refer to the on-screen information to verify test results.
IMPORTANT:
Refer to Scope and Multimeter Operations on page 84 for additional information on working with
the View Meter window.
Draft 4/14/15- Do Not Distribute
84
Chapter 8 Scope and Multimeter
Operations
The Scope Multimeter function provides all the tools needed for performing electrical and
electronic circuit tests and for monitoring signals and circuit activity. The Scope Module easily
separates from the Diagnostic Tool and connects with a USB cable so that test results can be
remotely monitored as you perform other tasks.
The Scope Multimeter function works interactively with other functions. Selecting “View Meter”
from a Guided Component Test or Scanner Test opens the Scope Multimeter function.
:$51 ,1*
Risk of electrical shock.
• Read the Safety Information provided for important warnings on the use of this product
• This product is intended for Measurement Category I (for example, automotive 12V
systems), do not use this product for Measurement Categories II, III, and IV.
• Measurement Category I is for performing measurements on circuits not directly
connected to MAINS or MAINS circuits (an example of a MAINS circuit is 120V AC or
240V AC household or industrial electricity), do not connect this product to MAINS or
MAINS circuits.
• Do not apply the Black Ground Lead to test points other than ground/system return/
vehicle chassis.
Electrical shock can cause personal injury, equipment damage, or circuit damage.
IMPORTANT:
Maximum rated transient over voltage impulse is 500 volts, do not exceed the rated
transient over voltage.
8.1 Using the Scope Module Remotely
The Scope Module (M4) module can be undocked from the Diagnostic Tool, and used remotely to
increase the range of mobility while monitoring signals on a test vehicle. An A/B type USB cable
(supplied) is used to connect the Scope Module to the Diagnostic Tool when used remotely.
As general practice, the Scope Module should only be undocked from the Diagnostic Tool when it
is off. To prevent accidental loss of data, make it a practice to first save the current data if desired,
then select either the Power Off or Back icon from the Scope Multimeter toolbar to stop meter
operation. Power Off saves the current settings, but does not save data. Settings are not saved if
Back is selected.
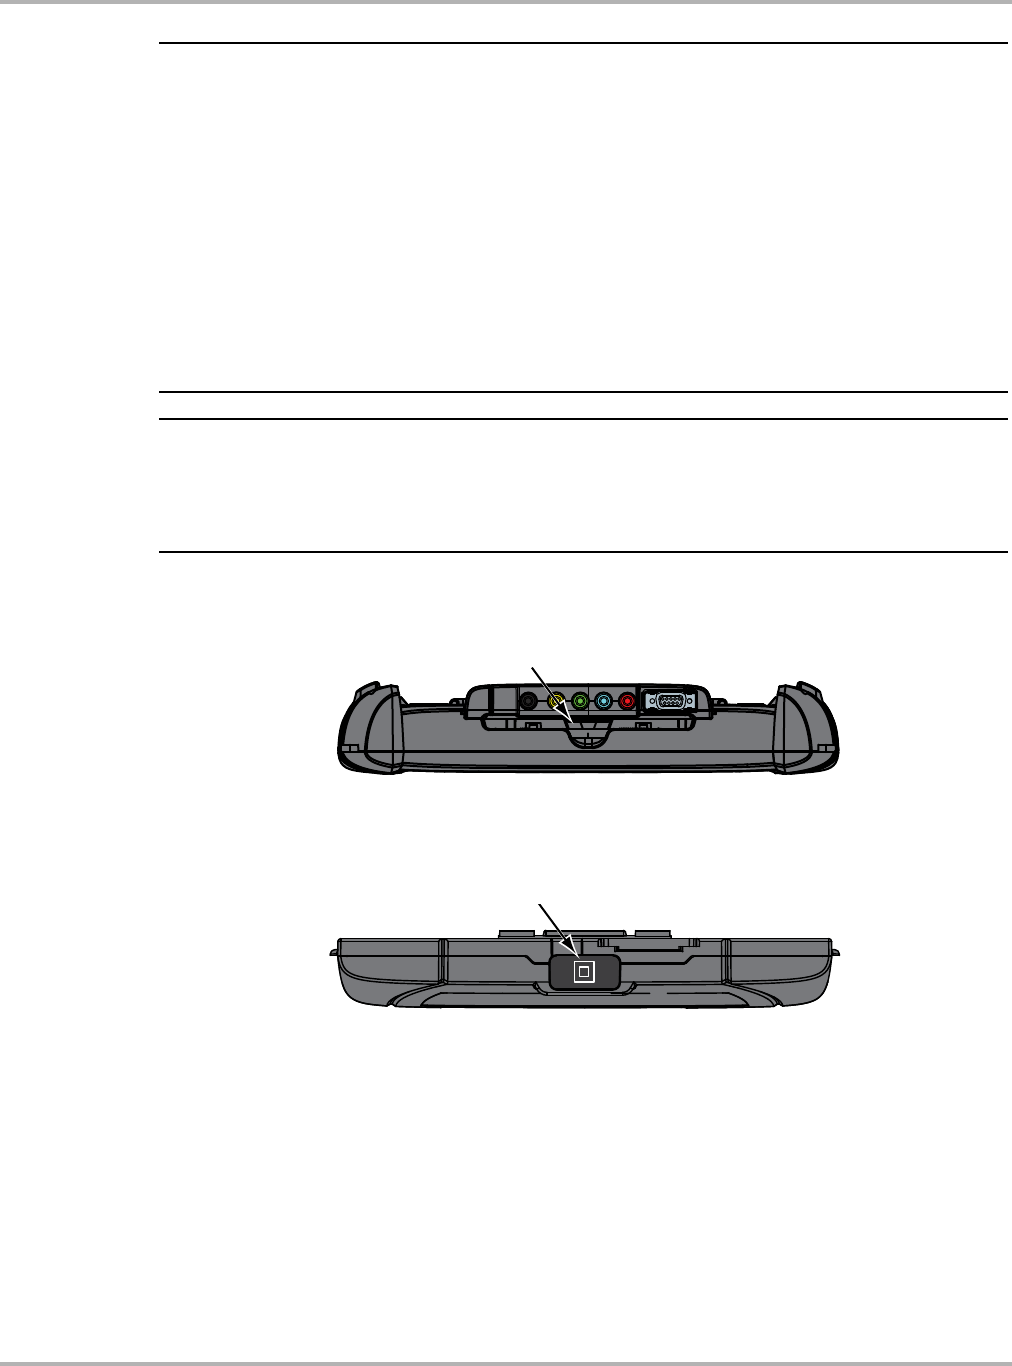
Draft 4/14/15- Do Not Distribute
85
Scope and Multimeter Operations Using the Scope Module Remotely
NOTE:
iIf the Scope Module:
○ Is undocked from the Diagnostic Tool when it is on, or
○ Is exposed to a electro static discharge (ESD) while it is being used remotely
the following will occur:
• Communication between the Diagnostic Tool and the Scope Module will be terminated.
• All current data and settings will be lost.
• An error message (e.g. Meter/Scope Not Found) will display to indicate that
Scope Module communication has terminated.
When communication is reestablished (after a communication loss), the Scope Multimeter
application is restarted and the Scope Multimeter main menu page is displayed.
NOTE:
iWhen the Scope Module is connected to it’s docking station or is connected to the Diagnostic Tool
with a USB cable remotely, the Scope Module USB connection status indicator (lower right of
screen) is displayed. When the Scope Module is removed from the docking station, and is not
connected by a USB cable the status indicator is not displayed.
zTo setup the Scope Module for remote operation:
1. Depress the Scope Module release tab located on the top of the Diagnostic Tool (Figure 8-1).
Figure 8-1 Scope Module release tab
2. Slide the Scope Module off of the Diagnostic Tool.
3. Locate the USB jack on the bottom of the Scope Module (Figure 8-2).
Figure 8-2 Scope Module USB jack location
4. Connect the square end of the USB cable to the jack on the Scope Module.
5. Connect the rectangular end of the USB cable to either of the two ports on the Diagnostic Tool.
The Scope Module is now ready for remote use.
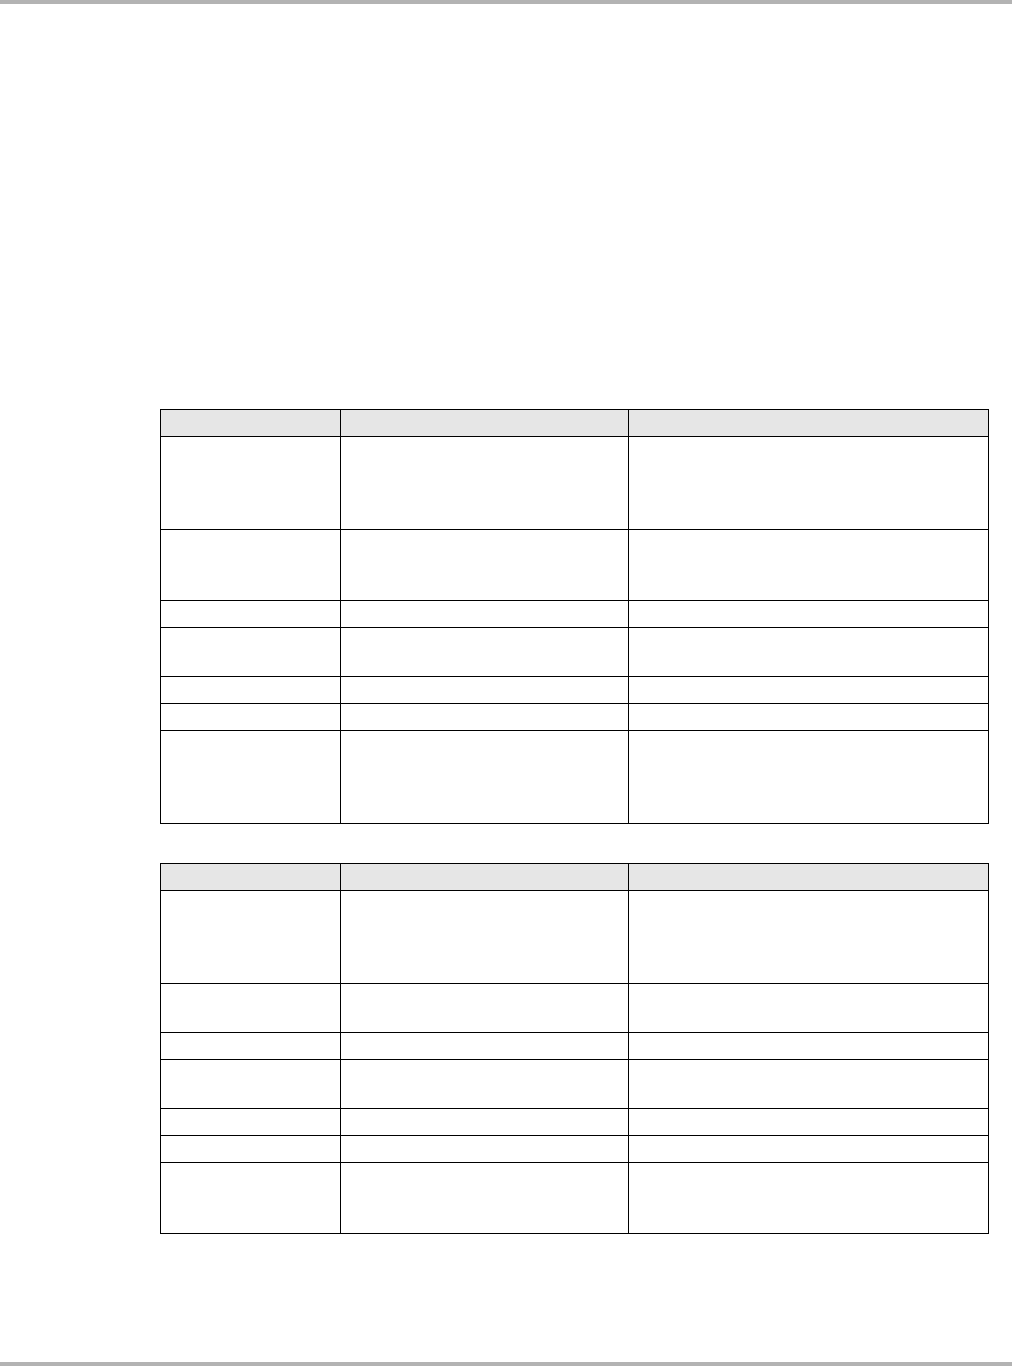
Draft 4/14/15- Do Not Distribute
86
Scope and Multimeter Operations Getting Started
8.2 Getting Started
The Scope and Multimeter module enables the following functions:
•Lab Scope
•Ignition Scope
•Graphing Multimeter
•Digital Multimeter
8.2.1 Capabilities
The following tables detail the software and hardware capabilities.
Table 8-1 Scope
Function Range Accuracy/Comments
Signal Measurement
Ch. 1—yellow banana jack
Ch. 2—green banana jack
Ch. 3—blue banana jack
Ch. 4—red banana jack
Each channel input is referenced to
common ground input (GND—black banana
jack)
Sample Rate
For 50uS sweep 6MSPS
For 100uS sweep 3MSPS
For all other sweeps 1.5 MSPS
Continuous sampling,
MSPS = mega samples per second
Bandwidth DC–3 MHz 3 db point @ 3 MHz
Input Impedance 10 MOhm@ DC
4kOhm @ 3MHz Channel 1–4
VDC (Full Scale) 100mV–400V Do not measure greater than 75VDC
VAC (Full Scale) 100mV–400V Do not measure greater than 50VAC (rms)
Low Amp Probe
20A scale (100mV/Amp)
40A scale (10mV/Amp)
60A scale (10mV/Amp)
Connect Low amp Probe (+) to Ch. 1
(yellow banana jack) and (–) to GND input
(black banana jack).
See NOTE below.
Table 8-2 Graphing Multimeter (part 1 of 2)
Function Range Accuracy/Comments
Signal Measurement
Ch. 1—yellow banana jack
Ch. 2—green banana jack
Ch. 3—blue banana jack
Ch. 4—red banana jack
Each channel input is referenced to
common ground input (GND—black banana
jack)
Sample Rate 1.5 MSPS Continuous sampling,
MSPS = mega samples per second
Bandwidth DC–3 MHz 3 db point @ 3 MHz
Input Impedance 10 MOhm@ DC
4kOhm @ 3MHz Channel 1–4
VDC (Full Scale) 75VDC Do not measure greater than 75VDC
VAC (Full Scale) 50VAC Do not measure greater than 50VAC (rms)
Ohm Measurement
Diode Test
Continuity Test
Ch. 3—blue banana jack
Ch. 4—red banana jack -
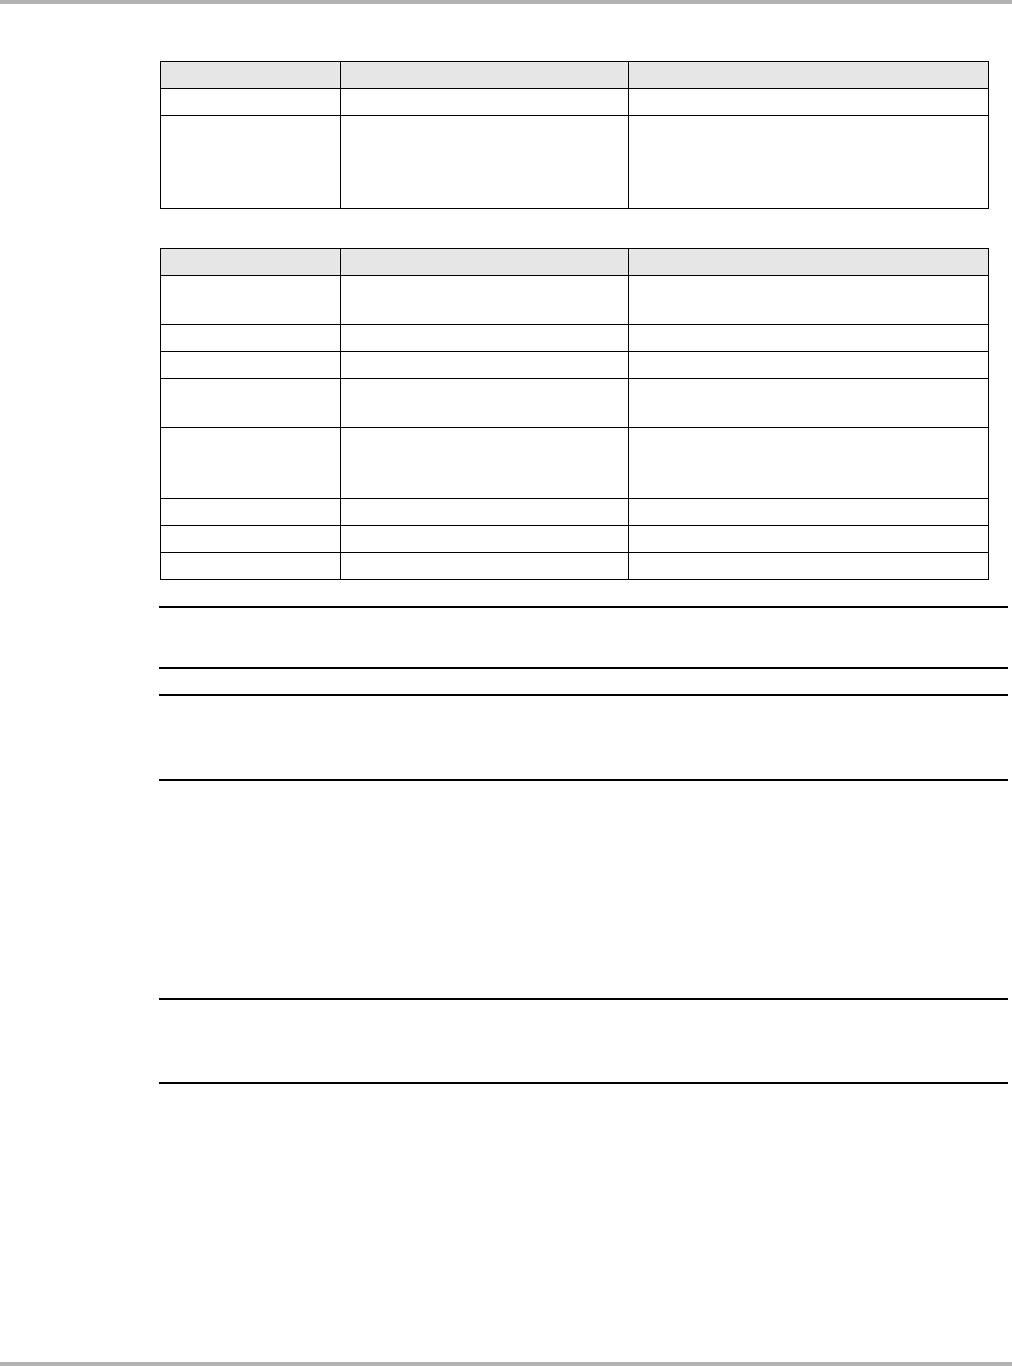
Draft 4/14/15- Do Not Distribute
87
Scope and Multimeter Operations Getting Started
NOTE:
i200V to 400V scales are not to be used to measure signals greater than 50VAC (rms) or 75VDC.
IMPORTANT:
Do not use the Low Amp Probe to measure current on conductors at a potential greater than
46VAC peak or 70VDC.
8.2.2 Leads, Probes and Adapters
The Scope Module uses standard safety banana plugs that are compatible with many
accessories. The various leads, probes, clips, and adapters that are supplied with, or available as
optional equipment, are explained in this section.
IMPORTANT:
When removing leads from their sockets, do not pull on the wire because it can damage the leads.
Pull on the plug.
Ohms 40 Ohm–4 MOhm Fixed scales
Low Amp Probe
20A scale (100mV/Amp)
40A scale (10mV/Amp)
60A scale (10mV/Amp)
Connect Low amp Probe (+) to Ch. 1
(yellow banana jack) and (–) to GND input
(black banana jack).
See NOTE below.
Table 8-3 Digital Multimeter
Function Range Accuracy/Comments
Signal Measurement Ch. 1—yellow banana jack Channel 1 input is referenced to common
ground (GND—black banana jack)
VDC (Full Scale) 75VDC Do not measure greater than 75VDC
VAC (Full Scale) 50VAC Do not measure greater than 50VAC (rms)
Signal Measurement
Input Impedance 10 MOhm -
Ohm Measurement
Diode Test
Continuity Test
Ch. 3—blue banana jack
Ch. 4—red banana jack -
Ohms 40 Ohm–4 MOhm Fixed scales or Auto Ranging
Glitch capture Approximately 50 uS -
Diode Test 2 V Scale -
Table 8-2 Graphing Multimeter (part 2 of 2)
Function Range Accuracy/Comments
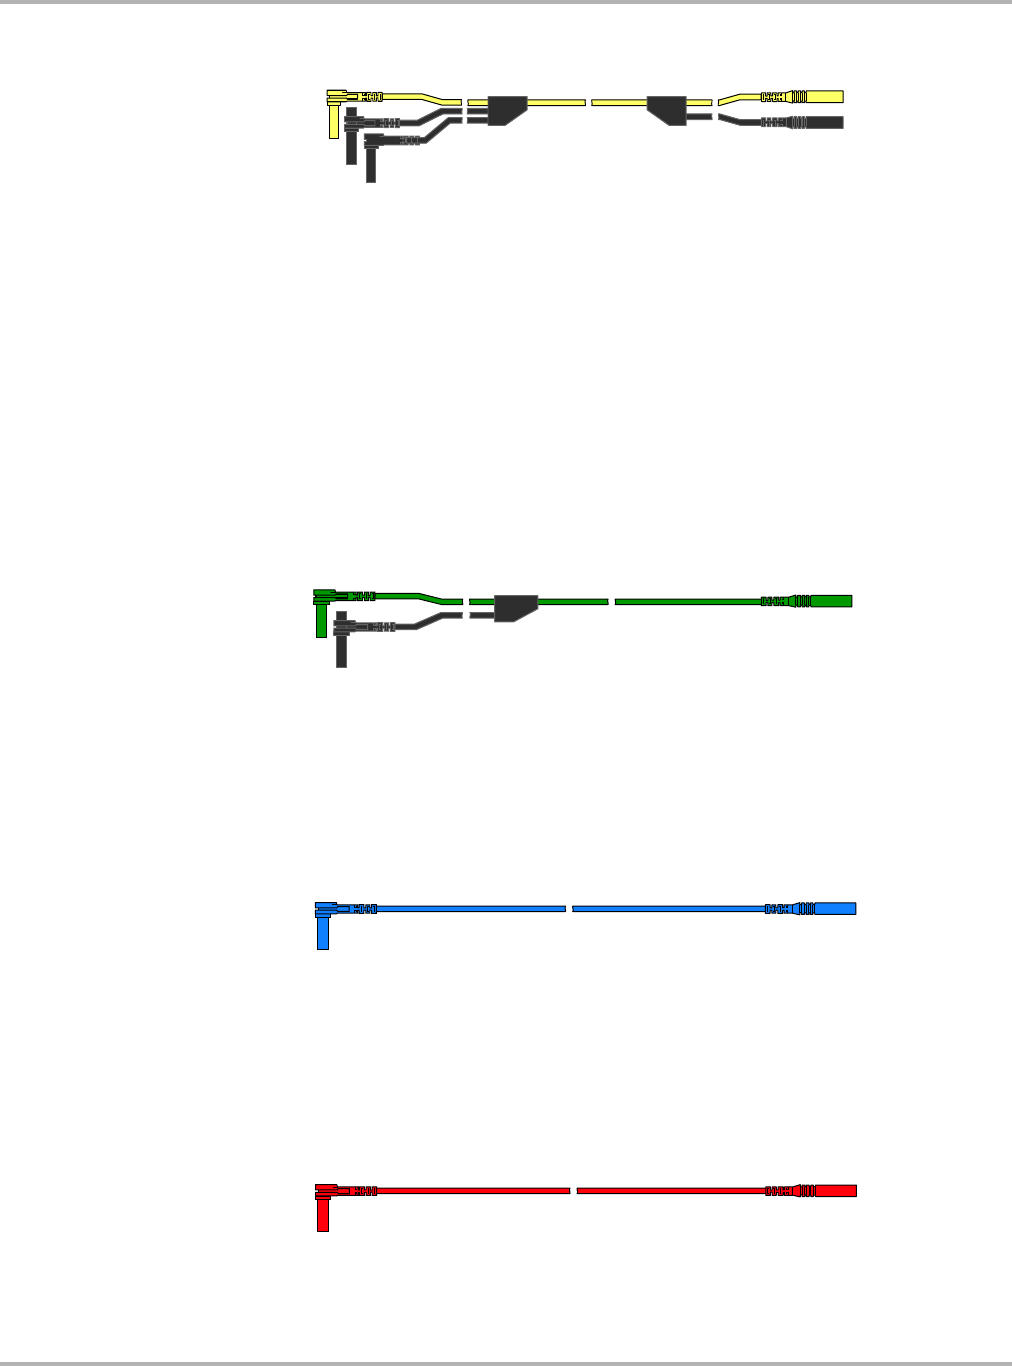
Draft 4/14/15- Do Not Distribute
88
Scope and Multimeter Operations Getting Started
Channel 1 Lead
Figure 8-3 Yellow Channel 1 Lead
The shielded yellow lead is used for Channel 1 (Figure 8-3) and other channel connections that
need additional grounding. The lead color matches the color of socket 1 on the Scope Module and
the color of trace 1 on the test screens.
This yellow lead includes a black, right-angle, common ground plug and a black, stackable,
common ground plug. The non-stackable ground plug always connects to the ground (GND) jack
on top of the Diagnostic Tool. The stackable ground plug is used for connecting additional leads,
such as the Channel 2 Lead or the Secondary Coil Adapter Lead, that require grounding. The
stackable lead grounds through the non-stackable lead and does not need to be connected to the
jack on the Diagnostic Tool.
Channel 2 Lead
Figure 8-4 Green Channel 2 lead
The shielded green lead (Figure 8-4) is used for Channel 2. The lead color matches the color of
socket 2 on the Scope Module and the color of trace 2 on the test screens. This green lead
includes a stackable, black, right-angle ground plug.
Channel 3 Lead
Figure 8-5 Blue Channel 3 lead
The non-shielded blue lead (Figure 8-5) is used for either Channel 3 or Digital Meter minus (–).
The lead color matches the color of socket 3 on the Scope Module, as well as the color of trace 3
on the test screen.
Channel 4 Lead
Figure 8-6 Red Channel 4 lead
The non-shielded red lead (Figure 8-6) is used for either Channel 4 or Digital Meter plus (+). The
lead color matches the color of socket 4 on the Scope Module, as well as the color of trace 4 on
the test screen.
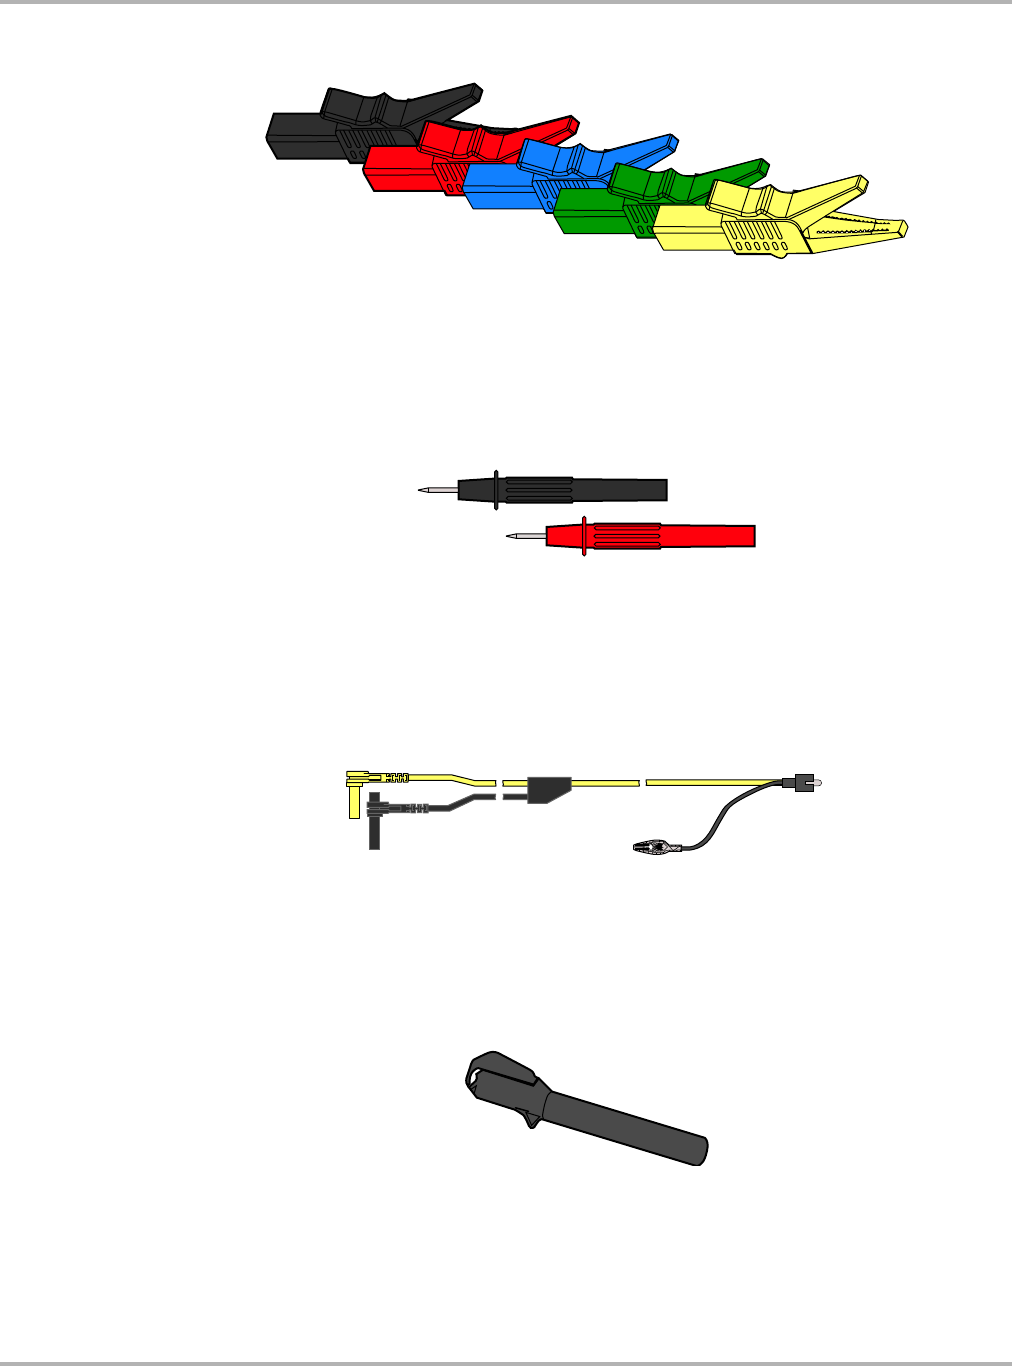
Draft 4/14/15- Do Not Distribute
89
Scope and Multimeter Operations Getting Started
Alligator Clips
Figure 8-7 Alligator clip
Insulated alligator clips, colored to match each test lead, are included. A black clip for the common
ground lead is also supplied (Figure 8-7). Each clip plugs into the straight end of a channel lead.
Test Probes
Figure 8-8 Test probe
Two test probes are included, one black and one red (Figure 8-8). The test probes plug into the
straight end of the test leads.
Secondary Coil Adapter Lead (optional)
Figure 8-9 Secondary Coil Adapter lead
The optional Secondary Coil Adapter lead (Figure 8-9) connects to the clip-on secondary wire
adapter, coil-in-cap adapter or coil-on-plug adapter to display secondary waveforms.
Secondary Ignition Clip-on Wire Adapter (optional)
Figure 8-10 Secondary Ignition Clip-on Wire Adapter
The optional Secondary Ignition Clip-on Wire Adapter (Figure 8-10) connects the Secondary Coil
Adapter lead to a secondary ignition lead on the vehicle to display ignition patterns.
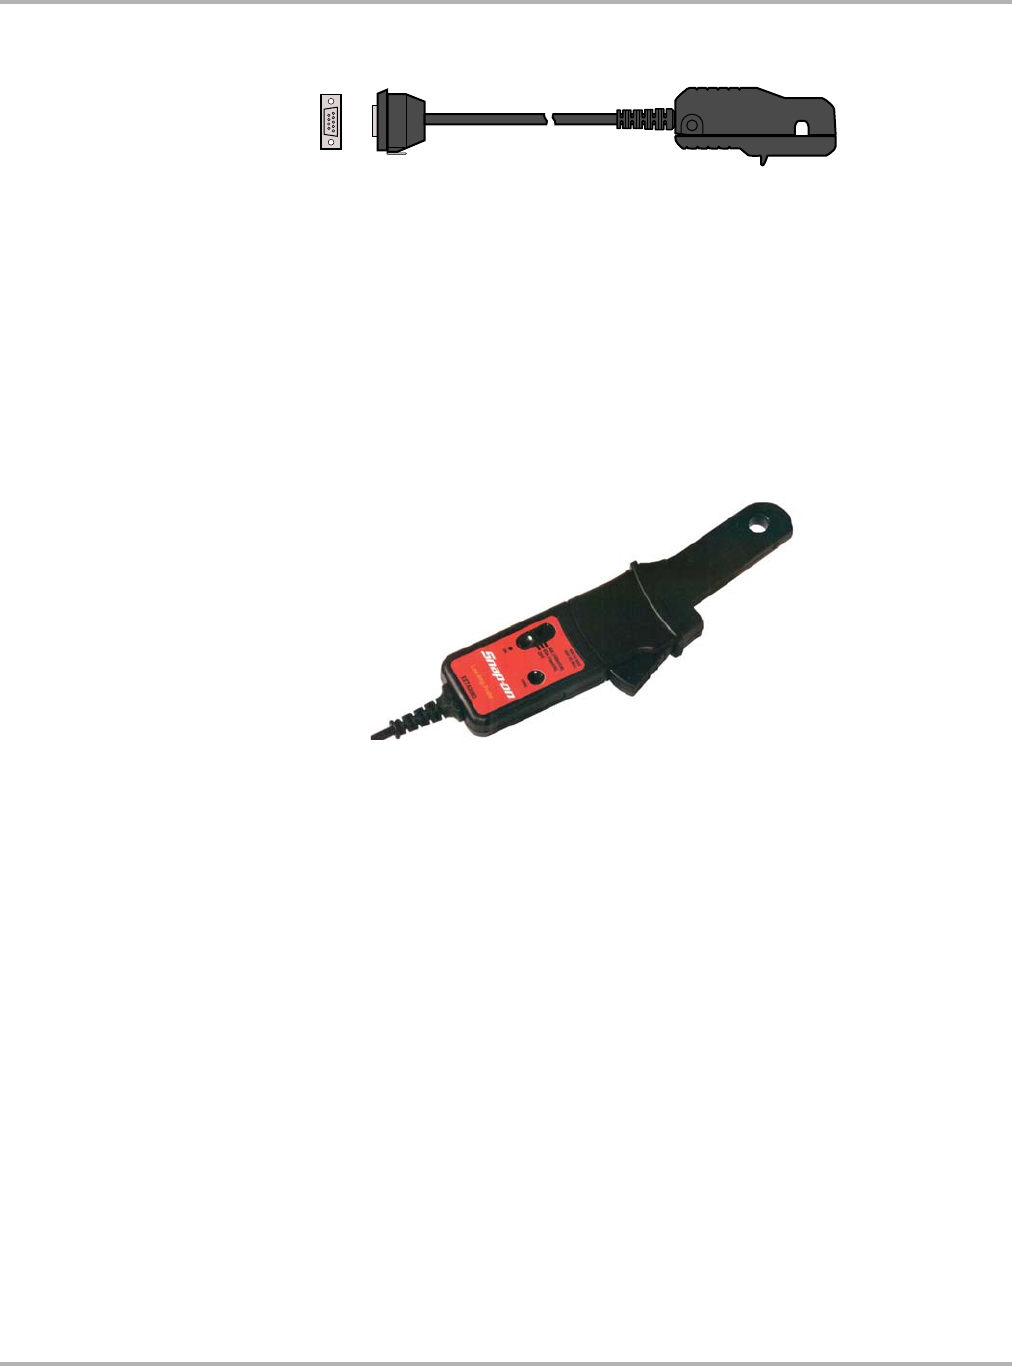
Draft 4/14/15- Do Not Distribute
90
Scope and Multimeter Operations Getting Started
Inductive RPM Pickup Adapter (optional)
Figure 8-11 Inductive RPM Pickup adapter
The optional Inductive RPM Pickup adapter (Figure 8-11) connects to the scope auxiliary
connector of the Diagnostic Tool with a DB9F plug. It can be used to trigger a waveform or display
RPM. With the Ignition Scope, the RPM Pickup connects to cylinder number one to establish the
firing order.
Low Amp Current Probe (optional)
The optional Low Amp Current Probe provides accurate and reliable non-intrusive testing of
ignition coils, fuel injectors, fuel pumps, relays, electric motors, and parasitic draw. The optional
Low Amp Current Probe measures current from 10 mA to 60 Amps.
Figure 8-12 Low Amp Current Probe
8.2.3 Menu Options, Scope Multimeter
The Menu icon on the Toolbar at the base of the screen opens a menu with the following options:
•Safety Information—opens the Important Safety Instructions document.
•File—allows you to print or save the data or meter setup being viewed.
•Setup—allows you to adjust certain tool settings once a test has been selected.
•Help—allows you to view supporting documentation.
File
Use to print or save a copy of the data currently being viewed. Selecting opens a submenu:
•Save Multimeter—opens an additional submenu with these options:
–Save Configuration—saves the current screen setup as a preset for quick access.
–Save Single Frame—saves a recording of the current screen.
–Save All Frames—saves a recording of the current screen plus all the data in the buffer.
•Print—opens a standard Windows Print dialog box for printing the current screen.

Draft 4/14/15- Do Not Distribute
91
Scope and Multimeter Operations Navigation
Setup
This option allows you to adjust tool settings to your personal preferences. Selecting opens a
menu of the following:
•Unit Setup—opens the Unit Setup dialog box to adjust trace and display settings
•Snapshot—opens the Snapshot dialog box for selecting how triggered data is saved.
•Ignition—opens the Ignition dialog box for setting up to display secondary ignition patterns.
Help
A variety of utilities and additional resources are available through the Help menu:
•User Manual
•Version Info
•Activation Status
•Scope About
The User Manual, Version Info, and Activation Status options are the same as explained
previously, see Menu Options on page 20 for details.
Scope About
This option opens a dialog box that contains the software version and other specific details about
the Scope module.
8.3 Navigation
The following section describes how to navigate the screen interface.
8.3.1 Screen Layout
The screens typically include the following sections (Figure 8-13):
•Scope Multimeter Toolbar—allows you to configure the tool for the type of test and to adjust
the settings for each channel, or trace.
•Main Body of the screen—displays test results. Options on the toolbar let you select how
tests display on the screen.
•Trace Details—displays trace settings, which can be adjusted or switched through the touch
screen.
•Record/Playback Control Toolbar—allows you to record and navigate through paused data.
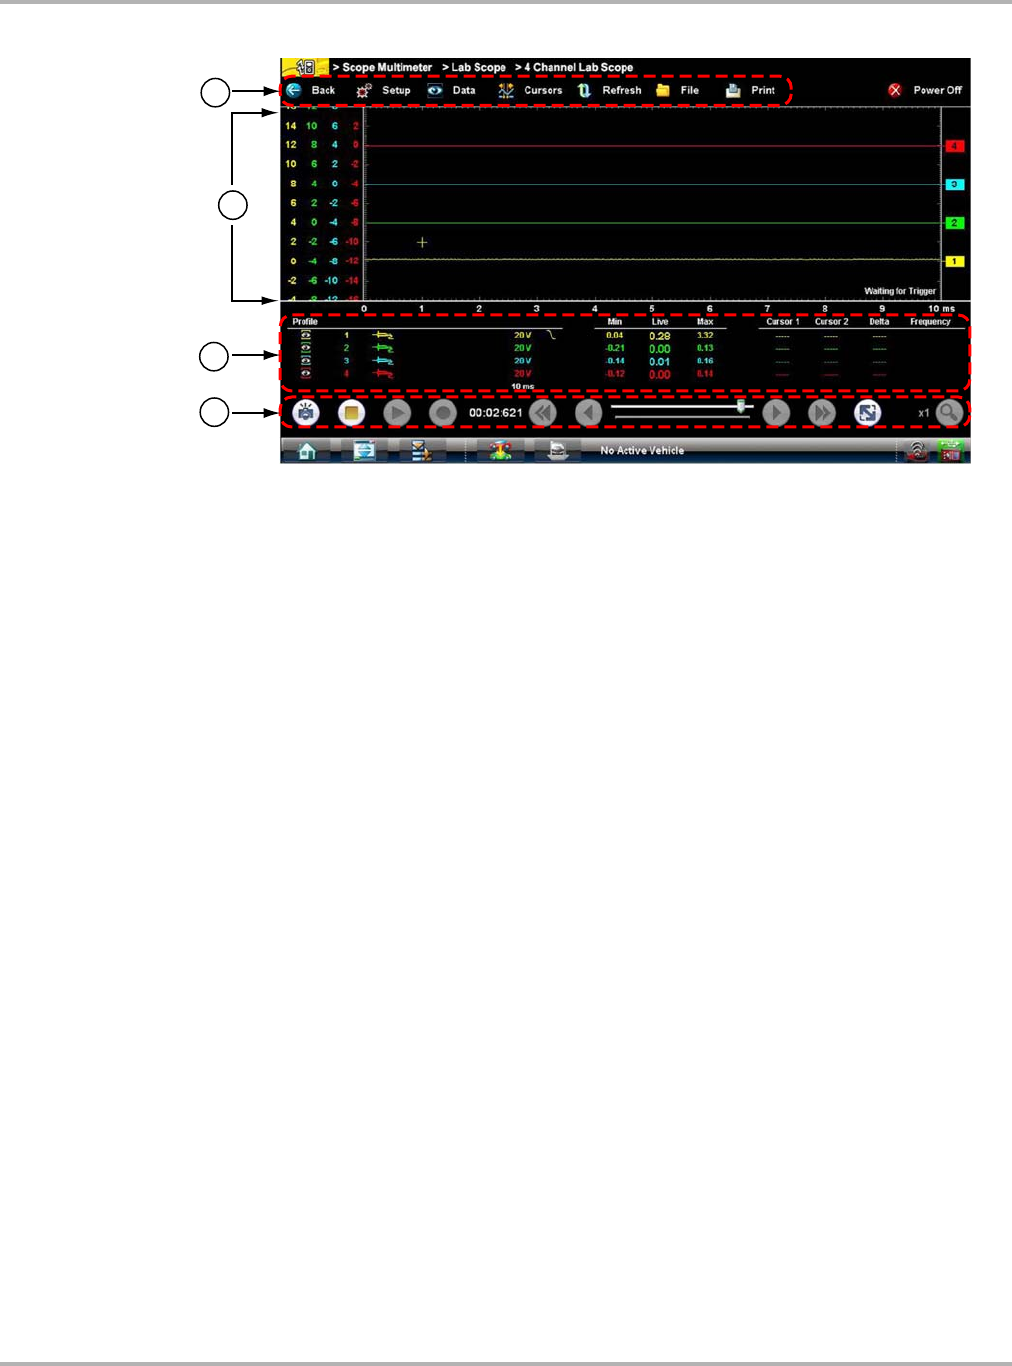
Draft 4/14/15- Do Not Distribute
92
Scope and Multimeter Operations Navigation
1— Scope Multimeter Toolbar
2— Main body
3— Trace Details
4— Record/Playback Control Toolbar
Figure 8-13 Scope Multimeter screen layout
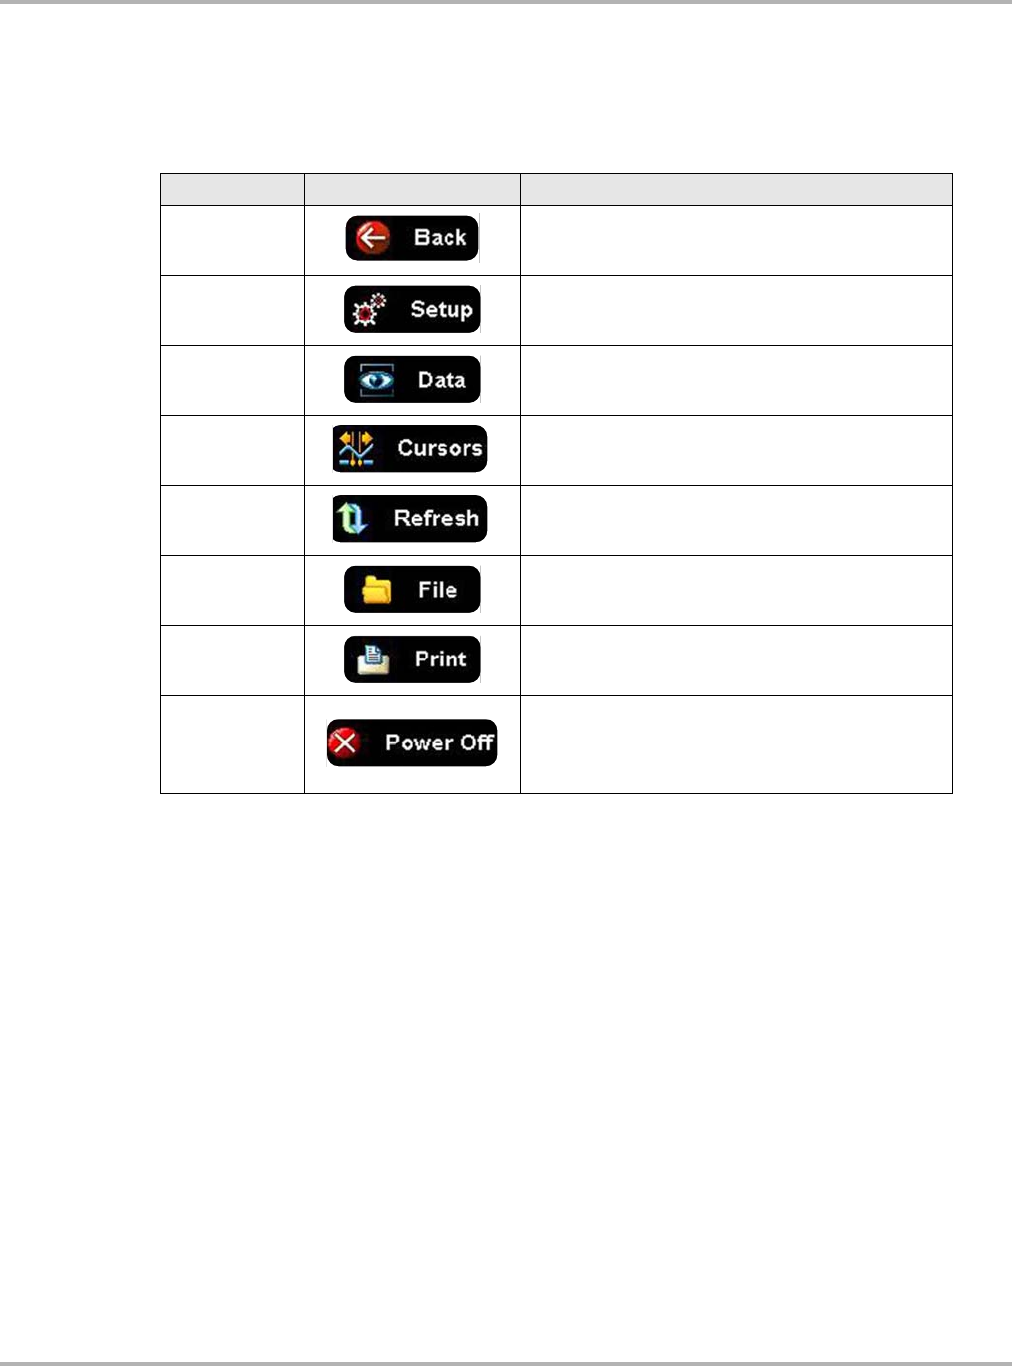
Draft 4/14/15- Do Not Distribute
93
Scope and Multimeter Operations Navigation
Scope Multimeter Toolbar
The Scope Multimeter toolbar is used to set up the tool for testing and to configure the settings for
each trace. Table 8 - 4 on page 93 gives brief descriptions of the control icons on the toolbar:
Main Body of the Screen
The main body of the screen varies depending on what display options have been selected. Up to
four traces, along with digital readouts of current signal values, signal status and triggering
conditions, can be displayed simultaneously on the main body of the screen. Adjustments to the
display are made through the scope toolbar as explained above.
Each trace is displayed as voltage over time on a standard oscilloscope screen. Voltage level is
recorded on the vertical, or “y”, axis and time is presented on the horizontal, or “x”, axis of the
screen. Values are shown for each graduation on the scales.
When using transducers, the pressure being sensed by the transducer is converted into a voltage
signal. However, the values are shown as pressure on the display screen rather than voltage.
Table 8-4 Scope Multimeter toolbar icons
Name Icon Description
Back Returns to the previously viewed screen.
Setup Opens a dialog box that allows you to select
personal preferences for viewing and saving data.
Data Switches the trace information displayed at the base
of the screen between three available states.
Cursors Opens a dialog box that allows you to switch cursors
on and off, and to reposition them on the screen.
Refresh Clears the Min/Max and Current values on the trace
details section of the screen.
File Opens a dialog box that allows you to select options
for saving data.
Print Opens a dialog box that allows you to configure and
print data.
Power Off
Switches the Scope Multimeter off. This retains the
settings and reduces battery drain when switching to
a different module. The Play and Record icons on the
Playback toolbar switch the meter back on.
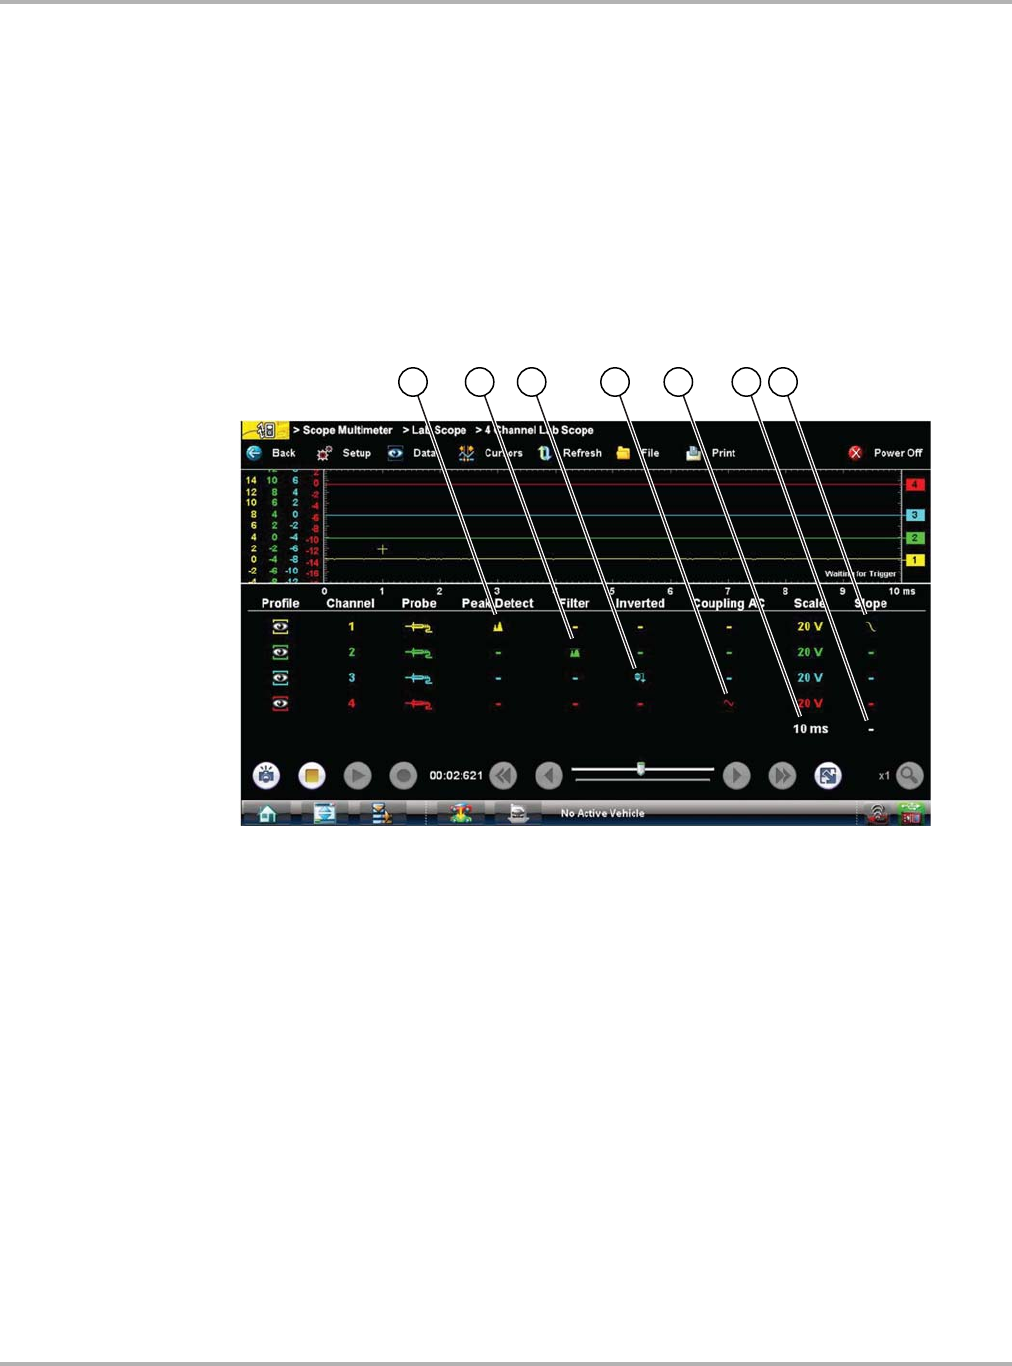
Draft 4/14/15- Do Not Distribute
94
Scope and Multimeter Operations Navigation
Trace Details
The Trace Details section displayed at the base of the screen can be used to quickly adjust
settings for capturing the trace. The Trace details are accessed using either the Data icon on the
upper toolbar or the Touch and Grow icon on the Playback toolbar. Both icons function the same
and cycle the Trace Details selection through three states:
•Displayed—trace settings are displayed in this mode.
•Expanded—trace settings are displayed in a larger format in this mode.
•Off—trace settings are not displayed in this mode.
Adjustments are made by selecting the item to be changed on the touch screen. A dash (–)
indicates a function that is not selected, and an icon indicates an active function (Figure 8-14).
1— Peak Detect on
2— Filter on
3— Inverted trace
4— Coupling AC on
5— Sweep setting
6— Trigger setup
7— Trigger set on the rising slope
Figure 8-14 Sample data detail display
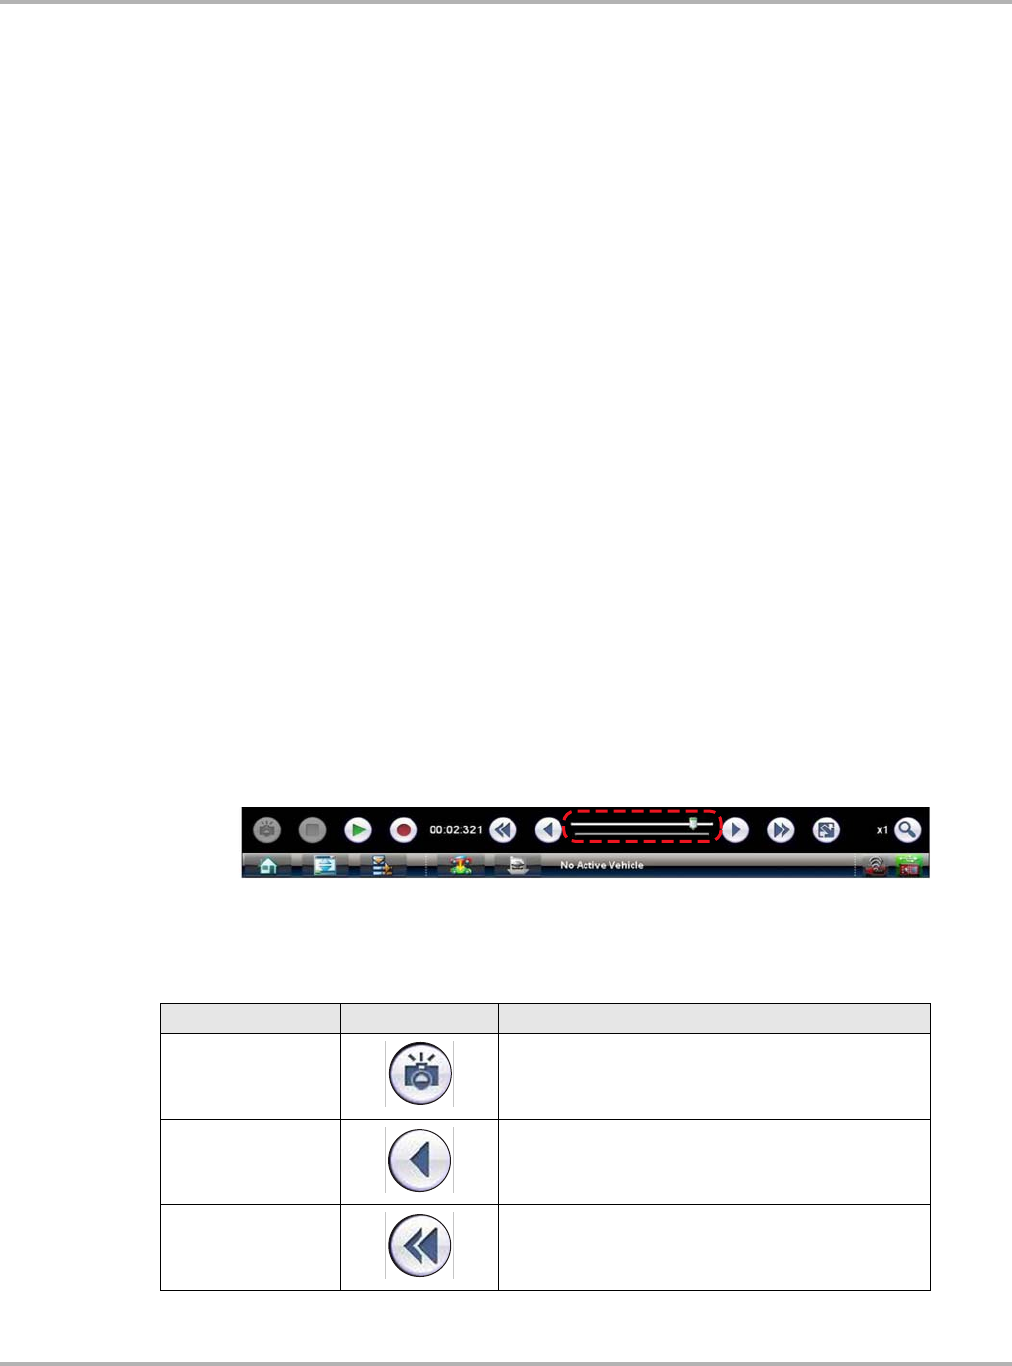
Draft 4/14/15- Do Not Distribute
95
Scope and Multimeter Operations Navigation
The following trace adjustments and settings are available:
•Profile—switches the trace for the selected channel on and off.
•Channel—opens a dialog box that allows you to configure the trace setup (see Trace Controls
on page 99 for details).
•Probe—opens a dialog box that allows you to select the type of test probe being used.
•Peak Detect—maximizes the signal sampling rate in order to capture fast events, such as
spikes, glitches and other anomalies, that may normally be undetected.
•Filter—smooths out the trace when the signal is disrupted by noise or other interference.
•Inverted—switches the polarity of the displayed signal.
•Coupling AC—subtracts the average value of the waveform by blocking the DC portion of an
input signal to amplify the AC portion. This makes small variations in the trace visible.
•Scale—opens a dialog box that allows you to select the scale, which is the total value
displayed on the vertical axis of the display.
•Sweep—the current sweep setting is shown in white at the end of the scale list, selecting
opens a dialog box that adjusts the sweep (see Sweep Controls on page 101 for details).
•Slope—only active when a trigger is set, indicates whether the trigger is set to activate on the
rising or falling slope of the trace. Selecting the slope icon switches the slope. The white dash
at the bottom of the slope column is used to set the trigger, selecting it opens the trigger setup
dialog box (see Trigger Controls on page 102 for details).
Record/Playback Control Toolbar
The record/playback control toolbar at the base of the screen is used for recording data and for
reviewing paused data. Use the stylus or your finger tip to activate the icons. A position counter in
the toolbar displays a numerical value of where the current screen is in relation to the entire
recorded file.
Use the slider in the middle of the toolbar to quickly move through paused data.
Figure 8-15 Sample data buffer slider
Use the toolbar icons (Table 8-5) to more precisely navigate the data.
Table 8-5 Data buffer toolbar icons (part 1 of 2)
Name Icon Description
Snapshot Arms the software to take a snapshot of the sampled
data
Step Back Moves to the previous point in the recorded data
Back 1 Frame Moves to the previous frame in the recorded buffer
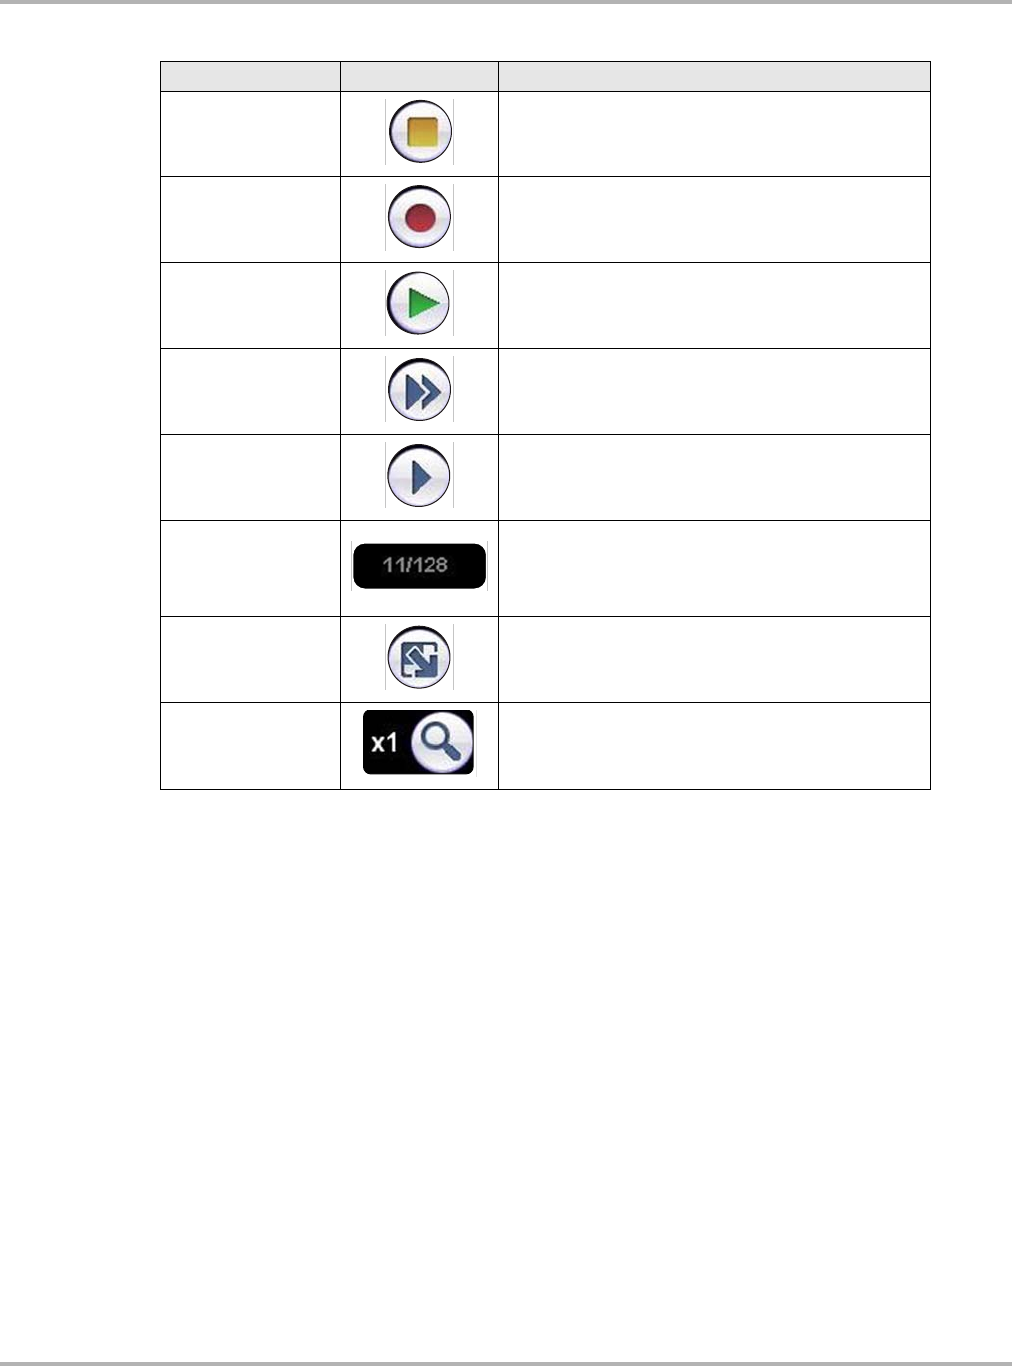
Draft 4/14/15- Do Not Distribute
96
Scope and Multimeter Operations Navigation
8.3.2 Making Selections
Most selections for setting up and operating the scope are made using the stylus and the scope
toolbar. The cursor lines, the trace zero line, and the trigger point indicator (+) can be repositioned
by selecting and dragging them in the main body of the screen.
There are two basic types of controls on the toolbar:
•Switches
•Dialog boxes
A Switch changes states when selected. Changes happen immediately as the selection is made.
A dialog box opens as a separate window on the screen and typically includes a number of
choices. Changes happen immediately, however, the dialog box must be closed to return to the
main window and continue. Make a selection to close the dialog box.
Stop Stops recording data
Record Begins recording data
Play Recording Plays the data recording in a continuous loop at
actual speed
Forward 1 Frame Moves to the next frame in the recorded data
Step Forward Moves to the next point in the recorded data
Position Indicator
In record mode, indicates how much data is
collected. In playback mode; shows the position of
the buffered data currently displayed as
minutes:seconds:milliseconds of elapsed time
Touch and Grow Expands and collapses the Trace Detail area on the
display screen to allow for easier finger tip control
Zoom Increases or decreases the magnification of the
graph
Table 8-5 Data buffer toolbar icons (part 2 of 2)
Name Icon Description