TandD RTR5X 900 MHz Data Recorder User Manual 2
TandD Corporation 900 MHz Data Recorder Users Manual 2
TandD >
Contents
- 1. Users Manual 1
- 2. Users Manual 2
Users Manual 2
40
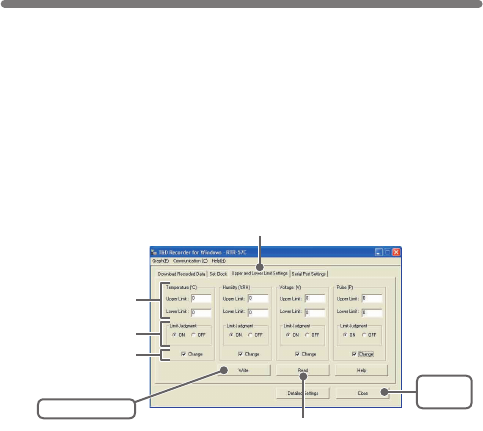
RTR-57C Upper and Lower Limits
RTR-57C Upper and Lower Limits can be set from
your computer.
Setting is directly possible in RTR-57C Main Units version 2 or higher.
The version can be conrmed in [Help]-[RTR-57C Version Info].
See the Help Menu in T&D Recorder for Windows for details.
1.In the main window, click the icon RTR-57C.
2.Click the [Upper and Lower Limit Settings] tab, and check the
<Change> box.
3.After entering the upper and lower limit values, check <ON> and by
clicking the [Write] button, the information will be transmitted.
ON: Judges whether recorded data is within the set range when RTR-57C
has downloaded the recorded data.
OFF: Judgment isn’t carried out even if upper and lower limits have been set.
4.Click [Close] button to complete the setting.
■[Read] Button
If you wish to view the current settings, click the [Read] button.
[Write] button
Enter upper and
lower limit values.
Check ON/OFF
Check <Change>
[Upper and Lower Limit Settings] tab
[Close]
button
[Read] button
■Display Names and Functions
41
Click
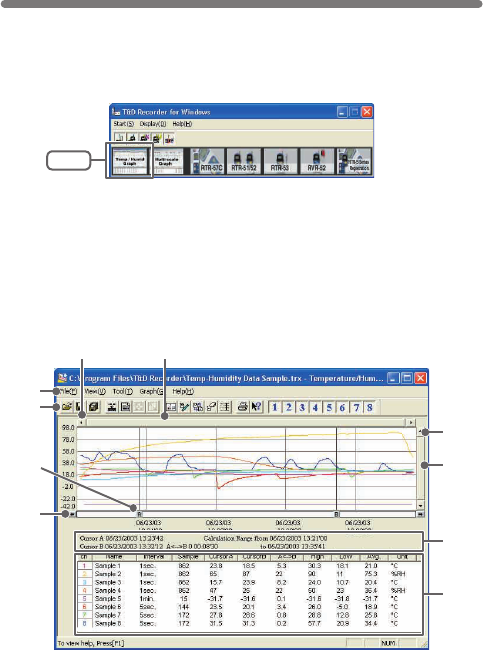
Temperature/Humidity Graph
■How to Open
Open the Graph display by clicking the icon [Temp/Humid Graph] in the
Main Window.
●In the Main Window or in the Settings/Communication Display of RTR-57C,
RTR-51/52, or RTR-53, select the [Temp/Humid Graph] from the [Start]
menu to open the graph.
●If you have clicked [Display the graph after downloading recorded data], the
graph will automatically open.
②
⑥⑤
①
③
④
⑦
⑧
⑨
⑩

④Menu Bar
Click on the desired menu in the Menu Bar to set or display each function
from which you can choose from an array of commands.
⑤Button for Moving Horizontal Axis
The time axis moves by clicking these arrow buttons.
⑥Horizontal Gauge Bar
By dragging the gauge you can move left and right to the data you want to
be displayed.
⑦Button for Moving Vertical Axis
The vertical axis moves up or down by clicking these arrow buttons.
⑧Vertical Gauge Bar
By dragging the gauge you can move up and down to the data you want to
be displayed.
⑨A and B Cursor Position Information
⑩Channel Info List Display
Displays data information for Channels 1 to 8.
①A and B Cursor Movement Buttons
By clicking the arrow buttons, you can simultaneously move the A/B
cursors.
②A and B Cursor Buttons
Click and drag the A or B button to move the cursor to the left or right.
③Toolbar
Buttons appear for frequently used commands.
42
①Open File
②Overwrite Data
③Save Data as…
④Change Data Display Colors
⑤Data Display ON/OFF
⑥Return to Original Size
⑦Step-by-Step to Original
⑧Set High, Low, Avg.
Calculation Range
⑨Edit Recording Conditions
⑩Re-order Channels
⑪Erase Selected
Channels Data
⑫Vertical Axis Settings
⑬Print
⑭Help
⑮Hide / View Channels
② ⑤ ⑦ ⑫
① ③ ⑥④ ⑪⑧ ⑨ ⑩ ⑬ ⑮
⑭
43
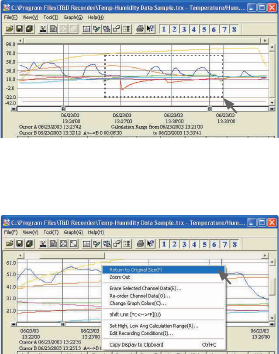
●Zoom in Using the Mouse
With the left button drag the mouse to outline the area you want to zoom in on.
●Menu Display Using the Mouse
By right clicking on the graph, the Menu will be displayed.
44
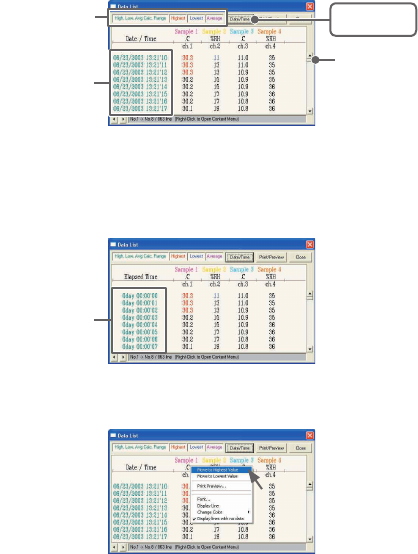
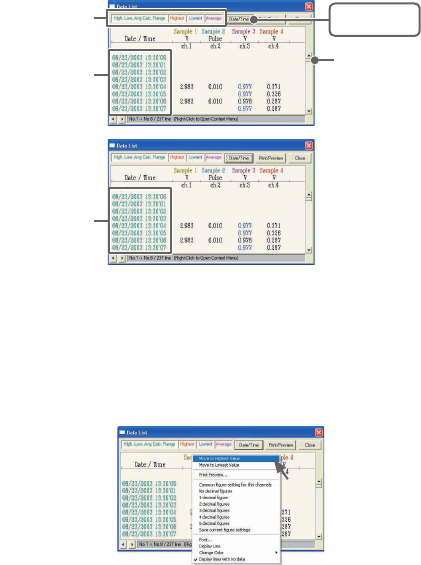
■Data List Display
●[Date / Time] Button
By clicking this button, you can shift the display between the recorded date
and amount of elapsed time since recording started.
①This is a list of the data that was displayed in graph form.
The highest value is in RED, lowest is in BLUE, and the average is in
PINK.
②Scroll Bar: By dragging it up and down you can move to the data you
want.
①
②
Recorded
Date Display
[Date / Time]
Button
Elapsed Time
Display
●Menu Display Using the Mouse
By right clicking on the list, the Menu will be displayed.
45
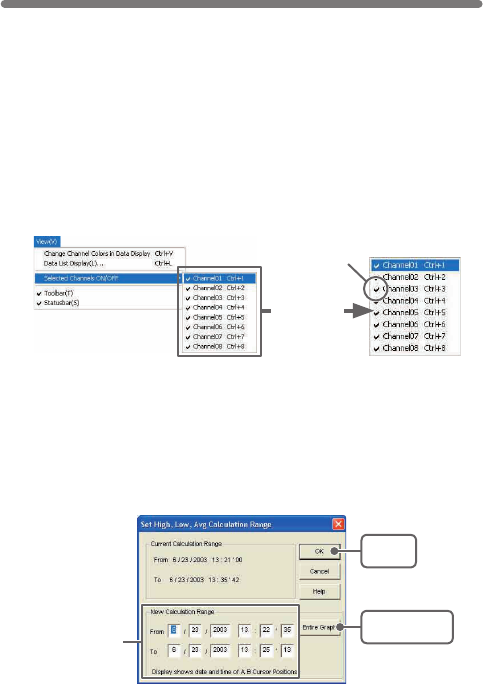
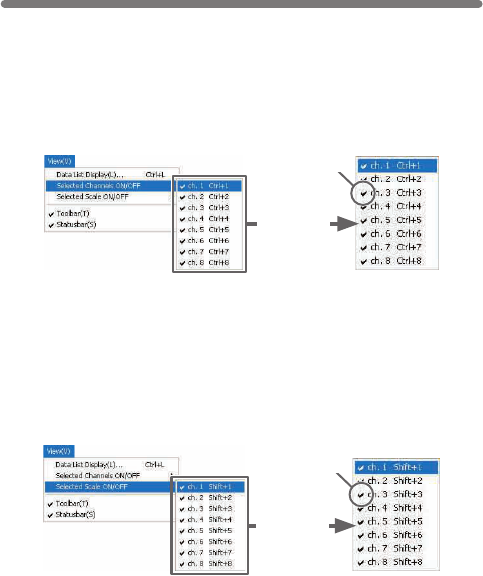
●Selected Channels ON/OFF: From the [View] Menu
1.The channel numbers are displayed in the pull down menu of
[Selected Channels ON/OFF].
2.Check the channel numbers you wish to display.
※By clicking a Channel Number in the Toolbar, you can carry out the same
operation.
Check
《Enlarged》
Editing the Graph
■Changing the Graph Display
●Changing graph display colors: From the [View] Menu
You can change the letters used in the data list display for each channel
between monochrome and channel color
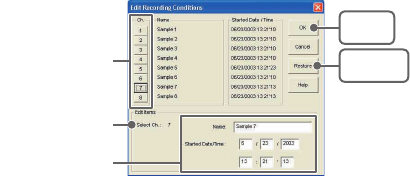
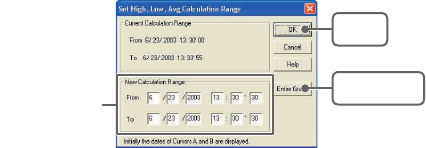
●Set High, Low, Average Calculation Range: From the [Tools]
Menu
1.Set the calculation range in [Set High, Low, Avg. Calculation Range]
box.
[OK]
button
[Entire Graph]
button
Enter the
numerical value.
46
2.By clicking the [OK] button, the high, low, average calculation range
of each channel data will be changed. On the graph display, the
calculation range that you have set will be displayed.
2.By clicking the [OK] button after changing, the setting will be
completed.
●If you wish to continue to change other channels, repeat the process
as in 1.
※The [Restore] button is effective only during the setting, and cannot return
to the condition it was after the [OK] button has been clicked.
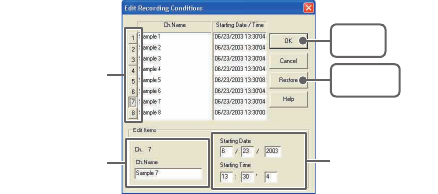
●Name: Up to 32 letters can be entered.
●Starting Date/Time: The month, day, year, hour, minute and second can
be changed.
●[Entire Graph] Button
To make the Calculation Range that of the Entire Graph, click the
"Entire Graph" button. The dates and times in the [Set High, Low, Avg.
Calculation Range] box will be displayed as those of the entire graph.
●Set by using the AB Cursors
In the Graph Display, open the [Set High, Low, Average Calculation Range]
box adjusting the AB cursors to the desired start and end positions. The
dates and times of those cursors will be displayed automatically.
●Edit Recording Conditions: From the [Tools] Menu
1.By clicking the [Ch.] button you wish to change, the information for
that number will be displayed in the "Edit Items".
[Restore]
button
[OK]
button
The selected
channel number
Channel Number
Enter letters and
numerical values
47
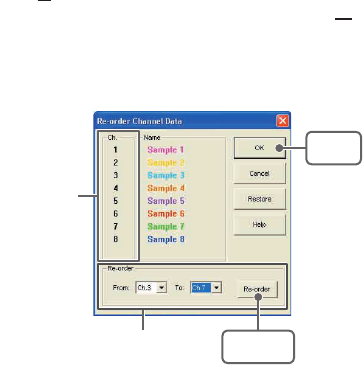
【Move by selecting the channel number】
1.Enter in From: , the Channel number you wish to move from, and
enter the Channel number to which you want to move in To: .
2.By clicking the [Re-order] button, the movement will be completed.
※The [Restore] button is effective only during the setting, and cannot
return to the condition it was by clicking the [OK] button.
【Move by dragging the channel number】
Click on the channel of data you wish to move and drag and drop it to the
desired new channel position.
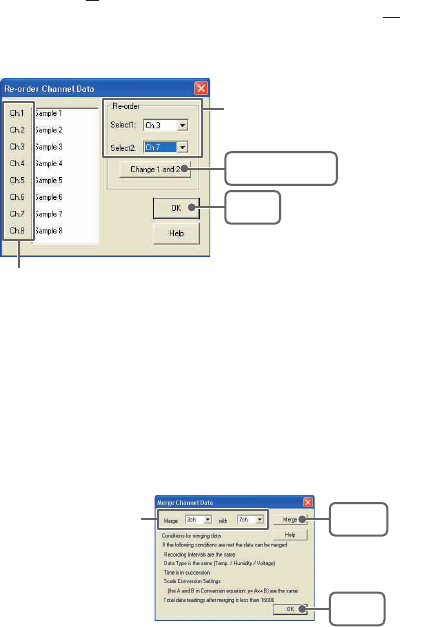
●Re-order Channel Data: From the [Tools] Menu
There are two ways for re-ordering.
・Move by dragging the channel number
・Move by selecting the channel number
[OK]
button
[Re-order]
button
If you wish to move Ch3. to Ch7.
simply set From→Ch3, To→Ch7.
Drag and drop the
channel number to the
desired new position.
48
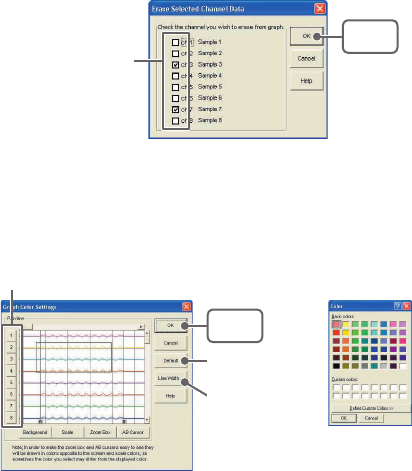
●Erase Selected Channel Data: From the [Tools] Menu
1.Put a check on the channel number you wish to erase.
2.By clicking on the [OK] button, the deletion will be completed.
[OK]
button
Put a check on the
check box
●Shift Unit (℃/゜
F) : From the [Tools] Menu
By clicking on [Shift Unit(℃/゜
F)], you can automatically change the
temperature unit scale in the graph display and in the channel info list.
●Change Graph Colors: From the [Tools] Menu
[Channel No.] button
[Default]
button
[OK]
button
[Line Width...]
button
1.Click the channel number of which you wish to change the color.
2.By clicking each button, color samples will be displayed. Choose the
color you want and click the [OK] button.
《Color Sample》
49
3.After conrming the color, by clicking the [OK] button the change will
be completed.
※By clicking the [Return to Default] button, you will return to the color
settings when the software was opened.
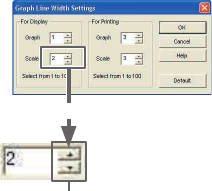
【Graph Line Width Settings】
Change the width of the data lines and the scale lines.
●Every time you click on ▲, the numerical value gets larger,
●And every time you click on ▼, the numerical value gets smaller.
《Enlagargement》
●Copy Display to Clipboard: From the [Tools] Menu
By clicking [Copy Display to Clipboard], you can copy the currently displayed
window to the clipboard and make use of the graph pasting in other software.
50
■Graph From the [Graph] Menu
●Return to Original Size
Return from zooming in on one part of data
●Zoom In / Zoom Out
Zooms in or out one step at a time
●Move Cursor Right / Left
Simultaneously move the AB Cursors to the right or left.
●Move Graph Right / Left
Move the Graph Display to the right or left.
●Move Graph Up / Down
Move the Graph Display up or down.
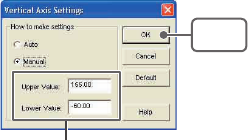
●Vertical Axis Settings (AUTO in Default Settings)
Set the vertical axis scale (temperature)
AUTO: The vertical axis will automatically be changed according to the
values of the data.
MANUAL: You can set the upper and lower values of the vertical axis scale.
Enter the range of the
vertical axis scale.
[OK]
button
51
①A and B Cursor Movement Buttons
By clicking the arrow buttons, you can simultaneously move the A/B
cursors.
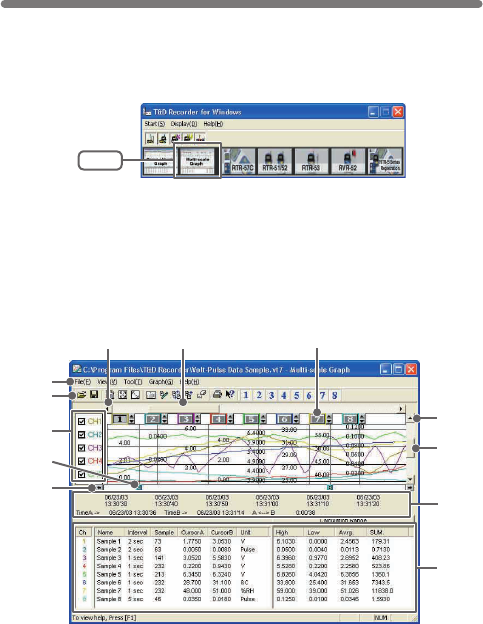
Multi-scale Graph
■Display Names and Functions
■How to Open
Open the Multi-scale Graph by clicking the [Multi-scale Graph] icon in
the Main Window.
●In the Main Window or in the Settings/Communication Display of RTR-57C,
or RVR-52, select [Multi-scale Graph] from the [Start] menu to open the
graph.
●If you have clicked [Display the graph after downloading recorded data], the
graph will automatically open.
Click
⑦⑥ ⑧
⑩
⑨
③
④
⑤
②
⑪
⑫
①

52
②A and B Cursor Buttons
Click and drag the A or B button to move the cursor to the left or right.
③The Vertical Axis Display ON/OFF
Shift the vertical axis scale display ON/OFF.
④Toolbar
Buttons appear for frequently used commands.
①Open File
②Overwrite Data
③Data List Display
④Return to Original Size
⑤Step by Step to Original
⑥Set High, Low, Avg. Calculation Range
⑦Edit Recording Conditions
⑧Re-order Channels
⑨Merge Channel Data
⑩Erase Selected Channel Data
⑪Print Preview
⑫Help
⑬Hide / View
Channels
② ⑤ ⑦ ⑫① ③ ⑥④ ⑪⑧ ⑨ ⑩ ⑬
⑤Menu Bar
Click on the desired menu in the Menu Bar to set or display each function
from which you can choose from an array of commands.
⑥Button for Moving Horizontal Axis
The time axis moves by clicking these arrow buttons.
⑦Horizontal Gauge Bar
By dragging the gauge you can move left and right to the data you want to
be displayed.
⑧Vertical Axis of Each Channel
The vertical axis scale is displayed for each channel. By clicking ▲▼, the
axis can be scrolled for each channel.
⑨Button for Moving Vertical Axis
The vertical axis moves up or down by clicking these arrow buttons.
⑩Vertical Gauge Bar
By dragging the gauge you can move up and down to the data you want to
be displayed.
⑪A and B Cursor Position Information
⑫Channel Info List Display
Displays data information for Channels 1 to 8.
53
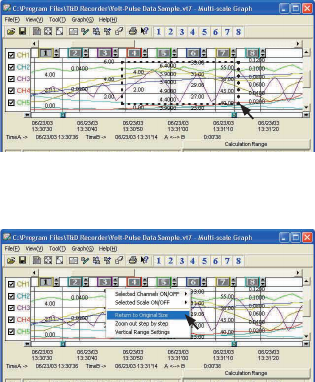
●Zoom in using the Mouse
With the left button drag the mouse to outline the area you want to zoom in on.
●Menu Display using the Mouse
By right clicking on the graph, the Menu will be displayed.
54
■Data List Display
●[Date / Time] Button
By clicking this button, you can shift the display between the recorded date
and amount of elapsed time since recording started.
①This is a list of the data that was displayed in graph form.
The highest value is in RED, lowest is in BLUE, and the average is in
PINK.
②Scroll Bar: By dragging it up and down you can move to the data you want.
●Menu Display Using the Mouse
By right clicking on the list, the Menu will be displayed.
[Date / Time]
button
②
Recorded
Date Display
①
Elapsed Time
Display
55
※You can also hide or view channel scales by checking or mchecking the
channel number fo the left of the graph.
Editing the Graph
■Changing the Graph Display
●Selected Channels ON/OFF: From the [View] Menu
1.The channel numbers are displayed in the pull down menu of
[Selected Channels ON/OFF].
2.Check the channel numbers you wish to display.
※By clicking a Channel Number in the Toolbar, you can carry out the same
operation.
Check
《Enlarged》
●Scale Display ON/OFF: From the [View] Menu
1.The channel numbers are displayed in the pull down menu of
[Selected Scale ON/OFF].
2.Put a check next to the channel number(s) you wish to be displayed.
Check
《Enlarged》
56
●Set High, Low, Average Calculation Range: From the [Tools]
Menu
1.Set the calculation range in [Set High, Low, Avg. Calculation Range]
box.
[OK]
button
[Entire Graph]
button
Enter the
numerical value.
2.By clicking the [OK] button, the high, low, average calculation range
of each channel data will be changed. On the graph display, the
calculation range that you have set will be displayed.
●[Entire Graph] Button
To make the Calculation Range that of the Entire Graph, click the
"Entire Graph" button. The dates and times in the [Set High, Low, Avg.
Calculation Range] box will be displayed as those of the entire graph.
●Set by using the AB Cursors
In the Graph Display, open the [Set High, Low, Average Calculation Range]
box adjusting the AB cursors to the desired start and end positions. The
dates and times of those cursors will be displayed automatically.
57
2.By clicking the [OK] button after changing, the setting will be
completed.
●If you wish to continue to change other channels, repeat the process
as in 1.
※The [Restore] button is effective only during the setting, and cannot return
to the condition it was after the [OK] button has been clicked.
●Name: Up to 32 letters can be entered.
●Starting Date/Time: The month, day, year, hour, minute and second can
be changed.
●Edit Recording Conditions: From the [Tools] Menu
1.By clicking the [Ch.] button you wish to change, the information for
that number will be displayed in the "Edit Items".
●Re-order Channel Data: From the [Tools] Menu
There are two ways for re-ordering.
・Move by dragging the channel number
・Move by selecting the channel number
【Move by dragging the channel number】
Click on the channel of data you wish to move and drag and drop it to the
desired new channel position.
Channel Number [Restore]
button
[OK]
button
Enter letters and
numerical values
The selected
channel number
58
【Move by selecting the channel number】
1.Enter in From: , the Channel number you wish to move from, and
enter the Channel number to which you want to move in To: .
2.By clicking the [Change 1 and 2] button, the movement will be
completed.
●Merge Channel Data: From the [Tools] Menu
You can merge two different sets of data into one set of data.
1.Click the▼button, and select the channels you wish to merge.
The following kinds of data cannot be merged:
●Recording intervals are different
●Measurement times overlap (Merging is possible after adjusting the
times in [Editing Recording Conditions])
●Data types are different (Merging is possible between same types of
data; like temperature/humidity)
[OK]
button
[Merge]
button
Example)
If you wish to merge
Ch.3 with Ch.7
Drag and drop the channel number
to the desired new position.
[OK]
button
[Change 1 and 2]
button
If you wish to move Ch3 to Ch7.
simply set From →Ch3,
To → Ch7.
59
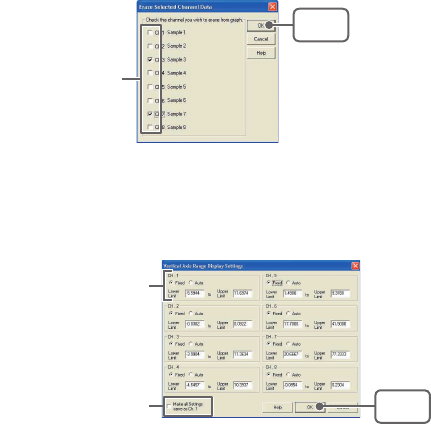
●Erase Selected Channel Data: From the [Tools] Menu
1.Put a check next to the channel number you wish to delete.
2.By clicking on the [OK] button, the deletion will be completed.
2.By clicking the [Merge] button, the merging will be completed.
3.Click the [Close] button to nish the merging.
※The channel number and other conditions of the merged data will become
those conditions set in the channel that you selected in the second box.
●Vertical Axis Range Display Settings: From the [Tools] Menu
You can set the upper and the lower limits of the graph's vertical axis scale for
each channel.
1.Check [Fixed] of the channel you wish to set.
[OK]
button
Check
[OK]
button
Select [Fixed] and enter
numerical values.
If you wish to make all
of the settings the same.
60
2.Enter upper and lower limit values.
●Set the lower limit at more than –40,000 and set the upper limit at less
than 40,000.
3.By clicking the [OK] button, the setting will be completed.
※If you have put a check on [Fixed], the lines in the graph may exceed the
boundaries of the graph.
【Making all channel settings the same】
Set CH.1 [Fixed] and by putting a check on [Make all Settings the same as
Ch. 1]; all channel settings will be the same as CH.1 regardless of other
channel settings.
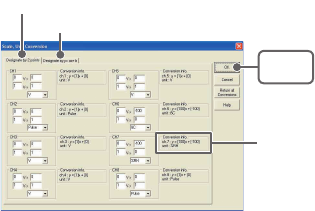
●Scale and Unit Conversion: From the [Tools] Menu
You can convert the scale and the unit of downloaded data for each channel.
1.Select from [Designate by 2 points] or [Designate by y=ax+b].
2.Set conversion formulas and units.
3.By clicking the [OK] button, the setting will be completed.
【Conversion Info】
Current conversion formulas and units are displayed here.
Y indicates the data after conversion, and x indicates the voltage entering
from the sensor.
[OK]
button
[Designate by y=ax+b]
[Designate by 2 points]
Conversion Info
61
For Display
For Print
[Save] button [View] button
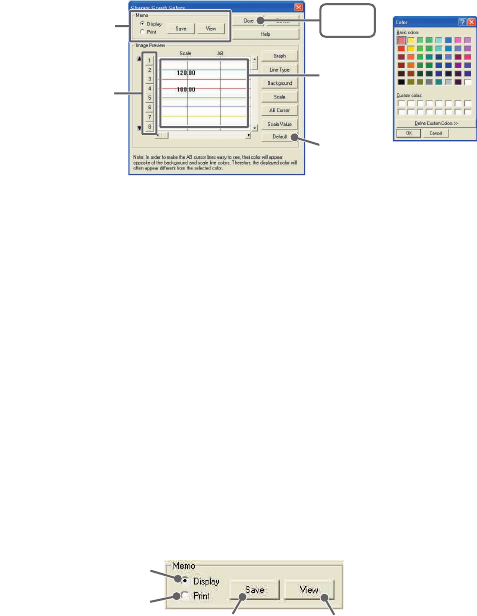
●Change Graph Colors: From the [Tools] Menu
1.Click the [Channel Number] button, and click the button of the item
that you wish to change.
●When changing colors, click on a button to display the color samples.
Choose the desired color and click the [OK] button to change the color.
●If you wish to change line width, every time you click the ▲ button, the
width gets wider, and every time you click the ▼ button, the width
becomes more narrow.
2.Conrm the width in the image preview and click the [Close] button
to complete the change.
※By clicking the [Return to Default] button, the color settings will return to
the default settings.
【Memo】
You can save the settings for Display and/or Print respectively.
1.Select Display or Print.
2.By clicking the [Save] button, the settings will be saved.
●By clicking the [View] button, you can see the settings that had been
previously saved.
《Color Sample》
Memo
[Close]
button
[Default]
button
Image
Preview
[Channel Number]
button
62
■Graph From the [Graph] Menu
●Return to Original Size
Return from zooming in on one part of data
●Step-by-Step to Original
Return step-by-step to display an increasingly wider range of data from
zooming in on one part of the data.
Event Viewer
63
Here you can manage (view data lists, print, and save as text le) recorded
event data.
■How to Open
●By selecting [Event Viewer] from the [Start] Menu in the settings/communication
display of the main window or RTR-57C or RVR-52, the Event Viewer will be
opened.
●If you have checked [After downloading, automatically show graph], the
viewer will automatically be opened.
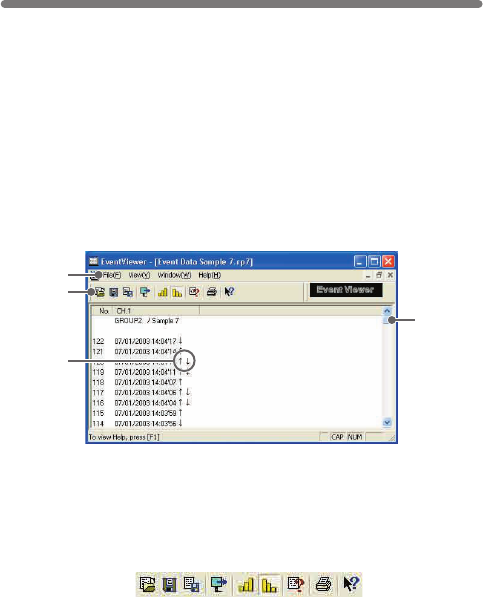
■Display Names and Functions
①Menu Bar
Click on the desired menu in the Menu Bar to set or display each function
from which you can choose from an array of commands.
②Toolbar
Buttons appear for frequently used commands.
①Open File
②Save Data as…
③Save as Text File
④Shift Display
⑤Display in ascending order
⑥Display in descending order
⑦File Info
⑧Print Preview and Print
⑨Help
②
①
③
④
⑨⑧⑦⑥⑤④③②①
64
③↑・↓・↑↓
↑ denotes rising pulse, ↓ denotes falling pulse, and ↑↓ denotes a
simultaneously occurring rising and falling pulse.
④Scroll Bar
You can move in the graph up and down to the desired position.
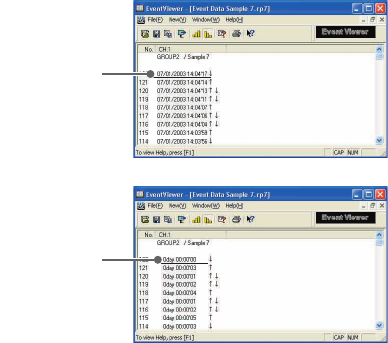
●Shift Display: From the [View] Menu or Toolbar
You can shift the display between the recorded date and the amount of
elapsed time from the last recorded data.
Recorded Date
Display
Elapsed Time
Display
●Shift Ascending/Descending: From the [View] Menu or Toolbar
You can shift the display to view the recorded data either from the oldest to
the newest or from the newest to the oldest.
65
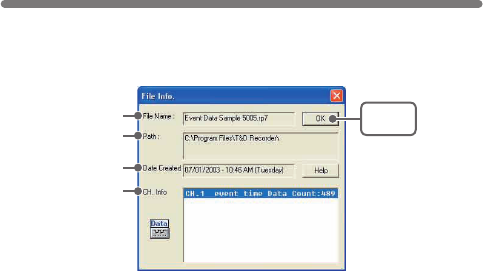
File Name:
File name of data currently in display.
Path:
Location where le is saved.
Date Created:
The date and time when the data le was created.
CH. Info:
Channel Number, Recording Method and Data Count.
View le info about data in the currently displayed data list.
1.Select [File Info] from the [View] Menu
2.Click the [OK] button to return to the previous window.
File Info
[OK]
button
File Name
Path
Date Created
CH. Info
66
[OK]
button
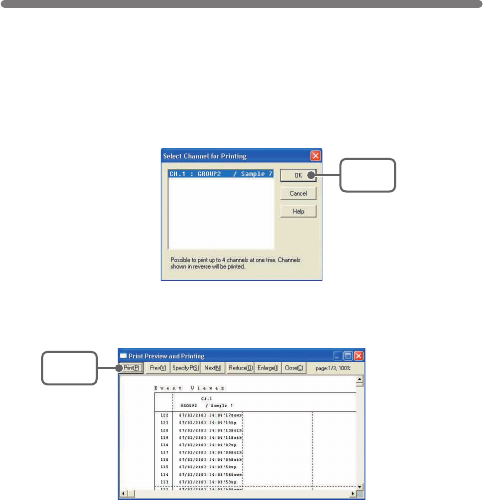
Print Preview and Print
1.In the [File] Menu, select [Print Preview and Print].
2.In [Select Channel for Printing] the channel numbers and names will
appear. Select the number of the channel(s) you wish to print and
click [OK].
※It is possible to choose up to 4 channels at one time.
3.The [Print Preview] will appear. After conrming it is what you wish
to print, click [Print] to start printing.
【Button Functions】
[Print] Print box will appear and printing will begin.
[Previous] Preview the previous page.
[Specify P] Specify the page you wish to preview in the [Specify Page to be
Viewed] box and a preview of that page will appear.
[Next] Preview the next page.
[Reduce] Reduce the size of the displayed page.
[Enlarge] Enlarge the size of the displayed page.
[Close] Close the Print Preview Window and return to the Main Window.
[Print]
button
67
EX: [Save All Data as...]
Specify Location
Enter a File Name [Save]
button
If you have clicked [Display the graph after downloading recorded data],
and you make any changes to the data after displaying, make sure to
save those changes if necessary.
■3 Ways to Save Files.
●In the [File] Menu, select [Overwrite All Data]
Will save any changes to le without changing File Name and Saving
Location. The same operation can be carried out from [Save] in the Toolbar.
●In the [File] Menu, select [Save All Data as...]
Save with a new File Name.
●In the [File] Menu, select [Save Displayed Data]
Save only that data in the current display. This is handy when you wish to
save only the desired data.
1.Select [Save All Data as...] in the [File] Menu.
2.Specify the [Location] and enter a [File Name].
3.Click [Save] to complete the saving process.
Saving a File
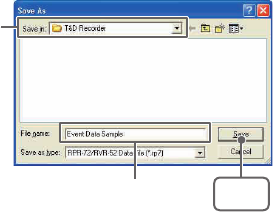
68
【Saving Event Viewer Data】
1.Selet [Save Data as...] in the [File] Menu
2.Specify the [Location] and enter a [File Name]
3.Click [Save] to complete the saving process.
Specify Location
Enter a File Name [Save]
button
69
By saving the recorded data as text le, you can create a le type
that can be read by common spreadsheet software.
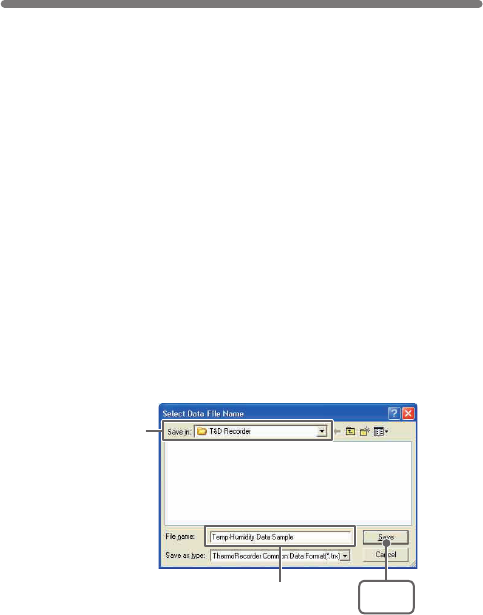
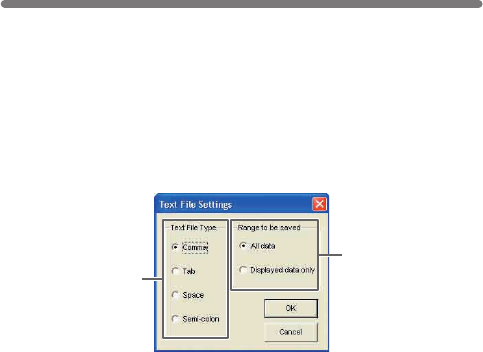
Saving Data in Text File
1.Select [Save in Text File] in the [File] Menu.
2.Select the [Text File Type] and [Range to be Saved], and click [OK].
●Comma, Tab, Space, and Semi-colon are codes used by common
spreadsheet software, such as Excel and Lotus, when reading Text
File to divide cells.
3.Designate the location to which the le should be saved and click
[Save] to create and save the data as a Text File document.
●The extension for the created le will be [.TXT].
※Text File cannot be read into T&D for Windows graphs.
Select the Text File
Type
Select the Range
to be Saved
70
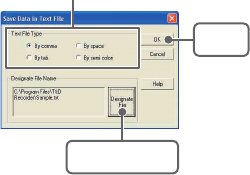
【When saving Event Viewer data as Text File】
1.Select [Save Data in Text File] in the [File] Menu.
2.Select the [Text File Type] and click [Designate File] and [OK].
●Comma, Tab, Space, and Semi-colon are codes used by common
spreadsheet software, such as Excel and Lotus, when reading Text
File to divide cells.
3.Designate the location to which the le should be saved by clicking
[Designate File] and click [OK] to create and save the data as a Text
File document.
●The extension for the created le will be [.TXT].
※Text File cannot be read into T&D for Windows graphs.
[OK]
button
[Designate File]
button
Select the Text File Type
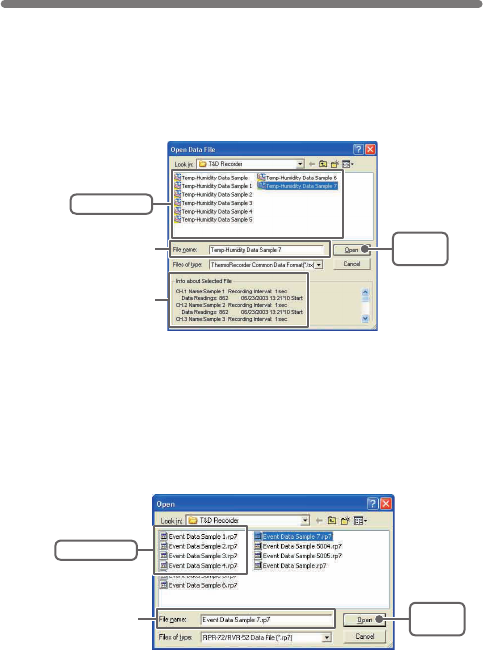
To open a previously saved le, designate the le name to open it.
71
【Opening a File with the Event Viewer】
Opening a File
1.Select [Open] in the [File] Menu
2.Select the name of the data you wish to open and click [Open] to
view the data in graph form.
1.Open the Event Viewer from the RTR-57C or RVR-52 [Graph]
Menu.
2.In the Event Viewer Window under the [File] Menu, click [Open] and
a list will appear.
[Open]
button
Selected File Info
Selected File Name
Select a le
[Open]
button
Select a le
Selected File Name
72
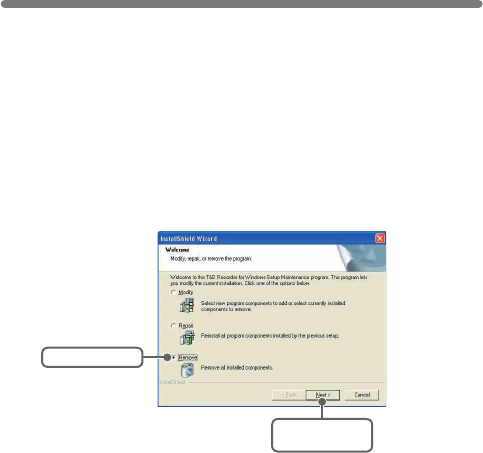
Before re-installing the software, make sure to carry out the uninstall
program rst. Before you begin the uninstall program, rst make
sure to quit all T&D Recorder for Windows programs.
Check Remove
Click the
[Next] button
How to Re-install
1.In the Windows Control Panel, click on [Add/Remove Programs].
2.From the list of currently installed programs, select [T&D Recorder
for Windows] and click the [Add / Remove] button.
3.The [Install Shield Wizard] will appear. Check [Remove], and click
[Next].
4.Follow the directions to Uninstall.
5.To re-install, follow the directions to [Install].
●Even after uninstalling, saved data les will still remain in the folders and
locations they were saved in. Also, saved Remote Unit registration info may
still remain. If you wish to delete all of these data and registration les,
make sure to delete all of the relevant folders after uninstalling but before
re-installing.
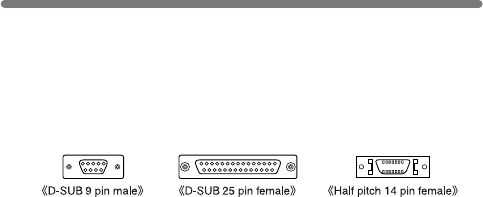
・If the connector on your computer is a D-SUB 9 pin male then there is
no need for an adapter.
・If the connector on your computer is a D-SUB 25 pin female then use
an adapter (D-SUB 25 pin male to a D-SUB 9 pin male).
・If the connector on your computer is a Half pitch 14 pin female then use
the adapter (Half pitch 14 pin male to a D-SUB 9 pin male) or a
combination (Half pitch 14 pin male to D-SUB 25 pin male) and (D-SUB
25 pin female to a D-SUB 9 pin male).
73
Troubleshooting
Q: I can’t get the communication cable connected to the computer.
What should I do?
A: Please connect the communication cable provided with the Thermo
Recorder into the serial port of your computer (D-SUB 9 pin male
connector). If for some reason you cannot connect directly, please use
an appropriate adapter (gender changer plug) as explained below.
Q: I can’t download settings and/or data from the Thermo Recorder
to my computer. What should I do?
A: Check to make sure that the power of the main unit is ON.
A: Check to make sure that the connection is proper. Communication
will take place only through the serial port (RS-232C) and will not
work through the printer port or any other port.
A: Check to make sure that you can control the Thermo Recorder via
the software.
A: Make sure that the serial port has been selected correctly in the
[Communication] pull down menu in the software. Please check
which port you are connected to (COM1-COM8) and select
appropriately.
A: If you have access to another computer, try to see if you can download
using it.
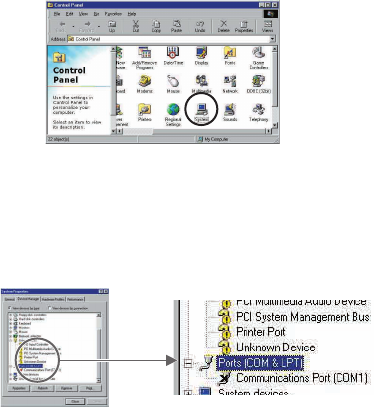
〔How to check〕
①In Windows 98, Open the [System] le in the [Control Panel] (Figure 1).
《Figure 1 Control Panel》
74
A: If you have a computer with energy saving function settings, make
sure that the serial port has not been turned off. Especially on NEC
brand PC98 notebook computers the default setting maybe such.
A: If your computer is a DOS/V type, check to make sure that the serial
port has not been rendered unusable by the BIOS setting.
A: If your computer is Windows 98/Me/NT/2000/XP please make sure
that the serial port setting has not been made to render it unusable.
With many all-in-one computers it serves as the modem jack.
②Open the [Device Manager] le in the [System Properties] window and
double click on [Port (COM&LPT)] (Figure2) to open. Check to see if
[Com Port (COM1)] and/or [Com Port (COM2)] are displayed. If so,
they should be usable unless they have a [!] or a [×] (Figure3) mark
on them. If such a mark exists, this port is unusable. If you cannot use
a communication port please contact your computer’s maker.
《Figure 3 [Port (COM&LPT)]
enlarged view》
《Figure 2 [Device Manager]》
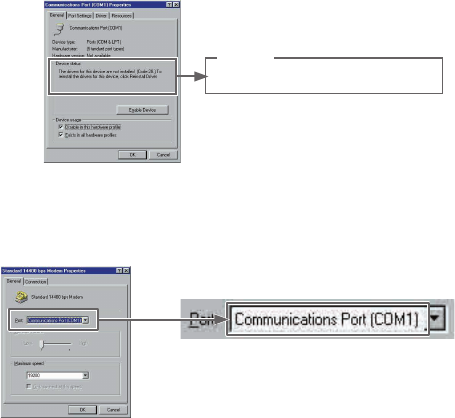
●To nd out more details about the port in question you can double
click on [!] to open [Properties] and a window giving details about
that port will appear.
75
Device status
The drivers for this device are not installed [Code 28.]. To
reinstall the drivers for this device, click Reinstall Driver.
A: Sometimes communication will not work if an extension cable has been
added to the communication cable, or if a switch has been added to the
serial port (RS-232C).
A: Check to see if some other communication software is in use.
A: Most desktop models have two serial ports, try changing the plug to
the other port and change the settings.
A: If your computer has an internal modem, make sure that the
communication port is not being used by it. In some cases, even
though no settings appear for the communication port, it cannot be
used. Check to see which port is being used by the modem.
Figure 7 Case where modem is using Port (COM1)
76
Q: The date and the time of the recorded data are different from
the actual date and time. What should I do?
A: The Thermo Recorder takes the date and time from your computer
when it is set up. Make sure that the date and time are correct on
your computer.

77
Specications
Compatible Devices
Number of Channels
Communication
Functions (RTR-5)
Communication
Functions (RVR-5)
Communication
Functions (RTR-57C)
[Temp/Humidity Graph]
Graph
Data Display
Others
[Multi-scale Graph]
Graph
Data Display
RTR-57C・RTR-51・RTR-52・RTR-53・RVR-52
8 Channel Simultaneous Display and Processing (Up to 4
RTR-53 units /Up to 8 units for RTR-51,52 and RVR-52 /
Possible to process mixed data from TR-5 and TR-7 Series units)
Recording Start (Immediate Start /Programmed Start)・
Recording Stop・Main Unit Settings (Recording Interval・
Recording Method・Upper and Lower Limits・Permission to Start
Recording by Wireless Communication)・Downloading of
Recorded Data
Recording Start (Immediate Start /Programmed Start)・
Recording Stop・Main Unit Settings (Recording Interval・
Recording Method・Upper and Lower Limits・Voltage
Measurement Method (Instantaneous Value /Average Value)・
Pulse Measurement Method (Rising Lo→Hi, Falling Hi→Lo) ・
Permission to Start Recording by Wireless Communication・
Downloading of Recorded Data
Remote Unit, Group Settings /Contents Display・
Communication Frequency Channel Settings・Collect Data Info・
Data Info Display
・
Delete Data
・
Download Data
・
Set Clock
・
Upper
and Lower Limit Settings
Temp /Humidity Graphs for Each Channel (Zoom out / in and
scroll)・Change Channel Colors・Turn ON and OFF Channel
Display
Channel Name・Recording Interval・Number of Readings・
Highest, Lowest and Average Reading
・
Unit of Measurement
・
AB
Cursor Dates /Times and Data Readings
・
Calculated Difference
between Cursor A and B
Data List Display・Calculation Range Settings・Data
Maintenance・Edit Recording Conditions・Delete Data by
Channel・Re-order Data by Channel
Graphs for Each Channel (Zoom in/out and scroll with mouse or
keyboard)・Vertically Scroll Graph for Each Channel・Channel
Graph Color
・
Background Color
・
Customize Graph Scale Lines
・
Turn ON and OFF Channel Display・Move Vertical Scale to
Desired Position in Graph (View /Hide Scale for Each Channel)
Channel Name・Recording Interval・Number of Readings・
Highest, Lowest and Average Reading
・
Unit of Measurement
・
AB
Cursor Dates /Times and Data Readings
・
Calculated Difference
between Cursor A and B
78
[Multi-scale Graph]
Others
[Event Viewer]
Event List
Others
File OutPut
Printing
Compatible OS
PC/CPU
Memory
Hard Disk
Monitor
Data List Display・Change Scales・Calculation Range Settings・
Set Display Range for Vertical Axis
Edit Recording Conditions・Delete Data by Channel・Re-order
Data by Channel・Event List Display showing Time of Event for
Each Channel (possible to scroll with mouse or keyboard) ・
Rising Signal (Lo→Hi) /Falling Signal (Hi→Lo) /Falling Signal
& Rising Signal・Hide or View Other Functions・Ascending
-Descending Order Switch.
Serial Port Auto Find Function
T&D Common Data File
・
Text File (CSV, etc)
・
(Selected Range or
File for Entire Period)
Graphs /Tables
Microsoft Windows 98 /Me /NT 4.0
Microsoft Windows 2000 /Xp
IBM Compatible with higher than Pentium 90MHz
Serial Port (RS232-C D-sub 9pin)
More than 16 MB
More than 4MB of free space (Data will need more space)
VGA (640×480) more than 256 colors

■For product information or questions contact us at:
Ofce Hours:Monday to Friday 9:00-12:00/13:00-17:00
(GMT +9:00 Tokyo Time)
[Home Page / T&D Online]
We have opened an English Homepage called "T&D Online"
for your convenience. Here you can nd information about our
company, news, products, upcoming events, software and
User’s Manual downloads, as well as, other support. Please
stop by and see what we have to offer.
http://www.tandd.com/
This is printed on 100% recycled paper.
Published by T&D CORPORATION
5652-169 Sasaga Matsumoto, Nagano Japan 399-0033
Tel:
+81-263-27-2131
Fax:
+81-263-26-4281
E-mail:
overseas@tandd.co.jp
T&D Recorder for Windows User's Manual