Trane Trg Trc001 En Users Manual
trg-trc001-en to the manual bc2b33fb-26bf-4a4d-8fe8-6b6dee3cbce6
2015-01-21
: Trane Trane-Trg-Trc001-En-Users-Manual-236134 trane-trg-trc001-en-users-manual-236134 trane pdf
Open the PDF directly: View PDF ![]() .
.
Page Count: 73
Air Conditioning
Clinic
Psychrometry
One of the Fundamental Series
TRG-TRC001-EN

Comment Card
We want to assure that our educational materials meet your ever-changing resource development needs.
Please take a moment to comment on the effectiveness of this Air Conditioning Clinic.
Give the completed card to the
presenter or drop it in the mail.
Thank you!
Psychrometry
One of the Fundamental Series
TRG-TRC001-EN
Level of detail (circle one) Too basic Just right Too difficult
Rate this clinic from 1–Needs Improvement to 10–Excellent …
Content 12345678910
Booklet usefulness 1 2 3 4 5 6 7 8 9 10
Slides/illustrations 12345678910
Presenter’s ability 1 2 3 4 5 6 7 8 9 10
Training environment 12345678910
Other comments? _________________________________________________________
_______________________________________________________________________________
_______________________________________________________________________________
About me … Type of business _________________________________________________________
Job function _________________________________________________________
Optional: name _________________________________________________________
phone _________________________________________________________
address _________________________________________________________
Response Card
We offer a variety of HVAC-related educational materials and technical references, as well as software tools
that simplify system design/analysis and equipment selection. To receive information about any of these
items, just complete this postage-paid card and drop it in the mail.
Thank you for your interest!
Education materials Air Conditioning Clinic series About me …
Engineered Systems Clinic series Name ____________________________________________
Trane Air Conditioning Manual Title ____________________________________________
Trane Systems Manual Business type ____________________________________________
Software tools Equipment selection Phone/fax _____________________ _____________________
System design & analysis E-mail address ____________________________________________
Periodicals Engineers Newsletter Company ____________________________________________
Other? _____________________________ Address ____________________________________________
____________________________________________
____________________________________________
The Trane Company • Worldwide Applied Systems Group
3600 Pammel Creek Road • La Crosse, WI 54601-7599
www.trane.com
An American-Standard Company
The Trane Company • Worldwide Applied Systems Group
3600 Pammel Creek Road • La Crosse, WI 54601-7599
www.trane.com
An American-Standard Company

Crop to width of 7.75”
NO POSTAGE
NECESSARY
IF MAILED
IN THE
UNITED STATES
BUSINESS REPLY MAIL
FIRST-CLASS MAIL LA CROSSE, WIPERMIT NO. 11
POSTAGE WILL BE PAID BY ADDRESSEE
THE TRANE COMPANY
Attn: Applications Engineering
3600 Pammel Creek Road
La Crosse WI 54601-9985
NO POSTAGE
NECESSARY
IF MAILED
IN THE
UNITED STATES
BUSINESS REPLY MAIL
FIRST-CLASS MAIL LA CROSSE, WIPERMIT NO. 11
POSTAGE WILL BE PAID BY ADDRESSEE
THE TRANE COMPANY
Attn: Applications Engineering
3600 Pammel Creek Road
La Crosse WI 54601-9985

Psychrometry
One of the Fundamental Series
A publication of
The Trane Company—
Worldwide Applied Systems Group

Preface
© 1999 American Standard Inc. All rights reserved
TRG-TRC001-EN
ii
The Trane Company believes that it is incumbent on manufacturers to serve the
industry by regularly disseminating information gathered through laboratory
research, testing programs, and field experience.
The Trane Air Conditioning Clinic series is one means of knowledge sharing. It
is intended to acquaint a nontechnical audience with various fundamental
aspects of heating, ventilating, and air conditioning.
We’ve taken special care to make the clinic as uncommercial and
straightforward as possible. Illustrations of Trane products only appear in cases
where they help convey the message contained in the accompanying text.
This particular clinic introduces the concept of psychrometry, the science
concerned with the physical laws that govern air – water mixtures.
$7UDQH$LU&RQGLWLRQLQJ&OLQLF
3V\FKURPHWU\
Figure 1

TRG-TRC001-EN iii
Contents
period one The Psychrometric Chart ................................... 1
Properties of Air ......................................................... 2
Constructing a Simple Psychrometric Chart .............. 8
Effect of Sensible Heat and Moisture Changes ....... 15
period two Air Mixtures ......................................................... 18
period three Sensible Heat Ratio ........................................... 22
period four Air Quantity .......................................................... 30
period five Tons of Refrigeration ........................................ 37
period six Psychrometric Analyses ................................... 42
period seven Review ................................................................... 52
Quiz ......................................................................... 57
Answers ................................................................ 59
Glossary ................................................................ 64

iv TRG-TRC001-EN

TRG-TRC001-EN 1
notes
period one
The Psychrometric Chart
Psychrometry is the science dealing with the physical laws of air – water
mixtures.
When designing an air conditioning system, the temperature and moisture
content of the air to be conditioned, and the same properties of the air needed
to produce the desired air conditioning effect, must be known. Once these
properties are known, the air conditioning task can be determined. This analysis
can be performed using the psychrometric chart. The psychrometric chart
graphically displays several physical properties of air over a broad range of
conditions. Knowing the relationship of these air properties aids the task of air
conditioning system design and analysis.
3V\FKURPHWU\
SHULRGRQH
7KH3V\FKURPHWULF&KDUW
Figure 2
2TRG-TRC001-EN
notes
period one
The Psychrometric Chart
Properties of Air
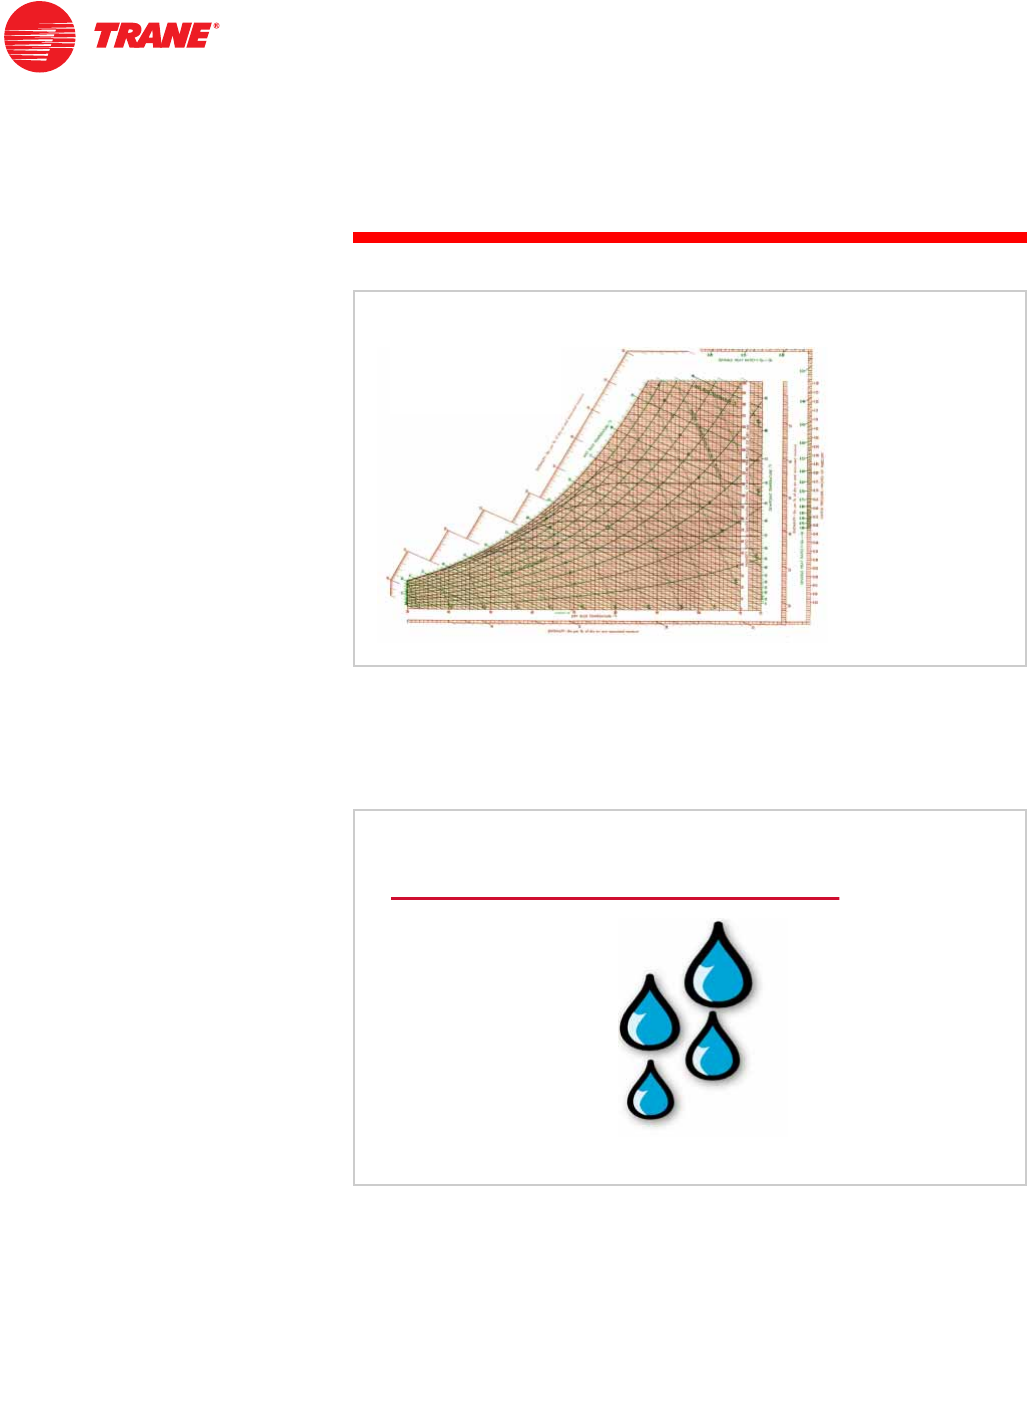
At first glance, the psychrometric chart appears to be an imposing network of
lines. When properly used, however, it provides valuable information about the
properties of air. During this session, the psychrometric chart and its use in
solving many air conditioning problems will be explained.
The psychrometric chart contains five physical properties to describe the
characteristics of air:
■Dry-bulb temperature
■Wet-bulb temperature
■Dew-point temperature
■Relative humidity
■Humidity ratio
3V\FKURPHWULF
&KDUW
Figure 3
3URSHUWLHVRI$LU
s'U\EXOEWHPSHUDWXUH
s:HWEXOEWHPSHUDWXUH
s'HZSRLQWWHPSHUDWXUH
s5HODWLYHKXPLGLW\
s+XPLGLW\UDWLR
Figure 4
TRG-TRC001-EN 3
period one
The Psychrometric Chart
notes
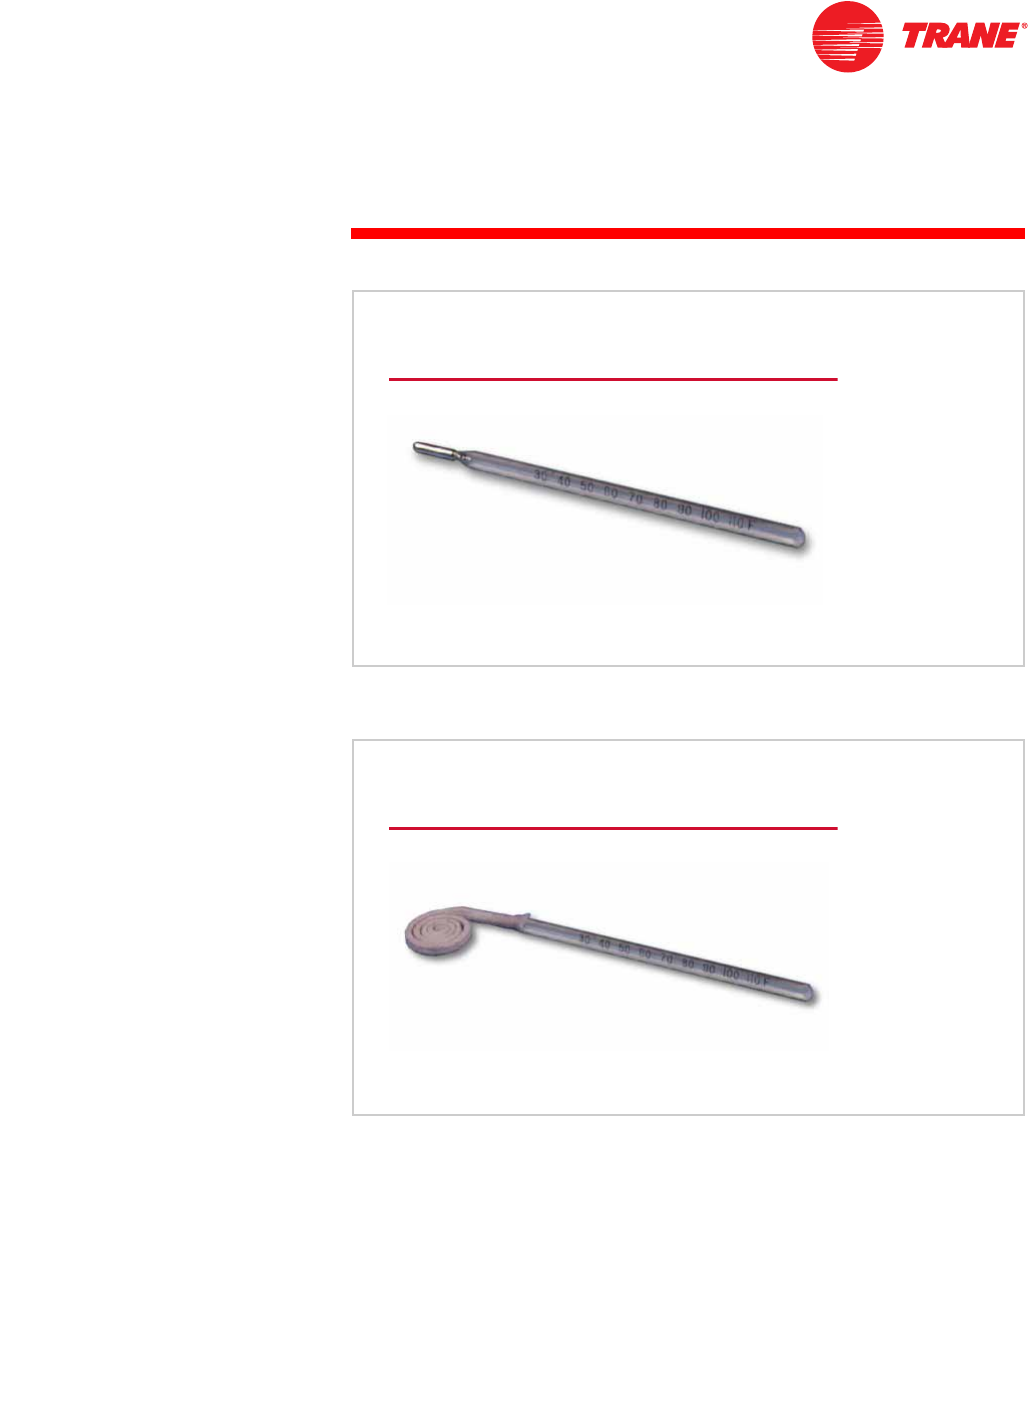
Dry-bulb temperatures are read from an ordinary thermometer that has a dry
bulb.
Wet-bulb temperatures are read from a thermometer whose bulb is covered
by a wet wick. The difference between the wet-bulb temperature and the dry-
bulb temperature is caused by the cooling effect produced by the evaporation
of moisture from the wick. This evaporation effect reduces the temperature of
the bulb and, therefore, the thermometer reading.
Consequently, the difference between dry-bulb and wet-bulb temperature
readings is a measure of the dryness of air. The drier the air, the greater the
difference between the dry-bulb and wet-bulb readings.
'U\%XOE7KHUPRPHWHU
Figure 5
:HW%XOE7KHUPRPHWHU
Figure 6

4TRG-TRC001-EN
notes
period one
The Psychrometric Chart
The third property, dew-point temperature, is the temperature at which
moisture leaves the air and condenses on objects, just as dew forms on grass
and plant leaves.
When the dry-bulb, wet-bulb, and dew-point temperatures are the same, the air
is saturated. It can hold no more moisture. When air is at a saturated
condition, moisture entering the air displaces moisture within the air. The
displaced moisture leaves the air in the form of fine droplets. When this
condition occurs in nature, it is called fog.
&RQGHQVDWLRQ2FFXUVDW'HZ3RLQW
Figure 7
)RJ2FFXUV:KHQ$LU,V6DWXUDWHG
Figure 8
TRG-TRC001-EN 5
period one
The Psychrometric Chart
notes
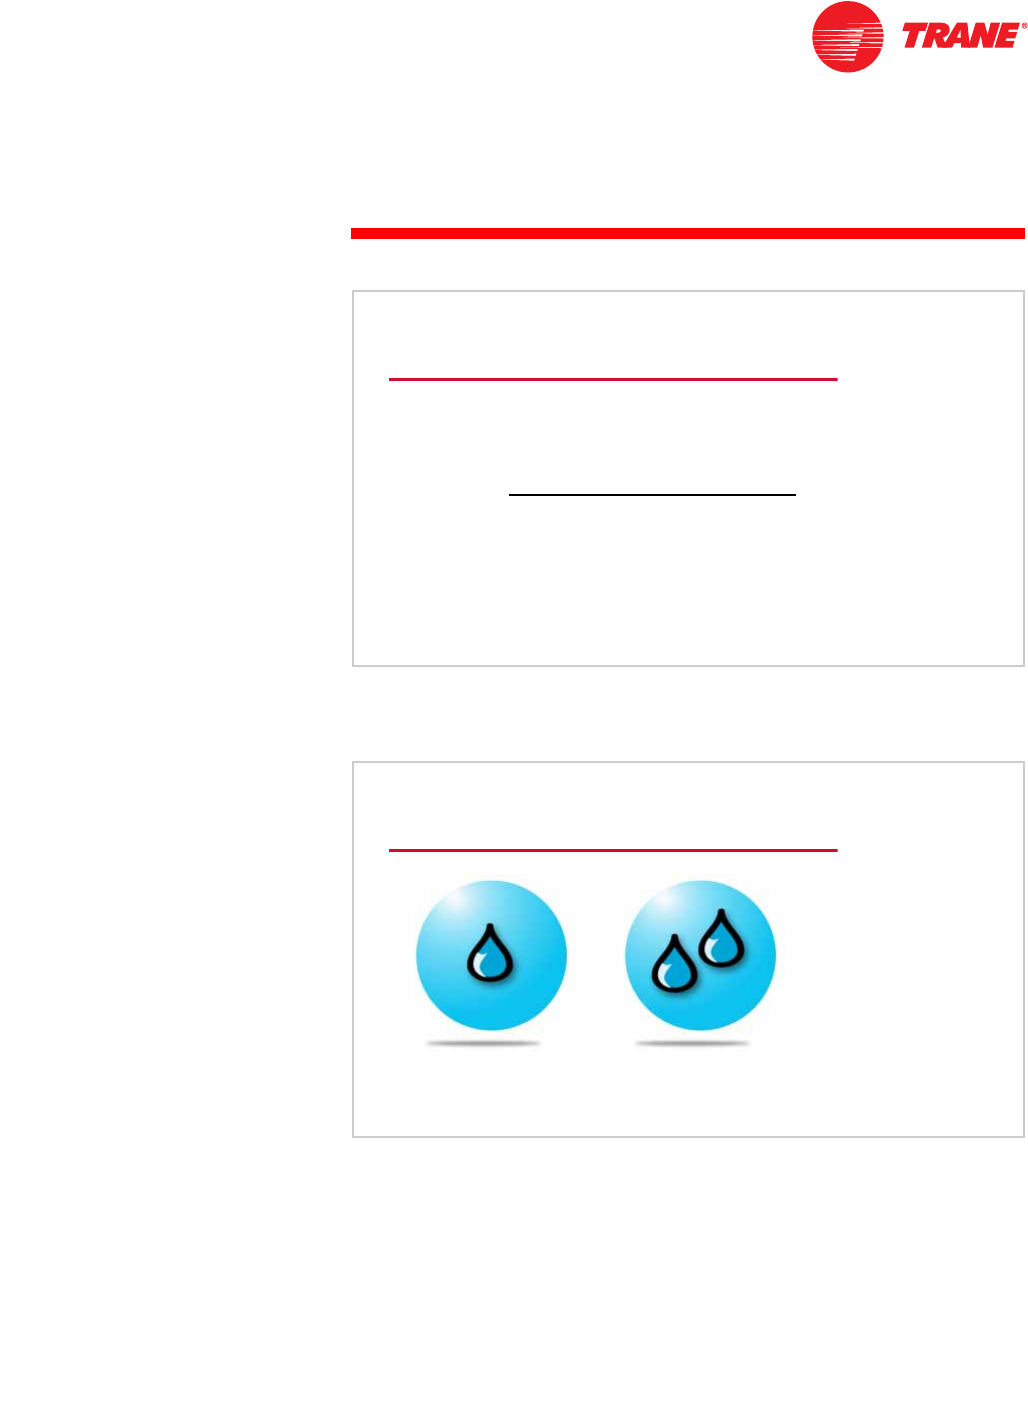
The fourth property, relative humidity, is a comparison of the amount of
moisture that a given amount of air
is
holding, to the amount of moisture that
the same amount of air
can
hold, at the same dry-bulb temperature.
Relative humidity is expressed as a percentage. For example, if the relative
humidity of the air is 50%, it contains one-half the amount of moisture possible
at the existing dry-bulb temperature.
5HODWLYH+XPLGLW\
5HODWLYH
+XPLGLW\
$PRXQWRIPRLVWXUHWKDWDJLYHQ
DPRXQWRIDLULVKROGLQJ
$PRXQWRIPRLVWXUHWKDWDJLYHQ
DPRXQWRIDLUFDQKROG
Figure 9
VDWXUDWHG
5HODWLYH+XPLGLW\
Figure 10

6TRG-TRC001-EN
notes
period one
The Psychrometric Chart
Finally, humidity ratio describes the actual weight of water in an air – water
vapor mixture. In other words, if one pound of air were wrung completely dry,
comparing the weight of the water to the weight of the dry air would yield its
humidity ratio.
Humidity ratio can be expressed as pounds of moisture per pound of dry air, or
as grains of moisture per pound of dry air. There are 7000 grains of water in a
pound. To appreciate the magnitude of these units of measurement, at sea level
one pound of 70°F air occupies approximately 13.5 cubic feet, and one grain of
water in that air weighs about two-thousandths (0.002) of an ounce.
When any two of these five properties of air are known, the other three can be
quickly determined from the psychrometric chart.
+XPLGLW\5DWLR
Figure 11
3URSHUWLHVRI$LU
s'U\EXOEWHPSHUDWXUH
s:HWEXOEWHPSHUDWXUH
s'HZSRLQWWHPSHUDWXUH
s5HODWLYHKXPLGLW\
s+XPLGLW\UDWLR
Figure 12
TRG-TRC001-EN 7
period one
The Psychrometric Chart
notes
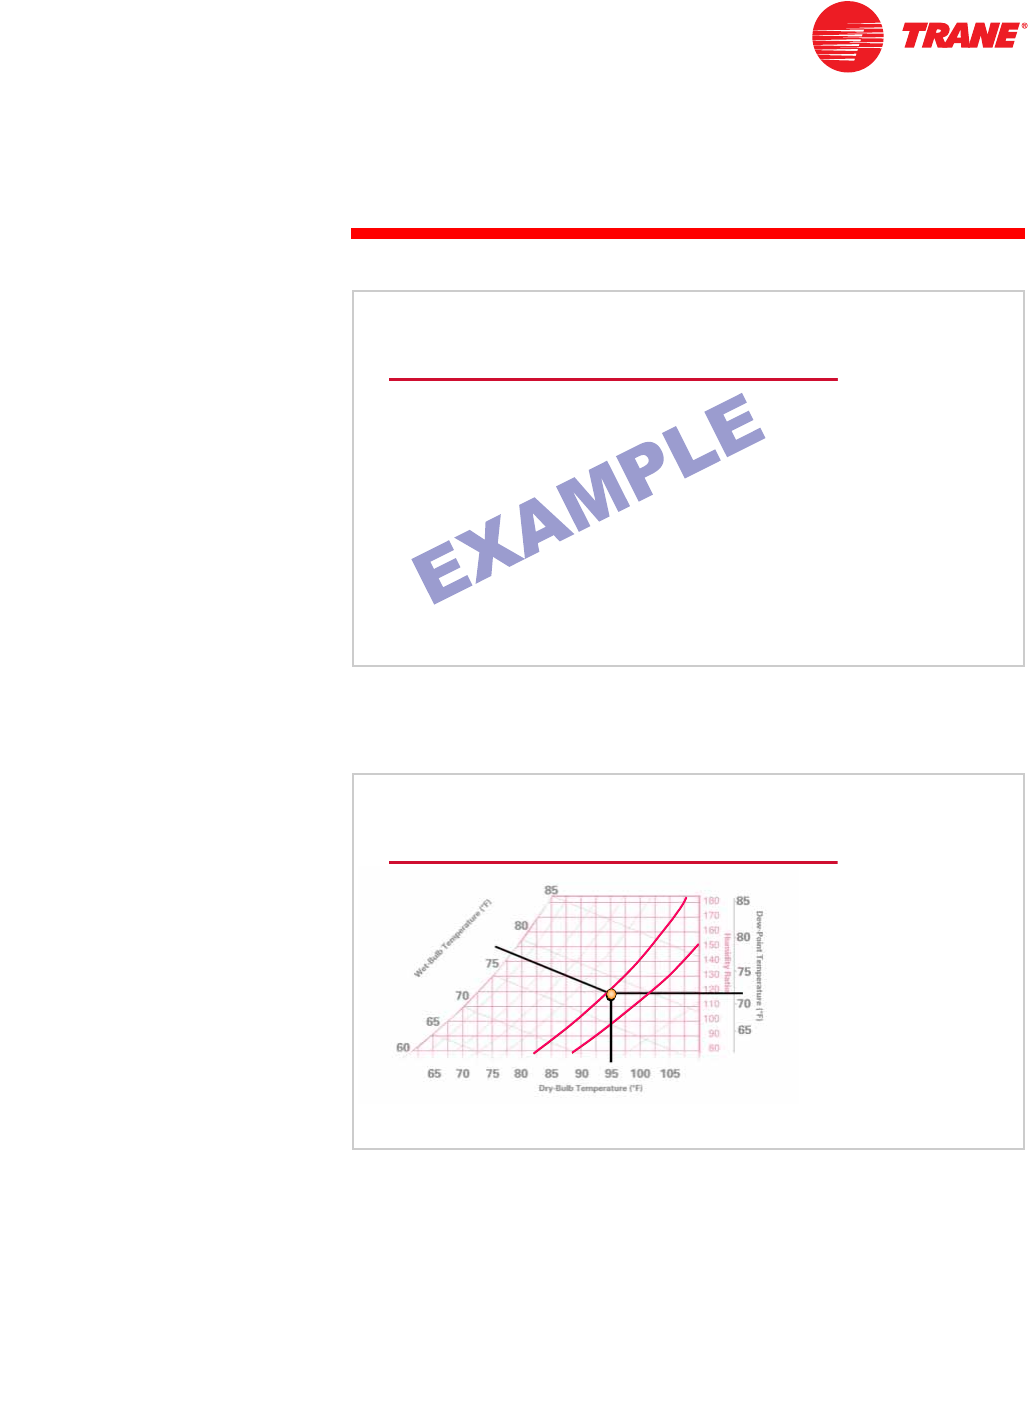
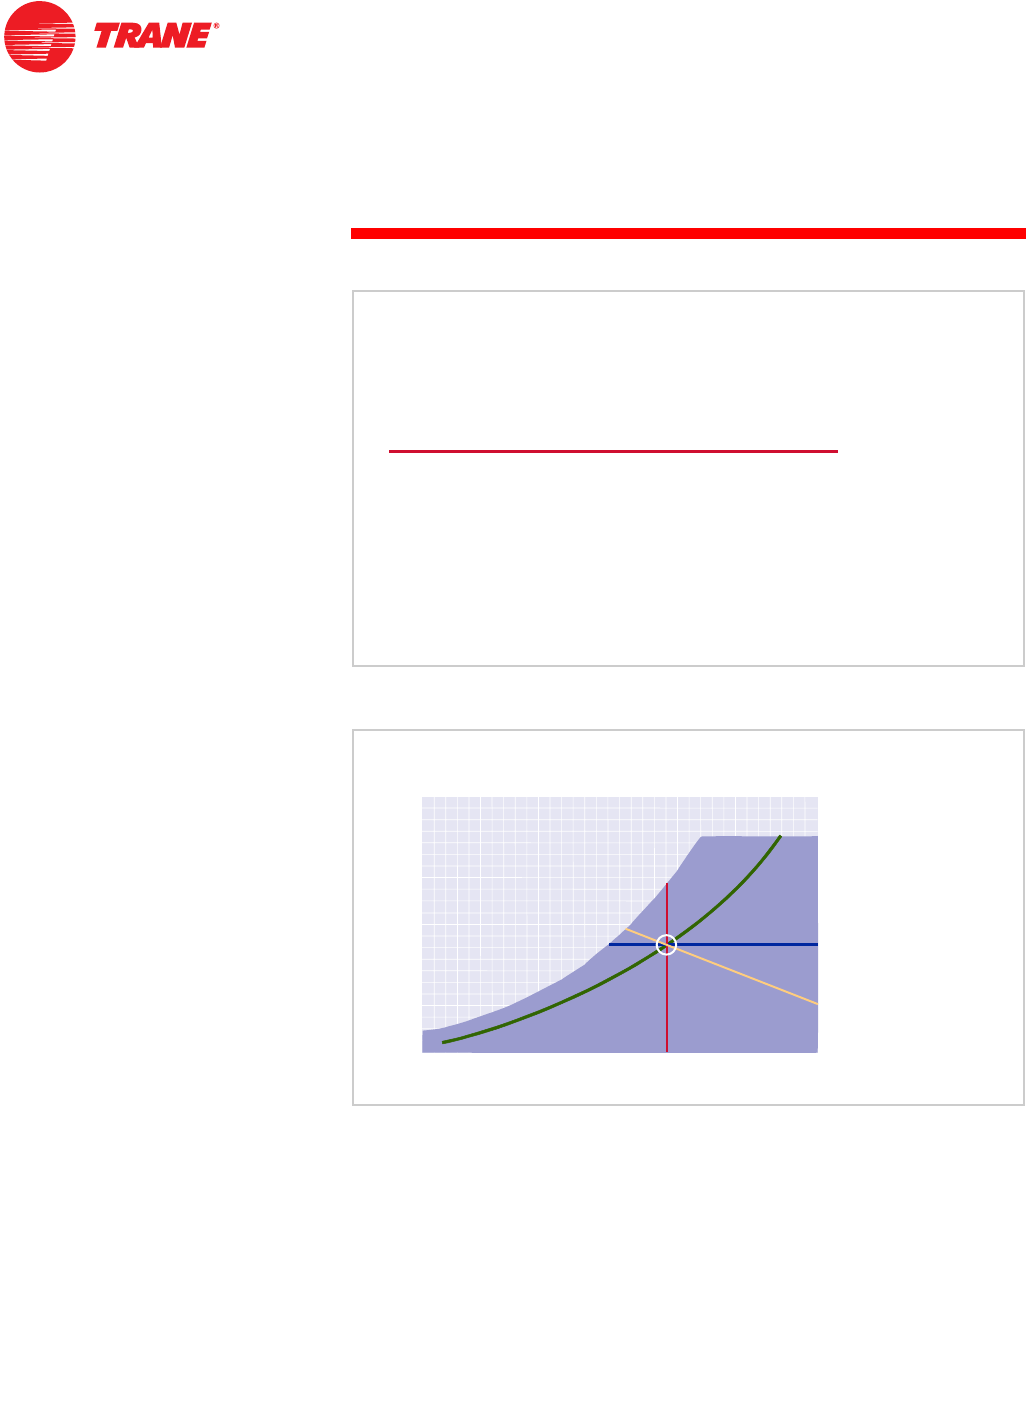
For example, let's assume that the summer design conditions are 95°F dry bulb
and 78°F wet bulb.
What is the relative humidity, humidity ratio, and dew point?
Only one point on the psychrometric chart represents air with both of these
conditions. This point is located where the vertical 95°F dry-bulb (DB) and
diagonal 78°F wet-bulb (WB) temperature lines intersect.
From this intersection, the remaining three air properties can be read from the
chart. Both the dew-point and humidity-ratio lines are horizontal and the values
are shown on the right side of the chart. In this example, the humidity ratio is
about 118 grains of moisture per pound of dry air and the dew-point
temperature is approximately 72°F.
6XPPHU'HVLJQ&RQGLWLRQV
s)'%GU\EXOE
s):%ZHWEXOE
Figure 13
3RLQWRI,QWHUVHFWLRQ
)
)
)
)
)
)
Figure 14

8TRG-TRC001-EN
notes
period one
The Psychrometric Chart
Notice that the point of intersection falls between two relative humidity curves:
40% and 50%. By interpolation, the relative humidity at this condition is
approximately 47%.
Constructing a Simple Psychrometric Chart
To better understand the psychrometric chart and show why the lines intersect
as they do, we will construct a simple chart.
The amount of moisture contained in saturated air depends on dry-bulb
temperature. This table shows the maximum amount of water vapor that one
pound of dry air can hold at various dry-bulb temperatures. For example, at
25°F, one pound of dry air can absorb and hold 19.14 grains of water; at 30°F it
can absorb 24.19 grains; at 35°F it can absorb 29.94 grains; and so on. Each of
these conditions is a saturation point.
)
)
)
)
)
)
)
)
)
)
)
)
)
)
GU\EXOE
WHPS
KXPLGLW\
UDWLR
GU\EXOE
WHPS
KXPLGLW\
UDWLR
3URSHUWLHVRI6DWXUDWHG$LU
Figure 15
TRG-TRC001-EN 9
period one
The Psychrometric Chart
notes
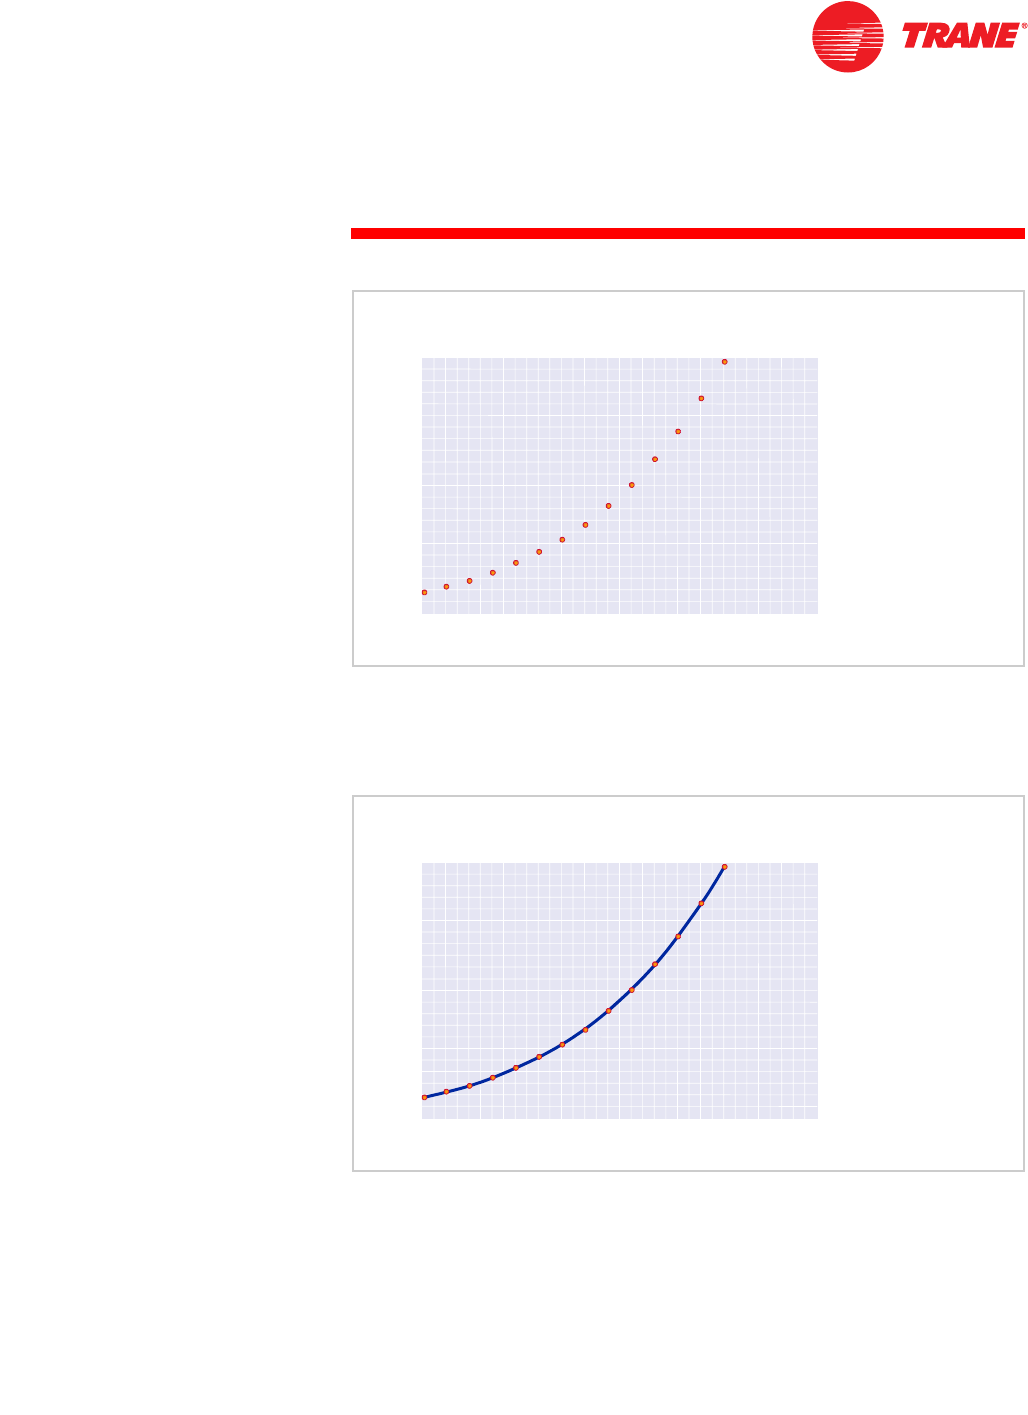
These saturation points can be plotted on a chart with dry-bulb temperature
along the horizontal axis and humidity ratio along the vertical axis.
When several saturation points are plotted, the curve created resembles the
relative humidity curves of the psychrometric chart.
In fact, this curve forms the 100% relative-humidity curve or saturation curve.
All points on this curve represent the moisture content that constitutes
complete saturation of air at the various dry-bulb temperatures.
'U\%XOE7HPSHUDWXUH)
'U\%XOE7HPSHUDWXUH)
+XPLGLW\5DWLRJUDLQV
+XPLGLW\5DWLRJUDLQVOE
OERIGU\DLU
RIGU\DLU
3ORWWLQJ6DWXUDWLRQ3RLQWV
Figure 16
6DWXUDWLRQ&XUYH
UHODWLYHKXPLGLW\FXUYH
UHODWLYHKXPLGLW\FXUYH
'U\%XOE7HPSHUDWXUH)
'U\%XOE7HPSHUDWXUH)
+XPLGLW\5DWLRJUDLQV
+XPLGLW\5DWLRJUDLQVOE
OERIGU\DLU
RIGU\DLU
Figure 17
10 TRG-TRC001-EN
notes
period one
The Psychrometric Chart
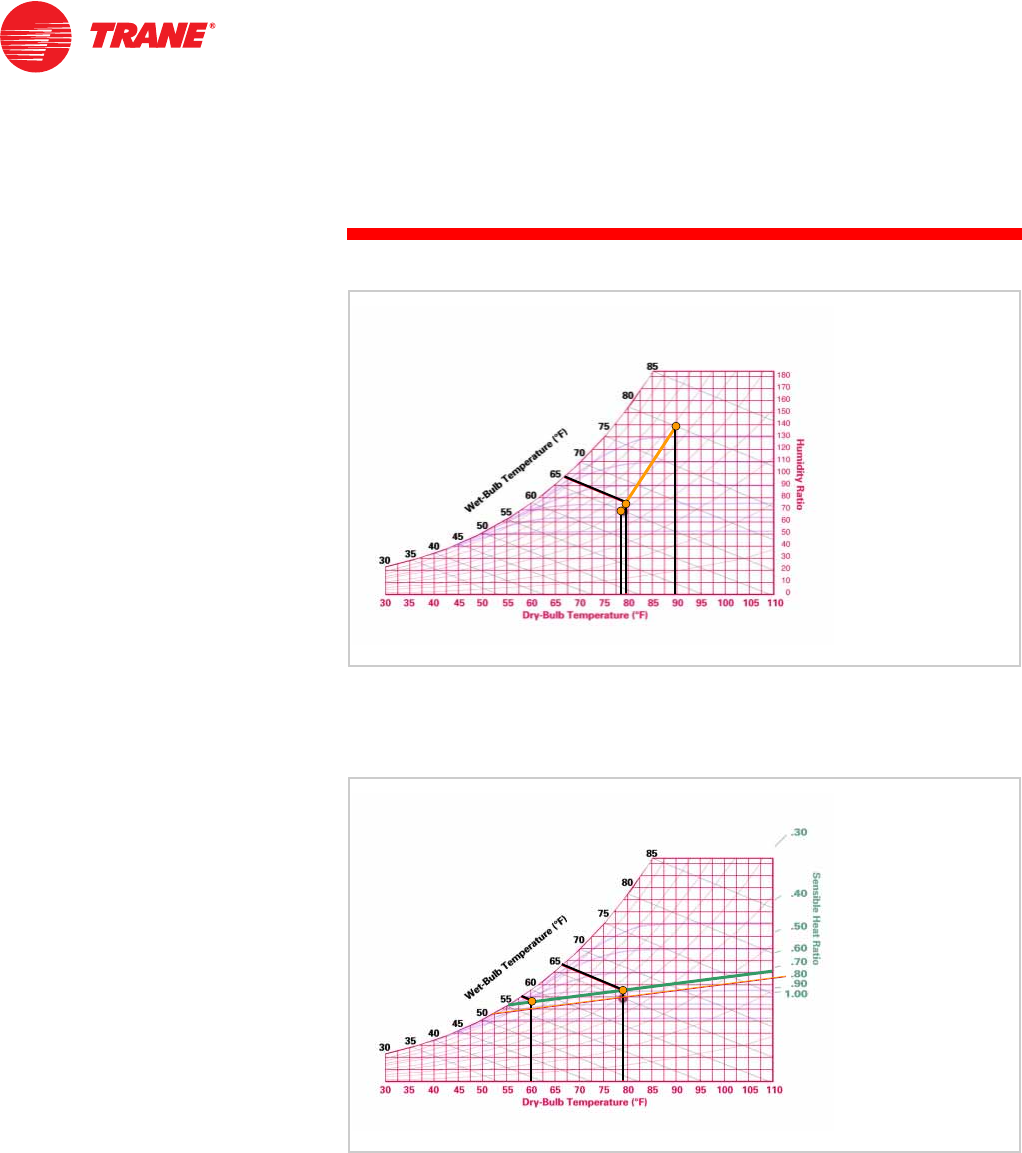
Another fact about saturated air should be discussed before we proceed.
Assume a volume of moist air has the initial conditions indicated in column D
of the table. The air has a 90°F dry-bulb temperature and a 60°F dew point. A
wet-bulb thermometer shows the wet-bulb temperature to be 70°F. From a
moisture-content table, the relative humidity of the air is approximately 37%.
With no change in the moisture content of this volume of air, the table shows
the progressive change that occurs as the air cools.
Point C: As the dry-bulb temperature drops from 90°F to 75°F, the wet-bulb
temperature drops from 70°F to 65.2°F, yet the dew point remains the same at
60°F. The relative humidity rises from 37% to 60%.
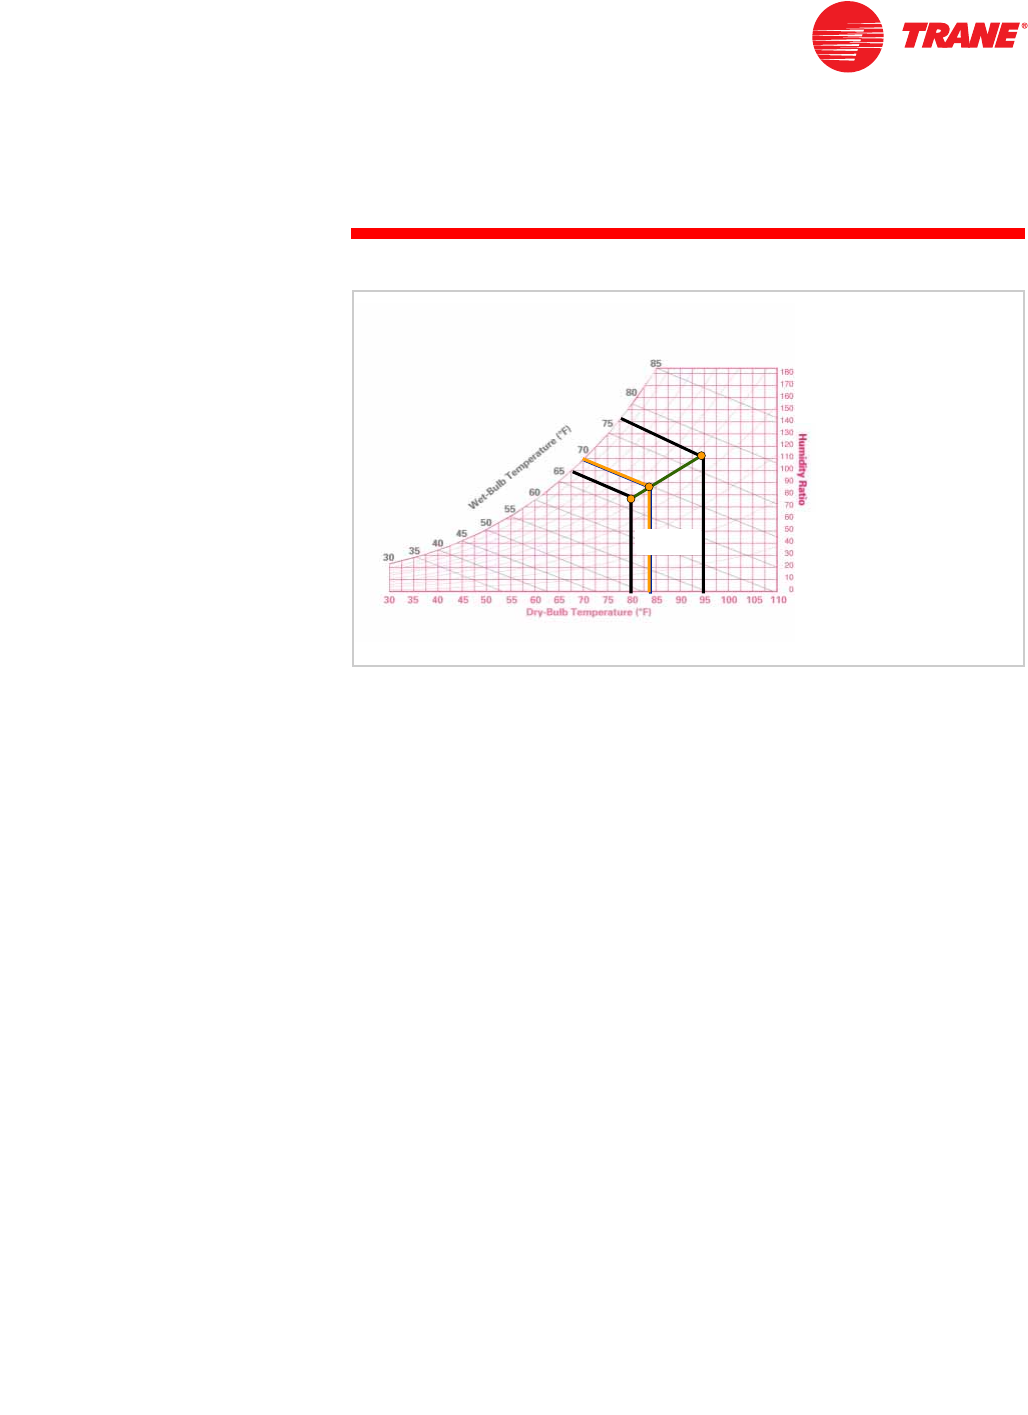
Point B: When the dry-bulb temperature reaches 62°F, the wet-bulb
temperature is about 60.8°F, the dew point remains constant at 60°F, and the
relative humidity is 92%.
Point A: Finally, when the dry-bulb temperature reaches the 60°F dew-point
temperature, the wet bulb cannot be reduced any lower because evaporation
can no longer occur: the air is saturated and contains all the moisture it can
hold. The relative humidity is now 100%.
At any point on a 100% relative-humidity curve, the three air
temperatures—dry bulb, wet bulb and dew point—are equal.
'U\%XOE:HW%XOEDQG'HZ3RLQW
)
GHZSRLQW
)
GHZSRLQW
)
ZHWEXOE
)
ZHWEXOE
$
%
&
'
GU\EXOE ) ) ) )
ZHWEXOE ) ) ) )
GHZSRLQW ) ) ) )
UHOKXPLGLW\
'
'
&
&
%
%
$
$
'U\%XOE7HPSHUDWXUH)
'U\%XOE7HPSHUDWXUH)
+XPLGLW\5DWLRJUDLQV
+XPLGLW\5DWLRJUDLQVOE
OERIGU\DLU
RIGU\DLU
Figure 18

TRG-TRC001-EN 11
period one
The Psychrometric Chart
notes
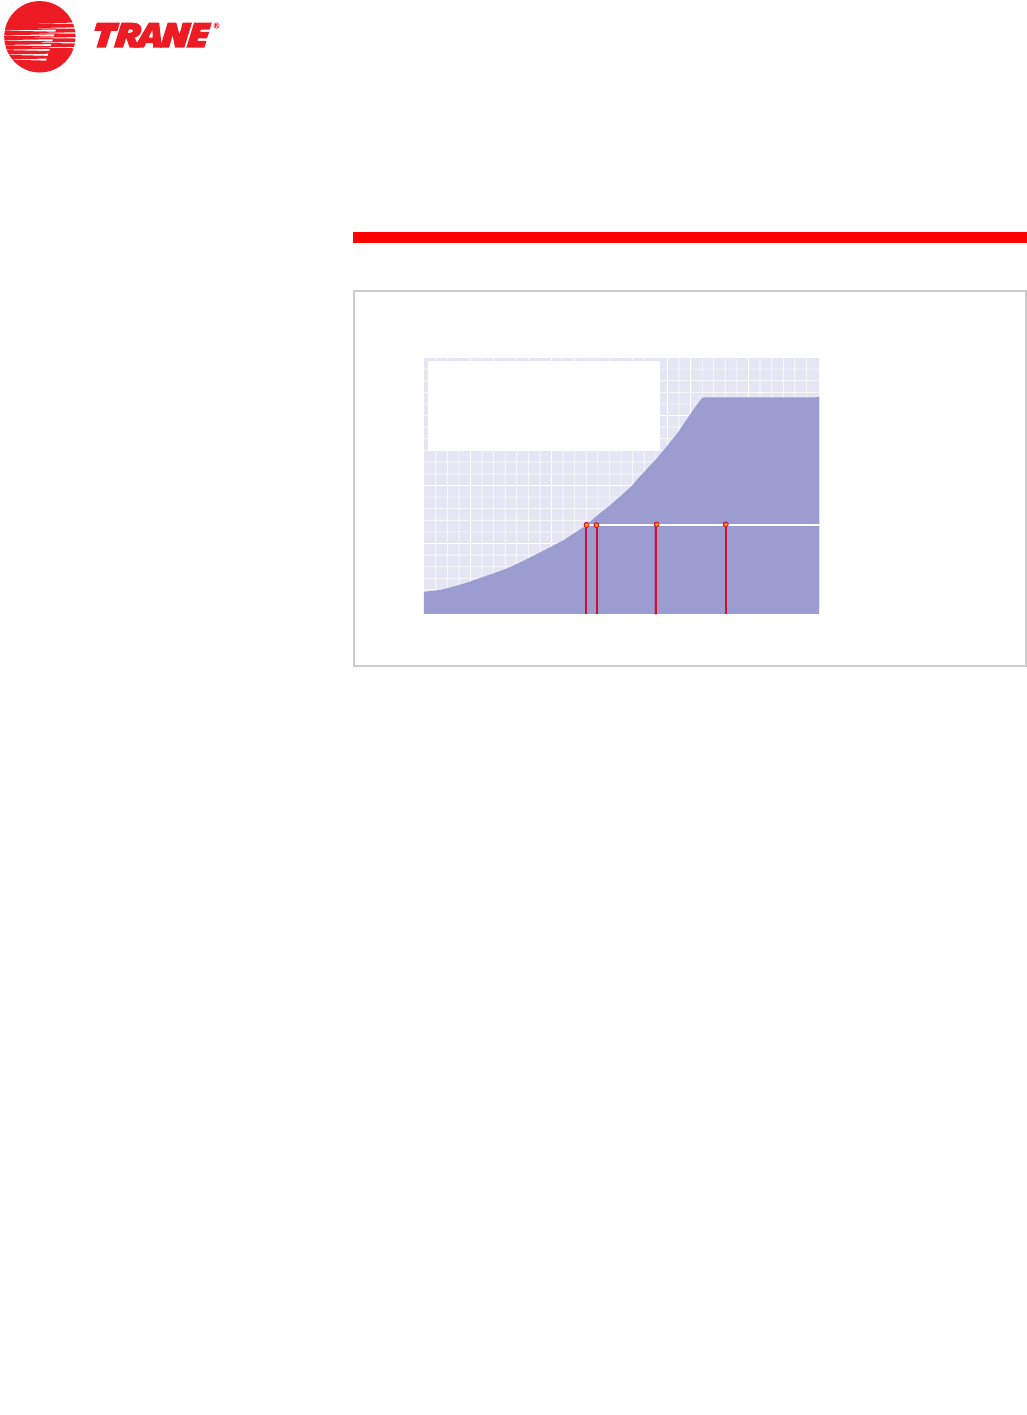
Additionally, the dew-point temperature does not change as the dry-bulb
temperature changes, provided that the moisture content of the air remains the
same. Merely heating the air does not change its moisture content. Therefore,
as the air is heated, its condition will move horizontally along a constant
humidity-ratio line.
In this example, heating 60°F saturated air moves the air condition along a
horizontal humidity-ratio line that corresponds to a constant 77.56 grains of
moisture per pound of dry air.
Horizontal lines can be drawn from each saturation point across to the right
side of the chart. A horizontal line can be provided for each humidity-ratio
value.
$GGLQJ6HQVLEOH+HDW
VDWXUDWLRQ
VDWXUDWLRQ
'U\%XOE7HPSHUDWXUH)
'U\%XOE7HPSHUDWXUH)
+XPLGLW\5DWLRJUDLQV
+XPLGLW\5DWLRJUDLQVOE
OERIGU\DLU
RIGU\DLU
)
GHZSRLQW
)
GHZSRLQW
)
ZHWEXOE
)
ZHWEXOE
Figure 19
12 TRG-TRC001-EN
notes
period one
The Psychrometric Chart
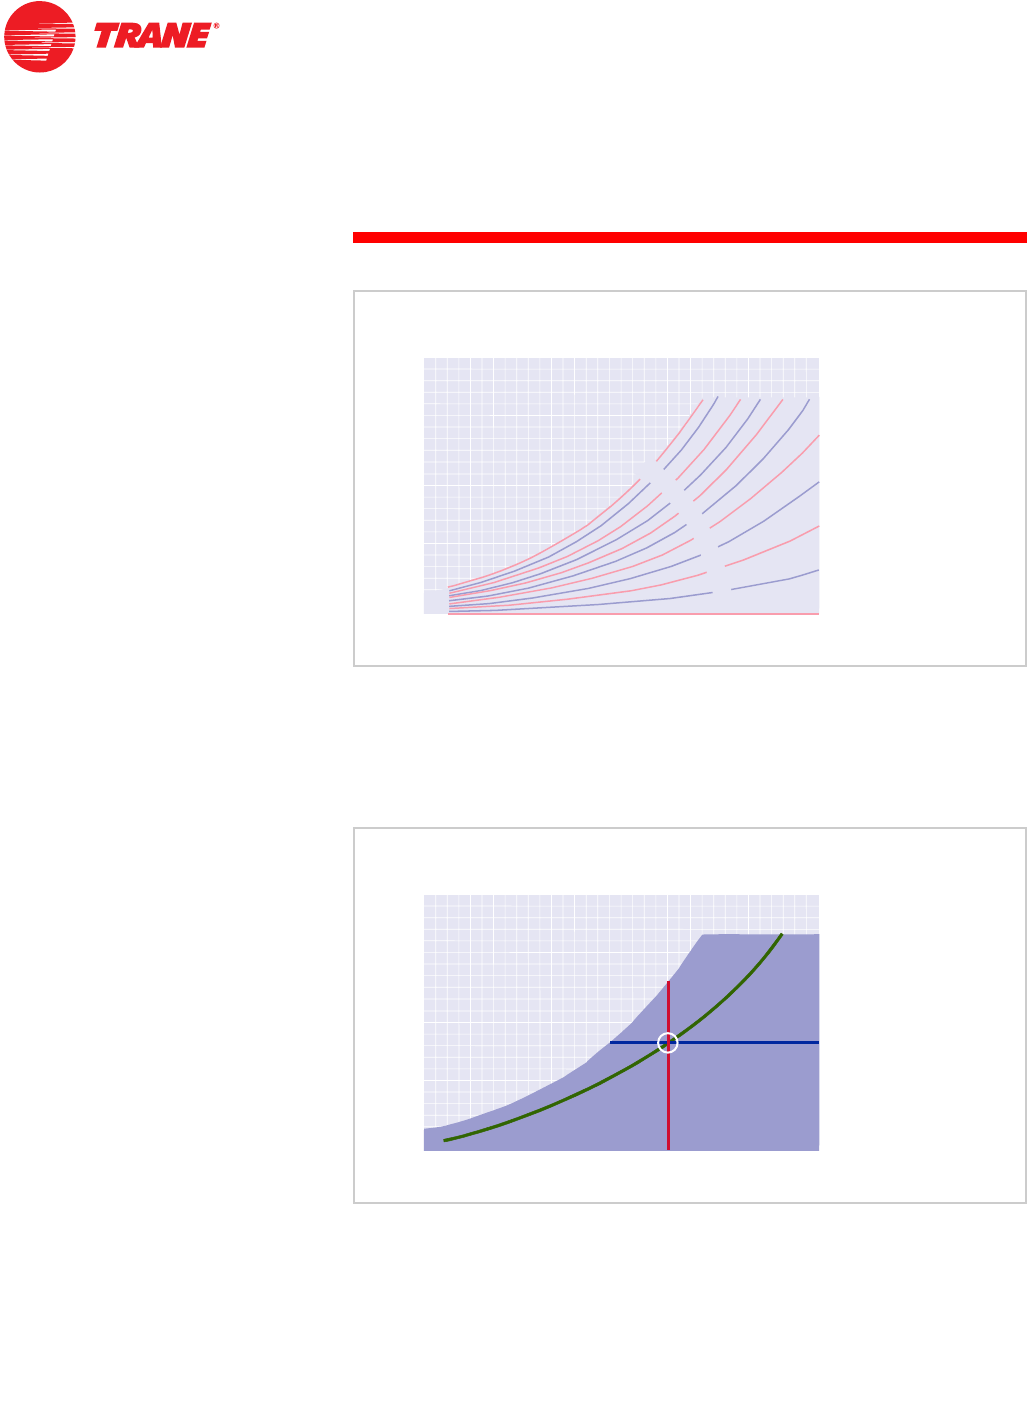
Additional curves can be added to the chart to represent relative humidity
conditions that are less than 100%. The curves shown are at 10% intervals and
represent humidity conditions ranging from completely saturated air to
completely dry air. When air is completely dry, its relative humidity cannot
change with temperature. The 0% condition is therefore represented by the
horizontal axis of the chart.
This basic chart now shows three air conditions: dry-bulb temperature (vertical
lines), humidity ratio (horizontal lines) and relative humidity (diagonally curved
lines).
5HODWLYH+XPLGLW\&XUYHV
UHODWLYHKXPLGLW\
UHODWLYHKXPLGLW\
'U\%XOE7HPSHUDWXUH)
'U\%XOE7HPSHUDWXUH)
+XPLGLW\5DWLRJUDLQV
+XPLGLW\5DWLRJUDLQVOE
OERIGU\DLU
RIGU\DLU
Figure 20
3URSHUWLHVRI$LU
KXPLGLW\UDWLR
KXPLGLW\UDWLR
GU\EXOE
GU\EXOE
UHODWLYHKXPLGLW\
UHODWLYHKXPLGLW\
'U\%XOE7HPSHUDWXUH)
'U\%XOE7HPSHUDWXUH)
+XPLGLW\5DWLRJUDLQV
+XPLGLW\5DWLRJUDLQVOE
OERIGU\DLU
RIGU\DLU
Figure 21
TRG-TRC001-EN 13
period one
The Psychrometric Chart
notes
To complete this basic chart, the wet-bulb temperature lines must be added.
Once again, at a saturated condition the wet-bulb, dry-bulb and dew-point
temperatures are equal. Therefore, the wet-bulb temperature lines start at the
saturation curve.
To observe what happens to wet-bulb temperatures when air is heated, start
with saturated air at 50°F dry bulb. At this condition, the air has a moisture
content of approximately 54 grains per pound as shown by A. If the
temperature of this air is increased to 75°F dry bulb without changing its
moisture content, the air condition will move along the constant humidity ratio
line (54 grains/lb) to B. The wet-bulb temperature of this warmed air is
approximately 60.1°F.
A line drawn from B to a point on the saturation curve that represents 60.1°F
saturation temperature (B’) gives an indication of the direction the wet-bulb
temperature lines will run. By taking numerous wet-bulb readings under
different conditions, the wet-bulb temperature lines can be added to the chart.
'HWHUPLQLQJ:HW%XOE/LQHV
$
$
%,
%,
&,
&,
',
',
%
%&
&'
'
$,
$,
'U\%XOE7HPSHUDWXUH)
'U\%XOE7HPSHUDWXUH)
+XPLGLW\5DWLRJUDLQV
+XPLGLW\5DWLRJUDLQVOE
OERIGU\DLU
RIGU\DLU
Figure 22

14 TRG-TRC001-EN
notes
period one
The Psychrometric Chart
The psychrometric chart now defines these five properties of air: dry-bulb
temperature (vertical lines), humidity ratio and dew-point temperature
(horizontal lines), relative humidity (curved lines) and wet-bulb temperature
(diagonal lines).
Remember: if any two of these five air conditions are known, the other three
can be found on the psychrometric chart by locating the point of intersection of
the two known conditions.
There is one more property of air that is displayed on the psychrometric chart—
specific volume. Specific volume is defined as the volume of one pound of
dry air at a specific temperature and pressure. As one pound of air is heated it
occupies more space—the specific volume increases.
3URSHUWLHVRI$LU
ZHWEXOE
ZHWEXOE
GHZSRLQW
GHZSRLQW
'U\%XOE7HPSHUDWXUH)
'U\%XOE7HPSHUDWXUH)
+XPLGLW\5DWLRJUDLQV
+XPLGLW\5DWLRJUDLQVOE
OERIGU\DLU
RIGU\DLU
KXPLGLW\UDWLR
KXPLGLW\UDWLR
GU\EXOE
GU\EXOE
UHODWLYHKXPLGLW\
UHODWLYHKXPLGLW\
Figure 23
6SHFLILF9ROXPH
VSHFLILFYROXPHOLQHV
FXELFIHHWSRXQGRIGU\DLU
VSHFLILFYROXPHOLQHV
FXELFIHHWSRXQGRIGU\DLU
'U\%XOE7HPSHUDWXUH)
'U\%XOE7HPSHUDWXUH)
+XPLGLW\5DWLRJUDLQV
+XPLGLW\5DWLRJUDLQVOE
OERIGU\DLU
RIGU\DLU
Figure 24

TRG-TRC001-EN 15
period one
The Psychrometric Chart
notes
Effect of Sensible Heat and Moisture Changes
When either the sensible heat content or the moisture content of air changes,
the point on the psychrometric chart that represents the original air condition
moves to a position that represents the new condition of temperature and/or
humidity.
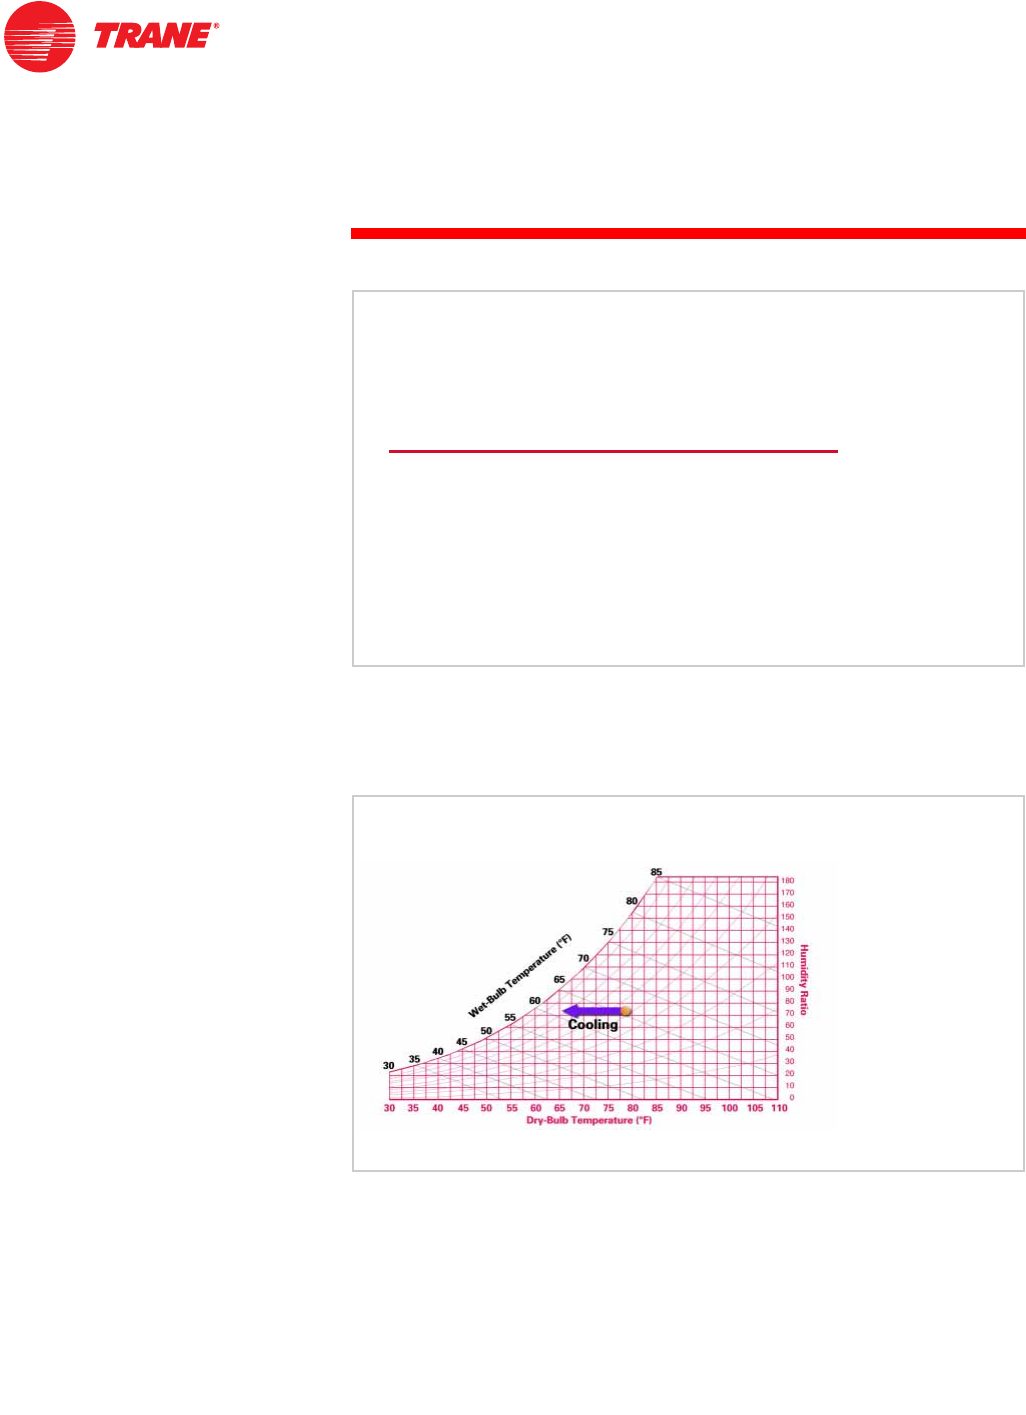
For example, if sensible heat is added to air, the air condition moves
horizontally to the right.
Conversely, if sensible heat is removed from air, the air condition moves
horizontally to the left. As long as the moisture content of the air remains
unchanged, the humidity ratio remains the same. Therefore, this movement
follows the horizontal humidity-ratio lines.
(IIHFWRI$GGLQJ6HQVLEOH+HDW
Figure 25
(IIHFWRI5HPRYLQJ6HQVLEOH+HDW
Figure 26
16 TRG-TRC001-EN
notes
period one
The Psychrometric Chart
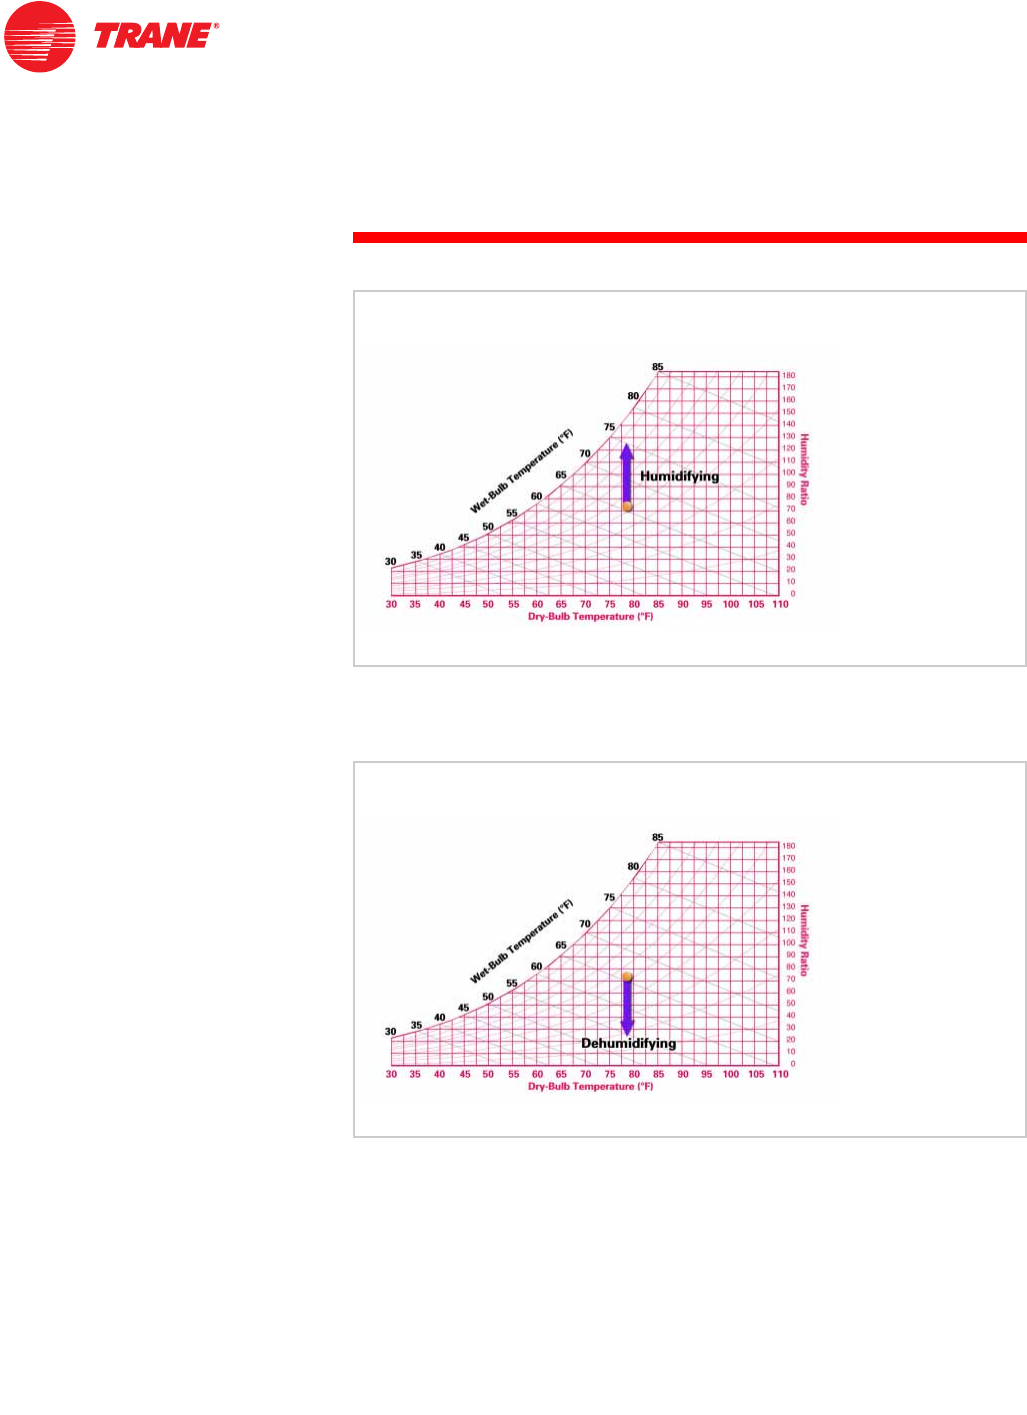
On the other hand, if moisture is added to air without changing the dry-bulb
temperature, the air condition moves upward along a dry-bulb temperature
line.
Finally, if moisture is removed from the air without changing its dry-bulb
temperature, the air condition moves downward along a dry-bulb temperature
line.
(IIHFWRI$GGLQJ0RLVWXUH
Figure 27
(IIHFWRI5HPRYLQJ0RLVWXUH
Figure 28
TRG-TRC001-EN 17
period one
The Psychrometric Chart
notes
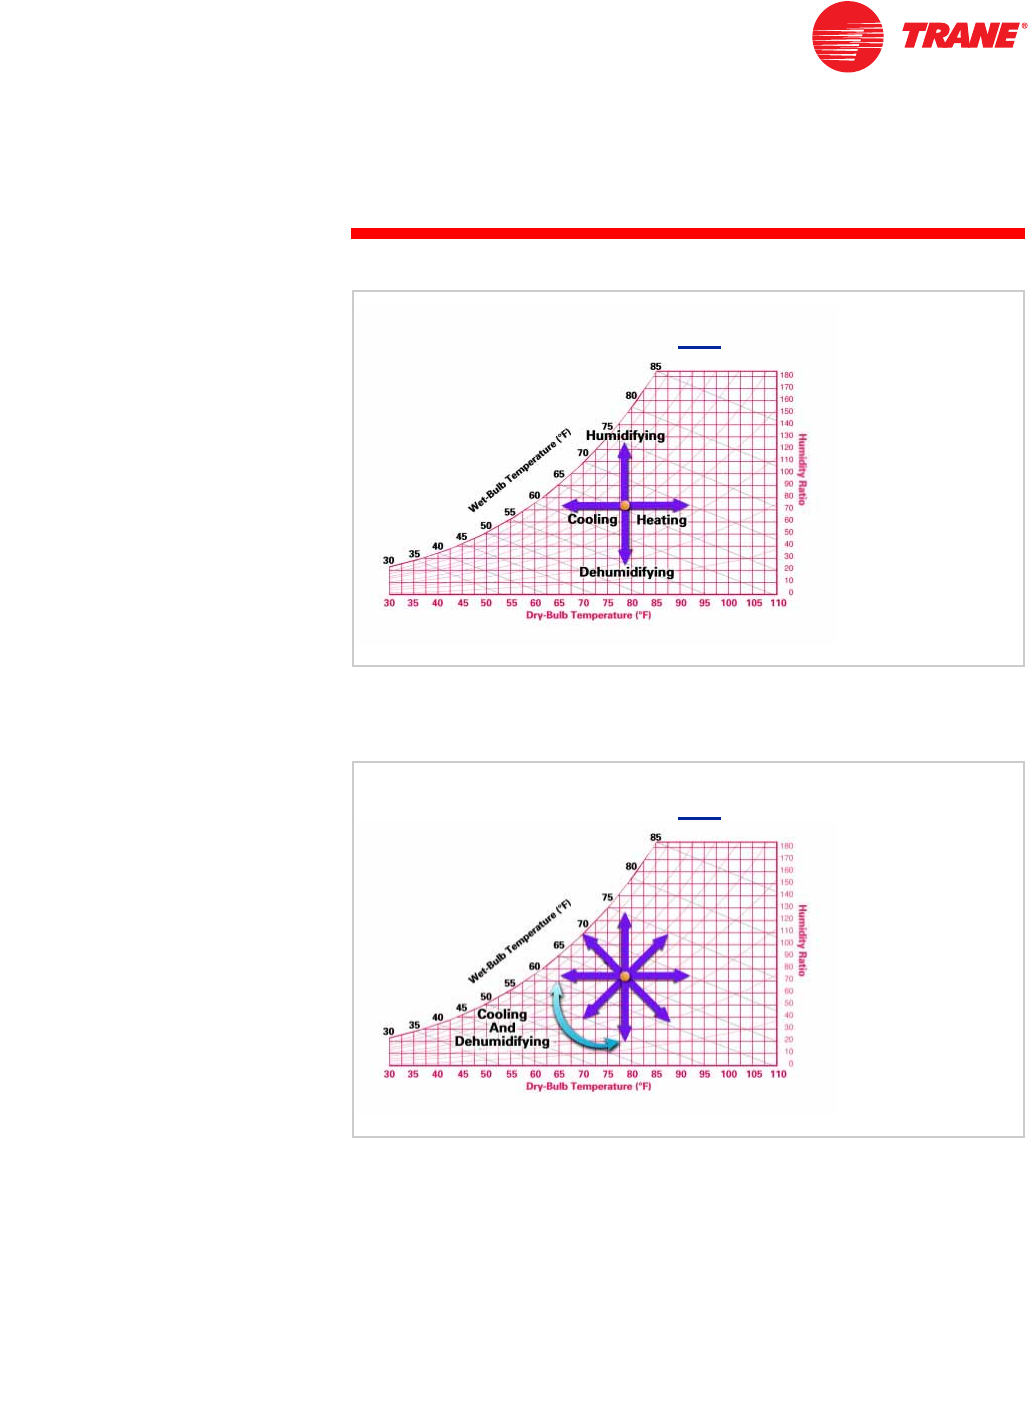
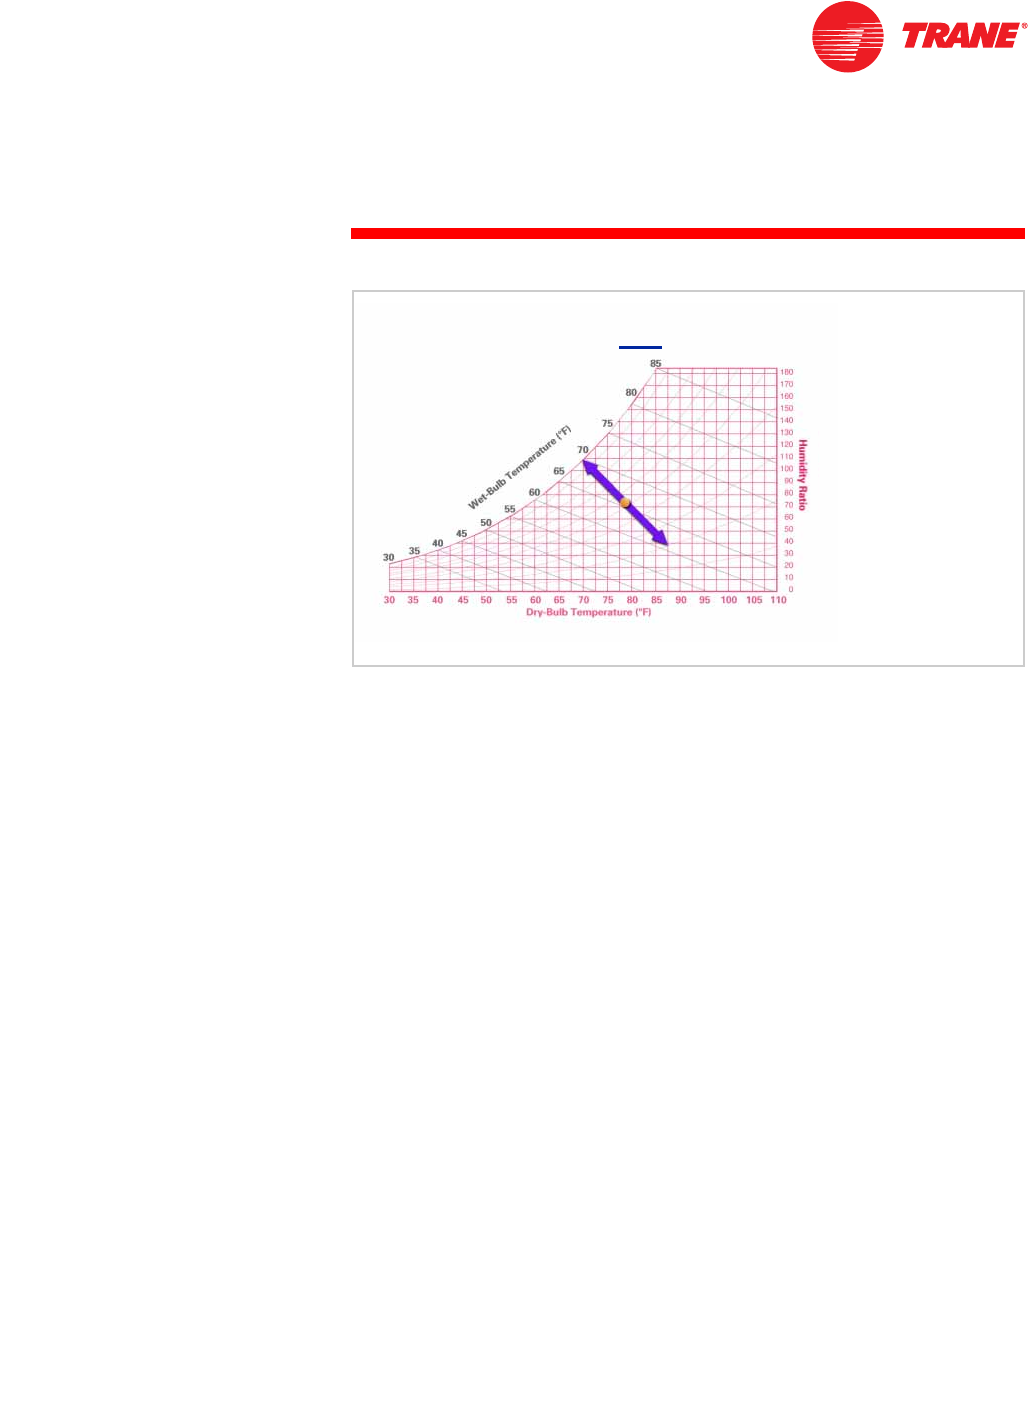
Put all of these changes together on one chart and they show the direction the
air condition will move when the dry-bulb temperature or moisture content is
altered.
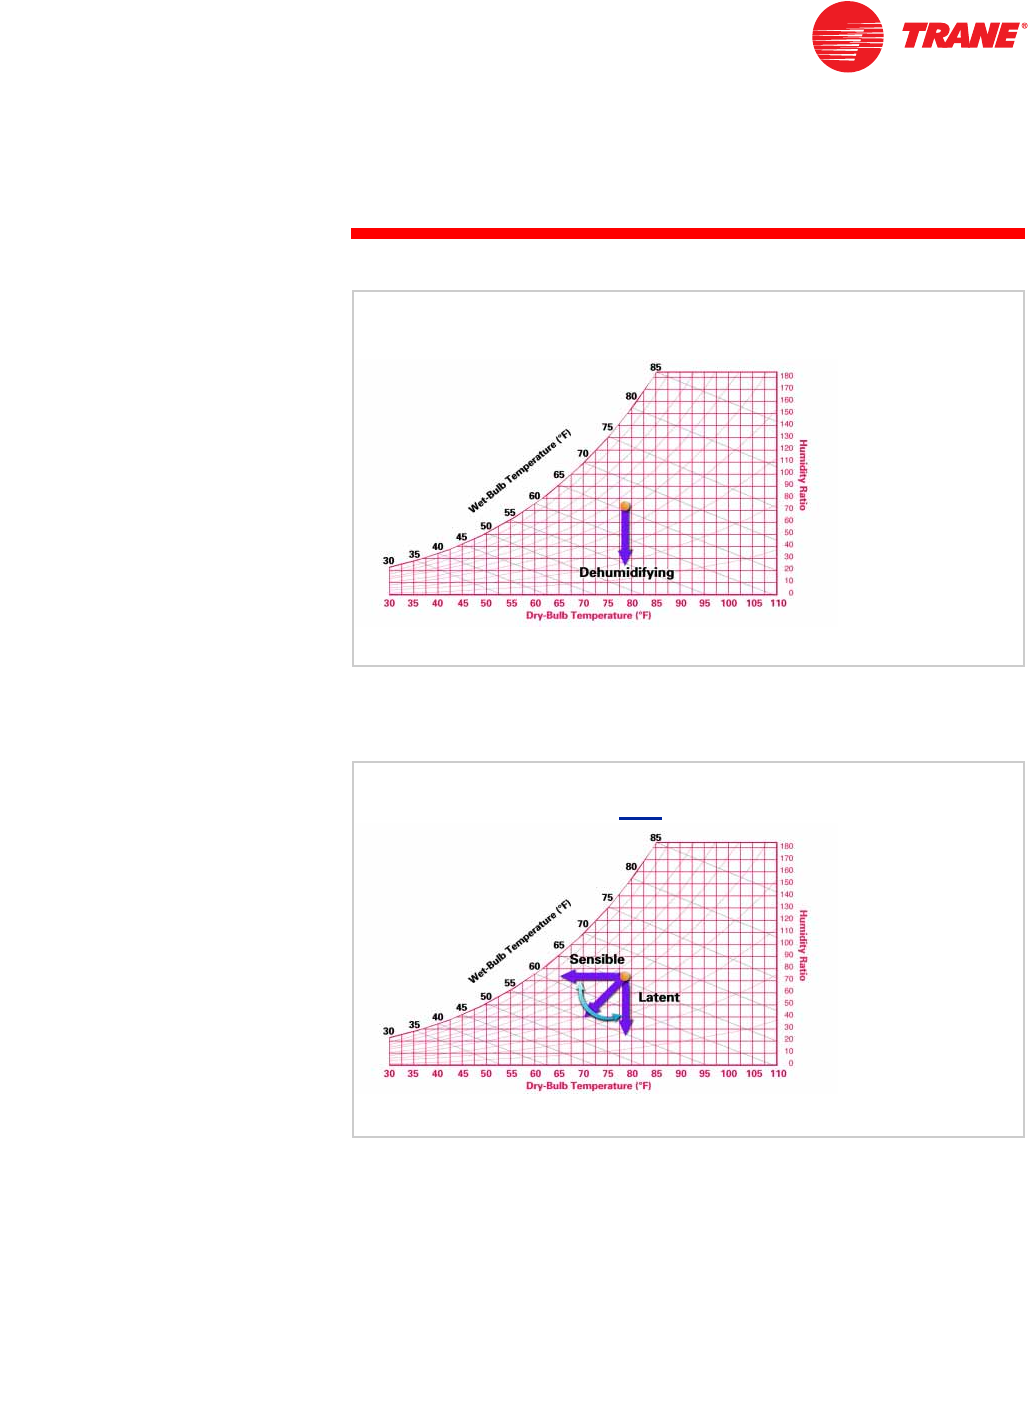
In actual practice, however, both the dry-bulb temperature and moisture
content of the air generally change simultaneously. When this happens, the
resulting air conditions move from A at some angle. The exact angle and
direction depend upon the proportions of sensible and latent heat added or
removed. Sensible heat causes a change in the air’s dry-bulb temperature
with no change in moisture content. Latent heat causes a change in the air’s
moisture content with no change in dry-bulb temperature.
To provide summer comfort, air is cooled and dehumidified, moving the air
condition downward and to the left, resulting in a lower dry-bulb temperature
and a lower moisture content.
5HPRYLQJ6HQVLEOH+HDWDQG0RLVWXUH
Figure 29
5HPRYLQJ6HQVLEOH+HDWDQG0RLVWXUH
$
$
Figure 30

18 TRG-TRC001-EN
notes
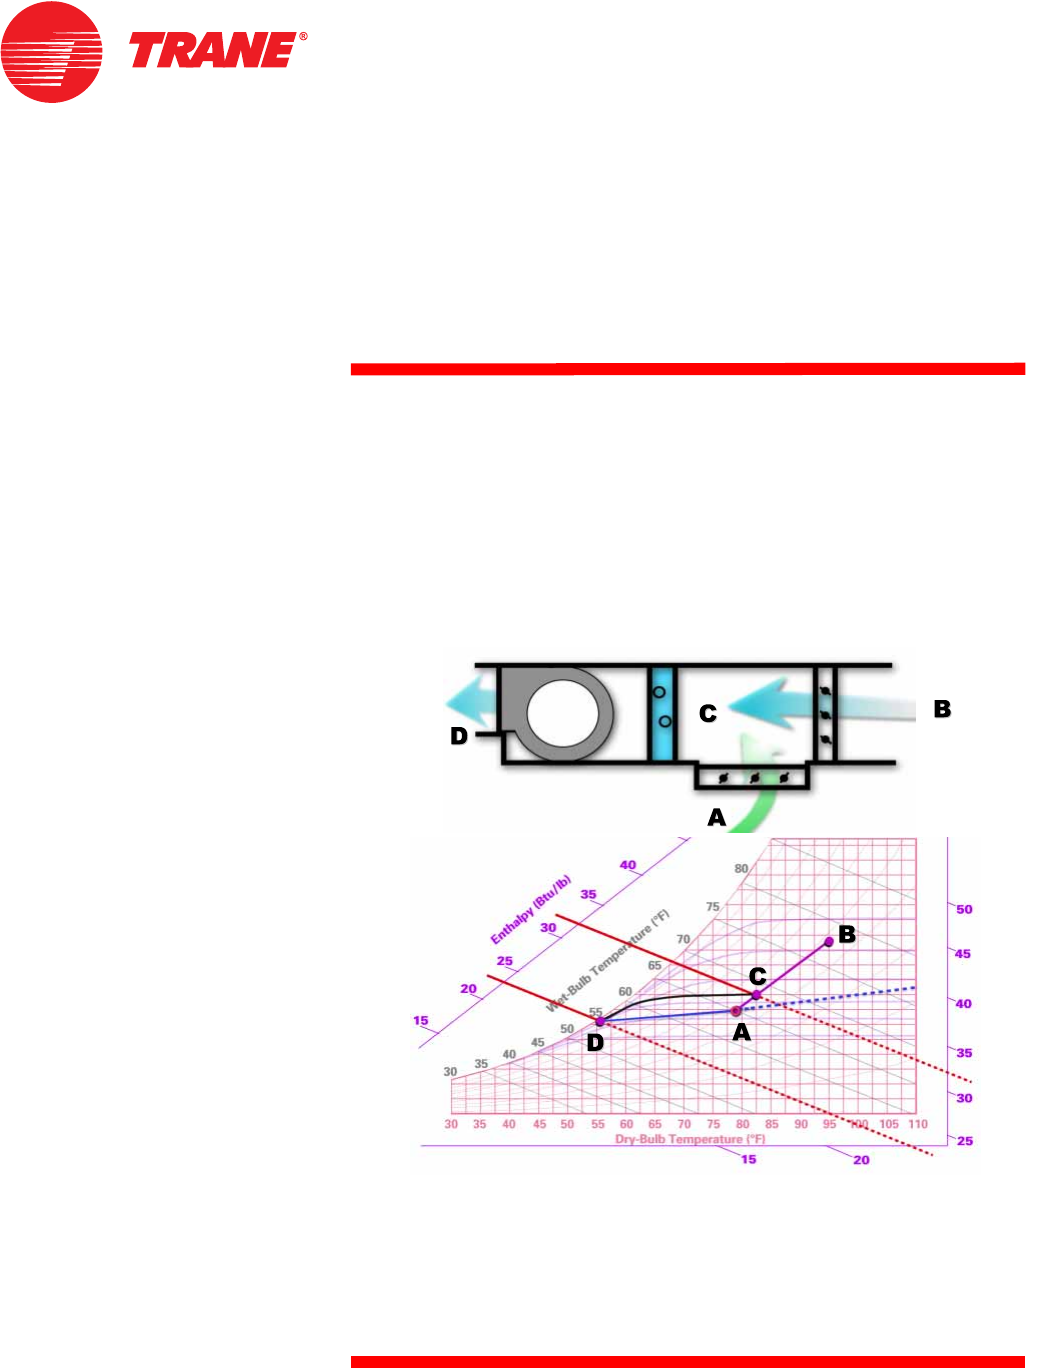
Before an air conditioning problem can be analyzed on the psychrometric chart,
the conditions of the air to be cooled or heated must be known.
The air entering the cooling coil may be 100% recirculated (A), 100% outdoor
(B), or a mixture of the two (C).
3V\FKURPHWU\
SHULRGWZR
$LU0L[WXUHV
Figure 31
VXSSO\
VXSSO\
IDQ
IDQ
PL[WXUH
PL[WXUH RXWGRRU
RXWGRRU
DLU2$
DLU2$
UHFLUFXODWHG
UHFLUFXODWHGDLU5$
DLU5$
$
$
&
&
%
%
FRROLQJ
FRROLQJ
FRLO
FRLO
'HWHUPLQLQJ(QWHULQJ$LU&RQGLWLRQV
Figure 32
period two
Air Mixtures
TRG-TRC001-EN 19
period two
Air Mixtures
notes
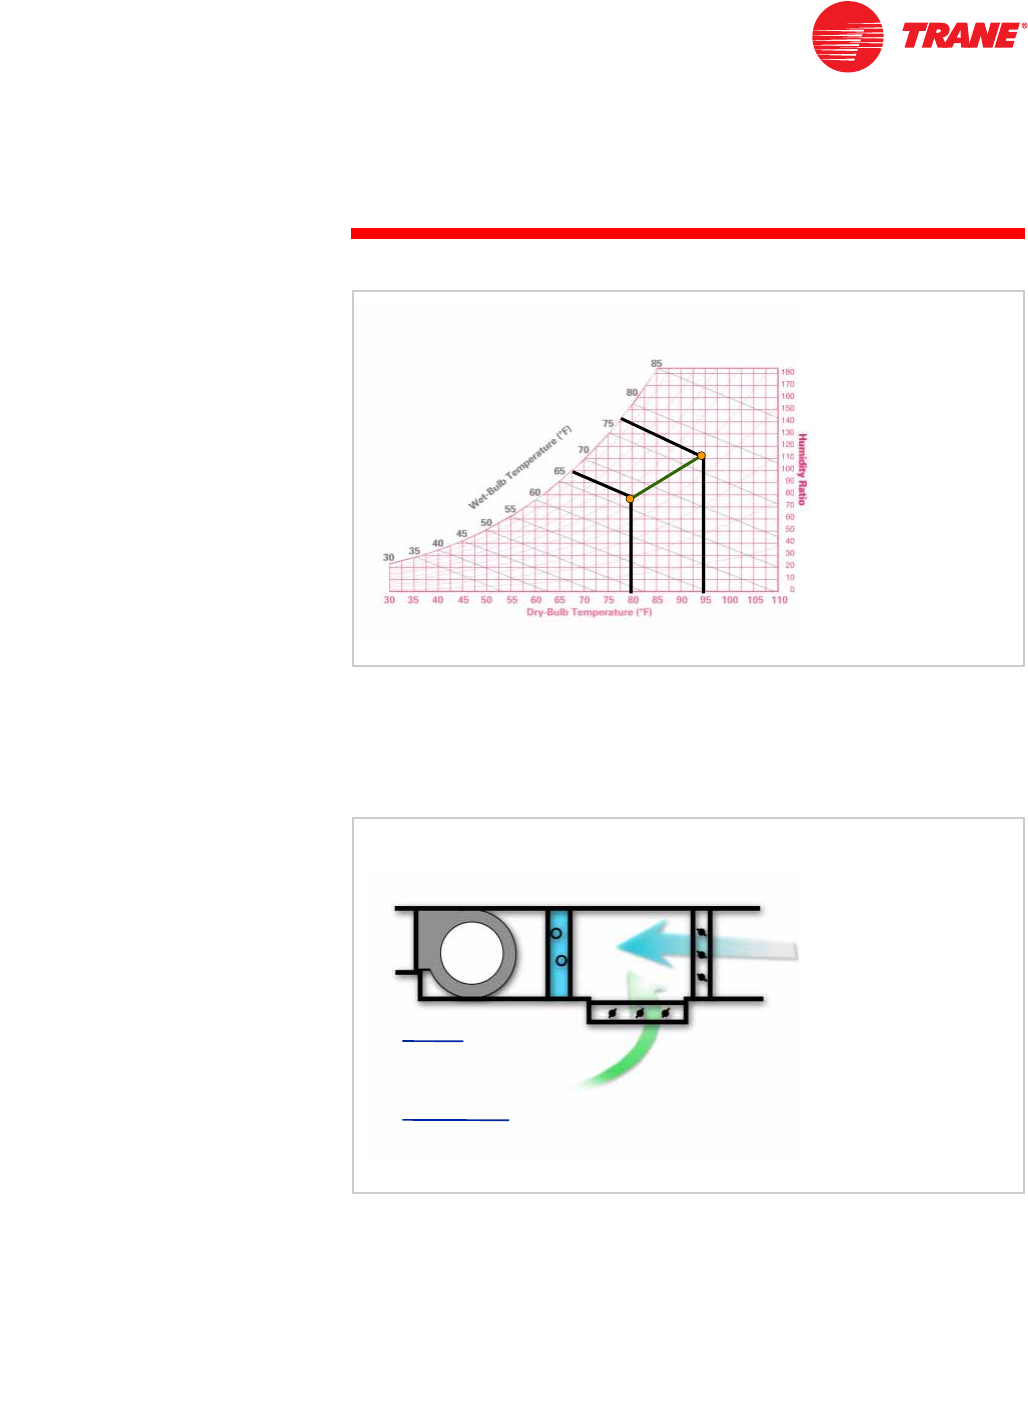
If outdoor air B is mixed with recirculated air A, the conditions of the resulting
mixture are found somewhere on a straight line connecting the two points.
If the mixture is half and half, this condition falls on the midpoint of the line
between A and B. If more than half of the mixture is recirculated air A, the
condition of the mixture will fall closer to A than to B.
In this example, 1,000 cfm of outdoor air (OA) is mixed with 3,000 cfm of
recirculated air (RA) for a total supply airflow of 4,000 cfm.
First, the percentage of outdoor air within the mixture is determined. This is
done by dividing the outdoor air quantity by the total air quantity.
)
) )
)
'HWHUPLQLQJ(QWHULQJ$LU&RQGLWLRQV
%
%
$
$
RXWGRRUDLU
RXWGRRUDLU
UHFLUFXODWHGDLU
UHFLUFXODWHGDLU
Figure 33
FIP
FIP
FIP
FIP
2$
2$
5$
5$
PL[WXUH
PL[WXUH
$
$
&
&%
%
FIP
PL[HGDLU
FIP
FIP
PL[HGDLU
PL[HGDLU
FIP
FIP
2$
2$
FIP
FIP
5$
5$
'HWHUPLQLQJ(QWHULQJ$LU&RQGLWLRQV
Figure 34
1,000 cfm
4,000 cfm
0.25=
20 TRG-TRC001-EN
notes
period two
Air Mixtures
The outdoor air quantity in this example constitutes 25% of the mixture, while
the recirculated air makes up the remaining 75%.
The next step is to determine the dry-bulb temperature of the air mixture.
This is done by multiplying the dry-bulb temperature of each air condition by its
percentage and summing the results.
For example, if the outdoor dry-bulb temperature is 95°F and it represents 25%
of the air mixture, it contributes 23.75°F (or 0.25 × 95) to the dry-bulb
temperature of the air mixture.
Similarly, if the dry-bulb temperature of the recirculated air is 80°F, it
contributes 60°F (or 0.75 × 80) to the dry-bulb temperature of the air mixture.
The sum of 23.75°F and 60°F equals 83.75°F, the resulting dry-bulb temperature
of this air mixture.
)Õ )
)Õ )
PL[WXUH )
'HWHUPLQLQJ(QWHULQJ$LU&RQGLWLRQV
Figure 35
TRG-TRC001-EN 21
period two
Air Mixtures
notes
Returning to the psychrometric chart, point C, at which the 83.75°F dry-bulb
temperature falls on the line from A to B, represents the conditions of the air
mixture: 83.75°F DB and approximately 70°F WB.
Because the recirculated air quantity constitutes a larger percentage (75%) of
the mixture, the mixed-air condition (C) is much nearer to the indoor design
condition (A) than to the outdoor design condition (B).
)
)
)
)
'HWHUPLQLQJ(QWHULQJ$LU&RQGLWLRQV
%
%
)
)
)
)
&
&
$
$
Figure 36
22 TRG-TRC001-EN
notes
period three
Sensible Heat Ratio
This period is devoted to understanding the term sensible heat ratio and how
it is represented on the psychrometric chart. The ratio of sensible heat gain to
total heat gain is one of the most important factors affecting air conditioning
system requirements.
If only sensible heat is removed from the air, the line representing this change
moves from the original condition horizontally to the left. This results in a lower
dry-bulb temperature, while the moisture content (the humidity ratio) remains
constant.
3V\FKURPHWU\
SHULRGWKUHH
6HQVLEOH+HDW5DWLR
Figure 37
(IIHFWRI5HPRYLQJ6HQVLEOH+HDW
Figure 38
TRG-TRC001-EN 23
period three
Sensible Heat Ratio
notes
Conversely, if only latent heat is removed, the line moves vertically downward
along a constant dry-bulb temperature line. This results in a lower moisture
content or humidity ratio.
If both sensible and latent heat are removed from the air, the resulting air
condition will be to the left and below the initial condition. The proportions of
sensible and latent heat removed will determine the exact direction the
resulting air condition follows.
(IIHFWRI5HPRYLQJ/DWHQW+HDW
Figure 39
5HPRYLQJ6HQVLEOHDQG/DWHQW+HDW
Figure 40
24 TRG-TRC001-EN
notes
period three
Sensible Heat Ratio
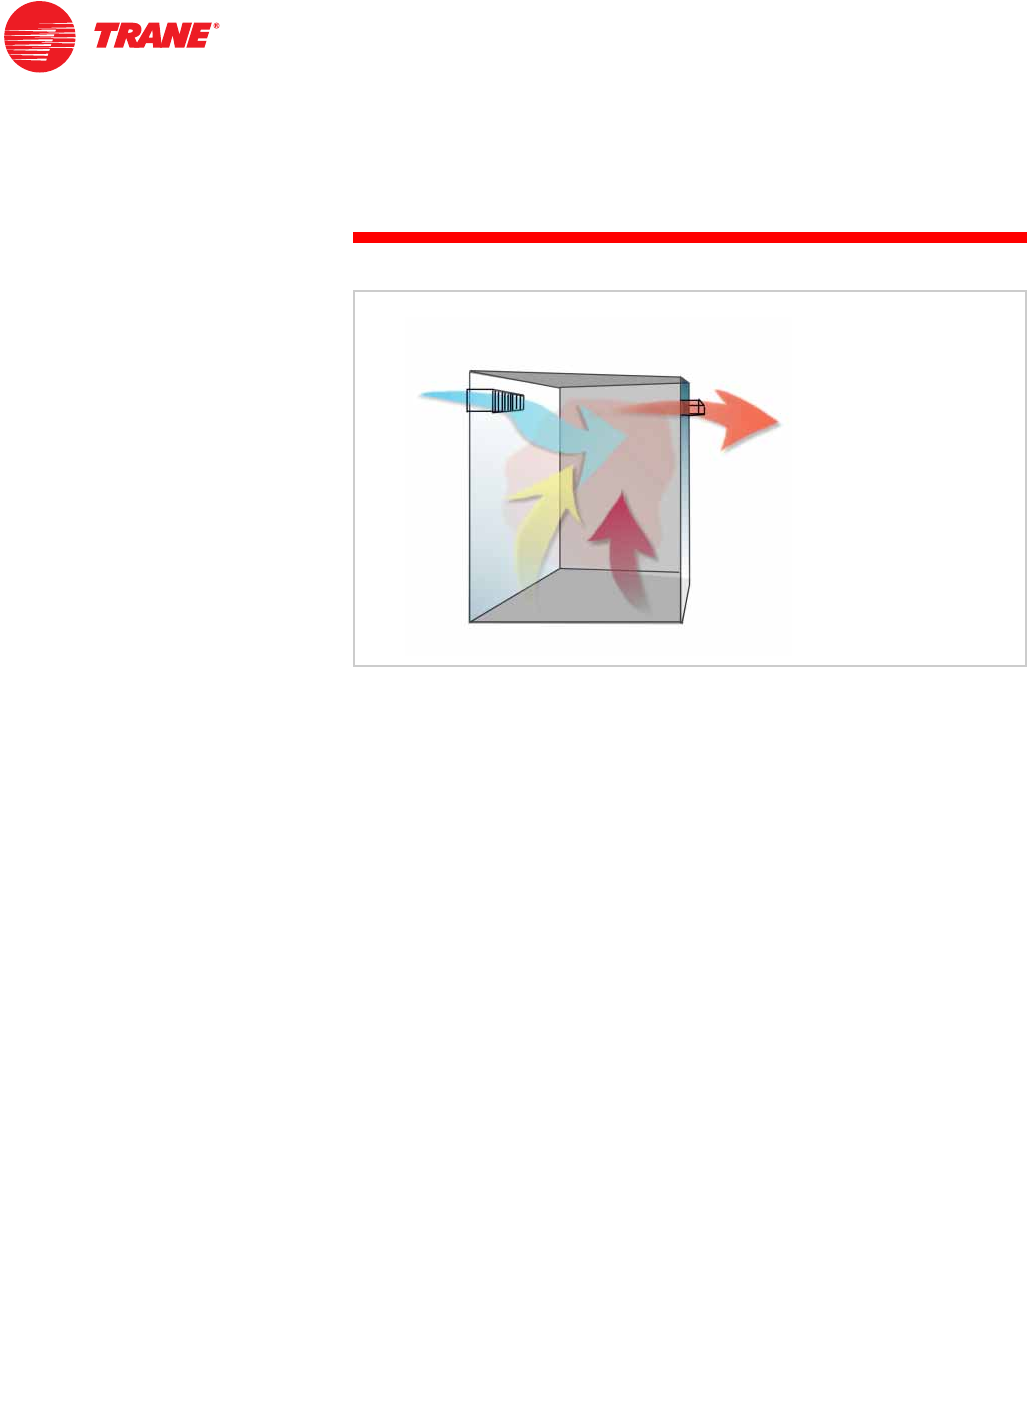
Imagine conditioned supply air as a sponge. As it enters a room, it absorbs heat
and moisture. The amount of heat and moisture absorbed depends on the
temperature and humidity of the supply air. This “sponge,” the supply air, must
be cool enough to pick up the room's excess sensible heat gain and dry enough
to pick up the room's excess latent heat (i.e., moisture.)
Therefore, the excess sensible and latent heat in the room determine the
required dry-bulb and wet-bulb temperatures of that supply air.
VXSSO\DLU
VXSSO\DLU
VHQVLEOH
KHDW
VHQVLEOH
KHDW
ODWHQW
KHDW
ODWHQW
KHDW
UHWXUQDLU
UHWXUQDLU
+HDWDQG0RLVWXUH7UDQVIHU
Figure 41
TRG-TRC001-EN 25
period three
Sensible Heat Ratio
notes
When the required amount of sensible and latent heat are not properly
removed from the room, the desired room conditions cannot be maintained.
For example, if too much sensible heat and not enough latent heat are
removed, the room feels cold and damp. On the psychrometric chart, room
conditions move up and to the left.
On the other hand, if too much latent heat but not enough sensible heat is
removed, the room feels warm and dry. On the psychrometric chart, room
conditions move down and to the right.
Therefore, the conditions of the supply air must be controlled accurately to
ensure that both sensible and latent heat are removed in the proper
proportions. There are several combinations of dry-bulb and wet-bulb
temperatures that will produce the desired room conditions. Each of these
combinations requires a different quantity of air.
5HPRYLQJ6HQVLEOHDQG/DWHQW+HDW
FRROHUGDPSHU
FRROHUGDPSHU
ZDUPHUGULHU
ZDUPHUGULHU
Figure 42
26 TRG-TRC001-EN
notes
period three
Sensible Heat Ratio
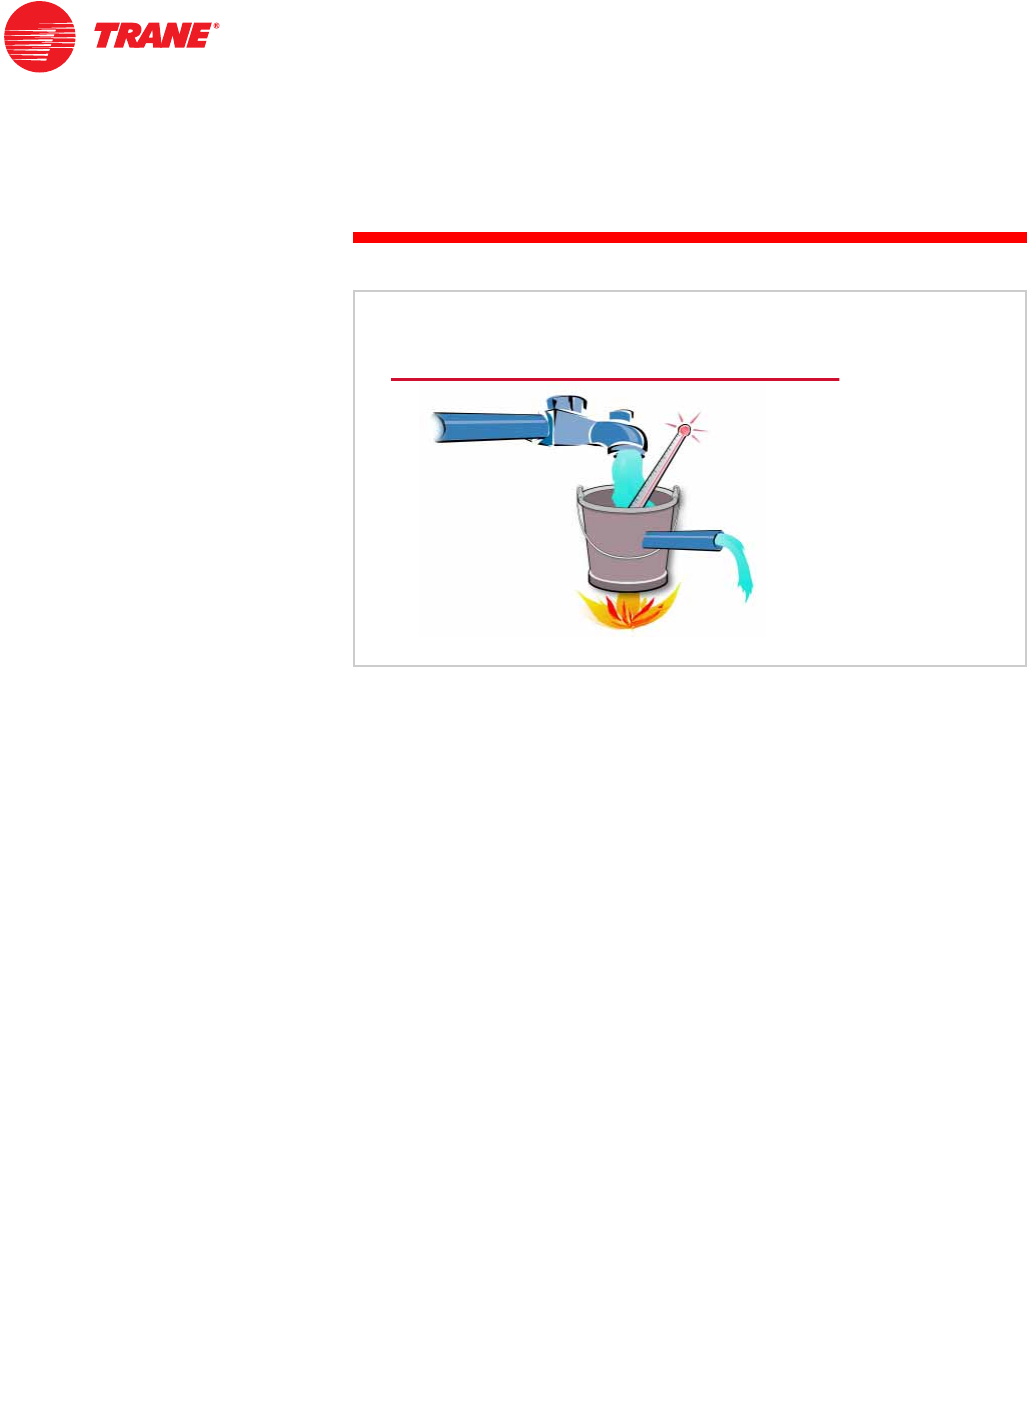
This relationship between the conditions and quantity of the supply air can be
described using the analogy of maintaining a constant temperature within a
container of water.
In this illustration, the container of water is capable of absorbing heat. The
amount of heat it absorbs is called heat gain. To maintain the water
temperature at a constant 75°F, any heat gain must be offset by mixing cool
water with the water already in the container.
The rate at which this cool water is added to the container is determined by its
temperature. For a given water temperature there is a certain flow rate—
measured in gallons per minute (gpm)—that will offset the heat gain and
maintain the desired temperature in the container. If the water is warm, a higher
flow rate is required than if the water is very cold.
+HDW*DLQ
Figure 43
TRG-TRC001-EN 27
period three
Sensible Heat Ratio
notes
The sensible heat ratio, abbreviated as SHR, refers to the comparison of
sensible heat gain to total heat gain (sensible heat plus latent heat). Once this
ratio is known, an SHR line can be drawn on the psychrometric chart.
A scale around the right and top edges of the chart gives the SHR values. Also,
there is an index point in the middle of the chart at the 78°F DB and 65°F WB
condition.
Using a straight edge, a sensible heat ratio line can be drawn by aligning the
appropriate SHR value on the scale with the index point.
6+5 6HQVLEOH+HDW*DLQ
6HQVLEOH+HDW*DLQ/DWHQW+HDW*DLQ
6HQVLEOH+HDW5DWLR6+5
Figure 44
Sensible Heat Ratio (SHR) Sensible Heat Gain
Sensible Heat Gain Latent Heat Gain+
=
)'%
):%
)'%
):%
LQGH[SRLQW
LQGH[SRLQW
6HQVLEOH+HDW5DWLR6FDOH
Figure 45
28 TRG-TRC001-EN
notes
period three
Sensible Heat Ratio
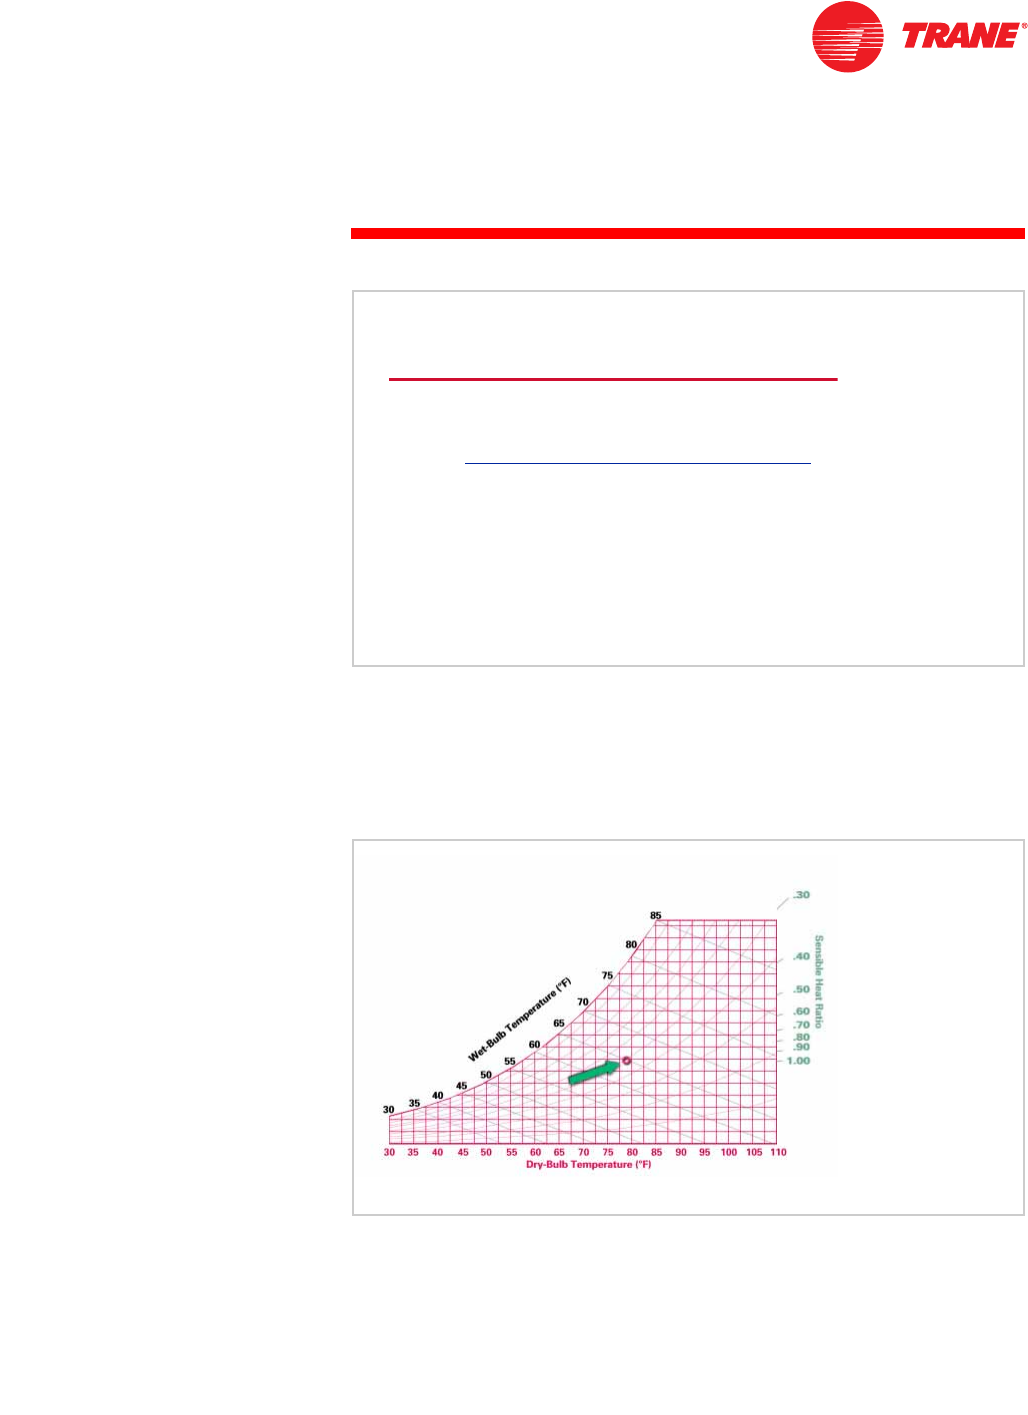
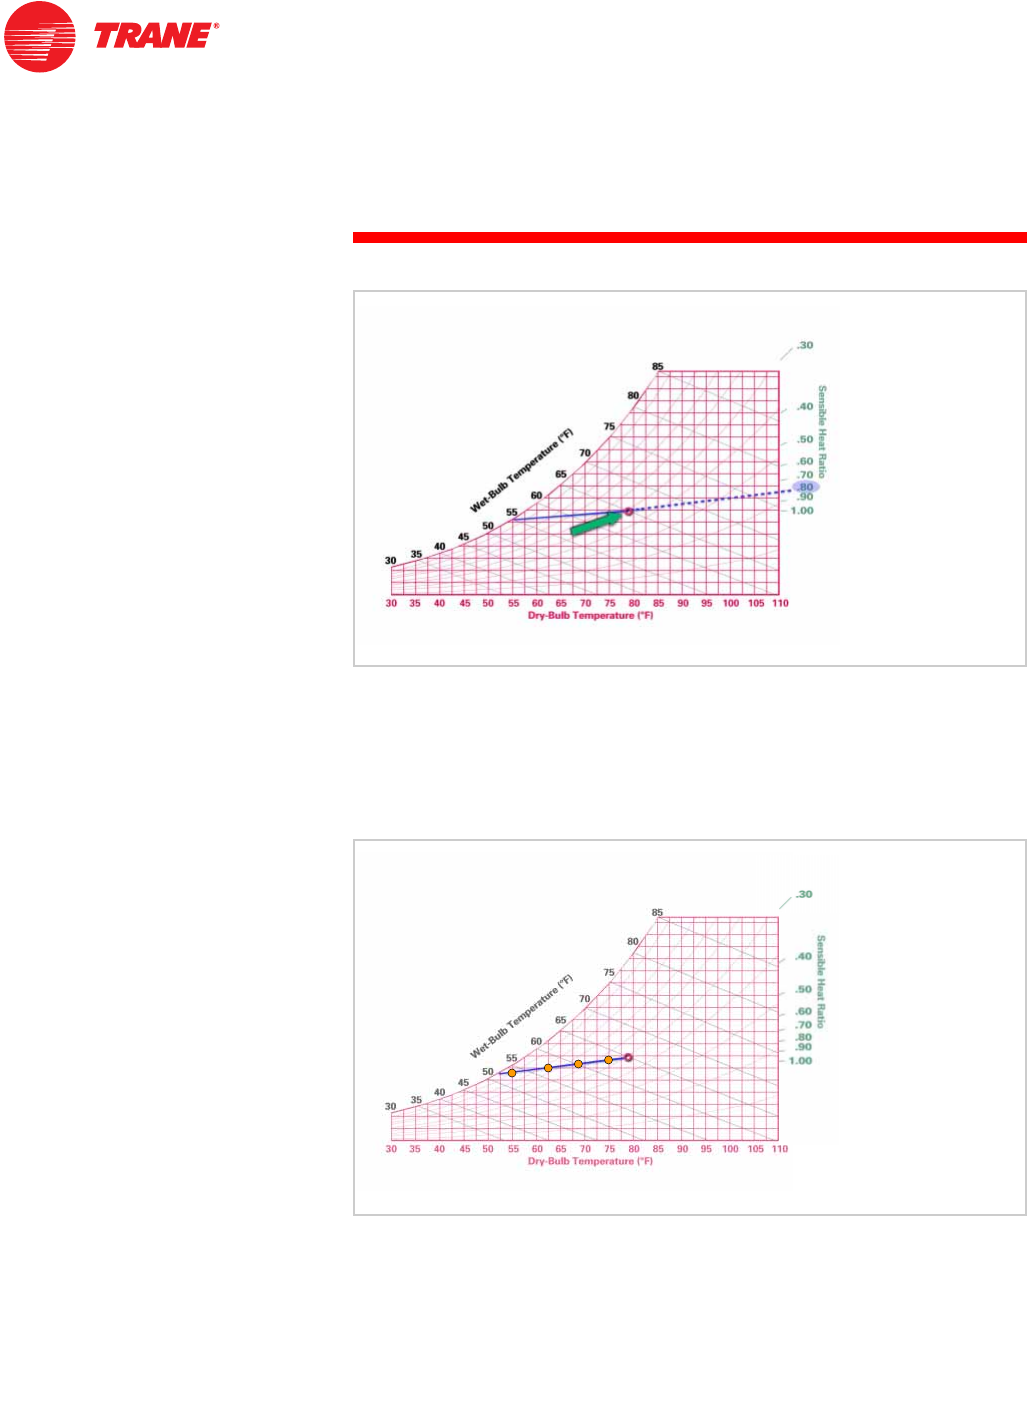
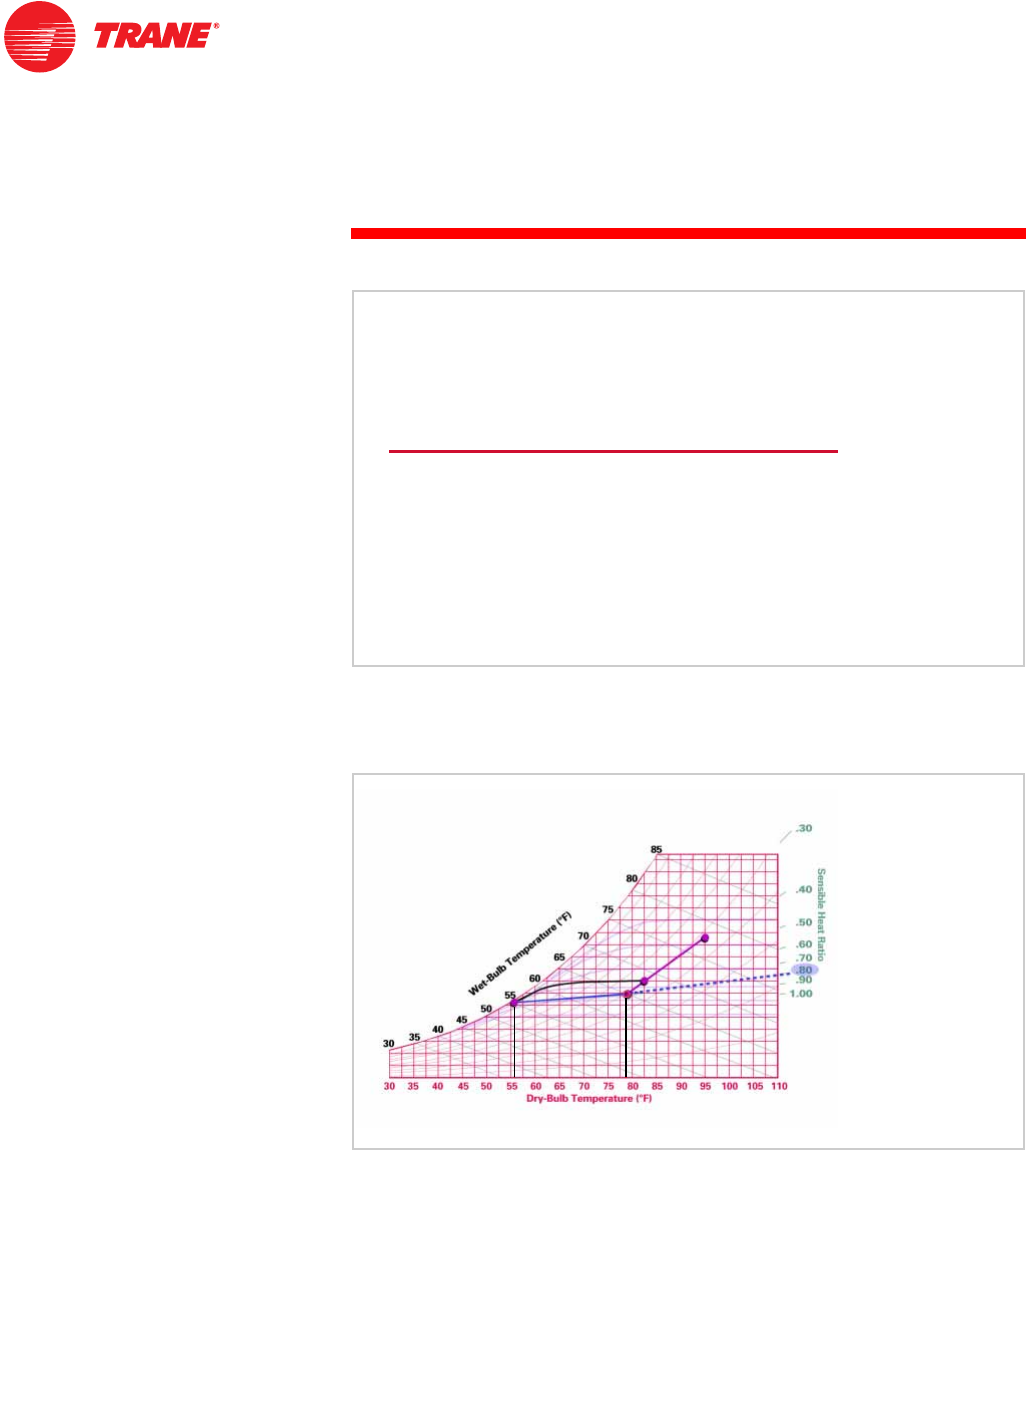
Assume that room design conditions (A) are 78°F DB and 65°F WB, and that the
sensible heat ratio is calculated as 0.80. That is, sensible heat gain represents
80% of the total (sensible plus latent) heat gain.
The SHR line is found by aligning the index point with the 0.80 marking on the
sensible-heat-ratio scale and drawing a line from the index point to the
saturation curve.
Supply air with any combination of dry-bulb and wet-bulb temperatures that
falls on this line will be able to absorb the room's sensible and latent heat in the
correct proportions needed to maintain the desired room conditions
(A = 78°F DB, 65°F WB).
Each of these combinations, however, requires a different quantity of air to do
the task. Recall the analogy with the container of water. If the supply air is
warm, a higher quantity of air is required than if the supply air is cold.
6+5OLQH
6+5OLQH
'UDZLQJDQ6+5/LQH
$
$
LQGH[SRLQW
LQGH[SRLQW
Figure 46
VHQVLEOHKHDWUDWLROLQH
VHQVLEOHKHDWUDWLROLQH
$
$
6+5'LFWDWHV6XSSO\$LU&RQGLWLRQ
Figure 47

TRG-TRC001-EN 29
period three
Sensible Heat Ratio
notes
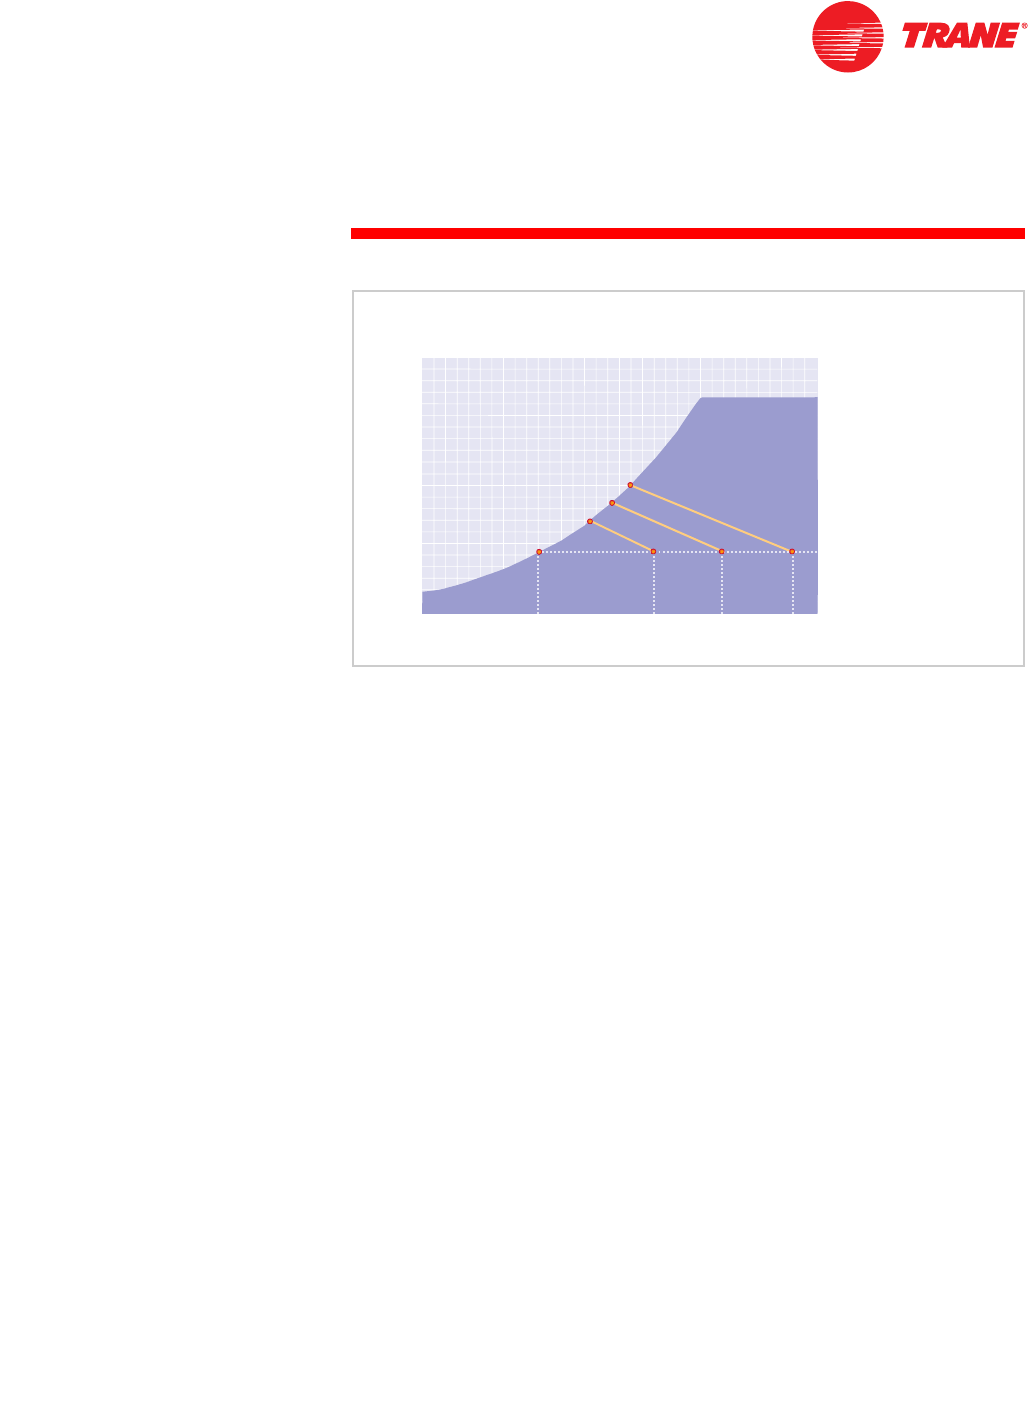
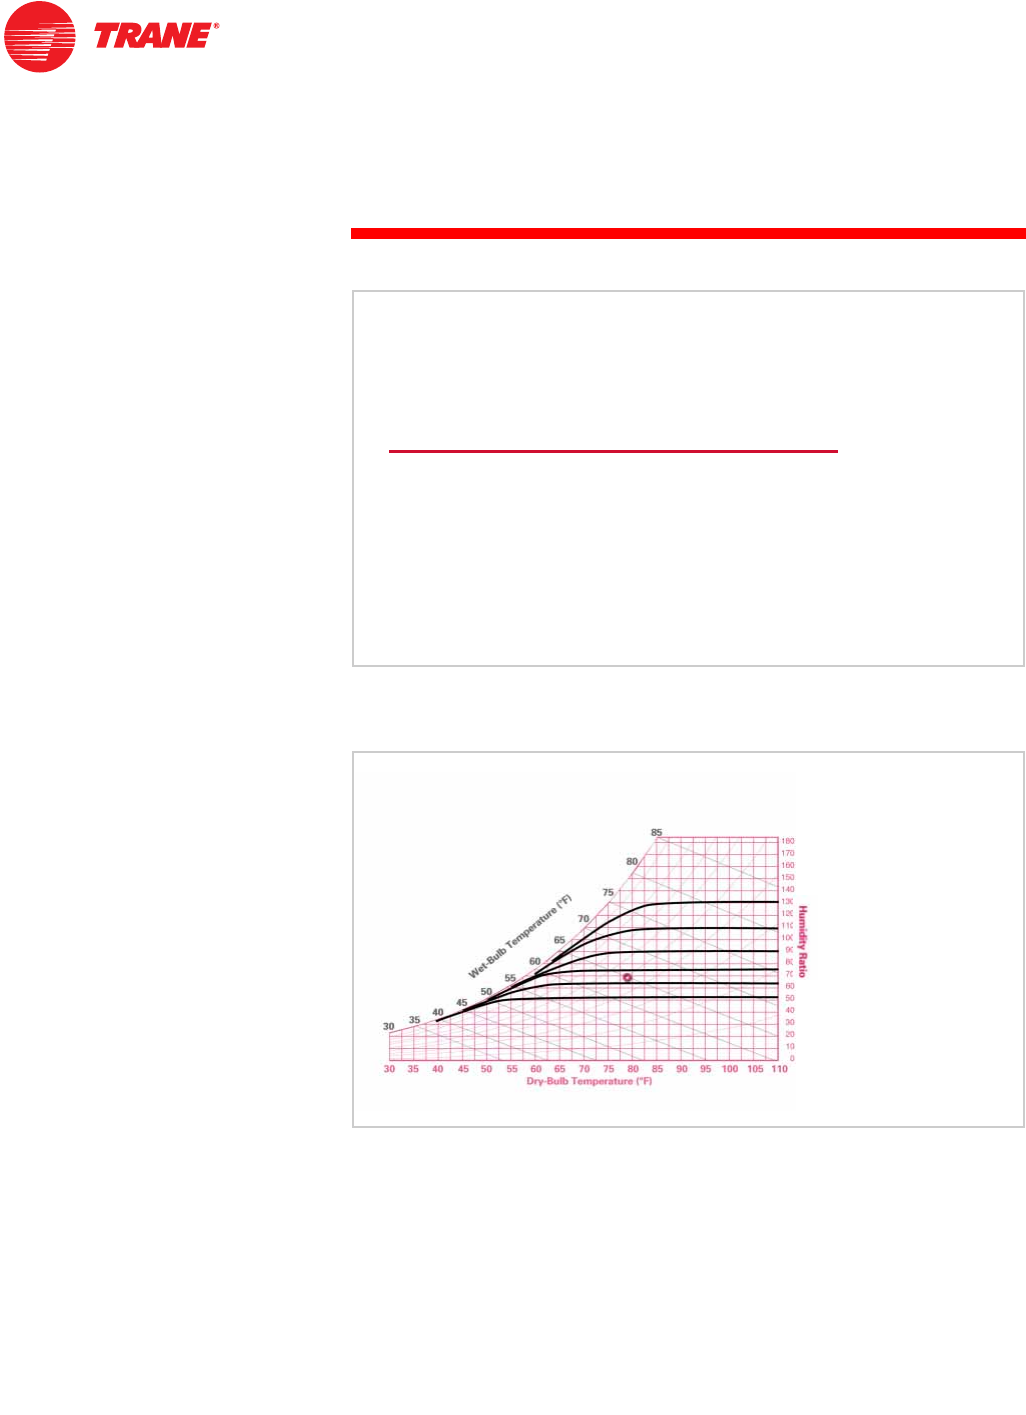
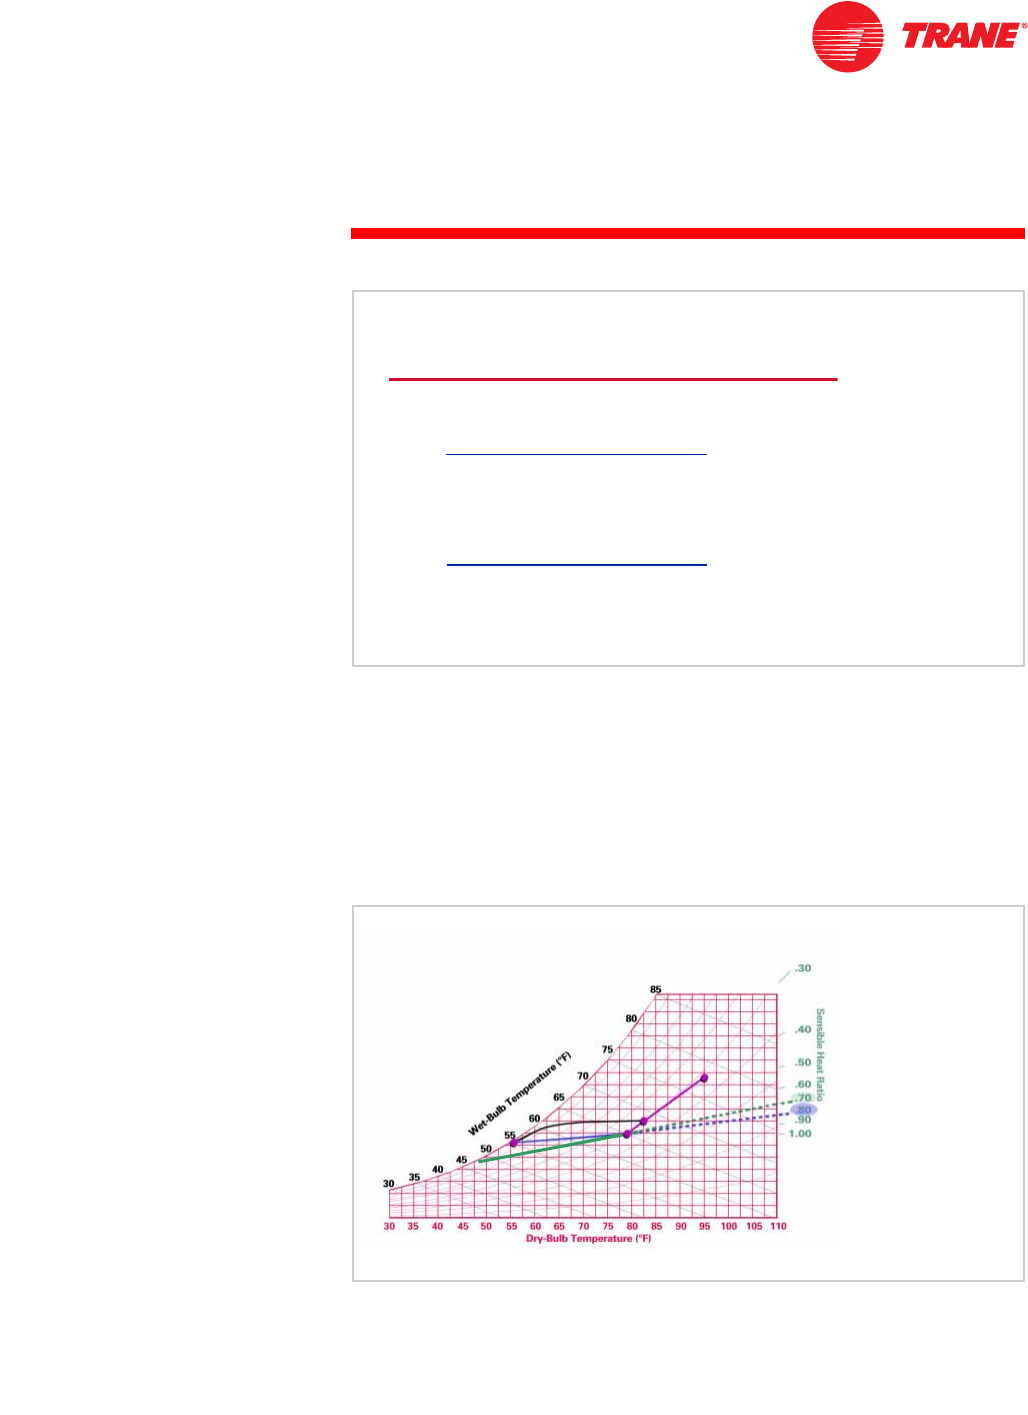
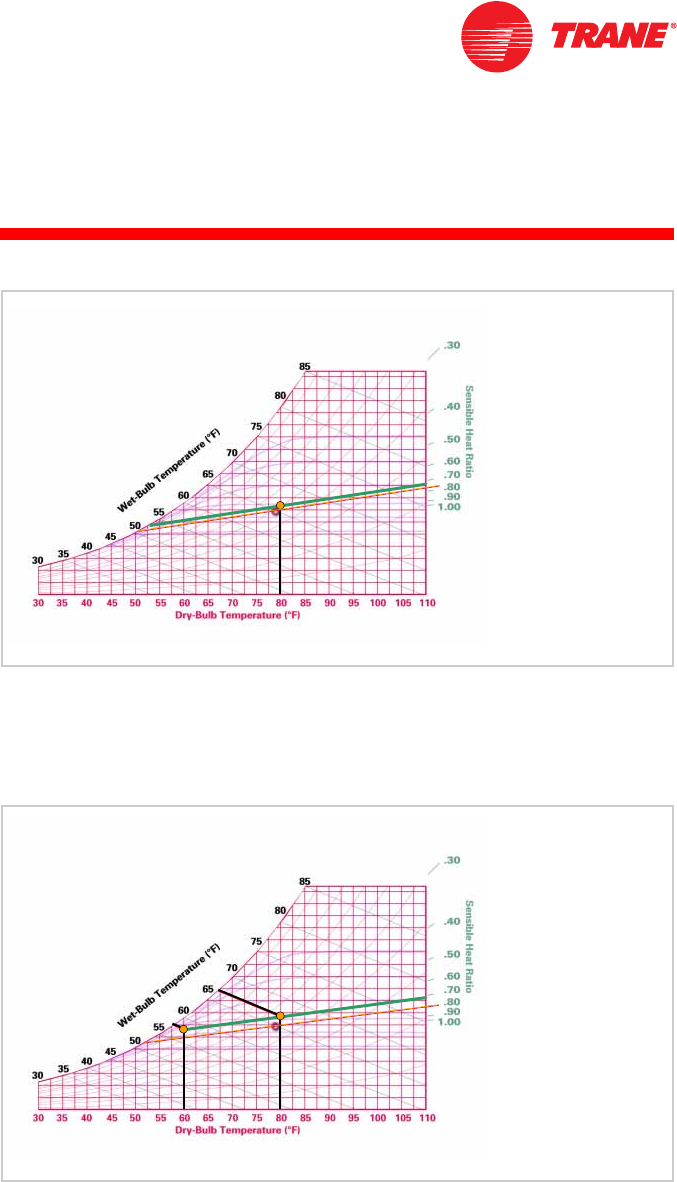
Sensible-heat-ratio lines for other conditions are drawn in the following
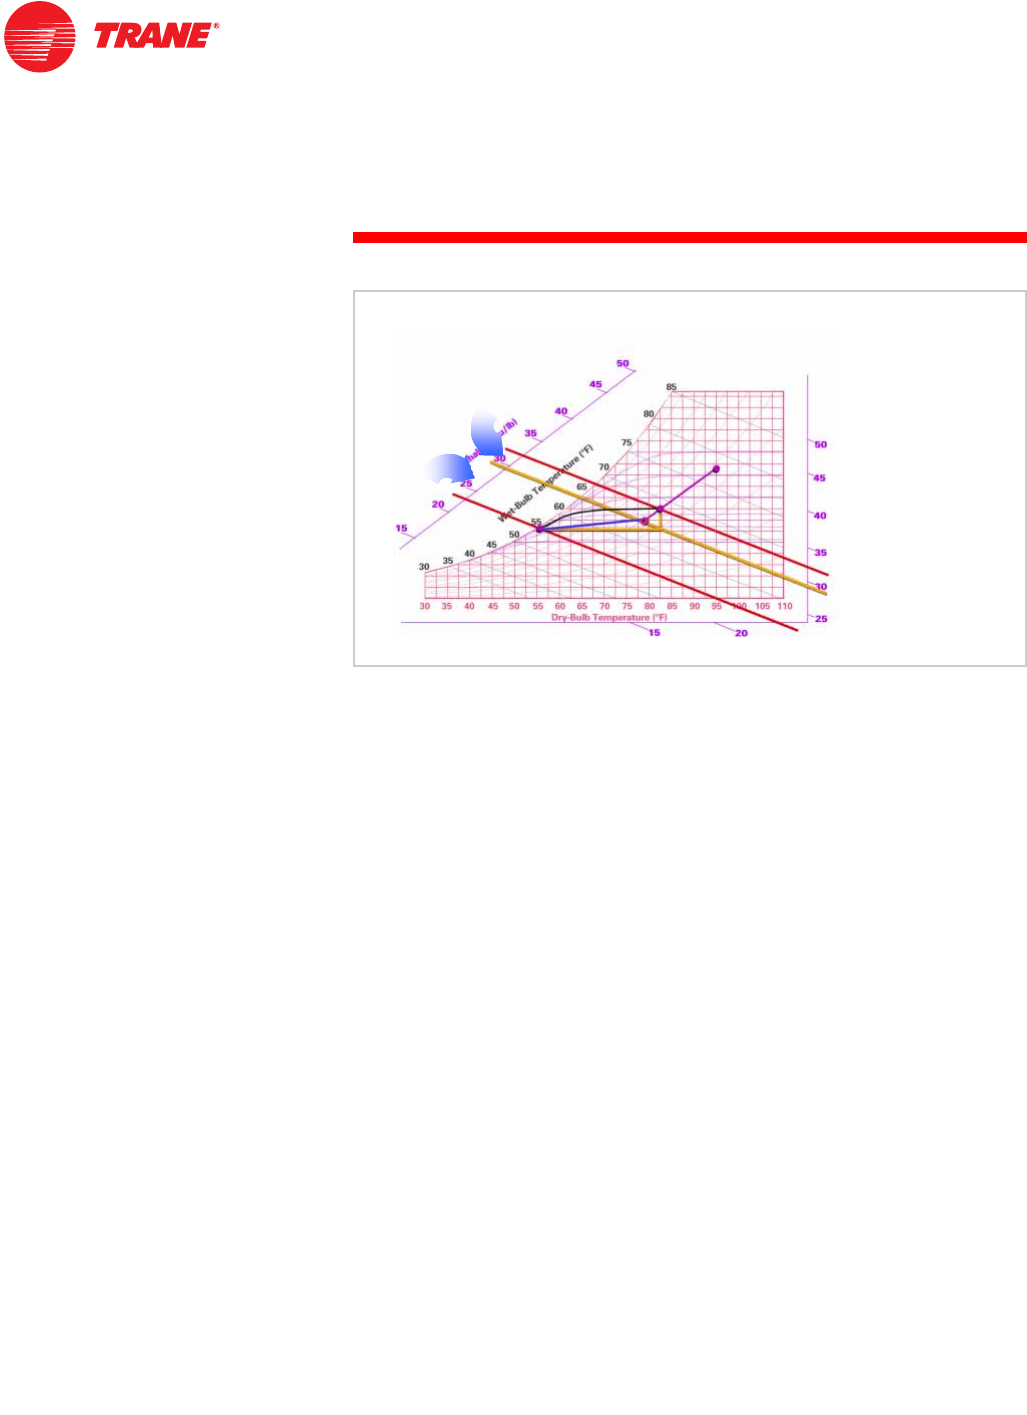
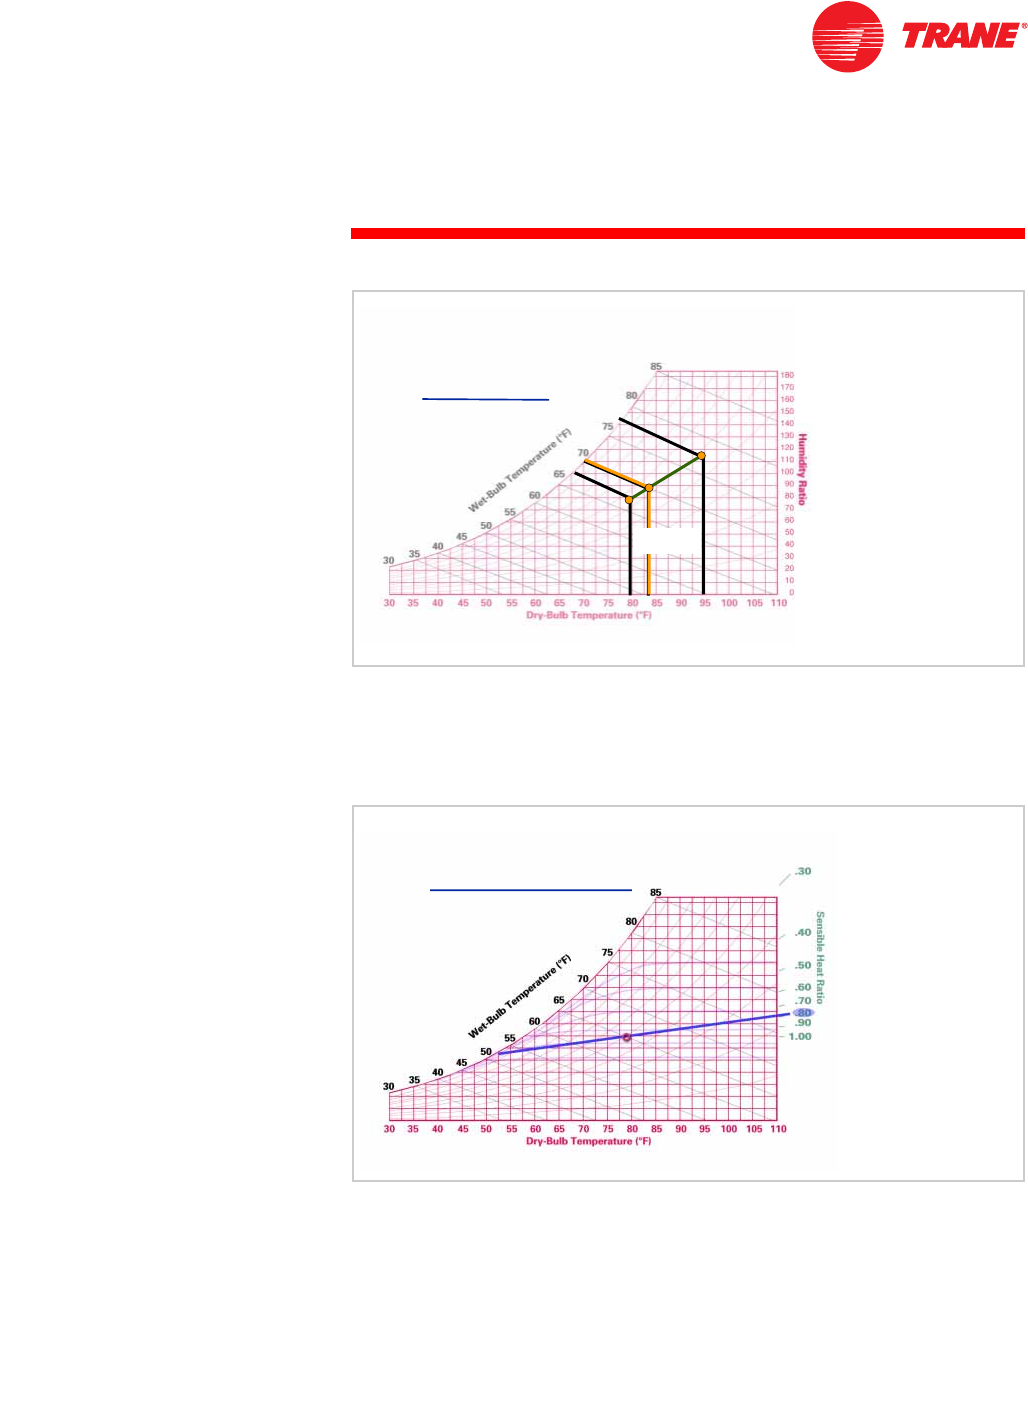
manner. Assume that room design conditions are 80°F DB and 60% RH, and
that the SHR is calculated as 0.60.
First, line up the index point with the 0.60 marking on the sensible-heat-ratio
scale and draw a line. Next, draw a second line, parallel to the first, through the
point (B) that represents the design room conditions. This is the 0.60 SHR line
for a room at 80°F DB and 60% RH.
Supply air at C (60°F DB and 58°F WB) will maintain the desired room
conditions, as will supply air at D (70°F DB and 64°F WB). To do so, each of
these combinations will require a different quantity of air.
&
&
'
'
%
%
)
)
6+5OLQH
6+5OLQH
'UDZLQJDQ6+5/LQH
LQGH[SRLQW
LQGH[SRLQW
Figure 48
30 TRG-TRC001-EN
notes
period four
Air Quantity
Next, we will determine the flow rate of supply air necessary to maintain a
given set of design room conditions.
Before proceeding, one more set of curves on the psychrometric chart must be
identified. These curved lines represent the changes in dry-bulb and wet-bulb
temperatures as air passes through a “typical” cooling coil. These are
commonly referred to as coil curves; they depict approximate coil
performance. Exact coil performance depends on the actual coil geometry and
can be precisely determined by coil selection software.
These curves were established from hundreds of laboratory tests of various coil
geometries at different air and coolant temperatures. They let you determine
leaving-coil conditions and postpone coil selection until the final design. The
use of these coil curves will be discussed later.
3V\FKURPHWU\
SHULRGIRXU
$LU4XDQWLW\
Figure 49
FRLOFXUYHV
FRLOFXUYHV
&RLO&XUYHV
Figure 50

TRG-TRC001-EN 31
period four
Air Quantity
notes
To demonstrate how the required supply airflow is determined, assume that a
room’s sensible heat gain is 80,000 Btu/hr and its latent heat gain is 20,000 Btu/
hr. First, divide the sensible heat gain by the total heat gain. The resulting
sensible heat ratio (SHR) is 0.80.
The second step is to determine the entering air conditions. Design room air is
78°F DB, 50% RH; design outdoor air is 95°F DB, 78°F WB
Twenty-five percent (25%) outdoor air is required for ventilation purposes.
%WXKUVHQVLEOHKHDWJDLQ
%WXKUODWHQWKHDWJDLQ
67(3&DOFXODWHWKHVHQVLEOHKHDWUDWLR6+5
'HWHUPLQLQJ6XSSO\$LUIORZ
%WXKU
%WXKU
6+5
Figure 51
URRP¥)'%5+
RXWGRRUDLU2$¥)'%):%
YHQWLODWLRQ¥2$
'HWHUPLQLQJ6XSSO\$LUIORZ
Figure 52
32 TRG-TRC001-EN
notes
period four
Air Quantity
Plot the outdoor air B (95°F DB, 78°F WB) and indoor air A (78°F DB, 65°F WB)
conditions on the psychrometric chart. Then calculate the mixed-air conditions
using the method learned in Period 2.
Locate the mixed air conditions C on the psychrometric chart (82.25°F DB,
68.6°F WB).
Next, establish the SHR line by aligning the 0.80 mark on the scale with the
index point and drawing a line through both points to the saturation curve. In
this case, the room design conditions and the index point are the same
(A = 78°F DB, 65°F WB).
)Õ )
)Õ )
PL[WXUH )
'HWHUPLQLQJ6XSSO\$LUIORZ
67(33ORWURRPRXWGRRUDQGHQWHULQJFRQGLWLRQV
6+5
6+5
$
$
&
&
%
%
Figure 53
95°F0.25×23.75°F=
78°F0.75×58.50°F=
Mixed-Air Temperature 23.75°F58.50°F+82.25°F==
TRG-TRC001-EN 33
period four
Air Quantity
notes
The third step is to determine the required supply air conditions. This is where
the coil curves are used. Using the curvature of the nearest coil line as a guide,
draw a curve from the mixed-air condition C until it intersects the SHR line.
Point D, at which this curve crosses the SHR line, represents the supply air
condition that will absorb the room’s sensible and latent heat in the correct
proportions needed to maintain the desired room conditions. Here, this supply
air condition is found to be 56.5°F DB and 55.2°F WB.
)
) )
)
67(3,GHQWLI\VXSSO\DLUFRQGLWLRQV
6+5
6+5
$
$
&
&
%
%
'
'
'HWHUPLQLQJ6XSSO\$LUIORZ
Figure 54
34 TRG-TRC001-EN
notes
period four
Air Quantity
With the supply air conditions known, the next step is to calculate the specific
quantity of air (cfm or cubic feet per minute) needed to satisfy the room heat
gains. The required supply airflow is determined using the following formula,
where the sensible heat gain is expressed in Btu/hr and the two temperatures
are in °F.
Realize that 1.085 is not a constant! It is the product of density, the specific heat
of air and the conversion factor of 60 minutes per hour. These properties of air
at “standard” conditions (69.5°F DB dry air at sea level) result in the value
1.085. Air at other conditions and elevations will cause this factor to change.
6HQVLEOH+HDW*DLQ
Õ5RRP'%¤6XSSO\'%
6XSSO\
$LUIORZ
67(36ROYHWKHVXSSO\DLUIORZHTXDWLRQ
'HWHUPLQLQJ6XSSO\$LUIORZ
Figure 55
Supply Airflow (cfm) Sensible Heat Gain
1.085 Room DB Supply DB–()×
=
Density 0.075 lb/ft3
=
Specific Heat 0.24 Btu/lb°F=
0.075 0.24×60 min/hr×1.085=
TRG-TRC001-EN 35
period four
Air Quantity
notes
For this example, the supply airflow is calculated as follows:
The cooling coil must cool and dehumidify 3,430 cfm of air from the entering
condition C to the supply air condition D to maintain the desired room
conditions.
%WXKU
Õ)¤)
FIP
67(36ROYHWKHVXSSO\DLUIORZHTXDWLRQ
'HWHUPLQLQJ6XSSO\$LUIORZ
Figure 56
Supply Airflow (cfm) 80,000 Btu/hr
1.085 75°F 56.5°F–()×
3,430 cfm==
'
$
&%
FIP
)'%
):%
5$
2$
)'%
):%
PL[WXUH
'HWHUPLQLQJ6XSSO\$LUIORZ
6$
)
)
'
'$
$
&
&
%
%
Figure 57
36 TRG-TRC001-EN
notes
period four
Air Quantity
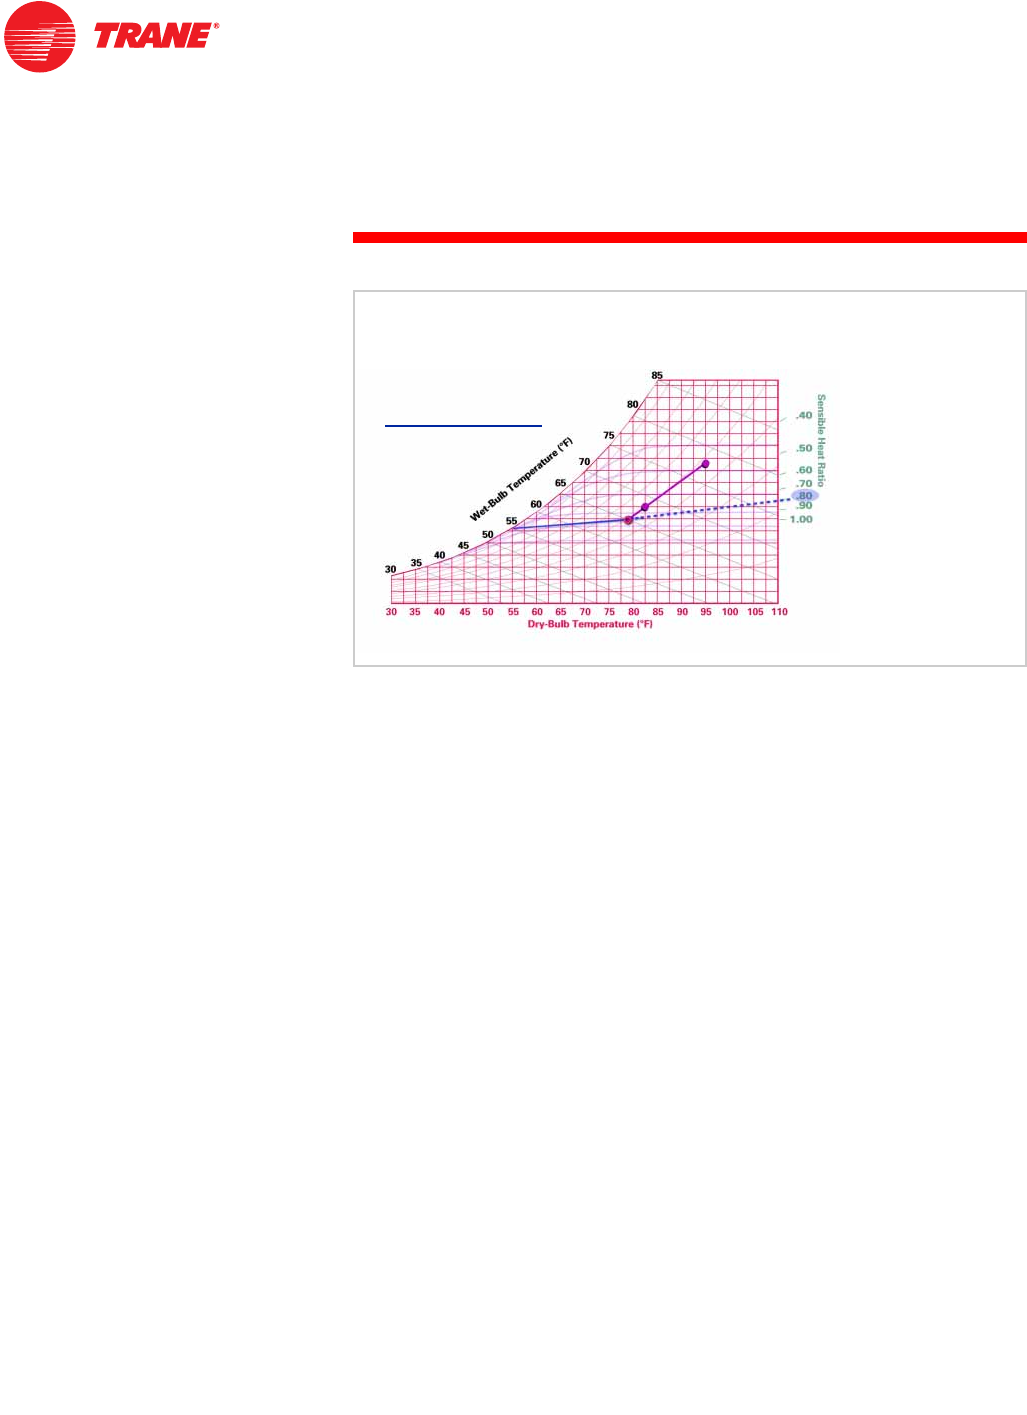
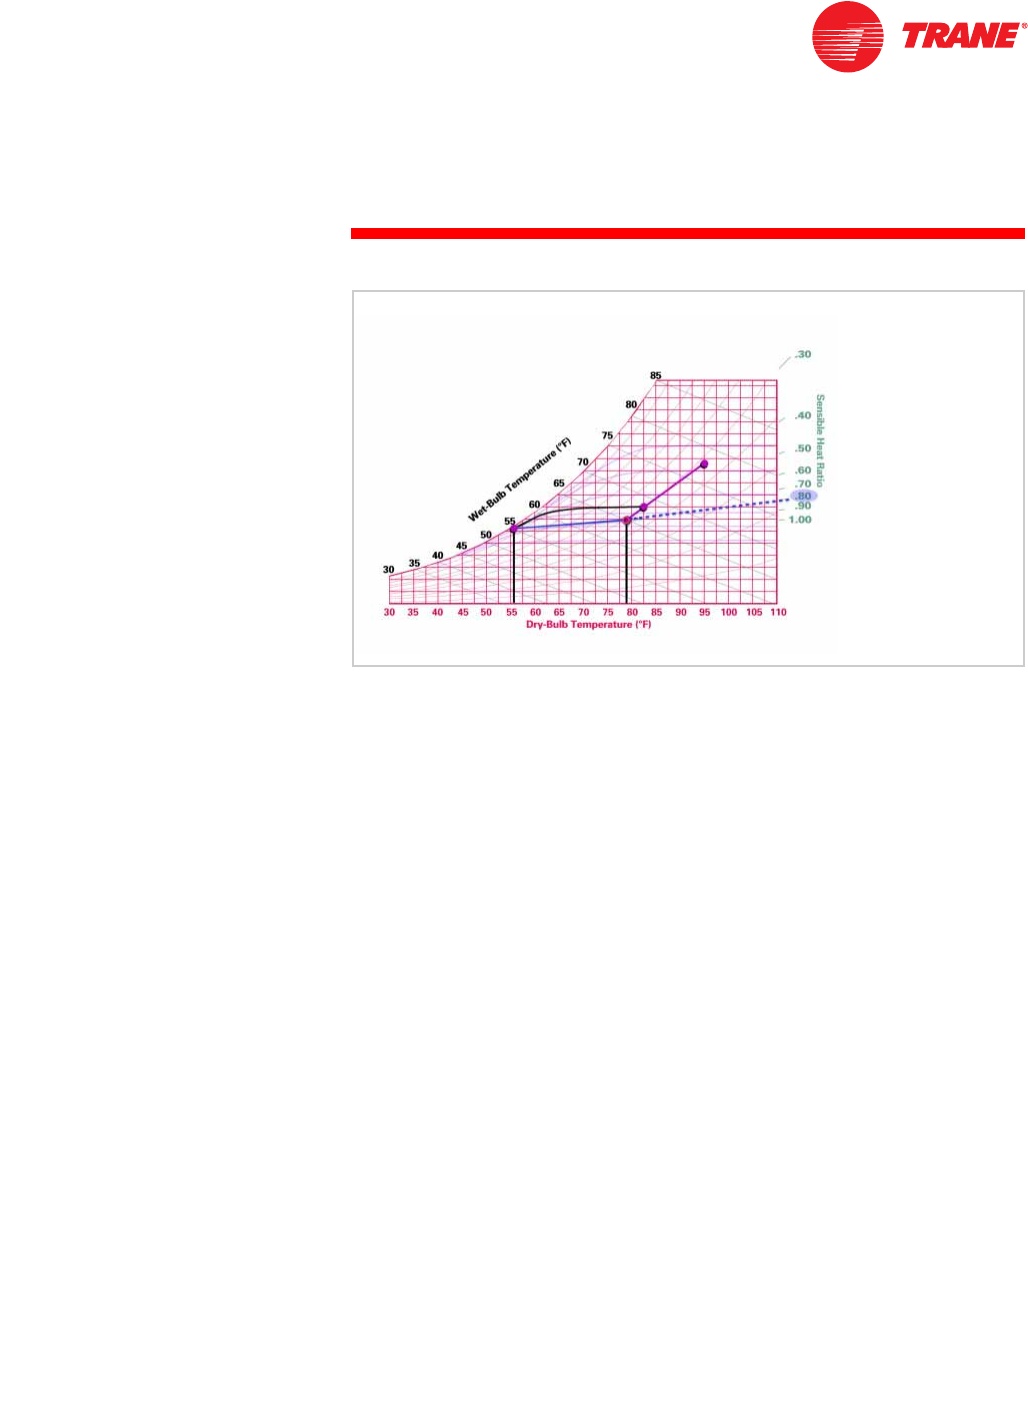
Some designers prefer to set the supply air temperature at 55°F or use a 20°F
temperature differential (Room DB – Supply DB) without regard for the actual
sensible heat ratio of the room.
Using our same example, let’s examine how this has the potential for creating a
problem. Assume that the building design changes to use a much-higher-
quality glass that will reduce the sensible portion of the design load from
80,000 Btu/hr to 47,000 Btu/hr. This reduces the SHR to 0.70.
Plotting this new SHR line on the psychrometric chart, we find that the SHR line
crosses the coil curve at approximately 49°F DB (D).
If the system is arbitrarily designed with a 55°F supply air temperature D’, the
resulting room conditions will fall on the 0.70 SHR line drawn through D’. The
resulting room conditions A’ will be 78°F DB, 57% RH. This arbitrary design
practice results in a higher room relative humidity than desired.
%WXKUVHQVLEOHKHDWJDLQ
%WXKUODWHQWKHDWJDLQ
%WXKU
%WXKU
6+5
$UELWUDULO\8VLQJ)6XSSO\$LU
Figure 58
$
$
&
&
%
%
'
'
)
)
',
',
$,
$,
$UELWUDULO\8VLQJ)6XSSO\$LU
)
)
6+5
6+5
Figure 59

TRG-TRC001-EN 37
notes
period five
Tons of Refrigeration
The psychrometric chart can also be used to determine the total load on the
refrigeration equipment, expressed in Btu per hour or tons of refrigeration.
One ton equals 12,000 Btu/hr.
Another property of air, enthalpy, must now be defined. Enthalpy describes the
total amount of heat energy, both sensible and latent, in one pound of air at its
present condition. It is expressed in Btu per pound of dry air (Btu/lb). When
displayed in formulas, enthalpy is usually designated as
h
.
3V\FKURPHWU\
SHULRGILYH
7RQVRI5HIULJHUDWLRQ
Figure 60
:KDWLV(QWKDOS\"
(QWKDOS\K 6HQVLEOH+HDW/DWHQW+HDW
7KHWRWDOKHDWHQHUJ\LQRQHSRXQGRIDLU
%WXOEDWLWVSUHVHQWFRQGLWLRQ
Figure 61

38 TRG-TRC001-EN
notes
period five
Tons of Refrigeration
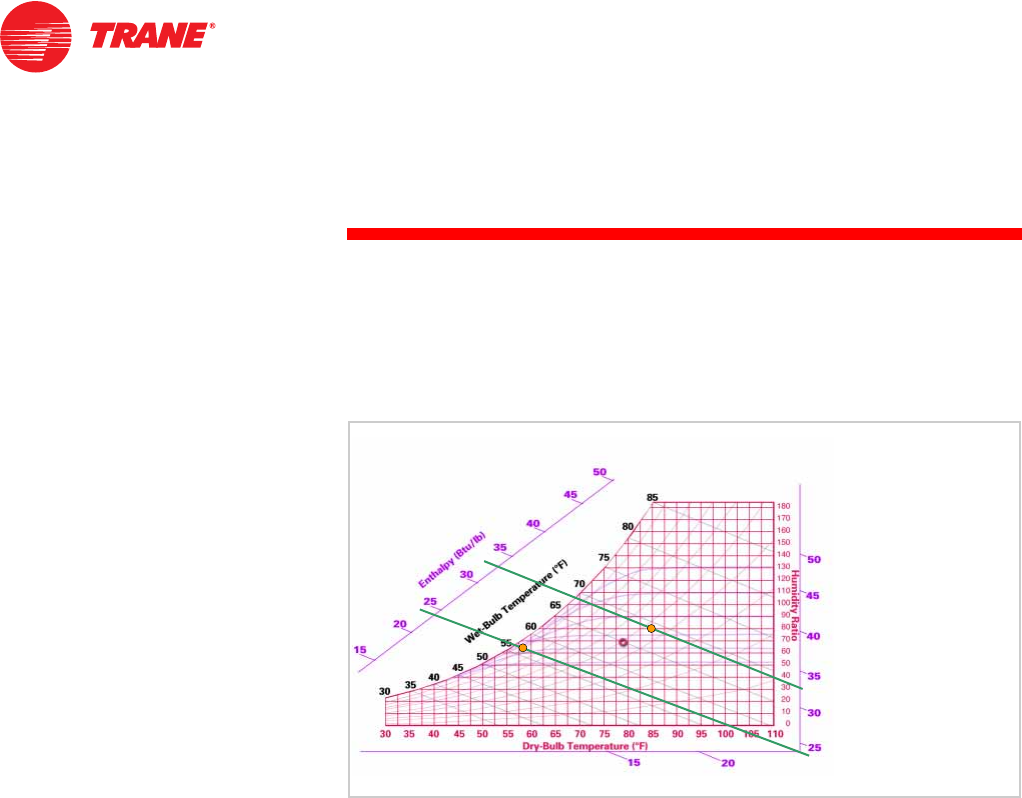
Using the previous example for calculating supply airflow, the first step is to
determine the enthalpies of the air entering and leaving the cooling coil. This is
accomplished by lining up three points on the chart, including the entering-air
condition and identical points on the two enthalpy scales—one each on the left
and right edges of the psychrometric chart.
Using this method, the enthalpy of the mixed air entering the coil C is found to
be 32.7 Btu/lb. Similarly, the enthalpy of the supply air leaving the coil D is
found to be 23.5 Btu/lb.
The total refrigeration load, in terms of Btu per hour, is then calculated using
the following formula, where the supply airflow is expressed in cfm,
h
1 is the
entering-air enthalpy in Btu/lb, and
h
2 is the leaving-air enthalpy in Btu/lb.
'HWHUPLQLQJ7RQVRI5HIULJHUDWLRQ
67(3
)LQGHQWKDOSLHV
HQWHULQJDQG
OHDYLQJFRLO
$
$
%
%
&
&
'
'
Figure 62
'HWHUPLQLQJ7RQVRI5HIULJHUDWLRQ
67(36ROYHWKHWRWDOUHIULJHUDWLRQORDGHTXDWLRQ
Õ6XSSO\$LUIORZÕK¤K
5HIULJHUDWLRQ
/RDG%WXKU
K HQWKDOS\RIDLUHQWHULQJFRLO%WXOE
K HQWKDOS\RIDLUOHDYLQJFRLO%WXOE
Figure 63
Refrigeration Load (Btu/hr) 4.5 Supply Airflow×
h
1
h
2
–()×=
TRG-TRC001-EN 39
period five
Tons of Refrigeration
notes Realize that 4.5 is not a constant! It is the product of density of air and the
conversion factor of 60 minutes per hour. The density of air at “standard”
conditions (69.5°F DB dry air at sea level) results in the value 4.5. Air at other
conditions and elevations will cause this factor to change.
Using the supply airflow calculated during Period 4 and the enthalpy values
read from the psychrometric chart:
Converting to the more common units of tons:
Density 0.075 lb/ft3
=
0.075 60 min/hr×4.5=
WRQVRIUHIULJHUDWLRQ
'HWHUPLQLQJ7RQVRI5HIULJHUDWLRQ
67(36ROYHWKHWRWDOUHIULJHUDWLRQORDGHTXDWLRQ
ÕFIPÕ¤ %WXKU
%WXKU
%WXKUWRQ
Figure 64
Refrigeration Load (Btu/hr 4.5 3,430 cfm×32.7 23.5–()×142,000 Btu/hr==
142,000 Btu/hr
12,000 Btu/hr/ton
11.8 tons of refrigeration=
40 TRG-TRC001-EN
notes
period five
Tons of Refrigeration
The psychrometric chart can also be used to determine the sensible and latent
components of the coil’s refrigeration load.
First, draw a right triangle though the coil entering and leaving air conditions.
The vertical leg represents the amount of moisture removed by the coil, i.e.,
latent load, and the horizontal leg represents the amount of change in dry-bulb
temperature through the coil, i.e., sensible load.
6HQVLEOHDQG/DWHQW&RLO/RDGV
$
$
%
%
&
&
'
'
VHQVLEOH
ORDG
VHQVLEOH
ORDG
ODWHQW
ORDG
ODWHQW
ORDG
Figure 65

TRG-TRC001-EN 41
period five
Tons of Refrigeration
notes
By determining the enthalpy values for these three points, the same equation
can be used to calculate both the sensible and the latent portions of the coil’s
refrigeration load.
ÕFIPÕ¤ %WXKU
WRQVRIUHIULJHUDWLRQVHQVLEOH
6HQVLEOHDQG/DWHQW&RLO/RDGV
ÕFIPÕ¤ %WXKU
WRQVRIUHIULJHUDWLRQODWHQW
Figure 66
Sensible Refrigeration Load 4.5 3,430 cfm×29.6 23.5–()×94,150 Btu/hr==
94,150 Btu/hr
12,000 Btu/hr/ton
7.8 tons of refrigeration (sensible)=
Latent Refrigeration Load 4.5 3,430 cfm×32.7 29.6–()×47,850 Btu/hr==
47,850 Btu/hr
12,000 Btu/hr/ton
4.0 tons of refrigeration (latent)=
42 TRG-TRC001-EN
notes
period six
Psychrometric Analyses
Now we will look at a few ways that the psychrometric chart can help us
analyze air conditioning systems. For simplicity, we will limit our examples to
systems serving a single zone.
In the previous example, the sensible heat ratio was based on full load or
design load conditions. It must be understood that the sensible portion of
total heat gain is particularly subject to change throughout the day, causing the
ratio of sensible to total heat gain to change.
3V\FKURPHWU\
SHULRGVL[
3V\FKURPHWULF$QDO\VHV
Figure 67
6+5DW)XOO/RDG&RQGLWLRQV
)
) )
)
'
'$
$
%
%
&
&
Figure 68
TRG-TRC001-EN 43
period six
Psychrometric Analyses
notes
For example, assume that at full load the room is subject to an 80,000 Btu/hr
sensible heat gain and a 20,000 Btu/hr latent heat gain. The full-load sensible
heat ratio is 0.80.
At other times during the day, clouds block the sun and reduce the solar heat
gain, and some of the lights are turned off. This reduces the room’s sensible
heat gain from 80,000 Btu/hr to 47,000 Btu/hr. The room’s latent heat gain
originates primarily from people. Assuming that the occupancy of the room
remains constant, the latent heat gain is still 20,000 Btu/hr and the part-load
sensible heat ratio becomes 0.70.
To maintain the design room conditions A for this part-load sensible heat ratio,
a different supply air condition—one that falls on the 0.70 SHR line—and a
different airflow are required. But suppose the system in this example was
designed to deliver a constant quantity of air and vary its supply temperature to
meet the changing loads.
%WXKU
%WXKU%WXKU
)XOO/RDG6+5
%WXKU
%WXKU%WXKU
6+5&KDQJHVZLWK5RRP/RDG
3DUW/RDG6+5
Figure 69
'
'
$
$
%
%
&
&
6+5DW3DUW/RDG&RQGLWLRQV
6+5
6+5
6+5
6+5
Figure 70

44 TRG-TRC001-EN
notes
period six
Psychrometric Analyses
In response to the reduction in room sensible heat gain, the coil capacity is
throttled, raising the supply air temperature from D to D’ to balance the new
room sensible heat gain. This new supply air temperature is dictated by the
equation:
Since the supply airflow and the desired room dry-bulb temperature are
constant, the only variable that responsed to this change in sensible heat gain is
supply air temperature.
This new supply air temperature D’ is delivered in sufficient quantity to absorb
the room’s sensible heat gain, but it does not fall on the part-load SHR line and
is not dry enough to completely absorb the latent heat gain. When the
conditioned air enters the room, it mixes with room air along the 0.70 sensible
heat ratio line from D’ to A’. The resulting room condition A’, where the SHR
line intersects the room dry-bulb temperature line (78°F), shows that the
relative humidity increased to 61%.
'
'
$
$
%
%
&
&
6+5
6+5
6+5
6+5
$,
$,
',
',
%WXKU
ï)²6XSSO\'% FIP
6XSSO\'% )
)
)
6+5DW3DUW/RDG&RQGLWLRQV
Figure 71
Supply Airflow (cfm) Sensible Heat Gain
1.085 Room DB Supply DB–()×
=
47,000 Btu/hr
1.085 78°F Supply DB–()×
3,430 cfm=
Supply DB 65.4°F=
TRG-TRC001-EN 45
period six
Psychrometric Analyses
notes
This is the manner in which a constant-volume, variable-temperature system
with a modulating coil performs. It provides a constant quantity of air to the
room and responds to part-load conditions by varying the supply air
temperature. This is performed by modulating the flow of the cooling fluid
through the coil, typically using a two-way or three-way control valve controlled
by a thermostat that senses the room dry-bulb temperature. Such a system can
provide good dry-bulb temperature control. As the sensible heat ratio changes
from full load, however, it may lose control of the room relative humidity.
One method of improving the constant-volume system’s ability to control room
humidity is to reheat the supply air. In this example, reheat is provided by a
heating coil located downstream of the air handler. This reheat coil is controlled
by a thermostat sensing the room dry-bulb temperature, while the cooling coil
is controlled to provide a constant leaving-air temperature.
FRQVWDQWTXDQWLW\RIYDULDEOHWHPSHUDWXUHDLU
FRQVWDQWTXDQWLW\RIYDULDEOHWHPSHUDWXUHDLU
2$
5$
6$
%
%
'
'&
&
$
$
PRGXODWLQJ
PRGXODWLQJ
FRROLQJFRLO
FRROLQJFRLO
&RQVWDQW9ROXPH6\VWHP
Figure 72
UHKHDW
UHKHDW
FRLO
FRLO
FRROLQJ
FRROLQJ
FRLO
FRLO
URRP
URRP
WKHUPRVWDW
WKHUPRVWDW
DGGLQJUHKHDWLPSURYHV
DGGLQJUHKHDWLPSURYHV
KXPLGLW\FRQWURO
KXPLGLW\FRQWURO
%
%
(
(
'
'&
&
$
$
&RQVWDQW9ROXPHZLWK5HKHDW
Figure 73

46 TRG-TRC001-EN
notes
period six
Psychrometric Analyses
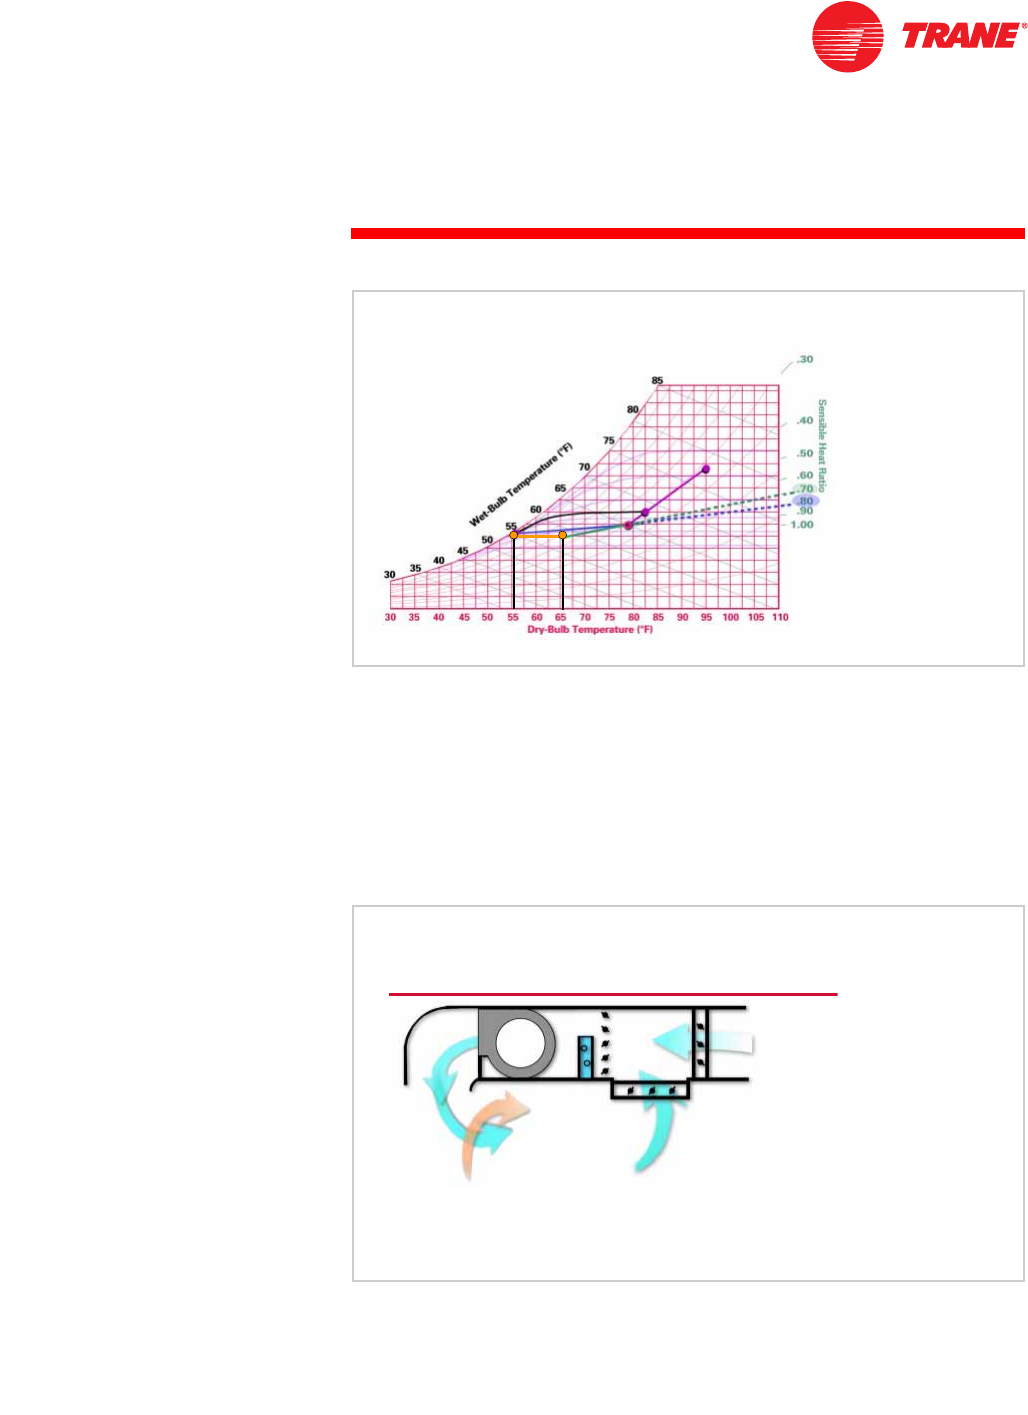
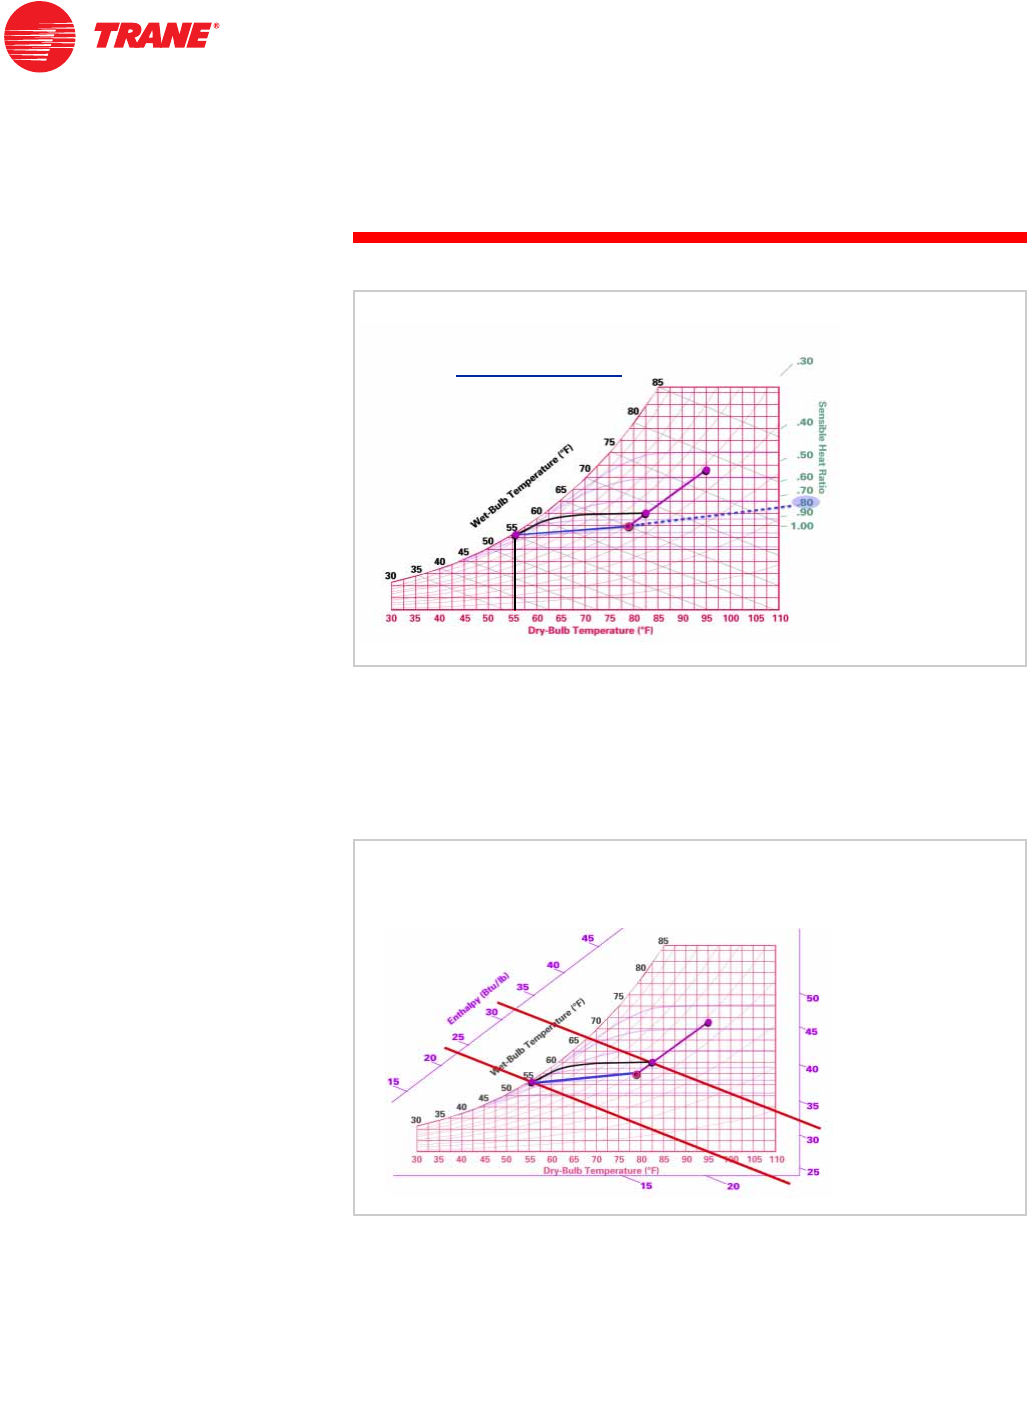
Using the part-load conditions from the previous example, the room’s sensible
heat gain is reduced from 80,000 Btu/hr to 47,000 Btu/hr while the latent heat
gain remains the same.
Sensing the reduction in dry-bulb temperature due to the lower sensible heat
gain, the room thermostat assumes control of the reheat coil. The cooling coil is
controlled to provide a constant supply air temperature
(D = 56.5°F DB), while the reheat coil is controlled to add just enough heat to
the supply air to offset the reduction in room sensible-heat gain.
Since the supply airflow is constant and the desired room dry-bulb temperature
and sensible heat gain are known, we can calculate the required “re-heated”
supply air temperature.
Since the supply air leaving the coil is sensibly heated (i.e., no moisture is
added or removed), it moves horizontally along a constant humidity-ratio line
from D to E. The resulting supply air conditions are 65.4°F DB, 58.9°F WB.
'
'$
$
&
%
%
(
(
6+5
6+5
)
)
)
)
%WXKU
ï)²6XSSO\'% FIP
6XSSO\'% )
(IIHFWRI$GGLQJ5HKHDW
Figure 74
47,000 Btu/hr
1.085 78°F Supply DB–()×
3,430 cfm=
Supply DB 65.4°F=
TRG-TRC001-EN 47
period six
Psychrometric Analyses
notes
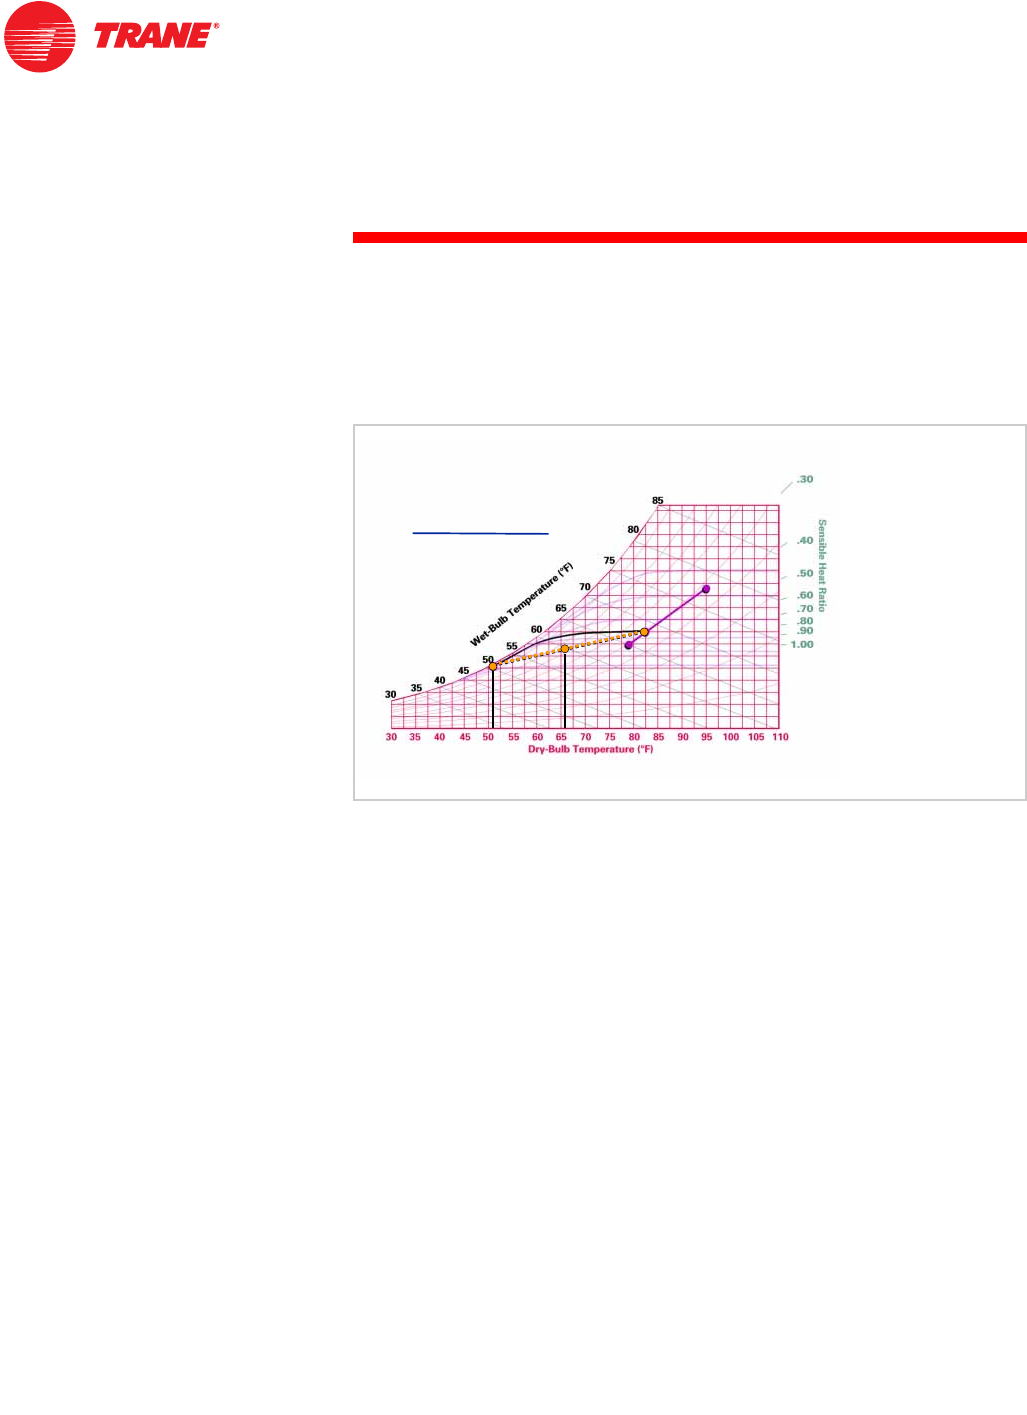
This supply air mixes with room air along the part-load 0.70 SHR line from E to
A, arriving at the desired room conditions A. Now, if the room’s latent heat gain
were also changed, the resulting room conditions would not fall exactly on A,
but on the appropriate SHR line that runs through E.
Adding reheat permits better room humidity control at various part-load
conditions while maintaining room dry-bulb temperature control. Realize,
however, that this system uses more energy than the previous constant-volume
system with a modulating cooling coil: it constantly cools the supply air to
56.5°F, then reheats the air as necessary when the building sensible load drops.
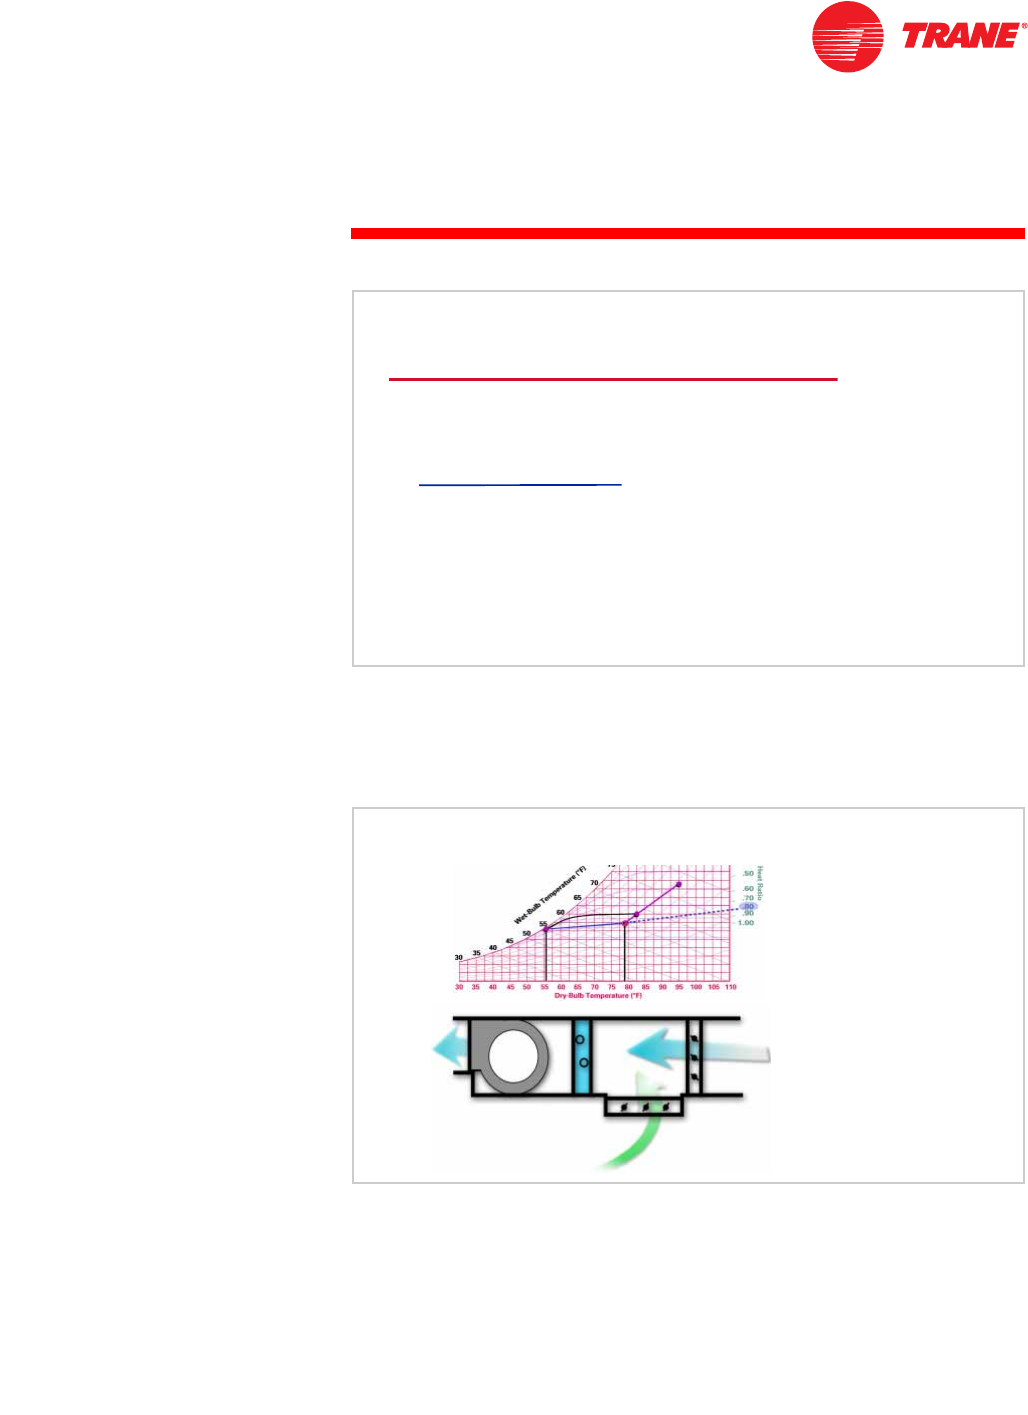
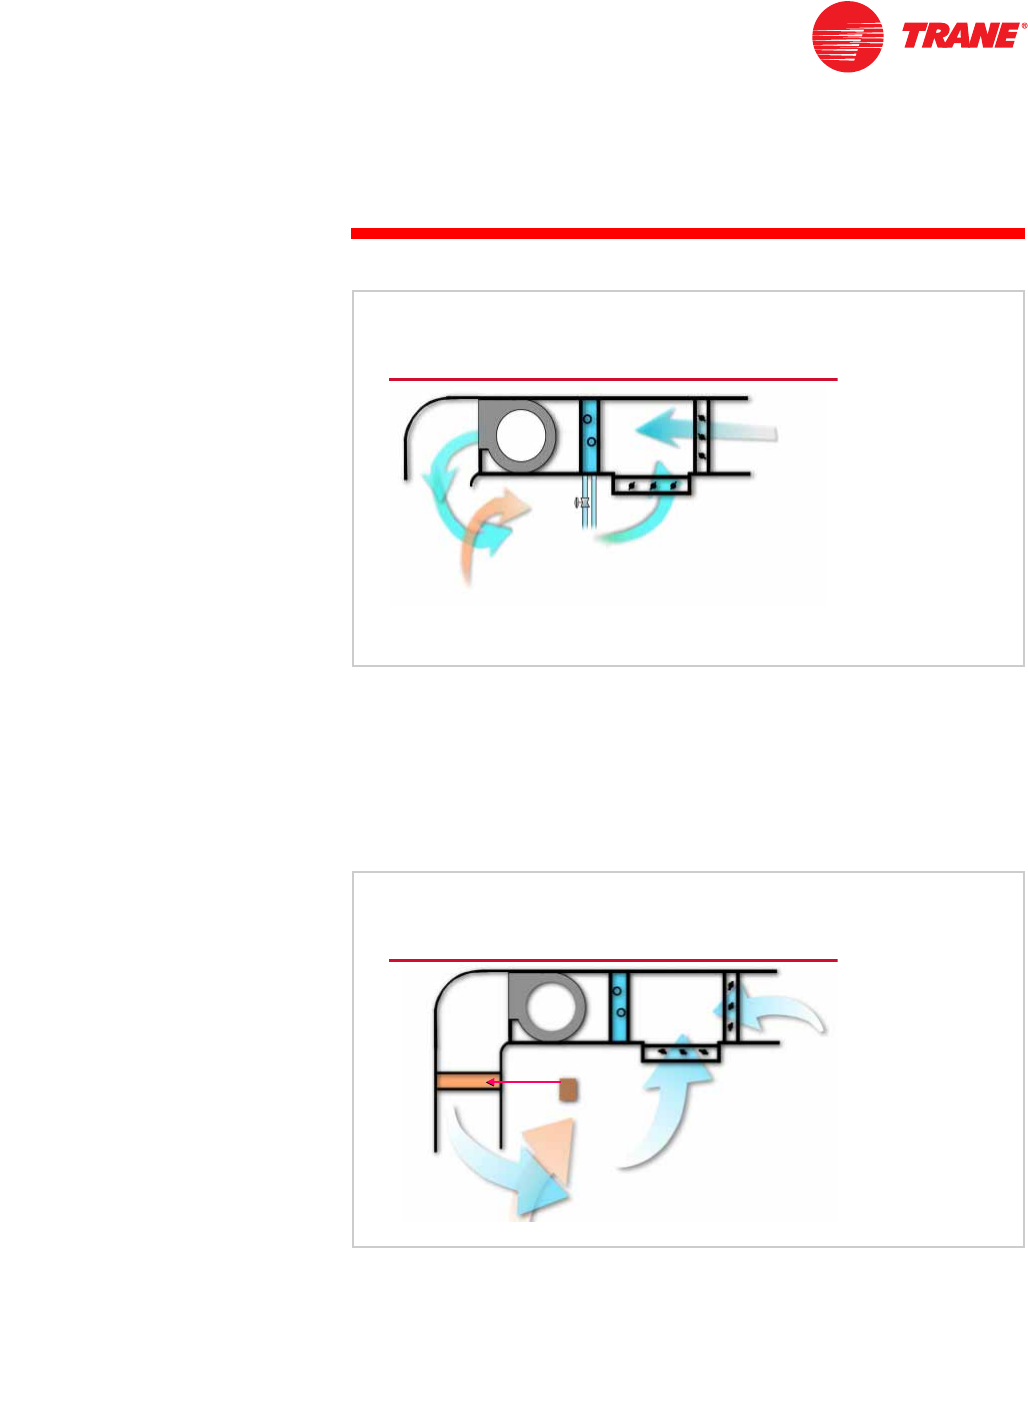
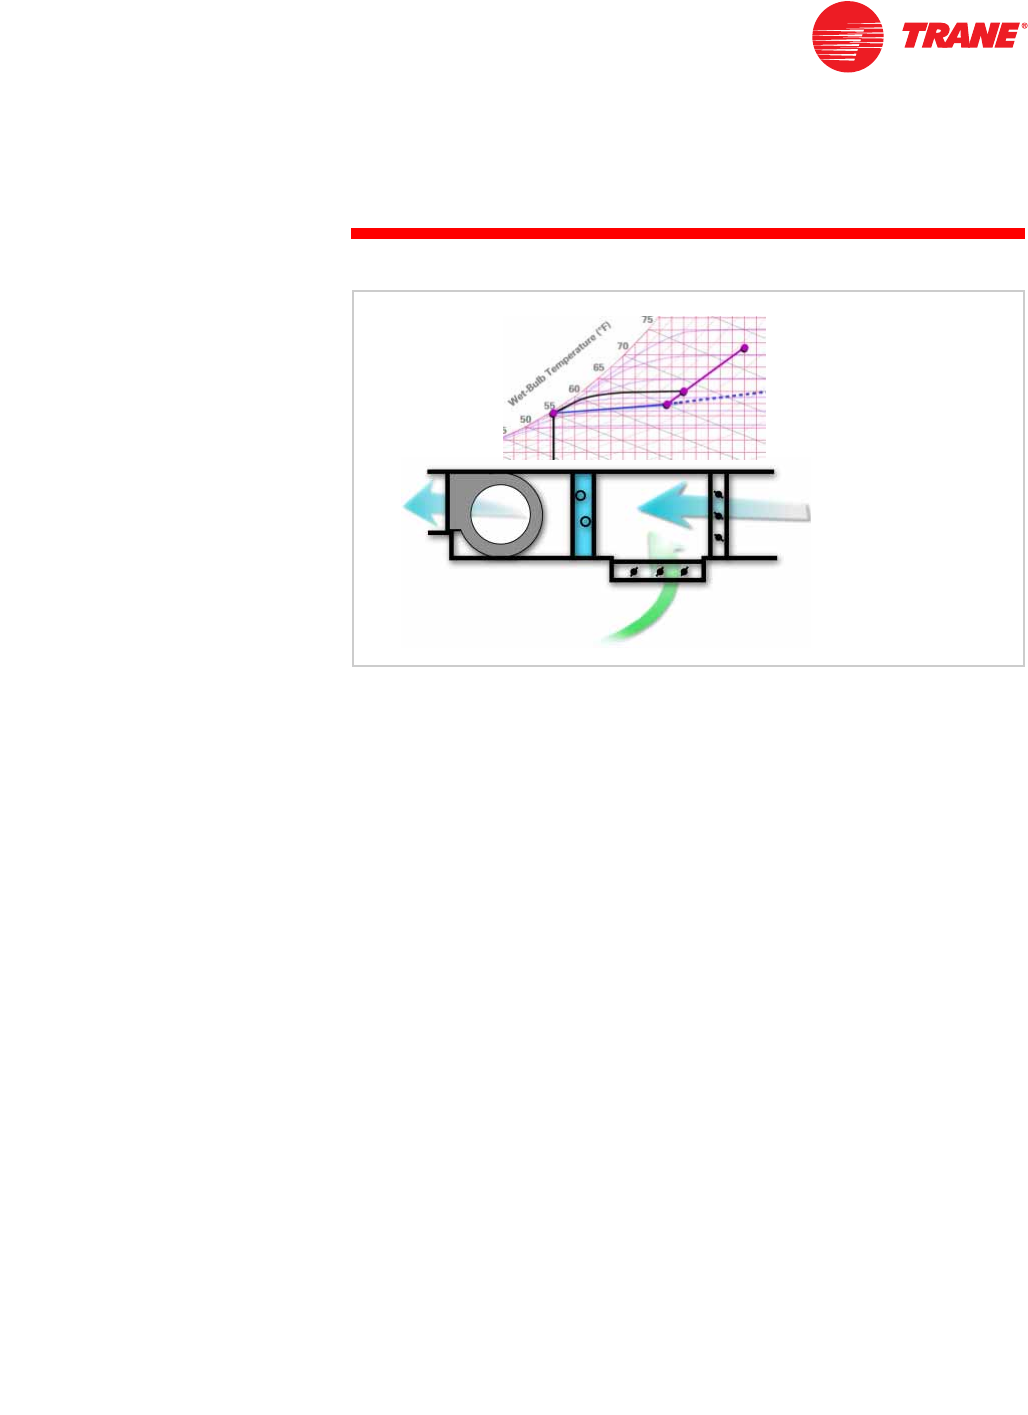
Another method of improving the constant-volume system's ability to control
room humidity is to bypass mixed air around the cooling coil. In this example,
face-and-bypass dampers are placed in front of the cooling coil and used to
vary the portion of the supply air that actually passes through the coil, thus
'
'$
$
&
&
%
%
(
(
6+5
6+5
)
)
)
)
6+5
6+5
(IIHFWRI$GGLQJ5HKHDW
Figure 75
PL[HGDLUE\SDVVLPSURYHVKXPLGLW\FRQWURO
PL[HGDLUE\SDVVLPSURYHVKXPLGLW\FRQWURO
2$
5$
6$
%
%
'
'&
&
$
$
IDFHDQG
IDFHDQG
E\SDVV
E\SDVV
GDPSHUV
GDPSHUV
0L[HG$LU%\SDVV
Figure 76
48 TRG-TRC001-EN
notes
period six
Psychrometric Analyses
varying the supply air temperature as the two airstreams mix downstream of
the air handler.
The face-and-bypass dampers are controlled by the room dry-bulb thermostat.
The cooling coil is allowed to “run wild,” causing the air that does pass through
it to be cooled more at partial airflows.
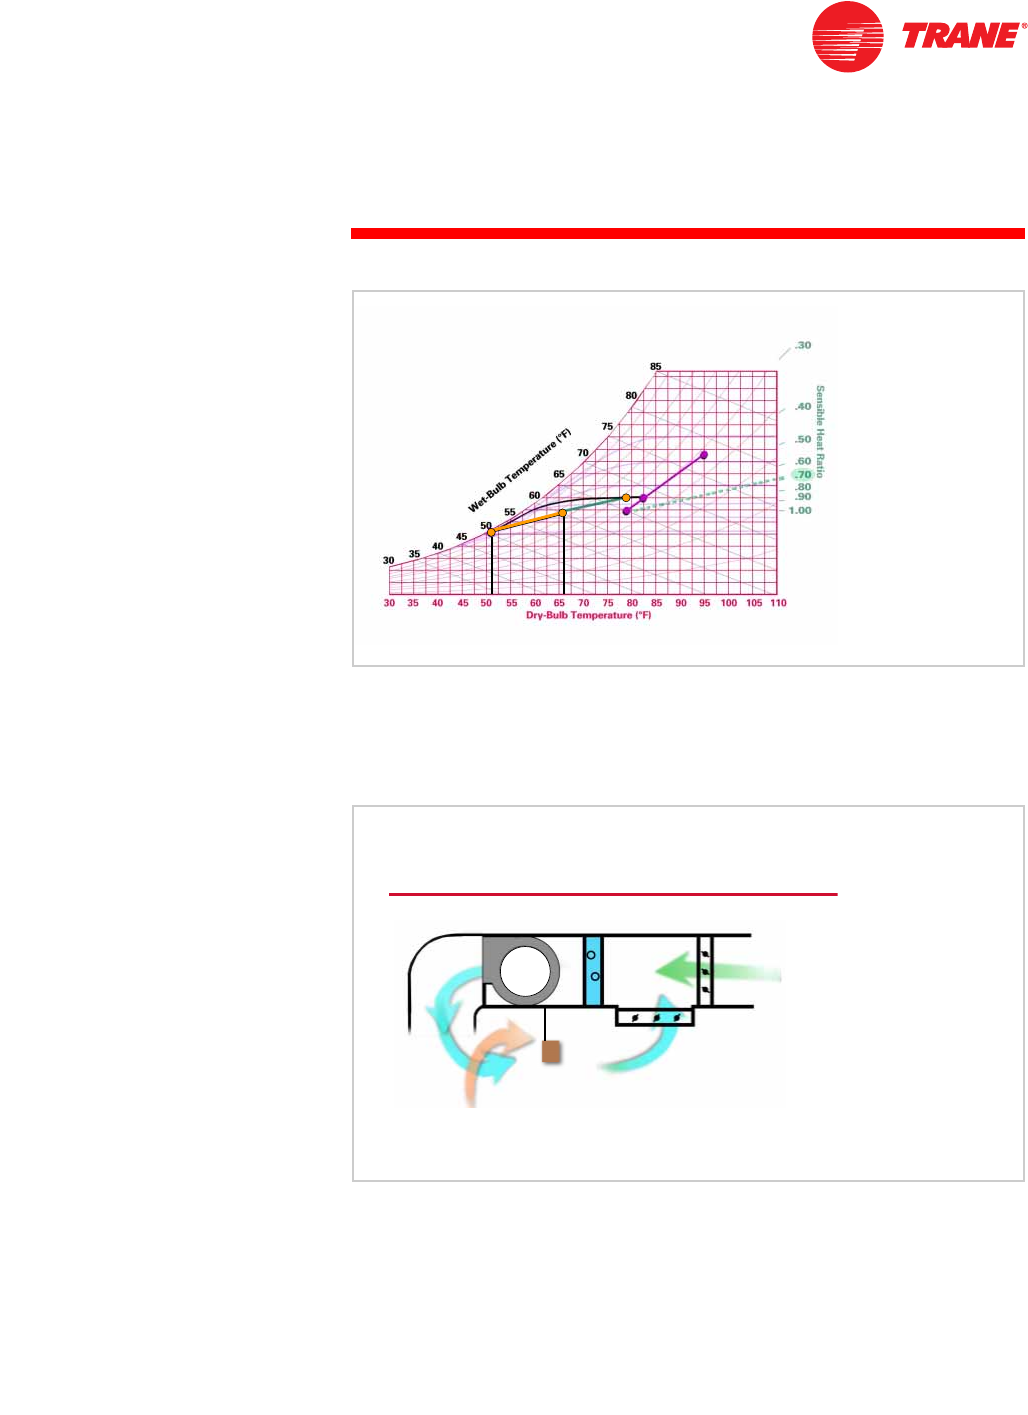
At our example part-load conditions, the room thermostat assumes control of
the face-and-bypass dampers, which reduces the amount of air passing
through the cooling coil. Since the coil is now “running wild,” the reduced
airflow through the coil (1,870 cfm) is cooled and dehumidified more than at full
load (D). When the conditioned air mixes with the bypass air (1,560 cfm), the
required supply air condition (3,430 cfm at E) results.
(IIHFWRI0L[HG$LU%\SDVV
'
'
$
$
&
&
%
%
(
(
)ï )
)ï )
PL[WXUH )
)
)
)
)
Figure 77
TRG-TRC001-EN 49
period six
Psychrometric Analyses
notes
This supply air E mixes with room air along the part-load 0.70 SHR line, arriving
at the resulting new room conditions A’. While the quantity and temperature of
supply air are suitable to absorb the room’s sensible heat gain, they are unable
to completely absorb the latent heat gain. The result is a shift in room
conditions from the design point A to 78°F DB, 58% RH (A’).
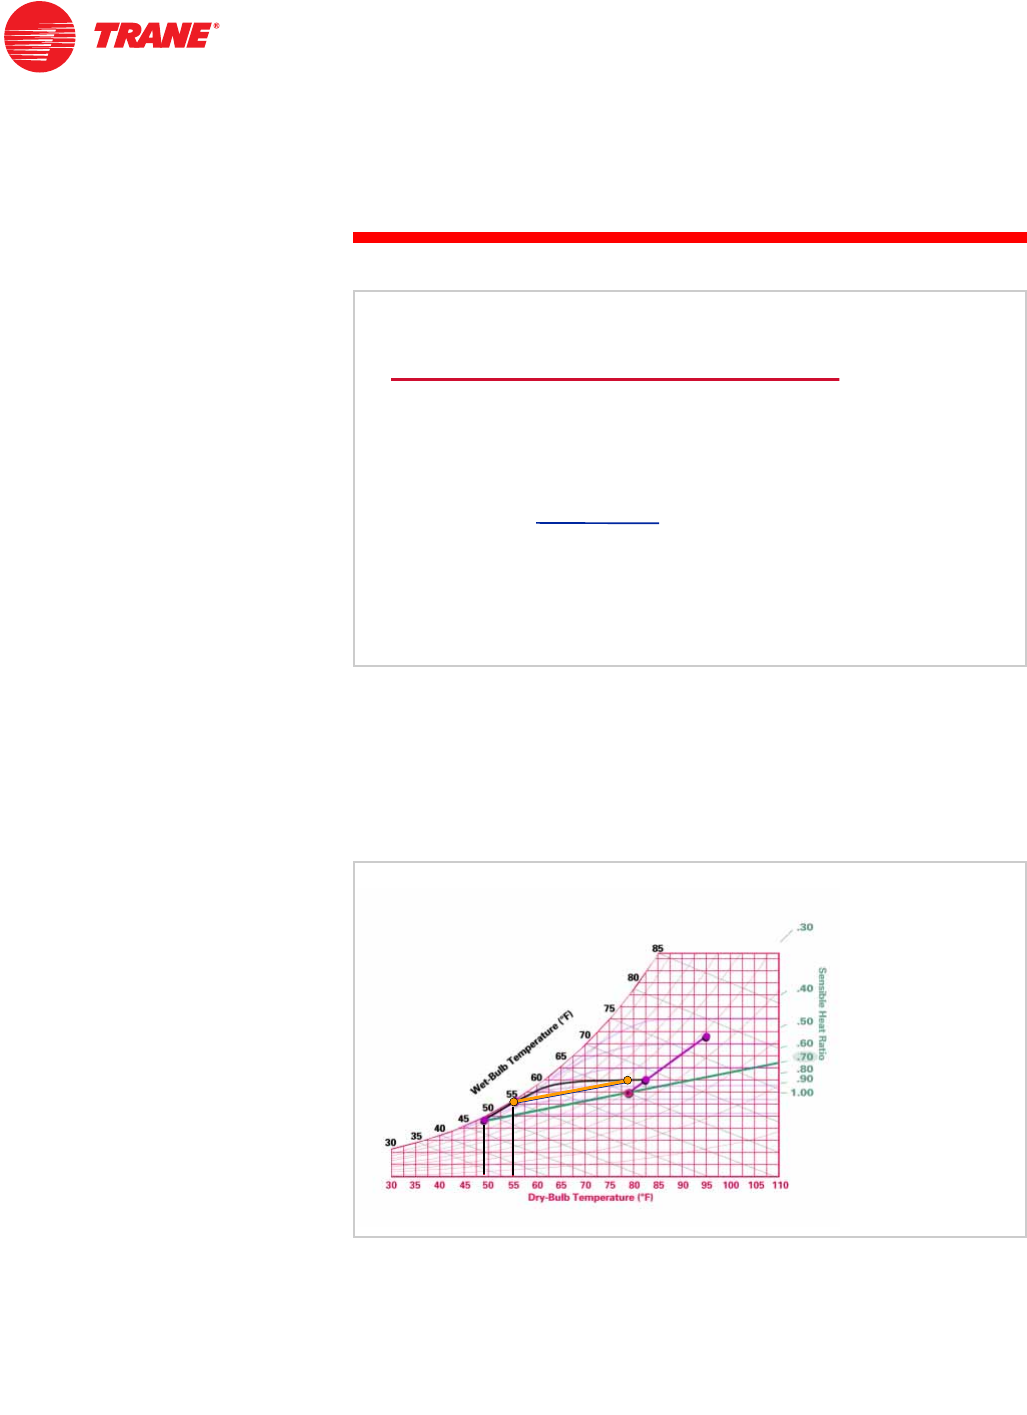
The final method of part-load control we will analyze is to vary the supply
airflow to the room.
Let’s look at the same example again, this time using a simple variable-air-
volume (VAV) system. This system responds to part-load conditions by
supplying a variable quantity of constant-temperature air. At full load, this
system looks the same on the psychrometric chart as the constant-volume
system—it supplies 3,430 cfm of 56.5°F air to the room.
(IIHFWRI0L[HG$LU%\SDVV
6+5
6+5
$
$
&
&
%
%
$,
$,
)
)
)
)
'
'
(
(
Figure 78
2$
5$
6$
%
%
'
'
$
$
&
&
YDULDEOHTXDQWLW\RIFRQVWDQWWHPSHUDWXUHDLU
YDULDEOHTXDQWLW\RIFRQVWDQWWHPSHUDWXUHDLU
YDULDEOHVSHHG
YDULDEOHVSHHG
GULYH
GULYH
9DULDEOH$LU9ROXPH9$96\VWHP
Figure 79

50 TRG-TRC001-EN
notes
period six
Psychrometric Analyses
At part load, when the SHR of the room is reduced from 0.80 to 0.70, the VAV
system responds by reducing the quantity of 56.5°F air supplied to the room to
match the reduced sensible heat gain. The part-load sensible heat gain of
47,000 Btu/hr and the constant supply air temperature, 56.5°F DB, are used to
determine the required part-load air quantity.
When the conditioned supply air D enters the room, it mixes with room air
along the part load SHR line from D to A’. This quantity and temperature of
supply air are suitable to absorb the room's sensible heat gain, but are unable
to completely absorb the latent heat gain. The result is a shift in the room
conditions from the design point A to 78°F DB and 59% RH (A’). While the
simple VAV system does a better job of controlling room humidity than the
simple constant-volume system, it is still unable to maintain the desired
condition of 50% RH.
To more accurately determine the final room conditions, you would cycle
through the psychrometric chart again. First, use the new room condition A’ to
calculate the mixed-air entering conditions. Then use the coil curves to find the
condition of the 56.5°F dry-bulb supply air. Finally, draw the SHR line through
this new supply air condition to find the resulting room conditions. Repeating
this process a few times allows the room condition to converge and be equal to
the condition used in the previous iteration.
'
'$
$
&
&
%
%
%WXKU
ï)²) FIP
6+5
6+5
6+5
6+5
$,
$,
)
)
&DOFXODWLQJ3DUW/RDG$LUIORZ
Figure 80
Supply Airflow (cfm) 47,000 Btu/hr
1.085 78°F 56.5°F–()×
2,015 cfm==

TRG-TRC001-EN 51
period six
Psychrometric Analyses
notes
The psychrometric chart is a visual tool that helps designers find solutions to
many common HVAC problems by plotting conditions on the chart.
Today, many of these same problems can be quickly solved by computers,
which can often eliminate the need for a graphical solution altogether. Still, a
basic understanding of psychrometric principles is required to use these tools,
and is fundamental to the science of air conditioning.
Instead of relying solely on the “typical” coil curves printed on the
psychrometric chart, many manufacturers provide computerized coil selection
programs to determine the actual performance of specific coils. Software tools
are also available to assist you in performing psychrometric calculations, such
as determining the properties of air at a given set of conditions, and finding the
conditions that result when two air streams are mixed.
6RIWZDUH7RROV
Figure 81
52 TRG-TRC001-EN
notes
Let’s review some of the main concepts from this clinic on psychrometry.
The lines of the psychrometric chart represent five physical properties of air:
dry bulb, wet bulb, dew point, humidity ratio, and relative humidity.
If any two of these properties are known, the remaining properties can be
determined from the chart.
3V\FKURPHWU\
SHULRGVHYHQ
5HYLHZ
Figure 82
3URSHUWLHVRI$LU
'U\%XOE7HPSHUDWXUH)
'U\%XOE7HPSHUDWXUH)
+XPLGLW\5DWLRJUDLQV
+XPLGLW\5DWLRJUDLQVOE
OERIGU\DLU
RIGU\DLU
ZHWEXOE
ZHWEXOE
GHZSRLQW
GHZSRLQW
KXPLGLW\UDWLR
KXPLGLW\UDWLR
GU\EXOE
GU\EXOE
UHODWLYHKXPLGLW\
UHODWLYHKXPLGLW\
Figure 83
period seven
Review
TRG-TRC001-EN 53
period seven
Review
notes
In Period Two, a method was discussed to determine the resulting properties of
an air mixture. By plotting the conditions of the outdoor air and recirculated
air, and using the percentage of outdoor air, the resulting condition of the air
mixture was calculated and plotted on a straight line from A to B connecting
the two air conditions.
In Period Three, the ratio of sensible heat gain to total heat gain was
discussed. With the aid of the sensible heat ratio scale on the chart, an SHR line
was drawn. It was also shown that any combination of air conditions that fall on
this line will maintain the desired room conditions A. Each set of conditions
requires a different supply airflow.
)
)
)
)
)
)
)
)
&
&
%
%
$
$
'HWHUPLQLQJ0L[HG$LU&RQGLWLRQV
)ï )
)ï )
PL[WXUH )
Figure 84
$
$
'HWHUPLQLQJ6HQVLEOH+HDW5DWLR
6+5 6HQVLEOH+HDW*DLQ
6HQVLEOH+HDW*DLQ/DWHQW+HDW*DLQ
VHQVLEOHKHDWUDWLROLQH
VHQVLEOHKHDWUDWLROLQH
Figure 85
54 TRG-TRC001-EN
notes
period seven
Review
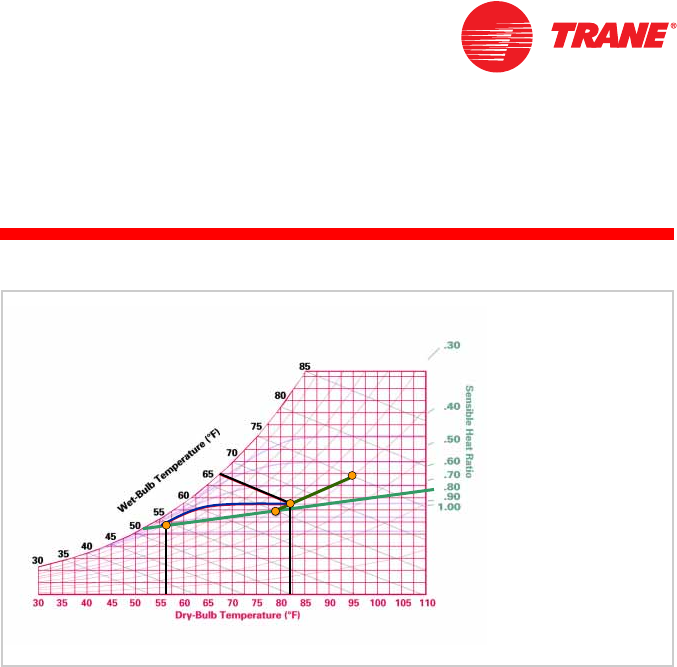
After determining the entering air conditions for the coil and the slope of the
SHR line, the coil curves were used to find the required supply air conditions.
This point (D) was established by the intersection of the coil curve and the SHR
line.
By knowing the design room conditions A and the required supply air
conditions D, the corresponding supply airflow could be calculated.
After the entering (C) and leaving (D) coil conditions were established, the
enthalpies for each were read from the psychrometric chart. These enthalpy
values and the previously calculated supply airflow were used to determine the
refrigeration load in Btu/hr or tons.
$
$
&
&
%
%
'
'
FRLOFXUYH
FRLOFXUYH
6HQVLEOH+HDW*DLQ
ï5RRP'%²6XSSO\'%
6XSSO\
$LUIORZ
'HWHUPLQLQJ&RLO/HDYLQJ&RQGLWLRQV
6+5/LQH
6+5/LQH
6+5/LQH
VXSSO\'%
VXSSO\'%
VXSSO\'%
Figure 86
$
$
&
&
%
%
'
'
'HWHUPLQLQJ7RQVRI5HIULJHUDWLRQ
5HIULJHUDWLRQ/RDG ï6XSSO\$LUIORZïK²K
Figure 87
TRG-TRC001-EN 55
period seven
Review
notes
The resulting psychrometric chart plot represents the changes that a volume of
air undergoes as it travels through a typical air conditioning system.
In this illustration, recirculated air A is mixed with outdoor air B, producing a
mixed air condition C.
This air mixture passes through the cooling and dehumidifying coil, with the
changes in dry-bulb temperature and humidity ratio represented by the coil
curve from C to D.
This supply air D enters the room and mixes with the room air along the SHR
line from D to A, absorbing the room’s sensible and latent heat gains, to
maintain the room at desired conditions A.
Again, for this specific supply air condition, a specific airflow is required to
maintain the desired room conditions.
&
&
2$
5$
%
%
$
$
'
'
6$
3V\FKURPHWULF
$QDO\VLV
6+5OLQH
6+5OLQH
$
$
%
%
&
&
'
'
Figure 88

56 TRG-TRC001-EN
notes
period seven
Review
For more information, refer to the following references:
■Trane Air Conditioning Manual
■ASHRAE Handbook—Fundamentals
■Fundamentals of Thermodynamics and Psychrometrics, ASHRAE self-
directed learning course
■Psychrometrics: Theory and Practice, ASHRAE
Visit the ASHRAE Bookstore at www.ashrae.org.
For information on additional educational materials available from Trane,
contact your local Trane sales office (request a copy of the Educational
Materials price sheet—Trane order number EM-ADV1) or visit our online
bookstore at www.trane.com/bookstore/.
Figure 89

TRG-TRC001-EN 57
Questions for Period 1
1Given air conditions of 80°F DB and 60% RH, find the humidity ratio and
dew-point temperature.
2Given air conditions of 85°F DB and a humidity ratio of 90 grains/lb, find the
relative humidity and wet-bulb temperature.
3Given air conditions of 74°F WB and 60% RH, find the dry-bulb temperature
and humidity ratio.
4Given air conditions of 80°F DB and a humidity ratio of 64 grains/lb, find the
relative humidity and wet-bulb temperature.
5Given air conditions of 90°F DB and 68°F WB, find the dew-point
temperature and relative humidity.
Questions for Period 2
6Given outdoor air conditions of 95°F DB, 78°F WB; indoor design conditions
of 80°F DB, 67°F WB; total airflow of 20,000 cfm; and outdoor airflow of
4,000 cfm:
aFind the dry-bulb temperature of the mixture.
bPlot all three conditions on the psychrometric chart.
cFind the wet-bulb temperature of the mixture.
7Given outdoor air conditions of 90°F DB, 80°F WB; indoor design conditions
of 78°F DB, 65°F WB; total airflow of 40,000 cfm; and outdoor airflow of
6,000 cfm:
aFind the dry-bulb temperature of the mixture.
bPlot all three conditions on the psychrometric chart.
cFind the wet-bulb temperature of the mixture.
Questions for Period 3
8Given a sensible heat ratio of 0.80 and indoor design conditions of 78°F DB
and 66°F WB:
aDraw the SHR line on the psychrometric chart.
bFind the dry-bulb and wet-bulb temperatures of the air where this SHR
line crosses the 90% RH curve.
Quiz

58 TRG-TRC001-EN
Quiz
Questions for Period 4
9Given a room with a 42,000 Btu/hr sensible heat gain and a 56,000 Btu/hr
total heat gain (excluding ventilation heat gain); and indoor design
conditions of 80°F DB and 50% RH:
aDetermine the sensible heat ratio.
bDraw the SHR line.
10 Given a room with an 80,000 Btu/hr sensible heat gain, a 20,000 Btu/hr
latent heat gain (excluding ventilation heat gain), and indoor design
conditions of 80°F DB and 67°F WB, find the wet-bulb temperature of the
supply air if it leaves the cooling coil at 60°F DB.
Questions for Period 5
11 Given indoor design conditions of 80°F DB and 67°F WB, if the air leaves
the cooling coil at 57°F DB, find the airflow (in cfm) required to satisfy a
1,000 Btu/hr sensible heat gain.
12 Given that air enters the cooling coil at 85°F DB, 69°F WB and leaves at 58°F
DB, 56.4°F WB, if the supply airflow is 7,000 cfm, find the total refrigeration
load, in tons.
13 Given indoor design conditions of 78°F DB, 65°F WB; outdoor conditions of
95°F DB, 75°F WB; a sensible heat gain of 156,000 Btu/hr; a latent heat gain
of 39,000 Btu/hr; and 25% outdoor air:
aPlot the indoor and outdoor design conditions on the psychrometric
chart.
bFind the mixed-air conditions entering the cooling coil.
cDraw the SHR line.
dDraw the coil curve and determine the coil leaving-air conditions.
eCalculate the supply airflow.
fDetermine the enthalpy difference between the entering- and leaving-
air conditions.
gCalculate the refrigeration load in tons.
TRG-TRC001-EN 59
193 grains/lb, 64.8°F DP
249.5% RH, 70.5°F WB
385°F DB, 110 grains/lb
441% RH, 64°F WB
556°F DP, 32% RH
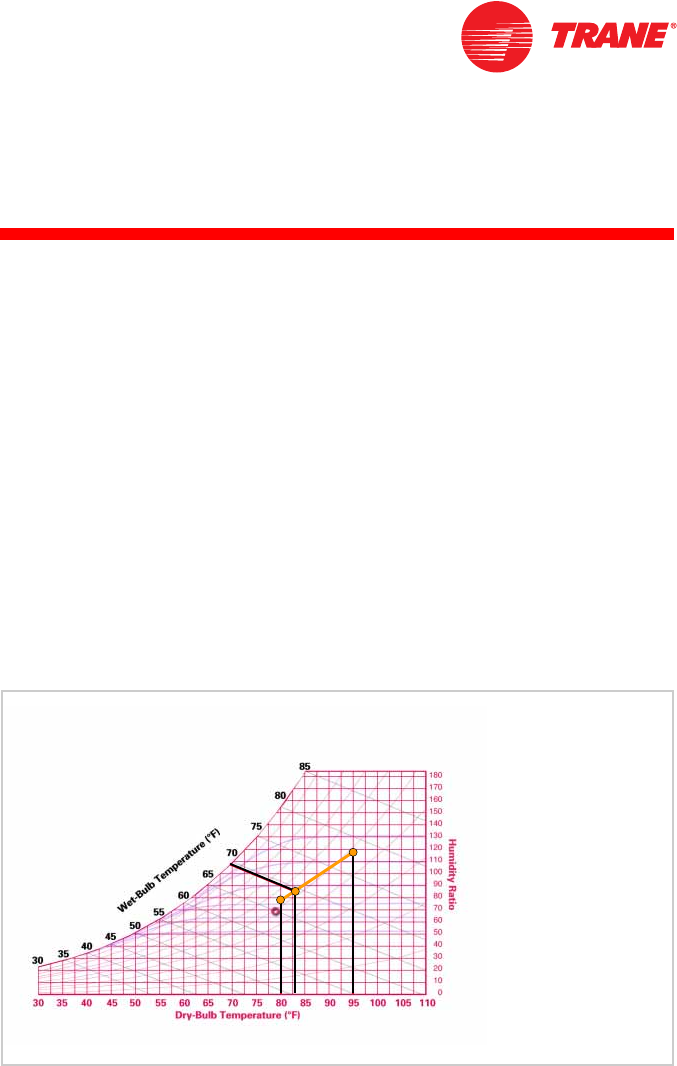
6a
95°F × 0.20 = 19°F
80°F × 0.80 = 64°F
Mixed-Air Temperature = 19°F + 64°F = 83°F
bSee Figure 90.
c69.4°F WB
7a
95°F × 0.15 = 13.5°F
78°F × 0.85 = 66.3°F
Mixed-Air Temperature = 13.5°F + 66.3°F = 79.8°F
bSee Figure 91.
c67.4°F WB (See Figure 91.)
4,000 cfm
20,000 cfm
0.20=
)
)
)
)
)
)
)
)
Figure 90
6,000 cfm
40,000 cfm
0.15=
Answers
60 TRG-TRC001-EN
Answers
8aThe SHR line crosses the saturation curve at 56°F WB (See Figure 92.)
b60°F DB, 58°F WB (See Figure 92.)
9a
bSee Figure 93.
)
)
)
)
)
)
)
)
Figure 91
)
)
)
) )
)
)
)
6+5
6+5
Figure 92
SHR 42,000 Btu/hr
56,000 Btu/hr
0.75==
TRG-TRC001-EN 61
Answers
10
58.3°F WB (See Figure 94.)
11
)
)
6+5
6+5
Figure 93
SHR 80,000 Btu/hr
80,000 Btu/hr 20,000 Btu/hr+
0.80==
)
)
6+5
6+5
)
)
)
)
Figure 94
Supply Airflow (cfm) 1,000 Btu/hr
1.085 80°F57°F–()×
40 cfm==
62 TRG-TRC001-EN
Answers
12 See Figure 95.
13 a See Figure 96.
b
c
d
Refrigeration Load 4.5 7,000 cfm×33.2 24.2–()×283,500 Btu/hr==
283,500 Btu/hr
12,000 Btu/hr/ton
23.6 tons of refrigeration=
%WXOE
%WXOE
%WXOE
%WXOE
Figure 95
95°F0.25×23.75°F=
78°F0.75×58.50°F=
Mixed-Air Temperature 23.75°F 58.50°F+82.25°F==
Mixed-Air Conditions 82.25°F DB, 67.7°F WB (See Figure 96.)=
SHR 156,000 Btu/hr
156,000 Btu/hr 39,000 Btu/hr+
0.80 (See Figure 96.)==
Leaving-Coil Conditions 57°F DB, 54.4°F WB (See Figure 96.)=
TRG-TRC001-EN 63
Answers
e
f
g
)
)
6+5
6+5
)
)
)
)
Figure 96
Airflow (cfm) 156,000 Btu/hr
1.085 78°F57°F–()×
6,847 cfm==
h
1
h
2
–32.1 23.7–8.4 Btu/lb==
Re
f
rigeration Load 4.5 6,847 c
f
m×8.4 Btu/lb×258,817 Btu/hr==
258,817 Btu/hr
12,000 Btu/hr/ton
21.6 tons=

64 TRG-TRC001-EN
ASHRAE American Society of Heating, Refrigerating and Air-Conditioning
Engineers
coil curves These represent the changes in dry-bulb and wet-bulb
temperatures as air passes through a “typical” cooling coil.
constant-volume system A type of air-conditioning system that varies the
temperature of a constant volume of air supplied to meet the changing load
conditions of the space.
dew-point temperature The temperature at which moisture leaves the air and
condenses on surfaces.
dry-bulb temperature A measure of the amount of sensible heat in the air.
enthalpy A quantity that describes the total amount of heat energy, both
sensible and latent, in one pound of air at a given condition.
humidity ratio A quantity that describes the actual weight of the water in an
air – water vapor mixture.
interior space A conditioned space that is surrounded by other conditioned
spaces, with no perimeter walls or windows. It typically requires some degree
of cooling all year long to overcome the heat generated by people, lighting, etc.
latent heat Heat that causes a change in the air’s moisture content with no
change in dry-bulb temperature.
mixed-air bypass A method of part-load control that uses face-and-bypass
dampers, located in front of the cooling coil, to vary the portion of the supply air
that passes through the coil. This varies the supply air temperature as the two
airstreams mix downstream of the coil.
outdoor air Air brought in to the building, either by a ventilation system or
through openings provided for natural ventilation, from outside the building.
psychrometric chart A tool used to graphically display the properties of air.
psychrometry The science dealing with the physical laws of air – water
mixtures.
recirculated return air Air removed from the conditioned space and reused as
supply air, usually after passing through an air-cleaning and -conditioning
system, for delivery to the conditioned space.
relative humidity A comparison of the amount of moisture that a given
amount of air
is
holding, to the amount of moisture that the same amount of air
can
hold, at the same dry-bulb temperature.
return air Air that is removed from the conditioned space(s) and either
recirculated or exhausted.
Glossary

TRG-TRC001-EN 65
Glossary
saturation curve This represents the moisture content that constitutes
complete saturation of air at the various dry-bulb temperatures.
saturation point The maximum amount of water vapor that one pound of dry
air can hold at a given dry-bulb temperature.
sensible heat Heat that causes a change in the air’s dry-bulb temperature with
no change in moisture content.
sensible heat ratio (SHR) The ratio of sensible heat gain to total (sensible +
latent) heat gain.
specific volume The volume of one pound of dry air at a specific temperature
and pressure.
supply air Air that is delivered to the conditioned space by mechanical means
for ventilation, heating, cooling, humidification, or dehumidification.
supply duct system A system that transports the primary air from the central
air handler to the VAV terminal units and then on to the space diffusers.
ton of refrigeration A quantity that is equal to 12,000 Btu/hr.
variable-air-volume (VAV) system A type of air-conditioning system that
varies the volume of constant temperature air supplied to meet the changing
load conditions of the space.
wet-bulb temperature A measure of the dryness of the air, obtained by using
a thermometer with a bulb that is covered by a wet wick.

The Trane Company
Worldwide Applied Systems Group
3600 Pammel Creek Road
La Crosse, WI 54601-7599
www.trane.com
An American Standard Company
Literature Order Number TRG-TRC001-EN
File Number E/AV-FND-TRG-TRC001-1099-EN
Supersedes ED-FND-TRG-TRC001-199-EN
Stocking Location Inland-La Crosse
Since The Trane Company has a policy of continuous product improvement, it reserves the right to change
design and specifications without notice.
