Trane Trg Trc007 En Users Manual
TRG-TRC007-EN to the manual 61fece07-31c3-43b9-9bb0-681fc3820853
2015-01-21
: Trane Trane-Trg-Trc007-En-Users-Manual-236104 trane-trg-trc007-en-users-manual-236104 trane pdf
Open the PDF directly: View PDF ![]() .
.
Page Count: 82
Air Conditioning
Clinic
Fundamentals of HVAC
Acoustics
One of the Fundamental Series
TRG-TRC007-EN
NO POSTAGE
NECESSARY
IF MAILED
IN THE
UNITED STATES
BUSINESS REPLY MAIL
FIRST-CLASS MAIL PERMIT NO. 11 LA CROSSE, WI
POSTAGE WILL BE PAID BY ADDRESSEE
TRANE
Attn: Applications Engineering
3600 Pammel Creek Road
La Crosse WI 54601-9985
NO POSTAGE
NECESSARY
IF MAILED
IN THE
UNITED STATES
BUSINESS REPLY MAIL
FIRST-CLASS MAIL PERMIT NO. 11 LA CROSSE, WI
POSTAGE WILL BE PAID BY ADDRESSEE
TRANE
Attn: Applications Engineering
3600 Pammel Creek Road
La Crosse WI 54601-9985
Crop to width of 7.75”

Perforation 5.5” from bottom/top
Perforation 0.75” from edge
Response Card
We offer a variety of HVAC-related educational materials and technical references, as well as software tools
that simplify system design/analysis and equipment selection. To receive information about any of these
items, just complete this postage-paid card and drop it in the mail.
Education materials ❏Air Conditioning Clinic series About me…
❏Engineered Systems Clinic series Name _______________________________________________
❏Trane Air Conditioning Manual Title _______________________________________________
❏Trane Systems Manual Business type _______________________________________________
Software tools ❏Equipment Selection Phone/fax _____________________ ________________________
❏System design & analysis E-mail address _______________________________________________
Periodicals ❏Engineers Newsletter Company _______________________________________________
Other? ❏_____________________________ Address _______________________________________________
_______________________________________________
_______________________________________________
Thank you for your interest!
Trane
An American Standard Company
www.trane.com
For more information contact
your local district office or
e-mail us at comfort@trane.com
Comment Card
We want to ensure that our educational materials meet your ever-changing resource development needs.
Please take a moment to comment on the effectiveness of this Air Conditioning Clinic.
Level of detail (circle one) Too basic Just right Too difficult
One of the Fundamental Series
Rate this clinic from 1–Needs Improvement to 10–Excellent
…
TRG-TRC007-EN Content 12345678910
Booklet usefulness 12345678910
Slides/illustrations 12345678910
Presenter’s ability 12345678910
Training environment 12345678910
Other comments? _________________________________________________________
_______________________________________________________________________________
_______________________________________________________________________________
About me … Type of business _________________________________________________________
Job function _________________________________________________________
Optional: name _________________________________________________________
phone _________________________________________________________
address _________________________________________________________
Give the completed card to the
presenter or drop it in the mail.
Thank you!
Trane
An American Standard Company
www.trane.com
For more information contact
your local district office or
e-mail us at comfort@trane.com
Fundamentals of HVAC
Acoustics

Fundamentals of HVAC
Acoustics
One of the Fundamental Series
A publication of
Trane, an American
Standard Company
Fundamentals of HVAC

Preface
© 2001 American Standard Inc. All rights reserved
TRG-TRC007-EN
ii
Trane believes that it is incumbent on manufacturers to serve the industry by
regularly disseminating information gathered through laboratory research,
testing programs, and field experience.
The Trane Air Conditioning Clinic series is one means of knowledge sharing.
It is intended to acquaint a nontechnical audience with various fundamental
aspects of heating, ventilating, and air conditioning (HVAC). We have taken
special care to make the clinic as uncommercial and straightforward as
possible. Illustrations of Trane products only appear in cases where they help
convey the message contained in the accompanying text.
This particular clinic introduces the reader to the fundamentals of HVAC
acoustics.
Fundamentals of HVAC Acoustics
A Trane Air Conditioning Clinic
Figure 1

TRG-TRC007-EN iii
Contents
period one Fundamentals of Sound ..................................... 1
What is Sound? ....................................................... 2
Octave Bands ......................................................... 6
Sound Power and Sound Pressure ........................... 9
period two Sound Perception and Rating Methods ...... 15
Human Ear Response ............................................ 15
Single-Number Rating Methods ............................. 17
Octave-Band Rating Method .................................. 28
period three Acoustical Analysis ............................................ 29
Setting a Design Goal ............................................ 30
Source–Path–Receiver Analysis ............................. 32
Sound-Path Modeling ............................................ 37
Terms Used in Sound-Path Modeling ..................... 41
period four Equipment Sound Rating ................................ 47
Fields of Measurement ......................................... 48
HVAC Equipment Sound Rating ............................. 54
period five Review ................................................................... 63
Quiz ......................................................................... 68
Answers ................................................................ 70
Glossary ................................................................ 71

iv TRG-TRC007-EN

TRG-TRC007-EN 1
notes
period one
Fundamentals of Sound
People have become increasingly conscious of acoustics as a component of a
comfortable environment. Sound levels, both indoor and outdoor, can be
affected to varying degrees by HVAC equipment and systems.
The degree to which the HVAC system affects the sound at a particular location
depends on the strength of the sound source and the environmental effects on
the sound as it travels from that source to the listener.
period one
Fundamentals of Sound
Fundamentals of HVAC Acoustics
Figure 2

2TRG-TRC007-EN
notes
period one
Fundamentals of Sound
What is Sound?
Sound is the audible emissions resulting from the vibration of molecules
within an elastic medium. It is generated by either a vibrating surface or the
movement of a fluid. In the context of building HVAC systems, this elastic
medium can be either air or the building structure. For structurally-borne sound
to become audible, however, it must first become airborne.
Noise is different than sound. Sound is always present, but is not always
obtrusive. Noise is defined as unwanted sound. Generally, people object to
sound when it interferes with speech, concentration, or sleep.
What is Sound?
IAudible emissions resulting from vibration of
molecules within an elastic medium
IGenerated by vibrating surface or movement
of a fluid
IIn buildings, it may be airborne or structure-
borne
INoise is unwanted sound
Figure 3
TRG-TRC007-EN 3
period one
Fundamentals of Sound
notes
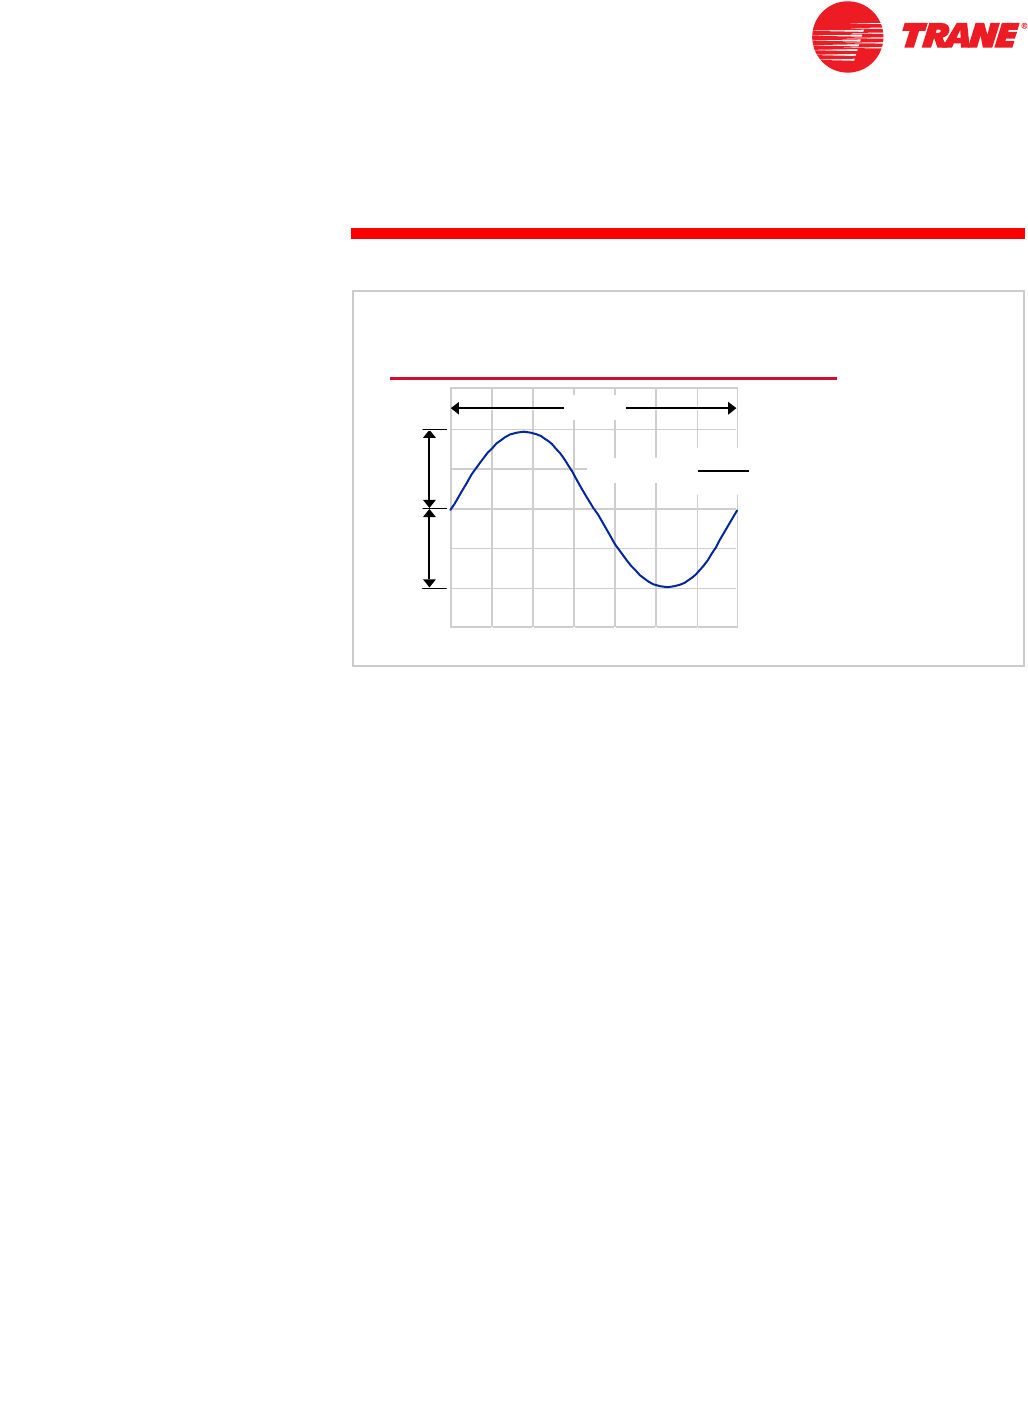
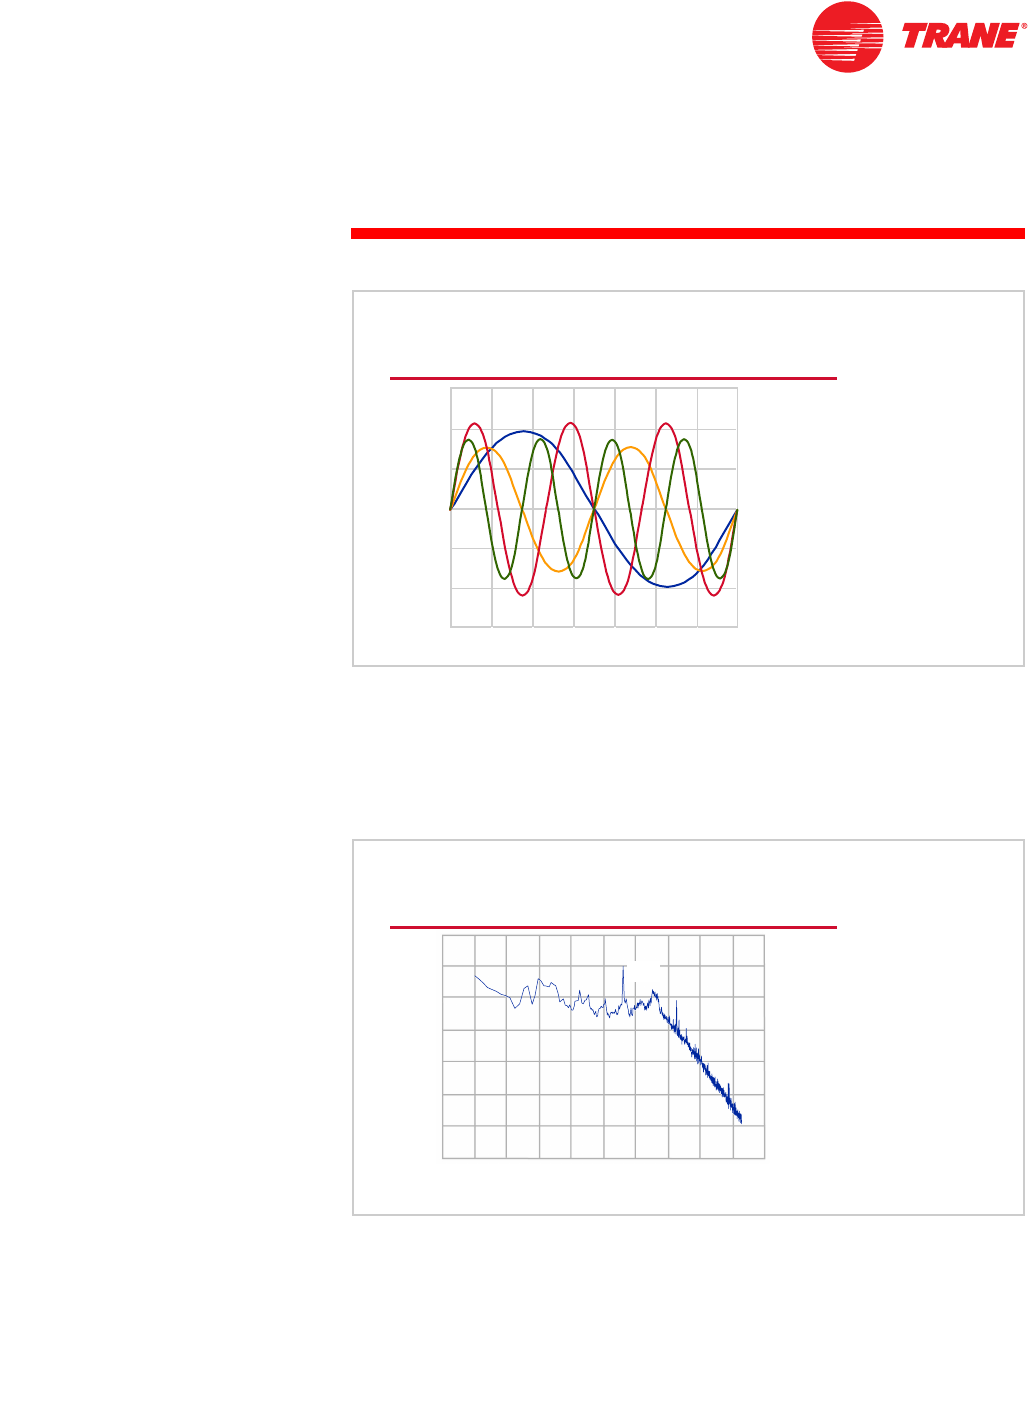
Airborne sound is transmitted away from a vibrating body through the transfer
of energy from one air molecule to the next. The vibrating body alternately
compresses and rarefies (expands) the air molecules. The pressure fluctuations
that result from the displacement of these air molecules take the form of a
harmonic, or sine, wave. The amplitude of the wave depicts pressure. The
higher the amplitude, the louder the sound.
This transfer of energy takes time. Each complete sequence of motion
(compression and rarefaction) constitutes a cycle, and the time required to
complete one cycle is the cycle period. The frequency of the periodic motion is
the number of cycles that occur in a second. The unit of measure for frequency
is the hertz (Hz). One hertz is equal to one cycle per second.
The terms pitch and frequency are often (incorrectly) used interchangeably.
Frequency is an objective quantity that is independent of sound-pressure level.
Pitch, however, is a subjective quantity that is primarily based on frequency,
but is also dependent on sound-pressure level and composition. Pitch is not
measured, but is described with terms like bass, tenor, and soprano.
Sound Wave and Frequency
amplitude
amplitude
+
+
-
-
one cycle
one cycle
time
time
cycles
cycles
seconds
seconds
frequency, Hz
frequency, Hz =
=
Figure 4
frequency, Hz cycles
seconds
-----------------------
=
4TRG-TRC007-EN
notes
period one
Fundamentals of Sound
The wavelength of the sound is the linear measurement of one complete
cycle. The wavelength and frequency of a sound are related by using the
following equation:
The speed of sound transmission is a physical property of the medium. For air,
the speed varies slightly with temperature change. Because the temperature
range encountered in the study of HVAC acoustics is relatively small, the speed
of sound can be considered a constant 1,127 ft/s (344 m/s). For example, sound
traveling through the air at a frequency of 200 Hz has a wavelength of 5.6 ft
(1.7 m).
Wavelength
one cycle
one cycle
frequency
frequency
wavelength
wavelength =
= speed of sound
speed of sound
Figure 5
wavelength speed of sound
frequency
-------------------------------------------
=
wavelength 1,127 ft/s
200 Hz
-------------------------
=5.6 ft=
wavelength 344 m/s
200 Hz
----------------------1.7 m==
èø
æö
TRG-TRC007-EN 5
period one
Fundamentals of Sound
notes
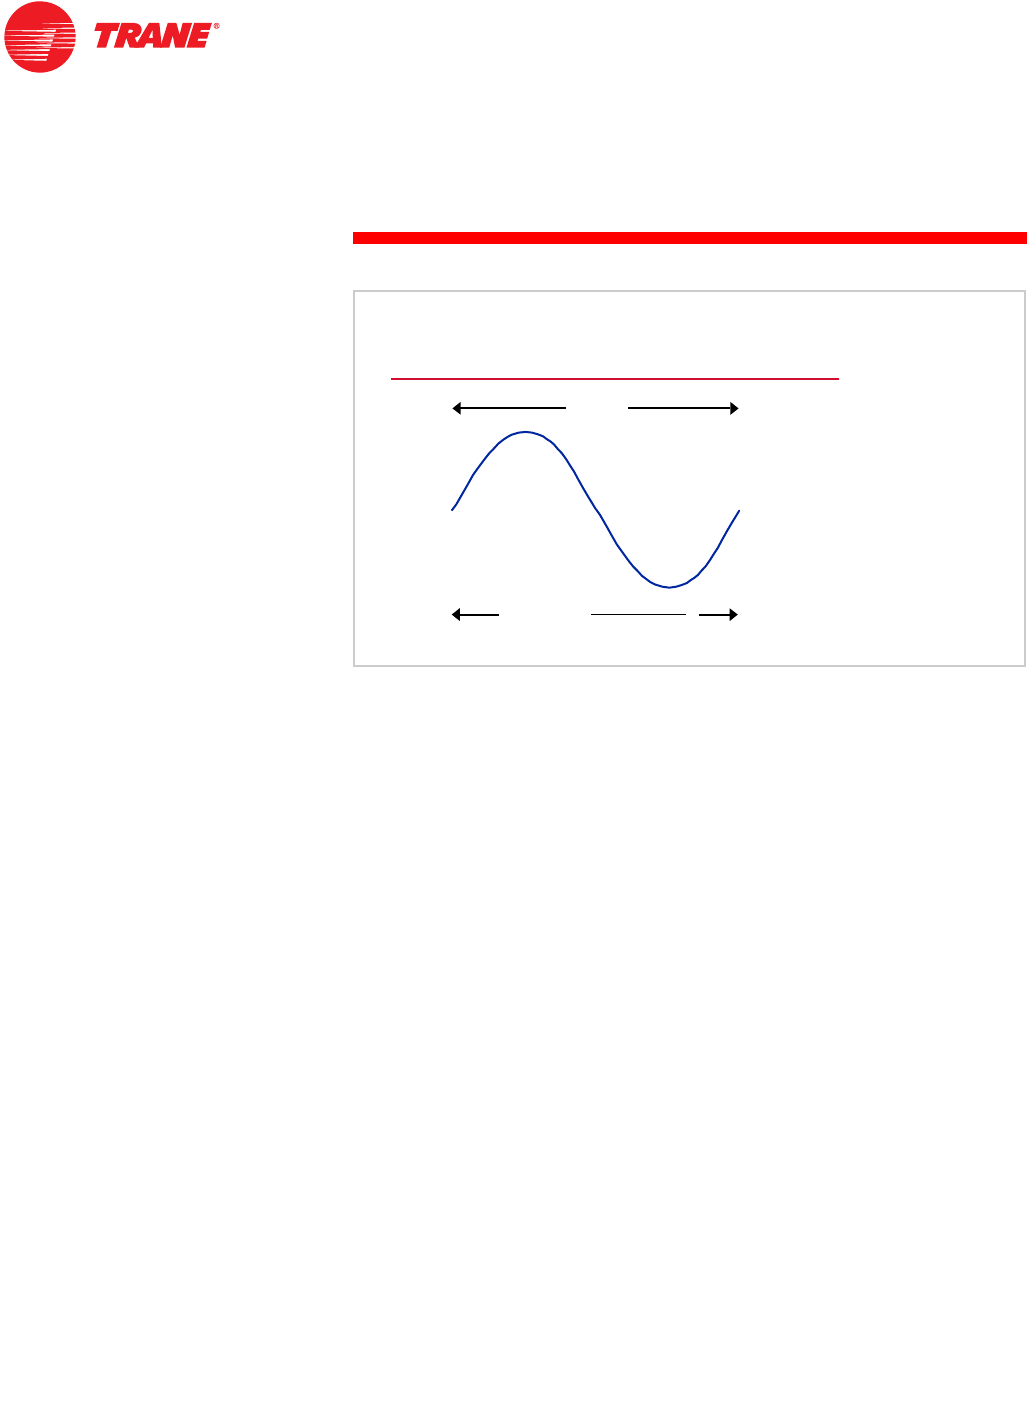
The wave form shown in Figure 5 represents sound occurring at a single
frequency. This is called a pure tone.
A pure sinusoidal wave form, however, is very rare in HVAC acoustics. Typically,
sounds are of a broadband nature, meaning that the sound is composed of
several frequencies and amplitudes, all generated at the same time. Figure 6
represents the components of broadband sound.
Alternatively, plotting the amplitude (vertical axis) of each sound wave at each
frequency (horizontal axis) results in a graphic of the broadband sound that
looks like this. As you can see from this example, the sound energy is greater at
some frequencies than at others.
Broadband Sound
amplitude
amplitude
time
time Figure 6
Broadband Sound and Tones
amplitude
amplitude
frequency
frequency
tone
tone
logarithmic scale
logarithmic scale
Figure 7

6TRG-TRC007-EN
notes
period one
Fundamentals of Sound
Again, a pure tone has a single frequency. If a sound in a narrow band of
frequencies is significantly greater than the sound at adjacent frequencies, it
would be similar to a tone. Tones that stand out enough from the background
sound can be objectionable. Many of the sounds generated by HVAC
equipment and systems include both broadband and tonal characteristics.
Octave Bands
Because sound occurs over a range of frequencies, it is considerably more
difficult to measure than temperature or pressure. The sound must be
measured at each frequency in order to understand how it will be perceived in a
particular environment. The human ear can perceive sounds at frequencies
ranging from 20 to 16,000 Hz, whereas, HVAC system designers generally focus
on sounds in the frequencies between 45 and 11,200 Hz. Despite this reduced
range, measuring a sound at each frequency would result in 11,156 data points.
For some types of analyses, it is advantageous to measure and display the
sound at each frequency over the entire range of frequencies being studied.
This is called a full-spectrum analysis and is displayed like the example shown
in Figure 7.
To make the amount of data more manageable, this range of frequencies is
typically divided into smaller ranges called octave bands. Each octave band is
defined such that the highest frequency in the band is two times the lowest
frequency. The octave band is identified by its center frequency, which is
calculated by taking the square root of the product of the lowest and highest
frequencies in the band.
The result is that this frequency range (45 to 11,200 Hz) is separated into eight
octave bands with center frequencies of 63, 125, 250, 500, 1,000, 2,000, 4,000,
and 8,000 Hz. For example, sounds that occur at the frequencies between 90 Hz
and 180 Hz are grouped together in the 125 Hz octave band.
Octave Bands
octave
band
1
2
3
4
5
6
7
8
octave
band
1
2
3
4
5
6
7
8
center
frequency (Hz)
63
125
250
500
1,000
2,000
4,000
8,000
center
frequency (Hz)
63
125
250
500
1,000
2,000
4,000
8,000
frequency
range (Hz)
45 to 90
90 to 180
180 to 355
355 to 710
710 to 1,400
1,400 to 2,800
2,800 to 5,600
5,600 to 11,200
frequency
range (Hz)
45 to 90
90 to 180
180 to 355
355 to 710
710 to 1,400
1,400 to 2,800
2,800 to 5,600
5,600 to 11,200
Figure 8
center frequency lowest frequency × highest frequency =
TRG-TRC007-EN 7
period one
Fundamentals of Sound
notes
Octave bands compress the range of frequencies between the upper and lower
ends of the band into a single value. Sound measured in an octave band is the
logarithmic sum of the sound level at each of the frequencies within the band.
Unfortunately, octave bands do not indicate that the human ear hears a
difference between an octave that contains a tone and one that does not, even
when the overall magnitude of both octaves is identical. Therefore, the process
of logarithmically summing sound measurements into octave bands, though
practical, sacrifices valuable information about the “character” of the sound.
Octave Bands
1,000
1,000
125
125 500
500
250
250 2,000
2,000 4,000
4,000 8,000
8,000
logarithmic
logarithmic
sums
sums
63
63
amplitude
amplitude
frequency, Hz
frequency, Hz Figure 9
8TRG-TRC007-EN
notes
period one
Fundamentals of Sound
Middle ground between octave-band analysis and full-spectrum analysis is
provided by one-third octave-band analysis. One-third octave bands divide
the full octaves into thirds. The upper cutoff frequency of each third octave is
greater than the lower cutoff frequency by a factor of the cube root of two
(approximately 1.2599). If tones are contained in the broadband sound, they will
be more readily apparent in the third octaves.
The use of octave bands is usually sufficient for rating the acoustical
environment in a given space. One-third octave bands are, however, more
useful for product development and troubleshooting acoustical problems.
One-Third Octave Bands
amplitude
amplitude
frequency, Hz
frequency, Hz
1,000
1,000
125
125 500
500
250
250 2,000
2,000 4,000
4,000 8,000
8,000
63
63
Figure 10

TRG-TRC007-EN 9
period one
Fundamentals of Sound
notes
Sound Power and Sound Pressure
Sound power and sound pressure are two distinct and commonly confused
characteristics of sound. Both are generally described using the term decibel
(dB), and the term “sound level” is commonly substituted for each. To
understand how to measure and specify sound, however, one must first
understand the difference between these two properties.
Sound power is the acoustical energy emitted by the sound source, and is
expressed in terms of watts (W). It is not affected by the environment.
Sound pressure is a pressure disturbance in the atmosphere, expressed in
terms of pascals (Pa), that can be measured directly. Sound pressure magnitude
is influenced not only by the strength of the source, but also by the
surroundings and the distance from the source to the listener. Sound pressure
is what our ears hear and what sound meters measure.
While sound-producing pressure variations within the atmosphere can be
measured directly, sound power cannot. It must be calculated from sound
pressure, knowing both the character of the source and the modifying
influences of the environment.
Sound Power and Sound Pressure
ISound power
KAcoustical energy emitted by the sound source
KUnaffected by the environment
ISound pressure
KPressure disturbance in the atmosphere
KAffected by strength of source, surroundings, and
distance between source and receiver
Figure 11
10 TRG-TRC007-EN
notes
period one
Fundamentals of Sound
The following comparison of sound and light may help illustrate the distinction
between these two properties. Think of sound power as the wattage rating of a
light bulb. Both measure a fixed amount of energy. Whether you put a 100-watt
light bulb outdoors or in a closet, it is always 100-watt light bulb and always
gives off the same amount of light.
Sound pressure corresponds to the brightness, from the light emitted by the
light bulb, in a particular location in the room. Both sound pressure and
brightness can be measured with a meter, and the immediate surroundings
influence the magnitude of each. In the case of light, brightness depends on
more than the wattage of the bulb. It also depends on how far the observer is
from the light bulb, the color of the room, how reflective the wall surfaces are,
and whether the light bulb is covered with a shade. These other factors affect
how much light reaches the receiver, but do not affect the wattage of the light
bulb.
Similarly, sound pressure depends not only on the sound power emitted by the
source, but also on the characteristics of the surrounding environment. These
might include the distance between the sound source and the listener, whether
the room is carpeted or tiled, and whether the room is furnished or bare. Just as
with light, environmental factors like these affect how much sound reaches the
listener.
An Analogy
ISound power
KCorrelates to bulb wattage
ISound pressure
KCorrelates to brightness
Figure 12

TRG-TRC007-EN 11
period one
Fundamentals of Sound
notes
Sounds encompass a wide range of volumes, or levels. The loudest sound the
human ear can hear without damage due to prolonged exposure is about
1,000,000,000 times greater than the quietest perceptible sound. A range of this
magnitude makes using an arithmetic scale cumbersome, so a logarithmic
scale is used instead.
The measurement of sound level is expressed in terms of decibels (dB), a
dimensionless quantity. A decibel is a calculated value based on the ratio of two
quantities. It is defined as ten times the logarithm to the base ten (log10) of the
measured quantity divided by the reference quantity. The reference quantity
must be specified to prevent confusion regarding the magnitude of the ratio.
Decibel
measured value
reference value
dB = 10 log10
Figure 13
dB 10 log10
measured value
reference value
---------------------------------------------
=

12 TRG-TRC007-EN
notes
period one
Fundamentals of Sound
A logarithm is the exponent power of the base. In this case, the base is ten. For
example, the log10 of 10 (or 101) equals 1, the log10 of 100 (or 102) equals 2, and
the log10 of 1,000,000,000 (or 109) equals 9.
As mentioned earlier, the loudest sound the human ear can hear without
damage due to prolonged exposure is about 1,000,000,000 times greater than
the quietest perceptible sound. If we use the quietest perceptible sound as the
reference value, this ratio would range from 1 to 1,000,000,000. Converting this
arithmetic range to a log10 scale yields a range of 0 to 9. This unitless result is
described in terms of bels. Multiplying by ten results in the more-commonly
used broader range of 0 to 90 decibels (dB).
Logarithmic Scale
ratio
1
10
100
1,000
10,000
100,000
1,000,000
10,000,000
100,000,000
1,000,000,000
ratio
1
10
100
1,000
10,000
100,000
1,000,000
10,000,000
100,000,000
1,000,000,000
log10
0
1
2
3
4
5
6
7
8
9
log10
0
1
2
3
4
5
6
7
8
9
10 ´
´´
´log10
0
10
20
30
40
50
60
70
80
90
10 ´
´´
´log10
0
10
20
30
40
50
60
70
80
90 Figure 14
TRG-TRC007-EN 13
period one
Fundamentals of Sound
notes
When a reference value is established and placed in the denominator of the
ratio, the dB can be calculated for any value entered into the numerator.
The reference value used for calculating sound-power level is 1 picowatt (pW),
or 10-12 watts. Therefore, sound-power level (Lw) in dB is calculated using the
following equation:
The reference value used for calculating sound-pressure level is 20
micropascals (µPa), or 2 ×10⁻⁵ Pa. Therefore, sound-pressure level (Lp) in dB,
is calculated using the following equation:
Equation for Sound Power
sound power, W
10-12 W
Lw= 10 log10
Figure 15
LW10 log10
sound power, watts
10-12watts
--------------------------------------------------------
=
Equation for Sound Pressure
sound pressure, m
mm
mPa
20 m
mm
mPa
Lp= 20 log10
Figure 16
14 TRG-TRC007-EN
notes
period one
Fundamentals of Sound
Again, these reference values can be considered the threshold of hearing. The
multiplier 20 is used in the sound-pressure level equation instead of 10 because
sound power is proportional to the square of sound pressure.
Measuring sound using a logarithmic scale means that decibel values cannot
be added arithmetically. Instead, logarithmic addition must be used to add two
or more sound levels. This involves converting the decibel values into ratios of
sound intensity, adding these ratios, and then converting the sum back into
decibels. The mathematics become rather involved—the graph in Figure 17 has
been developed to simplify the procedure.
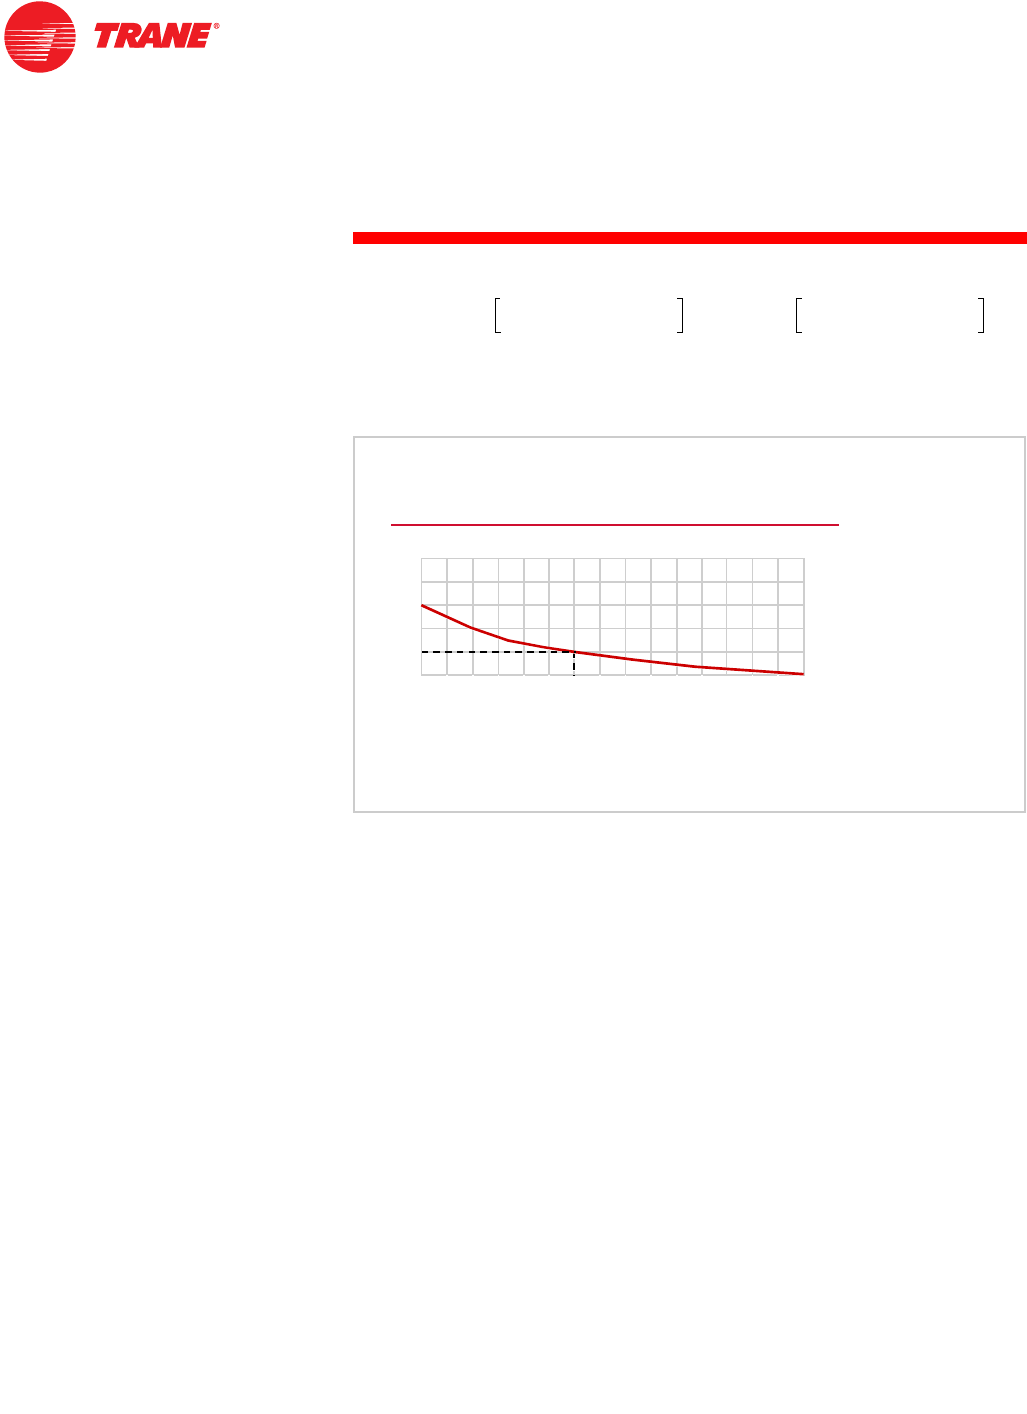
To demonstrate the use of this figure, consider the example of adding a 50 dB
sound to a 44 dB sound. The difference between these two sounds is 6 dB.
Therefore, 1 dB is added to the higher of the two sounds (50 plus 1) to arrive
at the logarithmic sum of 51 dB.
Also, notice that the logarithmic sum of two sounds of equal magnitude (0 dB
difference) results in a 3 dB increase. Therefore, adding two 50 dB sounds
would result in a combined sound level of 53 dB.
Lp20 log10
sound pressure, µPa
20 Pa
----------------------------------------------------------or 10 log10
sound pressure, µPa
20 Pa
----------------------------------------------------------
2
=
Logarithmic Addition of Decibels
0
05
510
10 15
15
3
3
2
2
1
1
0
0
dB difference between values being added
dB difference between values being added
add to the higher dB value
add to the higher dB value
50 dB + 44 dB = 51 dB
4
4
5
5
Figure 17
TRG-TRC007-EN 15
notes
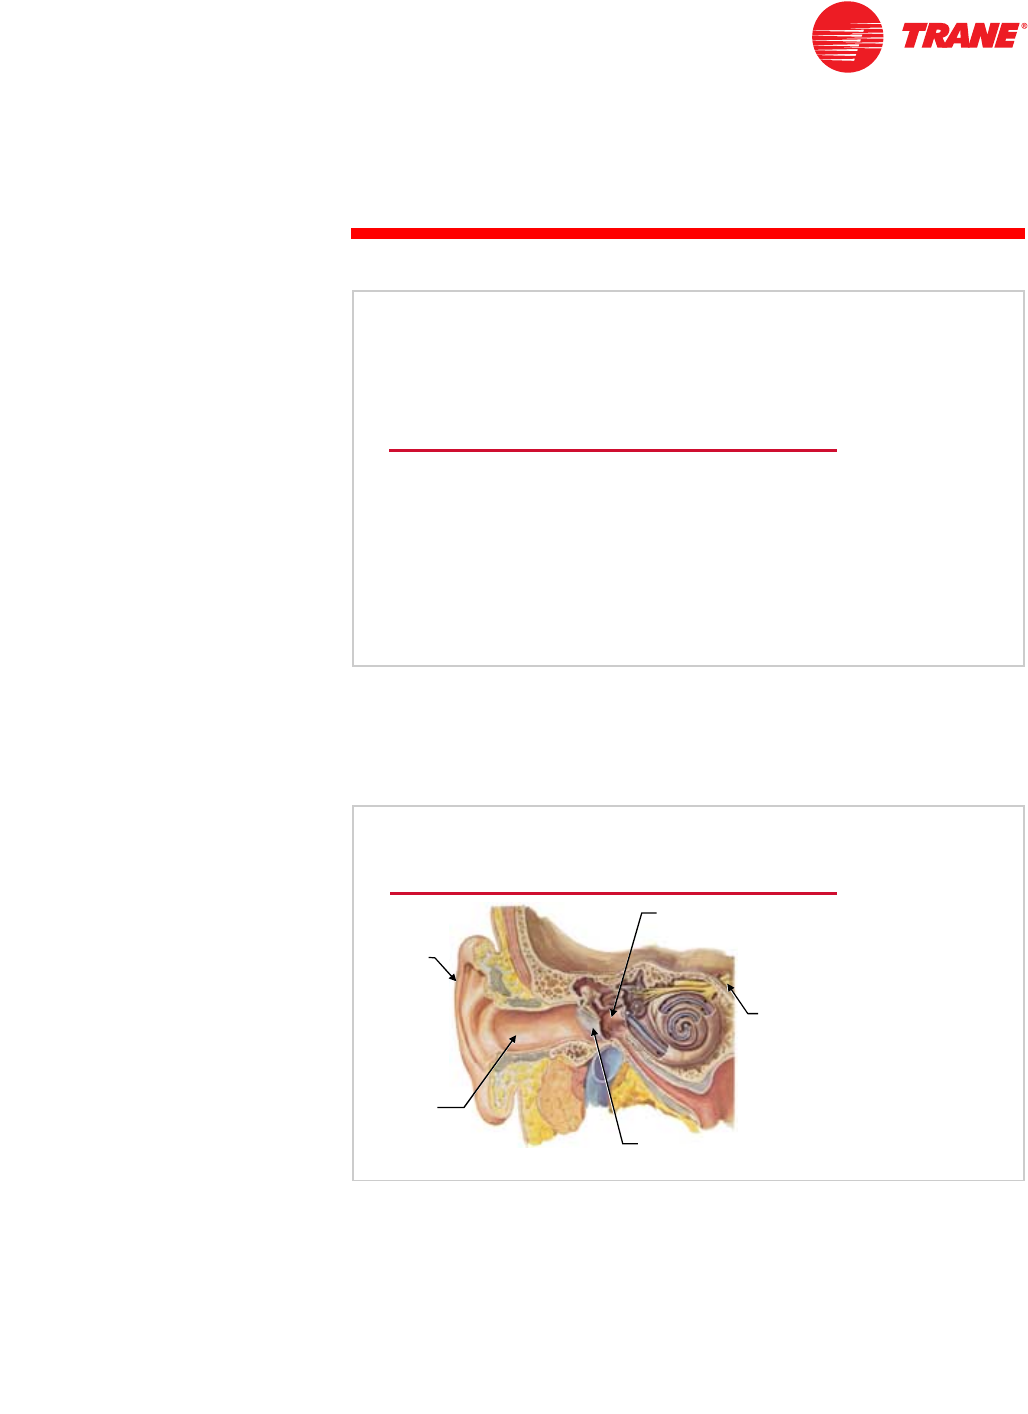
The study of acoustics is affected by the response of the human ear to sound
pressure. Unlike electronic sound-measuring equipment, which provides a
repeatable, unbiased analysis of sound pressure, the sensitivity of the human
ear varies by frequency and magnitude. Our ears are also attached to a highly
arbitrary evaluation device, the brain.
Human Ear Response
The ear acts like a microphone. Sound waves enter the auditory canal and
impinge upon the ear drum, causing it to vibrate. These vibrations are
ultimately transformed into impulses that travel along the auditory nerve to
the brain, where they are perceived as sound. The brain then analyzes and
evaluates the signal.
period two
Sound Perception and Rating
Methods
Fundamentals of HVAC Acoustics
Figure 18
The Human Ear
outer
ear
outer
outer
ear
ear
auditory
canal
auditory
auditory
canal
canal
eardrumeardrum
eardrum
middle
ear
middle
middle
ear
ear
nerves
to brain
nerves
nerves
to brain
to brain
Figure 19
period two
Sound Perception and
Rating Methods
16 TRG-TRC007-EN
notes
period two
Sound Perception and
Rating Methods
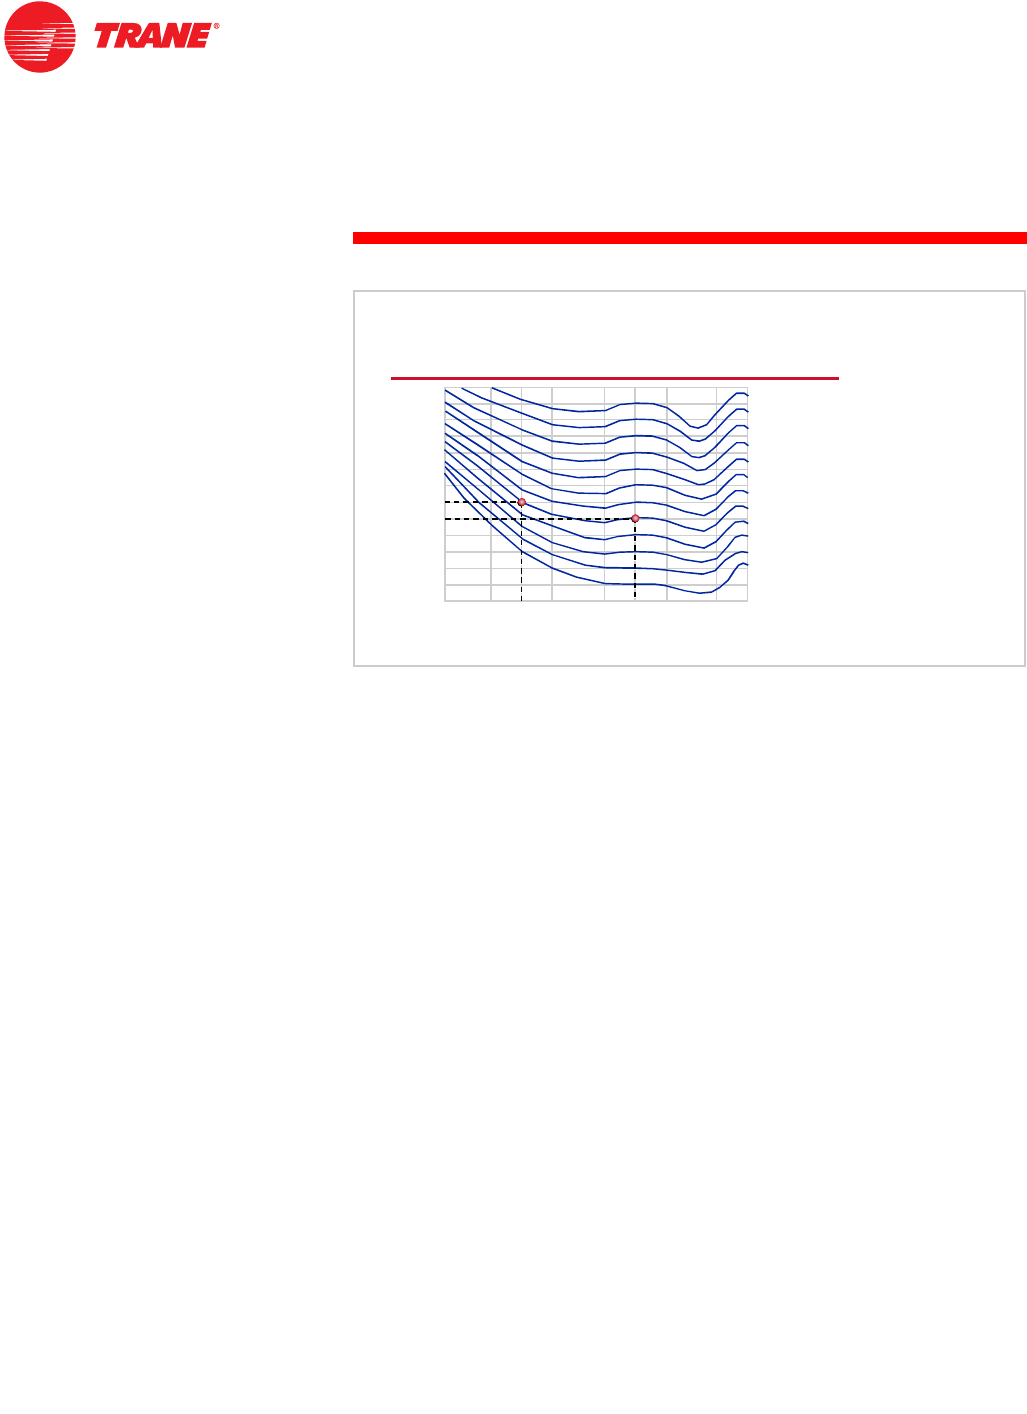
The sensation of loudness is principally a function of sound pressure, however,
it also depends upon frequency. As a selective sensory organ, the human ear
is more sensitive to high frequencies than to low frequencies. Also, the ear’s
sensitivity at a particular frequency changes with sound-pressure level. Figure
20 illustrates these traits using a set of contours. Each contour approximates an
equal loudness level across the frequency range shown.
For example, a 60 dB sound at a frequency of 100 Hz is perceived by the human
ear to have loudness equal to a 50 dB sound at a frequency of 1,000 Hz. Also,
notice that the contours slant downward as the frequency increases from 20
to 200 Hz, indicating that our ears are less sensitive to low-frequency sounds.
The contours are flatter at higher decibels (> 90 dB), indicating a more uniform
response to “loud” sounds across this range of frequencies.
As you can see, the human ear does not respond in a linear manner to pressure
and frequency.
frequency, Hz
frequency, Hz
50
50 100
100 200
200 500
500 1,000
1,000 2,000
2,000 5,000
5,000
20
20 10,000
10,000
120
120
100
100
80
80
60
60
40
40
20
20
0
0
sound pressure, dB ref 20
sound pressure, dB ref 20 m
mPa
Pa
Loudness Contours
Figure 20
TRG-TRC007-EN 17
period two
Sound Perception and
Rating Methods
notes
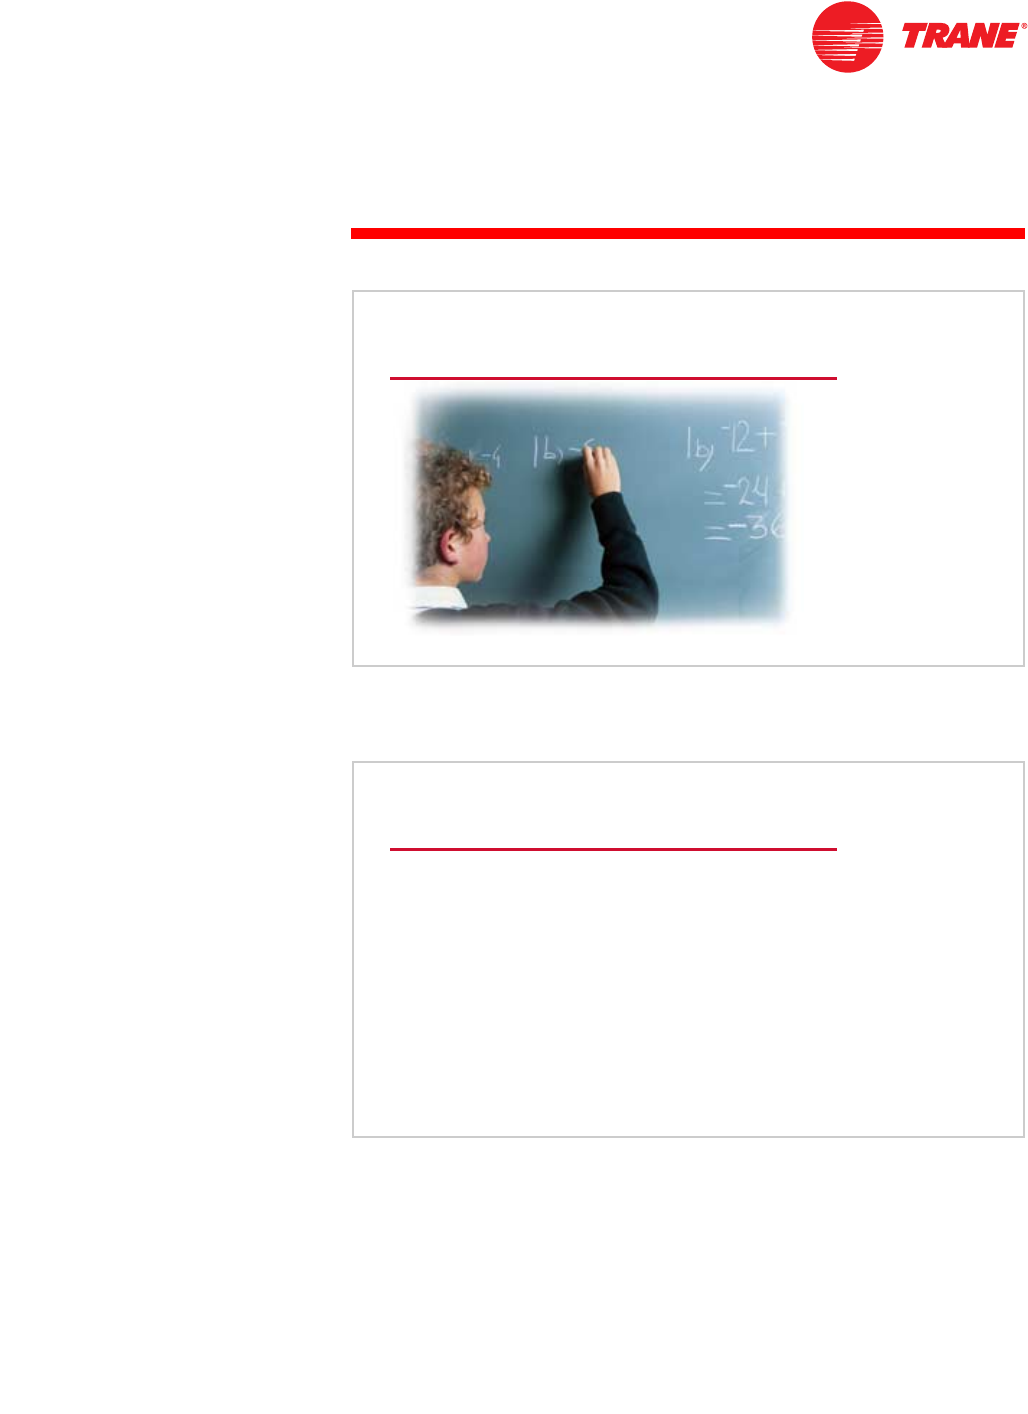
Additionally, tones evoke a particularly strong response. Recall that a tone is
a sound that occurs at a single frequency. Chalk squeaking on a blackboard,
for example, produces a tone that is extremely irritating to many people.
Single-Number Rating Methods
The human ear interprets sound in terms of loudness and pitch, while electronic
sound-measuring equipment interprets sound in terms of pressure and
frequency. As a result, considerable research has been done in an attempt to
equate sound pressure and frequency to sound levels as they are perceived
by the human ear. The goal has been to develop a system of single-number
descriptors to express both the intensity and quality of a sound.
With such a system, sound targets can be established for different
environments. These targets aid building designers in specifying appropriate
acoustical requirements that can be substantiated through measurement. For
example, a designer can specify that “the background sound level in the theater
Response to Tones
Figure 21
Single-Number Rating Methods
IA-, B-, and C-weighting
INoise criteria (NC) curves
IRoom criteria (RC) curves
ISones
IPhons
Figure 22
18 TRG-TRC007-EN
notes
period two
Sound Perception and
Rating Methods
shall be X,” where X is a single-number descriptor conveying the desired
quality of sound.
The most frequently used single-number descriptors are the A-weighting
network, noise criteria (NC), and room criteria (RC). All three share a common
problem, however: they unavoidably lose valuable information about the
character, or quality, of sound. Each of these descriptors is based on octave-
band sound data which, as noted earlier, may already mask tones. Further,
the process of converting from eight octave bands to a single number overlooks
even more sound data.
Despite this shortcoming, the single-number descriptors summarized in this
clinic are valuable tools for defining sound levels in a space, and are widely
used to specify the acoustical requirement of a space.
One simple method for combining octave-band sound data into a single-
number descriptor is A-, B-, or C-weighting. The weighting curves shown in
Figure 23 compensate for the varying sensitivity of the human ear to different
frequencies.
A-weighting, which is most appropriately used for low-volume (or quiet) sound
levels, best approximates human response to sound in the range where no
hearing protection is needed. B-weighting is used for medium-volume sound
levels. C-weighting is used for high-volume (or loud) sound levels where the
response of the ear is relatively flat.
relative response, dB
relative response, dB
frequency, Hz
frequency, Hz
50
50 100
100 200
200 500
500 1,000
1,000 2,000
2,000 5,000
5,000
20
20 10,000
10,000
-
-40
40
-
-30
30
-
-20
20
-
-10
10
0
0
A
A
B
B
C
C
frequency responses for sound
frequency responses for sound
meter weighting characteristics
meter weighting characteristics
A–B–C Weighting
Figure 23
TRG-TRC007-EN 19
period two
Sound Perception and
Rating Methods
notes
The following steps describe how to calculate an A-weighted value.
1Starting with the actual sound-pressure levels for the eight octave bands,
add or subtract the decibel values represented by the A-weighting curve
shown in Figure 23. These weighting factors are also listed in the table in
Figure 24. Subtract 26 dB from the 63 Hz sound-pressure level, 16 dB from
the 125 Hz level, 9 dB from the 250 Hz level, and 3 dB from the 500 Hz level.
Then, add 1 dB each to the sound-pressure levels in the 2,000 Hz and
4,000 Hz octave bands.
2Logarithmically sum all eight octave bands together to arrive at an overall
A-weighted sound-pressure level. This value is then expressed using the
units of dBA.
For the sound-pressure data in this example, the A-weighted sound-pressure
level is 42 dBA.
Most sound meters can automatically calculate and display the A-weighted
sound-pressure level, providing a simple and objective means of verifying
acoustical performance. However, as mentioned earlier, one of the drawbacks
of a single-number descriptor is that data about the relative magnitude of each
octave band is lost when the eight octave bands are combined into one value.
Therefore, even if the target dBA level is achieved, an objectionable tonal
quality or spectrum imbalance may exist.
A–Weighting Example
octave
band
1
2
3
4
5
6
7
8
octave
band
1
2
3
4
5
6
7
8
center
frequency (Hz)
63
125
250
500
1,000
2,000
4,000
8,000
center
frequency (Hz)
63
125
250
500
1,000
2,000
4,000
8,000
A-weighting
factor (dB)
–26
–16
–9
–3
+ 0
+ 1
+ 1
+ 0
A-weighting
factor (dB)
–26
–16
–9
–3
+ 0
+ 1
+ 1
+ 0
actual sound
pressure (dB)
63
52
45
38
31
24
16
10
actual sound
pressure (dB)
63
52
45
38
31
24
16
10
A-weighted
sound pressure (dB)
37
36
36
35
31
25
17
10
42 dBA
A-weighted
sound pressure (dB)
37
36
36
35
31
25
17
10
42 dBA Figure 24
20 TRG-TRC007-EN
notes
period two
Sound Perception and
Rating Methods
A-weighting is often used to define sound in outdoor environments. For
example, local sound ordinances typically regulate dBA levels at property lines.
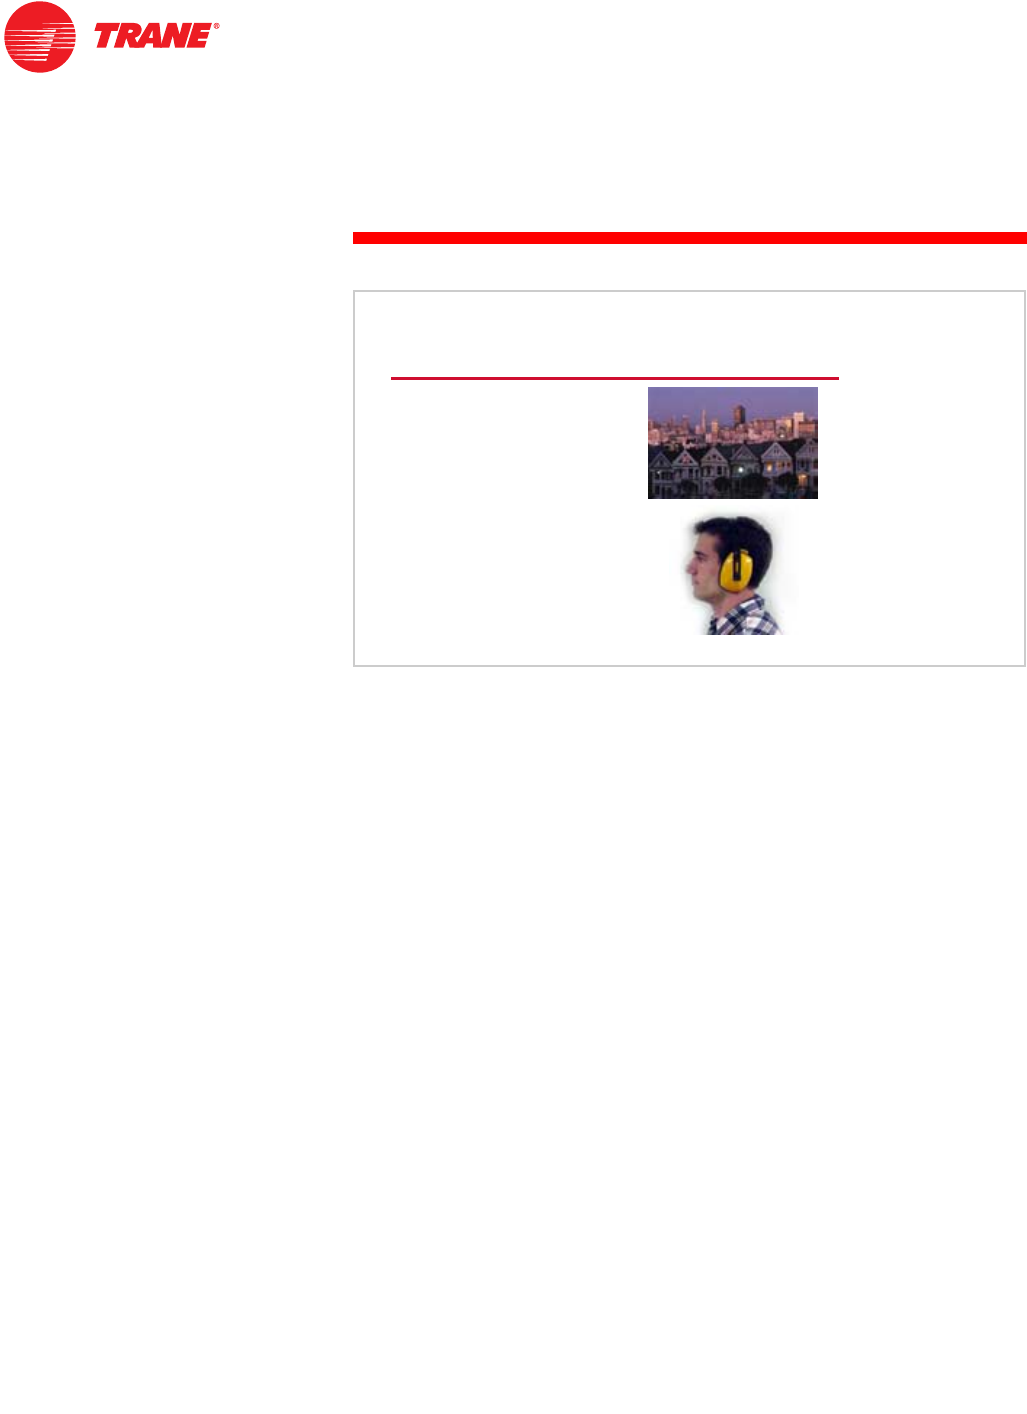
Hearing-related safety standards, written by organizations such as the
Occupational Safety and Health Administration (OSHA), also commonly refer to
A-weighted sound-pressure levels when determining whether hearing
protection is required in a certain environment.
To avoid confusion, we recommend that A-weighting be applied only to octave-
band sound-pressure data, not to sound-power data. Also, A-weighting should
be limited to expressing a single-number descriptor. Displaying sound data in
all eight octave bands in terms of A-weighted sound pressures should be
avoided.
A–Weighting
IUsed for outdoor sound
ordinances and indoor,
hearing-related safety
standards (OSHA)
IUse with sound pressure
data only, not sound power
IExpress as a single number
descriptor only, not as
octave-band data
Figure 25
TRG-TRC007-EN 21
period two
Sound Perception and
Rating Methods
notes
Noise criteria (NC) curves are probably the most common single-number
descriptor used to rate sound-pressure levels in indoor environments. Like the
equal-loudness contours on which they are based, the loudness along each NC
curve is about the same. Each NC curve slopes downward to reflect the
increasing sensitivity of the ear to higher frequencies.
It should also be noted that NC charts do not include the 16 Hz and 31.5 Hz
octave bands. Although HVAC equipment manufacturers typically do not
provide data in these bands (because it is very difficult to obtain reliably), these
octave bands do effect the acoustical comfort of the occupied space.
Nevertheless, these octave bands can be measured in a space that is already
built and may provide useful diagnostic information.
NC
NC-
-15
15
NC
NC-
-20
20
NC
NC-
-25
25
NC
NC-
-30
30
NC
NC-
-35
35
NC
NC-
-40
40
NC
NC-
-45
45
NC
NC-
-50
50
NC
NC-
-55
55
NC
NC-
-60
60
NC
NC-
-65
65
70
70
50
50
40
40
30
30
20
20
10
10
sound pressure, dB ref 20
sound pressure, dB ref 20 m
mPa
Pa
80
80
60
60
octave
octave-
-band frequency, Hz
band frequency, Hz
63
63 125
125 250
250 500
500 1,000
1,000 2,000
2,000 4,000
4,000 8,000
8,000
Noise Criteria (NC) Curves
approximate threshold for
approximate threshold for
hearing continuous noise
hearing continuous noise
Figure 26
22 TRG-TRC007-EN
notes
period two
Sound Perception and
Rating Methods
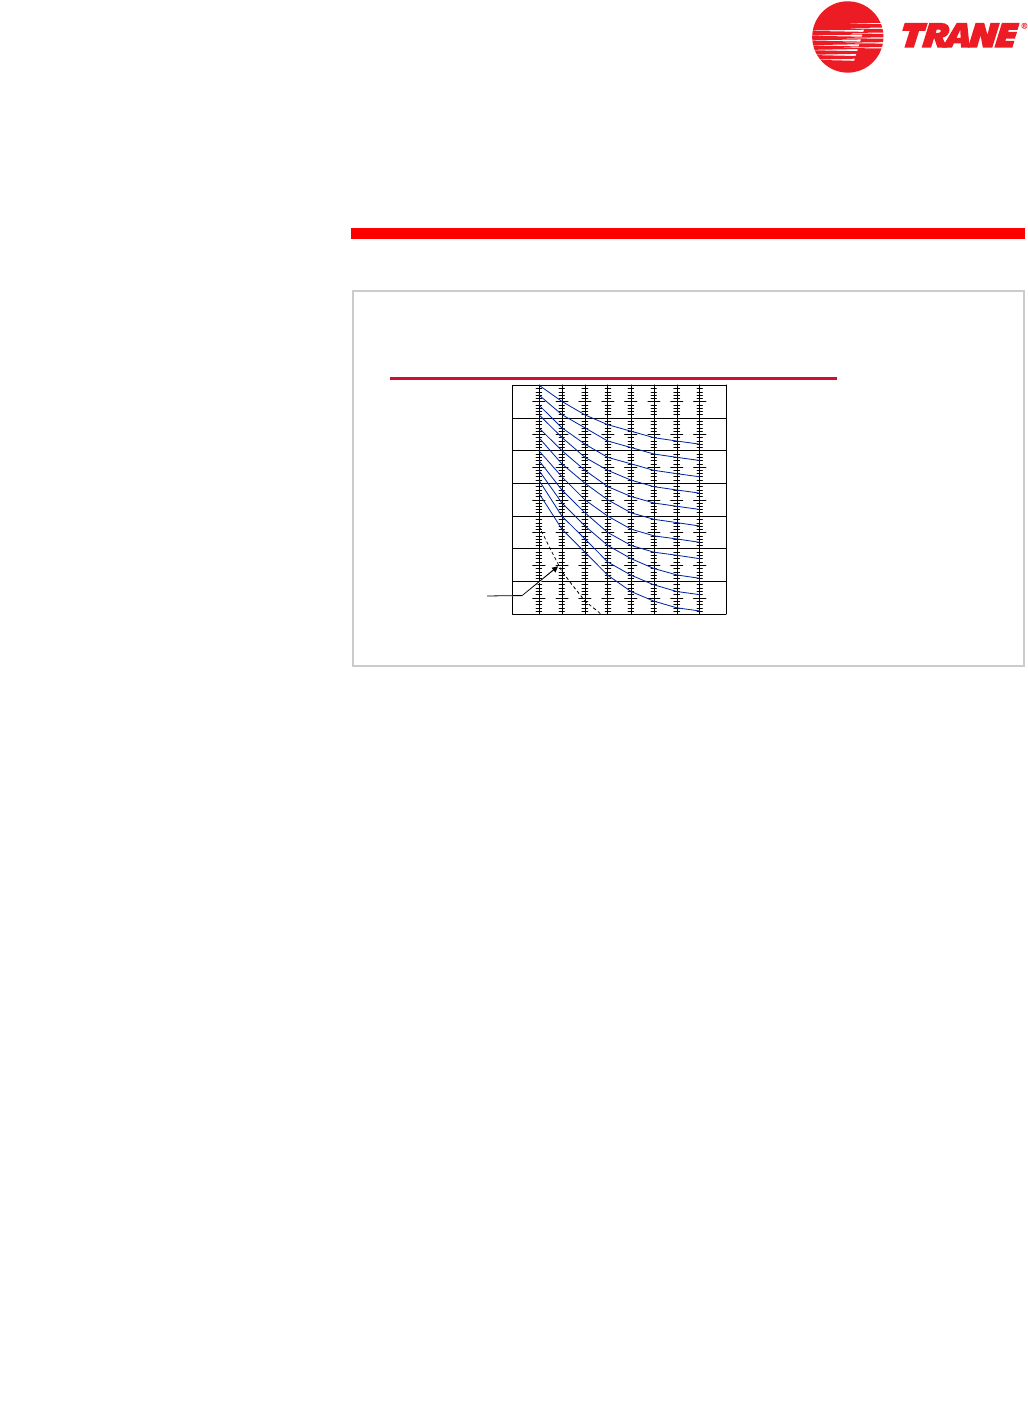
The following steps describe how to calculate an NC rating.
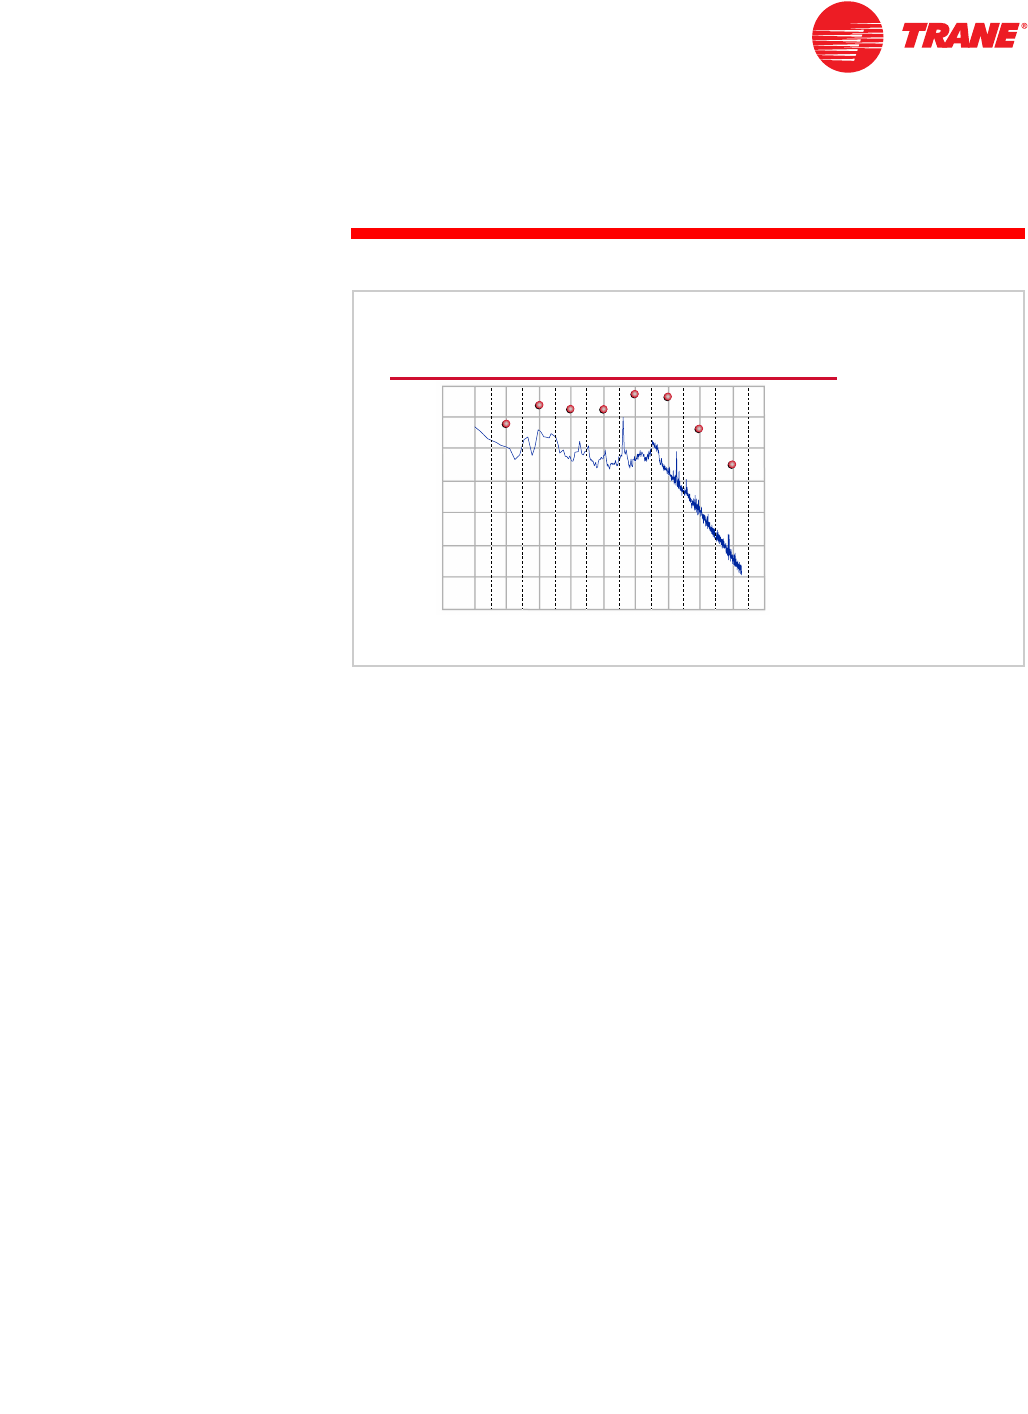
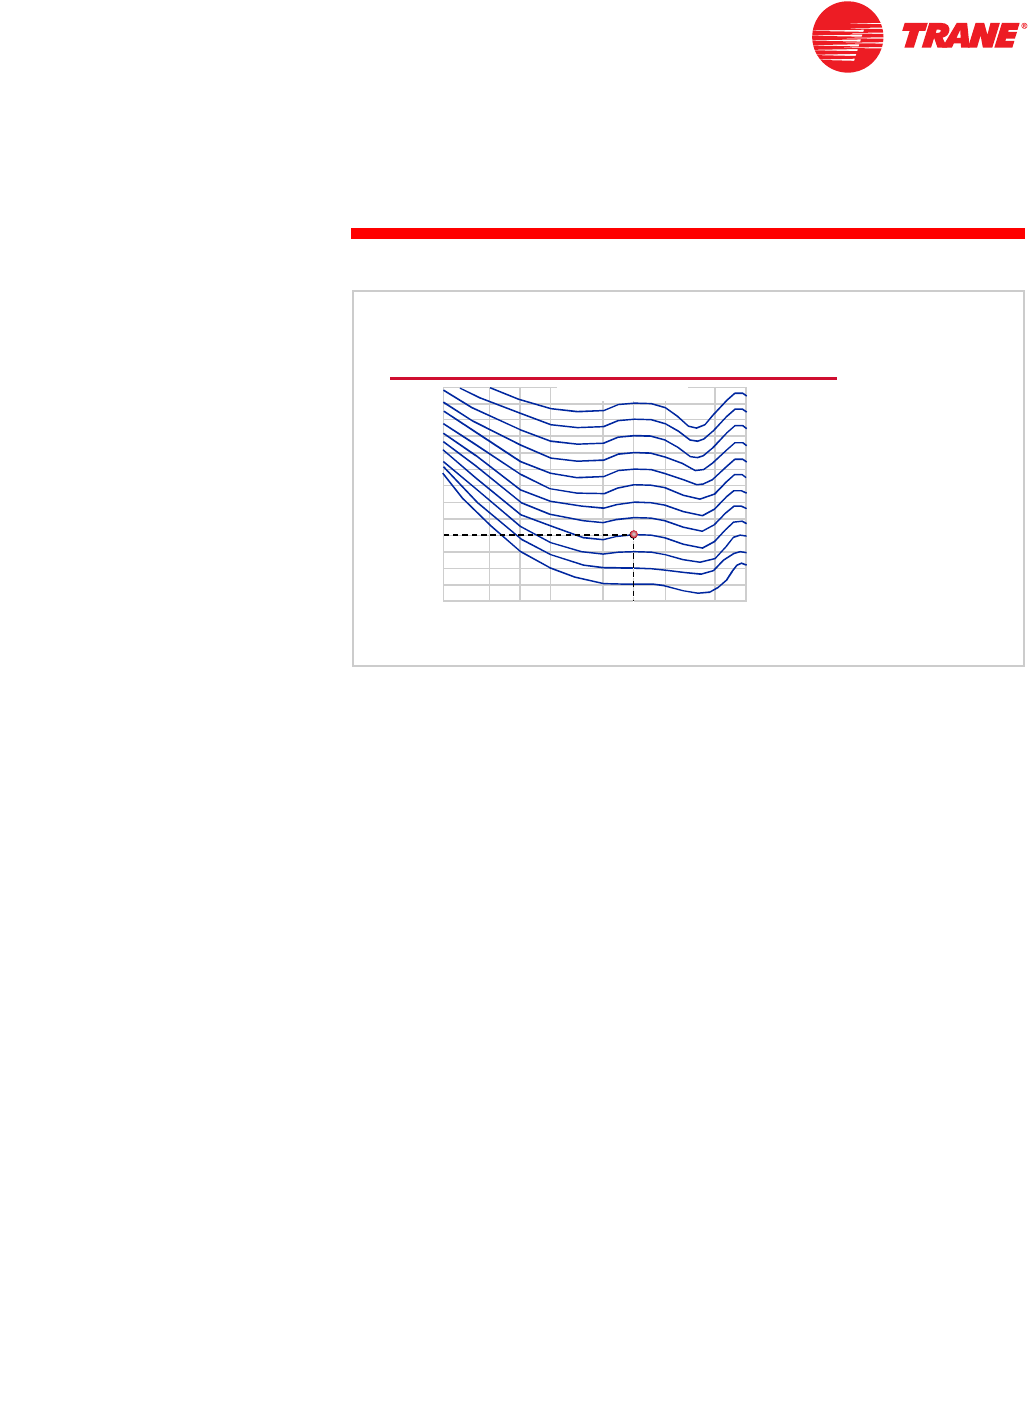
1Plot the octave-band sound-pressure levels on the NC chart.
2The highest curve crossed by the plotted data determines the NC rating.
Although the NC curves are popular and easy to use, they do have a few
shortcomings. Specifically, they do not account for the tonal nature and relative
magnitude of each octave band. Figure 27 shows octave-band data measured in
an open-plan office space and plotted on an NC chart. The resulting value, NC-
39, is generally considered to be acceptable for this type of environment. Notice
that this NC value is set by the 63 Hz octave band and the sound drops off
quickly in the higher octave bands.
In this particular example, sound generated by the air-handling unit travels
through the ductwork, breaks out through the duct walls, and radiates into the
office area. To achieve the desired NC level, two layers of sheet rock were added
to the exterior surface of the duct to block the low-frequency sound.
Unfortunately, because high-frequency sounds are much more easily
attenuated than low-frequency sounds, the upper octave bands are now over-
attenuated.
Although an objective analysis deems the resulting NC-39 sound level
acceptable in this type of open-plan office space, most listeners in the space
would probably perceive this unbalanced spectrum as having an annoying
rumble.
NC
NC-
-15
15
NC
NC-
-20
20
NC
NC-
-25
25
NC
NC-
-30
30
NC
NC-
-35
35
NC
NC-
-40
40
NC
NC-
-45
45
NC
NC-
-50
50
NC
NC-
-55
55
NC
NC-
-60
60
NC
NC-
-65
65
70
70
50
50
40
40
30
30
20
20
10
10
sound pressure, dB ref 20
sound pressure, dB ref 20 m
mPa
Pa
80
80
60
60
octave
octave-
-band frequency, Hz
band frequency, Hz
63
63 125
125 250
250 500
500 1,000
1,000 2,000
2,000 4,000
4,000 8,000
8,000
Noise Criteria (NC) Curves
NC
NC-
-39
39
Figure 27
TRG-TRC007-EN 23
period two
Sound Perception and
Rating Methods
notes
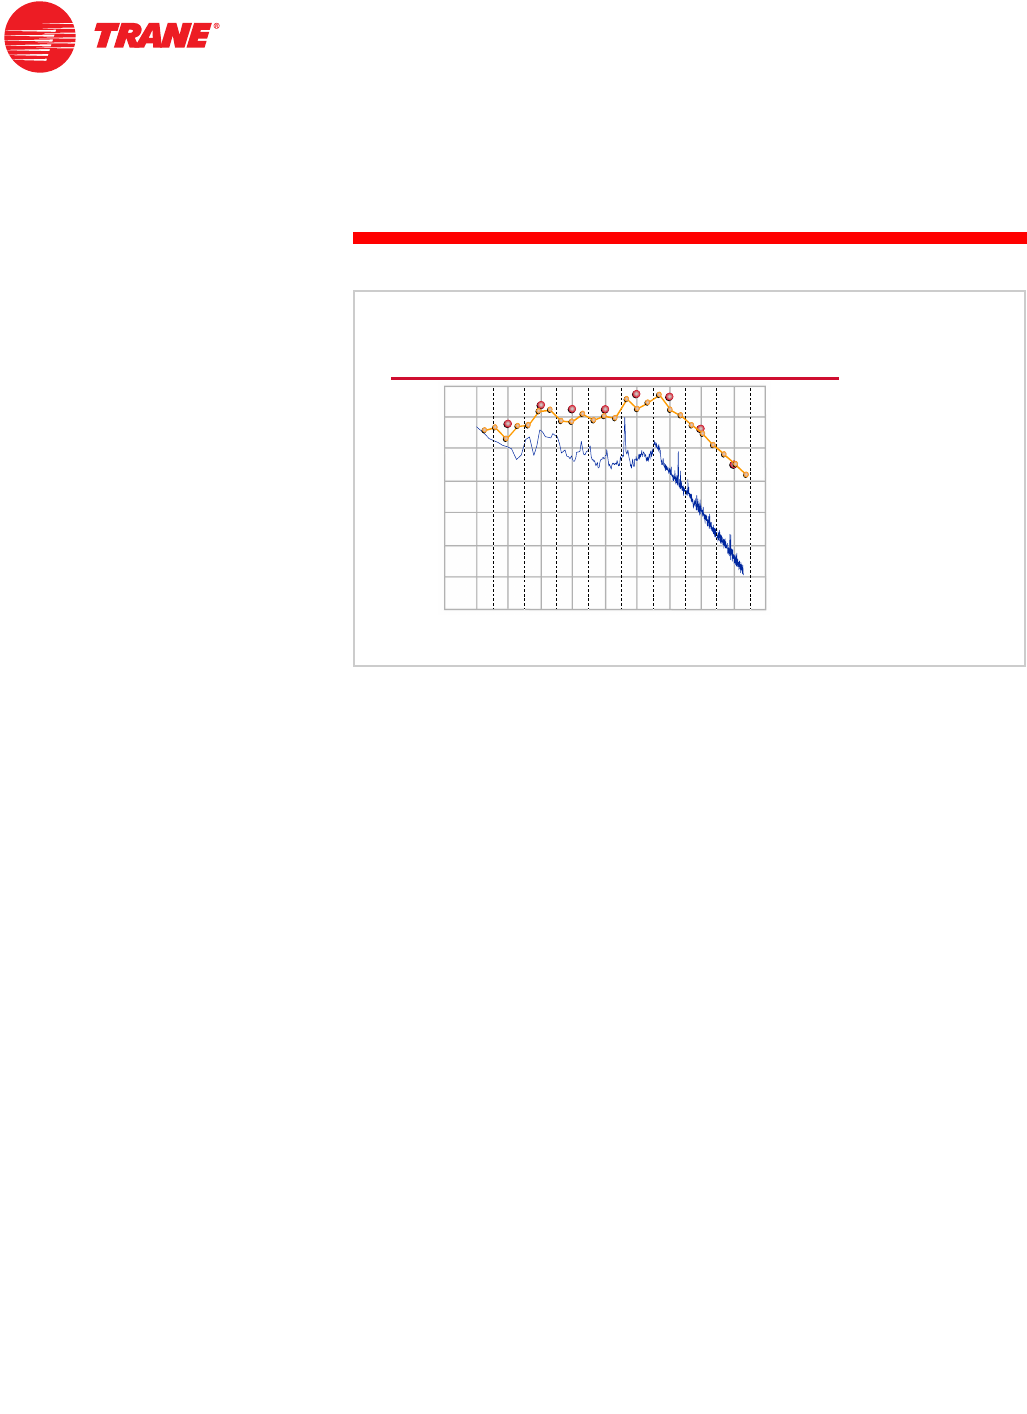
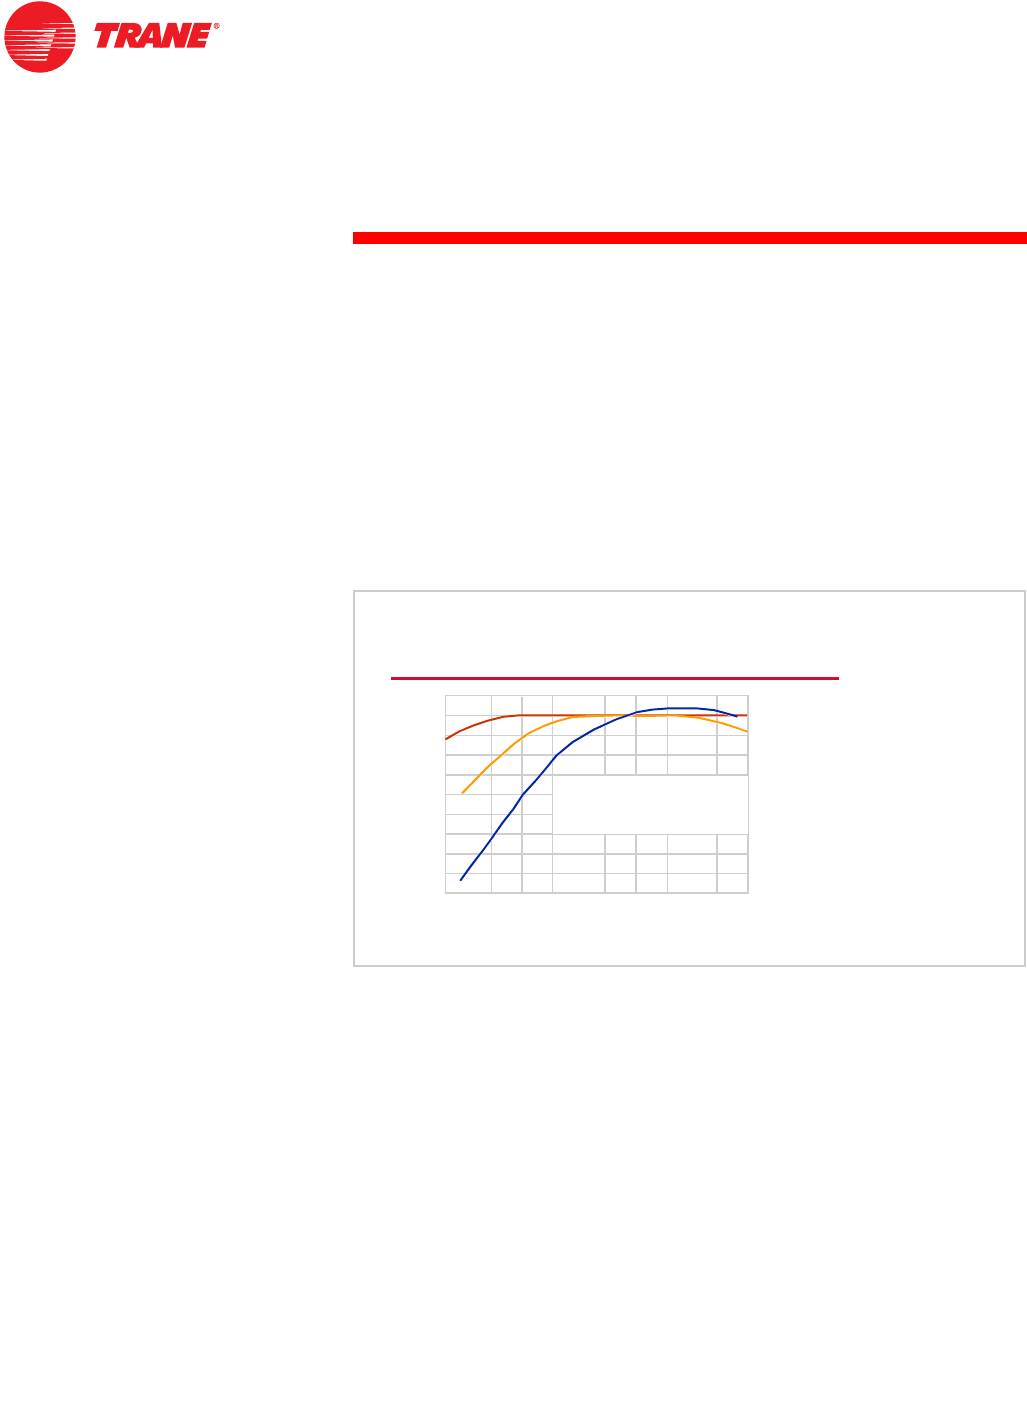
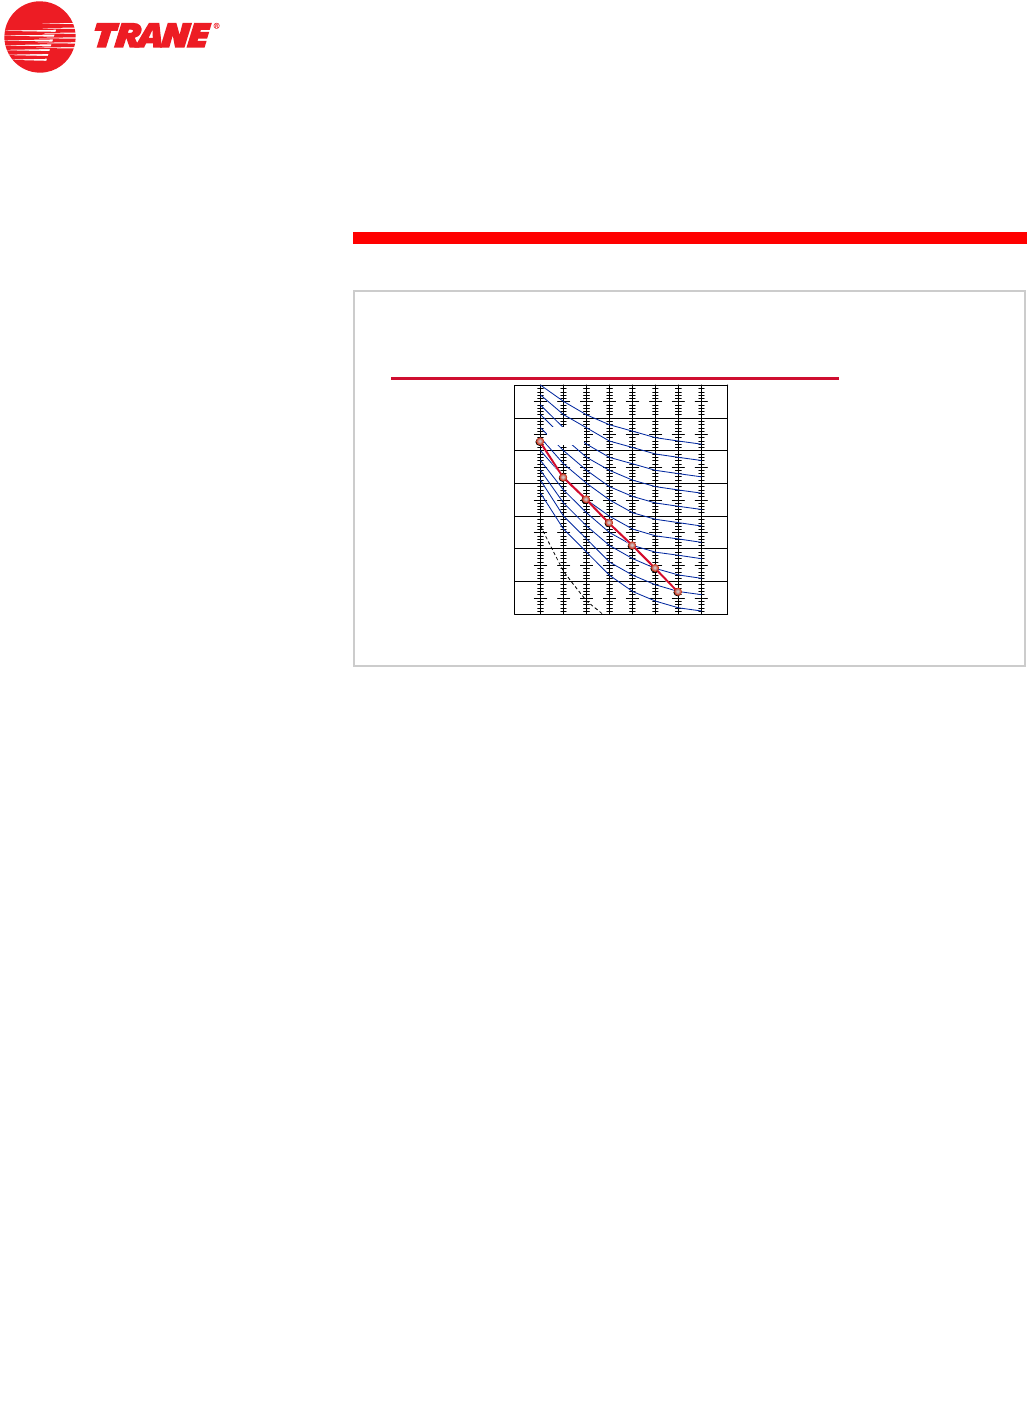
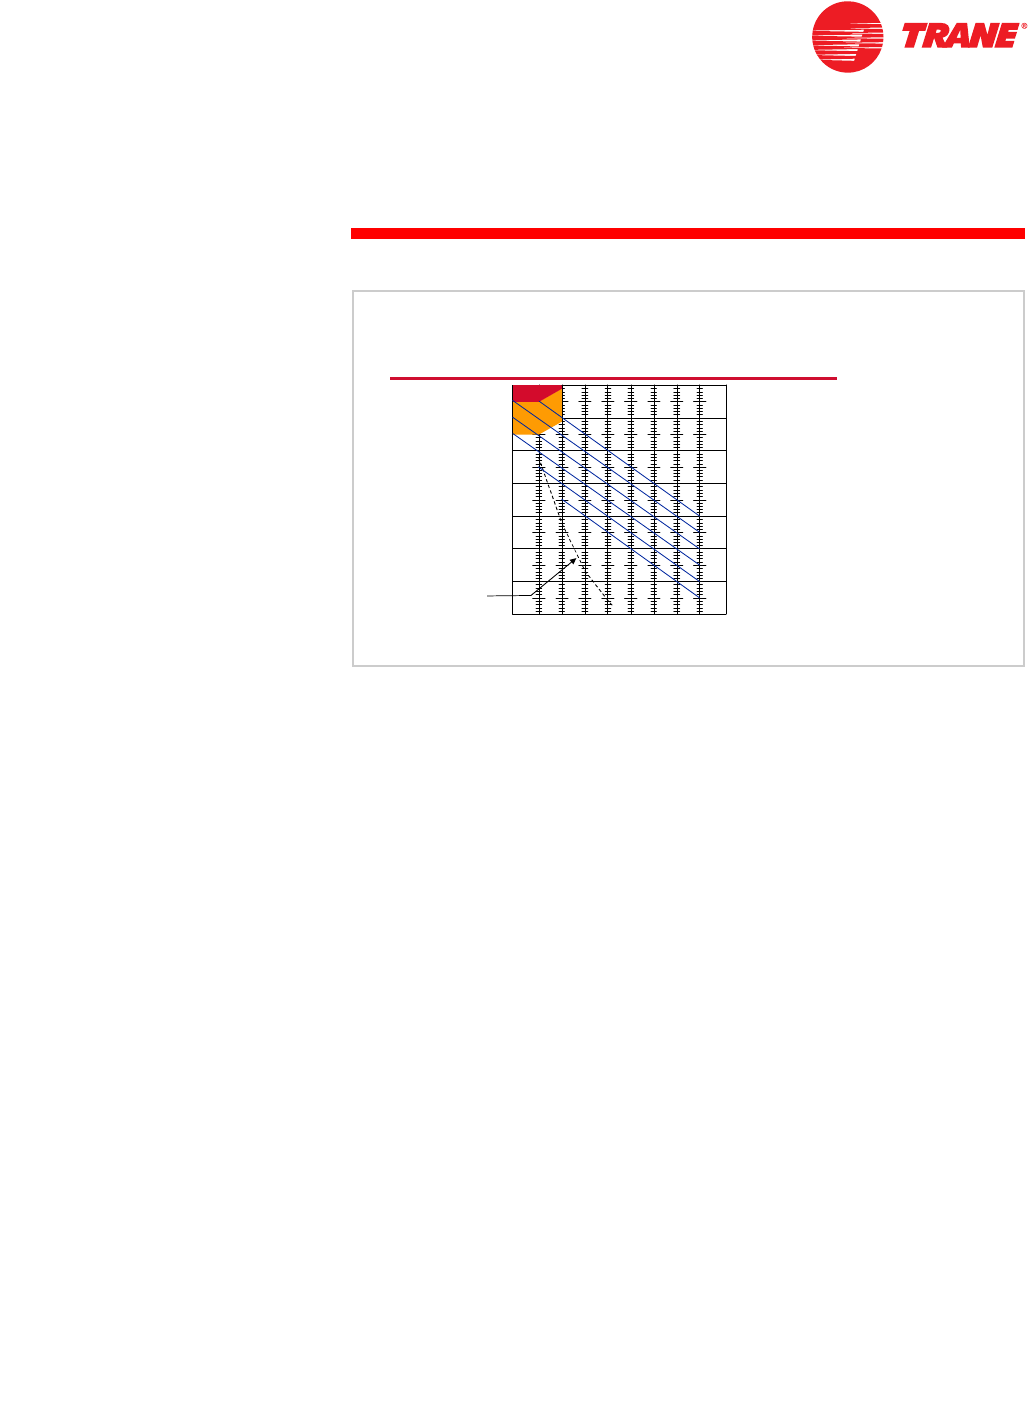
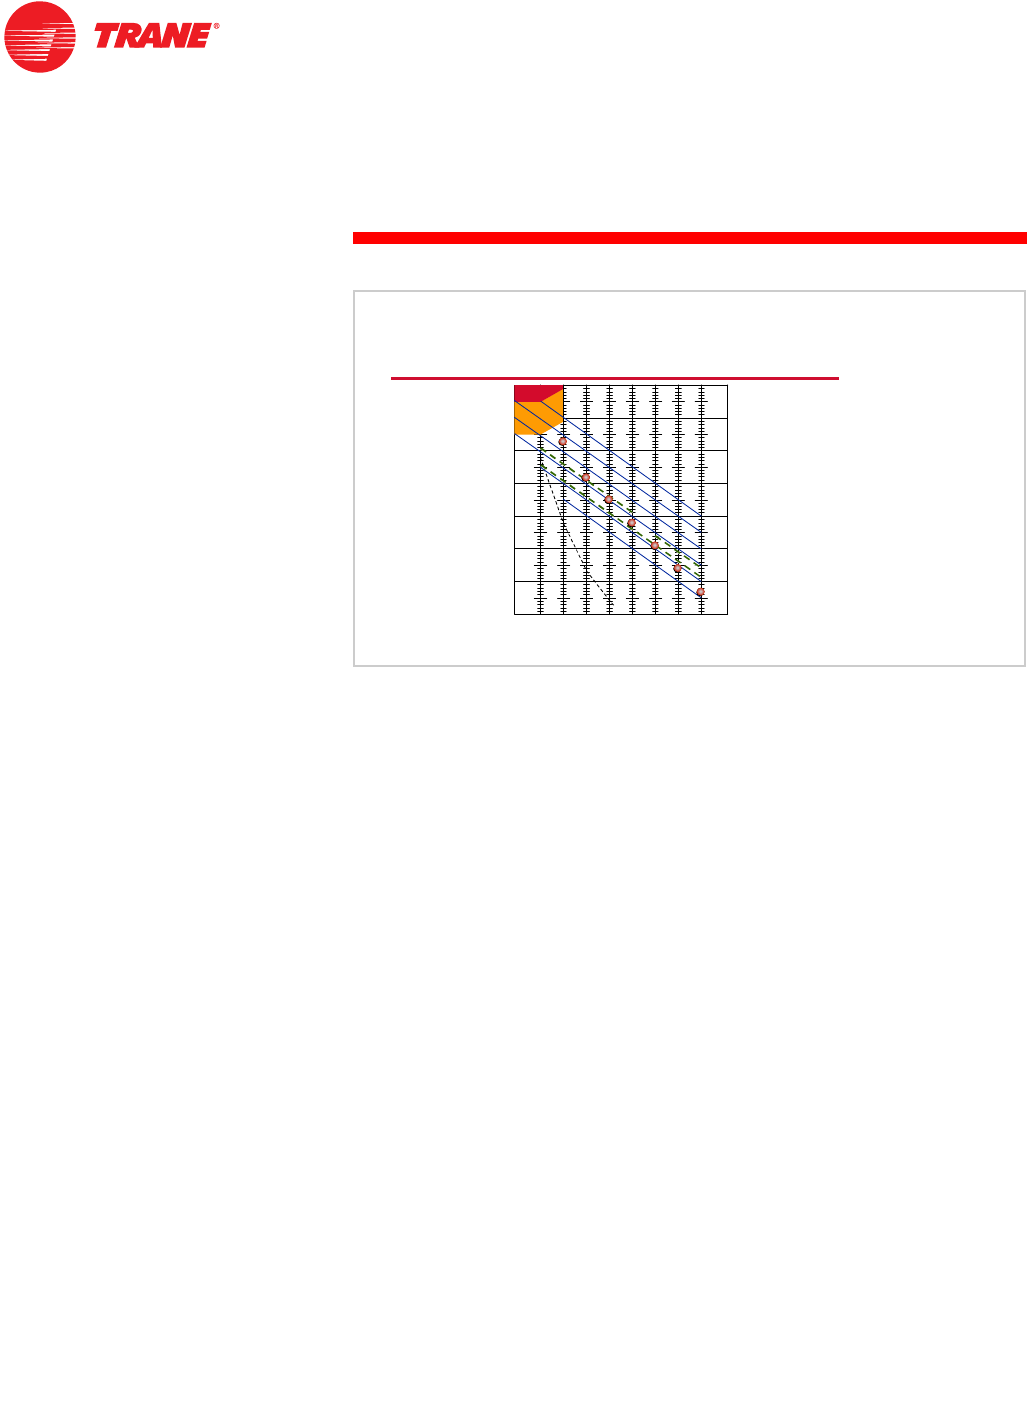
Room criteria (RC) curves are similar to NC curves in that they are used to
provide a rating for sound-pressure levels in indoor environments. The major
difference is that RC curves give an additional indication of sound character.
As discussed in the previous example, sound spectrums can be unbalanced in
ways that result in poor acoustical quality. Too much low-frequency sound
results in a rumble, and too much high-frequency sound produces a hiss.
RC curves provide a means of identifying these imbalances. An RC rating
consists of two descriptors. The first descriptor is a number representing the
speech interference level (SIL) of the sound. The second descriptor is a letter
denoting the character of the sound as a subjective observer might describe it.
nN identifies a neutral or balanced spectrum
nR indicates a “rumble”
nH represents a “hiss”
nRV denotes perceptible vibration
Calculating an RC value from octave-band sound-pressure data is not quite as
easy as determining an NC value, but it is still fairly simple. The RC value is
based on sound-pressure data from the eight octave bands between 31.5 Hz
and 4,000 Hz. Note that these are different than the octave bands included on
the NC chart.
Room Criteria (RC) Curves
approximate threshold for
approximate threshold for
hearing continuous noise
hearing continuous noise
70
70
50
50
40
40
30
30
20
20
10
10
sound pressure, dB ref 20
sound pressure, dB ref 20 m
mPa
Pa
80
80
60
60
octave
octave-
-band frequency, Hz
band frequency, Hz
31.5
31.5 63
63 125
125 250
250 500
500 1,000
1,000 2,000
2,000 4,000
4,000
RC
RC-
-25
25
RC
RC-
-30
30
RC
RC-
-35
35
RC
RC-
-40
40
RC
RC-
-45
45
RC
RC-
-50
50
A
A
B
B
Figure 28
24 TRG-TRC007-EN
notes
period two
Sound Perception and
Rating Methods
The following steps describe how to determine an RC rating.
1Plot the octave-band sound-pressure levels on the RC chart.
2Determine the SIL by calculating the arithmetic average of the sound-
pressure levels in the 500 Hz, 1,000 Hz, and 2,000 Hz octave bands. In this
example, the arithmetic average of 38 dB, 31 dB, and 24 dB is 31 dB.
3Draw a line (C) with a slope of –5 dB per octave that passes through the
calculated SIL at the 1,000 Hz octave band. This is the reference line for
evaluating the character of the sound spectrum.
4Between 31.5 Hz and 500 Hz, draw a line (D) that is 5 dB above the reference
line (C). Between 1,000 Hz and 4,000 Hz, draw a second line (E) that is 3 dB
above the reference line (C). These two boundary lines (D and E) represent
the maximum permitted deviation to receive a neutral (N) rating.
5Judge the character of the sound quality by observing how the sound
spectrum deviates from the boundary lines drawn in Step Four. Use the
following criteria to choose the appropriate letter descriptor that
characterizes the subjective quality of the noise.
nNeutral (N): The sound level in each of the octave bands between
31.5 Hz and 500 Hz is below line D, and the sound level in each of
the octave bands between 1,000 Hz and 4,000 Hz is below line E.
nRumble (R): The sound level in any octave band between 31.5 Hz
and 500 Hz is above line D.
nHiss (H): The sound level in any octave band between 1,000 Hz and
4,000 Hz is above line E.
70
70
50
50
40
40
30
30
20
20
10
10
sound pressure, dB ref 20
sound pressure, dB ref 20 m
mPa
Pa
80
80
60
60
octave
octave-
-band frequency, Hz
band frequency, Hz
31.5
31.5 63
63 125
125 250
250 500
500 1,000
1,000 2,000
2,000 4,000
4,000
RC
RC-
-25
25
RC
RC-
-30
30
RC
RC-
-35
35
RC
RC-
-40
40
RC
RC-
-45
45
RC
RC-
-50
50
A
A
B
B
Room Criteria (RC) Curves
C
C
D
D
E
E
Figure 29

TRG-TRC007-EN 25
period two
Sound Perception and
Rating Methods
notes nPerceptible vibration (RV): The sound level in the octave bands
between 16 Hz and 63 Hz falls in the shaded regions (A and B).
These regions indicate sound-pressure levels at which walls and
ceilings can vibrate perceptibly—rattling cabinet doors, pictures,
ceiling fixtures, and other furnishings in contact with them.
Region A: High probability that noise-induced vibration levels in
lightweight wall and ceiling constructions will be felt. Anticipate
audible rattles in light fixtures, doors, windows, and so on.
Region B: Noise-induced vibration levels in lightweight wall and
ceiling constructions may be felt. Slight possibility of rattles in light
fixtures, doors, windows, and so on.
The RC rating for the sound is the numerical SIL value calculated in Step Two
and the letter descriptor determined in Step Five.

26 TRG-TRC007-EN
notes
period two
Sound Perception and
Rating Methods
If we plot the acoustical data for our example office space on the RC chart, we
find that it results in a rating of RC-31(R). The SIL is 31 and the sound-pressure
levels in the 63 Hz and 125 Hz octave bands are above line D, indicating a
rumble characteristic of the sound.
This time, our objective and subjective analyses lead to the same conclusion.
Although the space is quiet enough, the background noise is perceived as
having a rumble. A sound spectrum that falls in the RC neutral category would
be judged as excellent by most observers. It is this conformity of analysis
results that makes the RC rating method a better tool than the other single-
number descriptors for specifying acoustical requirements indoors. Despite
the advantages of the RC rating system, it is less widely used than other single-
number descriptors.
Finally, accurate determination of sound-power levels for the 16 Hz and 31.5 Hz
octave bands requires a very large reverberant room. Most HVAC equipment
manufacturers do not provide sound data in these two octave
bands due the cost of constructing such a large test room and the difficulty in
qualifying it. This makes it difficult to predict sound-pressure levels in these
octave bands.
70
70
50
50
40
40
30
30
20
20
10
10
sound pressure, dB ref 20
sound pressure, dB ref 20 m
mPa
Pa
80
80
60
60
octave
octave-
-band frequency, Hz
band frequency, Hz
31.5
31.5 63
63 125
125 250
250 500
500 1,000
1,000 2,000
2,000 4,000
4,000
RC
RC-
-25
25
RC
RC-
-30
30
RC
RC-
-35
35
RC
RC-
-40
40
RC
RC-
-45
45
RC
RC-
-50
50
A
A
B
B
Room Criteria (RC) Curves
C
C
D
D
E
E
RC
RC-
-31 (R)
31 (R)
Figure 30
TRG-TRC007-EN 27
period two
Sound Perception and
Rating Methods
notes
The phon is another descriptor used to indicate loudness with a single number.
The loudness of a sound, expressed in phons, is equal to the sound- pressure
level of a standard sound, at 1,000 Hz, that is considered equally loud. For
example, a sound pressure level of 40 dB at 1,000 Hz is considered to have a
loudness of 40 phons. Any sound that falls on this same loudness curve, at any
frequency, would also be described as having a loudness equal to 40 phons.
While the phon scale is logarithmic, the sone is the linear equivalent to the
phon. In principle, the sone scale is linear when compared to the response of
the human ear. For example, two sones is twice as loud as one sone, and half
as loud as four sones.
While the phon and sone scales are not widely used, some HVAC equipment,
primarily non-ducted fans and power ventilators, is still rated in sones. AMCA
Standard 301, Methods for Calculating Fan Sound Ratings from Laboratory Test
Data, provides a method for calculating the sone rating from octave-band data.
Use caution when comparing equipment based on sones. Multiple methods
exist for calculating a sone rating, and they provide different results.
frequency, Hz
frequency, Hz
50
50 100
100 200
200 500
500 1,000
1,000 2,000
2,000 5,000
5,000
20
20 10,000
10,000
120
120
100
100
80
80
60
60
40
40
20
20
0
0
sound pressure, dB ref 20
sound pressure, dB ref 20 m
mPa
Pa
Phon and Sone
10
10
20
20
30
30
40
40
50
50
60
60
70
70
80
80
90
90
100
100
110
110
120
120
loudness level (
loudness level (phons
phons)
)
Figure 31

28 TRG-TRC007-EN
notes
period two
Sound Perception and
Rating Methods
Octave-Band Rating Method
A more useful method of rating sound level is to use the octave bands
discussed earlier. While octave-band data is not as simple to interpret as a
single-number rating, it provides much more information about the character of
the sound.
Both sound-power levels and sound-pressure levels can be presented in
octave-band format. When equipment sound data is provided in terms of
sound-power level in each octave band, an “apples to apples” comparison
can be made between various pieces of equipment. In addition, this sound-
power data can be converted to sound-pressure levels when the details of the
environment are known. This type of analysis will be discussed further in
Period Three.
Sound-pressure levels in each octave band, whether predicted from sound-
power data or measured in an existing environment, reveal much more about
the character of sound than any of the single-number rating methods. It is
important to note that any of the single-number ratings described in this section
can be calculated from octave-band sound-pressure data. However, octave-
band data cannot be derived from any of the single-number ratings.
Octave-Band Rating Method
octave
band
1
2
3
4
5
6
7
8
octave
band
1
2
3
4
5
6
7
8
center
frequency (Hz)
63
125
250
500
1,000
2,000
4,000
8,000
center
frequency (Hz)
63
125
250
500
1,000
2,000
4,000
8,000
equipment
sound power
(dB ref 10-12 W)
103
104
100
101
98
93
88
85
equipment
sound power
(dB ref 10-12 W)
103
104
100
101
98
93
88
85
sound pressure
in the space
(dB ref 20 m
mm
mPa)
63
52
45
38
31
24
16
10
sound pressure
in the space
(dB ref 20 m
mm
mPa)
63
52
45
38
31
24
16
10
Figure 32

TRG-TRC007-EN 29
notes
period three
Acoustical Analysis
The primary acoustical design goal for an HVAC system is to achieve a
background noise level that is quiet enough so that it does not interfere with
the activity requirements of the space and is not obtrusive in sound quality.
What is considered “acceptable” varies dramatically with the intended use
of the space. Obviously, a factory has less stringent acoustical requirements
than a church, while an office has a different set of requirements altogether.
Therefore, the acoustical design goal depends on the required use of the space.
period three
Acoustical Analysis
Fundamentals of HVAC Acoustics
Figure 33

30 TRG-TRC007-EN
notes
period three
Acoustical Analysis
Setting a Design Goal
The first step of an acoustical design is to quantify the goal. Period Two
introduced several single-number descriptors that designers commonly use
to define the acoustical design goal for a space. Each descriptor has its
advantages its and drawbacks.
In general, when defining the acoustical design goal for an interior space, either
an NC value or an RC value is used. To aid HVAC system designers, the
American Society of Heating, Refrigerating, and Air-Conditioning Engineers
(ASHRAE) recommends target RC ratings for various types of spaces, and
encourages the use of the RC rating method whenever the space requires a
neutral, unobtrusive background sound. Figure 34 includes an excerpt from the
ASHRAE Handbook—Applications (Table 43 in Chapter 46 of the 1999 edition).
As mentioned earlier, A-weighting is also used in many hearing-protection
safety standards for industrial environments. These standards generally take
the form of a maximum A-weighted sound-pressure level at a specified
distance from the piece of machinery.
Setting a Design Goal
room type
hotels/motels
guest rooms
banquet rooms
libraries
office buildings
open plan offices
public lobbies
performing arts
theaters
practice rooms
schools
small classrooms
large classrooms
room type
hotels/motels
guest rooms
banquet rooms
libraries
office buildings
open plan offices
public lobbies
performing arts
theaters
practice rooms
schools
small classrooms
large classrooms
RC(N) criteria
25 to 35
25 to 35
30 to 40
30 to 40
40 to 45
25 max
35 max
40 max
35 max
RC(N) criteria
25 to 35
25 to 35
30 to 40
30 to 40
40 to 45
25 max
35 max
40 max
35 max Figure 34
TRG-TRC007-EN 31
period three
Acoustical Analysis
notes
When defining the acoustical design goal for an outdoor environment, to meet
a local noise ordinance for example, the A-weighted scale is typically used. This
generally takes the form of a maximum A-weighted sound-pressure level at the
lot line of the property.
More-sophisticated noise ordinances may specify maximum sound-pressure
levels for each octave band and possibly a restriction on other characteristics
of the sound. For example, a sound ordinance may define that a tone is present
when the sound-pressure level in any one-third octave band exceeds the
arithmetic average of the sound-pressure levels in the two neighboring one-
third octave bands by 5 dB or more.
Setting a Design Goal
Figure 35
32 TRG-TRC007-EN
notes
period three
Acoustical Analysis
Source–Path–Receiver Analysis
Achieving the desired acoustical characteristics in a space, however, requires
more than selecting an appropriate single-number descriptor. Including a
single-number descriptor in a HVAC system specification means that someone
must perform an acoustical analysis to determine if the proposed HVAC system
and equipment will satisfy the space acoustical requirements. To make such a
prediction, the analysis must convert the sound-power level of the source (the
fan in the air handler in this example) to the sound-pressure level in the
occupied space, assessing the effect of installation and environmental factors
along the way.
Sound that reaches the occupied space will be altered by ductwork, wall and
ceiling construction, room furnishings, and many other factors. The validity
of an acoustical analysis, therefore, depends on the analyst’s familiarity with
construction details.
Acoustical Analysis
air handler
(source)
air handler
air handler
(source)
(source)
ductworkductwork
ductwork diffuserdiffuser
diffuser
occupied space
(receiver)
occupied space
occupied space
(receiver)
(receiver)
VAV boxVAV box
VAV box
Figure 36

TRG-TRC007-EN 33
period three
Acoustical Analysis
notes
Predicting the sound level in a given space requires making a model of the
system. A source–path–receiver model provides a systematic approach to
predict the acoustical characteristics in a space. As the name suggests, this
modeling method traces sound from the source to the location where we want
to predict the sound (the receiver). How the sound travels between the source
and the receiver, and everything it encounters as it travels along the way,
constitutes the path.
In the example shown in Figure 37, the source is the fan in the mechanical room.
The receiver is the person working in the adjacent office space. The supply duct
provides one of the paths for sound to travel from the source to the receiver.
Using such an analysis, the designer can determine the effect of the paths on
the sound emanating from the source, and can specify the maximum allowable
equipment sound power that will not exceed the sound-pressure target for
the space.
Source–Path–Receiver Model
receiver
receiver
path
path
source
source
Figure 37

34 TRG-TRC007-EN
notes
period three
Acoustical Analysis
The work, and art, of an acoustical analysis is in identifying and quantifying the
various paths that sound travels from the source to the receiver. There are
primarily three different types of sound paths.
nAirborne: This is a path where sound travels with, or against, the direction
of airflow. In a HVAC system, sound travels along this type of path through
the supply ductwork, return ductwork, or an open plenum.
nBreakout: This type of path is typically associated with sound breaking out
through the duct walls and into the space.
nTransmission: This is a path where sound travels through walls, floors,
and ceilings. In its simplest form, this path involves sound traveling directly
through the air from the source to the receiver.
Typical Sound Paths
IAirborne
KSound that travels through supply ductwork, return
ductwork, or an open plenum
KCan travel with or against the direction of airflow
IBreakout
KSound that breaks out through the walls of the supply
or return ductwork
ITransmission
KSound that travels through walls, floors, or ceilings
Figure 38

TRG-TRC007-EN 35
period three
Acoustical Analysis
notes
Sound can travel between a single source and the receiver along one or
multiple paths. In the case of an air-cooled chiller sitting on the roof of a
building, and a receiver located across a parking lot at the edge of the property,
sound travels along only one path.
Another example is a fan-coil unit installed under a window in an office. Sound
travels primarily along one path, from the fan-coil to the receiver in the same
room.
In other cases there may be several paths for sound to travel from a source
to the receiver. This particular example shows the paths associated with an
air handler that is installed in a mechanical equipment room adjacent to an
occupied space. Only one sound source is included in this analysis, the fan
located in the air handler. The receiver is the person working in the office.
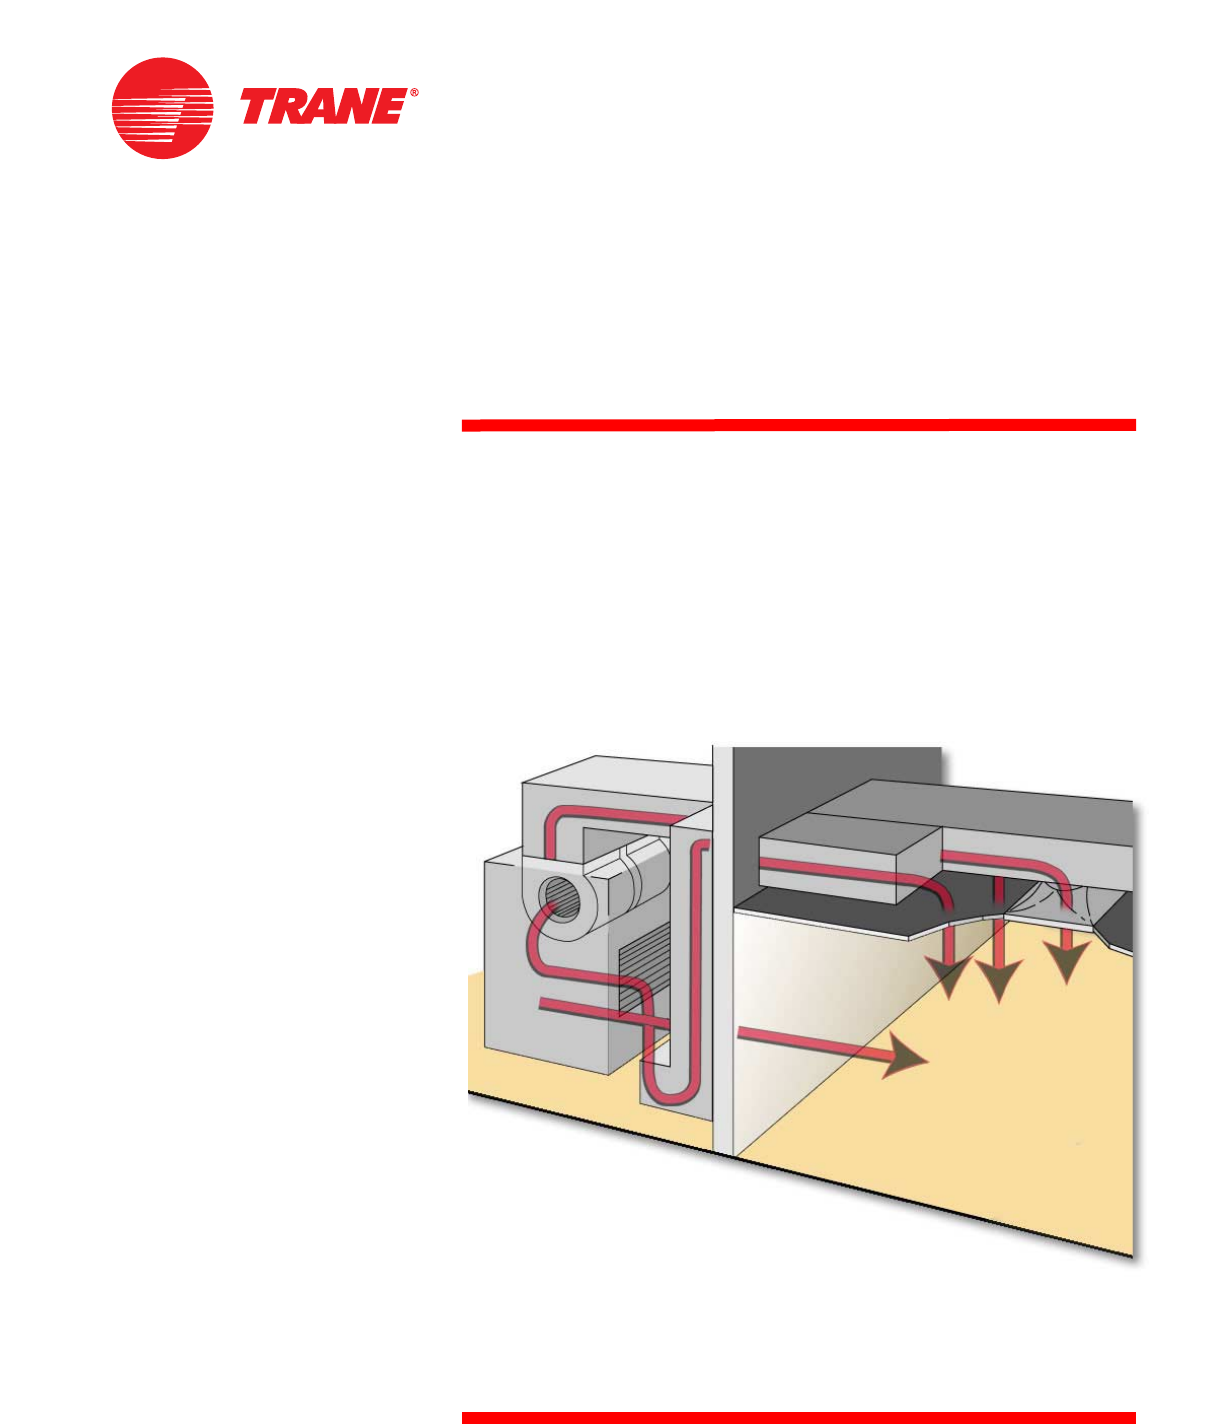
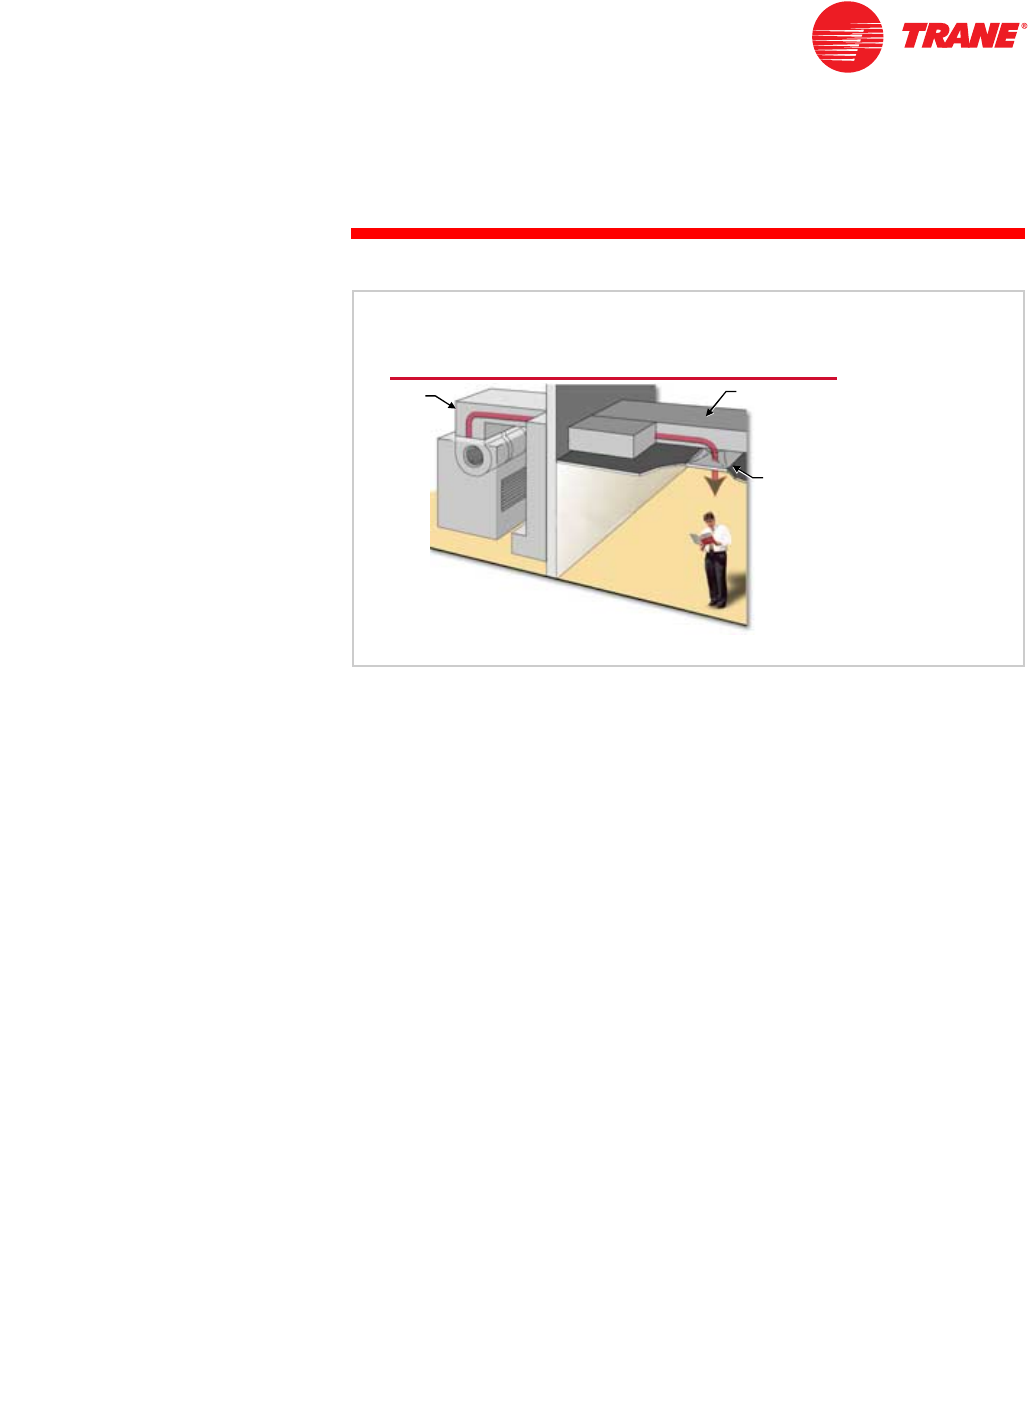
The sound travels from the source to the receiver along four separate paths:
Examples of a Single Sound Path
fan
fan-
-coil
coil
air
air-
-cooled chiller
cooled chiller
Figure 39
Example of Multiple Sound Paths
wall transmission
wall transmission
return
return
airborne
airborne supply
supply
airborne
airborne
supply
supply
breakout
breakout
1
1
2
2
3
3
4
4
source
source
Figure 40
36 TRG-TRC007-EN
notes
period three
Acoustical Analysis
1Supply airborne through the supply ductwork and diffusers and into
the space
2Supply breakout as the sound travels through the walls of the supply
ductwork, through the ceiling tile, and into the space
3Return airborne through the air-handler intake, return ductwork and grilles,
and into the space
4Wall transmission as the sound travels through the adjoining wall and
into the space
These paths are typical of most centralized air-handling equipment, including
packaged rooftop and self-contained air conditioners. Most other equipment
types have a subset of these paths.
There are a few important points to remember when identifying sources and
paths for a source–path–receiver acoustical analysis.
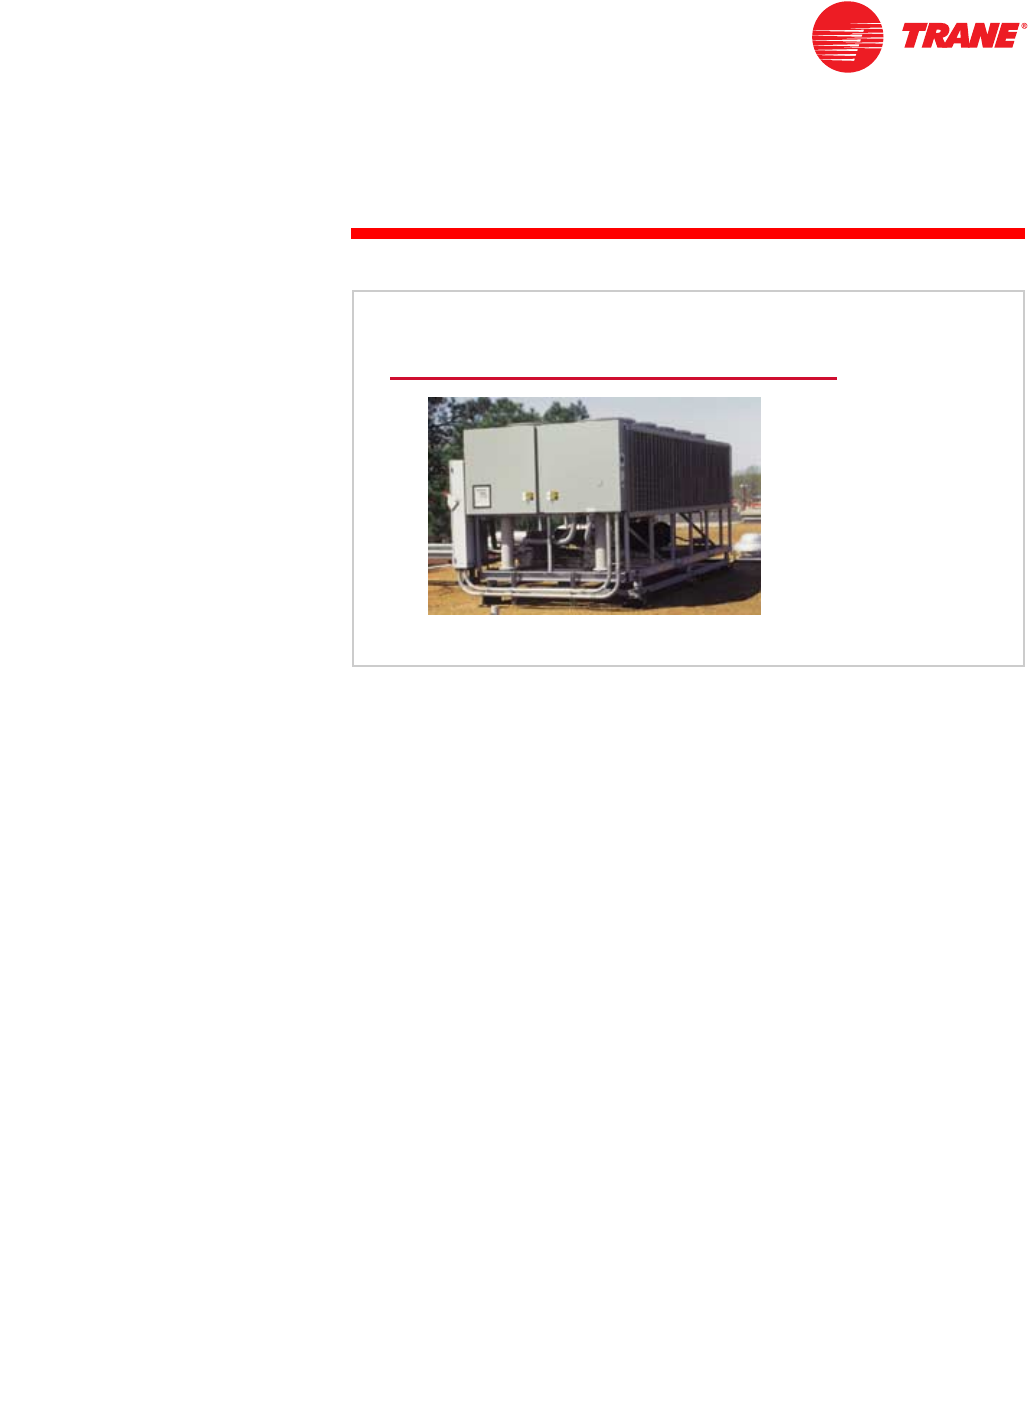
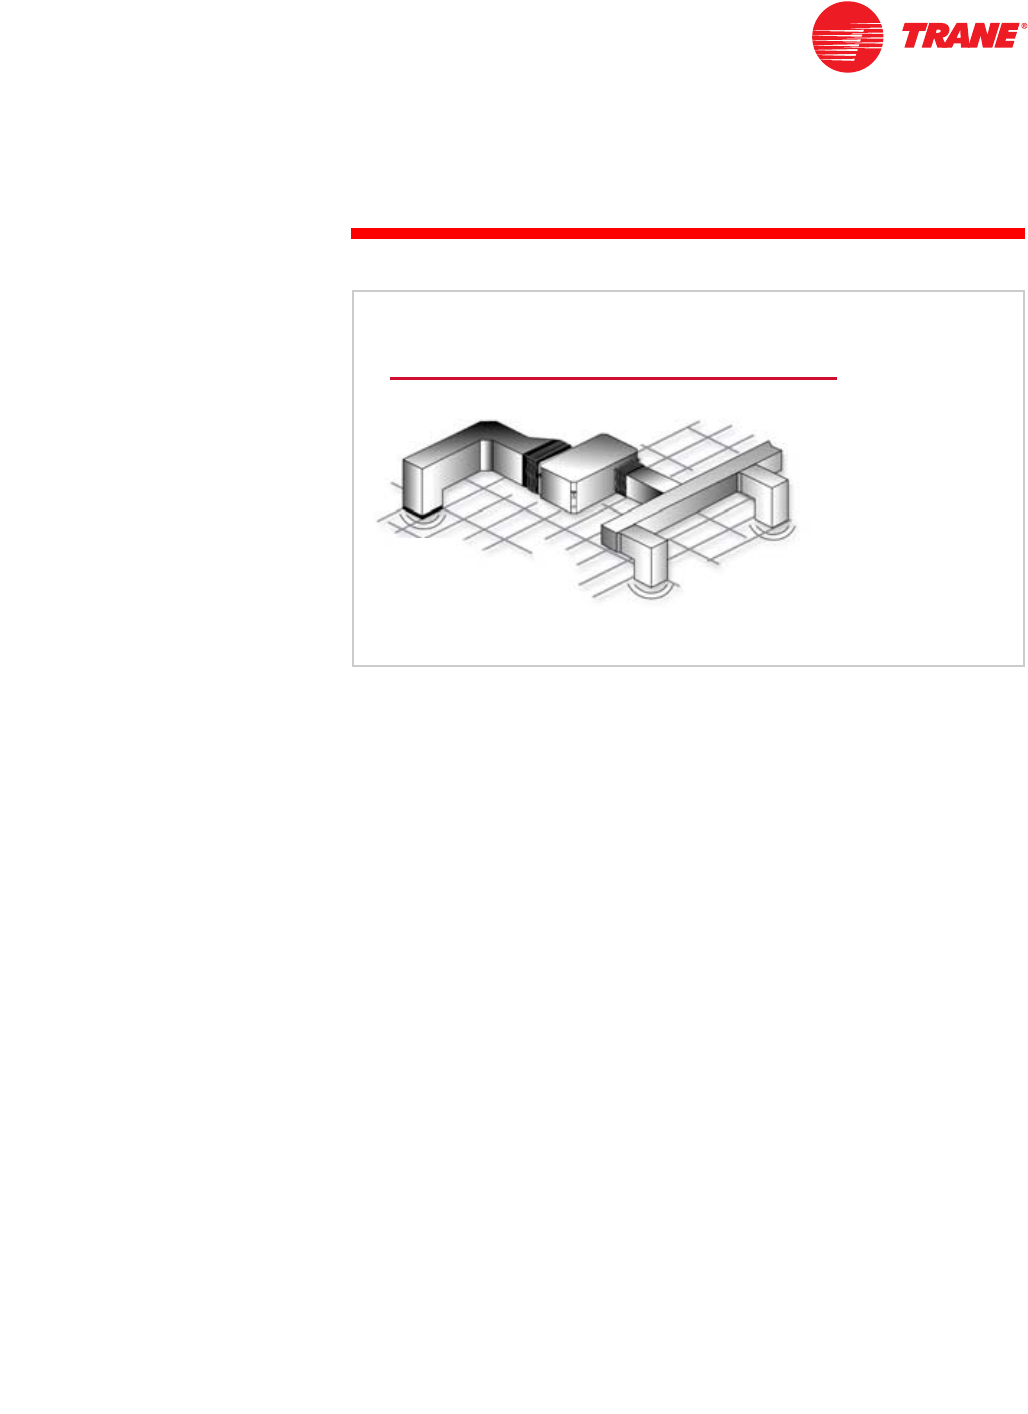
nOne piece of equipment may contain several sound sources. For example,
a packaged rooftop air conditioner (shown in Figure 41) contains supply and
exhaust (or return) fans, compressors, and condenser fans.
nSound may travel from a single source to the receiver along multiple paths.
This was demonstrated with the previous example.
nThe total sound heard by the receiver is the sum of all the sounds from
various sources that travel along several paths.
Identifying Sound Sources and Paths
IOne piece of equipment
may contain several
sound sources
ISound may travel from
source to receiver along
multiple paths
ITotal sound heard by the
receiver is the sum of all
sounds from all sources
and all paths
packaged rooftop
packaged rooftop
air conditioner
air conditioner
Figure 41
TRG-TRC007-EN 37
period three
Acoustical Analysis
notes
Sound-Path Modeling
When all the paths have been identified, they can be individually modeled to
determine the contribution of each to the total sound heard by the receiver.
Sound-path modeling studies how sound from a source changes on its way
to a receiver. The pieces that make up the path from source to receiver can be
called elements of the path.
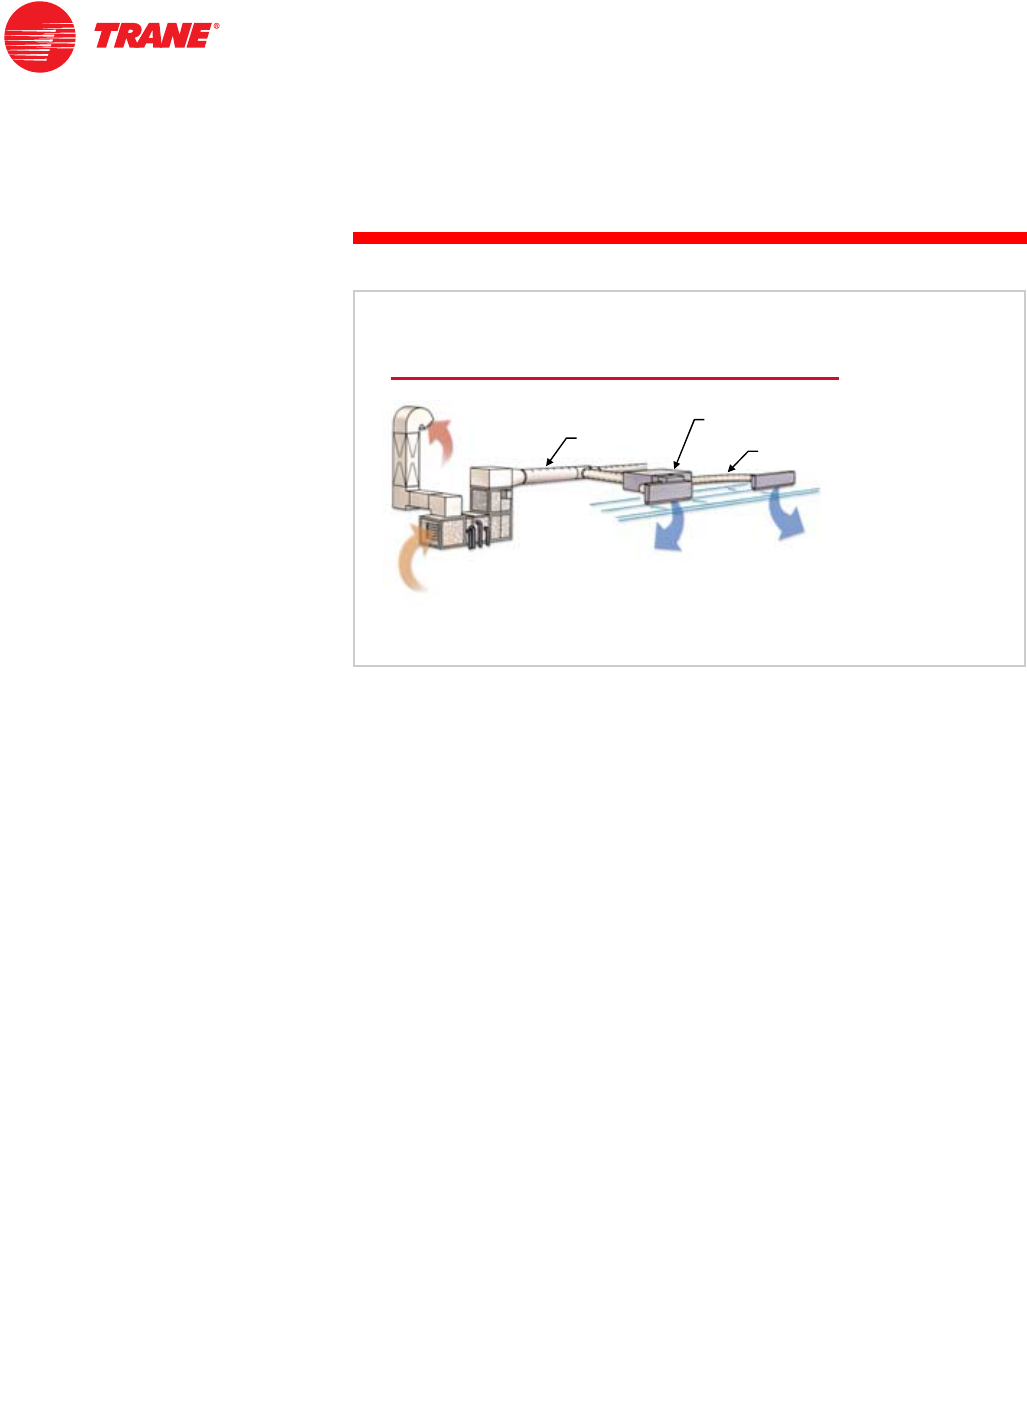
Returning to the air-handler example, one path that sound travels from the air-
handling unit (source) to the person in the office (receiver) is to follow the
conditioned air supplied to the space. In addition to the source and receiver,
the elements of this path include the components of the air distribution system,
such as straight pieces of duct, possibly duct silencers, elbows, junctions, and
diffusers. The path also includes the acoustical characteristics of the occupied
space, such as its size, floor coverings, furnishings, and wall construction.
receiver
receiver
source
source
Modeling Sound Paths
diffuser
diffuser
straight duct
straight duct
elbow
elbow
Figure 42
38 TRG-TRC007-EN
notes
period three
Acoustical Analysis
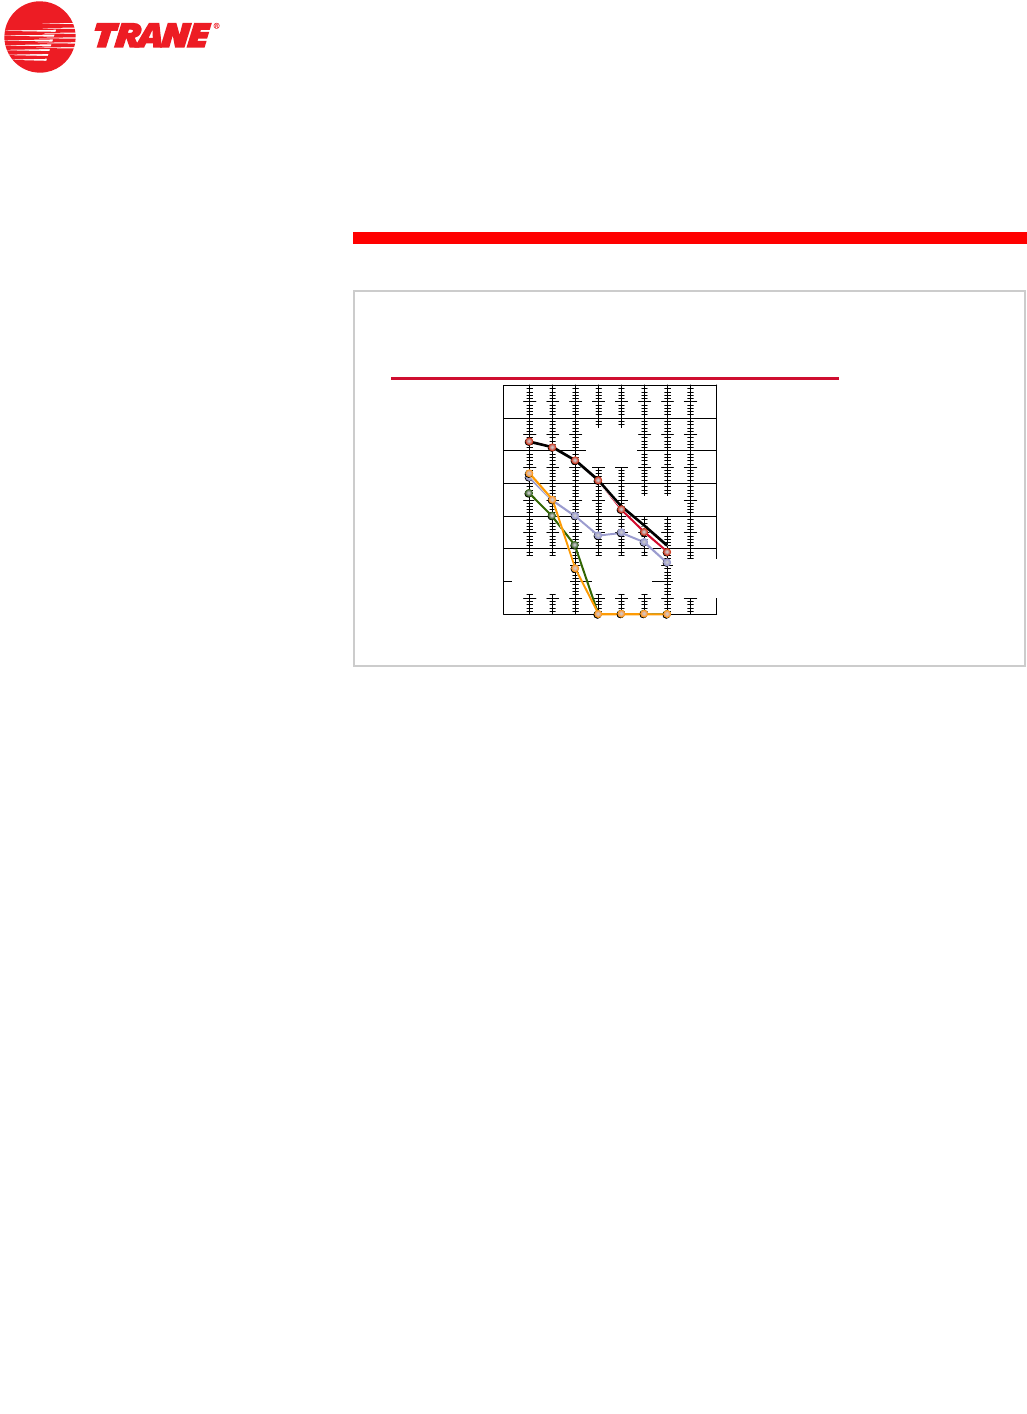
As mentioned previously, the total sound heard by the receiver is the sum of
sounds from multiple sources, following multiple paths. After each path is
modeled to determine its contribution to the sound-pressure level at the
receiver location, the paths must be summed to complete the model. While
separating the individual paths is necessary for modeling, a secondary benefit
is that the magnitude of the various paths can be compared.
In this example, sound travels from a single source to the receiver along four
separate paths: supply airborne, supply breakout, return airborne, and
transmission through the adjacent wall. By modeling these four paths
independently, you can see that the supply airborne path contributes to the
total sound-pressure level in the space much more than the other three paths.
In fact, when the sounds due to all four paths are logarithmically summed, the
total sound heard by the receiver is nearly the same as the sound due to the
supply airborne path alone.
This would indicate that, if the sound-pressure level in the space is too high,
the designer should focus first on reducing the sound due to the supply
airborne path. Reducing the sound due to the return airborne path, without
addressing the supply airborne path, would have no effect on the total sound-
pressure level heard in the space.
70
70
50
50
40
40
30
30
20
20
10
10
sound pressure, dB ref 20
sound pressure, dB ref 20 m
mPa
Pa
80
80
60
60
octave
octave-
-band frequency, Hz
band frequency, Hz
63
63 125
125 250
250 500
500 1,000
1,000 2,000
2,000 4,000
4,000 8,000
8,000
Example of Multiple Sound Paths
return
return
airborne
airborne wall
wall
transmission
transmission
supply
supply
breakout
breakout
total
total
supply
supply
airborne
airborne
Figure 43

TRG-TRC007-EN 39
period three
Acoustical Analysis
notes
Theoretical equations aid the analysis of some path elements, but prediction
equations based on test data and experience prevail. For example, an acoustical
lab may have measured the attenuation and regenerated sound from a number
of different types of duct elbows at various airflow rates. Data recorded from
tests is used to generate an equation that can be used to model the test data.
ASHRAE collected and developed numerous prediction equations for path
components in HVAC systems, and subsequently published them in their
Algorithms for HVAC Acoustics handbook. Similar information can be found in
the National Environmental Balancing Bureau (NEBB) publication titled Sound
and Vibration Design and Analysis.
ASHRAE algorithms are widely used and generally provide good results. When
using the algorithms, it should be remembered that they mainly come from test
data. As a result, if they are used to extrapolate beyond the test conditions, the
accuracy of the algorithms will diminish.
Algorithms for Sound-Path Modeling
Figure 44
40 TRG-TRC007-EN
notes
period three
Acoustical Analysis
Solving these algorithms manually can be tedious and time consuming,
especially when one or more paths need further attenuation and the
calculations have to be repeated. Fortunately, computer software tools are
available to spare analysts from the calculation-intensive equations.
Also, computer programs make it easier to perform tradeoff, or “what if?,”
analyses. Examples may include determining the effects of using a duct
silencer, changing the construction of the equipment-room wall, adding
absorptive materials to a ceiling, or placing a barrier wall between an outdoor
sound source and the property lot line.
Computerized Analysis Tools
Figure 45
TRG-TRC007-EN 41
period three
Acoustical Analysis
notes
Terms Used in Sound-Path Modeling
This section introduces several terms that are fairly specific to the science of
acoustics.
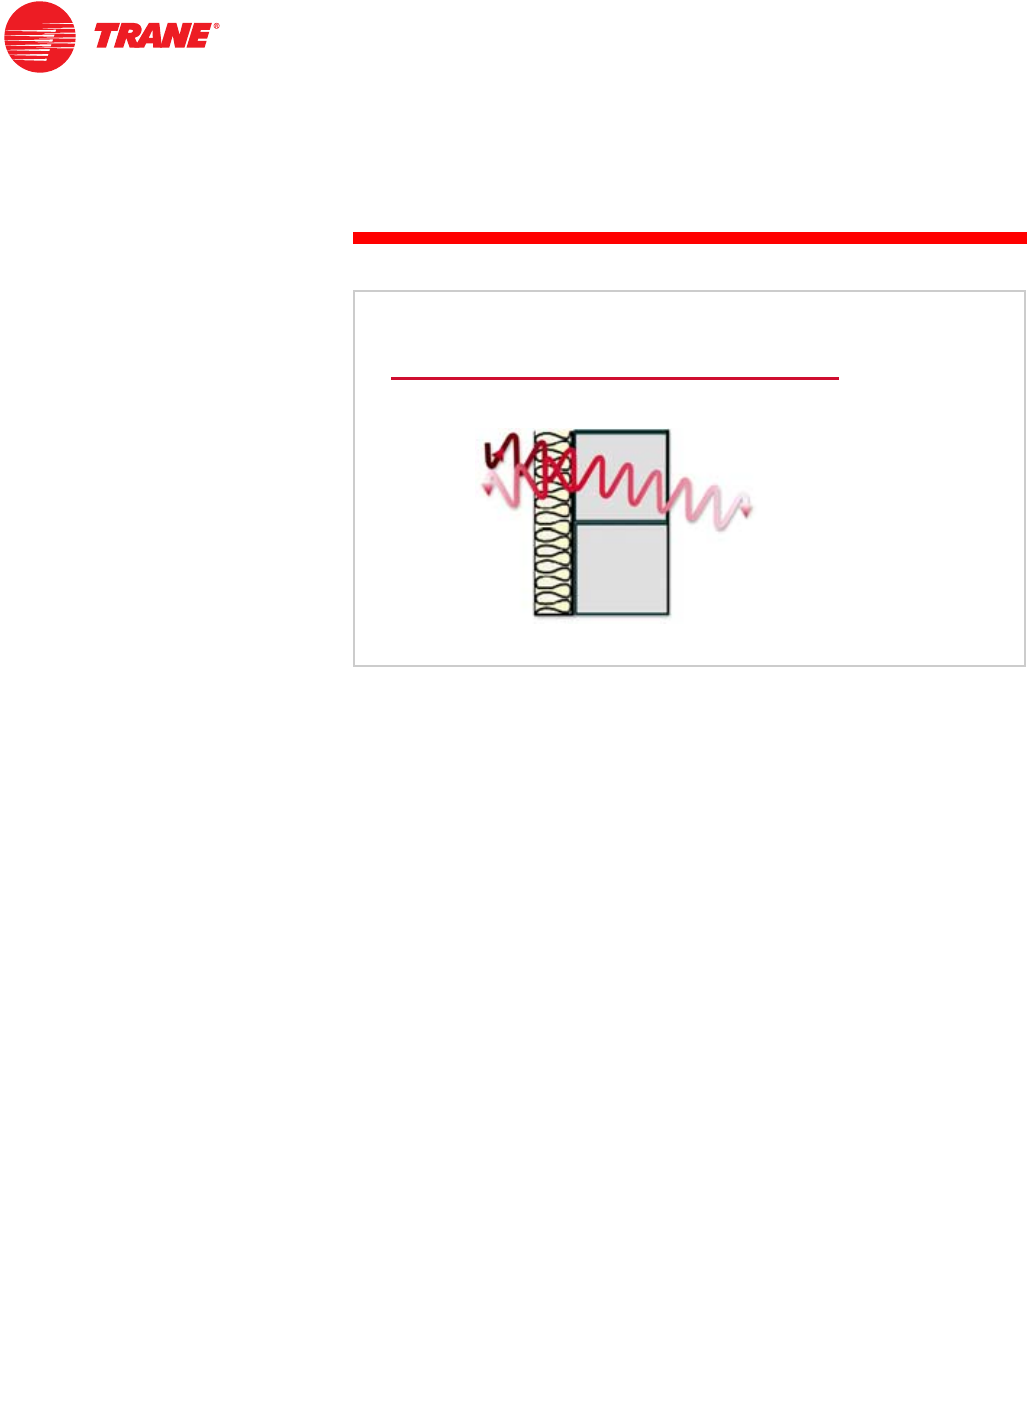
Attenuation refers to the reduction in sound level as sound travels along the
path from a source to a receiver. It is typically used to refer to the reduction
of sound as it travels through a duct system. Straight ducts, elbows, junctions,
and silencers are examples of elements that attenuate sound.
Regenerated sound results from components of the duct system that create
turbulence in the air stream. Turbulence is caused by an abrupt change in
airflow direction or velocity with a corresponding static-pressure loss.
Regenerated sound increases with air velocity or when the air is forced to
make sharp turns. Elbows, junctions, diffusers, silencers, and dampers are all
examples of elements that regenerate sound.
Notice that some elements can both attenuate and regenerate sound. For
example, as air makes a 90-degree turn in a rectangular duct elbow, some
of the sound is reflected back upstream, attenuating the airborne sound
downstream of the elbow. At the same time, however, the turbulence created
by the air turning the sharp corner causes some regenerated sound.
Attenuation and Regeneration
supply
supply
duct
duct
return
return
duct
duct
diffuser
diffuser
heat pump
heat pump
(source)
(source)
return
return-
-air
air
grille
grille
Figure 46
42 TRG-TRC007-EN
notes
period three
Acoustical Analysis
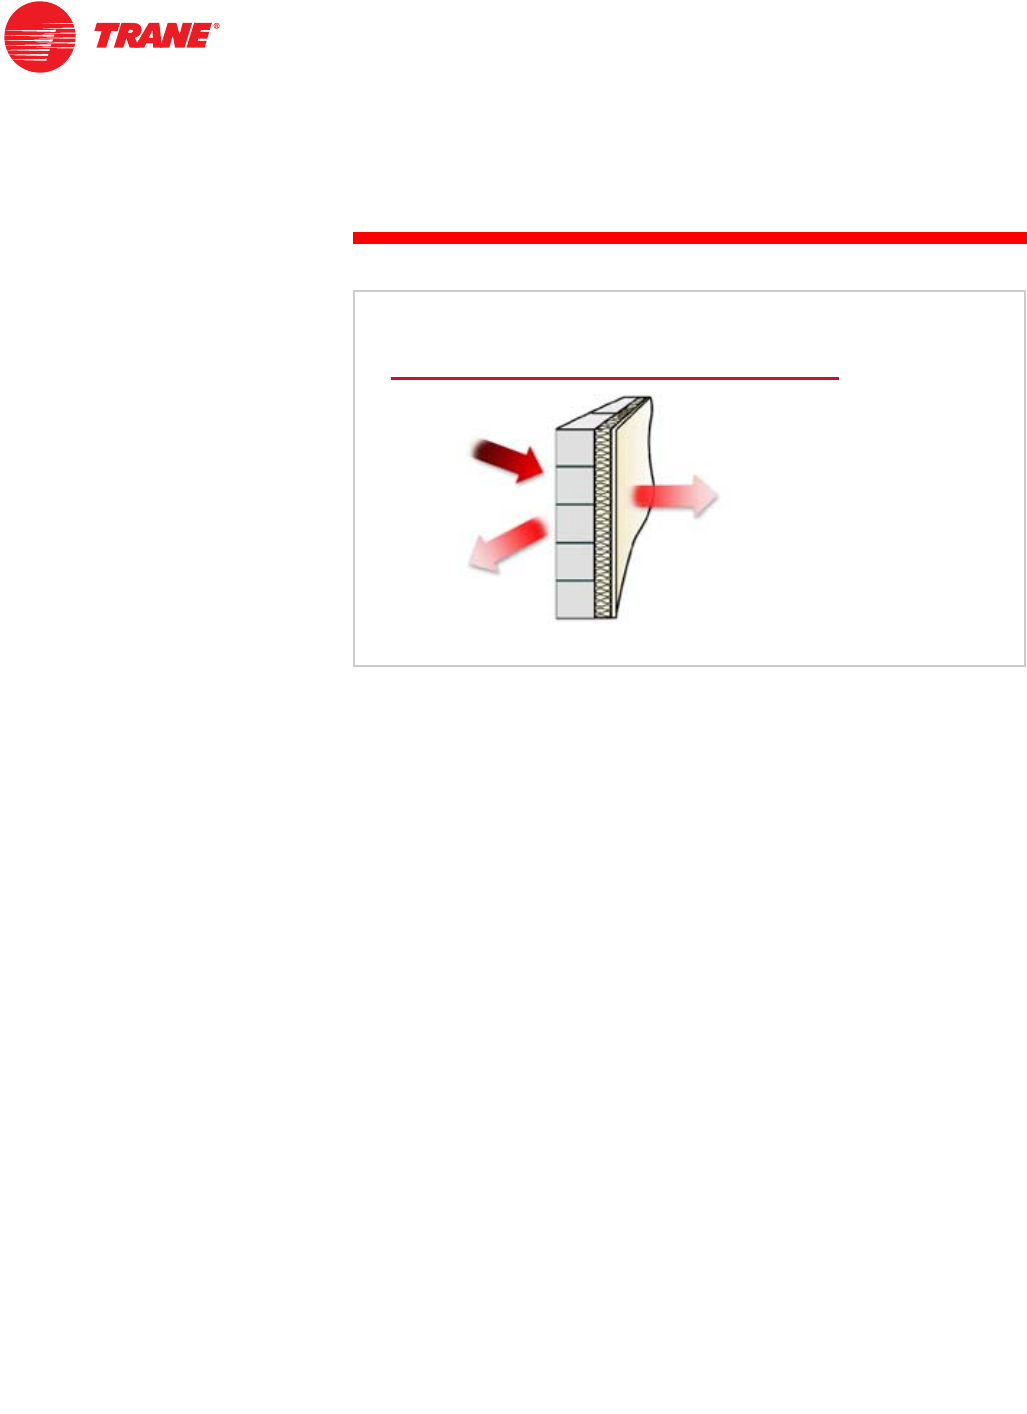
The total sound energy that strikes a surface (Wi) is either reflected (Wr),
absorbed by the material (Wa), or transmitted through the material (Wt).
A material provides a barrier to the incident sound energy (Wi) when it reduces
the amount of sound energy that is transmitted through the material (Wt). There
are a number of factors that affect the amount of sound transmitted through the
wall, including the type and thickness of material, frequency of the sound, and
quality of construction.
Materials that are dense (such as masonry block or wallboard) or stiff (such as
glass) are generally better at reducing transmitted sound than materials that
are lightweight or flexible. Increasing the thickness of a material reduces the
amount of sound transmitted through it. Finally, the ability of a material to
reduce transmitted sound depends on frequency. High-frequency sound is
more easily reduced than low-frequency sound.
W
Wi
i
incident
incident
sound energy
sound energy W
Wt
t
transmitted
transmitted
sound energy
sound energy
reflected
reflected
sound energy
sound energy
W
Wr
r
W
Wa
a
absorbed
absorbed
sound energy
sound energy
Sound Transmission
Figure 47

TRG-TRC007-EN 43
period three
Acoustical Analysis
notes
The ability of a material to reduce transmitted sound is most commonly
referred to in terms of its insertion loss, noise reduction, or transmission loss.
Insertion loss and noise reduction are both based on actual sound-pressure
measurements and are expressed in terms of dB reduction.
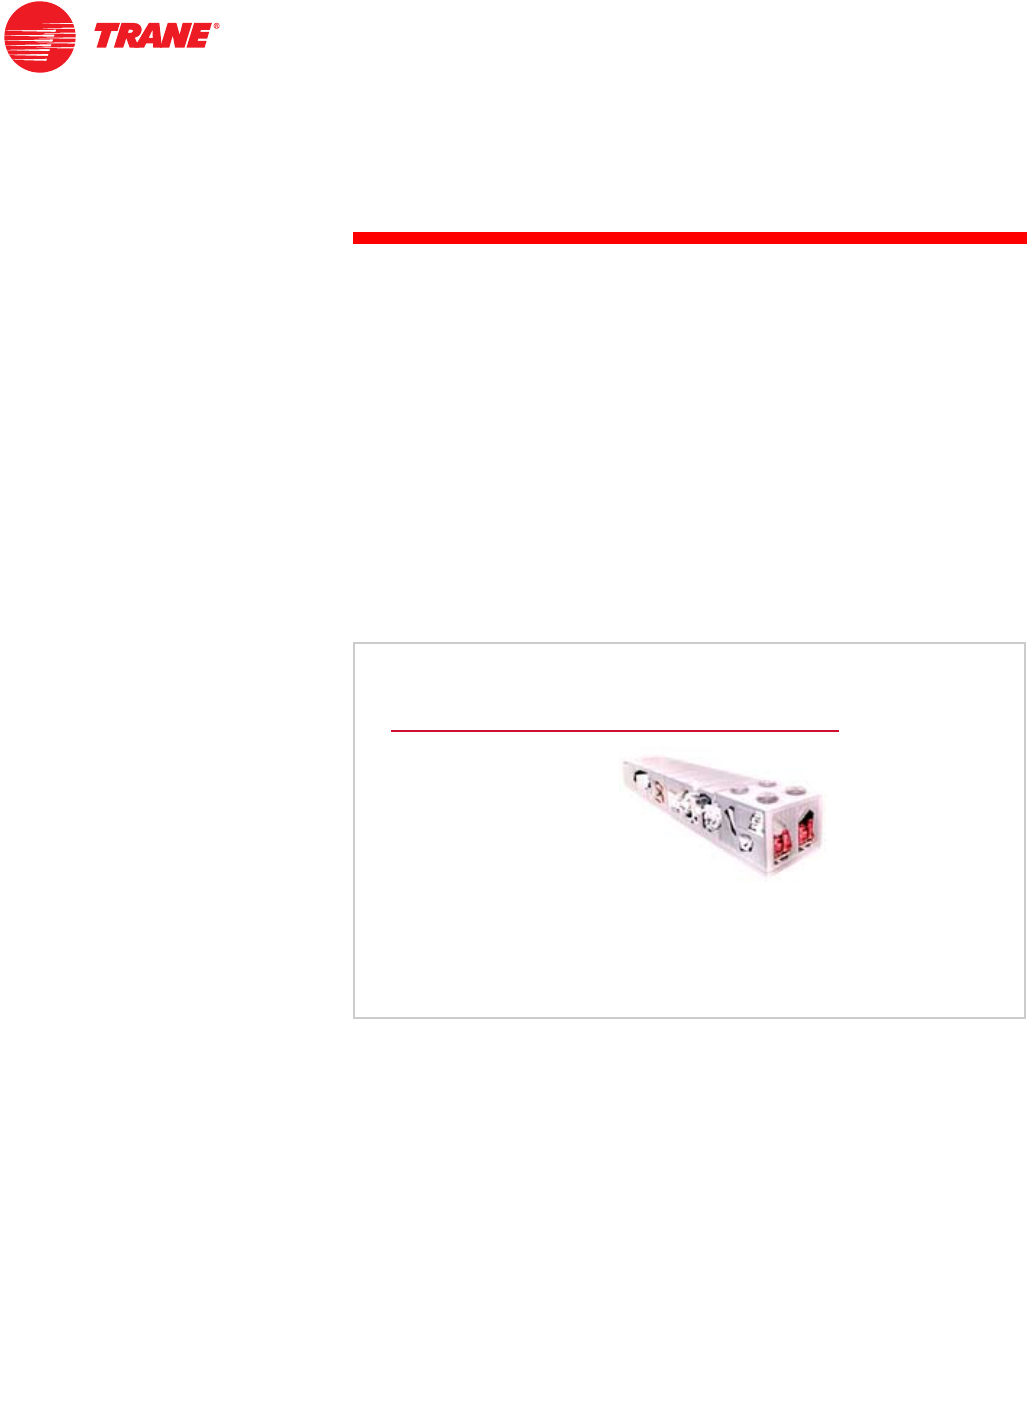
Insertion loss (IL) is the difference in sound pressure measured in a single
location with and without a noise-control device located between the source
and receiver. Using the air-handler example (Figure 42), assume there is a door
installed in the wall separating the equipment room from the office space. The
difference in the sound pressure measured in the occupied space with the door
open versus with the door closed is the IL of the door.
Noise reduction (NR) is the difference between sound-pressure
measurements taken on each side of a barrier. For example, the NR for this
same door can be determined by measuring the sound-pressure level inside the
office space, with the door closed, and on the other side of the door inside the
equipment room. The difference in these measurements is the NR of the door.
Transmission loss (TL) is proportional to the ratio of the sound-power level
on the receiver side of a barrier to the sound-power level on the source side.
Using the same door example, the transmission loss of the door is determined
by the manufacturer by taking measurements in a special laboratory and
expressing the results as sound power. It is also expressed in terms of dB
reduction.
Sound Transmission
IInsertion loss (IL)
INoise reduction (NR)
ITransmission loss (TL)
Figure 48
44 TRG-TRC007-EN
notes
period three
Acoustical Analysis
Absorptive materials work by converting acoustical energy into heat energy.
The absorbed energy (Wa) is the portion of the incident sound energy (Wi)
that is neither transmitted through the material nor reflected off the material.
The absorptivity of a material depends on several factors, including thickness,
frequency of the sound, and whether there is a reflective surface located behind
the absorptive material. Materials that are porous (such as open cell foam) or
fibrous (such as fiberglass insulation) are more absorptive than materials that
are smooth and dense (such as sheet metal or gypsum board). Increasing the
thickness of a material, and installing a reflective surface behind the material,
both increase its absorptivity. It is also important to note that absorption is
dependent on frequency. High-frequency sound is more easily absorbed than
low-frequency sound because it has a shorter wavelength and more cycles
occur within the thickness of the absorptive material.
The absorptivity of a material is typically described in terms of an absorption
coefficient. The absorption coefficient is the ratio of sound energy absorbed
by the material to the sound energy incident upon the surface of the material.
Preferably, absorption coefficients are reported for each octave band, but may
also be expressed in terms of a single Noise Reduction Coefficient (NRC).
The NRC is simply the arithmetic average of the absorption coefficients for the
250, 500, 1,000 and 2,000 Hz octave bands.
Absorption
W
Wi
i
incident
incident
sound energy
sound energy
W
Wt
t
transmitted
transmitted
sound energy
sound energy
reflected
reflected
sound energy
sound energy
W
Wr
r
W
Wa
a
absorbed
absorbed
sound energy
sound energy
Figure 49
TRG-TRC007-EN 45
period three
Acoustical Analysis
notes
Finally, some of the incident sound energy (Wi) bounces off of (or is reflected
from) the material. Reflected sound becomes especially important when the
sound source and the receiver are located in the same room.
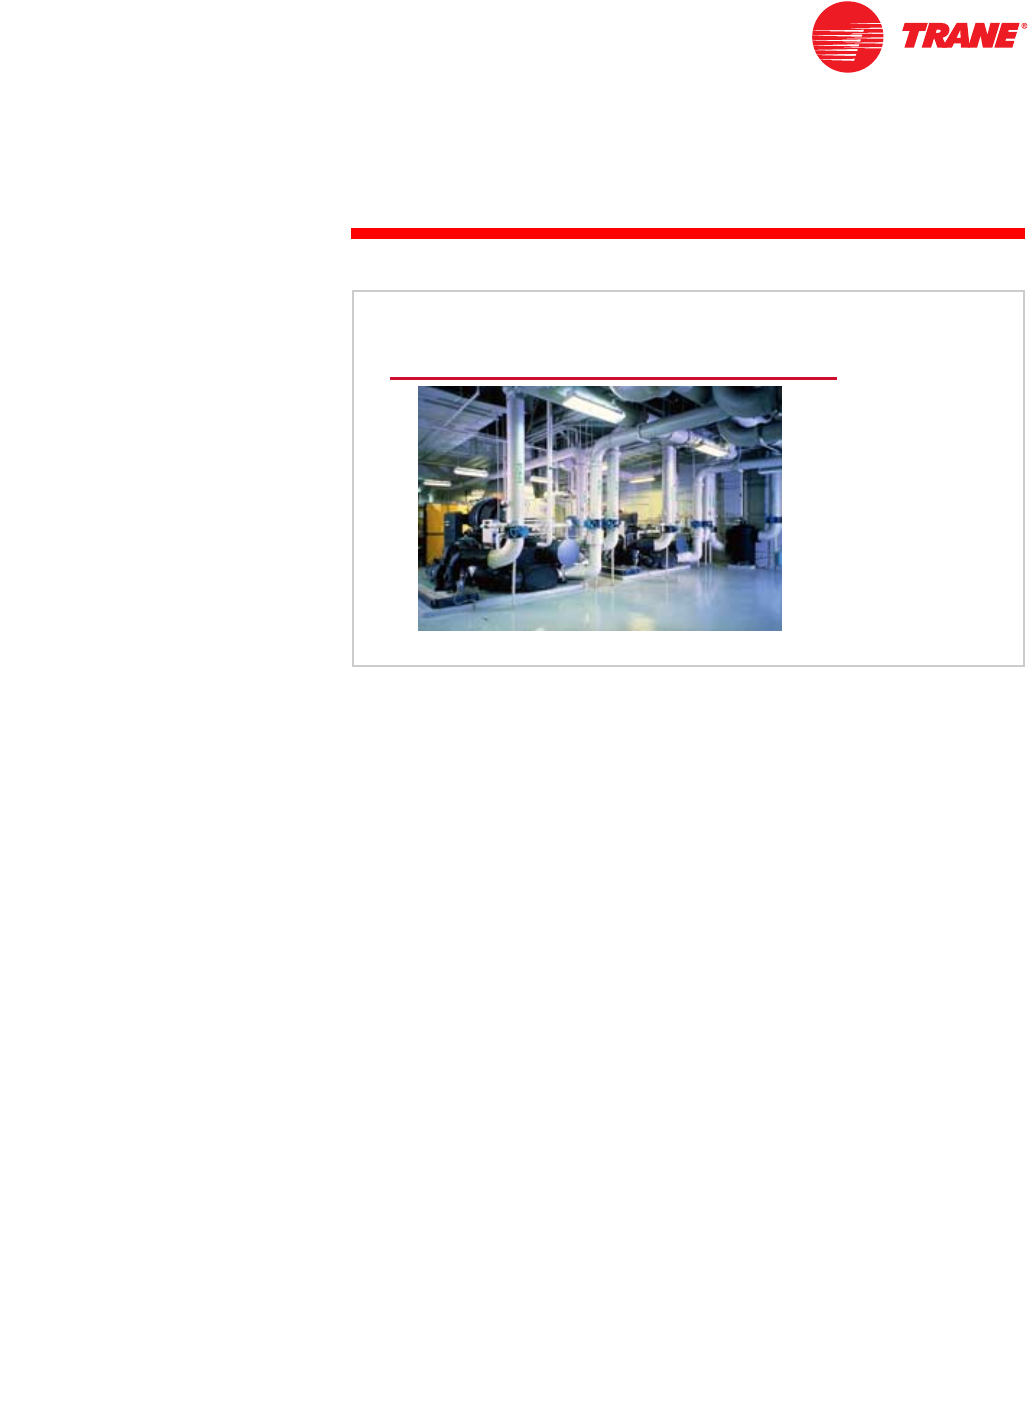
Consider a mechanical equipment room that contains a water chiller, pumps,
and other sound sources. Often the walls of the equipment room are
constructed of masonry—either cement block or poured concrete. Neither of
these materials absorb or transmit very much of the incident sound energy,
so most of it is reflected back into the room. The reflected sound adds to the
sound coming from the source, greatly increasing the sound level in the room.
The best way to reduce reflected sound is to add an absorptive material to as
much of the walls, floor, and ceiling as possible.
On occasion, reducing reflected sound may also lower the sound levels in
adjacent spaces. Using the equipment room example, reducing the reflected
sound energy lowers the sound level in the equipment room. Given a fixed
transmission loss for the walls, this will result in a decrease in sound that
travels to the adjacent space. Said another way, if it is quieter in the equipment
room, it will be quieter in the adjacent spaces.
Reflected Sound
Figure 50
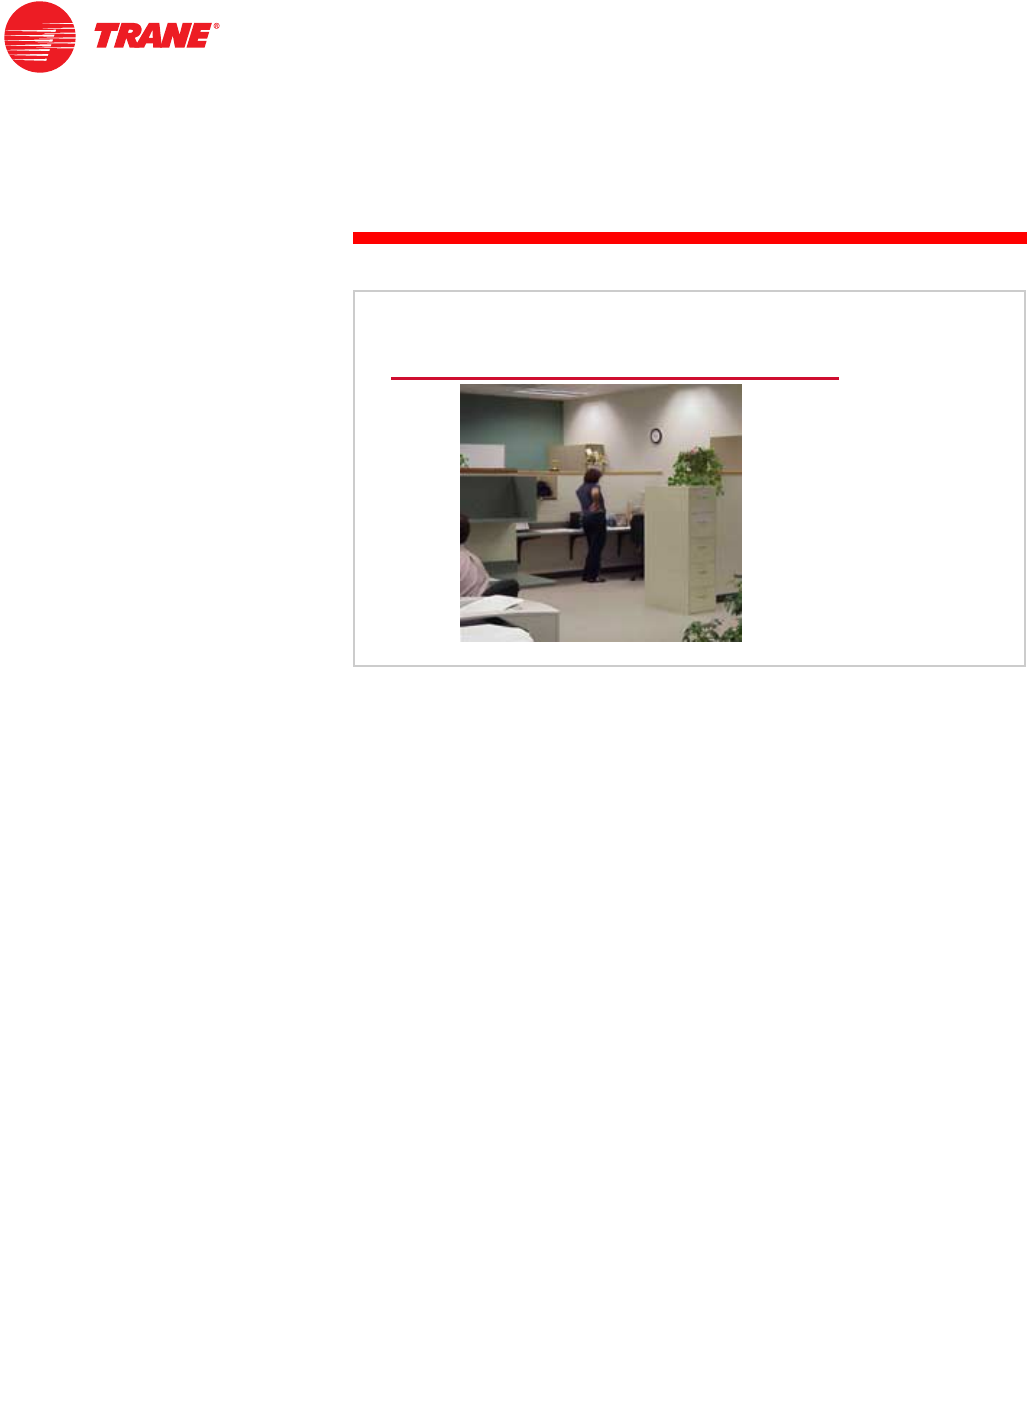
46 TRG-TRC007-EN
notes
period three
Acoustical Analysis
Receiver sound correction, also called room effect, is the relationship
between the sound energy (sound power) entering the room and the sound
pressure at a given point in the room where the receiver hears the sound.
This reduction in sound is due to a combination of effects, including distance
and the absorptive and reflective properties of the surrounding surfaces.
In an outdoor environment, such as a field or parking lot, the absorption of
sound is nearly perfect. Sound leaves the source in all directions and
diminishes as it travels away from the source. Only the portion of the sound
that travels in a direct line from the source ever reaches the receiver. In this
environment, the receiver sound correction is mainly a function of distance
between the source and receiver.
In contrast, sound entering a room bounces off walls and other surfaces.
Therefore, the receiver will hear sound reflecting off the surfaces, as well as the
sound coming directly from the source. The amount of sound that reaches
the receiver is dependent on the size of the room and the absorptivity and
reflectivity of the surfaces in the room. For example, in a completely “hard”
room (with concrete walls and floors and no furnishings) the room effect is very
small. Conversely, in a “soft” room (with carpeted floors and wall coverings)
the room effect can be quite substantial. Receiver sound correction will nearly
always result in a reduction in sound level in each octave band.
Sound spreading refers to the reduction of sound energy as a listener moves
away from the sound source. It is a factor in room acoustics and, typically, is the
primary factor in outdoor sound calculations.
Receiver Sound Correction
Figure 51

TRG-TRC007-EN 47
notes
period four
Equipment Sound Rating
As explained in Period One, sound pressure can be directly measured,
however, sound power cannot. Because sound pressure is influenced by the
surroundings, the most accurate sound data that can be provided for a piece of
equipment is sound power.
Sound-power levels are determined by measuring sound-pressure levels in an
environment with known acoustical characteristics, and adding back any effects
attributed to the surroundings.
period four
Equipment Sound Rating
Fundamentals of HVAC Acoustics
Figure 52
48 TRG-TRC007-EN
notes
period four
Equipment Sound Rating
Fields of Measurement
To measure sound pressure correctly, it is important to understand the behavior
of sound in various environments, or fields.
In theory, a free field is a homogeneous, isotropic medium that is free from
boundaries. In practice, an example of a free field over a reflecting plane would
be a large open area void of obstructions, like a parking lot or meadow.
An ideal sound source, that is, one that radiates sound equally in all directions,
placed in a free field generates sound-pressure waves in a spherical pattern.
At equal distances from the source, the sound pressure is same in all directions.
As the sound waves travel farther away from the source, the area of the sphere
increases. Doubling of the distance from the source spreads the sound over
four times as much surface area.
Free Field
source
source
Figure 53

TRG-TRC007-EN 49
period four
Equipment Sound Rating
notes
This type of relationship between distance and surface area provides the
following simple mathematical model for estimating how sound will change
as the distance from the source increases.
Lp2 = Lp1 - 20 log10 [r2 / r1]
where,
Lp2 = sound-pressure level at distance r2
Lp1 = sound-pressure level at distance r1
r1 = distance from the source where Lp1 was measured
r2 = distance from the source to where the sound pressure (Lp2) is desired
Using this expression, it can be shown that doubling the distance from the
sound source results in a 6 dB reduction in the sound-pressure level. This is a
handy fact to know when making estimates of outdoor sound levels.
Lp2 = Lp1 - 20 log10 [2 /1] = Lp1 - 6
Distance Correction in a Free Field
r2
r1
Lp2 = Lp1 – 20 log10
Figure 54
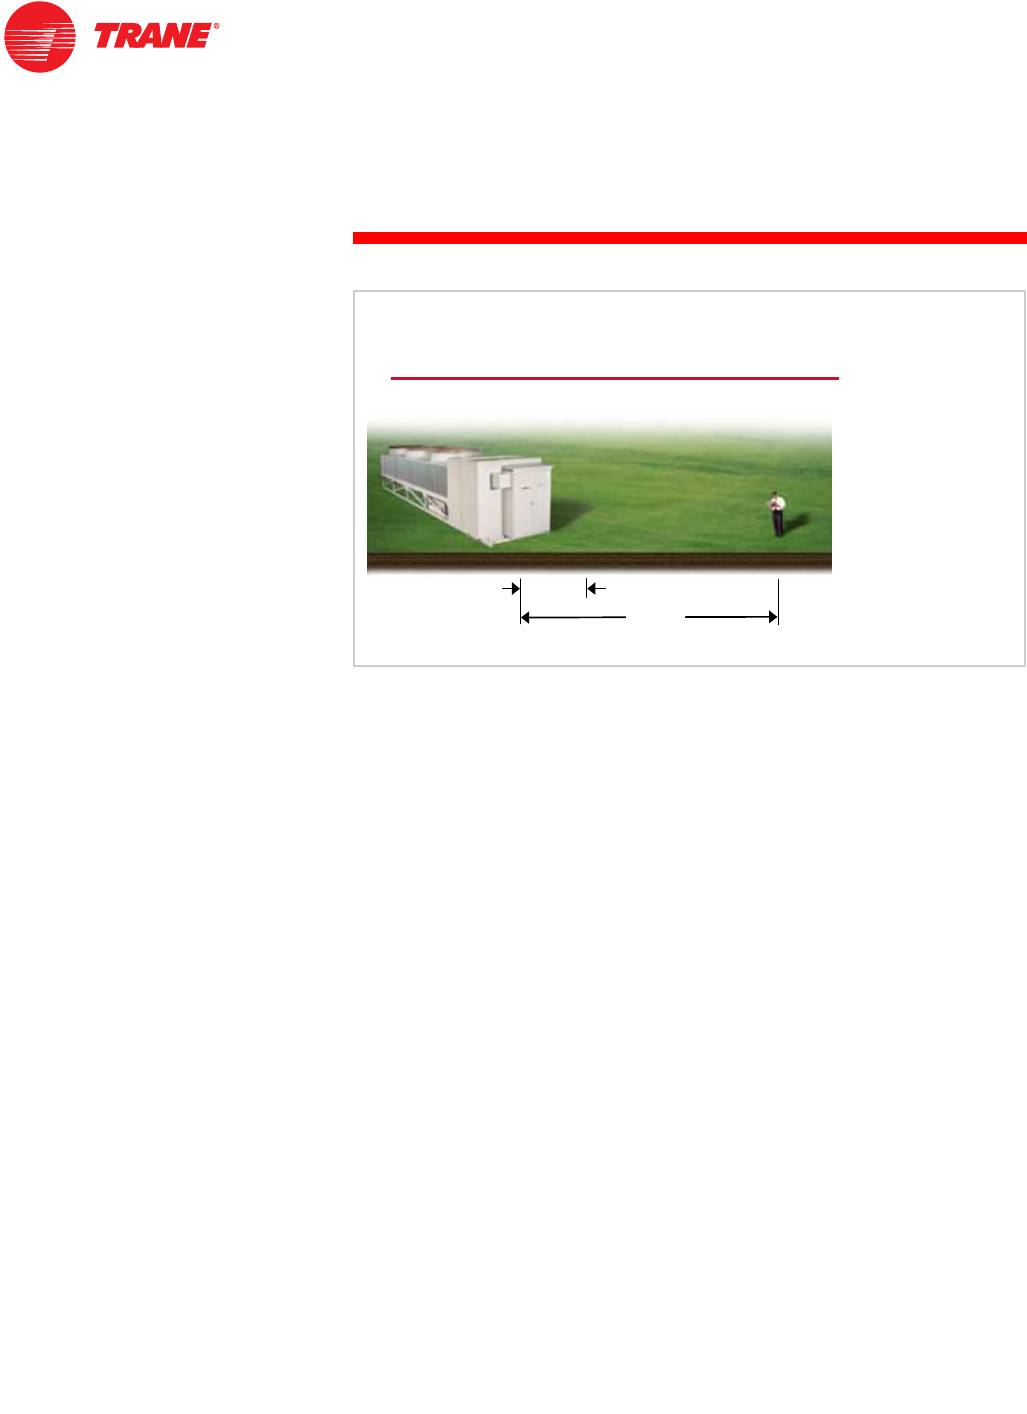
50 TRG-TRC007-EN
notes
period four
Equipment Sound Rating
In practice, this equation is commonly used to determine how loud a piece of
equipment will be at a given distance. For example, the manufacturer of an air-
cooled chiller lists the sound-pressure level of the chiller as 95 dB at a distance
of 30 ft (9.1 m) from the chiller. This equation can be used to estimate the
sound-pressure level at a lot line, which is 120 ft (36.6 m) from the chiller. In this
example, the sound-pressure level at the lot line is 83 dB.
Lp2 = 95 dB – 20 log10 [120 ft / 30 ft] = 83 dB
(Lp2 = 95 dB – 20 log10 [36.6 m / 9.1 m] = 83 dB)
This equation is only valid for sound pressure. It cannot be used to convert
sound power (Lw) to sound pressure (Lp). Also, it is only valid in a free-field
environment.
Distance Correction in a Free Field
r
r2
2= 120 ft
= 120 ft
(36.6 m)
(36.6 m)
r
r1
1= 30 ft
= 30 ft
(9.1 m)
(9.1 m)
L
Lp1
p1 = 95 dB
= 95 dB L
Lp2
p2 = 83 dB
= 83 dB
air
air-
-cooled chiller
cooled chiller
lot
lot
line
line
Figure 55

TRG-TRC007-EN 51
period four
Equipment Sound Rating
notes
The near field is an area adjacent to the source where sound does not behave
as it would in a free field. Most sound sources, including all HVAC equipment,
do not radiate sound in perfectly spherical waves. This is due to the irregular
shape of the equipment and different magnitudes of sounds radiating from the
various surfaces of the equipment. These irregularities cause pressure-wave
interactions that make the behavior of the sound waves unpredictable.
Sound-pressure measurements should not, therefore, be made in the near field.
The size of the near field is dependent on the type of source and dimensions
of the equipment.
Near Field
near
field
near
near
field
field
source
source
Figure 56
52 TRG-TRC007-EN
notes
period four
Equipment Sound Rating
A reverberant field is nearly the opposite of a free field. Reverberant fields
exist in rooms with reflective walls, floors, and ceilings. When a sound source is
placed in an enclosed room, the sound waves from the source bounce back and
forth between the reflective walls many times. This can create a uniform, or
diffuse, sound field. In a perfectly reverberant room, the sound-pressure level is
equal at all points within the room.
Special reverberant rooms are designed, built, and qualified for the purpose of
measuring the sound emitted by a piece of equipment. This type of facility will
be discussed later in this period.
Reverberant Field
source
source
reflective
walls
reflective
reflective
walls
walls
Figure 57
TRG-TRC007-EN 53
period four
Equipment Sound Rating
notes
Most rooms in buildings are somewhere between a free field and a reverberant
field environment. Called a semireverberant field, these spaces have some
characteristics of both free field and reverberant field environments. The walls,
floor, and ceiling prevent the sound from behaving as it would in a free field.
These surfaces are not, however, perfectly reflective. Some of the sound is
reflected by these surfaces, but a portion of the sound is absorbed or
transmitted.
An understanding of how sound behaves in a semireverberant field is
important when taking sound measurements. The characteristics of the sound
field change with distance when a small sound source is placed in the center
of a room. Close to the source, in the near field, sound measurement is
unpredictable. Near the wall, in the reverberant field, the reflected sound begins
to add to the sound coming directly from the source. The reduction in sound
level due to the distance from the source tends to be cancelled out by the
addition of the sound reflecting off the wall. This results in a near-constant
sound-pressure level near the wall.
In the semireverberant field, sound behaves similarly to how it would in a free
field. The sound level will decrease as the distance from the source increases,
but not as much as it would in an ideal free field.
The construction of the room plays a significant role in determining what
portion of the room behaves as a reverberant field, and what portion behaves
as a semireverberant field. Small rooms with hard, reflective surfaces behave
similarly to reverberant rooms. This description often fits a mechanical
equipment room that is constructed of concrete and is small with respect to
the size of the sound source.
Semireverberant Field
semireverberant
field
semireverberant
semireverberant
field
field
wallwall
wall
source
source
near
field
near
near
field
field
Figure 58
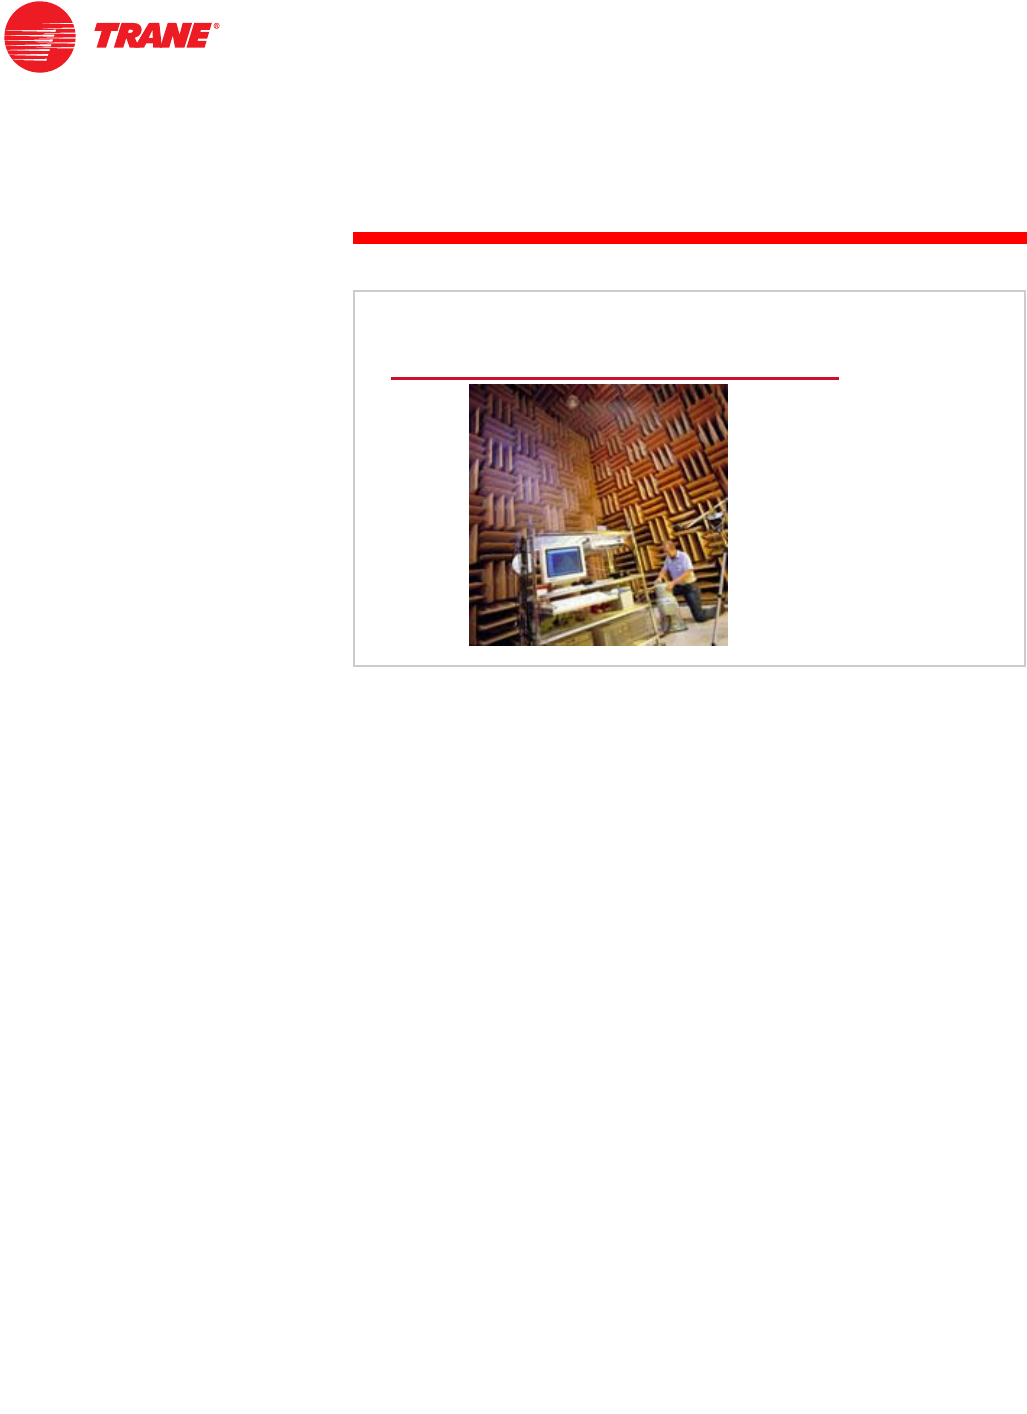
54 TRG-TRC007-EN
notes
period four
Equipment Sound Rating
HVAC Equipment Sound Rating
As mentioned earlier, because sound pressure is influenced by the
surroundings, often the best way for an equipment manufacturer to provide
sound data is to provide sound-power levels.
Sound-power levels for many types of HVAC equipment are determined in an
acoustics laboratory, usually by the manufacturer. Sound-power levels are
determined by measuring sound-pressure levels in a test facility with known
acoustical characteristics, and adding back any environmental effects attributed
to the surroundings. Formal written standards qualify such test facilities and
methods, in order to promote uniformity of data between different
manufacturers across the industry. This allows for objective comparisons of
similar equipment.
The two most common methods of determining the sound power of HVAC
equipment are the reverberant-room and free-field methods.
Rating HVAC Equipment
Figure 59
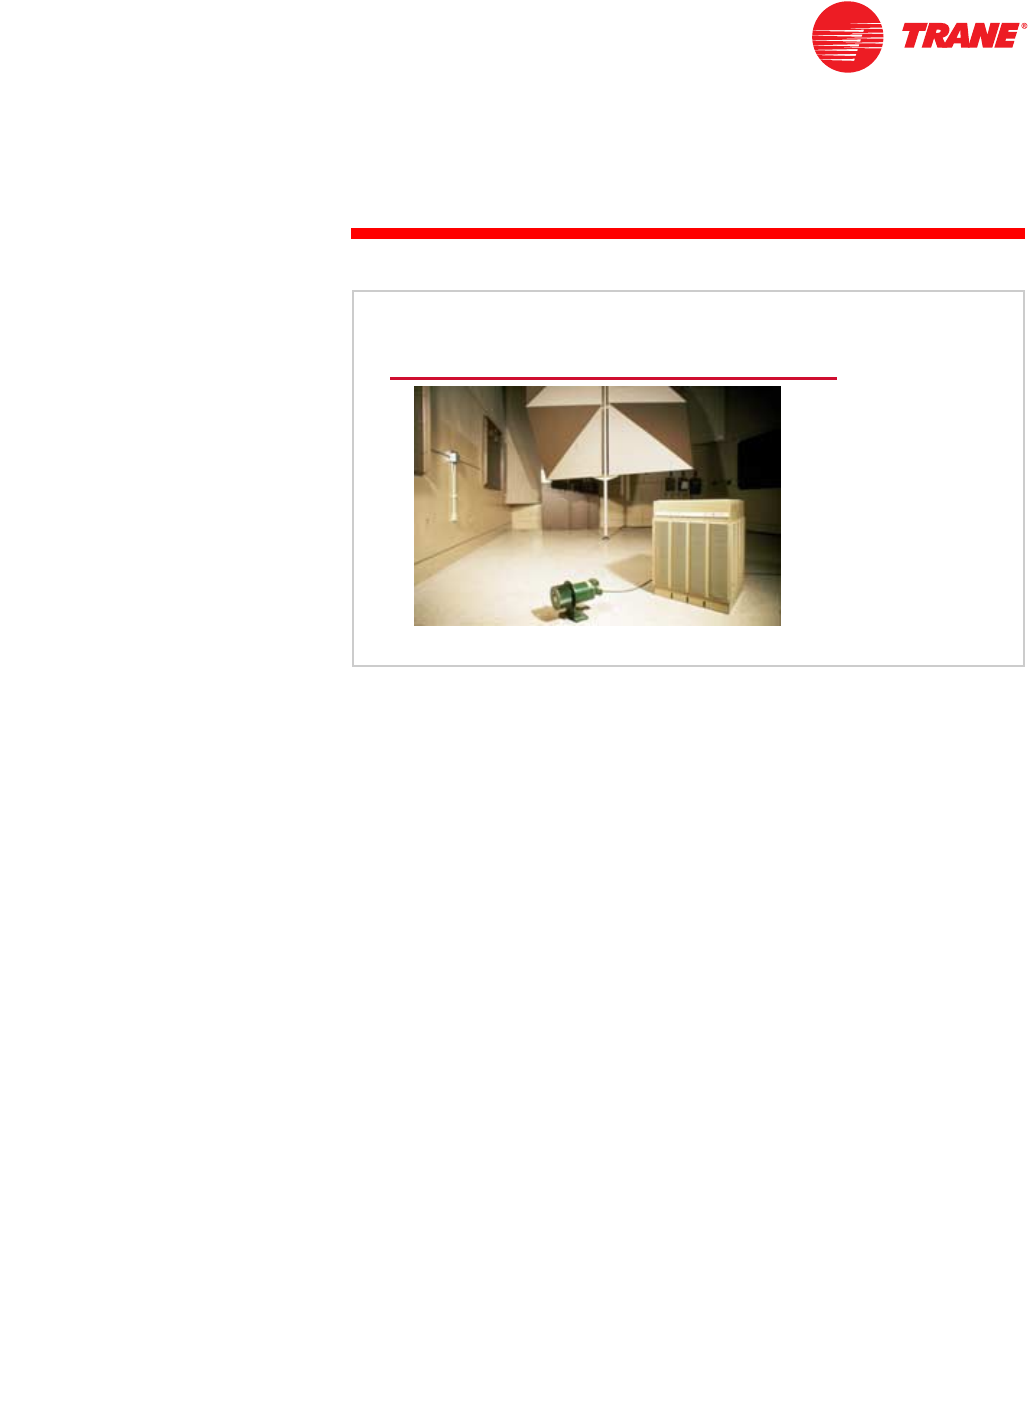
TRG-TRC007-EN 55
period four
Equipment Sound Rating
notes
The most common test method for HVAC equipment is the reverberant-room
method. The objective of a reverberant room is to create a uniform, or diffuse,
sound field by reflecting and mixing the sound waves. The walls, floor, and
ceiling of the reverberant room are hard, in order to cause multiple reflections
of sound waves. In this environment, the sound pressure is essentially the same
at all locations within the room.
Sound-pressure levels are measured in the reverberant room and used to
calculate sound-power levels for the piece of equipment. The reverberant-room
method is commonly used to determine the sound power of fans, air handlers,
compressors, in-room air conditioners, terminal equipment (such as fan-coils
and VAV boxes), and diffusers.
Reverberant-Room Method
Figure 60
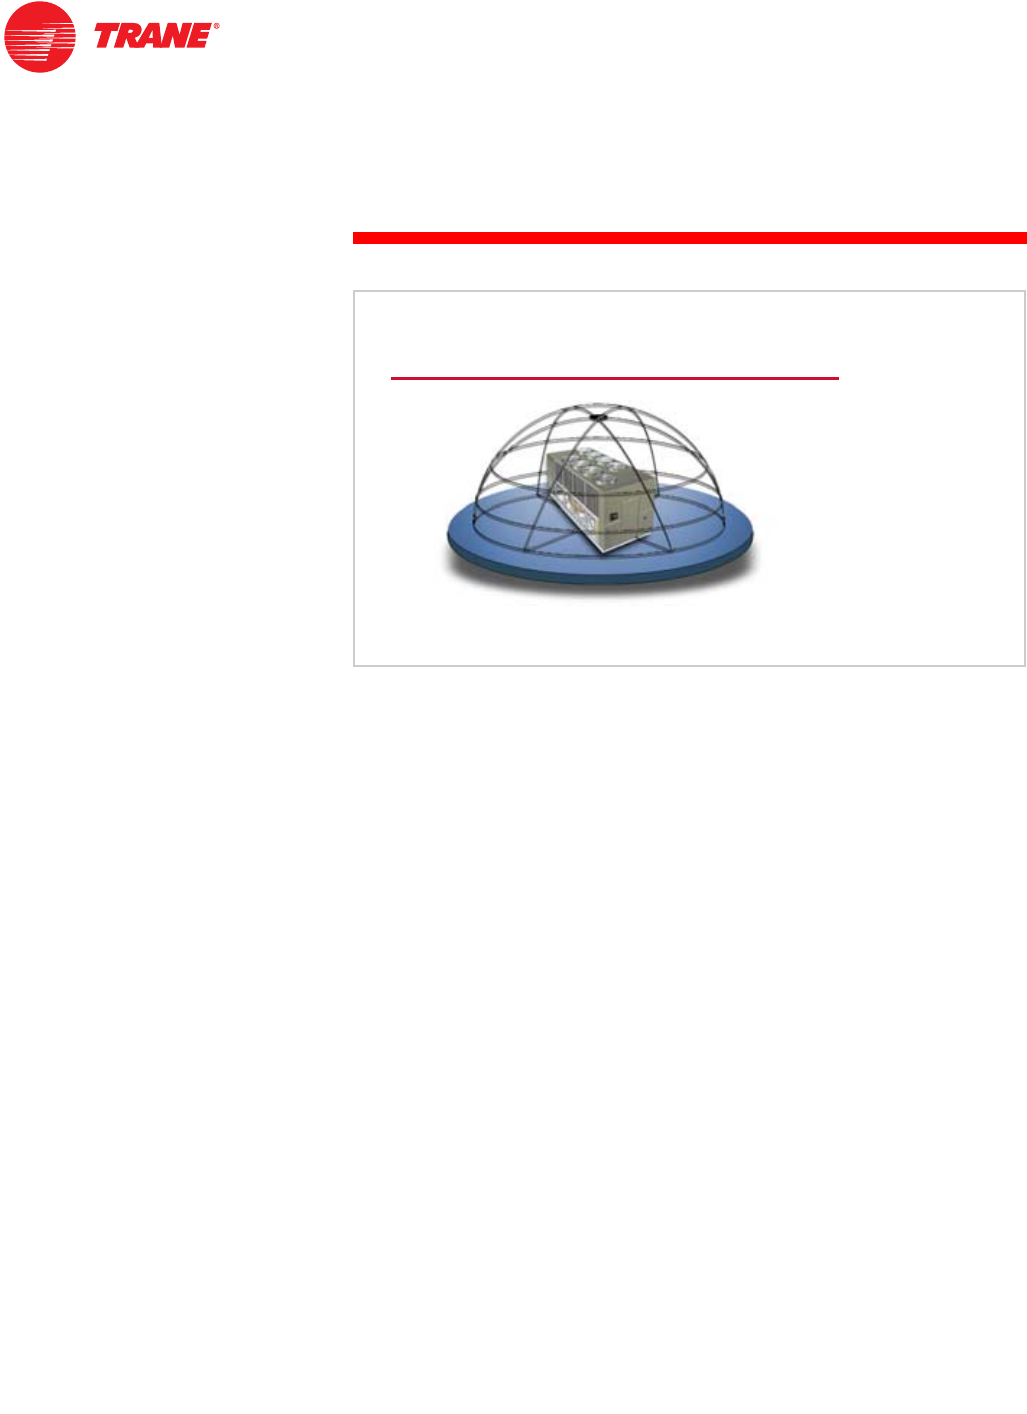
56 TRG-TRC007-EN
notes
period four
Equipment Sound Rating
The free-field method is commonly used for HVAC equipment that is too
large to be tested in a reverberant room. This includes water chillers, cooling
towers, and the outdoor sound from packaged rooftop air conditioners and
air-cooled condensers.
This type of equipment is placed on a hard surface in an anechoic (or sound-
absorbing) room or on a large parking lot outdoors. This approximates the
characteristics of sound in a free field above a reflecting plane. That is, the
sound-pressure waves travel evenly in a hemispherical pattern, away from the
equipment. Sound-power levels are determined by measuring sound-pressure
levels on an imaginary hemispherical surface surrounding the equipment.
Free-Field Method
Figure 61
TRG-TRC007-EN 57
period four
Equipment Sound Rating
notes
Formal standards are written by industry organizations to promote uniformity
of data between different manufacturers. Air-Conditioning & Refrigeration
Institute (ARI), the Air Movement and Control Association International (AMCA),
and the American Society of Heating, Refrigerating, and Air-Conditioning
Engineers (ASHRAE) are three such organizations.
However, methods for predicting sound data may still vary from manufacturer
to manufacturer, hampering comparisons of similar equipment. Done properly,
collecting accurate sound data for an entire line of products is an expensive and
time-consuming endeavor. A single product line may consist of many models,
and each model may come in a range of sizes with various options that alter the
sound generated by the equipment.
(The ARI, AMCA, and ASHRAE logos are registered trademarks of their
respective organizations.)
Industry Standards
Figure 62
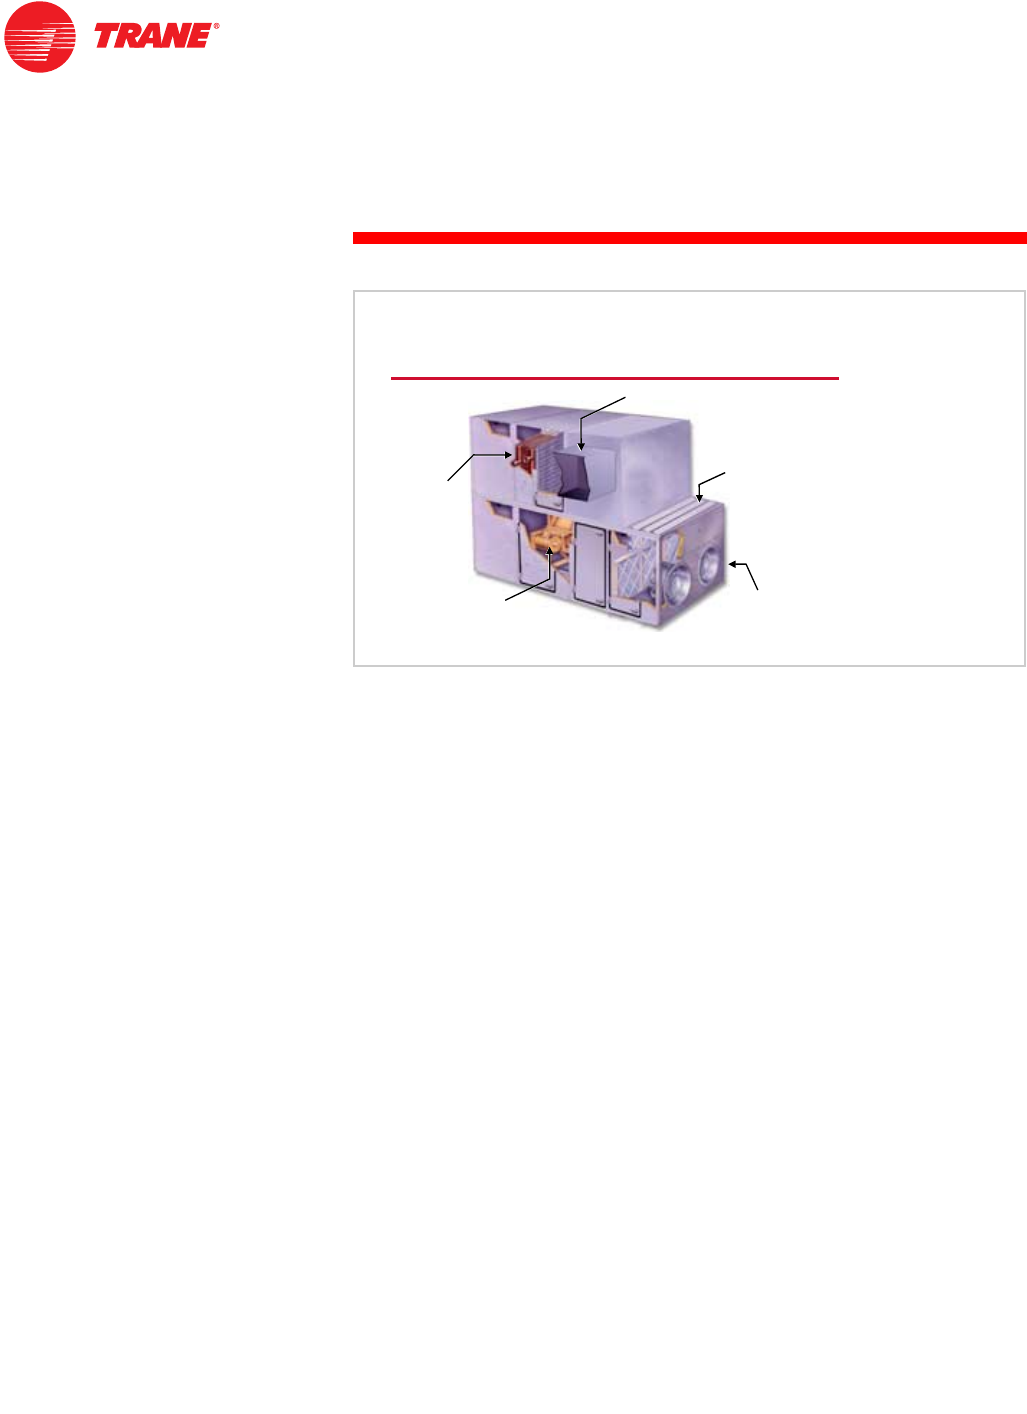
58 TRG-TRC007-EN
notes
period four
Equipment Sound Rating
One of the best examples to demonstrate the complexity of gathering complete
and accurate sound data is air-handling equipment. This involves any type of
HVAC equipment that contains a fan and is used to condition and move air
through a duct system.
Consider that each fan in an air-handling product line may run at multiple
speeds and within a range of flow and static-pressure conditions. The fact
that each type of fan (forward-curved, backward-inclined, and so forth) has a
different operating characteristic further complicates testing.
A fan performs differently inside an air handler than it does in a stand-alone
application. The air-handler casing generally changes the airflow patterns at
the fan inlet and discharge openings, which can change the sound power for
a given flow and static-pressure condition.
Additionally, an air handler may have only one source of sound or it may have
several. For example, a ducted, packaged rooftop air conditioner has multiple
sources. It contains a supply fan, refrigeration compressors, air-cooled
condenser fans, and possibly an exhaust or return fan.
Finally, sound may leave the air handler in multiple ways. In the case of the
indoor air handler, sound travels along with the conditioned air into the supply
duct system. It also travels back out the return-air inlet, against the direction of
airflow. Finally, sound is also radiated by the casing of the air handler into the
equipment room. In order to properly design the HVAC system, the designer
needs to know the sound power from all of these paths.
Ducted Air-Handling Equipment
coilcoil
coil
supply fansupply fan
supply fan outdoor-air
intake
outdoor
outdoor-
-air
air
intake
intake
return-air
inlet
return
return-
-air
air
inlet
inlet
supply-air outletsupply
supply-
-air outlet
air outlet
Figure 63
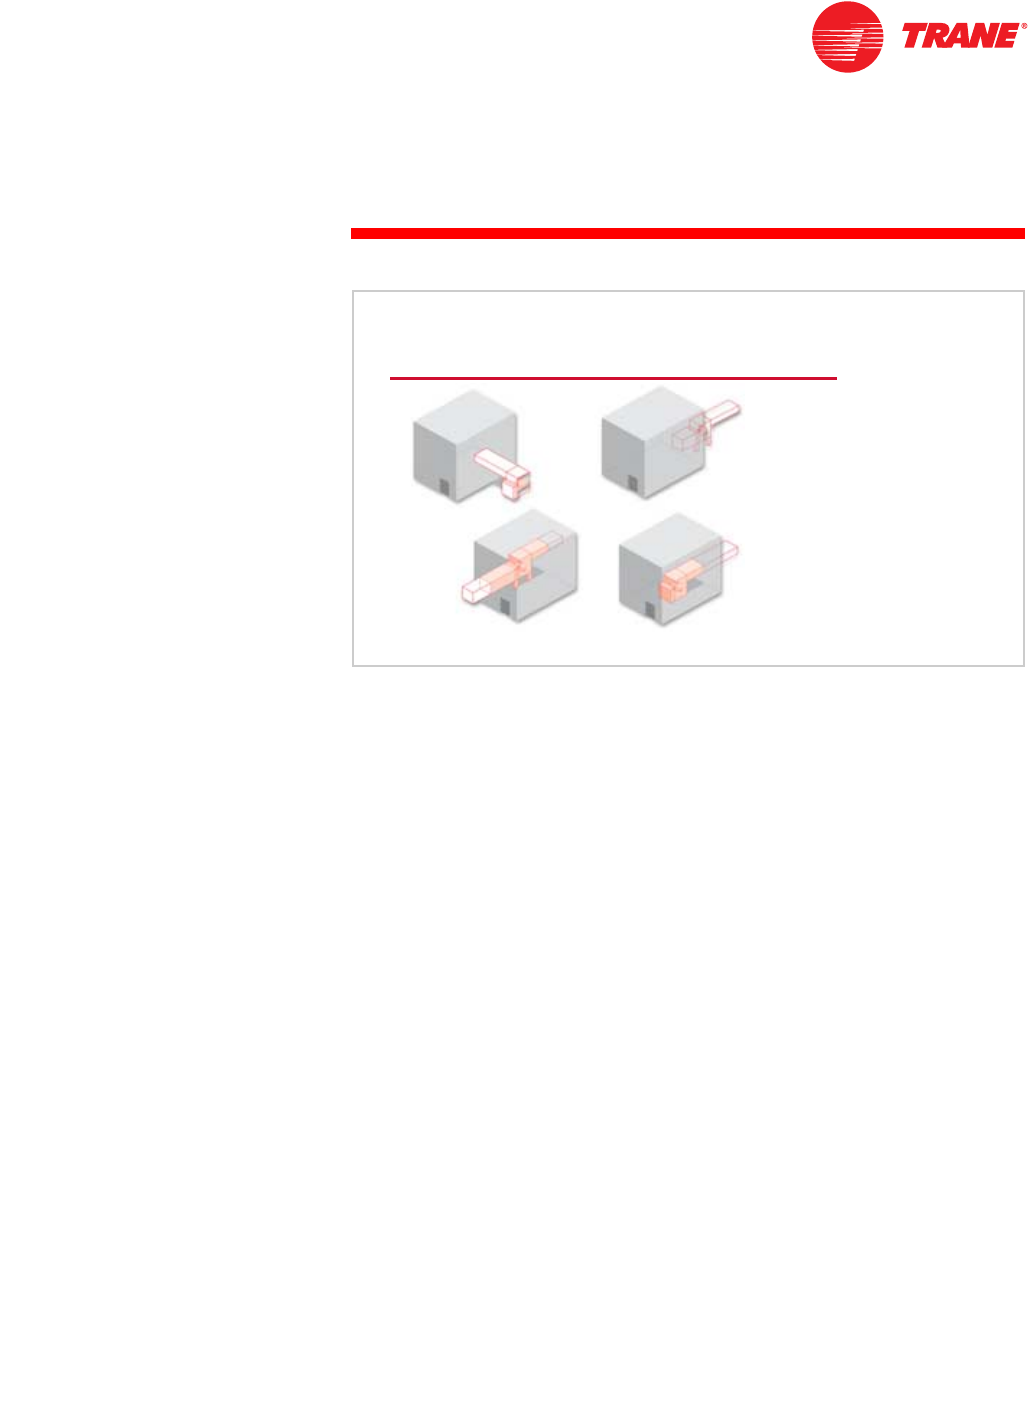
TRG-TRC007-EN 59
period four
Equipment Sound Rating
notes
In order to isolate these different paths, the air handler must be tested using
a number of different configurations. For example, to determine the portion
of the sound that is discharged with the air into the supply ductwork, the air
handler is installed outside of the reverberant room with the supply air ducted
into the room.
In order to determine the sound that travels back down the return duct in a
ducted inlet application, the air handler is again installed outside of the
reverberant room, but the return air duct is connected to the reverberant room.
In order to determine the portion of the sound that is radiated by the casing,
the air handler is installed inside the reverberant room with both the return and
supply air ducted outside of the room.
Finally, in cases where the return air travels back to the air handler through
an open plenum and into the open equipment room, the combined “free”
(or open) inlet plus casing radiated sound level must be known. Therefore,
the air handler is installed inside the reverberant room with a free inlet and
the supply air is ducted to outside of the room.
Air Handler Test Configurations
ducted
ducted
discharge
discharge ducted
ducted
inlet
inlet
unducted
unducted inlet
inlet
plus casing
plus casing
radiated
radiated
casing
casing
radiated
radiated
Figure 64
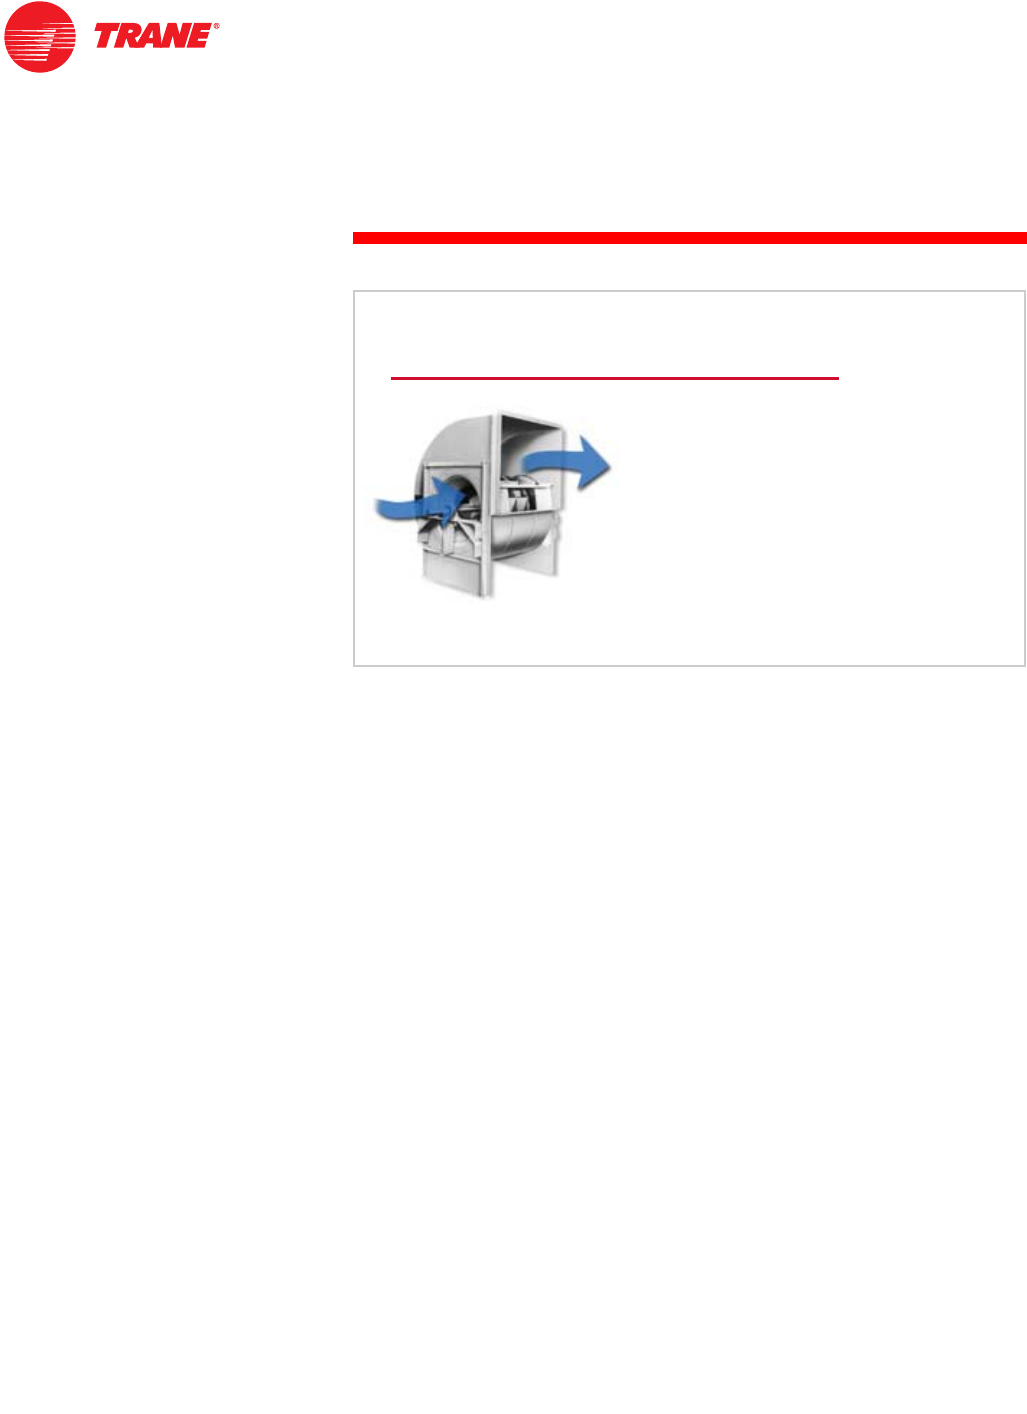
60 TRG-TRC007-EN
notes
period four
Equipment Sound Rating
Historically, there have been several methods used to generate sound data for
air handling equipment.
Though increasingly less common, there are still cases where fan-sound levels
are based on prediction equations such as the generic fan algorithm published
long ago by ASHRAE. Using this algorithm is much less costly than using an
acoustic test facility, but results in much less accurate data. In 1995, after tests
proved that sound levels predicted by the algorithm could vary from actual
measured readings by as much as 10 dB in a given octave band, ASHRAE
removed the fan prediction algorithm from the handbook, stating that:
The sound power generated by a fan performing at a given duty is best
obtained from manufacturers’ test data taken under approved test conditions.
[1999 ASHRAE Handbook–Applications, Chapter 46, page 4]
Another sometimes-used rating method measures actual sound data for the fan
by itself, then uses acoustical equations to predict the effects of the cabinet,
coils, filters, and other components that make up the air handler. These
prediction algorithms vary from manufacturer to manufacturer, and since they
are usually proprietary, it is difficult to judge their accuracy. This prevents
designers from effectively comparing data between manufacturers or applying
that data in an analysis.
AMCA Standard 300–1996, Reverberant Room Method for Sound Testing of
Fans, defines the test methodology for collecting fan-only sound-power data.
However, it has also been used to test entire air handlers. Just because the
data was “taken in accordance with AMCA 300” does not indicate whether
the sound data is for the fan only or for the entire air handler. This leaves the
designer to determine whether the data reflects the entire air handler or, as
intended, just the fan by itself.
Former Methods of Sound Testing
IASHRAE generic fan
algorithm
IMeasured fan-sound
data plus prediction
equations
IAMCA Standard 300
Figure 65
TRG-TRC007-EN 61
period four
Equipment Sound Rating
notes
The objective of ARI Standard 260–2001, Sound Rating of Ducted Air Moving
and Conditioning Equipment, is to deliver sound data that accurately represents
the acoustical impact of the air-handling equipment after it is installed.
This standard uses the reverberant-room method to measure the sound
generated by the entire air handler, not just the fan. As mentioned, a fan
performs differently inside an air handler than it does in a stand-alone
application. The air-handler casing generally changes the airflow patterns at
the fan inlet and discharge openings. This effect is the major reason for the
difference between fan-only sound data and the actual sound produced by
the air handler after it is installed.
To eliminate such inaccuracies, ARI 260 requires that the entire air handler be
tested in all of the configurations in which the equipment is commonly applied
in the field. This involves the four test configurations discussed in Figure 64,
as well as various combinations of options such as inlet and discharge
plenums, different types of filters, dampers, coils, and so forth.
Unlike the other methods, ARI 260 requires that secondary sound sources,
such as return or exhaust fans and compressors, be tested to determine their
acoustical impact on the air handler. Any secondary source that alters the
sound spectrum of the supply fan must be included in cataloged ratings.
In summary, ARI 260 addresses a wide range of air-handling equipment with a
consistent test method. It ensures accurate, verifiable sound data, and focuses
on the entire air handler in all of its common installation arrangements. ARI 260
enables designers to make equitable product comparisons, and to more
accurately predict sound-pressure levels for occupied spaces.
ARI Standard 260
IUses reverberant-
room method
ITests entire air
handler, not just fan
IAll common
configurations and
components included
IIncludes effects of
secondary sound
sources
Figure 66

62 TRG-TRC007-EN
notes
period four
Equipment Sound Rating
Depending on the type of equipment, sound ratings for HVAC equipment are
typically given as sound-power levels by octave band or as a single dBA rating.
Outdoor equipment, such as an air-cooled chiller or condensing unit, may be
rated in terms of A-weighted sound-pressure level (dBA) at a specific distance
from the equipment. This generally assumes a free-field environment and may
be useful for comparing equipment from various manufacturers. Nevertheless,
the sound-pressure level by octave band should still be available from the
manufacturer for use in an acoustical analysis.
As mentioned, air-handling equipment is typically rated in terms of sound-
power level per octave band. Typically, this data is given for the octave bands
from 63 Hz through 8,000 Hz. The availability of accurate, tested sound data for
HVAC equipment is vitally important to any acoustical analysis.
Sound Power by Octave Band
octave
band
1
2
3
4
5
6
7
8
octave
band
1
2
3
4
5
6
7
8
center
frequency (Hz)
63
125
250
500
1,000
2,000
4,000
8,000
center
frequency (Hz)
63
125
250
500
1,000
2,000
4,000
8,000
equipment
sound power
(dB ref 10-12 W)
103
104
100
101
98
93
88
85
equipment
sound power
(dB ref 10-12 W)
103
104
100
101
98
93
88
85 Figure 67
TRG-TRC007-EN 63
notes
We will now review the main concepts that were covered in this clinic on the
fundamentals of HVAC acoustics.
Period One explained some of the basic concepts of sound. Sound is the
audible emissions resulting from the vibration of molecules within an elastic
medium. It is generated at many different frequencies at the same time. Noise
is defined as unwanted, or obtrusive, sound.
Sound power and sound pressure are both terms that are used when describing
sound. Sound power is the acoustical energy emitted by the sound source and
is not affected by the environment. Sound pressure is a disturbance in the
atmosphere and can be measured directly. Its intensity is influenced not only by
the strength of the source, but also by the surroundings and the distance from
the source to the listener. Sound pressure is what our ears hear and what sound
meters measure.
period five
Review
Fundamentals of HVAC Acoustics
Figure 68
Review—Period One
ISound power
KAcoustical energy emitted by source
KUnaffected by the environment
KCorrelates to bulb wattage
ISound pressure
KPressure disturbance in atmosphere
KAffected by strength of source,
surroundings, and distance from source
KCorrelates to brightness in a particular
location
Figure 69
period five
Review
64 TRG-TRC007-EN
notes
period five
Review
Period Two discussed how the human ear perceives sound. As a selective
sensory organ, the human ear is more sensitive to high frequencies than to
low frequencies. The sensitivity of the human ear at a particular frequency also
changes with loudness.
Many single-number rating systems have been developed over the years and
each has its advantages and drawbacks. This clinic focused on some of the
more commonly used rating systems, including A-weighting, Noise Criteria
(NC), and Room Criteria (RC). A-weighting is typically used to describe the
sound in outdoor environments, and for determining whether or not hearing
protection is required in certain industrial environments. Noise Criteria and
Room Criteria are used to describe the sound in indoor environments. The RC
method has the added feature of describing the character, or quality, of the
sound, as well as its loudness. However, because most HVAC equipment
manufacturers do not have sound-power data for the 16 Hz and 31.5 Hz octave
bands, it is difficult to predict the sound-pressure levels in these octave bands.
Finally, both sound-power levels and sound-pressure levels can be described
using either full or one-third octave bands. Octave-band sound-power data is
commonly used for describing the sound generated by HVAC equipment. It can
also be used to describe the sound in either indoor or outdoor environments.
Review—Period Two
IA-weighting
KOutdoor environments
and hearing protection
INoise criteria (NC)
KIndoor environments
IRoom criteria (RC)
KIndoor environments
KAlso describes sound
character
IOctave-band data
70
70
50
50
40
40
30
30
20
20
10
10
sound pressure, dB ref 20
sound pressure, dB ref 20 m
mPa
Pa
80
80
60
60
octave
octave-
-band frequency, Hz
band frequency, Hz
31.5
31.5 63
63 125
125 250
250 500
500 1,000
1,000 2,000
2,000 4,000
4,000
25
25
30
30
35
35
40
40
45
45
50
50
RC
RC
chart
chart
Figure 70
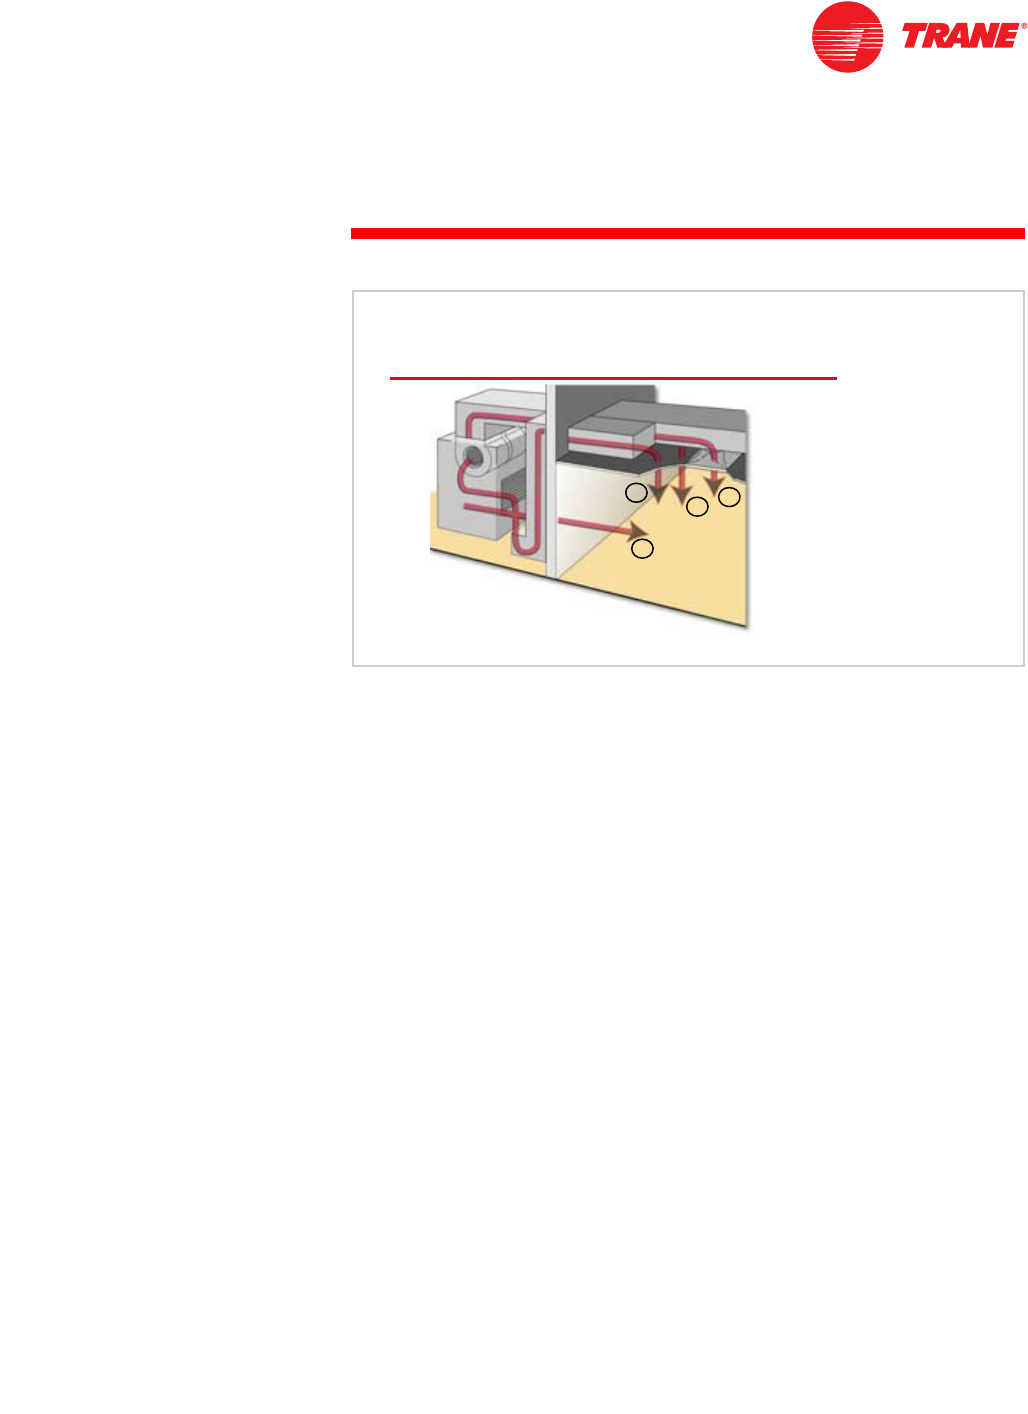
TRG-TRC007-EN 65
period five
Review
notes
Period Three walked through the steps of an acoustical analysis, including
setting the design target for the indoor or outdoor environment, and
performing a source–path–receiver analysis. This method of analysis traces
sound from the source to the location where we want to predict the sound
(the receiver). How the sound travels between the source and the receiver,
and everything it encounters as it travels along the way, constitutes the path.
Remember:
nOne piece of equipment may contain several sound sources.
nSound may travel from a single source to the receiver along multiple paths.
nThe total sound heard by the receiver is the sum of all the sounds from
various sources that travel along several paths.
Computer software analysis tools are available to aid in performing this type of
calculation-intensive analysis.
Review—Period Three
wall transmission
wall transmission
return
return
airborne
airborne supply
supply
airborne
airborne
supply
supply
breakout
breakout
source
source
1
1
2
2
3
3
4
4
Figure 71
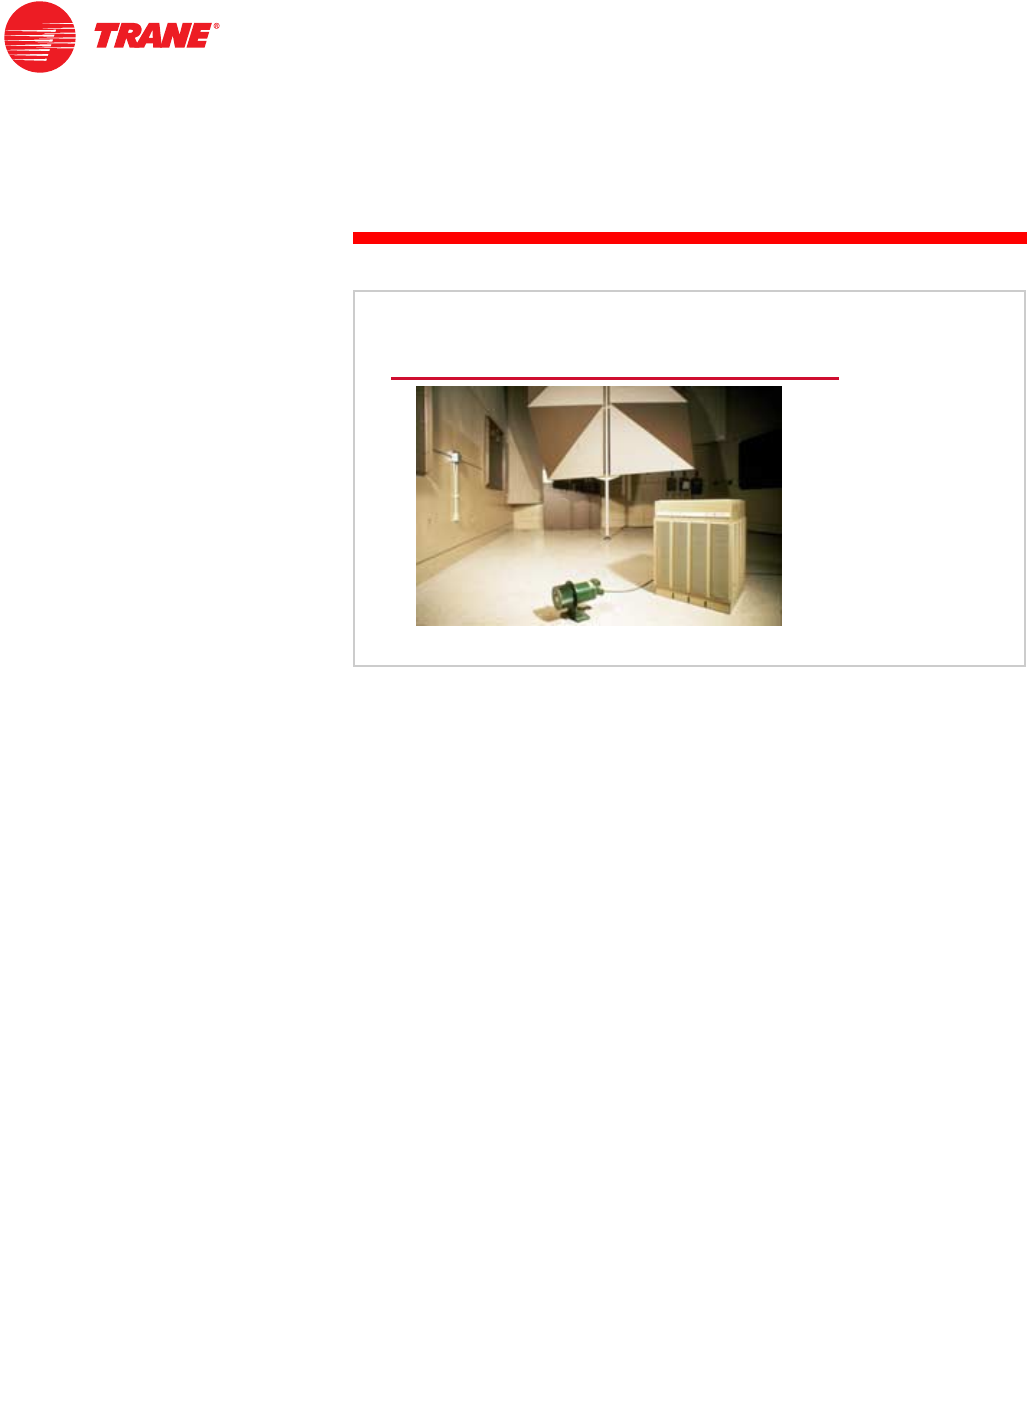
66 TRG-TRC007-EN
notes
period five
Review
Period Four introduced two common methods used by HVAC equipment
manufacturers to provide accurate sound data. Because sound pressure is
influenced by the surroundings, the most useful sound data that can be
provided for most pieces of equipment is sound power.
Sound-power levels are determined by measuring sound-pressure levels in an
environment with known acoustical characteristics, and adding back any effects
attributed to the surroundings. The most common method uses a special
acoustical testing facility called a reverberant room.
The availability of accurate, tested sound data for HVAC equipment is vitally
important to any acoustical analysis. ARI Standard 260–2001 is one example
of an industry standard for rating the sound level of equipment. This standard
addresses a wide range of air-handling equipment with a consistent test
method. It assures accurate, verifiable sound data, and focuses on the entire
air handler in all of its common installation arrangements. As with other
existing sound standards, ARI 260 enables designers to make equitable product
comparisons and to more accurately predict sound levels for occupied spaces.
Review—Period Four
Figure 72

TRG-TRC007-EN 67
period five
Review
notes
For more information, refer to the following references:
nAcoustics in Air Conditioning Applications Engineering Manual (Trane
literature order number FND-AM-5)
nTrane Acoustics Program (TAP™)
nASHRAE Handbook – Fundamentals (chapter 7, 2001)
nASHRAE Handbook – Applications (chapter 46, 1999)
nA Practical Guide to Noise and Vibration Control, ASHRAE, 1991
nApplication of Manufacturer’s Sound Data, ASHRAE, 1998
nAlgorithms for HVAC Acoustics, ASHRAE, 1991
nSound and Vibration Design and Analysis, National Environmental
Balancing Bureau (NEBB), 1994
Visit the ASHRAE Bookstore at www.ashrae.org and the NEBB Bookstore at
www.nebb.org.
For information on additional educational materials available from Trane,
contact your local Trane sales office (request a copy of the Educational Material
price list—Trane order number EM-ADV1) or visit our online bookstore at
www.trane.com/bookstore/.
Figure 73

68 TRG-TRC007-EN
Questions for Period 1
1What unit of measure is used to describe frequency?
2Define a tone.
3Sound _______ (power or pressure) is what our ears hear and is influenced
by the surroundings.
Questions for Period 2
4Which of these two single-number descriptors, A-weighted sound pressure
level or Noise Criteria (NC) rating, is better for describing outdoor sound?
5Which of the above mentioned descriptors is better for describing sound in
an office space or classroom?
6What is the NC rating of a space with the following sound-pressure levels?
octave
band
center
frequency
(Hz)
measured
sound pressure
(dB ref 20 µPa)
163 48
2125 47
3250 45
4500 39
51,000 35
62,000 27
74,000 19
88,000 14
Quiz
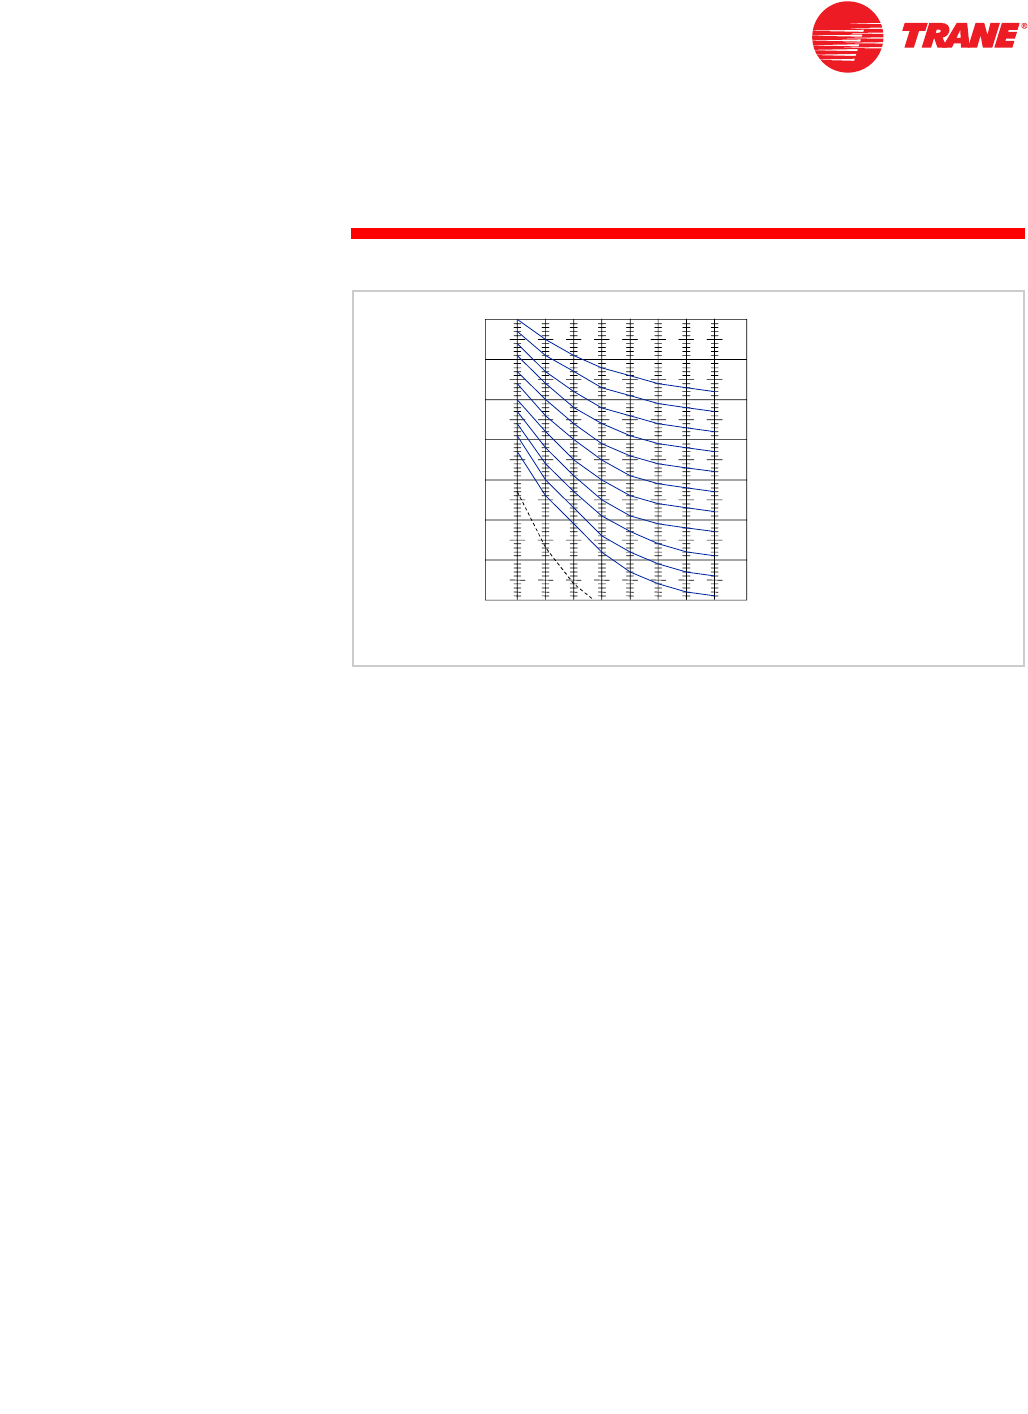
TRG-TRC007-EN 69
Quiz
notes
Questions for Period 3
7True or False: Sound can only travel from a source to the receiver along one
path.
8True or False: One piece of HVAC equipment may contain several sound
sources.
9What term is used to describe the reduction in sound that enters a room as
it travels to the receiver? It is influenced by distance and the absorptive and
reflective characteristics of the surfaces and furnishings in the room.
Questions for Period 4
10 A _______ (free or reverberant) sound field is characterized by a uniform, or
diffuse, sound field where the sound pressure is equal at all points in the
field.
11 What recent ARI standard, which rates the sound due to ducted air moving
and conditioning equipment, requires testing of the entire air handler, not
just the fan?
NC
NC-
-15
15
NC
NC-
-20
20
NC
NC-
-25
25
NC
NC-
-30
30
NC
NC-
-35
35
NC
NC-
-40
40
NC
NC-
-45
45
NC
NC-
-50
50
NC
NC-
-55
55
NC
NC-
-60
60
NC
NC-
-65
65
70
70
50
50
40
40
30
30
20
20
10
10
sound pressure, dB ref 20
sound pressure, dB ref 20 m
mPa
Pa
80
80
60
60
octave
octave-
-band frequency, Hz
band frequency, Hz
63
63 125
125 250
250 500
500 1,000
1,000 2,000
2,000 4,000
4,000 8,000
8,000
Figure 74
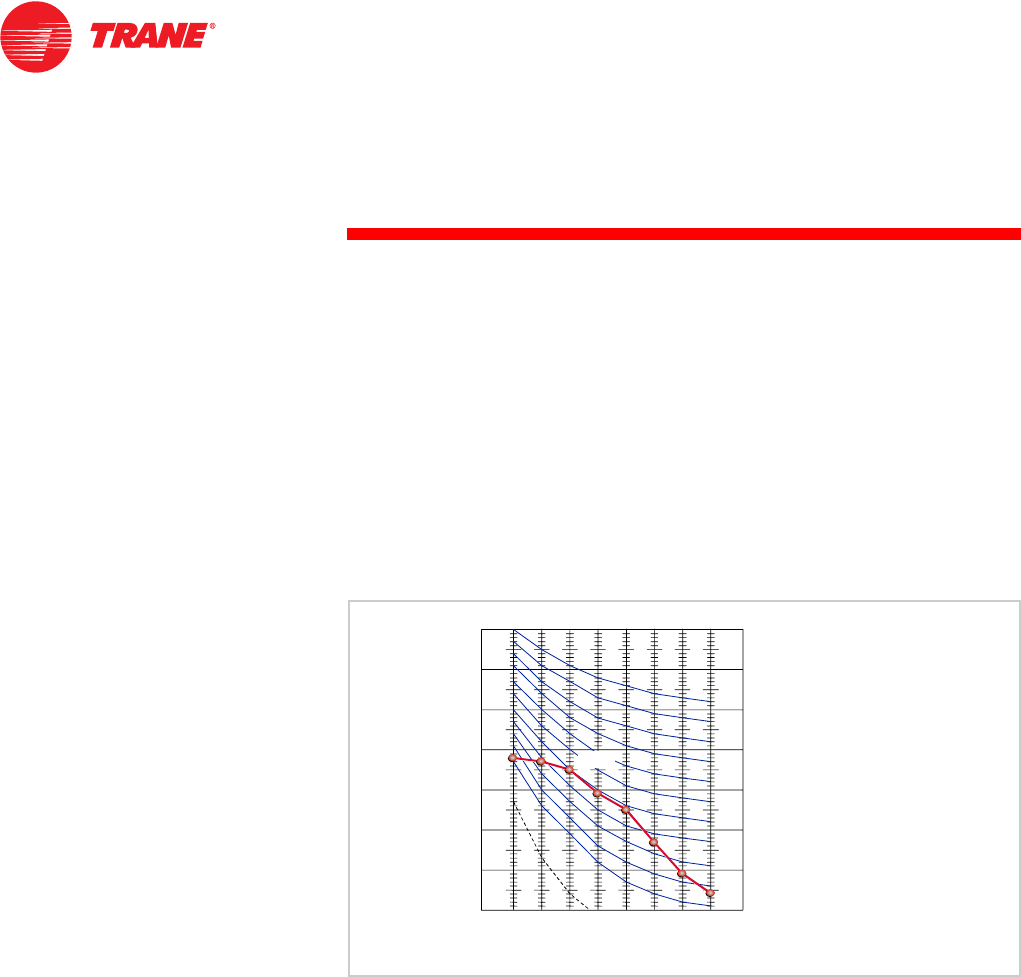
70 TRG-TRC007-EN
1Hertz (cycles per second)
2A sound at a single frequency. A sound at a narrow band of frequencies
that is significantly greater than the sound at adjacent frequencies would
be similar to a tone.
3Sound pressure
4A-weighted sound-pressure level is better for describing outdoor sound
5Noise Criteria rating is better for describing sound in an office or classroom
6NC-35 (see Figure 75)
7False
8True
9Receiver sound correction (or room effect)
10 Reverberant
11 ARI Standard 260–2001, Sound Rating of Ducted Air Moving and
Conditioning Equipment
NC
NC-
-15
15
NC
NC-
-20
20
NC
NC-
-25
25
NC
NC-
-30
30
NC
NC-
-35
35
NC
NC-
-40
40
NC
NC-
-45
45
NC
NC-
-50
50
NC
NC-
-55
55
NC
NC-
-60
60
NC
NC-
-65
65
70
70
50
50
40
40
30
30
20
20
10
10
sound pressure, dB ref 20
sound pressure, dB ref 20 m
mPa
Pa
80
80
60
60
octave
octave-
-band frequency, Hz
band frequency, Hz
63
63 125
125 250
250 500
500 1,000
1,000 2,000
2,000 4,000
4,000 8,000
8,000
NC
NC-
-35
35
Figure 75
Answers

TRG-TRC007-EN 71
absorbed sound Sound energy that strikes a material and is converted from
sound energy to heat energy within the material.
absorption coefficient The ratio of the sound energy absorbed by the material
to the total sound energy incident upon the surface of that material.
AMCA Air Movement and Control Association International (www.amca.org)
ARI Air-Conditioning & Refrigeration Institute (www.ari.org)
ASHRAE American Society of Heating, Refrigerating and Air Conditioning
Engineers (www.ashrae.org)
attenuation The reduction in the sound level as it travels along the path from
a source to the receiver.
A-weighting A single number used to describe sound. It uses weighting
factors, by octave band, to approximate human response to sound in the range
where no hearing protection is needed. It is most appropriately used for low-
volume (or quiet) sound levels and is expressed as dBA.
broadband sound Sound energy that occurs at many frequencies, usually
covering the entire audible range.
center frequency Single frequency used to identify an octave band. It is
calculated by taking the square root of the product of the lowest and highest
frequencies in the octave band.
decibel (dB) A dimensionless ratio of two quantities that is used to describe
both sound power and sound pressure. It is defined as ten times the logarithm
to the base ten (log10) of the measured quantity divided by the reference
quantity.
dynamic insertion loss The sound insertion loss of a duct silencer with air
flowing through it.
free field A homogeneous, isotropic medium, free from boundaries. An
example of a free field over a reflecting plane would be a large open area void
of obstructions, like a parking lot or meadow.
free-field method A common method for testing HVAC equipment that is too
large to be tested in a reverberant room, such as water chillers and cooling
towers. The equipment is placed on a hard surface on a large parking lot
outdoors to approximate the sound conditions in a free field above a reflecting
plane. The sound pressure waves travel evenly in a hemispherical pattern away
from the equipment. Sound-power levels are determined by measuring sound-
pressure levels on an imaginary hemispherical surface surrounding the
equipment.
frequency The number of cycles, or oscillations, per second of a wave in
periodic motion. Expressed in hertz.
Glossary

72 TRG-TRC007-EN
Glossary
hertz (Hz) The unit of measure for frequency. One hertz is equal to one cycle
per second.
insertion loss (IL) The difference in sound pressure measured in a single
location, with and without a noise control device (installed between the source
and receiver) in place.
near field The area adjacent to the source where sound does not behave as
it would in a free field, due to the fact that the source does not radiate sound
equally in all directions.
NEBB National Environmental Balancing Bureau (www.nebb.org)
noise Unwanted or obtrusive sound. Generally, people object to sound when
it interferes with speech, concentration, or sleep.
noise criteria (NC) A single number used to describe sound in a room. It uses
a series of curves for plotting sound pressure by octave band and determining
the NC value.
noise reduction (NR) A term used to measure the effect of a barrier on
reducing the amount of transmitted sound. It is the difference between sound-
pressure measurements taken on each side of a barrier.
noise reduction coefficient (NRC) A single number used to describe the
sound-absorbing characteristics of a material. It is the arithmetic average of
the absorption coefficients for the 250, 500, 1,000 and 2,000 Hz octave bands.
octave band A range of frequencies that is defined such that the highest
frequency in the band is two times the lowest frequency. The octave band is
identified by its center frequency.
phon A unit of measure, using a logarithmic scale, used to describe the
loudness of a sound.
pitch A subjective quantity used to describe a sound. It is primarily based on
frequency, but is also dependent on sound-pressure level and composition.
Pitch is not measured, but is described with terms like bass, tenor, and soprano.
receiver sound correction The relationship between the sound energy (sound
power) entering the room and the sound pressure at a given point in the room
where the receiver hears the sound. This reduction is due to a combination of
effects, including distance and the absorptive and reflective properties of the
surrounding surfaces. Also called room effect.
reflected sound The sound that bounces off, or is reflected by, a barrier back
toward the source.
regenerated sound The noise caused by turbulent flow in air and water
systems.

TRG-TRC007-EN 73
Glossary
reverberant field A uniform, or diffuse, sound field that is the opposite of a
free field. In a perfectly reverberant field, the sound-pressure level is equal at all
points.
reverberant room A specially constructed room with reflective walls, floors,
and ceilings. When a sound source is placed in this room, the sound waves
bounce back and forth between the reflective walls many times. In a perfectly
reverberant room, the sound-pressure level is equal at all points in the room.
reverberant-room method A common method for testing HVAC equipment.
It uses a specially-constructed room to create a uniform, or diffuse, sound field
by reflecting and mixing the sound waves. The walls, floor, and ceiling of the
reverberant room are hard in order to cause multiple reflections of sound
waves. In this environment, the sound pressure is essentially the same at all
locations in the room. Sound-pressure levels are measured in the reverberant
room and used to calculate sound-power levels for the piece of equipment.
room criteria (RC) A single number used to describe sound in a room. It uses a
series of curves and reference lines for plotting sound pressure by octave band
and determining the RC value and a descriptor of the sound quality (i.e., hiss,
rumble).
room effect See receiver room correction.
semireverberant field A sound field that is somewhere between a free field
and a reverberant field. The walls and ceiling of a room prevent the sound from
behaving in a free field manner, however, these surfaces are not perfectly
reflective. Some of the sound is reflected by these surfaces, but a portion is
absorbed.
sone A unit of measure, using a linear scale, used to describe the loudness of
a sound. A sone is the linear equivalent to a phon.
sound Audible emissions resulting from the vibration of molecules within an
elastic medium. It is generated by either a vibrating surface or the movement of
a fluid. In the context of building HVAC systems, this elastic medium can be
either air or the building structure. For structurally-borne sound to become
audible, however, it must first become airborne.
sound power The acoustical energy emitted by the sound source. It is not
affected by the environment.
sound pressure An audible pressure disturbance in the atmosphere that can
be measured directly. Its magnitude is influenced not only by the strength of the
source, but also by the surroundings and the distance from the source to the
listener. Sound pressure is what our ears hear and what sound meters
measure.
source–path–receiver model A systematic approach to analyzing the sound in
a space. It traces sound from the source to the location where we want to
predict the sound (the receiver). How the sound travels between the source and

74 TRG-TRC007-EN
notes
Glossary
the receiver, and everything it encounters as it travels along the way,
constitutes the path.
tone A sound in a single frequency. A sound in a narrow band of frequencies
that is significantly greater than the sound at adjacent frequencies would be
similar to a tone.
transmitted sound The sound that travels though a barrier.
transmission loss (TL) A term used to measure the effect of a barrier on
reducing the amount of transmitted sound. It is the ratio of sound power on the
receiver side of a barrier to the sound power on the source side.

Tr a n e
An American Standard Company
www.trane.com
For more information contact
your local district office or
e-mail us at comfort@trane.com
Literature Order Number TRG-TRC007-EN
File Number E/AV-FND-TRG-TRC007-1101-EN
Supersedes New
Stocking Location La Crosse
Since Trane has a policy of continuous product and product data improvement,
it reserves the right to change design and specifications without notice.
