Z Com 0XG880M Wireless CF Module User Manual FR660211 15 247 11bg
Z Com Inc Wireless CF Module FR660211 15 247 11bg
UserManual.wiki
>
Z Com
>
0XG880M User Manual
>
Test Report
Contents
1.
Test Report
2.
Users Manual
Test Report
Navigation menu
Upload a User Manual
Namespaces
Wiki Guide
HTML
PDF
Info
Views
User Manual
Discussion / Help
Navigation


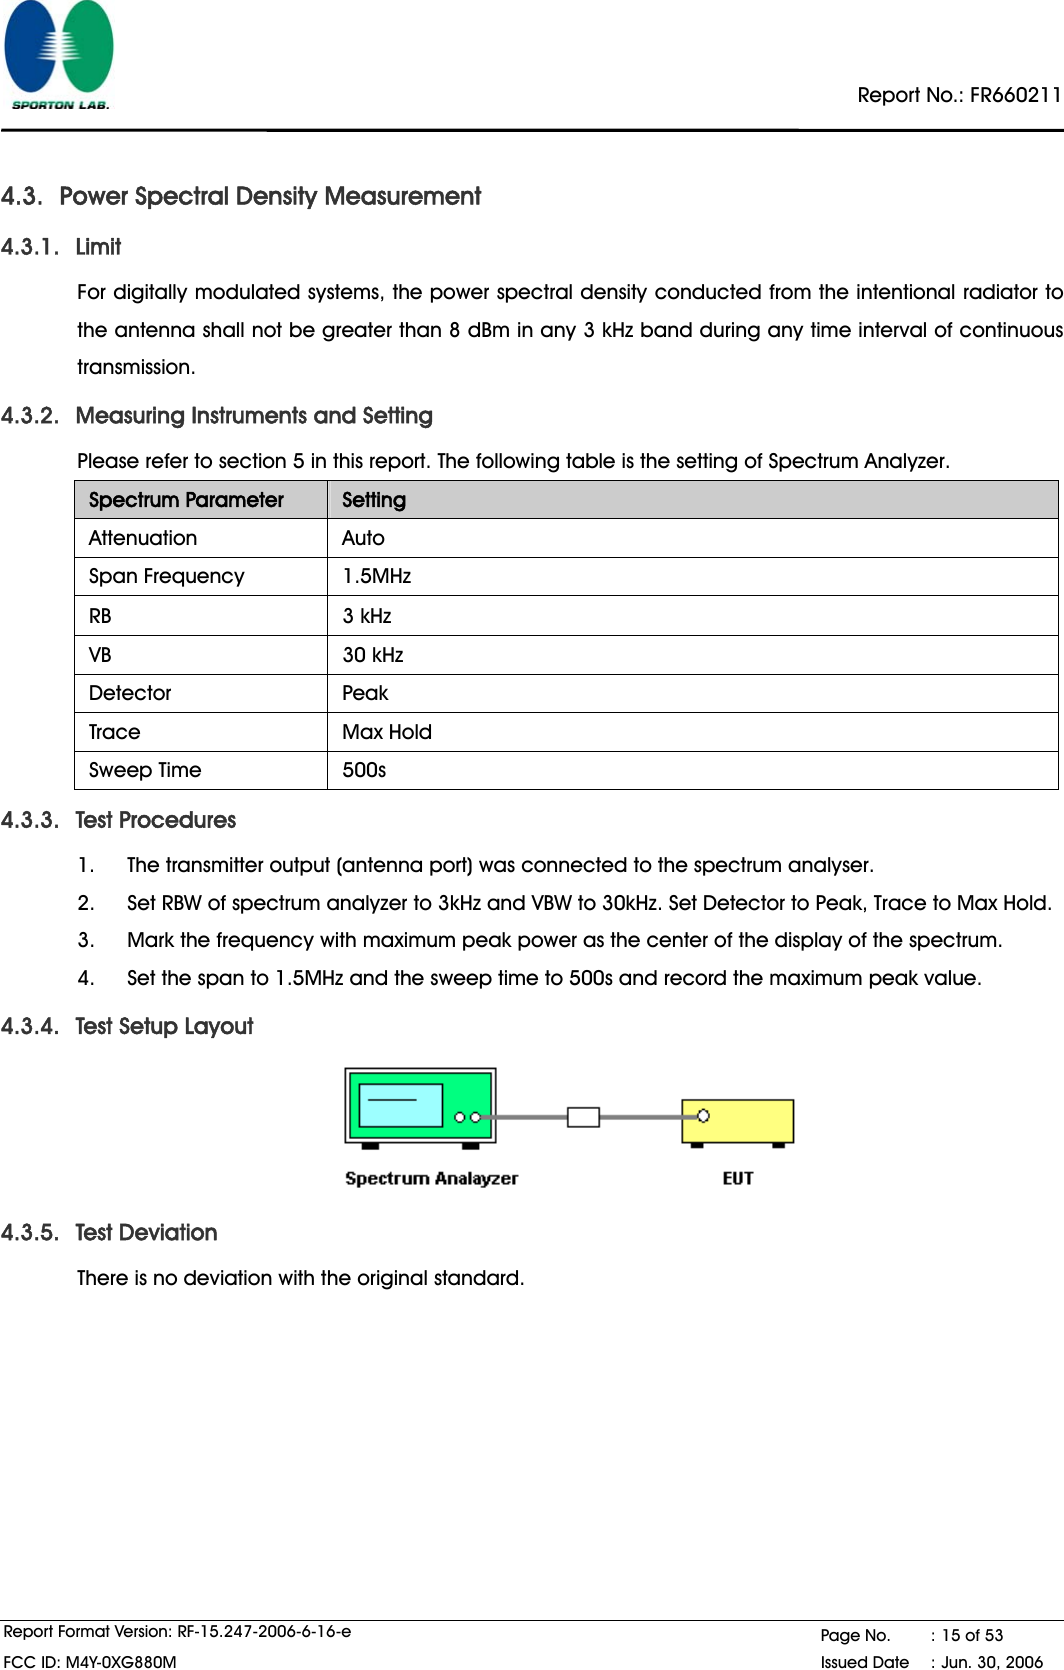
![Report No.: FR660211 Report Format Version: RF-15.247-2006-6-16-e Page No. : 17 of 53 FCC ID: M4Y-0XG880M Issued Date : Jun. 30, 2006 Power Density Plot on Configuration IEEE 802.11b / 2412 MHz A Att 30 dB*Ref 20 dBmCenter 2.410240385 GHz Span 1.5 MHz150 kHz/**RBW 3 kHzVBW 30 kHz1 PKVIEWSWT 500 s**-80-70-60-50-40-30-20-10010201Marker 1 [T1 ] -12.17 dBm2.410302885GHzDate: 20.JUN.2006 10:05:24 Power Density Plot on Configuration IEEE 802.11b / 2437 MHz A Att 30 dB*Ref 20 dBmCenter 2.435995192 GHz Span 1.5 MHz150 kHz/**RBW 3 kHzVBW 30 kHz1 PKVIEWSWT 500 s**-80-70-60-50-40-30-20-10010201Marker 1 [T1 ] -11.13 dBm2.436259615GHzDate: 20.JUN.2006 10:08:25](https://usermanual.wiki/Z-Com/0XG880M.Test-Report/User-Guide-691916-Page-20.png)
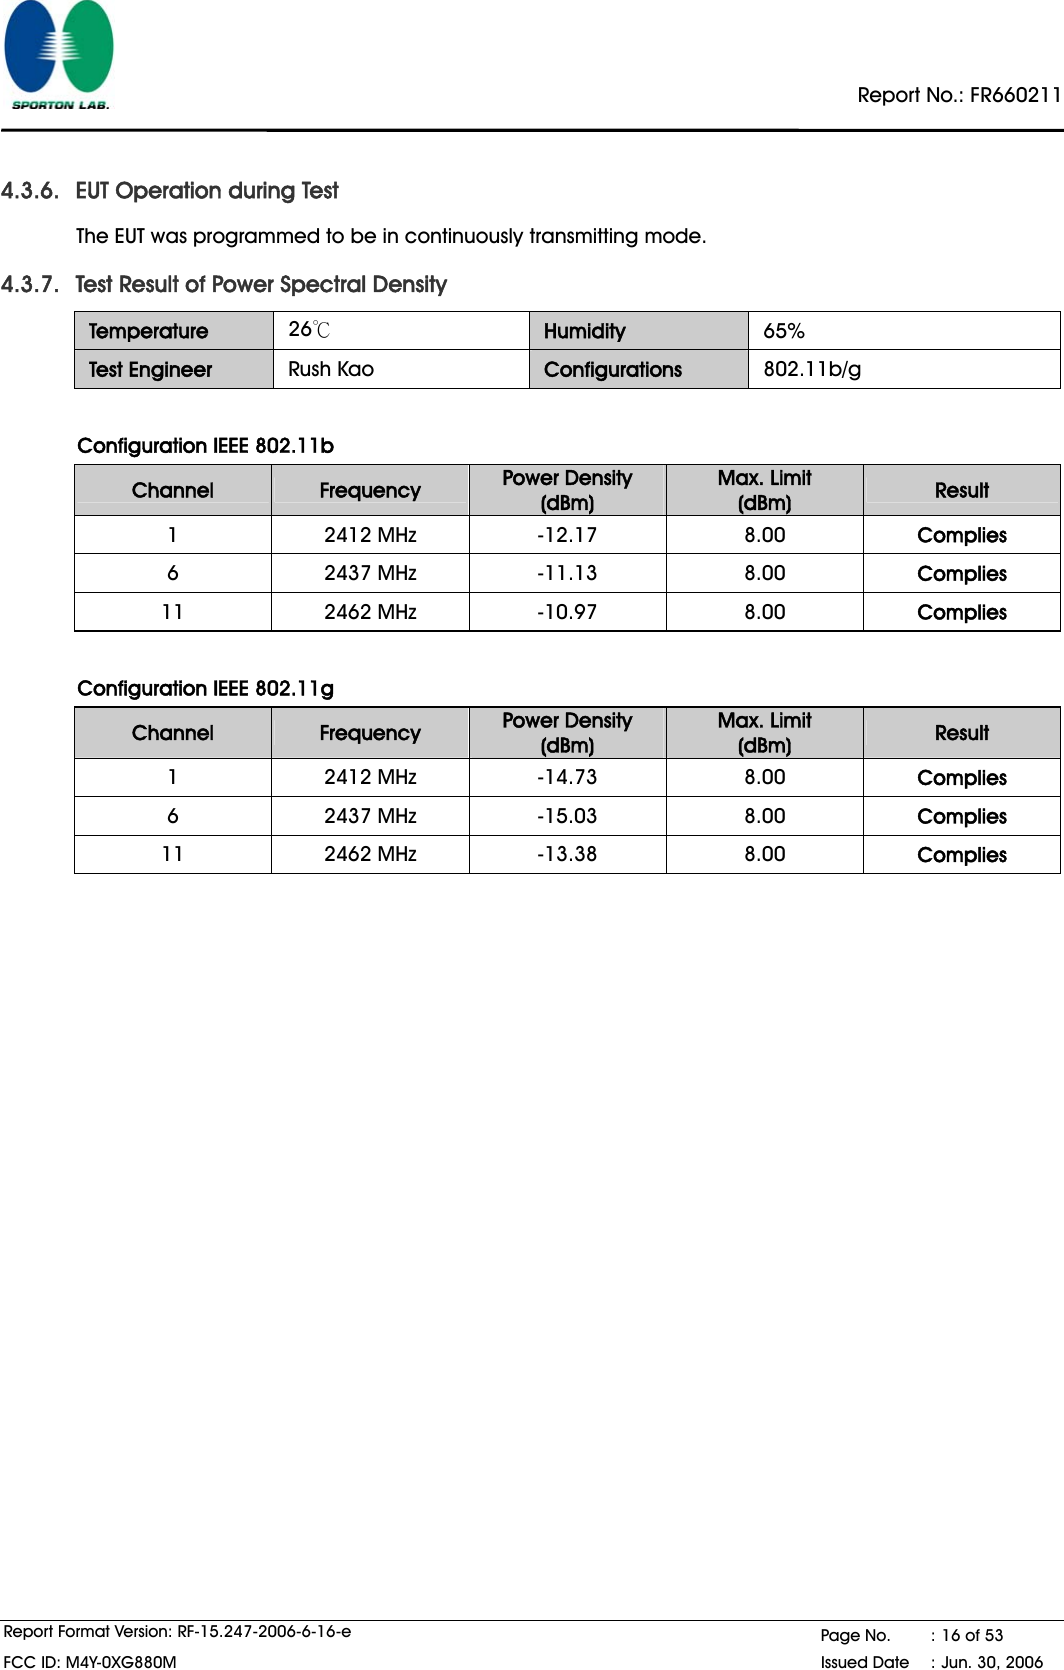
![Report No.: FR660211 Report Format Version: RF-15.247-2006-6-16-e Page No. : 18 of 53 FCC ID: M4Y-0XG880M Issued Date : Jun. 30, 2006 Power Density Plot on Configuration IEEE 802.11b / 2462 MHz A Att 30 dB*Ref 20 dBmCenter 2.462596154 GHz Span 1.5 MHz150 kHz/**RBW 3 kHzVBW 30 kHz1 PKVIEWSWT 500 s**-80-70-60-50-40-30-20-10010201Marker 1 [T1 ] -10.97 dBm2.462995192GHzDate: 20.JUN.2006 10:10:40 Power Density Plot on Configuration IEEE 802.11g / 2412 MHz A Att 30 dB*Ref 20 dBmCenter 2.415763622 GHz Span 1.5 MHz150 kHz/**RBW 3 kHzVBW 30 kHz1 PKVIEWSWT 500 s**-80-70-60-50-40-30-20-10010201Marker 1 [T1 ] -14.73 dBm2.415439103GHzDate: 20.JUN.2006 09:55:14](https://usermanual.wiki/Z-Com/0XG880M.Test-Report/User-Guide-691916-Page-21.png)
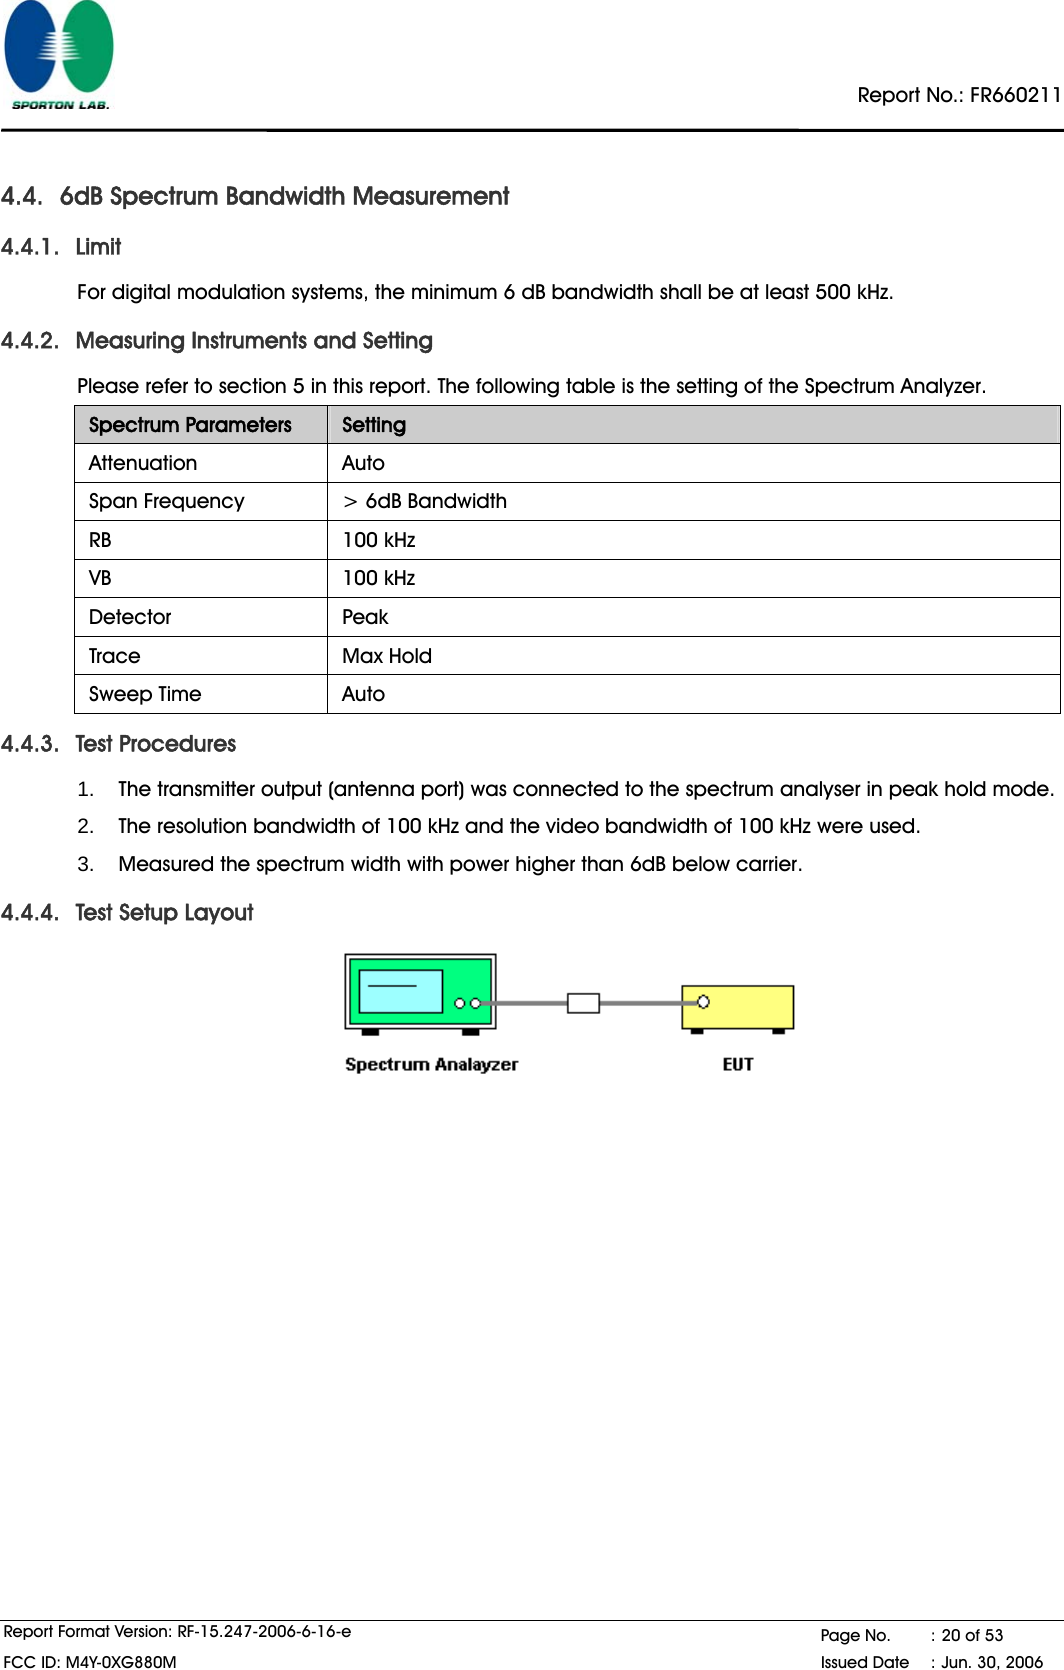
![Report No.: FR660211 Report Format Version: RF-15.247-2006-6-16-e Page No. : 19 of 53 FCC ID: M4Y-0XG880M Issued Date : Jun. 30, 2006 Power Density Plot on Configuration IEEE 802.11g / 2437 MHz A Att 30 dB*Ref 20 dBmCenter 2.44043109 GHz Span 1.5 MHz150 kHz/**RBW 3 kHzVBW 30 kHz1 PKVIEW*SWT 500 s*-80-70-60-50-40-30-20-10010201Marker 1 [T1 ] -15.03 dBm2.441060897GHzDate: 20.JUN.2006 09:58:17 Power Density Plot on Configuration IEEE 802.11g / 2462 MHz A Att 30 dB*Ref 20 dBmCenter 2.463855769 GHz Span 1.5 MHz150 kHz/**RBW 3 kHzVBW 30 kHz1 PKVIEWSWT 500 s**-80-70-60-50-40-30-20-10010201Marker 1 [T1 ] -13.38 dBm2.464468750GHzDate: 20.JUN.2006 10:00:30](https://usermanual.wiki/Z-Com/0XG880M.Test-Report/User-Guide-691916-Page-22.png)
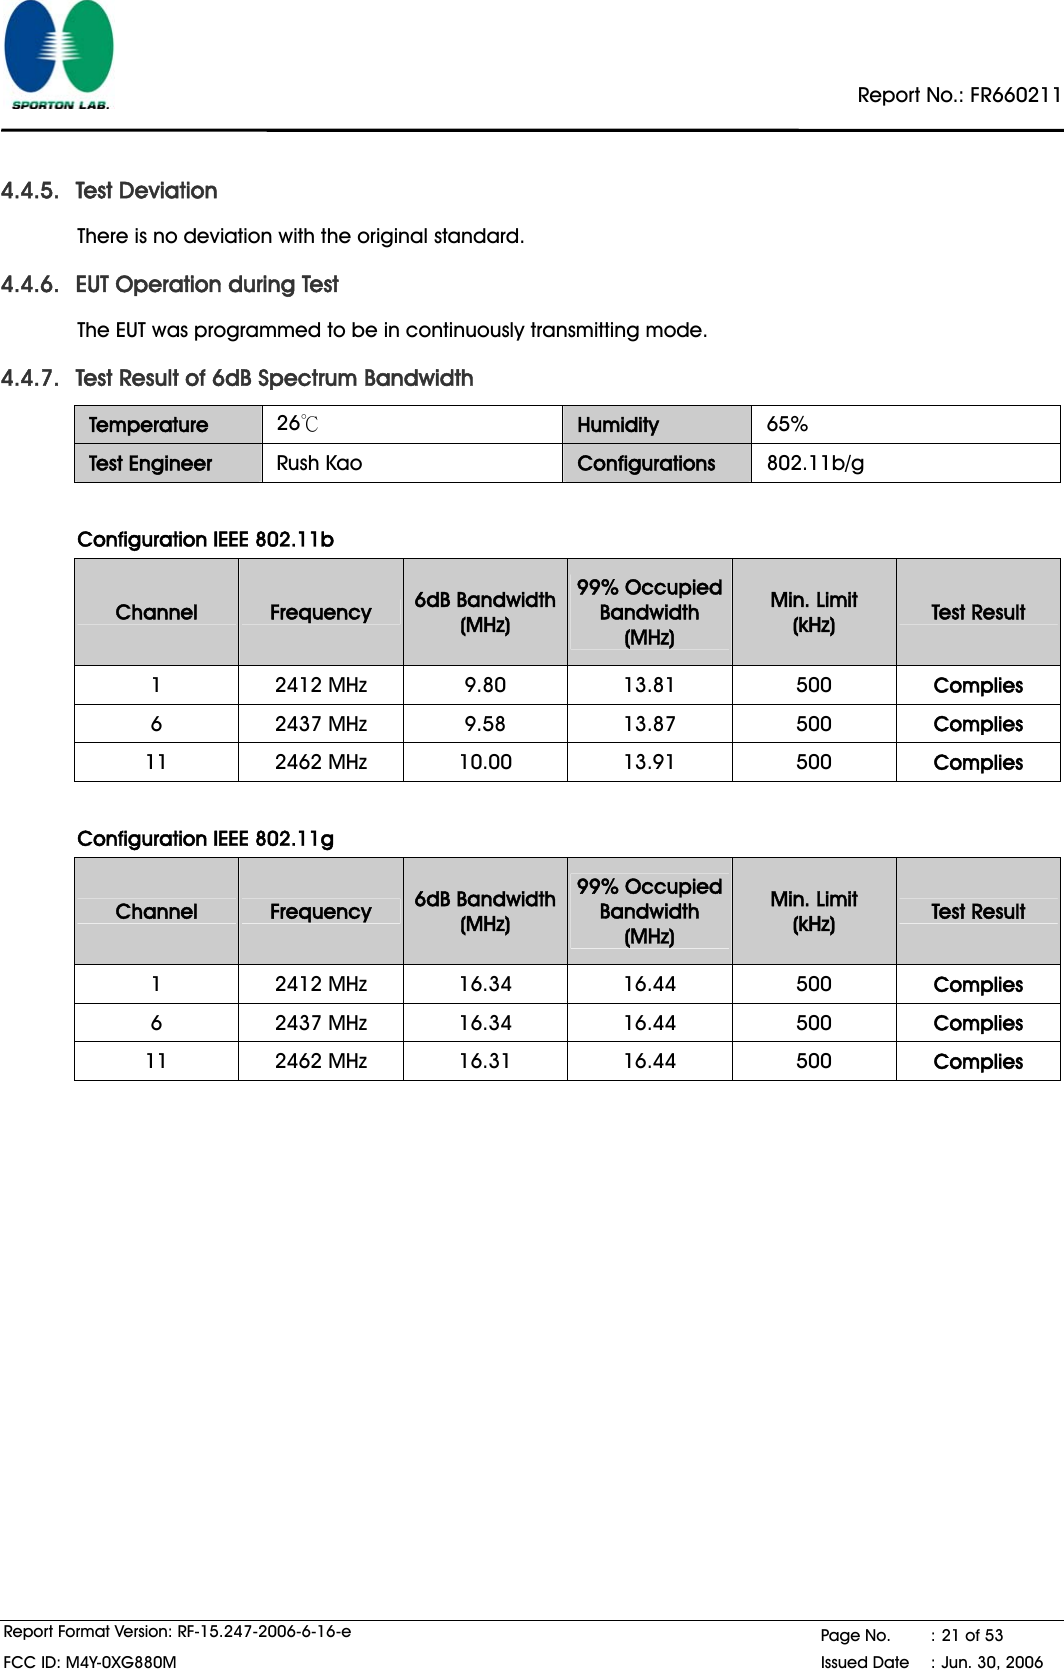
![Report No.: FR660211 Report Format Version: RF-15.247-2006-6-16-e Page No. : 22 of 53 FCC ID: M4Y-0XG880M Issued Date : Jun. 30, 2006 6 dB Bandwidth Plot on Configuration IEEE 802.11b / 2412 MHz A Att 30 dB*Ref 20 dBmCenter 2.412 GHz Span 20 MHz2 MHz/SWT 10 ms1 PKVIEW**RBW 100 kHzVBW 100 kHz-80-70-60-50-40-30-20-10010201Marker 1 [T1 ] -4.57 dBm 2.407224359 GHz1Delta 1 [T1 ] 1.34 dB 9.807692308MHzOBW 13.814102564 MHzT1Temp 1 [T1 OBW]-12.74dBm2.405108974GHzT2Temp2[T1OBW]-12.70dBm2.418923077GHzD1 2.71 dBmD2 -3.29 dBmF1F2Date: 20.JUN.2006 10:04:18 6 dB Bandwidth Plot on Configuration IEEE 802.11b / 2437 MHz A Att 30 dB*Ref 20 dBmCenter 2.437 GHz Span 20 MHz2 MHz/SWT 10 ms1 PKVIEW**RBW 100 kHzVBW 100 kHz-80-70-60-50-40-30-20-10010201Marker 1 [T1 ] -2.06 dBm 2.432032051 GHz1Delta 1 [T1 ] -0.81 dB 9.583333333MHzOBW 13.878205128 MHzT1Temp 1 [T1 OBW]-8.53dBm2.430012821GHzT2Temp2[T1OBW]-12.53dBm2.443891026GHzD1 3.11 dBmD2 -2.89 dBmF1F2Date: 20.JUN.2006 10:07:22](https://usermanual.wiki/Z-Com/0XG880M.Test-Report/User-Guide-691916-Page-25.png)
![Report No.: FR660211 Report Format Version: RF-15.247-2006-6-16-e Page No. : 23 of 53 FCC ID: M4Y-0XG880M Issued Date : Jun. 30, 2006 6 dB Bandwidth Plot on Configuration IEEE 802.11b / 2462 MHz A Att 30 dB*Ref 20 dBmCenter 2.462 GHz Span 20 MHz2 MHz/SWT 10 ms1 PKVIEW**RBW 100 kHzVBW 100 kHz-80-70-60-50-40-30-20-10010201Marker 1 [T1 ] -1.04 dBm 2.457000000 GHz1Delta 1 [T1 ] -2.08 dB 10.000000000MHzOBW 13.910256410 MHzT1Temp 1 [T1 OBW]-10.06dBm2.455044872GHzT2Temp2[T1OBW]-12.03dBm2.468955128GHzD1 2.53 dBmD2 -3.47 dBmF1F2Date: 20.JUN.2006 10:09:40 6 dB Bandwidth Plot on Configuration IEEE 802.11g / 2412 MHz A Att 30 dB*Ref 20 dBmCenter 2.412 GHz Span 20 MHz2 MHz/SWT 10 ms1 PKVIEW**RBW 100 kHzVBW 100 kHz-80-70-60-50-40-30-20-10010201Marker 1 [T1 ] -4.44 dBm 2.403826923 GHz1Delta 1 [T1 ] 0.61 dB 16.346153846MHzOBW 16.442307692 MHzT1Temp 1 [T1 OBW]-6.23dBm2.403794872GHzT2Temp2[T1OBW]-6.63dBm2.420237179GHzD1 1.09 dBmD2 -4.91 dBmF1F2Date: 20.JUN.2006 09:54:12](https://usermanual.wiki/Z-Com/0XG880M.Test-Report/User-Guide-691916-Page-26.png)
![Report No.: FR660211 Report Format Version: RF-15.247-2006-6-16-e Page No. : 24 of 53 FCC ID: M4Y-0XG880M Issued Date : Jun. 30, 2006 6 dB Bandwidth Plot on Configuration IEEE 802.11g / 2437 MHz A Att 30 dB*Ref 20 dBmCenter 2.437 GHz Span 20 MHz2 MHz/SWT 10 ms1 PKVIEW**RBW 100 kHzVBW 100 kHz-80-70-60-50-40-30-20-10010201Marker 1 [T1 ] -4.16 dBm 2.428858974 GHz1Delta 1 [T1 ] 0.10 dB 16.346153846MHzOBW 16.442307692 MHzT1Temp 1 [T1 OBW]-6.07dBm2.428794872GHzT2Temp2[T1OBW]-6.99dBm2.445237179GHzD1 1.47 dBmD2 -4.53 dBmF1F2Date: 20.JUN.2006 09:57:28 6 dB Bandwidth Plot on Configuration IEEE 802.11g / 2462 MHz A Att 30 dB*Ref 20 dBmCenter 2.462 GHz Span 20 MHz2 MHz/SWT 10 ms1 PKVIEW**RBW 100 kHzVBW 100 kHz-80-70-60-50-40-30-20-10010201Marker 1 [T1 ] -4.34 dBm 2.453858974 GHz1Delta 1 [T1 ] 0.91 dB 16.314102564MHzOBW 16.442307692 MHzT1Temp 1 [T1 OBW]-6.12dBm2.453794872GHzT2Temp2[T1OBW]-6.61dBm2.470237179GHzD1 1.49 dBmD2 -4.51 dBmF1F2Date: 20.JUN.2006 09:59:35](https://usermanual.wiki/Z-Com/0XG880M.Test-Report/User-Guide-691916-Page-27.png)


![Report No.: FR660211 Report Format Version: RF-15.247-2006-6-16-e Page No. : 27 of 53 FCC ID: M4Y-0XG880M Issued Date : Jun. 30, 2006 4.5.4. Test Setup Layout For radiated emissions below 30MHz For radiated emissions above 30MHz Above 10 GHz shall be extrapolated to the specified distance using an extrapolation factor of 20 dB/decade form 3m to 1m. Distance extrapolation factor = 20 log (specific distanc [3m] / test distance [1m]) (dB); Limit line = specific limits (dBuV) + distance extrapolation factor [9.54 dB]. 4.5.5. Test Deviation There is no deviation with the original standard. 4.5.6. EUT Operation during Test The EUT was programmed to be in continuously transmitting mode. 3 or 1m](https://usermanual.wiki/Z-Com/0XG880M.Test-Report/User-Guide-691916-Page-30.png)


![Report No.: FR660211 Report Format Version: RF-15.247-2006-6-16-e Page No. : 48 of 53 FCC ID: M4Y-0XG880M Issued Date : Jun. 30, 2006 For Emission not in Restricted Band Low Band Edge Plot on Configuration IEEE 802.11b / 2412 MHz A Att 30 dB*Ref 20 dBmCenter 2.373240385 GHz Span 100 MHz10 MHz/**RBW 100 kHzVBW 100 kHzSWT 10 ms1 PKVIEW-80-70-60-50-40-30-20-10010201Marker 1 [T1 ] -50.38 dBm 2.373653846 GHz1Delta 1 [T1 ] 54.44 dB 39.490384615MHzD1 4.06 dBmD2 -15.94 dBmF1F2Date: 20.JUN.2006 10:06:09 High Band Edge Plot on Configuration IEEE 802.11b / 2462 MHz A Att 30 dB*Ref 20 dBmCenter 2.503596154 GHz Span 100 MHz10 MHz/**RBW 100 kHzVBW 100 kHzSWT 10 ms1 PKVIEW-80-70-60-50-40-30-20-10010201Marker 1 [T1 ] -50.14 dBm 2.495583333 GHz1Delta 1 [T1 ] 54.05 dB -32.692307692MHzD1 3.92 dBmD2 -16.08 dBmF1F2Date: 20.JUN.2006 10:11:30](https://usermanual.wiki/Z-Com/0XG880M.Test-Report/User-Guide-691916-Page-51.png)
![Report No.: FR660211 Report Format Version: RF-15.247-2006-6-16-e Page No. : 49 of 53 FCC ID: M4Y-0XG880M Issued Date : Jun. 30, 2006 Low Band Edge Plot on Configuration IEEE 802.11g / 2412 MHz A Att 30 dB*Ref 20 dBmCenter 2.372763622 GHz Span 100 MHz10 MHz/**RBW 100 kHzVBW 100 kHzSWT 10 ms1 PKVIEW-80-70-60-50-40-30-20-10010201Marker 1 [T1 ] -42.85 dBm 2.389038462 GHz1Delta 1 [T1 ] 44.43 dB 24.270032051MHzD1 1.58 dBmD2 -18.42 dBmF1F2Date: 20.JUN.2006 09:56:10 High Band Edge Plot on Configuration IEEE 802.11g / 2462 MHz A Att 30 dB*Ref 20 dBmCenter 2.500855769 GHz Span 100 MHz10 MHz/**RBW 100 kHzVBW 100 kHzSWT 10 ms1 PKVIEW-80-70-60-50-40-30-20-10010201Marker 1 [T1 ] -40.73 dBm 2.483500000 GHz1Delta 1 [T1 ] 42.38 dB -20.304487179MHzD1 1.65 dBmD2 -18.35 dBmF1F2Date: 20.JUN.2006 10:01:19](https://usermanual.wiki/Z-Com/0XG880M.Test-Report/User-Guide-691916-Page-52.png)