Zephyr Technology BH16 900MHz BIO HARNESS TRANSMITTER User Manual ZephyrBioHarnessTCF
Zephyr Technology Corporation 900MHz BIO HARNESS TRANSMITTER ZephyrBioHarnessTCF
UserManual.wiki
>
Zephyr Technology
>
BH16 User Manual
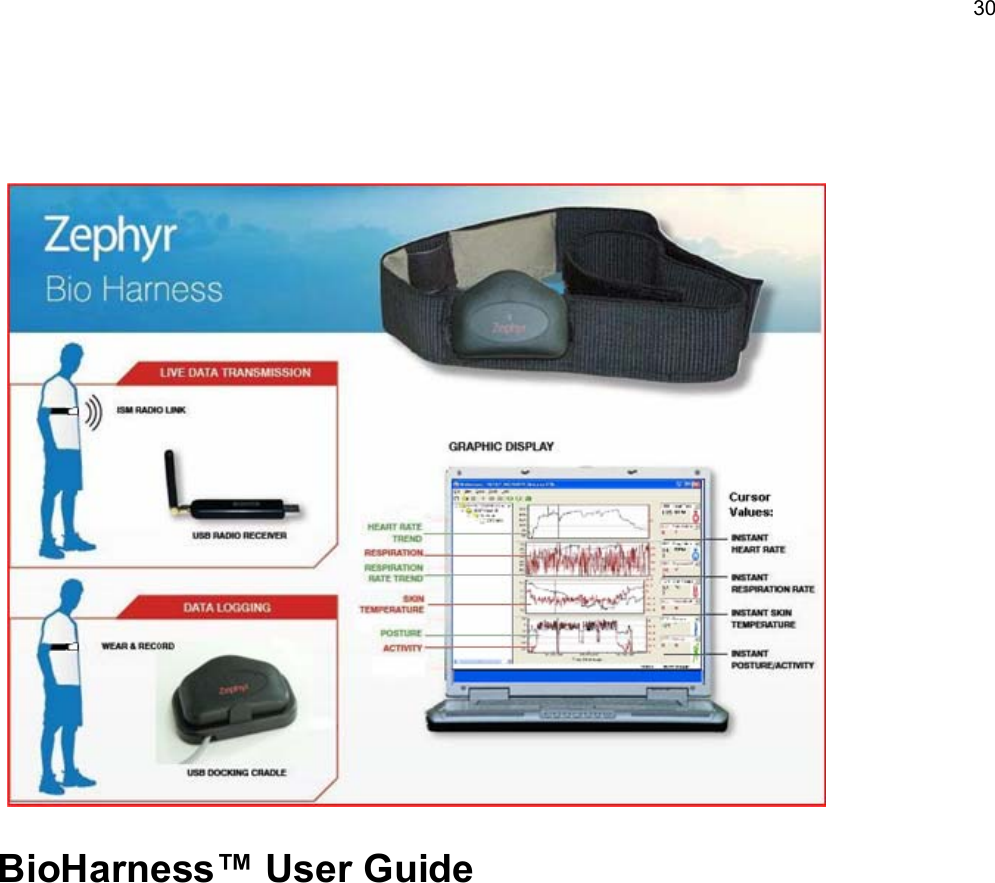
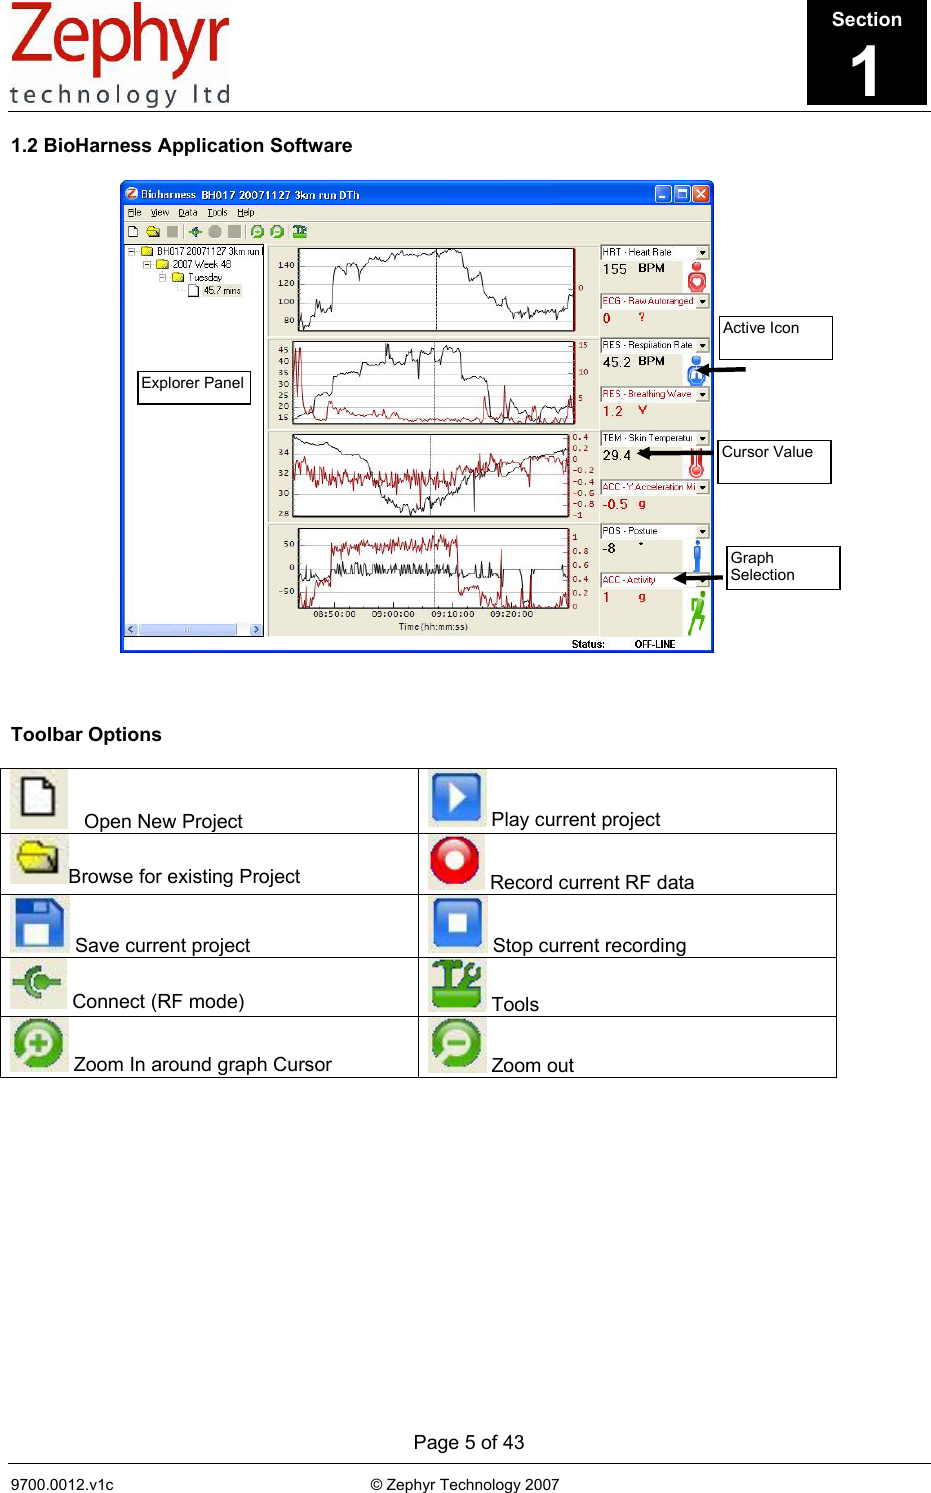
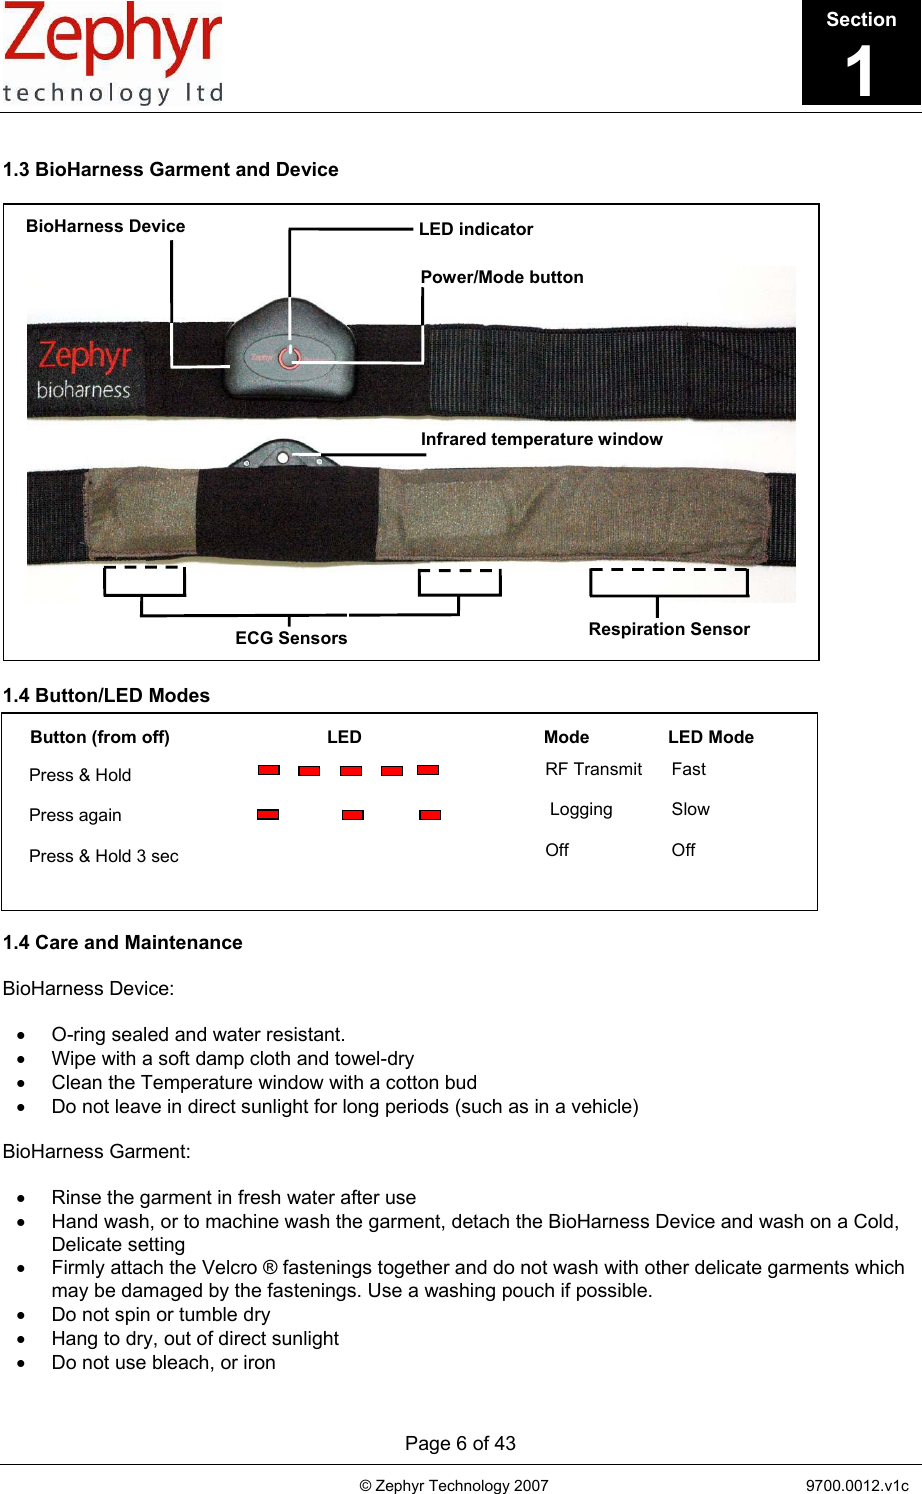
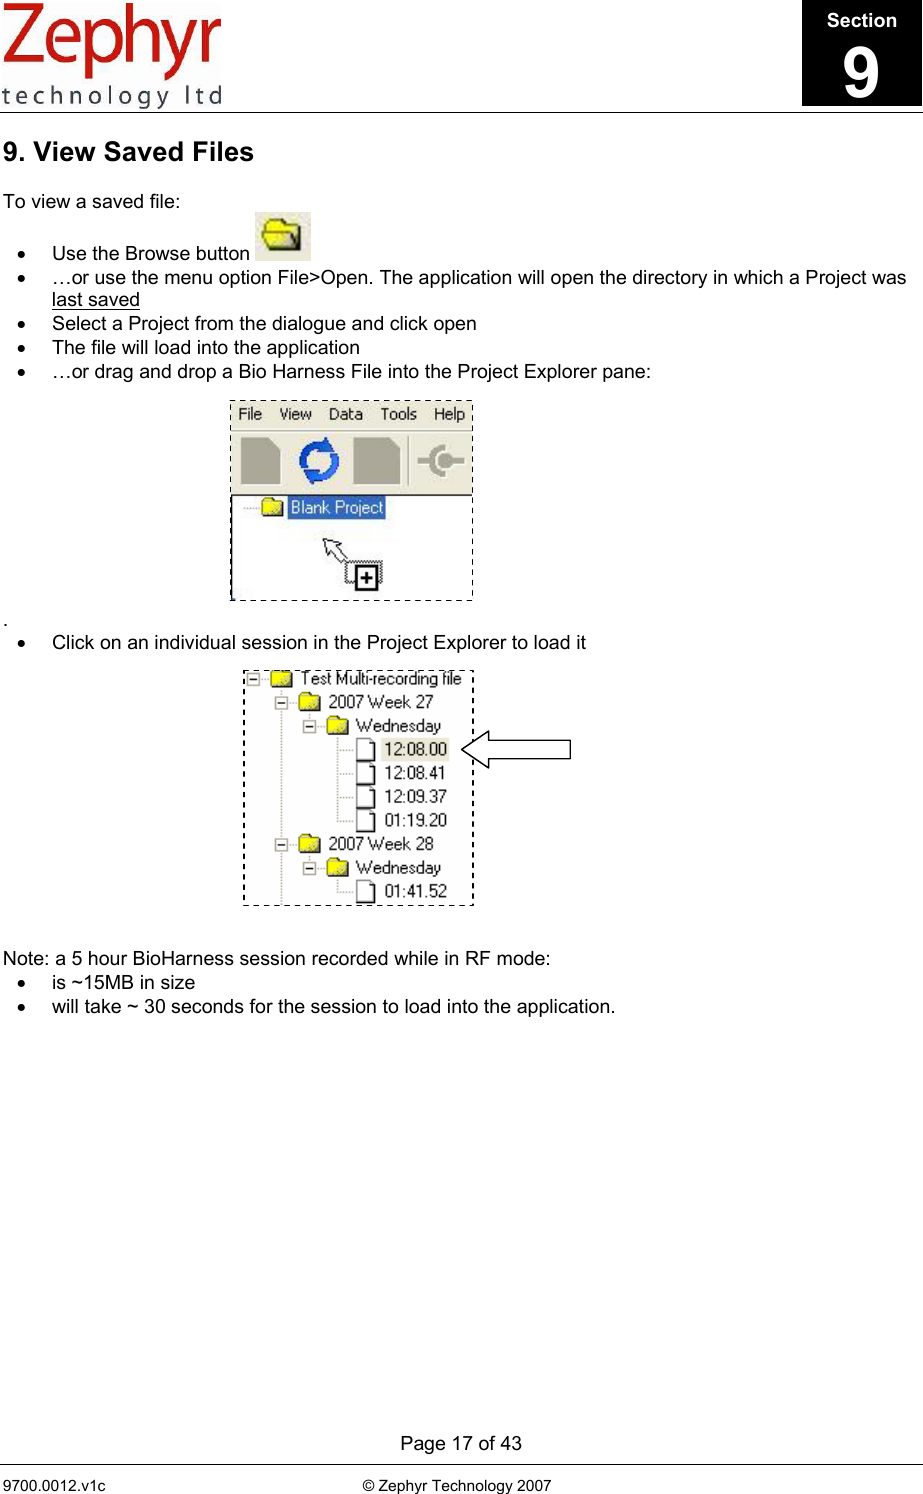
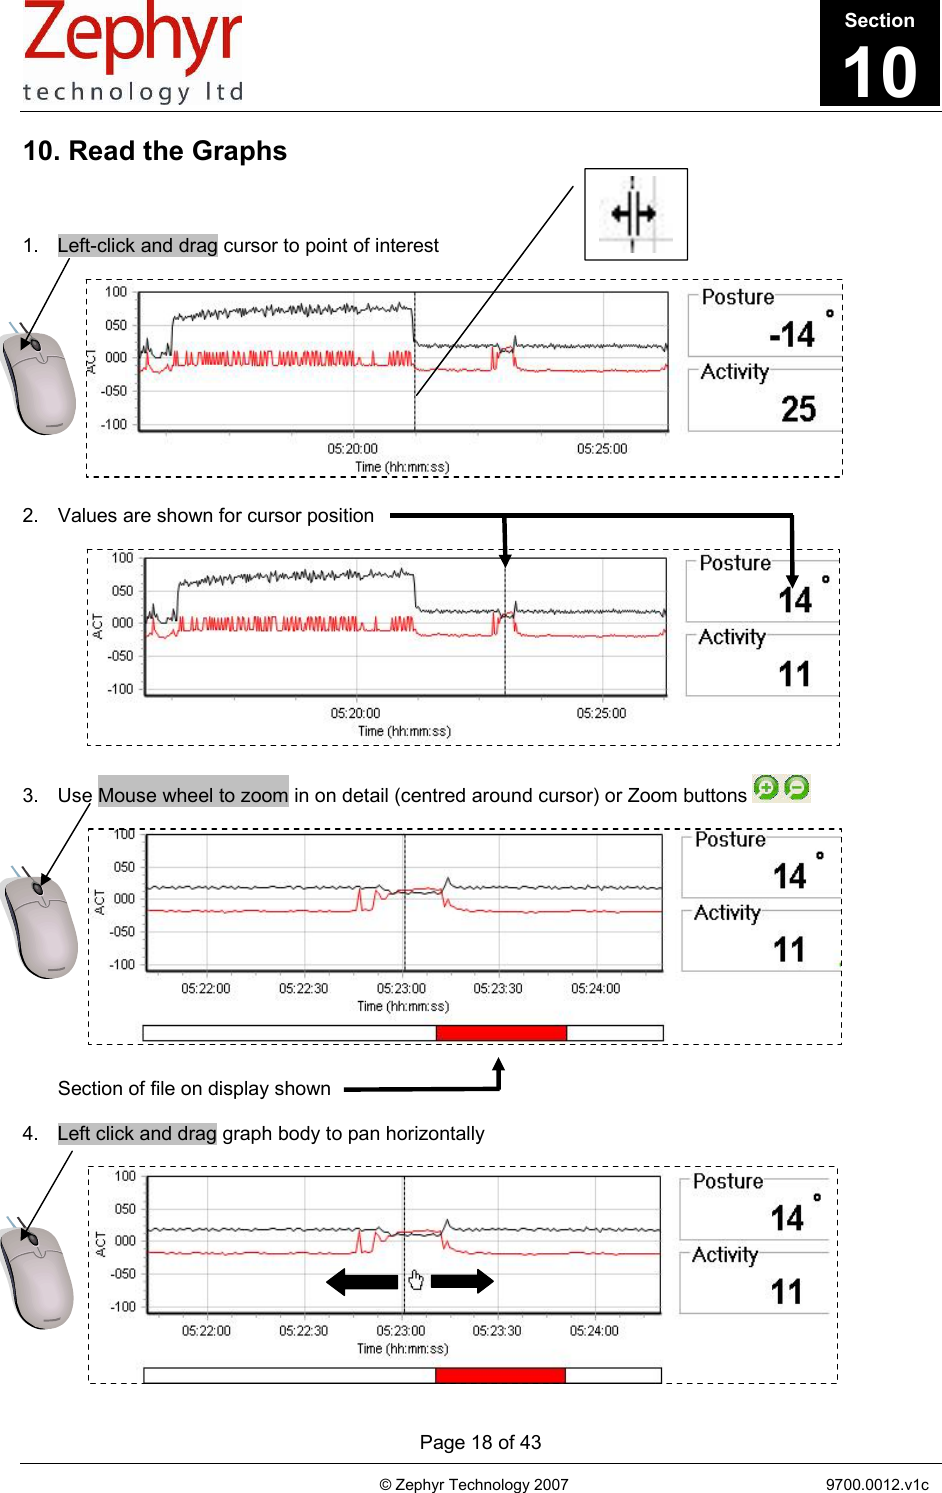
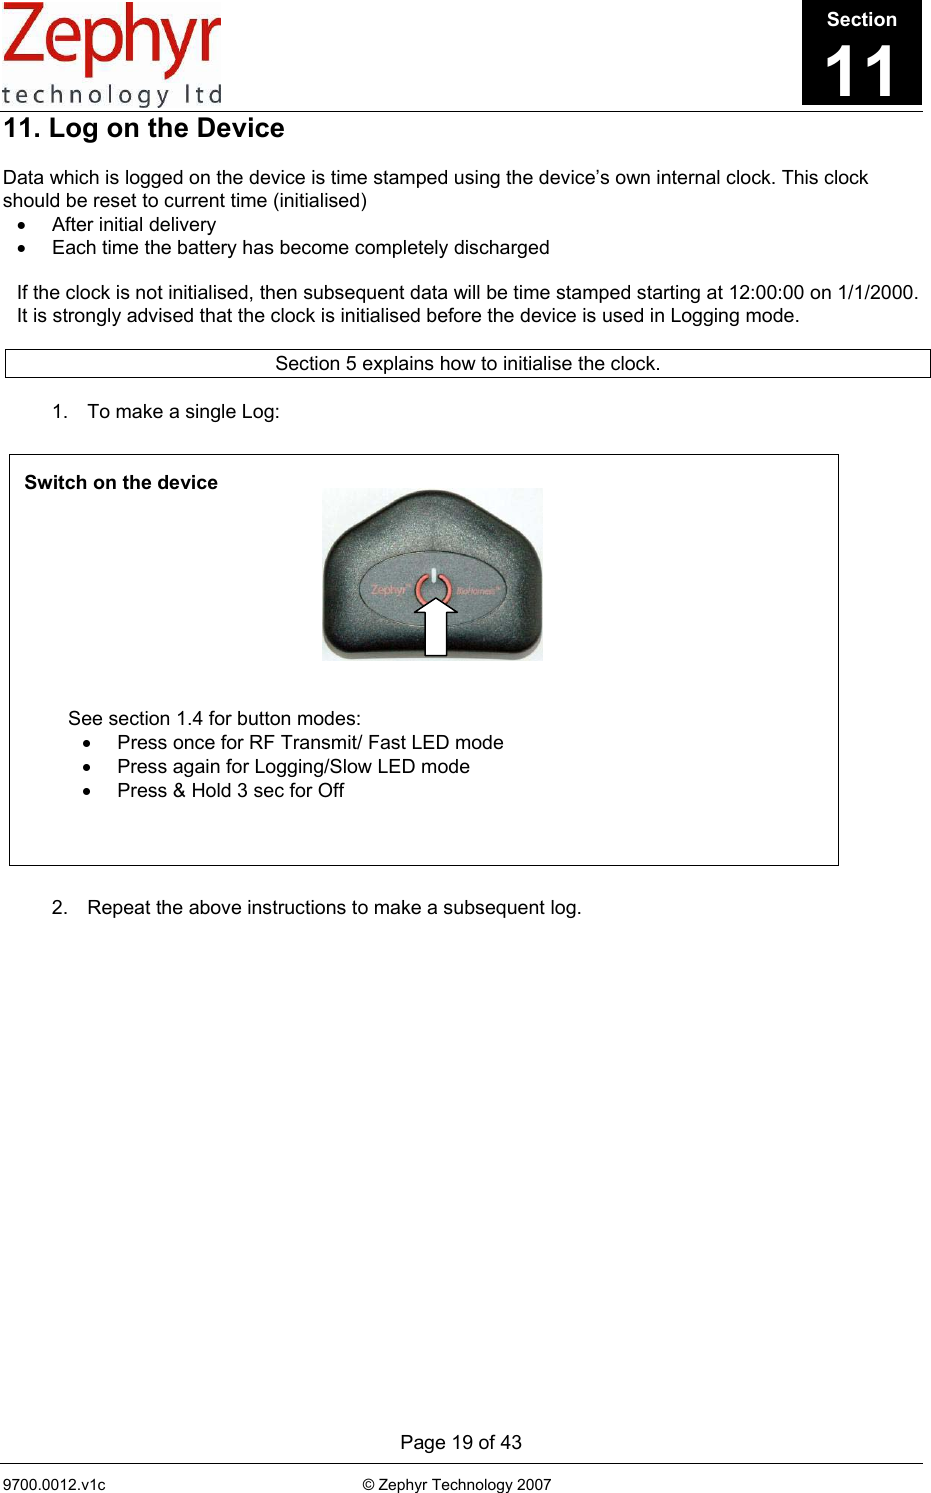
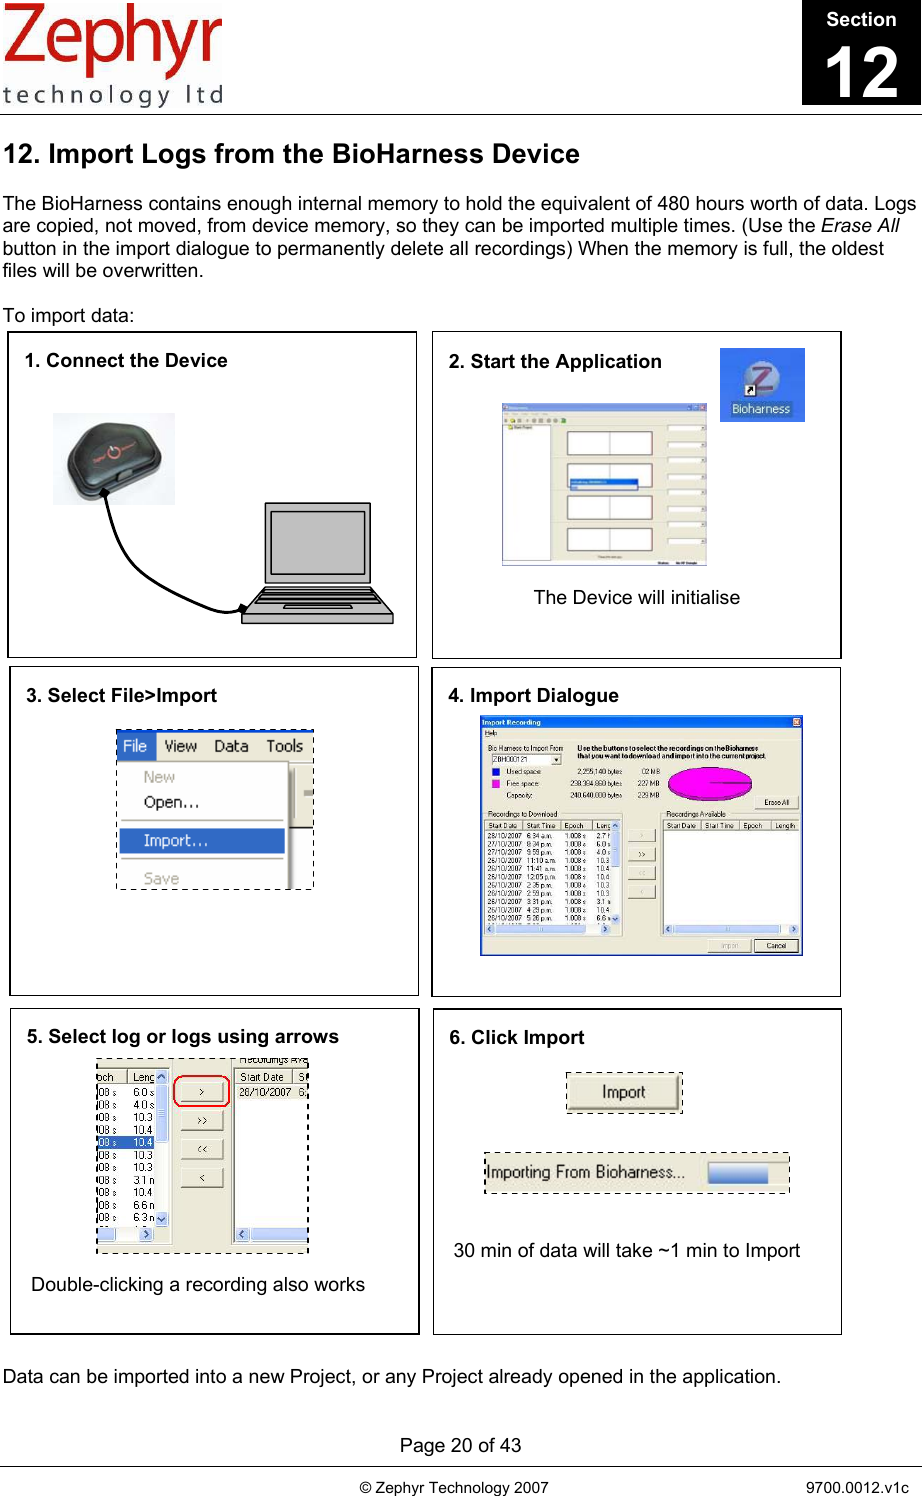
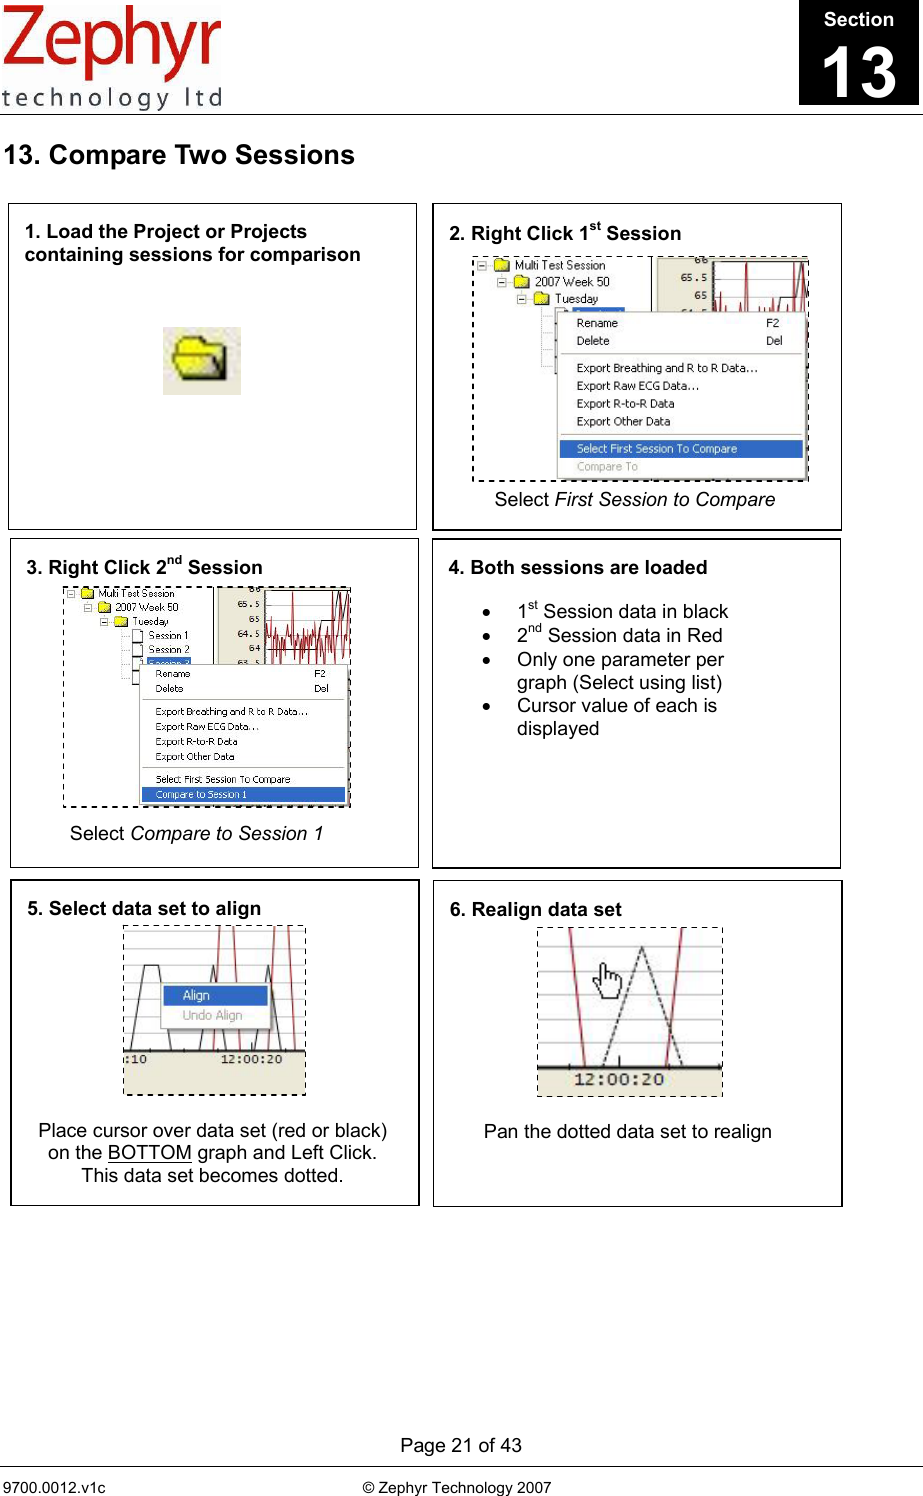
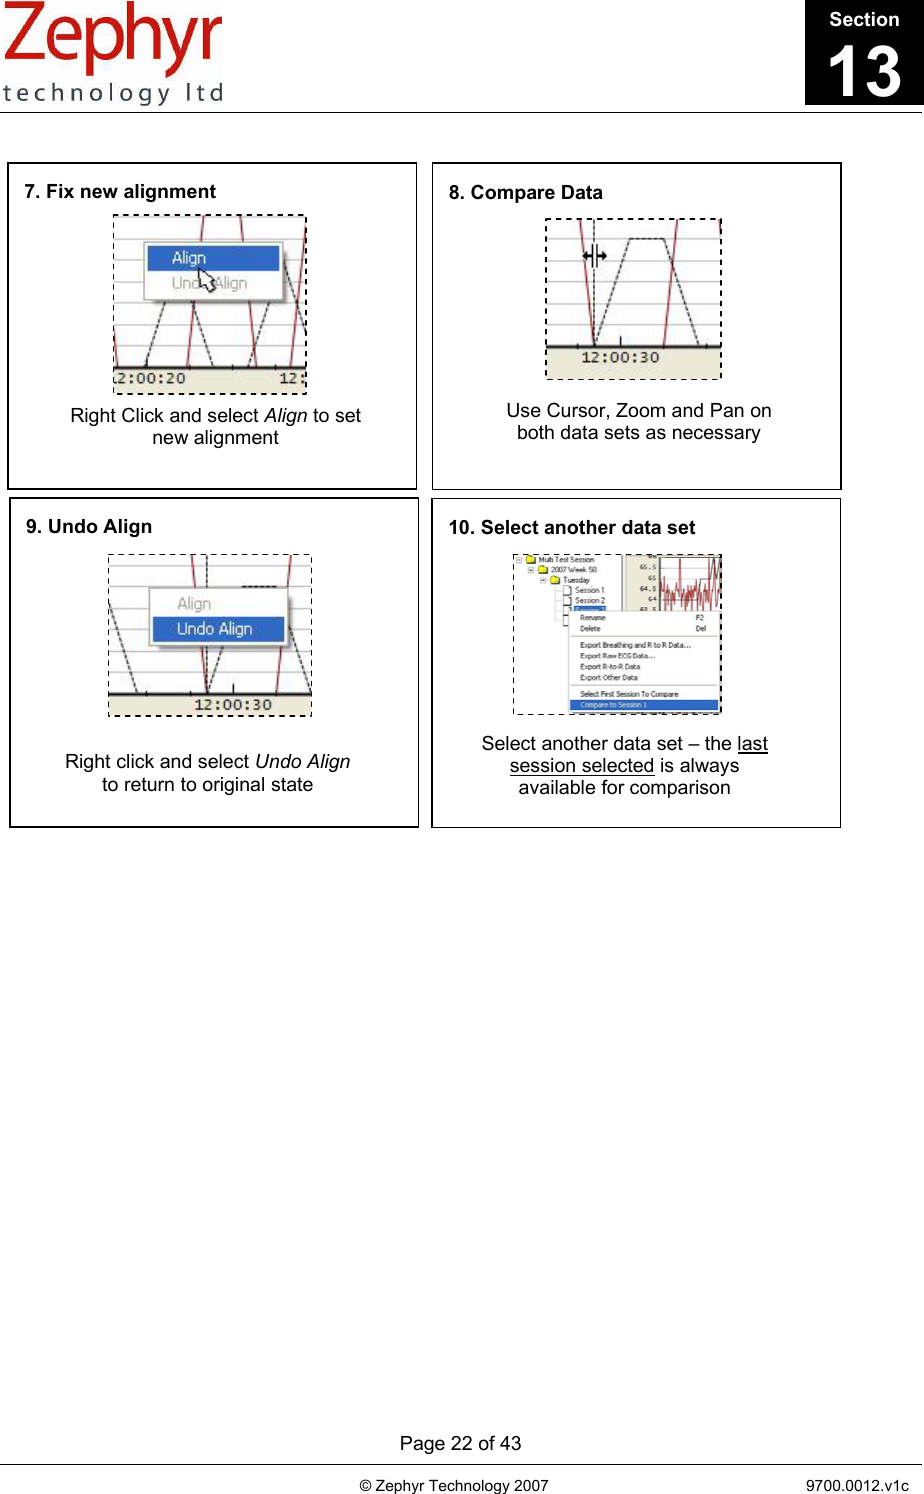
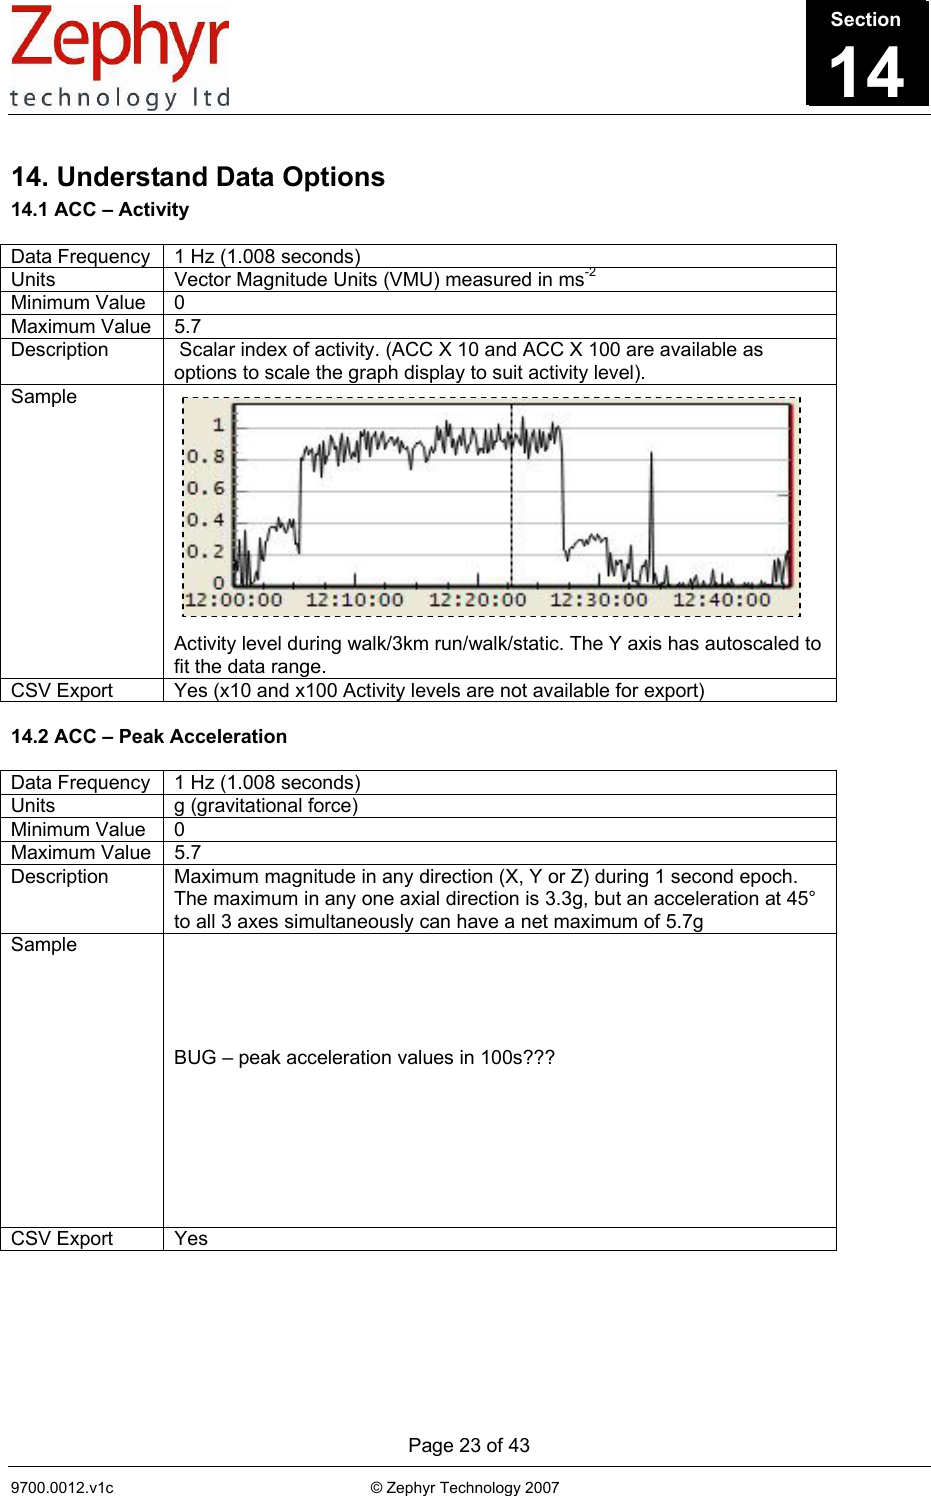
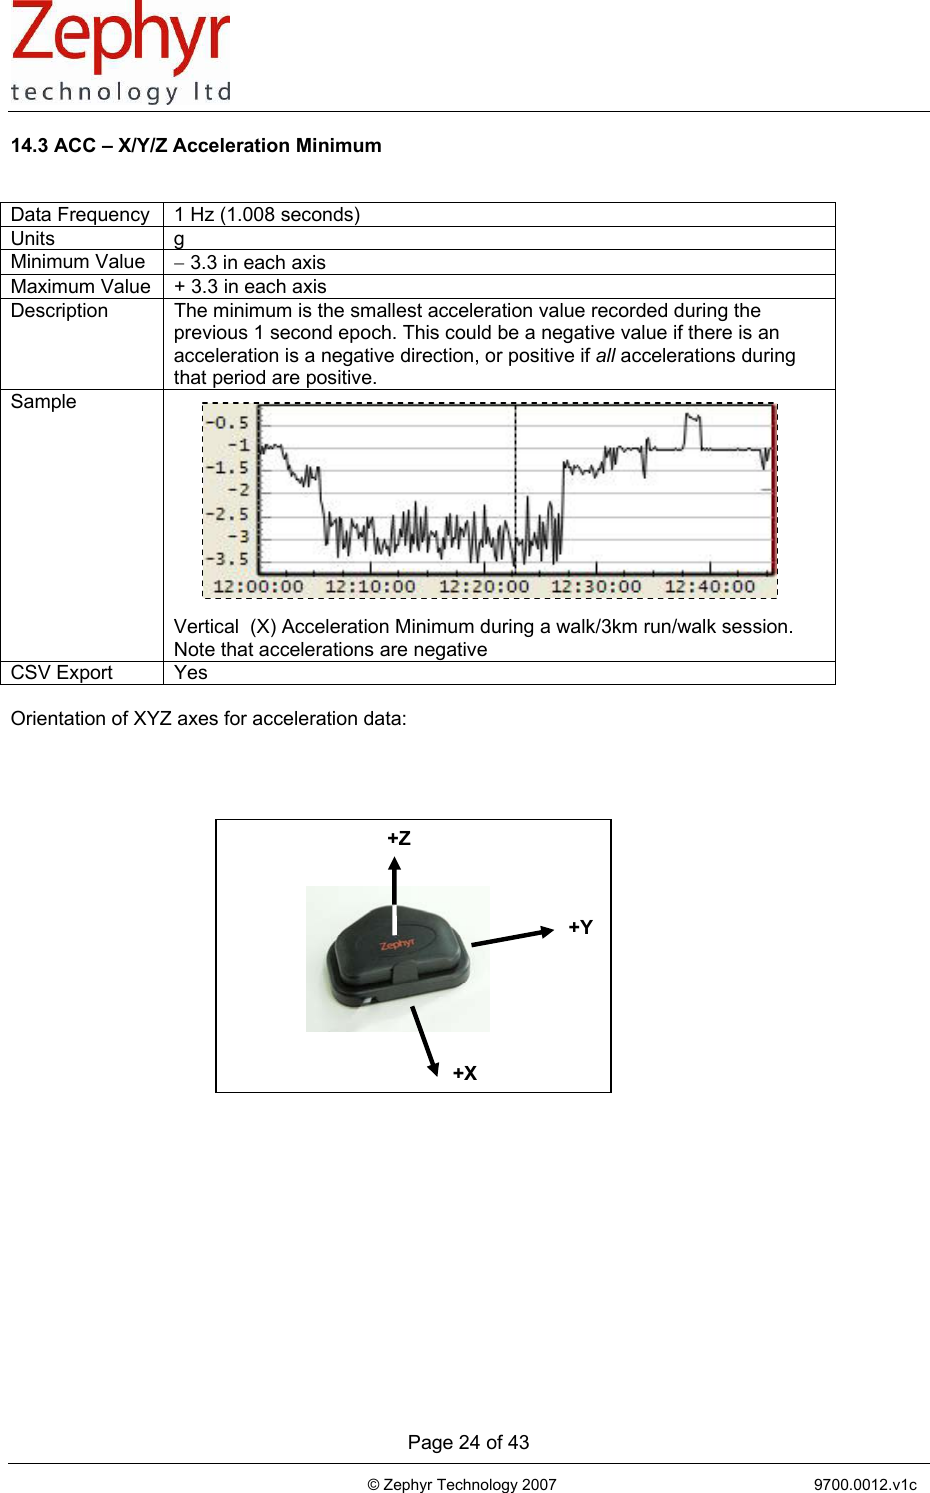
USERS MANUAL
Navigation menu
Upload a User Manual
Namespaces
Wiki Guide
HTML
PDF
Info
Views
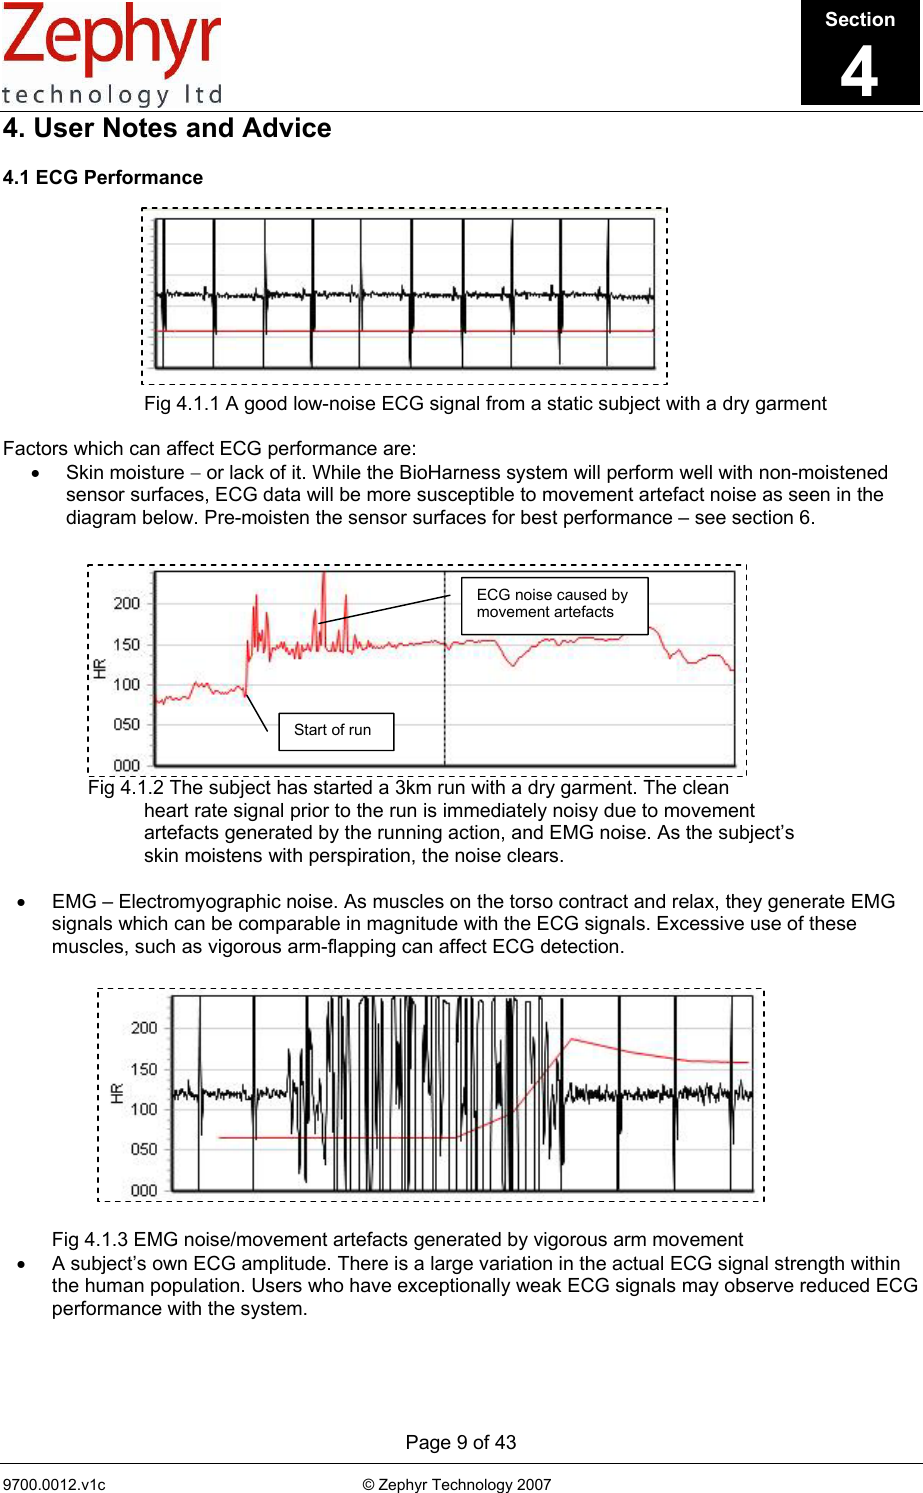
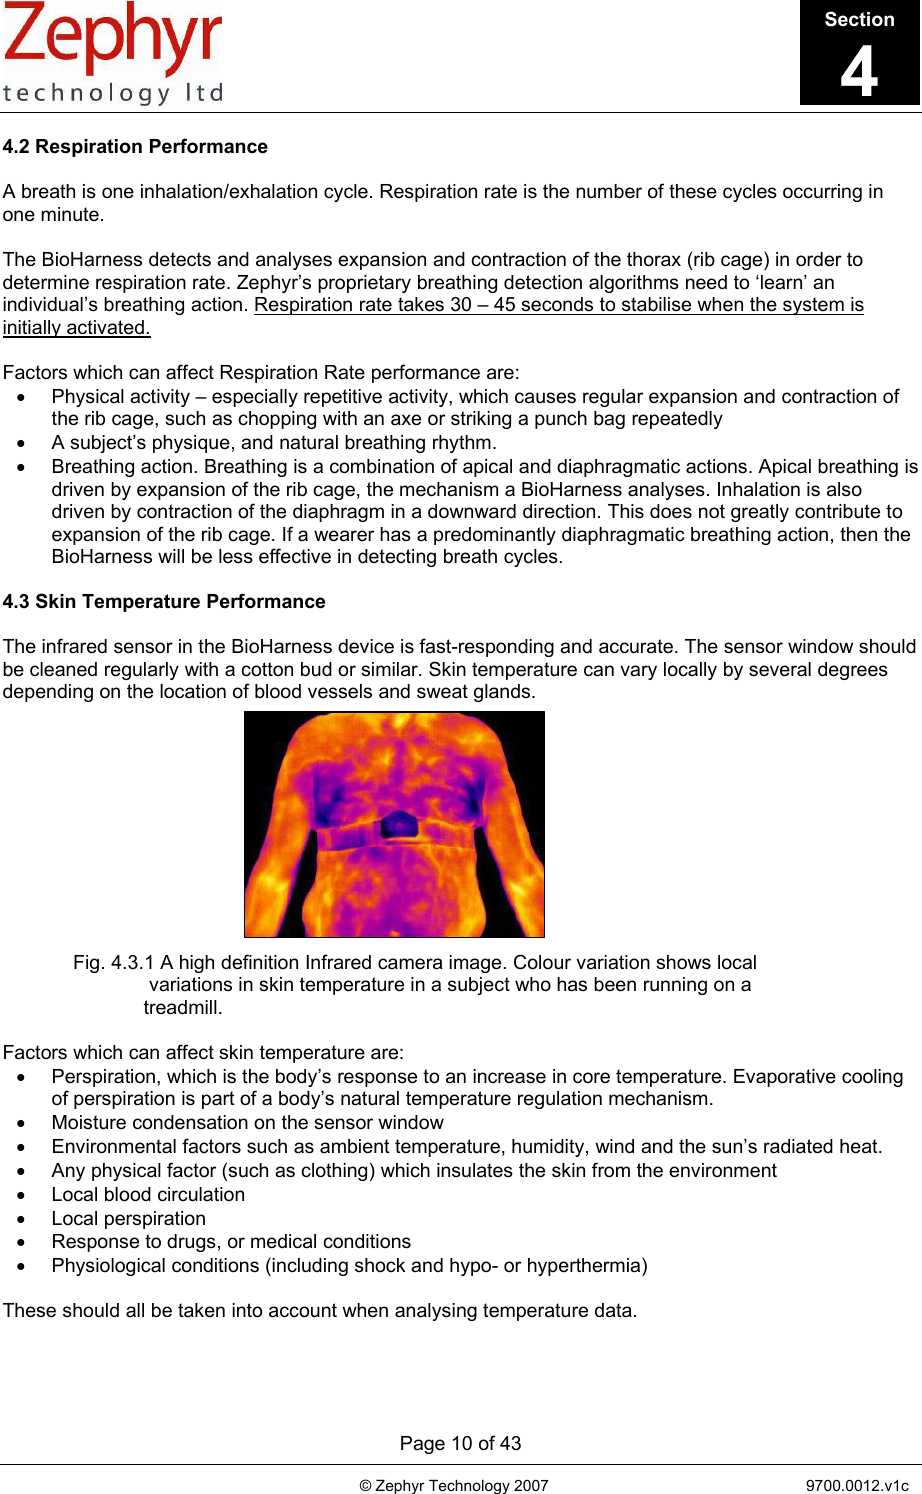
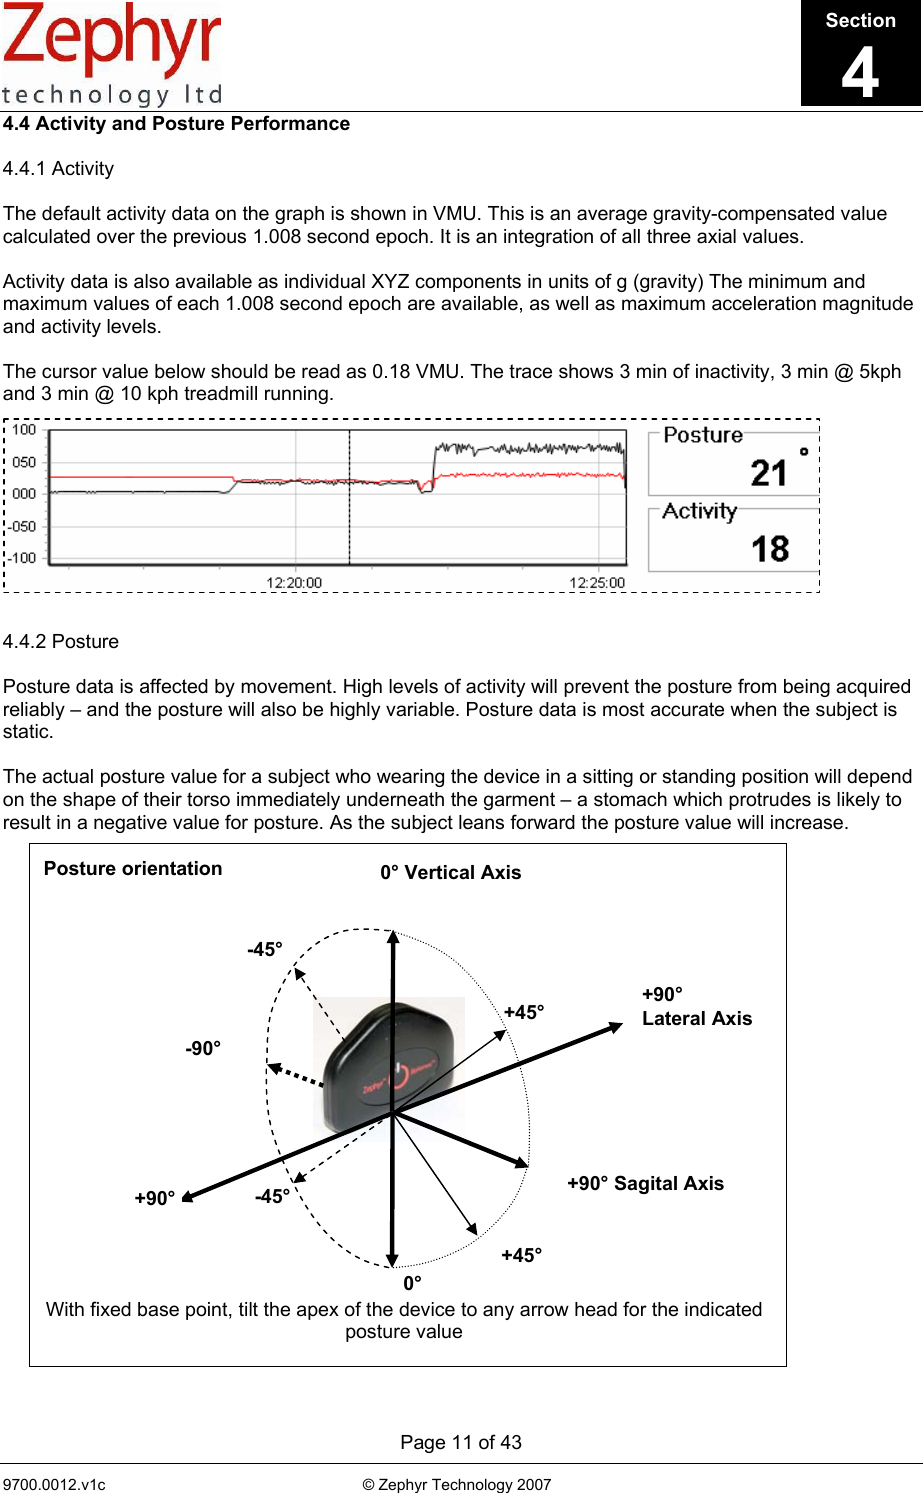
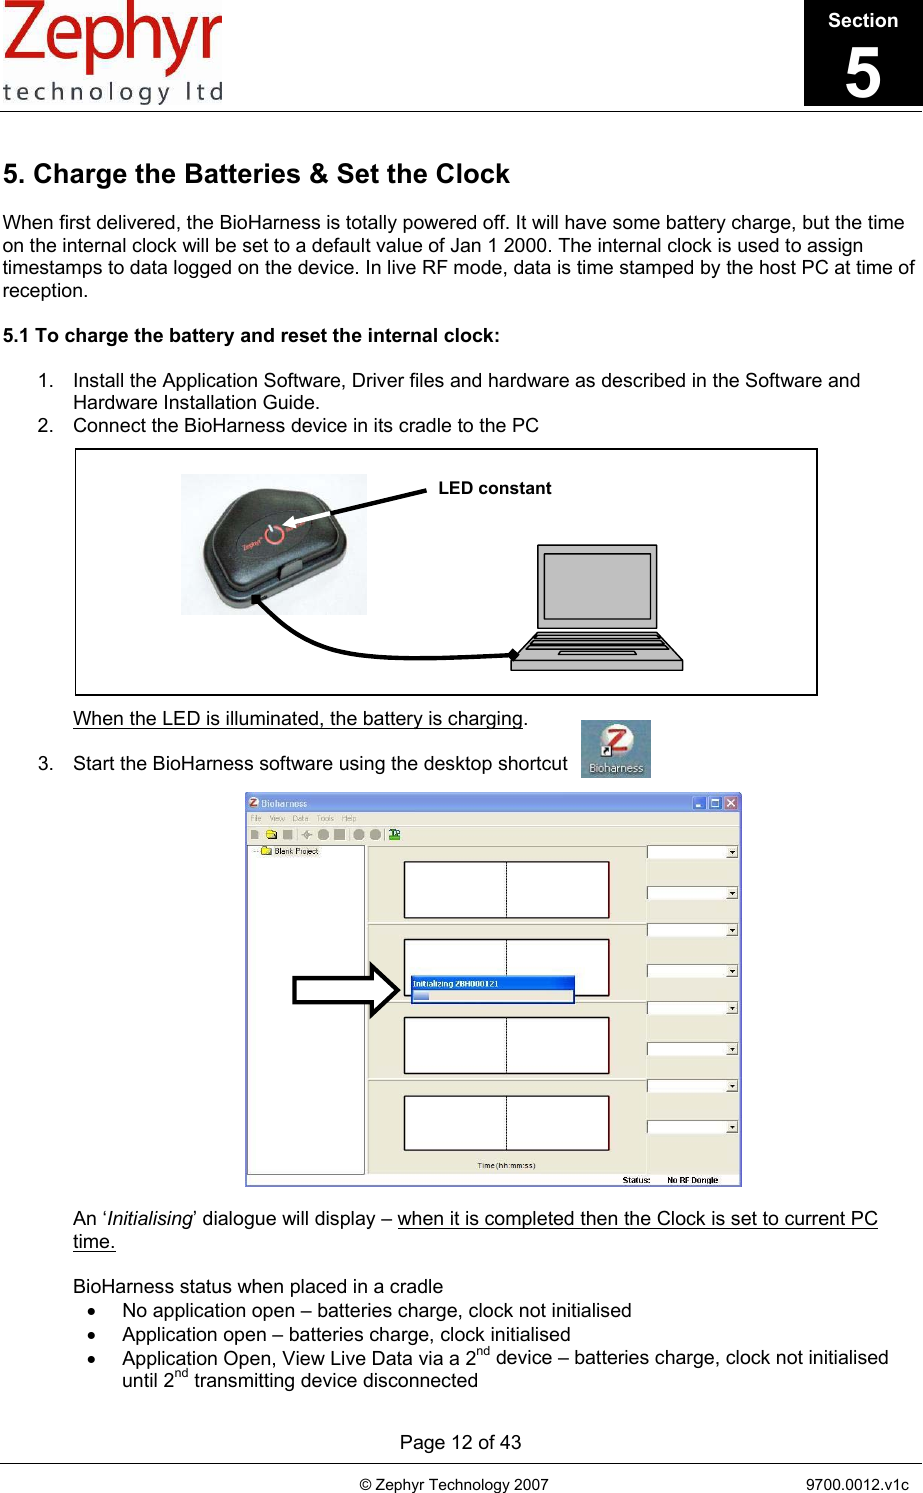
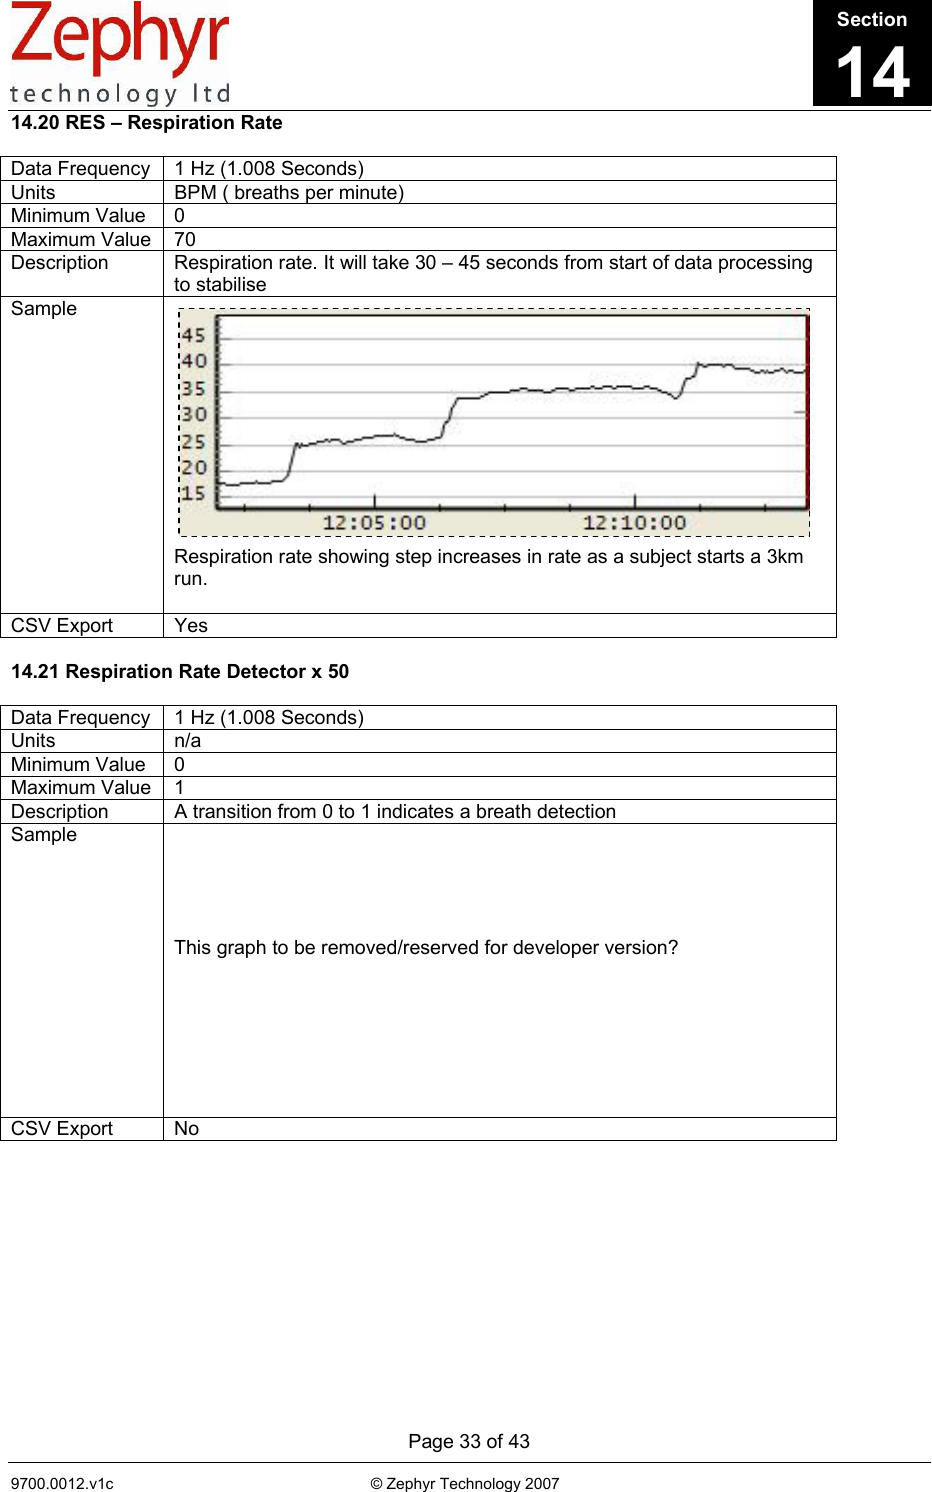
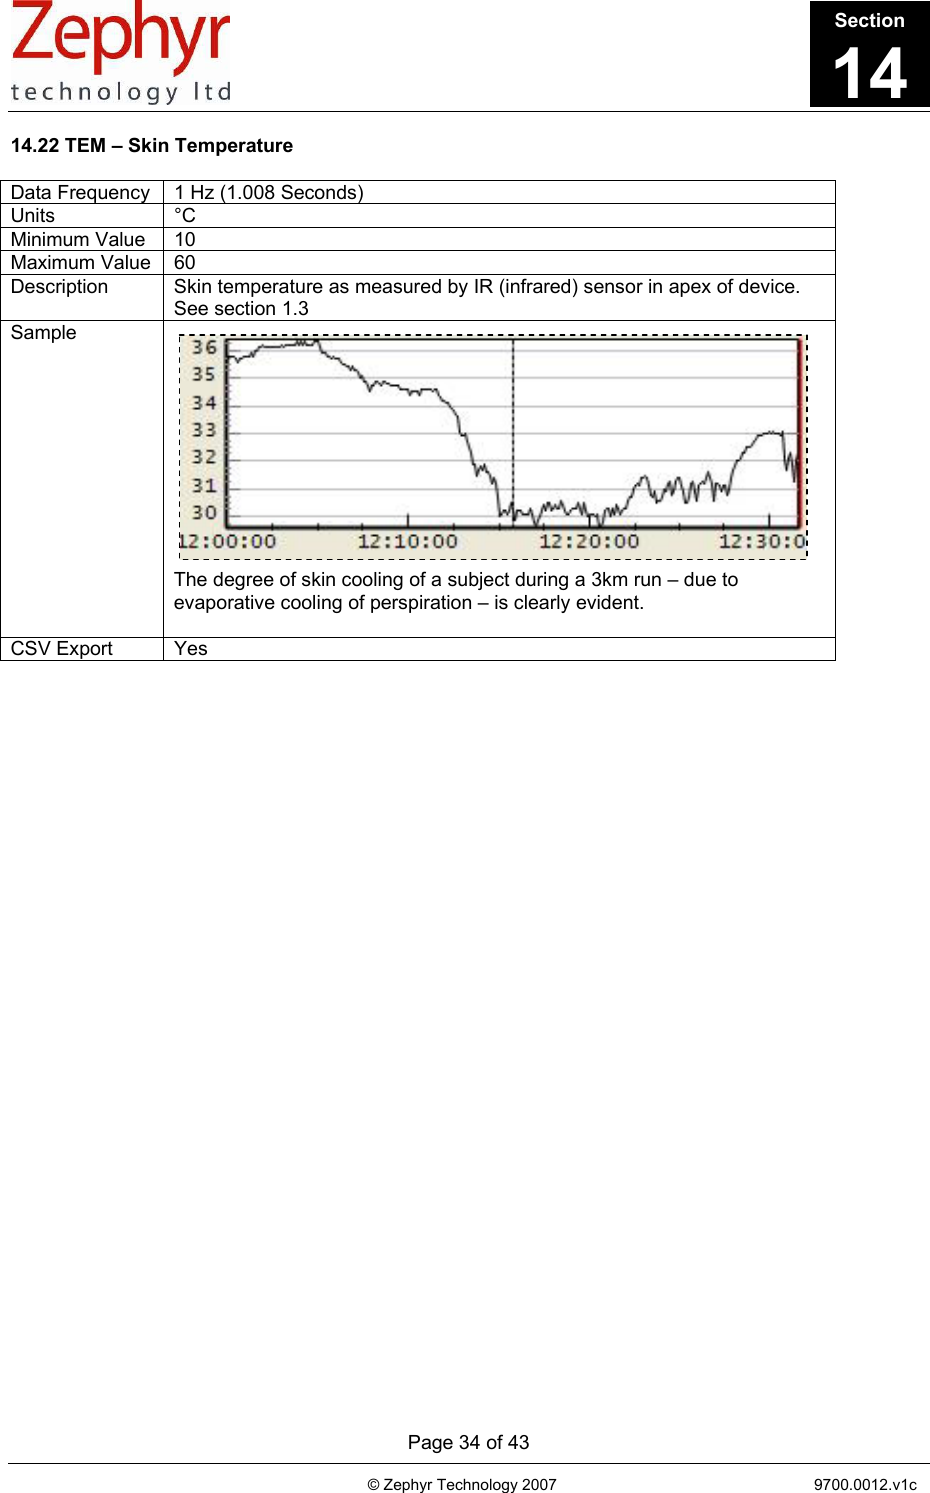
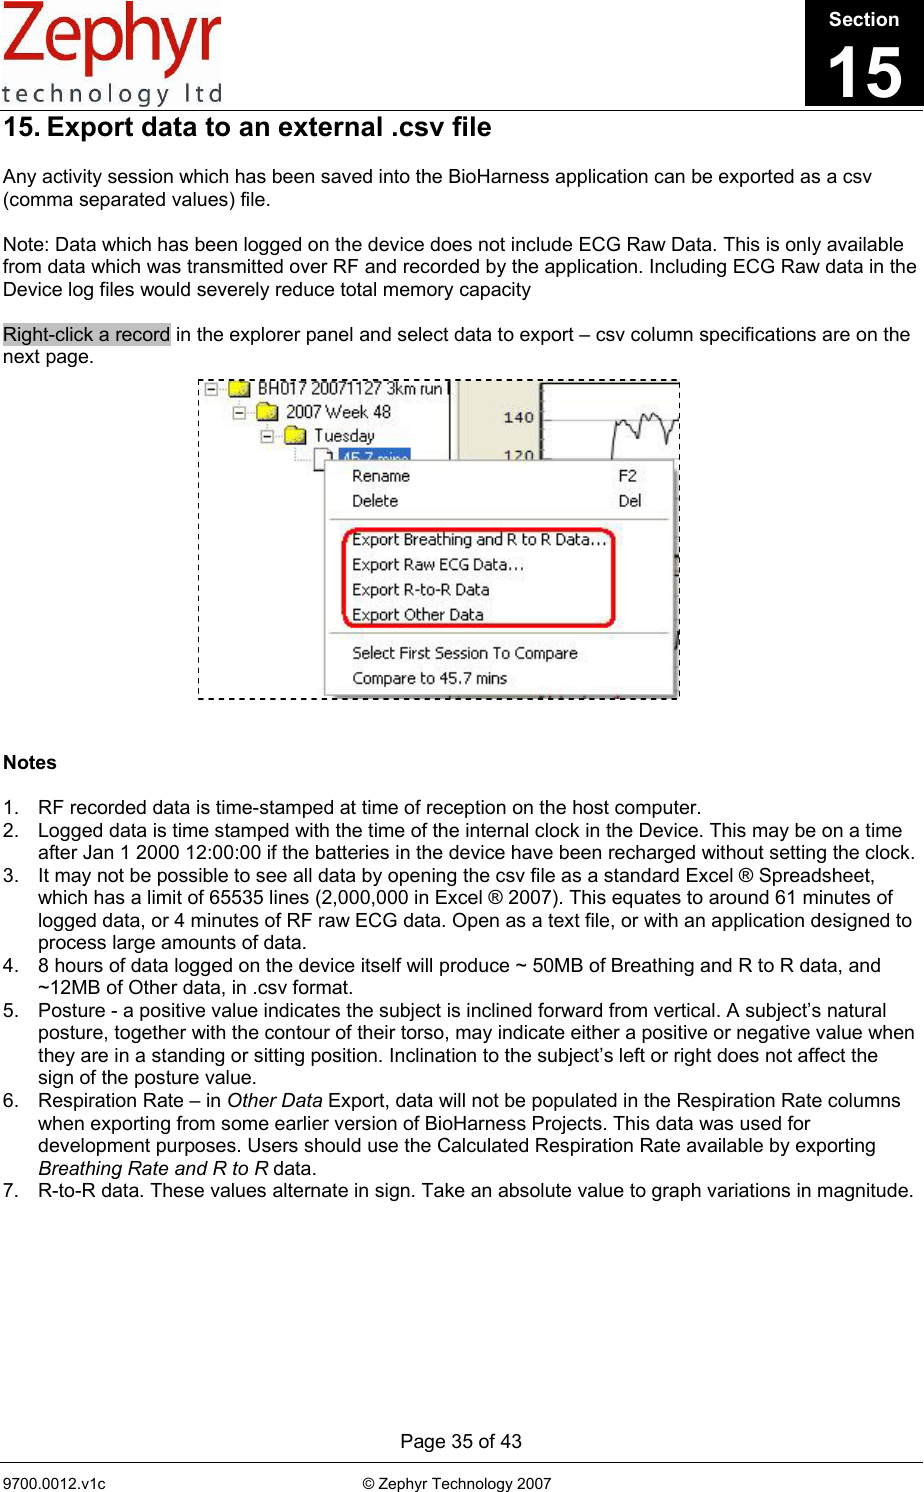
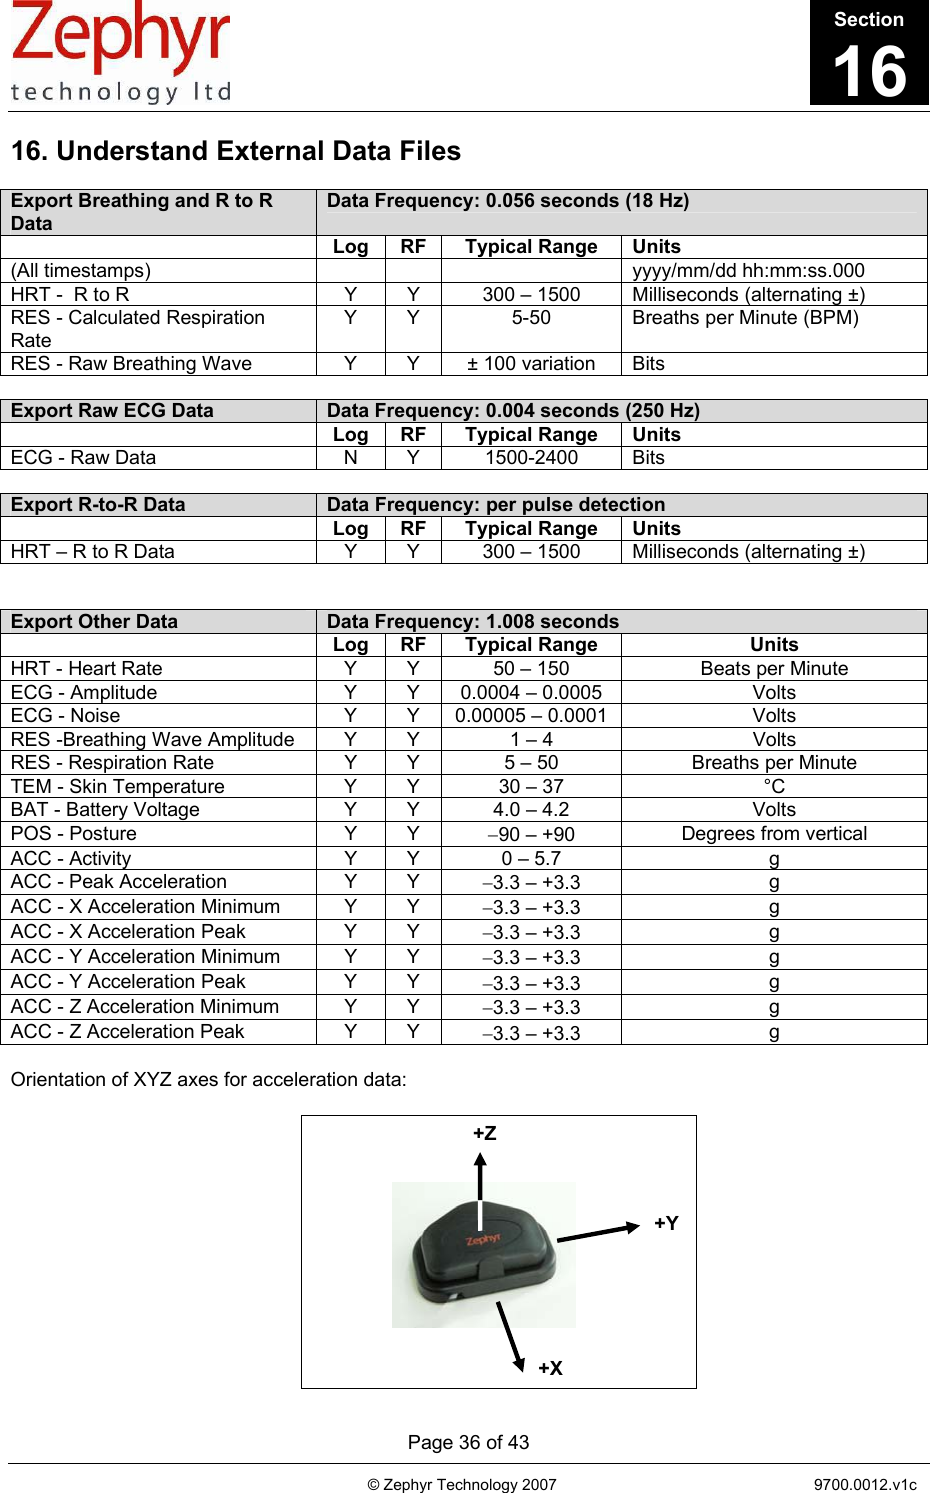
User Manual
Discussion / Help
Navigation