Zephyr Technology USB1 900 MHZ USB DONGEL RECEIVER User Manual ZephyrBioHarnessTCF
Zephyr Technology Corporation 900 MHZ USB DONGEL RECEIVER ZephyrBioHarnessTCF
USERS MANUAL
BioHarness™ User Guide
30

Page 2 of 43
© Zephyr Technology 2007 9700.0012.v1c
Contacts
Email: support@zephyr-technology.com
Web: www.zephyr-technology.com
Phone: +64 9 574 6523
Fax: +64 9 574 6527
Your BioHarness™ System comprises :
• BioHarness™ Garment incorporating Zephyr Smart Fabric sensors
• BioHarness™ Device
• 1 docking/charging cradle
• 1 USB lead
• 1 USB radio receiver dongle
• 1 Installation CD comprising
o Application software
o .NET installation software
o USB driver folder
o User Guide
o Adobe PDF Reader Installer
o Sample BioHarness™ projects Folder
• 1 User Guide (black & white)
• 1 Software & Hardware Installation Guide
The information in this document is believed to be accurate in all respects at the time of publication but is subject to change without
notice. Zephyr Technology assumes no responsibility for errors or omissions, and disclaims responsibility for any consequences
resulting from the use of information included herein. Additionally, Zephyr Technology assumes no responsibility for the functioning
of undescribed features or parameters. Zephyr Technology does not assume any liability arising out of the application or use of any
product, and specifically disclaims any and all liability, including without limitation consequential or incidental damages.
Zephyr Technology products are not designed, intended or authorised for use in applications intended to support or sustain life, or
for any application in which the failure of the Zephyr Technology product could create a situation where personal injury or death may
occur. Should Buyer purchase or use Zephyr Technology products for any such unintended or unauthorised application, Buyer shall
indemnify and hold Zephyr Technology harmless against all claims and damages.

Page 3 of 43
9700.0012.v1c © Zephyr Technology 2007
Contents
Section Page
1 System Overview……………………………………….
1.1 BioHarness System…………………………………….
1.2 BioHarness Application Software……………………..
1.3 BioHarness Garment and Device……………………..
1.4 Care and Maintenance…………………………………
2 Technical Specifications……………………………….
3 Get Started………………………………………………
3.1 Precautions………………………………………………
4 User Notes and Advice…………………………………
5 Charge the Batteries……………………………………
6 Put on the Garment……………………………………..
7 View Live Data…………………………………………..
8 Record & Save Files……………………………………
9 View Saved Files………………………………………..
10 Log on the Device………………………………………
11 Import Logs from the BioHarness Device…………….
12 Read the Graphs………………………………………..
13 Compare Files…………………………………………..
14 Understand Graph Options…………………………….
15 Export to an External csv File………………………….
16 Understand External Data Files………………………
17 Change Settings………………………………………...
18 Sample BioHarness Data Files………………………..
19 Troubleshooting…………………………………………
20 Glossary………………………………………………….
21 Index……………………………………………………...
22 Warranty…………………………………………………
Page 4 of 43
© Zephyr Technology 2007 9700.0012.v1c
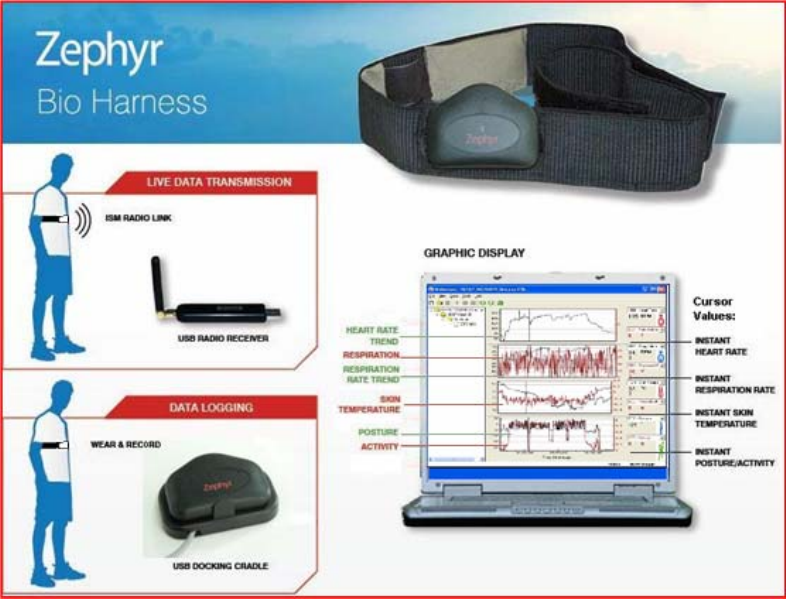
1 System Overview
1.1 BioHarness™ System
The Zephyr BioHarness is a state-of-the-art lightweight portable biological data collection and analysis
system. It monitors, analyses and records a variety of physiological parameters.
The system can operate in two modes:
RF (Radio Frequency) Transmitting mode for live viewing of data
Logging mode for remote monitoring of data
Live data viewing features include
• A variety of selectable waveforms and trend data including
o 250 Hz indicative ECG
o 18 Hz respiration and Heart Rate RR data
o 1 Hz for all trend, activity and 3-axis acceleration-based parameters
• Real time pulse and breath detection indicator icons
• Activity level in VMU
• Posture – attitude of device – in degrees from vertical
• Recording of data
Historical and Logged data can be displayed. Exact data values can be determined by cursor position,
with zoom and pan facilities on graphs.
All data can be exported to an external csv file with real-time timestamps for more detailed analysis.
Download data using
USB docking cradle
Wear & record Graphic display
USB ISM receiver
BioHarness garment and Device
ISM radio link
Graphic display
Section
1
Page 5 of 43
9700.0012.v1c © Zephyr Technology 2007
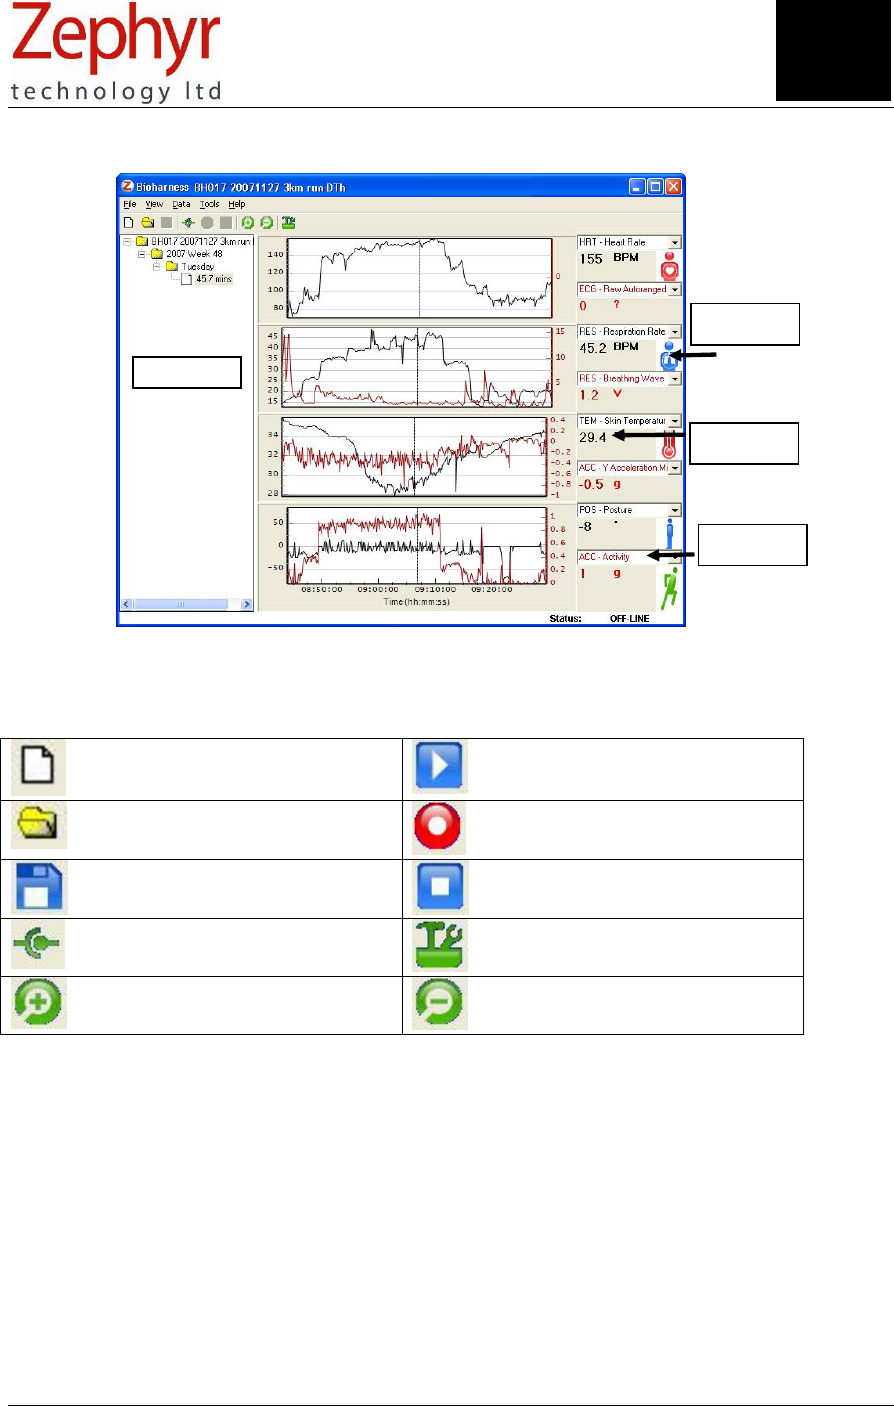
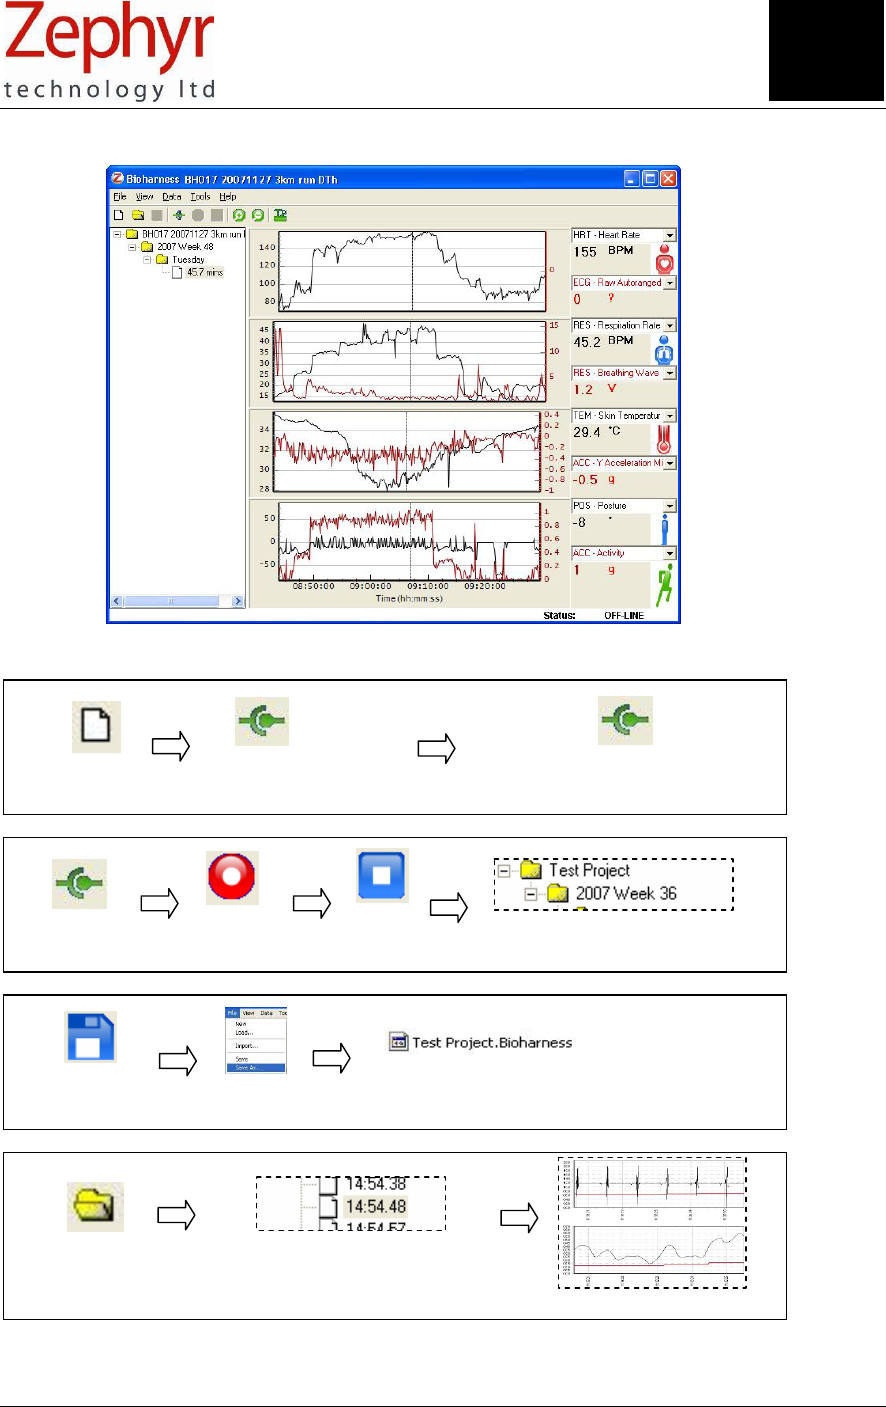
1.2 BioHarness Application Software
Toolbar Options
Open New Project Play current project
Browse for existing Project Record current RF data
Save current project Stop current recording
Connect (RF mode) Tools
Zoom In around graph Cursor Zoom out
Explorer Panel
Graph
Selection
Cursor Value
Active Icon
Section
1
Page 6 of 43
© Zephyr Technology 2007 9700.0012.v1c
Button (from off) LED Mode LED Mode
Press & Hold
Press again
Press & Hold 3 sec
RF Transmit Fast
Logging Slow
Off Off
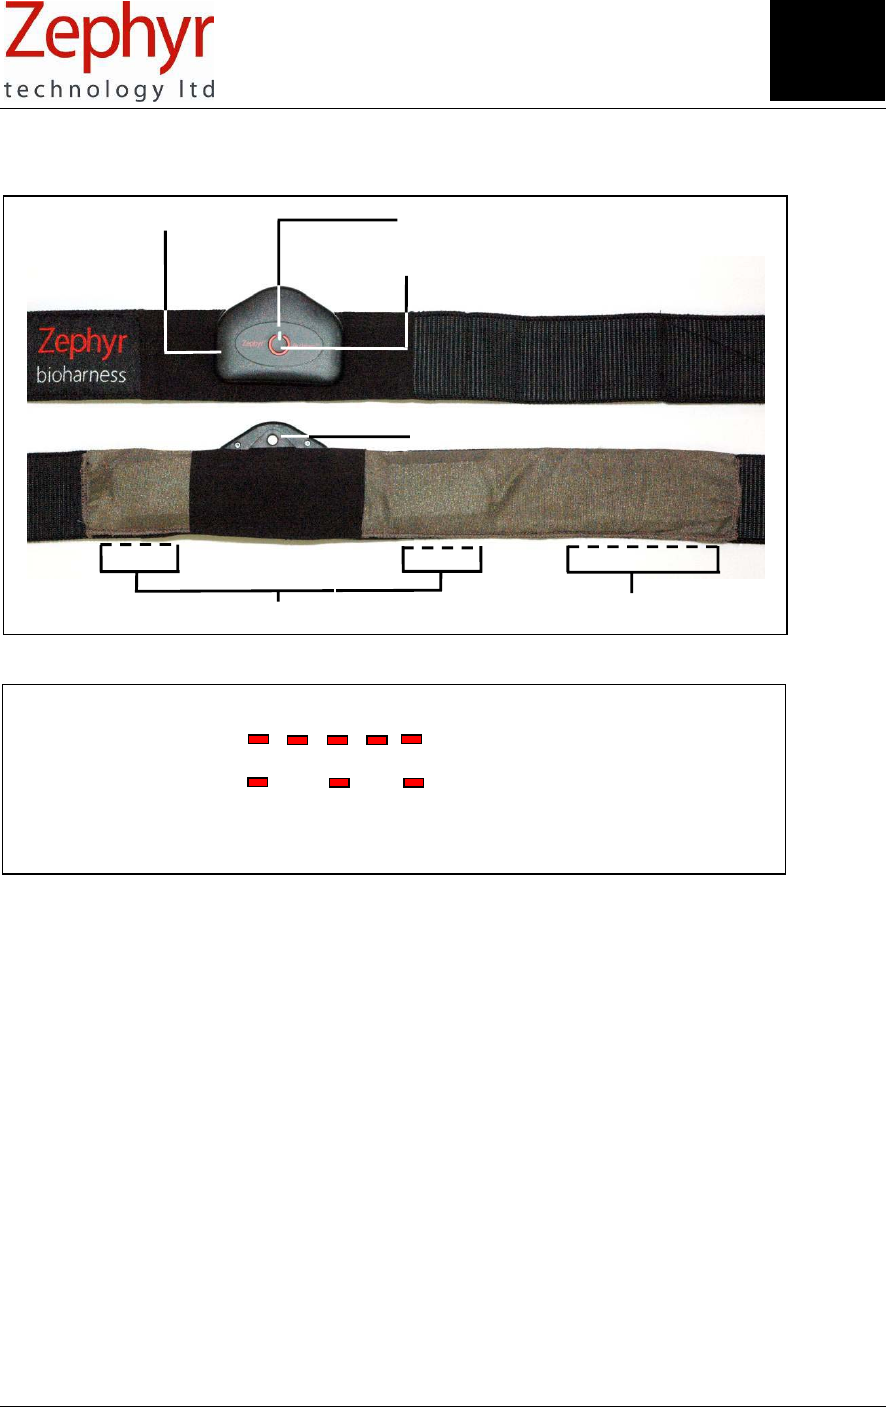
1.3 BioHarness Garment and Device
1.4 Button/LED Modes
1.4 Care and Maintenance
BioHarness Device:
• O-ring sealed and water resistant.
• Wipe with a soft damp cloth and towel-dry
• Clean the Temperature window with a cotton bud
• Do not leave in direct sunlight for long periods (such as in a vehicle)
BioHarness Garment:
• Rinse the garment in fresh water after use
• Hand wash, or to machine wash the garment, detach the BioHarness Device and wash on a Cold,
Delicate setting
• Firmly attach the Velcro ® fastenings together and do not wash with other delicate garments which
may be damaged by the fastenings. Use a washing pouch if possible.
• Do not spin or tumble dry
• Hang to dry, out of direct sunlight
• Do not use bleach, or iron
BioHarness Device
Power/Mode button
LED indicator
Infrared temperature window
ECG Sensors Respiration Sensor
Section
1
Page 7 of 43
9700.0012.v1c © Zephyr Technology 2007
2. Technical Specifications
Minimum PC Requirements
Operating System: Windows ® XP/SP2 with Microsoft ® .NET 1.1 Environment
Processor & Speed: 32 bit x86 2 GHz
Memory: 512 RAM
Connectors: USB
Smart Fabric Garment
Material: Elasticised webbing incorporating Zephyr Smart Fabric sensors
Width: 50mm
Weight: 50 grams
Length: S/M/L Adjustable, Velcro® fastening
BioHarness Device (Transmitter/Recorder)
Weight 35 grams
Dimensions 80 x 40 x 15 mm
Frequency ISM radio band (868 - 929MHz)
Frequency is software configurable for Country-specific bands
Sample Rate 250 Hz Max.
Memory Capacity ~480 hours
Transmit Range Up to 100m, environment and antenna dependent
Battery Life ~ 10 hours logging
~ 5 hours transmit
This device complies with Part 15 of the FCC Rules. Operation is subject to the following two conditions:
(1) this device may not cause harmful interference, and (2) this device must accept any interference
received, including interference that may cause undesired operation.
Part Numbers
Description Zephyr Part No.
BioHarness™ transmitter/recorder device 9800.0049
USB RF receiver dongle 9800.0018
Smart Fabric Garment - Small 9800.0056
- Medium 9800.0040
- Large 9800.0057
Docking Cradle 9800.0047
USB/mini connector lead 0015.0003
Software Installation CD 9700.0011
User Guide 9700.0012
Section
2
Page 8 of 43
© Zephyr Technology 2007 9700.0012.v1c
1. Install the software and hardware
See Installation Guide
2. Charge the Batteries
See section 5
Full charge – 3hrs
90% charge – 1 hour
(
Devices cannot be overchar
g
ed
)
3. Get Started
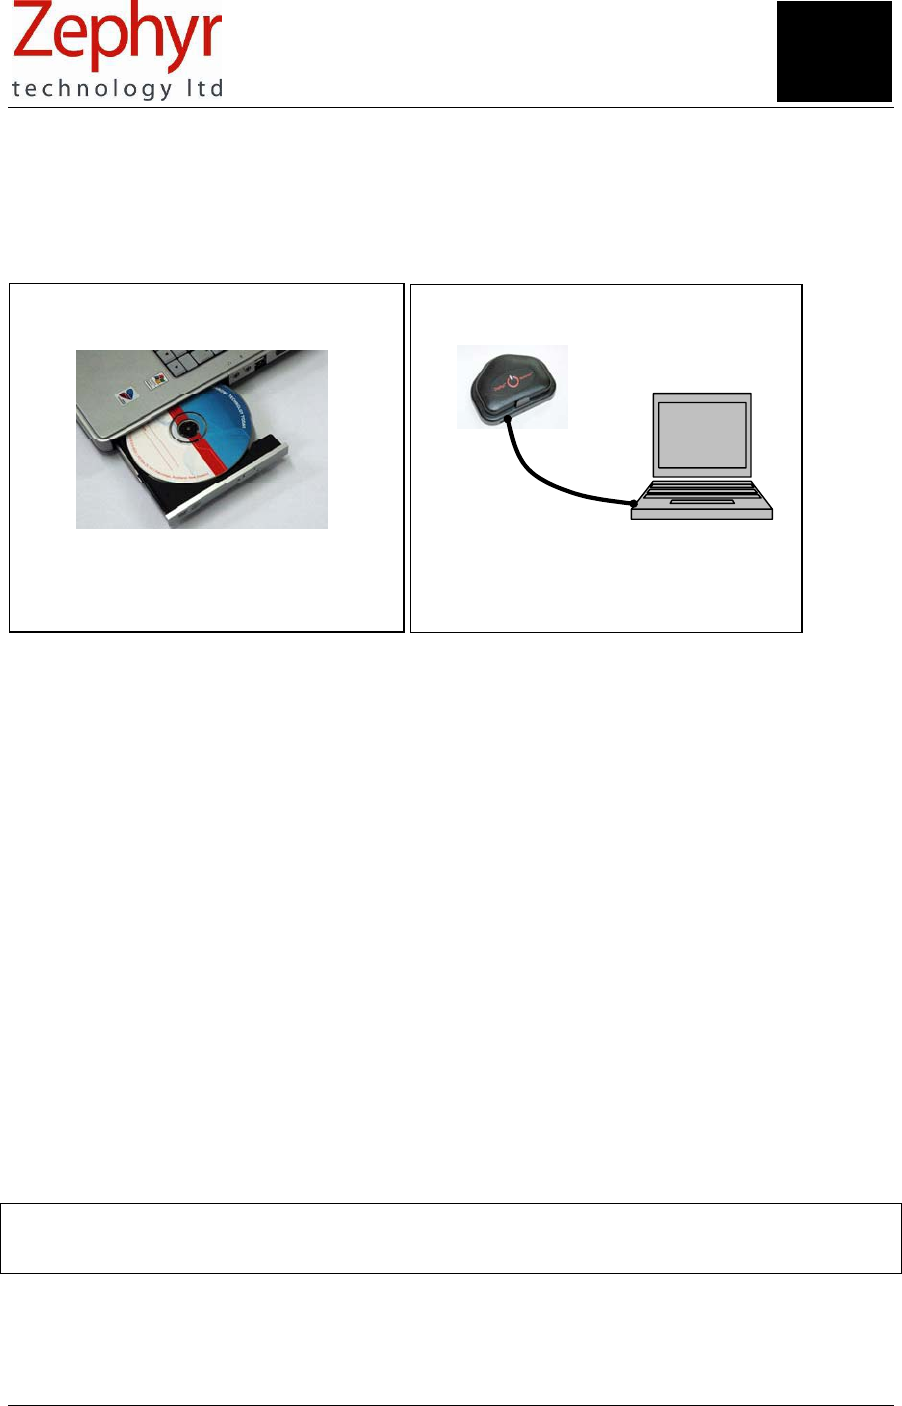
Insert the Installation CD into your CD reader drive, and follow the instructions in the Software and
Hardware Installation Guide to carry out the following:
3.1 Precautions
• Do not use the unit if you are fitted with a heart pacemaker
• Do not attempt to operate the receiver dongle in wet conditions as it is not water resistant (the
transmitter unit is water resistant and can be used in logging mode)
• Do not use in explosive atmospheres (such as gas stations)
• Do not use near blasting areas such as quarries
NOTE: THE MANUFACTURER IS NOT RESPONSIBLE FOR ANY RADIO OR TV INTERFERENCE
CAUSED BY UNAUTHORIZED MODIFICATIONS TO THIS EQUIPMENT. SUCH MODIFICATIONS
COULD VOID THE USER'S AUTHORITY TO OPERATE THE EQUIPMENT.
Section
3
Page 9 of 43
9700.0012.v1c © Zephyr Technology 2007
4. User Notes and Advice
4.1 ECG Performance
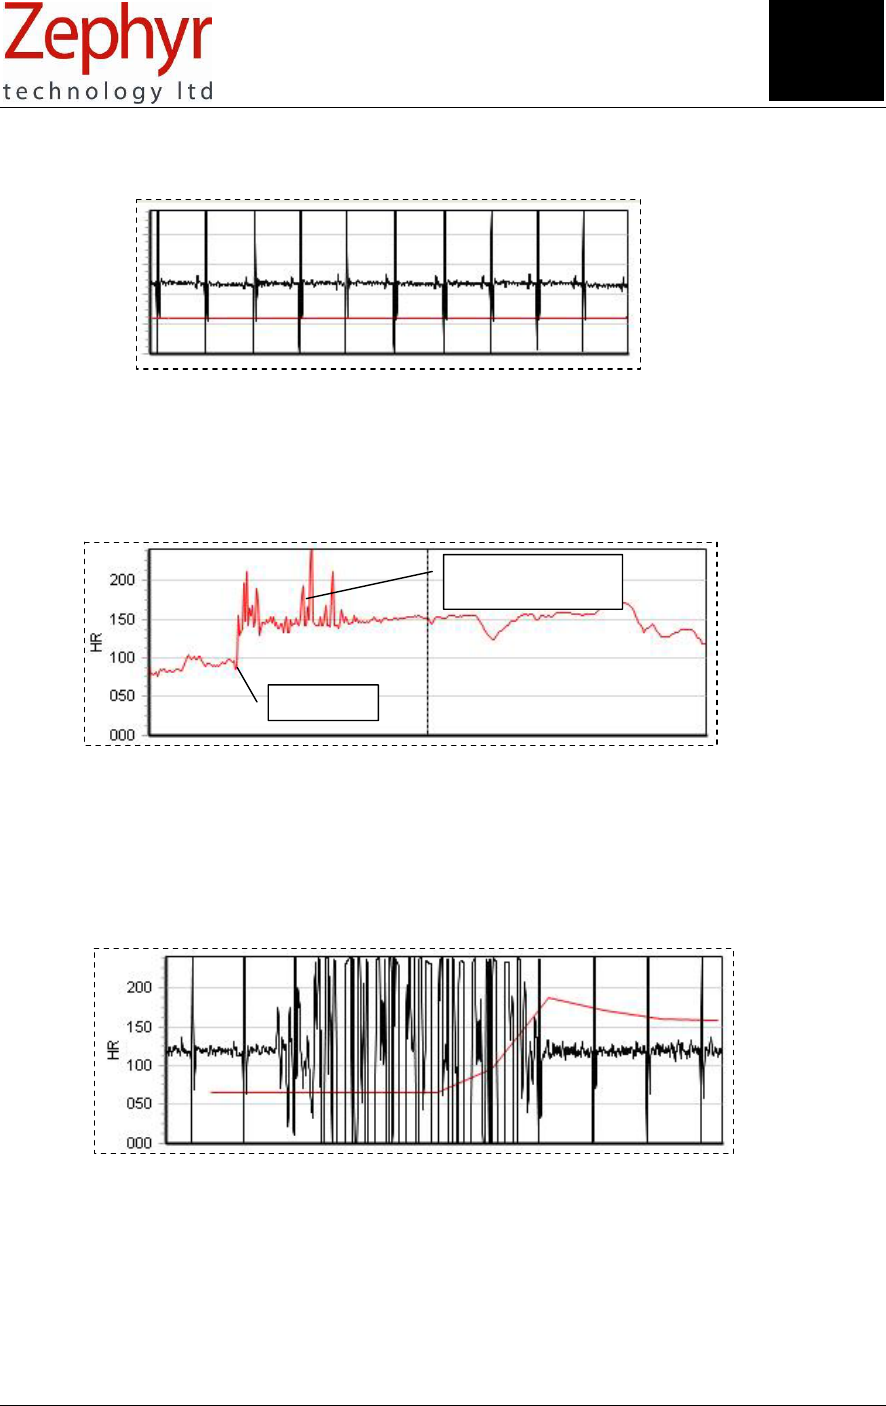
Fig 4.1.1 A good low-noise ECG signal from a static subject with a dry garment
Factors which can affect ECG performance are:
• Skin moisture − or lack of it. While the BioHarness system will perform well with non-moistened
sensor surfaces, ECG data will be more susceptible to movement artefact noise as seen in the
diagram below. Pre-moisten the sensor surfaces for best performance – see section 6.
Fig 4.1.2 The subject has started a 3km run with a dry garment. The clean
heart rate signal prior to the run is immediately noisy due to movement
artefacts generated by the running action, and EMG noise. As the subject’s
skin moistens with perspiration, the noise clears.
• EMG – Electromyographic noise. As muscles on the torso contract and relax, they generate EMG
signals which can be comparable in magnitude with the ECG signals. Excessive use of these
muscles, such as vigorous arm-flapping can affect ECG detection.
Fig 4.1.3 EMG noise/movement artefacts generated by vigorous arm movement
• A subject’s own ECG amplitude. There is a large variation in the actual ECG signal strength within
the human population. Users who have exceptionally weak ECG signals may observe reduced ECG
performance with the system.
Section
4
ECG noise caused by
movement artefacts
Start of run
Page 10 of 43
© Zephyr Technology 2007 9700.0012.v1c
4.2 Respiration Performance
A breath is one inhalation/exhalation cycle. Respiration rate is the number of these cycles occurring in
one minute.
The BioHarness detects and analyses expansion and contraction of the thorax (rib cage) in order to
determine respiration rate. Zephyr’s proprietary breathing detection algorithms need to ‘learn’ an
individual’s breathing action. Respiration rate takes 30 – 45 seconds to stabilise when the system is
initially activated.
Factors which can affect Respiration Rate performance are:
• Physical activity – especially repetitive activity, which causes regular expansion and contraction of
the rib cage, such as chopping with an axe or striking a punch bag repeatedly
• A subject’s physique, and natural breathing rhythm.
• Breathing action. Breathing is a combination of apical and diaphragmatic actions. Apical breathing is
driven by expansion of the rib cage, the mechanism a BioHarness analyses. Inhalation is also
driven by contraction of the diaphragm in a downward direction. This does not greatly contribute to
expansion of the rib cage. If a wearer has a predominantly diaphragmatic breathing action, then the
BioHarness will be less effective in detecting breath cycles.
4.3 Skin Temperature Performance
The infrared sensor in the BioHarness device is fast-responding and accurate. The sensor window should
be cleaned regularly with a cotton bud or similar. Skin temperature can vary locally by several degrees
depending on the location of blood vessels and sweat glands.
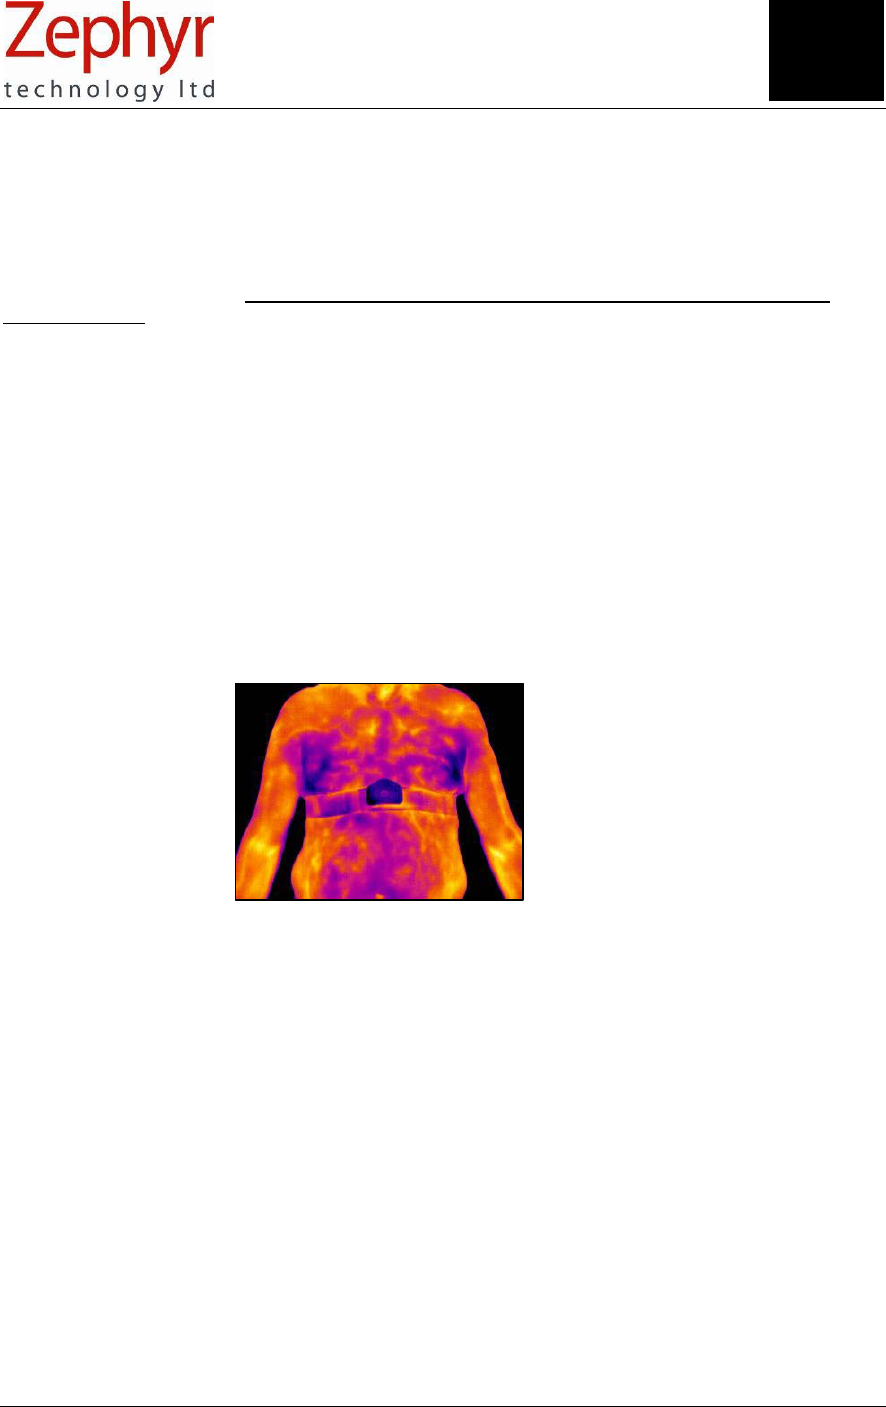
Fig. 4.3.1 A high definition Infrared camera image. Colour variation shows local
variations in skin temperature in a subject who has been running on a
treadmill.
Factors which can affect skin temperature are:
• Perspiration, which is the body’s response to an increase in core temperature. Evaporative cooling
of perspiration is part of a body’s natural temperature regulation mechanism.
• Moisture condensation on the sensor window
• Environmental factors such as ambient temperature, humidity, wind and the sun’s radiated heat.
• Any physical factor (such as clothing) which insulates the skin from the environment
• Local blood circulation
• Local perspiration
• Response to drugs, or medical conditions
• Physiological conditions (including shock and hypo- or hyperthermia)
These should all be taken into account when analysing temperature data.
Section
4
Page 11 of 43
9700.0012.v1c © Zephyr Technology 2007
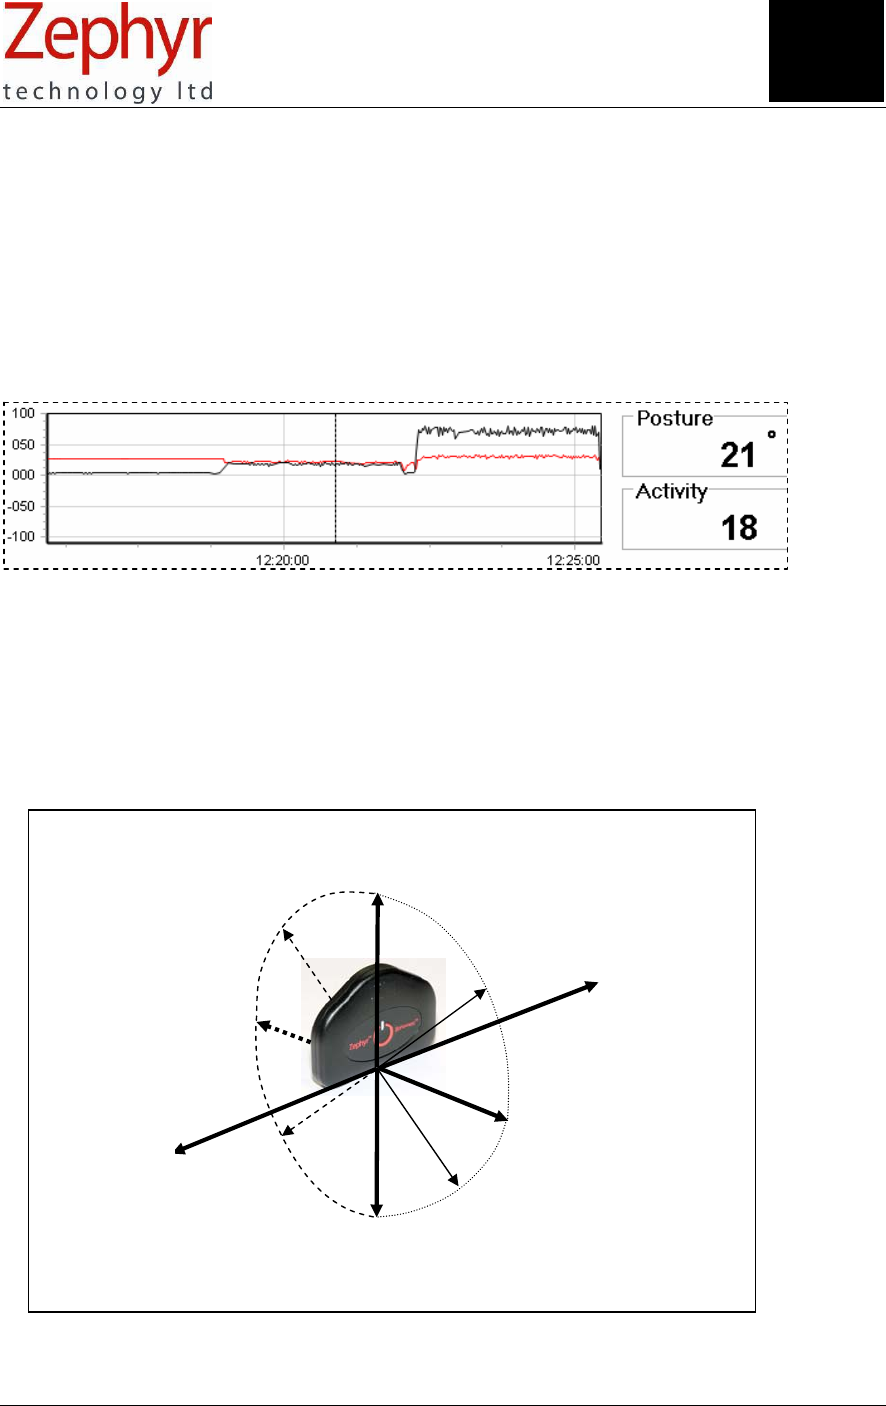
+90° Sagital Axis
+90°
Lateral Axis
+90°
-90°
0°
0° Vertical Axis
+45°
+45°
-45°
-45°
Posture orientation
With fixed base point, tilt the apex of the device to any arrow head for the indicated
posture value
4.4 Activity and Posture Performance
4.4.1 Activity
The default activity data on the graph is shown in VMU. This is an average gravity-compensated value
calculated over the previous 1.008 second epoch. It is an integration of all three axial values.
Activity data is also available as individual XYZ components in units of g (gravity) The minimum and
maximum values of each 1.008 second epoch are available, as well as maximum acceleration magnitude
and activity levels.
The cursor value below should be read as 0.18 VMU. The trace shows 3 min of inactivity, 3 min @ 5kph
and 3 min @ 10 kph treadmill running.
4.4.2 Posture
Posture data is affected by movement. High levels of activity will prevent the posture from being acquired
reliably – and the posture will also be highly variable. Posture data is most accurate when the subject is
static.
The actual posture value for a subject who wearing the device in a sitting or standing position will depend
on the shape of their torso immediately underneath the garment – a stomach which protrudes is likely to
result in a negative value for posture. As the subject leans forward the posture value will increase.
Section
4
Page 12 of 43
© Zephyr Technology 2007 9700.0012.v1c
LED constant
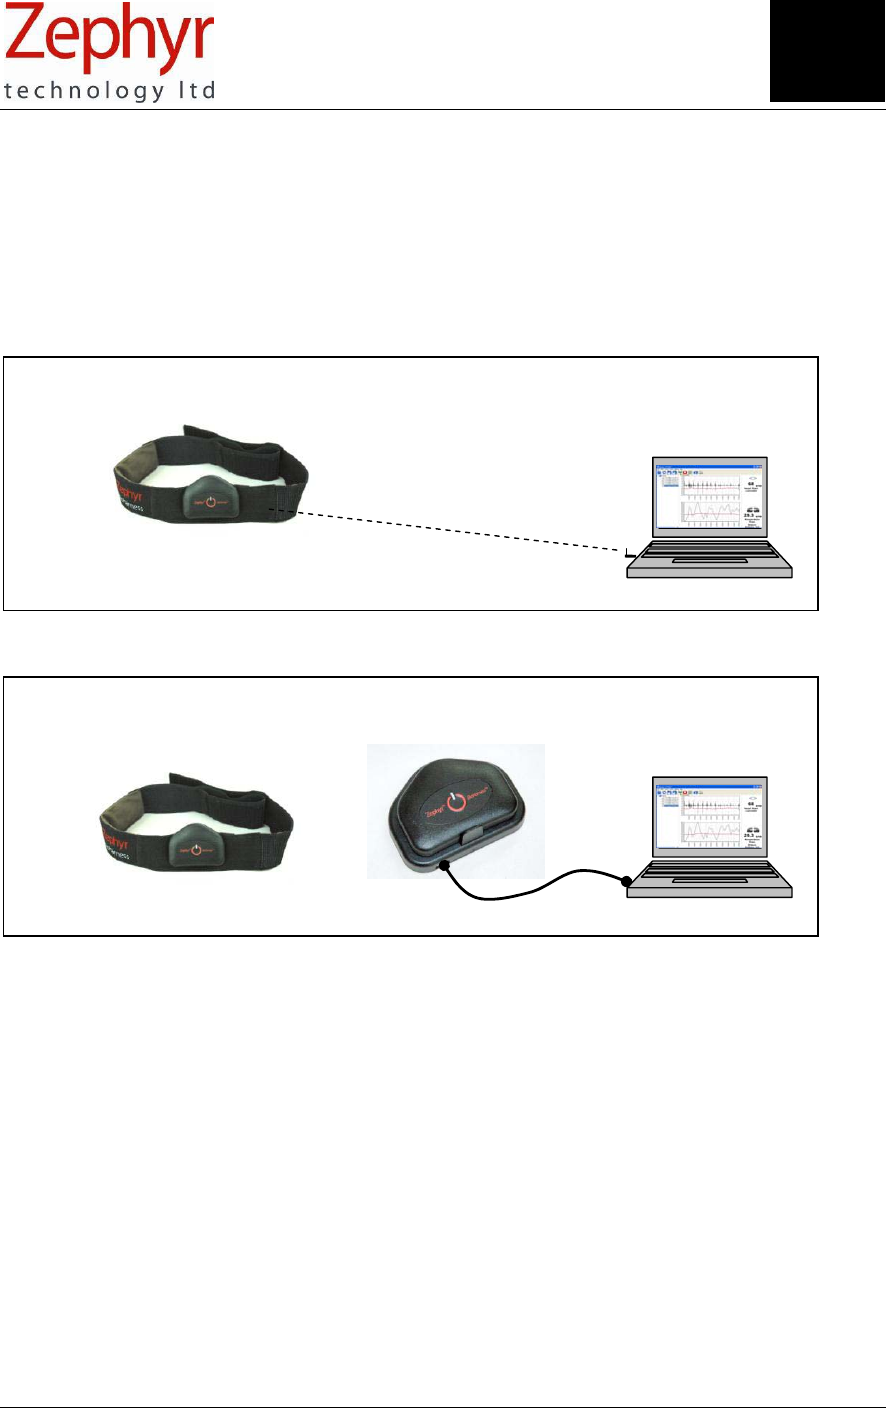
5. Charge the Batteries & Set the Clock
When first delivered, the BioHarness is totally powered off. It will have some battery charge, but the time
on the internal clock will be set to a default value of Jan 1 2000. The internal clock is used to assign
timestamps to data logged on the device. In live RF mode, data is time stamped by the host PC at time of
reception.
5.1 To charge the battery and reset the internal clock:
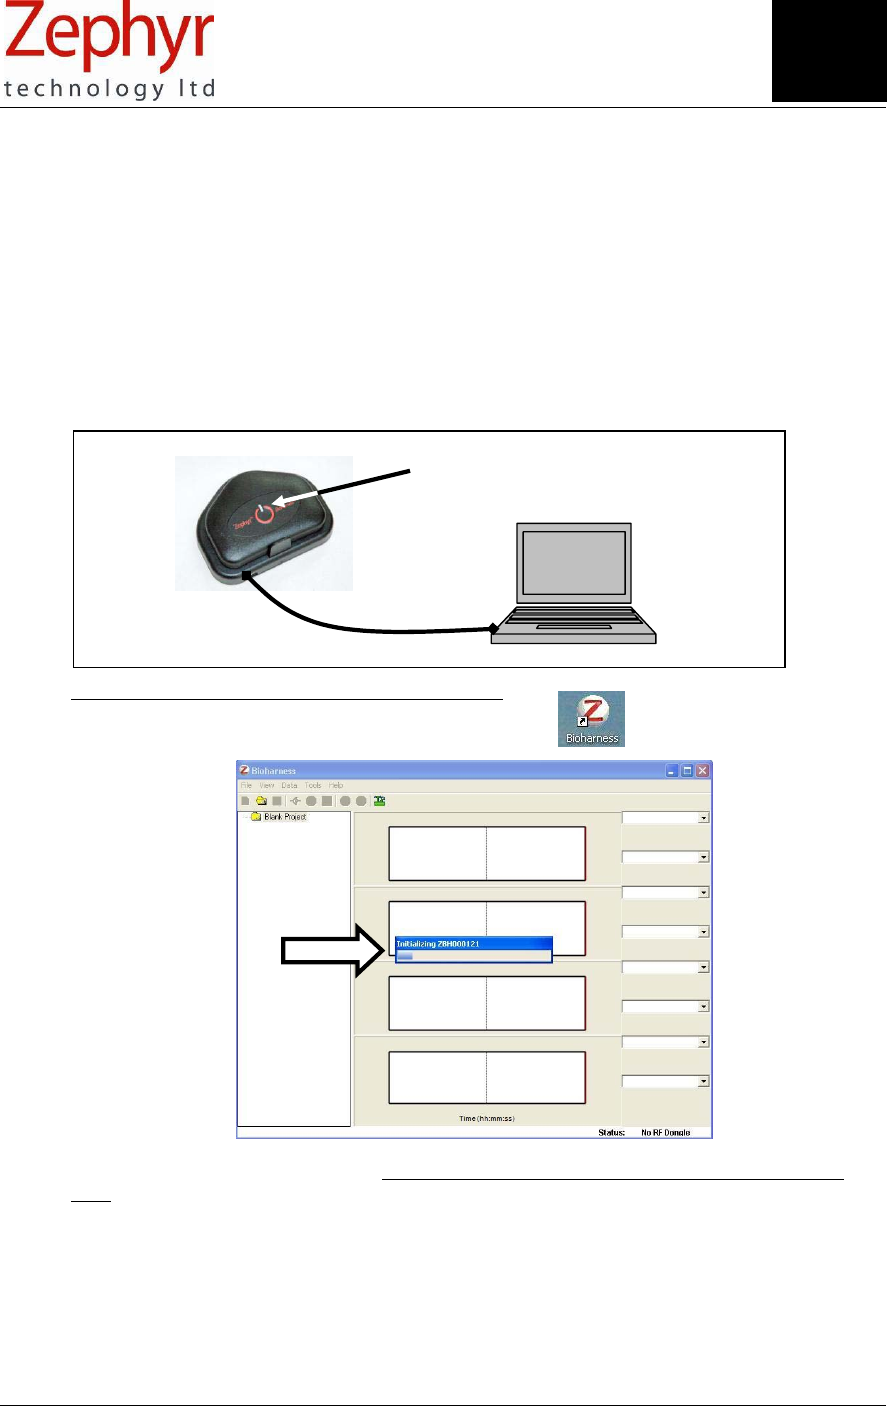
1. Install the Application Software, Driver files and hardware as described in the Software and
Hardware Installation Guide.
2. Connect the BioHarness device in its cradle to the PC
When the LED is illuminated, the battery is charging.
3. Start the BioHarness software using the desktop shortcut
An ‘Initialising’ dialogue will display – when it is completed then the Clock is set to current PC
time.
BioHarness status when placed in a cradle
• No application open – batteries charge, clock not initialised
• Application open – batteries charge, clock initialised
• Application Open, View Live Data via a 2nd device – batteries charge, clock not initialised
until 2nd transmitting device disconnected
Section
5

Page 13 of 43
9700.0012.v1c © Zephyr Technology 2007
5.2 Charge Time
Full charge (100%): 3 hours from fully discharged
Quick Charge (90%): 1 hour from fully discharged
Charging is intelligent – the device cannot be overcharged
5.3 Charge Duration
Time to full discharge of a fully charged Li-ion cell
Mode Quick Charge Full Charge
Power Off ~28 days ~ 30 days
RF transmitting mode 4 hours 5 hours
Logging Mode 7 hours 8 hours
In power off mode, the cell is discharged by the internal clock.
5.4 Charge Level
There is a charge level indicator on the Application software which is active when the BioHarness Device
is transmitting live data. The colour of the indicator bar reflects the battery level:
Battery Level
Blue 20 -100% capacity
Red < 20% capacity
5.5 Battery Life
Expected life ~500 cycles
As with all rechargeable cells, such as mobile phone batteries, charge duration will shorten as the battery
reaches the end of its life expectancy. The battery is not user replaceable. Contact your supplier for
battery replacement information.
Section
5
Page 14 of 43
© Zephyr Technology 2007 9700.0012.v1c
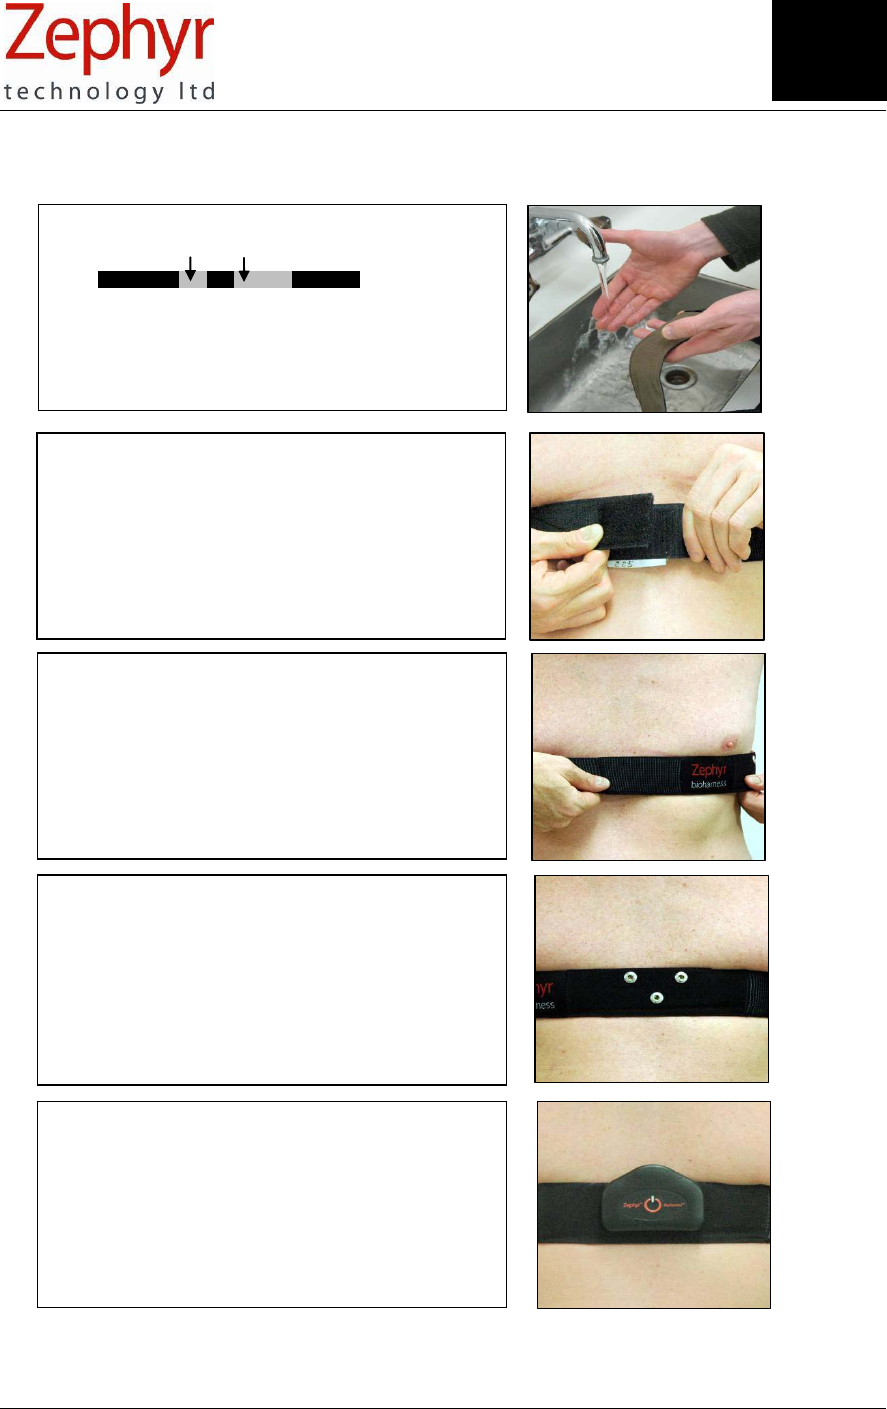
6. Put on the Garment
• Wet your fingers and lightly moisten the silver
ECG sensor pads for better performance
The ECG will work when dry, but be more
susceptible to signal noise when the wearer is
very active
• Put the garment on backwards first, for easier
adjustment of tension and alignment of the Velcro
® fastening
• Adjust the tension so that the garment is snug
but comfortable and will not move under
expected activity
• Position the garment so that is just below the
chest muscles
• Rotate the garment to that the fasteners are
centred on the torso, with middle snap above the
sternum
• Attach the BioHarness device, set to transmit or
recording mode as necessary (see sections 7 &
11)
Section
6
Page 15 of 43
9700.0012.v1c © Zephyr Technology 2007
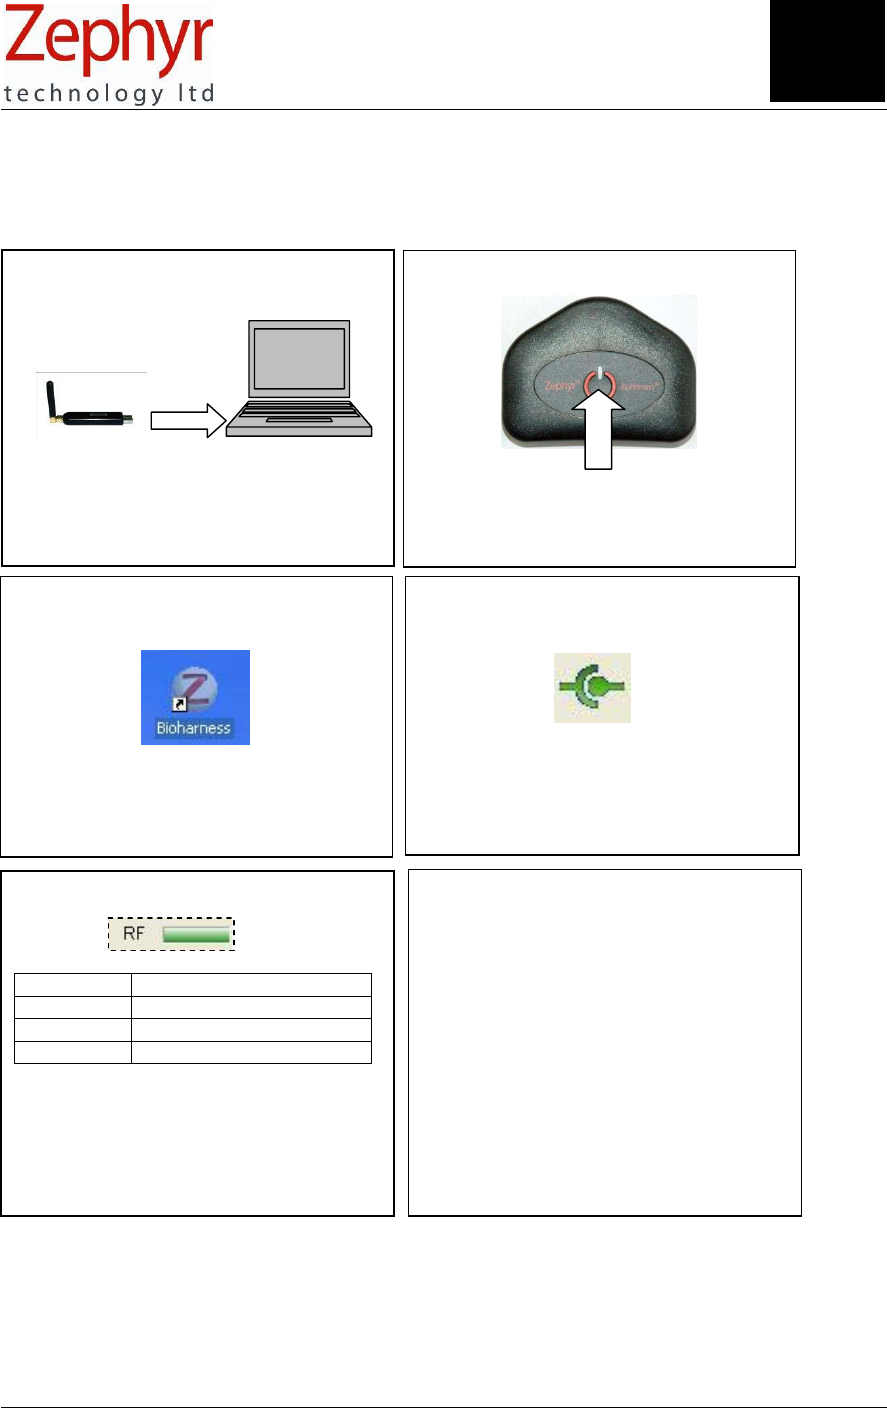
1. Connect the USB receiver dongle
3. Start the Application Software 4. Click the Connect button on the
Application Software toolbar
The graphs will populate with live data in
a few seconds
2. Switch the device on
Press and hold the button until the LED
flashes in Fast mode (Section 1.4)
5. Check Signal Quality
Colour Signal Quality
Green 100%
Yellow 50 – 99%
Red < 50%
Note that a yellow signal strength
indication may only mean a 1% loss of
quality – this is acceptable signal quality
6. Factors which may affect signal
q
ualit
y
•
Transmitter/receiver distance
• Orientation of subject
• Mobile phones
• Electrical equipment nearby
• Metallic obstructions
• Vehicle electrics
• Overhead lines
7. View Live Data
A BioHarness device with a fully-charged Li-ion cell should be able to transmit live data for approximately
5 hrs
Section
7
Page 16 of 43
© Zephyr Technology 2007 9700.0012.v1c
8. Record and Save Files
Viewing real-time data
Recording real-time data
Saving a Project
Review of Saved files
Browse for Project if
needed, or drag & drop
into Pro
j
ect Explorer
Select recording
Entire file dis
p
la
y
ed
Save Project …or Save As
(rename in dialogue) New Project created
Record Stop New file created automatically
Connect
Connect
Open New
Project (optional)
Disconnect
when finished
View Data
Section
8
Page 17 of 43
9700.0012.v1c © Zephyr Technology 2007
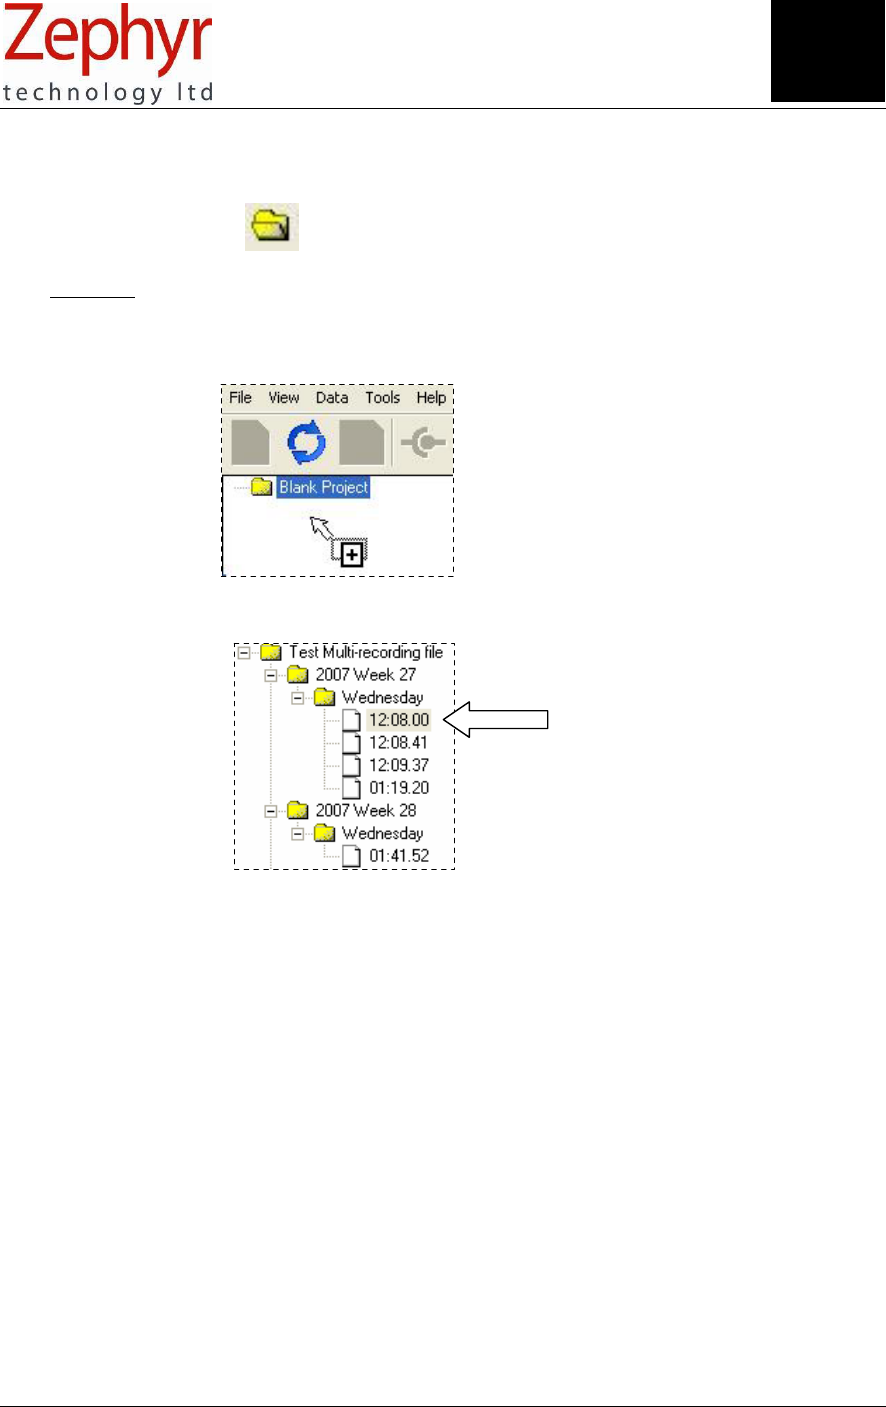
9. View Saved Files
To view a saved file:
• Use the Browse button
• …or use the menu option File>Open. The application will open the directory in which a Project was
last saved
• Select a Project from the dialogue and click open
• The file will load into the application
• …or drag and drop a Bio Harness File into the Project Explorer pane:
.
• Click on an individual session in the Project Explorer to load it
Note: a 5 hour BioHarness session recorded while in RF mode:
• is ~15MB in size
• will take ~ 30 seconds for the session to load into the application.
Section
9
Page 18 of 43
© Zephyr Technology 2007 9700.0012.v1c
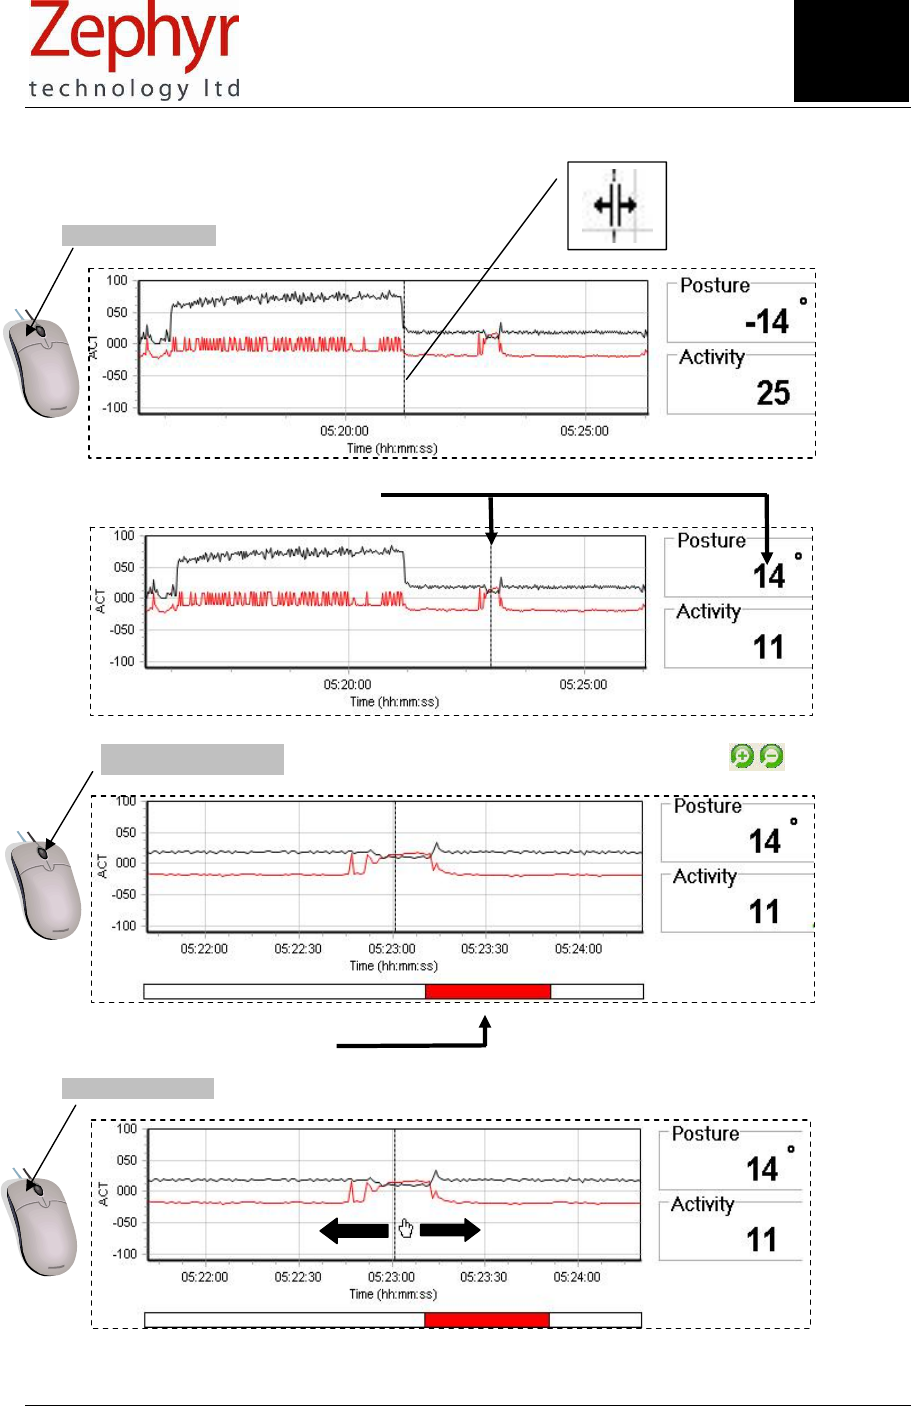
10. Read the Graphs
1. Left-click and drag cursor to point of interest
2. Values are shown for cursor position
3. Use Mouse wheel to zoom in on detail (centred around cursor) or Zoom buttons
Section of file on display shown
4. Left click and drag graph body to pan horizontally
Section
1
0
Page 19 of 43
9700.0012.v1c © Zephyr Technology 2007
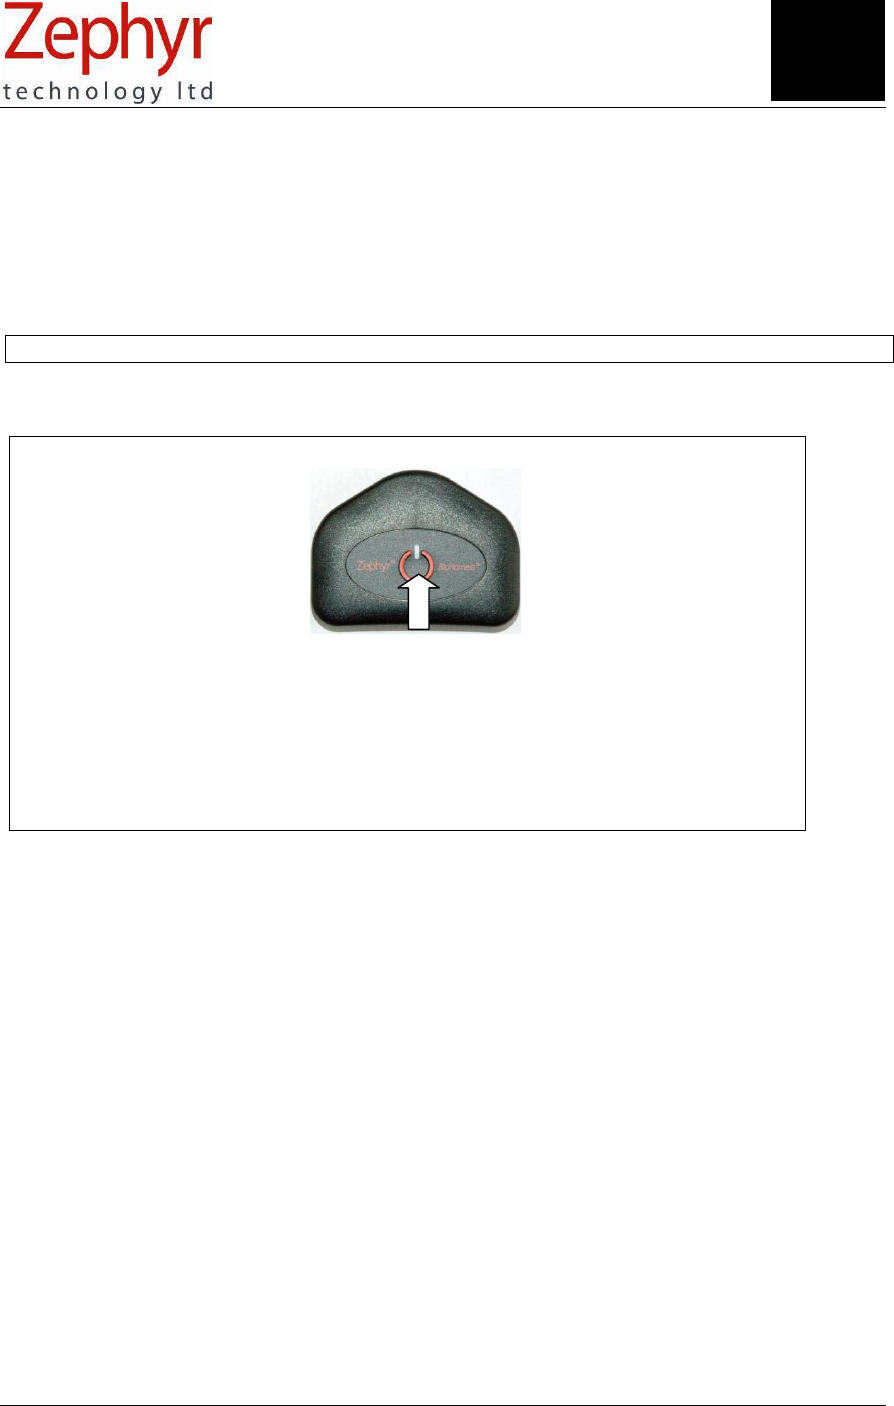
Switch on the device
See section 1.4 for button modes:
• Press once for RF Transmit/ Fast LED mode
• Press again for Logging/Slow LED mode
• Press & Hold 3 sec for Off
11. Log on the Device
Data which is logged on the device is time stamped using the device’s own internal clock. This clock
should be reset to current time (initialised)
• After initial delivery
• Each time the battery has become completely discharged
If the clock is not initialised, then subsequent data will be time stamped starting at 12:00:00 on 1/1/2000.
It is strongly advised that the clock is initialised before the device is used in Logging mode.
Section 5 explains how to initialise the clock.
1. To make a single Log:
2. Repeat the above instructions to make a subsequent log.
Section
11
Page 20 of 43
© Zephyr Technology 2007 9700.0012.v1c
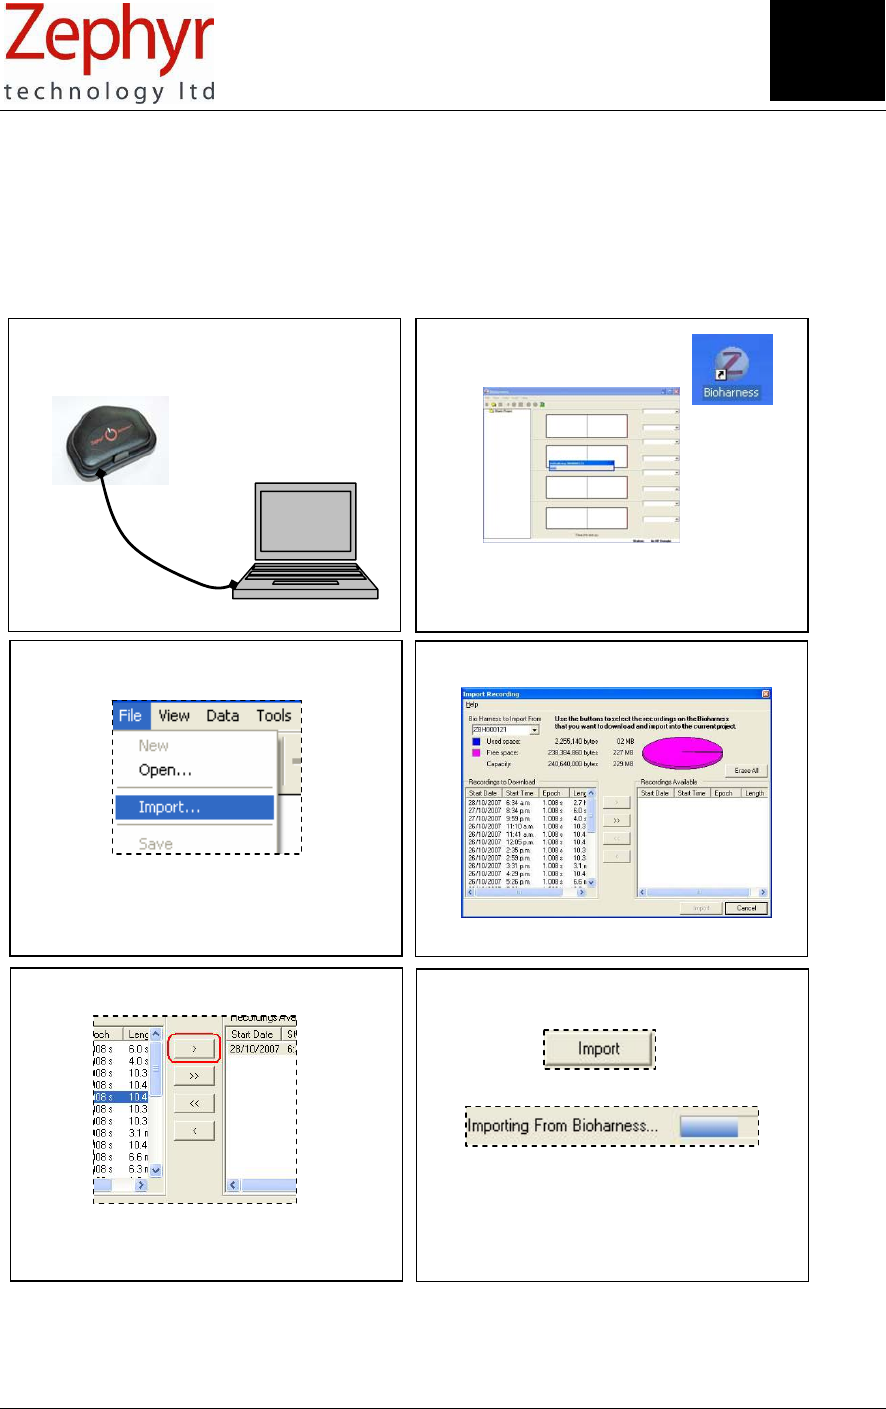
1. Connect the Device 2. Start the Application
The Device will initialise
3. Select File>Import 4. Import Dialogue
5. Select log or logs using arrows
Double-clicking a recording also works
6. Click Import
30 min of data will take ~1 min to Import
12. Import Logs from the BioHarness Device
The BioHarness contains enough internal memory to hold the equivalent of 480 hours worth of data. Logs
are copied, not moved, from device memory, so they can be imported multiple times. (Use the Erase All
button in the import dialogue to permanently delete all recordings) When the memory is full, the oldest
files will be overwritten.
To import data:
Data can be imported into a new Project, or any Project already opened in the application.
Section
12
Page 21 of 43
9700.0012.v1c © Zephyr Technology 2007
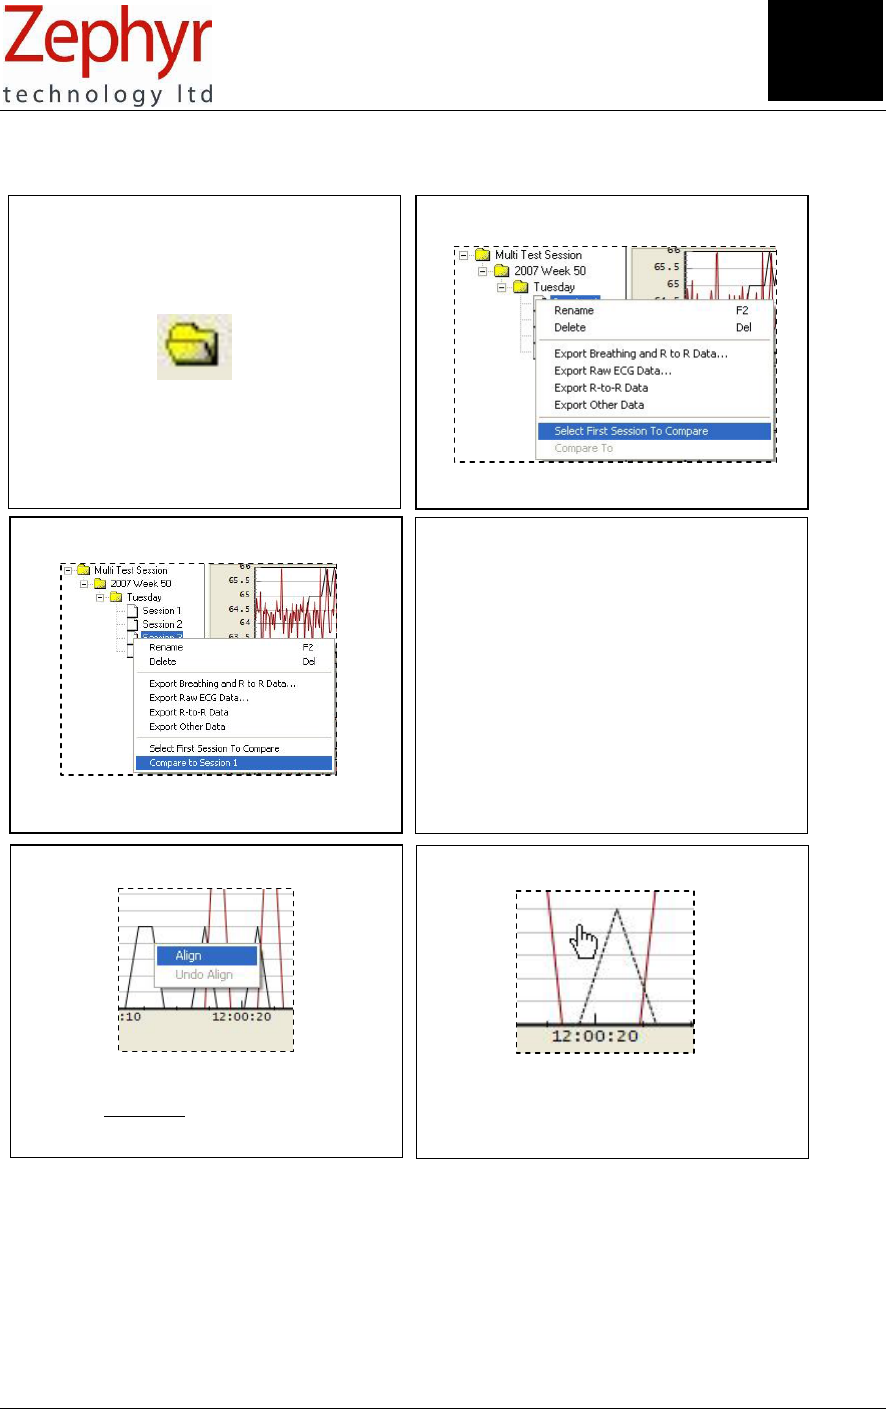
1. Load the Project or P
r
ojects
containing sessions for comparison
2. Right Click 1s
t
Session
Select First Session to Compare
3. Right Click 2n
d
Session
Select Compare to Session 1
4. Both sessions are loaded
•
1
st Session data in black
• 2
nd Session data in Red
• Only one parameter per
graph (Select using list)
• Cursor value of each is
displayed
5. Select data set to align
Place cursor over data set (red or black)
on the BOTTOM graph and Left Click.
This data set becomes dotted.
6. Realign data set
Pan the dotted data set to realign
13. Compare Two Sessions
Section
1
3
Page 22 of 43
© Zephyr Technology 2007 9700.0012.v1c
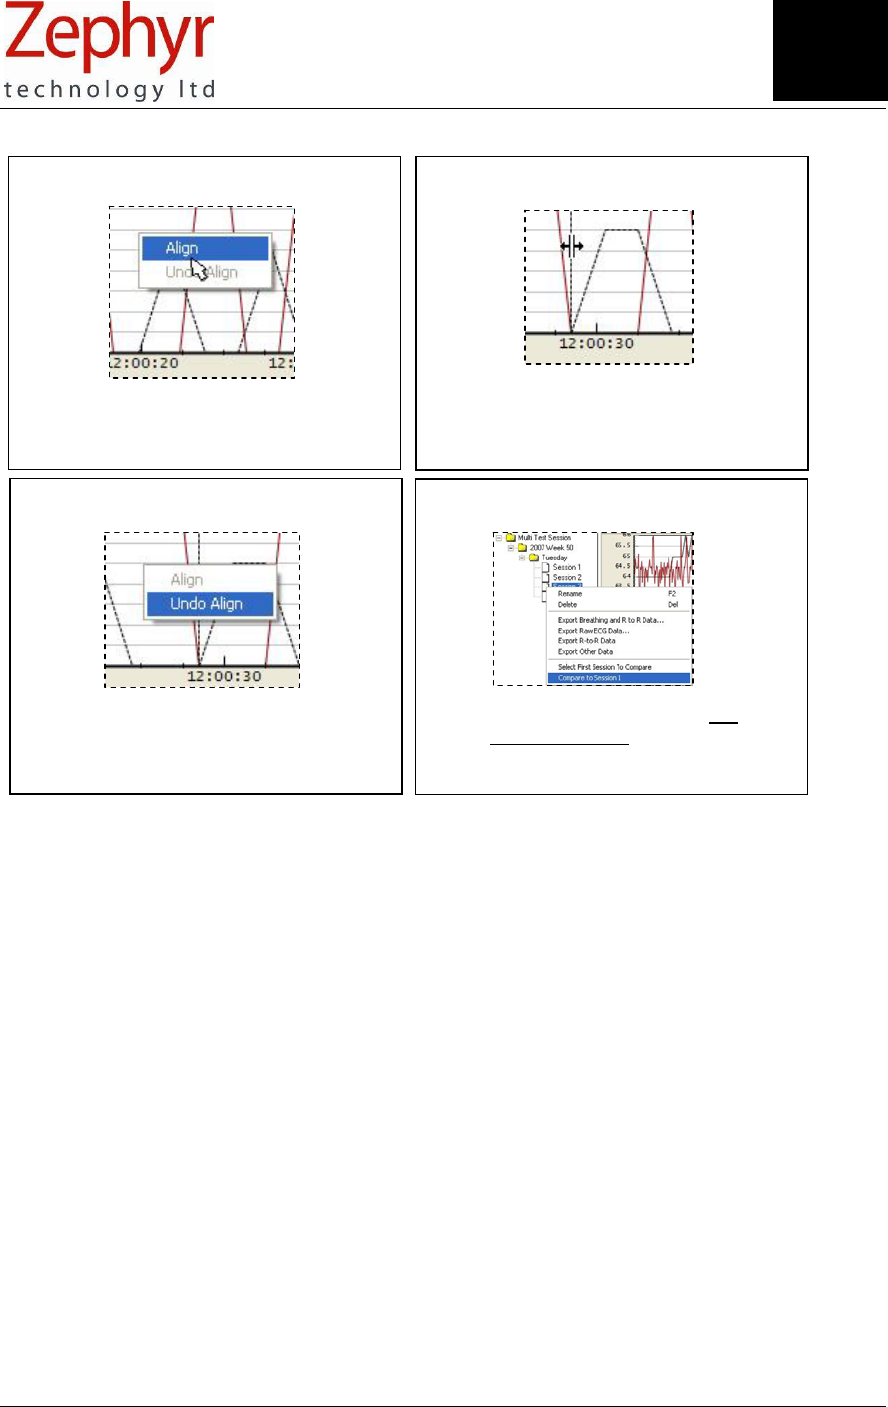
7. Fix new alignment
Right Click and select Align to set
new alignment
8. Compare Data
Use Cursor, Zoom and Pan on
both data sets as necessary
9. Undo Align
Right click and select Undo Align
to return to original state
10. Select another data set
Select another data set – the last
session selected is always
available for comparison
Section
1
3
Page 23 of 43
9700.0012.v1c © Zephyr Technology 2007
14. Understand Data Options
14.1 ACC – Activity
Data Frequency 1 Hz (1.008 seconds)
Units Vector Magnitude Units (VMU) measured in ms-2
Minimum Value 0
Maximum Value 5.7
Description Scalar index of activity. (ACC X 10 and ACC X 100 are available as
options to scale the graph display to suit activity level).
Sample
Activity level during walk/3km run/walk/static. The Y axis has autoscaled to
fit the data range.
CSV Export Yes (x10 and x100 Activity levels are not available for export)
14.2 ACC – Peak Acceleration
Data Frequency 1 Hz (1.008 seconds)
Units g (gravitational force)
Minimum Value 0
Maximum Value 5.7
Description Maximum magnitude in any direction (X, Y or Z) during 1 second epoch.
The maximum in any one axial direction is 3.3g, but an acceleration at 45°
to all 3 axes simultaneously can have a net maximum of 5.7g
Sample
BUG – peak acceleration values in 100s???
CSV Export Yes
Section
14
Section
14
Page 24 of 43
© Zephyr Technology 2007 9700.0012.v1c
+Y
+X
+Z
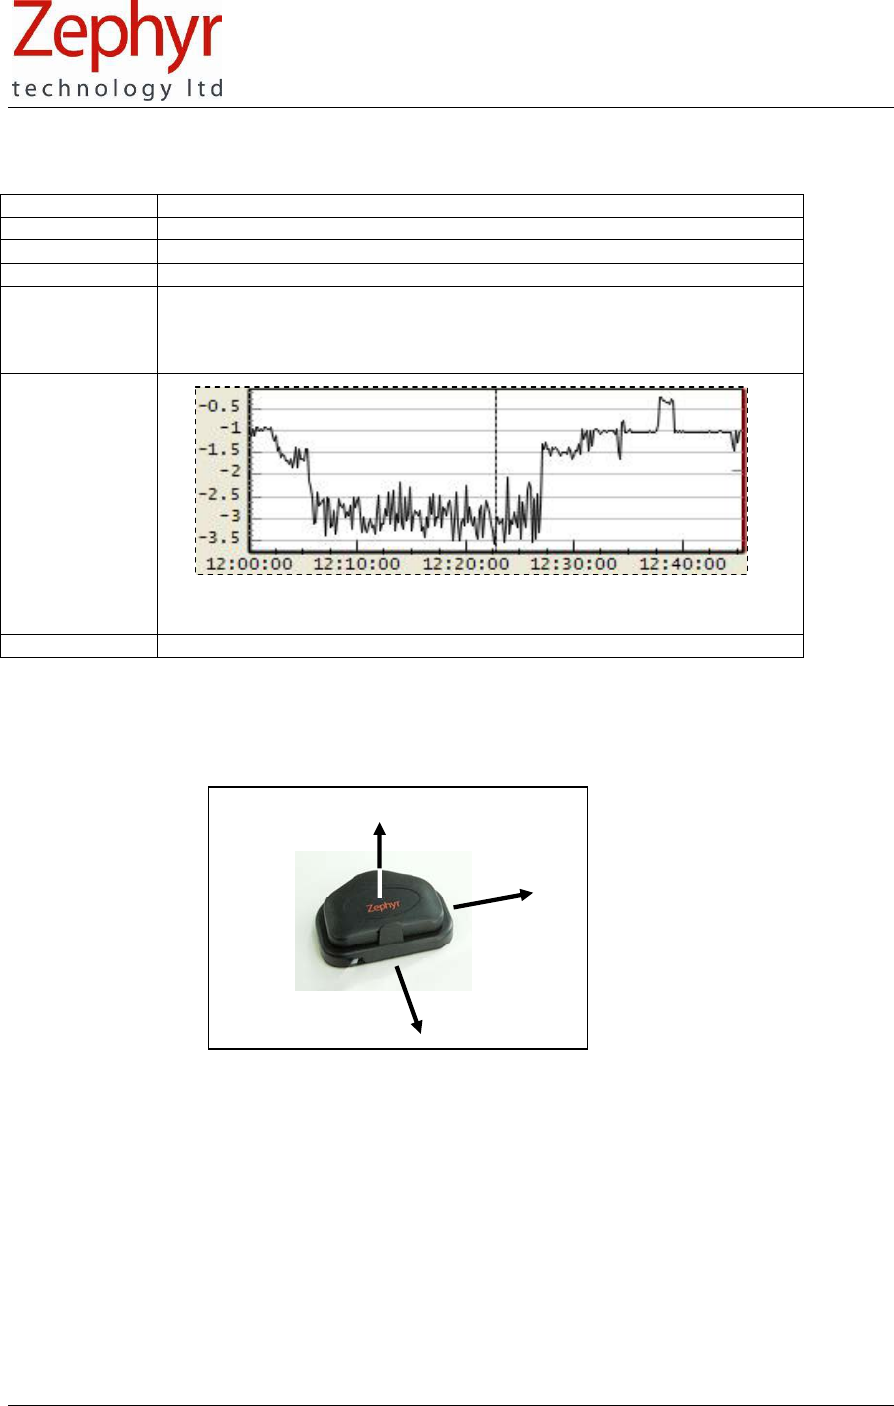
14.3 ACC – X/Y/Z Acceleration Minimum
Data Frequency 1 Hz (1.008 seconds)
Units g
Minimum Value − 3.3 in each axis
Maximum Value + 3.3 in each axis
Description The minimum is the smallest acceleration value recorded during the
previous 1 second epoch. This could be a negative value if there is an
acceleration is a negative direction, or positive if all accelerations during
that period are positive.
Sample
Vertical (X) Acceleration Minimum during a walk/3km run/walk session.
Note that accelerations are negative
CSV Export Yes
Orientation of XYZ axes for acceleration data:
Page 25 of 43
9700.0012.v1c © Zephyr Technology 2007
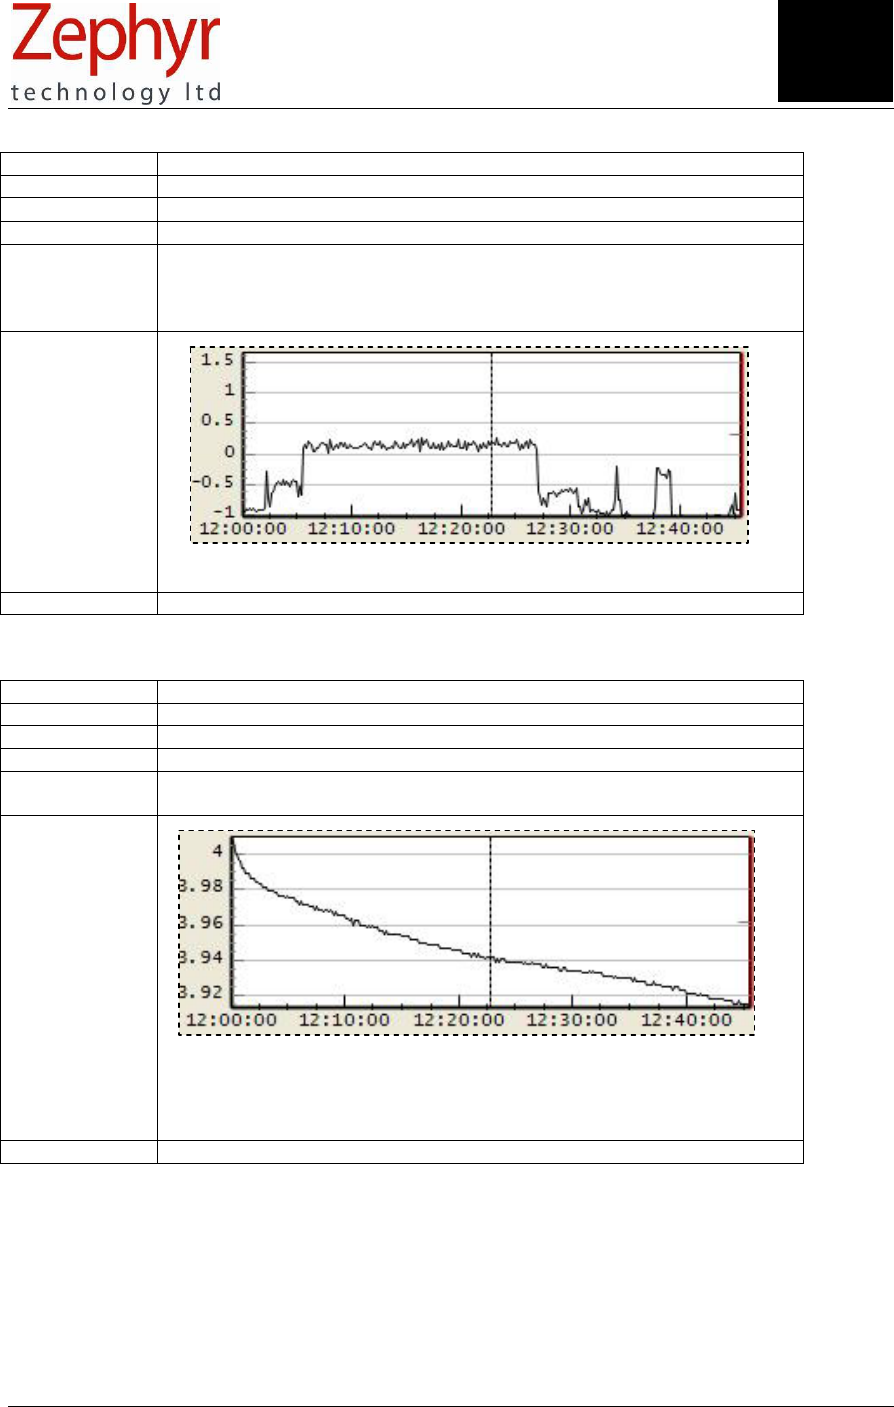
14.4 ACC – X/Y/Z Acceleration Peak
Data Frequency 1 Hz (1.008 Seconds)
Units g
Minimum Value − 3.3 in each axis
Maximum Value + 3.3 in each axis
Description The peak is the largest acceleration value recorded during the previous 1
second epoch. This could be a negative value if all accelerations are a
negative direction, or the largest positive value
Sample
Vertical acceleration during walk/3km run/walk. Note that peak
acceleration during some epochs is a negative (towards the ground) value.
CSV Export Yes
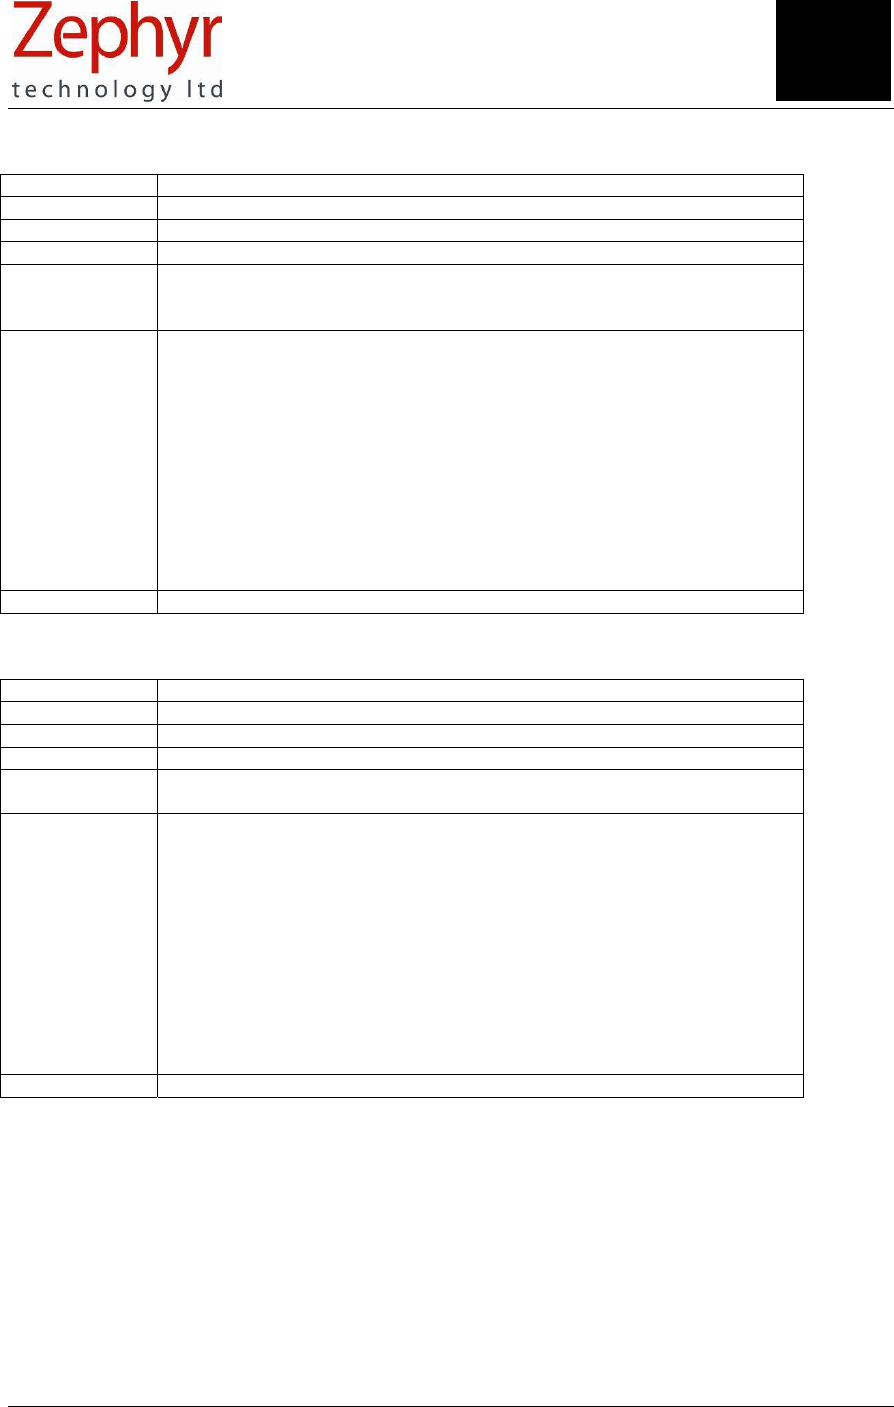
14.5 BAT – Battery Voltage
Data Frequency 1 Hz (1.008 Seconds)
Units Volts
Minimum Value ~ 3.6
Maximum Value ~ 4.2
Description Voltage level of the battery. The specified charging tolerances are slightly
above and below the stated limits. The cell cannot be overcharged.
Sample
Battery voltage level during a 45 min log recording. The Y axis has
autoscaled to fit the discharge curve. Comparison of discharge curves over
a time period could be used to determine the health of the battery.
CSV Export Yes
Section
14
Page 26 of 43
© Zephyr Technology 2007 9700.0012.v1c
14.6 ECG – Amplitude
Data Frequency 1 Hz (1.008 Seconds)
Units Volts (indicative)
Minimum Value 0
Maximum Value ~ 0.0001 V
Description This value is indicative – it is extracted during algorithmic processing of the
ECG sensor output data. It is not a measurement of a subject’s ECG
voltage level, and should be used for debugging purposes only.
Sample
BUG – Y-axis doesn’t include enough DPs to make sense of data
CSV Export Yes
14.7 ECG – Noise
Data Frequency 1 Hz (1.008 Seconds)
Units Volts (indicative)
Minimum Value 0
Maximum Value ~ 0.0001 V
Description As for ECG amplitude – extracted during algorithmic processing of ECG
sensor data.
Sample
BUG – Y-axis doesn’t include enough DPs to make sense of data
CSV Export Yes
Section
14

Page 27 of 43
9700.0012.v1c © Zephyr Technology 2007
14.8 ECG – Processed Autoranged
Data Frequency 250 Hz
Units n/a
Minimum Value To fit graph scale
Maximum Value To fit graph scale
Description The ECG waveform is autoscaled to fit the fixed Y axis of the graph in
which it is displayed. The processed waveform should show reduced noise
levels compared to the raw data.
Sample
BUG – all ECG waveforms not working – autoranging/refresh rate issue?
CSV Export No
14.9 ECG – Raw Data
Data Frequency 250 Hz
Units Bits
Minimum Value 0
Maximum Value + 4096
Description Indicative ECG only. Amplification, filtering and processing is applied to the
output from the ECG sensor. This parameter is only available from data
transmitted by RF. A strong ECG signal will maximise the sensor output.
Sample
Will there be a difference between Raw & Autoranged in new graphs???
BUG – all ECG waveforms not working – autoranging/refresh rate issue?
CSV Export Yes, but only from original data transmitted by RF
Section
14

Page 28 of 43
© Zephyr Technology 2007 9700.0012.v1c
14.10 ECG – Raw Autoranged
Data Frequency 250 Hz
Units n/a
Minimum Value To fit graph scale
Maximum Value To fit graph scale
Description
Sample
BUG – all ECG waveforms not working – autoranging/refresh rate issue?
CSV Export No
14.11HRT – Calculated Heart Rate
Data Frequency 250 Hz
Units BPM ( beats per minute)
Minimum Value 0
Maximum Value 240
Description This value is calculated from the RF-transmitted ECG data and used to
drive the flashing Heart icon on the application interface
Sample
CSV Export No
Section
14
Section
14
Page 29 of 43
9700.0012.v1c © Zephyr Technology 2007
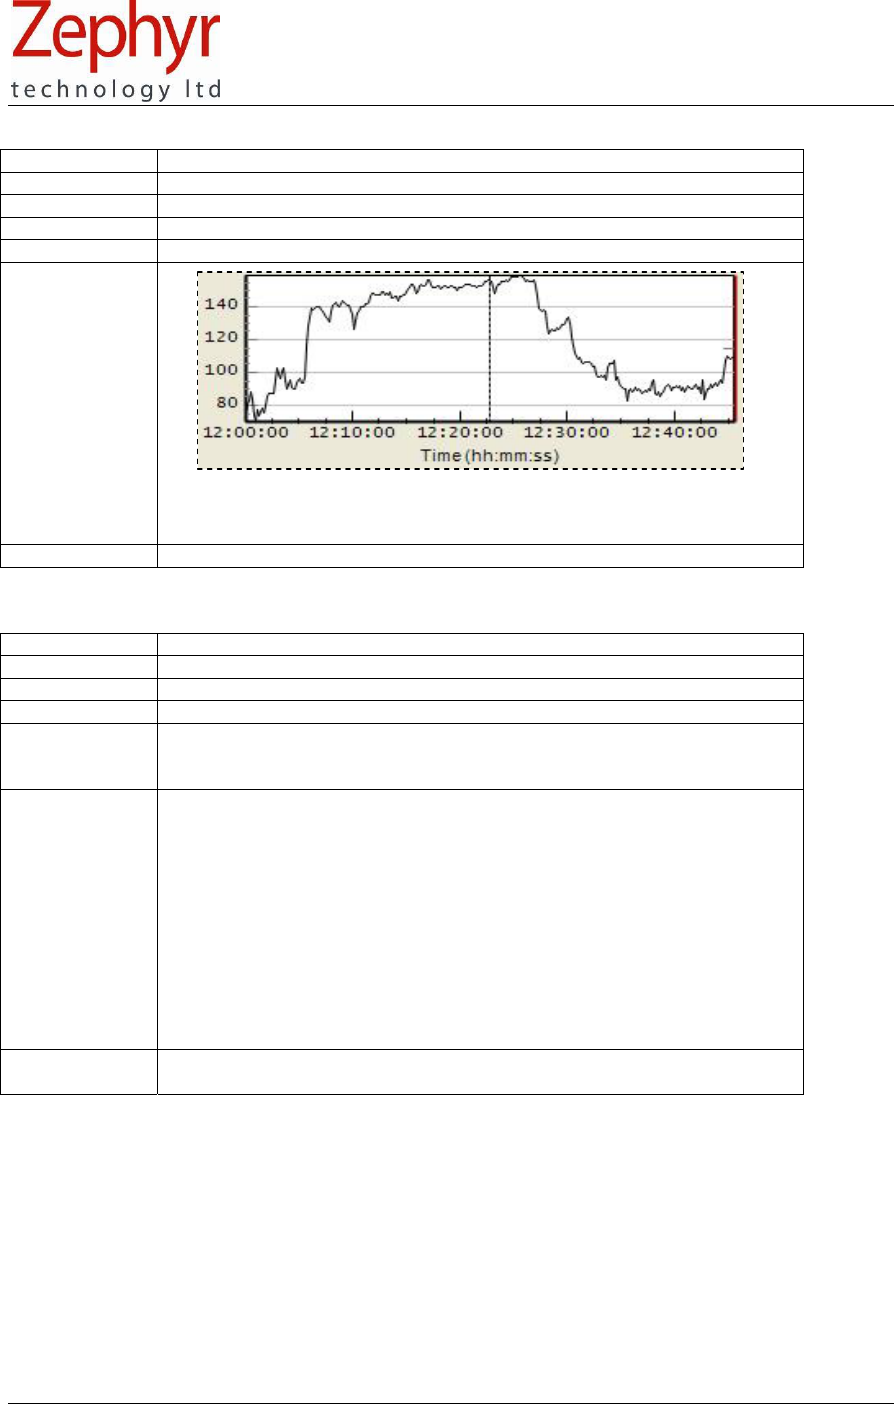
14.12 HRT – Heart Rate
Data Frequency 1 Hz (1.008 Seconds)
Units BPM (Beats per minute)
Minimum Value 0
Maximum Value 240
Description ECG data is filtered and processed to produce this value
Sample
Heart Rate before, during and after a 3km run (logged data). The Y axis
has auto-scaled to fit the data range of the entire session.
CSV Export Yes
14.13 HRT – RR
Data Frequency 18 Hz (0.056 seconds)
Units Milliseconds (ms)
Minimum Value 250 ms (=240 BPM) reducing HR in BPM increases RR interval
Maximum Value 1000 ms (=60 BPM)
Description Time interval between successive heart contractions. Calculated from ECG
data. Divide 60000 by the RR ms value to obtain instantaneous HR in
beats per minute.
Sample
BUG – RR data still has alternating sings so graph is a sawtooth
CSV Export Yes. Data is reported at 18 Hz, sign of values alternates positive and
negative. A change of sign indicates that a new pulse has been detected.

Page 30 of 43
© Zephyr Technology 2007 9700.0012.v1c
14.14 POS – Posture
Data Frequency 1 Hz (1.008 Seconds)
Units Degrees from vertical
Minimum Value − 90
Maximum Value + 90
Description Degrees off vertical in any orientation. A positive value indicates an
anterior (subject lean forward) component, negative a posterior
component. See Section 4.4.2 A subject’s natural posture may mean an
‘upright’ position does not generate a value of 0°
Sample
A section of posture of a subject walking and then reclining in a chair
(trough near end of recprding).
CSV Export
14.15 RES – Breathing Wave Amplitude
Data Frequency 1 Hz (1.008 Seconds)
Units Volts (indicated)
Minimum Value 0
Maximum Value TBD
Description Average indicated breathing sensor output over previous second
Sample
Breathing amplitude over a 3km run. This is an indicative measure of
breathing depth.
CSV Export Yes
Section
14
Page 31 of 43
9700.0012.v1c © Zephyr Technology 2007
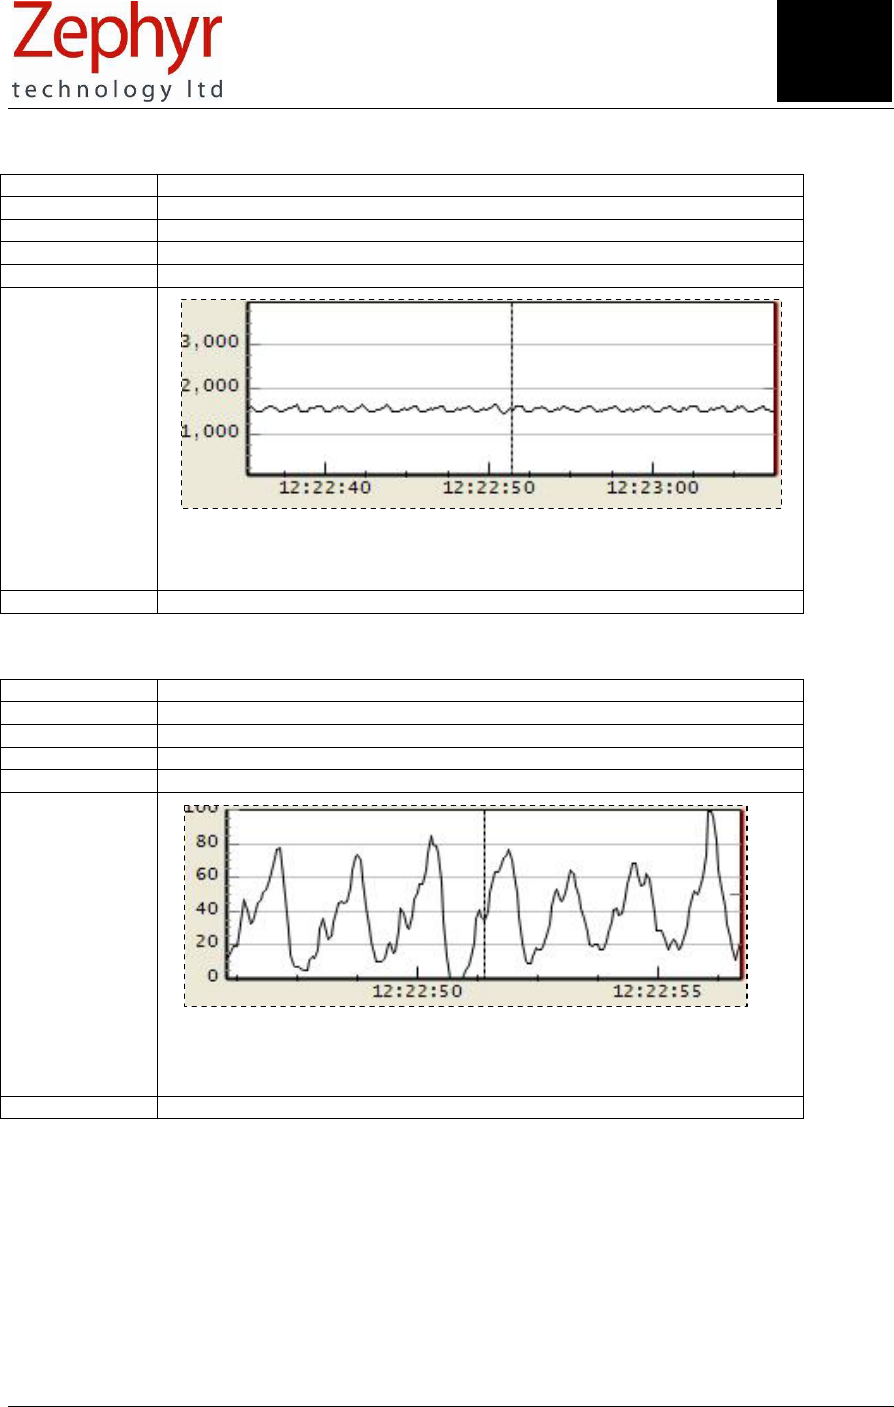
14.16 RES – Calculated Respiration Rate
Data Frequency 18 Hz (0.056 seconds)
Units BPM (breaths per minute)
Minimum Value 0
Maximum Value 70
Description Parameter calculated from raw RF-transmitted breathing data to drive the
Breath detection icon on the application interface
Sample
Section of data from a subject commencing a run. Note that isolated
troughs and peaks in the data are likely to be artefacts.
CSV Export No
14.17 RES – Processed Breathing Wave Autoranged
Data Frequency 1 Hz (1.008 Seconds)
Units n/a
Minimum Value To fit graph scale
Maximum Value To fit graph scale
Description An indicative value only, due to autoranging process. Filtered and
processed data – smooth waveform.
Sample
Section of processed waveform. This should give an indication of the
regularity of breathing action. The auto-range feature prevents any other
inference being made from this data.
CSV Export No
Section
14
Page 32 of 43
© Zephyr Technology 2007 9700.0012.v1c
14.18 RES – Raw Breathing Wave
Data Frequency 18 Hz (0.056 seconds)
Units Bits
Minimum Value 0
Maximum Value 4095
Description Raw bit output of breathing sensor. Unfiltered, unprocessed.
Sample
Raw breathing sensor output in bits. The variation in bits during breathing
action compared to the absolute value is small.
CSV Export Yes
14.19 Raw Breathing Wave Autoranged
Data Frequency 1 Hz (1.008 Seconds)
Units n/a
Minimum Value To fit graph scale
Maximum Value To fit graph scale
Description Unfiltered or processed data. A highly variable waveform
Sample
Compare raw autoranged data with processed autoranged data (14.17),
which is a much smoother curve.
CSV Export No
Section
14
Page 33 of 43
9700.0012.v1c © Zephyr Technology 2007
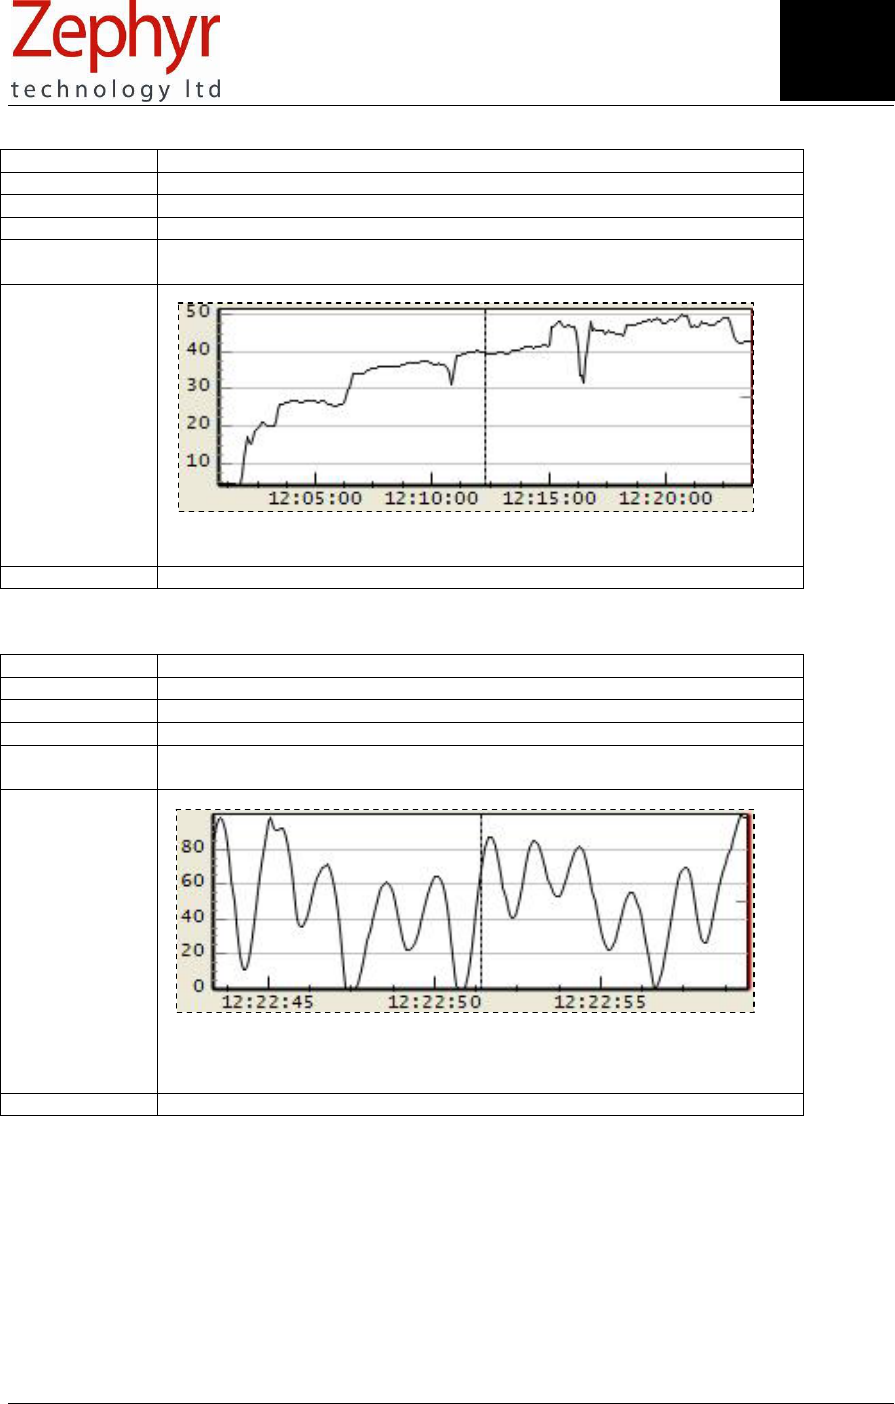
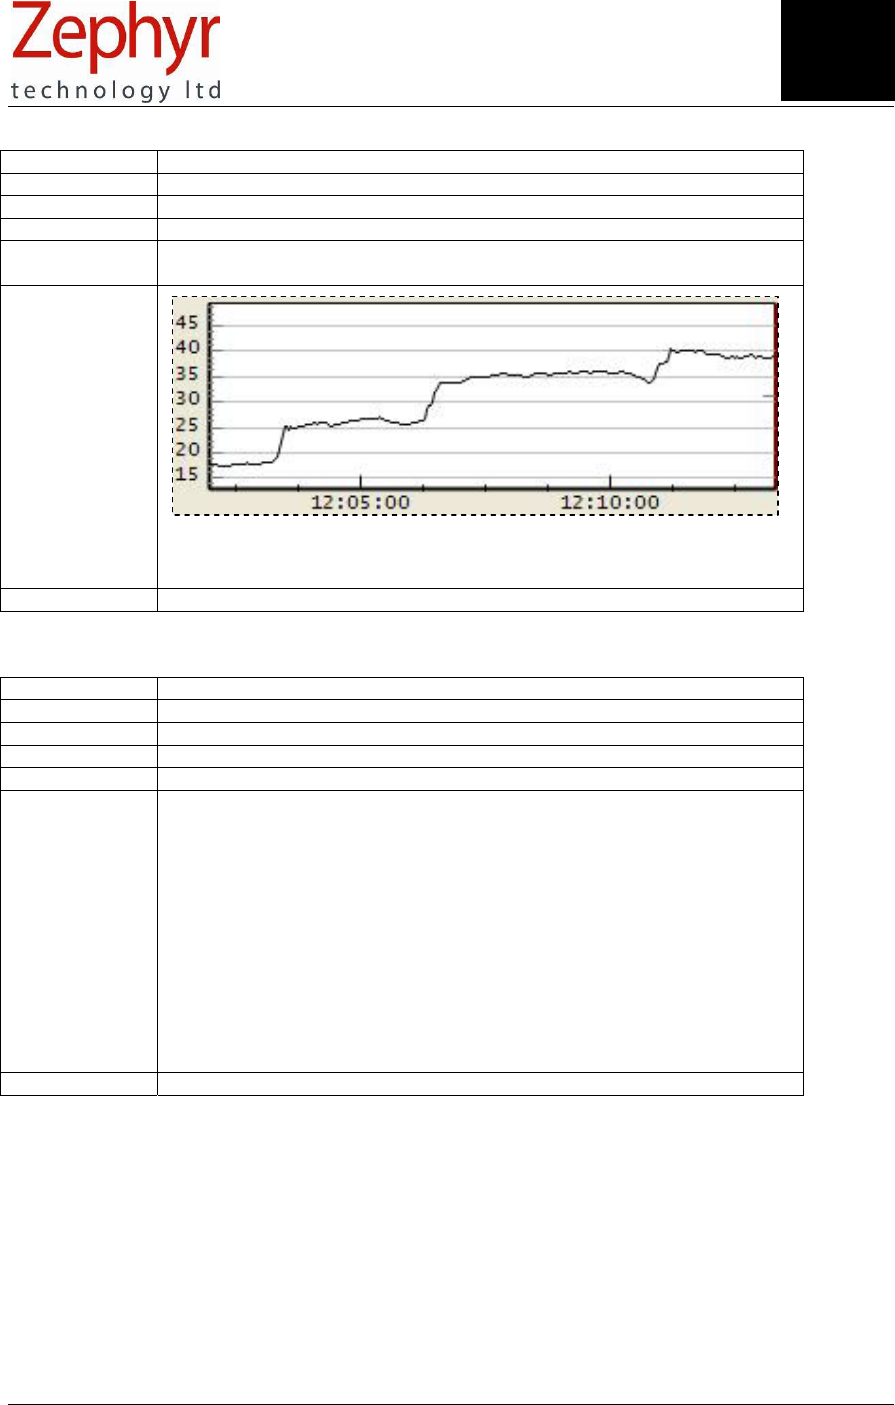
14.20 RES – Respiration Rate
Data Frequency 1 Hz (1.008 Seconds)
Units BPM ( breaths per minute)
Minimum Value 0
Maximum Value 70
Description Respiration rate. It will take 30 – 45 seconds from start of data processing
to stabilise
Sample
Respiration rate showing step increases in rate as a subject starts a 3km
run.
CSV Export Yes
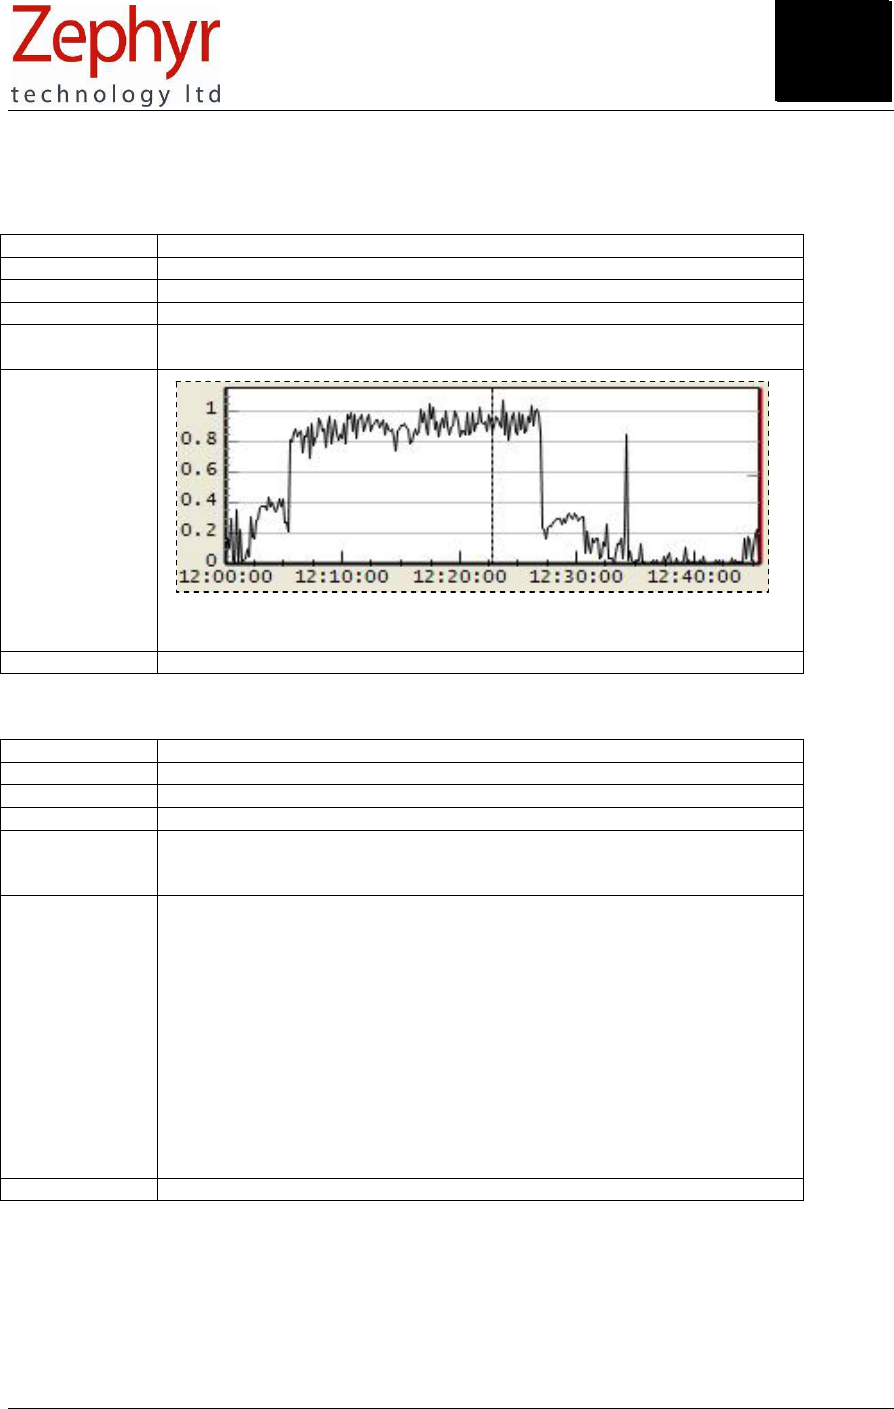
14.21 Respiration Rate Detector x 50
Data Frequency 1 Hz (1.008 Seconds)
Units n/a
Minimum Value 0
Maximum Value 1
Description A transition from 0 to 1 indicates a breath detection
Sample
This graph to be removed/reserved for developer version?
CSV Export No
Section
14
Page 34 of 43
© Zephyr Technology 2007 9700.0012.v1c
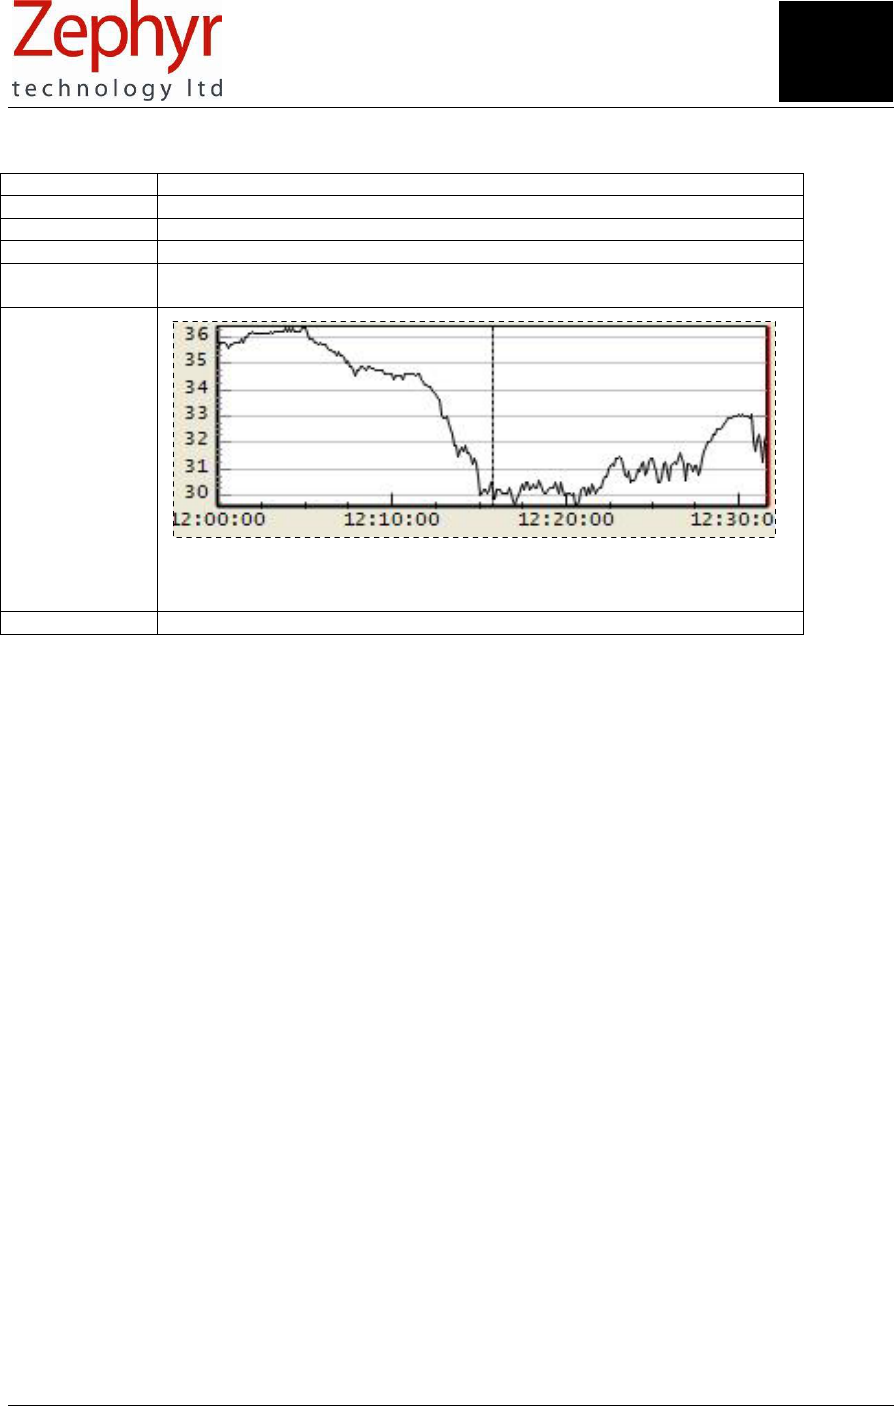
14.22 TEM – Skin Temperature
Data Frequency 1 Hz (1.008 Seconds)
Units °C
Minimum Value 10
Maximum Value 60
Description Skin temperature as measured by IR (infrared) sensor in apex of device.
See section 1.3
Sample
The degree of skin cooling of a subject during a 3km run – due to
evaporative cooling of perspiration – is clearly evident.
CSV Export Yes
Section
14
Page 35 of 43
9700.0012.v1c © Zephyr Technology 2007
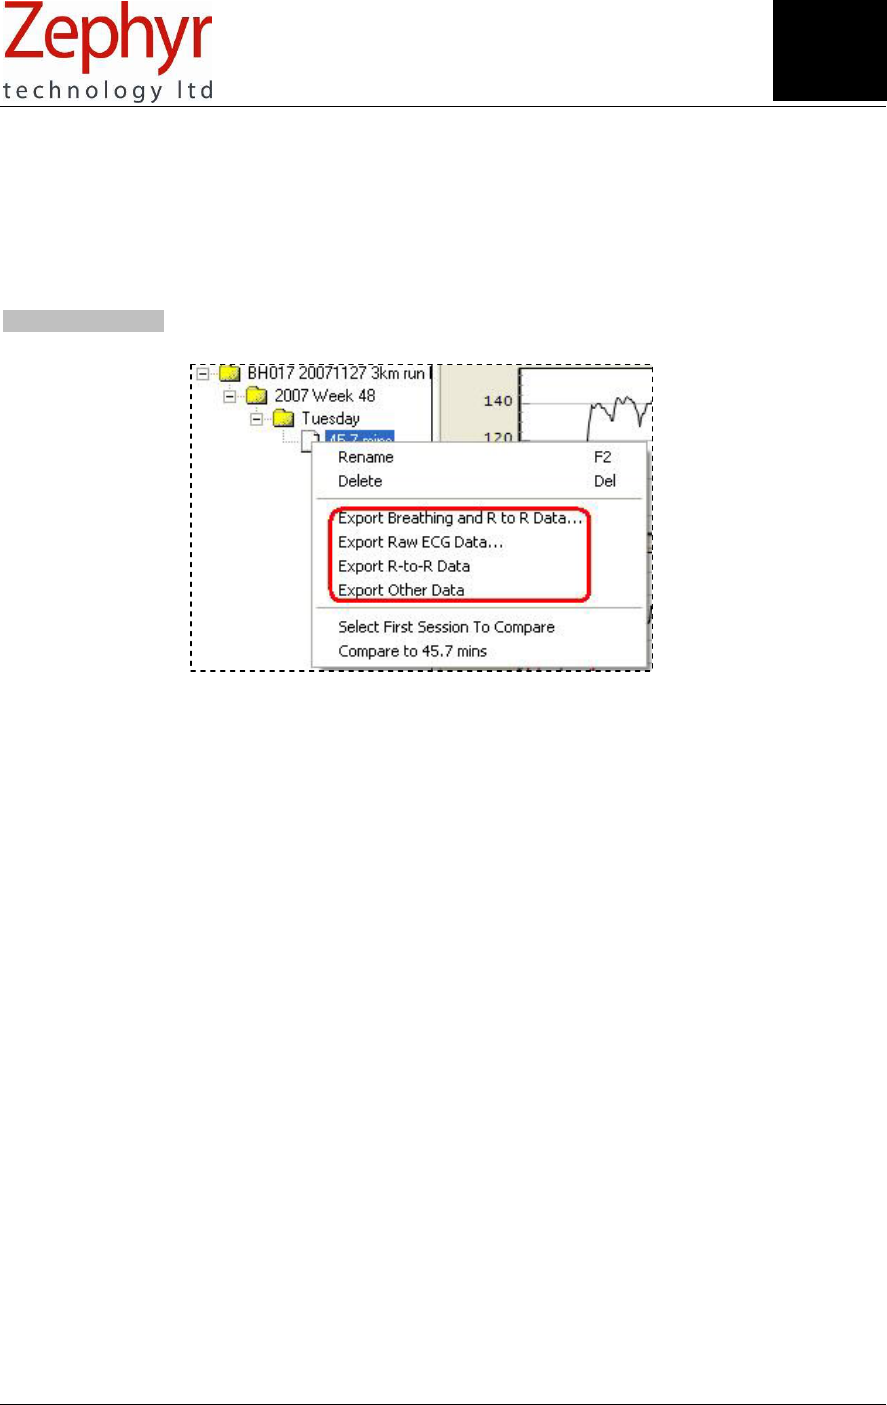
15. Export data to an external .csv file
Any activity session which has been saved into the BioHarness application can be exported as a csv
(comma separated values) file.
Note: Data which has been logged on the device does not include ECG Raw Data. This is only available
from data which was transmitted over RF and recorded by the application. Including ECG Raw data in the
Device log files would severely reduce total memory capacity
Right-click a record in the explorer panel and select data to export – csv column specifications are on the
next page.
Notes
1. RF recorded data is time-stamped at time of reception on the host computer.
2. Logged data is time stamped with the time of the internal clock in the Device. This may be on a time
after Jan 1 2000 12:00:00 if the batteries in the device have been recharged without setting the clock.
3. It may not be possible to see all data by opening the csv file as a standard Excel ® Spreadsheet,
which has a limit of 65535 lines (2,000,000 in Excel ® 2007). This equates to around 61 minutes of
logged data, or 4 minutes of RF raw ECG data. Open as a text file, or with an application designed to
process large amounts of data.
4. 8 hours of data logged on the device itself will produce ~ 50MB of Breathing and R to R data, and
~12MB of Other data, in .csv format.
5. Posture - a positive value indicates the subject is inclined forward from vertical. A subject’s natural
posture, together with the contour of their torso, may indicate either a positive or negative value when
they are in a standing or sitting position. Inclination to the subject’s left or right does not affect the
sign of the posture value.
6. Respiration Rate – in Other Data Export, data will not be populated in the Respiration Rate columns
when exporting from some earlier version of BioHarness Projects. This data was used for
development purposes. Users should use the Calculated Respiration Rate available by exporting
Breathing Rate and R to R data.
7. R-to-R data. These values alternate in sign. Take an absolute value to graph variations in magnitude.
Section
1
5
Page 36 of 43
© Zephyr Technology 2007 9700.0012.v1c
+Y
+X
+Z
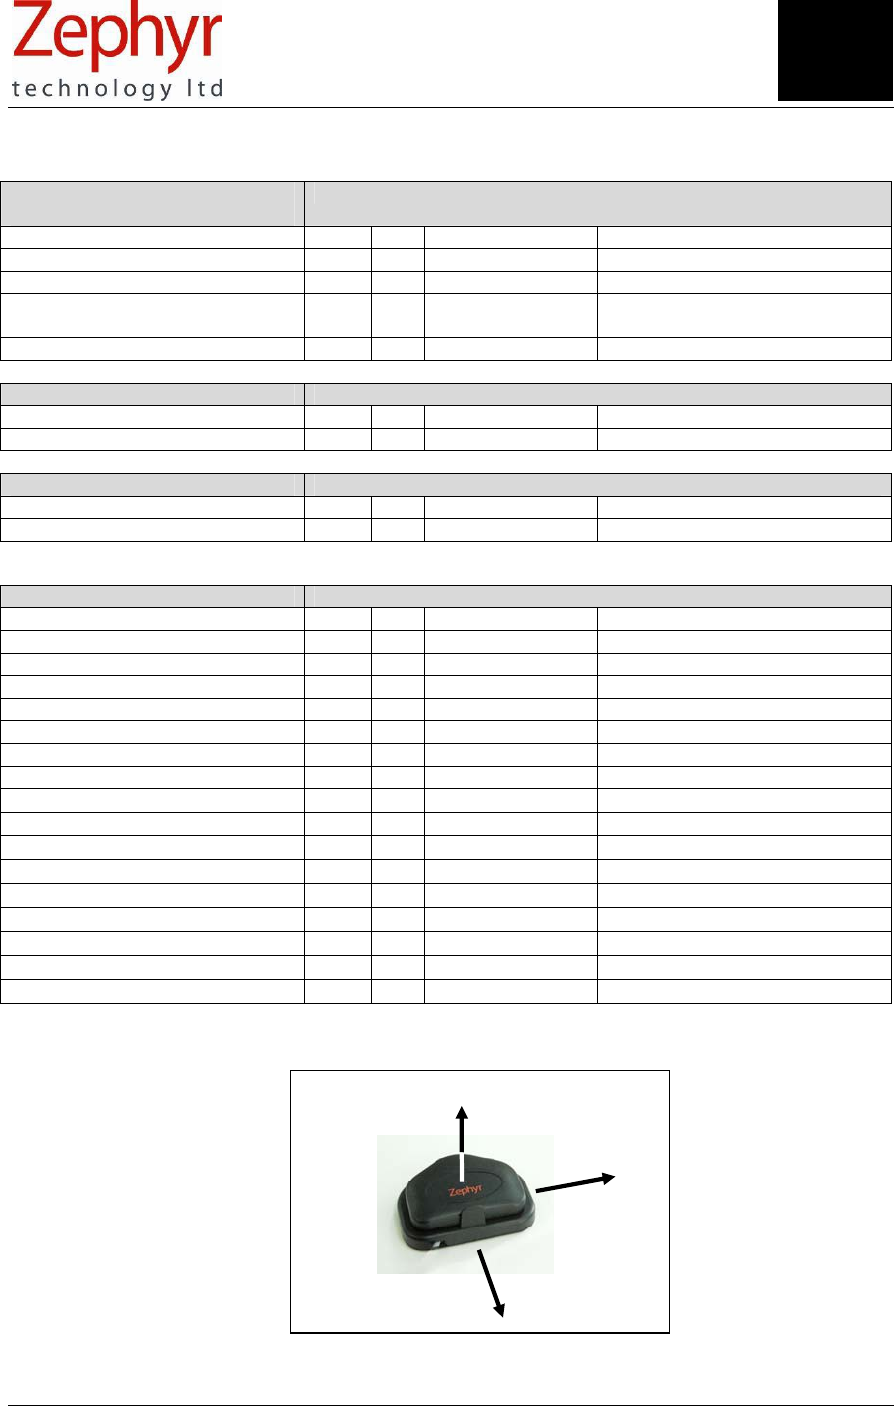
16. Understand External Data Files
Export Breathing and R to R
Data
Data Frequency: 0.056 seconds (18 Hz)
Log RF Typical Range Units
(All timestamps) yyyy/mm/dd hh:mm:ss.000
HRT - R to R Y Y 300 – 1500 Milliseconds (alternating ±)
RES - Calculated Respiration
Rate
Y Y 5-50 Breaths per Minute (BPM)
RES - Raw Breathing Wave Y Y ± 100 variation Bits
Export Raw ECG Data Data Frequency: 0.004 seconds (250 Hz)
Log RF Typical Range Units
ECG - Raw Data N Y 1500-2400 Bits
Export R-to-R Data Data Frequency: per pulse detection
Log RF Typical Range Units
HRT – R to R Data Y Y 300 – 1500 Milliseconds (alternating ±)
Export Other Data Data Frequency: 1.008 seconds
Log RF Typical Range Units
HRT - Heart Rate Y Y 50 – 150 Beats per Minute
ECG - Amplitude Y Y 0.0004 – 0.0005 Volts
ECG - Noise Y Y 0.00005 – 0.0001 Volts
RES -Breathing Wave Amplitude Y Y 1 – 4 Volts
RES - Respiration Rate Y Y 5 – 50 Breaths per Minute
TEM - Skin Temperature Y Y 30 – 37 °C
BAT - Battery Voltage Y Y 4.0 – 4.2 Volts
POS - Posture Y Y −90 – +90 Degrees from vertical
ACC - Activity Y Y 0 – 5.7 g
ACC - Peak Acceleration Y Y −3.3 – +3.3 g
ACC - X Acceleration Minimum Y Y −3.3 – +3.3 g
ACC - X Acceleration Peak Y Y −3.3 – +3.3 g
ACC - Y Acceleration Minimum Y Y −3.3 – +3.3 g
ACC - Y Acceleration Peak Y Y −3.3 – +3.3 g
ACC - Z Acceleration Minimum Y Y −3.3 – +3.3 g
ACC - Z Acceleration Peak Y Y −3.3 – +3.3 g
Orientation of XYZ axes for acceleration data:
Section
1
6
Page 37 of 43
9700.0012.v1c © Zephyr Technology 2007
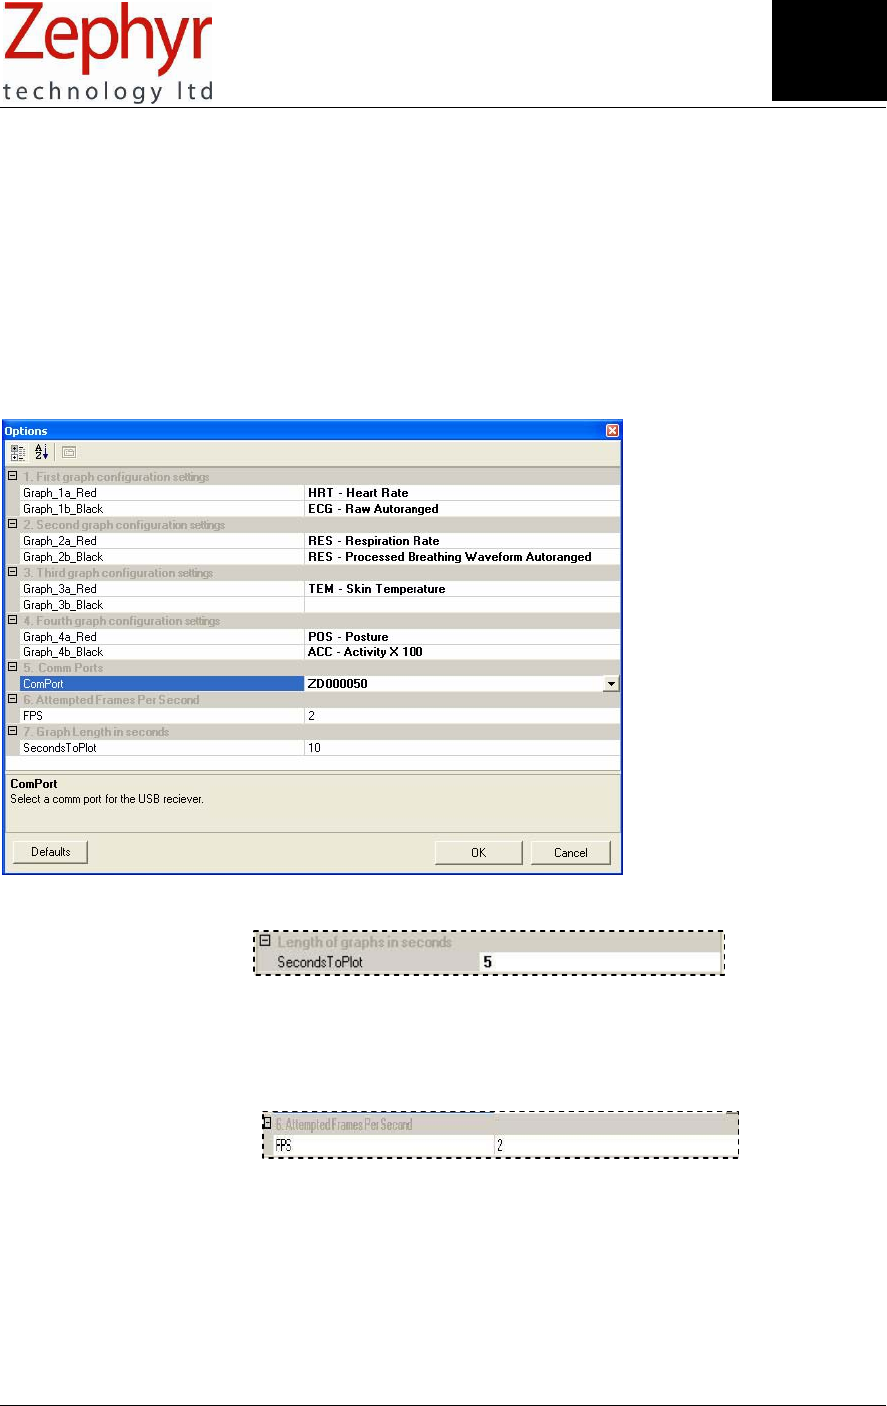
17. Change Settings
17.1 COM Port Selection
The COM port will auto-select and display the serial number of the Zephyr RF dongle connected when
used in Transmit mode. A ‘Too Many Dongles’ message appears in the Status field on the application if
more than one dongle is connected.
17.2 Display Settings
The default display settings (shown below) can be changed by selecting from the appropriate pull down
lists. Return to Default settings using the button provided. The application remembers the last display
settings selected.
17.3 Adjust Timescale Range
• Select Tools>Options
• Adjust Seconds to Plot if default 10 seconds displays too much or too little data
• Lower values cause graph to scroll faster, high values use more computer resource
• Available Range 2 − 100 seconds
17.4 Adjust Frame Refresh Rate for Graphs (Refreshes per Second)
• Range is 1 – 100. Default is 2. Increasing the rate improves graph refresh performance but will
require more PC resource – a faster processor and more RAM. Adjust if necessary for the best
performance for your particular PC.
Section
17
Page 38 of 43
© Zephyr Technology 2007 9700.0012.v1c
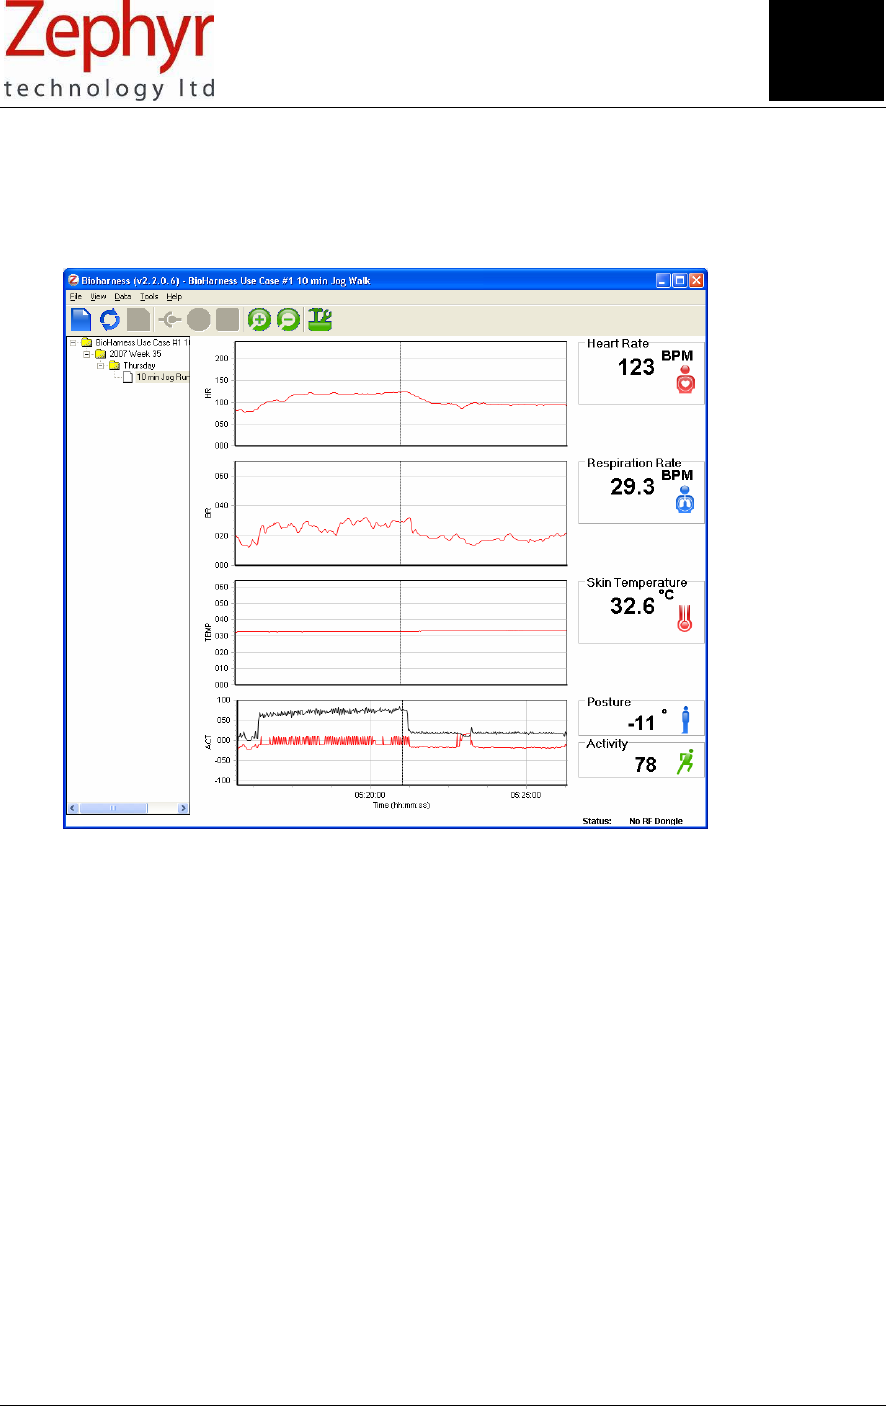
18. Sample BioHarness Projects
(These Projects are available on the installation CD – copy them to your PC before opening)
18.1 Use Case Example #1: Treadmill 7kph Jog / 4 kph walk Time: 10 min
This project has been made in RF recording mode. Raw ECG data is available for export to a csv file. The
ECG Raw data and Processed Breathing Waveform have been removed using Graph Settings so as not
to obscure the trend data.
1. Heart Rate – shows rise from rest value of ~ 80 bpm to peak of 123 bpm at end of jogging section
2. Respiration Rate – the subject’s breathing rate of 28 bpm while jogging eased to 18 bpm when
walking, to the immediate right of the cursor position.
3. Skin temperature – the readings are relatively stable during this 5 minute activity.
4. Posture – the actual posture reading depends on the exact attitude of the device. It may not be 0°
when the subject is standing or sitting upright. High levels of activity may result in offsets in the
posture reading. A negative Posture value indicates the device is inclined rearwards
5. Activity – activity levels are measured in Vector Magnitude Units, which are determined using the
acceleration values sampled in all three axes over the 1 second epoch. The change from stationary
to jogging to walking is clearly evident.
Use the Activity x 10 or Activity x 100 graph options to display activity data against the Y axis scale.
The actual unscaled value is shown at the end of the graph.
Section
1
8
Page 39 of 43
9700.0012.v1c © Zephyr Technology 2007
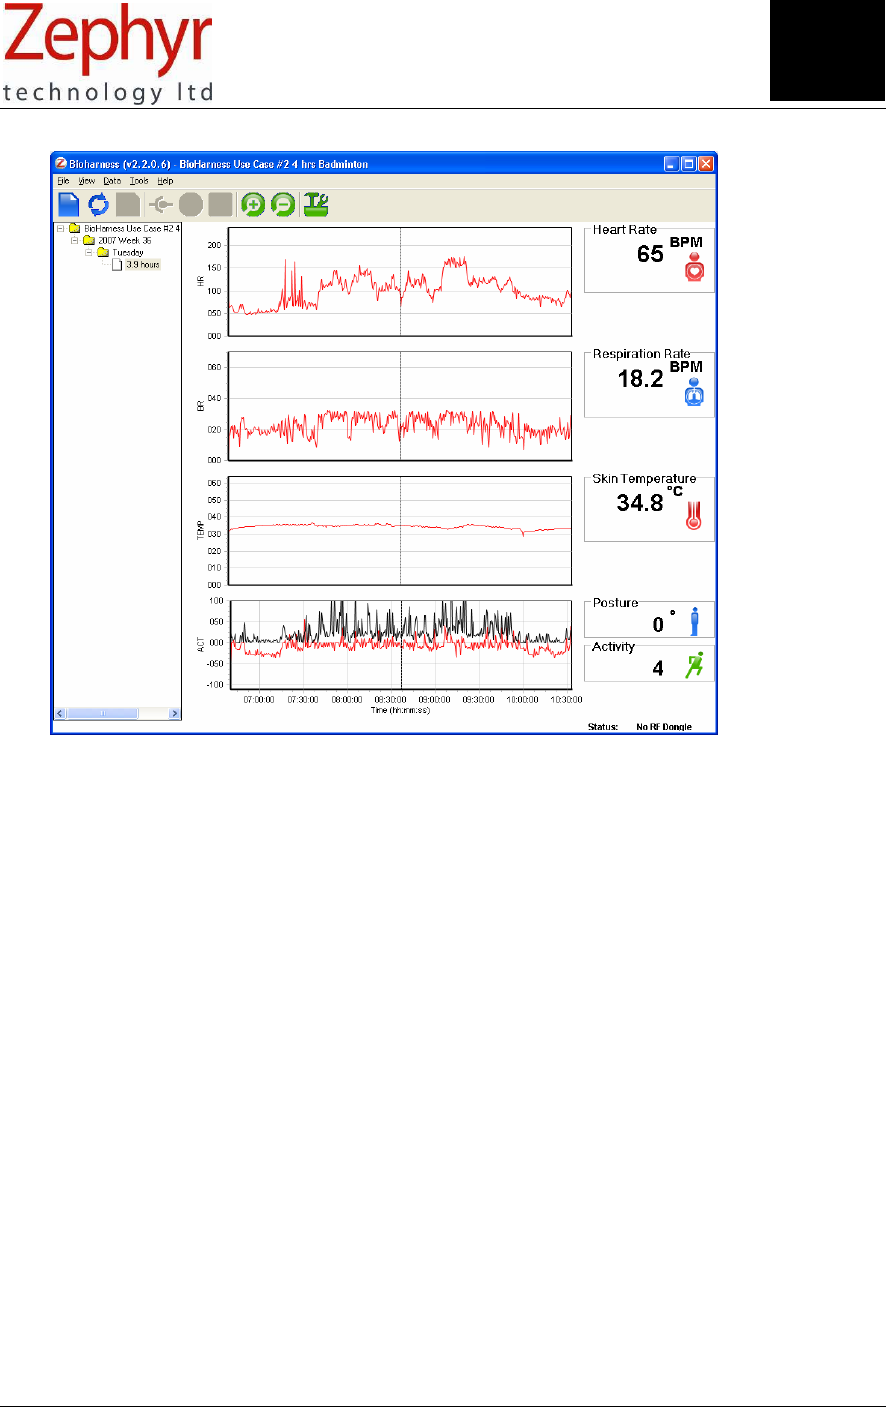
18.2 Use Case Example #2: Badminton Time: 3.9 hrs
This project has been made in logging mode. Raw ECG data is not available for export to a csv file.
1. Heart Rate – there is an initially noisy section. At this point the subject was helping to set up the nets
and other equipment.
2. Respiration Rate – breathing rate is inherently more variable during racket games. Reductions in
breathing rate between games are evident.
3. Skin temperature – the subject’s temperature climbs from 32° to 36° during the activity. The dip in
skin temperature occurred when the subject left the court and stopped to talk outside.
4. Posture – the actual posture reading depends on the exact attitude of the device. It may not be 0°
when the subject is standing or sitting upright. High levels of activity – as seen here - may result in
offsets in the posture reading. A negative Posture value indicates the device is inclined rearwards
5. Activity – activity levels are measured in Vector Magnitude Units, which are determined using the
acceleration values sampled in all three axes over the 1 second epoch.
6. Use the Activity x 10 or Activity x 100 graph options to display activity data against the Y axis scale.
The actual unscaled value is shown at the end of the graph. Closer study can identify the periods
when the subject drove to and from the site
Section
1
8

Page 40 of 43
© Zephyr Technology 2007 9700.0012.v1c
19. Troubleshooting
Issue Cause Action/Solution
Functionality
Poor conductive path between skin and sensor
pads
Moisten pads, adjust position of
garment, adjust garment tension
Movement artefacts Adjust the garment tension
Weak ECG signal Compare ECG amplitude when subject
stationary, with other subjects. Subjects
with exceptionally weak ECG signals
may not be good candidates for the
system
Poor HR performance
EMG noise caused by vigorous arm/torso
movements
Reduce movements - EMG can't be
eliminated
Regular or rhythmic activity which causes
expansion of rib cage
Cease or be aware of activity. This
doesn't appear to be a factor during
normal running activity, but thoracic
twisting, Arm lifts and chopping action all
compromise breath detection
Poor Breathing
performance
Sudden changes in breathing patterns
Rapid changes in skin
temperature
Perspiration droplets on skin within field of IR
sensor window; same on sensor window itself
Avoid excessive perspiration
accumulation in sensor field (if this is
practical)
Inaccurate skin
temperature
Dirty sensor window Check and clean sensor window
Straight lines in ECG
trace
Dropped RF data packets Check RF signal quality indicator, see
list of factors affecting RF performance
in Section 7. Move closer to receiver
antenna. Raise the receiver antenna.
Electronic
Faulty lead Check with replacement
USB Hub Com Port issues Connect direct to PC, not through hub
USB Device not
recognised
Driver issue Uninstall and reinstall driver - see
Section 4.2 Install Guide
GUI
Low specification PC Change to higher spec PC if possible
Change graph refresh rate - see Section
17.4
Poor graph response
Too many applications running concurrently Close other applications
Timeout Error on
Import from device
Retry
Data
Single data line
anomaly in Imported
log
File corruption during Import Re-import
Section
1
9

Page 41 of 43
9700.0012.v1c © Zephyr Technology 2007
20. Glossary
+
Section
21
Application
Software:
Program designed for a specific
use, often with a graphical user
interface (GUI)
BioHarness Device: Transmitter/recorder device
which attaches by snaps to
BioHarness garment
BPM: Beats per minute (ECG),
Breaths per minute
(Respiration)
CSV: Comma Separated Values - a
common data file format where
the data values are separated
by commas. Can be opened as
a text file or a spreadsheet.
Data Packet: A discrete collection of data
sent by radio transmission
Dongle: Communications device
designed to be plugged into a
computer
Drivers: Software program files which
facilitate communication
between a computer's
operating system, a hardware
device, and application
interface
ECG: Electrocardiogram (also EKG) -
a test which records the
electrical activity of the heart
EMG Noise: An electromyelogram is a
measurement of electrical
signals generated during the
course of muscular
contractions. EMG noise is
generated by skeletal muscle
tissue (other than the heart)
during activity
GUI: Graphical User Interface -
interactive graphical computer
interface
Initialise: In BioHarness context, a
process whereby the internal
clock of a BioHarness device is
set to a host PC's clock time
when the BioHarness is
connected to the computer in
its USB cradle
IR: Infrared - measurement of
temperature using an infrared-
sensitive sensor.
ISM: Industrial, Scientific & Medical -
a radio frequency band
allocated internationally for
short-range radio applications
LED: Light Emitting Diode - low
current illumination source
Li-ion: Lithium Ion - a type of
rechargeable power source
Logging Mode: A BioHarness Device state
where the device records data
to its internal memory, and
timestamps data according to
its internal clock
R to R / RR: The time interval between the
R peaks in the QRS pattern on
an ECG trace which represents
contraction of the heart
ventricles
RF: Radio Frequency
Timestamp: Data field time component
describing time of recording
USB: Universal Serial Bus -
common computer
communications protocol
VMU: Vector Magnitude Units - a
measurement of activity
which is an integration of
XYZ acceleration magnitudes
over a time interval
Section
2
0

Page 42 of 43
© Zephyr Technology 2007 9700.0012.v1c
21. Index

Page 43 of 43
9700.0012.v1c © Zephyr Technology 2007
Warranty
Limited Warranty for the Zephyr BioHarness™ physiological monitoring system
Zephyr Technology Ltd warrants to the original end purchaser that the BioHarness™ hardware shall be
free from material defects in material and workmanship for a period of one (1) year from the original date
of purchase (the "Hardware Warranty Period"), the BioHarness Chest Strap shall be free from material
defects in material and workmanship for a period of three (3) months or 50 hand washes, whichever
comes first, from the date of purchase (the “Chest Strap Warranty Period”) and the software shall be free
from material defects or errors for a period of one (1) year from the original date of purchase (the
“Software warranty period”). If the product is determined to be materially defective during the Warranty
Period, your sole remedy and Zephyr’s sole and exclusive liability shall be limited to the repair or
replacement of this product with a new or refurbished product at Zephyr’s or its licensed distributor’s
option. For purpose of this Limited Hardware Warranty and Liability, "refurbished" means a product that
has been returned to its original specifications. Visit www.zephyr-technology.com for instructions on how
to deliver the product to an authorized service facility.
This warranty shall not apply if this product
(a) is used with products that are not compatible with this product
(b) is modified, or tampered with
(c) is damaged by acts of God, misuse, abuse, negligence, accident, wear and tear, unreasonable use, or
by other causes unrelated to defective materials or workmanship
(d) has had the serial number altered, defaced or removed; or
(e) has, in the reasonable opinion of zephyr or it’s licensed distributors, been opened, altered, or
defaced. This warranty shall also be voidable by zephyr or its licensed distributors
If (1) Zephyr reasonably believes that the BioHarness™ system has been used in a manner that would
violate the terms and conditions of a separate end user license agreement for system software; or (2) the
product is used with products not sold or licensed by Zephyr. You assume all risks and liabilities
associated with use of third party products.
This warranty is provided to you in lieu of all other express or implied warranties including warranties of
merchantability and fitness for a particular purpose for the BioHarness™ system, which are disclaimed
hereunder. However, if such warranties are required as a matter of law, then they are limited in duration
to the warranty period.
Our sole and exclusive recourse in the event of any dissatisfaction with or damage arising from the use of
the BioHarness™ system and Zephyr's maximum liability shall be limited to repair or replacement of the
BioHarness™ system. Except as expressly stated above, Zephyr excludes all liability for any loss of data,
loss of profit, or any other loss or damage suffered by you or any third party, whether such damages are
direct, indirect, consequential, special, or incidental and however arising under any theory of law, as a
result of using your BioHarness™ system. Some countries, states or provinces do not allow limitation on
how long an implied warranty lasts and some countries, states and provinces do not allow the exclusion
or limitations of consequential or incidental damages, so the limitations or exclusions may not apply to
you.
This warranty gives you specific legal rights, and you may also have other rights which vary from country
to country, state to state or province to province. This warranty is in all countries where Zephyr has an
office or a licensed distributor. The warranty offered by Zephyr Technology Limited on your BioHarness™
hardware is the same whether or not you register your product. Failure to register within one (1) week of
receipt voids the warranty for the BioHarness Chest Strap.
Section
22