Autodesk Auto CAD 2011 User’s Guide Aug
User Manual: autodesk AutoCAD - 2011 - User’s Guide Free User Guide for Autodesk AutoCAD Software, Manual
Open the PDF directly: View PDF ![]() .
.
Page Count: 2280 [warning: Documents this large are best viewed by clicking the View PDF Link!]
- Contents
- Get Information
- The User Interface
- Tools in the Application Window
- Other Tool Locations
- Customize the Drawing Environment
- Start and Save Drawings
- Control the Drawing Views
- Change Views
- Use Viewing Tools
- Display Multiple Views in Model Space
- Organize Drawings and Layouts
- Create Single-View Drawings (Model Space)
- Create Multiple-View Drawing Layouts (Paper Space)
- Work with Sheets in a Sheet Set
- Create and Modify Objects
- Control the Properties of Objects
- Work with Object Properties
- Work with Layers
- Work with Colors
- Work with Linetypes
- Control Lineweights
- Control the Display Properties of Certain Objects
- Use Precision Tools
- Use Coordinates and Coordinate Systems (UCS)
- Use Dynamic Input
- Snap to Locations on Objects (Object Snaps)
- Restrict Cursor Movement
- Combine or Offset Points and Coordinates
- Specify Distances
- Extract Geometric Information from Objects
- Use a Calculator
- Draw Geometric Objects
- Change Existing Objects
- Add Constraints to Geometry
- Control the Properties of Objects
- Define and Reference Blocks
- Work with Blocks
- Create and Modify Blocks
- Add Behaviors to Blocks (Dynamic Blocks)
- Overview of Dynamic Blocks
- Quick Start to Creating Dynamic Blocks
- Create and Edit Dynamic Blocks
- Add Constraints to Dynamic Blocks
- Add Action Parameters to Dynamic Blocks
- Work with 3D Models
- Create 3D Models
- Overview of 3D Modeling
- Create Solids and Surfaces from Lines and Curves
- Create Solids
- Create Surfaces
- Create Meshes
- Create Wireframe Models
- Add 3D Thickness to Objects
- Modify 3D Models
- Create Sections and 2D Drawings from 3D Models
- Create 3D Models
- Annotate Drawings
- Work with Annotations
- Hatches, Fills, and Wipeouts
- Notes and Labels
- Tables
- Dimensions and Tolerances
- Understand Basic Concepts of Dimensioning
- Use Dimension Styles
- Set the Scale for Dimensions
- Create Dimensions
- Modify Existing Dimensions
- Add Geometric Tolerances
- Plot and Publish Drawings
- Prepare Drawings for Plotting and Publishing
- Quick Start to Saving Settings for Plotting and Publishing
- Specify Page Setup Settings
- Overview of Page Setup Settings
- Select a Printer or Plotter for a Layout
- Select a Paper Size for a Layout
- Set the Plot Area of a Layout
- Adjust the Plot Offset of a Layout
- Set the Plot Scale for a Layout
- Set the Lineweight Scale for a Layout
- Select a Plot Style Table for a Layout
- Set Shaded Viewport and Plot Options for a Layout
- Determine the Drawing Orientation of a Layout
- Use the Layout Wizard to Specify Layout Settings
- Import PCP or PC2 Settings into a Layout
- Create and Use Named Page Setups
- Use Named Page Setups with Sheet Sets
- Plot Drawings
- Quick Start to Plotting
- Overview of Plotting
- Use a Page Setup to Specify Plot Settings
- Select a Printer or Plotter
- Specify the Area to Plot
- Set Paper Size
- Position the Drawing on the Paper
- Control How Objects Are Plotted
- Preview a Plot
- Plot Files to Other Formats
- Publish Drawings
- Prepare Drawings for Plotting and Publishing
- Share Data Between Files
- Reference Other Drawing Files
- Link and Embed Data (OLE)
- Work with Data in Other Formats
- Import Other File Formats
- Attach Files as Underlays
- Attach Raster Image Files
- Export Drawings to Other File Formats
- Use Drawings from Different Versions and Applications
- Extract Data from Drawings and Spreadsheets
- Access External Databases
- Overview of Using External Databases
- Access a Database from Within AutoCAD
- Link Database Records to Graphical Objects
- Use Labels to Display Database Information in the Drawing
- Use Queries to Filter Database Information
- Share Link and Label Templates and Queries with Other Users
- Work with Links in Files from Earlier Releases
- Manage Files with Autodesk Vault
- Collaborate with Others
- Protect and Sign Drawings
- Use the Internet for Collaboration
- Use Markups for Design Review
- Render Drawings
- Draw 2D Isometric Views
- Add Lighting to Your Model
- Materials and Textures
- Render 3D Objects for Realism
- Glossary
- Index

AutoCAD 2011
User’s Guide
February 2010
©2010 Autodesk, Inc. All Rights Reserved. Except as otherwise permitted by Autodesk, Inc., this publication, or parts thereof, may not be
reproduced in any form, by any method, for any purpose.
Certain materials included in this publication are reprinted with the permission of the copyright holder.
Trademarks
The following are registered trademarks or trademarks of Autodesk, Inc., and/or its subsidiaries and/or affiliates in the USA and other countries:
3DEC (design/logo), 3December, 3December.com, 3ds Max, Algor, Alias, Alias (swirl design/logo), AliasStudio, Alias|Wavefront (design/logo),
ATC, AUGI, AutoCAD, AutoCAD Learning Assistance, AutoCAD LT, AutoCAD Simulator, AutoCAD SQL Extension, AutoCAD SQL Interface,
Autodesk, Autodesk Envision, Autodesk Intent, Autodesk Inventor, Autodesk Map, Autodesk MapGuide, Autodesk Streamline, AutoLISP, AutoSnap,
AutoSketch, AutoTrack, Backburner, Backdraft, Built with ObjectARX (logo), Burn, Buzzsaw, CAiCE, Civil 3D, Cleaner, Cleaner Central, ClearScale,
Colour Warper, Combustion, Communication Specification, Constructware, Content Explorer, Dancing Baby (image), DesignCenter, Design
Doctor, Designer's Toolkit, DesignKids, DesignProf, DesignServer, DesignStudio, Design Web Format, Discreet, DWF, DWG, DWG (logo), DWG
Extreme, DWG TrueConvert, DWG TrueView, DXF, Ecotect, Exposure, Extending the Design Team, Face Robot, FBX, Fempro, Fire, Flame, Flare,
Flint, FMDesktop, Freewheel, GDX Driver, Green Building Studio, Heads-up Design, Heidi, HumanIK, IDEA Server, i-drop, ImageModeler, iMOUT,
Incinerator, Inferno, Inventor, Inventor LT, Kaydara, Kaydara (design/logo), Kynapse, Kynogon, LandXplorer, Lustre, MatchMover, Maya,
Mechanical Desktop, Moldflow, Moonbox, MotionBuilder, Movimento, MPA, MPA (design/logo), Moldflow Plastics Advisers, MPI, Moldflow
Plastics Insight, MPX, MPX (design/logo), Moldflow Plastics Xpert, Mudbox, Multi-Master Editing, Navisworks, ObjectARX, ObjectDBX, Open
Reality, Opticore, Opticore Opus, Pipeplus, PolarSnap, PortfolioWall, Powered with Autodesk Technology, Productstream, ProjectPoint, ProMaterials,
RasterDWG, RealDWG, Real-time Roto, Recognize, Render Queue, Retimer,Reveal, Revit, Showcase, ShowMotion, SketchBook, Smoke, Softimage,
Softimage|XSI (design/logo), Sparks, SteeringWheels, Stitcher, Stone, StudioTools, ToolClip, Topobase, Toxik, TrustedDWG, ViewCube, Visual,
Visual LISP, Volo, Vtour, Wire, Wiretap, WiretapCentral, XSI, and XSI (design/logo).
All other brand names, product names or trademarks belong to their respective holders.
Disclaimer
THIS PUBLICATION AND THE INFORMATION CONTAINED HEREIN IS MADE AVAILABLE BY AUTODESK, INC. "AS IS." AUTODESK, INC. DISCLAIMS
ALL WARRANTIES, EITHER EXPRESS OR IMPLIED, INCLUDING BUT NOT LIMITED TO ANY IMPLIED WARRANTIES OF MERCHANTABILITY OR
FITNESS FOR A PARTICULAR PURPOSE REGARDING THESE MATERIALS.
Published by:
Autodesk, Inc.
111 McInnis Parkway
San Rafael, CA 94903, USA
Contents
Part 1 Get Information . . . . . . . . . . . . . . . . . . . . . . . 1
Chapter 1 Find the Information You Need . . . . . . . . . . . . . . . . . . 3
Find Information Using InfoCenter . . . . . . . . . . . . . . . . . . . . 3
Overview of InfoCenter . . . . . . . . . . . . . . . . . . . . . . . 3
Search For Information . . . . . . . . . . . . . . . . . . . . . . . . 4
Access Subscription Center . . . . . . . . . . . . . . . . . . . . . . 7
Receive Product Updates and Announcements . . . . . . . . . . . 8
Save and Access Favorite Topics . . . . . . . . . . . . . . . . . . . 10
Specify InfoCenter Settings . . . . . . . . . . . . . . . . . . . . . 11
Search Topics in Help . . . . . . . . . . . . . . . . . . . . . . . . 16
Learn the Product . . . . . . . . . . . . . . . . . . . . . . . . . . . . . 16
View the Product Readme . . . . . . . . . . . . . . . . . . . . . . . . . 17
Where to Find AutoCAD Express Tools Volumes 1-9 . . . . . . . . . . . 18
Join the Customer Involvement Program . . . . . . . . . . . . . . . . . 18
Chapter 2 Get Information from Drawings . . . . . . . . . . . . . . . . . 21
Obtain General Drawing Information . . . . . . . . . . . . . . . . . . 21
Count Objects Within a Drawing . . . . . . . . . . . . . . . . . . . . . 22
Part 2 The User Interface . . . . . . . . . . . . . . . . . . . . . 25
iii
Chapter 3 Tools in the Application Window . . . . . . . . . . . . . . . . . 27
The Application Menu . . . . . . . . . . . . . . . . . . . . . . . . . . 27
Search for Commands . . . . . . . . . . . . . . . . . . . . . . . . 27
Access Common Tools . . . . . . . . . . . . . . . . . . . . . . . 28
Browse Files . . . . . . . . . . . . . . . . . . . . . . . . . . . . . 29
Quick Access Toolbar . . . . . . . . . . . . . . . . . . . . . . . . . . . 34
The Ribbon . . . . . . . . . . . . . . . . . . . . . . . . . . . . . . . . 37
Overview of the Ribbon . . . . . . . . . . . . . . . . . . . . . . . 37
Display and Organize the Ribbon . . . . . . . . . . . . . . . . . . 38
Customize the Ribbon . . . . . . . . . . . . . . . . . . . . . . . 44
Chapter 4 Other Tool Locations . . . . . . . . . . . . . . . . . . . . . . . 47
Access the Classic Menu Bar . . . . . . . . . . . . . . . . . . . . . . . 47
Toolbars . . . . . . . . . . . . . . . . . . . . . . . . . . . . . . . . . . 48
Status Bars . . . . . . . . . . . . . . . . . . . . . . . . . . . . . . . . . 50
Application Status Bar . . . . . . . . . . . . . . . . . . . . . . . . 50
Drawing Status Bar . . . . . . . . . . . . . . . . . . . . . . . . . 52
Keytips . . . . . . . . . . . . . . . . . . . . . . . . . . . . . . . . . . . 53
The Command Window . . . . . . . . . . . . . . . . . . . . . . . . . 53
Enter Commands on the Command Line . . . . . . . . . . . . . 53
Enter System Variables on the Command Line . . . . . . . . . . . 56
Navigate and Edit Within the Command Window . . . . . . . . . 58
Switch Between Dialog Boxes and the Command Line . . . . . . 60
Dock, Resize, and Hide the Command Window . . . . . . . . . . 62
Shortcut Menus . . . . . . . . . . . . . . . . . . . . . . . . . . . . . . 65
Tool Palettes . . . . . . . . . . . . . . . . . . . . . . . . . . . . . . . . 69
Create and Use Tools from Objects and Images . . . . . . . . . . 69
Create and Use Command Tools . . . . . . . . . . . . . . . . . . 73
Change Tool Palette Settings . . . . . . . . . . . . . . . . . . . . 76
Control Tool Properties . . . . . . . . . . . . . . . . . . . . . . . 78
Customize Tool Palettes . . . . . . . . . . . . . . . . . . . . . . . 83
Organize Tool Palettes . . . . . . . . . . . . . . . . . . . . . . . . 86
Save and Share Tool Palettes . . . . . . . . . . . . . . . . . . . . 89
DesignCenter . . . . . . . . . . . . . . . . . . . . . . . . . . . . . . . 91
Overview of DesignCenter . . . . . . . . . . . . . . . . . . . . . 91
Understand the DesignCenter Window . . . . . . . . . . . . . . 92
Access Content with DesignCenter . . . . . . . . . . . . . . . . . 94
Add Content with DesignCenter . . . . . . . . . . . . . . . . . . 97
Retrieve Content from the Web with DesignCenter Online . . . 101
Chapter 5 Customize the Drawing Environment . . . . . . . . . . . . . . 109
Set Interface Options . . . . . . . . . . . . . . . . . . . . . . . . . . . 109
Set Up the Drawing Area . . . . . . . . . . . . . . . . . . . . . . 109
Set Options for 3D Modeling with Perspective Projection . . . . 118
iv | Contents
Switch Between Model Space and Layouts . . . . . . . . . . . . 123
Specify Application Fonts . . . . . . . . . . . . . . . . . . . . . 129
Specify the Behavior of Dockable Windows . . . . . . . . . . . . 134
Control the Display of Toolbars . . . . . . . . . . . . . . . . . . 142
Create Task-Based Workspaces . . . . . . . . . . . . . . . . . . . . . . 148
Save and Restore Interface Settings (Profiles) . . . . . . . . . . . . . . 151
Customize Startup . . . . . . . . . . . . . . . . . . . . . . . . . . . . 154
Play Back an Action Macro . . . . . . . . . . . . . . . . . . . . . . . 157
Migrate and Specify Initial Setup . . . . . . . . . . . . . . . . . . . . 160
Part 3 Start and Save Drawings . . . . . . . . . . . . . . . . . 163
Chapter 6 Start a Drawing . . . . . . . . . . . . . . . . . . . . . . . . . 165
Overview of Starting a New Drawing . . . . . . . . . . . . . . . . . . 165
Specify Units and Unit Formats . . . . . . . . . . . . . . . . . . . . . 167
Determine the Units of Measurement . . . . . . . . . . . . . . . 167
Set the Unit Format Conventions . . . . . . . . . . . . . . . . . 170
Use a Drawing Template File . . . . . . . . . . . . . . . . . . . . . . . 171
Add Identifying Information to Drawings . . . . . . . . . . . . . . . . 174
Specify the Geographic Location of a Drawing . . . . . . . . . . . . . 176
Chapter 7 Open or Save a Drawing . . . . . . . . . . . . . . . . . . . . . 181
Open a Drawing . . . . . . . . . . . . . . . . . . . . . . . . . . . . . 181
Open Part of a Large Drawing (Partial Load) . . . . . . . . . . . . . . 185
Work with Multiple Open Drawings . . . . . . . . . . . . . . . . . . . 188
Preview Open Drawings and Layouts . . . . . . . . . . . . . . . 188
Switch Between Open Drawings . . . . . . . . . . . . . . . . . . 189
Switch Between Layouts in the Current Drawing . . . . . . . . . 193
Transfer Information between Open Drawings . . . . . . . . . . 196
Save a Drawing . . . . . . . . . . . . . . . . . . . . . . . . . . . . . . 197
Find a Drawing File . . . . . . . . . . . . . . . . . . . . . . . . . . . 203
Specify Search Paths and File Locations . . . . . . . . . . . . . . . . . 204
Chapter 8 Repair, Restore, or Recover Drawing Files . . . . . . . . . . . . 207
Repair a Damaged Drawing File . . . . . . . . . . . . . . . . . . . . . 207
Create and Restore Backup Files . . . . . . . . . . . . . . . . . . . . . 210
Recover from a System Failure . . . . . . . . . . . . . . . . . . . . . . 212
Chapter 9 Maintain Standards in Drawings . . . . . . . . . . . . . . . . 217
Overview of CAD Standards . . . . . . . . . . . . . . . . . . . . . . . 217
Define Standards . . . . . . . . . . . . . . . . . . . . . . . . . . . . . 220
Check Drawings for Standards Violations . . . . . . . . . . . . . . . . 222
Translate Layer Names and Properties . . . . . . . . . . . . . . . . . . 229
Contents | v
Part 4 Control the Drawing Views . . . . . . . . . . . . . . . . 233
Chapter 10 Change Views . . . . . . . . . . . . . . . . . . . . . . . . . . 235
Pan or Zoom a View . . . . . . . . . . . . . . . . . . . . . . . . . . . 235
Pan and Zoom with the Aerial View Window . . . . . . . . . . . . . . 240
Save and Restore Views . . . . . . . . . . . . . . . . . . . . . . . . . 243
Control the 3D Projection Style . . . . . . . . . . . . . . . . . . . . . 247
Overview of Parallel and Perspective Views . . . . . . . . . . . . 247
Define a Perspective Projection (DVIEW) . . . . . . . . . . . . . 248
Define a Parallel Projection . . . . . . . . . . . . . . . . . . . . 251
Choose Preset 3D Views . . . . . . . . . . . . . . . . . . . . . . 253
Define a 3D View with Coordinate Values or Angles . . . . . . . 253
Change to a View of the XY Plane . . . . . . . . . . . . . . . . . 255
Shade a Model and Use Edge Effects . . . . . . . . . . . . . . . . . . . 257
Use a Visual Style to Display Your Model . . . . . . . . . . . . . 257
Customize a Visual Style . . . . . . . . . . . . . . . . . . . . . . 261
Control Performance . . . . . . . . . . . . . . . . . . . . . . . . 277
Chapter 11 Use Viewing Tools . . . . . . . . . . . . . . . . . . . . . . . . 285
Specify 3D Views . . . . . . . . . . . . . . . . . . . . . . . . . . . . . 285
Overview of 3D Views . . . . . . . . . . . . . . . . . . . . . . . 285
Use 3D Navigation Tools . . . . . . . . . . . . . . . . . . . . . . 287
Walk and Fly Through a Drawing . . . . . . . . . . . . . . . . . 290
Create a 3D Dynamic View (DVIEW) . . . . . . . . . . . . . . . 293
Use ViewCube . . . . . . . . . . . . . . . . . . . . . . . . . . . . . . 295
Overview of ViewCube . . . . . . . . . . . . . . . . . . . . . . . 295
ViewCube Menu . . . . . . . . . . . . . . . . . . . . . . . . . . 299
Reorient the View of a Model with ViewCube . . . . . . . . . . 301
Change the UCS with ViewCube . . . . . . . . . . . . . . . . . 308
Navigate with SteeringWheels . . . . . . . . . . . . . . . . . . . . . . 310
Overview of SteeringWheels . . . . . . . . . . . . . . . . . . . . 311
Wheel Menu . . . . . . . . . . . . . . . . . . . . . . . . . . . . 314
Navigation Wheels . . . . . . . . . . . . . . . . . . . . . . . . . 316
Navigation Tools . . . . . . . . . . . . . . . . . . . . . . . . . . 323
Define and Change Views with ShowMotion . . . . . . . . . . . . . . 340
Overview of ShowMotion . . . . . . . . . . . . . . . . . . . . . 340
Create and Modify Shots and Shot Sequences . . . . . . . . . . 342
Play Back a Shot . . . . . . . . . . . . . . . . . . . . . . . . . . 346
Define a 3D View with a Camera . . . . . . . . . . . . . . . . . . . . 348
Overview of Cameras . . . . . . . . . . . . . . . . . . . . . . . 349
Create a Camera . . . . . . . . . . . . . . . . . . . . . . . . . . 350
Change Camera Properties . . . . . . . . . . . . . . . . . . . . . 351
Create Preview Animations . . . . . . . . . . . . . . . . . . . . . . . 356
Create Motion Path Animations . . . . . . . . . . . . . . . . . . . . . 359
vi | Contents
Control a Camera Motion Path . . . . . . . . . . . . . . . . . . 359
Specify Motion Path Settings . . . . . . . . . . . . . . . . . . . 361
Record a Motion Path Animation . . . . . . . . . . . . . . . . . 363
Use Navigation Bar . . . . . . . . . . . . . . . . . . . . . . . . . . . . 364
Available Navigation Tools . . . . . . . . . . . . . . . . . . . . 364
Reposition and Reorient the Navigation Bar . . . . . . . . . . . 366
Control the Display of Navigation Tools on the Navigation
Bar . . . . . . . . . . . . . . . . . . . . . . . . . . . . . . . . 367
Use 3Dconnexion 3D mouse to Navigate Views . . . . . . . . . 369
Chapter 12 Display Multiple Views in Model Space . . . . . . . . . . . . . 373
Set Model Space Viewports . . . . . . . . . . . . . . . . . . . . . . . 373
Select and Use the Current Viewport . . . . . . . . . . . . . . . . . . 376
Save and Restore Model Tab Viewport Arrangements . . . . . . . . . . 378
Part 5 Organize Drawings and Layouts . . . . . . . . . . . . . 381
Chapter 13 Create Single-View Drawings (Model Space) . . . . . . . . . . 383
Quick Start for Model Space Drafting . . . . . . . . . . . . . . . . . . 383
Draw, Scale, and Annotate in Model Space . . . . . . . . . . . . . . . 385
Chapter 14 Create Multiple-View Drawing Layouts (Paper Space) . . . . . 391
Quick Start for Layouts . . . . . . . . . . . . . . . . . . . . . . . . . . 391
Understand the Layout Process . . . . . . . . . . . . . . . . . . . . . 393
Work with Model Space and Paper Space . . . . . . . . . . . . . . . . 396
Work on the Model Tab . . . . . . . . . . . . . . . . . . . . . . 396
Work on a Layout Tab . . . . . . . . . . . . . . . . . . . . . . . 397
Access Model Space from a Layout Viewport . . . . . . . . . . . 400
Export a Layout to Model Space . . . . . . . . . . . . . . . . . . 403
Create and Modify Layout Viewports . . . . . . . . . . . . . . . . . . 406
Control Views in Layout Viewports . . . . . . . . . . . . . . . . . . . 410
Scale Views in Layout Viewports . . . . . . . . . . . . . . . . . 410
Control Visibility in Layout Viewports . . . . . . . . . . . . . . 413
Scale Linetypes in Layout Viewports . . . . . . . . . . . . . . . 419
Align Views in Layout Viewports . . . . . . . . . . . . . . . . . 420
Rotate Views in Layout Viewports . . . . . . . . . . . . . . . . . 423
Reuse Layouts and Layout Settings . . . . . . . . . . . . . . . . . . . 426
Chapter 15 Work with Sheets in a Sheet Set . . . . . . . . . . . . . . . . . 431
Quick Start for Sheet Sets . . . . . . . . . . . . . . . . . . . . . . . . 431
Understand the Sheet Set Manager Interface . . . . . . . . . . . . . . 433
Create and Manage a Sheet Set . . . . . . . . . . . . . . . . . . . . . 435
Create a Sheet Set . . . . . . . . . . . . . . . . . . . . . . . . . 436
Contents | vii
Organize a Sheet Set . . . . . . . . . . . . . . . . . . . . . . . . 438
Create and Modify Sheets . . . . . . . . . . . . . . . . . . . . . 442
Include Information with Sheets and Sheet Sets . . . . . . . . . 451
Publish, Transmit, and Archive Sheet Sets . . . . . . . . . . . . . . . . 454
Use Sheet Sets in a Team . . . . . . . . . . . . . . . . . . . . . . . . . 459
Part 6 Create and Modify Objects . . . . . . . . . . . . . . . . 463
Chapter 16 Control the Properties of Objects . . . . . . . . . . . . . . . . 465
Work with Object Properties . . . . . . . . . . . . . . . . . . . . . . . 465
Overview of Object Properties . . . . . . . . . . . . . . . . . . . 465
Display and Change the Properties of Objects . . . . . . . . . . 467
Copy Properties Between Objects . . . . . . . . . . . . . . . . . 470
Work with Layers . . . . . . . . . . . . . . . . . . . . . . . . . . . . 471
Overview of Layers . . . . . . . . . . . . . . . . . . . . . . . . . 471
Use Layers to Manage Complexity . . . . . . . . . . . . . . . . 473
Create and Name Layers . . . . . . . . . . . . . . . . . . . . . . 479
Change Layer Settings and Layer Properties . . . . . . . . . . . . 482
Override Layer Properties in Viewports . . . . . . . . . . . . . . 486
Filter and Sort the List of Layers . . . . . . . . . . . . . . . . . . 494
Use New Layer Notification . . . . . . . . . . . . . . . . . . . . 500
Reconcile New Layers . . . . . . . . . . . . . . . . . . . . . . . 504
Work with Layer States . . . . . . . . . . . . . . . . . . . . . . . 505
Work with Colors . . . . . . . . . . . . . . . . . . . . . . . . . . . . 513
Set the Current Color . . . . . . . . . . . . . . . . . . . . . . . 513
Change the Color of an Object . . . . . . . . . . . . . . . . . . 516
Use Color Books . . . . . . . . . . . . . . . . . . . . . . . . . . 519
Work with Linetypes . . . . . . . . . . . . . . . . . . . . . . . . . . . 521
Overview of Linetypes . . . . . . . . . . . . . . . . . . . . . . . 521
Load Linetypes . . . . . . . . . . . . . . . . . . . . . . . . . . . 523
Set the Current Linetype . . . . . . . . . . . . . . . . . . . . . . 525
Change the Linetype of an Object . . . . . . . . . . . . . . . . . 527
Control Linetype Scale . . . . . . . . . . . . . . . . . . . . . . . 529
Display Linetypes on Short Segments and Polylines . . . . . . . 531
Control Lineweights . . . . . . . . . . . . . . . . . . . . . . . . . . . 532
Overview of Lineweights . . . . . . . . . . . . . . . . . . . . . 532
Display Lineweights . . . . . . . . . . . . . . . . . . . . . . . . 535
Set the Current Lineweight . . . . . . . . . . . . . . . . . . . . 537
Change the Lineweight of an Object . . . . . . . . . . . . . . . 538
Control the Display Properties of Certain Objects . . . . . . . . . . . 540
Control the Display of Polylines, Hatches, Gradient Fills,
Lineweights, and Text . . . . . . . . . . . . . . . . . . . . . . 540
Control the Transparency of Objects . . . . . . . . . . . . . . . 543
Control How Overlapping Objects Are Displayed . . . . . . . . . 545
Control the Display of Objects . . . . . . . . . . . . . . . . . . 547
viii | Contents
Chapter 17 Use Precision Tools . . . . . . . . . . . . . . . . . . . . . . . . 549
Use Coordinates and Coordinate Systems (UCS) . . . . . . . . . . . . 549
Overview of Coordinate Entry . . . . . . . . . . . . . . . . . . . 549
Enter 2D Coordinates . . . . . . . . . . . . . . . . . . . . . . . 552
Enter 3D Coordinates . . . . . . . . . . . . . . . . . . . . . . . 556
Understand the User Coordinate System (UCS) . . . . . . . . . . 561
Specify Workplanes in 3D (UCS) . . . . . . . . . . . . . . . . . 566
Assign User Coordinate System Orientations to Viewports . . . . 574
Control the Display of the User Coordinate System Icon . . . . . 576
Use Dynamic Input . . . . . . . . . . . . . . . . . . . . . . . . . . . 578
Snap to Locations on Objects (Object Snaps) . . . . . . . . . . . . . . 585
Use Object Snaps . . . . . . . . . . . . . . . . . . . . . . . . . . 585
The Object Snap Menu . . . . . . . . . . . . . . . . . . . . . . 588
Set Visual Aids for Object Snaps (AutoSnap) . . . . . . . . . . . 589
Override Object Snap Settings . . . . . . . . . . . . . . . . . . . 590
Restrict Cursor Movement . . . . . . . . . . . . . . . . . . . . . . . . 593
Adjust Grid and Grid Snap . . . . . . . . . . . . . . . . . . . . . 593
Use Orthogonal Locking (Ortho Mode) . . . . . . . . . . . . . . 600
Use Polar Tracking and PolarSnap . . . . . . . . . . . . . . . . . 601
Lock an Angle for One Point (Angle) . . . . . . . . . . . . . . . 605
Combine or Offset Points and Coordinates . . . . . . . . . . . . . . . 606
Combine Coordinate Values (Coordinate Filters) . . . . . . . . . 606
Track to Points on Objects (Object Snap Tracking) . . . . . . . . 608
Track to Offset Point Locations (Tracking) . . . . . . . . . . . . 612
Specify Distances . . . . . . . . . . . . . . . . . . . . . . . . . . . . . 613
Enter Direct Distances . . . . . . . . . . . . . . . . . . . . . . . 613
Offset from Temporary Reference Points . . . . . . . . . . . . . 614
Specify Intervals on Objects . . . . . . . . . . . . . . . . . . . . 615
Extract Geometric Information from Objects . . . . . . . . . . . . . . 620
Obtain Distances, Angles, and Point Locations . . . . . . . . . . 620
Obtain Area and Mass Properties Information . . . . . . . . . . 621
Use a Calculator . . . . . . . . . . . . . . . . . . . . . . . . . . . . . 627
Use the QuickCalc Calculator . . . . . . . . . . . . . . . . . . . 627
Use the Command Prompt Calculator . . . . . . . . . . . . . . 642
Chapter 18 Draw Geometric Objects . . . . . . . . . . . . . . . . . . . . . 647
Draw Linear Objects . . . . . . . . . . . . . . . . . . . . . . . . . . . 647
Draw Lines . . . . . . . . . . . . . . . . . . . . . . . . . . . . . 647
Draw Polylines . . . . . . . . . . . . . . . . . . . . . . . . . . . 649
Draw Rectangles and Polygons . . . . . . . . . . . . . . . . . . 654
Draw Multiline Objects . . . . . . . . . . . . . . . . . . . . . . 657
Draw Freehand Sketches . . . . . . . . . . . . . . . . . . . . . . 661
Draw Curved Objects . . . . . . . . . . . . . . . . . . . . . . . . . . 663
Draw Arcs . . . . . . . . . . . . . . . . . . . . . . . . . . . . . 663
Draw Circles . . . . . . . . . . . . . . . . . . . . . . . . . . . . 668
Contents | ix
Draw Polyline Arcs . . . . . . . . . . . . . . . . . . . . . . . . . 670
Draw Donuts . . . . . . . . . . . . . . . . . . . . . . . . . . . . 675
Draw Ellipses . . . . . . . . . . . . . . . . . . . . . . . . . . . . 677
Draw Splines . . . . . . . . . . . . . . . . . . . . . . . . . . . . 679
Draw Helixes . . . . . . . . . . . . . . . . . . . . . . . . . . . . 682
Draw Construction and Reference Geometry . . . . . . . . . . . . . . 683
Draw Reference Points . . . . . . . . . . . . . . . . . . . . . . . 683
Draw Construction Lines (and Rays) . . . . . . . . . . . . . . . 684
Create and Combine Areas (Regions) . . . . . . . . . . . . . . . . . . 687
Create Revision Clouds . . . . . . . . . . . . . . . . . . . . . . . . . 691
Chapter 19 Change Existing Objects . . . . . . . . . . . . . . . . . . . . 695
Select Objects . . . . . . . . . . . . . . . . . . . . . . . . . . . . . . . 695
Select Objects Individually . . . . . . . . . . . . . . . . . . . . . 695
Select Multiple Objects . . . . . . . . . . . . . . . . . . . . . . 698
Prevent Objects from Being Selected . . . . . . . . . . . . . . . 701
Select Objects by Properties . . . . . . . . . . . . . . . . . . . . 703
Customize Object Selection . . . . . . . . . . . . . . . . . . . . 707
Group Objects . . . . . . . . . . . . . . . . . . . . . . . . . . . 713
Correct Mistakes . . . . . . . . . . . . . . . . . . . . . . . . . . . . . 718
Erase Objects . . . . . . . . . . . . . . . . . . . . . . . . . . . . . . . 721
Use Windows Cut, Copy, and Paste . . . . . . . . . . . . . . . . . . . 724
Modify Objects . . . . . . . . . . . . . . . . . . . . . . . . . . . . . . 727
Choose a Method to Modify Objects . . . . . . . . . . . . . . . 727
Edit Objects with Grips . . . . . . . . . . . . . . . . . . . . . . 729
Move or Rotate Objects . . . . . . . . . . . . . . . . . . . . . . 742
Copy, Offset, or Mirror Objects . . . . . . . . . . . . . . . . . . 750
Change the Size and Shape of Objects . . . . . . . . . . . . . . 763
Fillet, Chamfer, Break, or Join Objects . . . . . . . . . . . . . . . 773
Modify Complex Objects . . . . . . . . . . . . . . . . . . . . . . . . 785
Disassociate Compound Objects (Explode) . . . . . . . . . . . . 786
Modify Polylines . . . . . . . . . . . . . . . . . . . . . . . . . . 787
Modify Splines . . . . . . . . . . . . . . . . . . . . . . . . . . . 794
Modify Helixes . . . . . . . . . . . . . . . . . . . . . . . . . . . 797
Modify Multilines . . . . . . . . . . . . . . . . . . . . . . . . . 799
Chapter 20 Add Constraints to Geometry . . . . . . . . . . . . . . . . . . 803
Overview of Constraints . . . . . . . . . . . . . . . . . . . . . . . . . 803
Constrain Objects Geometrically . . . . . . . . . . . . . . . . . . . . 808
Overview of Geometric Constraints . . . . . . . . . . . . . . . . 808
Apply or Remove Geometric Constraints . . . . . . . . . . . . . 810
Display and Verify Geometric Constraints . . . . . . . . . . . . 816
Modify Objects with Geometric Constraints Applied . . . . . . . 820
Infer Geometric Constraints . . . . . . . . . . . . . . . . . . . . 823
Constrain Distances and Angles between Objects . . . . . . . . . . . . 826
x | Contents
Overview of Dimensional Constraints . . . . . . . . . . . . . . 826
Apply Dimensional Constraints . . . . . . . . . . . . . . . . . . 829
Control the Display of Dimensional Constraints . . . . . . . . . 834
Modify Objects with Dimensional Constraints Applied . . . . . 836
Constrain a Design with Formulas and Equations . . . . . . . . . . . 840
Overview of Formulas and Equations . . . . . . . . . . . . . . . 841
Control Geometry with the Parameters Manager . . . . . . . . . 842
Organize Parameters into Groups . . . . . . . . . . . . . . . . . 847
Part 7 Define and Reference Blocks . . . . . . . . . . . . . . . 849
Chapter 21 Work with Blocks . . . . . . . . . . . . . . . . . . . . . . . . . 851
Overview of Blocks . . . . . . . . . . . . . . . . . . . . . . . . . . . . 851
Insert Blocks . . . . . . . . . . . . . . . . . . . . . . . . . . . . . . . 853
Work with Dynamic Blocks in Drawings . . . . . . . . . . . . . . . . 858
Overview of Dynamic Blocks . . . . . . . . . . . . . . . . . . . 858
Work With Action Parameters in Blocks . . . . . . . . . . . . . . 859
Work With Constraint Parameters in Blocks . . . . . . . . . . . 862
Remove Block Definitions . . . . . . . . . . . . . . . . . . . . . . . . 863
Chapter 22 Create and Modify Blocks . . . . . . . . . . . . . . . . . . . . 865
Define Blocks . . . . . . . . . . . . . . . . . . . . . . . . . . . . . . . 865
Create Blocks Within a Drawing . . . . . . . . . . . . . . . . . . 865
Create Drawing Files for Use as Blocks . . . . . . . . . . . . . . 867
Control the Color and Linetype Properties in Blocks . . . . . . . 870
Nest Blocks . . . . . . . . . . . . . . . . . . . . . . . . . . . . . 872
Create Block Libraries . . . . . . . . . . . . . . . . . . . . . . . 873
Use Tool Palettes to Organize Blocks . . . . . . . . . . . . . . . 874
Create Construction Geometry Within a Block . . . . . . . . . . 874
Attach Data to Blocks (Block Attributes) . . . . . . . . . . . . . . . . . 875
Overview of Block Attributes . . . . . . . . . . . . . . . . . . . 876
Define Block Attributes . . . . . . . . . . . . . . . . . . . . . . 878
Extract Data from Block Attributes . . . . . . . . . . . . . . . . 882
Extract Block Attribute Data (Advanced) . . . . . . . . . . . . . 883
Modify Blocks . . . . . . . . . . . . . . . . . . . . . . . . . . . . . . 889
Modify a Block Definition . . . . . . . . . . . . . . . . . . . . . 889
Modify the Data in Block Attributes . . . . . . . . . . . . . . . . 892
Modify a Block Attribute Definition . . . . . . . . . . . . . . . . 893
Disassemble a Block Reference (Explode) . . . . . . . . . . . . . 898
Chapter 23 Add Behaviors to Blocks (Dynamic Blocks) . . . . . . . . . . . 901
Overview of Dynamic Blocks . . . . . . . . . . . . . . . . . . . . . . 901
Quick Start to Creating Dynamic Blocks . . . . . . . . . . . . . . . . 902
Contents | xi
Create and Edit Dynamic Blocks . . . . . . . . . . . . . . . . . . . . . 903
Overview of the Block Editor . . . . . . . . . . . . . . . . . . . 904
Create Custom Block Authoring Tools . . . . . . . . . . . . . . 906
Test Blocks Within the Block Editor . . . . . . . . . . . . . . . . 909
Modify Dynamic Block Definitions . . . . . . . . . . . . . . . . 910
Add Constraints to Dynamic Blocks . . . . . . . . . . . . . . . . . . . 912
Overview of Constraints in Dynamic Blocks . . . . . . . . . . . 912
Define User Parameters in Dynamic Blocks . . . . . . . . . . . . 914
Control Constrained Blocks with the Parameters Manager . . . . 915
Use a Block Properties Table . . . . . . . . . . . . . . . . . . . . 916
Identify Fully Constrained Objects . . . . . . . . . . . . . . . . 918
Add Action Parameters to Dynamic Blocks . . . . . . . . . . . . . . . 920
Overview of Actions and Parameters . . . . . . . . . . . . . . . 920
Add Parameters to Dynamic Blocks . . . . . . . . . . . . . . . . 924
Add Actions to Dynamic Blocks . . . . . . . . . . . . . . . . . . 925
Specify Properties for Dynamic Blocks . . . . . . . . . . . . . . 939
Specify Value Sets for Dynamic Blocks . . . . . . . . . . . . . . 944
Specify Distance and Angle Values . . . . . . . . . . . . . . . . 947
Specify Grips for Dynamic Blocks . . . . . . . . . . . . . . . . . 947
Control the Visibility of Objects in a Block . . . . . . . . . . . . 953
Part 8 Work with 3D Models . . . . . . . . . . . . . . . . . . . 959
Chapter 24 Create 3D Models . . . . . . . . . . . . . . . . . . . . . . . . 961
Overview of 3D Modeling . . . . . . . . . . . . . . . . . . . . . . . . 961
Create Solids and Surfaces from Lines and Curves . . . . . . . . . . . 966
Overview of Creating Solids and Surfaces . . . . . . . . . . . . . 966
Create a Solid or Surface by Extruding . . . . . . . . . . . . . . 968
Create a Solid or Surface by Sweeping . . . . . . . . . . . . . . . 972
Create a Solid or Surface by Lofting . . . . . . . . . . . . . . . . 976
Create a Solid or Surface by Revolving . . . . . . . . . . . . . . 980
Create Solids . . . . . . . . . . . . . . . . . . . . . . . . . . . . . . . 983
Overview of Creating 3D Solids . . . . . . . . . . . . . . . . . . 983
Create 3D Solid Primitives . . . . . . . . . . . . . . . . . . . . . 987
Create a Polysolid . . . . . . . . . . . . . . . . . . . . . . . . . 1000
Create 3D Solids from Objects . . . . . . . . . . . . . . . . . . 1002
Combine or Slice 3D Objects . . . . . . . . . . . . . . . . . . . 1007
Check 3D Models for Interferences . . . . . . . . . . . . . . . 1012
Create Surfaces . . . . . . . . . . . . . . . . . . . . . . . . . . . . . 1014
Overview of Creating Surfaces . . . . . . . . . . . . . . . . . . 1014
Create Procedural Surfaces . . . . . . . . . . . . . . . . . . . . 1019
Create NURBS Surfaces . . . . . . . . . . . . . . . . . . . . . . 1031
Create Associative Surfaces . . . . . . . . . . . . . . . . . . . . 1036
Create Meshes . . . . . . . . . . . . . . . . . . . . . . . . . . . . . 1044
Overview of Creating Meshes . . . . . . . . . . . . . . . . . . 1044
xii | Contents
Create 3D Mesh Primitives . . . . . . . . . . . . . . . . . . . . 1049
Construct Meshes from Other Objects . . . . . . . . . . . . . . 1067
Create Meshes by Conversion . . . . . . . . . . . . . . . . . . 1074
Create Custom Mesh (Legacy) . . . . . . . . . . . . . . . . . . 1078
Create Wireframe Models . . . . . . . . . . . . . . . . . . . . . . . . 1083
Add 3D Thickness to Objects . . . . . . . . . . . . . . . . . . . . . . 1087
Chapter 25 Modify 3D Models . . . . . . . . . . . . . . . . . . . . . . . 1091
Overview of Modifying 3D Objects . . . . . . . . . . . . . . . . . . 1091
Use Gizmos to Modify Objects . . . . . . . . . . . . . . . . . . . . . 1093
Overview of Using Gizmos . . . . . . . . . . . . . . . . . . . . 1093
Use the Gizmos . . . . . . . . . . . . . . . . . . . . . . . . . . 1095
Move 3D Objects . . . . . . . . . . . . . . . . . . . . . . . . . 1099
Rotate 3D Objects . . . . . . . . . . . . . . . . . . . . . . . . . 1102
Scale 3D Objects . . . . . . . . . . . . . . . . . . . . . . . . . 1104
Use Grips to Modify Solids and Surfaces . . . . . . . . . . . . . . . . 1109
Use 3D Subobject Grips . . . . . . . . . . . . . . . . . . . . . . 1109
Cycle Through and Filter Subobjects . . . . . . . . . . . . . . . 1112
Use Grips to Edit 3D Solids and Surfaces . . . . . . . . . . . . . 1115
Modify 3D Subobjects . . . . . . . . . . . . . . . . . . . . . . . . . 1119
Move, Rotate, and Scale 3D Subobjects . . . . . . . . . . . . . 1119
Modify Faces on 3D Objects . . . . . . . . . . . . . . . . . . . 1122
Modify Edges on 3D Objects . . . . . . . . . . . . . . . . . . . 1126
Modify Vertices on 3D Objects . . . . . . . . . . . . . . . . . . 1131
Work with Complex 3D Solids and Surfaces . . . . . . . . . . . . . . 1134
Display Original Forms of Composite Solids . . . . . . . . . . . 1134
Modify Composite Solids and Surfaces . . . . . . . . . . . . . . 1136
Shell and Remove Redundancies in 3D Objects . . . . . . . . . 1138
Press or Pull Bounded Areas . . . . . . . . . . . . . . . . . . . 1140
Add Edges and Faces to Solids . . . . . . . . . . . . . . . . . . 1142
Modify Properties of 3D Solid, Surface, and Mesh . . . . . . . . . . . 1144
Modify Surfaces . . . . . . . . . . . . . . . . . . . . . . . . . . . . . 1149
Overview of Modifying Surfaces . . . . . . . . . . . . . . . . . 1149
Trim and Untrim Surfaces . . . . . . . . . . . . . . . . . . . . 1151
Extend a Surface . . . . . . . . . . . . . . . . . . . . . . . . . 1153
Fillet a Surface . . . . . . . . . . . . . . . . . . . . . . . . . . 1154
Edit NURBS Surfaces . . . . . . . . . . . . . . . . . . . . . . . 1155
Analyze Surfaces . . . . . . . . . . . . . . . . . . . . . . . . . 1158
Modify Mesh Objects . . . . . . . . . . . . . . . . . . . . . . . . . . 1167
Overview of Modifying Meshes . . . . . . . . . . . . . . . . . 1168
Change Mesh Smoothness Levels . . . . . . . . . . . . . . . . 1172
Refine Mesh Objects or Subobjects . . . . . . . . . . . . . . . . 1176
Add Creases to Mesh . . . . . . . . . . . . . . . . . . . . . . . 1178
Modify Mesh Faces . . . . . . . . . . . . . . . . . . . . . . . . 1181
Create and Close Mesh Gaps . . . . . . . . . . . . . . . . . . . 1186
Tips for Working with Mesh . . . . . . . . . . . . . . . . . . . 1189
Contents | xiii
Chapter 26 Create Sections and 2D Drawings from 3D Models . . . . . . 1197
Work with Sections . . . . . . . . . . . . . . . . . . . . . . . . . . . 1197
Overview of Section Objects . . . . . . . . . . . . . . . . . . . 1197
Create Section Objects . . . . . . . . . . . . . . . . . . . . . . 1199
Modify a Section View . . . . . . . . . . . . . . . . . . . . . . 1204
Save and Publish Section Objects . . . . . . . . . . . . . . . . 1213
Create a Flattened View . . . . . . . . . . . . . . . . . . . . . . . . . 1218
Part 9 Annotate Drawings . . . . . . . . . . . . . . . . . . . 1221
Chapter 27 Work with Annotations . . . . . . . . . . . . . . . . . . . . . 1223
Overview of Annotations . . . . . . . . . . . . . . . . . . . . . . . . 1223
Scale Annotations . . . . . . . . . . . . . . . . . . . . . . . . . . . . 1224
Overview of Scaling Annotations . . . . . . . . . . . . . . . . 1225
Set Annotation Scale . . . . . . . . . . . . . . . . . . . . . . . 1227
Create Annotative Objects . . . . . . . . . . . . . . . . . . . . 1229
Display Annotative Objects . . . . . . . . . . . . . . . . . . . 1251
Add and Modify Scale Representations . . . . . . . . . . . . . 1253
Set Orientation for Annotations . . . . . . . . . . . . . . . . . . . . 1256
Chapter 28 Hatches, Fills, and Wipeouts . . . . . . . . . . . . . . . . . . 1259
Overview of Hatch Patterns and Fills . . . . . . . . . . . . . . . . . . 1259
Specify Hatch and Fill Areas . . . . . . . . . . . . . . . . . . . . . . 1267
Control the Appearance of Hatches . . . . . . . . . . . . . . . . . . 1272
Choose a Hatch Pattern or Fill . . . . . . . . . . . . . . . . . . 1272
Control the Hatch Origin Point . . . . . . . . . . . . . . . . . 1278
Control the Scale of Hatch Patterns . . . . . . . . . . . . . . . 1280
Set Property Overrides for Hatches and Fills . . . . . . . . . . . 1283
Control the Display of Hatch Boundaries . . . . . . . . . . . . 1285
Control the Draw Order of Hatches and Fills . . . . . . . . . . 1288
Modify Hatches and Fills . . . . . . . . . . . . . . . . . . . . . . . . 1289
Modify Hatch Properties . . . . . . . . . . . . . . . . . . . . . 1289
Modify Hatch Alignment, Scale, and Rotation . . . . . . . . . . 1290
Reshape a Hatch or Fill . . . . . . . . . . . . . . . . . . . . . . 1291
Re-create the Boundary of a Hatch or Fill . . . . . . . . . . . . 1293
Create a Blank Area to Cover Objects . . . . . . . . . . . . . . . . . 1295
Chapter 29 Notes and Labels . . . . . . . . . . . . . . . . . . . . . . . . 1297
Overview of Notes and Labels . . . . . . . . . . . . . . . . . . . . . 1297
Create Text . . . . . . . . . . . . . . . . . . . . . . . . . . . . . . . 1300
Overview of Creating Text . . . . . . . . . . . . . . . . . . . . 1300
Create Single-Line Text . . . . . . . . . . . . . . . . . . . . . . 1304
Create Multiline Text . . . . . . . . . . . . . . . . . . . . . . . 1308
xiv | Contents
Create and Edit Columns in Multiline Text . . . . . . . . . . . 1331
Import Text from External Files . . . . . . . . . . . . . . . . . 1334
Create Leaders . . . . . . . . . . . . . . . . . . . . . . . . . . . . . 1336
Overview of Leader Objects . . . . . . . . . . . . . . . . . . . 1336
Create and Modify Leaders . . . . . . . . . . . . . . . . . . . . 1338
Work with Leader Styles . . . . . . . . . . . . . . . . . . . . . 1346
Add Content to a Leader . . . . . . . . . . . . . . . . . . . . . 1348
Use Fields in Text . . . . . . . . . . . . . . . . . . . . . . . . . . . . 1352
Insert Fields . . . . . . . . . . . . . . . . . . . . . . . . . . . . 1352
Update Fields . . . . . . . . . . . . . . . . . . . . . . . . . . . 1358
Use Hyperlinks in Fields . . . . . . . . . . . . . . . . . . . . . 1361
Work with Text Styles . . . . . . . . . . . . . . . . . . . . . . . . . . 1363
Overview of Text Styles . . . . . . . . . . . . . . . . . . . . . . 1363
Assign Text Fonts . . . . . . . . . . . . . . . . . . . . . . . . . 1366
Set Text Height . . . . . . . . . . . . . . . . . . . . . . . . . . 1373
Set Text Obliquing Angle . . . . . . . . . . . . . . . . . . . . . 1375
Set Horizontal or Vertical Text Orientation . . . . . . . . . . . 1376
Change Text . . . . . . . . . . . . . . . . . . . . . . . . . . . . . . 1377
Overview of Changing Text . . . . . . . . . . . . . . . . . . . 1377
Change Single-Line Text . . . . . . . . . . . . . . . . . . . . . 1378
Change Multiline Text . . . . . . . . . . . . . . . . . . . . . . 1380
Find and Replace Text . . . . . . . . . . . . . . . . . . . . . . 1383
Change Text Scale and Justification . . . . . . . . . . . . . . . 1385
Check Spelling . . . . . . . . . . . . . . . . . . . . . . . . . . . . . 1387
Use an Alternate Text Editor . . . . . . . . . . . . . . . . . . . . . . 1391
Overview of Using an Alternate Text Editor . . . . . . . . . . . 1391
Format Multiline Text in an Alternate Text Editor . . . . . . . . 1392
Chapter 30 Tables . . . . . . . . . . . . . . . . . . . . . . . . . . . . . . 1397
Create and Modify Tables . . . . . . . . . . . . . . . . . . . . . . . . 1397
Link a Table to External Data . . . . . . . . . . . . . . . . . . . . . . 1401
Work with Table Styles . . . . . . . . . . . . . . . . . . . . . . . . . 1404
Add Text and Blocks to Tables . . . . . . . . . . . . . . . . . . . . . 1407
Use Formulas in Table Cells . . . . . . . . . . . . . . . . . . . . . . 1412
Chapter 31 Dimensions and Tolerances . . . . . . . . . . . . . . . . . . 1417
Understand Basic Concepts of Dimensioning . . . . . . . . . . . . . 1417
Overview of Dimensioning . . . . . . . . . . . . . . . . . . . . 1417
Parts of a Dimension . . . . . . . . . . . . . . . . . . . . . . . 1420
Associative Dimensions . . . . . . . . . . . . . . . . . . . . . 1421
Use Dimension Styles . . . . . . . . . . . . . . . . . . . . . . . . . . 1424
Overview of Dimension Styles . . . . . . . . . . . . . . . . . . 1424
Compare Dimension Styles and Variables . . . . . . . . . . . . 1425
Control Dimension Geometry . . . . . . . . . . . . . . . . . . 1427
Control Dimension Text . . . . . . . . . . . . . . . . . . . . . 1437
Contents | xv
Control Dimension Values . . . . . . . . . . . . . . . . . . . . 1448
Set the Scale for Dimensions . . . . . . . . . . . . . . . . . . . . . . 1461
Create Dimensions . . . . . . . . . . . . . . . . . . . . . . . . . . . 1464
Create Linear Dimensions . . . . . . . . . . . . . . . . . . . . 1464
Create Radial Dimensions . . . . . . . . . . . . . . . . . . . . 1472
Create Angular Dimensions . . . . . . . . . . . . . . . . . . . 1480
Create Ordinate Dimensions . . . . . . . . . . . . . . . . . . . 1483
Create Arc Length Dimensions . . . . . . . . . . . . . . . . . . 1485
Modify Existing Dimensions . . . . . . . . . . . . . . . . . . . . . . 1486
Modify A Dimension . . . . . . . . . . . . . . . . . . . . . . . 1487
Apply a New Dimension Style to Existing Dimensions . . . . . 1500
Override a Dimension Style . . . . . . . . . . . . . . . . . . . 1501
Modify Dimension Text . . . . . . . . . . . . . . . . . . . . . 1504
Modify Dimension Geometry . . . . . . . . . . . . . . . . . . 1508
Change Dimension Associativity . . . . . . . . . . . . . . . . . 1511
Add Geometric Tolerances . . . . . . . . . . . . . . . . . . . . . . . 1513
Overview of Geometric Tolerances . . . . . . . . . . . . . . . . 1513
Material Conditions . . . . . . . . . . . . . . . . . . . . . . . 1516
Datum Reference Frames . . . . . . . . . . . . . . . . . . . . . 1516
Projected Tolerance Zones . . . . . . . . . . . . . . . . . . . . 1517
Composite Tolerances . . . . . . . . . . . . . . . . . . . . . . 1518
Part 10 Plot and Publish Drawings . . . . . . . . . . . . . . . . 1521
Chapter 32 Prepare Drawings for Plotting and Publishing . . . . . . . . 1523
Quick Start to Saving Settings for Plotting and Publishing . . . . . . 1523
Specify Page Setup Settings . . . . . . . . . . . . . . . . . . . . . . . 1524
Overview of Page Setup Settings . . . . . . . . . . . . . . . . . 1524
Select a Printer or Plotter for a Layout . . . . . . . . . . . . . . 1526
Select a Paper Size for a Layout . . . . . . . . . . . . . . . . . . 1527
Set the Plot Area of a Layout . . . . . . . . . . . . . . . . . . . 1532
Adjust the Plot Offset of a Layout . . . . . . . . . . . . . . . . 1533
Set the Plot Scale for a Layout . . . . . . . . . . . . . . . . . . 1535
Set the Lineweight Scale for a Layout . . . . . . . . . . . . . . 1536
Select a Plot Style Table for a Layout . . . . . . . . . . . . . . . 1537
Set Shaded Viewport and Plot Options for a Layout . . . . . . . 1540
Determine the Drawing Orientation of a Layout . . . . . . . . 1542
Use the Layout Wizard to Specify Layout Settings . . . . . . . . . . . 1543
Import PCP or PC2 Settings into a Layout . . . . . . . . . . . . . . . 1544
Create and Use Named Page Setups . . . . . . . . . . . . . . . . . . 1545
Use Named Page Setups with Sheet Sets . . . . . . . . . . . . . . . . 1549
Chapter 33 Plot Drawings . . . . . . . . . . . . . . . . . . . . . . . . . . 1553
Quick Start to Plotting . . . . . . . . . . . . . . . . . . . . . . . . . 1553
xvi | Contents
Overview of Plotting . . . . . . . . . . . . . . . . . . . . . . . . . . 1553
Use a Page Setup to Specify Plot Settings . . . . . . . . . . . . . . . . 1558
Select a Printer or Plotter . . . . . . . . . . . . . . . . . . . . . . . . 1560
Specify the Area to Plot . . . . . . . . . . . . . . . . . . . . . . . . . 1561
Set Paper Size . . . . . . . . . . . . . . . . . . . . . . . . . . . . . . 1562
Position the Drawing on the Paper . . . . . . . . . . . . . . . . . . . 1565
Specify the Printable Area . . . . . . . . . . . . . . . . . . . . 1565
Set the Position of the Plot . . . . . . . . . . . . . . . . . . . 1566
Set Drawing Orientation . . . . . . . . . . . . . . . . . . . . . 1567
Control How Objects Are Plotted . . . . . . . . . . . . . . . . . . . 1568
Set Plot Scale . . . . . . . . . . . . . . . . . . . . . . . . . . . 1568
Set Shaded Viewport Options . . . . . . . . . . . . . . . . . . 1571
Set Options for Plotted Objects . . . . . . . . . . . . . . . . . . 1575
Use Plot Styles to Control Plotted Objects . . . . . . . . . . . . 1579
Use Color-Dependent Plot Style Tables . . . . . . . . . . . . . 1588
Use Named Plot Style Tables . . . . . . . . . . . . . . . . . . . 1589
Change Plot Style Settings . . . . . . . . . . . . . . . . . . . . 1596
Preview a Plot . . . . . . . . . . . . . . . . . . . . . . . . . . . . . . 1608
Plot Files to Other Formats . . . . . . . . . . . . . . . . . . . . . . . 1609
Plot DWF Files . . . . . . . . . . . . . . . . . . . . . . . . . . 1609
Plot DWFx Files . . . . . . . . . . . . . . . . . . . . . . . . . . 1610
Plot to DXB File Formats . . . . . . . . . . . . . . . . . . . . . 1612
Plot to Raster File Formats . . . . . . . . . . . . . . . . . . . . 1613
Plot Adobe PDF Files . . . . . . . . . . . . . . . . . . . . . . . 1615
Plot Adobe PostScript Files . . . . . . . . . . . . . . . . . . . . 1616
Create Plot Files . . . . . . . . . . . . . . . . . . . . . . . . . . 1618
Chapter 34 Publish Drawings . . . . . . . . . . . . . . . . . . . . . . . . 1621
Overview of Publishing . . . . . . . . . . . . . . . . . . . . . . . . . 1621
Create and Modify a Drawing Set for Publishing . . . . . . . . . . . 1624
Create a Paper or Plot File Drawing Set . . . . . . . . . . . . . . . . . 1628
Publish an Electronic Drawing Set . . . . . . . . . . . . . . . . . . . 1631
Publish a Sheet Set . . . . . . . . . . . . . . . . . . . . . . . . . . . 1636
Republish a Drawing Set . . . . . . . . . . . . . . . . . . . . . . . . 1643
View Electronic Drawing Sets with Autodesk Design Review . . . . . 1645
Set Publish Options . . . . . . . . . . . . . . . . . . . . . . . . . . . 1646
Publish 3D DWF Files . . . . . . . . . . . . . . . . . . . . . . . . . . 1652
Print 3D Models . . . . . . . . . . . . . . . . . . . . . . . . . . . . 1660
Part 11 Share Data Between Files . . . . . . . . . . . . . . . . 1663
Chapter 35 Reference Other Drawing Files . . . . . . . . . . . . . . . . . 1665
Overview of Referenced Drawings (Xrefs) . . . . . . . . . . . . . . . 1665
Attach and Detach Referenced Drawings . . . . . . . . . . . . . . . 1668
Contents | xvii
Attach Drawing References (Xrefs) . . . . . . . . . . . . . . . . 1668
Set Paths to Referenced Drawings . . . . . . . . . . . . . . . . 1674
Detach Referenced Drawings . . . . . . . . . . . . . . . . . . . 1679
Update and Bind Referenced Drawings . . . . . . . . . . . . . . . . 1680
Nest and Overlay Referenced Drawings . . . . . . . . . . . . . 1680
Update Referenced Drawing Attachments . . . . . . . . . . . . 1682
Archive Drawings That Contain Referenced Drawings
(Bind) . . . . . . . . . . . . . . . . . . . . . . . . . . . . . . 1685
Clip External References and Blocks . . . . . . . . . . . . . . . . . . 1686
Edit Referenced Drawings . . . . . . . . . . . . . . . . . . . . . . . 1691
Edit a Referenced Drawing in a Separate Window . . . . . . . . 1691
Edit Selected Objects in Referenced Drawings and Blocks . . . . 1692
Use the Working Set to Edit Referenced Drawings and
Blocks . . . . . . . . . . . . . . . . . . . . . . . . . . . . . . 1696
Save Back Edited Referenced Drawings and Blocks . . . . . . . 1698
Edit Referenced Drawings and Blocks with Nesting, OLE, or
Attributes . . . . . . . . . . . . . . . . . . . . . . . . . . . . 1700
Resolve Referenced Drawing Errors . . . . . . . . . . . . . . . . . . . 1701
Resolve Missing External References . . . . . . . . . . . . . . . 1701
Resolve Circular External References . . . . . . . . . . . . . . . 1703
Resolve Name Conflicts in External References . . . . . . . . . 1704
Track External Reference Operations (Log File) . . . . . . . . . 1706
Increase Performance with Large Referenced Drawings . . . . . . . . 1709
Overview of Demand Loading . . . . . . . . . . . . . . . . . . 1709
Unload Xrefs . . . . . . . . . . . . . . . . . . . . . . . . . . . 1710
Work with Demand Loading . . . . . . . . . . . . . . . . . . . 1711
Work with Layer and Spatial Indexes . . . . . . . . . . . . . . 1712
Set Paths for Temporary Xref File Copies . . . . . . . . . . . . 1714
Chapter 36 Link and Embed Data (OLE) . . . . . . . . . . . . . . . . . . 1717
Overview of Object Linking and Embedding . . . . . . . . . . . . . 1717
Import OLE Objects . . . . . . . . . . . . . . . . . . . . . . . . . . . 1720
Overview of Importing OLE Objects into Drawings . . . . . . . 1720
Link OLE Objects in Drawings . . . . . . . . . . . . . . . . . . 1721
Embed OLE Objects in Drawings . . . . . . . . . . . . . . . . . 1724
Export OLE Objects from Drawings . . . . . . . . . . . . . . . . . . 1727
Edit OLE Objects in Drawings . . . . . . . . . . . . . . . . . . . . . 1729
Chapter 37 Work with Data in Other Formats . . . . . . . . . . . . . . . 1733
Import Other File Formats . . . . . . . . . . . . . . . . . . . . . . . 1733
Import Autodesk 3ds MAX Files . . . . . . . . . . . . . . . . . 1733
Import FBX Files . . . . . . . . . . . . . . . . . . . . . . . . . 1734
Import 3D Point Cloud Files . . . . . . . . . . . . . . . . . . . 1735
Import ACIS SAT Files . . . . . . . . . . . . . . . . . . . . . . 1739
Convert DXF and DXB Files to DWG Format . . . . . . . . . . 1740
xviii | Contents
Import MicroStation DGN Files . . . . . . . . . . . . . . . . . 1741
Manage Translation Mapping Setups . . . . . . . . . . . . . . . 1743
Insert WMF Files . . . . . . . . . . . . . . . . . . . . . . . . . 1747
Attach Files as Underlays . . . . . . . . . . . . . . . . . . . . . . . . 1749
Overview of Underlays . . . . . . . . . . . . . . . . . . . . . . 1749
Attach, Scale, and Detach Underlays . . . . . . . . . . . . . . . 1750
Work with Underlays . . . . . . . . . . . . . . . . . . . . . . . 1760
Manage and Publish Drawings Containing Underlays . . . . . 1774
Attach Raster Image Files . . . . . . . . . . . . . . . . . . . . . . . . 1781
Overview of Raster Images . . . . . . . . . . . . . . . . . . . . 1781
Attach, Scale, and Detach Raster Images . . . . . . . . . . . . . 1783
Modify Raster Images and Image Boundaries . . . . . . . . . . 1787
Manage Raster Images . . . . . . . . . . . . . . . . . . . . . . 1794
Tune Raster Image Performance . . . . . . . . . . . . . . . . . 1799
Export Drawings to Other File Formats . . . . . . . . . . . . . . . . 1802
Export DWF and DWFx Files . . . . . . . . . . . . . . . . . . . 1802
Export PDF Files . . . . . . . . . . . . . . . . . . . . . . . . . 1804
Export DXF Files . . . . . . . . . . . . . . . . . . . . . . . . . 1806
Export FBX Files . . . . . . . . . . . . . . . . . . . . . . . . . 1807
Export MicroStation DGN Files . . . . . . . . . . . . . . . . . 1808
Export WMF Files . . . . . . . . . . . . . . . . . . . . . . . . . 1811
Export Raster Files . . . . . . . . . . . . . . . . . . . . . . . . 1811
Export PostScript Files . . . . . . . . . . . . . . . . . . . . . . 1813
Export ACIS SAT Files . . . . . . . . . . . . . . . . . . . . . . . 1814
Export Stereolithography STL Files . . . . . . . . . . . . . . . . 1815
Use Drawings from Different Versions and Applications . . . . . . . 1817
Work with Drawings in Earlier Releases . . . . . . . . . . . . . 1817
Save Drawings to Previous Drawing File Formats . . . . . . . . 1822
Work with AutoCAD Drawings in AutoCAD LT . . . . . . . . . 1825
Work with Custom and Proxy Objects . . . . . . . . . . . . . . 1829
Chapter 38 Extract Data from Drawings and Spreadsheets . . . . . . . . 1833
Overview of Data Extraction . . . . . . . . . . . . . . . . . . . . . . 1833
Extract Data Using the Data Extraction Wizard . . . . . . . . . . . . 1835
Start the Data Extraction . . . . . . . . . . . . . . . . . . . . . 1838
Select the Source for a Data Extraction . . . . . . . . . . . . . . 1839
Select Objects for Data Extraction . . . . . . . . . . . . . . . . 1841
Organize and Refine the Extracted Data . . . . . . . . . . . . . 1844
Use Table Styles for Data Extraction Tables . . . . . . . . . . . 1850
Link an Excel Spreadsheet to Access Data . . . . . . . . . . . . . . . 1851
Output Extracted Data . . . . . . . . . . . . . . . . . . . . . . . . . 1855
Update Extracted Data . . . . . . . . . . . . . . . . . . . . . . . . . 1858
Overview of Updating Extracted Data . . . . . . . . . . . . . . 1858
Update Extracted Data Manually . . . . . . . . . . . . . . . . . 1859
Update Data Extraction Table Automatically . . . . . . . . . . 1861
Modify a Data Extraction Table . . . . . . . . . . . . . . . . . . . . 1863
Contents | xix
Detach a Data Extraction Table . . . . . . . . . . . . . . . . . . . . . 1866
Chapter 39 Access External Databases . . . . . . . . . . . . . . . . . . . 1867
Overview of Using External Databases . . . . . . . . . . . . . . . . . 1867
Access a Database from Within AutoCAD . . . . . . . . . . . . . . . 1869
Configure a Database for Use with AutoCAD Drawings . . . . . 1869
View Data in a Database Table . . . . . . . . . . . . . . . . . . 1872
Edit Data in a Database Table . . . . . . . . . . . . . . . . . . 1877
Link Database Records to Graphical Objects . . . . . . . . . . . . . . 1880
Create and Edit Links and Link Templates . . . . . . . . . . . . 1880
Identify and Select Existing Links . . . . . . . . . . . . . . . . 1885
Find and Correct Link Errors . . . . . . . . . . . . . . . . . . . 1888
Export Link Information . . . . . . . . . . . . . . . . . . . . . 1889
Use Labels to Display Database Information in the Drawing . . . . . 1891
Create and Edit Labels and Label Templates . . . . . . . . . . . 1891
Update Labels with New Values from the Database . . . . . . . 1896
Use Queries to Filter Database Information . . . . . . . . . . . . . . 1897
Overview of Queries . . . . . . . . . . . . . . . . . . . . . . . 1897
Construct Simple Queries . . . . . . . . . . . . . . . . . . . . 1899
Use the Query Builder . . . . . . . . . . . . . . . . . . . . . . 1903
Use SQL Queries . . . . . . . . . . . . . . . . . . . . . . . . . 1906
Combine Queries . . . . . . . . . . . . . . . . . . . . . . . . . 1907
Save and Reuse Queries . . . . . . . . . . . . . . . . . . . . . . 1910
Share Link and Label Templates and Queries with Other Users . . . . 1912
Work with Links in Files from Earlier Releases . . . . . . . . . . . . . 1913
Manage Files with Autodesk Vault . . . . . . . . . . . . . . . . . . . 1917
Part 12 Collaborate with Others . . . . . . . . . . . . . . . . . 1919
Chapter 40 Protect and Sign Drawings . . . . . . . . . . . . . . . . . . . 1921
Drawing Encryption . . . . . . . . . . . . . . . . . . . . . . . . . . 1921
Overview of Encryption . . . . . . . . . . . . . . . . . . . . . 1921
Protect Drawings with Encryption . . . . . . . . . . . . . . . . 1922
View Password-Protected Drawings . . . . . . . . . . . . . . . 1925
Sign Drawings . . . . . . . . . . . . . . . . . . . . . . . . . . . . . . 1927
Overview of Digital Signatures . . . . . . . . . . . . . . . . . . 1927
Personally Sign Drawings . . . . . . . . . . . . . . . . . . . . . 1929
View Drawings with Digital Signatures . . . . . . . . . . . . . 1937
Chapter 41 Use the Internet for Collaboration . . . . . . . . . . . . . . . 1943
Get Started with Internet Access . . . . . . . . . . . . . . . . . . . . 1943
Add Hyperlinks to a Drawing . . . . . . . . . . . . . . . . . . . . . . 1944
Overview of Using Hyperlinks in a Drawing . . . . . . . . . . . 1944
xx | Contents
Use a Hyperlink to Access a File or a Web Page . . . . . . . . . 1945
Use a Hyperlink to Create an Email Message . . . . . . . . . . 1950
Use Hyperlinks in Blocks . . . . . . . . . . . . . . . . . . . . . 1951
Use a Hyperlink to Start a New Drawing . . . . . . . . . . . . . 1952
Work with Drawing Files over the Internet . . . . . . . . . . . . . . 1953
Open and Save Drawing Files from the Internet . . . . . . . . . 1953
Share Drawing Files Internationally . . . . . . . . . . . . . . . 1958
Access Buzzsaw for Project Collaboration . . . . . . . . . . . . 1960
Work with Xrefs over the Internet . . . . . . . . . . . . . . . . 1967
Insert Content from a Website . . . . . . . . . . . . . . . . . . 1968
Package a Set of Files for Internet Transmission . . . . . . . . . 1971
Review and Markup Files with Design Review . . . . . . . . . . . . . 1980
Use the Publish to Web Wizard to Create Web Pages . . . . . . . . . 1982
Use Autodesk Seek to Add and Share Drawings . . . . . . . . . . . . 1984
Chapter 42 Use Markups for Design Review . . . . . . . . . . . . . . . . 1987
Overview of Using Markups for Design Review . . . . . . . . . . . . 1987
Publish Drawings for Review . . . . . . . . . . . . . . . . . . . . . . 1988
Insert Markups . . . . . . . . . . . . . . . . . . . . . . . . . . . . . 1989
View Markups . . . . . . . . . . . . . . . . . . . . . . . . . . . . . . 1989
Respond to Markups . . . . . . . . . . . . . . . . . . . . . . . . . . 1994
Republish a Markup Set . . . . . . . . . . . . . . . . . . . . . . . . . 1997
Part 13 Render Drawings . . . . . . . . . . . . . . . . . . . . . 1999
Chapter 43 Draw 2D Isometric Views . . . . . . . . . . . . . . . . . . . . 2001
Set Isometric Grid and Snap . . . . . . . . . . . . . . . . . . . . . . 2001
Draw Isometric Circles . . . . . . . . . . . . . . . . . . . . . . . . . 2003
Chapter 44 Add Lighting to Your Model . . . . . . . . . . . . . . . . . . 2005
Overview of Lighting . . . . . . . . . . . . . . . . . . . . . . . . . . 2005
Standard and Photometric Lighting Workflow . . . . . . . . . . . . . 2010
Illuminate a Scene . . . . . . . . . . . . . . . . . . . . . . . . . . . 2012
Guidelines for Lighting . . . . . . . . . . . . . . . . . . . . . . 2012
Use Point Lights . . . . . . . . . . . . . . . . . . . . . . . . . 2015
Use Spotlights . . . . . . . . . . . . . . . . . . . . . . . . . . . 2022
Use Weblights . . . . . . . . . . . . . . . . . . . . . . . . . . . 2028
Use Distant Lights . . . . . . . . . . . . . . . . . . . . . . . . 2039
Assigning a Shape to a Light . . . . . . . . . . . . . . . . . . . 2041
Adjust and Manipulate Lights . . . . . . . . . . . . . . . . . . . . . 2042
Control the Display of Lights . . . . . . . . . . . . . . . . . . 2043
Adjust Light Placement . . . . . . . . . . . . . . . . . . . . . . 2045
Control Light Properties . . . . . . . . . . . . . . . . . . . . . 2049
Contents | xxi
Sun and Sky Simulation . . . . . . . . . . . . . . . . . . . . . . . . 2056
Incorporate Luminaire Objects . . . . . . . . . . . . . . . . . . . . . 2061
Converting Lights . . . . . . . . . . . . . . . . . . . . . . . . . . . 2063
Work with Lights in Drawings from Previous Versions of
AutoCAD . . . . . . . . . . . . . . . . . . . . . . . . . . . . 2063
Import Drawings into 3ds Max or VIZ . . . . . . . . . . . . . . 2064
Chapter 45 Materials and Textures . . . . . . . . . . . . . . . . . . . . . 2065
Overview of Materials . . . . . . . . . . . . . . . . . . . . . . . . . 2065
Create and Modify Materials . . . . . . . . . . . . . . . . . . . . . . 2066
Browse Material Libraries . . . . . . . . . . . . . . . . . . . . . 2067
Create New Materials . . . . . . . . . . . . . . . . . . . . . . . 2071
Manage and Organize Materials . . . . . . . . . . . . . . . . . 2077
Modify Materials . . . . . . . . . . . . . . . . . . . . . . . . . 2080
Convert Materials . . . . . . . . . . . . . . . . . . . . . . . . . 2082
Apply Materials to Objects and Faces . . . . . . . . . . . . . . . . . 2082
Use Maps for Added Realism . . . . . . . . . . . . . . . . . . . . . . 2084
Overview of Maps . . . . . . . . . . . . . . . . . . . . . . . . 2084
Use Map Channels for Added Texture Realism . . . . . . . . . 2084
Understand Map Types . . . . . . . . . . . . . . . . . . . . . . 2087
Modify Map Properties . . . . . . . . . . . . . . . . . . . . . . 2093
Adjust Mapping On Objects and Faces . . . . . . . . . . . . . . 2098
Chapter 46 Render 3D Objects for Realism . . . . . . . . . . . . . . . . . 2101
Overview of Rendering . . . . . . . . . . . . . . . . . . . . . . . . . 2101
Prepare a Model for Rendering . . . . . . . . . . . . . . . . . . . . . 2103
Understand Face Normals and Hidden Surfaces . . . . . . . . . 2103
Minimize Intersecting and Coplanar Faces . . . . . . . . . . . 2106
Balance Mesh Density for Smooth Geometry . . . . . . . . . . 2108
Set Up the Renderer . . . . . . . . . . . . . . . . . . . . . . . . . . . 2111
Use the Render Settings Palette . . . . . . . . . . . . . . . . . . 2111
Create Custom Render Presets . . . . . . . . . . . . . . . . . . 2113
Control the Rendering Environment . . . . . . . . . . . . . . 2116
Basics of Rendering . . . . . . . . . . . . . . . . . . . . . . . . . . . 2119
Set the Render Destination . . . . . . . . . . . . . . . . . . . . 2119
Render Views, Selected Objects, or Cropped Content . . . . . . 2121
Set Output Resolution . . . . . . . . . . . . . . . . . . . . . . 2124
Material Adjustments . . . . . . . . . . . . . . . . . . . . . . . 2126
Adjust Sampling to Improve Image Quality . . . . . . . . . . . 2127
Use Shadows in Rendering . . . . . . . . . . . . . . . . . . . . 2130
Advanced Rendering . . . . . . . . . . . . . . . . . . . . . . . . . . 2133
Ray-traced Reflections and Refractions . . . . . . . . . . . . . 2133
Benefits of Indirect Illumination . . . . . . . . . . . . . . . . . 2136
Final Gathering . . . . . . . . . . . . . . . . . . . . . . . . . . 2138
Rendered Image Histories . . . . . . . . . . . . . . . . . . . . . . . . 2139
xxii | Contents
Save and Redisplay Rendered Images . . . . . . . . . . . . . . . . . . 2142
Save a Rendered Image . . . . . . . . . . . . . . . . . . . . . . 2142
Redisplay a Rendered Image . . . . . . . . . . . . . . . . . . . 2144
Save Copies of Rendered Images . . . . . . . . . . . . . . . . . 2145
Use Models with Other Applications . . . . . . . . . . . . . . . 2145
Update Legacy Drawings . . . . . . . . . . . . . . . . . . . . . 2146
Glossary . . . . . . . . . . . . . . . . . . . . . . . . . . . . . 2149
Index . . . . . . . . . . . . . . . . . . . . . . . . . . . . . . 2189
Contents | xxiii
xxiv
Part 1: Get Information
1
2
Find the Information You
Need
There are various ways to find information about how to use this program, and multiple
resources are available.
This program is a powerful application with tools that help you work with a high level of
efficiency and productivity. You install this software with the Installation wizard that starts
automatically when you insert the product media.
This application is often intuitive, but when you do need to look something up, you can save
time and avoid frustration if you use the Help system to find information. The Help system
is organized in a structured design that makes information easy to locate.
Find Information Using InfoCenter
You can use InfoCenter to search a variety of information sources with one
query. You can also easily access product updates and announcements.
Overview of InfoCenter
You can use InfoCenter to search a variety of information sources with one
query. You can also easily access product updates and announcements.
You can use InfoCenter to:
■Search for information through keywords (or by entering a phrase)
■Access subscription services through Subscription Center panel
■Access to product-related updates and announcements through
Communication Center panel
1
3
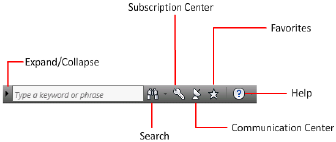
■Access saved topics through Favorites panel
■Access topics in Help
To display the InfoCenter box in a collapsed state, click the arrow to its left.
To browse search results
➤ On the panel for Search Results, Subscription Center, Communication
Center, or Favorites, on the right side of the category header, do one of
the following:
■Click the Next button.
■Click the Previous button.
To rearrange the topics displayed on a panel
1Display a panel by doing one of the following:
■In the InfoCenter box, enter a keyword or phrase. Then press ENTER
or click the Search button.
■In the InfoCenter box, click the Communication Center button.
■In the InfoCenter box, click the Favorites button.
2Click and drag a category or group header to the desired position.
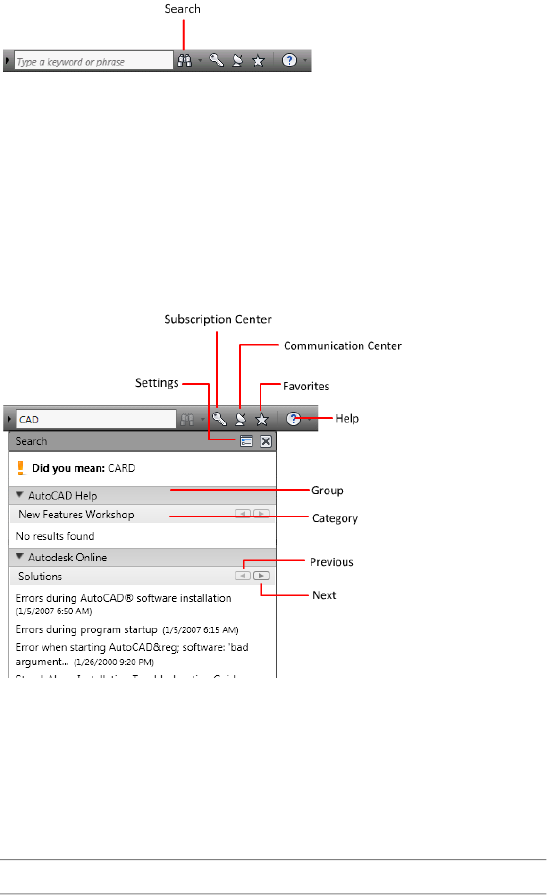
Search For Information
You can enter keywords or a phrase in the InfoCenter box to search for
information.
When you enter keywords or a phrase in the InfoCenter box, you search the
contents of multiple Help resources as well as any additional documents that
have been specified in the InfoCenter Settings dialog box or through the CAD
Manager Control Utility.
4 | Chapter 1 Find the Information You Need
When you enter keywords or a phrase in the InfoCenter box, you search the
contents of multiple Help resources as well as any additional documents that
have been specified in the InfoCenter Settings dialog box or through the CAD
Manager Control Utility.
Keyword searches produce better results. In case of a misspelled word, spelling
suggestions are displayed on the panel.
The results are displayed as links on the InfoCenter Search Results panel. Click
a link to display the topic, article, or document.
To keep Search Results, Subscription Center, Communication Center, and the
Favorites panel expanded, click the push pin icon in the bottom-right corner
of the panel.
When you use InfoCenter to search for information, you can use the following
special symbols in your query to refine or expand it. These symbols can be
used alone or can be combined.
DescriptionSymbol
Replaces one or more characters when used at the begin-
ning, middle, or end of a word. For example, “*lish”,
*
“p*lish”, and “pub*” will all find “publish”. Also, “anno*”
Search For Information | 5
DescriptionSymbol
will find “annotative”, “annotation”, “annoupdate”, “annore-
set”, and so on.
Replaces a single character. For example, “cop?” will find
“copy”, but not “copybase”.
?
Adds grammatical form variations to a keyword when added
at the beginning or end of a word. For example, “plotting~”
~
will find “plots”, “plotted”, and so on. Also, “~plot” will find
“preplot”, “replot”, and so on.
When performing the exact phrase search, use double quotation marks (" ")
to enclose words that must appear next to each other in the specified sequence.
For example, enter "specify units of measurement" to find only topics with
all those words in that order. You can also use the previously mentioned
symbols in a text string that is enclosed in double quotation marks.
See also:
■Specify InfoCenter Settings on page 11
To search multiple sources for information
1In the InfoCenter box, enter a keyword or phrase.
2Click the Search button.
To search a single location for information
1In the InfoCenter box, enter a keyword or phrase.
2Click the down arrow next to the Search button.
3Select a location from the list to search.
To add a location to search
1In the InfoCenter box, click the down arrow next to the Search button.
2Click Add Search Location.
3In the Add Search Location dialog box, specify a document or a file
location to search.
4Click Add.
6 | Chapter 1 Find the Information You Need
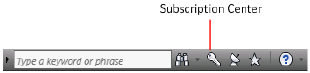
Access Subscription Center
You can click the Subscription Center button to display links to information
about subscription services such as product enhancements, personalized web
support from Autodesk technical experts, and self-paced e-Learning. To learn
more about Autodesk subscription membership, visit
http://www.autodesk.com/subscriptioncenter.
Autodesk Subscription Services
With Autodesk Subscription, you get the latest releases of Autodesk software,
incremental product enhancements, personalized web support from Autodesk
technical experts, and self-paced e-Learning.
Subscription services are available to subscription members only (available in
countries/regions where Autodesk subscriptions are offered).
Click the Subscription Center button in the InfoCenter box to access the
following options:
■Create support request. Provides direct communication with Autodesk
support technicians. You receive fast, complete answers to your installation,
configuration, and troubleshooting questions.
■View support request. Tracks and manages your questions and responses
through Autodesk's support system.
■Edit Subscription Center profile. Sets up and maintains your subscription
membership.
■View e-Learning catalog. Features interactive lessons organized into product
catalogs.
■e-Learning lessons. Provides e-Learning lessons. Each lesson is 15-30
minutes and features hands-on exercises, with an option to use a simulation
instead of the software application. You can use an online evaluation tool
that identifies gaps in skills, determines the lessons that will be most
helpful, and keeps track of learning progress.
Subscription Resources and Privacy
Subscription resources provide interactive product features over the Internet.
Each time you access subscription resources from Subscription Center in an
Access Subscription Center | 7
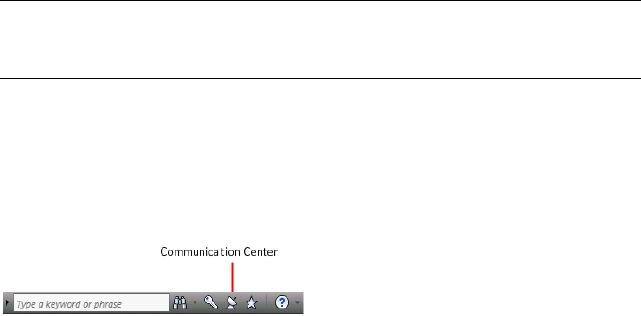
Autodesk product, product information (such as the serial number, version,
language, and the subscription contract ID) is sent to Autodesk for verification
that your product is on subscription.
Autodesk compiles statistics using the information sent to subscription
resources to monitor how they are being used and how they can be improved.
Autodesk maintains the information provided by or collected from you in
accordance with Autodesk's published privacy policy, which is available at
http://www.autodesk.com/privacy.
Enable Subscription Resources
The CAD Manager Control Utility can be used to turn Subscription Resources
on and off in the program.
To access the Subscription
1In the InfoCenter box, click the Subscription Center button.
2On the Subscription Center panel, under Subscription Center, click the
subscription resource you want to access.
NOTE Subscription Center is not available to all product users. If subscription
resources are not available in your product, your product is not entitled to
subscription benefits.
Receive Product Updates and Announcements
You can click the Communication Center button to display links to
information about product updates and announcements, and may include
links to RSS feeds.
Overview of Communication Center
To open Communication Center, click the Communication Center button in
the InfoCenter box.
8 | Chapter 1 Find the Information You Need
Communication Center provides the following types of announcements:
■Autodesk Channels: Receive support information, product updates, and
other announcements (including articles and tips).
■CAD Manager Channel. Receive information (RSS feeds) published by your
CAD manager.
■RSS Feeds. Receive information from RSS feeds to which you subscribe.
RSS feeds generally notify you when new content is posted. You are
automatically subscribed to several default RSS feeds when you install the
program.
You can customize the items that display in the Communication Center panel.
Communication Center Online Privacy
Communication Center is an interactive feature that must be connected to
the Internet in order to deliver content and information. Each time
Communication Center is connected, it sends your information to Autodesk
so that you receive the correct information. All information is sent
anonymously to Autodesk to maintain your privacy.
The following information is sent to Autodesk:
■Product name (in which you are using Communication Center)
■Product release number
■Product language
■Country/region (specified in the Communication Center settings)
■Your subscription contract number (if you’re a subscription customer)
Autodesk compiles statistics using the information sent from Communication
Center to monitor how it is being used and how it can be improved. Autodesk
maintains information provided by or collected from you in accordance with
the company's published privacy policy, which is available on
http://www.autodesk.com/privacy.
See also:
■Specify InfoCenter Settings on page 11
■Access Subscription Center on page 7
Receive Product Updates and Announcements | 9
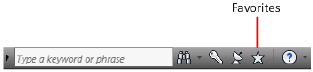
Receive New Information Notifications
Whenever new information is available, Communication Center notifies you
by displaying a balloon message below the Communication Center button
on the InfoCenter box.
Click the link in the balloon message to open the article or announcement.
If you don’t want to receive Communication Center notifications, in the
InfoCenter Settings dialog box, turn off Balloon Notification.
See also:
■Specify InfoCenter Settings on page 11
Save and Access Favorite Topics
You can click the Favorites button to display saved links to topics or web
locations.
Any link that displays on the Search Results panel, Subscription Center or
Communication Center panel can be marked as a favorite.
A link marked as a favorite displays a star icon on the Search Results panel,
Subscription Center panel or the Communication Center panel.
To display the InfoCenter Favorites panel
■In the InfoCenter box, click the Favorites button.
To save a link in InfoCenter as a favorite
1Display a panel by doing one of the following:
■In the InfoCenter box, enter a keyword or phrase. Then press ENTER
or click the Search button.
■In the InfoCenter box, click the Subscription Center button.
■In the InfoCenter box, click the Communication Center button.
2Click the star icon that is displayed next to the link that you want to save
as a favorite.
10 | Chapter 1 Find the Information You Need
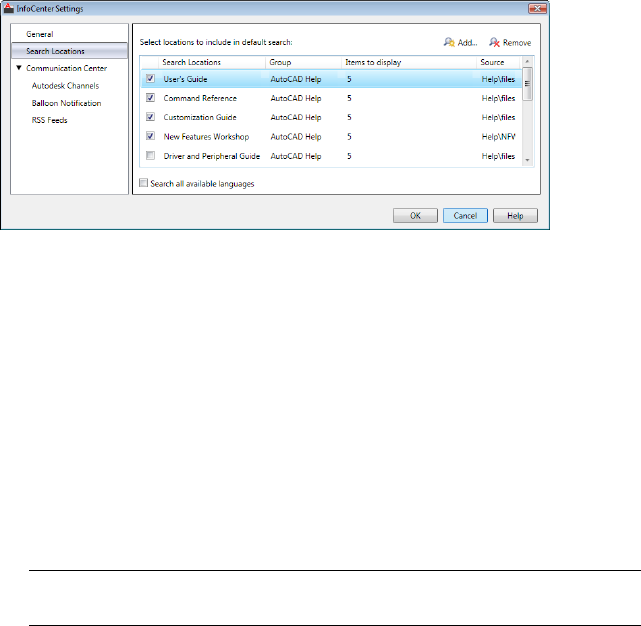
To remove a favorite link from the InfoCenter Favorites panel
1In the InfoCenter box, click the Favorites button to display the Favorites
panel.
2Click the star icon that is displayed next to the link that you want to
remove from the Favorites panel.
Specify InfoCenter Settings
You can specify InfoCenter Search and Communication Center settings in
the InfoCenter Settings dialog box.
In the InfoCenter Settings dialog box, you can specify the following settings:
■General. Your current location, frequency for checking new online content
and option to turn on or off animated transition effects for the InfoCenter
panels.
■Search Locations. Locations (documents, web locations, and files) to search
for information, as well as the name that displays for each location and
the number of results to display for each. Also, you can add or remove
search locations.
The Web Locations check box provides access to important information
on the Autodesk website, including the Knowledge Base and discussion
groups. When you add document locations, you can specify files on your
local drive.
NOTE User-specified CHM (compiled help) files must be located on your local
drive. InfoCenter cannot search CHM files located on network drives.
Specify InfoCenter Settings | 11

■Communication Center. Maximum age of the articles displayed on the
Communication Center panel and the location and name of the CAD
Manager Channel.
■Autodesk Channels. Channels to display in the Communication Center
panel as well as the number of articles to display for each channel.
■Balloon Notification. Notifications for new product information, software
updates, product support announcements, and Did You Know messages.
Also, you can customize the transparency and the display time of the
balloon.
NOTE Did You Know messages displayed below the Communication Center
button on the InfoCenter box provide Knowledge Base information and general
instructional messages such as tips. You can click on the text or the Expand
icon to expand the balloon to view the detailed information.
■RSS Feeds. RSS feed subscriptions. You can add or remove RSS feeds. RSS
feeds generally notify you when new content is posted.
You can use the CAD Manager Control utility to specify InfoCenter Search
and Communication Center settings. For more information about how to
install and run the utility, see To install the CAD Manager Control utility on
page 104. Click Help in the CAD Manager Control utility window for details
about the settings you can control.
To specify locations to search for information
1In the InfoCenter box, click the down arrow next to the Search button.
2Click Search Settings.
3In the InfoCenter Settings dialog box, Search Locations panel, in the right
pane, select or clear the search locations you want to include or exclude
when you search for information.
4Click OK.
To add new location to search for information
1In the InfoCenter box, click the down arrow next to the Search button.
2Click Search Settings.
3In the InfoCenter Settings dialog box, do one of the following:
■On the Search Locations panel, in the right pane, click Add.
12 | Chapter 1 Find the Information You Need
■On the Search Locations panel, in the right pane, right-click anywhere
in the pane. Click Add.
4In the Add Search Location dialog box, specify a file location to search.
5Click Add.
6Click OK.
To remove a search location
1In the InfoCenter box, click the down arrow next to the Search button.
2Click Search Settings.
3In the InfoCenter Settings dialog box, do one of the following:
■Select a location to remove, and then click Remove.
■Right-click a search location. Click Remove.
4In the InfoCenter - Remove Search Location dialog box, click Yes.
5Click OK.
To specify the CAD Manager Channel location and name
1Click Start menu (Windows) ➤ All Programs (or Programs) ➤ Autodesk
➤ CAD Manager Tools ➤ CAD Manager Control Utility.
2Select the product you want to modify. Click OK.
3In the CAD Manager Control Utility window, InfoCenter tab, select the
option to enable CAD Manager Channel.
4Enter an appropriate feed under Feed Location.
5Enter the display name for the CAD Manager and then click Apply. Click
OK.
6Restart AutoCAD.
7In the upper right-side of the application, on the InfoCenter box, click
the arrow next to the Search button.
8Click Search Settings.
Specify InfoCenter Settings | 13

9In the InfoCenter Settings dialog box, in the left pane, click
Communication Center. The CAD Manager Channel location and name
are displayed.
NOTE A green check mark is displayed if the channel can be located and a yellow
warning sign is displayed if it cannot be located.
To specify the channels to display in the Communication Center panel
1In the InfoCenter box, click the down arrow next to the Search button.
2Click Search Settings.
3In the InfoCenter Settings dialog box, in the left pane, click Autodesk
Channels.
4In the right pane, select or clear the channels you want to display in the
Communication Center panel.
5Click OK.
To specify InfoCenter balloon notification settings
1In the InfoCenter box, click the arrow next to the Search button.
2Click Search Settings.
3In the InfoCenter Settings dialog box, in the left pane, click Balloon
Notification.
4In the right pane, select or clear the options to turn balloon notification
on or off.
NOTE You can turn off the balloon notification for Did You Know messages
in the InfoCenter Settings dialog box.
5Select one of the following options to set the display time for the Did
You Know messages:
■Use Balloon Notification Display Time. Uses the display time specified
in the InfoCenter Settings dialog box (Balloon Notification panel) for
the Did You Know messages. This option is unavailable if the Did You
Know messages option is cleared.
■Display until Closed. Displays the Did You Know message until you
click the Close button.
14 | Chapter 1 Find the Information You Need
6Enter the number of seconds to set the length of time for balloon
notifications to display.
7Enter the transparency value of the balloon or set the value using the
slider.
8Click OK.
To turn on the display of Did You Know hidden messages
1Click Tools menu ➤ Options.
2In the Options dialog box, System tab, under General Options, click the
Hidden Message Settings button.
3In the Hidden Message Settings dialog box, select the InfoCenter Did You
Know Balloons option to turn on the display of all hidden messages.
Click OK.
4Click OK.
To add an RSS feed to Communication Center
1In the InfoCenter box, click the down arrow next to the Search button.
2Click Search Settings.
3In the InfoCenter Settings dialog box, in the left pane, click RSS Feeds.
4In the right pane, do one of the following:
■Click Add.
■Right-click anywhere in the right pane. Click Add.
5In the Add RSS Feed dialog box, enter the location of the RSS feed you
want to add. Click Add.
6In the InfoCenter - RSS Feed Confirmation dialog box, click Close.
7Click OK.
To remove an RSS feed from Communication Center
1In the InfoCenter box, click the down arrow next to the Search button.
2Click Search Settings.
3In the InfoCenter Settings dialog box, in the left pane, click RSS Feeds.
Specify InfoCenter Settings | 15
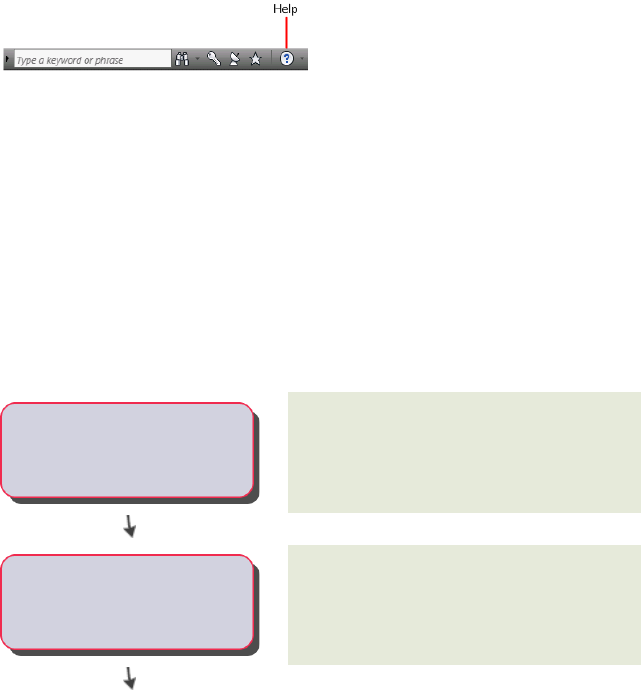
4In the right pane, do one of the following:
■Click Remove.
■Right-click an RSS feed. Click Remove.
5In the InfoCenter - Remove RSS Feed dialog box, click Yes.
6Click OK.
Search Topics in Help
You can click the Help button to display topics in Help.
You can get much more benefit from the Help system when you learn how
to use it efficiently. You can quickly find general descriptions, procedures,
details about dialog boxes and palettes, or definitions of terms.
To display topics in Help
■In the InfoCenter box, click the Help button.
Learn the Product
For the latest information about Autodesk training, visit
http://www.autodesk.com/training or contact your local Autodesk office.
The New Features Workshop introduces you to
what's new in PRODNAME.
-----New Features Workshop
More than 1,200 ATC sites are available
worldwide to meet your needs for
discipline-specific, locally based training.
-----Authorized Training Centers
16 | Chapter 1 Find the Information You Need
Autodesk Official Training Courseware (AOTC) is
technical training material developed by
-----
Autodesk Official Training
Courseware Autodesk. You can purchase AOTC from your
local reseller or distributor, or you can order it
online from the Autodesk Store.
Autodesk e-Learning for Autodesk Subscription
customers features interactive lessons organized
into product catalogs.
-----e-Learning
The Autodesk Developer (ADN) program provides
support for full-time, professional developers who
-----Autodesk Developer Network want to build software based on Autodesk
products.
Autodesk Consulting provides services that help
set up processes and provide critical training that
-----Consulting will help increase productivity so you can
capitalize on the power of your products.
Visit the Partner Products & Services page for a
list of resources available for your Autodesk
product and your industry.
-----Partner Products and Services
View the Product Readme
You can find late-breaking information about this software in the Readme.
It is suggested that you read through the Readme for information about
recommended hardware, updated installation instructions, and known software
problems.
■View the Readme
View the Product Readme | 17

Where to Find AutoCAD Express Tools Volumes 1-9
AutoCAD Express Tools Volumes 1-9 contain a library of productivity tools
designed to help you extend the power of AutoCAD. They are easy to use,
easily integrated into your menus and toolbars, and cover a wide range of
AutoCAD functions (including dimensioning, drawing, object selection, and
object modification).
AutoCAD Express Tools Volumes 1-9 are installed as a Typical installation of
AutoCAD. If you do not want them installed, you must disable them during
the AutoCAD installation by selecting the Express Tools option on the Select
the Installation Type page.
For more detailed information about using Express Tools, refer to the AutoCAD
Express Tools Help system found on the Express menu (in the Classic Menu
Bar on page 47).
NOTE Express Tools are available in their original form, in English only, and are
not supported. Double-byte characters are not supported.
To verify if Express Tools are loaded
■At the Command prompt, enter EXPRESSTOOLS to enable the tools.
You can install the AutoCAD Express Tools as part of the AutoCAD
installation, or you can add them later using Add or Remove Programs on
the Control Panel.
To access the Express Tools and their toolbars
■To display the Express menu, enter EXPRESSMENU at the Command
prompt.
■To display the Express toolbars, right-click next to any docked toolbar.
Click EXPRESS, and select an Express toolbar. Repeat these steps until all
of the Express toolbars you want are displayed.
TIP With the Express toolbars displayed, select a workspace and save it. The
Express Tools toolbars will then always be included with that workspace.
Join the Customer Involvement Program
You are invited to help guide the direction of Autodesk design software.
18 | Chapter 1 Find the Information You Need
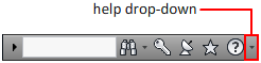
If you participate in the Customer Involvement Program (CIP), specific
information about how you use AutoCAD is forwarded to Autodesk. This
information includes what features you use the most, problems that you
encounter, and other information helpful to the future direction of the
product.
See the following links for more information.
■Learn more about the Autodesk Customer Involvement Program:
http://www.autodesk.com/cip
■Read the Autodesk Privacy Statement: http://www.autodesk.com/cipprivacy
When you join, you will be able to view reports that can help you optimize
your use of AutoCAD.
To turn the CIP on or off
1On the InfoCenter toolbar, to the right of the Help button, click the
drop-down arrow.
2Click Customer Involvement Program.
3In the Customer Involvement Program dialog box, select to start or stop
participating.
4Click OK.
Join the Customer Involvement Program | 19
20
Get Information from
Drawings
You can retrieve general information from a drawing including identifying information and
the number of objects that it contains.
There are types of information stored in a drawing that are not specific to objects within the
drawing, but provide useful information to help you understand the behavior of the drawing,
the settings of system variables, the number of objects, descriptive information, and so on.
Obtain General Drawing Information
You can retrieve general information about the drawing file and its settings.
This information includes the following:
■Custom descriptive information about the drawing (DWGPROPS)
■General drawing settings (STATUS)
■Amount of time spent in the drawing (TIME)
This information can help you document a drawing, displays a variety of drawing
settings such as the total number of objects in the drawing and the amount of
free space on your disk drive, and the total amount of time spent in the drawing
file.
See also:
■Enter System Variables on the Command Line on page 56
■Add Identifying Information to Drawings on page 174
■Extract Geometric Information from Objects on page 620
2
21
■Compare Dimension Styles and Variables on page 1425
Quick Reference
Commands
DWGPROPS
Sets and displays the file properties of the current drawing.
SETVAR
Lists or changes the values of system variables.
STATUS
Displays drawing statistics, modes, and extents.
TIME
Displays the date and time statistics of a drawing.
System Variables
CDATE
Stores the current date and time in decimal format.
DATE
Stores the current date and time in Modified Julian Date format.
SAVENAME
Displays the file name and directory path of the most recently saved drawing.
Count Objects Within a Drawing
You can count objects within a drawing using the QSELECT command.
The QSELECT command displays the Quick Select dialog box, which allows
you to create a selection set based on the filtering criteria. You can filter
selection sets by property such as color or linetype, and by object type.
Creating a selection set based on the filtering criteria in the Quick Select dialog
box, allows you to count specified types of objects within a drawing.
22 | Chapter 2 Get Information from Drawings

To count specified types of objects in a drawing
1Click Home tab ➤ Utilities panel ➤ Quick Select.
2In the Quick Select dialog box, do one of the following:
■In the Apply To List, select Entire Drawing.
■Click the Select Objects button to select a group of objects. Press Enter.
In the Apply To list, select Current selection.
3In the Object Type list, select the type of object you want to count.
4In the Properties list, select a property that belongs to the type of objects
you want to count.
5In the Operator list, select = Equals.
6In the Value list, select the property value of the type of objects you want
to count.
7Click OK.
The number of objects displays at the Command prompt.
Quick Reference
Commands
QSELECT
Creates a selection set based on filtering criteria.
Count Objects Within a Drawing | 23
24
Part 2: The User Interface
25
26
Tools in the Application
Window
Use the Application menu, Quick Access toolbar, and ribbon to access many frequently used
commands.
The Application Menu
Click the application button to search for commands, as well as access tools to
create, open, and publish a file.
Search for Commands
Perform a real-time search for commands on the Quick Access toolbar, in the
application menu, and on the ribbon.
The Search field displays at the top of the application menu. Search results can
include menu commands, basic tooltips, and command prompt text strings.
You can enter a search term in any language.
3
27
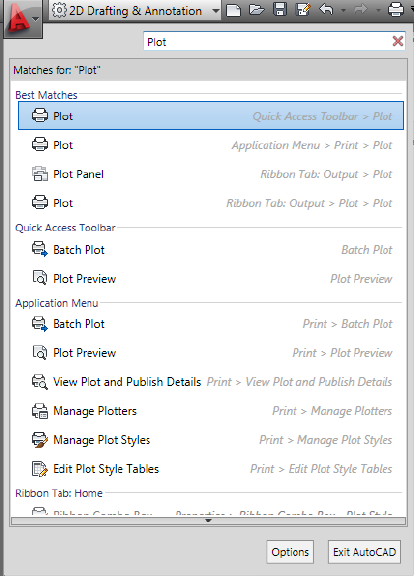
Quick Reference
Commands
CUI
Manages the customized user interface elements in the product.
OPTIONS
Customizes the program settings.
Access Common Tools
Access common tools to start or publish a file in the application menu.
28 | Chapter 3 Tools in the Application Window

Click the application button to quickly
■Create, open, or save a file
■Audit, recover, and purge a file
■Print or publish a file
■Access the Options dialog box
■Close AutoCAD
NOTE You can also close AutoCAD by double-clicking the Application button.
Quick Reference
Commands
CUI
Manages the customized user interface elements in the product.
OPTIONS
Customizes the program settings.
Browse Files
View, sort, and access supported files that you have recently opened.
Recent Documents
View the most recently used files with the Recent Documents list.
Files display in the Recent Documents list with the most recently used file at
the top by default.
Browse Files | 29
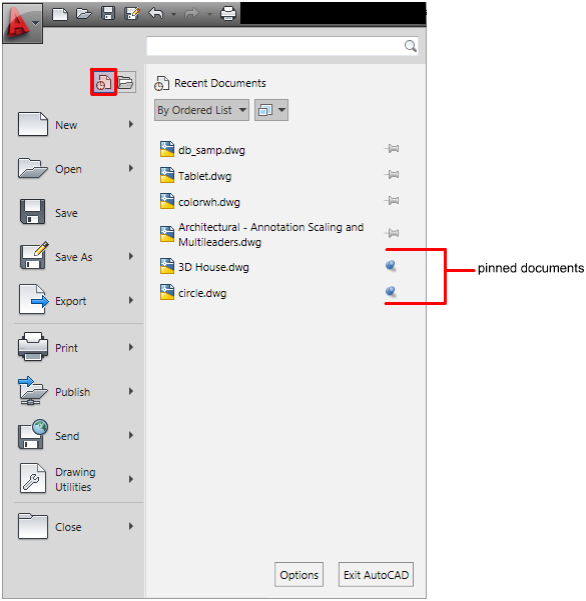
Pinned Files
You can keep a file listed regardless of files that you save later using the push
pin button to the right. The file is displayed at the bottom of the list until you
turn off the push pin button.
Sort and Group Options
Use the drop-down list at the top of the Recent Documents list to sort or group
files by
■File name
■File size
■File type
■Date the files were last modified
30 | Chapter 3 Tools in the Application Window
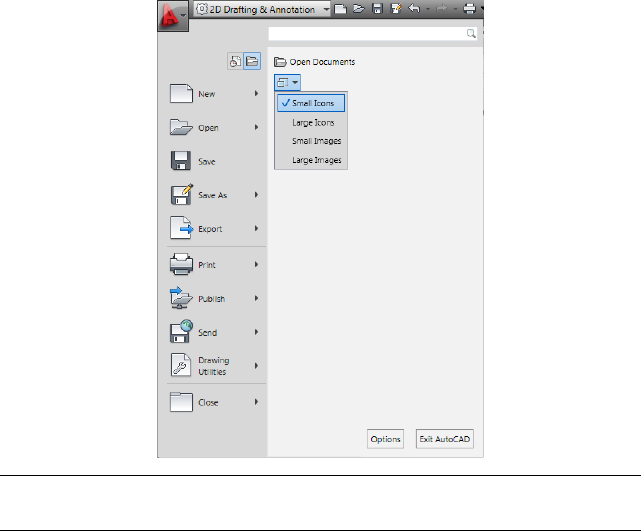
To change the preview display options for recent documents
1Click the Application menu and then, click Recent Documents.
2Under the Search text box, click the Display Options menu.
3Select a display option.
NOTE The preview display option you choose remains in both the Recent
Documents and Open Documents lists.
To change the number of recent documents listed
1Click Tools ➤ Options.
2In the Options dialog box, click the Open and Save tab.
3In the Application Menu ➤ Number of Recently Used Files text box,
enter the number of recent documents to be listed. You can choose any
number between 0 and 50.
Browse Files | 31
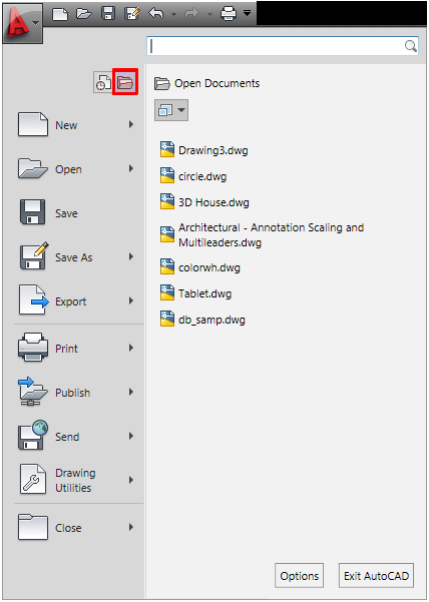
Quick Reference
Commands
CUI
Manages the customized user interface elements in the product.
OPTIONS
Customizes the program settings.
Currently Open Documents
View only files that are currently open with the Open Documents list.
Files display in the Open Documents list with the most recently opened file
at the top. To make a file current, click the file in the list.
32 | Chapter 3 Tools in the Application Window

To change the preview display options for currently open documents
1Click the Application menu and then, click Open Documents.
2Under the Search text box, click the Display Options menu.
3Select a display option.
NOTE The preview display option you choose remains in both the Recent
Documents and Open Documents quick menus.
Quick Reference
Commands
CUI
Manages the customized user interface elements in the product.
OPTIONS
Customizes the program settings.
Browse Files | 33
Preview Documents
View a thumbnail of files in the Recent Documents and Open Documents
lists.
When you hover over a file in either of the lists, a preview of the file is
displayed along with the following information:
■Path where the file is stored
■Date the file was last modified
■Version of the product used to create the file
■Name of the person who last saved the file
■Name of the person who is currently editing the file
You can also include a thumbnail of the file next to the files in the list. To
change the file icon to a thumbnail preview, click the drop-down list at the
top of the Recent Documents or Open Documents lists and choose small icons,
large icons, small images, or large images.
Quick Reference
Commands
CUI
Manages the customized user interface elements in the product.
OPTIONS
Customizes the program settings.
Quick Access Toolbar
Display frequently used tools with the Quick Access toolbar.
34 | Chapter 3 Tools in the Application Window
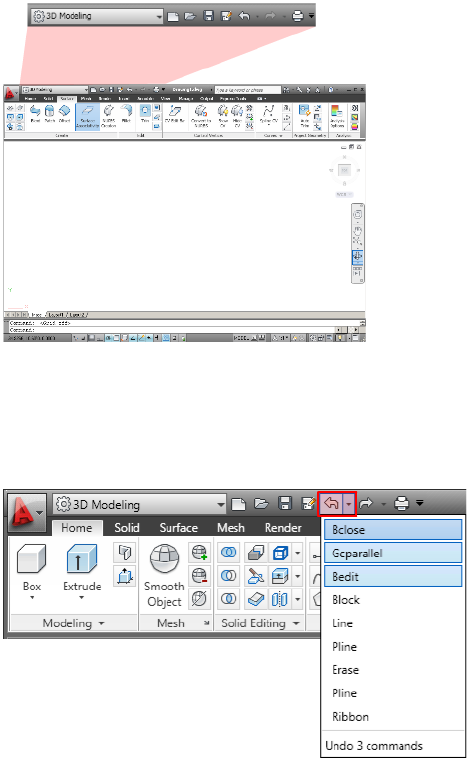
View Undo and Redo History
The Quick Access toolbar displays options to undo and redo changes to your
file. To undo or redo a less recent change, click the drop-down button to the
right of the Undo and Redo buttons.
Add Commands and Controls
Add unlimited tools to the Quick Access toolbar. Tools that extend past the
maximum length of the toolbar are displayed in a flyout button.
Quick Access Toolbar | 35
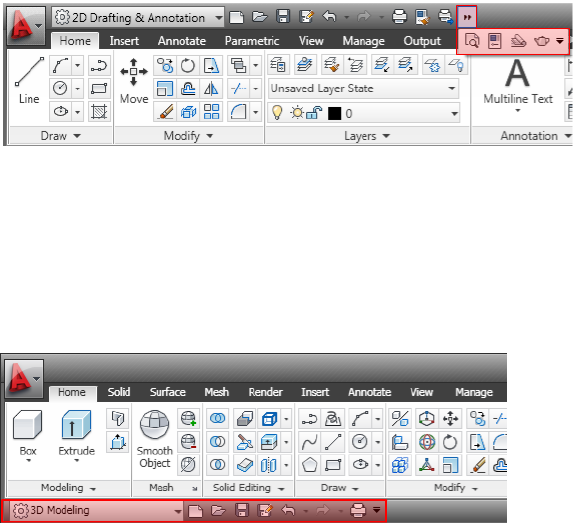
To add a ribbon button to the Quick Access toolbar, right-click the button on
the ribbon and click Add to Quick Access toolbar. Buttons are added to the
right of the default commands on the Quick Access toolbar.
Move the Quick Access Toolbar
Place the Quick Access toolbar either above or below the ribbon using the
Customization button.
See also:
■Quick Access Toolbars
■Toolbars on page 48
To add a command to the Quick Access toolbar
1Right-click the Quick Access toolbar.
2Click Customize Quick Access Toolbar.
3In the Customize User Interface (CUI) Editor, drag a command from the
Command list to the position you want it to be displayed on the Quick
Access toolbar.
For multiple commands, hold down CTRL and select the commands.
4Click OK.
36 | Chapter 3 Tools in the Application Window
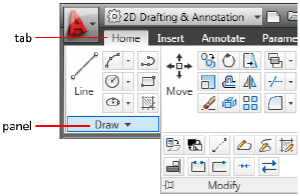
To remove a command from the Quick Access toolbar
1Right-click the command you want to remove.
2Click Remove from Quick Access Toolbar.
Quick Reference
Commands
CUI
Manages the customized user interface elements in the product.
The Ribbon
The ribbon is a palette that displays task-based tools and controls.
Overview of the Ribbon
The ribbon is displayed by default when you open a file, providing a compact
palette of all of the tools necessary to create or modify your drawing.
Quick Reference
Commands
CUI
Manages the customized user interface elements in the product.
RIBBON
Opens the ribbon window.
The Ribbon | 37
RIBBONCLOSE
Closes the ribbon window.
System Variables
MTEXTTOOLBAR
Controls the display of the Text Formatting toolbar.
RIBBONCONTEXTSELECT
Controls how ribbon contextual tabs are displayed when you single- or
double-click an object.
RIBBONCONTEXTSELLIM
Limits the number of objects that can be changed at one time with the ribbon
property controls or a contextual tab.
RIBBONDOCKEDHEIGHT
Determines whether the horizontally docked ribbon is set to the height of
the current tab or a predetermined height.
RIBBONSELECTMODE
Determines whether a pickfirst selection set remains selected after a ribbon
contextual tab is invoked and the command is completed.
RIBBONSTATE
Indicates whether the ribbon palette is open or closed.
TABLETOOLBAR
Controls the display of the Table toolbar.
Display and Organize the Ribbon
The ribbon is displayed horizontally or vertically.
The horizontal ribbon is displayed across the top of the file window. You can
dock the vertical ribbon to the left or right of the file window.
The vertical ribbon can also float in the file window or on a second monitor.
38 | Chapter 3 Tools in the Application Window
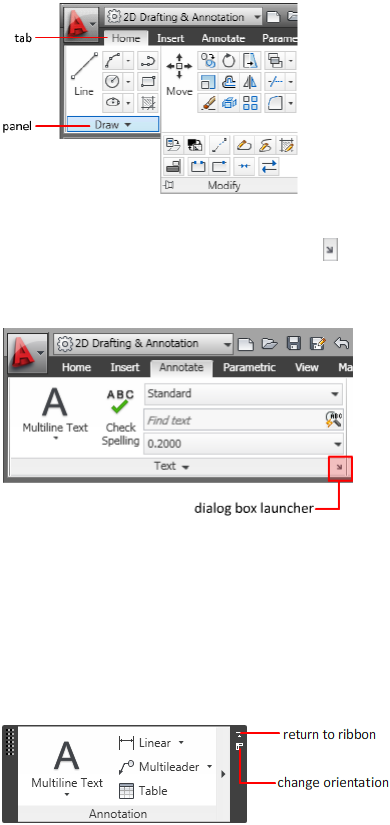
Ribbon Tabs and Panels
The ribbon is composed of a series of panels, which are organized into tabs
labeled by task. Ribbon panels contain many of the same tools and controls
available in toolbars and dialog boxes.
Some ribbon panels display a dialog box related to that panel. The dialog box
launcher is denoted by an arrow icon, , in the lower-right corner of the
panel. The dialog box launcher indicates that you can display a related dialog
box. Display the related dialog box by clicking the dialog box launcher.
To specify which ribbon tabs and panels are displayed, right-click the ribbon
and, on the shortcut menu, click or clear the names of tabs or panels.
Floating Panels
If you pull a panel off of a ribbon tab and into the drawing area or onto another
monitor, that panel floats where you placed it. The floating panel remains
open until you return it to the ribbon, even if you switch ribbon tabs.
Display and Organize the Ribbon | 39
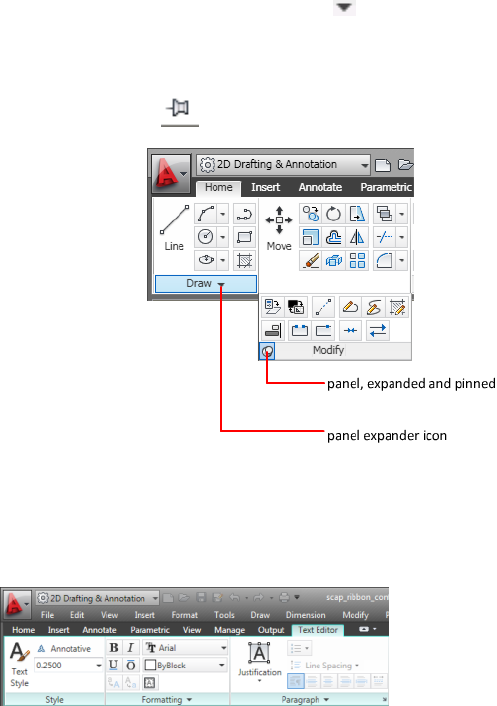
Slideout Panels
An arrow in the middle of a panel title, , indicates that you can slide out
the panel to display additional tools and controls. Click on the title bar of an
open panel to display the slideout panel. By default, a slideout panel
automatically closes when you click another panel. To keep a panel expanded,
click the push pin, , in the bottom-left corner of the slideout panel.
Contextual Ribbon Tabs
When you select a particular type of object or execute some commands, a
special contextual ribbon tab is displayed instead of a toolbar or dialog box.
The contextual tab is closed when you end the command.
Checkboxes
Checkboxes allow you to toggle an option on or off. A third, indeterminate
state occurs if the setting differes for multiple objects.
40 | Chapter 3 Tools in the Application Window
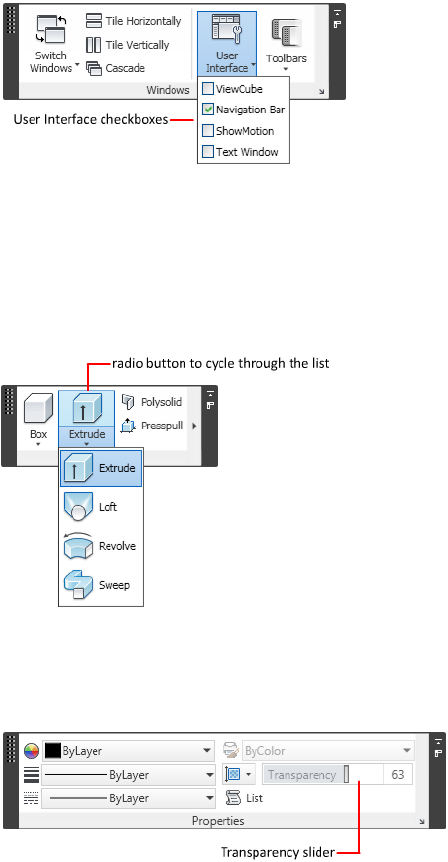
Radio Buttons
Depending on the available space in the vertical or horizontal ribbon, radio
buttons can collapse into a single button. A single radio button works as a
toggle, allowing you to cycle through each item in the list, or as a split button,
where the top half of the radio button is a toggle button and clicking on the
arrow icon in the lower half displays a drop-down of all items in the list.
Sliders
When an option can be executed with varying intensity, the slider allows you
to control the setting from lower to higher, or reverse.
See also:
■Create Task-Based Workspaces on page 148
Display and Organize the Ribbon | 41

To display the ribbon
■Click Tools menu ➤ Palettes ➤ Ribbon.
NOTE The ribbon displays the ribbon panels associated with the workspace
you used last.
To display the ribbon panels associated with a specific workspace, click
Tools menu ➤ Workspaces.
To minimize the ribbon
1The first button toggles the between the full ribbon state, the default
ribbon state, and the minimize ribbon state.
2The second drop-down button allows you to select the minimize ribbon
state. These are the four minimize ribbon states:
■Minimize to Tabs: Minimizes the ribbon so that only tab titles are
displayed.
■Minimize to Panel Titles: Minimizes the ribbon so that only tab and
panel titles are displayed.
■Minimize to Panel Buttons: Minimizes the ribbon so that only tab
titles and panel buttons are displayed.
■Cycle Through All: Cycles through all four ribbon states in the order,
full ribbon, minimize to panel buttons, minimize to panel titles,
minimize to tabs.
To display or hide a ribbon panel
■Right-click anywhere inside the ribbon. Under Panels, select or unselect
the name of a panel.
NOTE In the 3D Modeling workspace, both the Home and Render tabs include
additional panels that are turned off by default.
42 | Chapter 3 Tools in the Application Window
Quick Reference
Commands
CUI
Manages the customized user interface elements in the product.
RIBBON
Opens the ribbon window.
RIBBONCLOSE
Closes the ribbon window.
System Variables
MTEXTTOOLBAR
Controls the display of the Text Formatting toolbar.
RIBBONCONTEXTSELECT
Controls how ribbon contextual tabs are displayed when you single- or
double-click an object.
RIBBONCONTEXTSELLIM
Limits the number of objects that can be changed at one time with the ribbon
property controls or a contextual tab.
RIBBONDOCKEDHEIGHT
Determines whether the horizontally docked ribbon is set to the height of
the current tab or a predetermined height.
RIBBONSELECTMODE
Determines whether a pickfirst selection set remains selected after a ribbon
contextual tab is invoked and the command is completed.
RIBBONSTATE
Indicates whether the ribbon palette is open or closed.
TABLETOOLBAR
Controls the display of the Table toolbar.
Display and Organize the Ribbon | 43

Customize the Ribbon
You can customize the ribbon in the following ways:
■You can create and modify ribbon panels using the Customize User
Interface Editor. See Ribbon in the Customization Guide.
■You can associate a customizable tool palette group with each tab on the
ribbon. Right-click the ribbon tab to display a list of available tool palette
groups.
■You can change the order of ribbon tabs. Click the tab you want to move,
drag it to the desired position, and release.
■You can change the order of ribbon panels. Click the panel you want to
move, drag it to the desired position, and release.
■You can convert toolbars into ribbon panels using the Customize User
Interface Editor. See Ribbon in the Customization Guide.
See also:
■Ribbon
To associate a tool palette group with a ribbon tab
1Click Manage tab ➤ Customization panel ➤ User Interface.
2In the Customize User Interface (CUI) Editor, Customize tab, in the
Customizations In <file name> pane, click the plus sign (+) next to the
Workspaces node to expand it.
3Select the workspace that has the ribbon tab for which you want to assign
a tool palette group.
4In the Workspace Contents pane, click the plus sign (+) next to the Ribbon
Tabs node to expand it.
5Select the ribbon tab that you want to assign a tool palette group.
6In the Properties pane, in the ToolPalette Group box, click the down
arrow and select the tool palette group you want to assign to the ribbon
tab.
7Click OK.
44 | Chapter 3 Tools in the Application Window
To display the tool palette group associated with a ribbon tab
■Right-click a ribbon tab and click Show Related Tool Palette Group.
Quick Reference
Commands
CUI
Manages the customized user interface elements in the product.
RIBBON
Opens the ribbon window.
RIBBONCLOSE
Closes the ribbon window.
System Variables
MTEXTTOOLBAR
Controls the display of the Text Formatting toolbar.
RIBBONCONTEXTSELECT
Controls how ribbon contextual tabs are displayed when you single- or
double-click an object.
RIBBONCONTEXTSELLIM
Limits the number of objects that can be changed at one time with the ribbon
property controls or a contextual tab.
RIBBONDOCKEDHEIGHT
Determines whether the horizontally docked ribbon is set to the height of
the current tab or a predetermined height.
RIBBONSELECTMODE
Determines whether a pickfirst selection set remains selected after a ribbon
contextual tab is invoked and the command is completed.
RIBBONSTATE
Indicates whether the ribbon palette is open or closed.
Customize the Ribbon | 45
TABLETOOLBAR
Controls the display of the Table toolbar.
46 | Chapter 3 Tools in the Application Window
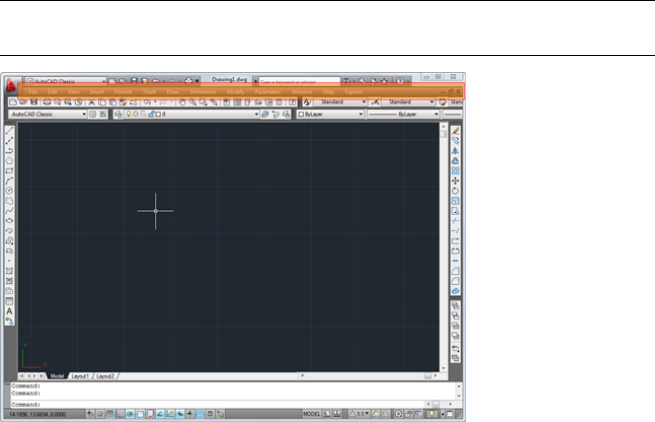
Other Tool Locations
Use common tools in the classic menu bar, toolbars, tool palettes, status bars, shortcut menus,
and Design Center to find more commands, settings, and modes.
Access the Classic Menu Bar
Display pull-down menus from the classic menu bar using one of several
methods. You can also specify alternate menus.
The classic menu bar can be displayed at the top of the drawing area. The classic
menu bar is displayed by default in the AutoCAD Classic workspace.
NOTE The classic menu bar is turned off by default in both the 2D Drafting and
Annotation and 3D Modeling workspaces.
4
47

You can specify menus to display in the menu browser for all workspaces by
customizing a CUIx file and loading it into the program.
See also:
■Create Task-Based Workspaces on page 148
■“Pull-down and Shortcut Menus” in the Customization Guide
To display the classic menu bar
■On the Quick Access toolbar, click the Customization drop-down menu
➤ Show Menu Bar.
Quick Reference
System Variables
MENUBAR
Controls the display of the menu bar.
Toolbars
Use buttons on toolbars to start commands, display flyout toolbars, and display
tooltips. You can display or hide, dock, and resize toolbars.
Toolbars contain buttons that start commands. When you move your mouse
or pointing device over a toolbar button, the tooltip displays the name of the
button. Buttons with a small black triangle in the lower-right corner are flyout
toolbars that contain related commands. With the cursor over the icon, hold
down the left button on your mouse until the flyout toolbar displays.
The Quick Access toolbar at the top of the application window is displayed
by default. This toolbar is like those found in Microsoft® Office programs. It
contains frequently used AutoCAD® commands such as PLOT, UNDO, and
REDO, as well as Microsoft Office standard commands such as New, Open,
and Save. For more information about the Quick Access toolbar, see Quick
Access Toolbar on page 34.
NOTE You can turn a toolbar into a ribbon panel using the Customize User
Interface dialog box.
48 | Chapter 4 Other Tool Locations

Display or Hide, Dock, and Resize Toolbars
You can display or hide toolbars, and you can save your selections as a
workspace. You can also create your own toolbars.
A toolbar displays as floating or docked. A floating toolbar displays anywhere
in the drawing area, and you can drag a floating toolbar to a new location,
resize it, or dock it. A docked toolbar is attached to any edge of the drawing
area. A toolbar docked at the top edge of the drawing area is located below
the ribbon. You can move a docked toolbar by dragging it to a new docking
location.
See also:
■Create Task-Based Workspaces on page 148
■“Toolbars” in the Customization Guide
■Ribbon in the Customization Guide
To display a toolbar
1Click View tab ➤ Windows panel ➤ Toolbars.
2Select a toolbar from the list.
TIP You can also right-click any toolbar and select a toolbar from the shortcut
menu.
Quick Reference
CUI
Manages the customized user interface elements in the product.
System Variables
TOOLTIPS
Controls the display of tooltips on the ribbon, toolbars, and other user
interface elements.
Toolbars | 49
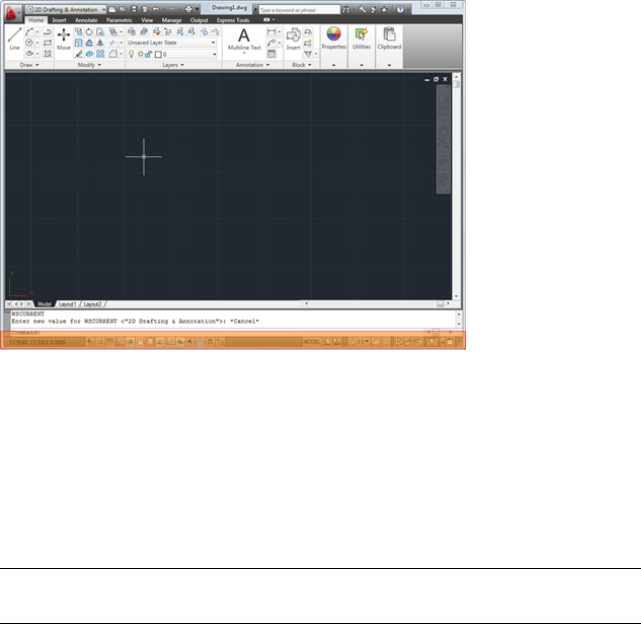
Status Bars
The application and drawing status bars provide useful information and
buttons for turning drawing tools on and off.
Application Status Bar
The application status bar displays the coordinate values of your cursor,
drawing tools, and tools for Quick View and annotation scaling.
You can view the drawing tool buttons as icons or text. You also can easily
change the settings of snap, polar, osnap, and otrack from the shortcut menus
of these drawing tools.
You can preview and switch between open drawings and layouts in a drawing.
You can also display tools for scaling annotations.
With the Workspace button, you can switch workspaces. The lock button
locks the current positions of the toolbars and windows. To expand the drawing
display area, click the Clean Screen button.
You can add or remove a button from the application status bar from the
shortcut menu of the status bar.
NOTE When the application status bar is turned off, the Clean Screen button is
not displayed on the screen.
50 | Chapter 4 Other Tool Locations

To control the display of icons and notifications in the status bar tray
1Click View tab ➤ Windows panel ➤ Status Bar.
2In the Status Bar drop-down, click Tray Settings.
3In the Tray Settings dialog box, select or clear the following display
options:
■Display Icons from Services. Displays the tray at the right end of the
status bar and displays icons from services. When this option is cleared,
the tray is not displayed.
■Display Notifications from Services. Displays notifications from services
such as Communications Center. When the Display Icons from
Services option is cleared, this option is unavailable.
4If Display Notifications from Services is selected, set a time for a
notification to be displayed, or select Display Until Closed.
5Click OK.
To control the display of buttons on the status bar
1Click View tab ➤ Windows panel ➤ Status Bar.
2In the Status Bar drop-down, select any button name to change the
display.
To control the display of cursor coordinates on the status bar
1Click View tab ➤ Windows panel ➤ Status Bar.
2In the Status Bar drop-down, select or clear Cursor Coordinate Values.
Quick Reference
TRAYSETTINGS
Controls the display of icons and notifications in the status bar tray.
Application Status Bar | 51
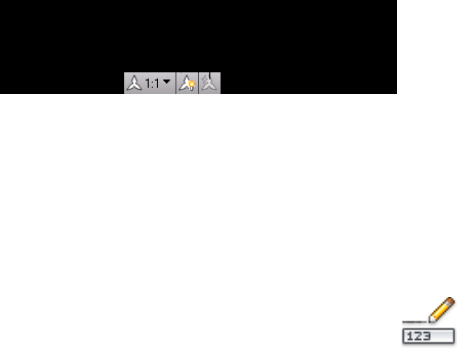
System Variables
STATUSBAR
Controls the display of the application and drawing status bars.
Drawing Status Bar
The drawing status bar displays several tools for scaling annotations.
Different tools display for model space and paper space.
When the drawing status bar is turned on, it displays at the bottom of the
drawing area. When the drawing status bar is turned off, the tools found on
the drawing status bar are moved to the application status bar.
When the drawing status bar is turned on, you can use the Drawing Status
Bar menu to select which tool to display on the status bar.
To turn the drawing status bar on or off
■Click View tab ➤ Windows panel ➤ Drawing Status Bar.
To control the display of buttons on the drawing status bar
■Click the arrow to the right of the drawing status bar and select or clear
any option name.
Checked items are displayed on the drawing status bar.
Quick Reference
System Variables
STATUSBAR
Controls the display of the application and drawing status bars.
52 | Chapter 4 Other Tool Locations
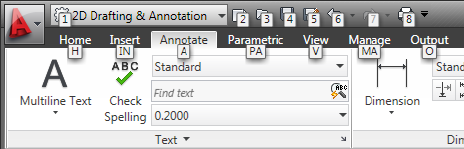
Keytips
Use the keyboard to access the Application menu, Quick Access toolbar, and
ribbon.
Press the Alt key to display shortcut keys for common tools in the application
window.
When you select a keytip, more keytips are displayed for that tool.
The Command Window
Enter Commands on the Command Line
You can enter a command by using the keyboard. Some commands also have
abbreviated names called command aliases.
Commands, system variables, options, messages, and prompts are displayed
in a dockable and resizable window called the command window. The bottom
line of the command window is called the command line. The command line
displays the operation in progress and provides an inside view of exactly what
the program is doing.
Keytips | 53
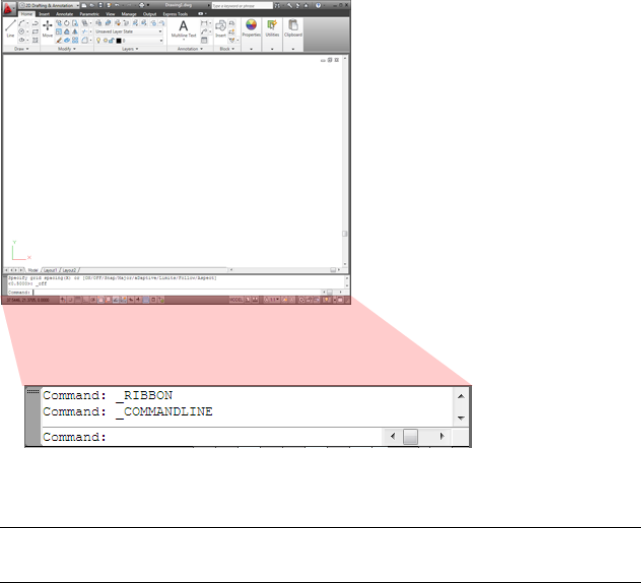
To enter a command by using the keyboard, type the full command name on
the command line and press Enter or Spacebar.
NOTE When Dynamic Input is on and is set to display dynamic prompts, you can
enter many commands in tooltips near the cursor.
Some commands also have abbreviated names. For example, instead of entering
line to start the LINE command, you can enter l. Abbreviated command names
are called command aliases and are defined in the acad.pgp file.
To define your own command aliases, see Create Command Aliases in the
Customization Guide.
To find a command, you can type a letter on the command line and press
TAB to cycle through all the commands that begin with that letter. Press Enter
or Spacebar. Restart a recently used command by right-clicking on the
command line.
Specify Command Options
When you enter commands on the command line, you see either a set of
options or a dialog box. For example, when you enter circle at the Command
prompt, the following prompt is displayed:
Specify center point for circle or [3P/2P/Ttr (tan, tan, radius)]:
54 | Chapter 4 Other Tool Locations
You can specify the center point either by entering X,Y coordinate values or
by using the pointing device to click a point on the screen.
To choose a different option, enter the letters capitalized in one of the options
in the brackets. You can enter uppercase or lowercase letters. For example, to
choose the three-point option (3P), enter 3p.
Execute Commands
To execute commands, press Spacebar or Enter, or right-click your pointing
device after entering command names or responses to prompts. The
instructions in Help assume this step and do not specifically instruct you to
press Enter after each entry.
Repeat and Cancel Commands
If you want to repeat a command that you have just used, press Enter or
Spacebar, or right-click your pointing device at the Command prompt.
You also can repeat a command by entering multiple, a space, and the
command name, as shown in the following example:
Command: multiple circle
To cancel a command in progress, press ESC.
Interrupt a Command with Another Command or System Variable
Many commands can be used transparently: that is, they can be entered on
the command line while you use another command. Transparent commands
frequently change drawing settings or display , for example, GRID or ZOOM.
In the Command Reference, transparent commands are designated by an
apostrophe in front of the command name.
To use a command transparently, click its toolbar button or enter an
apostrophe (') before entering the command at any prompt. On the command
line, double angle brackets (>>) precede prompts that are displayed for
transparent commands. After you complete the transparent command, the
original command resumes. In the following example, you turn on the dot
grid and set it to one-unit intervals while you draw a line, and then you
continue drawing the line.
Command: line
Specify first point: 'grid
>>Specify grid spacing (X) or [ON/OFF/Snap/Aspect] <0.000>: 1
Resuming LINE command
Specify first point:
Enter Commands on the Command Line | 55
Commands that do not select objects, create new objects, or end the drawing
session usually can be used transparently. Changes made in dialog boxes that
you have opened transparently cannot take effect until the interrupted
command has been executed. Similarly, if you reset a system variable
transparently, the new value cannot take effect until you start the next
command.
See also:
■“Keyboard Shortcuts” in the Customization Guide
To copy a command you have recently used
1Right-click on the command line. Click Recent Commands.
2Click the command you want to use.
Quick Reference
MULTIPLE
Repeats the next command until canceled.
OPTIONS
Customizes the program settings.
PASTECLIP
Pastes objects from the Clipboard into the current drawing.
System Variables
CMDNAMES
Displays the names of the active and transparent commands.
Enter System Variables on the Command Line
System variables are settings that control how certain commands work.
They can turn on or turn off modes such as Snap, Grid, or Ortho. They can
set default scales for hatch patterns. They can store information about the
current drawing and about program configuration. Sometimes you use a system
variable in order to change a setting. At other times you use a system variable
to display the current status.
56 | Chapter 4 Other Tool Locations
For example, the GRIDMODE system variable turns the dot grid display on
and off when you change the value. In this case, the GRIDMODE system
variable is functionally equivalent to the GRID command. DATE is a read-only
system variable that stores the current date. You can display this value, but
you cannot change it.
Bitcode Variables
Some system variables are controlled using bitcodes. With these system
variables, you add values to specify a unique combination of behaviors. For
example, the LOCKUI system variable provides the following bitcode values:
Toolbars and windows not locked0
Docked toolbars locked1
Docked or anchored windows locked2
Floating toolbars locked4
Floating windows locked8
Thus, if LOCKUI is set to 1 + 4 = 5, only docked and floating toolbars are
locked; docked, anchored, and floating windows are not locked.
NOTE You can examine or change a system variable's setting transparently, that
is, while using another command; however, new values may not take effect until
the interrupted command ends.
To change the setting of a system variable
1At the Command prompt, enter the system variable name. For example,
enter gridmode to change the grid setting.
2To change the status of GRIDMODE, enter 1 for on or 0 for off. To retain
the current value of the system variable, press Enter.
To see a complete list of system variables
1Click Tools menu ➤ Inquiry ➤ Set Variable..
2At the Variable Name prompt, enter ?.
3At the Enter Variable(s) to List prompt, press Enter.
Enter System Variables on the Command Line | 57
Quick Reference
SETVAR
Lists or changes the values of system variables.
Navigate and Edit Within the Command Window
You can edit text in the command window to correct or repeat commands.
Use the standard keys:
■Up, Down, Left Arrow, and Right Arrow
■Insert, Delete
■Page Up, Page Down
■Home, End
■Backspace
You can repeat any command used in the current session by cycling through
the commands in the command window with Up ArrowCtrl and Down Arrow
and pressing Enter. By default, pressing Ctrl+C copies highlighted text to the
Clipboard. Pressing Ctrl+V pastes text from the Clipboard to the text window
or the command window.
If you right-click in the command window or text window, a shortcut menu
is displayed from which you can access the six most recently used commands,
copy selected text or the entire command history, paste text, and access the
Options dialog box.
For most commands, a command line with two or three lines of previous
prompts, called the command history, is sufficient for viewing and editing.
To see more than one line of command history, you can scroll through the
history or resize the command window by dragging its border. For commands
with text output, such as LIST, you might need a larger command window,
or you can press F2 to use the text window.
Use the Text Window
The text window is a window similar to the command window in which you
can enter commands and view prompts and messages. The text window
displays a complete command history for the current work session. Use the
text window to view lengthy output of commands such as LIST, which displays
58 | Chapter 4 Other Tool Locations
detailed information about objects you select. To move forward and backward
in the command history, you can click the scroll arrows along the right edge
of the window.
Press SHIFT with a key to highlight text. For example, press SHIFT+HOME in
the text window to highlight all text from the cursor location to the beginning
of the line.
To copy all the text in the text window to the Clipboard, use the COPYHIST
command.
To save commands to a log file, use the LOGFILEON command.
See also:
■Dock, Resize, and Hide the Command Window on page 62
■Use Dynamic Input on page 578
To close the text window
■At the Command prompt, enter graphscr.
NOTE You can also close the text window by pressing F2, or using the standard
Windows controls.
To copy text from the text window to the command line
1If the text window is not displayed, click View tab ➤ Windows panel ➤
Text Window.
2Select the text you want to copy.
3Right-click in the command window or text window. Click Paste to
Command Line.
The text is copied to the Clipboard and then pasted on the command
line. After you press Enter, the commands are executed in sequence, like
a script. You can also use Ctrl+C and Ctrl+V to copy and paste text.
To display the text window
■Click View tab ➤ Windows panel ➤ Text Window.
Navigate and Edit Within the Command Window | 59
The text window is displayed in front of the drawing area.
Quick Reference
COPYCLIP
Copies selected objects to the Clipboard.
COPYHIST
Copies the text in the command line history to the Clipboard.
GRAPHSCR
Switches from the text window to the drawing area.
LOGFILEOFF
Closes the text window log file opened by LOGFILEON.
LOGFILEON
Writes the text window contents to a file.
PASTECLIP
Pastes objects from the Clipboard into the current drawing.
TEXTSCR
Opens the text window.
System Variables
LOGFILEMODE
Specifies whether the contents of the text window are written to a log file.
LOGFILENAME
Specifies the path and name of the text window log file for the current
drawing.
LOGFILEPATH
Specifies the path for the text window log files for all drawings in a session.
Switch Between Dialog Boxes and the Command Line
You can display prompts on the command line instead of using a dialog box,
or switch back again. This option is useful primarily when using scripts.
60 | Chapter 4 Other Tool Locations
Some functions are available both on the command line and in a dialog box.
In many cases, you can enter a hyphen before the command to suppress the
dialog box and display prompts on the command line instead. For example,
entering layer on the command line displays the Layer Properties Manager.
Entering -layer on the command line displays the equivalent command line
options. Suppressing the dialog box is useful for compatibility with earlier
versions of AutoCAD® and for using script files. There may be slight differences
between the options in the dialog box and those available on the command
line.
These system variables also affect the display of dialog boxes:
■ATTDIA controls whether INSERT uses a dialog box for attribute value
entry.
■CMDNAMES displays the name (in English) of the currently active
command and transparent command.
■EXPERT controls whether certain warning dialog boxes are displayed.
■FILEDIA controls the display of dialog boxes used with commands that
read and write files. For example, if FILEDIA is set to 1, SAVEAS displays
the Save Drawing As dialog box. If FILEDIA is set to 0, SAVEAS displays
prompts on the command line. The procedures in this documentation
assume that FILEDIA is set to 1. Even when FILEDIA is set to 0, you can
display a file dialog box by entering a tilde (~) at the first prompt.
FILEDIA and EXPERT are useful when you use scripts to run commands.
To use the command line version of a command
■For most commands, enter minus (-) in front of the command.
■For dialog boxes that open and save files, set the FILEDIA system variable
to 0.
Quick Reference
GRAPHSCR
Switches from the text window to the drawing area.
Switch Between Dialog Boxes and the Command Line | 61
System Variables
ATTDIA
Controls whether the INSERT command uses a dialog box for attribute value
entry.
CMDNAMES
Displays the names of the active and transparent commands.
EXPERT
Controls whether certain prompts are issued.
FILEDIA
Suppresses display of file navigation dialog boxes.
Dock, Resize, and Hide the Command Window
Change the position and display of the command window to suit the way
you work.
Dock the Command Window
By default, the command window is docked. The docked command window
is the same width as the AutoCAD window. If text that is entered becomes
longer than the width of the command line, the window pops up in front of
the command line to show the full text of the line.
Undock, or float, the command window by dragging it away from the docking
region. The docking region is an edge of the AutoCAD application window
that allows you to dock a toolbar, palette, or the command window. You can
move the floating command window anywhere on the screen and resize its
width and height with the pointing device.
Dock a floating command window again by dragging it to the docking region
of the AutoCAD window.
Anchoring the Command Window
The command window can be anchored on the left or right side of the
AutoCAD window. By anchoring the command window it remains on screen,
but in a minimized state, which allows you to bring it back up when needed.
This also helps to increase the amount of visible drawing area. The command
window must be floating before an anchoring side can be selected. To anchor
62 | Chapter 4 Other Tool Locations

the command window make sure it is floating, and then right-click over its
title bar and select either Anchor Left or Anchor Right.
Resize the Command Window
You can resize the command window vertically by dragging the splitter bar,
which is located on the top edge of the window when it is docked on the
bottom and at the bottom edge of the window when it is docked at the top.
Hide the Command Window
Hide and redisplay the command line by doing one of the following:
■Click View tab ➤ Palettes panel ➤ Command Line.
■Click Tools menu ➤ Command Line.
■Press Ctrl+9.
When you hide the command line, you can still enter commands. However,
some commands and system variables return values at the command line, so
you may want to redisplay the command line in those instances.
NOTE For information about display options (such as auto-hide or transparency)
for dockable windows, see “Control the Display of Dockable Windows” in the
topic Set Interface Options on page 109.
To float the command window
■Click the move handle (the double bars) on the left edge of the docked
command window and drag the command window away from the docking
region until it has a thick outline. Then drop it in the drawing area of the
AutoCAD window.
To make the floating command window transparent
1In the floating Command window, click the Properties button and select
Transparency.
2In the Transparency dialog box, move the slider to the left to make the
command window less transparent and to the right to make it more
transparent.
The range is from opaque to transparent. When the Turn Off Transparency
for All Palettes option is selected, the command window cannot be made
transparent.
Dock, Resize, and Hide the Command Window | 63
To dock the command window
■Click the title bar and drag the command window until it is over the top
or bottom docking region of the AutoCAD window. When the command
window becomes the same width as the AutoCAD window, release the
mouse button to dock it.
The docking region is an edge of the AutoCAD application window that
allows you to dock a toolbar, palette, or the command window.
■Right-click the title bar of the Command window, and select Allow
Docking.
NOTE You can control whether the command window docks by right-clicking
the title bar of the command window and then clicking Allow docking.
To resize the command window when it is docked
1Position the cursor over the horizontal splitter bar so that the cursor
appears as a double line and arrows.
2Drag the splitter bar vertically until the command window is the size you
want it to be.
To hide the command window
■Click View tab ➤ Palettes panel ➤ Command Line.
NOTE Some commands and system variables return values at the command line,
so you may want to display the command line in those instances. To display the
command line when it's hidden, press Ctrl+9. Alternate method:
Quick Reference
COMMANDLINE
Displays the Command Line window.
COMMANDLINEHIDE
Hides the Command Line window.
64 | Chapter 4 Other Tool Locations
System Variables
PALETTEOPAQUE
Controls whether palettes can be made transparent.
Shortcut Menus
Display a shortcut menu for quick access to commands that are relevant to
your current activity.
You can display different shortcut menus when you right-click different areas
of the screen. Shortcut menus typically include options to
■Repeat the last command entered
■Cancel the current command
■Display a list of recent user input
■Cut, copy, and paste from the Clipboard
■Select a different command option
■Display a dialog box, such as Options or Customize
■Undo the last command entered
You can customize right-click behavior to be time-sensitive, so that a quick
right-click acts the same as pressing Enter, and a longer right-click displays a
shortcut menu.
Shortcut menus can be customized using a customization (CUIx) file. The
main CUIx file is called acad.cuix by default.
See also:
■“Create Submenus” in the Customization Guide
To display a shortcut menu
1Move the cursor over an area, feature, or icon.
2Right-click your mouse, or press the equivalent button on your pointing
device.
A shortcut menu relevant to the cursor location is displayed. If one or
more objects are selected when you right-click in the drawing area, an
Shortcut Menus | 65
editing-oriented shortcut menu is displayed. You can also display a
shortcut menu during PAN or ZOOM.
To turn off shortcut menus in the drawing area
1Click Tools menu ➤ Options.
2In the Options dialog box, User Preferences tab, under Windows Standard
Behavior, clear Shortcut Menus in Drawing Area.
3To control Default, Edit, and Command shortcut menus individually,
select Shortcut Menus in Drawing Area. Right-Click Customization.
4In the Right-Click Customization dialog box, under Default Mode or Edit
Mode, select one of the following options to control what happens when
you right-click in the drawing area and no command is in progress:
■Repeat Last Command. Repeats the last command. Selecting this
option turns off the Default and Edit shortcut menus. Right-clicking
is the same as pressing Enter.
■Shortcut Menu. Displays the Default or Edit shortcut menu.
5Under Command Mode, select one of the following options to determine
what happens when you right-click in the drawing area while a command
is in progress:
■Enter. Turns off the Command shortcut menu. Right-clicking is the
same as pressing Enter.
■Shortcut Menu: Always Enabled. Displays the Command shortcut
menu.
■Shortcut Menu: Enabled When Command Options Are Present.
Displays the Command shortcut menu only when options are
currently available in the Command prompt. In a Command prompt,
options are enclosed in square brackets. If no options are available,
right-clicking is the same as pressing Enter.
In addition to turning the Default, Edit, and Command shortcut menus
on and off, you can customize the options that are displayed on them.
For example, you can add options to the Edit shortcut menu that are
displayed only when circles are selected.
To turn on time-sensitive right-click behavior
1Click Tools menu ➤ Options.
66 | Chapter 4 Other Tool Locations
2In the Options dialog box, User Preferences tab, under Windows Standard
Behavior, click Right-Click Customization.
3In the Right-Click Customization dialog box, select Turn on Time-Sensitive
Right-Click.
You can specify the duration of the longer click. The default is 250
milliseconds
4Click Apply & Close.
5In the Options dialog box, click OK.
To control the display of recent input
1At the Command prompt, enter inputhistorymode.
2Enter a sum of one or more of the following values:
■0. No history of recent input is displayed.
■1. History of recent input is displayed at the Command prompt with
access through Up Arrow and Down Arrow keys.
■2. History of recent input for the current command is displayed in
the shortcut menu.
■4. History of recent input for all commands in the current session is
displayed in the shortcut menu.
■8. Markers for recent input of point locations are displayed in the
drawing.
The default value is 15.
3(Optional) At the Command prompt, enter cmdinputhistorymax.
4Enter a value to control how many unique values entered at a prompt
are remembered and available to be displayed as recent input.
Quick Reference
COPYCLIP
Copies selected objects to the Clipboard.
COPYHIST
Copies the text in the command line history to the Clipboard.
Shortcut Menus | 67
CUI
Manages the customized user interface elements in the product.
CUTCLIP
Copies selected objects to the Clipboard and removes them from the drawing.
OPTIONS
Customizes the program settings.
PAN
Moves the view planar to the screen.
PASTECLIP
Pastes objects from the Clipboard into the current drawing.
PROPERTIES
Controls properties of existing objects.
TRAYSETTINGS
Controls the display of icons and notifications in the status bar tray.
U
Reverses the most recent operation.
ZOOM
Increases or decreases the magnification of the view in the current viewport.
System Variables
CMDINPUTHISTORYMAX
Sets the maximum number of previous input values that are stored for a
prompt in a command.
INPUTHISTORYMODE
Controls the content and location of the display of a history of user input.
PICKFIRST
Controls whether you select objects before (noun-verb selection) or after you
issue a command.
68 | Chapter 4 Other Tool Locations
SHORTCUTMENU
Controls whether Default, Edit, and Command mode shortcut menus are
available in the drawing area.
TRAYICONS
Controls whether a tray is displayed on the status bar.
TRAYNOTIFY
Controls whether service notifications are displayed in the status bar tray.
TRAYTIMEOUT
Controls the length of time (in seconds) that service notifications are
displayed.
Tool Palettes
Tool palettes are tabbed areas within the Tool Palettes window that provide
an efficient method for organizing, sharing, and placing blocks, hatches, and
other tools. Tool palettes can also contain custom tools provided by third-party
developers.
Create and Use Tools from Objects and Images
You can create a tool by dragging objects from your drawing onto a tool
palette. You can then use the new tool to create objects with the same
properties as the object you dragged onto the tool palette.
Tool palettes are tabbed areas within the Tool Palettes window. The items you
add to a tool palette are called tools. You can create a tool by dragging any of
the following, one at a time, onto your tool palette:
■Geometric objects such as lines, circles, and polylines
■Dimensions
■Blocks
■Hatches
■Solid fills
■Gradient fills
■Raster images
Tool Palettes | 69

■External references (xrefs)
NOTE When you drag an object onto a tool palette, you can switch to a different
tab by hovering over the tab for a few seconds.
You can then use the new tool to create objects in your drawing with the same
properties as the object you dragged to the tool palette. For example, if you
drag a red circle with a lineweight of .05 mm from your drawing to your tool
palette, the new tool creates a red circle with a lineweight of .05 mm. If you
drag a block or xref to a tool palette, the new tool inserts the block or xref
with the same properties into your drawing.
When you drag a geometric object or a dimension onto a tool palette, the
new tool is automatically created with an appropriate flyout. Dimension tool
flyouts, for example, provide an assortment of dimension styles. Click the
arrow on the right side of the tool icon on the tool palette to display the flyout.
When you use a tool on a flyout, the object in the drawing has the same
properties as the original tool on the tool palette.
Insert Blocks and Attach References
You can choose to be prompted for a rotation angle (starting from 0) when
you click and place a block or xref. This option ignores the angle specified
under Rotation in the Tool Properties dialog box. The rotation angle prompt
does not display if you drag the block or xref, or if you enter rotate at the
initial insertion Command prompt.
Blocks that are placed by dragging from a tool palette must often be rotated
or scaled after placement. You can use object snaps when dragging blocks
from a tool palette; however, grid snap is suppressed during dragging. You
can set an auxiliary scale for a block or a hatch tool to override the regular
scale setting when you use the tool. (An auxiliary scale multiplies your current
scale setting by the plot scale or the dimension scale.)
Blocks dragged from a tool palette are automatically scaled according to the
ratio of units in both the block and the current drawing. For example, if the
current drawing uses meters as units and a block uses centimeters, the unit
ratio is 1 m/100 cm. When you drag the block into the drawing, it is inserted
at 1/100 scale.
NOTE In the Options dialog box, User Preferences tab, the Source Content Units
and Target Drawing Units settings are used when Drag-and-Drop Scale is set to
Unitless, either in the source block or target drawing.
70 | Chapter 4 Other Tool Locations
Update Block Definitions on Tool Palettes
A block definition in your current drawing does not update automatically
when you modify the block in the source drawing. To update a block definition
in the current drawing, right-click the block tool on the tool palette and click
Redefine on the shortcut menu.
If the Redefine option is unavailable, then the block definition source is a
drawing file rather than a block within a drawing file. To update a block
definition that was created by inserting a drawing file, use DesignCenter. For
more information, see Add Content with DesignCenter on page 97.
NOTE If you move the source drawing file for a block tool to a different folder,
then modify the tool that references it by right-clicking the tool and, in the Tool
Properties dialog box, specifying the new source file folder.
See also:
■Control Tool Properties on page 78
■Customize Tool Palettes on page 83
■Create Task-Based Workspaces on page 148
■Add Content with DesignCenter on page 97
To open a block on a tool palette in the Block Editor
1If the Tool Palettes window is not already displayed, click View tab
➤ Palettes panel ➤ Tool Palettes.
2On the block icon’s shortcut menu, click Block Editor.
NOTE A block on a tool palette may reside in another drawing. The drawing that
contains the block definition is opened in the Block Editor.
To add or remove a tool flyout
1On a tool palette, right-click the geometric object tool or the dimension
tool whose flyout you want to add or remove. Click Properties.
2In the Tool Properties dialog box, under Command, click in the Use
Flyout box.
Create and Use Tools from Objects and Images | 71

3In the drop-down list, select Yes if you want to add a flyout, or select No
if you want to remove one.
4Click OK.
NOTE If you remove the flyout from a tool but then add the flyout back, the
image, name, and description (the tooltip) that displays on the tool palette
for each tool on the flyout will not be accurate. To correct this, return the
image, name, and description of the flyout tool to the default settings. See
To change the image, name, and description of a flyout tool to the default
settings.
To customize a tool flyout
1On a tool palette, right-click the geometric object tool or dimension tool
whose flyout you want to customize. Click Properties.
2In the Tool Properties dialog box, under Command, click in the Flyout
Options box. Click the [...] button.
3In the Flyout Options dialog box, select the tools that you want to show
on the flyout. Click OK. (You must select at least one tool.)
4In the Tool Properties dialog box, click OK.
To be prompted for a rotation angle when placing a block or xref from a tool
palette
1In a tool palette, right-click a block or xref tool. Click Properties.
2In the Tool Properties dialog box, under Insert, click Prompt for Rotation.
3In the drop-down list, select Yes.
4Click OK.
NOTE This option ignores the angle specified under Rotation in the Tool
Properties dialog box. The rotation angle prompt does not display if you drag
the block or xref, or if you enter rotate at the initial insertion Command
prompt.
72 | Chapter 4 Other Tool Locations
Quick Reference
CUSTOMIZE
Customizes tool palettes and tool palette groups.
TOOLPALETTES
Opens the Tool Palettes window.
TOOLPALETTESCLOSE
Closes the Tool Palettes window.
UNITS
Controls coordinate and angle display formats and precision.
System Variables
INSUNITSDEFSOURCE
Sets source content units value when INSUNITS is set to 0.
INSUNITSDEFTARGET
Sets target drawing units value when INSUNITS is set to 0.
PALETTEOPAQUE
Controls whether palettes can be made transparent.
TPSTATE
Indicates whether the Tool Palettes window is open or closed.
Create and Use Command Tools
You can create a tool on a tool palette that executes a single command or a
string of commands.
You can add frequently used commands to a tool palette. When the Customize
dialog box is open, you can drag tools from a toolbar to a tool palette or you
can drag tools from the Customize User Interface (CUI) Editor to a tool palette.
Once you add a command to a tool palette, you can click the tool to execute
the command. For example, clicking a Save tool on a tool palette saves a
drawing just as the Save button on the Standard toolbar does.
Create and Use Command Tools | 73
You can also create a tool that executes a string of commands or customized
commands, such as an AutoLISP® routine, a VBA macro or application, or a
script.
NOTE Even though the tools on palettes can be clicked when the Customize User
Interface (CUI) Editor is displayed, the end results might be unpredictable. It is
best to not use any of the tools on a palette while the Customize User Interface
(CUI) Editor is displayed.
To create a command tool from a toolbar button
1Make sure the toolbar that contains the command you want to add to
the tool palette is displayed.
If the required toolbar is not displayed, click Tools ➤ Toolbars and select
another toolbar from the list.
2Click Manage tab ➤ Customization panel ➤ Tool Palettes.
NOTE Even though you won't make any changes in the Customize dialog
box in this procedure, it must be displayed when you add command tools
to a tool palette.
3In the program, drag a command (button) from a toolbar to the tool
palette and, without releasing the mouse button, move the cursor to the
place on the tool palette where you want the tool.
The black horizontal line indicates where the tool will be located.
4Release the mouse button.
5In the Customize dialog box, click Close.
To create a command tool from the Customize User Interface
1Click Manage tab ➤ Customization panel ➤ User Interface.
If the CUI Editor is covering the Tool Palettes window, then move the
CUI Editor to the side.
2In the Command List pane, drag a command to the tool palette and,
without releasing the mouse button, move the cursor to the place on the
tool palette where you want the tool.
74 | Chapter 4 Other Tool Locations

The black horizontal line indicates where the tool will be located.
3Release the mouse button.
4In the CUI Editor, click Close.
To create a command tool that executes multiple or customized commands
(advanced)
1Click Manage tab ➤ Customization panel ➤ Tool Palettes.
2In the program, drag a command from a toolbar to the tool palette and,
without releasing the mouse button, move the cursor to the place on the
tool palette where you want the tool.
3Release the mouse button.
4On the tool palette, right-click the tool. Click Properties.
5In the Tool Properties dialog box, change the name and description to
an appropriate name and description for the string, AutoLISP routine, or
script.
6Under Command, in the Command String box, enter a string of
commands or customized commands, such as an AutoLISP routine, a
VBA macro or application, or a script.
7Click OK.
To use a command tool
1On a tool palette, click the command tool that you want to use.
2Follow any Command prompts that are shown.
Quick Reference
CUI
Manages the customized user interface elements in the product.
CUSTOMIZE
Customizes tool palettes and tool palette groups.
Create and Use Command Tools | 75
TOOLPALETTES
Opens the Tool Palettes window.
TOOLPALETTESCLOSE
Closes the Tool Palettes window.
Change Tool Palette Settings
The options and settings for tool palettes are accessible from shortcut menus
that are displayed when you right-click in different areas of the Tool Palettes
window.
You can dock the Tool Palettes window on the right or left edge of the
application window. Press the Ctrl key if you want to prevent docking as you
move the Tool Palettes window.
Tool palette settings are saved with your profile.
These settings include
■Allow Docking. Toggles the ability to dock or anchor palette windows. If
this option is selected, a window can be docked when you drag it over a
docking area at the side of a drawing. A docked window adheres to the
side of the application window and causes the drawing area to be resized.
Selecting this option also makes Anchor Right and Anchor Left available.
■Anchor Left or Anchor Right. Attaches the palette to an anchor tab base
at the left or right side of the drawing area. The palette rolls open and
closed as the cursor moves across it. When an anchored palette is open,
its content overlaps the drawing area. An anchored palette cannot be set
to stay open.
■Auto-hide. Controls the display of the palette when it is floating. When
this option is selected, only the tool palette title bar is displayed when the
cursor moves outside the tool palette. When this option is cleared, the
palette stays open continuously. You can display the tool palette title bar
as either icons or text from the shortcut menu of the title bar.
■Transparency. Sets the transparency of the Tool Palettes window so it does
not obscure objects under it.
■Views. Changes the display style and size of the icons in a tool palette.
76 | Chapter 4 Other Tool Locations
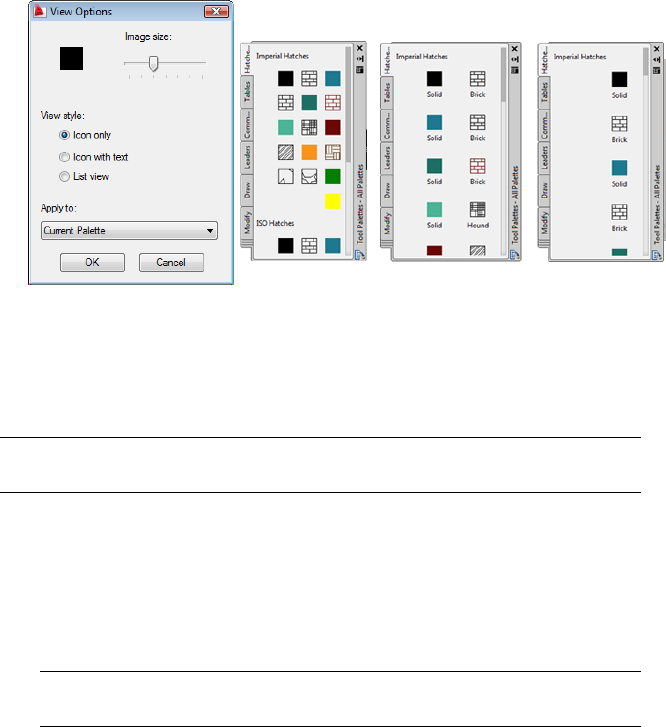
To change the rollover behavior of the Tool Palettes window
■In the Tool Palettes window, at the top of the title bar, click the Auto-Hide
button.
NOTE Rollover behavior is available only when the Tool Palettes window is
undocked.
To change the transparency of the Tool Palettes window
1In the Tool Palettes window, at the top of the title bar, click the Properties
button. Click Transparency.
2In the Transparency dialog box, adjust the level of transparency for the
Tool Palettes window. Click OK.
NOTE Transparency is available only when the Tool Palettes window is
undocked.
To change the icon display style in the Tool Palettes window
1Right-click a blank area inside the Tool Palettes window. Click View
Options.
2In the View Options dialog box, click the icon display option that you
want to set. You can also change the size of the icons.
3Click the list box under Apply To, and then select either Current Tool
Palette or All Tool Palettes.
Change Tool Palette Settings | 77
4Click OK.
Quick Reference
CUSTOMIZE
Customizes tool palettes and tool palette groups.
TOOLPALETTES
Opens the Tool Palettes window.
TOOLPALETTESCLOSE
Closes the Tool Palettes window.
System Variables
PALETTEOPAQUE
Controls whether palettes can be made transparent.
TPSTATE
Indicates whether the Tool Palettes window is open or closed.
Control Tool Properties
You can change the properties of any tool on a tool palette.
Once a tool is on a tool palette, you can change its properties. For example,
you can change the insertion scale of a block or the angle of a hatch pattern.
78 | Chapter 4 Other Tool Locations
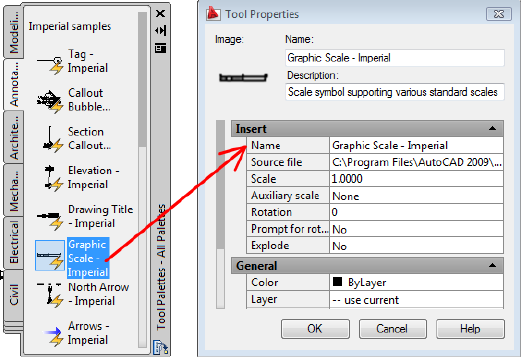
To change tool properties, right-click on a tool, and then click Properties on
the shortcut menu to display the Tool Properties dialog box. The Tool
Properties dialog box has the following two categories of properties:
■Insert or Pattern properties. Control object-specific properties such as
scale, rotation, and angle.
■General properties. Override the current drawing property settings such
as layer, color, and linetype.
You can expand and collapse the property categories by clicking the arrow
buttons.
Specify a Different Icon for a Tool
You can replace the icon for a tool with an image that you specify. This is
useful when the automatically generated icon is too cluttered to be easily
recognizable.
To replace the image, right-click the tool in the tool palette and click Specify
Image on the shortcut menu.
To restore the default image for a tool, right-click the tool and click Remove
Specified Image.
Update the Icon for a Tool
The icon for a block, xref, or raster image in a tool palette is not automatically
updated if its definition changes. If you change the definition for a block,
Control Tool Properties | 79
xref, or raster image, you can update the icon by right-clicking the tool in the
palette and clicking Update Tool Image. You must save the drawing before
you can update the tool image.
Alternatively, you can delete the tool, and then replace it using DesignCenter™.
Specify Overrides for Tool Properties
In some cases, you may want to assign specific property overrides to a tool.
For example, you may want a hatch to be placed automatically on a
pre-specified layer, regardless of the current layer setting. This feature can save
you time and reduce errors by setting properties automatically when creating
certain objects.
The Tool Properties dialog box provides areas for each possible property
override.
Layer property overrides affect color, linetype, lineweight, plot style, and plot.
Layer property overrides are resolved as follows:
■If a layer is missing from the drawing, that layer is created automatically.
■If a layer to which you are adding content is currently turned off or frozen,
the layer is temporarily turned on or thawed.
To display the properties of a tool on a tool palette
1On a tool palette, right-click a tool. Click Properties.
2In the Tool Properties dialog box, use the scroll bar to view all tool
properties.
You can resize the Tool Properties dialog box by dragging an edge, or you
can expand and collapse the property categories by clicking the double
arrow buttons.
3Click OK.
To change the property of a tool on a tool palette
1On a tool palette, right-click a tool. Click Properties.
2In the Tool Properties dialog box, click any property in the list of
properties and specify the new value or setting.
■Properties listed under the Insert or Pattern category control
object-specific properties such as scale, rotation, and angle.
80 | Chapter 4 Other Tool Locations

■Properties listed under the General category override the current
drawing property settings such as layer, color, and linetype.
■Auxiliary scale for a block or a hatch tool overrides the regular scale
setting when the tool is used. (An auxiliary scale multiplies your
current scale setting by the plot scale or the dimension scale.)
You can resize the Tool Properties dialog box by dragging an edge, or you
can expand and collapse the property categories by clicking the arrow
buttons.
3Click OK.
NOTE If you specify an image, name, or description for a tool that has a
flyout, that image, name, and description are displayed on the tool palette
for each tool on the flyout. To return the flyout tool's image, name, and
description to their default settings, leave the corresponding boxes blank in
the Tool Properties dialog box.
To refresh the image of a block tool on a tool palette
1On a tool palette, right-click a tool.
2Click Update Tool Image.
NOTE You must save the drawing before you can update the tool image.
To change the image of a tool on a tool palette
1On a tool palette, right-click a tool.
2On the shortcut menu, click Specify Image.
3In the Select Image File dialog box, locate the image file you want to use.
4Click Open to insert the new image.
NOTE If you specify an image for a tool that has a flyout, that image is
displayed on the tool palette for each tool on the flyout. To return the flyout
tool images to their default images, see To change the image, name, and
description of a flyout tool to the default settings.
Control Tool Properties | 81

To change the image, name, and description of a flyout tool to the default
settings
1On a tool palette, right-click a tool. Click Properties.
2In the Tool Properties dialog box, right-click in the image area. Click
Delete Image.
3Click in the Name box and delete the text.
4Click in the Description box and delete the text.
5Click OK.
NOTE Leaving the Image, Name, and Description boxes blank in the Tool
Properties dialog box will return the flyout tool's image, name, and description
to their default settings.
Quick Reference
CUSTOMIZE
Customizes tool palettes and tool palette groups.
TOOLPALETTES
Opens the Tool Palettes window.
TOOLPALETTESCLOSE
Closes the Tool Palettes window.
TPNAVIGATE
Displays a specified tool palette or palette group.
System Variables
PALETTEOPAQUE
Controls whether palettes can be made transparent.
TPSTATE
Indicates whether the Tool Palettes window is open or closed.
82 | Chapter 4 Other Tool Locations

Customize Tool Palettes
You can add tools to a tool palette with several methods.
You can create new tool palettes using the Properties button on the title bar
of the Tool Palettes window. Add tools to a tool palette with the following
methods:
■Drag any of the following onto your tool palette: geometric objects such
as lines, circles, and polylines; dimensions; hatches; gradient fills; blocks;
xrefs; raster images.
■Drag drawings, blocks, and hatches from DesignCenter to the tool palette.
Drawings that are added to a tool palette are inserted as blocks when
dragged into the drawing.
■Use the Customize dialog box to drag commands to a tool palette just as
you might add them to a toolbar.
■Use the Customize User Interface (CUI) Editor to drag commands to a tool
palette from the Command List pane.
■Use Cut, Copy, and Paste to move or copy tools from one tool palette to
another.
■Manage tool palettes by creating new palettes from scratch, renaming,
deleting or moving palettes with the shortcut menu.
NOTE It is not recommended to create or rename tool palettes when the
Customize User Interface (CUI) Editor is displayed.
■Create a tool palette tab with predetermined content by right-clicking a
folder, a drawing file, or a block in the DesignCenter tree view, and then
clicking Create Tool Palette on the shortcut menu.
Customize Tool Palettes | 83
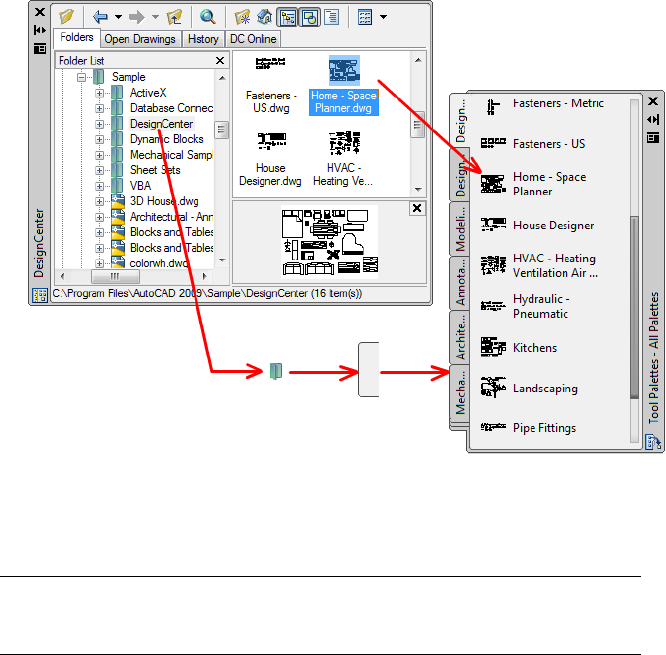
■You can associate a customizable tool palette group with each panel on
the ribbon. Right-click the ribbon panel to display a list of available tool
palette groups.
NOTE If the source drawing file for a block, xref, or raster image tool is moved to
a different folder, you must modify the tool that references it by right-clicking the
tool and, in the Tool Properties dialog box, specifying the new source file folder.
Rearranging Tools and Tool Palettes
Once tools are placed on a tool palette, you can rearrange them by dragging
them around or by sorting them. You can also add text and separator lines to
tool palettes.
You can move a tool palette tab up and down the list of tabs by using the tool
palette shortcut menu or the Tool Palettes tab of the Customize dialog box.
Similarly, you can delete tool palettes that you no longer need. Tool palettes
that are deleted are lost unless they are first saved by exporting them to a file.
You can control the path to your tool palettes on the Files tab in the Options
dialog box. This path can be to a shared network location.
84 | Chapter 4 Other Tool Locations
Read-Only Tool Palettes
If a tool palette file is set with a read-only attribute, a lock icon is displayed
in a lower corner of the tool palette. This indicates that you cannot modify
the tool palette beyond changing its display settings and rearranging the icons.
To apply a read-only attribute to a tool palette, right-click the tool palette
(ATC) file in the following location: C:\documents and settings\<user
name>\application data\autodesk\AutoCAD
2011\r17.2\enu\support\ToolPalette\Palettes. On the shortcut menu, click
Properties. On the General tab, select Read-only, and click OK.
To create a tool palette
1Click View tab ➤ Palettes panel ➤ Tool Palettes.
2In the Tool Palettes window, at the top of the title bar, click the Properties
button. Click New Palette.
3In the text box, enter a name for the new palette.
4If necessary, right-click over the tab and select Move Up or Move Down
to change the order in which the tab appears in.
To associate a tool palette group with a ribbon panel
1Click View tab ➤ Palettes panel ➤ Tool Palettes.
2On the ribbon, right-click a ribbon panel and click Tool Palette Group.
3Click an available tool palette group from the list.
4Click Tools menu ➤ Workspaces ➤ Save Current As.
5In the Save Workspace dialog box, enter a name for the new workspace
or select a name from the drop-down list. Click Save.
To display the tool palette group associated with a ribbon panel
■Right-click a ribbon panel and click Show Related Tool Palette Group.
To add text to a tool palette
1Right-click a blank area inside the Tool Palettes window. Click Add Text.
Customize Tool Palettes | 85
2In the text box, add the text you want to display in the window.
3If necessary, drag the text to the appropriate location in the window.
To add a separator line to a tool palette
1Right-click a blank area inside the Tool Palettes window. Click Add
Separator.
2If necessary, drag the separator to the appropriate location in the window.
Quick Reference
CUSTOMIZE
Customizes tool palettes and tool palette groups.
TOOLPALETTES
Opens the Tool Palettes window.
TOOLPALETTESCLOSE
Closes the Tool Palettes window.
System Variables
PALETTEOPAQUE
Controls whether palettes can be made transparent.
TPSTATE
Indicates whether the Tool Palettes window is open or closed.
Organize Tool Palettes
You can organize tool palettes into groups and specify which group of tool
palettes is displayed.
For example, if you have several tool palettes that contain hatch patterns, you
can use the CUSTOMIZE command to create a new palette group called Hatch
Patterns. You can then add all your tool palettes that contain hatch patterns
to the Hatch Pattern group.
When you set the Hatch Pattern group as the current group, only those tool
palettes you've added to the group are displayed.
86 | Chapter 4 Other Tool Locations
To create or remove a tool palette group
1Click Manage tab ➤ Customization panel ➤ Tool Palettes.
2In the Customize dialog box, under Palette Groups, right-click on the
lower, blank area. Click New Group.
If there are no groups listed in the Palette Groups area, you can create a
group by dragging a tool palette from the Tool Palettes area into the
Palette Groups area.
3Enter a name for the tool palette group.
4Click Close.
NOTE To delete a tool palette group, in the Customize dialog box, under Palette
Groups, right-click the tool palette group you want to delete. Click Delete.
To add a tool palette to a tool palette group
1Click Manage tab ➤ Customization panel ➤ Tool Palettes.
2In the Customize dialog box, drag a tool palette from the Tool Palettes
area into a group in the Palette Groups area.
3Click Close.
To display a tool palette group
1Right-click on the title bar of a tool palette.
2Click the name of the tool palette group that you want to display.
To delete all tool palette groups
1Right-click on the title bar of a tool palette. Click All Palettes.
NOTE You must display all tool palettes so that no tool palette group is set
as the current group.
2Click Manage tab ➤ Customization panel ➤ Tool Palettes.
Organize Tool Palettes | 87

3In the Customize dialog box, under Palette Groups, right-click a tool
palette group. Click Delete.
4Repeat step 3 until all tool palette groups are deleted.
5Click Close.
To copy and paste a tool palette from one group to another
1Click Manage tab ➤ Customization panel ➤ Tool Palettes.
2In the Customize dialog box, under Palette Groups, select the tool palette
that you want to copy.
3Press Ctrl while you drag the selected tool palette to another group.
When you release the mouse button, a copy of the tool palette is displayed
in the new location.
4Click Close.
To display all tool palettes
■Right-click on the title bar of a tool palette. Click All Palettes.
Quick Reference
CUSTOMIZE
Customizes tool palettes and tool palette groups.
TOOLPALETTES
Opens the Tool Palettes window.
TOOLPALETTESCLOSE
Closes the Tool Palettes window.
TPNAVIGATE
Displays a specified tool palette or palette group.
88 | Chapter 4 Other Tool Locations
Save and Share Tool Palettes
You can save and share a tool palette or tool palette group by exporting it or
importing it as a file.
You can save and share a tool palette by exporting it or importing it as a tool
palette file. Tool palette files have an .xtp file extension.
Similarly, you can save and share a tool palette group by exporting it or
importing it as a palette group file. Tool palette files have an .xpg file extension.
In some cases, when you export a customized tool palette, an image folder
with the same name as the exported tool palette is automatically created in
the same location as the XTP file. This image folder contains the icon images
used on the exported tool palette. The folder is created when you export a
tool palette that contains any of the following items:
■User-created content tools
■Command tools that contain user-specified (custom) tool palette icons
(images)
When you import a customized tool palette, this image folder must be in the
same location as the imported XTP file in order for the icons to appear on the
tool palette.
Tool palettes can be used only in the version of AutoCAD in which they were
created. For example, you cannot use a tool palette that was created in
AutoCAD 2011 in AutoCAD 2005.
The default path for tool palette files is set on the Files tab of the Options
dialog box under Tool Palettes File Locations.
Tool palette groups are saved in profiles.
If you send tool palettes to someone who uses AutoCAD LT, note that some
tools created in AutoCAD do not behave the same way or work in AutoCAD
LT. Note the following limitations:
■The color property of tools that use a color other than an AutoCAD Color
Index (ACI) color convert to ByLayer in AutoCAD LT.
■Gradient fill tools switch to hatch tools in AutoCAD LT.
■Raster image tools do not work in AutoCAD LT.
Save and Share Tool Palettes | 89
NOTE If a tool palette file is set with a read-only attribute, a lock icon is displayed
in a lower corner of the tool palette. This indicates that you cannot modify the
tool palette beyond changing its display settings and rearranging the icons.
See also:
■Save and Restore Interface Settings (Profiles) on page 151
To share a tool palette
1Click Manage tab ➤ Customization panel ➤ Tool Palettes.
2In the Customize dialog box, under Palettes, right-click a tool palette.
On the shortcut menu, click Export.
3In the Export Palette dialog box, enter a file name and click Save.
4Click Close.
To share a tool palette group
1Click Manage tab ➤ Customization panel ➤ Tool Palettes.
2In the Customize dialog box, under Palette Groups, right-click a tool
palette group. Click Export.
3In the Export Group dialog box, enter a file name and click Save.
4Click Close.
Quick Reference
CUSTOMIZE
Customizes tool palettes and tool palette groups.
TOOLPALETTES
Opens the Tool Palettes window.
TOOLPALETTESCLOSE
Closes the Tool Palettes window.
90 | Chapter 4 Other Tool Locations
DesignCenter
With DesignCenter, you can organize access to blocks, hatches, xrefs, and
other drawing content. You can drag content from any source drawing to
your current drawing. You can drag drawings, blocks, and hatches to a tool
palette. Source drawings can be on your computer, on a network location, or
on a website. In addition, if you have multiple drawings open, you can use
DesignCenter to streamline your drawing process by copying and pasting
other content, such as layer definitions, layouts, and text styles between
drawings.
Overview of DesignCenter
With DesignCenter, you can
■Browse for drawing content such as drawings or symbol libraries on your
computer, on a networked drive, and on a web page
■View definition tables for named objects such as blocks and layers in any
drawing file and then insert, attach, or copy and paste the definitions into
the current drawing
■Update (redefine) a block definition
■Create shortcuts to drawings, folders, and Internet locations that you access
frequently
■Add content such as xrefs, blocks, and hatches to a drawing
■Open drawing files in a new window
■Drag drawings, blocks, and hatches to a tool palette for convenient access
Quick Reference
ADCENTER
Manages and inserts content such as blocks, xrefs, and hatch patterns.
ADCNAVIGATE
Loads a specified DesignCenter drawing file, folder, or network path.
DesignCenter | 91
System Variables
ADCSTATE
Indicates whether the DesignCenter window is open or closed.
Understand the DesignCenter Window
You can control the size, location, and appearance of DesignCenter.
The Organization of the DesignCenter Window
The DesignCenter window is divided into the tree view on the left side and
the content area on the right side. Use the tree view to browse sources of
content and to display content in the content area. Use the content area to
add items to a drawing or to a tool palette.
Undocked, the DesignCenter window is displayed as shown.
Below the content area, you can also display a preview or a description of a
selected drawing, block, hatch pattern, or xref. A toolbar at the top of the
window provides several options and operations.
Control the Size, Location, and Appearance of DesignCenter
You can control the size, location, and appearance of DesignCenter. Many of
these options can be set by right-clicking and selecting an option on the
shortcut menu.
■Resize DesignCenter by dragging the bar between the content area and the
tree view or by dragging an edge of the window.
■Dock DesignCenter by dragging it over the right or left docking region of
the application window until it snaps into the docked position. You can
also dock the DesignCenter window by double-clicking its title bar.
■Undock DesignCenter by dragging the area above the toolbar away from
the docking region. Pressing Ctrl while dragging prevents docking.
■Anchor DesignCenter by choosing Anchor Right or Anchor Left from the
shortcut menu. An anchored DesignCenter window rolls open and closed
as the cursor moves across it. When an anchored DesignCenter window
is open, its content overlaps the drawing area. It cannot be set to stay open.
■When DesignCenter is floating, use Auto-hide to set it to roll open and
closed as the cursor moves across it.
92 | Chapter 4 Other Tool Locations

The DesignCenter Toolbar
The DesignCenter toolbar controls navigation and display of information in
the tree view and the content area. For information about these buttons, see
the ADCENTER command. The same navigation and display options are
available on the shortcut menu. Right-click in the DesignCenter content area
to display the menu.
To change the DesignCenter rollover behavior
1Click View tab ➤ Palettes panel ➤ DesignCenter.
2Right-click the DesignCenter title bar. Click Auto-hide.
When the DesignCenter rollover option is turned on, the DesignCenter
tree view and content area disappear when you move your cursor off the
DesignCenter window, leaving only the title bar. When you move your
cursor over the title bar, the DesignCenter window is restored.
To prevent DesignCenter from docking
1Click View tab ➤ Palettes panel ➤ DesignCenter.
2On the DesignCenter title bar, click Propert. Press Ctrl as you move your
mouse.
To display and hide the DesignCenter tree view
1Click View tab ➤ Palettes panel ➤ DesignCenter.
2On the DesignCenter toolbar, click Tree View Toggle.
Quick Reference
ADCENTER
Manages and inserts content such as blocks, xrefs, and hatch patterns.
ADCNAVIGATE
Loads a specified DesignCenter drawing file, folder, or network path.
Understand the DesignCenter Window | 93
System Variables
ADCSTATE
Indicates whether the DesignCenter window is open or closed.
Access Content with DesignCenter
The tree view in the left portion of the DesignCenter window and the four
DesignCenter tabs help you find and load content into the content area.
Folders Tab
The Folders tab displays a hierarchy of navigational icons, including
■Networks and computers
■Web addresses (URLs)
■Computer drives
■Folders
■Drawings and related support files
■Xrefs, layouts, hatch styles, and named objects, including blocks, layers,
linetypes, text styles, dimension styles, table styles, multileader styles, and
plot styles within a drawing
Click an item in the tree view to display its contents in the content area. Click
the plus (+) or minus (-) sign to display and hide additional levels in the
hierarchy. You can also double-click an item to display deeper levels.
Right-clicking in the tree view displays a shortcut menu with several related
options.
94 | Chapter 4 Other Tool Locations
Open Drawings, History, and DC Online Tabs
The Open Drawings, History, and DC Online tabs provide alternate methods
of locating content.
■Open Drawings. Displays a list of the drawings that are currently open.
Click a drawing file and then click one of the definition tables from the
list to load the content into the content area.
■History. Displays a list of files opened previously with DesignCenter.
Double-click a drawing file from the list to navigate to the drawing file in
the tree view of the Folders tab and to load the content into the content
area.
■DC Online. Provides content from the DesignCenter Online web page
including blocks, symbol libraries, manufacturer's content, and online
catalogs.
NOTE The DesignCenter Online (DC Online tab) is disabled by default. You can
enable it from the CAD Manager Control utility on page 104.
Bookmark Frequently Used Content
DesignCenter provides a solution to finding content that you need to access
quickly on a regular basis. Both the tree view and the content area include
options that activate a folder called Favorites. The Favorites folder can contain
shortcuts to content on local or network drives as well as in Internet locations.
When you select a drawing, folder, or another type of content and choose
Add to Favorites, a shortcut to that item is added to the Favorites folder. The
original file or folder doesn't actually move; in fact, all the shortcuts you create
are stored in the Favorites folder. The shortcuts saved in the Favorites folder can
be moved, copied, or deleted using Windows® Explorer.
To change the source of the content displayed in DesignCenter
1Click View tab ➤ Palettes panel ➤ DesignCenter.
2On the DesignCenter window, click one of the following tabs:
■Folders. Lists your local and network drives.
■Open Drawings. Lists the drawings that are currently open.
■History. Lists the last 20 locations accessed through DesignCenter.
Access Content with DesignCenter | 95
■DC Online. Displays online content from the Web.
NOTE The DesignCenter Online (DC Online tab) is disabled by default. You
can enable it from the CAD Manager Control utility on page 104.
To change the folder of the Home button in DesignCenter
1Click View tab ➤ Palettes panel ➤ DesignCenter.
2In the DesignCenter tree view, navigate to the folder that you want to
set as home.
3Right-click on the folder. Click Set as Home.
When you click the Home button, DesignCenter will automatically load this
folder.
To add items to the Favorites folder in DesignCenter
1Click View tab ➤ Palettes panel ➤ DesignCenter.
2Right-click the item in the DesignCenter tree view or content area. Click
Add to Favorites.
To display the contents of the Favorites folder in DesignCenter
1Click View tab ➤ Palettes panel ➤ DesignCenter.
2In DesignCenter, click the Favorites button.
When you are working in the tree view, you can use the Folders tab to
navigate to the Favorites folder.
To organize your DesignCenter Favorites folder
1Click View tab ➤ Palettes panel ➤ DesignCenter.
2In DesignCenter, click the Favorites button.
96 | Chapter 4 Other Tool Locations
3Right-click the background in the content area. Click Organize Favorites.
Your Autodesk Favorites folder is opened in a window.
Quick Reference
ADCENTER
Manages and inserts content such as blocks, xrefs, and hatch patterns.
ADCNAVIGATE
Loads a specified DesignCenter drawing file, folder, or network path.
System Variables
ADCSTATE
Indicates whether the DesignCenter window is open or closed.
Add Content with DesignCenter
The right portion of the DesignCenter window operates on the content
displayed.
Double-clicking an item in the content area displays successive levels of detail.
For example, double-clicking a drawing image displays several icons, including
an icon for blocks. Double-clicking the Blocks icon displays images of each
block in the drawing.
Add Content to a Drawing
You can add content from the content area into your current drawing using
several methods:
■Drag an item to the graphics area of a drawing to add it using default
settings, if any.
■Right-click an item in the content area to display a shortcut menu with
several options.
■Double-click a block to display the Insert dialog box; double-click a hatch
to display the Boundary Hatch and Fill dialog box.
You can preview graphical content such as a drawing, xref, or block in the
content area, and you can display a text description if available.
Add Content with DesignCenter | 97
Update Block Definitions with DesignCenter
Unlike xrefs, when the source file of a block definition is changed, block
definitions in the drawings that contain that block are not automatically
updated. With DesignCenter, you decide whether a block definition should
be updated in the current drawing. The source file of a block definition can
be a drawing file or a nested block in a symbol library drawing.
From the shortcut menu displayed when you right-click a block or drawing
file in the content area, click Redefine Only or Insert and Redefine to update
the selected block.
Open Drawings with DesignCenter
With DesignCenter, you can open a drawing from the content area using the
shortcut menu, pressing Ctrl while dragging a drawing, or dragging a drawing
icon to any location outside the graphics area of a drawing area. The drawing
name is added to the DesignCenter history list for quick access in future
sessions.
Add Items from DesignCenter to a Tool Palette
You can add drawings, blocks, and hatches from DesignCenter to the current
tool palette.
■From the DesignCenter content area, you can drag one or more items to
the current tool palette.
■From the DesignCenter tree view, you can right-click and, from the shortcut
menu, create a new tool palette from the current folder, drawing file, or
block icon.
When you add drawings to a tool palette, they are inserted as blocks when
you drag them into the current drawing.
NOTE You can select multiple blocks or hatches from the content area to add
them to a tool palette.
To create a tool palette containing DesignCenter content
1Click View tab ➤ Palettes panel ➤ DesignCenter.
98 | Chapter 4 Other Tool Locations
2Do one of the following:
■Right-click an item in the DesignCenter tree view. Click Create Tool
Palette. The new tool palette contains the drawings, blocks, or hatches
from the item you selected.
■Right-click the background in the DesignCenter content area. Click
Create Tool Palette. The new tool palette contains the drawings, blocks,
or hatches from the DesignCenter content area.
■Right-click a drawing in the DesignCenter tree view or content area.
Click Create Tool Palette of Blocks. The new tool palette contains the
blocks from the drawing you selected.
You can drag additional drawings, blocks, or hatches from the
DesignCenter content area to the tool palette.
To load the content area from the DesignCenter Search dialog box
1Click View tab ➤ Palettes panel ➤ DesignCenter.
2In DesignCenter, use one of the following methods:
■Drag the item from the search results list into the content area.
■Double-click the item in the search results list.
■Right-click the item in the search results list. Click Load into Content
Area.
3In the DesignCenter content area, double-click the Blocks icon.
To load the content area of DesignCenter with a symbol library
1Click View tab ➤ Palettes panel ➤ DesignCenter.
2On the DesignCenter toolbar, click Home.
3In the content area, double-click the symbol library drawing that you
want to load into the DesignCenter and then double-click the Blocks
icon.
The symbol library you selected is loaded into the DesignCenter content
area.
Add Content with DesignCenter | 99
NOTE You can set your home folder to any folder that contains symbol library
drawings. If your home folder is set to a different path, navigate to a folder that
contains symbol library drawings and right-click on the folder. Click Set as Home.
To load the content area of DesignCenter with hatch patterns
1Click View tab ➤ Palettes panel ➤ DesignCenter.
2On the DesignCenter toolbar, click Search.
3In the Search dialog box, click the Look For box. Click Hatch Pattern
Files.
4On the Hatch Pattern Files tab, in the Search for the Name box, enter *.
5Click Search Now.
6Double-click one of the hatch pattern files that was found.
The hatch pattern file you selected is loaded into DesignCenter.
To open a drawing from DesignCenter
1Click View tab ➤ Palettes panel ➤ DesignCenter.
2In DesignCenter, do one of the following:
■Right-click the drawing icon in the DesignCenter content area. Click
Open in Application Window.
■Press Ctrl and drag the drawing icon from the DesignCenter content
area to the drawing area.
■Drag the drawing icon from the DesignCenter content area to a
location anywhere outside the drawing area of the application window.
(If you drag the drawing icon into the drawing area, a block is created
in the current drawing.)
To update a block definition with DesignCenter
1Click View tab ➤ Palettes panel ➤ DesignCenter.
100 | Chapter 4 Other Tool Locations
2Right-click a block in the DesignCenter content area. Click Redefine Only
or Insert and Redefine.
NOTE If the source of the block that you want to update is an entire drawing
file rather than a block definition within a drawing file, right-click the drawing's
icon in the DesignCenter content area. Click Insert as Block.
To open a block from the DesignCenter window in the Block Editor
1Click View tab ➤ Palettes panel ➤ DesignCenter.
2On the block icon’s shortcut menu, click Block Editor.
Quick Reference
ADCENTER
Manages and inserts content such as blocks, xrefs, and hatch patterns.
ADCNAVIGATE
Loads a specified DesignCenter drawing file, folder, or network path.
System Variables
ADCSTATE
Indicates whether the DesignCenter window is open or closed.
Retrieve Content from the Web with DesignCenter Online
DesignCenter Online provides access to pre-drawn content such as blocks,
symbol libraries, manufacturers' content, and online catalogs.
NOTE The DesignCenter Online (DC Online tab) is disabled by default. You can
enable it from the CAD Manager Control utility on page 104.
Overview of DesignCenter Online
DesignCenter Online provides access to pre-drawn content such as blocks,
symbol libraries, manufacturers' content, and online catalogs. This content
Retrieve Content from the Web with DesignCenter Online | 101
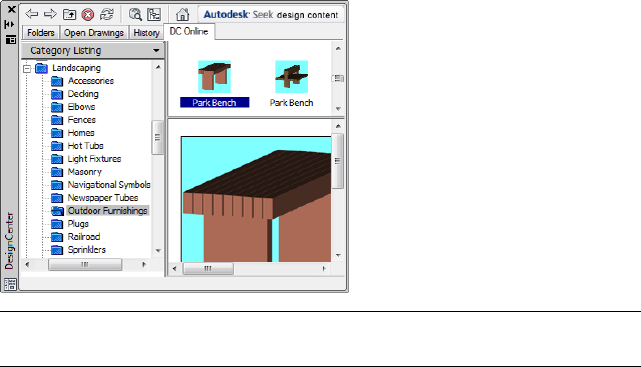
can be used in common design applications to assist you in creating your
drawings.
To access DesignCenter Online, click the DC Online tab in DesignCenter.
Once the DesignCenter Online window is open, you can browse, search, and
download content to use in your drawing.
NOTE The DesignCenter Online (DC Online tab) is disabled by default. You can
enable it from the CAD Manager Control utility on page 104.
In the DesignCenter Online window, two panes are displayed—a right pane
and a left pane. The right pane is called the content area. The content area
displays the items or folders that you selected in the left pane. The left pane
can display one of the following four views:
■Category Listing. Displays folders containing libraries of standard parts,
manufacturer-specific content, and content aggregator websites.
■Search. Searches for online content. You can query items with Boolean
and multiple-word search strings.
■Settings. Controls how many categories and items are displayed on each
page in the content area as a result of a search or folder navigation.
■Collections. Specifies the discipline-specific content types that are displayed
in DesignCenter Online.
You choose the view by clicking the heading at the top of the left pane.
102 | Chapter 4 Other Tool Locations
Once you select a folder in the left pane, all of its content is loaded into the
content area. You can select an item in the content area to load it into the
preview area. Items can be downloaded by dragging them from the preview
area into your drawing or tool palette, or by saving the items to your computer.
NOTE If the DC Online tab is not available in DesignCenter and you want to access
DesignCenter Online, see your network or CAD administrator.
DesignCenter Online Privacy
DesignCenter Online is an interactive feature that must be connected to the
Internet to deliver content and information. Each time DesignCenter Online
is connected, it sends information to Autodesk so that the correct information
can be returned. All information is sent anonymously to maintain your privacy.
The following information is sent to Autodesk:
■Product Name. The name of the product in which you are using
DesignCenter Online
■Product Release Number. The version of the product
■Product Language. The language version of your product
■Random Number Identifier. DesignCenter Online assigns a random number
identifier to each person who uses the feature. This identifier is used to
retain your Collections and your Settings views each time DesignCenter
Online is used.
Autodesk compiles statistics using the information sent from DesignCenter
Online to monitor how it is being used and how it can be improved. Autodesk
will maintain information provided by or collected from you in accordance
with Autodesk's published privacy policy, which is available on
http://www.autodesk.com/privacy.
Turn the DC Online Tab On or Off
The CAD Manager Control utility turns the DC Online tab in DesignCenter
on and off. Information about how to use the utility is available after you
install the utility from the Installation Wizard by running the utility and
clicking Help in the CAD Manager Control Utility window.
Retrieve Content from the Web with DesignCenter Online | 103

To install the CAD Manager Control utility
1Insert the product DVD, or the first CD, into your computer's drive.
2In the Installation Wizard, click Install Tools And Utilities.
3On the Welcome to the Installation wizard page, click Next.
4Choose Autodesk CAD Manager Tools 4.0 on the Select the Products to
Install page. Click Next.
5Review the Autodesk software license agreement for your country or
region. You must accept this agreement to procede with the installation.
Choose your country or region, click I Accept, and then click Next.
NOTE If you do not agree to the terms of the license and wish to terminate
the installation, click Cancel.
6On the Review - Configure - Install page, click Install if you want to accept
the default install location.
If you want the utility installed in a different installation path, click
Configure, set the path and then click Configuration Complete and then
Install.
7Click Finish when the Installation Complete page is displayed.
Quick Reference
ADCENTER
Manages and inserts content such as blocks, xrefs, and hatch patterns.
Understand DesignCenter Online Content Types
With DesignCenter Online, content is categorized into folders.
In the DesignCenter Online folders, you can retrieve discipline-specific content.
The content that you can retrieve includes the following:
■Standard Parts. Generic standard parts that are commonly used in design.
These parts include blocks for architectural, mechanical, and GIS
applications.
■Manufacturers. Blocks and 3D models that can be located and downloaded
by clicking a link to a manufacturer's website.
104 | Chapter 4 Other Tool Locations
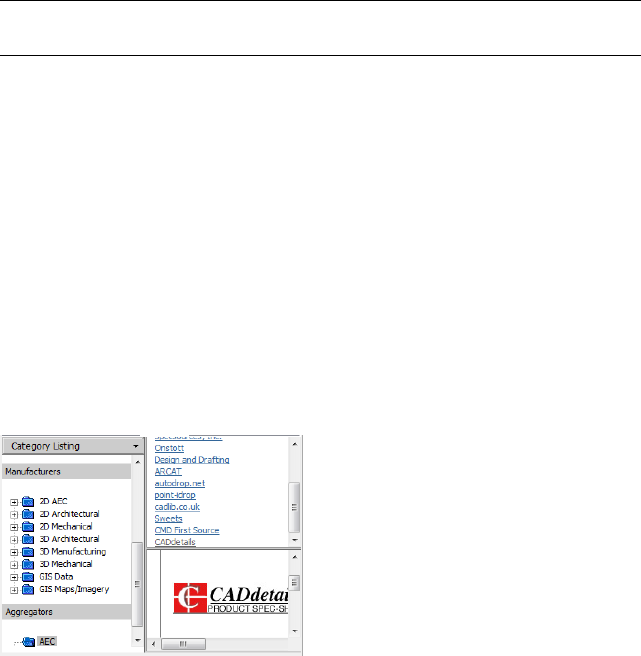
■Aggregators. Lists of libraries from commercial catalog providers can be
searched for parts and blocks.
You use the Collections view to select the categories of online content that
you want to display in the Category Listing view.
NOTE The DesignCenter Online (DC Online tab) is disabled by default. You can
enable it from the CAD Manager Control utility on page 104.
To view online content folders in the Category Listing view
■In DesignCenter Online, at the top of the left pane, click the heading, and
then click Category Listing.
The category folders are displayed in the left pane of the window.
Retrieve Content from the Web
You can download content from the Web and use it in your drawings.
Browse for Content
When you use the Category Listing view, you can click the folders in the left
pane to view their contents. These folders may contain other folders.
When you click a folder or an item inside a folder, the contents are displayed
in the Content area. When you click a block, graphical and descriptive
information about the block is displayed in the preview area.
Search for Content
When you search for online content with DesignCenter Online, you can query
items with Boolean and multiple-word search strings in the Search view. You
Retrieve Content from the Web with DesignCenter Online | 105
can access Search by clicking the magnifying glass or by choosing Search from
the drop-down heading at the top of the left pane.
Control the Number of Categories and Items in a Page
By using the Settings view, you can control how many categories or items are
displayed on each page in the content area as a result of a search or folder
navigation.
Collections
You can choose the type of content to navigate and search. In the Collections
pane, you can specify the content types that are displayed each time you open
DesignCenter Online. For example, if you use architectural blocks in your
drawings, you select collections that contain architectural items. Once you
make your selection, categories that you specified are displayed.
Download Content
To download content from the Web, locate the folder containing the content
that you want to use. Then, click a thumbnail image of the content in the
content area. The content is displayed in the preview area along with
information about the content. You can drag the block directly from the
preview area into a drawing or tool palette, or you can save it to your computer
to be used later.
See also:
■Use Autodesk Seek to Add and Share Drawings on page 1984
To search for content in DesignCenter Online
1In DesignCenter Online, at the top of the left pane, click the heading,
and then click Search.
2In the Search view, enter a single word or multiple-word strings.
NOTE The Need Help link provides more information about searches,
including examples of Boolean searches.
106 | Chapter 4 Other Tool Locations
To specify content collections
1In DesignCenter Online, at the top of the left pane, click the heading,
and then click Collections.
2In the Collections view, click the check boxes of the collections that you
want to use.
3Click Update Collections.
The categories that you have selected are displayed in the left pane.
To download content to your computer
1In DesignCenter Online, at the top of the left pane, click the heading,
and then click Category Listing.
2In the Category folders, click a content item.
3In the Preview area, under the image of the content item, click Save This
Symbol As.
4In the Save As dialog box, specify the location on your computer and the
file name.
5Click Save.
The content is downloaded to your computer.
To download content to your drawing
1In DesignCenter Online, at the top of the left pane, click the heading,
and then click Category Listing.
2In the Category folders, click a content item to display it in the Preview
area.
3Drag the image from the Preview area into your drawing or tool palette.
Quick Reference
ADCENTER
Manages and inserts content such as blocks, xrefs, and hatch patterns.
Retrieve Content from the Web with DesignCenter Online | 107
108
Customize the Drawing
Environment
You can change many window and drawing environment settings in the Options dialog box.
For example, you can change how often a drawing is automatically saved to a temporary file,
and you can link the program to folders containing files you use frequently. You can create
workspaces to set up a drawing environment that is specific to your drawing needs. Experiment
with different settings until you create the drawing environment that best fits your needs.
Set Interface Options
You can adjust the application interface and drawing area to match the way
you work.
Set Up the Drawing Area
You can adjust the color and display schemes used in the application and
drawing windows, and control the behavior of general features such as zoom
transitions.
Many of the settings are available from shortcut menus and the Options dialog
box. Some workspace elements, such as the presence and location of toolbars
and palettes, can be specified and saved using the Customize User Interface
dialog box.
Some settings affect how you work in the drawing area:
■Background Colors (Options dialog box, Display tab). You specify the
background colors used in the layout and Model tabs and the color used for
prompts and crosshairs.
5
109
■Color Scheme (Options dialog box, Display tab, Colors). You specify a dark
or light color scheme for the overall user interface. The settings affect the
window frame background, status bar, title bar, menu browser frame,
toolbars, and palettes.
■Background Colors (Options dialog box, Display tab, Colors). You specify
the background colors used in model space, layouts, and the block editor.
Background colors on the Model tab change to indicate whether you are
working in a 2D design context, 3D modeling (parallel projection), or 3D
modeling (perspective projection).
■UCS Icon and Crosshairs Cursor (Options dialog box, 3D Modeling tab).
You specify that the 3D display options and labels for the UCS icon can
be set in the 3D Modeling tab of the Options dialog box.
■Color Assignments for X, Y, and Z (Options dialog box, Display tab, Colors).
In 3D views, any interface elements that are associated with the UCS X, Y,
and Z axis use special color assignments. The X axis is colored or tinted
red, the Y axis is green, and the Z axis is blue. These tints can be turned on
or off in the Drawing Window Colors dialog box.
■Clean Screen. You can expand the drawing display area to display only
the menu bar, status bar, and command window with the clean screen
button on the application status bar. Click the button again to restore the
previous setup.
■View Transitions. You can control whether view transitions are smooth or
instantaneous when you pan, zoom, or change from one view to another
(VTOPTIONS command). The default is a smooth transition.
Tooltips
Several types of tooltips provide pop-up information for interaction with
toolbars, object snaps, and drafting operations.
You can view tooltips in toolbars, the menu browser, the ribbon, and dialog
boxes. Initially, a basic tooltip is displayed. If you continue to hover, the
tooltip expands to display additional information. You can customize the
display and content of a tooltip.
See also:
■Display Tab (Options Dialog Box) in the Command Reference
■User Interface Customization in the Customization Guide
110 | Chapter 5 Customize the Drawing Environment
■Rollover Tooltips in the Customization Guide
■Create Tooltips and Extended Help for Commands in the Customization
Guide
To set options
1Click the Application button. At the bottom of the Application menu,
click Options.
2In the Options dialog box, click a tab.
3Set options as desired.
4Do either or both of the following:
■Click Apply to record the current options settings in the system
registry.
■Click OK to record the current options settings in the system registry
and close the Options dialog box.
To customize the colors of the application window elements
1Click the Application button. At the bottom of the Application menu,
click Options.
2In the Options dialog box, Display tab, click Colors.
3In the Drawing Window Colors dialog box, select context and then the
interface element you want to change.
4Select the color you want to use from the Color list.
To specify a custom color, select Select Color from the Color list.
5If you want to revert to the default colors, click Restore Current Element,
Restore Current Context, or Restore All Contexts.
6Click Apply and Close to record the current option settings in the system
registry and close the dialog box.
7Click OK to close the Options dialog box.
To change the appearance of view transitions
1At the Command prompt, enter vtoptions.
Set Up the Drawing Area | 111
2In the View Transitions dialog box, check one or more of the following
options:
■Enable Animation for Pan and Zoom. Makes a smooth view transition
during panning and zooming.
■Enable Animation When View Rotates. Makes a smooth view transition
when the view angle is changed.
■Enable Animation During Scripts. Makes a smooth view transition
while a script is running.
3Set the transition speed by moving the slider.
4To preserve performance, set the minimum frames per second for showing
smooth view transitions. When a smooth view transition cannot maintain
this speed, an instant transition is used.
5Click OK.
To display hidden message dialogs
1Click the Application button. At the bottom of the Application menu,
click Options.
2In the Options dialog box, System tab, under General Options, click
Hidden Messages Settings button.
3The Hidden Message Settings dialog box is displayed.
4Check the corresponding dialog name from the tree directory.
5Click OK.
To turn tooltips on or off
1Click Tools menu ➤ Options.
2In the Options dialog box, Display tab, under Window Elements, click
Show Tooltips.
3Click OK.
112 | Chapter 5 Customize the Drawing Environment
Quick Reference
Commands
3DCONFIG
Sets options that affect 3D display performance.
CLEANSCREENON
Clears the screen of toolbars and dockable windows, excluding the command
window.
CLEANSCREENOFF
Restores display of toolbars and dockable windows, excluding the command
window.
OPTIONS
Customizes the program settings.
VIEWRES
Sets the resolution for objects in the current viewport.
VTOPTIONS
Displays a change in view as a smooth transition.
System Variables
APPLYGLOBALOPACITIES
Applies transparency settings to all palettes.
CALCINPUT
Controls whether mathematical expressions and global constants are
evaluated in text and numeric entry boxes of windows and dialog boxes.
CLEANSCREENSTATE
Indicates whether the clean screen state is on or off.
CURSORSIZE
Determines the size of the crosshairs as a percentage of the screen size.
DRAGMODE
Controls the way dragged objects are displayed.
Set Up the Drawing Area | 113
EXTNAMES
Sets the parameters for named object names (such as linetypes and layers)
stored in definition tables.
GLOBALOPACITY
Controls transparency level for all palettes.
GRIPCOLOR
Controls the color of unselected grips.
GRIPHOT
Controls the color of selected grips.
GRIPS
Controls the display of grips on selected objects.
HELPPREFIX
Sets the file path for the Help system.
INSUNITS
Specifies a drawing-units value for automatic scaling of blocks, images, or
xrefs when inserted or attached to a drawing.
INSUNITSDEFSOURCE
Sets source content units value when INSUNITS is set to 0.
INSUNITSDEFTARGET
Sets target drawing units value when INSUNITS is set to 0.
INTELLIGENTUPDATE
Controls the graphics refresh rate.
ISAVEBAK
Improves the speed of incremental saves, especially for large drawings.
ISAVEPERCENT
Determines the amount of wasted space tolerated in a drawing file.
LAYOUTREGENCTL
Specifies how the display list is updated in the Model tab and layout tabs.
114 | Chapter 5 Customize the Drawing Environment
LOCALE
Displays a code that indicates the current locale.
LOCALROOTPREFIX
Stores the full path to the root folder where local customizable files were
installed.
LOCKUI
Locks the position and size of toolbars and dockable windows such as
DesignCenter and the Properties palette.
LOGFILEMODE
Specifies whether the contents of the text window are written to a log file.
LOGFILENAME
Specifies the path and name of the text window log file for the current
drawing.
LOGFILEPATH
Specifies the path for the text window log files for all drawings in a session.
MTEXTED
Sets the application for editing multiline text objects.
OLEQUALITY
Sets the default plot quality for OLE objects.
OLESTARTUP
Controls whether the source application of an embedded OLE object loads
when plotting.
OSNAPCOORD
Controls whether coordinates entered on the command line will override
running object snaps.
PAPERUPDATE
Controls the display of a warning dialog box when attempting to print a
layout with a paper size different from the paper size specified by the default
for the plotter configuration file.
Set Up the Drawing Area | 115
PALETTEOPAQUE
Controls the display of a warning dialog box when attempting to print a
layout with a paper size different from the paper size specified by the default
for the plotter configuration file.
PICKADD
Controls whether subsequent selections replace the current selection set or
add to it.
PICKAUTO
Controls automatic windowing at the Select Objects prompt.
PICKBOX
Sets the object selection target height, in pixels.
PICKDRAG
Controls the method of drawing a selection window.
PICKFIRST
Controls whether you select objects before (noun-verb selection) or after you
issue a command.
PICKSTYLE
Controls the use of group selection and associative hatch selection.
PSTYLEPOLICY
Controls the plot style mode, Color-Dependent or Named, that is used when
opening a drawing that was created in a release prior to AutoCAD 2000 or
when creating a new drawing from scratch without using a drawing template.
QTEXTMODE
Controls how text is displayed.
RASTERPREVIEW
Controls whether BMP preview images are saved with the drawing.
ROLLOVEROPACITY
Controls the transparency of a palette while the cursor moves over the palette.
ROLLOVERTIPS
Controls the display of rollover tooltips in the application.
116 | Chapter 5 Customize the Drawing Environment
SAVEFILE
Stores the current automatic save file name.
SAVEFILEPATH
Specifies the path to the directory for all automatic save files for the current
session.
SAVETIME
Sets the automatic save interval, in minutes.
SPLINESEGS
Sets the number of line segments to be generated for each spline-fit polyline
generated by the Spline option of the PEDIT command.
TDUSRTIMER
Stores the user-elapsed timer.
TOOLTIPMERGE
Combines drafting tooltips into a single tooltip.
TOOLTIPS
Controls the display of tooltips on the ribbon, toolbars, and other user
interface elements.
VISRETAIN
Controls the properties of xref-dependent layers.
VTDURATION
Sets the duration of a smooth view transition, in milliseconds.
VTENABLE
Controls when smooth view transitions are used.
VTFPS
Sets the minimum speed of a smooth view transition, in frames per second.
XLOADCTL
Turns xref demand-loading on and off, and controls whether it opens the
referenced drawing or a copy.
Set Up the Drawing Area | 117
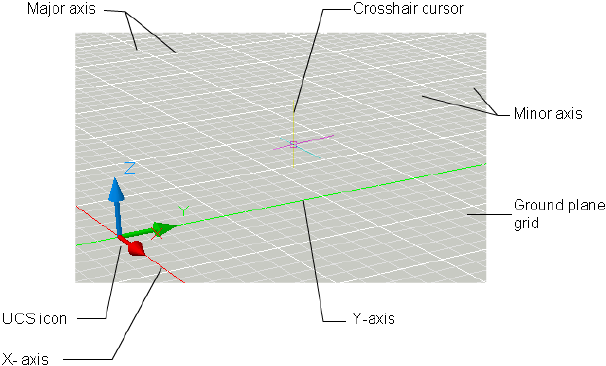
Set Options for 3D Modeling with Perspective Projection
You can set specific display options when working with 3D models using
perspective projection.
Using the Options dialog box, you can specify the following options when
your 3D model is set to use a perspective view:
■Ground Plane (Options dialog box, Display tab, Colors). When perspective
projection is turned on, the XY plane of the UCS displays as a ground plane
with a gradient color. The ground plane displays a gradient from the ground
horizon to the ground origin.
■Sky (Options dialog box, Display tab, Colors). The area not covered by the
ground plane is the sky, which displays a gradient color from the sky horizon
to the sky zenith.
■Underground (Options dialog box, Display tab, Colors). If the ground
plane is viewed from below ground, the ground plane displays a gradient
from the earth horizon to the earth azimuth.
■Ground Plane Grid (Options dialog box, Display tab, Colors). When
perspective projection is turned on, the grid displays as a ground plane grid.
Colors are set for major grid lines, minor grid lines, and axis lines.
118 | Chapter 5 Customize the Drawing Environment
Quick Reference
Commands
3DCONFIG
Sets options that affect 3D display performance.
OPTIONS
Customizes the program settings.
VIEWRES
Sets the resolution for objects in the current viewport.
System Variables
APERTURE
Sets the display size for the object snap target box, in pixels.
CALCINPUT
Controls whether mathematical expressions and global constants are
evaluated in text and numeric entry boxes of windows and dialog boxes.
CLEANSCREENSTATE
Indicates whether the clean screen state is on or off.
CURSORSIZE
Determines the size of the crosshairs as a percentage of the screen size.
DCTCUST
Displays the path and file name of the current custom spelling dictionary.
DCTMAIN
Displays the three letter keyword for the current main spelling dictionary.
DEFPLSTYLE
Specifies the default plot style for new objects in a drawing when opening a
drawing that was created in a release prior to AutoCAD 2000, or when creating
a new drawing from scratch without using a drawing template.
DRAGMODE
Controls the way dragged objects are displayed.
Set Options for 3D Modeling with Perspective Projection | 119
EXTNAMES
Sets the parameters for named object names (such as linetypes and layers)
stored in definition tables.
FILLMODE
Specifies whether hatches and fills, 2D solids, and wide polylines are filled
in.
GRIPBLOCK
Controls the display of grips in blocks.
GRIPCOLOR
Controls the color of unselected grips.
GRIPHOT
Controls the color of selected grips.
GRIPS
Controls the display of grips on selected objects.
INSUNITS
Specifies a drawing-units value for automatic scaling of blocks, images, or
xrefs when inserted or attached to a drawing.
INSUNITSDEFSOURCE
Sets source content units value when INSUNITS is set to 0.
INSUNITSDEFTARGET
Sets target drawing units value when INSUNITS is set to 0.
INTELLIGENTUPDATE
Controls the graphics refresh rate.
ISAVEBAK
Improves the speed of incremental saves, especially for large drawings.
ISAVEPERCENT
Determines the amount of wasted space tolerated in a drawing file.
LAYOUTREGENCTL
Specifies how the display list is updated in the Model tab and layout tabs.
120 | Chapter 5 Customize the Drawing Environment
LOCALE
Displays a code that indicates the current locale.
LOCALROOTPREFIX
Stores the full path to the root folder where local customizable files were
installed.
LOCKUI
Locks the position and size of toolbars and dockable windows such as
DesignCenter and the Properties palette.
LOGFILEMODE
Specifies whether the contents of the text window are written to a log file.
LOGFILENAME
Specifies the path and name of the text window log file for the current
drawing.
LOGFILEPATH
Specifies the path for the text window log files for all drawings in a session.
MTEXTED
Sets the application for editing multiline text objects.
OLEQUALITY
Sets the default plot quality for OLE objects.
OLESTARTUP
Controls whether the source application of an embedded OLE object loads
when plotting.
OSNAPCOORD
Controls whether coordinates entered on the command line will override
running object snaps.
PAPERUPDATE
Controls the display of a warning dialog box when attempting to print a
layout with a paper size different from the paper size specified by the default
for the plotter configuration file.
PALETTEOPAQUE
Controls whether palettes can be made transparent.
Set Options for 3D Modeling with Perspective Projection | 121
PICKADD
Controls whether subsequent selections replace the current selection set or
add to it.
PICKAUTO
Controls automatic windowing at the Select Objects prompt.
PICKBOX
Sets the object selection target height, in pixels.
PICKDRAG
Controls the method of drawing a selection window.
PICKFIRST
Controls whether you select objects before (noun-verb selection) or after you
issue a command.
PICKSTYLE
Controls the use of group selection and associative hatch selection.
PSTYLEPOLICY
Controls the plot style mode, Color-Dependent or Named, that is used when
opening a drawing that was created in a release prior to AutoCAD 2000 or
when creating a new drawing from scratch without using a drawing template.
QTEXTMODE
Controls how text is displayed.
RASTERPREVIEW
Controls whether BMP preview images are saved with the drawing.
ROLLOVERTIPS
Controls the display of rollover tooltips in the application.
SAVEFILEPATH
Stores the current automatic save file name.
SAVEFILEPATH
Specifies the path to the directory for all automatic save files for the current
session.
122 | Chapter 5 Customize the Drawing Environment
SAVETIME
Sets the automatic save interval, in minutes.
SPLINESEGS
Sets the number of line segments to be generated for each spline-fit polyline
generated by the Spline option of the PEDIT command.
TDUSRTIMER
Stores the user-elapsed timer.
TOOLTIPMERGE
Combines drafting tooltips into a single tooltip.
TOOLTIPS
Controls the display of tooltips on the ribbon, toolbars, and other user
interface elements.
VISRETAIN
Controls the properties of xref-dependent layers.
VTDURATION
Sets the duration of a smooth view transition, in milliseconds.
VTENABLE
Controls when smooth view transitions are used.
VTFPS
Sets the minimum speed of a smooth view transition, in frames per second.
XLOADCTL
Turns xref demand-loading on and off, and controls whether it opens the
referenced drawing or a copy.
Switch Between Model Space and Layouts
You can control how you change between model space and one or more
layouts.
The classic interface provides a Model tab and one or more layout tabs. To
optimize space in the drawing area, you can turn off these tabs and use the
equivalent buttons on the status bar. The control to change between the two
interface designs is included as an item on the Model and layout tab shortcut
Switch Between Model Space and Layouts | 123

menu, and on the shortcut menu of the Model/Layout button on the status
bar.
NOTE Access to all shortcut menu options is available from the tabs only.
To change the Model and layout tabs to status bar buttons
■Right-click the Model tab or a layout tab. Click Hide Layout and Model
Tabs.
To turn on the Model and layout tabs
■On the status bar, right-click the Model or layout button. Click Display
Layout and Model Tabs.
Quick Reference
Commands
DRAGMODE
Controls the way dragged objects are displayed.
OPTIONS
Customizes the program settings.
VIEWRES
Sets the resolution for objects in the current viewport.
System Variables
APERTURE
Sets the display size for the object snap target box, in pixels.
CALCINPUT
Controls whether mathematical expressions and global constants are
evaluated in text and numeric entry boxes of windows and dialog boxes.
CLEANSCREENSTATE
Indicates whether the clean screen state is on or off.
CURSORSIZE
Determines the size of the crosshairs as a percentage of the screen size.
124 | Chapter 5 Customize the Drawing Environment
DCTCUST
Displays the path and file name of the current custom spelling dictionary.
DCTMAIN
Displays the three letter keyword for the current main spelling dictionary.
DEFPLSTYLE
Specifies the default plot style for new objects in a drawing when opening a
drawing that was created in a release prior to AutoCAD 2000, or when creating
a new drawing from scratch without using a drawing template.
DRAGMODE
Controls the way dragged objects are displayed.
EXTNAMES
Sets the parameters for named object names (such as linetypes and layers)
stored in definition tables.
FILLMODE
Specifies whether hatches and fills, 2D solids, and wide polylines are filled
in.
GRIPBLOCK
Controls the display of grips in blocks.
GRIPCOLOR
Controls the color of unselected grips.
GRIPHOT
Controls the color of selected grips.
GRIPS
Controls the display of grips on selected objects.
INSUNITS
Specifies a drawing-units value for automatic scaling of blocks, images, or
xrefs when inserted or attached to a drawing.
INSUNITSDEFSOURCE
Sets source content units value when INSUNITS is set to 0.
Switch Between Model Space and Layouts | 125
INSUNITSDEFTARGET
Sets target drawing units value when INSUNITS is set to 0.
INTELLIGENTUPDATE
Controls the graphics refresh rate.
ISAVEBAK
Improves the speed of incremental saves, especially for large drawings.
ISAVEPERCENT
Determines the amount of wasted space tolerated in a drawing file.
LAYOUTREGENCTL
Specifies how the display list is updated in the Model tab and layout tabs.
LOCALE
Displays a code that indicates the current locale.
LOCALROOTPREFIX
Stores the full path to the root folder where local customizable files were
installed.
LOCKUI
Locks the position and size of toolbars and dockable windows such as
DesignCenter and the Properties palette.
LOGFILEMODE
Specifies whether the contents of the text window are written to a log file.
LOGFILENAME
Specifies the path and name of the text window log file for the current
drawing.
LOGFILEPATH
Specifies the path for the text window log files for all drawings in a session.
MTEXTED
Sets the application for editing multiline text objects.
OLEQUALITY
Sets the default plot quality for OLE objects.
126 | Chapter 5 Customize the Drawing Environment
OLESTARTUP
Controls whether the source application of an embedded OLE object loads
when plotting.
OSNAPCOORD
Controls whether coordinates entered on the command line will override
running object snaps.
PAPERUPDATE
Controls the display of a warning dialog box when attempting to print a
layout with a paper size different from the paper size specified by the default
for the plotter configuration file.
PALETTEOPAQUE
Controls whether palettes can be made transparent.
PICKADD
Controls whether subsequent selections replace the current selection set or
add to it.
PICKAUTO
Controls automatic windowing at the Select Objects prompt.
PICKBOX
Sets the object selection target height, in pixels.
PICKDRAG
Controls the method of drawing a selection window.
PICKFIRST
Controls whether you select objects before (noun-verb selection) or after you
issue a command.
PICKSTYLE
Controls the use of group selection and associative hatch selection.
PSTYLEPOLICY
Controls the plot style mode, Color-Dependent or Named, that is used when
opening a drawing that was created in a release prior to AutoCAD 2000 or
when creating a new drawing from scratch without using a drawing template.
Switch Between Model Space and Layouts | 127
QTEXTMODE
Controls how text is displayed.
RASTERPREVIEW
Controls whether BMP preview images are saved with the drawing.
ROLLOVERTIPS
Controls the display of rollover tooltips in the application.
SAVEFILEPATH
Stores the current automatic save file name.
SAVEFILEPATH
Specifies the path to the directory for all automatic save files for the current
session.
SAVETIME
Sets the automatic save interval, in minutes.
SPLINESEGS
Sets the number of line segments to be generated for each spline-fit polyline
generated by the Spline option of the PEDIT command.
TDUSRTIMER
Stores the user-elapsed timer.
TOOLTIPMERGE
Combines drafting tooltips into a single tooltip.
TOOLTIPS
Controls the display of tooltips on the ribbon, toolbars, and other user
interface elements.
VISRETAIN
Controls the properties of xref-dependent layers.
VTDURATION
Sets the duration of a smooth view transition, in milliseconds.
VTENABLE
Controls when smooth view transitions are used.
128 | Chapter 5 Customize the Drawing Environment

VTFPS
Sets the minimum speed of a smooth view transition, in frames per second.
XLOADCTL
Turns xref demand-loading on and off, and controls whether it opens the
referenced drawing or a copy.
Specify Application Fonts
Change the fonts used in the application window and in the text window.
You can specify the font that is displayed in both the application and text
windows. To change the application font, use the Options dialog box, Display
tab.
NOTE This setting does not affect the text in your drawings.
To change the font displayed in the Command window
1Click the Application button. At the bottom of the Application menu,
click Options.
2In the Options dialog box, Display tab, under Window Elements, click
Fonts.
3In the Command Line Window Font dialog box, select the appropriate
Font, Font Style, and Size.
An example of the current choices appears under Sample Command Line
Font.
4Click Apply & Close to record the current option settings in the system
registry and close the dialog box.
5In the Options dialog box, click OK.
Quick Reference
Commands
OPTIONS
Customizes the program settings.
Specify Application Fonts | 129
System Variables
APERTURE
Sets the display size for the object snap target box, in pixels.
CALCINPUT
Controls whether mathematical expressions and global constants are
evaluated in text and numeric entry boxes of windows and dialog boxes.
CLEANSCREENSTATE
Indicates whether the clean screen state is on or off.
CURSORSIZE
Determines the size of the crosshairs as a percentage of the screen size.
DCTCUST
Displays the path and file name of the current custom spelling dictionary.
DCTMAIN
Displays the three letter keyword for the current main spelling dictionary.
DEFPLSTYLE
Specifies the default plot style for new objects in a drawing when opening a
drawing that was created in a release prior to AutoCAD 2000, or when creating
a new drawing from scratch without using a drawing template.
DRAGMODE
Controls the way dragged objects are displayed.
EXTNAMES
Sets the parameters for named object names (such as linetypes and layers)
stored in definition tables.
FILLMODE
Specifies whether hatches and fills, 2D solids, and wide polylines are filled
in.
GRIPBLOCK
Controls the display of grips in blocks.
GRIPCOLOR
Controls the color of unselected grips.
130 | Chapter 5 Customize the Drawing Environment
GRIPHOT
Controls the color of selected grips.
GRIPS
Controls the display of grips on selected objects.
INSUNITS
Specifies a drawing-units value for automatic scaling of blocks, images, or
xrefs when inserted or attached to a drawing.
INSUNITSDEFSOURCE
Sets source content units value when INSUNITS is set to 0.
INSUNITSDEFTARGET
Sets target drawing units value when INSUNITS is set to 0.
INTELLIGENTUPDATE
Controls the graphics refresh rate.
ISAVEBAK
Improves the speed of incremental saves, especially for large drawings.
ISAVEPERCENT
Determines the amount of wasted space tolerated in a drawing file.
LAYOUTREGENCTL
Specifies how the display list is updated in the Model tab and layout tabs.
LOCALE
Displays a code that indicates the current locale.
LOCALROOTPREFIX
Stores the full path to the root folder where local customizable files were
installed.
LOCKUI
Locks the position and size of toolbars and dockable windows such as
DesignCenter and the Properties palette.
LOGFILEMODE
Specifies whether the contents of the text window are written to a log file.
Specify Application Fonts | 131
LOGFILENAME
Specifies the path and name of the text window log file for the current
drawing.
LOGFILEPATH
Specifies the path for the text window log files for all drawings in a session.
MTEXTED
Sets the application for editing multiline text objects.
OLEQUALITY
Sets the default plot quality for OLE objects.
OLESTARTUP
Controls whether the source application of an embedded OLE object loads
when plotting.
OSNAPCOORD
Controls whether coordinates entered on the command line will override
running object snaps.
PAPERUPDATE
Controls the display of a warning dialog box when attempting to print a
layout with a paper size different from the paper size specified by the default
for the plotter configuration file.
PALETTEOPAQUE
Controls whether palettes can be made transparent.
PICKADD
Controls whether subsequent selections replace the current selection set or
add to it.
PICKAUTO
Controls automatic windowing at the Select Objects prompt.
PICKBOX
Sets the object selection target height, in pixels.
PICKDRAG
Controls the method of drawing a selection window.
132 | Chapter 5 Customize the Drawing Environment
PICKFIRST
Controls whether you select objects before (noun-verb selection) or after you
issue a command.
PICKSTYLE
Controls the use of group selection and associative hatch selection.
PSTYLEPOLICY
Controls the plot style mode, Color-Dependent or Named, that is used when
opening a drawing that was created in a release prior to AutoCAD 2000 or
when creating a new drawing from scratch without using a drawing template.
QTEXTMODE
Controls how text is displayed.
RASTERPREVIEW
Controls whether BMP preview images are saved with the drawing.
ROLLOVERTIPS
Controls the display of rollover tooltips in the application.
SAVEFILEPATH
Stores the current automatic save file name.
SAVEFILEPATH
Specifies the path to the directory for all automatic save files for the current
session.
SAVETIME
Sets the automatic save interval, in minutes.
SPLINESEGS
Sets the number of line segments to be generated for each spline-fit polyline
generated by the Spline option of the PEDIT command.
TDUSRTIMER
Stores the user-elapsed timer.
TOOLTIPMERGE
Combines drafting tooltips into a single tooltip.
Specify Application Fonts | 133
TOOLTIPS
Controls the display of tooltips on the ribbon, toolbars, and other user
interface elements.
VISRETAIN
Controls the properties of xref-dependent layers.
VTDURATION
Sets the duration of a smooth view transition, in milliseconds.
VTENABLE
Controls when smooth view transitions are used.
VTFPS
Sets the minimum speed of a smooth view transition, in frames per second.
XLOADCTL
Turns xref demand-loading on and off, and controls whether it opens the
referenced drawing or a copy.
Specify the Behavior of Dockable Windows
Windows such as the ribbon, Properties palette, tool palettes, and DesignCenter
can be docked, anchored, or floated.
Settings for these and other options are often changed on a shortcut menu,
available by right-clicking the title bar of the palette or window.
■Resize. Drag an edge of the window to change its size. If the window has
panes, drag the bar between panes to resize the panes.
■Allow Docking. Select this option if you want to dock or anchor a dockable
window. A docked window adheres to one side of the application window,
causing the drawing area to be resized.
■Anchor. Attach, or anchor, a dockable window or palette to the left or right
side of the drawing area. An anchored window rolls open and closed as
the cursor moves across it. When an anchored window is open, its content
overlaps the drawing area. An anchored window cannot be set to stay
open. The Allow Docking option must be selected before you can anchor
a window.
134 | Chapter 5 Customize the Drawing Environment
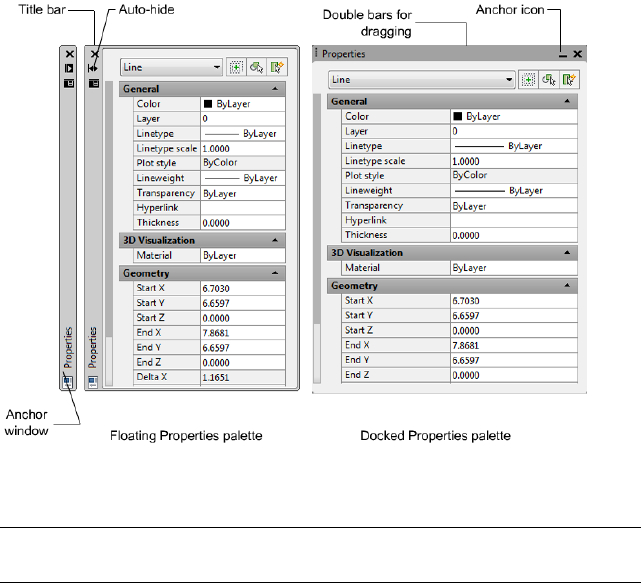
■Auto-hide. A floating window rolls open and closes as the cursor moves
across it. When this option is cleared, the window stays open continuously.
Docked windows with auto-hide show up as a bar inside the application.
■Transparency. Sets the degree of transparency for the window and on
mouse over. The window becomes transparent so that it does not obscure
objects under it. The window becomes more opaque when it is moused
over. This option is not available for all windows.
You can hide all the palettes at once with HIDEPALETTES and turn on all
hidden palettes with SHOWPALETTES.
NOTE If a palette has been turned back on manually and moved, it is not affected
by SHOWPALETTES.
To anchor a dockable window
1At the top of the window or palette title bar, click the Propterties button.
Click Allow Docking.
2Click the Properties button again. Click Anchor Right or Anchor Left.
Specify the Behavior of Dockable Windows | 135

To float an anchored window
Do one of the following:
■At the top of the window or palette title bar, click the Properties button.
Clear Allow Docking.
■When the anchored window is open, drag the window title bar away from
the anchor tab base.
■Double-click the anchor tab.
To dock a window or palette
1At the top of the window or palette title bar, click the Properties button.
Click Allow Docking.
2Click and drag the window or palette to a docking location on the right
or left side of the drawing area.
3When the outline of the window is displayed in the docking area, release
the button.
NOTE To place a toolbar in a docking region without docking it, hold down
the Ctrl key as you drag.
To undock a window or palette
Use one of the following methods:
■At the top of the window or palette title bar, click the Properties button.
Clear Allow Docking.
■Double-click the double bars on the side or top of the window.
■Position the cursor on the double bars at the top or side of the window,
hold down the left button on your pointing device, and drag the window
away from its docked location.
To turn Auto-hide on or off for a floating palette or window
■At the top of the window or palette title bar, click the Auto-hide button.
If Auto-hide is selected, floating windows roll open and closed as the cursor
moves across them. When this option is cleared, the full window stays open
continuously.
136 | Chapter 5 Customize the Drawing Environment

NOTE This procedure applies to the Tool palette, DesignCenter, the Properties
palette, and several other palettes.
Quick Reference
Commands
DRAGMODE
Controls the way dragged objects are displayed.
HIDEPALETTES
Hides all currently displayed palettes, including the command window.
LOGFILEOFF
Closes the text window log file opened by LOGFILEON.
LOGFILEON
Writes the text window contents to a file.
OPTIONS
Customizes the program settings.
SHOWPALETTES
Restores the display of hidden palettes.
VIEWRES
Sets the resolution for objects in the current viewport.
VTOPTIONS
Displays a change in view as a smooth transition.
System Variables
APERTURE
Sets the display size for the object snap target box, in pixels.
CALCINPUT
Controls whether mathematical expressions and global constants are
evaluated in text and numeric entry boxes of windows and dialog boxes.
Specify the Behavior of Dockable Windows | 137
CLEANSCREENSTATE
Indicates whether the clean screen state is on or off.
CURSORSIZE
Determines the size of the crosshairs as a percentage of the screen size.
DCTCUST
Displays the path and file name of the current custom spelling dictionary.
DCTMAIN
Displays the three letter keyword for the current main spelling dictionary.
DEFPLSTYLE
Specifies the default plot style for new objects in a drawing when opening a
drawing that was created in a release prior to AutoCAD 2000, or when creating
a new drawing from scratch without using a drawing template.
DRAGMODE
Controls the way dragged objects are displayed.
EXTNAMES
Sets the parameters for named object names (such as linetypes and layers)
stored in definition tables.
FILLMODE
Specifies whether hatches and fills, 2D solids, and wide polylines are filled
in.
GRIPBLOCK
Controls the display of grips in blocks.
GRIPCOLOR
Controls the color of unselected grips.
GRIPHOT
Controls the color of selected grips.
GRIPS
Controls the display of grips on selected objects.
138 | Chapter 5 Customize the Drawing Environment
INSUNITS
Specifies a drawing-units value for automatic scaling of blocks, images, or
xrefs when inserted or attached to a drawing.
INSUNITSDEFSOURCE
Sets source content units value when INSUNITS is set to 0.
INSUNITSDEFTARGET
Sets target drawing units value when INSUNITS is set to 0.
INTELLIGENTUPDATE
Controls the graphics refresh rate.
ISAVEBAK
Improves the speed of incremental saves, especially for large drawings.
ISAVEPERCENT
Determines the amount of wasted space tolerated in a drawing file.
LAYOUTREGENCTL
Specifies how the display list is updated in the Model tab and layout tabs.
LOCALE
Displays a code that indicates the current locale.
LOCALROOTPREFIX
Stores the full path to the root folder where local customizable files were
installed.
LOCKUI
Locks the position and size of toolbars and dockable windows such as
DesignCenter and the Properties palette.
LOGFILEMODE
Specifies whether the contents of the text window are written to a log file.
LOGFILENAME
Specifies the path and name of the text window log file for the current
drawing.
LOGFILEPATH
Specifies the path for the text window log files for all drawings in a session.
Specify the Behavior of Dockable Windows | 139
MTEXTED
Sets the application for editing multiline text objects.
OLEQUALITY
Sets the default plot quality for OLE objects.
OLESTARTUP
Controls whether the source application of an embedded OLE object loads
when plotting.
OSNAPCOORD
Controls whether coordinates entered on the command line will override
running object snaps.
PAPERUPDATE
Controls the display of a warning dialog box when attempting to print a
layout with a paper size different from the paper size specified by the default
for the plotter configuration file.
PALETTEOPAQUE
Controls whether palettes can be made transparent.
PICKADD
Controls whether subsequent selections replace the current selection set or
add to it.
PICKAUTO
Controls automatic windowing at the Select Objects prompt.
PICKBOX
Sets the object selection target height, in pixels.
PICKDRAG
Controls the method of drawing a selection window.
PICKFIRST
Controls whether you select objects before (noun-verb selection) or after you
issue a command.
PICKSTYLE
Controls the use of group selection and associative hatch selection.
140 | Chapter 5 Customize the Drawing Environment
PSTYLEPOLICY
Controls the plot style mode, Color-Dependent or Named, that is used when
opening a drawing that was created in a release prior to AutoCAD 2000 or
when creating a new drawing from scratch without using a drawing template.
QTEXTMODE
Controls how text is displayed.
RASTERPREVIEW
Controls whether BMP preview images are saved with the drawing.
ROLLOVERTIPS
Controls the display of rollover tooltips in the application.
SAVEFILEPATH
Stores the current automatic save file name.
SAVEFILEPATH
Specifies the path to the directory for all automatic save files for the current
session.
SAVETIME
Sets the automatic save interval, in minutes.
SPLINESEGS
Sets the number of line segments to be generated for each spline-fit polyline
generated by the Spline option of the PEDIT command.
TDUSRTIMER
Stores the user-elapsed timer.
TOOLTIPMERGE
Combines drafting tooltips into a single tooltip.
TOOLTIPS
Controls the display of tooltips on the ribbon, toolbars, and other user
interface elements.
VISRETAIN
Controls the properties of xref-dependent layers.
Specify the Behavior of Dockable Windows | 141
VTDURATION
Sets the duration of a smooth view transition, in milliseconds.
VTENABLE
Controls when smooth view transitions are used.
VTFPS
Sets the minimum speed of a smooth view transition, in frames per second.
XLOADCTL
Turns xref demand-loading on and off, and controls whether it opens the
referenced drawing or a copy.
Control the Display of Toolbars
Similar to dockable windows, you can control the behavior of toolbars.
To display or hide toolbars, right-click any toolbar to display a list of toolbars.
A check mark next to a toolbar name indicates that it is displayed. Click a
toolbar name in the list to display or clear the check mark.
A toolbar can be docked or floating. A docked toolbar is attached to any edge
of the drawing area. A toolbar docked at the top edge of the drawing area is
located below the ribbon. Undock a toolbar by clicking the double bars and
dragging it into the drawing area. You can click the title bar and drag it to a
new location or dock it. Resize a floating toolbar by dragging an edge.
Lock the Position of Toolbars and Dockable Windows
Once you have arranged toolbars and docked, floating, or anchored windows
the way you want them, you can lock their position. Locked toolbars and
windows can still be opened and closed and items can be added and deleted.
To unlock them temporarily, press and hold Ctrl.
To lock the position and size of toolbars and dockable windows
■Do one of the following:
■Click View tab ➤ Windows panel ➤ Window Locking ➤ Floating
Toolbars/Panels.
■Click View tab ➤ Windows panel ➤ Window Locking ➤ Docked
Toolbars/Panels.
142 | Chapter 5 Customize the Drawing Environment
■Click View tab ➤ Windows panel ➤ Window Locking ➤ Floating
Windows.
■Click View tab ➤ Windows panel ➤ Window Locking ➤ Docked
Windows.
A lock icon in the system tray indicates whether toolbars or dockable windows
are locked. To unlock them temporarily, hold down Ctrl.
Quick Reference
Commands
CLEANSCREENON
Clears the screen of toolbars and dockable windows, excluding the command
window.
CLEANSCREENOFF
Restores display of toolbars and dockable windows, excluding the command
window.
DRAGMODE
Controls the way dragged objects are displayed.
HIDEPALETTES
Hides all currently displayed palettes, including the command window.
LOGFILEOFF
Closes the text window log file opened by LOGFILEON.
LOGFILEON
Writes the text window contents to a file.
OPTIONS
Customizes the program settings.
SHOWPALETTES
Restores the display of hidden palettes.
VIEWRES
Sets the resolution for objects in the current viewport.
Control the Display of Toolbars | 143
VTOPTIONS
Displays a change in view as a smooth transition.
System Variables
APERTURE
Sets the display size for the object snap target box, in pixels.
CALCINPUT
Controls whether mathematical expressions and global constants are
evaluated in text and numeric entry boxes of windows and dialog boxes.
CLEANSCREENSTATE
Indicates whether the clean screen state is on or off.
CURSORSIZE
Determines the size of the crosshairs as a percentage of the screen size.
DCTCUST
Displays the path and file name of the current custom spelling dictionary.
DCTMAIN
Displays the three letter keyword for the current main spelling dictionary.
DEFPLSTYLE
Specifies the default plot style for new objects in a drawing when opening a
drawing that was created in a release prior to AutoCAD 2000, or when creating
a new drawing from scratch without using a drawing template.
DRAGMODE
Controls the way dragged objects are displayed.
EXTNAMES
Sets the parameters for named object names (such as linetypes and layers)
stored in definition tables.
FILLMODE
Specifies whether hatches and fills, 2D solids, and wide polylines are filled
in.
GRIPBLOCK
Controls the display of grips in blocks.
144 | Chapter 5 Customize the Drawing Environment
GRIPCOLOR
Controls the color of unselected grips.
GRIPHOT
Controls the color of selected grips.
GRIPS
Controls the display of grips on selected objects.
INSUNITS
Specifies a drawing-units value for automatic scaling of blocks, images, or
xrefs when inserted or attached to a drawing.
INSUNITSDEFSOURCE
Sets source content units value when INSUNITS is set to 0.
INSUNITSDEFTARGET
Sets target drawing units value when INSUNITS is set to 0.
INTELLIGENTUPDATE
Controls the graphics refresh rate.
ISAVEBAK
Improves the speed of incremental saves, especially for large drawings.
ISAVEPERCENT
Determines the amount of wasted space tolerated in a drawing file.
LAYOUTREGENCTL
Specifies how the display list is updated in the Model tab and layout tabs.
LOCALE
Displays a code that indicates the current locale.
LOCALROOTPREFIX
Stores the full path to the root folder where local customizable files were
installed.
LOCKUI
Locks the position and size of toolbars and dockable windows such as
DesignCenter and the Properties palette.
Control the Display of Toolbars | 145
LOGFILEMODE
Specifies whether the contents of the text window are written to a log file.
LOGFILENAME
Specifies the path and name of the text window log file for the current
drawing.
LOGFILEPATH
Specifies the path for the text window log files for all drawings in a session.
MTEXTED
Sets the application for editing multiline text objects.
OLEQUALITY
Sets the default plot quality for OLE objects.
OLESTARTUP
Controls whether the source application of an embedded OLE object loads
when plotting.
OSNAPCOORD
Controls whether coordinates entered on the command line will override
running object snaps.
PAPERUPDATE
Controls the display of a warning dialog box when attempting to print a
layout with a paper size different from the paper size specified by the default
for the plotter configuration file.
PALETTEOPAQUE
Controls whether palettes can be made transparent.
PICKADD
Controls whether subsequent selections replace the current selection set or
add to it.
PICKAUTO
Controls automatic windowing at the Select Objects prompt.
PICKBOX
Sets the object selection target height, in pixels.
146 | Chapter 5 Customize the Drawing Environment
PICKDRAG
Controls the method of drawing a selection window.
PICKFIRST
Controls whether you select objects before (noun-verb selection) or after you
issue a command.
PICKSTYLE
Controls the use of group selection and associative hatch selection.
PSTYLEPOLICY
Controls the plot style mode, Color-Dependent or Named, that is used when
opening a drawing that was created in a release prior to AutoCAD 2000 or
when creating a new drawing from scratch without using a drawing template.
QTEXTMODE
Controls how text is displayed.
RASTERPREVIEW
Controls whether BMP preview images are saved with the drawing.
ROLLOVERTIPS
Controls the display of rollover tooltips in the application.
SAVEFILEPATH
Stores the current automatic save file name.
SAVEFILEPATH
Specifies the path to the directory for all automatic save files for the current
session.
SAVETIME
Sets the automatic save interval, in minutes.
SPLINESEGS
Sets the number of line segments to be generated for each spline-fit polyline
generated by the Spline option of the PEDIT command.
TDUSRTIMER
Stores the user-elapsed timer.
Control the Display of Toolbars | 147
TOOLTIPMERGE
Combines drafting tooltips into a single tooltip.
TOOLTIPS
Controls the display of tooltips on the ribbon, toolbars, and other user
interface elements.
VISRETAIN
Controls the properties of xref-dependent layers.
VTDURATION
Sets the duration of a smooth view transition, in milliseconds.
VTENABLE
Controls when smooth view transitions are used.
VTFPS
Sets the minimum speed of a smooth view transition, in frames per second.
XLOADCTL
Turns xref demand-loading on and off, and controls whether it opens the
referenced drawing or a copy.
Create Task-Based Workspaces
Workspaces are sets of menus, toolbars, palettes, and ribbon control panels
that are grouped and organized so that you can work in a custom, task-oriented
drawing environment.
When you use a workspace, only the menus, toolbars, and palettes that are
relevant to a task are displayed. In addition, a workspace may automatically
display the ribbon, a special palette with task-specific control panels.
For more information about using the ribbon, see The Ribbon.
You can easily switch between workspaces. The following task-based workspaces
are already defined in the product:
■2D Drafting & Annotation
■3D Modeling
■AutoCAD Classic
148 | Chapter 5 Customize the Drawing Environment

For example, when you create 3D models, you can use the 3D Modeling
workspace that contains only 3D-related toolbars, menus, and palettes.
Interface items that you do not need for 3D modeling are hidden, maximizing
the screen area available for your work.
When you make changes to your drawing display (such as moving, hiding,
or displaying a toolbar or a tool palette group) and you want to preserve the
display settings for future use, you can save the current settings to a workspace.
Switch Workspaces
You can switch to another workspace whenever you need to work on a different
task from the Workspace icon on the status bar.
NOTE Saved workspaces are also accessible from the Quick Access toolbar.
Create or Change a Workspace
You can create your own workspaces and modify the default workspaces. To
create or change a workspace, use either of the following methods:
■Display, hide, and rearrange your toolbars and windows, modify your
ribbon settings, and then save the current workspace from t Workspaces
icon in the status bar, Workspaces toolbar or the Window menu, or use
the WORKSPACE command.
■For more extensive changes, open the Customize User Interface dialog box
to set up the workspace environment.
You can control the display order of your saved workspaces and other options
in the Workspace Settings dialog box.
NOTE For more information about creating or modifying workspaces, and how
toolbars and menus interact with workspaces, see Customize Workspaces in the
Customization Guide.
Select a Sample Workspace
You can experiment with the sample workspace included with the product.
This predefined workspace demonstrates how you might use a workspace to
streamline your work tasks.
You can find the sample workspace in the following location:
<drive>:\Documents and Settings\<user name>\Application Data\Autodesk\AutoCAD
2011\<release>\<product language>\Support\acadSampleWorkspaces.cuix
Create Task-Based Workspaces | 149

To use the sample workspace, you must first transfer it to your main
customization (CUIx) file. To learn more about transferring a workspace, see
Transfer and Migrate Customization in the Customization Guide.
Workspaces and Profiles
Workspaces work with and complement the control over your drawing
environment that profiles provide.
Workspaces control the display of menus, toolbars, and palettes in the drawing
area. When you use or switch a workspace, you change the display of your
drawing area. You manage your workspaces from the Customize User Interface
dialog box.
Profiles save environment settings including many of your user options, drafting
settings, paths, and other values. Profiles are updated each time you make a
change to an option, setting, or other value. You can manage your profiles
from the Options dialog box.
NOTE When you make changes to the drawing display, the changes are stored
in your profile and are displayed the next time you launch the program, regardless
of your workspace settings. The profile changes are not automatically saved to a
workspace unless you select the Automatically Save Workspace Changes option
in the Workspace Settings dialog box. To preserve profile settings in a workspace,
click Save Current As from the shortcut menu of the workspace icon on the status
bar.
For more information about profiles, see Save and Restore Interface Settings
(Profiles) on page 151.
To switch workspaces
1On the status bar, click Workspace Switching.
2From the list of workspaces, select the workspace you want to switch to.
The workspace with a check mark is your current workspace.
To change workspace settings
1Click Tools menu ➤ Workspaces ➤ Workspace Settings.
2In the Workspace Settings dialog box, change workspace settings as
needed.
3Click OK.
150 | Chapter 5 Customize the Drawing Environment
To save a workspace
1Tools ➤ Workspaces ➤ Save Current As.
2In the Save Workspace dialog box, enter a name for the new workspace
or select a name from the drop-down list.
3Click Save.
Quick Reference
Commands
WORKSPACE
Creates, modifies, and saves workspaces and makes a workspace current.
WSSAVE
Saves a workspace.
WSSETTINGS
Sets options for workspaces.
System Variables
WSAUTOSAVE
Saves changes you made to a workspace when you switch to another work
space.
WSCURRENT
Returns the current workspace name at the Command prompt and sets a
workspace to current.
Save and Restore Interface Settings (Profiles)
Profiles store drawing environment settings. You can create profiles for different
users or projects, and you can share profiles by importing and exporting them
as files.
Profiles store settings such as the following:
■Default search and project file paths
■Template file locations
Save and Restore Interface Settings (Profiles) | 151
■Initial folder specified in file navigation dialog boxes
■Default linetype and hatch pattern files
■Printer defaults
Profile information is typically set on the Files tab of the Options dialog box,
stored in the system registry, and can be exported to a text file (an ARG file).
Use Profiles for Shared Computers or Different Projects
Use the Profiles tab in the Options dialog box to create and save your drawing
environment settings as a profile. If you share your workstation with other
users who use the same login name, you can restore your options by making
the profile current. You can also create and save profiles to use with different
projects. By default, your current options are stored in a profile named
<<Unnamed Profile>>. The current profile name, as well as the current drawing
name, are displayed in the Options dialog box.
Transfer Profiles between Computers
Once you save a profile, you can export or import the ARG file to and from
different computers. This is useful for copying, restoring, or standardizing
project-oriented work environments over a network.
If you make changes to your current profile during a work session and you
want to save those changes in an ARG file, you must re-export the profile.
When you export the profile with the current profile name, the ARG file is
updated with the new settings.
For more information about profiles, see OPTIONS in the Command Reference.
Customize the Default Profile with Initial Setup
When using Initial Setup, a new profile is created based on the profile named
<<Unnamed profile>>, or the current profile if <<Unnamed profile>> does
not exist. The new profile created is named Initial Setup Profile, and is assigned
the industry or default drawing template selected from Initial Setup. For more
information on Initial Setup, see Customize AutoCAD with Initial Setup in
the Stand-Alone Installation Guide.
To make a profile current
1Click the Application button. At the bottom of the Application menu,
click Options.
152 | Chapter 5 Customize the Drawing Environment
2In the Options dialog box, Profiles tab, select the profile you want to
make current.
3Click Set Current.
4Click OK.
To save a profile
1Click the Application button. At the bottom of the Application menu,
click Options.
2In the Options dialog box, Profiles tab, click Add to List.
3In the Add Profiles dialog box, enter a Profile name and Description.
4Click Apply & Close to record the current option settings in the system
registry and close the dialog box.
5Click OK.
To make a profile current before starting the program
1On the Windows desktop, right-click the program icon. Click Properties.
2In the AutoCAD Properties dialog box, Shortcut tab, under Target, enter
/p currentprofile after the current target directory. For example, to make
the profile User12 current, enter the following in Target:
"c:\Program Files\<current release name>\acad.exe"/p user12
3Click OK.
The profile name you enter is the current profile each time you start the
program.
Quick Reference
Commands
OPTIONS
Customizes the program settings.
System Variables
CPROFILE
Displays the name of the current profile.
Save and Restore Interface Settings (Profiles) | 153

Customize Startup
Command line switches can specify a separate startup routine for each project.
You can use command line switches to specify several options when you start
the program. For example, you can run a script, start with a specified drawing
template, and display a specified view when a drawing is opened. With
command line switches, you can also set up several program icons, each with
different start-up options.
Command line switches are parameters you can add to the acad.exe command
line associated with a Microsoft® Windows® shortcut icon or the Windows
Run dialog box. You can include several switches within a single command
line. Valid switches are listed in the following table.
Designates a script to run after you start the
program (b stands for batch process). Scripts
Script name/b
can be used to set up drawing parameters
in a new drawing file. An SCR file type is as-
sumed.
Creates a new drawing based on a template
or prototype drawing. A DWT file type is
assumed.
Template file name/t
Specifies the path for the hardware config-
uration file that you want to use. You can
Configuration folder/c
specify a directory or a particular file. A CFG
file type is assumed.
If you don't set the /c switch, the executable
directory is searched and the ACADCFGW
or ACADCFG environment variable is used
as a way to define the configuration file and
directory location.
Designates a particular view of the drawing
for display at startup.
View name/v
Loads a specified ARX or DBX application.
Use the following format:
ARX or DBX application/ld
<path>\<filename>.ARX
If the path or file name contains spaces, then
the path or file name should be wrapped in
154 | Chapter 5 Customize the Drawing Environment

double quotes. If no path information is in-
cluded, the program search path is used.
Designates support folders other than the
current folder. Drawing support files include
Support folders/s
text fonts, menus, AutoLISP files, linetypes,
and hatch patterns. The maximum number
of folders you can specify in the path is 15.
Each folder name is delimited by semicolons.
Restores the default system pointing device.
It creates a new configuration file
Default system pointing
device
/r
(acad2010.cfg) and renames the previous
configuration file to acad2010.bak.
Starts the program without first displaying
the logo screen.
No AutoCAD logo screen/nologo
Specifies a user-defined registry profile for
starting the program. The selected profile is
User-defined registry
profile for starting the
/p
in effect only for the current session of theprogram
program, unless you make another profile
current in the Options dialog box during
that session.
You create or import profiles on the Profiles
tab in the Options dialog box. With the /p
switch, you can specify the name of a profile
that is listed in the Options dialog box or
the file name of an exported profile (ARG)
file. If the profile does not exist, the current
profile is used.
Disables hardware acceleration on startup.Disables hardware/nohard-
ware acceleration
Suppresses the display of the Sheet Set
Manager window on startup.
No Sheet Set Manager
window
/nossm
Loads the named sheet set on startup. Use
the following format:
Sheet set/set
<path>\<sheet set data file>.DST
Customize Startup | 155

Designates which workspace in the loaded
CUIx files should be restored on startup.
Default workspace/w
Publishes a drawing set descriptions (DSD)
file in the background. Use the following
format:
Background plotting/publish-
ing
/pl
<path>\<drawing set descriptions file>.DSD
The syntax for using command line switches is
"drive:pathname\acad.exe" ["drawingname"] [/switch "name"]
When using a switch option, you must follow the switch with a space and
then the name of a file, path, or view within quotation marks. For example,
the following entry starts the program from a folder named AutoCAD 2011
with the drawing template arch1.dwt, restores a named view PLAN1, and
executes a script file startup.scr.
"d:\AutoCAD 2011\acad.exe”/t "d:\AutoCAD 2011\template\arch1" /v "plan1"
/b "startup"
The environment settings are resolved in the following way:
■If you use a command line switch to specify an environment setting, the
command line switch overrides the settings specified in either the Options
dialog box or the environment variable.
■If a command line switch is not set, the corresponding value set in the
Options dialog box is used.
■If neither a command line switch nor an Options value is set, the
environment variable value is used.
NOTE Command line switches and environment variables override values set in
the Options dialog box for the current session only. They do not alter the system
registry.
To start the program with a command line switch
1Right-click the program icon on the Windows desktop. Click Properties.
2In the AutoCAD Properties dialog box, Shortcut tab, in the Target box,
edit the parameters for the switch using the following syntax:
"drive:pathname\acad.exe" ["drawing name"] [/switch "name"]
156 | Chapter 5 Customize the Drawing Environment

Valid switches are as follows:
Script name (b stands for batch process)/b
Template file name/t
Configuration folder/c
View name/v
Support folders/s
Default system pointing device/r
No AutoCAD logo screen/nologo
Disables hardware acceleration/nohardware
User-defined registry profile/p
No Sheet Set Manager window/nossm
Sheet Set name/set
Default workspace/w
Background plotting/publishing for a Drawing Set Descrip-
tions (DSD) file
/pl
For example, enter "d:\AutoCAD 2011\acad.exe" /t "d:\AutoCAD
2011\template\arch1" /v "plan1" /b "startup"
3Click OK.
Play Back an Action Macro
After an action macro is recorded with the Action Recorder, you can play back
the series of recorded commands and input values.
You play back an action macro from the Action Recorder panel. You can also
enter the name of the action macro at the Command prompt. As an action
macro is played back, you might be paused for input or requested to respond
to a message or requested to insert a base point.
Play Back an Action Macro | 157
Based on the current action or request for user interaction in the action macro,
an icon near the cursor is displayed to indicate when the action macro needs
input in order to continue. A dialog box may be displayed where you enter a
value or use the recorded value.
As an action macro is played back, the series of commands are performed one
after the other until playback is complete or an error is encountered. Some of
the reasons for the playback to stop or fail are as follows:
■Invalid command. The command that is defined in the action macro is
unknown to AutoCAD. The action macro might have been recorded in a
different product or contains custom commands or macros that are not
loaded.
■Empty selection. The current action expected a selection set of objects, but
no objects were selected.
■Macro cancelled. The Cancel button in one of the dialogs boxes was clicked.
Location of Action Macros
When you record an action macro, it is saved to the path defined by the system
variable ACTRECPATH. For playback, paths are defined by the system variable
ACTPATH.
Both sets of paths are used when loading and playing back an action macro.
In the Action Recorder Settings node on the Files tab of the Options dialog
box, you can to set the paths used for both recording and reading action macro
files.
Record and Modify Action Macros
Recording and modifying action macros is done with the Action Recorder
panel on the ribbon. To learn how to record and modify action macros, see
Record and Modify Action Macros in the Customization Guide.
See also:
■Record and Modify Action Macros
To play back an action macro from the Action Recorder panel
1On the ribbon, click Manage tab ➤ Action Recorder panel. Click the
down arrow next to the Action Macro list and select the action macro to
play back.
158 | Chapter 5 Customize the Drawing Environment
2Click Play.
3Follow any Command prompts and dialog boxes displayed to complete
the action macro.
To play back an action macro from the Command prompt
■At the Command prompt, enter the name of the action macro that you
want to play back and press Enter.
For example, if the action macro command name is DRAWLINE, enter
drawline at the Command prompt and press Enter.
To provide user input during playback
1Start the playback on an action macro.
2Follow the prompts displayed at the Command prompt.
To change the location used to search for recorded action macros
1Click the Application button. At the bottom of the Application menu,
click Options.
2In the Options dialog box, Files tab, in the list of nodes, click the plus
sign (+) next to Action Recorder Settings.
3Click the plus sign (+) next to Additional Actions Reading File Locations,
and specify a folder path.
4Click OK
Quick Reference
Commands
OPTIONS
Customizes the program settings.
RIBBON
Opens the ribbon window.
Play Back an Action Macro | 159
System Variables
ACTPATH
Specifies the additional paths to use when locating available action macros
for playback.
ACTRECPATH
Specifies the path used to store new action macros.
Migrate and Specify Initial Setup
Migrating from an older release or getting started with AutoCAD for the first
time present different challenges.
Migrate Custom Settings allows you to copy your custom settings and files
from a previous release of AutoCAD to the latest release, making it easier to
start using the new release. Initial Setup helps you to perform some basic
customization of AutoCAD.
Migrate Custom Settings and Files
One of the challenges when moving from a previous release of AutoCAD to
the latest release is getting the new release to look and behave like the previous
release. You can use Migrate Custom Settings and the Customize User Interface
(CUI) Editor to transfer many of your custom settings and files to the latest
release.
Initial Setup
You can perform some basic customization of AutoCAD with Initial Setup
which makes it easier to access specific tools and start a new drawing. Initial
Setup is accessed from the Options dialog box. The following can be done
with Initial Setup:
■Specify an industry that best describes your work to help search for related
content to use in drawings and companion products developed by partners.
■Add task-based tools to your default workspace.
■Specify a drawing template to use when creating new drawings.
For more information on Initial Setup, see Customize AutoCAD with Initial
Setup in the Stand-Alone Installation Guide.
160 | Chapter 5 Customize the Drawing Environment
See also:
■Migrate Custom Settings and Files from Previous Releases in the Stand-Alone
Installation Guide
■Basic Customization in the Customization Guide
■User Interface Customization in the Customization Guide
Migrate and Specify Initial Setup | 161
162
Part 3: Start and Save
Drawings
163
164
Start a Drawing
All drawings start from either a default drawing template file or a custom drawing template
file that you create. Drawing template files store default settings, styles, and additional data.
Overview of Starting a New Drawing
Before you start to draw, you need to decide what system of drawing units that
you will use in the drawing, and then choose a drawing template file appropriate
for those drawing units.
Choose Drawing Units
A drawing unit can equal one inch, one millimeter, or any other system of
measurement. For more information about drawing units, see Determine the
Units of Measurement on page 167.
Choose a Drawing Template File
When you start a new drawing, AutoCAD accesses a drawing template file to
determine many default settings such as unit precision, dimension styles, layer
names, a title block, and other settings. Many of the settings are based on
whether the drawing template file is intended for use with a drawing created
in inches, feet, millimeters,centimeters, or other unit of measurement.
6
165
Customize a Drawing Template File
By customizing your own drawing template file, you save yourself a lot of
work changing settings, and you also ensure that the settings are standardized.
Start a new drawing, choose a drawing template
file similar to what you need for your discipline
and units of measurement.
-----
Choose a drawing template file
Specify a unit format and precision.
-----Specify units and precision
Specify values and settings for text, dimensions,
and other styles.
-----Define various styles
Determine other settings, including layers, grid
spacing, linetypes, and layouts.
-----Specify additional settings
Save the file in the Template folder using a DWT
file extension.
-----
Save the drawing template file
You can create several drawing template files for different projects, and you
can choose one when you click New.
166 | Chapter 6 Start a Drawing
Quick Reference
Commands
NEW
Creates a new drawing.
OPTIONS
Customizes the program settings.
SAVEAS
Saves a copy of the current drawing under a new file name.
System Variables
MEASUREMENT
Controls whether the current drawing uses imperial or metric hatch pattern
and linetype files.
Specify Units and Unit Formats
Before you start to draw, you decide on the units of measurement to be used
in the drawing, and set the format, precision, and other conventions to be
used in coordinates and distances.
Determine the Units of Measurement
Before you start to draw, you must decide what one drawing unit represents
based on what you plan to draw. You can convert a drawing between systems
of measurement by scaling it.
Every object you create is measured in drawing units. Before you start to draw,
you must decide what one drawing unit will represent based on what you
plan to draw. Then you create your drawing at actual size with that convention.
For example, the objects in the illustration might represent two buildings that
are each 125 feet long, or a section of a mechanical part that is measured in
millimeters.
Specify Units and Unit Formats | 167
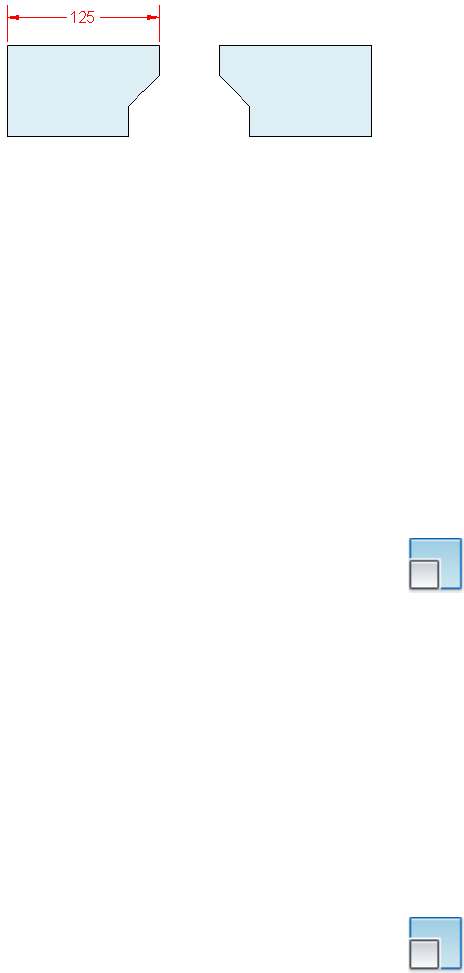
Convert Drawing Units
If you start a drawing in one system of measurement (imperial or metric) and
then want to switch to the other system, use SCALE to scale the model
geometry by the appropriate conversion factor to obtain correct distances and
dimensions.
For example, to convert a drawing created in inches to centimeters, you scale
the model geometry by a factor of 2.54. To convert from centimeters to inches,
the scale factor is 1/2.54 or about 0.3937.
See also:
■Set the Scale for Dimensions on page 1461
To convert a drawing from inches to centimeters
1Click Home tab ➤ Modify panel ➤ Scale.
2At the Select Objects prompt, enter all.
All objects in the drawing are selected for scaling.
3Enter a base point of *0,0.
Scaling will be relative to the world coordinate system origin and the
location of the drawing origin will remain at the WCS origin.
4Enter a scale factor of 2.54 (there are 2.54 centimeters per inch).
All objects in the drawing are now 2.54 times larger, corresponding to
the equivalent distance in centimeters.
To convert a drawing from centimeters to inches
1Click Home tab ➤ Modify panel ➤ Scale.
168 | Chapter 6 Start a Drawing
2At the Select Objects prompt, enter all.
All objects in the drawing are selected for scaling.
3Enter a base point of *0,0.
Scaling is performed relative to the world coordinate system origin, and
the location of the drawing origin will remain at the WCS origin.
4Enter a scale factor of 0.3937 (the inverse of 2.54 centimeters per inch).
All objects in the drawing are now smaller, corresponding to the
equivalent distance in inches.
Quick Reference
Commands
UNITS
Controls coordinate and angle display formats and precision.
SCALE
Enlarges or reduces selected objects, keeping the proportions of the object
the same after scaling.
System Variables
LUNITS
Sets linear units.
LUPREC
Sets the display precision for linear units and coordinates.
MEASUREINIT
Controls whether a drawing you start from scratch uses imperial or metric
default settings.
MEASUREMENT
Controls whether the current drawing uses imperial or metric hatch pattern
and linetype files.
UNITMODE
Controls the display format for units.
Determine the Units of Measurement | 169

Set the Unit Format Conventions
You can set the format and the number of decimal places to be used when
you enter and display linear and angular units.
Set Linear Units
You can choose from several common conventions to represent the format
and the precision of linear distances and coordinates displayed in the Properties
palette, dynamic input, the status bar, and other locations.
For example, here are three variations of dynamic input.
Set Angular Units
You can specify that positive values of angles are measured either clockwise
or counterclockwise, and the direction of angle 0 (usually East or North). You
can enter angles using grads, radians, or surveyor's units or using degrees,
minutes, and seconds.
If you use surveyor's angles when specifying polar coordinates, indicate whether
the surveyor's angles are in the north, south, east, or west direction. For
example, to enter the relative coordinates for a property line that is 72 feet,
8 inches long with a bearing of 45 degrees north, 20 minutes, 6 seconds east,
enter @72'8"<n45d20'6"e.
Understand Rounding and Precision
When you specify the display precision of units, the values for coordinates
and distances are rounded off. However, the internal precision of coordinates
and distances is always maintained regardless of the display precision.
For example, if you set the display precision of decimal-format units to 1 (or
0.0), the display of coordinates is rounded to one place after the decimal point.
Thus, the coordinates 0.000,1.375 are displayed as 0.0,1.4, but the internal
precision is still maintained.
170 | Chapter 6 Start a Drawing
Quick Reference
Commands
UNITS
Controls coordinate and angle display formats and precision.
System Variables
ANGBASE
Sets the base angle to 0 with respect to the current UCS.
ANGDIR
Sets the direction of positive angles.
AUNITS
Sets units for angles.
AUPREC
Sets the display precision for angular units and coordinates.
LUNITS
Sets linear units.
LUPREC
Sets the display precision for linear units and coordinates.
MEASUREINIT
Controls whether a drawing you start from scratch uses imperial or metric
default settings.
MEASUREMENT
Controls whether the current drawing uses imperial or metric hatch pattern
and linetype files.
UNITMODE
Controls the display format for units.
Use a Drawing Template File
A drawing template file provides consistency in the drawings that you create
by maintaining your standard styles and settings.
Use a Drawing Template File | 171
Select a Drawing Template File
A set of drawing template files is installed with AutoCAD. Many of them are
provided either for imperial or for metric units, and some are optimized for
3D modeling. All drawing template files have a .dwt file extension.
While these drawing templates provide a quick way to start a new drawing,
it is best to create drawing templates specific to your company and the type
of drawings you create.
Create a Drawing Template File
When you need to create several drawings that use the same conventions and
default settings, you can save time by creating or customizing a drawing
template file instead of specifying the conventions and default settings each
time you start. Conventions and settings commonly stored in template files
include
■Unit format and precision on page 167
■Title blocks and borders on page 1543
■Layer names on page 473
■Snap and Grid spacing on page 593
■Text styles on page 1363
■Dimension styles on page 1424
■Multileader styles on page 1346
■Table styles on page 1404
■Linetypes on page 521
■Lineweights on page 532
■Layouts on page 393
■Page setups on page 1524
By default, drawing template files are stored in the template folder, where they
are easily accessible. You can use the Options dialog box to set a default for
both the template folder and the drawing template file.
See also:
■Use a Hyperlink to Start a New Drawing on page 1952
172 | Chapter 6 Start a Drawing
To start a drawing by selecting a template file
1Click the Application menu, and click New menu ➤ Drawing.
2In the Select Template dialog box, select a template from the list.
3Click Open.
To start a new drawing with no template file, click the arrow next to the
Open button. Select one of the “no template” options from the list.
To create a drawing template file from an existing drawing
1Click the Application button, and click Open ➤ Drawing.
2In the Select File dialog box, select the file you want to use as a template.
Click OK.
3Erase all of the objects in the drawing that you do not want to keep.
4Click the Application button, and click Save As ➤ AutoCAD Drawing
Template.
DWT files must be saved in the current drawing file format. To create a
DWT file in a previous format, save the file in the desired DWG format,
and then rename the DWG file using a DWT extension.
5In the Save Drawing As dialog box, File Name text box, enter a name for
the drawing template.
6Click Save.
7Enter a description for the drawing template.
8Click OK.
The new template is saved in the template folder.
Quick Reference
Commands
NEW
Creates a new drawing.
OPEN
Opens an existing drawing file.
Use a Drawing Template File | 173
OPTIONS
Customizes the program settings.
SAVEAS
Saves a copy of the current drawing under a new file name.
System Variables
MEASUREMENT
Controls whether the current drawing uses imperial or metric hatch pattern
and linetype files.
Add Identifying Information to Drawings
You can keep track of your drawings more easily if you add keywords or other
information to them.
Use Windows Explorer
Drawing properties can help you identify a drawing. Some drawing properties
are stored by the operating system; for example, drawing type, location, and
size. These values are read-only in the drawing file and can only be changed
through Windows Explorer.
Use the Find Tool
The Find tool in a standard file selection dialog box can use this information.
For example, you can search for all files created on a certain date, or for files
you modified yesterday.
Use DesignCenter
You can create additional properties in drawing files. You can store author,
title, and subject, and you can assign keywords, hyperlink addresses or directory
paths, and custom properties to your drawings. The Advanced tab in the Search
tool in DesignCenter can use these properties to locate drawing files. For more
information about DesignCenter, see Access Content with DesignCenter on
page 94.
Use Sheet Set Manager Properties
With the Sheet Set Manager, you can assign a sheet title, number, and a
description to every sheet in a sheet set. For more information about sheet
sets, see Include Information with Sheets and Sheet Sets on page 451.
174 | Chapter 6 Start a Drawing
Display Properties in Fields
You can assign any of the drawing properties to a field in a text object. For
more information about fields, see Use Fields in Text on page 1352.
To display drawing properties for the active drawing
1Click the Application button, and click Drawing ➤ Drawing Properties.
2In the Drawing Properties dialog box, click tabs to view the different types
of information.
To define drawing properties
1Click the Application button, and click Drawing ➤ Drawing Properties.
2In the Drawing Properties dialog box, enter property information on the
following tabs:
■Summary tab. Enter the drawing title, subject, author, keywords,
comments, and a default address for hyperlinked data in your drawing.
For example, you can add the keyword Autodesk to certain drawing
files and then use DesignCenter to search for all drawing files with
that keyword. For a hyperlink base, you can specify an Internet address
or a path to a folder on a network drive.
■Custom tab. Click Add. In the Add Custom Property dialog box, enter
a name and a value for the custom property. Click OK. The new
custom property and its value are displayed on the Custom tab. This
information can be used for advanced searches in DesignCenter.
3Click OK.
Quick Reference
Commands
DWGPROPS
Sets and displays the file properties of the current drawing.
Add Identifying Information to Drawings | 175
System Variables
CDATE
Stores the current date and time in decimal format.
DATE
Stores the current date and time in Modified Julian Date format.
TDCREATE
Stores the local time and date the drawing was created.
TDINDWG
Stores the total editing time, which is the total elapsed time between saves
of the current drawing.
TDUCREATE
Stores the universal time and date that the drawing was created.
TDUPDATE
Stores the local time and date of the last update/save.
TDUUPDATE
Stores the universal time and date of the last update or save.
Specify the Geographic Location of a Drawing
You can specify the geographic location, orientation, and elevation of the
objects in a drawing.
This information is useful for sun studies, environment analysis, exporting
to AutoCAD Map 3D, and working with Google Earth.
Geographic location information can be specified in one of the following
ways:
■Enter the latitude, longitude, and altitude manually
■Import a KML or KMZ file with the geographic information
■Import a location from Google Earth
When you specify the geographic location of a drawing, a geographic marker
is created. The geographic marker is a visual representation of the location
information, and is created at a specified point on the drawing.
176 | Chapter 6 Start a Drawing
This marker cannot be selected, but you can control whether it is displayed
using the GEOMARKERVISIBILITY system variable.
You can display the latitude and longitude of the cursor in the coordinate
display area of the status bar.
To specify the geographic location of a drawing
1Click Render tab ➤ Sun & Location panel ➤ Set Location.
2Click Enter the Location Values.
3(Optional) Select the latitude and longitude format, or click Use Map to
specify the nearest city and time zone.
4Specify the X, Y, and Z coordinates in the drawing corresponding to the
geographic data.
The north direction angle is calculated when you select a point with
reference to the geographic location.
5Click OK.
To import a kml or kmz file into a drawing
1Click Render tab ➤ Sun & Location panel ➤ Set Location.
2Click Import a KML or KMZ File.
3Navigate to the location of the KML or KMZ file. Click Open.
NOTE If a KML or KMZ file references multiple locations, only the first location
is used. Click Close if the Multiple Locations Found dialog box is displayed.
Specify the Geographic Location of a Drawing | 177

4Click or specify the coordinates for the location in the World Coordinate
System (WCS) X, Y, Z format.
5Click to specify the north direction.
A geographic marker is inserted at the specified location.
To import a geographic location from Google Earth
1Start Google Earth and select a location.
2Click Render tab ➤ Sun & Location panel ➤ Set Location.
3Click Import the current location from Google Earth.
4Click Continue.
5Click or specify the coordinates for the location in the World Coordinate
System (WCS) X, Y, Z format.
6Click to specify the north direction.
The geographic marker is created at the specified point on the drawing.
To edit or delete a geographic marker
1Click Render tab ➤ Sun & Location panel ➤ Set Location.
2Do one of the following:
■Click Edit Current Geographic Location.
■Click Remove Geographic Location.
Quick Reference
Command
GEOGRAPHICLOCATION
Specifies the geographic location information for a drawing file.
INSERT
Inserts a block or drawing into the current drawing.
178 | Chapter 6 Start a Drawing
XATTACH
Inserts DWG files as an external reference (xref).
System Variables
GEOLATLONGFORMAT
Controls the format of the latitude or longitude values in the Geographic
Location dialog box, and the coordinate status bar in Geographic mode.
GEOMARKERVISIBILITY
Controls the visibility of geographic markers.
Specify the Geographic Location of a Drawing | 179
180
Open or Save a Drawing
You can use several methods to find and open drawings, even damaged drawings. You can
save and backup drawings automatically.
Open a Drawing
You open drawings to work on them just as you do with other Windows
applications. In addition, you can choose from several alternative methods.
To open a drawing, you can
■Use Open on the File menu or Quick Access toolbar to display the Select File
dialog box. If the FILEDIA system variable is set to 0, the Command prompt
version displays instead of a file navigation dialog box.
■Double-click a drawing in Windows Explorer to launch AutoCAD® and open
the drawing. If the program is already running, the drawing opens in the
current session rather than in a second session.
■Drag a drawing from Windows Explorer into AutoCAD.
If you drop a drawing anywhere outside the drawing area—for example, the
command line or the blank space next to the toolbars— the drawing is
opened. However, if you drag a single drawing into the drawing area of an
open drawing, the new drawing is not opened but inserted as a block
reference.
■Use DesignCenter to open drawings.
■Use the Sheet Set Manager to locate and open the drawings in a sheet set.
7
181
Work on Drawings During Loading
You can work on drawings before they are fully open. This is useful when you
work on large drawings and you want to begin working immediately. To take
advantage of this capability, three conditions are required.
■The drawing must have been saved in paper space.
■The OPENPARTIAL system variable must be set to 1.
■The INDEXCTL system variable must be set to a non-zero value.
When these conditions are met, you can create or modify visible objects, pan
or zoom, turn off or freeze layers, and any other operation that does not require
displaying objects not visible when the drawing was last saved.
NOTE The Quick View feature will not be fully functional during loading under
these conditions.
Resolve Missing References
As you open a drawing, you are notified (messages and task dialog boxes)
when a reference cannot be located. From the References - Unresolved
Reference Files task dialog box, click Update the Location of the Referenced
Files to open the External References palette to make changes to missing
external references.
The following table outlines some of the references that might be missing and
describes how to handle them.
DescriptionMissing Reference Types
Missing external references are the result of AutoCAD
not being able to resolve the last known location of
External references
an xref, raster image, or underlay. To resolve a missing
external reference, locate the file and update its loca-
tion using the External References palette. For inform-
ation about resolving missing referenced drawing files,
see Resolve Missing External References on page 1701.
For information about working with raster images and
underlays, see Attach Raster Image Files on page 1781
and Attach Files as Underlays on page 1749.
Missing shape files are often the result of custom
shapes being used in a linetype. Browse to the missing
Shapes
linetype file, or place the shape file in the folder with
182 | Chapter 7 Open or Save a Drawing
DescriptionMissing Reference Types
the drawing or one of the support paths defined in
the Options dialog box. For information about custom
shape files in linetypes, see Shapes in Custom Line-
types in the Customization Guide.
You can use eTransmit to avoid missing files when sharing drawings with
others outside of your company. For more information about eTransmit, see
Package a Set of Files for Internet Transmission on page 1971.
Work with Large Objects
AutoCAD 2010 supports object size limits greater than those available in
previous releases. With increased object size limits you can create larger and
more complex models. Using increased object size limits can result in
compatibility issues with legacy drawing file formats (AutoCAD 2007 and
earlier).
When working with drawings that you might need to exchange with others
using AutoCAD 2009 and earlier, set the LARGEOBJECTSUPPORT system
variable to 0. Setting LARGEOBJECTSUPPORT to 0 warns you when a drawing
contains large objects that cannot be opened by a release of the program prior
to AutoCAD 2010.
TrustedDWG™ Drawing Files
DWG, DWT, and DWS files created with Autodesk applications and
RealDWG™-based applications are trusted by Autodesk. When you open a
TrustedDWG file, the following icon displays in the application status bar or
the drawing status bar.
If the DWGCHECK system variable is set to On (1), an alert box is displayed
if
■The drawing file format is AutoCAD Release 14 or later and
■The drawing file was not originally created by an Autodesk application or
RealDWG-based application.
For more information about TrustedDWG, click the TrustedDWG icon.
Recover Defective Drawing Files
In some circumstances, it is possible that a drawing file becomes defective.
This can result from hardware problems or transmission errors. If a drawing
Open a Drawing | 183
file is corrupt, you might be able to recover it. See Repair, Restore, or Recover
Drawing Files on page 207.
Change the Default Drawing Folder
Each time you start AutoCAD, the My Documents folder is the default path in
each standard file selection dialog box. Alternatively, you can configure
AutoCAD to always default to a specified path by changing the default drawing
folder using the REMEMBERFOLDERS system variable.
See also:
■Overview of DesignCenter on page 91
■Work with Sheets in a Sheet Set on page 431
■Open and Save Drawing Files from the Internet on page 1953
■Overview of Using Markups for Design Review on page 1987
To change the default drawing folder
1At the Command prompt, enter rememberfolders, and then enter 0.
2On the Windows desktop, right-click the AutoCAD icon. Click Properties.
3Click the Shortcut tab.
4In the Start In box, enter the path of the folder that should be the default
when you open or save drawing files.
5Click OK.
To enable support for large object size limits
1Click the Application button, and click Options.
2In the Options dialog box, Open and Save tab, under File Save, clear
Maintain Drawing Size Compatibility.
3Click OK.
Quick Reference
CLOSE
Closes the current drawing.
184 | Chapter 7 Open or Save a Drawing
CLOSEALL
Closes all currently open drawings.
ETRANSMIT
Packages a set of files for Internet transmission.
OPEN
Opens an existing drawing file.
OPTIONS
Customizes the program settings.
WHOHAS
Displays ownership information for opened drawing files.
DWGCHECK
Checks drawings for potential problems when opening them.
FILEDIA
Suppresses display of file navigation dialog boxes.
INDEXCTL
Controls whether layer and spatial indexes are created and saved in drawing
files.
LARGEOBJECTSUPPORT
Controls large object size limit support when you open and save drawings.
OPENPARTIAL
Controls whether a drawing file can be worked on before it is fully open.
REMEMBERFOLDERS
Controls the default path displayed in standard file selection dialog boxes.
ROAMABLEROOTPREFIX
Stores the full path to the root folder where roamable customizable files were
installed.
Open Part of a Large Drawing (Partial Load)
If you work with large drawings, you can improve performance by opening
only the view and layer geometry that you want to work with.
Open Part of a Large Drawing (Partial Load) | 185
If you work with large drawings, you can use the Partial Open option of the
OPEN command to select which view and layer geometry (graphical objects
only) that you want to work with in a drawing. For example, if you load
geometry from the EXTENTS view and the SITE layer, everything on the SITE
layer that falls within the Extents view is loaded into the drawing.
You can only edit what is loaded into the drawing file, but all the drawing's
named objects are available in the partially open drawing. Named objects
include layers, views, blocks, dimension styles, text styles, viewport
configurations, layouts, UCSs, and linetypes.
By organizing large drawings into sectored views, you can load and edit only
what you need. For example, if you work with a city plan and need to edit
only the southeast sector (sector D3 in the illustration), you can load this
drawing area by specifying the predefined view. If you need to edit only the
city plot numbers, you can load just the geometry on this specific layer.
After a drawing is partially open, you can load additional geometry from a
view, selected area, or layer into the drawing by using PARTIALOAD. The
Partial Open option is available only for drawings in AutoCAD 2004 or later
format.
To partially open a drawing
1Click the Application button, and click Open ➤ Drawing.
2In the Select File dialog box, select a drawing.
3Click the arrow next to Open. Click Partial Open.
186 | Chapter 7 Open or Save a Drawing

4In the Partial Open dialog box, select a view; the default view is EXTENTS.
You can load only geometry from model space views that are saved in
the current drawing.
5Select one or more layers.
If you do not select a layer or layers to load, no layer geometry is loaded
into the drawing but all drawing layers exist in the drawing. If no layer
geometry is specified to load into the drawing, no geometry is loaded
even if the geometry from a view is specified to load. If you draw objects
on a layer that is not loaded, you may be drawing on top of existing
geometry that is not loaded in the drawing.
NOTE Xref-dependent layers are displayed in the Layer Geometry to Load
list only if the selected drawing was last saved with the VISRETAIN system
variable set to 1. Any layers created in the xref since the xref was loaded into
the drawing are not displayed in the Layer Geometry to Load list.
6If the drawing contains a spatial index, you can select the Use Spatial
Index option.
A spatial index is a list that organizes objects based on their location in
space. A spatial index is used to locate the portion of the drawing that is
read; this minimizes the time required to open the drawing.
7If the drawing contains xrefs but you don't want to load them, select
Unload All Xrefs on Open.
NOTE If you partially open a drawing that contains a bound xref, only the
portion of the xref that is loaded (defined by the selected view) is bound to
the partially open drawing.
8Click Open.
You can choose to load additional information into the current drawing
as long as the drawing is partially open.
To load additional geometry into a partially open drawing
1Click File menu ➤ Partial Load.
NOTE The Partial Load option is available only if the current drawing is a
partially open drawing.
Open Part of a Large Drawing (Partial Load) | 187

2In the Partial Load dialog box, select a view, or click Pick Window to
define a view.
The default view is Extents. You can load only geometry from model
space views that are saved in the current drawing.
3Select one or more layers.
If you do not select a layer or layers to load, no layer geometry is loaded
into the drawing, but all drawing layers exist in the drawing. If no layer
geometry is specified to load into the drawing, no geometry is loaded
even if the geometry from a view is specified to load. If you draw objects
on a layer that is not loaded, you may be drawing on top of existing
geometry that is not loaded in the drawing. You cannot unload any
geometry that is loaded in the current drawing.
4Click Open.
Quick Reference
PARTIALOAD
Loads additional geometry into a partially opened drawing.
PARTIALOPEN
Loads geometry and named objects from a selected view or layer into a
drawing.
Work with Multiple Open Drawings
You can preview and switch between open drawings and layouts in a drawing
and transfer information between open drawings.
Preview Open Drawings and Layouts
With Quick View, you can easily preview and switch between open drawings
and the model space and layouts in an open drawing. These are displayed in
thumbnail images called Quick View images at the bottom of the application
window.
The Quick View tools in the application status bar do the following:
■Quick View Drawings
188 | Chapter 7 Open or Save a Drawing
Displays all currently open drawings in a row of Quick View drawing
images. You can also preview and switch between the model space and
layouts in an open drawing when you move your cursor over a Quick View
drawing image. For more information, see Switch Between Open Drawings
on page 189.
■Quick View Layouts
Displays the model space and layouts in the current drawing in a row of
Quick View layout images. You can right-click a Quick View layout image
to view layout options. For more information, see Switch Between Layouts
in the Current Drawing on page 193.
The supported file formats are DWG, DWT, DXF, and DWS.
NOTE The application status bar must be displayed to view the Quick View tools.
Quick Reference
QVDRAWING
Displays open drawings and layouts in a drawing in preview images.
QVDRAWINGCLOSE
Closes preview images of open drawings and layouts in a drawing.
QVLAYOUT
Displays preview images of model space and layouts in a drawing.
QVLAYOUTCLOSE
Closes preview images of model space and layouts in a drawing.
STATUSBAR
Controls the display of the application and drawing status bars.
Switch Between Open Drawings
Preview and switch between all open drawings and layouts in a drawing in
two-level structure with the Quick View Drawings tool.
The first level displays the Quick View images of open drawings and the second
level displays the images for model space and all layouts in a drawing.
Switch Between Open Drawings | 189
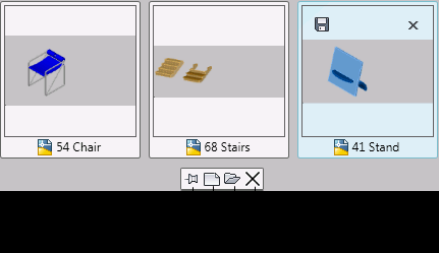
When you click the Quick View Drawings button on the status bar, each open
drawing displays as a thumbnail image in a row. The image of the current
drawing is highlighted by default. If you move your cursor over an image, all
the layouts and the model for that drawing are displayed in a row of images
above the Quick View drawing.
The Quick View Toolbar
The toolbar displayed below the Quick View drawings has the following
options:
■Pin Quick View Drawings
Pins the row of Quick View images of drawings so that it is always visible
while you are working in the drawing editor.
■New
Creates a drawing that is also displayed at the end of the Quick View images
row.
■Open
Opens an existing drawing that is also displayed at the end of the Quick
View images row.
■Close
Closes all the Quick View images.
Use the Quick View Drawings Tool
You can do any of the following with the Quick View Drawings tool:
■Click a Quick View drawing image to make that drawing current.
190 | Chapter 7 Open or Save a Drawing
■Move your cursor over the Quick View drawing image to display the Save
and Close buttons on the top corners of the image to save or close the
drawing.
■Move your cursor over a Quick View drawing to display the preview images
of the model space and layouts in the drawing.
■Close all drawings, except the drawing you want to work on, from the
shortcut menu.
■Close and save all open drawings.
■Manage the display of the drawings in the windows to be tiled vertically
or horizontally, or cascaded.
You can access more options for layouts from the Quick View layout image.
For more information, see Switch Between Layouts in the Current Drawing
on page 193.
TIP If you often work with many open drawings or many layouts in a drawing,
you can use multiple monitors to display complete rows of Quick View images.
Update Quick View Images
Quick View images are not updated dynamically when working on it. They
are updated when you switch between the model space and layouts; or use
the UPDATETHUMBSNOW command.
When a drawing does not have a stored image for a model space, a placeholder
image is displayed instead.
This placeholder image is displayed in the following cases:
■When the model space is not initialized
Switch Between Open Drawings | 191
■When the UPDATETHUMBNAIL system variable is set to 0. In this case,
the image is not updated even if you use the UPDATETHUMBSNOW
command.
When a drawing is saved in DXF format, it does not have a stored image for
a drawing. The image is not updated even if you use the UPDATETHUMBSNOW
command. A static image is displayed instead.
To preview and switch between open drawings
1Click the status bar.
A row of Quick View images is displayed at the bottom of the program.
2Click the Quick View image you want to work on.
To preview and switch between layouts in a drawing
1Click the status bar.
A row of Quick View images is displayed at the bottom of the program.
2Move your cursor over a drawing image to preview the model and layouts
in a drawing.
3Click a Quick View image to make the drawing or layout current.
To resize a Quick View image
1On the status bar, click .
192 | Chapter 7 Open or Save a Drawing

A row of Quick View images is displayed at the bottom of the program.
2Press Ctrl + scrollwheel over a Quick View image to resize.
Quick Reference
QVDRAWING
Displays open drawings and layouts in a drawing in preview images.
QVDRAWINGCLOSE
Closes preview images of open drawings and layouts in a drawing.
SYSWINDOWS
Arranges windows and icons when the application window is shared with
external applications.
UPDATETHUMBSNOW
Manually updates thumbnail previews in the Sheet Set Manager and the
Quick View tool.
QVDRAWINGPIN
Controls the default display state of preview images of drawings.
UPDATETHUMBNAIL
Controls updating of the thumbnail previews in the Sheet Set Manager and
Quick View.
Switch Between Layouts in the Current Drawing
Preview and switch between the model space and layouts in the current
drawing with the Quick View Layouts tool.
When you click the Quick View Layouts button on the status bar, the
model space and layouts in the drawing are displayed in a horizontal row.
Switch Between Layouts in the Current Drawing | 193
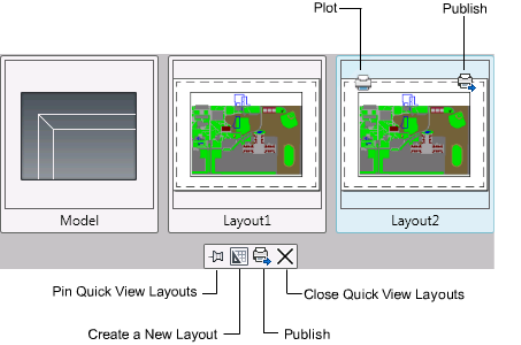
You can plot or publish when you move the cursor over a Quick View image
of a layout. The toolbar displayed below the Quick View images of drawings
has the following options:
■Pin Quick View Layouts
Pins the row of Quick View images of layouts so that it is always visible
while you are working in the drawing editor.
■New Layout
Creates a layout that is also displayed as a Quick View image at the end of
the row.
■Publish
Launches the Publish dialog box to publish the layouts.
■Close Quick View Layouts
Closes all the Quick View layout images.
You can do any of the following with a Quick View layout image:
■Click the image to display the associated layout or model in the drawing
area
■Move your cursor over the image to display the Plot and Publish buttons
■Right-click the image to display a shortcut menu with additional options
■Use Ctrl + scroll wheel to resize Quick View images dynamically
194 | Chapter 7 Open or Save a Drawing
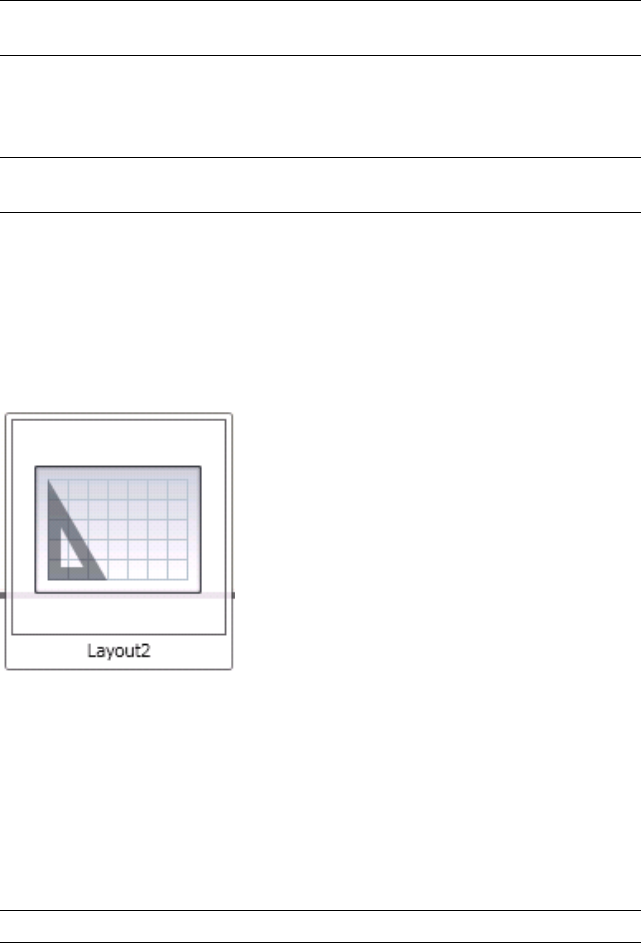
TIP If you often work with many open drawings or many layouts in a drawing,
you can use multiple monitors to display complete rows of Quick View images.
If a row of Quick View images extends beyond the application display area,
scroll arrows display on the left or right side of the row. You can scroll to view
the other images.
NOTE The Quick View feature will not be fully functional if the drawing is still
opening and not fully loaded.
Update Quick View Layout Images
Quick View images for layouts are not updated dynamically when working
on a layout. They are updated when you switch between layouts or use the
UPDATETHUMBSNOW command.
When a drawing does not have a stored image for a layout, a placeholder
image is displayed instead.
This placeholder image is displayed in the following cases:
■When the layout is not initialized
■When the UPDATETHUMBNAIL system variable is set to 0. In this case,
the image is not updated even if you use the UPDATETHUMBSNOW
command.
To update a thumbnail image
NOTE Verify that updatethumbnail is not set to 0
1At the Command prompt, enter updatethumbsnow.
Switch Between Layouts in the Current Drawing | 195

2On the status bar, click .
Quick Reference
PLOT
Plots a drawing to a plotter, printer, or file.
PUBLISH
Publishes drawings to DWF, DWFx, and PDF files, or to plotters.
QVLAYOUT
Displays preview images of model space and layouts in a drawing.
QVLAYOUTCLOSE
Closes preview images of model space and layouts in a drawing.
UPDATETHUMBSNOW
Manually updates thumbnail previews in the Sheet Set Manager and the
Quick View tool.
QVLAYOUTPIN
Controls the default display state of preview images of model space and
layouts in a drawing.
UPDATETHUMBNAIL
Controls updating of the thumbnail previews in the Sheet Set Manager and
Quick View.
Transfer Information between Open Drawings
You can easily transfer information between drawings that are open in a single
session.
When you open multiple drawings in a single session, you can
■Reference other drawings.
■Copy and paste between drawings.
■Drag selected objects from one drawing to another with the right-click
button on your pointing device.
196 | Chapter 7 Open or Save a Drawing

■Use Match Properties (MATCHPROP) to copy properties from objects in
one drawing to objects in another drawing.
■Use object snaps, the Copy with Basepoint (COPYBASE) command, and
the Paste to Original Coordinates (PASTEORIG) command to ensure
accurate placement.
To switch between open drawings
Do one of the following to switch between open drawings:
■On the status bar, click the Quick View Drawings tool.
■Click anywhere in a drawing to make it active.
■Use Ctrl+F6 or Ctrl+Tab.
Quick Reference
OPTIONS
Customizes the program settings.
TASKBAR
Controls whether multiple open drawings are displayed separately or grouped
on the Windows taskbar.
Save a Drawing
You save drawing files for later use just as you do with other Microsoft
Windows applications. You can also set up automatic saving and backup files
and save only selected objects.
When you work on a drawing, you should save it frequently. Saving protects
you from losing work in the event of a power failure or other unexpected
event. If you want to create a new version of a drawing without affecting the
original drawing, you can save it under another name.
The file extension for drawing files is .dwg, and unless you change the default
file format in which drawings are saved, drawings are saved in the latest
drawing file format. This format is optimized for file compression and for use
on a network.
The character limit for a DWG file name (including its path) is 256 characters.
Save a Drawing | 197

NOTE If the FILEDIA system variable is set to 0, the Command prompt version
displays instead of a file navigation dialog box.
Save Part of a Drawing File
If you want to create a new drawing file from part of an existing drawing, you
use the WBLOCK command. With the command, you can select objects or
specify a block definition in your current drawing and save them to a new
drawing file. You can also save a description with the new drawing.
Save to a Different Type of Drawing File
You can save a drawing to an earlier version of the drawing format (DWG) or
drawing interchange format (DXF), or save a drawing as a template file. Choose
the format from Files of Type in the Save Drawing As dialog box.
Save with Visual Fidelity for Annotative Objects
When working with annotative objects, this option allows you to maintain
visual fidelity for these objects when they are viewed in AutoCAD 2007 and
earlier releases. Visual fidelity is controlled by the SAVEFIDELITY system
variable.
If you work primarily in model space, it is recommended that you turn off
visual fidelity (set SAVEFIDELITY to 0). However, if you need to exchange
drawings with other users, and layout fidelity is most important, then visual
fidelity should be turned on (set SAVEFIDELITY to 1).
NOTE The SAVEFIDELITY system variable does not effect saving a drawing to the
AutoCAD 2010 drawing or DXF file formats.
Annotative objects may have multiple scale representation. When visual
fidelity is on, annotative objects are decomposed and scale representations
are saved (in an anonymous block) to separate layers, which are named based
on their original layer and appended with a number. If you explode the block
in AutoCAD 2007 or earlier releases, and then open the drawing in AutoCAD
2008 or later releases, each scale representation becomes a separate annotative
object, each with one annotation scale. It is not recommended that you edit
or create objects on these layers when working with a drawing created in
AutoCAD 2008 and later releases in AutoCAD 2007 and earlier releases.
When this option is not selected, a single model space representation is
displayed on the Model tab. More annotation objects may be displayed on
the Model tab depending on the ANNOALLVISIBLE setting. Also, more objects
198 | Chapter 7 Open or Save a Drawing

may be displayed in paper space viewports at different sizes than in AutoCAD
2008 and later releases.
Reduce the Time Required to Save a Drawing File
You can reduce the time required to save a drawing file if you specify
incremental saves rather than full saves. An incremental save updates only
those portions of the saved drawing file that you changed.
When you use incremental saves, drawing files will contain a percentage of
potentially wasted space. This percentage increases after each incremental
save until it reaches a specified maximum, at which time a full save is
performed instead. You can set the incremental save percentage in the Open
and Save tab of the Options dialog box or by setting the value of the system
variable ISAVEPERCENT. If you set the value of ISAVEPERCENT to 0, all saves
are full saves.
To reduce the size of drawing files, it is recommended that you perform a full
save (with ISAVEPERCENT set to 0) before transmitting or archiving a drawing.
Work Internationally
If you share drawing files with companies in other countries and regions, the
drawing file names might contain characters that are not used in other
languages.
If a drawing file is created in a different language version of Windows, the
following will occur:
■If support for the language is installed, the file name characters are visible
in Windows Explorer.
■If support for the language is not installed, the file name characters appear
as a series of boxes in Windows Explorer and a dialog box is displayed
offering to install the language pack.
In either case, you will be able to open the drawing file beginning with
AutoCAD 2007 or AutoCAD LT 2007 because these products are
Unicode-compliant applications.
NOTE If you share drawing files with companies using earlier releases of the
product, you can avoid file name issues for Asian languages and languages that
use accented characters. In those circumstances, do not use high ASCII values, or
values of 80 hexadecimal and above, when creating a file name.
Save a Drawing | 199

Maintain Compatibility with Large Object Limits
Drawings saved to a legacy drawing file format (AutoCAD 2007 or earlier) do
not support objects greater than 256MB. With the AutoCAD 2010 drawing
file format, these limitations have been removed allowing you to save objects
that are greater in size.
When saving to a legacy drawing file format (AutoCAD 2007 or earlier), the
drawing cannot contain large objects; there might be compatibility issues with
trying to open the drawing. The LARGEOBJECTSUPPORT system variable
controls the large object size limits used and the warning messages displayed
when a drawing is saved.
The following explains how object size limits for drawings is determined:
■Drawing files cannot exceed an internal size limit of 4GB. This size is based
on the total size of all objects in a drawing when uncompressed. Since a
drawing file is normally compressed, the final size of a saved drawing file
on disk will vary based on the size and number of objects in a drawing.
■Each individual object in a drawing cannot exceed an uncompressed size
limit of 256MB. For example, a mesh object, when saved to a file and
compressed, might be 75MB in size while the same object when
uncompressed might be 257MB.
In these situations, the drawing cannot be saved to an AutoCAD 2007 or earlier
file format until the issues are resolved. You can resolve the size limits by
breaking the drawing or objects up into several drawings or objects.
NOTE When working with the 64-bit release of AutoCAD, you can work more
efficiently with large objects and drawings. However, the drawing files you create
might be too large to open with the 32-bit release of AutoCAD.
See also:
■Save Drawings to Previous Drawing File Formats on page 1822
■Work with Drawings in Earlier Releases on page 1817
■Export Drawings to Other File Formats on page 1802
■Create Drawing Files for Use as Blocks on page 867
■Add Identifying Information to Drawings on page 174
■Create and Restore Backup Files on page 210
200 | Chapter 7 Open or Save a Drawing
■Share Drawing Files Internationally on page 1958
■Open and Save Drawing Files from the Internet on page 1953
To save a drawing automatically
1Click the Application button. At the bottom of the Application menu,
click the Options button.
2In the Options dialog box, Open and Save tab, select Automatic Save.
3Enter a number in Minutes Between Saves. Click OK.
To save a backup of the previous version every time the drawing is saved
1Click the Application button. At the bottom of the Application menu,
click the Options button.
2In the Options dialog box, Open and Save tab, select Create Backup Copy
with Each Save. Click OK.
To maintain visual fidelity for annotative objects
1Click the Application button, and click Options.
2In the Options dialog box, Open and Save tab, under File Save, select
Maintain Visual Fidelity for Annotative Objects.
3Click OK.
To maintain large object compatibility with legacy drawing file formats
1Click the Application button, click Options.
2In the Options dialog box, Open and Save tab, under File Save, select
Maintain Drawing Size Compatibility.
3Click OK.
Quick Reference
BLOCK
Creates a block definition from selected objects.
Save a Drawing | 201
OPTIONS
Customizes the program settings.
QSAVE
Saves the current drawing using the file format specified in the Options dialog
box.
QUIT
Exits the program.
SAVE
Saves the drawing under the current file name or a specified name.
SAVEAS
Saves a copy of the current drawing under a new file name.
WBLOCK
Writes objects or a block to a new drawing file.
DWGCHECK
Checks drawings for potential problems when opening them.
DWGNAME
Stores the name of the current drawing.
DWGPREFIX
Stores the drive and folder prefix for the drawing.
DWGTITLED
Indicates whether the current drawing has been named.
FILEDIA
Suppresses display of file navigation dialog boxes.
ISAVEBAK
Improves the speed of incremental saves, especially for large drawings.
ISAVEPERCENT
Determines the amount of wasted space tolerated in a drawing file.
LARGEOBJECTSUPPORT
Controls large object size limit support when you open and save drawings.
202 | Chapter 7 Open or Save a Drawing
RASTERPREVIEW
Controls whether BMP preview images are saved with the drawing.
SAVEFIDELITY
Controls whether the drawing is saved with visual fidelity.
SAVEFILE
Stores the current automatic save file name.
SAVEFILEPATH
Specifies the path to the directory for all automatic save files for the current
session.
SAVENAME
Displays the file name and directory path of the most recently saved drawing.
SAVETIME
Sets the automatic save interval, in minutes.
Find a Drawing File
You can search for a drawing using name, location, and date filters, properties
such as keywords that you added to the drawing, or text strings containing a
specific word or phrase.
■Use the Search tool in Microsoft® Windows® to search for drawings using
name, location, and date filters. You can also specify a word or phrase
contained in the drawing file. You can search for all textual data except
text in tables and fields, and xrefs within drawing files. Supported drawing
file types include DWG, DWF, DWT, and DWS.
■Use the Search dialog box for DesignCenter™ to search for Microsoft
Windows file properties, such as title or keyword, that you added to
drawings.
■Use the Select File dialog box for the OPEN command to display drawing
file previews. When the RASTERPREVIEW system variable is on, a raster
preview image is automatically generated and stored with the drawing
when you save it.
See also:
■Add Identifying Information to Drawings on page 174
Find a Drawing File | 203
■Access Content with DesignCenter on page 94
■Work with Sheets in a Sheet Set on page 431
To search for files
1Click the Application button, and click Open ➤ Drawing.
2In the Select File dialog box, click Tools ➤ Find
3In the Find dialog box, Name & Location tab, specify a file type, file name,
and path.
You can use wild cards when specifying a file name.
4On the Date Modified tab, click All Files, or click Find All Files Created
or Modified to specify a date filter.
You can search for drawings modified between a specified range of dates
or within a specified number of months or days.
5Click Find Now.
6Select one or more files from the search results. Click OK.
7In the Select File dialog box, click Open.
Quick Reference
OPEN
Opens an existing drawing file.
Specify Search Paths and File Locations
You can set the search path to drawing support files such as text fonts,
drawings, linetypes, and hatch patterns. You also can specify the location of
temporary files, which is important when working in a network environment.
The Files tab of the Options dialog box is where you set the search path that
is used by the program to find drawing support files such as text fonts,
drawings, linetypes, and hatch patterns. The MYDOCUMENTSPREFIX system
variable stores the location of the My Documents folder for the current user.
The working search path for drawing support files lists paths that are valid
and exist in the current system folder structure (including system network
204 | Chapter 7 Open or Save a Drawing
mapping). Using these options helps improve performance when these files
are loaded.
Using the Files tab of the Options dialog box, you can also specify the location
of temporary files. Temporary files are created on disk, and then deleted when
you exit the program. The temporary folder is set to the location that Microsoft
Windows uses. If you plan to run this program from a write-protected folder
(for example, if you work on a network or open files on a CD), specify a
different location for your temporary files.
The temporary folder that you specify must not be write-protected, and the
drive containing the folder should have sufficient disk space for the temporary
files. It is recommended that you manually delete the files from this folder
on a regular basis to ensure sufficient space is provided for temporary files. If
not enough space is available for temporary files, you may experience errors
or instability in the program.
If you want to use a file that contains custom interface elements, specify it in
the Customizations Files item on the Files tab of the Options dialog box. The
default customization file is acad.cuix.
To change a search path
1Click the Application button. At the bottom of the Application menu,
click the Options button.
2In the Options dialog box, Files tab, click the plus sign (+) to the left of
the kind of path you want to change.
3Select the path you want to change.
4Click Browse, and then search drives and folders until you find the one
you want.
5Select the drive and folder that you want to use. Click OK.
Quick Reference
OPTIONS
Customizes the program settings.
MYDOCUMENTSPREFIX
Stores the full path to the My Documents folder for the user currently logged
on.
Specify Search Paths and File Locations | 205
206
Repair, Restore, or Recover
Drawing Files
If a drawing file is damaged or if your program terminates unexpectedly, you can recover
some or all of the data by using commands to find and correct errors, or by reverting to a
backup file.
Repair a Damaged Drawing File
If a drawing file is damaged, you can recover some or all of the data by using
commands to find and correct errors.
Repair and Recovery
When an error occurs, diagnostic information is recorded in the acad.err file,
which you can use to report a problem.
A drawing file is marked as damaged if corrupted data is detected, or if you
request that the drawing be saved after a program failure. If the damage is minor,
sometimes you can repair the drawing simply by opening it. A recovery
notification is displayed while opening drawing files that are damaged and need
recovery. You can
■RECOVER. Performs an audit on, and attempts to open, any drawing file.
■RECOVERALL. Similar to recover, it additionally operates on all nested xrefs.
The results are displayed in the Drawing Recovery Log window.
■AUDIT. Finds and corrects errors in the current drawing.
■RECOVERAUTO. Controls the display of recovery notifications before or
after opening a damaged drawing file.
8
207

Example: Auditing Files
Auditing a file generates a description of problems with a drawing file and
recommendations for correcting them. As you start the audit, you specify
whether you want the program to try to fix the problems it encounters. The
report is similar to the following example:
Auditing Header
DXF NAME Current Value Validation Default
PDMODE 990 - 2040
UCSFOLLOW 811 or 0
Error found in auditing header variables
4 Blocks audited
Pass 1 4 objects audited
Pass 2 4 objects audited
Total errors found 2 fixed 2
If you chose not to correct the errors, the last statement changes to
Total errors found 2 fixed 0.
The output from a recovery audit is written to an audit log (ADT) file if the
AUDITCTL system variable is set to 1 (On).
Recovery does not necessarily preserve the high-level consistency of the
drawing file. The program extracts as much material as it can from the damaged
file.
To repair a damaged drawing file
1Click the Application button, and click Drawing Utilities ➤ Recover ➤
Recover.
2In the Select File dialog box, select a file. Click Open.
After the audit, all objects with errors are placed in the Previous selection
set for easy access. The output from the audit is written to an audit log
(ADT) file if the AUDITCTL system variable is set to 1 (On).
To repair a damaged drawing file due to a system failure
1If the program encounters a problem and cannot continue, it displays
an error message and, for some errors, an error code. Record the error
code number, save the changes if possible, and exit to the operating
system.
208 | Chapter 8 Repair, Restore, or Recover Drawing Files
2Restart the program.
3In the Drawing Recovery window, under Backup Files, double-click the
drawing node to expand it. On the list, double-click one of the drawing
or backup files to open it.
If the program detects that the drawing has been damaged, a message is
displayed asking if you want to proceed.
4Enter y to proceed.
As the program attempts to repair the drawing, a diagnostic report is
displayed. The output from the audit is written to an audit log (ADT) file
if the AUDITCTL system variable is set to 1 (On).
5Depending on whether the repair is successful, do one of the following:
■If the repair is successful, the drawing opens. Save the drawing file.
■If the program cannot repair the file, a message is displayed. In that
case, choose one of the other drawing or backup files listed in the
Drawing Recovery window beginning with step 3.
To repair an open drawing
1Click the Application button, and click Drawing ➤ Audit.
2At the Fix Any Errors Detected? prompt, enter y or n.
AUDIT places all objects with errors in the Previous selection set for easy
access. The output from the audit is written to an audit log (ADT) file if
the AUDITCTL system variable is set to 1 (On).
NOTE If the drawing contains errors that AUDIT cannot fix, try using
RECOVER. RECOVER repairs any specified DWG file that is not the current
drawing file.
To restore a drawing from a backup file
1In Windows Explorer, locate the backup file identified by the .bak file
extension.
2Right-click the backup file. Click Rename.
3Type a new name using the .dwg file extension.
4Open the file as you would open any other drawing file.
Repair a Damaged Drawing File | 209
Quick Reference
Commands
AUDIT
Evaluates the integrity of a drawing and corrects some errors.
DRAWINGRECOVERY
Displays a list of drawing files that can be recovered after a program or system
failure.
OPTIONS
Customizes the program settings.
RECOVER
Repairs and then opens a damaged drawing file.
RECOVERALL
Repairs and then opens a damaged drawing file.
System Variables
AUDITCTL
Controls whether AUDIT creates an audit report (ADT) file.
RECOVERAUTO
Controls the display of recovery notifications before or after opening a
damaged drawing file.
REPORTERROR
Controls whether an error report can be sent to Autodesk if the program
closes unexpectedly.
Create and Restore Backup Files
Backup files help ensure the safety of your drawing data. If a problem occurs,
you can restore a drawing backup file.
Computer hardware problems, power failures or surges, user mistakes, or
software problems can cause errors in a drawing. By saving your work
frequently, you can ensure a minimum of lost data if your system fails for any
reason. If a problem occurs, you can restore a drawing backup file.
210 | Chapter 8 Repair, Restore, or Recover Drawing Files
Use Backup Files
In the Options dialog box, on the Open and Save tab, you can specify that
backup files are created when you save drawings. If you do, each time you
save a drawing, the previous version of your drawing is saved to a file with
the same name and a .bak file extension. The backup file is located in the same
folder as the drawing file.
You can revert to your backup version by renaming the .bak file in Windows
Explorer to a file with a .dwg extension. You may want to copy it to a different
folder to avoid overwriting your original file.
Save Your Drawing Automatically at Specified Intervals
If you turn the automatic save option on, your drawing is saved at specified
time intervals. By default, files saved automatically are temporarily assigned
the name filename_a_b_nnnn.sv$.
■Filename is the current drawing name.
■a is the number of open instances of the same drawing file in the same
work session.
■b is the number of open instances of the same drawing in different work
sessions.
■nnnn is a random number.
These temporary files are automatically deleted when a drawing closes
normally. In the event of a program failure or a power failure, these files are
not deleted.
To recover a previous version of your drawing from the automatically saved
file, rename the file using a .dwg extension in place of the .sv$ extension before
you close the program.
See also:
■Recover from a System Failure on page 212
To restore a drawing from a backup file
1In Windows Explorer, locate the backup file identified by the .bak file
extension.
2Select the file you want to rename. You do not need to open it.
Create and Restore Backup Files | 211

3Click File menu ➤ Rename
4Enter a new name using the .dwg file extension.
5Open the file as you would open any other drawing file.
Quick Reference
Commands
OPTIONS
Customizes the program settings.
System Variables
ISAVEBAK
Improves the speed of incremental saves, especially for large drawings.
Recover from a System Failure
A hardware problem, power failure, or software problem can cause this program
to terminate unexpectedly. If this happens, you can restore the drawing files
that were open.
If the program fails, you can save your current work to a different file. This
file uses the format, DrawingFileName_recover.dwg, where DrawingFileName is
the file name of your current drawing.
Resolve Drawing Files
After a program or system failure, the Drawing Recovery Manager opens the
next time you start AutoCAD. Drawing Recovery Manager displays a list of all
drawing files that were open, including the following drawing file types:
■Drawing files (DWG)
■Drawing template files (DWT)
■Drawing Standards files (DWS)
NOTE Unsaved drawings that are open at the time of an unexpected failure are
not tracked by the Drawing Recovery Manager. Be sure to save your work after
you begin, and regularly thereafter.
212 | Chapter 8 Repair, Restore, or Recover Drawing Files
For each drawing, you can open and choose from the following files if they
exist:
■DrawingFileName_recover.dwg
■DrawingFileName_a_b_nnnn.sv$
■DrawingFileName.dwg
■DrawingFileName.bak
NOTE The drawing, backup, and recover files are listed in the order of their time
stamps—the time when they were last saved.
Double-click a top-level drawing node listed under Backup Files to display up
to four files as listed above. Right-click any node under Backup Files to display
shortcut menu options.
If you close the Drawing Recovery window before resolving all affected
drawings, you can open Drawing Recovery at a later time with the
DRAWINGRECOVERY command.
Send an Error Report Automatically to Autodesk
If the program encounters a problem and closes unexpectedly, you can send
an error report to help Autodesk diagnose problems with the software. The
error report includes information about the state of your system at the time
the error occurred. You can also add other information, such as what you were
doing at the time of the error. The REPORTERROR system variable controls
whether the error-reporting feature is available.
To open the Drawing Recovery Manager
■Click the Application button, and click Drawing Utilities ➤ Open the
Drawing Recovery Manager.
Any drawings that need to be restored from an unexpected program or
system failure are listed under Backup Files.
To restore a drawing using the Drawing Recovery Manager
1If necessary, click the Application button, and click Drawing Utilities ➤
Open the Drawing Recovery Manager.
Recover from a System Failure | 213

2In the Drawing Recovery Manager, under Backup Files, double-click a
drawing node to list all available drawing and backup files.
3Double-click a file to open it.
If the drawing file is damaged, the drawing is automatically repaired, if
possible.
To remove a drawing from the Drawing Recovery Manager
1If necessary, click the Application button, and click Drawing Utilities ➤
Open the Drawing Recovery Manager.
2Do one of the following:
■Restore the drawing and then save it.
■Right-click a drawing node. Click Remove.
To expand or collapse all nodes in the Drawing Recovery Manager
■Under the last drawing node listed, right-click in the Backup Files area.
Click Collapse All.
To turn error reporting on or off
1At the command prompt, enter reporterror.
2Enter 0 to turn off error reporting, or enter 1 to turn on error reporting.
Quick Reference
Commands
DRAWINGRECOVERY
Displays a list of drawing files that can be recovered after a program or system
failure.
DRAWINGRECOVERYHIDE
Closes the Drawing Recovery Manager.
OPTIONS
Customizes the program settings.
214 | Chapter 8 Repair, Restore, or Recover Drawing Files
RECOVER
Repairs and then opens a damaged drawing file.
System Variables
DRSTATE
Indicates whether the Drawing Recovery Manager window is open or closed.
ISAVEBAK
Improves the speed of incremental saves, especially for large drawings.
RECOVERYMODE
Controls whether drawing recovery information is recorded after a system
failure.
REPORTERROR
Controls whether an error report can be sent to Autodesk if the program
closes unexpectedly.
Recover from a System Failure | 215
216
Maintain Standards in
Drawings
Drawings are easier to interpret if you set standards to enforce consistency. You can set
standards for layer names, dimension styles, and other elements; check drawings against these
standards; and then change any properties that do not conform.
Overview of CAD Standards
You can create a standards file to define common properties in order to maintain
consistency throughout your drawing files. Standards define a set of common
properties for named objects such as layers and text styles. You or your CAD
manager can create, apply, and audit standards in drawings to enforce
consistency. Because standards make it easier for others to interpret drawings,
standards are particularly useful in collaborative environments, where many
individuals contribute to the creation of a drawing.
Named Objects for Standards-Checking
You can create standards for the following named objects:
■Layers
■Text styles
■Linetypes
■Dimension styles
9
217
Standards File
After you define standards, you save them as a standards file. You can then
associate the standards file with one or more drawing files. After you associate
a standards file with a drawing, you should periodically check the drawing to
make sure it conforms with the standards.
How a Standards Audit Works
When you check a drawing for standards violations, each named object of a
specific type is checked against the standards files associated with the drawing.
For example, each layer in the drawing is checked against the layers in the
standards file.
A standards audit can uncover two types of problems:
■An object with a nonstandard name is present in the drawing being
checked. For example, a layer named WALL is present in the drawing but
not in any associated standards files.
■A named object in a drawing matches the name of one in a standards file,
but their properties are different. For example, in the drawing the WALL
layer is yellow, but the standards file specifies red for the WALL layer.
When you fix objects with nonstandard names, the nonstandard objects are
purged from the drawing. Any drawing objects that are associated with the
nonstandard object are transferred to a replacement standard object that you
specify. For example, you fix a nonstandard layer, WALL, and replace it with
the standard ARCH-WALL. In this example, choosing Fix in the Check
Standards dialog box transfers all objects from layer WALL to layer ARCH-WALL
and then purges layer WALL from the drawing.
Standards Plug-Ins
The auditing process uses standards plug-ins, applications that define the rules
for the properties that are checked for individual named objects. Layers,
dimension styles, linetypes, and text styles are each checked against their
corresponding plug-ins. You can specify which plug-ins to use when checking
a drawing for standards violations. Autodesk or third-party developers may
add standards plug-ins for checking additional drawing properties.
All plug-ins check all properties for each named object except for the layer
plug-in. The following layer properties are checked when using the layer
plug-in:
■Color
218 | Chapter 9 Maintain Standards in Drawings
■Linetype
■Lineweight
■Plot style mode
■Plot style name (when the PSTYLEMODE system variable is set to 0)
The following layer properties are not checked by the layer plug-in:
■On/Off
■Freeze/Thaw
■Lock
■Plot/No Plot
Standards Settings
A variety of settings that may be useful to CAD managers are available in the
CAD Standards Settings dialog box. This dialog box can be accessed by clicking
Settings in the Check Standards and Configure Standards dialog boxes.
Quick Reference
CHECKSTANDARDS
Checks the current drawing for standards violations.
STANDARDS
Manages the association of standards files with drawings.
STANDARDSVIOLATION
Specifies whether a user is notified of standards violations in the current
drawing when a nonstandard object is created or modified.
Batch Standards Checker
Audits a set of drawings for standards violations.
Overview of CAD Standards | 219
Define Standards
To set standards, you create a file that defines properties for layers, dimension
styles, linetypes, and text styles, and you save it as a standards file with the
.dws file name extension.
Depending on how you organize your projects, you may decide to create and
associate more than one project-specific standards file with an individual
drawing. When you audit the drawing file, conflicts may arise between settings
in the standards files. For example, one standards file specifies that the layer
WALL is yellow, and another standards file specifies that it is red. In the case
of conflicts, the first standards file associated with the drawing takes
precedence. If necessary, you can change the order of the standards files to
change the precedence.
If you want to audit drawings using just a specific plug-in, you can specify the
plug-in when defining your standards file. For example, if recent changes to
a drawing are limited to text changes, you may want to audit the drawing
using only the layers and text styles plug-ins to save time. By default, all
plug-ins are used when auditing drawings for standards violations.
To create a standards file
1Click the Application button, and click New menu ➤ Drawing.
2Enter a template file name, or press Enter to continue.
3In a new drawing, create any layers, dimension styles, linetypes, and text
styles that you want to be part of the standards file.
4Click the Application button, and click Save As ➤ AutoCAD Drawing
Standards.
DWS files must be saved in the current drawing file format. To create a
DWS file in a previous drawing file format, save the file in the desired
DWG format, and then rename the DWG file using a .dws extension.
5In File Name, enter a name for the standards file. Click Save.
To associate a standards file with the current drawing
1Click Manage tab ➤ CAD Standards panel ➤ Configure.
220 | Chapter 9 Maintain Standards in Drawings

2In the Configure Standards dialog box, Standards tab, click the plus (+)
button (Add Standards File).
3In the Select Standards File dialog box, select a standards file. Click Open.
4(Optional) Repeat steps 2 and 3 if you want to associate additional
standards files with the current drawing.
5Click OK.
To remove a standards file from the current drawing
1Click Manage tab ➤ CAD Standards panel ➤ Configure.
2In the Configure Standards dialog box, Standards tab, select a standards
file in Standards Files Associated with the Current Drawing.
3Click the X button (Remove Standards File).
4(Optional) Repeat steps 2 and 3 if you want to remove additional standards
files.
5Click OK.
To change the order of standards files associated with the current drawing
1Click Manage tab ➤ CAD Standards panel ➤ Configure.
2In the Configure Standards dialog box, Standards tab, select the standards
file whose position you want to change in Standards Files Associated with
the Current Drawing.
3Do one of the following:
■Click the up arrow button (Move Up) to move the standards file up
one position in the list.
■Click the down arrow button (Move Down) to move the standards
file down one position in the list.
4(Optional) Repeat steps 2 and 3 if you want to change the position of
other standards files in the list.
5Click OK.
Define Standards | 221

To specify which standards plug-ins to use when auditing a drawing
1Click Manage tab ➤ CAD Standards panel ➤ Configure.
2In the Configure Standards dialog box, Plug-ins tab, do one of the
following:
■Select the check box for at least one plug-in to audit a drawing for
standards violations.
■To select all plug-ins, right-click in the Plug-ins list. Click Select All.
(You can clear all plug-ins. Right-click in the Plug-ins list. Click Clear
All.)
3Click OK.
Quick Reference
CHECKSTANDARDS
Checks the current drawing for standards violations.
STANDARDS
Manages the association of standards files with drawings.
Check Drawings for Standards Violations
You can audit a drawing file for violations of standards and then fix violations.
The Batch Standards Checker audits more than one file at a time.
After you associate a standards file with a drawing, you should periodically
check the drawing to make sure it conforms with its standards. This is especially
important when more than one person is updating the drawing file. For
example, in a project with multiple subcontractors, one subcontractor may
create new layers that do not comply with the standards you have defined.
In that case, you need to be able to identify the nonstandard layers and fix
them.
You can use the notification feature to alert users that a standards violation
has occurred while working in a drawing. This feature allows you to fix a
standards violation just after it has occurred, making it easier to create and
maintain drawings that comply with standards.
222 | Chapter 9 Maintain Standards in Drawings

Check a Single Drawing
You can use the CHECKSTANDARDS command to view all standards violations
in the current drawing. The Check Standards dialog box reports each
nonstandard object, along with any suggested fixes.
You can choose to fix or ignore each reported standards violation. If you ignore
a reported violation, it is flagged in the drawing. You can turn off the display
of ignored problems so that they are not reported as violations the next time
you audit the drawing.
If no fix is provided for the current standards violation, no item is highlighted
in the Replace With list, and the Fix button is not available. If you fix a
standards violation that is currently displayed in the Check Standards dialog
box, the violation is not removed from the dialog box until you click the Fix
or the Next button.
Once the entire drawing has been audited, the Checking Complete message
is displayed. This message summarizes the standards violations that were
found in the drawing. The message also shows the violations that were fixed
automatically, the violations that were fixed manually, and the violations
that were ignored.
NOTE When a nonstandard layer contains multiple violations (for example, a
violation where there is a nonstandard layer name and one for nonstandard layer
properties), the first violation that is encountered is displayed. Subsequent violations
that exist on the nonstandard layer are not evaluated, and therefore, not displayed.
You will need to run the command again to check for additional violations.
Check Multiple Drawings
You can use the Batch Standards Checker to analyze multiple drawings and
summarize standards violations in an HTML report. To run a batch standards
audit, you must first create a standards check (CHX) file. The CHX file is a
configuration and report file; it contains a list of drawing and standards files,
as well as a report on a standards check.
By default, each drawing is checked against the standards files that are
associated with it. Alternatively, you can override the default and choose
another set of standards files to be used.
After the batch standards audit is complete, you can view an HTML report
with details of the audit. You can also create notes that are included in the
HTML report. This report can be exported and printed. In a collaborative
environment, you can distribute the report to drafters so that they can fix any
problems with their sections.
Check Drawings for Standards Violations | 223
Use Notification of Standards Violations While Working in a Drawing
You can set options for notification in the CAD Standards Settings dialog box
and with the STANDARDSVIOLATION system variable. If you select Display
Alert upon Standards Violation in the dialog box, then an alert is displayed
when a violation occurs while you work. If you select Display Standards Status
Bar Icon, an icon is displayed when you open a file associated with a standards
file and when you create or modify nonstandard objects.
By default, if an associated standards file is missing or if a violation occurs
while you work, a pop-up message appears in the lower-right corner of the
application window (the status bar tray).
You should check a drawing for standards violations using the Check Standards
dialog box before using the notification options. This prevents triggering a
notification alert carried over from a previous session. After a drawing has
been checked and fixed, the notification options trigger an alert only if a new
violation occurs.
Display Alerts for Named Objects
If you select Display Alert upon Standards Violation, you are notified of
violations when you create or edit only named objects (linetypes, text styles,
layers, and dimensions). Standards violations that do not affect named objects
do not trigger a notification alert. Also, if a named object was marked as
ignored in the Check Standards dialog box, that object no longer triggers a
notification alert, even though the named object is nonstandard. Changing
nonstandard named objects, such as setting a nonstandard layer as current,
does trigger a notification alert.
After an alert is displayed, you can choose to fix or not fix the violation.
Choosing to fix the violation opens the Check Standards dialog box. If it is
already open, the dialog box addresses the specific violations that just occurred.
You can resume your previous work in the Check Standards dialog box after
you respond to the most recent standards violations. Alternatively, if you do
not want to fix violations when alerted, you can click Do Not Fix to dismiss
the alert.
If you open a drawing that has one or more associated standards files, an
Associated Standards File(s) icon is displayed in the status bar. If an associated
standards file is missing, a Missing Standards File(s) icon is displayed in the
status bar. If you double-click the Missing Standards File(s) icon and then
resolve or dissociate missing standards files, the Missing Standards File(s) icon
is replaced by the Associated Standards File(s) icon.
224 | Chapter 9 Maintain Standards in Drawings
NOTE If you select Display Alert upon Standards Violation in the Check Standards
dialog box and you fix a violation, you can return to a fixing operation where you
left off. If you select Display Standards Status Bar icon and you click the icon and
fix a violation, you must return to a standards-fixing operation from the beginning.
To audit a drawing for standards violations
1Open a drawing that has one or more associated standards files.
An Associated Standards File(s) icon is displayed in the status bar. If an
associated standards file is missing, a Missing Standards File(s) icon is
displayed in the status bar.
NOTE If you click the Missing Standards File(s) icon and then resolve or
dissociate missing standards files, the Missing Standards File(s) icon is replaced
by the Associated Standards File(s) icon.
2In the drawing with one or more associated standards files, click Manage
tab ➤ CAD Standards panel ➤ Check.
The Check Standards dialog box is displayed with the first standards
violation reported under Problem.
3Do one of the following:
■If you want to apply the item selected in the Replace With list to fix
the violation reported under Problem, click Fix. If there is a
recommended fix in the Replace With list, it is preceded by a check
mark. If no recommended fix exists for the current standards violation,
the Fix button is not available.
The Check Standards dialog box automatically displays the next
standards violation under Problem.
■Manually fix the standards violation. Click the Next button to display
the next violation.
■Select Mark This Problem as Ignored. Click the Next button to display
the next violation.
Selecting Mark This Problem as Ignored flags the standards violation
so you can prevent it from being displayed the next time you use the
CHECKSTANDARDS command.
■Click the Next button to display the next violation.
Check Drawings for Standards Violations | 225
4Repeat steps 2 and 3 until you have cycled through all standards
violations.
5Click Close.
To turn the display of ignored problems on or off
1In a drawing with one or more associated standards files, click Manage
tab ➤ CAD Standards panel ➤ Check.
2In the Check Standards dialog box, click Settings.
3In the CAD Standards Settings dialog box, select or clear Show Ignored
Problems. Click OK.
To turn notification for standards violations on or off
1Click Manage tab ➤ CAD Standards panel ➤ Configure.
2In the Configure Standards dialog box, click Settings.
3Do one of the following:
■To turn off standards notifications, select Disable Standards
Notifications.
■To be notified by alert, select Display Alert upon Standards Violation.
■To be notified by the display of an icon in the status bar, select Display
Standards Status Bar Icon.
4Click OK.
To start the Batch Standards Checker
■Click Start menu (Windows) ➤ All Programs ➤ Autodesk ➤
ProductNameLong ➤ Batch Standards Checker.
NOTE When you start the Batch Standards Checker from a DOS command line
using the DWGCHECKSTANDARDS command, the Batch Standards Checker
accepts a variety of command-line parameters that can be used for scripting batch
standards audits.
226 | Chapter 9 Maintain Standards in Drawings
To create a standards check file for the Batch Standards Checker
1Click Manage tab ➤ CAD Standards panel ➤ Check.
2In the Batch Standards Checker, click File menu ➤ New Check File. (You
can also click New on the Batch Standards Checker toolbar.)
3On the Drawings tab, click the + button (Add Drawing).
4In the Open dialog box, select a drawing to audit.
5(Optional) Repeat steps 3 and 4 if you want to add additional drawings
to the standards check file.
6Click File menu ➤ Save As. (You can also click the Save As button on
the Batch Standards Checker toolbar.)
7In the Save As dialog box, in File Name, enter a name for the file.
8Click Save.
To open an existing standards check file
1Click Manage tab ➤ CAD Standards panel ➤ Check.
2In the Batch Standards Checker, click File menu ➤ Open Check File.
(You can also click Open on the Batch Standards Checker toolbar.)
3In the Open dialog box, locate and select a standards check file.
4Click Open.
To specify a standards override for a standards check file
1Click Manage tab ➤ CAD Standards panel ➤ Check.
2Create a standards check file or open an existing one.
3In the Batch Standards Checker, Standards tab, select the Check All
Drawings Using the Following Standards Files option.
4Click the + button (Add Standards File).
5In the Open dialog box, select a standards file to use as an override. Click
Open.
6(Optional) Repeat steps 5 and 6 if you want to add additional standards
files as overrides.
Check Drawings for Standards Violations | 227

7In the Batch Standards Checker, click File menu ➤ Save Check File. (You
can also click Save on the Batch Standards Checker toolbar.)
To audit a set of drawings for standards violations
1Click Manage tab ➤ CAD Standards panel ➤ Check.
2Open an existing standards check file, or create a new one.
3In the Batch Standards Checker, click Check menu ➤ Start Check. (You
can also click Start Check on the Batch Standards Checker toolbar.)
When the batch audit is complete, the report is displayed in a browser
window.
You can cancel the batch audit at any time by click Stop Check.
NOTE You cannot check encrypted files using the Batch Standards Checker.
To add notes to the batch audit report
1Click Manage tab ➤ CAD Standards panel ➤ Check.
2Create a standards check file or open an existing one.
3In the Batch Standards Checker, Notes tab, enter notes to be included in
the report.
4Click File menu ➤ Save Check File. (You can also click Save on the Batch
Standards Checker toolbar.)
To view a previously generated batch audit report
1Click Manage tab ➤ CAD Standards panel ➤ Check.
2Open the standards check file that generated the report you want to view.
3In the Batch Standards Checker, click Check menu ➤ View Report.(You
can also click View Report on the Batch Standards Checker toolbar.)
The report is displayed in a browser window.
4Select one of the following options to filter the data displayed in the
report:
■Overview. Summarizes the number of problems encountered in each
audited drawing.
228 | Chapter 9 Maintain Standards in Drawings
■Plug-ins. Summarizes the standards plug-ins installed on the system
used to run the batch audit.
■Standards. Summarizes the standards files used to check the drawings
in the batch audit.
■Problems. Provides detailed information about each problem that was
encountered.
■Ignored Problems. Provides detailed information about problems that
were flagged as ignored.
■All. Shows all available standards audit information.
5In the For list, select individual drawings to view their audit information.
To export a batch audit report
1Click Manage tab ➤ CAD Standards panel ➤ Check.
2Create a standards check file or open an existing one.
3In the Batch Standards Checker, click Check ➤ Export Report. (You can
also click Export Report on the Batch Standards Checker toolbar.)
Quick Reference
CHECKSTANDARDS
Checks the current drawing for standards violations.
STANDARDS
Manages the association of standards files with drawings.
STANDARDSVIOLATION
Specifies whether a user is notified of standards violations in the current
drawing when a nonstandard object is created or modified.
Batch Standards Checker
Audits a set of drawings for standards violations.
Translate Layer Names and Properties
You can reorganize a drawing's layers to match a set of layer standards.
Translate Layer Names and Properties | 229

Convert Layers to Established Drawing Standards
With the Layer Translator, you can convert layers in one drawing to layer
standards that you define.
For example, if you receive a drawing from a company that does not follow
your company's layer standards, you can convert the drawing's layer names
and properties to your company's standards. You can map layers in the drawing
you are currently working on to different layers in another drawing or
standards file, and then convert the current layers using those mappings. If
the drawings contain layers of the same name, the Layer Translator can
automatically change the properties of the current layers to match those in
the other layers.
You can save your layer translation mappings in a file and reuse them with
other drawings.
View Selected Drawing Layers
With the Layer Translator, you can control which layers are visible in the
drawing area.
You can choose to display objects on all layers in your drawing, or objects on
layers you specify. By viewing selected layers, you can visually verify the
contents of those layers.
Purge Unreferenced Layers
With the Layer Translator, you can purge (delete) all unreferenced layers from
a drawing.
For example, if your drawing includes layers that you do not need, you may
want to remove those layers. Reducing the number of layers makes working
with the remaining layers more manageable.
To convert a drawing's layers to standard layer settings
1Click Manage tab ➤ CAD Standards panel ➤ Layer Translator.
2In the Layer Translator, do one of the following:
■Click Load to load layers from a drawing, a drawing template, or a
drawing standards file. In the Select Drawing File dialog box, select
the file you want. Click Open.
230 | Chapter 9 Maintain Standards in Drawings

■Click New to define a new layer. In the New Layer dialog box, enter
a name for the new layer and select its properties. Click OK.
You can repeat step 2 as many times as you want. If you load other files
containing layers of the same name as ones already shown in the Translate
To list, the layer properties first loaded in the list are maintained; any
duplicate layer properties are ignored.
3Map layers in the current drawing to the layers you want to convert to.
Use either or both of the following methods to map layers:
■To map all identically named layers from one list to the other, click
Map Same.
■To map individual layers, in the Translate From list, select one or
more layers. In the Translate To list, select the layer whose properties
you want to use. Click Map to define the mapping. You can repeat
this method for each layer or group of layers to be translated.
To remove a mapping, select the mapping from the Layer Translation
Mappings list. Click Remove. To remove all mappings, right-click in the
list. Click Remove All.
4(Optional) You can perform the following tasks in the Layer Translator:
■To change the properties of a mapped layer, in the Layer Translation
Mappings list, select the mapping whose properties you want to
change. Click Edit. In the Edit Layer dialog box, change the linetype,
color, lineweight, or plot style of the mapped layer. Click OK.
■To customize the process of layer translation, click Settings. In the
Settings dialog box, select the options you want. Click OK.
■To save layer mappings to a file, click Save. In the Save Layer Mappings
dialog box, enter a file name. Click OK.
5Click Translate to perform the layer translations you have specified.
To specify which layers are displayed in the drawing area
1Click Manage tab ➤ CAD Standards panel ➤ Layer Translator.
2In the Layer Translator, click Settings.
Translate Layer Names and Properties | 231

3In the Settings dialog box, do one of the following:
■To display objects on selected layers in your drawing, select Show
Layer Contents When Selected. Only the layers selected in the Layer
Translator dialog box are displayed in the drawing area.
■To display objects on all layers in your drawing, clear Show Layer
Contents When Selected.
4Click OK.
To purge all unreferenced layers from a drawing
1Click Manage tab ➤ CAD Standards panel ➤ Layer Translator.
2In the Layer Translator, right-click in the Translate From list. Click Purge
Layers. All unreferenced layers are deleted from the current drawing.
Quick Reference
LAYTRANS
Translates the layers in the current drawing to specified layer standards.
232 | Chapter 9 Maintain Standards in Drawings
Part 4: Control the Drawing
Views
233
234
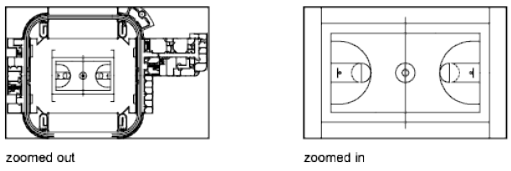
Change Views
You can magnify the details in your drawing for a closer view or shift the view to a different
part of the drawing. If you save views by name, you can restore them later.
Pan or Zoom a View
You can pan to reposition the view in the drawing area or zoom to change
magnification.
With the Realtime option of PAN, you pan dynamically by moving your pointing
device. Like panning with a camera, PAN does not change the location or
magnification of objects on your drawing; it changes only the view.
You can change the magnification of a view by zooming in and out, which is
similar to zooming in and out with a camera. ZOOM does not change the
absolute size of objects in the drawing; it changes only the magnification of the
view.
When you work with minute parts in your drawing, you may need to zoom out
frequently to see an overview of your work. Use ZOOM Previous to return quickly
to the prior view.
The options described here are the options most commonly used. For a
description of all ZOOM options, see the Command Reference.
10
235
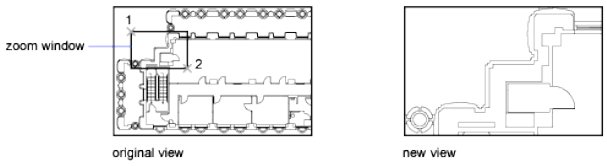
Zoom to Magnify a Specified Rectangular Area
You can quickly zoom on a rectangular area of your drawing by specifying
two diagonal corners of the area you are interested in.
The lower-left corner of the area you specify becomes the lower-left corner of
the new display. The shape of the zoom area you specify does not correspond
exactly to the new view, which must fit the shape of the viewport.
Zoom in Real Time
With the Realtime option, you zoom dynamically by moving your pointing
device up or down. By right-clicking, you can display a shortcut menu with
additional viewing options.
Zoom to Magnify One or More Objects
ZOOM Objects displays a view with the largest possible magnification that
includes all of the objects you selected.
Zoom to View All Objects in the Drawing
ZOOM Extents displays a view with the largest possible magnification that
includes all of the objects in the drawing. This view includes objects on layers
that are turned off but does not include objects on frozen layers.
ZOOM All displays either the user-defined grid limits or the drawing extents,
whichever view is larger.
236 | Chapter 10 Change Views
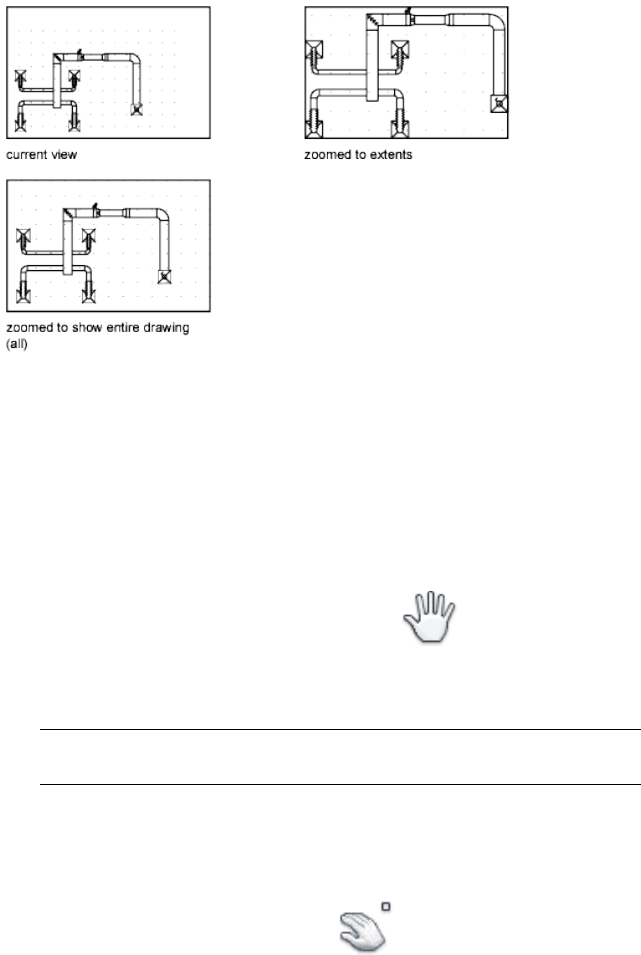
See also:
■Pointing Devices
■Scale Views in Layout Viewports on page 410
■Toolbars on page 48
To pan by dragging
1Click View tab ➤ Navigate panel ➤ Pan.
2When the hand cursor is displayed, click and hold your pointing device
as you move.
NOTE If you are using a wheel mouse, hold down the wheel button and
move the mouse.
3To exit, press Enter or Esc, or right-click.
To pan by specifying points
1Click View menu ➤ Pan ➤ Point.
2Specify a base point. This is the point you want to change.
Pan or Zoom a View | 237
3Specify a second (pan to) point. This is the new location for the point
you selected first.
To zoom by dragging
1Click View tab ➤ Navigate panel ➤ Zoom drop-down ➤ Realtime.
2When the magnifying glass cursor is displayed, click and hold your
pointing device and drag vertically to zoom in and out.
3To exit, press Enter or Esc, or right-click.
To zoom in to an area by specifying its boundaries
1Click View tab ➤ Navigate panel ➤ Zoom drop-down ➤ Window.
2Specify one corner of the rectangular area you want to view.
3Specify the opposite corner.
You automatically choose the Window option when you specify a point
immediately after starting the ZOOM command.
To display the drawing extents by zooming
■Click View tab ➤ Navigate panel ➤ Zoom drop-down ➤ Extents.
All objects in the drawing are displayed to be as large as possible and still fit
in the current viewport or the drawing area.
To display the area of the grid limits by zooming
■Click View tab ➤ Navigate panel ➤ Zoom drop-down ➤ All.
The limits of the drawing grid fill the current viewport or the drawing area.
If there are any objects outside the grid limits, they are also included.
238 | Chapter 10 Change Views

To restore the previous view
■Click View tab ➤ Navigate panel ➤ Zoom drop-down ➤ Previous.
Zoom Previous restores only the view magnification and position, not the
previous content of an edited drawing.
Quick Reference
Commands
DSVIEWER
Opens the Aerial View window.
PAN
Moves the view planar to the screen.
UNDO
Reverses the effect of commands.
VIEWRES
Sets the resolution for objects in the current viewport.
VTOPTIONS
Displays a change in view as a smooth transition.
ZOOM
Increases or decreases the magnification of the view in the current viewport.
System Variables
EXTMAX
Stores the upper-right point of the drawing extents.
EXTMIN
Stores the lower-left point of the drawing extents.
MBUTTONPAN
Controls the behavior of the third button or wheel on the pointing device.
Pan or Zoom a View | 239
RTDISPLAY
Controls the display of raster images and OLE objects during Realtime ZOOM
or PAN.
VTENABLE
Controls when smooth view transitions are used.
VTDURATION
Sets the duration of a smooth view transition, in milliseconds.
VTFPS
Sets the minimum speed of a smooth view transition, in frames per second.
WHIPARC
Controls whether the display of circles and arcs is smooth.
WHIPTHREAD
Controls whether to use an additional processor to improve the speed of
operations such as ZOOM that redraw or regenerate the drawing.
ZOOMFACTOR
Controls how much the magnification changes when the mouse wheel moves
forward or backward.
Pan and Zoom with the Aerial View Window
In a large drawing, you can pan and zoom quickly in a window that can display
the whole drawing.
You can use the Aerial View window to change the view in your current
viewport quickly. If you keep the Aerial View window open as you work, you
can zoom and pan without interrupting your current command. You can also
specify a new view without having to choose a menu option or enter a
command.
Use the View Box to Pan and Zoom
Within the Aerial View window is a view box, a heavy rectangle that displays
the boundary of the view in your current viewport. You can change the view
in the drawing by changing the view box in the Aerial View window. To zoom
in to the drawing, make the view box smaller. To zoom out of the drawing,
make the view box larger. All pan and zoom operations are performed by
left-clicking. Right-click to end a pan or zoom operation.
240 | Chapter 10 Change Views
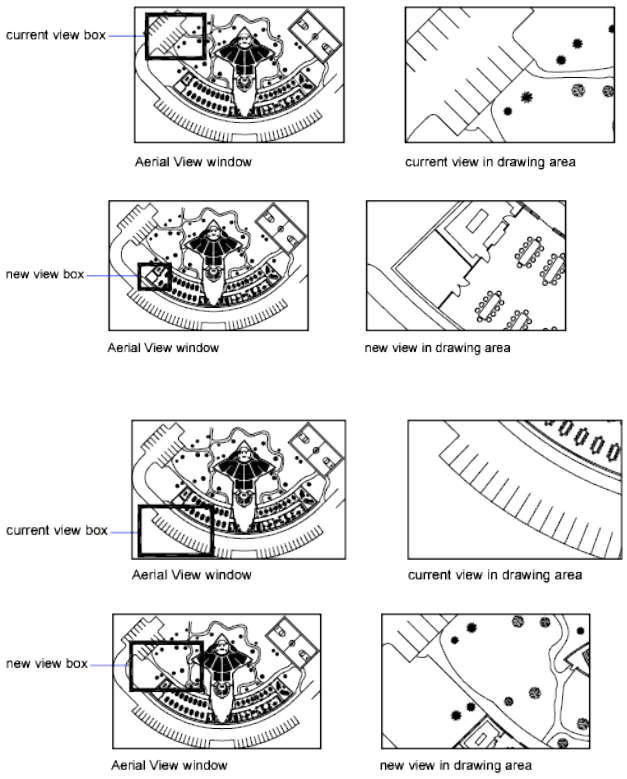
To pan the drawing, move the view box.
Change the View Displayed Inside the Aerial View Window
You can use the Aerial View toolbar buttons to change the magnification of
the image in the Aerial View window, or you can resize the image
incrementally. These changes do not affect the view in the drawing itself.
Use the Aerial View Window with Multiple Viewports
Only the view in the current viewport is used in the Aerial View window.
Pan and Zoom with the Aerial View Window | 241

The Aerial View image is updated as you make changes to your drawing and
as you select different viewports. In complex drawings, you may want to turn
off this dynamic updating to improve drawing speed. If you turn off this
feature, the Aerial View image is updated only when you activate the Aerial
View window.
To zoom to a new area using the Aerial View window
1Click View menu ➤ Aerial View.
2In the Aerial View window, click inside the view box until you see the
arrow.
3Drag to the right to zoom out. Drag to the left to zoom in.
4Right-click to end the zoom operation.
To pan using the Aerial View window
1Click View menu ➤ Aerial View.
2In the Aerial View window, click inside the view box until you see an X.
3Drag to change the view.
4Right-click to end the pan operation.
To display the entire drawing in the Aerial View window
1Click View menu ➤ Aerial View.
2In the Aerial View window, click View menu ➤ Global.
To increase or decrease magnification of the Aerial View image
1Click View menu ➤ Aerial View.
2On the Aerial View toolbar, click Zoom Out or Zoom In.
NOTE When the entire drawing is displayed in the Aerial View window, the Zoom
Out menu option and button are unavailable. When the current view nearly fills
the Aerial View window, the Zoom In menu option and button are unavailable.
To turn dynamic updating on and off
■Click View menu ➤ Aerial View.
242 | Chapter 10 Change Views
■In the Aerial View window, click Options menu ➤ Dynamic Update.
A check mark indicates that the Aerial View window shows changes as
they occur.
To turn viewport updating on and off
■Click View menu ➤ Aerial View.
■In the Aerial View window, click Options menu ➤ Auto Viewport.
A check mark indicates that Aerial View displays the current viewport as
you switch viewports.
Quick Reference
Commands
DSVIEWER
Opens the Aerial View window.
Save and Restore Views
When you save specific views by name, you can restore them for layout and
plotting or when you need to refer to specific details. You can create and save
views using the VIEW or the CAMERA command.
A named view created with the VIEW command consists of a specific
magnification, position, and orientation. In each drawing session, you can
restore the last view displayed in each viewport and up to 10 previous views.
Named views and cameras are saved with a drawing and can be used any time.
When you are composing a layout, you can restore a named view or a camera
to a viewport on the layout.
Save a View
When you name and save a view, the following settings are saved:
■Magnification, center point, and view direction
■View category that you assign to the view (optional)
■The location of the view (the Model tab or a specific layout tab)
■Layer visibility in the drawing at the time the view is saved
Save and Restore Views | 243

■User coordinate system
■3D perspective
■Live section
■Visual style
■Background
Restore a Named View
You restore a named view to the current viewport. You can use named views
to do the following:
■Compose a layout.
■Restore a view that you use frequently while you are working in model
space.
■Control which model space view is displayed when the drawing is opened.
To restore the previous view
■Click View tab ➤ Navigate panel ➤ Zoom drop-down ➤ Previous.
Zoom Previous restores only the view magnification and position, not the
previous content of an edited drawing.
To display the previous view during PAN Realtime and ZOOM Realtime
■Click View tab ➤ Navigate panel ➤ Zoom drop-down ➤ Previous
To save and name a view
1Do one of the following:
■If you have more than one viewport in model space, click inside the
viewport that contains the view you want to save.
■If you are working in a layout, select the viewport.
244 | Chapter 10 Change Views

2Click View tab ➤ Views panel ➤ Named Views.
3In the View Manager, click New.
4In the New View dialog box, View Name box, enter a name for the view.
If the drawing is part of a sheet set, the view categories for the sheet set
are listed. You can add a category or select one from the list.
5In the Boundary section, select one of the following options to define
the area of the view:
■Current Display. Includes all of the drawing that is currently visible.
■Define Window. Saves part of the current display. The dialog box
closes while you use the pointing device in the drawing to specify
opposite corners of the view. To redefine the window, click the Define
View Window button.
6Click OK twice to save the new view.
To restore a saved view
1Do one of the following:
■If you have more than one viewport in model space, click inside the
viewport that contains the view you want to restore.
■If you are working in a layout, select the viewport.
2Click View tab ➤ Views panel ➤ Named Views.
3In the View Manager, Views list, select the view that you want to restore.
4Click Set Current. Click OK.
To rename a view
1Click View tab ➤ Views panel ➤ Named Views.
2In the View Manager, click the view name you want to change. If the
view isn’t already displayed, expand the appropriate View list, and then
click a view name.
Save and Restore Views | 245
3In the General section of the Properties panel, select the view name. Enter
a new name.
4Click OK.
To change the properties of a view
1Click View tab ➤ Views panel ➤ Named Views.
2In the View Manager, click the view name you want to change. If the
view isn’t already displayed, expand the appropriate View list, and then
click a view name.
3In the Properties panel, click the property that you want to change.
4Specify the new property value by entering a new value or by selecting
from a list of values. Click OK.
To delete a named view
1Click View tab ➤ Views panel ➤ Named Views.
2In the View Manager, click a view, and then click Delete.
3Click OK.
To view a list of saved viewport arrangements
■Click View tab ➤ Viewports panel ➤ Named.
The list of saved viewports is displayed in the Viewports dialog box, Named
Viewports tab.
Quick Reference
Commands
VIEW
Saves and restores named views, camera views, layout views, and preset views.
246 | Chapter 10 Change Views
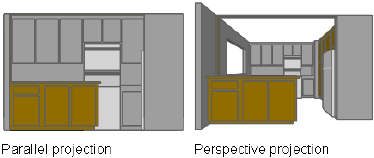
VPORTS
Creates multiple viewports in model space or paper space.
ZOOM
Increases or decreases the magnification of the view in the current viewport.
Control the 3D Projection Style
You can view both parallel and perspective projection of a 3D model.
Overview of Parallel and Perspective Views
You can create realistic visual effects in a drawing by defining either parallel
or perspective projections of a model.
The difference between perspective views and parallel projections is that
perspective views require a distance between a theoretical camera and target
point. Small distances produce severe perspective effects; large distances
produce mild effects.
The following illustration shows the same model in both a parallel projection
and perspective projection. Both are based on the same viewing direction.
Quick Reference
Commands
3DORBIT
Rotates the view in 3D space, but constrained to horizontal and vertical orbit
only.
DVIEW
Defines parallel projection or perspective views by using a camera and target.
Control the 3D Projection Style | 247
System Variables
BACKZ
Stores the back clipping plane offset from the target plane for the current
viewport, in drawing units.
FRONTZ
Stores the front clipping plane offset from the target plane for the current
viewport, in drawing units.
LENSLENGTH
Stores the length of the lens (in millimeters) used in perspective viewing.
TARGET
Stores the location (as a UCS coordinate) of the target point for the current
viewport.
VIEWDIR
Stores the viewing direction in the current viewport, expressed in UCS
coordinates.
VIEWMODE
Stores the View mode for the current viewport.
VIEWTWIST
Stores the view rotation angle for the current viewport measured relative to
the WCS.
WORLDVIEW
Define a Perspective Projection (DVIEW)
Perspective projections require a distance between a theoretical camera and
a target point. Small distances produce severe perspective effects; large distances
produce milder effects.
A perspective view remains in effect until the perspective effect is turned off
or until a new view is defined in its place.
To define a perspective view of a 3D model using DVIEW
1At the Command prompt, enter dview.
2Select the objects to display.
248 | Chapter 10 Change Views
3Enter ca (Camera).
By default, a camera point is set at the center of the drawing.
4Adjust the view as if you're aiming a camera.
A representation of a house shows the current viewing angle. You can
set your view dynamically by moving the crosshairs and clicking.
5To switch between angle-input methods, enter t (Toggle Angle).
You also can adjust the view with one of two angle-input methods.
■For the Enter Angle from the XY Plane option, enter the angle of the
camera up or down relative to the XY plane of the current UCS. The
default setting, 90 degrees, points the camera straight down from
above.
After you enter the angle, the camera is locked at that height, and
you can rotate the camera about the target with the rotation angle
measured relative to the X axis of the current UCS.
■For the Enter Angle in the XY Plane from the X Axis option, rotate
the camera about the target with the rotation angle measured relative
to the X axis of the current UCS.
6To turn on the perspective view, enter d (Distance).
7Specify a distance, or press Enter to set the perspective view.
You can use the slider bar to set the distance between the selected objects
and the camera, or you can enter a real number. If the target and camera
points are very close (or if the Zoom option is set high), you might see
only a small part of your drawing.
To turn off a perspective view using DVIEW
1At the Command prompt, enter dview.
2Select the objects to display.
3Enter o (Off).
Perspective is turned off and the view is restored to a parallel projection.
Define a Perspective Projection (DVIEW) | 249
Quick Reference
Commands
3DORBIT
Rotates the view in 3D space, but constrained to horizontal and vertical orbit
only.
DVIEW
Defines parallel projection or perspective views by using a camera and target.
System Variables
BACKZ
Stores the back clipping plane offset from the target plane for the current
viewport, in drawing units.
FRONTZ
Stores the front clipping plane offset from the target plane for the current
viewport, in drawing units.
LENSLENGTH
Stores the length of the lens (in millimeters) used in perspective viewing.
PERSPECTIVE
Specifies whether the current viewport displays a perspective view.
PERSPECTIVECLIP
Determines the location of eyepoint clipping.
TARGET
Stores the location (as a UCS coordinate) of the target point for the current
viewport.
VIEWDIR
Stores the viewing direction in the current viewport, expressed in UCS
coordinates.
VIEWMODE
Stores the View mode for the current viewport.
250 | Chapter 10 Change Views
VIEWTWIST
Stores the view rotation angle for the current viewport measured relative to
the WCS.
WORLDVIEW
Define a Parallel Projection
You can define a parallel projection.
To determine the point or angle in model space, you can
■Choose a preset 3D view from the View toolbar.
■Enter a coordinate or angles that represent your viewing location in 3D.
■Change to a view of the XY plane of the current UCS, a saved UCS, or the
WCS.
■Change the 3D view dynamically with your pointing device.
■Set front and back clipping planes to limit the objects being displayed.
Viewing in 3D is available only in model space. If you are working in paper
space, you cannot use 3D viewing commands such as VPOINT, DVIEW, or
PLAN to define paper space views. The view in paper space is always a plan
view.
To create a parallel projection dynamically
1At the Command prompt, enter dview.
2Do one of the following:
■Select the objects to display and press Enter.
■Press Enter without selecting objects to see a representation of a house
that shows the current viewing angle.
3Enter ca (Camera).
By default, a camera point is set at the center of the drawing.
4Adjust the view as if you're aiming a camera.
You can set your view dynamically by moving the crosshairs and clicking.
5To switch between the angle-input methods, enter t (Toggle Angle).
Define a Parallel Projection | 251
You can also adjust the view with one of two angle-input methods.
■For the Enter Angle from the XY Plane option, enter the angle of the
camera up or down relative to the XY plane of the current UCS. The
default setting, 90 degrees, points the camera straight down from
above.
After you enter the angle, the camera is locked at that height, and
you can rotate the camera about the target with the rotation angle
measured relative to the X axis of the current UCS.
■For the Enter Angle in the XY Plane from the X Axis option, rotate
the camera about the target with the rotation angle measured relative
to the X axis of the current UCS.
6When you finish specifying the parallel projection, press Enter.
Quick Reference
Commands
DVIEW
Defines parallel projection or perspective views by using a camera and target.
PLAN
Displays an orthographic view of the XY plane of a specified user coordinate
system.
VPOINT
Sets the viewing direction for a 3D visualization of the drawing.
System Variables
PERSPECTIVE
Specifies whether the current viewport displays a perspective view.
VIEWDIR
Stores the viewing direction in the current viewport, expressed in UCS
coordinates.
252 | Chapter 10 Change Views
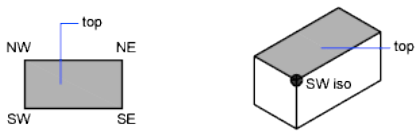
WORLDVIEW
Choose Preset 3D Views
You can select predefined standard orthographic and isometric views by name
or description.
A quick way to set a view is to choose one of the predefined 3D views. You
can select predefined standard orthographic and isometric views by name or
description. These views represent commonly used options: Top, Bottom,
Front, Left, Right, and Back. In addition, you can set views from isometric
options: SW (southwest) Isometric, SE (southeast) Isometric, NE (northeast)
Isometric, and NW (northwest) Isometric.
To understand how the isometric views work, imagine you are looking down
at the top of a box. If you move toward the lower-left corner of the box, you
are viewing the box from the SW Isometric View. If you move toward the
upper-right corner of the box, you are viewing it from NE Isometric View.
To use a preset 3D view
■Click View tab ➤ Views panel ➤ Named Views.
■Select a preset view (Top, Bottom, Left, and so on).
Quick Reference
Commands
VIEW
Define a 3D View with Coordinate Values or Angles
You can define a viewing direction by entering the coordinate values of a
point or the measures of two angles of rotation.
Choose Preset 3D Views | 253
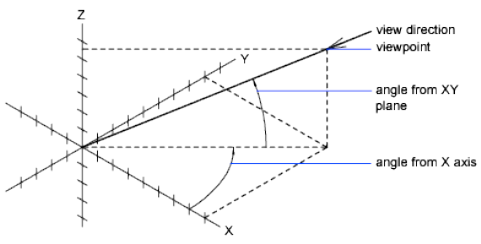
This point represents your position in 3D space as you view the model while
looking toward the origin (0,0,0). Viewpoint coordinate values are relative to
the world coordinate system unless you change the WORLDVIEW system
variable. The conventions for defining standard views differ between
architectural (AEC) and mechanical design. In AEC design, the perpendicular
view of the XY plane is the top or plan view; in mechanical design, the
perpendicular view of the XY plane is the front view.
You can rotate a view using DDVPOINT. The following illustration shows a
view defined by two angles relative to the X axis and the XY plane of the WCS.
To set a view with a viewpoint coordinate
1Click View menu ➤ 3D Views ➤ Viewpoint.
2Click inside the compass to specify the viewpoint. The selected viewpoint
is used to view the drawing in the direction of 0,0,0.
To set a view with two angles of rotation
1Click View menu ➤ 3D Views ➤ Viewpoint.
2Enter r (Rotate) to specify a new direction using two angles.
3Enter an angle in the XY plane measured from the positive X axis.
4Enter an angle from the XY plane that represents your position while
viewing the model in the direction of 0,0,0.
To set standard views with VPOINT (AEC convention)
1Click View menu ➤ 3D Views ➤ Viewpoint.
2Enter a coordinate according to the viewpoint you want:
■Enter 0,0,1 for a top (plan) view.
254 | Chapter 10 Change Views
■Enter 0,-1,0 for a front view.
■Enter 1,0,0 for a right side view.
■Enter 1,-1,1 for an isometric view.
To set standard views with VPOINT (mechanical design convention)
1Click View menu ➤ 3D Views ➤ Viewpoint.
2Enter a coordinate according to the viewpoint you want:
■Enter 0,1,0 for a top view.
■Enter 0,0,1 for a front view.
■Enter 1,0,0 for a right side view.
■Enter 1,1,1 for an isometric view. This view is identical to one with a
right-out of 45 degrees and a top-out of 35.267 degrees.
Quick Reference
Commands
VIEW
VPOINT
Sets the viewing direction for a 3D visualization of the drawing.
System Variables
WORLDVIEW
Change to a View of the XY Plane
You can change the current viewpoint to a plan view of the current UCS, a
previously saved UCS, or the WCS.
A plan view is a view aimed toward the origin (0,0,0) from a point on the
positive Z axis. This results in a view of the XY plane.
You can restore the view and coordinate system that is the default for most
drawings by setting the UCS orientation to World and then setting the 3D
view to Plan View.
Change to a View of the XY Plane | 255

To change the current view to the XY plane
1Click View menu ➤ 3D Views ➤ Plan View.
2Select one of the following options:
■Current (for the current UCS)
■World (for the WCS)
■Named (for a saved UCS)
NOTE PLAN changes the viewing direction and turns off perspective and
clipping; it does not change the current UCS. Any coordinates entered or
displayed subsequent to the PLAN command remain relative to the current
UCS.
Quick Reference
Commands
DVIEW
Defines parallel projection or perspective views by using a camera and target.
PLAN
Displays an orthographic view of the XY plane of a specified user coordinate
system.
System Variables
BACKZ
Stores the back clipping plane offset from the target plane for the current
viewport, in drawing units.
FRONTZ
Stores the front clipping plane offset from the target plane for the current
viewport, in drawing units.
VIEWDIR
Stores the viewing direction in the current viewport, expressed in UCS
coordinates.
256 | Chapter 10 Change Views
VIEWTWIST
Stores the view rotation angle for the current viewport measured relative to
the WCS.
WORLDVIEW
Shade a Model and Use Edge Effects
Hiding lines enhances the drawing and clarifies the design. The addition of
shading produces a more realistic image of your model.
Use a Visual Style to Display Your Model
Visual styles control the display of edges and shading a viewport.
Control the effect of a visual style by changing its properties. When you apply
a visual style or change its settings, the associated viewport is automatically
updated to reflect those changes.
The Visual Styles Manager displays all visual styles available in the drawing.
The selected visual style is indicated by a yellow border, and its settings are
displayed in the panel below the sample images.
From the ribbon, you can change some frequently used settings or open the
Visual Styles Manager.
The following predefined visual styles are supplied with the product:
■2D Wireframe. Displays objects using lines and curves to represent the
boundaries. Raster and OLE objects, linetypes, and lineweights are visible.
■Wireframe. Displays objects using lines and curves to represent the
boundaries.
■Hidden. Displays objects using wireframe representation and hides lines
representing back faces.
■Realistic. Displays objects using smooth shading and materials.
■Conceptual. Displays objects using smooth shading and the Gooch face
style. The Gooch face style transitions between cool and warm colors,
rather than dark and light. The effect is less realistic, but it can make the
details of the model easier to see.
■Shaded. Displays objects using smooth shading.
Shade a Model and Use Edge Effects | 257
■Shaded with Edges. Displays objects using smooth shading and visible
edges.
■Shades of Gray. Displays objects using smooth shading and monochromatic
shades of gray.
■Sketchy. Displays objects with a hand-sketched effect by using the Line
Extensions and Jitter edge modifiers.
■X-ray. Displays objects with partial transparency.
In shaded visual styles, faces are lit by two distant light sources that follow
the viewpoint as you move around the model. This default lighting is designed
to illuminate all faces in the model so that they are visually discernable. Default
lighting is available only when other lights, including the sun, are off.
Select a visual style and change its settings at any time. The changes are
reflected in the viewports to which the visual style is applied. For more
information about face settings, environment settings, and edge settings, see
Customize a Visual Style on page 261. Any changes you make to a visual style
are saved in the drawing.
258 | Chapter 10 Change Views
To save a visual style in the drawing
■At the Command prompt, enter vssave.
To apply a visual style to a viewport
1Click View tab ➤ Visual Styles panel ➤ ➤ Visual Styles Manager.
2Click in the viewport to make it current.
3In the Visual Styles Manager, double-click the sample image of the visual
style.
The selected visual style is applied to the model in the viewport.
An icon in the sample image indicates that the visual style is in use in
the current viewport. When you change viewports, the icon changes to
indicate that the visual style is in use in the current drawing.
To store a visual style on a tool palette
1Click View tab ➤ Visual Styles panel ➤ ➤ Visual Styles Manager.
2Click View tab ➤ Palettes panel ➤ Tool Palettes.
3In the Tool Palettes window, click the Visual Styles tab.
4In the Visual Styles Manager, select the sample image of the visual style.
5Below the images, click the Export the Selected Visual Style to the Tool
Palette button.
To use a visual style from another drawing
1Open the drawing that has the visual style that you want to use.
2Click View tab ➤ Visual Styles panel ➤ ➤ Visual Styles Manager.
Use a Visual Style to Display Your Model | 259
3Click View tab ➤ Palettes panel ➤ Tool Palettes.
4In the Tool Palettes window, click the Visual Styles tab.
5In the Visual Styles Manager, select the sample image of the visual style.
6Below the images, click the Export the Selected Visual Style to the Tool
Palette button.
7Open the drawing in which you want to use the visual style.
8In the Tool Palette window, right-click the visual style and click Add to
Current Drawing.
The visual style is added to the sample images in the Visual Styles Manager
and the ribbon.
To restore the default settings of a predefined visual style
1Click View tab ➤ Visual Styles panel ➤ ➤ Visual Styles Manager.
2Right-click a predefined visual style and click Reset to Default.
(Predefined visual styles display a drawing icon at bottom right in the
sample image.)
Quick Reference
Commands
SHADEMODE
Starts the VSCURRENT command.
TOOLPALETTES
Opens the Tool Palettes window.
VISUALSTYLES
Creates and modifies visual styles and applies a visual style to a viewport.
VISUALSTYLESCLOSE
Closes the Visual Styles Manager.
260 | Chapter 10 Change Views
System Variables
VSLIGHTINGQUALITY
Sets the lighting quality in the current viewport.
Customize a Visual Style
You can create your own visual styles by changing the face and edge settings
and using shadows and backgrounds.
Shade and Color Faces
Shading and color effects control the display of faces in a model.
Face Styles
The face style defines the shading on a face. Realistic (below left) is meant to
produce the effect of realism. Gooch (below right) can show details better by
softening the contrast between lit areas and shadowed areas. Lit areas use
warm tones and shadowed areas use cool tones.
Customize a Visual Style | 261
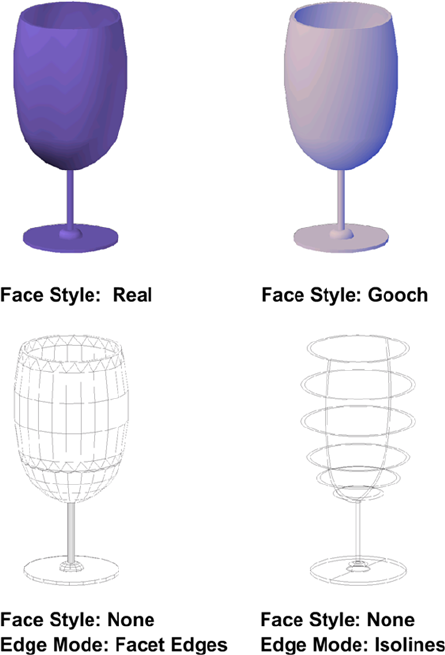
The None face style produces no shading, and displays only edges. Customize
edge settings to control whether facet edges or isolines are displayed.
Lighting Quality
Lighting quality determines the smoothness of shaded objects.
Faceted lighting computes a single color for each face. Individual faces appear
flat. Smooth lighting smoothes the edges between polygon faces by computing
the colors as a gradient between the faces’ vertices. This gives objects a smooth
appearance. For the Smoothest option, the Per-Pixel Lighting setting must be
enabled in the Manual Performance Tuning dialog box. The colors are
computed for individual pixels, giving a smoother appearance. If not, the
Smooth setting is used instead.
262 | Chapter 10 Change Views
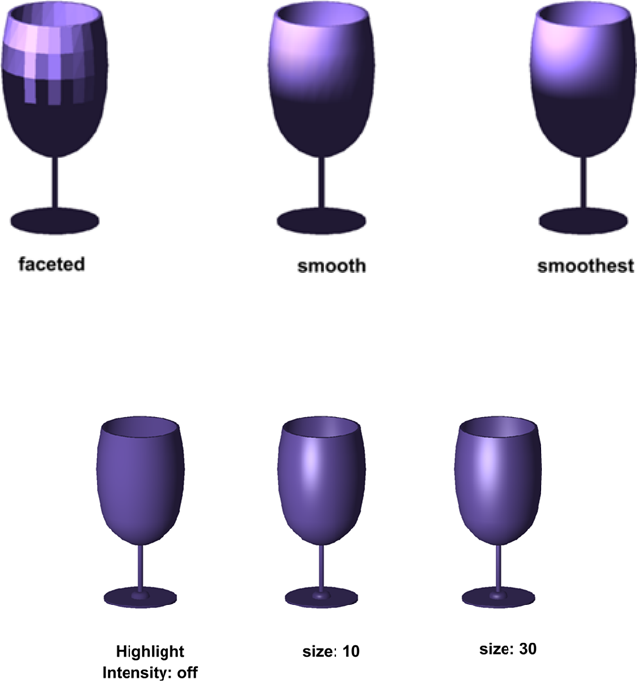
Highlights
The size of an object’s highlights affect the perception of shininess. A smaller,
more intense highlight makes objects appear shinier. The highlight intensity
that is set in a visual style does not apply to objects with attached materials.
Opacity
The opacity property controls the transparency of objects.
Customize a Visual Style | 263
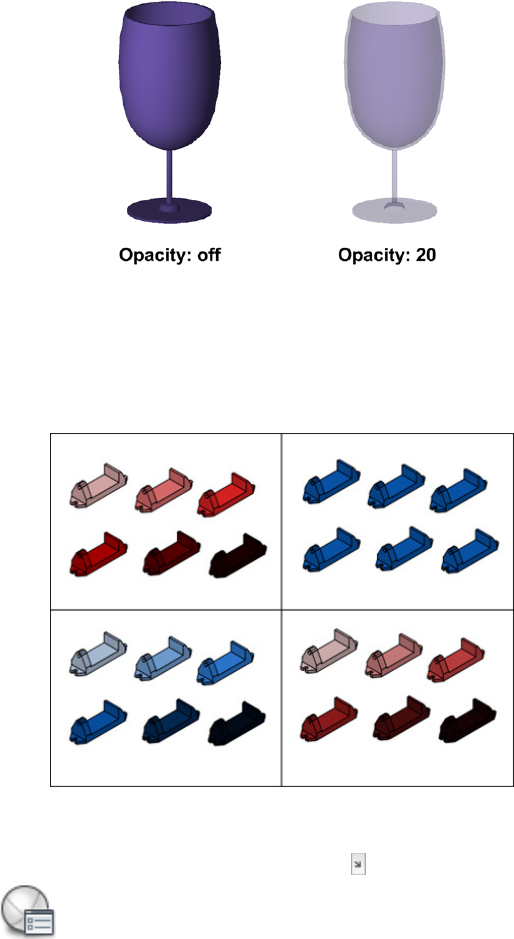
Face Color Modes
Display face colors in the normal way, or specify a face color mode.
Monochrome displays faces in the varying shades of a specified color. Tint
shades faces by changing the hue and saturation values based on a specified
color. Desaturate softens colors.
To change the display of faces from smooth to faceted
1Click View tab ➤ Visual Styles panel ➤ ➤ Visual Styles Manager.
264 | Chapter 10 Change Views
2With the current visual style selected in the sample images, under Face
Settings, Lighting Quality, change Smooth to Faceted.
To control the face style
1Click View tab ➤ Visual Styles panel ➤ ➤ Visual Styles Manager.
2With the current visual style selected in the sample images, under Face
Settings, Face Style, select one of the following options:
■Realistic. Shades faces as close as possible to how they would appear
in the real world.
■Gooch. Uses cool and warm colors instead of dark and light to enhance
the display of faces that might be shadowed and difficult to see in a
realistic display.
■None. does not apply a face style. Other face settings are disabled.
To control the display of colors on faces
1Click View tab ➤ Visual Styles panel ➤ ➤ Visual Styles Manager.
2With the current visual style selected in the sample images, under Face
Settings, Materials and Color, Face Color Mode, select one of the following
options:
■Normal. Does not apply a face color modifier.
■Monochrome. Displays faces in shades of a specified color.
■Tint. Changes the hue and saturation value of face colors based on a
specified color.
■Desaturate. Softens the color by reducing its saturation component
by 30 percent.
3If Monochrome or Tint is selected, specify a color. Select Color displays
the Select Color dialog box.
Customize a Visual Style | 265
To make all faces in a viewport transparent
1Click View tab ➤ Visual Styles panel ➤ Visual Styles.
2From the Visual Styles drop-down list, select X-Ray.
3On the Visual Styles panel, set the opacity by dragging the opacity slider.
Quick Reference
Commands
VISUALSTYLES
Creates and modifies visual styles and applies a visual style to a viewport.
System Variables
VISUALSTYLESCLOSE
Closes the Visual Styles Manager.
VSFACECOLORMODE
Controls how the color of faces is calculated.
VSFACEHIGHLIGHT
Controls the level of transparency for 3D objects.
VSFACEOPACITY
Turns on and off a preset level of transparency for 3D objects.
VSFACESTYLE
Controls how faces are displayed in the current viewport.
VSLIGHTINGQUALITY
Sets the lighting quality in the current viewport.
VSMONOCOLOR
Sets the color for monochrome and tint display of faces in the visual style
applied to the current viewport.
266 | Chapter 10 Change Views

Display Backgrounds and Shadows
The visual style also controls the display of backgrounds and shadows in the
viewport.
Backgrounds
You can use a color, a gradient fill, an image, or the sun & sky as a background
in the viewport in any 3D visual style, even one that does not shade objects.
To use a background, you first create a named view with a background and
set the named view as current in the viewport. When Background is set to On
in the current visual style, the background is displayed.
Shadows
Shaded objects in a viewport can display shadows. Ground shadows are
shadows that objects cast on the ground. Mapped object shadows are shadows
cast by objects onto other objects. The lighting in the viewport must be from
user-created lights or the sun for mapped object shadows to be displayed.
Where shadows overlap, they appear darker.
NOTE To display mapped object shadows, hardware acceleration is required.
When Enhanced 3D Performance is off, mapped object shadows cannot be
displayed. (To access these settings, enter 3dconfig at the Command prompt. In
the Adaptive Degradation and Performance Tuning dialog box, click Manual Tune.)
Displaying shadows can slow performance. You can turn off shadows in the
current visual style while you work and turn them back on when you need
them.
In the Properties palette, you can set the Shadow Display property for an
object: casts shadows, receives shadows, casts and receives shadows, or ignores
shadows.
More options are available for shadows used in rendering.
Customize a Visual Style | 267
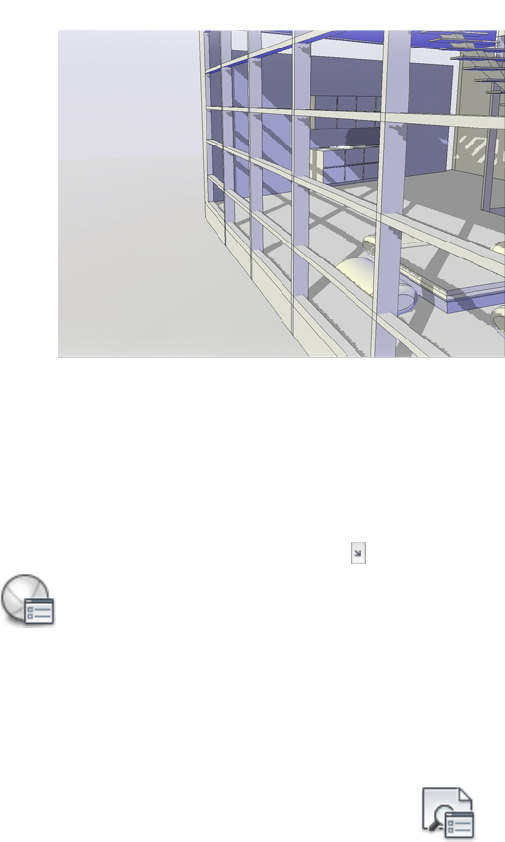
See also:
■Use Shadows in Rendering on page 2130
To control the display of shadows in a viewport
1Click View tab ➤ Visual Styles panel ➤ ➤ Visual Styles Manager.
2With the current visual style selected in the sample images, under
Lighting, Shadow Display, select Off, Ground Shadow, or Mapped Object
Shadows.
To set a solid as a viewport background
1Click View tab ➤ Views panel ➤ Named Views.
2In the View Manager, click the view name you want to change. If the
view is not already displayed, expand the appropriate View list, and then
click a view name.
3In the Properties panel, click the Background Override field.
4Select Solid from the Background Override drop-down list.
268 | Chapter 10 Change Views

5In the Background dialog box, click the swatch under the Color section.
6In the Select Color dialog box, specify the color you want to use for the
background.
7Click OK.
8In the Background dialog box, click OK.
9In the View Manager, click Set Current.
10 Click OK.
To set a gradient as a viewport background
1Click View tab ➤ Views panel ➤ Named Views.
2In the View Manager, click the view name you want to change. If the
view isn’t already displayed, expand the appropriate View list, and then
click a view name.
3In the Properties panel, click the Background Override field.
4Select Gradient from the Background Override drop-down list.
5In the Background dialog box, specify the desired options for the gradient
fill.
■Select Three Color to use a two or three color gradient fill.
■Click on the color swatches to display the Select Color dialog box to
specify the colors you want to use for the gradient fill.
■Enter a rotation value for the gradient fill in the Rotation text box.
6In the Background dialog box, click OK.
7In the View Manager, click Set Current.
8Click OK.
To set an image as a viewport background
1Click View tab ➤ Views panel ➤ Named Views.
Customize a Visual Style | 269

2In the View Manager, click the view name you want to change. If the
view isn’t already displayed, expand the appropriate View list, and then
click a view name.
3In the Properties panel, click the Background Override field.
4Select Image from the Background Override drop-down list.
5In the Background dialog box, click Browse and specify the image for the
background.
6Click Adjust Image.
7In the Adjust Background Image dialog box, specify the desired options
for the image.
■Specify the position for the image by choosing an option from the
Image Position drop-down list.
■Click Offset or Scale to adjust what functionality the sliders have.
■Click Maintain Aspect Ratio When Scaling to have the image scale
uniformily.
■Drag the sliders to adjust the offset or scale of the image based on the
current setting.
8In the Adjust Background Image dialog box, click OK.
9In the Background dialog box, click OK.
10 In the View Manager, click Set Current.
11 Click OK.
To set a Sun/Sky as a viewport background
1Before changing the background, make sure that photometric lighting is
enabled:
■Click Render tab ➤ Lights panel ➤ American Lighting Units
■Click Render tab ➤ Lights panel ➤ International Lighting Units
2Click View tab ➤ Views panel ➤ Named Views.
270 | Chapter 10 Change Views
3In the View Manager, click the view name you want to change. If the
view isn’t already displayed, expand the appropriate View list, and then
click a view name.
4In the middle section, click the Background Override drop-down list and
select Sun&Sky.
5In the Adjust Sun & Sky Background dialog box, specify the desired
options for the background.
6Click OK.
7In the View Manager, click Set Current. Click OK.
Quick Reference
Commands
VIEW
VISUALSTYLES
Creates and modifies visual styles and applies a visual style to a viewport.
System Variables
CSHADOW
Sets the shadow display property for a 3D object.
LIGHTINGUNITS
Controls whether generic or photometric lights are used, and specifies the
lighting units for the drawing.
SHADOWPLANELOCATION
Controls the location of an invisible ground plane used to display shadows.
VSBACKGROUNDS
Controls whether backgrounds are displayed in the visual style applied to
the current viewport.
VSSHADOWS
Controls whether a visual style displays shadows.
VISUALSTYLESCLOSE
Closes the Visual Styles Manager.
Customize a Visual Style | 271
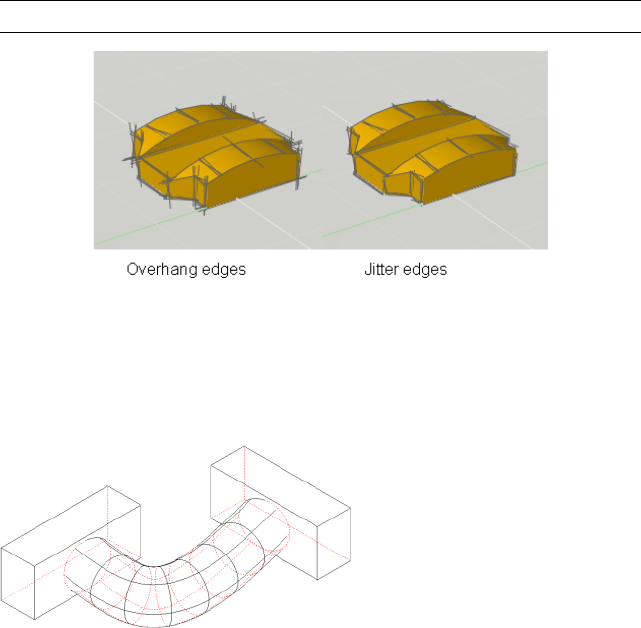
Control the Display of Edges
Different edge types can be displayed using different colors and linetypes. You
can also add special effects, such as Jitter and Line Extensions.
In a shaded or wireframe model, the visual style sets the visibility and
appearance of isolines, facet edges, silhouette edges, occluded edges, and
intersection edges. Facet edges (the edges between planar faces representing
a surface) are displayed only when the angle between the facets is smaller than
the crease angle value you specify.
Edge modifiers such as Line Extension and Jitter, produce the appearance of
a model that is still in the conceptual phase. Jitter makes lines appear as though
they were sketched with a pencil. Line Extension produces another kind of
hand-drawn effect.
NOTE Plot styles are not available for objects with the Jitter edge modifier applied.
Control the display of occluded lines in 2D View
Occluded lines are hidden lines made visible by changing its linetype and
color. In 2D View, you can change the display of occluded linetype with
OBSCUREDLTYPE system variable and occluded color with OBSCUREDCOLOR
system variable.
272 | Chapter 10 Change Views
To control the display of occluded lines in 2D View, you can:
■Hide them or make them partially visible with dashes and dots.
■Make them completely visible.
■Make them distinctive or indistinctive by changing its color.
NOTE You can only change occluded color when the occluded lines are partially
or completely visible.
IMPORTANT After you have changed the settings for occluded lines, use the HIDE
command to regenerate the drawing and display the changes.
To control the display of edges and edge colors
1Click View tab ➤ Visual Styles panel ➤ ➤ Visual Styles Manager.
2With the current visual style selected in the sample images, in Edge
Settings, Show, select Facet edges, Isolines, or None.
3If Isolines is selected, specify the number of lines.
4In Color, specify a color. Select Color opens the Select Color dialog box.
To add a line extension effect to edges
1Click View tab ➤ Visual Styles panel ➤ ➤ Visual Styles Manager.
2With the current visual style selected in the sample images, in Edge
Modifiers, click the Line Extensions Edges button and adjust the amount
of line extensions in Line Extensions.
NOTE The line extension is scaled to have an appropriate appearance in viewports
of different sizes. The line extension effect is not applied to a line that is less than
twice as long as the line extension would be.
Customize a Visual Style | 273
To add a jitter effect to edges
1Click View tab ➤ Visual Styles panel ➤ ➤ Visual Styles Manager.
2With the current visual style selected in the sample images, in Edge
Modifiers, adjust the amount of jitter in Jitter.
To control display of silhouette edges
1Click View tab ➤ Visual Styles panel ➤ ➤ Visual Styles Manager.
2With the current visual style selected in the sample images, in Silhouette
Edges, Show, select Yes or No.
3If Yes is selected, specify a width for silhouette edges.
To control the display of occluded edges
1Click View tab ➤ Visual Styles panel ➤ ➤ Visual Styles Manager.
2With the current visual style selected to Hidden in sample images, in
Edge Settings, Show, click Facet Edges.
3In Occluded Edges, Show, select Yes.
4In Color drop-down, select a color from the list.
5In Linetype drop-down, select a linetype.
To control the display of occluded lines and color
1Click View tab ➤ Visual Styles panel ➤ ➤ Visual Styles Manager.
2With the current visual style selected to 2D Wireframe in sample images,
in 2D Hide - Occluded Lines, Linetype drop-down, select a linetype.
274 | Chapter 10 Change Views
3In Color drop-down, select a color from the list.
4On the command line, enter HIDE and then press Enter for changed
occluded line and color settings to take effect.
Quick Reference
Commands
VISUALSTYLES
Creates and modifies visual styles and applies a visual style to a viewport.
System Variables
FACETRES
Adjusts the smoothness of shaded and rendered objects and objects with
hidden lines removed.
INTERSECTIONCOLOR
Controls the color of polylines at the intersection of 3D surfaces when the
visual style is set to 2D Wireframe.
INTERSECTIONDISPLAY
Specifies the display of intersection polylines.
VISUALSTYLESCLOSE
Closes the Visual Styles Manager.
VSEDGECOLOR
Sets the color of edges in the visual style in the current viewport.
VSEDGEJITTER
Makes edges on 3D objects appear wavy, as though they were sketched with
a pencil.
VSEDGELEX
Makes edges on 3D objects extend beyond their intersection for a hand-drawn
effect.
VSEDGEOVERHANG
Makes edges on 3D objects extend beyond their intersection for a hand-drawn
effect.
Customize a Visual Style | 275
VSEDGES
Controls the types of edges that are displayed in the viewport.
VSEDGESMOOTH
Specifies the angle at which crease edges are displayed.
VSHALOGAP
Sets the halo gap in the visual style applied to the current viewport.
VSINTERSECTIONEDGES
Controls the display of intersection edges in the visual style applied to the
current viewport.
VSINTERSECTIONCOLOR
Specifies the color of intersection polylines in the visual style applied to the
current viewport.
VSINTERSECTIONLTYPE
Sets the linetype for intersection lines in the visual style applied to the current
viewport.
VSOBSCUREDEDGES
Controls whether obscured (hidden) edges are displayed.
VSOBSCUREDCOLOR
Specifies the color of obscured (hidden) lines in the visual style applied to
the current viewport.
VSOBSCUREDLTYPE
Specifies the linetype of obscured (hidden) lines in the visual style applied
to the current viewport.
VSOCCLUDEDCOLOR
Specifies the color of occluded (hidden) lines in the visual style applied to
the current viewport.
VSOCCLUDEDEDGES
Controls whether occluded (hidden) edges are displayed.
VSOCCLUDEDLTYPE
Specifies the linetype of occluded (hidden) lines in the visual style applied
to the current viewport.
276 | Chapter 10 Change Views

VSSILHEDGES
Controls display of silhouette edges of solid objects in the visual style applied
to the current viewport.
VSSILHWIDTH
Specifies the width in pixels of silhouette edges in the current viewport.
Control Performance
3D graphics display and memory allocation can slow performance on your
system. Adaptive degradation, performance tuning and memory tuning are
different approaches to delivering the best performance possible.
Adaptive Degradation
Adaptive degradation is a way to control performance of features as you use
them.
With adaptive degradation on, if performance goes below the level you specify,
effects are turned off or turned down in a certain order until performance
returns to an acceptable level. Each visual style sets a degradation order
appropriate for itself, based on a master order that you can adjust manually.
You set the performance level in frames per second in the Adaptive Degradation
and Performance Tuning dialog box. You can also control the order in which
features are turned off when performance slows. For example, if you’re working
on your model with a visual style that has shadows and a background, you
can move Shadows and Backgrounds to the top of the list so that they degrade
first and preserve edge effects that you need while drafting.
To set the performance level for adaptive degradation
1On the status bar, click Performance Tuner.
2In the Adaptive Degradation and Performance Tuning dialog box, select
Adaptive Degradation.
3Enter or select a value for the frames per second. Degradation of the
display begins when performance is below this value.
4Click OK.
Control Performance | 277

To change the adaptive degradation order
1On the status bar, click Performance Tuner.
2In the Adaptive Degradation and Performance Tuning dialog box, select
a feature in the list.
3Click Move Up or Move Down to change its order in the list.
Items at the top of the list degrade first.
4Click OK.
Quick Reference
Commands
3DCONFIG
Sets options that affect 3D display performance.
GRAPHICSCONFIG
Sets options for 3D display performance.
System Variables
VSBACKGROUNDS
Controls whether backgrounds are displayed in the visual style applied to
the current viewport.
VSFACEOPACITY
Turns on and off a preset level of transparency for 3D objects.
VSINTERSECTIONEDGES
Controls the display of intersection edges in the visual style applied to the
current viewport.
VSSHADOWS
Controls whether a visual style displays shadows.
VSSILHEDGES
Controls display of silhouette edges of solid objects in the visual style applied
to the current viewport.
278 | Chapter 10 Change Views

Performance Tuning
Performance tuning examines your graphics card and 3D display driver and
determines whether to use software or hardware implementation for features
that support both.
Features that cannot work properly on your system are turned off. Some
features may work but not be recommended for use with your graphics card
or 3D graphics display driver. Enable these features at your own risk.
NOTE If you are using a graphics card that does not support all of the available
hardware effects, you can plot a drawing through software emulation. (To enable
the emulation of hardware effects in software, enter 3dconfig at the Command
prompt. In the Adaptive Degradation and Performance Tuning dialog box, click
Manual Tune. Then click Emulate Unsupported Hardware Effects in Software When
Plotting.)
The performance tuner creates a log that reports the graphics card and 3D
display driver found on your system and whether effects are enabled. The
Current Effects Status section displays the settings of the current display driver.
An example of the Current Effects Status section might look like the following:
Enhanced 3D Performance: Available and on
Smooth display: Available and off
Gooch shader: Available and using hardware
Per-pixel lighting: Available and off
Full-shadow display: Available and off
Texture compression: Available and off
Advanced material effects: Available and off
You can manually turn on and off features that your system supports,
recommended or not.
The log that is created by the performance tuner not only displays information
about the current application driver, but also displays information about all
the available application drivers and which effects are supported. This
information is in the Available Application Drivers and Effect Support section.
By using the information that is displayed, you can make the best decision
about which application driver to use for your graphics card or the Software
Control Performance | 279

driver. The Available Application Drivers and Effect Support section might
look like the following:
Software driver
Effect support:
Enhanced 3D Performance: Not applicable
Smooth display: Not applicable
Gooch shader: Software emulation only
Per-pixel lighting: Not applicable
Full-shadow display: Not applicable
Texture compression: Not applicable
Advanced material effects: Not applicable
Autodesk driver: Certified
Effect support:
Enhanced 3D Performance: Available
Smooth display: Available
Gooch shader: Available
Per-pixel lighting: Available
Full-shadow display: Available
Texture compression: Available
Advanced material effects: Available
NOTE To display mapped object shadows in viewports and to use per-pixel
lighting, hardware acceleration is required. When Enhanced 3D Performance is
off, mapped object shadows cannot be displayed in viewports. (To access these
settings, enter graphicsconfig at the Command prompt.)
NOTE When Texture Compression is turned on, the amount of video memory
required to open a drawing that contains materials with images or has attached
images is decreased. By using the effect it can reduce the amount of video memory
necessary to display the drawing, but the downside to this effect is it may increase
the time it takes to load the images the first time that they are accessed. Also,
there is a reduction in the quality of the images when they are displayed in the
viewport or plotted. (To access these settings, enter graphicsconfig at the
Command prompt.)
Certification Updates
As more graphics cards and 3D display drivers are tested, they are added to a
list on the Autodesk website. You can check for updates and download the
latest list at any time. In the Adaptive Degradation and Performance Tuning
dialog box, click Check for Updates.
280 | Chapter 10 Change Views

To view the performance tuner log
1On the status bar, click Performance Tuner.
2In the Adaptive Degradation and Performance Tuning dialog box, click
View Tune Log.
3Click OK to exit each dialog box.
To tune performance manually
1On the status bar, click Performance Tuner..
2In the Adaptive Degradation and Performance Tuning dialog box, click
Manual Tune.
3In the Manual Performance Tuning dialog box, you can enable hardware
acceleration if the icon next to the check box is a green check mark or a
yellow warning sign.
4In General Settings, you can clear or turn down settings to improve
performance.
5(Optional) Use the Reset to Recommended Values option.
6Click OK to exit each dialog box.
To check for graphics card and driver certification updates
1On the status bar, click Performance Tuner..
2In the Adaptive Degradation and Performance Tuning dialog box, click
Check for Updates.
A web page is displayed that describes the certification program.
3Look for your graphics card and driver in the list. If you find them, follow
the download instructions.
4Click OK to exit each dialog box.
Control Performance | 281
Quick Reference
Commands
3DCONFIG
Sets options that affect 3D display performance.
GRAPHICSCONFIG
Sets options for 3D display performance.
System Variables
VSSHADOWS
Controls whether a visual style displays shadows.
Memory Tuning
Performance can also be improved by adding memory to your system. This is
especially true when working on larger models.
The system requirements for AutoCAD require at least 512 MB of physical
memory (RAM) for working in 2D. For creating and working with 3D models,
at least 2 GB of RAM is required.
The size and complexity of a model often defines how efficiently an application
runs. If you notice increased hard drive activity, it means that physical memory
has been exceeded and data is being passed to a swap file (virtual memory).
A swap file is an area on the hard drive that Windows uses as if it were physical
memory (RAM). The swap file size is basically a limit which restricts the total
virtual size of the AutoCAD process. A good rule of thumb for configuring
your swap file is three times the amount of physical memory on your system.
This usually sets the limit high enough that AutoCAD doesn't run out of swap
space.
Typically, systems are limited to a maximum of 2 GB of virtual memory. On
some systems, you can set the /3GB switch that allows applications to use up
to 3 GB of virtual memory. Before attempting to set the switch, you need to
find out the following:
■If your system supports the switch.
■If other device drivers (video card, plotter drivers, etc.) may be affected if
the switch is set.
282 | Chapter 10 Change Views
■How to set the switch.
Refer to the Microsoft website for details regarding the /3GB switch.
To check physical memory (RAM)
1On the Start menu (Windows), click Control Panel (or Settings ➤ Control
Panel).
2In the Control Panel, click System. You might have to click Performance
and Maintenance and then System.
3On the General tab, review the information about your computer. The
amount of RAM should be listed on this tab.
To check swap file allocation
1On the Start menu (Windows), click Control Panel (or Settings ➤ Control
Panel).
2In the Control Panel, click System. You might have to click Performance
and Maintenance and then System.
3Open the Advanced tab and click the Settings (or Performance Options)
button under Performance.
4Check the allocated size under the Virtual Memory group, the file size
will be listed after the text “Total Paging File Size For All Drives”. You
might have to click the Advanced tab first in order to see the allocated
size.
Control Performance | 283
284
Use Viewing Tools
When working in 3D, you'll often want to display different views so that you can see and
verify the 3D effects in your drawing.
Specify 3D Views
You can control the 3D navigation display, projection, and visualization tools.
Overview of 3D Views
You can create an interactive view of your drawing in the current viewport.
Using the 3D viewing and navigation tools, you can navigate through a drawing,
set up a camera for a specific view, and create animations to share your design
with others. You can orbit, swivel, walk, and fly around a 3D model, set up a
camera, create a preview animation, and record motion path animations that
you can distribute to others to visually convey the intent of your design.
Quick Reference
Commands
3DCLIP
Starts an interactive 3D view and opens the Adjust Clipping Planes window.
3DCORBIT
Rotates the view in 3D space with continuous motion.
3DDISTANCE
Starts the interactive 3D view and makes objects appear closer or farther away.
11
285
3DFLY
Changes the 3D view in a drawing interactively to create the appearance of
flying through the model.
3DFORBIT
Rotates the view in 3D space without constraining roll.
3DORBIT
Rotates the view in 3D space, but constrained to horizontal and vertical orbit
only.
3DORBITCTR
Sets the center of rotation in 3D Orbit view.
3DPAN
When a drawing is in a Perspective view, starts the interactive 3D view and
enables you to drag the view horizontally and vertically.
3DSWIVEL
Changes the target of the view in the direction that you drag.
3DWALK
Changes the 3D view in a drawing interactively to create the appearance of
walking through the model.
3DZOOM
Zooms in and out in a perspective view.
ANIPATH
Saves an animation file of a camera moving or panning in a 3D model.
CAMERA
Sets a camera and target location to create and save a 3D perspective view
of objects.
VIEW
WALKFLYSETTINGS
Controls the walk and fly navigation settings.
286 | Chapter 11 Use Viewing Tools
System Variables
CAMERADISPLAY
Turns the display of camera objects on or off.
CAMERAHEIGHT
Specifies the default height for new camera objects.
Use 3D Navigation Tools
3D navigation tools allow you to view objects in a drawing from different
angles, heights, and distances.
Use the following 3D tools to orbit, swivel, adjust distance, zoom, and pan in
a 3D view.
■3D Orbit. Moves around a target. The target of the view stays stationary
while the camera location, or point of view, moves. The center of the
viewport, not the center of the objects you’re viewing, is the target point.
■Constrained Orbit. Constrains 3D Orbit along the XY plane or the Z axis.
(3DORBIT)
■Free Orbit. Orbits in any direction without reference to the planes. The
point of view is not constrained along the XY plane of the Z axis.
(3DFORBIT)
■Continuous Orbit. Orbits continuously. Click and drag in the direction
you want the continuous orbit to move, and then release the mouse button.
The orbit continues to move in that direction. (3DCORBIT)
■Adjust Distance. Changes the distance of objects as you move the cursor
vertically. You can make objects appear larger or smaller, and you can
adjust the distance. (3DDISTANCE)
■Swivel. Simulates panning with a camera in the direction that you drag.
The target of the view changes. You can swivel the view along the XY plane
or along the Z axis. (3DSWIVEL)
■Zoom. Simulates moving the camera closer to an object or farther away.
Zooming in magnifies the image. (3DZOOM)
■Pan. Starts the interactive 3D view and enables you to drag the view
horizontally and vertically. (3DPAN)
Use 3D Navigation Tools | 287
Animate a Navigation
You can create a preview animation of any navigation. Create the preview to
fine-tune your animation before you create a motion path animation. You
can create, record, play back, and save the animation. For more information
about previewing an animation, see Create Preview Animations on page 356.
For more information about creating motion path animations, see Create
Motion Path Animations on page 359.
To start 3D Orbit view
1Select one or more objects that you want to view with 3DORBIT or select
no objects if you want to view the entire drawing.
NOTE OLE objects and raster objects do not appear in the 3D Orbit view.
2Click View tab ➤ Navigate panel ➤ Orbit drop-down ➤ Orbit.
3Use one of the following methods to orbit around the objects:
■To rotate along the XY plane, click in the drawing and drag the cursor
left or right.
■To rotate along the Z axis, click in the drawing and drag the cursor
up or down.
■To allow unconstrained orbiting along the XY plane and the Z axis,
press Shift while you drag the cursor. An arcball is displayed and you
can use the 3D Free Orbit (3DFORBIT) interaction.
4Press Enter.
To switch to a different 3D navigation mode
1Start any 3D navigation command.
2Right-click in the drawing area. Click Other Navigation Modes, and click
another navigation mode.
To choose a parallel or perspective projection in a 3D view
1Start any 3D navigation command.
2Right-click in the drawing area. Click Parallel or Perspective.
A check mark is displayed next to the current projection.
288 | Chapter 11 Use Viewing Tools

To change a visual style in a 3D view
1Start any 3D navigation command, and right-click in the drawing area.
Click Visual Styles.
2Select a visual style.
For more information about visual styles, see Use a Visual Style to Display
Your Model on page 257.
To start a continuous orbit
1Click View tab ➤ Navigate panel ➤ Orbit drop-down ➤ Continuous
Orbit.
2Click in the drawing and drag the cursor to start a continuous motion.
When you release cursor, the orbit continues in the direction that you
were dragging.
To reset a view
■Start any 3D navigation command, and right-click in the drawing area.
Click Reset View.
The view that was originally displayed when you entered the 3D navigation
mode is restored.
To use preset views
1Start any 3D navigation command, and right-click in the drawing area.
Click Preset Views.
2Click a view.
To display a named view
1Start any 3D navigation command, and right-click in the drawing area.
Click Named Views.
2Click a named view or a camera.
Use 3D Navigation Tools | 289
Quick Reference
Commands
3DCORBIT
Rotates the view in 3D space with continuous motion.
3DDISTANCE
Starts the interactive 3D view and makes objects appear closer or farther
away.
3DFORBIT
Rotates the view in 3D space without constraining roll.
3DORBIT
Rotates the view in 3D space, but constrained to horizontal and vertical orbit
only.
3DORBITCTR
Sets the center of rotation in 3D Orbit view.
3DPAN
When a drawing is in a Perspective view, starts the interactive 3D view and
enables you to drag the view horizontally and vertically.
3DSWIVEL
Changes the target of the view in the direction that you drag.
3DZOOM
Zooms in and out in a perspective view.
System Variables
PERSPECTIVE
Specifies whether the current viewport displays a perspective view.
PERSPECTIVECLIP
Determines the location of eyepoint clipping.
Walk and Fly Through a Drawing
You can simulate walking and flying through a 3D drawing.
290 | Chapter 11 Use Viewing Tools

When you walk through a model, you travel along the XY plane. When you
fly through a model, you are not constrained by the XY plane, so you appear
to “fly” over an area in a model.
Use the Keyboard and Mouse Interactions to Walk and Fly
You can use a standard set of keys and mouse interactions to walk and fly
through a drawing. Use the four arrow keys or the W, A, S, and D keys to move
up, down, left, or right. To toggle between walk and fly mode, press the F key.
To specify the direction of the view, drag the mouse in the direction you want
to look.
NOTE The Walk and Fly Navigation Mappings balloon provides information about
the keyboard and mouse actions that control walk and fly modes. The appearance
of the balloon depends on the display option selected in the Walk and Fly settings
dialog box.
Display a Top View of a Model as You Walk or Fly
You can keep track of your position in a 3D model as you walk or fly through
it. When you start 3DWALK or 3DFLY, the Position Locator window displays
a top view of the model. A position indicator shows your location in
relationship to the model, and a target indicator shows the model you are
walking or flying through. You can edit the position settings in the Position
Locator window before you start walk or fly mode, or while you are moving
in the model.
NOTE If performance slows when the Position Locator window is displayed, you
can close the window.
Specify Walk and Fly Settings
Specify walk and fly settings in the 3D Navigate panel on the the ribbon or
in the Walk and Fly Settings dialog box. You can set the default step size, the
number of steps per second, and other display settings.
Animate Walk and Fly Navigation
You can create a preview animation of any navigation, including walking and
flying through a drawing. Create the preview to fine-tune your animation
before you create a motion path animation. You can create, record, play back,
and save the animation. For more information about previewing an animation,
see Create Preview Animations on page 356. For more information about
creating motion path animations, see Create Motion Path Animations on page
359.
Walk and Fly Through a Drawing | 291

To start walk mode
■Click Render tab ➤ Animations panel ➤ Walk and Fly drop-down ➤
Walk.
To start fly mode
■Click Render tab ➤ Animations panel ➤ Walk and Fly drop-down ➤
Fly.
To specify Walk or Fly settings
1Click Render tab ➤ Animations panel ➤ Walk and Fly drop-down ➤
Walk and Fly Settings.
2In the Walk and Fly Settings dialog box, under Settings, click the button
next to a display option.
3In the Display Position Locator Window option, clear the check box if
you do not want to display the window.
NOTE If performance slows when this window is displayed, you may want
to close the Position Locator window.
4In the Current Drawing Settings section, under Walk/Fly Step Size, enter
a number to set the step size in drawing units.
5In the Steps Per Second option, enter a number between 1 and 30.
6Click OK.
To change the viewing position in the Position Locator window
1Do one of the following:
■Click Render tab ➤ Animations panel ➤ Walk and Fly drop-down
➤ Walk.
■Click Render tab ➤ Animations panel ➤ Walk and Fly drop-down
➤ Fly.
2In the Position Locator window, Preview area, click the position indicator
(a colored dot) and drag it to a new position.
3If the target indicator is displayed, click it and drag it to the new target.
4In the General section, make any changes to the current settings.
292 | Chapter 11 Use Viewing Tools

5Continue walking or flying through the model.
To turn off the Position Locator window
1Click Render tab ➤ Animations panel ➤ Walk and Fly drop-down ➤
Walk and Fly Settings.
2In the Walk and Fly Settings dialog box, clear the check mark next to
Display Position Locator. Click OK.
Quick Reference
Commands
3DFLY
Changes the 3D view in a drawing interactively to create the appearance of
flying through the model.
3DWALK
Changes the 3D view in a drawing interactively to create the appearance of
walking through the model.
WALKFLYSETTINGS
Controls the walk and fly navigation settings.
Create a 3D Dynamic View (DVIEW)
You can change a view without interrupting your current operation using a
feature that combines panning and zooming.
With dynamic viewing, you can display the effects of changing your viewpoint
as you make the changes. Using this method, you can also simplify your view
temporarily by choosing only the objects that you need to determine the view.
Alternatively, if you press Enter without selecting any objects, 3D Dynamic
View displays a model of a small house instead of your actual drawing. You
can use this house to define the viewing angle and distance. When your
adjustments are complete and you exit the command, the changes are applied
to the entire 3D model in the current view.
NOTE More powerful options for dynamic viewing in 3D are available in the
3DORBIT command. For more information, see Use 3D Navigation Tools on page
287.
Create a 3D Dynamic View (DVIEW) | 293
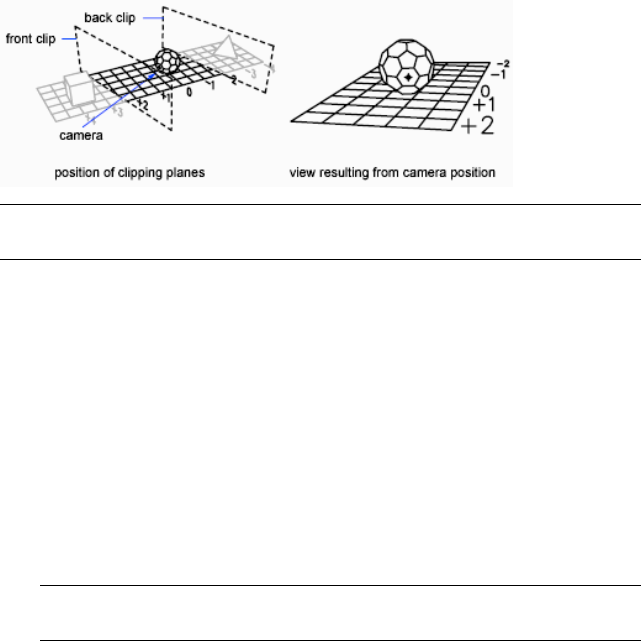
Set Clipping Planes
You can create cutaway, or section, views of your drawing by positioning front
and back clipping planes that control the visibility of objects based on their
distance from a theoretical camera. You can move the clipping planes
perpendicular to the line of sight between the camera and target (where the
camera is pointing). Clipping removes the display of objects from the front
and back of clipping planes. The following illustration shows how clipping
planes work:
NOTE You can also set clipping planes when you create a camera glyph. For more
information, see Change Camera Properties on page 351.
To set clipping planes (DVIEW)
1At the Command prompt, enter dview.
2Select the objects on which to base the view.
3At the Command prompt, enter cl (Clip).
4Enter f to set a front clipping plane or b to set a back clipping plane, or
press Enter.
5Position the clipping plane by dragging the slider or entering a distance
from the target.
6Press Enter to exit the command.
NOTE You can also set clipping planes when you create a camera glyph. For
more information, see Change Camera Properties on page 351.
To display the default view and UCS
■Click View menu ➤ 3D Views ➤ Plan View ➤ World UCS.
294 | Chapter 11 Use Viewing Tools
Quick Reference
Commands
DVIEW
Defines parallel projection or perspective views by using a camera and target.
PLAN
Displays an orthographic view of the XY plane of a specified user coordinate
system.
System Variables
VIEWDIR
Stores the viewing direction in the current viewport, expressed in UCS
coordinates.
VIEWTWIST
Stores the view rotation angle for the current viewport measured relative to
the WCS.
WORLDVIEW
Use ViewCube
ViewCube provides visual feedback of the current orientation of a model. You
can use the ViewCube tool to adjust the viewpoint of the model.
Overview of ViewCube
ViewCube tool is a navigation tool that is displayed when you are working in
2D model space or 3D visual style. With ViewCube tool, you can switch
between standard and isometric views.
The ViewCube tool is a persistent, clickable and draggable interface that you
use to switch between standard and isometric views of your model. When you
display the ViewCube tool, it is shown in one of the corners of the window
over the model in an inactive state. The ViewCube tool provides visual feedback
about the current viewpoint of the model as view changes occur. When the
cursor is positioned over the ViewCube tool, it becomes active. You can drag
Use ViewCube | 295

or click the ViewCube, switch to one of the available preset views, roll the
current view, or change to the Home view of the model.
Face
Corner
Edge
Control the Appearance of ViewCube
The ViewCube tool is displayed in one of two states: inactive and active. When
the ViewCube tool is inactive, it appears partially transparent by default so
that it does not obscure the view of the model. When active, it is opaque and
may obscure the view of the objects in the current view of the model.
In addition to controlling the inactive opacity level of the ViewCube tool,
you can also control the following properties for the ViewCube tool:
■Size
■Position
■Display of the UCS menu
■Default orientation
■Compass display
Using the Compass
The compass is displayed below the ViewCube tool and indicates which
direction North is defined for the model. You can click a cardinal direction
letter on the compass to rotate the model, or you can click and drag one of
296 | Chapter 11 Use Viewing Tools
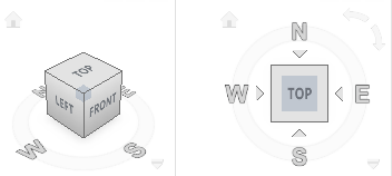
the cardinal direction letters or the compass ring to interactively rotate the
model around the pivot point.
To display or hide the ViewCube tool in the current viewport
1At the command prompt, enter options and press Enter.
2In the Options dialog box ➤ 3D Modeling tab ➤ Display ViewCube or
UCS Icon
■In 2D Model Space, turn the check box on to display the ViewCube
tool in all the viewports and drawings in 2D model space
■In 3D Model Space, turn the check box on to display the ViewCube
tool in all the viewports and drawings in 3D model space
3Click View tab ➤ Windows panel ➤ User Interface drop down ➤
ViewCube.
4Turn the check box on or off to hide or display the ViewCube in the
current viewport
To display or hide the ViewCube tool in all viewports and drawings
1At the command prompt, enter options and press Enter.
2In the Options dialog box ➤ 3D Modeling tab ➤ Display ViewCube or
UCS Icon
■In 2D Model Space, turn the check box on or off to hide and display
the ViewCube tool in all the viewports and drawings in 2D model
space
■In 3D Model Space, turn the check box on or off to hide and display
the ViewCube tool in all the viewports and drawings in 3D model
space
Overview of ViewCube | 297
To control the position of the ViewCube tool
1Click View tab ➤ Windows panel ➤ User Interface drop down ➤
ViewCube.
2Right-click the ViewCube tool and click ViewCube Settings.
3In the ViewCube Settings dialog box, under Display, select one of the
available positions from the On-screen Position drop-down list.
4Click OK.
To control the size of the ViewCube tool
1Click View tab ➤ Windows panel ➤ User Interface drop down ➤
ViewCube.
2Right-click the ViewCube tool and click ViewCube Settings.
3In the ViewCube Settings dialog box, Display, ViewCube Size, select or
clear Automatic. If Automatic is cleared, drag the ViewCube Size slider
left or right.
Dragging the slider to the left decreases the size of the ViewCube tool,
while dragging the slider to the right increases the size of the ViewCube
tool.
4Click OK.
To control the inactive opacity of the ViewCube tool
1Click View tab ➤ Windows panel ➤ User Interface drop down ➤
ViewCube.
2Right-click the ViewCube tool and click ViewCube Settings.
3In the ViewCube Settings dialog box, under Display, drag the Inactive
Opacity slider left or right.
Dragging the slider to the left increases the transparency of the ViewCube
tool, while dragging the slider to the right increases the opacity of the
ViewCube tool.
4Click OK.
To display the compass for the ViewCube tool
1Click View tab ➤ Windows panel ➤ User Interface drop down ➤
ViewCube.
298 | Chapter 11 Use Viewing Tools
2Right-click the ViewCube tool and click ViewCube Settings.
3In the ViewCube Settings dialog box, select Show Compass Below the
ViewCube.
The compass is displayed below the ViewCube tool and indicates which
direction North is in the model.
4Click OK.
Quick Reference
Commands
NAVVCUBE
Indicates the current viewing direction. Dragging or clicking the ViewCube
tool rotates the scene.
OPTIONS
Customizes the program settings.
System Variables
NAVVCUBEDISPLAY
Controls the display of the ViewCube tool in the current visual style and the
current viewport.
NAVVCUBELOCATION
Identifies the corner in a viewport where the ViewCube tool is displayed.
NAVVCUBEOPACITY
Controls the opacity of the ViewCube tool when inactive.
NAVVCUBESIZE
Specifies the size of the ViewCube tool.
ViewCube Menu
Use the ViewCube menu to restore and define the Home view of a model,
switch between view projection modes, and change the interactive behavior
and appearance of the ViewCube tool.
ViewCube Menu | 299
The ViewCube menu has the following options:
■Home. Restores the Home view saved with the model. This view is in
synchronization with the Go Home view option in the SteeringWheels
menu.
■Parallel. Switches the current view to parallel projection.
■Perspective. Switches the current view to perspective projection.
■Perspective with Ortho Faces. Switches the current view to perspective
projection unless the current view aligns with a face view defined on the
ViewCube tool.
■Set Current View as Home. Defines the Home view of the model based on
the current view.
■ViewCube Settings. Displays the dialog box where you can adjust the
appearance and behavior of the ViewCube tool.
■Help. Launches the online Help system and displays the topic for the
ViewCube tool.
To display the ViewCube menu
To display the ViewCube menu, do one of the following:
■Right-click on the compass, Home icon, or the main area of the ViewCube
tool.
■Click the context menu button located below the ViewCube tool.
Quick Reference
Commands
NAVVCUBE
Indicates the current viewing direction. Dragging or clicking the ViewCube
tool rotates the scene.
OPTIONS
Customizes the program settings.
300 | Chapter 11 Use Viewing Tools
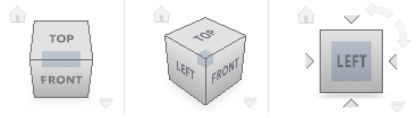
System Variables
PERSPECTIVE
Specifies whether the current viewport displays a perspective view.
Reorient the View of a Model with ViewCube
The ViewCube tool offers many intuitive ways to reorient the view of a model.
Reorient the Current View
You can reorient the current view of a model by clicking predefined areas on
the ViewCube tool or dragging the ViewCube tool.
The ViewCube tool provides twenty-six defined parts to click and change the
current view of a model. The twenty-six defined parts are categorized into
three groups: corner, edge, and face. Of the twenty-six defined parts, six of
the parts represent standard orthogonal views of a model: top, bottom, front,
back, left, and right. Orthogonal views are set by clicking one of the faces on
the ViewCube tool.
You use the other twenty defined parts to access angled views of a model.
Clicking one of the corners on the ViewCube tool reorients the current view
of the model to a three-quarter view, based on a viewpoint defined by three
sides of the model. Clicking one of the edges reorients the view of the model
to a half view based on two sides of the model.
The outline of the ViewCube tool helps you identify the form of orientation
it is in: standard or fixed. When the ViewCube tool is in standard orientation,
not orientated to one of the twenty-six predefined parts, its outline is displayed
as dashed. The ViewCube tool is outlined in a solid continuous line when it
is constrained to one of the predefined views.
Face
Corner
Edge
Reorient the View of a Model with ViewCube | 301
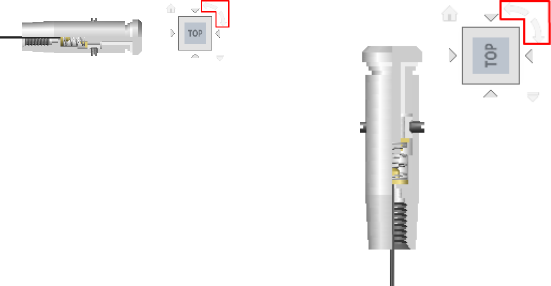
Drag or Click the ViewCube Tool
You can also click and drag the ViewCube tool to reorient the view of a model
to a custom view other than one of the twenty-six predefined parts. If you
drag the ViewCube tool close to one of the preset orientations and it is set to
snap to the closest view, the ViewCube tool rotates to the closest preset
orientation.
The ViewCube tool reorients the object’s view around a pivot point.
■When the object is unselected, drag the ViewCube tool to reorient the
object’s view around the pivot point displayed at the center of the view.
■When the object is selected, drag the ViewCube tool to reorient the object’s
view around the pivot point displayed at the center of the selected object.
■When the object is unselected and a pivot point is defined and used by
another navigation tool before using the ViewCube tool, drag the ViewCube
tool to reorient the object’s view around the defined pivot point.
Roll a Face View
When you view a model from one of the face views, two roll arrow buttons
are displayed near the ViewCube tool. Use the roll arrows to rotate the current
view 90 degrees clockwise or counterclockwise around the center of the view.
302 | Chapter 11 Use Viewing Tools
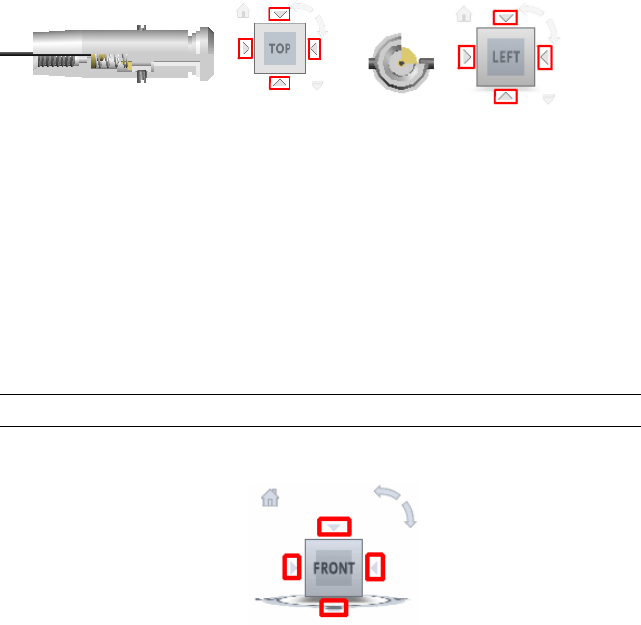
Switch to an Adjacent Face
When the ViewCube tool is active while viewing a model from one of the face
views, four orthogonal triangles are displayed near the ViewCube tool. You
use these triangles to switch to one of the adjacent face views.
To interactively reorient the view
1Click View tab ➤ Windows panel ➤ User Interface drop down ➤
ViewCube.
2Click the ViewCube tool or the compass below the ViewCube tool, hold
down the left mouse button, and drag in the direction that you want to
orbit the model.
To view an adjacent face
NOTE Make sure a face view is current.
■Click one of the triangles displayed near the edges of the ViewCube tool.
To interactively reorient the view
■Click the ViewCube tool, hold down the left mouse button, and drag in
the direction that you want to orbit the model.
To use animated transitions when reorienting a view to a preset orientation
1Click View tab ➤ Windows panel ➤ User Interface drop down ➤
ViewCube.
Reorient the View of a Model with ViewCube | 303

2Right-click the ViewCube tool, and click ViewCube Settings.
3In the ViewCube Settings dialog box, under When Clicking on the
ViewCube, select Use View Transitions when Switching Views.
Transitions from one view to another appear animated when you click
a predefined area on the ViewCube tool.
4Click OK.
To automatically fit the model after a view orientation
1Click View tab ➤ Windows panel ➤ User Interface drop down ➤
ViewCube.
2Right-click the ViewCube tool, and click ViewCube Settings.
3In the ViewCube Settings dialog box, under When Clicking on the
ViewCube, click Zoom to Extents After View Change.
Clicking a predefined area of the ViewCube tool reorients the model and
fits the model to the window.
4Click OK.
To roll a face view
NOTE Make sure a face view is displayed.
■Click one of the roll arrows displayed above and to the right of the
ViewCube tool.
The left roll arrow rotates the view 90 degrees counterclockwise; the right
roll arrow rotates the view 90 degrees clockwise.
Quick Reference
Commands
NAVVCUBE
Indicates the current viewing direction. Dragging or clicking the ViewCube
tool rotates the scene.
OPTIONS
Customizes the program settings.
304 | Chapter 11 Use Viewing Tools
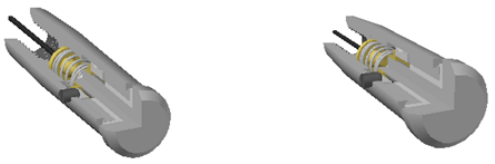
Set the View Projection Mode
View projection produces realistic visual effects of a model.
The ViewCube tool supports two view projection modes (Perspective and
Orthographic) and a combination of both these modes (Perspective with Ortho
faces). Orthographic projection is also referred to as parallel projection.
Perspective projected views are calculated based on the distance from a
theoretical camera and target point. The shorter the distance between the
camera and the target point, the more distorted the perspective effect appears;
greater distances produce less distorted affects on the model. Orthographic
projected views display all the points of a model being projected parallel to
the screen.
Orthographic projection mode makes it easier to work with a model due to
all the edges of the model appearing as the same size, regardless of the distance
from the camera. Orthographic projection mode though, is not how you
commonly see objects in the real world. Objects in the real world are seen in
perspective projection. So when you want to generate a rendering or hidden
line view of a model, using perspective projection will give the model a more
realistic look.
The following illustration shows the same model viewed from the same viewing
direction, but with different view projections.
Perspective
Parallel
When you change the view for a model, the view is updated using the previous
projection mode unless the current projection mode for the ViewCube tool
is Perspective with Ortho Faces. The Perspective with Ortho Faces mode forces
all views to be displayed in perspective projection unless the model is being
viewed from one of the face views: top, bottom, front, back, left, or right.
To change the view projection mode
1Click View tab ➤ Windows panel ➤ User Interface drop down ➤
ViewCube.
Reorient the View of a Model with ViewCube | 305
2Right-click the ViewCube tool and click one of the following options:
■Parallel
■Perspective
■Perspective with Ortho Faces
Quick Reference
Commands
NAVVCUBE
Indicates the current viewing direction. Dragging or clicking the ViewCube
tool rotates the scene.
OPTIONS
Customizes the program settings.
System Variables
NAVVCUBEDISPLAY
Controls the display of the ViewCube tool in the current visual style and the
current viewport.
PERSPECTIVE
Specifies whether the current viewport displays a perspective view.
Home View
You can define a Home view for a model so you can restore a familiar view
when you use the navigation tools.
The Home view is a special view stored with a model that makes it easy to
return to a known or familiar view. You can define any view of the model as
the Home view. The saved Home view can be applied to the current view by
clicking the Home button above the ViewCube tool or from the ViewCube
menu.
When you open a drawing that was created in a release earlier than AutoCAD
2008, the extents of a model are used as the default Home view. Drawings
created with AutoCAD 2011 have a Home view defined with a Top/Left/Front
orientation. While you can use the Home view to navigate back to a familiar
306 | Chapter 11 Use Viewing Tools

view, you can also use it to generate the thumbnail preview when you save a
model instead of using the last saved view.
The Thumbnail Preview Settings dialog box is used to control the thumbnail
preview for a drawing when saved (the Home or the last saved view). Along
with defining which view is used for the thumbnail preview, you can also set
the Home view back to its default view.
To define the Home view
■Right-click the ViewCube tool and click Set Current View as Home.
To reorient the model to the Home view
Use one of the following methods:
■Click the Home button ( ) located near the ViewCube tool.
■Right-click the ViewCube tool, and click Home.
To reset the Home view to the default view
1Click Tools menu ➤ Options.
2In the Options dialog box, Open and Save tab, under File Save, click
Thumbnail Preview Settings.
3In the Thumbnail Preview Settings dialog box, click Reset Home to
Default.
4Click OK to close the Thumbnail Preview Settings dialog box.
5Click OK to close the Options dialog box.
Quick Reference
Commands
NAVVCUBE
Indicates the current viewing direction. Dragging or clicking the ViewCube
tool rotates the scene.
OPTIONS
Customizes the program settings.
Reorient the View of a Model with ViewCube | 307
Examine Individual Objects with ViewCube
You can examine individual objects of a model using the ViewCube tool.
With the ViewCube tool, you can define the center of a view based on one or
more selected objects. Select an object or objects and use the ViewCube tool
to reorient the model. The model rotates around the center of the view.
Calculate the center of the view by the extents of the selected objects.
To examine an individual object with the ViewCube
1In the model, select one or more objects to define the centerpoint of the
view.
2Click one of the preset locations on the ViewCube tool, or click and drag
the ViewCube tool to reorient the view of the model.
The ViewCube tool reorients the view of the model based on the
centerpoint of the selected objects.
Quick Reference
Commands
NAVVCUBE
Indicates the current viewing direction. Dragging or clicking the ViewCube
tool rotates the scene.
Change the UCS with ViewCube
With the ViewCube tool you can change the current UCS for the model to
one of the named UCSs saved with the model or you can define a new UCS.
The UCS menu, located below the ViewCube tool, displays the name of the
current UCS in the model. From the menu, you can restore one of the named
UCSs saved with the model, switch to WCS, or define a new UCS. With the
WCS item on the menu, you can switch the coordinate system from the current
UCS to WCS. With the new UCS, you can rotate the current UCS based on
one, two, or three points to define a new UCS. When you click New UCS, a
new UCS is defined with the default name of Unnamed. To save the new
defined UCS with a name, use the Named option in the UCS command.
You can orient the ViewCube tool with the current UCS or WCS. By orienting
the ViewCube tool with the current UCS, you know in which direction you
308 | Chapter 11 Use Viewing Tools
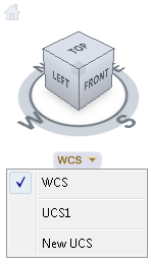
are modeling. Orienting the ViewCube tool with the WCS, you can navigate
the model based on the North and Up directions of the model. The settings
for controlling the orientation of the ViewCube tool are in the ViewCube
Settings dialog box.
To control the display of the UCS menu
1Click View tab ➤ Windows panel ➤ User Interface drop down ➤
ViewCube.
2Right-click the ViewCube tool and click ViewCube Settings.
3In the ViewCube Settings dialog box, under Display, click Show UCS
Menu.
The UCS menu is displayed below the ViewCube tool. You can see which
UCS is current and switch to a different named UCS.
4Click OK.
To switch to a different UCS
1Click View tab ➤ Windows panel ➤ User Interface drop down ➤
ViewCube.
2On the UCS menu located below the ViewCube tool, click the down
arrow next to the current UCS name.
3Select a named UCS from the list.
To switch to WCS
1Click View tab ➤ Windows panel ➤ User Interface drop down ➤
ViewCube.
Change the UCS with ViewCube | 309
2On the UCS menu located below the ViewCube tool, click the down
arrow next to the current UCS name.
3Select a WCS from the list.
To set the orientation of the ViewCube tool based on the current UCS or
WCS
1Click View tab ➤ Windows panel ➤ User Interface drop down ➤
ViewCube.
2Right-click the ViewCube tool and click ViewCube Settings.
3In the ViewCube Settings dialog box, select Orient ViewCube to Current
UCS.
The ViewCube tool aligns with the current UCS.
4Click OK.
Quick Reference
Commands
NAVVCUBE
Indicates the current viewing direction. Dragging or clicking the ViewCube
tool rotates the scene.
OPTIONS
Customizes the program settings.
UCS
Manages user coordinate systems.
System Variables
NAVVCUBEORIENT
Controls whether the ViewCube tool reflects the current UCS or WCS.
Navigate with SteeringWheels
SteeringWheels are tracking menus that allow you to access different 2D and
3D navigation tools from a single tool.
310 | Chapter 11 Use Viewing Tools
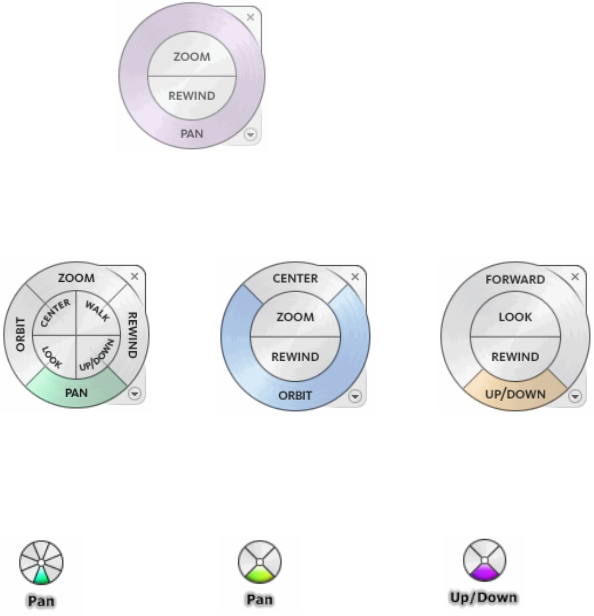
Overview of SteeringWheels
SteeringWheels are tracking menus that are divided into different sections
known as wedges. Each wedge on a wheel represents a single navigation tool.
SteeringWheels, also known as wheels, can save you time by combining many
of the common navigation tools into a single interface. Wheels are task specific
from which you can navigate and orient a model in different views.
The following illustrations show the different wheels available:
2D Navigation
Wheel
Tour Building
Wheel (Basic
Wheel)
View Object Wheel
(Basic Wheel)
Full Navigation
Wheel
Mini
Tour
Mini
View Ob-
Mini Full
Naviga- Building
Wheel
ject
Wheel
tion
Wheel
Overview of SteeringWheels | 311

NOTE In paper space only 2D Wheel is available.
Display and Use Wheels
Pressing and dragging on a wedge of a wheel is the primary mode of
interaction. After a wheel is displayed, click one of the wedges and hold down
the button on the pointing device to activate the navigation tool. Drag to
reorient the current view. Releasing the button returns you to the wheel.
Appearance of the Wheels
You can control the appearance of the wheels by switching between the
different styles of wheels that are available, or by adjusting the size and opacity.
Wheels (except the 2D Navigation wheel) are available in two different styles:
big and mini.
The size of a wheel controls how large or small the wedges and labels appear
on the wheel; the opacity level controls the visibility of the objects in the
model behind the wheel.
Wheel Tooltips, Tool Messages, and Tool Cursor Text
Tooltips are displayed for each button on a wheel as the cursor is moved over
them. The tooltips appear below the wheel and identify what action will be
performed if the wedge or button is clicked.
Similar to tooltips, tool messages and cursor text are displayed when you use
one of the navigation tools from a wheel. Tool messages are displayed when
a navigation tool is active; they provide basic instructions about using the
tool. Tool cursor text displays the name of the active navigation tool near the
cursor. Disabling tool messages and cursor text only affects the messages that
are displayed when using the mini wheels or the big Full Navigation wheel.
To display a wheel
■Click Navigation Bar ➤ Steering Wheels drop-down ➤ Full Navigation.
To close a wheel
Do one of the following:
■Press Esc or Enter
■Click the Close button
312 | Chapter 11 Use Viewing Tools

To change the size of the wheels
1Click Navigation Bar ➤ Steering Wheels drop-down .
2Click one of the available SteeringWheels.
3Right-click the wheel and click SteeringWheel Settings.
4In the SteeringWheels Settings dialog box, under Big Wheels or Mini
Wheels, move the Wheel Size slider left or right.
Moving the slider to the left decreases the size of the wheel, while moving
the slider to the right increases the size of the wheel.
5Click OK.
To change the opacity of the wheels
1Click Navigation Bar ➤ Steering Wheels drop-down ➤ click one of the
available SteeringWheels.
2Right-click the wheel and click SteeringWheel Settings.
3In the SteeringWheels Settings dialog box, under Big Wheels or Mini
Wheels, slide the Wheel Opacity slider left or right.
Sliding the slider to the left increases the transparency of the wheel, while
sliding the slider to the right decreases the transparency of the wheel
making it more opaque.
4Click OK.
To enable tooltips for wheels
1Click Navigation Bar ➤ Steering Wheels drop-down ➤ click one of the
available SteeringWheels.
2Right-click the wheel and click SteeringWheel Settings.
3In the SteeringWheels Settings dialog box, under Display, click Show
Tooltips.
Tooltips are displayed for each wedge and buttons on a wheel when the
cursor hovers over the wheel.
4Click OK.
Overview of SteeringWheels | 313

To enable messages for wheels
1Click Navigation Bar ➤ Steering Wheels drop-down ➤ click one of the
available SteeringWheels.
2Right-click the wheel and click SteeringWheel Settings.
3In the SteeringWheels Settings dialog box, under Display, click Show
Tool Messages.
Messages are displayed when you use the navigation tools.
4Click OK.
Quick Reference
Commands
NAVSWHEEL
Provides access to enhanced navigation tools that are quickly accessible from
the cursor.
OPTIONS
Customizes the program settings.
Wheel Menu
From the Wheel menu, you can switch between different wheels and change
the view of the model.
Use the Wheel menu to switch between the big and mini wheels that are
available, go to the Home view, change the preferences of the current wheel,
and control the behavior of the orbit, look, and walk 3D navigation tools. The
menu items available on the Wheel menu are dependent on the current wheel
and program.
The Wheel menu has the following options:
■Mini View Object Wheel. Displays the mini View Object wheel.
■Mini Tour Building Wheel. Displays the mini Tour Building wheel.
314 | Chapter 11 Use Viewing Tools
■Mini Full Navigation Wheel. Displays the mini Full Navigation wheel.
■Full Navigation Wheel. Displays the big Full Navigation wheel.
■Basic Wheels. Displays the big View Object or Tour Building wheel.
■Go Home. Goes to the Home view saved with the model. This view is in
synchronization with the Home view option in the ViewCube tool.
■Fit to Window. Resizes and centers the current view to display all objects.
■Restore Original Center. Restores the center point of the view to the extents
of the model.
■Level Camera. Rotates the current view so it is relative to the XY ground
plane.
■Increase Walk Speed. Increases the walk speed used for the Walk tool by
two times.
■Decrease Walk Speed. Decreases the walk speed used for the Walk tool by
one half.
■Help. Launches the online Help system and displays the topic about the
wheels.
■SteeringWheel Settings. Displays the dialog box where you can adjust the
preferences for the wheels.
■Close Wheel. Closes the wheel.
To display the wheel menu
■Click the down arrow in the lower-right corner of the wheel or right-click
on the wheel.
Wheel Menu | 315
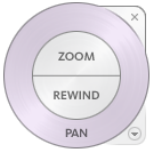
Quick Reference
Commands
NAVSWHEEL
Provides access to enhanced navigation tools that are quickly accessible from
the cursor.
System Variables
NAVSWHEELMODE
Specifies the current mode of the SteeringWheel.
Navigation Wheels
You can choose from several different wheels. Some wheels are designed for
2D navigation while other wheels are better suited for 3D navigation.
2D Navigation Wheel
The 2D Navigation wheel is for basic navigation of 2D views.
With this wheel you can access basic 2D navigation tools; it is particularly
useful when you do not have a pointing device with a scroll wheel. The wheel
includes the Pan and Zoom tools.
The 2D Navigation wheel wedges have the following options:
■
Pan
. Repositions the current view by panning.
■
Zoom
. Adjusts the magnification of the current view.
■
Rewind
. Restores the most recent view orientation. You can move backward
or forward by clicking and dragging left or right.
316 | Chapter 11 Use Viewing Tools
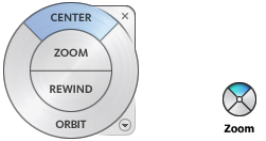
To switch to the 2D navigation wheel
■Click Navigation Bar ➤ SteeringWheels drop-down ➤ 2D Wheel.
Quick Reference
Commands
NAVSWHEEL
Provides access to enhanced navigation tools that are quickly accessible from
the cursor.
System Variables
NAVSWHEELMODE
Specifies the current mode of the SteeringWheel.
View Object Wheels
The View Object wheels are used for 3D navigation. Use these wheels to view
individual or groups of objects in a model.
With the View Object wheels (big and mini), you can view individual objects
or features in a model. The big View Object wheel is optimized for new 3D
users while the mini View Object wheel is optimized for experienced 3D users.
Big View Object Wheel
The big View Object wheel wedges have the following options:
■
Center
. Specifies a point on a model to adjust the center of the current
view or change the target point used for some of the navigation tools.
■
Zoom
. Adjusts the magnification of the current view.
■
Rewind
. Restores the most recent view orientation. You can move backward
or forward by clicking and dragging left or right.
Navigation Wheels | 317
■
Orbit
. Rotates the current view around a fixed pivot point at the view’s
center.
Mini View Object Wheel
The mini View Object wheel wedges have the following options:
■
Zoom (Top wedge)
. Adjusts the magnification of the current view.
■
Rewind (Right wedge)
. Restores the most recent view. You can move
backward or forward by clicking and dragging left or right.
■
Pan (Bottom wedge)
. Repositions the current view by panning.
■
Orbit (Left wedge)
. Rotates the current view around a fixed pivot point.
NOTE When the mini wheel is displayed, you can press and hold the middle
mouse button to pan, scroll the wheel button to zoom in and out, and hold the
SHIFT key while pressing and holding the middle mouse button to orbit the model.
To switch to the big View Objects wheel
Do one of the following:
■Click Navigation Bar ➤ Steering Wheels drop-down ➤ Basic View Object
Wheel .
■Right-click the wheel, and click Basic Wheels ➤ View Object Wheel.
To switch to the mini View Objects wheel
Do one of the following:
■Click Navigation Bar ➤ Steering Wheels drop-down ➤ Mini View Object
Wheel .
■Right-click the wheel, and click Mini View Object Wheel.
318 | Chapter 11 Use Viewing Tools
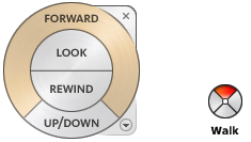
Quick Reference
Commands
NAVSWHEEL
Provides access to enhanced navigation tools that are quickly accessible from
the cursor.
System Variables
NAVSWHEELMODE
Specifies the current mode of the SteeringWheel.
Tour Building Wheels
The Tour Building wheels are for 3D navigation. Use these wheels to navigate
within the interior of a model.
With the Tour Building wheels (big and mini), you can move through a model,
such as a building, an assembly line, ship, or oil rig. You can also walk through
and navigate around a model. The big Tour Building wheel is optimized for
new 3D users while the mini Tour Building wheel is optimized for experienced
3D users.
Big Tour Building Wheel
The big Tour Building wheel wedges have the following options:
■
Forward
. Adjusts the distance between the current point of view and the
defined pivot point of the model. Clicking once moves forward half the
distance as far as the object you clicked.
■
Look
. Swivels the current view.
■
Rewind
. Restores the most recent view. You can move backward or forward
by clicking and dragging left or right.
Navigation Wheels | 319
■
Up/DownTool
. Slides the current view of a model along the Z axis of the
model.
Mini Tour Building Wheel
The mini Tour Building wheel wedges have the following options:
■
Walk (Top wedge)
. Simulates walking through a model.
■
Rewind (Right wedge)
. Restores the most recent view. You can move
backward or forward by clicking and dragging left or right.
■
Up/Down (Bottom wedge)
. Slides the current view of a model along the
Z axis of the model.
■
Look (Left wedge)
. Swivels the current view.
NOTE When the mini wheel is displayed, you can press and hold the middle
mouse button to pan, scroll the wheel button to zoom in and out, and hold the
SHIFT key while pressing and holding the middle mouse button to orbit the model.
To switch to the big Tour Building wheel
Do one of the following:
■Click Navigation Bar ➤ Steering Wheels drop-down ➤ Basic Tour Building
Wheel .
■Right-click the wheel, and click Basic Wheels ➤ Tour Building Wheel.
To switch to the mini Tour Building wheel
Do one of the following:
■Click Navigation Bar ➤ Steering Wheels drop-down ➤ Mini Tour Building
Wheel .
■Right-click the wheel, and click Mini Tour Building Wheel.
320 | Chapter 11 Use Viewing Tools
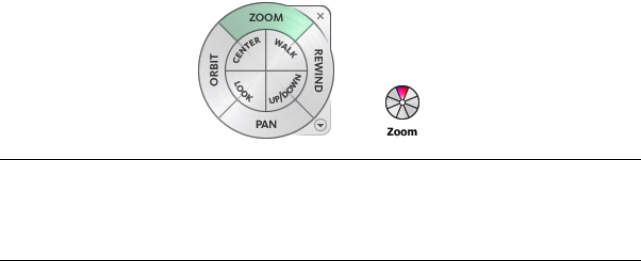
Quick Reference
Commands
NAVSWHEEL
Provides access to enhanced navigation tools that are quickly accessible from
the cursor.
System Variables
NAVSWHEELMODE
Specifies the current mode of the SteeringWheel.
Full Navigation Wheels
The Full Navigation wheels combine the 2D and 3D navigation tools found
on the 2D Navigation, View Object, and Tour Building wheels into a single
wheel.
The Full Navigation wheels (big and mini) contain common 3D navigation
tools used for both viewing an object and touring a building. The big and
mini Full Navigation wheels are optimized for experienced 3D users.
NOTE When one of the Full Navigation wheels is displayed, you can press and
hold the middle mouse button to pan, scroll the wheel button to zoom in and
out, and hold the SHIFT key while pressing and holding the middle mouse button
to orbit the model.
Big Full Navigation Wheel
The big Full Navigation wheel wedges have the following options:
■
Zoom
. Adjusts the magnification of the current view.
■
Rewind
. Restores the most recent view. You can move backward or forward
by clicking and dragging left or right.
Navigation Wheels | 321

■
Pan
. Repositions the current view by panning.
■
Orbit
. Rotates the current view around a fixed pivot point.
■
Center
. Specifies a point on a model to adjust the center of the current
view or change the target point used for some of the navigation tools.
■
Walk
. Simulates walking through a model.
■
Look
. Swivels the current view.
■
Up/Down
. Slides the current view of a model along the Z axis of the model.
Mini Full Navigation Wheel
The mini Full Navigation wheel wedges have the following options:
■
Zoom (Top wedge)
. Adjusts the magnification of the current view.
■
Walk (Upper right wedge)
. Simulates walking through a model.
■
Rewind (Right wedge)
. Restores the most recent view. You can move
backward or forward by clicking and dragging left or right.
■
Up/Down (Lower right wedge)
. Slides the current view of a model along
the Z axis of the model.
■
Pan (Bottom wedge)
. Repositions the current view by panning.
■
Look (Lower left wedge)
. Swivels the current view.
■
Orbit (Left wedge)
. Rotates the current view around a fixed pivot point.
■
Center (Upper left wedge)
. Specifies a point on a model to adjust the
center of the current view or change the target point used for some of the
navigation tools.
To switch to the big Full Navigation wheel
Do one of the following:
■Click Navigation Bar ➤ Steering Wheels drop-down ➤ Full Navigation
Wheel.
■Right-click the wheel, and click Full Navigation Wheel.
322 | Chapter 11 Use Viewing Tools

To switch to the mini Full Navigation wheel
Do one of the following:
■Click Navigation Bar ➤ Steering Wheels drop-down ➤ Mini Full
Navigation Wheel .
■Right-click the wheel, and click Mini Full Navigation Wheel.
Quick Reference
Commands
NAVSWHEEL
Provides access to enhanced navigation tools that are quickly accessible from
the cursor.
System Variables
NAVSWHEELMODE
Specifies the current mode of the SteeringWheel.
Navigation Tools
The navigation tools reorient the current view of a model.
The display of a model can be adjusted by increasing or decreasing the
magnification at which objects are displayed, rotating the model among other
ways of changing the orientation of the model using the tools on
SteeringWheels and 3Dconnexion 3D mouse. You can create a view that
defines an area of a model as the Home view and use preset views to restore
known viewpoints of a model with the Autodesk® ViewCube® navigation
tool.
Center Tool
The Center tool specifies a point on a model as the center of the current view.
It also changes the target point used for some of the navigation tools.
With the Center tool, you can define the center of the current view of a model.
To define the center, drag the cursor over your model. A sphere (pivot point)
is displayed in addition to the cursor. The sphere indicates that the point
Navigation Tools | 323
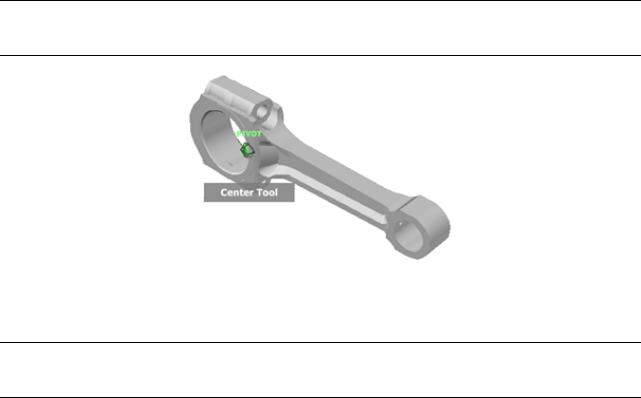
below the cursor in the model will be the center of the current view when
you release the mouse button. The model is centered on the sphere.
NOTE If the cursor is not over the model, the center cannot be set and a prohibited
cursor is displayed.
The point defined by the Center tool provides a focal point for the Zoom tool
and a pivot point for the Orbit tool.
NOTE If you want to zoom from the Full Navigation wheels from your defined
center point, hold down CTRL before zooming.
To specify a point on a model as the center of a view
1Display one of the Full Navigation wheels or the big View Object wheel.
2Click and hold down the Center wedge.
3Drag the cursor to the desired location of the model.
4Release the button on your pointing device when the sphere is displayed.
The model is panned until the sphere is centered.
To specify the target point for the Zoom and Orbit tools
1Display one of the Full Navigation wheels or the big View Object wheel.
2Click and hold down the Center wedge.
3Drag the cursor over the desired location of the model.
4Release the button on your pointing device when the sphere is displayed.
The model is panned until the sphere is centered.
5Use the Zoom or Orbit tool to reorient the view of the model.
If you are using one of the Full Navigation wheels, hold down the CTRL
key before using the Zoom tool.
324 | Chapter 11 Use Viewing Tools
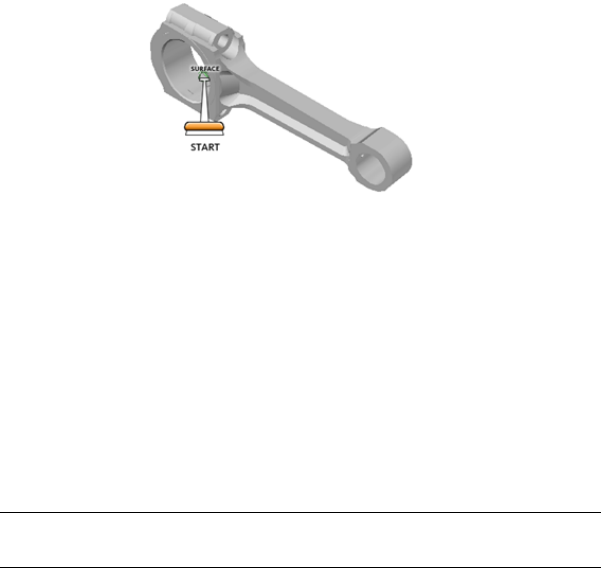
Quick Reference
Commands
NAVSWHEEL
Provides access to enhanced navigation tools that are quickly accessible from
the cursor.
Forward Tool
The Forward tool adjusts the distance between the current point of view and
the defined pivot point of the model.
You use the Forward tool to change the magnification of the model by
increasing or decreasing the distance between the current point of view and
the pivot point. The distance that you can move forward or backward is limited
by the position of the pivot point.
To adjust the distance between the current point of view and the pivot point
you use the Drag Distance indicator. The Drag Distance indicator has two
marks on it that show the start and destination distances from the current
point of view. The current traveled distance is shown by the orange position
indicator. Slide the indicator forward or backwards to decrease or increase the
distance towards the pivot point.
To reorient a view by moving towards or away from the model
1Display the big Tour Building wheel.
2Click and hold down the Forward wedge.
The Drag Distance indicator is displayed.
NOTE If you click the Forward wedge once, the model moves forward 50%
of the distance between the current location and the pivot point.
Navigation Tools | 325
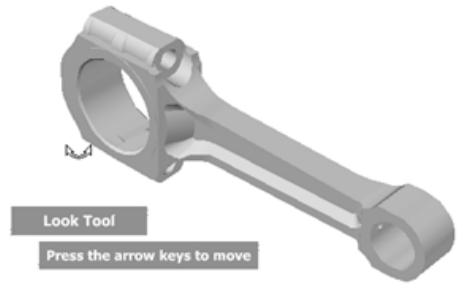
3Drag the cursor up or down to change the distance from which you view
the model.
4Release the button on your pointing device to return to the wheel.
Quick Reference
Commands
NAVSWHEEL
Provides access to enhanced navigation tools that are quickly accessible from
the cursor.
Look Tool
The Look tool rotates the view horizontally and vertically around a fixed point.
With the Look tool, you can rotate the current view vertically and horizontally.
When rotating the view, your line of sight rotates about the current eye
position, like turning your head. The Look tool can be compared to standing
in a fixed location, and looking up, down, left or right.
When using the Look tool, you adjust the view of the model by dragging the
cursor. As you drag, the cursor changes to the Look cursor and the model
rotates around the location of the current view.
326 | Chapter 11 Use Viewing Tools

Walking through a Model
When using the Look tool from the big Full Navigation wheel, you can walk
through a model by using the arrow keys on the keyboard. Use the properties
dialog box for the SteeringWheels to adjust the walk speed.
Invert Vertical Axis
When you drag the cursor upward, the target point of the view raises; dragging
the cursor downward lowers the target point of the view. Use the properties
dialog box for the SteeringWheels to invert the vertical axis for the Look tool.
To look around the view with the Look tool
1Display one of the Full Navigation wheels or the mini Tour Building
wheel.
2Click and hold down the Look wedge.
The cursor changes to the Look cursor.
3Drag the pointing device to change the direction in which you are
looking.
4Release the button on your pointing device to return to the wheel.
To look around and walk through the model with the Look tool
1Display the big Full Navigation wheel.
2Click and hold down the Look wedge.
The cursor changes to the Look cursor.
3Drag to change the direction in which you are looking.
4While holding down the button on your pointing device, press the arrow
keys to walk in the model.
5Release the button on your pointing device to return to the wheel.
6Click Close to exit the wheel.
To invert the vertical axis for the Look tool
1Click Navigation Bar ➤ Steering Wheels drop-down ➤ click one of the
available SteeringWheels.
Navigation Tools | 327
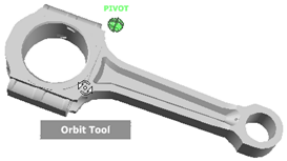
2Right-click the wheel and click SteeringWheel Settings.
3In the SteeringWheels Settings dialog box, click Invert Vertical Axis for
Look Tool.
Dragging the cursor downward lowers the target point of the view;
dragging the cursor upward raises the target point of the view.
4Click OK.
Quick Reference
Commands
NAVSWHEEL
Provides access to enhanced navigation tools that are quickly accessible from
the cursor.
Orbit Tool
The Orbit tool rotates the current view around a model based on a fixed pivot
point.
You use the Orbit tool to change the orientation of a model. The cursor changes
to the Orbit cursor. As you drag the cursor, the model rotates around a pivot
point while the view remains fixed.
Specify the Pivot Point
The pivot point is the base point used when rotating the model with the Orbit
tool. You can specify the pivot point in the following ways:
■Default pivot point. When you first open a model, the target point of the
current view is used as the pivot point for orbiting the model.
328 | Chapter 11 Use Viewing Tools

■Select objects. You can select objects before the Orbit tool is used to
calculate the pivot point. The pivot point is calculated based on the center
of the extents of the selected objects.
■Center tool. You can specify a point on the model to use as the pivot point
for orbiting with the Center tool.
■CTRL+Click and drag. Press and hold down the CTRL key before clicking
the Orbit wedge or while the Orbit tool is active; then drag to the point
on the model you want to use as the pivot point. This option is only
available when using the big and mini Full Navigation wheels or the mini
View Object wheel.
NOTE While the Orbit tool is active, you can press and hold the CTRL key at
anytime to move the pivot point used by the Orbit tool.This pivot point is used
for subsequent navigation until it is moved.
Maintain Up Direction
You can control how the model orbits around the pivot point by choosing to
maintain the up direction of the model. When the up direction is maintained,
orbiting is constrained along the XY axis and in the Z direction. If you drag
horizontally, the camera moves parallel to the XY plane. If you drag vertically,
the camera moves along the Z axis.
If the up direction is not maintained, you can roll the model using the roll
ring which is centered around the pivot point. Use the properties dialog box
for the SteeringWheels to control whether the up direction is maintained or
not for the Orbit tool.
To orbit a model with the Orbit tool
1Display one of the View Object or Full Navigation wheels.
2Click and hold down the Orbit wedge.
The cursor changes to the Orbit cursor.
3Drag to rotate the model.
NOTE Use the Center tool to re-center the model in the current view, if you
are using one of the Full Navigation or View Object wheels.
4Release the button on your pointing device to return to the wheel.
Navigation Tools | 329

To orbit around an object with the Orbit tool
1Press ESC to make sure no commands are active and to clear any
previously selected objects.
2Select the objects in the model for which you want to define the pivot
point.
3Display one of the View Object or Full Navigation wheels.
4Click and hold down the Orbit wedge.
The cursor changes to the Orbit cursor.
5Drag to rotate the model.
6Release the button on your pointing device to return to the wheel.
To turn on selection sensitivity for the Orbit tool
1Click Navigation Bar ➤ Steering Wheels drop-down ➤ click one of the
View Object or Full Navigation wheels.
2Right-click the wheel and click SteeringWheel Settings.
3In the SteeringWheels Settings dialog box, click Use Selection Sensitivity
for Orbit Tool.
The extents of any objects that are selected before the wheel is displayed
are used to define the pivot point for the Orbit tool. If no objects are
selected, the pivot point used by the Orbit tool is the one defined by the
Center tool.
4Click OK.
To maintain the up direction for the Orbit tool
1Click Navigation Bar ➤ Steering Wheels drop-down ➤ click one of the
View Object or Full Navigation wheels.
2Right-click the wheel and click SteeringWheel Settings.
3In the SteeringWheels Settings dialog box, click Maintain Up Direction
for Orbit Tool.
Orbiting the model is constrained along the XY plane and Z directions.
330 | Chapter 11 Use Viewing Tools
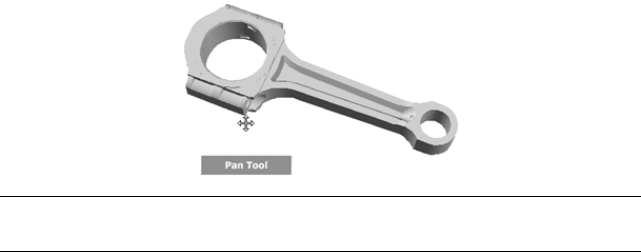
4Click OK.
Quick Reference
Commands
NAVSWHEEL
Provides access to enhanced navigation tools that are quickly accessible from
the cursor.
Pan Tool
The Pan tool repositions the current view of the model by panning.
When the pan tool is active, the Pan cursor (a four-sided arrow) is displayed.
Dragging the pointing device moves the model in the same direction. For
example, dragging upward moves the model up while dragging downward
moves the model down.
TIP If the cursor reaches the edge of the screen, you can continue panning by
dragging further to force it to wrap around the screen.
To pan the view with the Pan tool
1Display the 2D Navigation wheel, one of the Full Navigation wheels, or
the mini View Object wheel.
2Click and hold the Pan wedge.
The cursor changes to the Pan cursor.
3Drag to reposition the model.
4Release the button on your pointing device to return to the wheel.
Navigation Tools | 331
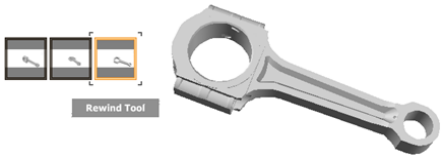
To start the Pan tool with the middle button
1Display the 2D Navigation wheel, the Full Navigation wheel, or one of
the mini wheels.
2Press and hold down the scroll wheel or middle button.
The cursor changes to the Pan cursor.
3Drag to reposition the model.
4Release the wheel or button on your pointing device to return to the
wheel.
Quick Reference
Commands
NAVSWHEEL
Provides access to enhanced navigation tools that are quickly accessible from
the cursor.
Rewind Tool
The Rewind tool restores the most recent view. You can also move backward
or forward through previous views.
As you use the navigation tools to reorient the view of a model, the previous
view is saved to the navigation history. The navigation history holds a
representation of the previous views of the model along with a thumbnail. A
separate navigation history is maintained for each window; it is not maintained
after the window is closed. Rewind navigation history is view-specific.
With the Rewind tool, you can retrieve previous views from the navigation
history. From the navigation history, you can restore a previous view or scroll
through all of the saved views.
332 | Chapter 11 Use Viewing Tools
When a view change occurs, the previous view is recorded to the navigation
history. If the view change is made with a wheel, a thumbnail is automatically
generated and added to the Rewind UI. For view changes that are made not
using a wheel, a thumbnail is only generated when the system variable
CAPTURETHUMBNAILS is set to a value of 2. You can control when thumbnails
are generated for view changes in the SteeringWheels Settings dialog box.
To restore the previous view
1Display a wheel.
2Click the Rewind wedge.
To restore a previous view with the Rewind History panel
1Display a wheel.
2Click and hold the Rewind wedge.
The Rewind History panel is displayed.
3While holding down the button on your pointing device, drag to the left
or to the right to restore a previous view.
Dragging to the left restores an older previous view. Dragging to the right
restores a view that is newer than the one you are currently viewing. You
must have previously used the Rewind tool to see views available on the
right. The current position in the navigation history is indicated by the
orange box that is dragged along the Rewind History panel.
To specify the display of rewind thumbnails
1Display a wheel.
2Right-click the wheel and click SteeringWheel Settings.
3In the SteeringWheels Settings dialog box, select one of the following:
■Never - Only display thumbnails for view changes made with the
SteeringWheels.
■On Demand When the Bracket Is Moved Over an Empty Frame -
Display thumbnails on demand for a previous view change when
using the Rewind UI.
■Automatically When a View Change Occurs - Display thumbnails for
all view changes saved to the navigation history.
4Click OK.
Navigation Tools | 333
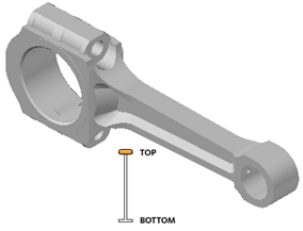
Quick Reference
Commands
NAVSWHEEL
Provides access to enhanced navigation tools that are quickly accessible from
the cursor.
System Variables
CAPTURETHUMBNAILS
Specifies if and when thumbnails are captured for the Rewind tool.
Up/Down Tool
The Up/Down tool slides the current view of a model along the Z axis of the
model.
Unlike the Pan tool, you use the Up/Down tool to adjust the height of the
current viewpoint along the model's Z axis. To adjust the vertical elevation
of the current view, you drag up or down. As you drag, the current elevation
and the allowed range of motion is displayed on a graphical element called
the Vertical Distance indicator.
The Vertical Distance indicator has two marks that show the highest (Top)
and lowest (Bottom) elevation the view can have. While changing the elevation
with the Vertical Distance indicator, the current elevation is shown by the
bright orange indicator, while the previous elevation is shown by the dim
orange indicator.
To change the elevation of a view
1Display one of the Full Navigation wheels or the Tour Building wheels.
334 | Chapter 11 Use Viewing Tools
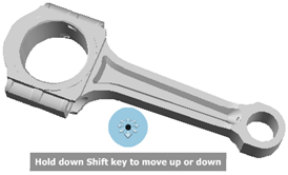
2Click and hold down the Up/Down wedge.
The Vertical Distance indicator is displayed.
3Drag up or down to change the elevation of the view.
4Release the button on your pointing device to return to the wheel.
Quick Reference
Commands
NAVSWHEEL
Provides access to enhanced navigation tools that are quickly accessible from
the cursor.
Walk Tool
The Walk tool simulates walking through a model.
With the Walk tool, you can navigate through a model as if you were walking
through it. Once you start the Walk tool, the Center Circle icon is displayed
near the base of the view and the cursor changes to display a series of arrows.
To walk through the model, you drag in the direction in which you want to
move in.
Constrain the Walk Angle
When walking through a model, you can constrain the movement angle to
the ground plane. If the Constrain Walk Angle to Ground Plane option is
enabled, you can freely walk around while maintaining a constant camera
viewpoint elevation; if the walk angle is not constrained, you will “fly” in the
direction you are looking. Use the properties dialog box for the SteeringWheels
to constrain the movement angle to the ground plane for the Walk tool.
Navigation Tools | 335

Movement Speed
As you walk or “fly” through a model, you can control the movement speed.
Movement speed is controlled by the distance in which the Cursor is moved
from the Center Circle icon and the current movement speed setting. You
can adjust the movement speed setting permanently and temporarily as you
use the Walk tool. To temporarily increase movement speed, press and hold
the + (plus) key while using the Walk tool.
Change the Elevation
As you use the Walk tool, you can adjust the camera elevation by holding
down the SHIFT key. This temporarily activates the Up/Down tool. With the
Up/Down tool active, drag up or down to adjust the elevation of the camera.
You can also use the UP ARROW and DOWN ARROW keys as you walk to adjust
the height of the view.
To use the Walk tool to move through the model
1Display one of the Full Navigation wheels or the mini Tour Building
wheel.
2Click and hold down the Walk wedge.
The cursor changes to the Walk cursor and the Center Circle icon is
displayed.
3Drag in the direction you want to walk.
NOTE While walking, press and hold down the + (plus) key to temporarily
increase your movement speed.
4Release the button on your pointing device to return to the wheel.
To change the movement speed for the Walk tool
1Display a wheel.
2Right-click the wheel and click SteeringWheel Settings.
3In the SteeringWheels Settings dialog box, under Walk Tool, drag the
Walk Speed slider to the left to decrease the walking speed or to the right
to increase the walking speed.
4Click OK.
336 | Chapter 11 Use Viewing Tools
To constrain the walk angle to the ground plane
1Display a wheel.
2Right-click the wheel and click SteeringWheel Settings.
3In the SteeringWheels Settings dialog box, under Walk Tool, click
Constrain Walk Angle to Ground Plane.
Movement when walking is done parallel to the ground plane of the
model.
4Click OK.
To adjust the height of the current view from the Walk tool
1Display one of the Full Navigation wheels or the mini Tour Building
wheel.
2Click and hold down the Walk wedge.
The cursor changes to the Walk cursor and the Center Circle icon is
displayed.
3Do one of the following:
■Press and hold down the SHIFT key to enable the Up/Down tool; drag
up or down.
■Press and hold down the UP ARROW or DOWN ARROW key.
4Release the button on your pointing device to return to the wheel.
Quick Reference
Commands
NAVSWHEEL
Provides access to enhanced navigation tools that are quickly accessible from
the cursor.
Zoom Tool
The Zoom tool adjusts the magnification of the current view of a model.
Navigation Tools | 337

You use the Zoom tool to change the zoom magnification of a model. The
following mouse click and key combinations are available to control how the
Zoom tool behaves:
■SHIFT+click. If you hold down the SHIFT key before you click the Zoom
tool on a wheel, the current view is zoomed out by a factor of 25 percent.
Zooming is performed from the current location of the cursor, and not the
current pivot point.
NOTE When you start the Zoom tool from the Full Navigation wheel,
incremental zooming must be enabled in the properties dialog box for the
SteeringWheels in order to use CTRL+click and SHIFT+click.
■CTRL+click. If you hold down the CTRL key before you click the Zoom tool
on a wheel, the current view is zoomed in by a factor of 25 percent.
Zooming is performed from the current pivot point, and not the location
of the cursor.
■Click and drag. If you click the Zoom tool and hold down the button on
your pointing device, you can adjust the magnification of the model by
dragging up and down.
■CTRL+click and drag. When using the Full Navigation wheels or the mini
View Object wheel, you can control the target point used by the Zoom
tool. By holding down the CTRL key, the Zoom tool uses the location of
the previous pivot point defined by the Zoom, Orbit, or Center tool.
NOTE When you start the Zoom tool from the Full Navigation wheel, incremental
zooming must be enabled in the properties dialog box for the SteeringWheels in
order to use CTRL+click and SHIFT+click.
NOTE When you use the Zoom tool from the Full Navigation wheel or the View
Object wheel, the point in the view where you click to zoom becomes the Center
point for future Orbit operations until you either use the Zoom tool again or use
the Center tool. If you press CTRL before you click the Zoom wedge, the Center
point does not change.
338 | Chapter 11 Use Viewing Tools
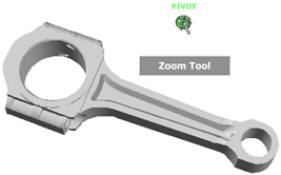
Zoom Constraints
When changing the magnification of a model with the Zoom tool, you cannot
zoom in any further than the focus point or out past the extents of the model.
The direction you can zoom in and out is controlled by the center point set
by the Center tool.
When changing the magnification of a model with the Zoom tool, you cannot
zoom in any further than the focus point or out past the extents of the model.
To zoom a view with a single click
1Display a wheel.
2Right-click the wheel and click SteeringWheel Settings.
3In the SteeringWheels Settings dialog box, under Zoom Tool, select Enable
Single Click Incremental Zoom.
4Click OK.
5Display one of the Full Navigation Wheels or the mini View Object Wheel.
6Click the Zoom wedge.
The magnification of the model is increased and you are zoomed in closer
to the model. If you hold down the Shift key while clicking the Zoom
wedge, the model is zoomed out or you can hold down the Ctrl key to
zoom in.
7Click Close to exit the wheel.
To zoom a view in and out by dragging
1Display the 2D Navigation wheel, one of the Full Navigation wheels, or
the mini View Object wheel.
2Click and hold down the Zoom wedge.
The cursor changes to the Zoom cursor.
Navigation Tools | 339
3Drag vertically to zoom in or out.
4Release the button on your pointing device to return to the wheel.
To zoom in and out by scrolling the mouse wheel when a wheel is displayed
1Display one of the wheels other than the big Tour Building wheel.
2Scroll the wheel forward or backward to zoom in or out.
3Release the button on your pointing device to return to the wheel.
Quick Reference
Commands
NAVSWHEEL
Provides access to enhanced navigation tools that are quickly accessible from
the cursor.
Define and Change Views with ShowMotion
The Autodesk® ShowMotion® navigation tool provides an onscreen display
that can be used to create and play back cinematic camera animations. These
animations can be used for presentation purposes or to navigate through a
design.
Overview of ShowMotion
Using ShowMotion, you can add movement and transitions to a saved view.
These saved views are called shots. The types of shots that you can create are:
■Still. Utilizes a single fixed camera position.
■Cinematic. Utilizes a single camera with cinematic camera movements.
■Recorded Walk. Records an animation by navigating around and through
a model.
340 | Chapter 11 Use Viewing Tools
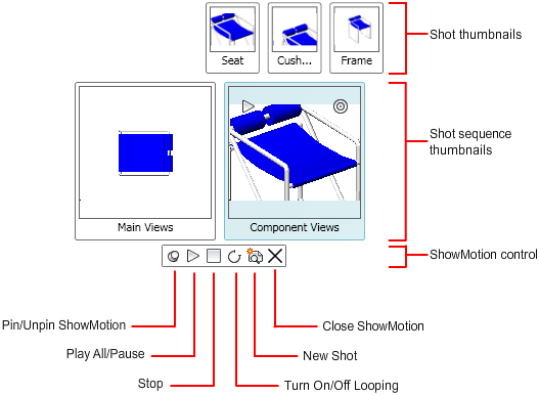
Shot Sequences
Shot sequences are used to organize related shots together. These sequences
are also called view categories. By using shot sequences, you can do the
following:
■Quickly locate a shot
■Play back more than one shot at a time
■Control the order in which shots are played back
Using ShowMotion
ShowMotion is made up of three main parts: shot thumbnails, shot sequence
thumbnails, and the ShowMotion control. With the ShowMotion control,
which is along the bottom, you can play the animations assigned to a shot,
pin and unpin ShowMotion, and close ShowMotion. Use the shot and shot
sequence thumbnails to navigate the shots in the current model.
The ShowMotion control has the following options:
■Pin/Unpin ShowMotion. Pins ShowMotion so the ShowMotion control
and all thumbnails remain displayed even if focus is shifted away from
ShowMotion. When ShowMotion is not pinned, the ShowMotion control
and all thumbnails disappear if the focus is switched away from
ShowMotion.
Overview of ShowMotion | 341

■Play All. Starts the playback of shots in all shot sequences. Shots are played
left to right, starting with the leftmost shot sequence.
■Stop. Stops the playback of the current shot.
■Turn On/Off Looping. Enables or disables playback looping for the
animation assigned to the shot or shot sequence when played back.
■New Shot. Displays the New View/Shot Properties dialog box where you
can create a new shot.
■Close ShowMotion. Closes the ShowMotion control and all thumbnails.
To launch ShowMotion
Use one of the following methods to launch ShowMotion
■Click Navigation Bar ➤ ShowMotion.
To pin or unpin ShowMotion
■On the ShowMotion control, click Pin ShowMotion or Unpin ShowMotion.
To close ShowMotion
■On the ShowMotion control, click Close ShowMotion or click in the
document window when ShowMotion is not pinned.
Quick Reference
Commands
NAVSMOTION
Provides an on-screen display for creating and playing back cinematic camera
animations for design review, presentation, and bookmark-style navigation.
Create and Modify Shots and Shot Sequences
You create and modify shots from ShowMotion. As you create or modify a
shot, a thumbnail is generated and added to a shot sequence.
342 | Chapter 11 Use Viewing Tools
Create and Modify a Shot
When a shot is created, it must be given a name and view type. The view type
assigned to the shot determines which transition and motion options you can
change. After a shot is created, a thumbnail is automatically generated and
placed under the shot sequence that was assigned to the shot. The name of
the shot is located below the thumbnail. If you need to change a shot, you
can right-click the shot that you want to modify.
The shortcut menu of a shot has the following options:
■Properties. Displays the dialog box to modify the shot’s transition and
motion settings, and assigned shot sequence, among other settings.
■Rename. Renames a shot.
■Delete. Removes a shot.
■Move Left and Move Right. Changes the position of a shot in the shot
sequence by one position to the left or right.
■Update the Thumbnail. Updates the thumbnail for a single shot or for all
shots saved with the model.
Create and Modify a Shot Sequence
When a shot is created, you can add the shot to the default shot sequence or
specify the shot sequence to which the shot should be added. Each shot
sequence is represented by a thumbnail in ShowMotion. The thumbnail is
identical to the first shot in the shot sequence. The name of the shot sequence
is below the thumbnail.
The shortcut menu of a shot sequence has the following options:
■Rename. Renames a shot sequence.
■Delete. Removes a shot sequence.
■Move Left and Move Right. Changes the position of a shot sequence in
ShowMotion by one position to the left or right.
■Update the Thumbnail. Updates the thumbnails for all shots in a shot
sequence or for all shots saved with the model.
To create a still shot
1On the ShowMotion control, click New Shot.
Create and Modify Shots and Shot Sequences | 343
2In the New View/Shot Properties dialog box, in the View Name text box,
enter a name.
3In the View Category drop-down list, select a view category.
4In the View Type drop-down list, select a shot type.
5On the Shot Properties tab, under Transition, select a transition type from
the Transition Type drop-down list.
6Under Transition, enter a transition duration in the Transition Duration
text box.
7Click OK.
To create a recorded walk shot
1On the ShowMotion control, click New Shot.
2In the New View/Shot Properties dialog box, in the View name box, enter
a name.
3In the View Category drop-down list, select a view category.
4In the View Type drop-down list, select Recorded Walk.
5On the Shot Properties tab, under Transition, select a transition type from
the Transition Type drop-down list.
6Under Transition, enter a transition duration in the Transition Duration
text box.
7Under Motion, click Start Recording.
8Click on the 3D canvas and drag the mouse along the desired path of
animation. Release the mouse to stop recording.
9Click OK.
To create a cinematic shot
1On the ShowMotion control, click New Shot.
2In the New View/Shot Properties dialog box, in the View name box, enter
a name.
3In the View Category drop-down list, select a view category.
4In the View Type drop-down list, select Cinematic.
344 | Chapter 11 Use Viewing Tools
5On the Shot Properties tab, under Transition, select a transition type from
the Transition Type drop-down list.
6Under Transition, enter a transition duration in the Transition Duration
text box.
7Under Motion, set the camera position.
8Under Motion, set the duration of the movement.
9Under Motion, set the travel distance of the camera.
10 Click OK.
To modify a shot
1On ShowMotion, hover the cursor over the shot sequence that contains
the shot you want to modify.
2Right-click the shot you want to modify, and click Properties.
3In the View/Shot Properties dialog box, change the desired settings.
4Click OK.
To rename a shot or shot sequence
1On ShowMotion, hover the cursor over the shot or shot sequence you
want to rename.
2Right-click, and click Rename.
3In the in-place editor, replace the existing name with the new name and
press ENTER.
To resequence a shot or shot sequence
1On ShowMotion, hover the cursor over the shot or shot sequence you
want to resequence.
2Right-click, and click Move Left or Move Right.
To delete a shot
1On ShowMotion, hover the cursor over the shot you want to delete.
2Right-click, and click Delete.
Create and Modify Shots and Shot Sequences | 345
To delete a shot sequence
1On ShowMotion, hover the cursor over the shot sequence you want to
delete.
2Right-click, and click Delete.
3In the ShowMotion - Delete View Category dialog box, click Delete
Category.
To update the thumbnail for a shot or shot sequence
1On ShowMotion, hover the cursor over the shot or shot sequence for
which you want to update the thumbnail.
2Right-click, and click Update the Thumbnail For ➤ This View or This
Category.
Click All to update the thumbnails for all shots stored in the model.
Quick Reference
Commands
EDITSHOT
Edits a saved named view with or without motion.
NAVSMOTION
Provides an on-screen display for creating and playing back cinematic camera
animations for design review, presentation, and bookmark-style navigation.
NEWSHOT
Creates a named view with motion that is played back when viewed with
ShowMotion.
Play Back a Shot
You can view shots individually or together in a shot sequence.
Once a shot is created, you can play back the animation assigned to the shot
by using the view controls located on each shot or shot sequence thumbnail
or the ShowMotion control. The available view controls are:
346 | Chapter 11 Use Viewing Tools
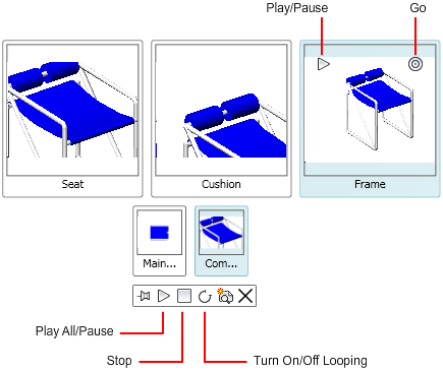
■Play. Starts the playback of a shot or shot sequence. When the cursor is
over the thumbnail, the Play button is displayed in the upper-left corner.
The Play button plays back the individual shot or all the shots in the shot
sequence.
■Play All. Starts the playback of all shots in all shot sequences. Shots are
played left to right, starting with the leftmost shot sequence.
■Pause. Stops the playback of a shot or shot sequence.
■Stop. Stops the playback of the current shot.
■Go. Restores the view of the model assigned to a shot or the first shot in
a shot sequence.
To play a shot
1On ShowMotion, hover the cursor over the shot sequence that contains
the shot you want to play.
2Position the cursor over the thumbnail of the shot you want to view.
3On the shot thumbnail, in the upper-left corner, click the Play button.
To play all shots within a shot sequence
1On ShowMotion, hover the cursor over the shot sequence that contains
the shots you want to play.
Play Back a Shot | 347

2On the thumbnail for the shot sequence, click the Play button located
on the upper-left corner of the thumbnail.
All the shots in the shot sequence are played.
To play all shots within all shot sequences
■On the ShowMotion control, click Play All.
All the shots saved in the model are played back in the order of each shot
sequence.
To pause or stop the playback of a shot
■On the ShowMotion control, click Pause to pause the playback of the
current shot or Stop to stop playback.
To loop the playback of a shot
■On the ShowMotion control, click Turn On/Off Looping.
NOTE If the loop setting is on, the shot loops until you click the Stop button
or press the ESC key.
Quick Reference
Commands
NAVSMOTION
Provides an on-screen display for creating and playing back cinematic camera
animations for design review, presentation, and bookmark-style navigation.
VIEWGO
Restores a named view.
VIEWPLAY
Plays the animation associated to a named view.
Define a 3D View with a Camera
Define a 3D view by placing a camera in model space and adjusting camera
settings to suit your needs.
348 | Chapter 11 Use Viewing Tools
Overview of Cameras
You can place a camera in a drawing to define a 3D view.
You can turn a camera on or off in a drawing and use grips to edit a camera’s
location, target, or lens length. A camera is defined by a location XYZ
coordinate, a target XYZ coordinate, and a field of view/lens length, which
determines the magnification, or zoom factor. You can also define clipping
planes, which establish front and back boundaries for the associated view.
■Location. Defines the point from which you are viewing a 3D model.
■Target. Defines the point you are viewing by specifying the coordinate at
the center of the view.
■Lens length. Defines the magnification properties of a camera’s lens. The
greater the lens length, the narrower the field of view.
■Front and back clipping planes. Specifies the location of clipping planes.
Clipping planes are boundaries that define, or clip, a view. In the camera's
view, everything between the camera and the front clipping plane is
hidden. Likewise, everything between the back clipping plane and the
target is hidden.
By default, saved cameras are given names such as Camera1, Camera2, and
so on. You can rename a camera to better describe its view. The View Manager
lists existing cameras in a drawing as well as other named views.
Use the Camera Glyph Appearance dialog box to control the camera glyph's
colors and size.
Quick Reference
Commands
CAMERA
Sets a camera and target location to create and save a 3D perspective view
of objects.
OPTIONS
Customizes the program settings.
Overview of Cameras | 349
System Variables
CAMERADISPLAY
Turns the display of camera objects on or off.
CAMERAHEIGHT
Specifies the default height for new camera objects.
Create a Camera
Set a camera and target location to create and save 3D perspective views of
objects.
You can create a new camera by defining its location and a target, and by
further defining its name, height, lens length, and clipping planes. You can
also use one of several pre-defined camera types that are available on the tool
palette.
To create a camera
1Click Render tab ➤ Camera panel ➤ Create Camera.
2Click in the drawing to specify the camera’s location.
3Click again in the drawing to specify a target location.
4Do one of the following:
■If you are finished setting up the camera, press Enter.
■To further define camera properties, right-click and select from the
list of options. Then press Enter to finish setting up the camera.
To create a camera from the Tool palette
1Click View tab ➤ Palettes panel ➤ Tool Palettes.
2In the Tool Palettes window, click the Camera tool palette tab to make
it active.
3Select a camera type. Drag the camera icon from the tool palette, and
click in the drawing where you want to set its location.
350 | Chapter 11 Use Viewing Tools

4Click again in the drawing when you want to place the target.
To display a camera
■Click Render tab ➤ Camera panel ➤ Show Cameras.
Quick Reference
Commands
CAMERA
Sets a camera and target location to create and save a 3D perspective view
of objects.
OPTIONS
Customizes the program settings.
System Variables
CAMERADISPLAY
Turns the display of camera objects on or off.
CAMERAHEIGHT
Specifies the default height for new camera objects.
Change Camera Properties
You can modify a camera’s lens length, change its front and back clipping
planes, name a camera, and turn the display of all cameras on or off in a
drawing.
When you select a camera, the Camera Preview dialog box opens to display
the camera's view.
Change Camera Properties | 351
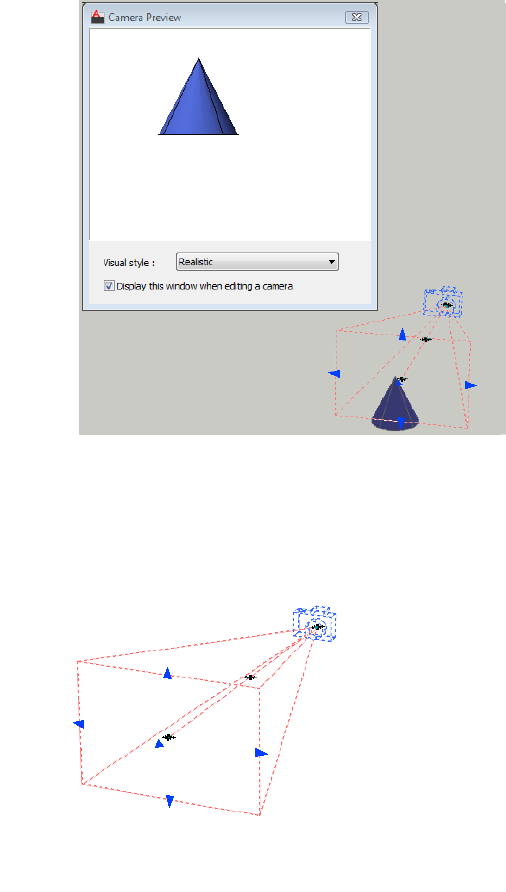
There are several ways to change camera settings:
■Click and drag grips to resize or relocate a lens length or field of view.
■Use the Dynamic Input tooltip to enter X,Y, Z coordinate values.
352 | Chapter 11 Use Viewing Tools
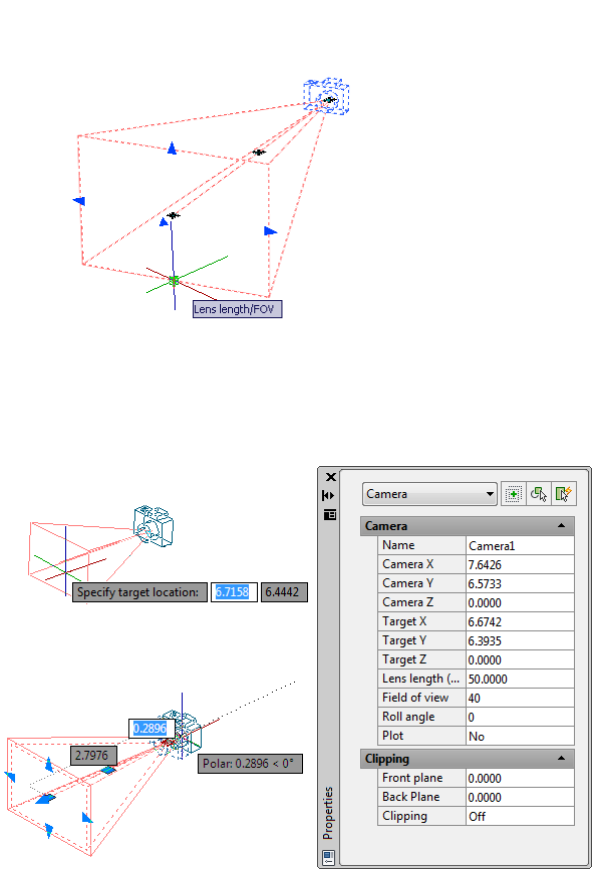
■Modify camera properties in the Camera Properties palette.
Change Camera Properties | 353
To change a camera’s lens length
1If cameras are not already displayed in the drawing, click Render tab ➤
Camera panel ➤ Show Cameras.
2Click the camera glyph.
3Click a Lens Length/FOV grip tool.
4Move the cursor and click where you want to position the lens.
5Press Enter.
NOTE To change a lens length to a precise value, double-click a camera
glyph to open the Properties palette. In the Cameras section, Lens Length
option (mm), enter a numeric value.
To set a camera’s clipping planes
1If cameras are not already displayed in the drawing, click Render tab ➤
Camera panel ➤ Show Cameras.
2Double-click the camera whose clipping planes you want to set.
3In the Properties palette, Clipping section, Clipping option, select Front
On, Back On, or Front and Back On.
4In the Front Plane or Back Plane option, enter numeric values.
5Press Enter.
To rename a camera
1If cameras are not already displayed in the drawing, click Render tab ➤
Camera panel ➤ Show Cameras.
2Double-click a camera glyph.
3In the Properties palette, General section, Name option, enter a new
name.
4Press Enter.
354 | Chapter 11 Use Viewing Tools

To change a camera’s location
1If cameras are not already displayed in the drawing, click Render tab ➤
Camera panel ➤ Show Cameras.
2Click the camera glyph, drag it to the new location, and click to place
the camera.
3Press Enter.
To change a camera’s target
1If cameras are not already displayed in the drawing, click Render tab ➤
Camera panel ➤ Show Cameras.
2Click the camera glyph whose target you want to change.
3Click the Target Distance grip tool (the blue grip in the center), drag it
to the new location, and click to place the target.
4Press Enter.
To specify whether the camera glyph plots
1If cameras are not already displayed in the drawing, click Render tab ➤
Camera panel ➤ Show Cameras.
2Double-click a camera.
3In the Properties palette, Camera section, Plot option, click Yes or No.
Quick Reference
Commands
CAMERA
Sets a camera and target location to create and save a 3D perspective view
of objects.
Change Camera Properties | 355
System Variables
CAMERADISPLAY
Turns the display of camera objects on or off.
CAMERAHEIGHT
Specifies the default height for new camera objects.
Create Preview Animations
You can create 3D preview animations and adjust the settings before you
create a motion path animation.
Preview animations are created with the controls on the Animation panel
found on the ribbon and the 3D navigation tools. Once a 3D navigation tool
is active, the controls on the Animation panel are enabled to start recording
an animation.
The following commands can be used to create an animation
■3DCORBIT
■3DDISTANCE
■3DFLY
■3DFORBIT
■3DORBIT
■3DPAN
■3DSWIVEL
■3DWALK
■3DZOOM
To learn more about the 3D navigation tools available for creating an
animation, see Use 3D Navigation Tools on page 287.
To create a preview animation
1If the Animations panel is not displayed on the Render tab, right-click
the Render tab and click Panels ➤ Animations.
2Start any 3D navigation command such as 3DORBIT.
356 | Chapter 11 Use Viewing Tools
3Click Render tab ➤ Animations panel ➤ Animation Record.
4Navigate through the drawing. If you are in walk or fly mode, you can
use the Position Locator window as a visual guide.
5(Optional) Do any of the following:
■Right-click the drawing and click Other Navigation Modes. Click
another navigation mode.
■Click Render tab ➤ Animations panel ➤ Animation Pause to set up
another navigation mode or adjust animation settings. If you are in
walk or fly mode, you can also adjust settings for the Position Locator
window.
6To review the animation, click Render tab ➤ Animations panel ➤
Animation Play. In the Animation Preview dialog box, view the animation,
and do the following:
■If you want to preview the animation in a different visual style, select
another style from the drop-down list.
■If you are satisfied with the animation playback, click the Pause
button. Then click the Save button.
7In the Save As dialog box, select a file location, file name, and file type
(AVI, MPG, MOV, or WMV).
8Click Save.
To record a preview animation
1If the Animations panel is not displayed on the Render tab, right-click
the Render tab and click Panels ➤ Animations.
2Start any navigation command such as 3DORBIT.
3Click Render tab ➤ Animations panel ➤ Animation Record.
4Navigate through the model to record the movement.
5When you are finished recording the animation, click Render tab ➤
Animations panel ➤ Animation Pause.
6To review the animation, click Render tab ➤ Animations panel ➤
Animation Play. In the Animation Preview dialog box, view the recording
to verify that the animation is suitable for your presentation needs.
Create Preview Animations | 357

NOTE The playback of the animation gives you a general visual idea of the
final output. It may not display the visual style or with the same quality of
the final output.
7If you are satisfied with the animation, click the Pause button. Then click
the Save button.
8In the Save As dialog box, choose a location and file name.
NOTE To change the file type, click the Animation Settings button. In the
Animation Settings dialog box, Format option, click a file type. Click OK to
return to the Save As dialog box.
9Click Save.
Quick Reference
Commands
3DCLIP
Starts an interactive 3D view and opens the Adjust Clipping Planes window.
3DCORBIT
Rotates the view in 3D space with continuous motion.
3DDISTANCE
Starts the interactive 3D view and makes objects appear closer or farther
away.
3DFLY
Changes the 3D view in a drawing interactively to create the appearance of
flying through the model.
3DFORBIT
Rotates the view in 3D space without constraining roll.
3DORBIT
Rotates the view in 3D space, but constrained to horizontal and vertical orbit
only.
358 | Chapter 11 Use Viewing Tools
3DORBITCTR
Sets the center of rotation in 3D Orbit view.
3DPAN
When a drawing is in a Perspective view, starts the interactive 3D view and
enables you to drag the view horizontally and vertically.
3DSWIVEL
Changes the target of the view in the direction that you drag.
3DWALK
Changes the 3D view in a drawing interactively to create the appearance of
walking through the model.
3DZOOM
Zooms in and out in a perspective view.
Create Motion Path Animations
Motion path animations, such as 3D animated walk-throughs of a model,
allow you to visually demonstrate a model to both a technical and
non-technical audience. You can record and play back a navigation to
communicate your design intent dynamically.
Control a Camera Motion Path
You control the camera motion, and therefore the animation, by linking the
camera and its target to a point or a path.
To create an animation using motion paths, you link the camera and its target
to either a point or a path. If you want the camera to remain still, link it to a
point. If you want the camera to move along a path, link it to a path.
If you want the target to remain still, link it to a point. If you want the target
to move, link it to a path. You cannot link both the camera and the target to
a point.
Use the same path when you want the animation view to follow in line with
the camera's path. You do this by setting the target's path to None in the
Motion Path Animation dialog box. This is the default setting.
Create Motion Path Animations | 359
NOTE To link a camera or target to a path, you must create the path object before
you create the motion path animation. A path can be a line, arc, elliptical arc,
circle, polyline, 3D polyline, or spline.
To create a motion path animation
1In the drawing, create a path object for either the camera or the target.
A path can be a line, arc, elliptical arc, circle, polyline, 3D polyline, or
spline.
NOTE The path you create is not visible in the animation.
2If the Animations panel is not displayed on the Render tab, right-click
the Render tab and click Panels ➤ Animations.
3Click Render tab ➤ Animations panel ➤ Animation Motion Path.
4In the Motion Path Animation dialog box, Camera section, click either
Point or Path.
5Do one of the following:
■To specify a new camera point, click the Pick Point button, and specify
a point in the drawing. Enter a name for the point. Click OK.
■To specify a new camera path, click the Select Path button, and specify
a path in the drawing. Enter a name for the path. Click OK.
■To specify an existing camera point or path, select it from the
drop-down list.
6In the Motion Path Animation dialog box, Target section, click either
Point or Path.
7Do one of the following:
■To specify a new target point, click the Pick Point button, and specify
a point in the drawing. Enter a name for the point. Click OK.
■To specify a new target path, click the Select Path button, and specify
a path in the drawing. Enter a name for the path. Click OK.
■To specify an existing target point or path, select it from the
drop-down list.
360 | Chapter 11 Use Viewing Tools

8In the Animation Settings section, adjust the animation settings to create
the animation to suit your needs.
9When you have finished adjusting the points, paths, and settings, click
Preview to view the animation, or OK to save it.
Quick Reference
Commands
ANIPATH
Saves an animation file of a camera moving or panning in a 3D model.
Specify Motion Path Settings
You determine the format of the animation file of a motion path animation
by specifying settings in the Motion Path Animation dialog box.
Several settings control the animation's frame rate, duration, resolution, visual
style, and file format.
To view a reverse motion path animation
1If the Animations panel is not displayed on the Render tab, right-click
the Render tab and click Panels ➤ Animations.
2Click Render tab ➤ Animations panel ➤ Animation Motion Path.
3In the Motion Path Animation dialog box, Animation Settings section,
click the Reverse check box.
4Click OK.
To control the speed and duration of the animation
1If the Animations panel is not displayed on the Render tab, right-click
the Render tab and click Panels ➤ Animations.
Specify Motion Path Settings | 361

2Click Render tab ➤ Animations panel ➤ Animation Motion Path.
3In the Motion Path Animation dialog box, Animation Settings section,
specify a Frame rate (FPS).
4Do one of the following:
■Specify a number of frames.
■Specify a duration, in seconds.
5Click Preview or OK.
To set animation resolution
1If the Animations panel is not displayed on the Render tab, right-click
the Render tab and click Panels ➤ Animations.
2Click Render tab ➤ Animations panel ➤ Animation Motion Path.
3In the Motion Path Animation dialog box, Animation Settings section,
select a resolution from the Resolution drop-down list.
To set the video format
1If the Animations panel is not displayed on the Render tab, right-click
the Render tab and click Panels ➤ Animations.
2Click Render tab ➤ Animations panel ➤ Animation Motion Path.
3In the Motion Path Animation dialog box, Animation Settings section,
click a video format (AVI, MPG, MOV, or WMV) from the Format
drop-down list.
362 | Chapter 11 Use Viewing Tools

Quick Reference
Commands
ANIPATH
Saves an animation file of a camera moving or panning in a 3D model.
Record a Motion Path Animation
You can preview the animation before you record it and then save it in the
desired format.
To preview and save a motion path animation
1If the Animations panel is not displayed on the Render tab, right-click
the Render tab and click Panels ➤ Animations.
2Click Render tab ➤ Animations panel ➤ Animation Motion Path.
3In the Motion Path Animations dialog box, do the following:
■Specify a point or path for the camera.
■Specify a point or path for the target.
■Adjust any animation settings.
4To preview the animation, click the Preview button.
5In the Animation Preview window, view the animation. When the preview
animation is complete, close the Animation Preview window.
6In the Motion Path Animations dialog box, click OK.
7In the Save As dialog box, specify a file name and location to save the
animation file.
8Click Save.
Record a Motion Path Animation | 363
Quick Reference
Commands
ANIPATH
Saves an animation file of a camera moving or panning in a 3D model.
Use Navigation Bar
Unified and product-specific navigation tools can be accessed from the
navigation bar.
Available Navigation Tools
The navigation bar is a user interface element where you can access both
unified and product-specific navigation tools.
Unified navigation tools (such as Autodesk®, ViewCube ®, ShowMotion®,
3Dconnexion®, and SteeringWheels®) are those that can be found across many
Autodesk products. Product-specific navigation tools are unique to a product.
The navigation bar floats over and along one of the sides of the current model’s
window.
You start navigation tools by clicking one of the buttons on the navigation
bar or selecting one of the tools from a list that is displayed when you click
the smaller portion of a split button.
The following unified navigation tools are available from the navigation bar:
■ViewCube. Indicates the current orientation of a model and is used to
reorient the current view of a model.
■SteeringWheels. Collection of wheels that offer rapid switching between
specialized navigation tools.
■ShowMotion. User interface element that provides an onscreen display for
creating and playing back cinematic camera animations for design review,
presentation, and bookmark-style navigation.
■3Dconnexion. Set of navigation tools used to reorient the current view of
a model with a 3Dconnexion 3D mouse.
364 | Chapter 11 Use Viewing Tools

The following product-specific navigation tools are available from the
navigation bar:
■Pan. Moves the view parallel to the screen.
■Zoom tools. Set of navigation tools for increasing or decreasing the
magnification of the current view of a model.
■Orbit tools. Set of navigation tools for rotating the current view of a model.
Use the Navigation Bar in Paper Space
In paper space, only the 2D navigation tools (such as 2D SteeringWheels, Pan,
Zoom, and the 2D Mode 3Dconnexion tools) are accessible.
See also:
■Use ViewCube on page 295
■Navigate with SteeringWheels on page 310
■Define and Change Views with ShowMotion on page 340
■Pan or Zoom a View on page 235
■Use 3D Navigation Tools on page 287
■Walk and Fly Through a Drawing on page 290
Quick Reference
Command
NAVBAR
Provides access to navigation and orientation tools from a single interface.
System Variable
NAVBARDISPLAY
Controls the display of the navigation bar in all viewports.
Available Navigation Tools | 365
Reposition and Reorient the Navigation Bar
The position and orientation of the navigation bar can be adjusted by linking
it to the ViewCube tool, docking it when the ViewCube tool is not displayed,
or freely positioning it along one of the edges of the current window.
When linked to the ViewCube tool, the navigation bar is positioned above or
below the ViewCube tool and in a vertical orientation. When not linked or
docked, the navigation bar can be freely aligned along one of the edges of the
current model’s window.
You can specify how the navigation bar can be repositioned from the
Customize menu. When the navigation bar is not linked to the ViewCube
tool or docked, a grip handle is displayed. Drag the grip handle on the
navigation bar to reposition it along one of the sides of the current model’s
window.
If the side of the window that the navigation bar is aligned to is not long
enough to show the entire navigation bar, it is truncated to fit. When
truncated, a More Controls button is displayed and replaces the Customize
button. When you click the More Controls button, a menu is displayed that
contains the navigation tools that are not currently being displayed.
To reposition the navigation bar and ViewCube
1On the navigation bar, click Customize.
2Click Customize menu ➤ Docking Positions ➤ check Link to ViewCube.
When Link to ViewCube is checked, both the navigation bar and
ViewCube are repositioned together around the current window. When
ViewCube is not displayed, the navigation bar is docked in the same
location in which ViewCube would be instead.
3Click Customize menu ➤ Docking Positions ➤ and then a docking
position.
The navigation bar and ViewCube are repositioned.
To link the position of the navigation bar to ViewCube
1On the navigation bar, click Customize.
2Click Customize menu ➤ Docking Positions ➤ check Link to ViewCube.
366 | Chapter 11 Use Viewing Tools
When Link to ViewCube is checked, both the navigation bar and
ViewCube are repositioned together around the current window.
To freely reposition the navigation bar along the edge of the current window
1On the navigation bar, click Customize.
2Click Customize menu ➤ Docking Positions ➤ uncheck Link to
ViewCube.
The grip handle for the navigation bar is displayed along the top of the
navigation bar.
3Click the grip handle and drag the navigation bar along the edge of the
window where you want it displayed. Release the button on the pointing
device to orient the navigation bar along the edge of the window.
4Drag the navigation bar along the window’s edge to adjust its position
along the window’s edge.
To display or hide the navigation bar
1Click View Tab ➤ Windows panel ➤ User Interface drop-down ➤
Navigation Bar.
2Select or clear Navigation Bar.
Quick Reference
Command
NAVBAR
Provides access to navigation and orientation tools from a single interface.
System Variables
NAVBARDISPLAY
Controls the display of the navigation bar in all viewports.
Control the Display of Navigation Tools on the Navigation Bar
You can control which unified and product-specific navigation tools are
displayed on the navigation bar with the Customize menu.
Control the Display of Navigation Tools on the Navigation Bar | 367
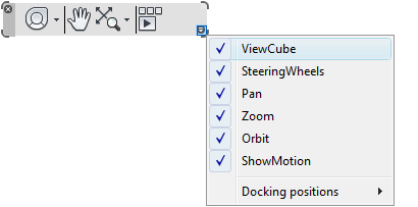
The Customize menu is displayed by clicking the Customize button on the
lower-right side of the navigation bar. From the Customize menus, you click
the navigation tools that you want displayed on the navigation bar. The
position of the navigation tools on the navigation bar is predefined and cannot
be changed.
The ViewCube button is displayed on the navigation bar only when the
ViewCube tool is hidden in the current window.
The 3Dconnexion button is displayed on the navigation bar only after the
3Dconnexion driver is installed and enabled.
To customize the navigation bar
1On the navigation bar, click Customize.
2On the Customize menu, click the navigation tool you want to display
on the navigation bar.
A check mark next to a navigation tool’s name indicates it is displayed
on the navigation bar. Uncheck the navigation tool to remove it from
the navigation bar.
Alternately, right click a tool from the navigation bar and click Remove From
Navigation Bar.
Quick Reference
Command
NAVBAR
Provides access to navigation and orientation tools from a single interface.
368 | Chapter 11 Use Viewing Tools
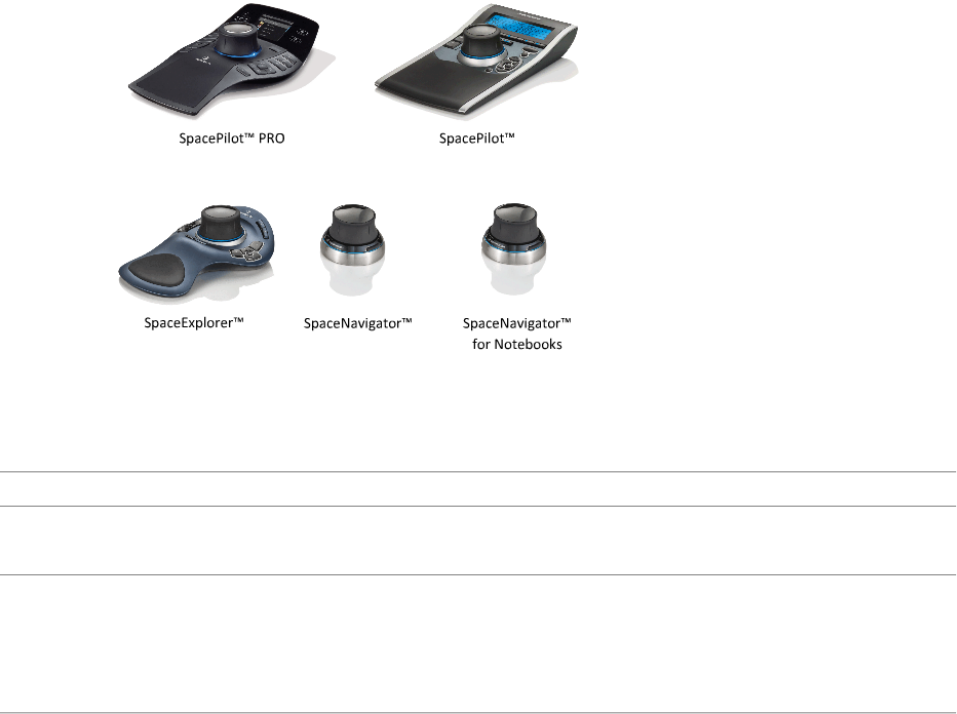
System Variables
NAVBARDISPLAY
Controls the display of the navigation bar in all viewports.
Use 3Dconnexion 3D mouse to Navigate Views
A 3Dconnexion 3D mouse is used to reorient and navigate a model’s view.
The device has a pressure sensitive controller cap designed to flex in all
directions. Push, pull, twist, or tilt the cap to pan, zoom, and rotate the current
view.
When a view change occurs with the 3Dconnexion 3D mouse, the ViewCube
tool is reoriented to reflect the current view. You can change the behavior of
the 3Dconnexion 3D mouse from the navigation bar.
3Dconnexion options on the navigation bar
ExampleDescriptionOption
Move the controller cap right to pan the
view to the right.
Navigates and reorients the view in the
direction of the controller cap.
Object Mode
Move the controller cap up to elevate the
view. This makes the model appear to
move down.
Simulates walking through a model. The
view of the model is moved in the opposite
direction of the controller cap. The orient-
Walk Mode
ation and height of the current view is
maintained.
Use 3Dconnexion 3D mouse to Navigate Views | 369

ExampleDescriptionOption
Move the controller cap up to elevate the
view. This makes the model appear to
move down.
Simulates flying through a model. The view
of the model is moved in the opposite dir-
ection of the controller cap. The orienta-
Fly Mode
tion and height of the current view is not
maintained.
Move the controller cap to pan and zoom
the view.
Navigates the view using only 2D naviga-
tion options. The view moves in the direc-
tion of the controller cap.
2D Mode
Adjust the navigation speed used for view
changes.
Displays 3Dconnexion Settings dialog box
to change the settings of the 3Dconnexion
3D mouse.
3Dconnexion Settings
In locked viewports, navigation bar options are disabled including
3Dconnexion tool options. Moving the controller cap of the 3Dconnexion
3D mouse will only pan and zoom the object.
NOTE While 3Dconnexion and other navigation tools are in synchronization,
using one temporarily disables the other.
Use View Management Keys in 3Dconnexion 3D Mouse
You can access different views (such as Top, Front, Left, Right, or Home) with
buttons available on some 3Dconnexion 3D mouse models. Use the Button
Configuration Editor to customize the operations of these buttons. When you
click any of these buttons on the device, you can
■Fit the view to the model extents. Rotates the view of the object around
the center of the scene and zooms out to fit the scene into the viewport.
■Reorient the current view to a preset view. Returns the view of the object
to a predetermined view.
■Maintain selection sensitivity. Reorients the model around a defined pivot
point based on the current selection.
370 | Chapter 11 Use Viewing Tools
Quick Reference
Command
NAVBAR
Provides access to navigation and orientation tools from a single interface.
System Variables
NAVBARDISPLAY
Controls the display of the navigation bar in all viewports.
Use 3Dconnexion 3D mouse to Navigate Views | 371
372
Display Multiple Views in
Model Space
To see several views at the same time, you can split the drawing area of the Model tab into
separate viewing areas called model space viewports. You can save arrangements of model space
viewports for reuse at any time.
Set Model Space Viewports
On the Model tab, you can split the drawing area into one or more adjacent
rectangular views known as model space viewports.
Viewports are areas that display different views of your model. As you work on
the Model tab, you can split the drawing area into one or more adjacent
rectangular views known as model space viewports. In large or complex drawings,
displaying different views reduces the time needed to zoom or pan in a single
view. Also, errors you might miss in one view may be apparent in the others.
Viewports created on the Model tab completely fill the drawing area and do not
overlap. As you make changes in one viewport, the others are updated
simultaneously. Three model space viewports are shown in the illustration.
12
373
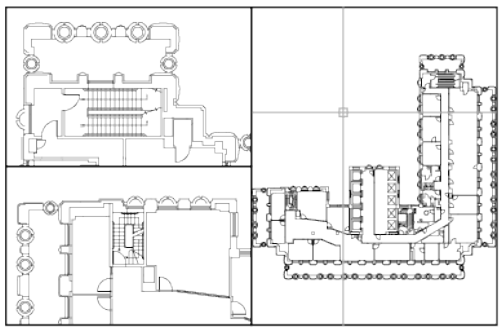
You can also create viewports on a layout tab. You use those viewports, called
layout viewports, to arrange the views of your drawing on a sheet. You can move
and resize layout viewports. By using layout viewports, you have more control
over the display; for example, you can freeze certain layers in one layout
viewport without affecting the others. For more information about layouts
and layout viewports, see Create Multiple-View Drawing Layouts (Paper Space)
on page 391.
Use Model Space Viewports
With model space viewports, you can do the following:
■Pan; zoom; set Snap, Grid, and UCS icon modes; and restore named views.
■Save user coordinate system orientations with individual viewports.
■Draw from one viewport to another when executing a command.
■Name a viewport arrangement so that you can reuse it on the Model tab
or insert it on a layout tab.
Setting up different coordinate systems in individual viewports is useful if you
typically work on 3D models. See Assign User Coordinate System Orientations
to Viewports on page 574.
Split and Join Model Space Viewports
The illustrations below show several default model space viewport
configurations.
374 | Chapter 12 Display Multiple Views in Model Space
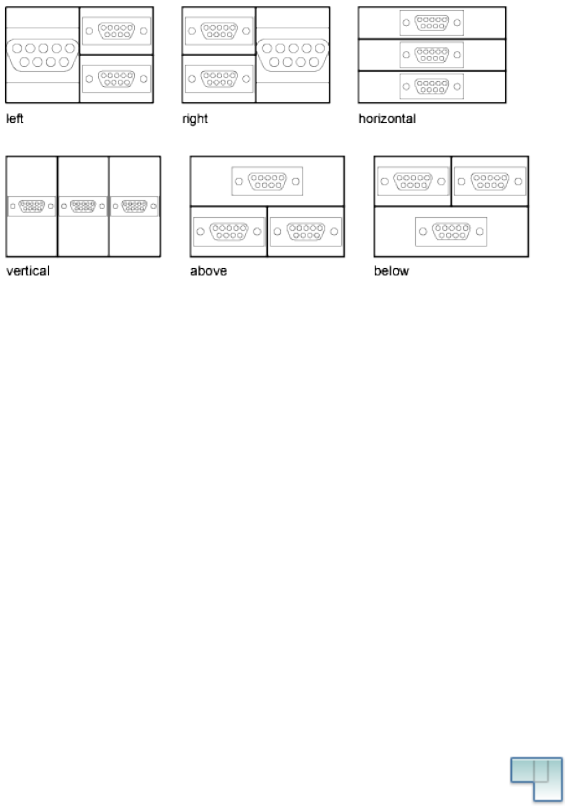
You can easily modify model space viewports by splitting and joining them.
If you want to join two viewports, they must share a common edge of the
same length.
To subdivide a viewport on the Model tab
1If you have more than one viewport, click inside the viewport you want
to subdivide.
2To indicate how many model space viewports should be created, do one
of the following:
■Click View menu ➤ Viewports ➤ 2 Viewports.
■ClickView menu ➤ Viewports ➤ 3 Viewports.
■Click Viewmenu ➤ Viewports ➤ 4 Viewports.
3At the Next prompt, specify the arrangement of the new viewports.
To join two viewports on the Model tab
1Click View tab ➤ Viewports panel ➤ Viewports, Join.
2Click within the model space viewport containing the view you want to
keep.
3Click within an adjacent viewport to join it to the first viewport.
Set Model Space Viewports | 375

To restore a single viewport on the Model tab
■Click View tab ➤ Viewports panel ➤ New.
To switch from a layout tab to the Model tab
■Click the Model tab at the bottom of the drawing area.
Quick Reference
Commands
MODEL
Switches from a layout tab to the Model tab.
VPORTS
Creates multiple viewports in model space or paper space.
System Variables
MAXACTVP
Sets the maximum number of viewports that can be active at one time in a
layout.
CTAB
Returns the name of the current (model or layout) tab in the drawing.
TILEMODE
Makes the Model tab or the last layout tab current.
Select and Use the Current Viewport
When you use multiple viewports, one of them is the current viewport, which
accepts cursor input and view commands.
When a viewport is current, the cursor is displayed as crosshairs rather than
an arrow, and the viewport boundary is highlighted. You can change the
current viewport at any time except when a View command is in progress.
To make a viewport the current viewport, you click inside it or press Ctrl+R
to cycle through the existing viewports.
376 | Chapter 12 Display Multiple Views in Model Space
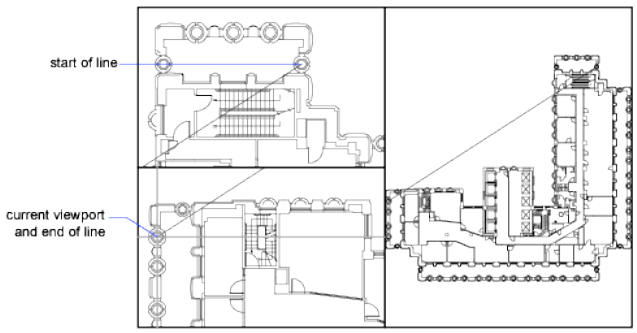
To draw a line using two model space viewports, you start the line in the
current viewport, make another viewport current by clicking within it, and
then specify the endpoint of the line in the second viewport. In a large
drawing, you can use this method to draw a line from a detail in one corner
to a detail in a distant corner.
To make a viewport current
■Click anywhere within the viewport border.
To cycle through viewports without clicking
■Press Ctrl+ R repeatedly.
Quick Reference
System Variables
CVPORT
Displays the identification number of the current viewport.
VIEWCTR
Stores the center of view in the current viewport.
VIEWSIZE
Stores the height of the view displayed in the current viewport, measured in
drawing units.
Select and Use the Current Viewport | 377
Save and Restore Model Tab Viewport Arrangements
Arrangements of model viewports can be saved and restored by name.
You don't have to set up viewports and views every time you need them. With
VPORTS, viewport arrangements can be saved and later restored by name.
Settings that are saved with viewport arrangements include
■The number and position of viewports
■The views that the viewports contain
■The grid and snap settings for each viewport
■The UCS icon display setting for each viewport
You can list, restore, and delete the available viewport arrangements. A
viewport arrangement saved on the Model tab can be inserted on a layout
tab.
To save and name a viewport arrangement
1Click View tab ➤ Viewports panel ➤ New.
2In the Viewports dialog box, New Viewports tab, enter a name for the
viewport configuration in the New Name box.
The name can be up to 255 characters long and contain letters, digits,
the special characters dollar sign ($), hyphen (-), and underscore (_).
3Click OK.
NOTE You can save a viewport arrangement only on the Model tab.
To restore a saved viewport arrangement
1Click View tab ➤ Viewports panel ➤ Named.
2In the Viewports dialog box, Named Viewports tab, select the name of
the viewport configuration from the list.
3Click OK.
378 | Chapter 12 Display Multiple Views in Model Space
To delete a saved viewport arrangement
1Click View tab ➤ Viewports panel ➤ Named.
2In the Viewports dialog box, Named Viewports tab, select the name of
the viewport configuration you want to delete.
3Press DELETE.
To view a list of saved viewport arrangements
■Click View tab ➤ Viewports panel ➤ Named.
The Viewports dialog box is displayed.
All saved viewport arrangements in the drawing are listed on the Named
Viewports tab under Named Viewports.
Quick Reference
Commands
RENAME
Changes the names assigned to items such as layers and dimension styles.
VPORTS
Creates multiple viewports in model space or paper space.
Save and Restore Model Tab Viewport Arrangements | 379
380
Part 5: Organize Drawings
and Layouts
381
382
Create Single-View
Drawings (Model Space)
If you are going to create a two dimensional drawing that has one view, you can create the
drawing and its annotation entirely in model space. This is the traditional method for creating
drawings with AutoCAD®.
With this method, you create the building, mechanical part, or geographic area that you want
to represent at full scale (1:1), but you create the text, dimensions, and the title block of the
drawing at a scale to match the intended plot scale.
Quick Start for Model Space Drafting
The process of creating and plotting a drawing file in model space is very
different from the process used in manual drafting.
In AutoCAD, there are two distinct working environments that are represented
by the Model and layout tabs. These tabs are located near the bottom of the
drawing area.
If you are going to create a two-dimensional drawing that has one view, you
can create both the model and its annotation entirely in model space, not using
a layout tab. This is the traditional method for creating drawings with AutoCAD.
This method is simple but has several limitations, including
■It is suitable for 2D drawings only
■It does not support multiple views and view-dependent layer settings
■Scaling the annotation and title block requires computation unless you use
objects.
13
383
With this method, you always draw geometric objects at full scale (1:1) and
text, dimensions, and other annotation at a scale that will appear at the correct
size when the drawing is plotted.
For information about using annotative objects and scaling annotations
automatically, see Scale Annotations on page 1224.
See also:
■Create Multiple-View Drawing Layouts (Paper Space) on page 391
■Work with Sheets in a Sheet Set on page 431
Quick Reference
Commands
MODEL
Switches from a layout tab to the Model tab.
RENAME
Changes the names assigned to items such as layers and dimension styles.
VPORTS
Creates multiple viewports in model space or paper space.
System Variables
CVPORT
Displays the identification number of the current viewport.
MAXACTVP
Sets the maximum number of viewports that can be active at one time in a
layout.
TILEMODE
Makes the Model tab or the last layout tab current.
VIEWCTR
Stores the center of view in the current viewport.
384 | Chapter 13 Create Single-View Drawings (Model Space)
VIEWSIZE
Stores the height of the view displayed in the current viewport, measured in
drawing units.
Draw, Scale, and Annotate in Model Space
If you draw and plot from model space, you must determine and apply a scale
factor to annotate objects before you plot.
You can draw and plot entirely from model space. This method is useful
primarily for two-dimensional drawings that have a single view. With this
method, you use the following process:
■Determine the unit of measurement (drawing units) for the drawing.
■Specify the display style for the drawing unit.
■Calculate and set the scale for dimensions, annotations, and blocks.
■Draw at full scale (1:1) in model space.
■Create the annotation and insert the blocks in model space.
■Plot the drawing at the predetermined scale.
You can also use objects if you want to scale annotations automatically. For
information about using annotative objects and scaling annotations
automatically, see Scale Annotations on page 1224.
Determine the Unit of Measurement
Before you begin drawing in model space, you determine the unit of
measurement (drawing units) that you plan to use. You decide what each unit
on the screen represents, such as an inch, a millimeter, a kilometer, or some
other unit of measurement. For example, if you are drawing a motor part, you
might decide that one drawing unit equals a millimeter. If you are drawing a
map, you might decide that one unit equals a kilometer.
Specify the Display Style of Drawing Units
Once you have determined a drawing unit for the drawing, you need to specify
the style for displaying the drawing unit, which includes the unit type and
precision. For example, a value of 14.5 can be displayed as 14.500, 14-1/2, or
1'2-1/2".
Draw, Scale, and Annotate in Model Space | 385
Specify the display style of drawing units with the UNITS command. The
default drawing unit type is decimal.
Set the Scale for Annotations and Blocks
Before you draw, you should set the scale for dimensions, annotations, and
blocks in your drawings. Scaling these elements beforehand ensures that they
are at the correct size when you plot the final drawing.
You should enter the scale for the following objects:
■Text. Set the text height as you create text or by setting a fixed text height
in the text style (STYLE).
■Dimensions. Set the dimension scale in a dimension style (DIMSTYLE) or
with the DIMSCALE system variable.
■Linetypes. Set the scale for noncontinuous linetypes with the CELTSCALE
and LTSCALE system variables.
■Hatch patterns. Set the scale for hatch patterns in the Hatch and Gradient
dialog box (HATCH) or with the HPSCALE system variable.
■Blocks. Specify the insertion scale for blocks either as you insert them, or
set an insertion scale in the Insert dialog box (INSERT) or in DesignCenter
(ADCENTER). The system variables used for inserting blocks are INSUNITS,
INSUNITSDEFSOURCE, and INSUNITSDEFTARGET. This also applies to
the border and title block of the drawing.
You can also use objects if you want to scale annotations automatically. For
information about using annotative objects and scaling annotations
automatically, see Scale Annotations on page 1224.
Determine the Scale Factor for Plotting
To plot your drawing from the Model tab, you calculate the exact scale factor
by converting the drawing scale to a ratio of 1:n. This ratio compares plotted
units to drawing units that represent the actual size of the objects you are
drawing.
For example, if you plan to plot at a scale of 1/4 inch = 1 foot, you would
calculate the scale factor 48 as follows:
1/4" = 12"
1 = 12 x 4
1 (plotted unit) = 48 (drawing units)
386 | Chapter 13 Create Single-View Drawings (Model Space)
Using the same calculation, the scale factor for 1 centimeter = 1 meter is 100,
and the scale factor for 1 inch = 20 feet is 240.
Sample Scale Ratios
The sample architectural scale ratios in the table can be used to calculate text
sizes in model space.
Set drawing text
size to
To plot text size
at
Scale factorScale
30 cm3 mm1001 cm = 1 m
12"1/8"961/8" = 1'-0"
8"1/8"643/16" = 1'-0"
6"1/8"481/4" = 1'-0"
4"1/8"323/8" = 1'-0"
3"1/8"241/2" = 1'-0"
2"1/8"163/4" = 1'-0"
1.5"1/8"121" = 1'-0"
1.0"1/8"81 1/2" = 1'-0"
If you are working in metric units, you might have a sheet size of 210 x 297
mm (A4 size) and a scale factor of 20. You calculate grid limits as follows:
210 x 20 = 4200 mm
297 x 20 = 5900 mm
See also:
■Specify Units and Unit Formats on page 167
To specify the display style for drawing units
1Click Format menu ➤ Units.
Draw, Scale, and Annotate in Model Space | 387
2In the Drawing Units dialog box, set the unit values for your drawing.
3As you change unit settings, you can see examples under Sample Output.
■Under Length, select a unit type and level of precision. This determines
the display style for linear drawing units.
■Under Drawing Units for DesignCenter Blocks, select the unit that
you want used to scale blocks, images, or other content inserted into
the drawing. If you do not want inserted content to be scaled, select
Unitless.
■Under Angle, select an angle type and precision. This determines the
display style for angular drawing units. The default starting angle, 0
degrees, is toward 3 o'clock (or east).
■To specify an angle direction, click Direction, and then select the base
angle in the Direction Control dialog box. The angle direction controls
the point from which angles are measured and the direction in which
they are measured. If you select Other, you can enter an angle, or click
Angle to specify an angle using your pointing device. The default
positive angle measurement is counterclockwise.
4Click OK to exit each dialog box.
Quick Reference
Commands
ADCENTER
Manages and inserts content such as blocks, xrefs, and hatch patterns.
DIMSTYLE
Creates and modifies dimension styles.
INSERT
Inserts a block or drawing into the current drawing.
LINETYPE
Loads, sets, and modifies linetypes.
PLOT
Plots a drawing to a plotter, printer, or file.
388 | Chapter 13 Create Single-View Drawings (Model Space)
STYLE
Creates, modifies, or specifies text styles.
UNITS
Controls coordinate and angle display formats and precision.
System Variables
CELTSCALE
Sets the current object linetype scaling factor.
DIMSCALE
Sets the overall scale factor applied to dimensioning variables that specify
sizes, distances, or offsets.
HPSCALE
Sets the hatch pattern scale factor.
HPSPACE
Sets the hatch pattern line spacing for user-defined patterns.
INSUNITS
Specifies a drawing-units value for automatic scaling of blocks, images, or
xrefs when inserted or attached to a drawing.
INSUNITSDEFSOURCE
Sets source content units value when INSUNITS is set to 0.
INSUNITSDEFTARGET
Sets target drawing units value when INSUNITS is set to 0.
LTSCALE
LUNITS
Sets linear units.
TEXTSIZE
Sets the default height for new text objects drawn with the current text style.
Draw, Scale, and Annotate in Model Space | 389
390

Create Multiple-View
Drawing Layouts (Paper
Space)
Paper space is a sheet layout environment where you can specify the size of your sheet, add a
title block, display multiple views of your model, and create dimensions and notes for your
drawing.
Quick Start for Layouts
There are two distinct working environments, or “spaces,” in which you can
create objects in a drawing. These are represented by the Model and layout tabs.
Typically, a model composed of geometric objects is created in a
three-dimensional space called model space. A final layout of specific views and
annotations of this model is created in a two-dimensional space called paper
space. These spaces are accessible on two or more tabs near the bottom of the
drawing area: the Model tab and one or more layout tabs.
NOTE These tabs can be hidden, appearing instead as buttons on the status bar at
the bottom-center of the application window.
Working on the Model tab, you draw a model of your subject at 1:1 scale.
Working on a layout tab, you can create one or more layout viewports, dimensions,
notes, and a title block to represent a drawing sheet.
14
391
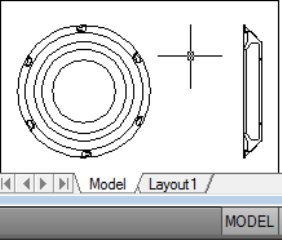
Each layout viewport is like a picture frame containing a “photograph” of the
model in model space. Each layout viewport contains a view that displays the
model at the scale and orientation that you specify. You can also specify which
layers are visible in each layout viewport.
After you finish arranging the layout, you turn off the layer that contains the
layout viewport objects. The views are still visible, and you can plot the layout
without displaying the viewport boundaries.
Quick Reference
LAYOUT
Creates and modifies drawing layout tabs.
LAYOUTWIZARD
Creates a new layout tab and specifies page and plot settings.
MODEL
Switches from a layout tab to the Model tab.
MSPACE
In a layout, switches from paper space to model space in a layout viewport.
MVIEW
Creates and controls layout viewports.
PAGESETUP
Controls the page layout, plotting device, paper size, and other settings for
each new layout.
392 | Chapter 14 Create Multiple-View Drawing Layouts (Paper Space)

PSETUPIN
Imports a user-defined page setup into a new drawing layout.
PSPACE
In a layout, switches from model space in a viewport to paper space.
VPORTS
Creates multiple viewports in model space or paper space.
VPLAYER
Sets layer visibility within viewports.
MAXACTVP
Sets the maximum number of viewports that can be active at one time in a
layout.
PSLTSCALE
Controls the linetype scaling of objects displayed in paper space viewports.
TILEMODE
Makes the Model tab or the last layout tab current.
Understand the Layout Process
When you use a layout tab to prepare your drawing for plotting, you follow
a series of steps in a process.
You design the subject of your drawing on the Model tab (in model space)
and prepare it for plotting on a layout tab (in paper space).
There is one Model tab and one or more layout tabs at the bottom of the
drawing window.
NOTE These tabs can be hidden, appearing instead as buttons on the status bar
at the bottom-center of the application window.
You can initialize a layout by clicking on its tab to activate the previously
unused layout. A layout does not contain any plot settings before initialization.
Once initialized, layouts can be drawn upon, published, and added to sheet
sets as sheets (after the drawing has been saved).
Understand the Layout Process | 393
Process Summary
When you prepare a layout, you typically step through the following process:
■Create a model of your subject on the Model tab.
■Click a layout tab.
■Specify layout page settings such as plotting device, paper size, plot area,
plot scale, and drawing orientation.
■Insert a title block into the layout (unless you have started with a drawing
template that already has a title block).
■Create a new layer to be used for layout viewports.
■Create layout viewports and position them on the layout.
■Set the orientation, scale, and layer visibility of the view in each layout
viewport.
■Add dimensions and annotate in the layout as needed.
■Turn off the layer containing the layout viewports.
■Plot your layout.
You can also use objects if you want to annotate your drawing in model space
and scale the annotations automatically. For information about using
annotative objects and scaling annotations automatically, see Scale Annotations
on page 1224.
The other topics in this chapter provide additional detail on how to create,
use, and modify layouts and layout viewports.
Quick Reference
LAYOUT
Creates and modifies drawing layout tabs.
LAYOUTWIZARD
Creates a new layout tab and specifies page and plot settings.
MODEL
Switches from a layout tab to the Model tab.
394 | Chapter 14 Create Multiple-View Drawing Layouts (Paper Space)
MSPACE
In a layout, switches from paper space to model space in a layout viewport.
MVIEW
Creates and controls layout viewports.
PAGESETUP
Controls the page layout, plotting device, paper size, and other settings for
each new layout.
PLOT
Plots a drawing to a plotter, printer, or file.
PSETUPIN
Imports a user-defined page setup into a new drawing layout.
PSPACE
In a layout, switches from model space in a viewport to paper space.
VPLAYER
Sets layer visibility within viewports.
VPMAX
Expands the current layout viewport for editing.
VPMIN
Restores the current layout viewport.
VPORTS
Creates multiple viewports in model space or paper space.
LAYOUTREGENCTL
Specifies how the display list is updated in the Model tab and layout tabs.
MAXACTVP
Sets the maximum number of viewports that can be active at one time in a
layout.
TILEMODE
Makes the Model tab or the last layout tab current.
Understand the Layout Process | 395
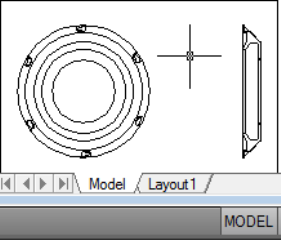
Work with Model Space and Paper Space
There are several benefits to switching between model space and paper space
to perform certain tasks. Use model space for creating and editing your model.
Use paper space for composing your drawing sheet and defining views.
Work on the Model Tab
The Model tab accesses a limitless drawing area called model space. In model
space, you draw, view, and edit your model.
In model space, you draw your model at 1:1 scale, and you decide whether
one unit represents one millimeter, one centimeter, one inch, one foot, or
whatever unit is most convenient or customary in your business.
On the Model tab, you can view and edit model space objects. The crosshairs
cursor is active over the entire drawing area.
In model space, you can also define named views that you display in layout
viewports on a layout.
To activate the Model tab
Do one of the following to make the Model tab current:
■Click the Model tab.
■Right-click any layout tab or the Model tab. Click Activate Model Tab.
■If the Model and layout tabs are hidden, click the Model button on the
status bar at the bottom of the application window.
396 | Chapter 14 Create Multiple-View Drawing Layouts (Paper Space)
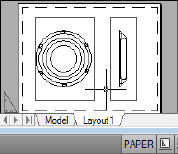
Quick Reference
MODEL
Switches from a layout tab to the Model tab.
MSPACE
In a layout, switches from paper space to model space in a layout viewport.
PSPACE
In a layout, switches from model space in a viewport to paper space.
LAYOUTREGENCTL
Specifies how the display list is updated in the Model tab and layout tabs.
MAXACTVP
Sets the maximum number of viewports that can be active at one time in a
layout.
TILEMODE
Makes the Model tab or the last layout tab current.
Work on a Layout Tab
Layout tabs access an area called paper space. In paper space, you place your
title block, create layout viewports to display views, dimension your drawing,
and add notes.
In paper space, one unit represents the paper distance on a plotted sheet. The
units will be in either millimeters or inches, depending on the plot setup for
your plotter.
On a layout tab, you can view and edit paper space objects, such as layout
viewports and title blocks. You can also move an object (such as a leader or a
title block) from model space to paper space (or vice versa). The crosshairs
cursor is active over the entire layout area.
Work on a Layout Tab | 397

NOTE These tabs can be hidden, appearing instead as buttons on the status bar
at the bottom-center of the application window. To display the tabs, right-click
the Model or layout button and click Display Layout and Model Tabs on the
shortcut menu.
Create Additional Layout Tabs
By default, a new drawing starts with two layout tabs, named Layout1 and
Layout2. If you use a drawing template or open an existing drawing, the layout
tabs in your drawing may be named differently.
You can create a new layout tab using one of the following methods:
■Add a new layout tab with no settings and then specify the settings in the
Page Setup Manager.
■Use the Create Layout wizard to create the layout tab and specify settings.
■Copy a layout tab and its settings from the current drawing file.
■Import a layout tab from an existing drawing template (DWT) file or
drawing (DWG) file.
NOTE You can create multiple layouts in a drawing; each layout can contain
different plot settings and paper sizes. However, to avoid confusion when
transmitting and publishing drawings, it is usually recommended that you create
only one layout for each drawing.
Use the Layout Wizard to Specify Layout Settings
You can create a new layout using the Create Layout wizard. The wizard
prompts you for information about the layout settings, including
■A name for the new layout
■The printer associated with the layout
■A paper size to use for the layout
■The orientation of the drawing on the paper
■A title block
■Viewport setup information
■A location for the viewport configuration in the layout
398 | Chapter 14 Create Multiple-View Drawing Layouts (Paper Space)
You can edit the information entered in the wizard later. Click Output
tab ➤ Plot panel ➤ Page Setup Manager.
To move an object from model space to paper space (or vice versa)
1Click Home tab ➤ Modify panel ➤ Change Space.
2Select one or more objects to move.
3Press Enter to end the command.
To activate the previous layout
1Right-click any layout tab or the Model tab.
2Click Activate Previous Layout.
To select all layouts
■Right-click any layout tab. Click Select All Layouts.
Quick Reference
LAYOUT
Creates and modifies drawing layout tabs.
LAYOUTWIZARD
Creates a new layout tab and specifies page and plot settings.
MODEL
Switches from a layout tab to the Model tab.
MSPACE
In a layout, switches from paper space to model space in a layout viewport.
MVIEW
Creates and controls layout viewports.
PAGESETUP
Controls the page layout, plotting device, paper size, and other settings for
each new layout.
Work on a Layout Tab | 399
PLOT
Plots a drawing to a plotter, printer, or file.
PSETUPIN
Imports a user-defined page setup into a new drawing layout.
PSPACE
In a layout, switches from model space in a viewport to paper space.
VPORTS
Creates multiple viewports in model space or paper space.
VPLAYER
Sets layer visibility within viewports.
CTAB
Returns the name of the current (model or layout) tab in the drawing.
CVPORT
Displays the identification number of the current viewport.
LAYOUTREGENCTL
Specifies how the display list is updated in the Model tab and layout tabs.
MAXACTVP
Sets the maximum number of viewports that can be active at one time in a
layout.
PLOTROTMODE
Controls the orientation of plots.
TILEMODE
Makes the Model tab or the last layout tab current.
Access Model Space from a Layout Viewport
You can access model space from a layout viewport to edit objects, to freeze
and thaw layers, and to adjust the view.
400 | Chapter 14 Create Multiple-View Drawing Layouts (Paper Space)

After creating viewport objects, you can access model space from a layout
viewport to perform the following tasks:
■Create and modify objects in model space inside the layout viewport.
■Pan the view inside the layout viewport and change layer visibility.
The method you use to access model space depends on what you plan to do.
Create and Modify Objects in a Layout Viewport
If you plan to create or modify objects, use the button on the status bar to
maximize the layout viewport. The maximized layout viewport expands to
fill the drawing area. The center point and the layer visibility settings of the
viewport are retained, and the surrounding objects are displayed.
You can pan and zoom while you are working in model space, but when you
restore the viewport to return to paper space, the position and scale of the
objects in the layout viewport are restored.
NOTE If you use PLOT while a viewport is maximized, the layout tab is restored
before the Plot dialog box is displayed. If you save and close the drawing while a
viewport is maximized, the drawing opens with the layout tab restored.
If you choose to switch to the Model tab to make changes, the layer visibility
settings are the settings for the drawing as a whole, not the settings for that
particular layout viewport. Also, the view is not centered or magnified the
same way it is in the layout viewport.
Adjust the View in a Layout Viewport
If you plan to pan the view and change the visibility of layers, double-click
within a layout viewport to access model space. The viewport border becomes
thicker, and the crosshairs cursor is visible in the current viewport only. All
active viewports in the layout remain visible while you work. You can freeze
and thaw layers in the current viewport in the Layer Properties Manager, and
you can pan the view. To return to paper space, double-click an empty area
on the layout outside a viewport. The changes you made are displayed in the
viewport.
If you set the scale in the layout viewport before you access model space, you
can lock the scale to prevent changes. When the scale is locked, you cannot
use ZOOM while you work in model space.
Access Model Space from a Layout Viewport | 401
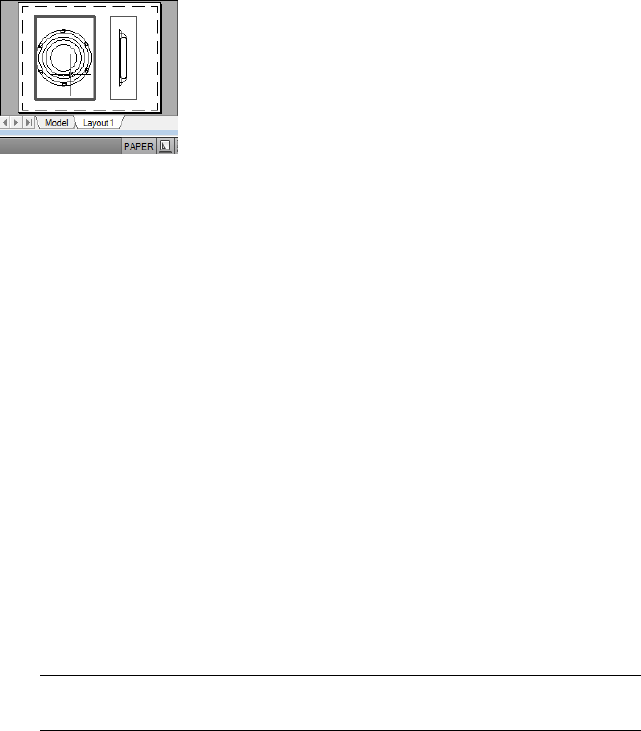
To switch between model space and paper space on a layout
On a layout, use one of the following methods:
■If you are in paper space, double-click within a layout viewport.
You are now in model space. The selected layout viewport becomes the
current viewport, and you can pan the view and change layer properties.
If you need to make significant changes to the model, it is recommended
that you use VPMAX to maximize the layout viewport or switch to the
Model tab.
■If you are in model space in a layout viewport, double-click outside the
viewport.
You are now in paper space. You can create and modify objects on the
layout.
■If you are in model space and want to switch to another layout viewport,
double-click within another layout viewport, or press Ctrl+R to cycle
through the existing layout viewports.
To edit in a maximized layout viewport
1Click the boundary of the layout viewport to select it.
NOTE You can maximize a locked viewport and modify objects. When you
restore the viewport, it is locked again.
2On the status bar, click the Maximize Viewport button.
You can restore the viewport and maximize another viewport by clicking
one of the arrows next to the Maximize Viewport button.
3Make any changes.
4To return to the layout viewport, click the Restore Viewport button on
the status bar.
The center point and magnification are returned to the settings that were
in effect before the viewport was maximized.
402 | Chapter 14 Create Multiple-View Drawing Layouts (Paper Space)
Quick Reference
MODEL
Switches from a layout tab to the Model tab.
MSPACE
In a layout, switches from paper space to model space in a layout viewport.
PSPACE
In a layout, switches from model space in a viewport to paper space.
VPMAX
Expands the current layout viewport for editing.
VPMIN
Restores the current layout viewport.
VPMAXIMIZEDSTATE
Indicates whether the viewport is maximized or not.
Export a Layout to Model Space
You can export all visible objects from the current layout to model space.
You can export all visible objects from the current layout to the model space
with the EXPORTLAYOUT command. Objects that are outside the boundaries
of “paper” in the layout are also exported.
Some objects are not exported to the model space drawing. The objects are
■Materials
■Cameras
■Lights
■Named views
■Objects on layers that are disabled (off) or frozen
■Model space objects not visible in a given viewport
Export a Layout to Model Space | 403
Changes to Exported Objects
When exported, some objects become a different object type, or are modified
in order to maximize visual fidelity with the layout.
Representation in Exported DrawingObject Type
Dimensions that exceed the boundaries of the layout viewport
are exploded.
Dimensions
Dimensional constraints are removed.Constraints
Standard or dynamic blocks, with or without attributes, that
exceed the boundaries of the layout viewport will be converted
Standard or dynamic
block (with or without
attributes) to a new, anonymous block. Attributes are converted to text
objects in the block.
NOTE The “Allow Exploding” setting (a setting on the block
definition) is ignored if the block exceeds the boundaries of
the layout viewport.
Objects become non-annotative.Annotative objects
An Xref with nested objects that exceed the boundaries of the
layout viewport is converted to a block reference and exploded.
External reference
(xref)
Layout viewports are represented by either a polyline or the
clipped viewport object.
Layout viewport
Custom objects are exploded and converted to anonymous
blocks.
Custom objects
Xrefs clipped with the XCLIP command are converted to a
clipped block reference.
Xref clipped with the
XCLIP command
The 2D wireframe visual style is used.Visual Styles
Objects within a perspective viewport will have parallel projec-
tion.
Perspective viewports
NOTE Objects that can be directly trimmed without changing their types are not
listed on the table.
404 | Chapter 14 Create Multiple-View Drawing Layouts (Paper Space)

Visual Changes to Objects
Not all objects when displayed in a layout will display the same in the Model
tab of the exported drawing. This includes (but is not limited to) the following
instances:
■The same object displayed in multiple viewports becomes multiple objects
in the exported model space drawing. In addition, objects are transformed
and often scaled. Both of these can affect data extraction of blocks.
■Some objects are converted or exploded in order to trim them.
■Viewports in a layout can each have a different visual style; only a single
visual style can be used in model space.
■Polylines with width that is clipped by the viewport boundary may not
be accurately trimmed in the exported drawing.
Recommendations
When exporting a layout to model space, consider the following:
■The performance of the EXPORTLAYOUT command may be slower if a
model space viewport is active.
■In the exported drawing, the viewport displays the original linetype, which
may not match the look of the original drawing. If this happens, assign
“Continuous” linetype to viewports in the original drawing.
■Linetype scaling may not be accurately maintained for objects in xrefs and
blocks if PSLTSCALE is 0.
■If you have a problem with xrefs during export, detach unresolved xrefs
or manually bind xrefs and then use the EXPORTLAYOUT command.
■Superhatch objects (from Express Tools) are exported, but the hatching
may not stay within the original boundaries. You can use the TRIM
command in the exported drawing to correct any problems with visual
appearance.
To export a layout to a model space drawing
1Click File menu ➤ Export Layout to Model.
NOTE You can use the EXPORTLAYOUT command only from a layout tab.
Export a Layout to Model Space | 405

2In the Export Layout to Model Space Drawing dialog box, enter a file
name.
3Specify the location where you want to save the file. The default location
is the location of the current drawing.
4Click Save.
To achieve better visual fidelity for a drawing containing AEC objects
1In an open drawing, enter aectoacad. The AECTOACAD command creates
a new DWG file with all AEC objects exploded into basic AutoCAD objects.
NOTE It is also recommended to select Insert as the bind type when using
the AECTOACAD command.
2Navigate to the converted drawing. Click Open.
3On the command line, enter exportlatyout.
Quick Reference
EXPORTLAYOUT
Creates a visual representation of the current layout in the model space of a
new drawing.
Create and Modify Layout Viewports
You can create a single layout viewport that fits the entire layout or create
multiple layout viewports in the layout. Once you create the viewports, you
can change their size, their properties, and also scale and move them as needed.
NOTE It is important to create layout viewports on their own layer. When you are
ready to plot, you can turn off the layer and plot the layout without plotting the
boundaries of the layout viewports.
With MVIEW, you have several options for creating one or more layout
viewports. You can also use COPY and ARRAY to create multiple layout
viewports.
406 | Chapter 14 Create Multiple-View Drawing Layouts (Paper Space)
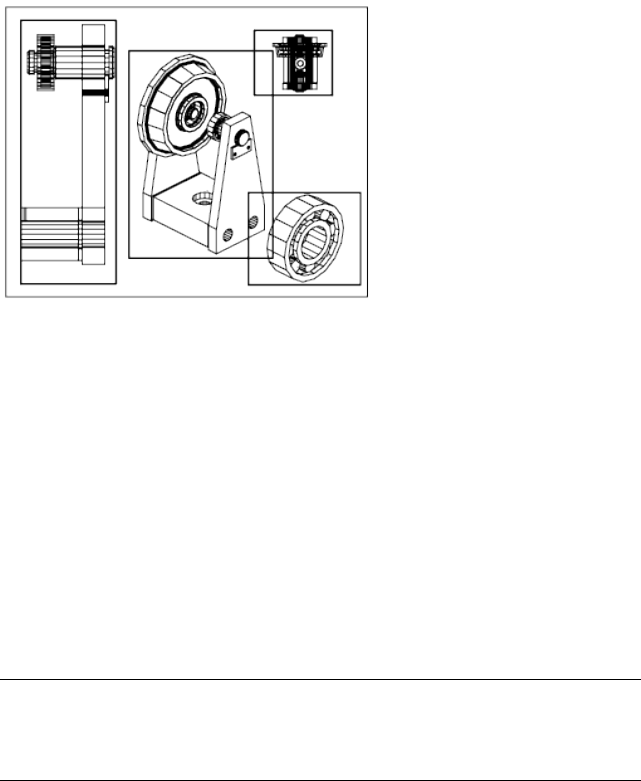
Create Nonrectangular Layout Viewports
You can create a new viewport with nonrectangular boundaries by converting
an object drawn in paper space into a layout viewport.
You can use the MVIEW command to create nonrectangular viewports.
■With the Object option, you can select a closed object, such as a circle or
closed polyline created in paper space, to convert into a layout viewport.
The object that defines the viewport boundary is associated with the
viewport after the viewport is created
■With the Polygonal option, you can create a nonrectangular layout
viewport by specifying points. The prompts are the same as the prompts
for creating a polyline
NOTE When you want to suppress the display of the boundary of a layout viewport,
you should turn off the layer of the nonrectangular viewport instead of freezing
it. If the layer of a nonrectangular layout viewport is frozen, the viewport is not
clipped correctly.
Redefine Layout Viewport Boundaries
You can redefine the boundary of a layout viewport by using the VPCLIP
command. You can either select an existing object to designate as the new
boundary, or specify the points of a new boundary. The new boundary does
not clip the old boundary, it redefines it.
Create and Modify Layout Viewports | 407

A nonrectangular viewport consists of two objects: the viewport itself and the
clipping boundary. You can make changes to the viewport, the clipping
boundary, or both.
NOTE In the Properties palette, the default selection for a nonrectangular viewport
is Viewport. This is because you are more likely to change the properties of the
viewport than of the clipping boundary.
Resize Layout Viewports
If you want to change the shape or size of a layout viewport, you can use grips
to edit the vertices just as you edit any object with grips.
To create a new layout viewport
1Click View tab ➤ Viewports panel ➤ New.
2In the Viewports dialog box, New Viewports tab, under Standard
Viewports, select Single.
3Click to specify one corner of the new layout viewport.
4Click to specify the opposite corner.
A new layout viewport object is available and displays a default view. To
adjust the view, double-click within the layout viewport to access model
space.
To create a viewport configuration on a layout
1Click a layout tab.
2Click View tab ➤ Viewports panel ➤ New.
3In the Viewports dialog box, New Viewports tab, under standard viewports
select a viewport configuration from the list.
4Under Setup, select either 2D or 3D.
When you select 3D, a set of standard 3D views is applied to each viewport
in the configuration.
5Under Viewport Spacing, select the amount of spacing you want to add
between the viewports.
6To change a view, select a viewport in the preview image. Under Change
View To, select a view from the list of standard views.
408 | Chapter 14 Create Multiple-View Drawing Layouts (Paper Space)
The list includes top, bottom, front, back, left, right, and isometric views,
along with any named views that are saved in the drawing. The selected
view is displayed under Preview.
7Click OK.
8In the drawing area, specify two points to indicate the area to contain
the viewport configuration.
To place a named viewport configuration into a layout
1Click a layout tab.
2Click View tab ➤ Viewports panel ➤ Named.
3In the Viewports dialog box, Named Viewports tab, select the named
viewport configuration from the list.
4Click OK.
5In the layout, specify a location for the named viewport configuration.
To modify layout viewport properties using the Properties palette
1Click the border of the layout viewport whose properties you want to
modify.
2Click View tab ➤ Palettes panel ➤ Properties
3In the Properties palette, select the value for the property you want to
modify. Enter a new value or select a new setting from the list provided.
The new property setting or value is assigned to the selected layout
viewport.
To clip a layout viewport boundary
1Click View tab ➤ Viewports panel ➤ Clip.
2Select the viewport to clip.
3(Optional) Enter d (Delete) to delete an existing clipping boundary.
4Do one of the following:
Create and Modify Layout Viewports | 409
5Enter p (Polygonal) to specify a series of points to define a polygonal
boundary.
■
■Select a paper space object that will define the new viewport boundary.
Quick Reference
MVIEW
Creates and controls layout viewports.
PROPERTIES
Controls properties of existing objects.
VPCLIP
Clips layout viewport objects and reshapes the viewport border.
VPORTS
Creates multiple viewports in model space or paper space.
MAXACTVP
Sets the maximum number of viewports that can be active at one time in a
layout.
Control Views in Layout Viewports
When you create a layout, you can add layout viewports that act as windows
into model space. In each layout viewport, you can control the view that is
displayed.
Scale Views in Layout Viewports
To scale each displayed view in the plotted drawing accurately, set the scale
of each view relative to paper space.
You can change the view scale of the viewport using
■The Properties palette
■The XP option of the ZOOM command
■The Viewports toolbar
410 | Chapter 14 Create Multiple-View Drawing Layouts (Paper Space)

NOTE You can modify the list of scales that are displayed in all view and plot scale
lists with SCALELISTEDIT.
When you work in a layout, the scale factor of a view in a layout viewport
represents a ratio between the actual size of the model displayed in the
viewport and the size of the layout. The ratio is determined by dividing the
paper space units by the model space units. For example, for a quarter-scale
drawing, the ratio would be a scale factor of one paper space unit to four model
space units, or 1:4.
Scaling or stretching the layout viewport border does not change the scale of
the view within the viewport.
When creating a new drawing based on a template, the scales in the template
are used in the new drawing. The scales in the registry are not imported.
Lock the Scale of Layout Viewports
Once you set the viewport scale, you cannot zoom within a viewport without
changing the viewport scale. By locking the viewport scale first, you can zoom
in to view different levels of detail in your viewport without altering the
viewport scale.
Scale locking locks the scale that you set for the selected viewport. Once the
scale is locked, you can continue to modify the geometry in the viewport
without affecting the viewport scale. If you turn a viewport's scale locking on,
most of the viewing commands, such as VPOINT, DVIEW, 3DORBIT, PLAN,
and VIEW, no longer function in that viewport.
NOTE Viewport scale locking is also available for nonrectangular viewports. To
lock a nonrectangular viewport, you must perform an extra step in the Properties
palette to select the viewport object rather than the viewport clipping boundary.
Annotative Objects and Scaling
Annotative objects are defined at a paper height instead of a model size and
assigned one or more scales. These objects are scaled based on the current
annotation scale setting and automatically displayed at the correct size in the
layout or when plotted. The annotation scale controls the size of the annotative
objects relative to the model geometry in the drawing.
You can specify the default list of scales available for layout viewports, page
layouts, and plotting in Default Scale List dialog box. For more information
about annotation scaling, see Scale Annotations on page 1224.
Scale Views in Layout Viewports | 411

To modify a layout viewport scale using the Properties palette
1Make sure you are on a layout tab in paper space.
2Click the border of the viewport whose scale you want to modify.
3Right-click, and then click Properties.
4In the Properties palette, select Standard Scale, and then select a new
scale from the list.
The scale you choose is applied to the viewport.
NOTE To use a custom scale, enter a scale in the Custom Scale field in the
Properties palette.
To turn on scale locking in a layout viewport
1In the layout, click the viewport whose scale you want to lock.
2If necessary, open the Properties palette.
3In the Properties palette, do one of the following:
■If you selected a rectangular viewport, select Display Locked, and then
click Yes.
■If you selected a nonrectangular viewport, first click All (2) and select
Viewport (1). Then select Display Locked, and click Yes.
The current viewport's scale is locked. If you change the zoom factor in
the viewport, only paper space objects are affected.
Quick Reference
SCALELISTEDIT
Controls the list of scales available for layout viewports, page layouts, and
plotting.
MVIEW
Creates and controls layout viewports.
PROPERTIES
Controls properties of existing objects.
412 | Chapter 14 Create Multiple-View Drawing Layouts (Paper Space)
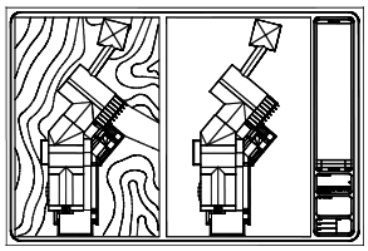
VPORTS
Creates multiple viewports in model space or paper space.
ZOOM
Increases or decreases the magnification of the view in the current viewport.
Control Visibility in Layout Viewports
You can control the visibility of objects in layout viewports using several
methods. These methods are useful for emphasizing or hiding different
elements of a drawing, and for reducing screen regeneration time.
Freeze Specified Layers in a Layout Viewport
A major benefit to using layout viewports is that you can selectively freeze
layers in each layout viewport. You can also specify default visibility settings
for new viewports and for new layers. As a result, you can view different objects
in each layout viewport.
You can freeze or thaw layers in current and future layout viewports without
affecting other viewports. Frozen layers are invisible. They are not regenerated
or plotted. In the illustration, the layer showing terrain has been frozen in
one viewport.
Thawing the layer restores visibility. The easiest way to freeze or thaw layers
in the current viewport is to use the Layer Properties Manager.
In the Layer Properties Manager, on the right side, use the column labeled VP
Freeze to freeze one or more layers in the current layout viewport. To display
the VP Freeze column, you must be on a layout tab. Specify the current layout
viewport by double-clicking anywhere within its borders.
Control Visibility in Layout Viewports | 413
Freeze or Thaw Layers Automatically in New Layout Viewports
You can set visibility defaults for specific layers in all new layout viewports.
For example, you can restrict the display of dimensions by freezing the
DIMENSIONS layer in all new viewports. If you create a viewport that requires
dimensions, you can override the default setting by changing the setting in
the current viewport. Changing the default for new viewports does not affect
existing viewports.
Create New Layers That Are Frozen in All Layout Viewports
You can create new layers that are frozen in all existing and new layout
viewports. Then you can thaw the layers in the viewports you specify. This is
a shortcut for creating a new layer that is visible only in a single viewport.
To freeze or thaw layers in the current layout viewport
1Double-click within a layout viewport to make it current.
2Click Home tab ➤ Layer panel ➤ Layer Properties.
3In the Layer Properties Manager, select the layers to freeze or thaw.
Hold down Ctrl to select more than one layer. Hold down Shift to select
a sequence of layers.
4Click the icon in the VP Freeze column for one of the selected layers.
5Click OK.
To view a list of layers that are frozen in the current viewport
1Click a layout tab.
2Double-click within a layout viewport to make it current.
3Click Home tab ➤ Layer panel ➤ Layer Properties.
4In the Layer Properties Manager, look at the VP Freeze column for the
Freeze/Thaw in Current Viewports icon.
5Click OK.
To freeze or thaw layers in all viewports
1Click a layout tab.
2Click Home tab ➤ Layer panel ➤ Layer Properties.
414 | Chapter 14 Create Multiple-View Drawing Layouts (Paper Space)
3In the Layer Properties Manager, select one or more layers to freeze or
thaw.
Hold down Ctrl to select more than one layer. Hold down Shift to select
a sequence of layers.
4In the Freeze column, click the icon to freeze or thaw.
To freeze or thaw layers in paper space
1Click a layout tab.
2Make sure that you are in paper space. (On the status bar, PAPER is on.)
3Click Home tab ➤ Layer panel ➤ Layer Properties.
4In the Layer Properties Manager, select the layer or layers you want to
freeze or thaw.
5In the Freeze column, click the icon to change a layer's state. The sun
icon means that a layer is thawed; the snowflake icon means that a layer
is frozen.
6Click OK.
To freeze or thaw layers in all new viewports
1Click a layout tab.
2Click Home tab ➤ Layer panel ➤ Layer Properties.
3In the Layer Properties Manager, select the layer or layers you want to be
automatically frozen or thawed in new viewports you create.
Hold down Ctrl to select more than one layer. Hold down Shift to select
a sequence of layers.
4In the New VP Freeze column, click the icon to change a layer's state.
The sun icon means that a layer is thawed; the snowflake icon means
that a layer is frozen.
5Click OK.
To create new layers that are frozen in all viewports
1Click a layout tab.
2Click Home tab ➤ Layer panel ➤ Layer Properties.
Control Visibility in Layout Viewports | 415
3Click the New Layer button to create a layer.
4Rename the new layer.
5Click the icon in the Freeze column to change the layer's state to frozen.
The sun icon means that a layer is thawed; the snowflake icon means
that a layer is frozen.
6Click OK.
Quick Reference
LAYER
Manages layers and layer properties.
VPLAYER
Sets layer visibility within viewports.
Screen Objects in Layout Viewports
Screening refers to applying less ink to an object when it is plotted. The object
appears dimmer on the screen and on the plotted paper. Screening can be
used to help differentiate objects in a drawing without changing the objects'
color properties.
To assign a screening value to an object, you must assign a plot style to the
object, and then define the screening value in that plot style.
You can assign a screening value from 0 to 100. The default setting, 100, means
no screening is applied, and the object is displayed with normal ink intensity.
A screening value of 0 means the object contains no ink and is thus invisible
in that viewport.
See also:
■Set Options for Plotted Objects on page 1575
To apply screening to objects in a layout viewport
1Click File menu ➤ Plot Style Manager.
2Right-click a CTB or STB file. Click Open.
3In the Plot Style Table Editor, Form View tab, select a plot style to change.
416 | Chapter 14 Create Multiple-View Drawing Layouts (Paper Space)
4In the Screening box, enter an intensity value between 1 and 100.
5Click Save & Close.
6Click Output tab ➤ Plot panel ➤ Page Setup Manager.
7In the Page Setup dialog box, Plot Device tab, select the edited plot style
table from the Plot Style Table (Pen Assignments) list.
8Double-click within the layout viewport that contains the objects whose
screening you want to change.
9Select the objects whose plot style you want to change.
10 Right-click in the drawing area and click Properties.
11 In the Properties palette, use one of the following methods:
■If you are using named plot style tables, next to Plot Style, select the
plot style you edited in the Plot Style Table Editor. If that plot style
is not listed, select Other and set Active Plot Style Table to the plot
style you edited in the Plot Style Table Editor. Select the edited plot
style from the Plot Styles list in the Select Plot Style dialog box.
■If you are using color-dependent plot style tables, next to Color, select
the color whose plot style you edited in the Plot Style Table Editor.
Quick Reference
PAGESETUP
Controls the page layout, plotting device, paper size, and other settings for
each new layout.
PROPERTIES
Controls properties of existing objects.
Turn Layout Viewports On or Off
You can save time by turning some layout viewports off or by limiting the
number of active viewports.
Displaying a large number of active layout viewports can affect your system's
performance as the content of each layout viewport regenerates. You can save
time by turning some layout viewports off or by limiting the number of active
Control Visibility in Layout Viewports | 417
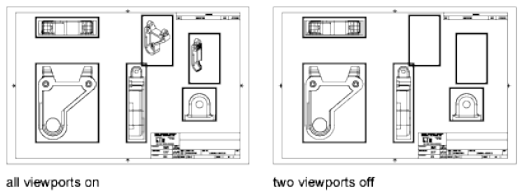
viewports. The following illustration shows the effects of turning off two
layout viewports.
New layout viewports are turned on by default. If you turn off the layout
viewports you aren't using, you can copy layout viewports without waiting
for each one to regenerate.
If you don't want to plot a layout viewport, you can turn the layout viewport
off.
To turn viewports on or off using the Properties palette
1Make sure you are on a layout tab in paper space.
2Click the border of the viewport to turn on or off.
3Click Home tab ➤ Layer panel ➤ Layer Properties.
4In the Properties palette, under Misc, select On, and then select Yes or
No to turn the viewport on or off.
For a nonrectangular viewport, select All (2) in the Properties palette, and
then select Viewport (1) before changing any viewport properties.
Quick Reference
MVIEW
Creates and controls layout viewports.
PAGESETUP
Controls the page layout, plotting device, paper size, and other settings for
each new layout.
PROPERTIES
Controls properties of existing objects.
418 | Chapter 14 Create Multiple-View Drawing Layouts (Paper Space)
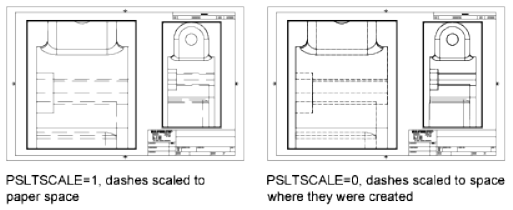
VPORTS
Creates multiple viewports in model space or paper space.
MAXACTVP
Sets the maximum number of viewports that can be active at one time in a
layout.
Scale Linetypes in Layout Viewports
You can scale linetypes in paper space either based on the drawing units of
the space in which the object was created or based on the paper space units.
You can set thePSLTSCALE system variable to maintain the same linetype
scaling for objects displayed at different zoom factors in a layout and in a
layout viewport. For example, with PSLTSCALE set to 1 (default), set the current
linetype to dashed, and then draw a line in a paper space layout. In the layout,
create a viewport with a zoom factor of 1x, make that layout viewport current,
and then draw a line using the same dashed linetype. The dashed lines should
appear to be the same. If you change the viewport zoom factor to 2x, the
linetype scaling for the dashed line in the layout and the dashed line in the
layout viewport will be the same, regardless of the difference in the zoom
factor.
With PSLTSCALE turned on, you can still control the dash lengths with
LTSCALE andCELTSCALE. In the following illustration, the pattern of the
linetypes in the drawing on the left has been scaled to be the same regardless
of the scale of the view. In the drawing on the right, the scale of the linetypes
matches the scale of each view.
See also:
■Set the Lineweight Scale for a Layout on page 1536
Scale Linetypes in Layout Viewports | 419

To scale linetypes globally in paper space
1Click Home tab ➤ Properties panel ➤ Linetype.
2In the Linetype Manager, click Show Details.
3Under Global Scale Factor, enter a global scale to apply to the linetypes.
4Click OK.
Quick Reference
LINETYPE
Loads, sets, and modifies linetypes.
PSLTSCALE
Controls the linetype scaling of objects displayed in paper space viewports.
Align Views in Layout Viewports
You can arrange the elements of your drawing by aligning the view in one
layout viewport with the view in another viewport.
For angled, horizontal, and vertical alignments, you can move each layout
viewport relative to distances defined by the model-space geometry displayed.
420 | Chapter 14 Create Multiple-View Drawing Layouts (Paper Space)
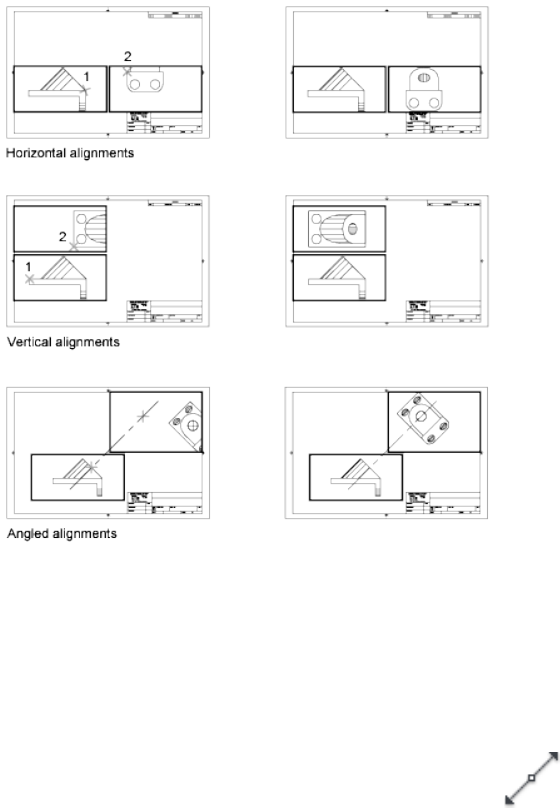
To adjust the views on a layout with precision, you can create construction
geometry, use object snaps on the model-space objects displayed in layout
viewports, or use one of the cursor constraint features available on the status
bar.
To align objects between viewports using a construction line
1Make sure you are on a layout tab.
2Click Home tab ➤ Draw panel ➤ Construction Line.
3Specify a point in the first viewport. Specify a second point to determine
a line for the alignment.
Choose a point that can be aligned with objects in the second viewport.
Use object snaps for precision.
Align Views in Layout Viewports | 421
4Click Home tab ➤ Modify panel ➤ Move.
5Select the viewport to align to the first viewport. Press Enter.
6When prompted for a base point, specify a point in the second viewport.
Choose a point that corresponds with the point selected in the first
viewport.
7When prompted for the second point, hold down Shift and right-click.
Click Object Snap ➤ Perpendicular.
8Click the construction line you created.
The first and second viewports, and the objects in the viewports, are
aligned.
NOTE When aligning objects in viewports, the scale of the viewports should
be the same.
To align objects between viewports using MVSETUP
1At the Command prompt, enter mvsetup.
2Enter a (Align).
3Select one of the following alignments:
■Horizontal. Aligns a point in one viewport horizontally with a base
point in another viewport.
■Vertical. Aligns a point in one viewport vertically with a base point
in another viewport.
■Angled. Aligns a point in one viewport at a specified distance and
angle from a base point in another viewport.
4Make sure the viewport with the view that is to remain stationary is
current. Then specify a base point.
5Select the viewport with the view you want to realign. Then specify an
alignment point in that view.
6For angled alignments only, specify a distance and displacement angle
from the base point to the alignment point in the second viewport.
422 | Chapter 14 Create Multiple-View Drawing Layouts (Paper Space)
Quick Reference
MOVE
Moves objects a specified distance in a specified direction.
MVSETUP
Sets up the specifications of a drawing.
UCS
Manages user coordinate systems.
UCSICON
Controls the visibility and placement of the UCS icon.
UCSMAN
Manages defined user coordinate systems.
UCSICON
Controls the visibility and placement of the UCS icon.
UCSVP
Determines whether the UCS in viewports remains fixed or changes to reflect
the UCS of the current viewport.
Rotate Views in Layout Viewports
You can rotate an entire view within a layout viewport with the
VPROTATEASSOC system variable.
When VPROTATEASSOC is set to 1, the view within a viewport is rotated with
the viewport. When VPROTATEASSOC is set to 0, the view remains when the
viewport is rotated.
You can also rotate an entire view within a layout viewport by changing the
UCS and using the PLAN command.
With the UCS command, you can rotate the XY plane at any angle around the
Z axis. When you enter the PLAN command, the view rotates to match the
orientation of the XY plane.
Rotate Views in Layout Viewports | 423
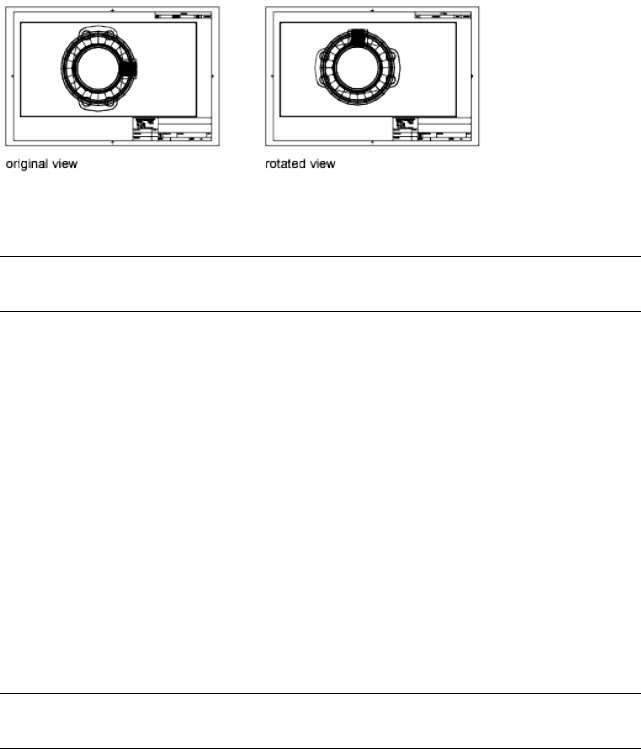
Another way is to use the Align and then Rotate View options in the MVSETUP
command.
NOTE The ROTATE command rotates individual objects only and should not be
used to try to rotate a view.
To rotate a view within a viewport
1At the Command prompt, enter vprotateassoc.
2Set the value to 1.
3Make sure you are on a layout tab.
4Select the viewport with the view you want to rotate.
5Enter r (Rotate) to rotate the view to a specified angle or with two points.
6Specify a base point for the rotation.
7Specify the rotation angle or specify a second point to determine the
angle of rotation.
The entire view rotates within the viewport.
NOTE When VPROTATEASSOC is set to 0, the view within the viewport is not
rotated when the viewport is rotated.
To rotate a view by changing the UCS
1Make sure you are on a layout tab.
2Double-click within the viewport whose objects you want to rotate.
3Make sure that the current UCS is parallel to the plane of rotation (the
UCS icon should look normal). If the UCS is not parallel to the plane of
rotation, Click View tab ➤ Coordinates panel ➤ View..
4Click View tab ➤ Coordinates panel ➤ Z.
424 | Chapter 14 Create Multiple-View Drawing Layouts (Paper Space)
To rotate the view 90 degrees clockwise, enter 90. To rotate the view 90
degrees counter-clockwise, enter -90.
5Click View menu ➤ 3D Views ➤ Plan View ➤ Current UCS.
The entire view rotates within the viewport. You may need to specify the
scale of the viewport again.
To rotate a layout view using MVSETUP
1On a layout, enter mvsetup at the Command prompt.
2Enter a (Align).
3Enter r (Rotate) to rotate the view to a specified angle or with two points.
4If multiple viewports are available on the layout, click the viewport with
the view that you want to rotate.
5Specify a base point for the rotation.
6Specify the rotation angle or specify a second point to determine the
angle of rotation.
The entire view rotates within the viewport.
7To restore the previous UCS, enter ucs and then p (Previous).
Quick Reference
MVSETUP
Sets up the specifications of a drawing.
PLAN
Displays an orthographic view of the XY plane of a specified user coordinate
system.
UCS
Manages user coordinate systems.
UCSICON
Controls the visibility and placement of the UCS icon.
UCSMAN
Manages defined user coordinate systems.
Rotate Views in Layout Viewports | 425
UCSICON
Controls the visibility and placement of the UCS icon.
UCSVP
Determines whether the UCS in viewports remains fixed or changes to reflect
the UCS of the current viewport.
VIEWTWIST
Stores the view rotation angle for the current viewport measured relative to
the WCS.
VPROTATEASSOC
Controls whether the view within a viewport is rotated with the viewport
when the viewport is rotated.
Reuse Layouts and Layout Settings
When you create a layout, you can choose to apply the information from an
existing template.
A layout template is a layout imported from a DWG or DWT file. When you
create a layout, you can choose to apply the information from an existing
template. The program has sample layout templates to use when you design
a new layout environment. The paper space objects and page setup in the
existing template are used in the new layout. Thus, the layout objects,
including any viewport objects, are displayed in paper space. You can keep
any of the existing objects from the template you import, or you can delete
the objects. No model space objects are imported.
The layout templates are identified with a .dwt file extension. However, a
layout template or layout from any drawing or drawing template can be
imported into the current drawing.
Save a Layout Template
Any drawing can be saved as a drawing template (DWT file), including all of
the objects and layout settings. You can save a layout to a new DWT file by
choosing the Save As option of the LAYOUT command. The template file is
saved in the drawing template file folder as defined in the Options dialog box,
Support tab. The layout template has a .dwt or .dwg extension like a drawing
template or drawing file, but it contains little information not essential to the
layout.
426 | Chapter 14 Create Multiple-View Drawing Layouts (Paper Space)
When you create a new layout template, any named items, such as blocks,
layers, and dimension styles, that are used in the layout are saved with the
template. These definition table items are imported as part of the layout
settings if you import this template into a new layout. It is recommended that
you use the Save As option of the LAYOUT command to create a new layout
template. When you use the Save As option, unused definition table items are
not saved with the file; they are not added to the new layout into which you
import the template.
If you insert a layout from a drawing or template that was not created using
the Save As option of the LAYOUT command, definition table items that are
used in the drawing but not in the layout are inserted with the layout. To
eliminate unnecessary definition table items, use the PURGE command.
Insert a Layout Using DesignCenter
Using DesignCenter™, you can drag a layout with its objects from any drawing
into the current drawing.
When you use DesignCenter to insert a layout into a drawing, a new layout
is created that includes all of the paper space objects, definition tables, and
block definitions from the source layout. You can delete unneeded paper space
objects. To eliminate any unnecessary definition table information from the
new layout, use the PURGE command.
To create a layout using a layout template
1Click Insert menu ➤ Layout ➤ Layout From Template.
2In the Select Template From File dialog box, select a drawing template
file from the list.
3Click Open.
4In the Insert Layout(s) dialog box, select the layout template from the
list. Click OK.
A new layout is created using the layout template you selected. The new
layout is assigned the name Layout with the next number in the sequence
and with the name of the imported layout attached.
For example, if you insert a layout called ANSI D from a layout template
and you already have two layouts in your drawing called Layout1 and
Layout2, the new layout is called Layout3 - ANSI D.
To save a layout template
1At the Command prompt, enter layout.
Reuse Layouts and Layout Settings | 427
2At the prompt, enter sa to save the current layout as a template.
3Enter the name of the layout you are saving.
4In the Create Drawing File dialog box, enter a name for the drawing
template file you are saving.
5In Files of Type, select Drawing Template File (*.dwt).
6Click Save.
To insert a layout using DesignCenter
1Click View tab ➤ Palettes panel ➤ DesignCenter.
2In the tree view, find the drawing that contains the layout you want to
reuse.
3Double-click the drawing name to expand the options beneath it.
4Select the Layouts icon to display the individual layouts in the content
area.
5Use one of the following methods to insert the layout into the current
drawing:
■Drag the layout icon from the content area into the drawing.
■Select a layout in the content area and right-click. Click Add Layout(s).
■Double-click the layout in the content area.
Quick Reference
ADCENTER
Manages and inserts content such as blocks, xrefs, and hatch patterns.
LAYOUT
Creates and modifies drawing layout tabs.
PAGESETUP
Controls the page layout, plotting device, paper size, and other settings for
each new layout.
428 | Chapter 14 Create Multiple-View Drawing Layouts (Paper Space)
PCINWIZARD
Displays a wizard to import PCP and PC2 configuration file plot settings into
the Model tab or current layout.
PURGE
Removes unused items, such as block definitions and layers, from the drawing.
TDCREATE
Stores the local time and date the drawing was created.
TDUCREATE
Stores the universal time and date that the drawing was created.
TDUPDATE
Stores the local time and date of the last update/save.
TDUUPDATE
Stores the universal time and date of the last update or save.
Reuse Layouts and Layout Settings | 429
430
Work with Sheets in a
Sheet Set
With the Sheet Set Manager, you can organize drawing layouts into named sheet sets. The
sheets in a sheet set can be transmitted, published, and archived as a unit.
Sheet sets facilitate the organization and management of drawings in a project, and improve
the communication in a work group.
Quick Start for Sheet Sets
A sheet set is an organized collection of sheets from several drawing files. A sheet
is a selected layout from a drawing file.
Sets of drawings are the primary deliverable for most design groups. Sets of
drawings communicate the overall design intent of a project and provide the
documentation and specifications for the project. However, managing sets of
drawings manually can be complicated and time consuming.
With the Sheet Set Manager, you can manage drawings as sheet sets. A sheet set
is an organized and named collection of sheets from several drawing files. A
sheet is a selected layout from a drawing file. You can import a layout from any
drawing into a sheet set as a numbered sheet.
15
431
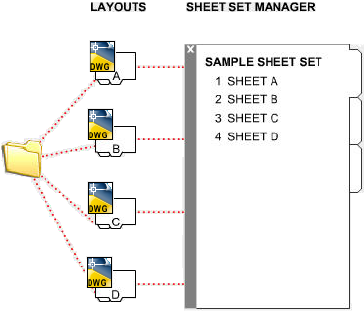
You can manage, transmit, publish, and archive sheet sets as a unit.
Quick Reference
NEWSHEETSET
Creates a new sheet set data file that manages drawing layouts, file paths,
and project data.
OPENSHEETSET
Opens a selected sheet set.
SHEETSET
Opens the Sheet Set Manager.
SHEETSETHIDE
Closes the Sheet Set Manager.
SSFOUND
Displays the sheet set path and file name if a search for a sheet set is
successful.
SSLOCATE
Controls whether the sheet set associated with a drawing is located and
opened when the drawing is opened.
432 | Chapter 15 Work with Sheets in a Sheet Set
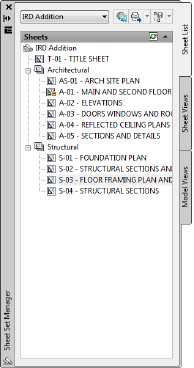
SSMAUTOOPEN
Controls the display behavior of the Sheet Set Manager when a drawing
associated with a sheet is opened.
SSMPOLLTIME
Controls whether plotting a sheet set, multi-sheet plot file, or plot spool file
can be interrupted by other plot jobs.
SSMSHEETSTATUS
Controls how the status data in a sheet set is refreshed.
SSMSTATE
Indicates whether the Sheet Set Manager window is open or closed.
Understand the Sheet Set Manager Interface
Using the controls in the Sheet Set Manager, you can create, organize, and
manage sheets in a sheet set.
You can use the following tabs and controls in the Sheet Set Manager:
Sheet Set Control. Lists menu options to create a new sheet set, open an
existing sheet set, or switch between open sheet sets.
Sheet List Tab. Displays an organized list of all sheets in the sheet set. Each
sheet in a sheet set is a specified layout in a drawing file.
Understand the Sheet Set Manager Interface | 433

Sheet Views Tab. Displays an organized list of all sheet views in the sheet set.
Only sheet views created with AutoCAD 2005 and later are listed.
Model Views Tab. Lists the paths and folder names for the drawings containing
model space views to be used in the sheet set.
■Click a folder to list the drawing files that are located in that folder.
■Click a drawing file to list the named model space views that are available
for placement in the current sheet.
■Double-click a view to open the drawing containing the view.
■Right-click or drag a view to place it in the current sheet.
Buttons. Provides convenient access for the most commonly used operations
for the currently selected tab.
Tree View. Displays the contents of a tab.
Details or Preview. Displays either descriptive information or a thumbnail
preview of the currently selected item in the tree view.
Actions Used in the Tree View
You can use the following actions in the tree view:
■Right-click to access shortcut menus of the operations that are relevant to
the currently selected item.
■Double-click items to open them. This is a convenient method for opening
drawing files from the Sheet List tab or from the Model Views tab. You
also double-click items in the tree view to expand or collapse them.
■Click one or more items to select them for operations such as opening,
publishing, or transmitting.
■Click a single item to display descriptive information or a thumbnail
preview of a selected sheet, view, or drawing file.
■Drag items within the tree view to reorder them.
NOTE To use the Sheet Set Manager effectively, right-click items in the tree view
to access relevant shortcut menus. For access to shortcut menus in the drawing
area that are needed for sheet set operations, the Shortcut Menus in Drawing Area
must be checked in the Options dialog box, User Preferences tab.
434 | Chapter 15 Work with Sheets in a Sheet Set
Quick Reference
NEWSHEETSET
Creates a new sheet set data file that manages drawing layouts, file paths,
and project data.
OPENSHEETSET
Opens a selected sheet set.
SHEETSET
Opens the Sheet Set Manager.
SHEETSETHIDE
Closes the Sheet Set Manager.
SSFOUND
Displays the sheet set path and file name if a search for a sheet set is
successful.
SSLOCATE
Controls whether the sheet set associated with a drawing is located and
opened when the drawing is opened.
SSMAUTOOPEN
Controls the display behavior of the Sheet Set Manager when a drawing
associated with a sheet is opened.
SSMPOLLTIME
Controls whether plotting a sheet set, multi-sheet plot file, or plot spool file
can be interrupted by other plot jobs.
SSMSHEETSTATUS
Controls how the status data in a sheet set is refreshed.
SSMSTATE
Indicates whether the Sheet Set Manager window is open or closed.
Create and Manage a Sheet Set
There are several methods for setting up and organizing a sheet set. You can
also include relevant information with a sheet set and its components.
Create and Manage a Sheet Set | 435

Create a Sheet Set
You create a sheet set with the Create a Sheet Set wizard. In the wizard, you
can either create a sheet set from scratch based on existing drawings or use
an example sheet set as a template.
Layouts from specified drawing files are imported into the sheet set. The
associations and information that define a sheet set are stored in a sheet set
data (DST) file.
When creating a new sheet set using the Create Sheet Set wizard, a new folder
is created as the default sheet set storage location. This new folder, named
AutoCAD Sheet Sets, is located in the My Documents folder. The default location
for the sheet set file can be changed, and it is recommended that the DST file
is stored with the project files.
NOTE The DST file should be stored in a network location that is accessible to all
sheet set users on the network and mapped using the same logical drive. It is
strongly recommended that you store the DST and the sheet drawings in the same
folder. If an entire sheet set needs to be moved, or a server or folder name changes,
the DST file will still be able to locate the sheets using relative path information.
Preparation Tasks
Before you begin creating a sheet set, you should complete the following tasks:
■Consolidate drawing files. Move the drawing files to be used in the sheet
set into a small number of folders. This will simplify sheet set
administration.
■Eliminate multiple layout tabs. Each drawing you plan to use in the sheet
set should have only one layout to be used as a sheet in the sheet set. This
is important for access to sheets by multiple users. Only one sheet in each
drawing can be open at a time.
■Create a sheet creation template. Create or identify a drawing template
(DWT) file to be used by the sheet set for creating new sheets. This drawing
template file is called the sheet creation template. You specify this template
file in the Sheet Set Properties dialog box or the Subset Properties dialog
box.
■Create a page setup overrides file. Create or identify a DWT file to store
page setups for plotting and publishing. This file, called the page setup
overrides file, can be used to apply a single page setup to all sheets in a sheet
set, overriding the individual page setups stored in each drawing.
436 | Chapter 15 Work with Sheets in a Sheet Set

NOTE Although it is possible to use several layouts from the same drawing file as
separate sheets in a sheet set, it is not recommended. This makes concurrent access
to each layout by multiple users impossible. This practice can also reduce your
management options and can complicate the organization of your sheet sets.
Create a Sheet Set from an Example Sheet Set
In the Create Sheet Set wizard, when you choose to create a sheet set from an
example, the example sheet set provides the organizational structure and
default settings for the new sheet set. You can also specify that folders are
created corresponding to the subset storage paths of the sheet set.
After you create an empty sheet set with this option, you can import layouts
or create sheets individually.
Create a Sheet Set from Existing Drawing Files
In the Create Sheet Set wizard, when you choose to create a sheet set from
existing drawing files, you specify one or more folders that contain drawing
files. With this option, you can specify that the subset organization for the
sheet set duplicates the folder structure of the drawing files. The layouts from
these drawings can be imported into the sheet set automatically.
You can easily add more folders containing drawings by clicking the Browse
button for each additional folder.
Backup and Recover Sheet Set Data Files
The data stored in the sheet set data file represents a significant amount of
work, so you should take the same care to create backups of DST files as you
do for drawing files.
In the unlikely event of DST file corruption or a major user error, the previously
saved sheet set data file can be recovered. Every time the sheet set data file is
opened, the current sheet set data file is copied to a backup file (DS$). This
backup file has the same file name and is located in the same folder as the
current sheet set data file.
To recover the previous version of the sheet set data file, first make sure that
no one else on your network is working on the sheet set. Then, it is
recommended that you copy the existing DST file to another file name. Finally,
rename the backup file from the DS$ file extension to the DST file extension.
Create a Sheet Set | 437
Quick Reference
NEWSHEETSET
Creates a new sheet set data file that manages drawing layouts, file paths,
and project data.
OPENSHEETSET
Opens a selected sheet set.
SHEETSET
Opens the Sheet Set Manager.
SHEETSETHIDE
Closes the Sheet Set Manager.
SSFOUND
Displays the sheet set path and file name if a search for a sheet set is
successful.
SSLOCATE
Controls whether the sheet set associated with a drawing is located and
opened when the drawing is opened.
SSMAUTOOPEN
Controls the display behavior of the Sheet Set Manager when a drawing
associated with a sheet is opened.
SSMPOLLTIME
Controls whether plotting a sheet set, multi-sheet plot file, or plot spool file
can be interrupted by other plot jobs.
SSMSHEETSTATUS
Controls how the status data in a sheet set is refreshed.
SSMSTATE
Indicates whether the Sheet Set Manager window is open or closed.
Organize a Sheet Set
With a large sheet set, you will find it essential to organize sheets and views
in the tree view.
438 | Chapter 15 Work with Sheets in a Sheet Set
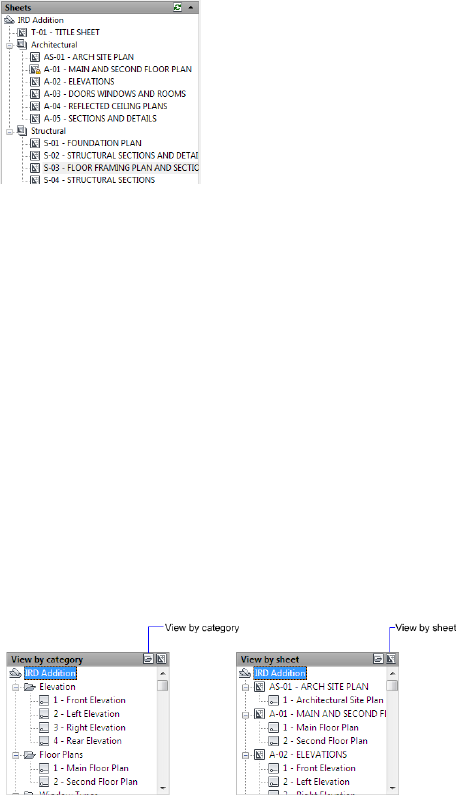
On the Sheet List tab, sheets can be arranged into collections called subsets.
On the Sheet Views tab, views can be arranged into collections called categories.
Use Sheet Subsets
Sheet subsets are often associated with a discipline such as architecture or
mechanical design. For example, in architecture, you might use a subset named
Structural; and in mechanical design, you might use a subset called Standard
Fasteners. In some cases, you might also find it useful to create subsets
associated with a review or completion status.
You can nest subsets into other subsets as needed. After you create or import
sheets or subsets, you can reorder them by dragging them in the tree view.
Use View Categories
View categories are often associated with a function. For example, in
architecture, you might use a view category called Elevations; and in
mechanical design, you might use a view category called Exploded.
You can display views either by category or by the sheet on which they are
located.
You can nest categories into other categories as needed. To move a view to a
different category, drag them in the tree view or use the Set Category shortcut
menu option.
Organize a Sheet Set | 439
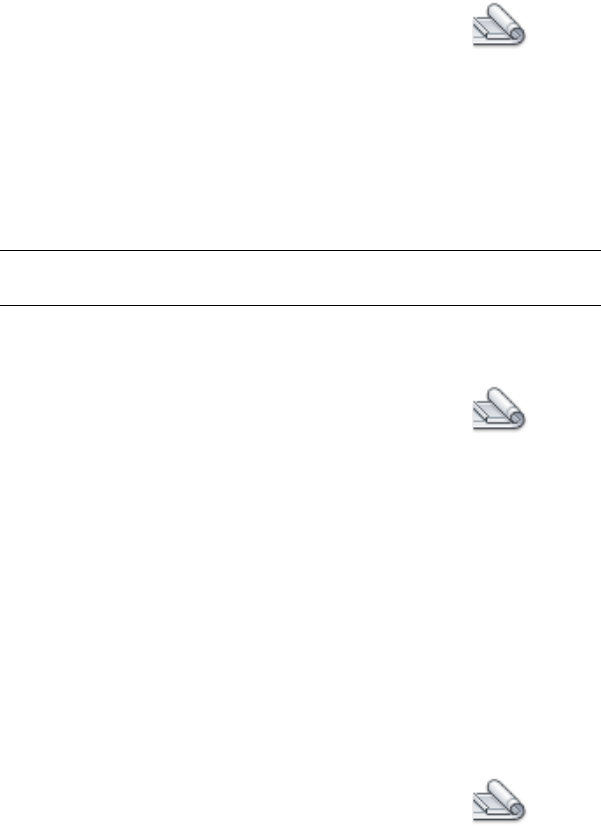
To create a new subset in the sheet list
1Click View tab ➤ Palettes panel ➤ Sheet Set Manager.
2In the Sheet Set Manager, Sheet List tab, right-click the sheet set node (at
the top of the list), or an existing subset. Click New Subset.
3In the Subset Properties dialog box, under Subset Name, enter the name
of the new subset. Click OK.
You can drag the new subset anywhere on the sheet list, even under other
subsets.
NOTE If you want to create a subset under an existing subset, you can
right-click the existing subset. On the shortcut menu, click New Subset.
To create a new view category in the view list
1Click View tab ➤ Palettes panel ➤ Sheet Set Manager.
2In the Sheet Set Manager, Sheet Views tab, click the View by Category
button.
3Right-click the sheet set node (at the top of the list). Click New View
Category.
4In the View Category dialog box, under Category Name, enter the name
of the new view category.
5If a list of blocks is displayed, select the callout blocks to be used for the
views in this view category. You can add blocks to the list by clicking the
Add Blocks button.
To remove a subset from the sheet list
1Click View tab ➤ Palettes panel ➤ Sheet Set Manager.
2In the Sheet Set Manager, Sheet List tab, drag all sheets out of the subset
that you want to remove.
3Right-click the subset that you want to remove. Click Remove Subset.
440 | Chapter 15 Work with Sheets in a Sheet Set

To remove a view category from the view list
1Click View tab ➤ Palettes panel ➤ Sheet Set Manager.
2In the Sheet Set Manager, Sheet Views tab, click the View by Category
button.
3Drag all views out of the view category that you want to remove.
4Right-click the view category that you want to remove. Click Remove
Category.
Quick Reference
NEWSHEETSET
Creates a new sheet set data file that manages drawing layouts, file paths,
and project data.
OPENSHEETSET
Opens a selected sheet set.
SHEETSET
Opens the Sheet Set Manager.
SHEETSETHIDE
Closes the Sheet Set Manager.
SSFOUND
Displays the sheet set path and file name if a search for a sheet set is
successful.
SSLOCATE
Controls whether the sheet set associated with a drawing is located and
opened when the drawing is opened.
SSMAUTOOPEN
Controls the display behavior of the Sheet Set Manager when a drawing
associated with a sheet is opened.
Organize a Sheet Set | 441
SSMPOLLTIME
Controls whether plotting a sheet set, multi-sheet plot file, or plot spool file
can be interrupted by other plot jobs.
SSMSHEETSTATUS
Controls how the status data in a sheet set is refreshed.
SSMSTATE
Indicates whether the Sheet Set Manager window is open or closed.
Create and Modify Sheets
There are several options in the Sheet Set Manager for creating sheets and
adding views either through a shortcut menu or one of the tab buttons.
Modifying a sheet should always be done from an open sheet set.
Following are descriptions of common sheet operations. You can access
commands by right-clicking an item in the tree view to display the relevant
shortcut menu.
■Import layout as sheet. After you create a sheet set, you can import one
or more layouts from existing drawings. You can initialize a layout by
clicking on its tab to activate the previously unused layout. A layout does
not contain any plot settings before initialization. Once initialized, layouts
can be drawn upon, published, and added to sheet sets as sheets (after the
drawing has been saved). This is a fast method for creating multiple sheets
from layouts in several drawings. In the current drawing, you can drag a
layout tab directly onto the Sheets area of the Sheet List tab in the Sheet
Set Manager.
■Create a new sheet. As an alternative to importing existing layouts, you
can create a new sheet. When you place views in this sheet, the drawing
files associated with the views are attached as xrefs to the sheet drawing.
The sheet drawing file is created using either the AutoCAD 2004 format
or the AutoCAD 2007 format, depending on the format specified on the
Open and Save tab in the Options dialog box.
■Modify a sheet. Double-click a sheet on the Sheet List tab to open a drawing
from the sheet set. Use SHIFT or CTRL to select multiple sheets. To review
a sheet, use the shortcut menu to open a drawing in read-only mode.
442 | Chapter 15 Work with Sheets in a Sheet Set

NOTE Modifying a sheet should always be done using an open sheet set in
the Sheet Set Manager. This ensures that all data associated with the sheet are
updated.
■Rename and renumber a sheet. After you create a sheet, you can change
the sheet title and the sheet number. You can also specify a different
drawing file associated with the sheet.
NOTE If you change the layout name, the corresponding sheet title in the
sheet set is also updated or vice versa.
■Remove a sheet from a sheet set. Removing a sheet from a sheet set
disassociates the sheet from the sheet set, but does not delete the drawing
file or the layout.
■Reassociate a sheet. If you move a sheet to a different folder, you should
reassociate the sheet to the sheet set with the Sheet Properties dialog box
to correct the path. For any relocated sheet drawing, the paths for Expected
Layout and Found Layout are displayed in the Sheet Properties dialog box.
To reassociate the sheet, click the path in Expected Layout and then click
to navigate to the new location of the sheet.
NOTE You can quickly confirm whether a sheet is in the expected folder by
looking at Details at the bottom of the Sheet List tab. If the selected sheet is
not in the expected location, path information for both Expected Location and
Found Location is displayed in Details.
■Add a view to a sheet. From the Model Views tab, you can easily add a
view to a sheet by placing a named model space view or the entire drawing
onto the current sheet.
NOTE After creating a named model space view, you must save the drawing
to add the view to the Model Views tab. Click Refresh on the Model Views tab
to update the Sheet Set Manager tree view.
■Add label blocks to views. With the Sheet Set Manager, you can label views
and details automatically as you place them. Labels contain data associated
with the referenced view.
Create and Modify Sheets | 443
■Add callout blocks to views. Callout blocks is the term for the symbols that
reference other sheets. Callout blocks have many industry-specific names
such as reference tags, detail keys, detail makers, building section keys,
and so on. Callout blocks contain data associated with the sheet and view
that are referenced.
NOTE When you place a callout block with fields or a view on a sheet, make
sure that the current layer is unlocked.
■Create a title sheet and table of contents. The first sheet in a sheet set will
usually be a title sheet that includes a description of the sheet set and a
table that lists all the sheets in the sheet set. You can create this table,
called a sheet list table, on an open sheet. The table automatically includes
all the sheets in the sheet set. Once a sheet list table is created, you also
have options to edit, update, or delete the cell content of the table.
You can create a sheet list table from the shortcut menu of sheet set subsets
and sheets only when a sheet is open. You can also create sheet list tables
for multiple subsets and sheets. Any sheets added to a subset later on are
automatically added to the sheet list table.
NOTE For access to shortcut menus in the drawing area that are needed for
sheet list table operations, the Shortcut Menus in Drawing Area must be
checked in the Options dialog box, User Preferences tab.
Create Callout Blocks and Label Blocks (Advanced)
If you create a block to be used as a callout block or label block in a sheet set,
you can use a placeholder field to display information such as view title or
sheet number. The callout or label block must be defined in a DWG or DWT
file that is specified in the Sheet Set Properties dialog box. Later, you can insert
the callout or label block from a shortcut menu on the Sheet Views tab in the
Sheet Set Manager.
444 | Chapter 15 Work with Sheets in a Sheet Set

For the field to display the correct information about a view or sheets on
which you later insert it, the field must be included within a block attribute,
not text, when you define the block. To create the block attribute definition,
insert a placeholder field as the value, select the Preset option, and specify a
tag.
NOTE If you create your own label blocks and callout blocks, set any attribute
definitions to Preset to avoid prompts when placing these blocks in a drawing.
For more information about fields, see Insert Fields on page 1352.
Place a Sheet View (Advanced)
The Sheet Set Manager automates and enhances the process for adding views
to a sheet. A view on a sheet, called a sheet view, consists of several coincident
entities: an xref or geometry in model space, a layout viewport on a sheet,
and a named view in paper space.
■The sheet view can display model space from a different drawing file. In
this case, that drawing is attached as an xref in your current drawing. The
layers of that drawing file are displayed only in the sheet view that you
create.
NOTE The xref is attached using a relative path. If you need to change the
path to a fully specified (absolute) path, use the External References palette.
■A layout viewport that displays the model space view is created on your
current sheet.
■A named view that encompasses the area of the layout viewport is created
in paper space.
When you place a sheet view on a sheet, all the layers in the current drawing
(including layer 0) are frozen in the new viewport created by the view. The
layers are shown as frozen in the VP Freeze column of the Layer Properties
Manager.
If you need to remove a sheet view from a sheet, you can delete the layout
viewport to remove the view. However, to remove all unused items, you need
to detach the xref and delete the named paper space view.
NOTE The easiest method for removing a sheet view immediately after placing it
is to use UNDO.
Create and Modify Sheets | 445

See also:
■Create Multiple-View Drawing Layouts (Paper Space) on page 391
■Use Fields in Text on page 1352
To import a layout from the current drawing as a sheet
1If the Model and layout tabs are not visible at the bottom of the drawing
area, right-click the Model button on the status bar and click Display
Layout and Model tabs.
2Do one of the following:
■Right-click a layout tab and click Import Layout as Sheet.
■Click View tab ➤ Palettes panel ➤ Sheet Set Manager.
■Drag a layout tab onto the Sheet Set Manager, Sheet List Tab, Sheets
area.
3Click Import Checked.
To import layouts from several drawings as sheets
1Click View tab ➤ Palettes panel ➤ Sheet Set Manager.
2In the Sheet Set Manager, Sheet List tab, right-click the sheet set node, a
subset node, or a sheet node. Click Import Layout as Sheet.
3In the Import Layouts as Sheets dialog box, click Browse for Drawings
and navigate to the drawing that you want to use.
To select several drawings, use SHIFT or CTRL when you click on the
drawing files.
4Click the check boxes of the layouts to be imported as sheets in the
current sheet set. Click Import Checked.
5(Optional) On the Sheet List tab, right-click a newly imported sheet. Click
Rename & Renumber.
6(Optional) In the Rename & Renumber Sheet dialog box, make any
changes to the sheet number and sheet title. Click OK.
NOTE Changes to the sheet number and sheet title have no effect on the
drawing file name unless a file rename option is checked.
446 | Chapter 15 Work with Sheets in a Sheet Set

To open a drawing file read-only within a sheet set
1Click View tab ➤ Palettes panel ➤ Sheet Set Manager.
2In the Sheet Set Manager, open a sheet set.
3On the Sheet List tab, right-click a sheet. Click Open Read-Only.
To reassociate a sheet in a sheet set
1Click View tab ➤ Palettes panel ➤ Sheet Set Manager.
2In the Sheet Set Manager, open a sheet set.
3On the Sheet List tab, open the sheet that you want to reassociate.
4In the Sheet Set Manager, right-click the sheet. Click Remove Sheet.
5Save the drawing.
6In the Sheet Set Manager, right-click the Sheet Set. Click Import Layout
as Sheet.
7In the Import Layout as Sheet dialog box, click Browse for Drawings.
Navigate to the drawing that you want to use.
8Click the check box of the layout to be reassociated as a sheet in the
current sheet set. Click Import Checked.
To add a view to a sheet
1Click View tab ➤ Palettes panel ➤ Sheet Set Manager.
2In the Sheet Set Manager, open a sheet set.
3On the Sheet List tab, do one of the following:
■Double-click a sheet to open it.
■Create a new sheet and open it.
4On the Model Views tab, click the plus sign (+) next to a folder to list the
drawings in the folder.
Create and Modify Sheets | 447
5From the list of drawing files, do one of the following:
■To add a model space view to a sheet, click the plus sign (+) next to
a drawing file to list its named model space views. Right-click a model
space view.
■To add an entire drawing as a view in a sheet, right-click a drawing
file.
6Click Place on Sheet.
NOTE As an alternative to the previous two steps, you can drag a model
space view or a drawing from the Model Views tab to a sheet.
7Right-click on the sheet. Click the scale for the sheet view.
8Specify the insertion point for the sheet view.
The specified view is added to the sheet. If a view label block is defined
in the sheet set properties, a view label that displays view-specific
information is automatically placed on the sheet.
To add a sheet list table
1Click View tab ➤ Palettes panel ➤ Sheet Set Manager.
2In the Sheet Set Manager, open a sheet set.
3Right-click a sheet set name, subset, or multiple sheet set names and
subsets. Click Insert Sheet List Table.
4In the Insert Sheet List Table dialog box, do the following:
■Set the Table Style in the Table Style Settings group.
■On the Table Data tab, specify Title Text for the table and add, remove,
or change the order of the column entries.
■On the Subsets and Sheets tab, select the subsets and sheets to be
included in the sheet list table.
NOTE If you add a sheet to a subset later on, you will be automatically
prompted to update the sheet list table.
5Click OK.
448 | Chapter 15 Work with Sheets in a Sheet Set

To add a block to be used for sheet view callouts
1Click View tab ➤ Palettes panel ➤ Sheet Set Manager.
2In the Sheet Set Manager, open a sheet set.
3On the Sheet Views tab, right-click the sheet set node.
4In the Sheet Set Properties dialog box, click Callout Blocks. Click the [...]
button.
5In the List of Blocks dialog box, do one of the following:
■Click a block from the list of blocks.
■Click the Add button and specify a new block to be added to the list.
6Click OK to close each dialog box.
To change the default block used for sheet view labels
1Click View tab ➤ Palettes panel ➤ Sheet Set Manager.
2In the Sheet Set Manager, open a sheet set.
3On the Sheet Views tab, right-click the sheet set node.
4In the Sheet Set Properties dialog box, click Label Block for Views. Click
the [...] button.
5In the Select Block dialog box, specify a new block to be used as the default
view label block.
6Click OK to close each dialog box.
To add a callout block to a sheet
1Click View tab ➤ Palettes panel ➤ Sheet Set Manager.
2In the Sheet Set Manager, open a sheet set.
3On the Sheet Views tab, right-click the view with which you want to
associate a callout. Click Place Callout Block.
4Specify the insertion point of the callout block.
Create and Modify Sheets | 449
The callout block is placed on the sheet. The callout block automatically
displays view-specific information about the view with which it is
associated.
Quick Reference
NEWSHEETSET
Creates a new sheet set data file that manages drawing layouts, file paths,
and project data.
OPENSHEETSET
Opens a selected sheet set.
SHEETSET
Opens the Sheet Set Manager.
SHEETSETHIDE
Closes the Sheet Set Manager.
SSFOUND
Displays the sheet set path and file name if a search for a sheet set is
successful.
SSLOCATE
Controls whether the sheet set associated with a drawing is located and
opened when the drawing is opened.
SSMAUTOOPEN
Controls the display behavior of the Sheet Set Manager when a drawing
associated with a sheet is opened.
SSMPOLLTIME
Controls whether plotting a sheet set, multi-sheet plot file, or plot spool file
can be interrupted by other plot jobs.
SSMSHEETSTATUS
Controls how the status data in a sheet set is refreshed.
SSMSTATE
Indicates whether the Sheet Set Manager window is open or closed.
450 | Chapter 15 Work with Sheets in a Sheet Set

Include Information with Sheets and Sheet Sets
Sheet sets, subsets, and sheets include several types of information. This
information, called properties, includes titles, descriptions, file paths, and
custom properties that you define.
Different Properties for Different Levels (Owners)
Sheet sets, subsets, and sheets represent different levels of organization, and
each of these includes different types of properties. You specify the values for
these properties when you create the sheet set, subset, or sheet.
In addition, you can define custom properties for a sheet and a sheet set. The
values for custom properties for sheets are typically specific to each sheet. For
example, a custom property for a sheet might include the name of the designer.
The values for custom properties for a sheet set are typically specific to a
project. For example, a custom property for a sheet set might include the
contract number.
You cannot create custom properties for subsets.
View and Edit Properties
You can view and edit properties from the Sheet List tab by right-clicking the
name of the sheet set, subset, or sheet. On the shortcut menu, click Properties.
The properties and values that are displayed in the Properties dialog box
depend on what you selected. You can edit the values of the properties by
clicking a value.
To edit the properties of a sheet set, subset, sheet, or view category
1Click View tab ➤ Palettes panel ➤ Sheet Set Manager.
2In the Sheet Set Manager, open a sheet set.
3Do one of the following:
■On the Sheet List tab, right-click the sheet set node, a subset, or a
sheet.
■On the Sheet Views tab, right-click a view category.
4Click Properties.
5In the dialog box that is displayed, click any field and enter the changes.
6Click OK.
Include Information with Sheets and Sheet Sets | 451

To create a custom property for a sheet set
1Click View tab ➤ Palettes panel ➤ Sheet Set Manager.
2In the Sheet Set Manager, open a sheet set.
3On the Sheet List tab, right-click the sheet set node. Click Properties.
4In the Sheet Set Properties dialog box, click the Edit Custom Properties
button.
5In the Custom Properties dialog box, do one of the following:
■Click Add to create a new custom property for the sheet set. Click the
name and the default value to enter the information for these fields.
To assign this property to the sheet set, make sure that Sheet Set is
selected under Owner.
■Click the name and the default value to change the information for
these fields.
■Click a custom property from the list. Click Delete to remove the
property.
6Click OK to close each dialog box.
To create a custom property for a sheet
1Click View tab ➤ Palettes panel ➤ Sheet Set Manager.
2In the Sheet Set Manager, open a sheet set.
3On the Sheet List tab, right-click the sheet set node.
4In the Sheet Set Properties dialog box, click the Edit Custom Properties
button.
5In the Custom Properties dialog box, do one of the following:
■Click Add to create a new custom property for the sheet. Click the
name and the default value to enter the information for these fields.
To assign this property to the sheet, make sure that Sheet is selected
under Owner.
452 | Chapter 15 Work with Sheets in a Sheet Set
■Click the name and the default value to change the information for
these fields. With this method, you can change the value for every
sheet in the sheet set.
■Click a custom property from the list. Click Delete to remove the
property.
6Click OK to close each dialog box.
Quick Reference
NEWSHEETSET
Creates a new sheet set data file that manages drawing layouts, file paths,
and project data.
OPENSHEETSET
Opens a selected sheet set.
SHEETSET
Opens the Sheet Set Manager.
SHEETSETHIDE
Closes the Sheet Set Manager.
SSFOUND
Displays the sheet set path and file name if a search for a sheet set is
successful.
SSLOCATE
Controls whether the sheet set associated with a drawing is located and
opened when the drawing is opened.
SSMAUTOOPEN
Controls the display behavior of the Sheet Set Manager when a drawing
associated with a sheet is opened.
SSMPOLLTIME
Controls whether plotting a sheet set, multi-sheet plot file, or plot spool file
can be interrupted by other plot jobs.
Include Information with Sheets and Sheet Sets | 453
SSMSHEETSTATUS
Controls how the status data in a sheet set is refreshed.
SSMSTATE
Indicates whether the Sheet Set Manager window is open or closed.
Publish, Transmit, and Archive Sheet Sets
After you have organized drawings into a sheet set, you can publish, transmit,
and archive the sheet set as a package.
■Publish a sheet set: Use the Publish feature to output the sheet set to a
plotter in either normal or reverse order. For more information, see Publish
a Sheet Set on page 1636. You can create single and multiple-sheet DWF or
DWFx files from a sheet set or portion of a sheet set.
For information on DWF files, see Plot DWF Files on page 1609.
For information on DWFx files, see Plot DWFx Files on page 1610.
■Set options for properties to include in a published DWF or DWFx file:
You can decide what types of information to reveal in your published DWF
or DWFx files. The types of metadata that you can include are sheet and
sheet set properties, block properties and attributes, dynamic block
properties and attributes, and properties contained in custom objects.
Metadata is only included when you publish to DWF or DWFx; it is not
available when plotting to DWF or DWFx.
■Transmit a sheet set: Package and send a sheet set or a portion of a sheet
set over the Internet. For more information, see Package a Set of Files for
Internet Transmission on page 1971.
■Archive a sheet set: Package a sheet set or portion of a sheet set for storage.
This is very similar to packaging a transmittal set, except that you specify
a folder for the archive and you do not transmit the package. For more
information, see the ARCHIVE command.
Use Page Setups
Page setups provide the settings that are used for publishing and plotting.
When you create a sheet set, you specify a drawing template (DWT) file that
contains one or more page setups for all new sheets. This DWT file is called
the sheet creation template.
454 | Chapter 15 Work with Sheets in a Sheet Set
Another DWT file, called the page setup overrides file, contains page setups that
can be specified to override the page setups in each sheet. You specify the
page setup overrides file in the Sheet Set Properties dialog box.
When you publish a sheet set, you can use the page setups defined in each
drawing file, you can use the page setup overrides for all drawing files, or you
can publish to a DWF or DWFx file. For more information about page setups,
see Use Named Page Setups with Sheet Sets on page 1549.
NOTE With page setup overrides, you can use the PUBLISHCOLLATE system
variable to control whether plotting a sheet set can be interrupted by other plot
jobs or not.
Save a Selection of Sheets
You can select part of a sheet set for publishing and transmitting. On the Sheet
List tab, you can select individual sheets using standard Microsoft® Windows®
selection methods—press CTRL or SHIFT when you click items. You can specify
all the sheets in a sheet subset by clicking the subset node.
You will likely need to perform operations on the same group of sheets in a
sheet set repeatedly. To speed up selecting the sheets and to ensure that the
same sheets are selected each time, you can use the Sheet Set Manager to
reselect groups of sheets by name. These named groups of sheets are called
sheet selections. You can create and manage sheet selections by using the Sheet
Selections button at the top of the Sheet List tab.
To save a sheet selection
1Click View tab ➤ Palettes panel ➤ Sheet Set Manager.
2In the Sheet Set Manager, open a sheet set.
3On the Sheet List tab, click the sheets and subsets to include in the sheet
selection.
You can use CTRL or SHIFT to specify several items from the list.
4In the Sheet List Manager, near the upper-right corner, click the Sheet
Selections button. Click Create.
5In the New Sheet Selection dialog box, enter the name of the sheet
selection. Click OK.
Publish, Transmit, and Archive Sheet Sets | 455
To restore a sheet selection
1Click View tab ➤ Palettes panel ➤ Sheet Set Manager.
2In the Sheet Set Manager, open a sheet set.
3On the Sheet List tab, near the upper-right corner, click the Sheet
Selections button. Select the name of the sheet selection that you want
to restore.
The sheet selection is activated and available for publishing and
transmitting operations.
To rename or delete a sheet selection
1Click View tab ➤ Palettes panel ➤ Sheet Set Manager.
2In the Sheet Set Manager, open a sheet set.
3On the Sheet List tab, near the upper-right corner, click the Sheet
Selections button. Click Manage.
4In the Sheet Selections dialog box, select the name of a sheet selection
and do one of the following:
■Click Rename to rename the sheet selection. Enter the new name for
the sheet selection.
■Click Delete to remove the sheet selection name from the list. Click
Yes to confirm that you want to remove this sheet selection name.
5Click OK.
To modify an existing sheet selection
NOTE You cannot modify a sheet selection directly. Instead, you activate a sheet
selection and modify it, delete the name of the sheet selection, and then create a
new sheet selection in its place.
1Click View tab ➤ Palettes panel ➤ Sheet Set Manager.
2In the Sheet Set Manager, open a sheet set.
456 | Chapter 15 Work with Sheets in a Sheet Set

3On the Sheet List tab, near the upper-right corner, click the Sheet
Selections button. Select the name of the sheet selection to modify.
4Use the CTRL key to add and remove items from the sheet selection.
5On the Sheet List Manager, near the upper-right corner, click the Sheet
Selections button. Click Manage.
6Click Delete to remove the sheet selection name from the list. Click Yes
to confirm that you want to remove this sheet selection name.
7Click OK to close the Sheet Selections dialog box.
8On the Sheet List Manager, near the upper-right corner, click the Sheet
Selections button. Click Create.
9In the New Sheet Selection dialog box, enter the name of the sheet
selection. Click OK.
To publish a DWF or DWFx file including layer, block, sheet set, and sheet
information
1Click View tab ➤ Palettes panel ➤ Sheet Set Manager.
2In the Sheet Set Manager, Sheet List tab, select the sheet set to publish
in a DWF or DWFx file.
3Click the Publish button. Click Sheet Set Publish Options.
4In the Sheet Set Publish Options dialog box, under DWF Data Options,
depending on what you want to include in the published DWF or DWFx
file, click any of the following to change the option to “Include.”
■Layer information
■Sheet set information (attributes you can choose to include are
description and custom properties)
■Sheet information (attributes you can choose to include are sheet title,
sheet number, description, sheet set, subset, and sheet custom
properties)
■Block information
Publish, Transmit, and Archive Sheet Sets | 457
NOTE Some sheet properties are always published in the DWF or DWFx
file (no matter what setting you make in the Sheet Set Publish Options
dialog box). These are: sheet name, sheet size, author, creator, creation
time, and modification time.
5Click OK.
To publish a DWF or DWFx file using a block template file to include block
properties and attributes
1Click View tab ➤ Palettes panel ➤ Sheet Set Manager.
2In the Sheet Set Manager, Sheet List tab, select the sheet set to publish
in a DWF or DWFx file.
3Click the Publish button. Click Sheet Set Publish Options.
4In the Sheet Set Publish Options dialog box, under DWF Data Options,
Block Information, click to display the drop-down list, and select
“Include.”
5Under DWF Data Options, Block Template File, select the block template
file you want to use or create a new one. Click OK.
The block template file defining the blocks and their properties and
attributes will be included in the published DWF or DWFx file.
Quick Reference
ARCHIVE
Packages the current sheet set files for archive.
NEWSHEETSET
Creates a new sheet set data file that manages drawing layouts, file paths,
and project data.
OPENSHEETSET
Opens a selected sheet set.
SHEETSET
Opens the Sheet Set Manager.
458 | Chapter 15 Work with Sheets in a Sheet Set
SHEETSETHIDE
Closes the Sheet Set Manager.
PUBLISHCOLLATE
Controls whether plotting a sheet set, multi-sheet plot file, or plot spool file
can be interrupted by other plot jobs.
SSFOUND
Displays the sheet set path and file name if a search for a sheet set is
successful.
SSLOCATE
Controls whether the sheet set associated with a drawing is located and
opened when the drawing is opened.
SSMAUTOOPEN
Controls the display behavior of the Sheet Set Manager when a drawing
associated with a sheet is opened.
SSMSHEETSTATUS
Controls how the status data in a sheet set is refreshed.
SSMSTATE
Indicates whether the Sheet Set Manager window is open or closed.
Use Sheet Sets in a Team
You can use sheet sets in a team that can involve network access, Internet
collaboration, and email transmittal. The team can also include people who
use software that does not include Sheet Set Manager.
Work in a Team That Uses Sheet Set Manager
When you use sheet sets in a team, each member should have network access
to the sheet set data (DST) file and the drawing template (DWT) files associated
with the sheet set. Each team member can open the sheet set to load the sheet
set information from the DST file into the Sheet Set Manager.
Any changes that any team member makes opens the DST file briefly and
updates the information stored in that file. When the DST file is opened, a
lock icon is displayed next to the sheet set name in the top left corner of the
Sheet Set Manager.
Use Sheet Sets in a Team | 459
A green dot in the lock icon indicates that the Sheet Set
Manager session on your computer has temporarily locked the DST file.
A red dot indicates that the Sheet Set Manager session
on a team member's computer has temporarily locked the DST file.
A yellow dot in the lock icon means that the sheet is in
a special state; for example, its file properties may be set to Read-Only.
Other members of the team can automatically see changes to the sheet set in
the Sheet Set Manager tree view.
If each member of the team has access to the sheet set DWT files, new drawing
files and their sheets are created using the same drawing template file; page
setups for these drawings are also standardized.
NOTE If two or more users access the same sheet files through different logical
drives on a network, each will in turn be prompted to resave the sheet set using
their own logical drive. To avoid unnecessary saving, users should map the same
logical drives, if possible.
Status data for sheets in the current sheet set is also available to other team
members. This status data is displayed in the tree view and indicates one of
the following conditions:
The sheet is available for editing.
The sheet is locked.
The sheet is missing or found in an unexpected folder location.
The active sheets of other team members are automatically polled for status
changes; the tree view is updated in your session of the Sheet Set Manager.
The polling cycle skips the poll interval in your session when a command is
active. To force a sheet status update, click Refresh Sheet Status on the Sheet
List tab.
You can click any sheet to display more information in the Details area of the
Sheet Set Manager.
NOTE A false lock icon may be displayed if there is a network problem or if the
program terminates unexpectedly. If you suspect a problem, click the sheet to
display more information.
460 | Chapter 15 Work with Sheets in a Sheet Set

Work in a Team That Does Not Use Sheet Set Manager
With some limitations, you can use sheet sets in a team with members who
do not have network access, or do not have access to the Sheet Set Manager.
These team members may be using AutoCAD LT or an older version of
AutoCAD. In those circumstances, not all members of the team will have
access to the DST file. However, relevant information from the DST file is
stored (cached) in each drawing file, and sheet set information, such as custom
properties, is preserved when the drawing file is shared by other team members.
After a member of the team changes information in the DST file, the
information in several drawing files might need to be updated. With the sheet
set open, update a sheet by opening and saving the sheet.
You can update all sheets in a sheet set automatically with the Resave All
Sheets option in the sheet set shortcut menu. Drawing files saved in a previous
DWG file format are saved without changing the format.
NOTE In a network environment, make sure that all drawing files used in the
current sheet set that are opened by other users are closed before performing the
Resave All Sheets operation.
Quick Reference
NEWSHEETSET
Creates a new sheet set data file that manages drawing layouts, file paths,
and project data.
OPENSHEETSET
Opens a selected sheet set.
SHEETSET
Opens the Sheet Set Manager.
SHEETSETHIDE
Closes the Sheet Set Manager.
SSFOUND
Displays the sheet set path and file name if a search for a sheet set is
successful.
Use Sheet Sets in a Team | 461
SSLOCATE
Controls whether the sheet set associated with a drawing is located and
opened when the drawing is opened.
SSMAUTOOPEN
Controls the display behavior of the Sheet Set Manager when a drawing
associated with a sheet is opened.
SSMPOLLTIME
Controls whether plotting a sheet set, multi-sheet plot file, or plot spool file
can be interrupted by other plot jobs.
SSMSHEETSTATUS
Controls how the status data in a sheet set is refreshed.
SSMSTATE
Indicates whether the Sheet Set Manager window is open or closed.
462 | Chapter 15 Work with Sheets in a Sheet Set
Part 6: Create and Modify
Objects
463
464
Control the Properties of
Objects
You can organize objects in your drawing and control how they are displayed and plotted by
changing their properties, which include layer, linetype, color, lineweight, transparency, and
plot style.
Work with Object Properties
You can change the object properties in your drawing by using the Properties
palette or the Quick Properties palette.
Overview of Object Properties
Every object you draw has properties. Some properties are general and apply to
most objects; for example, layer, color, linetype, transparency, and plot style.
Other properties are object-specific; for example, the properties of a circle include
radius and area, and the properties of a line include length and angle.
Most general properties can be assigned to an object by layer or can be assigned
to an object directly.
■When a property is set to the value BYLAYER, the object is assigned the same
value as the layer on which it is drawn.
For example, if a line drawn on layer 0 is assigned the color BYLAYER, and
layer 0 is assigned the color Red, the line is red.
■When a property is set to a specific value, that value overrides the value set
for the layer.
For example, if a line drawn on layer 0 is assigned the color Blue, and layer
0 is assigned the color Red, the line is blue.
16
465
See also:
■Control the Color and Linetype Properties in Blocks on page 870
Quick Reference
CHPROP
Changes the properties of an object.
PROPERTIES
Controls properties of existing objects.
PROPERTIESCLOSE
Closes the Properties palette.
CECOLOR
Sets the color of new objects.
CELTYPE
Sets the linetype of new objects.
CELWEIGHT
Sets the lineweight of new objects.
CETRANSPARENCY
Sets the transparency level for new objects.
CLAYER
Sets the current layer.
CPLOTSTYLE
Controls the current plot style for new objects.
PLOTTRANSPARENCYOVERRIDE
Controls whether object transparency is plotted.
TRANSPARENCYDISPLAY
Controls whether the object transparency is displayed.
466 | Chapter 16 Control the Properties of Objects

Display and Change the Properties of Objects
You can display and change the current properties for any object in your
drawing.
Use the Quick Properties Palette
The Quick Properties palette lists the most commonly used properties for each
object type or a set of objects. You can easily customize the quick properties
for any object in the Customize User Interface (CUI) editor. See Quick
Properties in the Customization Guide.
■When one or more objects of the same type are selected, the Quick
Properties palette displays the selected properties of that object type.
■When two or more objects of different types are selected, the Quick
Properties palette displays the common properties, if any for all objects in
the selection set.
Use the Properties Palette
The Properties palette lists the current settings for properties of the selected
object or set of objects. You can modify any property that can be changed by
specifying a new value.
■When more than one object is selected, the Properties palette displays only
those properties common to all objects in the selection set.
■When no objects are selected, the Properties palette displays only the
general properties of the current layer, the name of the plot style table
attached to the layer, the view properties, and information about the UCS.
You can double-click most objects to open the Properties palette when the
DBLCLKEDIT system variable is set to On (the default). The exceptions include
blocks and attributes, text, multilines, and xrefs. If you double-click any of
these objects, an object-specific dialog box is displayed instead of the Properties
palette.
NOTE The DBLCLKEDIT system variable must be set to On and the PICKFIRST
system variable must be set to 1(the default) for double-clicking to work.
Display and Change the Properties of Objects | 467
Use the Properties Panel on the Ribbon
On the Home tab, the Properties panel provides a convenient way to verify
or change the settings for properties such as color, layer, and linetype. The
Properties panel operates similarly to the Properties palette.
■If no objects are selected, the panel displays the default properties for objects
created in the future.
■If one or more objects are selected, the controls display the current
properties for the selected objects.
■If one or more objects are selected and their properties vary, the controls
for those properties will be blank.
■If one or more objects are selected, and a property is changed on the ribbon,
the selected objects will change to the specified value.
IMPORTANT For performance reasons, the number of objects controlled by the
ribbon when changing an object property or displaying a contextual tab is limited
to 2500 objects. You can change this limit by changing the value of the
RIBBONCONTEXTSELLIM system variable.
Change Object Property or ByBlock Settings to ByLayer
Objects that have a ByBlock setting can also be changed to ByLayer. When
an object’s properties are not set to ByLayer, those objects do not display the
layer property overrides that were set by viewport.
See also:
■Control the Color and Linetype Properties in Blocks on page 870
■Select Objects by Properties on page 703
■Set Interface Options on page 109
■Quick Properties in the Customization Guide
To change the settings of a Quick Properties palette
1Click Toolsmenu ➤ Drafting Settings.
468 | Chapter 16 Control the Properties of Objects
2In the Drafting Settings dialog box, Quick Properties tab, select Quick
Properties On.
3Select the location mode for the Quick Properties palette.
4Under Size Settings, select or clear the Auto-Collapse option to expand
or collapse the Quick Properties palette. If this option is selected, enter
the height value in the text box.
5Click OK.
Quick Reference
CUI
Manages the customized user interface elements in the product.
DSETTINGS
Sets grid and snap, polar and object snap tracking, object snap modes,
Dynamic Input, and Quick Properties.
ID
Displays the UCS coordinate values of a specified location.
LIST
Displays property data for selected objects.
PROPERTIES
Controls properties of existing objects.
PROPERTIESCLOSE
Closes the Properties palette.
SETBYLAYER
Changes the property overrides of selected objects to ByLayer.
CETRANSPARENCY
Sets the transparency level for new objects.
DBLCLKEDIT
Controls the double click editing behavior in the drawing area.
Display and Change the Properties of Objects | 469
LUPREC
Sets the display precision for linear units and coordinates.
OPMSTATE
Indicates whether the Properties palette is open, closed, or hidden.
PALETTEOPAQUE
Controls whether palettes can be made transparent.
PICKFIRST
Controls whether you select objects before (noun-verb selection) or after you
issue a command.
QPLOCATION
Sets the location mode of Quick Properties palette.
QPMODE
Sets the on or off state of Quick Properties palette.
RIBBONCONTEXTSELLIM
Limits the number of objects that can be changed at one time with the ribbon
property controls or a contextual tab.
SETBYLAYERMODE
Controls which properties are selected for the SETBYLAYER command.
TRANSPARENCYDISPLAY
Controls whether the object transparency is displayed.
Copy Properties Between Objects
You can copy some or all properties of one object to other objects using Match
Properties.
The types of properties that can be copied include, but are not limited to,
color, layer, linetype, linetype scale, lineweight, plot style, transparency,
viewport property overrides, and 3D thickness.
By default, all applicable properties are automatically copied from the first
object you selected to the other objects. If you don't want a specific property
or properties to be copied, use the Settings option to suppress the copying of
that property. You can choose the Settings option at any time during the
command.
470 | Chapter 16 Control the Properties of Objects
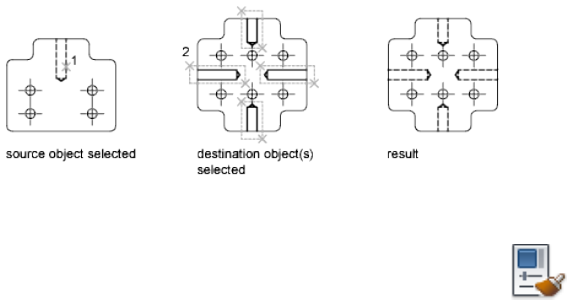
To copy properties from one object to other objects
1Click Home tab ➤ Properties panel ➤ Match Properties.
2Select the object whose properties you want to copy.
3If you want to control which properties are transferred, enter s (Settings).
In the Property Settings dialog box, clear the items that you do not want
copied (all are on by default). Click OK.
4Select the objects to which you want to apply the selected properties and
press Enter.
Quick Reference
MATCHPROP
Applies the properties of a selected object to other objects.
Work with Layers
Layers are like transparent overlays on which you organize and group objects
in a drawing.
Overview of Layers
Layers are used to group information in a drawing by function and to enforce
linetype, color, and other standards.
Layers are the equivalent of the overlays used in paper-based drafting. Layers
are the primary organizational tool used in drawing. Use layers to group
information by function and to enforce linetype, color, and other standards.
Work with Layers | 471
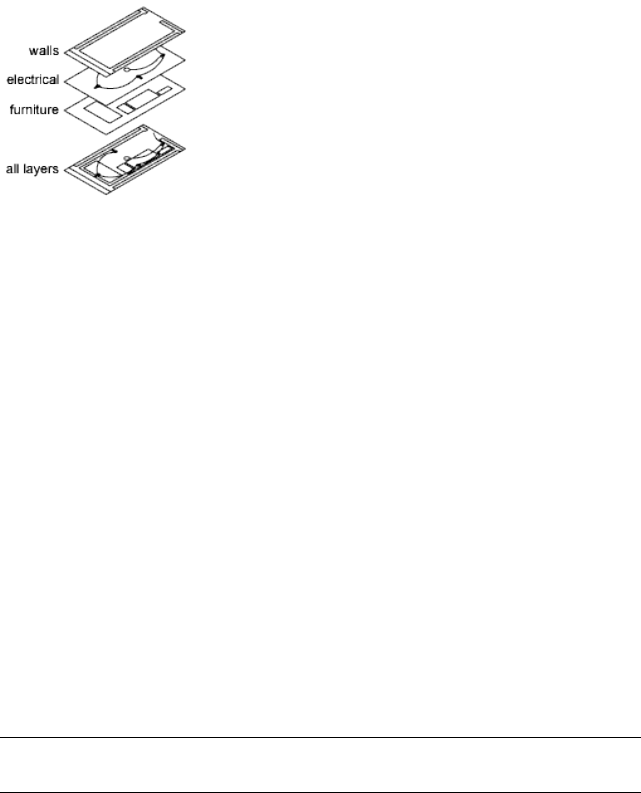
By creating layers, you can associate similar types of objects by assigning them
to the same layer. For example, you can put construction lines, text,
dimensions, and title blocks on separate layers. You can then control the
following:
■Whether objects on a layer are visible or dimmed in any viewports
■Whether and how objects are plotted
■What color is assigned to all objects on a layer
■What default linetype and lineweight are assigned to all objects on a layer
■Whether objects on a layer can be modified
■Whether objects display with different layer properties in individual layout
viewports
Every drawing includes a layer named 0. Layer 0 cannot be deleted or renamed.
It has two purposes:
■Ensure that every drawing includes at least one layer
■Provide a special layer that relates to controlling colors in blocks
NOTE It is recommended that you create several new layers with which to organize
your drawing rather than create your entire drawing on layer 0.
Quick Reference
CLASSICLAYER
Opens the legacy Layer Properties Manager.
472 | Chapter 16 Control the Properties of Objects
LAYER
Manages layers and layer properties.
LAYERPALETTE
Opens the modeless Layer Properties Manager.
LAYERDLGMODE
Sets the flavor of the Layer Properties Manager that is defined for the use of
the LAYER command.
SHOWLAYERUSAGE
Displays icons in the Layer Properties Manager to indicate whether layers
are in use.
Use Layers to Manage Complexity
You can use layers to control the visibility of objects and to assign properties
to objects. Layers can be locked to prevent objects from being modified.
You can reduce the visual complexity of a drawing and improve display
performance by controlling how objects are displayed or plotted. For example,
you can use layers to control the properties and visibility of similar objects,
such as electrical parts or dimensions. Also, you can lock a layer to prevent
objects on that layer from being accidentally selected and modified.
Control the Visibility of Objects on a Layer
You can make drawing layers invisible either by turning them off or by freezing
them. Turning off or freezing layers is useful if you need an unobstructed view
when working in detail on a particular layer or set of layers or if you don't
want to plot details such as reference lines. Whether you choose to freeze
layers or turn them off depends on how you work and on the size of your
drawing.
■On/Off. Objects on turned-off layers are invisible, but they still hide objects
when you use HIDE. When you turn layers on and off, the drawing is not
regenerated.
■Freeze/Thaw. Objects on frozen layers are invisible and do not hide other
objects. In large drawings, freezing unneeded layers speeds up operations
involving display and regeneration. Thawing one or more layers may cause
the drawing to be regenerated. Freezing and thawing layers takes more
time than turning layers on and off.
Use Layers to Manage Complexity | 473

In a layout, you can freeze layers in individual layout viewports.
NOTE Instead of turning off or freezing a layer, you can fade the layer by locking
it. See “Lock the Objects on a Layer” below.
Control Transparency on Layers
Set the transparency of layers and layout viewports to enhance drawings by
reducing the visibility of all object on specific layers as needed. Set layer (or
layout viewport) transparency in the Layer Properties Manager.
After you apply transparency to a layer, all objects added to that layer are
created at the same level of trasparency. The transparency property for all
objects on the layer is set to ByLayer.
Assign a Default Color and Linetype to a Layer
Each layer has associated properties such as color, linetype, and transparency
that are assumed by all objects on that layer when the setting is ByLayer. For
example, if the Color control on the Properties toolbar is set to BYLAYER, the
color of new objects is determined by the color setting for the layer in the
Layer Properties Manager.
If you set a specific color in the Color control, that color is used for all new
objects, overriding the default color for the current layer. The same is true for
the Linetype, Lineweight, and Plot Style controls on the Properties toolbar.
The BYBLOCK setting should be used only for creating blocks. See Control
the Color and Linetype Properties in Blocks on page 870.
Override Layer Properties in a Layout Viewport
Some layer properties can be changed using overrides on a viewport basis in
layouts. Using layer property overrides is an efficient way to display objects
with different property settings for color, linetype, lineweight, transparency,
and plot style. Layer property overrides are applied to the current layout
viewport.
For example, if you want objects on the Electrical layer to display prominently
in one of two layout viewports, you set a Color override on the Electrical layer
for each of the two viewports. By setting the color red for one viewport and
gray for the other, you easily accomplish this objective without changing the
global color property assigned to the layer. See Override Layer Properties in
Viewports on page 486 for more information.
474 | Chapter 16 Control the Properties of Objects
Lock the Objects on a Layer
When a layer is locked, none of the objects on that layer can be modified until
you unlock the layer. Locking layers reduces the possibility of modifying
objects accidentally. You can still apply object snaps to objects on a locked
layer and perform other operations that do not modify those objects.
You can fade the objects on locked layers to make them appear more faint
than other objects. This serves two purposes:
■You can easily see what objects are on locked layers.
■You can reduce the visual complexity of a drawing but still maintain visual
reference and object snapping capabilities to those objects.
The LAYLOCKFADECTL system variable controls the fading applied to locked
layers. Locked layers that are faded are plotted normally.
When you lock a layer that contains transparent objects, the visibiltiy of those
objects is further reduced by the specified locked layer fading value.
NOTE Grips are not displayed on objects that are on locked layers.
To copy an object to another layer
1Click Home tab ➤ Layers panel ➤ Copy Objects to New Layer.
2Select the objects you want to copy.
3Press Enter.
4Select an object on the layer where you want the copied object to be
placed.
5Do one of the following:
■Specify a base point, and then specify a second point for the location
of the object on the destination layer.
■Enter the displacement in the form of a Cartesian, polar, cylindrical,
or spherical coordinate value. At the prompt for the second point of
displacement, press Enter.
Use Layers to Manage Complexity | 475
To control the transparency of objects or layout viewports on a layer
1Click Home tab ➤ Layers panel ➤ Layer Properties.
2In the Layer Properties Manager, select a layer. Click the Transparency
or the VP Transparency column.
NOTE The VP Transparency column is only available when a layout tab is
active.
3In the Layer Transparency dialog box, click the drop-down list to select
a transparency level, or enter a value between 0 and 90 .
4Click OK.
TIP To set the same trasparency level for multiple selected layers, press CTRL and
click to select more than one layer. Then click the Transparency or the VP
Transparency column to display the Layer Transparency dialog box.
To turn the Always Show option on or off in the LayerWalk dialog box
1Click Home tab ➤ Layers panel ➤ Layer Walk.
2In the LayerWalk dialog box, Layer list, double-click the layer you want
to set to Always Show. To select more than one layer, press SHIFT and
double-click the additional layers.
An asterisk (*) is displayed to the left of each layer that you set to Always
Show. These layers are displayed in the drawing regardless of whether or
not they are in an active filter.
3Click Close.
To display selected layers while turning off all other layers
1Click Home tab ➤ Layers panel ➤ Isolate.
2Select an object on the layer you want to isolate.
3Press Enter.
The selected layer is isolated.
476 | Chapter 16 Control the Properties of Objects
NOTE To restore layers to the layer state before you isolated them, use the
LAYUNISO command. Any layer settings you changed are preserved.
To copy properties from one layer to other layers
1Click Home tab ➤ Layers panel ➤ Match.
2Select the object whose layer you want to change. Press Enter.
3Select an object on the layer where you want the object to move.
The object is moved to the selected layer.
To assign a color to a layer
1Click Home tab ➤ Layers panel ➤ Layer Properties
2In the Layer Properties Manager, select a layer. Click the color icon.
3In the Select Color dialog box, select a color.
4Click OK.
To change the properties of more than one layer
1Click Home tab ➤ Layers panel ➤ Layer Properties
2In the Layer Properties Manager list view, use one of the following
methods to select the layers:
■Hold down Ctrl and select layer names.
■Right-click. Click Show Filters in Layer List to display a check mark,
and then select a layer filter.
3Click the icons for the properties you want to change.
4Click OK.
Use Layers to Manage Complexity | 477
Quick Reference
CLASSICLAYER
Opens the legacy Layer Properties Manager.
COPYTOLAYER
Copies one or more objects to another layer.
LAYCUR
Changes the layer property of selected objects to the current layer.
LAYDEL
Deletes all objects on a layer and purges the layer.
LAYER
Manages layers and layer properties.
LAYERPALETTE
Opens the modeless Layer Properties Manager.
LAYFRZ
Freezes the layer of selected objects.
LAYISO
Hides or locks all layers except those of the selected objects.
LAYMCH
Changes the layer of a selected object to match the destination layer.
LAYMCUR
Sets the current layer to that of a selected object.
LAYMRG
Merges selected layers into a target layer, removing the previous layers from
the drawing.
LAYOFF
Turns off the layer of a selected object.
LAYON
Turns on all layers in the drawing.
478 | Chapter 16 Control the Properties of Objects

LAYTHW
Thaws all layers in the drawing.
LAYUNISO
Restores all layers that were hidden or locked with the LAYISO command.
LAYWALK
Displays objects on selected layers and hides objects on all other layers.
LAYERDLGMODE
Sets the flavor of the Layer Properties Manager that is defined for the use of
the LAYER command.
LAYLOCKFADECTL
Controls the amount of fading for objects on locked layers.
Create and Name Layers
You can create and name a new layer for each conceptual grouping (such as
walls or dimensions) and assign common properties to each layer.
By organizing objects into layers, you can control the visibility and object
properties of a large number of objects separately for each layer and make
changes quickly.
NOTE The number of layers that you can create in a drawing and the number of
objects that you can create on each layer are practically unlimited.
Choose Layer Names Carefully
A layer name can include up to 255 characters (double-byte or alphanumeric):
letters, numbers, spaces, and several special characters. Layer names cannot
include the following characters:
< > / \ “ : ; ? * | = ‘
In many cases, the layer names you choose are dictated by corporate, industry,
or client standards.
The Layer Properties Manager sorts layers alphabetically by name. If you
organize your own layer scheme, choose layer names carefully. Use common
prefixes to name layers with related drawing components, you can use
wild-card characters in layer name filters when you need to find those layers
quickly.
Create and Name Layers | 479
NOTE If you consistently use a specific layering scheme, you can set up a drawing
template with layers, linetypes, and colors already assigned. For more information
about creating templates, see Use a Drawing Template File on page 171.
Copy Layers from Another Drawing
You can use DesignCenter™ to copy layers from any drawing to another by
dragging. For example, you might have a drawing that contains all the standard
layers needed for a project. You can create a new drawing and use DesignCenter
to drag the predefined layers to the new drawing, which saves you time and
ensures consistency between drawings.
You can also drag layers or copy layers by double-clicking or by clicking Insert
on the shortcut menu.
NOTE You need to resolve duplicate layer names before you drag layers from
DesignCenter.
Select a Layer to Draw On
As you draw, newly created objects are placed on the current layer. The current
layer may be the default layer (0) or a layer you create and name yourself. You
switch from one layer to another by making a different layer current; any
subsequent objects you create are associated with the new current layer and
use its color, linetype, and other properties. You cannot make a layer the
current layer if it is frozen or if it is an xref-dependent layer.
Remove Layers
You can remove unused layers from your drawing with PURGE or by deleting
the layer from the Layer Properties Manager. You can delete only unreferenced
layers. Referenced layers include layers 0 and DEFPOINTS, layers containing
objects (including objects in block definitions), the current layer, and
xref-dependent layers.
WARNING Be careful about deleting layers if you are working on a drawing in a
shared project or one based on a set of layering standards.
To create a new layer
1Click Home tab ➤ Layers panel ➤ Layer Properties.
2In the Layer Properties Manager, click the New Layer button.
480 | Chapter 16 Control the Properties of Objects
A layer name, such as LAYER1, is automatically added to the layer list.
3Enter a new layer name by typing over the highlighted layer name.
4To change the properties, click icons.
When you click Color, Linetype, Lineweight, or Plot Style, a dialog box
is displayed.
5(Optional) Click in the Description column and enter text.
6Click OK.
To remove an unused layer
1Click Home tab ➤ Layers panel ➤ Layer Properties.
2In the Layer Properties Manager, select the layer. Click the Delete Layer
button.
Layers that have objects assigned to them cannot be removed until those
objects are reassigned to a different layer or are deleted. Layers 0 and
DEFPOINTS and the current layer cannot be removed.
3Click OK.
To purge all unused layers
1Click Tools tab ➤ Drawing Utilities panel ➤ Purge.
The Purge dialog box displays a tree view of object types with items that
can be purged (removed from the drawing).
2To purge unreferenced layers, use one of the following methods:
■To purge all unreferenced layers, select Layers.
■To purge specific layers, double-click Layers to expand the tree view.
Select the layers to be purged.
3If the item you want to purge is not listed, select View Items You Cannot
Purge, select the layer, and read the explanation.
4You are prompted to confirm each item in the list. If you do not want to
confirm each purge, clear the Confirm Each Item to Be Purged option.
Create and Name Layers | 481
5Click Purge.
6To confirm the purging of each item, respond to the prompt by choosing
Yes or No, or Yes to All if more than one item is selected.
7Click Close.
Quick Reference
CLASSICLAYER
Opens the legacy Layer Properties Manager.
LAYER
Manages layers and layer properties.
LAYERPALETTE
Opens the modeless Layer Properties Manager.
PURGE
Removes unused items, such as block definitions and layers, from the drawing.
CLAYER
Sets the current layer.
LAYERDLGMODE
Sets the flavor of the Layer Properties Manager that is defined for the use of
the LAYER command.
Change Layer Settings and Layer Properties
You can change the name of a layer and any of its properties, including color
and linetype, and you can reassign objects from one layer to another.
Because everything in your drawing is associated with a layer, it's likely that
in the course of planning and creating a drawing, you'll need to change what
you place on a layer or how you view the layers in combination. You can
■Reassign objects from one layer to another.
■Change the name of a layer.
■Change the default color, linetype, or other properties of the layer.
482 | Chapter 16 Control the Properties of Objects
Reassigning an object to a different layer is useful if you create an object on
the wrong layer or decide to change your layer organization. Unless the color,
linetype, or other properties of the object have been set explicitly, an object
that you reassign to a different layer will acquire the properties of that layer.
You can change layer properties in the Layer Properties Manager and in the
Layer control on the Layers toolbar. Click the icons to change settings. Layer
names and colors can be changed only in the Layer Properties Manager, not
the Layer control.
Undo Changes to Layer Settings
You can use Layer Previous to undo changes you make to layer settings. For
example, if you freeze several layers and change some of the geometry in a
drawing, and then want to thaw the frozen layers, you can do this with a
single command without affecting the geometry changes. In another example,
if you changed the color and linetype of several layers but later decide you
prefer the old properties, you can use Layer Previous to undo the changes and
restore the original layer settings.
When you use Layer Previous, it undoes the most recent change or set of
changes made using either the Layer control or the Layer Properties Manager.
Every change you make to layer settings is tracked and can be undone with
Layer Previous. You can use LAYERPMODE to suspend layer property tracking
when you don't need it, such as when you run large scripts. There is a modest
performance gain in turning off Layer Previous tracking.
Layer Previous does not undo the following changes:
■Renamed layers. If you rename a layer and change its properties, Layer
Previous restores the original properties but not the original layer name.
■Deleted layers. If you delete or purge a layer, using Layer Previous does
not restore it.
■Added layers. If you add a new layer to a drawing, using Layer Previous
does not remove it.
Changes in the Layer Properties Manager can be grouped by enabling Combine
Layer Property Change option in User Preferences tab in the Options dialog
box. Layer creation and deletion will be tracked in the Undo list as unique
items.
To change the layer of one or more objects
1Select the objects whose layer you want to change.
Change Layer Settings and Layer Properties | 483

2Click Home tab ➤ Layers panel ➤ Layer Properties
3In the Layer Properties Manager, select the layer that you want to assign
to the objects.
4Press ESC to remove selection.
To change the default linetype assigned to a layer
1Click Home tab ➤ Layers Panel ➤ Layer Properties .
2In the Layer Properties Manager, select the linetype for the layer you want
to change.
3In the Select Linetype dialog box, if the linetype you need is not displayed,
click Load and use one of the following methods:
■In the Load or Reload Linetypes dialog box, select one or more
linetypes to load. Click OK to return to the Select Linetype dialog box.
■In the Load or Reload Linetypes dialog box, click File to open
additional linetype definition (LIN) files. Select one or more linetypes
to load. Click OK to return to the Select Linetype dialog box.
4Select the linetype you want to use. Click OK to return to the Layer
Properties Manager.
5Click OK.
To rename a layer
1Click Home tab ➤ Layers panel ➤ Layer Properties
2In the Layer Properties Manager, select a layer. Click the name or press
F2.
3Enter a new name.
4Click OK.
484 | Chapter 16 Control the Properties of Objects

To rename more than one layer
1Click Tools tab ➤ Drawing Utilities panel ➤ Rename.
2In the Rename dialog box, in the Named Objects list, select Layers.
3In Old Name, enter the old name, using wild-card characters; for example,
enter stairs$*.
4In Rename To, enter the new name using wild-card characters; for
example, enter s_*.
Results for this example are as follows: the layers STAIR$LEVEL-1,
STAIR$LEVEL-2, STAIR$LEVEL-3 are renamed S_LEVEL-1, S_LEVEL-2,
S_LEVEL-3.
5Click OK.
Quick Reference
CHANGE
Changes the properties of existing objects.
CHPROP
Changes the properties of an object.
CLASSICLAYER
Opens the legacy Layer Properties Manager.
LAYER
Manages layers and layer properties.
LAYERP
Undoes the last change or set of changes made to layer settings.
LAYERPALETTE
Opens the modeless Layer Properties Manager.
LAYERPMODE
Turns on and off the tracking of changes made to layer settings.
Change Layer Settings and Layer Properties | 485
PROPERTIES
Controls properties of existing objects.
PURGE
Removes unused items, such as block definitions and layers, from the drawing.
RENAME
Changes the names assigned to items such as layers and dimension styles.
SETBYLAYER
Changes the property overrides of selected objects to ByLayer.
CLAYER
Sets the current layer.
LAYERDLGMODE
Sets the flavor of the Layer Properties Manager that is defined for the use of
the LAYER command.
LAYERMANAGERSTATE
Indicates whether the Layer Properties Manager is open or closed.
SETBYLAYERMODE
Controls which properties are selected for the SETBYLAYER command.
Override Layer Properties in Viewports
You can display objects differently by setting property overrides for color,
linetype, lineweight, transparency, and plot style and apply them to individual
layout viewports.
Using property overrides is an efficient way for displaying objects with different
property settings in individual viewports without changing their ByLayer or
ByBlock properties. For example, objects can be made to display more
prominently by changing their color. Because layer property overrides do not
change the layer’s global properties, you can have objects display differently
in various viewports without having to create duplicate geometry or use xrefs
that have different layer settings.
486 | Chapter 16 Control the Properties of Objects
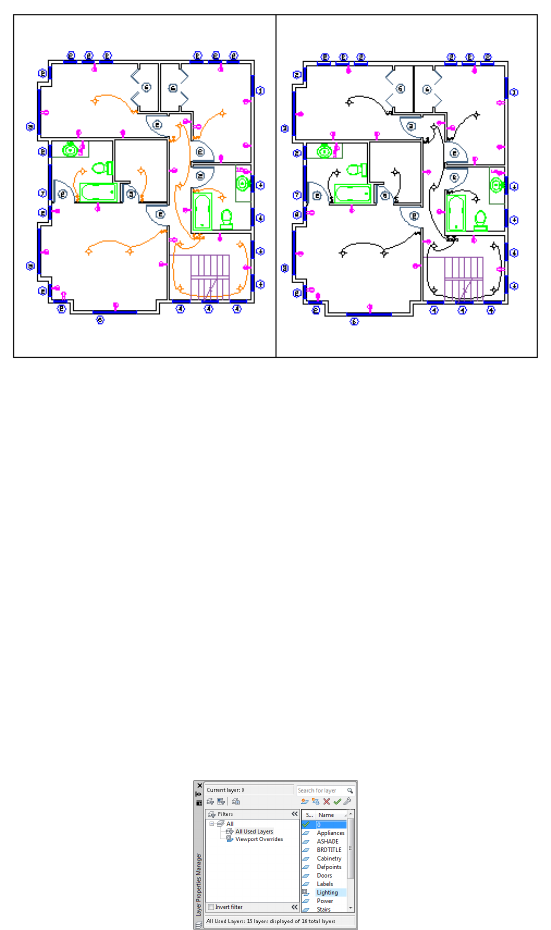
Property override settings for color and lineweight were set on the Wiring layer
for the viewport on the left. Notice the wiring is a different color and lineweight
than in the right viewport.
When the Layer Properties Manager is accessed from a layout tab, five columns
for layer property overrides are displayed
■VP Color
■VP Linetype
■VP Lineweight
■VP Transparency
■VP Plot Style (available only in named-plot style drawings)
When a property override is set for a layer, a Viewport Overrides filter is
automatically created in the Layer Properties Manager.
Override Layer Properties in Viewports | 487

If you do not want to display or plot property overrides, set the
VPLAYEROVERRIDESMODE system variable to 0. Objects will display and plot
with their global layer properties.
NOTE Property overrides can still be set even when VPLAYEROVERRIDESMODE is
set to 0.
Property overrides that are on xref layers are not retained when the VISRETAIN
system variable is set to 0.
Viewport Property Overrides and Visual Styles
Layer property overrides for color, linetype, and lineweights are displayed in
viewports regardless of the visual style that is current. Although plot style
overrides can be set when the visual style is set to Conceptual or Realistic style,
they are not displayed or plotted.
Identify Layers with Property Overrides
Layers containing property overrides are identifiable in the Layer Properties
Manager when accessed from a layout tab. You can see which layers have
overrides by the following:
■A background color displays for each layer name, override and
corresponding global property setting.
■A tooltip displays property override information when the cursor is placed
over the status icon for the layer containing overrides.
■A different icon displays in the Status column.
■A predefined filter named Viewport Overrides is displayed in the tree view
where all layers with viewport overrides are listed.
Layers that are assigned property overrides are also identifiable outside of the
Layer Properties Manager. Other areas of the user interface that indicate which
layers are assigned property overrides are as follows:
■Layers toolbar. A background color displays behind layer names for the
current viewport. For color overrides, the override color is displayed instead
of the global color.
■Properties toolbar. Displays ByLayer (VP) and a background color for layers
or objects that are assigned property overrides. Override properties are
displayed for color, linetype, and lineweight instead of global properties.
488 | Chapter 16 Control the Properties of Objects
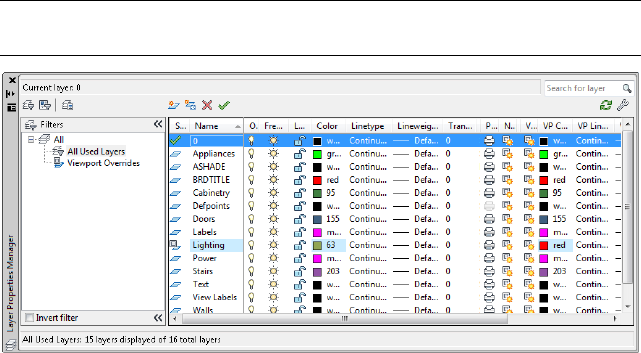
■Layers panel on the ribbon. A background color displays behind the layer
names in the Layer drop-down list. Override properties are displayed for
color, linetype, and lineweight instead of global properties.
■Properties panel on the ribbon. A background color displays behind the
color, linetype, lineweight, and plot style controls. Override properties are
displayed for color, linetype, and lineweight instead of global properties.
■Properties palette. Displays ByLayer (VP) and a background color for layers
or objects that are assigned property overrides. Override properties are
displayed for color, linetype, and lineweight instead of global properties.
NOTE The background color for viewport overrides can be changed in the Layer
Settings dialog box.
Property overrides that are set on the Lighting layer for the current viewport are
indicated by a blue background color.
Identify Viewports with Layer Property Overrides
Use the VPLAYEROVERRIDES system variable to check if the current viewport
contains layer property overrides. When VPLAYEROVERRIDES is equal to 1,
the viewport contains overrides.
You can also use the Properties palette to determine if a viewport contains
overrides. The Properties palette displays a Layer Property Overrides field. The
value that displays is the same as the setting for VPLAYEROVERRIDES.
Override Layer Properties in Viewports | 489
Remove Layer Property Overrides
When you right-click a layer in the Layer Properties Manager, a shortcut menu
is displayed that lists options for removing property overrides. You can remove
■A single property override from the selected layer for the selected viewport
or for all selected viewports
■All property overrides from the selected layer for the selected viewport or
for all selected viewports
■All property overrides from all layers in the selected viewport or for all
selected viewports
NOTE Another method for removing property overrides is to use the shortcut
menu when you right-click the border of the selected viewport or viewports. You
can remove viewport overrides for all layers for that viewport.
To assign property overrides for the current layout viewport
1On the layout tab, double-click inside a viewport to make it current.
2Click Home tab ➤ Layers panel ➤ Layer Properties
3In the Layer Properties Manager, select the global properties to override
in the VP Color, VP Linetype, VP Lineweight, and VP Plot Style columns.
To remove an override from a layer for the current layout viewport
1On the layout tab, double-click inside a viewport to make it current.
2Click Home tab ➤ Layers panel ➤ Layer Properties
3In the Layer Properties Manager, right-click the property override on the
layer you want to remove.
4Click Remove Viewport Overrides For ➤ Property Override (Color,
Linetype, Lineweight, Plot Style) ➤ In Current Viewport Only.
To remove an override from a layer for all layout viewports
1On the layout tab, double-click inside a viewport to make it current.
490 | Chapter 16 Control the Properties of Objects

2Click Home tab ➤ Layers panel ➤ Layer Properties
3In the Layer Properties Manager, right-click the property override on the
layer to remove.
4Click Remove Viewport Overrides For ➤ Property Override (Color,
Linetype, Lineweight, Plot Style) ➤ In All Viewports.
To remove all overrides from a layer for the current layout viewport
1On the layout tab, double-click inside a viewport to make it current.
2Click Home tab ➤ Layers panel ➤ Layer Properties
3In the Layer Properties Manager, right-click the layer.
4Click Remove Viewport Overrides For ➤ Selected Layers ➤ In Current
Viewport Only.
To remove all overrides for all layout viewports
1Click a layout tab.
2Click Home tab ➤ Layers panel ➤ Layer Properties
3In the Layer Properties Manager, select the Viewport Overrides filter.
4Right-click on any layer. Click Remove Viewport Overrides For ➤ All
Layers ➤ In All Viewports.
To check if the current layout viewport contains layer property overrides
1Double-click within a viewport to make it current.
2At the Command prompt, enter vplayeroverrides.
If VPLAYEROVERRIDES displays 1, the selected viewport contains layer
viewport overrides. If 0 is displayed, no overrides are found.
Override Layer Properties in Viewports | 491
To control the transparency of objects or layout viewports on a layer
1Click Home tab ➤ Layers panel ➤ Layer Properties.
2In the Layer Properties Manager, enter a value between 0 and 90 in the
Transparency or VP Transparency columns for each layer you want to
make transparent.
NOTE The VP Transparency column is only available when a Layout tab is
active.
3Press Enter.
To not display or plot layer viewport overrides
1At the Command prompt, enter vplayeroverridesmode.
2Enter 0.
To change the background color for property overrides
1Click Home tab ➤ Layers panel ➤ Layer Properties
2In the Layer Properties Manager, click Settings.
3In the Layer Settings dialog box, select a color for the viewport override
background color.
4Click OK.
To save layer viewport overrides in a layer state
1On a layout tab, double-click in a viewport to make it active.
2Click Home tab ➤ Layers panel ➤ Layer States Manager
3In the Layer States Manager, click New.
4In the New Layer State to Save dialog box, enter a name for the new layer
state, or select a name from the list. (Optional) Add a description.
5Click OK.
6Click Close to exit the Layer State Manager.
492 | Chapter 16 Control the Properties of Objects
Quick Reference
CHPROP
Changes the properties of an object.
CLASSICLAYER
Opens the legacy Layer Properties Manager.
LAYER
Manages layers and layer properties.
LAYERP
Undoes the last change or set of changes made to layer settings.
LAYERPALETTE
Opens the modeless Layer Properties Manager.
LAYERPMODE
Turns on and off the tracking of changes made to layer settings.
PROPERTIES
Controls properties of existing objects.
PURGE
Removes unused items, such as block definitions and layers, from the drawing.
RENAME
Changes the names assigned to items such as layers and dimension styles.
CLAYER
Sets the current layer.
LAYERDLGMODE
Sets the flavor of the Layer Properties Manager that is defined for the use of
the LAYER command.
VPLAYEROVERRIDES
Indicates if there are any layers with viewport (VP) property overrides for the
current layout viewport.
Override Layer Properties in Viewports | 493

VPLAYEROVERRIDESMODE
Controls whether layer property overrides for layout viewports are displayed
and plotted.
Filter and Sort the List of Layers
You can control which layer names are listed in the Layer Properties Manager
and sort them by name or by property, such as color or visibility.
A layer filter limits the display of layer names in the Layer Properties Manager
and in the Layer control on the Layers toolbar. In a large drawing, you can
use layer filters to display only the layers you need to work with.
There are two kinds of layer filters
■Layer property filter Includes layers that have names or other properties
in common. For example, you can define a filter that includes all layers
that are red and whose names include the letters mech.
■Layer group filter Includes the layers that are put into the filter when you
define it, regardless of their names or properties. Selected layers can be
added from the layer list by dragging them to the filter.
The tree view in the Layer Properties Manager displays default layer filters and
any named filters that you create and save in the current drawing. The icon
next to a layer filter indicates the type of filter. Five default filters are displayed
■All. Displays all the layers in the current drawing. (Filter is always displayed.)
■All Used. Displays all the layers on which objects in the current drawing
are drawn. (Filter is always displayed.)
■Xref. If xrefs are attached to the drawing, displays all the layers being
referenced from other drawings.
■Viewport Overrides. If there are layers with overrides for the current
viewport, displays all layers containing property overrides.
■Unreconciled New Layers. If new layers were added since the drawing was
last opened, saved, reloaded, or plotted, displays a list of new unreconciled
layers. See Reconcile New Layers on page 504 for more information.
NOTE The default filters cannot be renamed, edited, or deleted.
494 | Chapter 16 Control the Properties of Objects
Once you have named and defined a layer filter, you can select it in the tree
view to display the layers in the list view. You can also apply the filter to the
Layers toolbar, so that the Layer control displays only the layers in the current
filter.
When you select a filter in the tree view and right-click, options on the shortcut
menu can be used to delete, rename, or modify filters. For example, you can
convert a layer property filter to a layer group filter. You can also change a
property of all layers in a filter. The Isolate Group option turns off all layers
in the drawing that are not in the selected filter.
Define a Layer Property Filter
A layer property filter is defined in the Layer Filter Properties dialog box, where
you select any of the following properties you want to include in the filter
definition:
■Layer names, colors, linetypes, lineweights, and plot styles
■Whether layers are in use
■Whether layers are turned on or off
■Whether layers are frozen or thawed in the active viewport or all viewports
■Whether layers are locked or unlocked
■Whether layers are set to be plotted
You use wild-card characters to filter layers by name. For example, if you want
to display only layers that start with the letters mech, you can enter mech*.
See “Wild-Card Characters” for a complete list.
The layers in a layer property filter may change as the properties of the layers
change. For example, if you define a layer property filter named Site that
includes all layers with the letters site in the name and a CONTINUOUS
linetype, and then you change the linetype of some of those layers, the layers
with the new linetype are no longer part of the Site filter and are not displayed
when you apply that filter.
Layer property filters can be nested under other properties filters or under
group filters.
Define a Layer Group Filter
A layer group filter includes only those layers that you explicitly assign to it.
If the properties of the layers assigned to the filter change, the layers are still
Filter and Sort the List of Layers | 495
part of the filter. Layer group filters can be nested only under other layer group
filters.
TIP Layers from the layer list can be included in a filter by clicking and dragging
the selected layers to the filter.
Invert a Layer Filter
You can also invert a layer filter. For example, if all the site plan information
in a drawing is contained in multiple layers that include the word site as part
of the layer name, you can display all information except site plan information
by first creating a filter definition that filters layers by name (*site*) and then
using the Invert Filter option.
Sort Layers
Once you have created layers, you can sort them by name or other properties.
In the Layer Properties Manager, click the column heading to sort layers by
the property in that column. Layer names can be sorted in ascending or
descending alphabetical order.
Wild-Card Characters
You can use wild-card characters to sort layers by name.
DefinitionCharacter
Matches any numeric digit# (pound)
Matches any alphabetic character@ (at)
Matches any nonalphanumeric character. (period)
Matches any string and can be used anywhere in the search
string
* (asterisk)
Matches any single character; for example, ?BC matches ABC,
3BC, and so on
? (question mark)
Matches anything but the pattern; for example; ~*AB*matches
all strings that don't contain AB
~ (tilde)
Matches any one of the characters enclosed; for example,
[AB]C matches AC and BC
[ ]
496 | Chapter 16 Control the Properties of Objects
DefinitionCharacter
Matches any character not enclosed; for example, [~AB]C
matches XC but not AC
[~]
Specifies a range for a single character; for example, [A-G]C
matches AC, BC, and so on to GC, but not HC
[-]
Reads the next character literally; for example, `~AB matches
~AB
` (reverse quote)
NOTE To filter on a layer name that contains a wild-card character, precede the
character with a reverse quote (`) so that it is not interpreted as a wild-card
character.
See also:
■Reconcile New Layers on page 504
To quickly filter the display of layers by name
1Click Home tab ➤ Layers panel ➤ Layer Properties
2In the Layer Properties Manager, click in Search for Layer below the tree
view.
3(Optional) To limit your search, select a layer filter in the tree view.
4Enter a string of characters, including wild-card characters.
The list view displays all layers whose names match the string. For
example, if you enter *mech*, all layers with the letters mech in their
names are displayed.
This quick filter is discarded when the Layer Properties Manager closes.
To filter the display of layers by layer property
1Click Home tab ➤ Layers panel ➤ Layer Properties
2In the Layer Properties Manager, click the New Property Filter button.
3In the Layer Filter Properties dialog box, enter a name for the filter.
Filter and Sort the List of Layers | 497

4Under Filter Definition, set the layer properties that you want to use to
define the filter.
■To filter by name, use wild-card characters.
■To filter by property, click in the column for the property you want.
Some properties display a dialog box when you click the [...] button.
■To select more than one value for a property, right-click the row in
the filter definition. Click Duplicate Row. Select another value for that
property in the next row.
For example, the definition for a filter that displays only layers that
are on and are either yellow or red has two rows. The first row of the
filter definition has the On icon and red. The second row has the On
icon and yellow.
5Click OK.
To filter the display of layer names by selecting layers
1Click Home tab ➤ Layers panel ➤ Layer Properties
2In the Layer Properties Manager, click the New Group Filter button.
A new layer group filter named GROUP FILTER1 is created in the tree
view.
3Enter a name for the filter.
4In the tree view, click All or one of the other nodes to display layers in
the list view.
5In the list view, select the layers you want to add to the filter, and drag
them to the filter name in the tree view.
6Click OK.
To nest a layer filter under another layer filter
1Click Home tab ➤ Layers panel ➤ Layer Properties
2In the Layer Properties Manager tree view, select a layer filter.
■A new layer property filter can be nested under a group filter or
another property filter.
498 | Chapter 16 Control the Properties of Objects
■A new layer group filter can be nested only under another group filter.
3Right-click. Click New Properties Filter or New Group Filter.
4Use one of the following methods:
■For a new property filter, the Layer Properties Filter dialog box is
displayed. Under Filter Definition, set the layer properties that you
want to use to define the filter. Click OK.
■For a new group filter, a filter is added to the tree view. Rename it,
select the parent filter to display its layers in the list view, and drag
layers from the list view to the new layer group filter.
5Click OK.
To sort the layer list in the Layer Properties Manager
■Click Home tab ➤ Layers panel ➤ Layer Properties
■In the Layer Properties Manager, click any column heading.
To reverse the sorting order, click a second time.
To remove a layer from a layer group filter
1Click Home tab ➤ Layers panel ➤ Layer Properties
2In the Layer Properties Manager tree view, select a group filter.
3Select the layer you want to remove.
4Right-click in the list view. Click Remove from Group Filter.
Quick Reference
CLASSICLAYER
Opens the legacy Layer Properties Manager.
LAYER
Manages layers and layer properties.
Filter and Sort the List of Layers | 499
LAYERPALETTE
Opens the modeless Layer Properties Manager.
LAYERDLGMODE
Sets the flavor of the Layer Properties Manager that is defined for the use of
the LAYER command.
MAXSORT
Sets the maximum number of symbol names or block names sorted by listing
commands.
Use New Layer Notification
You can be notified when new layers are added to the drawing before certain
tasks, such as plotting, saving, or restoring a layer state.
It is important to be aware of new layers that have been added to a drawing
or to an attached xref without your knowledge. You can avoid potential
problems, such as plotting objects that were added to the drawing by the
addition of a new layer.
You can control when to evaluate a drawing for new layers. You can specify
which commands, such as SAVE or PLOT, trigger the program to check the
layer list and alert you of new layers. This can include new layers that have
been added to attached xrefs.
The LAYEREVAL and LAYERNOTIFY system variables work together to control
whether the layer list is evaluated and when notification occurs. Both system
variables are saved in the drawing so you have control over which drawings
are checked for new layers. When a project is started, it may not be necessary
to know when new layers have been created. For drawings that are nearing
completion, it may be important to be aware if new information has been
introduced into the drawing from the addition of new layers.
The LAYEREVALCTL controls the overall Unreconciled New Layer filter list
in the Layer Properties Manager which is evaluated for new layers. When the
New Layer Notification is checked (LAYEREVALCTL = 1), the new layer
notification feature is enabled and functions based on the LAYEREVAL and
LAYERNOTIFY drawing system variables. There should be no filter
(Unreconciled Layer filter) displayed when LAYEREVALCTL = 0. If one is
currently displayed, it will be turned off.
By default, LAYEREVAL is set to detect any new layers that have been added
to attached xrefs but not in the drawing. LAYERNOTIFY is set to notify you
500 | Chapter 16 Control the Properties of Objects
of new layers when opening the drawing, when loading, reloading, or attaching
xrefs, or when restoring a layer state. To make changes to these settings, you
can either use the system variables or the Layer Settings dialog box.
When layer notification is turned on, an Unreconciled New Layers icon displays
on the status bar.
At that time, you can choose to view the new layers by right-clicking the icon
and clicking the View Unreconciled New Layers link from the menu. When
you click the link, the Layer Properties Manager opens, and the Unreconciled
New Layers filter is automatically selected. All new layers that have been added
to the drawing or attached xrefs are displayed in the list view.
The new layers are unreconciled because they have not yet been reviewed. The
process of manually marking them as reconciled removes them from the
Unreconciled New Layers list. (See Reconcile New Layers on page 504 for more
information.) Until you reconcile the layers, the notification bubble will
display each time the command that triggered the notification is used.
By using the LAYERNOTIFY system variable or the Layer Settings dialog box,
you can turn off layer notification but still have the layer list evaluated for
new layers. Although the notification bubble does not display, you can still
check for new layers by right-clicking the alert icon on the status bar. From
the shortcut menu, click the View Unreconciled New Layers option.
New Layer Notification for Plotting
When the PLOT command is set to display new layer notification in the Layer
Settings dialog box, a dialog box is displayed instead of an icon on the status
bar. A message informs you that there are new layers in the drawing since the
layer list was last checked for new layers. Click Yes in the dialog box to view
the new layer list in the Layer Properties Manager before plotting.
Use New Layer Notification | 501
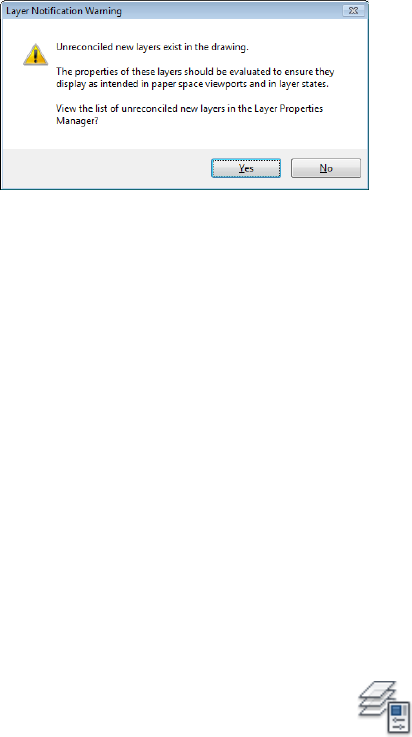
Saving a Template (DWT) File
When saving a drawing as a template (DWT) file, you can choose to save the
layers in the drawing as unreconciled or reconciled in the Template Options
dialog box. By default, all layers are saved as unreconciled, so that when a
new drawing is started using the template, a layer baseline is not yet created
until the drawing is first saved as a DWG file.
If the template file is saved with all layers as reconciled, a layer baseline is
created. That means when new layers are added to the drawing that is created
from the template file, any new layers that are created are unreconciled and
a new layer notification will display when the drawing is first saved or plotted.
Opening Multiple Drawings
When opening multiple drawings at the same time, an alert displays for each
drawing that contains new layers. This behavior occurs if layer notification is
turned on and the OPEN command is specified in the LAYERNOTIFY system
variable for each drawing.
To set new layer notification on and off
1Click Home tab ➤ Layers panel ➤ Layer Properties
2In the Layer Properties Manager, click Settings.
3In the Layer Settings dialog box, click Evaluate New Layers Added to
Drawing.
4Click Notify When New Layers are Present. Select one or more options.
5Click OK.
6Click OK to exit the Layer Properties Manager.
502 | Chapter 16 Control the Properties of Objects

To set when new layer notification is displayed
1Click Home tab ➤ Layers panel ➤ Layer Properties
2In the Layer Properties Manager, click Settings.
3In the Layer Settings dialog box, click Evaluate New Layers Added to
Drawing.
4Click Notify When New Layers are Present.
5Select the commands that will cause the layer list to be evaluated for new
layers.
6Click OK.
Quick Reference
CLASSICLAYER
Opens the legacy Layer Properties Manager.
LAYER
Manages layers and layer properties.
LAYERPALETTE
Opens the modeless Layer Properties Manager.
LAYERDLGMODE
Sets the flavor of the Layer Properties Manager that is defined for the use of
the LAYER command.
LAYEREVALCTL
Controls the overall Unreconciled New Layer filter list in Layer Properties
Manager which is evaluated for new layers.
LAYERNOTIFY
Specifies when an alert displays when unreconciled new layers are found.
LAYEREVAL
Specifies whether the layer list is evaluated for new layers when added to the
drawing or to attached xrefs.
Use New Layer Notification | 503
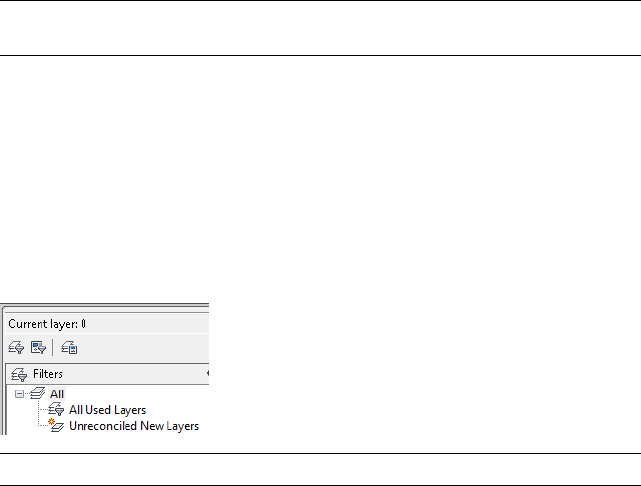
Reconcile New Layers
Unreconciled layers are new layers that have been added to the drawing and
have not yet been acknowledged by the user and manually marked as
reconciled.
Reconciling new layers is the process of manually reviewing new layers so that
you can avoid potential errors before plotting your drawing or when restoring
a layer state.
Unreconciled layers are new layers that have been added to the drawing or to
attached xrefs since the layer list was last evaluated. The layer list is checked
for new layers when a command, such as PLOT is used. In new drawings, the
layer baseline is created when the drawing is saved or plotted for the first time.
When a new drawing is first saved, the layer baseline is created, and all layers
present in the saved drawing are considered reconciled (not new). Layers that
are added after a drawing is first saved are considered new unreconciled layers.
NOTE The layer baseline is created when the LAYEREVAL system variable is set to
1 or 2.
When a command that is set in the Layer Settings dialog box or LAYEREVAL
system variable is used, the layer list is checked at that time and compared to
the baseline. If there are new layers, notification will display and the
Unreconciled New Layers filter is automatically created and activated in the
Layer Properties Manager.
Unreconciled layers become reconciled by right-clicking the layer and clicking
the Reconcile Layer option. Once a layer has become reconciled, it is removed
from the Unreconciled New Layers filter. After all new layers are reconciled,
the Unreconciled New Layers filter is removed.
NOTE You can reconcile multiple unreconciled layers at the same time.
504 | Chapter 16 Control the Properties of Objects
Quick Reference
CLASSICLAYER
Opens the legacy Layer Properties Manager.
LAYER
Manages layers and layer properties.
LAYERPALETTE
Opens the modeless Layer Properties Manager.
LAYERDLGMODE
Sets the flavor of the Layer Properties Manager that is defined for the use of
the LAYER command.
LAYERNOTIFY
Specifies when an alert displays when unreconciled new layers are found.
LAYEREVAL
Specifies whether the layer list is evaluated for new layers when added to the
drawing or to attached xrefs.
Work with Layer States
You can save layer settings as named layer states. You can then restore, edit,
import them from other drawings and files, and export them for use in other
drawings.
Save, Restore, and Edit Layer States
You can save the current layer settings to a layer state, make changes to the
layer state, and restore them to the drawing later.
You can save the current layer settings in a drawing as a named layer state
and restore them later. Saving layer settings is convenient if you need to return
to particular settings for all layers during different stages in completing a
drawing or for plotting.
Save Layer Settings
Layer settings include layer states, such as on or locked, and layer properties,
such as color or linetype. In a named layer state, you can choose which layer
Work with Layer States | 505

states and layer properties you want to restore later. For example, you can
choose to restore only the Frozen/Thawed setting of the layers in a drawing,
ignoring all other settings. When you restore that named layer state, all settings
remain as they are currently set except whether each layer is frozen or thawed.
Save Layer Property Override Settings
When layers contain viewport property overrides, those settings are saved to
a layer state when the viewport that contains overrides is active.
If the layer state is saved from model space, any layer property override settings
are not included. This is because only one value can be saved for each layer
property in a layer state. If layer property overrides need to be saved in the
layer state, make the viewport active on the layout tab and then save the layer
state.
Restore Layer Settings
When you restore a layer state, the layer settings (layer states and layer
properties) that were specified when the layer state was saved are restored.
You can specify specific settings to restore in the Layer States Manager. The
layer property settings that are not selected remain unchanged in the drawing.
If the drawing contains layers that were added since a layer state was saved,
you can add those layers. By editing the layer state and using the Select Layers
to Add to Layer State dialog box you can select the layers you want to add to
the layer state.
NOTE To be notified when new layers are added to the drawing, use the
LAYEREVAL and LAYERNOTIFY system variables.
When restoring layer states, the following additional behaviors can occur
■When restoring a layer state, the layer that was current when the layer
state was saved is made current. If that layer no longer exists, the current
layer does not change.
■If a layout viewport is active when a layer state is restored, and the Visibility
in Current VP restore option is selected, all layers that need to be visible
in the viewport are turned on and thawed in model space. All layers that
should not be visible in the viewport are set to VP Freeze in the current
viewport and the model space visibility is unchanged.
The Layers panel on the RIBBON contains controls for selecting and restoring
saved layer states, including a button to access the Layer States Manager. The
name of the last restored layer state is displayed in the Layers panel. When
506 | Chapter 16 Control the Properties of Objects
the layers are modified so that the current layer state is no longer current,
“Unsaved Layer State” is displayed instead of the name of the last restored
layer state.
Restore Property Override Settings
When the Apply Properties as Viewport Overrides restore option is selected
in the Layer States Manager, viewport overrides are restored to the viewport
that is current at the time the layer state is restored.
When a layer state is saved in model space and is restored in paper space,
■You can choose whether color, linetype, lineweight, transparency, or plot
style properties are restored as viewport overrides.
■Viewport overrides are applied to the current layout viewport.
■Layers that were turned off or frozen in model space are set to VP Freeze
in the Layer Properties Manager for the active layout viewport.
When a layer state is saved in paper space and is restored in model space,
■Layer property overrides are restored as global layer properties in model
space.
■Layers that were frozen in a layout viewport are also frozen in model space.
Edit Saved Layer Settings
Using the Edit Layer State dialog box, you can modify the properties of each
layer saved in a layer state.
All properties other than the layer name can be edited. Properties for multiple
layers can be changed at the same time.
You can also add layers to a layer state through the Select Layers to Add to
Layer State dialog box. For example, if new layers were added since the layer
state was saved, you can add them and resave the layer state. To delete layers,
use the Delete button in the Edit Layer State dialog box.
Layer States in Xrefs
When a drawing containing layer states is inserted in the host drawing, the
xref layer states are displayed in the Layer States Manager. The layer states are
listed by name and can be viewed in the Edit Layer State dialog box.
When an xref containing layer states is attached to the host drawing, those
layer states are also listed in the Layer States Manager. Although they can be
Work with Layer States | 507
restored, they cannot be edited. Xref layer states are identifiable because the
layer state name is preceded by the xref drawing’s name and separated by a
double underscore symbol. (Example: Xref Name__Layer State Name.) When
the xref is bound to the host drawing, layer states are identifiable by $0$ that
displays between the xref name and layer state name. (Example: Xref
Name$0$Layer State Name.)
Layer states from nested xrefs are also included. Layer states from xrefs are
removed from the host drawing when the xref is detached or unloaded.
To save layer settings in a named layer state
1Click Home tab ➤ Layers panel ➤ Layer State.
2In the Layer States drop-down list, click New Layer State.
3In the New Layer State to Save dialog box, enter a name for the new layer
state, or select a name from the list.
4(Optional) Add a description.
5Click Close.
6In the Layer States Manager, select the layer properties to restore by
default.
7(Optional) Select the Turn Off New Layers Not Found in Layer State
option.
When this option is selected and you restore a named layer state, the
drawing looks the same way it did when the named layer state was saved.
8Click Close to exit the Layer States Manager.
To restore a layer state
1Click Home tab ➤ Layers panel ➤ Layer State.
2In the Layer State drop-down list, select Manage Layer States.
3In the Layer States Manager dialog box, select a named layer state.
4Click More to select any specific layer properties you want to restore.
5Click Restore.
To add layers to a layer state
1Click Home tab ➤ Layers panel ➤ Layer State.
508 | Chapter 16 Control the Properties of Objects
2In the Layer State drop-down list, select Manage Layer States.
3In the Layer States Manager dialog box, select the named layer state that
you want to add layers to.
4Click Edit.
5In the Edit Layer State dialog box, click Add.
6In the Select Layers to Add to Layer State dialog box, select the layers you
want to add.
7Click OK.
8Click OK to exit the Edit Layer State dialog box.
9Click Close to exit the Layer States Manager.
To delete layers from a layer state
1Click Home tab ➤ Layers panel ➤ Layer State.
2In the Layer State drop-down list, select Manage Layer States.
3In the Layer States Manager dialog box, select the named layer state you
want to delete layers from.
4Click Edit.
5In the Edit Layer State dialog box, select the layers to delete and click the
Delete button.
6Click OK.
7Click OK to exit the Edit Layer State dialog box.
8Click Close to exit the Layer States Manager.
To include description and material properties to a layer state imported
from a previous release
1Click Home tab ➤ Layers panel ➤ Layer State.
2In the Layer State drop-down list, select Manage Layer States.
3In the Layer States Manager, select the layer state that was imported from
a previous release.
4Click Restore to restore the layer state.
Work with Layer States | 509
5Open the Layer States Manager. Click New.
6In the New Layer State to Save dialog box, enter a new name for the layer
state. In the Description field, enter descriptive text about the layer
settings.
7Click OK.
8(Optional) Click Delete to remove the legacy layer state.
9Click Close.
Description and material properties are saved with the updated layer state.
To select a layer state to restore
1Click Home tab ➤ Layers panel ➤ Layer State.
2In the Layer State drop-down list, select Manage Layer States.
3In the Layer States Manager dialog box, select the layer state you want
to restore.
4Click More and select any specific layer properties you want to restore.
5Click Restore.
The Layer States Manager closes.
Quick Reference
LAYERSTATE
Saves, restores, and manages named layer states.
LAYERNOTIFY
Specifies when an alert displays when unreconciled new layers are found.
LAYEREVAL
Specifies whether the layer list is evaluated for new layers when added to the
drawing or to attached xrefs.
Import and Export Layer States
You can import layer settings from other drawings and export layer states.
510 | Chapter 16 Control the Properties of Objects
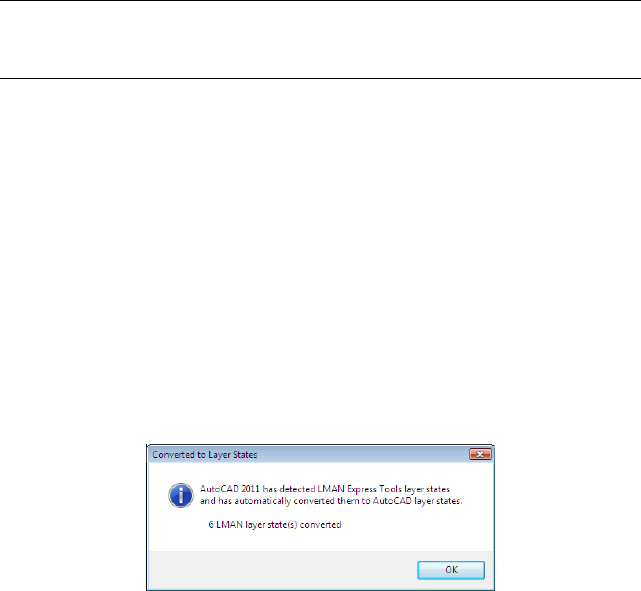
You can import layer states that are saved in drawing files (DWG, DWS, and
DWT) and from layer state (LAS) files. When importing layer states from a
drawing file, you can choose multiple layer states to import from the Select
Layer States dialog box. When exporting layer states, they are created as LAS
files.
If the layer state is imported from a drawing and it contains a layer property,
such as a linetype or plot style that is not loaded or available in the current
drawing, that property is automatically imported from the source drawing.
If the layer state is imported from an LAS file, and it contains linetype or plot
style properties that do not exist in the drawing, a message is displayed
notifying that the property could not be restored.
NOTE When a layer state contains more than one property that cannot be restored
from an LAS file, the message that displays only indicates the first property it
encountered that cannot be restored.
When importing a layer state from an LAS file or from another drawing that
are duplicates of layer states in the current drawing, you can choose to
overwrite the existing layer state or not import it.
Layer states can be imported into a previous release of the program.
Layer States from LMAN
Layer states that were created using the LMAN Express Tool cannot be
imported. A message is displayed that there are no layer states to import.
You can access LMAN layer states in a drawing through the Layer States
Manager. When the Layer States Manager is first opened in a drawing
containing LMAN layer states, they are automatically converted to AutoCAD
layer states. A dialog box displays the number of layer states that have been
converted.
When the current drawing does not contain any named layer states, the LMAN
layer state names are retained. If the current drawing contains layer states,
LMAN layer state names display with the prefix “LMAN” followed by the
original layer state name.
Work with Layer States | 511
To import saved layer settings from another drawing
1Click Home tab ➤ Layers panel ➤ Layer State.
2In the Layer State drop-down list, select Manage Layer States.
3In the Layer States Manager dialog box, click Import.
4In the Import Layer State dialog box, select a file name with a .dwg, .dws,
or .dwt file name extension. Click Open.
5In the Select Layer States dialog box, select the layer states to import.
Click OK.
6To restore the named layer state now, select it in the Layer States Manager.
and click Restore. Click Close to not restore it.
If you restore the named layer state, the Layer States Manager closes.
7Click Close to exit the Layer States Manager.
To import saved layer settings from a layer state (LAS) file
1Click Home tab ➤ Layers panel ➤ Layer State.
2In the Layer State drop-down list, select Manage Layer States.
3In the Layer States Manager dialog box, click Import.
4In the Import Layer State dialog box, select the LAS file you want to
import layer states from. Click Open.
5Click Yes to restore the named layer state now. Click No to add it to the
Layer States Manager without restoring it.
If you restore the named layer state, the Layer States Manager closes.
6Click Close to exit the Layer States Manager.
To export a saved layer state
1Click Home tab ➤ Layers panel ➤ Layer State.
2In the Layer State drop-down list, select Manage Layer States.
3In the Layer States Manager dialog box, select the named layer state (LAS)
file you want to export. Click Export.
4In the Export Layer State dialog box, specify where to export the layer
state file.
512 | Chapter 16 Control the Properties of Objects
5Click Save to exit the dialog box.
6Click Close to exit the Layer States Manager.
Quick Reference
LAYERSTATE
Saves, restores, and manages named layer states.
LAYERNOTIFY
Specifies when an alert displays when unreconciled new layers are found.
LAYEREVAL
Specifies whether the layer list is evaluated for new layers when added to the
drawing or to attached xrefs.
Work with Colors
Color helps to group objects visually. You can assign colors to objects by layer
or individually.
Set the Current Color
You can use color to help you identify objects visually. You can assign the
color of an object either by layer or by specifying its color explicitly,
independent of layer.
Assigning colors by layer makes it easy to identify each layer within your
drawing. Assigning colors explicitly provides additional distinctions between
objects on the same layer. Color is also used as a way to indicate lineweight
for color-dependent plotting.
You can use a variety of color palettes when assigning color to objects,
including
■AutoCAD Color Index (ACI)
■True Color®, PANTONE®
■RAL™ Classic and RAL Design color books
■DIC® Color Guide
Work with Colors | 513

■Colors from imported color books.
ACI Colors
ACI colors are the standard colors used in AutoCAD. Each color is identified
by an ACI number, an integer from 1 through 255. Standard color names are
available only for colors 1 through 7. The colors are assigned as follows: 1 Red,
2 Yellow, 3 Green, 4 Cyan, 5 Blue, 6 Magenta, 7 White/Black.
True Colors
True colors use 24-bit color definitions to display over 16 million colors. When
specifying true colors, you can use either an RGB or HSL color model. With
the RGB color model, you can specify the red, green, and blue components
of the color; with the HSL color model, you can specify the hue, saturation,
and luminance aspects of the color.
Color Books
This program includes several standard Pantone color books. You can also
import other color books such as the DIC color guide or RAL color sets.
Importing user-defined color books can further expand your available color
selections.
NOTE Pantone has provided new color definitions for Architectural & Interiors
Cotton and Architectural & Interiors Paper color books. If you used these color
books in releases prior to AutoCAD 2006, you may notice subtle changes in the
colors.
You install color books on your system by using the Files tab in the Options
dialog box. Once a color book is loaded, you can select colors from the color
book and apply them to objects in your drawings.
All objects are created using the current color, which is displayed in the Color
control on the Properties toolbar. You can also set the current color with the
Color control or the Select Color dialog box.
If the current color is set to BYLAYER, objects are created with the color
assigned to the current layer. If you do not want the current color to be the
color assigned to the current layer, you can specify a different color.
If the current color is set to BYBLOCK, objects are created using color 7 (white
or black) until the objects are grouped into a block. When the block is inserted
into the drawing, it acquires the current color setting.
514 | Chapter 16 Control the Properties of Objects

To set an ACI color for all new objects
1Click Home tab ➤ Properties panel ➤ Object Color.
2In the Object Color drop-down list, click a color to draw all new objects
in that color, or click Select Color to display the Select Color dialog box
and do one of the following:
■On the Index Color tab, click a color or enter the color name or
number in the Color box.
■On the Index Color tab, click BYLAYER to draw new objects in the
color assigned to the current layer.
■On the Index Color tab, click BYBLOCK to draw new objects in the
current color until they are grouped into a block. When the block is
inserted into the drawing, the objects in the block acquire the current
color setting.
3Click OK.
The Color control displays the current color.
To set a true color for all new objects
1Click Home tab ➤ Properties panel ➤ Object Color.
2In the Object Color drop-down list. click Select Color to display the Select
Color dialog box.
3In the Select Color dialog box, True Color tab, do one of the following:
■Select the HSL color model in the Color Model box. Specify a color
by entering a color value in the Color box or by specifying values in
the Hue, Saturation, and Luminance boxes.
■Select the RGB color model in the Color Model box. Specify a color
by entering a color value in the Color box or by specifying values in
the Red, Green, and Blue boxes.
4Click OK.
The Color control displays the current color.
Set the Current Color | 515

To set a color from a color book for all new objects
1Click Home tab ➤ Properties panel ➤ Object Color.
2In the Object Color drop-down list, click Select Color.
3In the Select Color dialog box, Color Book tab, select a color book from
the Color Book box.
4Select a color by clicking on a color chip. To browse through the color
book, use the up and down arrows on the color slider.
5Click OK.
The Color control displays the current color.
Quick Reference
COLOR
Sets the color for new objects.
CECOLOR
Sets the color of new objects.
Change the Color of an Object
You can change the color of an object by reassigning it to another layer, by
changing the color of the layer the object is on, or by specifying a color for
the object explicitly.
You have three choices for changing the color of an object:
■Reassign the object to another layer with a different color. If an object's
color is set to BYLAYER, and you reassign the object to a different layer, it
acquires its color from the new layer.
■Change the color assigned to the layer that the object is on. If an object's
color is set to BYLAYER, it acquires the color of its layer. When you change
the color assigned to a layer, all objects on that layer assigned the BYLAYER
color are updated automatically.
■Specify a color for an object to override the layer's color. You can specify
the color of each object explicitly. If you want to override the
516 | Chapter 16 Control the Properties of Objects

layer-determined color of an object with a different one, change an existing
object's color from BYLAYER to a specific color, such as red.
If you want to set a specific color for all subsequently created objects, change
the current color setting on the Properties toolbar from BYLAYER to a specific
color.
See also:
■Override Layer Properties in Viewports on page 486
To change the layer of an object
1Select the objects whose layer you want to change.
2Click Home tab ➤ Layers panel ➤ Layer Properties.
3In the Layers Properties Manager, click the Layer control.
4Select the layer that you want to assign to the objects.
To change the color assigned to a layer
1Click Home tab ➤ Layers panel ➤ Layer Properties.
2In the Layer Properties Manager, click the color you want to change.
3In the Select Color dialog box, do one of the following:
■On the Index tab, click a color or enter the ACI color number (1-255)
or name in the Color box. Click OK.
■On the True Color tab, select the HSL color model in the Color Model
option and specify a color by entering a color value in the Color box
or by specifying values in the Hue, Saturation, and Luminance boxes.
Click OK.
■On the Color Books tab, select a color book from the Color Book box;
select a color by navigating the color book (using the up and down
arrows) and clicking on a color chip. Click OK.
4Click OK to close each dialog box.
Change the Color of an Object | 517

To change the color of objects, overriding the layer's color
1Select the objects whose color you want to change.
2Click View tab ➤ Properties panel ➤ Properties.
Alternatively, you can right-click one of the objects and then, click
Properties.
3In the Properties palette, select Color.
An arrow is displayed in the right column.
4Click the arrow and select a color from the list or click Select Color to
display the Select Color dialog box. If you click Select Color, do one of
the following:
■On the Index tab, click a color or enter the ACI color number (1-255)
or name in the Color box.
■On the True Color tab, select the HSL color model in the Color Model
option and specify a color by entering a color value in the Color box
or by specifying values in the Hue, Saturation, and Luminance boxes.
Click OK.
■On the True Color tab, select the RGB color model in the Color Model
box. Specify a color by entering a color value in the Color box or by
specifying values in the Red, Green, and Blue boxes.
■On the Color Books tab, select a color book from the Color Book box;
select a color by navigating the color book (using the up and down
arrows) and clicking on a color chip. Click OK.
Quick Reference
CHANGE
Changes the properties of existing objects.
CHPROP
Changes the properties of an object.
COLOR
Sets the color for new objects.
518 | Chapter 16 Control the Properties of Objects

PROPERTIES
Controls properties of existing objects.
CECOLOR
Sets the color of new objects.
Use Color Books
When assigning colors to objects, you can choose colors from color books
that are loaded on your system. You can choose from a wide range of custom
colors when using color books. Color books include third-party or user-defined
files that contain named color swatches. These colors can be used to enhance
presentation drawings as well as to optimize the variety of color used in your
drawings. You can apply color book colors to objects in your drawings by
using the Color Books tab in the Select Color dialog box.
Install Color Books
Color book files must contain an .acb file extension in order to be recognized
by this program. To access color book colors from the Select Color dialog box,
you must first copy your color book files to a specified color book location.
On the Files tab of the Options dialog box, you can define the path where
color book files are stored. Multiple locations can be defined for the color
book path. These locations are saved in your user profile.
After loading a color book on your system, to access the new colors, you need
to close the Select Color dialog box and then open it again. The new color
book is displayed in the Color Book drop-down list on the Color Books tab.
Once you have loaded a color book, you can apply any colors that are defined
in the book to objects in your drawing.
Browse Color Books
Color books are organized alphabetically into pages that you can browse
through. A page holds up to ten colors. If the color book you are browsing
through is not organized into pages, the colors are arranged into pages, with
each page containing up to seven colors.
To install a color book
1Click Tools menu ➤ Options.
Use Color Books | 519
2In the Options dialog box, Files tab, click Color Book Locations.
3Click Add to add a color book location.
4Enter the new location in the blank path box.
5Click OK.
To search for color swatches within a color book
1Click Home tab ➤ Properties panel ➤ Object Color.
2In the Object Color drop-down list, click Select Color.
3In the Select Color dialog box, Color Books tab, select a color book from
the Color Book drop-down list.
You must first select any color swatch in the color book in order to
activate the Color edit box.
4Under Color, enter the number of the color swatch you would like to
locate and press Tab.
The Color edit box and the New color chip display the requested color
or the color that is the closest match.
5Click OK to apply the color.
To change the default location of color book files
1Click Tools menu ➤ Options.
2In the Options dialog box, Files tab, double-click Color Book Locations.
3Select the following default color book location:
C:\Program Files\[current AutoCAD release number]\support\color
4Click the location name to edit the path.
5Enter the new location in the path box.
6Click OK.
520 | Chapter 16 Control the Properties of Objects

To define multiple folders for the color book path
1Click Tools menu ➤ Options.
2In the Options dialog box, Files tab, click Color Book Locations.
3Click Add to add a color book location.
4Enter the new location in the blank path box.
5Click OK.
Quick Reference
CHANGE
Changes the properties of existing objects.
CHPROP
Changes the properties of an object.
COLOR
Sets the color for new objects.
PROPERTIES
Controls properties of existing objects.
CECOLOR
Sets the color of new objects.
Work with Linetypes
You can use linetypes to distinguish objects from one another visually and
make your drawing easier to read.
Overview of Linetypes
A linetype is a repeating pattern of dashes, dots, and blank spaces displayed
in a line or a curve. You assign linetypes to objects either by layer or by
specifying the linetype explicitly, independent of layers.
Work with Linetypes | 521
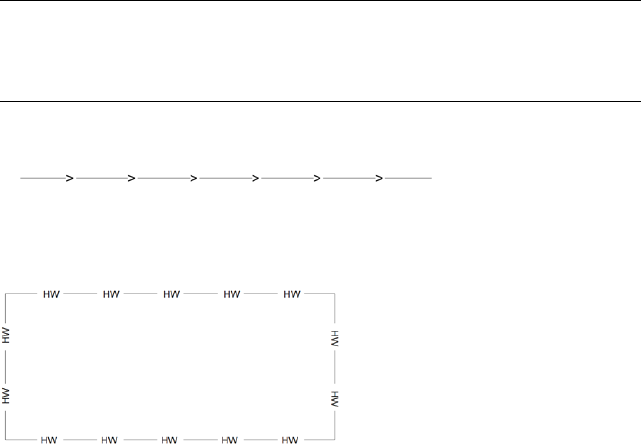
In addition to choosing a linetype, you can set its scale to control the size of
the dashes and spaces, and you can create your own custom linetypes.
NOTE These linetypes should not be confused with the hardware linetypes
provided by some plotters. The two types of dashed lines produce similar results.
Do not use both types at the same time, however, because the results can be
unpredictable.
Some linetype definitions include text and symbols.
You can define a custom linetype that will orient the imbedded text to keep
it readable automatically.
For more information about controlling text in linetypes, see Text in Custom
Linetypes.
See also:
■“Custom Linetypes” in the Customization Guide
Quick Reference
LINETYPE
Loads, sets, and modifies linetypes.
REVERSE
Reverses the vertices of selected lines, polylines, splines, and helixes, which
is useful for linetypes with included text, or wide polylines with differing
beginning and ending widths.
522 | Chapter 16 Control the Properties of Objects

Load Linetypes
At the start of a project, you load the linetypes that are required for the project
so that they are available when you need them.
If you want to know what linetypes are already available, you can display a
list of linetypes that are loaded in the drawing or stored in an LIN (linetype
definition) file.
This program includes the linetype definition files acad.lin and acadiso.lin.
Which linetype file is appropriate depends on whether you use imperial or
metric measurements.
■For imperial units, use the acad.lin file.
■For metric measurements, use the acadiso.lin file.
Both linetype definition files contain several complex linetypes.
If you select a linetype whose name begins with ACAD_ISO, you can use the
ISO pen-width option when you plot.
You can remove unreferenced linetype information with PURGE or by deleting
the linetype from the Linetype Manager. BYBLOCK, BYLAYER, and
CONTINUOUS linetypes cannot be removed.
To load a linetype
1Click Home tab ➤ Properties panel ➤ Linetype.
2In the Linetype drop-down list, click Other. Then, in the Linetype
Manager dialog box, click Load.
3In the Load or Reload Linetypes dialog box, select a linetype. Click OK.
If the linetype you need is not listed, click File. In the Select Linetype File
dialog box, select an LIN file whose linetypes you want to list and click.
The dialog box displays the linetype definitions stored in the selected
LIN file. Select a linetype. Click OK.
You can hold down Ctrl to select several linetypes or SHIFT to select a
range of linetypes.
4Click OK.
Load Linetypes | 523

To list the linetypes loaded in the current drawing
1Click Home tab ➤ Properties panel ➤ Linetype.
2Click anywhere outside the box to close it.
To list the linetypes in a linetype definition file
1Click Home tab ➤ Properties panel ➤ Linetype.
2In the Linetype drop-down list, click Other. Then, in the Linetype
Manager dialog box, click Load.
3In the Load or Reload Linetypes dialog box, click File.
4In the Select Linetype File dialog box, select an LIN (linetype definition)
file whose linetypes you want to lit. Click Open.
The dialog box displays the linetype definitions stored in the selected
LIN file.
5In the Load or Reload Linetypes dialog box, click Cancel.
6Click Cancel to close the Linetype Manager.
To unload an unused linetype
1Click Home tab ➤ Properties panel ➤ Linetype.
2In the Linetype drop-down list, click Other. Then, in the Linetype
Manager dialog box, select a linetype. Click Delete.
The selected linetype is unloaded. Certain linetypes cannot be unloaded:
BYLAYER, BYBLOCK, CONTINUOUS, and any linetypes currently in use.
To purge an unused linetype
1Click Tools tab ➤ Drawing Utilities panel ➤ Purge.
The Purge dialog box displays a tree view of object types with items that
can be purged.
524 | Chapter 16 Control the Properties of Objects
2To purge unreferenced linetypes, use one of the following methods:
■To purge all unreferenced linetypes, select Linetypes.
■To purge specific linetypes, double-click Linetypes to expand the tree
view. Then select the linetypes to be purged.
If the item you want to purge is not listed, select View Items You Cannot
Purge.
3You are prompted to confirm each item in the list. If you do not want to
confirm each purge, clear the Confirm Each Item to Be Purged option.
4Click Purge.
To confirm the purging of each item, respond to the prompt by choosing
Yes or No, or Yes to All if more than one item is selected.
5Click Close.
Quick Reference
LINETYPE
Loads, sets, and modifies linetypes.
PURGE
Removes unused items, such as block definitions and layers, from the drawing.
RENAME
Changes the names assigned to items such as layers and dimension styles.
MEASUREINIT
Controls whether a drawing you start from scratch uses imperial or metric
default settings.
MEASUREMENT
Controls whether the current drawing uses imperial or metric hatch pattern
and linetype files.
Set the Current Linetype
All objects are created using the current linetype, which is displayed in the
Linetype control on the Properties toolbar.
Set the Current Linetype | 525

You can also set the current linetype with the Linetype control.
If the current linetype is set to BYLAYER, objects are created with the linetype
assigned to the current layer.
If the current linetype is set to BYBLOCK, objects are created using the
CONTINUOUS linetype until the objects are grouped into a block. When the
block is inserted into the drawing, those objects acquire the current linetype
setting.
If you do not want the current linetype to be the linetype assigned to the
current layer, you can specify a different linetype explicitly.
The program does not display the linetype of certain objects: text, points,
viewports, hatches, and blocks.
To set the linetype for all new objects
1Click Home tab ➤ Properties panel ➤ Linetype.
2In the Linetype drop-down list, click Other. Then, in the Linetype
Manager dialog box, click Load.
You can hold down Ctrl to select several linetypes or SHIFT to select a
range of linetypes.
3In the Linetype Manager dialog box, do one of the following:
■Select a linetype and select Current to draw all new objects with that
linetype.
■Select BYLAYER to draw new objects in the linetype assigned to the
current layer.
■Select BYBLOCK to draw new objects in the current linetype until
they are grouped into a block. When the block is inserted into a
drawing, the objects in the block acquire the current linetype setting.
4Click OK.
NOTE The Linetype control displays the current linetype. If the linetype you want
to use is already loaded, you can click the Linetype control and click the linetype
to make it current.
526 | Chapter 16 Control the Properties of Objects

To change the linetype assigned to a layer
1Click Home tab ➤ Layers panel ➤ Layer Properties.
2In the Layer Properties Manager, select the linetype name you want to
change.
3In the Select Linetype dialog box, select the linetype you want. Click OK.
4Click OK again.
Quick Reference
LINETYPE
Loads, sets, and modifies linetypes.
CELTYPE
Sets the linetype of new objects.
Change the Linetype of an Object
You can change the linetype of an object by reassigning it to another layer,
by changing the linetype of the layer the object is on, or by specifying a
linetype for the object explicitly.
You have three choices for changing the linetype of an object:
■Reassign the object to another layer with a different linetype. If an object's
linetype is set to BYLAYER, and you reassign the object to a different layer,
it acquires its linetype from the new layer.
■Change the linetype assigned to the layer that the object is on. If an object's
linetype is set to BYLAYER, it acquires the linetype of its layer. When you
change the linetype assigned to a layer, all objects on that layer assigned
the BYLAYER linetype are updated automatically.
■Specify a linetype for an object to override the layer's linetype. You can
specify the linetype of each object explicitly. If you want to override the
layer-determined linetype of an object with a different one, change an
existing object's linetype from BYLAYER to a specific linetype, such as
DASHED.
Change the Linetype of an Object | 527
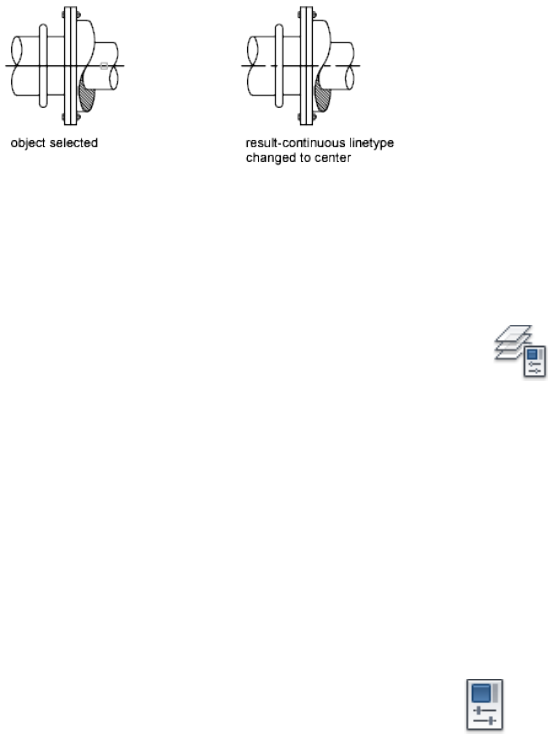
If you want to set a specific linetype for all subsequently created objects,
change the current linetype setting on the Properties toolbar from BYLAYER
to a specific linetype.
See also:
■Override Layer Properties in Viewports on page 486
To change the default linetype assigned to a layer
1Click Home tab ➤ Layers panel ➤ Layer Properties.
2In the Layer Properties Manager, select the linetype name you want to
change.
3In the Select Linetype dialog box, select a linetype.
If the linetype you need is not listed, click Load. Select a linetype and
click OK, or click File to open additional linetype definition (LIN) files.
4Click OK to exit each dialog box.
To change the linetype of an object, overriding the layer's linetype
1Select the objects whose linetype you want to change.
2Click Home tab ➤ Palettes panel ➤ Properties.
3On the Properties palette, click the Linetype control.
4Choose the linetype that you want to assign to the objects.
528 | Chapter 16 Control the Properties of Objects
Quick Reference
CHANGE
Changes the properties of existing objects.
CHPROP
Changes the properties of an object.
LAYER
Manages layers and layer properties.
LINETYPE
Loads, sets, and modifies linetypes.
PROPERTIES
Controls properties of existing objects.
Control Linetype Scale
You can use the same linetype at different scales by changing the linetype
scale factor either globally or individually for each object.
By default, both global and individual linetype scales are set to 1.0. The smaller
the scale, the more repetitions of the pattern are generated per drawing unit.
For example, with a setting of 0.5, two repetitions of the pattern in the linetype
definition are displayed for each drawing unit. Short line segments that cannot
display one full linetype pattern are displayed as continuous. You can use a
smaller linetype scale for lines that are too short to display even one dash
sequence.
The Linetype Manager displays the Global Scale Factor and Current Object
Scale.
■The Global Scale Factor value controls the LTSCALE system variable, which
changes the linetype scale globally for both new and existing objects.
■The Current Object Scale value controls the CELTSCALE system variable,
which sets the linetype scale for new objects.
The CELTSCALE value is multiplied by the LTSCALE value to get the displayed
linetype scale. You can easily change linetype scales in your drawing either
individually or globally.
Control Linetype Scale | 529

In a layout, you can adjust the scaling of linetypes in different viewports with
PSLTSCALE.
To change the linetype scale of selected objects
1Select the objects whose linetype scale you want to change.
2Click Home tab ➤ Palettes panel ➤ Properties.
Alternatively, right-click one of the objects. Click Properties.
3In the Properties palette, select Linetype Scale and enter the new value.
To set the linetype scale for new objects
1Click Home tab ➤ Properties panel ➤ Linetype.
2In the Linetype drop-down list, select Other.
3In the Linetype Manager, click Show Details to expand the dialog box.
4Enter a new value for Current Object Scale.
5Click OK.
To change linetype scale globally
1Click Home tab ➤ Properties panel ➤ Linetype.
2In the Linetype Manager, click Show Details to expand the dialog box.
3Enter a new value for Global Scale Factor.
4Click OK.
Quick Reference
LINETYPE
Loads, sets, and modifies linetypes.
530 | Chapter 16 Control the Properties of Objects
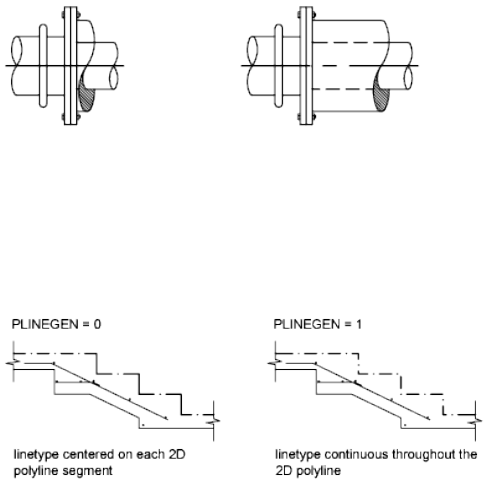
CELTSCALE
Sets the current object linetype scaling factor.
LTSCALE
PSLTSCALE
Controls the linetype scaling of objects displayed in paper space viewports.
Display Linetypes on Short Segments and Polylines
You can center the pattern of a linetype on each segment of a polyline, and
you can control how the linetype is displayed on short segments.
If a line is too short to hold even one dash sequence, the result is a continuous
line between the endpoints, as shown below.
You can accommodate short segments by using a smaller value for their
individual linetype scales. For more information, see Control Linetype Scale
on page 529.
For polylines, you can specify whether a linetype pattern is centered on each
segment or is continuous across vertices throughout the entire length of the
polyline. You do this by setting the PLINEGEN system variable.
To set the linetype display for all new polylines
1At the Command prompt, enter plinegen.
Display Linetypes on Short Segments and Polylines | 531

2Enter 1 to make the linetype pattern continue throughout the entire
length of two-dimensional polylines, or enter 0 to center the linetype
pattern on each segment.
To change the linetype display of existing polylines
1Select the polyline whose linetype display you want to change.
2Click Home tab ➤ Palettes panel ➤ Properties.
3In the Properties palette, click Linetype Generation and select Enabled
or Disabled.
Quick Reference
PROPERTIES
Controls properties of existing objects.
PLINEGEN
Sets how linetype patterns generate around the vertices of a 2D polyline.
Control Lineweights
You can control the thickness of an object’s lines in both the drawing display
and plotting.
Overview of Lineweights
Lineweights are width values that are assigned to graphical objects as well as
some types of text.
Using lineweights, you can create heavy and thin lines to show cuts in sections,
depth in elevations, dimension lines and tick marks, and differences in details.
For example, by assigning varying lineweights to different layers, you can
easily differentiate between new, existing, and demolition construction.
Lineweights are not displayed unless the LWT button on the status bar is
selected.
TrueType fonts, raster images, points, and solid fills (2D solids) cannot display
lineweight. Wide polylines show lineweights only when displayed outside of
532 | Chapter 16 Control the Properties of Objects

the plan view. You can export drawings to other applications or cut objects
to the Clipboard and retain lineweight information.
In model space, lineweights are displayed in pixels and do not change when
zoomed in or out. Thus, you should not use lineweights to represent the exact
width of an object in model space. For example, if you want to draw an object
with a real-world width of 0.5 inches, do not use a lineweight; instead, use a
polyline with a width of 0.5 inches to represent the object.
You can also plot objects in your drawing with custom lineweight values. Use
the Plot Style Table Editor to adjust the fixed lineweight values to plot at a
new value.
Lineweight Scale in Drawings
Objects with a lineweight are plotted with the exact width of the assigned
lineweight value. The standard settings for these values include BYLAYER,
BYBLOCK, and Default. They are displayed in either inches or millimeters,
with millimeters being the default. All layers are initially set to 0.25 mm,
controlled by the LWDEFAULT system variable.
A lineweight value of 0.025 mm or less is displayed as one pixel in model
space and is plotted at the thinnest lineweight available on the specified
plotting device. Lineweight values that you enter at the Command prompt
are rounded to the nearest predefined value.
You set the lineweight units and the default value in the Lineweight Settings
dialog box. You can access the Lineweight Settings dialog box by using the
LWEIGHT command, by right-clicking the LWT button on the status bar and
choosing Settings, or by choosing Lineweight Settings on the User Preferences
tab in the Options dialog box.
See also:
■Draw Polylines on page 649
To assign width to polylines
1Click Home tab ➤ Draw panel ➤ Polyline.
2Specify the start point for the first segment in the polyline.
3Enter w (width).
4Enter a value for the width at the start of the line segment.
Overview of Lineweights | 533

5Enter a value for the width at the end of the line segment.
6Specify the endpoint of the first segment of the polyline.
7Enter w to specify different widths for the next segment, or press Enter
to end the command.
To assign a lineweight to a layer
1Click Home tab ➤ Layers panel ➤ Layer Properties.
2In the Layer Properties Manager, select a layer. Click the lineweight
associated with that layer.
3In the Lineweight dialog box, select a lineweight from the list.
4Click OK to close each dialog box.
To set the display scale of lineweights on the Model tab
1Click Home tab ➤ Properties panel ➤ Lineweight.
2In the Lineweight drop-down list, select Lineweight Settings.
3In the Lineweight Settings dialog box, under Adjust Display Scale, move
the slider to change the scale.
4Click OK.
Quick Reference
LWEIGHT
Sets the current lineweight, lineweight display options, and lineweight units.
PLINE
Creates a 2D polyline.
LWDEFAULT
Sets the value for the default lineweight.
534 | Chapter 16 Control the Properties of Objects

LWDISPLAY
Controls whether the lineweights of objects are displayed.
LWUNITS
Controls whether lineweight units are displayed in inches or millimeters.
Display Lineweights
Lineweights can be turned on and off in a drawing, and are displayed
differently in model space than in a paper space layout.
■In model space, a 0-value lineweight is displayed as one pixel, and other
lineweights use a pixel width proportional to their real-unit value.
■In a paper space layout, lineweights are displayed in the exact plotting
width.
Regeneration time increases with lineweights that are represented by more
than one pixel. Turn off the display of lineweights to optimize performance
of the program.
You can turn the display of lineweights on or off by clicking LWT on the status
bar. This setting does not affect the plotting of lineweights.
Display Lineweights in Model Space
Lineweight display in model space does not change with the zoom factor. For
example, a lineweight value that is represented by a width of four pixels is
always displayed using four pixels regardless of how far you zoom in. If you
want the lineweights on objects to appear thicker or thinner on the Model
tab, use LWEIGHT to set their display scale. Changing the display scale does
not affect the lineweight plotting value.
In model space, weighted lines that are joined form a beveled joint with no
end caps. You can use plot styles to apply different joins and endcap styles to
objects with lineweights.
NOTE Different styles of endcaps and joins of objects with lineweight are displayed
only in a full plot preview.
Display Lineweights | 535
Display Lineweights in Layouts
In layouts and plot preview, lineweights are displayed in real-world units, and
lineweight display changes with the zoom factor. You can control lineweight
plotting and scaling in your drawing in the Plot dialog box, Plot Settings tab.
To display or hide lineweights
Use one of the following methods:
■Click LWT on the status bar.
■Select or clear Display Lineweight in the Lineweight Settings dialog box.
■Set the LWDISPLAY system variable to 0 or 1.
Quick Reference
LAYER
Manages layers and layer properties.
LWEIGHT
Sets the current lineweight, lineweight display options, and lineweight units.
PEDIT
Edits polylines and 3D polygon meshes.
PLINE
Creates a 2D polyline.
PLOT
Plots a drawing to a plotter, printer, or file.
LWDEFAULT
Sets the value for the default lineweight.
LWDISPLAY
Controls whether the lineweights of objects are displayed.
LWUNITS
Controls whether lineweight units are displayed in inches or millimeters.
PLINEWID
Stores the default polyline width.
536 | Chapter 16 Control the Properties of Objects

Set the Current Lineweight
The current lineweight is the lineweight used for any objects you draw until
you make another lineweight current.
All objects are created using the current lineweight, which is displayed in the
Lineweight control on the Properties toolbar. You can also set the current
lineweight with the Lineweight control.
If the current lineweight is set to BYLAYER, objects are created with the
lineweight assigned to the current layer.
If the current lineweight is set to BYBLOCK, objects are created using the
default lineweight setting until the objects are grouped into a block. When
the block is inserted into the drawing, it acquires the current lineweight setting.
If you do not want the current lineweight to be the lineweight assigned to
the current layer, you can specify a different lineweight explicitly.
Objects in drawings created in an earlier release of AutoCAD are assigned the
lineweight value of BYLAYER, and all layers are set to DEFAULT. Lineweight
assigned to objects is displayed as a solid fill drawn in the object's assigned
color.
To make a lineweight current for creating objects
1Click Home tab ➤ Properties panel ➤ Lineweight.
2In the Lineweight drop-down list, select Lineweight Settings.
3In the Lineweight Settings dialog box, select a lineweight.
4Click OK.
NOTE To display the lineweight at its current setting, the Display Lineweight
option must be selected in the Display Lineweight dialog box.
Quick Reference
LAYER
Manages layers and layer properties.
LWEIGHT
Sets the current lineweight, lineweight display options, and lineweight units.
Set the Current Lineweight | 537
PEDIT
Edits polylines and 3D polygon meshes.
PLINE
Creates a 2D polyline.
PLOT
Plots a drawing to a plotter, printer, or file.
LWDEFAULT
Sets the value for the default lineweight.
LWDISPLAY
Controls whether the lineweights of objects are displayed.
LWUNITS
Controls whether lineweight units are displayed in inches or millimeters.
PLINEWID
Stores the default polyline width.
Change the Lineweight of an Object
You can change the lineweight of an object by reassigning it to another layer,
by changing the lineweight of the layer the object is on, or by specifying a
lineweight for the object explicitly.
You have three choices for changing the lineweight of an object:
■Reassign the object to another layer with a different lineweight. If an
object's lineweight is set to BYLAYER, and you reassign the object to a
different layer, it acquires its lineweight from the new layer.
■Change the lineweight assigned to the layer that the object is on. If an
object's lineweight is set to BYLAYER, it acquires the lineweight of its layer.
When you change the lineweight assigned to a layer, all objects on that
layer assigned the BYLAYER lineweight are updated automatically.
■Specify a lineweight for an object to override the layer's lineweight. You
can specify the lineweight of each object explicitly. If you want to override
the layer-determined lineweight of an object with a different one, change
an existing object's lineweight from BYLAYER to a specific lineweight.
538 | Chapter 16 Control the Properties of Objects

If you want to set a specific lineweight for all subsequently created objects,
change the current lineweight setting on the Properties toolbar from BYLAYER
to a specific lineweight.
See also:
■Override Layer Properties in Viewports on page 486
To change the line width of a polyline, donut, rectangle, or polygon
1Click Home tab ➤ Modify panel ➤ Edit Polyline.
2Select one or more polyline objects.
3Enter w (Width) and enter a new width for all segments.
4Press Enter to end the command.
Quick Reference
LAYER
Manages layers and layer properties.
LWEIGHT
Sets the current lineweight, lineweight display options, and lineweight units.
PEDIT
Edits polylines and 3D polygon meshes.
PLINE
Creates a 2D polyline.
PLOT
Plots a drawing to a plotter, printer, or file.
LWDEFAULT
Sets the value for the default lineweight.
LWDISPLAY
Controls whether the lineweights of objects are displayed.
Change the Lineweight of an Object | 539
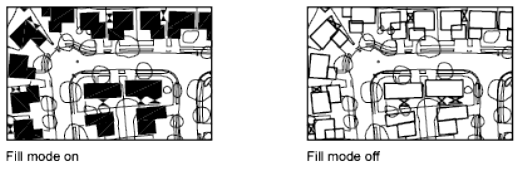
LWUNITS
Controls whether lineweight units are displayed in inches or millimeters.
PLINEWID
Stores the default polyline width.
Control the Display Properties of Certain Objects
You can control how overlapping objects and certain other objects are
displayed and plotted.
Control the Display of Polylines, Hatches, Gradient Fills,
Lineweights, and Text
You can simplify the display of certain kinds of objects in order to speed
performance.
Display performance is improved when wide polylines and donuts, solid-filled
polygons (two-dimensional solids), hatches, gradient fills, and text are
displayed in simplified form. Simplified display also increases the speed of
creating test plots.
Turn Off Solid Fill
When you turn off Fill mode, wide polylines, solid-filled polygons, gradient
fill, and hatches are displayed in outline form. Except for patterned hatches
and gradient fills, solid fill is automatically turned off for hidden view and
nonplan views in three dimensions.
Use Quick Text
When you turn on Quick Text mode in drawings that contain a lot of text
using complex fonts, only a rectangular frame defining the text is displayed
or plotted.
540 | Chapter 16 Control the Properties of Objects
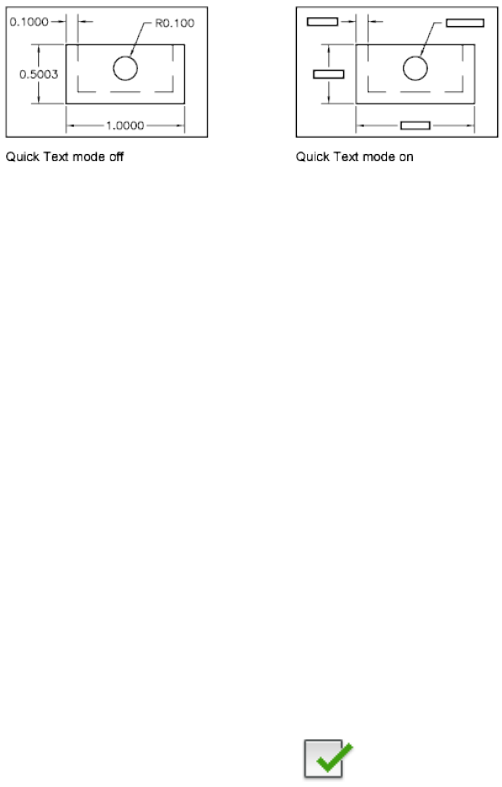
Turn Off Lineweights
Any lineweight width that is represented by more than one pixel may slow
down performance. If you want to improve display performance, turn
lineweights off. You can turn lineweights on and off by choosing the LWT
button on the status bar or by using the Lineweight Settings dialog box.
Lineweights are always plotted at their real-world value whether their display
is turned on or off.
Update the Display
New objects automatically use the current settings for displays of solid fill and
text. Except for lineweights, to update the display of existing objects using
these settings, you must use REGEN.
See also:
■Use Layers to Manage Complexity on page 473
■Display Lineweights on page 535
■Use TrueType Fonts on page 1367
To turn the display of solid fill on or off
1Click Tools menu ➤ Options.
2In the Options dialog box, Display tab, under Display Performance, select
Apply Solid Fill.
A check mark indicates that Fill mode is on.
3Click OK.
4To display your changes, click View menu ➤ Regen.
Control the Display of Polylines, Hatches, Gradient Fills, Lineweights, and Text | 541

To turn the display of text on or off
1Click Tools ➤ Options.
2In the Options dialog box, Display tab, under Display Performance, select
Show Text Boundary Frame Only.
The check mark indicates that text is displayed as a rectangular frame.
3Click OK.
4To display your changes, click View menu ➤ Regen.
To turn lineweights on or off
1Click Home tab ➤ Properties panel ➤ Lineweight.
2In the Lineweight drop-down list, select Lineweight Settings.
3In the Lineweight Settings dialog box, select or clear Display Lineweight.
4Click OK.
Quick Reference
DSETTINGS
Sets grid and snap, polar and object snap tracking, object snap modes,
Dynamic Input, and Quick Properties.
FILL
Controls the filling of objects such as hatches, 2D solids, and wide polylines.
LWEIGHT
Sets the current lineweight, lineweight display options, and lineweight units.
QTEXT
Controls the display and plotting of text and attribute objects.
REGEN
Regenerates the entire drawing from the current viewport.
542 | Chapter 16 Control the Properties of Objects
FILLMODE
Specifies whether hatches and fills, 2D solids, and wide polylines are filled
in.
LWDISPLAY
Controls whether the lineweights of objects are displayed.
QTEXTMODE
Controls how text is displayed.
TEXTFILL
Controls the filling of TrueType fonts while plotting.
TEXTQLTY
Sets the resolution tessellation fineness of text outlines.
Control the Transparency of Objects
You can control the transparency level of objects and layers.
Set the transparency level of selected objects or layers to enhance drawings
or reduce the visibility of areas that are included for reference only.
Control the Transparency of Objects | 543
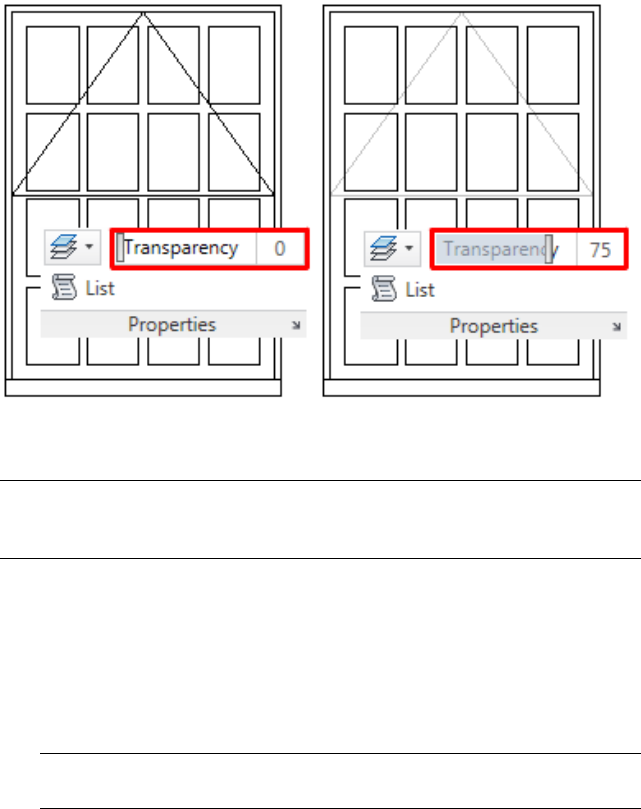
Transparency can be set to ByLayer, ByBlock, or to a specific value.
selected objects 75% transparentno transparent objects
IMPORTANT For perfomance reasons, plotting transparency is disabled by default.
To plot transparent objects, check the Plot Transparency option in either the Plot
dialog box or the Page Setup dialog box.
To control the transparency level of objects
1Select the objects whose transparency level you want to change.
2On the Home tab ➤ Properties panel, drag the Transparency slider, or
enter a value from 0 to 90 in the Trasparency box.
3Press Esc to set the transparency level and clear the selection.
TIP You can also control the transparency level from the Properties palette
by double clicking an object.
Double clicking hatches or fills displays the Hatch Editor ribbon contextual
tab, which contains a transparency control for these objects.
544 | Chapter 16 Control the Properties of Objects
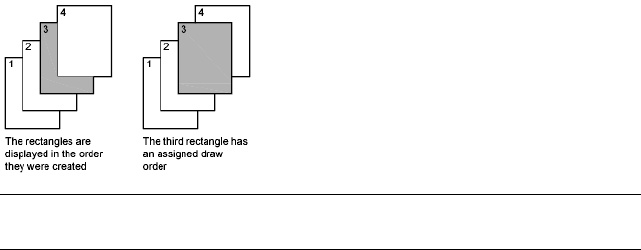
Quick Reference
CHPROP
Changes the properties of an object.
CHANGE
Changes the properties of existing objects.
-LAYER
Manages layers and layer properties.
CETRANSPARENCY
Sets the transparency level for new objects.
TRANSPARENCYDISPLAY
Controls whether the object transparency is displayed.
Control How Overlapping Objects Are Displayed
You can control which overlapping objects appear to be on top.
Generally, overlapping objects such as text, wide polylines, and solid-filled
polygons are displayed in the order they are created: newly created objects in
front of existing objects.
You can use DRAWORDER to change the draw order (which is the display
and plotting order) of any objects. TEXTTOFRONT changes the draw order of
all text and dimensions in the drawing. HATCHTOBACK changes the draw
order of hatches and gradient and solid fills in the drawing.
NOTE Overlapping objects cannot be controlled between model space and paper
space. They can be controlled only within the same space.
Control How Overlapping Objects Are Displayed | 545
To change the draw order of overlapping objects
1Click Home tab ➤ Modify panel ➤ Draw Order drop-down list.
2From the draw order drop down list, click one of the options.
3Select the object(s) whose draw order you want to modify and press Enter.
4Select the reference object(s) and press Enter. (This step is necessary only
for the Bring Above Objects and Send Under Objects options.)
Quick Reference
DRAWORDER
Changes the draw order of images and other objects.
HATCHTOBACK
Sets the draw order for all hatches in the drawing to be behind all other
objects.
QSELECT
Creates a selection set based on filtering criteria.
REGEN
Regenerates the entire drawing from the current viewport.
SELECT
Places selected objects in the Previous selection set.
TEXTTOFRONT
Brings text and dimensions in front of all other objects in the drawing.
WBLOCK
Writes objects or a block to a new drawing file.
DRAWORDERCTL
Controls the default display behavior of overlapping objects when they are
created or edited.
HPDRAWORDER
Controls the draw order of hatches and fills.
546 | Chapter 16 Control the Properties of Objects
SORTENTS
Controls object sorting in support of draw order for several operations.
Control the Display of Objects
Control the display of objects by isolating or hiding a selection set.
Use ISOLATEOBJECTS and HIDEOBJECTS to create a temporary drawing view
with selected objects isolated or hidden. This saves you the time of having to
track objects across layers. If you isolate objects, only the isolated objects
appear in the view. A light bulb icon on the status bar indicates when one or
more objects are isolated or hidden. To redisplay objects, use
UNISOLATEOBJECTS. When you close and reopen the drawing, all previously
hidden objects are displayed. Use the OBJECTISOLATIONMODE system variable
to control whether objects remain hidden between drawing sessions.
To isolate objects
1Select the objects you want to isolate.
2Right-click in the drawing area and select Isolate ➤ Isolate Objects.
Only the selected objects are displayed. All other objects are hidden.
3To redisplay hidden objects, right-click in the drawing area and select
Isolate ➤ End Object Isolation.
To hide objects
1Select the objects you want to hide.
2Right-click in the drawing area and select Isolate ➤ Hide Objects.
The selected objects are hidden.
3To redisplay hidden objects, right-click in the drawing area and select
Isolate ➤ End Object Isolation.
To keep objects hidden or isolated between drawing sessions
1Before hiding or isolating objects, set OBJECTISOLATIONMODE to 1.
2Hide or isolate objects in your drawing. When you save, close, and reopen
your drawing, the selected objects remain hidden or isolated.
Control the Display of Objects | 547
Quick Reference
HIDEOBJECTS
Hides selected objects.
ISOLATEOBJECTS
Displays selected objects across layers; unselected objects are hidden.
UNISOLATEOBJECTS
Displays previously hidden objects.
OBJECTISOLATIONMODE
Controls whether hidden objects remain hidden between drawing sessions.
548 | Chapter 16 Control the Properties of Objects
Use Precision Tools
You can use a variety of precision drawing tools to help you produce accurate drawings quickly
and without performing tedious calculations.
Use Coordinates and Coordinate Systems (UCS)
For precise coordinate input, you can use several coordinate system entry
methods. You can also use a movable coordinate system, the user coordinate
system (UCS), for convenient coordinate entry and to establish workplanes.
Overview of Coordinate Entry
When a command prompts you for a point, you can use the pointing device to
specify a point, or you can enter a coordinate value at the Command prompt.
When dynamic input is on, you can enter coordinate values in tooltips near
the cursor. You can enter two-dimensional coordinates as either Cartesian (X,Y)
or polar coordinates.
Cartesian and Polar Coordinates
A Cartesian coordinate system has three axes, X, Y, and Z. When you enter
coordinate values, you indicate a point's distance (in units) and its direction (+
or -) along the X, Y, and Z axes relative to the coordinate system origin (0,0,0).
In 2D, you specify points on the XY plane, also called the workplane. The
workplane is similar to a flat sheet of grid paper. The X value of a Cartesian
coordinate specifies horizontal distance, and the Y value specifies vertical
distance. The origin point (0,0) indicates where the two axes intersect.
Polar coordinates use a distance and an angle to locate a point. With both
Cartesian and polar coordinates, you can enter absolute coordinates based on
the origin (0,0), or relative coordinates based on the last point specified.
17
549

Another method of entering a relative coordinate is by moving the cursor to
specify a direction and then entering a distance directly. This method is called
direct distance entry.
You can enter coordinates in scientific, decimal, engineering, architectural,
or fractional notation. You can enter angles in grads, radians, surveyor's units,
or degrees, minutes, and seconds. The UNITS command controls unit format.
Display Coordinates on the Status Bar
The current cursor location is displayed as a coordinate value on the status
bar.
There are three types of coordinate display: static, dynamic, and distance and
angle.
■Static display. Updates only when you specify a point.
■Dynamic display. Updates as you move the cursor.
■Distance and angle display. Updates the relative distance (distance<angle)
as you move the cursor. This option is available only when you draw lines
or other objects that prompt for more than one point.
See also:
■Enter Cartesian Coordinates on page 552
■Enter Polar Coordinates on page 554
■Enter 3D Coordinates on page 556
■Use Dynamic Input on page 578
To display the coordinate values of a point
1Click Home tab ➤ Utilities panel ➤ ID Point.
2Select the location you want to identify.
The X,Y,Z coordinate values are displayed at the Command prompt.
550 | Chapter 17 Use Precision Tools

To visually locate a point
1Click Home tab ➤ Utilities panel ➤ ID Point.
2At the Command prompt, enter the coordinate values of the point you
want to locate.
If the BLIPMODE system variable is on, a blip (a small cross) is displayed
at the point location.
To change the coordinate display on the status bar
Use one of the following methods:
■Click the coordinate display at the Specify Next Point prompt.
■Press Ctrl+I.
■Set the COORDS system variable to 0 for static display, 1 for dynamic
display, or 2 for distance and angle display.
Quick Reference
BLIPMODE
Controls the display of marker blips.
ID
Displays the UCS coordinate values of a specified location.
LIST
Displays property data for selected objects.
BLIPMODE
Controls the display of marker blips.
COORDS
Controls the format and update frequency of coordinates on the status line.
LASTPOINT
Stores the last point specified, expressed as UCS coordinates for the current
space.
Overview of Coordinate Entry | 551
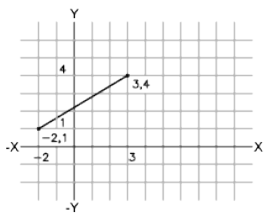
Enter 2D Coordinates
Absolute and relative 2D Cartesian and polar coordinates determine precise
locations of objects in a drawing.
Enter Cartesian Coordinates
You can use absolute or relative Cartesian (rectangular) coordinates to locate
points when creating objects.
To use Cartesian coordinates to specify a point, enter an X value and a Y value
separated by a comma (X,Y). The X value is the positive or negative distance,
in units, along the horizontal axis. The Y value is the positive or negative
distance, in units, along the vertical axis.
Absolute coordinates are based on the UCS origin (0,0), which is the
intersection of the X and Y axes. Use absolute coordinates when you know the
precise X and Y values of the point.
With dynamic input, you can specify absolute coordinates with the # prefix.
If you enter coordinates on the command line instead of in the tooltip, the
# prefix is not used. For example, entering #3,4 specifies a point 3 units along
the X axis and 4 units along the Y axis from the UCS origin. For more
information about dynamic input, see Use Dynamic Input on page 578.
The following example draws a line beginning at an X value of -2, a Y value
of 1, and an endpoint at 3,4. Enter the following in the tooltip:
Command: line
From point: #-2,1
To point: #3,4
The line is located as follows:
552 | Chapter 17 Use Precision Tools
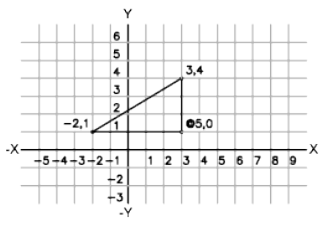
Relative coordinates are based on the last point entered. Use relative
coordinates when you know the location of a point in relation to the previous
point.
To specify relative coordinates, precede the coordinate values with an @ sign.
For example, entering @3,4 specifies a point 3 units along the X axis and 4
units along the Y axis from the last point specified.
The following example draws the sides of a triangle. The first side is a line
starting at the absolute coordinates -2,1 and ending at a point 5 units in the
X direction and 0 units in the Y direction. The second side is a line starting at
the endpoint of the first line and ending at a point 0 units in the X direction
and 3 units in the Y direction. The final line segment uses relative coordinates
to return to the starting point.
Command: line
From point: #-2,1
To point: @5,0
To point: @0,3
To point: @-5,-3
To enter absolute Cartesian coordinates (2D)
■At a prompt for a point, enter coordinates in the tooltip using the following
format:
#x,y
If dynamic input is turned off, enter coordinates on the command line
using the following format:
x,y
To enter relative Cartesian coordinates (2D)
■At a prompt for a point, enter coordinates using the following format:
@x,y
Enter 2D Coordinates | 553

Quick Reference
COORDS
Controls the format and update frequency of coordinates on the status line.
Enter Polar Coordinates
You can use absolute or relative polar coordinates (distance and angle) to
locate points when creating objects.
To use polar coordinates to specify a point, enter a distance and an angle
separated by an angle bracket (<).
By default, angles increase in the counterclockwise direction and decrease in
the clockwise direction. To specify a clockwise direction, enter a negative value
for the angle. For example, entering 1<315 locates the same point as entering
1<-45. You can change the angle conventions for the current drawing with
UNITS.
Absolute polar coordinates are measured from the UCS origin (0,0), which is
the intersection of the X and Y axes. Use absolute polar coordinates when you
know the precise distance and angle coordinates of the point.
With dynamic input, you can specify absolute coordinates with the # prefix.
If you enter coordinates on the command line instead of in the tooltip, the
# prefix is not used. For example, entering #3<45 specifies a point 3 units from
the origin at an angle of 45 degrees from the X axis. For more information
about dynamic input, see Use Dynamic Input on page 578.
The following example shows two lines drawn with absolute polar coordinates
using the default angle direction setting. Enter the following in the tooltip:
Command: line
From point: #0,0
To point: #4<120
To point: #5<30
554 | Chapter 17 Use Precision Tools
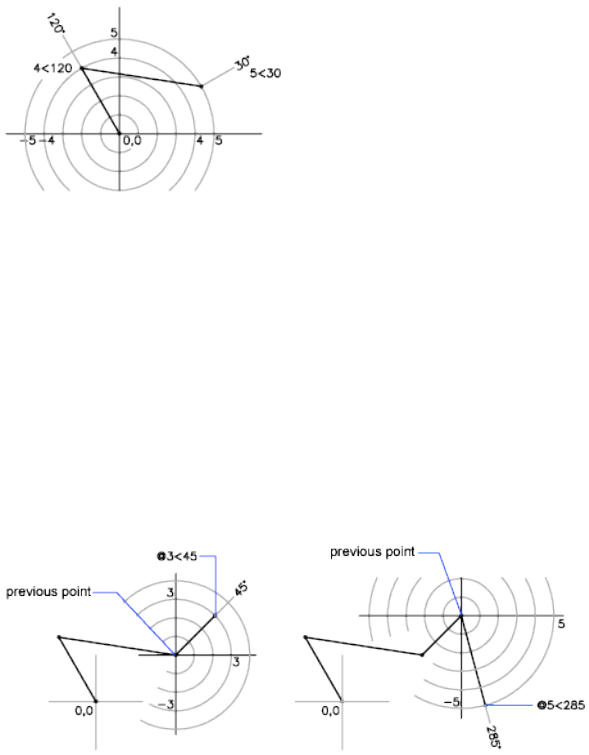
Relative coordinates are based on the last point entered. Use relative
coordinates when you know the location of a point in relation to the previous
point.
To specify relative coordinates, precede the coordinate values with an @ sign.
For example, entering @1<45 specifies a point at a distance of 1 unit from the
last point specified at an angle of 45 degrees from the X axis.
The following example shows two lines drawn with relative polar coordinates.
In each illustration, the line begins at the location labeled as the previous
point.
Command: line
From point: @3<45
To point: @5<285
To enter absolute polar coordinates (2D)
■At a prompt for a point, enter coordinates in the tooltip using the following
format:
#distance<angle
If dynamic input is turned off, enter coordinates on the command line
using the following format:
distance<angle
Enter 2D Coordinates | 555
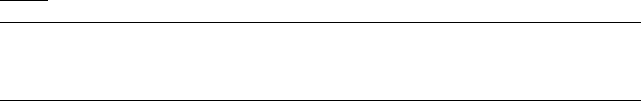
To enter relative polar coordinates (2D)
■At a prompt for a point, enter coordinates using the following format:
@distance<angle
Quick Reference
UNITS
Controls coordinate and angle display formats and precision.
COORDS
Controls the format and update frequency of coordinates on the status line.
Enter 3D Coordinates
Cartesian, cylindrical, or spherical coordinates locate points when you are
creating objects in 3D.
Enter 3D Cartesian Coordinates
3D Cartesian coordinates specify a precise location by using three coordinate
values: X, Y, and Z.
Entering 3D Cartesian coordinate values (X,Y,Z) is similar to entering 2D
coordinate values (X,Y). In addition to specifying X and Y values, you also
specify a Z value using the following format:
X,Y,Z
NOTE For the following examples, it is assumed that dynamic input is turned off
or that the coordinates are entered on the command line. With dynamic input,
you specify absolute coordinates with the # prefix.
In the illustration below, the coordinate values of 3,2,5 indicates a point 3
units along the positive X axis, 2 units along the positive Y axis, and 5 units
along the positive Z axis.
556 | Chapter 17 Use Precision Tools
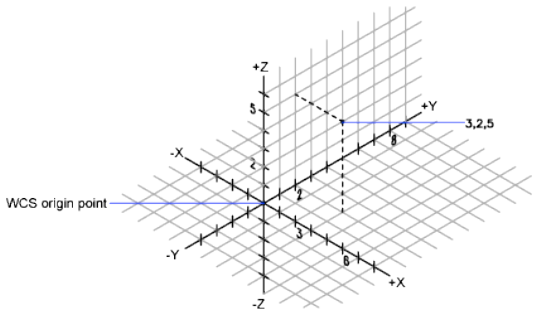
Use Default Z Values
When you enter coordinates in the format X,Y, the Z value is copied from the
last point you entered. As a result, you can enter one location in the X,Y,Z
format and then enter subsequent locations using the X,Y format with the Z
value remaining constant. For example, if you enter the following coordinates
for a line
From point: 0,0,5
To point: 3,4
both endpoints of the line will have a Z value of 5. When you begin or open
any drawing, the initial default value of Z is greater than 0.
Use Absolute and Relative Coordinates
As with 2D coordinates, you can enter absolute coordinate values, which are
based on the origin, or you can enter relative coordinate values, which are
based on the last point entered. To enter relative coordinates, use the @ sign
as a prefix. For example, use @1,0,0 to enter a point one unit in the positive
X direction from the previous point. To enter absolute coordinates at the
Command prompt, no prefix is necessary.
Digitize Coordinates
When you enter coordinates by digitizing, the UCS Z value for all coordinates
is 0. You can use ELEV to set a default height above or below the Z = 0 plane
for digitizing without moving the UCS.
Enter 3D Coordinates | 557
To enter absolute coordinates (3D)
■At a prompt for a point, enter coordinates in the tooltip using the following
format:
#x,y,z
If dynamic input is turned off, enter coordinates on the command line
using the following format:
x,y,z
To enter relative coordinates (3D)
■At a prompt for a point, enter coordinates using the following format:
@x,y,z
Quick Reference
GRID
Displays a grid pattern in the current viewport.
SNAP
Restricts cursor movement to specified intervals.
TABLET
Calibrates, configures, and turns on and off an attached digitizing tablet.
UCS
Manages user coordinate systems.
UCSICON
Controls the visibility and placement of the UCS icon.
UNITS
Controls coordinate and angle display formats and precision.
COORDS
Controls the format and update frequency of coordinates on the status line.
ELEVATION
Stores the current elevation of new objects relative to the current UCS.
558 | Chapter 17 Use Precision Tools
TABMODE
Controls the use of the tablet.
Enter Cylindrical Coordinates
3D cylindrical coordinates describe a precise location by a distance from the
UCS origin in the XY plane, an angle from the X axis in the XY plane, and a Z
value.
Cylindrical coordinate entry is the 3D equivalent of 2D polar coordinate entry.
It specifies an additional coordinate on an axis that is perpendicular to the
XY plane. Cylindrical coordinates define points by a distance in the XY plane
from the UCS origin, an angle from the X axis in the XY plane, and a Z value.
You specify a point using absolute cylindrical coordinates with the following
syntax:
X<[angle from X axis],Z
NOTE For the following examples, it is assumed that dynamic input is turned off
or that the coordinates are entered on the command line. With dynamic input,
you specify absolute coordinates with the # prefix.
In the illustration below, 5<30,6 indicates a point 5 units from the origin of
the current UCS, 30 degrees from the X axis in the XY plane, and 6 units along
the Z axis.
When you need to define a point based on a previous point rather than the
UCS origin, you can enter relative cylindrical coordinate values with the @
prefix. For example, @4<45,5 specifies a point 4 units in the XY plane from
Enter 3D Coordinates | 559
the last point entered, at an angle of 45 degrees from the positive X direction,
and extending 5 units in the positive Z direction.
To enter relative cylindrical coordinates
■At a prompt for a point, enter the coordinate values using the following
format:
@x<angle from the X axis,z
For example, @4<60,2 represents a location that is 4 units along the X axis
from the last point measured at 60 degrees from the positive X axis and at 2
units in the positive Z direction.
Quick Reference
UNITS
Controls coordinate and angle display formats and precision.
COORDS
Controls the format and update frequency of coordinates on the status line.
Enter Spherical Coordinates
3D spherical coordinates specify a location by a distance from the origin of
the current UCS, an angle from the X axis in the XY plane, and an angle from
the XY plane.
Spherical coordinate entry in 3D is similar to polar coordinate entry in 2D.
You locate a point by specifying its distance from the origin of the current
UCS, its angle from the X axis (in the XY plane), and its angle from the XY
plane, each angle preceded by an open angle bracket (<) as in the following
format:
X<[angle from X axis]<[angle from XY plane]
NOTE For the following examples, it is assumed that dynamic input is turned off
or that the coordinates are entered on the command line. With dynamic input,
you specify absolute coordinates with the # prefix.
In the following illustration, 8<60<30 indicates a point 8 units from the origin
of the current UCS in the XY plane, 60 degrees from the X axis in the XY plane,
and 30 degrees up the Z axis from the XY plane. 5<45<15 indicates a point 5
560 | Chapter 17 Use Precision Tools
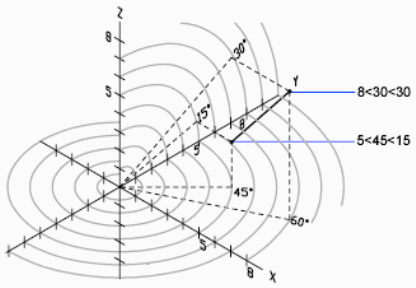
units from the origin, 45 degrees from the X axis in the XY plane, and 15
degrees up from the XY plane.
When you need to define a point based on a previous point, enter the relative
spherical coordinate values by preceding them with the @ sign.
To enter relative spherical coordinates
■At a prompt for a point, enter the coordinate values using the following
format:
@x<angle from the x axis<angle from the xy plane
For example, @4<60<30 represents a location that is 4 units from the last point
measured at 60 degrees from the positive X axis in the XY plane and at 30
degrees from the XY plane.
Quick Reference
UNITS
Controls coordinate and angle display formats and precision.
COORDS
Controls the format and update frequency of coordinates on the status line.
Understand the User Coordinate System (UCS)
You can relocate and rotate the user coordinate system for convenient
coordinate entry, grid display, grid snap, Ortho mode, and other drawing
tools.
Understand the User Coordinate System (UCS) | 561
Understand the World and User Coordinate Systems
There are two coordinate systems: a fixed system called the world coordinate
system (WCS) and a movable system called the user coordinate system (UCS).
By default, these two systems are coincident in a new drawing.
Normally in 2D views, the WCS X axis is horizontal and the Y axis is vertical.
The WCS origin is where the X and Y axes intersect (0,0). All objects in a drawing
file are defined by their WCS coordinates. However, it is usually more
convenient to create and edit objects based on the movable UCS.
Work with the User Coordinate System
Virtually all coordinate entry as well as many other tools and operations
reference the current UCS. 2D tools and operations that depend on the location
and orientation of the UCS include the following:
■Absolute and relative coordinate entry
■Absolute reference angles
■Definition of horizontal and vertical for Ortho mode, polar tracking, object
snap tracking, grid display, and grid snap
■Orientation of horizontal and vertical dimensions
■Orientation of text objects
■View rotation using the PLAN command
Moving or rotating the UCS can make it easier to work on particular areas of
a drawing.
You can relocate the user coordinate system with methods such as the
following:
■Move the UCS by defining a new origin point.
■Align the UCS with an existing object.
■Rotate the UCS by specifying a new origin point and a point on the new
X axis.
■Rotate the current UCS a specified angle around the Z axis.
■Revert to the previous UCS.
■Restore the UCS to be coincident with the WCS.
562 | Chapter 17 Use Precision Tools
Each of these methods have a corresponding option in the UCS command.
Once you have defined a UCS, you can name it and then restore it when you
need to use it again.
To define a new UCS origin in 2D
1Click View tab ➤ Coordinates panel ➤ Origin.
2Specify a point for the new origin.
The UCS origin (0,0) is redefined at the point you specify.
To change the rotation angle of the UCS
1Click View tab ➤ Coordinates panel ➤ Z.
2Specify a rotation angle.
To restore the UCS to be coincident with the WCS
1Click View tab ➤ Coordinates panel ➤ Named UCS.
2In the UCS dialog box, Named UCSs tab, select World.
3Click Set Current.
4Click OK.
To restore the previous UCS
1Click View tab ➤ Coordinates panel ➤ Named UCS.
2In the UCS dialog box, Named UCSs tab, select Previous.
3Click Set Current.
4Click OK.
To save a UCS
1Click View tab ➤ Coordinates panel ➤ Named UCS.
The new UCS is displayed in the UCS list as UNNAMED.
Understand the User Coordinate System (UCS) | 563
2In the UCS dialog box, Named UCSs tab, select UNNAMED and enter a
new name. (You can also select UNNAMED, and right-click. Click
Rename.)
3Click OK.
You can use up to 255 characters, including letters, digits, and the special
characters dollar sign ($), hyphen (-), and underscore (_). All UCS names
are converted to uppercase.
To restore a named UCS
1Click View tab ➤ Coordinates panel ➤ Named UCS.
2In the UCS dialog box, Named UCSs tab, you can view the origin and
axis direction of a listed UCS. Select the UCS name. Click Details.
When you have finished viewing the list, click OK to return to the UCS
dialog box.
3Select the coordinate system you want to restore. Click Set Current.
4Click OK.
To rename a UCS
1Click View tab ➤ Coordinates panel ➤ Named UCS.
2In the UCS dialog box, Named UCSs tab, select the coordinate system
you want to rename. (You can also select UNNAMED, and right-click.
Click Rename.)
3Enter a new name.
4Click OK.
To delete a named UCS
1Click View tab ➤ Coordinates panel ➤ Named UCS.
2In the UCS dialog box, Named UCSs tab, select the UCS you want to
delete.
3Press Delete.
You cannot delete the current UCS or a UCS with the default name
UNNAMED.
564 | Chapter 17 Use Precision Tools
Quick Reference
UCS
Manages user coordinate systems.
UCSICON
Controls the visibility and placement of the UCS icon.
UCSMAN
Manages defined user coordinate systems.
ERRNO
Displays the number of the appropriate error code when an AutoLISP function
call causes an error that AutoCAD detects.
PUCSBASE
Stores the name of the UCS that defines the origin and orientation of
orthographic UCS settings in paper space only.
UCSFOLLOW
Generates a plan view whenever you change from one UCS to another.
UCSNAME
Stores the name of the current coordinate system for the current viewport
in the current space.
UCSORG
Stores the origin point of the current coordinate system for the current
viewport in the current space.
UCSORTHO
Determines whether the related orthographic UCS setting is restored
automatically when an orthographic view is restored.
UCSXDIR
Stores the X direction of the current UCS for the current viewport in the
current space.
UCSYDIR
Stores the Y direction of the current UCS for the current viewport in the
current space.
Understand the User Coordinate System (UCS) | 565
Specify Workplanes in 3D (UCS)
Control of the user coordinate system is essential for effective 3D modeling.
Understand the User Coordinate System in 3D
When you work in 3D, the user coordinate system is useful for entering
coordinates, creating 3D objects on 2D workplanes, and rotating objects in
3D.
When you create or modify objects in a 3D environment, you can move and
reorient the UCS in 3D model space to simplify your work. The XY plane of
the UCS is called the workplane.
Important operations on objects in a 3D environment that depend on the
location and orientation of the UCS include the following:
■Establish the workplane in on which to create and modify objects
■Establish the workplane that contains the grid display and grid snap
■Establish a new UCS Z axis about which to rotate objects in 3D
■Determine up and down directions as well as horizontal and vertical for
Ortho mode, polar tracking, and object snap tracking
■Define a 3D view directly into the workplane with the PLAN command
Apply the Right-Hand Rule
Use the right-hand rule to determine the positive axis direction of the Z axis
when you know the direction of the X and Y axes in a 3D coordinate system.
Place the back of your right hand near the screen and point your thumb in
the direction of the positive X axis. Extend your index and middle fingers as
illustrated, pointing your index finger in the direction of the positive Y axis.
Your middle finger indicates the direction of the positive Z axis. By rotating
your hand, you see how the X, Y, and Z axes rotate as you change the UCS.
You can also use the right-hand rule for determining the default positive
direction of rotation about an axis in 3D space. Point your right thumb in the
positive direction of the axis and curl your fingers. Your fingers indicate the
positive rotation direction about the axis.
566 | Chapter 17 Use Precision Tools
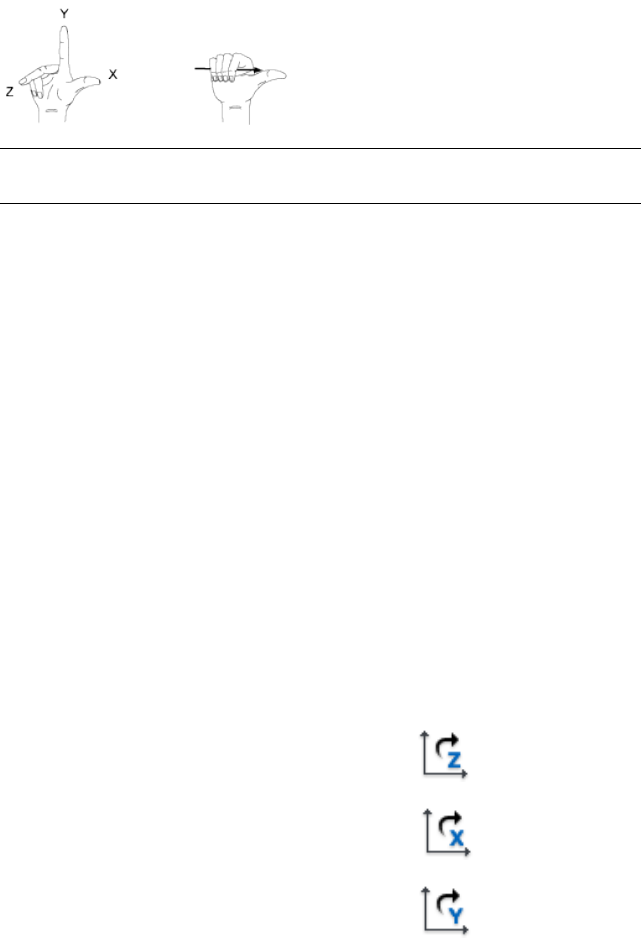
NOTE By default, when you specify a view in 3D, it is established relative to the
fixed WCS rather than the movable UCS.
To enter coordinates relative to the WCS
■Precede coordinate values with an asterisk (*).
Entering @*2,0,0 specifies a point two units in the X direction of the last point
entered relative to the WCS. Entering @2,0,0 specifies a point two units in
the X direction of the last point entered relative to the UCS.
In practice, most coordinates are entered relative to the UCS rather than the
WCS.
To specify a new UCS with three points
1Click View tab ➤ Coordinates panel ➤ 3 Point.
2Specify a new origin point. This is the point (0,0,0) on the new UCS.
3Specify a point on the positive X axis of the new UCS.
4Specify a point on the positive XY plane of the new UCS.
To rotate the UCS around a major axis
1Do one of the following:
■Click View tab ➤ Coordinates panel ➤ Z.
■Click View tab ➤ Coordinates panel ➤ X.
■Click View tab ➤ Coordinates panel ➤ Y.
2Enter a rotation angle. A common rotation angle is 90.
Specify Workplanes in 3D (UCS) | 567
Quick Reference
UCS
Manages user coordinate systems.
UCSICON
Controls the visibility and placement of the UCS icon.
UCSMAN
Manages defined user coordinate systems.
UCSICON
Displays the UCS icon for the current viewport or layout.
UCSVP
Determines whether the UCS in viewports remains fixed or changes to reflect
the UCS of the current viewport.
Control the User Coordinate System in 3D
Several methods are available for manipulating the user coordinate system in
3D. You can also save and restore user coordinate system orientations.
You define a user coordinate system (UCS) to change the location of the 0,0,0
origin point, the location and rotation of the XY plane, and the orientation
of the XY plane or Z axis. You can locate and orient a UCS anywhere in 3D
space, and you can define, save, and recall as many saved UCS locations as
you require.
If multiple viewports are active, you can assign a different UCS to each
viewport. With the UCSVP system variable turned on, you can lock a UCS to
a viewport, automatically restoring the UCS each time that viewport is made
current.
Define the UCS Location
You can define a UCS in the following ways:
■Specify a new origin (one point), new X axis (two points), or new XY plane
(three points).
■Align the UCS by selecting a face on a 3D solid object. The selection can
be on a face or on an edge of the solid.
568 | Chapter 17 Use Precision Tools
■Align the new UCS with an existing object. The origin of the UCS is located
at the vertex nearest to where the object was selected.
■Align the new UCS with the current viewing direction.
■Rotate the current UCS around any of its three major axes.
■Reorient the XY plane by specifying a new Z axis.
Use UCS Presets
If you do not want to define your own UCS, you can choose from several
preset coordinate systems. The images on the Orthographic UCSs tab of the
(Named) UCS dialog box show the available choices.
Change the Default Elevation
The ELEV command sets the default Z value for new objects above or below
the XY plane of the current UCS. This value is stored in the ELEVATION system
variable.
NOTE Generally, it is recommended that you leave the elevation set to zero and
control the XY plane of the current UCS with the UCS command.
Change the UCS in Paper Space
You can define a new UCS in paper space just as you can in model space;
however, the UCS in paper space is restricted to 2D manipulation. Although
you can enter 3D coordinates in paper space, you cannot use 3D viewing
commands such as PLAN and VPOINT.
Save and Restore UCS Locations by Name
If you plan to work extensively in 3D, you can save named UCS locations,
each having a different origin and orientation, for various construction
requirements. You can relocate, save, and recall as many UCS orientations as
you require.
To define a new UCS origin in 3D
1Click View tab ➤ Coordinates panel ➤ Origin.
2Specify a point for the new origin.
The UCS origin (0,0,0) is redefined at the point you specify.
Specify Workplanes in 3D (UCS) | 569
To define a new UCS with a specified Z axis
1Click View tab ➤ Coordinates panel ➤ Z.
2Specify a point for the new origin.
The UCS origin (0,0,0) is redefined at the point you specify.
3Specify a point that lies on the positive Z axis.
To define a new UCS with particular X and Y axes
1Click View tab ➤ Coordinates panel ➤ 3 Point.
2Specify a point for the new origin.
The UCS origin (0,0,0) is redefined at the point you specify.
3Specify a point that lies on the positive X axis.
4Specify a point that lies on the positive Y axis.
To shift the XY plane
1Click View tab ➤ Coordinates panel ➤ 3 Point.
2Specify an origin point for the new UCS (1).
For example, in a large drawing, you might specify an origin point near
the area in which you want to work.
3Specify a point to indicate the horizontal orientation of the new UCS (2).
This point should be on the positive portion of the new X axis.
4Specify a point to indicate the vertical orientation of the new UCS (3).
This point should be on the positive portion of the new Y axis.
The UCS, including grid, shifts to represent the X and Y axes you have
specified.
570 | Chapter 17 Use Precision Tools
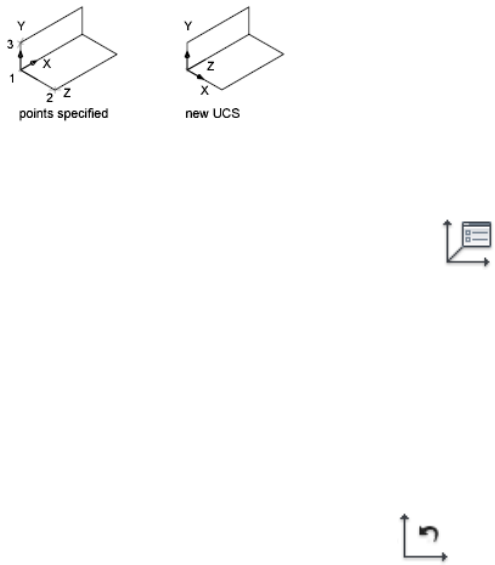
To select a UCS preset
1Click View tab ➤ Coordinates panel ➤ Named UCS.
2In the UCS dialog box, Orthographic UCSs tab, select a UCS orientation
from the list.
3Click Set Current.
4Click OK.
The UCS changes to the selected option.
To restore the location and orientation of the previous UCS
■Click View tab ➤ Coordinates panel ➤ Previous.
The previous UCS is restored.
Quick Reference
ELEV
Sets elevation and extrusion thickness of new objects.
UCS
Manages user coordinate systems.
UCSMAN
Manages defined user coordinate systems.
ELEVATION
Stores the current elevation of new objects relative to the current UCS.
Specify Workplanes in 3D (UCS) | 571
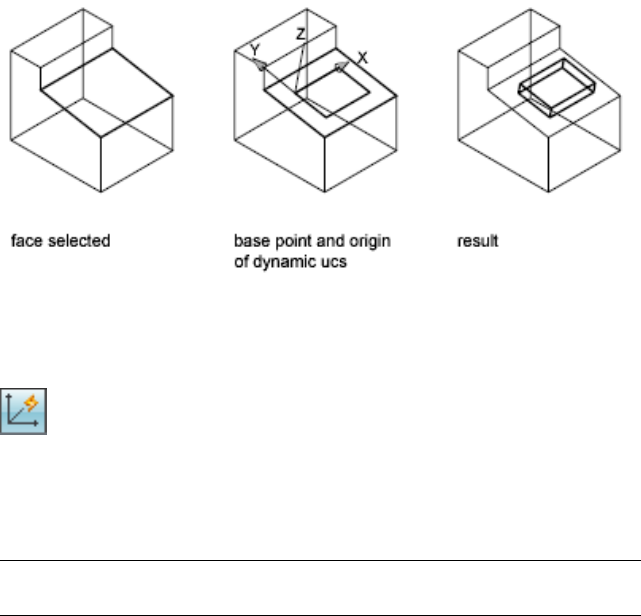
UCSVP
Determines whether the UCS in viewports remains fixed or changes to reflect
the UCS of the current viewport.
Use the Dynamic UCS with Solid Models
With the dynamic UCS feature, you can temporarily and automatically align
the XY plane of the UCS with a plane on a solid model while creating objects.
When in a draw command, you align the UCS by moving your pointer over
an edge of a face rather than having to use the UCS command. After you finish
the command, the UCS returns to its previous location and orientation.
For example, you can use the dynamic UCS to create a rectangle on an angled
face of a solid model as shown in the illustration.
In the illustration on the left, the UCS is not aligned with the angled face.
Instead of relocating the UCS, you turn on the dynamic UCS on the status
bar or by pressing F6.
When you move the pointer completely over an edge as shown in the middle
illustration, the cursor changes to show the direction of the dynamic UCS
axes. You can then create objects on the angled face easily as shown in the
illustration on the right.
NOTE To display the XYZ labels on the cursor, right-click the DUCS button and
click Display Crosshair Labels.
572 | Chapter 17 Use Precision Tools

The X axis of the dynamic UCS is located along an edge of the face and the
positive direction of the X axis always points toward the right half of the
screen. Only the front faces of a solid are detected by the dynamic UCS.
The types of commands that can use a dynamic UCS include the following:
■Simple geometry. Line, polyline, rectangle, arc, circle
■Text. Text, Multiline text, table
■References. Insert, xref
■Solids. Primitives and POLYSOLID
■Editing. Rotate, mirror, align
■Other. UCS, area, grip tool manipulation
TIP You can easily align the UCS with a plane on a solid model by turning on the
dynamic UCS feature and then using the UCS command to locate the origin on
that plane.
If Grid and Snap mode are turned on, they align temporarily to the dynamic
UCS. The limits of the grid display are set automatically.
You can temporarily turn off the dynamic UCS by pressing F6 or Shift+Z while
moving the pointer over a face.
NOTE The dynamic UCS is available only while a command is active.
To change the UCS dynamically
1Start a command supported by dynamic UCS.
2If necessary, click DUCS on the status bar to turn it on.
3Move your pointer over the edge of a face on a solid model.
4Complete the command.
Quick Reference
OPTIONS
Customizes the program settings.
Specify Workplanes in 3D (UCS) | 573
OSOPTIONS
Automatically suppresses object snaps on hatch objects and geometry with
negative Z values when using a dynamic UCS.
UCSDETECT
Controls whether dynamic UCS acquisition is active or not.
Assign User Coordinate System Orientations to Viewports
To facilitate editing objects in different views, you can define a different user
coordinate system orientation for each view.
Multiple viewports provide different views of your model. For example, you
might set up viewports that display top, front, right side, and isometric views.
To facilitate editing objects in different views, you can define a different UCS
for each view. Each time you make a viewport current, you can begin drawing
using the same UCS you used the last time that viewport was current.
The UCS in each viewport is controlled by the UCSVP system variable. When
UCSVP is set to 1 in a viewport, the UCS last used in that viewport is saved
with the viewport and is restored when the viewport is made current again.
When UCSVP is set to 0 in a viewport, its UCS is always the same as the UCS
in the current viewport.
For example, you might set up three viewports: a top view, front view, and
isometric view. If you set the UCSVP system variable to 0 in the isometric
viewport, you can use the Top UCS in both the top viewport and the isometric
viewport. When you make the top viewport current, the isometric viewport's
UCS reflects the UCS top viewport. Likewise, making the front viewport current
switches the isometric viewport's UCS to match that of the front viewport.
The example is illustrated in the following figures. The first figure shows the
isometric viewport reflecting the UCS of the upper-left, or top, viewport, which
is current.
574 | Chapter 17 Use Precision Tools
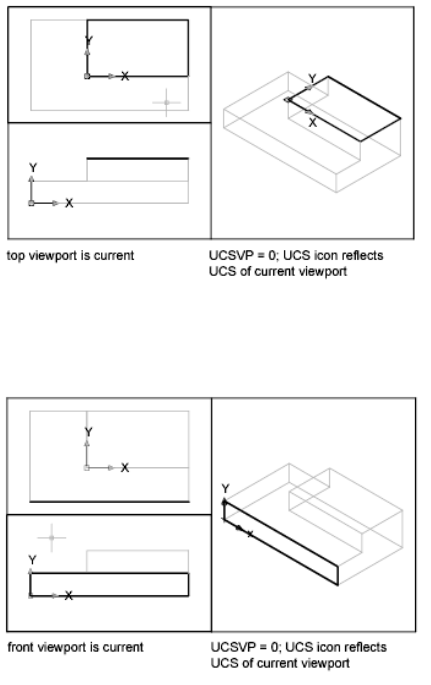
The second figure shows the change that occurs when the lower-left, or front,
viewport is made current. The UCS in the isometric viewport is updated to
reflect the UCS of the front viewport.
In previous releases, the UCS was a global setting for all viewports in either
model or paper space. If you want to restore the behavior of previous releases,
you can set the value of the UCSVP system variable to 0 in all active viewports.
Quick Reference
UCS
Manages user coordinate systems.
Assign User Coordinate System Orientations to Viewports | 575
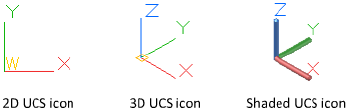
UCSVP
Determines whether the UCS in viewports remains fixed or changes to reflect
the UCS of the current viewport.
Control the Display of the User Coordinate System Icon
To help visualize the current orientation of the user coordinate system, you
can display the user coordinate system icon. Several versions of this icon are
available, and you can change its size, location, and color.
To indicate the location and orientation of the UCS, the UCS icon is displayed
either at the UCS origin point or in the lower-left corner of the current
viewport.
You can choose a 2D or 3D style of the icon to represent the UCS when
working in 2D environment. Shaded style of icon is displayed to represent
the UCS in the 3D environment.
Use the UCSICON command to choose between displaying the 2D or the 3D
UCS icon. The shaded UCS icon is displayed for a shaded 3D view. To indicate
the origin and orientation of the UCS, you can display the UCS icon at the
UCS origin point using the UCSICON command.
If you have multiple viewports, each viewport displays its own UCS icon.
The UCS icon is displayed in various ways to help you visualize the orientation
of the workplane. The following figure shows some of the possible icon
displays.
576 | Chapter 17 Use Precision Tools
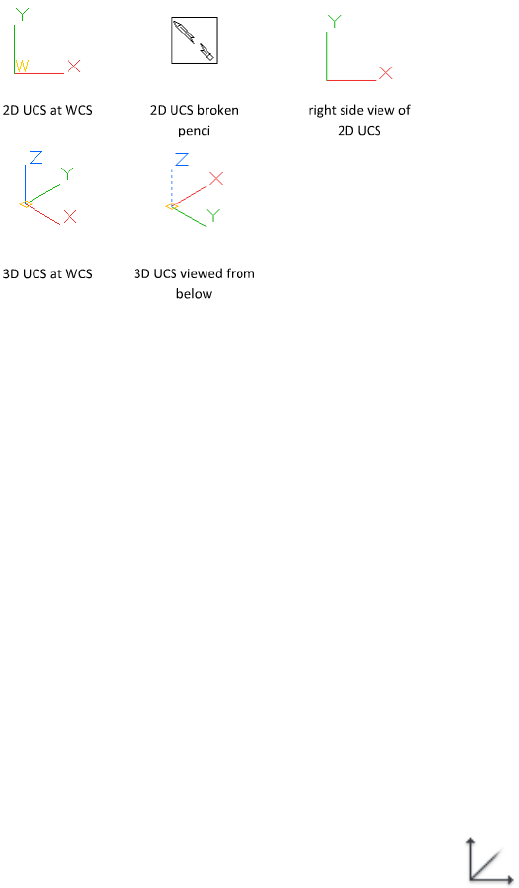
You can use the UCSICON command to switch between the 2D UCS icon and
the 3D UCS icon. You can also use the command to change the size, color,
and icon line width of the 3D UCS icon.
The UCS broken pencil icon replaces the 2D UCS icon when the viewing
direction is in a plane parallel to the UCS XY plane. The broken pencil icon
indicates that the edge of the XY plane is almost perpendicular to your viewing
direction. This icon warns you not to use your pointing device to specify
coordinates.
When you use the pointing device to locate a point, it's normally placed on
the XY plane. If the UCS is rotated so that the Z axis lies in a plane parallel to
the viewing plane—that is, if the XY plane is edge-on to the viewer—it may
be difficult to visualize where the point will be located. In this case, the point
will be located on a plane parallel to your viewing plane that also contains
the UCS origin point. For example, if the viewing direction is along the X axis,
coordinates specified with a pointing device will be located on the YZ plane,
which contains the UCS origin point.
Use the 3D UCS icon to help you visualize which plane these coordinates will
be projected on; the 3D UCS icon does not use a broken pencil icon.
To turn the display of the UCS icon on and off
■Click View tab ➤ Coordinates panel ➤ Toggle Icon.
The check mark indicates whether the icon is on or off.
Control the Display of the User Coordinate System Icon | 577

To display the UCS icon at the UCS origin
■Click View tab ➤ Coordinates panel ➤ Origin.
The UCS icon is displayed at the origin of the current coordinate system.
The check mark indicates whether the option is on or off.
To change the appearance of the UCS icon
1Click View tab ➤ Coordinates panel ➤ UCS Icon Properties.
2In the UCS Icon dialog box, change the settings.
3Click OK.
Quick Reference
UCSICON
Controls the visibility and placement of the UCS icon.
UCSICON
Displays the UCS icon for the current viewport or layout.
Use Dynamic Input
Dynamic Input provides a command interface near the cursor to help you
keep your focus in the drafting area.
When dynamic input is on, tooltips display information near the cursor that
is dynamically updated as the cursor moves. When a command is active, the
tooltips provide a place for user entry.
After you type a value in an input field and press Tab, the field then displays
a lock icon, and the cursor is constrained by the value that you entered. You
can then enter a value for the second input field. Alternately, if you type a
value and press Enter, the second input field is ignored and the value is
interpreted as direct distance entry.
The actions required to complete a command or to use grips are similar to
those for the Command prompt. The difference is that your attention can
stay near the cursor.
578 | Chapter 17 Use Precision Tools
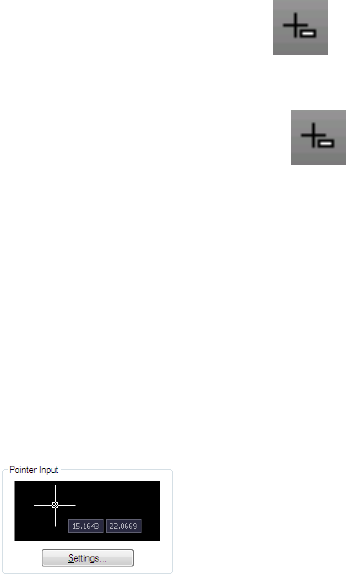
Dynamic input is not designed to replace the command window. You can
hide the command window to add screen area for drawing, but you will need
to display it for some operations. Press F2 to hide and display Command
prompts and error messages as needed. Alternately, you can undock the
command window and use Auto-hide to roll open or roll up the window.
Turn On or Turn Off Dynamic Input
Click the dynamic input button on the status bar to turn dynamic
input on and off. You can turn it off temporarily by holding down the F12
key. Dynamic input has three components: pointer input, dimensional input,
and dynamic prompts. Right-click and click Settings to control what
is displayed by each component when dynamic input is on.
Pointer Input
When pointer input is on and a command is active, the location of the
crosshairs is displayed as coordinates in a tooltip near the cursor. You can
enter coordinate values in the tooltip instead of on the command line.
The default for second and subsequent points is relative polar coordinates
(relative Cartesian for RECTANG). There is no need to type the at sign (@). If
you want to use absolute coordinates, use the pound sign (#) prefix. For
example, to move an object to the origin, for the second point prompt, enter
#0,0.
Use the pointer input settings to change the default format for coordinates
and to control when pointer input tooltips are displayed.
Dimensional Input
When dimensional input is on, the tooltips display distance and angle values
when a Command prompts for a second point. The values in the dimensional
tooltips change as you move the cursor. Press Tab to move to the value you
want to change. Dimensional input is available for ARC, CIRCLE, ELLIPSE,
LINE, and PLINE.
Use Dynamic Input | 579
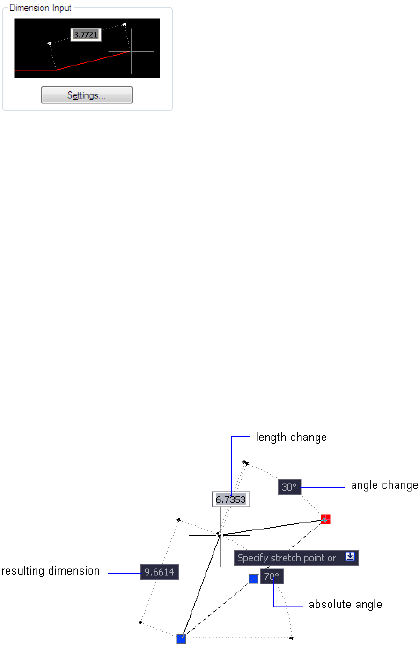
When you use grips to edit an object, the dimensional input tooltips can
display the following information:
■Original length
■A length that updates as you move the grip
■The change in the length
■Angle
■The change in the angle as you move the grip
■The radius of an arc
Use the dimensional input settings to display only the information you want
to see.
When you use grips to stretch objects or when you create new objects,
dimensional input displays only acute angles, that is, all angles are displayed
as 180 degrees or less. Thus, an angle of 270 degrees is displayed as 90 degrees
regardless of the ANGDIR system variable setting (set in the Drawing Units
dialog box). Angles specified when creating new objects rely on the cursor
location to determine the positive angle direction.
Dynamic Prompts
When dynamic prompts are on, prompts are displayed in a tooltip near the
cursor. You can enter a response in the tooltip instead of on the command
580 | Chapter 17 Use Precision Tools
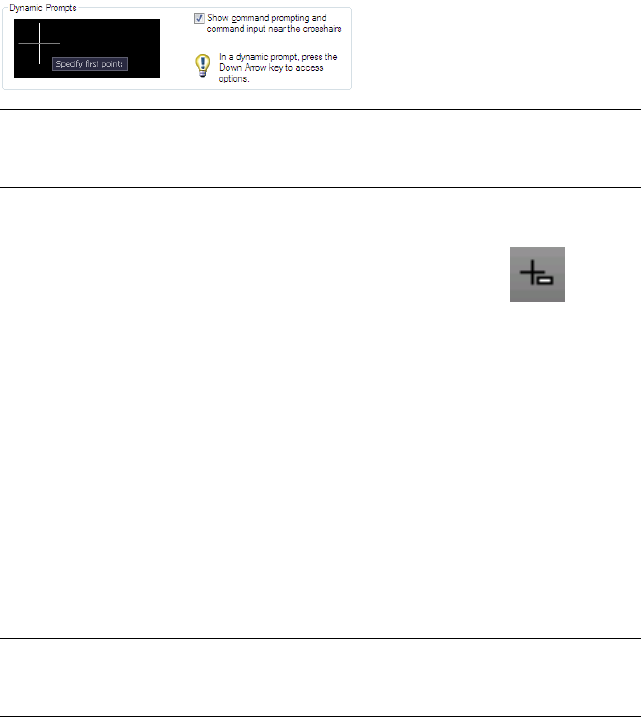
line. Press the DOWN ARROW key to view and select options. Press the UP
ARROW key to display recent input.
NOTE To use PASTECLIP in a dynamic prompt tooltip, type a letter and then
backspace to delete it before you paste the entry. Otherwise, the entry is pasted
into the drawing as text.
To enter coordinate values in dynamic input tooltips
1On the status bar, verify that the dynamic input button is on.
2Use one of the following methods to enter coordinate values or select
options:
■To enter polar coordinates, enter the distance from the first point and
press Tab, and then enter an angle value and press Enter.
■To enter Cartesian coordinates, enter an X coordinate value and a
comma (,), and then enter a Y coordinate value and press Enter.
■If a down-arrow icon follows the prompt, press the DOWN ARROW
key until a dot is displayed next to the option. Press Enter.
■Press the UP ARROW key to access recent coordinates, or right-click
and click Recent Input to access the coordinates from a shortcut menu.
NOTE For dimensional input, after you type a value in an input field and press
Tab, the field then displays a lock icon, and the cursor is constrained by the value
that you entered.
To correct typing errors in dynamic input tooltips
■When a dynamic input tooltip displays the red error outline, the current
entry is selected. Type over the selected text to replace it. You can also use
the RIGHT ARROW, LEFT ARROW, Backspace, and Delete keys to correct
your entry. After you make the correction, press Tab, comma (,), or a left
angle bracket (<) to remove the red outline and complete the coordinates.
Use Dynamic Input | 581

■If you type the @ or # or * prefixes in a pointer input tooltip and then want
to change it, you can just type the character you want. There is no need
to backspace.
To specify relative or absolute coordinates in pointer input tooltips
■To enter absolute coordinates when relative coordinates are displayed in
the tooltip, enter # to temporarily override the DYNPICOORDS system
variable.
■To enter relative coordinates when absolute coordinates are displayed,
enter @ to temporarily override the DYNPICOORDS system variable.
■To enter absolute world coordinate system (WCS) coordinates, enter *.
NOTE During pointer input, you can use the shortcut menu to access the # and
* prefixes.
To change the color, size, or transparency of tooltips
1Click Tools menu ➤ Drafting Settings.
2In the Drafting Settings dialog box, Dynamic Input tab, click Drafting
Tooltip Appearance.
3In the Tooltip Appearance dialog box, under Color, click Model Color or
Layout Color to display the Select Color dialog box, where you can specify
a color for tooltips in the space you selected.
4Under Size, move the slider to the right to make tooltips larger or to the
left to make them smaller. The default value, 0, is in the middle.
5Under Transparency, move the slider. The lower the setting, the more
transparent the tooltip. A value of 100 sets the tooltip to opaque.
6Under Apply To, choose an option:
■Override OS Settings for All Drafting Tooltips. Applies the settings to
all tooltips, overriding the settings in the operating system.
■Use Settings Only for Dynamic Input Tooltips. Applies the settings
only to the drafting tooltips used in dynamic input.
7Click OK.
582 | Chapter 17 Use Precision Tools
To change pointer input settings
1Click Tools menu ➤ Drafting Settings.
2In the Drafting Settings dialog box, Dynamic Input tab, under Pointer
Input, click Settings.
3In the Pointer Input Settings dialog box, select polar or Cartesian format
as the default.
4Select relative or absolute coordinate format as the default.
5Under Visibility, select one of the following options:
■As Soon As I Type Coordinate Data. When pointer input is turned
on, displays tooltips only when you start to enter coordinate data.
■When a Command Asks for a Point. When pointer input is turned on,
displays tooltips whenever a command prompts for a point.
■Always—Even When Not in a Command. Always displays tooltips
when pointer input is turned on.
6Click OK to close each dialog box.
To change dimensional input settings
1Click Tools menu ➤ Drafting Settings.
2In the Drafting Settings dialog box, Dynamic Input tab, under Dimension
Input, click Settings.
3In the Dimension Input Settings dialog box, select Polar or Cartesian
format as the default.
4Under Visibility, select one of the following options:
■Show Only 1 Dimension Input Field at a Time. Displays only the
distance dimensional input tooltip when you are using grip editing
to stretch an object.
■Show 2 Dimension Input Fields at a Time. Displays the distance and
angle dimensional input tooltips when you are using grip editing to
stretch an object.
■Show the Following Dimension Input Fields Simultaneously. Displays
the selected dimensional input tooltips when you are using grip editing
to stretch an object. Select one or more of the check boxes.
5Click OK to close each dialog box.
Use Dynamic Input | 583
To display prompts in tooltips
1Click Tools menu ➤ Drafting Settings.
2In the Drafting Settings dialog box, Dynamic Input tab, under Dynamic
Prompts, check Show Command Prompting and Command Input Near
the Crosshairs.
3Click OK.
Quick Reference
DSETTINGS
Sets grid and snap, polar and object snap tracking, object snap modes,
Dynamic Input, and Quick Properties.
DYNDIGRIP
Controls which dynamic dimensions are displayed during grip stretch editing.
DYNDIVIS
Controls how many dynamic dimensions are displayed during grip stretch
editing.
DYNMODE
Turns Dynamic Input features on and off.
DYNPICOORDS
Controls whether pointer input uses relative or absolute format for
coordinates.
DYNPIFORMAT
Controls whether pointer input uses polar or Cartesian format for coordinates.
DYNPIVIS
Controls when pointer input is displayed.
DYNPROMPT
Controls display of prompts in Dynamic Input tooltips.
DYNTOOLTIPS
Controls which tooltips are affected by tooltip appearance settings.
584 | Chapter 17 Use Precision Tools

TEMPOVERRIDES
Turns temporary override keys on and off.
TOOLTIPMERGE
Combines drafting tooltips into a single tooltip.
Snap to Locations on Objects (Object Snaps)
Instead of entering coordinates, you can specify points relative to existing
objects such as endpoints of lines or center points of circles.
Use Object Snaps
Use object snaps to specify precise locations on objects. For example, you can
use an object snap to draw a line to the center of a circle or to the midpoint
of a polyline segment.
You can specify an object snap whenever you are prompted for a point. By
default, a marker and a tooltip are displayed when you move the cursor over
an object snap location on an object. This feature, called AutoSnap™, provides
a visual clue that indicates which object snaps are in effect.
For a list of object snaps, see OSNAP.
Specify an Object Snap
To specify an object snap at a prompt for a point, you can
■Press Shift and right-click to display the Object Snap shortcut menu
■Click an object snap button on the Object Snap toolbar
■Enter the name of an object snap at the Command prompt
■On the status bar, right-click the object snap button
When you specify an object snap at a prompt for a point, the object snap stays
in effect only for the next point that you specify.
Snap to Locations on Objects (Object Snaps) | 585

NOTE Object snaps work only when you are prompted for a point. If you try to
use an object snap at the Command prompt, an error message is displayed.
Use Running Object Snaps
If you need to use one or more object snaps repeatedly, you can turn on running
object snaps. For example, you might set Center as a running object snap if
you need to connect the centers of a series of circles with a line.
You can specify one or more running object snaps on the Object Snaps tab in
the Drafting Settings dialog box, which is accessible from the Tools menu. If
several running object snaps are on, more than one object snap may be eligible
at a given location. Press Tab to cycle through the possibilities before you
specify the point.
Click the OSNAP button on the status bar or press F3 to turn running object
snaps on and off.
NOTE If you want object snaps to ignore hatch objects, set the OSOPTIONS
system variable to 1.
Use Object Snaps in 3D
By default, the Z-value of an object snap location is determined by the object's
location in space. However, if you work with object snaps on the plan view
of a building or the top view of a part, a constant Z-value is more useful.
If you turn on the OSNAPZ system variable, all object snaps are projected onto
the XY plane of the current UCS or, if ELEV is set to a non-zero value, onto a
plane parallel to XY plane at the specified elevation.
NOTE When you draw or modify objects, make sure that you know whether
OSNAPZ is on or off. There is no visual reminder, and you can get unexpected
results.
To snap to a geometric point on an object
1At the prompt for a point, hold down Shift and right-click in the drawing
area. Select the object snap you want to use.
2Move your cursor over the desired object snap location.
If AutoSnap is on, your cursor automatically locks onto the snap location
you selected, and a marker and tooltip indicate the object snap point.
3Select an object.
586 | Chapter 17 Use Precision Tools

The cursor snaps to the eligible location closest to your selection.
To set running object snaps
1Click Tools menu ➤ Drafting Settings.
2In the Drafting Settings dialog box, Object Snap tab, select the object
snaps you want to use.
3Click OK.
To turn on and turn off running object snaps as you work
■On the status bar, click Osnap , or press F3.
If running object snaps have been set, the settings are turned on or off.
To turn running object snaps on and off temporarily, hold down the F3 key
while you work.
To set object snaps to ignore hatch objects
1At the Command prompt, enter osoptions.
2Enter 1.
Quick Reference
APERTURE
Sets the display size for the object snap target box, in pixels.
OPTIONS
Customizes the program settings.
OSNAP
Sets running object snap modes.
APBOX
Turns the display of the AutoSnap aperture box on or off.
AUTOSNAP
Controls the display of the AutoSnap marker, tooltip, and magnet.
Use Object Snaps | 587
OSMODE
Sets running object snaps
OSNAPZ
Controls whether object snaps are automatically projected onto a plane
parallel to the XY plane of the current UCS at the current elevation.
OSNAPCOORD
Controls whether coordinates entered on the command line will override
running object snaps.
OSOPTIONS
Automatically suppresses object snaps on hatch objects and geometry with
negative Z values when using a dynamic UCS.
MTP (Command Modifier)
Locates the midpoint between two points.
The Object Snap Menu
Specify an object snap quickly and conveniently from a shortcut menu.
The object snap menu is displayed at your cursor location when you hold
down Shift and click the right mouse button or the equivalent button on
another pointing device.
The default object snap menu lists object snaps and tracking options. If you
want to change the options, you can modify a customization file. The main
customization file that’s shipped with the product is acad.cuix.
See also:
■“Pull-down and Shortcut Menus” in the Customization Guide
■Use Object Snaps on page 585
To display the object snap menu
1Enter any command that prompts you to specify a point. For example,
enter line.
2At the From Point prompt, hold down Shift and right-click.
The object snap menu is displayed, and you can click an object snap
option.
588 | Chapter 17 Use Precision Tools

Quick Reference
OSNAP
Sets running object snap modes.
Set Visual Aids for Object Snaps (AutoSnap)
Object snaps include a visual aid called AutoSnap™ to help you see and use
object snaps more efficiently. AutoSnap displays a marker and a tooltip when
you move your cursor over an object snap location.
AutoSnap Tools
AutoSnap consists of the following snap tools:
■Marker. Displays the object snap location when the cursor moves over or
near an object. Marker shape is dependent on the snap it is marking.
■Tooltip. Describes which part of the object you are snapping to in a small
flag at the cursor location.
■Magnet. Attracts and locks the cursor onto the nearest detected snap points.
Provides a visual cue, similar to snapping to a grid.
■Aperture box. Surrounds the crosshairs and defines an area within which
object snaps are evaluated. You can choose to display or not display the
aperture box, and you can change the aperture box size.
The AutoSnap markers, tooltips, and magnet are turned on by default. You
can change AutoSnap settings on the Drafting tab in the Options dialog box.
Use AutoSnap to Confirm or Change an Object Snap
If you have set more than one running object snap, you can press Tab to cycle
through all the object snap points available for a particular object.
To change the AutoSnap settings
1Click Tools menu ➤ Options.
2In the Options dialog box, Drafting tab, change settings as needed:
■Marker. Turns the marker on or off.
Set Visual Aids for Object Snaps (AutoSnap) | 589
■Magnet. Turns the magnet on or off.
■Display AutoSnap Tooltip. Turns tooltips on or off.
■Display AutoSnap Aperture Box. Turns the target box on or off when
you specify an object snap. This setting does not affect object snaps
when you are not using AutoSnap.
■AutoSnap Marker Color. Changes the color of the marker.
■AutoSnap Marker Size. Adjusts the size of the marker.
3Click OK.
Quick Reference
APERTURE
Sets the display size for the object snap target box, in pixels.
OPTIONS
Customizes the program settings.
OSNAP
Sets running object snap modes.
APBOX
Turns the display of the AutoSnap aperture box on or off.
AUTOSNAP
Controls the display of the AutoSnap marker, tooltip, and magnet.
OSMODE
Sets running object snaps
Override Object Snap Settings
While you work, you can turn running object snaps on and off temporarily
by using an override key. Temporary override keys can also be used for other
drawing aids; for example, Ortho mode and Polar mode.
590 | Chapter 17 Use Precision Tools
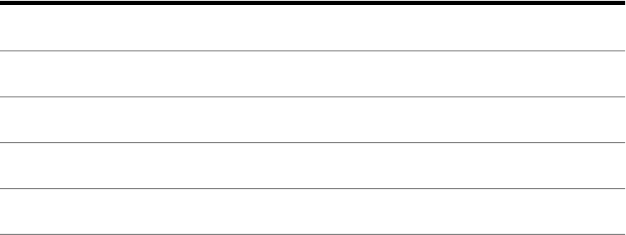
For example, if you have set running object snaps but you want to turn them
off for one point, you can hold down F3. When you release this override key,
running object snaps are restored.
There are also temporary override keys for individual object snaps. Override
keys are set up to be easy to find by touch without looking away from your
drawing.
The keys in the following illustration are the default keys, but you can change
key assignments and add your own as needed.
Hold down Shift and one of the temporary override keys in the illustration:
Turns off all snapping and tracking5Object snap override: Endpoint1
Object snap override: Center6Enforces object snap selection2
Object snap override: Midpoint7Toggles object snap tracking3
Toggles object snap mode (OSNAP)4
Override Object Snap Settings | 591
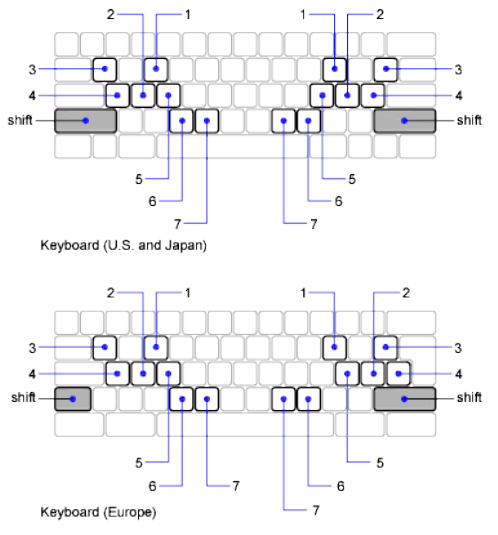
Temporary override keys are also available for the other drawing aids that you
set in the Drafting Settings dialog box.
See also:
■“Adjust Grid and Grid Snap”
■“Use Orthogonal Locking (Ortho Mode)”
■“Use Polar Tracking and PolarSnap”
■“Use Dynamic Input”
■Keyboard Shortcuts in the Customization Guide
To temporarily override the running object snap settings
■Hold down F3 while you work.
When you release the key, the current running object snap settings are
restored.
592 | Chapter 17 Use Precision Tools
To change the keyboard response time for temporary override keys
1In the Windows Control Panel, click Keyboard.
2In the Keyboard Properties dialog box, on the Speed tab, drag the Repeat
Rate slider to adjust the keyboard response time. Then click OK.
Quick Reference
CUI
Manages the customized user interface elements in the product.
CUSTOMIZE
Customizes tool palettes and tool palette groups.
OPTIONS
Customizes the program settings.
OSNAP
Sets running object snap modes.
OSMODE
Sets running object snaps
TEMPOVERRIDES
Turns temporary override keys on and off.
Restrict Cursor Movement
Several tools are available that you can use to restrict or lock the movement
of your cursor.
Adjust Grid and Grid Snap
To enhance drawing speed and efficiency, you can display and snap to a
rectangular grid. You can also control its spacing, angle, and alignment.
The grid is a rectangular pattern of dots or lines that extends over the area
you specify as the grid limits. Using the grid is similar to placing a sheet of
grid paper under a drawing. The grid helps you align objects and visualize the
distances between them. The grid is not plotted.
Restrict Cursor Movement | 593
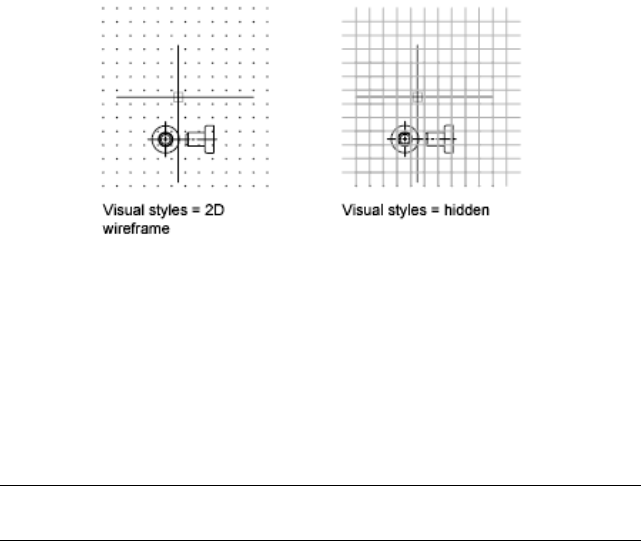
Snap mode restricts the movement of the crosshairs to intervals that you
define. When Snap mode is on, the cursor seems to adhere, or "snap," to an
invisible rectangular grid. Snap is useful for specifying precise points with the
arrow keys or the pointing device.
Grid mode and Snap mode are independent but are often turned on at the
same time.
Control the Display Style and Area of the Grid
You can display the grid either as a rectangular pattern of dots or as rectangular
pattern of lines. The grid displays lines for all visual styles. The grid displays
dots only when the current visual style is set to 2D Wireframe. By default, a
lined grid is displayed while working in both 2D and 3D. There are several
methods to change the current visual style, including the VSCURRENT
command.
By default, the X and Y axes of the UCS display in a different color than the
grid lines. You can control the color in the Drawing Window Colors dialog
box. This dialog box is accessible from the Drafting tab in the Options dialog
box.
The LIMITS command controls the drawing area covered by the grid. As an
option, you can override the limits to make the grid cover the entire XY plane
of the user coordinate system (UCS). You can access this option in the Drafting
Settings dialog box or use the GRIDDISPLAY system variable.
NOTE When you use dynamic UCS, the grid limits are set automatically relative
to the size of the selected face of the solid and the drawing area available.
Control the Frequency of Major Grid Lines
If the grid is displayed as lines rather than dots, darker lines called major grid
lines display at intervals. When working in decimal units or with feet and
inches, major grid lines are especially useful for measuring distances quickly.
594 | Chapter 17 Use Precision Tools
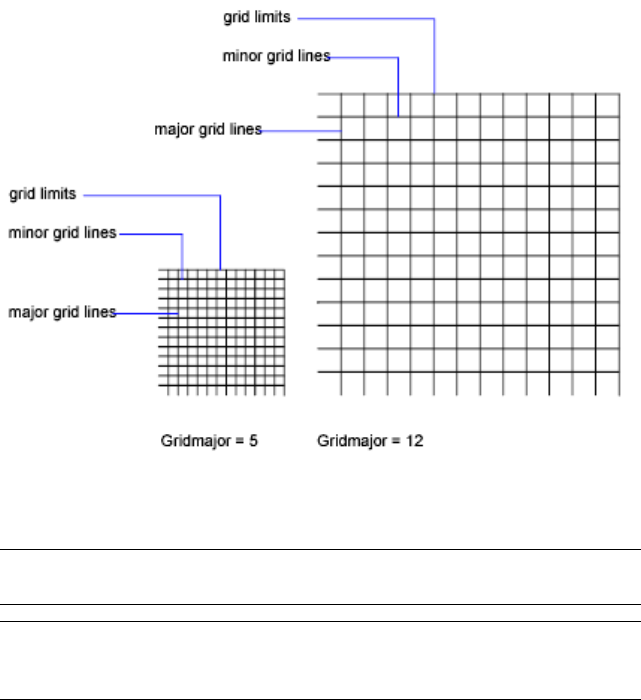
You can control the frequency of major grid lines in the Drafting Settings
dialog box.
To turn off the display of major grid lines, set the frequency of major grid
lines to 1.
NOTE If the grid is displayed as lines, the grid limits are displayed also as darker
lines. Do not confuse these boundaries with major grid lines.
NOTE When the grid is displayed as lines and SNAPANG is set to a value other
than 0, the grid will not display. SNAPANG does not affect the display of the dotted
grid.
Change the Grid Dynamically During Zooming
If you zoom in or out of your drawing, the grid spacing is adjusted
automatically to be more appropriate for the new magnification. This is called
adaptive grid display.
For example, if you zoom way out, the density of displayed grid lines reduces
automatically. Conversely, if you zoom way in, additional grid lines display
in the same proportion as the major grid lines.
Adjust Grid and Grid Snap | 595
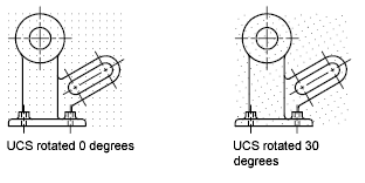
Change Grid and Snap Spacing
As you work, you can turn Grid and Snap mode on and off, and you can
change the grid and snap spacing. You can turn Snap mode on and off
temporarily by using an override key.
Snap spacing does not have to match grid spacing. For example, you might
set a wide grid spacing to be used as a reference but maintain a closer snap
spacing for accuracy in specifying points.
Change the Grid and Snap Angle and Base
If you need to draw along a specific alignment or angle, you can change the
grid and snap angle by rotating the user coordinate system (UCS). This rotation
realigns the crosshairs on the screen to match the new angle. In the following
example, the UCS is rotated 30 degrees to match the angle of the anchor
bracket.
The grid and snap points are always aligned with the UCS origin. If you need
to shift the grid and grid snap origin, move the UCS.
See also:
■“Set Isometric Grid and Snap”
■Override Object Snap Settings on page 590
■Use a Visual Style to Display Your Model on page 257
To display a grid and set grid spacing
1Click Tools menu ➤ Drafting Settings.
2In the Drafting Settings dialog box, Snap and Grid tab, select Grid On to
display the grid.
3Under Snap Type, make sure Grid Snap and Rectangular Snap are selected.
596 | Chapter 17 Use Precision Tools

4For Grid X Spacing, enter the horizontal grid spacing in units.
5To use the same value for vertical grid spacing, press Enter. Otherwise,
enter a new value for Grid Y Spacing.
6Click OK.
To turn on Snap mode and set snap spacing
1Click Tools menu ➤ Drafting Settings.
2In the Drafting Settings dialog box, Snap and Grid tab, select Snap On.
3Under Snap Type, make sure Grid Snap and Rectangular Snap are selected.
4In the Snap X Spacing box, enter the horizontal snap spacing value in
units.
5To specify the same vertical snap spacing, press Enter. Otherwise, enter
a new distance in the Snap Y Spacing box.
6Click OK.
To set the grid limits
1Click Format menu ➤ Drawing Limits.
2At the Command prompt, enter the coordinate values for a point at the
lower left corner of the grid limits.
3Enter the coordinate values for a point at the upper right corner of the
grid limits.
The grid limits are set to a rectangular area defined by the two points.
To temporarily override Snap mode
■Hold down F9 while you work.
When you release the key, Snap mode is restored.
To rotate the grid and snap angle and change the base point
1Click View tab ➤ Coordinates panel ➤ Z.
2Enter the rotation angle for the UCS.
Adjust Grid and Grid Snap | 597

3Click View tab ➤ Coordinates panel ➤ Origin.
4Specify a new origin point for the UCS.
5Click OK.
To change the grid display between dots and lines
1At the Command prompt, enter VSCURRENT.
2Do one of the following:
■To display the grid as dots, specify the 2D Wireframe option.
■To display the grid as lines, specify any other option.
To change the frequency of major grid lines
1If necessary, at the Command prompt, enter VSCURRENT and specify
any visual style other than 2D Wireframe.
2Click Tools menu ➤ Drafting Settings.
3In the Drafting Settings dialog box, Snap and Grid tab, specify a number
for Major Line Every.
4Click OK.
Quick Reference
DSETTINGS
Sets grid and snap, polar and object snap tracking, object snap modes,
Dynamic Input, and Quick Properties.
GRID
Displays a grid pattern in the current viewport.
LIMITS
Sets and controls the limits of the grid display in the current Model or layout
tab.
SHADEMODE
Starts the VSCURRENT command.
598 | Chapter 17 Use Precision Tools
SNAP
Restricts cursor movement to specified intervals.
GRIDDISPLAY
Controls the display behavior and display limits of the grid.
GRIDMODE
Specifies whether the grid is turned on or off.
GRIDMAJOR
Controls the frequency of major grid lines compared to minor grid lines.
GRIDUNIT
Specifies the grid spacing (X and Y) for the current viewport.
LIMCHECK
Controls the creation of objects outside the grid limits.
LIMMAX
Stores the upper-right grid limits for the current space, expressed as world
coordinates.
LIMMIN
Stores the lower-left grid limits for the current space, expressed as a world
coordinate.
SNAPANG
Sets the snap and grid rotation angle for the current viewport relative to the
current UCS.
SNAPBASE
Sets the snap and grid origin point for the current viewport relative to the
current UCS.
SNAPMODE
Turns the Snap mode on and off.
SNAPTYPE
Sets the type of snap for the current viewport.
SNAPUNIT
Sets the snap spacing for the current viewport.
Adjust Grid and Grid Snap | 599

TEMPOVERRIDES
Turns temporary override keys on and off.
Use Orthogonal Locking (Ortho Mode)
You can restrict cursor movement to horizontal and vertical for convenience
and precision when creating and modifying objects.
As you create or move objects, you can use Ortho mode to restrict the cursor
to the horizontal or vertical axis. As you move the cursor, the rubber-band
line follows the horizontal or vertical axis, whichever is nearest the cursor.
The orientation of the current user coordinate system (UCS) determines the
horizontal and vertical directions. In 3D views, Ortho mode additionally
restricts the cursor to the up and down directions. In that case, the tooltip
displays a +Z or -Z for the angle.
TIP Use direct distance entry with Ortho mode turned on to create orthogonal
lines of specified lengths or to move objects specified distances.
You can turn Ortho on and off at any time during drawing and editing. Ortho
is ignored when you enter coordinates or specify an object snap. To turn Ortho
on or off temporarily, hold down the temporary override key, Shift. While
you use the temporary override key, the direct distance entry method is not
available.
For drawing or editing objects at angles that are not parallel to the horizontal
or vertical axis, see Use Polar Tracking and PolarSnap on page 601.
If turned on, the isometric snap setting takes priority over the UCS in
determining horizontal and vertical directions.
NOTE Ortho mode and polar tracking cannot be on at the same time. Turning
on Ortho turns off polar tracking.
See also:
■Override Object Snap Settings on page 590
To turn on or turn off Ortho mode
■On the status bar, click the Ortho button.
600 | Chapter 17 Use Precision Tools
To turn Ortho on or off temporarily, hold down the Shift key while you
work. While you use the temporary override key, the direct distance entry
method is not available.
NOTE Turning on Ortho automatically turns off polar tracking.
Quick Reference
ORTHO
Constrains cursor movement to the horizontal or vertical direction.
ORTHOMODE
Constrains cursor movement to the perpendicular.
TEMPOVERRIDES
Turns temporary override keys on and off.
Use Polar Tracking and PolarSnap
Polar tracking restricts cursor movement to specified angles. PolarSnap restricts
cursor movement to specified increments along a polar angle.
When you are creating or modifying objects, you can use polar tracking to
display temporary alignment paths defined by the polar angles you specify.
In 3D views, polar tracking additionally provides an alignment path in the
up and down directions. In that case, the tooltip displays a +Z or -Z for the
angle.
Polar angles are relative to the orientation of the current user coordinate
system (UCS) and the setting for the base angle convention in a drawing. The
angle base direction is set in the Drawing Units dialog box.
Use PolarSnap™ to snap to specified distances along the alignment path. For
example, in the following illustration you draw a two-unit line from point 1
to point 2, and then draw a two-unit line to point 3 at a 45-degree angle to
the line. If you turn on the 45-degree polar angle increment, an alignment
path and tooltip are displayed when your cursor crosses the 0 or 45-degree
Use Polar Tracking and PolarSnap | 601
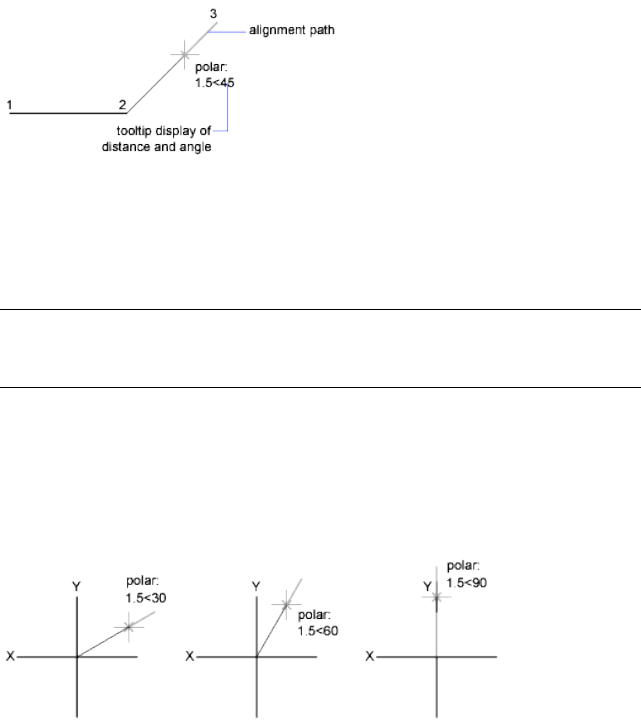
angle. The alignment path and tooltip disappear when you move the cursor
away from the angle.
As you move your cursor, alignment paths and tooltips are displayed when
you move the cursor near polar angles. The default angle measurement is 90
degrees. Use the alignment path and tooltip to draw your object. You can use
polar tracking with Intersection and Apparent Intersection object snaps to
find where a polar alignment path intersects another object.
NOTE Ortho mode and polar tracking cannot be on at the same time. Turning
on polar tracking turns off Ortho mode. Similarly, PolarSnap and grid snap cannot
be on at the same time. Turning on PolarSnap turns off grid snap.
Specify Polar Angles (Polar Tracking)
You can use polar tracking to track along polar angle increments of 90, 60,
45, 30, 22.5, 18, 15, 10, and 5 degrees, or you can specify other angles. The
following illustration shows the alignment paths displayed as you move your
cursor 90 degrees with the polar angle increment set to 30 degrees.
The orientation of 0 depends on the angle you set in the Drawing Units dialog
box (UNITS). The direction of snap (clockwise or counterclockwise) depends
on the units direction you specify when setting units of measurement.
You can turn polar tracking on and off temporarily by using an override key.
The direct distance entry method is not available while you are using the
temporary override key for polar tracking.
602 | Chapter 17 Use Precision Tools

Specify Polar Distances (PolarSnap)
PolarSnap restricts cursor movement to increments of a polar distance you
specify. For example, if you specify a length of 4 units, the cursor snaps from
the first point specified to lengths of 0, 4, 8, 12, 16, and so on. As you move
your cursor, a tooltip indicates the nearest PolarSnap increment. To restrict
point entry to polar distances, both polar tracking and Snap mode (set to
PolarSnap) must be on. You can turn off all snapping and tracking temporarily
by using an override key.
See also:
■Override Object Snap Settings on page 590
To turn on and turn off polar tracking
■Press F10, or click the polar button on the status bar.
To turn polar tracking on or off temporarily, hold down the F10 key while
you work.
To set polar snap distance
1Click Tools menu ➤ Drafting Settings.
2In the Drafting Settings dialog box, Snap and Grid tab, select Snap On.
3In Snap Type, select PolarSnap.
4Under Polar Spacing, enter the polar distance.
5On the Polar Tracking tab, select Polar Tracking On.
6Select the angle from the Increment Angle list.
You can specify your own angles by choosing Additional Angles and then
New.
7Click OK.
To draw objects using polar tracking
1Turn on polar tracking and start a drawing command, such as ARC,
CIRCLE, or LINE.
You can also use polar tracking with editing commands, such as COPY
and MOVE.
Use Polar Tracking and PolarSnap | 603

2As you move your cursor to specify points, notice the dotted polar tracking
line that appears at the tracking angles you specified. Points you specify
while the line is displayed conform to the polar tracking angle.
To draw objects using polar distance
1Turn on snap and polar tracking.
Make sure Polar Snap is selected in the Drafting Settings dialog box, Snap
& Grid tab.
2Start a drawing command, such as LINE.
3As you move your cursor, notice that the dotted polar tracking line
displays a tooltip that shows distance and angle.
4Specify a point.
The length of the new line conforms to the polar distance.
To set polar tracking angles
1Click Tools menu ➤ Drafting Settings.
2In the Drafting Settings dialog box, Polar Tracking tab, select Polar
Tracking On.
3In the Increment Angle list, select the polar tracking angle.
4To set additional tracking angles, select Additional Angles. Click New.
Enter the angle value in the text box.
5Under Polar Angle Measurement, specify whether polar tracking
increments are based on the UCS or relative to the last object you created.
6Click OK.
On the status bar, right-click . Click an available angle or Settings to
set additional tracking angles.
Quick Reference
DSETTINGS
Sets grid and snap, polar and object snap tracking, object snap modes,
Dynamic Input, and Quick Properties.
604 | Chapter 17 Use Precision Tools
SNAP
Restricts cursor movement to specified intervals.
UNITS
Controls coordinate and angle display formats and precision.
ANGBASE
Sets the base angle to 0 with respect to the current UCS.
ANGDIR
Sets the direction of positive angles.
AUTOSNAP
Controls the display of the AutoSnap marker, tooltip, and magnet.
POLARANG
Sets the polar angle increment.
POLARDIST
Sets the snap increment when the SNAPTYPE is set to 1 (PolarSnap).
POLARMODE
Controls settings for polar and object snap tracking.
SNAPTYPE
Sets the type of snap for the current viewport.
TEMPOVERRIDES
Turns temporary override keys on and off.
TRACKPATH
Controls the display of polar and object snap tracking alignment paths.
Lock an Angle for One Point (Angle)
You can specify an angle override that locks the cursor for the next point
entered.
To specify an angle override, enter a left angle bracket (<) followed by an angle
whenever a command asks you to specify a point. The Command prompt
sequence below shows a 30-degree override entered during a LINE command.
Command: line
Lock an Angle for One Point (Angle) | 605
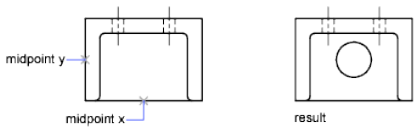
Specify first point: Specify a start point for the line
Specify next point or [Undo]: <30
Angle Override: 30
Specify next point or [Undo]: Specify a point
The angle you specify will lock the cursor, overriding Grid Snap, Ortho mode,
and PolarSnap. Coordinate entry and object snaps have precedence over an
angle override.
Combine or Offset Points and Coordinates
To specify a new point location, you can combine coordinate values from
several points or you can specify offsets from existing objects.
Combine Coordinate Values (Coordinate Filters)
You can use coordinate filters to extract one coordinate value at a time from
locations on existing objects.
Coordinate filters specify a new coordinate location by using the X value from
one location, the Y value of a second location, and, for 3D coordinates, the Z
value of a third location. When used with object snaps, coordinate filters
extract coordinate values from an existing object.
Coordinate filters are commonly used to locate the center of a rectangle and
to locate the projection of a 3D point on the XY plane of the UCS.
To specify a filter at the Command prompt, enter a period and one or more
of the letters X, Y, and Z. The next entry is limited to a specific coordinate
value.
Example: Use of Coordinate Filters in 2D
In the following illustration, the hole in the holding plate was centered in the
rectangle by extracting the X,Y coordinates from the midpoints of the plate's
horizontal and vertical line segments.
Here is the Command prompt sequence:
606 | Chapter 17 Use Precision Tools
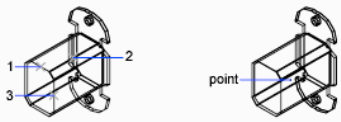
Command: circle
Specify center point for circle or [3P/2P/Ttr (tangent tangent radius)]: .x
of: mid
of: Select the horizontal line on the lower edge of the holding plate
of: (need YZ): mid
of: Select the vertical line on the left side of the holding plate
of: Diameter/<Radius> Specify the radius of the hole
Coordinate filters work only when the program prompts you for a point. If
you try to use a coordinate filter at the Command prompt, you see an error
message.
Example: Use of Coordinate Filters in 3D
This example shows how to use coordinate filters to create a point object at
the center (centroid) of a 3D object. Hidden lines have been removed for
clarity. The X value of the new point is extracted from the first location
specified, the Y value from the second location, and the Z value from the third.
The three values are combined to form the coordinate values of the new point.
Command: point
Point: .x
of mid
of select object (1)
(need YZ): .y
of mid
of select object (2)
(need Z): mid
of select object (3)
To use coordinate filters to specify a point in 2D
1At the prompt for a point, enter a coordinate filter (.x or .y).
For example, enter .x to specify the X value first.
2To extract the first coordinate value, specify a point.
For example, if you entered .x in step 1, the X value is extracted from this
point.
Combine Coordinate Values (Coordinate Filters) | 607

3To extract the next coordinate value, specify a different point.
The new point location combines the coordinate values extracted from
the points you specified in steps 2 and 3.
NOTE Instead of specifying a point in steps 2 or 3, you can enter a numeric value.
To use coordinate filters to specify a point in 3D
1At the prompt for a point, enter a coordinate filter (.x, .y, .z, .xy, .xz, or
.yz).
For example, enter .x to specify the X value first.
2To extract the specified coordinate value(s), specify a point.
For example, if you entered .x in step 1, the X value is extracted from this
point.
3At the prompt for the remaining coordinates, do one of the following:
■Extract the remaining coordinate values by specifying a point.
■Enter another coordinate filter and return to step 2.
For example, if you entered .x in step 1, specify a second point to extract
the Y and Z coordinates simultaneously, or enter .y or .z to specify Y and
Z values separately.
The new point location combines the coordinate values extracted from
the points specified in steps 2 and 3.
NOTE Instead of specifying a point in steps 2 or 3, you can enter a numeric value.
Quick Reference
Coordinate Filters (Command Modifier)
Combines X, Y, and Z values from different points to specify a single point.
Track to Points on Objects (Object Snap Tracking)
You can draw objects at specific angles or in specific relationship to other
objects along specified directions called alignment paths.
AutoTrack™ helps you draw objects at specific angles or in specific relationships
to other objects. When you turn on AutoTrack, temporary alignment paths
608 | Chapter 17 Use Precision Tools
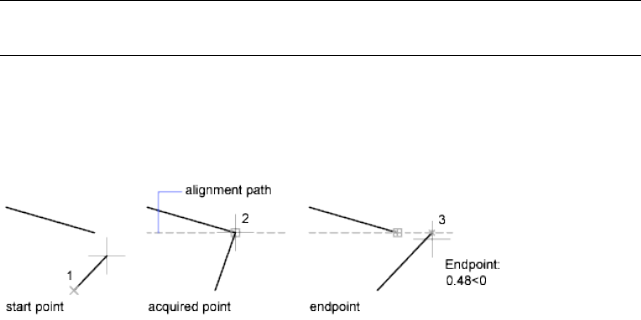
help you create objects at precise positions and angles. AutoTrack includes
two tracking options: polar tracking and object snap tracking.
You can toggle AutoTrack on and off with the Polar and Otrack buttons on
the status bar. Use temporary override keys to turn object snap tracking on
and off or to turn off all snapping and tracking. See the keyboard illustration
in Override Object Snap Settings on page 590.
Object snap tracking works in conjunction with object snaps. You must set
an object snap before you can track from an object's snap point.
Object Snap Tracking
Use object snap tracking to track along alignment paths that are based on
object snap points. Acquired points display a small plus sign (+), and you can
acquire up to seven tracking points at a time. After you acquire a point,
horizontal, vertical, or polar alignment paths relative to the point are displayed
as you move the cursor over their drawing paths. For example, you can select
a point along a path based on an object endpoint or midpoint or an
intersection between objects.
NOTE You can track Perpendicular or Tangent object snap from the last picked
point in a command even if the object snap tracking is off.
In the following illustration, the Endpoint object snap is on. You start a line
by clicking its start point (1), move the cursor over another line's endpoint
(2) to acquire it, and then move the cursor along the horizontal alignment
path to locate the endpoint you want for the line you are drawing (3).
Change Object Snap Tracking Settings
By default, object snap tracking is set to orthogonal. Alignment paths are
displayed at 0, 90, 180, and 270 degrees from acquired object points. However,
you can use polar tracking angles instead.
For object snap tracking, object points are automatically acquired. However,
you can choose to acquire points only when you press Shift.
Track to Points on Objects (Object Snap Tracking) | 609
Change Alignment Path Display
You can change how AutoTrack displays alignment paths, and you can change
how object points are acquired for object snap tracking. By default, alignment
paths stretch to the end of the drawing window. You can change their display
to abbreviated lengths, or no length.
Tips for Using Object Snap Tracking
As you use AutoTrack (polar tracking and object snap tracking), you will
discover techniques that make specific design tasks easier. Here are a few you
might try.
■Use Perpendicular, End, and Mid object snaps with object snap tracking
to draw to points that are perpendicular to the end and midpoints of
objects.
■Use the Tangent and End object snaps with object snap tracking to draw
to points that are tangent to the endpoints of arcs.
■Use object snap tracking with temporary tracking points. At a point prompt,
enter tt, then specify a temporary tracking point. A small + appears at the
point. As you move your cursor, AutoTrack alignment paths are displayed
relative to the temporary point. To remove the point, move the cursor
back over the +.
■After you acquire an object snap point, use direct distance to specify points
at precise distances along alignment paths from the acquired object snap
point. To specify a point prompt, select an object snap, move the cursor
to display an alignment path, then enter a distance at the Command
prompt.
NOTE The direct distance entry method is not available while you are using
the temporary override key for object snap tracking.
■Use the Automatic and Shift to Acquire options set on the Drafting tab of
the Options dialog box to manage point acquisition. Point acquisition is
set to Automatic by default. When working in close quarters, press Shift
to temporarily avoid acquiring a point.
To turn on and turn off object snap tracking
■Press F11, or click on the status bar.
610 | Chapter 17 Use Precision Tools
To turn object snap tracking on and off temporarily, hold down the F11
key while you work.
To change AutoTrack settings
1Click Tools menu ➤ Options.
2In the Options dialog box, Drafting tab, under AutoTrack Settings, select
or clear the following alignment path display options:
■Display Polar Tracking Vector. Controls alignment path display for
object snap tracking. When cleared, no polar tracking path is
displayed.
■Display Full Screen Tracking Vector. Controls alignment path display
for object snap tracking. When cleared, an alignment path is displayed
only from the object snap point to the cursor.
■Display AutoTrack Tooltip. Controls the display of AutoTrack tooltips.
Tooltips tell you the type of object snap (for object snap tracking),
alignment angle, and distance from the previous point.
3Under Alignment Point Acquisition, select a method for acquiring object
points for object snap tracking:
■Automatic. Acquires object points automatically. If you select this
option, you can press Shift to not acquire an object point
■Shift to Acquire. Acquires object points only when you press Shift
while the cursor is over an object snap point.
Quick Reference
DSETTINGS
Sets grid and snap, polar and object snap tracking, object snap modes,
Dynamic Input, and Quick Properties.
OPTIONS
Customizes the program settings.
AUTOSNAP
Controls the display of the AutoSnap marker, tooltip, and magnet.
Track to Points on Objects (Object Snap Tracking) | 611
POLARMODE
Controls settings for polar and object snap tracking.
TRACKPATH
Controls the display of polar and object snap tracking alignment paths.
Track to Offset Point Locations (Tracking)
You can use tracking to specify a point by offsetting vertically and horizontally
from a series of temporary points.
You can use the tracking method whenever you are prompted for a point.
Tracking uses the pointing device to specify a point by offsetting vertically
and horizontally from a series of temporary points. When you start tracking
and specify an initial reference point, the next reference point is constrained
to a path that extends vertically or horizontally from that point. The direction
of the offset is indicated by the rubber-band line. You change the direction
of the offset by moving the cursor through the reference point. You can track
as many points as you need. Typically, you use tracking in combination with
object snaps or direct distance entry.
For example, you can use tracking to find the center point of a rectangle
without using construction lines. Start tracking, and specify the midpoint of
a horizontal line. Drag the cursor vertically and specify the midpoint of a
vertical line (2). Press Enter to accept the point (3) at the center of the rectangle.
To use tracking to specify a point
1Start a command, such as the LINE command.
2Hold down Shift and right-click in the drawing area. Click Tracking.
3Specify a point.
4Move the cursor directly up, down, left, or right until you see the
rubber-band line.
The direction of movement affects the tracking direction. Notice that if
you move the cursor from left to right, you must then move it directly
over the last point specified in order to move it up or down.
5Specify a second point.
6Press Enter to end tracking.
The start point of the line snaps to the imaginary intersection of the
vertical and horizontal paths extending from the points you specified.
612 | Chapter 17 Use Precision Tools

The position is determined by the direction in which you moved the
cursor after specifying the first point.
Quick Reference
TRACKING (Command Modifier)
Locates a point from a series of temporary points.
Specify Distances
When specifying a point, you can enter distances, offsets, and measured
intervals.
Enter Direct Distances
You can specify a point by moving the cursor to indicate a direction and then
entering the distance.
To specify a line length quickly, without entering coordinate values, you can
specify a point by moving the cursor to indicate a direction and then entering
the distance from the first point. You can enter calculated distances from the
QuickCalc calculator. For more information, see Use the QuickCalc Calculator
on page 627.
You can use direct distance entry to specify points for all commands requiring
more than one point. When Ortho mode or polar tracking is on, this method
is an efficient way to draw lines of specified length and direction, and to move
or copy objects.
NOTE The direct distance entry method is not available while you are using the
temporary override keys for Ortho mode, object snap tracking, or polar tracking.
See also:
■Use Polar Tracking and PolarSnap on page 601
■Lock an Angle for One Point (Angle) on page 605
Specify Distances | 613

To draw a line using direct distance entry
1Click Home tab ➤ Draw panel ➤ Line.
2Specify the first point and then, move the pointing device until the
rubber-band line extends at the same angle as the line you want to draw.
3Enter a distance at the Command prompt.
The line is drawn at the length and angle you specified.
Quick Reference
LINE
Creates straight line segments.
Direct Distance Entry (Command Modifier)
Locates the next point at a specified distance in the direction of your cursor.
Offset from Temporary Reference Points
You can establish a temporary reference point as a base point for offsetting
subsequent points.
The From command modifier establishes a temporary reference point as a
base point for offsetting subsequent points. The From method does not
constrain the cursor to orthogonal movement. The From method usually is
used in combination with object snaps.
To offset a point from a temporary reference point
1At a prompt for a point, enter from. Alternately, press Shift and right-click
to display the object snap menu, and then choose From.
2If you want to offset from a location on an existing object, specify an
object snap method. Then select the object snap point.
3Enter a relative coordinate (i.e. @1,1).
614 | Chapter 17 Use Precision Tools
Quick Reference
FROM (Command Modifier)
Locates a point offset from a reference point within a command.
Specify Intervals on Objects
You can mark off equal distances along objects.
Overview of Specifying Intervals on Objects
Provides a high-level overview of two options for marking off equal distances
along objects.
Sometimes you need to create points or insert symbols (blocks) at intervals
on an object.
You can
■Specify the length of the segments (MEASURE)
■Specify the number of equal segments (DIVIDE)
You can measure or divide lines, arcs, splines, circles, ellipses, and polylines.
With both methods, you can identify the intervals by inserting either a point
or a block.
By specifying points, you can use the Node object snap to align other objects
at intervals on the measured or divided object. By specifying blocks, you can
create precise geometric constructions or insert custom markers. The blocks
can rotate at each insertion point.
You cannot insert a block unless it has already been defined within the
drawing. Variable attributes within the block are not included when you insert
the block references.
The points or blocks you draw using MEASURE or DIVIDE are placed in a
selection set. Therefore, if you want to edit them immediately, you can use
the Previous option of SELECT.
See also:
■Work with Blocks on page 851
Specify Intervals on Objects | 615
Quick Reference
BLOCK
Creates a block definition from selected objects.
DDPTYPE
Specifies the display style and size of point objects.
DIVIDE
Creates evenly spaced point objects or blocks along the length or perimeter
of an object.
MEASURE
Creates point objects or blocks at measured intervals along the length or
perimeter of an object.
WBLOCK
Writes objects or a block to a new drawing file.
PDMODE
Controls how point objects are displayed.
PDSIZE
Sets the display size for point objects.
Specify Measured Intervals on Objects
You can mark off equal lengths from one end of a selected object.
You can use MEASURE to mark an object at specified intervals. You can mark
the intervals with either points or blocks. The last segment of a measured
object may be shorter than the interval you specify.
The starting point for measurements or divisions varies with the object type.
For lines or open polylines, the starting point is the endpoint closest to the
selection point. For closed polylines, it is the polyline start point. For circles,
it is at the angle from the center point that is equivalent to the current snap
angle. For example, if the snap angle is 0, the circle starts at the three o'clock
position and continues counterclockwise.
If the point marker is displayed as a single dot (the default setting), you may
not be able to see the measured intervals. You can change the style of the
point markers using several methods. To change the point style in a dialog
616 | Chapter 17 Use Precision Tools
box, you can use DDPTYPE. Alternately, click Format menu ➤ Point Style.
The PDMODE system variable also controls the appearance of point markers.
For example, you can change the value to make points appear as crosses.PDSIZE
controls the size of point objects.
To insert points at measured intervals on an object
1Click Home tab ➤ Draw panel ➤ Point drop-down ➤ Measure.
2Select a line, arc, spline, circle, ellipse, or polyline.
3Enter an interval length, or specify points to indicate a length.
Points are placed on the object at the specified intervals.
To insert blocks at measured intervals on an object
1If necessary, create the block you want to insert.
2Click Home tab ➤ Draw panel ➤ Point drop-down ➤ Measure.
3Select a line, arc, spline, circle, ellipse, or polyline.
4Enter b (Block).
5Enter the name of the block you want to insert.
6Enter y to align the blocks with the measured object. Enter n to use a
rotation angle of 0 degrees.
7Enter an interval length, or specify points to indicate a length.
Blocks are inserted on the object at the specified intervals.
Quick Reference
BLOCK
Creates a block definition from selected objects.
DDPTYPE
Specifies the display style and size of point objects.
Specify Intervals on Objects | 617
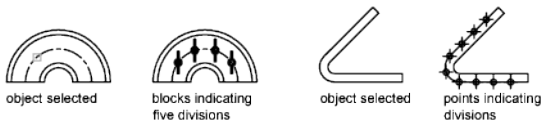
MEASURE
Creates point objects or blocks at measured intervals along the length or
perimeter of an object.
PDMODE
Controls how point objects are displayed.
PDSIZE
Sets the display size for point objects.
Divide an Object into Equal Segments
You can divide a selected object into a specified number of equal lengths.
You can create points or insert blocks on an object at a specific number of
equal intervals. This operation does not actually break an object into individual
objects; it only identifies the location of the divisions so that you can use
them as geometric reference points.
The starting point for measurements or divisions varies with the object type.
For lines or open polylines, the starting point is the endpoint closest to the
selection point. For closed polylines, it is the polyline start point. For circles,
it is at the angle from the center point that is equivalent to the current snap
angle. For example, if the snap angle is 0, the circle starts at the three o'clock
position and continues counterclockwise.
If the point marker is displayed as a single dot (the default setting), you may
not be able to see the segments. You can change the style of the point markers
using several methods. To change the point style in a dialog box, you can use
DDPTYPE. Alternately, click Format menu ➤ Point Style. The PDMODE
system variable also controls the appearance of point markers. For example,
you can change the value to make points appear as crosses. PDSIZE controls
the size of point objects.
618 | Chapter 17 Use Precision Tools
To insert points to mark equal segments
1Click Home tab ➤ Draw panel ➤ Point drop-down ➤ Divide.
2Select a line, circle, ellipse, polyline, arc, or spline.
3Enter the number of segments you want.
A point is placed between each segment.
To insert blocks to mark equal segments on an object
1If necessary, create the block you want to insert.
2Click Home tab ➤ Draw panel ➤ Point drop-down ➤ Divide.
3Select a line, arc, circle, ellipse, polyline, or spline.
4Enter b (Block).
5Enter the name of the block you want to insert.
6Enter y to align the blocks with the divided object. Enter n to use a
rotation angle of 0 degrees.
7Enter the number of segments you want.
Quick Reference
BLOCK
Creates a block definition from selected objects.
DDPTYPE
Specifies the display style and size of point objects.
DIVIDE
Creates evenly spaced point objects or blocks along the length or perimeter
of an object.
WBLOCK
Writes objects or a block to a new drawing file.
Specify Intervals on Objects | 619
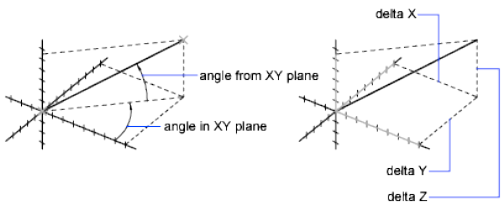
PDMODE
Controls how point objects are displayed.
PDSIZE
Sets the display size for point objects.
Extract Geometric Information from Objects
The inquiry and calculation commands can provide information about objects
in your drawing and do useful calculations.
Obtain Distances, Angles, and Point Locations
You can obtain information about the relation between two specified points
or multiple points; for example, the distance between points or their angle in
the XY plane.
To determine the relation between points, you can display the
■Distance between them
■Angle between the points in the XY plane
■Angle of the points from the XY plane
■Delta, or changed, X, Y, and Z distances between them
The ID command lists the X, Y, and Z coordinate values of a specified point.
See also:
■Overview of Coordinate Entry on page 549
620 | Chapter 17 Use Precision Tools
To calculate the distance and angle between two points
1Click Home tab ➤ Utilities panel ➤ Measure drop-down ➤ Distance.
2Specify a first and second point for the distance you want to calculate.
3Press Enter.
The distance displays at the Command prompt in the current units
format.
To calculate the distance and angle between multiple points
1Click Home tab ➤ Utilities panel ➤ Measure drop-down ➤ Distance.
2For the distance you want to calculate, specify a first and second point.
3For the distance you want to calculate, specify the next point or points.
4Press Enter.
The distance displays at the Command prompt in the current units
format.
Quick Reference
DIST
Measures the distance and angle between two points.
ID
Displays the UCS coordinate values of a specified location.
MEASUREGEOM
Measures the distance, radius, angle, area, and volume of selected objects or
sequence of points.
DISTANCE
Stores the distance computed by the DIST command.
Obtain Area and Mass Properties Information
You can obtain the area, perimeter, and mass properties defined by selected
objects or a sequence of points.
Obtain Area and Mass Properties Information | 621
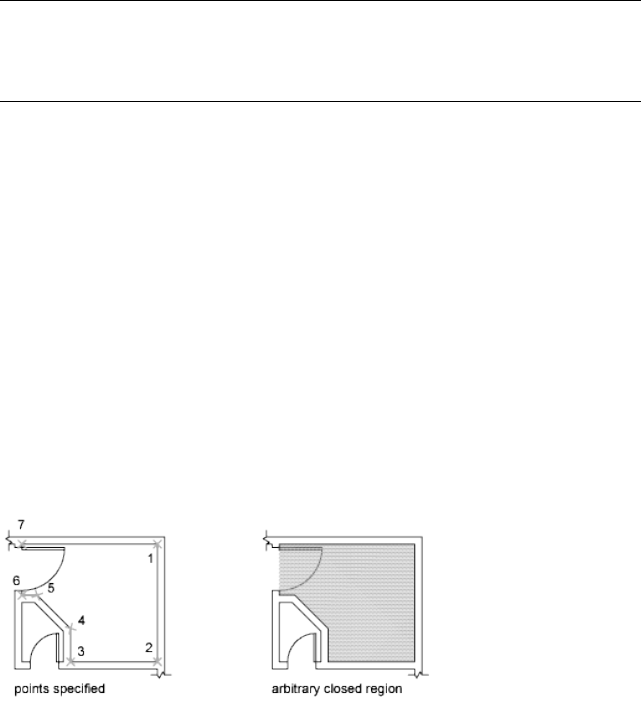
You can calculate the area and perimeter of a sequence of points. You can also
obtain the area, perimeter, and mass properties of any of several types of
objects.
TIP A fast way to calculate an area bounded by several objects in 2D is to use the
BOUNDARY command. With BOUNDARY, you can pick a point within the area to
create a closed polyline or region. You can then use the Properties palette or the
LIST command to find the area and perimeter of the polyline or region.
Use Commands to Calculate Area
With the MEASUREGEOM and AREA commands, you can specify a series of
points or select an object to calculate area. If you need to calculate the
combined area of multiple objects, you can keep a running total as you add
or subtract one area at a time from the selection set. You cannot use window
selection or crossing selection to select objects.
Total area and perimeter are saved in the AREA and PERIMETER system
variables.
In addition to area, with the MEASUREGEOM command, you can obtain
geometric information from objects such as distance, radius, angle, and volume.
Define an Area
You can measure an arbitrary closed region defined by the points you specify.
The points must lie on a plane parallel to the XY plane of the current UCS.
Calculate the Area, Perimeter, or Circumference of an Object
You can calculate the enclosed area and perimeter or circumference of circles,
ellipses, polylines, polygons, regions, and AutoCAD 3D solids. The information
displayed depends on the type of object selected:
■Circles. Area and circumference display.
622 | Chapter 17 Use Precision Tools
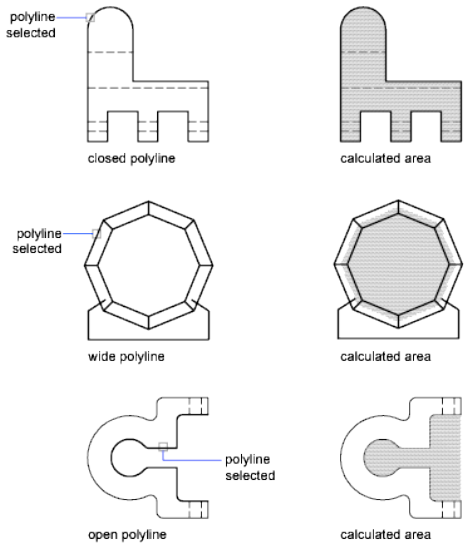
■Ellipses, closed polylines, polygons, planar closed spline curves, and regions.
Area and perimeter display. For wide polylines, this area is defined by the
center of the width.
■Open objects such as open spline curves and open polylines. Area and
length display. Area is calculated as though a straight line connects the
start point and endpoint.
■AutoCAD 3D solids. Total 3D area for the object displays.
Example: How Various Areas Are Calculated
Combined Areas
Calculate Combined Areas
You can calculate the total area of multiple areas by specifying points or by
selecting objects. For example, you can measure the total area of selected
rooms in a floor plan.
Obtain Area and Mass Properties Information | 623
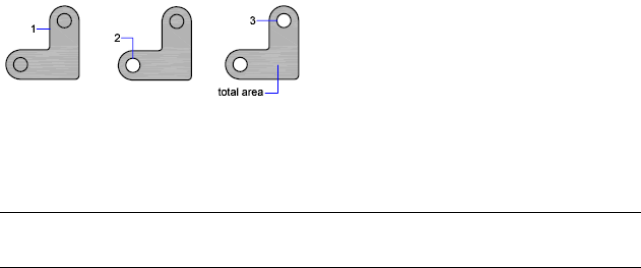
Subtract Areas from Combined Areas
You can subtract more than one area from a combined area as you calculate.
For example, if you have calculated the area of a floor plan, you can subtract
the area of a room.
Example: Subtraction of Areas from a Calculation
In the following example, the closed polyline represents a metal plate with
two large holes. The area of the polyline is first calculated and then the area
of each hole is subtracted. The area and perimeter or circumference of each
object displays, with a running total after each step.
The Command prompt sequence is
Command: area
Specify first corner point or [Object/Add/Subtract]: a
Specify first corner point or [Object/Subtract]: o
(ADD mode) Select objects: Select the polyline (1)
Area = 0.34, Perimeter = 2.71
Total area = 0.34
(ADD mode) Select objects: Press Enter
Specify first corner point or [Object/Subtract]: s
Specify first corner point or [Object/Add]: o
(SUBTRACT mode) Select objects: Select the lower circle (2)
Area = 0.02, Circumference = 0.46
Total area = 0.32
(SUBTRACT mode) Select objects: Select the upper circle (3)
Area = 0.02, Circumference = 0.46
Total area = 0.30
(SUBTRACT mode) Select circle or polyline: Press Enter
Specify first corner point or [Object/Add]: Press Enter
You can also use REGION to convert the plate and the holes to regions, subtract
the holes, and then use the Properties palette or the LIST command to find
the area of the plate.
TIP Use the QuickCalc calculator to convert from one system of area units to
another. For more information, see Use the QuickCalc Calculator on page 627.
624 | Chapter 17 Use Precision Tools
Calculate Mass Properties
With the MASSPROP command, you can analyze 3D solids and 2D regions
for their mass properties including volume, area, moments of inertia, center
of gravity, and so on. In addition, the result of the computations can be saved
to a text file.
See also:
■Create and Combine Areas (Regions) on page 687
■Overview of Object Properties on page 465
To calculate an area you define
1Click Home tab ➤ Utilities panel ➤ Measure drop-down ➤ Area.
2Specify points in a sequence that define the perimeter of the area you
want to measure. Press Enter.
The first and last points connect to form a closed area. The area and
perimeter display in the current units format.
To calculate the area of an object
1Click Home tab ➤ Utilities panel ➤ Measure drop-down ➤ Area.
2At the Command prompt, enter o (Object).
3Select an object.
The area and perimeter of the selected object display in the current units
format.
To add an area as you calculate
1Click Home tab ➤ Utilities panel ➤ Measure drop-down ➤ Area.
2Enter a (Add).
3Do one of the following:
■Specify points to define the area you want to add. Press Enter.
■Enter o (Object) and select the objects you want to add.
Each new area and a running total of all areas displays in the current
units format.
4Press Enter twice to end the command.
Obtain Area and Mass Properties Information | 625
To subtract an area as you calculate
1While a combined area displays, enter s (Subtract).
2Do one of the following:
■Specify points to define the area you want to subtract. Press Enter.
■Enter o (Object) and select the objects you want to subtract.
The running total of all areas updates and displays as you define new
areas.
3Press Enter to end the command.
Quick Reference
AREA
LIST
Displays property data for selected objects.
MASSPROP
Calculates the mass properties of regions or 3D solids.
MEASUREGEOM
Measures the distance, radius, angle, area, and volume of selected objects or
sequence of points.
PROPERTIES
Controls properties of existing objects.
QUICKCALC
Opens the QuickCalc calculator.
UNITS
Controls coordinate and angle display formats and precision.
AREA
PERIMETER
Stores the last perimeter value computed by the AREA or LIST command.
626 | Chapter 17 Use Precision Tools
Use a Calculator
You can access a calculator function as you work with the program. You can
use either the QuickCalc calculator interface or the Command prompt
calculator.
Use the QuickCalc Calculator
With the QuickCalc calculator, an interface that looks and functions like a
hand-held calculator, you can perform mathematical, scientific, and geometric
calculations, convert units of measurement, manipulate the properties of
objects, and evaluate expressions.
Overview of QuickCalc
The QuickCalc calculator includes basic features similar to most standard
mathematical calculators.
In addition, QuickCalc has features specific to AutoCAD such as geometric
functions, a Units Conversion area, and a Variables area.
Unlike most calculators, QuickCalc is an expression builder. For greater
flexibility, it does not immediately calculate an answer when you click a
function. Instead, you compose an expression that you can easily edit and,
when you are finished, you click the equal sign (=) or press Enter. Later, you
can retrieve the expression from the History area, modify it, and recalculate
the results.
With QuickCalc, you can
■Perform mathematical and trigonometric calculations
■Access and review previously entered calculations for re-evaluation
■Use the calculator with the Properties palette to modify object properties
■Convert units of measurement
■Perform geometric calculations related to specific objects
■Copy and paste values and expressions to and from the Properties palette
and the Command prompt
■Perform computations on mixed numbers (fractions), and feet and inches
■Define, store, and use calculator variables
Use a Calculator | 627
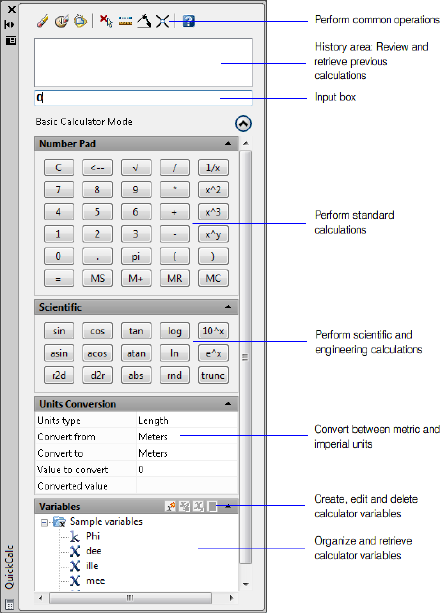
■Use geometric functions from the CAL command
Change QuickCalc Size and Appearance
Click the More/Less button on the calculator and only the Input box and
History area are displayed. You can use the expand/collapse arrows to open
and close areas. You can also control the size, location, and appearance of
QuickCalc. See Set Interface Options on page 109.
Quick Reference
QUICKCALC
Opens the QuickCalc calculator.
628 | Chapter 17 Use Precision Tools
QCCLOSE
Closes the QuickCalc calculator.
QCSTATE
Indicates whether the QuickCalc calculator is open or closed.
Access QuickCalc and Understand Its Behavior
Use QuickCalc directly as you would with a desktop calculator, or use it
transparently within a command or the Properties palette.
There are three ways to work with QuickCalc within the program:
■Directly from the Tools menu, the Standard toolbar, a shortcut menu, or
the Command prompt
■Transparently during a command from a shortcut menu or the Command
prompt
■Transparently from the Properties palette
The method that you choose depends on how you are using QuickCalc.
Use QuickCalc Directly
When you work directly with QuickCalc, you can perform calculations and
unit conversions just as you would with a desktop calculator. You can use the
Windows clipboard (Ctrl+C, Ctrl+V) to transfer the results of your calculations
to other parts of the program or to external programs. Calculations that you
perform directly do not affect or change anything in your drawing.
You can access QuickCalc directly in the following ways:
■Click Tools menu ➤ Palettes ➤ QuickCalc.
■On the Standard toolbar, click the QuickCalc button.
■In the drawing editor (with no command active), right-click and click
QuickCalc.
■At the Command prompt, enter quickcalc.
■At the Command prompt, enter qc.
Use the QuickCalc Calculator | 629

Use QuickCalc Transparently from Within a Command
During a command, you can access QuickCalc transparently in the following
ways:
■Right-click to display the shortcut menu. Click QuickCalc.
■At the Command prompt, enter quickcalc.
■At the Command prompt, enter qc.
Calculations that you transfer to the Command prompt affect the drawing.
For example, if you are drawing a line with the LINE command and you pass
an expression to the Command prompt from the calculator, the next point
of the line uses the results, which might be a distance or coordinate value. In
QuickCalc, you click the Apply button to pass the value to the drawing based
on that expression.
NOTE When using QuickCalc transparently to calculate a value for direct distance
entry, Apply transfers the value to the Command prompt. To use the value, position
the crosshairs to determine the direction and then press Enter.
Use QuickCalc Transparently from the Properties Palette
When you want to modify properties and apply evaluated expressions to
objects in your drawing, you can access QuickCalc transparently from the
Properties palette. Use the following method:
■Click any box in the Properties palette that contains a numeric value. Then
click the QuickCalc button that appears in the box.
■After calculating a value, transfer the result to the Properties palette by
clicking the Apply button.
The object or drawing property is modified and the changes are displayed in
the drawing.
Calculate Mathematical Expressions in a Dialog Box
You can also enter and evaluate mathematical expressions in a dialog box
using the following format: =expression<Alt+Enter>.
NOTE To evaluate expressions in a dialog box, make sure the system variable,
CALCINPUT, is set to 1.
630 | Chapter 17 Use Precision Tools
To use the QuickCalc calculator
Do one of the following:
■Click View tab ➤ Palettes panel ➤ QuickCalc.
■Right-click the drawing area to display a shortcut menu. Click QuickCalc.
To use the QuickCalc calculator within a command
Do one of the following:
■At the Command prompt, enter 'quickcalc or 'qc.
■Right-click to display a shortcut menu. Click QuickCalc.
To use the QuickCalc calculator with the Properties palette
1Click View tab ➤ Palettes panel ➤ Properties.
2Open the Properties palette.
3Click one or more objects.
4Click a box with a numeric property.
5Click the QuickCalc button in the box.
Quick Reference
QUICKCALC
Opens the QuickCalc calculator.
QCCLOSE
Closes the QuickCalc calculator.
Enter, Evaluate, and Retrieve Expressions
Enter expressions in QuickCalc using standard mathematical rules of
precedence; review and retrieve computations from the History area; and
understand the rules for using imperial units: length, area, and volume.
Use the QuickCalc Calculator | 631
QuickCalc evaluates expressions according to the following standard
mathematical rules of precedence:
■Expressions in parentheses first, starting with the innermost set
■Operators in standard order: exponents first, multiplication and division
second, and addition and subtraction last
■Operators of equal precedence from left to right
The Input box of the calculator is where you enter and retrieve expressions.
With QuickCalc, there are two ways you can enter data in the Input box. You
can either enter expressions using the QuickCalc Number Pad buttons, or you
can use the computer keyboard or numeric keypad. To use the computer
numeric keypad, you must have NUMLOCK on.
To evaluate an expression, click the equal (=) sign on the QuickCalc Number
Pad, or press Enter on the computer keyboard.
Understand the Syntax of Expressions
The syntax for QuickCalc expressions and Command prompt calculator
expressions is identical. For example, to perform an operation on the vector
or coordinates 5,2,0, you enter [5,2,0] in the Input box.
You can use the GETVAR function to read the value of a system variable. The
syntax is
getvar(variable_name)
For more information see CAL.
Use the History Area
The History area keeps an ongoing record of calculations, similar to the paper
tape in a physical desk calculator. You can use the History area to review
previous operations and pass them back to the Input box for re-evaluation
with different parameters.
Rules for Displaying and Handling Units
QuickCalc adheres to the following rules:
■Results of calculations are always expressed in decimal format unless a
distance is entered in feet and inches
632 | Chapter 17 Use Precision Tools

■Angular values entered in the Input box are assumed to be degrees
regardless of the settings in the Drawing Units dialog box. To specify
radians, grads, and degrees, append an r, g, or d after the angle value.
■Results of angular calculations are always expressed in degrees with full
AutoCAD precision.
When the drawing units are set to architectural units, the calculator displays
the results of calculations of imperial units in the architectural format and
rounds to the display precision (LUPREC) specified in the drawing. The results
for all other calculations display in decimal format with full precision.
You can separate feet, inches, and fractional inches with a dash, a space, or
nothing. You can use any of the following syntax cases to enter valid feet-inch
formatted values:
■5' or 60"
■5'-9" or 5' 9" or 5'9"
■5'-1/2" or 5' 1/2" or 5'1/2"
■5'-9-1/2" or 5' 9-1/2" or 5'9-1/2"
■5'-9 1/2" or 5' 9 1/2" or 5'9 1/2"
To designate inches for linear calculations, entering double quotes (") is
optional. For example, instead of entering 5'9-1/2", you could enter 5'9-1/2.
WARNING With imperial units, QuickCalc interprets a minus or a dash (-) as a
unit separator rather than a subtraction operation. To specify subtraction, include
at least one space before or after the minus sign. For example, to subtract 9" from
5', enter 5' -9" rather than 5'-9".
You can use QuickCalc to calculate square feet and cubic feet. To enter square
or cubic feet, you must enter units using these abbreviations:
■sq. ft. or sq ft
■cu. ft. or cu ft
Convert Decimal Units into Imperial Units
For distance measurements, enter an inches sign (") after the number in the
results display. For example, if the computed distance is 15, enter " after the
15, press Enter or click = and the result displays in imperial units as 1'-3".
Use the QuickCalc Calculator | 633

For computed results, enter the initial values in feet (') and inches (") to display
the results in feet and inches. For example:
■5 * 6 = 30
■5" * 6 = 2'-6"
■5" * 6" = 30 sq. in.
■5" * 0'-6" = 0.208333333 sq. ft.
To change the font color of values or expressions in the QuickCalc History
area
1Right-click in the History area. Click either Value Font Color or Expression
Font Color.
2In the Color dialog box, click a Basic Color or click Define Custom Colors.
With Define Custom Colors, you can select a custom color and add it to
Custom Colors.
3Click OK.
The colors you selected for values and expressions in the History area are
displayed.
To modify a property in the Properties palette with QuickCalc
1Click View tab ➤ Palettes panel ➤ Properties.
2Select an object.
NOTE If QuickCalc is displayed on your desktop when you work with the
Properties palette, it is temporarily hidden while you use the modal calculator
from within the Properties palette.
3In the Geometry section of the Properties palette, click on the value of a
property.
A small calculator icon is displayed to the right of the value.
NOTE Only properties that are displayed with a white background can be
changed.
4Click the calculator icon.
634 | Chapter 17 Use Precision Tools

QuickCalc opens and displays the current value of the object in the Input
box.
5Perform a calculation on the displayed value and click the equal sign (=)
button.
The new value is displayed in the Input box.
6Click Apply.
NOTE The Apply button is only available for editable number-based
properties.
The calculator closes and the new value is displayed in the Properties
palette. The object is modified in the drawing.
To obtain X, Y, Z coordinate values for a point using QuickCalc
1NOTE The QuickCalc toolbar Get Coordinates button uses the cur function.
On the QuickCalc toolbar, click the Get Coordinates button.
QuickCalc temporarily closes and you are prompted to specify a point.
2In the drawing, click a point.
QuickCalc opens and displays the coordinate values of the point in the
Input box.
To measure the distance between two points using QuickCalc
1NOTE The QuickCalc toolbar Distance Between Two Points button uses the
dist(p1,p2) function.
On the QuickCalc toolbar, click the Distance Between Two Points button.
QuickCalc temporarily closes and you are prompted to specify two points.
2In the drawing, click the first point and then the second point.
QuickCalc opens and displays the value of the distance between the two
points in the Input box.
To get the angle of a line defined by two points using QuickCalc
1 NOTE The QuickCalc toolbar Angle of Line Defined by Two Points button
uses the ang(p1,p2) function.
Use the QuickCalc Calculator | 635

On the QuickCalc toolbar, click the Angle of Line Defined by Two Points
button.
QuickCalc temporarily closes and you are prompted to specify two points.
2Enter the coordinate values for the first point and then the second point.
QuickCalc opens and appends the value of the angle between the two
points to the end of any value or expression already present in the Input
box.
To get the intersection of a line defined by four points using QuickCalc
1NOTE The QuickCalc Intersection of Two Lines Defined by Four Points button
uses the ill(p1,p2,p3,p4) function.
On the QuickCalc toolbar, click the Intersection of Two Lines Defined
by Four Points button.
QuickCalc temporarily closes and you are prompted to specify four points.
2Enter the coordinate values for the first point of line one, then the second
point of line one. Next, enter the coordinate values for the first point of
line two, then the second point of line two.
QuickCalc opens and appends the value of the evaluated expression to
the end of any value or expression already present in the Input box.
Quick Reference
QUICKCALC
Opens the QuickCalc calculator.
QCCLOSE
Closes the QuickCalc calculator.
Convert Units of Measurement
In the Units Conversion area of QuickCalc, you can obtain equivalent values
for different units of measurement.
Unit conversions are available for length, area, volume, and angular values.
Based on which unit type you select, you can then select a list of units to
convert from and a list of units to convert to.
636 | Chapter 17 Use Precision Tools
The Value to Convert box automatically displays the value from the Input
box. You can also enter a different value. The results of the units conversion
displays in the Converted Value box. You can paste this result to the Input
box by clicking the QuickCalc icon in the Converted Value box.
NOTE In the Value to Convert box, enter decimal values without units.
To convert units of measurement with QuickCalc
1In the Units Conversion area, select a unit category on the Units Type
list.
2In the Convert From list, select the type of unit you are converting from.
3In the Convert To list, select the type of unit you are converting to.
4In the Value to Convert box, enter the value you want to convert. Press
Enter.
The converted value is displayed in the Converted Value box.
To copy a unit conversion result to the Input box of QuickCalc
■On the Units Conversion title bar, click the Return Conversion Value to
Input Area button.
The converted value is displayed in the Input box.
To convert radians to degrees using QuickCalc
1On the Number Pad, enter a value in radians.
2In the Scientific area, click the r2d button.
3On the Number Pad, click the equal (=) sign.
The conversion is displayed in the Input box.
To convert degrees to radians using QuickCalc
1On the Number Pad, enter a value in degrees.
Use the QuickCalc Calculator | 637
2In the Scientific area, click the d2r button.
3On the Number Pad, click the equal (=) sign.
The conversion is displayed in the Input box.
Quick Reference
QUICKCALC
Opens the QuickCalc calculator.
QCCLOSE
Closes the QuickCalc calculator.
Create and Use Calculator Variables
The Variables area of QuickCalc stores calculator variables that you can access
as needed. Calculator variables can either be constants or functions.
You can use the Variables area to define, store, and retrieve calculator variables.
Calculator variables can either be constants (coordinates/vectors, real numbers,
and integers) or functions. In the Variables area, you can
■Click a calculator variable to display information such as value, type, and
description in the Details box at the bottom of the Variables area.
■Double-click a calculator variable to load it into the QuickCalc Input box.
Additional operations are available on the shortcut menus in the Variables
area.
Create New Calculator Variables
You can create new calculator variables using the shortcut menus in the
Variables area. When defining new calculator variables in the Variable
Definition dialog box, the following rules apply:
■Constants. Any expression entered in the Value or Expression text entry
box is evaluated before the calculator variable is stored. Calculator variables
that are defined as constants are available “globally.” You can access and
use global constants in different drawings and sessions.
638 | Chapter 17 Use Precision Tools

■Functions. Any expression entered in the Value or Expression text entry
box is stored as text. Functions are evaluated when used in the QuickCalc
Input box.
Create Global Constants
You can use one of the following methods to create global constants:
■Enter an expression in the Input box using the format $variable_name=value.
For example, to define the golden ratio to 8 decimal places as a global
constant called Phi, enter $Phi=1.61803399 in the Input box.
■Click the New Variable button in the Variables area title bar. In the
Variables Definition dialog box, click Constant and fill in the other boxes.
■Right-click the Variables area. Click New Variable.
Access Global Constants
You can access global constants and pass them to the Input box of the
QuickCalc as follows:
■Double-click a variable in the Variables area of QuickCalc.
■Click a variable from the list of calculator variables, and click the Return
Variable to Input Area button.
■Enter a dollar sign ($) followed by the variable name, and press Enter.
To use a global constant in a text or numeric entry box in a window or dialog
box, use the syntax: =$variable_name followed by pressing the END key. For
example, to use the previously mentioned global variable, Phi, enter =$Phi
and press the END key.
NOTE In QuickCalc, only constants can be directly referred to by their global
variable names in the text or numeric entry boxes in windows and dialog boxes.
Use Shortcut Functions
Several sample calculator variables have been predefined and stored in the
Shortcut Functions category. These are geometric expressions that combine
Use the QuickCalc Calculator | 639

CAL functions with the Endpoint Snap mode. The following table describes
the predefined variables that are available in the Variables area of the calculator.
DescriptionShortcut ForVariable
Distance between two endpointsdist(end,end)dee
Intersection of two lines defined by four end-
points
ill(end,end,end)ille
Midpoint between two endpoints(end+end)/2mee
Unit vector in the XY plane and normal to two
endpoints
nor(end,end)nee
Radius of a selected circle, arc, or polyline arcradrad
Vector from two endpointsvee(end,end)vee
Unit vector from two endpointsvec1(end,end)vee1
You can easily modify these calculator variables or create your own. For more
information, see the CAL command.
Organize Variables into Categories
You can organize calculator variables in the Variables area under several
categories. This results in a one-level tree structure. The Shortcut Functions
category has already been created and contains several functions.
Use the shortcut menu in the Variables area to create, rename, or delete variable
categories.
To use a predefined variable in a QuickCalc expression
1In the Variables area, click the variable you want to use.
2On the QuickCalc Variables title bar, click the Return Variable to Input
Area button.
The variable is displayed in the Input box as part of your expression.
To create a new variable in QuickCalc
1On the QuickCalc Variables title bar, click the New Variable button.
640 | Chapter 17 Use Precision Tools

2In the Variable Definition dialog box, under Variable Type, select Constant
or Function.
3In the Variable Definition dialog box, under Variable Properties Name,
enter a name for the variable. Variable names cannot contain spaces or
special characters.
NOTE When referencing this variable from the Input box, the variable name
must begin with the dollar sign ($) to differentiate it from local LISP variables.
4Under Variable Properties Group With, click New.
5In the Category Definition dialog box, under Category Properties Name,
enter a name for the new category.
6Under Description, enter a description for the new category. Click OK.
7In the Variable Definition dialog box, under Value or Expression, enter
a value or expression for the new variable.
8Under Description, enter a description of the new variable. Click OK.
The new variable is now displayed in the Variables area.
To edit a variable in QuickCalc
1In the Variables area, click the variable you want to edit.
2On the QuickCalc Variables title bar, click the Edit Variable button.
3In the Variable Definition dialog box, make the edits to the variable.
Click OK.
To delete a variable in QuickCalc
1In the Variables area, click the variable you want to delete.
2On the QuickCalc Variables title bar, click the Delete button.
To create a new global constant in the Input box of QuickCalc
■In the Input box of QuickCalc, enter the following syntax:
$variable_name=value.
For example, you could center $Phi=1.618
NOTE Global variables are not case-sensitive.
Use the QuickCalc Calculator | 641
QuickCalc adds the global constant to the list of variables in the Variables
area.
To access a global constant from dialog box or window
■In any text or numeric entry box, enter an expression using the syntax:
=$variable_name followed by pressing the END key.
To evaluate mathematical expressions in a dialog box
1If necessary, set the CALCINPUT system variable to 1.
2In a dialog box, in an area where you can enter a numeric value, enter a
mathematical expression in the following format: =expression (for example,
=5+3).
3Press Alt+Enter on the keyboard.
The expression is evaluated and its value is displayed.
Quick Reference
QCCLOSE
Closes the QuickCalc calculator.
QUICKCALC
Opens the QuickCalc calculator.
CALCINPUT
Controls whether mathematical expressions and global constants are
evaluated in text and numeric entry boxes of windows and dialog boxes.
Use the Command Prompt Calculator
By entering an expression in the Command prompt calculator, you can quickly
solve a mathematical problem or locate points in your drawing.
The CAL command runs the 3D calculator utility to evaluate vector expressions
(combining points, vectors, and numbers) and real and integer expressions.
The calculator performs standard mathematical functions. It also contains a
642 | Chapter 17 Use Precision Tools
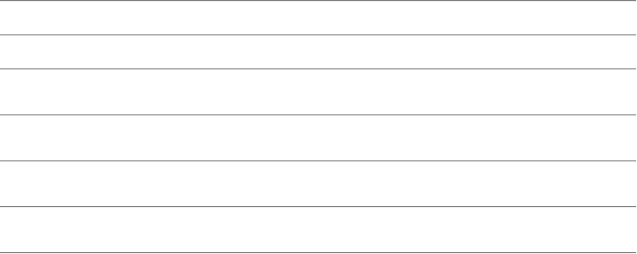
set of specialized functions for calculations involving points, vectors, and
AutoCAD geometry. With the CAL command, you can
■Calculate a vector from two points, the length of a vector, a normal vector
(perpendicular to the XY plane), or a point on a line
■Calculate a distance, radius, or angle
■Specify a point with the pointing device
■Specify the last-specified point or intersection
■Use object snaps as variables in an expression
■Convert points between a UCS and the WCS
■Filter the X, Y, and Z components of a vector
■Rotate a point around an axis
Evaluating Expressions
CAL evaluates expressions according to standard mathematical rules of
precedence.
Mathematical operators in order of precedence
OperationOperator
Groups expressions( )
Indicates numeric exponent^
Multiplies and divides numbers*, /
Adds and subtracts numbers+, -
Calculating Points
You can use CAL whenever you need to calculate a point or a number within
a command.
For example, you enter (mid+cen)/2 to specify a point halfway between the
midpoint of a line and the center of a circle.
The following example uses CAL as a construction tool. It locates a center
point for a new circle, and then calculates one fifth of the radius of an existing
circle.
Use the Command Prompt Calculator | 643
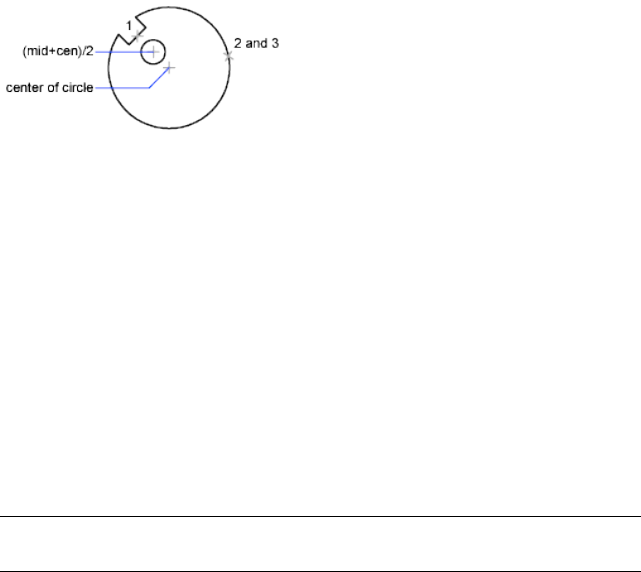
Here is the command prompr sequence:
Command: circle
Specify center point for circle or [3P/2P/Ttr (tan tan radius)]: 'cal
>> Expression: (mid+cen)/2
>> Select entity for MID snap: Select the notch line (1)
>> Select entity for CEN snap: Select the large circle (2)
Diameter/<Radius>: 'cal
>> Expression: 1/5*rad
>> Select circle, arc or polyline segment for RAD function: Select the large circle
(3)
Calculate Mathematical Expressions in a Dialog Box
You can also enter and evaluate mathematical expressions in a dialog box
using the following format: =expression<Alt+Enter>.
NOTE To evaluate expressions in a dialog box, make sure the system variable,
CALCINPUT, is set to 1.
To start the Command prompt calculator
Do one of the following:
■At the Command prompt, enter CAL. Then, enter a CAL expression.
■At a prompt for a command in progress, enter ‘CAL to start the CAL
command transparently. Then, enter a CAL expression to calculate a value
for that prompt.
Quick Reference
CAL
Evaluates mathematical and geometric expressions.
644 | Chapter 17 Use Precision Tools
CALCINPUT
Controls whether mathematical expressions and global constants are
evaluated in text and numeric entry boxes of windows and dialog boxes.
Use the Command Prompt Calculator | 645
646
Draw Geometric Objects
You can create a range of objects, from simple lines and circles to spline curves, and ellipses.
In general, you draw objects by specifying points with the pointing device or by entering
coordinate values at the Command prompt.
Draw Linear Objects
A line, the most basic object, can be one segment or a series of connected
segments.
Draw Lines
You can close a sequence of line segments so that the first and last segments
are joined.
You can assign properties to lines including color, linetype, and lineweight. For
more information about properties, see Work with Object Properties on page
465.
You specify the locations that define the endpoints of each line with precision.
You can
■Enter the coordinate values for an endpoint, using either absolute or relative
coordinates
■Specify an object snap relative to an existing object. For example, you can
specify the center of a circle as one endpoint of the line
■Turn grid snap on and snap to a location
There are other methods for creating precise lines. A highly efficient technique
is to offset a line from an existing line, and then trim or extend it to the desired
length.
18
647

Use polyline objects instead of line objects if you want the segments to be
connected as a single object.
See also:
■Use Coordinates and Coordinate Systems (UCS) on page 549
■Use Object Snaps on page 585
■Adjust Grid and Grid Snap on page 593
■Draw Polylines on page 649
■Offset an Object on page 758
■Break and Join Objects on page 783
■Infer Geometric Constraints on page 823
To draw lines
1Click Home tab ➤ Draw panel ➤ Line.
2Specify the start point.
You can use the pointing device or enter coordinate values at the
Command prompt.
3Complete the first line segment by specifying the endpoint.
To undo the previous line segment during the LINE command, enter u
or click Undo on the toolbar.
4Specify the endpoints of any additional line segments.
5Press Enter to end or c to close a series of line segments.
To start a new line at the endpoint of the last line drawn, start the LINE
command again and press Enter at the Specify Start Point prompt.
Quick Reference
Commands
LINE
Creates straight line segments.
648 | Chapter 18 Draw Geometric Objects
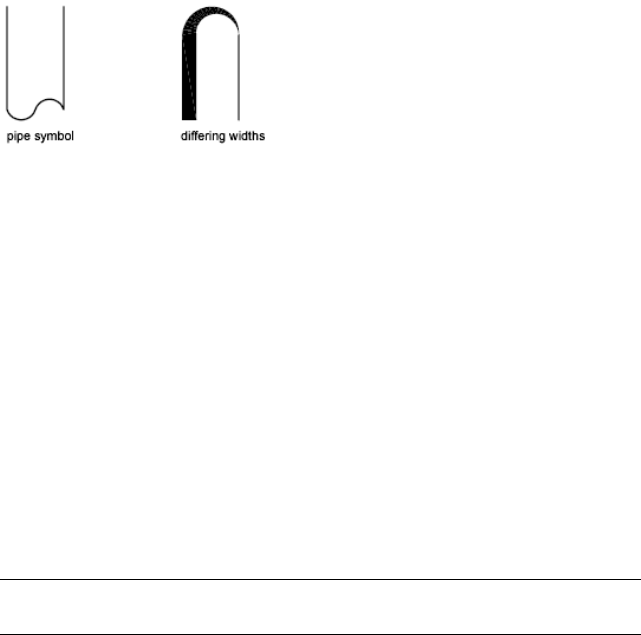
RAY
Creates a line that starts at a point and continues to infinity.
XLINE
Creates a line of infinite length.
Draw Polylines
A polyline is a connected sequence of segments created as a single object. You
can create straight line segments, arc segments, or a combination of the two.
Polylines are ideal for applications including the following:
■Contour lines for topographic, isobaric, and other scientific applications
■Wiring diagrams and printed cicuit board layouts
■Process and piping diagrams
■Extrusion profiles and extrusion paths for 3D solid modeling
Polylines can be created with several commands including PLINE, RECTANG,
POLYGON, DONUT, BOUNDARY, and REVCLOUD. All of these commands
result in a LWPOLYLINE (lightweight polyline) object type.
With the 3DPOLY command, you can create non-planar polylines that result
in a POLYLINE object type. Fewer options are available with 3D polylines.
After you create a polyline, you can edit it using grips or PEDIT. You can use
EXPLODE to convert polylines to individual line and arc segments.
NOTE You can convert a spline-fit polyline created with PEDIT into a true spline
object with SPLINE.
Draw Polylines | 649
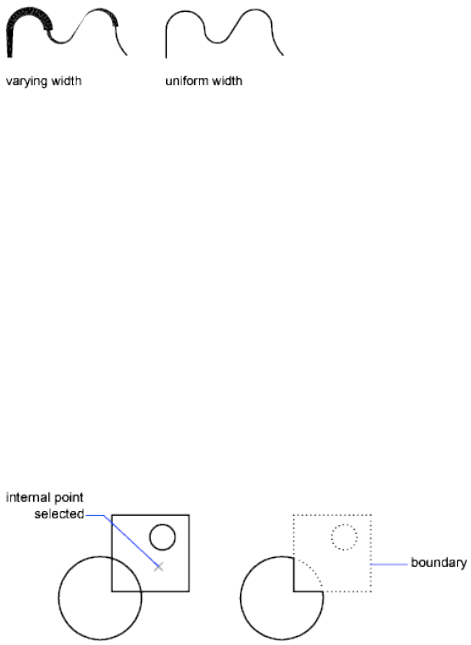
Create Wide Polylines
You can draw polylines of various widths by using the Width and Halfwidth
options. You can set the width of individual segments and make them taper
gradually from one width to another. These options become available after
you specify a starting point for the polyline.
The Width and Halfwidth options set the width of the next polyline segments
you draw. Widths greater than zero produce wide lines, which are filled if Fill
mode is on and outlined if Fill mode is off.
Intersections of adjacent wide segments are usually beveled. However,
nontangent arc segments, acute angles, or segments that use a dash-dot
linetype are not beveled.
Create Polylines from the Boundaries of Objects
You can create a polyline from the boundaries of objects that form a closed
area with BOUNDARY. A polyline created using this method is a separate
object, distinct from the objects used to create it.
To expedite the boundary selection process in large or complex drawings, you
can specify a group of boundary candidates, called a boundary set. You create
this set by selecting the objects you want to use define the boundary.
See also:
■Draw Rectangles and Polygons on page 654
■Modify Complex Objects on page 785
■Break and Join Objects on page 783
■Control Lineweights on page 532
650 | Chapter 18 Draw Geometric Objects

■Infer Geometric Constraints on page 823
To draw a polyline with straight segments
1Click Home tab ➤ Draw panel ➤ Polyline.
2Specify the first point of the polyline.
3Specify the endpoint of the first polyline segment.
4Continue specifying segment endpoints as needed.
5Press Enter to end, or enter c to close the polyline.
To start a new polyline at the endpoint of the last polyline drawn, start
the PLINE command again and press Enter at the Specify Start Point
prompt.
To draw a line and arc combination polyline
1Click Home tab ➤ Draw panel ➤ Polyline.
2Specify the start point of the polyline segment.
3Specify the endpoint of the polyline segment.
■Switch to Arc mode by entering a (Arc) at the Command prompt.
■Return to Line mode by entering L (Line).
4Specify additional polyline segments as needed.
5Press Enter to end, or enter c to close the polyline.
To create a wide polyline
1Click Home tab ➤ Draw panel ➤ Polyline.
2Specify the start point of the line segment.
3Enter w (Width).
4Enter the starting width of the line segment.
Draw Polylines | 651

5Specify the ending width of the line segment using one of the following
methods:
■To create a line segment of equal width, press Enter.
■To create a tapering line segment, enter a different width.
6Specify the endpoint of the polyline segment.
7Continue specifying segment endpoints as needed.
8Press Enter to end, or enter c to close the polyline.
To create a boundary polyline
1Click Home tab ➤ Draw panel ➤ Boundary.
2In the Boundary Creation dialog box, in the Object Type list, select
Polyline.
3Under Boundary Set, do one of the following:
■To create a boundary set from all objects visible in the current
viewport, select Current Viewport. Avoid this option for large, complex
drawings.
■To specify which objects to include in the boundary set, click New.
Select the objects that you want to use to create the boundary. Using
this option automatically selects the Existing Set option.
4Click Pick Points.
5Specify points within each area that you want to form a boundary
polyline.
This area must be totally enclosed; that is, there can be no gaps between
enclosing objects. You can select more than one area. Click Island
Detection if you want internal closed areas to be included in the boundary
set.
6Press Enter to create the boundary polyline and end the command.
The command creates a polyline in the shape of the boundary. Because
this polyline overlaps the objects used to create it, it may not be visible.
However, you can move, copy, or modify it just as you can any other
polyline.
652 | Chapter 18 Draw Geometric Objects
Quick Reference
Commands
3DPOLY
Creates a 3D polyline.
BOUNDARY
Creates a region or a polyline from an enclosed area.
EXPLODE
Breaks a compound object into its component objects.
FILL
Controls the filling of objects such as hatches, 2D solids, and wide polylines.
PEDIT
Edits polylines and 3D polygon meshes.
PLINE
Creates a 2D polyline.
POLYGON
Creates an equilateral closed polyline.
RECTANG
Creates a rectangular polyline.
System Variables
FILLMODE
Specifies whether hatches and fills, 2D solids, and wide polylines are filled
in.
HPBOUND
Controls the object type created by HATCH and BOUNDARY.
PLINECONVERTMODE
Specifies the fit method used in converting splines to polylines.
PLINEGEN
Sets how linetype patterns generate around the vertices of a 2D polyline.
Draw Polylines | 653
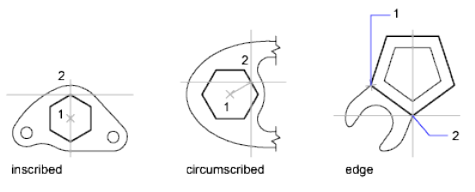
PLINETYPE
Specifies whether optimized 2D polylines are used.
PLINEWID
Stores the default polyline width.
Draw Rectangles and Polygons
You can create rectangles and regular polygons quickly. Creating polygons is
a simple way to draw equilateral triangles, squares, pentagons, hexagons, and
so on.
If necessary, you can use EXPLODE to convert the resulting polyline object
into lines.
Draw Rectangles
Use RECTANG to create closed polylines in a rectangular shape.
Draw Regular Polygons
Use POLYGON to create closed polylines with between 3 and 1,024
equal-length sides. The following illustrations show polygons created using
three methods. In each case, two points are specified.
See also:
■Draw Polylines on page 649
■Infer Geometric Constraints on page 823
654 | Chapter 18 Draw Geometric Objects

To draw a circumscribed polygon
1Click Home tab ➤ Draw panel ➤ Polygon.
2At the Command prompt, enter the number of sides.
3Specify the center of the polygon (1).
4Enter c to specify a polygon circumscribed about a circle.
5Enter the radius length (2).
To draw a polygon by specifying one edge
1Click Home tab ➤ Draw panel ➤ Polygon.
2At the Command prompt, enter the number of sides.
3Enter e (Edge).
4Specify the start point for one polygon segment.
5Specify the endpoint of the polygon segment.
To draw an inscribed polygon
1Click Home tab ➤ Draw panel ➤ Polygon.
2At the Command prompt, enter the number of sides.
3Specify the center of the polygon.
4Enter i to specify a polygon inscribed within a circle of specified points.
5Enter the radius length.
Draw Rectangles and Polygons | 655

To draw a rectangle
1Click Home tab ➤ Draw panel ➤ Rectangle.
2Specify the first corner of the rectangle.
3Specify the other corner of the rectangle.
Quick Reference
Commands
BOUNDARY
Creates a region or a polyline from an enclosed area.
EXPLODE
Breaks a compound object into its component objects.
POLYGON
Creates an equilateral closed polyline.
RECTANG
Creates a rectangular polyline.
System Variables
FILLMODE
Specifies whether hatches and fills, 2D solids, and wide polylines are filled
in.
HPBOUND
Controls the object type created by HATCH and BOUNDARY.
PLINEWID
Stores the default polyline width.
POLYSIDES
Sets the default number of sides for the POLYGON command.
656 | Chapter 18 Draw Geometric Objects
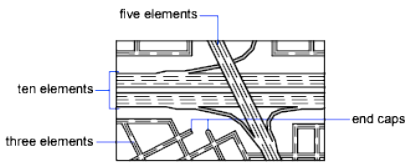
SNAPANG
Sets the snap and grid rotation angle for the current viewport relative to the
current UCS.
Draw Multiline Objects
Multilines are composed of parallel lines, called elements.
When you draw a multiline, you can use the STANDARD style, which has two
elements, or specify a style that you created previously. You can also change
the justification and scale of the multiline before you draw it.
Multiline justification determines which side of the cursor that the multiline
is drawn, or whether it is centered on the cursor.
Multiline scale controls the overall width of the multiline using the current
units. Multiline scale does not affect linetype scale. If you change the multiline
scale, you might need to make equivalent changes to the linetype scale to
prevent dots or dashes from being disproportionately sized.
Create Multiline Styles
You can create named styles for multilines to control the number of elements
and the properties of each element. The properties of multilines include
■The total number of elements and position of each element
■The offset distance for each element from the middle of the multiline
■The color and linetype of each element
■The visibility of the lines, called joints, that appear at each vertex
■The type of end caps that are used
■The background fill color of the multiline
Draw Multiline Objects | 657
Elements with a positive offset appear on one side of the middle of the
multiline; elements with a negative offset appear on the other side of the
middle of the multiline.
See also:
■Modify Multilines on page 799
To draw a multiline
1Click Draw menu ➤ Multiline.
2At the Command prompt, enter st to select a style.
3To list available styles, enter the style name or enter ?.
4To justify the multiline, enter j and select top, zero, or bottom
justification.
5To change the scale of the multiline, enter s and enter a new scale.
Now draw the multiline.
6Specify the starting point.
7Specify a second point.
8Specify additional points, or press Enter. If you specify three or more
points, you can enter c to close the multiline.
To create a multiline style
1Click Format menu ➤ Multiline Style.
658 | Chapter 18 Draw Geometric Objects
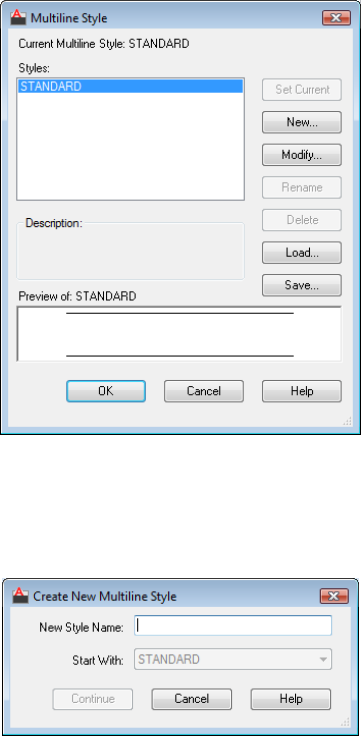
2In the Multiline Style dialog box, click New.
3In the Create New Multiline Style dialog box, enter a name for the
multiline style and select a multiline style from which to start. Click
Continue.
4In the New Multiline Style dialog box, select the parameters for the
multiline style. You can also enter a description.
Descriptions are optional and can be up to 255 characters, including
spaces.
Draw Multiline Objects | 659
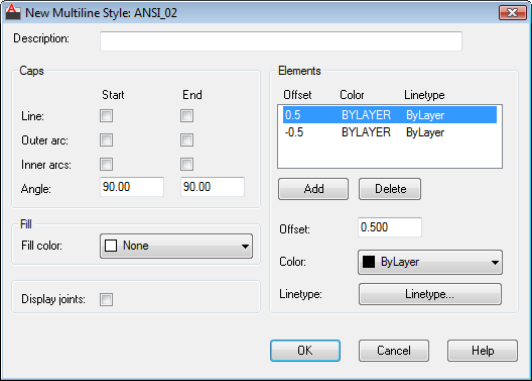
5Click OK.
6In the Multiline Style dialog box, click Save to save the multiline style to
a file (the default is acad.mln). You can save multiline styles to the same
file.
If you create more than one multiline style, save the current style before
creating a new one or you lose the changes to the first style.
Quick Reference
Commands
OFFSET
Creates concentric circles, parallel lines, and parallel curves.
MLINE
Creates multiple parallel lines.
MLSTYLE
Creates, modifies, and manages multiline styles.
660 | Chapter 18 Draw Geometric Objects
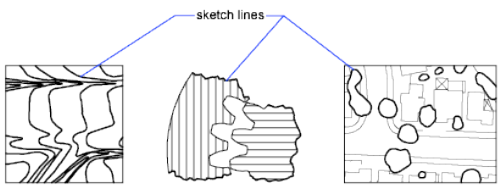
System Variables
CMLSTYLE
Sets the multiline style that governs the appearance of the multiline.
Draw Freehand Sketches
Sketching is useful for creating irregular boundaries or for tracing with a
digitizer.
Draw freehand sketches with the SKETCH command. Freehand sketches
comprise many line segments that are converted into a line, polyline, or spline.
For Splines, you can determine how closely the spline’s curve fits to the
freehand sketch.
For any sketch type, set the minimum length (increment) of the line segments.
Small line segments allow greater accuracy, but they can greatly increase the
drawing file size.
Before sketching, check the CELTYPE system variable to make sure the current
linetype is BYLAYER. When you sketch with dot or dash linetypes, smaller
line segments can become invisible.
Sketch in Tablet Mode
You use Tablet mode with a digitizer. Sketching in Tablet mode is useful for
such things as tracing map outlines from paper directly into a drawing. You
cannot turn off Tablet mode while sketching.
When Tablet mode is on, you can configure the program to map the paper
drawing's coordinate system directly into the world coordinate system. Thus,
there is a direct correlation between the coordinates where screen crosshairs
appear, the coordinates on the tablet, and the coordinates in the original paper
drawing. After configuring the program to match the coordinates of the paper
drawing, you may find that the area shown on the screen is not the area you
Draw Freehand Sketches | 661
need. To avoid this problem, use ZOOM to display the entire work area before
you start to sketch.
With some digitizers, you cannot select the menus while Tablet mode is on.
See your digitizer documentation for details.
To draw freehand sketches
1At the Command prompt, enter sketch and press Enter.
2Press Enter again to accept the last saved type, increment, and tolerance
values.
3Click in the drawing area to begin sketching.
4As you move the pointing device, freehand line segments of the specified
length are drawn. SKETCH does not accept coordinate input. During the
command, freehand lines are displayed in a different color.
5Click the endpoint to suspend sketching, allowing you to move around
the screen without drawing. Click a new start point to resume drawing
from the new cursor position.
6Press Enter to complete the sketch.
Quick Reference
Commands
SKETCH
Creates a series of freehand line segments.
System Variables
DIGITIZER
Identifies digitizers connected to the system.
MAXTOUCHES
SKETCHINC
Sets the record increment for the SKETCH command.
SKPOLY
Determines whether the SKETCH command generates lines, polylines, or
splines.
662 | Chapter 18 Draw Geometric Objects
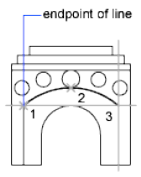
SKTOLERANCE
Draw Curved Objects
Curved objects are arcs, circles, polyline arcs, donuts, ellipses, and splines.
Draw Arcs
To create an arc, you can specify various combinations of center, endpoint,
start point, radius, angle, chord length, and direction values.
You can create arcs in several ways. With the exception of the first method,
arcs are drawn counterclockwise from the start point to the endpoint.
Draw Arcs by Specifying Three Points
You can create an arc by specifying three points. In the following example,
the start point of the arc snaps to the endpoint of a line. The second point of
the arc snaps to the middle circle in the illustration.
Draw Arcs by Specifying Start, Center, End
You can create an arc using a start point, center, and a third point that
determines the endpoint.
The distance between the start point and the center determines the radius.
The endpoint is determined by a line from the center that passes through the
third point. The resulting arc is always created counterclockwise from the start
point.
Using different options, you can specify either the start point first or the center
point first.
Draw Curved Objects | 663
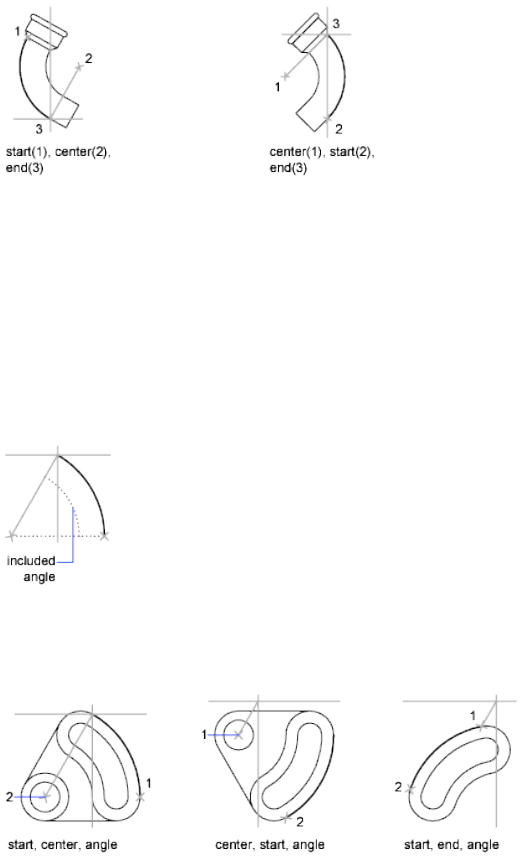
Draw Arcs by Specifying Start, Center, Angle
You can create an arc using a start point, center, and an included angle.
The distance between the start point and the center determines the radius.
The other end of the arc is determined by specifying an included angle that
uses the center of the arc as the vertex. The resulting arc is always created
counterclockwise from the start point.
Using different options, you can specify either the start point first or the center
point first.
The included angle determines the endpoint of the arc. Use the Start, End,
Angle method when you know both endpoints but cannot snap to a center
point.
Draw Arcs by Specifying Start, Center, Length
You can create an arc using a start point, center, and the length of a chord.
The distance between the start point and the center determines the radius.
The other end of the arc is determined by specifying the length of a chord
664 | Chapter 18 Draw Geometric Objects
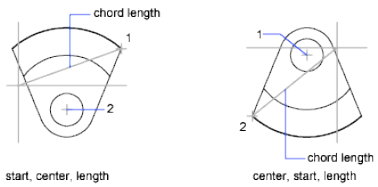
between the start point and the endpoint of the arc. The resulting arc is always
created counterclockwise from the start point.
Using different options, you can specify either the start point first or the center
point first.
The length of the chord of the arc determines the included angle.
Draw Arcs by Specifying Start, End, Angle
You can create an arc using a start point, endpoint, and an included angle.
The included angle between the endpoints of the arc determines the center
and the radius of the arc.
Draw Arcs by Specifying Start, End, Direction
You can create an arc using a start point, endpoint, and a tangent direction
at the start point.
The tangent direction can be specified either by locating a point on the desired
tangent line, or by entering an angle. You can determine which endpoint
controls the tangent by changing the order in which you specify the two
endpoints.
Draw Arcs by Specifying Start, End, Radius
You can create an arc using a start point, endpoint, and a radius.
The direction of the bulge of the arc is determined by the order in which you
specify its endpoints. You can specify the radius either by entering it or by
specifying a point at the desired radius distance.
Draw Arcs | 665
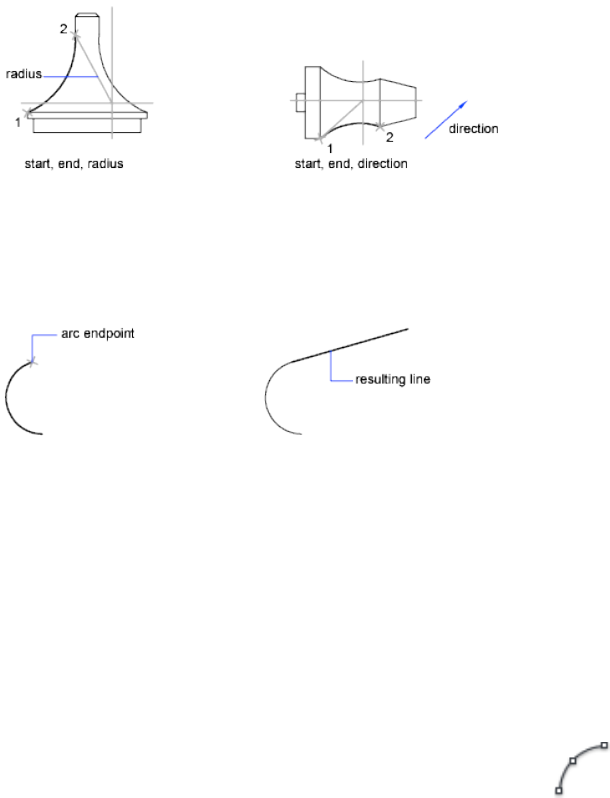
Draw Contiguous Tangent Arcs and Lines
Immediately after you create an arc, you can start a line that is tangent to the
arc at an endpoint by starting the LINE command and pressing Enter at the
Specify First Point prompt. You need to specify only the line length.
Immediately after you create a line or an arc, you can start an arc that is
tangent at an endpoint by starting the ARC command and pressing Enter at
the Specify Start Point prompt. You need to specify only the endpoint of the
new arc.
See also:
■Draw Polylines on page 649
■Break and Join Objects on page 783
To draw an arc by specifying three points
1Click Home tab ➤ Draw panel ➤ Arc drop-down ➤ 3-Point.
2Specify the start point.
3Specify a point on the arc.
4Specify the endpoint.
666 | Chapter 18 Draw Geometric Objects
To draw an arc using a start point, a center point, and an endpoint
1Click Home tab ➤ Draw panel ➤ Arc drop-down ➤ Start, Center, End.
2Specify a start point.
3Specify the center point.
4Specify the endpoint.
To continue an arc with a tangential line
1Complete the arc.
2Click Home tab ➤ Draw panel ➤ Line.
3Press Enter at the first prompt.
4Enter the length of the line and press Enter.
To continue an arc with a tangential arc
1Complete the arc.
2Click Home tab ➤ Draw panel ➤ Arc drop-down ➤ Continue.
3Specify the second endpoint of the tangent arc.
Quick Reference
Commands
ARC
Creates an arc.
LINE
Creates straight line segments.
OFFSET
Creates concentric circles, parallel lines, and parallel curves.
Draw Arcs | 667
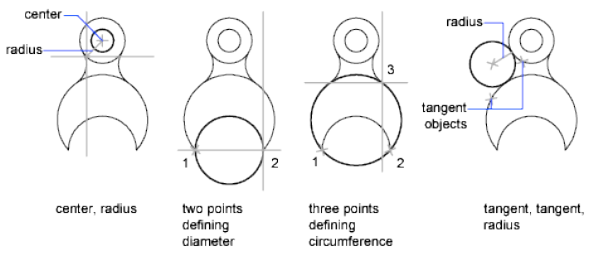
VIEWRES
Sets the resolution for objects in the current viewport.
System Variables
ANGDIR
Sets the direction of positive angles.
LASTANGLE
Stores the end angle of the last arc entered relative to the XY plane of the
current UCS for the current space.
WHIPARC
Controls whether the display of circles and arcs is smooth.
Draw Circles
To create circles, you can specify various combinations of center, radius,
diameter, points on the circumference, and points on other objects.
You can create circles in several ways. The default method is to specify the
center and the radius. Three other ways to draw a circle are shown in the
illustration.
Draw a Circle Tangent to Other Objects
The tangent point is a point where an object touches another object without
intersecting it. To create a circle that is tangent to other objects, select the
objects and then specify the radius of the circle. In the illustrations below,
the bold circle is the one being drawn, and points 1 and 2 select the objects
to which it is tangent.
668 | Chapter 18 Draw Geometric Objects
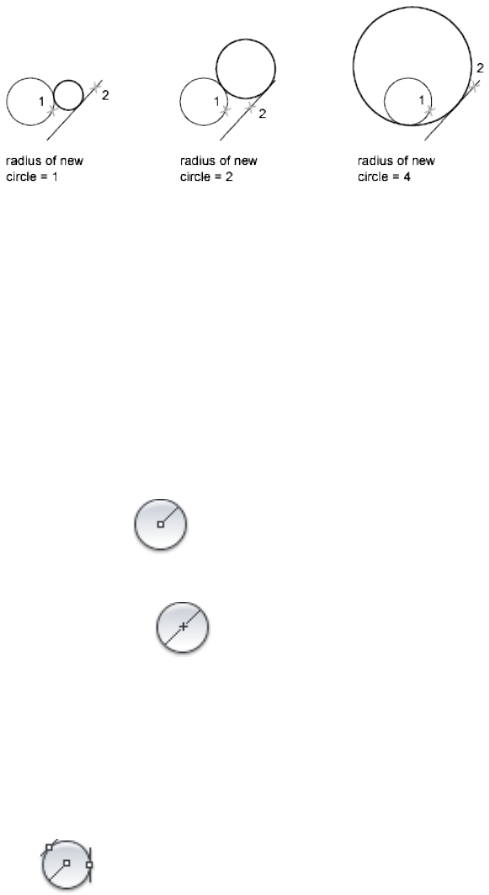
To create a circle tangent at three points, set running object snaps (OSNAP)
to Tangent and use the three-point method to create the circle.
See also:
■Use Object Snaps on page 585
■Draw Isometric Circles on page 2003
To draw a circle by specifying a center point and radius or diameter
1Do one of the following:
■Click Home tab ➤ Draw panel ➤ Circle drop-down ➤ Center,
Radius.
■Click Home tab ➤ Draw panel ➤ Circle drop-down ➤ Center,
Diameter.
2Specify the center point.
3Specify the radius or diameter.
To create a circle tangent to two objects
1Click Home tab ➤ Draw panel ➤ Circle drop-down ➤ Tan, Tan, Radius.
The command starts Tangent object snap mode.
2Select the first object to draw the circle tangent to.
Draw Circles | 669
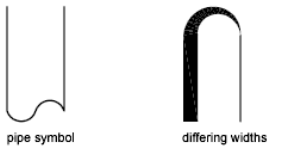
3Select the second object to draw the circle tangent to.
4Specify the radius of the circle.
Quick Reference
Commands
CIRCLE
Creates a circle.
OFFSET
Creates concentric circles, parallel lines, and parallel curves.
System Variables
CIRCLERAD
Sets the default circle radius.
WHIPARC
Controls whether the display of circles and arcs is smooth.
Draw Polyline Arcs
A polyline is a connected sequence of line segments created as a single object.
You can create straight line segments, arc segments, or a combination of the
two.
Multisegmented lines provide editing capabilities unavailable for single lines.
For example, you can adjust their width and curvature. After you've created
a polyline, you can edit it with PEDIT or use EXPLODE to convert it to
individual line and arc segments. You can
■Convert a spline-fit polyline into a true spline with SPLINE
670 | Chapter 18 Draw Geometric Objects
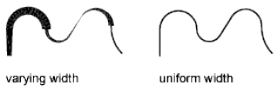
■Use closed polylines to create a polygon
■Create a polyline from the boundaries of overlapping objects
Create Arc Polylines
When you draw arc segments in a polyline, the first point of the arc is the
endpoint of the previous segment. You can specify the angle, center point,
direction, or radius of the arc. You can also complete the arc by specifying a
second point and an endpoint.
Create Closed Polylines
You can draw a closed polyline to create a polygon. To close a polyline, specify
the starting point of the last side of the object, enter c (Close), and press Enter.
Create Wide Polylines
You can draw polylines of various widths by using the Width and Halfwidth
options. You can set the width of individual segments and make them taper
gradually from one width to another. These options become available after
you specify a starting point for the polyline.
The Width and Halfwidth options set the width of the next polyline segments
you draw. Zero (0) width produces a thin line. Widths greater than zero
produce wide lines, which are filled if Fill mode is on and outlined if Fill mode
is off. The Halfwidth option sets width by specifying the distance from the
center of the wide polyline to an outside edge.
Taper
When you use the Width option, you are prompted for both a starting and
an ending width. By entering different values, you can taper the polyline. The
starting and ending points of wide polyline segments are in the center of the
line. Intersections of adjacent wide segments are usually beveled. However,
nontangent arc segments, acute angles, or segments that use a dash-dot
linetype are not beveled.
Draw Polyline Arcs | 671
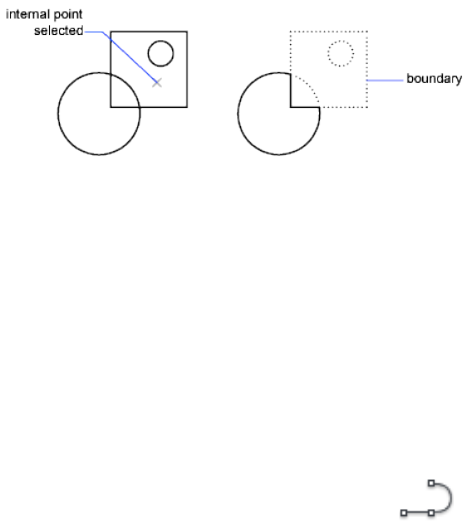
Create Polylines from the Boundaries of Objects
You can create a polyline from the boundaries of overlapping objects that
form a closed area. A polyline created using the boundary method is a separate
object, distinct from the objects used to create it. You can edit it using the
same methods used to edit other polylines.
To expedite the boundary selection process in large or complex drawings, you
can specify a group of boundary candidates, called a boundary set. You create
this set by selecting the objects you want to use to define the boundary.
See also:
■Modify Splines on page 794
■Modify Polylines on page 787
■Break and Join Objects on page 783
■Control Lineweights on page 532
■Infer Geometric Constraints on page 823
To draw a polyline with straight segments
1Click Home tab ➤ Draw panel ➤ Polyline.
2Specify the first point of the polyline.
3Specify the endpoint of the first polyline segment.
4Continue specifying segment endpoints as needed.
5Press Enter to end, or enter c to close the polyline.
To start a new polyline at the endpoint of the last polyline drawn, start
the PLINE command again and press Enter at the Specify Start Point
prompt.
672 | Chapter 18 Draw Geometric Objects

To draw a line and arc combination polyline
1Click Home tab ➤ Draw panel ➤ Polyline.
2Specify the start point of the polyline segment.
3Specify the endpoint of the polyline segment.
■Switch to Arc mode by entering a (Arc) at the Command prompt.
■Return to Line mode by entering L (Line).
4Specify additional polyline segments as needed.
5Press Enter to end, or enter c to close the polyline.
To create a wide polyline
1Click Home tab ➤ Draw panel ➤ Polyline.
2Specify the start point of the line segment.
3Enter w (Width).
4Enter the starting width of the line segment.
5Specify the ending width of the line segment using one of the following
methods:
■To create a line segment of equal width, press Enter.
■To create a tapering line segment, enter a different width.
6Specify the endpoint of the polyline segment.
7Continue specifying segment endpoints as needed.
8Press Enter to end, or enter c to close the polyline.
To create a boundary polyline
1Click Home tab ➤ Draw panel ➤ Boundary.
2In the Boundary Creation dialog box, in the Object Type list, select
Polyline.
Draw Polyline Arcs | 673
3Under Boundary Set, do one of the following:
■To create a boundary set from all objects visible in the current
viewport, select Current Viewport in the list. Avoid this option for
large, complex drawings.
■To specify which objects to include in the boundary set, click New.
Select the objects that you want to use to create the boundary.
Choosing this option automatically selects the Existing Set option.
4Click Pick Points.
5Specify points within each area that you want to form a boundary
polyline.
This area must be totally enclosed; that is, there can be no gaps between
enclosing objects. You can select more than one area.
6Press Enter to create the boundary polyline and end the command.
The command creates a polyline in the shape of the boundary. Because
this polyline overlaps the objects used to create it, it may not be visible.
However, you can move, copy, or modify it just as you can any other
polyline.
Quick Reference
Commands
3DPOLY
Creates a 3D polyline.
BOUNDARY
Creates a region or a polyline from an enclosed area.
OFFSET
Creates concentric circles, parallel lines, and parallel curves.
PEDIT
Edits polylines and 3D polygon meshes.
PLINE
Creates a 2D polyline.
674 | Chapter 18 Draw Geometric Objects
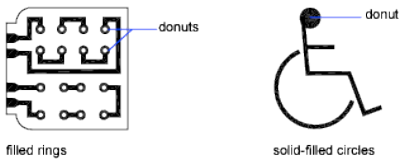
VIEWRES
Sets the resolution for objects in the current viewport.
System Variables
FILLMODE
Specifies whether hatches and fills, 2D solids, and wide polylines are filled
in.
HPBOUND
Controls the object type created by HATCH and BOUNDARY.
PLINECONVERTMODE
Specifies the fit method used in converting splines to polylines.
PLINEGEN
Sets how linetype patterns generate around the vertices of a 2D polyline.
PLINETYPE
Specifies whether optimized 2D polylines are used.
PLINEWID
Stores the default polyline width.
Draw Donuts
Donuts are filled rings or solid-filled circles that actually are closed polylines
with width.
To create a donut, you specify its inside and outside diameters and its center.
You can continue creating multiple copies with the same diameter by
specifying different center points. To create solid-filled circles, specify an inside
diameter of 0.
Draw Donuts | 675
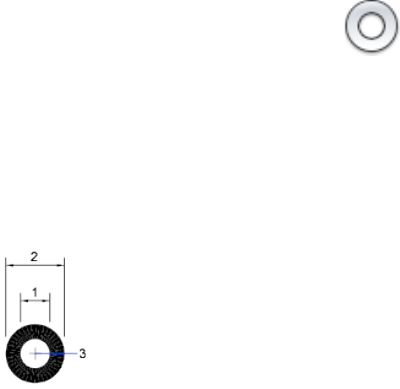
To create a donut
1Click Home tab ➤ Draw panel ➤ Donut.
2Specify the inside diameter (1).
3Specify the outside diameter (2).
4Specify the center of the donut (3).
5Specify the center point for another donut, or press Enter to complete
the command.
Quick Reference
Commands
DONUT
Creates a filled circle or a wide ring.
FILL
Controls the filling of objects such as hatches, 2D solids, and wide polylines.
System Variables
DONUTID
Sets the default for the inside diameter of a donut.
DONUTOD
Sets the default for the outside diameter of a donut.
FILLMODE
Specifies whether hatches and fills, 2D solids, and wide polylines are filled
in.
676 | Chapter 18 Draw Geometric Objects
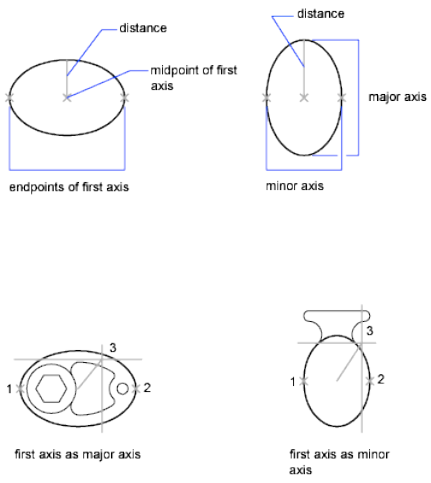
Draw Ellipses
The shape of an ellipse is determined by two axes that define its length and
width. The longer axis is called the major axis, and the shorter one is the
minor axis.
The illustrations below show two different ellipses created by specifying axis
and distance. The third point specifies only a distance and does not necessarily
designate the axis endpoint.
If you are drawing on isometric planes to simulate 3D, you can use ellipses to
represent isometric circles viewed from an oblique angle. First you need to
turn on Isometric Snap in the Drafting Settings dialog box.
See also:
■Draw Isometric Circles on page 2003
■Break and Join Objects on page 783
To draw an isometric circle
1Click Tools menu ➤ Drafting Settings.
2In the Drafting Settings dialog box, Snap and Grid tab, under Snap Type
and Style, click Isometric Snap. Click OK.
Draw Ellipses | 677
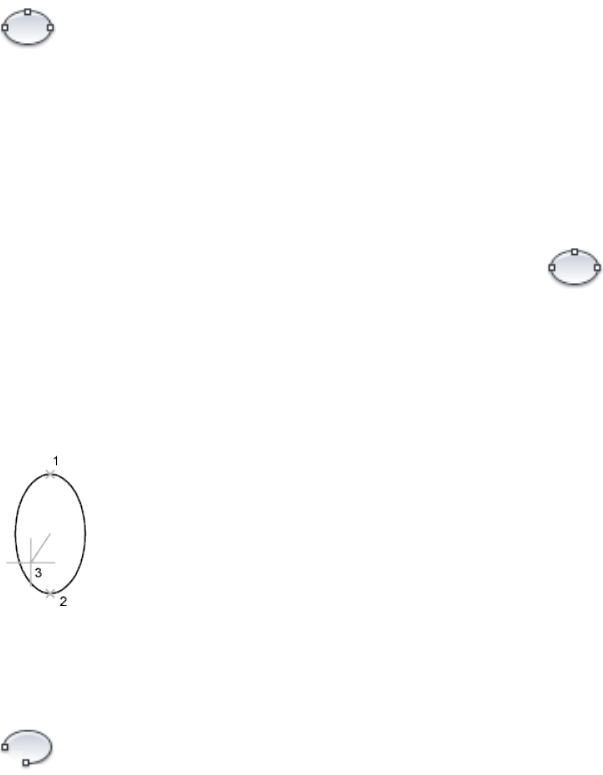
3Click Home tab ➤ Draw panel ➤ Ellipse drop-down ➤ Axis, End.
4Enter i (Isocircle).
5Specify the center of the circle.
6Specify the radius or diameter of the circle.
To draw a true ellipse using endpoints and distance
1Click Home tab ➤ Draw panel ➤ Ellipse drop-down ➤ Axis, End.
2Specify the first endpoint of the first axis (1).
3Specify the second endpoint of the first axis (2).
4Drag the pointing device away from the midpoint, and click to specify a
distance (3) for half the length of the second axis.
To draw an elliptical arc using start and end angles
1Click Home tab ➤ Draw panel ➤ Ellipse drop-down ➤ Elliptical Arc.
2Specify endpoints for the first axis (1 and 2).
3Specify a distance to define half the length of the second axis (3).
4Specify the start angle (4).
5Specify the end angle (5).
678 | Chapter 18 Draw Geometric Objects
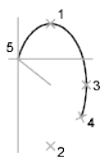
The elliptical arc is drawn counterclockwise between the start point and
endpoint.
Quick Reference
Commands
ELLIPSE
Creates an ellipse or an elliptical arc.
System Variables
ANGDIR
Sets the direction of positive angles.
PELLIPSE
Controls the ellipse type created with ELLIPSE.
Draw Splines
See also:
■Modify Splines on page 794
■Break and Join Objects on page 783
■Create Solids and Surfaces from Lines and Curves on page 966
■Edit NURBS Surfaces on page 1155
■Rebuild NURBS Surfaces and Curves on page 1157
A spline is a smooth curve that passes through or near a given set of points.
Draw Splines | 679
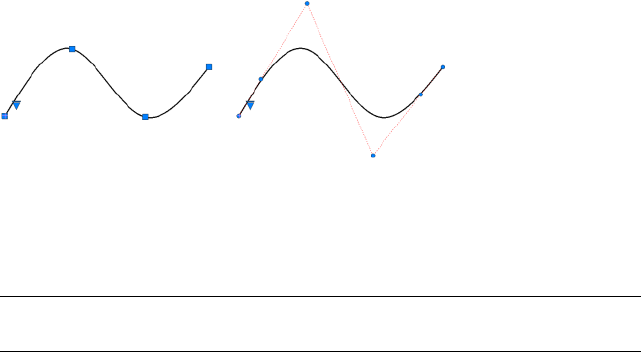
The SPLINE command creates a type of curve known as a nonuniform rational
B-spline (NURBS). A NURBS curve produces a smooth curve between control
vertices or fit points. The spline on the left is drawn with fit points, and the
spline on the right is drawn with control vertices.
Close the spline so that the start and endpoints are coincident and tangent.
Splines are a critical tool for creating NURBS surfaces for 3D modeling. You
can revolve, loft, sweep, and extrude open and closed splines to create surface
objects.
NOTE Because periodic curves on page 2174 are not currently supported, 3D surfaces
created from closed spines may kink when reshaped.
Fit Points vs. Control Vertices
There are different drawing options available depending on whether you use
fit points or control vertices.
■Fit Points (Interpolated) - Specify the knot parameterization and tolerance
settings, but not the degree setting (a degree 3 spline is always created).
■Control Vertices - You can specify the tolerance and degree settings, but
not the knot parameterization.
To draw a spline with control vertices
1Click Surface tab ➤ Curves panel ➤ Spline CV.
2Click in the drawing area to create the spline.
3When you are done, press Enter.
To draw a spline with fit points
1Click Surface tab ➤ Curves panel ➤ Spline Knot.
2Click in the drawing area to create the spline.
680 | Chapter 18 Draw Geometric Objects

3When you are done, press Enter.
To draw a spline in 2D workspace
1Click Home tab ➤ Draw panel ➤ Spline.
2Click in the drawing area to create the spline.
3When you are done, press Enter.
To convert a spline-fit polyline to a spline
1Click Home tab ➤ Draw panel ➤ Spline.
2Enter o (Object).
3Select a spline-fit polyline and press Enter.
The selected object changes from a polyline to a spline.
Quick Reference
Commands
PEDIT
Edits polylines and 3D polygon meshes.
PLINE
Creates a 2D polyline.
SPLINE
Creates a smooth curve that passes through fit points or near control vertices.
SPLINEDIT
Edits a spline or spline-fit polyline.
System Variables
PLINECONVERTMODE
Specifies the fit method used in converting splines to polylines.
Draw Splines | 681

Draw Helixes
A helix is an open 2D or 3D spiral.
You can use a helix as a path with the SWEEP command. For example, you
might sweep a circle along a helix path to create a solid model of a spring.
When you create a helix, you can specify the following:
■Base radius
■Top radius
■Height
■Number of turns
■Turn height
■Twist direction
If you specify the same value for both the base radius and the top radius, then
a cylindrical helix is created. By default, the top radius is set to the same value
as the base radius. You cannot specify 0 for both the base radius and top radius.
If you specify different values for the top radius and the base radius, then a
conical helix is created.
If you specify a height value of 0, then a flat, 2D spiral is created.
NOTE A helix is a spline approximation of a real helix. Length values may not be
completely accurate. However, when you use a helix as a sweep path, the resulting
values will be accurate regardless of the approximation.
See also:
■Modify Helixes on page 797
■Create a Solid or Surface by Sweeping on page 972
To create a helix
1Click Home tab ➤ Draw panel ➤ Helix.
2Specify the center point for the base of the helix.
3Specify the base radius.
682 | Chapter 18 Draw Geometric Objects

4Specify the top radius or press Enter to specify the same value as the base
radius.
5Specify the height of the helix.
Quick Reference
Commands
HELIX
Creates a 2D spiral or 3D spring.
Draw Construction and Reference Geometry
Construction lines and reference points are temporary objects you create to
help you draw accurately.
Draw Reference Points
Point objects are useful as nodes or reference geometry for object snaps and
relative offsets.
You can set the style of the points and their size relative to the screen or in
absolute units. Changing the style of points
■Makes them more visible and easier to differentiate from grid dots
■Affects the display of all point objects in the drawing
■Requires using REGEN to make the change visible
To set point style and size
1Click Format menu ➤ Point Style.
2In the Point Style dialog box, select a point style.
3In the Point Size box, specify a size, either relative to the screen or in
absolute units.
4Click OK.
Draw Construction and Reference Geometry | 683

To create a point object
1Click Home tab ➤ Draw panel ➤ Point drop-down ➤ Multiple Points.
2Specify the point location.
You can snap to a point using the Node object snap.
Quick Reference
Commands
DDPTYPE
Specifies the display style and size of point objects.
POINT
Creates a point object.
System Variables
PDMODE
Controls how point objects are displayed.
PDSIZE
Sets the display size for point objects.
Draw Construction Lines (and Rays)
Lines that extend to infinity in one or both directions, known as rays and
construction lines, respectively, can be used as references for creating other
objects.
For example, you can use construction lines to find the center of a triangle,
prepare multiple views of the same item, or create temporary intersections to
use for object snaps.
Infinite lines do not change the total area of the drawing. Therefore, their
infinite dimensions have no effect on zooming or viewpoints, and they are
ignored by commands that display the drawing extents. You can move, rotate,
and copy infinite lines just as you can move, rotate, and copy other objects.
684 | Chapter 18 Draw Geometric Objects
You may want to create infinite lines on a construction line layer that can be
frozen or turned off before plotting.
Construction Lines
A construction line () can be placed anywhere in three-dimensional space.
You can specify its orientation in several ways. The default method for creating
the line is the two-point method: you specify two points to define the
orientation. The first point, the root, is the conceptual midpoint of the
construction line, that is, the point snapped to by the Midpoint object snap.
You can also create construction lines in several other ways.
■Horizontal and Vertical. Create construction lines that pass through a point
you specify and are parallel to the X or Y axis of the current UCS.
■Angle. Creates a construction line in one of two ways. Either you select a
reference line and then specify the angle of the construction line from
that line, or you create a construction line at a specific angle to the
horizontal axis by specifying an angle and then a point through which
the construction line should pass.
■Bisector. Creates a construction line that bisects an angle you specify. You
specify the vertex and the lines that create the angle.
■Offset. Creates a construction line parallel to a baseline you specify. You
specify the offset distance, select the baseline, and then indicate on which
side of the baseline to locate the construction line.
Rays
A ray is a line in three-dimensional space that starts at a point you specify and
extends to infinity. Unlike construction lines, which extend in two directions,
rays extend in only one direction. Using rays instead of construction lines can
help reduce visual clutter. Like construction lines, rays are ignored by
commands that display the drawing extents.
Draw Construction Lines (and Rays) | 685
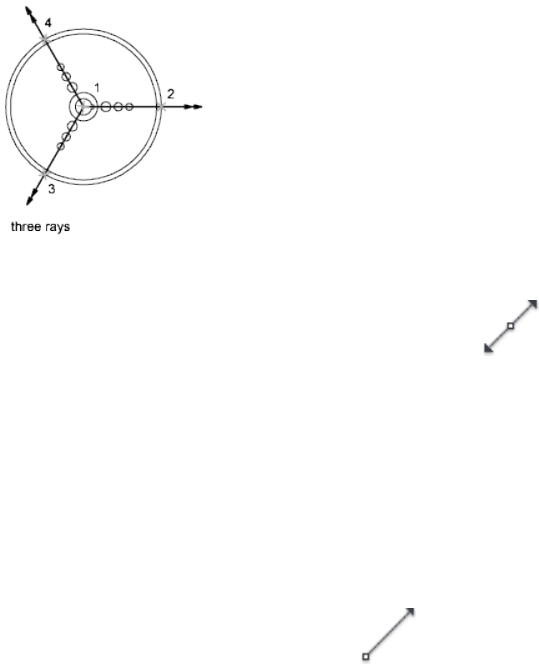
To create a construction line by specifying two points
1Click Home tab ➤ Draw panel ➤ Construction Line.
2Specify a point to define the root of the construction line.
3Specify a second point through which the construction line should pass.
4Continue to specify construction lines as needed.
All subsequent xlines pass through the first point specified.
5Press Enter to end the command.
To create a ray
1Click Home tab ➤ Draw panel ➤ Ray.
2Specify a starting point for the ray.
3Specify a point through which the ray should pass.
4Continue to specify points to create additional rays as needed.
All subsequent rays pass through the first point specified.
5Press Enter to end the command.
686 | Chapter 18 Draw Geometric Objects
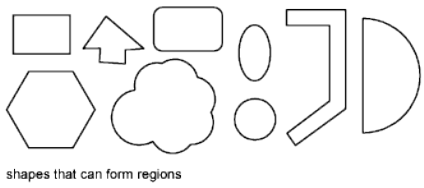
Quick Reference
Commands
RAY
Creates a line that starts at a point and continues to infinity.
XLINE
Creates a line of infinite length.
Create and Combine Areas (Regions)
Regions are two-dimensional enclosed areas that have physical properties such
as centroids or centers of mass. You can combine existing regions into a single,
complex region to calculate area.
You can create regions from objects that form closed loops. Loops can be
combinations of lines, polylines, circles, arcs, ellipses, elliptical arcs, and splines
that enclose an area.
Regions can be used for
■Applying hatching and shading
■Analyzing properties, such as area, using MASSPROP
■Extracting design information, such as the centroid
You can create regions out of multiple loops and out of open curves whose
endpoints are connected and form loops. You cannot form regions from open
objects that intersect to form a closed area: for example, intersecting arcs or
self-intersecting curves.
Create and Combine Areas (Regions) | 687
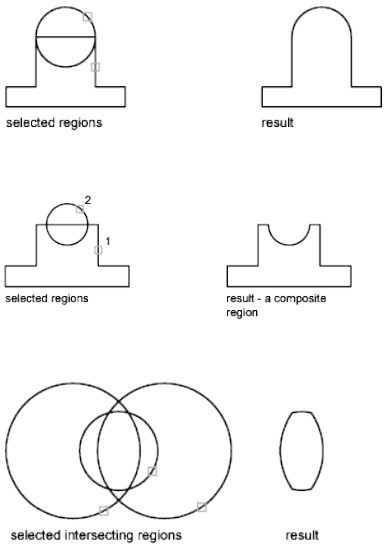
You can create regions using the REGION and BOUNDARY commands. You
create composite regions by combining, subtracting, or finding the intersection
of regions.
Objects combined using UNION:
Objects combined using SUBTRACT:
Objects combined using INTERSECT:
Invalid Boundaries
When a boundary cannot be determined, it might be because the specified
internal point is not within a fully enclosed area. Red circles are displayed
around unconnected endpoints of the boundary to identify gaps in the
boundary.
688 | Chapter 18 Draw Geometric Objects
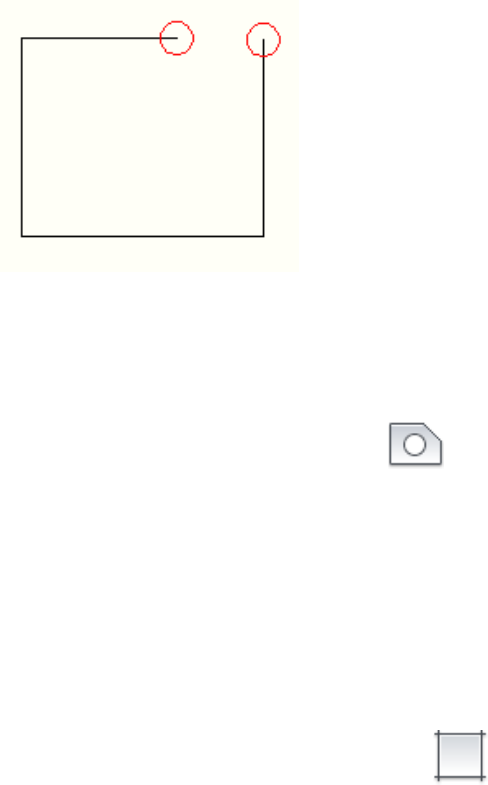
The red circles remain displayed even after you exit the REGION or BOUNDARY
command. They are removed when you specify a closed boundary, or by using
the REDRAW, REGEN, or REGENALL command.
To define regions
1Click Home tab ➤ Draw panel ➤ Region.
2Select objects to create the region.
These objects must each form an enclosed area, such as a circle or a closed
polyline.
3Press Enter.
A message at the Command prompt indicates how many loops were
detected and how many regions were created.
To define regions by using boundaries
1Click Home tab ➤ Draw panel ➤ Boundary.
2In the Boundary Creation dialog box, in the Object Type list, select
Region.
3Click Pick Points.
4Specify a point in your drawing inside each closed area that you want to
define as a region and press Enter.
This point is known as the internal point.
Create and Combine Areas (Regions) | 689
NOTE You can make a new boundary set to limit the objects used to
determine the boundary.
To combine regions by adding
1Click Home tab ➤ Solid Editing panel ➤ Union.
2Select one region for the union.
3Select another region.
You can select regions to unite in any order.
4Continue selecting regions or press Enter to end the command.
The command converts the selected regions to a new combined region.
To combine regions by subtracting
1Click Home tab ➤ Solid Editing panel ➤ Subtract.
2Select one or more regions from which to subtract and press Enter.
3Select the region to subtract and press Enter.
The areas of the second regions you selected are subtracted from the areas
of the first regions.
To combine regions by finding intersections
1Click Home tab ➤ Solid Editing panel ➤ Intersect.
2Select one region of the intersection.
3Select another intersecting region.
You can select regions in any order to find their intersection.
4Continue selecting regions or press Enter to end the command.
The command converts the selected regions to a new region defined by
the intersection of the selected regions.
690 | Chapter 18 Draw Geometric Objects
Quick Reference
Commands
BOUNDARY
Creates a region or a polyline from an enclosed area.
INTERSECT
Creates a 3D solid, surface, or 2D region from overlapping solids, surfaces,
or regions.
MASSPROP
Calculates the mass properties of regions or 3D solids.
REGION
Converts an object that encloses an area into a region object.
SUBTRACT
Combines selected 3D solids or 2D regions by subtraction.
UNION
Combines selected 3D solids, surfaces, or 2D regions by addition.
System Variables
DELOBJ
Controls whether geometry used to create 3D objects is retained or deleted.
Create Revision Clouds
Revision clouds are polylines that consist of sequential arcs. They are used to
call attention to parts of a drawing during the review stage.
If you review or redline drawings, you can increase your productivity by using
the Revision Cloud feature to highlight your markups. REVCLOUD creates a
polyline of sequential arcs to form a cloud-shaped object. You can select a
style for a revision cloud: Normal or Calligraphy. If you select Calligraphy,
the revision cloud looks as if it was drawn with a calligraphy pen.
You can create a revision cloud from scratch, or you can convert objects, such
as a circle, ellipse, polyline, or spline, to a revision cloud. When you convert
an object to a revision cloud, the original object is deleted if DELOBJ is set to
1 (the default).
Create Revision Clouds | 691
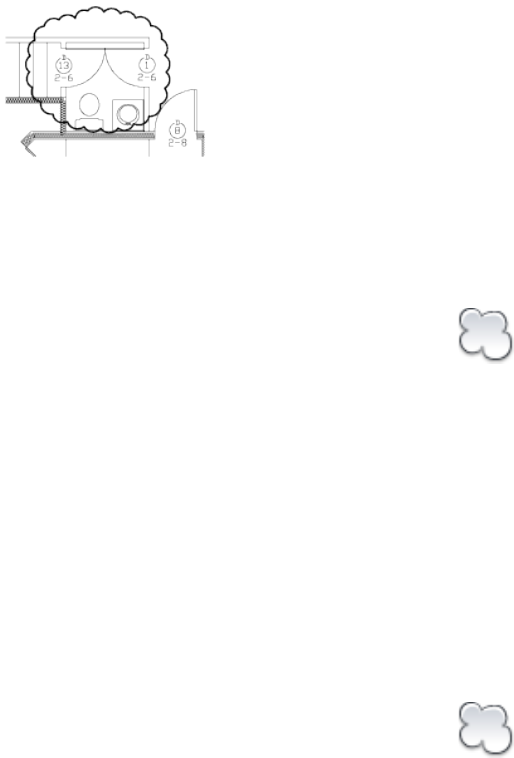
You can set the minimum and maximum default values for the arc lengths
of a revision cloud. When you draw a revision cloud, you can vary the size of
the arcs by using pick points for the smaller arc segments. You can also edit
the individual arc lengths and chord lengths of a revision cloud by adjusting
the pick points.
REVCLOUD stores the last used arc length as a multiple of the DIMSCALE
system variable to provide consistency among drawings with different scale
factors.
Make sure that you can see the entire area to be outlined with REVCLOUD
before you begin the command. REVCLOUD is not designed to support
transparent and real-time panning and zooming.
To create a revision cloud from scratch
1Click Home tab ➤ Draw panel ➤ Revision Cloud.
2At the Command prompt, specify a new minimum and maximum arc
length or specify a revision cloud starting point.
The default minimum and maximum arc lengths are set to 0.5000 units.
The maximum arc length can be no more than three times the minimum
arc length.
3Guide the crosshairs along the cloud path. You can click pick points along
the path if you want to vary the size of the arcs.
4Press Enter at any time to stop drawing the revision cloud.
To close the revision cloud, return to its starting point.
To create revision clouds with a calligraphy pen style
1Click Home tab ➤ Draw panel ➤ Revision Cloud.
692 | Chapter 18 Draw Geometric Objects

2At the Command prompt, enter style.
3At the Command prompt, enter calligraphy.
4Press Enter to save the calligraphy setting and to continue with the
command, or press ESC to end the command.
To convert an object to a revision cloud
1Click Home tab ➤ Draw panel ➤ Revision Cloud.
2At the Command prompt, specify a new minimum and maximum arc
length or press Enter.
The default minimum and maximum arc lengths are set to 0.5000 units.
The maximum arc length can be no more than three times the minimum
arc length.
3Select the circle, ellipse, polyline, or spline that you want to convert to
a revision cloud.
To reverse the direction of the arcs, enter yes at the Command prompt
and press Enter.
4Press Enter to change the selected object to a revision cloud.
To change the default values for arc lengths in a revision cloud
1Click Home tab ➤ Draw panel ➤ Revision Cloud.
2At the Command prompt, specify a new minimum arc length and press
Enter.
3At the Command prompt, specify a new maximum arc length and press
Enter.
The maximum arc length can be no more than three times the minimum
arc length.
4Press Enter to continue with the command or ESC to end the command.
To edit the individual lengths of arcs or chords in a revision cloud
1In your drawing, select the revision cloud you want to edit.
Create Revision Clouds | 693
2Move the pick points along the path of the revision cloud to change the
arc lengths and chords.
Quick Reference
Commands
REVCLOUD
Creates a revision cloud using a polyline.
System Variables
DIMSCALE
Sets the overall scale factor applied to dimensioning variables that specify
sizes, distances, or offsets.
DELOBJ
Controls whether geometry used to create 3D objects is retained or deleted.
694 | Chapter 18 Draw Geometric Objects
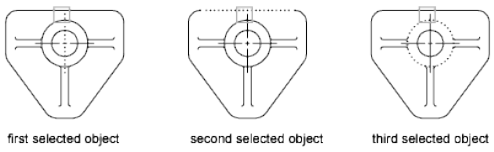
Change Existing Objects
You can select objects, view and edit object properties, and perform general and object-specific
editing operations.
Select Objects
You have a wide range of options when you need to select objects for editing
operations.
Select Objects Individually
At the Select Objects prompt, you can select one or more objects individually.
Use the Pickbox Cursor
When the square pickbox cursor is in position to select an object, the object is
highlighted. Click to select the object.
You can control the size of the pickbox in the Options dialog box, Selection
tab.
Select Objects Close Together
It is difficult to select objects that are close together or lie directly on top of one
another. The example shows two lines and a circle that lie within the pickbox.
19
695

If selection preview is turned on, you can cycle through the objects by rolling
over the object on top to highlight it, and pressing and holding Shift and then
pressing Spacebar continuously. When the required object is highlighted,
left-click to select it.
If selection preview is turned off, hold down Shift + Spacebar and click to cycle
through these objects, one after the other, until the one you want is selected.
Press Esc to turn off cycling.
Remove Selection from Objects
Remove objects from the current selection set by holding down Shift and
selecting them again.
See also:
■Modify 3D Subobjects on page 1119
■Modify Composite Solids and Surfaces on page 1136
To select a single object
1At the Select Objects prompt of any command, move the rectangular
pickbox cursor so that the object that you want to select is highlighted.
2Click the object.
The object you selected is highlighted.
3Press Enter to end object selection.
NOTE If the PICKFIRST system variable is set to 1 (noun-verb selection), you
can select objects before entering a command.
To change the size of the pickbox cursor
1Click Tools menu ➤ Options.
2On the Selection tab, under Pickbox Size, move the pickbox size slider
until the pickbox is the size you want to use.
3Click OK.
To cycle through objects for selection
1At the Select Objects prompt, hold down Shift + Spacebar. Click as near
as possible to the object you want.
696 | Chapter 19 Change Existing Objects

2Keep clicking until the object you want is highlighted.
3Press Enter to select the object.
NOTE If selection preview is turned on, you can cycle through the objects by
rolling over the object on top to highlight it, and pressing and holding Shift and
then pressing Spacebar continuously. When the required object is highlighted,
left-click to select it.
To remove selection from objects
■Hold down Shift. Click the objects that you want removed from the
selection set.
Quick Reference
PROPERTIES
Controls properties of existing objects.
SELECT
Places selected objects in the Previous selection set.
3DSELECTIONMODE
Controls the selection precedence of both visually and physically overlapping
objects when using 3D visual styles.
HIGHLIGHT
Controls object highlighting; does not affect objects selected with grips.
LEGACYCTRLPICK
Specifies the keys for selection cycling and the behavior for Ctrl+click.
PICKADD
Controls whether subsequent selections replace the current selection set or
add to it.
PICKAUTO
Controls automatic windowing at the Select Objects prompt.
PICKBOX
Sets the object selection target height, in pixels.
Select Objects Individually | 697
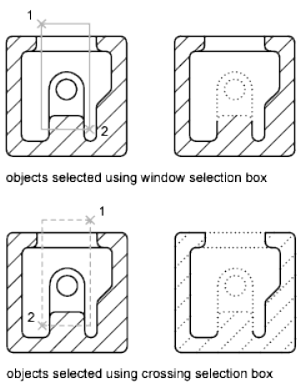
PICKDRAG
Controls the method of drawing a selection window.
PICKFIRST
Controls whether you select objects before (noun-verb selection) or after you
issue a command.
Select Multiple Objects
At the Select Objects prompt, you can select many objects at the same time.
Specify a Rectangular Selection Area
Specify opposite corners to define a rectangular area. The background inside
the area changes color and becomes transparent. The direction that you drag
your cursor from the first point to the opposite corner determines which
objects are selected.
■Window selection. Drag your cursor from left to right to select only objects
that are entirely enclosed by the rectangular area.
■Crossing selection. Drag your cursor from right to left to select objects that
the rectangular window encloses or crosses.
698 | Chapter 19 Change Existing Objects
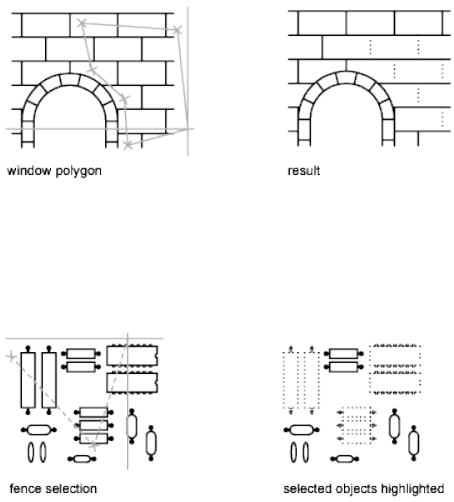
With a window selection, usually the entire object must be contained in the
rectangular selection area. However, if an object with a noncontinuous (dashed)
linetype is only partially visible in the viewport and all the visible vectors of
the linetype can be enclosed within the selection window, the entire object
is selected.
Specify an Irregularly Shaped Selection Area
Specify points to define an irregularly shaped area. Use window polygon
selection to select objects entirely enclosed by the selection area. Use crossing
polygon selection to select objects enclosed or crossed by the selection area.
Specify a Selection Fence
In a complex drawing, use a selection fence. A selection fence looks like a
polyline and selects only the objects it passes through. The circuit board
illustration shows a fence selecting several components.
Use Other Selection Options
You can see all selection options by entering ? at the Select Objects prompt.
For a description of each of the selection options, see SELECT.
Remove Selection from Multiple Objects
You can enter r (Remove) at the Select Objects prompt and use any selection
option to remove objects from the selection set. If you are using the Remove
option and want to return to adding objects to the selection set, enter a (Add).
Select Multiple Objects | 699
You can also remove objects from the current selection set by holding down
Shift and selecting them again, or by holding down Shift and then clicking
and dragging window or crossing selections. You can add and remove objects
repeatedly from the selection set.
To see a list of options at the Select Objects prompt
■Enter ? at the Select Objects prompt.
To select objects within an irregularly shaped area
1At the Select Objects prompt, enter wp (Window Polygon).
2Specify points that define an area entirely enclosing the objects you want
to select.
3Press Enter to close the polygon selection area and complete the selection.
To select objects crossing an irregularly shaped area
1At the Select Objects prompt, enter cp (Crossing Polygon).
2Specify points that define an area that encloses or crosses the objects you
want to select.
3Press Enter to close the polygon selection area and complete the selection.
To select objects with a fence
1At the Select Objects prompt, enter f (Fence).
2Specify points to create a fence that passes through the objects you want
to select.
3Press Enter to complete the selection.
To remove several objects from the selection set
1After selecting objects, at the Select Objects prompt, enter r (Remove).
2Enter any selection option such as cp (Crossing Polygon) or f (Fence),
and select the objects to be removed from the selection set.
To return to adding objects to the selection set, enter a (Add).
700 | Chapter 19 Change Existing Objects
Quick Reference
PROPERTIES
Controls properties of existing objects.
QSELECT
Creates a selection set based on filtering criteria.
SELECT
Places selected objects in the Previous selection set.
HIGHLIGHT
Controls object highlighting; does not affect objects selected with grips.
PICKADD
Controls whether subsequent selections replace the current selection set or
add to it.
PICKAUTO
Controls automatic windowing at the Select Objects prompt.
PICKBOX
Sets the object selection target height, in pixels.
PICKDRAG
Controls the method of drawing a selection window.
PICKFIRST
Controls whether you select objects before (noun-verb selection) or after you
issue a command.
PREVIEWEFFECT
Specifies the visual effect used for previewing selection of objects.
Prevent Objects from Being Selected
You can prevent objects on specified layers from being selected and modified
by locking those layers.
Typically, you lock layers to prevent accidental editing of particular objects.
Other operations are still possible when a layer is locked. For example, you
can make a locked layer current, and you can add objects to it. You can also
Prevent Objects from Being Selected | 701
use inquiry commands (such as LIST), use object snaps to specify points on
objects on locked layers, and change the draw order of objects on locked layers.
To help you differentiate between locked and unlocked layers, you can do the
following:
■Hover over an object to see whether a lock icon is displayed
■Dim the objects on locked layers
NOTE Grips are not displayed on objects that are on locked layers.
To lock or unlock a layer
1Click Home tab ➤ Layers panel ➤ Layer Properties.
2In the Layer Properties Manager, click the padlock for the layers that you
want to lock.
3Click OK.
If the padlock is closed, the layer is locked and objects on that layer
cannot be selected.
To lock or unlock a layer by selecting an object on that layer
1Click the Model tab.
2Do either of the following:
■Click Home tab ➤ Layers panel ➤ Lock.
■Click Home tab ➤ Layers panel ➤ Unlock.
3Select an object on the layer you want to lock or unlock.
702 | Chapter 19 Change Existing Objects
Quick Reference
LAYER
Manages layers and layer properties.
LAYISO
Hides or locks all layers except those of the selected objects.
LAYLCK
Locks the layer of a selected object.
LAYULK
Unlocks the layer of a selected object.
LAYLOCKFADECTL
Controls the amount of fading for objects on locked layers.
Select Objects by Properties
Use object properties or object types to include objects in a selection set, or
to exclude them.
To quickly define a selection set based on specified filtering criteria, use
■Quick Select (QSELECT) from the Properties palette to filter selection sets
by property (such as color) and by object type
■Object Selection Filters dialog box (FILTER) to filter selection sets by
property and by object type
■Select Similar (SELECTSIMILAR) to select similar objects of the same type
based on specified matching properties
If you added a feature classification to an object using Autodesk or a third-party
application, you can select objects by classification property. With object
selection filters, you can name and save filters for future use.
With Quick Select or object selection filters, to filter your selection set based
on color, linetype, or lineweight, consider whether these properties are set to
BYLAYER for any objects in your drawing. For example, an object may appear
red because its color is set to BYLAYER and the layer color is red.
By default, objects of the same type are considered similar if they are on the
same layer, and, for blocks and other referenced objects, have the same name.
Select Objects by Properties | 703
Subobjects are only considered at the object level. For example, when a mesh
vertex is selected, SELECTSIMILAR selects other mesh objects, not just the
mesh vertices.
NOTE If an application such as AutoCAD® Map 3D was used to add a feature
classification to an object, and the associated classification (XML) file is present,
you can select objects by classification property. Specifically, you can select a
classification in the Object Type box and a property in the Properties box.
See also:
■Customize Object Selection on page 707
■Work with Layers on page 471
To create a selection set using Quick Select
1Click Home tab ➤ Utilities panel ➤ Quick Select.
2In the Quick Select dialog box, under Apply To, select Entire Drawing.
3Under Object Type, select Multiple.
4Under Properties, select Color.
5Under Operator, select Equals.
6Under Value, specify the color.
7Under How to Apply, select Include in New Selection Set.
8Click OK.
To exclude objects from the selection set
You can exclude objects from the current selection set by using the Exclude
from New Selection Set option. In the following example, you exclude all
circles with a radius greater than 1 from a set of objects already selected.
1Select several objects.
2Click Home tab ➤ Utilities panel ➤ Quick Select.
3In the Quick Select dialog box, under Apply To, select Current Selection.
704 | Chapter 19 Change Existing Objects

4Under Object Type, select Circle.
5Under Properties, select Radius.
6Under Operator, select Greater Than.
7Under Value, enter 1.
8Under How to Apply, select Exclude from New Selection Set.
9Click OK.
All circles with a radius greater than 1 are removed from the selection
set.
To append objects to the selection set
You can use Quick Select to append objects to a current selection set. In the
following example, you keep the current selection set and append all objects
in the drawing that contain hyperlinks whose names begin with bld1_.
1Click Home tab ➤ Utilities panel ➤ Quick Select.
2In the Quick Select dialog box, select Append to Current Selection Set.
3In the Object Type box, select Multiple.
4Under Properties, select Hyperlink.
5Under Operator, select Wildcard Match.
6Under Value, enter bld1_*.
7Under How to Apply, select Include in New Selection Set.
8Click OK.
To name and save a filtered list
1At the Command prompt, enter filter.
2In the Object Selection Filters dialog box, under Select Filter, select a filter
such as Line.
3Click Add to List.
4Under Save As, enter a filter name such as Linefilter.
5Click Save As.
Select Objects by Properties | 705
6Click Apply.
The filter is applied so you can select, in this case, only lines in the
drawing. If you select objects with a selection, the filter is applied to all
objects in the selection area.
To use a named filter
1At the Select Object prompt, enter 'filter. (The apostrophe makes it a
transparent command.)
2In the Object Selection Filters dialog box, under Select Filter, select the
filter you want to use. Click Apply.
3Use a crossing window to specify objects for selection.
Only the objects selected by the crossing window that match the filter
criteria are selected.
To create a selection set of similar objects
1Enter selectsimilar.
2Enter se (settings).
3In the Select Similar Settings dialog box, select the properties that must
match for objects of the same type to be considered similar.
If no properties are selected, objects of the same type are selected.
4Click OK.
5Select object(s) as the selection criteria.
6Press Enter to select similar objects.
Quick Reference
FILTER
Creates a list of requirements that an object must meet to be included in a
selection set.
PROPERTIES
Controls properties of existing objects.
706 | Chapter 19 Change Existing Objects
QSELECT
Creates a selection set based on filtering criteria.
SELECT
Places selected objects in the Previous selection set.
SELECTSIMILAR
Adds similar objects to the selection set based on selected objects.
PICKADD
Controls whether subsequent selections replace the current selection set or
add to it.
PICKAUTO
Controls automatic windowing at the Select Objects prompt.
PICKBOX
Sets the object selection target height, in pixels.
PICKDRAG
Controls the method of drawing a selection window.
PICKFIRST
Controls whether you select objects before (noun-verb selection) or after you
issue a command.
SELECTSIMILARMODE
Controls which properties must match for an object of the same type to be
selected with SELECTSIMILAR.
Customize Object Selection
You can control several aspects of selecting objects, such as whether you enter
a command first or select objects first, the size of the pickbox cursor, and how
selected objects are displayed.
For commands that use the Select Objects prompt, you can
■Enter a command first, and then select objects
■Select the objects first, and then enter a command
Customize Object Selection | 707
You can also choose
■Whether objects to be selected are previewed during selection
■Whether selected objects are highlighted
■How you define selection areas and how you create selection sets
Select the Command First
When you use an editing command, a Select Objects prompt is displayed and
the crosshairs is replaced with a pickbox. You can respond to the Select Objects
prompt in various ways:
■Select objects one at a time.
■Click an empty area. Drag the cursor to define a rectangular selection area.
■Enter a selection option. Enter ? to display all selection options.
■Combine selection methods. For example, to select most of the objects in
the drawing area, select all objects and then remove the objects that you
do not want selected.
■Enter 'filter to use a named selection filter. The apostrophe runs the
command transparently.
Select Objects First
You can use one of two methods to select objects before starting a command:
■Use the SELECT command, and enter ? to display all selection options. All
objects selected are put into the Previous selection set. To use the Previous
selection set, enter p at the Select Objects prompt of any subsequent
command.
■When noun/verb selection is turned on, select objects at the Command
prompt before entering a command such as MOVE, COPY, or ERASE. With
this method, you can only select objects by clicking them individually or
by using automatic selection.
■Enter qselect to filter the selection. Then enter p at the Select Objects
prompt of any subsequent command.
708 | Chapter 19 Change Existing Objects
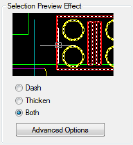
Highlight Objects to Be Selected
Objects are highlighted when the pickbox cursor rolls over them, providing
a preview of which object will be selected when you click.
When you specify an area to select multiple objects, the background of the
area becomes transparent.
These selection previewing effects are turned on by default. You can turn them
off or change the appearance of selection previewing (Options dialog box,
Selection tab). When the PICKBOX system variable is set to 0, selection
previewing of objects is not available.
Control the Appearance of Selected Objects
By default, selected objects are displayed with dashed lines. You can increase
program performance by setting the HIGHLIGHT system variable to 0. Turning
off selection highlighting does not affect grips on selected objects.
Set Up Default Selection Methods
Options on the Selection tab of the Options dialog box control default selection
methods:
■Use selection previewing and selection area effects to preview selection.
■Select objects before entering a command (noun-verb selection) or after
entering a command. (PICKFIRST)
■Press Shift to append objects to the selection set. (PICKADD)
■Click and drag to create a selection window. Otherwise you must click
twice to define the corners of a selection window. (PICKDRAG)
■Start Window or Crossing selection automatically when you click an empty
space. Otherwise, you must enter c or w to specify window crossing
selection. (PICKAUTO)
■Change the size of the pickbox. (PICKBOX)
■Select all objects in a group when you select one object in that group.
Customize Object Selection | 709

■Include the boundary in the selection set when you select a hatch.
To change the size of the pickbox cursor
1Click Tools menu ➤ Options.
2In the Options dialog box, Selection tab, under Pickbox Size, move the
slider until the pickbox is the size you want to use.
3Click OK.
To change object selection settings
1Click Tools menu ➤ Options.
2In the Options dialog box, Selection tab, make changes to the Selection
Preview and Selection Modes areas and the pickbox size.
3Click OK.
To turn on or turn off selection previewing
1Click Tools menu ➤ Options.
2In the Options dialog box, Selection tab, select or clear options as follows:
■Select the When a Command Is Active option to display the check
mark.
■Select the When No Command Is Active option to display the check
mark.
■Select both options to turn on selection preview whenever it is
available.
■Clear both options to turn off selection preview entirely.
To change the appearance of selection previewing
1Click Tools menu ➤ Options.
710 | Chapter 19 Change Existing Objects

2In the Options dialog box, Selection tab, click Visual Effect Settings.
3In the Visual Effect Settings dialog box, select one of the following
options:
■Dash. Displays dashed lines.
■Thicken. Displays thickened lines.
■Both. Displays dashed and thickened lines.
4Click OK to exit each dialog box.
To exclude objects from selection previewing
1Click Tools menu ➤ Options.
2In the Options dialog box, Selection tab, click Visual Effect Settings.
3In the Visual Effect Settings dialog box, click Advanced Options.
4In the Advanced Preview Options dialog box, select any of the following
options to exclude objects from selection previewing:
■Exclude Objects on Locked Layers
■Xrefs
■Tables
■Groups
■Multiline Text
■Hatches
5Click OK to exit each dialog box.
To change the appearance of the selection area
1Click Tools menu ➤ Options.
2In the Options dialog box, Selection tab, click Visual Effect Settings.
Customize Object Selection | 711
3In the Visual Effect Settings dialog box, change any of the following
settings:
■Indicate Selection Area. Select to display effects for selection areas.
■Window Selection Color. Select a color, or click Select Color to display
the Select Color dialog box. (WINDOWAREACOLOR system variable)
■Crossing Selection Color. Select a color, or click Select Color to display
the Select Color dialog box. (CROSSINGAREACOLOR system variable)
■Selection Area Opacity. Use the slider to set transparency for selection
areas. The lower the setting, the more transparent the area. A value
of 100 makes the area opaque. (SELECTIONAREAOPACITY system
variable)
4Click OK to exit each dialog box.
Quick Reference
FILTER
Creates a list of requirements that an object must meet to be included in a
selection set.
PROPERTIES
Controls properties of existing objects.
QSELECT
Creates a selection set based on filtering criteria.
CROSSINGAREACOLOR
Controls the color of the selection area during crossing selection.
DRAGMODE
Controls the way dragged objects are displayed.
HIGHLIGHT
Controls object highlighting; does not affect objects selected with grips.
PICKADD
Controls whether subsequent selections replace the current selection set or
add to it.
712 | Chapter 19 Change Existing Objects
PICKAUTO
Controls automatic windowing at the Select Objects prompt.
PICKBOX
Sets the object selection target height, in pixels.
PICKDRAG
Controls the method of drawing a selection window.
PICKFIRST
Controls whether you select objects before (noun-verb selection) or after you
issue a command.
PREVIEWEFFECT
Specifies the visual effect used for previewing selection of objects.
PREVIEWFILTER
Excludes specified object types from selection previewing.
SELECTIONAREA
Controls the display of effects for selection areas.
SELECTIONAREAOPACITY
Controls the transparency of the selection area during window and crossing
selection.
SELECTIONPREVIEW
Controls the display of selection previewing.
WINDOWAREACOLOR
Controls the color of the transparent selection area during window selection.
Group Objects
A group is a saved set of objects that you can select and edit together or
separately as needed. Groups provide an easy way to combine drawing elements
that you need to manipulate as a unit.
Group Objects | 713

Overview of Groups
A group is a saved set of objects that you can select and edit together or
separately as needed. Groups provide an easy way to combine drawing elements
that you need to manipulate as a unit. You can create them quickly and with
a default name.
TIP Groups are useful in associating 3D solids when you do not want to combine
them with a Boolean operation.
You can change the components of groups as you work by adding or removing
objects.
In some ways, groups resemble blocks, which provide another method of
combining objects into a named set. For example, the groups you create are
saved from session to session. However, you can edit individual objects in
groups more easily than you can edit them in blocks, which must be exploded
first. Unlike blocks, groups cannot be shared with other drawings.
Quick Reference
GROUP
Creates and manages saved sets of objects called groups.
PICKSTYLE
Controls the use of group selection and associative hatch selection.
Create Groups
In addition to choosing the objects that will become the members of a group,
you can give the group a name and description.
When you create a group, you can give the group a name and description. If
you copy a group, the copy is given the default name Ax and is considered
unnamed. Unnamed groups are not listed in the Object Grouping dialog box
unless you select Include Unnamed.
If you choose a member of a group that can be selected for inclusion in a new
group, all members of the former group are included in the new group.
The objects in your drawing can be members of more than one group, and
groups themselves can be nested in other groups. You can ungroup a nested
group to restore the original group configuration.
714 | Chapter 19 Change Existing Objects

Named groups are not maintained when you use a drawing as an external
reference or insert it as a block. However, you can bind and then explode the
external reference or explode the block to make the group available as an
unnamed group.
NOTE Avoid creating large groups containing hundreds or thousands of objects.
A large group significantly degrades the performance of this program.
To create a group
1At the Command prompt, enter group.
2In the Object Grouping dialog box, under Group Identification, enter a
group name and a description.
3In the Create Group area, click New.
The dialog box closes temporarily.
4Select objects and press Enter.
5Click OK.
Quick Reference
GROUP
Creates and manages saved sets of objects called groups.
PICKSTYLE
Controls the use of group selection and associative hatch selection.
Select Objects in Groups
There are several methods for choosing a group, including selecting the group
by name or selecting one of the members of the group.
You can select groups by name at the Select Objects prompt. If the PICKSTYLE
system variable is set to 1 or 3 and you select any member of a selectable
group, all group members that meet the selection criteria are selected. You
can also turn group selection on and off by pressing Ctrl+ H or Shift+Ctrl+A.
All members of selectable groups are also selected when you use object selection
cycling (for example, if you want to select an object that lies directly behind
another object). Selecting an object that is a member of more than one
selectable group selects all the members of all the groups that contain that
Group Objects | 715
object. To select groups for editing with grips, use the pointing device to select
the group at the Command prompt.
To control whether all grouped objects can be selected individually
Do one of the following:
■At the Command prompt, enter pickstyle. Enter 1 to turn on group
selection. Objects within groups can be selected as a group only, not
individually.
■At the Command prompt, enter pickstyle. Enter 0 to turn off group
selection. Objects within groups can be selected individually only, not as
a group.
■At any time, turn group selection on and off by pressing either Ctrl+H or
Ctrl+Shift+A.
To control selectability for a specific group
1At the Command prompt, enter group.
2In the Object Grouping dialog box, under Group Name, click the group
for which you want to change selectability.
3Under Change Group, click Selectable.
This changes whether objects within the group are either selectable as a
group, subject to the PICKSTYLE system variable. If selectability is turned
off, the objects in a group are selectable only as individual objects. At the
top of the Object Grouping dialog box, under Selectable, each group
displays its current status.
4Click OK.
To turn group selection on and off for all groups
Quick Reference
GROUP
Creates and manages saved sets of objects called groups.
PICKSTYLE
Controls the use of group selection and associative hatch selection.
716 | Chapter 19 Change Existing Objects

Edit Groups
You can modify groups in a number of ways, including changing their
membership, modifying their properties, revising the names and descriptions
of groups, and removing them from the drawing.
Edit Objects as a Group
When group selection is turned on, you can move, copy, rotate, and modify
groups just as you can modify individual objects. If you need to edit objects
within a group, turn off group selection or use grips to edit individual objects.
For more information, see Select Objects in Groups on page 715.
In some circumstances, it is useful to control the order in which objects that
belong to the same group are selected. For example, a custom routine that
generates toolpaths for numerical control devices might depend on a series
of contiguous objects in a specified order.
You can reorder group members in two ways: either change the numerical
position of individual members or ranges of group members, or reverse the
order of all members. The first object in each group is number 0, not number
1.
Change Group Components, Name, or Description
With the Object Grouping dialog box, you can specify objects to be added to
or removed from a group at any time. You can also revise a group's name or
description. If deleting an object or removing it from a group leaves the group
empty, the group remains defined but without any members.
NOTE Exploding an object such as a block instance or hatch that belongs to a
group does not automatically add the resulting components to any group.
Remove Groups
You can delete a group definition by using the “explode” option in the Object
Grouping dialog box. This operation is not the same as exploding a block,
hatch, or dimension. Objects that belonged to the exploded group remain in
the drawing.
As a result, the group is disbanded but the members are not changed in any
other way.
To delete a named group
1At the Command prompt, enter group.
Group Objects | 717
2In the Object Grouping dialog box, select the group name from the list
of groups.
3Under Change Group, select Explode.
4Click OK.
The group is deleted.
To reorder group members
1At the Command prompt, enter group.
2In the Object Grouping dialog box, under Change Group, click Re-Order.
3In the Order Group dialog box, under Group Name, select the group to
reorder.
4To view the current order of this group, click Highlight.
5In the Object Grouping dialog box, click Next or Previous to view the
objects. Click OK when you have finished viewing the order of the objects.
6In the Order Group dialog box, under Remove From Position, enter an
object number.
7Under Enter New Position Number for the Object, enter a new position.
8Under Number of Objects, enter the object number or range of numbers
to reorder. Click Re-Order.
9Click OK to close each dialog box.
Quick Reference
GROUP
Creates and manages saved sets of objects called groups.
PICKSTYLE
Controls the use of group selection and associative hatch selection.
Correct Mistakes
You can backtrack your recent actions using one of several methods.
718 | Chapter 19 Change Existing Objects

Undo a Single Action
The simplest method of backtracking is to use Undo on the Standard toolbar
or the U command to undo a single action. Many commands include their
own U (undo) option so that you can correct mistakes without leaving the
command. When you are creating lines and polylines, for example, enter u
to undo the last segment.
NOTE By default, the UNDO command is set to combine consecutive pan and
zoom commands into a single operation when you undo or redo. However, pan
and zoom commands that are started from the menu are not combined, and
always remain separate actions.
Undo Several Actions at Once
Use the Mark option of UNDO to mark an action as you work. You can then
use the Back option of UNDO to undo all actions that occurred after the
marked action. Use the Begin and End options of UNDO to define a set of
actions to be treated as a group.
You can also undo several actions at once with the Undo list on the Standard
toolbar.
Reverse the Effect of Undo
You can reverse the effect of a single U or UNDO command by using REDO
immediately after using U or UNDO.
You can also redo several actions at once with the Redo list on the Standard
toolbar.
Erase Objects
You can erase any object that you draw. If you accidentally erase the wrong
object, you can use the UNDO command or the OOPS command to restore
it.
For more information, see Erase Objects on page 721.
Cancel a Command
You can cancel a command without completing it by pressing Esc.
To undo the most recent action
■Click Edit menu ➤ Undo.
Correct Mistakes | 719
To undo a specific number of actions
1On the Standard toolbar, click the Undo list arrow.
A list of actions that you can undo, starting with the most recent action,
is displayed.
2Drag to select the actions to undo.
3Click to undo the selected actions.
To redo an action
■Click Edit menu ➤ Redo.
Only the action immediately preceding an UNDO command can be reversed
with REDO. You cannot use REDO to repeat another command.
To redo a specific number of actions
1On the Standard toolbar, click the Redo list arrow.
A list of undo actions that you can redo, starting with the most recent
action, is displayed.
2Drag to select the actions to redo.
3Click to redo the selected actions.
Quick Reference
ERASE
Removes objects from a drawing.
OPTIONS
Customizes the program settings.
OOPS
Restores erased objects.
REDO
Reverses the effects of previous UNDO or U command.
MREDO
Reverses the effects of several previous UNDO or U commands.
720 | Chapter 19 Change Existing Objects
U
Reverses the most recent operation.
UNDO
Reverses the effect of commands.
UNDOCTL
Indicates the state of the Auto, Control, and Group options of the UNDO
command.
UNDOMARKS
Stores the number of marks placed in the UNDO control stream by the Mark
option.
Erase Objects
There are many ways to delete objects from your drawing and clean up the
display.
Remove Unused Definitions, Styles, and Objects
You can remove unused named and unnamed objects with PURGE. Some of the
unnamed objects you can purge include block definitions, dimension styles,
layers, linetypes, and text styles. With PURGE you can also remove zero-length
geometry and empty text objects.
Clean Up the Display
You can remove the plus-shaped markers called blips and stray pixels that
may be left over from some editing operations from the display area.
■To remove blips, use REDRAW.
■To remove stray pixels, use REGEN.
See also:
■Correct Mistakes on page 718
To erase an object
1Click Home tab ➤ Modify panel ➤ Erase.
Erase Objects | 721
2At the Select Objects prompt, use a selection method to select the objects
to be erased or enter an option:
■Enter L (Last) to erase the last object drawn.
■Enter p (Previous) to erase the last selection set.
■Enter all to erase all objects from the drawing.
■Enter ? to see a list of all selection methods.
3Press Enter to end the command.
To restore the last erased object
■At the Command prompt, enter oops.
The last objects that were removed by ERASE, BLOCK, or WBLOCK are restored.
To cut objects to the Clipboard
1Select the objects you want to cut.
2Click Home tab ➤ Utilities panel ➤ Cut. You can also press Ctrl+X.
The objects are available to be pasted into other Windows applications.
To remove plus-shaped marker blips
■Click View menu ➤ Redraw.
To purge an unused linetype
1Click Tools tab ➤ Drawing Utilities panel ➤ Purge.
The Purge dialog box displays a tree view of object types with items that
can be purged.
2To purge unreferenced linetypes, use one of the following methods:
■To purge all unreferenced linetypes, select Linetypes.
722 | Chapter 19 Change Existing Objects

■To purge specific linetypes, double-click Linetypes to expand the tree
view. Then select the linetypes to be purged.
If the item you want to purge is not listed, select View Items You Cannot
Purge.
3You are prompted to confirm each item in the list. If you do not want to
confirm each purge, clear the Confirm Each Item to Be Purged option.
4Click Purge.
To confirm the purging of each item, respond to the prompt by choosing
Yes or No, or Yes to All if more than one item is selected.
5Click Close.
To remove zero-length geometry and empty text objects
1Click Tools tab ➤ Drawing Utilities panel ➤ Purge.
The Purge dialog box displays.
2Select Purge zero-length geometry and empty text objects.
3Click Purge.
4Click Close.
Quick Reference
CUTCLIP
Copies selected objects to the Clipboard and removes them from the drawing.
ERASE
Removes objects from a drawing.
OOPS
Restores erased objects.
PURGE
Removes unused items, such as block definitions and layers, from the drawing.
Erase Objects | 723
REDRAW
Refreshes the display in the current viewport.
REDRAWALL
Refreshes the display in all viewports.
REGEN
Regenerates the entire drawing from the current viewport.
UNDO
Reverses the effect of commands.
Use Windows Cut, Copy, and Paste
When you want to use objects from a drawing file in another application, you
can cut or copy these objects to the Clipboard and then paste them from the
Clipboard into the other application.
Cut Objects
Cutting deletes selected objects from the drawing and stores them on the
Clipboard. The objects are now available to be pasted into other Microsoft®
Windows® documents.
Copy Objects
You can use the Clipboard to copy part or all of a drawing into a document
created by another application. The objects are copied in vector format, which
retains the high resolution in other applications. These objects are stored in
WMF (Windows metafile) format in the Clipboard. The information stored
in the Clipboard can then be embedded in the other document. Updating the
original drawing does not update the copy embedded in the other application.
Paste Objects
Applications use different internal formats to store Clipboard information.
When you copy objects to the Clipboard, information is stored in all available
formats. When you paste the Clipboard contents into a drawing, the format
that retains the most information is used. However, you can override this
setting and convert pasted information to AutoCAD format.
Because it is the easiest format to edit, the AutoCAD format is the preferred
format for copying objects to and from AutoCAD. It retains all relevant object
information, including block references and 3D aspects.
724 | Chapter 19 Change Existing Objects
The Windows metafile (picture) format contains screen vector information,
and files can be scaled and printed without losing resolution. Use this format
to paste objects into Windows applications that support WMF files. Metafiles
pasted into AutoCAD are of higher resolution than bitmapped images (BMP
files) but are not as easily manipulated as AutoCAD objects. Bitmapped images
are raster images consisting of a pattern of pixels and are commonly used by
paint applications.
The color of the object doesn't change when copied to the Clipboard. For
example, white objects pasted onto a white background won't be visible. Use
the WMFBKGND and WMFFOREGND system variables to control whether
the background or foreground is transparent for metafile objects pasted into
other applications.
You can insert a linked or embedded object from the Clipboard into a drawing
with PASTESPEC. If you convert pasted information to AutoCAD format, the
object is inserted as a block reference. To edit the pasted information, explode
the block reference into its component objects. When you convert a Windows
metafile stored on the Clipboard to AutoCAD format, you may lose some
scaling precision. To retain proper scaling, save objects in the original drawing
as a block (WBLOCK), and then insert them into AutoCAD using INSERT.
To cut objects to the Clipboard
1Select the objects you want to cut.
2Click Home tab ➤ Utilities panel ➤ Cut.
You can also press Ctrl+X.
The objects can be pasted into other Windows applications as well.
To copy objects to the Clipboard
1Select the objects you want to copy.
2Click Home tab ➤ Utilities panel ➤ Copy Clip.
You can also press Ctrl+C.
To paste objects from the Clipboard
■Click Home tab ➤ Utilities panel ➤ Paste.
You can also press Ctrl+V.
Use Windows Cut, Copy, and Paste | 725

The objects currently on the Clipboard are pasted into the drawing.
To convert pasted information to drawing file format
1Click Home tab ➤ Utilities panel ➤ Paste Special.
2In the Paste Special dialog box, select Paste.
3From the list of formats, select Picture.
4Click OK.
Quick Reference
COPYBASE
Copies selected objects to the Clipboard along with a specified base point.
COPYCLIP
Copies selected objects to the Clipboard.
CUTCLIP
Copies selected objects to the Clipboard and removes them from the drawing.
PASTEBLOCK
Pastes objects from the Clipboard into the current drawing as a block.
PASTECLIP
Pastes objects from the Clipboard into the current drawing.
PASTEORIG
Pastes objects from the Clipboard into the current drawing using the original
coordinates.
PASTESPEC
Pastes objects from the Clipboard into the current drawing and controls the
format of the data.
WMFIN
Imports a Windows metafile.
726 | Chapter 19 Change Existing Objects
WMFOPTS
Sets options for WMFIN.
WMFOUT
Saves objects to a Windows metafile.
OLEHIDE
Controls the display and plotting of OLE objects.
WMFBKGND
Controls the background display when objects are inserted in Windows
metafile (WMF) format.
WMFFOREGND
Controls the assignment of the foreground color when objects are inserted
in Windows metafile (WMF) format.
Modify Objects
You can modify the size, shape, and location of objects.
See also:
■Work with Custom and Proxy Objects on page 1829
■Modify Existing Dimensions on page 1486
Choose a Method to Modify Objects
Access object editing options using the following methods:
DescriptionsMethods
Enter a command and then select the ob-
jects to modify. Alternatively, select the
objects first and then enter a command.
Command line
Select and right-click an object to display
a shortcut menu with relevant editing op-
tions.
Shortcut menu
Modify Objects | 727
DescriptionsMethods
Double-click an object to display the
Properties palette or, in some cases, a dia-
Double-click
log box or editor that is specific to that
type of object. (You can specify the double-
click action for each object type by custom-
izing a CUIx file and loading it into the
program.)
Control grip behavior with the following
methods:
Grips
■Grip Modes. Click a grip and right-
click to select one of the Grip modes
(Stretch, Move, Rotate, Scale, or Mir-
ror).
■Multi-functional grip-editing op-
tions. Select a polyline, spline, or non-
associative polyline hatch object and
hover over a grip to access additional
options for reshaping the obejct.
See also:
■Change Text on page 1377
■Select Objects on page 695
■Modify Existing Dimensions on page 1486
■Display and Change the Properties of Objects on page 467
■Work with Custom and Proxy Objects on page 1829
■“Double Click Actions” in the Customization Guide
Quick Reference
CUI
Manages the customized user interface elements in the product.
728 | Chapter 19 Change Existing Objects
DRAGMODE
Controls the way dragged objects are displayed.
PROPERTIES
Controls properties of existing objects.
SELECT
Places selected objects in the Previous selection set.
DBLCLKEDIT
Controls the double click editing behavior in the drawing area.
DRAGMODE
Controls the way dragged objects are displayed.
PICKADD
Controls whether subsequent selections replace the current selection set or
add to it.
PICKFIRST
Controls whether you select objects before (noun-verb selection) or after you
issue a command.
Edit Objects with Grips
Grips are displayed at strategic points on selected objects. Manipulate grips
to modify objects.
Use Grip Modes
Grip modes control how an object behaves when manipulated with grips. Use
Grip modes to stretch, move, scale, rotate, or mirror an object.
To use a Grip mode, select a grip (base grip) to act as the base point for the
action. (A selected grip is also called a hot grip.)Then press Enter or Spacebar
to cycle through the Grip modes. You can also use shortcut keys or right-click
to see all of the modes.
Edit Objects with Grips | 729
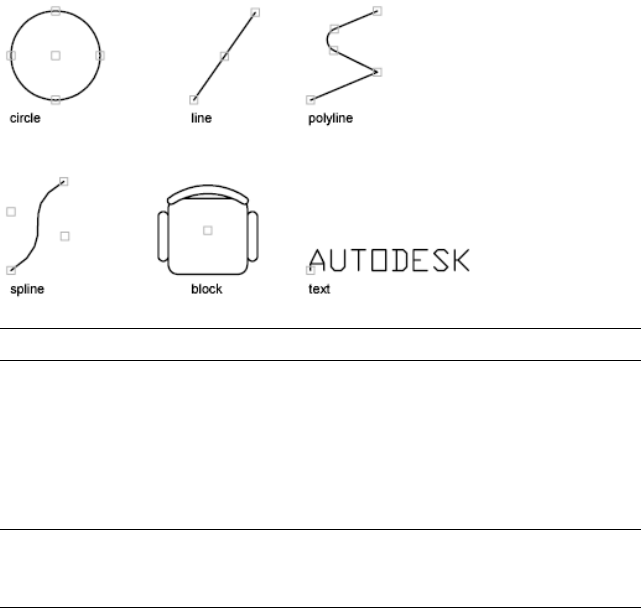
NOTE Grips are not displayed on objects that are on locked layers.
Stretch with Grips
You can stretch an object by moving selected grips to new locations. Grips
on text, block references, midpoints of lines, centers of circles, and point
objects move the object rather than stretching it. This is an excellent method
for moving block references and adjusting dimensions.
NOTE When a 2D object lies on a plane other than the current UCS, the object
is stretched on the plane on which it was created, not on the plane of the current
UCS.
Move with Grips
You can move objects by the grip selected. Selected objects are highlighted
and are moved the direction and distance of the next point location you
specify.
Scale with Grips
You can scale selected objects relative to a base point. Increase the size of an
object by dragging outward from the base grip and specifying a point location,
or decrease the size by dragging inward. Alternatively, you can enter a value
for relative scaling.
Mirror with Grips
You can mirror selected objects across a temporary mirror line. Turning Ortho
on helps you specify a vertical or horizontal mirror line.
730 | Chapter 19 Change Existing Objects

Rotate with Grips
You can rotate selected objects around a base point by dragging and specifying
a point location. Alternatively, you can enter an angle value. This is an
excellent method for rotating block references.
Select and Modify Multiple Grips
You can use more than one grip as the base grips for the action. When you
select more than one grip (also called multiple hot grip selection), the shape of
the object is kept intact between the selected grips. To select more than one
grip, press and hold the Shift key, and then select the appropriate grips.
Limit the Display of Grips to Improve Performance
You can limit the maximum number of objects that display grips. For example,
when a drawing contains hatch objects or polylines with many grips, selecting
these objects can take a long time. The GRIPOBJLIMIT system variable
suppresses the display of grips when the initial selection set includes more
than the specified number of objects. If you add objects to the current selection
set, the limit does not apply.
NOTE Grips are not displayed on objects that are on locked layers.
Work with Quadrant Grips
For quadrant grips on circles and ellipses, distance is measured from the center
point, not the selected grip. For example, in Stretch mode, you can select a
quadrant grip to stretch a circle and then specify a distance at the Command
prompt for the new radius. The distance is measured from the center of the
circle, not the selected quadrant. If you select the center point to stretch the
circle, the circle moves.
See also:
■Choose a Method to Modify Objects on page 727
■Modify Polylines on page 787
■Modify Hatches and Solid-Filled Areas
■Use Dynamic Input on page 578
■Work with Dynamic Blocks in Drawings on page 858
Edit Objects with Grips | 731

To turn on grips
1At the Command prompt, enter options.
2In the Options dialog box, Selection tab, select Enable Grips.
3Click OK.
To stretch an object using grips
1Select the object to stretch.
2Select a base grip on the object.
The selected grip is highlighted, and Stretch, the default grip mode, is
active.
3Move the pointing device and click.
The selected object is stretched as the grip moves.
NOTE To copy the selected object while stretching, press and hold the Ctrl key.
To stretch using more than one grip
1Select several objects to stretch.
2Hold down Shift and click several grips so that they are highlighted.
3Release Shift and select a grip as the base grip by clicking the grip.
The default grip mode, Stretch, is active.
4Move the pointing device and click.
The selected grips act in unison and the selected objects are stretched.
To move objects using grips
1Select the objects to move.
2Select a base grip on an object by clicking the grip.
The selected grip is highlighted, and Stretch, the default grip mode, is
active.
3Cycle through the grip modes by pressing Enter until the grip mode Move
appears.
Alternatively, you can right-click to display a shortcut menu of modes
and options.
732 | Chapter 19 Change Existing Objects

4Move the pointing device and click.
The selected objects are moved along with the grip.
NOTE To copy the selected object while moving, press and hold the Ctrl key.
To rotate objects using grips
1Select the objects to rotate.
2Select a base grip on an object by clicking the grip.
The selected grip is highlighted, and Stretch, the default grip mode, is
active.
3Cycle through the grip modes by pressing Enter until the grip mode
Rotate appears.
Alternatively, you can right-click to display shortcut menu modes and
options.
4Move the pointing device and click.
The selected objects are rotated around the base grip.
NOTE To copy the selected object while rotating, press and hold the Ctrl key.
To scale objects using grips
1Select the objects to scale.
2Select a base grip on an object by clicking the grip.
The selected grip is highlighted, and Stretch, the default grip mode, is
active.
3Cycle through the grip modes by pressing Enter until the grip mode Scale
appears.
Alternatively, you can right-click to display shortcut menu modes and
options.
4Enter the scale factor or drag and click to specify a new scale.
NOTE To copy the selected object while scaling, press and hold the Ctrl key.
To mirror objects using grips
1Select the objects to mirror.
Edit Objects with Grips | 733
2Select a base grip on an object by clicking the grip.
The selected grip is highlighted, and the default grip mode, Stretch, is
active.
3Cycle through the grip modes by pressing Enter until the grip mode
Mirror appears.
Alternatively, you can right-click to display shortcut menu modes and
options.
4Click to specify the second point of the mirror line.
Turning on Ortho mode is often useful when mirroring objects.
Quick Reference
OPTIONS
Customizes the program settings.
GRIPBLOCK
Controls the display of grips in blocks.
GRIPCOLOR
Controls the color of unselected grips.
GRIPCONTOUR
Controls the color of the grip contour.
GRIPHOT
Controls the color of selected grips.
GRIPHOVER
Controls the fill color of an unselected grip when the cursor pauses over it.
GRIPOBJLIMIT
Suppresses the display of grips when the selection set includes more than
the specified number of objects.
GRIPS
Controls the display of grips on selected objects.
GRIPSIZE
Sets the size of the grip box in pixels.
734 | Chapter 19 Change Existing Objects

GRIPTIPS
Controls the display of grip tips and Ctrl-cycling tooltips.
Modify Objects with Multi-Functional Grips
Modify polylines, splines, and non-associative polyline hatch objects with
multi-functional grips.
Control the display of these grips with the GRIPS system variable.
With multi-functional grips, you can
■Modify the position, size, and orientation of objects. Use Grip modes on
page 729 to move, rotate, scale, or mirror objects.
■Reshape Objects. Use the multi-functional grip-editing options to edit
vertices, fit points, control points, segment types, and tangent directions.
To activate a multi-functional grip, select the grip, or hover over it and choose
a multi-functional grip-editing option from the dynamic menu. Once a grip
is active, change the grip behavior with the Hot Grip shortcut menu, or by
cycling through options as follows:
■Press Enter or Spacebar to cycle through the Grip modes
■Press Ctrl to cycle through the multi-functional grip-editing options.
NOTE If the object is constrained, the first Ctrl relaxes constraints.
Control the access methods to multi-functional grips with the
GRIPMULTIFUNCTIONAL system variable.
To reshape an object with multi-functional grips
1Select a polyline, spline, or non-associative polyline hatch object.
2Hover the cursor over a multi-functional grip.
3From the dynamic menu, click a multi-functional grip-editing option.
4While manipulating the grip, press Ctrl to cycle through the other
multi-functional grip-editing options.
Edit Objects with Grips | 735
Quick Reference
OPTIONS
Customizes the program settings.
GRIPBLOCK
Controls the display of grips in blocks.
GRIPCOLOR
Controls the color of unselected grips.
GRIPCONTOUR
Controls the color of the grip contour.
GRIPHOT
Controls the color of selected grips.
GRIPHOVER
Controls the fill color of an unselected grip when the cursor pauses over it.
GRIPOBJLIMIT
Suppresses the display of grips when the selection set includes more than
the specified number of objects.
GRIPS
Controls the display of grips on selected objects.
GRIPSIZE
Sets the size of the grip box in pixels.
GRIPTIPS
Controls the display of grip tips and Ctrl-cycling tooltips.
GRIPMULTIFUNCTIONAL
Specifies the access methods to multi-functional grips.
Make Multiple Copies with Grips
You can create multiple copies of objects as you modify them with any of the
grip modes.
736 | Chapter 19 Change Existing Objects
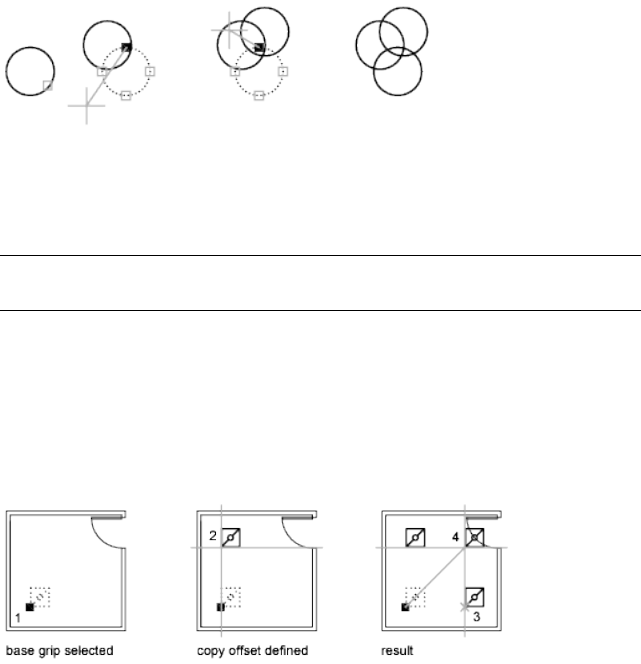
For example, by using the Copy option, you can rotate the selected objects,
leaving copies at each location you specify with the pointing device.
You can also make multiple copies by holding down Ctrl as you select the
first point. For example, with the Stretch grip mode, you can stretch an object,
such as a line, and then copy it to any point in the drawing area. Multiple
copies continue being made until you turn off grips.
NOTE When you use grips to make multiple copies of an object that contains
multiple , only the current scale representation is copied.
Define an Offset Snap or a Rotation Snap
You can place multiple copies at regularly spaced intervals with an offset snap.
The offset snap is defined by the distance between an object and the next
copy. In the lighting layout below, the first copy of the light fixture symbol
is placed at an offset of two units. All subsequent copies are then placed two
units apart.
If you hold down Ctrl while you select multiple copy points with the pointing
device, the graphics cursor snaps to an offset point based on the last two points
you selected. In the illustration below, the midpoint of line 1 is at coordinate
8,5. Based on that midpoint, line 2 was copied using the Ctrl key and Stretch
grip mode; its midpoint is at 9,5. The third line snaps to an offset based on
the coordinate values 10,5.
Edit Objects with Grips | 737
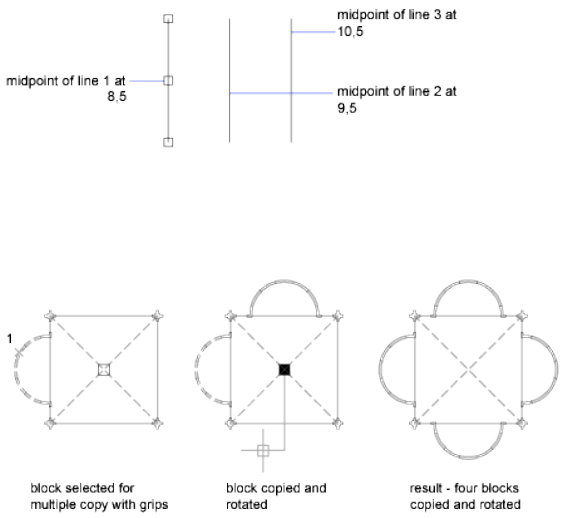
Similarly, you can place multiple copies at angular intervals around a base
grip with a rotation snap. The rotation snap is defined as the angle between
an object and the next copy when you are using Rotate grip mode. Hold down
Ctrl to use the rotation snap.
To create copies in any grip mode
1Select the objects to copy.
2Select a base grip on an object by clicking the grip.
The selected grip is highlighted, and the default grip mode, Stretch, is
active.
3Cycle through the grip modes by pressing Enter until the grip mode you
want appears.
Alternatively, you can right-click to display shortcut menu modes and
options.
4Enter c (Copy) or press and hold the Ctrl key while you stretch, move,
rotate, or scale.
Copies continue being made until you turn off grips.
5Enter or specify the additional input required for the current grip mode.
6Turn off grips by pressing Enter, Spacebar, or Esc.
738 | Chapter 19 Change Existing Objects
To create an offset snap for multiple copies using grips
1Select the objects to copy.
2Select a base grip on an object by clicking the grip.
The selected grip is highlighted, and the default grip mode, Stretch, is
active.
3Cycle through the grip modes by pressing Enter until the grip mode Move
appears.
Alternatively, you can right-click to display shortcut menu modes and
options.
4Enter c (Copy).
5Move the cursor and click.
The offset snap is the distance between the grip you selected and the
location you specified for the copy.
6Hold down Ctrl and place additional copies by specifying additional
locations.
These copies are created at the same offset snap distance as the last copy.
7Turn off grips by pressing Enter, Spacebar, or Esc.
To create a rotation snap for multiple rotated copies using grips
1Select the objects to rotate.
2Select a base grip on an object by clicking the grip.
The selected grip is highlighted, and the default grip mode, Stretch, is
active.
3Cycle through the grip modes by pressing Enter until the grip mode
Rotate appears.
Alternatively, you can right-click to display shortcut menu modes and
options.
4Enter c (Copy).
5Move the pointing device and click.
The rotation snap is the angle between the grip you selected and the
location you specified for the copy.
6Hold down Ctrl and place additional copies by specifying additional
locations.
Edit Objects with Grips | 739
These copies are created at the same rotation snap angle as the first copy.
7Turn off grips by pressing Enter, Spacebar, or Esc.
To mirror objects and retain the originals using grips
1Select the objects to mirror.
2Select a base grip on an object by clicking the grip.
The selected grip is highlighted, and the default grip mode, Stretch, is
active.
3Cycle through the grip modes by pressing Enter until the grip mode
Mirror appears.
Alternatively, you can right-click to display shortcut menu modes and
options.
4Hold down Ctrl (or enter c for Copy) to retain the original image, and
specify the second point of the mirror line.
Turning on Ortho mode is often useful when mirroring objects.
5Turn off grips by pressing Enter, Spacebar, or Esc.
Quick Reference
OPTIONS
Customizes the program settings.
GRIPBLOCK
Controls the display of grips in blocks.
GRIPCOLOR
Controls the color of unselected grips.
GRIPCONTOUR
Controls the color of the grip contour.
GRIPHOT
Controls the color of selected grips.
GRIPS
Controls the display of grips on selected objects.
740 | Chapter 19 Change Existing Objects
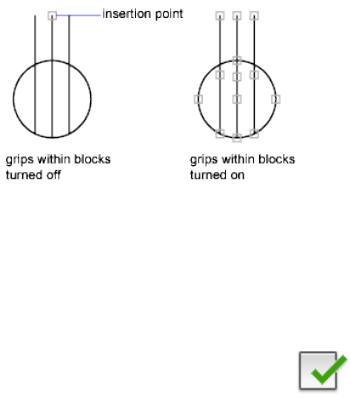
GRIPSIZE
Sets the size of the grip box in pixels.
Control Grips in Blocks
You can specify whether a block displays a single grip or multiple grips.
You can specify whether a selected block reference displays a single grip at its
insertion point or displays multiple grips associated with the objects grouped
within the block.
See also:
■Specify Grips for Dynamic Blocks on page 947
To turn grips within blocks on or off
1Click Tools menu ➤ Options.
2In the Options dialog box, Selection tab, select or clear Enable Grips
Within Blocks.
3Click OK.
Quick Reference
OPTIONS
Customizes the program settings.
GRIPBLOCK
Controls the display of grips in blocks.
Edit Objects with Grips | 741
GRIPCOLOR
Controls the color of unselected grips.
GRIPCONTOUR
Controls the color of the grip contour.
GRIPHOT
Controls the color of selected grips.
GRIPS
Controls the display of grips on selected objects.
GRIPSIZE
Sets the size of the grip box in pixels.
Move or Rotate Objects
You can move objects to a different location, or change the orientation of
objects by rotating them by an angle or to other objects.
Move Objects
You can move objects at a specified distance and direction from the originals.
Use coordinates, grid snap, object snaps, and other tools to move objects with
precision.
Specify Distance with Two Points
Move an object using the distance and direction specified by a base point
followed by a second point. In this example, you move the block representing
a window. Click Home tab ➤ Modify panel ➤ Move. Then select the object
to be moved (1). Specify the base point for the move (2) followed by a second
point (3). The object is moved the distance and direction of point 2 to point
3.
742 | Chapter 19 Change Existing Objects
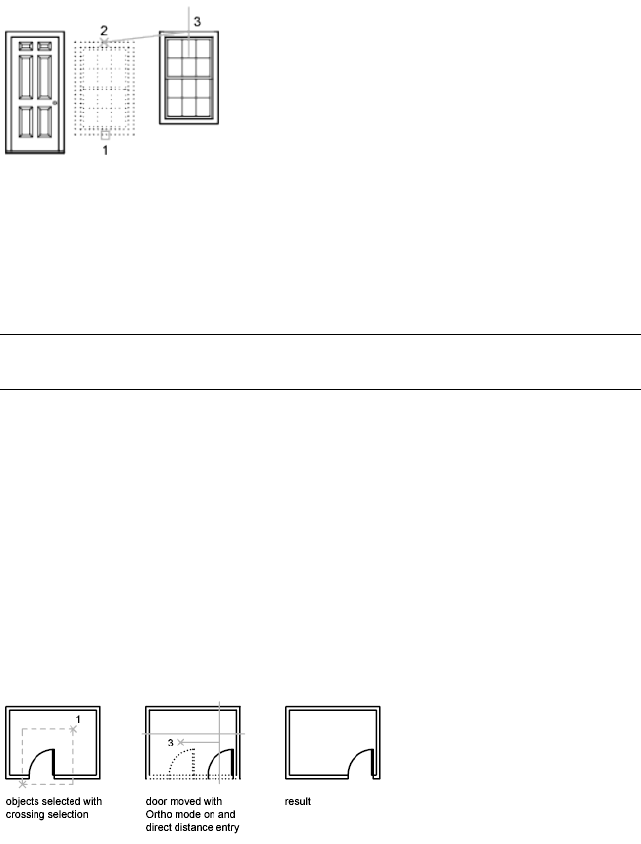
Specify Distance with Relative Coordinates
You can move an object using a relative distance by entering coordinate values
for the first point and pressing Enter for the second point. The coordinate
values are used as a relative displacement rather than the location of a base
point.
NOTE Do not include an @ sign as you normally would for relative coordinates,
because relative coordinates are expected.
To copy objects a specified distance, you can also use direct distance entry
with Ortho mode and polar tracking. For more information, see Enter Direct
Distances on page 613
Use a Stretch-Move
You can also use STRETCH to move objects if all their endpoints lie entirely
within the selection window. Turn on Ortho mode or polar tracking to move
the objects at a specific angle.
A practical example is moving a door in a wall. The door in the illustration is
entirely within a crossing selection, while the wall lines are only partly within
the crossing selection area.
The result is that only the endpoints that lie within the crossing selection
move.
Move or Rotate Objects | 743

Use Alternate Methods
You can use grips to move and copy objects quickly. See Edit Objects with
Grips on page 729.
You can also select objects and drag them to a new location; press Ctrl to make
a copy. Using this method, you can drag objects between open drawings and
other applications. If you drag with the right mouse button instead of the left,
a shortcut menu is displayed. The menu options include Move Here, Copy
Here, Paste as Block, and Cancel. See Embed OLE Objects in Drawings on page
1724.
To move an object using two points
1Click Home tab ➤ Modify panel ➤ Move.
2Select the objects to move.
3Specify a base point for the move.
4Specify a second point.
The objects you selected are moved to a new location determined by the
distance and direction between the first and second points.
To move an object using a displacement
1Click Home tab ➤ Modify panel ➤ Move.
2Select the object to move.
3Enter the displacement in the form of a Cartesian, polar, cylindrical, or
spherical coordinate value. Do not include the @ sign, because a relative
coordinate is assumed.
4At the prompt for the second point, press Enter.
The coordinate values are used as a relative displacement rather than the
location of a base point. The selected objects are moved to a new location
determined by the relative coordinate values you enter.
To move an object from model space to paper space (or vice versa)
1Click a layout tab.
744 | Chapter 19 Change Existing Objects
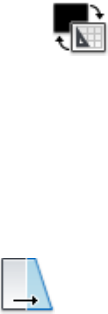
2Click Home tab ➤ Modify panel ➤ Change Space.
3Select one or more objects to move.
4Press Enter.
The object is moved to the new space, and is scaled appropriately to the
new space.
To move by stretching
1Click Home tab ➤ Modify panel ➤ Stretch.
2Select the object by using crossing selection.
The crossing selection must include at least one vertex or endpoint.
Specify crossing selection by clicking, moving your pointing device from
right to left, and clicking again.
3Do one of the following:
■Specify the base point for the move, and then specify a second point.
■Enter the displacement in the form of a Cartesian, polar, cylindrical,
or spherical coordinate value. Do not include the @ sign, because a
relative coordinate is assumed. At the prompt for the second point of
displacement, press Enter.
Any objects with at least one vertex or endpoint included within the
crossing selection are stretched. Any objects that are completely within
the crossing selection are moved without being stretched.
Quick Reference
CHSPACE
Moves objects between model space and paper space.
MOVE
Moves objects a specified distance in a specified direction.
PROPERTIES
Controls properties of existing objects.
Move or Rotate Objects | 745
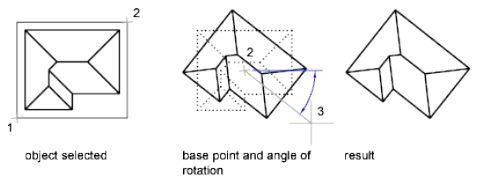
STRETCH
Stretches objects crossed by a selection window or polygon.
Direct Distance Entry (Command Modifier)
Locates the next point at a specified distance in the direction of your cursor.
Rotate Objects
You can rotate objects in your drawing around a specified base point.
To determine the angle of rotation, you can enter an angle value, drag using
the cursor, or specify a reference angle to align to an absolute angle.
Rotate an Object by a Specified Angle
Enter a rotation angle value from 0 to 360 degrees. You can also enter values
in radians, grads, or surveyor bearings. Entering a positive angle value rotates
the objects counterclockwise or clockwise, depending on the Direction Control
setting in the Drawing Units dialog box.
Rotate an Object by Dragging
Drag the object around the base point and specify a second point. Use Ortho
mode, polar tracking, or object snaps for greater precision.
For example, you can rotate the plan view of a house by selecting the objects
(1), specifying a base point (2), and specifying an angle of rotation by dragging
to another point (3).
Rotate an Object to an Absolute Angle
With the Reference option, you can rotate an object to align it to an absolute
angle.
For example, to rotate the part in the illustration so the diagonal edge rotates
to 90 degrees, you select the objects to be rotated (1, 2), specify the base point
746 | Chapter 19 Change Existing Objects
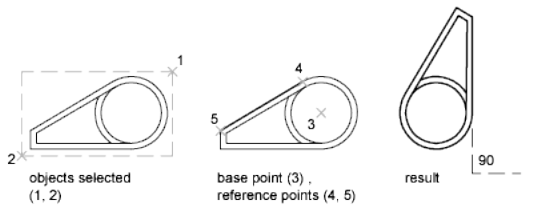
(3), and enter the Reference option. For the reference angle, specify the two
endpoints of the diagonal line (4, 5). For the new angle, enter 90.
Rotate an Object in 3D
To rotate 3D objects, you can use either ROTATE or ROTATE3D.
■With ROTATE, you can rotate objects around a specified base point. The
axis of rotation passes through the base point and is parallel to the Z axis
of the current UCS.
■With ROTATE3D, you can specify the axis of rotation using either two
points; an object; the X, Y, or Z axis; or the Z direction of the current view.
See also:
■Rotate Views in Layout Viewports on page 423
To rotate an object
1Click Home tab ➤ Modify panel ➤ Rotate.
2Select the object to rotate.
3Specify the base point for the rotation.
4Do one of the following:
■Enter the angle of rotation.
■Drag the object around its base point and specify a point location to
which you want to rotate the object.
■Enter c to create a copy of the selected objects.
■Enter r to rotate the selected objects from a specified reference angle
to an absolute angle.
Move or Rotate Objects | 747
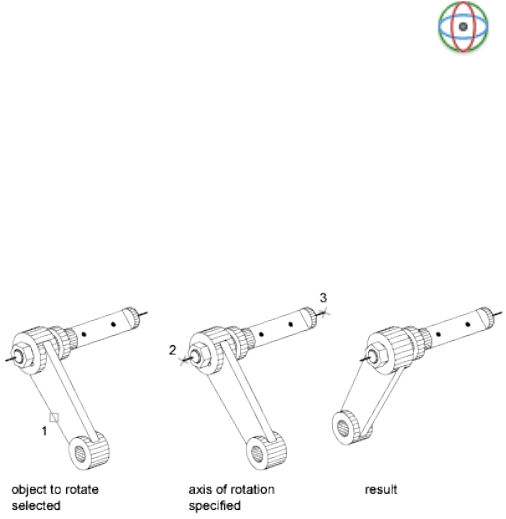
To rotate an object to an absolute angle
1Click Home tab ➤ Modify panel ➤ Rotate.
2Select the objects to rotate.
3Specify the base point for the rotation.
4Enter r (Reference).
5Enter a reference angle value or specify two point locations.
This determines an imaginary line that will be rotated to a new angle.
6Enter the new angle, or specify a point.
The value that you enter for the new angle is an absolute angle, not a
relative value. Alternatively, if you specify a point, the reference angle
will be rotated to that point.
To rotate a 3D object around an axis
1Click Modify menu ➤ 3D Operations ➤ Rotate 3D.
2Select the object to rotate (1).
3Specify the start point and endpoint of the axis about which the objects
are to be rotated (2 and 3).
The positive axis direction is from the start point to the end point, and
the rotation follows the right-hand rule (see Understand the User
Coordinate System in 3D on page 566).
4Specify the angle of rotation.
748 | Chapter 19 Change Existing Objects
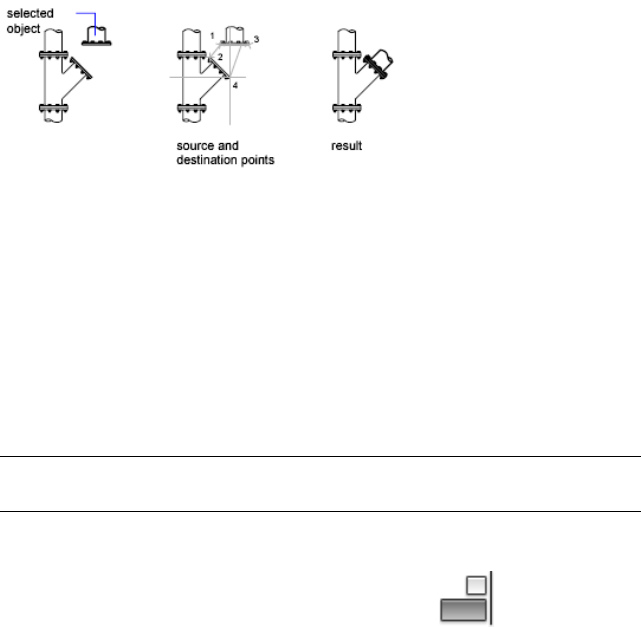
Quick Reference
ROTATE
Rotates objects around a base point.
ROTATE3D
Moves objects about a 3D axis.
Align Objects
You can move, rotate, or tilt an object so that it aligns with another object.
In the following example, two pairs of points are used to align the piping in
2D using the ALIGN command. Endpoint object snaps align the pipes precisely.
In 3D, use the 3DALIGN command to specify up to three points to define the
source plane followed by up to three points to define the destination plane.
■The first source point on an object, called the base point, is always moved
to the first destination point.
■Specifying a second point for either the source or the destination results
in the selected objects being rotated.
■A third point for either the source or the destination results in further
rotation of the selected objects.
TIP With 3D solid models, it is recommended that you turn on dynamic UCS to
speed the selection of the destination plane.
To align two objects in 2D
1Click Modify menu ➤ 3D Operations ➤ Align.
Move or Rotate Objects | 749

2Select the objects that you want to align.
3Specify a source point and then the corresponding destination point. To
rotate the object, specify a second source point followed by a second
destination point.
4Press Enter to end the command.
The selected objects are moved from the source point to the destination
point, and second and third points, if you specify them, rotate, and tilt
the selected objects.
To align two objects in 3D
1Click Home tab ➤ Modify panel ➤ 3D Align.
2Select the objects that you want to align.
3Specify either one, two, or three source points and then the corresponding
first, second, or third destination points. The first point is called the base
point.
The selected objects are moved from the source point to the destination
point, and second and third points, if you specify them, rotate, and tilt
the selected objects.
Quick Reference
3DALIGN
Aligns objects with other objects in 2D and 3D.
ALIGN
Aligns objects with other objects in 2D and 3D.
UCSDETECT
Controls whether dynamic UCS acquisition is active or not.
Copy, Offset, or Mirror Objects
You can create duplicates of objects in your drawing that are either identical
or similar to selected objects.
750 | Chapter 19 Change Existing Objects
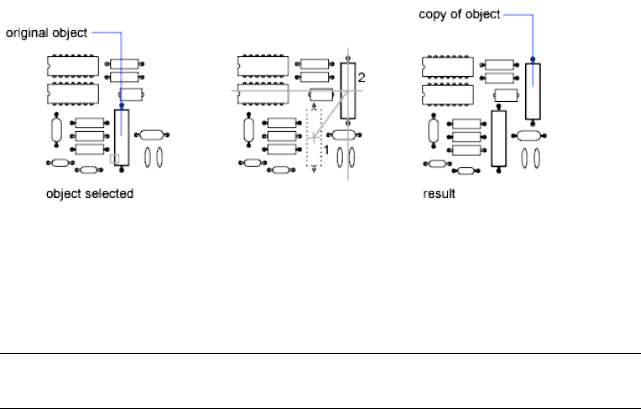
Copy Objects
You can create duplicates of objects at a specified distance and direction from
the originals.
Use coordinates, grid snap, object snaps, and other tools to copy objects with
precision.
You can also use grips to move and copy objects quickly. See Edit Objects with
Grips on page 729.
Specify Distance with Two Points
Copy an object using the distance and direction specified by a base point
followed by a second point. In this example, you copy the block representing
an electronic component. Click Edit menu ➤ Copy.Then select the original
object to be copied. Specify the base point for the move (1) followed by a
second point (2). The object is copied the distance and direction of point 1
to point 2.
Specify Distance with Relative Coordinates
Copy an object using a relative distance by entering coordinate values for the
first point and pressing Enter for the second point. The coordinate values are
used as a relative displacement rather than the location of a base point.
NOTE Do not include an @ sign as you normally would for relative coordinates,
because relative coordinates are expected.
To copy objects a specified distance, you can also use direct distance entry
with Ortho mode and polar tracking. For more information, see Enter Direct
Distances on page 613.
Copy, Offset, or Mirror Objects | 751
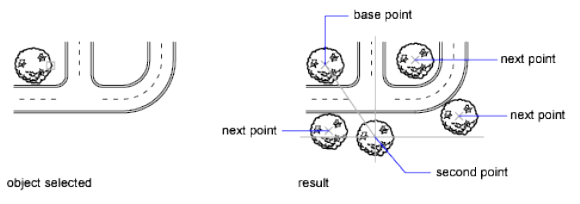
Create Multiple Copies
The COPY command repeats automatically by default. To exit the command,
press Enter. To change the default, use the COPYMODE system variable.
Move and Copy Objects by Dragging
You can also select objects and drag them to a new location using the left
mouse button over one of the selected objects; press Ctrl to make a copy.
Using this method, you can drag objects between open drawings and other
applications.
If you drag with the right mouse button instead of the left, a shortcut menu
is displayed after you drag the objects. The menu options include Move Here,
Copy Here, Paste as Block, and Cancel.
For information about using object linking and embedding, see Embed OLE
Objects in Drawings on page 1724.
To copy an object using two points
1Click Home tab ➤ Modify panel ➤ Copy.
2Select the objects to copy.
3Specify the base point.
4Specify the second point. Press Enter.
To create an object based on a selected object
1Select the object on which to base the new object.
2Right-click and select Add Selected.
3Follow the prompts to create an object similar to the selected object.
752 | Chapter 19 Change Existing Objects
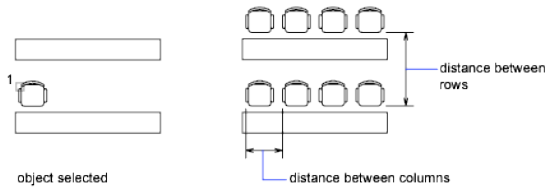
Quick Reference
ADDSELECTED
Creates a new object based on the object type and general properties of a
selected object.
COPY
Copies objects a specified distance in a specified direction.
COPYMODE
Controls whether the COPY command repeats automatically.
Create an Array of Objects
You can create copies of objects in a rectangular or polar (circular) pattern
called an array.
For rectangular arrays, you control the number of rows and columns and the
distance between each. For polar arrays, you control the number of copies of
the object and whether the copies are rotated. To create many regularly spaced
objects, arraying is faster than copying.
Create Rectangular Arrays
A rectangular array is built along a baseline defined by the current snap rotation
angle. This angle is zero by default, so the rows and columns of a rectangular
array are orthogonal with respect to the X and Y axes. The default angle 0
direction setting can be changed in UNITS.
Copy, Offset, or Mirror Objects | 753
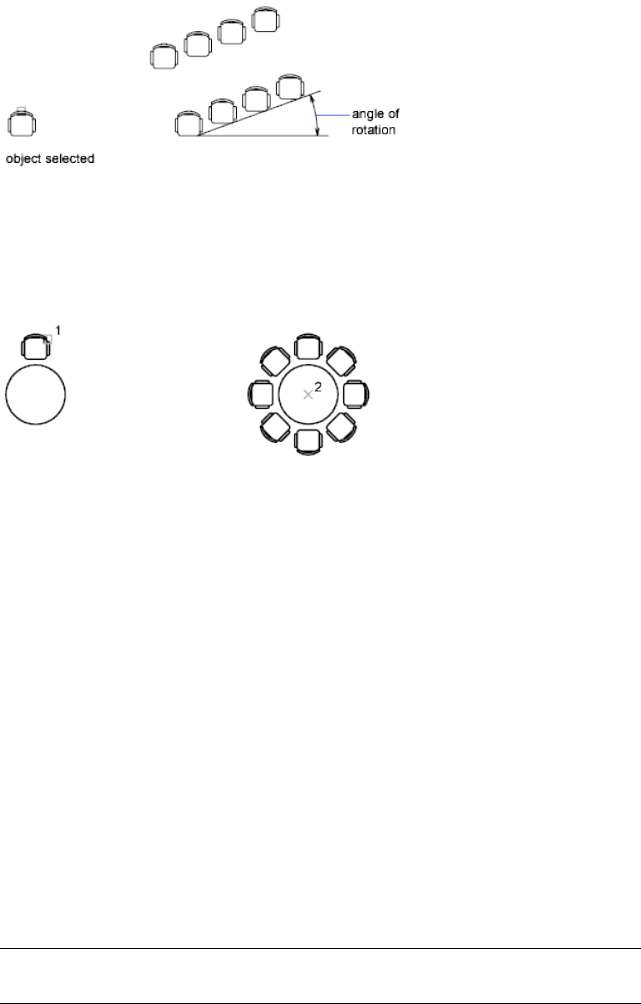
Create Polar Arrays
When you create a polar array, the array is drawn counterclockwise or
clockwise, depending on whether you enter a positive or a negative value for
the angle to fill.
The radius of the array is determined by the distance from the specified center
point to a reference or base point on the last selected object. You can use the
default reference point (usually an arbitrary point that coincides with a snap
point), or you can specify a new base point to be used as the reference point.
Array in 3D
With 3DARRAY, you can create a rectangular array or a polar array of objects
in 3D. In addition to specifying the number of columns (X direction) and rows
(Y direction), you also specify the number of levels (Z direction).
Limit the Size of Arrays
If you specify a very large number of rows and columns for an array, it may
take a long time to create the copies. By default, the number of array elements
that can be generated by one command is limited to approximately 100,000.
This limit is controlled by the MaxArray setting in the registry.
You can change the limit by setting the MaxArray system registry variable
using (setenv “MaxArray” “n”) where n is a number between 100 and 10000000
(ten million).
NOTE When changing the value of MaxArray, you must enter MaxArray with the
capitalization shown.
754 | Chapter 19 Change Existing Objects

To create a rectangular array
1Click Home tab ➤ Modify panel ➤ Array.
2In the Array dialog box, select Rectangular Array.
3Click Select Objects.
The Array dialog box closes. You are prompted for object selection.
4Select the objects to be arrayed and press Enter.
5In the Rows and Columns boxes, enter the number of rows and columns
in the array.
6Specify the horizontal and vertical spacing (offsets) between objects by
using one of the following methods:
■In the Row Offset and Column Offset boxes, enter the distance
between rows and between columns. Adding a plus sign (+) or a minus
sign (-) determines direction.
■Click the Pick Both Offsets button to use the pointing device to specify
the diagonal corners of a cell in the array. The cell determines the
vertical and horizontal spacing of the rows and columns.
■Click the Pick Row Offset or Pick Column Offset button to use the
pointing device to specify the horizontal and vertical spacing.
The example box displays the result.
7To change the rotation angle of the array, enter the new angle next to
Angle of Array.
8The default angle 0 direction setting can also be changed in UNITS.
9Click OK to create the array.
To create a polar array
1Click Home tab ➤ Modify panel ➤ Array.
2In the Array dialog box, select Polar Array.
3Next to Center Point, do one of the following:
■Enter an X value and a Y value for the center point of the polar array.
Copy, Offset, or Mirror Objects | 755

■Click the Pick Center Point button. The Array dialog box closes and
you are prompted for object selection. Use the pointing device to
specify the center point of the polar array.
4Click Select Objects.
The Array dialog box closes and you are prompted for object selection.
5Select the objects to be arrayed.
6In the Method box, select one of the following methods:
■Total Number of Items & Angle to Fill
■Total Number of Items & Angle Between Items
■Angle to Fill & Angle Between Items
7Enter the number of items (including the original object), if available.
8Use one of the following methods:
■Enter the angle to fill and angle between items, if available. Angle to
Fill specifies the distance to fill around the circumference of the array.
Angle Between Items specifies the distance between each item.
■Click the Pick Angle to Fill button and the Pick Angle Between Items
button. Use the pointing device to specify the angle to fill and the
angle between items.
The example box displays the result.
9You can set any of the following options:
■To rotate the objects as they are arrayed, select Rotate Items As Copied.
The example area displays the result.
■To specify the X,Y base point, select More, clear the Set to Object's
Default option and enter values in the X and Y boxes, or click the Pick
Base Point button and use the pointing device to specify the point.
10 Click OK to create the array.
To create a 3D rectangular array of objects
1Click Home tab ➤ Modify panel ➤ 3D Array.
2Select the object to array (1).
756 | Chapter 19 Change Existing Objects
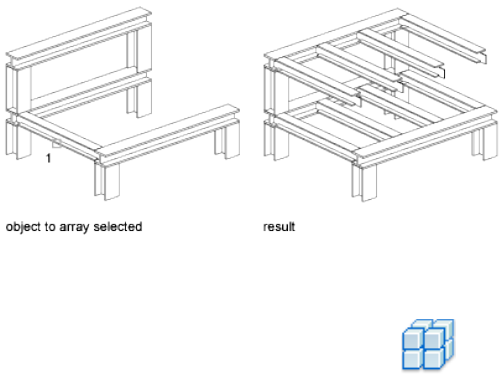
3Specify Rectangular.
4Enter the number of rows.
5Enter the number of columns.
6Enter the number of levels.
7Specify the distance between rows.
8Specify the distance between columns.
9Specify the distance between levels.
To create a 3D polar array of objects
1Click Home tab ➤ Modify panel ➤ 3D Array.
2Select the object to array (1).
3Specify Polar.
4Enter the number of items to array.
5Specify the angle that the arrayed objects are to fill.
6Press Enter to rotate the objects as they are arrayed, or enter n to retain
their orientation.
7Specify the start point and endpoint of the axis about which the objects
are to be rotated (2 and 3).
Copy, Offset, or Mirror Objects | 757
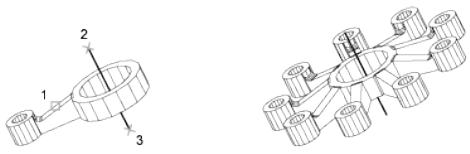
Quick Reference
3DARRAY
Creates a 3D matrix of objects in a rectangular or polar arrangement.
ARRAY
Creates multiple copies of objects in a pattern.
DSETTINGS
Sets grid and snap, polar and object snap tracking, object snap modes,
Dynamic Input, and Quick Properties.
UCS
Manages user coordinate systems.
UNITS
Controls coordinate and angle display formats and precision.
ANGBASE
Sets the base angle to 0 with respect to the current UCS.
ANGDIR
Sets the direction of positive angles.
SNAPANG
Sets the snap and grid rotation angle for the current viewport relative to the
current UCS.
Offset an Object
Offset an object to create a new object whose shape parallels the shape of the
original object.
758 | Chapter 19 Change Existing Objects
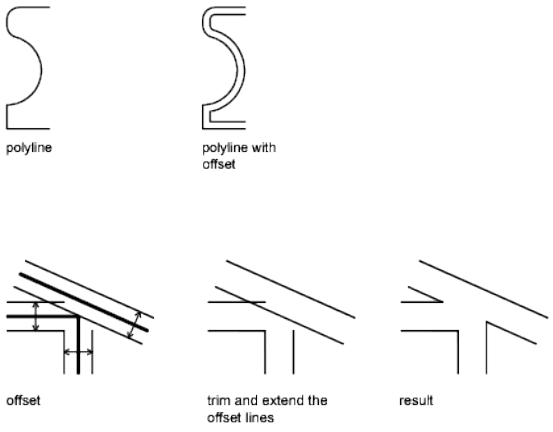
OFFSET creates a new object whose shape parallels the shape of a selected
object. Offsetting a circle or an arc creates a larger or smaller circle or arc,
depending on which side you specify for the offset.
A highly effective drawing technique is to offset objects and then trim or
extend their ends.
You can offset
■Lines
■Arcs
■Circles
■Ellipses and elliptical arcs (resulting in an oval-shaped spline)
■2D polylines
■Construction lines (xlines) and rays
■Splines
Special Cases for Offset Polylines and Splines
2D polylines and splines are trimmed automatically when the offset distance
is larger than can otherwise be accommodated.
Copy, Offset, or Mirror Objects | 759
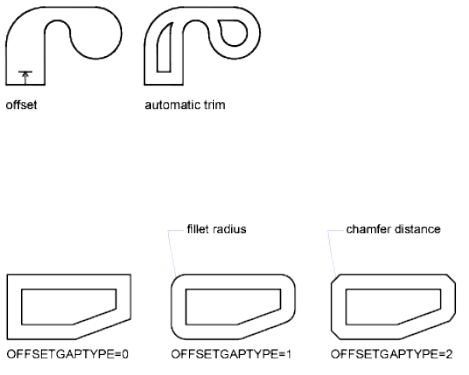
Closed 2D polylines that are offset to create larger polylines result in potential
gaps between segments. The OFFSETGAPTYPE system variable controls how
these potential gaps are closed.
To offset an object by specifying a distance
1Click Home tab ➤ Modify panel ➤ Offset.
2Specify the offset distance.
You can enter a value or use the pointing device.
3Select the object to offset.
4Specify a point on the side where you want to place the new objects.
5Select another object to offset, or press Enter to end the command.
To offset an object through a point
1Click Home tab ➤ Modify panel ➤ Offset.
2Enter t (Through).
3Select the object to offset.
4Specify the through point.
5Select another object to offset, or press Enter to end the command.
760 | Chapter 19 Change Existing Objects
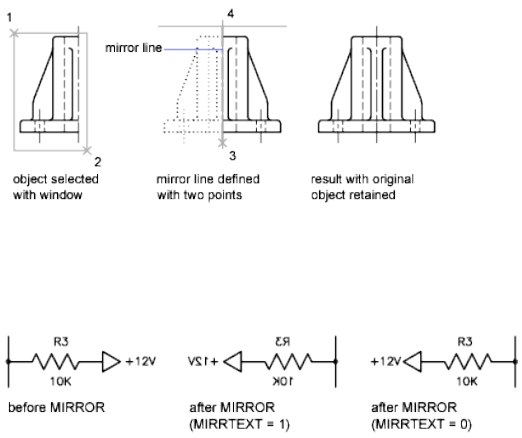
Quick Reference
OFFSET
Creates concentric circles, parallel lines, and parallel curves.
OFFSETDIST
Sets the default offset distance.
OFFSETGAPTYPE
Controls how potential gaps between segments are treated when closed
polylines are offset.
Mirror Objects
You can flip objects about a specified axis to create a symmetrical mirror image.
Mirroring is useful for creating symmetrical objects because you can quickly
draw half the object and then mirror it instead of drawing the entire object.
You flip objects about an axis called a mirror line to create a mirror image. To
specify this temporary mirror line, you enter two points. You can choose
whether to erase or retain the original objects.
By default, when you mirror text, hatches, attributes, and attribute definitions,
they are not reversed or turned upside down in the mirror image. The text
has the same alignment and justification as before the object was mirrored.
If you do want text to be reversed, set the MIRRTEXT system variable to 1.
Copy, Offset, or Mirror Objects | 761
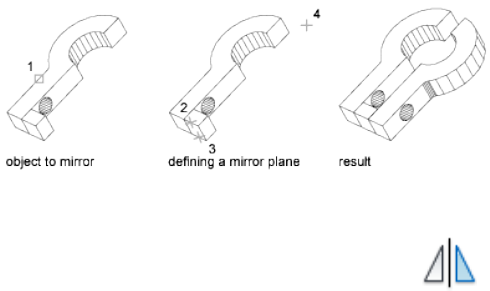
MIRRTEXT affects text that is created with the TEXT, ATTDEF, or MTEXT
commands; attribute definitions; and variable attributes. Text and constant
attributes that are part of an inserted block are reversed when the block is
mirrored regardless of the MIRRTEXT setting.
MIRRHATCH affects hatch objects created with the GRADIENT or HATCH
commands. Use the MIRRHATCH system variable control whether hatch
pattern direction is mirrored or retained.
Mirror in 3D
With MIRROR3D, you can mirror objects across a specified mirroring plane.
The mirroring plane can be one of the following:
■The plane of a planar object
■A plane parallel to the XY, YZ, or XZ plane of the current UCS that passes
through a specified point
■A plane defined by three specified points (2, 3, and 4)
To mirror objects in 2D
1Click Home tab ➤ Modify panel ➤ Mirror.
2Select the objects to mirror.
3Specify the first point of the mirror line.
4Specify the second point.
5Press Enter to retain the original objects, or enter y to erase them.
762 | Chapter 19 Change Existing Objects

To mirror objects in 3D
1Click Home tab ➤ Modify panel ➤ 3D Mirror.
2Select the object to mirror.
3Specify three points to define a mirroring plane.
4Press Enter to retain the original objects, or enter y to delete them.
Quick Reference
MIRROR
Creates a mirrored copy of selected objects.
MIRROR3D
Creates a mirrored copy of selected objects across a mirroring plane.
MIRRHATCH
Controls how MIRROR reflects hatch patterns.
MIRRTEXT
Controls how MIRROR reflects text.
Change the Size and Shape of Objects
There are several methods for adjusting the lengths of existing objects relative
to other objects, both symmetrically and asymmetrically.
Trim or Extend Objects
You can shorten or lengthen objects to meet the edges of other objects.
This means you can first create an object such as a line and then later adjust
it to fit exactly between other objects.
Objects you select as cutting edges or boundary edges are not required to
intersect the object being trimmed. You can trim or extend an object to a
projected edge or to an extrapolated intersection; that is, where the objects
would intersect if they were extended.
Change the Size and Shape of Objects | 763
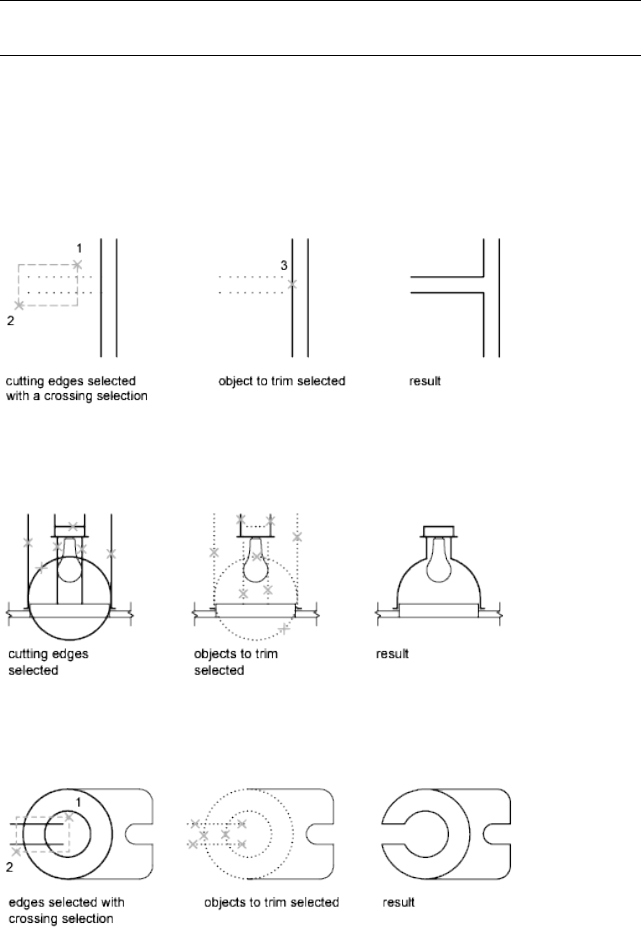
If you do not specify a boundary and press Enter at the Select Objects prompt,
all displayed objects become potential boundaries.
NOTE To select cutting edges or boundary edges that include blocks, you can
use only the single selection, Crossing, Fence, and Select All options.
Trim Objects
You can trim objects so that they end precisely at boundary edges defined by
other objects.
For example, you can clean up the intersection of two walls smoothly by
trimming.
An object can be one of the cutting edges and one of the objects being
trimmed. For example, in the illustrated light fixture, the circle is a cutting
edge for the construction lines and is also being trimmed.
When you trim several objects, the different selection methods can help you
choose the current cutting edges and objects to trim. In the following example,
the cutting edges are selected using crossing selection.
764 | Chapter 19 Change Existing Objects
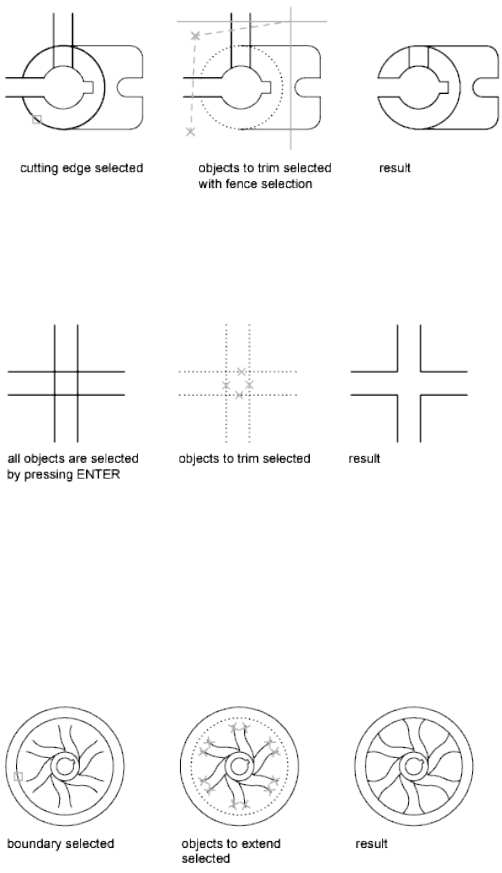
The following example uses the fence selection method to select a series of
objects for trimming.
You can trim objects to their nearest intersection with other objects. Instead
of selecting cutting edges, you press Enter. Then, when you select the objects
to trim, the nearest displayed objects act as cutting edges. In this example,
the walls are trimmed so that they intersect smoothly.
You can extend objects without leaving the TRIM command. Hold down Shift
and select the objects to be extended.
Extend Objects
Extending operates the same way as trimming. You can extend objects so they
end precisely at boundary edges defined by other objects. In this example,
you extend the lines precisely to a circle, which is the boundary edge.
You can trim objects without leaving the EXTEND command. Hold down
Shift and select the objects to be trimmed.
Change the Size and Shape of Objects | 765
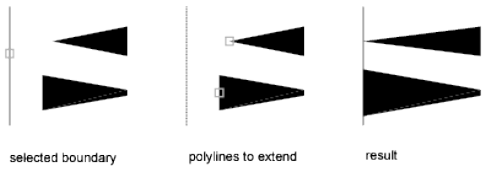
Trim and Extend Wide Polylines
2D wide polylines trim and extend at their centerlines. The ends of wide
polylines are always square. Trimming a wide polyline at an angle causes
portions of the end to extend beyond the cutting edge
If you trim or extend a tapered 2D polyline segment, the width of the extended
end is corrected to continue the original taper to the new endpoint. If this
correction gives the segment a negative ending width, the ending width is
forced to 0.
Trim and Extend Spline-Fit Polylines
Trimming a spline-fit polyline removes the curve-fit information and changes
the spline-fit segments into ordinary polyline segments.
Extending a spline-fit polyline adds a new vertex to the control frame for the
polyline.
Trim or Extend in 3D
You can trim or extend an object to any other object in 3D space, regardless
of whether the objects are on the same plane or parallel to the cutting or
boundary edges. In the TRIM and EXTEND commands, use the Project and
Edge options to select one of three projections for trimming or extending:
■The XY plane of the current UCS
■The plane of the current view
■True 3D, which is not a projection
See also:
■Break and Join Objects on page 783
766 | Chapter 19 Change Existing Objects
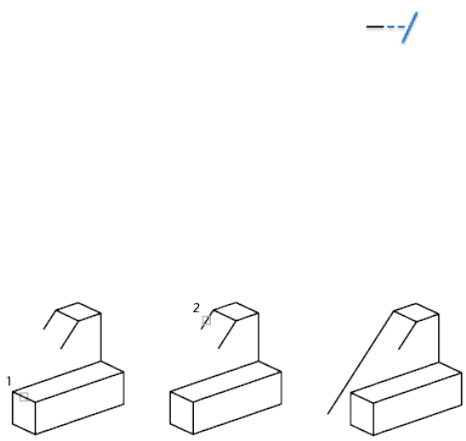
To extend an object
1Click Home tab ➤ Modify panel ➤ Extend.
2Select the objects to serve as boundary edges.
To select all displayed objects as potential boundary edges, press Enter
without selecting any objects.
3Select the objects to extend.
To trim an object
1Click Home tab ➤ Modify panel ➤ Trim.
2Select the objects to serve as cutting edges.
To select all displayed objects as potential cutting edges, press Enter
without selecting any objects.
3Select the objects to trim.
To extend objects in 3D wireframe models
1Click Home tab ➤ Modify panel ➤ Extend .
2Select the boundary edge for extending (1).
3Enter e (Edge).
4Enter e (Extend).
5Enter p (Project).
6Enter u (UCS).
7Select the object to extend (2).
Change the Size and Shape of Objects | 767
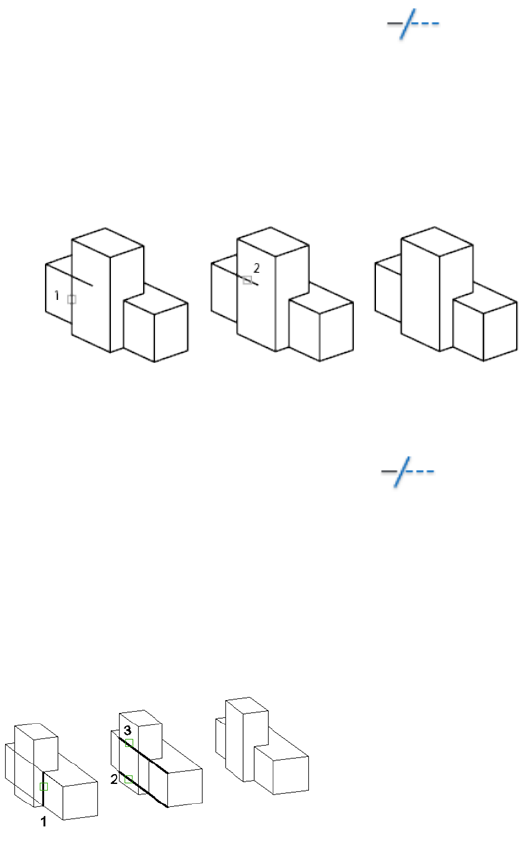
To trim in 3D using the current view plane
1Click Home tab ➤ Modify panel ➤ Trim .
2Select the cutting edge for trimming (1).
3Enter p (Project).
4Enter v (View).
5Select the object to trim (2).
To trim objects in 3D wireframe models
1Click Home tab ➤ Modify panel ➤ Trim .
2Select the cutting edges to use for trimming (1).
3Enter p (Project).
4Enter n (None).
5Select the object to trim (2 and 3).
768 | Chapter 19 Change Existing Objects
Quick Reference
BREAK
Breaks the selected object between two points.
EXTEND
Extends objects to meet the edges of other objects.
JOIN
Joins similar objects to form a single, unbroken object.
LENGTHEN
Changes the length of objects and the included angle of arcs.
PROPERTIES
Controls properties of existing objects.
TRIM
Trims objects to meet the edges of other objects.
EDGEMODE
Controls how the TRIM and EXTEND commands determine cutting and
boundary edges.
PROJMODE
Sets the current Projection mode for trimming or extending.
Resize or Reshape Objects
You can resize objects to make them longer or shorter in only one direction
or to make them proportionally larger or smaller.
You can also stretch certain objects by moving an endpoint, vertex, or control
point.
Lengthen Objects
With LENGTHEN, you can change the included angle of arcs and the length
of the following objects:
■Lines
■Arcs
Change the Size and Shape of Objects | 769
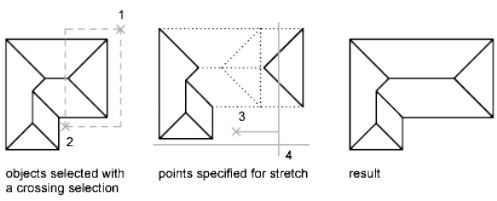
■Open polylines
■Elliptical arcs
■Open splines.
The results are similar to extending and trimming. You can
■Drag an object endpoint dynamically
■Specify a new length or angle as a percentage of the total length or angle
■Specify an incremental length or angle measured from an endpoint
■Specify the object's total absolute length or included angle
Stretch Objects
With STRETCH, you relocate the endpoints of objects that lie across or within
a crossing selection window.
■Objects that are partially enclosed by a crossing window are stretched.
■Objects that are completely enclosed within the crossing window, or that
are selected individually, are moved rather than stretched.
To stretch an object, you specify a base point and then a point of displacement.
To stretch with precision, use object snaps, grid snaps, and relative coordinate
entry.
Scale Objects Using a Scale Factor
With SCALE, you can make an object uniformly larger or smaller. To scale an
object, you specify a base point and a scale factor. Alternatively, you can
specify a length to be used as a scale factor based on the current drawing units.
770 | Chapter 19 Change Existing Objects
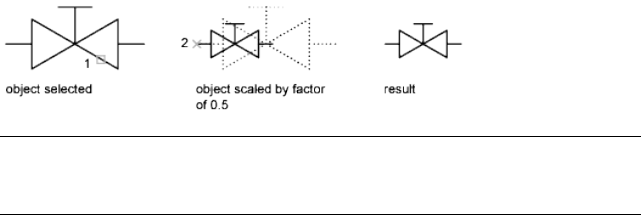
A scale factor greater than 1 enlarges the object. A scale factor between 0 and
1 shrinks the object.
Scaling changes the size of all dimensions of the selected object. A scale factor
greater than 1 enlarges the object. A scale factor less than 1 shrinks the object.
NOTE When you use the SCALE command with objects, the position or location
of the object is scaled relative to the base point of the scale operation, but the size
of the object is not changed.
Scale Objects Using a Reference Distance
You can also scale by reference. Scaling by reference uses an existing distance
as a basis for the new size. To scale by reference, specify the current distance
and then the new desired size. For example, if one side of an object is 4.8 units
long and you want to expand it to 7.5 units, use 4.8 as the reference length.
You can use the Reference option to scale an entire drawing. For example, use
this option when the original drawing units need to be changed. Select all
objects in the drawing. Then use Reference to select two points and specify
the intended distance. All the objects in the drawing are scaled accordingly.
See also:
■Break and Join Objects on page 783
To stretch an object
1Click Home tab ➤ Modify panel ➤ Stretch.
2Select the object using a crossing window selection.
The crossing window must include at least one vertex or endpoint.
3Do one of the following:
■Enter the displacement in the form of a relative Cartesian, polar,
cylindrical, or spherical coordinate. Do not include the @ sign, because
a relative coordinate is assumed. Press Enter at the prompt for the
second point of displacement.
Change the Size and Shape of Objects | 771

■Specify the base point for the stretch, and then specify a second point,
to determine the distance and direction.
Any objects with at least one vertex or endpoint included within the
crossing window are stretched. Any objects that are completely within
the crossing window, or selected individually, are moved without
stretching.
To scale an object by a scale factor
1Click Home tab ➤ Modify panel ➤ Scale.
2Select the object to scale.
3Specify the base point.
4Enter the scale factor or drag and click to specify a new scale.
To scale an object by reference
1Click Home tab ➤ Modify panel ➤ Scale.
2Select the object to scale.
3Select the base point.
4Enter r (Reference).
5Select the first and second reference points, or enter a value for the
reference length.
To change the length of an object by dragging
1Click Home tab ➤ Modify panel ➤ Lengthen.
2Enter dy (Dynamic Dragging mode).
3Select the object you want to lengthen.
4Drag the endpoint closest to the point of selection, and specify a new
endpoint.
The selected object is lengthened or shortened without changing its
location or orientation.
772 | Chapter 19 Change Existing Objects
Quick Reference
JOIN
Joins similar objects to form a single, unbroken object.
LENGTHEN
Changes the length of objects and the included angle of arcs.
PEDIT
Edits polylines and 3D polygon meshes.
PROPERTIES
Controls properties of existing objects.
SCALE
Enlarges or reduces selected objects, keeping the proportions of the object
the same after scaling.
SPLINEDIT
Edits a spline or spline-fit polyline.
STRETCH
Stretches objects crossed by a selection window or polygon.
PLINECONVERTMODE
Specifies the fit method used in converting splines to polylines.
Fillet, Chamfer, Break, or Join Objects
You can change objects to meet in rounded or flattened corners. You can also
create or close gaps in objects.
Create Fillets
A fillet connects two objects with an arc that is tangent to the objects and has
a specified radius.
Fillet, Chamfer, Break, or Join Objects | 773
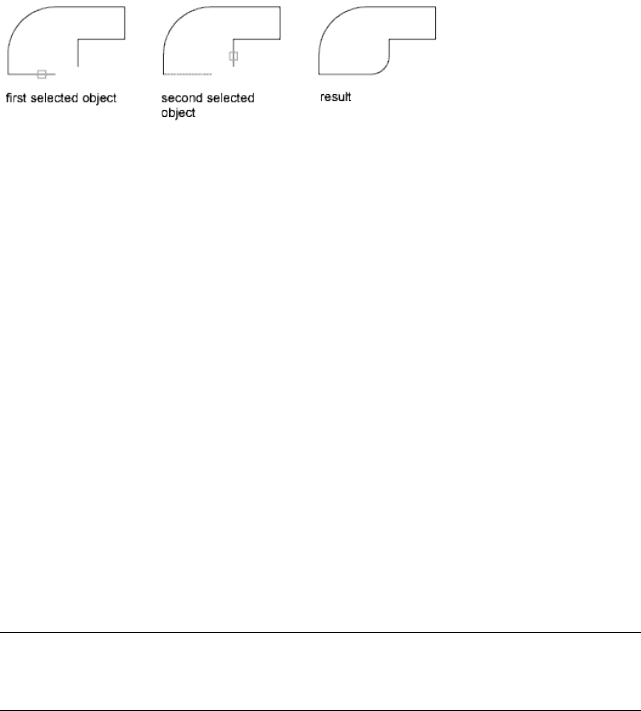
An inside corner is called a fillet and an outside corner is called a round; you
can create both using the FILLET command.
You can fillet
■Arcs
■Circles
■Ellipses and elliptical arcs
■Lines
■Polylines
■Rays
■Splines
■Xlines
■3D solids
FILLET can be used to round all corners on a polyline using a single command.
NOTE Filleting a hatch boundary that was defined from line segments removes
hatch associativity. If the hatch boundary was defined from a polyline, associativity
is maintained.
If both objects being filleted are on the same layer, the fillet arc is created on
that layer. Otherwise, the fillet arc is created on the current layer. The layer
affects object properties including color and linetype.
Use the Multiple option to fillet more than one set of objects without leaving
the command.
Set the Fillet Radius
The fillet radius is the radius of the arc that connects filleted objects. Changing
the fillet radius affects subsequent fillets. If you set the fillet radius to 0, filleted
objects are trimmed or extended until they intersect, but no arc is created.
774 | Chapter 19 Change Existing Objects
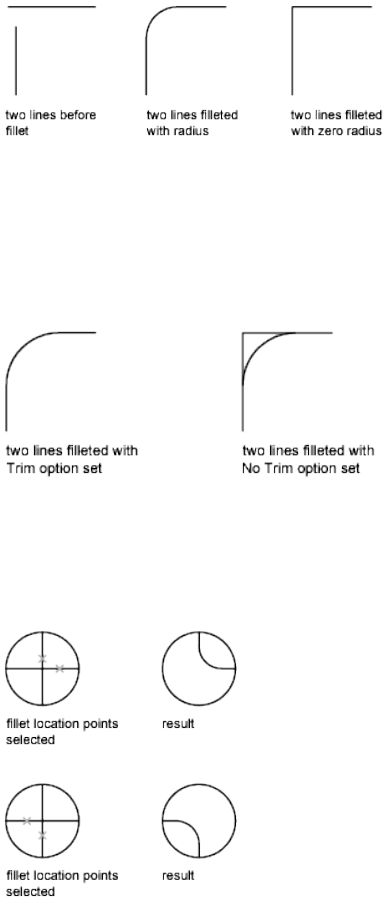
You can hold down Shift while selecting the objects to override the current
fillet radius with a value of 0.
Trim and Extend Filleted Objects
You can use the Trim option to specify whether the selected objects are
trimmed or extended to the endpoints of the resulting arc or left unchanged.
Control the Location of the Fillet
Depending on the locations you specify, more than one possible fillet can
exist between the selected objects. Compare the selection locations and
resulting fillets in the illustrations.
Fillet, Chamfer, Break, or Join Objects | 775
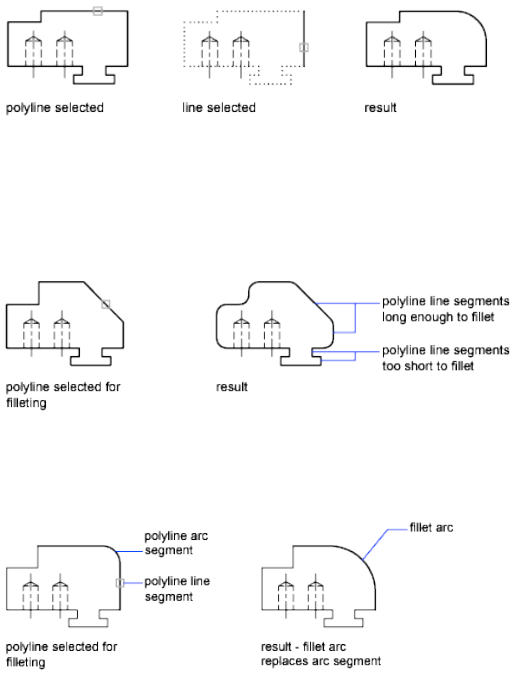
Fillet Line and Polyline Combinations
To fillet lines with polylines, each line or its extension must intersect one of
the polyline line segments. If the Trim option is on, the filleted objects and
the fillet arc join to form a single new polyline.
Fillet an Entire Polyline
You can fillet an entire polyline or remove fillets from an entire polyline.
If you set a nonzero fillet radius, FILLET inserts fillet arcs at the vertex of each
polyline segment that is long enough to accommodate the fillet radius.
If two polyline line segments converge as they approach an arc segment that
separates them, FILLET removes the arc segment and replaces it with a fillet
arc.
If you set the fillet radius to 0, no fillet arcs are inserted. If two polyline line
segments are separated by one arc segment, FILLET removes that arc and
extends the lines until they intersect.
Fillet Parallel Lines
You can fillet parallel lines, xlines, and rays. The current fillet radius
temporarily adjusts to create an arc that is tangent to both objects and located
in the plane common to both objects.
776 | Chapter 19 Change Existing Objects
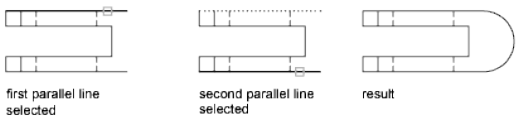
The first selected object must be a line or a ray, but the second object can be
a line, an xline, or a ray. The fillet arc connects as shown in the illustration.
Fillet Objects with Non-Zero Thickness in 3D
You can fillet coplanar objects with extrusion directions not parallel to the Z
axis of the current UCS. FILLET determines the extrusion direction for the
fillet arc in 3D space closest to the direction of the Z axis of the current UCS.
To set the fillet radius
1Click Home tab ➤ Modify panel ➤ Fillet.
2Enter r (Radius).
3Enter the fillet radius
4Select the objects to fillet.
To fillet two line segments
1Click Home tab ➤ Modify panel ➤ Fillet.
2Select the first line.
3Select the second line.
To fillet without trimming
1Click Home tab ➤ Modify panel ➤ Fillet.
2If necessary, enter t (Trim). Enter n (No Trim).
3Select the objects to fillet.
To fillet an entire polyline
1Click Home tab ➤ Modify panel ➤ Fillet.
2Enter p (Polyline).
3Select the polyline.
Fillet, Chamfer, Break, or Join Objects | 777
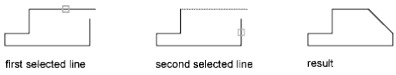
To fillet multiple sets of objects
1Click Home tab ➤ Modify panel ➤ Fillet.
2Enter m (Multiple).
The main prompt is displayed.
3Select the first line, or enter an option and complete the prompts for that
option. Select the first line.
4Select the second line.
The main prompt is displayed again.
5Select the first line for the next fillet, or press Enter or Esc to end the
command.
Quick Reference
FILLET
Rounds and fillets the edges of objects.
FILLETRAD
Stores the current fillet radius for 2D objects.
TRIMMODE
Controls whether selected edges for chamfers and fillets are trimmed.
Create Chamfers
A chamfer connects two objects to meet in a flattened or beveled corner.
A chamfer connects two objects with an angled line. It is usually used to
represent a beveled edge on a corner.
You can chamfer
■Lines
■Polylines
778 | Chapter 19 Change Existing Objects
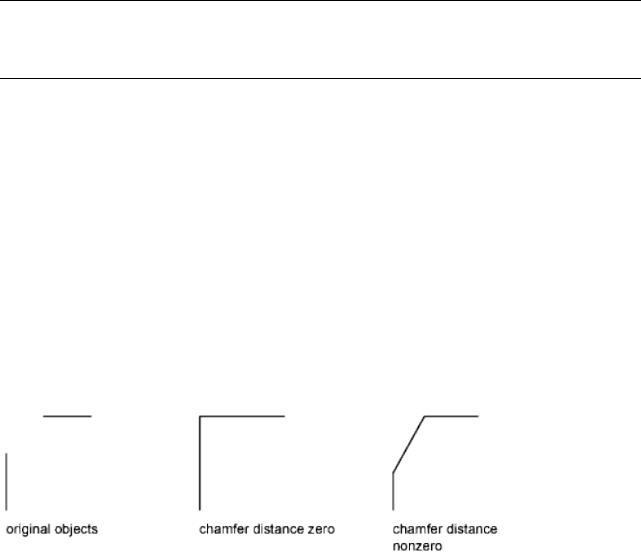
■Rays
■Xlines
■3D solids
CHAMFER can be used to bevel all corners of a polyline using a single
command.
NOTE Chamfering a hatch boundary that was defined from line segments removes
hatch associativity. If the hatch boundary was defined from a polyline, associativity
is maintained.
If both objects being chamfered are on the same layer, the chamfer line is
created on that layer. Otherwise, the chamfer line is created on the current
layer. The layer affects object properties including color and linetype.
Use the Multiple option to chamfer more than one set of objects without
leaving the command.
Chamfer by Specifying Distances
The chamfer distance is the amount each object is trimmed or extended to
meet the chamfer line or to intersect the other. If both chamfer distances are
0, chamfering trims or extends the two objects until they intersect but does
not create a chamfer line. You can hold down Shift while selecting the objects
to override the current chamfer distances with a value of 0.
In the following example, you set the chamfer distance to 0.5 for the first line
and 0.25 for the second line. After you specify the chamfer distance, you select
the two lines as shown.
Fillet, Chamfer, Break, or Join Objects | 779
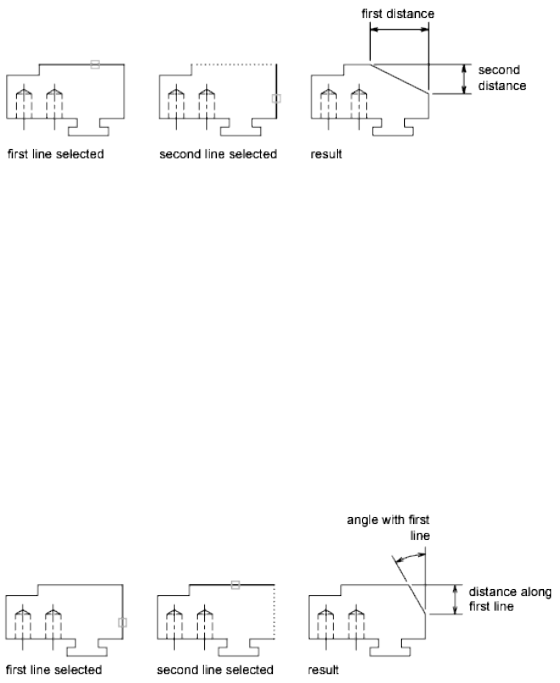
Trim and Extend Chamfered Objects
By default, objects are trimmed when chamfered, but you can use the Trim
option to specify that they remain untrimmed.
Chamfer by Specify Length and Angle
You can chamfer two objects by specifying where on the first selected object
the chamfer line starts, and then the angle the chamfer line forms with this
object.
In this example, you chamfer two lines so that the chamfer line starts 1.5
units from the intersection along the first line and forms an angle of 30 degrees
with this line.
Chamfer Polylines and Polyline Segments
If the two objects you select for chamfering are segments of a polyline, they
must be adjacent or separated by no more than one arc segment. If they are
separated by an arc segment, as shown in the illustration, chamfering deletes
the arc and replaces it with a chamfer line.
780 | Chapter 19 Change Existing Objects
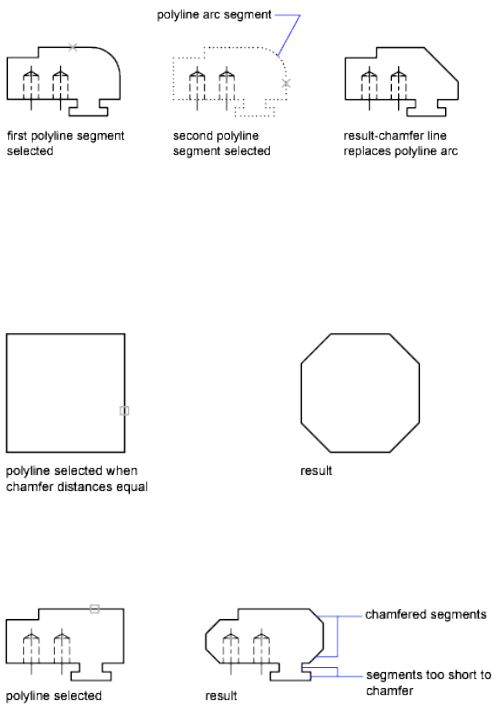
Chamfer an Entire Polyline
When you chamfer an entire polyline, each intersection is chamfered. For
best results, keep the first and second chamfer distances equal.
In this example, the chamfer distances are set to equal values.
When you chamfer an entire polyline, only the segments that are long enough
to accommodate the chamfer distance are chamfered. The polyline in the
following illustration has some segments too short to be chamfered.
To set chamfer distances
1Click Home tab ➤ Modify panel ➤ Chamfer.
2Enter d (Distances).
3Enter the first chamfer distance.
4Enter the second chamfer distance.
5Select the lines for chamfering.
Fillet, Chamfer, Break, or Join Objects | 781
To chamfer two nonparallel line segments
1Click Home tab ➤ Modify panel ➤ Chamfer.
2Select the first line.
3Select the second line.
To chamfer by specifying chamfer length and angle
1Click Home tab ➤ Modify panel ➤ Chamfer.
2Enter a (Angle).
3Enter the distance from the corner to be chamfered along the first line.
4Enter the chamfer angle.
5Select the first line. Then select the second line.
To chamfer without trimming
1Click Home tab ➤ Modify panel ➤ Chamfer.
2Enter t (Trim Control).
3Enter n (No Trim).
4Select the objects to chamfer.
To chamfer an entire polyline
1Click Home tab ➤ Modify panel ➤ Chamfer.
2Enter p (Polyline).
3Select the polyline.
The polyline is chamfered using the current chamfer method and the
default distances.
To chamfer multiple sets of objects
1Click Home tab ➤ Modify panel ➤ Chamfer.
2Enter m (Multiple).
The main prompt is displayed.
3Select the first line, or enter an option and complete the prompts for that
option and then select the first line.
782 | Chapter 19 Change Existing Objects
4Select the second line.
The main prompt is displayed again.
5Select the first line for the next chamfer, or press Enter or Esc to end the
command.
Quick Reference
CHAMFER
Bevels the edges of objects.
CHAMFERA
Sets the first chamfer distance when CHAMMODE is set to 0.
CHAMFERB
Sets the second chamfer distance when CHAMMODE is set to 0.
CHAMFERC
Sets the chamfer length when CHAMMODE is set to 1.
CHAMFERD
Sets the chamfer angle when CHAMMODE is set to 1.
CHAMMODE
Sets the input method for CHAMFER
TRIMMODE
Controls whether selected edges for chamfers and fillets are trimmed.
Break and Join Objects
You can break an object into two objects with or without a gap between them.
You can also join objects to make a single object.
Break Objects
Use BREAK to create a gap in an object, resulting in two objects with a gap
between them. BREAK is often used to create space for block or text.
Fillet, Chamfer, Break, or Join Objects | 783
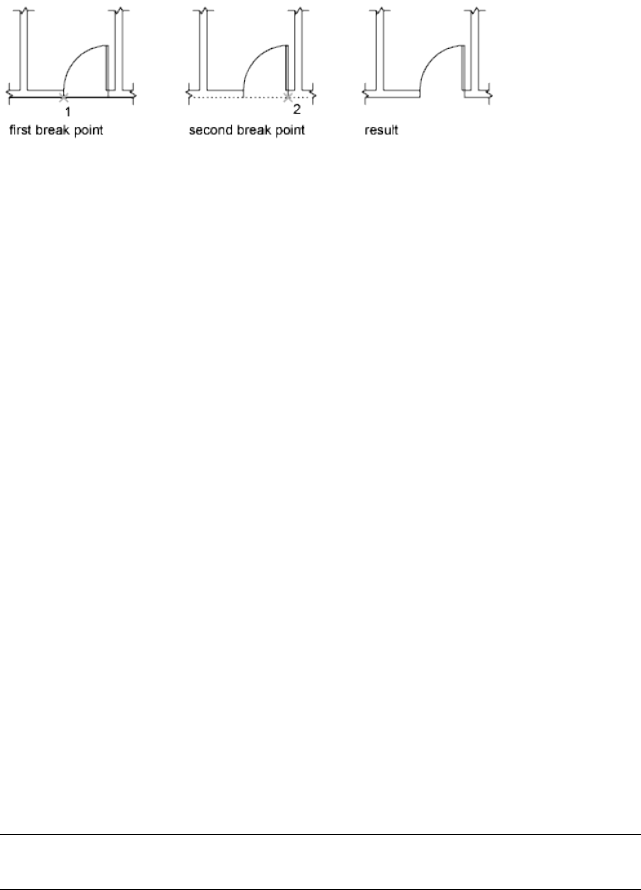
To break an object without creating a gap, specify both break points at the
same location. The fastest way to do this is to enter @0,0 at the prompt for
the second point.
You can create breaks in most geometric objects except
■Blocks
■Dimensions
■Mlines
■Regions
Join Objects
Use JOIN to combine similar objects into a single object. You can also create
complete circles and ellipses from arcs and elliptical arcs. You can join
■Arcs
■Elliptical arcs
■Lines
■Polylines
■Splines
The object to which you want to join similar objects is called a source object.
Objects to be joined must be located in the same plane. Additional restrictions
for each type of objects are described in the JOIN command.
NOTE When joining two or more arcs (or elliptical arcs), the arcs are joined
counterclockwise beginning from the source object.
See also:
■Modify Polylines on page 787
784 | Chapter 19 Change Existing Objects
■Modify Complex Objects on page 785
To break an object
1Click Home tab ➤ Modify panel ➤ Break.
2Select the object to break.
By default, the point at which you select the object is the first break point.
To select a different pair of break points, enter f (First) and specify the
first break point.
3Specify the second break point.
To break an object without creating a gap, enter @0,0 to specify the
previous point.
To join objects
1Click Home tab ➤ Modify panel ➤ Join.
2Select the source object to which you want to join objects.
3Select one or more objects to join to the source object.
Valid objects include arcs, elliptical arcs, lines, polylines, and splines.
Additional restrictions for each type of objects are described in the JOIN
command.
Quick Reference
BREAK
Breaks the selected object between two points.
JOIN
Joins similar objects to form a single, unbroken object.
Modify Complex Objects
Additional editing operations are available for complex objects, such as blocks,
dimensions, hatches, and polylines.
Modify Complex Objects | 785

Disassociate Compound Objects (Explode)
You can convert a compound object, such as a polyline, dimension, hatch,
or block reference, into individual elements.
You can explode a compound object, such as a polyline, dimension, hatch,
or block reference, to convert it into individual elements. For example,
exploding a polyline breaks it down to simple lines and arcs. Exploding a
block reference or an associative dimension replaces it with copies of the
objects that compose the block or dimension.
Explode Dimensions and Hatches
When you explode a dimension or a hatch, all associativity is lost and the
dimension or hatch object is replaced by individual objects such as lines, text,
points, and 2D solids. To explode dimensions automatically when you create
them, set the DIMASSOC system variable to 0.
Explode Polylines
When you explode a polyline, any associated width information is discarded.
The resulting lines and arcs follow the polyline's centerline. If you explode a
block that contains a polyline, you need to explode the polyline separately.
If you explode a donut, its width becomes 0.
Explode Block References
If you explode a block with attributes, the attribute values are lost, leaving
only the attribute definitions. The colors and linetypes of objects in exploded
block references can change.
Explode External References
An external reference (xref) is a drawing file linked (or attached) to another
drawing. You cannot explode xrefs and their dependent blocks.
To explode an object
1Click Home tab ➤ Modify panel ➤ Explode.
2Select the objects to be exploded.
For most objects, exploding has no visible effect.
786 | Chapter 19 Change Existing Objects
Quick Reference
EXPLODE
Breaks a compound object into its component objects.
XPLODE
Breaks a compound object into its component objects.
DIMASSOC
Controls the associativity of dimension objects and whether dimensions are
exploded.
EXPLMODE
Controls whether the EXPLODE command supports nonuniformly scaled
(NUS) blocks.
Modify Polylines
Change the shape and display of polyline objects with polyline editing options.
You can also join separate polylines.
For example, modify polylines in several ways using PEDIT, the Properties
palette, or grips.
■Move, add, or delete individual vertices
■Set a uniform width for the entire polyline or control the width of each
segment
■Create an approximation of a spline called a spline-fit polyline
■Display noncontinuous linetypes with or without a dash before and after
each vertex
■Change the orientation of text in a polyline’s linetype by reversing its
direction
Modify Polylines with Multi-Functional Grips
Polyline grips are multi-functional, providing context-sensitive options for
reshaping the polyline. Polyline segments have additional multi-functional
grips displayed at their midpoints. Control the display of these grips with the
GRIPS system variable.
Modify Polylines | 787

NOTE Multi-functional grips also support the standard Grip modes (Stretch, Move,
Rotate, Scale, and Mirror). For information on working with multi-functional grips,
see Modify Objects with Multi-Functional Grips on page 735.
The multi-functional grip-editing options that are available for polylines
depend on
■The grip’s location (vertex or midpoint)
■The segment type (line or arc)
■The type of Polyline (standard, curve-fit, or spline-fit)
Polyline multi-functional grip editing options
AnimationOption
Stretch or Stretch Vertex. Specify a
stretch point.
Add Vertex. Specify a point for the new
vertex.
Remove Vertex. Delete the selected ver-
tex.
Convert to Arc. Specify the midpoint of a
straight segment to convert it to an arc
segment.
Convert to Line. Specify the midpoint of
an arc segment to convert into a straight
segment.
Tangent Direction. Manipulate the tan-
gent directions to redefine the shape of a
curve-fit polyline.
Modify a Segment Within a Polyline
To select individual segments (or subobjects) of a polyline, press Ctrl while
clicking the segments. Use Grip modes and multi-functional grip-editing
options to modify the polyline segments. The GRIPSUBOBJMODE system
variable controls whether grips are automatically made hot when subobjects
are selected.
788 | Chapter 19 Change Existing Objects
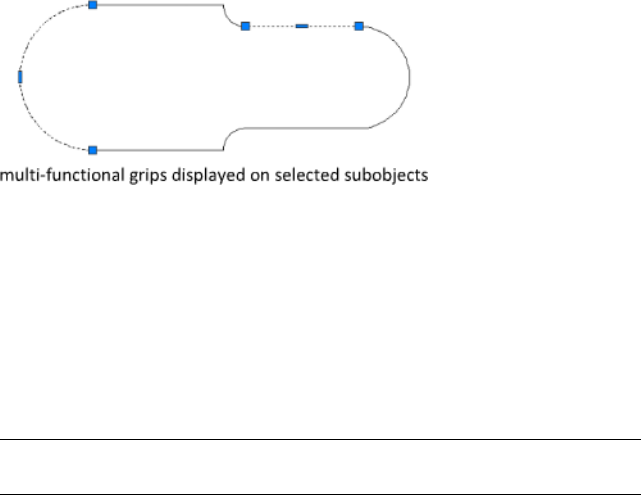
You can modify the width of individual segments with the Properties palette.
Changing any other property for a polyline segment affects the entire polyline.
Modify Polylines with Coincident Grips
Coincident grips are grips that are shared between multiple objects. When
polyline objects sharing the same grip are selected together, multi-functional
grip-editing options are not supported for the coincident grip. However, you
can still edit the coincident grip using the standard Grip modes (Stretch, Move,
Rotate, Scale, and Mirror).
NOTE Multi-functional grip-editing options for coincident grips are supported
when only one of the polyline objects is selected.
Join Polyline Segments
You can join a line, an arc, or another polyline to an open polyline if their
ends connect or are close to each other.
If the ends are not coincident but are within a distance that you can set, called
the fuzz distance, the ends are joined by either trimming them, extending
them, or connecting them with a new segment.
Spline-fit polylines return to their original shape when joined. Polylines cannot
be joined into a Y shape.
If the properties of several objects being joined into a polyline differ, the
resulting polyline inherits the properties of the first object that you selected.
See also:
■Choose a Method to Modify Objects on page 727
■Use Grip Modes on page 729
■Modify Objects with Multi-Functional Grips on page 735
■Overview of Constraints on page 803
Modify Polylines | 789
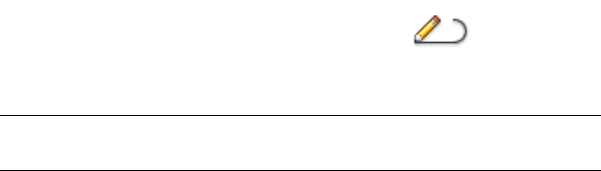
■Trim or Extend Objects on page 763
■Break and Join Objects on page 783
To modify a polyline
1Click Home tab ➤ Modify panel ➤ Edit Polyline.
2Select the polyline to modify.
NOTE To select a single arc or line segment, press Ctrl while clicking the
segment.
3If the selected object is a spline, line, or an arc, the following prompt is
displayed:
Object selected is not a polyline.
Do you want it to turn into one? <Y>: Enter y or n, or press Enter
If you enter y, the object is converted into a single-segment 2D polyline
that you can edit.
Before the selected spline is converted to a polyline, the following prompt
is displayed:
Specify a precision <10>: Enter a new precision value or press Enter
The PLINECONVERTMODE system variable determines whether the
polylines are created with linear or arc segments. When the PEDITACCEPT
system variable is set to 1, this prompt is suppressed, and the selected
object is automatically converted to a polyline.
4Edit the polyline by entering one or more of the following options:
■Enter c (Close) to create a closed polyline.
■Enter j (Join) to join contiguous lines, splines, arcs, or polylines.
■Enter w (Width) to specify a new uniform width for the entire polyline.
■Enter e (Edit Vertex) to edit a vertex.
■Enter f (Fit) to create an arc-fit polyline, a smooth curve consisting of
arcs joining each pair of vertices
■Enter s (Spline) to create an approximation of a spline.
790 | Chapter 19 Change Existing Objects

■Enter d (Decurve) to remove extra vertices inserted by a fit or spline
curve and to straighten all segments of the polyline.
■Enter L (Ltype Gen) to generate the linetype in a continuous pattern
through the vertices of the polyline.
■Enter r (Reverse) to reverse the order of vertices of the polyline.
■Enter u (Undo) to reverse actions back to the start of PEDIT.
5Enter x (Exit) to end a command option. Press Enter to exit the PEDIT
command.
To reverse lines, polylines, splines, or helixes
1Click Home tab ➤ Modify panel ➤ Reverse.
2Select a line, polyline, spline, or helix to reverse.
3Press Enter to end the command.
To join polylines, splines, lines, and arcs into a single polyline
1Click Home tab ➤ Modify panel ➤ Edit Polyline.
2Select a polyline, spline, line, or arc to edit. If you selected a spline, line,
or arc, press Enter to convert the selected object into a polyline.
3Enter j (Join).
4Select one or more polylines, splines, lines, or arcs that are located end
to end.
Each selected polyline, spline, line, or arc is now joined into a single
polyline.
5Press Enter to end the command.
To delete a vertex in a polyline
1Click Home tab ➤ Modify panel ➤ Edit Polyline.
2Select a polyline.
3Enter e (Edit vertex).
Modify Polylines | 791
The first vertex is marked with an X. Use the Next option to move the X
to the vertex preceding the one that you want to delete.
4Enter s (Straighten).
5Use the Next option to move the X to the vertex immediately following
the one that you want to delete.
6Enter g (Go).
The vertex on the polyline is deleted. The vertices on either side of the
deleted vertex are joined by a straight polyline segment.
7Enter x (Exit) to end editing vertices.
8Press Enter to end the command.
To taper the width of individual polyline segments
1Click Home tab ➤ Modify panel ➤ Edit Polyline.
2Select the polyline to edit.
3Enter e (Edit Vertex).
The first vertex is marked with an X. Move to the appropriate vertex with
Next or Previous.
4Enter w (Width).
5Enter new starting and ending widths, and press Enter to move to the
next vertex. Repeat steps 4 and 5 for each segment.
6Enter u (Undo) to reverse actions back to the start of PEDIT.
7Enter x (Exit) to end editing vertices.
8Press Enter to end the command.
Quick Reference
PEDIT
Edits polylines and 3D polygon meshes.
JOIN
Joins similar objects to form a single, unbroken object.
792 | Chapter 19 Change Existing Objects
REVERSE
Reverses the vertices of selected lines, polylines, splines, and helixes, which
is useful for linetypes with included text, or wide polylines with differing
beginning and ending widths.
GRIPS
Controls the color of selected grips.
GRIPMULTIFUNCTIONAL
Specifies the access methods to multi-functional grips.
GRIPSUBOBJMODE
Controls whether grips are automatically made hot when subobjects are
selected.
PEDITACCEPT
Suppresses display of the Object Selected Is Not a Polyline prompt in PEDIT.
PLINECONVERTMODE
Specifies the fit method used in converting splines to polylines.
SPLINESEGS
Sets the number of line segments to be generated for each spline-fit polyline
generated by the Spline option of the PEDIT command.
SPLINETYPE
Sets the type of curve generated by the Spline option of the PEDIT command.
SURFTYPE
Controls the type of surface-fitting to be performed by the Smooth option
of the PEDIT command.
SURFU
Sets the surface density for PEDIT Smooth in the M direction and the U
isolines density on surface objects.
Modify Polylines | 793
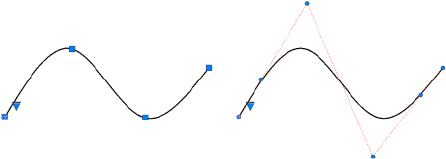
SURFV
Sets the surface density for PEDIT Smooth in the N direction and the V
isolines density on surface objects.
Modify Splines
See also:
■Draw Splines on page 679
■Break and Join Objects on page 783
■Create Solids and Surfaces from Lines and Curves on page 966
■Edit NURBS Surfaces on page 1155
■Rebuild NURBS Surfaces and Curves on page 1157
Modify splines with multi-functional grips or with SPLINEDIT.
Spline editing options are available through both multi-functional grips and
SPLINEDIT. These options include add, remove, stretch, refine, and change
the tangent direction. SPLINEDIT offers more editing options than the grips,
but, to save time, the most commonly-used options are available in the grips.
The grip editing options differ depending on whether the spline is displaying
control vertices (CV’s) or fit points. The spline below displays fit point grips
on the left, and CV grips on the right.
To switch between the fit point grips and the CV grips, click the triangular
grip.
794 | Chapter 19 Change Existing Objects
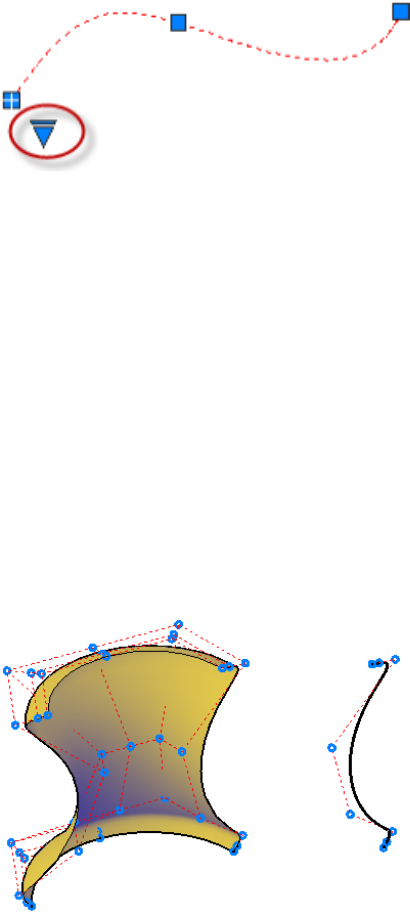
In general, editing a spline with CVs allows you to reshape a small area of the
curve, while editing the spline with fit points allows you to reshape the entire
curve. Depending on the degree of the curve, the spline only changes through
a given set of CVs and you can add more CVs to obtain greater control for a
given area of the spline (the refine option). Mathematically, fit points affect
the entire spline and force the curve to pass through specific points.
To display the grip-editing options, hover over the CV and fit point grips, or
select a grip and press Ctrl to cycle through the options. For more information,
see Modify Objects with Multi-Functional Grips on page 735.
Use Splines to Create 3D NURBS Surfaces
Splines are one of the many 2D object types that can be lofted, extruded,
swept, and revolved to create NURBS surfaces. Other 2D objects that can be
used include lines, polylines, arcs, and circles. Splines, however, are the only
2D object customized to create NURBS surfaces. Because they allow you to
adjust tolerance, degree, and tangency, they are better suited than other types
of 2D profiles (line, plines, circles) for surface modeling.
Modify Splines | 795

Many of the same commands used with NURBS surfaces, can also be used
with CV splines. These include:
■CVADD
■CVREMOVE
■CVREBUILD
■CVSHOW
■CVHIDE
For more information, see Create Solids and Surfaces from Lines and Curves
on page 966.
NOTE Because periodic curves on page 2174 and surfaces on page 2174 are not
currently supported, the objects may kink if they are reshaped.
To convert a spline to a polyline
1Click Home tab ➤ Modify panel ➤ Edit Spline.
2Select the spline to convert.
3Enter p to convert to Polyline.
4Specify a precision value or press Enter to end the command.
Quick Reference
Commands
CVSHOW
Displays the control vertices for specified NURBS surfaces or curves.
CVADD
Adds control vertices to NURBS surfaces and splines.
CVHIDE
Turns off the display of control vertices for all NURBS surfaces and curves.
CVREBUILD
Rebuilds the shape of NURBS surfaces and curves.
796 | Chapter 19 Change Existing Objects
CVREMOVE
Removes control vertices from NURBS surfaces and curves.
JOIN
Joins similar objects to form a single, unbroken object.
SPLINE
Creates a smooth curve that passes through fit points or near control vertices.
SPLINEDIT
Edits a spline or spline-fit polyline.
REVERSE
Reverses the vertices of selected lines, polylines, splines, and helixes, which
is useful for linetypes with included text, or wide polylines with differing
beginning and ending widths.
System Variables
GRIPS
Controls the display of grips on selected objects.
PLINECONVERTMODE
Specifies the fit method used in converting splines to polylines.
Modify Helixes
You can use grips or the Properties palette to modify the shape and size of a
helix.
You can use the grips on a helix to change the following properties:
■Start point
■Base radius
■Top radius
■Height
■Location
Modify Helixes | 797

When you use a grip to change the base radius of a helix, the top radius scales
to maintain the current ratio. Use the Properties palette to change the base
radius independent of the top radius.
You can use the Properties palette to change other helix properties, such as
■Number of turns (Turns)
■Turn height
■Direction of the twist — clockwise (CW) or counterclockwise (CCW)
With the Constrain property, you can specify that the Height, Turns, or Turn
Height properties of the helix are constrained. The Constrain property affects
how the helix changes when the Height, Turns, or Turn Height properties are
changed either through the Properties palette or through grip editing. The
table below shows the behavior of the helix depending on which property is
constrained.
Effect on these helix propertiesProperty to
change
Constrained
property
Turn HeightTurnsHeight
ChangedFixedChangedHeightHeight
ChangedChangedFixedTurns
ChangedChangedFixedTurn Height
ChangedFixedChangedHeightTurns
ChangedChangedFixedTurns
ChangedFixedChangedTurn Height
FixedChangedChangedHeightTurn Height
FixedChangedChangedTurns
ChangedChangedFixedTurn Height
See also:
■Draw Helixes on page 682
798 | Chapter 19 Change Existing Objects
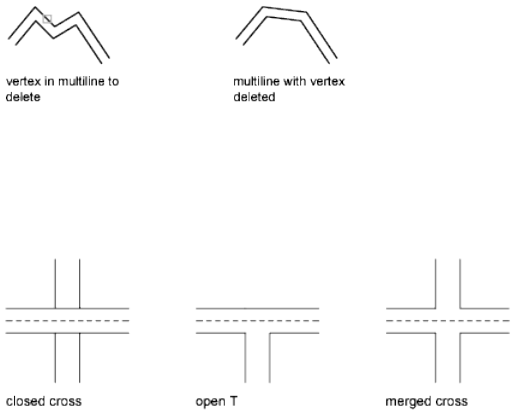
Quick Reference
HELIX
Creates a 2D spiral or 3D spring.
Modify Multilines
Multiline objects are composed of 1 to 16 parallel lines, called elements. To
modify multilines or their elements, you can use common editing commands,
a multiline editing command, and multiline styles.
Special multiline editing features are available with the MLEDITcommand
including the following:
■Add or delete a vertex
■Control the visibility of corner joints
■Control the style of intersection with other multilines
■Open or close gaps in a multiline object
Add and Delete Multiline Vertices
You can add or delete any vertex in a multiline.
Edit Multiline Intersections
If you have two multilines in a drawing, you can control the way they intersect.
Multilines can intersect in a cross or a T shape, and the crosses or T shapes
can be closed, open, or merged.
Modify Multilines | 799

Edit Multiline Styles
You can use MLSTYLE to edit multiline styles to change the properties of
multiline elements or the end caps and background fill of subsequently created
multilines.
Multiline styles control the number of line elements in a multiline and the
color, linetype, lineweight, and offset of each element. You can also modify
the display of joints, end caps, and background fill.
Multiline styles have the following limitations:
■You cannot edit the element and multiline properties of the STANDARD
multiline style or any multiline style already used in the drawing.
■To edit an existing multiline style, you must do so before you draw any
multilines in that style.
NOTE If you use MLSTYLE to create a multiline style without saving it, and then
select another style or create a new style, the first MLSTYLE properties are lost. To
maintain the properties, save each multiline style to an MLN file before creating
a new one.
Use Common Editing Commands on Multilines
You can use most of the common editing commands on multilines except
■BREAK
■CHAMFER
■FILLET
■LENGTHEN
■OFFSET
To perform these operations, first use EXPLODE to replace the multiline object
with separate line objects.
NOTE If you trim or extend a multiline object, only the first boundary object
encountered determines the shape of the end of the multiline. A multiline cannot
have a complex boundary at its endpoint.
See also:
■Draw Multiline Objects on page 657
800 | Chapter 19 Change Existing Objects

To delete a vertex from a multiline
1Click Modify menu ➤ Object ➤ Multiline.
2In the Multiline Edit Tools dialog box, select Delete Vertex.
3In the drawing, specify the vertex to delete. Press Enter.
To create a closed cross intersection
1Click Modify menu ➤ Object ➤ Multiline.
2In the Multiline Edit Tools dialog box, select Closed Cross.
3Select the multiline for the foreground.
4Select the multiline for the background.
The intersection is modified. You can continue selecting intersecting
multilines to modify, or press Enter to end the command. Press Enter
again to redisplay the Multiline Edit Tools dialog box.
To edit a multiline style
1Click Format menu ➤ Multiline Style.
2In the Multiline Styles dialog box, select the style name from the list.
Click Modify.
3Click Element Properties.
4In the Modify Multiline Styles dialog box, change the settings as needed.
5Click OK.
6In the Multiline Styles dialog box, click Save to save the changes to the
style in the MLN file.
7Click OK.
Quick Reference
MLEDIT
Edits multiline intersections, breaks, and vertices.
Modify Multilines | 801
MLSTYLE
Creates, modifies, and manages multiline styles.
802 | Chapter 19 Change Existing Objects
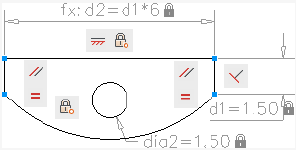
Add Constraints to
Geometry
With parametric drawing, you can add constraints to geometry to ensure that the design
conforms to specified requirements.
Overview of Constraints
Parametric drawing is a technology that is used for designing with constraints.
Constraints are associations and restrictions applied to 2D geometry.
There are two general types of constraints:
■Geometric constraints control the relationships of objects with respect to each
other
■Dimensional constraints control the distance, length, angle, and radius values
of objects
The following illustration displays geometric and dimensional constraints using
the default format and visibility.
A blue cursor icon always displays when you move the cursor over an object
that has constraints applied to it.
20
803
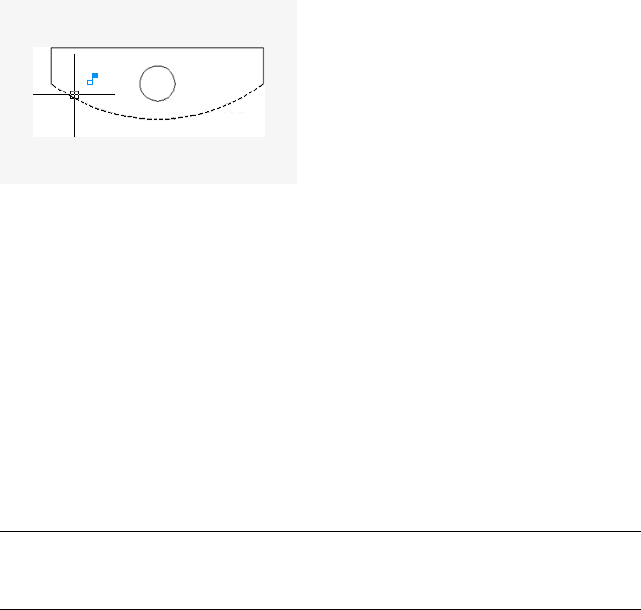
In the design phase of a project, constraints provide a way to enforce
requirements when experimenting with different designs or when making
changes. Changes made to objects can adjust other objects automatically, and
restrict changes to distance and angle values.
With constraints, you can
■Maintain design specifications and requirements by constraining the
geometry within a drawing
■Apply multiple geometric constraints to objects instantly
■Include formulas and equations within dimensional constraints
■Make design changes quickly by changing the value of a variable
BEST PRACTICE It is recommended that you first apply geometric constraints to
determine the shape of a design, and then apply dimensional constraints to
determine the size of objects in a design.
Design Using Constraints
When you are creating or changing a design, a drawing will be in one of three
states:
■Unconstrained. No constraints are applied to any geometry.
■Underconstrained. Some constraints are applied to the geometry.
■Fully constrained. All relevant geometric and dimensional constraints are
applied to the geometry. A fully constrained set of objects also needs to
include at least one Fix constraint to lock the location of the geometry.
804 | Chapter 20 Add Constraints to Geometry

Thus, there are two general methods for designing with constraints:
■You can work in an underconstrained drawing and make changes as you
go, using a combination of editing commands, grips, and adding or
changing constraints.
■You can create and fully constrain a drawing first, and then control the
design exclusively by relaxing and replacing geometric constraints, and
changing the values in dimensional constraints.
The method that you choose depends on your design practices and the
requirements of your discipline.
NOTE The program prevents you from applying any constraints that result in an
overconstrained condition.
Use Constraints with Blocks and Xrefs
You can apply constraints between
■An object in the drawing and an object within a block reference
■An object within a block reference and an object within a different block
reference (not between objects within the same block reference)
■The insertion point of an xref and an object or a block, but not to any
objects within xrefs
When you apply constraints to block references, the objects contained within
the block are automatically available for selection. You do not need to press
Ctrl for subobject selection. Adding constraints to a block reference can cause
it to move or rotate as a result.
NOTE Applying constraints to dynamic blocks suppresses the display of their
dynamic grips. You can still change the values in a dynamic block using the
Properties palette, but to redisplay the dynamic grips, the constraints must first
be removed from the dynamic block.
Constraints can be used in block definitions, resulting in dynamic blocks. You
can control the size and shape of dynamic blocks directly from within the
drawing. For more information, see Add Constraints to Dynamic Blocks on
page 912.
Overview of Constraints | 805

Remove or Relax Constraints
There are two ways to cancel the effects of constraints when you need to make
design changes:
■Delete the constraints individually and later apply new constraints. While
the cursor hovers over a geometric constraint icon, you can use the Delete
key or the shortcut menu to delete the constraint.
■Relax the constraints temporarily on selected objects to make the changes.
With a grip selected or when you specify options during an editing
command, tap the Ctrl key to alternate between relaxing constraints and
maintaining constraints.
Relaxed constraints are not maintained during editing. Constraints are restored
automatically if possible when the editing process is complete. Constraints
that are no longer valid are removed.
NOTE The DELCONSTRAINT command deletes all geometric and dimensional
constraints from an object.
Quick Reference
AUTOCONSTRAIN
Applies geometric constraints to a selection set of objects based on orientation
of the objects relative to one another.
CONSTRAINTBAR
Displays or hides the geometric constraints on an object.
CONSTRAINTSETTINGS
Controls the display of geometric constraints on constraint bars.
DCDISPLAY
Displays or hides the dynamic constraints associated with a selection set of
objects.
DELCONSTRAINT
Removes all geometric and dimensional constraints from a selection set of
objects.
806 | Chapter 20 Add Constraints to Geometry
DIMCONSTRAINT
Applies dimensional constraints to selected objects or points on objects, or
converts associative dimensions to dimensional constraints.
GEOMCONSTRAINT
Displays or hides the geometric constraints on an object.
LIST
Displays property data for selected objects.
PARAMETERS
Controls the associative parameters used in the drawing.
-PARAMETERS
Controls the associative parameters used in the drawing.
PARAMETERSCLOSE
Closes the Parameters Manager palette.
TEXTEDIT
Edits a dimensional constraint, dimension, or text object.
CCONSTRAINTFORM
Controls whether annotational or dynamic constraints are applied to objects.
CONSTRAINTBARDISPLAY
Controls the display of constraint bars after you apply constraints and when
you select geometrically constrained drawings.
CONSTRAINTBARMODE
Controls the display of geometrical constraints on constraint bars.
CONSTRAINTNAMEFORMAT
Controls the text format for dimensional constraints.
CONSTRAINTRELAX
Indicates whether constraints are enforced or relaxed when editing an object.
CONSTRAINTSOLVEMODE
Controls constraint behavior when applying or editing constraints.
Overview of Constraints | 807
DIMCONSTRAINTICON
Displays the lock icon next to the text for dimensional constraints.
DYNCONSTRAINTMODE
Displays hidden dimensional constraints when constrained objects are
selected.
PARAMETERCOPYMODE
Controls how constraints and referenced user parameters are handled when
constrained objects are copied between drawings, Model space and layouts,
and block definitions.
PARAMETERSSTATUS
Indicates whether the Parameters Manager is displayed or hidden.
Constrain Objects Geometrically
Geometric constraints determine the relationships between 2D geometric
objects or points on objects relative to each other.
Overview of Geometric Constraints
You can specify geometric constraints between 2D objects or points on objects.
When you later edit the constrained geometry, the constraints are maintained.
Thus, using geometric constraints, you have a method of including design
requirements in your drawing.
For example, in the illustration below, the following constraints are applied
to the geometry.
■Every endpoint is constrained to remain coincident with the endpoint of
every adjacent object—these constraints are displayed as small blue squares
■The vertical lines are constrained to remain parallel with each other and
to remain equal to each other in length
■The left vertical line is constrained to remain perpendicular to the
horizontal line
■The horizontal line is constrained to remain horizontal
■The location of the circle and the horizontal line are constrained to remain
fixed in space—these constraints are displayed as lock icons
808 | Chapter 20 Add Constraints to Geometry
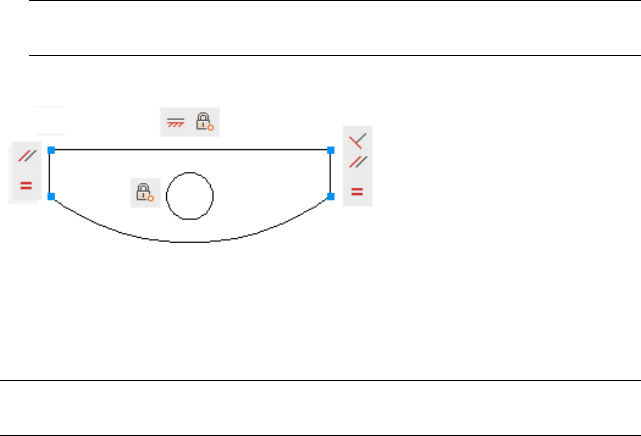
NOTE The locked geometry is not associated to the other geometry without
geometric constraints linked to it.
The geometry is not fully constrained, however. Using grips, you can still change
the radius of the arc, the diameter of the circle, the length of the horizontal
line, and the length of the vertical lines. To specify these distances, you need
to apply dimensional constraints.
NOTE Constraints can be added to segments within a polyline as if they were
separate objects.
See also:
■Overview of Dimensional Constraints on page 826
Quick Reference
AUTOCONSTRAIN
Applies geometric constraints to a selection set of objects based on orientation
of the objects relative to one another.
CONSTRAINTBAR
Displays or hides the geometric constraints on an object.
CONSTRAINTSETTINGS
Controls the display of geometric constraints on constraint bars.
DELCONSTRAINT
Removes all geometric and dimensional constraints from a selection set of
objects.
GEOMCONSTRAINT
Displays or hides the geometric constraints on an object.
Overview of Geometric Constraints | 809
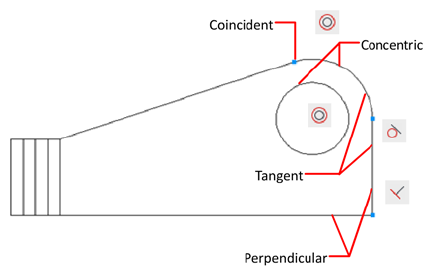
LIST
Displays property data for selected objects.
CONSTRAINTBARMODE
Controls the display of geometrical constraints on constraint bars.
CONSTRAINTBARDISPLAY
Controls the display of constraint bars after you apply constraints and when
you select geometrically constrained drawings.
CONSTRAINTNAMEFORMAT
Controls the text format for dimensional constraints.
CONSTRAINTRELAX
Indicates whether constraints are enforced or relaxed when editing an object.
CONSTRAINTSOLVEMODE
Controls constraint behavior when applying or editing constraints.
Apply or Remove Geometric Constraints
Geometric constraints associate geometric objects together, or specify a fixed
location or angle.
For example, you can specify that a line should always be perpendicular to
another one, that an arc and a circle should always remain concentric, or that
a line should always be tangent to an arc.
810 | Chapter 20 Add Constraints to Geometry
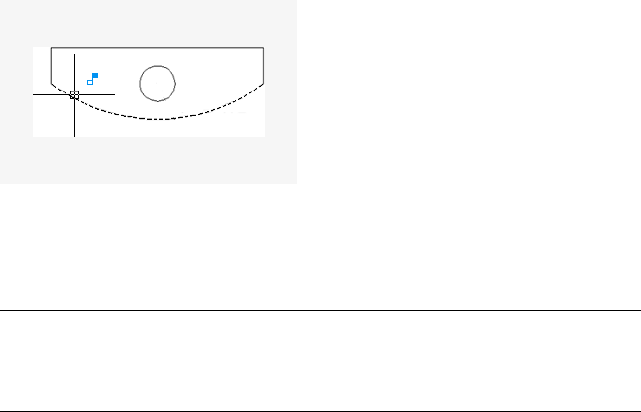
When you apply a constraint, two things occur:
■The object that you select adjusts automatically to conform to the specified
constraint
■By default, a gray constraint icon displays near the constrained object as
shown in the previous illustration, and a small blue glyph displays with
your cursor when you move it over a constrained object
Once applied, constraints permit only those changes to the geometry that do
not violate the constraints. This provides a method for exploring design options
or making design changes while maintaining the requirements and
specifications of the design.
NOTE The order in which you select two objects when you apply a constraint is
important in some cases. Normally, the second object you select adjusts to the
first object. For example, when you apply a perpendicular constraint, the second
object you select will adjust to become perpendicular to the first.
You can apply geometric constraints to 2D geometric objects only. Objects
cannot be constrained between model space and paper space.
Specify Constraint Points
With some constraints, you specify constraint points on objects instead of
selecting the objects. This behavior is similar to that of object snaps, but the
locations are limited to endpoints, midpoints, center points, and insertion
points.
For example, a coincident constraint can restrict the location of the endpoint
of one line to the endpoint of another line.
The following glyph is displayed on the object as you roll over the object.
Apply or Remove Geometric Constraints | 811
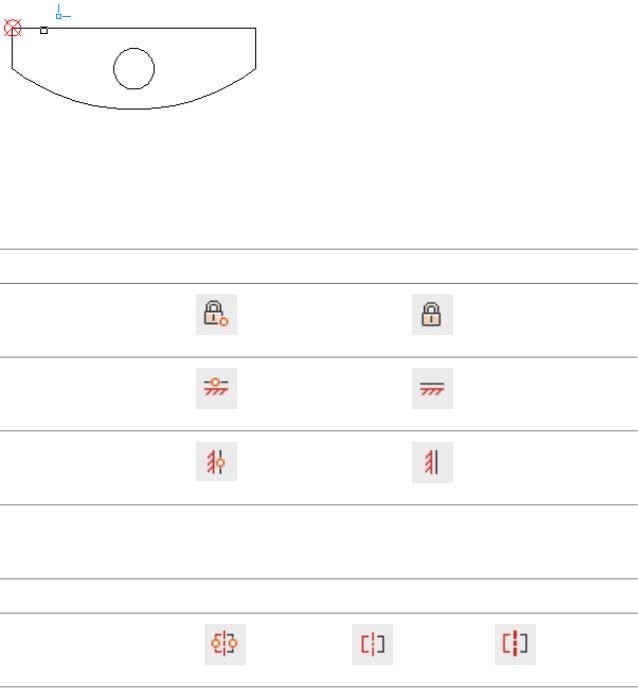
You use this glyph to confirm whether you are specifying the intended point
to constrain.
The fix, horizontal, and vertical constraint icons indicate whether the
constraints are applied to an object or a point.
ObjectPointConstraint
Fix
Horizontal
Vertical
The symmetric constraint icons indicate whether it identifying a symmetrical
point or object, or the symmetrical line.
LineObjectPointConstraint
Symmetric
When rolling over any icon, the constraint point markers are displayed
indicating the constrained points. You do not need to roll over the icon to
identify the constraints that are applied to the points of the selected object.
A different set of constraint bar icons are displayed when a horizontal or
vertical constraint is not parallel or perpendicular with the current UCS.
812 | Chapter 20 Add Constraints to Geometry
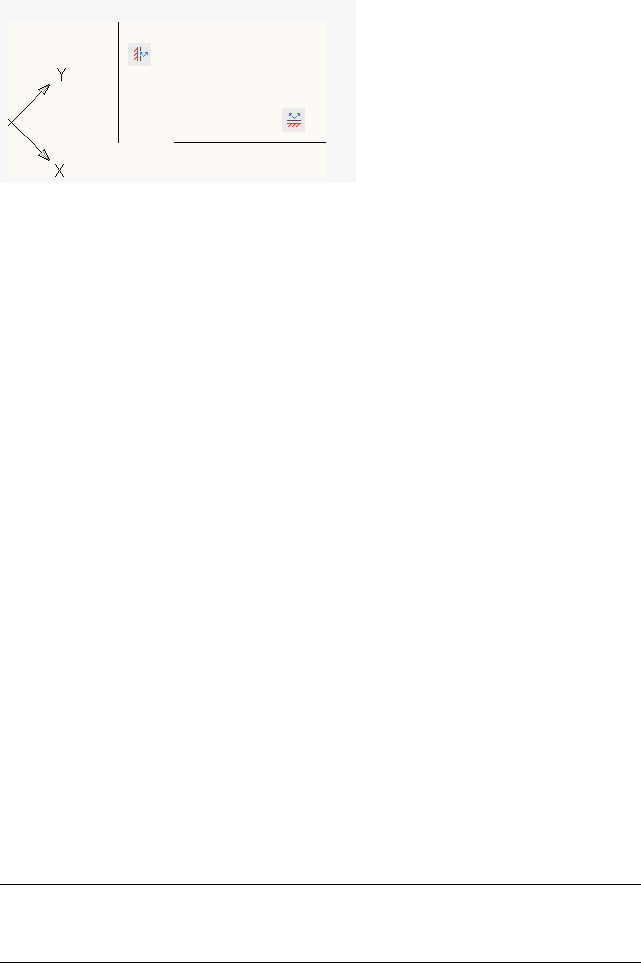
Use Fix Constraints
A fix constraint associates a constraint point on an object, or the object itself
with a fixed location with respect to the World Coordinate System.
It is often advisable to specify a fix constraint at an important geometric
feature. This locks the location of that point or object, and prevents geometry
from relocating when you make changes to the design.
When you fix an object, the angle of a line, or the center of an arc or circle is
also fixed.
Apply Multiple Geometric Constraints
You can apply multiple geometric constraints to objects either manually or
automatically.
When you want to apply all essential geometric constraints to a design
automatically, you can use AUTOCONSTRAIN with the objects that you select
in your drawing. This helps constrain the geometric shape of the
design—depending on your design, there might be cases where you need to
apply additional geometric constraints.
AUTOCONSTRAIN also provides settings in which you can specify the
following options:
■What geometric constraints to apply
■What order to apply geometric constraints
■What tolerances are used to determine whether objects are horizontal,
vertical, or touching
NOTE Fix constraint is not applied with AUTOCONSTRAIN. You must apply the
constraint individually. Equal constraint applied with AUTOCONSTRAIN resizes
the selected arcs to the same radius only. It is not applied to the arc length.
Apply or Remove Geometric Constraints | 813

To fully constrain the size and proportions of a design, you will later need to
apply dimensional constraints.
Remove Geometric Constraints
A geometric constraint cannot be modified, but you can delete it and apply
a different one. Several constraint options, including Delete, are available from
the shortcut menu that is displayed when you right-click a constraint icon in
the drawing.
You can delete all constraints from a selection set in a single operation with
DELCONSTRAINT.
To set the order for applying multiple geometric constraints to an object
1Click Parametric tab ➤ Geometric panel ➤ AutoConstrain.
2At the Command prompt, enter s (Settings).
3In the Constraint Settings dialog box, on the AutoConstrain tab, select
a Constraint Type.
4Click Move Up or Move Down. This changes the priority for a constraint
when you use the AUTOCONSTRAIN command on an object.
5Click OK.
Quick Reference
CONSTRAINTBAR
Displays or hides the geometric constraints on an object.
CONSTRAINTSETTINGS
Controls the display of geometric constraints on constraint bars.
GCCOINCIDENT
Constrains two points together or a point to a curve (or an extension of a
curve).
GCCOLLINEAR
Causes two or more line segments to lie along the same line.
814 | Chapter 20 Add Constraints to Geometry
GCCONCENTRIC
Constrains two arcs, circles, or ellipses to the same center point.
GCEQUAL
Resizes selected arcs and circles to the same radius, or selected lines to the
same length.
GCFIX
Locks points and curves in position.
GCHORIZONTAL
Causes lines or pairs of points to lie parallel to the X axis of the current
coordinate system.
GCPARALLEL
Causes selected lines to lie parallel to each other.
GCPERPENDICULAR
Causes selected lines to lie 90 degrees to one another.
GCSMOOTH
Constrains a spline to be contiguous and maintain G2 continuity with
another spline, line, arc, or polyline.
GCSYMMETRIC
Causes selected objects to become symmetrically constrained about a selected
line.
GCTANGENT
Constrains two curves to maintain a point of tangency to each other or their
extensions.
GCVERTICAL
Causes lines or pairs of points to lie parallel to the Y axis of the current
coordinate system.
GEOMCONSTRAINT
Displays or hides the geometric constraints on an object.
CONSTRAINTBARMODE
Controls the display of geometrical constraints on constraint bars.
Apply or Remove Geometric Constraints | 815
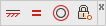
CONSTRAINTBARDISPLAY
Controls the display of constraint bars after you apply constraints and when
you select geometrically constrained drawings.
CONSTRAINTNAMEFORMAT
Controls the text format for dimensional constraints.
CONSTRAINTRELAX
Indicates whether constraints are enforced or relaxed when editing an object.
CONSTRAINTSOLVEMODE
Controls constraint behavior when applying or editing constraints.
Display and Verify Geometric Constraints
You can determine visually what objects are associated with any geometric
constraint, or what constraints are associated with any object.
Constraint icons provide information about how objects are constrained. A
constraint bar displays one or more icons that represent the geometric
constraints applied to an object.
You can drag constraint bars when you need to move them out of the way,
and you can also control whether they are displayed or hidden.
Verify the Geometric Constraints on Objects
You can confirm the association of geometric constraints with objects in two
ways.
■When you roll over a constraint icon on a constraint bar, the objects
associated with that geometric constraint are highlighted.
816 | Chapter 20 Add Constraints to Geometry
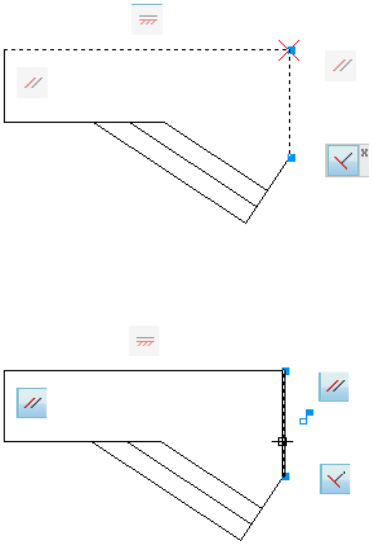
■When you roll over an object that has geometric constraints applied to it,
all constraint bars that are associated with the object are highlighted.
These highlighting features simplify working with constraints especially when
you have many constraints applied throughout a drawing.
Control the Display of Constraint Bars
Geometric constraints and constraint bars can be displayed or hidden, either
individually or globally. You can do any of the following:
■Display or hide all geometric constraints
■Display or hide specified types of geometric constraints
■Display or hide all geometric constraints associated with a selected object
■Temporarily display the geometric constraints of the selected object
Use the Constraint Settings dialog box to control the types of geometric
constraints that are displayed or hidden on constraint bars.
Display and Verify Geometric Constraints | 817
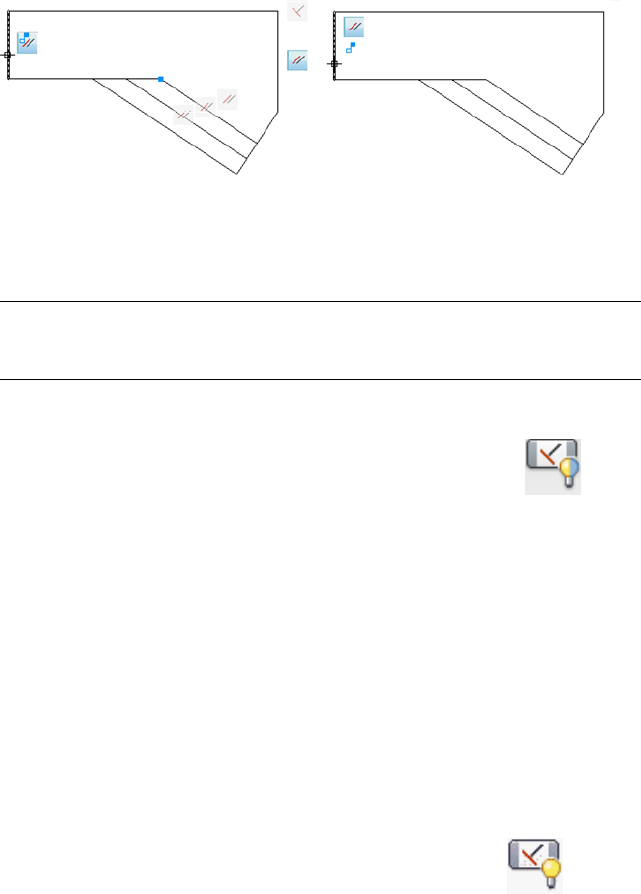
You can set the constraint bars to automatically and temporarily display when
the constrained geometry is selected. When the geometry is no longer selected,
the temporarily displayed constraint bars are hidden.
Hiding geometric constraints is useful when you analyze a design and want
to filter the display of geometric constraints. For example, you can choose to
display the icons for Parallel constraints only. Next, you might choose to
display the icons for Perpendicular constraints only.
NOTE To reduce clutter, Coincident constraints display by default as small,
light-blue squares. You can use an option in the Constraint Settings dialog box to
turn them off if necessary.
To display or hide a geometric constraint
1Click Parametric tab ➤ Geometric panel ➤ Show/Hide.
2Select the constrained objects.
3Press Enter.
4Select one of following:
■Show. Displays the geometric constraints.
■Hide. Hides the geometric constraints.
■Reset. Displays the geometric constraints and resets the contraint bar
to the default position relative to the parameters they are associated
with.
To display all geometric constraints
➤ Click Parametric tab ➤ Geometric panel ➤ Show All.
818 | Chapter 20 Add Constraints to Geometry

To hide all geometric constraints
➤ Click Parametric tab ➤ Geometric panel ➤ Hide All.
To change the constraint bar settings using the constraint bar shortcut menu
1Select a constrained object.
2Ensure that the constraint bar is visible for the selected object.
3Right-click the constraint bar, and click Constraint Bar Settings.
4In the Constraint Settings dialog box, on the Geometric tab, select or
clear the appropriate check boxes.
5Use the slider, or enter a value, to set the transparency level of constraint
bars in the drawing. The default value is 50.
6Click OK.
Quick Reference
GEOMCONSTRAINT
Displays or hides the geometric constraints on an object.
CONSTRAINTBAR
Displays or hides the geometric constraints on an object.
CONSTRAINTSETTINGS
Controls the display of geometric constraints on constraint bars.
CONSTRAINTBARMODE
Controls the display of geometrical constraints on constraint bars.
CONSTRAINTBARDISPLAY
Controls the display of constraint bars after you apply constraints and when
you select geometrically constrained drawings.
CONSTRAINTNAMEFORMAT
Controls the text format for dimensional constraints.
Display and Verify Geometric Constraints | 819
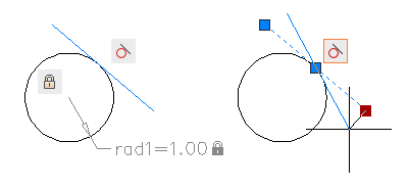
CONSTRAINTRELAX
Indicates whether constraints are enforced or relaxed when editing an object.
CONSTRAINTSOLVEMODE
Controls constraint behavior when applying or editing constraints.
Modify Objects with Geometric Constraints Applied
You can edit constrained geometric objects with grips, editing commands, or
by relaxing or applying geometric constraints.
By definition, geometric constraints that are applied to geometric objects limit
the editing actions that you perform on the objects.
Modify Constrained Objects with Grips
You can modify constrained geometry using grip editing modes. The geometry
will maintain all applied constraints.
For example, if a line object is constrained to remain tangent to a circle, you
can rotate the line and change its length and endpoints, but the line or its
extension will remain tangent to the circle.
If the circle was an arc instead, the line or its extension would remain tangent
to the arc or its extension.
The results of modifying underconstrained objects are based on what
constraints have already been applied and the object types involved. For
example, if the Radius constraint had not been applied, the radius of the circle
would have been modified instead of the tangent point of the line.
820 | Chapter 20 Add Constraints to Geometry
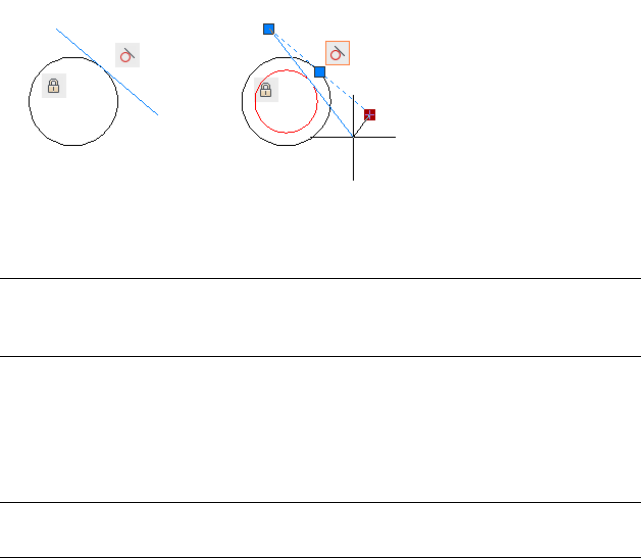
The CONSTRAINTSOLVEMODE system variable determines the way an object
behaves when constraints are applied or when grips are used to edit it.
BEST PRACTICE You can limit unexpected changes by applying additional
geometric or dimensional constraints. Common choices include coincident and
fix constraints.
Modify Constrained Objects with Editing Commands
You can use editing commands such as MOVE, COPY, ROTATE, SCALE, and
STRETCH to modify constrained geometry. The results maintain the constraints
applied to the objects.
NOTE The TRIM, EXTEND, BREAK, and JOIN commands in some circumstances
can remove constraints.
By default, if an editing command results in copying the constrained objects,
the constraints applied to the original objects will also be duplicated. This
behavior is controlled by the PARAMETERCOPYMODE system variable. Using
the copying technique, you can save work by taking advantage of multiple
instances of objects, bilateral symmetry, or radial symmetry.
For information about temporarily relaxing constraints, see Overview of
Constraints on page 803.
To grip-edit constrained geometry
1Select the constrained object.
2Click the grips and drag it to edit the geometry.
To turn a constraint off
1Click the constrained object to select it.
2Move your mouse over a grip.
Modify Objects with Geometric Constraints Applied | 821

The grips are displayed in red to show that the object is selected.
3Click the grip.
4Press and release the Ctrl key.
5Move the object. The object moves freely as it is no longer constrained.
Constraint bars will no longer be displayed (if enabled) for the object, as
the constraints are turned off.
To delete a geometric constraint
1Select a constrained object.
2Ensure that the constraint bar is visible for the selected object.
3Right-click the constraint bar. Click Delete.
Constraint bars for the deleted constraint will no longer display for the
object.
To delete all geometric constraints from an object
1Select a constrained object.
2Click Parametric tab ➤ Manage panel ➤ Delete Constraint.
NOTE All geometric and dimensional constraints are removed from the
object.
3Press Enter.
Quick Reference
GEOMCONSTRAINT
Displays or hides the geometric constraints on an object.
CONSTRAINTBAR
Displays or hides the geometric constraints on an object.
CONSTRAINTSETTINGS
Controls the display of geometric constraints on constraint bars.
822 | Chapter 20 Add Constraints to Geometry
CONSTRAINTBARMODE
Controls the display of geometrical constraints on constraint bars.
CONSTRAINTBARDISPLAY
Controls the display of constraint bars after you apply constraints and when
you select geometrically constrained drawings.
CONSTRAINTNAMEFORMAT
Controls the text format for dimensional constraints.
CONSTRAINTRELAX
Indicates whether constraints are enforced or relaxed when editing an object.
CONSTRAINTSOLVEMODE
Controls constraint behavior when applying or editing constraints.
Infer Geometric Constraints
You can automatically apply geometric constraints while creating and editing
geometric objects.
Enabling Infer Constraints mode automatically applies constraints between the
object you are creating or editing and the object or points associated with
object snaps.
Similar to the AUTOCONSTRAIN command, constraints are applied only if
the objects meet the constraint conditions. Objects are not repositioned as a
result of inferring constraints.
With Infer Constraints turned on, the object snaps that you specify when
creating geometry are used to infer geometric constraints. However, the
following object snaps are not supported: Intersection, Apparent Intersection,
Extension, and Quadrant.
The following constraints cannot be inferred:
■Fix
■Smooth
■Symmetric
■Concentric
■Equal
Infer Geometric Constraints | 823
■Collinear
Infer Constraints with Line and Polyline
Certain object creation and editing commands can infer constraints regardless
of the current object snap settings.
LINE and PLINE commands infer coincident point-to-point constraints. The
Close option infers a coincident constraint between the start point of the first
line and the endpoint of the last line.
Infer Constraints with Rectangle, Fillet, and Chamfer
The RECTANG, FILLET, and CHAMFER commands infer constraints as follows:
■RECTANG applies a pair of parallel constraints and a perpendicular
constraint to the closed polyline.
■FILLET applies tangent and coincident constraints between the newly
created arc and the existing trimmed or extended pair of lines.
■CHAMFER applies coincident contraints between the newly created line
and the existing trimmed or extended pair of lines.
The following commands are unaffected by the Infer Constraints setting:
■SCALE
■MIRROR
■OFFSET
■BREAK
■TRIM
■EXTEND
■ARRAY
Infer Constraints with Move, Copy, and Stretch
When moving, copying, or stretching with the Infer Constraints on, you can
apply coincident, perpendicular, parallel, or tangent constraints between the
object being edited and the object being snapped to if the base point of the
edited object is a valid constraint point of that object.
824 | Chapter 20 Add Constraints to Geometry

For example, if a line is stretched and snapped to an endpoint of another line,
a coincident constraint is applied between the endpoints of the two lines.
A vertical or horizontal constraint can be applied between objects when you
move, copy, or stretch an object from a valid constraint point while object
tracking vertically or horizontally along a valid constraint point on another
object.
See also:
■Use Object Snaps on page 585
To turn on and off inferred constraints
1Click Parametric tab ➤ Geometric panel ➤ Constraint Settings,
Geometric.
2In the Constraint Settings dialog box, Geometric tab, click or clear Infer
Geometric Constraints.
3Click OK.
NOTE Alternatively, you can click the Infer Constraints button on the Status bar.
Quick Reference
CHAMFER
Bevels the edges of objects.
CONSTRAINTSETTINGS
Controls the display of geometric constraints on constraint bars.
DIMCONSTRAINT
Applies dimensional constraints to selected objects or points on objects, or
converts associative dimensions to dimensional constraints.
FILLET
Rounds and fillets the edges of objects.
LINE
Creates straight line segments.
Infer Geometric Constraints | 825
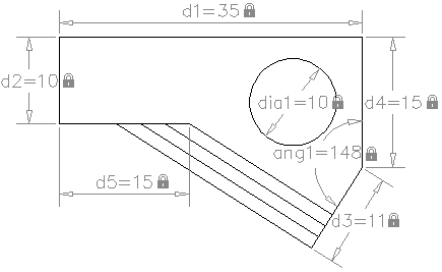
PLINE
Creates a 2D polyline.
RECTANG
Creates a rectangular polyline.
CONSTRAINTINFER
Controls whether the geometric constraints are inferred while drawing and
editing geometry.
Constrain Distances and Angles between Objects
You can control distances or angles between 2D geometric objects or points
on objects applying dimensional constraints and specifying values. You can
also constrain geometry with variables and equations.
Overview of Dimensional Constraints
Dimensional constraints control the size and proportions of a design. They
can constrain the following:
■Distances between objects, or between points on objects
■Angles between objects, or between points on objects
■Sizes of arcs and circles
For example, the following illustration includes linear, aligned, angular, and
diameter constraints.
826 | Chapter 20 Add Constraints to Geometry

If you change the value of a dimensional constraint, all the constraints on the
object are evaluated, and the objects that are affected are updated
automatically.
Also, constraints can be added directly to segments within a polyline as if they
were separate objects.
NOTE The number of decimal places displayed in dimensional constraints is
controlled by the LUPREC and AUPREC system variables.
Compare Dimensional Constraints with Dimension Objects
Dimensional constraints are different from dimension objects in the following
ways:
■Dimensional constraints are used in the design phase of a drawing, but
dimensions are typically created in the documentation phase
■Dimensional constraints drive the size or angle of objects, but dimensions
are driven by objects
■By default, dimensional constraints are not objects, display with only a
single dimension style, maintain the same size during zoom operations,
and are not plotted
If you need to plot dimensional constraints or use dimension styles, you can
change the form of a dimensional constraint from dynamic to annotational.
See Apply Dimensional Constraints on page 829 for more detail.
Define Variables and Equations
With the Parameters Manager, you can define custom user variables that you
can reference from within dimensional constraints and other user variables.
The expressions that you define can include a variety of predefined functions
and constants.
Overview of Dimensional Constraints | 827
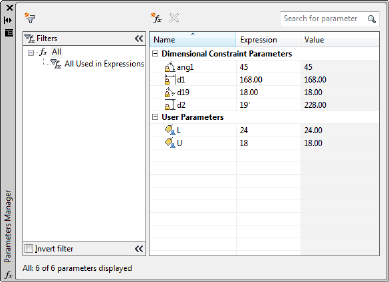
For more information about using variables and equations with constraints,
see Constrain a Design with Formulas and Equations on page 840
See also:
■Overview of Geometric Constraints on page 808
Quick Reference
DCDISPLAY
Displays or hides the dynamic constraints associated with a selection set of
objects.
DELCONSTRAINT
Removes all geometric and dimensional constraints from a selection set of
objects.
DIMCONSTRAINT
Applies dimensional constraints to selected objects or points on objects, or
converts associative dimensions to dimensional constraints.
LIST
Displays property data for selected objects.
PARAMETERS
Controls the associative parameters used in the drawing.
-PARAMETERS
Controls the associative parameters used in the drawing.
828 | Chapter 20 Add Constraints to Geometry
PARAMETERSCLOSE
Closes the Parameters Manager palette.
TEXTEDIT
Edits a dimensional constraint, dimension, or text object.
CCONSTRAINTFORM
Controls whether annotational or dynamic constraints are applied to objects.
CONSTRAINTNAMEFORMAT
Controls the text format for dimensional constraints.
CONSTRAINTRELAX
Indicates whether constraints are enforced or relaxed when editing an object.
CONSTRAINTSOLVEMODE
Controls constraint behavior when applying or editing constraints.
DIMCONSTRAINTICON
Displays the lock icon next to the text for dimensional constraints.
DYNCONSTRAINTMODE
Displays hidden dimensional constraints when constrained objects are
selected.
PARAMETERCOPYMODE
Controls how constraints and referenced user parameters are handled when
constrained objects are copied between drawings, Model space and layouts,
and block definitions.
PARAMETERSSTATUS
Indicates whether the Parameters Manager is displayed or hidden.
Apply Dimensional Constraints
Dimensional constraints maintain specified distances and angles between
geometric objects or points on objects.
For example, you can specify that the length of a line should always remain
at 6.00 units, that the vertical distance between two points be maintained at
1.00 unit, and that a circle should always remain at 1.00 unit in diameter.
Apply Dimensional Constraints | 829
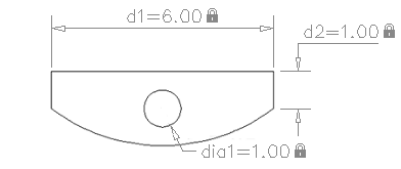
When you apply a dimensional constraint to an object, a constraint variable is
automatically created for maintaining the constraint value. By default, these
are assigned names such as d1 or dia1, but you can rename them in the
Parameters Manager.
Dimensional constraints can be created in one of the following forms:
■Dynamic constraints
■Annotational constraints
The forms have different purposes. In addition, any dynamic or annotational
constraint can be converted to a reference parameter.
Dynamic Constraints
By default, dimensional constraints are dynamic. They are ideal for normal
parametric drawing and design tasks.
Dynamic constraints have the following characteristics:
■Maintain the same size when zooming in or out
■Can easily be turned on or off globally in the drawing
■Display using a fixed, predefined dimension style
■Position the textual information automatically, and provide triangle grips
with which you can change the value of a dimensional constraint
■Do not display when the drawing is plotted
If you need to control the dimension style of dynamic constraints, or if you
need to plot dimensional constraints, use the Properties palette to change
dynamic constraints to annotational constraints.
830 | Chapter 20 Add Constraints to Geometry
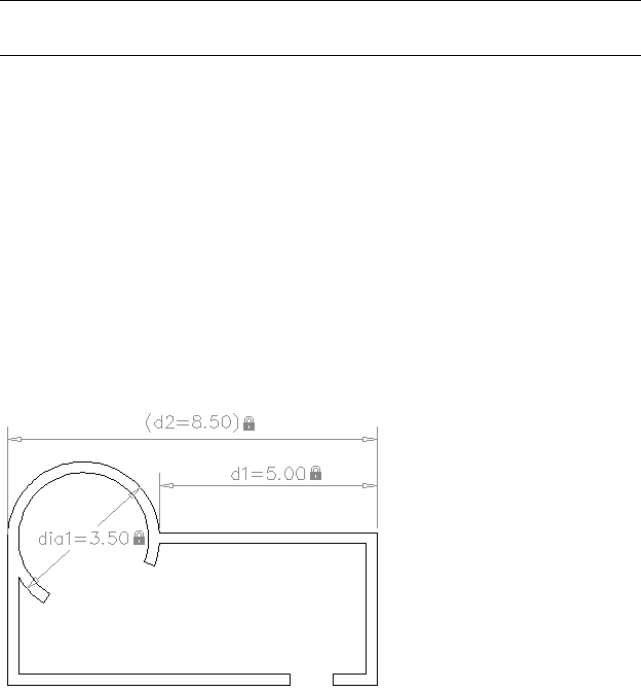
Annotational Constraints
Annotational constraints are useful when you want dimensional constraints
to have the following characteristics:
■Change their size when zooming in or out
■Display individually with layers
■Display using the current dimension style
■Provide grip capabilities that are similar to those on dimensions
■Display when the drawing is plotted
NOTE To display the text used in annotational constraints in the same format as
used in dimensions, set the CONSTRAINTNAMEFORMAT system variable to 1.
After plotting, you can use the Properties palette to convert annotational
constraints back to dynamic constraints.
Reference Parameters
A reference parameter is a driven dimensional constraint, either dynamic or
annotational. This means that it does not control the associated geometry,
but rather reports a measurement similar to a dimension object.
You use reference parameters as a convenient way to display measurements
that you would otherwise have to calculate. For example, the width in the
illustration is constrained by the diameter constraint, dia1, and the linear
constraint, d1. The reference parameter, d2, displays the total width but does
not constrain it. The textual information in reference parameters is always
displayed within parentheses.
Apply Dimensional Constraints | 831
You can set the Reference property in the Properties palette to convert a
dynamic or annotational constraint to a reference parameter.
NOTE You cannot change a reference parameter back to a dimensional constraint
if doing so would overconstrain the geometry.
To convert associative dimensions to dimensional constraints
1Click Parametric tab ➤ Dimensional panel ➤ Convert.
2Select the associative dimensions you want to convert.
3Press Enter.
To change the dimension name format
1Select an annotational constraint, right-click in the drawing area, and
click Dimension Name Format.
2Select Value, Name, or Name and Expression.
The Expression reflects the selected dimension name format.
Quick Reference
DCALIGNED
Constrains the distance between two points on different objects.
DCANGULAR
Constrains the angle between line or polyline segments, the angle swept out
by an arc or a polyline arc segment, or the angle between three points on
objects.
DCCONVERT
Converts associative dimensions to dimensional constraints.
DCDIAMETER
Constrains the diameter of a circle or an arc.
DCDISPLAY
Displays or hides the dynamic constraints associated with a selection set of
objects.
832 | Chapter 20 Add Constraints to Geometry
DCFORM
Specifies whether the dimensional constraint being created is dynamic or
annotational.
DCHORIZONTAL
Constrains the X distance between points on an object, or between two
points on different objects.
DCLINEAR
Creates a horizontal, vertical, or rotated constraint based on the locations
of the extension line origins and the dimension line.
DCRADIUS
Constrains the radius of a circle or an arc.
DCVERTICAL
Constrains the Y distance between points on an object, or between two points
on different objects.
DELCONSTRAINT
Removes all geometric and dimensional constraints from a selection set of
objects.
DIMCONSTRAINT
Applies dimensional constraints to selected objects or points on objects, or
converts associative dimensions to dimensional constraints.
LIST
Displays property data for selected objects.
PARAMETERS
Controls the associative parameters used in the drawing.
-PARAMETERS
Controls the associative parameters used in the drawing.
PARAMETERSCLOSE
Closes the Parameters Manager palette.
TEXTEDIT
Edits a dimensional constraint, dimension, or text object.
Apply Dimensional Constraints | 833
CONSTRAINTNAMEFORMAT
Controls the text format for dimensional constraints.
CONSTRAINTRELAX
Indicates whether constraints are enforced or relaxed when editing an object.
CONSTRAINTSOLVEMODE
Controls constraint behavior when applying or editing constraints.
DIMCONSTRAINTICON
Displays the lock icon next to the text for dimensional constraints.
DYNCONSTRAINTMODE
Displays hidden dimensional constraints when constrained objects are
selected.
PARAMETERCOPYMODE
Controls how constraints and referenced user parameters are handled when
constrained objects are copied between drawings, Model space and layouts,
and block definitions.
PARAMETERSSTATUS
Indicates whether the Parameters Manager is displayed or hidden.
Control the Display of Dimensional Constraints
You can display or hide dynamic and annotational constraints within a
drawing.
Display or Hide Dynamic Constraints
You can hide all dynamic constraints to reduce clutter when you want to work
with geometric constraints only, or when you need to continue other work
in the drawing. You can turn on their display when needed from the ribbon
or with the DCDISPLAY command.
By default, if you select an object associated with a hidden dynamic constraint,
all dynamic constraints associated with that object are temporarily displayed.
You can display or hide the dynamic constraints for all objects or for a selection
set.
834 | Chapter 20 Add Constraints to Geometry
Display or Hide Annotational Constraints
You control the display of annotational constraints as you would with
dimension objects—you assign them to a layer and turn the layer on or off as
needed. You can also specify object properties for annotational constraints
such as dimension style, color, and lineweight.
To display or hide dynamic dimensional constraints
1Click Parametric tab ➤ Dimensional panel ➤ Show/Hide.
2Select the constrained objects.
3Press Enter.
4Select one of following:
■Show. Displays the dimensional constraints.
■Hide. Hides the dimensional constraints.
Quick Reference
DCDISPLAY
Displays or hides the dynamic constraints associated with a selection set of
objects.
DELCONSTRAINT
Removes all geometric and dimensional constraints from a selection set of
objects.
DIMCONSTRAINT
Applies dimensional constraints to selected objects or points on objects, or
converts associative dimensions to dimensional constraints.
LIST
Displays property data for selected objects.
PARAMETERS
Controls the associative parameters used in the drawing.
-PARAMETERS
Controls the associative parameters used in the drawing.
Control the Display of Dimensional Constraints | 835
PARAMETERSCLOSE
Closes the Parameters Manager palette.
TEXTEDIT
Edits a dimensional constraint, dimension, or text object.
CONSTRAINTNAMEFORMAT
Controls the text format for dimensional constraints.
CONSTRAINTRELAX
Indicates whether constraints are enforced or relaxed when editing an object.
CONSTRAINTSOLVEMODE
Controls constraint behavior when applying or editing constraints.
DIMCONSTRAINTICON
Displays the lock icon next to the text for dimensional constraints.
DYNCONSTRAINTMODE
Displays hidden dimensional constraints when constrained objects are
selected.
PARAMETERCOPYMODE
Controls how constraints and referenced user parameters are handled when
constrained objects are copied between drawings, Model space and layouts,
and block definitions.
PARAMETERSSTATUS
Indicates whether the Parameters Manager is displayed or hidden.
Modify Objects with Dimensional Constraints Applied
You can control lengths, distances, and angles of objects by changing
constraint values, by manipulating dimensional constraints using grips, or by
changing user variables or expressions associated with dimensional constraints.
836 | Chapter 20 Add Constraints to Geometry
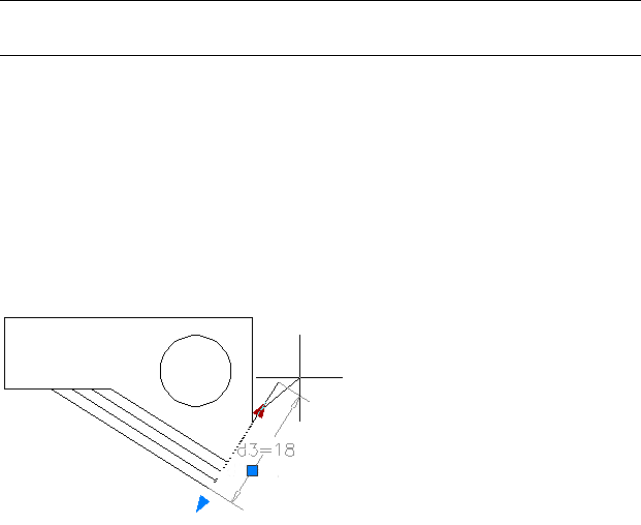
Edit Dimensional Constraint Names, Values, and Expressions
You can edit the names, values, and expressions that are associated with
dimensional constraints using in-place editing:
■Double-click the dimensional constraint, select the dimensional constraint
and use the shortcut menu, or the TEXTEDIT command.
■Open the Properties palette and select the dimensional constraint
■Open the Parameters Manager and select the dimensional constraint either
from the list or from within the drawing
■Customize the Quick Properties palette to display several constraint
properties
You can reference other dimensional constraints by selecting them during an
in-place editing operation.
NOTE You cannot edit the Expression and Value properties for a reference
parameter.
Modify Dimensional Constraints Using Their Grips
You can modify a constrained object either by using the triangular grips or
the square grips on the associated dimensional constraint.
The triangular grips on dimensional constraints provide a way of changing
the constraint value while maintaining the constraint.
For example, you can change the length of the diagonal line by using the
triangular grips on the Aligned dimensional constraint. The diagonal line
maintains its angle and the location of one of its endpoints.
The square grip on dimensional constraints provides a way of changing the
location of the text and other elements.
Modify Objects with Dimensional Constraints Applied | 837
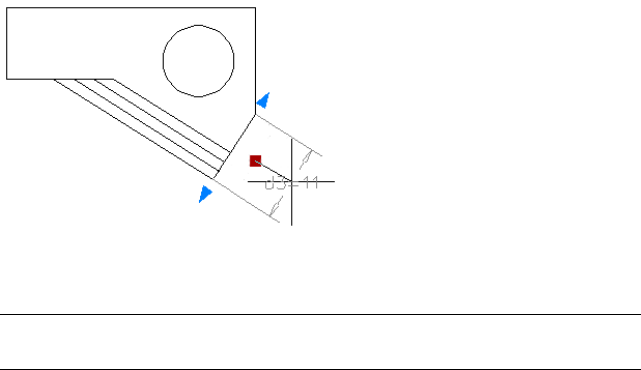
Dynamic dimensional constraints are more limited than annotational
dimensional constraints in where the text can be located.
NOTE Triangular grips are not available for dimensional constraints that reference
other constraint variables in expressions.
For information about temporarily relaxing constraints, see Overview of
Constraints on page 803.
To grip-edit a dimensional constraint
1Select a constrained object.
2Click the grips and drag to edit the geometry.
To edit a dimensional constraint in-place
1Double-click a dimensional constraint to display the in-place text editor.
2Enter the new name, value, or expression (name=value).
3Press Enter to confirm the change.
To edit a dimensional constraint using the Properties palette
1Select a dimensional constraint, right-click in the drawing area, and click
Properties.
2Enter the new values for Name, Expression, and Description text boxes.
To turn a dimensional constraint off
1Click a constrained object in a drawing to select it.
The grips are displayed on the object to show that it is selected.
838 | Chapter 20 Add Constraints to Geometry
2Move your cursor over a grip. The grip color turns red.
3Click the grip.
4Press and release the Ctrl key.
5Move the object to the desired location.
The constraint is relaxed for the object, and you should be able to move
it.
To edit the dimensions using the Parameters Manager palette
1Click Parametric tab ➤ Manage panel ➤ Parameters Manager.
2Double-click the variable you want to edit.
3Press Tab to navigate across the columns.
4Change the values in the appropriate column.
NOTE You can modify only the Name, Expression, and Description columns.
5Press Enter.
Quick Reference
DCDISPLAY
Displays or hides the dynamic constraints associated with a selection set of
objects.
DELCONSTRAINT
Removes all geometric and dimensional constraints from a selection set of
objects.
DIMCONSTRAINT
Applies dimensional constraints to selected objects or points on objects, or
converts associative dimensions to dimensional constraints.
LIST
Displays property data for selected objects.
Modify Objects with Dimensional Constraints Applied | 839
PARAMETERS
Controls the associative parameters used in the drawing.
-PARAMETERS
Controls the associative parameters used in the drawing.
PARAMETERSCLOSE
Closes the Parameters Manager palette.
TEXTEDIT
Edits a dimensional constraint, dimension, or text object.
CONSTRAINTNAMEFORMAT
Controls the text format for dimensional constraints.
CONSTRAINTRELAX
Indicates whether constraints are enforced or relaxed when editing an object.
CONSTRAINTSOLVEMODE
Controls constraint behavior when applying or editing constraints.
DIMCONSTRAINTICON
Displays the lock icon next to the text for dimensional constraints.
DYNCONSTRAINTMODE
Displays hidden dimensional constraints when constrained objects are
selected.
PARAMETERCOPYMODE
Controls how constraints and referenced user parameters are handled when
constrained objects are copied between drawings, Model space and layouts,
and block definitions.
PARAMETERSSTATUS
Indicates whether the Parameters Manager is displayed or hidden.
Constrain a Design with Formulas and Equations
You can control geometry using mathematical expressions that include the
names of dimensional constraints, user variables, and functions.
840 | Chapter 20 Add Constraints to Geometry
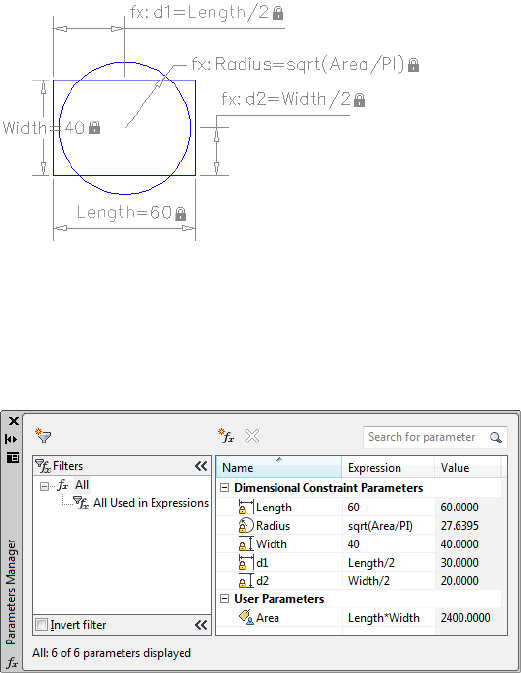
Overview of Formulas and Equations
Formulas and equations can be represented either as expressions within
dimensional constraint parameters or by defining user variables. For example,
the following illustration represents a design that constrains a circle to the
center of the rectangle with an area equal to that of the rectangle.
The Length and Width dimensional constraint parameters are set to constants.
The d1 and d2 constraints are simple expressions that reference the Length
and Width. The Radius dimensional constraint parameter is set to an expression
that includes the square root function, parentheses to determine the
precedence of operations, the Area user variable, the division operator, and
the constant, PI. These parameters are all displayed in the Parameters Manager.
As you can see, part of the equation for determining the area of the circle is
included in the Radius dimensional constraint parameter and part was defined
as a user variable. Alternatively, the entire expression, sqrt (Length * Width /
PI), could have been assigned to the Radius dimensional constraint parameter,
defined in a user variable, or some other combination.
Overview of Formulas and Equations | 841
Protect Expressions in Dynamic Constraints
When a dynamic dimensional constraint references one or more parameters, the
prefix fx: is added to the name of the constraint. This prefix is displayed only
in the drawing. Its purpose is to help you avoid accidentally overwriting
parameters and formulas when the dimension name format is set to Value or
Name, which suppresses the display of the parameters and formulas.
Quick Reference
DIMCONSTRAINT
Applies dimensional constraints to selected objects or points on objects, or
converts associative dimensions to dimensional constraints.
PARAMETERS
Controls the associative parameters used in the drawing.
-PARAMETERS
Controls the associative parameters used in the drawing.
Control Geometry with the Parameters Manager
The Parameters Manager displays dimensional constraint parameters (both
dynamic constraints and annotational constraints), reference parameters, and
user variables.
You can easily create, modify, and delete parameters from the Parameters
Manager.
The Parameters Manager supports the following operations:
■Click the name of a dimensional constraint parameter to highlight the
constraint in the drawing.
■Double-click a name or expression to edit it.
■Right-click and click Delete to remove a dimensional constraint parameter
or user variable.
■Click a column heading to sort the list of parameters by name, expression,
or value.
842 | Chapter 20 Add Constraints to Geometry
Use Operators in Expressions
Dimensional constraint parameters and user variables support the following
operators within expressions:
DescriptionOperator
Addition+
Subtraction or unary negation-
Floating point modulo%
Multiplication*
Division/
Exponentiation^
Parenthesis, expression delimiter( )
Decimal separator.
NOTE With imperial units, the Parameters Manager interprets a minus or a dash
(-) as a unit separator rather than a subtraction operation. To specify subtraction,
include at least one space before or after the minus sign. For example, to subtract
9" from 5', enter 5' -9" rather than 5'-9".
Understand Precedence in Expressions
Expressions are evaluated according to the following standard mathematical
rules of precedence:
1Expressions in parentheses first, starting with the innermost set
2Operators in standard order: (1) unary negation, (2) exponents, (3)
multiplication and division, and (4) addition and subtraction
3Operators of equal precedence from left to right
Control Geometry with the Parameters Manager | 843

Functions Supported in Expressions
The following functions are available for use in expressions:
SyntaxFunction
cos(expression)Cosine
sin(expression)Sine
tan(expression)Tangent
acos(expression)Arc cosine
asin(expression)Arc sine
atan(expression)Arc tangent
cosh(expression)Hyperbolic cosine
sinh(expression)Hyperbolic sine
tanh(expression)Hyperbolic tangent
acosh(expression)Arc hyperbolic cosine
asinh(expression)Arc hyperbolic sine
atanh(expression)Arc hyperbolic tangent
sqrt(expression)Square root
sign(expression)Signum function (-
1,0,1)
round(expression)Round to nearest in-
teger
trunc(expression)Truncate decimal
floor(expression)Round down
ceil(expression)Round up
844 | Chapter 20 Add Constraints to Geometry
SyntaxFunction
abs(expression)Absolute value
max(expression1;expression2)Largest element in array
min(expression1;expression2)Smallest element in ar-
ray
d2r(expression)Degrees to radians
r2d(expression)Radians to degrees
ln(expression)Logarithm, base e
log(expression)Logarithm, base 10
exp(expression)Exponent, base e
exp10(expression)Exponent, base 10
pow(expression1;expression2)Power function
RandomRandom decimal, 0-1
In addition to these functions, the constants Pi and e are also available for use
in expressions.
To reference a variable within an expression
1Click Parametric tab ➤ Manage panel ➤ Parameters Manager.
2Double-click the variable you want to reference.
3Right-click the cell in the Name column, and click Copy.
4Double-click the Expression column where you want to include the
referenced variable.
5Right-click the Expression column, and click Paste.
Control Geometry with the Parameters Manager | 845
To include a function in an expression
1Click Parametric tab ➤ Manage panel ➤ Parameters Manager.
2Double-click the Expression column of the variable to which you want
to add the function.
3Right-click the Expression column, and click Expressions.
4Select the function to insert it in the Expression column.
To modify a user parameter
1Click Parametric tab ➤ Manage panel ➤ Parameters Manager.
2Double-click the columns of the variable you want to edit.
3Change the values of the appropriate columns.
NOTE You can modify only the Name, Expression, and Description columns.
4Press Enter.
To select a constrained object associated with a user parameter
1Click Parametric tab ➤ Manage panel ➤ Parameters Manager.
2Click the dimensional variable to view the associated object in the
drawing.
Quick Reference
DIMCONSTRAINT
Applies dimensional constraints to selected objects or points on objects, or
converts associative dimensions to dimensional constraints.
PARAMETERS
Controls the associative parameters used in the drawing.
846 | Chapter 20 Add Constraints to Geometry

-PARAMETERS
Controls the associative parameters used in the drawing.
Organize Parameters into Groups
Organize dimensional and user-defined parameters into groups, and control
whether they are displayed in the Parameters Manager list.
When many dimensional and user-defined parameters are defined in a drawing,
it can be useful to use the Parameters Manager to create several parameter
groups, and then assign the parameters to one or more of the groups with a
simple drag and drop operation. The result lets you view one group of
parameters at a time, organizing and limiting their display in the Parameters
Manager. Thus, parameter groups are used as a display filter for the parameter
list.
Expanding the filter tree in the Parameters Manager displays all group filters
created in the current space, Model space or a layout. There are two predefined
filters displayed in the filter tree that cannot be edited:
■All. Lists all parameters in the current space.
■All Used in Expressions. Lists all parameters used in expressions or defined
by an expression.
When you use the Invert Filter option, it will display all the parameters not
in the group instead of displaying only the parameters belonging to the group.
Search For Parameters
You can enter characters and wildcards such as * in the edit box of the
Parameters Manager to search for parameters by name. This immediately filters
the parameter list as you enter the characters.
To create, modify, or delete a parameter group
1Click Parametric tab ➤ Manage panel ➤ Parameters Manager.
2In the Parameters Manager, you can do the following:
■Create a parameter group. Click the Parameter Group button and
specify a group name.
■Rename a parameter group. Right-click the parameter group, choose
Rename, and specify a new group name.
Organize Parameters into Groups | 847

■Delete a parameter group. Right-click the parameter group and choose
Delete.
To add or remove parameters to or from parameter groups
1Click Parametric tab ➤ Manage panel ➤ Parameters Manager.
2In the Parameters Manager, you can do the following:
■Add parameters to any user-defined parameter group. Select the
parameters that you want to add to a parameter group. Drag and drop
the selected parameters into a parameter group in the filter tree.
A parameter can belong to multiple groups.
■Remove parameters from a group. Select the parameters you want to
remove. Right-click the selected parameters and choose Remove from
Group Filter.
Quick Reference
PARAMETERS
Controls the associative parameters used in the drawing.
-PARAMETERS
Controls the associative parameters used in the drawing.
PARAMETERSCLOSE
Closes the Parameters Manager palette.
848 | Chapter 20 Add Constraints to Geometry
Part 7: Define and
Reference Blocks
849
850
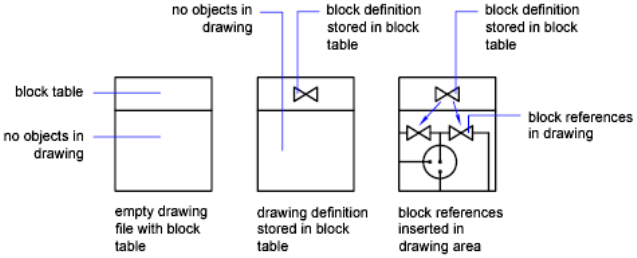
Work with Blocks
A block is one or more objects combined to create a single object. Blocks help you reuse objects
in the same drawing or in other drawings.
Overview of Blocks
How Blocks Are Stored and Referenced
Every drawing file has a block definition table that stores all block definitions,
which consist of all information associated with the block. It is these block
definitions that are referenced when you insert blocks in your drawing.
Each rectangle below represents a separate drawing file and is divided into two
parts:
■The block definition table
■The objects in the drawing
21
851
When you insert a block you are inserting a block reference. The information
is not copied from the block definition to the drawing area. Instead, a link is
established between the block reference and the block definition. Therefore,
if the block definition is changed, all references are updated automatically.
Use PURGE to remove unused block definitions from a drawing.
Blocks and Layers
A block can be composed of objects drawn on several layers with various
colors, linetypes, and lineweight properties. Although a block is always inserted
on the current layer, the block reference preserves information about the
original layer, color, and linetype properties of the objects that are contained
in the block. You can control whether objects in a block retain their original
properties or inherit their properties from the current layer, color, linetype,
or lineweight settings.
Annotative Blocks
You can also create blocks. For more information about creating and working
with an annotative blocks, see Create Annotative Blocks and Attributes on
page 1246.
See also:
■Scale Annotations on page 1224
Quick Reference
BLOCK
Creates a block definition from selected objects.
PURGE
Removes unused items, such as block definitions and layers, from the drawing.
WBLOCK
Writes objects or a block to a new drawing file.
MAXSORT
Sets the maximum number of symbol names or block names sorted by listing
commands.
852 | Chapter 21 Work with Blocks
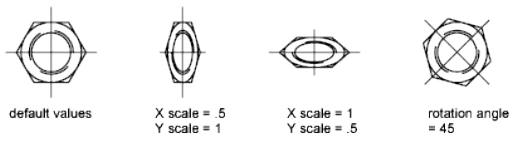
Insert Blocks
When you insert a block, you create a block reference and specify its location,
scale, and rotation.
Scale Block References
You can specify the scale of a block reference using different X, Y, and Z values.
A block that uses different drawing units than the units specified for the
drawing is automatically scaled by a factor equivalent to the ratio between
the two units.
Edit Custom Properties
If you insert a block reference that includes editable custom properties or
attributes, you can change the values of these custom properties and attributes
in the Properties palette while you insert the block. The block’s custom
properties and attributes become editable in the Properties palette after the
block is specified in one of the following ways:
■In the Insert dialog box after clicking OK.
■Using the -INSERT command after entering the block name.
■Clicking a block tool on a tool palette.
Insert a Drawing File as a Block
When you insert an entire drawing file into another drawing, the drawing
information is copied into the block table of the current drawing as a block
definition. Subsequent insertions reference the block definition with different
position, scale, and rotation settings, as shown in the following illustration.
Insert Blocks | 853
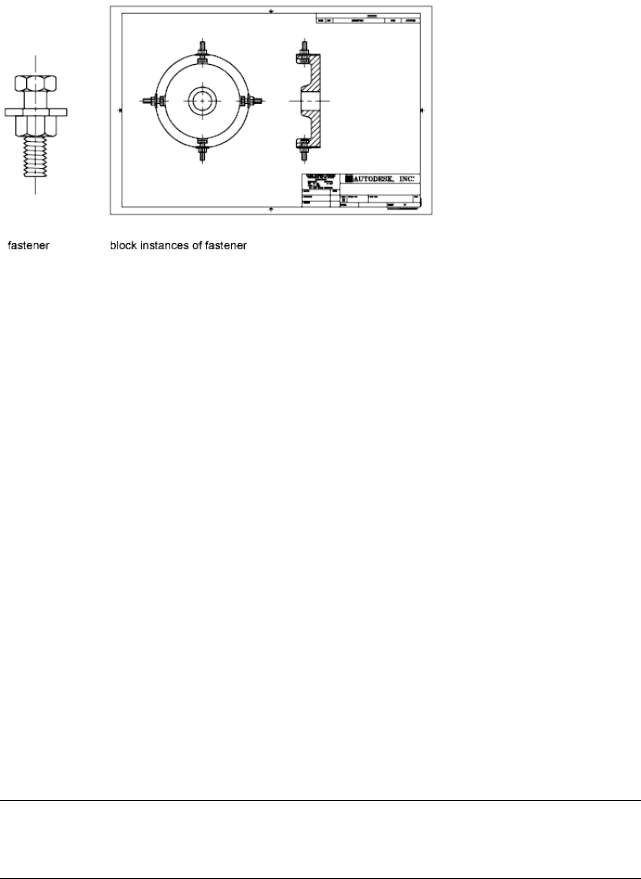
Xrefs contained in a drawing you insert may not be displayed properly unless
the xref was previously inserted or attached to the destination drawing.
Insert Blocks from Tool Palettes
You can insert blocks from tool palettes by dragging the block tool into the
drawing or by clicking the block tool and then specifying an insertion point.
You can choose to be prompted for a rotation angle (starting from 0) when
you click and place the block. When you select this option, the angle that is
specified under Rotation in the Tool Properties dialog box is ignored. The
prompt for a rotation angle is not shown if you drag the block or xref or, if at
the initial insertion Command prompt, you enter rotate.
Blocks that are placed by dragging from a tool palette must often be rotated
or scaled after they are placed. You can use object snaps when dragging blocks
from a tool palette; however, grid snap is suppressed during dragging.
When a block is dragged from a tool palette into a drawing, it is scaled
automatically according to the ratio of units defined in the block and defined
in the current drawing. For example, if the current drawing uses meters as its
units and a block is defined using centimeters as its units, the ratio of the
units is 1 m/100 cm. When the block is dragged into the drawing, it is inserted
at 1/100 scale.
NOTE In the Options dialog box, User Preferences tab, the Source Content Units
and Target Drawing Units settings are used when Drag-and-Drop Scale is set to
Unitless, either in the source block or target drawing.
Insert Blocks from Block Libraries
You can insert one or more block definitions from an existing drawing file
into your current drawing file. Choose this method when retrieving blocks
854 | Chapter 21 Work with Blocks
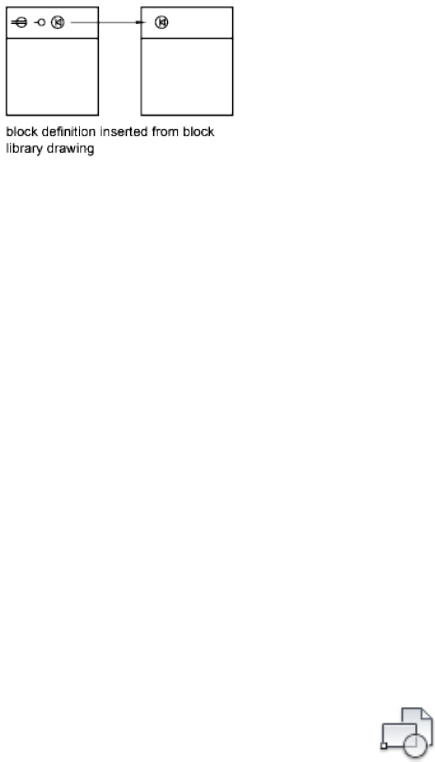
from block library drawings. A block library drawing contains block definitions
of symbols with similar functions. These block definitions are stored together
in a single drawing file for easy accessibility and management.
Insert Blocks with DesignCenter
Use DesignCenter to insert blocks from the current drawing or from another
drawing. Drag and drop the block names for quick placement. Double-click
the block names to specify the precise location, rotation, and scale of the
blocks.
See also:
■Create Drawing Files for Use as Blocks on page 867
■Overview of Blocks on page 851
■Create Block Libraries on page 873
■Work with Dynamic Blocks in Drawings on page 858
■Add Text and Blocks to Tables on page 1407
■Add Content with DesignCenter on page 97
■Create and Use Tools from Objects and Images on page 69
To insert a block defined in the current drawing
1Click Home tab ➤ Block panel ➤ Insert.
2In the Insert dialog box, in the Name box, select a name from a list of
block definitions.
3If you want to use the pointing device to specify the insertion point,
scale, and rotation, select Specify On-Screen. Otherwise, enter values in
the Insertion Point, Scale, and Rotation boxes.
Insert Blocks | 855
4If you want the objects in the block to be inserted as individual objects
instead of as a single block, select Explode.
5Click OK.
To insert a drawing file as a block by dragging
1From Windows Explorer or any folder, drag the drawing file icon into
the drawing area.
When you release the button, you are prompted for an insertion point.
2Specify the insertion point and scale and rotation values.
To insert a block using DesignCenter
1If DesignCenter is not already open, click Tools menu ➤ Palettes ➤
DesignCenter.
2Do one of the following to list the content you want to insert:
■On the DesignCenter toolbar, click Tree View Toggle. Click the folder
that contains the drawing you want to insert.
■Click the icon of a drawing file displayed in the tree view.
3Do one of the following to insert the content:
■Drag the drawing file or block into your current drawing. Use this
option when you want to insert blocks quickly and move or rotate
the blocks to their precise locations later.
■Double-click the drawing file or block that you want to insert into
your current drawing. Use this option when you want to specify the
exact placement, rotation, and scale of the block as you insert it. Use
this option also when you want to update a block reference in your
drawing from the original source drawing file.
To change properties of a block as you insert it
1Click View tab ➤ Palettes panel ➤ Properties.
2Click Home tab ➤ Block panel ➤ Insert.
3In the Insert dialog box, in the Name box, select a name from a list of
block definitions.
856 | Chapter 21 Work with Blocks
4Select Specify On-Screen to use the pointing device to specify one or more
of the following:
■Insertion Point
■Scale
■Rotation
5Click OK.
6In the Properties palette, change the properties of the block (or dynamic
block).
Quick Reference
ADCENTER
Manages and inserts content such as blocks, xrefs, and hatch patterns.
DIVIDE
Creates evenly spaced point objects or blocks along the length or perimeter
of an object.
INSERT
Inserts a block or drawing into the current drawing.
MEASURE
Creates point objects or blocks at measured intervals along the length or
perimeter of an object.
ATTDIA
Controls whether the INSERT command uses a dialog box for attribute value
entry.
INSNAME
Sets a default block name for the INSERT command.
INSUNITS
Specifies a drawing-units value for automatic scaling of blocks, images, or
xrefs when inserted or attached to a drawing.
INSUNITSDEFSOURCE
Sets source content units value when INSUNITS is set to 0.
Insert Blocks | 857
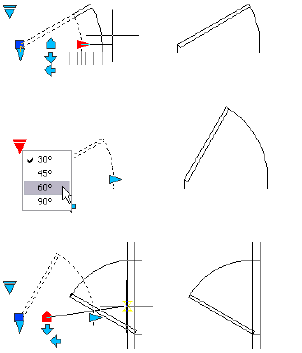
INSUNITSDEFTARGET
Sets target drawing units value when INSUNITS is set to 0.
Work with Dynamic Blocks in Drawings
A dynamic block reference can be changed in a drawing while you work.
Overview of Dynamic Blocks
Dynamic block references contain grips or custom properties that change the
way the reference is displayed in the drawing after it is inserted. For example,
a dynamic block reference of a door can change size after you insert the block
reference into your drawing. Dynamic blocks allow you to insert one block
that can change shape, size, or configuration, instead of inserting one of many
static block definitions.
Work with Action Parameters
Dynamic blocks that contain action parameters display grips that are associated
with a point, object, or region in the block definition. When you edit the grip,
an associated action is triggered that changes the way the block reference is
displayed.
You can hover over a grip to display a tooltip or prompt that explains the
parameter related to the grip. The display of the tooltip is controlled by
theGRIPTIPS system variable.
858 | Chapter 21 Work with Blocks
Some dynamic blocks are defined so that geometry within the block can only
be edited to certain sizes specified in the block definition. When you use a
grip to edit the block reference, tick marks are displayed at the locations of
valid values for the block reference. If you change a block property value to
a value other than one specified in the definition, the parameter will adjust
to the closest valid value.
Quick Reference
ATTSYNC
Updates block references with new and changed attributes from a specified
block definition.
INSERT
Inserts a block or drawing into the current drawing.
PROPERTIES
Controls properties of existing objects.
RESETBLOCK
Resets one or more dynamic block references to the default values of the
block definition.
BTMARKDISPLAY
Controls whether or not value set markers are displayed for dynamic block
references.
GRIPTIPS
Controls the display of grip tips and Ctrl-cycling tooltips.
Work With Action Parameters in Blocks
Use grips or the Properties palette to manipulate a block reference that contains
action parameters.
Use Grips to Change Blocks Containing Action Parameters
You can manipulate a block that contains action parameters with custom
grips. For example, when you drag the grip on the chair in the block reference
below, the chair moves.
Work With Action Parameters in Blocks | 859
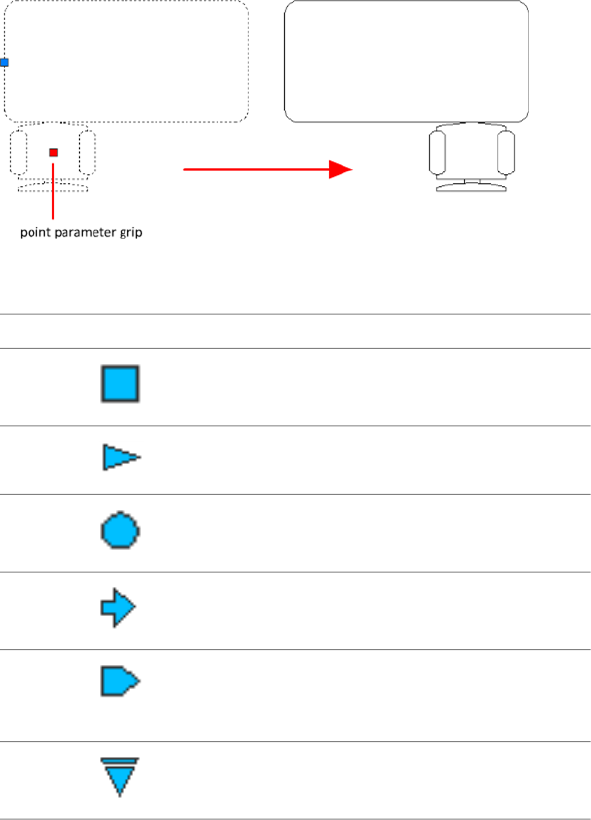
The following table shows the different types of custom grips that can be
included in a dynamic block.
How the Grip Can Be Manipulated in a DrawingGrip Type
Within a plane in any directionStandard
Back and forth in a defined direction or along an axisLinear
Around an axisRotation
Clicked to flip the dynamic block referenceFlip
Within a plane in any direction; when moved over an
object, triggers the block reference to align with the ob-
ject
Alignment
Clicked to display a list of itemsLookup
Work with Custom Properties
When you select a dynamic block reference, custom properties are listed in
the Properties palette under Custom. When you change the value of the custom
property, the block reference is updated accordingly.
860 | Chapter 21 Work with Blocks
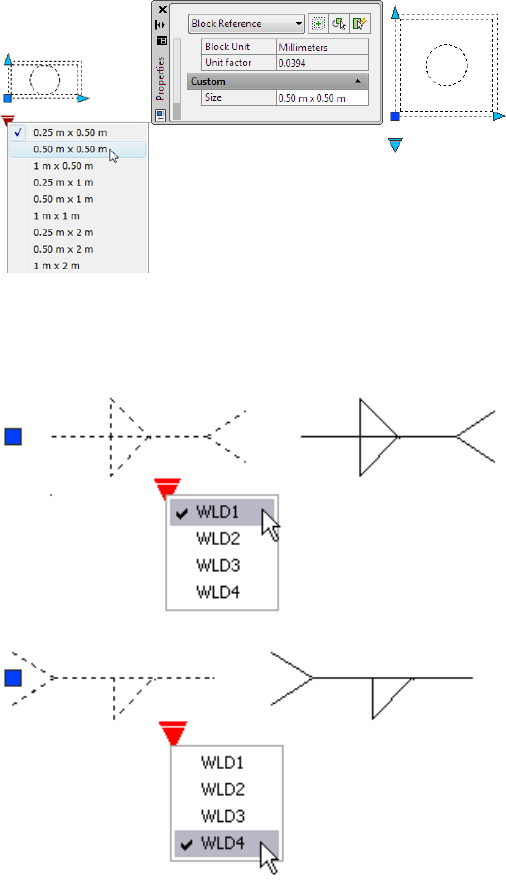
Work With Lookup Grips
A block reference that contains a lookup grip allows you to specify a preset
value that changes the way the block reference is displayed. The new size is
displayed in the Properties palette under Custom.
Control Visibility of Block References
A block definition can contain a visibility state grip, which determines several
graphical representations of the same block reference.
Work With Action Parameters in Blocks | 861
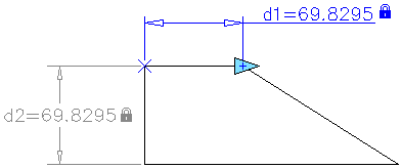
Reset a Block to Display Default Geometry
When you reset a block reference, the block changes back to the default
specified in the block definition. For example, you can make a block dynamic
again if you non-uniformly scale or explode a dynamic block reference.
Quick Reference
RESETBLOCK
Resets one or more dynamic block references to the default values of the
block definition.
GRIPDYNCOLOR
Controls the color of custom grips for dynamic blocks.
Work With Constraint Parameters in Blocks
Use the Parameters Manager to manipulate a block reference that contains
constraint parameters.
Constraint parameters are authored with mathematical expressions that affect
the geometry of the block reference. They display dynamic, editable custom
properties that can be manipulated outside of the Block Editor, similar to
action parameters.
block reference with constraint (gray) and constraint
parameter (blue, with grip)
When you select a block reference that contains constraint parameters, the
editable parameters are listed in the Parameters Manager. When you change
the value of the parameter, the block reference is updated accordingly.
862 | Chapter 21 Work with Blocks

Quick Reference
PARAMETERS
Controls the associative parameters used in the drawing.
Remove Block Definitions
To reduce the size of a drawing, you can remove unused block definitions.
You can remove a block reference from your drawing by erasing it; however,
the block definition remains in the drawing's block definition table.
To remove unused block definitions and decrease the drawing size, use PURGE
at any time in your drawing session.
All references to a block must be erased before you can purge the block
definition.
See also:
■Overview of Blocks on page 851
To remove a block definition
1Click Tools tab ➤ Drawing Utilities panel ➤ Purge.
The Purge dialog box displays a tree view of named objects that can be
purged.
2To purge blocks, use one of the following methods:
■To purge all unreferenced blocks, select Blocks. To include nested
blocks, select Purge Nested Items.
■To purge specific blocks, double-click Blocks to expand the Block tree
view. Select the blocks to be purged.
If the item you want to purge is not listed, select View Items You Cannot
Purge.
3You are prompted to confirm each item in the list. If you do not want to
confirm each purge, clear the Confirm Each Item to Be Purged option.
4Click Purge.
Remove Block Definitions | 863
To confirm the purging of each item, respond to the prompt by choosing
Yes or No, or Yes to All if more than one item is selected.
5Select more items to purge, or click Close.
Quick Reference
PURGE
Removes unused items, such as block definitions and layers, from the drawing.
864 | Chapter 21 Work with Blocks
Create and Modify Blocks
A block definition is a set of objects that are grouped together as one named object with a
base point and unique properties.
Define Blocks
You create blocks by associating objects and giving them a name.
Create Blocks Within a Drawing
After you define a block in a drawing, you can insert a block reference in the
drawing as many times as necessary. Use this method to create blocks quickly.
Each block definition includes a block name, one or more objects, the coordinate
values of the base point to be used for inserting the block, and any associated
attribute data.
The base point is used as a reference for positioning the block when you insert
it. Suppose you specify that the base point is at the lower-left corner of an object
in the block. Later, when you insert the block, you are prompted for an insertion
point. The block base point is aligned at the insertion point you specified.
The block definition in the illustration comprises a name, PLUG_VALVE, four
lines, and a base point at the intersection of the two diagonal lines. For an
explanation of the schematic representation shown, see Overview of Blocks on
page 851.
22
865
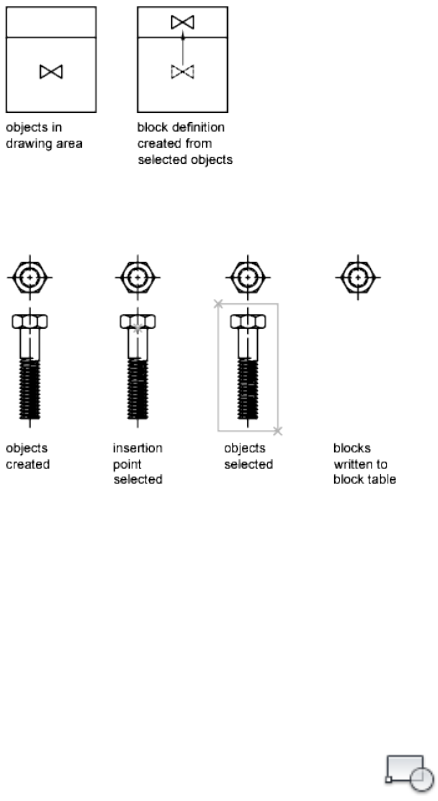
The illustration shows a typical sequence for creating a block definition within
a drawing.
You can also use the Block Editor to create blocks that are saved within a
drawing.
See also:
■Overview of the Block Editor on page 904
To define a block for the current drawing
1Create the objects you want to use in the block definition.
2Click Insert tab ➤ Block panel ➤ Create.
3In the Block Definition dialog box, enter a block name in the Name box.
4Under Objects, select Convert to Block.
If you want the original objects used to create the block definition to
remain in your drawing, make sure the Delete option is not selected. If
this option is selected, the original objects are erased from the drawing.
If necessary, you can use OOPS to restore them.
866 | Chapter 22 Create and Modify Blocks
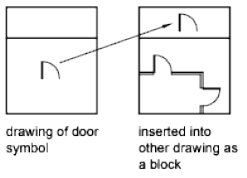
5Click Select Objects.
6Use your pointing device to select the objects to be included in the block
definition. Press Enter to complete object selection.
7In the Block Definition dialog box under Base Point, specify the block
insertion point using one of these methods.
■Click Pick Point to specify a point using the pointing device.
■Enter the X,Y,Z coordinate values of the point.
8In the Description box, enter a description for the block definition. This
description is displayed in DesignCenter™ (ADCENTER).
9Click OK.
The block is defined in the current drawing and can be inserted at any
time.
Quick Reference
BLOCK
Creates a block definition from selected objects.
Create Drawing Files for Use as Blocks
You can create drawing files for the purpose of inserting them into other
drawings as blocks. Individual drawing files are easy to create and manage as
the source of block definitions. Collections of symbols can be stored as
individual drawing files and grouped in folders.
Create Drawing Files for Use as Blocks | 867
Create a New Drawing File
You have two methods for creating drawing files:
■Create and save a complete drawing file using SAVE or SAVEAS.
■Create and save only selected objects from your current drawing to a new
drawing using EXPORT or WBLOCK.
With either method, you create an ordinary drawing file that can be inserted
as a block into any other drawing file. Using WBLOCK is recommended when
you need to create several versions of a symbol as separate drawing files, or
when you want to create a drawing file without leaving the current drawing.
Change the Base Point of Drawings to Be Used as Blocks
By default, the WCS (world coordinate system) origin (0,0,0) is used as the
base point for drawing files inserted as blocks. You can change the base point
by opening the original drawing and using BASE to specify a different base
point for insertion. The next time you insert the block, the new base point is
used.
Update Changes in the Original Drawing
If you change the original drawing after inserting it, the changes have no
effect on the current drawing. If you expect the original drawing to change,
and you want the changes to be reflected in the current drawing, you may
want to attach it as an external reference instead of inserting it as a block. For
more information about external references, see Reference Other Drawing
Files on page 1665.
Use Paper Space Objects in Blocks
Objects in paper space are not included when you insert a drawing as a block.
To transfer paper space objects to another drawing, make the objects into a
block or save them in a separate drawing file, and then insert the block or
drawing file into the other drawing.
To create a new drawing file from selected objects
1Open an existing drawing or create a new drawing.
2At the Command prompt, enter wblock.
3In the Write Block dialog box, select Objects.
868 | Chapter 22 Create and Modify Blocks

If you want the original objects used to create the new drawing to remain
in your drawing, make sure the Delete From Drawing option is not
selected. If this option is selected, the original objects are erased from the
drawing. If necessary, you can use OOPS to restore them.
4Click Select Objects.
5Use your pointing device to select the objects to be included in the new
drawing. Press Enter to complete object selection.
6In the Write Block dialog box under Base Point, specify the point to be
the origin point (0,0,0) for the new drawing using one of these methods:
■Click Specify Point to specify a point using the pointing device.
■Enter the X,Y,Z coordinate values of the point.
7Under Destination, enter a file name and path for the new drawing, or
click the [...] button to display a standard file selection dialog box.
8Click OK.
A new drawing is created with the selected objects.
To create a new drawing file from an existing block definition
1Click Insert tab ➤ Block panel ➤ Create.
2In the Block Definition dialog box, in the Name box, select the block to
modify.
3In the Name box, enter a new name.
4In the Description box, enter or modify the description for the new
drawing file. Click OK.
Quick Reference
ADCENTER
Manages and inserts content such as blocks, xrefs, and hatch patterns.
BASE
Sets the insertion base point for the current drawing.
Create Drawing Files for Use as Blocks | 869
BLOCK
Creates a block definition from selected objects.
EXPORT
Saves the objects in a drawing to a different file format.
INSERT
Inserts a block or drawing into the current drawing.
OOPS
Restores erased objects.
WBLOCK
Writes objects or a block to a new drawing file.
Control the Color and Linetype Properties in Blocks
Assign Color and Linetype Properties
Generally when you insert a block, the color, linetype, and lineweight of
objects in the block retain their original settings regardless of the current
settings in the drawing. However, you can create blocks with objects that
inherit the current color, linetype, and lineweight settings. These objects have
floating properties.
You have three choices for how the color, linetype, and lineweight properties
of objects are treated when a block reference is inserted.
■Objects in the block do not inherit color, linetype, and lineweight
properties from the current settings. The properties of objects in the block
do not change regardless of the current settings.
For this choice, it is recommended that you set the color, linetype, and
lineweight properties individually for each object in the block definition:
do not use BYBLOCK or BYLAYER color, linetype, and lineweight settings
when creating these objects.
■Objects in the block inherit color, linetype, and lineweight properties from
the color, linetype, and lineweight assigned to the current layer only.
For this choice, before you create objects to be included in the block
definition, set the current layer to 0, and set the current color, linetype,
and lineweight to BYLAYER.
870 | Chapter 22 Create and Modify Blocks

■Objects inherit color, linetype, and lineweight properties from the current
color, linetype, and lineweight that you have set explicitly, that is, that
you have set to override the color, linetype, or lineweight assigned to the
current layer. If you have not explicitly set them, then these properties are
inherited from the color, linetype, and lineweight assigned to the current
layer.
For this choice, before you create objects to be included in the block
definition, set the current color or linetype to BYBLOCK.
Create objects with
these properties
Create objects on these
layers
If you want objects in a
block to
Any but BYBLOCK or
BYLAYER
Any but 0 (zero)Retain original properties
BYLAYER0 (zero)Inherit properties from the
current layer
BYBLOCKAnyInherit individual properties
first, then layer properties
Floating properties also apply to nested blocks when the nested block references
and the objects they contain use the settings required for floating properties.
Change the Color and Linetype in a Block
You can change the color and linetype of the objects within a block only if
the objects in that block were created with floating properties.
If a block was not created using objects with floating color and linetype
properties, the only way to change these properties is to redefine the block.
See also:
■Control the Properties of Objects on page 465
Quick Reference
COLOR
Sets the color for new objects.
LAYER
Manages layers and layer properties.
Control the Color and Linetype Properties in Blocks | 871
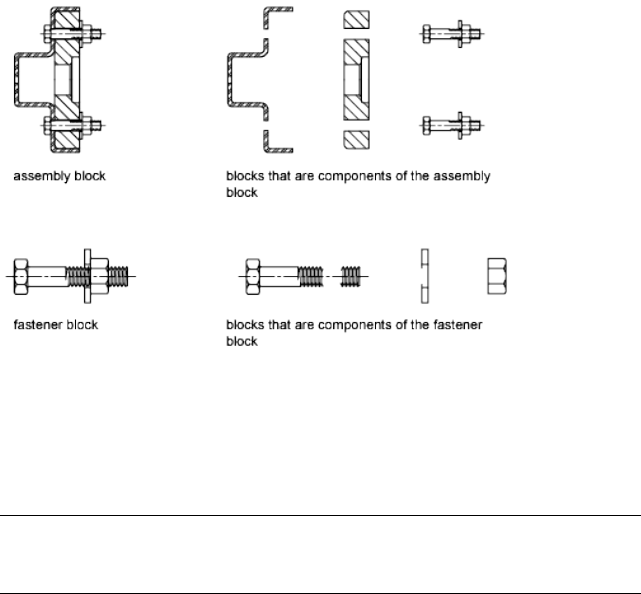
LINETYPE
Loads, sets, and modifies linetypes.
PROPERTIES
Controls properties of existing objects.
Nest Blocks
The only restriction on nested blocks is that you cannot insert blocks that
reference themselves.
You can apply geometric constraints and constraint parameters to nested
objects in blocks. AutoCAD detects the nested entity or valid constraint point
for the nested entity regardless of the nesting level of the object.
NOTE Constraints can only be applied between nested objects in the block and
objects in the drawing file, not between pairs of nested objects in the block
reference.
When a block definition is redefined, AutoCAD will re-evaluate the constraints
between geometry in the drawing and the nested geometry in the block
references. The drawing will then be updated appropriately. If a constraint
cannot be resolved as a result of the change to the block definition, then the
constraint is removed and an unresolved constraints message is displayed at
the command line.
872 | Chapter 22 Create and Modify Blocks
See also:
■Add Constraints to Dynamic Blocks on page 912
Quick Reference
BLOCK
Creates a block definition from selected objects.
Create Block Libraries
A block library is a collection of block definitions stored in a single drawing
file. You can use block libraries supplied by Autodesk or other vendors or
create your own.
You can organize a set of related block definitions by creating the blocks in
the same drawing file. Drawing files used this way are called block, or symbol,
libraries. These block definitions can be inserted individually into any drawing
that you are working on. Block library drawings are not different from other
drawing files except in how they are used.
When you use BLOCK to define each block definition in the block library
drawing, you can include a short description of the block that can be viewed
in DesignCenter.
Optionally, you can also document each block definition by inserting it in
the drawing area of the library drawing. In addition to the block geometry,
you can include text that provides the block name, the date of creation, the
date of the last modification, and any special instructions or conventions.
This creates a visual index of the blocks in the block library drawing.
Use DesignCenter to view and copy block definitions individually from block
library drawings (or from any existing drawing) to your current drawing.
DesignCenter does not overwrite an existing block definition in a drawing
with one that comes from another drawing.
Create Block Libraries | 873
To create a block library drawing
1Begin a new drawing.
2Define a block.
3Repeat step 2 for as many related block definitions as you want to make.
4Save the drawing using a name appropriate for a library drawing.
These blocks can be inserted into any drawing using DesignCenter
(ADCENTER).
Quick Reference
BLOCK
Creates a block definition from selected objects.
Use Tool Palettes to Organize Blocks
You can use tool palettes to organize blocks that are stored in one drawing
file or separate drawing files.
Once you've added a block tool to a tool palette, you can insert the block
reference by dragging it from the tool palette to the drawing or by clicking
and placing it in the drawing. For information about using tool palettes to
organize and insert blocks, see Create and Use Tools from Objects and Images
on page 69.
Quick Reference
TOOLPALETTES
Opens the Tool Palettes window.
Create Construction Geometry Within a Block
You can convert objects to construction geometry in the Block Editor.
You can create construction geometry that will display within the Block Editor,
but not in the drawing editor.
In the example below, a symmetric constraint has been added to the block
definition on the left. However, you may not want the line of symmetry to
874 | Chapter 22 Create and Modify Blocks
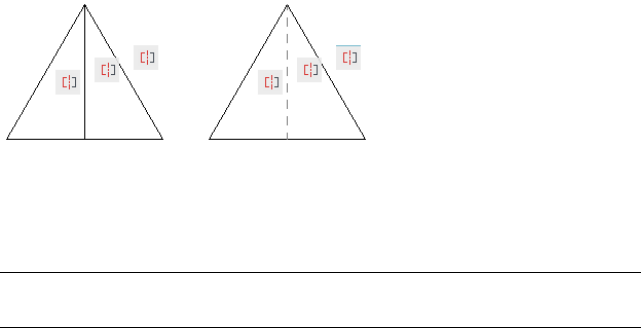
be displayed when the block is inserted into your drawing. In the example on
the right, the line of symmetry has been converted to a dashed line that will
not display when the block is inserted into a drawing.
You can add construction geometry (BCONSTRUCTION command) to the
selection sets of legacy actions. The construction geometry is not affected by
the visibility states. It is filtered from the selection set in the BVSTATE
command when you add or remove geometry from a visibility state.
NOTE When you explode a block containing construction geometry in previous
versions of AutoCAD, the geometry is hidden in the drawing.
See also:
■Draw Construction and Reference Geometry on page 683
■Add Constraints to Geometry on page 803
Quick Reference
BCONSTRUCTION
Converts geometry into construction geometry.
BVSTATE
Creates, sets, or deletes a visibility state in a dynamic block.
BLOCKTESTWINDOW
Indicates whether or not a test block window is current.
Attach Data to Blocks (Block Attributes)
You can attach information to blocks and later extract the information to
create a bill of materials or other report.
Attach Data to Blocks (Block Attributes) | 875
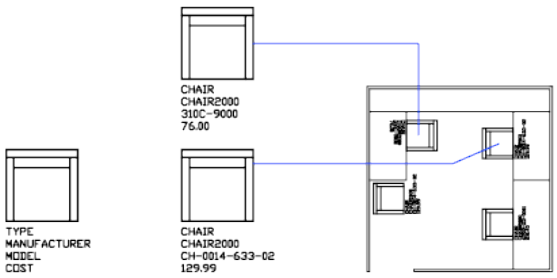
Overview of Block Attributes
An attribute is a label or tag that attaches data to a block. Examples of data
that might be contained in an attribute are part numbers, prices, comments,
and owners' names. The tag is equivalent to a column name in a database
table. The following illustration shows a block with four attributes: type,
manufacturer, model, and cost.
The attributes in the illustration are single-line attributes. You can also create
multiple-line attributes to store data such as addresses and descriptions.
Attribute information extracted from a drawing can be used in a spreadsheet
or database to produce a parts list or a bill of materials. You can associate more
than one attribute with a block, provided that each attribute has a different
tag.
Attributes also can be "invisible." An invisible attribute is not displayed or
plotted; however, the attribute information is stored in the drawing file and
can be written to an extraction file for use in a database program.
Whenever you insert a block that has a variable attribute, you are prompted
to enter data to be stored with the block. Blocks can also use constant
attributes, attributes whose values do not change. Constant attributes do not
prompt you for a value when you insert the block.
You can also create attributes. For more information about creating and
working with an annotative attributes, see Create Annotative Blocks and
Attributes on page 1246.
See also:
■Modify a Block Attribute Definition on page 893
876 | Chapter 22 Create and Modify Blocks
■Modify the Data in Block Attributes on page 892
■Scale Annotations on page 1224
Quick Reference
ATTDEF
Creates an attribute definition for storing data in a block.
ATTDISP
Controls the visibility overrides for all block attributes in a drawing.
ATTEDIT
Changes attribute information in a block.
ATTIPEDIT
Changes the textual content of an attribute within a block.
DDEDIT
Edits single-line text, dimension text, attribute definitions, and feature control
frames.
PROPERTIES
Controls properties of existing objects.
AFLAGS
Sets options for attributes.
ATTDIA
Controls whether the INSERT command uses a dialog box for attribute value
entry.
ATTIPE
Controls the display of the in-place editor used to create multiline attributes.
ATTMODE
Controls display of attributes.
ATTMULTI
Controls whether multiline attributes can be created.
Overview of Block Attributes | 877
ATTREQ
Controls whether INSERT uses default attribute settings during insertion of
blocks.
Define Block Attributes
The characteristics include the tag, which is a name that identifies the attribute,
the prompt displayed when you insert the block, value information, text
formatting, location within the block, and any optional modes (Invisible,
Constant, Verify, Preset, Lock Position, and Multiple Lines).
If you plan to extract the attribute information for use in a parts list, you may
want to keep a list of the attribute tags you have created. You will need this
tag information later when you create the attribute template file.
Choose Attribute Modes
Attribute modes control the behavior of attributes in blocks. For example, you
can control
■Whether an attribute is visible or invisible in the drawing
■Whether an attribute has a constant value, such as a part number
■Whether the attribute can be moved relative to the rest of the block
■Whether the attribute is a single-line attribute or a multiple-line attribute
If an attribute has a constant value, you will not be prompted for its value
when you insert the block. If an attribute has a variable value, such as the
asset number of a computer, you will be prompted when you insert the block.
Understand Single-Line and Multiple-Line Attributes
There are several differences between single-line and multiple-line attributes.
■Single-line attributes are limited to 255 characters from the user interface.
■Multiple-line attributes provide more formatting options than single-line
attributes.
■When editing single-line and multiple line attributes, different editors are
displayed.
■Multiple line attributes display four grips similar to MTEXT objects, while
single-line attributes display only one grip.
878 | Chapter 22 Create and Modify Blocks
■When a drawing is saved to AutoCAD 2007 or earlier, a multiple-line
attribute is converted to several single-line attributes, one for every line of
text in the original multiple-line attribute. If the drawing file is opened in
the current release, these single line attributes are automatically merged
back into a multiple-line attribute.
NOTE If a multiple-line attribute makes a round trip to an earlier release of
AutoCAD, the differences between these two types of attributes might result in
truncating very long lines of text and loss of formatting. However, before any
characters are truncated, AutoCAD displays a dialog box that lets you cancel the
operation.
Correct Mistakes in Block Attribute Definitions
If you make a mistake, you can use the Properties palette or DDEDIT to make
limited changes to an attribute definition before it is associated with a block.
If you need to make more extensive changes, delete the attribute definition
and create a new one.
Attach Attributes to Blocks
After you create one or more attribute definitions, you attach the attributes
to a block when you define or redefine that block. When you are prompted
to select the objects to include in the block definition, include in the selection
set any attributes you want to attach to the block.
To use several attributes together, define them and then include them in the
same block. For example, you can define attributes tagged "Type,"
"Manufacturer," “Model,” and “Cost,” and then include them in a block called
CHAIR.
Usually, the order of the attribute prompts is the same as the order in which
you selected the attributes when you created the block. However, if you used
crossing or window selection to select the attributes, the order of the prompts
is the reverse of the order in which you created attributes. You can use the
Block Attribute Manager to change the order in which you are prompted for
attribute information when you insert the block reference.
Define Block Attributes | 879

When you open a block definition in the Block Editor, you can use the
Attribute Order dialog box to change the order in which you are prompted
for attribute information when you insert the block reference.
Use Attributes Without Attaching Them to Blocks
Stand-alone attributes can also be created. Once attributes have been defined,
and the drawing is saved, this drawing file can be inserted into another
drawing. When the drawing is inserted, you are prompted for the attribute
values.
To create an attribute definition
1Click Home tab ➤ Block panel ➤ Define Attributes.
2In the Attribute Definition dialog box, set the attribute modes and enter
tag information, location, and text options.
3(Optional) Under Text Settings, Boundary Width, specify a value.
4(Optional) Click the Multiline In-Place Text Editor button to use the
in-place text editor to format the attribute in the drawing.
5Click OK.
After creating the attribute definition, you can select it as an object while
creating a block definition. If the attribute definition is incorporated into
a block, whenever you insert the block, you are prompted with the text
string you specified for the attribute. Each subsequent instance of the
block can have a different value specified for the attribute.
To edit an attribute definition before it is associated with a block
1Click Modify menu ➤ Object ➤ Text.
2Select the attribute to edit.
3In the Edit Attribute Definition dialog box, specify the attribute tag,
prompt, and default value. Then click OK.
880 | Chapter 22 Create and Modify Blocks

To change the prompt order of attribute definitions
1Click Insert tab ➤ Block panel ➤ Block Editor.
2In the Block Editor, select a block attribute.
3Right-click in the Block Editor drawing area.
4Click Attribute Order.
5In the Attribute Order dialog box, select an attribute definition.
6Click Move Up or Move Down to change the prompt order of the attribute
definitions.
7Repeat steps 2 and 3 until the attribute definition list is in the desired
order.
8Click OK.
Quick Reference
ATTDEF
Creates an attribute definition for storing data in a block.
ATTDISP
Controls the visibility overrides for all block attributes in a drawing.
BATTORDER
Specifies the order of attributes for a block.
DDEDIT
Edits single-line text, dimension text, attribute definitions, and feature control
frames.
PROPERTIES
Controls properties of existing objects.
AFLAGS
Sets options for attributes.
ATTIPE
Controls the display of the in-place editor used to create multiline attributes.
Define Block Attributes | 881

ATTMULTI
Controls whether multiline attributes can be created.
Extract Data from Block Attributes
Extracting attribute information is an easy way to produce a schedule or bill
of materials directly from your drawing data. For example, a facilities drawing
might contain blocks representing office equipment. If each block has attributes
identifying the model and manufacturer of the equipment, you can generate
a report that estimates the cost of the equipment.
The Data Extraction wizard guides you through selecting drawings, block
instances, and attributes. The wizard can also create a file with a .dxe file
extension that contains all the settings for later reuse.
Output to a Table
If you extract attribute data to a table, the table is inserted in the current
drawing and current space (model space or paper space) and on the current
layer.
When you update the table, the attribute information is extracted again and
the data rows in the table are replaced. If you have included a title row or one
or more header rows in the table, they are not replaced during the update.
NOTE For access to shortcut menus in the drawing area that are needed for editing
and updating tables, the Shortcut Menus in Drawing Area must be checked in the
Options dialog box, User Preferences tab.
Output to a File
If you save the data to an external file, the comma-separated (CSV),
tab-separated (TXT), Microsoft Excel (XLS), and Microsoft Access (MDB) file
formats are available.
When the characters period (.), comma (,), or pound sign (#) are written to
an Excel or Access file, they are replaced with their Unicode representation.
See also:
■Extract Data from Drawings and Spreadsheets on page 1833
882 | Chapter 22 Create and Modify Blocks

Quick Reference
DATAEXTRACTION
Extracts drawing data and merges data from an external source to a data
extraction table or external file.
DXEVAL
Controls when update notification displays for data extraction tables.
Extract Block Attribute Data (Advanced)
You can extract attribute information from a drawing and create a separate
text file for use with database software. This feature is useful for creating parts
lists with information already entered in the drawing database. Extracting
attribute information does not affect the drawing.
To create a parts list
■Create and edit an attribute definition
■Enter values for the attributes as you insert the blocks
■Create a template file and then extract attribute information to a text file
To extract attribute information, you first create an attribute template file
using any text processor, then generate the attribute extraction file using
AutoCAD, and, finally, open the attribute extraction file in a database
application. If you plan to extract the attribute information to a DXF (drawing
interchange format) file, it is not necessary to first create an attribute template
file.
NOTE Make sure that the attribute extraction file does not have the same name
as the attribute template file.
Create an Attribute Extraction Template File
Before you extract attribute information, you must create an ASCII template
file to define the structure of the file that will contain the extracted attribute
information. The template file contains information about the tag name, data
type, field length, and number of decimal places associated with the
information you want to extract.
Each field in the template file extracts information from the block references
in the drawing. Each line in the template file specifies one field to be written
Extract Block Attribute Data (Advanced) | 883
to the attribute extraction file, including the name of the field, its character
width, and its numerical precision. Each record in the attribute extraction file
includes all the specified fields in the order given by the template file.
The following template file includes the 15 possible fields. N means numeric,
C means character, www means a 3 digit number for the total width of the
field, and ddd means a 3 digit number representing how many numeric decimal
places are to be displayed to the right of the decimal point.
BL:NAME Cwww000 (Block name)
BL:LEVEL Nwww000 (Block nesting level)
BL:X Nwwwddd(X coordinate of block insertion point)
BL:Y Nwwwddd(Y coordinate of block insertion point)
BL:Z Nwwwddd(Z coordinate of block insertion point)
BL:NUMBER Nwww000 (Block counter; the same for MINSERT)
BL:HANDLE Cwww000 (Block handle; the same for MINSERT)
BL:LAYER Cwww000 (Block insertion layer name)
BL:ORIENT Nwwwddd(Block rotation angle)
BL:XSCALE Nwwwddd(X scale factor)
BL:YSCALE Nwwwddd(Y scale factor)
BL:ZSCALE Nwwwddd(Z scale factor)
BL:XEXTRUDE Nwwwddd(X component of block extrusion direction)
BL:YEXTRUDE Nwwwddd(Y component of block extrusion direction)
BL:ZEXTRUDE Nwwwddd(Z component of block extrusion direction)
numericNwwwddd (Numeric attribute tag)
characterCwww000 (Character attribute tag)
The template file can include any or all of the BL:xxxxxxx field names listed,
but must include at least one attribute tag field. The attribute tag fields
determine which attributes, hence which blocks, are included in the attribute
extraction file. If a block contains some, but not all, of the specified attributes,
the values for the absent ones are filled with blanks or zeros, depending on
whether the field is a character field or a numeric field.
Comments should not be included in an attribute template file.
The illustration and table show an example of the type of information you're
likely to extract, including block name, manufacturer, model number, and
cost.
884 | Chapter 22 Create and Modify Blocks
Decimal placesMaximum field
length
(C)haracter or
(N)umeric data
Field
000040CBlock name
000006CManufacturer
000015CModel
002006NCost
You can create any number of template files, depending on how you'll use
the data. Each line of a template file specifies one field to be written in the
attribute extraction file.
Follow these additional guidelines:
■Be sure to place a space between the attribute tag and the character or
numeric data. Use SPACEBAR, not TAB, to enter the space.
■Press Enter at the end of each line, including the last line.
■Each attribute extraction template file must include at least one attribute
tag field, but the same field can appear only once in the file.
The following is a sample template file.
BL:NAME C008000 (Block name, 8 characters)
BL:X N007001 (X coordinate, format nnnnnn.d)
BL:Y N007001 (Y coordinate, format nnnnnn.d)
SUPPLIER C016000 (Manufacturer's name, 16 characters)
MODEL C009000 (Model number, 9 characters)
PRICE N009002 (Unit price, format nnnnnnnn.dd)
Extract Block Attribute Data (Advanced) | 885

NOTE The format code for a numeric field includes the decimal point in the total
field width. For example, the minimum field width to accommodate the number
249.95 would be 6 and would be represented as N006002. Character fields do
not use the last three digits of the format code.
Create an Attribute Extraction File
After creating a template file, you can extract the attribute information using
one of the following formats:
■Comma-delimited format (CDF)
■Space-delimited format (SDF)
■Drawing interchange format (DXF)
The CDF format produces a file containing one record for each block reference
in a drawing. A comma separates the fields of each record, and single quotation
marks enclose the character fields. Some database applications can read this
format directly.
The SDF format also produces a file containing one record for each block
reference in a drawing. The fields of each record have a fixed width and employ
neither field separators nor character-string delimiters. The dBASE III Copy .
. . SDF operation also produces SDI-format files. The Append From... SDF
operation can read a file in dBASE IV format, which user programs written in
FORTRAN can easily process.
DXF produces a subset of the drawing interchange format containing only
block reference, attribute, and end-of-sequence objects. This option requires
no attribute extraction template. The file extension .dxx distinguishes an
extraction file in DXF format from normal DXF files.
Use the Attribute Extraction File
The attribute extraction file lists values and other information for the attribute
tags you specified in the template file.
If you specified a CDF format using the sample template, the output might
appear as follows:
'DESK', 120.0, 49.5, 'ACME INDUST.', '51-793W', 379.95
'CHAIR', 122.0, 47.0, 'ACME INDUST.', '34-902A', 199.95
'DESK', -77.2, 40.0, 'TOP DRAWER INC.', 'X-52-44',249.95
886 | Chapter 22 Create and Modify Blocks
By default, character fields are enclosed with single quotes (apostrophes). The
default field delimiter is a comma. The following two template records can be
used to override these defaults:
C:QUOTE c (Character string delimiter)
C:DELIM c (Field delimiter)
The first nonblank character following the C:QUOTE or C:DELIM field name
becomes the respective delimiter character. For example, if you want to enclose
character strings with double quotes, include the following line in your
attribute extraction template file:
C:QUOTE "
The quote delimiter must not be set to a character that can appear in a
character field. Similarly, the field delimiter must not be set to a character
that can appear in a numeric field.
If you specified an SDF format using the sample template, the file might be
similar to the following example.
(PRICE)(MODEL)(SUPPLIER)(Y)(X)(NAME)
379.9551-793WACME IN-
DUST.
49.5120.0DESK
199.9534-902AACME IN-
DUST.
47.0122.0CHAIR
249.95X-52-44TOP DRAWER
INC.
40.0-77.2DESK
The order of the fields corresponds to the order of the fields in the template
files. You can use these files in other applications, such as spreadsheets, and
you can sort and manipulate the data as needed. For example, you can open
an attribute extraction file in Microsoft Excel in which you can specify a
separate column for each field. See the documentation for your spreadsheet
program for information about how to use data from other applications. If
you open the file in Notepad or another Windows text processor, you can
paste the information back into the drawing as text.
Nested Blocks
The line BL:LEVEL in a template file reports the nesting level of a block
reference. A block that is inserted in a drawing has a nesting level of 1. A block
Extract Block Attribute Data (Advanced) | 887

reference that is part of (nested within) another block has a nesting level of
2, and so on.
For a nested block reference, the X,Y, Z coordinate values, scale factors,
extrusion direction, and rotation angle reflect the actual location, size,
orientation, and rotation of the nested block in the world coordinate system.
In some complex cases, nested block references cannot be correctly represented
with only two scale factors and a rotation angle, for example, if a nested block
reference is rotated in 3D. When this happens, the scale factors and rotation
angle in the extracted file record are set to zero.
Error Handling
If a field is not wide enough for the data that is to be placed in it, the data is
truncated and the following message is displayed:
** Field overflow in record <record number>
This could happen, for example, if you have a BL:NAME field with a width of
8 characters and a block in your drawing has a name 10 characters long.
To create an attribute extraction template file
1Start Notepad.
You can use any text editor or word processor that can save a text file in
ASCII format.
2Enter template information in Notepad. See Extract Block Attribute Data
(Advanced) on page 883 for format information.
3Save the file with a .txt file extension.
To extract data about a specific tag, insert the tag name in place of the
"numeric" or "character" fields.
WARNING Do not use tab characters when constructing the template file with a
word processor. If you use tab character alignment, the attribute information file
is not created. To align the columns, insert ordinary spaces by pressing SPACEBAR.
The use of tab characters may cause inconsistent alignment.
To extract attribute information
1At the Command prompt, enter attext.
2In the Attribute Extraction dialog box, specify the appropriate file format:
CDF, SDF, or DXF.
888 | Chapter 22 Create and Modify Blocks
3Specify the objects to extract attributes from by choosing Select Objects.
You can select a single block or multiple blocks in the drawing.
4Specify the attribute template file to use by entering the file name or by
choosing Template File and browsing.
5Specify the output attribute information file by entering the file name
or by choosing Output File and browsing.
6Click OK.
Quick Reference
ATTEXT
Extracts attribute data, informational text associated with a block, into a file.
DATAEXTRACTION
Extracts drawing data and merges data from an external source to a data
extraction table or external file.
Modify Blocks
You can modify a block definition or a block reference already inserted in the
drawing.
Modify a Block Definition
You can redefine block definitions in your current drawing. Redefining a block
definition affects both previous and future insertions of the block in the current
drawing and any associated attributes.
There are two methods for redefining a block definition:
■Modify the block definition in the current drawing.
■Modify the block definition in the source drawing and reinsert it into the
current drawing.
The method you choose depends on whether you want to make changes in
the current drawing only or in a source drawing also.
Modify Blocks | 889

Modify a Block Definition in the Current Drawing
To modify a block definition, follow the procedure to create a new block
definition, but enter the name of the existing block definition. This replaces
the existing block definition, and all the references to that block in the drawing
are immediately updated to reflect the new definition.
To save time, you can insert and explode an instance of the original block
and then use the resulting objects in creating the new block definition.
Update a Block Definition That Originated from a Drawing File
Block definitions created in your current drawing by inserting a drawing file
are not updated automatically when the original drawing is modified. You
can use INSERT to update a block definition from the drawing file.
Update a Block Definition That Originated from a Library Drawing
(Advanced)
DesignCenter™ does not overwrite an existing block definition in a drawing
with one that comes from another drawing. To update a block definition that
came from a library drawing, use WBLOCK to create a separate drawing file
from the library drawing block. Then, use INSERT to overwrite the block
definition in the drawing that uses the block.
NOTE Block descriptions are stripped off when using INSERT. Use the Clipboard
to copy and paste a block description displayed in the Block Definition dialog box
from one block definition to another.
Modify the Description of a Block
To modify the DesignCenter description of a block definition, use BLOCK.
You can also add descriptions to any number of existing blocks in the Block
Definition dialog box.
Redefine Block Attributes
You can attach attributes to a block when you define or redefine that block.
When you are prompted to select the objects to include in the block definition,
include the desired attributes in the selection set. Redefining the attributes in
the block definition has the following effects on block references that were
previously inserted:
■Constant attributes, which have a fixed value, are lost and replaced by any
new constant attributes.
890 | Chapter 22 Create and Modify Blocks
■Variable attributes remain unchanged, even if the new block definition
has no attributes.
■New attributes do not appear in the existing block references.
See also:
■Attach Data to Blocks (Block Attributes) on page 875
■Modify Dynamic Block Definitions on page 910
To modify an existing block definition
1Select the block to modify.
2Right-click the block and click Properties on the shortcut menu.
3In the Properties palette, select and modify X and Y position, scale, rotation
values, or other properties.
To update a block definition that originated from a drawing file
1If DesignCenter is not already open, click Tools menu ➤ Palettes ➤
DesignCenter.
2In the tree view, click the folder that contains the drawing file from which
the block originated.
3In the content area (on the right side), right-click the drawing file.
4On the shortcut menu, click Insert as Block.
5In the Insert dialog box, click OK.
6In the Block - Redefine Block dialog box, click Redefine Block.
7Press ESC to exit the command.
To modify a block description
1Click Modify menu ➤ Object ➤ Block Description.
2In the Block Definition dialog box, in the Name list, select the block for
which you want to modify the block description.
3In the Description box, enter or modify the description of the block.
4Click OK.
Modify a Block Definition | 891
5In the Block - Redefine Block dialog box, click Redefine Block.
Quick Reference
BLOCK
Creates a block definition from selected objects.
EXPLODE
Breaks a compound object into its component objects.
PROPERTIES
Controls properties of existing objects.
Modify the Data in Block Attributes
You can use any of the following methods to edit the values of attributes
attached to a block:
■Double-click the block to display the Enhanced Attributes Editor
■Press Ctrl and double-click the attribute to display the in-place editor
■Open the Properties palette and select the block
You can also change the location of attributes in a block using grips. With
multiple-line attributes, you can also move grips to resize the width of the
text.
NOTE If you press Ctrl and double-click an attribute that includes a hyperlink, the
hyperlink opens the web page. To edit the attribute, use one of the other methods
listed.
See also:
■Modify a Block Definition on page 889
To edit attribute data
1Click Modify menu ➤ Objects ➤ Attribute ➤ Single.
892 | Chapter 22 Create and Modify Blocks
2Select the block to edit.
3In the Edit Attributes dialog box, retype the attribute information as
necessary and click OK.
Quick Reference
ATTEDIT
Changes attribute information in a block.
ATTIPEDIT
Changes the textual content of an attribute within a block.
ATTSYNC
Updates block references with new and changed attributes from a specified
block definition.
BATTMAN
Manages the attributes for a selected block definition.
EATTEDIT
Edits attributes in a block reference.
ATTIPE
Controls the display of the in-place editor used to create multiline attributes.
ATTMULTI
Controls whether multiline attributes can be created.
Modify a Block Attribute Definition
You can modify attributes in block definitions with the Block Attribute
Manager. For example, you can modify the following:
■Properties that define how values are assigned to an attribute and whether
or not the assigned value is visible in the drawing area
■Properties that define how attribute text is displayed in the drawing
■Properties that define the layer that the attribute is on and the attribute
line's color, weight, and type
Modify a Block Attribute Definition | 893
By default, attribute changes you make are applied to all existing block
references in the current drawing.
Changing the attribute properties of existing block references does not affect
the values assigned to those blocks. For example, in a block containing an
attribute whose tag is Cost and value is 19.99, the 19.99 value is unaffected
if you change the tag from Cost to Unit Cost.
Updating attributes with duplicate tag names can lead to unpredictable results.
Use the Block Attribute Manager to find duplicate tags and change tag names.
If constant attributes or nested attributed blocks are affected by your changes,
use REGEN to update the display of those blocks in the drawing area.
Change the Prompt Order for Attribute Values
When you define a block, the order in which you select the attributes
determines the order in which you are prompted for attribute information
when you insert the block. You can use the Block Attribute Manager to change
the order of prompts that request attribute values.
Remove Block Attributes
You can remove attributes from block definitions and from all existing block
references in the current drawing. Attributes removed from existing block
references do not disappear in the drawing area until you regenerate the
drawing using REGEN.
You cannot remove all attributes from a block; at least one attribute must
remain. If you need to remove all attributes, redefine the block.
Update Block References
You can update attributes in all block references in the current drawing with
changes you made to the block definition. For example, you may have used
the Block Attribute Manager to modify attribute properties in several block
definitions in your drawing but elected not to automatically update existing
block references when you made the changes. Now that you are satisfied with
the attribute changes you made, you can apply those changes to all blocks in
the current drawing.
You can also use ATTSYNC to update attribute properties in block references
to match their block definition, or to update a block instance after you redefine
a block attribute using BLOCK, -BLOCK, or BEDIT.
Updating attribute properties in block references does not affect any values
that have been assigned to those attributes.
894 | Chapter 22 Create and Modify Blocks

Edit Attributes in a Block Reference
You can select an attribute in a block reference and use the Properties palette
to change its properties, or you can use the Enhanced Attribute Editor to
modify all the attributes in a selected block reference.
See also:
■Define Block Attributes on page 878
■Modify a Block Definition on page 889
To edit attributes assigned to a block definition
1Click Home tab ➤ Block panel ➤ Manage Attributes.
2In the Block Attribute Manager, select a block from the Block list, or click
Select Block and select a block in the drawing area.
3In the list of attributes, double-click the attribute you want to edit, or
select the attribute and click Edit.
4In the Edit Attribute dialog box, make the attribute changes you want,
and then click OK.
To specify whether changes are applied to existing block references
1Click Home tab ➤ Block panel ➤ Manage Attributes.
2In the Block Attribute Manager, click Settings.
3In the Settings dialog box, do one of the following:
■To apply changes to existing block references, select the Apply Changes
to Existing References option.
■To apply changes only to new block insertions, clear the Apply
Changes to Existing References option.
4Click OK.
Modify a Block Attribute Definition | 895
To highlight duplicate attribute tags in a block
1Click Home tab ➤ Block panel ➤ Manage Attributes.
2In the Block Attribute Manager, click Settings.
3In the Settings dialog box, select Emphasize Duplicate Tags.
4Click OK.
To change the prompt order for attribute values
1Click Home tab ➤ Block panel ➤ Manage Attributes.
2In the Block Attribute Manager, select a block from the Block list, or click
Select Block and select a block in the drawing area.
For the selected block, attributes are listed in their prompt order.
3To move an attribute up in the prompt order, select the attribute, and
then click Move Up; to move an attribute down in the prompt order,
select the attribute, and then click Move Down.
NOTE The Move Up and Move Down buttons are unavailable for attributes
with constant values (Mode=C).
To remove an attribute from a block definition and all block references
1Click Home tab ➤ Block panel ➤ Manage Attributes.
2In the Block Attribute Manager, select a block from the Block list, or click
Select Block and select a block in the drawing area.
3(Optional) If you do not want attributes removed from existing instances
of the block, click Settings, and, in the Settings dialog box, clear Apply
Changes to Existing References.
4In the Block Attribute Manager, select an attribute from the attribute list,
and then click Remove.
Attributes removed from existing block instances do not disappear until
you regenerate the drawing using REGEN.
896 | Chapter 22 Create and Modify Blocks
To update existing block references with attributes you have modified
1Click Home tab ➤ Block panel ➤ Manage Attributes.
2In the Block Attribute Manager, select a block from the Block list, or click
Select Block and select a block in the drawing area.
3Click Sync to update attributes you have changed in all block references
for the selected block.
To update the attributes in block references for a selected block definition
1Click Home tab ➤ Block panel ➤ Synchronize Attributes.
2At the prompt, do one of the following:
■Enter name, and then enter the name of the block whose block
references you want to update.
■Enter ? to view a list of blocks, and then enter name, followed by the
name of the block.
■Press Enter, and then use your pointing device to select a block in the
drawing area.
If you specify a block that does not exist, or if the block exists but does
not contain attributes, an error message is displayed.
Alternate
1Click Home tab ➤ Block panel ➤ Edit Single Attribute.
2In the drawing area, select the block you want to edit.
3In the Enhanced Attribute Editor, select the attribute you want to edit.
You can change the attribute value or choose another tab and edit other
attribute properties.
4Make the attribute changes you want, and then do one of the following:
■Click Apply to save your changes. The Enhanced Attribute Editor
remains open.
If you click Cancel later to exit the Enhanced Attribute Editor, attribute
changes you made prior to choosing Apply are not reversed.
Modify a Block Attribute Definition | 897
■Click OK to save your changes and close the Enhanced Attribute
Editor.
■Click Select Block to edit the attributes of a different block. If you
made changes to the current block, but have not saved them, you are
prompted to do so before selecting a new block.
Quick Reference
ATTIPEDIT
Changes the textual content of an attribute within a block.
ATTSYNC
Updates block references with new and changed attributes from a specified
block definition.
BATTMAN
Manages the attributes for a selected block definition.
EATTEDIT
Edits attributes in a block reference.
ATTIPE
Controls the display of the in-place editor used to create multiline attributes.
ATTMULTI
Controls whether multiline attributes can be created.
Disassemble a Block Reference (Explode)
If you need to modify one or more objects within a block separately, you can
disassemble, or explode, the block reference into its component objects. After
making the changes, you can
■Create a new block definition
■Redefine the existing block definition
■Leave the component objects uncombined for other uses
898 | Chapter 22 Create and Modify Blocks
When you explode a block reference, the block reference is disassembled into
its component objects; however, the block definition still exists in the drawing
for insertion later.
You can automatically explode block references as you insert them by selecting
the Explode option in the Insert dialog box.
To control properties while you explode an object
1Enter xplode.
2Select the objects to be exploded.
3If you selected more than one object, enter i to control properties for
individual objects, or enter g to control properties for all the selected
objects.
4Enter an option for a property you want to change.
The property is applied to the compound object and the prompt is
redisplayed.
5Enter another option, or enter e to explode the selected objects.
The selected objects are exploded and the properties you specified are
applied to the component objects.
Quick Reference
EXPLODE
Breaks a compound object into its component objects.
XPLODE
Breaks a compound object into its component objects.
Disassemble a Block Reference (Explode) | 899
900

Add Behaviors to Blocks
(Dynamic Blocks)
Instead of being a fixed part of a drawing, a dynamic block reference can be changed or
manipulated as you work in a drawing.
Overview of Dynamic Blocks
Dynamic block definitions allow you to edit a block reference outside of the
Block Editor. They contain rules, or parameters, for how to change the
appearance of the block reference when it is inserted in the drawing.
A dynamic block reference inserts one block that can be edited in several different
ways. For example, instead of creating multiple interior door blocks of different
sizes, you can create one resizable door block.
You author dynamic blocks with either constraint parameters or action
parameters.
NOTE Using both constraint parameters and action parameters in the same block
definition is not recommended.
Constrain Block Definitions
In a block definition, constraint parameters
■Associate objects with one another
■Restrict geometry or demensions
Once the block is inserted into the drawing, the constraint parameters can be
edited as properties by using the Properties Manager.
23
901
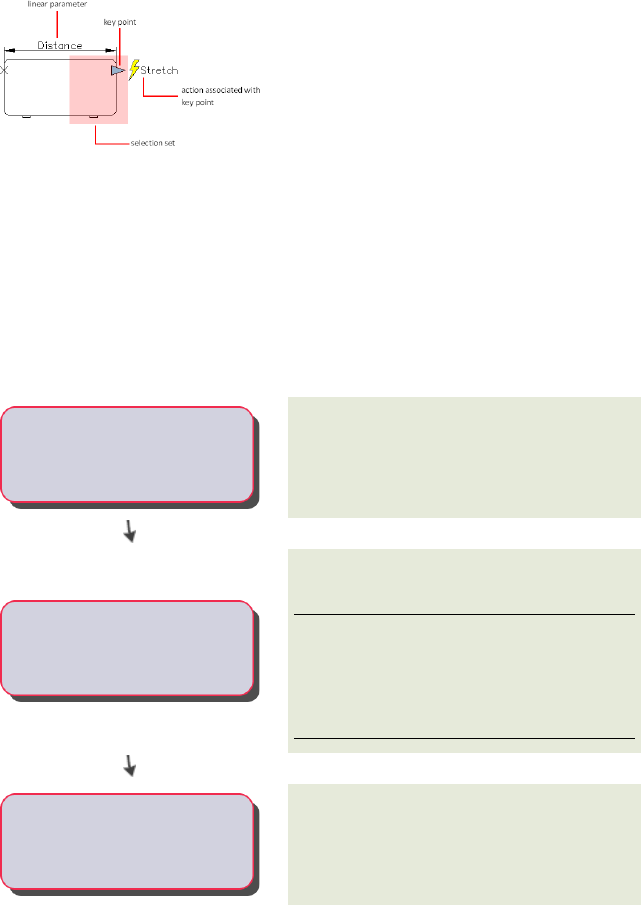
Add Actions and Parameters to Block Definitions
In a block definition, actions and parameters provide rules for the behavior
or a block once it is inserted into the drawing.
Depending on the specified block geometry, or parameter, you can associate
an action to that parameter. The parameter is represented as a grip in the
drawing. When you edit the grip, the associated action determines what will
change in the block reference.
Just as with constraint parameters, action parameters can have editable
properties that are changed using the Properties Manager.
Quick Start to Creating Dynamic Blocks
Know how the block should change or move, and
what parts will depend on the others.
Example: The block will be resizable, and after it
is resized, additional geometry is displayed.
-----Plan the block content.
Draw the block geometry in the drawing area or
the Block Editor.
NOTE If you will use visibility states to change
how geometry is displayed, you may not want to
include all the geometry at this point. For more
information, see Control the Visibility of Objects
in a Block on page 953.
-----Draw the geometry.
Add either individual parameters or parameter
sets to define geometry that will be affected by
-----Add parameters. an action or manipulation. Keep in mind the
objects that will be dependent on one another.
902 | Chapter 23 Add Behaviors to Blocks (Dynamic Blocks)
If you are working with action parameters on
page 925, if necessary, add actions to define what
-----Add actions. will happen to the geometry when it is
manipulated.
Add properties that determine how the block is
displayed in the drawing area. Custom properties
-----Define custom properties. affect grips, labels, and preset values for block
geometry.
On the ribbon, in the Block Editor contextual tab,
Open/Save panel, click Test Block to test the block
before you save it.
-----Test the block.
Quick Reference
BEDIT
Opens the block definition in the Block Editor.
BLOCK
Creates a block definition from selected objects.
BTESTBLOCK
Displays a window within the Block Editor to test a dynamic block.
Create and Edit Dynamic Blocks
The Block Editor provides tools for adding dynamic behavior to block
definitions.
Create and Edit Dynamic Blocks | 903
Overview of the Block Editor
In the Block Editor, you can
■Define a block
■Add a geometric or dimensional constraint
■Add an action parameter
■Define attributes
■Manage visibility states
■Test and save the block definition
UCS in the Block Editor
Within the Block Editor, the origin of the UCS icon defines the base point for
the block. You can change the base point for the block by moving the geometry
relative to the origin of the UCS icon, or by adding a base point parameter.
The UCS command is disabled in the Block Editor. Keep the following in mind:
■While you can assign parameters to an existing 3D block definition, the
block reference cannot be edited along the Z axis.
■While you can add actions to a dynamic block that contains solid objects,
you can't perform solid editing features within a dynamic block reference
(for example, stretch a solid, move a hole within a solid, and so on).
NOTE The Command window should be displayed in the Block Editor, as it displays
prompts for many aspects of creating dynamic blocks.
See also:
■Define Block Attributes on page 878
To open an existing block definition in the Block Editor
1Click Insert tab ➤ Block panel ➤ Edit.
2In the Edit Block Definition dialog box, do one of the following:
■Select a block definition from the list.
904 | Chapter 23 Add Behaviors to Blocks (Dynamic Blocks)
■Select <Current Drawing> if the drawing is the block definition you
want to open.
3Click OK.
To create a new block definition in the Block Editor
1Click Home tab ➤ Block panel ➤ Create.
2In the Edit Block Definition dialog box, enter a name for the new block
definition. Click OK.
3Click Block Editor tab ➤ Open/Save panel ➤ Save Block.
NOTE This saves the block definition even if you have not added any objects
in the Block Editor drawing area.
4Click Close Block Editor.
To open a drawing file saved as a block (not dynamic) in the Block Editor
1Click the Application button, and click Open ➤ Drawing.
2Open the drawing file that is saved as a block.
3Click Insert tab ➤ Block panel ➤ Edit.
4In the Edit Block Definition dialog box, select <Current Drawing>. Click
OK.
To open a drawing file saved as a dynamic block in the Block Editor
1Click the Application button, and click Open ➤ Drawing.
2Open the drawing file that is saved as a block.
An alert is displayed that states that the drawing file contains authoring
elements.
3In the alert dialog box, click Yes to open the drawing in the Block Editor.
Overview of the Block Editor | 905
To view properties of a block definition in the Block Editor
1Click Insert tab ➤ Block panel ➤ Edit.
2In the Edit Block Definition dialog box, do one of the following:
■Select a block definition from the list.
■Select <Current Drawing> if the drawing is the block definition you
want to open.
3Click OK.
4Click View tab ➤ Palettes panel ➤ Properties.
5In the Properties Palette window, under Block, view the properties of the
block definition.
Quick Reference
BCLOSE
Closes the Block Editor.
BEDIT
Opens the block definition in the Block Editor.
OPTIONS
Customizes the program settings.
PROPERTIES
Controls properties of existing objects.
BLOCKEDITLOCK
Disallows opening of the Block Editor and editing of dynamic block
definitions.
Create Custom Block Authoring Tools
Use the Block Authoring palettes to create custom tools for authoring dynamic
blocks.
906 | Chapter 23 Add Behaviors to Blocks (Dynamic Blocks)

Similar to tool palettes, you can also use these palettes to add parameters and
actions to your dynamic block definition.
Change Properties of Tools
In the Tool Properties dialog box, you can change the following properties of
custom tools:
■Tool description
■Parameter type
■Associated action(s)
■Key point on the parameter to which the action is tied (if applicable)
■Tool palette image
NOTE You cannot drag parameters and actions from the Block Editor onto a
regular tool palette.
Use Parameter Sets
The Parameter Sets tab of the Block Authoring palettes allows you to add
commonly paired parameters and actions to your dynamic block definition.
When you first add a parameter set to your dynamic block definition, a yellow
alert icon is displayed next to each action. This indicates that you need to
associate a selection set with each action. You can double click the yellow
alert icon (or use the BACTIONSET command) and follow the Command
prompts to associate the action with a selection set.
NOTE When you insert a lookup parameter set and double click the yellow alert
icon, the Property Lookup Table dialog box is displayed. Lookup actions are
associated with the data you add to this table, not a selection set.
See also:
■Add Parameters to Dynamic Blocks on page 924
■Overview of Actions on page 925
■Control Tool Properties on page 78
■Organize Tool Palettes on page 86
Create Custom Block Authoring Tools | 907
To make a copy of a parameter set
1Click Insert tab ➤ Block panel ➤ Block Editor.
2In the Edit Block Definition dialog box, Under Block To Create or Edit,
select a name from the list and then, click OK.
3Click Block Editor tab ➤ Manage panel ➤ Authoring Palettes.
4In the Block Authoring Palettes window, Parameters Sets tab, right-click
a parameter set. Click Copy.
5Right-click anywhere on the palette to which you want to add the
parameter set (except on a parameter set). Click Paste.
To add or remove an action from a parameter set
1Click Insert tab ➤ Block panel ➤ Block Editor.
2In the Edit Block Definition dialog box, Under Block To Create or Edit,
select a name from the list and then, click OK.
3Click Block Editor tab ➤ Manage panel ➤ Authoring Palettes.
4In the Block Authoring Palettes window, Parameters Sets tab, right-click
a parameter set. Click Properties.
5In the Tool Properties dialog box, under Parameter, click Actions, and
then click the [...] button.
6In the Add Actions dialog box, under Action Object to Add, select an
action from the list.
7Click either Add or Delete.
8(Optional) Repeat steps 3 and 4 to add or remove additional actions.
9Click OK.
10 In the Tool Properties dialog box, click OK.
908 | Chapter 23 Add Behaviors to Blocks (Dynamic Blocks)

Quick Reference
BAUTHORPALETTE
Opens the Block Authoring Palettes window in the Block Editor.
BAUTHORPALETTECLOSE
Closes the Block Authoring Palettes window in the Block Editor.
BEDIT
Opens the block definition in the Block Editor.
TOOLPALETTES
Opens the Tool Palettes window.
BLOCKEDITOR
Indicates whether or not the Block Editor is open.
Test Blocks Within the Block Editor
Test your block definition before you save or exit the Block Editor.
The test block window reflects the current block definition in the Block Editor.
The test block window closes when you
■Open a different block definition
■Save the current block definition with a different name
■Exit the Block Editor
NOTE If you exit AutoCAD while in the Test Block window, you will not be
prompted to save the file.
Quick Reference
BTESTBLOCK
Displays a window within the Block Editor to test a dynamic block.
BLOCKTESTWINDOW
Indicates whether or not a test block window is current.
Test Blocks Within the Block Editor | 909
Modify Dynamic Block Definitions
Correct Errors in Action Parameters
A yellow alert icon is displayed when
■A parameter is not associated with an action
■An action is not associated with a parameter or selection set
To correct these errors, hover over the yellow alert icon until the tooltip
displays a description of the problem. Then double-click the constraint and
follow the prompts.
Save Dynamic Blocks
When you save a block definition, the current values of the geometry and
parameters in the block become the default values for the block reference.
The default visibility state for the block reference is the visibility state at the
top of the list in the Manage Visibility States dialog box.
NOTE If you click File menu ➤ Save while you are in the Block Editor, you will
save the drawing but not the block definition. You must specifically save the block
definition while you are in the Block Editor.
To save a copy of the current block definition in the Block Editor under a
new name
1Click Insert tab ➤ Block panel ➤ Block Editor.
2Click Block Editor tab ➤ Open/Save panel ➤ Save Block As.
3In the Save Block As dialog box, enter a name for the new block definition.
Click OK.
4To save the block definition in the drawing, click File menu ➤ Save.
910 | Chapter 23 Add Behaviors to Blocks (Dynamic Blocks)
To save the current block definition as a new drawing file
1Click Insert tab ➤ Block panel ➤ Block Editor.
2Click Block Editor tab ➤ Open/Save panel ➤ Save Block As.
3In the Save Block As dialog box, enter a name for the new block definition.
4Select the Save Block Definition to Drawing File check box. Click OK.
5In the Browse For Drawing File dialog box, click Save.
Quick Reference
BACTION
Adds an action to a dynamic block definition.
BACTIONTOOL
Adds an action to a dynamic block definition.
BACTIONSET
Specifies the selection set of objects associated with an action in a dynamic
block definition.
BASSOCIATE
Associates an action with a parameter in a dynamic block definition.
BCLOSE
Closes the Block Editor.
BEDIT
Opens the block definition in the Block Editor.
BGRIPSET
Creates, deletes, or resets grips associated with a parameter.
BPARAMETER
Adds a parameter with grips to a dynamic block definition.
Modify Dynamic Block Definitions | 911
BLOOKUPTABLE
Displays or creates a lookup table for a dynamic block definition.
BSAVE
Saves the current block definition.
BSAVEAS
Saves a copy of the current block definition under a new name.
BVSTATE
Creates, sets, or deletes a visibility state in a dynamic block.
Add Constraints to Dynamic Blocks
You can add geometric and dimensional constraints to a dynamic block.
Overview of Constraints in Dynamic Blocks
When you add constraints to a dynamic block definition, you have the option
of adding editable properties that control the parameters once they are inserted
in a drawing.
Geometric Constraints in Block Definitions
You can add geometric constraints to blocks the same way you would to
geometry outside of the Block Editor. Geometric constraints are available both
on the ribbon and on the Block Authoring palettes.
Dimensional Constraints in Block Definitions
A dimensional constraint applied within the Block Editor using the
BCPARAMETER command is called a constraint parameter. While you can use
both dimensional constraints and constraint parameters in a block definition,
only constraint parameters will display editable custom properties for that
block reference.
Constraint parameters contain parameter information that can be displayed
or edited for the block reference.
912 | Chapter 23 Add Behaviors to Blocks (Dynamic Blocks)
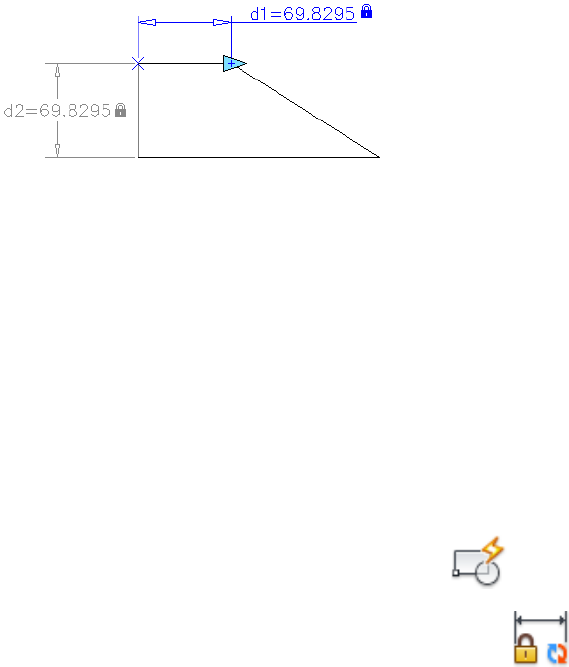
The above block definition contains both a linear constraint and a horizontal
constraint parameter. The horizontal constraint parameter includes a grip,
while the linear constraint does not. The horizontal constraint parameter is
also dynamic, while the linear constraint is not.
See also:
■Constrain Objects Geometrically on page 808
■Apply Dimensional Constraints on page 829
■Specify Properties for Dynamic Blocks on page 939
■Associative Dimensions on page 1421
To convert a dimensional constraint into a constraint parameter
1Click Insert tab ➤ Block panel ➤ Block Editor.
2Click Block Editor tab ➤ Dimensional panel ➤ Convert.
3Select a dimensional constraint in the Block Editor or enter a constraint
parameter type option in the command line.
Quick Reference
BCPARAMETER
Applies constraint parameters to selected objects, or converts dimensional
constraints to parameter constraints.
DIMCONSTRAINT
Applies dimensional constraints to selected objects or points on objects, or
converts associative dimensions to dimensional constraints.
Overview of Constraints in Dynamic Blocks | 913
BCONSTATUSMODE
Turns the constraint display status on and off and controls the shading of
objects based on their constraint level.
Define User Parameters in Dynamic Blocks
You can control the geometry of constraint parameters with mathematical
expressions.
While you can insert both user variables and user parameters in the Block
Editor, only user parameters are displayed as editable custom properties for a
block reference.
There are several types of user parameters. For more information, see Parameters
Manager - Block Editor.
NOTE User parameters can be exposed as custom properties of the block reference.
If it does not define an equation, then the property can be edited. If it is an
equation, then the property is read-only.
See also:
■Parameters Manager - Block Editor
■Constrain a Design with Formulas and Equations on page 840
■Specify Properties for Dynamic Blocks on page 939
To create a new user parameter
1Click Insert tab ➤ Block panel ➤ Block Editor.
2Click Block Editor tab ➤ Dimensional panel ➤ Block Table.
3In the Block Properties Table dialog box, click New Properties.
4In the New Parameter dialog box, specify a name and a value. Click OK.
914 | Chapter 23 Add Behaviors to Blocks (Dynamic Blocks)
Quick Reference
BCPARAMETER
Applies constraint parameters to selected objects, or converts dimensional
constraints to parameter constraints.
BTABLE
Displays a dialog box to define variations of a block.
DIMCONSTRAINT
Applies dimensional constraints to selected objects or points on objects, or
converts associative dimensions to dimensional constraints.
BCONSTATUSMODE
Turns the constraint display status on and off and controls the shading of
objects based on their constraint level.
Control Constrained Blocks with the Parameters Manager
The Parameters Manager allows you to display and edit constraints, user
parameters, action parameters, and block attributes from within the Block
Editor.
Within the Block Editor, the Parameters Manager displays and controls the
following categories:
■Action Parameters
■Dimensional Constraint Parameters
■Reference Parameters
■User Parameters
■Attributes
For each of the above categories, you can display and control the following:
■Name
■Expression
■Value
■Type
Control Constrained Blocks with the Parameters Manager | 915
■Show or Hide Information
■Display Order
■Description
For more information on the Parameters Manager in the Block Editor, see
Parameters Manager - Block Editor.
To display or hide additional columns in the Parameters Manager
■In the Parameters Manager, right-click a column header and select or
de-select a column name.
Quick Reference
PARAMETERS
Controls the associative parameters used in the drawing.
PARAMETERSCLOSE
Closes the Parameters Manager palette.
PARAMETERSSTATUS
Indicates whether the Parameters Manager is displayed or hidden.
Use a Block Properties Table
You can define and control values for parameters and properties within a
block definition using a Block Properties table.
The Block Properties Table dialog box consists of a grid with parameters
defining column headings and rows defining the different property set values.
When selecting a block reference, it can be set to the values defined by one
of the rows in the block properties table.
916 | Chapter 23 Add Behaviors to Blocks (Dynamic Blocks)
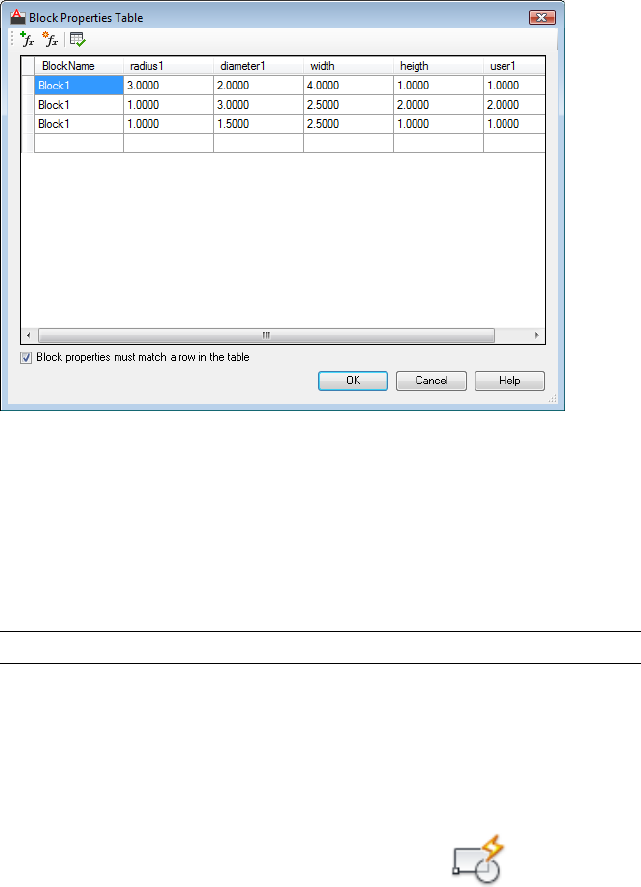
A table can include any of the following parameters and properties:
■Action parameters
■User parameters
■Constraint parameters
■Attributes
NOTE Only one table is allowed in the block definition.
You can restrict the property set for block references to only values defined
by one of the rows of the table. You can also change individual properties of
the reference so that the property set no longer matches one of the defined
rows.
To add parameter properties to a block table
1Click Insert tab ➤ Block panel ➤ Block Editor.
2In the Block Editor, double-click a block properties table in the block
definition.
3In the Block Properties Table dialog box, click Add Properties.
Use a Block Properties Table | 917

4In the Add Parameter Properties dialog box, under the Parameter
Properties list, select the parameter properties you want to add to the
block table. Hold Ctrl to select more than one property.
5Click OK.
To check for errors in a block properties table
1Click Block Editor tab ➤ Dimensional panel ➤ Block Table.
2In the Block Properties Table dialog box, click Audit.
Quick Reference
BCPARAMETER
Applies constraint parameters to selected objects, or converts dimensional
constraints to parameter constraints.
BTABLE
Displays a dialog box to define variations of a block.
DIMCONSTRAINT
Applies dimensional constraints to selected objects or points on objects, or
converts associative dimensions to dimensional constraints.
BCONSTATUSMODE
Turns the constraint display status on and off and controls the shading of
objects based on their constraint level.
Identify Fully Constrained Objects
When an object is fully constrained, all relevant geometric and dimensional
constraints are applied to the geometry.
You should always fully constrain geometry in a dynamic block definition
that contains constraints. If a block definition is not fully constrained, you
may get unpredictable behavior when the block is inserted in a drawing.
For more information on fully constrained objects, see Overview of Constraints
on page 803.
918 | Chapter 23 Add Behaviors to Blocks (Dynamic Blocks)
Work with Fully Constrained Block Definitions
You can identify fully constrained objects with the constrained status mode
in the Block Editor. The BCONSTATUSMODE system variable allows you to
switch between the constrained status modes. You can also use the ribbon to
switch between modes while in the Block Editor.
The constrained geometry is represented with different colors. For more
information see the Block Editor Settings dialog box.
NOTE A fully constrained block definition must contain at least one fixed geometric
constraint.
See also:
■Apply or Remove Geometric Constraints on page 810
To identify the constrained objects
1Click Insert tab ➤ Block panel ➤ Block Editor.
2Click Block Editor tab ➤ Manage panel ➤ Constraint Status.
The constrained objects are represented with the constraint status colors
specified in the Block Editor Settings dialog box.
To specify color assignment for the constraint display status
1Click Insert tab ➤ Block panel ➤ Block Editor.
2Click Block Editor tab ➤ Manage panel ➤ Block Editor Settings.
3In the Block Editor Settings dialog box, under Constraint Status, specify
colors for the following constrained objects:
■Unconstrained
■Partially Constrained
■Fully Constrained
■Improperly Constrained
Identify Fully Constrained Objects | 919
4Click OK.
Quick Reference
BESETTINGS
Displays the Block Editor Settings dialog box.
BCONSTATUSMODE
Turns the constraint display status on and off and controls the shading of
objects based on their constraint level.
Add Action Parameters to Dynamic Blocks
You can add actions and parameters to dynamic blocks to determine how a
block should behave when it is inserted into a drawing.
Overview of Actions and Parameters
Parameters, actions, and their relationships (dependencies) are displayed in
different ways in the Block Editor. You can specify settings for some of these
elements.
Actions
An action displays its name and icon (a lightning bolt) in the Block Editor.
Actions are grouped into bars, which display all actions associated with a
parameter.
920 | Chapter 23 Add Behaviors to Blocks (Dynamic Blocks)
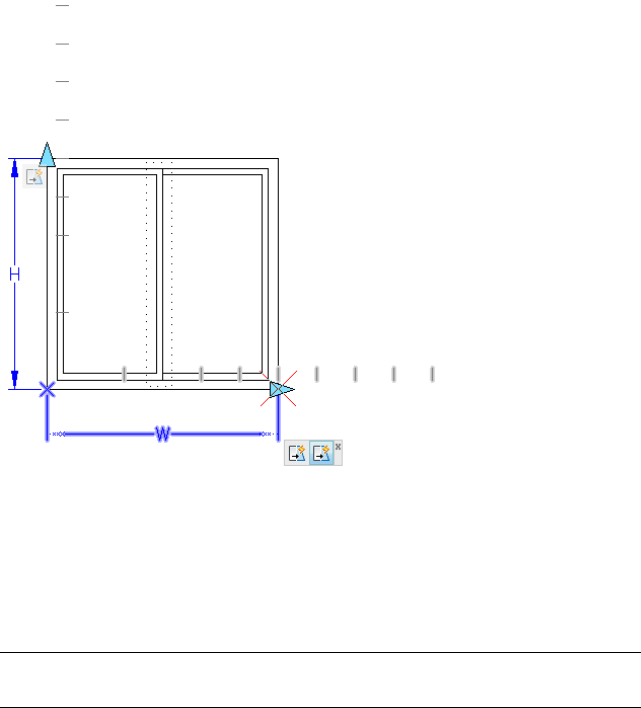
Hover the cursor over an action icon to display
■The associated parameter
■The associated selection set
■Additional objects that belong to the action
NOTE In order to use the BASSOCIATE command, you must first set
BACTIONBARMODE to 0.
Custom Tools
You can create custom block authoring tools, which you access from the block
authoring palettes. In order to preserve the default tools on the block authoring
palettes, you should create a new palette for custom block authoring tools.
You can then copy a parameter set tool from one of the existing palettes and
paste the copy onto the new palette.
Overview of Actions and Parameters | 921
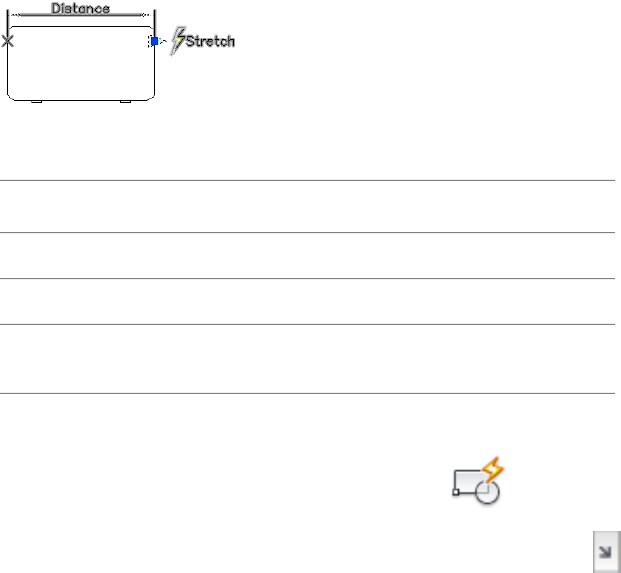
Dependencies
When you select a parameter, grip, or action in the Block Editor, its associated
objects are highlighted. This is called dependency highlighting. You can turn
dependency highlighting on or off.
The following example shows how dependency highlighting creates a halo
effect for the associated parameter (labeled Distance) and action (labeled
Stretch) when you select the custom grip in the Block Editor.
The following table details what is dependency highlighted when you select
an element in the Block Editor.
Objects that are dependency highlightedSelected object in
the Block Editor
Associated grips and actionsParameter
Associated parameter and actionsGrip
Associated parameters, grips, and the selection set (geo-
metry)
Action
To specify settings for parameters and actions in the Block Editor
1Click Insert tab ➤ Block panel ➤ Block Editor.
2Click Block Editor tab ➤ Manage panel ➤ Dialog box launcher.
3In the Block Editor Settings dialog box, set the desired options.
4Click OK.
To specify the text color for actions in the Block Editor
1At the Command prompt, enter bactionbarmode.
2Enter 0 to view legacy action objects.
922 | Chapter 23 Add Behaviors to Blocks (Dynamic Blocks)
3At the Command prompt, enter bactioncolor.
4Enter one of the following values:
■BYLAYER
■BYBLOCK
■An integer from 1 to 255.
■A true color specified by three integers each ranging from 1 to 255 in
the following format: RGB:000,000,000.
5Press Enter.
6At the Command prompt, enter regen to regenerate the drawing.
Quick Reference
BACTIONBAR
Displays or hides action bars for a selection set of parameter objects.
BEDIT
Opens the block definition in the Block Editor.
BESETTINGS
Displays the Block Editor Settings dialog box.
BLOCK
Creates a block definition from selected objects.
REGEN
Regenerates the entire drawing from the current viewport.
BACTIONBARMODE
Indicates whether the action bars or the legacy action objects are displayed
in the Block Editor.
BACTIONCOLOR
Sets the text color of actions in the Block Editor.
BDEPENDENCYHIGHLIGHT
Controls whether or not dependent objects are dependency highlighted
when a parameter, action, or grip is selected in the Block Editor.
Overview of Actions and Parameters | 923
BGRIPOBJCOLOR
Sets the color of grips in the Block Editor.
BGRIPOBJSIZE
Sets the display size of custom grips in the Block Editor relative to the screen
display.
BPARAMETERCOLOR
Sets the color of parameters in the Block Editor.
BPARAMETERFONT
Sets the font used for parameters and actions in the Block Editor.
BPARAMETERSIZE
Sets the size of parameter text and features in the Block Editor relative to the
screen display.
BPTEXTHORIZONTAL
Forces the text displayed for action parametes and constraint parameters in
the Block Editor to be horizontal.
BTMARKDISPLAY
Controls whether or not value set markers are displayed for dynamic block
references.
BVMODE
Controls how objects that are made invisible for the current visibility state
are displayed in the Block Editor.
Add Parameters to Dynamic Blocks
Grips
When you add a parameter to a dynamic block definition, grips are added to
key points of the parameter. Key points are the parts of a parameter that you
use to manipulate the block reference. For example, a linear parameter has
key points at its base point and end point. You can manipulate the parameter
distance from either key point.
You can specify grip size and color for display in the Block Editor. This setting
does not affect the size and color of the grips in a block reference.
924 | Chapter 23 Add Behaviors to Blocks (Dynamic Blocks)
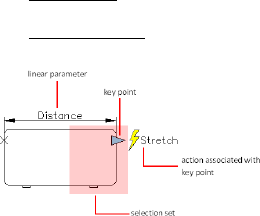
See also:
■Specify Value Sets for Dynamic Blocks on page 944
■Specify Properties for Dynamic Blocks on page 939
■Extract Data from Block Attributes on page 882
■Extract Block Attribute Data (Advanced) on page 883
Quick Reference
BEDIT
Opens the block definition in the Block Editor.
BPARAMETER
Adds a parameter with grips to a dynamic block definition.
BSAVE
Saves the current block definition.
Add Actions to Dynamic Blocks
Actions define how the geometry of a dynamic block reference will move or
change when the custom properties of the block reference are manipulated
in a drawing.
Overview of Actions
In general, you associate an action with a parameter and the following:
■Key point. The point on a parameter that drives the action.
■Selection set. The geometry that will be affected by the action.
Add Actions to Dynamic Blocks | 925
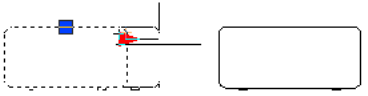
When you move the grip in the example above, only the geometry in the
selection set is stretched.
Quick Reference
BEDIT
Opens the block definition in the Block Editor.
BACTION
Adds an action to a dynamic block definition.
BACTIONSET
Specifies the selection set of objects associated with an action in a dynamic
block definition.
BASSOCIATE
Associates an action with a parameter in a dynamic block definition.
BLOOKUPTABLE
Displays or creates a lookup table for a dynamic block definition.
PROPERTIES
Controls properties of existing objects.
Move Actions
Move selected objects a specified distance and angle.
Apply a Move Action to a Point Parameter
A move action associated with a point parameter moves all objects in a
selection set in any direction. The point parameter is the location of the grip
for the move action in the block reference.
926 | Chapter 23 Add Behaviors to Blocks (Dynamic Blocks)
Apply a Move Action to a Linear Parameter
A move action associated with a linear parameter moves all objects in a
selection set only in the direction of the linear parameter. The parameter key
point is the location of the grip in the block reference.
Apply a Move Action to a Polar Parameter
A move action associated with a polar parameter moves all objects in a selection
set in any direction. In the block reference, the parameter key point is
■The location of the move grip
■The offset distance from the selected objects
Applying a move action to a polar parameter gives the same result as applying
a move action to a point parameter.
Quick Reference
BEDIT
Opens the block definition in the Block Editor.
BACTION
Adds an action to a dynamic block definition.
BACTIONSET
Specifies the selection set of objects associated with an action in a dynamic
block definition.
BASSOCIATE
Associates an action with a parameter in a dynamic block definition.
BLOOKUPTABLE
Displays or creates a lookup table for a dynamic block definition.
PROPERTIES
Controls properties of existing objects.
Scale Actions
Scale selected objects relative to the base point specified by the action.
Add Actions to Dynamic Blocks | 927
Apply a Scale Action to a Linear Parameter
A scale action applied to a linear parameter scales the selected objects in the
direction of the parameter.
Apply a Scale Action to a Polar Parameter
A scale action applied to a polar parameter scales the selected objects by the
specified distance and angle. While the resulting geometry behaves in the
same way as a scale action applied to a linear parameter, the way the grips are
manipulated is different in the Properties palette.
Apply a Scale Action to an XY Parameter
A scale action applied to an XY parameter scales the selected objects only in
the X and Y direction specified by the parameter. While the resulting geometry
behaves in the same way as a scale action applied to a linear parameter, the
way the grips are manipulated is different in the Properties palette.
Quick Reference
BEDIT
Opens the block definition in the Block Editor.
BACTION
Adds an action to a dynamic block definition.
BACTIONSET
Specifies the selection set of objects associated with an action in a dynamic
block definition.
BASSOCIATE
Associates an action with a parameter in a dynamic block definition.
BLOOKUPTABLE
Displays or creates a lookup table for a dynamic block definition.
PROPERTIES
Controls properties of existing objects.
928 | Chapter 23 Add Behaviors to Blocks (Dynamic Blocks)
Stretch Actions
Move and stretch objects a specified distance in a specified direction relative
to the base point specified by the action.
Apply a Stretch Action to a Point Parameter
A stretch action applied to a point parameter moves and stretches selected
objects a specified distance in any direction.
Apply a Stretch Action to a Linear or Polar Parameter
A stretch action applied to a linear parameter moves and stretches selected
objects a specified distance in the direction of the parameter.
Apply a Stretch Action to an XY Parameter
A stretch action applied to an XY parameter stretches the selected objects only
in the X and Y direction specified by the parameter.
Quick Reference
BEDIT
Opens the block definition in the Block Editor.
BACTION
Adds an action to a dynamic block definition.
BACTIONSET
Specifies the selection set of objects associated with an action in a dynamic
block definition.
BASSOCIATE
Associates an action with a parameter in a dynamic block definition.
BLOOKUPTABLE
Displays or creates a lookup table for a dynamic block definition.
PROPERTIES
Controls properties of existing objects.
Add Actions to Dynamic Blocks | 929
Polar Stretch Actions
Rotate, move, and stretch objects a specified angle and distance.
Apply a Polar Stretch Action to a Polar Parameter
A polar stretch action can only be applied to a polar parameter. Like the stretch
action, selected objects stretch when this action is applied. However, a polar
stretch action also allows you to stretch the objects at any angle.
Quick Reference
BEDIT
Opens the block definition in the Block Editor.
BACTION
Adds an action to a dynamic block definition.
BACTIONSET
Specifies the selection set of objects associated with an action in a dynamic
block definition.
BASSOCIATE
Associates an action with a parameter in a dynamic block definition.
BLOOKUPTABLE
Displays or creates a lookup table for a dynamic block definition.
PROPERTIES
Controls properties of existing objects.
Rotate Actions
Rotate selected objects.
A rotate action is always associated with a rotate parameter.
Dependent and Independent Base Points
When you apply a rotate action, you can choose to make the base point of
the action dependent or independent of the parameter’s base point.
930 | Chapter 23 Add Behaviors to Blocks (Dynamic Blocks)
Quick Reference
BEDIT
Opens the block definition in the Block Editor.
BACTION
Adds an action to a dynamic block definition.
BACTIONSET
Specifies the selection set of objects associated with an action in a dynamic
block definition.
BASSOCIATE
Associates an action with a parameter in a dynamic block definition.
BLOOKUPTABLE
Displays or creates a lookup table for a dynamic block definition.
PROPERTIES
Controls properties of existing objects.
Flip Actions
Mirror selected objects in a dynamic block reference about a specified reflection
line.
A flip action is always associated with a flip parameter.
Quick Reference
BEDIT
Opens the block definition in the Block Editor.
BACTION
Adds an action to a dynamic block definition.
BACTIONSET
Specifies the selection set of objects associated with an action in a dynamic
block definition.
Add Actions to Dynamic Blocks | 931
BASSOCIATE
Associates an action with a parameter in a dynamic block definition.
BLOOKUPTABLE
Displays or creates a lookup table for a dynamic block definition.
PROPERTIES
Controls properties of existing objects.
Array Actions
Copy and array objects in a rectangular pattern.
Apply an Array Action to a Linear Parameter
An array action applied to a linear parameter copies and arrays selected objects
in a rectangular pattern along the parameter only.
Apply an Array Action to a Polar Parameter
An array action applied to a polar parameter copies and arrays selected objects
in a rectangular pattern in any direction and angle.
Apply an Array Action to an XY Parameter
An array action applied to an XY parameter copies and arrays selected objects
in a rectangular pattern only in the X and Y direction specified by the
parameter.
Quick Reference
BEDIT
Opens the block definition in the Block Editor.
BACTION
Adds an action to a dynamic block definition.
BACTIONSET
Specifies the selection set of objects associated with an action in a dynamic
block definition.
932 | Chapter 23 Add Behaviors to Blocks (Dynamic Blocks)

BASSOCIATE
Associates an action with a parameter in a dynamic block definition.
BLOOKUPTABLE
Displays or creates a lookup table for a dynamic block definition.
PROPERTIES
Controls properties of existing objects.
Lookup Actions
Lookup tables associate parameter values for the dynamic block reference with
other specified data (for example, a model or part number).
You can extract data from block references just as you would extract block
attribute data.
When the parameter values in a dynamic block reference match a row of input
property values in the lookup table, the corresponding lookup property values
are assigned to the block reference. These lookup properties and values are
displayed in the Properties palette under Custom.
Lookup tables support the following:
■All numeric parameter properties (for example, distance and angles for
point, linear, polar, XY, and rotation parameters)
■Text string parameter properties (for example, flip and visibility parameter
values)
NOTE Constraint parameters cannot be added to a lookup table. Instead, you
should use a Block Properties Table. For more information, see Use a Block
Properties Table on page 916.
Add Properties and Values to a Lookup Table
The Property Lookup Table consists of input properties and lookup properties.
■Input properties. Parameters. Each parameter can correspond to one column
(except for lookup, alignment, and base point parameters). The parameter
label is used as the property name.
■Lookup properties. Lookup parameters. Each lookup parameter can
correspond to one column. The lookup parameter label is used as the
property name.
Add Actions to Dynamic Blocks | 933
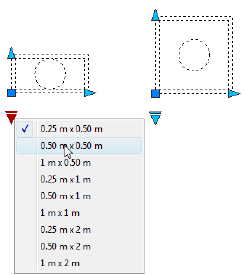
To add values to the cells in each column, click a cell and enter a value. If you
defined a value set for an input property (parameter) in the table, a drop-down
list of available values will display. Make sure to follow the guidelines in Specify
Values for Lookup Tables on page 934.
Custom Values
In a lookup table that does not use value sets, parameter values that do not
match a row of input property values from the lookup table are assigned the
lookup property value that corresponds to <Unmatched>. The default value
is Custom.
Enable Reverse Lookup
A lookup property with reverse lookup enabled adds a lookup grip to the
dynamic block reference. When you click this grip, a drop-down list of that
column’s lookup values is displayed. The corresponding input property values
of the selected list item are assigned to the block reference.
To enable reverse lookup for a lookup property, each row in the lookup table
must be unique. To check for errors and empty cells, in the Property Lookup
Table dialog box, click the Audit button. You can also use the shortcut menu
options to insert, delete, or reorder rows.
Specify Values for Lookup Tables
The following rules apply when you specify values in lookup tables:
■Use a comma as the delimiter between values.
■You can specify any number of unique values separated by commas. For
example: 5,6,7 5.5,6.25
934 | Chapter 23 Add Behaviors to Blocks (Dynamic Blocks)

■To specify a range, use brackets [ ] to specify that the range includes the
values separated by a comma, or use parentheses ( ) to specify that the
range does not include the values separated by a comma.
■For a continuous range, use a pair of values separated by a comma, enclosed
in brackets or parentheses. For example: [3,10] specifies any value between
3 and 10, including 3 and 10 (3,10) specifies any value between 3 and 10,
not including 3 and 10.
■For an open-ended range, use one value with a comma, enclosed in brackets
or parentheses. For example: [,5] specifies less than or equal to 5; (5,)
specifies greater than 5.
■Use no more than 256 characters in a table cell.
■You can use architectural and mechanical unit syntax (for example,
15'1/4").
■If you enter a value in an invalid format, the value will be reset to the last
value when you move to another cell in the table.
See also:
■Extract Data from Block Attributes on page 882
■Extract Block Attribute Data (Advanced) on page 883
To add a lookup action to a dynamic block definition
1Click Insert tab ➤ Block panel ➤ Block Editor.
2In the Block Editor, in the Block Authoring Palettes window, Actions tab,
click the Lookup Action tool.
3In the Block Editor drawing area, select one or more lookup parameters
to associate with the action. (You can associate only a lookup action with
lookup parameters.)
4Specify the location of the action.
5In the Property Lookup Table dialog box, complete the table as necessary.
6Click OK.
Add Actions to Dynamic Blocks | 935
7Click Block Editor tab ➤ Open/Save panel ➤ Save Block.
8If you are finished using the Block Editor, click Close Block Editor.
To edit a lookup table while the action bars are displayed in the Block Editor
1Hover the cursor over the lookup action icon.
2Right-click and select Display Lookup Table.
To display and add properties to a lookup table
1In the Block Editor, double-click a lookup action in a dynamic block
definition.
2In the Property Lookup Table dialog box, click Add Properties.
3In the Add Parameter Properties dialog box, in the bottom-left corner of
the dialog box, click Add Input Properties or Add Lookup Properties.
4In the Parameter Properties list, select the parameter properties you want
to add to the lookup table. Hold Ctrl down to select more than one
property.
5Click OK.
6In the Property Lookup Table dialog box, click an empty cell and do one
of the following:
■Select a value from the drop-down list. (A drop-down list only displays
if a value set has been defined for the parameter.)
■Enter a value.
7Click OK.
To allow or disallow reverse lookup
1Click Insert tab ➤ Block panel ➤ Block Editor.
2In the Block Editor, double-click a lookup action in a dynamic block
definition.
936 | Chapter 23 Add Behaviors to Blocks (Dynamic Blocks)

3In the Property Lookup Table dialog box, at the bottom of a Lookup
Property column, do one of the following:
■Click Read Only, and then select Allow Reverse Lookup from the list.
■Click Allow Reverse Lookup, and then select Read Only from the list.
NOTE You can only select Allow Reverse Lookup if you have entered data in
the column.
4Click OK.
Quick Reference
BACTION
Adds an action to a dynamic block definition.
BEDIT
Opens the block definition in the Block Editor.
BLOOKUPTABLE
Displays or creates a lookup table for a dynamic block definition.
BPARAMETER
Adds a parameter with grips to a dynamic block definition.
Use Chained Actions
Point, linear, polar, XY, and rotation parameters have a property called Chain
Actions. This property affects the parameter behavior if the parameter is part
of an action's selection set.
For example, you might include a point parameter in the selection set of a
stretch action that is associated with a linear parameter. When the linear
parameter is edited in a block reference, its associated stretch action triggers
a change in its selection set. Because the point parameter is included in the
selection set, the point parameter is edited by the change in the linear
parameter.
The following example shows a block definition in the Block Editor. The point
parameter (labeled Position) is included in the stretch action's selection set.
Add Actions to Dynamic Blocks | 937
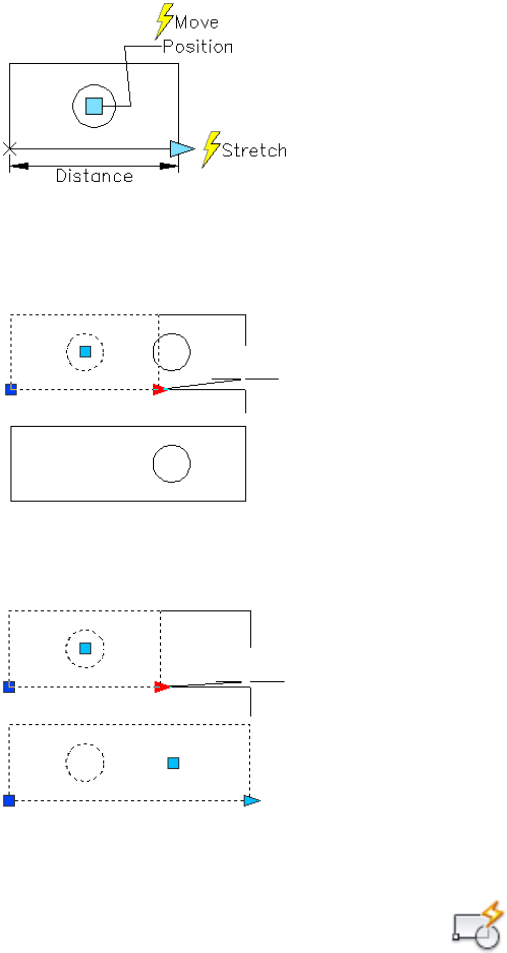
If the Chain Actions property for the point parameter is set to Yes, a change
in the linear parameter will trigger the move action associated with the point
parameter, just as if you edited the point parameter in the block reference
through a grip or custom property.
If the Chain Actions property is set to No, the point parameter's associated
move action is not triggered by the changes to the linear parameter. Thus, the
circle doesn't move.
To specify the Chain Actions property for a point, linear, polar, XY, or
rotation parameter
1Click Insert tab ➤ Block panel ➤ Block Editor.
938 | Chapter 23 Add Behaviors to Blocks (Dynamic Blocks)

2In the Block Editor, click Tools menu ➤ Properties. The Properties palette
is displayed.
3In the Block Editor, select a point, linear, polar, XY, or rotation parameter.
4In the Properties palette, under Misc, click Chain Actions.
5On the drop-down list, select Yes or No.
6Click Block Editor tab ➤ Open/Save panel ➤ Save Block.
7(Optional) If you are finished using the Block Editor, click Close Block
Editor.
Quick Reference
BEDIT
Opens the block definition in the Block Editor.
BPARAMETER
Adds a parameter with grips to a dynamic block definition.
PROPERTIES
Controls properties of existing objects.
Specify Properties for Dynamic Blocks
Control the way parameters are displayed using the Properties palette.
Custom Properties
In the Block Editor, you can specify properties for a parameter in a dynamic
block definition. Some of these properties can be displayed as custom properties
for the dynamic block reference when it is in a drawing. These properties are
displayed under Custom in the Properties palette.
Other parameter properties, such as Value Set properties and Chain Actions,
define how the block reference will function in a drawing.
Specify Properties for Dynamic Blocks | 939

Assign Labels to Parameters
When you select the dynamic block reference in a drawing, parameter labels
are assigned to custom properties in the Properties palette. You can specify
whether or not these custom properties are displayed for the block reference
when it is selected in a drawing. These properties can also be extracted using
the Attribute Extraction wizard.
It is good practice to specify unique parameter labels within the block.
Distance Multiplier Overrides
Use the distance multiplier property to change a parameter value by a specified
factor. For example, if you set the distance multiplier property to 2 for a stretch
action, the associated geometry in the block reference would increase and
double the distance of the grip movement.
Angle Offset Overrides
Use the angle offset property to increase or decrease the angle of a changed
parameter value by a specified amount. For example, if you set the angle offset
property of a move action to 90, the block reference would move 90 degrees
beyond the angle value of the grip movement.
List of Properties for Action Parameters
The following properties are available to customize the way your action
parameters behave.
Associated
parameter
DescriptionProperty name
Defines a label for the parameter. Dis-
played in the drawing space of the Block
■Point■Angle Name
■Distance Name ■Linear
Editor and the custom properties of the
block reference when the grip is selected.
■ ■Flip Name Polar
■XY■Hor Distance
Name ■Rotation
■Lookup Name ■Flip
■Position Name ■Visibility
■Ver Distance
Name
■Lookup
■Visibility Name
940 | Chapter 23 Add Behaviors to Blocks (Dynamic Blocks)

Associated
parameter
DescriptionProperty name
Defines a description that will further ex-
plain the purpose of the parameter. The
■Point■Angle Description
■Distance Descrip-
tion
■Linear
text string will display in the tooltip when
the mouse pointer hovers over the position
name.
■Polar
■Flip Description ■XY
■Hor Distance De-
scription
■Rotation
■Flip
■Position Descrip-
tion ■Visibility
■Lookup
■Ver Distance De-
scription
■Visibility Descrip-
tion
■Lookup Descrip-
tion
FlipIn a Flip parameter, displays the label that
will be displayed when the specified object
■Base State Name
■Flipped State
Name is displayed as it was drawn (Base State)
or as manipulated (Flipped State). Dis-
played in the custom properties of the
block reference when the grip is selected.
RotateIn a Rotate action, specifies whether the
base point for the rotation is dependent
Base Type
on the base point of the parameter or an
independent base point that you specify
in the block definition.
Specifies whether the distance applied to
the move is the parameter's X value, Y
Distance Type ■Move
■Stretch
value, or X an Y coordinate value from the
parameter's base point.
Specifies whether custom properties will
be displayed in the Properties palette for
the selected block reference.
Show Properties ■Point
■Linear
■Polar
Specify Properties for Dynamic Blocks | 941
Associated
parameter
DescriptionProperty name
■XY
■Rotate
■Flip
■Visibility
■Lookup
See also:
■Define User Parameters in Dynamic Blocks on page 914
■Specify Value Sets for Dynamic Blocks on page 944
■Use Chained Actions on page 937
■Specify Grips for Dynamic Blocks on page 947
■Extract Data from Block Attributes on page 882
To specify the display of custom properties in a dynamic block reference
1Ensure that the Properties palette is displayed. If not, click Tools
menu ➤ Palettes ➤ Properties.
2Click Insert tab ➤ Block panel ➤ Block Editor.
3In the Block Editor, select a parameter.
4In the Properties palette, under Misc., click Show Properties.
5On the drop-down list, do one of the following:
■Select Yes to display custom properties for the block reference.
■Select No to specify that the custom properties will not display for a
block reference.
6Click Block Editor tab ➤ Open/Save panel ➤ Save Block.
942 | Chapter 23 Add Behaviors to Blocks (Dynamic Blocks)

7(Optional) If you are finished using the Block Editor, click Close Block
Editor.
To specify that dynamic block reference can be exploded
1Open a block definition in the Block Editor
2In the Block Editor, make sure nothing is selected.
3In the Properties palette, under Block, click Allow Exploding.
4On the drop-down list, select Yes or No.
5Click Block Editor tab ➤ Open/Save panel ➤ Save Block.
6(Optional) If you are finished using the Block Editor, click Close Block
Editor.
To prevent non-uniform scaling in dynamic block reference
1Open a block definition in the Block Editor
2In the Block Editor, make sure nothing is selected.
3In the Properties palette, under Block, click Scale Uniformly.
4On the drop-down list, select Yes.
5Click Block Editor tab ➤ Open/Save panel ➤ Save Block.
6(Optional) If you are finished using the Block Editor, click Close Block
Editor.
Quick Reference
BEDIT
Opens the block definition in the Block Editor.
BPARAMETER
Adds a parameter with grips to a dynamic block definition.
Specify Properties for Dynamic Blocks | 943
PROPERTIES
Controls properties of existing objects.
Specify Value Sets for Dynamic Blocks
A value set is a range or list of values specified for a parameter. These values
can be displayed for the block reference as a drop-down list next to the
parameter label under Custom in the Properties palette. When you define a
value set for a parameter, the parameter is limited to these values when the
block reference is manipulated in a drawing. For example, if you define a linear
parameter in a block that represents a window to have a value set of 20, 40,
and 60, the window can only be stretched to 20, 40, or 60 units.
When you create a value list for a parameter, the value of the parameter as it
exists in the definition is automatically added to the value set. This is the
default value for the block reference when you insert it in a drawing.
NOTE If you redefine the values in a value set after you've added the parameter
properties to a lookup table, make sure to update the lookup table to match the
new values in the value set.
To add or remove a value set for a parameter
1Ensure that the Properties palette is displayed. If not, click Tools
menu ➤ Palettes ➤ Properties.
2Click Insert tab ➤ Block panel ➤ Block Editor.
3In the Block Editor, select a parameter.
4In the Properties palette, under Value Set, click one of the following:
■Ang Type
944 | Chapter 23 Add Behaviors to Blocks (Dynamic Blocks)
■Dist Type
■Hor Type
■Ver Type
5On the drop-down list, select List.
6In the Properties palette, under Value Set, click one of the following:
■Ang Value List
■Dist Value List
■Hor Value List
■Ver Value List
7Click the [...] button.
8In the Add Distance Value/Angle dialog box, enter one value or two or
more values separated by commas, or to delete a value, select it from the
list.
9Click Add or Delete.
10 Click OK.
11 Click Block Editor tab ➤ Open/Save panel ➤ Save Block.
12 (Optional) If you are finished using the Block Editor, click Close Block
Editor.
To specify an incremental value set for a linear, polar, XY, or rotation
parameter
1Ensure that the Properties palette is displayed. If not, click Tools
menu ➤ Palettes ➤ Properties.
2Click Insert tab ➤ Block panel ➤ Block Editor.
3In the Block Editor, select a linear, polar, XY, or rotation parameter.
4In the Properties palette, under Value Set, click Dist Type, Ang Type, Hor
Type, or Ver Type.
Specify Value Sets for Dynamic Blocks | 945
5On the drop-down list, select Increment.
6In the Properties palette, under Value Set, click Dist Increment, Ang
Increment, Hor Increment, or Ver Increment, and then enter an
incremental value for the parameter.
7Click Dist Minimum, Ang Minimum, Hor Minimum, or Ver Minimum,
and then enter a minimum value for the parameter.
8Click Dist Maximum, Ang Maximum, Hor Maximum, or Ver Maximum,
and then enter a maximum value for the parameter.
9Click Block Editor tab ➤ Open/Save panel ➤ Save Block.
10 (Optional) If you are finished using the Block Editor, click Close Block
Editor.
To specify minimum and maximum values for a linear, polar, XY, or rotation
parameter
1Ensure that the Properties palette is displayed. If not, click Tools
menu ➤ Palettes ➤ Properties.
2Click Insert tab ➤ Block panel ➤ Block Editor.
3In the Block Editor, select a linear, polar, XY, or rotation parameter.
4In the Properties palette, under Value Set, click Dist Minimum, Ang
Minimum, Hor Minimum, or Ver Minimum, and then enter a minimum
value for the parameter.
5Click Dist Maximum, Ang Maximum, Hor Maximum, or Ver Maximum,
and then enter a maximum value for the parameter.
6Click Block Editor tab ➤ Open/Save panel ➤ Save Block.
7(Optional) If you are finished using the Block Editor, click Close Block
Editor.
946 | Chapter 23 Add Behaviors to Blocks (Dynamic Blocks)
Quick Reference
BEDIT
Opens the block definition in the Block Editor.
BPARAMETER
Adds a parameter with grips to a dynamic block definition.
PROPERTIES
Controls properties of existing objects.
Specify Distance and Angle Values
Action overrides are properties of actions that have no effect on the block
reference until it is manipulated in a drawing. Use distance multiplier overrides
with the following actions:
■Move on page 926
■Stretch on page 929
■Polar Stretch on page 930
You can specify these action override properties by following the Command
prompts when you add an action to a dynamic block definition. You can also
specify these properties in the Properties palette when you select an action in
the Block Editor.
Quick Reference
PROPERTIES
Controls properties of existing objects.
Specify Grips for Dynamic Blocks
Actions You Can Associ-
ate with a Parameter
Grip TypeParameter Type
Move, StretchStandardPoint
Specify Distance and Angle Values | 947
Actions You Can Associ-
ate with a Parameter
Grip TypeParameter Type
Move, Scale, Stretch, ArrayLinearLinear
Move, Scale, Stretch, Polar
Stretch, Array,
StandardPolar
Move, Scale, Stretch, ArrayStandardXY
RotateRotationRotation
FlipFlipFlip
None (The action is im-
plied and contained within
the parameter.)
AlignmentAlignment
None (The action is im-
plied and controlled by
visibility states.)
LookupVisibility
LookupLookupLookup
NoneStandardBase
When you add a parameter to a dynamic block definition, custom grips
associated with key points of the parameter are automatically added to the
block.
All parameters (except the alignment parameter, which always displays one
grip) have a property called Number of Grips. When you select a parameter in
the Block Editor, the Number of Grips property is displayed in the Properties
palette. This property allows you to specify, from a preset list, the number of
grips you want to display for the parameter.
948 | Chapter 23 Add Behaviors to Blocks (Dynamic Blocks)
NOTE Parameters that are not associated with an action do not display grips.
If you specify that a parameter has 0 grips, you can still edit the dynamic block
reference through the Properties palette (if the block is defined that way).
If a dynamic block definition contains visibility states on page 953 or a lookup
table on page 933, you can define the block so that the only grip that is
displayed is a lookup grip. When you click this grip on the block reference, a
drop-down list is displayed. When you select an item from the list, the display
of the block reference may change.
Grips are automatically added at key points on the parameter. You can
reposition a grip anywhere in the block space relative to its associated key
point on the parameter. When you reposition a grip, it is still tied to the key
point with which it is associated.
NOTE Grips are not displayed for key points that are not associated with an action.
The type of parameter you add to the dynamic block definition determines
the type of grips that are added to the block..
Associated Paramet-
ers
How the Grip Can Be Manipu-
lated in a Drawing
Grip
Type
Base, Point, Polar, and
XY
Within a plane in any directionStand-
ard
LinearBack and forth in a defined direction
or along an axis
Linear
RotationAround an axisRota-
tion
FlipClick to flip the dynamic block refer-
ence
Flip
Specify Grips for Dynamic Blocks | 949
Associated Paramet-
ers
How the Grip Can Be Manipu-
lated in a Drawing
Grip
Type
AlignmentWithin a plane in any direction; when
moved over an object, triggers the
Align-
ment
block reference to align with the object
Visibility, LookupClick to display a list of itemsLookup
Specify Tooltips on Grips
Each of the dynamic block parameters has one or more description fields with
the exception of the basepoint and alignment parameters.
DescriptionParamet-
er
Position descriptionPoint
Distance descriptionLinear
Distance description, angle descriptionPolar
Horizontal distance description, vertical distance descrip-
tion
XY
Angle descriptionRotation
Flip descriptionFlip
Visibility descriptionVisibility
Lookup descriptionLookup
Set to “Aligns block to object”Align-
ment
No special tooltip is requiredBasepoint
Specify Insertion Cycling for Grips in Dynamic Blocks
Grips in dynamic blocks have a property called Cycling. When this property
is set to Yes, the grip becomes an available insertion point for the dynamic
950 | Chapter 23 Add Behaviors to Blocks (Dynamic Blocks)
block reference. When you insert the dynamic block reference in a drawing,
you can use the Ctrl key to cycle through the available grips to select which
grip will be the insertion point for the block.
To specify the number of custom grips displayed for a parameter in a dynamic
block
1Click Insert tab ➤ Block panel ➤ Block Editor.
2In the Block Editor, select a parameter.
3On the Properties palette, under Misc, click Number of Grips, and then
select the number of grips you want to display for the parameter.
4Click Block Editor tab ➤ Open/Save panel ➤ Save Block.
5(Optional) If you are finished using the Block Editor, click Close Block
Editor.
To reposition a grip in a dynamic block definition
1Click Insert tab ➤ Block panel ➤ Block Editor.
2In the Block Editor, select a custom grip (not the standard grip associated
with the key point of the parameter).
3Do one of the following to reposition the grip:
■Drag the grip to another position in the block space.
■On the Properties palette, under Geometry, enter values for the Base
X and Base Y properties. (These values are relative to the base point
of the parameter.)
4Click Block Editor tab ➤ Open/Save panel ➤ Save Block.
5(Optional) If you are finished using the Block Editor, click Close Block
Editor.
Specify Grips for Dynamic Blocks | 951
To reset grips in a dynamic block definition to their default locations
1Click Insert tab ➤ Block panel ➤ Block Editor.
2In the Block Editor, at the Command prompt, enter bgripset.
3Select the grip for which you want to reset the grip position(s).
4At the Command prompt, enter reposition.
5Click Block Editor tab ➤ Open/Save panel ➤ Save Block.
6(Optional) If you are finished using the Block Editor, click Close Block
Editor.
To turn insertion cycling on or off for a custom grip in a dynamic block
reference
1Click Insert tab ➤ Block panel ➤ Block Editor.
2In the Block Editor, at the Command prompt, enter bcycleorder.
3In the Insertion Cycling Order dialog box, select a grip from the list, and
click Cycling to turn cycling on or off for the grip. (A check mark in the
Cycling column indicates that cycling is turned on for the grip.)
4Click OK.
5Click Block Editor tab ➤ Open/Save panel ➤ Save Block.
6(Optional) If you are finished using the Block Editor, click Close Block
Editor.
To modify the insertion cycling order for custom grips in a dynamic block
reference
1Click Insert tab ➤ Block panel ➤ Block Editor.
2In the Block Editor, enter bcycleorder at the Command prompt.
952 | Chapter 23 Add Behaviors to Blocks (Dynamic Blocks)

3In the Insertion Cycling Order dialog box, select a grip from the list, and
click Move Up or Move Down. (A check mark in the Cycling column
indicates that cycling is turned on for the grip.)
4Repeat step 2 until you are finished modifying the grip cycling order.
5Click OK.
6Click Block Editor tab ➤ Open/Save panel ➤ Save Block.
7(Optional) If you are finished using the Block Editor, click Close Block
Editor.
Quick Reference
BEDIT
Opens the block definition in the Block Editor.
BCYCLEORDER
Changes the cycling order of grips for a dynamic block reference.
BGRIPSET
Creates, deletes, or resets grips associated with a parameter.
BPARAMETER
Adds a parameter with grips to a dynamic block definition.
GRIPTIPS
Controls the display of grip tips and Ctrl-cycling tooltips.
Control the Visibility of Objects in a Block
Using visibility states, you can create a block with different graphical
representations.
For example, you have the following four different weld symbols. Using
visibility states, you can combine these weld symbols into a single dynamic
block.
Control the Visibility of Objects in a Block | 953
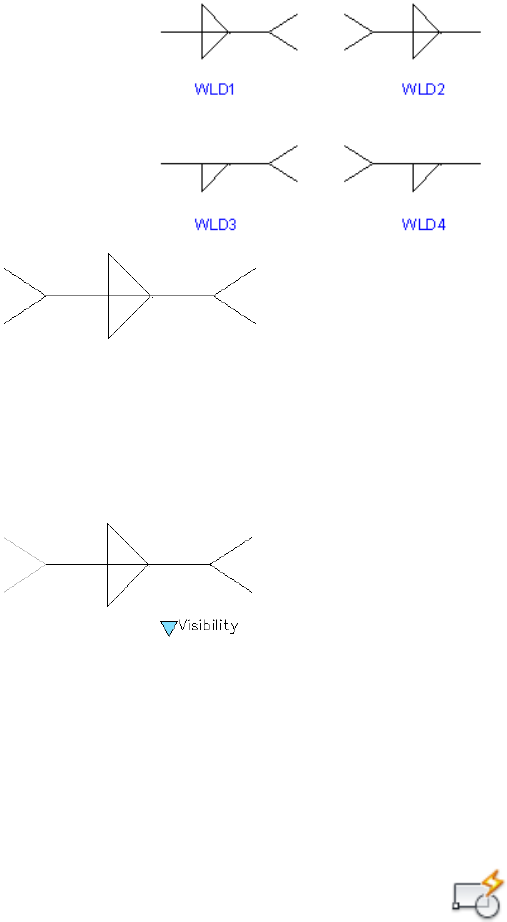
After you combine the geometry in the Block Editor, you add a visibility
parameter.
You can then create and name a different visibility state for each weld symbol
(for example, WLD1, WLD2, WLD3, and WLD4). In the following example,
the WLD1 visibility state is displayed in the Block Editor. The geometry that
displays in a dimmed state is invisible for the WLD1 visibility state.
The Block Editor contextual tab displays the name of the current visibility
state. This area of the tool bar also provides several tools for working with
visibility states.
When you work with visibility states, you may or may not want to see the
geometry that is invisible for a given state. Use the Visibility Mode button
(BVMODE) to determine whether geometry is displayed.
To create a new visibility state
1Click Insert tab ➤ Block panel ➤ Block Editor.
954 | Chapter 23 Add Behaviors to Blocks (Dynamic Blocks)
2Click Block Editor tab ➤ Visibility panel ➤ Visibility States.
3In the Visibility States dialog box, click New.
4In the New Visibility State dialog box, enter a name for the new visibility
state.
5Do one of the following:
■Click Hide All Existing Objects in New State
■Click Show All Existing Objects in New State
■Click Leave Visibility of Existing Objects Unchanged in New State
6Click OK.
To make a visibility state current
1Click Insert tab ➤ Block panel ➤ Block Editor.
2Click Block Editor tab ➤ Visibility panel ➤ Visibility States.
3Select the visibility state that you want to set as the current state.
To rename or delete a visibility state
1Click Insert tab ➤ Block panel ➤ Block Editor.
2Click Block Editor tab ➤ Visibility panel ➤ Visibility States.
3In the Visibility States dialog box, select a visibility state from the list.
4Do one of the following:
■Click Rename and enter a new name for the visibility state
■Click Delete
5Click OK.
Control the Visibility of Objects in a Block | 955
To make objects visible or invisible in the current visibility state
1Click Insert tab ➤ Block panel ➤ Block Editor.
2Do one of the following:
■Click Block Editor tab ➤ Visibility panel ➤ Make Visible.
■Click Block Editor tab ➤ Visibility panel ➤ Make Invisible.
3In the drawing area, select the objects. Press Enter.
4At the Command prompt, enter current. Press Enter.
To make objects visible or invisible in all visibility states
1Click Insert tab ➤ Block panel ➤ Block Editor.
2In the Block Editor drawing area, select the objects that you want to make
visible in all visibility states.
3Right-click in the drawing area and click one of the following:
■Object Visibility ➤ Show For All States
■Object Visibility ➤ Hide For All States
To show or hide invisible geometry for visibility states
1Click Insert tab ➤ Block panel ➤ Block Editor.
2Click Block Editor tab ➤ Visibility panel ➤ Visibility Mode.
956 | Chapter 23 Add Behaviors to Blocks (Dynamic Blocks)
To change the order of the visibility states list for a dynamic block reference
1Click Insert tab ➤ Block panel ➤ Block Editor.
2Click Block Editor tab ➤ Visibility panel ➤ Visibility States.
3In the Visibility States dialog box, select a visibility state in the list.
4Click Move Up or Move Down to change the order.
5Repeat steps 2 and 3 until the list of visibility states is in the desired order.
6Click OK.
To set the default visibility state for the dynamic block reference
1Click Insert tab ➤ Block panel ➤ Block Editor.
2Click Block Editor tab ➤ Visibility panel ➤ Visibility States.
3In the Visibility States dialog box, select a visibility state in the list.
4Click Move Up until the selected visibility state is at the top of the list.
5Click OK.
Quick Reference
BEDIT
Opens the block definition in the Block Editor.
BPARAMETER
Adds a parameter with grips to a dynamic block definition.
BVHIDE
Makes objects invisible in the current visibility state or all visibility states in
a dynamic block definition.
Control the Visibility of Objects in a Block | 957
BVSHOW
Makes objects visible in the current visibility state or all visibility states in a
dynamic block definition.
BVSTATE
Creates, sets, or deletes a visibility state in a dynamic block.
BVMODE
Controls how objects that are made invisible for the current visibility state
are displayed in the Block Editor.
958 | Chapter 23 Add Behaviors to Blocks (Dynamic Blocks)
Part 8: Work with 3D
Models
959
960
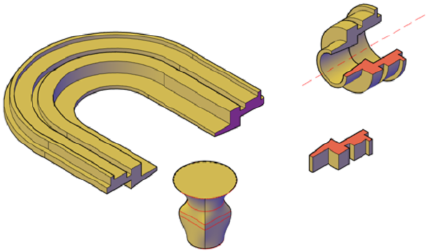
Create 3D Models
Use three-dimensional models to help you visualize and test your designs in 3D space.
Overview of 3D Modeling
AutoCAD 3D modeling allows you to create drawings using solid, surface, and
mesh objects.
Solid, surface, and mesh objects offer different functionality, that, when used
together, offer a powerful suite of 3D modeling tools. For example, you can
convert a primitive solid to a mesh to take advantage of mesh creasing and
smoothing. You can then convert the model to a surface to take advantage of
associativity and NURBS modeling.
Solid Modeling
A solid model is an enclosed 3D body that has properties such as mass, volume,
center of gravity, and moments of inertia.
Start with primitive solids such as cones, boxes, cylinders, and pyramids and
modify and recombine them to create new shapes. Or draw a custom polysolid
24
961
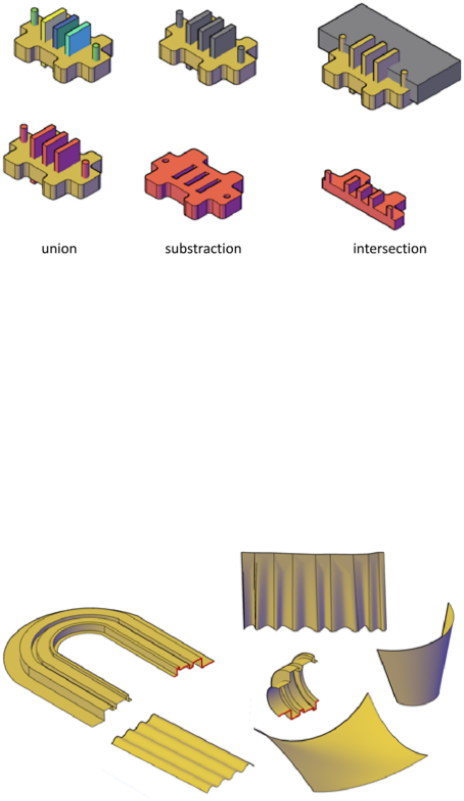
extrusion and use various sweeping operations to create solids from 2D curves
and lines.
Surface Modeling
A surface model is a thin shell that does not have mass or volume. AutoCAD
offers two types of surfaces: procedural and NURBS. Use prodecural surfaces
to take advantage of associative modling, and use NURBS surfaces to take
advantage of sculpting with control vertices.
A typical modeling workflow is to create a basic model using mesh, solids,
and procedural surfaces, and then convert them to NURBS surfaces. This allows
you to utilize not only the unique tools and primitive shapes offered by solids
and meshes, but also the shaping capabilities provided by surfaces - associative
modeling and NURBS modeling.
You create surface models using some of the same tools that you use for solid
models: sweeping, lofting, extruding, and revolving. You can also create
surfaces by blending, patching, offsetting, filleting, and extending other
surfaces.
962 | Chapter 24 Create 3D Models
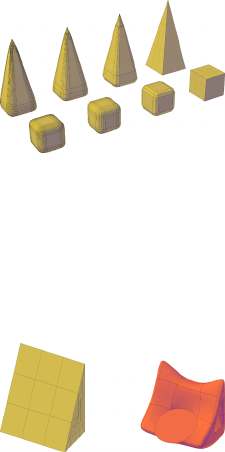
Mesh Modeling
A mesh model consists of vertices, edges, and faces that use polygonal
representation (including triangles and quads) to define a 3D shape.
Unlike solid models, mesh has no mass properties. However, as with 3D solids,
you can create primitive mesh forms such as boxes, cones, and pyramids,
starting in AutoCAD 2010. You can then modify mesh models in ways that
are not available for 3D solids or surfaces. For example you can apply creases,
splits, and increasing levels of smoothness. You can drag mesh subobjects
(faces, edges, and vertices) to deform the object. To achieve more granular
results, you can refine the mesh in specific areas before modifying it.
Use mesh models to provide the hiding, shading, and rendering capabilities
of a solid model without the physical properties such as mass, moments of
inertia, and so on.
Advantages of 3D Modeling
Modeling in 3D has several advantages. You can
■View the model from any vantage point
■Generate reliable standard and auxiliary 2D views automatically
■Create sections and 2D drawings
■Remove hidden lines and do realistic shading
■Check interferences and perform engineering analysis
■Add lighting and create realistic rendering
■Navigate through the model
Overview of 3D Modeling | 963
■Use the model to create an animation
■Extract manufacturing data
See also:
■Enter 3D Coordinates on page 556
■Specify Workplanes in 3D (UCS) on page 566
■Use the Dynamic UCS with Solid Models on page 572
Quick Reference
Commands
BOX
Creates a 3D solid box.
CONE
Creates a 3D solid cone.
CONVTOMESH
Converts 3D objects such as polygon meshes, surfaces, and solids to mesh
objects.
CONVTONURBS
Converts 3D solids and surfaces into NURBS surfaces.
CONVTOSOLID
Converts 3D meshes and polylines and circles with thickness to 3D solids.
CONVTOSURFACE
Converts objects to 3D surfaces.
CYLINDER
Creates a 3D solid cylinder.
EXTRUDE
Creates a 3D solid or surface by extending the dimensions of an object.
964 | Chapter 24 Create 3D Models
LOFT
Creates a 3D solid or surface in the space between several cross sections.
MESH
Creates a 3D mesh primitive object such as a box, cone, cylinder, pyramid,
sphere, wedge, or torus.
POLYSOLID
Creates a 3D wall-like polysolid.
PLANESURF
Creates a planar surface.
PYRAMID
Creates a 3D solid pyramid.
REVOLVE
Creates a 3D solid or surface by sweeping an object around an axis.
SPHERE
Creates a 3D solid sphere.
SURFBLEND
Creates a continuous blend surface between two existing surfaces.
SURFNETWORK
Creates a surface in the space between several curves in the U and V directions
(including surface and solid edge subobjects).
SURFOFFSET
Creates a parallel surface a specified distance from the original surface.
SURFPATCH
Creates a new surface by fitting a cap over a surface edge that forms a closed
loop.
SWEEP
Creates a 3D solid or surface by sweeping a 2D or 3D object or subobject
along a path.
TORUS
Creates a donut-shaped 3D solid.
Overview of 3D Modeling | 965
UCS
Manages user coordinate systems.
WEDGE
Creates a 3D solid wedge.
System Variables
DELOBJ
Controls whether geometry used to create 3D objects is retained or deleted.
PSOLWIDTH
Controls the default width for a swept solid object created with the
POLYSOLID command.
PSOLHEIGHT
Controls the default height for a swept solid object created with the
POLYSOLID command.
SUBOBJSELECTIONMODE
Filters whether faces, edges, vertices or solid history subobjects are highlighted
when you roll over them.
SURFACEASSOCIATIVITY
Controls whether surfaces maintain a relationship with the objects from
which they were created.
SURFACEMODELINGMODE
Controls whether surfaces are created as procedural surfaces or NURBS
surfaces.
Create Solids and Surfaces from Lines and Curves
Use lines and curves to extrude, sweep, loft, and revolve 3D solids, surfaces,
and NURBS surfaces.
Overview of Creating Solids and Surfaces
Understand the differences between creating solids and surfaces with the
EXTRUDE, SWEEP, LOFT, and REVOLVE commands.
966 | Chapter 24 Create 3D Models
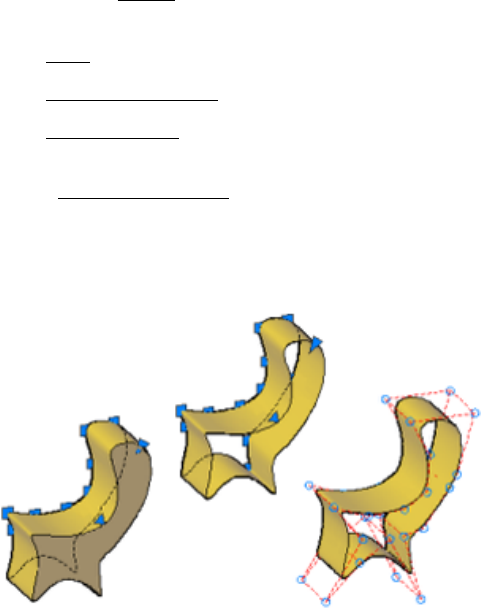
See also:
■Create a Solid or Surface by Extruding on page 968
■Create a Solid or Surface by Sweeping on page 972
■Create a Solid or Surface by Lofting on page 976
■Create a Solid or Surface by Revolving on page 980
Surfaces Vs. Solids
When you extrude, sweep, loft, and revolve curves, you can create both solids
and surfaces. Open curves always create surfaces, but closed curves can create
either solids or surfaces depending on the situation.
If you select a closed curve and click EXTRUDE, SWEEP, LOFT, and REVOLVE
on the ribbon, you create:
■A solid if the Solid tab is active.
■A procedural surface if the Surface tab is active.
■A NURBS surface if the Surface tab is active and the
SURFACEMODELINGMODE system variable is set to NURBS.
■An associative surface if the Surface tab is active and if surface
associativity is on.
In this illustration, the same profile creates a solid (left), a procedural surface
(middle), and a NURBS surface (right).
Overview of Creating Solids and Surfaces | 967

To create a surface when the Solid tab is active or a solid when the Surface tab
is active, select the Mode option and select surface while you are creating the
object.
Geometry That Can Be Used As Profiles and Guide Curves
The curves that you use as profile and guide curves when you extrude, sweep,
loft, and revolve can be:
■Open or closed
■Planar or non-planar
■Solid and surface edge subobjects
■A single object (to extrude multiple lines, convert them to a single object
with the JOIN command)
■A single region (to extrude multiple regions, convert them to a single object
with the REGION command)
Create Associative Surfaces
Surfaces can be associative while solids cannot. If surface associativity is on
when a surface is created, it maintains a relationship with the curve from
which it is was generated (even if the curve is the subobject of another solid
or surface). If the curve is reshaped, the surface profile automatically updates.
See Create Associative Surfaces on page 1036.
NOTE To modify a surface that is associative, you must modify the generating
curve and not the surface itself. If you reshape the surface, its link to the generating
curve will be broken and the surface will lose associativity and become a generic
surface.
Deleting the Curves that Generate the Solid or Surface
The DELOBJ system variable controls whether the curves that generate an
object are automatically deleted after the solid or surface is created. However,
if surface associativity is on, the DELOBJ setting is ignored and the generating
curves are not deleted.
Create a Solid or Surface by Extruding
Create a 3D solid or surface by stretching curves into 3D space.
968 | Chapter 24 Create 3D Models
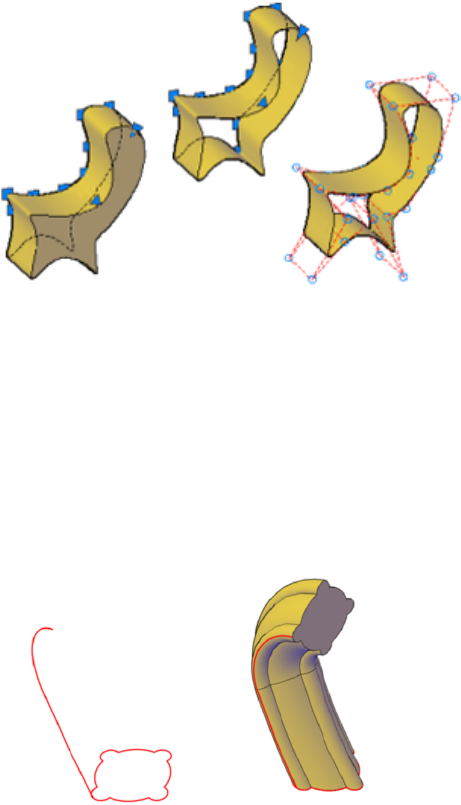
The EXTRUDE command creates a solid or surface that extends the shape of
a curve. Open curves create surfaces and closed curves create solids or surfaces.
See Overview of Creating Solids and Surfaces on page 966.
Options for Extrusion
When you extrude objects, you can specify any of the following options:
■Mode. Sets whether the extrude creates a surface or a solid.
■Specify a path for extrusion. With the Path option, create a solid or surface
by specifying an object to be the path for the profile, or shape, of the
extrusion. The extruded object starts from the plane of the profile and
ends on a plane perpendicular to the path at the endpoint of the path. For
best results, use object snaps to make sure that the path is on or within
the boundary of the object being extruded.
Extruding is different from sweeping. When you extrude a profile along a
path, the profile follows the shape of the path, even if the path does not
intersect the profile. Sweeping usually provides greater control and better
results.
Create a Solid or Surface by Extruding | 969
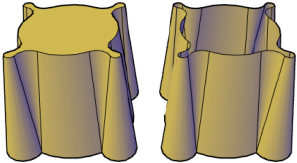
■Taper angle. Tapering the extrusion is useful for defining part that require
a specific taper angle, such as a mold used to create metal products in a
foundry.
■Direction. With the Direction option, you can specify two points to set
the length and direction of the extrusion.
■Expression. Enter a mathematical expression to constrain the height of
the extrusion. See Create Geometric Relationships between Associative
Surfaces on page 1039.
To extrude a NURBS surface
1Click Surface tab ➤ Create panel ➤ NURBS Creation.
2Click Home tab ➤ Surface panel ➤ Extrude.
3Select the objects or edge subobjects to extrude.
4Specify the height.
After the extrusion, the original objects are deleted or retained, depending
on the setting of the DELOBJ system variable.
To extrude a solid
1Click Solid tab ➤ Create panel ➤ Extrude.
2Select the objects or edge subobjects to extrude.
3Specify the height.
After the extrusion, the original objects are deleted or retained, depending
on the setting of the DELOBJ system variable.
To extrude a procedural surface along a path
1Click Surface tab ➤ Create panel ➤ Extrude.
970 | Chapter 24 Create 3D Models
2Select the objects or edge subobjects to extrude.
3At the Command prompt, enter p (Path).
4Select the object or edge subobject to use as the path.
After the extrusion, the original objects are deleted or retained, depending
on the setting of the DELOBJ system variable.
Quick Reference
Commands
3DOSNAP
Sets the object snap modes for 3D objects.
BREP
Removes the history from 3D solids and composite solids, and associativity
from surfaces.
EXTRUDE
Creates a 3D solid or surface by extending the dimensions of an object.
JOIN
Joins similar objects to form a single, unbroken object.
LIST
Displays property data for selected objects.
MEASUREGEOM
Measures the distance, radius, angle, area, and volume of selected objects or
sequence of points.
REGION
Converts an object that encloses an area into a region object.
System Variables
3DOSMODE
Controls the settings for the 3D object snaps.
DELOBJ
Controls whether geometry used to create 3D objects is retained or deleted.
Create a Solid or Surface by Extruding | 971
SOLIDHIST
Controls the default history property setting for solid objects.
SUBOBJSELECTIONMODE
Filters whether faces, edges, vertices or solid history subobjects are highlighted
when you roll over them.
SURFACEASSOCIATIVITY
Controls whether surfaces maintain a relationship with the objects from
which they were created.
SURFACEASSOCIATIVITYDRAG
Sets the dragging preview behavior of associative surfaces to increase
performance.
SURFACEMODELINGMODE
Controls whether surfaces are created as procedural surfaces or NURBS
surfaces.
Create a Solid or Surface by Sweeping
Create a 3D solid or surface by sweeping a profile along a path.
The SWEEP command creates a solid or surface by extending a profile shape
(the object that is swept) along a specified path. When you sweep a profile
along a path, the profile is moved and aligned normal (perpendicular) to the
path. Open profiles create surfaces and closed curves create solids or surfaces.
See Overview of Creating Solids and Surfaces on page 966.
You can sweep more than one profile object along a path.
Options for Sweeping
When you extrude objects, you can specify any of the following options:
■Mode. Sets whether the sweep creates a surface or a solid.
■Alignment. If the profile is not on the same plane as the sweep path, specify
how the profile aligns with the sweep path.
972 | Chapter 24 Create 3D Models
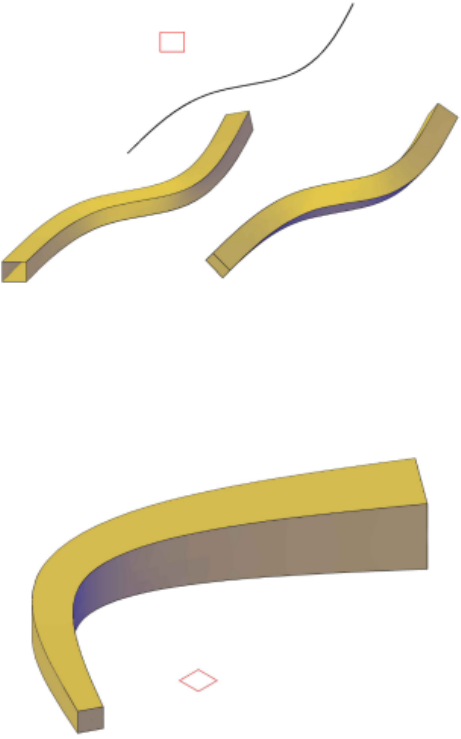
■Base Point. Specify a base point on the profile to sweep along the profile.
■Scale. Specify a value that will change the size of the object from the
beginning of the sweep to the end. Enter a mathematical expression to
constrain the object scaling. See Create Geometric Relationships between
Associative Surfaces on page 1039.
■Twist. By entering a twist angle, the object rotates along the length of the
profile. Enter a mathematical expression to constrain the object ‘s twist
angle. See Create Geometric Relationships between Associative Surfaces
on page 1039.
Create a Solid or Surface by Sweeping | 973
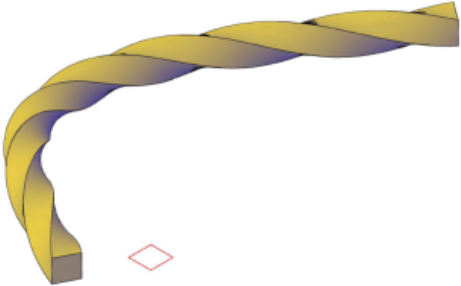
See also:
■Create Associative Surfaces on page 1036
■Create Geometric Relationships between Associative Surfaces on page 1039
■Draw Splines on page 679
■Modify Splines on page 794
To create a solid by sweeping an object along a path
1Click Solid tab ➤ Create panel ➤ Sweep.
2Select objects to sweep.
3Press Enter.
4Select an object or edge subobject as a sweep path.
After the sweep, the original objects are deleted or retained, depending
on the setting of the DELOBJ system variable.
To create a surface by sweeping an object along a path
1Click Surface tab ➤ Create panel ➤ Sweep.
2Select objects to sweep.
3Press Enter.
4Select an object or edge subobject as a sweep path.
974 | Chapter 24 Create 3D Models
After the sweep, the original objects are deleted or retained, depending
on the setting of the DELOBJ system variable.
Quick Reference
Commands
3DOSNAP
Sets the object snap modes for 3D objects.
BREP
Removes the history from 3D solids and composite solids, and associativity
from surfaces.
JOIN
Joins similar objects to form a single, unbroken object.
LIST
Displays property data for selected objects.
MEASUREGEOM
Measures the distance, radius, angle, area, and volume of selected objects or
sequence of points.
REGION
Converts an object that encloses an area into a region object.
SWEEP
Creates a 3D solid or surface by sweeping a 2D or 3D object or subobject
along a path.
System Variables
3DOSMODE
Controls the settings for the 3D object snaps.
DELOBJ
Controls whether geometry used to create 3D objects is retained or deleted.
SOLIDHIST
Controls the default history property setting for solid objects.
Create a Solid or Surface by Sweeping | 975
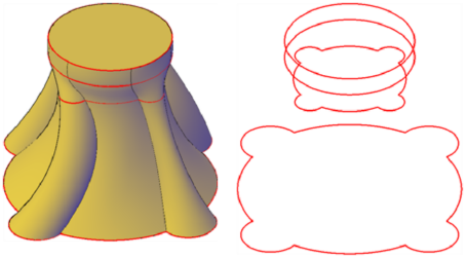
SUBOBJSELECTIONMODE
Filters whether faces, edges, vertices or solid history subobjects are highlighted
when you roll over them.
SURFACEASSOCIATIVITY
Controls whether surfaces maintain a relationship with the objects from
which they were created.
SURFACEASSOCIATIVITYDRAG
Sets the dragging preview behavior of associative surfaces to increase
performance.
SURFACEMODELINGMODE
Controls whether surfaces are created as procedural surfaces or NURBS
surfaces.
Create a Solid or Surface by Lofting
Create a 3D solid or surface by lofting a profile through a set of two or more
cross-section profiles.
The cross-section profiles define the shape of the resulting solid object.
Cross-section profiles can be open or closed curves. Open curves create surfaces
and closed curves create solids or surfaces. See Overview of Creating Solids
and Surfaces on page 966.
Options for Lofting
■Mode. Sets whether the loft creates a surface or a solid.
976 | Chapter 24 Create 3D Models
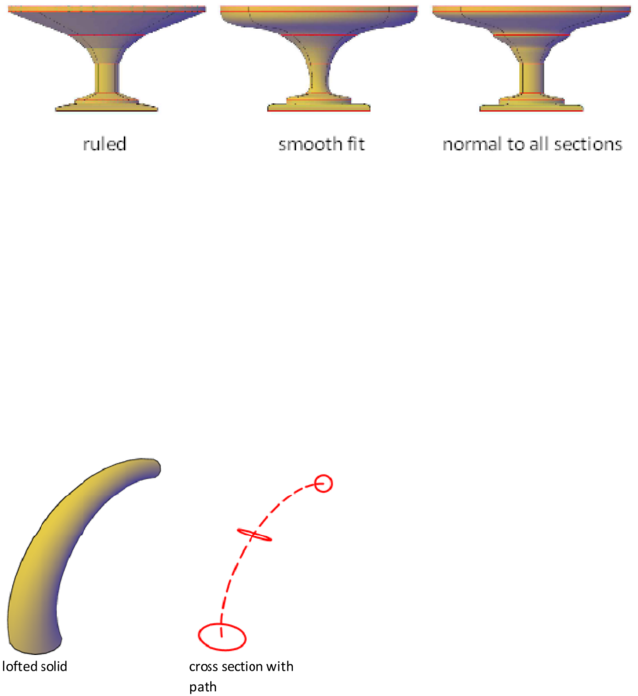
■Cross-section profiles. Select a series of cross-section profiles to define the
shape of the new 3D object.
lofted objects with different cross-section settings
As you create a lofted object, you can adjust its shape by specifying how
the profile passes through the cross sections (for example, a sharp or smooth
curve). You can also modify the settings later in the Properties dialog box.
For more information, see Modify Properties of 3D Solid, Surface, and Mesh
on page 1144.
■Paths. Specify a path for the loft operation to obtain more control over
the shape of the lofted object. For best results, start the path curve on the
plane of the first cross section and end it on the plane of the last cross
section.
■Guide curves. Specify guide curves to match points on corresponding cross
sections. This method prevents undesired results, such as wrinkles in the
resulting 3D object.
Create a Solid or Surface by Lofting | 977
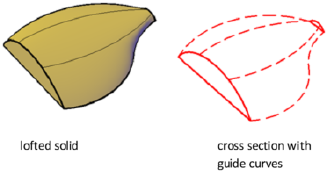
Each guide curve must meet the following criteria:
■Intersects each cross section
■Starts on the first cross section
■Ends on the last cross section
See also:
■Create Associative Surfaces on page 1036
■Create Geometric Relationships between Associative Surfaces on page 1039
■Draw Splines on page 679
■Modify Splines on page 794
To create a NURBS surface by lofting
1Click Surface tab ➤ Create panel ➤ NURBS Creation.
2Click Surface tab ➤ Create panel ➤ Loft.
3In the drawing area, select cross-section profiles and press Enter. (Select
them in the order in which you want the new 3D object to pass through
the cross sections.)
After the loft operation, the original objects are deleted or retained, depending
on the setting of the DELOBJ system variable.
To create a solid by lofting through a set of cross-section profiles
1Click Solid tab ➤ Create panel ➤ Loft.
2In the drawing area, select cross-section profiles and press Enter. (Select
them in the order in which you want the new 3D object to pass through
the cross sections.)
978 | Chapter 24 Create 3D Models
3Do one of the following:
■Use cross-section profiles only. Press Enter again or enter c (Cross
sections only).
In the Loft Settings dialog box, modify the options to control the
shape of the new object. Click the Preview Changes box to preview
the changes as you make them.
Click OK when finished.
■Follow guide curves. Enter g (Guide curves). Select the guide curves
and press Enter.
■Follow a path. Enter p (Path). Select a path and press Enter.
After the loft operation, the original objects are deleted or retained, depending
on the setting of the DELOBJ system variable.
Quick Reference
Commands
3DOSNAP
Sets the object snap modes for 3D objects.
BREP
Removes the history from 3D solids and composite solids, and associativity
from surfaces.
JOIN
Joins similar objects to form a single, unbroken object.
LIST
Displays property data for selected objects.
MEASUREGEOM
Measures the distance, radius, angle, area, and volume of selected objects or
sequence of points.
LOFT
Creates a 3D solid or surface in the space between several cross sections.
REGION
Converts an object that encloses an area into a region object.
Create a Solid or Surface by Lofting | 979
System Variables
3DOSMODE
Controls the settings for the 3D object snaps.
DELOBJ
Controls whether geometry used to create 3D objects is retained or deleted.
SOLIDHIST
Controls the default history property setting for solid objects.
SUBOBJSELECTIONMODE
Filters whether faces, edges, vertices or solid history subobjects are highlighted
when you roll over them.
SURFACEASSOCIATIVITY
Controls whether surfaces maintain a relationship with the objects from
which they were created.
SURFACEASSOCIATIVITYDRAG
Sets the dragging preview behavior of associative surfaces to increase
performance.
SURFACEMODELINGMODE
Controls whether surfaces are created as procedural surfaces or NURBS
surfaces.
Create a Solid or Surface by Revolving
Create a 3D object by revolving curves about an axis.
If the Surface tab is active, you will create a surface and if the Solid tab is active
you will create a solid regardless of whether the curve is open or closed. See
Overview of Creating Solids and Surfaces on page 966 for more information.
When revolving a solid, you can only use a revolve angle of 360 degrees.
Options for Revolving
■Mode. Sets whether the revolve creates a surface or a solid.
■Start Angle. Specifies an offset for the revolution from the plane of the
object being revolved.
■Reverse. Changes the direction of the revolve.
980 | Chapter 24 Create 3D Models
■Expression. Enter a formula or equation to specify the revolve angle. This
option is only available if you are creating associative surfaces. See Create
Geometric Relationships between Associative Surfaces on page 1039.
See also:
■Create Associative Surfaces on page 1036
■Draw Splines on page 679
■Modify Splines on page 794
To revolve objects about an axis to create a NURBS surface
1Click Surface tab ➤ Create panel ➤ Revolve.
2Select the objects or edge subobjects to revolve.
3To specify the axis of revolution, specify one of the following:
■The start and endpoint. Click to points on the screen to set the axis
orientation. The axis points must be on one side of the revolved object.
The positive axis direction extends from the start point to the
endpoint.
■The X, Y, or Z axis. Enter x, y, or z.
■An object. Select a line, a linear edge of a polyline segment, or the
linear edge of a surface or solid.
4Specify the angle of revolution.
To revolve objects about an axis to create a solid
1Click Solid tab ➤ Create panel ➤ Revolve.
2Select the objects or edge subobject to revolve.
3To specify the axis of revolution, specify one of the following:
■The start and endpoint. Click to points on the screen to set the axis
orientation. The axis points must be on one side of the revolved object.
The positive axis direction extends from the start point to the
endpoint.
■The X, Y, or Z axis. Enter x, y, or z.
Create a Solid or Surface by Revolving | 981
■An object. Select a line, a linear edge of a polyline segment, or the
linear edge of a surface or solid.
4Press Enter. To create a solid the angle must be 360 degrees. If you enter
a smaller angle of revolution, a surface is created instead of a solid.
Quick Reference
Commands
3DOSNAP
Sets the object snap modes for 3D objects.
BREP
Removes the history from 3D solids and composite solids, and associativity
from surfaces.
JOIN
Joins similar objects to form a single, unbroken object.
LIST
Displays property data for selected objects.
MEASUREGEOM
Measures the distance, radius, angle, area, and volume of selected objects or
sequence of points.
REGION
Converts an object that encloses an area into a region object.
REVOLVE
Creates a 3D solid or surface by sweeping an object around an axis.
System Variables
3DOSMODE
Controls the settings for the 3D object snaps.
DELOBJ
Controls whether geometry used to create 3D objects is retained or deleted.
982 | Chapter 24 Create 3D Models
SOLIDHIST
Controls the default history property setting for solid objects.
SUBOBJSELECTIONMODE
Filters whether faces, edges, vertices or solid history subobjects are highlighted
when you roll over them.
SURFACEASSOCIATIVITY
Controls whether surfaces maintain a relationship with the objects from
which they were created.
SURFACEASSOCIATIVITYDRAG
Sets the dragging preview behavior of associative surfaces to increase
performance.
SURFACEMODELINGMODE
Controls whether surfaces are created as procedural surfaces or NURBS
surfaces.
Create Solids
Create 3D solids from primitives or by combining or extending existing objects.
Overview of Creating 3D Solids
3D solid objects often start as one of several basic shapes, or primitives, that
you can then modify and recombine. A 3D solid can also be the result of
extruding a 2D shape to follow a specified path in 3D space.
About Solid Primitives
You can create several basic 3D shapes, known as solid primitives: boxes, cones,
cylinders, spheres, wedges, pyramids, and tori (donuts).
Create Solids | 983
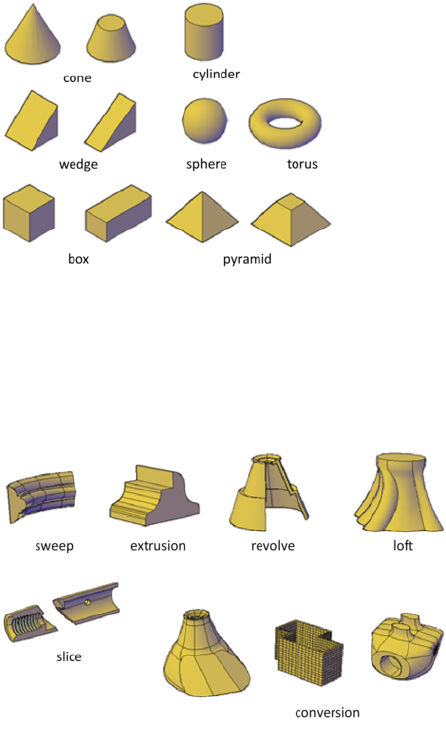
By combining primitive shapes, you can create more complex solids. For
example, you can join two solids, subtract one from the other, or create a
shape based on the intersection of their volumes.
About Solids Based on Other Objects
You can also create 3D solids from 2D geometry or other 3D objects.
The following methods are available:
■Sweep. Extends a 2D object along a path.
■Extrusion. Extends the shape of a 2D object in a perpendicular direction
into 3D space.
■Revolve. Sweeps a 2D object around an axis.
■Loft. Extends the contours of a shape between one or more open or closed
objects.
984 | Chapter 24 Create 3D Models
■Slice. Divides a solid object into two separate 3D objects.
■Sculpting Surfaces. Converts and trims a group of surfaces that enclose a
watertight area into a solid.
■Conversion. Converts mesh objects and planar objects with thickness into
solids and surfaces.
Quick Reference
Commands
BOX
Creates a 3D solid box.
CONE
Creates a 3D solid cone.
CONVTOSOLID
Converts 3D meshes and polylines and circles with thickness to 3D solids.
CONVTOSURFACE
Converts objects to 3D surfaces.
CYLINDER
Creates a 3D solid cylinder.
EXTRUDE
Creates a 3D solid or surface by extending the dimensions of an object.
INTERSECT
Creates a 3D solid, surface, or 2D region from overlapping solids, surfaces,
or regions.
INSERT
Inserts a block or drawing into the current drawing.
LOFT
Creates a 3D solid or surface in the space between several cross sections.
PYRAMID
Creates a 3D solid pyramid.
Overview of Creating 3D Solids | 985
REVOLVE
Creates a 3D solid or surface by sweeping an object around an axis.
SLICE
Creates new 3D solids and surfaces by slicing, or dividing, existing objects.
SUBTRACT
Combines selected 3D solids or 2D regions by subtraction.
SURFSCULPT
Trims and combines surfaces that bound a watertight area to create a solid.
SWEEP
Creates a 3D solid or surface by sweeping a 2D or 3D object or subobject
along a path.
TORUS
Creates a donut-shaped 3D solid.
UNION
Combines selected 3D solids, surfaces, or 2D regions by addition.
VISUALSTYLES
Creates and modifies visual styles and applies a visual style to a viewport.
WEDGE
Creates a 3D solid wedge.
System Variables
SURFACEMODELINGMODE
Controls whether surfaces are created as procedural surfaces or NURBS
surfaces.
FACETRES
Adjusts the smoothness of shaded and rendered objects and objects with
hidden lines removed.
ISOLINES
Specifies the number of contour lines per surface on objects.
986 | Chapter 24 Create 3D Models
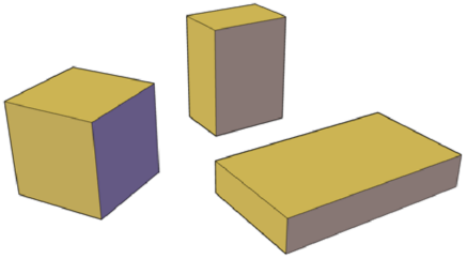
Create 3D Solid Primitives
Start with standard shapes known as solid primitives to create boxes, cones,
cylinders, spheres, tori (donuts), wedges, and pyramids.
Create a Solid Box
Create a rectangular or cubical solid box.
The base of the box is always drawn parallel to the XY plane of the current
UCS (workplane).
Box Creation Options
Use the following options to control the size and rotation of the boxes you
create:
■Create a cube. Use the Cube option of the BOX command to create a box
with sides of equal length.
■Specify rotation. Use the Cube or Length option if you want to set the
rotation of the box in the XY plane.
■Start from the center point. Use the Center Point option to create a box
using a specified center point.
To create a solid box based on two points and a height
1Click Home tab ➤ Modeling panel ➤ Box.
2Specify the first corner of the base.
3Specify the opposite corner of the base.
Create 3D Solid Primitives | 987
4Specify the height.
To create a solid cube
1Click Home tab ➤ Modeling panel ➤ Box.
2Specify the first corner, or enter c (Center) to specify the center point of
the base.
3At the Command prompt, enter c (Cube). Specify the length of the cube
and a rotation angle.
The length value sets both the width and height of the cube.
Quick Reference
Commands
BOX
Creates a 3D solid box.
System Variables
DRAGVS
Sets the visual style that is displayed while creating 3D solid and mesh
primitives and extruded solids, surfaces, and meshes.
Create a Solid Wedge
Create a solid wedge with rectangular or cubical faces.
988 | Chapter 24 Create 3D Models
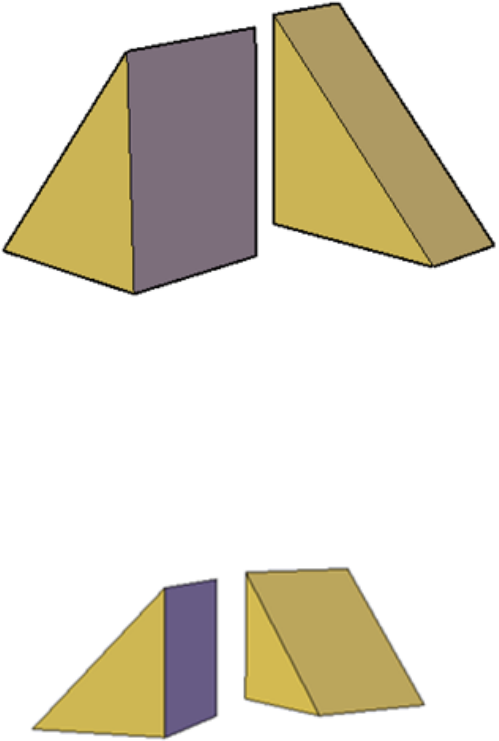
The base of the wedge is drawn parallel to the XY plane of the current UCS
with the sloped face opposite the first corner. The height of the wedge is
parallel to the Z axis.
Wedge Creation Options
Use the following options to control the size and rotation of the wedges you
create:
■Create a wedge with sides of equal length. Use the Cube option of the
WEDGE command.
■Specify rotation. Use the Cube or Length option if you want to set the
rotation of the wedge in the XY plane.
■Start from the center point. Use the Center Point option to create a wedge
using a specified center point.
To create a solid wedge based on two points and a height
1Click Home tab ➤ Modeling panel ➤ Wedge.
2Specify the first corner of the base.
Create 3D Solid Primitives | 989
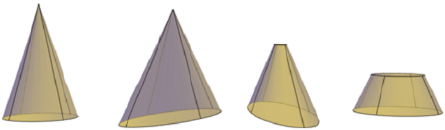
3Specify the opposite corner of the base.
4Specify the height of the wedge.
To create a solid wedge with equal length, width, and height
1Click Home tab ➤ Modeling panel ➤ Wedge.
2Specify the first corner or enter c (Center) to set the center point of the
base.
3At the Command prompt, enter c (Cube). Specify the length of the wedge
and a rotation angle.
The length value sets both the width and height of the wedge.
Quick Reference
Commands
WEDGE
Creates a 3D solid wedge.
System Variables
DRAGVS
Sets the visual style that is displayed while creating 3D solid and mesh
primitives and extruded solids, surfaces, and meshes.
Create a Solid Cone
Create a pointed or frustum of a cone with a circular or elliptical base.
By default, the base of the cone lies on the XY plane of the current UCS. The
height of the cone is parallel to the Z axis.
990 | Chapter 24 Create 3D Models
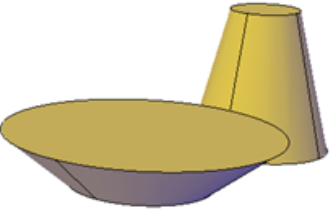
Cone Creation Options
Use the following options to control the size and rotation of the cones you
create:
■Set the height and orientation. Use the Axis Endpoint option of the CONE
command. Use the Top Radius option to specify the axis endpoint as the
point of the cone or the center of the top face. The axis endpoint can be
located anywhere in 3D space.
■Create a frustum of a cone. Use the Top Radius option of the CONE
command to create a frustum, which tapers to an elliptical or planar face.
The Frustum tool is also available from the Modeling tab of the tool palette.
You can also use grips to modify the tip of a cone and convert it to a flat
face.
■Specify circumference and base plane. The 3P (Three Points) option of the
CONE command defines the size and plane of the base of the cone
anywhere in 3D space.
■Define the angle of the taper. To create a conical solid that requires a
specific angle to define its sides, draw a 2D circle. Then use EXTRUDE and
the Taper Angle option to taper the circle at an angle along the Z axis. This
method, however, creates an extruded solid, not a true solid cone primitive.
See also:
■Use Grips to Edit 3D Solids and Surfaces on page 1115
To create a solid cone with a circular base
1Click Home tab ➤ Modeling panel ➤ Cone.
2Specify the center point of the base.
3Specify the radius or diameter of the base.
Create 3D Solid Primitives | 991
4Specify the height of the cone.
To create a solid cone with an elliptical base
1Click Home tab ➤ Modeling panel ➤ Cone.
2At the Command prompt, enter e (Elliptical).
3Specify the start point of first axis.
4Specify the endpoint of the first axis.
5Specify the endpoint (length and rotation) of the second axis.
6Specify the height of the cone.
To create a frustum of a solid cone
1Click Home tab ➤ Modeling panel ➤ Cone.
2Specify the center point of the base.
3Specify the radius or diameter of the base.
4At the Command prompt, enter t (Top radius). Specify the top radius.
5Specify the height of the cone.
To create a solid cone with the height and orientation specified by the axis
endpoint
1Click Home tab ➤ Modeling panel ➤ Cone.
2Specify the center point of the base.
3Specify the radius or diameter of the base.
4At the Command prompt, enter a (Axis endpoint). Specify the endpoint
and rotation of the cone.
This endpoint can be located anywhere in 3D space.
Quick Reference
Commands
CONE
Creates a 3D solid cone.
992 | Chapter 24 Create 3D Models
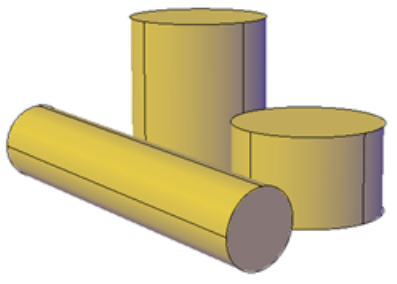
System Variables
DRAGVS
Sets the visual style that is displayed while creating 3D solid and mesh
primitives and extruded solids, surfaces, and meshes.
Create a Solid Cylinder
Create a solid cylinder with a circular or elliptical base.
By default, the base of the cylinder lies on the XY plane of the current UCS.
The height of the cylinder is parallel to the Z axis.
Cylinder Creation Options
Use the following options to control the size and rotation of the cylinders you
create:
■Set rotation. Use the Axis Endpoint option of the CYLINDER command
to set the height and rotation of the cylinder. The center point of the top
plane of the cylinder is the axis endpoint, which can be located anywhere
in 3D space.
■Use three points to define the base. Use the 3P (Three Points) option to
define the base of the cylinder. You can set three points anywhere in 3D
space.
■Construct a cylindrical form with special detail, such as grooves. Create a
closed polyline (PLINE to represent a 2D profile of the base. Use EXTRUDE
to define the height along the Z axis. The resulting extruded solid is not
a true solid cylinder primitive.
Create 3D Solid Primitives | 993
To create a solid cylinder with a circular base
1Click Home tab ➤ Modeling panel ➤ Cylinder.
2Specify the center point of the base.
3Specify the radius or diameter of the base.
4Specify the height of the cylinder.
To create a solid cylinder with an elliptical base
1Click Home tab ➤ Modeling panel ➤ Cylinder.
2At the Command prompt, enter e (Elliptical).
3Specify the start point of the first axis.
4Specify the endpoint of the first axis.
5Specify the endpoint (length and rotation) of the second axis.
6Specify the height of the cylinder.
To create a solid cylinder with the height and rotation specified (axis
endpoint)
1Click Home tab ➤ Modeling panel ➤ Cylinder.
2Specify the center point of the base.
3Specify the radius or diameter of the base.
4At the Command prompt, enter a (Axis endpoint). Specify the axis
endpoint of the cylinder.
This endpoint can be located anywhere in 3D space.
Quick Reference
Commands
CYLINDER
Creates a 3D solid cylinder.
994 | Chapter 24 Create 3D Models
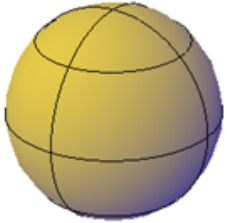
System Variables
DRAGVS
Sets the visual style that is displayed while creating 3D solid and mesh
primitives and extruded solids, surfaces, and meshes.
Create a Solid Sphere
Create a solid sphere using one of several methods.
When you start with the center point, the central axis of the sphere parallels
the Z axis of the current user coordinate system (UCS).
Sphere Creation Options
Use the following options to draw a sphere with the SPHERE command:
■Specify three points to set the size and plane of the circumference or
radius. Use the 3P (Three Points) option to define the size of the sphere
anywhere in 3D space. The three points also define the plane of the
circumference.
■Specify two points to set the circumference or radius. Use the 2P (Two
Points) option to define the size of the sphere anywhere in 3D space. The
plane of the circumference matches the Z value of the first point.
■Set the size and location of the sphere based on other objects. Use the
Ttr (Tangent, Tangent, Radius) option to define a sphere that is tangent
to two circles, arcs, lines, and some 3D objects. The tangency points are
projected onto the current UCS.
To create a solid sphere
1Click Home tab ➤ Modeling panel ➤ Sphere.
Create 3D Solid Primitives | 995
2Specify the center of the sphere.
3Specify the radius or diameter of the sphere.
To create a solid sphere defined by three points
1Click Home tab ➤ Modeling panel ➤ Sphere.
2At the Command prompt, enter 3p (Three Points). Specify the first point.
3Specify the second point.
4Specify the third point.
Quick Reference
Commands
SPHERE
Creates a 3D solid sphere.
System Variables
DRAGVS
Sets the visual style that is displayed while creating 3D solid and mesh
primitives and extruded solids, surfaces, and meshes.
Create a Solid Pyramid
Create a solid pyramid with up to 32 sides.
996 | Chapter 24 Create 3D Models
You can create a pyramid that tapers to a point, or create a frustum of a
pyramid, which tapers to a planar face.
Pyramid Creation Options
Use the following options to control the size, shape, and rotation of the
pyramids you create:
■Set the number of sides. Use the Sides option of the PYRAMID command
to set the number of sides for the pyramid.
■Set the length of the edges. Use the Edges option to specify the dimension
of the sides at the base.
■Create a frustum of a pyramid. Use the Top Radius option to create a
frustum, which tapers to a planar face. The frustum face is parallel to, and
has the same number of sides as, the base.
■Set the height and rotation of the pyramid. Use the Axis Endpoint option
of the PYRAMID command to specify the height and rotation of the
pyramid. This endpoint, or top of the pyramid, can be located anywhere
in 3D space.
To create a solid pyramid
1Click Home tab ➤ Modeling panel ➤ Pyramid.
2At the Command prompt, enter s (Sides). Enter the number of sides to
use.
3Specify the center point of the base.
Create 3D Solid Primitives | 997
4Specify the radius or diameter of the base.
5Specify the height of the pyramid.
To create a frustum of a solid pyramid
1Click Home tab ➤ Modeling panel ➤ Pyramid.
2At the Command prompt, enter s (Sides). Enter the number of sides to
use.
3Specify the center point of the base.
4Specify the radius or diameter of the base.
5Enter t (Top radius). Specify the radius of the planar face at the top of
the pyramid.
6Specify the height of the pyramid.
Quick Reference
Commands
PYRAMID
Creates a 3D solid pyramid.
System Variables
DRAGVS
Sets the visual style that is displayed while creating 3D solid and mesh
primitives and extruded solids, surfaces, and meshes.
Create a Solid Torus
Create a ring-shaped solid that resembles the inner tube of a tire.
998 | Chapter 24 Create 3D Models
A torus has two radius values. One value defines the tube. The other value
defines the distance from the center of the torus to the center of the tube. By
default, a torus is drawn parallel to and is bisected by the XY plane of the
current UCS.
A torus can be self-intersecting. A self-intersecting torus has no center hole
because the radius of the tube is greater than the radius of the torus.
Torus Creation Options
Use the following options to control the size and rotation of the tori you
create.
■Set the size and plane of the circumference or radius. Use the 3P (Three
Points) option to define the size of the torus anywhere in 3D space. The
three points also define the plane of the circumference. Use this option to
rotate the torus as you create it.
■Set the circumference or radius. Use the 2P (Two Points) option to define
the size of the torus anywhere in 3D space. The plane of the circumference
matches the Z value of the first point.
■Set the size and location of the torus based on other objects. Use the Ttr
(Tangent, Tangent, Radius) option to define a torus that is tangent to two
circles, arcs, lines, and some 3D objects. The tangency points are projected
onto the current UCS.
To create a solid torus
1Click Home tab ➤ Modeling panel ➤ Torus.
2Specify the center of the torus.
3Specify the radius or diameter of the path that is swept by the torus tube.
4Specify the radius or diameter of the tube.
Create 3D Solid Primitives | 999
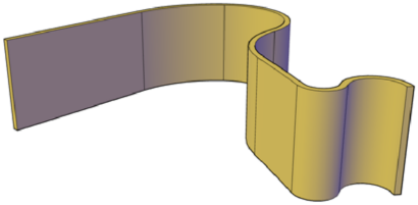
Quick Reference
Commands
TORUS
Creates a donut-shaped 3D solid.
System Variables
DRAGVS
Sets the visual style that is displayed while creating 3D solid and mesh
primitives and extruded solids, surfaces, and meshes.
Create a Polysolid
Use the same techniques you use to create polylines to create a polysolid
object.
The POLYSOLID command provides a quick way to draw 3D walls. A polysolid
is like an extruded, wide polyline. In fact, you can draw polysolids the same
way that you draw a polyline, using both straight and curved segments. Unlike
extruded polylines, which lose any width properties upon extrusion, polysolids
retain the width of their line segments.
You can also convert objects such as a line, 2D polyline, arc, or circle to a
polysolid.
Polysolids are displayed as swept solids in the Properties palette.
1000 | Chapter 24 Create 3D Models
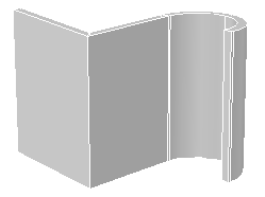
Polysolid Creation Options
Use the following options to control the size and shape of the polysolids you
create:
■Create arced segments. Use the Arc option to add curved segments to the
polysolid. The profile of a polysolid with curved segments remains
perpendicular to the path.
■Create a polysolid from a 2D object. Use the Object option to convert an
object such as a polyline, circle, line, or arc to a polysolid. The DELOBJ
system variable controls whether the path (a 2D object) is automatically
deleted when you create a polysolid.
■Close the gap between the first and last points. Use the Close option to
create a connecting segment.
■Set the height and width. Use the Height and Width options for the
POLYSOLID command. The values you set are stored in the PSOLWIDTH
and PSOLHEIGHT system variables.
■Set where the object is drawn in relation to the specified points. Use the
Justification option to place the path of the polysolid to the right, to the
left, or down the center of the points you specify.
To draw a polysolid
1Click Home tab ➤ Modeling panel ➤ Polysolid.
2Specify a start point.
3Specify the next point.
To create a curved segment, at the Command prompt, enter a (Arc) and
specify the next point.
4Repeat step 3 to complete the desired solid.
Create a Polysolid | 1001
5Press Enter.
To create a polysolid from an existing object
1Click Home tab ➤ Modeling panel ➤ Polysolid.
2At the Command prompt, enter o (Object).
3Select a 2D object such as a line, polyline, arc, or circle.
A 3D polysolid is created using the current height and width settings.
The original 2D object is deleted or retained, depending on the setting
of the DELOBJ system variable.
Quick Reference
Commands
POLYSOLID
Creates a 3D wall-like polysolid.
System Variables
DELOBJ
Controls whether geometry used to create 3D objects is retained or deleted.
PSOLHEIGHT
Controls the default height for a swept solid object created with the
POLYSOLID command.
PSOLWIDTH
Controls the default width for a swept solid object created with the
POLYSOLID command.
Create 3D Solids from Objects
Convert existing objects to 3D solids.
You can use several methods to convert objects in your drawing to 3D solids:
■Convert surfaces and objects with Thickness to 3D Solids
■Convert a group of surfaces to a 3D solid
1002 | Chapter 24 Create 3D Models
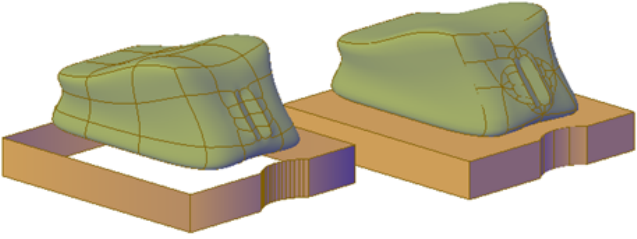
■Convert mesh to 3D solids
■Thicken surfaces to convert them to 3D solids
mesh and polyline with thickness converted to optimized 3D solids
The DELOBJ system variable controls whether the objects you select are
automatically deleted when the 3D object is created.
Convert Surfaces and Objects with Thickness to 3D Solids
You can convert different types of objects into extruded 3D solids with the
CONVTOSOLID command. These objects include closed polylines and circles
with thickness, as well as watertight meshes and surfaces. For a complete list
of objects that can be converted using this method, see CONVTOSOLID.
Convert a Group of Surfaces to a 3D Solid
Use the SURFSCULPT command to convert a group of surfaces that enclose a
water tight region to a 3D solid.
Convert Mesh to 3D Solids
When you convert mesh objects to 3D solids, the shape of the new solid object
approximates, but does not exactly duplicate, the original mesh object. You
can control the differentiation somewhat by specifying whether the result is
smooth or faceted (SMOOTHMESHCONVERT). You can also specify whether
the resulting faces are merged (optimized).
Create 3D Solids from Objects | 1003
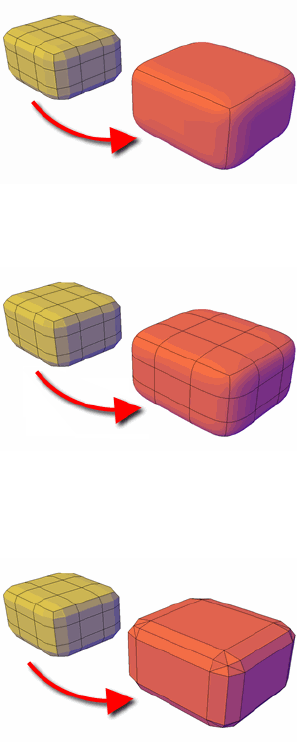
For example, if you convert a mesh box to a solid object, you have the
following options (available on the Mesh Modeling ribbon):
■Smoothed and optimized. Coplanar faces are merged into a single face.
The overall shape of some faces can change. Edges of faces that are not
coplanar are rounded.
■Smoothed and not optimized. Each original mesh face is retained in the
converted object. Edges of faces that are not coplanar are rounded.
■Faceted and optimized. Coplanar faces are merged into a single, flat face.
The overall shape of some faces can change. Edges of faces that are not
coplanar are creased, or angular.
■Faceted and not optimized. Each original mesh face is converted to a flat
face. Edges of faces that are not coplanar are creased, or angular.
1004 | Chapter 24 Create 3D Models
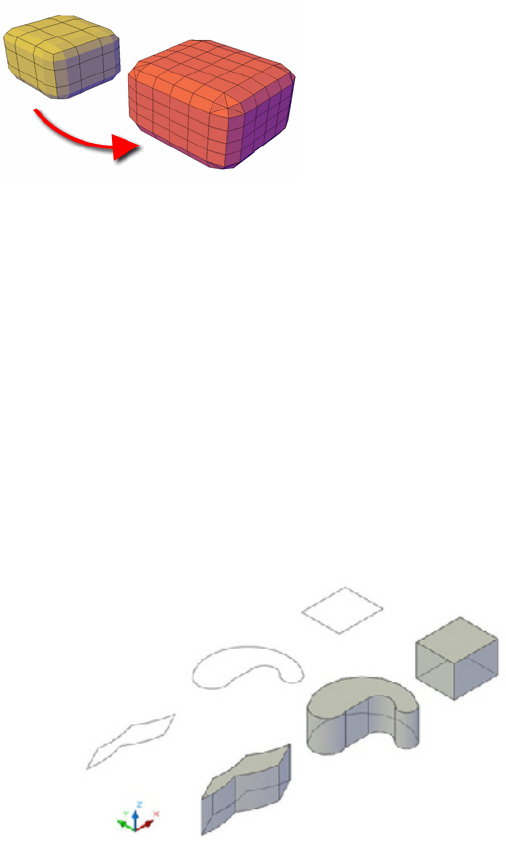
You cannot convert the following types of mesh objects to a 3D solid:
■Mesh with gaps between faces. Gizmo editing can sometimes result in
gaps, or holes between the faces. In some cases, you can close the gaps by
smoothing the mesh object.
■Mesh that has self-intersecting boundaries. If you have modified a mesh
object so that one or more faces intersect faces in the same object, you
cannot convert it to a 3D solid.
In some cases, mesh that is not eligible to be converted to a solid object can
be converted to a surface.
Thicken Surfaces to Convert Them to 3D Solids
You can convert 3D surface objects to 3D solids with the THICKEN command.
Grip editing is limited for objects that are created using this method.
Create 3D Solids from Objects | 1005
To convert objects with thickness to extruded solids
1Click Home tab ➤ Solid Editing panel ➤ Convert to Solid.
2Select one or more of the following types of objects and press Enter:
■Uniform-width polylines with thickness
■Closed, 0-width polylines with thickness
■Circles with thickness
To convert one or more surfaces to solids
1Click Home tab ➤ Solid Editing panel ➤ Thicken.
2Select the surfaces you want to thicken. Press Enter.
3Specify a thickness for the solid. Press Enter.
To convert contiguous surfaces that enclose a volume to a 3D solid object
1Click Home tab ➤ Solid Editing panel ➤ Sculpt.
2Select surfaces that enclose a watertight region.
A solid is created.
3Click Home tab ➤ Solid Editing panel ➤ Convert to Solid.
4Select the new compound object.
To convert a mesh object to a 3D solid
1Click Mesh Modeling tab ➤ Convert Mesh panel ➤ Convert Options
drop-down.
2Specify one of the following conversion options:
■Smooth, optimized. The resulting model is smoothed, with merged
faces (SMOOTHMESHCONVERT = 0).
■Smooth, not optimized. The resulting model is smooth, with the same
number of faces as the original mesh object (SMOOTHMESHCONVERT
= 1).
1006 | Chapter 24 Create 3D Models
■Faceted, optimized. The resulting model is angular, with merged,
planar faces (SMOOTHMESHCONVERT = 2).
■Faceted, not optimized. The resulting model is angular, with the same
number of faces as the original mesh object (SMOOTHMESHCONVERT
= 3).
3Click Mesh Modeling tab ➤ Convert Mesh panel ➤ Convert to Solid.
4Select a mesh object that has no gaps or intersecting faces.
Quick Reference
Commands
CONVTOSOLID
Converts 3D meshes and polylines and circles with thickness to 3D solids.
SURFSCULPT
Trims and combines surfaces that bound a watertight area to create a solid.
THICKEN
Converts a surface into a 3D solid with a specified thickness.
UNION
Combines selected 3D solids, surfaces, or 2D regions by addition.
System Variables
DELOBJ
Controls whether geometry used to create 3D objects is retained or deleted.
SMOOTHMESHCONVERT
Sets whether mesh objects that you convert to 3D solids or surfaces are
smoothed or faceted, and whether their faces are merged.
Combine or Slice 3D Objects
Create new composite 3D objects or slice objects to divide them.
Combine or Slice 3D Objects | 1007
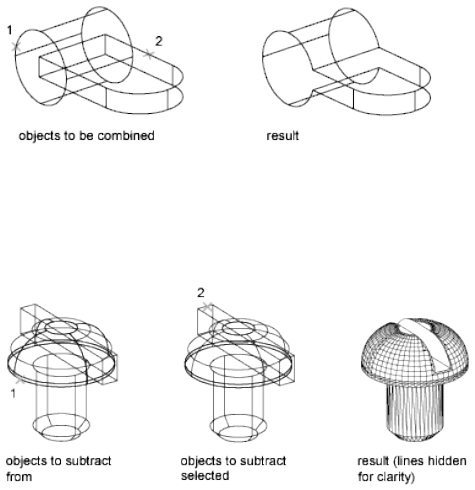
Create Composite Objects
Create composite 3D objects by combining, subtracting, or finding the
intersecting mass of two or more 3D solids, surfaces, or regions.
Composite solids are created from two or more solids, surfaces, or regions
through any of the following commands: UNION, SUBTRACT, and INTERSECT.
3D solids record a history of how they were created. This history allows you to
see the original forms that make up composite solids. For more information,
see Display Original Forms of Composite Solids on page 1134.
Methods for Creating Composite Objects
Three methods are available for creating composite solids, surfaces, or regions:
■Combine two or more objects.
With UNION, you can combine the total volume of two or more objects.
■Subtract one set of solids from another.
With SUBTRACT, you can remove the common area of one set of solids
from another. For example, you can use SUBTRACT to add holes to a
mechanical part by subtracting cylinders from the object.
■Find the common volume.
With INTERSECT, you can create a composite solid from the common
volume of two or more overlapping solids. INTERSECT removes the portions
1008 | Chapter 24 Create 3D Models
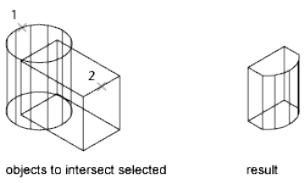
that do not overlap and creates a composite solid from the common
volume.
Create Composites from Mixed Object Types
In addition to creating composite objects from the same object types, you can
also create composites from mixed surfaces and solids.
■Mixed intersections. Combining a solid and a surface through intersection
results in a surface.
■Mixed subtractions. Subtracting a 3D solid from a surface results in a
surface. However, you cannot subtract a surface from a 3D solid object.
■Mixed unions. You cannot create a union between 3D solid and surface
objects.
You cannot combine solids with mesh objects. However, you can convert
them to 3D solids in order to combine them with solids.
If a selection set of mixed objects contains regions, the regions are ignored.
To combine objects
1Click Home tab ➤ Solid Editing panel ➤ Union.
2Select the 3D solid, surface, or region objects to combine. Press Enter.
To subtract objects from one another
1Click Home tab ➤ Solid Editing panel ➤ Subtract.
2Select the 3D solid, surface, or region to subtract from. Press Enter.
3Select the 3D solid, surface, or region to subtract. Press Enter.
Combine or Slice 3D Objects | 1009
To create a compound object from the intersection with other objects
1Click Home tab ➤ Solid Editing panel ➤ Intersect.
2Select the 3D solid, surface, or region to intersect. Press Enter.
Quick Reference
Commands
INTERSECT
Creates a 3D solid, surface, or 2D region from overlapping solids, surfaces,
or regions.
SUBTRACT
Combines selected 3D solids or 2D regions by subtraction.
UNION
Combines selected 3D solids, surfaces, or 2D regions by addition.
System Variables
SHOWHIST
Controls the Show History property for solids in a drawing.
SOLIDHIST
Controls the default history property setting for solid objects.
Create 3D Solids by Slicing
Create new 3D solids by slicing, or dividing, existing objects.
When you use the SLICE command to slice a 3D solid, you can define the
cutting plane in several ways. For example, you can specify three points, an
axis, a surface, or a planar object to act as a cutting plane. You can retain one
or both halves of the sliced object.
1010 | Chapter 24 Create 3D Models
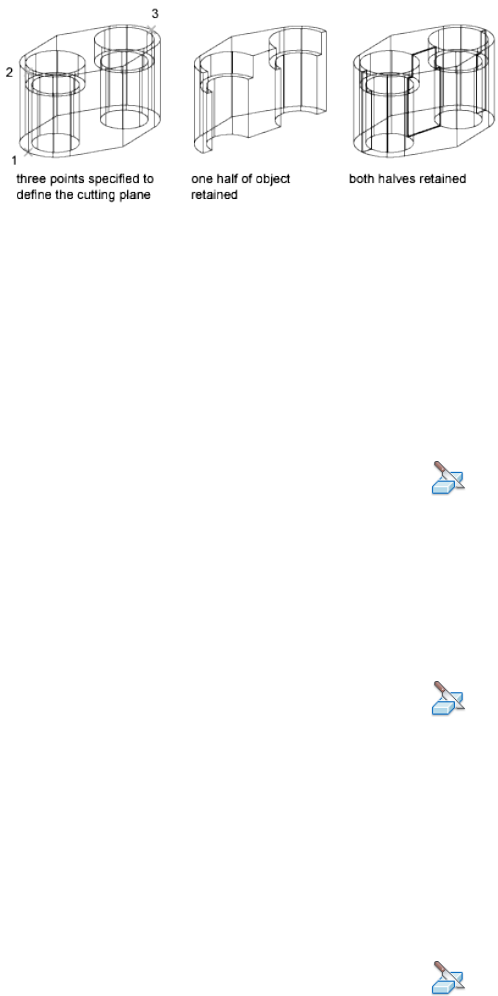
Sliced 3D solids do not retain a history of the original forms that created them.
However, they do retain the layer and color properties of the original objects.
For a complete list of objects that can be used for a slice operation, see SLICE.
See also:
■Create Sections and 2D Drawings from 3D Models on page 1197
To slice solids
1Click Home tab ➤ Solid Editing panel ➤ Slice.
2Select the 3D solid or surface objects to slice. Press Enter.
3Specify two points to define the cutting plane.
4Specify which side to retain, or enter b (Both) to retain both sides.
To slice solids with a planar object
1Click Home tab ➤ Solid Editing panel ➤ Slice.
2Select the 3D solid or surface objects to slice. Press Enter.
3At the Command prompt, enter o (Object). Press Enter.
4Select a circle, ellipse, arc, 2D spline, or 2D polyline to use as the cutting
plane.
5Specify which side to retain, or enter b (Both) to retain both sides.
To slice solids or surfaces with a surface
1Click Home tab ➤ Solid Editing panel ➤ Slice.
Combine or Slice 3D Objects | 1011
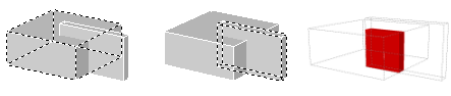
2Select the 3D solid or surface objects to slice. Press Enter.
3At the Command prompt, enter s (Surface).
4Press Enter.
5Select a surface to use as the cutting plane.
6Specify which side to retain, or enter b (both) to retain both sides.
Quick Reference
Commands
SLICE
Creates new 3D solids and surfaces by slicing, or dividing, existing objects.
Check 3D Models for Interferences
Find areas where 3D solids or surfaces intersect or overlap.
Use the INTERFERE command to check for areas of interference within a set
of 3D solid or surface models. You can compare two sets of objects or check
all 3D solids and surfaces in a drawing.
Interference checking creates temporary solid or surface objects and highlights
where the models intersect.
If the selection set contains both 3D solids and surfaces, the resulting
interference object is a surface.
You cannot check interference for mesh objects. However, if you select mesh
objects, you can choose to convert them to a solid or surface object and
continue the operation.
During the checking operation, you can use the Interference Checking dialog
box to cycle through and zoom to interference objects. You can also specify
whether to delete the temporary objects that are created during interference
checking.
1012 | Chapter 24 Create 3D Models

Methods for Checking Interference
You can check interference using the following methods:
■Define one selection set. Check the interference of all the 3D solids and
surfaces in a single selection set.
■Define two selection sets. Check the interference of the objects in the first
set of objects against the objects in the second selection set.
■Individually specify solids that are nested within blocks or xrefs.
Individually select 3D solid or surface objects that are nested in blocks and
external references (xrefs) and compare them against other objects in the
selection set.
To check for interferences within a solid model
1Click Home tab ➤ Solid Editing panel ➤ Interference Checking.
2Select the first set of 3D solids and surfaces in the model. Press Enter.
3Select the second set of 3D solids and surfaces in the model. Press Enter.
The Interference Checking dialog box is displayed. The areas of
interference are displayed as new, highlighted solid objects.
4To cycle through the interference objects, in the Interference Checking
dialog box, click Next and Previous.
5To retain the new interference objects after you close the Interference
Checking dialog box, clear Delete Interference Objects Created on Close.
6Click Close.
If Delete Interference Objects on Close is selected, the new interference
objects are deleted.
To change the display of interference objects
1Click Home tab ➤ Solid Editing panel ➤ Interference Checking.
2Enter s (Settings). Press Enter.
3In the Interference Settings dialog box, change any of the settings and
click OK.
Check 3D Models for Interferences | 1013
Quick Reference
Commands
INTERFERE
Creates a temporary 3D solid from the interferences between two sets of
selected 3D solids.
System Variables
INTERFERECOLOR
Sets the color for interference objects.
INTERFEREOBJVS
Sets the visual style for interference objects.
INTERFEREVPVS
Specifies the visual style for the viewport during interference checking.
Create Surfaces
Create procedural surfaces and NURBS surfaces from curves or by combining
or extending existing surfaces.
Overview of Creating Surfaces
Surface modeling provides the ability to edit multiple surfaces as an associative
group or in a more free-form way.
In addition to 3D solid and mesh objects, AutoCAD offer two type of surfaces:
procedural and NURBS.
■Procedural Surfaces can be associative, maintaining relationships with
other objects so that they can be manipulated as a group.
■NURBS Surfaces - are not associative. Instead, they have control vertices
that allow you to sculpt shapes in a more natural way.
Use procedural surfaces to take advantage of associative modeling, and use
NURBS surfaces to take advantage of sculpting with control vertices. The
illustration below shows a procedural surface on the left, and a NURBS surface
on the right.
1014 | Chapter 24 Create 3D Models
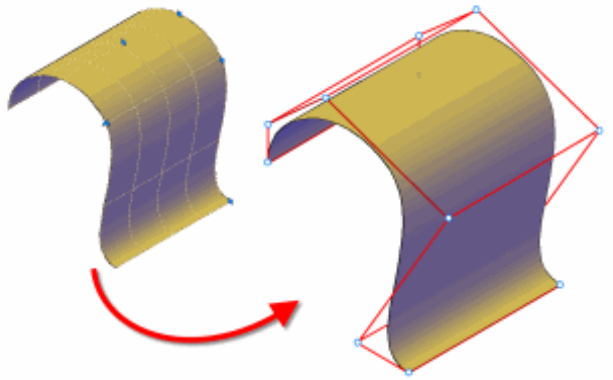
Choose a Surface Creation Method
Create procedural and NURBS surfaces using the following methods:
■Create surfaces from profiles on page 966. Create surfaces from profile
shapes composed of lines and curves with EXTRUDE, LOFT, PLANESURF,
REVOLVE, SURFNETWORK, and SWEEP.
■Create surfaces from other surfaces on page 1020. Blend, patch, extend,
fillet, and offset surfaces to create new surfaces (SURFBLEND, SURFPATCH,
SURFEXTEND, SURFFILLET and SURFOFFSET).
■Convert objects into procedural surfaces on page 1030. Convert existing
solids (including composite objects), surfaces, and meshes into procedural
surfaces (CONVTOSURFACE).
■Convert procedural surfaces into NURBS surfaces on page 1031. Some objects
cannot be converted directly to NURBS (for example, mesh objects). In
that case, convert the object to a procedural surface and then convert it
to a NURBS surface. (CONVTONURBS).
Overview of Creating Surfaces | 1015
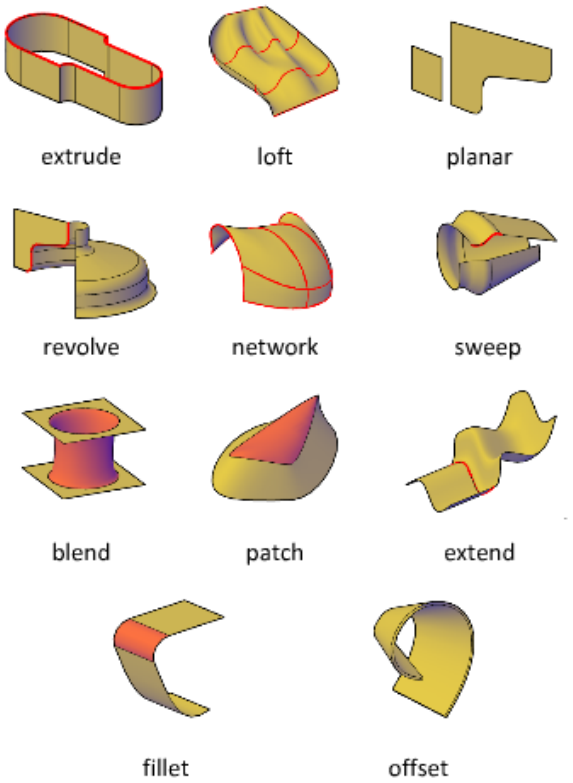
Understand Surface Continuity and Bulge Magnitude
Surface continuity and bulge magnitude are properties that are frequently
used when creating surfaces. When you create a new surface, you can specify
the continuity and bulge magnitude with special grips.
Continuity is a measure of how smoothly two curves or surfaces flow into
each other. The type of continuity can be important if you need to export
your surfaces to other applications.
1016 | Chapter 24 Create 3D Models
Continuity types include the following:
■G0 (Position). Measures location only. If the edge of each surface is
collinear, the surfaces are positionally continuous (G0) at the edge curves.
Note that two surfaces can meet at any angle and still have positional
continuity.
■G1 (Tangency). Includes both positional and tangential continuity (G0 +
G1). With tangentially continuous surfaces, the end tangents match at the
common edges. The two surfaces appear to be traveling in the same
direction at the join, but they may have very different apparent “speeds”
(or rates of change in direction, also called curvature).
■G2 (Curvature). Includes positional, tangential, and curvature continuity
(G0 + G1+G2). The two surfaces share the same curvature.
Bulge magnitude is a measure of how much surface curves or “bulges” as it
flows into another surface. Magnitude can be between 0 and 1 where 0 is flat
and 1 curves the most.
Set Surface Properties Before and After Creation
Set defaults that control a variety of surface properties before and after you
create the surface objects.
■Surface Modeling System Variables. There are a number of system variables
that are frequently used and changed during surface creation:
SURFACEMODELINGMODE, SURFACEASSOCIATIVITY,
SURFACEASSOCIATIVITYDRAG, SURFACEAUTOTRIM, and
SUBOBJSELECTIONMODE.
■Properties palette. Modifies properties for both the surface objects and
their subobjects after they are created. For example, you can change the
number of isolines in the U and V directions.
Quick Reference
Commands
3DOSNAP
Sets the object snap modes for 3D objects.
ANALYSISZEBRA
Projects stripes onto a 3D model to analyze surface continuity.
Overview of Creating Surfaces | 1017
BREP
Removes the history from 3D solids and composite solids, and associativity
from surfaces.
CONVTONURBS
Converts 3D solids and surfaces into NURBS surfaces.
CONVTOSURFACE
Converts objects to 3D surfaces.
EXTRUDE
Creates a 3D solid or surface by extending the dimensions of an object.
JOIN
Joins similar objects to form a single, unbroken object.
LOFT
Creates a 3D solid or surface in the space between several cross sections.
PLANESURF
Creates a planar surface.
REVOLVE
Creates a 3D solid or surface by sweeping an object around an axis.
SURFBLEND
Creates a continuous blend surface between two existing surfaces.
SURFNETWORK
Creates a surface in the space between several curves in the U and V directions
(including surface and solid edge subobjects).
SURFOFFSET
Creates a parallel surface a specified distance from the original surface.
SURFPATCH
Creates a new surface by fitting a cap over a surface edge that forms a closed
loop.
SWEEP
Creates a 3D solid or surface by sweeping a 2D or 3D object or subobject
along a path.
1018 | Chapter 24 Create 3D Models
VISUALSTYLES
Creates and modifies visual styles and applies a visual style to a viewport.
System Variables
3DOSMODE
Controls the settings for the 3D object snaps.
DELOBJ
Controls whether geometry used to create 3D objects is retained or deleted.
FACETRES
Adjusts the smoothness of shaded and rendered objects and objects with
hidden lines removed.
ISOLINES
Specifies the number of contour lines per surface on objects.
SUBOBJSELECTIONMODE
Filters whether faces, edges, vertices or solid history subobjects are highlighted
when you roll over them.
SURFACEASSOCIATIVITY
Controls whether surfaces maintain a relationship with the objects from
which they were created.
SURFACEASSOCIATIVITYDRAG
Sets the dragging preview behavior of associative surfaces to increase
performance.
SURFACEMODELINGMODE
Controls whether surfaces are created as procedural surfaces or NURBS
surfaces.
Create Procedural Surfaces
Create procedural surfaces by blending, patching, and offsetting existing
surfaces or by converting 3D solids, meshes and other planar geometry.
Create Procedural Surfaces | 1019
Create Surfaces from Other Surfaces
There are many ways to create procedural surfaces from existing surfaces.
These include blending, patching, and offsetting or creating network and
planar surfaces.
When you create procedural surfaces, use SURFACEASSOCIATIVITY to work
with the surfaces as a group. Just as you can modify the face of a solid and
have the entire solid update, when you modify a group of surfaces that are
associative, all of the surfaces update accordingly.
Create Planar Surfaces
Create planar surfaces in the space between edge subobjects, splines and other
2D and 3D curves.
Create planar surfaces with the PLANESURF command Planar surfaces can be
created from multiple closed objects and the curves can be surface or solid
edge subobjects. During creation, specify the tangency and bulge magnitude.
See also:
■Overview of Creating Surfaces on page 1014
To create a planar surface
1Click Surface tab ➤ Create panel ➤ Planar.
2Click and drag an area onscreen.
3Hold Shift and press the mouse wheel to orbit and inspect the planar
surface.
Quick Reference
Commands
3DOSNAP
Sets the object snap modes for 3D objects.
LIST
Displays property data for selected objects.
1020 | Chapter 24 Create 3D Models
MEASUREGEOM
Measures the distance, radius, angle, area, and volume of selected objects or
sequence of points.
PLANESURF
Creates a planar surface.
UCS
Manages user coordinate systems.
VISUALSTYLES
Creates and modifies visual styles and applies a visual style to a viewport.
System Variables
3DOSMODE
Controls the settings for the 3D object snaps.
DELOBJ
Controls whether geometry used to create 3D objects is retained or deleted.
LIST
Displays property data for selected objects.
MEASUREGEOM
Measures the distance, radius, angle, area, and volume of selected objects or
sequence of points.
SUBOBJSELECTIONMODE
Filters whether faces, edges, vertices or solid history subobjects are highlighted
when you roll over them.
SURFACEASSOCIATIVITY
Controls whether surfaces maintain a relationship with the objects from
which they were created.
Create Network Surfaces
Create non-planar surfaces in the space between edge subobjects, splines and
other 2D and 3D curves.
Create Procedural Surfaces | 1021
Create non-planar, network surfaces with the SURFNETWORK command.
Network surfaces are similar to lofted surfaces in that they are created in the
space between several curves in the U and V directions. The curves can be
surface or solid edge subobjects. When you create the surface you can specify
the tangency and bulge magnitude of the surface edges.
See also:
■Overview of Creating Surfaces on page 1014
To create a network surface
1Click Surface tab ➤ Create panel ➤ Network.
2In the drawing area, select cross section curves in the first direction (U
or V) and press Enter.
3Select cross sections in the second direction and press Enter.
Quick Reference
Commands
3DOSNAP
Sets the object snap modes for 3D objects.
LIST
Displays property data for selected objects.
MEASUREGEOM
Measures the distance, radius, angle, area, and volume of selected objects or
sequence of points.
SURFNETWORK
Creates a surface in the space between several curves in the U and V directions
(including surface and solid edge subobjects).
UCS
Manages user coordinate systems.
VISUALSTYLES
Creates and modifies visual styles and applies a visual style to a viewport.
1022 | Chapter 24 Create 3D Models

System Variables
3DOSMODE
Controls the settings for the 3D object snaps.
DELOBJ
Controls whether geometry used to create 3D objects is retained or deleted.
LIST
Displays property data for selected objects.
MEASUREGEOM
Measures the distance, radius, angle, area, and volume of selected objects or
sequence of points.
SUBOBJSELECTIONMODE
Filters whether faces, edges, vertices or solid history subobjects are highlighted
when you roll over them.
SURFACEASSOCIATIVITY
Controls whether surfaces maintain a relationship with the objects from
which they were created.
Blend a Surface
Create a transition surface between two existing surfaces.
Use SURFBLEND to create a new surface between existing surfaces and solids.
When you blend surfaces together, specify the surface continuity and bulge
magnitude for the start and end edges.
See also:
■Overview of Creating Surfaces on page 1014
To create a blend surface between a surface and a solid
1Click Surface tab ➤ Create panel ➤ Blend.
2Click Home tab ➤ Subobject panel ➤ Edges.
NOTE If the drawing area is very busy, use the CULLINGOBJ and the
CULLINGOBJSELECTION to further filter out unneeded objects.
Create Procedural Surfaces | 1023
3In the drawing area, select a surface edge subobject and a solid edge
subobject.
4Specify the continuity and bulge magnitude for each edge and press Enter.
Quick Reference
Commands
3DOSNAP
Sets the object snap modes for 3D objects.
LIST
Displays property data for selected objects.
MEASUREGEOM
Measures the distance, radius, angle, area, and volume of selected objects or
sequence of points.
SURFBLEND
Creates a continuous blend surface between two existing surfaces.
UCS
Manages user coordinate systems.
VISUALSTYLES
Creates and modifies visual styles and applies a visual style to a viewport.
System Variables
3DOSMODE
Controls the settings for the 3D object snaps.
CULLINGOBJ
Controls whether 3D subobjects that are hidden from view can be highlighted
or selected.
CULLINGOBJSELECTION
Controls whether 3D objects that are hidden from view can be highlighted
or selected.
1024 | Chapter 24 Create 3D Models

DELOBJ
Controls whether geometry used to create 3D objects is retained or deleted.
SUBOBJSELECTIONMODE
Filters whether faces, edges, vertices or solid history subobjects are highlighted
when you roll over them.
SURFACEASSOCIATIVITY
Controls whether surfaces maintain a relationship with the objects from
which they were created.
Patch a Surface
Create a surface by patching a closed surface or curve.
Use SURFPATCH to create a surface inside a closed curve (such as a closed
spline) that is another surface’s edge. You can also draw a guide curve to
constrain the shape of the patch surface with the constrain geometry option.
When you patch surfaces, specify the continuity and bulge magnitude.
See also:
■Overview of Creating Surfaces on page 1014
To patch the top of a closed surface
1Click Surface tab ➤ Create panel ➤ Patch.
2Click Home tab ➤ Subobject panel ➤ Edge.
NOTE If the drawing area is very busy, use the CULLINGOBJ and the
CULLINGOBJSELECTION to further filter out unneeded objects.
3In the drawing area, select a surface edge subobject.
4Specify the continuity and bulge magnitude and press Enter.
Create Procedural Surfaces | 1025
Quick Reference
Commands
3DOSNAP
Sets the object snap modes for 3D objects.
LIST
Displays property data for selected objects.
MEASUREGEOM
Measures the distance, radius, angle, area, and volume of selected objects or
sequence of points.
SURFPATCH
Creates a new surface by fitting a cap over a surface edge that forms a closed
loop.
UCS
Manages user coordinate systems.
VISUALSTYLES
Creates and modifies visual styles and applies a visual style to a viewport.
System Variables
3DOSMODE
Controls the settings for the 3D object snaps.
CULLINGOBJ
Controls whether 3D subobjects that are hidden from view can be highlighted
or selected.
CULLINGOBJSELECTION
Controls whether 3D objects that are hidden from view can be highlighted
or selected.
DELOBJ
Controls whether geometry used to create 3D objects is retained or deleted.
1026 | Chapter 24 Create 3D Models
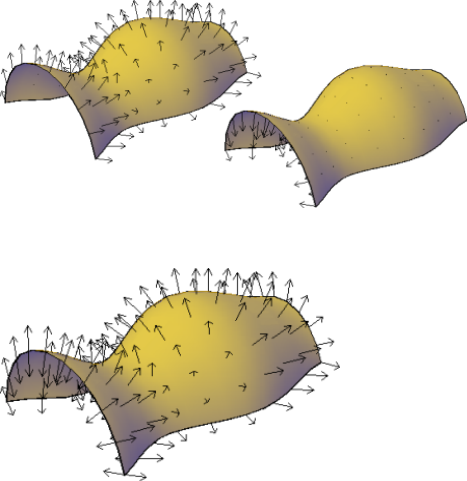
SUBOBJSELECTIONMODE
Filters whether faces, edges, vertices or solid history subobjects are highlighted
when you roll over them.
SURFACEASSOCIATIVITY
Controls whether surfaces maintain a relationship with the objects from
which they were created.
Offset a Surface
Create a parallel surface a specified distance from the original surface.
With SURFOFFSET specify the offset distance and whether or not the offset
surface maintains associativity with the original surface. You can also specify
the offset distance with a mathematical expression. See Constrain a Design
with Formulas and Equations on page 840.
Surface Offset Options
When you offset a surface, you can do the following:
■Change the offset direction with the Flip option
■Offset in both directions to create two new surfaces
Create Procedural Surfaces | 1027
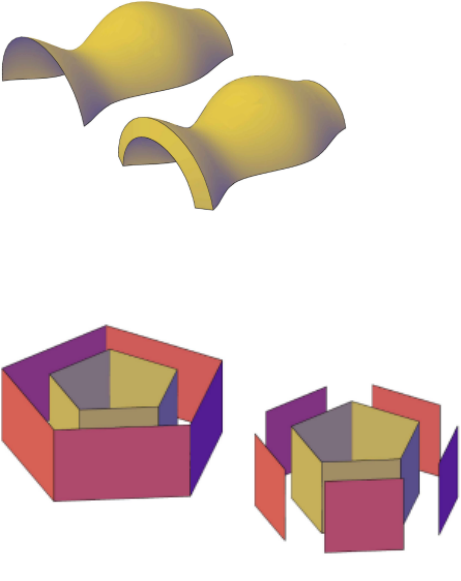
■Create a solid between the offset surfaces
■If you are offsetting more than one surface, you can specify whether the
offset surfaces remain connected.
■Enter an expression that will constrain the distance of the offset surface
to the original surface. This option only appears if associativity is on. See
Constrain a Design with Formulas and Equations on page 840.
See also:
■Overview of Creating Surfaces on page 1014
To create a solid from an offset surface
1Click Surface tab ➤ Create panel ➤ Offset.
2In the drawing area, select a surface and press Enter. Arrows display to
show the offset direction.
3Enter s and press Enter.
1028 | Chapter 24 Create 3D Models
4Enter an offset distance and press Enter.
The surface creates a parallel surface and connects the two to form a 3D solid
object.
Quick Reference
Commands
3DOSNAP
Sets the object snap modes for 3D objects.
LIST
Displays property data for selected objects.
MEASUREGEOM
Measures the distance, radius, angle, area, and volume of selected objects or
sequence of points.
SURFOFFSET
Creates a parallel surface a specified distance from the original surface.
UCS
Manages user coordinate systems.
VISUALSTYLES
Creates and modifies visual styles and applies a visual style to a viewport.
System Variables
3DOSMODE
Controls the settings for the 3D object snaps.
CULLINGOBJ
Controls whether 3D subobjects that are hidden from view can be highlighted
or selected.
CULLINGOBJSELECTION
Controls whether 3D objects that are hidden from view can be highlighted
or selected.
Create Procedural Surfaces | 1029

DELOBJ
Controls whether geometry used to create 3D objects is retained or deleted.
SUBOBJSELECTIONMODE
Filters whether faces, edges, vertices or solid history subobjects are highlighted
when you roll over them.
SURFACEASSOCIATIVITY
Controls whether surfaces maintain a relationship with the objects from
which they were created.
Convert Objects to Procedural Surfaces
Convert 3D solids, meshes, and 2D geometry to procedural surfaces.
Use CONVTOSURFACE to convert any of the following objects into surfaces:
■2D solids
■Meshes
■Regions
■Open, zero-width polylines with thickness
■Lines with thickness
■Arcs with thickness
■Planar 3D faces
To convert one or more objects to surfaces
1Click Home tab ➤ Solid Editing panel ➤ Convert to Surface.
2Select the objects you want to convert and press Enter.
1030 | Chapter 24 Create 3D Models
Quick Reference
Commands
CONVTOSURFACE
Converts objects to 3D surfaces.
Create NURBS Surfaces
Create NURBS surfaces by enabling NURBS creation and using many of the
same commands used to create procedural surfaces. You can also convert
existing procedural surfaces into NURBS surfaces.
See also:
■Create Solids and Surfaces from Lines and Curves on page 966
■Create Surfaces from Other Surfaces on page 1020
■Edit NURBS Surfaces on page 1155
■Rebuild NURBS Surfaces and Curves on page 1157
■Draw Splines on page 679
■Modify Splines on page 794
NURBS (Non-Uniform Rational B-Splines) surfaces are part of the suite of 3D
modeling objects that AutoCAD offers (in addition to 3D solids, procedural
surfaces, and meshes).
NURBS surfaces are based on Bezier curves or splines. Therefore, settings such
as degree, fit points, control vertices, weights, and knot parameterization are
important in defining a NURBS surface or curve. AutoCAD splines are
optimized to create NURBS surfaces allowing you to control many of these
options (see SPLINE and SPLINEDIT). The illustration below shows the control
vertices that display when you select a NURBS surface or spline.
Create NURBS Surfaces | 1031
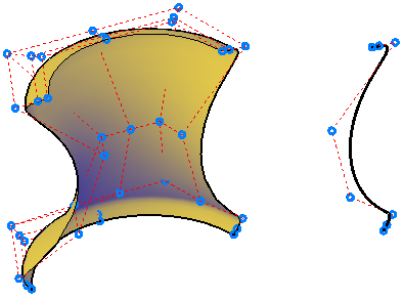
Two Methods for Creating NURBS Surfaces
There are two ways to create NURBS surfaces:
■SURFACEMODELINGMODE system variable - Use any of the surface creation
commands while this system variable is set to 1.
■CONVTONURBS command - Convert any existing surfaces with this
command.
It is important to plan ahead with NURBS modeling, since NURBS surfaces
cannot be converted back into procedural surfaces.
To create a NURBS surface by lofting
1Click Surface tab ➤ Create panel ➤ NURBS Creation (if it is not already
enabled).
2Click Surface tab ➤ Create panel ➤ Loft.
3Select the cross section profiles and press Enter. Select them in the order
in which you want the new 3D object to pass through them.
After the loft operation, the original objects are deleted or retained,
depending on the setting of the DELOBJ system variable.
To convert a solid into a NURBS surface
1Click Surface tab ➤ Control Vertices panel ➤ Convert to NURBS.
2Select a solid and press Enter. The object is converted into multiple NURBS
surfaces (each face becomes a separate surface).
1032 | Chapter 24 Create 3D Models

NOTE To display the control vertices, click Surface tab ➤ Control Vertices
panel ➤ Show CV.
To convert a mesh object into a NURBS surface
1Click Mesh tab ➤ Convert Mesh ➤ Convert to Surface.
2Select a mesh object and press Enter.
The object is converted to a procedural surface.
3Click Surface tab ➤ Create panel ➤ NURBS Creation.
The object is converted to a NURBS surface.
NOTE To display the control vertices, click Surface tab ➤ Control Vertices
panel ➤ Show CV.
Quick Reference
Commands
CONVTONURBS
Converts 3D solids and surfaces into NURBS surfaces.
CVSHOW
Displays the control vertices for specified NURBS surfaces or curves.
EXTRUDE
Creates a 3D solid or surface by extending the dimensions of an object.
LIST
Displays property data for selected objects.
LOFT
Creates a 3D solid or surface in the space between several cross sections.
MEASUREGEOM
Measures the distance, radius, angle, area, and volume of selected objects or
sequence of points.
Create NURBS Surfaces | 1033
REVOLVE
Creates a 3D solid or surface by sweeping an object around an axis.
SPLINE
Creates a smooth curve that passes through fit points or near control vertices.
SPLINEDIT
Edits a spline or spline-fit polyline.
SURFBLEND
Creates a continuous blend surface between two existing surfaces.
SURFEXTEND
Lengthens a surface by a specified distance.
SURFFILLET
Creates a filleted surface between two other surfaces.
SURFNETWORK
Creates a surface in the space between several curves in the U and V directions
(including surface and solid edge subobjects).
SURFOFFSET
Creates a parallel surface a specified distance from the original surface.
SURFPATCH
Creates a new surface by fitting a cap over a surface edge that forms a closed
loop.
SWEEP
Creates a 3D solid or surface by sweeping a 2D or 3D object or subobject
along a path.
System Variables
SURFACEMODELINGMODE
Controls whether surfaces are created as procedural surfaces or NURBS
surfaces.
Using the Spline tool to create NURBS Surfaces and Splines
The spline tool is optimized to work with NURBS modeling
1034 | Chapter 24 Create 3D Models
See also:
■Draw Splines on page 679
■Modify Splines on page 794
NURBS surfaces can be created from a number of 2D objects, including edge
subobjects, polylines, and arcs. But the spline tool is the only object that has
options that are compatible with creating NURBS surface. Not only do splines
consists of Bezier arcs, but they also can be defined with both control vertices
and fit points. The fit points and control vertices offer different editing options
such as knot parameterization and degree options. See
Moving Fit Points vs. Moving Control Vertices
NURBS curves have both fit points and control vertices. The fit points lie on
the line, and the control vertices lay outside the line. Use fit points to make
a change to one small part of a curve; use control vertices to make changes
that will affect the shape of the curve as a whole.
Clamp Surfaces and Curves with Open and Closed Geometry
NURBS surfaces and curves can have a clamp, closed, or open form. The form
affects how the object deforms.
■Open Curves and surfaces - have their start and end CVs in different
positions - it doesn’t form a loop. If you snap the start and end CVs of an
open curve to the same position, it’s still an open curve, because you can
still drag these points away from one another.
■Closed Curves and Surfaces - a loop with coinciding start and end CVs.
Where they meet is called a seam. If you move one CV, the other moves
with it.
■Clamp Curve - is a closed loop with a seam that creates extra, unseen CVs.
These unseen CVs can cause the shape to wrinkle and crease when it is
reshaped.
Quick Reference
Commands
SPLINE
Creates a smooth curve that passes through fit points or near control vertices.
Create NURBS Surfaces | 1035

SPLINEDIT
Edits a spline or spline-fit polyline.
System Variables
SURFACEMODELINGMODE
Controls whether surfaces are created as procedural surfaces or NURBS
surfaces.
Create Associative Surfaces
Associative surfaces automatically adjust to changes made to other, related
objects.
When surface associativity is on, surfaces are created with a relationship to
the surface or profiles that created them.
Associativity allows you to:
■Reshape the generating profiles to automatically reshape the surface.
■Work with a group of surfaces as if they were one object. Just as reshaping
one face of a solid box adjusts the entire primitive, reshaping one surface
or edge in a group of associated surfaces adjusts the entire group.
■Use geometric constraints on the 2D profiles of a surface.
■Assign mathematical expressions to derive properties of surfaces, such as
height and radius. For example, specify that the height of an extruded
surface be equal to one half the lengh of another object.
As you add more objects and edit them, all these objects become related and
create a chain of dependency. Editing one object can ripple through and affect
all associated objects.
It is important to understand the chain of associativity because moving or
deleting one of the links in the chain can break the relationship between all
the objects.
NOTE To modify the shape of a surface that is generated from a curve or spline,
you must select and modify the generating curve or spline, not the surface itself.
If you modify the surface itself, you will lose associativity.
1036 | Chapter 24 Create 3D Models

When associativity is on, the DELOBJ system variable is ignored. If Surface
Associativity and NURBS Creation are both on, surface are created as NURBS
surfaces, not associative surfaces.
Save time by planning your model ahead; you cannot go back and add
associativity after the model has been created. Also, be careful not to
accidentally break associativity by dragging objects away from the group.
To create an associative surface
■Click Surface tab ➤ Create panel ➤ Surface Associativity.
Any new procedural surfaces will be associative.
NOTE NURBS creation overrides Surface Associativity. If Surface Associativity
and NURBS Creation are both on, surface associativity will not work.
To see what objects a surface is associated with
1In a drawing, select an associative surface.
2Open the properties palette, in Surface Associativity, select Show from
the Show Associativity drop-down list.
3Roll over the surface and nearby objects.
The associated objects, such as generating curves or edge subobjects highlight
as well as the surface itself.
To turn associativity off for a particular surface
1In a drawing, select an associative surface.
2Open the properties palette, in Surface Associativity, select Non from the
Maintain Associativity drop-down list.
The surface maintains its associativity to other objects. But any new objects
that are created will not be associated with this surface. It breaks the chain of
associativity.
To remove associativity from a surface
1In a drawing, select an associative surface.
2Open the properties palette, in Surface Associativity, select Remove from
the Maintain Associativity drop-down list.
Create Associative Surfaces | 1037
The surface becomes a generic surface. You can no longer change any or its
properties in the properties palette and it loses its relationship with other
objects.
Quick Reference
Commands
BREP
Removes the history from 3D solids and composite solids, and associativity
from surfaces.
EXTRUDE
Creates a 3D solid or surface by extending the dimensions of an object.
JOIN
Joins similar objects to form a single, unbroken object.
LIST
Displays property data for selected objects.
LOFT
Creates a 3D solid or surface in the space between several cross sections.
MEASUREGEOM
Measures the distance, radius, angle, area, and volume of selected objects or
sequence of points.
PLANESURF
Creates a planar surface.
PROJECTGEOMETRY
Projects points, lines, or curves onto a 3D solid or surface from different
directions.
REVOLVE
Creates a 3D solid or surface by sweeping an object around an axis.
SURFBLEND
Creates a continuous blend surface between two existing surfaces.
1038 | Chapter 24 Create 3D Models
SURFNETWORK
Creates a surface in the space between several curves in the U and V directions
(including surface and solid edge subobjects).
SURFOFFSET
Creates a parallel surface a specified distance from the original surface.
SURFPATCH
Creates a new surface by fitting a cap over a surface edge that forms a closed
loop.
SWEEP
Creates a 3D solid or surface by sweeping a 2D or 3D object or subobject
along a path.
VISUALSTYLES
Creates and modifies visual styles and applies a visual style to a viewport.
System Variables
SURFACEASSOCIATIVITY
Controls whether surfaces maintain a relationship with the objects from
which they were created.
SURFACEASSOCIATIVITYDRAG
Sets the dragging preview behavior of associative surfaces to increase
performance.
Create Geometric Relationships between Associative Surfaces
Use geometric constraints to constrain and restrict surfaces. And use
mathematical expressions to derive surface properties.
Use Geometric Constraints with Surface Profiles
Just as with 2D drafting, geometric constraints can be used to restrict the
movement of 3D surfaces. For example, you can specify that a surface remain
fixed in a perpendicular or parallel location to another object. In the example
below, an offset surface is locked in a parallel position to its original surface.
Create Associative Surfaces | 1039
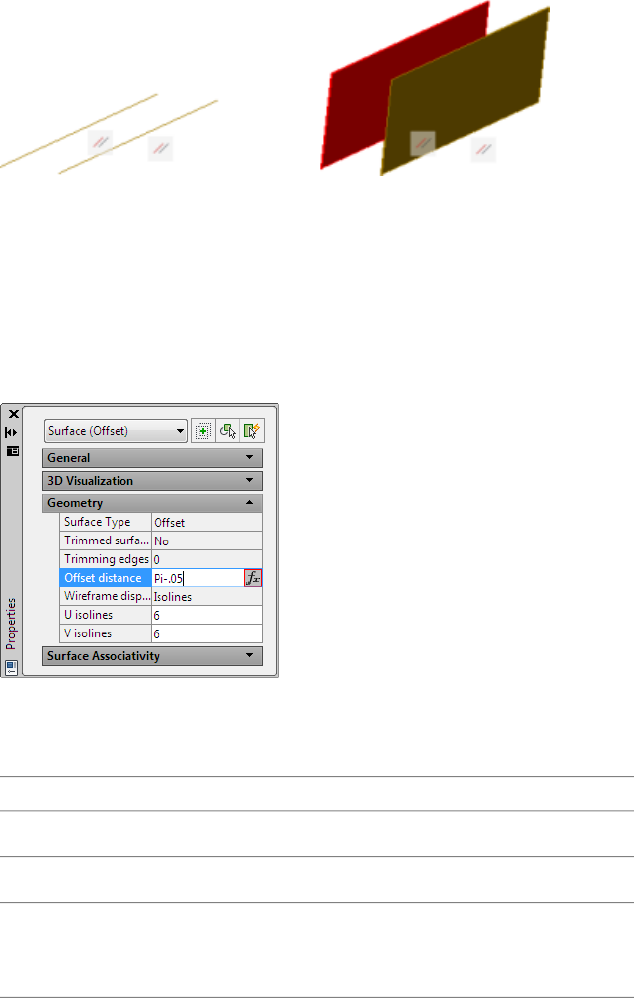
Constraints are applied to the 2D profile object used to create the surface, not
the surface itself. Use selection cycling to be sure that you are selecting the
profile curve and not the surface or the edge subobject. See Apply or Remove
Geometric Constraints on page 810.
Use Mathematical Expressions to Derive Surface Properties
Dimensional constraints are user-defined expressions that are applied in the
properties palette for that surface.
For a complete list of operators and functions allowed in expressions, see
Control Geometry with the Parameters Manager on page 842. The following
table lists the surface types and their properties that accept expressions
Surface properties that can be constrained.Type of Surface
Bulge MagnitudeBlend Surface
Extension DistanceExtend Surface
Extruded Surface ■Height
■Taper
1040 | Chapter 24 Create 3D Models

Surface properties that can be constrained.Type of Surface
Fillet RadiusFillet Surface
Bulge MagnitudeLoft Surface
Bulge MagnitudeNetwork Surface
Offset DistanceOffset Surface
Bulge MagnitudePatch Surface
Revolve AngleRevolve Surface
To create a parallel relationship between two surfaces
1Enter dsettings and select the Selection Cycling tab.
2Click Allow Selection Cycling to turn selection cycling on.
3Enter geomconstraint. Enter pa to select the parallel option.
4Select the first and second profile objects. Be careful not to select the
surface or the edge subobject.
If the surfaces were not already parallel, they are moved into a parallel location
and the parallel constraint symbol appears.
To add a user expression to specify the height of a surface
1Right-click on a surface and select Properties.
The properties palette displays.
2In the Geometry section, enter an expression in the Height field.
A symbol appears next to that field to indicate that a dimensional
constraint is applied to this property.
Create Associative Surfaces | 1041
Quick Reference
Commands
AUTOCONSTRAIN
Applies geometric constraints to a selection set of objects based on orientation
of the objects relative to one another.
CONSTRAINTBAR
Displays or hides the geometric constraints on an object.
CONSTRAINTSETTINGS
Controls the display of geometric constraints on constraint bars.
DCDISPLAY
Displays or hides the dynamic constraints associated with a selection set of
objects.
DELCONSTRAINT
Removes all geometric and dimensional constraints from a selection set of
objects.
DIMCONSTRAINT
Applies dimensional constraints to selected objects or points on objects, or
converts associative dimensions to dimensional constraints.
GEOMCONSTRAINT
Displays or hides the geometric constraints on an object.
LIST
Displays property data for selected objects.
MEASUREGEOM
Measures the distance, radius, angle, area, and volume of selected objects or
sequence of points.
PARAMETERS
Controls the associative parameters used in the drawing.
-PARAMETERS
Controls the associative parameters used in the drawing.
1042 | Chapter 24 Create 3D Models
PARAMETERSCLOSE
Closes the Parameters Manager palette.
TEXTEDIT
Edits a dimensional constraint, dimension, or text object.
System Variables
CCONSTRAINTFORM
Controls whether annotational or dynamic constraints are applied to objects.
CONSTRAINTBARDISPLAY
Controls the display of constraint bars after you apply constraints and when
you select geometrically constrained drawings.
CONSTRAINTBARMODE
Controls the display of geometrical constraints on constraint bars.
CONSTRAINTNAMEFORMAT
Controls the text format for dimensional constraints.
CONSTRAINTRELAX
Indicates whether constraints are enforced or relaxed when editing an object.
CONSTRAINTSOLVEMODE
Controls constraint behavior when applying or editing constraints.
DIMCONSTRAINTICON
Displays the lock icon next to the text for dimensional constraints.
DYNCONSTRAINTMODE
Displays hidden dimensional constraints when constrained objects are
selected.
PARAMETERCOPYMODE
Controls how constraints and referenced user parameters are handled when
constrained objects are copied between drawings, Model space and layouts,
and block definitions.
PARAMETERSSTATUS
Indicates whether the Parameters Manager is displayed or hidden.
Create Associative Surfaces | 1043
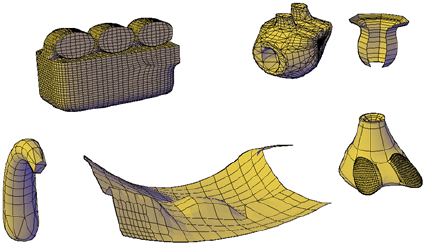
SURFACEASSOCIATIVITY
Controls whether surfaces maintain a relationship with the objects from
which they were created.
Create Meshes
Create meshes from primitive forms or by filling between points on other
objects.
Overview of Creating Meshes
Mesh tessellation provides enhanced capabilities for modeling object shapes
in a more detailed way.
Starting with AutoCAD 2010, the default mesh object type can be smoothed,
creased, split, and refined. Although you can continue to create the legacy
polyface and polygon mesh types, you can obtain more predictable results by
converting to the newer mesh object type.
Methods for Creating Mesh
You can create mesh objects using the following methods:
■Create mesh primitives. Create standard shapes, such as boxes, cones,
cylinders, pyramids, spheres, wedges, and tori (MESH).
■Create mesh from other objects. Create ruled, tabulated, revolved, or
edge-defined mesh objects, whose boundaries are interpolated from other
objects or points (RULESURF, TABSURF, REVSURF, EDGESURF).
■Convert from other object types. Convert existing solid or surface models,
including composite models, to mesh objects (MESHSMOOTH).
1044 | Chapter 24 Create 3D Models
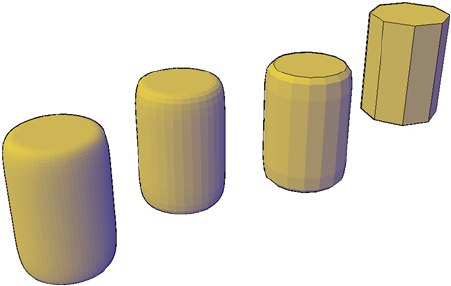
You can also convert the legacy style of mesh to the new mesh object type.
■Create custom meshes (legacy). Use 3DMESH to create polygon meshes,
usually scripted with AutoLISP routines, to create open-ended mesh. Use
PFACE to create mesh with multiple vertices defined by coordinates that
you specify. Although you can continue to create legacy polygonal and
polyface meshes, it is recommended that you convert to the enhanced
mesh object type to obtain enhanced editing capabilities.
About Tessellation
Tessellation is a collection of planar shapes that tile a mesh object. The
tessellation divisions, visible in unselected mesh objects, mark the edges of
the editable mesh faces. (To see these divisions in the 3D Hidden or Conceptual
visual styles, VSEDGES must be set to 1.)
When you smooth and refine mesh objects, you increase the density of the
tessellation (the number of subdivisions).
■Smoothing. Increases how closely the mesh surface adheres to a rounded
form. You can increase mesh smoothness levels for selected objects in
increments or by changing the smoothness level in the Properties palette.
Smoothness level 0 (zero) applies the lowest level of smoothing to a mesh
object. Smoothness level 4 applies a high degree of smoothness.
■Refinement. Quadruples the number of subdivisions in a selected mesh
object or in a selected subobject, such as a face. Refinement also resets the
current smoothness level to 0, so that the object can no longer be sharpened
beyond that level. Because refinement greatly increases the density of a
mesh, you might want to restrict this option to areas that require finely
Overview of Creating Meshes | 1045
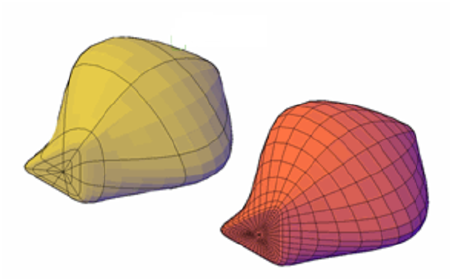
detailed modification. Refinement also helps you mold smaller sections
with less effect on the overall shape of the model.
While highly refined mesh gives you the ability to make detailed modifications,
it also comes at a cost: it can decrease program performance. By maintaining
maximum smoothness, face, and grid levels, you can help ensure that you do
not create meshes that are too dense to modify effectively. (Use
SMOOTHMESHMAXLEV, SMOOTHMESHMAXFACE, and
SMOOTHMESHGRID.)
Set Mesh Properties Before and After Creation
You can set defaults that control a variety of mesh properties before and after
you create the mesh objects.
■Mesh Primitive Options dialog box. Sets the density of the tessellation (the
number of subdivisions) per dimension for each type of mesh object you
create.
■Mesh Tessellation Options dialog box. Sets the default settings for 3D solid
or surface objects that you convert to mesh. Options define how closely
mesh faces adhere to the shape of the object and level of smoothness. You
can also set the default to prefer the settings in the Mesh Primitive Options
dialog box for object conversions.
■Properties palette. Modifies properties for both the mesh object and its
subobjects after they are created. For a selected mesh object, you can modify
the level of smoothness. For faces and edges, you can apply or remove
creasing, and modify crease retention levels.
■Level of smoothness. By default, the mesh primitive objects that you create
have no smoothness. You can change this default with the Settings option
1046 | Chapter 24 Create 3D Models
of the MESH command. The modified smoothness value is maintained
only during the current drawing session.
See also:
■Modify Mesh Objects on page 1167
To set the maximum smoothness level for mesh objects
1At the Command prompt, enter smoothmeshmaxlev.
2Enter a value from 1 to 255.
(Use lower numbers to prevent extremely dense meshes that might affect
program performance.)
To set the maximum number of faces for mesh objects
1At the Command prompt, enter smoothmeshmaxface.
2Enter a value from 1 to 16,000,000.
To control the display of the mesh facet grid
1At the Command prompt, enter smoothmeshgrid.
2Set the smoothness level at which the mesh object displays the underlying
facet grid:
■0 hides the display of the underlying facet grid.
■1 displays the facet grid for smoothness levels 0 and 1.
■2 or higher specifies the highest level of smoothness at which the
facet grid is displayed.
To change the default level of smoothness of new mesh primitive objects
1At the Command prompt, enter mesh. Then enter se (SEttings).
2Enter a smoothness value and press Enter.
(A smoothness level of 5 or less is recommended.)
3Press Esc to end the command or specify a mesh primitive type to create.
The smoothness value is retained for the current drawing session.
Overview of Creating Meshes | 1047
Quick Reference
Commands
3DFACE
Creates a three-sided or four-sided surface in 3D space.
3DMESH
Creates a free-form polygon mesh.
EDGESURF
Creates a mesh between four contiguous edges or curves.
MESH
Creates a 3D mesh primitive object such as a box, cone, cylinder, pyramid,
sphere, wedge, or torus.
MESHOPTIONS
Displays the Mesh Tessellation Options dialog box, which controls default
settings for converting existing objects to mesh objects.
MESHPRIMITIVEOPTIONS
Displays the Mesh Primitive Options dialog box, which sets the tessellation
defaults for primitive mesh objects.
MESHSMOOTH
Converts 3D objects such as polygon meshes, surfaces, and solids to mesh
objects.
PFACE
Creates a 3D polyface mesh vertex by vertex.
PROPERTIES
Controls properties of existing objects.
REVSURF
Creates a mesh by revolving a profile about an axis.
RULESURF
Creates a mesh that represents the surface between two lines or curves.
TABSURF
Creates a mesh from a line or curve that is swept along a straight path.
1048 | Chapter 24 Create 3D Models
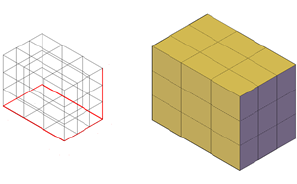
System Variables
SMOOTHMESHMAXLEV
Sets the maximum smoothness level for mesh objects.
SMOOTHMESHMAXFACE
Sets the maximum number of faces permitted for mesh objects.
SMOOTHMESHGRID
Sets the maximum level of smoothness at which the underlying mesh facet
grid is displayed on 3D mesh objects.
VSEDGES
Controls the types of edges that are displayed in the viewport.
Create 3D Mesh Primitives
Create mesh boxes, cones, cylinders, pyramids, spheres, wedges, and tori.
Create a Mesh Box
Create a rectangular or cubical mesh box.
The base of the mesh box is drawn parallel to the XY plane of the current UCS
(workplane).
You can set defaults for the number of divisions for each dimension of new
mesh boxes in the Mesh Primitive Options dialog box. You can also modify
these settings and the level of smoothness as you create the mesh object.
Create 3D Mesh Primitives | 1049

Mesh Box Creation Options
The Box option of the MESH command provides several methods for
determining the size and rotation of the mesh boxes you create.
■Create a cube. Use the Cube option to create a mesh box with sides of
equal length.
■Specify rotation. Use the Cube or Length option if you want to set the
rotation of the box in the XY plane.
■Start from the center point. Use the Center option to create a box using
a specified center point.
To create a mesh box based on two points and a height
1Click Mesh Modeling tab ➤ Primitives panel ➤ Mesh Box.
2Specify the first corner of the base.
3Specify the opposite corner of the base.
4Specify the height.
To create a mesh box based on length, width, and height
1Click Mesh Modeling tab ➤ Primitives panel ➤ Mesh Box.
2Specify the first corner of the base.
3At the Command prompt, enter l (Length). Specify the length of the base.
4Specify the width of the base.
5Specify the height.
To create a mesh box based on a center point, corner of base, and height
1Click Mesh Modeling tab ➤ Primitives panel ➤ Mesh Box.
2At the Command prompt, enter c (Center). Specify the center point of
the base.
1050 | Chapter 24 Create 3D Models

3To set the location of the corner of the base, use one of the following
methods:
■To set the length and width simultaneously: Specify the location of
one corner of the base.
■To set the length and width separately: At the Command prompt,
enter l (Length) and specify the length. Then specify the width.
■Specify the height.
To create a mesh cube
1Click Mesh Modeling tab ➤ Primitives panel ➤ Mesh Box.
2Specify the first corner or enter c (Center) and specify the center point
of the base.
3At the Command prompt, enter c (Cube). Specify the length of the cube
and a rotation angle.
Quick Reference
Commands
MESH
Creates a 3D mesh primitive object such as a box, cone, cylinder, pyramid,
sphere, wedge, or torus.
MESHPRIMITIVEOPTIONS
Displays the Mesh Primitive Options dialog box, which sets the tessellation
defaults for primitive mesh objects.
System Variables
DIVMESHBOXHEIGHT
Sets the number of subdivisions for the height of a mesh box along the Z
axis.
DIVMESHBOXLENGTH
Sets the number of subdivisions for the length of a mesh box along the X
axis.
Create 3D Mesh Primitives | 1051
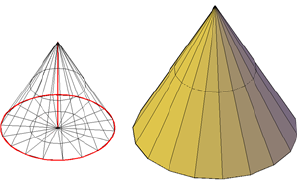
DIVMESHBOXWIDTH
Sets the number of subdivisions for the width of a mesh box along the Y axis.
DRAGVS
Sets the visual style that is displayed while creating 3D solid and mesh
primitives and extruded solids, surfaces, and meshes.
Create a Mesh Cone
Create a pointed or frustum mesh cone with a circular or elliptical base.
By default, the base of the mesh cone lies on the XY plane of the current UCS
and the height of the cone is parallel to the Z axis.
You can set the number of divisions for each dimension of new mesh cones
in the Mesh Primitive Options dialog box. You can also modify these settings
and the level of smoothness as you create the mesh object.
Mesh Cone Creation Options
The Cone option of the MESH command provides several methods for
determining the size and rotation of the mesh cones you create.
■Set the height and orientation. Use the Axis Endpoint option when you
want to reorient the cone by placing the tip or axis endpoint anywhere in
3D space.
■Create a frustum of a cone. Use the Top Radius option to create a frustum
of a cone, which tapers to an elliptical or planar face.
■Specify circumference and base plane. The 3P (Three Points) option defines
the size and plane of the base of the cone anywhere in 3D space.
■Create an elliptical base. Use the Elliptical option to create a cone base
whose axes are different lengths.
1052 | Chapter 24 Create 3D Models

■Set the location to be tangent to two objects. Use the Ttr (Tangent,
Tangent, Radius) option to define points on two objects. Depending on
the radius distance, the new cone is located as near as possible to the
tangent points you specify. You can set up tangency with circles, arcs,
lines, and some 3D objects. The tangency points are projected onto the
current UCS. The appearance of tangency is affected by the current level
of smoothness.
To create a mesh cone with a circular base
1Click Mesh Modeling tab ➤ Primitives panel ➤ Mesh Cone.
2Specify the center point of the base.
3Specify the radius or diameter of the base.
4Specify the height of the cone.
To create a mesh cone with an elliptical base
1Click Mesh Modeling tab ➤ Primitives panel ➤ Mesh Cone.
2At the Command prompt, enter e (Elliptical).
3Specify the start point of first axis.
4Specify the endpoint of the first axis.
5Specify the endpoint (length and rotation) of the second axis.
6Specify the height of the cone.
To create a frustum of a mesh cone
1Click Mesh Modeling tab ➤ Primitives panel ➤ Mesh Cone.
2Specify the center point of the base.
3Specify the radius or diameter of the base.
4At the Command prompt, enter t (Top radius). Specify the top radius.
5Specify the height of the cone.
Create 3D Mesh Primitives | 1053

To create a mesh cone with the height and orientation specified by the axis
endpoint
1Click Mesh Modeling tab ➤ Primitives panel ➤ Mesh Cone.
2Specify the center point of the base.
3Specify the radius or diameter of the base.
4At the Command prompt, enter a (Axis endpoint). Specify the endpoint
and rotation of the cone.
This endpoint can be located anywhere in 3D space.
Quick Reference
Commands
MESH
Creates a 3D mesh primitive object such as a box, cone, cylinder, pyramid,
sphere, wedge, or torus.
MESHPRIMITIVEOPTIONS
Displays the Mesh Primitive Options dialog box, which sets the tessellation
defaults for primitive mesh objects.
System Variables
DIVMESHCONEAXIS
Sets the number of subdivisions around the perimeter of the mesh cone base.
DIVMESHCONEBASE
Sets the number of subdivisions between the perimeter and the center point
of the mesh cone base.
DIVMESHCONEHEIGHT
Sets the number of subdivisions between the base and the point or top of
the mesh cone.
DRAGVS
Sets the visual style that is displayed while creating 3D solid and mesh
primitives and extruded solids, surfaces, and meshes.
1054 | Chapter 24 Create 3D Models
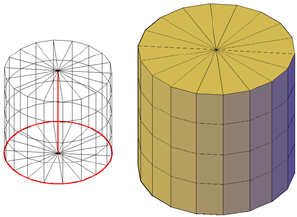
Create a Mesh Cylinder
Create a mesh cylinder with a circular or elliptical base.
By default, the base of the mesh cylinder lies on the XY plane of the current
UCS. The height of the cylinder is parallel to the Z axis.
You can set the number of divisions for each dimension of new mesh cylinders
in the Mesh Primitive Options dialog box. You can also modify these settings
and the level of smoothness as you create the mesh object.
Mesh Cylinder Creation Options
The Cylinder option of the MESH command provides several methods for
determining the size and rotation of the mesh cylinders you create.
■Set rotation. Use the Axis Endpoint option to set the height and rotation
of the cylinder. The center point of the top plane of the cylinder is the
axis endpoint, which can be located anywhere in 3D space.
■Use three points to define the base. Use the 3P (Three Points) option to
define the base of the cylinder. You can set three points anywhere in 3D
space.
■Create an elliptical base. Use the Elliptical option to create a cylinder base
whose axes are different lengths.
■Set the location to be tangent to two objects. Use the Ttr (Tangent,
Tangent, Radius) option to define points on two objects. Depending on
the radius distance, the new cylinder is located as near as possible to the
tangent points you specify. You can set up tangency with circles, arcs,
lines, and some 3D objects. The tangency points are projected onto the
current UCS. The appearance of tangency is affected by the current level
of smoothness.
Create 3D Mesh Primitives | 1055

To create a mesh cylinder with a circular base
1Click Mesh Modeling tab ➤ Primitives panel ➤ Mesh Cylinder.
2Specify the center point of the base.
3Specify the radius or diameter of the base.
4Specify the height of the cylinder.
To create a mesh cylinder with an elliptical base
1Click Mesh Modeling tab ➤ Primitives panel ➤ Mesh Cylinder.
2At the Command prompt, enter e (Elliptical).
3Specify the start point of the first axis.
4Specify the endpoint of the first axis.
5Specify the endpoint (length and rotation) of the second axis.
6Specify the height of the cylinder.
To create a mesh cylinder with the height and rotation specified (axis
endpoint)
1Click Mesh Modeling tab ➤ Primitives panel ➤ Mesh Cylinder.
2Specify the center point of the base.
3Specify the radius or diameter of the base.
4At the Command prompt, enter a (Axis endpoint). Specify the axis
endpoint of the cylinder.
This endpoint can be located anywhere in 3D space.
1056 | Chapter 24 Create 3D Models
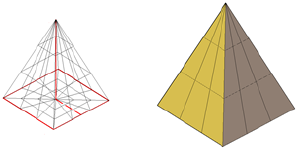
Quick Reference
Commands
MESH
Creates a 3D mesh primitive object such as a box, cone, cylinder, pyramid,
sphere, wedge, or torus.
MESHPRIMITIVEOPTIONS
Displays the Mesh Primitive Options dialog box, which sets the tessellation
defaults for primitive mesh objects.
System Variables
DIVMESHCYLAXIS
Sets the number of subdivisions around the perimeter of the mesh cylinder
base.
DIVMESHCYLBASE
Sets the number of radial subdivisions from the center of the mesh cylinder
base to its perimeter.
DIVMESHCYLHEIGHT
Sets the number of subdivisions between the base and the top of the mesh
cylinder.
DRAGVS
Sets the visual style that is displayed while creating 3D solid and mesh
primitives and extruded solids, surfaces, and meshes.
Create a Mesh Pyramid
Create a mesh pyramid with up to 32 sides.
Create 3D Mesh Primitives | 1057
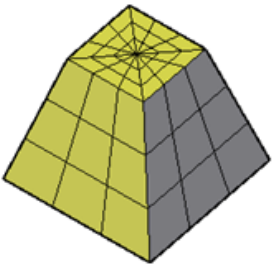
Create a pyramid that tapers to a point, or create a frustum of a pyramid,
which tapers to a planar face.
You can set the number of divisions for each dimension of new mesh pyramids
in the Mesh Primitive Options dialog box. You can also modify these settings
and the level of smoothness as you create the mesh object.
Mesh Pyramid Creation Options
The Pyramid option of the MESH command provides several methods for
determining the size and rotation of the mesh pyramids you create.
■Set the number of sides. Use the Sides option to set the number of sides
for the mesh pyramid.
■Set the length of the edges. Use the Edges option to specify the dimension
of the sides at the base.
■Create a frustum of a pyramid. Use the Top Radius option to create a
frustum, which tapers to a planar face. The frustum face is parallel to, and
has the same number of sides as, the base.
■Set the height and rotation of the pyramid. Use the Axis Endpoint option
to specify the height and rotation of the pyramid. This endpoint is the top
of the pyramid. The axis endpoint can be located anywhere in 3D space.
■Set the perimeter to be inscribed or circumscribed. Specify whether the
pyramid base is drawn inside or outside of the radius.
1058 | Chapter 24 Create 3D Models
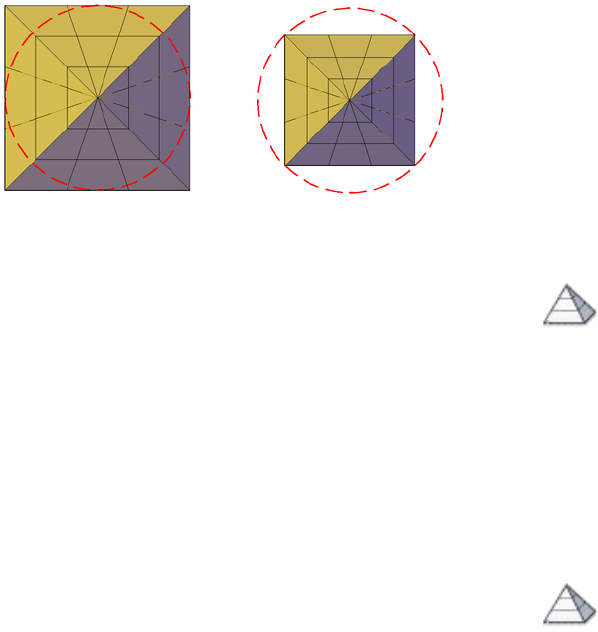
To create a mesh pyramid
1Click Mesh Modeling tab ➤ Primitives panel ➤ Mesh Pyramid.
2At the Command prompt, enter s (Sides). Enter the number of sides to
use.
3Specify the center point of the base.
4Specify the radius or diameter of the base.
5Specify the height of the pyramid.
To create a frustum of a mesh pyramid
1Click Mesh Modeling tab ➤ Primitives panel ➤ Mesh Pyramid.
2At the Command prompt, enter s (Sides). Enter the number of sides to
use.
3Specify the center point of the base.
4Specify the radius or diameter of the base.
5Enter t (Top radius). Specify the radius of the planar face at the top of
the pyramid. Specify the height of the pyramid.
Create 3D Mesh Primitives | 1059
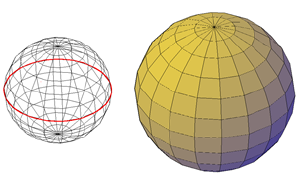
Quick Reference
Commands
MESH
Creates a 3D mesh primitive object such as a box, cone, cylinder, pyramid,
sphere, wedge, or torus.
MESHPRIMITIVEOPTIONS
Displays the Mesh Primitive Options dialog box, which sets the tessellation
defaults for primitive mesh objects.
System Variables
DIVMESHPYRBASE
Sets the number of radial subdivisions between the center of the mesh
pyramid base and its perimeter.
DIVMESHPYRHEIGHT
Sets the number of subdivisions between the base and the top of the mesh
pyramid.
DIVMESHPYRLENGTH
Sets the number of subdivisions along each dimension of a mesh pyramid
base.
DRAGVS
Sets the visual style that is displayed while creating 3D solid and mesh
primitives and extruded solids, surfaces, and meshes.
Create a Mesh Sphere
Create a mesh sphere using one of several methods.
1060 | Chapter 24 Create 3D Models

When you start with the center point, the central axis of the mesh sphere
parallels the Z axis of the current user coordinate system (UCS).
You can set the number of divisions for each dimension of new mesh spheres
in the Mesh Primitive Options dialog box. You can also modify these settings
and the level of smoothness as you create the mesh object.
Mesh Sphere Creation Options
The Sphere option of the MESH command provides several methods for
determining the size and rotation of the mesh spheres you create.
■Specify three points to set the size and plane of the circumference or
radius. Use the 3P (Three Points) option to define the size of the sphere
anywhere in 3D space. The three points also define the plane of the
circumference.
■Specify two points to set the circumference or radius. Use the 2P (Two
Points) option to define the size of the sphere anywhere in 3D space. The
plane of the circumference matches the Z value of the first point.
■Set the location to be tangent to two objects. Use the Ttr (Tangent,
Tangent, Radius) option to define points on two objects. Depending on
the radius distance, the sphere is located as near as possible to the tangent
points you specify. You can set up tangency with circles, arcs, lines, and
some 3D objects. The tangency points are projected onto the current UCS.
The appearance of tangency is affected by the current level of smoothness.
To create a mesh sphere
1Click Mesh Modeling tab ➤ Primitives panel ➤ Mesh Sphere.
2Specify the center of the sphere.
3Specify the radius or diameter of the sphere.
To create a mesh sphere defined by three points
1Click Mesh Modeling tab ➤ Primitives panel ➤ Mesh Sphere.
2Specify the center of the sphere.
3Specify the radius or diameter of the sphere.
Create 3D Mesh Primitives | 1061
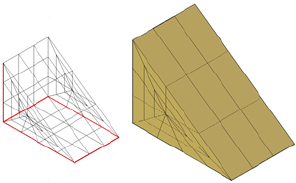
Quick Reference
Commands
MESH
Creates a 3D mesh primitive object such as a box, cone, cylinder, pyramid,
sphere, wedge, or torus.
MESHPRIMITIVEOPTIONS
Displays the Mesh Primitive Options dialog box, which sets the tessellation
defaults for primitive mesh objects.
System Variables
DIVMESHSPHEREAXIS
Sets the number of radial subdivisions around the axis endpoint of the mesh
sphere.
DIVMESHSPHEREHEIGHT
Sets the number of subdivisions between the two axis endpoints of the mesh
sphere.
DRAGVS
Sets the visual style that is displayed while creating 3D solid and mesh
primitives and extruded solids, surfaces, and meshes.
Create a Mesh Wedge
Create a mesh wedge with rectangular or cubical faces.
The base of the wedge is drawn parallel to the XY plane of the current UCS
with the sloped face opposite the first corner. The height of the wedge is
parallel to the Z axis.
1062 | Chapter 24 Create 3D Models

You can set the number of divisions for each dimension of new mesh wedges
in the Mesh Primitive Options dialog box. You can also modify these settings
and the level of smoothness as you create the mesh object.
Mesh Wedge Creation Options
The Wedge option of the MESH command provides several methods for
determining the size and rotation of the mesh wedges you create.
■Create a wedge with sides of equal length. Use the Cube option.
■Specify rotation. Use the Cube or Length option if you want to set the
rotation of the mesh wedge in the XY plane.
■Start from the center point. Use the Center Point option.
To create a mesh wedge based on two points and a height
1Click Mesh Modeling tab ➤ Primitives panel ➤ Mesh Wedge.
2Specify the first corner of the base.
3Specify the opposite corner of the base.
4Specify the height of the wedge.
To create a mesh wedge based on length, width, and height
1Click Mesh Modeling tab ➤ Primitives panel ➤ Mesh Wedge.
2Specify the first corner of the base.
3At the Command prompt, enter l (Length). Specify the length of the base.
4Specify the width of the base.
5Specify the height of the wedge.
To create a mesh wedge based on a center point, corner of base, and height
1Click Mesh Modeling tab ➤ Primitives panel ➤ Mesh Wedge.
Create 3D Mesh Primitives | 1063

2At the Command prompt, enter c (Center). Specify the center point of
the base.
3To set the location of a corner of the base, use one of the following
methods:
■To set the length and width simultaneously: Specify the location of
one corner of the base.
■To set the length and width separately: At the Command prompt,
enter l (Length) and specify the length. Then specify the width.
4Specify the height of the wedge.
To create a mesh wedge with equal length, width, and height
1Click Mesh Modeling tab ➤ Primitives panel ➤ Mesh Wedge.
2Specify the first corner or enter c (Center) to set the center point of the
base.
3At the Command prompt, enter c (Cube). Specify the length of the wedge
and a rotation angle.
The length value sets both the width and height of the wedge.
Quick Reference
Commands
MESH
Creates a 3D mesh primitive object such as a box, cone, cylinder, pyramid,
sphere, wedge, or torus.
MESHPRIMITIVEOPTIONS
Displays the Mesh Primitive Options dialog box, which sets the tessellation
defaults for primitive mesh objects.
System Variables
DIVMESHWEDGEBASE
Sets the number of subdivisions between the midpoint of the perimeter of
triangular dimension of the mesh wedge.
1064 | Chapter 24 Create 3D Models
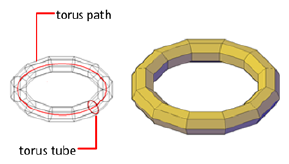
DIVMESHWEDGEHEIGHT
Sets the number of subdivisions for the height of the mesh wedge along the
Z axis.
DIVMESHWEDGELENGTH
Sets the number of subdivisions for the length of a mesh wedge along the X
axis.
DIVMESHWEDGESLOPE
Sets the number of subdivisions in the slope that extends from the apex of
the wedge to the edge of the base.
DIVMESHWEDGEWIDTH
Sets the number of subdivisions for the width of the mesh wedge along the
Y axis.
DRAGVS
Sets the visual style that is displayed while creating 3D solid and mesh
primitives and extruded solids, surfaces, and meshes.
Create a Mesh Torus
Create a ring-shaped solid that resembles the inner tube of a tire.
A mesh torus has two radius values. One value defines the tube. The other
value defines the path, which is equivalent to the distance from the center of
the torus to the center of the tube. By default, a torus is drawn parallel to and
is bisected by the XY plane of the current UCS.
You can set the number of divisions for each dimension of new mesh tori in
the Mesh Primitive Options dialog box. You can also modify these settings
and the level of smoothness as you create the mesh object.
A mesh torus can be self-intersecting. A self-intersecting mesh torus has no
center hole because the radius of the tube is greater than the radius of the
torus.
Create 3D Mesh Primitives | 1065

Torus Creation Options
The Torus option of the MESH command provides several methods for
determining the size and rotation of the mesh tori you create.
■Set the size and plane of the circumference or radius. Use the 3P (Three
Points) option to define the size of the mesh torus anywhere in 3D space.
The three points also define the plane of the circumference. Use this option
to rotate the mesh torus as you create it.
■Set the circumference or radius. Use the 2P (Two Points) option to define
the size of the mesh torus anywhere in 3D space. The plane of the
circumference matches the Z value of the first point.
■Set the location to be tangent to two objects. Use the Ttr (Tangent,
Tangent, Radius) option to define points on two objects. Depending on
the specified radius distance, the path of the torus is located as near as
possible to the tangent points you specify. You can set up tangency with
circles, arcs, lines, and some 3D objects. The tangency points are projected
onto the current UCS. The appearance of tangency is affected by the current
level of smoothness.
To create a mesh torus
1Click Mesh Modeling tab ➤ Primitives panel ➤ Mesh Torus.
2Specify the center of the torus.
3Specify the radius or diameter of the overall path that is swept by the
torus tube.
4Specify the radius or diameter of the tube.
Quick Reference
Commands
MESH
Creates a 3D mesh primitive object such as a box, cone, cylinder, pyramid,
sphere, wedge, or torus.
1066 | Chapter 24 Create 3D Models
MESHPRIMITIVEOPTIONS
Displays the Mesh Primitive Options dialog box, which sets the tessellation
defaults for primitive mesh objects.
System Variables
DIVMESHTORUSPATH
Sets the number of subdivisions in the path that is swept by the profile of a
mesh torus.
DIVMESHTORUSSECTION
Sets the number of subdivisions in the profile that sweeps the path of a mesh
torus.
DRAGVS
Sets the visual style that is displayed while creating 3D solid and mesh
primitives and extruded solids, surfaces, and meshes.
Construct Meshes from Other Objects
Create mesh forms by filling the space between other objects such as lines
and arcs.
You can use a variety of methods to create mesh objects whose edges are
defined by other objects. The MESHTYPE system variable controls whether
the new objects are valid mesh objects, or whether they are created using
legacy polyface or polygon geometry.
You can control whether the mesh is displayed as a wireframe, hidden, or
conceptual image by changing the visual style (VISUALSTYLES).
Types of Meshes Created from Other Objects
You can create several types of meshes that are based on existing objects.
■Ruled mesh. RULESURF creates a mesh that represents the ruled surface
between two lines or curves.
Construct Meshes from Other Objects | 1067
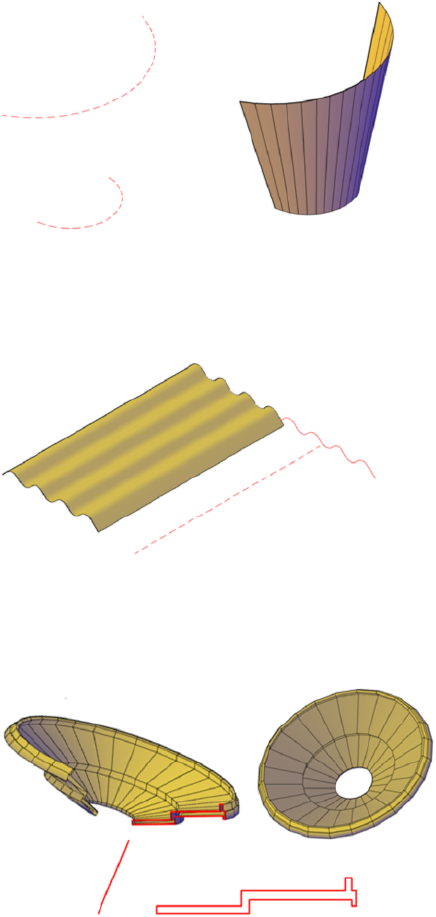
■Tabulated mesh. TABSURF creates a mesh that represents a general
tabulated surface. The surface is defined by the extrusion of a line or curve
(called a path curve) in a specified direction and distance (called a direction
vector or path).
■Revolved mesh. REVSURF creates a mesh that approximates a surface of
revolution by rotating a profile about a specified axis. A profile can consist
of lines, circles, arcs, ellipses, elliptical arcs, polylines, splines, closed
polylines, polygons, closed splines, and donuts.
■Edge-defined mesh. EDGESURF creates a mesh approximating a Coons
surface patch mesh from four adjoining edges. A Coons surface patch mesh
1068 | Chapter 24 Create 3D Models
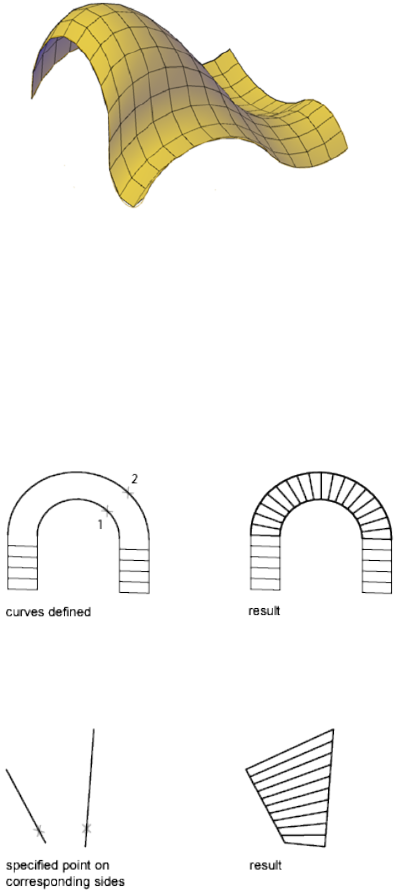
is a bicubic surface that is interpolated between four adjoining edges (which
can be general space curves).
Create a Ruled Mesh
There are several methods for creating meshes.
With RULESURF, you create a mesh between two lines or curves. Use two
different objects to define the edges of the ruled mesh: lines, points, arcs,
circles, ellipses, elliptical arcs, 2D polylines, 3D polylines, or splines.
Both objects that are used as the “rails” of a ruled mesh must be either open
or closed. You can pair a point object with either an open or a closed object.
You can specify any two points on closed curves to complete the operation.
For open curves, construction of the ruled mesh is based on the locations of
the specified points on the curves.
Construct Meshes from Other Objects | 1069
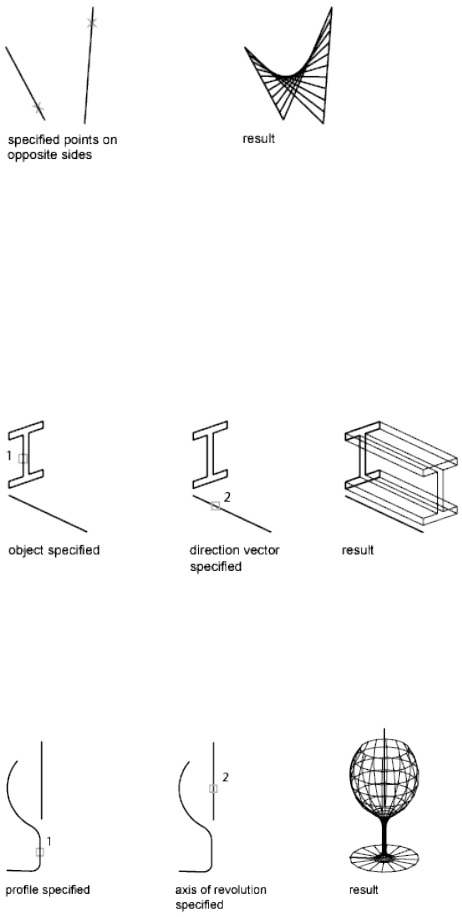
Create a Tabulated Mesh
With the TABSURF command, you can create a mesh that represents a general
tabulated surface defined by a path curve and a direction vector. The path
curve can be a line, arc, circle, ellipse, elliptical arc, 2D polyline, 3D polyline,
or spline. The direction vector can be a line or an open 2D or 3D polyline.
TABSURF creates the mesh as a series of parallel polygons running along a
specified path. The original object and the direction vector must already be
drawn, as shown in the following illustrations.
Create a Revolved Mesh
Use the REVSURF command to create a revolved mesh by rotating a profile
of the object about an axis. REVSURF is useful for mesh forms with rotational
symmetry.
The profile is called a path curve. It can consist of any combination of lines,
circles, arcs, ellipses, elliptical arcs, polylines, splines, closed polylines,
polygons, closed splines, or donuts.
1070 | Chapter 24 Create 3D Models
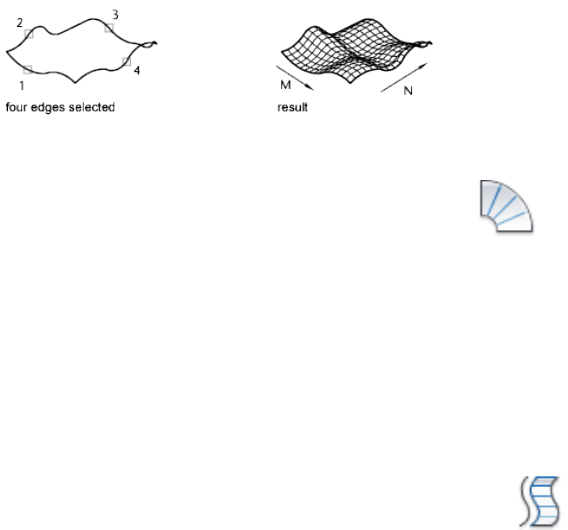
Create an Edge-Defined Mesh
With the EDGESURF command, you can create a Coons surface patch mesh, as
shown in the following illustration, from four objects called edges. Edges can
be arcs, lines, polylines, splines, or elliptical arcs that form a closed loop and
share endpoints. A Coons patch is a bicubic surface (one curve in the M
direction and another in the N direction) interpolated between the four edges.
To create a ruled mesh
1Click Home tab ➤ Modeling panel ➤ Ruled Surface.
2Select an object to act as the first defining curve.
3Select a second object as the second defining curve.
Mesh segments are drawn between the defining curves. The number of
segments equals the value set for SURFTAB1.
4Erase the original curves if necessary.
To create a tabulated mesh
1Click Home tab ➤ Modeling panel ➤ Tabulated Surface.
2Specify an object to define the overall shape of the tabulated surface (the
path curve).
The object can be a line, arc, circle, ellipse, or a 2D or 3D polyline.
3Specify an open line or polyline that defines the direction vector.
The mesh is extended from the start point to the endpoint of the direction
vector.
4Erase the original objects if necessary.
Construct Meshes from Other Objects | 1071
To create a revolved mesh
1Click Home tab ➤ Modeling panel ➤ Revolved Surface.
2Specify an object to define the path curve.
The path curve, which defines the N direction of the mesh, can be a line,
arc, circle, ellipse, elliptical arc, 2D polyline, 3D polyline, or spline. If you
select a circle, closed ellipse, or closed polyline, the mesh is closed in the
N direction.
3Specify an object to define the axis of revolution.
The direction vector can be a line or an open 2D or 3D polyline. If you
choose a polyline, the vector sets the rotation axis from its first vertex to
its last vertex. Any intermediate vertices are ignored. The axis of revolution
determines the M direction of the mesh.
4Specify the start angle.
If you specify a nonzero start angle, the mesh is generated at a position
offset from the path curve by that angle.
5Specify the included angle.
The included angle specifies how far the mesh extends around the axis
of revolution.
6Erase the original objects if necessary.
To create an edge-defined Coons surface patch mesh
1Click Home tab ➤ Modeling panel ➤ Edge Surface.
2Select four objects to define the four adjoining edges of the mesh patch.
The objects can be arcs, lines, polylines, splines, or elliptical arcs that
form a closed loop and share endpoints.
The first edge you select determines the M direction of the mesh.
1072 | Chapter 24 Create 3D Models
Quick Reference
Commands
EDGESURF
Creates a mesh between four contiguous edges or curves.
PEDIT
Edits polylines and 3D polygon meshes.
PFACE
Creates a 3D polyface mesh vertex by vertex.
REVSURF
Creates a mesh by revolving a profile about an axis.
RULESURF
Creates a mesh that represents the surface between two lines or curves.
TABSURF
Creates a mesh from a line or curve that is swept along a straight path.
VISUALSTYLES
Creates and modifies visual styles and applies a visual style to a viewport.
System Variables
FACETRATIO
Controls the aspect ratio of faceting for cylindrical and conic solids.
MESHTYPE
Controls the type of mesh that is created by REVSURF, TABSURF, RULESURF
and EDGESURF.
PLINECONVERTMODE
Specifies the fit method used in converting splines to polylines.
PFACEVMAX
Sets the maximum number of vertices per face.
Construct Meshes from Other Objects | 1073
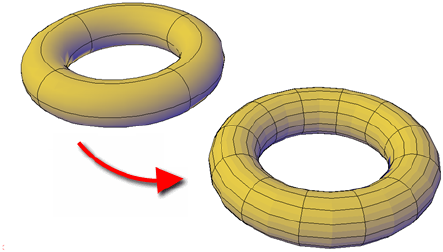
SURFTAB1
Sets the number of tabulations to be generated for the RULESURF and
TABSURF commands.
SURFTAB2
Sets the mesh density in the N direction for the REVSURF and EDGESURF
commands.
SURFTYPE
Controls the type of surface-fitting to be performed by the Smooth option
of the PEDIT command.
SURFU
Sets the surface density for PEDIT Smooth in the M direction and the U
isolines density on surface objects.
SURFV
Sets the surface density for PEDIT Smooth in the N direction and the V
isolines density on surface objects.
Create Meshes by Conversion
Convert solids, surfaces, and legacy mesh types to mesh objects.
You can use the MESHSMOOTH command to convert certain objects to mesh.
Convert 3D solids, surfaces, and legacy mesh objects to the enhanced mesh
object in order to take advantage of capabilities such as smoothing, refinement,
creasing, and splitting.
1074 | Chapter 24 Create 3D Models
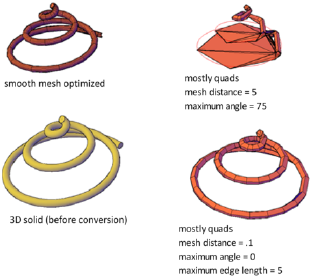
Object Types That Can Be Converted
You obtain the most predictable results when you convert primitive solid
objects to mesh. That is, the resulting mesh adheres closely to the shape of
the original solid model.
You can also convert other types of objects, although the conversion results
may differ from what you expect. These objects include swept surfaces and
solids, legacy polygon and polyface mesh objects, regions, closed polylines,
and objects created with 3DFACE. For these objects, you can often improve
results by adjusting the conversion settings.
Adjust Mesh Conversion Settings
If the conversion does not work as expected, try changing the settings in the
Mesh Tessellation Options dialog box. For example, if the Smooth Mesh
Optimized mesh type results in incorrect conversions, you can set the
tessellation shape to be Triangle or Mostly Quads.
You also can control the adherence to the original shape by setting the
maximum distance offset, angles, aspect ratios, and edge lengths for new faces.
The following example shows a 3D solid helix that has been converted to
mesh using different tessellation settings. The optimized mesh version has
been smoothed, but the other two conversions have no smoothness. Notice,
however, that the mostly quads conversion with the lower tessellation values
creates a mesh object that adheres most closely to the original version.
Smoothing this object improves its appearance even more.
Similarly, if you notice that a converted mesh object has a number of long,
slivered faces (which can sometimes cause gaps), try decreasing the Maximum
Edge Length for New Faces value.
Create Meshes by Conversion | 1075

If you are converting primitive solid objects, this dialog box also offers the
option of using the same default settings used to create primitive mesh objects.
When you select conversion candidates directly from this dialog box, you can
preview the results before you accept them.
See also:
■Objects That Can Be Converted to Mesh
To convert objects to mesh using defaults
1Click Home tab ➤ Mesh panel ➤ Smooth Object.
2Select an object such as a 3D solid or surface.
(For a list of eligible objects, see Objects That Can Be Converted to Mesh.)
The objects are converted to mesh using the settings in the Mesh
Tessellation Options dialog box.
To modify conversion settings as you convert objects to mesh
1Click Home tab ➤ Mesh panel ➤ dialog box launcher.
2In the Mesh Tessellation Options dialog box, update the settings that
you want to change.
3Click Select Objects to Tessellate.
4Select an object such as a 3D solid or surface and press Enter.
(For a list of eligible objects, see Objects That Can Be Converted to Mesh.)
5To display a preview of the converted object, click Preview.
The updated object is displayed in the drawing area.
6Do one of the following:
■To adjust the settings, press Esc to display the dialog box again. Repeat
steps 2 to 6.
■To accept the conversion, press Enter.
To modify mesh conversion settings
1Click Home tab ➤ Mesh panel ➤ dialog box launcher.
1076 | Chapter 24 Create 3D Models
2In the Mesh Tessellation Options dialog box, update the settings that
you want to change and click OK.
Quick Reference
Commands
MESHOPTIONS
Displays the Mesh Tessellation Options dialog box, which controls default
settings for converting existing objects to mesh objects.
MESHPRIMITIVEOPTIONS
Displays the Mesh Primitive Options dialog box, which sets the tessellation
defaults for primitive mesh objects.
MESHSMOOTH
Converts 3D objects such as polygon meshes, surfaces, and solids to mesh
objects.
System Variables
FACETERDEVNORMAL
Sets the maximum angle between the surface normal and contiguous mesh
faces.
FACETERDEVSURFACE
Sets how closely the converted mesh object adheres to the original shape of
the solid or surface.
FACETERGRIDRATIO
Sets the maximum aspect ratio for the mesh subdivisions that are created
for solids and surfaces converted to mesh.
FACETERMAXEDGELENGTH
Sets the maximum length of edges for mesh objects that are created by
conversion from solids and surfaces.
FACETERMAXGRID
Sets the maximum number of U and V grid lines for solids and surfaces
converted to mesh.
Create Meshes by Conversion | 1077
FACETERMESHTYPE
Sets the type of mesh to be created.
FACETERMINUGRID
Sets the minimum number of U grid lines for solids and surfaces that are
converted to mesh.
FACETERMINVGRID
Sets the minimum number of V grid lines for solids and surfaces that are
converted to mesh.
FACETERPRIMITIVEMODE
Specifies whether smoothness settings for objects that are converted to mesh
are derived from the Mesh Tessellation Options or the Mesh Primitive Options
dialog box.
FACETERSMOOTHLEV
Sets the default level of smoothness for objects that are converted to mesh.
Create Custom Mesh (Legacy)
Create custom polygon or polyface mesh by specifying vertices.
Specify individual vertices when you create mesh using the 3DMESH, PFACE,
and 3DFACE commands.
Understand Legacy Mesh Construction
The mesh density controls the number of facets in legacy polygonal and
polyface meshes. Density is defined in terms of a matrix of M and N vertices,
like a grid consisting of columns and rows. M and N specify the column and
row position, respectively, of any given vertex.
A mesh can be open or closed. If the start and end edges of the mesh do not
touch, a mesh is open in a given direction, as shown in the following
illustrations.
1078 | Chapter 24 Create 3D Models
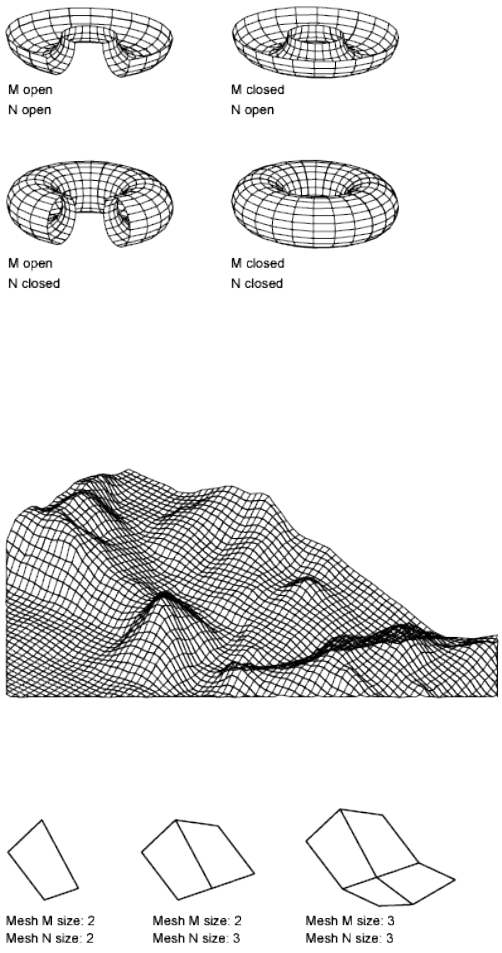
Create a Rectangular Mesh
With the 3DMESH command, you can create polygon meshes that are open
in both the M and N directions (like the X and Y axes of an XY plane). In most
cases, you can use 3DMESH in conjunction with scripts or AutoLISP routines
when you know the mesh points.
As you create the mesh, you specify the size of the mesh in the M and N
directions. The total number of vertices you specify for the mesh is equal to
the M value times the N value.
Create Custom Mesh (Legacy) | 1079
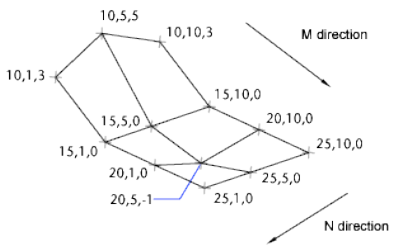
You can close the meshes with PEDIT. You can use 3DMESH to construct
irregular meshes.
Example:
In the following example of text at the Command prompt, you enter the
coordinate values for each vertex to create the mesh in the illustration.
Command: 3dmesh
Mesh M size: 4
Mesh N size: 3
Vertex (0, 0): 10,1, 3
Vertex (0, 1): 10, 5, 5
Vertex (0, 2): 10,10, 3
Vertex (1, 0): 15,1, 0
Vertex (1, 1): 15, 5, 0
Vertex (1, 2): 15,10, 0
Vertex (2, 0): 20,1, 0
Vertex (2, 1): 20, 5, -1
Vertex (2, 2): 20,10 ,0
Vertex (3, 0): 25,1, 0
Vertex (3, 1): 25, 5, 0
Vertex (3, 2): 25,10, 0
Create a Polyface Mesh
The PFACE command produces a polyface (polygon) mesh, with each face
capable of having numerous vertices. PFACE is typically used by applications
rather than by direct user input.
Creating a polyface mesh is like creating a rectangular mesh. To create a
polyface mesh, you specify coordinates for its vertices. You then define each
face by entering vertex numbers for all the vertices of that face. As you create
1080 | Chapter 24 Create 3D Models
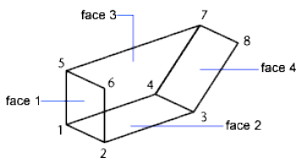
the polyface mesh, you can set specific edges to be invisible, assign them to
layers, or give them colors.
To make the edge invisible, enter the vertex number as a negative value. For
instance, to make the edge between vertices 5 and 7 invisible in the following
illustration, you enter the following:
Face 3, vertex 3: -7
In the illustration, face 1 is defined by vertices 1, 5, 6, and 2. Face 2 is defined
by vertices 1, 4, 3, and 2. Face 3 is defined by vertices 1, 4, 7, and 5, and face
4 is defined by vertices 3, 4, 7, and 8.
Create Polyface Mesh Vertex by Vertex
With the 3DFACE command, you can create three-dimensional polyface mesh
by specifying each vertex. You can control visibility of each mesh edge
segment.
If you select a 3DFACE object during some mesh smoothing operations (such
as with MESHSMOOTHMORE), you are prompted to convert 3DFACE objects
to mesh objects.
Create a Predefined 3D Mesh
The 3D command creates the following 3D shapes: boxes, cones, dishes, domes,
meshes, pyramids, spheres, tori (donuts), and wedges.
In the following illustrations, the numbers indicate points you specify to create
the mesh.
Create Custom Mesh (Legacy) | 1081
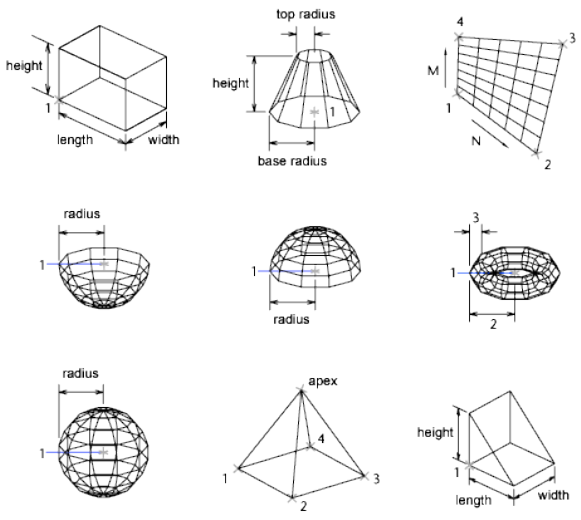
To view the objects you are creating with the 3D command more clearly, set
a viewing direction with 3DORBIT, DVIEW, or VPOINT.
To create a rectangular mesh
1At the Command prompt, enter 3dmesh.
2Specify the M size, using an integer from 2 through 256.
3Specify the N size, using an integer from 2 through 256.
4Specify the vertex points as prompted. The number of vertices equals the
M value times the N value. Specifying the last vertex point completes the
mesh.
1082 | Chapter 24 Create 3D Models
Quick Reference
Commands
3DFACE
Creates a three-sided or four-sided surface in 3D space.
3DMESH
Creates a free-form polygon mesh.
PEDIT
Edits polylines and 3D polygon meshes.
PFACE
Creates a 3D polyface mesh vertex by vertex.
System Variables
PFACEVMAX
Sets the maximum number of vertices per face.
Create Wireframe Models
A wireframe model is an edge or skeletal representation of a real-world 3D
object using lines and curves.
You can specify a wireframe visual style to help you see the overall structure
of 3D objects such as solids, surfaces, and meshes. In older drawings, you
might also encounter wireframe models that were created using legacy
methods.
Create Wireframe Models | 1083
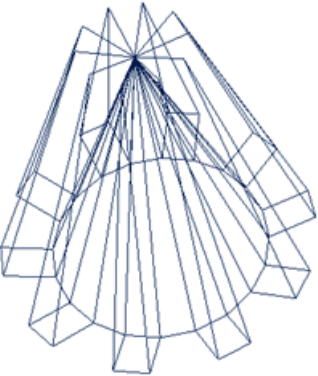
Wireframe models consist only of points, lines, and curves that describe the
edges of the object. Because each object that makes up a wireframe model
must be independently drawn and positioned, this type of modeling can be
the most time-consuming.
You can use a wireframe model to
■View the model from any vantage point
■Generate standard orthographic and auxiliary views automatically
■Generate exploded and perspective views easily
■Analyze spatial relationships, including the shortest distance between
corners and edges, and checking for interferences
■Reduce the number of prototypes required
The ISOLINES system variable controls the number of tessellation lines used
to visualize curved portions of the wireframe. The FACETRES system variable
adjusts the smoothness of shaded and hidden-line objects.
Methods for Creating Wireframe Models
You can create wireframe models by positioning any 2D planar object anywhere
in 3D space, using the following methods:
■Use the XEDGES command to create wireframe geometry from regions,
3D solids, surfaces, and meshes. XEDGES extracts all the edges on the
1084 | Chapter 24 Create 3D Models
selected objects or subobjects. The extracted edges form a duplicate
wireframe composed of 2D objects such as lines, circles, and 3D polylines.
■Enter 3D coordinates that define the X, Y, and Z location of the object.
■Set the default workplane (the XY plane of the UCS) on which to draw the
object.
■Move or copy the object to its proper 3D location after you create it.
Wireframe modeling is a skill that requires practice and experience. The best
way to learn how to create wireframe models is to begin with simple models
before attempting models that are more complex.
Tips for Working with Wireframe Models
Creating 3D wireframe models can be more difficult and time-consuming
than creating their 2D views. Here are some tips that will help you work more
effectively:
■Plan and organize your model so that you can turn off layers to reduce the
visual complexity of the model. Color can help you differentiate between
objects in various views.
■Create construction geometry to define the basic envelope of the model.
■Use multiple views, especially isometric views, to make visualizing the
model and selecting objects easier.
■Become adept at manipulating the UCS in 3D. The XY plane of the current
UCS operates as a workplane to orient planar objects such as circles and
arcs. The UCS also determines the plane of operation for trimming and
extending, offsetting, and rotating objects.
■Use object snaps and grid snap carefully to ensure the precision of your
model.
■Use coordinate filters to drop perpendiculars and easily locate points in
3D based on the location of points on other objects.
To drop a perpendicular line from a 3D point down to the XY plane
1Click Home tab ➤ Draw panel ➤ Line.
2Use an object snap to specify a point on an object that is not on the XY
plane of the UCS.
This location defines the first point of the line.
Create Wireframe Models | 1085

3Enter .xy and then enter @ at the Of prompt.
This operation extracts the X and Y coordinate values from the first point.
4Enter 0 to specify the Z value.
The X and Y values extracted from the first point are combined with a
new Z value (0) to finish the definition of the second point.
5Press Enter to end the command.
To create wireframe geometry by extracting edges
1Click Home tab ➤ Solid Editing panel ➤ Extract Edges.
2Select one or more of the following objects:
■3D solids
■Surfaces
■Meshes
■Regions
■Edges (on 3D solids, surfaces, or meshes)
■Faces (on 3D solids or meshes)
3Press Enter.
Objects such as lines, arcs, splines, or 3D polylines are created along the
edges of the selected objects or subobjects.
Quick Reference
Commands
UCS
Manages user coordinate systems.
XEDGES
Creates wireframe geometry from the edges of a 3D solid, surface, mesh,
region, or subobject.
1086 | Chapter 24 Create 3D Models
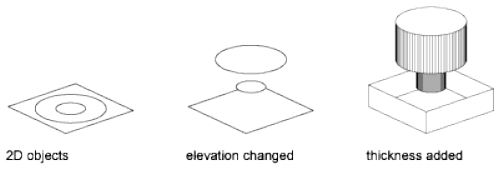
System Variables
ELEVATION
Stores the current elevation of new objects relative to the current UCS.
FACETRES
Adjusts the smoothness of shaded and rendered objects and objects with
hidden lines removed.
ISOLINES
Specifies the number of contour lines per surface on objects.
Add 3D Thickness to Objects
Use the thickness property to give objects a 3D appearance.
The 3D thickness of an object is the distance that object is extended, or
thickened, above or below its location in space. Positive thickness extrudes
upward in the positive Z direction; negative thickness extrudes downward
(negative Z). Zero (0) thickness means that there is no 3D thickening of the
object.
The orientation of the UCS when the object was created determines the Z
direction. Objects with a non-zero thickness can be shaded and can hide other
objects behind them.
The thickness property changes the appearance of the following types of
objects:
■2D solids
■Arcs
■Circles
■Lines
Add 3D Thickness to Objects | 1087

■Polylines (including spline-fit polylines, rectangles, polygons, boundaries,
and donuts)
■Text (only if created as a single-line text object using an SHX font)
■Traces
■Points
Modifying the thickness property of other types of objects does not affect
their appearance.
You can set the default thickness property for new objects you create by setting
the THICKNESS system variable. For existing objects, change the thickness
property on the Properties palette.
The 3D thickness is applied uniformly to an object; a single object cannot
have different thicknesses.
You might need to change the 3D viewpoint to see the effect of thickness on
an object.
NOTE Although the THICKNESS variable sets an extruded thickness for new 2D
objects, those objects continue to be 2D objects. The THICKEN command adds
volume to a surface object, converting it to a 3D solid.
See also:
■Create Solids and Surfaces from Objects
To set the 3D thickness of new objects
1Click Format menu ➤ Thickness.
2At the Command prompt, enter the value for the thickness distance.
When new objects are created, they have the specified 3D thickness.
To change the 3D thickness of existing objects
1Select the objects whose 3D thickness you want to change.
2Right-click one of the objects. Click Properties.
3In the Properties palette, select Thickness and enter a new value.
The selected objects change to display the specified 3D thickness.
1088 | Chapter 24 Create 3D Models
Quick Reference
Commands
ELEV
Sets elevation and extrusion thickness of new objects.
PROPERTIES
Controls properties of existing objects.
THICKEN
Converts a surface into a 3D solid with a specified thickness.
System Variables
BACKZ
Stores the back clipping plane offset from the target plane for the current
viewport, in drawing units.
FRONTZ
Stores the front clipping plane offset from the target plane for the current
viewport, in drawing units.
THICKNESS
Sets the current 3D thickness.
VIEWMODE
Stores the View mode for the current viewport.
Add 3D Thickness to Objects | 1089
1090
Modify 3D Models
Change the appearance of a 3D model by manipulating both the object and its components.
Overview of Modifying 3D Objects
3D modeling tools range from entering precise measurements in the Properties
palette, to more free-form methods such as grip and gizmo editing. Some
methods are specific to 3D solids, surfaces or meshes. Other methods are shared.
Convert to Other Object Types
In many cases, you can convert from one object type to another to take
advantage of specific editing capabilities.
For example you can convert selected surfaces, solids, and legacy mesh types
to mesh objects so that you can take advantage of smoothing and modeling
capabilities.
25
1091
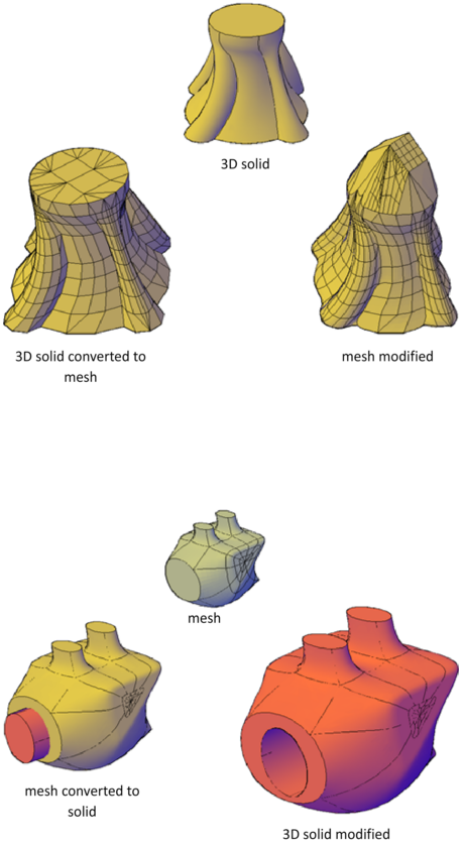
Similarly, you can convert mesh to 3D solids and surfaces to accomplish some
composite object modeling tasks that are available only for those objects.
Conversion is often offered as a choice when you start activities that are
available only for solids and surfaces.
View Your Model from All Angles
When you work with any 3D object, you can easily make changes that are
not accurately reflected in the current view. To ensure that your modifications
1092 | Chapter 25 Modify 3D Models
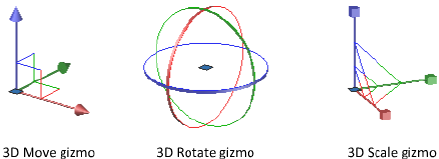
conform to your expectations, make sure you understand and use the
following:
■Manipulate the 3D workplane (UCS). To understand how your model is
projected in 3D space, learn how to use the X, Y, and Z axes. See Specify
Workplanes in 3D (UCS) on page 566.
■Rotate the view to display the model from different viewpoints. Several
navigation tools, including 3D Orbit and the ViewCube, are available to
help you rotate around your workspace. See Use Viewing Tools on page
285.
■Display multiple viewports. Set up two or more viewports with different
viewing angles and visual styles. When you make a change in one viewport,
you can see its impact from several viewpoints at the same time. See Display
Multiple Views in Model Space on page 373.
Use Gizmos to Modify Objects
Use gizmos to move, rotate, or scale objects and subobjects in a 3D view.
Overview of Using Gizmos
Gizmos help you move, rotate, or scale a set of objects along a 3D axis or
plane.
There are three types of gizmos:
■3D Move gizmo. Relocates selected objects along an axis or plane.
■3D Rotate gizmo. Rotates selected objects about a specified axis.
■3D Scale gizmo. Scales selected objects along a specified plane or axis, or
uniformly along all 3 axes.
Use Gizmos to Modify Objects | 1093
By default, gizmos are displayed automatically when you select an object or
subobject in a view that has a 3D visual style. Because they constrain
modifications along specific planes or axes, gizmos help ensure more
predictable results.
You can specify which gizmos are displayed when an object is selected, or you
can suppress their display.
Quick Reference
Commands
3DMOVE
In a 3D view, displays the 3D Move gizmo to aid in moving 3D objects a
specified distance in a specified direction.
3DROTATE
In a 3D view, displays the 3D Rotate gizmo to aid in revolving 3D objects
around a base point.
3DSCALE
In a 3D view, displays the 3D Scale gizmo to aid in resizing 3D objects.
System Variables
DEFAULTGIZMO
Sets the 3D Move, 3D Rotate, or 3D Scale gizmo as the default during
subobject selection.
GRIPSUBOBJMODE
Controls whether grips are automatically made hot when subobjects are
selected.
GTAUTO
Controls whether 3D gizmos are automatically displayed when you select
objects before you start a command in a viewport with a 3D visual style.
GTDEFAULT
Controls whether the 3D Move, 3D Rotate, or 3D Scale operation starts
automatically when you start the MOVE, ROTATE, or SCALE command in
a viewport with a 3D visual style.
1094 | Chapter 25 Modify 3D Models
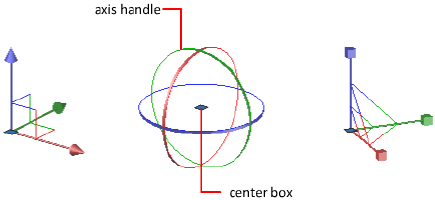
GTLOCATION
Controls the initial location of the 3D Move, 3D Rotate, or 3D Scale gizmo
when you select objects before you start a command in a viewport with a
3D visual style.
Use the Gizmos
Gizmos help move, rotate, and scale 3D objects and subobjects.
Display the Gizmos
Gizmos are available only in 3D views that are set to use a 3D visual style such
as 3D Hidden. You can set the gizmo to be displayed automatically when you
select a 3D object or subobject. Gizmos are also displayed during the 3DMOVE,
3DROTATE, and 3DSCALE commands.
If the visual style is set to 2D Wireframe, entering 3DMOVE, 3DROTATE, or
3DSCALE automatically converts the visual style to 3D Wireframe.
By default, the gizmo is initially placed in the center of the selection set.
However, you can relocate it anywhere in 3D space. The center box (or base
grip) of the gizmo sets the base point for the modification. This behavior is
equivalent to temporarily changing the position of the UCS as you move or
rotate the selected objects. The axis handles on the gizmo constrain the
movement or rotation to an axis or plane.
For best results, use object snaps to locate the grip center box.
Switch Between the Gizmos
Whenever you select an object in a 3D view, the default gizmo is displayed.
You can select a different default on the ribbon, or change the value of the
the DEFAULTGIZMO system variable. You can also suppress the display of
gizmos when objects are selected.
Use the Gizmos | 1095
After the gizmo is active, you can also switch to a different type of gizmo. The
switching behavior differs, depending on when you select the objects:
■Select objects first. If a gizmo operation is in progress, you can press the
Spacebar repeatedly to cycle through the other gizmo types. When you
switch gizmos this way, the gizmo activity is constrained to the originally
selected axis or plane.
During a gizmo operation, you can also select a different gizmo type on
the shortcut menu.
■Run the command first. When you start the 3D Move, 3D Rotate, or 3D
Scale operation before selecting objects, the gizmo is placed at the center
of the selection set. Use the Relocate Gizmo option on the shortcut menu
to relocate the gizmo anywhere in 3D space. You can also choose a different
type of gizmo on the shortcut menu.
Change the Gizmo Settings
The following settings affect the display of gizmos:
■Default gizmo. The DEFAULTGIZMO system variable specifies which gizmo
is displayed by default when an object is selected in a view with a 3D visual
style. You can turn off display of the gizmo. This setting is also available
on the ribbon.
■Default location. The GTLOCATION system variable sets the default
location of the gizmo. The gizmo can be displayed at the center of the
selection set (default), or it can be positioned at the 0,0,0 coordinates of
the current UCS.
■Automatic display. The GTAUTO system variable sets whether gizmos are
displayed automatically whenever you select objects in a 3D view that is
set to a 3D visual style (default). If you turn off this system variable, the
grips are not displayed until the gizmos are active.
■Conversion of move, rotate, and scale operations from 2D to 3D. Turn on
the GTDEFAULT system variable to start the 3DMOVE, 3DROTATE, or
3DSCALE command automatically when the MOVE, ROTATE, or SCALE
command is started in a 3D view. This system variable is turned off by
default.
■Active status of subobject grips. If you select a subobject on page 2183, the
GRIPSUBOBJMODE system variable sets whether the subobject grips are
active immediately. Setting subobject grips to be active upon selection
helps you modify groups of mesh subobjects without selecting them again.
1096 | Chapter 25 Modify 3D Models

To specify which 3D gizmo is displayed by default when an object is selected
■Click Home tab ➤ Subobject panel ➤ Move Gizmo, Rotate Gizmo, or
Scale Gizmo.
To suppress the display of the 3D gizmo when an object is selected
■Click Home tab ➤ Subobject panel ➤ No Gizmo.
To set the default location for gizmos
1At the Command prompt, enter gtlocation.
2Do one of the following:
■Enter 1 to set the location at the geometric center of the selection set.
■Enter 0 to set the location to overlap the UCS icon.
3Press Enter.
To relocate a gizmo
1Right-click the center box (base grip) of the gizmo. Click Relocate Gizmo.
2Click in the drawing area to specify a new location.
To change the type of gizmo while moving, rotating, or scaling objects
1Select the 3D objects that you want to move, rotate, or scale.
■To modify the entire object, select the object.
■To modify a subobject (face, edge, or vertex), press Ctrl+click the
subobject. (You can limit the selection set by specifying a subobject
selection filter on the shortcut menu.)
2Hover the cursor over an axis handle on the gizmo until it turns yellow
and the axis vector displays. Then click the axis handle.
3Press the Spacebar to cycle through the gizmo types until the correct
gizmo is displayed.
When you change gizmos this way, the movement remains constrained
to the selected axis.
Use the Gizmos | 1097

NOTE You cannot use the Spacebar to change the type of gizmo when the
3DMOVE, 3DROTATE, or 3DSCALE command is active.
Quick Reference
Commands
3DMOVE
In a 3D view, displays the 3D Move gizmo to aid in moving 3D objects a
specified distance in a specified direction.
3DROTATE
In a 3D view, displays the 3D Rotate gizmo to aid in revolving 3D objects
around a base point.
3DSCALE
In a 3D view, displays the 3D Scale gizmo to aid in resizing 3D objects.
System Variables
DEFAULTGIZMO
Sets the 3D Move, 3D Rotate, or 3D Scale gizmo as the default during
subobject selection.
GRIPSUBOBJMODE
Controls whether grips are automatically made hot when subobjects are
selected.
GTAUTO
Controls whether 3D gizmos are automatically displayed when you select
objects before you start a command in a viewport with a 3D visual style.
GTDEFAULT
Controls whether the 3D Move, 3D Rotate, or 3D Scale operation starts
automatically when you start the MOVE, ROTATE, or SCALE command in
a viewport with a 3D visual style.
GTLOCATION
Controls the initial location of the 3D Move, 3D Rotate, or 3D Scale gizmo
when you select objects before you start a command in a viewport with a
3D visual style.
1098 | Chapter 25 Modify 3D Models
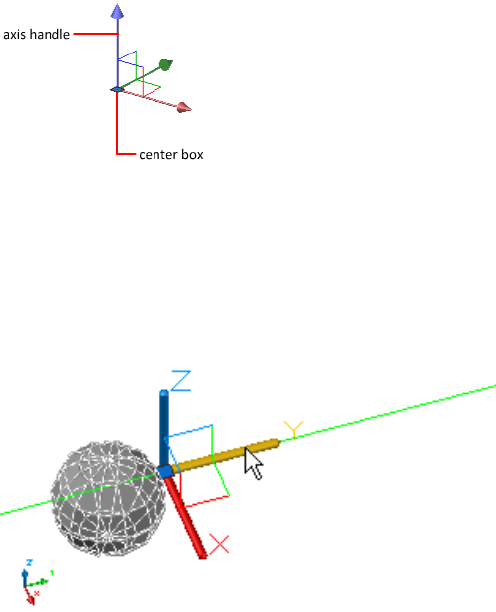
Move 3D Objects
Move a selection set of objects and subobjects freely or constrain the movement
to an axis or plane.
To move 3D objects and subobjects, click and drag the gizmo anywhere in 3D
space. This location (indicated by the center box [or base grip] of the gizmo)
sets the base point for the movement and temporarily changes the position
of the UCS while you move the selected objects.
To move the objects freely, drag outside the gizmo or specify the axis or plane
to which you will constrain the movement.
Constrain the Movement to an Axis
You can use the Move gizmo to constrain the movement to an axis. As the
cursor hovers over an axis handle on the gizmo, a vector aligned with the axis
is displayed, and the specified axis turns yellow. Click the axis handle.
As you drag the cursor, movement of the selected objects and subobjects is
constrained to the highlighted axis. You can click or enter a value to specify
the distance of the move from the base point. If you enter a value, the
movement direction of the object follows the initial direction of the cursor
movement.
Move 3D Objects | 1099
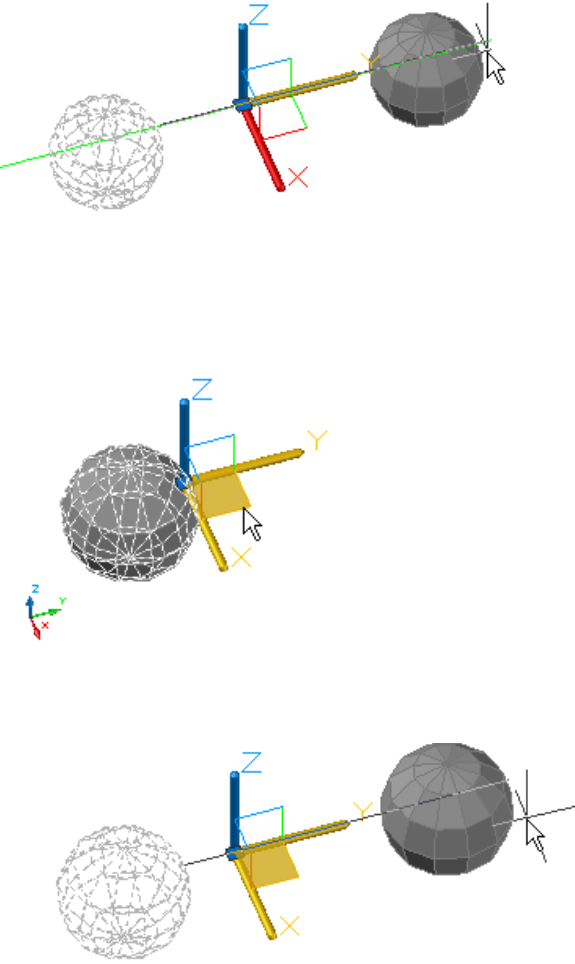
Constrain the Movement to a Plane
You can use the Move gizmo to constrain the movement to a plane. Each
plane is identified by a rectangle that extends from the respective axis handles.
You can specify the plane of movement by moving the cursor over the
rectangle. When the rectangle turns yellow, click it.
As you drag the cursor, the selected objects and subobjects move only along
the highlighted plane. Click or enter a value to specify the distance of the
move from the base point.
1100 | Chapter 25 Modify 3D Models
To move objects in 3D space along a specified axis
1Click Home tab ➤ Modify panel ➤ Move Gizmo.
2Select the objects and subobjects you want to move using the following
methods:
■Press and hold Ctrl to select subobjects (faces, edges, and vertices).
■Release Ctrl to select entire objects.
NOTE If a subobject filter is active, you do not need to press Ctrl to select a
subobject. To select the entire object, turn off the filter.
3When you have selected all objects, press Enter.
The Move gizmo is displayed at the center of the selected objects.
4Move the cursor over an axis handle on the gizmo until it turns yellow
and the vector is displayed. Then click the axis handle.
5Click another location or enter a value to specify the distance of the
move.
To move objects in 3D space constrained to a specified plane
1Click Home tab ➤ Modify panel ➤ Move Gizmo.
2Select the objects and subobjects you want to move using the following
methods:
■Press and hold Ctrl to select subobjects (faces, edges, and vertices).
■Release Ctrl to select entire objects.
NOTE If a subobject filter is active, you do not need to press Ctrl to select a
subobject. To select the entire object, turn off the filter.
3When you have selected all objects, press Enter.
The Move gizmo is displayed at the center of the selected objects.
4Move the cursor over the planar rectangle that intersects the axis handles
that define the plane of constraint. When the rectangle turns yellow,
click it.
Move 3D Objects | 1101
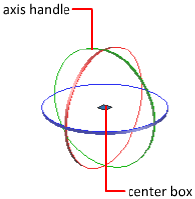
5Click a different location or enter a value to specify the distance of the
move.
Quick Reference
Commands
3DMOVE
In a 3D view, displays the 3D Move gizmo to aid in moving 3D objects a
specified distance in a specified direction.
System Variables
DEFAULTGIZMO
Sets the 3D Move, 3D Rotate, or 3D Scale gizmo as the default during
subobject selection.
Rotate 3D Objects
Constrain the rotation of 3D objects and subobjects to an axis.
After you select the objects and subobjects that you want to rotate, the gizmo
is located at the center of the selection set. This location is indicated by the
center box (or base grip) of the gizmo. It sets the base point for the movement
and temporarily changes the position of the UCS while you rotate the selected
objects.
You then rotate the objects freely by dragging outside the gizmo. You can also
specify an axis about which to constrain the rotation.
If you want to realign the center of rotation, you can relocate the gizmo by
using the Relocate Gizmo option on the shortcut menu.
1102 | Chapter 25 Modify 3D Models
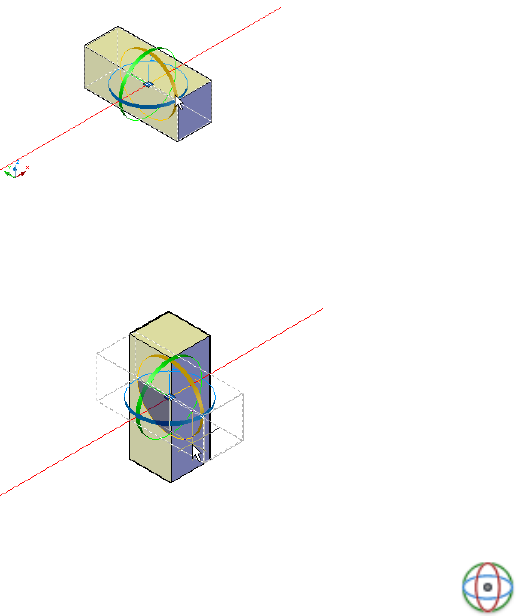
Constrain the Rotation to an Axis
You can constrain the rotation to a specified axis. As you move the cursor
over the rotation paths on the 3D rotate gizmo, a vector line representing the
axis of rotation is displayed. Specify an axis of rotation by clicking the rotation
path when it turns yellow.
When you drag the cursor, the selected objects and subobjects rotate about
the base point along the specified axis. The gizmo displays the degree of
rotation from the original position of the object as the object moves. You can
click or enter a value to specify the angle of the rotation.
To rotate objects in 3D space along a specified axis
1Click Home tab ➤ Modify panel ➤ Rotate Gizmo.
2Select the objects and subobjects you want to rotate using the following
methods:
■Press and hold Ctrl to select subobjects (faces, edges, and vertices).
■Release Ctrl to select entire objects.
3When you have selected all objects, press Enter.
The rotate gizmo is displayed attached to the cursor.
4Click to place the rotate gizmo, specifying the base point for the move.
Rotate 3D Objects | 1103
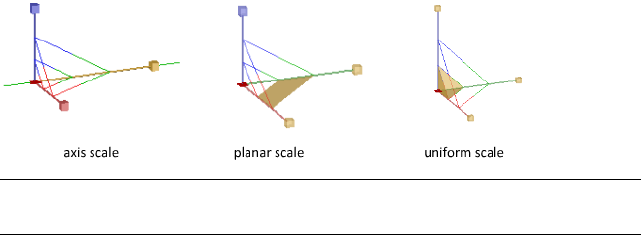
5Hover the cursor over an axis path on the gizmo until it turns yellow and
the vector that represents the axis of rotation is displayed. Click the path.
6Click or enter a value to specify the angle of the rotation.
Quick Reference
Commands
3DROTATE
In a 3D view, displays the 3D Rotate gizmo to aid in revolving 3D objects
around a base point.
System Variables
DEFAULTGIZMO
Sets the 3D Move, 3D Rotate, or 3D Scale gizmo as the default during
subobject selection.
Scale 3D Objects
Change the size of 3D objects uniformly or along a specified axis or plane.
After you select the objects and subobjects to scale, constrain the object scaling
by clicking the gizmo axis, plane, or the portion of the gizmo between all
three axes.
NOTE Non-uniform scaling (along an axis or a plane) is only available for meshes,
it is not available for solids and surfaces.
Scale a 3D Object Along an Axis
Constrain mesh object scaling to a specified axis. As you move the cursor over
the axes on the 3D Scale gizmo, a vector line representing the axis of scale is
displayed. Specify an axis of scale by clicking the axis when it turns yellow.
1104 | Chapter 25 Modify 3D Models
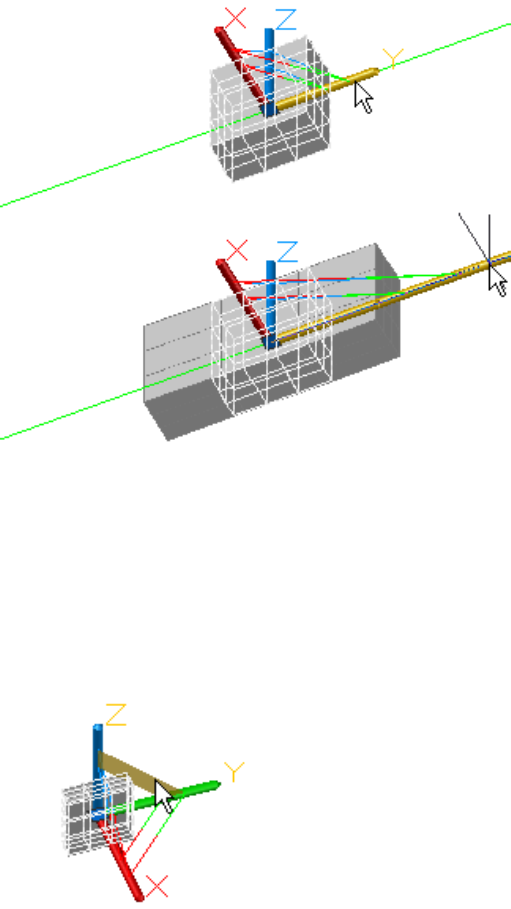
When you drag the cursor, the selected objects and subobjects are resized
along the specified axis. Click or enter a value to specify the scale from the
selected base point.
Scale a 3D Object Along a Plane
Constrain the mesh object scaling to a specified plane. Each plane is identified
by a bar that extends from the outer ends of the respective axis handles. Specify
the plane of scale by moving the cursor over one of the bars. When the bar
turns yellow, click it.
Scale 3D Objects | 1105
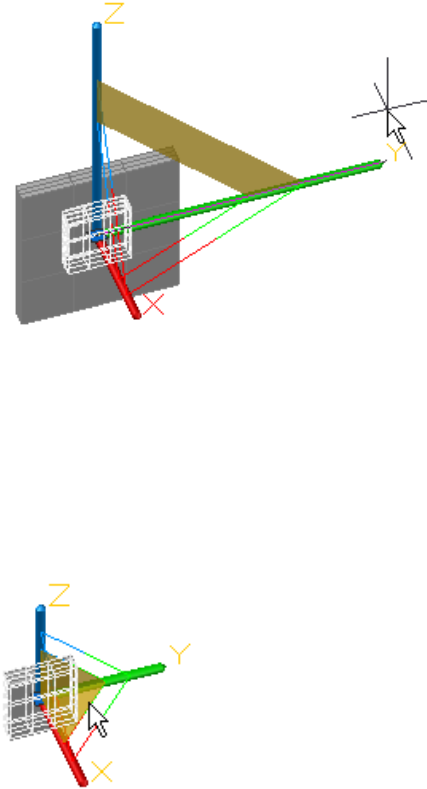
As you drag the cursor, the selected objects and subobjects are scaled only
along the highlighted plane. Click or enter a value to specify the scale from
the selected base point.
Scale a 3D Object Uniformly
Scale solid, surface, and mesh objects uniformly along all axes. As you move
the cursor toward the center point of the gizmo, a highlighted triangular area
indicates that you can click to scale the selected objects and subobjects along
all three axes.
1106 | Chapter 25 Modify 3D Models
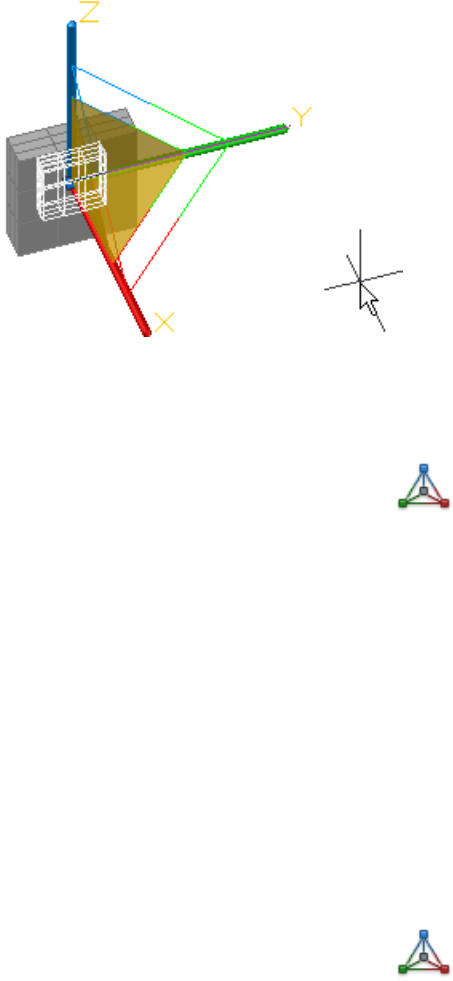
As you drag the cursor, the selected objects and subobjects are scaled uniformly.
Click or enter a value to specify the scale from the selected base point.
To scale a 3D object along a specified axis
1Click Home tab ➤ Modify ➤ Scale Gizmo.
2Select the objects and subobjects you want to scale using the following
methods:
■Press and hold Ctrl to select subobjects (faces, edges, and vertices).
■Release Ctrl to select entire objects.
3When you have selected all objects, press Enter.
The Scale gizmo is displayed at the center of the selected object or objects.
4Specify a base point for the scale.
5Hover the cursor over one of the axes of the gizmo until it turns yellow.
Click the yellow axis.
6Click or enter a value to specify the scale of the selected object.
To scale a 3D object along a specified plane
1Click Home tab ➤ Modify ➤ Scale Gizmo.
Scale 3D Objects | 1107

2Select the objects and subobjects you want to scale using the following
methods:
■Press and hold Ctrl to select subobjects (faces, edges, and vertices).
■Release Ctrl to select entire objects.
3When you have selected all objects, press Enter.
The Scale gizmo is displayed at the center of the selected object or objects.
4Specify a base point for the scale.
5Hover the cursor over one of the bars found between each of the axes of
the gizmo until it turns yellow. Click the yellow bar.
6Click or enter a value to specify the scale of the selected object.
To scale a 3D object uniformly
1Click Home tab ➤ Modify ➤ Scale Gizmo.
2Select the objects and subobjects you want to scale using the following
methods:
■Press and hold Ctrl to select subobjects (faces, edges, and vertices).
■Release Ctrl to select entire objects.
3When you have selected all objects, press Enter.
The Scale gizmo is displayed at the center of the selected object or objects.
4Specify a base point for the scale.
5Hover the cursor over the triangular area closest to the center point of
the gizmo until it turns yellow. Click the yellow area.
6Click or enter a value to specify the scale of the selected object.
Quick Reference
Commands
3DSCALE
In a 3D view, displays the 3D Scale gizmo to aid in resizing 3D objects.
1108 | Chapter 25 Modify 3D Models
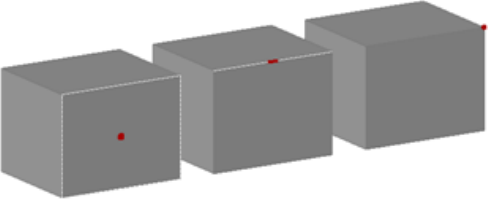
System Variables
DEFAULTGIZMO
Sets the 3D Move, 3D Rotate, or 3D Scale gizmo as the default during
subobject selection.
Use Grips to Modify Solids and Surfaces
Use grips to change the shape and size of solids and surfaces.
Use 3D Subobject Grips
Select faces, edges, and vertices on 3D objects.
A subobject is a face, edge or vertex of a solid, surface, or mesh object.
Select Subobjects
To select a face, edge, or vertex of a 3D object, press Ctrl as you select the
object. (If you have set a subobject filter, you do not need to press Ctrl first.)
Selected subobjects display different types of grips, depending on the subobject
type.
You can select one or more subobjects on any number of 3D objects. The
selection set can include more than one type of subobject. Press Ctrl to select
subobjects at the selection prompts of the MOVE, ROTATE, SCALE, and ERASE
commands.
Use Grips to Modify Solids and Surfaces | 1109
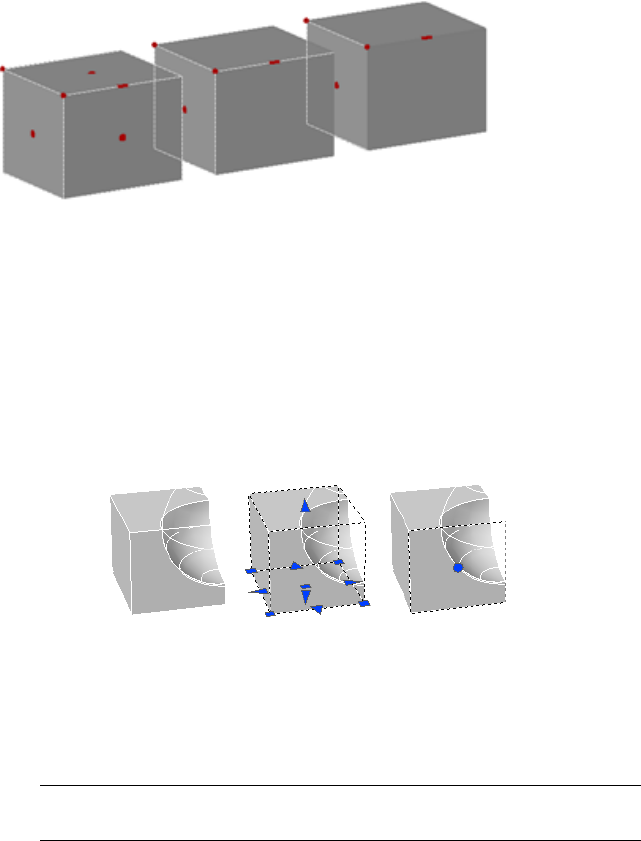
You can remove an item from the selection set by pressing the Shift key and
selecting it again.
Select Subobjects on Composite 3D Solids
Press and hold Ctrl to select faces, edges, and vertices on composite solids. If
the History property of the composite solid is set to Record, the first “pick”
might select the history subobject. (The history subobject is the portion of the
original object that was removed during the union, subtract, or intersect
operation.) Continue to hold down Ctrl and pick again to select a face, edge,
or vertex on the original form.
If you set a subobject selection filter on page 1112, you can select the face, edge,
or vertex by clicking it once.
To select one or more faces, edges, or vertices on a 3D object
1Press Ctrl+click a face, edge, or vertex.
NOTE If a subobject selection filter is active, you do not need to press Ctrl
before clicking a face, edge, or vertex.
2Repeat step 1 until all subobjects are selected.
To remove a subobject from a selection set
■Press and hold Ctrl+Shift. Click a selected face, edge, or vertex.
The grip, if displayed, changes from red to blue.
1110 | Chapter 25 Modify 3D Models

NOTE If a subobject selection filter is active, you do not need to press Ctrl
before clicking a face, edge, or vertex.
To select a face, edge, or vertex on the history form of a composite solid
1Click Home tab ➤ Subobject panel ➤ Edge, Vertex, or Face.
2On the history form, click a face, edge, or vertex.
NOTE If the Show History property for the history subobject is not turned
on, you can display the history by pressing Ctrl as you move the cursor over
the object.
Quick Reference
Commands
DSETTINGS
Sets grid and snap, polar and object snap tracking, object snap modes,
Dynamic Input, and Quick Properties.
ERASE
Removes objects from a drawing.
MOVE
Moves objects a specified distance in a specified direction.
ROTATE
Rotates objects around a base point.
SCALE
Enlarges or reduces selected objects, keeping the proportions of the object
the same after scaling.
SELECT
Places selected objects in the Previous selection set.
SOLIDEDIT
Edits faces and edges of 3D solid objects.
Use 3D Subobject Grips | 1111
System Variables
GRIPHOVER
Controls the fill color of an unselected grip when the cursor pauses over it.
GRIPOBJLIMIT
Suppresses the display of grips when the selection set includes more than
the specified number of objects.
GRIPS
Controls the display of grips on selected objects.
GRIPSIZE
Sets the size of the grip box in pixels.
GRIPSUBOBJMODE
Controls whether grips are automatically made hot when subobjects are
selected.
LEGACYCTRLPICK
Specifies the keys for selection cycling and the behavior for Ctrl+click.
SUBOBJSELECTIONMODE
Filters whether faces, edges, vertices or solid history subobjects are highlighted
when you roll over them.
Cycle Through and Filter Subobjects
Filter and select faces, edges, and vertices on 3D objects.
A subobject is a face, edge or vertex of a solid, surface, or mesh object.
Cycle Through Multiple Subobjects
In 3D views, some objects or subobjects might be hidden behind others. You
can press Ctrl+Spacebar to cycle through the hidden subobjects until the object
you want to select is highlighted.
For example, when you select faces on a box, the face in the foreground is
detected first. To select a hidden face, press the Spacebar (with Ctrl still
pressed). Release the Spacebar and click to select the face.
1112 | Chapter 25 Modify 3D Models
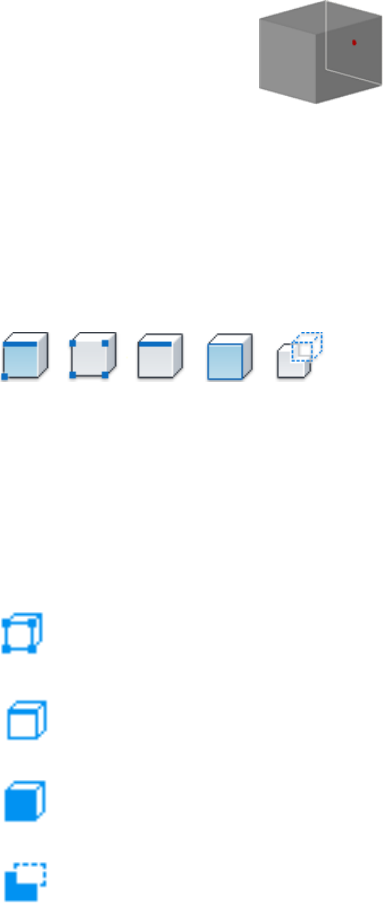
For best results, make sure that Selection Cycling is turned on in the Selection
Cycling Tab (Draft Settings Dialog Box). Or cycle through hidden subobjects
by pressing Ctrl+Spacebar as you click until the subobject is selected.
Turn on the Subobject Selection Filter
Selecting a specific type of subobject can be difficult on complex objects, such
as meshes. You can limit the selection to a face, edge, vertex, or history
subobject by setting a subobject selection filter.
When a subobject selection filter is on, you do not need to press Ctrl to select
the face, edge, or vertex of a 3D model. To select the entire object, however,
you need to turn off the filter.
Stored in the SUBOBJSELECTIONMODEsystem variable, this filter can be
changed from the shortcut menu or the ribbon.
When a subobject filter is turned on, the following icons are displayed near
the cursor:
Shift + F2Vertex filtering is on
Shift + F3Edge filtering is on
Shift + F4Face filtering is on
Shift + F5History subobject filtering is on
Cycle Through and Filter Subobjects | 1113

Shift + F1Subobject filtering is off
To cycle through and select subobjects that are overlapping
1Press and hold Ctrl as you press the Spacebar to cycle through the
subobjects that are both visible and hidden.
2If the subobject that you want to select is not highlighted during the
cycle, move the cursor and repeat.
3When the subobject is highlighted, release the Spacebar and click.
The subobject is selected.
To limit selection to a specific type of subobject
1Click Home tab ➤ Subobject panel ➤ No Filter, Edge, Vertex, Face, or
Solid History.
2Click a 3D solid or mesh subobject.
Only the subobject type that you specified can be selected.
Quick Reference
Commands
ERASE
Removes objects from a drawing.
MOVE
Moves objects a specified distance in a specified direction.
ROTATE
Rotates objects around a base point.
SCALE
Enlarges or reduces selected objects, keeping the proportions of the object
the same after scaling.
SELECT
Places selected objects in the Previous selection set.
1114 | Chapter 25 Modify 3D Models

SOLIDEDIT
Edits faces and edges of 3D solid objects.
System Variables
GRIPHOVER
Controls the fill color of an unselected grip when the cursor pauses over it.
GRIPOBJLIMIT
Suppresses the display of grips when the selection set includes more than
the specified number of objects.
GRIPS
Controls the display of grips on selected objects.
GRIPSIZE
Sets the size of the grip box in pixels.
GRIPSUBOBJMODE
Controls whether grips are automatically made hot when subobjects are
selected.
LEGACYCTRLPICK
Specifies the keys for selection cycling and the behavior for Ctrl+click.
SUBOBJSELECTIONMODE
Filters whether faces, edges, vertices or solid history subobjects are highlighted
when you roll over them.
Use Grips to Edit 3D Solids and Surfaces
Use grips to change the size and shape of some individual solids and surfaces.
The method you use to manipulate the 3D solid or surface depends on the
type of object and the method used to create it.
NOTE For mesh objects, only the center grip is displayed. However you can edit
mesh objects with the 3D Move, Rotate, or Scale gizmos.
Primitive Solid Forms and Polysolids
You can drag grips to change the shape and size of primitive solids and
polysolids. For example, you can change the height and base radius of a cone
Use Grips to Edit 3D Solids and Surfaces | 1115
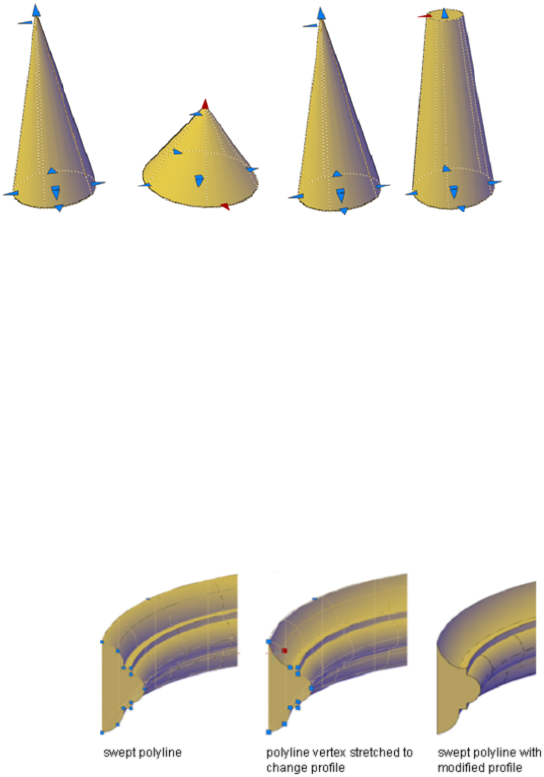
without losing the overall cone shape. Drag the top radius grips to transform
the cone to a flat-topped, frustum cone.
Extruded Solids and Surfaces
You can convert 2D objects to solids and surfaces with the EXTRUDE
command. When selected, extruded solids and surfaces display grips on their
profiles. A profile is the original outline that defines the shape of the extruded
solid or surface. Drag profile grips to modify the overall shape of the object.
If the extrusion was created along a sweep path, the path can be manipulated
with grips. If a path was not used, you can modify the height of the object
using a grip at the top of the extruded solid or surface.
Swept Solids and Surfaces
Swept solids and surfaces display grips on the swept profile as well as on the
sweep path. You can drag these grips to modify the solid or surface.
When you click and drag a grip on the profile, the changes are constrained
to the plane of the profile curve.
1116 | Chapter 25 Modify 3D Models
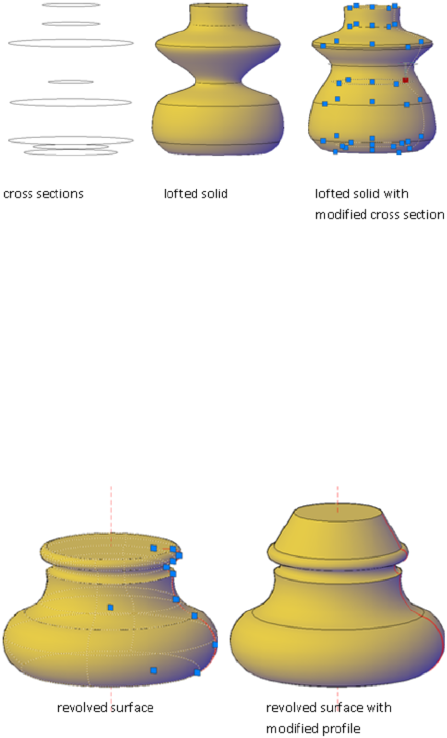
Lofted Solids and Surfaces
Depending on how a lofted solid or surface was created, the solid or surface
displays grips on the following, defining lines or curves:
■Cross section
■Path
Drag grips on any of the defining lines or curves to modify the shape. If the
lofted object contains a path, you can only edit the portion of the path that
is between the first and last cross sections.
You cannot use grips to modify lofted solids or surfaces that are created with
guide curves.
Revolved Solids and Surfaces
Revolved solids and surfaces display grips on the revolved profile at the start
of the revolved solid or surface. You can use these grips to modify the profile
of the solid of surface.
A grip is also displayed at the axis of revolution endpoint. You can relocate
the axis of revolution by dragging the grip to another location.
Use Grips to Edit 3D Solids and Surfaces | 1117
See also:
■Create Solids on page 983
■Create a Solid Cone on page 990
To relocate the axis of revolution for a revolved solid or surface
1In a drawing, select a revolved solid or surface.
2Select the grip on the axis of revolution.
3Click in another location to relocate the axis of revolution.
Quick Reference
Commands
EXTRUDE
Creates a 3D solid or surface by extending the dimensions of an object.
SELECT
Places selected objects in the Previous selection set.
System Variables
GRIPHOVER
Controls the fill color of an unselected grip when the cursor pauses over it.
GRIPOBJLIMIT
Suppresses the display of grips when the selection set includes more than
the specified number of objects.
GRIPS
Controls the display of grips on selected objects.
GRIPSIZE
Sets the size of the grip box in pixels.
GRIPSUBOBJMODE
Controls whether grips are automatically made hot when subobjects are
selected.
1118 | Chapter 25 Modify 3D Models
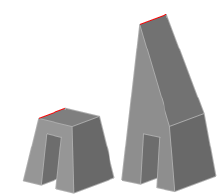
Modify 3D Subobjects
Modify the shape of a 3D solid or surface by editing its subobjects (faces, edges,
and vertices).
Move, Rotate, and Scale 3D Subobjects
Move, rotate, and scale individual subobjects on 3D solids and surfaces.
Use the same methods to modify a face, edge, or vertex that you use to modify
the entire object:
■Drag grips
■Use gizmos (3DMOVE, 3DROTATE, and 3DSCALE)
■Enter object editing commands (MOVE, ROTATE, and SCALE)
When you move, rotate, or scale a subobject, the subobject is modified in a
way that maintains the integrity of the 3D solid or surface. For example, when
you drag an edge to move it, the adjacent faces are adjusted so that they remain
adjacent to the edge.
Several results are possible when you modify a solid or surface. When you
move, rotate, or scale subobjects, you can press Ctrl one or more times as you
drag to cycle through modification options. The following illustration shows
the modification options for moving a face.
Modify 3D Subobjects | 1119
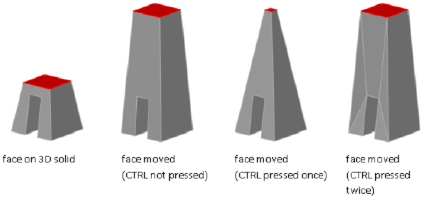
Move, Rotate, and Scale Subobjects on Composite Solids
When you modify composite solids, the effect of the edits depends on the
current setting of the History property.
■To modify subobjects of each history component separately, the History
property must be set to Record.
■To modify subobjects of the combined composite solid as a whole, the
History property must be set to None.
Rules and Limitations When Moving, Rotating, and Scaling Subobjects
You can only move, rotate, and scale subobjects on 3D solids if the operation
maintains the integrity of the solid. The following rules and limitations apply
to moving, rotating, and scaling subobjects:
■When you use grips to modify subobjects, grips are not displayed on the
subobjects that cannot be moved, rotated, or scaled.
■In most cases, you can move, rotate, and scale both planar and non-planar
faces.
■You can only modify an edge that is a straight line and that has at least
one planar adjacent face. The planes of the adjacent planar faces are
adjusted to contain the modified edge.
■You cannot move, rotate, or scale edges (or their vertices) that are imprinted
inside faces.
■You can only modify a vertex if it has at least one planar adjacent face.
The planes of the adjacent planar faces are adjusted to contain the modified
vertex.
■When you drag a subobject, the final result might be different than the
preview displayed during the modification. This result occurs when the
solid geometry is adjusted in order to maintain its topology. In some cases,
1120 | Chapter 25 Modify 3D Models
the modification is not possible because it changes the topology of the
solid too severely.
■If the modification causes spline surfaces to be extended, the operation is
often unsuccessful.
■You cannot move, rotate, or scale non-manifold edges (edges that are
shared by more than two faces) or non-manifold vertices. Also, if some
non-manifold edges or vertices are present near faces, edges, and vertices
that you modify, the operation might not be possible.
See also:
■Modify Mesh Objects on page 1167
Quick Reference
Commands
3DMOVE
In a 3D view, displays the 3D Move gizmo to aid in moving 3D objects a
specified distance in a specified direction.
3DROTATE
In a 3D view, displays the 3D Rotate gizmo to aid in revolving 3D objects
around a base point.
3DSCALE
In a 3D view, displays the 3D Scale gizmo to aid in resizing 3D objects.
MOVE
Moves objects a specified distance in a specified direction.
ROTATE
Rotates objects around a base point.
SCALE
Enlarges or reduces selected objects, keeping the proportions of the object
the same after scaling.
Move, Rotate, and Scale 3D Subobjects | 1121
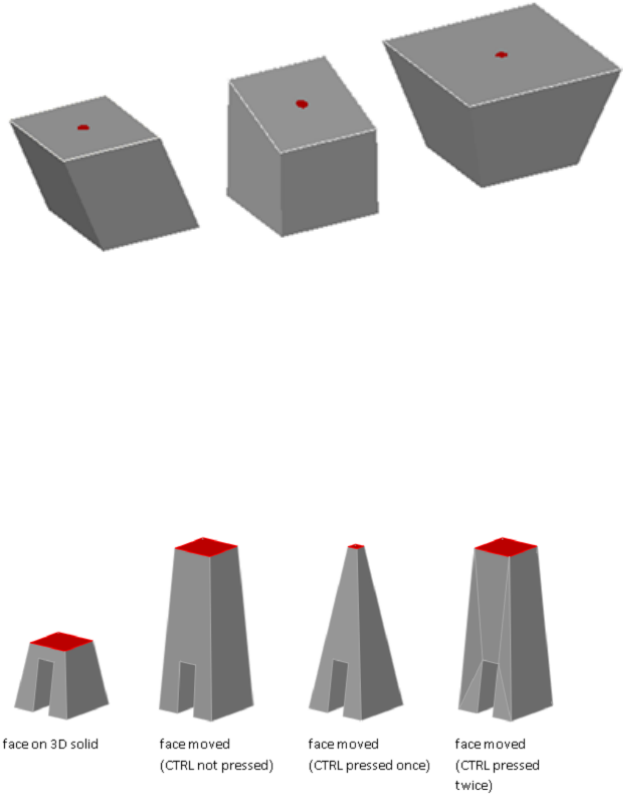
Modify Faces on 3D Objects
Modify individual faces on 3D objects using a variety of methods.
Move, Rotate, and Scale Faces on 3D Solids and Surfaces
Modify the location, rotation, and size of faces on a 3D solids and surfaces.
cube with top face moved, rotated, and scaled
Use the MOVE, ROTATE, and SCALE commands to modify faces just as you
would with any other object. Press Ctrl+click to select a face on a solid.
If you move, rotate, or scale a face on a 3D solid primitive, the solid primitive’s
history is removed. The solid is no longer a true primitive and cannot be
manipulated using grips or the Properties palette.
Face Modification Options
As you drag a face, press Ctrl to cycle through modification options.
1122 | Chapter 25 Modify 3D Models
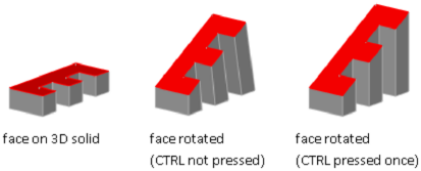
■Maintain shape of face, modify adjacent faces. When you move or rotate
a face without pressing Ctrl, the shape and size of the face is maintained.
However, the planes of adjacent faces might change.
■Modify shape of face, retain edges. When you move or rotate a face and
press and release Ctrl once while dragging, the size of the face is modified
within the boundary, or footprint, of the adjacent faces.
■Modify face, triangulate adjacent faces. When you move or rotate a face
and press and release Ctrl twice while dragging, the size and shape of the
face is maintained. (This behavior is the same as if you had not pressed
Ctrl). However, the adjacent planar faces are triangulated (divided into
two or more planar triangular faces), if necessary.
If you press and release Ctrl a third time, the modification returns to the first
option, as if you had not pressed Ctrl.
Quick Reference
Commands
MOVE
Moves objects a specified distance in a specified direction.
ROTATE
Rotates objects around a base point.
SCALE
Enlarges or reduces selected objects, keeping the proportions of the object
the same after scaling.
Copy, Delete, and Color Faces on 3D Solids
Copy, remove, or change the color of faces on 3D solid objects.
Modify Faces on 3D Objects | 1123
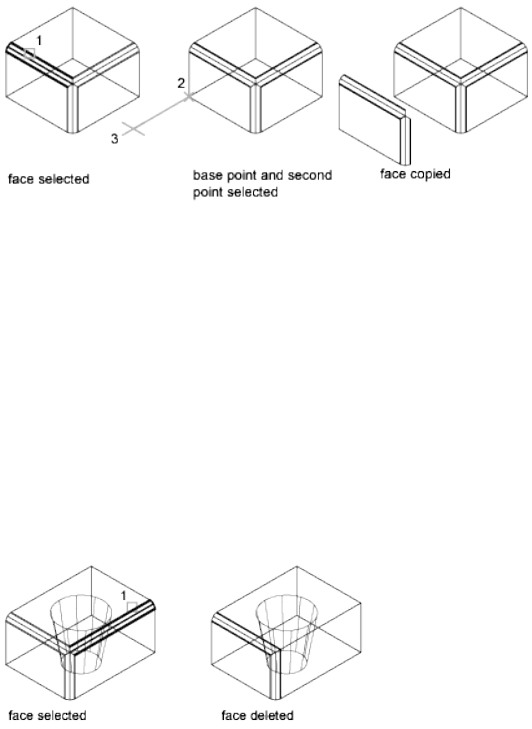
Copy a Face
You can duplicate the face of a 3D solid object using the copy option of the
SOLIDEDIT command. The selected faces are copied as regions or bodies.
Delete a Face
If you specify two points, the first point is used as a base point and a single
copy is placed relative to the base point. If you specify a single point and press
Enter, the original selection point is used as a base point. The next point is
the point of displacement.
If a face is surrounded by coplanar faces, you can delete it using the following
methods:
■Select the face and press Delete.
■Select the face and enter erase.
■Use the Delete option of the SOLIDEDIT command.
Color a Faces
You can modify the color of a face on a 3D solid by selecting the face and
then changing the Color property in the Properties palette.
1124 | Chapter 25 Modify 3D Models
See also:
■Modify Mesh Faces on page 1181
To copy a face on a solid object
1Click Home tab ➤ Solid Editing panel ➤ Face Editing drop-down ➤ Copy
Faces.
2Select the face to copy.
3Select additional faces or press Enter to copy.
4Specify the base point for the copy.
5Specify the second point of displacement and press Enter.
NOTE Use EXTRUDE to extrude a copied face.
To delete a face on a solid object
1Click Home tab ➤ Solid Editing panel ➤ Face Editing drop-down ➤ Delete
Faces.
2Select the face to delete. (It must be surrounded by faces that share the
same plane.)
3Select additional faces or press Enter to delete.
4Press Enter to complete the command.
To change the color of a face on a solid object
1Press and hold Ctrl as you click a face on a 3D solid.
2If the Properties palette is not displayed, select any object. Right-click the
object to display the shortcut menu. Click Properties.
3In the Properties palette, under General, click the Color arrow and select
a color from the list
For additional color options, click Select Color to display the Select Color
dialog box. Specify a color and click OK.
Modify Faces on 3D Objects | 1125
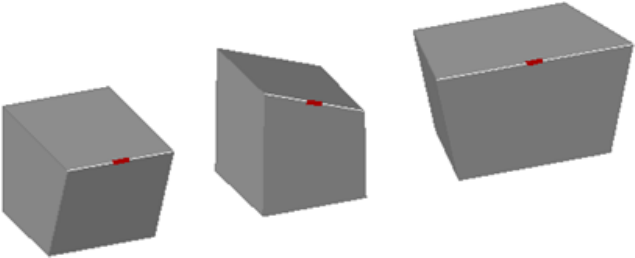
Quick Reference
Commands
PROPERTIES
Controls properties of existing objects.
SOLIDEDIT
Edits faces and edges of 3D solid objects.
Modify Edges on 3D Objects
You can select and modify edges on a 3D solid or surface.
Move, Rotate, and Scale Edges
Move, rotate, and scale the edges on 3D solids and surfaces using grips, gizmos,
and commands.
cubes with edges moved, rotated, and scaled
You can use MOVE, ROTATE, and SCALE to modify edges on 3D solids and
surfaces just as you can for any other object. Press and hold Ctrl to select the
edge.
If you move, rotate, or scale an edge on a 3D solid primitive, the history of
the solid primitive is removed. The solid is no longer a true primitive and
cannot be manipulated using grips and the Properties palette.
Edges on regions can be selected, but do not display grips. These edges can
also be moved, rotated, and scaled.
1126 | Chapter 25 Modify 3D Models
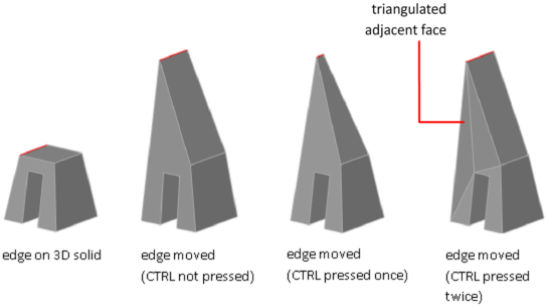
Edge Modification Options
As you drag an edge, press Ctrl to cycle through modification options.
■Maintain length of edge. When you move, rotate, or scale an edge without
pressing Ctrl, the shared length of the edge and its vertices is maintained.
However, the planes of the adjacent faces adjacent might be changed.
■Change the length of the edge. When you move, rotate, or scale an edge
and press and release Ctrl once while dragging, the edge is modified without
its vertices. The surfaces of the adjacent faces are maintained, but the
length of the modified edge might change.
■Triangulate adjacent faces. When you move, rotate, or scale an edge and
press and release Ctrl twice while dragging, the edge and its vertices are
modified. (This behavior is the same as if you had not pressed Ctrl).
However, if the adjacent faces are no longer planar, they are triangulated
(divided into two or more planar triangular faces).
If you press and release Ctrl a third time, the modification returns to the first
option, as if you had not pressed Ctrl.
Delete Edges
You can also delete edges that completely divide two coplanar faces using one
of the following methods:
■Select the edge and press Delete.
■Select the edge and enter the ERASE command.
Modify Edges on 3D Objects | 1127
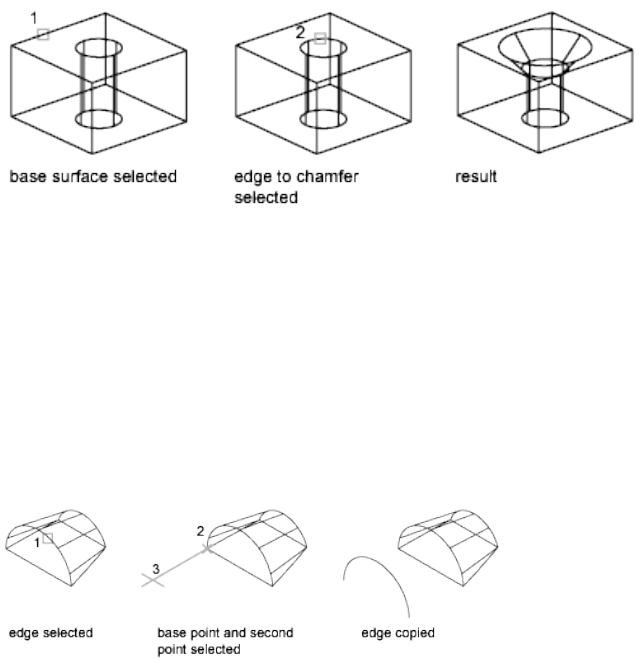
Fillet and Chamfer 3D Solids
Add rounds and bevels to 3D solids using FILLETEDGE and CHAMFEREDGE.
Use the fillet and chamfer grips to modify the fillet radius of the chamfer
distance. The default radius is set by the FILLETRAD system variable.
Color Edges
You can modify the color of an edge on a 3D object by selecting the edge and
changing the Color property in the Properties palette.
Copy Edges
You can copy individual edges on a 3D solid object. Edges are copied as lines,
arcs, circles, ellipses, or splines.
If you specify two points, the first point is used as a base point and a single
copy is placed relative to the base point. If you specify a single point, and then
press Enter, the original selection point is used as a base point. The next point
is used as a point of displacement.
See also:
■Move, Rotate, and Scale 3D Subobjects on page 1119
■Use Gizmos to Modify Objects on page 1093
1128 | Chapter 25 Modify 3D Models

■Modify Objects on page 727
■Move or Rotate Objects on page 742
■Resize or Reshape Objects on page 769
■Overview of Modifying Meshes on page 1168
To fillet a solid object
1Click Solid tab ➤ Solid Editing panel ➤ fill Edge.
2Select the edge of the solid to fillet.
3Specify the fillet radius.
4Select additional edges or press Enter to fillet.
To chamfer a 3D solid object
1Click Solid tab ➤ Solid Editing panel ➤ Chamfer Edge.
2Select the edge of the base surface to chamfer.
One of two surfaces adjacent to the selected edge is highlighted.
3Do one of the following:
■To select a different surface, enter n (Next).
■To use the current surface, press Enter.
4Specify the base surface distance.
The base surface distance is measured from the selected edge to a point
on the base surface. The other surface distance is measured from the
selected edge to a point on the adjacent surface.
5Specify the location of the chamfer using one of the following options.
■To specify an individual edge, select the edge.
■To select all edges around the base surface, enter l (Loop). Specify an
edge.
6To complete the chamfer, press Enter.
Modify Edges on 3D Objects | 1129
To modify a fillet or chamfer on a 3D solid
1Press and hold Ctrl as you select a fillet or chamfer on a 3D solid.
2If the Properties palette is not displayed, select any object. Right-click the
object to display the shortcut menu. Click Properties.
3In the Properties palette, modify the properties of the fillet or chamfer.
To change the color of an edge on a solid object
1Press and hold Ctrl as you click an edge on a 3D solid.
2If the Properties palette is not displayed, select any object. Right-click the
object to display the shortcut menu. Click Properties.
3In the Properties palette, under General, click the Color arrow and select
a color from the list
For additional color options, click Select Color to display the Select Color
dialog box. Specify a color and click OK.
To copy an edge on a solid object
1Click Home tab ➤ Solid Editing panel ➤ Edge Editing drop-down ➤ Copy
Edges.
2Press Ctrl+click the edge of the face to copy.
3Select additional edges, if needed, and press Enter.
4Specify the base point of the copied edges.
5Specify the second point of displacement to indicate the location of the
copied edges.
6Press Enter to complete the command.
Quick Reference
Commands
EDGE
Changes the visibility of 3D face edges.
CHAMFER
Bevels the edges of objects.
1130 | Chapter 25 Modify 3D Models
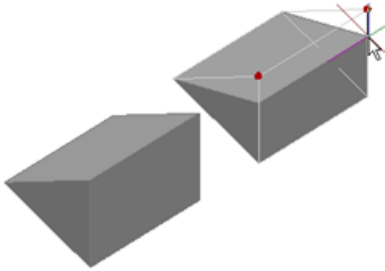
FILLET
Rounds and fillets the edges of objects.
MOVE
Moves objects a specified distance in a specified direction.
PROPERTIES
Controls properties of existing objects.
ROTATE
Rotates objects around a base point.
SCALE
Enlarges or reduces selected objects, keeping the proportions of the object
the same after scaling.
SOLIDEDIT
Edits faces and edges of 3D solid objects.
System Variables
FILLETRAD3D
Stores the current fillet radius for 3D objects.
Modify Vertices on 3D Objects
Move, rotate, scale, or drag the vertices of 3D solids and surfaces.
wedge with two vertices moved
Modify Vertices on 3D Objects | 1131
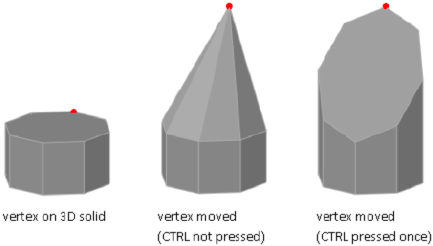
You can modify the form of a 3D solid or surface by modifying one or more
vertices. Use grips and gizmos, or run the MOVE, ROTATE, or SCALE command.
When you scale or rotate vertices, you must select two or more vertices to see
a change in the object. Clicking and dragging a vertex “stretches” the 3D
object.
If you move, rotate, or scale one or more vertices on a 3D solid primitive, the
solid primitive history is removed. The solid is no longer a true primitive and
cannot be modified using grips and the Properties palette.
Vertex Modification Options
As you drag a vertex, press Ctrl to cycle through modification options.
■Triangulate adjacent faces. When you move, rotate, or scale a vertex
without pressing Ctrl, some adjacent planar faces may be triangulated
(divided into two or more planar triangular faces).
■Modify some adjacent faces without triangulation. When you move, rotate,
or scale a vertex and press and release Ctrl once, some adjacent planar
faces might be adjusted.
If you press and release Ctrl a second time, the modification returns to the
first option, as if you had not pressed Ctrl.
Delete a Vertex
You can delete a vertex that connects two parallel edges that are collinear and
do not intersect on any other edges.
See also:
■Move, Rotate, and Scale 3D Subobjects on page 1119
1132 | Chapter 25 Modify 3D Models
■Use Gizmos to Modify Objects on page 1093
■Modify Objects on page 727
■Overview of Modifying Meshes on page 1168
To move a vertex on a 3D object
1Click Home tab ➤ Subobject panel ➤ Vertex.
2Click a vertex on a 3D object.
3Drag the vertex to the required location.
To delete a vertex on a 3D object
1Click Home tab ➤ Subobject panel ➤ Vertex.
2Click a vertex that connects collinear edges are parallel and do not lie on
any other edges.
3Press Delete.
Quick Reference
Commands
MOVE
Moves objects a specified distance in a specified direction.
ROTATE
Rotates objects around a base point.
SCALE
Enlarges or reduces selected objects, keeping the proportions of the object
the same after scaling.
SOLIDEDIT
Edits faces and edges of 3D solid objects.
Modify Vertices on 3D Objects | 1133
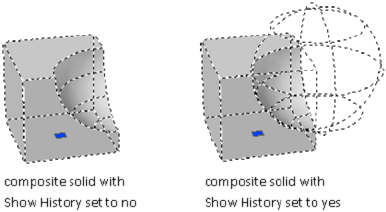
Work with Complex 3D Solids and Surfaces
Modify composite solids that are created by a union, subtract, intersect, fillet,
or chamfer process.
Display Original Forms of Composite Solids
By default, 3D composite objects retain a history that displays an editable
image of their original component forms.
Retain the History of the Composite Components
After you create a composite object, you can modify the shape of the new
object by modifying a highlighted wireframe image of its original components.
If the Show History property is Yes, wireframes of the original forms—including
forms that have been removed—are displayed in a dimmed state. (The
SHOWHIST system variable also controls this setting.)
To retain a history of the original parts of composite solids, the History
property must be set to Record (Properties Palette) when the composite
operation occurs. (You can also use the SOLIDHIST system variable to set this
property.)
Display and Remove the History to Modify the Composite
When you modify the composite object, you can display the history. Then
use the grips on the history subobject to modify the object. For more
information about using grips with composite solids, see Modify Composite
Solids and Surfaces on page 1136.
You can remove the history of a selected composite object by changing its
History setting to None, or by entering the BREP command. After a history
has been removed, you can no longer select and modify the original, removed,
components of the solid. You can restart history retention for the solid by
changing its History setting back to Record.
1134 | Chapter 25 Modify 3D Models
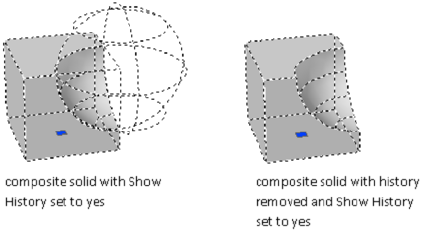
Removing a composite history is useful when you work with complex
composite solids. After you create the initial complex form, set History to
None to remove the history. Then reset the value to Record. With this process,
you can create a complex composite object, and then reset it to serve as a base
form for additional composite operations.
To display the original components of a composite solid
1If the Properties palette is not displayed, select any object. Right-click the
object to display the shortcut menu. Click Properties.
2In a drawing, select a 3D composite solid.
3On the Properties palette, Solid History area, under Show History, select
Yes.
To remove the history of a solid object
1If the Properties palette is not displayed, select any object. Right-click the
object to display the shortcut menu. Click Properties.
2In a drawing, select a 3D solid.
3On the Properties palette, Solid History area, under History, select None.
To set a 3D solid to record a history of its original forms
1If the Properties palette is not displayed, select any object. Right-click the
object to display the shortcut menu. Click Properties.
2In a drawing, select a solid.
3On the Properties palette, Solid History area, under History, select Record.
Display Original Forms of Composite Solids | 1135
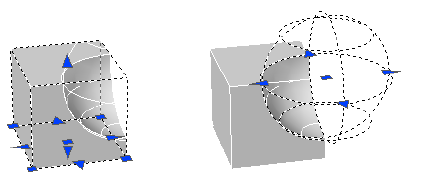
Quick Reference
Commands
BREP
Removes the history from 3D solids and composite solids, and associativity
from surfaces.
System Variables
SHOWHIST
Controls the Show History property for solids in a drawing.
SOLIDHIST
Controls the default history property setting for solid objects.
Modify Composite Solids and Surfaces
Modify the entire form of a composite 3D object or the original forms that
make up the composite.
You can move, scale, or rotate a selected composite object using grips or
gizmos.
Modify Original Components of Composites
When the History property is set to Record, press the Ctrl key to display any
original forms that were removed during a union, subtract, or intersect
operation. If the original, removed form was a solid primitive, you can drag
the displayed grips to change its shape and size. As a result, the composite
object is modified.
If the selected individual form does not contain its history, you can move,
rotate, scale, or delete the form.
1136 | Chapter 25 Modify 3D Models
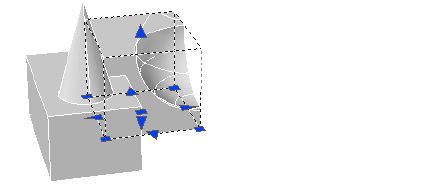
Modify Complex Composites
A composite object might be made up of other composite objects. You can
select the history images of composite objects by holding down the Ctrl key
as you click the forms. (For best results, set the subobject selection filter to
Solid History.)
You can also change the size and shape of composite objects by clicking and
dragging grips on individual faces, edges, and vertices. For more information,
see Modify 3D Subobjects on page 1119.
Separate Discrete Objects Combined with a Union
If you have combined discrete 3D solids or surfaces using a union operation,
you can separate them into their original components. (Use the Separate
option of the SOLIDEDIT command.) To be separated, the composite objects
cannot overlap or share a common area or volume.
After separation, the individual solids retain their original layers and colors.
All nested 3D solid objects are restored to their simplest forms.
See also:
■Edit Objects with Grips on page 729
■Overview of Modifying Meshes on page 1168
To select an individual solid that is part of a composite solid
■Press Ctrl + click an individual solid that is part of a composite solid.
To separate a 3D solid composite into individual solids
1Click Home tab ➤ Solid Editing panel ➤ Solid Editing
drop-down ➤ Separate.
2Select the 3D solid object.
Modify Composite Solids and Surfaces | 1137
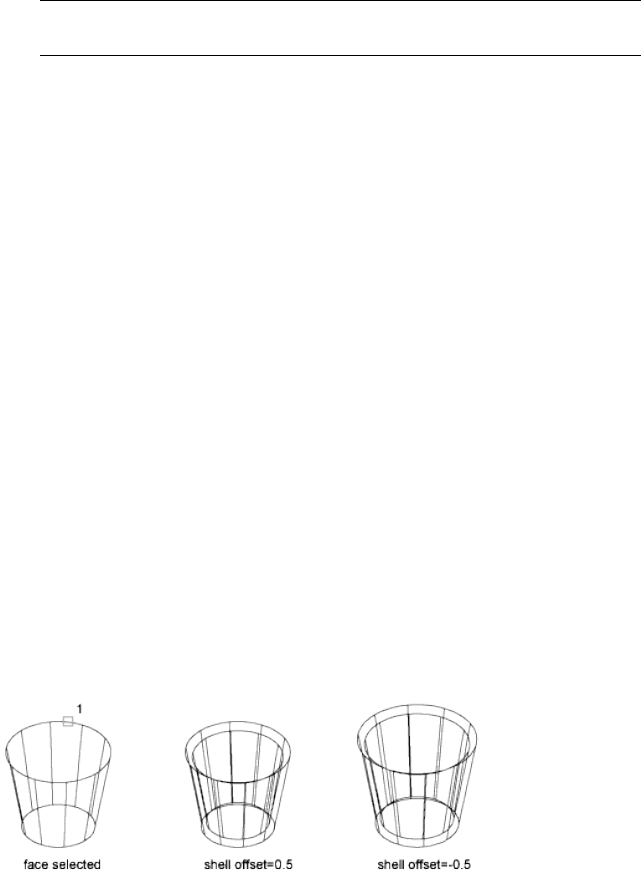
NOTE This operation only applies to non-intersecting objects that have been
combined by union.
3Press Enter to complete the command.
Quick Reference
Commands
SOLIDEDIT
Edits faces and edges of 3D solid objects.
System Variables
LEGACYCTRLPICK
Specifies the keys for selection cycling and the behavior for Ctrl+click.
Shell and Remove Redundancies in 3D Objects
Convert 3D solids to shells and remove redundant lines and edges.
Shell 3D Solids
Convert a 3D solid to a hollow wall, or shell.
When you can convert a solid object to a shell, new faces are created by
offsetting existing faces inside or outside their original positions.
Continuously tangent faces are treated as a single face when they are offset.
To create a 3D solid shell
1Click Home tab ➤ Solid Editing panel ➤ Solid Editing drop-down ➤ Shell.
1138 | Chapter 25 Modify 3D Models
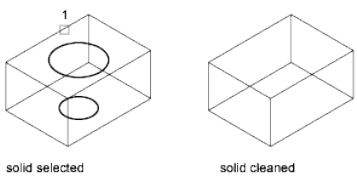
2Select the 3D solid object.
3Select one or more faces to be excluded from shelling.
4Press Enter.
5Specify the shell offset value.
A positive offset value creates a shell wall in a positive direction from the
face. A negative value creates a shell wall in a negative direction from the
face.
6Press Enter to complete the command.
Quick Reference
Commands
SOLIDEDIT
Edits faces and edges of 3D solid objects.
Clean and Check 3D Solids
Remove redundant faces, edges, and vertices from a 3D solid, and verify
whether the 3D solid is valid.
You can remove redundant edges or vertices that share the same surface or
vertex definition. This operation merges adjacent faces and deletes all
redundant edges, including imprinted and unused edges.
True 3D solid objects have editable properties, volume, and mass that are not
shared by objects created with thickness or closed surfaces. You can check
whether an object is a valid 3D solid by verifying whether it is listed as “3D
Solid” on the Properties palette. You can also use SOLIDEDIT to verify whether
a solid object is a valid 3D solid object.
Shell and Remove Redundancies in 3D Objects | 1139
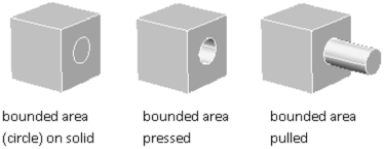
To remove redundant lines from a 3D solid object
1Click Home tab ➤ Solid Editing panel ➤ Solid Editing flyout ➤ Clean.
2Select the 3D solid object.
3Press Enter to complete the command.
To validate a 3D solid object
1Click Home tab ➤ Solid Editing panel ➤ Solid Editing flyout ➤ Check.
2Select the 3D solid object.
3Press Enter to complete the command.
If the object is a valid 3D object, a message is displayed at the Command
prompt. If it is not valid, you continue to be prompted to select a 3D
solid.
Quick Reference
Commands
SOLIDEDIT
Edits faces and edges of 3D solid objects.
System Variables
SOLIDCHECK
Turns 3D solid validation on and off for the current session.
Press or Pull Bounded Areas
Create a positive or negative extrusion in the shape of a bounded area.
1140 | Chapter 25 Modify 3D Models
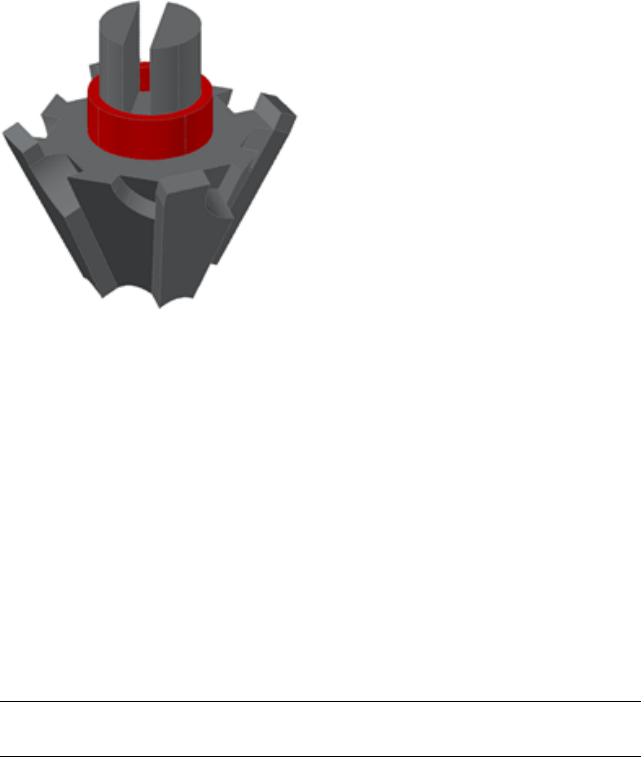
Press in or pull out bounded, or closed, areas to create 3D holes and positive
extrusions.
object formed using press and pull
operations on an imprinted pyramid
In combination with imprinted faces, you can form complex shapes using
press or pull operations to create extrusions and notches.
Methods for Press and Pull Modifications
With the PRESSPULL command, you specify the area to be extruded, and then
move the cursor or enter a value to specify the length of the extrusion. The
result is a single 3D solid object, often with a composite shape.
You can also press Ctrl+Shift+E to initiate a press or pull operation. To limit
the type of objects that can act as boundaries, turn off the IMPLIEDFACE
system variable. When the variable is off, only 3D faces and 3D solid faces
can be extruded using Ctrl+Shift+E. (This variable does not affect the
PRESSPULL command.)
NOTE If you alternatively use EXTRUDE to extend an existing face on a 3D solid,
a separate extruded object is created.
Types of Objects That Can Be Pressed or Pulled
You can press or pull several types of bounded areas, including closed objects,
areas enclosed by coplanar geometry, the faces of 3D solids, and an imprinted
area on the face of a 3D solid. For a complete list of objects that are eligible
for a press or pull extrusion, see PRESSPULL.
Press or Pull Bounded Areas | 1141
You cannot taper the pressed or pulled shape as you create it. However, you
can achieve the same effect later by modifying the edges of the bounded area.
To press or pull a bounded area
1Press and hold Ctrl+Shift+E.
2Click any area bounded by coplanar lines or edges.
3Drag the mouse to press or pull the bounded area.
4Click two points or enter a value to specify the height or depth of the
extrusion.
Quick Reference
Commands
EXTRUDE
Creates a 3D solid or surface by extending the dimensions of an object.
PRESSPULL
Presses or pulls bounded areas.
System Variables
IMPLIEDFACE
Controls the detection of implied faces.
Add Edges and Faces to Solids
Add editable faces to 3D solids and surfaces by imprinting other objects, such
as arcs and circles.
With the IMPRINT command, you can add a new face to a 3D solid by
imprinting a coplanar object that overlaps the selected face. Imprinting
provides additional edges that you can modify to reshape the solid object.
For example, if a circle overlaps the face of a box, you can imprint the
intersecting curves on the solid.
1142 | Chapter 25 Modify 3D Models
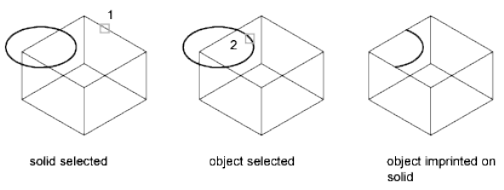
You can delete or retain the original object as you imprint it.
Objects that can be imprinted on 3D solids include arcs, circles, lines, 2D and
3D polylines, ellipses, splines, regions, bodies, and other 3D solids.
Edit Imprinted Objects
You can edit imprinted objects and subobjects in many of the same ways that
you can edit other faces. For example, you can Ctrl+click to select a new edge
and then drag to change its location.
The following limitations exist for imprinted objects:
■You can move the edges of the imprinted face only within the plane of a
face.
■You might be unable to move, rotate, or scale some subobjects.
■Imprinted edges and faces might be lost when some subobjects are moved,
rotated, or scaled.
Subobjects with editing limitations include
■Faces with imprinted edges or faces
■Edges or vertices with adjacent faces that contain imprinted edges or faces
To imprint a 3D solid object
1Click Home tab ➤ Solid Editing panel ➤ Edge Editing
drop-down ➤ Imprint.
2Select the 3D solid object.
3Select a co-planar object that you want to imprint.
4Press Enter to retain the original objects, or enter y to delete them.
5Select additional objects to imprint or press Enter.
Add Edges and Faces to Solids | 1143
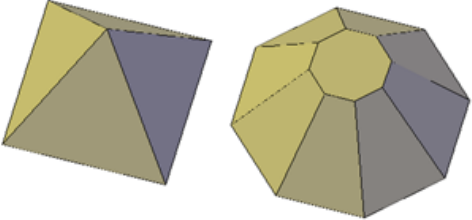
6Press Enter to complete the command.
Quick Reference
Commands
IMPRINT
Imprints 2D geometry on a 3D solid or surface, creating additional edges on
planar faces.
Modify Properties of 3D Solid, Surface, and Mesh
Modify 3D objects by changing their settings in the Properties palette.
3D objects, solids, surfaces, and mesh, and their subobjects can be modified
in the properties palette.
Modify Solid Objects by Changing Properties
By changing settings in the Properties palette, you can modify basic size,
height, and shape characteristics of primitive solids. For example, to change
a four-sided pyramid that ends in a point to an eight-sided pyramid that ends
in a planar surface (pyramid frustum), update the Top Radius and Sides
properties.
Set Whether to Retain Compound Object History
With 3D solids that have been recombined to form compound objects, you
can choose to retain the history subobject, which represents components that
have been removed. The Properties palette controls the availability and display
of these histories. See Work with Complex 3D Solids and Surfaces on page 1134.
1144 | Chapter 25 Modify 3D Models
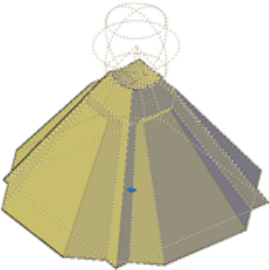
Modify Surface Objects by Changing Properties
Surface objects have additional properties that are not found in 3D solid or
mesh objects. The properties differ depending on the type of surface (NURBS,
blend, patch, network, offset, fillet, chamfer, extend, loft, extrude, sweep,
planar, or revolve).
Surface’s include the following information in the Properties palette:
■Basic geometric information - Contains information such as radius for
fillet surfaces, offset distance for offset surfaces, and taper angle for extruded
surfaces. You can also enter mathematical expressions to control some of
these properties.
■Trimmed Edges/Surface - Tells you if the surface has any trimmed areas
and on which edges.
■Maintain Associativity - Displays whether surface is associative or not. Use
this property to turn associativity off.
■Show Associativity - Turns dependency highlighting on and off if the
surface is associated with other surfaces.
■Edge Continuity and Bulge Magnitude - Displays for surfaces that join
other surfaces.
■Wireframe Display and U/V Isolines - Turns the wireframe and U/V Isoline
display on and off (for non-NURBS surfaces).
■CV Hull Display and U/V Isoparms - Turns the CV Hull and U/V Isoparm
display on and off (for NURBS surfaces).
Modify Properties of 3D Solid, Surface, and Mesh | 1145
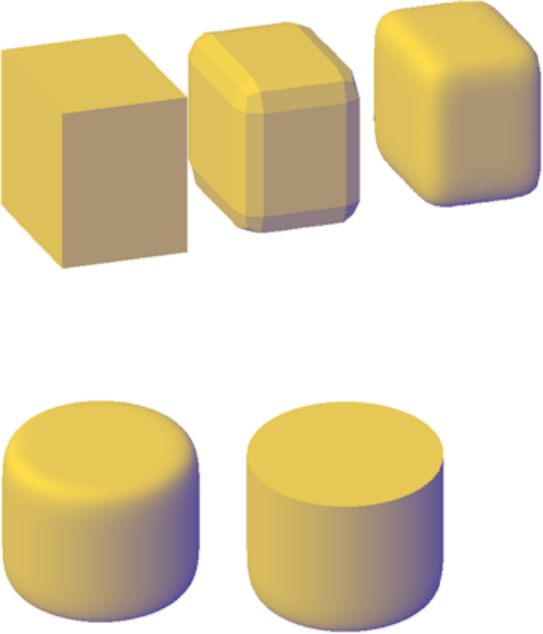
Modify Mesh Objects by Changing Properties
Mesh objects have additional properties that control the level of smoothness
and creases. Crease properties of face, edge, and vertex subobjects are also
reflected in the Properties palette.
■Level of Smoothness. Smooths or sharpens the edges of a mesh object.
■Crease Type. Specifies the presence of a crease (or sharpened edge) and
the effect of smoothing. Smoothing does not affect a crease with a value
of Always. A crease set to By Level retains its sharpness until the mesh
object is smoothed to the specified crease level.
■Crease Level. When a crease is set to By Level, indicates the smoothing
level at which the crease starts to lose its sharpness.
1146 | Chapter 25 Modify 3D Models
Modify 3D Subobject Properties
In addition to solids, surfaces, and meshes, you can also use the properties
palette to modify the properties of individual subobjects, such as faces, edges,
and vertices. Different properties are available for different types of subobjects.
In some cases, the application of properties can differ depending on the object
type. For example, you can modify the properties of mesh faces, including
their color. However, the color appearance of a mesh face might differ from
the equivalent color on a 3D solid face. This difference occurs because changing
the color of a face modifies the diffuse color of the face, but not the ambient
color (which is derived from the mesh material property). To obtain a closer
match between the color of 3D solid and mesh faces, you can add lights and
turn off the default lighting (which disables ambient lighting). You can also
try assigning a material that has the same ambient and diffuse color. For more
information see Create Materials.
To modify the contour of a lofted solid or surface by changing the surface
normal settings (Properties palette)
1In a drawing, select a lofted solid or surface that was created with cross
sections.
2If the Properties palette is not displayed, select any object. Right-click the
object to display the shortcut menu. Click Properties.
3On the Properties palette, Geometry area, change the Surface Normals
setting. (For a description, see Modify Loft Settings.)
To modify a mesh object in the Properties palette
1If the Properties palette is not displayed, select any object. Right-click the
object to display the shortcut menu. Click Properties.
Modify Properties of 3D Solid, Surface, and Mesh | 1147

2Click the mesh object to select it.
3In the Properties palette, modify the properties you want to change.
To modify a mesh face, edge, or vertex in the Properties palette
1If the Properties palette is not displayed, select any object. Right-click the
object to display the shortcut menu. Click Properties.
2Press Ctrl+click the mesh face, edge, or vertex that you want to modify.
NOTE If you cannot select a specific subobject, verify whether subobject
selection filtering is turned on for a different subobject type. (Right-click in
the drawing area and click Subobject Selection Filter.)
3In the Properties palette, modify the properties you want to change.
Quick Reference
Commands
PROPERTIES
Controls properties of existing objects.
System Variables
FILLETRAD
Stores the current fillet radius for 2D objects.
FILLETRAD3D
Stores the current fillet radius for 3D objects.
LOFTANG1
Sets the draft angle through the first cross section in a loft operation.
LOFTANG2
Sets the draft angle through the last cross section in a loft operation.
LOFTMAG1
Sets the magnitude of the draft angle through the first cross section in a loft
operation.
1148 | Chapter 25 Modify 3D Models
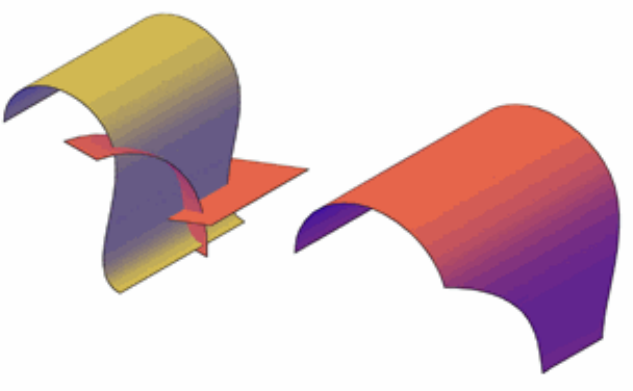
LOFTMAG2
Sets the magnitude of the draft angle through the last cross section in a loft
operation.
Modify Surfaces
Reshape surfaces, and then analyze and rebuild the model if necessary to
ensure quality and smoothness.
Overview of Modifying Surfaces
Fillet, extend, and trim surfaces or modify NURBS surfaces with control vertices.
Procedural and NURBS surfaces can be edited with basic editing tools such as
trimming, extending and filleting. NURBS surfaces can be modified with these
tools as well, but they can also be reshaped by stretching control vertices.
When your surface design is complete, use the surface analysis tools to ensure
the quality of your model and to rebuild it if necessary.
■Trim and Untrim Surfaces
■Extend Surfaces
Modify Surfaces | 1149
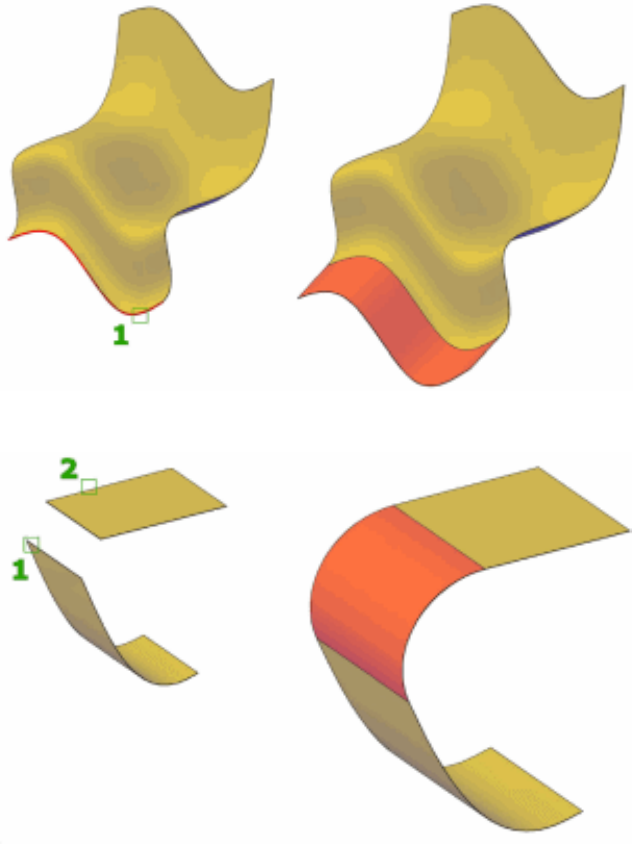
■Fillet Surfaces
■Edit NURBS Surfaces
1150 | Chapter 25 Modify 3D Models
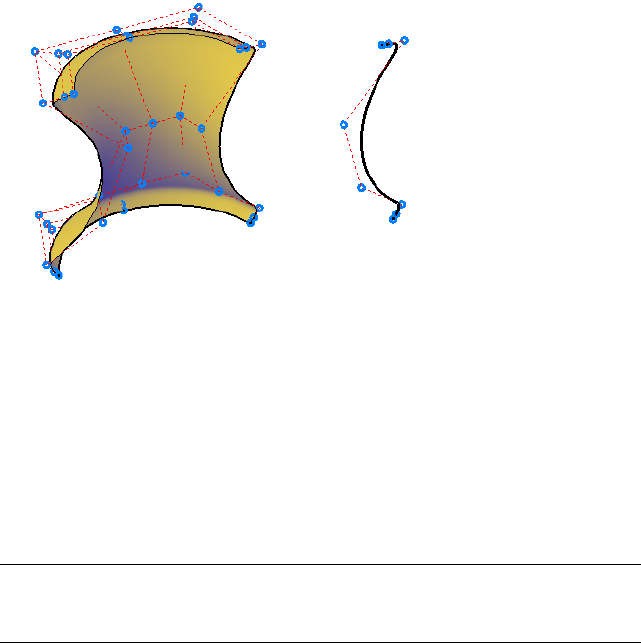
Trim and Untrim Surfaces
Trim and untrim surfaces to meet the edges of other objects.
An important step in the surface modeling workflow is trimming surfaces.
You can trim a surface where it meets an intersecting object or you can project
geometry onto a surface as a trimming edge.
When a surface is trimmed, the removed surface areas can be replaced with
SURFUNTRIM.
NOTE SURFUNTRIM does not restore areas removed by the SURFAUTOTRIM
system variable and PROJECTGEOMETRY. It only restores areas trimmed with
SURFTRIM.
The Properties palette indicates if the surface contains any trimmed edges.
Projecting Geometry onto Surfaces, Solids, and Regions
Similar to projecting a movie onto a screen, you can project geometry onto
3D solids, surfaces, and regions from different directions to create trimming
edges. The PROJECTGEOMETRY command creates a duplicate curve on the
object that you can move and edit. You can also trim against 2D curves that
do not actually touch the surface, but that appear to intersect the object in
the current view.
Use the SURFACEAUTOTRIM system variable to automatically trim a surface
when you project geometry onto it.
Trim and Untrim Surfaces | 1151

Options for Projecting Geometry
Project geometry from 3 different angles: the Z axis of the current UCS, the
current view, or a path between two points.
■Project to UCS - Projects the geometry along the positive or negative Z axis
of the current UCS.
■Project to View - Projects the geometry based on the current view.
■Project to Two Points - Projects the geometry along a path between two
points.
To trim a surface
1Click Surface tab ➤ Create panel ➤ Trim.
2Select the surface and press Enter.
3Select the cutting curves and press Enter.
4Select the surface areas to remove and press Enter.
The selected areas are removed.
To untrim a surface
1Click Surface tab ➤ Create panel ➤ Untrim.
2Select a visible part of the surface and press Enter.
The trimmed areas are replaced.
NOTE When you trim a surface multiple times, you may lose some of the original
trimming edges. In this case, some untrim actions may not be possible if the
trimming edge has been lost.
To automatically trim areas to projected curves
1Click Surface tab ➤ Project Geometry panel ➤ Auto Trim.
2Click Surface tab ➤ Project Geometry panel ➤ Project to View.
3Select the curve to project onto the surface and press Enter.
4Select a surface as the target and press enter.
The area is automatically trimmed.
1152 | Chapter 25 Modify 3D Models
Quick Reference
Commands
3DOSNAP
Sets the object snap modes for 3D objects.
PROJECTGEOMETRY
Projects points, lines, or curves onto a 3D solid or surface from different
directions.
PROPERTIES
Controls properties of existing objects.
SURFTRIM
Trims portions of a surface where it meets another surface or type of geometry.
SURFUNTRIM
Replaces surface areas removed by the SURFTRIM command.
VISUALSTYLES
Creates and modifies visual styles and applies a visual style to a viewport.
System Variables
3DOSMODE
Controls the settings for the 3D object snaps.
SUBOBJSELECTIONMODE
Filters whether faces, edges, vertices or solid history subobjects are highlighted
when you roll over them.
SURFACEAUTOTRIM
Controls whether surfaces are automatically trimmed when you project
geometry onto them.
Extend a Surface
Create a new surface by extending it to meet the edge of another object or by
specifying an extension length.
Extend a Surface | 1153
There are two types of extend surfaces: merge and append. The merge surface
is a continuation of the surface with no seam. The append surface extends the
surface by adding a second surface with a seam. Because it creates a seam,
append surfaces have continuity and bulge magnitude on page 1016 properties.
For both surface types, use the Properties palette to change the length or to
derive the length from a mathematical expression.
To create a new surface by extending a surface
1Select a surface.
2Right-click and select Properties.
3In the Properties palette, under Geometry, change the desired settings.
Quick Reference
Commands
PROPERTIES
Controls properties of existing objects.
SURFEXTEND
Lengthens a surface by a specified distance.
Fillet a Surface
Create a new transition surface that fillets an area between two existing surfaces
or regions.
Create a tangent surface between two surfaces or regions with a constant radius
profile. The original surfaces will trim to meet the fillet surface.
By default, the fillet surface uses the radius value set in the FILLETRAD3D
system variable. Change the radius while you are creating the surface with
the radius option or by dragging the fillet grip. Use the Properties palette to
change the fillet radius or to derive the radius using a mathematical expression.
To create a fillet surface
1Click Surface tab ➤ Edit panel ➤ Fillet.
2Select the first and second surfaces.
1154 | Chapter 25 Modify 3D Models
The fillet surface is created and the originating are surfaces automatically
trimmed if necessary.
Quick Reference
Commands
SURFFILLET
Creates a filleted surface between two other surfaces.
PROPERTIES
Controls properties of existing objects.
System Variables
FILLETRAD3D
Stores the current fillet radius for 3D objects.
Edit NURBS Surfaces
Change the shape of NURBS surfaces and curves by using the 3D Edit Bar or
by editing control vertices.
Use the Control Vertices Edit Bar (3DEDITBAR) to drag and reshape surfaces.
A second way to edit NURBS surfaces is to drag and edit the control vertices
directly. Hold the Shift key down to select multiple control vertices.
Edit NURBS Surfaces | 1155
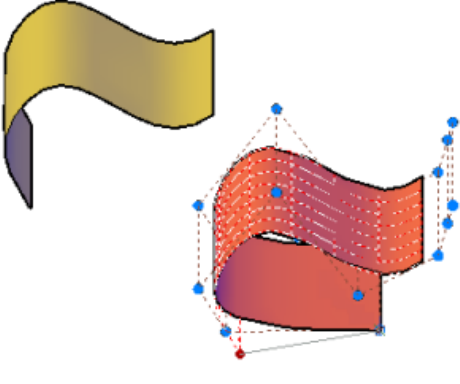
Use CVSHOW to display the control vertices for both NURBS surfaces and
curves.
Drag the control vertices to reshape the curve or surface; you can also add or
delete control vertices in both the U and V directions.
The typical surface modeling workflow is to:
■Create a model that combines 3D solids, surfaces, and mesh objects.
■Convert the model to procedural surfaces to take advantage of associative
modeling.
■Convert the procedural surfaces to NURBS surfaces with CONVTONURBS
to take advantage of NURBS editing.
■Check for imperfections and wrinkles with the surface analysis tools.
■If necessary, rebuild the surfaces to restore smoothness with CVREBUILD.
Quick Reference
Commands
3DEDITBAR
Reshapes, scales, and edits the tangency of NURBS surfaces.
1156 | Chapter 25 Modify 3D Models
CONVTONURBS
Converts 3D solids and surfaces into NURBS surfaces.
CVSHOW
Displays the control vertices for specified NURBS surfaces or curves.
CVADD
Adds control vertices to NURBS surfaces and splines.
CVHIDE
Turns off the display of control vertices for all NURBS surfaces and curves.
CVREBUILD
Rebuilds the shape of NURBS surfaces and curves.
CVREMOVE
Removes control vertices from NURBS surfaces and curves.
System Variables
SURFACEMODELINGMODE
Controls whether surfaces are created as procedural surfaces or NURBS
surfaces.
Rebuild NURBS Surfaces and Curves
Reconstruct NURBS surfaces and curves to a specified degree and number of
control vertices.
Editing a NURBS surface or curve can create discontinuity and wrinkles.
Reconstruct the surface or curve by changing the degree and the number of
control vertices. Rebuilding also allows you to delete the original geometry,
and, for surfaces only, to replace trimmed areas.
To rebuild a NURBS surface
1Click Surface tab ➤ Control Vertices panel ➤ Rebuild.
The Rebuild Surface dialog box displays.
2Select the desired rebuild options and click OK.
Edit NURBS Surfaces | 1157
Quick Reference
Commands
CONVTONURBS
CVSHOW
Displays the control vertices for specified NURBS surfaces or curves.
CVADD
Adds control vertices to NURBS surfaces and splines.
CVHIDE
Turns off the display of control vertices for all NURBS surfaces and curves.
CVREBUILD
Rebuilds the shape of NURBS surfaces and curves.
CVREMOVE
Removes control vertices from NURBS surfaces and curves.
Analyze Surfaces
Surface analysis tools check the continuity, curvature and draft angles of
surfaces.
Use the surface analysis tools to validate surfaces and curves before
manufacturing. Analysis tools include:
■Zebra Analysis on page 1162 - Analyzes surface continuity by projecting
parallel lines onto the model.
1158 | Chapter 25 Modify 3D Models
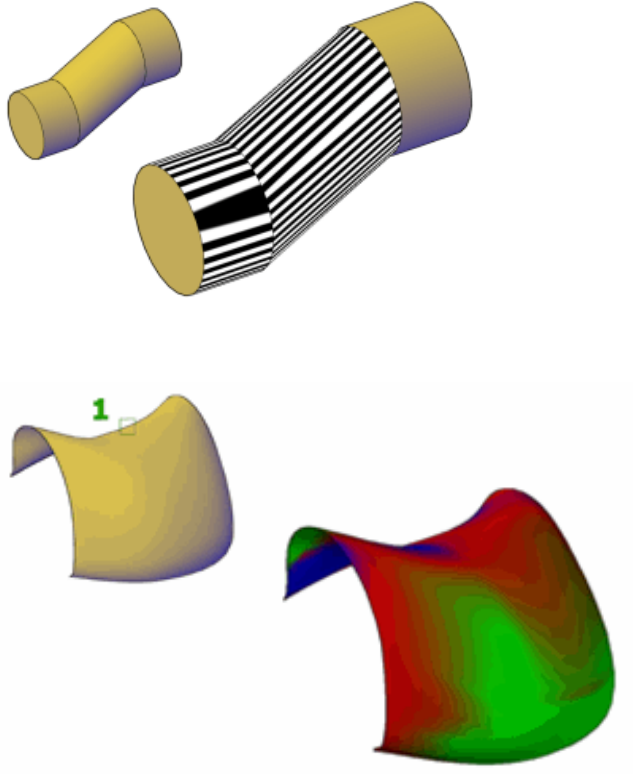
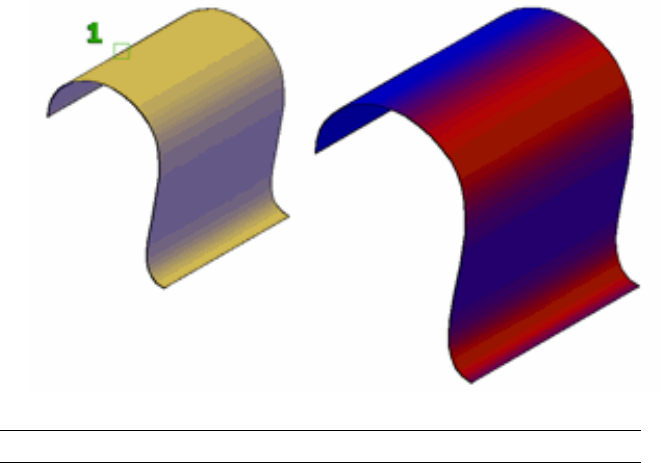
NOTE Analysis tools only work in the 3D visual styles; they will not work in 2D.
Quick Reference
Commands
ANALYSISCURVATURE
Displays a color gradient onto a surface to evaluate different aspects of its
curvature.
ANALYSISDRAFT
Displays a color gradient onto a 3D model to evaluate whether there is
adequate space between a part and its mold.
ANALYSISOPTIONS
Sets the display options for zebra, curvature, and draft analysis.
ANALYSISZEBRA
Projects stripes onto a 3D model to analyze surface continuity.
1160 | Chapter 25 Modify 3D Models
System Variables
VSACURVATUREHIGH
Sets the value at which a surface displays as green during curvature analysis
(ANALYSISCURVATURE).
VSACURVATURELOW
Sets the value at which a surface displays as blue during curvature analysis
(ANALYSISCURVATURE).
VSACURVATURETYPE
Controls which type of curvature analysis is used with the
(ANALYSISCURVATURE).
VSADRAFTANGLEHIGH
Sets the value at which a model displays as green during draft analysis
(ANALYSISDRAFT).
VSADRAFTANGLELOW
Sets the value at which a model displays as blue during draft analysis
(ANALYSISDRAFT).
VSAZEBRACOLOR1
Sets the first color of the zebra stripes displayed during zebra analysis
(ANALYSISZEBRA).
VSAZEBRACOLOR2
Sets the second (contrasting) color of the zebra stripes displayed during zebra
analysis (ANALYSISZEBRA).
VSAZEBRADIRECTION
Controls whether zebra stripes display horizontally, vertically, or at an angle
during zebra analysis (ANALYSISBRA).
VSAZEBRASIZE
Controls the width of the zebra stripes displayed during zebra analysis
(ANALYSISZEBRA).
VSAZEBRATYPE
Sets the type of zebra display when using zebra analysis (ANALYSISZEBRA).
Analyze Surfaces | 1161
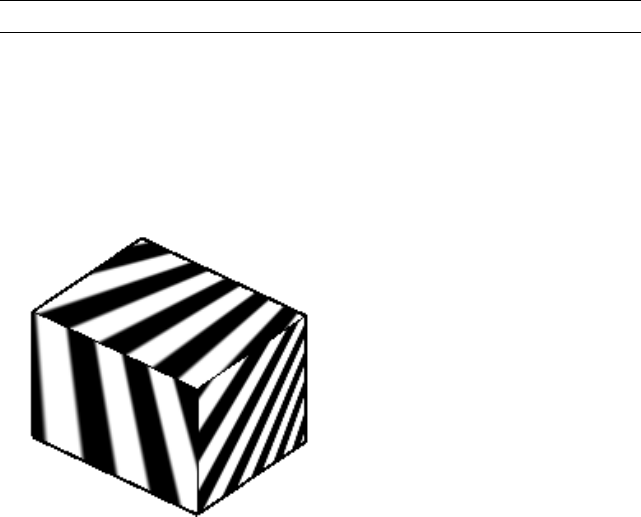
Analyze Surface Continuity with Zebra Analysis
The zebra analysis tool projects stripes onto a surface so that you can inspect
the continuity between surfaces.
Surface continuity is a measure of how smoothly two surfaces flow into each
other. A car hood, for example, can be composed of multiple small surfaces
that appear to be one because of the smoothness of the surface continuity.
NOTE Analysis tools only work in the 3D visual styles; they will not work in 2D.
How to Interpret the Zebra Stripes
In the seam where two surfaces meet, the way that the zebra stripes align and
curve tells you a lot about the smoothness of the join.
■G0 Position. The position of the surface edges is collocated; they touch.
But the tangency and curvature do not match. The zebra stripes do not
line up.
■G1 Tangency. The position and tangency of surfaces is the same. This
indicates G1 (G0 + G1 or position + tangency). The zebra stripes line up,
but they veer away from one another at sharp curves.
1162 | Chapter 25 Modify 3D Models
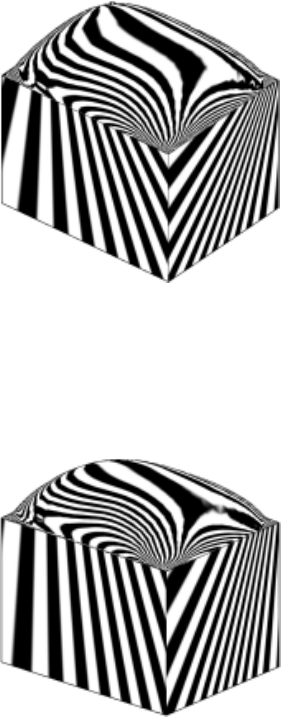
■G2 Curvature. The position, tangency, and curvature of the surface edges
is the same. This indicates G2 (G0 + G1 + G2 or position + tangency +
curvature).
The stripes line up, but they do not veer away from each other at sharp
curves (because they share the same curvature). This distinction is subtle
and a little harder to discern from G1 continuity.
To analyze surface continuity
1Click Surface tab ➤ Analysis panel ➤ Zebra.
2Select a surface and press Enter.
The zebra stripes display.
To turn off the zebra display
1Click Surface tab ➤ Analysis panel ➤ Analysis Options.
Analyze Surfaces | 1163
2Click the Clear Zebra Analysis button.
The zebra stripes disappear.
To change the zebra analysis options
1Click Surface tab ➤ Analysis panel ➤ Analysis Options.
2In the Zebra tab of the Analysis Options dialog box, select the desired
options and click OK.
Quick Reference
Commands
ANALYSISOPTIONS
Sets the display options for zebra, curvature, and draft analysis.
ANALYSISZEBRA
Projects stripes onto a 3D model to analyze surface continuity.
System Variables
VSAZEBRACOLOR1
Sets the first color of the zebra stripes displayed during zebra analysis
(ANALYSISZEBRA).
VSAZEBRACOLOR2
Sets the second (contrasting) color of the zebra stripes displayed during zebra
analysis (ANALYSISZEBRA).
VSAZEBRADIRECTION
Controls whether zebra stripes display horizontally, vertically, or at an angle
during zebra analysis (ANALYSISBRA).
VSAZEBRASIZE
Controls the width of the zebra stripes displayed during zebra analysis
(ANALYSISZEBRA).
VSAZEBRATYPE
Sets the type of zebra display when using zebra analysis (ANALYSISZEBRA).
1164 | Chapter 25 Modify 3D Models

Analyze the Curvature of a NURBS Surface
Displays a color gradient onto surfaces to evaluate areas of high, low and
Gaussian curvature.
The color gradient allows you to visualize Gaussian, minimum, maximum,
and mean U and V surface curvature. Maximum curvature and a positive
Gaussian value display as red, and minimum curvature and a negative Gaussian
value display as blue. Positive Gaussian curvature means the surface is shaped
like a bowl. Negative Gaussian curvature means the surface is shaped like a
saddle as shown in this illustration. Mean curvature and a zero Gaussian value
means the surface is flat in at least one direction (planes, cylinders, and cones
have zero Gaussian curvature).
The curvature analysis tool ensures that your model stays within a specified
range. You can analyze the following on a point on a surface or curve:
NOTE Analysis tools only work in the 3D visual styles; they will not work in 2D.
To analyze the curvature of a surface
1Click Surface tab ➤ Analysis panel ➤ Curvature.
2Select a surface and press Enter.
The curvature coloring display.
To turn off the curvature color display
1Click Surface tab ➤ Analysis panel ➤ Analysis Options.
2Click the Clear Curvature Analysis button.
The curvature coloring disappears.
To change the curvature analysis options
1Click Surface tab ➤ Analysis panel ➤ Analysis Options.
2In the Curvature tab of the Analysis Options dialog box, select the desired
options and click OK.
Analyze Surfaces | 1165

Quick Reference
Commands
ANALYSISCURVATURE
Displays a color gradient onto a surface to evaluate different aspects of its
curvature.
ANALYSISOPTIONS
Sets the display options for zebra, curvature, and draft analysis.
System Variables
VSACURVATUREHIGH
Sets the value at which a surface displays as green during curvature analysis
(ANALYSISCURVATURE).
VSACURVATURELOW
Sets the value at which a surface displays as blue during curvature analysis
(ANALYSISCURVATURE).
VSACURVATURETYPE
Controls which type of curvature analysis is used with the
(ANALYSISCURVATURE).
Use the Draft Analysis Tool
Evaluates if a model has adequate space between a part and its mold.
If you are creating shapes or parts that need to be molded, the draft analysis
tool evaluates if their is adequate draft between a part and its mold (based on
the pull direction).
NOTE Analysis tools only work in the 3D visual styles; they will not work in 2D.
To analyze the draft of a model
1Click Surface tab ➤ Analysis panel ➤ Draft.
2Select a model and press Enter.
The draft analysis colors display.
1166 | Chapter 25 Modify 3D Models
To turn off the draft color display
1Click Surface tab ➤ Analysis panel ➤ Analysis Options.
2Click the Clear Draft Analysis button.
The draft analysis colors disappears.
To change the draft analysis options
1Click Surface tab ➤ Analysis panel ➤ Analysis Options.
2In the Draft Angle tab of the Analysis Options dialog box, select the
desired options and click OK.
Quick Reference
Commands
ANALYSISDRAFT
Displays a color gradient onto a 3D model to evaluate whether there is
adequate space between a part and its mold.
ANALYSISOPTIONS
Sets the display options for zebra, curvature, and draft analysis.
System Variables
VSADRAFTANGLEHIGH
Sets the value at which a model displays as green during draft analysis
(ANALYSISDRAFT).
VSADRAFTANGLELOW
Sets the value at which a model displays as blue during draft analysis
(ANALYSISDRAFT).
Modify Mesh Objects
Model mesh objects by changing smoothing levels, refining specific areas, or
adding creases.
Modify Mesh Objects | 1167
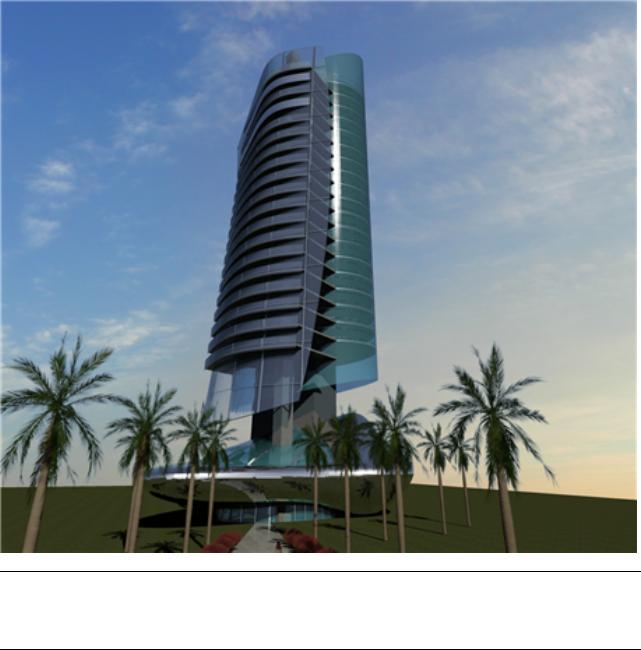
Overview of Modifying Meshes
Modeling mesh objects differs from modeling 3D solids and surfaces in some
important ways.
Mesh objects do not have the mass and volume properties of 3D solids.
However, they do offer unique capabilities that enable you to design less
angular, more rounded models. Mesh objects are easier to mold and reshape
than their solid and surface counterparts.
NOTE The capabilities described in this section apply only to mesh objects created
in AutoCAD 2010 and later. They cannot be used with legacy polyface or polygon
mesh.
About Mesh Faces
Mesh objects are composed of faces and facets.
1168 | Chapter 25 Modify 3D Models
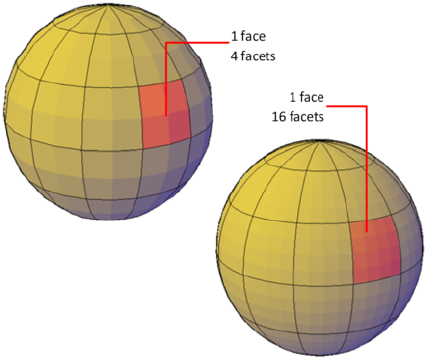
Faces are non-overlapping units that—along with their edges and
vertices—form the basic editable units of a mesh object. When you move,
rotate, and scale individual mesh faces, surrounding faces are stretched and
deformed in order to avoid introducing gaps. When gaps occur, you can often
close them by smoothing the object or refining individual faces.
About Mesh Facets
Mesh faces have underlying structures, known as facets. The density of the
facet grid corresponds to the smoothness of the mesh. As the smoothness
level is increased, the density of the underlying facet grid also increases. When
you want to confine detailed mesh editing to a smaller area, you can convert
facets to editable faces by using refinement.
Unlike faces, facets cannot be individually modified. However, you can make
them more visible by modifying the VSLIGHTINGQUALITY system variable.
About Mesh Modeling
You can work with mesh objects in the following ways:
■Add smoothness. Increase or decrease smoothness levels to round the
overall shape of the model. The underlying density of the mesh facet grid
increases as the mesh object smoothness level increases
(MESHSMOOTHMORE, MESHSMOOTHLESS).
■Refine the object to reset the baseline smoothness level. Refine a mesh
object to convert the underlying facet grid to editable faces. Refinement
Overview of Modifying Meshes | 1169
also resets the lowest level of smoothness that can be applied to the object
(MESHREFINE).
■Refine a face. Restrict the refinement to a specific mesh face. This method
avoids resetting the smoothness baseline.
■Crease an edge. Remove the smoothness from specified edges. You can
also remove an existing crease (MESHCREASE).
■Split or merge faces. Divide an existing face into separate components
along a specified path. Merge two or more faces to create a single face
(MESHSPLIT, MESHMERGE).
■Collapse vertices. Alter the mesh model by collapsing the vertices of
adjacent faces to a single point (MESHCOLLAPSE.
■Spin edges. Spin the shared edge of adjacent triangular faces to alter the
shapes and orientation of the faces (MESHSPIN).
■Extrude a face. Extend a specified face by extruding it into 3D space. Unlike
3D solid extrusion, a mesh extrusion does not create a separate object
(MESHEXTRUDE).
■Repair holes. Close a gap between faces by selecting the surrounding edges.
Holes in mesh objects can prevent you from converting a mesh object to
a solid object (MESHCAP).
Use Grip Editing with Mesh
Grips, as described in Use Grips to Edit 3D Solids and Surfaces on page 1115, are
not available with meshes. However, you can manipulate the entire mesh
model or individual subobjects using the following methods:
■Subobject selection and editing. Select faces, edges, and vertices the same
way you select 3D solid subobjects. Press Ctrl and click the component.
The subobject highlighting indicates what is selected. Press Shift and click
again to remove the selection from a subobject. By turning on the Subobject
Selection Filter, you can restrict selection to a specific subobject, which
you can select without pressing Ctrl. See Use 3D Subobject Grips on page
1109.
■Gizmo editing. When you select a mesh object or subobject, the 3D Move,
Rotate, or Scale gizmo is displayed automatically. (You can set which gizmo
is displayed by default.) Use these gizmos to modify the selection uniformly,
or along a specified plane or axis. See Use Gizmos to Modify Objects on
page 1093.
1170 | Chapter 25 Modify 3D Models
Because dense meshes can be difficult to work with, you can change settings
to improve the display and behavior of grips.
■Set the subobject selection filter to select only faces, edges, or vertices:
Set the DEFAULTGIZMO system variable or use the shortcut menu.
■Set whether a grip on a face, edge, or vertex is active immediately when
you select the subobject: Set the GRIPSUBOBJMODE system variable.
Quick Reference
Commands
MESHCAP
Creates a mesh face that connects open edges.
MESHCOLLAPSE
Merges the vertices of selected mesh faces or edges.
MESHCREASE
Sharpens the edges of selected mesh subobjects.
MESHEXTRUDE
Extends a mesh face into 3D space.
MESHMERGE
Merges adjacent faces into a single face.
MESHREFINE
Multiplies the number of faces in selected mesh objects or faces.
MESHSMOOTHLESS
Decreases the level of smoothness for mesh objects by one level.
MESHSMOOTHMORE
Increases the level of smoothness for mesh objects by one level.
MESHSPIN
Spins the adjoining edge of two triangular mesh faces.
MESHSPLIT
Splits a mesh face into two faces.
Overview of Modifying Meshes | 1171
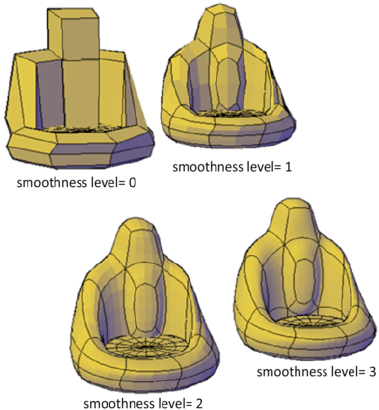
MESHUNCREASE
Removes the crease from selected mesh faces, edges, or vertices.
System Variables
DEFAULTGIZMO
Sets the 3D Move, 3D Rotate, or 3D Scale gizmo as the default during
subobject selection.
GRIPSUBOBJMODE
Controls whether grips are automatically made hot when subobjects are
selected.
VSLIGHTINGQUALITY
Sets the lighting quality in the current viewport.
Change Mesh Smoothness Levels
Increase the roundness of mesh objects by increasing the smoothness levels.
Mesh objects are made up of multiple subdivisions, or tessellations, which
define the editable faces. Each face consists of underlying facets. When you
increase smoothness, you increase the number of facets to provide a smoother,
more rounded look.
1172 | Chapter 25 Modify 3D Models
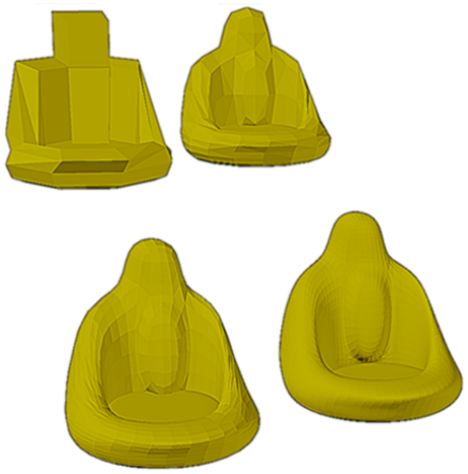
Increase or Decrease Smoothness
As you work, you can increase and decrease the level of smoothness. The
differences are apparent both in the wireframe and conceptual visual styles
and in the rendered output.
The lowest level of smoothness, or baseline, is 0. By default, Level 0 has no
smoothness. You can increase the smoothness of any mesh object up to the
current limits. However, you cannot decrease the smoothness of a mesh object
whose level of smoothness is zero.
If you have added creases to a mesh object, the effect of smoothing differs,
depending on the crease setting. The effect of creases added to mesh that has
no smoothness (Level 0) is not apparent until the mesh is smoothed.
As you edit an object using gizmos or grips, you might create gaps in the mesh
object. One way to close the gap is to smooth the object or refine individual
subobjects. Using hardware acceleration might also help resolve this problem.
(For more information, see Graphics System.)
Limit Mesh Density
Mesh is created at the level of smoothness that you specify. The smoothness
can range from None (0), to the default maximum (6), or to a level that you
Change Mesh Smoothness Levels | 1173

specify. As an object is smoothed, the density of the mesh facet grid also
increases. For best results, model mesh objects at lower smoothness levels and
increase the smoothness only after modeling is complete.
Dense meshes can result in subobjects that are difficult to select and edit. They
can also affect performance. Therefore you might want to set limits that
prevent the mesh from becoming too dense.
■Maximum level of smoothness at which a grid is displayed
(SMOOTHMESHGRID). Displays the effects of modeling without the
complexity of the underlying facet grid. The default smoothness level is
3. The tessellation display becomes increasingly dense until the maximum
level is exceeded. Beyond that level, the display reverts to the most basic
level, even though the smoothing level can continue to increase.
■Maximum number of faces in a drawing (SMOOTHMESHMAXFACE). Sets
the maximum number of mesh faces that are permitted per mesh object.
■Maximum level of smoothness (SMOOTHMESHMAXLEV). Sets the
maximum smoothness level permitted for mesh objects.
To increase the smoothness of a mesh object
1Click Mesh tab ➤ Mesh panel ➤ Smooth More.
2Select the mesh objects that you want to modify.
The smoothness of each object that you select is increased one level.
To decrease the smoothness of a mesh object
1Click Mesh tab ➤ Mesh panel ➤ Smooth Less.
2Select the mesh objects that you want to modify.
The smoothness of each object that you select is decreased one level.
To increase or decrease the smoothness of a mesh object (Properties palette)
1If the Properties palette is not displayed, select any object. Right-click the
object to display the shortcut menu. Click Properties.
2Select the mesh objects that you want to modify.
1174 | Chapter 25 Modify 3D Models
3In the Properties palette, Geometry area, Smoothness box, select a new
smoothness level.
To control the display of the mesh facet grid
1At the Command prompt, enter smoothmeshgrid.
2Enter one of the following values:
■0 suppresses the display of the underlying mesh facet grid.
■1 displays the mesh facet grid only when the object has a level of
smoothness of 0 or 1.
■2 and higher sets the highest level of smoothness at which the facet
grid is displayed.
To set the maximum smoothness level for mesh objects
1At the Command prompt, enter smoothmeshmaxlev.
2Enter a value that represents the highest level of smoothness permissible
for mesh objects. The recommended range is 1 - 5.
To set the maximum number of mesh faces
1At the Command prompt, enter smoothmeshmaxface.
2Enter the maximum number of faces permitted for an object.
You can set a value up to 16,000,000.
Quick Reference
Commands
MESHSMOOTHLESS
Decreases the level of smoothness for mesh objects by one level.
MESHSMOOTHMORE
Increases the level of smoothness for mesh objects by one level.
PROPERTIES
Controls properties of existing objects.
Change Mesh Smoothness Levels | 1175
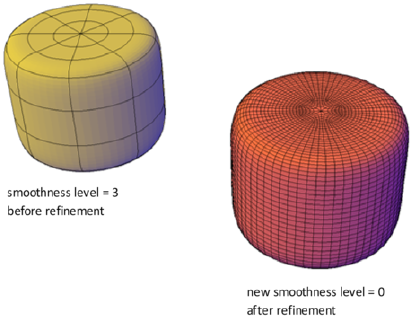
System Variables
SMOOTHMESHGRID
Sets the maximum level of smoothness at which the underlying mesh facet
grid is displayed on 3D mesh objects.
SMOOTHMESHMAXFACE
Sets the maximum number of faces permitted for mesh objects.
SMOOTHMESHMAXLEV
Sets the maximum smoothness level for mesh objects.
Refine Mesh Objects or Subobjects
Refine a mesh object or subobject to convert underlying facets to editable
faces.
You can refine any mesh that has a level of smoothness of 1 or higher.
Refine a Mesh Object and Reset the Baseline
Refining an object increases the number of editable faces by converting the
underlying facets to faces. The number of resulting faces depends on the
current level of smoothness. Higher smoothness levels result in a higher
number of faces after refinement.
In addition to increasing the number of faces, refining a mesh object resets
its level of smoothness back to the baseline. Therefore, an object might appear
to be smoothed, but its smoothness level can still equal 0 (zero).
1176 | Chapter 25 Modify 3D Models
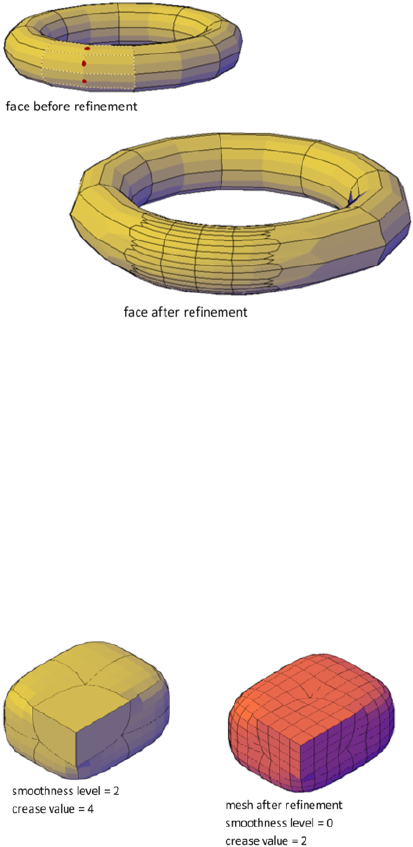
Refine a Mesh Face
You can refine an entire mesh object as shown in the previous illustration, or
select a specific face to refine. A refined face is subdivided into four faces and
the surrounding faces are deformed slightly to accommodate the change.
Refining a mesh face does not affect the overall smoothing level of the mesh
object. Unlike a refined mesh object, refined faces can be refined again
immediately. With mesh face refinement, you can target smaller areas for
detailed modeling.
How Refinement Affects Creases
A crease that is set to Always retains its sharpness no matter how much you
smooth or refine the object. However, the behavior is different when you
assign a crease value. If you refine an object or edge that has a crease value,
the assigned crease value is lowered by the value of the original level of
smoothing. Suppose that you add a crease with a crease value of 4 and then
refine a mesh whose level of smoothness is 2. The new crease value is 2.
Refine Mesh Objects or Subobjects | 1177

If a crease is applied before an object is smoothed or refined, the effect is not
apparent until after the object is smoothed or refined.
To refine a mesh object
1Click Mesh tab ➤ Mesh panel ➤ Refine Mesh.
2Select the mesh object that you want to refine. (The object must have a
smoothness level of 1 or higher.)
The underlying mesh facets are converted to faces and the level of
smoothness for the object is set to 0. Higher levels of smoothness result
in a higher number of faces.
To refine a mesh face
1Set the subobject selection filter to select only faces: right-click anywhere
in the drawing area. Click Subobject Selection Filter ➤ Face.
2Click Mesh tab ➤ Mesh panel ➤ Refine Mesh.
3Click one or more mesh faces that you want to refine. Press Enter. (The
object must have a smoothness level of 1 or higher.)
Each face is subdivided into four new faces.
Quick Reference
Commands
MESHREFINE
Multiplies the number of faces in selected mesh objects or faces.
Add Creases to Mesh
Add creases to sharpen mesh edges.
You can add creases to mesh objects that have a smoothing level of 1 or higher.
1178 | Chapter 25 Modify 3D Models
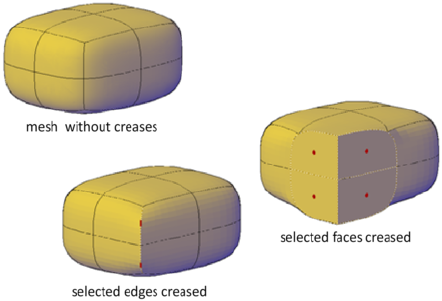
Add Creases to Different Subobjects
The result of creasing differs, depending on what type of subobject you select.
■Edge. The selected edge is sharpened. The adjacent faces are deformed to
accommodate the new crease angle.
■Face. The selected face is flattened and all edges that bound that face are
sharpened. Adjacent faces are deformed to accommodate the new shape
of the face.
■Vertex. The point of the vertex and all intersecting edges are sharpened.
Adjacent faces are deformed to accommodate the new vertex angle.
Assign a Crease Value to the Edge
As you apply a crease, you set a crease value that determines how the crease
is affected by smoothing. A value of Always ensures that the crease is always
retained, even when the mesh is repeatedly smoothed. Higher crease values
ensure that the crease is retained through several smoothing processes. (During
smoothing, the assigned crease value is decreased by the value of the original
level of smoothing.)
You can add a crease to mesh that has not been smoothed. However, the effect
is not visible unless you smooth the object.
Remove a Crease
You can restore a crease to a smoothed state that corresponds to the smoothing
level for the object. If you remove a crease that is adjacent to other creased
subobjects, their contours are adjusted.
Add Creases to Mesh | 1179
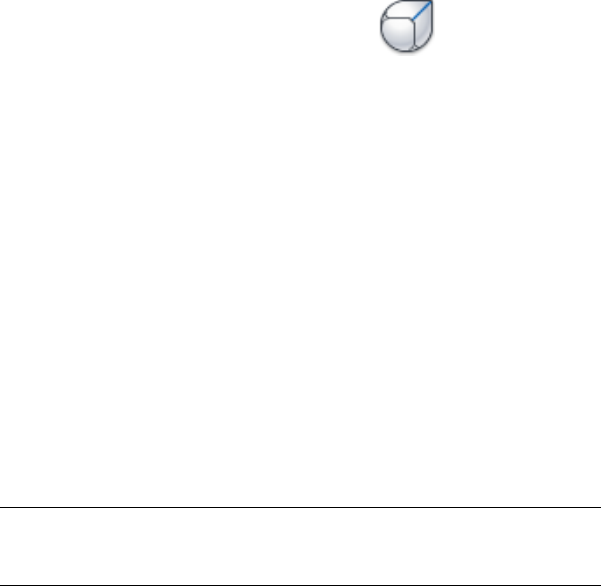
To add creases to a mesh object
1(Optional) Specify the type of subobject to crease: right-click in the
drawing area and click Subobject Selection Filter ➤ Face, Vertex, or Edge.
2Click Mesh tab ➤ Mesh panel ➤ Add Crease.
3Select the mesh edges, faces, or vertices to crease. (If you have set a
subobject selection filter, only one type of subobject can be selected.)
To remove a subobject from the selection set, Shift+click the subobject.
4Specify the crease value:
■Always retains the crease at all levels of smoothness.
■Values of 1 or higher sets the level of smoothness that starts to affect
the crease.
The specified subobjects are creased. A crease is not visible on objects
that have not been smoothed (the level of smoothness = 0).
To change the crease value of an existing mesh crease (Properties palette)
1If the Properties palette is not displayed, select any object. Right-click the
object to display the shortcut menu. Click Properties.
2Press Ctrl+click the mesh subobject that you want to modify.
NOTE If you cannot select a specific subobject, verify whether subobject
selection filtering is turned on for a different subobject type. (Right-click in
the drawing area and click Subobject Selection Filter.)
3In the Properties palette, Crease area, Type box, change the crease value:
■None removes the crease and sets the subobject to the current level
of smoothness.
■Always retains the crease at all levels of smoothness.
■By Level sets the level of smoothness that starts to affect the crease.
When this setting is selected, you can specify the crease level in the
Level box.
1180 | Chapter 25 Modify 3D Models

To remove an existing mesh crease
1(Optional) Specify the type of subobject to modify: right-click in the
drawing area and click Subobject Selection Filter ➤ Face, Vertex, or Edge.
2Click Mesh tab ➤ Mesh panel ➤ Remove Crease.
3Press Ctrl+click the mesh subobjects to be modified and press Enter.
You can also use window selection to specify multiple subobjects.
Quick Reference
Commands
MESHCREASE
Sharpens the edges of selected mesh subobjects.
MESHUNCREASE
Removes the crease from selected mesh faces, edges, or vertices.
PROPERTIES
Controls properties of existing objects.
Modify Mesh Faces
Split, extrude, merge, collapse, or spin mesh faces to modify their shapes.
Split a Mesh Face
You can split a mesh face to make custom subdivisions. Use this method to
prevent deforming a larger area for small modifications.
Modify Mesh Faces | 1181
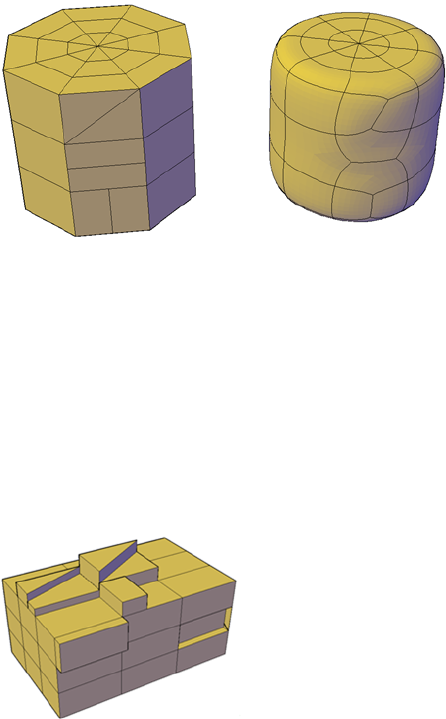
Because you specify the start point and end point of the split, this method
also gives you control over the shape of the two new faces. Use the Vertex
option to snap automatically to the vertices of the face. If you plan to split a
face to create—and then spin the edge of—two triangular faces (MESHSPIN),
use the Vertex option to ensure precision.
Extrude Mesh Faces
You can add definition to a 3D object by extruding a mesh face. Extruding
other types of objects creates a separate 3D solid object. However extruding
a mesh face extends, or deforms, the existing object and subdivides the
extruded face.
You can use the same methods for extrusion of the faces of 3D solids and
meshes as you use for other types of objects. For example, you can specify an
extrusion direction, a path, or a taper angle. However, when you extrude mesh
faces, the MESHEXTRUDE command provides an option that sets whether
adjacent faces are extruded individually or whether their shared edges remained
joined.
1182 | Chapter 25 Modify 3D Models
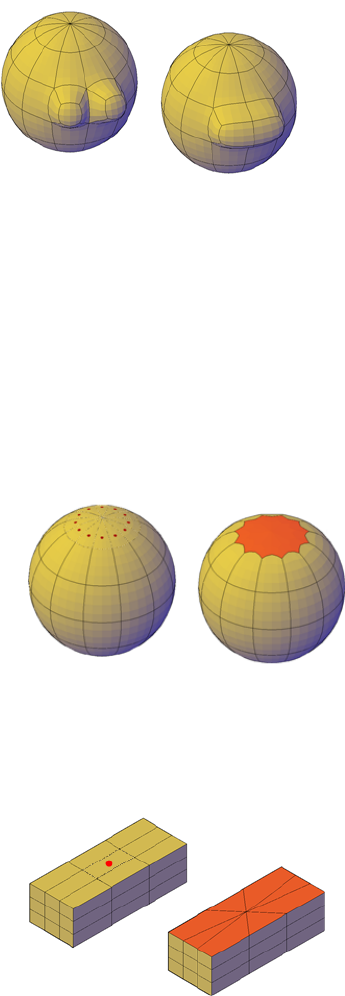
You cannot create joined extrusions for mesh faces in which only the vertices
are shared.
For more information about extrusion, see Create a Solid or Surface by
Extruding on page 968.
Reconfigure Adjacent Mesh Faces
You can extend your editing options by reconfiguring adjacent faces. Several
options are available:
■Merge adjacent faces. Combine adjacent faces to form a single face.
Merging works best with faces that are on the same plane.
Although you can merge faces that wrap a corner, additional modifications
to the resulting mesh object can have unexpected results.
■Collapse the mesh vertices. Merge adjacent vertices of surrounding faces
form a single point. The selected face is removed.
Modify Mesh Faces | 1183
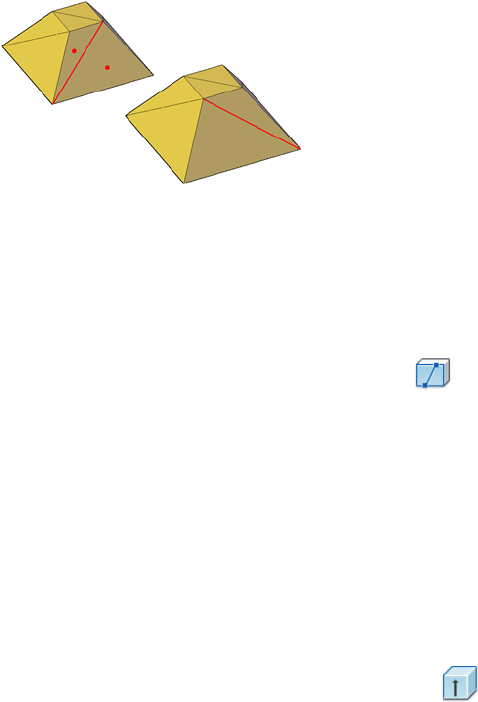
■Spin edges of triangular faces. Rotate an edge that is shared by two
triangular faces. The shared edge spins to extend from the opposite vertices.
This activity works best when the adjoined triangles form a rectangular,
not a triangular, shape.
See also:
■Tips for Working with Mesh on page 1189
To split a mesh face
1Click Mesh tab ➤ Mesh Edit panel ➤ Split Face.
2Click the mesh face that you want to split.
3To snap to a vertex of the face, enter v (Vertex).
4Click the location where you want to start the split.
5Click a second location to end the split.
The mesh face is split along the boundary you specified. Surrounding
faces are adjusted.
To extrude mesh faces
1Click Mesh tab ➤ Mesh Edit panel ➤ Extrude Face.
2To review or change the extrusion method, press s (Setting) and set one
of the following options:
■To keep adjacent faces joined as you extend them, enter y (Yes).
■To extend adjacent faces separately, enter n (No).
3Click one or more mesh faces and press Enter.
1184 | Chapter 25 Modify 3D Models

4Specify the amount of extrusion using one of the following methods:
■(Single face extrusion only) Press Enter to set the extrusion
dynamically.
■Enter a value to indicate the height or depth of the extrusion and
press Enter.
The selected face is extruded.
To merge mesh faces
1Click Mesh tab ➤ Mesh Edit panel ➤ Merge Face.
2On a mesh object, select two or more mesh faces and press Enter.
The selected faces are combined to form a single face.
To collapse mesh faces
1Click Mesh tab ➤ Mesh Edit panel ➤ Mesh Edit drop-down ➤ Collapse
Face or Edge.
2Select a mesh face or edge.
NOTE If you cannot select a face or edge, verify whether subobject selection
filtering is turned on for a different subobject type. (Right-click the drawing
area and click Subobject Selection Filter.)
The vertices of the face or edge that you selected are collapsed to a single
point.
To spin the shared edge of triangular mesh faces
1Click Mesh Modeling tab ➤ Mesh Edit panel ➤ Mesh Edit drop-down
➤ Spin Triangle Face.
2Select two triangular mesh faces that are adjacent to one another.
The edge shared by the original triangles rotates, or spins, to connect two
different vertices.
Modify Mesh Faces | 1185
Quick Reference
Commands
MESHCOLLAPSE
Merges the vertices of selected mesh faces or edges.
MESHEXTRUDE
Extends a mesh face into 3D space.
MESHMERGE
Merges adjacent faces into a single face.
MESHSMOOTHLESS
Decreases the level of smoothness for mesh objects by one level.
MESHSMOOTHMORE
Increases the level of smoothness for mesh objects by one level.
MESHSPIN
Spins the adjoining edge of two triangular mesh faces.
MESHSPLIT
Splits a mesh face into two faces.
Create and Close Mesh Gaps
Delete mesh faces or close gaps in mesh objects.
Remove Mesh Faces
You can press Delete or use the ERASE command to remove mesh faces. The
removal leaves a gap in the mesh.
■Deleting a face removes only the face.
1186 | Chapter 25 Modify 3D Models
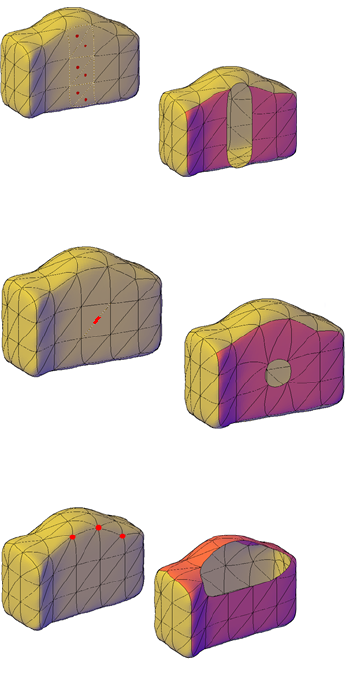
■Deleting an edge removes each adjacent face.
■Deleting a vertex removes all faces that are shared by the vertex.
If removal of a mesh face creates a gap, the mesh object is not “watertight.”
It can be converted to a surface object, but not to a 3D solid object.
Close Gaps in Mesh Objects
If a mesh object is not watertight due to gaps, or holes, in the mesh, you can
make it watertight by closing the holes. The cap, or new face, spans the
boundary formed by the mesh edges that you specify (MESHCAP).
Create and Close Mesh Gaps | 1187
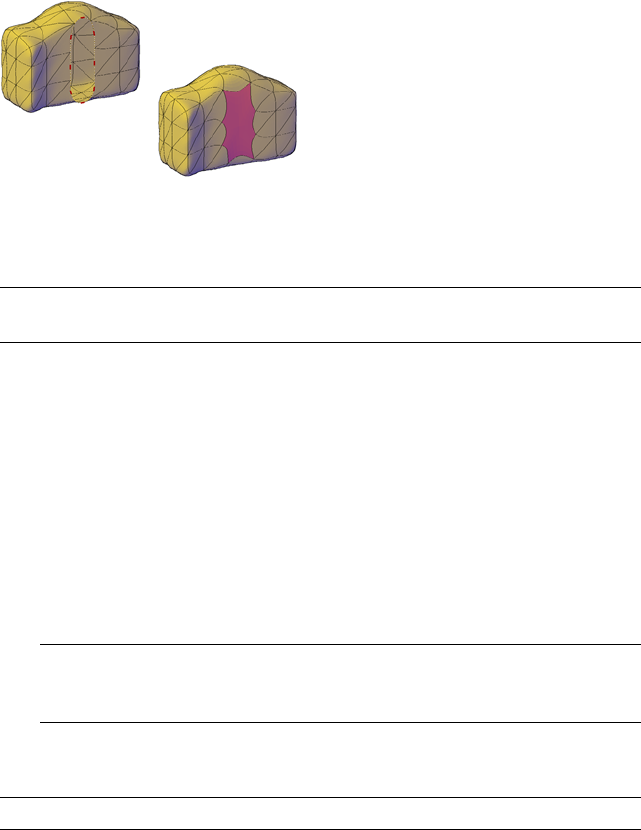
This process works best when all edges are on the same plane. The edges you
select as boundaries cannot be shared by two faces. For example, you cannot
close the center hole in a mesh torus.
NOTE You can sometimes close gaps in mesh by smoothing the object, by using
MESHCOLLAPSE, or by splitting adjacent faces (MESHSPLIT).
See also:
■Tips for Working with Mesh on page 1189
To delete faces from a mesh object
1Press Ctrl+click one of the following mesh subobject types:
■To remove only that face, click the face.
■To remove adjacent faces, click their shared edge.
■To remove all faces that share a vertex, click the vertex.
NOTE If you cannot select the subobject you want, verify whether subobject
selection filtering is turned on for a different subobject type. (Right-click in
the drawing area and click Subobject Selection Filter.)
2Press Delete.
NOTE You can also remove mesh faces with the ERASE command.
To repair a hole in a mesh object
1Click Mesh tab ➤ Mesh Edit panel ➤ Close Hole.
2Select contiguous edges to serve as the boundary for the mesh face that
will span the gap.
1188 | Chapter 25 Modify 3D Models
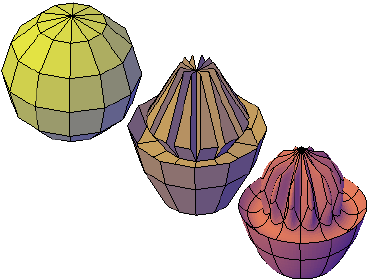
Quick Reference
Commands
ERASE
Removes objects from a drawing.
MESHCAP
Creates a mesh face that connects open edges.
Tips for Working with Mesh
Learn some best practices for working with mesh models.
Mesh, with its enhanced modeling capabilities, offers a way to create more
fluid, free-form designs. Keep these tips in mind as you work.
Model mesh before you smooth it.
Mesh modeling is a powerful way to design, but higher levels of smoothness
increase complexity and can affect performance. You can work more efficiently
if you complete editing operations such as gizmo editing, extrusion, and face
splitting, on mesh objects that have not been smoothed. (That is, their level
of smoothness is 0.)
mesh sphere modeled by grip editing and
extrusion, then smoothed
You can quickly switch between the levels of smoothness in the Properties
palette to get a preview of how your activities affect the smoothed object.
Tips for Working with Mesh | 1189
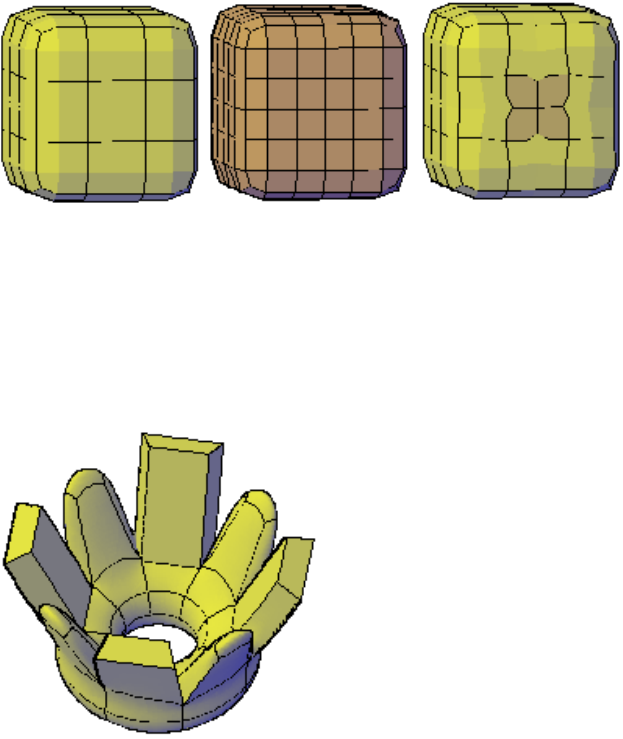
Refine or split a face instead of refining the entire object.
Refinement is a powerful way to subdivide faces. However, by increasing the
number of faces, you add to the overall complexity of the model. In addition,
refining an entire mesh object resets the base level of smoothness to 0. This
change can result in a dense grid that can no longer be simplified. For best
results, avoid refining the object, and refine or split only the individual faces
that require more detailed modeling.
mesh box, refined mesh box, and mesh box with one face refined
Refining individual faces does not reset the level of smoothness for the object.
Crease edges to help limit distortion when the object is smoothed.
Creased edges can be set to maintain their sharpness, no matter how much
the object is smoothed. You may also need to crease the edges in surrounding
faces to obtain the result you want.
extruded faces on mesh torus, creased and
not creased
1190 | Chapter 25 Modify 3D Models
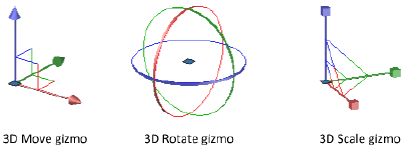
Creasing set to Always retains its sharpness after smoothing. If you set a crease
value, the creased edge becomes smoother at the equivalent level of
smoothness.
Use gizmos to model faces, edges, and vertices.
3D Move, 3D Rotate, and 3D Scale gizmos can be used to modify entire mesh
objects, or specific subobjects.
For example, you can rotate and scale an individual face using the 3D Move,
Rotate, and Scale gizmos.
By constraining the modifications to a specified axis or plane, gizmos help
you avoid unexpected results. The default gizmo is displayed whenever you
select an object in a view that uses a 3D visual style. (You can also suppress
this display.) Therefore, you do not have to explicitly start the 3D Move, 3D
Rotate, or 3D Scale command to initiate these activities. You just need to select
an object.
When a gizmo is selected, you can use the shortcut menu to switch to a
different type of gizmo.
Use subobject selection filters to narrow the available selection candidates.
In a smoothed mesh, trying to select a specific subject can be difficult unless
you turn on subobject selection (shortcut menu). By specifying that the
selection set is limited to faces, edges, vertices, or even solid history subobjects,
you can restrict which subobject type is available for selection.
Tips for Working with Mesh | 1191
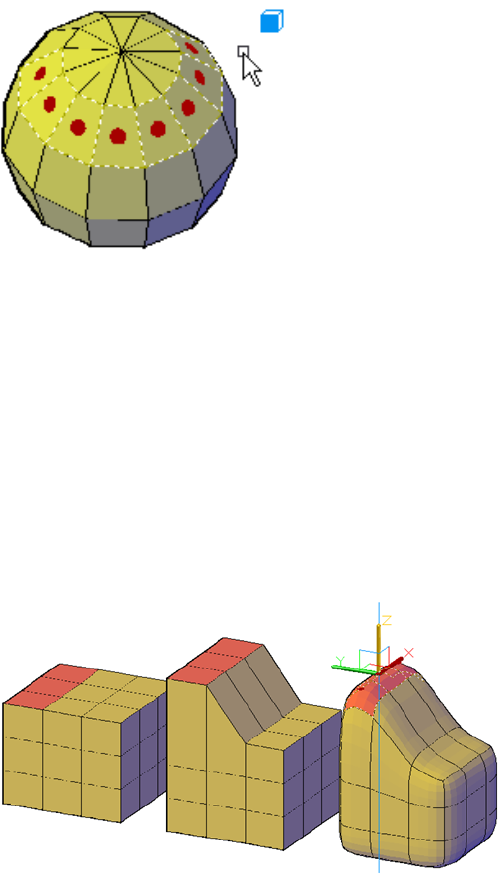
mesh faces selected when the face
subobject selection filter is on
A filter is especially valuable for selecting mesh vertices, which are not
highlighted as you move the mouse over them.
In order to select the entire mesh object, you need to turn off the subselection
filters.
Model by extruding faces.
A key difference between gizmo editing and extrusion occurs in the way each
face is modified. With gizmo editing, if you select and drag a set of faces,
adjacent faces are stretched to accommodate the modification. When the
object is smoothed, the adjacent faces adapt to the new location of the face.
mesh faces extended using 3D Move gizmo
Mesh extrusion, however, inserts additional faces to close the gap between
the extruded face and its original surface. With mesh extrusion, you can set
whether adjacent faces are extruded as a unit (joined) or separately (unjoined).
1192 | Chapter 25 Modify 3D Models
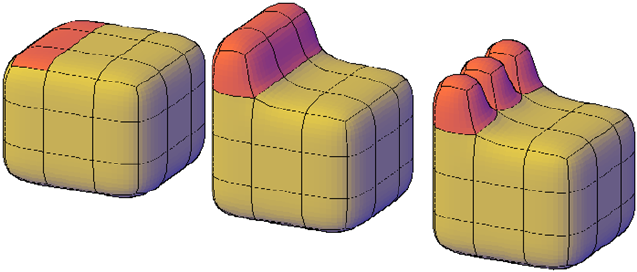
mesh faces extruded, then smoothed
If you are working on an object that has not been smoothed, try smoothing
it periodically to see how the extrusion is affected by smoothing.
Convert between mesh and 3D solids or surfaces.
Mesh modeling is powerful, but it cannot do everything that solid modeling
can do. If you need to edit mesh objects through intersection, subtraction, or
union, you can convert mesh to 3D solid or surface objects. Similarly, if you
need to apply creasing or smoothing to 3D solid or surface objects, you can
convert those objects to mesh.
Keep in mind that not all conversions retain complete fidelity to the shape
of the original object. Avoid switching between object types more than once,
if possible. If you notice that the conversion modifies the shape of the object
in an unacceptable way, undo the conversion and try again with different
settings.
■The Mesh Tessellation Options Dialog Box (MESHOPTIONS) controls the
smoothness and shape of the faces for 3D solids or surfaces that are
converted to mesh. Although you can convert an object to mesh without
opening this dialog box (MESHSMOOTH), you can more easily experiment
with different conversion settings by launching the conversion operation
from within the dialog box.
■The SMOOTHMESHCONVERT system variable (also available on the ribbon)
sets whether the mesh objects that you convert to 3D solids or surfaces are
smoothed or faceted, and whether their co-planar faces are optimized
(merged).
Tips for Working with Mesh | 1193
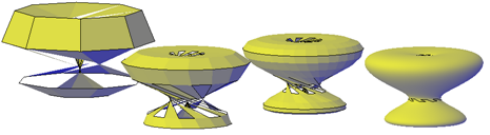
You might have trouble converting some non-primitive mesh to solid objects
due to the following problems:
■Gaps in the mesh. If you notice gaps, you can sometimes close them by
smoothing the object or by refining the faces that are adjacent to the gap.
mesh torus that has been twisted using 3D Rotate at various
smoothing levels
You can also close holes by using MESHCAP.
In some cases, you can also obtain better results by using hardware
acceleration to improve your graphics system.
■Intersecting mesh faces. Be especially careful not to create self-intersections
as you move, rotate, or scale subobjects. (You create self-intersections when
you cause one or more faces to cross, or intersect other faces in the same
mesh model.) View the object from all viewpoints to ensure you create a
viable model.
1194 | Chapter 25 Modify 3D Models
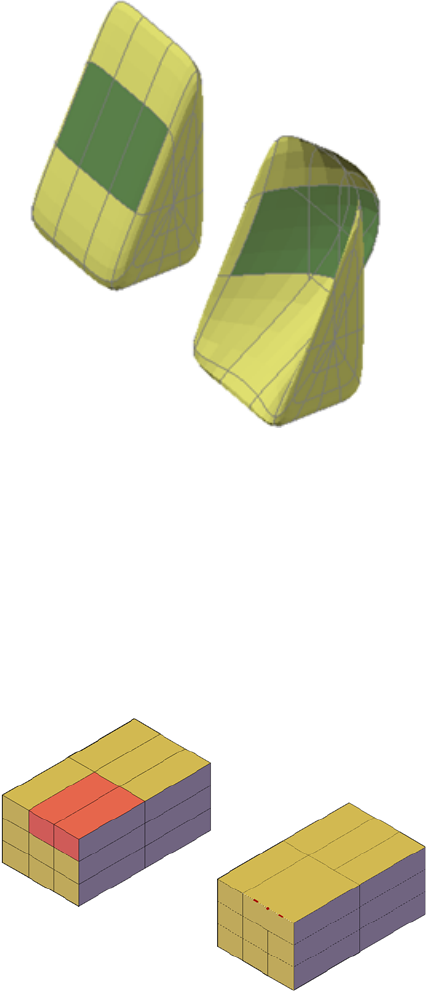
mesh wedge with front faces dragged past the
back faces
Mesh objects that cannot be converted to solids can often be converted to
surfaces instead.
Avoid merging faces that wrap a corner
When you merge faces, you can create a mesh configuration in which the
merged face wraps a corner. If a resulting face has a vertex that has two edges
and two faces, you cannot convert the mesh to a smooth 3D solid object.
Tips for Working with Mesh | 1195
One way to resolve this problem is to convert the mesh to a faceted solid
instead of a smooth solid. You might also be able to repair the problem by
splitting the adjacent faces, starting at the shared vertex (MESHSPLIT).
1196 | Chapter 25 Modify 3D Models
Create Sections and 2D
Drawings from 3D Models
Create cross sections, cutting planes, and flattened views of 3D objects.
Work with Sections
Create cross sections of 3D models.
Overview of Section Objects
Create a section plane that can be modified and moved to achieve the cross
section view that you need.
With the SECTIONPLANE command, you can create one or more section objects
and place them throughout a 3D model (3D solids, surfaces, or mesh). By
activating live sectioning, you can then view transient cuts in the 3D model as
you move the section object through it. The 3D objects themselves do not
change.
Set the Cross-Section with the Section Plane Indicator
Section objects have a transparent section plane indicator that acts as a cutting
plane. This plane can be moved through a 3D model that is composed of 3D
solids, surfaces, or regions to obtain different section views.
26
1197
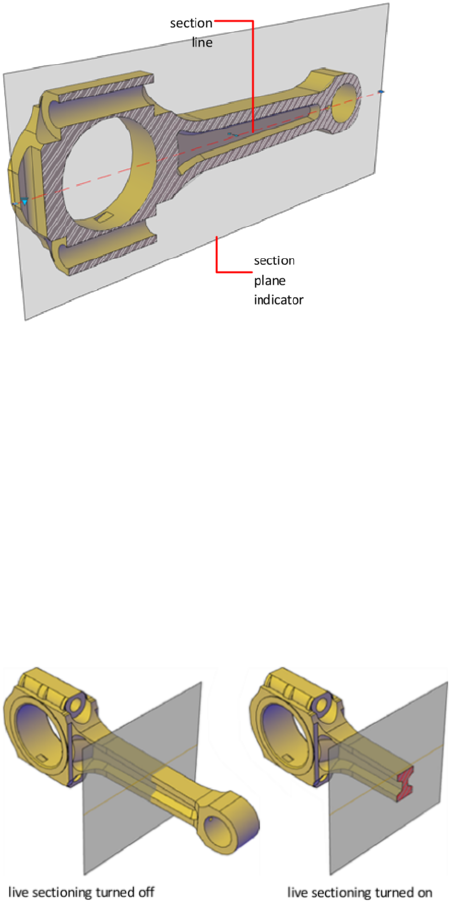
Store Properties in Section Lines
The section plane contains a section line that stores section object properties.
You can create multiple section objects to store different properties. For
example, one section object can display a hatch pattern at the section plane
intersection. Another section object can display a specific linetype for the
boundary of the intersected area.
Analyze the Model with Live Sectioning
With live sectioning, you can dynamically analyze the interior details of 3D
objects by moving and adjusting the section plane. You can specify whether
to hide, or cut away, the portion of the model that is on the viewing side of
the section plane indicator.
1198 | Chapter 26 Create Sections and 2D Drawings from 3D Models
Save and Share Section Images
After you create a sectional view, you can generate an accurate 2D or 3D block
from the 3D model. These blocks can be analyzed or checked for clearances
and interference conditions. They can also be dimensioned, or used as
wireframe or rendered illustrations in documentation and presentation
drawings.
You can also save each section object as a tool on the tool palette. That way,
you can avoid resetting properties each time you create a section object.
Quick Reference
Commands
LIVESECTION
Turns on live sectioning for a selected section object.
SECTIONPLANE
Creates a section object that acts as a cutting plane through 3D objects.
SECTIONPLANESETTINGS
Sets display options for the selected section plane.
SECTIONPLANETOBLOCK
Saves selected section planes as 2D or 3D blocks.
Create Section Objects
Create cross sections to show interior details of 3D objects.
With the SECTIONPLANE command, you create a section object that acts as a
cutting plane through solids, surfaces, meshes, or regions. Then turn on live
sectioning to move the section object through the 3D model to reveal its inner
details in real time.
You can align a section object using several methods.
Align the Section Plane to a 3D Face
One way to set the section plane is to click the face of an existing 3D object.
(As you move the cursor, a dotted outline indicates the side of the plane to
be selected.) The section plane is automatically aligned to the plane of the
face you select.
Create Section Objects | 1199
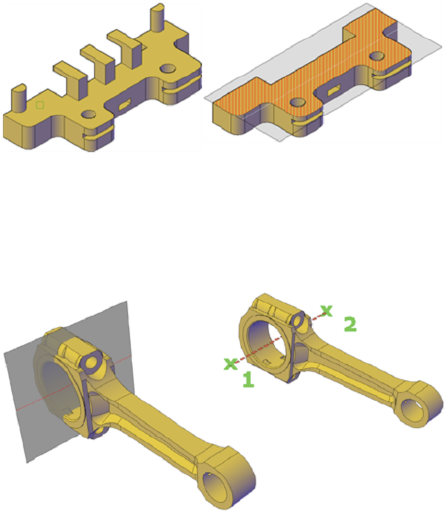
Section object aligned to face
Create a Straight Cutting Plane
Pick two points to create a straight cutting plane.
Add a Jogged Segment
The section plane can be a straight line or it can have multiple or jogged
sections. For example, a section containing a jog is one that cuts away a pie
slice-shaped wedge from a cylinder.
Create a section line that has jogged segments by using the Draw Section
option to pick multiple points throughout the 3D model.
1200 | Chapter 26 Create Sections and 2D Drawings from 3D Models
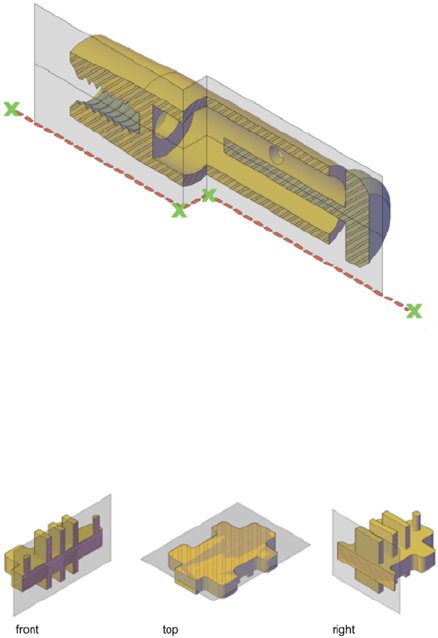
Section object with jogged segment
Create Orthographic Sections
You can align section objects to a specified orthographic orientation of the
current UCS, such as front, back, bottom, top, left, or right.
Orthographic section planes are placed so that they pass through the center
of the 3D extents of all 3D objects in the drawing.
Create a Region to Represent the Cross Section
With the SECTION command, you can create a 2D region object that represents
a planar cross section through a 3D solid object. You do not have live
sectioning capabilities when you use this legacy method to create cross sections.
Create Section Objects | 1201
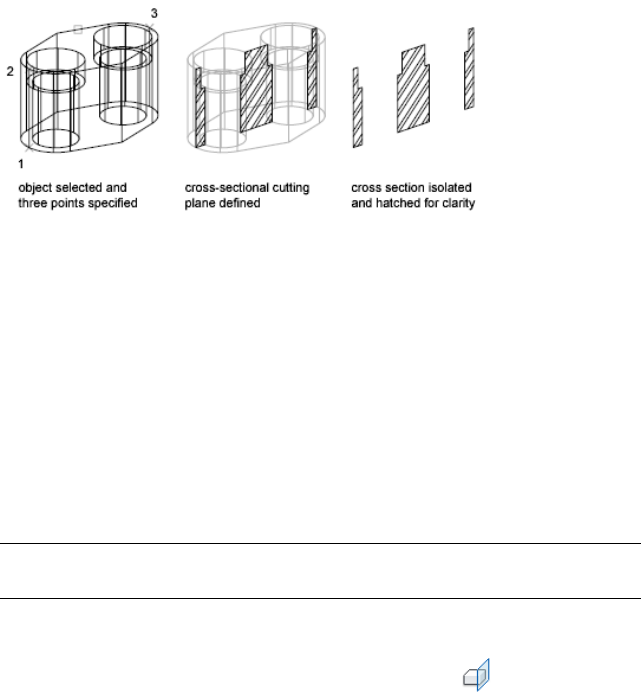
Define the plane of the cross section using one of the following methods:
■Specify three points.
■Specify a 2D object such as a circle, ellipse, arc, spline, or polyline.
■Specify a view.
■Specify the Z axis.
■Specify the XY, YZ, or ZX plane.
The new region that represents the cross-sectional plane is placed on the
current layer.
NOTE Before you apply hatching to the cross-sectional cutting plane, align the
UCS with the cutting plane.
To create a section object by selecting a face
1Click Home tab ➤ Section panel ➤ Section Plane.
2Click to select a face on your model.
A section object is created on the plane of the selected face.
3Click the section line to display its grips.
4Select a grip to move the section plane through the 3D object.
A section object is created in the Section Plane state. Live sectioning is
turned on.
1202 | Chapter 26 Create Sections and 2D Drawings from 3D Models

To create a section object by specifying two points
1Click Home tab ➤ Section panel ➤ Section Plane.
2Specify the first point of the section object.
3Specify the endpoint.
The section object is created between the two points. Live sectioning is turned
off.
To create a section object with jogged segments
1Click Home tab ➤ Section panel ➤ Section Plane.
2At the Command prompt, enter d (Draw Section).
3Specify the start point of the section object.
4Specify a second point to create the first jogged segment.
From this point, you cannot create segments that intersect.
5Continue specifying segment endpoints, then press Enter.
6Specify a point in the direction of the sectional cut.
A section object with multiple segments is created in a Section Boundary state.
Live sectioning is turned off.
To create a section object on a preset orthographic plane
1Click Home tab ➤ Section panel ➤ Section Plane.
2At the Command prompt, enter o (Orthographic).
3Select an alignment option.
The new section object intersects the center point of the 3D extents of all 3D
objects in the drawing. It is placed on the selected orthographic plane. Live
sectioning is turned on.
To create a region that represents the cross section of a 3D solid object
1At the Command prompt, enter section.
2Select the object to cross section.
Create Section Objects | 1203
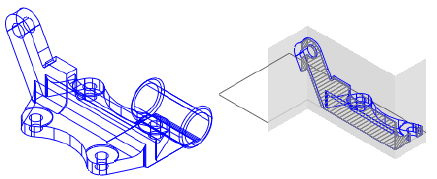
3Specify three points to define the cross-sectional plane.
Quick Reference
Commands
SECTIONPLANE
Creates a section object that acts as a cutting plane through 3D objects.
SECTION
Uses the intersection of a plane and solids, surfaces, or mesh to create a
region.
Modify a Section View
After you create a section, adjust its display or modify its shape and location
to change the represented section view.
Add Jogs to a Section
Add jogs, or angular segments, to existing section lines.
You can create a section line that has multiple segments (jogs), using the Draw
Section option of the SECTIONPLANE command. You can also add a jog to
an existing section object using the Add Jog to Section option on the shortcut
menu with SECTIONPLANEJOG.
A jog that is added to an existing section object creates a segment that is
perpendicular to the selected segment. Its viewpoint is oriented in the direction
set by the Direction grip. The Nearest object snap is temporarily turned on to
help you place the jogs on a section.
You cannot add jogs to the side or back lines of the section object.
1204 | Chapter 26 Create Sections and 2D Drawings from 3D Models
After adding jogs, you can reposition and resize the jogged sections by dragging
the section object grips.
To add jogs to a section
1Click Home tab ➤ Section panel ➤ Jog.
2On a section object, select the section line.
3Move the cursor over the section line.
4Select a point on the section line where you want to place a jog that is
perpendicular to the selected segment.
To create additional jogs, repeat the steps.
NOTE You cannot create jogs that cause the line to intersect itself or close.
Quick Reference
Commands
SECTIONPLANE
Creates a section object that acts as a cutting plane through 3D objects.
SECTIONPLANEJOG
Adds a jogged segment to a section object.
Use Live Section to Adjust the Cross Section
Use live sectioning to move a section object through the 3D model or region
dynamically.
What Is Live Sectioning?
Live sectioning is an analytical tool for viewing cut geometry in a 3D solid,
surface, or region.
Modify a Section View | 1205
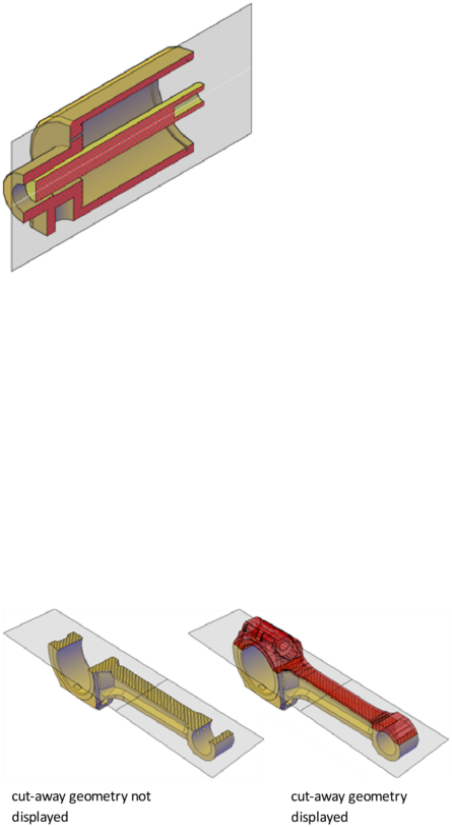
You can use live sectioning to analyze a model by moving the section object
through the object. For example, sliding the section object through an engine
assembly helps you visualize its internal components. You can use this method
to create a cross section view that you can save or reuse.
Turn on and Use Live Sectioning
Live sectioning works with 3D objects and regions in model space. When live
sectioning is activated, you can change the viewing planes by using grips to
adjust the location of the section object or its segments.
By turning on cutaway geometry, you can display the entire object that
contains the section plane. This option (available on the shortcut menu) can
only be turned on when section plane is active.
Live sectioning is turned on or off automatically, depending on how you
create the section object. For example, when you select a face to define the
section plane, live sectioning is turned on. When you create sections using
the Draw Section option of the SECTIONPLANE command, live sectioning is
turned off. Live sectioning can be manually turned on or off after a section
object is created.
1206 | Chapter 26 Create Sections and 2D Drawings from 3D Models

A drawing can contain multiple section objects. However, live sectioning can
only be active for one section object at a time. Suppose that your model has
two sections objects: Section A and Section B. If Section A has live sectioning
turned on and you activate live sectioning for Section B, live sectioning for
Section A is automatically turned off.
Turning off a section object layer does not turn off live sectioning. However,
freezing the layer turns off live sectioning.
To turn live sectioning on and off
1Select a section object.
2Click Home tab ➤ Section panel ➤ Live Section.
To display cutaway geometry
1Select a section object.
2Right-click the section line. Click Show Cut-away Geometry to turn it
on.
The cut geometry is displayed according to the Foreground Line settings
in the Section Settings dialog box.
Quick Reference
Commands
LIVESECTION
Turns on live sectioning for a selected section object.
SECTIONPLANE
Creates a section object that acts as a cutting plane through 3D objects.
SECTIONPLANESETTINGS
Sets display options for the selected section plane.
Use Grips to Modify Section Objects
Section object grips help you move and resize the section object.
Modify a Section View | 1207
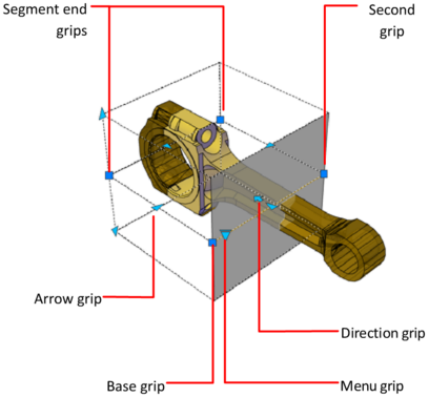
Grips allow you to adjust the location, length, width, and height of the cutting
area.
■Base grip. Acts as the basepoint for moving, scaling, and rotating the
section object. It is always adjacent to the Menu grip.
■Second grip. Rotates the section object around the base grip.
■Menu grip. Displays a menu of section object states, which control the
display of visual information about the cutting plane.
■Direction grip. Controls the viewing direction of the 2D section. To reverse
the viewing direction of the section plane, click the Direction grip.
■Arrow grip. (Section Boundary and Volume states only.) Modifies the
section object by modifying the shape and position of the section plane.
Only orthogonal movements in the direction of the arrow are permitted.
■Segment end grips. (Section Boundary and Volume states only.) Stretches
the vertices of the section plane. You cannot move segment end grips so
that segments intersect. Segment end grips are displayed at the endpoints
of jogged segments.
You can select only one section object grip at a time.
To adjust a section object using grips
1In the drawing area, click the section plane.
1208 | Chapter 26 Create Sections and 2D Drawings from 3D Models
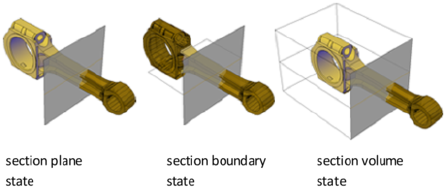
Depending on the current section plane state, different grips are displayed.
2Hover over the grip with the cursor until it turns red. Then drag the grip
to a new location.
3To adjust the height, width, or depth of a section plane, click the Menu
grip and select Section Volume or Section Boundary.
Quick Reference
Commands
SECTIONPLANE
Creates a section object that acts as a cutting plane through 3D objects.
System Variables
GRIPSIZE
Sets the size of the grip box in pixels.
Set Section Object States and Properties
Set the display of the section object.
Set Section Object States
Section objects have the following display states:
■Section Plane. The section line and transparent section plane indicator are
displayed. The cutting plane extends infinitely in all directions.
■Section Boundary. A 2D box shows the XY extents of the cutting plane.
The cutting plane along the Z axis extends infinitely.
Modify a Section View | 1209
■Section Volume. A 3D box shows the extents of the cutting plane in all
directions.
You can switch between object states by clicking the Menu grip that is
displayed when you select the section object.
Set Section Object Properties
Section objects have properties like other AutoCAD objects. Properties are
stored in the section line and can be accessed in the Properties palette.
For each section object, you can change the name, layer, and linetype. You
can also change the color and transparency of the section plane indicator (the
cutting plane).
To change the state of a section object by using the Menu grip
1Select the section object to display its grips.
2Click the Menu grip.
3On the section state menu, click the state you want to display.
The section display is updated to the selected state.
To change the state of a section object (Properties palette)
1Right-click the section object. Click Properties.
2In the Properties palette, under Section Object, change the value for Type.
The section display is updated to the selected state.
To rename a section object
1Right-click the section object. Click Properties.
2In the Properties palette, under Section Object, in the Name box, enter
a different name.
To change the transparency and color of the section plane indicator
1Right-click the section object. Click Properties.
2In the Properties palette, under Section Object, in the Plane Transparency
box, enter a value of 1-100. Entering 1 makes the section plane indicator
opaque.
1210 | Chapter 26 Create Sections and 2D Drawings from 3D Models
3In the Plane Color box, select a color.
The section plane indicator is updated in the viewport.
To change the height of the section plane indicator
1Right-click the section object. Click Properties.
2In the Properties palette, under Geometry, in the Top Plane box, change
the value.
This value changes the distance from the section line to the upper edge
of the section plane.
3In the Bottom Plane box, enter a value.
This value changes the distance from the section line to the bottom edge
of the section plane.
The section plane indicator is updated in the viewport.
To modify the live section display settings
1Click Home tab ➤ Section panel ➤ Panel dialog box launcher.
2Right-click the section object. Click Live Section Settings.
3In the Section Settings Dialog Box, click Live Section Settings.
4Modify the sections that you want to change and click OK.
Quick Reference
Commands
PROPERTIES
Controls properties of existing objects.
SECTIONPLANE
Creates a section object that acts as a cutting plane through 3D objects.
SECTIONPLANESETTINGS
Sets display options for the selected section plane.
SECTIONPLANETOBLOCK
Saves selected section planes as 2D or 3D blocks.
Modify a Section View | 1211
Associate Section Objects with Views and Cameras
Associate section objects with named views and cameras in the View Manager.
When you activate a named view or camera that has an associated section
object, live sectioning is turned on for that section object. For a 3D model
with multiple section objects, you might want to associate a particular section
object to a view or camera. Later, you can restore a saved sectional view or
camera and activate live sectioning for the associated section object.
For example, you can set up two section objects that cut through the 3D model
in different directions. Section object A cuts the model along its width; Section
object B cuts the model along its length. Perhaps you want to view the sectional
cut that is perpendicular to your line of sight. By associating each section
object with a view or camera, you can quickly switch between the two views
and see the desired cross section.
To associate a section object with a view or camera
1Click View tab ➤ Views panel ➤ Named Views.
2In the View Manager, in the left pane, under Model Views, select a named
view or camera.
3In the General section, in the Live Section drop-down list, select a section
object by name.
4Click OK.
The section object is now associated with a named view or camera. When
the named view or camera is restored, live sectioning is turned on for the
associated section object.
Quick Reference
Commands
SECTIONPLANE
Creates a section object that acts as a cutting plane through 3D objects.
VIEW
Saves and restores named views, camera views, layout views, and preset views.
1212 | Chapter 26 Create Sections and 2D Drawings from 3D Models
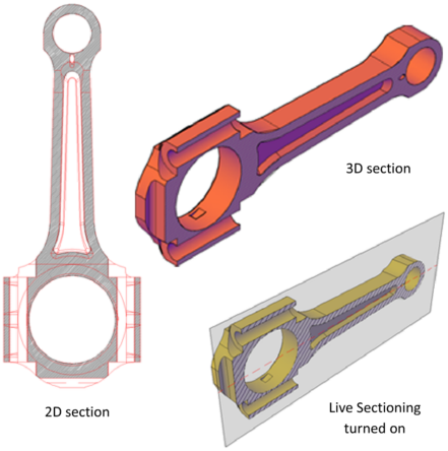
Save and Publish Section Objects
Save a section object as a block or tool, or publish it.
Save Sections as Blocks, Drawings, or Tools
Save the representation of the cross-sectional area where a section object
intersects a 3D model as a block.
Save Sections as Blocks or Drawings
You can save the section objects you create as blocks. Working from the
Generate Section / Elevation Dialog Box, you can choose the type of block
that is created.
For example, suppose your project requires 2D elevation drawings or 2D cross
sections. The 2D Section / Elevation option creates an accurate block
representation that is ready for dimensioning.
To publish or render a cutaway of the 3D model, select the 3D Section option.
3D section geometry consists of mostly 3D solids and surfaces. However, profile
outlines and hatch patterns consist of 2D lines.
Save and Publish Section Objects | 1213
The display properties of 2D section/elevation blocks and 3D section blocks
are controlled in the Section Settings dialog box.
When you create section blocks, you have the following choices for how they
are handled:
■Insert the section blocks. At the time of creation, you can insert a 2D or
3D section block into the drawing or save it to an external file. A 2D section
block is inserted on the XY plane of the current UCS, including section
blocks that extend into 3D space.
Inserted section blocks are initially unnamed. You can set the scale,
rotation, and basepoint upon insertion. You can modify and rename them
later by editing the block with BEDIT.
■Export section blocks to a file. Save and name the new section objects so
they can be inserted later.
■Save section block components on separate layers. By default, section
block components such as intersection boundary, intersection fill,
background lines, cutaway geometry, and curve tangency lines are saved
on Layer 0. However, you can separate the components of saved section
blocks onto separate layers with a suffix or prefix that you specify.
Assigning a suffix or prefix helps you organize the block components into
layers that you can sort and identify quickly. The Layer properties lists in
the Section Settings dialog box provide the opportunity to customize the
layer names.
■Specify whether to limit the section block to certain objects. The objects
that are included in a section block vary, depending on which section
object state is selected. You can also select specific objects to be included
as you create the section block.
Save Section Objects as Tools
As with other objects, you can create tools from individual section objects
and then access them in a tool palette when you need them.
If each of several section objects has its own set of properties, you can save
each section object as a tool. Later, you can quickly create new section objects
that use the same settings.
See also:
■Create and Use Tools from Objects and Images on page 69
1214 | Chapter 26 Create Sections and 2D Drawings from 3D Models

To save and insert a 2D or 3D section as a block
1Click Home tab ➤ Section panel ➤ Create Block.
2Select the section object.
3In the Generate Section/Elevation dialog box, click 2D Section/Elevation
or 3D Section.
4In the expanded dialog box, select Include All Objects.
5Under Destination, click Insert as New Block.
6Click Create.
7In the drawing area, specify an insertion point for the new block.
An unnamed block is inserted consisting of 2D or 3D geometry.
To save section block components on separate layers
1Click Home tab ➤ Section panel ➤ Create Block.
2Click a section object.
3In the Generate Section/Elevation dialog box, click 2D Section/Elevation
or 3D Section.
4In the expanded dialog box, click Section Settings.
5In the Section Settings dialog box, in the list of properties, click the Layer
box under the section component that you want to update.
6In the expanded Layer list, specify the layer on which to place the section
block component:
■To set an existing layer name, click *ObjectByLayer* or the name of
another layer. Go to step 7.
■To create a descriptive label to be added to the block section layer
names, click New Layer Name Settings.
7In the New Layer Name dialog box, specify how the descriptive text will
look:
■Under Added Text Type, specify whether you want the descriptive
text to be a prefix or a suffix.
Save and Publish Section Objects | 1215
■Under Text Added to the Existing Layer Name, enter descriptive text
to be added to the layer name.
Click OK.
8In the Section Settings dialog box, click OK.
9In the Generate Section / Elevation dialog box, click Create.
To save a section object tool as a tool palette tool
1On a section object, select the section line.
2Drag the section object to the position on the tool palette where you
want to place the tool.
The black line indicates the new location of the tool.
3Release the mouse button.
The section object is saved as a tool on the tool palette.
Quick Reference
Commands
BEDIT
Opens the block definition in the Block Editor.
SECTIONPLANE
Creates a section object that acts as a cutting plane through 3D objects.
SECTIONPLANESETTINGS
Sets display options for the selected section plane.
SECTIONPLANETOBLOCK
Saves selected section planes as 2D or 3D blocks.
TOOLPALETTES
Opens the Tool Palettes window.
1216 | Chapter 26 Create Sections and 2D Drawings from 3D Models
Publish Section Objects
Control the visibility of section objects when you render, plot, or view them
in the DWF file viewer.
Render Section Objects
With live sectioning turned on, all lines on a section object are rendered as
2D lines. The section plane indicator is rendered as a transparent material. Its
degree of transparency is controlled in the Properties palette.
If you want to render a 3D cutaway, save the cutaway section as a 3D block
and render the block reference.
Plot Section Objects
When a section object is in a Section Boundary or Section Volume state,
displayed lines cannot be plotted. The section plane indicator is plotted as if
it were transparent. However, it does not have the same visual quality that it
has when it is rendered.
If you do not want to plot the section line, place the section object on a layer
that is turned off.
View Section Objects in the DWF file viewer
When live sectioning is active for a section object, the 3D model is displayed
in the DWF Viewer with the best possible visual quality. Geometry that is
hidden by live sectioning is also hidden in the DWF Viewer.
Display settings for live sections have the same appearance in the viewer as
they have in the drawing. For example, dashed linetypes and hatch patterns
assigned to intersected areas of a 3D model are retained in the DWF Viewer
display.
The section object is not visible in the DWF Viewer.
Quick Reference
Commands
3DDWF
Creates a 3D DWF or 3D DWFx file of your 3D model and displays it in the
DWF Viewer.
Save and Publish Section Objects | 1217
PLOT
Plots a drawing to a plotter, printer, or file.
PUBLISH
Publishes drawings to electronic sheet sets (DWF, DWFx, or PDF files) or
plotters.
RENDER
Creates a photorealistic or realistically shaded image of a 3D solid or surface
model.
SECTIONPLANE
Creates a section object that acts as a cutting plane through 3D objects.
SECTIONPLANESETTINGS
Sets display options for the selected section plane.
SECTIONPLANETOBLOCK
Saves selected section planes as 2D or 3D blocks.
Create a Flattened View
Create a flattened view of the 3D solids and regions in the current view.
Create a Flatshot Object
With the FLATSHOT command, you can create a flattened, 2D representation
of the 3D model projected onto the XY plane. The resulting objects can be
inserted as a block or saved as a separate drawing.
The process is like taking a photograph of the entire 3D model and then laying
the photograph flat. This feature is useful for creating technical illustrations.
1218 | Chapter 26 Create Sections and 2D Drawings from 3D Models
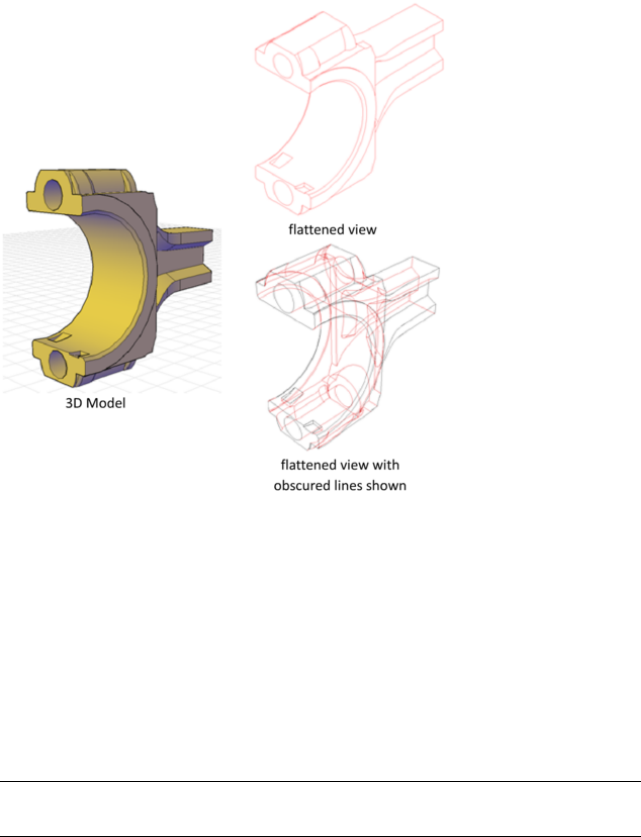
The flatshot process works only in model space. Start by setting up the view
you want, including orthographic or parallel views. All 3D objects in the model
space viewport are captured. Therefore, be sure to place the objects you do
not want captured on layers that are turned off or frozen.
As you create the block, you can control how hidden lines are displayed by
adjusting the Foreground and Obscured Lines settings in the Flatshot dialog
box. For best results with mesh objects, clear the Show box under Obscured
Lines so that hidden lines are not represented.
Three-dimensional objects that have been sectioned are captured in their
entirety, as if they had not been sectioned.
NOTE To create profile images of 3D solids in paper space, use the SOLPROF
command.
Modify a Flatshot Block
You can modify a flattened view that has been inserted as a block in the same
way that you modify any other 2D block geometry.
Create a Flattened View | 1219

To create a flattened 2D view of a 3D model
1Set up the view of the 3D model.
2Click Home tab ➤ Section panel ➤ Flatshot.
3In the Flatshot dialog box, under Destination, click one of the options.
4Change the color and linetype settings for Foreground and Obscured
lines.
5Click Create.
6Specify an insertion point on the screen to place the block. Adjust the
basepoint, scale, and rotation if necessary.
A block is created consisting of 2D geometry that is projected onto the
XY plane of the current UCS.
Quick Reference
Commands
FLATSHOT
Creates a 2D representation of all 3D objects based on the current view.
SOLPROF
Creates 2D profile images of 3D solids for display in a layout viewport.
SOLDRAW
Generates profiles and sections in layout viewports created with SOLVIEW.
Content Reference to: SOLVIEW
Creates orthographic views, layers, and layout viewports automatically for
3D solids.
1220 | Chapter 26 Create Sections and 2D Drawings from 3D Models
Part 9: Annotate Drawings
1221
1222
Work with Annotations
When you annotate your drawings, you can use certain tools and properties to make working
with annotations easier.
Overview of Annotations
Annotations are notes or other types of explanatory symbols or objects that are
commonly used to add information to your drawing.
Examples of annotations include
■Notes and labels
■Tables
■Dimensions and tolerances
■Hatches
■Callouts
■Blocks
The types of objects that you use to create annotations include
■Hatches
■Text (single-line and multiline)
■Tables
■Dimensions
■Tolerances
■Leaders and multileaders
27
1223
■Blocks
■Attributes
Quick Reference
Commands
ATTDEF
Creates an attribute definition for storing data in a block.
BLOCK
Creates a block definition from selected objects.
DIMSTYLE
Creates and modifies dimension styles.
HATCH
Fills an enclosed area or selected objects with a hatch pattern, solid fill, or
gradient fill.
MLEADERSTYLE
Creates and modifies multileader styles.
MTEXT
Creates a multiline text object.
OBJECTSCALE
Adds or deletes supported scales for annotative objects.
STYLE
Creates, modifies, or specifies text styles.
TEXT
Creates a single-line text object.
Scale Annotations
You can automate the process of scaling annotations in various layout
viewports and in model space.
1224 | Chapter 27 Work with Annotations
Overview of Scaling Annotations
Objects that are commonly used to annotate drawings have a property called
Annotative. This property allows you to automate the process of scaling
annotations so that they plot or display at the correct size on the paper.
Instead of creating multiple annotations at different sizes and on separate
layers, you can turn on the annotative property by object or by style, and set
the annotation scale for layout or model viewports. The annotation scale
controls the size of the annotative objects relative to the model geometry in
the drawing.
The following objects are commonly used to annotate drawings and contain
an annotative property:
■Text
■Dimensions
■Hatches
■Tolerances
■Multileaders
■Blocks
■Attributes
When the Annotative property for these objects is turned on (set to Yes), these
objects are called annotative objects.
You define a paper size for annotative objects. The annotation scale you set for
layout viewports and model space determines the size of the annotative objects
in those spaces.
Save to Legacy Drawing File Format
Set the system variable SAVEFIDELITY to 1 when you save a drawing that
contains annotative objects to a legacy drawing file format (AutoCAD 2007
or earlier). This preserves the visual fidelity of the drawing when it is opened
in a release earlier than AutoCAD 2008 by saving individual representations
of each scale of each annotative object. The individual objects are saved to
layers that are used to organize objects of the same scale. Setting SAVEFIDELITY
to 0, when opening the drawing in AutoCAD 2008 or later release, results in
improved performance. For more information about saving a drawing to a
previous release, see Save a Drawing on page 197.
Overview of Scaling Annotations | 1225
Workflow for Annotating Drawings
The following steps represent a typical workflow for annotating a drawing so
that your annotations will scale automatically.
1Create annotative styles on page 1234.
2In model space, set the annotation scale to the scale at which the
annotations will be plotted or displayed on page 1227.
3Create annotative objects using annotative styles on page 1234.
If one or more annotative objects needs to be displayed at an additional scale,
follow these steps.
1Add the additional scale to the annotative objects on page 1253.
2Set the annotation scale to the new scale on page 1228 (the annotative
objects that support the new scale will be resized based on the annotation
scale).
3Reposition the annotative objects as needed for the new scale
When you create your layouts, follow these steps.
1Create a new layout on page 391 or make a layout current on page 399.
2Create viewports on page 408.
3Set the annotation scale for each viewport on page 1228. (For each viewport,
the annotation scale and viewport scale should be the same).
For more information about setting visibility for annotative objects, see Display
Annotative Objects on page 1251. For more information about adding scales to
annotative objects, see Add and Modify Scale Representations on page 1253.
Quick Reference
Commands
OBJECTSCALE
Adds or deletes supported scales for annotative objects.
1226 | Chapter 27 Work with Annotations

System Variables
ANNOAUTOSCALE
Updates annotative objects to support the annotation scale when the
annotation scale is changed.
CANNOSCALE
Sets the name of the current annotation scale for the current space.
CANNOSCALEVALUE
Returns the value of the current annotation scale.
MSLTSCALE
Scales linetypes displayed on the model tab by the annotation scale.
Set Annotation Scale
is a setting that is saved with model space, layout viewports, and model views.
When you add objects to your drawing, they support the current annotation
scale and are scaled based on that scale setting and automatically displayed
at the correct size in model space.
Before you add annotative objects to your model, you set the annotation scale.
Think about the eventual scale settings of the viewports in which the
annotations will display. The annotation scale should be set to the same scale
as the viewport in which the annotative objects will display in the layout (or
the plot scale if plotting from model space). For example, if the annotative
objects will display in a viewport that has a scale of 1:2, then you set the
annotation scale to 1:2.
When working on the model tab or when a viewport is selected, the current
annotation scale is displayed on the application or drawing status bar. You
can use the status bars to change the annotation scale. You can reset the
annotation scale list to the default list of scales defined in the registry in the
Default Scale List dialog box.
You can use the ANNOAUTOSCALE system variable to update annotative
objects to support the current scale automatically when the annotation scale
is changed. ANNOAUTOSCALE is turned off by default to keep file size down
and improve performance. When ANNOAUTOSCALE is off, this button
is displayed this way on the right side of the drawing status bar or application
status bar.
Set Annotation Scale | 1227
Use the CANNOSCALE system variable to set a default annotation scale setting.
You can reset the list of annotative scales in a drawing to the default list of
either metric or imperial scales defined in the registry with the Default Scale
dialog box. The unused scales in the drawing are purged and the customized
list of scales from the registry are merged into the drawing
See also:
■Drawing Status Bar on page 52
To set the annotation scale while working on the Model tab
1On the right side of the drawing or application status bar, click the arrow
next to the displayed annotation scale.
2Select a scale from the list.
To set the annotation scale for a layout viewport
1On a layout tab, select a viewport.
2On the right side of the drawing or application status bar, click the arrow
next to the displayed annotation scale.
3Select a scale from the list.
To set the default annotation scale
1At the command prompt, enter cannoscale.
2Enter a scale name. Press ENTER
Quick Reference
Commands
OBJECTSCALE
Adds or deletes supported scales for annotative objects.
System Variables
ANNOAUTOSCALE
Updates annotative objects to support the annotation scale when the
annotation scale is changed.
1228 | Chapter 27 Work with Annotations
CANNOSCALE
Sets the name of the current annotation scale for the current space.
CANNOSCALEVALUE
Returns the value of the current annotation scale.
MSLTSCALE
Scales linetypes displayed on the model tab by the annotation scale.
Create Annotative Objects
Objects that are commonly used to annotate drawings have a property called
Annotative. When the Annotative property for these objects is turned on (set
to Yes), these objects are called annotative objects
Overview of Creating Annotative Objects
When you add annotations to your drawing, you can turn on the property
for those objects. These annotative objects are scaled based on the current
setting and are automatically displayed at the correct size
Annotative objects are defined at a paper height and display at the size
determined by the annotation scale.
The following objects can be annotative (have an Annotative property):
■Hatches
■Text (single-line and multiline)
■Dimensions
■Tolerances
■Leaders and multileaders (created with MLEADER)
■Blocks
■Attributes
Create Annotative Objects | 1229
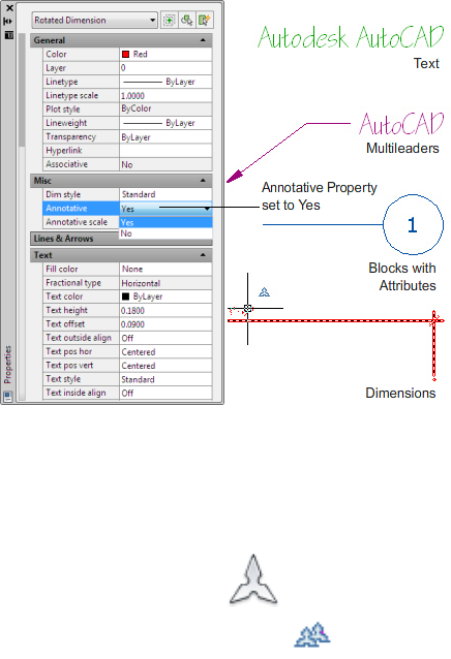
Many of the dialog boxes used to create these objects contain an Annotative
check box where you can make the object annotative. You can also change
existing objects to be annotative by changing the annotative property in the
Properties palette.
When you hover the cursor over an annotative object that supports one
annotation scale, the cursor displays a icon. When the object supports
more than one annotation scale, it displays a icon.
1230 | Chapter 27 Work with Annotations
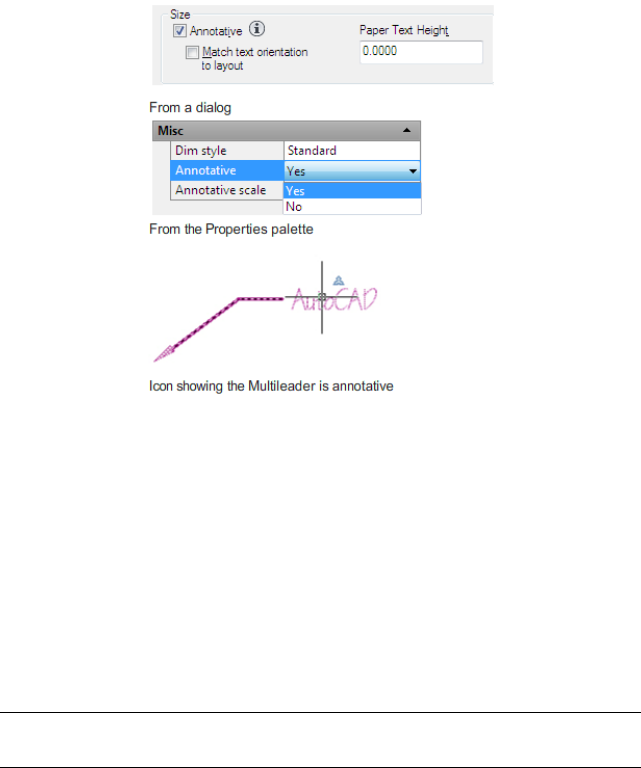
Text, dimension, and multileader styles can also be annotative. Annotative
styles create annotative objects.
Visual Fidelity for Annotative Objects
When working with objects, this option allows you to maintain visual fidelity
for these objects when they are viewed in AutoCAD 2007 and earlier releases.
Visual fidelity is controlled by the SAVEFIDELITY system variable.
If you work primarily in model space, it is recommended that you turn off
visual fidelity (set SAVEFIDELITY to 0). However, if you need to exchange
drawings with other users, and layout fidelity is most important, then visual
fidelity should be turned on (set SAVEFIDELITY to 1).
NOTE The SAVEFIDELITY system variable does not affect saving a drawing to the
AutoCAD 2010 drawing or DXF file formats.
Annotative objects may have multiple . When visual fidelity is on, annotative
objects are decomposed and scale representations are saved (in an ) to separate
layers, which are named based on their original layer and appended with a
number. If you explode the block in AutoCAD 2007 or earlier releases, and
then open the drawing in AutoCAD 2008 or later releases, each scale
representation becomes a separate annotative object, each with one annotation
scale. It is not recommended that you edit or create objects on these layers
when working with a drawing created in AutoCAD 2008 and later releases in
AutoCAD 2007 and earlier releases.
Create Annotative Objects | 1231
When this option is not selected, a single model space representation is
displayed on the Model tab. More annotation objects may be displayed on
the Model tab depending on the ANNOALLVISIBLE setting. Also, more objects
may be displayed in paper space viewports at different sizes than in AutoCAD
2008 and later releases.
For a procedure to set this option for annotative objects, see To save drawings
with visual fidelity for annotative objects.
See also:
■Work with Annotative Styles on page 1233
Quick Reference
Commands
ATTDEF
Creates an attribute definition for storing data in a block.
BLOCK
Creates a block definition from selected objects.
DIMSTYLE
Creates and modifies dimension styles.
HATCH
Fills an enclosed area or selected objects with a hatch pattern, solid fill, or
gradient fill.
MLEADERSTYLE
Creates and modifies multileader styles.
MTEXT
Creates a multiline text object.
STYLE
Creates, modifies, or specifies text styles.
TEXT
Creates a single-line text object.
1232 | Chapter 27 Work with Annotations
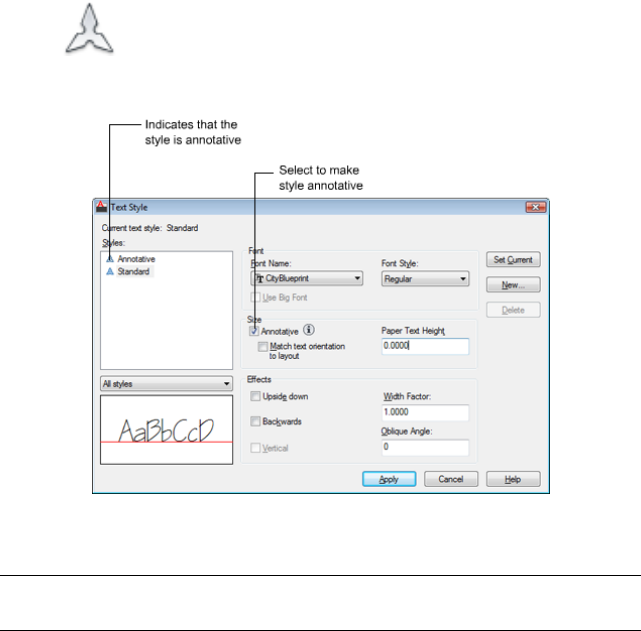
Work with Annotative Styles
You can minimize the steps to annotate a drawing by using annotative styles.
Annotative text, dimension, and multileader styles create objects.
The dialog boxes used to define these objects contain an Annotative check
box where you can make the styles annotative. Annotative styles display a
special icon before their names in dialog boxes and the Properties
palette.
You should specify the Paper Height value for any annotative text styles you
create. The Paper Height setting specifies the height of the text in paper space.
NOTE If you’ve specified the Paper Height value for a dimension or multileader
style, this setting overrides the text style Paper Height setting.
If you redefine styles to be annotative or nonannotative, existing objects that
reference those styles are not automatically updated to reflect the annotative
property of the style or definition. Use the ANNOUPDATE command to update
the existing objects to the current Annotative properties of the style.
When you change the Style property of an existing object (whether it’s
annotative or nonannotative), the object’s annotative properties will match
that of the new style. If the style does not have a fixed height (the Height
Create Annotative Objects | 1233
value is 0), the paper height of the object is calculated based on the object’s
current height and the annotation scale.
See also:
■Work with Text Styles on page 1363
■Create Annotative Text on page 1235
■Use Dimension Styles on page 1424
■Create Annotative Dimensions and Tolerances on page 1239
■Work with Leader Styles on page 1346
■Create Annotative Leaders and Multileaders on page 1244
To create an annotative style
■Follow the steps in one of the following procedures
■To create a new annotative text style
■To change an existing nonannotative text style to annotative
■To create a new annotative dimension style
■To change an existing dimension style to annotative
■To create a new annotative multileader style
■To change an existing multileader style to annotative
To create annotative objects from annotative styles
■Follow the steps in one of the following procedures
■To create annotative single-line text
■To create annotative multiline text
■To create an annotative dimension
■To create an annotative multileader
1234 | Chapter 27 Work with Annotations
Quick Reference
Commands
ANNOUPDATE
Updates existing annotative objects to match the current properties of their
styles.
DIMSTYLE
Creates and modifies dimension styles.
MLEADERSTYLE
Creates and modifies multileader styles.
STYLE
Creates, modifies, or specifies text styles.
Create Annotative Text
Use text for notes and labels in your drawing. You create annotative text by
using an annotative text style, which sets the height of the text on the paper.
The current automatically determines the display size of the text in model
space or paper space viewports.
For example, you want text to display at a height of 3/16" on the paper, so
you can define a text style to have a paper height of 3/16". When you add
text to a viewport that has a scale of 1/2"=1'0", the current annotation scale,
which is set to the same scale as the viewport’s, automatically scales the text
to display appropriately at 4.5".
You can also change existing nonannotative text to annotative by changing
the text’s Annotative property to Yes. This applies to any text created through
text styles or through the TEXT and MTEXT commands.
You can set the orientation of annotative text objects to match the orientation
of the paper. For more information about setting the orientation of annotative
objects, see Set Orientation for Annotations on page 1256.
See also:
■Create Text on page 1300
■Work with Annotative Styles on page 1233
Create Annotative Objects | 1235
To create a new annotative text style
1Click Annotate tab ➤ Text panel ➤ Text Style.
2In the Text Style dialog box, click New.
3In the New Text Style dialog box, enter a new style name.
4Click OK.
5In the Text Style dialog box, under Size, select Annotative.
6In the Paper Text Height box, enter the height of the text as it will display
on paper.
7Click Apply.
8(Optional) Click Set Current to set this style as the current text style.
9Click Close.
To change an existing nonannotative text style to annotative
1Click Annotate tab ➤ Text panel ➤ Text Style.
2In the Text Style dialog box, Styles list, select a style.
NOTE A icon next to a text style name indicates that the style is
already annotative.
3Under Size, select Annotative.
4In the Paper Text Height box, enter the height of the text as it will display
on paper.
5Click Apply.
6(Optional) Click Set Current to set this style as the current text style.
7Click Close.
1236 | Chapter 27 Work with Annotations
To create annotative single-line text
1Click Annotate tab ➤ Text panel ➤ Text Style.
2In the Text Style dialog box, Styles list, select an annotative text style.
NOTE A icon next to a text style name indicates that the style is
annotative.
3Click Set Current to set this style as the current text style.
4Click Close.
5Click Annotate tab ➤ Text panel ➤ Single Line Text.
6Specify the insertion point for the first character.
7Specify a text rotation angle.
8Enter the text.
To create annotative multiline text
1Click Annotate tab ➤ Text panel ➤ Multiline Text.
2Specify opposite corners of a bounding box to define the width of the
multiline text object. The In-Place Text Editor is displayed.
3Do one of the following:
■On the Text Formatting toolbar, in the Text Style control, click the
arrow and select an existing annotative text style from the list.
■Click the Annotative button on the toolbar to create annotative
multiline text.
4Enter the text.
5On the Text Formatting toolbar, click OK.
Create Annotative Objects | 1237
To change existing multiline text to annotative or nonannotative
1Double-click a multiline text object. The In-Place Text Editor is displayed.
2Click the Annotative button on the toolbar to change existing
multiline text to annotative or nonannotative.
When the Annotative button is depressed, the text is annotative. When
the button is not depressed, the text is nonannotative.
3Click OK to save the changes.
To change existing text (single-line or multiline) to be annotative or
nonannotative
1In the drawing, select a text object.
2Click View tab ➤ Palettes panel ➤ Properties.
3In the Properties palette, under Text, click Annotative.
4On the drop-down list, select Yes or No.
To update text to reflect the current annotative properties of the text style
1Click Annotate tab ➤ Text panel ➤ Text Style.
2In the Text Style dialog box, Styles list, select the style used by the text
that you want to update.
NOTE A icon next to a text style name indicates that the style is
already annotative.
3Under Size, select Annotative.
4In the Paper Text Height box, enter the height of the text as it will display
on paper.
5Click Apply.
6(Optional) Click Set Current to set this style as the current text style.
1238 | Chapter 27 Work with Annotations

7Click Close.
8In the drawing, select all the text objects (text and mtext) that you want
to update.
9At the command prompt, enter annoupdate.
To change the height of annotative text as it will display on the paper
1In the drawing, select a text object.
2Click View tab ➤ Palettes panel ➤ Properties.
3In the Properties palette, under Paper Text Height, enter a new value.
Quick Reference
Commands
MTEXT
Creates a multiline text object.
STYLE
Creates, modifies, or specifies text styles.
TEXT
Creates a single-line text object.
Create Annotative Dimensions and Tolerances
You can create dimensions for measurements in your drawing through
annotative dimension styles.
Annotative dimension styles create dimensions in which all the elements of
the dimension, such as text, spacing, and arrows, scale uniformly by the .
Create Annotative Objects | 1239
If you associate a dimension to an annotative object, the associativity of the
dimension is lost.
You can also change an existing nonannotative dimension to annotative by
changing the dimension’s Annotative property to Yes.
NOTE When the current dimension style is annotative, the value of DIMSCALE is
automatically set to zero, and does not affect the dimension scale.
You can also create annotative tolerances. Geometric tolerances show
acceptable deviations of form, profile, orientation, location, and runout of a
feature.
See also:
■Dimensions and Tolerances on page 1417
■Use Dimension Styles on page 1424
■Work with Annotative Styles on page 1233
To create a new annotative dimension style
1Click Annotate tab ➤ Dimensions panel ➤ Dimension Style.
2In the Dimension Style Manager dialog box, click New.
3In the Create New Dimension Style dialog box, enter a new style name.
4Select Annotative.
5Click Continue.
1240 | Chapter 27 Work with Annotations
6In the New Dimension Style dialog box, select the appropriate tab and
make changes to define the dimension style.
7Click OK.
8(Optional) Click Set Current to set this style as the current dimension
style.
9Click Close.
To change an existing dimension style to annotative
1Click Annotate tab ➤ Dimensions panel ➤ Dimension Style.
2In the Dimension Style Manager dialog box, Styles list, select a style.
NOTE A icon next to a dimension style name indicates that the style
is already annotative.
3Click Modify.
4In the Modify Dimension Style dialog box, Fit tab, under Scale for
Dimension Features, select Annotative.
5Click OK.
6(Optional) Click Set Current to set this style as the current dimension
style.
7Click Close.
To create an annotative dimension
1Click Annotate tab ➤ Dimensions panel ➤ Dimension Style.
2In the Dimension Style Manager dialog box, Styles list, select an
annotative dimension style.
A icon next to a dimension style name indicates that the style is
annotative. If an annotative style does not exist, you will need to create
Create Annotative Objects | 1241
one first. For information on creating an annotative dimension style see,
To create a new annotative dimension style.
3Click Set Current.
4Click Close.
5Click Annotate tab ➤ Dimensions panel ➤ Dimension drop-down list
➤ select a dimension type, or at the Command prompt, enter a
dimension command.
If the Select Annotation Scale dialog box is displayed, select the default
scale you want to use for the new dimension object and click OK.
6Place the dimension in the drawing area.
7Select the new dimension and right-click. Click Annotative Object Scale
➤ Add/Delete Scales.
8In the Annotation Object Scale dialog box, click Add.
9In the Add Scales to Object dialog box, select the object scales you want
to assign to the dimension. Click OK.
10 In the Annotation Object Scale dialog box, click OK.
To change an existing dimension to annotative or nonannotative
1Select a dimension in a drawing.
2Click View tab ➤ Palettes panel ➤ Properties.
3In the Properties palette, under Misc, click Annotative.
4On the drop-down list, select Yes or No.
To update dimensions to reflect the current annotative properties of the
dimension style
1Click Annotate tab ➤ Dimensions panel ➤ Dimension Style.
2In the Dimension Style Manager dialog box, Styles list, select a style.
1242 | Chapter 27 Work with Annotations
NOTE A icon next to a dimension style name indicates that the style
is already annotative.
3Click Modify.
4In the Modify Dimension Style dialog box, Fit tab, under Scale for
Dimension Features, select Annotative.
5Click OK.
6(Optional) Click Set Current to set this style as the current dimension
style.
7Click Close.
8In the drawing, select all the dimensions that you want to update.
9At the command prompt, enter annoupdate.
To create an annotative tolerance
1Follow the steps in To create geometric tolerances.
2Click View tab ➤ Palettes panel ➤ Properties.
3In the Properties palette, under Misc, click Annotative.
4On the drop-down list, select Yes or No.
Quick Reference
Commands
DIMSTYLE
Creates and modifies dimension styles.
STYLE
Creates, modifies, or specifies text styles.
Create Annotative Objects | 1243
System Variables
DIMANNO
Creates a single-line text object.
Create Annotative Leaders and Multileaders
Leaders and multileader on page 2171 are used to add call outs to your drawings.
You can create leaders through an annotative dimension style and multileaders
through an annotative multileader style.
When you create a leader, you create two separate objects: the leader and the
text, block, or tolerance associated with the leader. When you create a
multileader, you create a single object.
If the multileader style is annotative, the associated text or tolerance will be
annotative as well, regardless of the annotative setting of the text style or
tolerance.
NOTE It is recommended that you create non-annotative entities when creating
a mleader content block.
Blocks used in leaders and multileaders must be non-annotative.
You can change the Annotative property of leaders and multileaders in the
Properties palette.
See also:
■Create Leaders on page 1336
■Work with Leader Styles on page 1346
To create a new annotative multileader style
1Click Annotate tab ➤ Multileaders panel ➤ Multileader Style.
2In the Multileader Style Manager dialog box, click New.
3In the Create New Multileader Style dialog box, enter a new style name,
and select Annotative.
4Click Continue.
1244 | Chapter 27 Work with Annotations

5In the Modify Multileader Style dialog box, select the appropriate tab and
make changes to define the multileader style.
6Click OK.
7(Optional) Click Set Current to set this style as the multileader style.
8Click Close.
To change an existing multileader style to annotative
1Click Annotate tab ➤ Multileaders panel ➤ Multileader Style.
2In the Multileader Style Manager dialog box, Styles list, select a style.
NOTE A icon next to a multileader style name indicates that the style
is already annotative.
3Click Modify.
4In the Modify Multileader Style dialog box, Leader Structure tab, under
Scale, select Annotative.
5Click OK.
6(Optional) Click Set Current to set this style as the multileader style.
7Click Close.
To create an annotative multileader
1Click Annotate tab ➤ Multileaders panel ➤ Multileader Style.
2In the Multileader Style Manager dialog box, Styles list, select an
annotative multileader style.
NOTE A icon next to a multileader style name indicates that the style
is annotative.
Create Annotative Objects | 1245
3Click Set Current.
4Click Close.
5Click Annotate tab ➤ Multileaders panel ➤ Multileader.
6Choose a point for the leader head.
7Choose the last point for the leader.
8Specify the text width.
9Enter text.
10 On the Text Formatting toolbar, click OK.
To change an existing leader or multileader to annotative or nonannotative
1Select a leader or multileader in a drawing.
2Click View tab ➤ Palettes panel ➤ Properties.
3In the Properties palette, under Misc, click Annotative.
4On the drop-down list, select Yes or No.
Quick Reference
Commands
MLEADERSTYLE
Creates and modifies multileader styles.
STYLE
Creates, modifies, or specifies text styles.
Create Annotative Blocks and Attributes
If you want to use geometric objects to annotate your drawing, combine the
objects into an annotative block definition.
1246 | Chapter 27 Work with Annotations
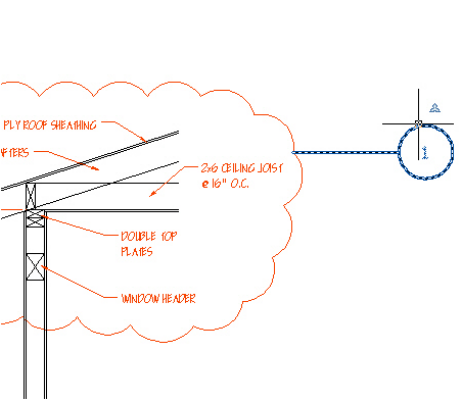
block definitions create annotative block references. Annotative block
references and attributes initially support the current annotation scale at the
time they are inserted. You should insert annotative block references with a
unit factor of 1.
You cannot change the Annotative property of individual block references.
To set an annotative block’s paper size, you should define the block in paper
space or on the Model tab with the set to 1:1.
When creating and working with annotative blocks and annotative objects
within blocks, the following points should be noted:
■Nonannotative blocks can contain annotative objects, which are scaled
by the block’s scale factor in addition to the annotation scale.
■Annotative blocks cannot reside in annotative blocks.
■Annotative block references are scaled uniformly by the current annotation
scale as well as any user scale applied to the block reference.
■Blocks that contain annotative objects should not be manually scaled.
You can define annotative attributes for annotative and nonannotative blocks.
Use annotative attributes with nonannotative blocks when you want the
geometry in the block to display on the paper based on the scale of the
viewport, but you want the attribute text to display at the Paper Height defined
for the attribute.
Create Annotative Objects | 1247

You can set the orientation of annotative blocks to match the orientation of
the paper. For more information about setting the orientation of annotative
objects, see Set Orientation for Annotations on page 1256.
You can use the ANNOTATIVEDWG system variable to specify whether or
not the entire drawing will behave as an annotative block when inserted into
another drawing. The ANNOTATIVEDWG system variable becomes read-only
if the drawing contains annotative objects.
NOTE The INSUNITS setting is ignored when inserting blocks into a drawing.
See also:
■Work with Blocks on page 851
■Attach Data to Blocks (Block Attributes) on page 875
To create an annotative block definition
1Click Blocks & References tab ➤ Block panel ➤ Create.
2In the Block Definition dialog box, enter a block name in the Name box.
3Under Objects, select Convert to Block.
4Click Select Objects.
5Under Behavior, select Annotative.
6Use your pointing device to select objects to be included in block
definition. Press ENTER to complete object selection.
7In the Block Definition dialog box, under Base Point, specify the block
insertion point.
8Click OK.
To update existing block references to be annotative
1Click Blocks & References tab ➤ Block panel ➤ Create.
2In the Block Definition dialog box, Name box, click the arrow and select
the name of the block you want to update to be annotative.
1248 | Chapter 27 Work with Annotations

3Under Behavior, select Annotative.
4Click OK.
The existing block references in the drawing are now annotative.
To create an annotative attribute definition
1Click Blocks & References tab ➤ Attributes panel ➤ Define Attributes.
2In the Attribute Definition dialog box, set the Attribute Modes and enter
Tag information, Insertion Point and Text Settings.
3Under Text Settings, select Annotative.
4Click OK.
5Specify the start point.
6Press ENTER.
Quick Reference
Commands
ATTDEF
Creates an attribute definition for storing data in a block.
BLOCK
Creates a block definition from selected objects.
System Variables
ANNOTATIVEDWG
Specifies whether or not the drawing will behave as an annotative block
when inserted into another drawing.
Create Annotative Hatches
Use an annotative hatch to symbolically represent material such as sand,
concrete, steel, earth, etc.
Create Annotative Objects | 1249
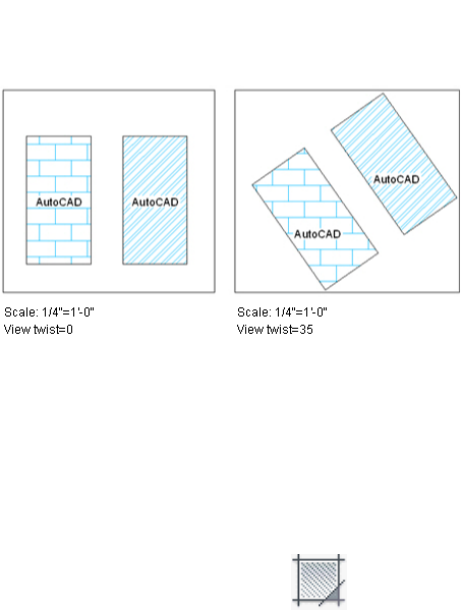
An hatch is defined at a paper size. You can create individual annotative hatch
objects as well as annotative hatch patterns.
The hatch pattern definitions stored in the acad.pat file contain information
that indicates whether the pattern is annotative or non-annotative. When
the selected hatch pattern is annotative, the Annotative checkbox in the Hatch
and Gradient dialog box should be selected.
You can use the HPANNOTATIVE system variable to specify whether or notnew
hatches are annotative. By default, new hatch objects are nonannotative.
The orientation of annotative hatches always matches the orientation of the
layout.
See also:
■Overview of Hatch Pattern Definitions in the Customization Guide
To create an annotative hatch object
1Click Home tab ➤ Draw panel ➤ Hatch.
2At the command prompt, enter settings.
3In the Hatch and Gradient dialog box, click Add: Select Objects.
4Specify the object or objects you want to hatch.
1250 | Chapter 27 Work with Annotations
5Under Options, select Annotative.
6Click OK.
To change an existing hatch object to annotative
1In model space, at the command prompt, enter cannoscale.
2Enter the scale set for the viewport in which the hatch is displayed.
3In the drawing, select the hatch.
4In the Properties palette, under Pattern, click Annotative.
5On the drop-down list, select Yes.
Quick Reference
Commands
HATCH
Fills an enclosed area or selected objects with a hatch pattern, solid fill, or
gradient fill.
System Variables
HPANNOTATIVE
Display Annotative Objects
For model space or a layout viewport, you can display all the annotative objects
or only those that support the current annotation scale.
This reduces the need to use multiple layers to manage the visibility of your
annotations.
You use the Annotation Visibility button on the right side of the application
or drawing status bar to choose the display setting for annotative objects.
Annotation visibility is turned on by default. When annotation visibility
is turned on, all annotative objects are displayed. When annotation visibility
is turned off , only annotative objects for the current scale are displayed.
Display Annotative Objects | 1251

In general, you should turn off annotation visibility, except when inspecting
a drawing created by another person or when adding scales to existing
annotative objects.
Annotation visibility is also controlled by the ANNOALLVISIBLE system
variable.
In order for an annotative object to be visible, the layer the object is on must
be turned on.
If an object supports more than one annotation scale, the object will display
at the current scale.
When the MSLTSCALE system variable is set to 1 (default), linetypes displayed
on the model tab are scaled by the annotation scale
See also:
■Drawing Status Bar on page 52
To display or hide annotative objects in a drawing
➤ On the drawing or application status bar, click the Annotation Visibility
button.
When the button is displayed, all annotative objects are displayed.
When the button is displayed, only annotative objects that support
the current annotation scale are displayed.
Quick Reference
System Variables
ANNOALLVISIBLE
Hides or displays annotative objects that do not support the current
annotation scale.
MSLTSCALE
Scales linetypes displayed on the model tab by the annotation scale.
1252 | Chapter 27 Work with Annotations
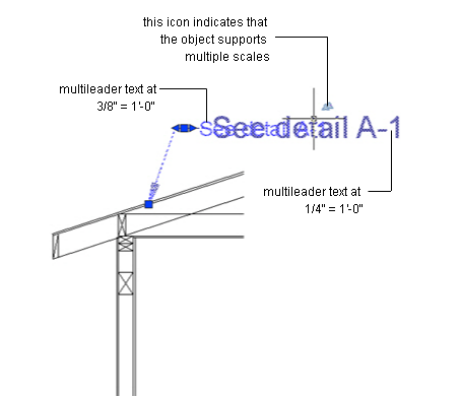
SELECTIONANNODISPLAY
Controls whether alternate scale representations are temporarily displayed
in a dimmed state when an annotative object is selected.
Add and Modify Scale Representations
When you create an object in your drawing, it supports one : the annotation
scale that was current when you created the object. You can update annotative
objects to support additional annotation scales.
When you update an annotative object to support additional scales, you add
additional to the object.
For example, if an annotative multileader supports two annotations scales, it
has two scale representations.
When you select an annotative object, grips are displayed on the scale
representation that supports the current annotation scale. You can use these
grips to manipulate the current scale representation. All other scale
representations of the object are displayed in a dimmed state when the
SELECTIONANNODISPLAY system variable is set to 1 (default).
Use the ANNORESET command to reset the location of all scale representations
for an annotative object to that of the current scale representation.
Add and Modify Scale Representations | 1253
To add the current annotation scale to an annotative object
1Click Annotate tab ➤ Annotation Scaling panel ➤ Add/Delete Scales.
2In a drawing, select one or more annotative objects.
3Press ENTER.
To delete the current annotation scale from an annotative object
1Click Annotate tab ➤ Annotation Scaling panel ➤ Add/Delete Scales.
2In a drawing, select one or more annotative objects.
3Press ENTER.
To automatically update annotative objects to support the current
annotation scale
■On the drawing or application status bar, click the button so it
displays as .
To add an annotation scale to an annotative object
1Click Annotate tab ➤ Annotation Scaling panel ➤ Add/Delete Scales.
2In the drawing area, select one or more annotative objects.
3Press ENTER.
4In the Annotative Object Scale dialog box, click Add.
5In the Add Scales to Object dialog box, select one or more scales to add
to the objects. (Press and hold the SHIFT key to select more than one
scale.)
1254 | Chapter 27 Work with Annotations

6Click OK.
7In the Annotative Object Scale dialog box, click OK.
To delete an annotation scale from an annotative object
1Click Annotate tab ➤ Annotation Scaling panel ➤ Add/Delete Scales.
2In the drawing area, select one or more annotative objects.
3Press ENTER.
4In the Annotative Object Scale dialog box, select one or more scales to
delete from the objects. (Press and hold the SHIFT key to select more than
one scale.).
NOTE You cannot delete the 1:1 scale.
5Click OK.
Quick Reference
Commands
ANNORESET
Resets the locations of all alternate scale representations of the selected
annotative objects.
OBJECTSCALE
Adds or deletes supported scales for annotative objects.
System Variables
SELECTIONANNODISPLAY
Controls whether alternate scale representations are temporarily displayed
in a dimmed state when an annotative object is selected.
Add and Modify Scale Representations | 1255
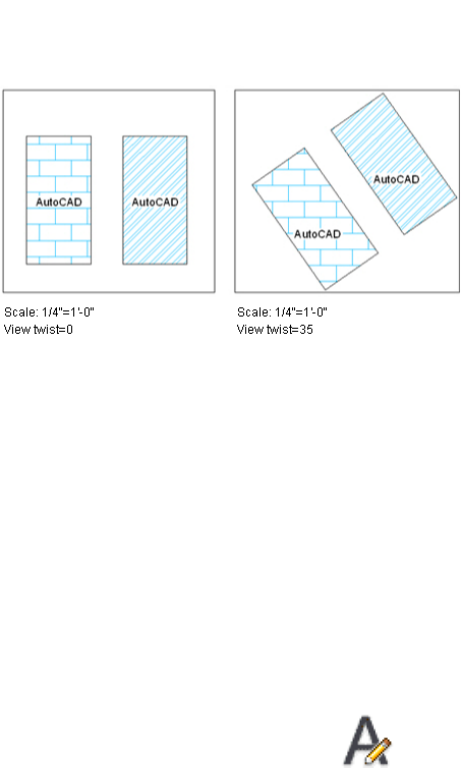
Set Orientation for Annotations
blocks and text can be set so that their orientation matches the orientation
of the layout. The orientation of annotative hatches always matches the
orientation of the layout.
Even if the view in the layout viewport is twisted or if the viewpoint is
non-planar, the orientation of these objects in layout viewports will match
the orientation of the layout.
Annotative attributes in blocks match the paper orientation of the block.
See also:
■Work with Text Styles on page 1363
■Create Annotative Text on page 1235
■Create Annotative Blocks and Attributes on page 1246
■Create Annotative Hatches on page 1249
To match the layout’s orientation for an annotative text style
1Click Annotate tab ➤ Text panel ➤ Text Style.
1256 | Chapter 27 Work with Annotations

2In the Text Style dialog box, Styles list, select an annotative text style.
NOTE A icon next to a text style name indicates that the style is
annotative.
3Under Size, select Match Text Orientation to Layout.
4Click Apply.
5Click Close.
To match the layout’s orientation for an annotative block definition
1Click Blocks & References tab ➤ Block panel ➤ Create.
2In the Block Definition dialog box, under Name, select a block.
3Under Behavior, select Annotative.
4Under Behavior, select Match Block Orientation to Layout.
5Click Close.
To match the layout’s orientation for an existing annotative text object
1In the drawing, select an annotative text object.
2Click Annotate tab ➤ Text panel ➤ Text Style.
3In the Text Style dialog box, under Size, select Match Orientation to
Layout.
Set Orientation for Annotations | 1257
1258
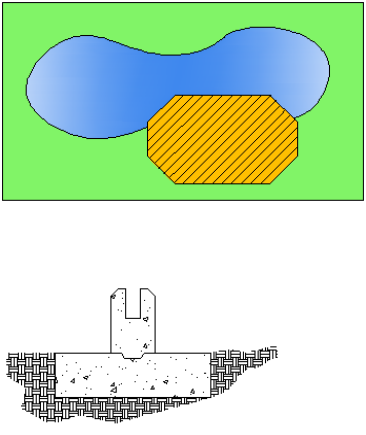
Hatches, Fills, and
Wipeouts
■Overview of Hatch Patterns and Fills on page 1259
■Specify Hatch and Fill Areas on page 1267
■Control the Appearance of Hatches on page 1272
■Modify Hatches and Fills on page 1289
■Create a Blank Area to Cover Objects on page 1295
Overview of Hatch Patterns and Fills
Hatches and fills do not have to be bounded. In the following illustration, the
concrete hatches are bounded, while the earth hatches are unbounded.
28
1259
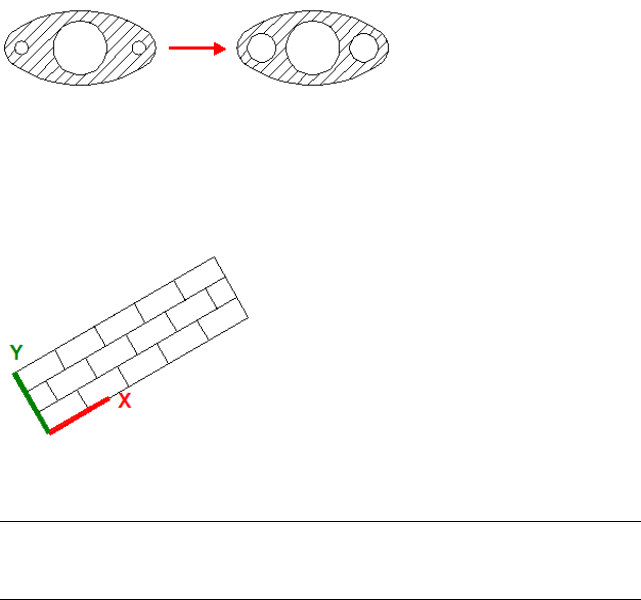
By default, bounded hatches are associative, which means that the hatch object
is associated with the hatch boundary objects, and changes to the boundary
objects are automatically applied to the hatch.
To maintain associativity, the boundary objects must continue to completely
enclose the hatch.
The alignment and orientation of a hatch pattern is determined by the current
location and orientation of the user coordinate system, in addition to controls
in the user interface.
Moving or rotating the UCS is an alternate method for controlling hatch
patterns.
NOTE By default, a preview of the hatch displays as you move the cursor over
enclosed areas. To improve the response time in large drawings, turn off the hatch
preview feature with the HPQUICKPREVIEW system variable.
Alternatively, solid-filled areas can be created using
■2D solids (SOLID)
■Wide polylines (PLINE)
■Donuts (DONUT)
To drag hatch patterns into your drawing
1Click Insert tab ➤ Content panel ➤ Design Center.
1260 | Chapter 28 Hatches, Fills, and Wipeouts

NOTE This procedure describes how to use DesignCenter to drag hatch
patterns into your drawing. You can also drag hatch patterns from a tool
palette.
2On the DesignCenter toolbar, click Search.
3In the Search dialog box, do the following:
■From the Look For drop-down list, select Hatch Pattern Files.
■From the In drop-down list, select the drive where the program is
installed.
■Confirm that Search Subfolders is selected.
■On the Hatch Pattern Files tab, in Search for the Name, enter *
(asterisk).
4Click Search Now.
The default hatch pattern file is acad.pat or acadiso.pat. The search results
may display the same file in different locations.
NOTE For convenient access, you can add the PAT file to Favorites by selecting
the file and clicking the Favorites button. A shortcut to the PAT file is displayed
in the Favorites folder in DesignCenter folders list.
5In the search results, double-click the filename to load the hatch patterns
into the content area of DesignCenter.
6(Optional) Right-click a pattern to display a shortcut menu with the
following options:
■HATCH. Opens the Hatch and Gradient dialog box.
■Copy. Stores the hatch pattern on the Clipboard.
■Create Tool Palette. Creates a new tool palette that contains the
selected pattern.
7From the content area of DesignCenter, drag a hatch pattern into an
enclosed area in your drawing or onto a tool palette.
NOTE If the hatch pattern scale is too large or small, an error message is
displayed. You can adjust the scale for any hatch pattern by selecting it to
display the Hatch Editor tab. If the ribbon is closed, use the Properties palette
or HATCHEDIT.
Overview of Hatch Patterns and Fills | 1261
To hatch or fill areas (ribbon turned on)
1Click Home tab ➤ Draw panel ➤ Hatch.
2On the Properties panel, select one of the options from the Hatch Type
drop-down list.
3On the Pattern panel, click a hatch pattern or fill.
4Specify a point inside each area to be hatched.
5On the ribbon, make any adjustments as needed.
On the Properties panel, you can change the hatch type and colors or
modify the transparency level, angle, or scale for the hatch.
6(Optional) Expand the Options panel, and select one of the draw order
options from the bottom drop-down list.
You can change the draw order of the hatch so that the hatch is displayed
either behind or in front of the hatch boundary, or behind or in front of
all other objects.
7Press Enter, or click Close on the ribbon to apply the hatch and exit the
command.
To hatch or fill areas (ribbon turned off)
1Start the Hatch command from a menu or toolbar.
2In the Hatch and Gradient dialog box, under Boundaries, click Add: Pick
Points.
3Specify a point inside each area that you want to hatch, and press Enter.
4In the Hatch and Gradient dialog box, select a pattern or Solid from the
Pattern list.
To see how the hatch pattern will look, click the Preview button. Press
Esc when you finish previewing to return to the dialog box.
5In the Hatch and Gradient dialog box, make adjustments, if necessary.
To access additional options, click the More Options button at the
bottom-right of the dialog box.
1262 | Chapter 28 Hatches, Fills, and Wipeouts
6(Optional) From the Draw Order drop-down list, choose one of the
options.
You can change the draw order of the hatch so that the hatch is displayed
either behind or in front of the hatch boundary, or behind or in front of
all other objects.
7Click OK to apply the hatch.
To hatch selected objects (ribbon turned on)
1Click Home tab ➤ Draw panel ➤ Hatch.
2On the Boundaries panel, click Select.
3Select the objects that you want to hatch.
4Press Enter, or click Close on the ribbon to apply the hatch and exit the
command.
To hatch selected objects (ribbon turned off)
1Start the Hatch command from a menu or toolbar.
2In the Hatch and Gradient dialog box, under Boundaries, click Add: Select
Objects.
3Select the objects that you want to hatch and press Enter.
4Click OK to apply the hatch.
Quick Reference
Commands
ADCENTER
Manages and inserts content such as blocks, xrefs, and hatch patterns.
GRADIENT
Fills an enclosed area or selected objects with a gradient fill.
Overview of Hatch Patterns and Fills | 1263
HATCH
Fills an enclosed area or selected objects with a hatch pattern, solid fill, or
gradient fill.
HATCHEDIT
Modifies an existing hatch or fill.
HATCHTOBACK
Sets the draw order for all hatches in the drawing to be behind all other
objects.
MATCHPROP
Applies the properties of a selected object to other objects.
PROPERTIES
Controls properties of existing objects.
UCS
Manages user coordinate systems.
System Variables
GFANG
Specifies the angle of a gradient fill.
GFCLR1
Specifies the color for a one-color gradient fill or the first color for a two-color
gradient fill.
GFCLR2
Specifies the second color for a two-color gradient fill.
GFCLRLUM
Controls the tint or shade level in a one-color gradient fill.
GFCLRSTATE
Specifies whether a gradient fill uses one color or two colors.
GFNAME
Specifies the pattern of a gradient fill.
1264 | Chapter 28 Hatches, Fills, and Wipeouts
GFSHIFT
Specifies whether the pattern in a gradient fill is centered or is shifted up
and to the left.
HPANG
Sets the angle for new hatch patterns.
HPANNOTATIVE
Controls whether a new hatch pattern is annotative.
HPASSOC
Controls whether hatches and fills are associative.
HPBACKGROUNDCOLOR
Controls the background color for hatch patterns.
HPBOUND
Controls the object type created by HATCH and BOUNDARY.
HPBOUNDRETAIN
Controls whether boundary objects are created for new hatches and fills.
HPCOLOR
Sets a default color for new hatches.
HPDLGMODE
Controls the display of the Hatch and Gradient dialog box and the Hatch
Edit dialog box.
HPDOUBLE
Specifies hatch pattern doubling for user-defined patterns.
HPDRAWORDER
Controls the draw order of hatches and fills.
HPGAPTOL
Treats a set of objects that almost enclose an area as a closed hatch boundary.
HPINHERIT
Controls whether to inherit the hatch origin when using the Inherit Properties
option in HATCH and HATCHEDIT.
Overview of Hatch Patterns and Fills | 1265
HPISLANDDETECTION
Controls how islands within the hatch boundary are treated.
HPISLANDDETECTIONMODE
Controls whether internal closed boundaries, called islands, are detected.
HPLAYER
Specifies a default layer for new hatches and fills.
HPMAXLINES
Sets the maximum number of hatch lines that are generated in a hatch
operation.
HPNAME
Sets the default hatch pattern name.
HPOBJWARNING
Sets the number of hatch boundary objects that can be selected before
displaying a warning message.
HPORIGIN
Sets the hatch origin point for new hatch patterns relative to the current
user coordinate system.
HPORIGINMODE
Controls how the default hatch origin point is determined.
HPQUICKPREVIEW
Controls whether to display a preview when specifying internal points for a
hatch.
HPSCALE
Sets the hatch pattern scale factor.
HPSEPARATE
Controls whether a single hatch object or separate hatch objects are created
when operating on several closed boundaries.
HPSPACE
Sets the hatch pattern line spacing for user-defined patterns.
1266 | Chapter 28 Hatches, Fills, and Wipeouts
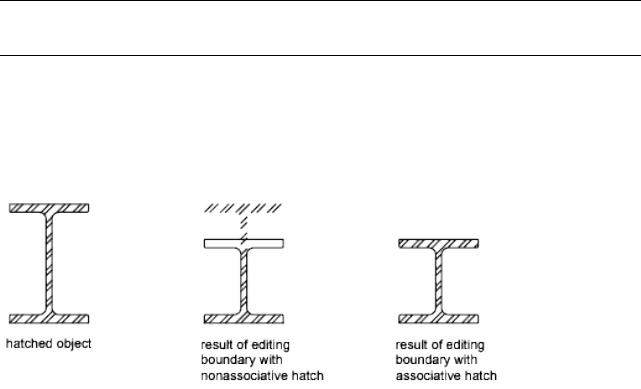
HPTRANSPARENCY
Sets the default transparency for new hatches and fills.
MIRRHATCH
Controls how MIRROR reflects hatch patterns.
PICKSTYLE
Controls the use of group selection and associative hatch selection.
Specify Hatch and Fill Areas
Define boundaries for hatches and fills from existing objects or from specified
boundary points.
Use one of several methods to specify the 2D geometric boundaries of a hatch
or fill.
■Specify a point in an area that is enclosed by objects.
■Select objects that enclose an area.
■Specify boundary points using the -HATCH Draw option.
■Drag a hatch into an enclosed area from a tool palette or DesignCenter.
NOTE Enclosed areas can be hatched only if they are in a plane parallel to the XY
plane of the current UCS.
Create Associative Hatches
Associative hatches are automatically updated when their boundary objects
are modified. Minor changes in the boundary of an associative hatch do not
require erasing and re-creating the hatch.
Specify Hatch and Fill Areas | 1267
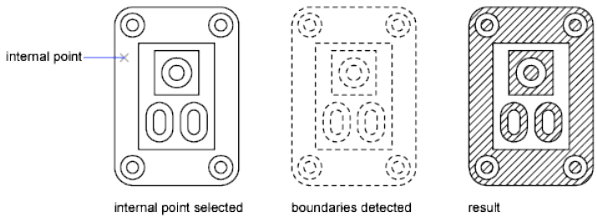
Hatch associativity is turned on by default and is controlled by the HPASSOC
system variable. You can also control hatch associativity using the following
tools in the user interface:
■Hatch and Gradient dialog box
■Hatch Edit dialog box
■Hatch panel on the ribbon
■Properties palette
Nonassociative hatches are not updated when their original boundary is
changed.
Hatch Enclosed Areas Within Boundaries
Enclosed areas within hatch boundaries are called islands. There are four island
detection styles available from the user interface:
■Normal Island Detection
■Outer Island Detection (recommended)
■Ignore Island Detection
■No Island Detection (legacy behavior that is similar to the Ignore style)
Using Normal Island Detection, if you specify the internal Pick Point shown,
islands remain unhatched and islands within islands are hatched.
Using the same pick point, the results of the options are compared below.
1268 | Chapter 28 Hatches, Fills, and Wipeouts
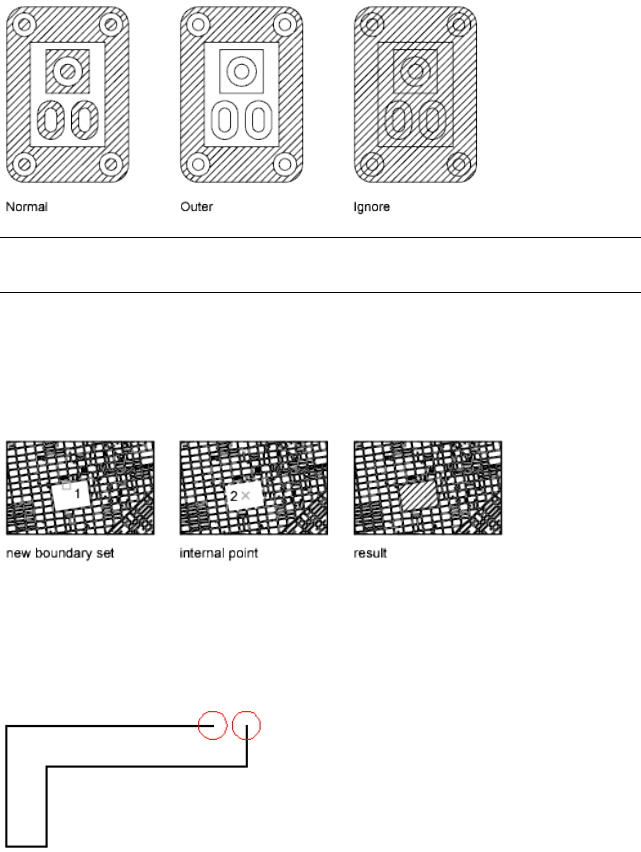
NOTE Text objects are treated as islands. If island detection is turned on, the result
always leaves a rectangular space around the text.
Include Objects in a Boundary Set
When hatching a small area in a large, complex drawing, you can save time
by selecting a smaller set of objects in the drawing to be used in determining
the hatch boundary.
Identify Gaps in Hatch Boundaries
If the specified internal point is not within a fully enclosed area, red circles
are displayed at the unconnected endpoints of the boundary to identify the
gaps.
The red circles remain displayed after you exit the HATCH command. They
are removed when you specify another internal point for the hatch, or when
you use the REDRAW, REGEN, or REGENALL commands.
Specify Hatch and Fill Areas | 1269
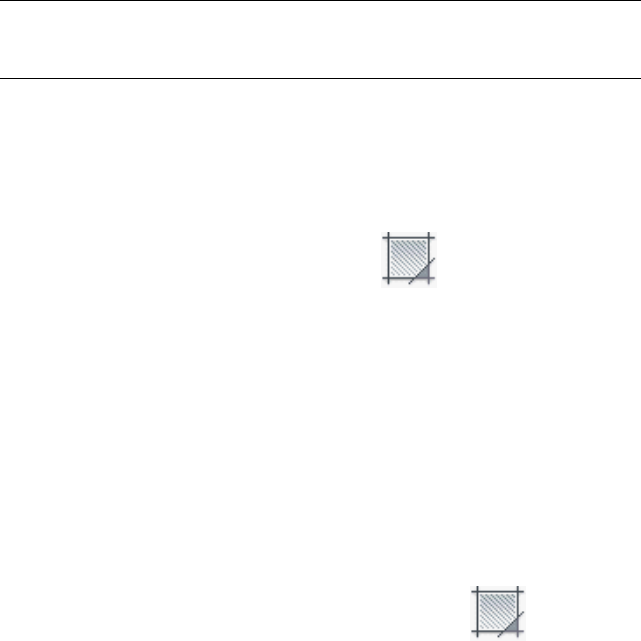
To hatch an area whose boundary is not quite closed, do one of the following:
■Locate the gaps and modify the boundary objects so they form a closed
boundary.
■Set the HPGAPTOL system variable to a value large enough to bridge the
gaps. HPGAPTOL applies only to gaps between geometric objects that
would meet if extended.
NOTE By default, a preview of the hatch displays as you move the cursor over
bounded areas. To improve the response time in large drawings, turn off the hatch
preview feature with the HPQUICKPREVIEW system variable.
See also:
■Reshape a Hatch or Fill on page 1291
To define a boundary set in a complex drawing (ribbon turned on)
1Click Home tab ➤ Draw panel ➤ Hatch.
2Expand the Boundaries panel, and click the Select New Boundary Set
button at the bottom-left of the expanded panel.
3Select the objects to be considered for the hatch and press Enter.
Selecting the objects with a crossing window is often the best method.
4Specify a point inside each area that you want hatched.
5Press Enter, or click Close on the ribbon to apply the hatch and exit the
command.
To define a boundary set in a complex drawing (ribbon turned off)
1Start the Hatch command from a menu or toolbar.
2In the Hatch and Gradient dialog box, click the More Options button at
the bottom-right.
3Under Boundary Set, click New.
4Select the objects to be considered for the hatch and press Enter.
1270 | Chapter 28 Hatches, Fills, and Wipeouts
Selecting the objects with a crossing window is often the best method.
5In the Hatch and Gradient dialog box, click Add: Pick Points.
6Specify a point inside each area that you want to hatch.
7Click OK to apply the hatch.
Quick Reference
Commands
HATCH
Fills an enclosed area or selected objects with a hatch pattern, solid fill, or
gradient fill.
HATCHEDIT
Modifies an existing hatch or fill.
System Variables
HPANG
Sets the angle for new hatch patterns.
HPASSOC
Controls whether hatches and fills are associative.
HPBOUND
Controls the object type created by HATCH and BOUNDARY.
HPBOUNDRETAIN
Controls whether boundary objects are created for new hatches and fills.
HPGAPTOL
Treats a set of objects that almost enclose an area as a closed hatch boundary.
HPISLANDDETECTION
Controls how islands within the hatch boundary are treated.
HPISLANDDETECTIONMODE
Controls whether internal closed boundaries, called islands, are detected.
Specify Hatch and Fill Areas | 1271
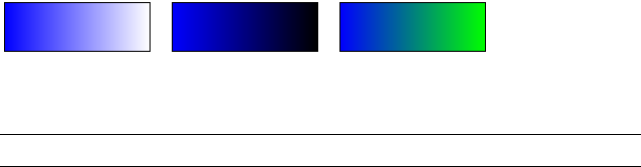
HPQUICKPREVIEW
Controls whether to display a preview when specifying internal points for a
hatch.
HPSEPARATE
Controls whether a single hatch object or separate hatch objects are created
when operating on several closed boundaries.
Control the Appearance of Hatches
Specify a hatch pattern or fill, and control its alignment and scale.
Choose a Hatch Pattern or Fill
Choose from three types of hatch patterns, and two types of fills.
■Predefined hatch patterns. Choose from over 70 ANSI, ISO, and other
industry-standard hatch patterns that are available. You can also use hatch
patterns from hatch pattern libraries supplied by other companies. Hatch
patterns are defined in the acad.pat text file.
■User-defined hatch patterns. Define a hatch pattern that uses the current
linetype with a specified spacing and angle.
■Custom hatch patterns. Define a custom hatch pattern definition in a .pat
file.
■Solid fill. Fill an area with a solid color by choosing the SOLID predefined
hatch.
■Gradient fill. Fill an enclosed area with a color gradient. A gradient fill can
be displayed as a tint (a color mixed with white), a shade (a color mixed
with black), or a smooth transition between two colors.
Gradients that mimic colors displayed on a cylinder, a sphere, or other shapes
are available.
NOTE You cannot use plot styles to control the plotted color of gradient fills.
1272 | Chapter 28 Hatches, Fills, and Wipeouts
Assign a Background Color to Hatch Patterns
Predefined, user defined, and custom hatch patterns, can be assigned a
background fill color. The background fill color shares the same level of
transparency as the pattern itself.
See also:
■Modify Hatch Properties on page 1289
■“Overview of Hatch Pattern Definitions” in the Customization Guide
To create a hatch with a predefined hatch pattern (ribbon turned on)
1Click Home tab ➤ Draw panel ➤ Hatch.
2On the Properties panel, click Pattern from the Hatch Type drop-down
list.
3(Optional) On the Properties panel, click a color override from the Hatch
Color drop-down list. Specify any other options as needed.
4On the Pattern panel, click a hatch pattern.
5Specify a point inside each area that you want hatched.
6Press Enter, or click Close on the ribbon to apply the hatch and exit the
command.
To create a hatch with a predefined hatch pattern (ribbon turned off)
1Start the Hatch command from a menu or toolbar.
2In the Hatch and Gradient dialog box, Hatch tab, under Type and Pattern,
click Predefined from the Type drop-down list.
3Select a pattern from the Pattern drop-down list.
4(Optional) Select a color override from the Color drop-down list. Specify
any other options as needed.
5Under Boundaries, click Add: Pick Points.
6Specify a point inside each area that you want to hatch and press Enter.
Choose a Hatch Pattern or Fill | 1273
7Click OK to apply the hatch.
To fill an area with a solid color (ribbon turned on)
1Click Home tab ➤ Draw panel ➤ Hatch.
2On the Properties panel, click Solid from the Hatch Type drop-down list,
or click Solid on the Pattern panel.
3(Optional) On the Properties panel, click a color override from the Hatch
Color drop-down list. Specify any other options as needed.
4Specify a point inside each area that you want to fill.
5Press Enter, or click Close on the ribbon to apply the hatch and exit the
command.
To fill an area with a solid color (ribbon turned off)
1Start the Hatch command from a menu or toolbar.
2In the Hatch and Gradient dialog box, Hatch tab, under Type and Pattern,
click Predefined from the Type drop-down list.
3Click Solid from the Pattern drop-down list.
4(Optional) Select a color override from the Color drop-down list. Specify
any other options as needed.
5Under Boundaries, click Add: Pick Points.
6Specify a point inside each area that you want to hatch and press Enter.
7Click OK to apply the hatch.
Quick Reference
Commands
GRADIENT
Fills an enclosed area or selected objects with a gradient fill.
1274 | Chapter 28 Hatches, Fills, and Wipeouts
HATCH
Fills an enclosed area or selected objects with a hatch pattern, solid fill, or
gradient fill.
HATCHEDIT
Modifies an existing hatch or fill.
HATCHTOBACK
Sets the draw order for all hatches in the drawing to be behind all other
objects.
MATCHPROP
Applies the properties of a selected object to other objects.
PROPERTIES
Controls properties of existing objects.
UCS
Manages user coordinate systems.
System Variables
GFANG
Specifies the angle of a gradient fill.
GFCLR1
Specifies the color for a one-color gradient fill or the first color for a two-color
gradient fill.
GFCLR2
Specifies the second color for a two-color gradient fill.
GFCLRLUM
Controls the tint or shade level in a one-color gradient fill.
GFCLRSTATE
Specifies whether a gradient fill uses one color or two colors.
GFNAME
Specifies the pattern of a gradient fill.
Choose a Hatch Pattern or Fill | 1275
GFSHIFT
Specifies whether the pattern in a gradient fill is centered or is shifted up
and to the left.
HPANG
Sets the angle for new hatch patterns.
HPANNOTATIVE
Controls whether a new hatch pattern is annotative.
HPASSOC
Controls whether hatches and fills are associative.
HPBACKGROUNDCOLOR
Controls the background color for hatch patterns.
HPBOUND
Controls the object type created by HATCH and BOUNDARY.
HPBOUNDRETAIN
Controls whether boundary objects are created for new hatches and fills.
HPCOLOR
Sets a default color for new hatches.
HPDOUBLE
Specifies hatch pattern doubling for user-defined patterns.
HPDRAWORDER
Controls the draw order of hatches and fills.
HPINHERIT
Controls whether to inherit the hatch origin when using the Inherit Properties
option in HATCH and HATCHEDIT.
HPISLANDDETECTION
Controls how islands within the hatch boundary are treated.
HPISLANDDETECTIONMODE
Controls whether internal closed boundaries, called islands, are detected.
1276 | Chapter 28 Hatches, Fills, and Wipeouts
HPLAYER
Specifies a default layer for new hatches and fills.
HPMAXLINES
Sets the maximum number of hatch lines that are generated in a hatch
operation.
HPNAME
Sets the default hatch pattern name.
HPOBJWARNING
Sets the number of hatch boundary objects that can be selected before
displaying a warning message.
HPINHERIT
Controls whether to inherit the hatch origin when using the Inherit Properties
option in HATCH and HATCHEDIT.
HPORIGIN
Sets the hatch origin point for new hatch patterns relative to the current
user coordinate system.
HPORIGINMODE
Controls how the default hatch origin point is determined.
HPQUICKPREVIEW
Controls whether to display a preview when specifying internal points for a
hatch.
HPSCALE
Sets the hatch pattern scale factor.
HPSEPARATE
Controls whether a single hatch object or separate hatch objects are created
when operating on several closed boundaries.
HPSPACE
Sets the hatch pattern line spacing for user-defined patterns.
HPTRANSPARENCY
Sets the default transparency for new hatches and fills.
Choose a Hatch Pattern or Fill | 1277
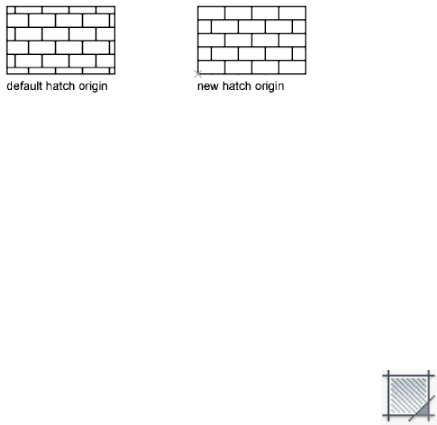
MIRRHATCH
Controls how MIRROR reflects hatch patterns.
Control the Hatch Origin Point
Each hatch pattern is aligned with an origin point. Changing the origin point
shifts the pattern.
By default, hatch patterns are aligned with the origin point of the user
coordinate system. However, sometimes you need to move the origin point
of the hatch object. For example, if you create a brick pattern, you can start
with a complete brick in the lower-left corner of the hatched area by specifying
a new origin point.
The hatch origin and its behavior depend on settings in the user interface that
control the HPORIGIN, HPORIGINMODE, and HPINHERIT system variables.
Alternatively, you can control hatch patterns by changing the location and
orientation of the user coordinate system.
See also:
■Modify Hatch Alignment, Scale, and Rotation on page 1290
To specify the alignment of a hatch pattern (ribbon turned on)
1Click Home tab ➤ Draw panel ➤ Hatch.
2On the Properties panel, click Pattern from the Hatch Type drop-down
list.
3On the Pattern panel, click a hatch pattern.
4On the Origin panel, click Set Origin, and specify a point in the drawing.
The hatch pattern will be aligned to this point.
5On the Properties panel, specify a hatch angle.
6Specify a point inside each area that you want to hatch.
1278 | Chapter 28 Hatches, Fills, and Wipeouts

7Press Enter, or click Close on the ribbon to apply the hatch and exit the
command.
Alternatively, you can control the origin and rotation of a hatch pattern by
changing the origin and rotation of the user coordinate system (UCS) before
you create the hatch.
To specify the alignment of a hatch pattern (ribbon turned off)
1Start the Hatch command from a menu or toolbar.
2In the Hatch and Gradient dialog box, Hatch tab, under Type and Pattern,
click Predefined from the Type drop-down list.
3Select a hatch pattern from the Pattern drop-down list.
4Under Hatch Origin, click Specified Origin and click Click to Set New
Origin. Specify a point in the drawing.
The hatch pattern will be aligned to this point.
5Under Angle and Scale, specify a hatch angle to rotate the hatch pattern.
6Under Boundaries, click Add: Pick Points.
7Specify a point inside each area that you want to hatch and press Enter.
8Click OK to apply the hatch.
Alternatively, you can control the origin and rotation of a hatch pattern by
changing the origin and rotation of the user coordinate system (UCS) before
you create the hatch.
Quick Reference
Commands
HATCH
Fills an enclosed area or selected objects with a hatch pattern, solid fill, or
gradient fill.
HATCHEDIT
Modifies an existing hatch or fill.
Control the Hatch Origin Point | 1279
PROPERTIES
Controls properties of existing objects.
UCS
Manages user coordinate systems.
System Variables
HPINHERIT
Controls whether to inherit the hatch origin when using the Inherit Properties
option in HATCH and HATCHEDIT.
HPORIGIN
Sets the hatch origin point for new hatch patterns relative to the current
user coordinate system.
HPORIGINMODE
Controls how the default hatch origin point is determined.
HPQUICKPREVIEW
Controls whether to display a preview when specifying internal points for a
hatch.
HPSCALE
Sets the hatch pattern scale factor.
HPSEPARATE
Controls whether a single hatch object or separate hatch objects are created
when operating on several closed boundaries.
HPSPACE
Sets the hatch pattern line spacing for user-defined patterns.
Control the Scale of Hatch Patterns
The scale of hatch patterns can be set individually, or it can be set
automatically based on the scale of each layout viewport.
■If you create hatch patterns exclusively for a single view or at a constant
scale, you can set the current hatch scale manually in the interface or with
the HPSCALE system variable.
1280 | Chapter 28 Hatches, Fills, and Wipeouts
■If you work with layout viewports in different scales, you can apply scale
factors automatically by making them annotative. This method is more
efficient than creating duplicate hatch pattern objects with different scale
factors. For more information about using annotative scaling, see Create
Annotative Hatches on page 1249.
NOTE To prevent accidental creation of an enormous number of hatch lines, the
maximum number of hatch lines created in a single hatch operation is limited.
This limit prevents memory and performance problems. However, you can change
the maximum number of hatch lines with the HPMAXLINES system variable.
See also:
■Scale Annotations on page 1224
■Modify Hatch Alignment, Scale, and Rotation on page 1290
To set the scale of a hatch pattern (ribbon turned on)
1Click Home tab ➤ Draw panel ➤ Hatch.
2On the Properties panel, click Pattern from the Hatch Type drop-down
list.
3On the Pattern panel, click a hatch pattern.
4On the Properties panel, enter a hatch pattern scale.
5Specify a point inside each area that you want to hatch.
6Press Enter, or click Close on the ribbon to apply the hatch and exit the
command.
To set the scale of a hatch pattern (ribbon turned off)
1Start the Hatch command from a menu or toolbar.
2In the Hatch and Gradient dialog box, Hatch tab, under Type and Pattern,
click Predefined from the Type drop-down list.
3Select a pattern from the Pattern drop-down list.
Control the Scale of Hatch Patterns | 1281
4Under Angle and Scale, enter a new scale value or click the drop-down
arrow to display a list of scales.
5Under Boundaries, click Add: Pick Points.
6Specify a point inside each area that you want to hatch and press Enter.
7Click OK to apply the hatch.
Quick Reference
Commands
HATCH
Fills an enclosed area or selected objects with a hatch pattern, solid fill, or
gradient fill.
HATCHEDIT
Modifies an existing hatch or fill.
MATCHPROP
Applies the properties of a selected object to other objects.
PROPERTIES
Controls properties of existing objects.
System Variables
HPANNOTATIVE
Controls whether a new hatch pattern is annotative.
HPINHERIT
Controls whether to inherit the hatch origin when using the Inherit Properties
option in HATCH and HATCHEDIT.
HPMAXLINES
Sets the maximum number of hatch lines that are generated in a hatch
operation.
HPOBJWARNING
Sets the number of hatch boundary objects that can be selected before
displaying a warning message.
1282 | Chapter 28 Hatches, Fills, and Wipeouts
HPINHERIT
Controls whether to inherit the hatch origin when using the Inherit Properties
option in HATCH and HATCHEDIT.
HPSCALE
Sets the hatch pattern scale factor.
HPSPACE
Sets the hatch pattern line spacing for user-defined patterns.
Set Property Overrides for Hatches and Fills
Control the default color, layer, and transparency of hatch objects separately
from other objects.
Hatch objects have an additional capability that is not available with other
types of objects. You can specify which layer, color, and transparency settings
will be automatically applied to each new hatch object, regardless of the current
property settings. This can save you time.
For example, you can specify that all new hatch objects are automatically
created on a specified layer regardless of the current layer setting.
NOTE If you do not want to override the current property settings, select Use
Current for the hatch’s layer, color, and transparency settings.
See also:
■Modify Hatch Properties on page 1289
■Control How Overlapping Objects Are Displayed on page 545
To set a transparency override for new hatches (ribbon turned on)
1Click Home tab ➤ Draw panel ➤ Hatch.
2On the Properties panel, drag the Hatch Transparency slider or enter a
value.
3Specify a point inside each area that you want to hatch.
4Press Enter, or click Close on the ribbon to apply the hatch and exit the
command.
Set Property Overrides for Hatches and Fills | 1283

All new hatch objects will use this transparency value instead of the current
transparency value used by all other objects.
To set a transparency override for new hatches (ribbon turned off)
1Start the Hatch command from a menu or toolbar.
2In the Hatch and Gradient dialog box, under Options, select Specify Value
from the Transparency drop-down list.
3Enter transparency value or drag the slider.
4Under Boundaries, click Add: Pick Points.
5Specify a point inside each area that you want to hatch and press Enter.
6Click OK to apply the hatch.
All new hatch objects will use this transparency value instead of the current
transparency value used by all other objects.
Quick Reference
Commands
HATCH
Fills an enclosed area or selected objects with a hatch pattern, solid fill, or
gradient fill.
HATCHEDIT
Modifies an existing hatch or fill.
HATCHTOBACK
Sets the draw order for all hatches in the drawing to be behind all other
objects.
MATCHPROP
Applies the properties of a selected object to other objects.
PROPERTIES
Controls properties of existing objects.
1284 | Chapter 28 Hatches, Fills, and Wipeouts
System Variables
HPANNOTATIVE
Controls whether a new hatch pattern is annotative.
HPASSOC
Controls whether hatches and fills are associative.
HPBACKGROUNDCOLOR
Controls the background color for hatch patterns.
HPCOLOR
Sets a default color for new hatches.
HPDRAWORDER
Controls the draw order of hatches and fills.
HPINHERIT
Controls whether to inherit the hatch origin when using the Inherit Properties
option in HATCH and HATCHEDIT.
HPLAYER
Specifies a default layer for new hatches and fills.
HPSCALE
Sets the hatch pattern scale factor.
HPSEPARATE
Controls whether a single hatch object or separate hatch objects are created
when operating on several closed boundaries.
HPTRANSPARENCY
Sets the default transparency for new hatches and fills.
MIRRHATCH
Controls how MIRROR reflects hatch patterns.
Control the Display of Hatch Boundaries
Hide or remove boundary objects to create hatches without borders.
Control the Display of Hatch Boundaries | 1285
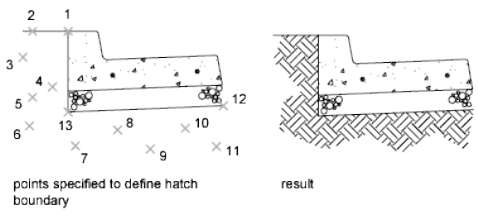
To create hatches that have no boundary objects, do one of the following:
■Erase the boundary objects of an existing hatch.
■Trim an existing hatch to objects that cross the edges of the hatch. After
trimming, erase the objects.
■Define hatch boundary points with the Draw option of the -HATCH
command.
To hide a hatch's boundary objects, assign the boundary objects to a different
layer than the hatch object, and then turn off or freeze the layer of the
boundary objects. This method maintains hatch associativity.
See also:
■Reshape a Hatch or Fill on page 1291
To create an unbounded hatch
1At the Command prompt, enter -hatch.
2Enter p to specify Properties.
3Enter the name of the pattern. For example, enter earth to specify the
EARTH pattern.
4Specify the scale and angle for the hatch pattern.
5Enter w to specify Draw Boundary.
6Enter n to discard the polyline boundary once the hatch area has been
defined.
7Specify points to define the boundary. Enter c to close the polyline
boundary.
1286 | Chapter 28 Hatches, Fills, and Wipeouts
8Press Enter twice to create the hatch.
Quick Reference
Commands
-HATCH
conref to -Hatch blurb
PROPERTIES
Controls properties of existing objects.
System Variables
HPANG
Sets the angle for new hatch patterns.
HPBOUNDRETAIN
Controls whether boundary objects are created for new hatches and fills.
HPCOLOR
Sets a default color for new hatches.
HPDLGMODE
Controls the display of the Hatch and Gradient dialog box and the Hatch
Edit dialog box.
HPDOUBLE
Specifies hatch pattern doubling for user-defined patterns.
HPMAXLINES
Sets the maximum number of hatch lines that are generated in a hatch
operation.
HPNAME
Sets the default hatch pattern name.
HPOBJWARNING
Sets the number of hatch boundary objects that can be selected before
displaying a warning message.
Control the Display of Hatch Boundaries | 1287
HPINHERIT
Controls whether to inherit the hatch origin when using the Inherit Properties
option in HATCH and HATCHEDIT.
HPORIGIN
Sets the hatch origin point for new hatch patterns relative to the current
user coordinate system.
HPORIGINMODE
Controls how the default hatch origin point is determined.
HPSCALE
Sets the hatch pattern scale factor.
HPSPACE
Sets the hatch pattern line spacing for user-defined patterns.
HPTRANSPARENCY
Sets the default transparency for new hatches and fills.
Control the Draw Order of Hatches and Fills
Specify the draw order for a hatch object to control whether it is displayed
behind or in front of the hatch boundary, or behind or in front of all other
objects.
This behavior is controlled by the HPDRAWORDER system variable.
In drawings that contain many hatch objects, use the HATCHTOBACK
command to display all hatch objects behind all other objects.
Quick Reference
Commands
HATCHTOBACK
Sets the draw order for all hatches in the drawing to be behind all other
objects.
1288 | Chapter 28 Hatches, Fills, and Wipeouts
System Variables
HPDRAWORDER
Controls the draw order of hatches and fills.
Modify Hatches and Fills
Modify hatch properties and boundaries, or re-create the boundaries hatch
objects.
Modify Hatch Properties
Modify the properties of hatch objects directly or copy them from another
hatch object.
The following tools are available for modifying hatch properties:
■Hatch panel controls. Display on the ribbon by selecting a hatch object.
■Hatch Edit dialog box. Access the dialog box with HATCHEDIT.
■Properties palette.
■Hatch shortcut menu. Access the menu by right-clicking a hatch object.
■Hatch dynamic menu. Access the menu by hovering over the control grip
on a selected hatch.
■Command line. Enter -HATCHEDIT.
Copy the properties of one hatch to another using the following methods:
■Inherit Properties button in the Hatch Edit dialog box. Copy all
hatch-specific properties.
■Match Properties command. Use MATCHPROP to copy general properties
and hatch-specific properties, with the exception of the hatch origin.
See also:
■Control How Overlapping Objects Are Displayed on page 545
Modify Hatches and Fills | 1289
Quick Reference
Commands
HATCHEDIT
Modifies an existing hatch or fill.
HATCHTOBACK
Sets the draw order for all hatches in the drawing to be behind all other
objects.
MATCHPROP
Applies the properties of a selected object to other objects.
PROPERTIES
Controls properties of existing objects.
System Variables
HPDLGMODE
Controls the display of the Hatch and Gradient dialog box and the Hatch
Edit dialog box.
HPINHERIT
Controls whether to inherit the hatch origin when using the Inherit Properties
option in HATCH and HATCHEDIT.
Modify Hatch Alignment, Scale, and Rotation
Shift, scale, or rotate hatch patterns to align them with existing objects.
To shift a hatch pattern, relocate the origin point of the hatch object. The
same tools in the user interface as listed in Modify Hatch Properties on page
1289 include options for specifying a new origin point, specifying a different
rotation angle, and changing the scale of the hatch pattern.
In some cases, it might be easier to move or rotate the user coordinate system
to align with existing objects, and then recreate the hatch.
To modify the properties of a hatch object
1Select a hatch object.
1290 | Chapter 28 Hatches, Fills, and Wipeouts
2Change the desired hatch settings from the Hatch Editor tab on the
ribbon, the Modify menu, Modify toolbar, or enter hatchedit at the
Command prompt.
3In the user interface, a panel in the Hatch Editor tab, or the Hatch Edit
dialog box, change the hatch settings or properties as needed.
Quick Reference
Commands
HATCHEDIT
Modifies an existing hatch or fill.
MATCHPROP
Applies the properties of a selected object to other objects.
PROPERTIES
Controls properties of existing objects.
System Variables
HPDLGMODE
Controls the display of the Hatch and Gradient dialog box and the Hatch
Edit dialog box.
HPINHERIT
Controls whether to inherit the hatch origin when using the Inherit Properties
option in HATCH and HATCHEDIT.
Reshape a Hatch or Fill
Reshape an associative hatch by modifying the boundary objects. Reshape a
nonassociative hatch by modifying the hatch object.
Modify the Extents of Associative Hatches and Fills
If you modify the boundary objects of an associative hatch, and the result
maintains a closed boundary, the associated hatch object is automatically
updated. If the changes result in an open boundary, the hatch loses its
associativity with the boundary objects, and the hatch remains unchanged.
Reshape a Hatch or Fill | 1291
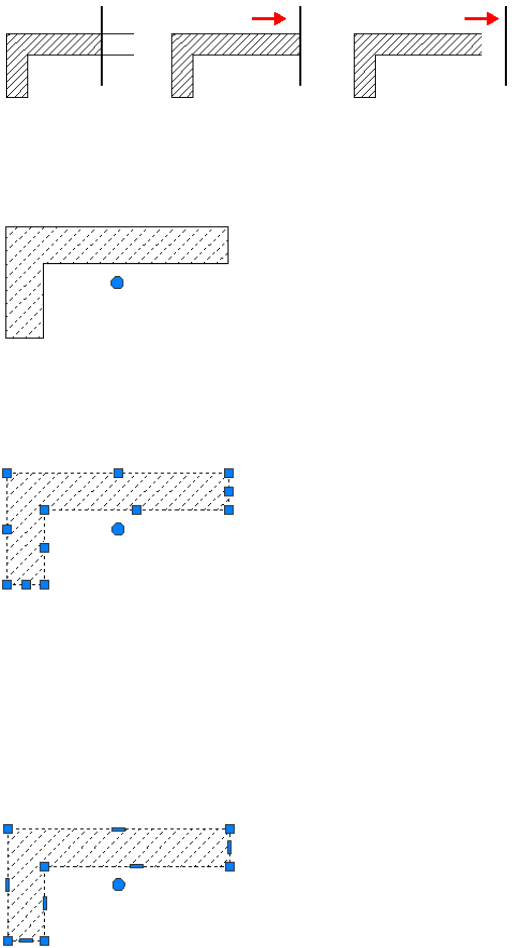
When you select an associative hatch object, it displays a circular grip, called
the control grip, at the center of the hatch extents. Hover over the control grip
to display a shortcut menu with several hatch options, or right-click to display
additional options.
You can also change the hatch object by editing the grips of the associated
boundary objects. To easily select all of the objects in a complex boundary,
use the Display Boundary Objects option available from the ribbon or the
Hatch Edit dialog box.
If the boundary object is a polyline or spline, multi-functional grips are displayed.
For more information, see Modify Objects with Multi-Functional Grips on
page 735.
Modify the Extents of Nonassociative Hatches and Fills
When you select a nonassociative hatch, multi-functional grips are displayed
on the hatch. Use these grips to modify the hatch extents and some several
hatch properties.
1292 | Chapter 28 Hatches, Fills, and Wipeouts
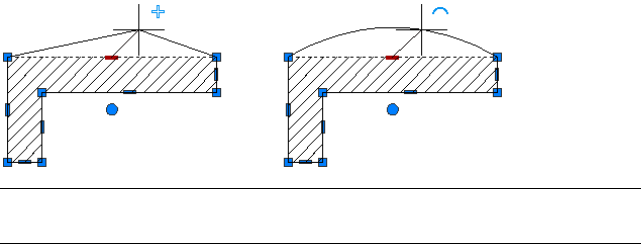
When you hover over a grip on a nonassociative hatch object, a grip menu
displays several edit options based on the type of grip. For example, a linear
segment grip has an option to convert the segment to an arc, or to add a
vertex.
NOTE For drastic changes, you can use TRIM to reduce the area covered by a
hatch object, or EXPLODE to disassemble a hatch into its component objects.
Quick Reference
Commands
EXPLODE
Breaks a compound object into its component objects.
TRIM
Trims objects to meet the edges of other objects.
System Variables
GRIPS
Controls the display of grips on selected objects.
Re-create the Boundary of a Hatch or Fill
Create a new boundary object for a nonassociative or an unbounded hatch
or fill.
Use the Recreate Boundary option to generate a closed polyline or a region
object around a selected hatch or fill. You can also specify that the new
boundary object is associated with the hatch.
Re-create the Boundary of a Hatch or Fill | 1293
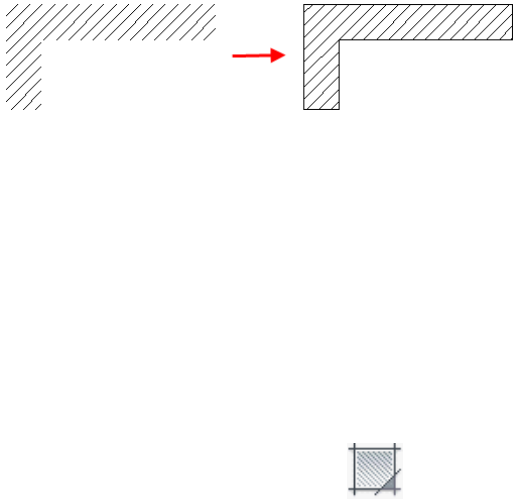
To re-create the boundary object of a hatch or fill (ribbon turned on)
1Select the hatch object.
2On the ribbon, Boundaries panel, click Recreate Boundary.
3At the prompt, specify the type of object to create as the new boundary,
and whether to associate the boundary with the hatch.
4Press Enter, or click Close on the ribbon to apply the hatch and exit the
command.
To re-create the boundary object of a hatch or fill (ribbon turned off)
1Start the Modify Hatch command from a menu or toolbar, or enter
hatchedit at the Command prompt.
2Select the hatch object.
3In the Hatch Edit dialog box, under Boundaries, click Recreate Boundary.
4Specify the type of object to create as the new boundary.
5Specify whether to associate the boundary with the hatch object.
6Click OK to apply the hatch.
Quick Reference
Commands
HATCHEDIT
Modifies an existing hatch or fill.
1294 | Chapter 28 Hatches, Fills, and Wipeouts
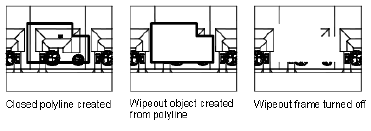
System Variables
HPDLGMODE
Controls the display of the Hatch and Gradient dialog box and the Hatch
Edit dialog box.
HPBOUND
Controls the object type created by HATCH and BOUNDARY.
HPBOUNDRETAIN
Controls whether boundary objects are created for new hatches and fills.
HPSEPARATE
Controls whether a single hatch object or separate hatch objects are created
when operating on several closed boundaries.
Create a Blank Area to Cover Objects
Create a polygonal area, called a wipeout to mask underlying objects with the
current background color.
A wipeout object covers existing objects with a blank area to make room for
notes or to mask details. This area is defined by the wipeout frame, which you
can turn on for editing, and turn off for plotting.
Use the WIPEOUT command both for creating a wipeout object, and for
controlling whether wipeout frames are displayed or hidden in the drawing.
If a polyline is used to create a wipeout object, the polyline must be closed,
contain line segments only, and have zero width.
Use Wipeout Objects on a Layout
You can create wipeout objects on a layout in paper space to mask objects in
model space. However, in the Page Settings dialog box, under Plot Options,
the Plot Paper Space Last option must be cleared before you plot to ensure
that the wipeout object is plotted correctly.
Create a Blank Area to Cover Objects | 1295
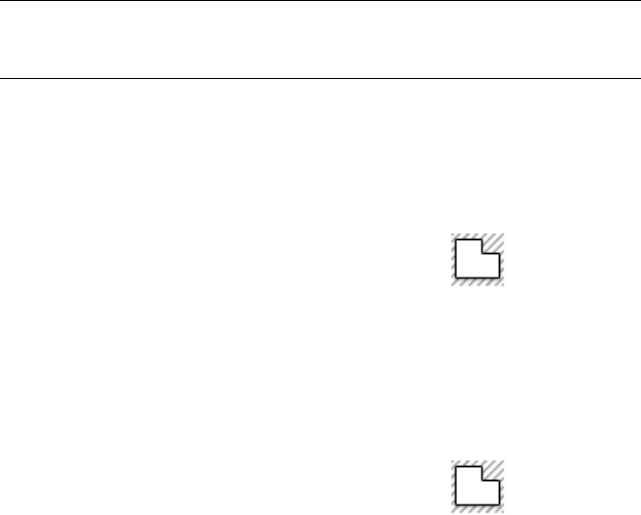
NOTE Because a wipeout object is similar to a raster image, it has the same
requirements for plotting. You need a raster-capable plotter with either an ADI
4.3 raster-capable driver or the system printer driver.
See also:
■Control How Overlapping Objects Are Displayed on page 545
To cover existing objects with a blank area
1Click Annotate tab ➤ Markup panel ➤ Wipeout.
2Specify points in a sequence that defines the perimeter of the area to be
masked.
3Press Enter to end the command.
To turn all wipeout frames on or off
1Click Annotate tab ➤ Markup panel ➤ Wipeout.
2At the prompt, enter f (Frames).
3Enter on or off, and press Enter.
Quick Reference
Commands
WIPEOUT
Creates a wipeout object, and controls whether wipeout frames are displayed
in the drawing.
1296 | Chapter 28 Hatches, Fills, and Wipeouts

Notes and Labels
You can create and modify several types of text, including text with leaders. You can control
most text style settings by defining text styles.
Overview of Notes and Labels
You can create text in various ways. For short, simple entries, use single-line
text. For longer entries with internal formatting, use multiline text (mtext).
Although all entered text uses the current text style, which establishes the default
font and format settings, you can use several methods to customize the text
appearance. There are several tools that can change text scale and justification,
find and replace text, and check for spelling errors.
Text that is included in a dimension or tolerance is created using the
dimensioning commands. You can also create multiline text with leaders.
To create single-line text
1Click Home tab ➤ Annotation panel ➤ Single Line Text.
2Specify the insertion point for the first character. If you press ENTER, the
program locates the new text immediately below the last text object you
created, if any.
3Specify the height of the text. This prompt is displayed only if text height
is set to 0 in the current text style.
A rubber-band line is attached from the text insertion point to the cursor.
Click to set the height of the text to the length of the rubber-band line.
4Specify a text rotation angle.
You can enter an angle value or use your pointing device.
29
1297

5Enter the text. At the end of each line, press ENTER. Enter more text as
needed.
NOTE Text that would otherwise be difficult to read (if it is very small, very
large, or is rotated) is displayed at a legible size and is oriented horizontally
so that you can easily read and edit it.
If you specify another point during this command, the cursor moves to
that point, and you can continue typing. Every time you press ENTER or
specify a point, a new text object is created.
6Press ENTER on a blank line to end the command.
To create multiline text
1Click Home tab ➤ Annotation panel ➤ Multiline Text.
2Specify opposite corners of a bounding box to define the width of the
multiline text object.
If the ribbon is active, the MTEXT ribbon contextual tab displays. If the
ribbon is not active, the In-Place Text Editor is displayed.
3To indent the first line of each paragraph, drag the first-line indent slider
on the ruler. To indent the other lines of each paragraph, drag the
paragraph slider.
4To set tabs, click the ruler where you want a tab stop.
5If you want to use a text style other than the default, on the ribbon, click
the Annotate tab, Text panel. Select the desired text style from the
drop-down list.
6Enter text.
NOTE Text that would otherwise be difficult to read (if it is very small, very
large, or is rotated) is displayed at a legible size and is oriented horizontally
so that you can easily read and edit it.
7To override the current text style, select text as follows:
■To select one or more letters, click and drag the pointing device over
the characters.
■To select a word, double-click the word.
1298 | Chapter 29 Notes and Labels

■To select a paragraph, triple-click the paragraph.
8On the ribbon, make format changes as follows:
■To change the font of the selected text, select a font from the list.
■To change the height of the selected text, enter a new value in the
Height box.
NOTE The MText height value is reset to 0 if its default height is not
modified during creation.
■To format text in a TrueType font with boldface or italics, or to create
underlined or overlined text for any font, click the corresponding
button on the ribbon. SHX fonts do not support boldface or italics.
■To apply color to selected text, choose a color from the Color list.
Click Other to display the Select Color dialog box.
9To save your changes and exit the editor, use one of the following
methods:
■On the MTEXT ribbon contextual tab, in the Close panel, click Close
Text Editor.
■Click in the drawing outside the editor.
■Press CTRL+ENTER.
Quick Reference
Commands
DDEDIT
Edits single-line text, dimension text, attribute definitions, and feature control
frames.
MLEADER
Creates a multileader object.
MTEXT
Creates a multiline text object.
Overview of Notes and Labels | 1299
SPELL
Checks spelling in a drawing.
STYLE
Creates, modifies, or specifies text styles.
TEXT
Creates a single-line text object.
System Variables
DIMASZ
Controls the size of dimension line and leader line arrowheads.
DIMLDRBLK
Specifies the arrow type for leaders.
Create Text
You can create text using several methods, depending on your needs.
Overview of Creating Text
The text you add to your drawings conveys a variety of information. It may
be a complex specification, title block information, a label, or even part of
the drawing.
Single-Line Text
For short entries that do not require multiple fonts or lines, create single-line
text. Single-line text is most convenient for labels.
Multiline Text
For long, complex entries, create multiline, or paragraph text. Multiline text
consists of any number of text lines or paragraphs that fit within a width you
specify; it can extend vertically to an indefinite length.
Regardless of the number of lines, each set of paragraphs created in a single
editing session forms a single object, which you can move, rotate, erase, copy,
mirror, or scale.
1300 | Chapter 29 Notes and Labels

There are more editing options for multiline text than there are for single-line
text. For example, you can apply underlining, fonts, color, and text height
changes to individual characters, words, or phrases within a paragraph.
Annotative Text
Use text for notes and labels in your drawing. You create annotative text by
using an annotative text style, which sets the height of the text on the paper.
For more information about creating and working with an annotative text,
see Create Annotative Text on page 1235.
See also:
■Scale Annotations on page 1224
To create single-line text
1Click Home tab ➤ Annotation panel ➤ Single Line Text.
2Specify the insertion point for the first character. If you press ENTER, the
program locates the new text immediately below the last text object you
created, if any.
3Specify the height of the text. This prompt is displayed only if text height
is set to 0 in the current text style.
A rubber-band line is attached from the text insertion point to the cursor.
Click to set the height of the text to the length of the rubber-band line.
4Specify a text rotation angle.
You can enter an angle value or use your pointing device.
5Enter the text. At the end of each line, press ENTER. Enter more text as
needed.
NOTE Text that would otherwise be difficult to read (if it is very small, very
large, or is rotated) is displayed at a legible size and is oriented horizontally
so that you can easily read and edit it.
If you specify another point during this command, the cursor moves to
that point, and you can continue typing. Every time you press ENTER or
specify a point, a new text object is created.
6Press ENTER on a blank line to end the command.
Overview of Creating Text | 1301

To create multiline text
1Click Home tab ➤ Annotation panel ➤ Multiline Text.
2Specify opposite corners of a bounding box to define the width of the
multiline text object.
If the ribbon is active, the MTEXT ribbon contextual tab displays. If the
ribbon is not active, the In-Place Text Editor is displayed.
3To indent the first line of each paragraph, drag the first-line indent slider
on the ruler. To indent the other lines of each paragraph, drag the
paragraph slider.
4To set tabs, click the ruler where you want a tab stop.
5If you want to use a text style other than the default, on the ribbon, click
the Annotate tab, Text panel. Select the desired text style from the
drop-down list.
6Enter text.
NOTE Text that would otherwise be difficult to read (if it is very small, very
large, or is rotated) is displayed at a legible size and is oriented horizontally
so that you can easily read and edit it.
7To override the current text style, select text as follows:
■To select one or more letters, click and drag the pointing device over
the characters.
■To select a word, double-click the word.
■To select a paragraph, triple-click the paragraph.
8On the ribbon, make format changes as follows:
■To change the font of the selected text, select a font from the list.
■To change the height of the selected text, enter a new value in the
Height box.
NOTE The MText height value is reset to 0 if its default height is not
modified during creation.
1302 | Chapter 29 Notes and Labels
■To format text in a TrueType font with boldface or italics, or to create
underlined or overlined text for any font, click the corresponding
button on the ribbon. SHX fonts do not support boldface or italics.
■To apply color to selected text, choose a color from the Color list.
Click Other to display the Select Color dialog box.
9To save your changes and exit the editor, use one of the following
methods:
■On the MTEXT ribbon contextual tab, in the Close panel, click Close
Text Editor.
■Click in the drawing outside the editor.
■Press CTRL+ENTER.
Quick Reference
Commands
MTEXT
Creates a multiline text object.
TEXT
Creates a single-line text object.
System Variables
MTEXTED
Sets the application for editing multiline text objects.
STYLE
Creates, modifies, or specifies text styles.
TEXTED
Specifies the user interface displayed for editing single-line text.
TEXTFILL
Controls the filling of TrueType fonts while plotting.
TEXTQLTY
Sets the resolution tessellation fineness of text outlines.
Overview of Creating Text | 1303
TEXTSIZE
Sets the default height for new text objects drawn with the current text style.
TEXTSTYLE
Sets the name of the current text style.
Create Single-Line Text
You can use single-line text to create one or more lines of text, where each
text line is an independent object that you can relocate, reformat, or otherwise
modify.
Use single-line text (TEXT) to create one or more lines of text, ending each
line when you press ENTER. Each text line is an independent object that you
can relocate, reformat, or otherwise modify.
When you create single-line text, you assign a text style and set alignment.
The text style sets the default characteristics of the text object. The alignment
determines what part of the text character aligns with the insertion point. Use
the TEXT command to enter the text in-place, or enter -text at the Command
prompt to enter the text at the Command prompt.
You can insert a field in single-line text. A field is text that is set up to display
data that might change. When the field is updated, the latest value of the field
is displayed.
The text styles used for single-line text are the same as those used for multiline
text. When you create text, you assign an existing style by entering its name
at the Style prompt. If you need to apply formatting to individual words and
characters, use multiline text instead of single-line text.
You can also compress single-line text to fit between points that you specify.
This option stretches or squeezes the text to fill the designated space.
The TEXTED system variable specifies the user interface displayed for editing
single-line text.
Align Single-Line Text
As you create text, you can align it. That is, you can justify it with one of the
alignment options shown in the following illustrations. Left alignment is the
default. To left-align text, do not enter an option at the Justify prompt.
1304 | Chapter 29 Notes and Labels
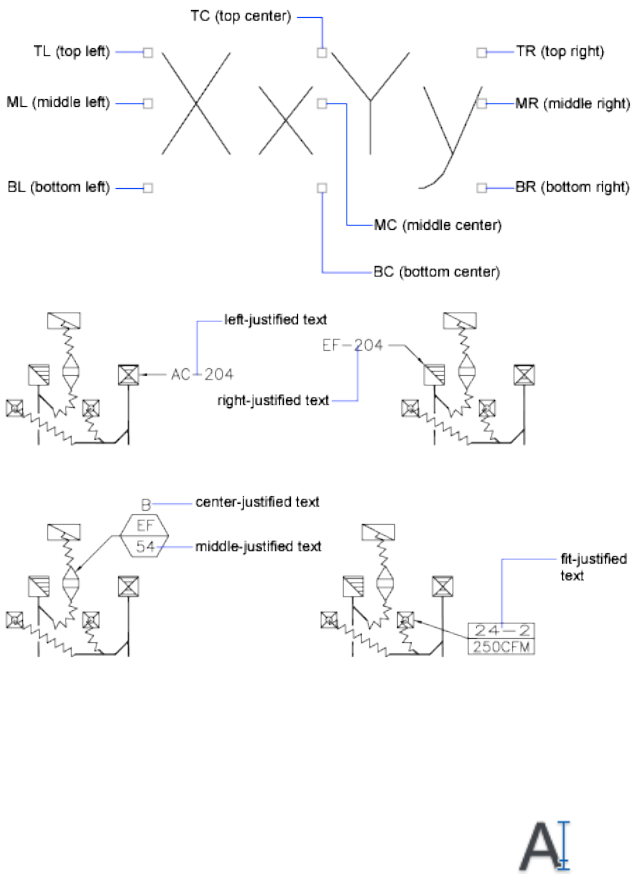
See also:
■Use Fields in Text on page 1352
To create single-line text
1Click Home tab ➤ Annotation panel ➤ Single Line Text.
2Specify the insertion point for the first character. If you press ENTER, the
program locates the new text immediately below the last text object you
created, if any.
Create Single-Line Text | 1305
3Specify the height of the text. This prompt is displayed only if text height
is set to 0 in the current text style.
A rubber-band line is attached from the text insertion point to the cursor.
Click to set the height of the text to the length of the rubber-band line.
4Specify a text rotation angle.
You can enter an angle value or use your pointing device.
5Enter the text. At the end of each line, press ENTER. Enter more text as
needed.
NOTE Text that would otherwise be difficult to read (if it is very small, very
large, or is rotated) is displayed at a legible size and is oriented horizontally
so that you can easily read and edit it.
If you specify another point during this command, the cursor moves to
that point, and you can continue typing. Every time you press ENTER or
specify a point, a new text object is created.
6Press ENTER on a blank line to end the command.
To specify a text style when you create single-line text
1Click Home tab ➤ Annotation panel ➤ Single Line Text.
2Enter s (Style).
3At the Style Name prompt, enter an existing text style name.
If you first want to see a list of text styles, enter ? and press ENTER twice.
4Continue creating text.
To align single-line text as you create it
1Click Home tab ➤ Annotation panel ➤ Single Line Text.
2Enter j (Justify).
3Enter an alignment option. For example, enter br to align text at its
bottom-right corner.
4Continue creating text.
1306 | Chapter 29 Notes and Labels
Quick Reference
Commands
QTEXT
Controls the display and plotting of text and attribute objects.
STYLE
Creates, modifies, or specifies text styles.
TEXT
Creates a single-line text object.
System Variables
FONTALT
Specifies the alternate font to be used when the specified font file cannot be
located.
FONTMAP
Specifies the font mapping file to be used.
MIRRTEXT
Controls how MIRROR reflects text.
QTEXTMODE
Controls how text is displayed.
TEXTED
Specifies the user interface displayed for editing single-line text.
TEXTEVAL
Controls how text strings entered with TEXT (using AutoLISP) or with -TEXT
are evaluated.
TEXTFILL
Controls the filling of TrueType fonts while plotting.
TEXTQLTY
Sets the resolution tessellation fineness of text outlines.
Create Single-Line Text | 1307

TEXTSIZE
Sets the default height for new text objects drawn with the current text style.
TEXTSTYLE
Sets the name of the current text style.
Create Multiline Text
A multiline text (mtext) object includes one or more paragraphs of text that
can be manipulated as a single object.
Overview of Multiline Text
You can create a multiline text (mtext) object by entering or importing text.
You can create one or more paragraphs of multiline text (mtext) in the MTEXT
ribbon contextual tab (if the ribbon is active), or the In-Place Text Editor (or
an alternative text editor, if the ribbon is not active) You can also use
Command prompts. You can insert text from a file saved in ASCII or RTF
format.
Before entering or importing text, you specify opposite corners of a text
bounding box that defines the width of the paragraphs in the multiline text
object. The length of the multiline text object depends on the amount of text,
not the length of the bounding box. You can use grips to move or rotate a
multiline text object.
NOTE Multiline text objects and imported text files are limited to 256 KB in size.
The MTEXT ribbon contextual tab and In-Place Text Editor display the
bounding box with a ruler at the top. If the ribbon is not active, the Text
Formatting toolbar is also displayed. The editor is transparent so that, as you
create text, you can see whether the text overlaps other objects. To turn off
transparency while you work, select Opaque Background on the Options
menu. You can also make the background of the finished multiline text object
opaque and set its color.
You can also insert fields in multiline text. A field is text that is set up to
display data that might change. When the field is updated, the latest value of
the field is displayed.
1308 | Chapter 29 Notes and Labels
Text Style
Most characteristics of the text are controlled by the text style, which sets the
default font and other options, such as line spacing, justification, and color.
You can use the current text style or select a new one. The STANDARD text
style is the default.
Within the multiline text object, you can override the current text style by
applying formatting such as underlining, boldface, and different fonts to
individual characters. You can also create stacked text, such as fractions or
geometric tolerances and insert special characters, including Unicode
characters, for TrueType fonts.
NOTE Not all SHX and TrueType text fonts support Unicode characters.
Text Properties
In the Properties palette, you can view and change the object properties of a
multiline text object, including properties that apply specifically to text.
■Justification determines where text is inserted with respect to the bounding
box and sets the direction of text flow as text is entered.
■Line space options control the amount of space between lines of text.
■Width defines the width of the bounding box and therefore controls where
the text wraps to a new line.
■Background inserts an opaque background so that objects under the text
are masked.
To create multiline text
1Click Home tab ➤ Annotation panel ➤ Multiline Text.
2Specify opposite corners of a bounding box to define the width of the
multiline text object.
If the ribbon is active, the MTEXT ribbon contextual tab displays. If the
ribbon is not active, the In-Place Text Editor is displayed.
3To indent the first line of each paragraph, drag the first-line indent slider
on the ruler. To indent the other lines of each paragraph, drag the
paragraph slider.
4To set tabs, click the ruler where you want a tab stop.
Create Multiline Text | 1309

5If you want to use a text style other than the default, on the ribbon, click
the Annotate tab, Text panel. Select the desired text style from the
drop-down list.
6Enter text.
NOTE Text that would otherwise be difficult to read (if it is very small, very
large, or is rotated) is displayed at a legible size and is oriented horizontally
so that you can easily read and edit it.
7To override the current text style, select text as follows:
■To select one or more letters, click and drag the pointing device over
the characters.
■To select a word, double-click the word.
■To select a paragraph, triple-click the paragraph.
8On the ribbon, make format changes as follows:
■To change the font of the selected text, select a font from the list.
■To change the height of the selected text, enter a new value in the
Height box.
NOTE The MText height value is reset to 0 if its default height is not
modified during creation.
■To format text in a TrueType font with boldface or italics, or to create
underlined or overlined text for any font, click the corresponding
button on the ribbon. SHX fonts do not support boldface or italics.
■To apply color to selected text, choose a color from the Color list.
Click Other to display the Select Color dialog box.
9To save your changes and exit the editor, use one of the following
methods:
■On the MTEXT ribbon contextual tab, in the Close panel, click Close
Text Editor.
■Click in the drawing outside the editor.
■Press CTRL+ENTER.
1310 | Chapter 29 Notes and Labels
To insert symbols or special characters in multiline text
1If the ribbon is active, double-click a multiline text object to open the
MTEXT ribbon contextual tab. If the ribbon is not active, the In-Place
Text Editor is displayed.
2On either the ribbon contextual tab or expanded toolbar, click Symbol.
3Click one of the options on the menu, or click Other to display the
Character Map dialog box.
To access the Character Map dialog box, you must have charmap.exe
installed. See Microsoft® Windows® Help for information about adding
programs to your system.
4In the Character Map dialog box, select a font.
5Select a character, and use one of the following methods:
■To insert a single character, drag the selected character into the editor.
■To insert multiple characters, click Select to add each character to the
Characters to Copy box. When you have all the characters you want,
click Copy. Right-click in the editor. Click Paste.
6To save your changes and exit the editor, use one of the following
methods:
■On the MTEXT ribbon contextual tab, in the Close panel, click Close
Text Editor.
■Click in the drawing outside the editor.
■Press CTRL+ENTER.
To add an opaque background or fill to a multiline text object
1If the ribbon is active, double-click a multiline text object to open the
MTEXT ribbon contextual tab. If the ribbon is not active, the In-Place
Text Editor is displayed.
2On the ribbon contextual tab, click Background Mask. In the editor,
right-click. Click Background Mask.
3In the Background Mask dialog box, select Use Background Mask.
4Enter a value for Border Offset Factor.
Create Multiline Text | 1311
The value is based on the text height. A factor of 1.0 exactly fits the
multiline text object. A factor of 1.5 (the default) extends the background
by 0.5 times the text height.
5Under Fill Color, do one of the following:
■Select the Use Drawing Background Color option.
■Select a color for the background, or click Select Color to open the
Select Color dialog box.
6Click OK to return to the editor.
7To save your changes and exit the editor, use one of the following
methods:
■On the MTEXT ribbon contextual tab, in the Close panel, click Close
Text Editor.
■Click in the drawing outside the editor.
■Press CTRL+ENTER.
The opaque background is applied when you exit the editor.
To change the Windows font smoothing setting to improve visibility of text
in the Multiline Text editor
1On the Windows desktop, right-click. Click Properties.
2In the Display Properties dialog box, click the Appearance tab.
3Click Effects.
4In the Effects dialog box, click the Use the Following Method to Smooth
Edges of Screen Fonts to clear the setting.
5Click OK to exit the Effects dialog box.
6Click OK to exit the Display Properties dialog box.
Quick Reference
Commands
MTEXT
Creates a multiline text object.
1312 | Chapter 29 Notes and Labels
QTEXT
Controls the display and plotting of text and attribute objects.
STYLE
Creates, modifies, or specifies text styles.
System Variables
MTEXTCOLUMN
Sets the default column setting for an mtext object.
MTEXTED
Sets the application for editing multiline text objects.
MTEXTFIXED
Sets the display size and orientation of multiline text in a specified text editor.
MTEXTTOOLBAR
Controls the display of the Text Formatting toolbar.
MTJIGSTRING
Sets the content of the sample text displayed at the cursor location when
the MTEXT command is started.
QTEXTMODE
Controls how text is displayed.
TEXTFILL
Controls the filling of TrueType fonts while plotting.
TEXTQLTY
Sets the resolution tessellation fineness of text outlines.
TEXTSIZE
Sets the default height for new text objects drawn with the current text style.
TEXTSTYLE
Sets the name of the current text style.
Create Multiline Text | 1313
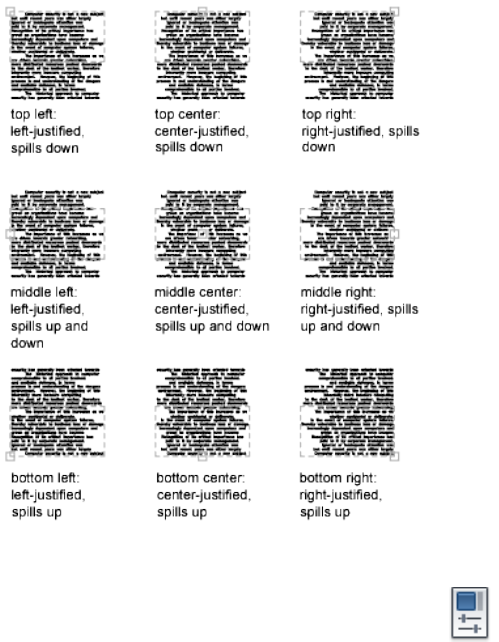
Justify Multiline Text
Justification of multiline text objects controls both text alignment and text
flow relative to the text insertion point.
Justification controls both text alignment and text flow relative to the text
insertion point. Text is left-justified and right-justified with respect to the
boundary rectangle that defines the text width. Text flows from the insertion
point, which can be at the middle, the top, or the bottom of the resulting text
object.
There are nine justification settings for multiline text.
If a single word is longer than the width of the paragraph, the word will extend
beyond the paragraph boundary.
To justify multiline text
1Click View tab ➤ Palettes panel ➤ Properties.
1314 | Chapter 29 Notes and Labels
2Select the multiline text object.
3On the Properties palette, select one of the Justification options.
4Click outside the Properties palette.
Quick Reference
Commands
PROPERTIES
Controls properties of existing objects.
Format Characters Within Multiline Text
You can override the text style and apply different formatting to individual
words and characters within multiline text.
The format changes affect only the text you select; the current text style is
not changed.
You can specify a different font and text height and apply boldface, italics,
underlining, overlining, and color. You can also set an obliquing angle, change
the space between characters, and make characters wider or narrower. The
Remove Formatting option on the menu of options resets the character
attributes of selected text to the current text style and also resets the text color
to the color of the mtext object.
The text height setting specifies the height of capitalized text. For more
information about how height is calculated, see MTEXT.
See also:
■Use an Alternate Text Editor on page 1391
To format characters in multiline text
1If the ribbon is active, double-click a multiline text object to open the
MTEXT ribbon contextual tab. If the ribbon is not active, the In-Place
Text Editor is displayed.
2Select the text you want to format:
■To select one or more letters, click and drag the pointing device over
the characters.
Create Multiline Text | 1315
■To select a word, double-click the word.
■To select a paragraph, triple-click the paragraph.
3On either the ribbon contextual tab or toolbar, make format changes as
follows:
■To change the font of the selected text, select a font from the list.
■To change the height of the selected text, enter a new value in the
Height box.
■To format text in a TrueType font with boldface or italics, or to create
underlined or overlined text for any font, click the corresponding
button on the ribbon. SHX fonts do not support boldface or italics.
■To apply color to selected text, select a color from the Color list. Click
Other to display the Select Color dialog box.
■To set an obliquing angle for the text, enter a value between -85 and
85. A positive value slants text to the right. A negative value slants
text to the left.
■To change letter spacing in the selected text, enter a new value.
■To change the width of characters in the selected text, enter a new
value.
4To save your changes and exit the editor, use one of the following
methods:
■On the MTEXT ribbon contextual tab, in the Close panel, click Close
Text Editor.
■Click in the drawing outside the editor.
■Press CTRL+ENTER.
Quick Reference
Commands
DDEDIT
Edits single-line text, dimension text, attribute definitions, and feature control
frames.
1316 | Chapter 29 Notes and Labels
MTEXT
Creates a multiline text object.
PROPERTIES
Controls properties of existing objects.
STYLE
Creates, modifies, or specifies text styles.
System Variables
TEXTFILL
Controls the filling of TrueType fonts while plotting.
TEXTSTYLE
Sets the name of the current text style.
Create Lists in Multiline Text
You can create bulleted lists, lettered or numbered lists, or simple outlines in
multiline text.
Lines of multiline text can be formatted as a list. When you add or delete an
item, or move an item up or down a level, the list numbering automatically
adjusts. You can remove and reapply list formatting with the same method
as used in most text editors.
Use Automatic List Formatting
By default, list formatting is applied to all text that looks like a list. Text that
meets all the following criteria is considered to be a list:
■The line begins with one or more letters or numbers or a symbol.
■The letters or numbers is followed by punctuation.
■A space after the punctuation is created by pressing TAB.
■The text following the space is ended by ENTER or SHIFT+ENTER.
Create Multiline Text | 1317
NOTE If you do not want list formatting applied to all text that fits the criteria,
clear the Allow Bullets and Lists option. (Right-click in the In-Place Text Editor,
click Bullets and Lists, and clear Allow Bullets and Lists.) When Allow Bullets and
Lists is not checked, you cannot create new formatted lists in the multiline text
object.
To create a list, use one of the following methods:
■Apply list formatting to new or selected text.
■Use Auto-list (on by default) and type the elements of a list.
■With Auto-list off, type the elements of a list and close and reopen the
editor to convert the text to a list.
Apply List Formatting
When you apply list formatting, you can specify bullets, uppercase or lowercase
letters, or numbers. Default settings are used for the type of list you choose.
Letters or numbers are followed by a period. Nested lists use a double bullet,
letter, or number. Items are indented based on the tab stops on the ruler in
the In-Place Text Editor.
Use Auto-list to Type a List
When Auto-list is on, you can create a list as you type. You can use letters,
numbers, or symbols.
For example, in the editor, enter \U+25CB, press TAB, and then enter some
text. This creates a empty circle style bullet.
Not all symbols are available from the character map for a particular text font.
However, if you specify the Unicode text directly (\U+25CB in this case), you
can always get the bullet format of your choice.
NOTE Press TAB after you enter the Unicode text or symbol, or it will remain a
separate character.
You can also paste a symbol from the Character Map dialog box
The following characters can be used as punctuation after the number or letter
when you type a list but cannot be used as bullets:
DescriptionCharac-
ter
Period.
1318 | Chapter 29 Notes and Labels

DescriptionCharac-
ter
Colon:
Close parenthesis)
Close angle bracket>
Close square bracket]
Close curly bracket}
Paste a List from Another Document
If you copy a nested bulleted list (a list within a list) from Microsoft Word and
paste the list into multiline text, the bullets that are displayed as empty circles
cannot be formatted like other bullets in multiline text. This is because Word
uses the letter o instead of a bullet for nested bulleted lists. You can remove
formatting from the nested list and reapply to change the bullets to double
bullets.
To format multiline text as a list
1Click Home tab ➤ Annotation panel ➤ Multiline Text.
2Specify opposite corners of a bounding box to define the width of the
multiline text object.
3To expand the Text Formatting toolbar, click Options button ➤ Show
Options.
4If you are converting multiline text to a list, select the paragraphs.
NOTE List formatting is only available when the Allow Bullets and Lists option
is checked (the default).
5On the expanded toolbar, click Numbering, Bullets, or Uppercase Letters.
■Numbering. Uses numbers with periods for the items in a list.
■Bullets. Uses a bullet or other character for the items in a list.
Create Multiline Text | 1319

■Uppercase Letters. Uses uppercase letters with periods for the items
in a list. If the list has more items than the alphabet has letters, the
sequence continues by using double letters. To use lowercase letters,
right-click in the editor. Click Bullets and Lists ➤ Lettered ➤
Lowercase.
6If you are creating new list items, enter the text.
7To end the list, press ENTER to move to a new line. Click the button that
you clicked to start the list.
8To save your changes and exit the editor, use one of the following
methods:
■On the MTEXT ribbon contextual tab, in the Close panel, click Close
Text Editor.
■Click in the drawing outside the editor.
■Press CTRL+ENTER.
To remove list formatting from multiline text
1If the ribbon is active, double-click a multiline text object to open the
MTEXT ribbon contextual tab. If the ribbon is not active, the In-Place
Text Editor is displayed.
2Select the list items.
3To expand the Text Formatting toolbar, click Options button ➤ Show
Options.
4On the expanded toolbar, click the active list button to make it inactive:
Numbering, Bullets, or Uppercase Letters.
NOTE If the list uses lowercase letters, click Uppercase Letters to convert the
list to uppercase. Then click Uppercase Letters to make it inactive.
5To save your changes and exit the editor, use one of the following
methods:
■On the MTEXT ribbon contextual tab, in the Close panel, click Close
Text Editor.
■Click in the drawing outside the editor.
■Press CTRL+ENTER.
1320 | Chapter 29 Notes and Labels

To create a lettered or numbered list in multiline text as you type
1Click Home tab ➤ Annotation panel ➤ Multiline Text.
2Specify opposite corners of a bounding box to define the width of the
multiline text object.
3To expand the Text Formatting toolbar, click Options button ➤ Show
Options.
4Click Bullets and Lists. Verify that Allow Auto-list and Allow Bullets and
Lists are checked.
5Enter a letter or a number and a period (or other punctuation).
The following characters can be used as punctuation after letters and
numbers: period (.), colon (:), close parenthesis ()), close angle bracket
(>), close square bracket (]), and close curly bracket (}).
6Press TAB.
7Enter the text of the list item. Press ENTER to move to the next item, or
press SHIFT+ENTER to add a plain paragraph before the next item.
The item is automatically lettered or numbered in sequence.
8Press ENTER twice to end the list.
9To save your changes and exit the editor, use one of the following
methods:
■Click in the drawing outside the editor.
■Press CTRL+ENTER.
■Click the Close Editor icon in the Multiline Text panel.
To create a bulleted list in multiline text as you type
1Click Home tab ➤ Annotation panel ➤ Multiline Text.
2Specify opposite corners of a bounding box to define the width of the
multiline text object.
3In the Options panel, click the Options icon.
Create Multiline Text | 1321

4Click Bullets and Lists. Verify that Allow Auto-list and Allow Bullets and
Lists are selected (tick mark).
5Start a line of text by entering \U+2022 (the Unicode string for a bullet)
or by selecting a bullet character or another symbol.
NOTE The following characters cannot be used as bullets: period (.), colon
(:), close parenthesis ()), close angle bracket (>), close square bracket (]), and
close curly bracket (}).
6Alternatively, click Options ➤ Symbol ➤ Other.
The Character Map dialog box appears.
7Double-click a symbol to copy it to the clipboard.
8Close the Character Map dialog box.
9Paste the symbol to the drawing, and press the up-arrow and End key to
return the cursor to the same line.
10 Press TAB.
11 Enter the text of the list item. Press ENTER to move to the next item, or
press SHIFT+ENTER to add a plain paragraph before the next item.
The bullet character is automatically added to the next item.
12 Press ENTER twice to end the list.
13 To save your changes and exit the editor, use one of the following
methods:
■On the MTEXT ribbon contextual tab, in the Close panel, click Close
Text Editor.
■Click in the drawing outside the editor.
■Press CTRL+ENTER.
To move a list item in multiline text down a level
1If the ribbon is active, double-click a multiline text object to open the
MTEXT ribbon contextual tab. If the ribbon is not active, the In-Place
Text Editor is displayed.
2Place the cursor at the beginning of a list item and press TAB.
The item moves down one level and begins a nested list.
1322 | Chapter 29 Notes and Labels
3Press ENTER to start the next item at the same level, or press SHIFT+TAB
to move the item up a level.
4To save your changes and exit the editor, use one of the following
methods:
■On the MTEXT ribbon contextual tab, in the Close panel, click Close
Text Editor.
■Click in the drawing outside the editor.
■Press CTRL+ENTER.
To separate an existing list
1If the ribbon is active, double-click a multiline text object to open the
MTEXT ribbon contextual tab. If the ribbon is not active, the In-Place
Text Editor is displayed.
2Select a sequence of list items or place the cursor at the beginning of the
item where you want to start the new list.
3Right-click in the editor. Click Bullets and Lists ➤ Restart.
The selected items are renumbered as a separate sequence. If you select
items in the middle of a list, unselected items below the selected items
also become part of the new list.
4To continue the original list below the new list, select the first item below
the new list.
5Right-click in the editor. Click Bullets and Lists ➤ Continue.
The selected item and the items following it are renumbered to continue
the previous list.
6To save your changes and exit the editor, use one of the following
methods:
■Click OK on the toolbar.
■Click in the drawing outside the editor.
■Press CTRL+ENTER.
Create Multiline Text | 1323
To convert the lists in a multiline text object to plain text
1If the ribbon is active, double-click a multiline text object to open the
MTEXT ribbon contextual tab. If the ribbon is not active, the In-Place
Text Editor is displayed.
2Right-click in the editor. Click Bullets and Lists. Remove the check mark
next to Allow Bullets and Lists.
The plain text lists retain their bullets, numbers, or letters. If you add an
item to the list, the number or letter sequence does not change.
Quick Reference
Commands
DDEDIT
Edits single-line text, dimension text, attribute definitions, and feature control
frames.
MTEXT
Creates a multiline text object.
PROPERTIES
Controls properties of existing objects.
System Variables
TEXTFILL
Controls the filling of TrueType fonts while plotting.
TEXTQLTY
Sets the resolution tessellation fineness of text outlines.
Indent Multiline Text and Use Tabs
You can control how paragraphs are indented in a multiline text (mtext)
object. The ruler in the In-Place Text Editor shows the settings for the current
paragraph.
Tabs and indents that you set before you start to enter text apply to the whole
multiline text object. To apply different tabs and indents to individual
1324 | Chapter 29 Notes and Labels
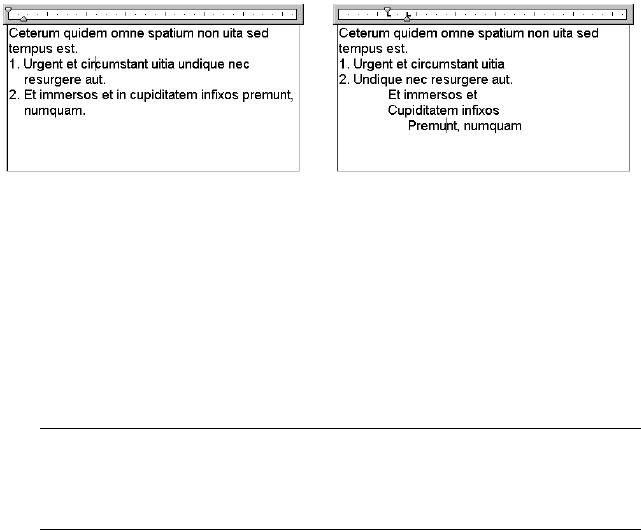
paragraphs, click in a single paragraph or select multiple paragraphs and then
change the settings.
Sliders on the ruler show indentation relative to the left side of the bounding
box. The top slider indents the first line of the paragraph, and the bottom
slider indents the other lines of the paragraph.
The long tick marks on the ruler show the default tab stops. If you click the
ruler to set your own tabs, the ruler displays a small, L-shaped marker at each
custom tab stop. You can delete a custom tab stop by dragging the marker off
the ruler.
To create paragraphs with hanging indentation
1If the ribbon is active, double-click a multiline text object to open the
MTEXT ribbon contextual tab. If the ribbon is not active, the In-Place
Text Editor is displayed.
2Select the paragraphs you want to indent.
3On the ruler, slide the top indent marker to where you want the first line
of the paragraphs to start.
NOTE The ruler displays the tabs and indents that are set for the selected
paragraphs or, if no text is selected, the paragraph where the cursor is located.
The default tab stops are the long tick marks on the ruler. To set a custom
tab stop, click the ruler where you want the tab stop.
4Slide the bottom indent marker to where you want the other lines of the
paragraphs to start.
This step indents turnover lines in paragraphs that are more than one
line long.
5To change the indentation, select the paragraphs you want to change,
click the ruler to set new tab stops, if needed, and move the indent
markers.
Create Multiline Text | 1325
6To save your changes and exit the editor, use one of the following
methods:
■On the MTEXT ribbon contextual tab, in the Close panel, click Close
Text Editor.
■Click in the drawing outside the editor.
■Press CTRL+ENTER.
Quick Reference
Commands
DDEDIT
Edits single-line text, dimension text, attribute definitions, and feature control
frames.
MTEXT
Creates a multiline text object.
PROPERTIES
Controls properties of existing objects.
System Variables
TEXTFILL
Controls the filling of TrueType fonts while plotting.
TEXTQLTY
Sets the resolution tessellation fineness of text outlines.
Specify the Line Spacing Within Multiline Text
Line spacing for multiline text is the distance between the baseline (bottom)
of one line of text and the baseline of the next line of text. The line space
factor applies to the entire multiline text object, not to selected lines.
You can set the spacing increment to a multiple of single line spacing, or as
an absolute distance. Single spacing is 1.66 times the height of the text
characters.
1326 | Chapter 29 Notes and Labels
The default line space style, At Least, automatically increases line spacing to
accommodate characters that are too large to fit the line spacing you set for
the multiline text object. Use the other line space style, Exactly, to line up
text in tables.
To ensure that line spacing is identical in multiple multiline text objects, use
Exactly and set the Line Space Factor to the same value in each multiline text
object.
NOTE Using Exactly can cause text in lines located above or below lines with large
font characters to overlap the larger characters.
To change the line spacing of multiline text
1Click View tab ➤ Palettes panel ➤ Properties.
2Select the multiline text object you want to edit.
3In the Properties palette, for Line Space Style, select one of the following:
■At Least. Adjusts lines of text automatically based on the height of
the largest character in the line. More space is added between lines
of text with taller characters. This is the default setting.
■Exactly. Forces the line spacing to be the same size for all lines of text
regardless of format differences such as font or text height.
4Change the line spacing by entering a new value for either of the
following options. The two line spacing options provide different ways
to set the same thing:
■Line Space Factor. Sets the line spacing to a multiple of single-line
spacing. Single spacing is 1.66 times the height of the text characters.
■Line Space Distance. Sets the line spacing to an absolute value
measured in drawing units. Valid values must be between 0.0833 and
1.3333.
NOTE After you exit the Properties palette, the value of the other line spacing
option is updated to correspond with the line spacing value that you entered.
Create Multiline Text | 1327
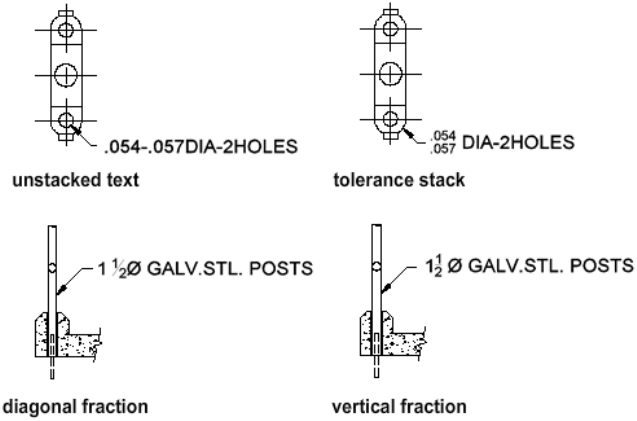
Quick Reference
Commands
PROPERTIES
Controls properties of existing objects.
System Variables
TSPACEFAC
Controls the multiline text line-spacing distance measured as a factor of text
height.
TSPACETYPE
Controls the type of line spacing used in multiline text.
Create Stacked Characters Within Multiline Text
Characters representing fractions and tolerances can be formatted to conform
to several standards.
Stacked text refers to the fraction and tolerance formats applied to characters
within multiline text object and multileaders.
1328 | Chapter 29 Notes and Labels

You use special characters to indicate how selected text should be stacked.
■Slash (/) stacks text vertically, separated by a horizontal line.
■Pound sign (#) stacks text diagonally, separated by a diagonal line.
■Carat (^) creates a tolerance stack, which is stacked vertically and not
separated by a line.
To stack characters manually within the In-Place Text Editor, select the text
to be formatted, including the special stacking character, and click the Stack
button on the Text Formatting toolbar.
Stack Numeric and Tolerance Characters Automatically
You can specify that numeric characters entered before and after a slash, pound
sign, or carat will stack automatically. For example, if you enter 1#3 followed
by a nonnumeric character or space, the AutoStack Properties dialog box is
displayed by default, and you can change the settings in the AutoStack dialog
box to specify your formatting preferences.
The automatic stacking feature applies only to numeric characters immediately
before and after the slash, pound sign, and carat. For tolerance stacking, the
+, -, and decimal character also stack automatically.
See also:
■Use an Alternate Text Editor on page 1391
To create stacked text
1Click Home tab ➤ Annotation panel ➤ Multiline Text.
2Specify opposite corners of a bounding box to define the width of the
multiline text object.
3In either the MTEXT ribbon contextual tab or In-Place Text Editor, set
text style and other multiline text properties as needed.
4Enter the text you want to stack separated by one of the following
characters:
■Slash (/) stacks text vertically, separated by a horizontal line.
■Pound sign (#) stacks text diagonally, separated by a diagonal line.
Create Multiline Text | 1329
■Carat (^) creates a tolerance stack, which is not separated by a line.
If you enter numbers separated by stack characters and then enter a
nonnumeric character or press SPACEBAR, the AutoStack Properties dialog
box is displayed.
5In the AutoStack Properties dialog box, you can choose to automatically
stack numbers (not nonnumeric text) and to remove leading blanks. You
can also specify whether the slash character creates a diagonal fraction
or creates a vertical fraction. If you do not want to use AutoStack, click
Cancel to exit the dialog box.
6Select the text that you want to stack, and click the Stack button on the
toolbar.
7To save your changes and exit the editor, use one of the following
methods:
■Click OK on the toolbar.
■Click in the drawing outside the editor.
■Press CTRL+ENTER.
To change stack properties
1Double-click the multiline text object you want to edit.
2In either the MTEXT ribbon contextual tab (Formatting tab drop-down)
or In-Place Text Editor, select the stacked text.
3Right-click in the editor. Click Properties.
4In the Stack Properties dialog box, change settings as needed.
5To set properties for automatic stacking, click Autostack.
6To save your changes and exit the editor, use one of the following
methods:
■Click OK on the toolbar.
■Click in the drawing outside the editor.
■Press CTRL+ENTER.
To unstack text
1Double-click the multiline text object you want to edit.
1330 | Chapter 29 Notes and Labels
2In either the MTEXT ribbon contextual tab (Formatting tab drop-down)
or In-Place Text Editor, select the stacked text.
3Click Stack on the Text Formatting toolbar.
4To save your changes and exit the editor, use one of the following
methods:
■Click OK on the toolbar.
■Click in the drawing outside the editor.
■Press CTRL+ENTER.
Quick Reference
Commands
MTEXT
Creates a multiline text object.
System Variables
TSTACKALIGN
Controls the vertical alignment of stacked text.
TSTACKSIZE
Controls the percentage of stacked text fraction height relative to selected
text's current height.
Create and Edit Columns in Multiline Text
You can create and edit multiple columns using the In-Place Text Editor
column options and column grips.
Multiple columns can be created and edited in either the MTEXT ribbon
contextual tab or In-Place Text Editor and through the grip editing mode.
Editing columns using grips allows you the flexibility of seeing the changes
as you make them.
Columns follow a few rules. All columns have equal width and equal gutters.
A gutter is the space between columns. The height of columns remains constant
unless more text than the column can accommodate is added, or you manually
move the editing grip to adjust the column height.
Create and Edit Columns in Multiline Text | 1331
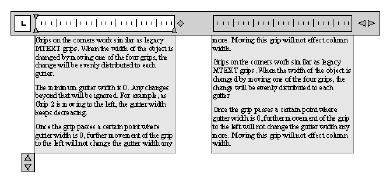
Editing Columns in the In-Place Text Editor
When you are working with columns using either the MTEXT ribbon
contextual tab or In-Place Text Editor, the columns will be in a frame. If the
Opaque background is turned on, the background covers each column, leaving
gutter space blank. The ruler bar when applied, spans across all the columns,
but the ruler is only active for the column that is selected as current.
Adding text to a column with an arbitrary height will not increase the column
height even if text is already filling the column. Text will flow into another
column.
You can also insert a column break to force text to start flowing into the next
column. Anytime a column break is inserted, it is assumed that the current
height of the column is fixed. To delete the break, highlight it and delete or
or use the Backspace key right after the break.
Editing Columns in the Property Palette
You will be able to select Static or Dynamic columns, turn off columns and
change column and gutter width through the Property Palette. Changing
column width in the palette will exhibit results similar to changing width
using grips. The palette is the only place that you can also change gutter
setting.
To create multiple columns in the In-Place Text Editor
1If the ribbon is active, double-click a multiline text object to open the
MTEXT ribbon contextual tab. If the ribbon is not active, the In-Place
Text Editor is displayed.
2In the In-Place Text Editor, select a column option and suboption from
columns list. You have a choice between Dynamic or Static columns.
You have two suboptions with Dynamic Columns – Auto height or
Manual height. Static Columns allows you to choose the number of
columns.
1332 | Chapter 29 Notes and Labels
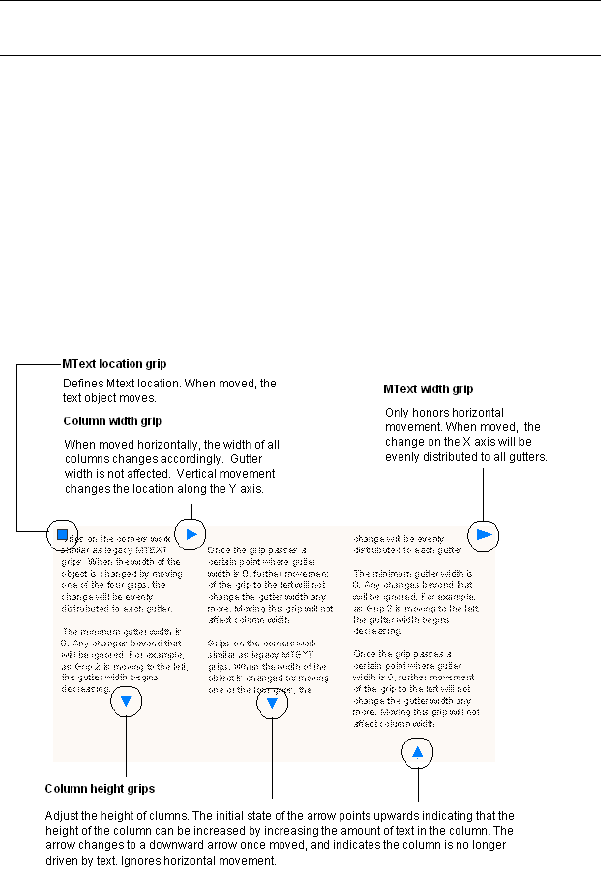
3Adjust the column height by moving the arrows located on the bottom
left of the first column.
NOTE The arrows on the ruler on the upper right side only adjust gutter
width, not column width.
To adjust columns using grips
1Select an area outside the mtext object. The In-Place Text Editor toolbar
will disappear.
2Click once in the text area and grips will appear.
Grips control the location of the mtext object, the gutter width, and
vertical and horizontal movement of colmns.
The following illustration demonstrates how grips are used with Dynamic
Columns - Manual Height.
The following illustration demonstrates how grips are used with Static
Columns.
Create and Edit Columns in Multiline Text | 1333
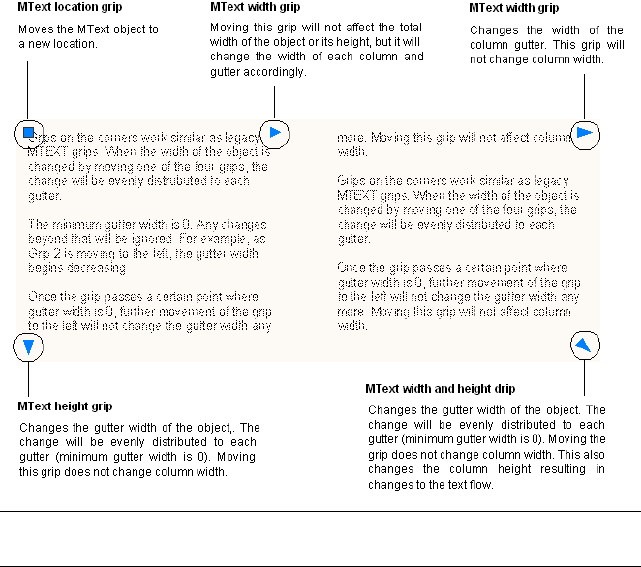
NOTE In general, grips only update the mtext object after the mouse button is
released.
Quick Reference
Commands
MTEXT
Creates a multiline text object.
System Variables
MTEXTCOLUMN
Sets the default column setting for an mtext object.
Import Text from External Files
You can insert TXT or RTF text files into your drawing by either importing
the text or dragging a file icon from Windows Explorer.
1334 | Chapter 29 Notes and Labels

You can insert TXT or RTF text files created in word processors into your
drawing by either importing the text or dragging a file icon from Windows
Explorer.
Importing TXT or RTF files from other sources gives you the most flexibility.
For example, you can create a text file of standard notes that you include in
drawings. The imported text becomes a multiline text object, which you can
edit and reformat. Text imported from a TXT file inherits the current text
style. Text imported from an RTF file inherits the current text style name, but
retains its original fonts and format. Imported text files are limited to 256 KB
and must have a file extension of .txt or .rtf.
If you drag a text file into a drawing, text width is determined by line breaks
and carriage returns in the original document. When you drag an RTF file into
a drawing, the text is inserted as an OLE object.
If you use the Clipboard to paste text from another application, the text
becomes an OLE object. If you use the Clipboard to paste text from another
file, the text is inserted as a block reference, and it retains its original text
style.
See also:
■Import OLE Objects on page 1720
To import text files
1Click Home tab ➤ Annotation panel ➤ Multiline Text.
2Specify opposite corners of a bounding box to define the width of the
multiline text object.
3Right-click in the editor. Click Import Text.
The size limit for an imported file is 256 KB.
4In the Select File dialog box, double-click the file you want to import, or
select the file. Click Open.
The text is inserted at the cursor location.
5Change the text as needed.
6To save your changes and exit the editor, use one of the following
methods:
■Click OK on the toolbar.
Import Text from External Files | 1335
■Click in the drawing outside the editor.
■Press Ctrl+Enter.
To insert a text file using the drag-and-drop method
1Open Windows Explorer, but make sure it does not fill the screen.
2Display the folder that contains the TXT or RTF file you want.
3Drag the TXT or RTF file icon onto the drawing. TXT files are inserted as
multiline text objects using the current text style. RTF files are inserted
as OLE objects.
Quick Reference
Commands
MTEXT
Creates a multiline text object.
Create Leaders
You can create, modify and add content to a leader object.
Overview of Leader Objects
A leader object is a line or a spline with an arrowhead at one end and a
multiline text object or block at the other.
In some cases, a short horizontal line, called a landing, connects text or blocks
and feature control frames to the leader line.
The landing and leader line are associated with the multiline text object or
block, so when the landing is relocated, the content and leader line move
along with it.
1336 | Chapter 29 Notes and Labels
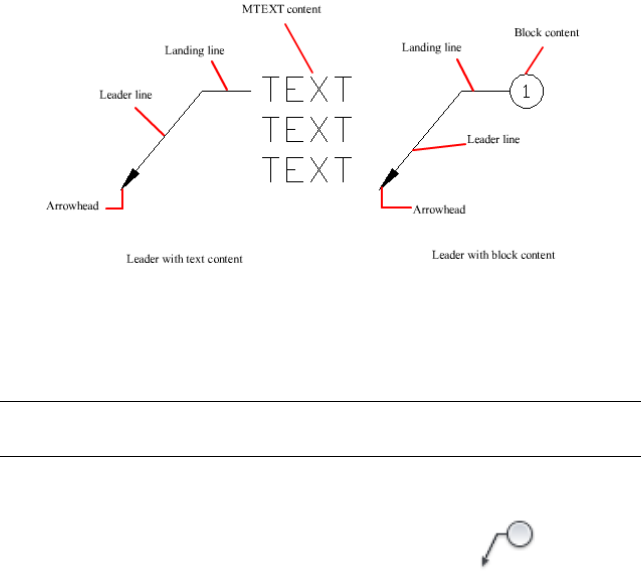
When associative dimensioning is turned on and object snaps are used to
locate the leader arrowhead, the leader is associated with the object to which
the arrowhead is attached. If the object is relocated, the arrowhead is relocated,
and the landing stretches accordingly.
NOTE The leader object should not be confused with the leader line that is
automatically generated as part of a dimension line.
To create a leader with straight lines
1Click Home tab ➤ Annotation panel ➤ Multileader.
2At the Command prompt, enter o to select options.
3Enter l to specify leaders.
4Enter t to specify the leader type.
5Enter s to specify straight leaders.
6In the drawing, click a start point for the leader head.
7Click an end point for the leader.
8Enter your MTEXT content.
9On the Text Formatting toolbar, click OK.
Overview of Leader Objects | 1337
Quick Reference
Commands
LEADER
Creates a line that connects annotation to a feature.
MLEADER
Creates a multileader object.
QLEADER
Creates a leader and leader annotation.
System Variables
DIMASSOC
Controls the associativity of dimension objects and whether dimensions are
exploded.
DIMGAP
Sets the distance around the dimension text when the dimension line breaks
to accommodate dimension text.
DIMLDRBLK
Specifies the arrow type for leaders.
MLEADERSCALE
Sets the overall scale factor applied to multileader objects.
Create and Modify Leaders
A leader object typically consists of an arrowhead, an optional horizontal
landing, a leader line or curve, and either a multiline text object or block.
You can create a leader line from any point or feature in a drawing and control
its appearance as you draw. Leaders can be straight line segments or smooth
spline curves.
1338 | Chapter 29 Notes and Labels
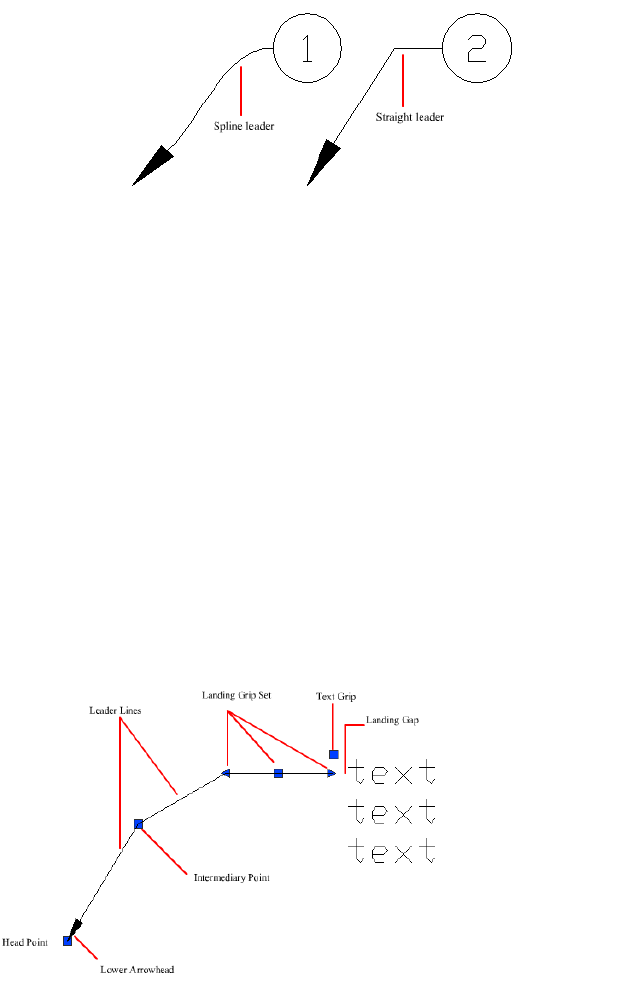
A multileader object, or MLEADER, comprises a leader and a note. It can be
created arrowhead first, tail first, or content first. If a multileader style has
been used, then the multileader can be created from that style
Multileader objects can contain multiple leader lines, each of which can have
one or more segments, so that one note can point to multiple objects in your
drawing. You can modify the properties of leader segment in the Properties
palette. Using the MLEADEREDIT command, you can add leaders to, or remove
leaders from, an established multileader object.
Annotative multileaders containing multiple leader segments can have different
head points in each scale representation. Horizontal landings and arrowheads
can have different sizes, and landing gaps can have different distances,
depending on the scale representation. The appearance of the horizontal
landing within a multileader, as well as the type of leader line (straight or
spline) and number of leader segments will remain the same in all scale
representations. For more information, see Create Annotative Leaders and
Multileaders on page 1244.
You can use grips to modify the look of a multileader. Using grips, you can
lengthen or shorten a landing or leader line, or move the entire leader object.
Create and Modify Leaders | 1339
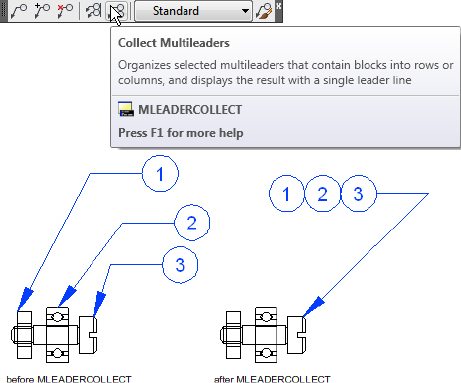
Arrange Leaders
Multileaders can be arranged to add order and consistency to your drawing.
Multileader objects with blocks as content can be collected and attached to
one landing line. Using the MLEADERCOLLECT command, multileaders can
be collected horizontally, vertically, or within a specified area depending on
your drawing needs.
Multileader objects can be sorted evenly along a specified line. Using the
MLEADERALIGN command, selected multileaders can be aligned and evenly
spaced as specified.
Associate Leaders with Objects
When associative dimensioning is turned on (DIMASSOC), the leader
arrowhead can be associated with a location on an object using an object snap.
If the object is relocated, the arrowhead remains attached to the object and
the leader line stretches, but the multiline text remains in place.
See also:
■Create Annotative Leaders and Multileaders on page 1244
1340 | Chapter 29 Notes and Labels
To create a leader with straight lines
1Click Home tab ➤ Annotation panel ➤ Multileader.
2At the Command prompt, enter o to select options.
3Enter l to specify leaders.
4Enter t to specify the leader type.
5Enter s to specify straight leaders.
6In the drawing, click a start point for the leader head.
7Click an end point for the leader.
8Enter your MTEXT content.
9On the Text Formatting toolbar, click OK.
To create a leader attached to block content at an angle
1Click Home tab ➤ Annotation panel ➤ Multileader Style.
2In the Multileader Style Manager, click New.
3In the Create New Multileader Style dialog box, specify a name for the
new multileader style.
4In the Modify Multileader Style dialog box, Leader Structure tab, under
Landing Settings, uncheck Automatically Include Landing.
5On the Content tab, next to Multileader Type, choose Block content.
6Under Block Options, next to Attachment, choose one of the following:
■Center Extents: Attaches the leader line to the center extent of the
block content
■Insertion Point: Attaches the leader line to the block content from
any point you specify
7Click OK.
8In the Multileader Style Manager, click Close.
Create and Modify Leaders | 1341
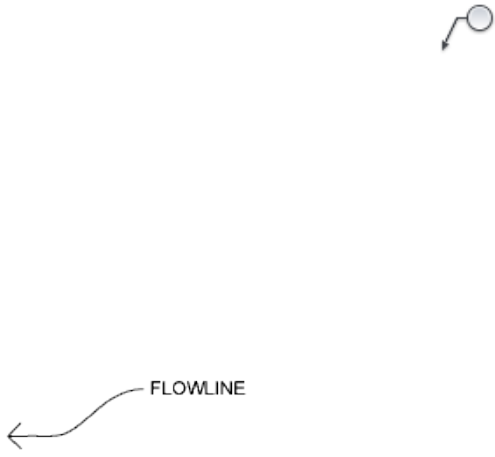
9Do one of the following:
■Create a multileader object
■Apply the new multileader style to an existing multileader object
To create a spline leader with text or a block
1Click Home tab ➤ Annotation panel ➤ Multileader.
2At the Command prompt, enter o to select options.
3Enter l to specify leaders.
4Enter t to specify the leader type.
5Enter p to specify a spline leader.
6In the drawing, click a start point for the leader head.
7Click the end point for the leader.
8Enter your MTEXT content.
9In the Text Formatting toolbar, click OK.
To edit leader text
1Double-click the text you want to edit.
If the ribbon is active, the MTEXT ribbon contextual tab is displayed. IF
the ribbon is not active, the In-Place Text Editor is displayed for both
single-line text and multiline text. The Text Formatting toolbar is not
available for single-line text.
2Edit the text.
To create multiple leaders from the same annotation
1Select the multileader.
1342 | Chapter 29 Notes and Labels
2Click Annotate tab ➤ Multileaders panel ➤ Add Leader.
3Specify the endpoint for the new leader.
To remove leaders from an annotation
1Select the multileader.
2On the Multileader toolbar, click Remove Leader.
3Select the leader or leaders you want to remove. Press ENTER.
To align and space leaders
1Click Annotate tab ➤ Multileaders panel ➤ Align.
2Select the multileaders to be aligned. Press ENTER.
3Specify a starting point in the drawing to begin the alignment. The point
you select is the position of the landing head.
4If you want to change the spacing of the multileader objects, enter s and
specify one of the following spacing methods:
■Distribute. Spaces content evenly between two selected points.
■Use Current. Uses the current spacing between multileaders.
■Make Parallel. Places content so that each of the last line segments
in the selected multileaders are parallel.
5In the drawing click a point to end the alignment.
To collect multiple notes to be attached to a single landing
1Click Annotate tab ➤ Multileaders panel ➤ Collect. On the
Multileader toolbar, click Collect Multileaders.
2Select multileaders in the order you want them to be collected. The last
multileader selected retains its landing. Press ENTER.
Create and Modify Leaders | 1343

To create a landing line with multiple segments
1Click Home tab ➤ Annotation panel ➤ Multileader Style.
2In the Multileader Style Manager, click New to create a new multileader
style.
3In the Create New Multileader Style dialog box, specify a name for the
new multileader style.
4In the Modify Multileader Style dialog box, select the Leader Structure
tab.
5In the Constraints group box, select the Maximum Leader Points check
box. In the box to the right, specify a maximum number of points to be
prompted for upon creation of a new multileader. Click OK.
6In the Multileader Style Manager, click Set Current to apply the new
multileader style to new multileaders that you create.
To change the properties of a multileader object
1Press CTRL and select a segment of the leader line.
2Right-click and then select Properties from the shortcut menu.
3In the Properties palette, specify the properties of the segment.
Quick Reference
Commands
DDEDIT
Edits single-line text, dimension text, attribute definitions, and feature control
frames.
MLEADER
Creates a multileader object.
MLEADERALIGN
Aligns and spaces selected multileader objects.
1344 | Chapter 29 Notes and Labels
MLEADERCOLLECT
Organizes selected multileaders that contain blocks into rows or columns,
and displays the result with a single leader.
MLEADEREDIT
Adds leader lines to, or removes leader lines from, a multileader object.
MLEADERSTYLE
Creates and modifies multileader styles.
PROPERTIES
Controls properties of existing objects.
System Variables
DIMASSOC
Controls the associativity of dimension objects and whether dimensions are
exploded.
DIMASZ
Controls the size of dimension line and leader line arrowheads.
DIMCLRD
Assigns colors to dimension lines, arrowheads, and dimension leader lines.
DIMGAP
Sets the distance around the dimension text when the dimension line breaks
to accommodate dimension text.
DIMLDRBLK
Specifies the arrow type for leaders.
DIMSCALE
Sets the overall scale factor applied to dimensioning variables that specify
sizes, distances, or offsets.
DIMTAD
Controls the vertical position of text in relation to the dimension line.
DIMTXTDIRECTION
Specifies the reading direction of the dimension text.
Create and Modify Leaders | 1345
MLEADERSCALE
Sets the overall scale factor applied to multileader objects.
Work with Leader Styles
The appearance of a leader is controlled by its multileader style. You can use
the default multileader style, STANDARD, or create your own multileader
styles.
The multileader style can specify formatting for landing lines, leader lines,
arrowheads, and content. For example, the STANDARD multileader style uses
a straight leader line with a closed filled arrowhead and multiline text content.
NOTE Annotative blocks cannot be used as either content or arrowheads in
multileader objects.
Once a multileader style has been defined, you can set it as the current
multileader style to be used when the MLEADER command is invoked.
To define a leader style
1Click Home tab ➤ Annotation panel ➤ Multileader Style.
2In the Multileader Style Manager, click New.
3In the Create New Multileader Style dialog box, specify a name for the
new multileader style.
4In the Modify Multileader Style dialog box, Leader Format tab, select or
clear the following options:
■Type. Determines the type of landing. You can choose a straight
landing, spline landing, or no landing.
■Color. Determines the color of the landing.
■Linetype. Determines the linetype of the landing.
■Lineweight. Determines the lineweight of the landing.
5Specify a symbol and size for the multileader arrowhead.
6On the Leader Structure tab, select or clear the following options:
■Maximum Leader Points. Specifies a maximum number of points for
the multileader landing line.
1346 | Chapter 29 Notes and Labels
■First and Second Segment Angles. Specifies the angle of the first and
second points in the landing.
■Landing - Keep Horizontal. Attaches a horizontal landing to the
multileader content.
■Set Landing Distance. Determines the fixed distance for the
multileader landing line.
7On the Content tab, specify either text or block content for the
multileader. If the multileader object will contain text content, then
select or clear the following options:
■Default Text. Sets default text for the multileader content. A field can
be inserted here.
■Text Style. Specifies a predefined text style for the attribute text.
Currently loaded text styles are displayed.
■Text Angle. Specifies the rotation angle of the multileader text.
■Text Color. Specifies the color of the multileader text.
■Paper Height. Sets the height of the text as it will display in paper
space.
■Frame Text. Frames the multileader text content with a text box.
■Attachment. Controls the attachment of the landing to the multileader
text.
■Landing Gap. Specifies the distance between the landing and the
multileader text.
If block content is specified, then select or clear the following options:
■Source Block. Specifies the block used for multileader content.
■Attachment. Specifies the way the block is attached to the multileader
object. You can attach the block by specifying the extents, the
insertion point, or the center point of the block.
■Color. Specifies the color of the multileader block content. ByBlock
is selected by default.
8Click OK.
Work with Leader Styles | 1347
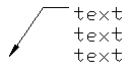
To apply a leader style to an existing leader
1Select the multileader to which you want to apply a new style.
2On the ribbon, click the Annotate tab, Multileaders panel. Select the
desired multileader style from the drop-down list.
3To create a new style, click the Multileader Style icon.
Quick Reference
Commands
MLEADERSTYLE
Creates and modifies multileader styles.
System Variables
CMLEADERSTYLE
Sets the name of the current multileader style.
Add Content to a Leader
Leaders can contain multiline text or blocks to label parts of your drawing.
Leaders Containing Multiline Text
Leaders can contain multiline text as content. Text can be inserted by default
when creating a leader style. Text style, color, height, and alignment can be
applied and modified in leader annotations. You can also offset a multiline
text object by specifying a landing gap distance in the current leader style.
You can create annotative multileaders with text as content. The text content
will be scaled according to the specified scale representation. Width,
justification, attachment, and rotation settings for text content can be different
depending on the specified scale representation. Actual text content cannot
change with the scale representation.
There are several options for placing multiline text as content in a leader
object.
Top of top line
1348 | Chapter 29 Notes and Labels
Middle of top line
Bottom of top line
Underline top line
Middle of text
Middle of bottom line
Bottom of bottom line
Underline bottom line
Underline all text
Add Content to a Leader | 1349

Leaders Containing Blocks
Multileaders can contain blocks as content by applying a multileader style
that references a block in your drawing.
NOTE Annotative Blocks cannot be used as either content or arrowheads in
multileader objects.
Blocks can be connected to a multileader by attaching the landing to a selected
insertion point on the block. You can also connect a multileader to a center
point on the selected block.
You can create annotative multileaders with blocks as content. The block
content will be scaled according to the specified scale representation. Any
attributes within the block content will not change with the scale
representation. Non-annotative multileader objects can be scaled using the
MLEADERSCALE system variable.
See also:
■Use Fields in Text on page 1352
Quick Reference
Commands
DDEDIT
Edits single-line text, dimension text, attribute definitions, and feature control
frames.
DIMSTYLE
Creates and modifies dimension styles.
MLEADER
Creates a multileader object.
MTEXT
Creates a multiline text object.
OPTIONS
Customizes the program settings.
1350 | Chapter 29 Notes and Labels
PROPERTIES
Controls properties of existing objects.
PURGE
Removes unused items, such as block definitions and layers, from the drawing.
QTEXT
Controls the display and plotting of text and attribute objects.
SPELL
Checks spelling in a drawing.
STYLE
Creates, modifies, or specifies text styles.
TEXT
Creates a single-line text object.
System Variables
DIMGAP
Sets the distance around the dimension text when the dimension line breaks
to accommodate dimension text.
FONTALT
Specifies the alternate font to be used when the specified font file cannot be
located.
FONTMAP
Specifies the font mapping file to be used.
MLEADERSCALE
Sets the overall scale factor applied to multileader objects.
MTEXTED
Sets the application for editing multiline text objects.
QTEXTMODE
Controls how text is displayed.
TEXTFILL
Controls the filling of TrueType fonts while plotting.
Add Content to a Leader | 1351
TEXTQLTY
Sets the resolution tessellation fineness of text outlines.
Use Fields in Text
A field is updatable text that is set up to display data that may change during
the life cycle of the drawing. When the field is updated, the latest value of the
field is displayed.
Insert Fields
A field is text that contains instructions to display data that you expect to
change during the life cycle of the drawing.
When a field is updated, the latest data is displayed. For example, the value
of the FileName field is the name of the file. If the file name changes, the new
file name is displayed when the field is updated.
Fields can be inserted in any kind of text (except tolerances), including text
in table cells, attributes, and attribute definitions. When any text command
is active, Insert Field is available on the shortcut menu.
Some sheet set fields can be inserted as placeholders. For example, you can
insert SheetNumberAndTitle as a placeholder. Later, when the layout is added
to a sheet set, the placeholder field displays the correct sheet number and
title.
Block placeholder fields can be used in block attribute definitions while you're
working in the Block Editor.
A field for which no value is available displays hyphens (----). For example,
the Author field, which is set in the Drawing Properties dialog box, may be
blank. An invalid field displays pound signs (####). For example, the
CurrentSheetName field, which is valid only in paper space, displays pound
signs if it is placed in model space.
Change the Appearance of a Field
The field text uses the same text style as the text object in which it is inserted.
By default, fields are displayed with a light gray background that is not plotted
(FIELDDISPLAY system variable).
Formatting options in the Field dialog box control the appearance of the text
that is displayed. The options that are available depend on the type of field.
For example, the format for date fields includes options for displaying the day
1352 | Chapter 29 Notes and Labels
of the week and the time, and the format for named object fields includes
capitalization options.
Edit a Field
A field is part of a text object and it can be edited from a text editor. The easiest
way to edit a field is to double click the text object that contains the field and
then, to display the Field dialog box, double click the field. These operations
are available on the shortcut menus as well.
If you no longer want to update a field, you can preserve the value that is
currently displayed by converting the field to text.
The field expression, consisting of escape characters and a field code, is shown
in the Field dialog box but cannot be edited.
To insert a field in text
1Double-click the text to display the appropriate text editing dialog box.
2Place the cursor where you want the field text to appear and right-click.
Click Insert Field.
For keyboard access, press CTRL+F.
3In the Field dialog box, in Field Category, select All or select a category.
The fields in the selected category are displayed in the Field Names list.
4In the Field Names list, select a field.
The current value of most fields is displayed in a shaded text box to the
right of Field Category. The current value of a date field is displayed in
the Examples list.
5Select a format and any other options.
For example, when the NamedObject field is selected, you select a type
(for example, layer or textstyle) and a name (for example, 0 for layer or
STANDARD for textstyle).
Field Expression displays the expression that underlies the field. The field
expression cannot be edited, but you can learn how fields are constructed
by viewing this area.
6Click OK to insert the field.
The field displays its current value in the text when the Field dialog box
closes.
Insert Fields | 1353

To insert a field in a table
1Double-click inside a cell in a table to select it for editing.
2Place the cursor where you want the field text to appear and right-click.
Click Insert Field.
3In the Field dialog box, select All or select a category.
4In the Field Names list, select a field.
The current value of the field is displayed in a shaded text box to the
right of Field Category.
5Select a format and any other option.
6Click OK to insert the field.
The field displays its current value when you move to the next cell.
To use a field to display a property of an object
1Double-click a text object to display the appropriate text editing dialog
box.
2Place the cursor where you want the field text to appear and right-click.
Click Insert Field.
3In the Field dialog box, in Field Category, select All.
4In the Field Names list, select Object.
5In Object Type, click the Select Object button, and select an object in the
drawing.
6In the Field dialog box, in Property, select the property whose value you
want to display in the text.
For example, the field could display the radius of a selected circle.
7Select a format for the text.
8Click OK.
The current value for the object's property is displayed in the text.
To insert a sheet set placeholder field
1Click Home tab ➤ Block panel ➤ Define Attributes.
1354 | Chapter 29 Notes and Labels

2In the Attribute Definition dialog box, under Mode, click Preset. Specify
any text options.
3Under Attribute, in the Tag box, enter a name for the field.
4To the right of the Value box, click the Insert Field button.
5In the Field dialog box, under Field Category, select SheetSet.
6In the Field Names list, select SheetSetPlaceholder.
7In Placeholder Type, select the type of field that you want.
Temporary Value previews the placeholder field.
8In Format, select a capitalization style for the placeholder field.
When the field is updated, the same style is used for the value of the
field.
9(Optional) Click Associate Hyperlink if you want the field to serve as a
hyperlink to a location.
NOTE Associate Hyperlink is not available for the ViewportScale field.
10 Click OK to exit the Field dialog box.
The placeholder field displays its name when the Field dialog box closes:
for example, SheetNumber. Later, when the block is inserted from the
Views List tab shortcut menu in the Sheet Set Manager, the field displays
a value based on the sheet it is dragged to: for example, its sheet number.
11 Click OK in the Attribute Definition dialog box. Specify the location for
the field text to appear near the geometry that you have created to use
with the Sheet Set Manager as a callout block or a label block.
12 Create a block that includes the newly created attribute object along with
the geometry for the block.
To format a field value
1Double-click a text object to display the appropriate text editing dialog
box.
2Double-click the field you want to format.
The Field dialog box is displayed. If formatting is available for the field,
the Field Format button is displayed.
3Click Field Format.
Insert Fields | 1355
In the Additional Format dialog box, the current value of the field is
displayed. When you select an option, the result is displayed in Preview.
4Enter a conversion factor to apply to the current value.
For example, to convert inches to millimeters, enter 0.03937.
5Enter any text that you want to precede or follow the field value.
For example, enter mm for millimeters.
6Select a decimal separator. Select None or Comma to group thousands.
7Select an option for suppressing zeros:
■Leading: Suppresses leading zeros in all decimal field values. For
example, 0.5000 becomes .5000.
■Trailing: Suppresses trailing zeros in all decimal field values. For
example, 12.5000 becomes 12.5, and 30.0000 becomes 30.
■0 Feet: Suppresses the feet portion of a feet-and-inches field value
when the distance is less than one foot. For example, 0'-6 1/2" becomes
6 1/2".
■0 Inches: Suppresses the inches portion of a feet-and-inches field value
when the distance is an integral number of feet. For example, 1'-0"
becomes 1'.
8Click OK.
In the Field dialog box, the field value is displayed in Preview with the
formatting you specified.
9Click OK.
To edit a field
1Double-click a text object to display the appropriate text editing dialog
box.
2Double-click the field that you want to edit.
The Field dialog box is displayed.
3Make any needed changes.
4Click OK to exit the Field dialog box.
5Exit the text editor.
1356 | Chapter 29 Notes and Labels
Quick Reference
Commands
FIELD
Creates a multiline text object with a field that can be updated automatically
as the field value changes.
FIND
Finds the text that you specify, and can optionally replace it with other text.
INSERT
Inserts a block or drawing into the current drawing.
LIST
Displays property data for selected objects.
MTEXT
Creates a multiline text object.
SPELL
Checks spelling in a drawing.
TABLE
Creates an empty table object.
TABLEEXPORT
Exports data from a table object in CSV file format.
TABLESTYLE
Creates, modifies, or specifies table styles.
UPDATEFIELD
Manually updates fields in selected objects in the drawing.
System Variables
CTABLESTYLE
Sets the name of the current table style.
FIELDDISPLAY
Controls whether fields are displayed with a gray background.
Insert Fields | 1357
FIELDEVAL
Controls how fields are updated.
Update Fields
When a field is updated, it displays the latest value. You can update fields
individually or update all fields in one or more selected text objects.
You can also set fields to be updated automatically when the drawing is
opened, saved, plotted, regenerated, or sent through ETRANSMIT.
Settings on the User Preferences Tab (Options Dialog Box) control whether
fields are updated automatically or on demand (FIELDEVAL system variable).
The Date field cannot be updated automatically regardless of the setting of
FIELDEVAL.
NOTE When the DEMANDLOAD system variable is set to 2, fields cannot be
updated until you use FIELD or UPDATEFIELD.
Contextual Fields in Blocks and Xrefs
Some fields are contextual; that is, their value is different depending on which
space or layout they reside in. For example, because each layout can have a
different page setup attached, the value displayed by the PlotOrientation field
can be different in different layouts in the same drawing.
List of contextual fields
CurrentSheetTitleCurrentSheetCustom
DeviceNameCurrentSheetDescription
PaperSizeCurrentSheetNumber
PlotDateCurrentSheetNumberAndTitle
PlotOrientationCurrentSheetSet
PlotScaleCurrentSheetSetCustom
PageSetupNameCurrentSheetSetDescription
PlotStyleTableCurrentSheetSubSet
1358 | Chapter 29 Notes and Labels
For compatibility with previous versions, contextual fields in blocks and xrefs
are not updated when you insert them in a drawing; instead, the field displays
the last cached value. Therefore, if you want to use a contextual field within
a block, for example, a title block, you must insert the field as an attribute.
For example, a title block can use the CurrentSheetNumber field as an attribute.
When you insert the title block, the field displays the sheet number of the
sheet on which the title block is inserted.
Most fields are not contextual and are updated in blocks and xrefs. Fields in
xrefs are updated based on the host file, not the source xref. These fields do
not have to be placed in attributes. For example, a field that displays the sheet
number of a particular sheet in a sheet set and that updates if that sheet
number changes, is a property of the sheet set. When you create the field, you
select the SheetSet field name, select the sheet set and the sheet that you want
in the tree view, and then select the property SheetNumber for the field value
to be displayed. This field displays the sheet number of that sheet, even if you
put the field in a block and insert it in another drawing. If the sheet is removed
from the sheet set, it no longer has a sheet number, and the field becomes
invalid and displays pound signs.
Some sheet set fields can be inserted as placeholders. For example, when you
create your own callout blocks and label blocks, you can insert the
SheetNumber field as a placeholder. Later, when the block is inserted from
the Views List tab shortcut menu in the Sheet Set Manager, the field displays
the sheet number of the drawing.
Compatibility with Previous Releases
When a drawing with fields is opened in AutoCAD 2004 or earlier, the fields
are not updated; they display the value last displayed in the drawing before
it was opened. If no changes are made to a field, it is updated normally when
it is reopened in a release that supports fields.
Fields are not available in the previous releases of AutoCAD LT. When a
drawing with fields is opened in the previous releases of AutoCAD LT, the
fields are evaluated based on the setting of the FIELDEVAL system variable in
the drawing, but the FIELDEVAL system variable is not accessible.
See also:
■Work with AutoCAD Drawings in AutoCAD LT on page 1825
To update a field manually
1Double-click text.
Update Fields | 1359

2Select the field to update and right-click. Click Update Field.
To update multiple fields manually
1Click Blocks & References tab ➤ Data panel ➤ Update Fields .
2At the Select Objects prompt, select the objects that contain the fields
you want to update and press ENTER.
All of the fields in the selected objects are updated.
To update fields automatically
1At the Command prompt, enter fieldeval.
2Enter a bitcode that is the sum of any of the following values:
■0: Not updated
■1: Updated on open
■2: Updated on save
■4: Updated on plot
■8: Updated on use of ETRANSMIT
■16: Updated on regeneration
For example, to update fields only when the file is opened, saved, or
plotted, enter 7.
Quick Reference
Commands
FIELD
Creates a multiline text object with a field that can be updated automatically
as the field value changes.
UPDATEFIELD
Manually updates fields in selected objects in the drawing.
1360 | Chapter 29 Notes and Labels
System Variables
FIELDDISPLAY
Controls whether fields are displayed with a gray background.
FIELDEVAL
Controls how fields are updated.
Use Hyperlinks in Fields
The Hyperlink field assigns a hyperlink to any piece of text.
The hyperlink works the same way as a hyperlink attached to an object. When
the cursor pauses over the text, a hyperlink cursor is displayed, along with a
tooltip that describes the hyperlink. Hold down the CTRL key and click to
follow the link.
NOTE The Hyperlink field uses an absolute path to a file; the HYPERLINK command
can create a hyperlink with a relative path.
The fields that point to sheet and view titles and numbers can be assigned a
hyperlink when they are created. When these items are changed or moved in
the Sheet Set Manager, the hyperlinks associated with them still jump to the
correct location.
Hyperlinks in fields are converted from links to DWG files into links to DWF
files when published to a multi-sheet DWF file format.
To add a hyperlink field to text
1Click Home tab ➤ Annotation panel ➤ Multiline Text.
2Place the cursor where you want the hyperlink text to appear.
3Right-click in the editor. Click Insert Field.
4In the Field dialog box, in Field Category, select Linked.
5In Field Names, select Hyperlink, and click Hyperlink.
6In the Insert Hyperlink dialog box, use one of the following methods to
specify a location:
■Under Type the File or Web Page Name, enter the path and name of
the file that you want to associate with the hyperlink.
Use Hyperlinks in Fields | 1361
■Under Browse For, click File, Web Page, or Target. Navigate to the
location to which you want to link. Click Open or OK.
7(Optional) In Text to Display, select the default text that is displayed,
and enter the link text that you want to appear in the mtext object.
8Click OK to close each dialog box.
9To save your changes and exit the editor, use one of the following
methods:
■Click OK on the toolbar.
■Click in the drawing outside the editor.
■Press CTRL+ENTER.
The hyperlink is displayed in the mtext object with the link text that you
entered. Use CTRL+click to jump to the hyperlinked location.
Quick Reference
Commands
FIELD
Creates a multiline text object with a field that can be updated automatically
as the field value changes.
FIND
Finds the text that you specify, and can optionally replace it with other text.
INSERT
Inserts a block or drawing into the current drawing.
LIST
Displays property data for selected objects.
MTEXT
Creates a multiline text object.
SPELL
Checks spelling in a drawing.
1362 | Chapter 29 Notes and Labels
TABLE
Creates an empty table object.
TABLEEXPORT
Exports data from a table object in CSV file format.
TABLESTYLE
Creates, modifies, or specifies table styles.
UPDATEFIELD
Manually updates fields in selected objects in the drawing.
System Variables
CTABLESTYLE
Sets the name of the current table style.
FIELDDISPLAY
Controls whether fields are displayed with a gray background.
FIELDEVAL
Controls how fields are updated.
Work with Text Styles
When you enter text into your drawing, the current text style determines the
text font, size, angle, orientation, and other text characteristics.
Overview of Text Styles
All text in a drawing has a text style associated with it. When you enter text,
the program uses the current text style.
The current text style sets the font, size, obliquing angle, orientation, and
other text characteristics. If you want to create text using a different text style,
you can make another text style current. The table shows the settings for the
STANDARD text style.
The settings for the current text style are displayed at the Command prompts.
You can use or modify the current text style or create and load a new text
style. Once you've created a text style, you can modify its characteristics,
change its name, or delete it when you no longer need it.
Work with Text Styles | 1363
Create and Modify Text Styles
Except for the default STANDARD text style, you must create any text style
that you want to use.
Text style names can be up to 255 characters long. They can contain letters,
numbers, and the special characters dollar sign ($), underscore (_), and hyphen
(-). If you don't enter a text style name, the text styles are automatically named
Stylen, where n is a number that starts at 1.
You can modify an existing text style in the Text Style dialog box by changing
the settings. You can also update existing text of that text style to reflect the
changes.
Certain style settings affect multiline and single-line text objects differently.
For example, changing the Upside Down and Backwards options has no effect
on multiline text objects. Changing Width Factor and Obliquing has no effect
on single-line text.
If you rename an existing text style, any text using the old name assumes the
new text style name.
You can remove unreferenced text styles from your drawing with PURGE or
by deleting the text styles from the Text Styles dialog box. The STANDARD
text style cannot be removed.
Change Text Style
When you change the text style of a multiline text object, the updated settings
are applied to the entire object, and some formatting of individual characters
might not be retained. The following table describes the effects of text style
change on character formatting.
Retained?Formatting
NoBold
YesColor
NoFont
NoHeight
NoItalic
YesStacking
1364 | Chapter 29 Notes and Labels
Retained?Formatting
YesUnderlining
Annotative Text Styles
Use text for notes and labels in your drawing. You create annotative text by
using an annotative text style, which sets the height of the text on the paper.
For more information about creating and working with an annotative text,
see Create Annotative Text on page 1235.
See also:
■Scale Annotations on page 1224
To set the current text style
■On the ribbon, click the Annotate tab ➤ Text panel. in the Text Style
drop-down list, select a text style.
Quick Reference
Commands
PURGE
Removes unused items, such as block definitions and layers, from the drawing.
STYLE
Creates, modifies, or specifies text styles.
System Variables
FONTALT
Specifies the alternate font to be used when the specified font file cannot be
located.
FONTMAP
Specifies the font mapping file to be used.
TEXTSIZE
Sets the default height for new text objects drawn with the current text style.
Overview of Text Styles | 1365
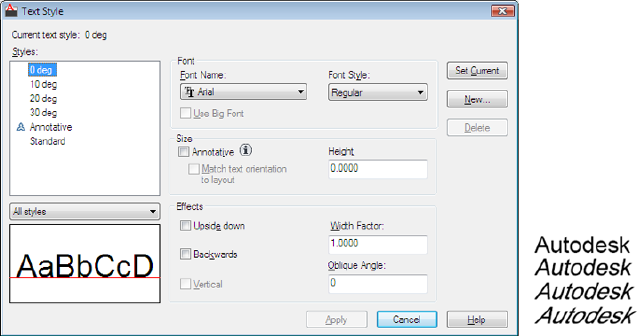
TEXTSTYLE
Sets the name of the current text style.
Assign Text Fonts
You can assign a text font as part of the text style definition. Several factors
depend on the type of text you are working with.
Overview of Assigning Text Fonts
Fonts define the shapes of the text characters that make up each character set.
You can use TrueType fonts in addition to compiled SHX fonts.
A single font can be used by more than one text style. If your company has a
standard font, you can modify other text style settings to create a set of text
styles that use this standard font in different ways. The following illustration
shows the same font used by different text styles that use different obliquing
settings to define the slant of the text.
You can assign a font to a text style by selecting a font file from the list in the
Text Style dialog box.
1366 | Chapter 29 Notes and Labels
Quick Reference
Commands
STYLE
Creates, modifies, or specifies text styles.
System Variables
FONTALT
Specifies the alternate font to be used when the specified font file cannot be
located.
FONTMAP
Specifies the font mapping file to be used.
Use TrueType Fonts
Several factors affect the display of TrueType fonts in a drawing.
TrueType fonts always appear filled in your drawing; however, when you plot,
the TEXTFILL system variable controls whether the fonts are filled. By default
TEXTFILL is set to 1 to plot the filled-in fonts.
The In-Place Text Editor can display only fonts that are recognized by Microsoft
Windows. Because SHX fonts are not recognized by Windows, a TrueType
equivalent is supplied in the In-Place Text Editor when you select an SHX or
any other non-TrueType font for editing.
See also:
■Set Text Height on page 1373
To assign a TrueType font to a text style
1Click Annotate tab ➤ Text panel ➤ Panel Launcher button.
2In the Text Style dialog box under Style Name, click New.
3In the New Text Style dialog box, enter a style name for the new text
style. Click OK.
4Under Font Name, select a TrueType font from the list.
TrueType fonts display a TrueType icon in front of their names.
Assign Text Fonts | 1367
5To update text of the current style in the drawing, click Apply.
6Click Close.
Quick Reference
Commands
QTEXT
Controls the display and plotting of text and attribute objects.
STYLE
Creates, modifies, or specifies text styles.
System Variables
QTEXTMODE
Controls how text is displayed.
TEXTFILL
Controls the filling of TrueType fonts while plotting.
TEXTQLTY
Sets the resolution tessellation fineness of text outlines.
Use Text Fonts for International Work
Several factors affect your choosing, entering, and displaying international
text in a drawing.
The program supports the Unicode character-encoding standard. An SHX font
encoded using the Unicode standard font can contain many more characters
than are defined in your system; therefore, to use a character not directly
available from the keyboard, you can enter the escape sequence \U+nnnn,
where nnnn represents the Unicode hexadecimal value for the character.
Beginning with AutoCAD 2007, all SHX shape fonts are encoded with the
Unicode standard with the exception of Big Fonts. When choosing a text font
for international work, you can use either a TrueType Font or a Big Font.
1368 | Chapter 29 Notes and Labels
Asian Big Font SHX Files
Asian alphabets contain thousands of non-ASCII characters. To support such
text, the program provides a special type of shape definition known as a Big
Font file. You can set a style to use both regular and Big Font files.
Asian Language Big Fonts Included in the Product
DescriptionFont File Name
Japanese vertical font (a few characters are ro-
tated to work correctly in vertical text)
@extfont2.shx
Japanese font, subset of charactersbigfont.shx
Traditional Chinese fontchineset.shx
Japanese extended font, level 1extfont.shx
Japanese extended font, level 2extfont2.shx
Simplified Chinese fontgbcbig.shx
Korean fontwhgdtxt.shx
Korean fontwhgtxt.shx
Korean fontwhtgtxt.shx
Korean fontwhtmtxt.shx
When you specify fonts using -STYLE, the assumption is that the first name
is the normal font and the second (separated by a comma) is the Big Font. If
you enter only one name, it's assumed that it is the normal font and any
associated Big Font is removed. By using leading or trailing commas when
specifying the font file names, you can change one font without affecting the
other, as shown in the following table.
Specifying fonts and Big Fonts at the Command prompt
To specify this ...Enter this ...
Both normal fonts and Big Fonts[font name],[big font name]
Only a normal font (Big Font unchanged)[font name],
Assign Text Fonts | 1369
Specifying fonts and Big Fonts at the Command prompt
To specify this ...Enter this ...
Only a Big Font (normal font unchanged),[big font name]
Only a normal font (Big Font, if any, removed)[font name]
No changeENTER (null response)
NOTE Long file names that contain commas as font file names are not accepted.
The comma is interpreted as a separator for an SHX font-Big Font pair.
See also:
■Substitute Fonts on page 1371
To assign an Asian-language SHX font to a text style
1Click Home tab ➤ Annotation panel ➤ Text Style.
2In the Text Style dialog box, under Style Name, click New.
3In the New Text Style dialog box, enter a style name for the new text
style. Click OK.
4Under Font Name, select the name of an SHX font file, and then select
Use Big Font to select an Asian-language big font.
When you select Use Big Font, the Font Style box changes to a Big Font
Name box. Only SHX fonts are available for selection, and only Big Font
names are shown in the Big Font box.
5To see the effects on different characters, enter a text string in the sample
text box that is located to the left of the Preview button. Click Preview.
6To update text of the current style in the drawing, click Apply.
7Click Close.
1370 | Chapter 29 Notes and Labels
Quick Reference
Commands
STYLE
Creates, modifies, or specifies text styles.
Substitute Fonts
A font used in a drawing but that is not currently available on your system is
automatically substituted with another font.
The program accommodates a font that is not currently on your system by
substituting another font.
Specify an Alternate Font
If your drawing specifies a font that is not currently on your system, the font
designated as your alternate font is automatically substituted. By default, the
simplex.shx file is used. If you want to specify a different font, enter the alternate
font file name by changing the FONTALT system variable. If you use a text
style that uses a Big Font, you can map it to another font using the FONTALT
system variable. This system variable uses a default font file pair: txt.shx and
bigfont.shx. For more information, see Use Text Fonts for International Work
on page 1368.
In previous releases, you could display PostScript® fonts in the drawing. Because
later releases cannot display PostScript fonts, Autodesk has supplied TrueType
font equivalents. These PostScript fonts are mapped to the equivalent TrueType
fonts in a font mapping file. Additionally, when a TrueType font is not
available, you can specify a different TrueType font, making sure that the
fonts are similar to avoid text length or wrapping problems.
If the default font does not support the characters you enter using the In-Place
Text Editor (MTEXT command), an alternative font is substituted.
CIF or MIF codes entered with the In-Place Text Editor or with the TEXT
command are now automatically converted to display the actual characters.
Edit the Font Mapping File
A font mapping file is a list of text fonts and their substitutes. If a text font
used in a drawing cannot be located, another text font is substituted for the
missing font using a font mapping file.
Assign Text Fonts | 1371
Each line in the font mapping file contains the name of a font file (with no
file extension or path) followed by a semicolon (;) and the name of the
substitute font file. The substitute file name includes a file extension such as
.ttf.
A font mapping file is an ordinary ASCII text file with a .fmp extension. The
default font mapping file is acad.fmp for AutoCAD, and acadlt.fmp for AutoCAD
LT. You can change the font assignments in a font mapping file using any
ASCII text editor.
For example, you could use the following entry in a font map file to specify
that the timesnr.pfb font file be substituted with the times.ttf font file:
timesnr;times.ttf
The following table shows the font substitution rules used if a font file cannot
be located when a drawing is opened.
Font substitution
Fourth map-
ping order
Third mapping or-
der
Second mapping
order
First mapping or-
der
File exten-
sion
Windows substitutes
a similar font
Use font defined in
text style
Use font mapping
table
.ttf
Prompt for new
font
Use FONTALTUse font defined in
text style
Use font mapping
table
.shx
Prompt for new fontUse FONTALTUse font mapping
table
.pfb
Display Proxy Fonts
For third-party or custom SHX fonts that have no TrueType equivalent, one
of several different TrueType fonts called proxy fonts is substituted. In the
In-Place Text Editor, proxy fonts look different from the fonts they represent
to indicate that the proxy fonts are substitutions for the fonts used in the
drawing.
Custom SHX fonts do not appear in the Font list on either the Text Editor
Ribbon Contextual Tab or the Text Formatting toolbar. If you want to format
characters by assigning one of these fonts, first create a text style that uses the
font and then apply that text style to the characters.
To specify a font mapping file
1Click Tools menu ➤ Options.
1372 | Chapter 29 Notes and Labels
2On the Files tab, in the list, double-click Text Editor, Dictionary, and Font
File Names.
3Double-click Font Mapping File.
The acad.fmp file is specified by default.
4To change the font mapping file, double-click the arrow line to open the
Select a File dialog box. Select a file and click Open. Click OK.
5At the Command prompt, enter regen to convert existing text using the
new font mappings.
To specify a default alternate font
1At the Command prompt, enter fontalt.
2Enter the name of the font file you want to use as the alternative.
Quick Reference
Commands
MTEXT
Creates a multiline text object.
OPTIONS
Customizes the program settings.
System Variables
FONTALT
Specifies the alternate font to be used when the specified font file cannot be
located.
FONTMAP
Specifies the font mapping file to be used.
Set Text Height
Text height determines the size in drawing units of the letters in the font you
are using.
Set Text Height | 1373

The exception is TrueType fonts: the value usually represents the size of the
uppercase letters.
If you specify a fixed height as part of a text style, the Height prompt is
bypassed when you create single-line text. When the height is set to 0 in the
text style, you are prompted for the height each time you create single-line
text. Set the value to 0 if you want to specify the height as you create text.
TrueType Fonts
For TrueType fonts, the value specified for text height represents the height
of a capital letter plus an ascent area reserved for accent marks and other marks
used in non-English languages. The relative portion of text height that is
assigned to capital letters and ascent characters is determined by the font
designer at the time the font is designed; consequently, it varies from font to
font.
In addition to the height of a capital letter and the ascent area that make up
the text height specified by the user, TrueType fonts have a descent area for
portions of characters that extend below the text insertion line, for example,
y, j, p, g, and q.
When you apply a text height override to all text in the editor, the entire
multiline text object is scaled, including its width.
To set text height in a text style
1Click Home tab ➤ Annotation panel ➤ Text Style.
2In the Text Style dialog box, select a style from the Style Name list.
3Under Font, enter the text height (in drawing units) in the Height box.
4To update existing text that uses this text style, click Apply.
5Click Close.
Quick Reference
Commands
STYLE
Creates, modifies, or specifies text styles.
1374 | Chapter 29 Notes and Labels
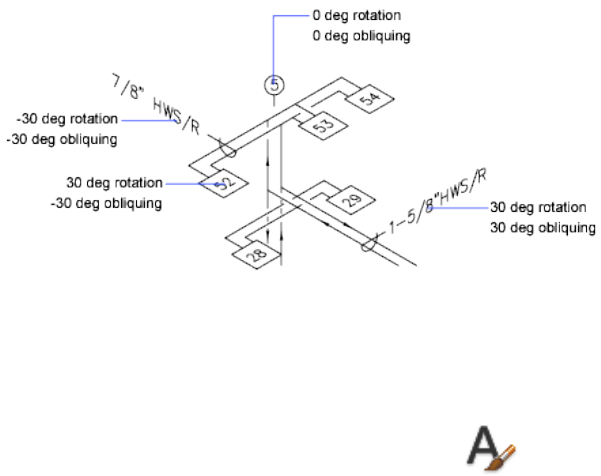
System Variables
TEXTSIZE
Sets the default height for new text objects drawn with the current text style.
TEXTSTYLE
Sets the name of the current text style.
Set Text Obliquing Angle
The obliquing angle determines the forward or backward slant of the text.
The angle represents the offset from 90 degrees.
Entering a value between -85 and 85 makes the text oblique. A positive
obliquing angle slants text to the right. A negative obliquing angle slants text
to the left.
To set the obliquing angle in a text style
1Click Home tab ➤ Annotation panel ➤ Text Style.
2In the Text Style dialog box, select a text style from the Style Name list.
3Under Effects, enter an angle between -85 and 85 in the Oblique Angle
box.
A positive value slants text to the right. A negative value slants text to
the left.
4To update existing text that uses this text style, click Apply.
Set Text Obliquing Angle | 1375
5Click Close.
Quick Reference
Commands
STYLE
Creates, modifies, or specifies text styles.
Set Horizontal or Vertical Text Orientation
Text can be vertical or horizontal. Text can have a vertical orientation only if
the associated font supports dual orientation.
Lines of text are oriented to be vertical or horizontal. Text can have a vertical
orientation only if the associated font supports dual orientation. You can
create more than one line of vertical text. Each successive text line is drawn
to the right of the preceding line. The normal rotation angle for vertical text
is 270 degrees.
NOTE Vertical orientation is not supported for TrueType fonts and symbols.
Vertical Text for Asian Languages
■SHX fonts. Text can be created with SHX fonts and Big Fonts for vertical
display in the same way as for previous releases. For best results, use the
single-line TEXT command, not MTEXT. You can select a vertical style in
the Text Style dialog box.
1376 | Chapter 29 Notes and Labels

■TrueType fonts. You still select fonts starting with the @ sign, but now the
text is automatically rotated 270 degrees. (In AutoCAD 2005 and earlier
versions, you had to manually rotate this text.) Vertical cursor movement
is now supported for vertical text.
To set vertical orientation in a text style
1Click Home tab ➤ Annotation panel ➤ Text Style.
2In the Text Style dialog box, select a text style from the Style Name list.
3Under Effects, select Vertical.
4To update existing text that uses this text style, click Apply.
5Click Close.
Quick Reference
Commands
STYLE
Creates, modifies, or specifies text styles.
Change Text
You can change text content, formatting, and properties such as scale and
justification.
Overview of Changing Text
Text, whether created with TEXT, MTEXT, or MLEADER can be modified like
any other object.
You can move, rotate, erase, and copy it. You can change text properties in
the Properties palette.
You can also edit the contents of existing text and create a mirror image of
it. The MIRRTEXT system variable controls whether text is also reversed when
you mirror objects in your drawing. The procedures for modifying text vary
slightly, depending on how the text was created.
Change Text | 1377
Quick Reference
Commands
DDEDIT
Edits single-line text, dimension text, attribute definitions, and feature control
frames.
FIND
Finds the text that you specify, and can optionally replace it with other text.
PROPERTIES
Controls properties of existing objects.
System Variables
MIRRTEXT
Controls how MIRROR reflects text.
TEXTFILL
Controls the filling of TrueType fonts while plotting.
TEXTQLTY
Sets the resolution tessellation fineness of text outlines.
Change Single-Line Text
You can change the contents, formatting and properties of single-line text.
You can change single-line text with DDEDIT and PROPERTIES. Use DDEDIT
when you need to change only the content of the text, not the formatting or
properties of the text object. Use PROPERTIES when you want to change
content, text style, location, orientation, size, justification, and other
properties.
Text objects also have grips for moving, scaling, and rotating. A text object
has grips at the lower-left corner of the baseline and at the alignment point.
1378 | Chapter 29 Notes and Labels
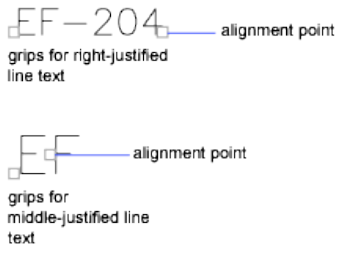
The effect of a command depends on which grip you choose.
To edit single-line text
1Click Modify menu ➤ Object ➤ Text ➤ Edit.
2Select a single-line text object.
3In the in-place editor, enter the new text.
4Press ENTER.
5Select another text object to edit, or press ENTER to end the command.
To modify properties of single-line text objects
1Select a single-line text object.
2Right-click the selected object. Click Properties.
3In the Properties palette, enter any new text, and then change formatting
and other properties as needed.
Quick Reference
Commands
DDEDIT
Edits single-line text, dimension text, attribute definitions, and feature control
frames.
PROPERTIES
Controls properties of existing objects.
Change Single-Line Text | 1379
TEXT
Creates a single-line text object.
System Variables
TEXTED
TEXTFILL
Controls the filling of TrueType fonts while plotting.
TEXTQLTY
Sets the resolution tessellation fineness of text outlines.
Change Multiline Text
You can change the location and content of multiline text objects with the
Properties palette, the In-Place Text Editor, and grips.
After you create multiline text, you can use the Properties palette to change
■Text style assignment
■Justification
■Width
■Rotation
■Line spacing
In addition, you can use either the MTEXT ribbon contextual tab (if the ribbon
is active) or the In-Place Text Editor (if the ribbon is not active) to modify
individual formatting, such as boldface and underlining, and to change the
width of the multiline text object.
Change Text Location
You can use grips to move multiline text or to resize the line width. A multiline
text object has grips at the four corners of the text boundary and, in some
cases, at the justification point.
If you use the Properties palette to move multiline text, you can edit content
and change properties at the same time.
1380 | Chapter 29 Notes and Labels
Commands such as DIMLINEAR or LEADER create multiline text automatically
without requiring that a bounding box be specified; these objects have only
a single grip at the justification point.
When you need to align or move multiline text objects, you can use the Node
and Insertion object snaps for precision. If the OSNAPNODELEGACY system
variable is set to 0, the Node object snap ignores multiline text.
See also:
■Work with Text Styles on page 1363
■Control the Display of Polylines, Hatches, Gradient Fills, Lineweights, and
Text on page 540
To change multiline text
1Select a multiline text object.
2Right-click the selected object. Click Properties.
3In the Properties palette, enter any new text and change formatting and
other settings as needed.
To change the width of a multiline text object
1Double-click the multiline text object.
2In the In-Place Text Editor, use one of the following methods:
■Move the cursor over the right end of the ruler until the cursor changes
to a double arrow. As you drag to the right to stretch the ruler, a tooltip
displays the width. Release to set a new width.
■Right-click the bottom of the ruler. Click Set Mtext Width. In the
dialog box, enter the width in drawing units.
3To save your changes and exit the editor, use one of the following
methods:
■On the MTEXT ribbon contextual tab, in the Close panel, click Close
Text Editor.
■Click in the drawing outside the editor.
■Press CTRL+ENTER.
Change Multiline Text | 1381
Quick Reference
Commands
DDEDIT
Edits single-line text, dimension text, attribute definitions, and feature control
frames.
FIND
Finds the text that you specify, and can optionally replace it with other text.
MTEDIT
Edits multiline text.
PROPERTIES
Controls properties of existing objects.
STYLE
Creates, modifies, or specifies text styles.
System Variables
CENTERMT
Controls how grips stretch multiline text that is centered horizontally.
MIRRTEXT
Controls how MIRROR reflects text.
MTEXTED
Sets the application for editing multiline text objects.
OSNAPNODELEGACY
Controls whether the Node object snap can be used to snap to multiline text
objects.
TEXTFILL
Controls the filling of TrueType fonts while plotting.
TEXTQLTY
Sets the resolution tessellation fineness of text outlines.
1382 | Chapter 29 Notes and Labels

Find and Replace Text
You can easily find and replace text with the FIND command
To search for and replace text, use FIND. Replacement is based on text content
only; character formatting and text properties are not changed.
When searching for text in a 3D environment, the viewport will temporarily
change to a 2D viewport so that text isn’t blocked by 3D objects in your
drawing.
With FIND, you can use wild-card characters in your search.
DefinitionCharacter
Matches any numeric digit# (Pound)
Matches any alphabetic character@ (At)
Matches any nonalphanumeric character. (Period)
Matches any string and can be used anywhere in the search
string
* (Asterisk)
Matches any single character; for example, ?BC matches ABC,
3BC, and so on
? (Question mark)
Matches anything but the pattern; for example; ~*AB*matches
all strings that don't contain AB
~ (Tilde)
Matches any one of the characters enclosed; for example,
[AB]C matches AC and BC
[ ]
Matches any character not enclosed; for example, [~AB]C
matches XC but not AC
[~]
Specifies a range for a single character; for example, [A-G]C
matches AC, BC, and so on to GC, but not HC
[-]
Reads the next character literally; for example, `~AB matches
~AB
` (Reverse quote)
To search for drawing files that contain a specific word or phrase, use the
Search tool in Microsoft® Windows® . You can use the Search tool to find all
textual data except text in tables and fields, and xrefs within drawing files.
Find and Replace Text | 1383

To find specified text in a drawing
1Click Annotate tab ➤ Text panel ➤ Find Text.
2In Find What, enter the text you want to find.
3In Find Where, specify the parts of the drawing to search, or click the
Select Objects button to select one or more text objects.
4Click the Expand Find Options button to specify search options and text
types for the specified text.
5Click Find.
6Use one of the following options to view the results of your search:
■To list all results in a table, click the List Results check box.
■To zoom to and highlight each result individually, leave the List
Results check box unchecked.
7Click Close.
To replace text using the Find and Replace Dialog box
1Click Annotate tab ➤ Text panel ➤ Find Text.
2In Find What, enter the text you want to find.
3In Find Where, specify the parts of the drawing to search, or click the
Select Objects button to select one or more text objects.
4Click the Expand Find Options button to specify search options and text
types for the specified text.
5In Replace With, enter the text with which you want to replace the found
text.
6Click Find.
7Use one of the following options to view the results of your search:
■To list all results in a table, click the List Results check box.
■To zoom to and highlight each result individually, leave the List
Results check box unchecked.
1384 | Chapter 29 Notes and Labels
8Use one of the following methods to replace text:
■To replace only the found instance of the text string, click Replace.
■To replace all instances of the text in Find Text String, click Replace
All.
■If search results have been listed in a table using the List Results
option, then you can select certain results in the list by pressing Click
+ CTRL. Alternately, you can select a range of results in the list by
pressing Shift + Click.
9Click Close.
Change Text Scale and Justification
Several commands are available for changing the scale of one or more text
and attribute objects, or their insertion points, simultaneously without
changing the location of the objects.
You can change the scale of one or more text objects, attributes, and attribute
definitions, or their insertion points, simultaneously without changing the
location of the objects.
Change the Scale of Multiple Text Objects
A drawing may contain hundreds of text objects that need to be scaled, and
it would be tedious to scale them individually. Use SCALETEXT to change the
scale of one or more text objects such as text, multiline text, and attributes.
You can specify a relative scale factor or an absolute text height, or you can
scale selected text to match the height of existing text. Each text object is
scaled using the same scale factor, and it maintains its current location.
Convert Text Height Between Model Space and Paper Space
The SPACETRANS command calculates equivalent lengths between model
space units and paper space units. By using SPACETRANS transparently, you
can provide commands with distance or length values relative to another
space. For example, you may want to create a text object in model space that
matches the height of other text in a layout. From model space, you could
enter
Command: text
Specify start point of text or [Justify/Style]: 1,3
Specify height <0.375>: 'spacetrans
Change Text Scale and Justification | 1385
>>Specify paper space distance <1.000>: 3/8
Resuming TEXT command
Specify height <0.375>: 1.173
When the command is complete, a text object is created in model space with
a height of 1.173, which appears as 3/8 when viewed from a layout.
NOTE The SPACETRANS command is not available from the Model tab or in a
perspective view.
For more information about entering commands transparently, see Enter
Commands on the Command Line on page 53.
Change the Justification of Text Objects Without Changing Their Location
Use JUSTIFYTEXT to redefine the insertion point of text without moving the
text. For example, a table or schedule may contain text that is located correctly
but each text object in the table should be right-justified instead of left-justified
for future entries or modifications.
To scale multiline text objects without changing their locations
1Click Annotate tab ➤ Text panel ➤ Scale.
2Select one or more multiline text objects and press ENTER.
3Specify one of the justification options or press ENTER to accept the
existing text justifications.
4Enter s and enter the scale factor to be applied to each mtxt object.
Quick Reference
Commands
JUSTIFYTEXT
Changes the justification point of selected text objects without changing
their locations.
PROPERTIES
Controls properties of existing objects.
1386 | Chapter 29 Notes and Labels
SCALETEXT
Enlarges or reduces selected text objects without changing their locations.
SPACETRANS
Calculates equivalent model space and paper space lengths in a layout.
Check Spelling
You can check the spelling of all text as it is entered in your drawing. You can
also specify the specific language dictionary that is used and customize and
manage multiple custom spelling dictionaries.
You can check the spelling of all text objects in your drawing, including
■Single and multiline text
■Dimension text
■Multileader text
■Text within block attributes
■Text within xrefs
With Check Spelling, your drawing or the areas of your drawing’s text that
you specify are searched for misspelled words. If a misspelled word is identified,
the word is highlighted and the drawing area zooms to that word in a scale
that is easy to read.
Check Spelling As You Type
By default, you can check spelling as you enter text in the In-Place Text Editor.
Any word you enter is checked for spelling errors when it is completed. A
word is considered completed when one of the following actions are taken:
■Pressing SPACEBAR or ENTER
■Moving the cursor to another position within the In-Place Text Editor.
Check Spelling | 1387
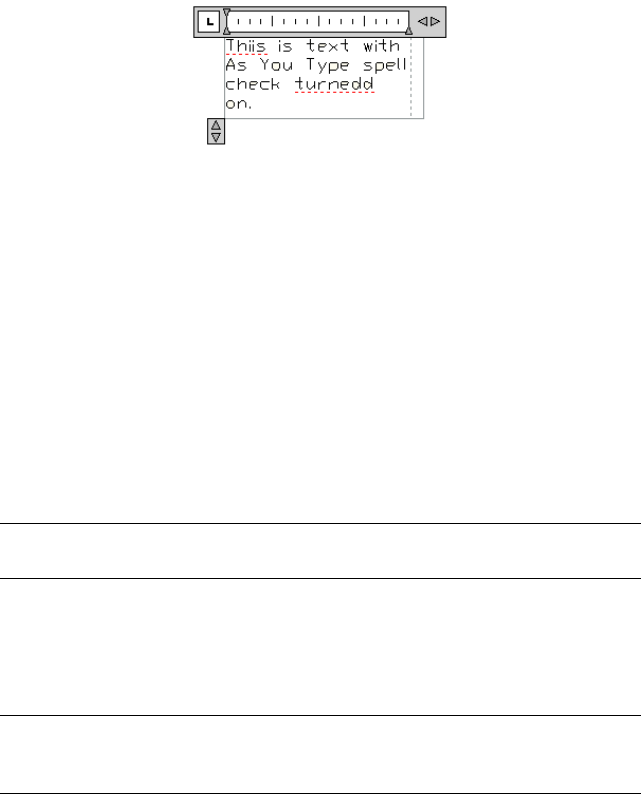
Misspelled words are underlined
with a red dotted line
Any word not found in the current dictionary is underlined as misspelled.
Spelling suggestions are displayed when you right-click the underlined word.
Switch Dictionaries
The Check Spelling feature contains several main dictionaries, which are
available in different languages. You can also create any number of custom
dictionaries and switch between them as needed.
During a spelling check, the words in the drawing are matched to the words
in the current main dictionary. Any words you add are stored in the custom
dictionary that is current at the time of the spelling check. For example, you
can add proper names so they are no longer identified as misspelled words.
NOTE By default AutoCAD provides you with one sample custom dictionary that
contains words such as AutoCAD and Autodesk.
To check spelling in another language, change to a different main dictionary.
You can change dictionaries in the Dictionaries dialog box or by specifying
the dictionary name in the DCTMAIN or DCTCUST system variable. For a list
of the main dictionary file names, see DCTMAIN.
NOTE The filename for a custom dictionary cannot use any non-current code
page characters in its name. If you are sharing a custom dictionary between
different locals or languages do not use non-ASCII characters.
Create and Edit Custom Dictionaries
A custom dictionary is a list of spelling exceptions that you have identified.
The files that contain them have a .cus file extension. You can use any ASCII
text editor to add or delete words, or combine several dictionaries.
1388 | Chapter 29 Notes and Labels
To check spelling
1Click Annotate tab ➤ Text panel ➤ Check Spelling.
2Click an option of where you want to check. Click Start. If no misspelled
words are found, a message is displayed. If a misspelling is found, the
Check Spelling dialog box identifies the misspelled word. The word is
highlighted and zoomed to in the drawing area.
3Do one of the following:
■To correct a word, select an alternate word from the Suggestions list
or type a word in the Suggestions box. Click Change or Change All.
■To leave a word unchanged, click Ignore or Ignore All.
■To leave a word unchanged and add it to the dictionary, click Add to
Dictionary.
4Repeat step 3 for each misspelled word. Click Close to exit.
NOTE Click Undo to reverse the preceding Check Spelling action or series of
actions in the Check Spelling dialog box.
To check spelling in a block attribute
1Click Annotate tab ➤ Text panel ➤ Check Spelling.
2In the Check Spelling dialog box, click Settings.
3In the Check Spelling Settings dialog box, click Block Attributes. Click
OK.
4In the Check Spelling dialog box, click Start.
5Do one of the following:
■To correct a word, select an alternate word from the Suggestions list
or type a word in the Suggestions box. Click Change or Change All.
■To leave a word unchanged, click Ignore or Ignore All.
■To leave a word unchanged and add it to the dictionary, click Add to
Dictionary.
6Repeat step 5 for each misspelled word. Click Close to exit.
Check Spelling | 1389

To switch dictionaries while checking spelling
1Click Annotate tab ➤ Text panel ➤ Check Spelling.
2In the Check Spelling dialog box, click Dictionaries.
3Do one of the following:
■To change the main dictionary, select a dictionary from the Current
Main Dictionary list.
■To change the custom dictionary, select a dictionary under Current
Custom Dictionary.
4Click Close.
To add a custom dictionary or word list
1Click Annotate tab ➤ Text panel ➤ Check Spelling.
2In the Check Spelling dialog box, click Dictionaries.
3In the Dictionaries dialog box, in the Current Custom dictionary list,
select Manage Custom Dictionaries.
4In the Custom Dictionaries list, click Add and browse to the dictionary’s
location. To create a new custom dictionary, click New and enter the
dictionary’s name. The name must contain the .cus extension.
5Click OK. The newly selected dictionary is highlighted as the current
custom dictionary.
6If you would like to import a word list into your custom dictionary, click
Import.
7Click OK.
Quick Reference
Commands
SPELL
Checks spelling in a drawing.
1390 | Chapter 29 Notes and Labels
System Variables
DCTCUST
Displays the path and file name of the current custom spelling dictionary.
DCTMAIN
Displays the three letter keyword for the current main spelling dictionary.
Use an Alternate Text Editor
The default text editor is either the MTEXT ribbon contextual tab (if the ribbon
is active) or the In-Place Text Editor (if the ribbon is not active), but you can
elect to use any alternate editor that saves files in ASCII format.
Overview of Using an Alternate Text Editor
You can use any text editor, such as Microsoft Notepad, that saves files in
ASCII format.
You can elect to use an alternate editor by specifying the editor with the
MTEXTED system variable.
If you use an alternate text editor for multiline text, you specify the properties
of the multiline text object at the Command prompt first. Then the text editor
opens for entering text. When you close the text editor, the text is inserted
within the width limit you specified.
If you use an alternate editor, you must enter special codes to apply formatting.
To edit text using an alternate text editor, use the same format codes. To avoid
losing format information when you make changes to the text, use the same
text editor you used to create the text.
Quick Reference
Commands
MTEXT
Creates a multiline text object.
OPTIONS
Customizes the program settings.
Use an Alternate Text Editor | 1391
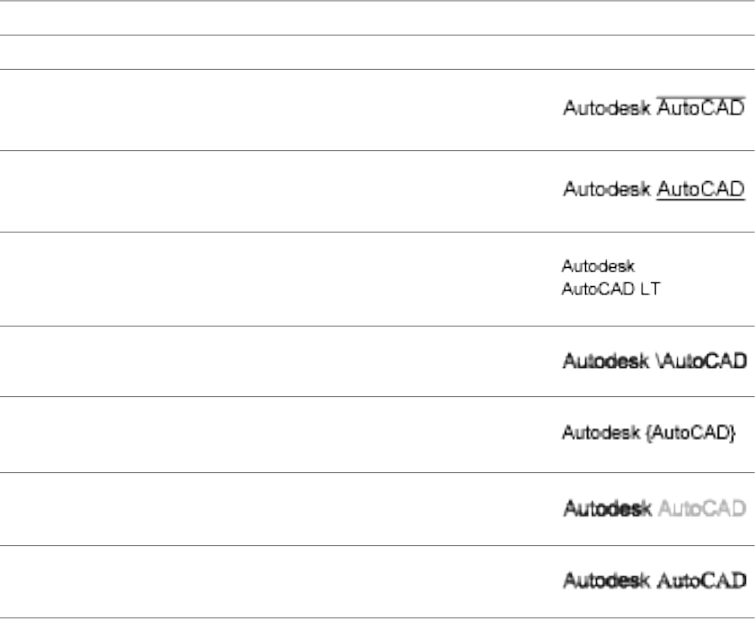
System Variables
MTEXTED
Sets the application for editing multiline text objects.
Format Multiline Text in an Alternate Text Editor
If you use an alternate text editor, you apply formatting by entering format
codes.
You can underline text, add a line over text, and create stacked text. You can
also change color, font, and text height. You can change the spaces between
text characters or increase the width of the characters themselves. To apply
formatting, use the format codes shown in the following table.
Format codes for paragraphs
To produce this …Enter this …PurposeFormat code
Autodesk \OAutoCAD\oTurns overline on
and off
\0...\o
Autodesk \LAutoCAD\lTurns underline on
and off
\L...\l
Autodesk AutoCAD\~LTInserts a nonbreaking
space
\~
Autodesk \\AutoCADInserts a backslash\\
Autodesk \{AutoCAD\}Inserts an opening and
closing brace
\{...\}
Autodesk \C2;AutoCADChanges to the
specified color
\Cvalue;
Autodesk \Ftimes; AutoCADChanges to the
specified font file
\File name;
1392 | Chapter 29 Notes and Labels
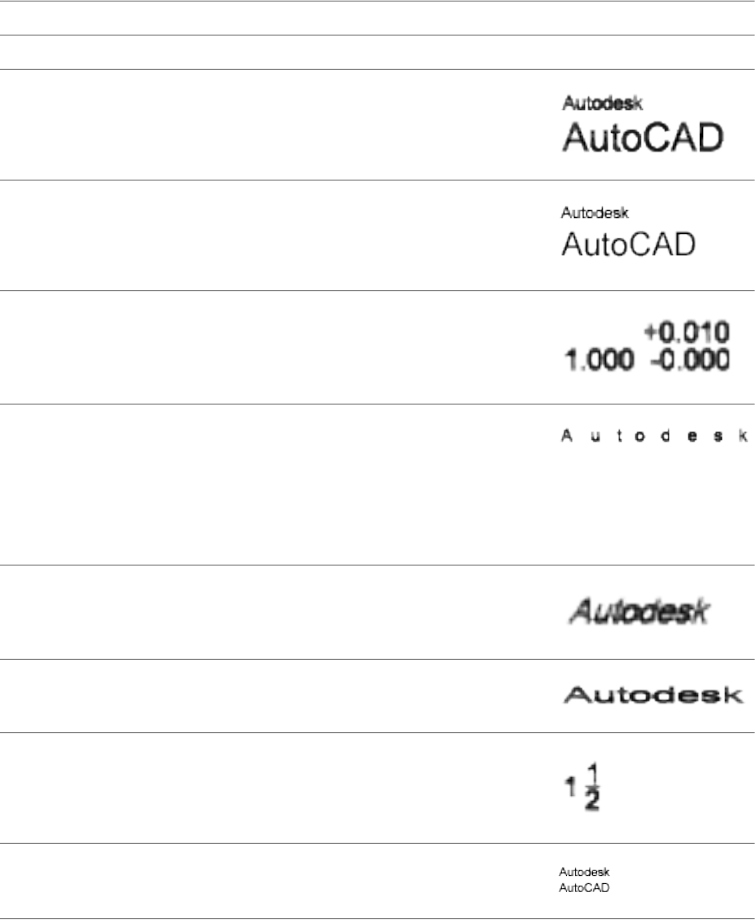
Format codes for paragraphs
To produce this …Enter this …PurposeFormat code
Autodesk \H2;AutoCADChanges to the text
height specified in
drawing units
\Hvalue;
Autodesk \H3x;AutoCADChanges the text height
to a multiple of the
current text height
\Hvaluex;
1.000\S+0.010^-0.000;Stacks the subsequent
text at the /, #, or ^ sym-
bol
\S...^...;
\T2;AutodeskAdjusts the space between
characters. Valid values
\Tvalue;
range from a minimum of
.75 to 4 times the original
spacing between charac-
ters.
\Q20;AutodeskChanges obliquing angle\Qangle;
\W2;AutodeskChanges width factor to
produce wide text
\Wvalue;
\A1;1\S1/2Sets the alignment value;
valid values: 0, 1, 2
(bottom, center, top)
\A
Autodesk\PAutoCADEnds paragraph\P
Braces can be nested up to eight levels deep.
Format Multiline Text in an Alternate Text Editor | 1393
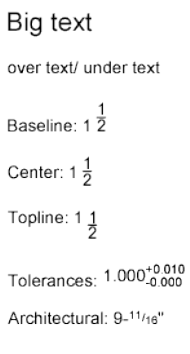
You can also use control codes to add special characters, such as tolerance or
dimensioning symbols. See MTEXT.
Example: Formatting Text in an Alternate Text Editor
This example describes how the text in the following illustration was created.
Each line below was entered in an alternate text editor:
{{\H1.5x; Big text} \A2; over text\A1;/\A0; under text}\P
{\A0;Baseline: 1 \S1/2;}\P
{\A1;Center: 1 \S1/2;}\P
{\A2;Topline: 1 \S1/2;}\P
{Tolerances: \A1;1.000\H.75x;\S+0.010^-0.000;}\P
{Architectural: 9-{\H.666x;\A2;11\A1;/\A0;16}\A2;"}\P
To specify an alternate text editor
1At the Command prompt, enter mtexted.
2At the prompt do one of the following:
■Enter the path and name of the executable file for the ASCII text editor
that you want to use to create or edit multiline text.
■Enter internal to restore the text editor.
1394 | Chapter 29 Notes and Labels

To create multiline text in an alternate text editor
1To specify a text editor, at the Command prompt, enter mtexted. Then
enter the path of the editor you want to use.
2Click Home tab ➤ Annotation panel ➤ Multiline Text.
3Specify the first corner of the multiline text boundary rectangle.
4Specify the opposite corner of the multiline text boundary rectangle.
5In the text editor, enter the text. Enter \P to end a paragraph and start a
new paragraph on the next line. (Be sure to capitalize the P.)
6When your text entry is complete, save the changes and exit the text
editor.
Quick Reference
Commands
MTEXT
Creates a multiline text object.
OPTIONS
Customizes the program settings.
System Variables
MTEXTED
Sets the application for editing multiline text objects.
Format Multiline Text in an Alternate Text Editor | 1395
1396
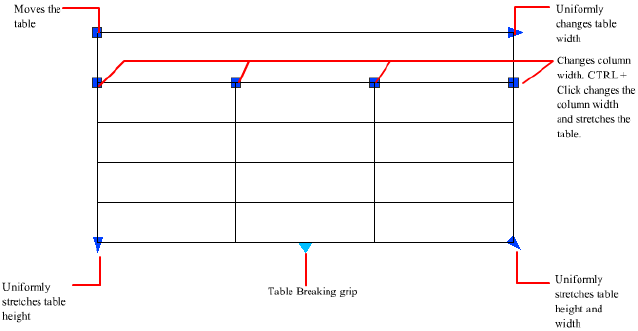
Tables
A table is a rectangular array of cells that contain annotation, primarily text but also blocks.
Tables appear in many different forms on many of the sheets that make up drawing sets. In
the AEC industry, tables are often referred to as “schedules” and contain information about
the materials needed for the construction of the building being designed. In the manufacturing
industry, they are often referred to as “BOM” (bills of materials).
The table object creates a table of any size that can be used for any purpose, including as a
list or index to a set of drawing sheets to be published.
Create and Modify Tables
A table is an object that contains data in rows and columns. A table object can
be created from an empty table or table style. A table can also be linked to data
in a Microsoft Excel spreadsheet.
After the table has been created, you can click any gridline on the table to select
it and then modify it by using the Properties palette or grips.
30
1397
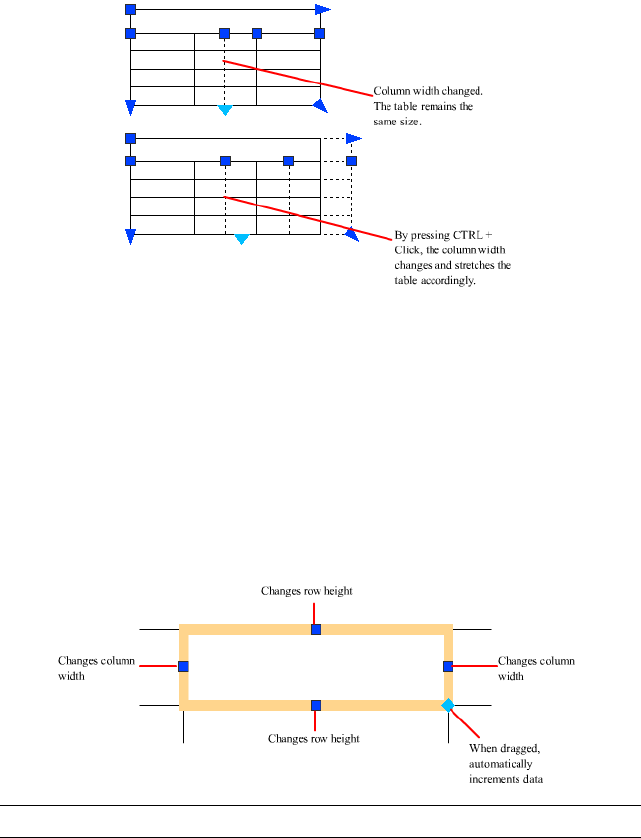
When you change the height or width of the table, only the row on page 2179
or column on page 2156 adjacent to the grip you have selected will change. The
table will maintain its height or width. To change the size of the table
proportionally to the size of the row or column you are editing, press Ctrl
while using a column grip.
Break Tables into Multiple Parts
A table with a large amount of data can be broken into primary and secondary
table fragments. Use the table breaking grips found at the bottom of your table
to make a table span multiple columns in your drawing or to manipulate the
different table parts you have already created.
Modify a Table Cell
You can click inside a cell to select it. Grips are displayed in the middle of the
cell borders. Click inside another cell to move selection to that cell. Drag the
grips on a cell to make the cell and its column or row larger or smaller.
NOTE When a cell is selected, press F2 to edit the cell text.
1398 | Chapter 30 Tables

To select more than one cell, click and drag over several cells. You can also
hold down Shift and click inside another cell to select those two cells and all
the cells between them.
When you click inside a table cell when the ribbon is active, the Table ribbon
contextual tab is displayed. If the ribbon is not active, the Table toolbar is
displayed. From here, you can
■Edit rows and columns
■Merge and unmerge cells
■Alter the appearance of cell borders
■Edit data formatting and alignment
■Lock and unlock cells from editing
■Insert blocks, fields, and formulas
■Create and edit cell styles
■Link the table to external data
With a cell selected, you can also right-click and use the options on the
shortcut menu to insert or delete columns and rows, combine adjacent cells,
or make other changes. When cells are selected, you can use Ctrl+Y to repeat
the last action.
NOTE Using Ctrl+Y to repeat the last action only repeats actions executed through
the shortcut menu, the Table ribbon contextual tab, or the Table toolbar.
Add a Table to a Tool Palette
When you add a table to a tool palette, the table properties (for example, table
style and number of rows and columns) and the cell property overrides (for
example, alignment and border lineweight) are stored in the tool definition.
The text, block content, and character formatting are also stored in the tool
definition.
Customize Display of Column Letters and Row Numbers
By default, the In-Place Text Editor displays column letters and row numbers
when a table cell is selected for editing. Use the TABLEINDICATOR system
variable to turn this display on and off. To set a new background color, select
a table, right-click, and click Table Indicator Color on the shortcut menu. The
Create and Modify Tables | 1399

text color, size, and style and the line color are controlled by the settings for
column heads in the current table style.
See also:
■Add Text and Blocks to Tables on page 1407
To create a tool from a table in the current drawing
1In the current drawing, select the table.
2Using the right mouse button, drag the table to a tool palette and, without
releasing the mouse button, move the cursor to the place on the tool
palette where you want the tool.
You can switch to a different tab by hovering over the tab for a few
seconds. The black line indicates where the tool will be located.
3Release the mouse button.
NOTE All formatting, table properties, and cell properties are saved in the
tool palette tool, as well as text and block content.
Quick Reference
FIELD
Creates a multiline text object with a field that can be updated automatically
as the field value changes.
FIND
Finds the text that you specify, and can optionally replace it with other text.
INSERT
Inserts a block or drawing into the current drawing.
LIST
Displays property data for selected objects.
MTEXT
Creates a multiline text object.
SPELL
Checks spelling in a drawing.
1400 | Chapter 30 Tables

TABLE
Creates an empty table object.
TABLEDIT
Edits text in a table cell.
TABLEEXPORT
Exports data from a table object in CSV file format.
TABLESTYLE
Creates, modifies, or specifies table styles.
UPDATEFIELD
Manually updates fields in selected objects in the drawing.
CTABLESTYLE
Sets the name of the current table style.
FIELDDISPLAY
Controls whether fields are displayed with a gray background.
FIELDEVAL
Controls how fields are updated.
TABLETOOLBAR
Controls the display of the Table toolbar.
Link a Table to External Data
A table can be linked to data in a Microsoft Excel (XLS, .XLSX, or CSV) file.
You can link to an entire spreadsheet, individual row, column, cell, or cell
range in Excel.
NOTE Microsoft Excel must be installed to use Microsoft Excel data links. To link
to the XLSX filetype, Microsoft Excel 2007 must be installed.
You can bring data from Microsoft Excel into a table in the following three
ways:
■As formulas with supported data formats attached.
■As calculated data from formulas calculated in Excel (supported data formats
not attached).
Link a Table to External Data | 1401
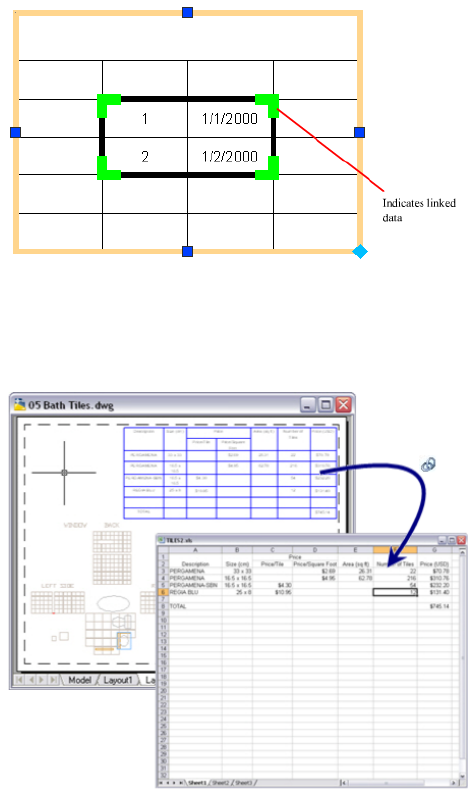
■As calculated data from formulas calculated in Excel (with data formats
attached).
A table that contains data links displays indicators around linked cells. If you
hover your mouse cursor over the data link, information about the data link
is displayed.
If a linked spreadsheet has been changed, such as adding a row or column,
the table in your drawing can be updated accordingly using the
DATALINKUPDATEcommand. Likewise, if a change is made to a table in your
drawing, then you can update the linked spreadsheet using the same command.
1402 | Chapter 30 Tables
By default, a data link is locked from editing to prevent undesired changes to
the linked spreadsheet. You can lock cells from data changes, format changes,
or both. To unlock a data link, click Locking on either the Table ribbon
contextual tab or the Table toolbar.
See also:
■Extract Data from Drawings and Spreadsheets on page 1833
To link to a table in an external spreadsheet
1In your table, select the table cells to link.
2On either the Table ribbon contextual tab or Table toolbar, click Link
Cell.
3In the Data Link Manager tree view, select Click to Create a New Excel
Data Link.
4In the Enter Data Link Name dialog box, enter a name for the data link.
Click OK.
5Click the [...] button to browse for the XLS or CSV file to link.
6In the New Excel Data Link dialog box, do one of the following:
■Select Link to a Named Range. Click OK.
■Select Link to Range. Enter a valid range from the Excel spreadsheet
(for example, A1:D17). Click OK.
7Select the new data link in the Data Link Manager tree view. Click OK.
To remove a link to an external spreadsheet
1Click inside a cell within the data linked table to select the cell.
2Right-click and click Data Links ➤ Detach Data Link.
To set up a named range in Microsoft Excel
1In Microsoft Excel, open the workbook or spreadsheet that you want to
access.
2Select a range of cells to function as a linked range.
3In the Name Box, enter a name for the range of cells, then press Enter.
4Repeat steps 2 and 3, if desired, to specify additional linked ranges.
Link a Table to External Data | 1403
5On the File menu (Microsoft Excel), choose Save.
To open an external spreadsheet from a data link
1Select any cell in the linked table or range of linked cells.
2Right-click and click Data Links ➤ Open Data Link File.
Quick Reference
DATALINK
Displays the Data Link dialog box.
DATALINKUPDATE
Updates data to or from an established external data link.
DATALINKNOTIFY
Controls the notification for updated or missing data links.
Work with Table Styles
The appearance of the table is controlled by its table style. You can use the
default table style, STANDARD, or create your own table styles.
When you create a new table style, you can specify a starting table. A starting
table is a table in your drawing that is used as an example for formatting the
new table style. Once a table is selected, you can specify the structure and
contents to copy from that table to the table style.
Cell styles can be created and applied to a table style upon insertion of a new
table. A table style can specify different cell styles in each type of row to display
a different justification and appearance for the text and gridlines. These cell
styles are specified upon insertion of a table. The STANDARD table style, for
example, contains a cell style consisting of merged cells with text that is
centered. This cell style, named Title, can be specified as the first row cell of
the table. This creates a title row at the top of the new table.
The table can read from top to bottom or from the bottom up. The number
of columns and rows is almost unlimited.
The border properties in a table’s cell style control the display of the gridlines
that divide the table into cells. The borders of the title row, the column heads
row, and the data rows can have different lineweight and color and can be
1404 | Chapter 30 Tables

displayed or not displayed. The Cell Style preview image in the bottom right
corner of the Table Style dialog box updates as you select border options.
The appearance of text in the cells of the table is controlled by the text style
that is specified in the current cell style. You can use any text style in the
drawing or create a new one. You can also use DesignCenter to copy table
styles from other drawings.
You can define the data and formatting for any cell style within a table style.
You can also overwrite the data and formatting for specific cells. For example,
you could set the formatting for all column heading rows to display text in
uppercase, and then select a single table cell to display text in lowercase. The
type of data you display in a row and the formatting for that data type is
controlled by the formatting options you select in the Table Cell Format dialog
box.
See also:
■Work with Text Styles on page 1363
To define or modify a cell style
1Click Home tab ➤ Annotation panel ➤ Table Style.
2Select the table style that contains the cell style you want to modify, or
click New to create a new table style.
3In the Table Style dialog box, in the Cell Styles drop-down list, select a
cell style to modify, or create a new cell style by clicking the button to
the right of the drop-down list.
4Click OK.
To create a table style from an existing table
1Click a gridline to select the table.
2Right-click and click Table Style ➤ Save as New Table Style.
To create a cell style from an existing cell
1Click inside the cell to create a cell style from.
2Right-click and click Cell Style ➤ Save as New Cell Style.
Work with Table Styles | 1405

To apply a new table style to a table
1Click a gridline to select the table.
2Right-click and select Table Style.
3On the Table Style flyout, select a table style from the list.
The new table style is applied to the table.
NOTE If the previous table style had a title row and the new one does not,
the title text is placed in the first cell of the table, and the other cells in the
first row are left blank.
4Press Esc twice to remove selection.
Quick Reference
FIND
Finds the text that you specify, and can optionally replace it with other text.
INSERT
Inserts a block or drawing into the current drawing.
LIST
Displays property data for selected objects.
MTEXT
Creates a multiline text object.
SPELL
Checks spelling in a drawing.
TABLE
Creates an empty table object.
TABLEDIT
Edits text in a table cell.
TABLEEXPORT
Exports data from a table object in CSV file format.
1406 | Chapter 30 Tables
TABLESTYLE
Creates, modifies, or specifies table styles.
UPDATEFIELD
Manually updates fields in selected objects in the drawing.
CTABLESTYLE
Sets the name of the current table style.
FIELDDISPLAY
Controls whether fields are displayed with a gray background.
FIELDEVAL
Controls how fields are updated.
Add Text and Blocks to Tables
Table cell data can include text and multiple blocks.
When a table is created, the first cell is highlighted, the Text Formatting toolbar
is displayed, and you can begin entering text. The row height of the cell
increases to accommodate the number of lines of text. To move to the next
cell, press TAB, or use the arrow keys to move left, right, up, and down. You
can quickly edit cell text by pressing F2 in a selected cell.
When you insert a block into a table cell, either the block can be automatically
fit to the size of the cell, or the cell can adjust to accommodate the size of the
block. Blocks can be inserted from the Table toolbar, or from the shortcut
menu. Multiple blocks can be inserted in a table cell. If there is more than
one block in a table cell, use the Manage Cell Content dialog box to customize
the way the cell content is displayed.
Add Text and Blocks to Tables | 1407
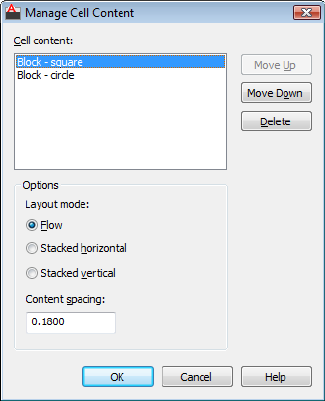
Inside the cell, the arrow keys move the cursor. Use the Table toolbar and the
shortcut menu to format text, import text, or make other changes to the text
in the cell.
See also:
■Use Fields in Text on page 1352
■Create Multiline Text on page 1308
To define or modify data formats
1In a table, click the table cells where you want to redefine data and
formatting.
2On the Table toolbar, click Data Format.
3Choose a data type, format, and other options for the selected table cells.
4Enter data in the selected table cells. The data type and format you chose
determines how the data is displayed.
5Click OK.
To change the properties of cells in a table
1Click inside the table cell you want to change.
1408 | Chapter 30 Tables
Hold down Shift and click inside another cell to select those two cells
and all the cells between them.
2Use one of the following methods:
■To change one or more properties, in the Properties palette, click the
value you want to change and enter or select a new value.
■To restore the default properties, right-click. Click Remove Property
Overrides.
To copy the properties of a cell to other cells
1Click inside the table cell whose properties you want to copy.
2(Optional) To view the current properties of the selected table cell, press
Ctrl+1 to open the Properties palette.
All the properties of the cell are copied except the cell type: text or block.
3On the Table toolbar, click Match Cell.
The cursor changes to a paintbrush.
4To copy the properties to another table cell in the drawing, click inside
the cell.
5Right-click or press Esc to stop copying properties.
To change the lineweight, linetype, or color of the borders of table cells
1Click inside the table cell you want to change.
Hold down Shift and click inside another cell to select those two cells
and all the cells between them.
2On the Table toolbar, click Cell Borders.
3In the Cell Border Properties dialog box, select a lineweight, linetype and
color. To specify a double line border, select Double Line.
Use BYBLOCK to set the border properties to match the settings in the
table style that has been applied to the table.
4Click one of the border type buttons to specify which borders of the cell
to modify, or select a border in the preview image.
5Click OK.
6Move the cursor outside the Properties palette, and press Esc to remove
selection, or select another cell.
Add Text and Blocks to Tables | 1409
To insert a block in a table cell
1Select and right-click a cell. Click Insert ➤ Block.
2In the Insert dialog box, select a block from the list of blocks in the
drawing, or click Browse to find a block in another drawing.
3Specify the following properties for the block:
■Cell Alignment. Specifies alignment for the block in the table cell. The
block is middle-, top-, or bottom-aligned with respect to the top and
bottom borders of the cell. The block is center-, left-, or right-aligned
with respect to the left and right borders of the cell.
■Scale. Specifies the scale for the block reference. Enter a value or select
AutoFit to scale the block to fit in the selected cell.
■Rotation Angle. Specifies a rotation angle for the block.
4Click OK.
If the block has attributes attached, the Edit Attributes dialog box is
displayed.
To insert a field in a table cell
1Double-click inside the table cell.
2On the Table toolbar, click Insert Field, or press Ctrl+F.
3In the Field dialog box, select a category in the Field Category list to
display the field names in that category.
4Select a field.
5Select the format or other options available for that field.
6Click OK.
Quick Reference
FIELD
Creates a multiline text object with a field that can be updated automatically
as the field value changes.
FIND
Finds the text that you specify, and can optionally replace it with other text.
1410 | Chapter 30 Tables
INSERT
Inserts a block or drawing into the current drawing.
LIST
Displays property data for selected objects.
MATCHCELL
Applies the properties of a selected table cell to other table cells.
MTEXT
Creates a multiline text object.
SPELL
Checks spelling in a drawing.
TABLE
Creates an empty table object.
TABLEDIT
Edits text in a table cell.
TABLEEXPORT
Exports data from a table object in CSV file format.
TABLESTYLE
Creates, modifies, or specifies table styles.
UPDATEFIELD
Manually updates fields in selected objects in the drawing.
CTABLESTYLE
Sets the name of the current table style.
FIELDDISPLAY
Controls whether fields are displayed with a gray background.
FIELDEVAL
Controls how fields are updated.
Add Text and Blocks to Tables | 1411
Use Formulas in Table Cells
Table cells can contain formulas that do calculations using the values in other
table cells.
With a table cell selected, you can insert formulas from the Table toolbar as
well as the shortcut menu. You can also open the In-Place Text Editor and
enter a formula in a table cell manually.
Insert a Formula
In formulas, cells are referred to by their column letter and row number. For
example, the cell at top left in the table is A1. Merged cells use the number
of what would be the top-left cell. A range of cells is defined by the first and
last cells, with a colon between them. For example, the range A5:C10 includes
cells in rows 5 through 10 in columns A, B, and C.
A formula must start with an equal sign (=). The formulas for sum, average,
and count ignore empty cells and cells that do not resolve to a numeric value.
Other formulas display an error (#) if any cell in the arithmetic expression is
empty or contains nonnumeric data.
Use the Cell option on the shortcut menu to select a cell in another table in
the same drawing. When you have selected the cell, the In-Place Text Editor
opens so you can enter the rest of the formula. You can also insert a formula
using the Table toolbar.
Copy a Formula
When you copy a formula to another cell in the table, the range changes to
reflect the new location. For example, if the formula in A10 sums A1 through
A9, when you copy it to B10, the range of cells changes so that it sums B1
through B9.
If you don't want a cell address to change when you copy and paste the
formula, add a dollar sign ($) to the column or row part of the address. For
example, if you enter $A10, the column stays the same and the row changes.
If you enter $A$10, both column and row stay the same.
Insert Data Automatically
You can automatically increment data in adjacent cells within a table by using
the AutoFill grip. For example, a table with a date column can have the dates
automatically entered by entering the first necessary date and dragging the
AutoFill grip.
1412 | Chapter 30 Tables
Numbers will fill automatically by increments of 1 if one cell is selected and
dragged. Similarly, dates will resolve by increments of one day if only one cell
is selected. If two cells are manually filled with dates one week apart, the
remaining cells are incremented by one week.
See also:
■Use Fields in Text on page 1352
To add a formula to table cells
1Select the table cell where you want to place the formula by clicking
inside it. The Table toolbar is displayed.
2On the Table toolbar, click one of the following:
■Insert Formula ➤ Average
■Insert Formula ➤ Sum
■Insert Formula ➤ Count
■Insert Formula ➤ Cell
3Follow the prompts.
4Edit the formula, if necessary.
5To save your changes and exit the editor, click in the drawing outside
the editor.
To manually enter a formula in a table cell
1Double-click inside a table cell.
The In-place Text Editor opens.
2Enter a formula (a function or an arithmetic expression), as in the
following examples:
■=sum(a1:a25,b1). Sums the values in the first 25 rows of column A
and the first row in column B.
■=average(a100:d100). Calculates the average of the values in the first
4 columns in row 100.
■=count(a1:m500). Displays the total number of cells in column A
through column M in rows 1 through 100.
Use Formulas in Table Cells | 1413
■=(a6+d6)/e1. Adds the values in A6 and D6 and divides the total by
the value in E1.
Use a colon to define a range of cells and a comma for individual cells.
A formula must start with an equal sign (=) and can contain any of
the following signs: plus (+), minus (-), times (*), divided by (/),
exponent (^), and parentheses ().
3To save your changes and exit the editor, click in the drawing outside
the editor.
The cell displays the result of the calculation.
To change the background color of column letters and row numbers for
tables
1Click a grid line to select a table.
2Right-click. Click Table Indicator Color.
3In the Select Color dialog box, select a color.
4Click OK.
The text color, size, and style and the line color are controlled by the
settings for column heads in the current table style.
To insert a Formula field in a table cell
1Click inside the table cell.
2On the Table toolbar, click Insert Field.
3In the Field dialog box, Field Category list, select Objects.
4In Field Names, select Formula.
5To enter a formula, do one of the following:
■Click Average, Sum, or Count. The Field dialog box closes temporarily.
To specify a range, click inside the first and the last cell. The result is
appended to the formula.
■Click Cell. The Field dialog box closes temporarily. Select a cell in a
table in the drawing. The cell address is appended to the formula.
6(Optional) Select a format and a decimal separator.
7Click OK.
1414 | Chapter 30 Tables
8To save your changes and exit the editor, click in the drawing outside
the editor.
The cell displays the result of the calculation.
To automatically fill cells with incremented data
1Double-click inside a table cell.
2Enter a numeric value; for example, 1 or 01/01/2000.
3Press the down arrow and enter the next desired numeric value.
4On the Text Formatting toolbar, click OK.
To change the format of the cell data, right-click the cell. Select Data
Format.
5Select the cell or cells from which you want to increment data from.
6Click the grip in the lower right corner of the cell or cells.
To change AutoFill options, right-click the AutoFill grip in the bottom
right-hand corner of the selected cell range and select an AutoFill option.
7Drag the grip through the cells you would like to automatically increment.
A preview of the value for each cell will display to the right of the selected
grip.
Quick Reference
FIELD
Creates a multiline text object with a field that can be updated automatically
as the field value changes.
MTEXT
Creates a multiline text object.
TABLE
Creates an empty table object.
TABLEEXPORT
Exports data from a table object in CSV file format.
TABLESTYLE
Creates, modifies, or specifies table styles.
Use Formulas in Table Cells | 1415
UPDATEFIELD
Manually updates fields in selected objects in the drawing.
CTABLESTYLE
Sets the name of the current table style.
FIELDDISPLAY
Controls whether fields are displayed with a gray background.
FIELDEVAL
Controls how fields are updated.
TABLEINDICATOR
Controls the display of row numbers and column letters when the In-Place
Text Editor is open for editing a table cell.
1416 | Chapter 30 Tables
Dimensions and Tolerances
You can add measurements to your drawing with several dimensioning commands. Use
dimension styles to format dimensions quickly and maintain industry or project dimensioning
standards.
Understand Basic Concepts of Dimensioning
You can create several types of dimensions, and you can control their appearance
by setting up dimension styles or by editing individual dimensions.
Overview of Dimensioning
Dimensioning is the process of adding measurement annotation to a drawing.
You can create dimensions for a variety of object types in many orientations.
The basic types of dimensioning are
■Linear
■Radial (radius, diameter and jogged)
■Angular
■Ordinate
■Arc Length
Linear dimensions can be horizontal, vertical, aligned, rotated, baseline, or
continued (chained). Some examples are shown in the illustration.
31
1417
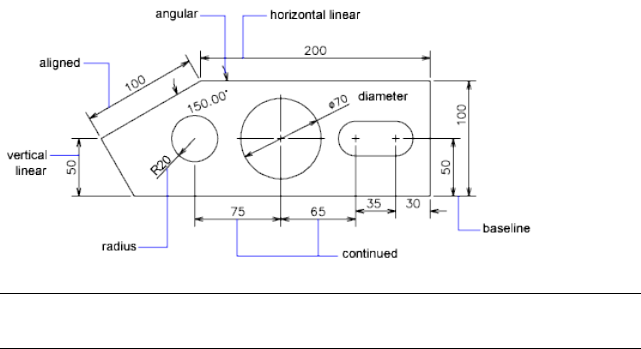
NOTE To simplify drawing organization and dimension scaling, it is recommended
that you create dimensions on layouts rather than in model space.
To create a dimension
1Create a layer designated for dimensions and make it the current layer.
2Near the bottom-left corner of the application window, click a layout
tab.
3Click Dimension menu. Click a dimension option.
4Follow the Command prompts.
Quick Reference
Commands
DIMANGULAR
Creates an angular dimension.
DIMARC
Creates an arc length dimension.
DIMBREAK
Breaks or restores dimension and extension lines where they cross other
objects.
DIMDIAMETER
Creates a diameter dimension for a circle or an arc.
1418 | Chapter 31 Dimensions and Tolerances
DIMEDIT
Edits dimension text and extension lines.
DIMBREAK
Adds or removes inspection information for a selected dimension.
DIMJOGGED
Creates jogged dimensions for circles and arcs.
DIMBREAK
Adds or removes a jog line on a linear or aligned dimension.
DIMLINEAR
Creates a linear dimension.
DIMORDINATE
Creates ordinate dimensions.
DIMRADIUS
Creates a radius dimension for a circle or an arc.
DIMREASSOCIATE
Associates or reassociates selected dimensions to objects or points on objects.
DIMBREAK
Adjusts the spacing between linear dimensions or angular dimensions.
DIMSTYLE
Creates and modifies dimension styles.
DIMTEDIT
Moves and rotates dimension text and relocates the dimension line.
PROPERTIES
Controls properties of existing objects.
QDIM
Creates a series of dimensions quickly from selected objects.
Overview of Dimensioning | 1419
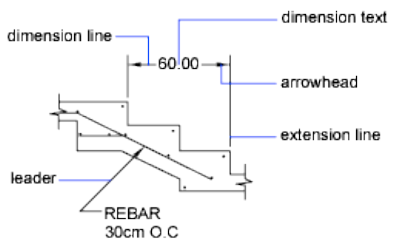
System Variables
DIMASSOC
Controls the associativity of dimension objects and whether dimensions are
exploded.
Parts of a Dimension
Here is a list of the parts of a dimension along with their descriptions.
Dimensions have several distinct elements: dimension text, dimension lines,
arrowheads, and extension lines.
Dimension text is a text string that usually indicates the measurement value.
The text can also include prefixes, suffixes, and tolerances.
A dimension line indicates the direction and extent of a dimension. For angular
dimensions, the dimension line is an arc.
Arrowheads, also called symbols of termination, are displayed at each end of
the dimension line. You can specify different sizes and shapes for arrowheads
or tick marks.
Extension lines, also called projection lines or witness lines, extend from the
feature to the dimension line.
A center mark is a small cross that marks the center of a circle or arc.
Centerlines are broken lines that mark the center of a circle or arc.
1420 | Chapter 31 Dimensions and Tolerances
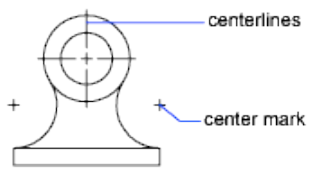
Quick Reference
Commands
DIMSTYLE
Creates and modifies dimension styles.
Associative Dimensions
Dimensions can be associative, nonassociative, or exploded. Associative
dimensions adjust to changes in the geometric objects that they measure.
Dimension associativity defines the relationship between geometric objects
and the dimensions that give their distance and angles. There are three types
of associativity between geometric objects and dimensions.
■Associative dimensions. Automatically adjust their locations, orientations,
and measurement values when the geometric objects associated with them
are modified. Dimensions in a layout may be associated to objects in model
space. The DIMASSOC system variable is set to 2.
■Nonassociative dimensions. Selected and modified with the geometry they
measure. Nonassociative dimensions do not change when the geometric
objects they measure are modified. The dimension variable DIMASSOC is
set to 1.
■Exploded dimensions. Contain a collection of separate objects rather than
a single dimension object. The DIMASSOC system variable is set to 0.
You can determine whether a dimension is associative or nonassociative by
selecting the dimension and doing one of the following:
■Use the Properties palette to display the properties of the dimension.
■Use the LIST command to display the properties of the dimension.
Associative Dimensions | 1421
You can also use the Quick Select dialog box to filter the selection of associative
or nonassociative dimensions. A dimension is considered associative even if
only one end of the dimension is associated with a geometric object. The
DIMREASSOCIATE command displays the associative and nonassociative
elements of a dimension.
Special Situations and Limitations
You may need to use DIMREGEN to update associative dimensions after
panning or zooming with a wheel mouse, after opening a drawing that was
modified with an earlier release, or after opening a drawing with external
references that have been modified.
Although associative dimensions support most object types that you would
expect to dimension, they do not support the following:
■Hatches
■Multiline objects
■2D solids
■Objects with nonzero thickness
■Images
■DWF underlays
When selecting objects to dimension, make sure that the objects that you
select don't include a directly overlapping object that does not support
associative dimensioning such as a 2D solid.
Associativity is not maintained between a dimension and a block reference if
the block is redefined.
Associativity is not maintained between a dimension and a 3D solid if the
shape of the 3D solid is modified.
Dimensions created with QDIM are not associative but may be associated
individually with DIMREASSOCIATE.
For information about working with associative dimensions in combination
with previous releases, see Save Drawings to Previous Drawing File Formats
on page 1822.
See also:
■Change Dimension Associativity on page 1511
1422 | Chapter 31 Dimensions and Tolerances
To change the dimension associativity default
1Click Tools menu ➤ Options.
2In the Options dialog box, User Preferences tab, under Associative
Dimensioning, select or clear Make New Dimensions Associative.
3Do either or both of the following:
■Click Apply to record the current Options settings in the system
registry.
■Click OK to record the current Options settings in the system registry
and close the Options dialog box.
All subsequently created dimensions in the drawing use the new setting. Unlike
most other option settings, dimension associativity is saved in the drawing
file rather than in the system registry.
Quick Reference
Commands
DIMDISASSOCIATE
Removes associativity from selected dimensions.
DIMREASSOCIATE
Associates or reassociates selected dimensions to objects or points on objects.
DIMREGEN
Updates the locations of all associative dimensions.
EXPLODE
Breaks a compound object into its component objects.
LIST
Displays property data for selected objects.
OPTIONS
Customizes the program settings.
Associative Dimensions | 1423

System Variables
DIMASSOC
Controls the associativity of dimension objects and whether dimensions are
exploded.
Use Dimension Styles
You can control the appearance of dimensions by changing settings. For
convenience and to help maintain dimensioning standards, you can store
these settings in dimension styles.
Overview of Dimension Styles
A dimension style is a named collection of dimension settings that controls
the appearance of dimensions, such as arrowhead style, text location, and
lateral tolerances.
You create dimension styles to specify the format of dimensions quickly, and
to ensure that dimensions conform to industry or project standards.
■When you create a dimension, it uses the settings of the current dimension
style
■If you change a setting in a dimension style, all dimensions in a drawing
that use the style update automatically
■You can create dimension substyles that, for specified types of dimensions,
deviate from the current dimension style
■If necessary, you can override a dimension style temporarily
To set the current dimension style
■On the Styles toolbar, in the Dimension Styles control, click the arrow and
select a dimension style from the list.
To create a dimension substyle
1Click Home tab ➤ Annotation panel ➤ Dimension Style.
1424 | Chapter 31 Dimensions and Tolerances
2In the Dimension Style Manager, select the style from which you want
to create a substyle. Click New.
3In the Create New Dimension Style dialog box, select the type of
dimension that will apply to the substyle from the Use For list. Click
Continue.
4In the New Dimension Style dialog box, select the appropriate tab and
make changes to define the dimension substyle.
5Click OK.
6Click Close to exit the Dimension Style Manager.
Quick Reference
Commands
DIMSTYLE
Creates and modifies dimension styles.
Compare Dimension Styles and Variables
You can view all the settings in a dimension style. Dimension styles used in
externally referenced drawings are differentiated from those defined in your
current drawing.
You can list the dimension styles in the current drawing. You can also list all
dimensioning system variables and their current status or only the variables
affected by a dimension style.
When you list the current status of all dimensioning system variables, any
running overrides that apply to the current dimension style are listed. You
can also list the differences between a named dimension style and the current
dimension style.
Use Externally Referenced Dimension Styles
The program displays externally referenced dimension style names using the
same syntax as for other externally dependent named objects. When you view
externally referenced dimension styles using the Dimension Style Manager,
the name of the xref displays in the Styles list as Xref:drawing name with each
xref style appearing below the drawing name. For example, if the drawing file
baseplat.dwg has a dimension style called FRACTIONAL-1, and you attach
Compare Dimension Styles and Variables | 1425

baseplat.dwg as an xref to a new drawing, then the xref dimension style is
displayed in the Styles list of the Dimension Style Manager as Xref:baseplat.dwg,
and FRACTIONAL-1 appears under the drawing name.
Externally referenced dimension styles can be examined, but they cannot be
modified or made current. You can use an externally referenced dimension
style as a template for creating a new dimension style in your current drawing.
To list all dimension settings for the current dimension style
1Click Home tab ➤ Annotation panel ➤ Dimension Style.
2In the Dimension Style Manager, select the style from the Styles list.
3Click Compare.
The dimensioning system variables, their current settings, and a brief
description are listed. Overrides are included.
To list settings for an existing dimension style
1Click Home tab ➤ Annotation panel ➤ Dimension Style.
2In the Dimension Style Manager, enter a dimension style name, or select
a dimension whose dimension style you want to examine.
3Click Compare.
Affected variables, their settings, and a brief description of each are listed.
Overrides are not included.
To list dimension styles in the current drawing
1Click Home tab ➤ Annotation panel ➤ Dimension Style.
2In the Dimension Style Manager, under List, select All Styles or Style in
Use.
To compare dimension styles
1Click Home tab ➤ Annotation panel ➤ Dimension Style.
1426 | Chapter 31 Dimensions and Tolerances
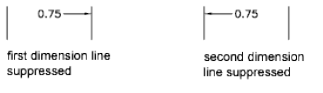
2In the Dimension Style Manager, select the style to compare from the
Styles list.
3Click Compare.
The dimension style is compared to the current dimension style.
Quick Reference
Commands
DIMSTYLE
Creates and modifies dimension styles.
Control Dimension Geometry
You can control the appearance of dimension lines, extension lines,
arrowheads, and center marks.
Control Dimension Lines
You can control dimension line properties including color, lineweight, and
spacing.
You can control several aspects of a dimension line. You can
■Specify color and lineweight for visual effect and plotting
■Suppress the dimension line or, if the dimension line is broken by text,
one or both halves
■Control the spacing between successive dimension lines in baseline
dimensions
Control Dimension Geometry | 1427
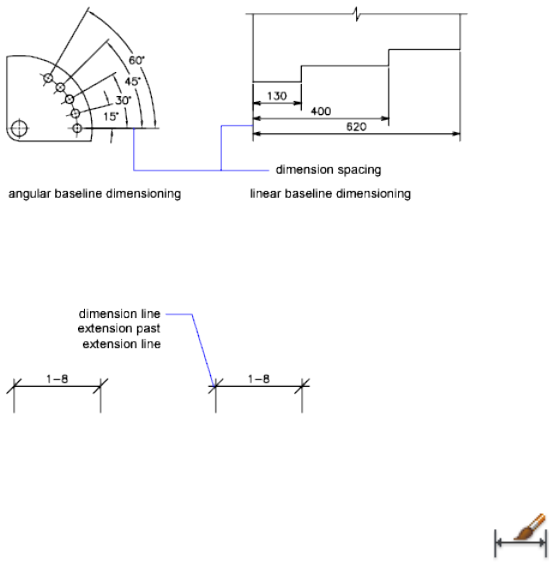
■Control the distance by which the dimension line extends beyond the
extension lines for architectural tick (oblique stroke) arrowheads
To modify the display of dimension lines
1Click Home tab ➤ Annotation panel ➤ Dimension Style.
2In the Dimension Style Manager, select the style you want to change.
Click Modify.
3In the Modify Dimension Style dialog box, Lines tab, change the settings
under Dimension Lines as needed.
4Click OK.
5Click Close to exit the Dimension Style Manager.
Quick Reference
Commands
DIMSTYLE
Creates and modifies dimension styles.
1428 | Chapter 31 Dimensions and Tolerances
System Variables
DIMCLRD
Assigns colors to dimension lines, arrowheads, and dimension leader lines.
DIMDLE
Sets the distance the dimension line extends beyond the extension line when
oblique strokes are drawn instead of arrowheads.
DIMDLI
Controls the spacing of the dimension lines in baseline dimensions.
DIMGAP
Sets the distance around the dimension text when the dimension line breaks
to accommodate dimension text.
DIMLTYPE
Sets the linetype of the dimension line.
DIMLWD
Assigns lineweight to dimension lines.
DIMSD1
Controls suppression of the first dimension line and arrowhead.
DIMSD2
Controls suppression of the second dimension line and arrowhead.
DIMSOXD
Suppresses arrowheads if not enough space is available inside the extension
lines.
DIMTOFL
Controls whether a dimension line is drawn between the extension lines
even when the text is placed outside.
Control Extension Lines
You can control extension line properties including color, lineweight,
overshoot, and offset length.
Control Dimension Geometry | 1429
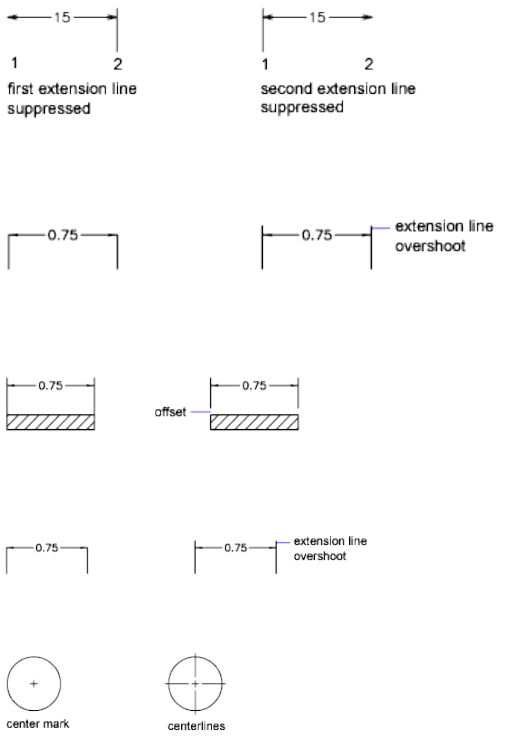
You can
■Specify color and lineweight for visual effect and plotting
■Suppress one or both extension lines if they are unnecessary, or if there is
not enough space
■Specify how far beyond from the dimension line the extension line extends
(overshoot)
■Control the extension origin offset, the distance between the extension
line origin, and the start of the extension line
■Specify a fixed length for extension lines, as measured from the dimension
line toward the extension line origin
■Specify a noncontinuous linetype, typically used for centerlines
■Modify the angle of the extension lines of a selected dimension to make
them oblique
1430 | Chapter 31 Dimensions and Tolerances
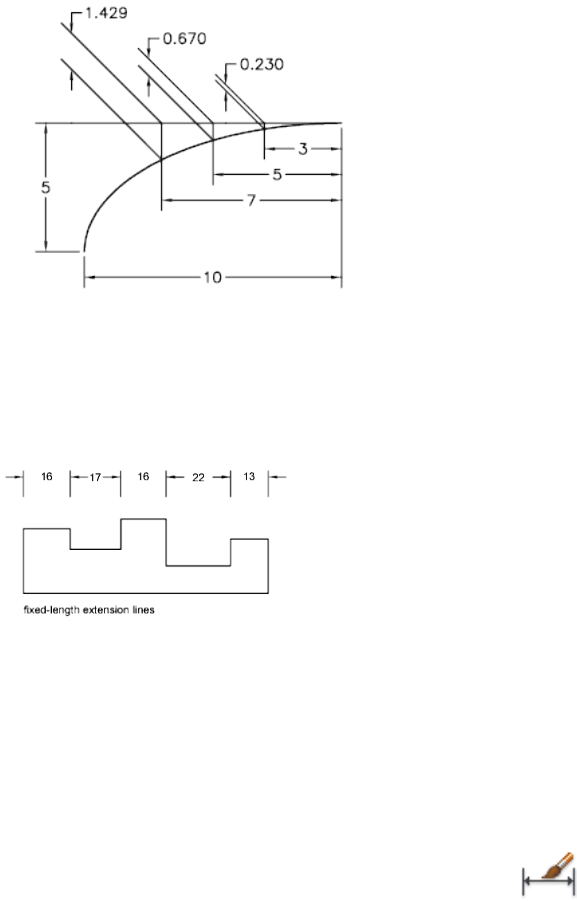
Fixed-Length Extension Lines
With the Dimension Style Manager, on the Lines tab, you can specify a
dimension style that sets the total length of extension lines starting from the
dimension line toward the dimension origin point.
The extension-line offset distance from the origin will never be less than the
value specified by the DIMEXO system variable.
See also:
■Create Dimensions with Oblique Extension Lines on page 1471
To modify the display of extension lines
1Click Home tab ➤ Annotation panel ➤ Dimension Style.
2In the Dimension Style Manager, select the style you want to change.
Click Modify.
Control Dimension Geometry | 1431
3In the Modify Dimension Style dialog box, Lines tab, under Extension
Lines, change the settings as needed.
4Click OK.
5Click Close to exit the Dimension Style Manager.
Quick Reference
Commands
DIMSTYLE
Creates and modifies dimension styles.
System Variables
DIMCLRE
Assigns colors to extension lines, center marks, and centerlines.
DIMDLE
Sets the distance the dimension line extends beyond the extension line when
oblique strokes are drawn instead of arrowheads.
DIMEXE
Specifies how far to extend the extension line beyond the dimension line.
DIMEXO
Specifies how far extension lines are offset from origin points.
DIMFXL
Sets the total length of the extension lines starting from the dimension line
toward the dimension origin.
DIMFXLON
Controls whether extension lines are set to a fixed length.
DIMLTEX1
Sets the linetype of the first extension line.
DIMLTEX2
Sets the linetype of the second extension line.
1432 | Chapter 31 Dimensions and Tolerances
DIMLWE
Assigns lineweight to extension lines.
DIMSE1
Suppresses display of the first extension line.
DIMSE2
Suppresses display of the second extension line.
Control Dimension Arrowheads
You can control the arrowhead symbols in dimensions and leaders including
their type, size, and visibility.
You can choose from many standard types of arrowheads, or you can create
your own arrowheads. Additionally, you can
■Suppress the display of arrowheads, or use one arrowhead only
■Apply a different type of arrowhead to each end of a dimension line
■Control the size of arrowheads
■Flip the direction of an arrowhead using the dimension shortcut menu
NOTE Flipped arrowheads maintain their appearance in versions later than
AutoCAD 2002. However, if you edit a drawing with flipped arrowheads in a
release earlier than AutoCAD 2006, the arrowhead directions will revert to their
original orientations.
See also:
■Customize Arrowheads on page 1435
To choose an arrowhead
1Click Home tab ➤ Annotation panel ➤ Dimension Style.
2In the Dimension Style Manager, select the style you want to change.
Click Modify.
Control Dimension Geometry | 1433
3In the Modify Dimension Style dialog box, Symbols and Arrows tab,
under Arrowheads, select the arrowhead type for the first end of the
dimension line.
The second arrowhead is automatically set to the same type.
4To set the second end of the dimension line to a different arrowhead
type, select an arrowhead type from the Second list.
5In the Size box, enter a size for the arrowhead.
6Click OK.
7Click Close to exit the Dimension Style Manager.
To flip the direction of an arrowhead
1At the Command prompt, select a single dimension object near the
arrowhead that you want to flip.
2Right-click. Click Flip Arrow.
Quick Reference
Commands
DIMSTYLE
Creates and modifies dimension styles.
System Variables
DIMCLRD
Assigns colors to dimension lines, arrowheads, and dimension leader lines.
DIMDLE
Sets the distance the dimension line extends beyond the extension line when
oblique strokes are drawn instead of arrowheads.
DIMSD1
Controls suppression of the first dimension line and arrowhead.
DIMSD2
Controls suppression of the second dimension line and arrowhead.
1434 | Chapter 31 Dimensions and Tolerances
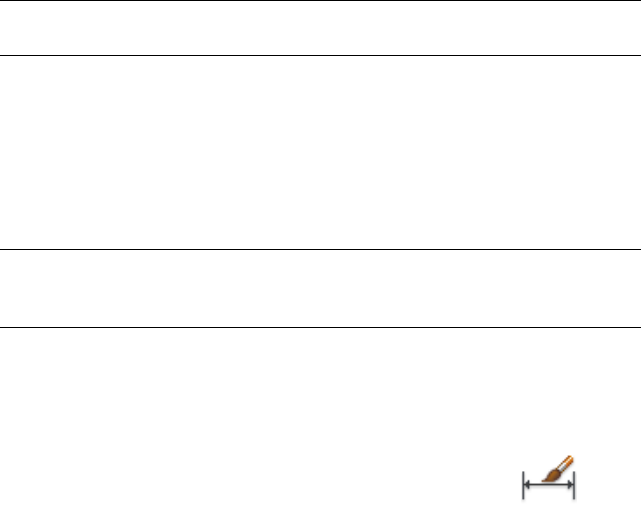
Customize Arrowheads
You can create your own custom arrowheads.
Arrowheads are stored as block definitions. To use your own arrowhead,
provide the name of an existing block definition. For information about
creating blocks, see Create Blocks Within a Drawing on page 865.
NOTE Annotative blocks cannot be used as custom arrowheads for dimensions
or leaders.
Arrowhead sizing relies on the overall dimension scale factor. When you create
a dimension, the block is inserted where the arrowheads would normally go.
The object's X and Y scale factors are set to arrowhead size overall scale. The
dimension line is trimmed by text gap x overall scale units at each end. To trim
the dimension line, the rightmost block is inserted with a zero rotation angle
for horizontal dimensioning. The leftmost block is rotated 180 degrees about
its insertion point.
NOTE The insertion point a block is defined with affects its placement as a custom
arrowhead on a dimension or leader. For information on changing the insertion
point of a block, see Create Drawing Files for Use as Blocks on page 867.
If you use paper-space scaling, the scale factor is computed before applying it
to the arrowhead size value.
To use your own arrowhead symbol
1Click Home tab ➤ Annotation panel ➤ Dimension Style.
2In the Dimension Style Manager, select the style you want to change.
Click Modify.
3In the Dimension Style Manager, Symbols and Arrows tab, under
Arrowheads, select User Arrow from the First arrowhead list.
4In the Select Custom Arrow Block dialog box, enter the name of your
block. Click OK.
5To choose a different custom arrowhead for the second arrowhead, repeat
steps 3 and 4, choosing User Arrow from the Second arrowhead list
(optional).
6Click OK.
Control Dimension Geometry | 1435
7Click Close to exit the Dimension Style Manager.
Quick Reference
Commands
BLOCK
Creates a block definition from selected objects.
DIMSTYLE
Creates and modifies dimension styles.
WBLOCK
Writes objects or a block to a new drawing file.
System Variables
DIMASZ
Controls the size of dimension line and leader line arrowheads.
DIMBLK
Sets the arrowhead block displayed at the ends of dimension lines.
DIMBLK1
Sets the arrowhead for the first end of the dimension line when DIMSAH is
on.
DIMBLK2
Sets the arrowhead for the second end of the dimension line when DIMSAH
is on.
DIMCLRD
Assigns colors to dimension lines, arrowheads, and dimension leader lines.
DIMDLE
Sets the distance the dimension line extends beyond the extension line when
oblique strokes are drawn instead of arrowheads.
DIMSAH
Controls the display of dimension line arrowhead blocks.
1436 | Chapter 31 Dimensions and Tolerances
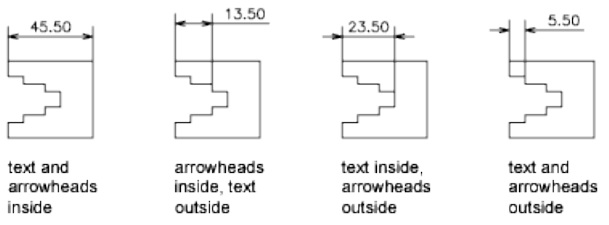
DIMTSZ
Specifies the size of oblique strokes drawn instead of arrowheads for linear,
radius, and diameter dimensioning.
Control Dimension Text
You can control the placement of dimension text, arrowheads, and leader
lines relative to the dimension and extension lines.
Fit Dimension Text Within Extension Lines
Dimension text and arrowheads usually appear between the extension lines
when there is enough space. You can specify how these elements are placed
when space is limited.
Many factors, such as the size of extension line spacing and arrowhead size,
influence how dimension text and arrowheads fit within the extension lines.
In general, the best fit, given the available space, is applied. If possible, both
text and arrowheads are accommodated between the extension lines, no matter
what fit option you choose.
When creating new dimensions, you can choose to place text by entering a
coordinate or using the pointing device; this is known as user-defined text
placement. Alternatively, the program can compute the text position for you.
The options for automatic fitting of text and arrowheads are listed in the
Dimension Style Manager, Fit tab. For example, you can specify that text and
arrowheads be kept together. In this case, if there is not room for both between
the extension lines, they are both placed outside. You can specify that if there
is room for only text or arrowheads, then either text only or arrowheads only
are placed between the extension lines.
The following illustrations show how the program applies a "best fit" for
arrowheads and text.
Control Dimension Text | 1437
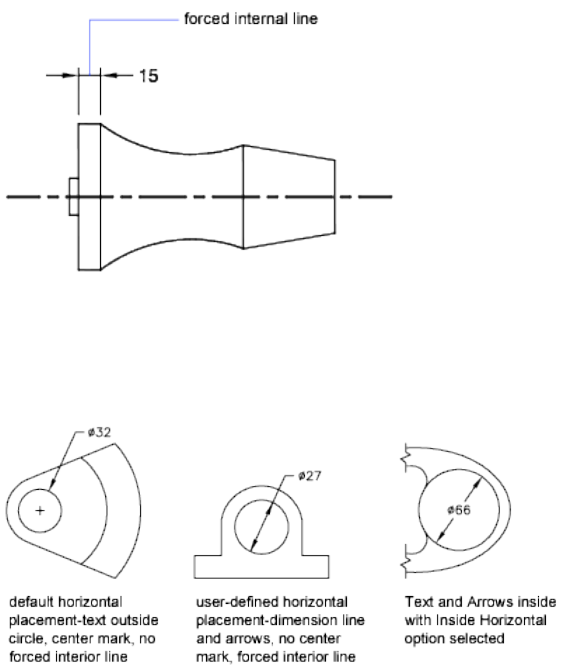
If there is no room for text between the extension lines, you can have a leader
line created automatically. This is useful in cases where text outside the
extension lines would interfere with other geometry, for example, in continued
dimensions. Whether text is drawn to the right or the left of the leader is
controlled by the horizontal justification setting on the Text tab of the
Modify/New Dimension Style dialog box. Also, you can fit text and arrowheads
by changing their size.
Even if the arrowheads are outside the extension lines, you can have a line
drawn between the extension lines. This is called forcing an internal line and
is illustrated as follows.
Fit Diameter Dimension Text
You can draw several different diameter dimensions depending on text
placement, horizontal settings on the Text tab, and whether you select the
Draw Dim Line Between Ext Lines option on the Fit tab.
1438 | Chapter 31 Dimensions and Tolerances
To place text within extension lines
1Click Home tab ➤ Annotation panel ➤ Dimension Style.
2In the Dimension Style Manager, select the style you want to change.
Click Modify.
3In the Modify Dimension Style dialog box, Fit tab, under Fit Options,
select an option.
4Click OK.
5Click Close to exit the Dimension Style Manager.
If there is enough room, text is fit between extension lines.
To force an internal line and choose a fit option
1Click Home tab ➤ Annotation panel ➤ Dimension Style.
2In the Dimension Style Manager, select the style you want to change.
Click Modify.
3In the Modify Dimension Style dialog box, Fit tab, Under Fine Tuning,
select Always Draw Dim Line Between Ext Lines.
4Under Fit Options, select an option.
5Click OK.
6Click Close to exit the Dimension Style Manager.
Quick Reference
Commands
DIMSTYLE
Creates and modifies dimension styles.
Control Dimension Text | 1439
System Variables
DIMATFIT
Determines how dimension text and arrows are arranged when space is not
sufficient to place both within the extension lines.
DIMJUST
Controls the horizontal positioning of dimension text.
DIMLWD
Assigns lineweight to dimension lines.
DIMTAD
Controls the vertical position of text in relation to the dimension line.
DIMTXTDIRECTION
Specifies the reading direction of the dimension text.
DIMTIH
Controls the position of dimension text inside the extension lines for all
dimension types except Ordinate.
DIMTIX
Draws text between extension lines.
DIMTOFL
Controls whether a dimension line is drawn between the extension lines
even when the text is placed outside.
DIMTOH
Controls the position of dimension text outside the extension lines.
DIMTVP
Controls the vertical position of dimension text above or below the dimension
line.
DIMUPT
Controls options for user-positioned text.
1440 | Chapter 31 Dimensions and Tolerances
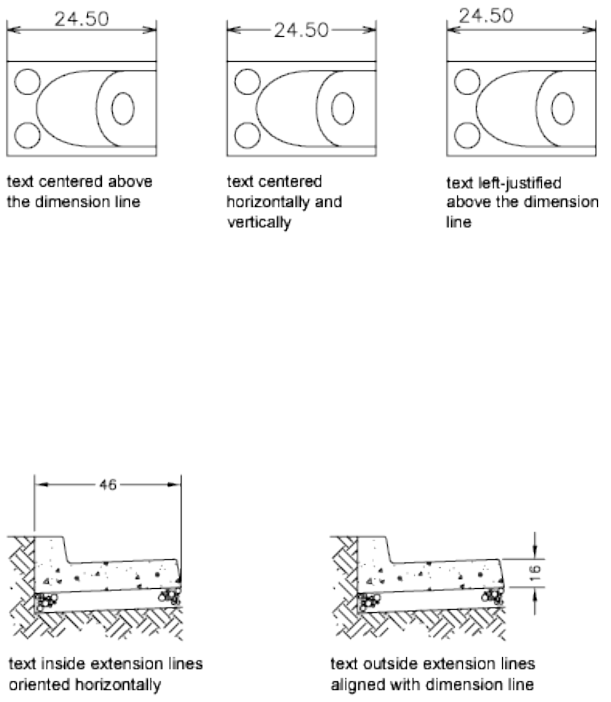
Control the Location of Dimension Text
You can locate dimension text manually and specify its alignment and
orientation.
The program comes with several justification settings that facilitate compliance
with international standards, or you can choose your own location for the
text.
Many of the settings are interdependent. Example images in the Dimension
Style Manager are updated dynamically to illustrate how text appears as you
change the settings.
Align Dimension Text
Whether text is inside or outside the extension lines, you can choose whether
it is aligned with the dimension line or remains horizontal. The following
examples show two combinations of these options.
The default alignment is horizontal dimension text, even for vertical
dimensions.
Control Dimension Text | 1441
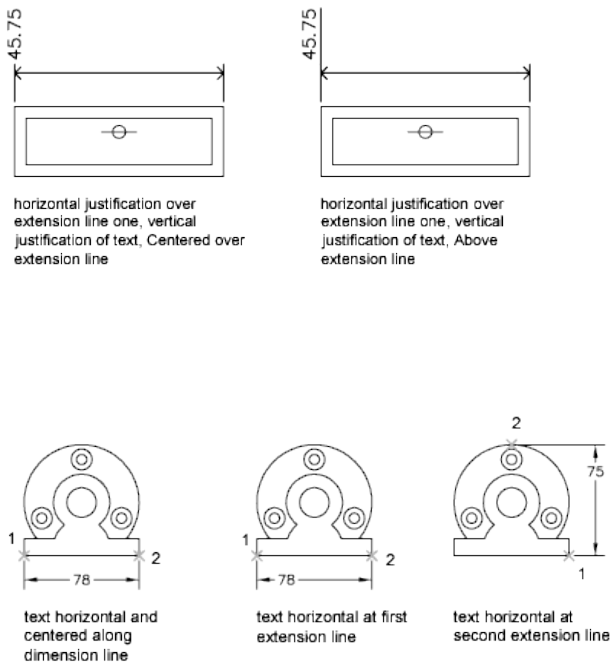
Position Dimension Text Horizontally
The position of the text along the dimension line in relation to the extension
lines is referred to as text placement. To place text yourself when you create
a dimension, use the Place Text Manually When Dimensioning option on the
Fit tab of the Modify/New Dimension Style dialog box. Use the text placement
options to automatically place text at the center of the dimension line, at
either extension line, or over either extension line.
First and second extension lines are defined by the order in which you specified
the extension line origins when you created the dimension. For angular
dimensions, the second extension line is counterclockwise from the first. In
the following illustrations, 1 is the first extension line origin and 2 the second.
If you place text manually, you can place the dimension text anywhere along
the dimension line, inside or outside the extension lines, as you create the
dimension. This option provides flexibility and is especially useful when space
is limited. However, the horizontal alignment options provide better accuracy
and consistency between dimensions.
1442 | Chapter 31 Dimensions and Tolerances
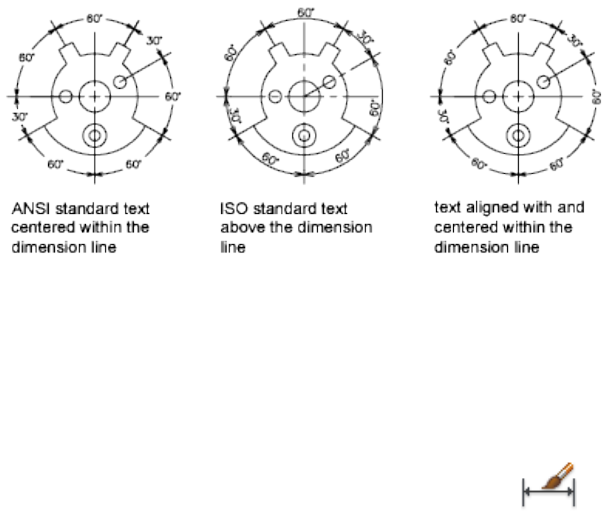
Position Dimension Text Vertically
The position of the text relative to the dimension line is referred to as vertical
text placement. Text can be placed above or below or centered within the
dimension line. In the ANSI standards, centered text usually splits the
dimension line. In the ISO standards, it is usually above or outside the
dimension line. For example, ISO standards permit angular dimension text
to appear in any of the ways shown.
Other settings, such as Text Alignment, affect the vertical alignment of text.
For example, if Horizontal Alignment is selected, text inside the extension
lines and centered within the dimension line is horizontal, as shown in the
leftmost illustration above. The text is horizontal even if the dimension line
is not itself horizontal.
To align text with the dimension line
1Click Home tab ➤ Annotation panel ➤ Dimension Style.
2In the Dimension Style Manager, select the style you want to change.
Click Modify.
3In the Modify Dimension Style dialog box, Text tab, under Text
Alignment, select Aligned with Dimension Line.
4Click OK.
5Click Close to exit the Dimension Style Manager.
Control Dimension Text | 1443

To place text at the second extension line
1Click Home tab ➤ Annotation panel ➤ Dimension Style.
2In the Dimension Style Manager, select the style you want to change.
Click Modify.
3In the Modify Dimension Style dialog box, Text tab, under Text
Placement, select Over Ext Line 2 from the Horizontal list box.
The example area reflects your selection.
4Click OK.
5Click Close to exit the Dimension Style Manager.
To place dimension text manually
1Click Home tab ➤ Annotation panel ➤ Dimension Style.
2In the Dimension Style Manager, select the style you want to change.
Click Modify.
3In the Modify Dimension Style dialog box, Fit tab, under Fine Tuning,
select Place Text Manually When Dimensioning.
4Click OK.
5Click Close to exit the Dimension Style Manager.
As you create dimensions, you can move the text along the dimension
line. Use the pointing device or enter coordinates to specify the dimension
line and text locations.
To place text above the dimension line
1Click Home tab ➤ Annotation panel ➤ Dimension Style.
2In the Dimension Style Manager, select the style you want to change.
Click Modify.
3In the Modify Dimension Style dialog box, Text tab, under Text
Placement, select Above from the Vertical list box.
The example area reflects your selection.
1444 | Chapter 31 Dimensions and Tolerances
4Click OK.
5Click Close to exit the Dimension Style Manager.
Quick Reference
Commands
DIMSTYLE
Creates and modifies dimension styles.
DIMTEDIT
Moves and rotates dimension text and relocates the dimension line.
System Variables
DIMJUST
Controls the horizontal positioning of dimension text.
DIMTAD
Controls the vertical position of text in relation to the dimension line.
DIMTXTDIRECTION
Specifies the reading direction of the dimension text.
DIMTIH
Controls the position of dimension text inside the extension lines for all
dimension types except Ordinate.
DIMTOH
Controls the position of dimension text outside the extension lines.
DIMTVP
Controls the vertical position of dimension text above or below the dimension
line.
DIMUPT
Controls options for user-positioned text.
Control Dimension Text | 1445
Control the Appearance of Dimension Text
You can include prefixes, suffixes, and user-supplied text in dimensions. You
can also control the text style and formatting used in dimension text.
The program supports a mixture of user-supplied text, prefixes and suffixes
supplied by the dimension style, and generated measurements. For example,
you could add a diameter symbol as a prefix to a measurement or add the
abbreviation for a unit, such as mm, as a suffix. Text in this context refers to
all dimension text, prefixes and suffixes, primary and alternate units, and
lateral tolerances. Geometric tolerances are controlled independently.
Dimension text is treated as a single string of text, which you create and format
using your text editor.
Control the Text Style in Dimensions
The appearance of dimension text is governed by the text style selected in the
Dimension Style Manager, Text tab. You can choose a text style while creating
a dimension style and specify a text color and a height independent of the
current text style's height setting. You can also specify the gap between base
dimension text and the box that surrounds it.
The text styles used for dimensions are the same text styles used by all text
created in your drawing.
For more information, see Work with Text Styles on page 1363.
Supply User Text to Dimensions
In addition to the prefixes and suffixes specified for primary and alternate
units, you can supply your own text as you create a dimension. Because the
prefix, suffix, and user-supplied text form a single text string, you can represent
tolerance stacks and apply changes to font, text size, and other characteristics
using the text editor.
To add user text above and below the dimension line, use the separator symbol
\X. Text that precedes this symbol is aligned with and above the dimension
line. Text that follows the \X symbol is aligned with and below the dimension
line. The space between the dimension line and the text is determined by the
value you enter under Gap in the Annotation dialog box.
Example: User Text in Dimensions
In this example, the primary dimension measurement is 5.08, and the alternate
dimension measurement is 2.00. The primary units have the suffix H7/h6, and
the alternate units have the suffix inches.
1446 | Chapter 31 Dimensions and Tolerances
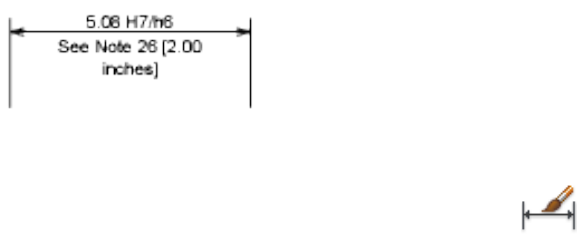
At the text prompt, while creating the dimension, you enter the following
format string:
<> H7/h6\XSee Note 26\P[ ]
The angle brackets represent the primary units, and the square brackets
represent the alternate units. The \X separates text above the dimension line
from text below the dimension line. The \P is a paragraph break.
The resulting text appears as follows:
To control the text style in dimensions
1Click Home tab ➤ Annotation panel ➤ Dimension Style.
2In the Dimension Style Manager, select the style you want to change.
Click Modify.
3In the Modify Dimension Style dialog box, Text tab, under Text
Appearance, select a text style.
4If the current text style does not have a fixed height, enter the height of
dimension text in the Text Height box.
5Under Tolerances, enter a height for tolerance values in the Scaling for
Height box.
6In the Offset from Dim Line box, enter a value for the gap around base
dimension text.
7Select a color from the Text Color box.
8Click OK
9Click Close to exit the Dimension Style Manager.
Control Dimension Text | 1447
Quick Reference
Commands
DIMSTYLE
Creates and modifies dimension styles.
System Variables
DIMCLRT
Assigns colors to dimension text.
DIMGAP
Sets the distance around the dimension text when the dimension line breaks
to accommodate dimension text.
DIMTFAC
Specifies a scale factor for the text height of fractions and tolerance values
relative to the dimension text height, as set by DIMTXT.
DIMTFILL
Controls the background of dimension text.
DIMTFILLCLR
Sets the color for the text background in dimensions.
DIMTXSTY
Specifies the text style of the dimension.
DIMTXT
Specifies the height of dimension text, unless the current text style has a
fixed height.
DIMTXTDIRECTION
Specifies the reading direction of the dimension text.
Control Dimension Values
The numeric values displayed in dimensions can appear in several formats.
You can also control how numeric distances are represented.
1448 | Chapter 31 Dimensions and Tolerances
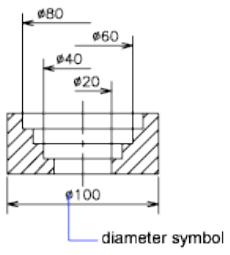
Control the Display of Dimension Units
The numeric values of dimensions can be displayed as a single measurement
or in two measurement systems. In either case, you can control details of how
the numeric values are presented.
The settings for primary units control the display of the dimension values,
including the unit format, the numeric precision, and the decimal separator
style. For example, you can enter the diameter symbol as a prefix, as shown
in the illustration. Any prefix you specify replaces the prefixes normally used
for diameter and radius dimensions (Diameter (unicode 2205 and R,
respectively).
These settings are available on the Primary Units tab of the Dimension Style
Manager.
Control the Display of Alternate Units
You can create dimensions in two systems of measurement simultaneously.
A common use of this feature is to add feet and inches dimensions to drawings
created using metric units. The alternate units appear in square brackets ([ ])
in the dimension text. Alternate units cannot be applied to angular dimensions.
If alternate-units dimensioning is on when you edit a linear dimension, the
measurement is multiplied by an alternate scale value that you specify. This
value represents the number of alternate units per current unit of measurement.
The default value for imperial units is 25.4, which is the number of millimeters
per inch. The default value for metric units is about 0.0394, which is the
number of inches per millimeter. The number of decimal places is specified
by the precision value for alternate units.
For example, for imperial units, if the alternate scale setting is the default
value, 25.4, and the alternate precision is 0.00, the dimension might look like
the following figure.
Control Dimension Values | 1449
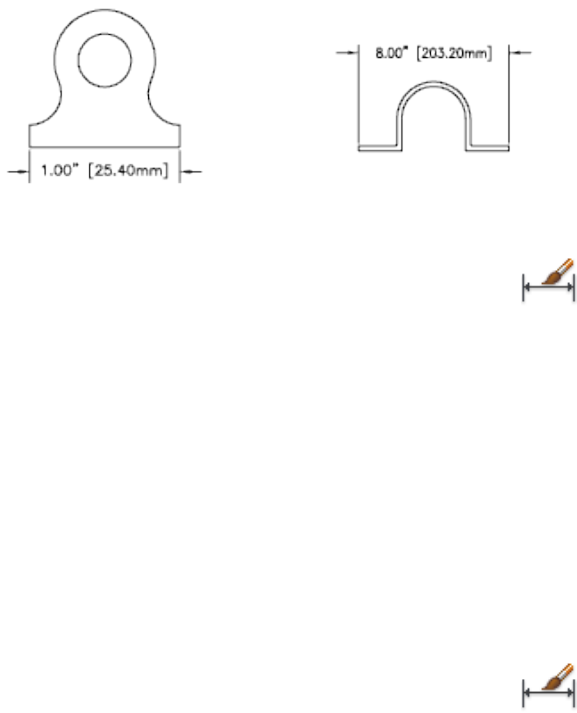
To add and format primary units
1Click Home tab ➤ Annotation panel ➤ Dimension Style.
2In the Dimension Style Manager, select the style you want to change.
Click Modify.
3In the Modify Dimension Style dialog box, Primary Units tab, under
Linear or Angular Dimensions, select a unit format and precision value
for the primary units.
4Under Linear Dimensions, enter any prefix and suffix for the displayed
dimension.
5Click OK.
6Click Close to exit the Dimension Style Manager.
To add and format alternate units
1Click Home tab ➤ Annotation panel ➤ Dimension Style.
2In the Dimension Style Manager, select the style you want to change.
Click Modify.
3In the Modify Dimension Style dialog box, Alternate Units tab, select
Display Alternate Units.
4Under Alternate Units
■Select a unit format from the list.
■Select a precision value for the alternate units.
1450 | Chapter 31 Dimensions and Tolerances
■Enter any prefix and suffix for the displayed dimension, including a
space character if you want a gap between the dimension and the
prefix or suffix.
5Click OK.
6Click Close to exit the Dimension Style Manager.
Quick Reference
Commands
DIMSTYLE
Creates and modifies dimension styles.
System Variables
DIMALT
Controls the display of alternate units in dimensions.
DIMALTD
Controls the number of decimal places in alternate units.
DIMALTF
Controls the multiplier for alternate units.
DIMALTTD
Sets the number of decimal places for the tolerance values in the alternate
units of a dimension.
DIMALTU
Sets the units format for alternate units of all dimension substyles except
Angular.
DIMALTZ
Controls the suppression of zeros for alternate unit dimension values.
DIMAPOST
Specifies a text prefix or suffix (or both) to the alternate dimension
measurement for all types of dimensions except angular.
Control Dimension Values | 1451
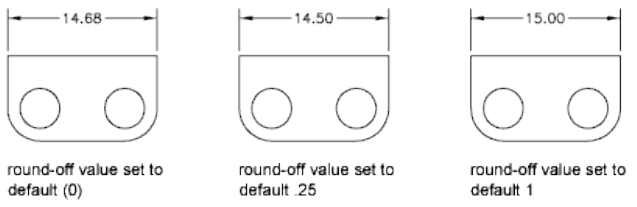
DIMAUNIT
Sets the units format for angular dimensions.
DIMDEC
Sets the number of decimal places displayed for the primary units of a
dimension.
DIMDSEP
Specifies a single-character decimal separator to use when creating dimensions
whose unit format is decimal.
DIMLFAC
Sets a scale factor for linear dimension measurements.
DIMLUNIT
Sets units for all dimension types except Angular.
DIMPOST
Specifies a text prefix or suffix (or both) to the dimension measurement.
DIMTDEC
Sets the number of decimal places to display in tolerance values for the
primary units in a dimension.
Round Off Dimension Values
You can round off the numeric values in dimensions and lateral tolerances.
You can round off all dimension values except those for angular dimensions.
For example, if you specify a round-off value of 0.25, all distances are rounded
to the nearest 0.25 unit. The number of digits displayed after the decimal
point depends on the precision set for primary and alternate units and lateral
tolerance values.
1452 | Chapter 31 Dimensions and Tolerances

To round off dimension values
1Click Home tab ➤ Annotation panel ➤ Dimension Style.
2In the Dimension Style Manager, select the style you want to change.
Click Modify.
3In Modify Dimension Style dialog box, Primary Units tab, under Linear
Dimensions, enter the round-off value.
4Click OK.
5Click Close to exit the Dimension Style Manager.
Quick Reference
Commands
DIMSTYLE
Creates and modifies dimension styles.
System Variables
DIMRND
Rounds all dimensioning distances to the specified value.
Suppress Zeros in Dimensions
You can suppress leading and trailing zeros in the numeric portion of
dimension text. You can also specify the sub unit for the dimension distance.
If you suppress leading zeros in decimal dimensions, 0.500 becomes .500. If
you suppress trailing zeros, 0.500 becomes 0.5. You can suppress both leading
and trailing zeros so that 0.5000 becomes .5 and 0.0000 becomes 0.
For dimension distances less than one unit, you can set the dimension distance
to display in sub units. If the distance is shown in m, you can set to display
distances less than one m in cm or mm.
The table shows the effect of selecting each option and provides examples of
the architectural units style. If feet are included with a fractional inch, the
Control Dimension Values | 1453
number of inches is indicated as zero, no matter which option you select.
Thus, the dimension 4'-3/4" becomes 4'-0 3/4".
Zero suppression for feet and inches
ExamplesEffectOption
1'-0
3/4"
1'-0"0'-6"0'-0 1/2"Includes zero feet and
zero inches
No options
selected
1'-0
3/4"
1'0'-6"0'-0 1/2"Suppresses zero inches
(includes zero feet)
0 Inches se-
lected
1'-0
3/4"
1'-0"6"1/2"Suppresses zero feet (in-
cludes zero inches)
0 Feet selec-
ted
1'-0
3/4"
1'6"1/2"Suppresses zero feet and
zero inches
0 Feet and 0
Inches selec-
ted
To suppress zeros in dimension values
1Click Home tab ➤ Annotation panel ➤ Dimension Style.
2In the Dimension Style Manager, select the style you want to change.
Click Modify.
3In the Modify Dimension Style dialog box, Primary Units tab or Alternate
Units tab, under Zero Suppression, select from the following:
■Sub-units factor: Suppresses leading zeros in decimal values.
■Trailing. Suppresses trailing zeros in decimal values.
■0 Feet. Suppresses display of 0 feet in feet and inches values.
■0 Inches. Suppresses display of 0 inches in feet and inches values.
4Click OK.
5Click Close to exit the Dimension Style Manager.
1454 | Chapter 31 Dimensions and Tolerances

To display dimension value in sub units
1Click Home tab ➤ Annotation panel ➤ Dimension Style.
2In the Dimension Style Manager, select the style you want to change.
Click Modify.
3In the Modify Dimension Style dialog box, Primary Units tab or Alternate
Units tab, under Zero Suppression, select Leading.
■Sub-units factor: Sets the number of sub units to a unit. It is used to
display the dimension distance in a sub unit, for distances less than
one unit. For example, enter 100 if the suffix is m and the sub-unit
suffix is to display in cm.
■Sub-units suffix: Includes a suffix to the dimension text sub unit. You
can enter text or use control codes to display special symbols. For
example, enter cm to for .96m to display as 96cm.
4Click OK.
5Click Close to exit the Dimension Style Manager.
Quick Reference
Commands
DIMSTYLE
Creates and modifies dimension styles.
System Variables
DIMALTTZ
Controls suppression of zeros in tolerance values.
DIMALTZ
Controls the suppression of zeros for alternate unit dimension values.
DIMAZIN
Suppresses zeros for angular dimensions.
DIMTZIN
Controls the suppression of zeros in tolerance values.
Control Dimension Values | 1455
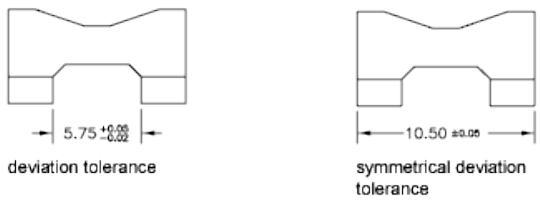
DIMZIN
Controls the suppression of zeros in the primary unit value.
Display Lateral Tolerances
Lateral tolerances are values indicating the amount a measured distance can
vary. You can control whether lateral tolerances are displayed and you can
choose from several styles of lateral tolerances.
A lateral tolerance specifies the amount by which a dimension can vary. By
specifying tolerances in manufacturing, you can control the degree of accuracy
needed for a feature. A feature is some aspect of a part, such as a point, line,
axis, or surface.
You can apply tolerances directly to a dimension by appending the tolerances
to the dimension text. These dimension tolerances indicate the largest and
smallest permissible size of the dimension. You can also apply geometric
tolerances, which indicate deviations of form, profile, orientation, location,
and runout.
Lateral tolerances can be specified from theoretically exact measurements.
These are called basic dimensions and have a box drawn around them.
If the dimension value can vary in both directions, the plus and minus values
you supply are appended to the dimension value as deviation tolerances. If
the deviation tolerance values are equal, they are displayed with a sign and
they are known as symmetrical. Otherwise, the plus value goes above the
minus value.
If the tolerances are applied as limits, the program uses the plus and minus
values you supply to calculate a maximum and minimum value. These values
replace the dimension value. If you specify limits, the upper limit goes above
the lower.
1456 | Chapter 31 Dimensions and Tolerances
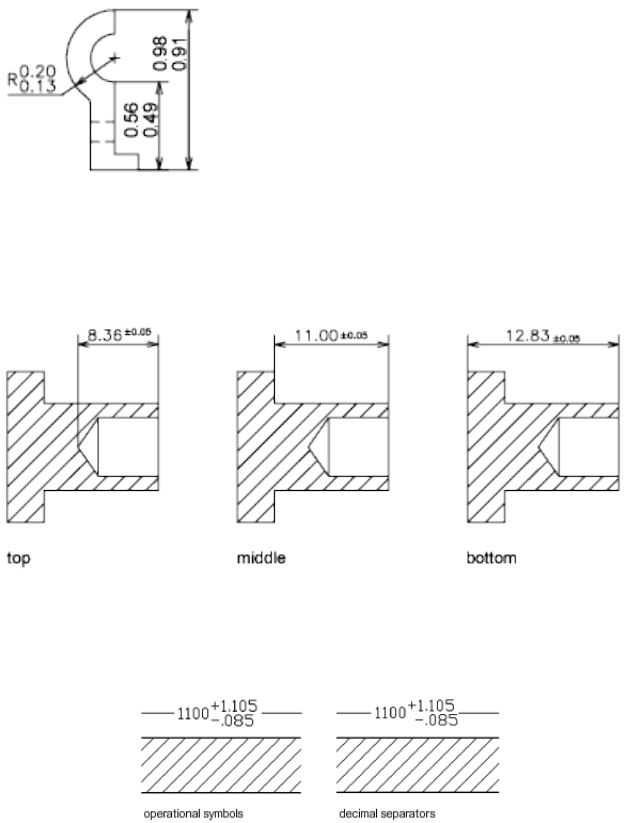
Format Lateral Tolerances
You can control the vertical placement of tolerance values relative to the main
dimension text. Tolerances can align with the top, middle, or bottom of the
dimension text.
Along with vertical placement of tolerance values, you can also control the
horizontal alignment of the upper and lower tolerance values.The upper and
lower tolerance values can be aligned using either the operational symbols or
decimal separators.
You can also control zero suppression as you can with the primary and
alternate units. Suppressing zeros in lateral tolerances has the same effect as
suppressing them in the primary and alternate units. If you suppress leading
zeros, 0.5 becomes .5, and if you suppress trailing zeros, 0.5000 becomes 0.5.
Control Dimension Values | 1457

See also:
■Add Geometric Tolerances on page 1513
To specify methods for lateral tolerances
1Click Home tab ➤ Annotation panel ➤ Dimension Style.
2In the Dimension Style Manager, select the style you want to change.
Click Modify.
3In the Modify Dimension Style dialog box, Tolerances tab, under
Tolerance Format, select a method from the Method list, and then do
one of the following:
■If you select Limits, enter upper and lower tolerance deviation in the
Upper Value and Lower Value boxes.
■If you select Symmetrical tolerances, Lower Value is not available,
because you need only one tolerance value.
■If you select Basic, enter a value in Offset from Dim Line (on the Text
tab) to represent the gap between the text and its enclosing box.
4Click OK.
5Click Close to exit the Dimension Style Manager.
To align and suppress zeros in tolerance values
1Click Home tab ➤ Annotation panel ➤ Dimension Style.
2In the Dimension Style Manager, select the style you want to change.
Click Modify.
3In the Modify Dimension Style dialog box, Tolerances tab, under
Tolerance Format, select the alignment from the Vertical Position list.
4To suppress zeros in primary or alternate units, under Zero Suppression,
select Leading to suppress leading zeros. Select Trailing to suppress trailing
zeros.
5Click OK.
6Click Close to exit the Dimension Style Manager.
1458 | Chapter 31 Dimensions and Tolerances
Quick Reference
Commands
DIMSTYLE
Creates and modifies dimension styles.
System Variables
DIMALTTD
Sets the number of decimal places for the tolerance values in the alternate
units of a dimension.
DIMALTTZ
Controls suppression of zeros in tolerance values.
DIMGAP
Sets the distance around the dimension text when the dimension line breaks
to accommodate dimension text.
DIMLIM
Generates dimension limits as the default text.
DIMTDEC
Sets the number of decimal places to display in tolerance values for the
primary units in a dimension.
DIMTFAC
Specifies a scale factor for the text height of fractions and tolerance values
relative to the dimension text height, as set by DIMTXT.
DIMTM
Sets the minimum (or lower) tolerance limit for dimension text when
DIMTOL or DIMLIM is on.
DIMTOL
Appends tolerances to dimension text.
DIMTP
Sets the maximum (or upper) tolerance limit for dimension text when
DIMTOL or DIMLIM is on.
Control Dimension Values | 1459
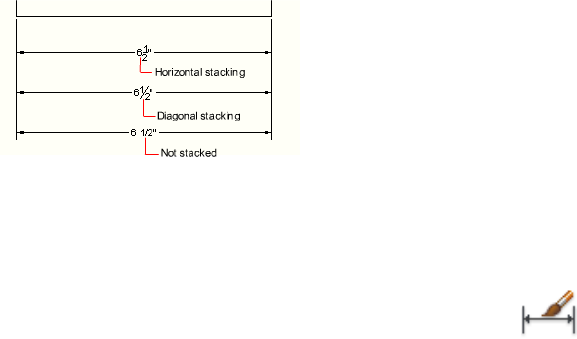
DIMTZIN
Controls the suppression of zeros in tolerance values.
Control the Display of Fractions
You can control the format of the fraction displayed in dimensions.
You can set the fraction format in dimensions using the DIMFRAC system
variable when the DIMLUNIT system variable is set to 4 (architecture) or 5
(fractional).
The following illustration shows the different fraction formats available.
These settings are available on the Primary Units tab of the Dimension Style
Manager.
To specify the fraction format
1Click Home tab ➤ Annotation panel ➤ Dimension Style.
2In the Dimension Style Manager, select the style you want to change.
Click Modify.
3In the Modify Dimension Style dialog box, Primary Units tab, under
Linear dimensions, select one of the following from Fraction format:
■Horizontal
■Diagonal
■Not Stacked
4Click OK.
5Click Close to exit the Dimension Style Manager.
1460 | Chapter 31 Dimensions and Tolerances

Quick Reference
Commands
DIMSTYLE
Creates and modifies dimension styles.
System Variables
DIMFRAC
Sets the fraction format when DIMLUNIT is set to 4 (Architectural) or 5
(Fractional).
DIMLUNIT
Sets units for all dimension types except Angular.
Set the Scale for Dimensions
You can specify the size of dimensions in your drawing. How you set dimension
size depends on the method you use to lay out and plot drawings.
Dimension scale affects the size of the dimension geometry relative to the
objects in the drawing. Dimension scale affects sizes, such as text height and
arrowhead size, and offsets, such as the extension line origin offset. You should
set these sizes and offsets to values that represent their actual plotted size.
Dimension scale does not apply the overall scale factor to tolerances or
measured lengths, coordinates, or angles.
NOTE You can use annotative scaling to control the overall scale of dimensions
displayed in layout viewports. When you create annotative dimensions, they are
scaled based on the current annotation scale setting and automatically displayed
at the correct size.
Setting dimension scale depends on how you lay out your drawing. There are
three methods used to create dimensions in a drawing layout:
■Dimension in model space for plotting in model space. This is the
traditional method used with single-view drawings. To create dimensions
that are scaled correctly for plotting, set the DIMSCALE system variable to
the inverse of the intended plot scale. For example, if the plot scale is 1/4,
set DIMSCALE to 4.
Set the Scale for Dimensions | 1461
■Dimension in model space for plotting in paper space. This was the
preferred method for complex, multiple-view drawings prior to AutoCAD
2002. Use this method when the dimensions in a drawing need to be
referenced by other drawings (xrefs) or when creating isometric dimensions
in 3D isometric views. To prevent the dimensions in one layout viewport
from being displayed in other layout viewports, create a dimensioning
layer for each layout viewport that is frozen in all other layout viewports.
To create dimensions that are scaled automatically for display in a paper
space layout, set the DIMSCALE system variable to 0.
■Dimension in layouts. This is the simplest dimensioning method.
Dimensions are created in paper space by selecting model space objects or
by specifying object snap locations on model space objects. By default,
associativity between paper space dimensions and model space objects is
maintained. No additional scaling is required for dimensions created in a
paper space layout: DIMLFAC and DIMSCALE do not need to be changed
from their default value of 1.0000.
NOTE When you dimension model space objects in paper space using associative
dimensions, dimension values for the display scale of each viewport are
automatically adjusted. This adjustment is combined with the current setting for
DIMLFAC and is reported by the LIST command as a dimension style override. For
nonassociative dimensions, you must set DIMLFAC manually.
See also:
■Draw, Scale, and Annotate in Model Space on page 385
■Scale Views in Layout Viewports on page 410
■Scale Annotations on page 1224
To set the overall dimension scale
1Click Home tab ➤ Annotation panel ➤ Dimension Style.
2In the Dimension Style Manager, select the style you want to change.
Click Modify.
3In Modify Dimension Style dialog box, Fit tab, under Scale for Dimension
Features, enter a value for the overall scale.
4Click OK.
1462 | Chapter 31 Dimensions and Tolerances

5Click Close to exit the Dimension Style Manager.
To set the dimension scale for model space dimensions in layouts
1Click Home tab ➤ Annotation panel ➤ Dimension Style.
2In the Dimension Style Manager, select the style you want to change.
Click Modify.
3In Modify Dimension Style dialog box, Fit tab, under Scale for Dimension
Features, select Scale Dimension to Layout (Paper space).
4Click OK.
5Click Close to exit the Dimension Style Manager.
To set dimension scale for creating dimensions in a layout
1Click a layout tab to switch to paper space.
2To create dimensions in paper space with the correct model space
dimension values, use object snap modes to snap to points in model
space from paper space or select the objects directly.
The DIMLFAC system variable can be changed if you need to convert the
linear dimension values between the imperial and metric measurement
systems.
Quick Reference
Commands
DIMREGEN
Updates the locations of all associative dimensions.
DIMSTYLE
Creates and modifies dimension styles.
System Variables
DIMASSOC
Controls the associativity of dimension objects and whether dimensions are
exploded.
Set the Scale for Dimensions | 1463
DIMLFAC
Sets a scale factor for linear dimension measurements.
DIMSCALE
Sets the overall scale factor applied to dimensioning variables that specify
sizes, distances, or offsets.
Create Dimensions
You can create all of the standard types of dimensions.
Create Linear Dimensions
You can create linear dimensions with horizontal, vertical, and aligned
dimension lines. These linear dimensions can also be stacked, or they can be
created end to end.
Overview of Creating Linear Dimensions
Linear dimensions can be horizontal, vertical, or aligned. With aligned
dimensions, the dimension line is parallel to the line (imaginary or real)
between the extension line origins. Baseline (or parallel) and continued (or
chain) dimensions are series of consecutive dimensions that are based on a
linear dimension.
In all four illustrations, the extension line origins are designated explicitly at
1 and 2, respectively. The dimension line location is specified at 3.
1464 | Chapter 31 Dimensions and Tolerances
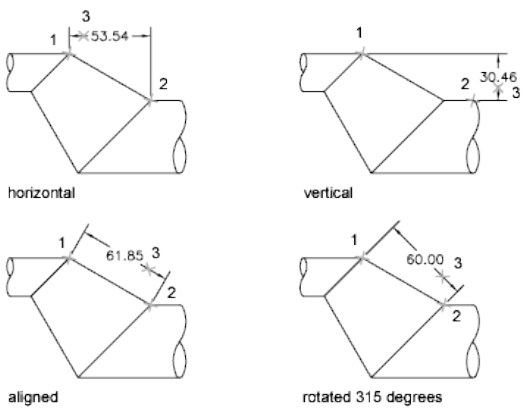
As you create linear dimensions, you can modify the content of the text, the
angle of the text, or the angle of the dimension line.
Quick Reference
Commands
DIMALIGNED
Creates an aligned linear dimension.
DIMBASELINE
Creates a linear, angular, or ordinate dimension from the baseline of the
previous or selected dimension.
DIMCONTINUE
Creates a dimension that starts from an extension line of a previously created
dimension.
DIMEDIT
Edits dimension text and extension lines.
DIMLINEAR
Creates a linear dimension.
Create Linear Dimensions | 1465
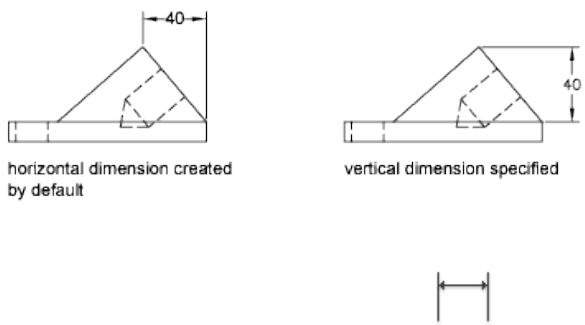
DIMSTYLE
Creates and modifies dimension styles.
QDIM
Creates a series of dimensions quickly from selected objects.
System Variables
DIMDLI
Controls the spacing of the dimension lines in baseline dimensions.
Create Horizontal and Vertical Dimensions
You can create dimensions using only the horizontal or vertical components
of the locations or objects that you specify.
The program automatically applies a horizontal or vertical dimension according
to the extension line origins that you specify or the location where you select
an object; however, you can override this as you create the dimension by
specifying that a dimension be horizontal or vertical. For example, in the
following illustration, a horizontal dimension is drawn by default unless you
specify a vertical one.
To create a horizontal or vertical dimension
1Click Home tab ➤ Annotation panel ➤ Linear.
2Press Enter to select the object to dimension, or specify the first and
second extension line origins.
1466 | Chapter 31 Dimensions and Tolerances
3Before specifying the dimension line location, you can override the
dimension direction and edit the text, the text angle, or the dimension
line angle:
■To rotate the extension lines, enter r (Rotated). Then enter the
dimension line angle.
■To edit the text, enter m (multiline text). In the In-place Text Editor,
revise the text. Click OK.
Editing within or overwriting the brackets (<>) changes or removes
the dimension value calculated by the program. Adding text before
or after the brackets appends text before or after the dimension value.
■To rotate the text, enter a (Angle). Then enter the text angle.
4Specify the dimension line location.
Quick Reference
Commands
DIMLINEAR
Creates a linear dimension.
System Variables
DIMEXO
Specifies how far extension lines are offset from origin points.
Create Aligned Dimensions
You can create dimensions that are parallel to the locations or objects that
you specify.
In aligned dimensions, the dimension line is parallel to the extension line
origins. The illustration shows two examples of aligned dimensioning. The
object is selected (1), and the location of the aligned dimension is specified
(2). The extension lines are drawn automatically.
Create Linear Dimensions | 1467

To create an aligned dimension
1Click Home tab ➤ Annotation panel ➤ Aligned.
2Press Enter to select the object to dimension, or specify the first and
second extension line origins.
3Before specifying the dimension line location, you can edit the text or
change the text angle. Editing within or overwriting the brackets (<>)
changes or removes the dimension value calculated by the program.
Adding text before or after the brackets appends text before or after the
dimension value.
■To edit the text using multiline text, enter m (multiline text). In the
In-place Text Editor, revise the text. Click OK.
■To edit the text using single-line text, enter t (Text). Revise the text
at the Command prompt and press Enter.
■To rotate the text, enter a (Angle). Then enter the text angle.
4Specify the dimension line location.
Quick Reference
Commands
DIMALIGNED
Creates an aligned linear dimension.
DIMSTYLE
Creates and modifies dimension styles.
1468 | Chapter 31 Dimensions and Tolerances
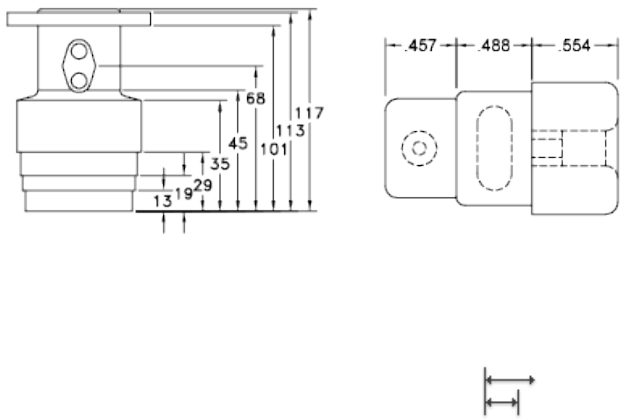
System Variables
DIMEXO
Specifies how far extension lines are offset from origin points.
Create Baseline and Continued Dimensions
Baseline dimensions are multiple dimensions measured from the same baseline.
Continued dimensions are multiple dimensions placed end to end.
You must create a linear, aligned, or angular dimension before you create
baseline or continued dimensions. You create baseline dimensions
incrementally from the most recently created dimension in the current session.
Both baseline and continued dimensions are measured from the previous
extension line unless you specify another point as the point of origin.
To create a baseline linear dimension
1Click Annotate tab ➤ Dimensions panel ➤ Baseline.
By default, the origin of the last linear dimension created is used as the
first extension line for the new baseline dimension. You are prompted
for the second dimension line.
2Use an object snap to select the second extension line origin, or press
Enter to select any dimension as the base dimension.
The program automatically places the second dimension line at the
distance specified by the Baseline Spacing option in the Dimension Style
Manager, Lines tab.
3Use an object snap to specify the next extension line origin.
Create Linear Dimensions | 1469

4Continue to select extension line origins as required.
5Press Enter twice to end the command.
To create a continued linear dimension
1Click Annotate tab ➤ Dimensions panel ➤ Continue.
The program uses the origin of the second extension line of the existing
dimension as the first extension line origin.
2Use object snaps to specify additional extension line origins.
3Press Enter twice to end the command.
Quick Reference
Commands
DIMBASELINE
Creates a linear, angular, or ordinate dimension from the baseline of the
previous or selected dimension.
DIMCONTINUE
Creates a dimension that starts from an extension line of a previously created
dimension.
DIMSTYLE
Creates and modifies dimension styles.
System Variables
DIMDLI
Controls the spacing of the dimension lines in baseline dimensions.
Create Rotated Dimensions
In rotated dimensions, the dimension line is placed at an angle to the extension
line origins.
The illustration shows an example of a rotated dimension. In the example,
the angle specified for dimension rotation is equal to the angle of the slot.
1470 | Chapter 31 Dimensions and Tolerances
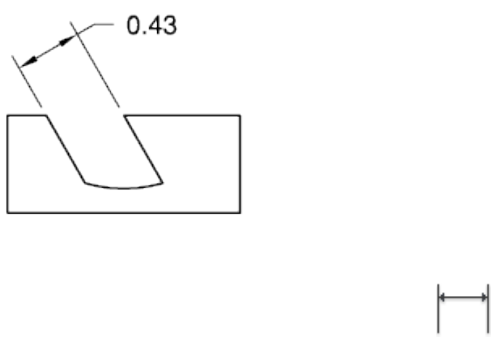
To create a rotated dimension
1Click Home tab ➤ Annotation panel ➤ Linear.
2Press Enter to select the object to dimension or specify the first and second
extension line origins.
3To rotate the dimension line, enter r (Rotated). Then enter the dimension
line angle.
4Specify the dimension line location.
Quick Reference
Commands
DIMALIGNED
Creates an aligned linear dimension.
DIMLINEAR
Creates a linear dimension.
Create Dimensions with Oblique Extension Lines
You can create dimensions with extension lines that are not perpendicular to
their dimension lines.
Extension lines are created perpendicular to the dimension line. However, if
the extension lines conflict with other objects in a drawing, you can change
their angle after the dimension has been drawn.
Create Linear Dimensions | 1471
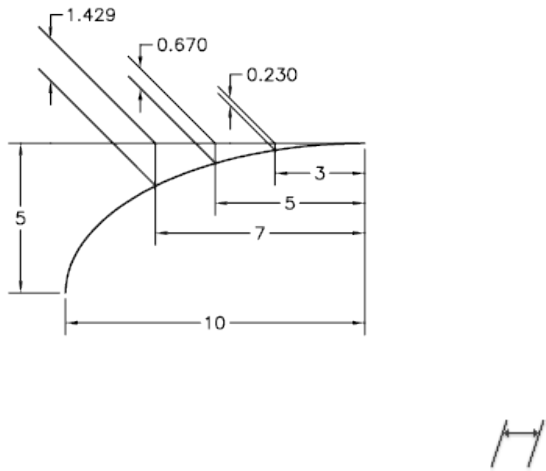
New dimensions are not affected when you make an existing dimension
oblique.
To make extension lines oblique
1Click Annotate tab ➤ Dimensions panel ➤ Oblique..
2Select the dimension.
3Enter a value for the angle of obliqueness, or specify two points.
Quick Reference
Commands
DIMEDIT
Edits dimension text and extension lines.
Create Radial Dimensions
Radial dimensions measure the radii and diameters of arcs and circles with
optional centerlines or a center mark.
1472 | Chapter 31 Dimensions and Tolerances
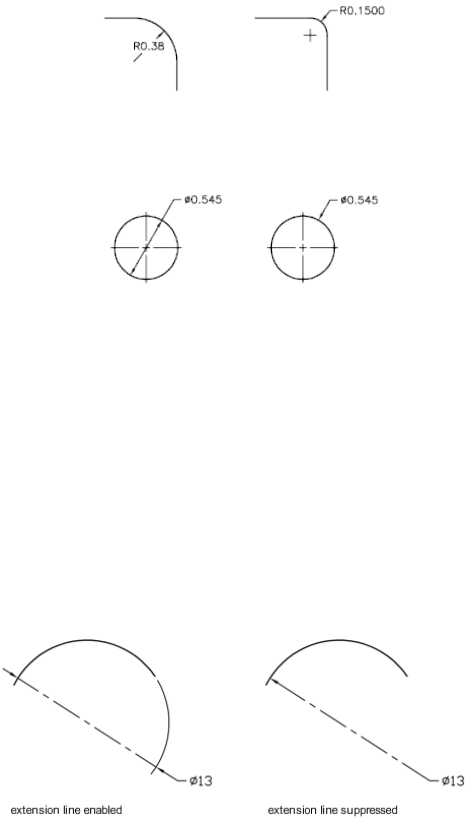
There are two types of radial dimensions:
■DIMRADIUS measures the radius of an arc or circle, and displays the
dimension text with the letter R in front of it.
■DIMDIAMETER measures the diameter of an arc or circle, and displays the
dimension text with the diameter symbol in front of it.
For horizontal dimension text, if the angle of the radial dimension line is
greater than 15 degrees from horizontal, a hook line, also called a dogleg or
landing, one arrowhead long, is created next to the dimension text.
Control Extension Lines
When an arc is dimensioned, the radial or diametric dimension does not have
to be positioned along the arc directly. If a dimension is positioned past the
end of an arc, either an extension line will be drawn that follows the path of
the arc being dimensioned or no extension line will be drawn. When the
extension line is suppressed (off), the dimension line of the radial or diametric
dimension is drawn through the center point of the arc instead of to the
extension line.
The DIMSE1 system variable controls whether or not a radial or diametric
dimension will be drawn with an extension line when it is positioned off the
end of an arc. When the display of the arc extension line is not suppressed,
Create Radial Dimensions | 1473
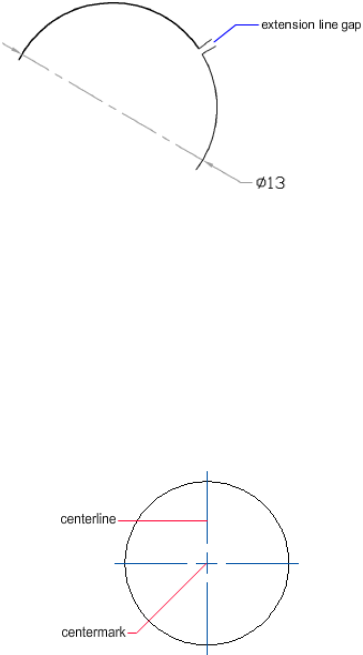
a gap between the arc and arc extension line is made. The size of the gap
drawn is controlled with the DIMEXO system variable.
Control Centerlines and Center Marks
Depending on your dimension style settings, center marks and lines generate
automatically for diameter and radius dimensions. They are created only if
the dimension line is placed outside the circle or arc. You can create centerlines
and center marks directly with the DIMCENTER command.
You can control the size and visibility of centerlines and center marks on the
Modify Dimension Style dialog box, Symbols and Arrows tab, under Center
Marks. You can also access this setting with the DIMCEN system variable.
The size of the centerline is the length of the centerline segment that extends
outside the circle or arc. It is also the size of the gap between the center mark
and the start of the centerline. The size of the center mark is the distance from
the center of the circle or arc to the end of the center mark.
1474 | Chapter 31 Dimensions and Tolerances
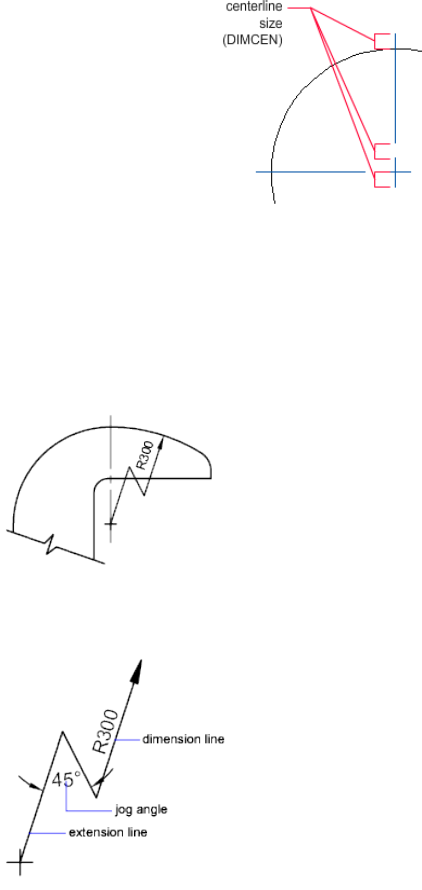
Create Jogged Radius Dimensions
With the DIMJOGGED command, you can create jogged radius dimensions,
also called “foreshortened radius dimensions,” when the center of an arc or
circle is located off the layout and cannot be displayed in its true location.
The origin point of the dimension can be specified at a more convenient
location called the center location override.
You can control the default angle of the jog in the Modify Dimension Style
dialog box, Symbols and Arrows tab, under Radius Dimension Jog.
Once a jogged radius dimension is created, you can modify the jog and the
center location override by
■Using grips to move the features
Create Radial Dimensions | 1475
■Changing the locations of the features with the Properties palette
■Using STRETCH
NOTE Jogged radius dimensions can be viewed but not edited in versions previous
to AutoCAD 2006. Also, if you make dramatic changes to the associated geometry,
you may get unpredictable results for the jogged radius dimension.
See also:
■Fit Dimension Text Within Extension Lines on page 1437
To create a diameter dimension
1Click Home tab ➤ Annotation panel ➤ Diameter.
2Select the arc or circle to dimension.
3Enter options as needed:
■To edit the dimension text content, enter t (Text) or m (multiline
text). Editing within or overwriting the brackets (<>) changes or
removes the dimension value. Adding text before or after the brackets
appends text before or after the dimension value.
■To change the dimension text angle, enter a (Angle).
4Specify the leader line location.
To create a radius dimension
1Click Home tab ➤ Annotation panel ➤ Radius.
2Select an arc, circle, or polyline arc segment.
3Enter options as needed:
■To edit the dimension text content, enter t (Text) or m (multiline
text). Editing within or overwriting the brackets (<>) changes or
removes the dimension value. Adding text before or after the brackets
appends text before or after the dimension value.
■To edit the dimension text angle, enter a (Angle).
1476 | Chapter 31 Dimensions and Tolerances
4Specify the leader line location.
To create a jogged radius dimension
1Click Dimension menu ➤ Jogged.
2Select an arc, circle, or polyline arc segment.
3Specify a point for the dimension origin (the center location override).
4Specify a point for the dimension line angle and the dimension text
location.
5Specify another point for the location of the dimension jog.
To create centerlines automatically with radial dimensions
1Click Home tab ➤ Annotation panel ➤ Dimension Style.
2In the Dimension Style Manager, select the style you want to change.
Click Modify.
3In the Modify Dimension Style dialog box, Symbols and Arrows tab,
under Center Marks, click Line.
4In the Size box, enter the length of the centerline overshoot. Click OK.
5Click Close to exit the Dimension Style Manager.
The example area in the dialog box displays the results of your changes.
To create centerlines or center marks on an arc or circle
1Click Home tab ➤ Annotation panel ➤ Dimension Style.
2In the Dimension Style Manager, select the style you want to change.
Click Modify.
3In the Modify Dimension Style dialog box, Symbols and Arrows tab,
under Center Marks, click Line.
4In the Size box, enter the length of the centerline overshoot. Click OK.
Create Radial Dimensions | 1477

5Click Close to exit the Dimension Style Manager.
6Click Annotate tab ➤ Dimensions panel ➤ Center Mark.
7Select an arc or a circle.
To change the display arc extension line for radial or diametric dimensions
1Select the radial or diametric dimension for which you want to suppress
the arc extension line.
2Right-click in the drawing. Click Properties.
3In the Properties palette, Lines & Arrows category, click Ext Line.
4Click the arrow next to Ext Line, and select On or Off from the list.
■Select On to display the arc extension line.
■Select Off to suppress the display of the arc extension line.
5Press Esc to deselect the selected dimension.
Quick Reference
Commands
DIMCENTER
Creates the center mark or the centerlines of circles and arcs.
DIMDIAMETER
Creates a diameter dimension for a circle or an arc.
DIMJOGGED
Creates jogged dimensions for circles and arcs.
DIMRADIUS
Creates a radius dimension for a circle or an arc.
DIMSTYLE
Stores the name of the current dimension style.
1478 | Chapter 31 Dimensions and Tolerances
QDIM
Creates a series of dimensions quickly from selected objects.
System Variables
DIMATFIT
Determines how dimension text and arrows are arranged when space is not
sufficient to place both within the extension lines.
DIMCEN
Controls drawing of circle or arc center marks and centerlines by the
DIMCENTER, DIMDIAMETER, and DIMRADIUS commands.
DIMEXO
Specifies how far extension lines are offset from origin points.
DIMJOGANG
Determines the angle of the transverse segment of the dimension line in a
jogged radius dimension.
DIMJUST
Controls the horizontal positioning of dimension text.
DIMSE1
Suppresses display of the first extension line.
DIMTAD
Controls the vertical position of text in relation to the dimension line.
DIMTXTDIRECTION
Specifies the reading direction of the dimension text.
DIMTIH
Controls the position of dimension text inside the extension lines for all
dimension types except Ordinate.
DIMTMOVE
Sets dimension text movement rules.
DIMTOFL
Controls whether a dimension line is drawn between the extension lines
even when the text is placed outside.
Create Radial Dimensions | 1479

DIMTOH
Controls the position of dimension text outside the extension lines.
DIMUPT
Controls options for user-positioned text.
Create Angular Dimensions
Angular dimensions measure the angle between two lines or three points.
To measure the angle between two radii of a circle, you select the circle and
specify the angle endpoints. With other objects, you select the objects and
then specify the dimension location. You can also dimension an angle by
specifying the angle vertex and endpoints. As you create the dimension, you
can modify the text content and alignment before specifying the dimension
line location.
NOTE You can create baseline and continued angular dimensions relative to
existing angular dimensions. Baseline and continued angular dimensions are limited
to 180 degrees or less. To obtain baseline and continued angular dimensions larger
than 180 degrees, use grip editing to stretch the location of the extension line of
an existing baseline or continued dimension.
Dimension Lines
If you use two straight, nonparallel lines to specify an angle, the dimension
line arc spans the angle between the two lines. If the dimension line arc does
not meet one or both of the lines being dimensioned, The program draws one
or two extension lines to intersect the dimension line arc. The arc is always
less than 180 degrees.
Dimension Circles and Arcs
If you use an arc or a circle or three points to specify an angle, the program
draws the dimension line arc between the extension lines. The extension lines
are drawn from the angle endpoints to the intersection of the dimension line
arc.
1480 | Chapter 31 Dimensions and Tolerances
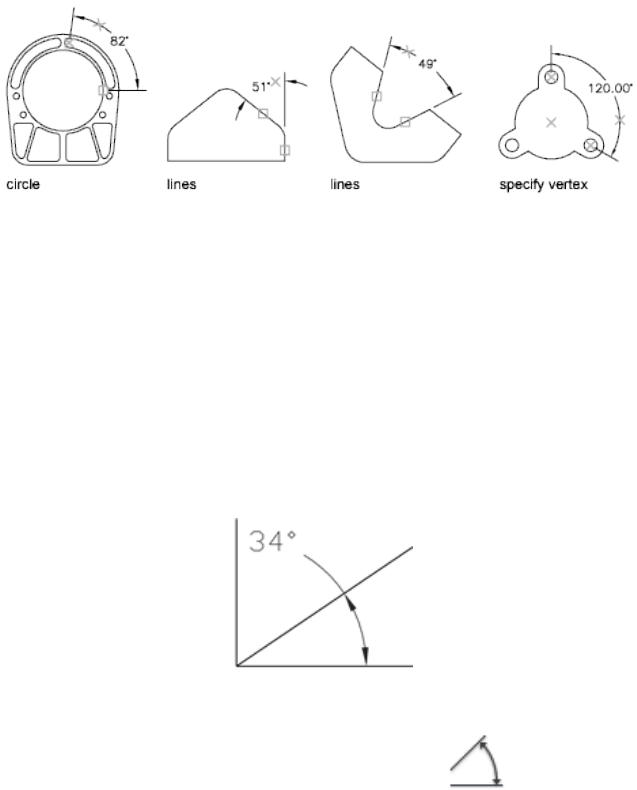
The location that you specify for the dimension line arc determines the
quadrant of the dimensioned angle.
Dimension to a Quadrant
Angular dimensions can measure a specific quadrant that is formed when
dimensioning the angle between of the endpoints of a line or arc, center point
of a circle, or two vertices. As an angular dimension is being created, there are
four possible angles that can be measured. By specifying a quadrant it allows
you to ensure that the correct angle is dimensioned. When placing an angular
dimension after a quadrant has been specified, you can place the dimension
text outside of the extension lines of the dimension. The dimension line is
automatically extended.
To create an angular dimension
1Click Home tab ➤ Annotation panel ➤ Angular.
2Use one of the following methods:
■To dimension a circle, select the circle at the first endpoint of the
angle and then specify the second endpoint of the angle.
■To dimension any other object, select the first line, and then select
the second line.
Create Angular Dimensions | 1481
3Enter options as needed:
■To edit the dimension text content, enter t (Text) or m (multiline
text). Editing within or overwriting the brackets (<>) changes or
removes the calculated dimension value. Adding text before or after
the brackets appends text before or after the dimension value.
■To edit the dimension text angle, enter a (Angle).
■To confine the dimension to a quadrant, enter q (Quadrant) and
specify the quadrant to measure.
4Specify the dimension line arc location.
Quick Reference
Commands
DIMANGULAR
Creates an angular dimension.
DIMBASELINE
Creates a linear, angular, or ordinate dimension from the baseline of the
previous or selected dimension.
DIMCONTINUE
Creates a dimension that starts from an extension line of a previously created
dimension.
System Variables
DIMADEC
Controls the number of precision places displayed in angular dimensions.
DIMAUNIT
Sets the units format for angular dimensions.
DIMDEC
Sets the number of decimal places displayed for the primary units of a
dimension.
1482 | Chapter 31 Dimensions and Tolerances
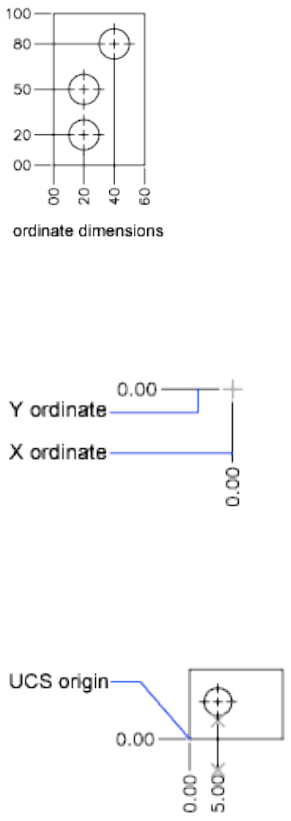
Create Ordinate Dimensions
Ordinate dimensions measure the perpendicular distance from an origin point
called the datum to a feature, such as a hole in a part. These dimensions prevent
escalating errors by maintaining accurate offsets of the features from the
datum.
Ordinate dimensions consist of an X or Y value with a leader line. X-datum
ordinate dimensions measure the distance of a feature from the datum along
the X axis. Y-datum ordinate dimensions measure the distance along the Y
axis.
Locate the Datum
The location and orientation of the current UCS determines the ordinate
values. Before creating ordinate dimensions, you typically set the UCS origin
to coincide with the datum.
Create Ordinate Dimensions | 1483
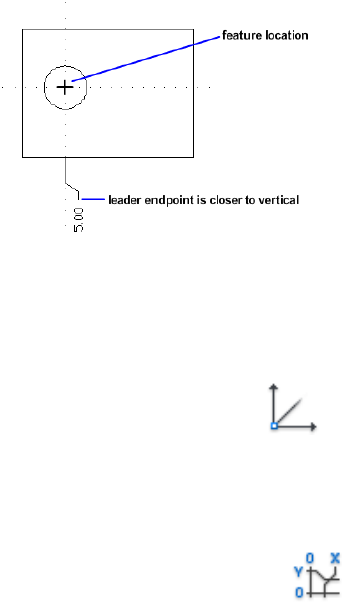
Locate the Leader
After you specify the feature location, you are prompted for the leader
endpoint. By default, the leader endpoint that you specify automatically
determines whether an X- or a Y-datum ordinate dimension is created. For
example, you can create an X-datum ordinate dimension by specifying a
location for the leader endpoint that is closer to vertical than horizontal.
After creating an ordinate dimension, you can easily relocate the dimension
leader and text using grip editing. The dimension text is always aligned with
the ordinate leader line.
To create ordinate dimensions
1Click View tab ➤ Coordinates panel ➤ Origin.
2At the Specify New Origin Point prompt, specify an origin point.
The origin point specified is used to define the value assigned to the
ordinate dimension. Typically, the origin point is defined on the model.
3Click Home tab ➤ Annotation panel ➤ Ordinate.
4If straight ordinate leaders are required, turn Ortho mode on.
5At the Select Feature Location prompt, specify a point location.
6Enter x (X Datum) or y (Y Datum).
You can skip this step by making sure that the ordinate leader endpoint
is close to vertical for an X datum or close to horizontal for a Y datum.
7Specify the ordinate leader endpoint.
1484 | Chapter 31 Dimensions and Tolerances
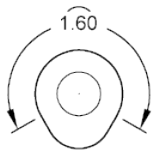
Quick Reference
Commands
DIMORDINATE
Creates ordinate dimensions.
QDIM
Creates a series of dimensions quickly from selected objects.
UCS
Manages user coordinate systems.
Create Arc Length Dimensions
Arc length dimensions measure the distance along an arc or polyline arc
segment.
Typical uses of arc length dimensions include measuring the travel distance
around a cam or indicating the length of a cable. To differentiate them from
linear or angular dimensions, arc length dimensions display an arc symbol
by default.
The arc symbol, also called a hat or cap, is displayed either above the dimension
text or preceding the dimension text. You can specify the placement style
using the Dimension Style Manager. The placement style can be changed on
the Symbols and Arrows tab of either the New Dimension Style dialog box or
the Modify Dimension Style dialog box.
The extension lines of an arc length dimension can be orthogonal or radial.
Create Arc Length Dimensions | 1485
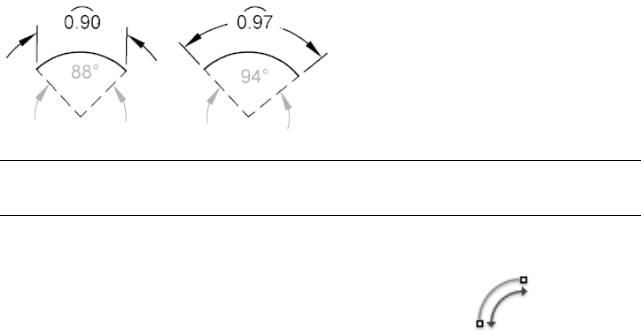
NOTE Orthogonal extension lines are displayed only when the included angle of
the arc is less than 90 degrees.
To create an arc length dimension
1Click Home tab ➤ Annotation panel ➤ Arc Length.
2Select an arc or polyline arc segment.
3Specify the dimension line location.
Quick Reference
Commands
DIMARC
Creates an arc length dimension.
DIMSTYLE
Creates and modifies dimension styles.
PROPERTIES
Controls properties of existing objects.
System Variables
DIMARCSYM
Controls display of the arc symbol in an arc length dimension.
Modify Existing Dimensions
You can modify all components of the existing dimension objects in a drawing
either individually or by using dimension styles.
1486 | Chapter 31 Dimensions and Tolerances
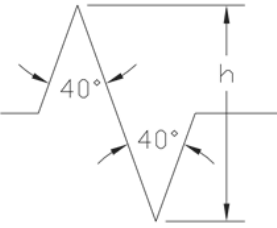
Modify A Dimension
Dimensions can be modified to include more information than just the values
of the dimension. Dimensions can also be modified visually by using breaks
and by adjusting the spacing between them.
Overview of Modifying Demensions
After you place a dimension, there are times when you need to modify the
information that the dimension represents. You can add a jog line to a linear
dimension to indicate that the dimension value does not represent the actual
dimensioned value or add an inspection dimension to represent how often a
dimension value of a manufactured part should be checked.
At times you might want to modify a dimension to simply improve readability.
You can make sure that the extension or dimension lines do not obscure any
objects; you can adjust the placement of linear dimensions so they are evenly
spaced.
Dimension Jog
JJog lines are used to represent a dimension value that does not display the
actual measurement in a linear dimension. Typically, the actual measurement
value of the dimension is smaller than the displayed value.
The jog is made up of two parallel lines and a cross line that forms two
40-degree angles. The height of the jog is determined by the linear jog size
value of the dimension style.
Once you add a jog to a linear dimension, you can position it by using grips.
To reposition the jog, select the dimension and then select the grip. Move the
grip to another point along the dimension line. You can also adjust the height
Modify A Dimension | 1487
of the jog symbol on a linear dimension on the Properties palette under Lines
& Arrows.
To add a jog to a linear dimension
1Click Home tab ➤ Annotation panel ➤ Jog Line.
2Select a linear dimension.
3Specify a point on the dimension line to place the jog.
To add a jog to a linear dimension based on the midpoint of the selected
dimension line
1Click Home tab ➤ Annotation panel ➤ Jog Line.
2Select a linear dimension.
3Press Enter to position the jog at the midpoint of the selected dimension
line.
To reposition a jog using grips
1With no command active, select the linear dimension that has the jog
you want to reposition.
2Select the grip in the middle of the jog.
The selected grip is highlighted, and the default grip mode, Stretch, is
active.
3Drag the crosshairs along the dimension line and click to reposition the
jog.
TIP If you want to place the jog along the dimension line without changing
the position of the dimension line, turn Ortho mode on.
To remove a jog
1Click Home tab ➤ Annotation panel ➤ Jog Line.
2Enter r (Remove) and press Enter.
1488 | Chapter 31 Dimensions and Tolerances
3Select the linear dimension to remove the jog from.
To modify the height of a jog using the Properties palette
1With no command active, select the linear dimension with the jog whose
height you want to change.
2Right-click over the drawing window. Click Properties.
3On the Properties palette, expand Lines & Arrows.
4Select Jog Height Factor, and enter a new height for the jog.
5Click outside the Properties palette. Press Esc.
Quick Reference
Commands
DIMALIGNED
Creates an aligned linear dimension.
DIMBASELINE
Creates a linear, angular, or ordinate dimension from the baseline of the
previous or selected dimension.
DIMCONTINUE
Creates a dimension that starts from an extension line of a previously created
dimension.
DIMJOGLINE
Adds or removes a jog line on a linear or aligned dimension.
DIMLINEAR
Creates a linear dimension.
DIMSTYLE
Creates and modifies dimension styles.
QDIM
Creates a series of dimensions quickly from selected objects.
Modify A Dimension | 1489
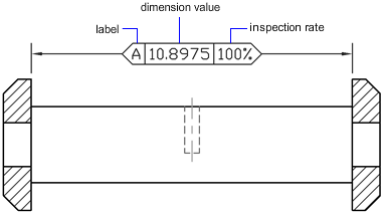
Inspection Dimension
Inspection dimensions allow you to effectively communicate how frequently
manufactured parts should be checked to ensure that the dimension value
and tolerances of the parts are within the specified range.
When working with parts that need to met a specific tolerance or dimension
value before installing them into the final assembled product, you can use an
inspection dimension to specify how often the part should be tested.
You can add an inspection dimension to any type of dimension object; it is
composed of a frame and text values. The frame for an inspection dimension
is made up of two parallel lines and the end is round or square. The text values
are separated by vertical lines. An inspection dimension can contain up to
three different fields of information: inspection label, dimension value, and
inspection rate.
Inspection Dimension Fields
Inspection Label Text used to identify individual inspection dimensions. The
label is located in the leftmost section of the inspection dimension.
Dimension Value Dimension value that is displayed is the same value before
the inspection dimension is added. The dimension value can contain
tolerances, text (both prefix and suffix), and the measured value. The
dimension value is located in the center section of the inspection dimension.
Inspection Rate Text used to communicate the frequency that the dimension
value should be inspected, expressed as a percentage. The rate is located in
the rightmost section of the inspection dimension.
You can add inspection dimensions to any type of dimension. The current
values of an inspection dimension are displayed on the Properties palette,
under Misc. The values include the properties that are used to control the look
of the frame, and the text for both the label and rate values.
1490 | Chapter 31 Dimensions and Tolerances

To create an inspection dimension
1Click Annotate tab ➤ Dimensions panel ➤ Inspect.
2In the Inspection Dimension dialog box, click Select Dimensions.
The Inspection Dimension dialog box closes. You are prompted to select
dimensions.
3Select the dimension you want to make an inspection dimension. Press
Enter to return to the dialog box.
4Under the Shape section, specify the frame type.
5Under the Label/Inspection rate section, specify the desired options.
■Select the Label check box, and enter the desired label in the text box.
■Select the Inspection Rate check box, and enter the desired rate in the
text box.
6Click OK.
To modify an inspection dimension from the Inspection dialog box
1Click Annotate tab ➤ Dimensions panel ➤ Inspect.
2In the Inspection Dimension dialog box, click Select Dimensions.
The Inspection Dimension dialog box closes. You are prompted to select
dimensions.
3Select the inspection dimension you want to modify. Press Enter to return
to the dialog box.
4Under the Shape section, make the desired changes to the frame type.
5Under the Label/Inspection rate section, make the desired changes to the
label and inspection rate.
6Click OK.
To remove an inspection dimension
1Click Annotate tab ➤ Dimensions panel ➤ Inspect.
Modify A Dimension | 1491
2In the Inspection Dimension dialog box, click Select Dimensions.
The Inspection Dimension dialog box closes. You are prompted to select
dimensions.
3Select the dimension you want to remove the inspection dimension from.
Press Enter to return to the dialog box.
4Click Remove Inspection.
5Click OK.
To modify an inspection dimension using the Properties palette
1With no command active, select the inspection dimension you want to
modify.
2Right-click over the drawing window. Click Properties.
3On the Properties palette, double-click the Misc caption of the pane to
expand it.
4Specify the new values for the Inspection shape, label, and rate.
5Click outside the Properties palette. Press Esc.
Quick Reference
Commands
DIMINSPECT
Adds or removes inspection information for a selected dimension.
Dimension Breaks
With dimension breaks, you can keep the dimension, extension, or leader
lines from appearing as if they are a part of the design.
Dimension breaks can be added to a dimension or a multileader automatically
or manually. The method that you choose to place dimension breaks depends
on the number of objects that intersect a dimension or multileader.
1492 | Chapter 31 Dimensions and Tolerances
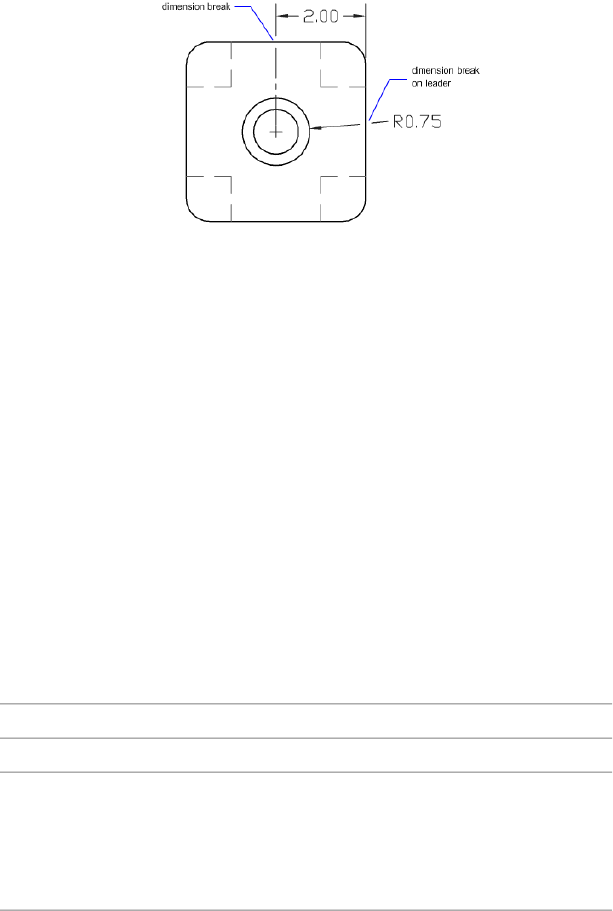
You can add dimension breaks to the following dimension and leader objects:
■Linear dimensions (aligned and rotated)
■Angular dimensions (2- and 3-point)
■Radial dimensions (radius, diameter, and jogged)
■Arc length dimensions
■Ordinate dimensions
■Multileaders (straight only)
The following dimension and leader objects do not support dimension breaks:
■Multileaders (spline only)
■“Legacy” leaders (straight or spline)
The following table explains the conditions where dimension breaks do not
work or are not supported.
Dimension Break Exceptions
DescriptionCondition
Dimension breaks on dimensions or multileaders in xrefs
and blocks are not supported. However, the objects in an
No break in xrefs or
blocks
xref or block can be used as the cutting edges for dimension
breaks on dimensions or multileaders that are not in an
xref or block.
Dimension breaks cannot be placed on an arrowhead or
the dimension text. If you want a break to appear at the
No break on arrow-
head and dimension
text dimension text, it is recommended to use the background
Modify A Dimension | 1493
Dimension Break Exceptions
DescriptionCondition
mask option. If the intersecting point of an object and the
dimension are at the arrowhead or dimension text, the
break will not be displayed until the intersecting object, or
dimension or multileader are moved.
Automatic breaks are not supported for objects and dimen-
sions or multileaders that are in different spaces. In order
No break on trans-
spatial dimensions
to break a dimension or multileader that is in a different
space, you need to use the Manual option of the DIMBREAK
command.
You can move dimension breaks from dimensions or multileaders. When
removing dimension breaks from a dimension or multileader, all dimension
breaks are removed. If there are some dimension breaks that you don’t want
to remove, you need to add them again.
The following objects can be used as cutting edges when adding a dimension
break:
■Dimension
■Leader
■Line
■Circle
■Arc
■Spline
■Ellipse
■Polyline
■Text
■Multiline text
■Blocks but limited to the previously mentioned objects in this list
■Xrefs but limited to the previously mentioned objects in this list
1494 | Chapter 31 Dimensions and Tolerances

Automatic Dimension Breaks
To create an automatically placed dimension break, you select a dimension
or multileader, and then use the Auto option of the DIMBREAK command.
Automatic dimension breaks are updated any time the dimension or
multileader, or intersecting objects are modified.
You control the size of automatically placed dimension breaks on the Symbols
and Arrows tab of the Dimension Style dialog box. The specified size is affected
by the dimension break size, dimension scale, and current annotation scale
for the current viewport. For more information about annotation scaling, see
Scale Annotations on page 1224.
Dimension Break Created by Selecting an Object
Instead of placing a dimension break for each object that intersects a dimension
or multileader, you can specify which of the intersecting objects to use.
Dimension breaks that are added by selecting individual intersecting objects
are updated any time the dimension or multileader, or intersecting objects
are modified.
Dimension Break Created by Picking Two Points
You can place a dimension break by picking two points on the dimension,
extension, or leader line to determine the size and placement of the break.
Dimension breaks that are added manually by picking two points are not
automatically updated if the dimension or multileader, or intersecting object
is modified.
So if a dimension or multileader with a manually added dimension break is
moved or the intersecting object is modified, you might have to restore the
dimension or multileader, and then add the dimension break again. The size
of a dimension break that is created by picking two points is not affected by
the current dimension scale or annotation scale value for the current viewport.
To automatically create dimension breaks for each intersecting object
1Click Annotate tab ➤ Dimensions panel ➤ Break.
2Select a dimension or multileader.
3Enter a (Auto) and press Enter.
Modify A Dimension | 1495

To create a single dimension break based on an intersecting object
1Click Annotate tab ➤ Dimensions panel ➤ Break.
2Select a dimension or multileader.
3Select an object that intersects the dimension or multileader. Press Enter.
To create a manual dimension break
1Click Annotate tab ➤ Dimensions panel ➤ Break.
2Select a dimension or multileader.
3Enter m (Manual) and press Enter.
4Specify the first point on the dimension, extension, or leader line for the
dimension break.
5Specify the second point along the dimension, extension, or leader line
for the dimension break.
To create dimension breaks for multiple dimensions or multileaders at one
time
1Click Annotate tab ➤ Dimensions panel ➤ Break.
2Enter m (Multiple) and press Enter.
3Select the dimensions or multileaders to which to add the dimension
breaks.
4Enter a (Auto) and press Enter.
To remove all dimension breaks from a dimension or multileader
1Click Annotate tab ➤ Dimensions panel ➤ Break.
2Select a dimension or multileader.
3Enter r (Remove) and press Enter.
1496 | Chapter 31 Dimensions and Tolerances

To remove all dimension breaks from multiple dimensions or multileaders
1Click Annotate tab ➤ Dimensions panel ➤ Break.
2Enter m (Multiple), and press Enter.
3Select the dimensions or multileaders from which to remove the
dimension breaks, and press Enter.
4Enter r (Remove), and press Enter.
Quick Reference
Commands
DIMBREAK
Breaks or restores dimension and extension lines where they cross other
objects.
DIMSTYLE
Creates and modifies dimension styles.
Adjust Dimension Spacing
You can automatically adjust existing parallel linear and angular dimensions
in a drawing so they are equally spaced or aligned at the dimension line with
each other.
Parallel linear and angular dimensions can be created in a number of different
ways in a drawing. With the DIMLINEAR and DIMANGULAR commands you
can place one dimension at a time; you can use the DIMBASELINE and
DIMCONTINUE commands to help place additional linear dimensions based
on the previous linear dimension placed.
The DIMBASELINE command uses the DIMDLI system variable to create
equally spaced dimensions, but once the dimensions are placed, changing the
value of the system variable has no affect on the spacing of dimensions. If
you change the text size or adjust the scale for the dimensions, they remain
in the original position which can cause problems with overlapping dimension
lines and text.
You can space linear and angular dimensions that overlap or are not equally
spaced with the DIMSPACE command. The dimensions that are selected must
Modify A Dimension | 1497
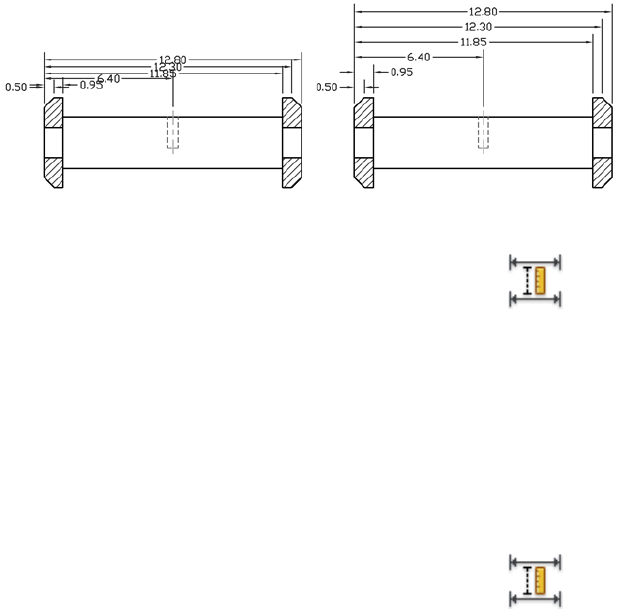
be linear or angular, of the same type (rotated or aligned), parallel or concentric
to one another, and on the extension lines of each other. You can also align
linear and angular dimensions by using a spacing value of 0.
The following illustration shows parallel linear dimensions that are not equally
spaced and then those that are equally spaced after using the DIMSPACE
command.
To equally space parallel linear and angular dimensions automatically
1Click Annotate tab ➤ Dimensions panel ➤ Adjust Space.
2Select the dimension that you want to use as the base dimension when
equally spacing dimensions.
3Select the next dimension to equally space.
4Continue to select dimensions and then press Enter.
5Enter a (Auto) and press Enter.
To equally space parallel linear and angular dimensions based on a distance
1Click Annotate tab ➤ Dimensions panel ➤ Adjust Space.
2Select the dimension that you want to use as the base dimension when
equally spacing dimensions.
3Select the next dimension to equally space.
4Continue to select dimensions and then press Enter.
5Enter a spacing value and press Enter.
1498 | Chapter 31 Dimensions and Tolerances

To align parallel linear and angular dimensions
1Click Annotate tab ➤ Dimensions panel ➤ Adjust Space.
2Select the dimension that you want to use as the base dimension when
equally spacing dimensions.
3Select the next dimension to align.
4Continue to select dimensions and then press Enter.
5Enter 0 and press Enter.
Quick Reference
Commands
DIMALIGNED
Creates an aligned linear dimension.
DIMANGULAR
Creates an angular dimension.
DIMBASELINE
Creates a linear, angular, or ordinate dimension from the baseline of the
previous or selected dimension.
DIMCONTINUE
Creates a dimension that starts from an extension line of a previously created
dimension.
DIMLINEAR
Creates a linear dimension.
DIMSPACE
Adjusts the spacing between linear dimensions or angular dimensions.
DIMSTYLE
Creates and modifies dimension styles.
QDIM
Creates a series of dimensions quickly from selected objects.
Modify A Dimension | 1499
System Variables
DIMDLI
Controls the spacing of the dimension lines in baseline dimensions.
Apply a New Dimension Style to Existing Dimensions
You can modify existing dimensions by applying a different dimension style.
If you make changes to a dimension style, you can choose whether to update
the dimensions associated with that dimension style.
When you create a dimension, the current dimension style is associated with
that dimension. The dimension retains this dimension style unless you apply
a new dimension style to it or set up dimension style overrides.
You can modify existing dimensions by applying a different dimension style.
If you make changes to a dimension style, you can choose whether to update
the dimensions associated with that dimension style.
You can restore an existing dimension style or apply the current dimension
style, including any dimension style overrides, to selected dimensions.
To apply the current dimension style to existing dimensions
1Click Annotate tab ➤ Dimensions panel ➤ Update.
2Select the dimensions to update to the current dimension style.
3Press Enter.
To restore a dimension style
1Click Home tab ➤ Annotation panel ➤ Dimension Style.
2In the Dimension Style Manager, select the dimension style to restore.
Click Set Current.
3Click Close.
1500 | Chapter 31 Dimensions and Tolerances
Alternate
■On the Styles toolbar, click the arrow in the Dimension Styles control and
select a dimension style.
Quick Reference
Commands
DIMOVERRIDE
Controls overrides of system variables used in selected dimensions.
DIMSTYLE
Creates and modifies dimension styles.
PROPERTIES
Controls properties of existing objects.
System Variables
DIMCLRD
Assigns colors to dimension lines, arrowheads, and dimension leader lines.
Override a Dimension Style
With dimension style overrides, you can temporarily change a dimensioning
system variable without changing the current dimension style.
A dimension style override is a change made to specific settings in the current
dimension style. It is equivalent to changing a dimensioning system variable
without changing the current dimension style.
You can define dimension style overrides for individual dimensions, or for
the current dimension style.
■For individual dimensions, you may want to create overrides to suppress
a dimension's extension lines or modify text and arrowhead placement so
that they do not overlap drawing geometry without creating a different
dimension style.
■You can also set up overrides to the current dimension style. All dimensions
you create in the style include the overrides until you delete the overrides,
save the overrides to a new style, or set another style current. For example,
Override a Dimension Style | 1501

if you choose Override in the Dimension Style Manager, and change the
color of extension lines on the Lines tab, the current dimension style
remains unchanged. However, the new value for color is stored in the
DIMCLRE system variable. The next dimension you create will have
extension lines in the new color. You can save the dimension style overrides
as a new dimension style.
Some dimension characteristics are common to a drawing or to a style of
dimensioning and are therefore suited to be permanent dimension style
settings. Others generally apply on an individual basis and can be applied
more effectively as overrides. For example, a drawing usually uses a single type
of arrowhead, so it makes sense to define the arrowhead type as part of the
dimension style. Suppression of extension lines, however, usually applies in
individual cases only and is more suited to a dimension style override.
There are several ways to set up dimension style overrides. You can change
options in the dialog boxes or change system variable settings at the Command
prompt. You reverse the override by returning the changed settings to their
original values. The overrides apply to the dimension you are creating and all
subsequent dimensions created with that dimension style until you reverse
the override or make another dimension style current.
Example: Change a Dimension Style Override at the Command Prompt
You can override the current dimension style while creating a dimension by
entering the name of any dimensioning system variable at any prompt. In
this example, the dimension line color is changed. The change affects
subsequent dimensions you create until you reverse the override or make
another dimension style current.
Command: dimoverride
Enter dimension variable name to override or [Clear overrides]: dimclrd
Enter new value for dimension variable <BYBLOCK>: 5
Enter dimension variable name to override: Enter another dimension variable
name or press Enter
Select objects: Use an object selection method and press Enter when you finish
To set up dimension style overrides
1Click Home tab ➤ Annotation panel ➤ Dimension Style.
2In the Dimension Style Manager, under Styles, select the dimension style
for which you want to create an override. Click Override.
1502 | Chapter 31 Dimensions and Tolerances

3In the Override Current Style dialog box, make changes to the dimension
style by clicking the appropriate tab.
4Click OK to return to the Dimension Style Manager.
The dimension style overrides are listed below the style they modify in
the dimension style name list.
5Click Close.
To apply dimension style overrides
1Click Home tab ➤ Annotation panel ➤ Dimension Style.
2In the Dimension Style Manager, click Override.
3In the Override Current Style dialog box, enter the style overrides. Click
OK.
The program displays <style overrides> below the dimension style name
in the Dimension Style Manager dialog box. After you create dimension
style overrides, you can continue to modify dimension styles, compare
them with other dimension styles, or delete or rename the overrides.
Quick Reference
Commands
DIMOVERRIDE
Controls overrides of system variables used in selected dimensions.
DIMSTYLE
Creates and modifies dimension styles.
PROPERTIES
Controls properties of existing objects.
System Variables
DIMCLRD
Assigns colors to dimension lines, arrowheads, and dimension leader lines.
Override a Dimension Style | 1503
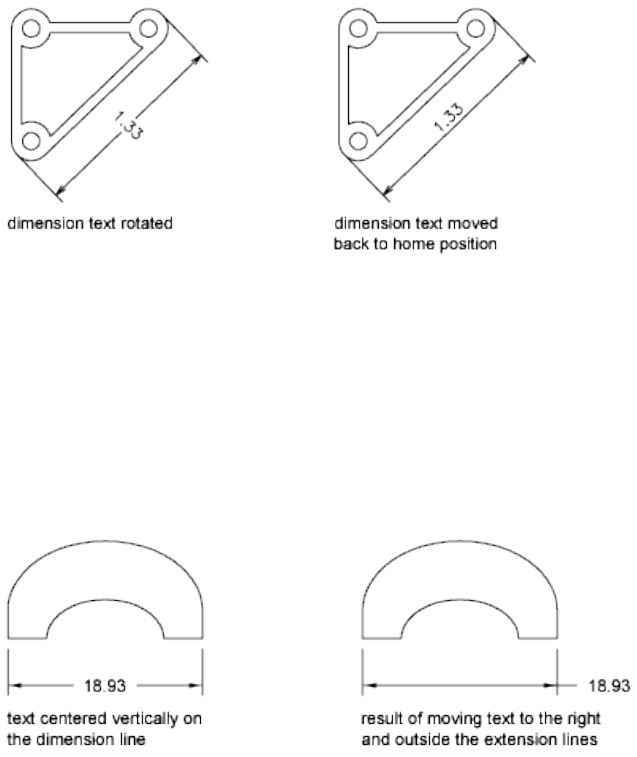
Modify Dimension Text
Once you've created a dimension, you can change the location and orientation
of the existing dimension text or replace it with new text.
Once you've created a dimension, you can rotate the existing text or replace
it with new text. You can move the text to a new location or back to its home
position, which is the position defined by the current dimension style. In the
following illustration, the home position is above and centered on the
dimension line.
When you rotate or replace dimension text, you specify the change first, for
example, rotating the text to be at an angle. When you move dimension text,
you select a single dimension to move.
You can move dimension text to the left, right, or center along the dimension
line or to any position inside or outside the extension lines. A quick and simple
way to do this is by using grips. If you move text up or down, the current
vertical alignment of the text relative to the dimension line is not changed,
so the dimension and extension lines are modified accordingly. The following
illustration shows the result of moving text down and to the right. The text
remains centered vertically in relation to the dimension line.
1504 | Chapter 31 Dimensions and Tolerances
See also:
■Control Dimension Text on page 1437
To rotate dimension text
1Annotate tab ➤ Dimensions panel ➤ Text Angle.
2Select the dimension to edit.
3Enter the new angle for the text.
To return dimension text to its home position
1Click Dimension menu ➤ Align Text ➤ Home.
2Select the dimension text you want to return to its home position.
To replace existing dimension text with new text
1Click Modify menu ➤ Object ➤ Text ➤ Edit.
2Select the dimension text you want to edit.
3In the In-Place Text Editor, enter the new dimension text. Click OK.
To move text to the left side of the dimension line
1Click Annotate tab ➤ Dimensions panel ➤ Left Justify.
2Select the dimension.
The dimension text is left-justified along the dimension line inside the
extension lines. You can choose the Center or Right options to move the
text to the center or right of the dimension line.
To set dimension line spacing for baseline and continued dimensions
1Click Home tab ➤ Annotation panel ➤ Dimension Style.
2In the Dimension Style Manager, select the style you want to change.
Click Modify.
Modify Dimension Text | 1505

3In the Modify Dimension Style dialog box, Lines tab, under Dimension
Lines, enter in the Baseline Spacing box the offset distance between
dimension lines for baseline and continued dimensions.
4Click OK.
5Click Close to exit the Dimension Style Manager.
To change the extension origin offset
1Click Home tab ➤ Annotation panel ➤ Dimension Style.
2In the Dimension Style Manager, select the style you want to change.
Click Modify.
3In the Modify Dimension Style dialog box, Lines tab, under Extension
Lines, enter the new value for Offset from Origin.
4Click OK.
5Click Close to exit the Dimension Style Manager.
Quick Reference
Commands
DDEDIT
Edits single-line text, dimension text, attribute definitions, and feature control
frames.
DIMEDIT
Edits dimension text and extension lines.
DIMTEDIT
Moves and rotates dimension text and relocates the dimension line.
PROPERTIES
Controls properties of existing objects.
1506 | Chapter 31 Dimensions and Tolerances
System Variables
DIMCLRT
Assigns colors to dimension text.
DIMDSEP
Specifies a single-character decimal separator to use when creating dimensions
whose unit format is decimal.
DIMJUST
Controls the horizontal positioning of dimension text.
DIMTAD
Controls the vertical position of text in relation to the dimension line.
DIMTXTDIRECTION
Specifies the reading direction of the dimension text.
DIMTIH
Controls the position of dimension text inside the extension lines for all
dimension types except Ordinate.
DIMTMOVE
Sets dimension text movement rules.
DIMTOH
Controls the position of dimension text outside the extension lines.
DIMTVP
Controls the vertical position of dimension text above or below the dimension
line.
DIMUPT
Controls options for user-positioned text.
MTEXTED
Sets the application for editing multiline text objects.
Modify Dimension Text | 1507

Modify Dimension Geometry
Grip editing is the quickest and easiest way to modify the location of
dimension elements. How you edit dimensions depends whether the dimension
is associative.
You can modify dimensions with the editing commands and with grip editing.
Grip editing is the quickest and easiest way to modify dimensions. How you
edit dimensions depends on whether the dimension is associative.
Modify Associative Dimensions
Associative dimensions retain their associativity to dimensioned objects
through many editing commands if both the dimension and the associated
geometry are selected and operated on with a single command. For example,
if a dimension and its associated geometry are moved, copied, or arrayed in
the same command, each dimension retains associativity with its respective
geometry.
In some circumstances, dimensions are automatically disassociated, including
■If the associated geometric object is erased
■If the associated geometric object undergoes a Boolean operation such as
UNION or SUBTRACT
■If grip editing is used to stretch a dimension parallel to its dimension line
■If the association to a geometric object is specified using the Apparent
Intersection object snap, and the geometric object is moved so that the
apparent intersection no longer exists
In other circumstances, a dimension may become partially associated. For
example, if a linear dimension is associated with the endpoints of two
geometric objects and one of the objects is erased, the remaining association
is preserved. The disassociated end of the linear dimension may then be
associated with another geometric object using DIMREASSOCIATE.
NOTE The Command prompt displays a warning message if a dimension is
disassociated.
Modify Nonassociative Dimensions
For nonassociative dimensions, when you edit dimensioned objects, you must
include the relevant dimension definition points in the selection set, or the
dimension is not updated. Definition points determine the dimension location.
1508 | Chapter 31 Dimensions and Tolerances
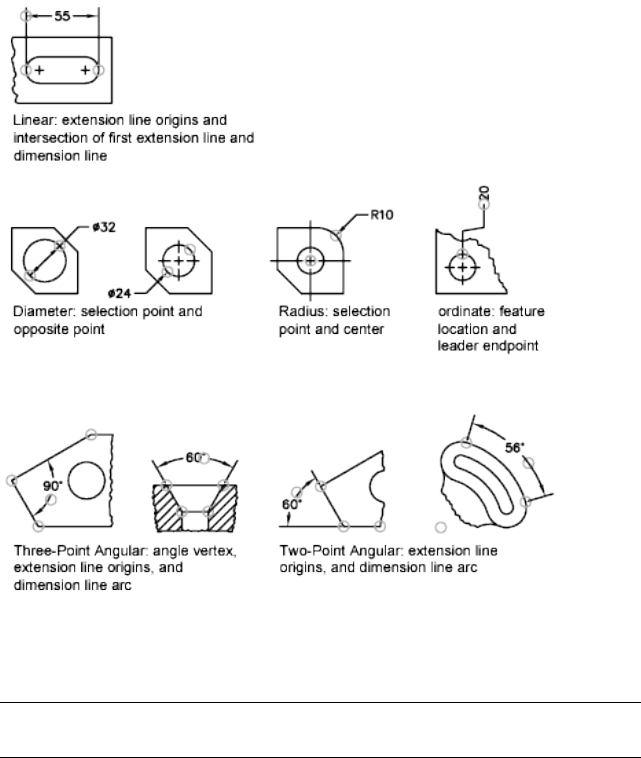
For example, to stretch a dimension, you must include the appropriate
definition points in the selection set. You can easily include them by turning
on grips and selecting the object so that the grips are highlighted.
The definition points for each type of dimension are indicated in the following
illustrations. The middle point of the dimension text is a definition point for
all dimension types.
If no angle vertex is shown, definition points are placed at the ends of the
lines that form the angle. In the two-line angular example, a definition point
is placed at the center point of the dimensioned arc.
NOTE Definition points are drawn on a special layer named DEFPOINTS, which
is not plotted.
Modify Dimension Geometry | 1509
Modify Exploded Dimensions
You can edit exploded dimensions as you would any other objects because
an exploded dimension is a collection of separate objects: lines, 2D solids, and
text. Occasionally you may need to explode a dimension to make changes
such as creating a break in a dimension line or extension line. Once a
dimension is exploded, you cannot reassociate the dimension into a dimension
object.
See also:
■Control Dimension Geometry on page 1427
Quick Reference
Commands
DIMEDIT
Edits dimension text and extension lines.
DIMDISASSOCIATE
Removes associativity from selected dimensions.
DIMREASSOCIATE
Associates or reassociates selected dimensions to objects or points on objects.
EXPLODE
Breaks a compound object into its component objects.
STRETCH
Stretches objects crossed by a selection window or polygon.
System Variables
DIMASSOC
Controls the associativity of dimension objects and whether dimensions are
exploded.
1510 | Chapter 31 Dimensions and Tolerances

Change Dimension Associativity
You may need to change the associativity of dimensions in several
circumstances including adding associativity to dimensions created in previous
releases.
You may need to change the associativity of dimensions in several
circumstances such as the following:
■Redefine the associativity of dimensions in drawings that have been edited
significantly.
■Add associativity to dimensions that have been partially disassociated.
■Add associativity to dimensions in legacy drawings.
■Remove associativity from dimensions in drawings that will be used by
people working in releases prior to AutoCAD 2002, but who do not want
any proxy objects in the drawings.
Reassociate Dimensions to Different Objects
With DIMREASSOCIATE, you can select one or more dimensions and step
through the extension-line origin points of each dimension. For each
extension-line origin point, you can specify a new association point on a
geometric object. Association points determine the attachment of extension
lines to locations on geometric objects.
NOTE When you create or modify associative dimensions, it is important to locate
their association points carefully so that if you make a future design change, the
geometric objects that you change will also change the dimensions associated
with them.
When you use the DIMREASSOCIATE command, a marker is displayed that
indicates whether each successive extension line origin point of the dimension
is associative or nonassociative. A square with an X in it means that the point
is associated with a location on an object, while an X without the square
means that the point is not associated with an object. Use an object snap to
specify the new association for the extension-line origin point or press Enter
to skip to the next extension-line origin point.
NOTE The marker disappears if you pan or zoom with a wheel mouse.
Change Dimension Associativity | 1511

Change Nonassociative Dimensions to Associative
You can change all the nonassociative dimensions in a drawing to associative.
Use QSELECT to select all nonassociative dimensions, and then use
DIMREASSOCIATE to step through the dimensions, associating each one with
locations on geometric objects.
Change Associative Dimensions to Nonassociative
You can change all associative dimensions in a drawing to nonassociative
dimensions. Use QSELECT to select all associative dimensions, and then use
DIMDISASSOCIATE to convert them into nonassociative dimensions.
See also:
■Associative Dimensions on page 1421
■Save Drawings to Previous Drawing File Formats on page 1822
To associate or reassociate a dimension
1Click Annotate tab ➤ Dimensions panel ➤ Reassociate.
2Select one or more dimensions to associate or reassociate.
3Do one of the following:
■Specify the new location of the extension-line origin point.
■Enter s and select a geometric object to associate with the dimension.
■Press Enter to skip to the next extension-line origin point.
■Press Esc to end the command but keep any associations you made
up to that point.
4Repeat the previous step as needed.
To disassociate a dimension
1At the Command prompt, enter DIMDISASSOCIATE.
2Select one or more dimensions to disassociate and press Enter when you
finish.
1512 | Chapter 31 Dimensions and Tolerances
Quick Reference
Commands
DIMDISASSOCIATE
Removes associativity from selected dimensions.
DIMREASSOCIATE
Associates or reassociates selected dimensions to objects or points on objects.
DIMREGEN
Updates the locations of all associative dimensions.
EXPLODE
Breaks a compound object into its component objects.
System Variables
DIMASSOC
Controls the associativity of dimension objects and whether dimensions are
exploded.
Add Geometric Tolerances
You can add geometric tolerances that show acceptable deviations of form,
profile, orientation, location, and runout of a feature.
Overview of Geometric Tolerances
Geometric tolerances show acceptable deviations of form, profile, orientation,
location, and runout of a feature.
You add geometric tolerances in feature control frames. These frames contain
all the tolerance information for a single dimension. Geometric tolerances
can be created with or without leader lines, depending on whether you create
them with TOLERANCE or LEADER.
A feature control frame consists of two or more components. The first feature
control frame contains a symbol that represents the geometric characteristic
to which a tolerance is being applied, for example, location, profile, form,
orientation, or runout. Form tolerances control straightness, flatness, circularity
Add Geometric Tolerances | 1513
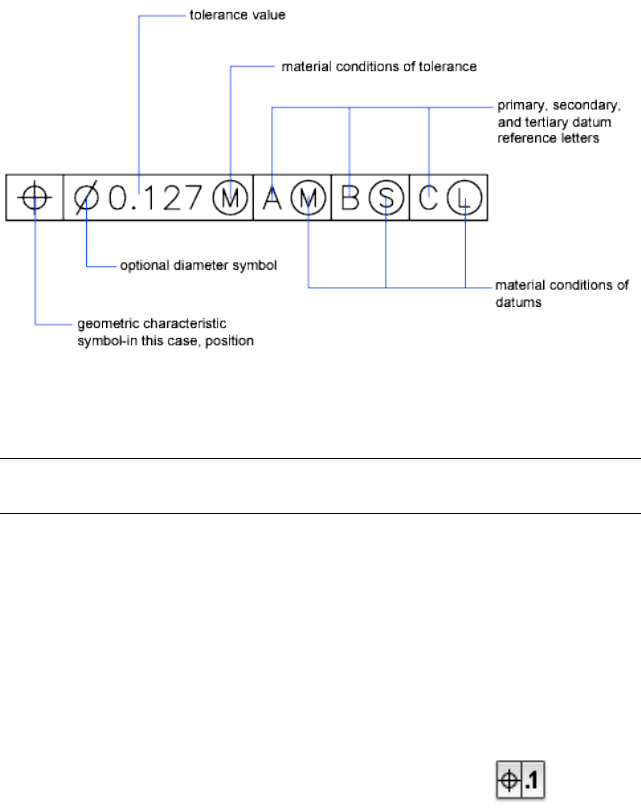
and cylindricity; profiles control line and surface. In the illustration, the
characteristic is position.
You can use most editing commands to change feature control frames, and
you can snap to them using the object snap modes. You can also edit them
with grips.
NOTE Unlike dimensions and leaders, geometric tolerances cannot be associated
with geometric objects.
You can also create tolerances. For more information about creating and
working with an annotative tolerances, see Create Annotative Dimensions
and Tolerances on page 1239.
See also:
■Scale Annotations on page 1224
To create geometric tolerances
1Click Annotate tab ➤ Dimensions panel ➤ Tolerance.
2In the Geometric Tolerance dialog box, click the first square under Sym
and select a symbol to insert.
3Under Tolerance 1, click the first black box to insert a diameter symbol.
4In the Text box, enter the first tolerance value.
1514 | Chapter 31 Dimensions and Tolerances
5To add a material condition (optional), click the second black box and
click a symbol in the Material Conditions dialog box to insert it.
6In the Geometric Tolerance dialog box, add a second tolerance value
(optional) in the same way as the first tolerance value.
7Under Datum 1, Datum 2, Datum 3, enter the datum reference letter.
8Click the black box to insert a material condition symbol for each datum
reference.
9In the Height box, enter a height.
10 Click the Projected Tolerance Zone box to insert the symbol.
11 In the Datum Identifier box, add a datum value.
12 Click OK.
13 In the drawing, specify a location for the feature control frame.
To create a geometric tolerance with a leader
1At the Command prompt, enter leader.
2Specify the start point of the leader.
3Specify the second point of the leader.
4Press Enter twice to display the Annotation options.
5Enter t (Tolerance), and create a feature control frame.
The feature control frame is attached to the endpoint of the leader.
Quick Reference
Commands
LEADER
Creates a line that connects annotation to a feature.
TOLERANCE
Creates geometric tolerances contained in a feature control frame.
Overview of Geometric Tolerances | 1515
Material Conditions
Material conditions apply to features that can vary in size.
The second compartment contains the tolerance value. Depending on the
control type, the tolerance value is preceded by a diameter symbol and followed
by a material condition symbol.
Material conditions apply to features that can vary in size:
■At maximum material condition (symbol M, also known as MMC), a feature
contains the maximum amount of material stated in the limits.
■At MMC, a hole has minimum diameter, whereas a shaft has maximum
diameter.
■At least material condition (symbol L, also known as LMC), a feature contains
the minimum amount of material stated in the limits.
■At LMC, a hole has maximum diameter, whereas a shaft has minimum
diameter.
■Regardless of feature size (symbol S, also known as RFS) means a feature can
be any size within the stated limits.
Quick Reference
Commands
LEADER
Creates a line that connects annotation to a feature.
TOLERANCE
Creates geometric tolerances contained in a feature control frame.
Datum Reference Frames
The tolerance values in the feature control frame are followed by up to three
optional datum reference letters and their modifying symbols.
A datum is a theoretically exact point, axis, or plane from which you make
measurements and verify dimensions. Usually, two or three mutually
perpendicular planes perform this task best. These are jointly called the datum
reference frame.
1516 | Chapter 31 Dimensions and Tolerances
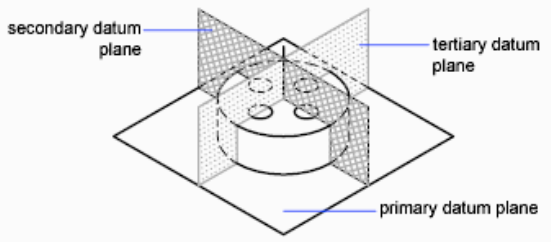
The following illustration shows a datum reference frame verifying the
dimensions of the part.
Quick Reference
Commands
LEADER
Creates a line that connects annotation to a feature.
TOLERANCE
Creates geometric tolerances contained in a feature control frame.
Projected Tolerance Zones
Projected tolerances are used to make the tolerance more specific.
Projected tolerances are specified in addition to positional tolerances to make
the tolerance more specific. For example, projected tolerances control the
perpendicularity tolerance zone of an embedded part.
The symbol for projected tolerance ( ) is preceded by a height value, which
specifies the minimum projected tolerance zone. The projected tolerance zone
height and symbol appear in a frame below the feature control frame, as shown
in the following illustration.
Projected Tolerance Zones | 1517
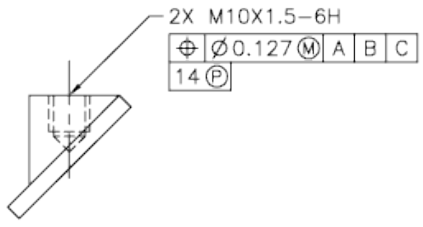
Quick Reference
Commands
LEADER
Creates a line that connects annotation to a feature.
TOLERANCE
Creates geometric tolerances contained in a feature control frame.
Composite Tolerances
A composite tolerance specifies two tolerances for the same geometric
characteristic of a feature or for features that have different datum
requirements. One tolerance relates to a pattern of features and the other
tolerance to each feature within the pattern. The individual feature tolerance
is more restrictive than the pattern tolerance.
In the following illustration, the point where datums A and B intersect is called
the datum axis, the point from which the position of the pattern is calculated.
A composite tolerance could specify both the diameter of the pattern of holes
and the diameter of each individual hole, as in the following illustration.
1518 | Chapter 31 Dimensions and Tolerances
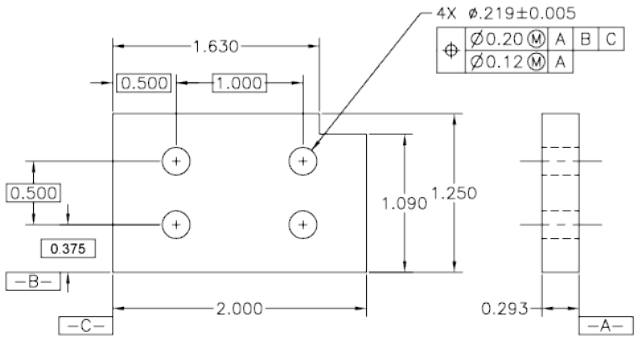
When you add composite tolerances to a drawing, you specify the first line
of a feature control frame and then choose the same geometric characteristic
symbol for the second line of the feature control frame. The geometric symbol
compartment is extended over both lines. You can then create a second line
of tolerance symbols.
Quick Reference
Commands
LEADER
Creates a line that connects annotation to a feature.
TOLERANCE
Creates geometric tolerances contained in a feature control frame.
Composite Tolerances | 1519
1520
Part 10: Plot and Publish
Drawings
1521
1522
Prepare Drawings for
Plotting and Publishing
You prepare your drawing for plotting or publishing by specifying page setup settings. These
settings are stored in the drawing file with the layout. Once a layout is established, you can
modify the settings of its page setup or apply a different page setup.
Quick Start to Saving Settings for Plotting and Publishing
Preparing a drawing for plotting or publishing requires specifying many settings
and options that define the output of your drawing. To save time, you can save
these settings as a named page setup.
You can apply a named page setup to paper space layouts using the Page Setup
Manager. You can also import a named page setup from another drawing and
apply it to layouts in the current drawing.
Quick Reference
Commands
PAGESETUP
Controls the page layout, plotting device, paper size, and other settings for
each new layout.
PSETUPIN
Imports a user-defined page setup into a new drawing layout.
32
1523
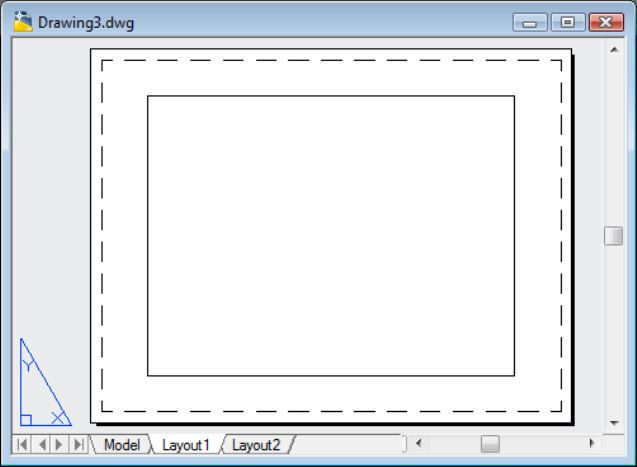
Specify Page Setup Settings
Page setups are associated with layouts and stored in the drawing file. The
settings specified in a page setup determine the appearance and format of
your final output.
Overview of Page Setup Settings
A page setup is a collection of plot device and other settings that affect the
appearance and format of your final output. These settings can be modified
and applied to other layouts.
After you complete a drawing on the Model tab, you can begin creating a
layout to plot by clicking a layout tab. When you click a layout tab for the
first time, a single viewport is displayed on the page. A dashed line indicates
the printable area of the paper for the currently configured paper size and
plotter.
Once you have your layout set up, you specify the settings for the layout's
page setup, which includes the plot device settings and other settings that
affect the appearance and format of the output. The settings you specify in
the page setup are stored in the drawing file with the layout. You can modify
the settings of a page setup at any time.
1524 | Chapter 32 Prepare Drawings for Plotting and Publishing

By default, every initialized layout has a page setup associated with it. You
can initialize a layout by clicking on its tab to activate the previously unused
layout. A layout does not contain any plot settings before initialization. A
layout must be initialized (its paper size can be defined in the page setup to
any size other than 0 x 0) before it can be published. Once initialized, layouts
can be drawn upon, published, and added to sheet sets as sheets (after the
drawing has been saved). You can apply a named page setup saved with one
layout to another layout. This creates a new page setup with the same settings
as the first one.
If you want the Page Setup Manager to be displayed each time you begin a
new drawing layout, select the Show Page Setup Manager for New Layouts
option on the Display tab in the Options dialog box. If you don't want a
viewport to be automatically created for each new layout, clear the Create
Viewport in New Layouts option on the Display tab in the Options dialog
box.
To modify the settings of a layout's page setup
1Click the layout tab for which you want to modify the page setup settings.
2Click Output tab ➤ Plot panel ➤ Page Setup Manager.
3In the Page Setup Manager, Page Setups area, select the page setup that
you want to modify.
4Click Modify.
5In the Page Setup dialog box, modify the required settings. Click OK.
6In the Page Setup Manager, click Close.
To apply a layout's named page setup to another layout
1Click the layout tab to which you want to apply another layout's page
setup settings.
2Click Output tab ➤ Plot panel ➤ Page Setup Manager.
3In the Page Setup Manager, Page Setups area, select a named page setup
that you want to apply to the layout selected in the drawing area.
4Click Set Current.
Overview of Page Setup Settings | 1525

5Click Close.
Quick Reference
Commands
PAGESETUP
Controls the page layout, plotting device, paper size, and other settings for
each new layout.
Select a Printer or Plotter for a Layout
To print a layout, select a printing or plotting device in the Page Setup dialog
box. You can also view details about the name and location of the device, and
change the device's configuration.
The printer or plotter you select in the Page Setup dialog box determines the
printable area of the layout. This printable area is indicated by the dashed line
in the layout. If you change the paper size or the printing or plotting device,
it may change the printable area of your drawing page.
See also:
■Select a Printer or Plotter on page 1560
■“Control PC3 File Device and Document Settings” in the Driver and Peripheral
Guide
To select a printer or plotter for a layout
1Click the layout tab for which you want to specify a printer or plotter.
2Click Output tab ➤ Plot panel ➤ Page Setup Manager.
3In the Page Setup Manager, Page Setups area, select the page setup that
you want to modify.
4Click Modify.
5In the Page Setup dialog box, under Printer/Plotter, select a printer or
plotter from the list. Click OK.
6In the Page Setup Manager, click Close.
1526 | Chapter 32 Prepare Drawings for Plotting and Publishing

To change the configuration of a printer or plotter specified in a page setup
1Click the layout tab for which you want to specify a printer or plotter.
2Click Output tab ➤ Plot panel ➤ Page Setup Manager.
3In the Page Setup Manager, Page Setups area, select the page setup that
you want to modify.
4Click Modify.
5In the Page Setup dialog box, under Printer/Plotter, click Properties.
6In the Plotter Configuration Editor, change the required settings. Click
OK.
7In the Page Setup dialog box, click OK.
8In the Page Setup Manager, click Close.
Quick Reference
Commands
PAGESETUP
Controls the page layout, plotting device, paper size, and other settings for
each new layout.
PLOT
Plots a drawing to a plotter, printer, or file.
Select a Paper Size for a Layout
You can select a paper size from a standard list, or you can add custom paper
sizes using the Plotter Configuration Editor.
You can select a paper size from a standard list. The paper sizes available in
the list are determined by the plot device that is currently selected for the
layout. If your plotter is configured for raster output, you must specify the
output size in pixels. You can add custom paper sizes, which are stored in the
plotter configuration (PC3) file, using the Plotter Configuration Editor.
If you are using a system printer, the paper size is determined by the document
defaults that are set in the Windows Control Panel. The default paper size is
Select a Paper Size for a Layout | 1527
displayed in the Page Setup dialog box when you create a new layout for that
configured device. If you change the paper size in the Page Setup dialog box,
the new paper size is saved with the layout and overrides the size saved in the
plotter configuration (PC3) file.
See also:
■“Control PC3 File Device and Document Settings” in the Driver and Peripheral
Guide
To set the paper size for a layout
1Click the layout tab for which you want to set the paper size.
2Click Output tab ➤ Plot panel ➤ Page Setup Manager.
3In the Page Setup Manager, Page Setups area, select the page setup that
you want to modify.
4Click Modify.
5In the Page Setup dialog box, under Paper Size, select a paper size from
the list. Click OK.
6In the Page Setup Manager, click Close.
To start the Plotter Configuration Editor
1Click Output tab ➤ Plot panel ➤ Plotter Manager.
2In the Plotter Manager, double-click the plotter configuration (PC3) file
you want to edit.
The Plotter Configuration Editor is displayed.
To add a custom paper size from scratch
1Click Output tab ➤ Plot panel ➤ Plotter Manager.
2In the Plotter Manager, double-click the plotter configuration (PC3) file
you want to edit.
1528 | Chapter 32 Prepare Drawings for Plotting and Publishing
3In the Plotter Configuration Editor, Device and Document Settings tab,
double-click User-Defined Paper Sizes & Calibration to display the
calibration and paper size options.
4Select Custom Paper Sizes.
5Under Custom Paper Sizes, click Add.
6In the Custom Paper Size wizard, Begin page, select Start from Scratch.
Click Next.
7On the Media Bounds page, in the Units list, select either Inches or
Millimeters for paper size.
When a nondimensional raster image, such as BMP or TIFF, is plotted,
the size of the plot is specified in pixels, not inches or millimeters.
8In the Width and Length lists, specify the paper width and length. Click
Next.
NOTE Each plotter has a maximum printable area determined by where it
grips the paper and how far the pen shuttle reaches. If you are creating a
paper size that is larger than the paper sizes offered in the Custom Paper Size
wizard, verify that the plotter is capable of plotting the new dimensions.
9On the Printable Area page, use Top, Bottom, Left, and Right to specify
the printable area. Click Next.
10 On the Paper Size Name page, enter a name for the paper size. Click Next.
11 On the File Name page, enter a name for the PMP file.
12 On the Finish page, specify whether the paper source is Sheet-Fed or
Roll-Fed.
13 Click Print Test Page to verify the custom size.
A cross is printed that defines the paper size and a rectangle that defines
the printable area. If all four sides of the rectangle are not printed, increase
the printable area.
14 Click Finish to exit the Custom Paper Size wizard.
To add a new custom paper size starting from an existing paper size
1Click Output tab ➤ Plot panel ➤ Plotter Manager.
Select a Paper Size for a Layout | 1529

2In the Plotter Manager, double-click the plotter configuration (PC3) file
you want to edit.
3In the Plotter Configuration Editor, Device and Document Settings tab,
double-click User-Defined Paper Sizes & Calibration to display the
calibration and paper size settings.
4Select Custom Paper Sizes.
5Under Custom Paper Sizes, click Add.
6In the Custom Paper Size wizard, Begin page, select Use Existing.
7In the list of existing standard paper sizes, select a paper size on which
to base the custom paper size you are creating.
8Follow the instructions in To add a custom paper size from scratch to
continue through the Custom Paper Size wizard.
The new paper size is a user-defined size, not a standard size.
9Click Finish to exit the Custom Paper Size wizard.
To edit a custom paper size
1Click Output tab ➤ Plot panel ➤ Plotter Manager.
2In the Plotter Manager, double-click the plotter configuration (PC3) file
you want to edit.
3In the Plotter Configuration Editor, Device and Document Settings tab,
double-click User-Defined Paper Sizes & Calibration to display the
calibration and paper size settings.
4Select Custom Paper Sizes.
5Under Custom Paper Sizes, select a paper size from the list. Click Edit.
6In the Custom Paper Size wizard, make changes to the paper size, printable
area, custom paper size name, and source.
7Click Finish to exit the Custom Paper Size wizard.
To delete a custom paper size
1Click Output tab ➤ Plot panel ➤ Plotter Manager.
1530 | Chapter 32 Prepare Drawings for Plotting and Publishing

2In the Plotter Manager, double-click the plotter configuration (PC3) file
you want to edit.
3In the Plotter Configuration Editor, Device and Document Settings tab,
double-click User-Defined Paper Sizes & Calibration to display the
calibration and paper size settings.
4Click Custom Paper Sizes.
5Under Custom Paper Sizes, select a paper size from the list.
6Click Delete.
To modify a standard paper size
1Click Output tab ➤ Plot panel ➤ Plotter Manager.
2In the Plotter Manager, double-click the Plotter Configuration (PC3) file
you want to edit.
3In the Plotter Configuration Editor, Device and Document Settings tab,
double-click User-Defined Paper Sizes & Calibration to display the
calibration and paper size settings.
4Select Modify Standard Paper Sizes.
5Under Modify Standard Paper Sizes, select the paper size you want to
adjust. Click Modify.
6In the Custom Paper Size wizard, adjust the printable area as necessary.
Click Finish to exit the Custom Paper Size wizard.
Quick Reference
Commands
PAGESETUP
Controls the page layout, plotting device, paper size, and other settings for
each new layout.
PLOTTERMANAGER
Displays the Plotter Manager, where you can add or edit a plotter
configuration.
Select a Paper Size for a Layout | 1531

Set the Plot Area of a Layout
You can specify the plot area to determine what will be included in the plot.
When you prepare to plot from the Model tab or a layout tab, you can specify
the plot area to determine what will be included in the plot. When you create
a new layout, the default Plot Area option is Layout. Layout plots all objects
within the printable area of the specified paper size.
The Display Plot Area option plots all the objects displayed in the drawing.
The Extents Plot Area option plots all the visible objects in the drawing. The
View Plot Area option plots a saved view. You can use the Window Plot Area
option to define an area to be plotted.
See also:
■Specify the Area to Plot on page 1561
To set the plot area and adjust the display
1Click the layout tab for which you want to set the plot area and adjust
the display.
2Click Output tab ➤ Plot panel ➤ Page Setup Manager.
3In the Page Setup Manager, Page Setups area, select the page setup that
you want to modify.
4Click Modify.
5In the Page Setup dialog box, under Plot Area, select one of the following
options:
■Layout. Prints all objects within the printable area of the paper. This
option is only available from a layout tab.
■Limits. Prints or plots the current grid limits. This option is only
available from the Model tab.
■Extents. Plots all objects in the drawing.
■Display. Plots all objects displayed in the drawing area.
■View. Prints or plots a saved view. Select a named view from the list
provided.
1532 | Chapter 32 Prepare Drawings for Plotting and Publishing
■Window. Plots objects in the area you define. Select the Window
option, and then respond to the prompts to define the area. Click the
Window button to edit the defined area.
6Click OK.
7In the Page Setup Manager, click Close.
Quick Reference
Commands
PAGESETUP
Controls the page layout, plotting device, paper size, and other settings for
each new layout.
Adjust the Plot Offset of a Layout
The printable area of a drawing sheet is defined by the selected output device
and is represented by the dashed line in a layout. When you change the output
device, the printable area may change.
The plot offset specifies an offset of the plot area relative to the lower-left
corner (the origin) of the printable area or the edge of the paper, depending
on the Specify Plot Offset Relative To option specified in the Options dialog
box, Plot and Publish tab. The Plot Offset area of the Plot dialog box displays
the specified plot offset option in parentheses.
You can offset the geometry on the paper by entering a positive or negative
value in the X and Y Offset boxes. However, this may result in the plot area
being clipped.
If you choose to plot an area other than the entire layout, you can also center
the plot on the sheet of paper.
Adjust the Plot Offset of a Layout | 1533
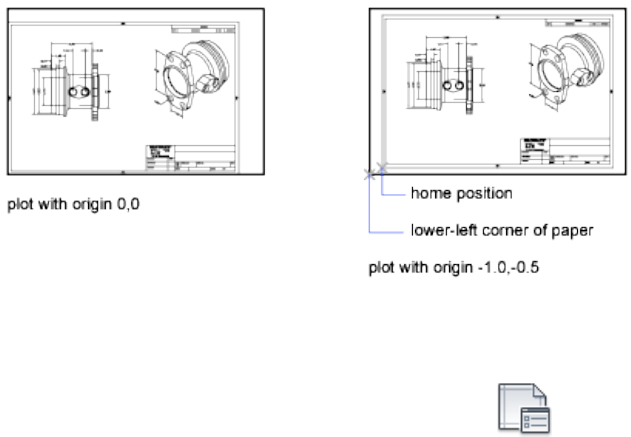
To adjust the plot offset of a layout
1Click the layout tab for which you want to adjust the plot offset.
2Click Output tab ➤ Plot panel ➤ Page Setup Manager.
3In the Page Setup Manager, Page Setups area, select the page setup that
you want to modify.
4Click Modify.
5In the Page Setup dialog box, under Plot Offset, enter a value in units for
X or Y or both. Click OK.
6In the Page Setup Manager, click Close.
Quick Reference
Commands
PAGESETUP
Controls the page layout, plotting device, paper size, and other settings for
each new layout.
System Variables
PLOTOFFSET
Controls whether the plot offset is relative to the printable area or to the
edge of the paper.
1534 | Chapter 32 Prepare Drawings for Plotting and Publishing
Set the Plot Scale for a Layout
When you plot a drawing layout, you can either specify a precise scale for the
layout or fit the image to the paper.
Normally, you plot a layout at a 1:1 scale. To specify a different scale for the
layout, set the plot scale for the layout in the Page Setup or the Plot dialog
box. In those dialog boxes, you can select a scale from a list or enter a scale.
NOTE You can modify the list of scales with SCALELISTEDIT.
When you are reviewing an early draft view, a precise scale is not always
important. You can use the Fit to Paper setting to plot the layout at the largest
possible size that fits the paper.
See also:
■Scale Views in Layout Viewports on page 410
■Draw, Scale, and Annotate in Model Space on page 385
To set the plot scale in a layout
1Click the layout tab for which you want to set the plot scale.
2Click Output tab ➤ Plot panel ➤ Page Setup Manager.
3In the Page Setup Manager, Page Setups area, select the page setup that
you want to modify.
4Click Modify.
5In the Page Setup dialog box, under Plot Scale, select a scale from the
Scale list.
The default scale when plotting a layout is 1:1. To set a custom plot scale,
enter values in the Inches or Millimeters box and the Units box. The type
of unit is determined by the paper size, but you can change it in the list
box.
6Click OK.
7In the Page Setup Manager, click Close.
Set the Plot Scale for a Layout | 1535
To set the Fit to Paper option when plotting
1Click the layout tab for which you want to set the plot scale to Fit to
Paper.
2Click Output tab ➤ Plot panel ➤ Page Setup Manager.
3In the Page Setup Manager, Page Setups area, select the page setup that
you want to modify.
4Click Modify.
5In the Page Setup dialog box, Under Plot Scale, select Fit to Paper.
NOTE If the Plot Area is set to Layout, you cannot select the Fit to Paper
option.
6Click OK.
7In the Page Setup Manager, click Close.
Quick Reference
Commands
SCALELISTEDIT
Controls the list of scales available for layout viewports, page layouts, and
plotting.
PAGESETUP
Controls the page layout, plotting device, paper size, and other settings for
each new layout.
Set the Lineweight Scale for a Layout
You can scale lineweights proportionately in a layout with the plot scale.
Typically, lineweights specify the line width of plotted objects and are plotted
with the line width size regardless of the plot scale. Most often, you use the
default plot scale of 1:1 when plotting a layout. However, if you want to plot
an E-size layout that is scaled to fit on an A-size sheet of paper, for example,
you can specify lineweights to be scaled in proportion to the new plot scale.
1536 | Chapter 32 Prepare Drawings for Plotting and Publishing

See also:
■Control Lineweights on page 532
To scale lineweights in a layout
1Click the layout tab for which you want to scale lineweights.
2Click Output tab ➤ Plot panel ➤ Page Setup Manager.
3In the Page Setup Manager, Page Setups area, select the page setup that
you want to modify.
4Click Modify.
5In the Page Setup dialog box, under Plot Scale, select Scale Lineweights.
The lineweights in the current layout are scaled in proportion to the
designated plot scale. When you are working in the Model tab, this option
is not available.
6Click OK.
7In the Page Setup Manager, click Close.
Quick Reference
Commands
PAGESETUP
Controls the page layout, plotting device, paper size, and other settings for
each new layout.
Select a Plot Style Table for a Layout
A plot style table is a collection of plot styles assigned to a layout or the Model
tab.
A plot style is an object property, similar to linetype and color. Therefore, it
can be assigned to an object or a layer and they control an object's plotted
properties.
Select a Plot Style Table for a Layout | 1537

If you select the Display Plot Styles option under Plot Style Table (Pen
Assignments), the properties of the plot styles assigned to objects are displayed
in the selected layout.
See also:
■Control How Objects Are Plotted on page 1568
To select a plot style table for a layout
1Click the layout tab for which you want to select a plot style table.
2Click Output tab ➤ Plot panel ➤ Page Setup Manager.
3In the Page Setup Manager, Page Setups area, select the page setup that
you want to modify.
4Click Modify.
5In the Page Setup dialog box, Under Plot Style Table, select a Plot Style
Table from the list.
6Click OK.
7In the Page Setup Manager, click Close.
To create a new plot style table for a layout
1Click the layout tab for which you want to create a new plot style table.
2Click Output tab ➤ Plot panel ➤ Page Setup Manager.
3In the Page Setup Manager, Page Setups area, select the page setup that
you want to modify.
4Click Modify.
5In the Page Setup dialog box, Under Plot Style Table, select New from the
list.
6Follow the instructions in the wizard that is shown (the Add
Color-Dependent Plot Style Table wizard or the Add Named Plot Style
Table wizard).
7In the Page Setup dialog box, click OK.
1538 | Chapter 32 Prepare Drawings for Plotting and Publishing

8In the Page Setup Manager, click Close.
To edit a plot style table for a layout
1Click the layout tab for which you want to edit a plot style table.
2Click Output tab ➤ Plot panel ➤ Page Setup Manager.
3In the Page Setup Manager, Page Setups area, select the page setup that
you want to modify.
4Click Modify.
5In the Page Setup dialog box, under Plot Style Table, select the plot style
table you want to edit from the list.
6Click the Edit button.
7In the Plot Style Table Editor, make the required changes. Click Save &
Close.
8In the Page Setup dialog box, click OK.
9In the Page Setup Manager, click Close.
To display plot styles in a layout
1Click the layout tab for which you want to display plot styles.
2Click Output tab ➤ Plot panel ➤ Page Setup Manager.
3In the Page Setup Manager, Page Setups area, select the page setup that
you want to modify.
4Click Modify.
5In the Page Setup dialog box, under Plot Style Table, select the Display
Plot Styles option.
6Click OK.
7In the Page Setup Manager, click Close.
Select a Plot Style Table for a Layout | 1539

Quick Reference
Commands
PAGESETUP
Controls the page layout, plotting device, paper size, and other settings for
each new layout.
STYLESMANAGER
Displays the Plot Style Manager, where you can revise plot style tables.
Set Shaded Viewport and Plot Options for a Layout
Shaded viewport and plot options settings affect how objects are plotted and
are saved in the page setup.
Shaded viewport and plot options affect how objects are plotted. The options
for shaded viewport plotting give you a large degree of flexibility in conveying
your three-dimensional designs to others. You can convey your design intent
by choosing how viewports are plotted and by specifying resolution levels.
Shaded Viewport Plotting Options
With shaded plotting options, you can choose whether to plot a set of shaded
objects using the As Displayed, Wireframe, Hidden, or Rendered option.
Shaded viewport plotting options apply to all objects in viewports and model
space. If you use the Shaded or Rendered options, plot style tables included
in the page setup do not affect plots. If you use the Render option,
two-dimensional wireframe objects, such as lines, arcs, and text, are not plotted.
NOTE Shaded viewport plotting requires a raster-capable device. Most modern
plotters and printers are raster-capable devices.
Plot Options
The following options that can be specified for layouts affect how objects are
plotted.
■Plot Object Lineweights. Specifies that lineweights assigned to objects and
layers are plotted.
■Plot with Transparency. Specifies that transparency applied to objects and
layers is plotted.
1540 | Chapter 32 Prepare Drawings for Plotting and Publishing

■Plot with Plot Styles. Specifies that the drawing is plotted using plot styles.
Selecting this option automatically plots lineweights. If you do not select
this option, objects are plotted with their assigned properties and not with
the plot style overrides.
■Plot Paper Space Last. Specifies that objects in model space are plotted
before those in paper space.
■Hide Paperspace Objects. Specifies whether the Hide operation applies to
objects in the paper space viewport. This option is available only from a
layout tab. The effect of this setting is reflected in the plot preview, but
not in the layout.
See also:
■Set Shaded Viewport Options on page 1571
■Set Options for Plotted Objects on page 1575
To set shaded viewport options for a layout
1Click the layout tab for which you want to set shaded viewport options.
2Click Output tab ➤ Plot panel ➤ Page Setup Manager.
3In the Page Setup Manager, Page Setups area, select the page setup that
you want to modify.
4Click Modify.
5In the Page Setup dialog box, under Shaded Viewport Options, select the
required settings.
6Click OK.
7In the Page Setup Manager, click Close.
To set plot options for a layout
1Click the layout tab for which you want to set plot options.
2Click Output tab ➤ Plot panel ➤ Page Setup Manager.
Set Shaded Viewport and Plot Options for a Layout | 1541
3In the Page Setup Manager, Page Setups area, select the page setup that
you want to modify.
4Click Modify.
5In the Page Setup dialog box, under Plot Options, select the required
settings.
6Click OK.
7In the Page Setup Manager, click Close.
Quick Reference
Commands
PAGESETUP
Controls the page layout, plotting device, paper size, and other settings for
each new layout.
Determine the Drawing Orientation of a Layout
You can specify the orientation of the drawing on the paper using the
Landscape and Portrait settings. Landscape orients the drawing on the paper
so that the long edge of the paper is horizontal, and Portrait orients the paper
so that the short edge is horizontal. Changing the orientation creates the effect
of rotating the paper underneath the drawing.
In either landscape or portrait orientation, you can select Plot Upside-Down
to control whether the top or bottom of the drawing is plotted first.
Although you can specify the drawing orientation in both the Page Setup
dialog box and the Plot dialog box, the Page Setup settings are always saved
and reflected in the layout. In the Plot dialog box, you can override the page
setup settings for a single plot; however, the settings you apply are not saved
in the layout. To save the settings you apply using the Plot dialog box, click
the Apply to Layout button in the Plot dialog box.
If you change the drawing orientation, the layout origin remains in the
lower-left corner of the rotated page.
To set the orientation of the plotted drawing
1Click the layout tab for which you want to set the drawing orientation.
1542 | Chapter 32 Prepare Drawings for Plotting and Publishing

2Click Output tab ➤ Plot panel ➤ Page Setup Manager.
3In the Page Setup Manager, Page Setups area, select the page setup that
you want to modify.
4Click Modify.
5In the Page Setup dialog box, under Drawing Orientation, do one of the
following:
■If your drawing is horizontal, select Landscape.
■If your drawing is vertical, select Portrait.
■To rotate 180 degrees, select either Portrait or Landscape, and then
select Plot Upside-Down.
6Click OK.
7In the Page Setup Manager, click Close.
Quick Reference
Commands
PAGESETUP
Controls the page layout, plotting device, paper size, and other settings for
each new layout.
Use the Layout Wizard to Specify Layout Settings
You can create a new layout using the Create Layout wizard.
The wizard prompts you for information about the layout settings, including
■A name for the new layout
■The printer associated with the layout
■A paper size to use for the layout
■The orientation of the drawing on the paper
■A title block
Use the Layout Wizard to Specify Layout Settings | 1543

■Viewport setup information
■A location for the viewport configuration in the layout
You can edit the information entered in the wizard later. Click Output
tab ➤ Plot panel ➤ Page Setup Manger. In the Page Setup Manager,
click Modify.
To create a layout using the wizard
1Click Insert menu ➤ Layout ➤ Layout Wizard.
2On each page of the Create Layout wizard, select the appropriate settings
for the new layout.
When finished, the new layout will be the current layout tab.
Quick Reference
Commands
LAYOUTWIZARD
Creates a new layout tab and specifies page and plot settings.
PAGESETUP
Controls the page layout, plotting device, paper size, and other settings for
each new layout.
Import PCP or PC2 Settings into a Layout
You can import layout and plot settings contained in PCP or PC2 files into
the current layout.
If you work with drawings created in AutoCAD Release 14 or earlier, you can
choose to import layout and plot settings contained in a PCP or PC2 file and
apply them to the current layout. Settings that are saved in a PCP or PC2 file
include
■Plot Area
■Rotation
1544 | Chapter 32 Prepare Drawings for Plotting and Publishing
■Paper Size
■Plot Scale
■Plot Origin
■Plot Offset
In addition, a PC2 file contains any resolution information that has been
modified by a plotter calibration. Pen assignment information can also be
imported and saved in a plot style table using the Add Plot Style Table wizard.
To import plotting device and pen settings information, you can use the
Import PCP or PC2 Plot Settings wizard to choose a PCP or PC2 file whose
settings you want to import. You can also choose to modify any of the
imported settings using the Page Setup dialog box.
To import PCP or PC2 settings into the current layout
1At the command prompt, enter pcinwizard.
2In the Import PCP or PC2 Plot Settings wizard, select the PCP or PC2 file
whose settings you want to import into the current layout.
Quick Reference
Commands
PCINWIZARD
Displays a wizard to import PCP and PC2 configuration file plot settings into
the Model tab or current layout.
Create and Use Named Page Setups
You can save plot device and other page setup settings as named page setups
that can be modified and imported into other drawings.
You can create named page setups and apply them to other layouts in your
drawing. Named page setups are saved in the drawing file and can be imported
into other drawing files and applied to other layouts. You can also modify the
settings of named page setups. If you modify a named page setup, you can
choose whether the modifications apply to the current layout or to all the
layouts in the current drawing that use the named page setup.
Create and Use Named Page Setups | 1545
If you want to plot the same layout more than one way, or if you want to
specify the same output options for several layouts, use named page setups.
You can apply different named page setups to the same layout to achieve
specific results when plotting. For example, you might create the named page
setups in the following table to control scaling and paper size.
DescriptionPage setup name
Plot at scale 1:1, E-size sheetNoScaling
Plot at scale 1:2, C-size sheetScale 1 to 2
Plot to the draft-quality plotterDraft
Plot to the high-quality plotterFinal
Fit to Paper, A-size sheetFit-to-Paper
Once you specify a named page setup for a layout, whenever you plot or
publish the layout, it is plotted or published with the settings specified in the
named page setup set for the layout.
To create a new named page setup
1Click Output tab ➤ Plot panel ➤ Page Setup Manager.
2In the Page Setup Manager, Page Setups area, click New.
3In the New Page Setup dialog box, enter a name for the new page setup.
4Under Start With, select a page setup in the list. The settings specified in
the selected page setup will be displayed in the Page Setup dialog box
after you click OK.
5Click OK.
6In the Page Setup dialog box, change any required settings. Click OK.
The new page setup is displayed in the Page Setups list in the Page Setup
Manager.
7To apply the new page setup to the current layout, in the Page Setup
Manager, click Set Current.
8In the Page Setup Manager, click Close.
1546 | Chapter 32 Prepare Drawings for Plotting and Publishing
To apply a named page setup to a layout
1Click the layout tab for which you want to apply a named page setup.
2Click Output tab ➤ Plot panel ➤ Page Setup Manager.
3In the Page Setup Manager, under Page Setups, select a named page setup
from the list.
NOTE A page setup that is not named is shown in the Page Setup Manager
with an asterisk on either side of its layout name. An unnamed page setup
does not have the same functionality as a named page setup. For example,
if you set an unnamed page setup as the current page setup for another
layout, the values are applied to the layout. If you make changes to the original
unnamed page setup, those changes do not carry over to the layout to which
the unnamed page setup was applied.
4Click Set Current.
5Click Close.
To modify a named page setup
1Click Output tab ➤ Plot panel ➤ Page Setup Manager.
2In the Page Setup Manager, under Page Setups, select a named page setup
from the list.
NOTE A page setup that is not named is shown in the Page Setup Manager
with an asterisk on either side of its layout name. An unnamed page setup
does not have the same functionality as a named page setup. For example,
if you set an unnamed page setup as the current page setup for another
layout, the values are applied to the layout. If you make changes to the original
unnamed page setup, those changes do not carry over to the layout to which
the unnamed page setup was applied.
3Click Modify.
4In the Page Setup dialog box, make the required changes. Click OK.
5In the Page Setup Manager, click Close.
Create and Use Named Page Setups | 1547
To import named page setups from another drawing
1Click Output tab ➤ Plot panel ➤ Page Setup Manager.
2In the Page Setup Manager, click Import.
3In the Select Page Setup From File dialog box, select a drawing file from
which you want to import one or more named page setups. Click Import.
4In the Import Page Setups dialog box, select one or more page setups to
import. Click OK.
If a page setup with the same name already exists in the drawing, you
can redefine the settings of the existing one with the settings of the
imported page setup, or you can cancel the operation.
The imported page setups are displayed in the Page Setup Manager in the
list of page setups.
NOTE You can import both model space and layout page setups at the same
time. However, an imported model space page setup is shown in the Page
Setup Manager only if the model tab was current when you opened the Page
Setup Manager. Similarly, an imported layout page setup is shown in the
Page Setup Manager only if a layout tab was current when you opened the
Page Setup Manager.
5In the Page Setup Manager, click Close.
To delete a named page setup
1Click Output tab ➤ Plot panel ➤ Page Setup Manager.
2In the Page Setup Manager, under Page Setups, right-click the named
page setup you want to delete. Click Delete.
NOTE A page setup that is not named is shown in the Page Setup Manager
with an asterisk on either side of its layout name. An unnamed page setup
does not have the same functionality as a named page setup. For example,
if you set an unnamed page setup as the current page setup for another
layout, the values are applied to the layout. If you make changes to the original
unnamed page setup, those changes do not carry over to the layout to which
the unnamed page setup was applied.
1548 | Chapter 32 Prepare Drawings for Plotting and Publishing
3Click Close.
To rename a page setup
1Click Output tab ➤ Plot panel ➤ Page Setup Manager.
2In the Page Setup Manager, under Page Setups, right-click the named
page setup you want to rename. Click Rename.
NOTE A page setup that is not named is shown in the Page Setup Manager
with an asterisk on either side of its layout name. An unnamed page setup
does not have the same functionality as a named page setup. For example,
if you set an unnamed page setup as the current page setup for another
layout, the values are applied to the layout. If you make changes to the original
unnamed page setup, those changes do not carry over to the layout to which
the unnamed page setup was applied.
3Enter a new name for the page setup.
4Click Close.
Quick Reference
Commands
PAGESETUP
Controls the page layout, plotting device, paper size, and other settings for
each new layout.
Use Named Page Setups with Sheet Sets
You can use named page setups to specify the same output options for all the
sheets in a sheet set.
You can create a sheet from scratch using the Sheet Set Manager, and then
apply a named page setup to the layout.
You can also apply named page setups that are stored in the sheet set's page
setup overrides DWT file to a single sheet or to an entire sheet set for a
one-time publish operation.
Use Named Page Setups with Sheet Sets | 1549
See also:
■Create and Use Named Page Setups on page 1545
To apply a named page setup to a sheet created from scratch
1Click View tab ➤ Palettes panel ➤ Sheet Set Manager.
2In the Open Sheet Set dialog box, select a sheet set. Click Open.
3In the Sheet Set Manager, right click in the Sheets area. Click New Sheet.
4In the New Sheet dialog box, enter a number and sheet title. Click OK.
5In the Sheet Set Manager, under Sheets, double-click the new sheet.
6Click Output tab ➤ Plot panel ➤ Page Setup Manager.
7In the Page Setup Manager, under Page Setups, select a named page setup.
Click Set Current.
Named page setups are not enclosed in asterisks.
8Click Close.
To apply a named page setup as an override when publishing sheets
1Click View tab ➤ Palettes panel ➤ Sheet Set Manager.
2In the Open Sheet Set dialog box, select a sheet set. Click Open.
3In the Sheet Set Manager, in the Sheets area, select a sheet set, a subset,
or a sheet to publish.
4At the top of the Sheet Set Manager, click the Publish button.
5On the shortcut menu, place your cursor over Publish Using Page Setup
Override.
6On the submenu, click the named page setup you want to use.
1550 | Chapter 32 Prepare Drawings for Plotting and Publishing
Quick Reference
Commands
PAGESETUP
Controls the page layout, plotting device, paper size, and other settings for
each new layout.
PUBLISH
Publishes drawings to DWF, DWFx, and PDF files, or to plotters.
SHEETSET
Opens the Sheet Set Manager.
Use Named Page Setups with Sheet Sets | 1551
1552
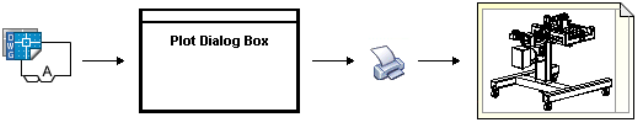
Plot Drawings
Once you have completed a drawing, you can use a number of methods to output the drawing.
You can plot the drawing on paper or create a file for use with another application. In either
case, you select the plot settings.
Quick Start to Plotting
To print a single layout or part of a drawing, use the Plot dialog box.
Use a named page setup or change the settings in the Plot dialog box to define
the output of your drawing.
To output more than one drawing, use the Publish dialog box.
Quick Reference
Commands
PLOT
Plots a drawing to a plotter, printer, or file.
Overview of Plotting
Understanding terms and concepts that relate to plotting makes your first
plotting experience in the program easier.
33
1553
Plotter Manager
The Plotter Manager is a window that lists plotter configuration (PC3) files
for every non-system printer that you install. Plotter configuration files can
also be created for Windows® system printers if you want to use default
properties different from those used by Windows. Plotter configuration settings
specify port information, raster and vector graphics quality, paper sizes, and
custom properties that depend on the plotter type.
The Plotter Manager contains the Add-a-Plotter wizard, which is the primary
tool for creating plotter configurations. The Add-a-Plotter wizard prompts you
for information about the plotter you want to set up.
Layouts
A layout represents a plotted page. You can create as many layouts as you
need. Each layout is saved on its own layout tab and can be associated with
a different page setup.
Elements that appear only on a plotted page, such as title blocks and notes,
are drawn in paper space in a layout. The objects in the drawing are created
in model space on the Model tab. To view these objects in the layout, you
create layout viewports.
Layout Initialization
Layout initialization is a process in which a previously unused layout is made
active, by clicking on its tab.
A layout does not contain any plot settings before initialization. Once
initialized, layouts can be drawn upon, published, and added to sheet sets as
sheets (after the drawing has been saved).
Page Setups
When you create a layout, you specify a plotter and settings such as page size
and plot orientation. These settings are saved in a page setup. You can control
these settings for layouts and for the Model tab using the Page Setup Manager.
You can name and save page setups for use with other layouts.
If you don't specify all the settings in the Page Setup dialog box when you
create a layout, you can set up the page just before you plot. Or you can
override a page setup at plot time. You can use the new page setup temporarily
for the current plot, or you can save the new page setup.
1554 | Chapter 33 Plot Drawings

Plot Styles
A plot style controls how an object or layer is plotted by determining plotted
properties such as lineweight, color, and fill style. Plot style tables collect
groups of plot styles. The Plot Style Manager is a window that shows all the
plot style tables available.
There are two plot style types: color-dependent and named. A drawing can
use only one type of plot style table. You can convert a plot style table from
one type to the other. You can also change the type of plot style table a
drawing uses once it has been set.
For color-dependent plot style tables, an object's color determines how it is plotted.
These plot style table files have .ctb extensions. You cannot assign
color-dependent plot styles directly to objects. Instead, to control how an
object is plotted, you change its color. For example, all objects assigned the
color red in a drawing are plotted the same way.
Named plot style tables use plot styles that are assigned directly to objects and
layers. These plot style table files have .stb extensions. Using them enables
each object in a drawing to be plotted differently, independent of its color.
Plot Stamps
A plot stamp is a line of text that is added to your plot. You can specify where
this text is located on the plot in the Plot Stamp dialog box. Turn this option
on to add specified plot stamp information—including drawing name, layout
name, date and time, and so on—to a drawing that is plotted to any device.
You can choose to record the plot stamp information to a log file instead of
plotting it, or in addition to plotting it.
NOTE A drawing file or drawing template file that was created with an educational
version will always be plotted with the following plot stamp: PRODUCED BY AN
AUTODESK EDUCATIONAL PRODUCT. Blocks and xrefs created with an educational
version and used in a commercial version will also result in the educational plot
stamp being plotted.
See also:
■Create Multiple-View Drawing Layouts (Paper Space) on page 391
■“To view the custom properties Help” in the Driver and Peripheral Guide
Overview of Plotting | 1555
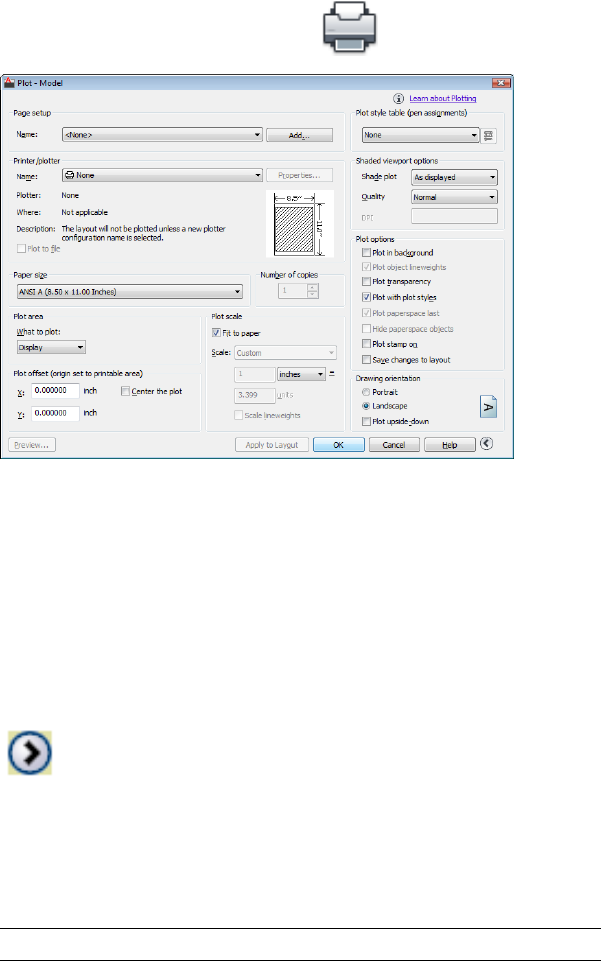
To plot a drawing
1Click Output tab ➤ Plot panel ➤ Plot.
2In the Plot dialog box, under Printer/Plotter, select a plotter from the
Name list.
3Under Paper Size, select a paper size from the Paper Size box.
4(Optional) Under Number of Copies, enter the number of copies to plot.
5Under Plot Area, specify the portion of your drawing to plot.
6Under Plot Scale, select a scale from the Scale box.
7For more options, click the More Options button.
8(Optional) Under Plot Style Table (Pen Assignments), select a plot style
table from the Name box.
9(Optional) Under Shaded Viewport Options and Plot Options, select any
appropriate settings.
NOTE Plot stamping happens at plot time and is not saved with the drawing.
1556 | Chapter 33 Plot Drawings
10 Under Drawing Orientation, select an orientation.
11 Click OK.
To plot at the command prompt instead of in a dialog box, use -PLOT.
To turn background plotting on or off
1Click Application menu ➤ Options.
2In the Options dialog box, Plot and Publish tab, under Background
Processing Options, select or clear the Enable Background Plot When
Plotting option.
3Click OK.
NOTE When you plot in the background, you can return immediately to
your drawing. While a plot job is being processed in the background, you
can check the status of your job by placing your cursor over the plotter icon
in the status tray. You can also view details about all completed jobs from
the current program session.
To check the status of a plot job currently processing in the background
■In the status tray, place your mouse over the plotter icon. The tooltip
displays the status of the plot job.
To cancel part or all of a plot job that is processing in the background
■In the status tray, right-click the plotter icon. Click Cancel Sheet
<sheetname> or Cancel Entire Job.
To view details about jobs you have plotted
1Do one of the following:
■Click Output tab ➤ Plot panel ➤ View Details.
■In the status tray, click the plotter icon.
2In the Plot and Publish Details dialog box, view details about plotted
jobs.
Overview of Plotting | 1557
Quick Reference
Commands
OPTIONS
Customizes the program settings.
PAGESETUP
Controls the page layout, plotting device, paper size, and other settings for
each new layout.
PCINWIZARD
Displays a wizard to import PCP and PC2 configuration file plot settings into
the Model tab or current layout.
PLOT
Plots a drawing to a plotter, printer, or file.
PLOTSTAMP
Places a plot stamp on a specified corner of each drawing and logs it to a file.
PLOTTERMANAGER
Displays the Plotter Manager, where you can add or edit a plotter
configuration.
STYLESMANAGER
Displays the Plot Style Manager, where you can revise plot style tables.
VIEWPLOTDETAILS
Displays information about completed plot and publish jobs.
System Variables
BACKGROUNDPLOT
Controls whether background plotting is turned on or off for plotting and
publishing.
Use a Page Setup to Specify Plot Settings
You can use a page setup to save and reuse settings for your plot jobs.
1558 | Chapter 33 Plot Drawings

When you select a page setup in the Plot dialog box, the settings from the
page setup are added to the Plot dialog box. You can choose to plot with those
settings, or change any of the settings individually and then plot.
Any settings you specify in the Plot dialog box can be saved as a new named
page setup by clicking the Add button in the Page Setup area.
Any settings specified in the Plot dialog box, whether you've applied a page
setup from the Page Setup list, or changed the settings individually, can be
saved to the layout for use the next time you plot.
To plot a drawing using the settings specified in a page setup
1Click Output tab ➤ Plot panel ➤ Plot.
2In the Plot dialog box, under Page Setups, select a page setup from the
list.
3(Optional) Change any of the individual settings in the Plot dialog box.
4To save these settings to the layout, click Apply to Layout.
5Click Plot.
To save plot settings as a new named page setup
1Click Output tab ➤ Plot panel ➤ Plot.
2In the Plot dialog box, change the required settings.
3Under Page Setups, click Add.
4In the Add Page Setup dialog box, enter a name for the new named page
setup. Click OK.
To save plot settings to the layout
1Select a layout tab.
2Click Output tab ➤ Plot panel ➤ Plot.
3In the Plot dialog box, under Page Setups, select a page setup or specify
settings individually.
Use a Page Setup to Specify Plot Settings | 1559

4Click Apply to Layout.
Quick Reference
Commands
PAGESETUP
Controls the page layout, plotting device, paper size, and other settings for
each new layout.
PLOT
Plots a drawing to a plotter, printer, or file.
PLOTTERMANAGER
Displays the Plotter Manager, where you can add or edit a plotter
configuration.
Select a Printer or Plotter
Before plotting a drawing, you must select a printer or plotter. The device you
select affects the printable area of the drawing.
After selecting a printing or plotting device, you also can easily plot a drawing
using the default settings in the Plot dialog box.
To select a printer or plotter
1Click Output tab ➤ Plot panel ➤ Plot.
2In the Plot dialog box, under Printer/Plotter, select a plotter from the
Name list.
If you have already selected a paper size and it is not supported by the
plotter you have chosen, you are warned that a paper size supported by
the plotter will be used. Click OK if the warning is displayed.
3Once you have selected a plotter, you can continue to select a paper size,
or if the paper size is correct, click OK to plot the drawing.
1560 | Chapter 33 Plot Drawings
Quick Reference
Commands
PAGESETUP
Controls the page layout, plotting device, paper size, and other settings for
each new layout.
PLOT
Plots a drawing to a plotter, printer, or file.
PLOTTERMANAGER
Displays the Plotter Manager, where you can add or edit a plotter
configuration.
Specify the Area to Plot
When plotting a drawing, you must specify the area of the drawing to plot.
The Plot dialog box provides the following options under Plot Area.
■Layout or Limits. When plotting a layout, plots everything within the
printable area of the specified paper size, with the origin calculated from
0,0 in the layout. When plotting the Model tab, plots the entire drawing
area defined by the grid limits. If the current viewport does not display a
plan view, this option has the same effect as the Extents option.
■Extents. Plots the portion of the current space of the drawing that contains
objects. All geometry in the current space is plotted. The drawing might
be regenerated to recalculate the extents before plotting.
■Display. Plots the view in the current viewport in the Model tab or the
current paper space view in a layout tab.
■View. Plots a view saved previously with the VIEW command. You can
select a named view from the list provided. If there are no saved views in
the drawing, this option is unavailable.
■Window. Plots any portion of the drawing you specify. Click the Window
button to use a pointing device to specify opposite corners of the area to
be plotted, or enter coordinate values.
Specify the Area to Plot | 1561

To set the drawing area as you plot
1Click Output tab ➤ Plot panel ➤ Plot.
2In the Plot dialog box, under Plot Area, specify the portion of your
drawing that you want to plot.
3Change other settings as needed. Click OK to plot the drawing.
Quick Reference
Commands
PAGESETUP
Controls the page layout, plotting device, paper size, and other settings for
each new layout.
PLOT
Plots a drawing to a plotter, printer, or file.
Set Paper Size
In the Plot dialog box, select the paper size that you want to use.
If you plot from a layout, you may have already specified a paper size in the
Page Setup dialog box. However, if you plot from the Model tab, you need to
specify a paper size when you plot. In the Plot dialog box, select the paper
size that you want to use. The list of paper sizes depends on the printer or
plotter that you have selected in either the Plot or Page Setup dialog box. The
list of available plotters includes all those that are currently configured for use
with Windows and those for which you have installed non-system drivers.
You can also set the default page size used to create new layouts for most
plotters by editing the PC3 file associated with that plotter. For Windows
system printers, you can use this technique to specify different default page
sizes for Windows and for this program.
NOTE If the PAPERUPDATE system variable is set to 0, you are prompted if the
layout's existing paper size is not supported by the plotter you have selected. If
the PAPERUPDATE system variable is set to 1, the paper size is automatically
updated to reflect the default paper size of the selected plotter.
1562 | Chapter 33 Plot Drawings
Use a Custom Paper Size
If you need to specify a paper size that is not listed in either the Plot dialog
box or the Page Setup dialog box, you can add a custom paper size for a
non-system plotter using the Plotter Configuration Editor. Typically, you
cannot add a custom paper size to Windows system printers because the
allowable page sizes and printable areas are determined by the manufacturer.
However, you can modify the printable area for paper sizes associated with a
Windows system printer.
To select a paper size for the current plot
1Click Output tab ➤ Plot panel ➤ Plot.
2In the Plot dialog box, under Printer/Plotter, select a plotter in the Name
box.
3Under Paper Size, select a paper size from the list.
The paper sizes that are listed depend on the plotter you selected.
To set the default paper size for a layout
1Click Output tab ➤ Plot panel ➤ Page Setup.
2In Page Setup Manager, Page Setups area, the layout for which you want
to set the paper size should be selected. If not, select the layout. Click
Modify.
3In the Page Setup dialog box, under Paper Size, select a paper size from
the list. Click OK.
The paper sizes that are listed depend on the plotter specified in the page
setup.
4In Page Setup Manager, click Close.
The layout reflects the changes.
To set the default paper size for a plotter
1Click Output tab ➤ Plot panel ➤ Plot.
Set Paper Size | 1563
2In the Plot dialog box, under Printer/Plotter, select a plotter from the
Name list.
3Click Properties.
The Plotter Configuration Editor is displayed.
4To specify a default paper size, use one of the following methods:
■For a non-system plotter, under Media, select Source and Size.
■For a system printer, in the tree view, select Custom Properties. Then
under Access Custom Dialog, select Custom Properties.
5Select the appropriate paper size.
6Click OK to close each dialog box.
NOTE The available paper sizes depend on the printer or plotter. Some plotter
manufacturers may control paper size differently in the Plotter Configuration
Editor.
To create or edit a custom paper size for a non-system printer
1Click Output tab ➤ Plot panel ➤ Manage Plotters.
2In the Plotter Manager, double-click the PC3 file whose configuration
you want to change.
3In the Plotter Configuration Editor, Device and Document Settings tab,
under the User Defined Paper Sizes & Calibration, select Custom Paper
Sizes.
4Set a new paper size using one of the following methods:
■To add a custom paper size, click Add and follow the steps in the
Custom Paper Size wizard. You specify the size of the paper, the
printable area, and a name for the new paper size.
■To edit an existing paper size, under Custom Paper Sizes, select the
paper size and click Edit. The Custom Paper Size wizard opens. Change
any of the paper size settings.
5Click OK.
The new or edited paper size is available in both the Plot and Page Setup
dialog boxes when that PC3 file is selected.
1564 | Chapter 33 Plot Drawings

NOTE Creating a custom paper size for a non-system driver attaches a plot
model parameter (PMP) file to the plotter configuration (PC3) file. The PMP
file contains custom plotter calibration and custom paper size information.
By default, PMP files are stored in the Drv folder.
Quick Reference
Commands
PAGESETUP
Controls the page layout, plotting device, paper size, and other settings for
each new layout.
PLOT
Plots a drawing to a plotter, printer, or file.
PLOTTERMANAGER
Displays the Plotter Manager, where you can add or edit a plotter
configuration.
System Variables
PAPERUPDATE
Controls the display of a warning dialog box when attempting to print a
layout with a paper size different from the paper size specified by the default
for the plotter configuration file.
Position the Drawing on the Paper
There are several ways to position a drawing on the paper. You can specify
the printable area, set the position of the plot, and set the drawing orientation.
Specify the Printable Area
The printable area is displayed by a dashed border in a layout. The plotter and
paper size you select determine the printable area.
Position the Drawing on the Paper | 1565

WARNING If you set your plotter to use paper-saving features such as plotting
inked area or nesting, your plotter will probably not use the printable area and
plot offset specifications.
If your plotter reports an incorrect printable area for your paper size, you can
adjust the printable area in the Modify Standard Paper Sizes area under the
Modify Standard Paper Sizes (Printable Area) option on the Device and
Document Settings tab in the Plotter Configuration Editor.
NOTE The Modify Standard Paper Sizes option is not a margins feature. Specify
where your drawing is plotted on the page in the Plot Offset area in the Plot dialog
box.
Quick Reference
Commands
PAGESETUP
Controls the page layout, plotting device, paper size, and other settings for
each new layout.
PLOT
Plots a drawing to a plotter, printer, or file.
PLOTTERMANAGER
Displays the Plotter Manager, where you can add or edit a plotter
configuration.
Set the Position of the Plot
The printable area of a drawing sheet is defined by the selected output device
and is represented by the dashed line in a layout. You can change the position
of plot relative to the printable area or to the edge of the paper.
The printable area of a drawing sheet is defined by the selected output device
and is represented by the dashed line in a layout. When you change to another
output device, the printable area may change.
The settings in the Plot Offset area of the Plot dialog box specify an offset of
the plot area relative to the lower-left corner (the origin) of the printable area
or the edge of the paper, depending on the setting made in the Specify Plot
Offset Relative To option (Options dialog box, Plot and Publish tab). The Plot
1566 | Chapter 33 Plot Drawings
Offset area of the Plot dialog box displays the specified plot offset option in
parentheses.
You can offset the drawing on the paper by entering positive or negative values
in the X and Y offset boxes. However, this may result in the plot area being
clipped. If the Plot Area is not set to Layout (Extents, Display, View, or
Window), you can also select the Center the Plot option.
Quick Reference
Commands
PAGESETUP
Controls the page layout, plotting device, paper size, and other settings for
each new layout.
PLOT
Plots a drawing to a plotter, printer, or file.
PLOTTERMANAGER
Displays the Plotter Manager, where you can add or edit a plotter
configuration.
Set Drawing Orientation
The drawing orientation determines whether the position of the plotted
drawing is landscape (the longer edge of the drawing is horizontal) or portrait
(the longer edge of the drawing is vertical). This is based on the size of paper
selected. You can also choose to plot upside down.
Quick Reference
Commands
PAGESETUP
Controls the page layout, plotting device, paper size, and other settings for
each new layout.
PLOT
Plots a drawing to a plotter, printer, or file.
Set Drawing Orientation | 1567

PLOTTERMANAGER
Displays the Plotter Manager, where you can add or edit a plotter
configuration.
System Variables
PLOTROTMODE
Controls the orientation of plots.
Control How Objects Are Plotted
You can control how objects are plotted by setting the plot scale, by using
plot styles and plot style tables, and by setting an object's layer properties.
Set Plot Scale
When you specify a scale to output your drawing, you can choose from a list
of real-world scales, enter your own scale, or select Fit to Paper to scale the
drawing to fit onto the selected paper size.
Usually, you draw objects at their actual size. That is, you decide how to
interpret the size of a unit (an inch, a millimeter, a meter) and draw on a 1:1
scale. For example, if your unit of measurement is millimeters, then every unit
in your drawing represents a millimeter. When you plot the drawing, you
either specify a precise scale or fit the image to the paper.
Most final drawings are plotted at a precise scale. The method used to set the
plot scale depends on whether you plot the Model tab or a layout:
■On the Model tab, you can establish the scale in the Plot dialog box. This
scale represents a ratio of plotted units to the world-size units you used to
draw the model.
■In a layout, you work with two scales. The first affects the overall layout
of the drawing, which usually is scaled 1:1, based on the paper size. The
second is the scale of the model itself, which is displayed in layout
viewports. The scale in each of these viewports represents a ratio of the
paper size to the size of the model in the viewport.
NOTE You can modify the list of scales that are displayed in all view and plot scale
lists with SCALELISTEDIT.
1568 | Chapter 33 Plot Drawings
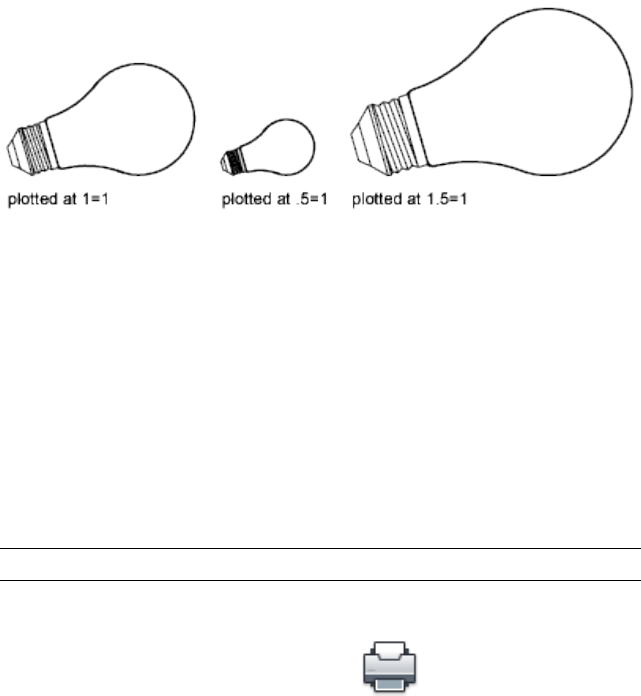
Set a Specific Scale
When you plot, the paper size you select determines the unit type, inches or
millimeters. For example, if the paper size is in mm, entering 1 under mm
and 10 under Units produces a plotted drawing in which each plotted
millimeter represents 10 actual millimeters.
The illustrations show a light bulb plotted at three different scales.
Scale the Drawing to Fit the Page
When you review drafts, a precise scale is not always important. You can use
the Fit to Paper option to plot the view at the largest possible size that fits the
paper. The height or width of the drawing is fit to the corresponding height
or width of the paper.
When you plot a perspective view from model space, the view is scaled to fit
the paper even when you enter a scale.
When you select the Fit to Paper option, the text boxes change to reflect the
ratio of plotted units to drawing units. This scale is updated whenever you
change the paper size, plotter, plot origin, orientation, or size of the plotted
area in the Plot dialog box.
NOTE This option is not available when the Plot Area is set to Layout.
To plot using a real-world scale
1Click Output tab ➤ Plot panel ➤ Plot.
2In the Plot dialog box, under Plot Scale, select a scale from the Scale box.
3Click OK to plot the drawing.
Set Plot Scale | 1569
To plot using a custom scale
1Click Output tab ➤ Plot panel ➤ Plot.
2In the Plot dialog box, under Plot Scale, enter a custom scale. The scale
requires two values, the number of plotted units (inches or mm) per the
number of drawing units. The type of unit is determined by the paper
size, but you can change it in the list box.
If you enter a custom scale, Custom is automatically selected in the Scale
box, even if the scale you enter is the same as a standard scale in the list.
A custom scale is the ratio between the plotted units and drawing units.
For example, 1:12 and 2:24 are plotted at the same scale.
3Click OK to plot the drawing.
To scale a drawing to fit the page
1Click Output tab ➤ Plot panel ➤ Plot.
2In the Plot dialog box, under Plot Scale, select the Fit to Paper option.
The resulting scale is automatically calculated. The ratio of plotted units
to drawing units in the custom scale boxes is displayed.
3Click OK to plot the drawing.
NOTE This option is not available when the Plot Area is set to Layout.
Quick Reference
Commands
PAGESETUP
Controls the page layout, plotting device, paper size, and other settings for
each new layout.
PLOT
Plots a drawing to a plotter, printer, or file.
1570 | Chapter 33 Plot Drawings

SCALELISTEDIT
Controls the list of scales available for layout viewports, page layouts, and
plotting.
Set Shaded Viewport Options
You can choose among several options for plotting shaded and rendered
viewports. You can plot a viewport as it is displayed, in wireframe, with hidden
lines removed, or as rendered.
Overview of Shaded Viewport Plotting
The options for shaded viewport plotting give you a large degree of flexibility
in conveying your three-dimensional designs to others. You can convey your
design intent by choosing how viewports are plotted and by specifying
resolution levels.
With shaded plotting options, you can choose whether to plot a set of shaded
objects as displayed or in wireframe, hidden mode, a visual style, or rendered.
Shaded and rendered viewports are plot-previewed, plotted, plotted to file,
and published with full shading and rendering.
You can use realistic plots in your presentations by plotting viewports as they
are displayed on the screen or otherwise.
NOTE If hardware acceleration is disabled or is enabled, but does not support all
of the available hardware effects, it is possible to plot a drawing that contains
shaded viewports with unsupported hardware effects by the graphics card through
software emulation. To enable software emulation of hardware effects that are
not supported by your graphics card, enter 3dconfig, and click Manual Tune. In
the Manual Performance Tuning dialog box, click Emulate unsupported hardware
effects in software when plotting. The effects will not appear in the viewport in
real-time, but will appear in the hardcopy or electronic file that is created during
the plot process.
Shaded viewport plotting options apply to all objects in viewports and model
space. If you use the Shaded or Rendered options plot style tables included in
the page setup do not affect plots. If you use the Render option,
two-dimensional wireframe objects, such as lines, arcs, and text, are not plotted.
NOTE Shaded viewport plotting requires a raster-capable device. Most modern
plotters and printers are raster-capable devices.
Set Shaded Viewport Options | 1571
Quick Reference
Commands
3DCONFIG
Sets options that affect 3D display performance.
GRAPHICSCONFIG
Sets options for 3D display performance.
PLOT
Plots a drawing to a plotter, printer, or file.
SHADEMODE
Starts the VSCURRENT command.
Specify Shaded Plotting Settings
If you are plotting a drawing that contains 3D solids that are shaded, you can
control how the drawing is plotted.
Specifically, you can choose from the following options:
■As Displayed. Plots the design as it is displayed; all the shading is preserved.
■Wireframe. Displays lines and curves to represent object boundaries.
■Hidden. Suppresses the plotting of objects that are located behind other
objects.
■Visual Styles. Plots the design as it appears in the visual style you select.
■Rendered. Renders objects before they are plotted, based on Render options
you set before you plot or based on the render preset you select.
■Render Presets. Renders objects based on the render preset you select.
You can select an option for your drawing either from model space or from a
layout. From model space, the options are available in the Properties palette
and the Plot dialog box. From a layout, after you select a viewport, the options
are available from the shortcut menu and from the Properties palette.
Either way, you can save your settings with the drawing.
1572 | Chapter 33 Plot Drawings
NOTE If you select the Rendered option, specify Render settings before plotting.
If the Rendered option is used for a highly complex set of objects, the hardcopy
output might contain only the viewport border.
To modify the shade plot setting of a viewport
1Make sure you are on a layout tab.
2Double-click the border of the viewport you want to modify.
3In the Properties palette, under Misc., select Shade Plot, and then select
an option for plotting.
To modify the shade plot setting in model space
1Make sure you are on the Model tab and no objects are selected.
2Click Output tab ➤ Plot panel ➤ Plot.
3In the Plot dialog box, under Shaded Viewport Options, Shade Plot
drop-down list, select an option.
Quick Reference
Commands
PLOT
Plots a drawing to a plotter, printer, or file.
3DCONFIG
Sets options that affect 3D display performance.
GRAPHICSCONFIG
Sets options for 3D display performance.
SHADEMODE
Starts the VSCURRENT command.
Set Shaded Viewport Options | 1573

Specify a Resolution Level for Shaded Plotting
You can set the resolution of shaded plots for either greater speed or higher
fidelity.
After you select an appropriate plotter, you can specify the level of quality for
plotted output. The quality level determines the dots per inch (dpi). The dpi
that corresponds to a quality level is based on the plotter you select.
The maximum dpi available is also based on the plotter you select. You can
specify a custom quality level and directly change the dpi to a setting between
100 and the maximum dpi of the plotter.
The higher the fidelity, the more computer memory is used, so the longer it
takes to plot. High fidelity is not necessary for all plots, and a setting between
300 and 600 dpi is generally sufficient for most plots.
To specify a resolution level for shaded plotting
1Click Output tab ➤ Plot panel ➤ Plot.
2In the Plot dialog box, under Shaded Viewport Options, Quality
drop-down list, select an option.
If you want to enter a custom dpi, select Custom and specify a dpi in the
DPI box.
3Click OK.
Quick Reference
Commands
PLOT
Plots a drawing to a plotter, printer, or file.
1574 | Chapter 33 Plot Drawings

Set Options for Plotted Objects
In the Plot and the Page Setup dialog boxes, you can choose from options that
affect how objects are plotted.
■Shaded Viewport Plotting. Specifies shaded plotting options: As Displayed,
Wireframe, or Hidden. The effect of this setting is reflected in the plot
preview, but not in the layout.
■Plot Object Lineweights. Specifies that lineweights assigned to objects and
layers are plotted.
■Plot Transparency. Specifies that transparency levels applied to objects
and layers are plotted. Plot Transparency applies to wireframe and hidden
plots only. Other visual styles, such as Realistic, Conceptual, or Shaded
will always plot with transparency.
IMPORTANT This setting can be overridden by the
PLOTTRANSPARENCYOVERRIDE system variable. By default, the system variable
honors the setting in the Page Setup or the Plot dialog boxes.
■Plot with Plot Styles. Specifies that the drawing is plotted using plot styles.
Selecting this option automatically plots lineweights. If you do not select
this option, objects are plotted with their assigned properties and not with
the plot style overrides.
NOTE Plot styles are not available for objects with the Jitter edge modifier
applied (VISUALSTYLES).
■Plot Paper Space Last. Specifies that objects in model space are plotted
before those in paper space.
■Hide Paperspace Objects. Specifies whether the Hide operation applies to
objects in the paper space viewport. This option is available only from a
layout tab. The effect of this setting is reflected in the plot preview, but
not in the layout.
■Plot Stamp On. Turns on plot stamping and places a plot stamp on a
specified corner of each drawing and/or logs it to a file. Plot stamp settings
are specified in the Plot Stamp dialog box, where you can specify the
information you want applied to the plot stamp, such as drawing name,
date and time, plot scale, and so on. To open the Plot Stamp dialog box,
select Plot Stamp On in the Plot dialog box, and then click the Plot Stamp
Settings button.
Set Options for Plotted Objects | 1575
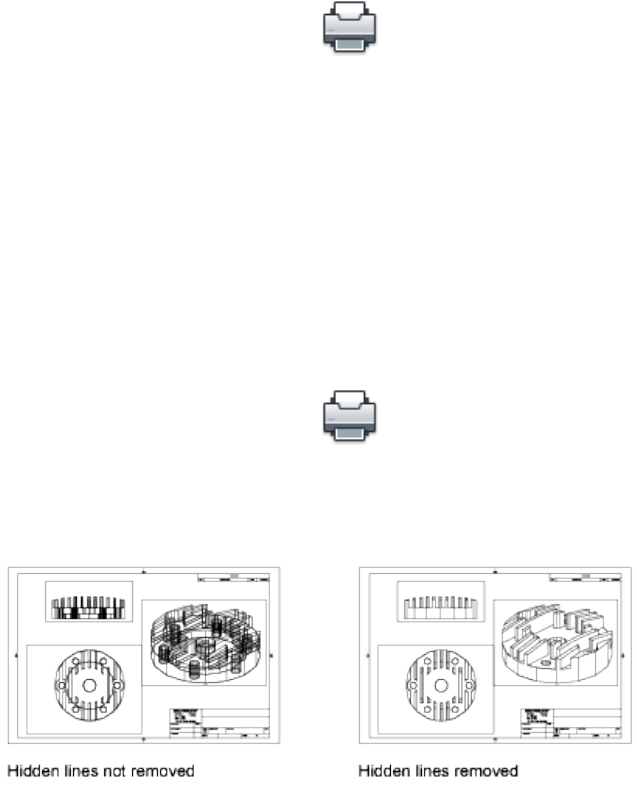
■Save Changes to Layout. Saves changes you make in the Plot dialog box
to the layout if you click OK.
To set shaded plotting options from the Model tab
1Click Output tab ➤ Plot panel ➤ Plot.
2In the Plot dialog box, Shaded Viewport Options area, Shade Plot
drop-down list, select an option.
To set shaded plotting options from a layout tab
1Select a layout viewport.
2Double-click the viewport border to display the Properties palette.
3On the Properties palette, click Shade Plot.
4In the Shade Plot drop-down list, select an option.
To remove hidden lines when plotting from the Model tab
1Click Output tab ➤ Plot panel ➤ Plot.
2In the Plot dialog box, under Shaded Viewport Options area, Shade Plot
drop-down list, select Hidden.
3Click OK to plot the drawing.
1576 | Chapter 33 Plot Drawings
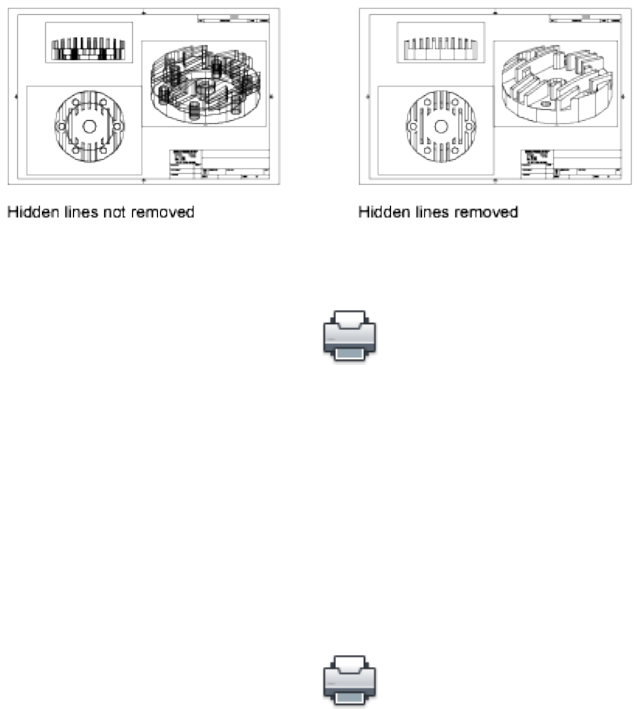
To remove hidden lines when plotting from a layout tab
1Select a layout viewport.
2Double-click the viewport border to display the Properties palette.
3On the Properties palette, click Shade Plot.
4In the Shade Plot drop-down list, select Hidden.
5Click OK to plot the drawing.
To plot lineweights
1Click Output tab ➤ Plot panel ➤ Plot.
2In the Plot dialog box, under Plot Options, select Plot Object Lineweights.
You can change this option only if the Plot with Plot Styles option is
cleared.
3Click OK to plot the drawing.
To plot transparency
Plot Transparency applies to wireframe and hidden plots only. Other visual
styles, such as Realistic, Conceptual, or Shaded will always plot with
transparency.
1Click Output tab ➤ Plot panel ➤ Plot.
2In the Plot dialog box, under Plot Options, select Plot Transparency.
3Click OK to plot the drawing.
Set Options for Plotted Objects | 1577
WARNING Enabling this option may reduce plot performance, even if your drawing
does not contain transparent objects. The PLOTTRANSPARENCYOVERRIDE system
variable honors the Plot Transparency setting by default, but can be set to always
or never plot transparency.
To turn off plot styles
1Click Output tab ➤ Plot panel ➤ Plot.
2In the Plot dialog box, under Plot Options, clear the Plot with Plot Styles
option.
3Click OK to plot the drawing.
To change the order in which objects are plotted
1Click Output tab ➤ Plot panel ➤ Plot.
2In the Plot dialog box, under Plot Options, select Plot Paperspace Last.
Clear the Plot Paperspace Last option to plot paper space first.
3Click OK to plot the drawing.
To hide paper space objects when plotting from a layout tab
1Click Output tab ➤ Plot panel ➤ Plot.
2In the Plot dialog box, under Plot Options, select Hide Paperspace Objects.
3Click OK to plot the drawing.
Quick Reference
Commands
LWEIGHT
Sets the current lineweight, lineweight display options, and lineweight units.
1578 | Chapter 33 Plot Drawings
OPTIONS
Customizes the program settings.
PAGESETUP
Controls the page layout, plotting device, paper size, and other settings for
each new layout.
PLOT
Plots a drawing to a plotter, printer, or file.
PLOTSTAMP
Places a plot stamp on a specified corner of each drawing and logs it to a file.
PROPERTIES
Controls properties of existing objects.
Use Plot Styles to Control Plotted Objects
You can control many aspects of how an object is plotted by using plot styles.
Overview of Plot Styles
A plot style controls an object's plotted properties.
A plot style is an object property, similar to linetype and color. A plot style
can be assigned to an object or assigned to a layer. A plot style controls an
object's plotted properties, including
■Color
■Dither
■Grayscale
■Pen number
■Virtual pen
■Screening
■Linetype
■Lineweight
■Transparency
Use Plot Styles to Control Plotted Objects | 1579

■Line end style
■Line join style
■Fill style
Using plot styles gives you great flexibility because you can set them to override
other object properties or turn off the override as needed.
Groups of plot styles are saved in either of two types of plot style tables:
color-dependent (CTB) or named (STB). Color-dependent plot style tables set
style based on the color of the object. Named plot styles can be assigned to
an object independent of color.
NOTE Plot styles are not available for objects with the Jitter edge modifier applied
(VISUALSTYLES).
Quick Reference
Commands
CONVERTCTB
Converts a color-dependent plot style table (CTB) to a named plot style table
(STB).
CONVERTPSTYLES
Converts the current drawing to either named or color-dependent plot styles.
OPTIONS
Customizes the program settings.
PAGESETUP
Controls the page layout, plotting device, paper size, and other settings for
each new layout.
System Variables
CPLOTSTYLE
Controls the current plot style for new objects.
1580 | Chapter 33 Plot Drawings
DEFLPLSTYLE
Specifies the default plot style for all layers in a drawing when opening a
drawing that was created in a release prior to AutoCAD 2000, or for Layer 0
when creating a new drawing from scratch without using a drawing template.
DEFPLSTYLE
Specifies the default plot style for new objects in a drawing when opening a
drawing that was created in a release prior to AutoCAD 2000, or when creating
a new drawing from scratch without using a drawing template.
PSTYLEMODE
Indicates whether the current drawing is in a Color-Dependent or Named
Plot Style mode.
PSTYLEPOLICY
Controls the plot style mode, Color-Dependent or Named, that is used when
opening a drawing that was created in a release prior to AutoCAD 2000 or
when creating a new drawing from scratch without using a drawing template.
Choose a Type of Plot Style Table
A plot style table is a collection of plot styles assigned to a layout or the Model
tab. There are two types of plot style tables: color-dependent plot style tables
and named plot style tables.
Color-dependent plot style tables (CTB) use an object's color to determine
characteristics such as lineweight. Every red object in a drawing is plotted the
same way. While you can edit plot styles in a color-dependent plot style table,
you cannot add or delete plot styles. There are 256 plot styles in a
color-dependent plot style table, one for each color.
Named plot style tables (STB) contain user-defined plot styles. When you use a
named plot style table, objects that have the same color may be plotted
differently, based on the plot style assigned to the object. A named plot style
table can contain as many or as few plot styles as required. Named plot styles
can be assigned to objects or layers, just like any other property.
To set a plot style table type for new drawings
1Click Tools menu ➤ Options.
2In the Options dialog box, Plot and Publish tab, click the Plot Style Table
Settings button.
Use Plot Styles to Control Plotted Objects | 1581

3In the Plot Style Table Settings dialog box, select Use Color-dependent
Plot Styles or Use Named Plot Styles.
4(Optional) In the Default Style Table box, select a default plot style table.
5(Optional) If Use Named Plot Styles is selected, select plot styles to assign
to Layer 0 and to new objects.
6Click OK.
NOTE Setting plot style table types for new drawings does not affect existing
drawings.
Quick Reference
Commands
OPTIONS
Customizes the program settings.
Switch the Type of Plot Style Table
You can change which type of plot style table, color-dependent or named, is
used in a drawing.
You can use CONVERTPSTYLES to change which type of plot style table,
color-dependent or named, is used in a drawing.
When you convert a drawing from using color-dependent plot style tables to
using named plot style tables, any color-dependent plot style tables attached
to layouts in the drawing are removed, and named plot styles are attached in
their place. If you want to use the styles defined in the color-dependent plot
style tables after you convert to using named plot styles tables, you should
first convert any color-dependent plot style tables to named plot style tables.
When you convert a drawing from using named plot style tables to using
color-dependent plot style tables, the plot style names assigned to the objects
in the drawing are lost.
In addition to changing which type of plot style table a drawing uses, you can
use CONVERTCTB to convert color-dependent plot style tables to named plot
style tables. You cannot, however, convert a named plot style table to a
color-dependent plot style table.
1582 | Chapter 33 Plot Drawings

To convert a drawing to use named plot styles
1At the command prompt, enter convertpstyles.
2Click OK when the alert box appears.
3In the Select File dialog box, select a named plot style table to use for the
Model tab and any layouts that use plot style tables of the same name.
4Click Open.
A message is displayed to confirm that the drawing was converted.
NOTE If the Display Plot Styles option was already selected in the dialog box,
you must enter regen at the command prompt to display the plot style
settings.
To convert a drawing to use color-dependent plot styles
1At the command prompt, enter convertpstyles.
2Click OK.
A message is displayed to confirm that the drawing was converted.
To convert a color-dependent plot style table into a named plot style table
1At the command prompt, enter convertctb.
2In the Select File dialog box, select the name of the plot style table to
convert, and then click Open. By default, plot style tables are saved in
the Plot Styles folder.
3Enter the new plot style table name. Click Save.
4Click OK when the alert box appears.
NOTE Be sure to use the Plot Style Table Editor to change the names of the plot
styles in their new plot style table to be more meaningful before using the plot
style table with any drawings.
Use Plot Styles to Control Plotted Objects | 1583
Quick Reference
Commands
CONVERTCTB
Converts a color-dependent plot style table (CTB) to a named plot style table
(STB).
CONVERTPSTYLES
Converts the current drawing to either named or color-dependent plot styles.
OPTIONS
Customizes the program settings.
OPTIONS
Customizes the program settings.
Assign Plot Style Tables to Layouts
By assigning different plot style tables to each layout in your drawing, you
can control how objects in the layout are plotted.
The plot style table affects both model space and paper space objects. To plot
the drawing without applying plot style properties, select None from the list
of plot style tables.
If you use named plot style tables, each object in the drawing either is assigned
a plot style directly or inherits a plot style from its layer.
To display the effects of a plot style table in a layout, select Display Plot Styles
under Plot Style Table in the Page Setup dialog box.
NOTE If you insert an xref into your current drawing, all defined plot style tables
are also inserted. You can modify the appearance of your objects by editing the
attached plot style tables with the Plot Style Table Editor.
To assign a plot style table to a layout
1Click the Model tab or the layout tab to which you want to assign the
plot style table.
2Click Output tab ➤ Plot panel ➤ Page Setup.
1584 | Chapter 33 Plot Drawings
3In Page Setup Manager, click Modify.
4Under Plot Style Table (Pen Assignments), select a plot style table from
the list.
5In the Question dialog box, click Yes or No to indicate whether the
selection should be applied to the current tab only or to all layouts.
This option is available only for the Model tab.
6To preview the effects of the plot style table in the layout, select Display
Plot Styles.
This option is available only for layouts.
7Click OK.
8In Page Setup Manager, click Close.
NOTE If the Display Plot Styles option was already selected in the dialog box, you
must enter regen at the command prompt to display the plot style settings.
To preview the effects of a plot style table in a layout
1Click the layout tab in which you want to preview the effects of the plot
style table.
2Click Output tab ➤ Plot panel ➤ Page Setup.
3In Page Setup Manager, click Modify.
4In the Page Setup dialog box, under Plot Style Table (Pen Assignments),
select the Display Plot Styles option.
5Click OK.
6In Page Setup Manager, click Close.
The effects of the plot style table are previewed in the layout.
Use Plot Styles to Control Plotted Objects | 1585
Quick Reference
Commands
PAGESETUP
Controls the page layout, plotting device, paper size, and other settings for
each new layout.
Manage Plot Style Tables
You can use the Plot Style Manager to add, delete, rename, copy, and edit plot
style tables.
Color-dependent (CTB) and named (STB) plot style tables are stored in the
Plot Styles folder by default. This folder is also known as the Plot Style Manager.
You can use the Plot Style Manager to add, delete, rename, copy, and edit plot
style tables. The Plot Style Manager lists all of the available plot style tables.
To create a plot style table
1Click Tools menu ➤ Wizards ➤ Add Plot Style Table.
2Read the first page. Click Next.
3On the Begin page, you can choose to use an configuration file (CFG) or
plotter configuration file (PCP or PC2) to import pen settings, base the
new plot style table on an existing plot style table, or start from scratch.
If you use an existing plot style table, the new plot style table uses the
same type of table as the original. Click Next.
4On the Pick Plot Style Table page, select Color-Dependent Plot Style Table
or Named Plot Style Table.
5If you are importing pen settings from a PCP, PC2, or CFG file, or if you
are basing the new plot style table on an existing plot style table, specify
the file on the Browse File Name page. If you use a CFG file, you may
need to select which plotter's configuration to import. Click Next.
6On the File Name page, enter a name for the new plot style table. Click
Next.
7On the Finish page, you can edit the new plot style table by choosing
Plot Style Table Editor. You can assign the new plot style table so that it
can be used in all drawings.
1586 | Chapter 33 Plot Drawings

8Click Finish.
The new plot style table is available in both the Plot and the Page Setup
dialog boxes for all drawings using color-dependent plot style tables.
To rename a plot style table
1Click Output tab ➤ Plot panel ➤ Plot Style Manager.
2Right-click the plot style whose name you want to change. Click Rename.
3Enter the new file name. Be sure to add the same file extension (.ctb or
.stb). When finished, press ENTER.
The renamed plot style table is available in the Plot and Page Setup dialog
boxes for all drawings using that type of plot style table.
To change a plot style table description
1Click Output tab ➤ Plot panel ➤ Plot Style Manager.
2Double-click the plot style table file whose description you want to
change.
3In the Plot Style Table Editor, General tab, enter the new description for
the plot style table.
4Click Save & Close.
To edit plot styles in a plot style table
1Click Output tab ➤ Plot panel ➤ Plot Style Manager.
2Double-click the plot style table you want to change.
3In the Plot Style Table Editor, Form View tab, under Plot Styles, select a
plot style and edit the settings.
4Click Save & Close.
Use Plot Styles to Control Plotted Objects | 1587

Quick Reference
Commands
STYLESMANAGER
Displays the Plot Style Manager, where you can revise plot style tables.
Use Color-Dependent Plot Style Tables
By using color-dependent plot styles to control how objects are plotted, you
ensure that all objects that share the same color are plotted the same way.
When a drawing uses color-dependent plot style tables, you cannot assign a
plot style to individual objects or layers. Instead, to assign plot style properties
to an object, you change the color of the object or layer.
You can assign color-dependent plot style tables to layouts. You can use several
predefined color-dependent plot style tables, edit existing plot style tables, or
create your own.
Color-dependent plot style tables are stored in the Plot Styles folder and have
a .ctb extension.
Use Predefined Color-Dependent Plot Style Tables
Several color-dependent plot style tables are installed in the Plot Styles folder,
also known as the Plot Style Manager.
DescriptionTable
Default plot style tableacad.ctb
Sets first 9 colors to use first 9 fill patterns, all others to use
object's fill
fillPatterns.ctb
Converts all colors to grayscale when plottedgrayscale.ctb
Plots all colors as blackmonochrome.ctb
Applies no plot style tableNone
Uses 100% ink for all colorsscreening 100%.ctb
Uses 75% ink for all colorsscreening 75%.ctb
1588 | Chapter 33 Plot Drawings
DescriptionTable
Uses 50% ink for all colorsscreening 50%.ctb
Uses 25% ink for all colorsscreening 25%.ctb
NOTE You can assign a color-dependent plot style table to a layout only if the
drawing has been set to use color-dependent plot style tables.
See also:
■Assign Plot Style Tables to Layouts on page 1584
Quick Reference
Commands
STYLESMANAGER
Displays the Plot Style Manager, where you can revise plot style tables.
Use Named Plot Style Tables
You can only create, delete, and apply plot styles in a named plot style table.
You can define as many or as few plot styles as you need in a drawing.
Use Named Plot Styles
Named plot styles are assigned to objects and layers in the same way that
linetype and color are assigned to objects.
An object whose plot style is set to BYLAYER inherits the plot style assigned
to its layer.
Use the Properties palette to change an object's plot style and the Layer
Properties Manager to change the plot style for a layer.
Because different plot style tables can be assigned to each layout and a named
plot style table can contain any number of plot styles, an object or layer may
have a plot style assigned to it that is not in every plot style table. In this case,
the plot style as missing in the Select Plot Style dialog box; the object's default
plotting properties are used. For example, named plot style table Style1 contains
plot styles A and B. Named plot style table Style2 contains plot styles B and
Use Named Plot Style Tables | 1589
C. In a layout that uses Style1, any objects that use plot style C are listed as
having a missing plot style. Objects that are assigned plot style C in this layout
are plotted using their default settings.
To change an object's plot style
You can change an object's plot style only if the drawing uses named plot
style tables. If the drawing uses color-dependent plot style tables, change the
object's color to alter its plotted appearance.
1Select one or more objects whose plot style you want to change.
2Click Veiw tab ➤ Palettes panel ➤ Properties.
TIP You can also right-click in the drawing area and then, click Properties.
3In the Properties palette, select a plot style from the list of available plot
styles. Click the column next to Plot Style.
The plot styles listed are those already in use by objects and in the plot
style table attached to the current layout.
4To select a plot style from a different plot style table, select Other. In the
Select Plot Style dialog box, you can attach a different plot style table to
the current layout and select a plot style from that plot style table.
5To edit the current plot style table, click Editor.
6Click OK when finished.
Any changes made in the Properties palette are immediate. If you change
the plot style table attached to the current layout, both model space and
paper space objects are affected.
To change a layer's plot style
1Click Home tab ➤ Layers panel ➤ Layer Properties Manager.
2In the Layer Properties Manager, select the layer whose plot style you
want to change.
3Click the current plot style in the Plot Style column. Select the plot style
you want to use.
1590 | Chapter 33 Plot Drawings
4To select a plot style from a different plot style table, select an active plot
style table from the Active Plot Style Tables list.
The list of plot styles changes to those in the selected plot style table.
5To edit the selected plot style table, click Editor. Change settings as
necessary and click Save & Close.
6Click OK.
You can change a layer's plot style only if the drawing uses named plot
style tables. If the drawing uses color-dependent plot style tables, change
the layer's color to alter the plotted appearance of objects on the layer.
NOTE An object's plot style property can be set to BYLAYER to inherit the
plot style of its layer.
To set the current plot style
1Click Home tab ➤ Properties panel ➤ Plot Style.
2In the Current Plot Style dialog box, select a plot style from the list.
The plot styles displayed are those available in the current plot style table.
3To select a plot style from a different plot style table, under Active Plot
Style Table, select a plot style table.
The list of plot styles changes to those in the selected plot style table.
4To edit the selected plot style table, click Editor. Change settings as
necessary. Click Save & Close.
5Click OK.
The plot style that you made current is used for any new objects created
in the drawing.
You can change the current plot style only if the drawing uses named
plot style tables. If the drawing uses color-dependent plot style tables,
change the color to alter the plotted appearance of objects and layers.
NOTE The current plot style property can be set to BYLAYER to inherit the
plot style of the current layer.
Use Named Plot Style Tables | 1591
Quick Reference
Commands
LAYER
Manages layers and layer properties.
PLOTSTYLE
Controls the named plot styles that are attached to the current layout and
can be assigned to objects.
PROPERTIES
Controls properties of existing objects.
Manage Named Plot Styles
You can add, delete, rename, and copy plot styles in a named plot style table
using the Plot Style Table Editor.
The Plot Style Table Editor is also used to change plot style settings for both
named and color-dependent plot style tables.
NOTE You cannot delete or edit the NORMAL plot style. Also, you cannot add,
delete, copy, or rename plot styles in a named plot style table if a color mapping
table has been attached to the plot style table. A color mapping table associates
every plot style with an ACI color.
See also:
■Change Plot Style Settings on page 1596
To create a named plot style
1Click Home tab ➤ Properties panel ➤ Plot Style.
2Double-click the STB file to which you want to add a plot style.
3(Optional) If you want to position the plot style in the list, on the Form
View tab, select the plot style that should precede the new plot style.
4On the Form View or Table View tab, click Add Style.
5In the Add Plot Style dialog box, enter the name of the plot style.
1592 | Chapter 33 Plot Drawings
6Click Save & Close.
NOTE You cannot edit the NORMAL plot style.
To copy a named plot style
1Click Home tab ➤ Properties panel ➤ Plot Style.
2Double-click the STB file you want to edit.
3In the Plot Style Table Editor, Form View tab, right-click the plot style
that you want to copy. Click Copy.
4Right-click a plot style. Click Paste. If you want to position the new plot
style in the list, right-click the plot style that should precede the new plot
style.
5In the Add Plot Style dialog box, enter the name of the plot style.
6Click Save & Close.
NOTE You cannot copy plot styles if the plot style table uses a color mapping
table. You cannot copy plot styles in a color-dependent plot style table.
To change a plot style's description
1Click Home tab ➤ Properties panel ➤ Plot Style.
2Double-click the plot style table that contains the plot style whose
description you want to change.
3In the Plot Style Table Editor, Form View tab, select the plot style whose
description you want to change.
4Under Description, change the plot style's description.
You can select additional plot styles and modify their descriptions or
settings.
5Click Save & Close.
NOTE You cannot delete or edit the NORMAL plot style.
Use Named Plot Style Tables | 1593
To rename a named plot style
1Click Home tab ➤ Properties panel ➤ Plot Style.
2Double-click the STB file that contains the plot style you want to rename.
3In the Plot Style Table Editor, Form View tab, right-click the plot style
whose name you want to change. Click Rename.
4Enter the new name for the plot style.
5Click Save & Close.
NOTE You cannot rename the NORMAL style. You cannot rename plot styles in
a color-dependent plot style table.
To delete a named plot style
1Click Home tab ➤ Properties panel ➤ Plot Style.
2Double-click the STB file you want to edit.
3In the Plot Style Table Editor, Form View tab, select the plot style that
you want to delete from the list of plot styles.
4Click Delete Style.
5Click Save & Close.
NOTE You cannot delete or edit the NORMAL plot style. You cannot delete plot
styles if the plot style table uses a color mapping table. You cannot delete plot
styles from a color-dependent plot style table.
Quick Reference
Commands
PLOTSTYLE
Controls the named plot styles that are attached to the current layout and
can be assigned to objects.
1594 | Chapter 33 Plot Drawings

STYLESMANAGER
Displays the Plot Style Manager, where you can revise plot style tables.
Use Predefined Named Plot Style Tables
One additional named plot style table is installed for you to use beyond the
default plot style table. All named plot style tables have an .stb extension.
■acad.stb: Default plot style table
■Monochrome.stb: All colors plot as black
■None: No plot style table applied
NOTE Named plot style tables are available only if the drawing has been set to
use named plot style tables.
See also:
■Assign Plot Style Tables to Layouts on page 1584
Quick Reference
Commands
PLOTSTYLE
Controls the named plot styles that are attached to the current layout and
can be assigned to objects.
STYLESMANAGER
Displays the Plot Style Manager, where you can revise plot style tables.
Delete Color Mapping Tables
If you delete the mapping table, the plot style table becomes an ordinary plot
style table and is no longer useful for applying plot styles to old drawings.
Named plot style tables that you create using CFG, PCP, or PC2 files have
color mapping tables that are created from your previous pen mappings.
Color-dependent plot style tables also have color mapping tables. Color
mapping tables are used to map plot styles to colors and thus to objects of
Use Named Plot Style Tables | 1595
each color when opening pre- AutoCAD 2000 drawings. This enables you to
simulate the way drawings were plotted in previous versions.
While the color mapping table exists, you cannot add, delete, or rename plot
styles in that plot style table.
If you delete the mapping table, the plot style table becomes an ordinary plot
style table and is no longer useful for applying plot styles to old drawings. It
continues to be useful for new drawings.
WARNING If you delete a color mapping table, plot styles cannot automatically
be assigned to objects when older drawings are opened for the first time.
To delete a color mapping table
1Click Output tab ➤ Plot panel ➤ Plot Style Manager.
2Double-click the plot style table that you want to modify.
3In the Plot Style Table Editor, General tab, click Delete AutoCAD Release
14 Color Mapping Table.
4Read the warning. Click Yes to delete the color mapping table, or click
No to keep it.
5Click Save & Close.
Quick Reference
Commands
STYLESMANAGER
Displays the Plot Style Manager, where you can revise plot style tables.
Change Plot Style Settings
You can modify plot styles using the Plot Style Table Editor. Changes you
make to a plot style affect the objects to which that plot style is assigned.
1596 | Chapter 33 Plot Drawings

Overview of Plot Style Settings
You can open the Plot Style Table Editor by double-clicking a CTB or STB file
in the Plotter Manager. The Plot Style Table Editor displays the plot styles
contained in the specified plot style table.
The General tab lists general information about the table. The Table View and
Form View tabs provide two ways to modify plot style settings. In general, the
Table View tab is convenient if you have a small number of plot styles. If you
have a large number of plot styles, the Form View tab might be more
convenient.
In a named plot style table, the NORMAL plot style represents an object's
default properties (no plot style applied). You cannot modify or delete the
NORMAL style.
To edit plot style settings
1Click Output tab ➤ Plot panel ➤ Plot Style Manager.
2Double-click the plot style table you want to modify.
3In the Plot Style Table Editor, Form View tab, under Plot Styles, select the
plot style you want to modify.
4Under Properties, click the arrow next to the property you want to change.
Select an option from the list.
5Edit other properties or plot styles as needed.
6Click Save & Close.
Quick Reference
Commands
STYLESMANAGER
Displays the Plot Style Manager, where you can revise plot style tables.
Set Color, Screening, Grayscale, and Dither in Plot Style Tables
You can use a plot style to assign color, screening, grayscale, and dither
properties.
Change Plot Style Settings | 1597

Assign Plot Style Colors
The default setting for plot style color is Use Object Color. With this setting,
the object retains its layer or individually set color. If you assign a plot style
color, the color overrides the object's color at plot time. You can specify one
of 255 ACI colors, a true color, or a color book color. The plotter must be
configured for True Color if you want to plot True Color plot styles.
NOTE If you use a plot style table saved in AutoCAD 2000 or later, the True Color
values change to the nearest match in the current version's palette.
Use Screening
You can select a color intensity setting that determines the amount of ink
placed on the paper while plotting. The valid range is 0 through 100. Selecting
0 reduces the color to white. Selecting 100 displays the color at its full intensity.
Screening is effective only if your plotter is configured to plot colors or
grayscale. Also, dithering must be enabled.
Use Dithering
A plotter uses dithering to approximate colors with dot patterns, giving the
impression of plotting with more colors than the ink colors available in the
plotter. If the plotter does not support dithering, the dithering setting is
ignored.
The most common reason for turning off dithering is to avoid false line typing
from dithering of thin vectors and to make dim colors more visible. When
you turn off dithering, colors are mapped to the nearest color, which limits
the range of colors used for plotting. Dithering is available whether you use
the object's color or assign a plot style color.
NOTE Dithering disables merge control.
Convert to Grayscale
When you select Convert to Grayscale, the object's colors are converted to
grayscale if the plotter supports grayscale. Light colors, such as yellow, are
plotted with light gray values. Dark colors are plotted with dark gray values.
If you clear Convert to Grayscale, the RGB values are used for the object's
colors. Conversion to grayscale is available whether you use the object's color
or assign a plot style color.
1598 | Chapter 33 Plot Drawings
To assign a plot style color
1Click Output tab ➤ Plot panel ➤ Plot Style Manager.
2Right-click a CTB or STB file. Click Open.
3In the Plot Style Table Editor, Table View tab, click the Color field for the
plot style you want to change.
4On the Color drop-down list, click the color you want to use or click
Select Color to display the Select Color dialog box and do one of the
following:
■On the Index tab, click a color or enter the ACI color number (1-255)
or name in the Color box. Click OK.
■On the True Color tab, in the Color Model box, specify a color. (Enter
a color value in the Color box or specify values in the Hue, Saturation,
and Luminance boxes.) Click OK.
■On the Color Books tab, in the Color Book box, select a color (use the
up and down arrow and click on a color chip.) Click OK.
To use screening
1Click Output tab ➤ Plot panel ➤ Plot Style Manager.
2Double-click the plot style table that you want to modify.
3In the Plot Style Table Editor, Form View tab, select the plot style you
want to change.
4In the Screening box, enter an intensity value between 1 and 100.
5When finished, click Save & Close.
You can edit properties for multiple plot styles while in the Plot Style
Table Editor.
NOTE A common practice when using screening is to set the plotted color
to black for each style so that the screening will be a percentage of black.
Change Plot Style Settings | 1599

To enable or disable dithering
1Click Output tab ➤ Plot panel ➤ Plot Style Manager.
2Double-click the plot style table that you want to modify.
3In the Plot Style Table Editor, Form View tab, select the plot style you
want to change and select Dither.
4Select On or Off.
5When finished, click Save & Close.
You can edit properties for multiple plot styles while in the Plot Style
Table Editor.
To enable or disable conversion to grayscale
1Click Output tab ➤ Plot panel ➤ Plot Style Manager.
2Double-click the plot style table that you want to modify.
3In the Plot Style Table Editor, Form View tab, select the plot style you
want to change and select Grayscale.
4Select On or Off.
5When finished, click Save & Close.
You can edit properties for multiple plot styles while in the Plot Style
Table Editor.
Quick Reference
Commands
STYLESMANAGER
Displays the Plot Style Manager, where you can revise plot style tables.
Assign Pen Numbers and Virtual Pens in Plot Style Tables
The pen assignments used by the plotter differ depending on whether you
use a pen plotter or another kind of printer, such as a laser printer.
1600 | Chapter 33 Plot Drawings
Assign Pens to Plot Styles
The Use Assigned Pen Number setting in the Plot Style Table Editor specifies
which physical pen to use for each plot style. The physical pens in the plotter
are described in the plotter's configuration (PC3) file. If you use a pen plotter,
you must provide information about the color, speed, and width of each pen
in the Physical Pen Configuration section of the Plotter Configuration Editor.
For example, when you specify pen information in the Plotter Configuration
Editor, you might specify that pen #1 is black and 0.010 inches and pen #2 is
red and 0.020 inches. In the Plot Style Table Editor you can assign pen #1 to
the plot style called WATER PIPES and pen #2 to the plot style called SEWER
PIPES.
You can assign a pen to a plot style by selecting from a range of 32 pen
numbers in the Use Assigned Pen Number field. The default value is 1. If plot
style color is set to Use Object Color, or if you are editing a plot style in a
color-dependent plot style table, you cannot change the assigned pen number.
If you specify 0, the field is updated to read Automatic. The information you
provided under Physical Pen Characteristics in the Plotter Configuration Editor
is used to select the pen closest in color to the color of the object you are
plotting.
Assign Pen Settings to Plotters Without Pens
Many plotters that do not use pens can simulate the performance of a pen
plotter by using virtual pens. For many devices, you can control the virtual
pens in the device with software or, by configuring them from the plotter's
control panel, with hardware.
If you allow software to control the pens, the Plot Style Table values for the
Lineweight, Linetype, Screening, Line End Style, Line Join Style, and Fill Style
settings are effective and override the settings on the plotter's control panel.
If you turn off software control of the pen attributes (typically done on the
plotter), then the software can select virtual pens but can't control lineweight,
linetype, end style, join style, fill style, or color. In the program, you select
hardware (virtual pen) control over software (normal) control by selecting
255 Virtual Pens in the Color Depth area of the Vector Graphics option on
the Device and Document Settings tab in the Plotter Configuration Editor.
Selecting any other color depth specifies software control.
In the Plot Style Table Editor under Virtual Pen #, you can specify a virtual
pen number between 1 and 255. Enter 0 or Automatic to specify that the
virtual pen assignment should be made from the ACI.
Change Plot Style Settings | 1601
When you create a plot style table, it is important to remember that it can be
used with many different plotters and that the plotter and mode determine
what parts of the plot style table are enabled.
■When using a pen plotter with user assigned pens, the virtual pen number
and any color assignments are ignored.
■When using a pen plotter with automatically assigned pens, pens are
selected based on entity color and entity lineweight. Virtual pen numbers
are ignored.
■When using a raster plotter in raster mode, the physical pen number and
the virtual pen number are ignored.
■When using a raster plotter in virtual pen mode, everything except the
virtual pen number is ignored.
NOTE If you use another application to process your plot files after creating them,
and you modify the pen attributes, plotting without using virtual pens results in
pen numbers in the plot file having no simple relationship to object colors in the
program. This makes it difficult to apply additional pen attributes.
To specify a virtual pen number
1Click Output tab ➤ Plot panel ➤ Plot Style Manager.
2Double-click the plot style table that you want to modify.
3In the Plot Style Table Editor, Form View tab, select the plot style you
want to change and click Virtual Pen.
4Under Virtual Pen #, enter a number between 1 and 255 or enter 0 or
Automatic to have the program assign the ACI color of the object you
are plotting to the virtual pen.
5When finished, click Save & Close.
You can edit properties for multiple plot styles while in the Plot Style
Table Editor.
1602 | Chapter 33 Plot Drawings
Quick Reference
Commands
STYLESMANAGER
Displays the Plot Style Manager, where you can revise plot style tables.
Control Plotted Lineweight and Linetype
Both lineweight and linetype can be set as an object property or controlled
when plotted by using a plot style. Lineweight or linetype settings in the plot
style override the object's lineweight or linetype at plot time.
Assign and Display Lineweights
When you select the Lineweight field in the Plot Style Table Editor, a sample
of the lineweight as well as its numeric value are displayed. The default setting
for plot style lineweight is Use Object Lineweight. You can modify an existing
lineweight if the one you need is not available.
To view plot style lineweights in a layout, select Display Plot Styles under Plot
Style Table in the Page Setup dialog box.
Assign Linetypes
When you select the Linetype field in the Plot Style Table Editor, a list with
a sample and a description of each linetype are displayed. The default setting
for plot style linetype is Use Object Linetype.
Whether you choose to assign a linetype as a property of the object or as a
plot style, you can set the Adaptive Adjustment option. This option adjusts
the scale of the linetype to complete the linetype pattern. If you don't select
Adaptive Adjustment, the line might end in the middle of a pattern. Turn off
Adaptive Adjustment if linetype scale is important. Turn on Adaptive
Adjustment if complete linetype patterns are more important than correct
linetype scaling.
You can apply a global scale factor to non-ISO linetypes and fill patterns in
plot styles.
See also:
■Work with Linetypes on page 521
■Control Lineweights on page 532
Change Plot Style Settings | 1603

To set the plotted lineweight
1Click Output tab ➤ Plot panel ➤ Plot Style Manager.
2Double-click the plot style table that you want to modify.
3In the Plot Style Table Editor, Form View tab, select the plot style you
want to change.
4Click the Lineweight arrow and select a lineweight from the list. To specify
that the object's lineweight should be used select Use Object Lineweight.
5Click Save & Close.
You can edit properties for multiple plot styles while in the Plot Style
Table Editor.
To set the plotted linetype
1Click Output tab ➤ Plot panel ➤ Plot Style Manager.
2Double-click the plot style table that you want to modify.
3In the Plot Style Table Editor, Form View tab, select the plot style you
want to change.
4Click the Linetype arrow and select a linetype from the list. To specify
that the object's linetype should be used, select Use Object Linetype.
5To adjust the linetype scale to show the complete pattern, on the Form
View tab, select On in the Adaptive box.
6Click Save & Close.
You can edit properties for multiple plot styles while in the Plot Style
Table Editor.
To apply scaling to non-ISO linetypes and fill patterns
1Click Output tab ➤ Plot panel ➤ Plot Style Manager.
2Double-click the plot style table that you want to modify.
1604 | Chapter 33 Plot Drawings

3In the Plot Style Table Editor, General tab, select Apply Global Scale Factor
to Non-ISO Linetypes.
This option scales linetypes and fill patterns according to a value that
you specify.
4In the Scale Factor box, enter a scale factor to apply.
5Click Save & Close.
Quick Reference
Commands
STYLESMANAGER
Displays the Plot Style Manager, where you can revise plot style tables.
Assign Plotted Line End and Join Styles
You can set the line end and join styles for objects that have lineweight
assigned, either as an object property or as a plot style override.
Assign Line End Style
The program includes the following line end style options:
■Butt
■Square
■Round
■Diamond
The default setting for Line End Style is Use Object End Style, which is rounded.
Assign a line end style in a plot style to override the object's default line end
style at plot time.
NOTE SHX text plots best with the Round End and Round Join styles.
Assign Line Join Style
The program includes the following line join style options:
■Miter
Change Plot Style Settings | 1605

■Bevel
■Round
■Diamond
The default setting for Line Join Style is Use Object Join Style, which is
rounded. Assign a line join style in a plot style to override the object's default
line join style at plot time.
To assign a line end or line join style
1Click Output tab ➤ Plot panel ➤ Plot Style Manager.
2Right-click a CTB or STB file. Click Open.
3In the Plot Style Table Editor, Table View tab, click the Line End Style or
Line Join Style field for the plot style you want to change.
4Select an option from the drop-down list.
Quick Reference
Commands
STYLESMANAGER
Displays the Plot Style Manager, where you can revise plot style tables.
Assign Plotted Fill Styles
You can assign a variety of fill style options when plotting wide polylines,
donuts, objects hatched with a solid fill, and solids.
The program includes the following fill style options when plotting wide
polylines, donuts, objects hatched with a solid fill, and solids:
■Solid
■Checkerboard
■Crosshatch
■Diamonds
1606 | Chapter 33 Plot Drawings

■Horizontal Bars
■Slant Left
■Slant Right
■Square
■Dots
■Vertical Bar
The default setting for Fill Style is Use Object Fill Style. Assign a fill style in a
plot style to override the object's fill style at plot time.
You can apply a global scale factor to non-ISO linetypes and fill patterns in
plot styles.
See also:
■Modify Hatches and Fills on page 1289
To assign a fill style
1Click Output tab ➤ Plot panel ➤ Plot Style Manager.
2Right-click a CTB or STB file. Click Open.
3In the Plot Style Table Editor, Table View tab, click the Fill Style field for
the plot style you want to change.
4Select a fill style from the drop-down list.
Quick Reference
Commands
STYLESMANAGER
Displays the Plot Style Manager, where you can revise plot style tables.
Change Plot Style Settings | 1607
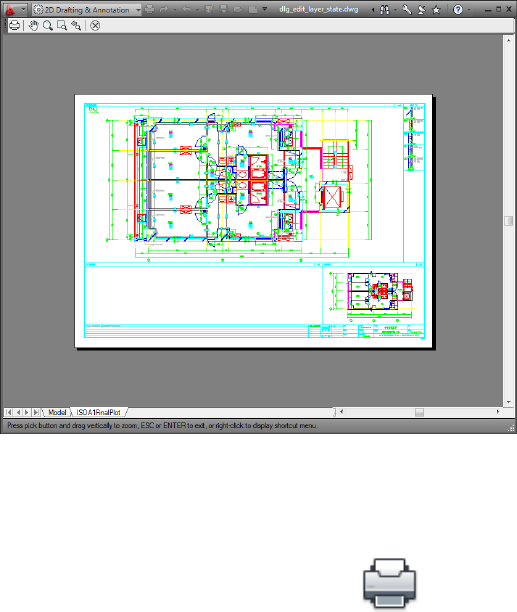
Preview a Plot
It is good practice to generate a preview of the plotted drawing before sending
the drawing to the printer or plotter. Generating a preview saves time and
material.
You can preview the drawing from the Plot dialog box. The preview shows
exactly how the drawing will look when plotted, including lineweights, fill
patterns, and other plot style options.
When you preview your drawing, the active toolbars and tool palettes are
hidden and a temporary Preview toolbar is displayed that provides buttons
to plot, pan, and zoom the drawing.
In the Plot and Page Setup dialog boxes, a thumbnail preview is also displayed,
which shows the printable area and the position of the drawing on the page.
To preview a plot
1Click Output tab ➤ Plot panel ➤ Plot.
2In the Plot dialog box, click Preview.
A preview window opens, and the cursor changes to the real-time zoom
cursor.
1608 | Chapter 33 Plot Drawings
3Right-click to display a shortcut menu with the following options: Plot,
Pan, Zoom, Zoom Window, or Zoom Original (to zoom to the original
preview magnification).
4Press ESC to exit the preview and return to the Plot dialog box.
5If necessary, make additional adjustments to the plot settings and preview
the plotted drawing again.
6Once the settings are correct, click OK to plot the drawing.
Quick Reference
Commands
PAN
Moves the view planar to the screen.
PLOT
Plots a drawing to a plotter, printer, or file.
PREVIEW
Displays the drawing as it will be plotted.
ZOOM
Increases or decreases the magnification of the view in the current viewport.
System Variables
RASTERPREVIEW
Controls whether BMP preview images are saved with the drawing.
Plot Files to Other Formats
You can export or plot your drawings in a number of formats, including DWF,
DWFx, DXF, PDF, and Windows metafile (WMF). You can also output your
drawings in image formats using specially designed plotter drivers.
Plot DWF Files
You can create DWF files (a 2D vector file) to publish your drawings on the
web or across an intranet.
Plot Files to Other Formats | 1609

You can use the program to create DWF files. A DWF file is a 2D vector file
that you can use to publish your drawing on the World Wide Web or an
intranet network. Each DWF file can contain one or more drawing sheets.
DWF files can be opened, viewed, and plotted by anyone using Autodesk®
Design Review. With the DWF file viewer, you can also view DWF files in
Microsoft® Internet Explorer 5.01 or later. DWF files support real-time panning
and zooming as well as control over the display of layers and named views.
See also:
■Publish Drawings on page 1621
■Review and Markup Files with Design Review on page 1980
To plot a DWF file
1Click Output tab ➤ Plot panel ➤ Plot.
2In the Plot dialog box, under Printer/Plotter, in the Name box, select the
DWF6 ePlot.pc3 configuration from the Name list.
3Select plot settings for the DWF file as needed.
4Click OK
5In the Browse for Plot File dialog box, select a location and enter a file
name for the DWF file.
6Click Save.
Quick Reference
Commands
PLOT
Plots a drawing to a plotter, printer, or file.
Plot DWFx Files
You can create DWFx files (DWF and XPS) to publish your drawings on the
web or across an intranet.
1610 | Chapter 33 Plot Drawings

You can use the DWFx ePlot (XPS Compatible) plot configuration file to plot
to a DWFx file. Each DWFx file can contain one or more drawing sheets.
DWFx files can be opened, viewed, and plotted by anyone using the following
applications:
■With Internet Explorer, you can view and print the 2D geometry of DWFx
files.
■With Autodesk Design Review, you can view the complete DWFx file;
zoom and pan within the DWF file; turn layers on and off; and mark up
the drawings.
See also:
■Publish Drawings on page 1621
■Review and Markup Files with Design Review on page 1980
To plot a DWFx file
1Click Output tab ➤ Plot panel ➤ Plot.
2In the Printer/plotter group, click the Name drop-down list, and select
the DWFx ePlot (XPS Compatible).pc3 configuration from the Name list.
3Select plot settings for the DWFx file as needed.
4Click OK.
5In the Browse for Plot File dialog box, select a location and enter a file
name for the DWFx file.
6Click Save.
Quick Reference
Commands
PLOT
Plots a drawing to a plotter, printer, or file.
Plot DWFx Files | 1611

Plot to DXB File Formats
DXB (drawing interchange binary) file formats are supported using the DXB
non-system file driver. This is commonly used to “flatten” 3D drawings to
2D.
The output is compatible with the DXBIN command and with the ADI DXB
driver delivered with earlier releases. The DXB driver shares these limitations
of the ADI driver:
■The driver produces 16-bit integer DXB files containing only vectors.
■DXB output is monochrome; all vectors are color 7.
■Raster images and embedded OLE objects are not supported.
■The driver ignores object and plot style lineweights.
See also:
■“Configure for File Output” in the Driver and Peripheral Guide
To create a DXB file
1Make sure you have configured a plotter driver for DXB file output. (See
Configure for File Output in the Driver and Peripheral Guide.)
2Click Output tab ➤ Plot panel ➤ Plot.
3In the Plot dialog box, under Printer/Plotter, in the Name box, select a
DXB format configuration from the list.
4Select plot settings for the DXB file as needed.
5Click OK.
6In the Browse for Plot File dialog box, select a location and enter a file
name for the DXB file.
7Click Save.
1612 | Chapter 33 Plot Drawings
Quick Reference
Commands
PLOT
Plots a drawing to a plotter, printer, or file.
Plot to Raster File Formats
The nonsystem raster driver supports several raster file formats, including
Windows BMP, CALS, TIFF, PNG, TGA, PCX, and JPEG. The raster driver is
most commonly used to plot to files for desktop publishing.
All but one of the formats supported by this driver produce “dimensionless”
raster files that have size in pixels but do not have size in inches or millimeters.
The Dimensional CALS format is for plotters that can accept CALS files. If
your plotter accepts CALS files, you must specify a real paper size and
resolution. Specify the resolution in dots per inch in the Vector Graphics pane
of the Plotter Configuration Editor.
By default, the raster driver plots only to files. However, you can select Show
All Ports on the Ports page of the Add-a-Plotter wizard or the Ports tab in the
Plotter Configuration Editor; all of the ports on your computer are then
available for configuration. When configured for plotting to a port, this driver
plots to a file and then copies that file to the specified port. To plot successfully,
make sure that the device connected to the configured port can accept and
process the file. For more information, refer to the documentation provided
by the device manufacturer.
The type, size, and color depth of the raster file determine the final file size.
Raster files can grow very large. Use only the pixel dimensions and color depth
that you need.
You can configure the background color for raster plots in the custom
Properties dialog box in the Plotter Configuration Editor. If you change the
background color, any objects plotted in that color are invisible.
See also:
■“Configure for File Output” in the Driver and Peripheral Guide
To create a raster file
1Make sure you have configured a plotter driver for raster file output. (See
Configure for File Output in the Driver and Peripheral Guide.)
Plot to Raster File Formats | 1613

2Click Output tab ➤ Plot panel ➤ Plot.
3In the Plot dialog box, under Printer/Plotter, in the Name box, select a
raster format configuration from the list.
4Select plot settings for the raster file as needed.
5Click OK.
6In the Browse for Plot File dialog box, select a location and enter a file
name for the raster file.
7Click Save.
Quick Reference
Commands
BMPOUT
Saves selected objects to a file in device-independent bitmap format.
JPGOUT
Saves selected objects to a file in JPEG file format.
PLOT
Plots a drawing to a plotter, printer, or file.
PNGOUT
Saves selected objects to a file in a Portable Network Graphics format.
TIFOUT
Saves selected objects to a file in TIFF file format.
System Variables
RASTERDPI
Controls paper size and plot scaling when changing from dimensional to
dimensionless output devices, or vice versa.
1614 | Chapter 33 Plot Drawings
Plot Adobe PDF Files
Using the DWG to PDF driver, you can create Adobe® Portable Document
Format (PDF) files from drawings.
The Adobe® Portable Document Format (PDF) is a standard for electronic
information exchange. PDF files can be easily distributed for viewing and
printing in the Adobe Reader available from the Adobe web site without cost.
Using PDF files, you can share drawings with virtually anyone.
Like DWF6 files, PDF files are generated in a vector-based format, for
maintaining precision. Drawings that are converted to PDF can be easily
distributed for viewing and printing in Adobe Reader, versions 7 or later.
Use the custom Properties dialog box in the Plotter Configuration Editor to
customize the output. To display this dialog box, on the Device and Document
Settings tab, in the tree view, select Custom Properties. Then under Access
Custom Dialog, click the Custom Properties button.
You can customize the PDF output by specifying resolution. In the Custom
Properties dialog box in the Plotter Configuration Editor, you can specify the
resolution for vector and raster images ranging from 150 dpi to a maximum
of 4800 dpi. You can also specify custom resolutions for vector, gradient, color,
and black and white output.
NOTE Although transparent objects and wipeouts are displayed correctly in the
PDF viewer, they may not print with the same visual fidelity when default print
settings are used. If your drawing contains transparent objects, you may need to
adjust some settings in Adobe Acrobat. Set Transparency Flattening to "Print as
Image" or reduce the Raster/Vector Balance in Adobe Acrobat. Refer to the Adobe
documentation for more information.
See also:
■“Configure for File Output” in the Driver and Peripheral Guide
To plot a PDF file
1Click Output tab ➤ Plot panel ➤ Plot.
2In the Plot dialog box, under Printer/Plotter, in the Name box, select the
DWG to PDF.pc3 configuration from the Name list.
3Select plot settings for the PDF file as needed.
Plot Adobe PDF Files | 1615

4Click OK.
5In the Browse for Plot File dialog box, select a location and enter a file
name for the PDF file.
6Click Save.
To plot a PDF file in landscape orientation
1Click Output tab ➤ Plot panel ➤ Plot.
2In the Plot dialog box, under Printer/Plotter, in the Name box, select the
DWG to PDF.pc3 configuration from the Name list.
3Under Paper Size, select a paper size that has the longer dimension listed
first. For example, ANSI A (11.00 x 8.50 Inches).
4Click OK.
5In the Browse for Plot File dialog box, select a location and enter a file
name for the PDF file.
6Click Save.
Quick Reference
Commands
PLOT
Plots a drawing to a plotter, printer, or file.
Plot Adobe PostScript Files
Using the Adobe PostScript driver, you can use DWGs with an array of page
layout programs and archive tools such as the Adobe Acrobat Portable
Document Format (PDF).
You can use the non-system PostScript driver to plot drawings to PostScript
printers and PostScript files. Use the PS file format for printers and the EPS
file format for files. If you plot to a hardware port, PS output is automatic. If
you plot to a file and plan to copy the file to a printer, configure for PS output.
1616 | Chapter 33 Plot Drawings
Use the custom Properties dialog box in the Plotter Configuration Editor to
customize the output. To display this dialog box, on the Device and Document
Settings tab, in the tree view, select Custom Properties. Then under Access
Custom Dialog, click the Custom Properties button.
The PostScript driver supports three types of PostScript.
■Level 1: Use for most plotters.
■Level 1.5: Use for plotters that support color images.
■Level 2: If your plotter supports Level 2 PostScript, use to produce smaller
files that print more rapidly.
The Tokenize PostScript Code and Compression options in the PostScript
Custom Properties dialog box reduce output file size and improve printing
speed on devices that support these options. If you have problems printing,
try clearing all the options. If you successfully print with no optimizations,
you can try turning the options on one at a time to determine the options
your printer supports.
Some desktop publishing applications only support Level 1 PostScript. If you
have problems using your EPS files, try a lower PostScript level and turn off
the optimizations just described.
Including a preview thumbnail in your EPS file makes the file substantially
larger but allows quick preview by many applications. The WMF preview is
for Windows; the EPSF preview is for Macintosh and other platforms.
NOTE Including both preview images can triple your file size.
See also:
■Export PostScript Files on page 1813
■“Configure for File Output” in the Driver and Peripheral Guide
To plot a PostScript file
1Make sure you have configured a plotter driver for PostScript file output.
(See “Configure for File Output” in the Driver and Peripheral Guide.)
2Click Output tab ➤ Plot panel ➤ Plot.
Plot Adobe PostScript Files | 1617

3In the Plot dialog box, under Printer/Plotter, in the Name box, select a
PostScript format configuration.
4Select plot settings for the PostScript file as needed.
5Click OK.
6In the Browse for Plot File dialog box, select a location and enter a file
name for the PostScript file.
7Click Save.
Quick Reference
Commands
PLOT
Plots a drawing to a plotter, printer, or file.
Create Plot Files
You can use any plotter configuration to create plot files that can be used with
spooling software or given to service bureaus for output.
See also:
■“Set Device-Specific Configurations” in the Driver and Peripheral Guide
To create a plot (PLT) file
1Click Output tab ➤ Plot panel ➤ Plot.
2In the Plot dialog box, under Printer/Plotter, in the Name box, select a
plotter configuration.
NOTE You must use the correct plotter configuration for the output device
in order to produce a valid PLT file.
3If the Plot to File option is available and is not selected, select it.
4Select plot settings for the plot file as needed.
1618 | Chapter 33 Plot Drawings

5Click OK.
6In the Browse for Plot File dialog box, select a location and enter a file
name for the plot file.
7Click Save.
To create a batch file for plot spooling
Plot files are meant to be used with spooling software or to be given to a service
bureau for output. A simple batch file can be used to output PLT files.
1Open a text editor and save a batch file to a folder where you save your
PLT files.
2Name the batch file something like MySpooler.bat.
3Add a single line to the batch file that reads:
copy%1 \\server\printer
The%1 is a parameter that the batch file will replace with the name of
the .plt file being sent to the output device.
TIP If the output device is connected directly to the computer, you can
substitute the print server path with the printer port, such as LPT1.
4Save the batch file and close the text editor.
To plot a plot (PLT) file from a batch file
This procedure uses the batch file created in To create a batch file for plot
spooling.
1Open a Command Prompt window and change directories to the folder
containing your PLT file and spooling batch file.
2At the command prompt, enter the following:
MySpooler.bat MyDrawing.plt
where MySpooler.bat is the name of the batch file you created and
MyDrawing.plt is the name of the plot file.
The PLT file is copied to the output device and the drawing is created.
Create Plot Files | 1619
Quick Reference
Commands
PLOT
Plots a drawing to a plotter, printer, or file.
1620 | Chapter 33 Plot Drawings
Publish Drawings
Publishing provides a streamlined alternative to plotting multiple drawings. You can easily
publish an entire sheet set from the Sheet Set Manager as a set of paper drawings or as a single,
electronic, multi-sheet DWF, DWFx, or PDF file.
Publishing an electronic drawing set as a DWF, DWFx, or PDF file saves time and increases
productivity by providing accurate, compressed representations of drawings in a file that's
easy to distribute and view.
Using Autodesk Design Review, you can view and plot DWF and DWFx files. Using Internet
Explorer 7, you can view and print the 2D geometry of a DWFx file.
Overview of Publishing
An electronic drawing set is the digital equivalent of a set of plotted drawings.
You create an electronic drawing set by publishing drawings to a DWF, DWFx,
or PDF file.
You can publish an entire sheet set from the Sheet Set Manager. With one click,
you can create an electronic drawing set by publishing the sheet set to a single,
multi-sheet DWF, DWFx, or PDF file.
You can create a paper drawing set by publishing the sheet set to the plotter
named in each sheet's page setup.
Using the Publish dialog box, you can assemble a collection of drawings to
publish and save the list as a Drawing Set Descriptions (DSD) file. You can
customize this collection of drawings for a specific user, and you can add and
remove sheets as a project evolves. Once you've created a list of drawing sheets
in the Publish dialog box, you can publish the drawings to any of the following:
■The plotter named in each sheet's page setup (including drawings that you
want to plot to file)
34
1621
■A single, multi-sheet DWF or DWFx file containing both 2D and 3D content
■A single, multi-sheet PDF file containing 2D content
■Multiple single-sheet DWF or DWFx files containing both 2D and 3D
content
■Multiple single-sheet PDF files containing 2D content
Using 3D DWF publishing, you can create and publish DWF files of your
three-dimensional models and view them with Autodesk Design Review.
For more on publishing 3D DWF files, refer to 3D DWF Publishing on page
1652.
Publishing for Autodesk Design Review
Publishing an electronic drawing set as a DWF or DWFx file saves time and
increases productivity by providing accurate, compressed representations of
drawings in a file that is easy to distribute and view. This also maintains the
integrity of your original drawings.
DWF files, when published, are created in a vector-based format (except for
inserted raster image content), ensuring that precision is maintained.
DWFx files are created using Microsoft’s XPS format. DWFx files are ZIP files
and contain metadata. This metadata can be viewed only by Autodesk Design
Review.
You can view and print general graphics in Autodesk Design Review or in
Internet Explorer 7. Rich DWFx metadata can only be viewed in Autodesk
Design Review.
You can view or plot DWF or DWFx files using Autodesk Design Review. DWF
or DWFx files can be distributed using e-mail, FTP sites, project websites, or
CDs.
You can specify which block-related properties and attributes you want to
make available to Autodesk Design Review users. For example, you can publish
a DWF file or DWFx file for a plumbing contractor that contains block attribute
information about the plumbing fixtures specified in your drawing data. And,
from the same set of sheets, you can include only the block attribute data
about light fixtures for an electrical contractor.
By default, jobs that are published are processed in the background, so that
you can return immediately to your drawing. Only one job that you have
published can be processed in the background at a time. While a job is being
processed in the background, you can check its status by placing the cursor
1622 | Chapter 34 Publish Drawings

over the plotter icon on the right side of the status bar. You can also view
details about all completed jobs that you have plotted or published from the
current session.
See also:
■Publish, Transmit, and Archive Sheet Sets on page 454
■Specify Page Setup Settings on page 1524
■Publish 3D DWF Files on page 1652
■Review and Markup Files with Design Review on page 1980
To check the status of a published job that is being processed in the
background
■Place the cursor over the plotter icon in the status tray. A tooltip displays
the status of the job.
To cancel part or all of a published job that is processing in the background
■Right-click the plotter icon in the status tray. Click Cancel Sheet
<sheetname> or Cancel Entire Job.
To view details about jobs you have published
1Do one of the following:
■Click Output tab ➤ Plot panel ➤ View Details.
■In the status tray, click the plotter icon.
2In the Plot and Publish Details dialog box, view details about published
jobs.
To turn background publishing on or off using the options dialog box
1Click Tools menu ➤ Options.
2In the Options dialog box, Plot and Publish tab, under Background
Processing Options, select or clear the Enable Background Plot When
Publishing option.
3Click OK.
Overview of Publishing | 1623

To turn background publishing on or off using the publish dialog box
1Click Output tab ➤ Publish panel ➤ Publish.
2In the Publish Controls group, select or clear Publish in background.
Quick Reference
PAGESETUP
Controls the page layout, plotting device, paper size, and other settings for
each new layout.
PUBLISH
Publishes drawings to DWF, DWFx, and PDF files, or to plotters.
BACKGROUNDPLOT
Controls whether background plotting is turned on or off for plotting and
publishing.
PUBLISHCOLLATE
Controls whether plotting a sheet set, multi-sheet plot file, or plot spool file
can be interrupted by other plot jobs.
Create and Modify a Drawing Set for Publishing
You can assemble a collection of drawing sheets to publish to a plotter, plot
files, DWF, DWFx, or PDF file. You can customize your drawing set for a
specific user, and you can add, remove, reorder, copy, and rename sheets in
a drawing set as a project evolves.
You can publish the drawing set directly to paper and single or multiple DWF,
DWFx, or PDF files. DWF, DWFx, and PDF files can be distributed using e-mail,
FTP sites, project websites, or CD. You can save a description of a drawing set
that has been assembled to publish in a Drawing Set Descriptions (DSD) file.
NOTE You must remove the drawing sheets that you don't want to become a
part of the drawing set. Layouts must be initialized before they can be published.
(A layout is initialized if its paper size is defined in the page setup to any size other
than 0 x 0.)
1624 | Chapter 34 Publish Drawings

To create a drawing set for publishing
1Open a drawing. Click Output tab ➤ Publish panel ➤ Publish.
The Publish dialog box is displayed. If the Include Layouts When Adding
Sheets option is selected, either in the shortcut menu or in the Publish
dialog box, all the layouts in the current drawing are listed in the sheetlist.
2In the Publish dialog box, you can modify the list of sheets by doing any
of the following as needed:
■Add sheets. To add sheets from other drawings, click the Add Sheets
button (or drag drawings from the desktop). In the Select Drawings
dialog box, select drawings. Click Select to add them to the list of
sheets in the Publish dialog box. All of the layouts in a drawing become
individual sheets in the list of drawing sheets. You can remove the
individual sheets if you do not want them to become part of the
drawing set. A layout must be initialized (its paper size must be defined
in the page setup to any size other than 0 x 0) before it can be
published.
NOTE To include all layouts when you add sheets to a drawing set, ensure
the Include Layouts When Adding Sheets option is selected either in the
shortcut menu or in the Publish dialog box.
■Include model layouts. If you include an uninitialized (the paper size
is not defined in the page setup or is set to 0 x 0) model layout, it will
be marked as Uninitialized in the Status column on the sheet list. It
can be plotted if you select an override page setup for it in the Publish
dialog box from the page setup drop-down list under Page Setups in
the sheet list.
NOTE To include the model when you add sheets to a drawing set, ensure
the Include Model When Adding Sheets option is selected either in the
shortcut menu or in the Publish dialog box.
■Remove sheets. To remove sheets from the list, select one or more
sheets in the list. Click the Remove Sheets button. To remove all
sheets, right-click the selection. Click Remove All.
■Reorder sheets. To reorder the sheets up or down one position in the
list, select a sheet. Click either the Move Sheet Up or Move Sheet
Create and Modify a Drawing Set for Publishing | 1625
Down button. Sheets in the drawing set are viewed or plotted in the
order shown in the list.
■Rename sheets. To rename a sheet, select it in the list and right-click.
Click Rename Sheet. Enter the new sheet name.
■Change page setups. To change the page setup for a layout, select the
sheet, and in the Page Setup list select a named page setup from the
list; or select one or more sheets and right-click. Click Change Page
Setup. In the Page Setup list, select a page setup, or select Import to
import page setups from another drawing or template. In the Import
Page Setups dialog box, select a drawing with one or more page setups.
Click Import. In the Page Setup list, select a named page setup.
NOTE Change the page setup for each layout depending on your desired
output. Model space page setups can only be applied to model space sheets;
paper space page setups can only be applied to paper space sheets.
■Copy sheets. To copy one or more drawing sheets, select the sheets
in the list and right-click. Click Copy Selected Sheets. The copied
drawing sheets are added and highlighted at the end of the sheet list.
When a sheet is copied, its name is created by the addition of -Copy(n)
at the end of the original sheet name. For example, if you create one
copy of a sheet called Plumbing, the copied sheet is called
Plumbing-Copy(1). Each time you copy the same sheet, the n is
incremented by 1. By creating copies of a sheet, you can have different
page setups and other settings for the same sheet.
3When your list of drawing sheets is assembled and configured the way
you want for your drawing set, click the Save List button.
4In the Save List As dialog box, in the File Name box, enter a name for the
list. Click Save.
The drawing set list is saved as a DSD (Drawing Set Descriptions) file.
To copy sheets in a drawing set for publishing
1Click Output tab ➤ Publish panel ➤ Publish.
2In the Publish dialog box, ensure the sheets that you want to copy are
listed.
1626 | Chapter 34 Publish Drawings
3Right-click the selection. Click Copy Selected Sheets.
The copied drawing sheets are added and highlighted at the end of the
sheet list. When a sheet is copied, its name is created by the addition of
-copy(n) at the end of the original sheet name.
For example, if you create one copy of a sheet called Plumbing, the copied
sheet is called Plumbing-Copy(1).
Each time you copy the same sheet, the n is incremented by 1. By creating
copies of a sheet, you can have different page setups and other settings
for the same sheet.
To change the page setup of one or more sheets in a drawing set for
publishing
1Click Output tab ➤ Publish panel ➤ Publish.
2In the Publish dialog box, ensure the sheets for which you want to change
the page setups are listed.
3Select one or more sheets in the list.
4Right-click the selection. Click Change Page Setup.
5In the Page Setup list, select a page setup to apply to the drawing sheets.
NOTE Change the page setup for each layout depending on your desired
output. Model space page setups can only be applied to model space sheets;
paper space page setups can only be applied to paper space sheets.
To publish multiple layouts in a drawing
1In the drawing area, click a layout tab that you want to publish.
2Press and hold the Ctrl key, and then click the other layout tabs that you
want to publish.
3Right-click one of the selected layout tabs. Click Publish Selected Layouts.
4In the Publish dialog box, change any settings for the selected layouts.
5Click Publish.
Create and Modify a Drawing Set for Publishing | 1627

Quick Reference
PUBLISH
Publishes drawings to DWF, DWFx, and PDF files, or to plotters.
Create a Paper or Plot File Drawing Set
You can publish a drawing set to a plotter or plot file.
You can assemble drawing sheets into a customized drawing set and publish
the sheets to the plotter named in the page setup specified for each sheet. If
the plot device named in the page setup is a paper plotter, then your output
will be a paper drawing set.
If the plotter is configured to plot to a file, the sheets are saved to files in the
plot file location specified in the Publish Options dialog box. Each drawing
sheet's plot file is saved with the same name as the sheet, with the appropriate
file extension for the file (for example, .plt, .jpg, or .bmp). The default location
can be changed in the Options dialog box, Plot and Publish tab, under Plot
to File.
See also:
■Set Publish Options on page 1646
To create and publish a paper or plot file drawing set
1Open a drawing. Click Output tab ➤ Publish panel ➤ Publish.
2In the Publish dialog box, the drawing layouts are shown in the Sheets
List. To create the drawing set, modify the list of drawing sheets by doing
any of the following as needed:
■Add sheets. To add sheets from other drawings, click the Add Sheets
button (or drag drawings from the desktop). In the Select Drawings
dialog box, select drawings. Click Select to add them to the list of
sheets in the Publish dialog box. All of the layouts in a drawing become
individual sheets in the list of drawing sheets. You can remove the
individual sheets if you do not want them to become part of the
drawing set. A layout must be initialized (its paper size must be defined
in the page setup to any size other than 0 x 0) before it can be
published.
1628 | Chapter 34 Publish Drawings

NOTE To include all layouts when you add sheets to a drawing set, ensure
the Include Layouts When Adding Sheets option is selected on the shortcut
menu or in the Publish dialog box.
■Include model layouts. If an uninitialized (the paper size is not defined
in the page setup or is set to 0 x 0) model layout is included, it will
be marked as Uninitialized in the Status column on the sheet list. It
can be plotted if a page setup override is applied.
NOTE To include the Model when you add sheets to a drawing set, ensure
the Include Model When Adding Sheets option on the shortcut menu is
selected.
■Remove sheets. To remove sheets from the list, select one or more
sheets in the list. Click the Remove Sheets button. To remove all
sheets, right-click. Click Remove All.
■Reorder sheets. To reorder the sheets up or down one position in the
list, select a sheet. Click either the Move Sheet Up or Move Sheet
Down button. Sheets in the drawing set are viewed or plotted in the
order shown in the list.
■Rename sheets. To rename a sheet, select it in the list and right-click,
Click Rename Sheet. Enter the new sheet name.
■Change page setups. To change the page setup for a layout, select the
sheet. In the Page Setup list, select a named page setup from the list,
or select one or more sheets in the list and right-click. Click Change
Page Setup. In the Page Setup list, select a page setup or select Import
to import page setups from another drawing or template. In the Import
Page Setups dialog box, select a drawing with one or more page setups.
Click Import. In the Page Setup list, select a named page setup.
NOTE Change the page setup for each layout depending on your desired
output. Model space page setups can only be applied to model space sheets;
paper space page setups can only be applied to paper space sheets.
■Copy sheets. To copy one or more drawing sheets, select the sheets
in the list and right-click. Click Copy Selected Sheets. The copied
drawing sheets are added and highlighted at the end of the sheet list.
When a sheet is copied, its name is created by the addition of -Copy(n)
at the end of the original sheet name. For example, if you create one
copy of a sheet called Plumbing, the copied sheet is called
Create a Paper or Plot File Drawing Set | 1629
Plumbing-Copy(1). Each time you copy the same sheet, the n is
incremented by 1. By creating copies of a sheet, you can have different
page setups and other settings for the same sheet.
3When your list of drawing sheets is assembled and configured the way
you want for your paper or plot file drawing set, click the Save Sheet List
button.
4In the Save List As dialog box, in the File Name box, enter a name for the
drawing set list. Click Save.
The drawing set list is saved as a DSD (Drawing Set Descriptions) file.
5In the Publish dialog box, under Publish To, select Plotter Named in Page
Setup.
6Click Publish to start the process.
If you have background publishing enabled, the animated plotter icon
on the right side of the status bar indicates that the publish job is in
progress: paper drawings are being plotted or plot files are being created.
7To view information about the processed publish job, right-click the
plotter icon on the right side of the status bar. Click View Plot and Publish
Details.
To publish multiple layouts
1Hold the Shift key down and click to select the layout tabs.
2Right click and select Publish Selected Layouts.
3In the Publish dialog box, select Plotter, PDF, DWF, or DWFx from the
Publish To: drop-down list and click Publish.
Quick Reference
PAGESETUP
Controls the page layout, plotting device, paper size, and other settings for
each new layout.
PLOT
Plots a drawing to a plotter, printer, or file.
1630 | Chapter 34 Publish Drawings

PLOTTERMANAGER
Displays the Plotter Manager, where you can add or edit a plotter
configuration.
PUBLISH
Publishes drawings to DWF, DWFx, and PDF files, or to plotters.
PUBLISHCOLLATE
Controls whether plotting a sheet set, multi-sheet plot file, or plot spool file
can be interrupted by other plot jobs.
Publish an Electronic Drawing Set
You can publish an electronic drawing set as a DWF, DWFx, or PDF file.
You can assemble drawing sheets into a customized electronic drawing set.
An electronic drawing set is the digital equivalent of a set of plotted drawings.
This enables you to share your work with customers, suppliers, or people
within your own company who may need the drawings for review or for their
records.
An electronic drawing set can be saved as
■A single, multi-sheet DWF, DWFx, or PDF file
■Multiple, single-sheet DWF or DWFx, or PDF files
You can also send the published electronic drawing set as an e-mail attachment,
share it using a project collaboration site such as Autodesk Buzzsaw, or post
it to a website. Using Autodesk Design Review, you can view or plot only the
layouts you need.
You can use the default plotter driver as installed, or you can modify
configuration settings such as color depth, display resolution, file compression,
font handling, and other options. Once you modify the original plotter
configuration file, all future plotting and publishing of DWF, DWFx, or PDF
files will be affected.
IMPORTANT Create a copy of the original plotter configuration file before you
make any changes.
See also:
■Set Publish Options on page 1646
Publish an Electronic Drawing Set | 1631
■Review and Markup Files with Design Review on page 1980
To create a DWF, DWFx, or PDF file using publish
1Open a drawing. Click Output tab ➤ Publish panel ➤ Publish.
The Publish dialog box is displayed. If the Include Layouts When Adding
Sheets option is selected either in the shortcut menu or in the Publish
dialog box, all the layouts in the current drawing are listed in the sheet
list.
2In the Publish dialog box, you can modify the list of sheets by doing any
of the following as needed:
■Add sheets. To add sheets from other drawings, click the Add Sheets
button (or drag drawings from the desktop). In the Select Drawings
dialog box, select drawings. Click Select to add them to the list of
sheets in the Publish dialog box. All of the layouts in a drawing become
individual sheets in the list of drawing sheets. You must remove those
sheets that you don't want to become a part of the drawing set.
NOTE To include all layouts when you add sheets to a drawing set, select —
Include Layouts When Adding Sheets option in the shortcut menu or Layout
Tab in the Include when adding sheets group.
■Include model layouts. If you include an uninitialized (the paper size
is not defined in the page setup or is set to 0 x 0) model layout, it will
be marked as Uninitialized in the Status column on the sheet list. It
can be plotted if you select an override page setup for it in the Publish
dialog box from the page setup drop-down list under Page Setups in
the sheet list.
NOTE To include the model space when you add sheets to a drawing set,
select — Include Model When Adding Sheets option in the shortcut menu
or Model Tab in the Include when adding sheets group.
■Remove sheets. To remove sheets from the list, select one or more
sheets, and then click the Remove Sheets button. To remove all sheets,
right-click. Click Remove All.
■Reorder sheets. To reorder the sheets up or down one position in the
list, select a sheet. Click either the Move Sheet Up or Move Sheet
1632 | Chapter 34 Publish Drawings

Down button. Sheets in the drawing set are viewed or plotted in the
order shown in the list.
■Rename sheets. To rename a sheet, select it in the list and right-click.
Click Rename Sheet. Enter the new sheet name.
■Change page setups. To change the page setup for a layout, select the
sheet, and in the Page Setup list select a named page setup from the
list; or select one or more sheets and right-click. Click Change Page
Setup. In the Page Setup list, select a page setup, or select Import to
import page setups from another drawing or template. In the Import
Page Setups dialog box, select a drawing with one or more page setups.
Click Import. In the Page Setup list, select a named page setup.
NOTE Change the page setup for each layout depending on your desired
output. Model space page setups can only be applied to model space sheets;
paper space page setups can only be applied to paper space sheets.
■Copy sheets. To copy one or more drawing sheets, select the sheets
in the list and right-click. Click Copy Selected Sheets. The copied
drawing sheets are added and highlighted at the end of the sheet list.
When a sheet is copied, its name is created by the addition of -Copy(n)
at the end of the original sheet name. For example, if you create one
copy of a sheet called Plumbing, the copied sheet is called
Plumbing-Copy(1). Each time you copy the same sheet, the n is
incremented by 1. By creating copies of a sheet, you can have different
page setups and other settings for the same sheet.
3When your list of drawing sheets is assembled and configured the way
you want for your drawing set, click the Save Sheet List button.
NOTE Ensure that you have saved your drawing before you click the Save
Sheet List button.
4In the Save List As dialog box, in the File Name box, enter a name for the
list. Click Save.
The drawing set list is saved as a drawing set descriptions (DSD) file.
5In the Publish dialog box, under Publish To, click DWF Format, and select
DWF File or DWFx File. Click Publish.
6In the Specify DWF File dialog box, enter a file name.
The Files of Type is DWF or DWFx based on the selected DWF format.
Publish an Electronic Drawing Set | 1633

7Click Select to provide the name and destination for the DWF or DWFx
file.
NOTE You can also enter a URL so that the DWF or DWFx file is uploaded to
an FTP or HTTP site.
8Click Save to start the electronic drawing set creation.
If you have background publishing enabled, the animated plotter icon
on the right side of the status bar indicates that the publish job is in
progress.
9To view information about the processed publish job, right-click the
plotter icon on the right side of the status bar. Click View Plot and Publish
Details.
The information in the Plot and Publish Details dialog box is also saved
to the plot and Publish log file.
10 If you have the appropriate viewer installed, you can view the DWF or
DWFx file. Right-click the plotter icon on the right side of the status.
Click View DWF File.
To create a DWF, DWFx, or PDF file using Windows Explorer
1Launch Windows Explorer.
2Select the drawings to publish to DWF or DWFx.
Use Shift or Ctrl + Click to select contiguous or non-contiguous files.
NOTE You can publish only 2D DWF or 2D DWFx files using the shortcut
menu in Windows Explorer.
3Right-click the selection. Click Publish DWF.
The Specify DWF File dialog box appears in a temporary AutoCAD session.
4Specify Files of type as either *.dwfx or *.dwf.
5Type a file name, or select a file.
AutoCAD publishes the drawing file with the following options:
DWF type = Multi-sheet
Password = Disabled
1634 | Chapter 34 Publish Drawings

Layer information = Don’t include
Block information = Don’t include
By default, the DWF/ DWFx/PDF file will be saved to the same location
as the selected drawing file/s.
To create and email a DWF, DWFx, or PDF file using Windows Explorer
1Launch Windows Explorer.
2Select the drawings to publish to DWF / DWFx.
Use Shift or Ctrl + Click to select contiguous or non-contiguous files.
NOTE You can publish only 2D DWF or 2D DWFx using the shortcut menu
in Windows Explorer.
3Right-click the selection. Click Publish DWF and Email.
The Specify DWF File dialog box is displayed in a temporary AutoCAD
session.
4Specify Files of type as either *.dwfx or *.dwf.
5Type a file name, or select a file.
The DWF or DWFx file contains the following settings:
DWF type = Multi-sheet
Password = Disabled
Layer information = Don’t include
Block information = Don’t include
6AutoCAD launches your default mail application with the newly created
DWF or DWFx as an attachment.
Publish an Electronic Drawing Set | 1635

Quick Reference
PAGESETUP
Controls the page layout, plotting device, paper size, and other settings for
each new layout.
PUBLISH
Publishes drawings to DWF, DWFx, and PDF files, or to plotters.
PUBLISHCOLLATE
Controls whether plotting a sheet set, multi-sheet plot file, or plot spool file
can be interrupted by other plot jobs.
PUBLISHHATCH
Controls whether hatch patterns published to DWF or DWFx format are
treated as a single object when they are opened in Autodesk Impression.
Publish a Sheet Set
From the Sheet Set Manager, you can easily publish an entire sheet set, a subset
of a sheet set, or a single sheet. It is quicker to publish a sheet set in the Sheet
Set Manager rather than using the Publish dialog box.
When you publish from the Sheet Set Manager, you can publish an electronic
sheet set by publishing to a DWF, DWFx, or PDF file, or you can publish a
paper set by publishing to the plotter named in the page setup that is associated
with each drawing sheet. You can also publish your sheets using a page setup
that is saved in the page setup overrides DWT file associated with the sheet
set. This page setup overrides the current page setup settings for the individual
publish job.
When you open the Publish dialog box from the Sheet Set Manager, the Publish
dialog box automatically lists the sheets you selected in the sheet set. You can
then modify the sheet set for publishing.
NOTE You can specify that sheets are sent to the plotter in reverse order. This
option is available from the Publish dialog box and from the Sheet Set Manager.
See also:
■Use Named Page Setups with Sheet Sets on page 1549
■Work with Sheets in a Sheet Set on page 431
1636 | Chapter 34 Publish Drawings
■Set Publish Options on page 1646
To publish a sheet set to a DWF file
1Click View tab ➤ Palettes panel ➤ Sheet Set Manager.
2In the Sheet Set Manager, under Sheets, select a sheet set, subset, or sheet.
3In the upper-right corner of the Sheet Set Manager, click the Publish
button.
NOTE Sheet sets cannot contain 3D DWF (or 3D DWFx) entries.
4Click Publish to DWF from the flyout menu.
If you have background publishing enabled, the animated plotter icon
on the right side of the status bar indicates that the publish job is in
progress. Right-click this icon for options to view the DWF file or to view
information about the publish job.
TIP Publishing performance can be improved by disabling background
publishing. Ensure that background publishing is not selected in the Plot and
Publish tab (Tools ➤ Options), and in the Publish Controls group.
To publish a sheet set to a DWFx file
1Click View tab ➤ Palettes panel ➤ Sheet Set Manager.
2In the Sheet Set Manager, under Sheets, select a sheet set, subset, or sheet.
3In the upper-right corner of the Sheet Set Manager, click the Publish
button.
NOTE Sheet sets cannot contain 3D DWF (or 3D DWFx) entries.
Publish a Sheet Set | 1637
4Click Publish to DWFx from the flyout menu.
If you have background publishing enabled, the animated plotter icon
on the right side of the status bar indicates that the publish job is in
progress. Right-click this icon for options to view the DWF file or to view
information about the publish job.
TIP Publishing performance can be improved by disabling background
publishing. Ensure that background publishing is not selected in the Plot and
Publish tab (Tools ➤ Options), and in the Publish Controls group.
To publish a sheetset to a PDF file
1Click View tab ➤ Palettes panel ➤ Sheet Set Manager.
2In the Sheet Set Manager, right-click a sheet set, subset, or sheet. Click
Publish ➤ Manage Page Setups.
3In the Page Setup Manager dialog box, click New.
4In the New Page Setup dialog box, under New Page Setup Name, enter a
name for the PDF page setup. Click OK.
5In the Page Setup dialog box, under Printer/Plotter, select the DWG to
PDF.pc3 configuration file.
If the Paper Size Not Found dialog box displays, choose the paper size
option for the sheet set.
6In the Page Setup dialog box, set the desired page setup options. Click
OK.
7In the Page Setup Manager, click Close.
8In the Sheet Set Manager, right-click the sheet set to publish. Click
Publish ➤ Publish Using Page Setup Override. Click the page setup you
created.
The PDF file is plotted to the directory listed in the Plot and Publish
Details (VIEWPLOTDETAILS) dialog box.
TIP Publishing performance can be improved by disabling background
publishing. Background publishing can be disabled by clearing the Publish
in background check box (Publish Controls group) in the Publish dialog box.
1638 | Chapter 34 Publish Drawings
To publish a subset of a sheet set or an individual sheet to a DWF file
1Click View tab ➤ Palettes panel ➤ Sheet Set Manager.
2In the Sheet Set Manager, under Sheets, select a sheet set, subset, or sheet.
3In the upper-right corner of the Sheet Set Manager, click the Publish
button.
4Click Publish to DWF from the flyout menu.
NOTE If you have background publishing enabled, the animated plotter icon
on the right side of the status bar indicates that the publish job is in progress.
Right-click this icon for options to view the DWF file or to view information
about the publish job.
To publish a subset of a sheet set or an individual sheet to a DWFx file
1Click View tab ➤ Palettes panel ➤ Sheet Set Manager.
2In the Sheet Set Manager, under Sheets, select a sheet set, subset, or sheet.
3In the upper-right corner of the Sheet Set Manager, click the Publish
button.
4Click Publish to DWFx from the flyout menu.
NOTE If you have background publishing enabled, the animated plotter icon
on the right side of the status bar indicates that the publish job is in progress.
Right-click this icon for options to view the DWFx file or to view information
about the publish job.
Publish a Sheet Set | 1639
To publish a subset of a sheet set or an individual sheet to a PDF file
1Click View tab ➤ Palettes panel ➤ Sheet Set Manager.
2In the Sheet Set Manager, under Sheets, select a sheet set, subset, or sheet.
3In the upper-right corner of the Sheet Set Manager, click the Publish
button.
4Click Publish to DWFx from the flyout menu.
NOTE If you have background publishing enabled, the animated plotter icon
on the right side of the status bar indicates that the publish job is in progress.
Right-click this icon for options to view the DWFx file or to view information
about the publish job.
To publish sheets in a sheet set to the plotter named in the sheet's page
setup
1Click View tab ➤ Palettes panel ➤ Sheet Set Manager.
2In the Sheet Set Manager, under Sheets, select a sheet set, subset, or sheet.
3In the upper-right corner of the Sheet Set Manager, click the Publish
button. Click Publish To Plotter.
NOTE If you have background publishing enabled, the animated plotter icon
on the right side of the status bar indicates that the publish job is in progress.
Right-click this icon for options to view the DWF file or to view information
about the publish job.
1640 | Chapter 34 Publish Drawings
To publish sheets in a sheet set using a page setup from the page setup
overrides file
1Click View tab ➤ Palettes panel ➤ Sheet Set Manager.
2In the Sheet Set Manager, under Sheets, select the sheet set, subset, or
sheet.
3In the upper-right corner of the Sheet Set Manager, click the Publish
button. Click Publish Using Page Setup Override ➤ <filename.dwt>. (All
the named page setups that are saved in the page setup override DWT
file are listed.)
The settings in the selected page setup override file take precedence over
(override) the page setup settings currently set for the selected sheets.
The page setup override settings apply only for this individual publish
job.
NOTE If you have background publishing enabled, the animated plotter icon
on the right side of the status bar indicates that the publish job is in progress.
Right-click this icon for options to view the DWF file or to view information
about the publish job.
To include a plot stamp on published sheets from a sheet set
1Click View tab ➤ Palettes panel ➤ Sheet Set Manager.
2In the upper-right corner of the Sheet Set Manager, click the Publish
button. Click Include Plot Stamp.
A plot stamp will be included on all published sheets.
NOTE To change the plot stamp settings, click the Publish button. Click Plot
Stamp Settings.
Publish a Sheet Set | 1641
To publish sheets in a sheet set in reverse order
1Click View tab ➤ Palettes panel ➤ Sheet Set Manager.
2In the Sheet Set Manager, under Sheets, select the name of a sheet set or
a subset.
3In the upper-right corner of the Sheet Set Manager, click the Publish
button. Click Publish In Reverse Order.
A tick mark against the menu item indicates that when you click Publish,
the sheets will be published in reverse order.
NOTE This option is not available for DWF files.
To set options for publishing sheet sets
1Click View tab ➤ Palettes panel ➤ Sheet Set Manager.
2In the upper-right corner of the Sheet Set Manager, click the Publish
button. Click Sheet Set Publish Options.
3In the Sheet Set Publish Options dialog box, modify the settings as
required.
4Click OK.
To modify the sheet set for publishing using the publish dialog box
1Click View tab ➤ Palettes panel ➤ Sheet Set Manager.
2In the Sheet Set Manager, under Sheets, select the node or name of a
sheet set, subset, or an individual sheet.
1642 | Chapter 34 Publish Drawings
3In the upper-right corner of the Sheet Set Manager, click the Publish
button. Click Publish Dialog Box.
The Publish dialog box is displayed and lists the sheets you selected in
the Sheet Set Manager.
4In the Publish dialog box, modify the sheet list and settings as required.
5Click Publish to publish the modified sheet set.
NOTE If you have background publishing enabled, the animated plotter icon
on the right side of the status bar indicates that the publish job is in progress.
Right-click this icon for options to view the DWF or DWFx file or to view
information about the publish job.
Quick Reference
PAGESETUP
Controls the page layout, plotting device, paper size, and other settings for
each new layout.
PLOT
Plots a drawing to a plotter, printer, or file.
PUBLISH
Publishes drawings to DWF, DWFx, and PDF files, or to plotters.
SHEETSET
Opens the Sheet Set Manager.
PUBLISHCOLLATE
Controls whether plotting a sheet set, multi-sheet plot file, or plot spool file
can be interrupted by other plot jobs.
Republish a Drawing Set
You can easily republish lists of drawing sheets that you previously saved in
the Drawing Set Descriptions (DSD) file format.
Republish a Drawing Set | 1643

After drawings have been updated, you may want to republish a drawing set
for viewing or plotting. You can easily republish a sheet set (DST file) or a
collection of drawing sheets that you saved as a DSD (Drawing Set Descriptions)
file. You can also load and republish BP3 (Batch Plot) files.
To republish a drawing set
1Click Output tab ➤ Publish panel ➤ Publish.
If you have a drawing open, all the layouts in your drawing are shown
in the sheet list in the Publish dialog box. Right-click in the sheet list.
Click Remove All to delete the layouts from the list of drawing sheets.
2In the Publish dialog box, click the Load Sheet List button.
3In the Load List of Sheets dialog box, select the location of the DSD file
or the BP3 file. Click Load.
The drawing sheets in the saved drawing set are displayed in the sheet
list in the Publish dialog box.
4In the Publish to group, do one of the following:
■To publish to a DWF file —click DWF format, and select DWF File.
■To publish to a DWFx file — click DWF format, and select DWFx File.
■To publish to a PDF file — click PDF format, and select PDF File.
■To publish to a plotter or printer — click Plotter Named in Page Setup.
5Click Publish.
If you have background publishing enabled, the animated plotter icon
on the right side of the status bar indicates that the publish job is in
progress.
6If you have background publishing enabled, you can view information
about the processed publish job. Right-click the plotter icon on the right
side of the status bar. Click View Plot and Publish Details. The information
in the Plot and Publish Details dialog box is also saved to the plot and
publish log file.
1644 | Chapter 34 Publish Drawings

Quick Reference
PUBLISH
Publishes drawings to DWF, DWFx, and PDF files, or to plotters.
View Electronic Drawing Sets with Autodesk Design
Review
A published DWF or DWFx electronic drawing set can be viewed and plotted
with Autodesk Design Review.
A published drawing set is the digital equivalent of paper plots created from
your original drawings. The drawing set, which can be saved as a DWF or
DWFx file, can be viewed or plotted by anyone using Autodesk Design Review.
NOTE For DWFx files, you can view the 2D geometry of a DWFx file using Internet
Explorer 7.
With Autodesk Design Review, you can open, view, and print all DWF or
DWFx file formats and other raster format images. You can pan, zoom, and
view individual drawing sheets and viewports. You can also view layer
information, sheet and sheet set properties, block information and attributes,
and custom properties, if they are included in the DWF or DWFx file. As you
move your cursor across DWF or DWFx geometry in the viewer, objects with
associated data are displayed with a red highlighting effect. For more
information about Autodesk Design Review, see Review and Markup Files with
Design Review on page 1980.
Recipients of drawing sets in DWF or DWFx format do not have to own or
know the program. From anywhere in the world, they can view and print
high-quality layouts using Autodesk Design Review.
Autodesk Design Review runs as a stand-alone application or embedded in
any application that supports ActiveX controls, such as Microsoft® Internet
Explorer.
For product information and a download link for the Autodesk Design Review,
refer to the Products page on the Autodesk website.
See also:
■Review and Markup Files with Design Review on page 1980
View Electronic Drawing Sets with Autodesk Design Review | 1645

To view a 2D DWFx in Internet Explorer 7
■Click and drag the DWFx file to the Internet Explorer 7 window.
■Click OK at the Internet Explorer dialog box.
A new window displays the contents of the DWFx file.
NOTE If you have a pop-up blocker, select “Allow Blocked Content”, and click
Yes when prompted.
To view the most recently published DWF file
■In the program, right-click the plotter icon on the right side of the status
bar. Click View DWF file.
NOTE This option is available if you have the appropriate viewer installed on your
machine.
The DWF File is displayed in Autodesk Design Review (if installed), or in the
installed DWF Viewer (if you do not have Autodesk Design Review).
To view the most recently published DWFx file
■In the program, right-click the plotter icon on the right side of the status
bar. Click View DWF file.
This option is available if you have the appropriate viewer installed on
your machine.
The DWFx file is displayed in either of the following applications (if
installed): Autodesk Design Review (by default), or in Internet Explorer 7
(2D DWFx files only).
Quick Reference
PUBLISH
Publishes drawings to DWF, DWFx, and PDF files, or to plotters.
Set Publish Options
Set options for publishing, such as output file location, multi-sheet name
options, password protection, and whether or not to include layer information.
1646 | Chapter 34 Publish Drawings

You can also decide what types of information to reveal in your published
DWF, DWFx, and PDF files and whether to publish drawings automatically.
You can include the following types of metadata:
■Sheet set properties (must publish using the Sheet Set Manager)
■Sheet properties (must publish using the Sheet Set Manager)
■Block standard properties and block custom properties and attributes
■Properties contained in custom objects
You use a block template (BLK) file to determine which blocks and properties
to include in your published DWF, DWFx, or PDF file. You use the Block
Template dialog box to create or modify the settings of a block template (BLK)
file. You can also use BLK files created with the Attribute Extraction wizard.
When you change settings in the Publish Options dialog box, you can save
the settings to the Drawing Set Descriptions (DSD) file to reuse the next time
you publish drawings.
You can also specify whether a DWF, DWFx, or PDF file is created automatically
when a drawing is saved or closed in the Auto Publish Options Dialog Box.
NOTE PDF files cannot be password protected.
To specify output locations and types, file names, and security settings for
DWF, DWFx, PDF, and plot files
1Click Output tab ➤ Plot panel ➤ Batch Plot.
2In the Publish To group, select DWF Format; and select DWF File or DWFx
File.
3Click Publish Options.
To be prompted for a name for a multi-sheet DWF, DWFx, or PDF file
1Click Output tab ➤ Plot panel ➤ Batch Plot.
2Click Publish Options.
The Publish Options dialog box appears.
3In the General DWF Options pane, under DWF Type, select Multi-sheet
DWF from the drop-down list.
Set Publish Options | 1647

4In the Multi-sheet DWF Options, select Prompt for Name to be prompted
for a file name every time you publish a DWF file.
5Click OK.
6In the Publish dialog box, contine with publishing tasks, and then close
the dialog box.
To include layer or block information in a published DWF, DWFx, or PDF file
NOTE You can use block template (BLK) files created with the Publish Options
dialog box or BLK files created using the Attribute Extraction wizard.
1Click Output tab ➤ Plot panel ➤ Batch Plot.
2Click Publish Options.
The Publish Options dialog box appears.
3In the DWF Data Options, do one of the following:
■Under Layer Information, click to display the drop-down list, and
select Include.
■Under Block Information, click to display the drop-down list, and
select Include.
NOTE By default, Layer and Block Information is set to Don't Include. If you
change the setting to include layer or block information, you can turn
individual layers on and off when you view or print the DWF file, or use the
viewer to view or print block property and attribute information in the DWF
or DWFx file.
4Click OK.
5In the Publish dialog box, contine with publishing tasks, and then close
the dialog box.
To create a block template (BLK) file
1Click Output tab ➤ Plot panel ➤ Batch Plot.
2Click Publish Options.
The Publish Options dialog box appears.
1648 | Chapter 34 Publish Drawings

3In the DWF Data Options pane, under Block Information, click to display
the drop-down list, and select Include.
4Under DWF Data Options, Block Template File, click to display the
drop-down list, and select Create.
The Publish Block Template dialog box opens with the Block Source
Drawing area displaying the current drawing.
NOTE The working set of drawings for this list is completely independent of
the drawings to include in the Publish operation.
5Do one of the following:
■If this drawing contains the block properties you want to include in
the published DWF or DWFx file, click Scan for Blocks.
The program scans the DWG file for all unique block definitions and
their associated properties and attributes.
■If this drawing does not contain the block properties you want to
include in the published DWF or DWFx file, click Add.
The Select Drawings dialog box is displayed. Select drawings to add
to the block source drawings list. You can also add and remove
drawings that contain target blocks whose properties you want to
include in the published DWF or DWFx file. Click Scan for Blocks.
The DWG file is scanned for all unique block definitions and their
associated properties and attributes.
NOTE By default, block settings for nested blocks and blocks in xrefs are
included. If you don't want to include these block settings, click Options
in the Publish Block Template dialog box and clear the related options.
6In the Publish Block Template dialog box, under Block Data to Publish,
Unique Blocks From Source Drawings, Check Blocks to Publish, select
the block names you want to include in the published DWF or DWFx
files. You can right-click to select or clear all boxes.
7Under Block Data to Publish, Properties of Selected Blocks, Check
Properties to Publish, select the properties you would like to include in
your published DWF or DWFx files. You can right-click to select or clear
all boxes.
The list displays the union of the properties of all selected blocks.
Set Publish Options | 1649

NOTE If you select a block on the block list and clear the check marks of all
its properties, only the name of the block is published to the resultant DWF
or DWFx file; no property information is included.
8Click Save to name and save the block template file. Click OK.
The new block template file is now available under DWF Data Options
in the Publish Block Template dialog box.
9In the Publish dialog box, contine with publishing tasks, and then close
the dialog box.
To edit a block template (BLK) file
1Click Output tab ➤ Plot panel ➤ Batch Plot.
2Click Publish Options.
The Publish Options dialog box appears.
3In the DWF Data Options pane, under Block Information, click to display
the drop-down list, and select Include.
4Under DWF Data Options, Block Template File, click to display the
drop-down list, and select Edit.
5In the Select Block Template dialog box, click the Block Template (BLK)
file you want to edit, and then click Select.
NOTE The working set of drawings for this list is completely independent of
the drawings to include in the Publish operation.
6In the Publish Block Template dialog box, click Scan for Blocks.
The program scans the DWG files for all unique block definitions and
their associated properties and attributes.
NOTE By default, block settings for nested blocks and blocks in xrefs are
included. If you don't want to include these block settings, click Options in
the Publish Block Template dialog box and clear the related options.
7Under Block Data to Publish, Unique Blocks From Source Drawings, Check
Blocks to Publish, select or clear the block names you want to include in
the published DWF files.
1650 | Chapter 34 Publish Drawings

8Under Block Data to Publish, Properties of Selected Blocks, Check
Properties to Publish, select or clear the properties you want to include
in your published DWF or DWFx files.
This list displays the union of the properties of all selected blocks.
NOTE If you select a block from the block list and clear the check marks of
all its properties, only the name of the block is published to the resultant DWF
or DWFx file; no property information is included.
9Click Save. Click OK.
The modified block template file is now available under DWF Data
Options in the Publish Block Template dialog box.
10 In the Publish dialog box, contine with publishing tasks, and then close
the dialog box.
Quick Reference
AUTOPUBLISH
Publishes drawings to DWF, DWFx, or PDF files automatically to a specified
location.
PUBLISH
Publishes drawings to DWF, DWFx, and PDF files, or to plotters.
AUTODWFPUBLISH
Controls whether DWF (Design Web Format) files are created automatically
when you save or close drawing (DWG) files.
AUTOMATICPUB
Controls whether electronic files (DWF/PDF) are created automatically when
you save or close drawing (DWG) files.
PUBLISHCOLLATE
Controls whether plotting a sheet set, multi-sheet plot file, or plot spool file
can be interrupted by other plot jobs.
PUBLISHHATCH
Controls whether hatch patterns published to DWF or DWFx format are
treated as a single object when they are opened in Autodesk Impression.
Set Publish Options | 1651
Publish 3D DWF Files
You can create and publish DWF or DWFx files of your 3D models and view
them with Autodesk Design Review.
You can generate DWF or DWFx files of your 3D models with nearly the same
visual fidelity as your original DWG files. You can create a single or multi-sheet
DWF or DWFx file with 2D and 3D model space objects. To access single sheet
3D DWF publishing, use the 3DDWF, EXPORT. To access multi-sheet
publishing with 2D and 3D model space objects use the PUBLISH command.
Recipients of 3D DWF or 3D DWFx files can view and print them using
Autodesk Design Review.
For product information and a download link for the Autodesk Design Review,
refer to the Products page on the Autodesk website.
For more information about using the Autodesk Design Review, see the
Autodesk Design Review Help system.
Publish Single and Multiple 3D DWF or 3D DWFx Files
To publish a single 3D DWF or 3D DWFx file, use the EXPORT or 3DDWF
commands. With either of those commands running, the model you are
currently working on is saved as a 3D DWF or 3D DWFx file.
To publish multiple 3D DWF or 3D DWFx files at one time, you use the
PUBLISH command. The Publish dialog box displays a list of all the sheet
names of the drawing files that are currently open. You can determine which
sheets are published to a 3D DWF or 3D DWFx file by adding or removing
sheets on the Sheet Name list.
Publishing Materials
If you assigned texture mapped materials to your models, those materials can
be published with the 3D DWF or 3D DWFx file. Texture map orientation and
scaling that is set in the drawing editor is retained in the published 3D DWF
or 3D DWFx file.
There are some limitations to materials publishing.
■The Diffuse Map channel is the only mapping that gets published. If you
use Opacity, Reflection, or Bump maps in your material, they do not get
published.
■Procedural materials such as Wood or Marble do not get published.
1652 | Chapter 34 Publish Drawings

NOTE Because the DWF Viewer and the rendering engine are different, you may
encounter some deviation in how the texture maps appear in the DWF Viewer.
Increase the Smoothness of 3D DWF or 3D DWFx Models
The smoothness of 3D DWF or 3D DWFx models is improved by changing
the value of the 3DDWFPREC system variable. The setting for 3DDWFPREC
ranges from 1 to 6. Higher settings greatly improve the appearance of objects
in the DWF Viewer.
NOTE 3DDWFPREC is a global setting that affects all objects in the 3D model.
Therefore, higher values can result in very large file sizes.
Improve Performance with Large Models
Every object in your model gets processed when a DWF or DWFx file is
published. When working with large models, you can greatly improve
publishing performance by using blocks. For instance, your office model
contains a basic cubicle arrangement of eight partition walls, a desk, and a
chair. Those ten objects do not take much time to process by themselves.
However, if that basic cubicle arrangement is used 100 times, it means that
1000 objects must be processed and the publishing time increases accordingly.
If the basic cubicle arrangement is inserted into the model as a single block,
those ten objects are processed once for each insertion.
You can improve publishing performance even more by grouping
miscellaneous objects into temporary blocks. Once the publishing is complete,
you can explode those blocks and continue working on those objects.
As a design gets closer to completion, you can create blocks comprised of
portions of the model that are less likely to need further editing. If the first
floor of the office model is not going to change much, create a block containing
all of its components. During publishing, that block is processed as one object
instead of each individual object on that floor.
3D DWF or 3D DWFx Unsupported Content
When publishing a 3D DWF or 3D DWFx file, some drawing content may not
appear in the DWF Viewer. The content listed in the following table is not
supported when you output a 3D DWF or 3D DWFx file.
DetailsUnsupported Content
Animations and Walkthroughs
Publish 3D DWF Files | 1653
DetailsUnsupported Content
Block attributes
See the “Supported Text Fonts” tableFont types (Various)
Gradient fills (Hatches)
Hidden edges
Hyperlinks
Images
Layer information
Lights and Shadows
Material components ■Bump, Opacity, and Specular texture
maps
■Procedural materials (for example,
wood & marble)
■Reflection and refraction
■Self-Illumination
■Shininess
■Translucency
Bold and Italic textMtext (partial)
Named views and cameras
OLE objects
Rays and X-lines
Section clipping and XClipping
Text thickness
Visual styles
1654 | Chapter 34 Publish Drawings

Supported Text Fonts
Many text fonts are not supported when you publish a 3D DWF or 3D DWFx
file. The following table lists the fonts that are published.
Supported Text Fonts
Arial
Arial Black
Comic Sans MS
Courier New
Impact
Lucinda Console
Lucinda Sans Unicode
Martlett
Tahoma
Times New Roman
Verdana
Verdana Italic
Webdings
Wingdings
See also:
■Review and Markup Files with Design Review on page 1980
Publish 3D DWF Files | 1655

To publish a single 3D DWF file
1Click Output tab ➤ Export to DWF/PDF panel ➤ 3D DWF.
2In the Export Data dialog box, specify a name and location of the DWF
file. Click Save.
By default, all model space objects are published to the 3D DWF file and,
if your drawing contains xrefs, the Group By Xref Hierarchy option is
active.
3(Optional) Click Yes to open the Autodesk Design Review and view the
published 3D DWF file.
To publish a single 3D DWFx file
1Click Output tab ➤ Export to DWF/PDF panel ➤ 3D DWF.
2In the Export Data dialog box, specify a name and location of the DWFx
file.
3In the Files of type drop-down list box, click 3D DWFx.
4Click Save.
By default, all model space objects are published to the 3D DWFx file,
and if your drawing contains xrefs, the Group By Xref Hierarchy option
is active.
5(Optional) Click Yes to open the Autodesk Design Review and view the
published 3D DWFx file.
To export a 3D DWF file
1Click Output tab ➤ Export to DWF/PDF panel ➤ 3D DWF.
2In the Export 3D DWF dialog box, specify the name and location of the
DWF file.
1656 | Chapter 34 Publish Drawings
3If necessary, select 3D DWF (*.dwf) from the Files Of Type list. Click Save.
By default, all model space objects are exported to the 3D DWF file and
if your drawing contains xrefs, the Group By Xref Hierarchy option is
active.
4(Optional) Click Yes to open the Autodesk Design Review and view the
published 3D DWF file.
To export a 3D DWFx file
1Click Output tab ➤ Export to DWF/PDF panel ➤ 3D DWF.
2In the Export Data dialog box, specify the name and location of the DWFx
file.
3Select 3D DWFx (*.dwfx) from the Files Of Type list. Click Save.
By default, all model space objects are exported to the 3D DWFx file, and
if your drawing contains xrefs, the Group By Xref Hierarchy option is
active.
4(Optional) Click Yes to open the Autodesk Design Review and view the
published 3D DWFx file.
To publish multiple 3D or combined 2D and 3D DWF files
1Click Output tab ➤ Plot panel ➤ Batch Plot.
2In the Publish dialog box, under Sheets to Publish, select the sheets you
want to publish and set their Page Setup / 3D DWF setting to 3D DWF.
The sheets that are displayed in the Sheets to Publish group are controlled
by the PUBLISHALLSHEETS system variable.
3In Publish To group, click to select DWF Format.
4Select DWF File from the drop-down list.
NOTE The Status of the selected sheet will show, “3D DWF cannot be
published to a “Plotter Named in Paget Setup”, until you change the Publish
to option to DWF Format.
Publish 3D DWF Files | 1657
5Click Publish Options. In General DWF Options, set the DWF Type to
Multi-sheet DWF.
6Select the Publish Output options.
NOTE The Precision Override setting does not affect models sheets that are
converted to 3D DWF.
7In 3D DWF options group, click Yes to publish materials. Click OK.
8Click Publish.
To publish multiple 3D or combined 2D and 3D DWFx files
1Click Output tab ➤ Plot panel ➤ Batch Plot.
2In the Publish dialog box, under Sheets to Publish, select the sheets you
want to publish and set their Page Setup / 3D DWF setting to 3D DWF.
The sheets that are displayed in the Sheets to Publish group are controlled
by the PUBLISHALLSHEETS system variable.
NOTE The Status of the selected sheet will show, “3D DWF cannot be
published to a “Plotter Named in Paget Setup”, until you change the Publish
to option to DWF Format.
3In Publish To group, click to select DWF Format.
4Select DWFx File from the drop-down list.
5Click Publish Options. In General DWF Options, set the DWF Type to
Multi-sheet DWF.
6Select the Publish Output options.
NOTE The Precision Override setting does not affect models sheets that are
converted to 3D DWF.
7In 3D DWF options group, click Yes to publish materials. Click OK.
8Click Publish.
1658 | Chapter 34 Publish Drawings

To publish selected objects in your model to a 3D DWF or 3D DWFx file
1Click Output tab ➤ Export to DWF/PDF panel ➤ 3D DWF.
2In the Export Data dialog box, specify a name and location for the DWF
or DWFx file.
3Click the Tools button at the upper right.
4Click Tools menu ➤ Options.
5In the 3D DWF Publish dialog box, Objects To Publish, click Selected
Model Space Objects and then click the Select Objects button.
6In the model, select the objects that you want to publish.
7Press Enter or the Spacebar when you’re done selecting objects.
8Click OK.
9In the Export Data dialog box, click Save.
10 (Optional) Click Yes to open the Autodesk Design Review and view the
published 3D DWF or 3D DWFx file.
To view and print a published 3D DWF file or 3D DWFx file
1If you want to view a 3D DWF or 3D DWFx file, do either of the following:
■Immediately after the 3D DWF or 3D DWFx file has been published,
click Yes to the question "Would you like to view it now?"
Autodesk Design Review opens the 3D DWF or 3D DWFx file.
■In Windows Explorer, double-click the 3D DWF or 3D DWFx file to
open Autodesk Design Review and view the file.
■Open Autodesk Design Review. Click File menu ➤ Open. Select the
3D DWF or 3D DWFx file you want to view.
2If you want to print a 3D DWF or 3D DWFx file, in Autodesk Design
Review, click File menu ➤ Print.
For more information, see the Autodesk Design Review Help system.
Publish 3D DWF Files | 1659
Quick Reference
3DDWF
Creates a 3D DWF or 3D DWFx file of your 3D model and displays it in the
DWF Viewer.
EXPORT
Saves the objects in a drawing to a different file format.
PUBLISH
Publishes drawings to DWF, DWFx, and PDF files, or to plotters.
3DDWFPREC
Controls the precision of 3D DWF or 3D DWFx publishing.
PUBLISHALLSHEETS
Specifies whether to load the contents of the active document or of all open
documents in the Publish dialog box.
Print 3D Models
You can obtain physical models of 3D models created in AutoCAD.
3D Printing Service Providers
Autodesk has partnered with several 3D printing service providers. They can
ouput physical models from 3D models created in AutoCAD.
When you use the 3DPRINT command, you specify 3D data from a DWG file
that is then translated to a faceted mesh representation consisting of triangles.
This representation is saved as binary STL file that can used by a 3D printing
service provider to create a physical model.
Autodesk 3D Printing Website
To avoid errors and broken parts when you print 3D models, it is strongly
recommended that you follow guidelines on the Autodesk 3D Printing website.
This website provides information on 3D printing service providers and
optimizing models.
1660 | Chapter 34 Publish Drawings

How to Create and Obtain Physical Models
The following diagram illustrates, from begining to end, the basic steps of
creating and obtaining a physical model:
To ensure successful printing of your 3D
model, you may need to make some adjust-
ments to your drawing.
Prepare your 3D model
You must select the 3D solids you want to
print.
Select the 3D solids you want to print
Only the 3D solids you select are printed,
even if there are others in your drawing.
You must save your drawing as an STL file.Save your drawing as an STL file
3D printing service providers require that
your drawing be saved in this format.
After you do this, no other dialog boxes
display in AutoCAD as part of the 3D
printing process.
You must select a 3D printing service pro-
vider. When making your decision carefully
Select a service provider
consider cost, materials, and minimum re-
quirements.
For a list of Autodesk-approved 3D printing
service providers, see the Autodesk 3D
Printing website.
After you select a 3D printing service pro-
vider, follow the directions on their website
to obtain your model.
Send the STL file to your service provider
To send a model to a 3D printing service
1Open the DWG file that contains the 3D model you wish to print.
2Optimize your model for 3D printing.
3Click the Output tab ➤ 3D Print panel ➤ Send to 3D Print Service.
4In the 3D Printing - Prepare Model for Printing dialog box, click Continue.
Print 3D Models | 1661

5In the selected DWG file, select the solids or watertight meshes you wish
to print. Press Enter. In the Send to 3D Print Service Dialog Box, under
Output Preview, selected solids and watertight meshes display.
6In the Send to 3D Print Service dialog box, under Output Dimensions,
specify output dimensions, including scale and bounding box length,
width, and height. Click OK.
NOTE If you modify output dimensions, the output preview remains
unchanged.
7Save your prepared drawing as an STL file. The Autodesk 3D Printing Website
displays.
8Select a 3D printing service provider.
9Follow the directions on your service provider’s website to
■Set up an account
■Receive a price quote
■Upload your STL file
■Order your model
■Pay for your model
Quick Reference
3DPRINT
Sends a 3D model to a 3D printing service.
System Variable
SMOOTHMESHCONVERT
Sets whether mesh objects that you convert to 3D solids or surfaces are
smoothed or faceted, and whether their faces are merged.
1662 | Chapter 34 Publish Drawings
Part 11: Share Data
Between Files
1663
1664
Reference Other Drawing
Files
You can attach an entire drawing to the current drawing as a referenced drawing. With xrefs,
changes made in the referenced drawing are reflected in the current drawing.
Attached xrefs are linked to, but not actually inserted in, another drawing. Therefore, with
xrefs you can build drawings without significantly increasing the drawing file size.
Overview of Referenced Drawings (Xrefs)
You can attach an entire drawing file to the current drawing as a referenced
drawing (xref). With xrefs, changes made in the referenced drawing are reflected
in the current drawing. Attached xrefs are linked to, but not actually inserted
in, another drawing. Therefore, with xrefs you can build drawings without
significantly increasing the drawing file size.
By using referenced drawings, you can
■Coordinate your work with the work of others by referencing other drawings
in your drawing to keep up with the changes being made by other designers.
You can also assemble a master drawing from component drawings that
may undergo changes as a project develops.
■Ensure that the most recent version of the referenced drawing is displayed.
When you open your drawing, each referenced drawing is automatically
reloaded, so it reflects the latest state of the referenced drawing file.
■Keep the names of layers, dimensioning styles, text styles, and other named
elements in your drawing separate from those in referenced drawings.
■Merge (bind) attached referenced drawings permanently with your current
drawing when the project is complete and ready to be archived.
35
1665

NOTE Like a block reference, an xref appears in the current drawing as a single
object. However, you cannot explode an xref without binding it first.
See also:
■DesignCenter on page 91
Quick Reference
Commands
ADCENTER
Manages and inserts content such as blocks, xrefs, and hatch patterns.
BASE
Sets the insertion base point for the current drawing.
EXTERNALREFERENCES
Opens the External References palette.
EXTERNALREFERENCESCLOSE
Closes the External References palette.
REFCLOSE
Saves back or discards changes made during in-place editing of a reference,
either an xref or a block definition.
REFEDIT
Edits an xref or a block definition directly within the current drawing.
REFSET
Adds or removes objects from a working set during in-place editing of a
reference, either an xref or a block definition.
RENAME
Changes the names assigned to items such as layers and dimension styles.
XATTACH
Inserts DWG files as an external reference (xref).
1666 | Chapter 35 Reference Other Drawing Files
XBIND
Binds one or more definitions of named objects in an xref to the current
drawing.
XCLIP
Crops the display of a selected external reference or block reference to a
specified boundary.
XREF
Starts the EXTERNALREFERENCES command.
System Variables
BINDTYPE
Controls how xref names are handled when binding xrefs or editing xrefs in
place.
ERSTATE
Indicates whether the External References palette is open or closed.
INDEXCTL
Controls whether layer and spatial indexes are created and saved in drawing
files.
INSBASE
Stores the insertion base point set by BASE, which gets expressed as a UCS
coordinate for the current space.
PROJECTNAME
Assigns a project name to the current drawing.
VISRETAIN
Controls the properties of xref-dependent layers.
XCLIPFRAME
Determines whether xref clipping boundaries are visible or plotted in the
current drawing.
XEDIT
Controls whether the current drawing can be edited in-place when being
referenced by another drawing.
Overview of Referenced Drawings (Xrefs) | 1667
XLOADCTL
Turns xref demand-loading on and off, and controls whether it opens the
referenced drawing or a copy.
XLOADPATH
Creates a path for storing temporary copies of demand-loaded xref files.
XREFNOTIFY
Controls the notification for updated or missing xrefs.
Attach and Detach Referenced Drawings
You can perform several operations on referenced drawing files (xrefs).
Attach Drawing References (Xrefs)
You can insert any drawing file as an external reference or xref in the current
drawing.
When you attach a drawing file as an xref, you link that referenced drawing
to the current drawing. Any changes to the referenced drawing are displayed
in the current drawing when it is opened or reloaded.
A drawing file can be attached as an xref to multiple drawings at the same
time. Conversely, multiple drawings can be attached as referenced drawings
to a single drawing.
Tools for Attaching Xrefs
You can use several methods to attach an xref:
■Click View tab ➤ Palettes panel ➤ External References Palette.
■At the Command prompt, enter externalreferences
■At the Command prompt, enter xattach.
You can also use DesignCenter™ to attach xrefs to a drawing. Use DesignCenter
for simple attachments, previewing drawing references and their descriptions,
and quick placement by dragging.
You can attach an xref by dragging it from DesignCenter or by clicking Attach
as Xref on the shortcut menu.
1668 | Chapter 35 Reference Other Drawing Files
The saved path used to locate the xref can be a full path, a relative (partially
specified) path, or no path.
If an xref contains any variable block attributes, they are ignored.
NOTE When using the External References palette, it is recommended that you
turn on the Auto-hide feature or anchor the palette. The palette will then hide
automatically when you specify the insertion point of the external reference.
Receive Notification of Attached Xrefs
An xref icon is displayed in the lower-right corner of the application window
(the status bar tray) when xrefs are attached to the drawing.
When one or more xrefs are not found or if any of the xrefs need reloading,
an exclamation point is added to the Xref icon. If you click the Xref icon, the
External References palette is displayed.
Highlight External References in a Drawing
To find an external reference in a complex drawing, select an item in the
External References palette to highlight all visible instances in the drawing.
Conversely, select an external reference in the drawing to highlight its name
in the External References palette.
Attach Drawing References (Xrefs) | 1669
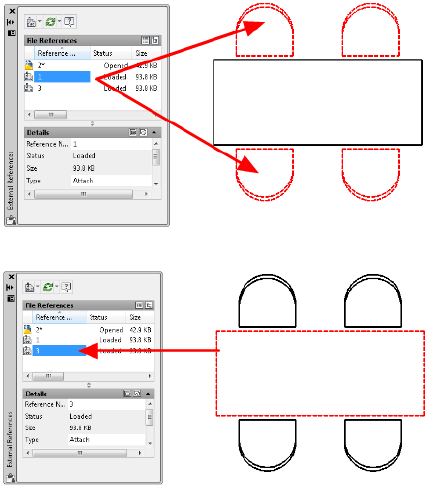
Control the Properties of Xref’s Layers
You can control the visibility, color, linetype, and other properties of an xref's
layers and make these changes temporary or permanent. If the VISRETAIN
system variable is set to 0, these changes apply only to the current drawing
session. They are discarded when you end the drawing session, or when you
reload or detach the xref.
You can also control the fade display of the DWG xref. The XDWGFADECTL
system variable defines the fade percentage for all DWG xrefs.
Xref Clipping Boundaries
Drawings can include xrefs that are clipped. If you want to see the clipping
boundary, you can turn on the XCLIPFRAME system variable.
Attachments from Educational Products
If you open, insert, or attach an xref from an Autodesk Educational Product,
the drawings you plot contain the following banner: “PRODUCED BY AN
AUTODESK EDUCATIONAL PRODUCT.”
1670 | Chapter 35 Reference Other Drawing Files
See also:
■Nest and Overlay Referenced Drawings on page 1680
■Clip External References and Blocks on page 1686
■Set Paths to Referenced Drawings on page 1674
■DesignCenter
■Set Interface Options on page 109
To attach an xref
1Click Blocks & References tab ➤ Reference panel ➤ DWG.
2In the Select Reference File dialog box, select one or more files you want
to attach and then click Open.
3In the Attach External Reference dialog box, under Reference Type, select
Attachment.
4Specify the insertion point, scale, and rotation angle. Click Specify
On-Screen to use the pointing device.
Attachment includes all nested xrefs.
5Click OK.
To attach or overlay an xref using DesignCenter
1Click View tab ➤ Palettes panel ➤ DesignCenter.
2In the content area or in the Search dialog box, locate the DWG reference
you want to attach or overlay.
3Right-click. Drag the DWG reference into the open drawing.
4Release the right-pointing device button. Click Attach as Xref.
5In the External Reference dialog box, under Reference Type, select
Attachment or Overlay.
6Enter values for Insertion Point, Scale, and Rotation, or select Specify
On-Screen to use the pointing device.
Attach Drawing References (Xrefs) | 1671

7Click OK.
You can also attach an xref by dragging or by clicking Attach as Xref on
the shortcut menu.
8Click OK.
To view referenced files by type in the External References palette
1Click Insert tab ➤ Reference panel ➤ Dialog box launcher.
2In the External References palette, in the File References pane, click the
List View button.
3Click the Icon column.
The attached referenced files are sorted by type in the list view.
To adjust the fade display of the DWG xref
1Click Insert tab ➤ Reference panel ➤ Xref Fading.
2Drag the slider to adjust the fade display of the DWG xref.
The DWG xref fades as you drag the slider.
Quick Reference
Commands
ADCENTER
Manages and inserts content such as blocks, xrefs, and hatch patterns.
EXTERNALREFERENCES
Opens the External References palette.
EXTERNALREFERENCESCLOSE
Closes the External References palette.
TRAYSETTINGS
Controls the display of icons and notifications in the status bar tray.
XATTACH
Inserts DWG files as an external reference (xref).
1672 | Chapter 35 Reference Other Drawing Files
XREF
Starts the EXTERNALREFERENCES command.
System Variables
ERHIGHLIGHT
Controls whether reference names or reference objects are highlighted when
their counterparts are selected in the External References palette or in the
drawing window.
ERSTATE
Indicates whether the External References palette is open or closed.
INDEXCTL
Controls whether layer and spatial indexes are created and saved in drawing
files.
TRAYICONS
Controls whether a tray is displayed on the status bar.
TRAYNOTIFY
Controls whether service notifications are displayed in the status bar tray.
TRAYTIMEOUT
Controls the length of time (in seconds) that service notifications are
displayed.
VISRETAIN
Controls the properties of xref-dependent layers.
XDWGFADECTL
Controls the dimming for all DWG xref objects.
XLOADCTL
Turns xref demand-loading on and off, and controls whether it opens the
referenced drawing or a copy.
XLOADPATH
Creates a path for storing temporary copies of demand-loaded xref files.
XREFNOTIFY
Controls the notification for updated or missing xrefs.
Attach Drawing References (Xrefs) | 1673

Set Paths to Referenced Drawings
You can view and edit the file name and path used when locating a particular
drawing reference (xref). Use this option if the referenced file has been moved
to a different folder or renamed since it was first attached.
You can choose from three types of folder path information to save with an
attached reference: a full path, a relative path, and no path.
Specify a Full (Absolute) Path
A full path is a fully specified hierarchy of folders that locates the file reference.
A full path includes a local hard drive letter, a URL to a website, or a network
server drive letter. This is the most specific but least flexible option.
Specify a Relative Path
Relative paths are partially specified folder paths that assume the current drive
letter or the folder of the host drawing. This is the most flexible option, and
enables you to move a set of drawings from your current drive to a different
drive that uses the same folder structure.
If the file that is being referenced is located on a different local hard drive or
on a network server, the relative path option is not available.
The conventions for specifying a relative folder path are as follows:
\ Look in the root folder of the host drawing's drive
path From the folder of the host drawing, follow the specified path
\path From the root folder, follow the specified path
.\path From the folder of the host drawing, follow the specified path
..\path From the folder of the host drawing, move up one folder level and
follow the specified path
..\..\path From the folder of the host drawing, move up two folder levels and
follow the specified path
NOTE If a drawing that contains referenced files is moved or saved to a different
path, to a different local hard drive, or to a different network server, you must edit
any relative paths to accommodate the host drawing's new location or you must
relocate the referenced files.
1674 | Chapter 35 Reference Other Drawing Files
Specify No Path
When no path information is saved with the attached external reference, the
following search is initiated in the order shown:
■Current folder of the host drawing
■Project search paths defined on the Files tab in the Options dialog box and
in the PROJECTNAME system variable
■Support search paths defined on the Files tab in the Options dialog box
■Start In folder specified in the Microsoft® Windows® application shortcut
Specifying the No Path option is useful when moving a set of drawings to a
different folder hierarchy or to an unknown folder hierarchy.
Know when a Referenced Drawing has been Relocated
If the drawing you are working on contains an xref that has been moved to
a different folder, a message is displayed at the site of the xref when you load
the drawing. The message indicates that the xref cannot be loaded using the
old path. When you specify the new path, the xref is reloaded into your
drawing.
Use Project Names to Define Referenced Drawing Paths
Project names make it easier for you to manage xrefs when drawings are
exchanged between customers or if you have different drive mappings to the
same location on a server. The project name points to a section in the registry
that can contain one or more search paths for each project name defined.
If the program cannot find an xref at the location specified by the search path,
the prefix (if any) is stripped from the path. If the drawing has a
PROJECTNAME value set and a corresponding entry exists in the registry, the
program searches for the file along the project search paths. If the xref still is
not located, the program search path is searched again.
You can add, remove, or modify the project names that exist in the registry.
The folder search paths beneath the project name can also be added, removed,
or modified.
The search paths beneath the project name can be added, removed, or modified
in the same manner as the project name. The order in which the folders are
searched can also be modified. Projects and their search paths can only be
edited through the Files tab in the Options dialog box. You cannot edit project
names at the Command prompt.
Set Paths to Referenced Drawings | 1675

Once you have established a project name and the search paths you want
associated with that project name, you can make that project name the
currently active project. The program searches the paths associated with that
currently active project for xrefs that were not found in the current folder of
the host drawing, the full search path, the current drawing folder, or the
program support paths.
Change Reference Paths in Multiple Drawings (Advanced)
When you relocate drawing files or the external files that they reference,
including other drawing files, text fonts, images, and plot configurations, the
reference paths that are saved in the drawing need to be updated. The Autodesk
Reference Manager lists referenced files in selected drawings and provides
tools to modify the saved reference paths without having to open each drawing
file. You can also use Reference Manager to identify and fix unresolved
references.
Reference Manager is a stand-alone application with its own Help system. To
access it, click Start menu (Windows) ➤ (All) Programs ➤ Autodesk ➤
AutoCAD ➤ Reference Manager. If you are working on a network, it may not
have been installed on your computer.
WARNING Reference Manager is intended primarily for CAD managers who
thoroughly understand paths. It changes multiple paths at once, and you cannot
undo your actions. Use extreme caution, especially if you are working on a network.
To change the path of a DWG reference
1Click Insert menu ➤ External References.
2In the External References palette, select a DWG reference name.
3Under Found At, do one of the following:
■Edit the xref path directly.
■Click within the edit box, and then click the Browse button (...) that
appears. Select the xref in its new path.
4Click OK.
The program reloads the xref and then regenerates the drawing with the
xref in place.
To display the currently defined project names
1Click Tools menu ➤ Options.
1676 | Chapter 35 Reference Other Drawing Files
2In the Options dialog box, Files tab, double-click Project Files Search Path.
3Click each project name folder to display the search paths associated with
it.
4Click OK (or Apply).
To add a project name
1Click Tools menu ➤ Options.
2In the Options dialog box, Files tab, double-click Project Files Search Path.
Click Add.
A folder named projectx (where x indicates the next available number) is
created and indented beneath the project folder.
3Either enter a new name, or press Enter to accept projectx.
The project name must be 31 characters or fewer, and it cannot contain
leading spaces or terminating spaces.
4Click OK (or Apply).
To remove a project name
1Click Tools menu ➤ Options.
2In the Options dialog box, Files tab, double-click Project Files Search Path.
3Select a project name. Click Remove.
4Click OK (or Apply).
To modify a project name
1Click Tools menu ➤ Options.
2In the Options dialog box, Files tab, select a project name. Enter a new
name.
3Click OK (or Apply).
You can also modify a project name by selecting the name in the project
folder and pressing F2.
To add a search path
1Click Tools menu ➤ Options.
Set Paths to Referenced Drawings | 1677
2In the Options dialog box, Files tab, select a project name. Click Add.
3Add a new search path beneath the project name by entering a new path,
or click Browse and select a new path.
4Click OK (or Apply).
The new path is indented and placed beneath the project name.
To delete a search path
1Click Tools menu ➤ Options.
2In the Options dialog box, Files tab, select a project name. Click Remove.
3Click OK.
To change a search path
1Click Tools menu ➤ Options.
2In the Options dialog box, Files tab, select a project name. Click Browse.
3In the Browse for Folder dialog box, select a new path.
4Click OK to close each dialog box.
You can also change a search path by selecting the project path and
pressing F2.
To make a project current
1Click Tools menu ➤ Options.
2In the Options dialog box, Files tab, double-click Project Files Search Path.
3Select a Project name. Click Set Current.
4Click OK (or Apply).
You can also set a project current by entering projectname at the
Command prompt and then entering the name of the project.
To clear the current project
1Click Tools menu ➤ Options.
2In the Options dialog box, Files tab, click Project Files Search Path.
3Click Clear Current.
1678 | Chapter 35 Reference Other Drawing Files

This clears the setting for the current drawing.
4Click OK (or Apply).
You can also clear the current project at the Command prompt by
entering projectname and then entering a period (.).
Quick Reference
Commands
XREF
Starts the EXTERNALREFERENCES command.
System Variables
PROJECTNAME
Assigns a project name to the current drawing.
Detach Referenced Drawings
To completely remove DWG references (xrefs) from your drawing, you need
to detach them rather than erase them.
To completely remove xrefs from your drawing, you need to detach them.
Erasing xrefs does not remove, for example, layer definitions associated with
those xrefs. Using the Detach option removes the xrefs and all associated
information.
To detach an xref
1Click View tab ➤ Palettes panel ➤ External References .
2In the External Reference palette, select a DWG reference.
3Right-click the selected DWG reference and select Detach from the
shortcut menu.
Detach Referenced Drawings | 1679
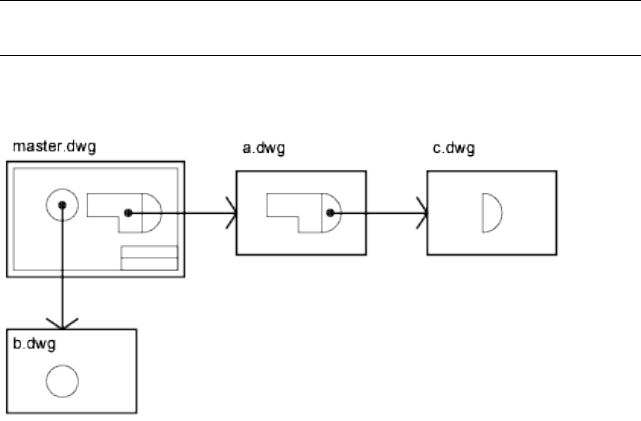
Quick Reference
Commands
EXTERNALREFERENCES
Opens the External References palette.
Update and Bind Referenced Drawings
Beyond attaching and detaching referenced drawings (xrefs,), you can also
update and bind drawing references.
Nest and Overlay Referenced Drawings
Attached DWG references (xrefs) can be nested: that is, you can attach an xref
that contains another xref.
Xrefs can be nested within other xrefs: that is, you can attach an xref that
contains another xref. You can attach as many copies of an xref as you want,
and each copy can have a different position, scale, and rotation.
NOTE You can only constrain objects in the drawing file to the insertion point on
an Xref, and not its nested objects.
In the following illustration, master.dwg references a.dwg and b.dwg. Drawing
a.dwg references c.dwg. In master.dwg, c.dwg is a nested xref.
You can also overlay an xref on your drawing. Unlike an attached xref, an
overlaid xref is not included when the drawing is itself attached or overlaid as
1680 | Chapter 35 Reference Other Drawing Files
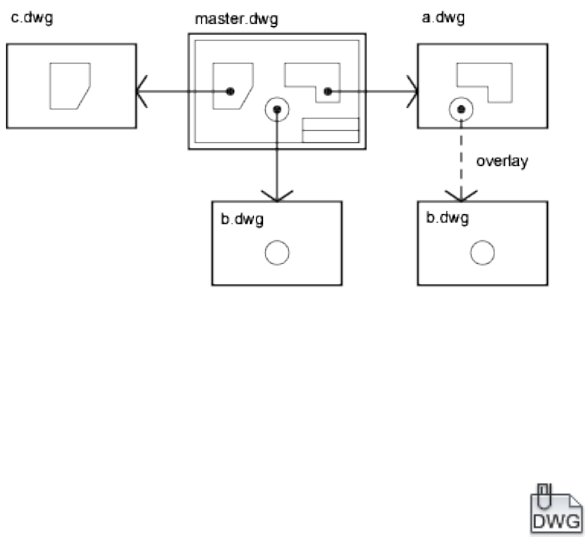
an xref to another drawing. Overlaid xrefs are designed for data sharing in a
network environment. By overlaying an xref, you can see how your drawing
relates to the drawings of other groups without changing your drawing by
attaching an xref.
In the following illustration, several people are working on drawings referenced
by master.dwg. The person working on a.dwg needs to see the work being
completed by the person working on b.dwg, but does not want to xref b.dwg
because it would then appear twice in master.dwg. Instead, the person overlays
b.dwg, which is not included when a.dwg is referenced by master.dwg.
Relative Saved Paths and Nested Xrefs
The saved path for an xref can be a full path, a relative (partially specified)
path, or no path. For a nested xref, a relative path always references the
location of its immediate host and not necessarily the currently open drawing.
To overlay an xref
1Click Blocks & References tab ➤ Reference panel ➤ DWG.
2In the Select Reference File dialog box, select the file you want to attach
and then click Open.
3In the External Reference dialog box, under Reference Type, select Overlay.
4Specify the insertion point, scale, and rotation angle. Click Specify
On-Screen to use the pointing device.
Using the Overlay option excludes any nested xrefs.
5Click OK.
Nest and Overlay Referenced Drawings | 1681
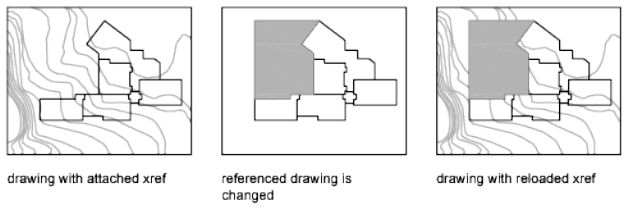
Quick Reference
Commands
EXTERNALREFERENCES
Opens the External References palette.
System Variables
XREFTYPE
Controls the default reference type when attaching or overlaying an external
reference.
Update Referenced Drawing Attachments
When you open a drawing, all DWG references (xrefs) update automatically.
You can also update xrefs whenever you want to ensure that the most current
versions are displayed in your drawing.
When you open a drawing, all xrefs update automatically. Use the Reload
option from the External References palette to update xrefs whenever you
want to ensure that the most current versions are displayed in your drawing.
Whenever you modify and save an externally referenced drawing in a network
environment, other people can access your changes immediately by reloading
the xrefs in their open drawings.
Receive Notification of Changed Xrefs
When you attach xrefs to a drawing, the program periodically checks whether
the referenced files have changed since the last time the xrefs were loaded or
reloaded. The XREFNOTIFY system variable controls xref notification.
1682 | Chapter 35 Reference Other Drawing Files
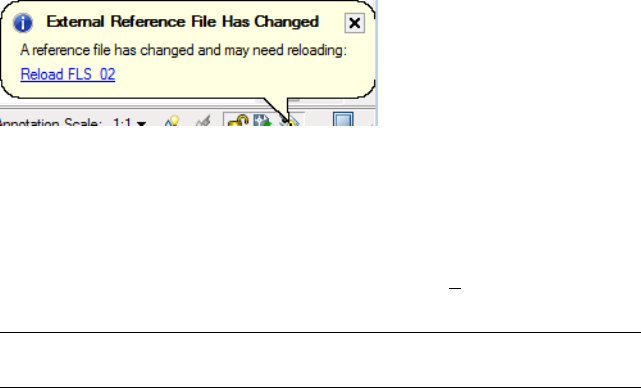
By default, if a referenced file has changed, a balloon message is displayed
near the Xref icon in the lower-right corner of the application window (the
status bar tray). Click the link in the balloon to reload all changed xrefs.
If you close the balloon message without reloading, an exclamation point is
added to the Xref icon. If you click the Xref icon, the External References
palette is displayed.
By default, the program checks for changed xrefs every five minutes. You can
change the number of minutes between checks by setting the XNOTIFYTIME
system registry variable using (setenv "XNOTIFYTIME" "n") where n is a number
of minutes between 1 and 10080 (seven days).
NOTE When changing the value of XNOTIFYTIME, you must enter XNOTIFYTIME
with the capitalization as shown.
Update Xrefs with Demand Loading Turned On
If demand loading is turned on when you load or reload an xref
■With the XLOADCTL system variable set to 1, the referenced drawing is
kept open and locked. No one else can modify the referenced drawing.
■With XLOADCTL set to 2, a temporary copy of the most recently saved
version of the referenced file is opened and locked. Others can open and
modify the referenced drawing.
For information about demand loading, see Increase Performance with Large
Referenced Drawings on page 1709.
To update an attached xref
1Click Insert menu ➤ External References.
2In the External References palette, select the reference name that you
want to reload.
3Right-click, and click Reload.
Update Referenced Drawing Attachments | 1683

NOTE If the drawing you selected has been changed since you opened your
drawing, the xref is reloaded.
Quick Reference
Commands
EXTERNALREFERENCES
Opens the External References palette.
EXTERNALREFERENCESCLOSE
Closes the External References palette.
TRAYSETTINGS
Controls the display of icons and notifications in the status bar tray.
System Variables
INDEXCTL
Controls whether layer and spatial indexes are created and saved in drawing
files.
TRAYICONS
Controls whether a tray is displayed on the status bar.
TRAYNOTIFY
Controls whether service notifications are displayed in the status bar tray.
TRAYTIMEOUT
Controls the length of time (in seconds) that service notifications are
displayed.
XEDIT
Controls whether the current drawing can be edited in-place when being
referenced by another drawing.
XLOADCTL
Turns xref demand-loading on and off, and controls whether it opens the
referenced drawing or a copy.
XLOADPATH
Creates a path for storing temporary copies of demand-loaded xref files.
1684 | Chapter 35 Reference Other Drawing Files
XREFNOTIFY
Controls the notification for updated or missing xrefs.
Archive Drawings That Contain Referenced Drawings (Bind)
When you archive final drawings that contain xrefs, you can choose how you
store the xrefs in the drawings.
When you archive final drawings that contain xrefs, you have two choices:
■Store the xref drawings along with the final drawing
■Bind the xref drawings to the final drawing
Storing an xref drawing along with the final drawing requires that the drawings
always remain together. Any change to the referenced drawing will continue
to be reflected in the final drawing.
To prevent unintentional updating of archived drawings by later changes to
referenced drawings, bind the xrefs to the final drawing.
Binding an xref to a drawing makes the xref a permanent part of the drawing
and no longer an externally referenced file. You can bind the entire database
of the xref drawing, including all its xref-dependent named objects (blocks,
dimension styles, layers, linetypes, and text styles), by using the XREF Bind
option. For more information, see Resolve Name Conflicts in External
References on page 1704.
Binding xrefs to a drawing is also an easy way to send a drawing to reviewers.
Rather than sending a master drawing plus each of the drawings it references,
you can use the Bind option to merge the xrefs into the master drawing.
NOTE You cannot bind xrefs that contain proxy objects. For more information,
see Work with Custom and Proxy Objects on page 1829.
To bind an xref to the current drawing
1Click Insert tab ➤ Reference panel ➤ Dialog box launcher.
2In the External References palette, select the reference name that you
want to bind.
3Right-click, and click Bind.
Archive Drawings That Contain Referenced Drawings (Bind) | 1685
4In the Bind Xrefs dialog box, select one of the following options:
■Bind converts the objects in the xref into a block reference. Named
object definitions are added to the current drawing with a prefix of
blockname$n$.
■Insert also converts the objects in the xref into a block reference.
Named object definitions are merged into the current drawing without
adding prefixes.
5Click OK to close each dialog box.
Quick Reference
Commands
EXTERNALREFERENCES
Opens the External References palette.
XBIND
Binds one or more definitions of named objects in an xref to the current
drawing.
System Variables
BINDTYPE
Controls how xref names are handled when binding xrefs or editing xrefs in
place.
XEDIT
Controls whether the current drawing can be edited in-place when being
referenced by another drawing.
Clip External References and Blocks
You can specify clipping boundaries to display a limited portion of an external
reference drawing or block reference.
You can clip external references such as DGN, DWF, IMAGE, PDF underlays,
or block references. With a clipping boundary, you can determine the portions
of an external reference or block reference that you want to display by hiding
the redundant parts of the reference inside or outside the boundary.
1686 | Chapter 35 Reference Other Drawing Files
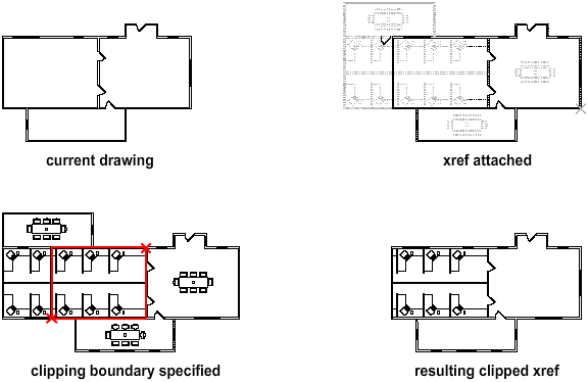
The clipping boundary can be a polyline, rectangle, or a polygon with vertices
within the boundaries of the image. You can change the boundary of a clipped
image. When you clip a boundary, the objects in the external reference or
block are not altered; only their display is changed.
With the XCLIP, DGNCLIP, DWFCLIP, PDFCLIP, and IMAGECLIP commands,
you can control the following viewing options:
Control the visibility of the clipped area of the external reference or block
reference. When clipping is turned off, the boundary is not displayed and
the entire external reference or block is visible, provided that the objects are
on layers that are turned on and thawed.
Clipping results can be turned on or off using the clipping commands. This
controls whether the clipped area is hidden or displayed.
Control the visibility of clipping boundaries. You can control the display
of the clipping boundary with a clipping frame. The clipping system variable
for XREF, PDF, DGN, DWG, and IMAGE underlays are XCLIPFRAME,
PDFFRAME, DGNFRAME, DWGFRAME, and IMAGEFRAME respectively.
Invert the area to be hidden, inside or outside the clipping boundary When
you want the hidden parts of the clipped reference displayed or vice versa,
use the grips to alter the display of the external reference or blocks. With grips
located at the midpoint on the first edge of the clipping boundary, you can
invert the display of the clipped reference inside or outside the boundary.
Clip External References and Blocks | 1687
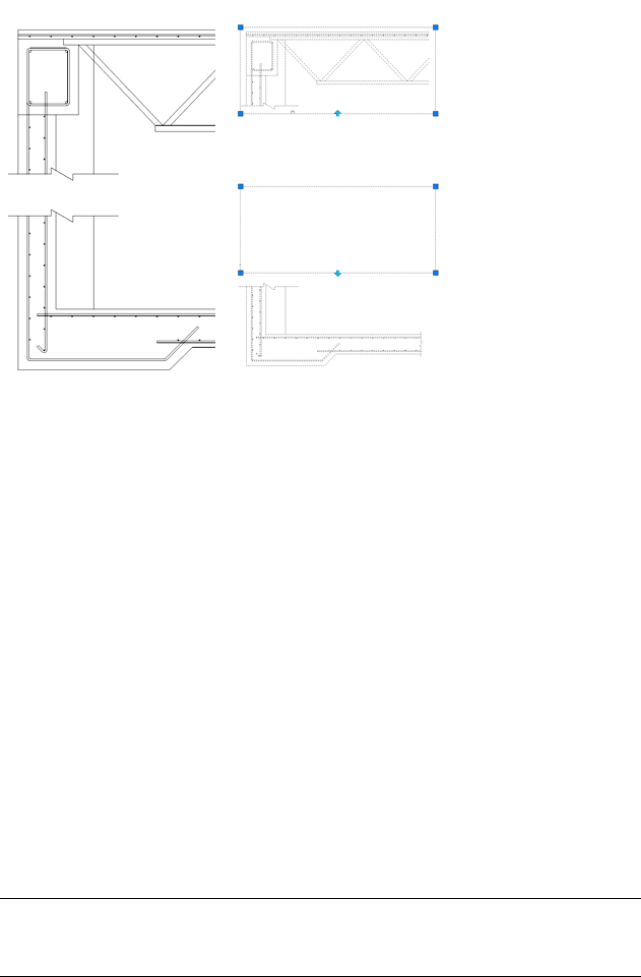
The grips are visible and can be used when the clipping system variable is
turned on, the reference is selected, and clipped.
Editing Options
After an external reference or block reference has been clipped, it can be
moved, copied, or rotated just like an unclipped external reference or block
reference. The clipping boundary moves with the reference. If an xref contains
nested clipped xrefs, they appear clipped in the drawing. If the parent xref is
clipped, the nested xrefs are also clipped.
Resize Clipping Boundaries
If you want to change the shape or size of a clipping boundary for external
references and block references, you can use grips to edit the vertices just as
you edit any object with grips.
In case of rectangular grip editing, you can maintain the closed four-sided
rectangle or square shape of the rectangular clipping boundary because two
vertices of the same side of the rectangular clipping boundary are edited
together.
NOTE With Clipping boundaries, you cannot display self-intersecting polygonal
boundaries. An error message is displayed and the boundary reverts to the last
boundary.
1688 | Chapter 35 Reference Other Drawing Files

Limitations for Clipping Boundaries
When clipping an referenced drawing or block the following limitations apply:
■A clipping boundary can be specified anywhere in 3D space, but it is always
applied planar to the current UCS.
■If a polyline is selected, the clipping boundary is applied in the plane of
that polyline.
■Images in external references or blocks are always clipped within the
rectangular extents of the reference. When you apply polygonal clipping
to images in externally referenced drawings, the clipping boundary is
applied to the rectangular extents of the polygonal boundary, rather than
to the polygon itself.
See also:
■Clip Raster Images on page 1788
■Clip Underlays
To clip an xref
1Click Blocks and References tab ➤ Reference panel ➤ Clip Xref.
2Select an xref.
3At the prompt, specify New Boundary by pressing Enter.
4Select a polyline or specify a rectangular or polygonal clipping boundary.
Specify the corners or vertices of the boundary.
5(Optional) Use the Invert Clip option to change the area to be hidden
from outside to inside the clipping boundary.
The xref is clipped based on the area that you specified.
NOTE You can use DGNCLIP, DWFCLIP, PDFCLIP, or IMAGECLIP to clip their
corresponding xref attachments: DGNATTACH, DWFATTACH, PDFATTACH, or
IMAGEATTACH.
To invert a clipped reference
1Select the external reference or block reference to be clipped.
Clip External References and Blocks | 1689
2Set XCLIPFRAME, DWFFRAME, DGNFRAME, IMAGEFRAME, or
PDFFRAME to 1. This specifies that the clipping boundary is displayed.
3Select the clipped boundary to see the grip at the midpoint on the first
edge of the clipped boundary.
4Click the grip to invert the display of the reference clipped inside or
outside the boundary.
Quick Reference
Commands
DGNCLIP
Crops the display of a selected DGN underlay to a specified boundary.
DWFCLIP
Crops the display of a selected DWF or DWFx underlay to a specified
boundary.
IMAGECLIP
Crops the display of a selected image to a specified boundary.
PDFCLIP
Crops the display of a selected PDF underlay to a specified boundary.
XCLIP
Crops the display of a selected external reference or block reference to a
specified boundary.
System Variables
DGNFRAME
Determines whether DGN underlay frames are visible or plotted in the current
drawing.
DWFFRAME
Determines whether DWF or DWFx underlay frames are visible or plotted
in the current drawing.
IMAGEFRAME
Controls whether image frames are displayed and plotted.
1690 | Chapter 35 Reference Other Drawing Files

XCLIPFRAME
Determines whether xref clipping boundaries are visible or plotted in the
current drawing.
Edit Referenced Drawings
Referenced drawings can be edited by opening them directly, or you can edit
the xref in place from within the current drawing. You can edit a block
definition directly from any selected block reference.
Edit a Referenced Drawing in a Separate Window
The simplest and most direct method for editing xrefs is to open the source
file for the referenced drawing in a separate window. This method gives you
access to all objects in the referenced drawing.
Edit an xref or its nested xrefs with the External References palette or the
XOPEN command. Select the xref and open its source file in a separate window.
Save the edits, close the drawing, resume working and save back edited
referenced drawings on page 1698 in your original drawing.
See also:
■Edit Referenced Drawings and Blocks with Nesting, OLE, or Attributes on
page 1700
■Edit Selected Objects in Referenced Drawings and Blocks on page 1692
To edit an xref in a separate window
1Click View tab ➤ Palettes panel ➤ External References Palette.
2In the External References palette, select the xref that you want to edit.
3Right-click, and click Open.
4The source file for the selected xrefs opens in a new window, where you
can edit, save, and close the drawing.
To edit a nested xref in a separate window
1Select an xref that contains nested xrefs.
Edit Referenced Drawings | 1691

2At the command prompt, enter xopen and press Enter.
3In the Open Reference Files dialog box, select a nested xref from the
reference tree. Press Ctrl to select multiple xrefs.
4Click Open.
The source file for the selected xrefs opens in a new window, where you
can edit, save, and close the drawing.
Quick Reference
Commands
EXTERNALREFERENCES
Opens the External References palette.
XOPEN
Opens a selected drawing reference (xref) in a new window.
Edit Selected Objects in Referenced Drawings and Blocks
You can modify external references and redefine block definitions from within
the current drawing by using in-place reference editing. Both blocks and xrefs
are considered references.
By editing the reference in place, you can modify the reference within the
visual context of your current drawing.
Often, a drawing contains one or more xrefs as well as multiple block
references. When working with block references, you can select a block, modify
it, view and edit its properties, and update the block definition.
When working with xrefs, you can select the reference you want to work with,
modify its objects, and save back the changes to the reference drawing. You
can make minor changes without having to go back and forth between
drawings.
NOTE If you plan to make major changes to a reference, open the reference
drawing and edit directly within the file. Using in-place reference editing to make
major changes can increase the size of your current drawing file significantly during
the in-place reference editing session.
1692 | Chapter 35 Reference Other Drawing Files
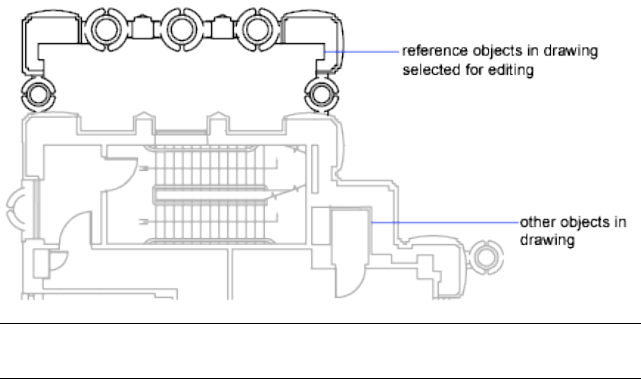
Understand the Working Set
The objects that you select from the selected xref or block are temporarily
extracted and made available for editing in the current drawing. The set of
extracted objects is called the working set, which can be modified and then
saved back to update the xref or block definition.
Objects that make up the working set are visually distinct from other objects
in the drawing. All objects in the current drawing, except objects in the
working set, are faded.
Control the Fading of Objects
The XFADECTL system variable controls how objects are displayed while a
reference is edited in place. The set of objects extracted from the reference are
displayed normally. All other objects in the drawing, including objects in the
current drawing and in any references not belonging to the working set, are
faded. The value indicates the intensity of display for objects not in the
working set. The larger the value is for XFADECTL, the more the objects are
faded.
NOTE Objects outside the working set are not faded during in-place reference
editing unless VSCURRENT is set to a value of 2D wireframe.
Use the Refedit Ribbon Contextual Tab
If you select nested objects to edit when the ribbon is active, the Edit Reference
ribbon contextual tab is displayed. Using the buttons on the Edit Reference
ribbon contextual tab, you can add objects to or remove objects from the
working set, and you can discard or save back changes to the reference. The
Edit Selected Objects in Referenced Drawings and Blocks | 1693

Edit Reference ribbon contextual tab is automatically dismissed after you save
back or discard changes made to the working set.
Use the Refedit Toolbar
When the ribbon is not active, The Refedit toolbar is displayed and activated
after you select which nested objects to edit. Using the buttons on the Refedit
toolbar, you can add objects to or remove objects from the working set, and
you can discard or save back changes to the reference. Unless it is docked, the
Refedit toolbar is automatically dismissed after you save back or discard changes
made to the working set.
See also:
■Edit a Referenced Drawing in a Separate Window on page 1691
■Edit Referenced Drawings and Blocks with Nesting, OLE, or Attributes on
page 1700
To edit an xref or block reference in place
1Click Insert tab ➤ Reference panel ➤ Edit Reference.
2From within the current drawing, select the reference that you would
like to edit.
If the object you select in the reference belongs to any nested references,
all the references available for selection are displayed in the Reference
Edit dialog box.
3In the Reference Edit dialog box, select the specific reference that you
want to edit.
The reference file is locked to prevent multiple users from opening the
file at once. You cannot edit a reference in place if the drawing file is
being used by another user.
4Click OK.
5Select the objects you would like to edit in the reference and press Enter.
The objects that you select become the working set. By default, all other
objects are locked and faded.
6Edit the objects in the working set. Click Save Back Changes to Reference.
1694 | Chapter 35 Reference Other Drawing Files
The objects in the working set are saved to the reference and the xref or
the block is updated.
Quick Reference
Commands
REFCLOSE
Saves back or discards changes made during in-place editing of a reference,
either an xref or a block definition.
REFEDIT
Edits an xref or a block definition directly within the current drawing.
REFSET
Adds or removes objects from a working set during in-place editing of a
reference, either an xref or a block definition.
SHADEMODE
System Variables
BINDTYPE
Controls how xref names are handled when binding xrefs or editing xrefs in
place.
REFEDITNAME
Displays the name of the reference being edited.
XEDIT
Controls whether the current drawing can be edited in-place when being
referenced by another drawing.
XFADECTL
Controls the amount of fading within a reference being edited in place. This
setting affects only the objects that are not being edited in the reference.
Edit Selected Objects in Referenced Drawings and Blocks | 1695
Use the Working Set to Edit Referenced Drawings and Blocks
To edit a referenced drawing from within the current drawing, you use the
working set to identify objects that belong to the xref or block definition rather
than the current drawing.
While editing a reference in place, you can add or remove objects from the
working set. If you create a new object while editing a reference in place, it is
almost always added to the working set automatically. Objects that are not
added to the working set are displayed as faded in the drawing.
If a new object is created because of changes made to objects outside the
working set, the new object is not added to the working set. For example, your
drawing contains two lines that are not a part of the working set. If you edit
the lines by using FILLET, a new arc is created between the two lines. The arc
is not added to the working set.
When a reference object is part of the working set, you can select the object
for editing even if it is drawn on a locked layer in the reference file. You can
unlock the object's layer and make changes to the object. Changes made to
the object can be saved, but the layer state remains the same in the reference
file, whether it is locked or unlocked.
An object that is removed from the working set is added to the host drawing
and removed from the reference when changes are saved back. An object that
is added to the working set is removed from the host drawing and is added
to the reference when changes are saved back. If you create or delete objects,
they are automatically added to or removed from the working set. For example,
if you use ERASE while editing a reference in place, the erased objects are
removed from the working set. You can tell whether an object is in the working
set or not by the way it is displayed; a faded object is not in the working set.
Use the Refedit Ribbon Contextual Tab
If you select a reference to edit in-place when the ribbon is active, the Edit
Reference ribbon contextual tabis displayed. The name of the selected reference
is displayed on the contextual tab. The editing buttons on the contextual tab
(Add Objects to the Working Set, Remove Objects from the Working Set,
Discard Changes to Reference, and Save Back Changes to Reference) are active
only during in-place reference editing. The Refedit ribbon contextual tab is
dismissed automatically after changes made to the reference are saved back
or discarded.
1696 | Chapter 35 Reference Other Drawing Files

Use the Refedit Toolbar
When the ribbon is not active, the Refedit toolbar is displayed when a reference
is being edited in place. The name of the selected reference is displayed in the
toolbar. The editing buttons on the toolbar (Add Objects to the Working Set,
Remove Objects from the Working Set, Discard Changes to Reference, and
Save Back Changes to Reference) are active only during in-place reference
editing. The Edit Block or Xref button is active whenever the toolbar is initiated
and a reference editing session is not already in progress within the current
drawing. The Refedit toolbar is dismissed automatically after changes made
to the reference are saved back or discarded.
To add objects to the working set
1Click Tools menu ➤ Xref And Block In-Place Editing ➤ Add To Working
Set.
2Select the objects you want to add. You can also set PICKFIRST to 1 and
create a selection set before using the Add option.
REFSET can be used only with objects in the space (paper space or model
space) in which REFEDIT is initiated.
To remove objects from the working set
1Click Tools menu ➤ Xref And Block In-Place Editing ➤ Remove from
Working Set.
2Select the objects you want to remove. You can also set PICKFIRST to 1
and create a selection set before using the Remove option.
REFSET can be used only with objects in the space (paper space or model
space) in which REFEDIT is initiated.
Quick Reference
Commands
REFCLOSE
Saves back or discards changes made during in-place editing of a reference,
either an xref or a block definition.
Use the Working Set to Edit Referenced Drawings and Blocks | 1697
REFEDIT
Edits an xref or a block definition directly within the current drawing.
REFSET
Adds or removes objects from a working set during in-place editing of a
reference, either an xref or a block definition.
System Variables
XEDIT
Controls whether the current drawing can be edited in-place when being
referenced by another drawing.
Save Back Edited Referenced Drawings and Blocks
While editing a referenced drawing or a block definition in place, you can
save back or discard changes.
While editing a block reference in place, you either can save back or discard
changes made to the reference. If you save back changes to a reference, the
drawing is regenerated.
When the changes are saved back, the block definition is redefined and all
instances of the block are regenerated to reflect the changes. If you choose to
discard the changes, the working set is deleted and the block reference returns
to its original state.
Similarly, while editing an xref in place, you can save back or discard changes.
Objects in the working set that inherit properties not originally defined in the
xref retain those new properties. For example, an xref contains layers A, B,
and C, and the drawing that references it contains layer D. If new objects are
drawn on layer D during in-place reference editing and changes are saved back
to the reference, layer D is copied to the xref drawing.
If you remove objects from the working set and save changes, the objects are
removed from the reference and added to the current drawing. Any changes
you make to objects in the current drawing (not in the xref or block) are not
discarded. If you delete any object that is not in the working set, the object
is not restored even if you choose to discard changes. You can return the
drawing to its original state by using UNDO. If you make unwanted changes
to an xref and use REFCLOSE to save back the changes, you must use UNDO
to undo any changes made during the reference editing session. After you
have undone any unwanted changes, use REFCLOSE to save changes to restore
the xref file to its original state.
1698 | Chapter 35 Reference Other Drawing Files
WARNING While editing a reference in place, if you delete an object that is not
in the working set, the object is not restored if you discard changes at the closing
of the reference editing session.
Objects in the current drawing that inherit properties defined by the xref
retain those new properties. Properties taken from the xref drawing are bound
to the current drawing. The xref layer named SITE, for example, appears in
the current drawing as $#$SITE when assigned to an object not in the working
set.
If BINDTYPE is set to 0, a prefix of $#$ is added to the reference name in the
current drawing. If BINDTYPE is set to 1, reference names remain unchanged
in the current drawing, similar to names of inserted objects.
NOTE When you edit and save an xref in place, the original drawing preview is
no longer available unless you open and save the referenced drawing.
To save back changes from edited xrefs and blocks
■Click Tools menu ➤ X ref And Block In-Place Editing ➤ Save Reference
Edits.
NOTE Alternatively, click the Save Back Changes to Reference button on either
the Edit Reference ribbon contextual tab or the Refedit toolbar.
To discard all changes from edited xrefs and blocks
■On either the Edit Reference ribbon contextual tab or the Refedit toolbar,
click the Discard Changes to Reference button.
Quick Reference
Commands
REFCLOSE
Saves back or discards changes made during in-place editing of a reference,
either an xref or a block definition.
XOPEN
Opens a selected drawing reference (xref) in a new window.
Save Back Edited Referenced Drawings and Blocks | 1699
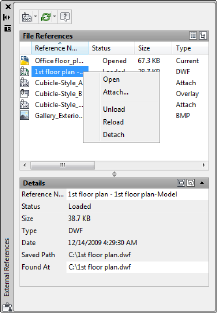
System Variables
BINDTYPE
Controls how xref names are handled when binding xrefs or editing xrefs in
place.
Edit Referenced Drawings and Blocks with Nesting, OLE, or
Attributes
If the reference you select for editing has attached xrefs or block definitions,
the reference and its nested references are displayed and available for selection
in the Reference Edit dialog box. Nested references are displayed only if the
object chosen for selection is part of a nested reference. Only one reference
at a time can be selected for editing. If you are editing a reference that contains
OLE objects, the OLE objects are displayed but cannot be selected for editing.
If a block reference with attributes is selected for editing, you can choose to
display the attribute definitions in the reference and make them available for
editing. The attributes are made invisible and the attribute definitions are
available for editing along with the selected reference geometry. When changes
are saved back to the block reference, the attributes of the original reference
remain unchanged. The new or altered attribute definitions only affect
subsequent insertions of the block; the attributes in existing block instances
are not affected.
See also:
■Edit a Referenced Drawing in a Separate Window on page 1691
1700 | Chapter 35 Reference Other Drawing Files
■Edit Selected Objects in Referenced Drawings and Blocks on page 1692
Quick Reference
Commands
EXTERNALREFERENCES
Opens the External References palette.
REFEDIT
Edits an xref or a block definition directly within the current drawing.
REFSET
Adds or removes objects from a working set during in-place editing of a
reference, either an xref or a block definition.
Resolve Referenced Drawing Errors
If a referenced drawing cannot be loaded when you open a drawing, an error
message is displayed.
Resolve Missing External References
If a referenced drawing cannot be located when you open a drawing, an error
message is displayed. There are several options available to you if this occurs.
The program stores the path of the drawing that is used to create the referenced
drawing. Each time you load or plot the drawing or use the xref Reload option
in the External References palette to update the xref, the program checks this
path to determine the name and location of the referenced drawing file. If
the name or location of the drawing file has changed, the program cannot
reload the xref.
If the program cannot load an xref when it is loading your drawing, it displays
an error message. In this example, the program can't find the xref HOUSE:
"\acad\dwg\house.dwg": Can't open file
** Error resolving Xref HOUSE.
For each insertion of the referenced drawing, the program displays text (at
the location, scale, and rotation angle of the original reference) that contains
Resolve Referenced Drawing Errors | 1701

the path of the missing xref. You can use the XREF Path option to update or
correct the path.
Along with error messages being displayed at the Command window, a task
dialog box might be displayed which allows you to ignore all missing reference
files or update their locations. You can use the External References paletteto
update the locations of the unresolved references.
One way to avoid these errors is to be sure that when you give other people
files that have xrefs attached, you also give them all the referenced files.
Change Nested Xref Paths
When the drawing is reopened and the nested xref is loaded, the program
attempts to find the xref in the original xref path first. If the xref is not found,
the following search is initiated in the order shown:
■Current folder of the host drawing
■Project search paths defined on the Files tab in the Options dialog box and
in the PROJECTNAME system variable
■Support search paths defined on the Files tab in the Options dialog box
■Start In folder specified in the Microsoft® Windows® application shortcut
This ensures that revisions made to the xref are reflected in the current drawing
and also makes it possible for the xref to be found if its path has changed.
For example, suppose that the xref tree of the current drawing A is A>B>C,
and the owner of drawing B changes the path of xref C to point to C1.dwg.
When drawing A is reopened, it reflects the path change in drawing B and
displays C1.dwg. However, if C1.dwg is not found, the program looks for xref
C at the last location it was saved in drawing A.
See also:
■Update Referenced Drawing Attachments on page 1682
To change an xref path
1Click View tab ➤ Palettes panel ➤ External References Palette.
2In the External References palette, select the external reference.
1702 | Chapter 35 Reference Other Drawing Files
3Under Found At, do one of the following:
■Edit the xref path directly.
■Click the [...] button and browse to the xref in its new path.
Quick Reference
Commands
EXTERNALREFERENCES
Opens the External References palette.
Resolve Circular External References
If a referenced drawing contains a sequence of nested references that refers
back to itself, an error message is displayed.
A reference file that contains a sequence of nested references that refers back
to itself is considered a circular reference. For example, if drawing A attaches
drawing B, which attaches drawing C, which attaches drawing A, the reference
sequence A>B>C>A is a circular reference.
If the program detects a circular reference while attaching an xref, a warning
is displayed asking you if you want to continue. If you respond with yes, the
program reads in the xref and any nested xrefs to the point where it detects
the circularity. If you respond with no, the process is halted and the xref is
not attached.
If a circular reference is encountered while loading a drawing, an error message
is displayed and the circular reference for the current session is broken. For
example, if you have the circular reference A>B>C>A, and you open a.dwg,
the program detects and breaks the circularity between c.dwg and a.dwg. The
following error message is displayed:
Breaking circular reference from C to current drawing.
Quick Reference
Commands
EXTERNALREFERENCES
Opens the External References palette.
Resolve Circular External References | 1703
Resolve Name Conflicts in External References
When you attach an xref, the names of its blocks, dimensioning styles, layers,
linetypes, and text styles are differentiated from those in the current drawing.
A typical xref definition includes objects, such as lines or arcs. It also includes
xref-dependent definitions of blocks, dimension styles, layers, linetypes, and
text styles. When you attach an xref, the program differentiates the names of
these xref-dependent named objects from those in the current drawing by
preceding their names with the name of the referenced drawing and a vertical
bar character ( | ). For example, in the Layer Properties Manager, the
xref-dependent named object that is a layer named STEEL in a referenced
drawing called stair.dwg is listed as STAIR|STEEL.
When you attach an xref, the definitions of its dependent named objects are
not added to your drawing permanently. Instead, these definitions are loaded
from the referenced drawing file each time you reload it.
Bind Xref-Dependent Definitions
An xref-dependent named object's definition can change if the referenced
drawing file is modified. For example, a layer name from a referenced drawing
can change if the referenced drawing is modified. The layer name can even
disappear if it is purged from the referenced drawing. This is why the program
does not allow you to use an xref-dependent layer or other named object
directly. For example, you cannot insert an xref-dependent block or make an
xref-dependent layer the current layer and begin creating new objects on it.
To avoid the restrictions on xref-dependent named objects, you can bind them
to your current drawing. Binding makes the xref-dependent named objects
that you select become a permanent part of your current drawing.
When xref-dependent named objects are merged into a drawing through
binding, you can use them the same way you use the drawing's own named
objects. After you bind an xref-dependent named object, the vertical bar
character ( | ) is removed from the name and replaced with two dollar signs
($$) separated by a number (usually zero): for example, the referenced layer,
STAIR|STEEL, becomes STAIR$0$STEEL. You can then use the RENAME
command to change STAIR$0$STEEL to STEEL.
If you specify a layer whose associated linetype is not CONTINUOUS, the
referenced linetype is also bound. If you apply XBIND to a block, all named
objects that are referenced by the objects in the block are also bound. If the
block contains a reference to an xref, that xref and all of its dependent
definitions are bound.
1704 | Chapter 35 Reference Other Drawing Files

To bind xref-dependent named objects to the current drawing
1Click Modify ➤ Object ➤ External Reference ➤ Bind.
2In the Xbind dialog box, click the plus (+) sign next to an external
reference.
The five types of named object definitions (Block, Dimstyle, Layer,
Linetype, and Textstyle) are listed.
3Click the plus (+) sign of one of the definition types.
The names of the definition table entries are listed.
4Select a named object definition. Click Add.
The named object definition is listed under Definitions to Bind.
5If necessary, repeat steps 3 and 4.
6Click OK.
To change the names of layers, dimension styles, and other named objects
1Click Tools tab ➤ Drawing Utilities panel ➤ Rename.
2In the Rename dialog box, select the named object type and then the
item you want to rename.
3Enter the new name in the Rename To box below the old name.
4Click Rename To. Click OK.
Quick Reference
Commands
RENAME
Changes the names assigned to items such as layers and dimension styles.
XBIND
Binds one or more definitions of named objects in an xref to the current
drawing.
Resolve Name Conflicts in External References | 1705
System Variables
BINDTYPE
Controls how xref names are handled when binding xrefs or editing xrefs in
place.
Track External Reference Operations (Log File)
You can maintain a record of actions while attaching, detaching, and reloading
xrefs and while loading a drawing containing xrefs.
The program can maintain a log of its actions while attaching, detaching, and
reloading xrefs and while loading a drawing containing xrefs. This log is
maintained only if the XREFCTL system variable is set to 1. The default setting
is 0.
The log file is an ordinary ASCII text file with the same name as the current
drawing and the file extension .xlg. If you load a drawing with the file name
sample.dwg, for example, the program searches for a log file named sample.xlg
in the current folder. If the file does not exist, a new file is created with that
name.
Once a log file has been created for a drawing, the program continues to
append information to it. The program writes a title block to the log file each
time the file is opened. If the log file becomes too large, you can delete it.
Example: A Sample Title Block from an Xref Log File
This title block contains the name of the current drawing, the date and time,
and the operation being performed.
=============================
Drawing: detail
Date/Time: 09/28/99 10:45:20
Operation: Attach Xref
=============================
During a detaching or reloading operation, the program prints the nesting
level of all affected xrefs immediately following the title block. To see a
reference tree for a set of xrefs in your current drawing, use Detach or Reload
and check the resulting entries in the log file.
1706 | Chapter 35 Reference Other Drawing Files
Example: A Sample Log File Entry Showing Nested Xrefs
In the following example, the xref ENTRY_DR contains two nested xrefs:
HARDWARE and PANELS. The xrefs HARDWARE and PANELS also each contain
two xrefs.
==============================
Drawing: detail
Date/Time: 10/05/99 15:47:39
Operation: Reload Xref
=============================
Reference tree for ENTRY_DR:
ENTRY_DR Xref
-HARDWARE Xref
--LOCKSET Xref
--HINGES Xref
-PANELS Xref
--UPPER Xref
--LOWER Xref
The program writes an entry in the log file for each xref-dependent named
object temporarily added to the current drawing and for any errors that occur.
Most error messages are written both to the screen and to the log file.
Example: A Sample Log File That Shows the Results of Attaching an Xref
The following example shows a partial listing of the log file entries generated
when the external reference STAIR is attached to the working drawing test.dwg.
Track External Reference Operations (Log File) | 1707
The log file lists the definition (symbol) table affected and the name of the
definition added, along with a status message.
==============================
Drawing: test
Date/Time: 12/18/99 14:06:34
Operation: Attach Xref
=============================
Attach Xref STAIR: \ACAD\DWGS\STAIR.dwg
Searching in ACAD search path
Update block symbol table:
Appending symbol: STAIR|BOLT
Appending symbol: STAIR|BOLT-HALF
...
block update complete.
Update Ltype symbol table:
Appending symbol: STAIR|DASHED
Appending symbol: STAIR|CENTER
Appending symbol: STAIR|PHANTOM
Ltype update complete.
Update Layer symbol table:
Appending symbol: STAIR|STEEL-HIDDEN
Appending symbol: STAIR|OAK
...
Layer update complete.
STAIR loaded.
To use the xref log file
1At the Command prompt, enter xrefctl.
2Enter 1 to turn logging on or 0 to turn logging off.
3Press Enter.
Logging is off by default.
Quick Reference
Commands
XREF
Starts the EXTERNALREFERENCES command.
1708 | Chapter 35 Reference Other Drawing Files
System Variables
XREFCTL
Controls whether external reference log (XLG) files are created.
Increase Performance with Large Referenced Drawings
There are several features that can improve performance when dealing with
large referenced drawings.
Overview of Demand Loading
Provides a high-level description of using demand loading to improve
performance when working with large referenced drawings.
The program uses demand loading and saving drawings with indexes to increase
performance with large referenced drawings that have been clipped using the
program or that have many objects on frozen layers. With demand loading,
the program loads into memory only the data from the reference drawing
that is necessary to regenerate the current drawing. In other words, referenced
material is read in “on demand.” Demand loading works in conjunction with
the INDEXCTL, XLOADCTL, and XLOADPATH system variables.
Quick Reference
Commands
XREF
Starts the EXTERNALREFERENCES command.
System Variables
INDEXCTL
Controls whether layer and spatial indexes are created and saved in drawing
files.
XLOADCTL
Turns xref demand-loading on and off, and controls whether it opens the
referenced drawing or a copy.
Increase Performance with Large Referenced Drawings | 1709

XLOADPATH
Creates a path for storing temporary copies of demand-loaded xref files.
Unload Xrefs
When a DWG reference (xref) is unloaded from the current drawing, the
drawing opens much faster and uses less memory.
When an xref is unloaded from the current drawing, the drawing opens much
faster and uses less memory. The xref definition is unloaded from the drawing
file, but the pointer to the reference drawing remains. The xref is not displayed,
and nongraphical object information does not appear in the drawing. However,
you can restore all the information by reloading the xref. If XLOADCTL
(demand loading) is set to 1, unloading the drawing unlocks the original file.
You should unload a reference file if it is not needed in the current drawing
session but may be used later for plotting. You can maintain a working list of
unloaded xrefs in the drawing file that you can load as needed.
To unload an xref
1Click View tab ➤ Palettes panel ➤ External References Palette.
2In the External References palette, select the reference name you want
to unload.
3Right-click, and click Unload.
Quick Reference
Commands
EXTERNALREFERENCES
Opens the External References palette.
System Variables
XLOADCTL
Turns xref demand-loading on and off, and controls whether it opens the
referenced drawing or a copy.
1710 | Chapter 35 Reference Other Drawing Files
Work with Demand Loading
With demand loading, only the data from the referenced drawing that is
necessary to regenerate the current drawing is loaded into memory.
To realize the maximum benefits of demand loading, you need to save the
referenced drawings with layer and spatial indexes. The performance benefits
of demand loading are most noticeable when you do one of the following:
■Clip the xref with the program to display a small fraction of it. A spatial
index is saved in the externally referenced drawing.
■Freeze several layers of the xref. The externally referenced drawing is saved
with a layer index.
If demand loading is turned on, and you have clipped xrefs that were saved
with spatial indexes, objects in the referenced drawing database that are
contained within the clip volume comprise the majority of the objects read
into the drawing. If the clip volume is modified, more objects are loaded as
required from the reference drawing. Similarly, if you have xrefs with many
layers frozen that were saved with layer indexes, only the objects on those
thawed layers are read into the current drawing. If those xref-dependent layers
are thawed, the program reads in that geometry from the reference drawing
as required.
When demand loading is turned on, the program places a lock on all reference
drawings so that it can read in any geometry it needs to on demand. Other
users can open those reference drawings, but they cannot save changes to
them. If you want other users to be able to modify an xref that is being demand
loaded into another drawing, use demand loading with the Copy option.
If you turn on demand loading with the Enable with Copy option, the program
makes a temporary copy of the referenced drawing and demand loads the
temporary file. You can then demand load the xref while allowing the original
reference drawing to be available for modification. When you turn off demand
loading, the program reads in the entire reference drawing regardless of layer
visibility or clip instances.
Layer and spatial indexes were added in AutoCAD Release 14 and AutoCAD
LT 97. If you externally reference a drawing saved in a release previous to this,
you do not see the same performance benefit as drawings saved with the
indexes. For maximum performance, use demand loading with referenced
drawings saved with layer and spatial indexes turned on in AutoCAD Release
14, AutoCAD LT 97, or more recent versions.
Work with Demand Loading | 1711
To turn on demand loading
1Click Tools menu ➤ Options.
2In the Options dialog box, Open and Save tab, under External References,
select Disabled, Enabled, or Enabled with Copy.
3Click OK.
Quick Reference
Commands
EXTERNALREFERENCES
Opens the External References palette.
System Variables
INDEXCTL
Controls whether layer and spatial indexes are created and saved in drawing
files.
XLOADCTL
Turns xref demand-loading on and off, and controls whether it opens the
referenced drawing or a copy.
Work with Layer and Spatial Indexes
To receive the maximum benefit of demand loading, it is recommended that
you save any drawings that are used as xrefs with layer and spatial indexes.
A layer index is a list showing which objects are on which layers. This list is
used when the program is referencing the drawing in conjunction with demand
loading to determine which objects need to be read in and displayed. Objects
on frozen layers in a referenced drawing are not read in if the referenced
drawing has a layer index and is being demand loaded.
The spatial index organizes objects based on their location in 3D space. This
organization is used to efficiently determine which objects need to be read in
when the drawing is being demand loaded and clipped as an xref. If demand
loading is turned on, and the drawing is attached as an xref and clipped, the
program uses the spatial index in the externally referenced drawing to
1712 | Chapter 35 Reference Other Drawing Files
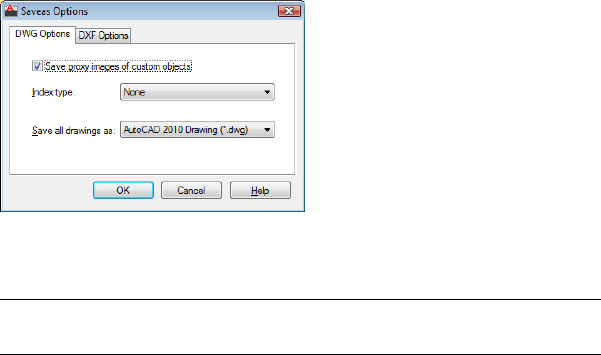
determine which objects lie within the clip boundary. The program then reads
only those objects into the current session.
Spatial and layer indexes are best used in drawings that will be used as xrefs
in other drawings where demand loading is enabled. Drawings that are not
going to be used as xrefs or partially opened will not benefit from layer and
spatial indexing or demand loading.
To save a drawing with layer and spatial indexes
1Click File menu ➤ Save As.
2In the Save Drawing As dialog box, click Tools ➤ Options.
3In the Saveas Options dialog box, under Index Type, select Layer, Spatial,
or Layer & Spatial. Click OK.
NOTE If you are saving a partially open drawing that does not already contain
layer and spatial indexes, this option is disabled.
4Click Save.
Quick Reference
Commands
EXTERNALREFERENCES
Opens the External References palette.
Work with Layer and Spatial Indexes | 1713
System Variables
INDEXCTL
Controls whether layer and spatial indexes are created and saved in drawing
files.
TREEDEPTH
Specifies the maximum depth, that is, the number of times the tree-structured
spatial index can divide into branches.
TREEMAX
Limits memory consumption during drawing regeneration by limiting the
number of nodes in the spatial index (oct-tree).
XLOADCTL
Turns xref demand-loading on and off, and controls whether it opens the
referenced drawing or a copy.
Set Paths for Temporary Xref File Copies
When you turn on demand loading with copy, you can control where copies
of externally referenced drawings are to be placed.
When you turn on demand loading with copy, the XLOADPATH system
variable can be used to indicate the path where copies of externally referenced
drawings are to be placed. The path you specify remains in effect for all drawing
sessions until you indicate a different path. If no value for XLOADPATH is
specified, the temporary file copies are placed in the standard folder for
temporary files.
If you find that referencing drawings over a network is slow, it is recommended
that you set XLOADPATH to reference a local folder, and set XLOADCTL to
2 so that the externally referenced files are demand loaded from your local
machine. Conversely, to minimize the number of temporary files created by
multiple users referencing the same drawing, those users can set XLOADPATH
to point to a common folder. In this manner, multiple sessions of the program
can share the same temporary copies of reference drawings.
You can set XLOADPATH in the Options dialog box and indicate the path
where copies of externally referenced files are to be placed.
To set the file path for xref copies
1Click Application menu ➤ Options.
1714 | Chapter 35 Reference Other Drawing Files
2In the Options dialog box, Files tab, select the Temporary External Reference
File Location folder.
The expanded tree view displays the path where copies of xref files are
placed. If no path is specified, the temporary copies are placed in the
location specified by Temporary Drawing File Location.
3Edit the path by selecting it and entering a new path.
4Click OK (or Apply) to set the path.
Quick Reference
Commands
EXTERNALREFERENCES
Opens the External References palette.
System Variables
XLOADPATH
Creates a path for storing temporary copies of demand-loaded xref files.
Set Paths for Temporary Xref File Copies | 1715
1716
Link and Embed Data (OLE)
With the Microsoft Windows OLE feature, you can copy or move information from one
application to another while retaining the ability to edit the information in the original
application.
Object linking and embedding (OLE) is a Windows feature that combines data from different
applications into one document. For example, you can create an Adobe PageMaker layout
that contains an AutoCAD drawing, or you can create an AutoCAD drawing that contains all
or part of a Microsoft Excel spreadsheet.
Overview of Object Linking and Embedding
Object linking and embedding is a way to use information from one application
in another application. To use OLE, you need both source and destination
applications that support OLE.
Both linking and embedding insert information from one document into another
document. Also, both linked and embedded OLE objects can be edited from
within the destination application. However, linking and embedding store
information differently.
The relationship between embedding and linking is similar to that between
inserting a block and creating an external reference.
Embed Objects
An embedded OLE object is a copy of information from another document.
When you embed objects, there is no link to the source document and any
changes made to the source document are not reflected in destination
documents. Embed objects if you want to be able to use the application that
created them for editing, but you do not want the OLE object to be updated
when you edit information in the source document.
36
1717
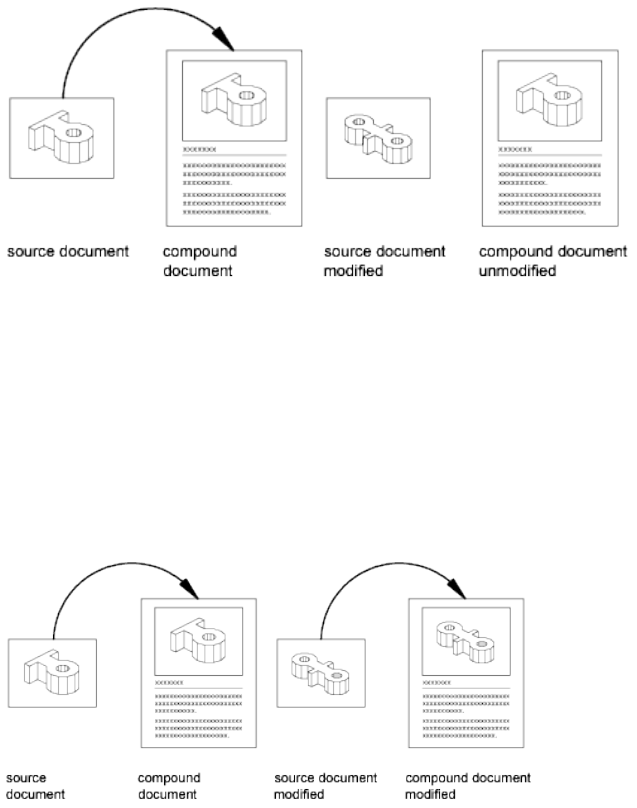
Link Objects
A linked object is a reference to information in another document. Link objects
when you want to use the same information in more than one document.
Then, if you change the original information, you need to update only the
links in order to update the document containing the OLE objects. You can
also set links to be updated automatically.
When you link a drawing, you need to maintain access to the source
application and the linked document. If you rename or move either of them,
you may need to reestablish the link.
Control the Plot Quality of OLE Objects
OLE objects are treated as raster objects when a raster plotter is used. Because
large, high-resolution, color-rich rasters can be expensive to plot, you can set
the OLEQUALITY system variable to control how each OLE object is plotted.
The default setting, Automatically Select, assigns a plot-quality level based on
the type of object. The higher the plot-quality setting, the more time and
memory are used to plot.
1718 | Chapter 36 Link and Embed Data (OLE)

You can also adjust OLE plot quality in the Plotter Configuration Editor. The
Graphics option displays a Raster Graphics dialog box with a slider that controls
OLE plot quality.
NOTE Nested OLE objects may cause problems. For example, an Excel spreadsheet
embedded in a Word document may fail to plot. Also, an OLE object that is not
in the current view plane is not plotted, but the frame is plotted based on the
setting of the OLEFRAME system variable.
See also:
■Use Windows Cut, Copy, and Paste on page 724
To set the plot quality for OLE objects
1Click Tools menu ➤ Options.
2In the Options dialog box, Plot and Publish tab, in the OLE Plot Quality
list, select one of the following settings:
■Monochrome. For example, spreadsheets
■Low Graphics. For example, color text and pie charts
■High Graphics. For example, photographs
■Automatically Select. Plot-quality setting assigned based on the type
of file
3Click Apply to continue setting options, or click OK to close the dialog
box.
Quick Reference
Commands
COPYLINK
Copies the current view to the Clipboard for linking to other OLE
applications.
INSERTOBJ
Inserts a linked or embedded object.
Overview of Object Linking and Embedding | 1719

OLELINKS
Updates, changes, and cancels existing OLE links.
System Variables
OLEHIDE
Controls the display and plotting of OLE objects.
Import OLE Objects
You can import information into a drawing from other applications that
support OLE.
Overview of Importing OLE Objects into Drawings
Use one of the following methods to insert information from another
application as an OLE object:
■Copy or cut information from an existing file and paste it into the drawing.
■Import an existing file created in another application.
■Open another application from within the drawing and create the
information that you want to use.
When you insert the information, you specify an insertion point.
By default the OLE object is displayed with a frame that is not plotted. OLE
objects are opaque and are plotted as opaque; they hide objects in back of
them. OLE objects support draw order. You control the display of OLE objects
in two ways:
■Set the OLEHIDE system variable to display or suppress the display of all
OLE objects in paper space, model space, or both.
■Turn off or freeze a layer to suppress the display of OLE objects on that
layer.
When OLE objects with text are printed, the text size approximates the text
size in the source application.
NOTE OLE objects in drawings are not displayed or plotted in external references
or block references.
1720 | Chapter 36 Link and Embed Data (OLE)
Quick Reference
Commands
INSERTOBJ
Inserts a linked or embedded object.
OLELINKS
Updates, changes, and cancels existing OLE links.
OLESCALE
Controls the size, scale, and other properties of a selected OLE object.
OPTIONS
Customizes the program settings.
PASTESPEC
Pastes objects from the Clipboard into the current drawing and controls the
format of the data.
System Variables
MSOLESCALE
Controls the size of an OLE object with text that is pasted into model space.
OLEHIDE
Controls the display and plotting of OLE objects.
Link OLE Objects in Drawings
When you link information from another document in a drawing, the
information can be updated when it changes in the source document.
You can link information from a document created by another application
to a drawing. For example, you might want to insert a schedule that will be
automatically updated. You can also install multimedia icons that are activated
when double-clicked.
Update Links
Links can be set to be updated either automatically or manually when
information in the linked document changes. By default, links are updated
automatically. Use OLELINKS to specify automatic or manual updating.
Link OLE Objects in Drawings | 1721

Reconnect Links
Because a link references the location of the linked document, you need to
reconnect the link if the document changes location or is renamed.
Break Links
Breaking a link does not remove the inserted information from the drawing.
Instead, it removes the connection to the linked document. You can break a
link when you no longer need to update the information.
To link objects in a drawing
1Start the source application and open a document.
2Select the information you want to link and copy it to the Clipboard.
3Open the drawing.
4Click Home tab ➤ Clipboard panel ➤ Paste drop-down ➤ Paste Special.
5In the Paste Special dialog box, click Paste Link.
Paste Link pastes the contents of the Clipboard into the current drawing
and creates a link to the file in the source application. If you click Paste,
the Clipboard contents are embedded instead of linked.
6In the As box, select the data format you want to use.
7Click OK.
To link an entire file as an OLE object in a drawing
1Open the drawing.
2Click Blocks & References tab ➤ Data panel ➤ OLE Object.
3In the Insert Object dialog box, select Create from File.
4Select Link. Click Browse.
5In the Browse dialog box, select the file you want to link. Click Open.
6In the Insert Object dialog box, click OK.
The entire file is linked to the drawing.
1722 | Chapter 36 Link and Embed Data (OLE)

To update links manually
1Click Edit menu ➤ OLE Links.
2In the Links dialog box, select the links you want to update.
3Click Update Now.
4Click Close.
NOTE If you want to select the links from the drawing area rather than from a list
in the Links dialog box, select the OLE objects before step 1.
To reconnect a link to an OLE object
1In the drawing, select the OLE object whose link you want to change.
2Click Edit menu ➤ OLE Links.
3In the Links dialog box, click Change Source.
4In the Change Source dialog box, search for the source file.
5Select the source file. Click Open.
6Click OK.
To break a link to an OLE object
1Select the linked object whose link you want to break.
2Click Edit menu ➤ OLE Links.
3In the OLE Links dialog box, click Break Link.
4Click Yes.
5Click Close.
Quick Reference
Commands
INSERTOBJ
Inserts a linked or embedded object.
Link OLE Objects in Drawings | 1723
OLELINKS
Updates, changes, and cancels existing OLE links.
OLESCALE
Controls the size, scale, and other properties of a selected OLE object.
OPTIONS
Customizes the program settings.
OPTIONS
Customizes the program settings.
PASTESPEC
Pastes objects from the Clipboard into the current drawing and controls the
format of the data.
System Variables
OLEHIDE
Controls the display and plotting of OLE objects.
Embed OLE Objects in Drawings
When you embed information from another document in a drawing, the
information is not updated when it changes in the source document.
You can embed an object in a drawing by copying the object to the Clipboard
and then pasting it into the drawing file. For example, you can embed a
company logo created with another application into a drawing.
Drag Objects into a Drawing
You can drag selected data and graphics into a drawing from another
application window. Both applications must be running and visible on your
screen. The other application must support ActiveX to drag information
between applications. Objects dragged into a drawing are embedded, not
linked.
Dragging data is the same as cutting and pasting. The information is removed
from one document and pasted into the other document. Holding down CTRL
while dragging is the same as copying and pasting in that it creates a copy of
the information, leaving the original document intact.
1724 | Chapter 36 Link and Embed Data (OLE)
To embed an OLE object in a drawing
1Open the document in the source application.
2Copy the information you want to embed to the Clipboard.
3Open the drawing.
4Click Home tab ➤ Utilities panel ➤ Paste.
5Click OK.
To create an object in another application and embed it in a drawing
1Open the drawing.
2Click Blocks & References tab ➤ Data panel ➤ OLE Object.
3In the Insert Object dialog box, under Object Type, select Create New.
4Under Object Type, select an application. Click OK.
The source application opens.
5Using the server application, create the information you want to insert.
Save the document.
6On the source application's File menu, click Exit and Return.
7Close the source application.
The OLE object is embedded in the drawing.
To specify a new height or width for an OLE object
1Right-click an OLE object. Click Properties.
2In the Properties palette, enter new values for Width or Height, or enter
a percentage for Scale Width or Scale Height.
NOTE When Lock Aspect is set to Yes, if you change either height or width,
the other automatically changes to maintain the current ratio between the
two. For example, if you change height to 50 percent, width automatically
changes to 50 percent. Set Lock Aspect to No if you want to change only
height or only width.
Embed OLE Objects in Drawings | 1725
3Click OK to apply changes.
To scale text in an OLE object according to its font
1Select an OLE object.
2Right-click. Click Text Size.
3In the OLE Text Size dialog box, select a font.
The OLE Text Font list contains all of the fonts that appear in the selected
OLE object.
4Select a point size.
The OLE Point Size list contains all of the sizes for the selected font.
5In Text Height, enter a value in drawing units.
This value is the height for text in the selected font and point size. For
example, if you select Arial and 10 points, and then enter .5 in Text
Height, all text in the selected OLE object that is currently 10-point Arial
changes to 0.5 drawing units in height. All other text in the object changes
size in relation to the selected font. The size of the OLE object adjusts to
accommodate the new text sizes.
Quick Reference
Commands
INSERTOBJ
Inserts a linked or embedded object.
OLESCALE
Controls the size, scale, and other properties of a selected OLE object.
OPTIONS
Customizes the program settings.
OPTIONS
Customizes the program settings.
PASTECLIP
Pastes objects from the Clipboard into the current drawing.
1726 | Chapter 36 Link and Embed Data (OLE)
PASTESPEC
Pastes objects from the Clipboard into the current drawing and controls the
format of the data.
System Variables
OLEHIDE
Controls the display and plotting of OLE objects.
OLEQUALITY
Sets the default plot quality for OLE objects.
OLESTARTUP
Controls whether the source application of an embedded OLE object loads
when plotting.
Export OLE Objects from Drawings
You can link or embed a view of a drawing in another application that supports
OLE.
Link Views to Other Documents
A drawing can be a source document linked to one or more documents in
other applications. The COPYLINK command copies the view in the current
viewport to the Clipboard. You can then paste the view into the destination
document.
If you paste an unnamed view into a document, it is assigned a view name
such as OLE1. If you then exit the drawing, you are prompted to save your
changes to the newly named view. To establish the link and to save the view
name, OLE1, you must save the drawing.
Embed Drawing Objects in Other Documents
You can select objects and embed them in documents created by other
applications. Embedding places a copy of the selected objects in the destination
document. If you use AutoCAD to edit the OLE object from within the
destination document, the object is not updated in the original drawing.
Export OLE Objects from Drawings | 1727

To embed objects in another document
1Click Edit menu ➤ Copy.
2In the drawing area, select the objects that you want to embed and then
press ENTER.
The selected objects are copied to the Clipboard.
3Start the destination application, and open a new or existing document.
4Paste the Clipboard contents into the document, following the destination
application's instructions for embedding the Clipboard contents.
To link a view to another document
1Save the drawing that you want to link, so that it has a drawing name.
2If multiple viewports are displayed, select a viewport.
3Enter copylink at the Command prompt.
4Open a new or existing document in the destination application.
5Paste the Clipboard contents into the document, following that
application's procedures for inserting linked data.
The inserted OLE object is displayed in the document and can be edited
from AutoCAD through the destination application.
Quick Reference
Commands
COPYCLIP
Copies selected objects to the Clipboard.
COPYLINK
Copies the current view to the Clipboard for linking to other OLE
applications.
CUTCLIP
Copies selected objects to the Clipboard and removes them from the drawing.
1728 | Chapter 36 Link and Embed Data (OLE)
INSERTOBJ
Inserts a linked or embedded object.
OLELINKS
Updates, changes, and cancels existing OLE links.
System Variables
WMFBKGND
Controls the background display when objects are inserted in Windows
metafile (WMF) format.
WMFFOREGND
Controls the assignment of the foreground color when objects are inserted
in Windows metafile (WMF) format.
Edit OLE Objects in Drawings
You can edit a linked or embedded OLE object in a drawing by double-clicking
the object to open the source application.
You can use any selection method to select OLE objects and then use most
editing commands, the Properties palette, or grips to make changes. When
you use grips to change the size of an OLE object, the shape of the object does
not change if the aspect ratio is locked in the Properties palette. The following
editing commands are not available for OLE objects: BREAK, CHAMFER,
FILLET, and LENGTHEN.
In a 2D visual style, when an OLE object is rotated or is not in Plan view, the
content of the OLE object is temporarily hidden and only the frame is
displayed. The content is always shown in a 3D visual style.
In the Properties palette, the general properties listed for an OLE object apply
to the frame.
Because grips are displayed on the frame, grip editing is not available if the
frame is not displayed. To display the frame, change the setting of the
OLEFRAME system variable.
Edit Information in OLE Objects
You can edit the information in linked or embedded OLE objects by
double-clicking the object to open the source application.
Edit OLE Objects in Drawings | 1729
Edit OLE Objects When AutoCAD Is the Source Application
The document that contains a linked drawing stores the drawing's file location.
You can edit a linked drawing either from the destination application or in
the source program. The program must be loaded or accessible on the system
along with the document you are editing.
An AutoCAD drawing that is embedded in a document can be edited only
from within the destination application. Double-click the OLE object to start
the program. Editing the original drawing in the program has no effect on
documents in which that drawing is embedded.
See also:
■Copy Objects on page 751
To edit a linked drawing from within the destination application
1Open the document that contains the linked drawing (for example, a
Microsoft Word file).
2Double-click the linked drawing.
The drawing opens.
3Modify the drawing as necessary.
4To save the changes to the drawing, click File menu ➤ Save.
5To return to the destination application, click File menu ➤ Exit.
The drawing is changed in all documents that have links to it.
How the link is updated depends on the destination application. Some
applications support automatic updating of links; others require manual
updating of links.
To edit a linked drawing in the source application
1Start the program and open the linked drawing.
2Modify the drawing and view as necessary.
3To save the changes to the drawing, click File menu ➤ Save.
4Update the link in the destination document if necessary.
The drawing is changed in all documents that have links to it.
1730 | Chapter 36 Link and Embed Data (OLE)
How the link is updated depends on the destination application. Some
applications support automatic updating of links; others require manual
updating of links.
To edit embedded objects
1Open the document that contains the embedded AutoCAD objects (for
example, a Microsoft Word file).
2Double-click the embedded objects to start the program and display the
objects.
3Modify the objects as necessary.
4To save changes to the embedded objects, click File menu ➤ Update.
5To return to the destination application, click File menu ➤ Exit.
To restore an OLE object to its original size and shape
1Select the OLE object.
2Right-click.Click OLE ➤ Reset.
The Reset option is also available in the Text Size dialog box.
To control the display of OLE objects
1At the Command prompt, enter olehide.
2Enter one of the following values:
■0 Displays OLE objects in both paper space and model space.
■1 Displays OLE objects in paper space only.
■2 Displays OLE objects in model space only.
■3 Does not display OLE objects.
To turn the display of the frames of OLE objects on or off
1At the Command prompt, enter oleframe.
2Enter one of the following values:
■0 Frame is not displayed and not plotted.
■1 Frame is displayed and is plotted.
Edit OLE Objects in Drawings | 1731
■2 Frame is displayed but is not plotted.
The frame must be displayed in order for grips to be visible.
Quick Reference
Commands
COPYCLIP
Copies selected objects to the Clipboard.
CUTCLIP
Copies selected objects to the Clipboard and removes them from the drawing.
ERASE
Removes objects from a drawing.
PASTECLIP
Pastes objects from the Clipboard into the current drawing.
U
Reverses the most recent operation.
System Variables
OLEFRAME
Controls whether a frame is displayed and plotted on all OLE objects in the
drawing.
OLEHIDE
Controls the display and plotting of OLE objects.
1732 | Chapter 36 Link and Embed Data (OLE)
Work with Data in Other
Formats
You can work with many different types of files, including files created with other applications
and files created in earlier releases of the program. You can also specify search paths for
drawing and support files.
Import Other File Formats
You can import files, other than DWG files, that were created with other
applications into your drawings.
Import Autodesk 3ds MAX Files
You can import a 3DS file created with Autodesk® 3ds MAX®.
Geometry and rendering data from 3ds MAX are imported, which includes
meshes, materials, mappings, lights, and cameras. However, procedural materials,
smoothing groups, and keyframe data cannot be imported. Imported objects
are assigned a color as close as possible to the object's 3ds MAX color.
For lights and materials, use CONVERTOLDLIGHTS and
CONVERTOLDMATERIALS. Lights are converted to the nearest equivalent.
■Ambient light loses its color.
■Omni lights become point lights.
■Spotlights become AutoCAD spotlights.
■Cameras become named views.
37
1733

If the name of any 3ds MAX object conflicts with a name already in the
AutoCAD drawing, the 3ds MAX name is assigned a sequence number to
resolve the conflict. The name might be truncated to resolve the conflict.
To import an Autodesk 3ds MAX file
1Click Blocks & References tab ➤ Import panel ➤ 3DS File.
2In the 3D Studio File Import dialog box, select the file that you want to
import.
3Click Open.
Quick Reference
Commands
3DSIN
Imports an Autodesk 3ds MAX (3DS) file.
IMPORT
Imports files of different formats into the current drawing.
Import FBX Files
FBX files allow you to import and export 3D objects, 2D objects with thickness,
lights, cameras, and materials from one Autodesk program to another.
The FBX file format is an open framework for 3D data transfer that creates a
high level of interoperability among Autodesk programs. For example, in
Autodesk 3ds Max, you can export a file as an FBX file, and then open that
file in AutoCAD to view and edit the objects, lights, cameras, and materials.
Likewise, in AutoCAD, you can export a drawing as an FBX file, and then view
and edit that file in 3ds Max.
Points (not point clouds), meshes, NURBS curves and surfaces, subdivided
meshes, target cameras, lights, and materials are imported into AutoCAD in
the same form in which they existed when exported from 3ds Max.
When importing FBX files from 3ds Max into AutoCAD,
■Target cameras created in 3ds Max are imported accurately.
1734 | Chapter 37 Work with Data in Other Formats
■The LIGHTINGUNITS system variable controls whether lights are imported
as standard or photometric lights.
When exporting FBX files from AutoCAD to 3ds Max,
■3D objects, 2D objects with thickness, lights, cameras, and materials are
rotated by 90 degrees on the Z axis.
■You can export 2D objects by increasing their thickness. Any visible and
renderable object with thickness can be exported to FBX.
To export a 2D object to an FBX file, increase its thickness to convert to a 3D
object. Any visible and renderable object or geometry with thickness can be
exported to FBX.
To import an FBX file
1In AutoCAD, click Insert tab ➤ Import panel ➤ Import.
2In the Import File dialog box, select the FBX file type, select the FBX file,
and click Open.
The FBX Import Options dialog box displays.
3Specify the items to be imported, the assigned layer for the objects, and
the conversion units. Importing the FBX file as a block allows you to
modify it.
4Click Ok to import the as specified.
Quick Reference
FBXIMPORT
Imports an Autodesk® FBX file, which can contain objects, lights, cameras
and materials.
Import 3D Point Cloud Files
Index and attach point cloud data created with 3D tripod and LiDAR scanners.
Import 3D Point Cloud Files | 1735
Index Point Cloud Data
A point cloud is a large collection of points placed on a 3D coordinate system.
The points create a 3D representation of an object or geographic feature.
Create Point Cloud Files
AutoCAD can create 3D point clouds from the following point cloud data file
types:
■FLS
■FWS
■LAS
■XYB
Index a file of one of these types to create either an ISD or PCG file in
AutoCAD.
Work While Indexing a Point Cloud Data File
You can continue to use AutoCAD while your point cloud data file is being
indexed. To view the status of indexing, hover the pointing device over the
icon in the drawing status bar.
To cancel indexing, right-click the icon and click Cancel Indexing.
1736 | Chapter 37 Work with Data in Other Formats

NOTE To attach a point cloud data file to an AutoCAD drawing, the data file must
be indexed in AutoCAD.
Quick Reference
POINTCLOUD
Provides options to create and attach an indexed point cloud file.
POINTCLOUDINDEX
Creates an indexed point cloud (PCG or ISD) file from a scan file.
Attach a Point Cloud to a Drawing
When you attach a point cloud file to a drawing, you can specify whether it
is locked for editing.
Insert Point Clouds with Geographic Data
If geographic location information exists in both the current drawing and the
point cloud file, then you can insert the file based on that data.
Lock a Point Cloud from Editing
An indexed point cloud contains a Lock property that controls whether the
point cloud can be selected and edited.
Quick Reference
POINTCLOUD
Provides options to create and attach an indexed point cloud file.
POINTCLOUDATTACH
Inserts an indexed point cloud (PCG or ISD) file into the current drawing.
POINTCLOUDAUTOUPDATE
Controls whether a point cloud is regenerated automatically after
manipulation, panning, zooming, or orbiting.
Import 3D Point Cloud Files | 1737
POINTCLOUDDENSITY
Controls the number of points displayed at once for all point clouds in the
drawing view.
POINTCLOUDLOCK
Controls whether an attached point cloud can be manipulated, moved, or
rotated.
POINTCLOUDRTDENSITY
Improves performance by degrading the number of points displayed in the
drawing view zooming, panning, or orbiting in real time.
Work with 3D Point Clouds
You can use several common commands to edit, or add geometry to, a 3D
point cloud.
When an attached point cloud file is unlocked, you can click the point cloud
to display an editing grip at the insertion point of the point cloud.
The default insertion point is the origin of the coordinate system (0, 0, 0) of
the indexed file. If, in the indexed file, a point cloud is offset from the origin,
when attached, the insertion point is also offset from the points of the point
cloud.
To align point clouds, enter the same insertion point, rotation, and scale for
each point cloud.
Edit a Point Cloud
Use the following commands to modify a point cloud:
■BLOCK
■COPY
■COPYCLIP
■CUTCLIP
■ERASE
■MOVE
■PASTECLIP
■ROTATE
1738 | Chapter 37 Work with Data in Other Formats

■SCALE
■STRETCH
NOTE The MIRROR3D command copies and moves a point cloud, but does not
mirror it. You cannot explode a point cloud.
Snap to Points on a Point Cloud
The Node object snap allows you to snap to individual points on a point cloud.
The Insertion object snap allows you to snap to the insertion point of the
point cloud. For more information, see Object Snap Modes.
Quick Reference
POINTCLOUD
Provides options to create and attach an indexed point cloud file.
POINTCLOUDAUTOUPDATE
Controls whether a point cloud is regenerated automatically after
manipulation, panning, zooming, or orbiting.
POINTCLOUDDENSITY
Controls the number of points displayed at once for all point clouds in the
drawing view.
POINTCLOUDLOCK
Controls whether an attached point cloud can be manipulated, moved, or
rotated.
POINTCLOUDRTDENSITY
Improves performance by degrading the number of points displayed in the
drawing view zooming, panning, or orbiting in real time.
Import ACIS SAT Files
You can import geometry objects stored in SAT (ASCII) files using the ASCISIN
command.
ACISIN converts the model to a body object or to 3D solids and regions if the
body is a true solid or a true region.
Import ACIS SAT Files | 1739

Quick Reference
Commands
ACISIN
Imports an ACIS (SAT) file and creates 3D solid, body, or region objects.
IMPORT
Imports files of different formats into the current drawing.
Convert DXF and DXB Files to DWG Format
DXF and DXB files are two types of drawing interchange files used to transfer
data between various applications.
A DXF (drawing interchange format) file is either a binary or an ASCII
representation of a drawing file. It is often used to share drawing data between
other CAD programs.
A DXB (drawing interchange binary) file is a specially coded binary version
of a DXF file used for plotting, and can be used to “flatten” 3D wireframe
drawings into 2D vectors.
You can convert a DXF or DXB file to DWG format by opening the file and
saving it in DWG format. You can then work with the resulting drawing file
as you would with any other drawing file.
To open a DXF file
1Click File menu ➤ Open.
2In the Select File dialog box, in the Files of Type box, select DXF (*.dxf).
3Find and select the DXF file you want to import, or enter the name of
the DXF file at File Name.
4Click Open.
To open a DXB file
1Click Blocks & References tab ➤ Import panel ➤ DXB File.
2In the Select DXB File dialog box, find and select the DXB file you want
to import.
1740 | Chapter 37 Work with Data in Other Formats

3Click Open.
Quick Reference
Commands
DXBIN
Imports an AutoCAD DXB (drawing interchange binary) file.
OPEN
Opens an existing drawing file.
Import MicroStation DGN Files
You can import MicroStation® DGN drawing files into DWG files.
The import process translates basic DGN data into the corresponding DWG
file data. There are several translation options to determine how certain data
such as text elements and external references are handled. Users can not only
manipulate text elements and xrefs, but also select the conversion units based
on DGN unit settings, and most importantly, preview the default mapping
translation or create and use their own mapping setups (see DGNMAPPING).
Exchanging and reusing basic drawing data is useful in collaborative projects.
For example, service organizations such as AEC and design-build firms might
need to import mapping data created with MicroStation into a site plan created
with an AutoCAD-based product. The DGN data can serve as an accurate
reference for creating the site plan.
NOTE DGNIMPORT is not limited to files with *.dgn extensions. It supports all
DGN files, even those that do not have a .dgn extension.
Understand the Limitations
The DGN import and export capabilities are designed to provide a fundamental
exchange of information between MicroStation V7/V8 DGN files and AutoCAD
DWG files. However, translating data from one format to a completely different
format inevitably require compromises and substitutions.
■Simple geometric objects such as lines, arcs, and circles, and properties
such as layer assignments correlate directly between the DWG and DGN
data formats.
Import MicroStation DGN Files | 1741
■Data with built-in features or variations are visually approximated. For
example, text and dimensions might have specialized formatting, and
color definitions might be customized.
■Some data cannot be translated completely. For example, product-specific
features such as data fields or dynamic blocks can be represented visually
but not behaviorally.
See the DGNIMPORT Conversion Table for specific details about the scope of
importing MicroStation objects and other data.
See the DGNIMPORT Unit Mapping Table for specific details about unit
conversions when importing MicroStation objects.
Recommendations
To optimize the data transfer from the MicroStation® DGN file format, request
that the creator of the MicroStation drawings consider the following
recommendations:
■Create a separate DGN file for each design model
■Do not reference sheet models from design models
■Minimize the use of custom objects and other data unique to MicroStation
■Use ByLevel for color, line style, and weight properties
■Use simple line styles as much as possible
■Use simple patterns and pattern styles
■Use TrueType text fonts rather than SHX text fonts
■Use defined styles for dimensions and text rather than a “none” style
■Use simple dimension styles if possible
■Use shared cells as opposed to normal (library) cells
■Work primarily in one format, DWG or DGN, rather than switching back
and forth
When importing a DGN file, specify the conversion units (master units or
sub-units) based on the DWG file's drawing units. For example, if you receive
a DGN file with master units set to meters, and sub-units set to millimeters,
and you need the drawing units of the DWG file to be in meters, then select
1742 | Chapter 37 Work with Data in Other Formats

master units in the Import DGN Settings dialog box. This matches the meters
in the DGN file to the meters in the DWG file.
To import a MicroStation DGN drawing
1Click Blocks & References tab ➤ Import panel ➤ Import.
2In the Import File dialog box, in the Files of Type box, select MicroStation
DGN (*.dgn).
3Find and select the DGN file you want to import, or enter the name of
the DGN file at File Name.
4Click Open.
5In the Import DGN Settings dialog box, select a design model from the
list and specify the desired import options.
6Click OK.
Quick Reference
Commands
DGNIMPORT
Imports the data from a DGN file into a new DWG file.
System Variables
DGNIMPORTMAX
Sets the maximum number of elements that are translated when importing
a DGN file.
Manage Translation Mapping Setups
You can manage translation mapping setups for DGN file import and export
operations.
You can create, modify, rename, or delete mapping translations based on your
company’s CAD standards such as:
■Change DGN level names to appropriate DWG layer names
Manage Translation Mapping Setups | 1743

■Remap unsupported DGN linestyles to DWG linetypes
■Remap lineweights and adjust color mapping
Therefore, you can streamline the import/export process while minimizing
the need for more extensive editing.
The DGN Mapping Setups dialog box is displayed when you click the Mapping
Setups button in the Import DGN Settings and Export DGN Settings dialog
boxes. You can also enter DGNMAPPING at the Command prompt.
To create a new DGN mapping setup
1In Import (or Export) DGN Settings dialog box, click Mapping Setups.
The DGN Mapping Setups dialog box is displayed.
2Click New. The New Mapping Setup dialog box is displayed.
3Under New DGN mapping setup name, enter a mapping setup name.
4Under Based On, select a mapping setup. If there is no existing mapping
setup, the default is Standard.
5Select a mapping type.
6Click Continue. The Modify DGN Mapping Setup dialog box is displayed.
7Specify property mapping for DGN Import (or Export).
8Click Ok.
To rename a DGN mapping setup
1In the DGN Mapping Setups dialog box , select the mapping setup you
want to rename.
NOTE The Rename button is disabled when the Standard mapping setup is
selected.
2Click Rename.
3Enter new mapping setup name.
4Click anywhere outside the text box.
You can also right-click the mapping setup name from the mapping setup list,
click Rename and then continue with step 3.
1744 | Chapter 37 Work with Data in Other Formats

To modify a DGN mapping setup
1In the DGN Mapping Setups dialog box , select the mapping setup you
want to modify.
NOTE The Modify button is disabled when the Standard mapping setup is
selected.
2Click Modify. The Modify DGN Mapping Setup: <mapping_setup> dialog
box is displayed.
3Specify property mapping for DGN Import (or Export).
4Click Ok.
You can also right-click the mapping setup name from the mapping setup list,
click Modify and then continue with step 3.
To delete a DGN mapping setup
1In the DGN Mapping Setups dialog box , select the mapping setup you
want to delete.
NOTE The Delete button is disabled when the Standard mapping setup is
selected.
2Click Delete.
3When the Delete Mapping Setup prompt is displayed, click Yes.
You can also right-click the mapping setup name from the mapping setup list
and click Delete.
To select a linetype from .lin file
1In the Modify DGN Mapping Setup dialog box, click Linetype tab.
2Click the drop-down list in the cell on the right-hand column.
3Click Other... button.
4Click Load button to select a linetype from the acad.lin (acadiso.lin) file.
If several linetypes are loaded in the Load or Reload Linetypes dialog box,
select a single linetype in the Select Linetype dialog box to populate the current
cell. After loading several linetypes, the additional linetypes are added to the
Manage Translation Mapping Setups | 1745

drop-down list so you can just select from the drop-down list for the other
cells.
To add properties from a DGN file
1In the DGN Mapping Setups dialog box , click Modify.
NOTE The Modify button is disabled when the Standard mapping setup is
selected.
2In the Modify DGN Mapping Setup dialog box, click Add Properties from
DGN File button.
3The Add Properties from DGN File dialog box is displayed. Select a DGN
file and click Open.
The unique properties of the file are added to the bottom of the DGN column
for each tab (Level, Linestyle, Lineweight, and Color).
NOTE Duplicate properties will be ignored.
To add properties from a drawing file
1In the DGN Mapping Setups dialog box , click Modify.
NOTE The Modify button is disabled when the Standard mapping setup is
selected.
2In the Modify DGN Mapping Setup dialog box, click Add Properties from
Drawing File button.
3The Add Properties from Drawing File dialog box is displayed. Select a
drawing file and click Open.
The unique properties of the file are added to the bottom of the DWG column
for each tab (Level, Linestyle, Lineweight, and Color).
NOTE Duplicate properties will be ignored.
1746 | Chapter 37 Work with Data in Other Formats

Quick Reference
Commands
DGNMAPPING
Specifies the location of the dgnsetups.ini file where DGN mapping setups
are stored.
System Variables
DGNMAPPINGPATH
Specifies the location of the dgnsetups.ini file where DGN mapping setups
are stored.
Insert WMF Files
WMF (Windows metafile format) files are frequently used to produce clip art
and other nontechnical images that you need for drawings. You can insert a
WMF file into a drawing file as a block. Unlike bitmaps, WMF files contain
vector information that can be resized and printed without losing resolution.
If the WMF file contains 2D solids or wide lines, you can turn off their display
to increase drawing speed.
WMF files can contain both vector and raster information. However, the
program uses only the vector information from a WMF file. When a WMF file
containing raster information is imported into the program, the raster
information is ignored.
See also:
■Import Text from External Files on page 1334
To insert a WMF file
1Click Blocks & References tab ➤ Import panel ➤ WMF File.
2In the Import WMF dialog box, select the WMF file you want to open.
Click Open.
3Specify an insertion point for the WMF file.
Insert WMF Files | 1747

4To specify the scaling, use one of the following methods:
■To specify an imaginary box whose dimensions correspond to the
scale factor, enter c (Corner) at the Command prompt. Specify the
opposite corner above and to the right of the insertion point to avoid
inserting a mirror image.
■To specify 3D scale factors, enter xyz.
■To set the X and Y scale settings, enter a scale at the Command prompt.
You can set different horizontal and vertical scales. Enter 1 to retain
the current scale. Enter a higher number to enlarge the metafile image.
(Enter 2 to double the size of the image.) Enter a positive number less
than 1 to shrink the image. (Enter .5 to halve the size of the image.)
Note that using this option makes it very difficult to import the WMF
file at a specific scale or size.
5Specify the rotation angle.
To control the display of solid fills and wide lines in WMF files
1Click Blocks & References tab ➤ Import panel ➤ WMF File.
2In the Import WMF dialog box, click Tools ➤ Options.
3In the WMF In Options dialog box, select or clear Wire Frame (No Fills)
and Wide Lines to set the display of solid fills and wide lines. By default,
these options are on.
4Click OK.
5Import the WMF file in the normal manner.
Quick Reference
Commands
IMPORT
Imports files of different formats into the current drawing.
WMFIN
Imports a Windows metafile.
1748 | Chapter 37 Work with Data in Other Formats
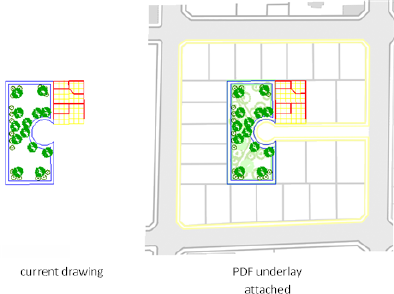
WMFOPTS
Sets options for WMFIN.
Attach Files as Underlays
You can display DWF, DWFx, PDF, and DGN files as underlays in your drawing.
Overview of Underlays
You can underlay and snap to 2D geometry stored in DWF, DWFx, DGN, and
PDF files.
Underlays are similar to attached raster images in that they provide visual
content but also support object snapping and clipping. Unlike external
references, underlays cannot be bound to the drawing.
You can underlay the following file types:
■DWF - A DWF (Design Web Format) file is a highly compressed file format
that is created from a DWG file.
■DWFx - DWFx, the future of DWF, is based on the XML Paper Specification
(XPS) format from Microsoft.
■PDF - Adobe System’s document exchange format.
■DGN - Bentley System’s Microstation format. DGN support is limited to
V7/V8 DGN files and 2D objects. The 2D objects are imported or attached
with full (X, Y, Z) coordinate information, as was present in the original
Attach Files as Underlays | 1749

file. If the file contains 3D solids, surfaces, or other 3D objects, a warning
is displayed. This content is not supported in this file.
Use the Ribbon Contextual Tab to Work with Underlays
If you select an underlay when the ribbon is active, the DWF Underlay Ribbon
Contextual Tab, PDF Underlay Ribbon Contextual tab, or the DGN Underlay
Ribbon Contextual tab displays depending on the type of underlay selected.
The contextual tab contains options for adjusting, clipping and displaying
underlays. The ribbon contextual tab is dismissed automatically after the
underlay is deselected.
Attach, Scale, and Detach Underlays
You can add or remove references to underlays within drawing files, or you
can change their relative size.
Attach Files as Underlays
You can attach a DWF, DWFx, DGN, or PDF file as an underlay to a drawing
file.
You reference and place underlay files in drawing files the same as you do
raster image files; they are not actually part of the drawing file. Like raster
files, the underlay is linked to the drawing file through a path name. The path
to the file can be changed or removed at any time. By attaching underlays
this way, you can use files in your drawing without greatly increasing the
drawing file size. You can only view DWF and PDF underlays in the 2D
Wireframe visual style. DGN underlays can be viewed in any visual style.
NOTE Although underlay files are reproductions of their source drawing, they are
not as precise as drawing files. Underlays may show slight discrepancies in precision.
See also:
■For information on identifying referenced underlays, see Highlight External
References in a Drawing in Attach and Detach Referenced Drawings on page
1668.
Attach PDF Files
There are a few things specific to PDF files that you do not have to consider
with DWF or DGN files. PDF files with more than one page are attached one
1750 | Chapter 37 Work with Data in Other Formats
page at a time (as opposed to one sheet at a time for DWF files or one model
at a time for DGN files). Also, hypertext links from PDF files are converted to
straight text and digital Signatures are not supported.
Drag Underlay Files
You can drag underlays directly into the drawing. Once you drag the file into
the drawing, you can enter
■A sheet name (DWF and DWFx)
■A page number (PDF)
■Or a model name (DGN)
from the file at the Command prompt and then specify an insertion point,
scale factor, and rotation.
Attaching an Underlay Multiple Times
You can reattach an underlay multiple times, treating it as a block. Each
underlay has its own clip boundary and settings for contrast, fade, and
monochrome. However, you cannot bind an underlay to a drawing and you
cannot edit or modify the underlay’s content.
Layers in Underlay Files
If the underlay file contains layers, you can control how the layers display
after attaching the file. If the file does not contain layer information, the
Underlay Layers dialog box does not display any layer information.
Underlay Files in Xrefs
DWG file references (xrefs), in a drawing can include an underlay. In this
situation, objects in the underlay are visible in the parent DWG file.
For example, drawing A includes a DWF underlay showing some mechanical
details. You need the content of drawing A attached to your current drawing,
drawing B. If you attach drawing A as an external reference to drawing B, the
DWF underlay that was already attached to drawing A is also be present.
All of the property settings made to the underlay in the external reference,
such as clipping boundaries, appear as they do in the parent drawing.
Attach, Scale, and Detach Underlays | 1751

Password Protected Underlay Files
If a file you want to attach as an underlay is password protected, you are
prompted to enter the password after you have selected the file. You cannot
attach the file until you have correctly entered the password.
After an underlay is attached to a DWG file, you are prompted for the underlay
file’s password each time you open the DWG file. If the DWG file is also
password protected, or has several other protected drawing references attached,
you may be prompted for multiple passwords.
If you change the path of an underlay to a file that requires a password, you
are prompted for a password as well.
NOTE DWF, DWFx, and PDF file passwords are case sensitive but DWG file
passwords are not. To make synchronization between DWG and DWF file passwords
easier, make sure the DWF, DWFx, and PDF file passwords match the DWG file
password and are entirely uppercase.
To attach a DWF or DWFx underlay
1Click Insert tab ➤ Reference panel ➤ Attach.
2In the Select Reference File dialog box, select the file you want to attach.
3Click Open.
4In the Attach DWF Underlay dialog box, select one sheet, or use SHIFT
or CTRL to select multiple sheets.
5Use one of the following methods to specify the insertion point, scale,
or rotation of the underlay file:
■Select Specify On-Screen to use the pointing device to attach the DWF
underlay at the location, scale, or angle you want.
■Clear Specify On-Screen and enter values under Insertion Point, Scale,
or Rotation.
6Click OK.
To attach a PDF underlay
1Click Insert tab ➤ Reference panel ➤ Attach.
2In the Select Reference File dialog box, select the PDF file you want to
attach.
3Click Open.
1752 | Chapter 37 Work with Data in Other Formats
4In the Attach PDF Underlay dialog box, select one page, or use SHIFT or
CTRL to select multiple pages.
5Use one of the following methods to specify the insertion point, scale,
or rotation of the underlay file:
■Select Specify On-Screen to use the pointing device to attach the
underlay at the location, scale, or angle you want.
■Clear Specify On-Screen and enter values for Insertion Point, Scale,
and Rotation at the command prompt.
6Click OK.
To attach a DGN underlay
1Click Insert tab ➤ Reference panel ➤ Attach.
2In the Select Reference File dialog, select the DGN file you want to attach.
3Click Open.
4In the Attach DGN Underlay dialog, select a model name and click OK.
5Use one of the following methods to specify the insertion point, scale,
or rotation of the underlay file:
■Select Specify On-Screen to use the pointing device to attach the
underlay at the location, scale, or angle you want.
■Clear Specify On-Screen and enter values for Insertion Point, Scale,
and Rotation at the command prompt.
6Click OK.
Quick Reference
Commands
ATTACH
Inserts an external reference, image, or underlay (DWF, DWFx, PDF, or DGN
files) in the current drawing.
DGNATTACH
Insert a DGN file as an underlay into the current drawing.
Attach, Scale, and Detach Underlays | 1753

DWFATTACH
Insert a DWF or DWFx file as an underlay into the current drawing.
EXTERNALREFERENCES
Opens the External References palette.
IMAGEATTACH
Inserts a reference to an image file.
PDFATTACH
Insert a PDF file as an underlay into the current drawing.
XATTACH
Inserts DWG files as an external reference (xref).
System Variables
ERHIGHLIGHT
Controls whether reference names or reference objects are highlighted when
their counterparts are selected in the External References palette or in the
drawing window.
Cross-reference of MicroStation to AutoCAD Terms
Understanding the differences between MicroStation and AutoCAD
terminology helps when attaching DGN files as underlays.
The table below explains many of the different terms that are used in
MicroStation and provides a reference to the term that is used in AutoCAD
when possible.
MicroStation to AutoCAD Terms
NotesAutoCAD TermMicroStation Term
Drafting tool for automatic snaps.OsnapAccuSnap
Coordinate system acronyms.UCSACS
ACS = Auxiliary Coordinate System
UCS = User Coordinate System
1754 | Chapter 37 Work with Data in Other Formats

MicroStation to AutoCAD Terms
NotesAutoCAD TermMicroStation Term
Setting that controls whether color,
line weight, and line style are set for
each level (layer).
BYLAYER settingByLevel setting
No reference in AutoCAD termino-
logy.
N/ACell libraries
In AutoCAD, all blocks behave like
shared cells. There is no reference in
BlocksCells: shared and normal
AutoCAD terminology to a normal
cell.
DWG workmode and AutoCAD only
allow for a single model. MicroStation
Model spaceDesign model
DGN workmode allows for multiple
models.
Native file format for each program.DWG fileDGN file
Command used to demote ele-
ment/object types to lower level. For
ExplodeDrop Element
example, cells/blocks can be demoted
to geometry.
Name for characteristics of ele-
ments/objects.
PropertiesElement Attributes
Command for zooming in on all ele-
ments currently in the drawing.
Zoom extentsFit View
■MicroStation’s “Fit View” tool fits
only visible geometry.
■“Zoom Extents” area includes
layers that have display turned
off.
Vertices on geometry that can be se-
lected and manipulated.
GripsHandles
Attach, Scale, and Detach Underlays | 1755

MicroStation to AutoCAD Terms
NotesAutoCAD TermMicroStation Term
Place for entering commands/vari-
ables manually.
Command LineKey-in
Organizational structure used to
control the appearance of objects in
a drawing.
LayersLevels
Setting used to control the appear-
ance of the line work in a drawing.
LinetypesLine styles
Inserting an external reference into
the current drawing.
Bind XREFMerge into Master
Place for viewing text messages from
program feedback.
Text WindowMessage Center
Native 3D modeling kernel for each
program.
ACISParasolid
Filling of a defined area with a defined
pattern.
HatchingPatterning
Used to control how linework appears
when printing or plotting.
Plot stylesPen tables
References to the current drawing are
stored externally, which keeps the file
References: attach-
ments, overlays,
and underlays
References
size down, but still allows for access
to the geometry for drafting and
plotting. In Microstation, you can
have references with Live Nesting or
No Nesting. References with No
Nesting are translated as overlays in
AutoCAD-based products.
MicroStation V7 does not support
nested references.
Files are used as a starting point for
newly created files and store com-
monly used settings.
Template drawing
file
Seed file
1756 | Chapter 37 Work with Data in Other Formats

MicroStation to AutoCAD Terms
NotesAutoCAD TermMicroStation Term
For DGNEXPORT, the chosen seed
file determines what master and sub
units are used for translation to DGN
as well as resolution and accuracy
values.
Commonly used to control the output
of a drawing for plotting.
Drawing layout
(paper space)
Sheet model
Multi-segmented lines.PolylineSmart Line
Element used to store textual inform-
ation in a cell (block).
AttributesTags
Used to control the visibility of differ-
ent sections of a drawing.
ViewportView
There is no direct reference in Auto-
CAD terminology. Similar options can
Drafting settingsView Attributes
be found in the taskbar/drafting set-
tings area of AutoCAD.
Used to control command input val-
ues that are dependent on unit val-
ues.
Drawing unitsWorking units
Quick Reference
Commands
DGNADJUST
Adjust the fade, contrast, and monochrome settings of a DGN underlay.
DGNATTACH
Insert a DGN file as an underlay into the current drawing.
DGNCLIP
Crops the display of a selected DGN underlay to a specified boundary.
Attach, Scale, and Detach Underlays | 1757

DGNEXPORT
Creates one or more DGN files from the current drawing.
DGNIMPORT
Imports the data from a DGN file into a new DWG file.
DGNLAYERS
Controls the display of layers in a DGN underlay.
DGNMAPPING
Allows users to create and edit user-defined DGN mapping setups.
System Variables
DGNFRAME
Determines whether DGN underlay frames are visible or plotted in the current
drawing.
DGNIMPORTMAX
Sets the maximum number of elements that are translated when importing
a DGN file.
DGNMAPPINGPATH
Specifies the location of the dgnsetups.ini file where DGN mapping setups
are stored.
DGNOSNAP
Determines whether object snapping is active for geometry in DGN underlays
that are attached to the drawing.
Detach Underlay Files
Underlays that are no longer needed can be detached from a drawing file.
When you detach an underlay, all instances of the underlay are removed from
the drawing, and the linking path to the file is removed.
To hide the display of an underlay temporarily, you can unload it rather than
detach it. This action preserves the underlay location for reloading later.
NOTE Erasing an individual instance of an underlay is not the same as detaching
it. An underlay must be detached to remove the link from your drawing to the
file.
1758 | Chapter 37 Work with Data in Other Formats
To detach an underlay
1Click Insert tab ➤ Reference ➤ .
2In the External References palette, in the File References pane, select the
underlay you want to detach.
3Right-click on the underlay and click Detach.
The underlay is no longer linked to the drawing file. All instances of the
underlay are removed from the drawing.
NOTE Erasing an individual instance of an underlay is not the same as detaching
it. An underlay must be detached to remove the link from your drawing to the
file.
Quick Reference
Commands
EXTERNALREFERENCES
Opens the External References palette.
Unload Underlay Files
To improve performance, you can unload underlays from a drawing file.
When you do not need an underlay in the current drawing session, you can
improve performance by temporarily unloading it. Unloaded underlays are
not displayed or plotted. Unloading an underlay does not remove its link. If
you do not have sufficient memory to open multiple underlays in a drawing,
underlays are automatically unloaded.
To unload or reload an underlay
1Click Insert tab ➤ Reference ➤ .
2In the File References pane, select a DGN underlay.
3Right-click, and click Unload or Reload.
When unloaded, the DGN underlay is still linked to the drawing file, but
it is not displayed in the drawing.
Attach, Scale, and Detach Underlays | 1759
Quick Reference
Commands
EXTERNALREFERENCES
Opens the External References palette.
Work with Underlays
You can control the display of layers, use object snaps, and adjust display
settings with attached underlays.
Control the Display of Layers in an Underlay
You can turn layers on and off in an underlay.
By default, all visible layers of an underlay are turned on when you attach the
file. It is usually convenient to turn off any unneeded layers to reduce the
visual complexity of your work.
1760 | Chapter 37 Work with Data in Other Formats
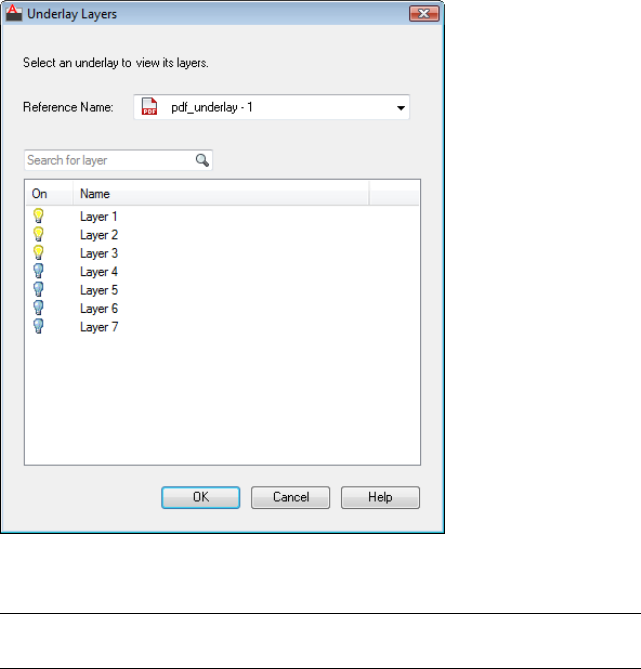
Use the DWFLAYERS, PDFLAYERS, DGNLAYERS, or ULAYERScommand or
right-click a selected underlay and click Layers on the shortcut menu.
NOTE If the Underlay Layers dialog box is empty, there are no layers in the
underlay.
You can use the Properties palette to determine whether any layers are turned
off in an underlay.
■If no layers are turned off, the Layer Display Override property is set to
None.
■If at least one layer is turned off, the Layer Display Override property is
set to Applied.
To turn layers on and off in an underlay
1Select an underlay by clicking its bounding frame.
Work with Underlays | 1761
2Right-click and then do one of the following:
■If it is a DWF or DWFx underlay, click DWF Layers.
■If it is a PDF underlay, click PDF Layers.
■If it is a DGN underlay, click DGN Layers.
3In the Underlay Layers dialog box, click the light bulb icon for the layer
name that you want to turn on or off.
You can use CTRL or SHIFT when you click to select several layers.
4Click Apply to save your changes, or click OK to save and close.
Quick Reference
Commands
DGNLAYERS
Controls the display of layers in a DGN underlay.
DWFLAYERS
Controls the display of layers in a DWF or DWFx underlay.
PDFLAYERS
Controls the display of layers in a PDF underlay.
ULAYERS
Controls the display of layers in a DWF, DWFx, PDF, or DGN underlay.
PROPERTIES
Controls properties of existing objects.
Modify the Position, Scale, or Rotation of an Underlay
You specify an underlay’s position, scale, or rotation when you attach an
underlay file. You can also modify these settings later during the drafting
process.
By default, the insertion point of a file is 0,0,0, its scale factor is 1, and its
rotation angle is 0. You can use general modify commands such as move,
scale, rotate, mirror, array, and so on. After you select an underlay, you can
alter it using the options in the Properties Palette.
1762 | Chapter 37 Work with Data in Other Formats
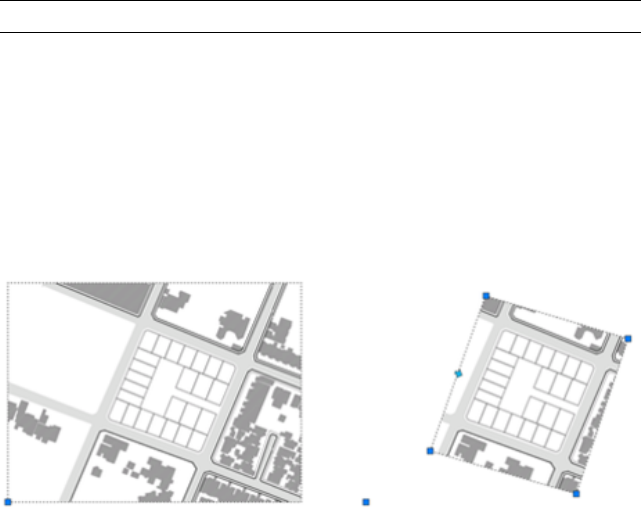
TIP Double-clicking an underlay opens the Properties palette for that underlay.
Use Grips with Underlays
While underlay behavior generally mimics raster image behavior, one exception
is the way that grips work. In this case, the behavior more closely parallels
block behavior. Normally, an underlay displays only a base grip. You can use
a base grip to reposition an underlay in a drawing. If you create a clipping
boundary, additional grips display for each corner of the boundary. See Clip
Underlays on page 1769.
The grip for the base point is the lower-left corner of the underlay.
To edit the position, scale, or rotation of an underlay from the Properties
palette
1In the drawing viewport, double-click the underlay that you want to edit.
2In the Properties palette, display the Geometry area and do one of the
following:
■To change the underlay position, change the settings for Position X,
Y, or Z.
■To change the underlay scale, width, or height, change the settings
for Scale, Width, and Height.
■To change the underlay rotation, change the setting for Rotation.
To edit the position of an underlay using its base grip
1Click the frame of an attached underlay.
2To reposition the underlay, click the base grip.
Work with Underlays | 1763
3Drag the cursor to the new location and then click again to place the
underlay.
Quick Reference
Commands
DWFATTACH
Insert a DWF or DWFx file as an underlay into the current drawing.
DGNATTACH
Insert a DGN file as an underlay into the current drawing.
PDFATTACH
Insert a PDF file as an underlay into the current drawing.
PROPERTIES
Controls properties of existing objects.
Use Object Snaps with Underlays
Use object snaps to draw or edit objects relative to a precise location.
Underlay object snaps are similar to regular object snaps except that they can
be turned on and off separately from regular object snaps, and that they apply
only to the objects in the attached file.
1764 | Chapter 37 Work with Data in Other Formats
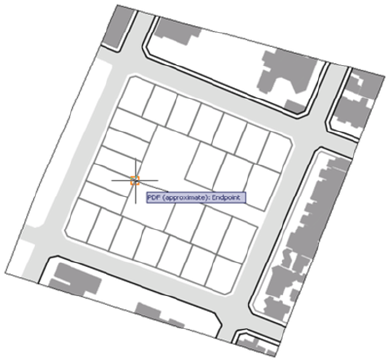
Object snapping to PDF underlays is similar to object snapping to drawing
geometry. However, object snapping might not behave as expected, depending
on how the PDF was created. For example, if the PDF was made from scanned
architectural plans, the PDF is a raster image, not a vector-based image.
Therefore, object snapping does not work. Also, geometry from PDF’s that
were created outside of AutoCAD may contain nonstandard snapping points,
such as circles with no center points.
Use the DWFOSNAP, PDFOSNAP, DGNOSNAP, and UOSNAP system variables
to turn object snapping on and off.
Object snapping can also be turned on and off from a shortcut menu. Select
an underlay and right-click to display the object snap menu option.
To snap to a geometric point on an underlay
1Move your cursor over the desired object snap location.
If UOSNAP is on, your cursor automatically locks onto the snap location
in the drawing.
2Select an object in the drawing.
The cursor snaps to the eligible location closest to your selection.
Work with Underlays | 1765
Quick Reference
System Variables
DGNOSNAP
Determines whether object snapping is active for geometry in DGN underlays
that are attached to the drawing.
DWFOSNAP
Determines whether object snapping is active for geometry in DWF or DWFx
underlays that are attached to the drawing.
PDFOSNAP
Determines whether object snapping is active for geometry in PDF underlays
that are attached to the drawing.
UOSNAP
Determines whether object snapping is active for geometry in DWF, DWFx,
PDF, and DGN underlays that are attached to the drawing.
Adjust Underlay Contrast, Fade, Monochrome, and Colors for
the Background
You can modify the contrast, fade, and monochrome settings of an underlay.
Also, so that the underlay is visible, you can adjust the underlay colors based
on the AutoCAD background colors.
Adjusting these settings does not alter the original file and does not affect
other instances of the underlay in the drawing. You can change the contrast,
fade, monochrome, and colors in the Properties palette when an underlay is
selected. You can also use the DWFADJUST, PDFADJUST, DGNADJUST, or
ADJUST commands.
If you change contrast, fade, and monochrome values, plotted output is
affected.
Adjust Colors for Background
Adjust Colors for Background controls whether the underlay colors are visible
against the drawing background color. The default setting of Yes indicates
that the background colors of the underlay and the drawing environment are
analyzed to see if they are both light or both dark, or is one dark and the other
light. When one background is light and the other dark, the colors of the
1766 | Chapter 37 Work with Data in Other Formats

underlay are inverted so the underlay is displayed. If the setting is changed
to No, the original colors of the underlay are used. Depending on the
background colors, the underlay might not be visible.
To use the Properties palette to adjust the underlay contrast, fade,
monochrome, and background color setting
1Double-click the underlay to display the Properties palette.
2In the Properties palette, do one of the following:
■Adjust the contrast by entering a new value.
■Adjust the fade by entering a new value.
■Turn Monochrome On or Off.
■Set Adjust Colors for Background to Yes or No.
The appearance of the underlay is updated in real-time as you make
adjustments in the Properties palette.
To use the DWFADJUST command to adjust the fade, contrast, and
monochrome settings of a DWF underlay
1Click Insert tab ➤ Reference panel ➤ Adjust.
2Select the DWF underlay to adjust.
3On the Enter DWF Underlay Options menu, select one of the following:
■Select Fade and enter a fade value.
■Select Contrast and enter a contrast value.
■Select Monochrome and set monochrome to Yes or No.
The appearance of the DWF underlay is updated after you enter the new value
and the command is completed.
To use the PDFADJUST command to adjust the fade, contrast, and
monochrome settings of a PDF underlay
1Click Insert tab ➤ Reference panel ➤ Adjust.
Work with Underlays | 1767

2Select the PDF underlay to adjust.
3On the Enter PDF Underlay Options menu, select one of the following:
■Select Fade and enter a fade value.
■Select Contrast and enter a contrast value.
■Select Monochrome and set monochrome to Yes or No.
The appearance of the PDF underlay is updated after you enter the new value
and the command is completed.
To use the DGNADJUST command to adjust the fade, contrast, and
monochrome settings of a DGN underlay
1Click Insert tab ➤ Reference panel ➤ Adjust.
2Select the DGN underlay to adjust.
3On the Enter DGN Underlay Options menu, select one of the following:
■Select Fade and enter a fade value.
■Select Contrast and enter a contrast value.
■Select Monochrome and set monochrome to Yes or No.
The appearance of the PDF underlay is updated after you enter the new value
and the command is completed.
Quick Reference
Commands
DWFADJUST
Adjust the fade, contrast, and monochrome settings of a DWF or DWFx
underlay.
DGNADJUST
Adjust the fade, contrast, and monochrome settings of a DGN underlay.
PDFADJUST
Adjust the fade, contrast, and monochrome settings of a PDF underlay.
1768 | Chapter 37 Work with Data in Other Formats
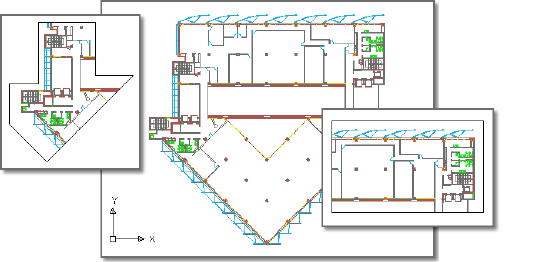
PROPERTIES
Controls properties of existing objects.
Clip Underlays
You can use a clipping boundary to clip an underlay.
You can define part of an underlay that you want to display and plot by setting
up a clipping boundary with DGNCLIP, DWFCLIP, PDFCLIP, DGNCLIP,
IMAGECLIP, VPCLIP, and XCLIP. The clipping boundary can be a closed
polyline, rectangle or a polygon with vertices within the overall extents of
the underlay. Each instance of an underlay can only have one clipped
boundary. Multiple instances of the same underlay can have different
boundaries.
Following is an example of an underlay with insets showing polygonal (l) and
rectangular (r) clipping boundaries:
When the clipping boundary is no longer needed, you can delete the clipped
boundary from the underlay and the underlay is displayed with its original
boundary. You can also invert the area to be hidden inside or outside the
clipping boundary. With grips located at the midpoint on the first edge of the
clipping boundary, you can invert the display of the clipped reference inside
or outside the boundary.
Work with Underlays | 1769
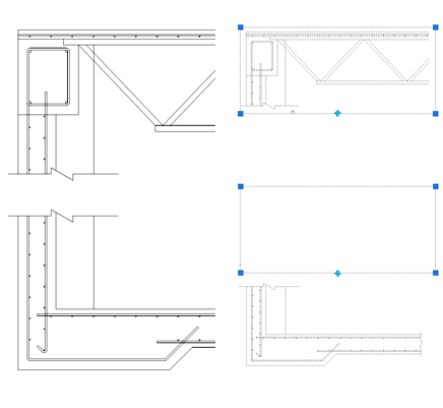
You can control the way clipping boundaries and grips display with the
clipping frame system variables. The clipping frame system variable are FRAME,
PDFFRAME, DGNFRAME, DWFFRAME, XCLIPFRAME, and IMAGEFRAME.
See also:
■Clip External References and Blocks on page 1686
■Clip Raster Images on page 1788
To clip an underlay
1Click the bounding box of an underlay to select it.
2Click Contextual tab ➤ Clipping panel ➤ Create Clipping Boundary.
3At the command prompt, Enter s (Select Polyline), p (Polygonal), r
(Rectangular), or i (Invert Clip) and then, draw the specified boundary
on the underlay.
To draw a boundary by selecting a polyline, draw or overlay a polygonal
shape created with a polyline on the underlay. Then, click Create Clipping
Boundary and select the polyline to create a boundary.
To draw a polygonal boundary, you are prompted to specify consecutive
vertices. To finish drawing a polygon, press Enter or right-click anywhere
in the drawing area.
1770 | Chapter 37 Work with Data in Other Formats
To specify a new boundary on a clipped underlay
1Select a clipped underlay.
2Click Contextual tab ➤ Clipping panel ➤ Create Clipping Boundary.
3Enter y (Yes) to delete the old boundary.
4At the command prompt, Enter s (Select Polyline), p (Polygonal), r
(Rectangular), or i (Invert Clip) and then, draw the specified boundary
on the underlay.
To draw a boundary by selecting a polyline, draw or overlay a polygonal
shape created with a polyline on the underlay. Then, click Create Clipping
Boundary and select the polyline to create a boundary.
If you are drawing a polygonal boundary, you are prompted to specify
consecutive vertices. To finish drawing a polygon, press Enter or right-click
anywhere in the drawing area.
To edit the existing boundary on a clipped underlay
1Select a clipped underlay.
2Click one of the corner grips and drag it to a new location.
3Click again to set the corner grip.
For more information, see Edit Objects with Grips on page 729
To show or hide the clipped portion of an underlay
1Select the clipped underlay you want to show or hide.
2Right-click, and click Properties.
3Scroll to Misc and select Yes or No for the Show Clipped option.
To delete the boundary of a clipped underlay
1Select the clipped underlay.
2Click Contextual tab ➤ Clipping panel ➤ Remove Clipping.
The boundary of the clipped underlay is deleted, and the original
boundary of the underlay is restored.
Work with Underlays | 1771

Quick Reference
Commands
DGNCLIP
Crops the display of a selected DGN underlay to a specified boundary.
DWFCLIP
Crops the display of a selected DWF or DWFx underlay to a specified
boundary.
PDFCLIP
Crops the display of a selected PDF underlay to a specified boundary.
PROPERTIES
Controls properties of existing objects.
Hide and Show Underlay Frames
You can display and plot a border around the underlay or the clipping
boundary.
A frame is a visual border that shows the extents of the underlay, or the clipped
boundary of the underlay. When underlay frames are hidden, clipped underlays
are still displayed to their specified boundary limits; only the boundary is
affected.
Use the DWFFRAME, PDFFRAME, DGNFRAME, or FRAME system variables to
not only display frames, but also to specify whether or not to plot them. The
FRAME system variable changes the setting for all underlays in the drawing
regardless of type.
NOTE Underlays can be selected if they are not on a locked layer; for example, if
the underlay is part of a named selection set made with the All option when
selecting objects.
The following foreground example shows the underlay with a visible frame:
1772 | Chapter 37 Work with Data in Other Formats
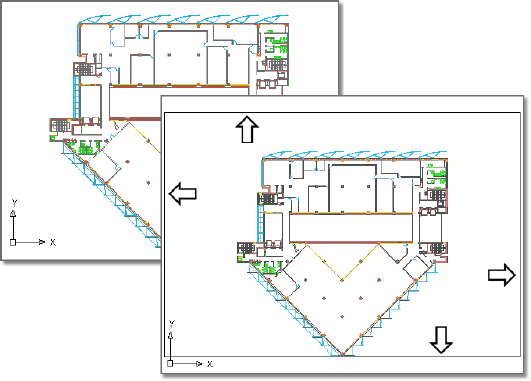
The foreground example shows the underlay with a visible frame.
To hide and show underlay frames
Do the following:
1To hide frames, click Insert tab ➤ Reference panel ➤ Frame Settings
drop-down ➤ Hide Frames
2To display and plot frames, click Insert tab ➤ Reference panel ➤ Frame
Settings drop-down ➤ Display And Plot Frames.
3To display frames without plot, click Insert tab ➤ Reference panel ➤
Frame Settings drop-down ➤ Display But Don’t Plot Frames.
Quick Reference
System Variables
DGNFRAME
Determines whether DGN underlay frames are visible or plotted in the current
drawing.
DWFFRAME
Determines whether DWF or DWFx underlay frames are visible or plotted
in the current drawing.
Work with Underlays | 1773
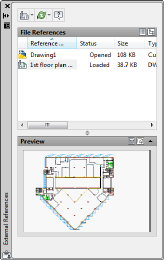
FRAME
Turns the display of frames on and off for all external references, images,
and DWF, DWFx, PDF, and DGN underlays.
PDFFRAME
Determines whether the PDF underlay frame is visible.
Manage and Publish Drawings Containing Underlays
You can view and manipulate underlays and change paths to underlays in
the External References palette.
View Underlay Information
You can view file-specific information about the underlays that are attached
to a drawing in the External References palette. You can also load and unload
underlays and perform other operations there.
In the External References palette, you can view underlay information either
as a list or as a tree. To control how the information is displayed in the External
References palette, click the List View or Tree View button in the upper-right
corner. The list view displays the name of each underlay in the drawing, its
loading status, file size, date last modified, and search path. The tree view lists
the underlays in a hierarchy that shows their nesting level within xrefs and
blocks. The status, size, and other information are not displayed in the tree
view.
In either view, you can display information about an underlay; attach or
detach the underlay; unload or reload the underlay; and browse for and save
a new search path.
1774 | Chapter 37 Work with Data in Other Formats
Use the List View
The list view displays all underlays attached to the current drawing, but it
does not specify the number of instances. It is the default view. You can sort
underlays by category by clicking the column heading. Change the width of
a column by dragging its border to the right or left.
The following information is displayed in the list view:
■Name of DWF, DWFx, PDF, or DGN file
■Status (loaded, unloaded, or not found)
■File size
■File type
■Date and time file was last saved
■Name of the saved path
If the program cannot find an underlay, its status is listed as Not Found. If
the underlay is unreferenced, no instances are attached for the underlay. If
the underlay is not loaded, its status is Unloaded. Underlays with a status of
Unloaded or Not Found are not displayed in the drawing.
Use the Tree View
The top level of the tree view lists DWF, DWFx, PDF, and DGN files in
alphabetical order. In most cases an underlay file is linked directly to the
drawing and listed at the top level. However, if an xref or a block contains an
attached underlay, additional levels are displayed.
View Underlay File Details
You can preview a selected underlay and view DWF, DWFx, PDF, and DGN
file details, including
■Reference name
■Status
■File size
■File type
■File creation date
■Saved path
Manage and Publish Drawings Containing Underlays | 1775

■Found At path
To display a list of the underlays attached to a drawing
1Click Insert tab ➤ Reference ➤ .
2In the External References palette, click the List View button.
To display underlay names and their nesting levels within xrefs and blocks
1Click Insert tab ➤ Reference ➤ .
2In the External References palette, click the Tree View button.
To display underlay layer override status
1Select the underlay of which you want to view the layer override status.
2Click View tab ➤ Palettes panel ➤ Properties.
3In the Properties palette, scroll to Misc and view the status of the layer
display in the Layer Display Override option.
Quick Reference
Commands
EXTERNALREFERENCES
Opens the External References palette.
DWFLAYERS
Controls the display of layers in a DWF or DWFx underlay.
DGNLAYERS
Controls the display of layers in a DGN underlay.
PDFLAYERS
Controls the display of layers in a PDF underlay.
ULAYERS
Controls the display of layers in a DWF, DWFx, PDF, or DGN underlay.
1776 | Chapter 37 Work with Data in Other Formats

PROPERTIES
Controls properties of existing objects.
Change File Paths of Underlays
You can change the file path to a referenced DWF, DWFx, PDF, or DGN file
or search for an underlay when it is reported as not found.
When you open a drawing with an attached DWF, DWFx, PDF, or DGN file,
the path of the selected underlay is displayed in the External References palette
under Found At in the Detail list. The displayed path is the actual path where
the source file was found. The path where the source file was originally
attached is displayed under Saved Path.
To locate the file, the program searches the following paths and folders in the
following order:
■Path specified when the underlay was attached
■Folder containing the current drawing file
■Project search paths specified on the Files tab of the Options dialog box
■Support search paths specified on the Files tab of the Options dialog box
■Start In folder specified in the program shortcut
If you open a drawing that contains a DWF, DWFx, PDF, or DGN file that is
not in the saved path location or in any of the defined search paths, the
External References palette displays Not Found in the Status column of the
File References list, and the Found At entry is blank in the Details list.
For more information about using full paths, relative paths, and project names,
see Set Paths to Referenced Drawings on page 1674.
To change the underlay path
1Click Insert tab ➤ Reference ➤ .
2In the External References palette, select an underlay whose path you
want to change. Click the [...] at the right side of the Found At box.
3In the Select File dialog box, select a new path. Click Open.
The new path is displayed in the Saved Path column.
Manage and Publish Drawings Containing Underlays | 1777
Quick Reference
Commands
EXTERNALREFERENCES
Opens the External References palette.
OPTIONS
Customizes the program settings.
System Variables
DGNMAPPINGPATH
Specifies the location of the dgnsetups.ini file where DGN mapping setups
are stored.
Publish, Save, and eTransmit Drawings Containing Underlays
When you eTransmit a file, DWF, DWFx, PDF, and DGN underlays are tracked
and managed.
Plot and Publish
When a drawing file containing an underlay is plotted or published to a new
file, any visible geometry is included in the newly plotted or published file.
However, none of the layer data from the original DWF, DWFx, PDF, or DGN
attachment gets published with the new file.
Save to a Previous DWG Format
If you save a drawing that contains underlays to a previous DWG format, note
the following exceptions:
■DWF underlays do not display and are not replaced by a proxy object in
releases earlier than AutoCAD 2007.
■DWFx underlays do not display and are not replaced by a proxy object in
releases earlier than AutoCAD 2008.
■PDF underlays are not supported in releases earlier than AutoCAD 2010
(unless you have a Bonus Pack installed).
■DGN underlays are only supported in AutoCAD 2008 or later. They will
not display in earlier versions of AutoCAD. Also, if you save a drawing in
1778 | Chapter 37 Work with Data in Other Formats
AutoCAD 2009, AutoCAD 2008 will only recognize the underlay if it is a
V8 MicroStation file.
eTransmit
Underlay attachments are tracked and managed when you use eTransmit in
the same way you track and manage raster image attachments.
Quick Reference
Commands
DGNEXPORT
Creates one or more DGN files from the current drawing.
EXPORT
Saves the objects in a drawing to a different file format.
EXPORTDWF
Creates a DWF file and allows you to set individual page setup overrides on
a sheet by sheet basis.
EXPORTDWFX
Creates a DWFx file where you can set individual page setup overrides on a
sheet-by-sheet basis.
EXPORTPDF
Creates a PDF filewhere you can set individual page setup overrides on a
sheet-by-sheet basis.
EXPORTSETTINGS
Adjusts the page setup and drawing selection when exporting to a DWF,
DWFx, or PDF file.
PUBLISH
Publishes drawings to DWF, DWFx, and PDF files, or to plotters.
PLOT
Plots a drawing to a plotter, printer, or file.
Manage and Publish Drawings Containing Underlays | 1779

System Variables
EXPORTEPLOTFORMAT
Sets the default electronic file output type: PDF, DWF, or DWFx.
EXPORTMODELSPACE
Specifies what part of the drawing to export to a DWF, DWFx, or PDF file
from Model space
EXPORTPAGESETUP
Specifies whether to export to a DWF, DWFx, or PDF file with the current
page setup.
Reference Manager and Underlays
With the Reference Manager, you can view DWF, DWFx, PDF, and DGN
underlays that are attached to a DWG file and edit the paths of the
attachments.
With the Reference Manager you can check any file dependencies that a
drawing file may have. You can also load and unload underlays and perform
various other operations. The properties reported by the Reference Manager
include
■File type
■Status
■File name
■Reference name
■Saved path
■Found path
■Host drawing
■Host version
You can view the list of references by drawing or by reference type.
NOTE If an underlay’s status is Not Found or Unloaded, it displays in the drawing
as an underlay boundary box.
1780 | Chapter 37 Work with Data in Other Formats
To check underlays with the Reference Manager
1Click Start menu (Windows) ➤ All Programs (Programs) ➤ Autodesk
➤ AutoCAD 2011 ➤ Reference Manager.
2In the Reference Manager, click the Add Drawings button.
3In the Add Drawings dialog box, select a drawing and then click Open.
Attach Raster Image Files
You can view and manipulate raster images and associated file paths in
drawings.
You can add raster images to your vector-based drawings, and then view and
plot the resulting file. There are a number of reasons for combining raster
images with vector files, including scanning documents, faxes, or microfilm
drawings; using aerial and satellite photographs; using digital photographs;
creating effects such as watermarks and logos; and adding computer-rendered
images.
Overview of Raster Images
Raster images consist of a rectangular grid of small squares or dots known as
pixels. For example, a photograph of a house is made up of a series of pixels
colorized to represent the appearance of a house. A raster image references
the pixels in a specific grid.
Raster images, like many other drawing objects, can be copied, moved, or
clipped. You can modify an image with grip modes, adjust an image for
contrast, clip the image with a rectangle or polygon, or use an image as a
cutting edge for a trim.
The image file formats supported by the program include the most common
formats used in major technical imaging application areas: computer graphics,
Attach Raster Image Files | 1781
document management, engineering, mapping, and geographic information
systems (GIS). Images can be bitonal, 8-bit gray, 8-bit color, or 24-bit color.
Images with 16-bit color depth are not supported starting with AutoCAD 2011.
Several image file formats support images with transparent pixels. When image
transparency is set to on, the program recognizes those transparent pixels and
allows graphics in the drawing area to “show through” those pixels. (In bitonal
images, background pixels are treated as transparent.) Transparent images can
be gray-scale or color.
NOTE Although the file name extension is listed in the following table, the file
format is determined from the file contents, not from the file extension.
Use the Ribbon Contextual Tab to Work with Raster Images
If you select an image when the ribbon is active, the Image Ribbon Contextual
tab displays. The contextual tab contains options for adjusting, clipping and
displaying images. The ribbon contextual tab is dismissed automatically after
the image is deselected.
Supported image file formats
File extensionDescription and versionsType
.bmp, .dib, .rleWindows and OS/2 bitmap formatBMP
.gp4, .mil, .rst, .cg4, .calMil-R-Raster ICALS-I
.flc, .fliFLIC Autodesk Animator AnimationFLIC
.bilGeoSPOT (BIL files must be accompan-
ied with HDR and PAL files with correla-
tion data, in the same directory)
GeoSPOT
.ig4Image Systems Group 4IG4
.jpg or .jpegJoint Photographics Expert GroupJFIF or JPEG
.pcxPicture PC Paintbrush PicturePCX
.pctPicture Macintosh PicturePICT
.pngPortable Network GraphicPNG
.rlcRun-Length CompressedRLC
1782 | Chapter 37 Work with Data in Other Formats
Supported image file formats
File extensionDescription and versionsType
.tgaTrue Vision Raster-Based Data FormatTARGA
.tif or .tiffTagged Image File FormatTIFF
Quick Reference
Commands
IMAGE
Displays the External References palette.
IMAGEATTACH
Inserts a reference to an image file.
Attach, Scale, and Detach Raster Images
You can add or remove references to raster images within drawing files, or
you can change their relative size.
Attach Raster Images
You can attach a reference to a raster image file to a drawing file using a linked
image path. The image file can be accessed from the Internet.
Images can be referenced and placed in drawing files, but like external
references (xrefs), they are not actually part of the drawing file. The image is
linked to the drawing file through a path name. Linked image paths can be
changed or removed at any time. By attaching images using linked image
paths, or by dragging images using DesignCenter™, you can place images in
your drawing and only slightly increase the drawing file size. See Add Content
with DesignCenter on page 97.
Once you've attached an image, you can reattach it multiple times, treating
it as if it were a block. Each insertion has its own clip boundary and its own
settings for brightness, contrast, fade, and transparency.
Attach, Scale, and Detach Raster Images | 1783
NOTE AutoCAD 2000, AutoCAD LT 2000, and later releases do not support
LZW-compressed TIFF files, with the exception of English language versions sold
in the US and Canada. If you have TIFF files that were created using LZW
compression and want to insert them into a drawing, you must resave the TIFF
files with LZW compression disabled.
See also:
■For information on identifying referenced images, see Highlight External
References in a Drawing in Attach and Detach Referenced Drawings on page
1668
Access Raster Images Using the Internet
Designers and manufacturers store images of their designs or products on the
Internet. You can easily access image files from the Internet. URL image file
names are stored in the drawing.
Accessing images from the Internet saves time and provides for rapid
distribution of designs. For example, an architect who needs to show a client
what custom cabinets will look like has the manufacturer create a rendered
image of the cabinets, post it to a website, and then attach the image to the
drawing file as a URL; any design changes can be updated immediately. For
more information, see Reference Other Drawing Files on page 1665.
To attach an image
1Click Blocks & References tab ➤ References panel ➤ Image.
2In the Select Image File dialog box, select a file name from the list or enter
the name of the image file in the File Name box. Click Open.
3In the Image dialog box, use one of the following methods to specify
insertion point, scale, or rotation:
■Select Specify On-Screen to use the pointing device to insert the image
at the location, scale, or angle you want.
■Clear Specify On-Screen and enter values under Insertion Point, Scale,
or rotation.
To view the unit of measurement for the image, click Details.
4Click OK.
1784 | Chapter 37 Work with Data in Other Formats

To attach and scale an image file from the Internet
1Click Blocks & References tab ➤ References panel ➤ Image.
2In the Select Image File dialog box, click the Search the Web button.
3In the Browse the Web—Open dialog box, enter the URL for the location
of the image file in Look In.
4Enter the image file name in the File Name box. Click Open.
You can also select an image by right-clicking the image. Click Properties.
You can highlight, copy, and paste the complete image URL Address into
the File Name box.
5In the Image dialog box, click OK.
6If prompted, specify an insertion point and scale factor.
Quick Reference
Commands
IMAGE
Displays the External References palette.
IMAGEATTACH
Inserts a reference to an image file.
Scale Raster Images
You can control the size of a raster image in a drawing to match the scale of
the drawing.
You can specify the raster image scale factor when you attach the image so
that the scale of the geometry in the image matches the scale of the geometry
in the drawing. The default image scale factor is 1, and the default unit for all
images is “Unitless.” The image file can contain resolution information
defining the dots per inch (DPI), relating to how the image was scanned.
If an image has resolution information, the program combines this information
with the scale factor and the unit of measurement of the drawing to scale the
image in your drawing. For example, if your raster image is a scanned blueprint
on which the scale is 1 inch equals 50 feet, or 1:600, and your drawing is set
Attach, Scale, and Detach Raster Images | 1785

up so that 1 unit represents 1 inch, then in the Image dialog box under Scale,
select Specify On-Screen. To scale the image, you clear Specify On-Screen, and
then enter 600 in Scale. The image is then attached at a scale that brings the
geometry in the image into alignment with the geometry in the drawing.
If no resolution information is defined with the attached image file, the width
of the raster image is set to one unit. Thus, when the image file is attached,
the image width in units is equal to the raster image scale factor.
To attach and scale an image
1Click Blocks & References tab ➤ References panel ➤ Image.
2In the Select Image File dialog box, select a file name from the list or enter
the name of the image file in the File Name box. Click Open.
3In the Image dialog box, use one of the following methods to specify
insertion point, scale, or rotation:
■Select Specify On-Screen to use the pointing device to insert the image
at the location, scale, or angle you want.
■Clear Specify On-Screen and enter values under Insertion Point, Scale,
or Rotation.
To view the unit of measurement for the image, click Details.
4Click OK.
Quick Reference
Commands
IMAGE
Displays the External References palette.
IMAGEATTACH
Inserts a reference to an image file.
Detach Raster Images
You can detach the reference to an image file in a drawing.
1786 | Chapter 37 Work with Data in Other Formats

You can detach images that are no longer needed in a drawing. When you
detach an image, all instances of the image are removed from the drawing,
the image definition is purged, and the link to the image is removed. The
image file itself is not affected.
NOTE Erasing an individual instance of an image is not the same as detaching an
image. An image must be detached to remove the link from your drawing to the
image file.
To detach an image
1Click Insert menu ➤ External References.
2In the External References palette, right-click the image name.
3Click Detach.
The image is no longer linked to the drawing file, and all instances of
the image are removed from the drawing.
Quick Reference
Commands
EXTERNALREFERENCES
Opens the External References palette.
Modify Raster Images and Image Boundaries
You can control the clipping boundaries and image display properties of a
raster image.
Show and Hide Raster Image Boundaries
You can control whether the clipping boundaries of a raster image are displayed
or hidden in a drawing.
You can hide image boundaries. Hiding the image boundary prevents the
boundary from being plotted or displayed. Also, hiding the image boundary
prevents you from selecting the image with the pointing device, ensuring that
the image cannot accidentally be moved or modified. However, images can
still be selected if they are not on a locked layer, for example, if the image is
part of a named selection set made with the All option. When image
Modify Raster Images and Image Boundaries | 1787
boundaries are hidden, clipped images are still displayed to their specified
boundary limits; only the boundary is affected. Showing and hiding image
boundaries affects all images attached to your drawing.
NOTE When an image frame is turned off, you cannot select images using the
Pick or Window options of SELECT.
To show and hide image boundaries
1Click Modify menu ➤ Object ➤ Image ➤ Frame.
2To hide image boundaries, enter 0; to show and plot image boundaries,
enter 1; to show image boundaries but not plot them, enter 2.
Quick Reference
Commands
IMAGEFRAME
Controls whether image frames are displayed and plotted.
Clip Raster Images
You can clip and display specific portions of a raster image in a drawing with
a clipping boundary.
With a clipping boundary, only the parts of the image that you want visible
are displayed. You can define the part of an image that you want to display
and plot by clipping the image with IMAGECLIP. The clipping boundary can
be a polyline, rectangle, or a polygon with vertices within the boundaries of
the image. You can change the boundary of a clipped image.You can also
delete the clipped boundary of an image. When you delete a clipping boundary,
the original image is displayed.
1788 | Chapter 37 Work with Data in Other Formats
You can invert the area to be hidden, inside or outside the clipping boundary.
With grips located at the midpoint on the first edge of the clipping boundary,
you can invert the display of the clipped reference inside or outside the
boundary.
With IMAGEFRAME system variable, you can control the visibility of the
clipping boundary.
See also:
■Clip External References and Blocks on page 1686
■Clip Underlays on page 1769
To clip an image
1Click Modify menu ➤ Clip ➤ Image.
2Select the image to clip by selecting the image boundary.
3At the Command prompt, Enter n (New Boundary).
Modify Raster Images and Image Boundaries | 1789
4Enter p (Polygonal) or r (Rectangular), and then draw the boundary on
the image.
If you are drawing a polygonal boundary, you are prompted to specify
consecutive vertices. To finish drawing a polygon, press Enter or right-click
anywhere in the drawing area.
To invert the clipped image
1Set IMAGEFRAME, to 1. This displays the clipping boundaries.
2Select the clipped boundary. You should see the grip at the midpoint on
the first edge of the clipped boundary.
3Click the grip to invert the current x-clip region. The grip now points
the other way.
To change the boundary of a clipped image
1Click Modify menu ➤ Clip ➤ Image.
2Select the image to clip by selecting the image boundary.
3Enter n (New Boundary).
4Enter n (No) or y (Yes) to delete the old boundary.
5Enter p (Polygonal) or r (Rectangular), and then draw the new boundary
on the image.
If you are drawing a polygonal boundary, you are prompted to specify
consecutive vertices. To finish drawing a polygon, press Enter or right-click
anywhere in the drawing area.
You can modify clipped boundaries with grips. See Edit Objects with
Grips on page 729.
To show or hide the clipped portion of an image
1Select the clipped image you want to show or hide.
2Right-click in the drawing area. Click Properties.
3In the Properties palette, select Yes or No in the Show Image list.
To delete the boundary of a clipped image
1Click Modify menu ➤ Clip ➤ Image.
1790 | Chapter 37 Work with Data in Other Formats
2Select the clipped image with the boundary you want to delete.
3Enter d (Delete).
The boundary of the clipped image is deleted, and the original boundary
of the image is restored.
Quick Reference
Commands
IMAGECLIP
Crops the display of a selected image to a specified boundary.
PROPERTIES
Controls properties of existing objects.
System Variables
IMAGEFRAME
Controls whether image frames are displayed and plotted.
Change Raster Image Brightness, Contrast, and Fade
You can change several display properties of raster images in a drawing for
easier viewing or special effects.
You can adjust brightness, contrast, and fade for the display of an image as
well as for plotted output without affecting the original raster image file and
without affecting other instances of the image in the drawing. Adjust brightness
to darken or lighten an image. Adjust contrast to make poor-quality images
easier to read. Adjust fade to make drawing geometry easier to see over images
and to create a watermark effect in your plotted output.
Bitonal images cannot be adjusted for brightness, contrast, or fade. Images
fade to the current screen background when displayed, and they fade to white
when plotted.
To adjust brightness, contrast, and fade of an image
1Click Modify menu ➤ Object ➤ Image ➤ Adjust.
2Select the image to modify.
Modify Raster Images and Image Boundaries | 1791

3In the Image Adjust dialog box, to adjust brightness, contrast, and fade,
use the appropriate slider or enter a value.
The default value for both brightness and contrast is 50. You can adjust
to a maximum brightness of 100 or to a minimum of 0. The default fade
value is 0. You can adjust to a maximum fade of 100.
4Click OK.
Quick Reference
Commands
IMAGEADJUST
Controls the image display of the brightness, contrast, and fade values of
images.
PROPERTIES
Controls properties of existing objects.
Modify Color and Transparency for Bitonal Raster Images
Bitonal images are images that consist only of a foreground color and a
background color. You can change the foreground color and turn the
transparency of the background color on and off.
Bitonal raster images are images consisting only of a foreground color and a
background color. When you attach a bitonal image, the foreground pixels
in the image inherit the current settings for color. In addition to the
modifications you make to any attached image, you can modify bitonal images
by changing the foreground color and by turning on and off the transparency
of the background.
NOTE Bitonal images and their boundaries are always the same color.
To change the color and transparency of a bitonal image
1Select the image to modify.
2Right-click in the drawing area. Click Properties.
3In the Properties palette, to change image color, click Color.
1792 | Chapter 37 Work with Data in Other Formats
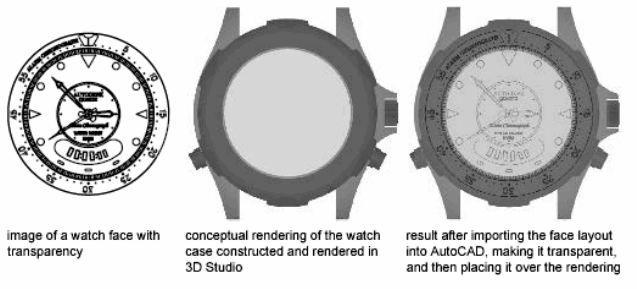
4In the Color drop-down list, select a color or click Select Color to open
the Select Color dialog box. In the Select Color dialog box, specify a color.
Click OK.
5To change the background of the selected image to transparent, or to
change the background image from transparent to opaque, select Yes or
No in the Transparency list.
To change only the transparency of a bitonal image
1Click Modify menu ➤ Object ➤ Image ➤ Transparency.
2Select the image to modify.
To change the background of the selected image to transparent, enter
on. Enter off to change the background to opaque.
Quick Reference
Commands
PROPERTIES
Controls properties of existing objects.
TRANSPARENCY
Controls whether background pixels in an image are transparent or opaque.
Modify Raster Images and Image Boundaries | 1793
Manage Raster Images
You can view and manipulate raster images and change paths to image files
using the External References palette.
View Raster Image Information
You can view file-specific information about the raster images that are attached
to a drawing. You can also load and unload the images and perform other
operations using the External References palette.
In the External References palette, you can view image information either as
a list or as a tree in the File References Pane. To control how the information
is displayed in the External References palette, click the List View or Tree View
button in the upper-right corner. The list view displays the name of each
image in the drawing, its loading status, size, date last modified, and search
path. The tree view lists the images in a hierarchy that shows their nesting
level within referenced drawings and blocks. The status, size, and other
information is displayed below in the Details pane.
In either view, you can display information about an image; attach or detach
the image; unload or reload the image; and browse for and save a new search
path.
Use the List View
The list view displays the images and any other external references attached
to the current drawing, but it does not specify the number of instances. It is
the default view. You can sort the external references by categories by clicking
the column headings. Change the width of a column by dragging its border
to the right or left.
The following information is displayed in the list view:
■Name of the image or selected external reference
■Status (loaded, unloaded, or not found)
■File size
■File type
■Date and time file was last saved
■Name of the saved path
1794 | Chapter 37 Work with Data in Other Formats

If an image cannot be found, its status is listed as Not Found. A Not Found
image is displayed as an image boundary in the drawing even if the
IMAGEFRAME system variable is set to off. If the image is unreferenced, no
instances are attached for the image. If the image is not loaded, its status is
Unloaded. Images with a status of Unloaded or Not Found are not displayed
in the drawing.
Use the Tree View
The top level of the tree view lists referenced files in the order that they were
attached. In most cases an image file is linked directly to the drawing and
listed at the top level. However, if a DWG file reference or a block contains a
linked image, additional levels are displayed.
View Image File Details
In the lower panes of the External References palette, you can preview a
selected image or view image file details, including
■Image name
■Saved path
■Active path (where the image is found)
■File creation date
■File size
■File type
■Color
■Color depth
■Image size (pixel width and height, resolution and default size)
View Image Information in the Text Window
You can view image information at the Command prompt. Command prompt
image information includes image name, image path, the number of
definitions, and the number of instances of the image attached to the drawing.
To display a list of the images attached to the drawing
1Click Insert tab ➤ Reference ➤ .
Manage Raster Images | 1795

2In the External References palette, click the List View button.
To display image names and their nesting levels within DWG file references
and blocks
1Click Insert menu ➤ External References.
2In the External References palette, click the Tree View button.
To preview an image and view file details
1Click Insert menu ➤ External References.
2In the External References palette, select an image file.
3If the View Pane is not open, click the Preview button.
The file preview is displayed.
4To view file details, click the Details button.
The file details (image size) are displayed.
To preview an image that has not been attached
1Click Blocks & References tab ➤ References panel ➤ Image.
2In the Select Image File dialog box, select an image file to display a
preview.
If a preview of the image is not displayed, click Show Preview.
3Click Open.
4In the Image dialog box, click Details.
The file details of the image are displayed.
To view image information in the text window
1At the Command prompt, enter -image.
2Enter ? (List).
3Press Enter to list all images.
The text window displays image information as a list.
1796 | Chapter 37 Work with Data in Other Formats

Quick Reference
Commands
EXTERNALREFERENCES
Opens the External References palette.
IMAGEATTACH
Inserts a reference to an image file.
Assign Descriptive Names to Raster Images
When the name of a raster image file is not sufficient to identify an image,
you can add a descriptive name using the External Reference palette.
Image names are not necessarily the same as image file names. When you
attach an image to a drawing, the program uses the file name without the file
extension as the image name. Image names are stored in a symbol table; thus
you can change the image name without affecting the name of the file. Up
to 255 characters are accepted for image file names. In addition to letters and
numbers, names can have spaces and any special characters not used by
Microsoft® Windows® or AutoCAD for other purposes.
If you attach and place images with the same name but from two different
directories, numbers are appended to the image names.
To change an image name
1Click Insert tab ➤ Reference ➤ .
2In the External Reference palette, in the Detail Pane, select the image
name, and then modify the name.
Quick Reference
Commands
EXTERNALREFERENCES
Opens the External References palette.
Manage Raster Images | 1797

Change File Paths of Raster Images
With the External References palette, you can change the file path to a
referenced raster image file or search for a referenced image when it is reported
as not found.
When you open a drawing with an attached image, the path of the selected
image is displayed in the External References palette in the Details Pane under
Found At. The path displayed is the actual path where the image file was
found. The path where the image file was originally attached is displayed
under Saved Path.
To locate the image file, the program searches the following paths and folders
in the following order:
■Path specified when the image was attached
■Folder containing the current drawing file
■Project search paths specified on the Files tab of the Options dialog box
■Support search paths specified on the Files tab of the Options dialog box
■Start In folder specified in the program shortcut
If you open a drawing that contains an image that is not in the saved path
location or in any of the defined search paths, the External References palette
displays Not Found in the image list, and the Found At properties is blank.
You can remove the path from the file name or specify a relative path by
editing the path in the Found At properties and then clicking OK in the Select
Image File dialog box.
For more information about using full paths, relative paths, and project names,
see Set Paths to Referenced Drawings on page 1674.
To change the image path
1Click Insert tab ➤ Reference ➤ .
2In the External References palette, select an image whose path you want
to change.
3In the Details Pane, click the Browse button for Found At.
4In the Select Image File dialog box, browse to the new path. Click OK.
The new path is displayed in the Found At properties.
1798 | Chapter 37 Work with Data in Other Formats

Quick Reference
Commands
EXTERNALREFERENCES
Opens the External References palette.
OPTIONS
Customizes the program settings.
System Variables
PROJECTNAME
Assigns a project name to the current drawing.
Tune Raster Image Performance
You can reduce the demands on system performance when manipulating large
or many small raster images.
Load and Unload Raster Images
You can improve performance by unloading images when you do not need
them in the current drawing session. Unloaded images are not displayed or
plotted; only the image boundary is displayed. Unloading an image does not
alter its link. If memory is not sufficient to open multiple attached images in
a drawing, images are automatically unloaded.
In the External References palette, you can use Reload to reload an unloaded
image or to update a loaded image by reloading the image from the specified
directory path. If a drawing is closed after an image is unloaded, the image
file is not loaded when the drawing is next opened; you must reload it.
To unload or reload images
1Click Insert tab ➤ Reference ➤ .
2In the External References palette, in the File References pane, right-click
the image name, and then click Unload or Reload.
The status of the selected image changes.
All instances of the selected attached images are unloaded or reloaded.
Tune Raster Image Performance | 1799
To display specific image instances
1Select the images you don't want to display.
2Right-click in the drawing area. Click Properties.
3In the Properties palette, select Yes or No in the Show Image list.
Quick Reference
Commands
EXTERNALREFERENCES
Opens the External References palette.
PROPERTIES
Controls properties of existing objects.
Improve the Display Speed of Raster Images
To increase the display speed of images, you can change image display quality,
hide images not currently needed, use image tiling, or suppress image selection
highlighting.
To increase the display speed of images, you can change image display quality
from the default high quality to draft quality. Draft-quality images appear
more grainy (depending on the image file type), but they are displayed more
quickly than high-quality images.
You can improve the image quality when using True Color (24 or 32 bits per
pixel) for raster images by selecting or clearing certain options on the Display
tab in the Options dialog box. When images are displayed at optimum quality,
regeneration time increases significantly. To improve performance, decrease
the number of colors for the system display setting while working in a drawing.
You can increase redrawing speed by hiding images you do not need in the
current drawing session. Hidden images are not displayed or plotted; only the
drawing boundary is displayed. You can choose to hide an image regardless
of the user coordinate system (UCS) in the current viewport.
Use Tiled Images
Tiled images are small portions (a series of tiles) of large images that load much
faster than non-tiled images. If you edit or change any properties of an image,
only the modified portion is regenerated, thus improving the regeneration
1800 | Chapter 37 Work with Data in Other Formats
time. TIFF (Tagged Image File Format) is the only tiled format that the program
supports. The TIFF reader supports all image types:
■Bitonal (1 bit per pixel)
■Gray scale and indexed color (8 bits per pixel)
■True Color (24 or 32 bits per pixel)
You can save tiled TIFF images with most image scanning tools. The image
tiles should be no smaller than 64 x 64 pixels and no larger than 512 x 512
pixels. Additional file readers that support other tiled formats, such as CALS
Type II, are available from third-party developers.
Suppress Highlighting When Selecting Images
You can turn on or off the highlighting that identifies the selection of a raster
image or the image frame by selecting Highlight Raster Image Frame Only on
the Display tab in the Options dialog box. You can also set theIMAGEHLT
system variable directly. By default, IMAGEHLT is set to 0, to highlight only
the raster image frame. Turning off highlighting of the entire image improves
performance.
To change the image display quality
1Click Modify menu ➤ Object ➤ Image ➤ Quality.
2Enter d (Draft) or h (High).
Images are displayed at the specified quality.
To show or hide an image
1Select the image to modify.
2Right-click in the drawing area. Click Properties.
3In the Properties palette, to show or hide the image, select Yes or No in
the Show Image list.
4To switch the background of the selected image between transparent and
opaque, select Yes or No in the Transparency list.
Tune Raster Image Performance | 1801
Quick Reference
Commands
IMAGEQUALITY
Controls the display quality of images.
OPTIONS
Customizes the program settings.
PROPERTIES
Controls properties of existing objects.
System Variables
IMAGEHLT
Controls whether the entire raster image or only the raster image frame is
highlighted.
Export Drawings to Other File Formats
If you need to use the information from a drawing file in another application,
you can convert it to a specific format by exporting it. You can also use the
Clipboard.
Export DWF and DWFx Files
You can easily assemble a collection of drawings and export them to the DWF
or DWFx file formats.
Sets of drawings are the primary deliverable for most design groups. Creating
a drawing set to distribute for review can be complicated and time consuming.
Electronic drawing sets are saved as DWF or DWFx files. You can view or plot
DWF and DWFx files using Autodesk Design Review.
To output a single drawing, use the Plot dialog box.
See also:
■Export PDF Files on page 1804
■Review and Markup Files with Design Review on page 1980
1802 | Chapter 37 Work with Data in Other Formats
To export a drawing to a DWF file
1Click Output tab ➤ Export to DWF/PDF panel ➤ Export ➤ DWF.
2In the Save as DWF dialog box, select the desired options, enter a file
name, and click Save.
To export a drawing to a DWFx file
1Click Output tab ➤ Export to DWF/PDF panel ➤ Export ➤ DWFx.
2In the Save as DWFx dialog box, select the desired options, enter a file
name, and click Save.
To export multiple layouts to a DWF or DWFx file
1Hold the Shift key down and click to select the layout tabs.
2Right click and select Publish Selected Layouts.
3In the Publish dialog box, select DWF or DWFx from the Publish To:
drop-down list and click Publish.
Quick Reference
Commands
DGNEXPORT
Creates one or more DGN files from the current drawing.
EXPORT
Saves the objects in a drawing to a different file format.
EXPORTDWF
Creates a DWF file and allows you to set individual page setup overrides on
a sheet by sheet basis.
EXPORTDWFX
Creates a DWFx file where you can set individual page setup overrides on a
sheet-by-sheet basis.
EXPORTPDF
Creates a PDF filewhere you can set individual page setup overrides on a
sheet-by-sheet basis.
Export DWF and DWFx Files | 1803
EXPORTSETTINGS
Adjusts the page setup and drawing selection when exporting to a DWF,
DWFx, or PDF file.
PUBLISH
Publishes drawings to DWF, DWFx, and PDF files, or to plotters.
PLOT
Plots a drawing to a plotter, printer, or file.
System Variables
DWFFORMAT
Sets the default format to DFW or DWFx for the PUBLISH, 3DDWF, EXPORT,
EXPORTDWF, AND EXPORTDWFX commands.
EXPORTEPLOTFORMAT
Sets the default electronic file output type: PDF, DWF, or DWFx.
EXPORTMODELSPACE
Specifies what part of the drawing to export to a DWF, DWFx, or PDF file
from Model space
EXPORTPAGESETUP
Specifies whether to export to a DWF, DWFx, or PDF file with the current
page setup.
Export PDF Files
You can export a drawing as a PDF file to facilitate sharing information with
other design groups.
Sets of drawings are the primary deliverable for most design groups. Creating
a drawing set to distribute for review can be complicated and time consuming.
Electronic drawing sets are saved as PDF files. You can view or plot PDF files
using Autodesk Design Review.
To output a single drawing, use the Plot dialog box.
See also:
■Export DWF and DWFx Files on page 1802
1804 | Chapter 37 Work with Data in Other Formats
■Review and Markup Files with Design Review on page 1980
To export a drawing to a PDF file
1Click Output tab ➤ Export to DWF/PDF panel ➤ Export ➤ PDF.
2In the Save as PDF Dialog BoxSave as PDF dialog box, select the desired
options, enter a file name, and click Save.
To export multiple layouts
1Hold the Shift key down and click to select the layout tabs.
2Right click and select Publish Selected Layouts.
3In the Publish dialog box, select PDF from the Publish To: drop-down list
and click Publish.
Quick Reference
Commands
EXPORT
Saves the objects in a drawing to a different file format.
EXPORTPDF
Creates a PDF filewhere you can set individual page setup overrides on a
sheet-by-sheet basis.
EXPORTSETTINGS
Adjusts the page setup and drawing selection when exporting to a DWF,
DWFx, or PDF file.
PUBLISH
Publishes drawings to DWF, DWFx, and PDF files, or to plotters.
PLOT
Plots a drawing to a plotter, printer, or file.
System Variables
EXPORTEPLOTFORMAT
Sets the default electronic file output type: PDF, DWF, or DWFx.
Export PDF Files | 1805
EXPORTPAGESETUP
Specifies whether to export to a DWF, DWFx, or PDF file with the current
page setup.
Export DXF Files
You can export a drawing as a DXF file, which contains drawing information
that can be read by other CAD systems.
You can export a drawing as a DXF (drawing interchange format) file. DXF
files are text or binary files that contain drawing information that can be read
by other CAD programs. If you are working with consultants who use a CAD
program that accepts DXF files, you can share a drawing by saving it as a DXF
file.
You can control floating-point precision of the DXF format up to 16 decimal
places and save the drawing in either ASCII or binary format. ASCII format
results in a text file that you can read and edit; binary format results in a
significantly smaller file that is faster to work with.
If you do not want to save the entire drawing, you can choose to export
selected objects only. You can use this option to remove extraneous material
from drawing files.
To create a DXF file
1Click File menu ➤ Save As.
2In the Save Drawing As dialog box, in the Files of Type box, select a DXF
format.
■To save the entire drawing in DXF format, go directly to step 4.
■To save specific objects in DXF format, click Tools ➤ Options.In the
Saveas Options dialog box, select the DXF format you want and select
Select Objects. Enter a value for the number of decimal places of
accuracy. Click OK.
3In the Save Drawing As dialog box, select a folder and enter a file name.
Click Save.
The .dxf extension is appended to the file name.
4If you chose to save specific objects, select the objects and press Enter.
1806 | Chapter 37 Work with Data in Other Formats
Quick Reference
Commands
EXPORT
Saves the objects in a drawing to a different file format.
SAVEAS
Saves a copy of the current drawing under a new file name.
Export FBX Files
FBX files allow you to import and export 3D objects, 2D objects with thickness,
lights, cameras, and materials from one Autodesk program to another.
The FBX file format is an open framework for 3D data transfer that creates a
high level of interoperability among Autodesk programs. For example, in
Autodesk 3ds Max, you can export a file as an FBX file, and then open that
file in AutoCAD to view and edit the objects, lights, cameras, and materials.
Likewise, in AutoCAD, you can export a drawing as an FBX file, and then view
and edit that file in 3ds Max.
Points (not point clouds), meshes, NURBS curves and surfaces, subdivided
meshes, target cameras, lights, and materials are imported into AutoCAD in
the same form in which they existed when exported from 3ds Max.
When importing FBX files from 3ds Max into AutoCAD,
■Target cameras created in 3ds Max are imported accurately.
■The LIGHTINGUNITS system variable controls whether lights are imported
as standard or photometric lights.
When exporting FBX files from AutoCAD to 3ds Max,
■3D objects, 2D objects with thickness, lights, cameras, and materials are
rotated by 90 degrees on the Z axis.
■You can export 2D objects by increasing their thickness. Any visible and
renderable object with thickness can be exported to FBX.
To export a 2D object to an FBX file, increase its thickness to convert to a 3D
object. Any visible and renderable object or geometry with thickness can be
exported to FBX.
Export FBX Files | 1807

To export a drawing as an FBX file
1In your drawing, select the objects, lights, cameras, and materials to
export to FBX.
2Click Application menu ➤ Export ➤ FBX.
3In the FBX Export dialog box, specify a name and location for the file
and click Save.
The FBX Export Options dialog box displays.
4Specify the items to export, the texture options, and click OK.
Quick Reference
FBXEXPORT
Creates an Autodesk® FBX file containing selected objects in the current
drawing.
Export MicroStation DGN Files
You can export DWG files created by AutoCAD-based products to the
MicroStation® DGN drawing file format.
The export process translates basic DWG file data into the corresponding DGN
file data. There are several translation options to determine how certain data
such as external references are handled, the dynamic range of the DGN file
as controlled by the master and subunits specified, and whether the DGN file
is to accept data with non-zero Z coordinates.
Exchanging and reusing basic drawing data is very useful in collaborative
projects. For example, service organizations such as AEC and design-build
firms using an AutoCAD-based product might need to export a site plan to
DGN format for access by a landscape firm or perhaps a city planning
department.
A Standard (default) mapping translation is used to map DWG-format layers,
linetypes, lineweights, and colors to DGN-format levels, linestyles, lineweights,
and colors. You can remap these elements based on your company CAD
standards, therefore, streamlining the export process while minimizing the
need for editing the resulting DGN file (see DGNMAPPING).
1808 | Chapter 37 Work with Data in Other Formats

Understand the Limitations
The DGN import and export capabilities are designed to provide a fundamental
exchange of information between MicroStation DGN files and AutoCAD DWG
files. However, translating data from one format to a completely different
format inevitably requires compromises and substitutions.
■Simple geometric objects such as lines, arcs, and circles, and properties
such as layer assignments correlate directly between the DWG and DGN
data formats.
■Data with built-in features or variations are visually approximated. For
example, text and dimensions might have specialized formatting, and
color definitions might be customized.
■Some data cannot be translated completely. For example, product-specific
features such as dynamic blocks, can be represented visually but not
behaviorally.
■Nested references are not merged into the host DGN file when exporting
a DWG file with nested references as V7 DGN. The nested reference is not
displayed in the host DGN file but the reference chain still exists.
■AEC objects are not supported and users must use EXPORTTOAUTOCAD
command to convert the objects to base ACAD objects before exporting
to DGN.
See the DGNEXPORT Conversion Table specific details about the scope of
exporting DWG objects and other data to DGN files.
NOTE Do not export drawings that include V8 DGN underlays to a V7 DGN format
file. The V8 DGN references cannot display in a V7 DGN file because the V8 DGN
file format is not a valid design file for the resulting V7 DGN file.
Recommendations
To optimize the data transfer to the MicroStation DGN file format, consider
the following recommendations:
■Minimize the use of custom objects and other data unique to
AutoCAD-based products
■Use simple linetypes as much as possible
■Use simple hatches and hatch styles
■Use simple gradients and gradient styles
Export MicroStation DGN Files | 1809
■Use simple dimension styles if possible
■Use TrueType text fonts rather than SHX text fonts
■Work primarily in one format, DWG or DGN, rather than switching back
and forth
When exporting DWG data to DGN files, you need to specify the conversion
units of the DGN seed file (master units or sub-units) correctly based on the
drawing units of the DWG file. For example, if the DWG file you are exporting
to DGN is drawn in inches, and the DGN seed file you are exporting to has
master units set to feet and sub-units set to inches, you need to select sub-units
in the Export DGN dialog box. If you select master units instead of sub-units,
the scale of the imported DWG file will be incorrect. For example, a 36-inch
door would display as a 36-foot door.
WARNING Some programs that work with DGN files do not support extended
characters that the Windows operating system considers valid for file names. Thus,
it is recommended that you do not use accented or Asian characters in file names
when using DGNEXPORT.
To export a MicroStation DGN drawing
1Click Output tab ➤ Send panel ➤ Export.
2In the Export Data dialog box, in the Files of Type box, select V8 DGN
(*.dgn) or V7 DGN (*.dgn).
3Specify the name of the DGN file at File Name. Do not use accented or
Asian characters.
4Click Save.
5In the Export DGN Settings dialog box, specify the desired export options.
6Click OK.
Quick Reference
Commands
DGNEXPORT
Creates one or more DGN files from the current drawing.
1810 | Chapter 37 Work with Data in Other Formats

Export WMF Files
A WMF (Windows metafile format) file can be either a vector graphic or a
raster graphic format. AutoCAD exports WMF files as vector graphics only;
this allows for faster panning and zooming.
To create a Windows metafile (WMF)
1Click Output tab ➤ Send panel ➤ Export.
2In the Export Data dialog box, in the Files of Type box, select Metafile
(*.wmf).
3Select a folder and enter a file name. Click Save.
The .wmf extension is appended to the file name.
Quick Reference
Commands
EXPORT
Saves the objects in a drawing to a different file format.
WMFOUT
Saves objects to a Windows metafile.
System Variables
WMFBKGND
Controls the background display when objects are inserted in Windows
metafile (WMF) format.
Export Raster Files
You can create a device-independent raster image of the objects in your
drawing.
Several commands can be used to export objects into device-independent
raster images in the bitmap, JPEG, TIFF, and PNG formats.
Export WMF Files | 1811
Objects are displayed in the raster image as they appear on the screen,
including objects in shaded and rendered viewports.
File formats such as JPEG are compressed as they are created. Compressed files
take up less disk space, but they might not be readable by certain applications.
To create a bitmap file (BMP)
1At the Command prompt, enter bmpout.
2In the Create Raster File dialog box, select a folder and enter a file name.
Click Save.
The .bmp extension is appended to the file name.
3Select the objects you want to save.
To create a JPEG file (JPG)
1At the Command prompt, enter jpgout.
2In the Create Raster File dialog box, select a folder and enter a file name.
Click Save.
The .jpg extension is appended to the file name.
3Select the objects you want to save.
To create a TIFF file (TIF)
1At the Command prompt, enter tifout.
2In the Create Raster File dialog box, select a folder and enter a file name.
Click Save.
The .tif extension is appended to the file name.
3Select the objects you want to save.
To create a Portable Network Graphics file (PNG)
1At the Command prompt, enter pngout.
2In the Create Raster File dialog box, select a folder and enter a file name.
Click OK.
The .png extension is appended to the file name.
3Select the objects you want to save.
1812 | Chapter 37 Work with Data in Other Formats
Quick Reference
Commands
BMPOUT
Saves selected objects to a file in device-independent bitmap format.
EXPORT
Saves the objects in a drawing to a different file format.
JPGOUT
Saves selected objects to a file in JPEG file format.
PNGOUT
Saves selected objects to a file in a Portable Network Graphics format.
TIFOUT
Saves selected objects to a file in TIFF file format.
Export PostScript Files
You can convert a drawing file to a PostScript file, a format that is used by
many desktop publishing applications.
The PostScript file format type is used by many desktop publishing
applications. Its high-resolution print capabilities make it preferable to raster
formats, such as GIF, PCX, and TIFF. By converting the drawing to a PostScript
format, you can also use PostScript fonts.
Export in PostScript Format
When you export a file in PostScript format as an EPS file, some objects are
handled specially.
■Thickened text, text control codes. If text has a thickness greater than 0
or contains control codes (such as %%O or %%D), it is not plotted as
PostScript text, although the text is accurately plotted. International and
special symbols (such as %%213) are output as PostScript text.
■ISO 8859 Latin/1 character set. When text uses character codes in the 127
to 255 range, the text is interpreted according to the ISO 8859 Latin/1
character set. If such a character appears in text that is mapped to
PostScript, a version of the font is generated with an encoding vector
Export PostScript Files | 1813

remapped to represent the ISO character set. The resulting text is output
in PostScript in a form compatible with the font.
■Circles, arcs, ellipses, elliptical arcs. Except when they have thickness, arcs
and circles are translated into the equivalent PostScript path objects.
■Filled solids. A solid fill is plotted as a PostScript filled path.
■Two-dimensional polylines. A 2D (planar) polyline with uniform width is
output as a PostScript stroked path. The PostScript end cap and miter limit
variables are set to approximate the segment joining.
See also:
■Plot Adobe PostScript Files on page 1616
To export a drawing to an Encapsulated PostScript (EPS) file
1Click Output tab ➤ Send panel ➤ Export.
2In the Export Data dialog box, specify a location and file name for the
EPS file.
3Under Files of Type, select Encapsulated PS (*.eps)
4Click Save.
Quick Reference
Commands
EXPORT
Saves the objects in a drawing to a different file format.
PLOT
Plots a drawing to a plotter, printer, or file.
Export ACIS SAT Files
You can export certain object types to an ACIS file in ASCII (SAT) format.
1814 | Chapter 37 Work with Data in Other Formats

You can export trimmed NURBS surfaces, regions, and 3D solids to an ACIS
file in ASCII (SAT) format. Other objects, such as lines and arcs, are ignored.
Use the ACISOUTVER system variable to specify the ACIS version for the
output of the ACISOUT command.
To create an ACIS file
1Click Output tab ➤ Send panel ➤ Export.
2In the Export Data dialog box, enter a file name.
3Under Files of Type, select ACIS (*.sat). Click Save.
4Select the objects you want to save as an ACIS file.
The file extension .sat is automatically appended.
Quick Reference
Commands
ACISOUT
Exports a body object, solid, or region to an ACIS file.
EXPORT
Saves the objects in a drawing to a different file format.
System Variables
ACISOUTVER
Controls the ACIS version of SAT files created using the ACISOUT command.
Export Stereolithography STL Files
You can export 3D solid objects in the STL file format compatible with
stereolithography or 3D printing.
Stereolithography or 3D printing is used in rapid prototyping, rapid
manufacturing, and other applications to create physical parts and models.
Export Stereolithography STL Files | 1815
The 3D solid data is translated to a faceted mesh representation consisting of
a set of triangles and saved to an STL file. Use the FACETRES system variable
to adjust the facet density to an appropriate detail level.
NOTE Setting the resolution too high slows down the fabrication process without
improving the output quality of the stereolithography device.
The STL data is used to create an object by depositing a succession of thin
layers of plastics, metals, or composite materials. The resulting parts and
models are commonly used for the following:
■Visualize design concepts
■Create product mockups, architectural models, and terrain models
■Test form, fit, and function
■Identify design problems
■Create masters for vacuum forming applications
■Create Marketing tools
To export 3D solids to an STL file
1Click Output tab ➤ Send panel ➤ Export.
2In the Export Data dialog box, enter a file name.
3Under Files of Type, select Lithography (*.stl). Click Save.
4Select one or more solid objects. All objects must be entirely within the
positive XYZ octant of the world coordinate system (WCS). That is, their
X, Y, and Z coordinates must be greater than zero.
The file extension .stl is automatically appended to the file name.
Quick Reference
Commands
EXPORT
Saves the objects in a drawing to a different file format.
1816 | Chapter 37 Work with Data in Other Formats
System Variables
FACETRES
Adjusts the smoothness of shaded and rendered objects and objects with
hidden lines removed.
Use Drawings from Different Versions and Applications
You can share drawing files from AutoCAD and AutoCAD LT, drawing files
from previous versions, and drawing files that contain custom objects. In some
cases there are limitations.
Work with Drawings in Earlier Releases
When you work with drawings created in AutoCAD 2008 (and later releases)
in AutoCAD 2007 (and earlier releases), you should be aware of the following
visual fidelity issues.
Visual Fidelity for Annotative Objects in Previous Releases
You can specify that annotative on page 2151 objects maintain visual fidelity
when they are viewed in AutoCAD 2007 (and earlier releases) with the
SAVEFIDELITY system variable.
If you work primarily in model space, it is recommended that you turn off
visual fidelity (set SAVEFIDELITY to 0). However, if you need to exchange
drawings with other users, and layout fidelity is most important, then visual
fidelity should be turned on (SAVEFIDELITY set to 1).
Annotative objects may have multiple scale representations on page 2180. When
visual fidelity is on, annotative objects are decomposed and scale
representations are saved (in an anonymous block on page 2151) to separate
layers. These layers are named based on their original layer and appended
with a number. If you explode the block in AutoCAD 2007 (or earlier releases),
and then open the drawing in AutoCAD 2008 (or later releases), each scale
representation becomes a separate annotative object, each with one annotation
scale. It is recommended that you do not edit or create objects on these layers
when working with a drawing created in AutoCAD 2008 (and later releases)
in AutoCAD 2007 (and earlier releases).
When visual fidelity for annotative objects is not selected, a single model
space representation is displayed on the Model tab. Depending on the setting
of the ANNOALLVISIBLE system variable, more annotation objects may be
Use Drawings from Different Versions and Applications | 1817
displayed on the Model tab, and more objects may be displayed in paper space
viewports at different sizes than in AutoCAD 2008 and later releases.
For a procedure to set visual fidelity for annotative objects, see To save drawings
with visual fidelity for annotative objects.
Annotative Object Properties in Previous Releases
In an AutoCAD 2008 drawing, when an annotative block does not have its
paper orientation set to match the layout, and the block contains multiline
attributes that are based on a text style that is not set to match the orientation
of the layout, the attributes may shift positions if you open this drawing in
AutoCAD 2007 (and earlier releases).
Layer Property Overrides in Previous Releases
When you open an AutoCAD 2008 drawing containing layer property
overrides, overrides are not visible. The property override settings are retained
when the drawing is saved in a previous release, and are visible again when
the drawing is opened in AutoCAD 2008.
If a viewport containing layer property overrides is deleted when the drawing
is opened in a previous release, the override settings are not retained and are
not available when the drawing is opened in AutoCAD 2008.
When the VISRETAIN system variable is set to 0 when the drawing is opened
in a previous release, xref layers containing viewport property overrides are
not retained.
If you open an AutoCAD 2008 drawing in a previous release, property overrides
may display in a thumbnail image. When the drawing is saved with a layout
tab, and then opened in the previous release, those property overrides do not
display.
DGN Underlays in Previous Releases
DGN underlays do not display in releases prior to AutoCAD 2008.
Dimension Enhancements in Previous Releases
AutoCAD 2008 dimension enhancements are lost when they are edited in
earlier releases. If you don’t change these dimensions, they are restored when
you open the drawing in AutoCAD 2008.
The following dimension enhancements do not lose visual fidelity in previous
releases if they are not edited:
■Dimension breaks
1818 | Chapter 37 Work with Data in Other Formats
■Jogged linear dimensions
■Inspection dimensions
■Angular dimensions that are dimensioned using the quadrant option
■Arc extension lines for radial and diameter dimensions
Multileader Objects in Previous Releases
Multileaders display as proxy objects in releases prior to AutoCAD 2008. The
PROXYSHOW system variable controls the display of proxy objects in a
drawing.
MTEXT Paragraph and Paragraph Line Spacing in Previous Releases
Some of the new paragraph spacing and paragraph line spacing options are
not supported when an AutoCAD 2008 mtext object is opened in AutoCAD
2007 (and earlier releases).
The following mtext formatting features have no visual fidelity in previous
releases:
■Paragraphs with justified alignment
■Paragraphs with distributed alignment
■Fields that wrap across columns
■Fields that wrap across lines that have new paragraph alignments
■Paragraphs with non-default alignments in mtext without left object-level
justification
The following mtext formatting features have some visual fidelity in previous
releases (when it’s possible to add white spaces or replace text with white
spaces):
■Paragraphs with non-default alignments (other than justified or distributed)
in mtext that has left object-level justification
■Paragraphs with tabs using new tab alignments (center, right, or decimal
alignment applied)
■Paragraphs with new line spacing that can be "approximated" with "tall"
spaces
Work with Drawings in Earlier Releases | 1819
Mtext with new formatting that is edited and saved in previous releases loses
the new formatting when re-opened in AutoCAD 2008.
Tables in Previous Releases
Editing AutoCAD 2008 tables in previous releases removes AutoCAD 2008
table formatting. Also, AutoCAD 2008 table cells with long block and text
strings may extend outside of cell borders when opened in previous releases.
Data Extraction Tables in Previous Releases
For tables that were created with the Data Extraction wizard in AutoCAD 2008,
you can’t edit or update the extracted data in previous releases.
Materials in Previous Releases
AutoCAD 2008 introduces new procedural maps for materials and luminance.
Drawings created earlier than AutoCAD 2007 that contain materials need to
be converted. AutoCAD 2008 provides a system variable,
3DCONVERSIONMODE, that is set to automatically convert old materials to
the AutoCAD 2008 format. However, there are some fidelity issues when saving
back to previous versions of AutoCAD.
■Procedural maps Checker, Noise, Speckle, Tiles, and Waves are not available
in AutoCAD 2007 (and previous releases.) They do not appear when an
AutoCAD 2008 drawing is opened in AutoCAD 2007. Marble and Wood
are available but the material mayshow some variation.
■The behavior of the Opacity map channel under the Realistic material type
has been corrected in AutoCAD 2008. In AutoCAD 2008, the Opacity map
channel behaves like a transparency map, where white is transparent and
black is opaque (this was how it behaved prior to AutoCAD 2007). In
AutoCAD 2007, white represented opaque areas and black represented
transparent areas.
■The spherical map rotation is different in AutoCAD 2008. When you open
a drawing prior to AutoCAD 2008, the seam for the map is towards the +Y
axis. In AutoCAD 2008, it is towards the +X axis.
Lighting in Previous Releases
AutoCAD 2008 provides two options for lighting: standard (generic) lighting
and photometric lighting. Previous versions offered only standard (generic)
lighting. There is no explicit conversion required for lights from AutoCAD
2007 to AutoCAD 2008. Drawings from AutoCAD 2007 open by default in
AutoCAD 2008 in the standard (generic) lighting workflow. The additional
1820 | Chapter 37 Work with Data in Other Formats
photometric properties available in AutoCAD 2008 are available as soon as
the photometric lighting workflow is enabled in the drawing.
There is a conversion process required for drawings with lighting prior to
AutoCAD 2007. You can use a system variable, 3DVCONVERSTIONMODE,
to automatically convert drawings with lighting from previous versions to the
AutoCAD 2007 and AutoCAD 2008 lighting format. 3DCONVERSIONMODE
has three settings. If set to 0, no conversion takes place. If set to 1, the default
value, the conversion takes place automatically. If set to 2, then you are
prompted when lights need to be converted and will have the option to convert
or not to convert.
Other lighting fidelity issues include
■Lights in blocks. Lights in blocks created in AutoCAD 2008 do not always
display in AutoCAD 2007.
■Texture illumination. In AutoCAD 2007 (and earlier releases), you can’t
add lighting to textures. In AutoCAD 2008, you can.
■Ground Shadows. The intensity of ground shadows in AutoCAD 2008
depends on the brightness of the light and angle of incidence.
Multiple-Language Support in Previous Releases
Drawing properties in AutoCAD 2008 are saved with Unicode characters. For
instance, if you save the latest format drawing containing multiple language
drawing properties to a 2004-format drawing, the drawing properties are
converted to the native characters of the current Windows language. If text
cannot be converted to the native characters, it is saved to CIF codes
(\U+nnnn) or MIF codes (\M+nxxxx).
When saving the latest format drawing to a 2004-format drawing, any new
symbol or dictionary names (for example, layout name, text style name,
dimension style name) created in AutoCAD 2008 are saved in the language
that was used when the symbol names were created.
In order to view and edit drawings with characters that are not included in
the languages specified for your operating system, make sure supplemental
language support is installed in your computer operating system. You can
specify the language in the Regional and Language Options dialog box,
available from the Windows Control Panel. (You may be able to view text
that uses SHX fonts without specifying extra language support.)
Text styles for Asian languages that use SHX and Big Font can support
characters only from the same code page. For example, text styles that use a
Japanese Big Font cannot support German or Korean characters. (English
Work with Drawings in Earlier Releases | 1821

characters, which are part of every code page, are supported.) Multiple-language
support for non-Asian languages is supported for text styles that use SHX fonts
with Big Fonts disabled. (The SHX font must define the required characters.)
Multiple-language support does not exist in some earlier versions of AutoCAD.
For example, when you save a file to AutoCAD 2000 format, the contents of
multiple-language multiline text may be corrupted. This problem is more
likely to happen when you open and save a drawing on an operating system
with a system language setting that differs from the system in which the
drawing was last saved.
NOTE Drawings that include external references (xrefs) to drawing files saved in
earlier releases also have the limitations described above.
See also:
■Converting Materials
■Converting Lights on page 2063
To save drawings with visual fidelity for annotative objects
1Click Tools menu ➤ Options.
2In the Options dialog box, Open and Save tab, under File Save, select
Maintain Visual Fidelity for Annotative Objects.
3Click OK.
Save Drawings to Previous Drawing File Formats
You can save a drawing in a format compatible with previous versions of the
product.
You can save a drawing created with the current release of the program in a
format compatible with previous versions. This process creates a drawing with
information specific to the current release stripped out or converted to another
object type.
If you use the current release to open a drawing created with a previous release,
and you do not add any information specific to the current release, you can
then save the drawing in the format of the previous release without loss of
data.
1822 | Chapter 37 Work with Data in Other Formats

NOTE To use files with AutoCAD Release 12 or AutoCAD LT Release 2, save the
drawing using the AutoCAD R12/LT2 DXF option.
If you need to keep a drawing created in a previous release in its original
format, either mark the file as read-only, or open it in the current release and
use the File Type options in the Save As dialog box to save it in its original
format.
Because saving a drawing in an earlier release format may cause some data
loss, be sure to assign a different name to avoid overwriting the current
drawing. If you overwrite the current drawing, you can restore the overwritten
version from the backup file (filename.bak) that is created during the saving
process.
Maintain Associativity in Dimensions
Associative dimensions created in AutoCAD 2002 or later generally maintain
their associativity when saved to a previous release and then reopened in the
current release. However, if you modify dimensioned objects using a previous
release to the extent that new objects are formed, the dimension associations
change when the drawing is loaded into the current release. For example, if
a line that was dimensioned is trimmed so that an interior portion of the line
is removed, two line objects result and the associated dimension applies to
only one of the line objects.
Dimension associativity is not maintained when a drawing is saved as an
AutoCAD R12/LT 2 DXF file and then reopened in the current release.
Save Drawings with Large Objects
Drawings saved to a legacy drawing file format (AutoCAD 2007 or earlier) do
not support objects greater than 256MB. For more information about saving
drawings that contain large objects to a previous release, see Maintain
Compatibility with Large Object Limits on page 200.
Limitations of Saving to Earlier Versions
Saving a drawing in Release 2000/LT 2000 format is subject to the following
limitations:
■File size can increase.
■Encryption and digital signatures are not preserved.
Save Drawings to Previous Drawing File Formats | 1823
Saving a drawing in Release 14/LT 98/LT 97 format is subject to the following
limitations:
■Hyperlinks are converted to Release 14/LT 98/LT 97 attached URLs.
■Database links and freestanding labels are converted to Release 14/LT 98/LT
97 links and displayable attributes.
■Database attached labels are converted to multiline text and leader objects,
and their link information is not available. Attached labels are restored if
you open the drawing in AutoCAD 2000 or later.
■Dynamic block geometry can be redefined independent of the block’s
dynamic elements, and the geometry in the block reference is not updated
when the drawing is opened in AutoCAD 2011 or later.
■Dimensions created using the DIMARC and DIMJOGGED commands may
not retain their original color in Release 14/LT 98/LT 97.
Saving a drawing in Release 12/LT 2 DXF format is subject to the following
limitations:
■Lightweight polylines and hatch patterns are converted to Release 12
polylines and hatch patterns.
■All solids, bodies, regions, ellipses, leaders, multilines, rays, tolerances, and
xlines are converted to lines, arcs, and circles as appropriate.
■Groups, complex linetypes, OLE objects, and preview images are not
displayed.
■Many objects are lost if you save a drawing as Release 12 and open it in
Release 2000/LT 2000 or later.
■Multiple layouts and layout names are lost. Only the Model tab and the
current layout tab are saved.
■Spaces in the names of layers and other objects are converted to
underscores, and their maximum length is 32 characters.
■DWF or DWFx underlay files attached to drawings cannot be saved to
Release 12/LT 2 DXF format.
■The status of external references as unloaded is lost.
To save an drawing to a previous release format
1Click File menu ➤ Save As.
1824 | Chapter 37 Work with Data in Other Formats
2In the Save Drawing As dialog box, in the File Name box, enter a new
drawing name.
3Under Files of Type, select the AutoCAD or AutoCAD LT file format you
want.
4Click OK.
Quick Reference
Commands
CONVERT
Optimizes 2D polylines and associative hatches created in AutoCAD Release
13 or earlier.
OPTIONS
Customizes the program settings.
SAVE
Saves the drawing under the current file name or a specified name.
SAVEAS
Saves a copy of the current drawing under a new file name.
System Variables
PLINETYPE
Specifies whether optimized 2D polylines are used.
Work with AutoCAD Drawings in AutoCAD LT
AutoCAD LT offers full compatibility when working with AutoCAD drawings.
However, you should understand how AutoCAD LT handles AutoCAD-only
features.
Work with Fields
In AutoCAD, you can create a sheet set and insert LispVariables and SheetSet
Manager fields. The LispVariables and SheetSet Manager fields are not available
in AutoCAD LT. The drawings created in AutoCAD that contain LispVariables
Work with AutoCAD Drawings in AutoCAD LT | 1825
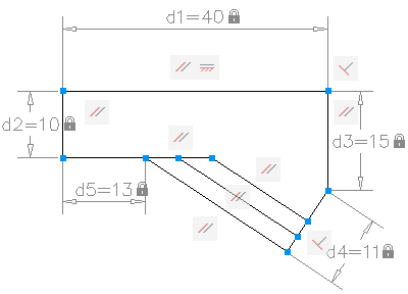
or SheetSet Manager fields can be opened without errors in AutoCAD LT and
the cached value is displayed.
Work with Multiple User Coordinate Systems
In AutoCAD, you can choose to use a different user coordinate system (UCS)
in each viewport in a single drawing file. In AutoCAD LT, you can use only
one UCS in each drawing file. The AutoCAD LT behavior is the same as it was
in previous releases.
When you open an AutoCAD drawing file in AutoCAD LT, AutoCAD LT uses
only the UCS from the current viewport. If you edit the drawing in AutoCAD
LT, and then save it and reopen it in AutoCAD, you may notice some
discrepancies in UCS usage. User coordinate systems that were set individually
in AutoCAD will probably change if the viewports that use them were activated
in the AutoCAD LT session.
Work with AutoCAD 2D and 3D Solid Object Shading
In AutoCAD, visual styles provide shading and wireframe options for objects
in the current viewport. AutoCAD LT does not support visual styles. The
SHADEMODE command in AutoCAD LT provides only the 2D Wireframe and
Hidden options. You can use SHADEMODE in AutoCAD LT to turn off visual
styles in viewports that were created in AutoCAD. This exposes the underlying
geometry so you can easily edit drawings and use the geometry with precision
drawing tools such as object snaps.
Work with Constraints
Some of the drawings that you work with will contain design requirements
enforced within the drawing itself through the use of constraints. Using
1826 | Chapter 37 Work with Data in Other Formats

constraints, you can enforce requirements while experimenting with different
designs.
A constrained object will move in a predictable manner when edited or moved.
A single variable change can cause all related objects to change automatically,
enabling you to run through design iterations simply and effectively.
There are two general types of constraints supported: Geometric and
Dimensional.
■Geometric constraints determine the relationships between 2D geometric
objects or points on objects relative to each other.
Use constraint bars to view the geometric constraints applied to objects.
Constraint bars are visible only when you place your cursor over the
highlighted nodes.
■Dimensional constraints control distances or angles between 2D geometric
objects in a drawing.
The main dimensional constraints are: dynamic, annotational, and
reference constraints.
■Dynamic constraints (default) - Used to constrain objects and are
displayed on demand.
■Annotational constraints - Used to create associative variables, offset
distances, and so on.
■Reference constraints (read-only) - Read-only dimensional constraints
(either dynamic or annotational).
When you place your cursor over a constrained object, you will see a glyph
denoting the object is constrained.
With AutoCAD LT, you can do the following:
■View drawings containing constraints created using AutoCAD.
■View and edit the geometric and dimensional constraints.
NOTE You cannot create constraints within AutoCAD LT.
Work with Dynamic Blocks
In AutoCAD, you can add new constraint parameters to a dynamic block in
the Block Editor. In AutoCAD LT, you can open drawings which include a
Work with AutoCAD Drawings in AutoCAD LT | 1827

block definition containing geometric or dimensional constraints or a block
properties table but cannot add new parameters to the block definition.
When you work with constrained dynamic blocks in the Block Editor in
AutoCAD LT, you can modify the constraint values and delete constraints but
cannot add constraints in the Block Editor. You can manage the constraints
while in the Block Editor from the Parametric tab.
Modify 3D Point Clouds
While you cannot index or attach a point cloud in AutoCAD LT, you can open
drawings created in AutoCAD that contain point clouds. When an attached
point cloud file is unlocked, you can select the point cloud with a grip that is
displayed at the centroid of the point cloud.
NOTE You cannot explode a point cloud.
Quick Reference
System Variables
FIELDDISPLAY
Controls whether fields are displayed with a gray background.
PERSPECTIVE
Specifies whether the current viewport displays a perspective view.
POINTCLOUDAUTOUPDATE
Controls whether a point cloud is regenerated automatically after
manipulation, panning, zooming, or orbiting.
POINTCLOUDDENSITY
Controls the number of points displayed at once for all point clouds in the
drawing view.
POINTCLOUDRTDENSITY
Improves performance by degrading the number of points displayed in the
drawing view zooming, panning, or orbiting in real time.
1828 | Chapter 37 Work with Data in Other Formats
Work with Custom and Proxy Objects
Custom objects provide additional capabilities to the program and related
products. When the application that created the custom object is not available,
a proxy object is substituted in its place.
A custom object is a type of object created by an ObjectARX® (AutoCAD
Run-Time Extension) application, which typically has more specialized
capabilities than standard AutoCAD objects. Custom objects include parametric
solids (AutoCAD® Mechanical), intelligently interactive door symbols
(AutoCAD® Architecture), polygon objects (AutoCAD® Map 3D), and associative
dimension objects (AutoCAD and AutoCAD LT).
In addition to Autodesk, many software vendors use ObjectARX to write
programs that create graphical and nongraphical custom objects that are useful
in their AutoCAD based applications.
Proxy Objects
A proxy object is a substitute for a custom object when the ObjectARX
application that created the custom object is not available to AutoCAD or
other host applications. Later, when the application is available, the proxy
object is replaced by the custom object.
Proxy objects have significantly reduced capabilities compared to their
corresponding custom objects. The extent to which proxy objects can be edited
is determined by the parent ObjectARX application. For example, operations
such as erasing and moving an object, or changing object properties, may or
may not be possible on a proxy object, depending on the application that
created it.
When you open a drawing, you might see a Proxy Information dialog box.
The dialog box tells you the total number of proxy objects in the drawing
(both graphical and nongraphical) and the name of the missing application
and provides additional information about the proxy object type and display
state. You can use the dialog box to control the display of proxy objects.
Object Enablers
An object enabler is a tool that provides specific viewing and standard editing
access to a custom object in the host applications when the application that
created the custom object is not present.
Object Enablers allow custom objects in a drawing to behave with more
intelligence than proxy graphics. Object enablers also facilitate workgroup
collaboration when using other Autodesk products.
Work with Custom and Proxy Objects | 1829
If the ObjectARX application is not installed on your system, you can check
for available Object Enablers on the Web. For example, if you receive a drawing
that contains objects that were created in AutoCAD Architecture, but you
don't have that application installed on your system, the AEC Object Enabler
is downloaded so you can view those drawings as they were intended. To
control whether the program checks for Object Enablers, use the Live Enabler
settings on the System tab of the Options dialog box.
For a complete list of the currently available Object Enablers, go to the
Autodesk Web site at http://www.autodesk.com/enablers.
Object Classification
If an application such as AutoCAD® Map 3D was used to add a feature (object)
classification to an object, you can view the classification in the Properties
palette in the Class Name entry. If the object's classification is missing from
the associated classification (XML) file, or if the associated classification file
is missing, an exclamation mark is displayed in the Class Name entry. For
information about what is required to create a feature classification, see the
AutoCAD® Map 3D documentation.
You can also use the Quick Select feature to select objects by their Class names
and Class properties.
Quick Reference
Commands
EXPORTTOAUTOCAD
Creates a new DWG file with all AEC objects exploded.
System Variables
PROXYGRAPHICS
Specifies whether images of proxy objects are saved in the drawing.
PROXYNOTICE
Displays a notice when a proxy is created.
PROXYSHOW
Controls the display of proxy objects in a drawing.
1830 | Chapter 37 Work with Data in Other Formats
PROXYWEBSEARCH
Specifies how the program checks for object enablers.
Work with Custom and Proxy Objects | 1831
1832
Extract Data from
Drawings and Spreadsheets
You can extract property data from objects in drawings and export the output to a table or
to an external file.
Overview of Data Extraction
You can extract information from objects, such as block attributes and drawing
properties, to create a schedule, a parts list, or a bill of materials.
For example, let’s say you have a residential construction project and you need
to create a door installation schedule to place in the drawing. By using the Data
Extraction wizard, you can select only those objects that are doors (blocks in
this case), and extract the attribute data. Because the Data Extraction wizard
also extracts property information from objects, you have more flexibility.
After you select the properties of the doors, the extracted data is displayed in
the wizard in columns. You can organize and refine the information in these
columns. Once the data is organized, you can format it by specifying a table
style or using an existing table as a template.
When you’re satisfied with how the table looks, the extraction is complete when
you insert the table into the drawing. If you need to share the extracted
information with others on the project, you can output the same extracted data
to an external file.
Information stored in an Excel spreadsheet can be linked and combined with
the extracted drawing data (object property data). Expanding on the same
example, you have some additional information about the doors in the your
drawing in an Excel spreadsheet (supplier and cost). You select these columns
38
1833
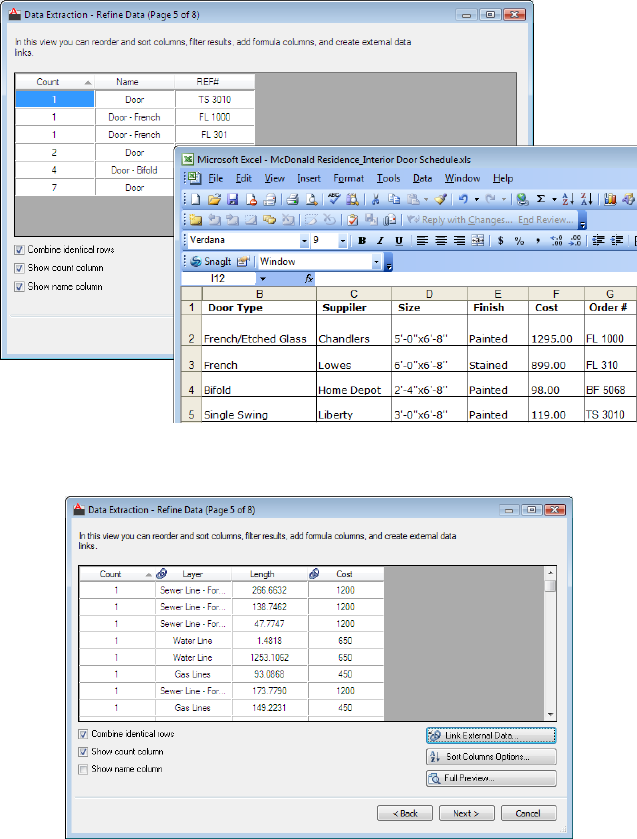
for supplier and cost in the spreadsheet and combine them with the other
data in the data extraction.
The columns in the Excel spreadsheet will be added to the columns on the Refine Data
page in the Data Extraction wizard.
All the columns except for Cost were added to the extracted data columns. Excel
columns are designated with a symbol in the column label.
1834 | Chapter 38 Extract Data from Drawings and Spreadsheets
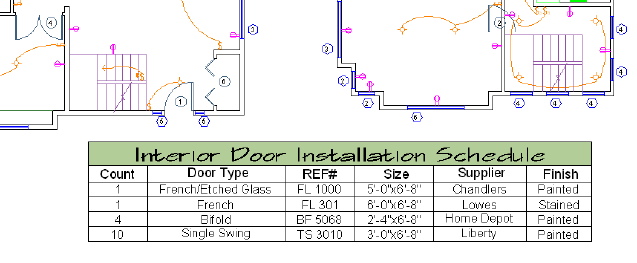
The table inserted in the drawing contains columns from both the extracted data and
from the Excel spreadsheet.
When a drawing from which property data was extracted has changed, you
can be notified that the data extraction table is no longer current. For example,
if some doors in the drawing were resized or removed, you can choose to be
notified that the data extraction table needs to be updated. Notification is
especially useful during critical times when it’s important to know if the data
is not current in the table, such as when plotting or publishing.
Extract Data Using the Data Extraction Wizard
You use the Data Extraction wizard to choose the data source (drawings) to
extract property data from selected objects. You can output the data to a table
or external file.
The Data Extraction wizard guides you through the process of
■Selecting the data source, which can be a drawing, set of drawings, or
folders.
■Filtering objects (non-blocks and blocks) are extracted and selecting
properties from which data is extracted.
■Organizing and refining the extracted data.
■Merging information from an Excel spreadsheet with the extracted data.
■Choosing an output format for the data (a table and/or an external file).
■Formatting the extracted data in a table by specifying a table style or
selecting an existing pre-formatted table.
Extract Data Using the Data Extraction Wizard | 1835
The first time you extract data, you are prompted to save the data extraction
settings in a data extraction (DXE) file. Later, if you need to edit the data
extraction, you select the DXE file, which contains all the settings (data source,
selected objects and their properties, output format and table style) that you
used to create the extraction. For example, if you wanted to remove some
property data from the extraction, you would select the DXE file that was used
to create the extraction and made the desired changes.
A data extraction file can also be used as a template to perform the same type
of extraction in a different drawing. The DXE file stores drawing and folder
selections, object and property selections, and formatting choices. If you need
to extract the same type of information repeatedly, using a DXE file is
time-saving and convenient.
You can also edit a DXE file. You can add or remove drawings, add or remove
objects, or select different properties from which to extract data. Tables that
reference the same DXE file, even if those tables are in other drawings, display
the changes when those tables are updated.
NOTE You can use an attribute extraction (BLK) file as a template for extracting
data from blocks and attributes. When using a BLK file for extracting data or editing
an existing extraction, you are prompted to save the data extraction to a DXE file
in order to proceed with the extraction.
See also:
■For information on identifying data extraction objects, see Highlight External
References in a Drawing in Attach and Detach Referenced Drawings on page
1668.
To create a new data extraction table
It is recommended you save the current drawing before using the Data
Extraction wizard. If the current drawing is not saved, you are prompted to
save the drawing before proceeding with the data extraction.
1Click Annotate tab ➤ Tables panel ➤ Extract Data.
2On the Data Extraction wizard on the Begin page, click Create a New
Data Extraction. If you want to use a template (DXE or BLK) file, click
Use Previous Extraction as a Template. Click Next.
3On the Save Data Extraction As dialog box, specify a file name for the
data extraction file. Click Save.
1836 | Chapter 38 Extract Data from Drawings and Spreadsheets
4On the Define Data Source page, specify the drawings or folders from
which to extract data. Click Next.
5On the Select Objects page, select the objects from which to extract data.
Click Next.
6On the Select Properties page, select the properties from which to extract
data. Click Next.
7On the Refine Data page, organize the columns if necessary. Click Next.
8On the Choose Output page, click Insert Data Extraction Table into
Drawing to create a data extraction table. Click Next.
9On the Table Styles page, choose a table style. Enter a title for the table
if necessary. Click Next.
10 On the Finish page, click Finish.
11 In the drawing, click an insertion point when prompted to create the
table.
To link to a Microsoft Excel spreadsheet, see Link an Excel Spreadsheet to
Access Data on page 1851.
To edit a data extraction for a table
1Right-click a cell in the data extraction table. Click Data Extraction ➤ Edit
Data Extraction Settings.
The Define Data Source page in the Data Extraction wizard is displayed.
The data extraction (DXE) file that was used for the table is automatically
loaded.
2Click Next.
3Proceed through the pages in the wizard making the necessary changes
to the data extraction.
4On the Finish page, click Finish.
To detach a data extraction (DXE) file from a table
■Right-click a cell in the data extraction table. Click Data
Extraction ➤ Detach Data Link.
The data in the table is no longer linked to a data extraction (DXE) file,
and cannot be updated.
Extract Data Using the Data Extraction Wizard | 1837
Quick Reference
Commands
DATAEXTRACTION
Extracts drawing data and merges data from an external source to a data
extraction table or external file.
System Variables
ERHIGHLIGHT
Controls whether reference names or reference objects are highlighted when
their counterparts are selected in the External References palette or in the
drawing window.
Start the Data Extraction
When you create a new data extraction, you are prompted to save all the
specific details about the extraction to a data extraction (DXE) file. The DXE
file stores drawing and folder selections, object and property selections, and
formatting choices.
You can use a data extraction file as a template to perform the same type of
extraction at any time. If you need to extract the same type of information
repeatedly, using a DXE file is time-saving and convenient.
You can also edit an existing data extraction to add or remove drawings, add
or remove objects, or select different properties from which to extract data.
Tables that reference the same DXE file, even if those tables are in other
drawings, will display the changes when those tables are updated.
Quick Reference
Commands
DATAEXTRACTION
Extracts drawing data and merges data from an external source to a data
extraction table or external file.
1838 | Chapter 38 Extract Data from Drawings and Spreadsheets

Select the Source for a Data Extraction
You can extract data from individual objects in a drawing, and all objects in
a single drawing, multiple drawings, or folders.
If you select a drawing, all objects in a drawing are extracted, even those that
are not visible. If you have specific objects in a drawing that you want to
extract data from, you can create an object selection set.
After selecting the drawing or objects for the data extraction, you can choose
to filter the output by selecting options from the Data Extraction Wizard. For
example, you can choose to include xrefs, or only model space objects. These
options are useful for filtering the data before it is extracted. Later, you have
less information to sort through.
When the drawings change in a way that affects the extracted data, you can
choose to be notified that the data is not current. See Update Data Extraction
Table Automatically on page 1861 for more information.
NOTE The DXEVALsystem variable controls when update notification occurs.
Select Folders for Data Extraction
Using the Add Folder Options dialog box, you can select folders for the data
extraction, including subfolders. If the “Automatically Include New Drawings
Added In This Folder To The Data Extraction” option is not checked in the
dialog box, the selected folder becomes “live”, which means its contents are
monitored. That means if drawings are added or to the folder, you can be
notified that the data extraction is no longer current.
When new drawings are added to the folder, the New Drawings Found dialog
box displays a list of the drawings when the data extraction is edited. At that
point, you can select the new drawings to add to the extraction.
Select the Source for a Data Extraction | 1839
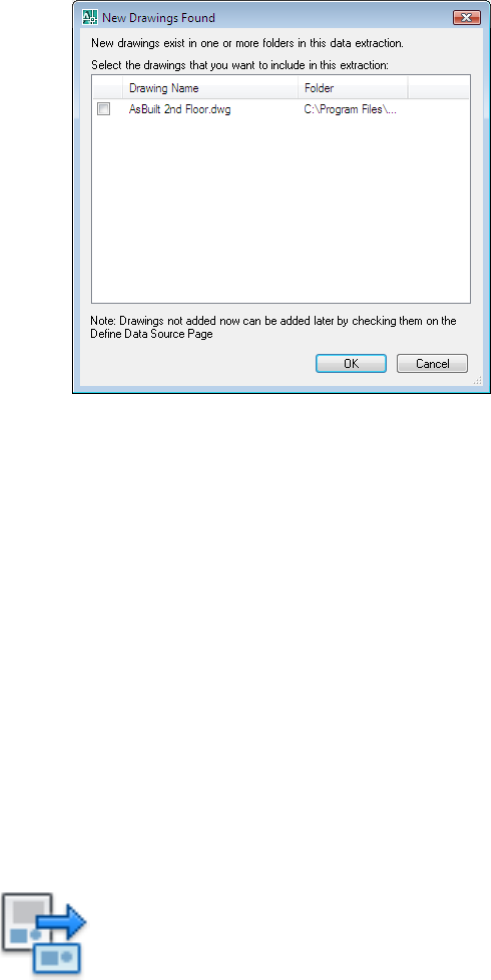
The name of a drawing that was added to the folder after
the data extraction was performed is listed in the New
Drawings Found dialog box.
Using wildcard characters (* and ?) as a search filter, data is extracted from
only those drawings that match the search criteria. For example, if a folder
contains an entire drawing set for a project, but you want only those drawings
that contain piping data, use wild-card characters to find only those drawings.
For example, *Pipe*.dwg.
If a new drawing is added to the folder that matches the wild-card search
criteria, it will not trigger an update notification because it was not included
in the original data extraction. To include the new drawing, you need to edit
the data extraction.
If the wildcard search criteria is removed after the data extraction has been
performed, the drawings that match the search criteria are no longer
monitored. If the wildcard search criteria is changed, only those drawings that
match the new criteria are monitored accordingly.
To monitor selected folders for new drawings
1Click Insert tab ➤ Linking & Extraction panel ➤ Extract Data.
1840 | Chapter 38 Extract Data from Drawings and Spreadsheets
2In the Data Extraction wizard, on the Define Data Source page, click Add
Folder.
3In the Add Folder Options dialog box, clear Automatically Include New
Drawings Added in This Folder to the Data Extraction.
4To monitor subfolders, click Include Subfolders.
5Click OK.
Quick Reference
Commands
DATAEXTRACTION
Extracts drawing data and merges data from an external source to a data
extraction table or external file.
Select Objects for Data Extraction
You can select objects, including blocks and their attributes and drawing
property information, from which to extract data.
After you have selected the drawings from which to extract data, the next step
is to specify which objects and their properties to extract. This is the data that
is output to a table or to an external file. By default, objects are extracted from
both model space and paper space, including objects in blocks and xrefs. Using
the Data Extraction - Additional Settings dialog box, you can change the
default settings.
The Select Objects page in the wizard displays a list of objects. From this page,
you can use filters to sort by object type (block or non-block). You can narrow
the list of objects even more. For example, you can display only those blocks
that have attributes.
Objects and their properties are always extracted using the world coordinate
system (WCS), regardless if a user coordinate system (UCS) is current when
the data extraction is performed.
Select Object Properties to Be Extracted
After you have selected the objects, the next step is to specify which properties
to extract.
Select Objects for Data Extraction | 1841
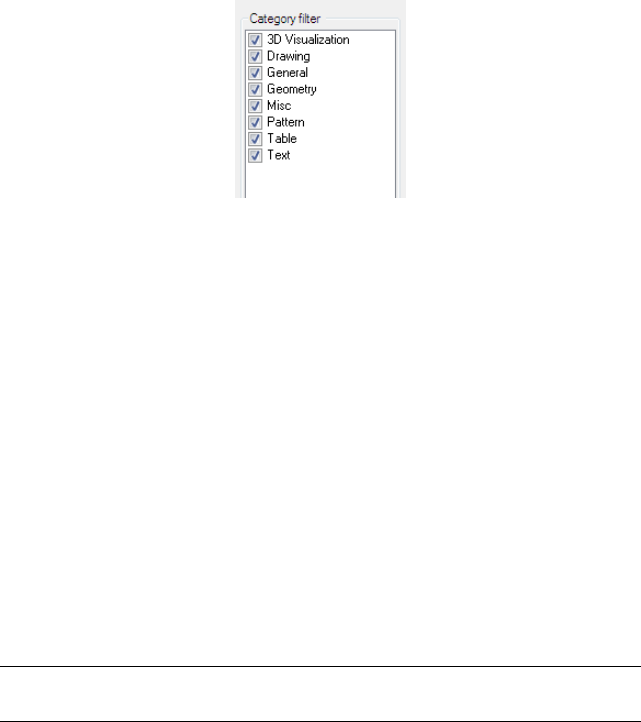
The Select Properties page in the Data Extraction wizard displays a list of
properties in columns from the selected objects from the Select Objects page.
This is where you make a final selection of the properties from which data
will be extracted and output to a columnar format. Using predefined category
filters such as general, geometry, or attribute, you can narrow the property
list.
Property Categories for Filtering a Data Extraction
Extracted properties are categorized for easier filtering. For example, if you
wanted to see only those properties pertaining to geometry, select the
Geometry filter on the Select Properties page.
The following is a list of the filter categories for the extracted properties
displayed on the Select Properties page. The categories include
■3D Visualization. Materials.
■Attribute. Attribute tags.
■Drawing. File name, location, size, when created and modified.
■Dynamic Block. Dynamic block properties.
■General. Color, hyperlink, layer, linetype, and so on.
■Geometry. Area, start point, end point, radius, and so on.
■Misc. Dimension style and block name.
■Pattern. Hatch pattern name, angle, scale, spacing, and so on.
■Table. Table style.
■Text. Single line text, multiline text, dimension text, and so on.
NOTE The category filters on the Select Properties page are the same categories
that display in the Properties palette.
1842 | Chapter 38 Extract Data from Drawings and Spreadsheets
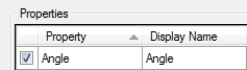
Property Names
After the property data is extracted, the default property names are used as
the column labels in the data grid (example: Width, Length, Area, and so on).
You can change these property names so that column labels are replaced with
a name you specify. For example, if you extracted the length property of lines,
but the column label needs to indicate the data refers to distance, you can
change Length to Distance on the Display Name column on the Select Properties
page.
The display name for the length
property for polylines is renamed
Distance.
Property Data and Unit Settings
If you select multiple drawings as the data source, and the unit setting is not
the same in all the drawings, a message displays that there is a mismatch of
drawing units. In this situation, the current drawing's unit settings are used
for converting the numerical value of properties.
For example, if the current drawing’s unit setting is set to inches, and another
drawing’s unit setting is set to millimeters, the extracted numerical data is
automatically converted to inches. This happens even if the current drawing
is not included in the data source.
Property Types
Each property value is treated as either text or numerical data. For example,
properties such as radius or length, are treated as numerical data. Attribute
numerical values are treated as text. This is important to consider when using
formula columns to perform arithmetic functions on extracted data.
Non-Uniformly Scaled Blocks
Objects in blocks that were not scaled uniformly cannot be extracted because
the numerical values may not be correct or useful. For example, if a circle is
in a block that was inserted with a non-uniform scale factor, the object is no
longer a true circle.
A dialog box will display during the extraction that indicates blocks were
found that were not uniformly scaled, and the objects within those blocks are
not included in the extraction.
Select Objects for Data Extraction | 1843
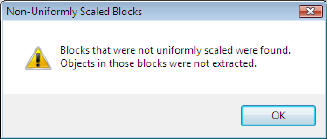
Annotative Objects
The property data for annotative objects is extracted using the current
annotation scale setting.
Quick Reference
Commands
DATAEXTRACTION
Extracts drawing data and merges data from an external source to a data
extraction table or external file.
Organize and Refine the Extracted Data
Extracted data can be organized, refined, and formatted before it is output to
a table or external file.
The next step in the data extraction process is to refine how the data appears
in the data extraction table. Once the data has been extracted from the
drawing, it is displayed in columns on the Refine Data page where you can
sort and reorder columns, add a formula column, and so on. You can also link
to an Excel spreadsheet to add information from a spreadsheet to the extracted
data.
From this page in the wizard, you can do the following organizational and
refining tasks:
■Reorder, rename, hide, and sort data in columns
■Format data in cells (for example: specify a data format or convert text to
lowercase)
■Insert a formula column or insert a totals footer for individual columns
■Filter data in columns
■Display or hide the Count or Name columns
1844 | Chapter 38 Extract Data from Drawings and Spreadsheets

■Group identical rows or display them individually
■Preview the table in a separate window
■Create a data link to an Excel spreadsheet
By right-clicking on a column label in the grid view on the Refine Data page,
you access options for organizing the information the way you want it to
appear in a table or in the order you want it in an external file.
Data can be displayed in either an expanded or collapsed format. In an
expanded format, each property is displayed in an individual row in the data
grid. In a collapsed format, duplicate property names are grouped together.
A Count column is automatically created where the total number of properties
are shown for each property row.
All columns that are visible in the data grid are output to the table or external
file. Any columns that have been hidden are not included.
NOTE Columns that have been extracted from an Excel spreadsheet can also be
hidden. These hidden columns will not be included in the data extraction table.
You can sort a single column or multiple columns at the same time using the
Sort Columns dialog box.
You can insert formula columns into the data grid. Basic arithmetic operations
(+, -, *, /) are available including functions from QUICKCALC and CAL
commands, such as SIN, COS, and LOG. An icon displays in column labels
for formula columns.
When identical rows containing numerical data are combined, where all rows
containing the same property are collapsed into one row, the sum of the data
is displayed.
After the data has been organized, the next step is to choose an output format
on the Choose Output page.
Columns from Excel Spreadsheet
If you want to include columns from an Excel spreadsheet with the extracted
data, use the Link External Data dialog box, where you can set up a link to an
XLS file.
If columns from an Excel spreadsheet are extracted, you can organize,
manipulate, and hide the columns as data extraction columns. An icon displays
Organize and Refine the Extracted Data | 1845
in each Excel column label so that you can easily distinguish the columns
that are from a spreadsheet from those columns that are from the extracted
data. The icon is not displayed in the data extraction table.
If column names in the spreadsheet contain the following characters, they
are removed before the columns are displayed in the data grid on the Refine
Data page:
< > / “ : ; ? * | = ‘
When a column from an Excel spreadsheet is labeled the same as a column
from the extracted drawing data, both columns are displayed; however, the
Excel column label has -(External) added to the label name.
See also:
■Link an Excel Spreadsheet to Access Data on page 1851
■Use Formulas in Table Cells on page 1412
To view the path and file name of the data extraction file linked to a table
1Click View tab ➤ Palettes panel ➤ Properties.
Alternatively, you can right-click the data extraction table and then, click
Properties.
2In the Properties palette, click the button next to Cell Data Link.
The path and name of the data extraction (DXE) file is displayed.
To rename a column label
1Click Insert tab ➤ Linking & Extraction panel ➤ Extract Data.
2In the Data Extraction wizard, on the Refine Data page, right-click a
column label. Click Rename Column.
3Click Rename Column.
1846 | Chapter 38 Extract Data from Drawings and Spreadsheets

4In the column label field, enter a new name. Press ENTER.
To sort extracted data in a column
1Click Insert tab ➤ Linking & Extraction panel ➤ Extract Data.
2In the Data Extraction wizard on the Refine Data page, click Sort Columns
Options.
3In the Sort Columns dialog box, select a column name from the
drop-down list.
4In the Order column, click Ascending or Descending. Click OK.
The order of the data in the column is changed.
5(Optional) To sort additional columns, click Add.
6Repeat steps 2 and 3.
7Click Insert tab ➤ Linking & Extraction panel ➤ Extract Data.
To filter extracted data in columns
1Click Insert tab ➤ Linking & Extraction panel ➤ Extract Data.
2In the Data Extraction wizard on the Refine Data page, right-click a
column label. Click Filter Options.
3In the Filter dialog box, select a predefined filter from the drop-down list.
4From the drop-down list on the left, select a value.
5In the Filter Across These Values field, clear any values so that they are
not included.
Organize and Refine the Extracted Data | 1847

To specify formatting for extracted data in a column
1Click Insert tab ➤ Linking & Extraction panel ➤ Extract Data.
2In the Data Extraction wizard on the Refine Data page, right-click the
column label for the column that will have its data type changed. From
the shortcut menu, click Set Column Data Format.
3In the Set Cell Format dialog box, select the data type from the Data Type
list (Angle, Currency, Data, Decimal Number, General, Percentage, Point,
Text, or Whole Number.)
4Depending on the selected data type, specify additional options from the
right side of the dialog box.
5Click OK.
To insert a formula column in the extracted data
1Click Insert tab ➤ Linking & Extraction panel ➤ Extract Data.
2In the Data Extraction wizard on the Refine Data page, right-click a
column label. Click Insert Formula Column.
3In the Insert Formula Column dialog box, in the Column Name field,
enter a name for the formula column.
4In the Columns list, double-click a column name that contains numerical
data. The column name displays in the Formula field.
5Choose an operator button [ + - * / ]. The operator displays in the Formula
field.
6Add another column from the Column Name list, or enter a numerical
value.
7Click Validate.
8Click OK.
1848 | Chapter 38 Extract Data from Drawings and Spreadsheets

To edit a formula in a formula column added to extracted data
1Click Insert tab ➤ Linking & Extraction panel ➤ Extract Data.
2In the Data Extraction wizard on the Refine Data page, right-click the
column label of the formula column. Click Edit Formula Column.
3In the Edit Formula Column dialog box, make changes to the formula.
4Click Validate.
5Click OK.
To insert a totals footer row for a column in a data extraction table
1Click Insert tab ➤ Linking & Extraction panel ➤ Extract Data.
2In the Data Extraction wizard on the Refine Data page, right-click the
label for the column that will have a footer row. Click Insert Totals Footer.
3From the flyout menu, click Sum, Max, Min, or Average.
The totals footer row is placed as the last row for the selected column.
To display the sum of numerical data in identical property rows
1Click Insert tab ➤ Linking & Extraction panel ➤ Extract Data.
2In the Data Extraction wizard on the Refine Data page, click Combine
Identical Rows.
3Right-click the column label. Click Combine Record Mode ➤ Sum Values.
The sum of the numerical data is displayed.
Organize and Refine the Extracted Data | 1849
Quick Reference
Commands
DATAEXTRACTION
Extracts drawing data and merges data from an external source to a data
extraction table or external file.
System Variables
DXEVAL
Controls when update notification displays for data extraction tables.
Use Table Styles for Data Extraction Tables
A table style or existing table can be used to format a data extraction table.
If you chose the option to create a data extraction table on the Choose Output
page, the Table Style page is displayed in the wizard.
On the Table Style page in the wizard, you have three options for formatting
the table. You can
■Create a new table style.
■Select an existing table style.
■Select an existing table that is stored in a table style.
When you use create a new table style, the Table Style Dialog Box opens where
you can choose formatting settings.
If there are table styles defined in the drawing, you can select an existing table
style by name. With either choice, you can add a title.
If a table is already defined in a table style, its title and header cells already
contain text, and the table is formatted. Using an existing table eliminates
repetitive formatting and standardizes how tables are created.
Regardless of whether you use a table style or a table within a table style, the
extracted data is inserted between the title, header, and footer rows (if any
exist in the table).
1850 | Chapter 38 Extract Data from Drawings and Spreadsheets
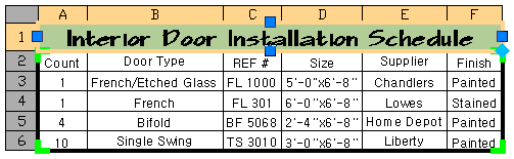
The bold line around the cells indicate the boundary of the cells that
contain the extracted data.
Before completing the extraction, you can see the results of your formatting
choices in a separate preview window.
See also:
■Work with Table Styles on page 1404
Quick Reference
Commands
DATAEXTRACTION
Extracts drawing data and merges data from an external source to a data
extraction table or external file.
Link an Excel Spreadsheet to Access Data
Information in a Microsoft Excel spreadsheet can be combined with extracted
data from drawings.
By linking to an Excel spreadsheet, you can include information from an entire
worksheet, or part of a worksheet, referred to as a named range. Using the Link
External Data dialog box, you can
■Specify a data link by selecting an XLS file to which the extracted data
from the drawing will be linked.
■Match the extracted drawing data and the spreadsheet data. (See
Understand Data Linking and Matching for more information.)
■Select the columns in the XLS file to merge with the extracted drawing
data.
Link an Excel Spreadsheet to Access Data | 1851

On the Refine Data page, you access the Link External Data dialog box; you
can set up a link to an entire Excel spreadsheet, or to a range of rows and
columns, to the extracted data.
Before you can link a spreadsheet, Microsoft Excel needs to be installed on
the same computer on which the data extraction is performed. If Microsoft
Excel is not installed, or if the XLS file is not saved locally on the computer
that is performing the data extraction, a data link cannot be established.
If a linked spreadsheet has been changed, such as a row or column has been
added, the table in your drawing can be updated accordingly using the
DATALINKUPDATE command. Likewise, if a change is made to the table in
the drawing, the linked spreadsheet can be updated using the same command.
NOTE To delete a data link, use the DATALINK command. You cannot delete a
data link from the External References Palette.
Understand Data Linking and Matching
Data linking is the process of selecting a Microsoft Excel spreadsheet with the
purpose of merging all or some of its contents with extracted drawing data.
See Link a Table to External Data on page 1401 for more information about data
linking.
Data matching creates a relationship between two sets of data; the data in a
column from the extracted drawing data and the data in a column from an
Excel spreadsheet.
For example, you have a simple bill of materials (BOM). Three columns of
data are extracted from a drawing. These columns contain data for: Part #,
Revision, and Quantity. You want to include two additional columns of data in
the BOM from a spreadsheet. These columns contain data for Cost and Supplier.
In this example, the spreadsheet contains a column of part numbers labeled
Catalog Number that matches the Part Number column in the extracted data.
In the Link External Data dialog box, you select Part # as the column for the
drawing data and Catalog Number as the column for the external data. Because
there is at least one cell of matching data in the drawing data column and the
external data column, the data extraction feature “knows” how both sources
are tied together.
You can test if the data matching is valid by clicking the Check Match button
from the Link External Data dialog box. If the match is unsuccessful, a warning
message indicates what the problem is. In some situations, the drawing data
might not link correctly to the data in the spreadsheet. See Data Matching
Validation for more information.
1852 | Chapter 38 Extract Data from Drawings and Spreadsheets
Validate Matched Data
The data matching validation process fails when it cannot find a valid match
between the drawing data and external data (spreadsheet). The following error
messages will display:
No match was found between any values in the drawing data and external
data.
■If the problem is not resolved, the external data will not be merged.
Compare the spreadsheet column data to the drawing data column for
any matching values. For example, the numerical data in the drawing data
may be set to a different precision level than in the external data.
The data column in the external data does not contain unique values.
■The data in the external data column contains one or more cells that
contain identical data. This condition makes it so that one match cannot
be configured between the drawing data and the external data.
See also:
■Link a Table to External Data on page 1401
■Overview of Data Extraction on page 1833
To link data to an Excel spreadsheet in a data extraction table
1In the Data Extraction wizard on the Refine Data page, click Link External
Data.
2In the Link External Data dialog box, click Launch Data Link Manager.
3In the Data Link Manager tree view, select Click the Create a New Excel
Data Link option.
4In the Enter Data Link Name dialog box, enter a name for the data link.
Click OK.
5Click the [...] button to browse for the .xls or .csv file to be linked to.
6In the New Excel Data Link dialog box, select a link option (whole sheet,
range, or Excel named range). Click OK.
7Select the new data link in the Data Link Manager tree view. Click OK.
Link an Excel Spreadsheet to Access Data | 1853
8In the Link External Data dialog box, in the Drawing Data Column list,
specify the column you want to link.
9In the External Data Column list, specify the Excel column you want to
link.
10 Click Check Match. If an error displays, see Data Matching Validation.
11 From the Select External Data Columns to Include, select the Excel
columns from the list you want to add to the extracted data.
12 Click OK.
To set up a named range in Microsoft Excel to use in a data extraction
1In Microsoft Excel, open the workbook or spreadsheet that you want to
access.
2Select a range of cells to function as a linked range.
3Enter a name for the range of cells in the Name Box, then press ENTER.
4Repeat steps 2 and 3, if desired, to specify additional linked ranges.
5On the File menu (Microsoft Excel), click Save.
To view the data link from a data extraction table to an Excel spreadsheet
■Right-click the data extraction table. Click Properties.
The Cell Data Link field in the Properties palette displays the name of the data
link associated with the table.
To detach a link from a data extraction table to an Excel spreadsheet
■Select the data extraction table and right-click. Click Data Links ➤ Detach
Data Link.
The data link to the Excel spreadsheet is removed from the data extraction
table.
1854 | Chapter 38 Extract Data from Drawings and Spreadsheets
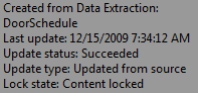
Quick Reference
Commands
DATAEXTRACTION
Extracts drawing data and merges data from an external source to a data
extraction table or external file.
System Variables
DXEVAL
Controls when update notification displays for data extraction tables.
Output Extracted Data
You can export extracted data to a table or an external file.
On the Choose Output page in the Data Extraction wizard, you can output
the extracted data to a data extraction table, to an external file, or both.
Output Extracted Data to a Table
By choosing the Insert Data Extraction Table into Drawing option on the
Choose Output page, you are prompted to insert the table into the current
drawing when the extraction is complete. The table is created using the table
style you selected, and is populated with the data that was extracted from the
data source. If an Excel spreadsheet is linked, the selected columns from the
spreadsheet are included in the table.
Although a data extraction table looks like a table that was created using the
TABLE command, there are some key differences.
■A tooltip displays information about the data extraction when the table
is selected.
When a drawing containing a data extraction table is opened in AutoCAD
LT, the tooltip text indicates the table contains extracted data. You cannot
update the extracted data or change a data link, if one exists
Output Extracted Data | 1855

■The cells are locked and their contents cannot be modified unless they are
unlocked. (Be default, formatting for cells is unlocked.)
Cells in a data extraction table are locked by default to prevent editing.
Individual cells or the entire table can be unlocked if you want to make data
changes. See Modify a Data Extraction Table on page 1863 for more information.
See also:
■Modify a Data Extraction Table on page 1863
Output Extracted Data to a File
The same data that is extracted to a table can be exported to an external file.
On the Choose Output page, select the Output Data to an External File option.
If a data link was established to an Excel spreadsheet, the data in the
spreadsheet is also exported.
You can export the data to the following file formats:
■Microsoft Excel (XLS).
■Microsoft Access (MDB).
■Comma-Separated (CSV). A .csv file is a data file in which the fields are
separated by the comma character and records (rows) are separated by new
lines. This format is suitable for input into most spreadsheet applications.
■Tab-Separated (TXT). A txt file is a data file in which the fields are separated
by tab characters. This format is suitable for input into a spreadsheet
application. Formatting information is not included.
NOTE When the characters period (.), comma (,), or pound sign (#) are written
to an Excel or Access file, they are replaced with their Unicode representation.
By right-clicking a data extraction table, you can access the Export option to
output the contents of the entire table to a comma-separated (CSV) file. You
can also use the -DATAEXTRACTION command to export data in the drawing
using a BLK or DXE template file.
A maximum of 255 columns can be output when exporting to either a
Microsoft Excel (XLS) file or Microsoft Access (MDB) file. If the extracted data
exceeds 255 columns, a dialog box is displayed after clicking Next on the
Choose Output page when either file format is chosen. The dialog box indicates
only the first 255 columns of data will be exported. An unlimited number of
1856 | Chapter 38 Extract Data from Drawings and Spreadsheets

columns can be exported to the comma-separated (CSV) and tab-separated
(TXT) file formats.
To export extracted data to an external file using the Data Extraction wizard
1Click Annotate tab ➤ Tables panel ➤ Extract Data.
2In the Data Extraction wizard, click Next on each page until the Choose
Output page is displayed.
3Click Output Data to External File.
4Click the Browse button. Select a file format from the drop-down list.
5Click Next. Proceed through the wizard until the Finish page displays.
6Click Finish.
The external file is created.
To export extracted data in a table to a comma-separated (CSV) file
1Select the table and right-click. Click Export.
2In the Export Data dialog box, enter a file name or accept the default file
name. Click Save.
The external file is created as a CSV file.
Quick Reference
Commands
DATAEXTRACTION
Extracts drawing data and merges data from an external source to a data
extraction table or external file.
System Variables
DXEVAL
Controls when update notification displays for data extraction tables.
Output Extracted Data | 1857

Update Extracted Data
Extracted data in a table can be updated either manually or automatically.
Overview of Updating Extracted Data
Extracted data can be updated so that it is current with the data source. You
can manually update the extracted data, whether it is output to a data
extraction table or to an external file, or rely on a notification to display when
using certain trigger commands, such as SAVE or PLOT. You can then update
the table from the Data Extraction - Outdated Table dialog box.
NOTE Extracted data in external files is not checked to see if it is current with the
data source, and notification does not occur.
Update an Attribute Extraction Table
You can update the contents of a table that was created using the Attribute
Extraction wizard. Before it can be updated, the table first needs to be converted
to a data extraction table.
NOTE The width and height of columns of the attribute extraction table are not
retained after it is converted to a data extraction table.
See also:
■Select the Source for a Data Extraction on page 1839
To edit the data extraction settings for a data extraction table
1In the drawing, right-click the data extraction table. Click Data
Extraction ➤ Edit Data Extraction Settings.
2In the Data Extraction wizard, on the Define Data source page, make any
changes.
3Click Next. Proceed through the wizard and make the necessary changes
until the Finish page is displayed.
4Click Finish.
1858 | Chapter 38 Extract Data from Drawings and Spreadsheets

To convert an attribute extraction table to a data extraction table
1Right-click the attribute extraction table. Click Convert to Data Extraction
Table.
2In the dialog box, enter a name for the data extraction (DXE) file and
click Save.
Quick Reference
Commands
DATAEXTRACTION
Extracts drawing data and merges data from an external source to a data
extraction table or external file.
System Variables
DXEVAL
Controls when update notification displays for data extraction tables.
Update Extracted Data Manually
You can update the extracted data in a table or external file manually.
If the drawings that were used for the data extraction have changed, you can
manually update the data. To update a data extraction table, you can use
either of two methods.
■Open the drawing that contains the table and use the Data Extraction
wizard to edit the DXE file that contains the extraction settings.
■Right-click the data extraction table to access its shortcut menu. Click Data
Extraction ➤ Update Data Extraction.
To update the extracted data that was output to an external file, you use the
Data Extraction wizard and specify the DXE file that was used for the
extraction.
NOTE The .dxe file is saved with the file name and location that was specified
when a new data extraction was created.
Update Extracted Data Manually | 1859

Using the data extraction (DXE) file, you can also edit an existing data
extraction to add or remove drawings, add or remove objects, or select different
properties from which to extract data. Tables that reference the same DXE
file, even if those tables are in other drawings, will display the changes when
those tables are updated.
NOTE For access to shortcut menus in the drawing area that are needed for editing
and updating tables, the Shortcut Menus in Drawing Area must be checked in the
Options dialog box, User Preference tab.
To modify an existing data extraction in an external file
1In the drawing, right-click the data extraction table. Click Data
Extraction ➤ Edit Data Extraction Settings.
2In the Data Extraction wizard, on the Define Data Source page, make any
changes.
3Click Next. Proceed through the wizard and make the necessary changes
until the Finish page displays.
4Click Finish.
To change a data link for a data extraction table
1In the drawing, right-click the data extraction table. Click Data
Extraction ➤ Edit Data Extraction Settings.
2In the Data Extraction wizard, on the Define Data Source page, click Next
and proceed to the Refine Data page displays.
3Click Link External Data.
4Click Launch Data Link Manager.
5Click the Create a New Excel Data Link option.
6In the Enter Data Link Name dialog box, enter a name for the data link.
Click OK.
7Click the [...] button to browse for the .xls file.
8In the New Excel Data Link dialog box, select a link option (whole sheet,
range, or Excel named range). Click OK.
9Select the new data link in the Data Link Manager tree view. Click OK.
1860 | Chapter 38 Extract Data from Drawings and Spreadsheets
To view a data extraction (DXE) file associated with a data extraction table
■In the drawing, right-click a cell in the data extraction table. Click Cell
Data Link.
The path and the DXE file name is displayed.
To view a data extraction (DXE) file and linked Excel (XLS) file associated
with a drawing
■Click Insert ➤ External References.
The file name and path are displayed. If a data link exists to a Microsoft Excel
(XLS) file, information about the data link is displayed on the Details pane.
To detach a data link for a data extraction table
■In the drawing, right-click the data extraction table. Click Data
Extraction ➤ Detach Data Link.
The .DXE file is detached from the data extraction table.
To manually update a data extraction table
■Right-click the data extraction table. Click Data Extraction ➤ Update Data
Extraction.
Quick Reference
Commands
DATAEXTRACTION
Extracts drawing data and merges data from an external source to a data
extraction table or external file.
System Variables
DXEVAL
Controls when update notification displays for data extraction tables.
Update Data Extraction Table Automatically
You can specify to be notified when extracted data has changed.
Update Data Extraction Table Automatically | 1861

When information in the data source has changed that affects the extracted
data in a table, you are notified the data is not current. (Notification does not
occur with attribute extraction tables.) Depending on how the DXEVAL system
variable is set, the Data Extraction - Outdated Table dialog box displays when
certain commands are used, such as OPEN or SAVE. By default, DXEVAL is
set to check if the extracted data is not current without automatically updating
it when the PLOTor ETRANSMIT commands are used.
IMPORTANT When DXEVAL = 8 (update on publish) and BACKGROUNDPLOT is
set to 2 or 3, then you will be prompted to update when publishing the files.
However, the tables in the DWF file will not be updated. To include table updates
in the published files, set BACKGROUNDPLOT to 0 or 1.
You can set auto-updating to occur with these commands: SAVE, PLOT,
PUBLISH, or ETRANSMIT. When auto-updating is enabled, the extracted data
is automatically checked to see if it is current with the data source. If not, the
update process occurs without user intervention. With PLOT or ETRANSMIT,
the data extraction is updated prior to the plotting or electronically
transmitting the drawings, which are not saved.
When you open multiple drawings at the same time, and the DXEVAL setting
in each drawing is 1 (to check for updates as the drawing is open), a dialog
box displays for each drawing that contains a data extraction table that is not
current. You can choose to update the drawing or to skip all updates.
You can run the update later from the shortcut menu for the data extraction
table.
If the cells in a data extraction table are edited in a previous release of the
program, and then opened in the current version, the table cells that were
edited are unlocked. When the table is updated in the current release, a dialog
box displays indicating some cells were overwritten. You can choose to
overwrite the cells or skip the cells during the update.
NOTE It is recommended you turn on notification before doing a final save, plot,
publish, electronic transmittal, or archive.
Quick Reference
Commands
DATAEXTRACTION
Extracts drawing data and merges data from an external source to a data
extraction table or external file.
1862 | Chapter 38 Extract Data from Drawings and Spreadsheets
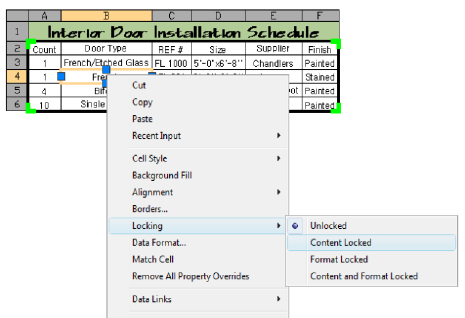
System Variables
DXEVAL
Controls when update notification displays for data extraction tables.
Modify a Data Extraction Table
You can modify a data extraction table by changing the formatting, adding
columns and rows, or editing data in the cells.
Once a data extraction table is inserted into the drawing, you can make
formatting changes, add columns and rows, and edit cells containing extracted
data.
Any formatting, structural, or data changes that are made are retained after
the table is updated. For example, if you added shading to a header row, or
the formatting of text in certain columns changed, those changes are not lost
when the table is updated.
By default, all cells in a data extraction table are locked for editing and
unlocked for formatting changes. You can unlock or lock cells for data and
formatting edits by accessing the table’s shortcut menu.
Add Columns and Rows
You can add columns and rows to a data extraction table without affecting
the extracted data. When you select a table, the lines around cells that contain
extracted data is bold. Columns and rows can only be added outside this
perimeter. You should be aware that blank cells may be created as a result if
Modify a Data Extraction Table | 1863
additional data is extracted during an update, or conversely, there are fewer
columns or rows containing extracted data.
For example, if you added a row and column to a table after you inserted into
the drawing, the area populated with extracted data will be expanded by an
additional column after the table is updated. The column and row that you
manually added are still part of the table, but a blank cell is created where a
void exists in the table.
Using the same example, if the table was updated and the number of columns
and rows containing extracted data were reduced, the columns and rows you
inserted would remain in the same place. The area that originally contained
data extraction columns and rows is now replaced with blank cells.
Edit Cell Content
Data cells are locked by default in order to prevent unintentional changes.
You can manually unlock a cell to edit its contents. When the table updates,
you are given a choice to overwrite the edited cells or choose to have the
update not update the cells.
See also:
■Create and Modify Tables on page 1397
To edit/unlock the cells in a data extraction table
■In the drawing, right-click a cell in the data extraction table. Click Cell
Locking ➤ Data.
The cells are unlocked for editing.
To edit/unlock the cells in an entire data extraction table
■In the drawing, right-click a cell in the data extraction table. Click Cell
Locking ➤ All ➤ Unlocked.
All the data cells in the table are unlocked for editing.
To edit the text in an unlocked cell in a table
■In the drawing, right-click the cell in the data extraction table. Click Edit
Cell Text.
All the data cells in the table are unlocked for editing.
1864 | Chapter 38 Extract Data from Drawings and Spreadsheets
To identify which cells in a table are unlocked or locked
1In the drawing, right-click a cell in the data extraction table. Click
Properties.
2In the Properties palette, look at the Cell Locking field.
One of the following states display
■If the cell is unlocked for data and formatting, Unlocked displays.
■If the cell is locked for data, Data Locked displays.
■If the cell is locked for formatting, Format Locked displays.
■If the cell is locked for data and formatting, Data and Format Locked displays.
To add a column to a data extraction table
1Right-click in a table cell in the first column or last column.
2To insert a column before the first column, click Columns ➤ Insert Left.
To insert a column after the last column, click Columns ➤ Insert Right.
To add a row to a data extraction table
1Right-click in a table cell in the first row or last row.
2To insert a row above the first row, click Rows ➤ Insert above. To insert
a column after the last row, click Rows ➤ Insert Below.
To equally size all columns and rows in a table
■Select the table and right-click. Click Size Columns Equally or Size Rows
Equally.
Quick Reference
Commands
DATAEXTRACTION
Extracts drawing data and merges data from an external source to a data
extraction table or external file.
Modify a Data Extraction Table | 1865
System Variables
DXEVAL
Controls when update notification displays for data extraction tables.
Detach a Data Extraction Table
To completely remove a data extraction table, you need to detach it.
You can delete a data extraction table from the External References Palette by
detaching it.
Quick Reference
Commands
DATAEXTRACTION
Extracts drawing data and merges data from an external source to a data
extraction table or external file.
EXTERNALREFERENCES
Opens the External References palette.
1866 | Chapter 38 Extract Data from Drawings and Spreadsheets
Access External Databases
You can associate, or link, data stored in external databases with graphical objects in a drawing.
You can use the program to associate, or link, data stored in external database programs such
as dBASE, Oracle, and Microsoft Access with graphical objects. You can use all of the external
database features without prior knowledge of databases or query languages. This section,
however, does not cover in detail the theory of database design or the semantics of Structured
Query Language (SQL).
Overview of Using External Databases
When you link database records to graphical objects in a drawing, you can use
powerful database queries to filter and sort information. You can present the
results of a query graphically.
A database is a collection of logically related information, usually presented in
a table format similar to a typical spreadsheet. The table below is an example
of a simple database that might be used by a Facilities department to schedule
maintenance work. It consists of four columns, or fields, labeled Maintenance
task, Estimated hours, Frequency, and Assigned to. Individual fields, or cells,
store data for a particular variable. Individual rows within the database table
are called records.
Maintenance database table
Assigned toFrequencyEstimated
hours
Maintenance task
RON SMITHQUARTERLY3.5ELEVATOR SRV
VICKI ROBERTSWEEKLY5.25CARPET VAC
AMY REEDBIWEEKLY2.00A/C CHECK
39
1867
Maintenance database table
Assigned toFrequencyEstimated
hours
Maintenance task
DAT TANMONTHLY3.00AIR FILTER
Most database systems are extremely flexible and can be easily modified. You
can add new fields or remove existing ones from database tables. Likewise,
you can add or delete records from database tables and edit existing records.
With many databases, you can also define relationships between multiple
database tables. For example, suppose you have two database tables that share
a common field, Room ID. Using a relational database, you can join these two
database tables using their common field. You don't have to maintain and
input duplicate data across multiple database tables.
You can use the program to associate data contained in an external database
table with graphical objects through the process of linking. Links are pointers
to a database table that reference data from one or more records in that table.
You can also use the program to attach labels that display data from selected
database table fields as text objects in your drawing.
The database connectivity feature provides the following:
■An external configuration utility that enables the program to access the
data contained in a particular database system
■A dbConnect Manager where you can associate links, labels, and queries
with drawings
■A Data View window that displays records from a database table within
an program session
■A Query Editor where you can construct, execute, and store SQL queries
■A migration tool that converts links and displayable attributes to AutoCAD
2000 or later format from files created in earlier releases
■A Link Select operation that creates iterative selection sets based on queries
and graphical objects
1868 | Chapter 39 Access External Databases
Quick Reference
Commands
DBCONNECT
Provides an interface to external database tables.
System Variables
DBCSTATE
Indicates whether the dbConnect Manager is open or closed.
Access a Database from Within AutoCAD
When you have configured a data source, you can view and edit its records
from within the program.
Configure a Database for Use with AutoCAD Drawings
The configuration process involves creating a new data source that points to
a collection of data and provides information about the drivers necessary to
access it.
Before you can access an external database from within the program, you must
configure it using the Microsoft ODBC (Open Database Connectivity) and
OLE DB programs. Using ODBC and OLE DB, the program can utilize data
from other applications, regardless of the format that it's stored in or the
database platform on which it is created.
A data source may be either an individual database table or a collection of
them stored in an environment, catalog, or schema. Environments, catalogs, and
schemas are hierarchical database elements used by most database management
systems that help you organize your data. They are in many ways analogous
to a Windows-based directory structure: you can think of the environment as
a folder that holds additional subdirectories of catalogs. Catalogs in turn
contain additional subdirectories of schemas. Each schema is a collection of
database tables.
The configuration process varies slightly for different database systems. For
example, server-based databases such as Oracle and Microsoft SQL Server
require that you enter a valid user name and password and specify the network
location where the database is located. File-based systems such as Microsoft
Access and dBASE III do not require this information. Because of these
Access a Database from Within AutoCAD | 1869

variations, it is not possible to provide a generic configuration procedure that
works for all databases. Individual procedures for configuring all the databases
that the program supports are provided in the Configure External Databases.
You should also refer to the documentation for your particular database system
and the Microsoft Help files for ODBC and OLE DB for additional information.
The connectivity feature supports the following external applications:
■Microsoft Access
■dBASE
■Microsoft Excel
■Oracle
■Paradox
■Microsoft Visual FoxPro
■SQL Server
NOTE The 64-bit release of AutoCAD does not support the use of Microsoft Jet
4.0 OLE DB Provider (for .MDB connectivity) and Microsoft OLE DB Provider for
ODBC Drivers (for .XLS connectivity). For more information, see Substituting SQL
Server for OLE DB.
The program includes a Microsoft Access sample database file and a
preconfigured direct driver (jet_dbsamples.udl) that you can use to work with
the database. You do not need to have Access installed. The file is located in
the Sample folder, which is located in the installation directory. If you moved
the Sample folder to a different location, you must update the path in the
jet_dbsamples.udl configuration file before you can work with the database file.
The dbConnect Manager
The dbConnect Manager is a dockable, resizable window that contains a set
of buttons and a tree view. In the dbConnect Manager, you can open the Data
View window to view or edit a database table. You can also associate various
database objects (such as link templates, label templates, and queries) with a
drawing.
1870 | Chapter 39 Access External Databases
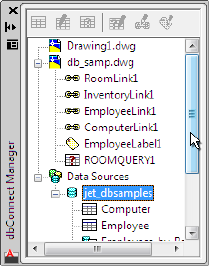
The tree view of the dbConnect Manager contains the following nodes:
■Drawing Nodes. Display each open drawing. Each drawing's node shows
all database objects that are associated with the drawing.
■Data Sources Node. Displays all configured data sources on your system.
All of the various nodes and database objects in the dbConnect Manager have
shortcut menu options associated with them. For example, you can use shortcut
menu options to configure a data source or edit a stored query.
To open and close the dbConnect Manager
■Click Tools menu ➤ Palettes ➤ DbConnect.
To update the jet_dbsamples.udl configuration file with new information
1Click Tools menu ➤ Palettes ➤ DbConnect.
2In the dbConnect Manager, in the tree view, right-click Data Sources.
Click Configure Data Source.
3In the Configure a Data Source dialog box, select Jet_dbsamples from the
Data Sources list. Click OK.
4In the Data Link Properties dialog box, Connection tab, click the [...]
button.
5In the Select Access Database dialog box, navigate to and select the
db_samples.mdb file. Click Open.
This file is located in the Sample folder.
6Click Test Connection to verify that your connection is working properly.
Configure a Database for Use with AutoCAD Drawings | 1871
7If the connection fails, verify that you selected the appropriate file.
8Click OK to close each dialog box.
Quick Reference
Commands
DBCONNECT
Provides an interface to external database tables.
System Variables
DBCSTATE
Indicates whether the dbConnect Manager is open or closed.
View Data in a Database Table
When you have configured a data source, you can use the Data View window
to view database records from within the program.
Once you have configured a data source, you can access its database tables
from within the program. The Data View is a window where you can view
and edit database records. You can open database tables in Read-only mode
or in Edit mode. You cannot add, delete, or edit records in a database table
that you open in Read-only mode. Opening a database table establishes a
connection to its parent database. Some database systems require that you enter
a valid user name and password before you can connect to them.
The Data View window is a spreadsheet-like environment that presents a
database table's records. With the scroll bars and navigation buttons at the
right and at the bottom of the window, you can move through the record set.
1872 | Chapter 39 Access External Databases
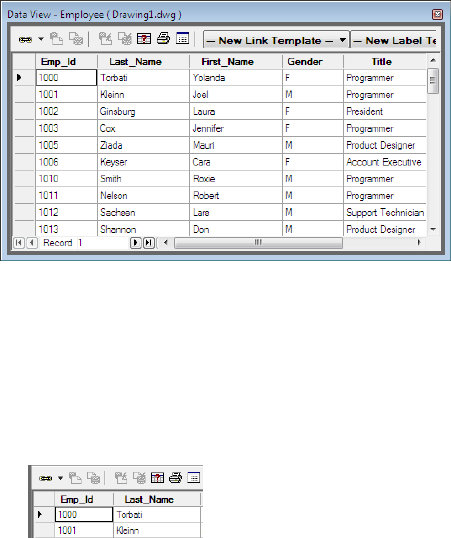
The grid in the Data View window contains the following elements:
■Column header. Selects all records in a column when you click it.
■Record header. Selects an individual record when you click it.
■Grid cells. Selects one field of a given record when you click it.
■Grid header. Selects the entire database table.
The Data View window provides a great deal of flexibility in how records are
displayed. You can
■Move or resize columns
■Hide columns to remove them from the Data View window display
■Sort column data in ascending or descending order
■Freeze a column or combination of columns so that they stay in place and
do not scroll with the horizontal scroll bar
■Align text within individual columns
■Apply a variety of font styles and sizes to the Data View window display
Column formatting and database table sorts in the Data View window are not
stored. This information is discarded when you open a new database table or
close the current table. If you want to create and save a formatted report, you
must copy the contents of the Data View window to the Clipboard and paste
View Data in a Database Table | 1873

it into an external program such as Microsoft Excel. You can then use the
external program to apply and save the desired formatting. For details about
creating a template, refer to the documentation of the external program that
you are using to format the data.
Database Views and External Queries
Some database management systems support views. Views provide additional
ways to display data from a database table. For example, you can use a view
to display a subset of the overall database table. You can also use views to
define relationships between database tables and create a new table that
contains combined records from the original database tables.
Database systems that do not support views can produce similar results with
queries. Refer to your database system documentation for information about
creating and working with views and queries.
Views and external queries are displayed in the Data Sources node of the
dbConnect Manager. External queries are queries created and stored outside of
the program but within an external database system. You can work with
external queries and views as you would work with any other database table.
You can view or edit them in the Data View window, construct queries based
on them, and create links and labels based on their records.
To open a database table for viewing or editing
1Click Toolsmenu ➤ Palettes ➤ DbConnect.
2Do one of the following:
■To open a database table in Read-only mode, click DbConnect
menu ➤ View Data ➤ View External Table.
■To open a database table in Edit mode, click DbConnect menu ➤
View Data ➤ Edit External Table.
If required by the database to which you are connecting, you are prompted
to enter a valid user name and password.
3In the Select Data Object dialog box, navigate to and select the database
table you want to open. Click OK.
NOTE Some database systems require that you obtain access privileges before
you can view or edit database tables. Refer to the documentation for your database
system, or check with your database administrator.
1874 | Chapter 39 Access External Databases
To open a database table directly from the Data Sources node of the
dbConnect Manager
■Double-click a database table in the dbConnect Manager.
By default, double-clicked database tables are opened in Edit mode. You
can change the default double-click behavior to Read-only mode, if desired.
To change the double-click open setting for database tables
1Click Tools menu ➤ Options.
2On the System tab, select Open Tables in Read-only Mode.
3Click OK.
To move a column in a database table
1Click the column header of the column that you want to move.
2Click the column header again and drag it to the desired location.
To resize a column in a database table
1In the Data View window, select the grid line at the right border of the
column header of the column you want to resize.
2Drag to the right to enlarge the column, or to the left to shrink it.
To hide a column in a database table
1In the Data View window, select the column header of the column that
you want to hide.
2Right-click the column header. Click Hide.
To display all hidden columns in a database table
■Right-click any column header in the Data View window. Click Unhide
All.
To specify a sort order for the Data View window display
1Right-click any column header in the Data View window. Click Sort.
2Select a column to sort in the Sort By list. Select Ascending or Descending
to specify a sort order.
View Data in a Database Table | 1875

Ascending order sorts the column starting with the smallest value and
ending with the largest value. Descending order sorts the column starting
with the largest value and ending with the smallest value.
3If desired, select an additional column to sort in the Then By list. Select
the Ascending or Descending option to specify a sort order.
The sort operation sorts all database table records according to the value
specified in the Sort By list, and then continues to sort based on the value
specified in the Then By list.
4Repeat step 2 for any additional fields that you want to add to the sort.
You can sort by a combination of up to five table columns at a time.
To freeze a column or columns
1In the Data View window, select one or more columns to freeze.
2Right-click one of the selected column headers. Click Freeze.
NOTE The Freeze option can be applied only to contiguous columns. If not all of
the columns you want to freeze are contiguous, move them as described in To
move a column in a database table.
To unfreeze all frozen columns
■Right-click any column header in the Data View window. Click Unfreeze
All.
To align text in a column or columns
1Select one or more columns in the Data View window whose text you
want to align.
2Right-click any column header. Click Align.
3Select one of the following to align the text:
■Standard. Right-aligns numeric fields and left-aligns all other fields.
■Left. Left-aligns the column cells.
■Center. Center-aligns the column cells.
■Right. Right-aligns the column cells.
1876 | Chapter 39 Access External Databases
To select a font size and style for the Data View
1In the Data View window, right-click the empty, top-left square of the
database table. Click Format.
2Select the font settings you want to use. Click OK.
To export data from the Data View window
1Open a database table by double-clicking it in the dbConnect Manager.
2Select the records that you want to export from the Data View window.
3Right-click in any cell. Click Copy.
4Open the external application to which you want to export the data.
Click Home tab ➤ Utilities panel ➤ Paste.
The text is inserted into the external application in tab-delimited format.
Quick Reference
Commands
DBCONNECT
Provides an interface to external database tables.
Edit Data in a Database Table
In the Data View window, you can search database records for a particular
value, and you can add, delete, or change records.
If you have opened a database table in Edit mode, you can edit its data in a
number of ways. You can add or delete records, or edit a record's values. You
can also search a particular column for occurrences of a specific value.
NOTE The Find option limits its search to records contained in the same column
as the currently selected cell. There is no way to issue a global Find command that
searches the entire database table for a specific value. You must select individual
cells in any additional columns you want to search and click Find.
Changes that you make to individual records in a database table are not written
to the database until you commit them. The Commit option updates the
Edit Data in a Database Table | 1877

database table currently loaded in the Data View window with any changes
that you make during an editing session and closes the Data View window.
The Restore option undoes any changes you made in the Data View window
during an editing session and closes the Data View window.
NOTE If you quit the program, open a new database table, or close the Data View
window before committing changes you've made to a database table, the program
automatically commits all changes you've made during an editing session.
To help you track your editing during a work session, changed records are
marked with an edit icon. You can easily review your changes before
committing them to the source database table.
To edit a database record
1Select a cell to edit in the Data View window.
2Enter a new value in the cell.
3Repeat as necessary for any additional cells that you want to edit.
You can use the keyboard arrow keys to move from cell to cell.
To add a new database record
1In the Data View window, right-click a record header (the empty square
at the left of the row). Click Add New Record.
A new record with blank field values is added to the end of the current
record set.
2Select a cell in the new record and enter a value.
3Repeat step 2 for any additional fields.
To delete a database record
■In the Data View window, right-click a record header (the empty square
at the left of the row) of the record that you want to delete. Click Delete
Record.
To search the Data View window for a particular value
1Right-click a cell in the column that you want to search. Click Find.
2Enter a value to search for in Find What.
1878 | Chapter 39 Access External Databases

3Select a direction to search the Data View window:
■Up. Searches the column records from the selected cell through the
first record.
■Down. Searches the column records from the selected cell through
the last record.
4Click Find Next.
5Repeat step 4 to find additional occurrences of the specified value.
NOTE The Find option limits its search to records contained in the same column
as the currently selected cell. There is no way to issue a global Find command that
searches the entire database table for a specific value. You must select individual
cells in any additional columns you want to search, and then click Find.
To search the Data View window for a particular value to replace
1Right-click a cell in the column that you want to search. Click Replace.
2Enter a value to search for in Find What.
3Enter a replacement value in Replace With.
4Click Find Next.
5Do one of the following:
■Click Replace to replace the current occurrence of the search value.
■Click Replace All to replace all occurrences of the search value.
6Repeat steps 4 and 5 to replace additional occurrences of the value you're
searching for.
NOTE The Replace option limits its search to records contained in the same column
as the currently selected cell. There is no way to issue a global Replace command
that searches the entire database table for a specific value. You must select
individual cells in any additional columns you want to search, and then click Replace
again.
To commit Data View window editing
■In the Data View window, right-click the empty, top-left square of the
database table. Click Commit.
Edit Data in a Database Table | 1879

To restore original values to the Data View window
■In the Data View window, right-click the empty, top-left square of the
database table. Click Restore.
NOTE If you quit the program, or open a new database table, or close the Data
View window before committing changes you've made to a database table, the
program automatically commits all changes you've made during an editing session.
Quick Reference
Commands
DBCONNECT
Provides an interface to external database tables.
Link Database Records to Graphical Objects
Links connect graphical objects with tables in an external database.
Create and Edit Links and Link Templates
Each link requires a link template, which identifies what fields from a table
are associated with the links that use that template.
The primary function of the database connectivity feature is to associate
external data with program graphical objects. You can, for example, associate
information contained in a room database with a polyline object representing
a room boundary in a drawing. You establish the association between the
graphical object and the database table by creating a link, which references
one or more records stored in the database table. You cannot create links to
nongraphical objects such as layers and linetypes.
Links are tightly connected with the graphical objects they are associated with.
If you move or copy a linked object, the link is moved or copied with it. If
you delete a linked object, the link is also deleted.
When you create a link, a dynamic relationship is established between the
database record and the object. If, for example, you convert a room from a
storage area to an office in the database table, the program provides a
mechanism to update the information stored in the drawing so that it matches
the database table.
1880 | Chapter 39 Access External Databases

To establish links between database table records and graphical objects, you
must first create a link template. Link templates identify what fields from a
database table are associated with the links that share that template. For
example, you can create a link template that uses the field Room Number
from a room database table. You can then use this link template to create links
that point to different records in the database table.
Link templates also function as shortcuts that point to the database tables
that they're based on. You can use the link templates that are associated with
a drawing to open the database tables that they reference for viewing or editing.
This is particularly useful if you have a large number of data sources configured
on your system. Rather than scrolling through a list of data sources each time
you want to locate an individual database table, you can open it directly from
the drawing node of the drawing that it is associated with. To open a link
template's database table, right-click a link template in the dbConnect Manager.
Click View Table or Edit Table.
You can attach multiple links using different link templates to a single
graphical object. This is useful when you want to associate data from multiple
database tables with an individual object.
Links in External References and Blocks
Links stored in externally referenced drawings cannot be viewed or modified
in the master drawing that they're attached to. This information is only
available when you open the source drawing directly.
Links contained in blocks are available, but can only be accessed through the
REFEDIT command.
Edit Link Templates
Occasionally after creating a link template, you may want to edit it. For
example, you might decide to add an additional key field or remove an existing
one. You may also need to update a link template if any changes are made to
the data source it points to. For example, you might rename a database table
or move it to a different location.
NOTE You can only change the key fields of link templates that don't have any
links defined in their associated drawing. Changing the key fields of a link template
invalidates its links and breaks their association to the database table. To edit a
link template with links already defined, you must first delete all links based on
the link template from its associated drawing.
Create and Edit Links and Link Templates | 1881
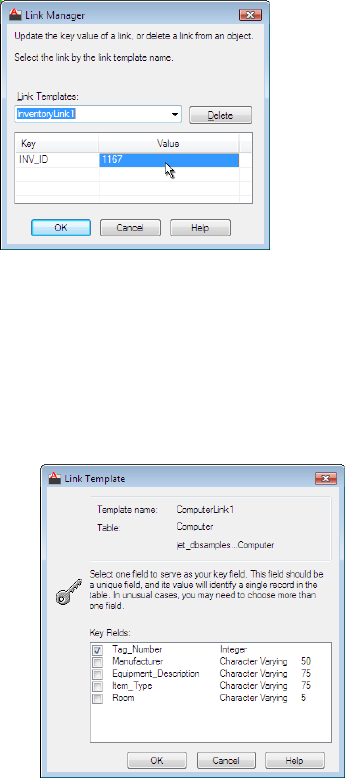
Edit Links
After you have created links, you may periodically need to update their key
field values. For example, you might change the numbering scheme for a
group of offices, or reallocate some rooms from the accounting department
to the sales department. You can use the Link Manager to enter new key values
for a selected link. The key values must reference a record that already exists
in the source database table.
To create a link template in the current drawing
1Click Toolsmenu ➤ Palettes ➤ DbConnect.
2In the dbConnect Manager, in the tree view, right-click a data source file.
Click New Link Template.
3In the New Link Template dialog box, enter a name for the link template
in New Link Template Name. Click Continue.
1882 | Chapter 39 Access External Databases
4Select one or more key fields by clicking in their check boxes.
You should keep the number of key fields to a minimum. Large numbers
of key fields can have a negative impact on the performance of Link Select
and other connectivity operations.
5Click OK to create the link template.
To create a link between an object and a record in an external database
1Click Toolsmenu ➤ Palettes ➤ DbConnect.
2In the dbConnect Manager, open a database table that has at least one
link template defined.
3In the Data View window, select the link template that you want to use
from the Link Template list.
4In the Data View window, select one or more records that you want to
link.
5Click the arrow to the right of the Link button to display the drop-down
list.
6In the drop-down list, click Create Links.
7Select one or more objects in the drawing that you want to link the data
to.
8Press Enter.
To edit a link template
1Click Toolsmenu ➤ Palettes ➤ DbConnect.
2Click DbConnect menu ➤ Templates ➤ Edit Link Template.
3In the Select a Database Object dialog box, select a link template to edit.
Click Continue.
4Select one or more key fields from the list by clicking their check boxes.
5Click OK to save your changes to the link template.
To update a link template's properties
1Click Toolsmenu ➤ Palettes ➤ DbConnect.
2Click DbConnect menu ➤ Templates ➤ Link Template Properties.
Create and Edit Links and Link Templates | 1883

3In the Select a Database Object dialog box, select a link template. Click
Continue.
4In the Link Template Properties dialog box, update the data source
information as appropriate. Click OK.
To delete all links based on a link template from the current drawing
1Click Toolsmenu ➤ Palettes ➤ DbConnect.
2Click DbConnect menu ➤ Links ➤ Delete Links.
3In the Select a Database Object dialog box, select the link template whose
links you want to delete. Click OK.
To edit a link's key values using the Link Manager
1Click Toolsmenu ➤ Palettes ➤ DbConnect.
2Click DbConnect menu ➤ Links ➤ Link Manager.
3In the drawing, select a linked object.
4Note that the Link Manager can work with just one graphical object at
a time.
5In the Link Manager, select a link from those available for the selected
object in the Link Templates list.
6Enter a new value in the Value field of the key field you want to edit, or
click the [...] button. Repeat, if necessary, for any additional key fields
that you want to edit.
The [...] button displays a list of all values for the specified field from the
database table, allowing you to select the value you want. After selecting
a value, click OK.
NOTE The [...] button is available only if you are connected to the data source
that the selected link references.
7Click OK to update the link and close the dialog box.
1884 | Chapter 39 Access External Databases
Quick Reference
Commands
DBCONNECT
Provides an interface to external database tables.
Identify and Select Existing Links
You can select linked records in the data source to automatically select the
linked objects in the drawing, and you can select objects to select the linked
records in the data source
After you have created links to program graphical objects, you may want to
view the data that is associated with them. For example, suppose you have
linked employee database records to an office layout and you want to locate
a particular employee's office in the drawing. You can select the employee's
record in the Data View window to select any corresponding linked graphical
objects in your drawing. Conversely, you can select objects to select any linked
database records in the Data View window.
Automatic Selection of Linked Objects
You can set up the program to automatically select linked graphical objects
in your drawing as additional records are selected in the Data View window.
Conversely, you can set up the program to select linked database records as
additional graphical objects are selected in your drawing. Only one of these
automatic viewing modes can be active at a time.
Other Display Options
You can use the Data View and Query Options dialog box to set a number of
viewing options that affect how linked records and linked graphical objects
are displayed whenever a corresponding linked item is selected.
Identify and Select Existing Links | 1885
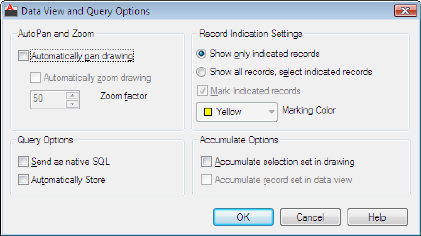
The Automatically Pan Drawing option automatically pans the drawing to
display objects that are associated with the current selection set of records in
the Data View window. If you have multiple records selected in the Data View
window, AutoPan may not be able to fit all of them in the drawing window
with your drawing's current zoom factor. To control for this, you can set a
zoom factor for the AutoPan mode that ensures that all linked objects
associated with the current record set are displayed.
The Automatically Zoom Drawing option automatically zooms the drawing
so that all objects associated with the current record set are displayed. You
must specify a zoom factor that sets the size of the extents of the indicated
object set to a defined percentage of the drawing area. The available range is
20 percent to 90 percent, and the default value is 50 percent. A value of 50
percent means that either the height of the extents is 50 percent of the height
of the drawing area, or the width of the extents is 50 percent of the drawing
area, whichever is less.
You can also specify the following link viewing settings:
■Record Indication Settings. Specify whether all records or only the subset
associated with the current selection set of graphical objects are displayed
in the Data View window. If the Show All Records, Select Indicated Records
option is selected, you can specify a marking color to apply to the linked
records.
■Accumulate Options. Specify whether the program accumulates selection
sets of linked graphical objects or Data View records, or creates new
selection sets as additional objects or records are selected.
For a description of all the options available, see “Data View and Query Options
Dialog Box” under DBCONNECT in the Command Reference.
1886 | Chapter 39 Access External Databases
To view graphical objects that are linked to a set of database records
1In the dbConnect Manager, double-click a database table to open it.
2In the Data View window, select a link template from the Link Template
list.
3In the Data View window, select one or more records.
4Right-click the selected record. Click View Linked Objects
Any objects that are linked to the selected records are selected in the
drawing area.
To view database records that are linked to a selection set of graphical
objects
1In the dbConnect Manager, double-click a database table to open it.
2In the Data View window, select a link template from the Link Template
list.
3In the drawing area, create a selection set of graphical objects.
4In the Data View window, click the View Linked Records in Data View
button.
By default, only database table records linked to the current drawing
selection set are displayed in the Data View window. You can change the
settings in the Data View and Query Options dialog box to display all
records, if desired.
To automatically view graphical objects that are linked to a set of database
table records
1In the dbConnect Manager, double-click a database table to open it.
2In the Data View window, select a link template from the Link Template
list.
3In the Data View window, click the AutoView Linked Objects in Drawing
button.
4In the Data View window, select one or more records.
Any corresponding linked graphical objects are selected in the drawing
area.
5Repeat step 4 to select additional linked graphical objects.
Identify and Select Existing Links | 1887
6Repeat step 3 to turn off the AutoView Linked Objects mode.
To automatically view database table records that are linked to a selection
set of objects
1In the dbConnect Manager, double-click a database table to open it.
2In the Data View window, select a link template from the Link Template
list.
3In the Data View window, click the AutoView Linked Records in Data
View button.
4In the drawing area, select one or more graphical objects.
By default, only database table records linked to the current drawing
selection set are displayed in the Data View window. You can change the
settings in the Data View and Query Options dialog box to display all
records, if desired.
5Repeat step 4 to select additional linked records.
6Repeat step 3 to turn off the AutoView Linked Records mode.
To specify additional link viewing settings
1In the Data View window, click the Data View and Query Options button.
2In the Data View and Query Options dialog box, change the default
settings as desired.
3Click OK to save your changes and close the dialog box.
Quick Reference
Commands
DBCONNECT
Provides an interface to external database tables.
Find and Correct Link Errors
The Synchronize option analyzes the links in your drawing and detects errors.
1888 | Chapter 39 Access External Databases
It is recommended that you periodically check the links in your drawings to
update or delete broken links. The program provides a Synchronize option to
analyze the links in a drawing that are based on a particular link template.
After you run the Synchronize option, a list of detected errors is provided in
the Synchronize dialog box. Certain errors (such as a resized column in the
source database table) can be fixed directly from the Synchronize dialog box.
Other errors (such as links that point to non-existent records) must be fixed
in the source database table.
To synchronize the links in a drawing
1In the dbConnect Manager, right-click a link template. Click Synchronize.
If no errors are detected, a message is displayed. If there are errors, they
are summarized in the Synchronize dialog box.
2In the Synchronize dialog box, select an error and do one or more of the
following:
■Click Indicate Drawing Objects to highlight the linked graphical
objects.
■Click Fix to fix the broken link.
■Click Delete to delete the broken link.
3Repeat step 3 for any additional errors.
4Click Close.
Quick Reference
Commands
DBCONNECT
Provides an interface to external database tables.
Export Link Information
You can export information about links to a text file.
You can use the program to export links contained in a drawing. This is useful
when you have multiple graphical objects linked to a single database row.
Suppose, for example, that you want to prepare a bill of materials that
summarizes the number of different light fixtures in a drawing. The external
Export Link Information | 1889
database that your drawing is linked to does not contain this information. All
the database provides is a list of the various light fixtures that make up its
record set. The database table has no knowledge of the number of instances
of individual light fixtures in your drawing. If you want to prepare a summary
report containing this information, you have to export the links in your
drawing.
To export links from a drawing
1Click Toolsmenu ➤ Palettes ➤ DbConnect.
2Click DbConnect menu ➤ Links ➤ Export Links.
3Create a selection set of graphical objects whose links you want to export.
If more than one link template exists for the set of graphical objects that
you select, the Select Link Template dialog box is displayed and you are
prompted to select a link template. If your selection set contains only
one link template, the Export Links dialog box is displayed.
4In the Export Links dialog box, select the fields to include by clicking
them in the Include Fields list.
The key fields for the selected link template are included automatically.
The program also exports the entity handle of the object that each link
is associated with.
5Enter a name for the exported file in File Name.
6Select a file format for the file from the Save As Type list.
You may save the file in the native database format of the current table
or as a comma-delimited or space-delimited text file.
7Click Save to export the links and close the dialog box.
8Repeat steps 1 through 6, as necessary, for any additional link templates
whose links you want to export.
Quick Reference
Commands
DBCONNECT
Provides an interface to external database tables.
1890 | Chapter 39 Access External Databases
Use Labels to Display Database Information in the
Drawing
Labels are multiline text objects that display data in a drawing from selected
fields stored in an external database table.
Create and Edit Labels and Label Templates
Labels may be freestanding or attached to an object. The label template defines
what fields from the database table are displayed in the label.
Links provide a powerful mechanism for associating external data with program
graphical objects. By selecting linked objects, you can readily access their
associated records in the database table. Links do, however, have some inherent
limitations. Suppose, for example, that you wanted to print a drawing and
include the external data associated with individual links. Because the links
are merely pointers to the external database table, the external data would
not appear in your printed drawing. For those occasions when you want a
visible representation of external data in a drawing, the program provides
labels.
Labels are multiline text objects that display data in a drawing from selected
fields stored in an external database table.
The labels that you create in the program can be freestanding, or they can be
attached to a graphical object. Freestanding labels exist in the drawing
independent of any graphical objects. Labels that are attached to a graphical
object are tightly connected with it. If you move the graphical object, the
label moves with it. If you copy the object to the Clipboard, the label is also
copied. If you delete an object that has an attached label, the label is deleted
as well. Labels associated with graphical objects are displayed with a leader.
To work with labels, you must first create a label template that defines what
fields from the database table are displayed in the label and how the label text
is formatted.
Use Labels to Display Database Information in the Drawing | 1891
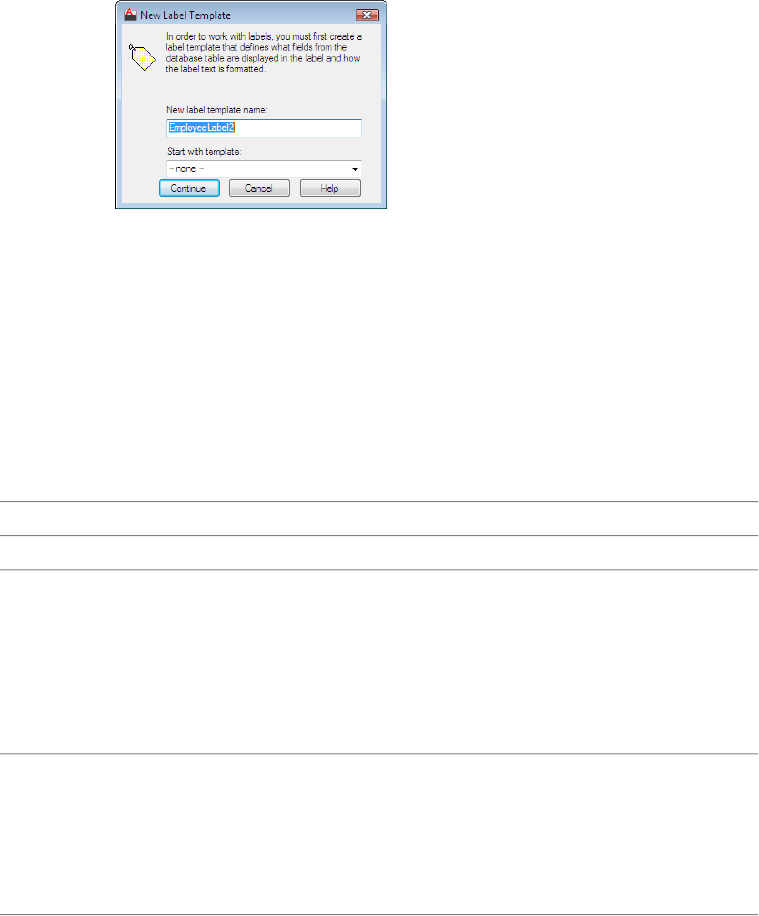
Edit Label Templates
After defining a label template, you might have cause to edit it. For example,
you may decide that you want additional database table fields to be displayed
in your drawings, or that you want to change the font or size of the label
object. You can also specify a number of offset settings that affect the insertion
point of labels and, in the case of attached labels, their associated leader objects.
The Label Offset tab of the Label Template dialog box specifies X and Y
coordinate offset values for labels and leader objects. The following table
summarizes the effect these settings have on both freestanding and attached
labels.
Label Offset tab options
Attached labelsFreestanding labelsOption
Specifies the start point for the leader object. The
point is defined with respect to the extents of the
N/AStart
graphical object that the label is attached to. Sup-
pose, for example, that you specify a Start setting
of Top Left for a label attached to a rectangle
graphical object. The tip of the leader is inserted in
the upper left corner of the rectangle.
Specifies an X and Y offset for the multiline text
object with respect to the associated leader object.
N/ALeader
Offset
By default, the X and Y Leader Offset options are
set to 1, indicating that the label text is offset 1 unit
in the X and Y planes from the tip of the leader
object.
Specifies an X and Y offset for the tip of the leader
object from the value specified with the Start op-
Specifies an X and Y label offset
from the insertion point you specify
for the label. For example, X and
Tip
Offset
tion. Suppose, for example, that you specify a Start
1892 | Chapter 39 Access External Databases
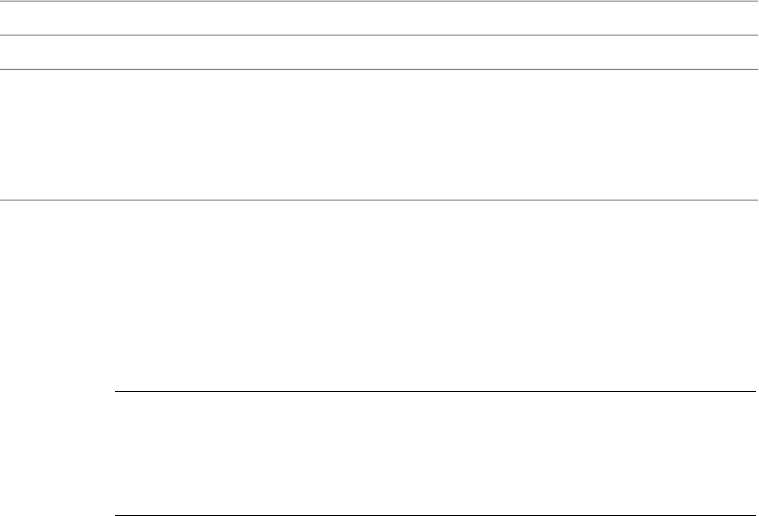
Label Offset tab options
Attached labelsFreestanding labelsOption
setting of Top Left for a label attached to a rect-
angle graphical object. You also specify X and Y Tip
Y Tip Offset settings of -1 cause the
label to be inserted offset 1 negat-
Offset values of 1. The tip of the leader is insertedive unit in the X and Y planes from
offset 1 positive unit in the X and Y planes from the
upper left corner of the rectangle.
the insertion point you specify in
the drawing.
Edit Labels
Once you have created labels, you can edit and manipulate them in a variety
of ways. Labels and their leaders can be moved and resized using standard
commands such as COPY, MOVE, and SCALE. It is important to note that
changes made to individual label instances do not affect or redefine the label
template.
NOTE It is not recommended that you edit the text of labels using the In-place
Text Editor. The new text values are not updated in the link or the database table,
and original field values are restored if you click Reload. If you want to change
field values for an existing label, edit the link values as described in Create and
Edit Links and Link Templates on page 1880 and click Reload.
To create a label template
1Click Toolsmenu ➤ Palettes ➤ DbConnect.
2In the dbConnect Manager, click the New Label Template button.
3In the New Label Template dialog box, enter a name for the label template
in New Label Template Name.
4To open the Label Template dialog box, click Continue.
5In the Label Template dialog box, Label Fields tab, select a field to appear
in the label from the Field list. Click Add to add it to the label.
You can also enter any additional static text that you want to precede or
follow the label directly in the Label Template dialog box. For example,
you might create a label template that uses the field Room Number from
a room database table. If you want the field name to precede the field
value when the label is created, enter Room Number: in the Label
Template dialog box before selecting the field from the Field list.
6Repeat step 5 for any additional fields that you want displayed in your
label.
Create and Edit Labels and Label Templates | 1893
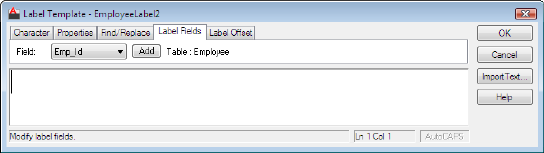
7Click OK.
To create a link with a freestanding label
1Click Toolsmenu ➤ Palettes ➤ DbConnect.
2In the dbConnect Manager, open a database table that has at least one
link template and one label template defined.
3In the Data View window, select a link template from the Link Template
list.
4In the Data View window, select a label template from the Label Template
list.
5In the Data View window, select the record that you want to link.
6Right-click the record header (the empty square to the left of the row) of
the selected record. Click Link And Label Settings ➤ Create Freestanding
Labels.
7Click Data View menu ➤ Link.
8Select an area in the drawing to insert the label.
To create a link to an object with an attached label
1Click Toolsmenu ➤ Palettes ➤ DbConnect.
2In the dbConnect Manager, open a database table that has at least one
link template and one label template defined.
3In the Data View window, select a link template from the Link Template
list.
4In the Data View window, select a label template from the Label Template
list.
5Select the record that you want to link from the Data View window.
1894 | Chapter 39 Access External Databases
6Click Data View menu ➤ Link And Label Settings ➤ Create Attached
Labels.
7Click Data View menu ➤ Link.
8Select an object or objects in the drawing that you want the label
associated with.
9Press Enter.
To edit a label template
1Click Toolsmenu ➤ Palettes ➤ DbConnect.
2In the dbConnect Manager, in the tree view, right-click a label template
to edit. Click Edit.
3In the Label Template dialog box, make the changes you want as described
in To create a label template.
4Click OK.
To specify label formatting
1Create a new label template as described in To create a label template.
2In the Label Template dialog box, select text formatting options using
the Character and Properties tabs, as described in MTEXT in the Command
Reference.
3In the Label Offset tab, specify the insertion point for the tip of the leader
object in Start.
The Start setting has no effect on freestanding labels.
4Enter both X and Y offset values in Leader Offset to specify the offset of
the label from the tip of the leader object.
By default, the X and Y offset values are set to 1, indicating that the label
is offset by one drawing unit in both the X and the Y directions from the
tip of the leader object.
5Enter both X and Y offset values in Tip Offset to specify the offset for the
leader object or, for freestanding labels, the offset of the label from the
insertion point you specify for the label.
Create and Edit Labels and Label Templates | 1895
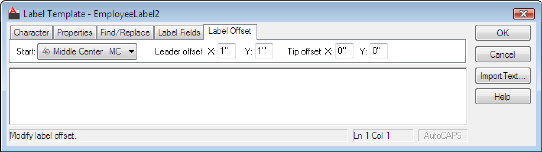
Quick Reference
Commands
DBCONNECT
Provides an interface to external database tables.
Update Labels with New Values from the Database
When database records change, you update labels to reflect the new values.
After you have added labels to your drawings, you may make occasional
changes to the database tables that affect the label values. If you make frequent
changes to your database tables, you must regularly update the labels in your
drawings to ensure data integrity.
To update all label values in the current drawing
1Click Toolsmenu ➤ Palettes ➤ DbConnect.
2In the dbConnect Manager, in the tree view, right-click a drawing file.
Click Reload Labels.
Quick Reference
Commands
DBCONNECT
Provides an interface to external database tables.
1896 | Chapter 39 Access External Databases
Use Queries to Filter Database Information
A query to the database is a search criterion that you construct to return the
records you want.
Overview of Queries
Part of the fundamental power of database systems is their ability to present
a subset of records based on a search criterion or query that you specify. For
example, you might have a database table containing records of all the rooms
that exist at your company's headquarters facilities. Suppose that you want
to prepare a report that lists all conference rooms that can seat more than 20
people. Using the Query Editor, you can easily construct a query that returns
the subset of records or linked graphical objects that you want to see.
The Query Editor consists of a series of four tabs that you can use to develop
queries. The tabbed progression is designed to make working with queries
simple, even if you are not familiar with Structured Query Language (SQL). If
you are unfamiliar with queries, work with the Quick Query and Range Query
tabs initially until you become familiar with query syntax. Once you learn
the basics involved in developing meaningful queries, you can progress to the
Query Builder and SQL Query tabs.
You can begin creating a query in one tab and continue to refine it or add
additional parameters in subsequent tabs. You might, for example, begin
creating a simple query in the Quick Query tab and subsequently decide that
you would like to add an additional condition using the Query Builder tab.
When you click the Query Builder tab, it displays the values that you initially
selected using the Quick Query tab, and you can add additional conditions
to the query. However, you cannot move backwards through the tabs once
you have changed the query in one of the later tabs, because each subsequent
tab provides additional functions that are not available in the previous tabs.
If you attempt to move backwards through the query tabs after modifying a
query, you are prompted with a warning indicating that the query will be
reset with its original default values.
The tabbed progression of the Query Editor is particularly useful in becoming
familiar with SQL syntax. For example, you can create a query using the Quick
Query tab and then select the SQL Query tab to view how your query is
formatted using SQL.
The Query Editor provides the following tabs for building queries:
■Quick Query. Provides an environment where you can develop simple
queries based on a single database field, single operator, and single value.
Use Queries to Filter Database Information | 1897
For example, you can find all records from the current database table where
the value of the "room type" field equals "office."
■Range Query. Provides an environment where you can develop a query
that returns all records that fall within a given range of values. For example,
you can find all records from the current database table where the value
of the "room area" field is greater than or equal to 90 square feet and less
than or equal to 120 square feet.
■Query Builder. Provides an environment where you can develop more
complicated queries based on multiple search criteria. For example, you
can find all records from the current database table where the "room type"
equals "cubicle" and room area is greater than 80 square feet.
■SQL Query. Provides an environment where you can develop sophisticated
queries that conform with the SQL 92 protocol. For example, you can select
* from california.headquarters.room where
california.headquarters.room.type = 'cubicle'
and
california.headquarters.room.area < 80.
See Construct Simple Queries on page 1899 for detailed information about
constructing queries and working with operators. If you are already comfortable
building database queries, see Use the Query Builder on page 1903.
To open the Query Editor
1Click Toolsmenu ➤ Palettes ➤ DbConnect.
2In the dbConnect Manager, in the tree view, select a database table.
3Click the New Query button.
4In the New Query dialog box, enter a name for the query in New Query
Name.
5Click Continue to open the Query Editor.
Quick Reference
Commands
DBCONNECT
Provides an interface to external database tables.
1898 | Chapter 39 Access External Databases

Construct Simple Queries
The simplest query uses one operator to search one field for a certain value.
The range query searches one field to return records that fall within a range
you specify.
The Quick Query Tab
The Quick Query tab is designed to familiarize you with query syntax as quickly
as possible. Constructing a quick query involves selecting a field from the
current database table, applying a conditional operator to it, and specifying a
value for the field.
Conditional operators are constraints such as equal, greater than, or less than.
The following table summarizes the Quick Query tab's operators.
Query Operators
Query Operators
DescriptionOperator
Returns all records that exactly match the value that you specify.Equal (=)
Returns all records except those matching the value that you specify.Not equal (<>)
Returns all records that exceed the value that you specify.Greater than (>)
Returns all records with values that are less than the value that you specify.Less than (<)
Returns all records that exceed or equal the value that you specify.Greater than or equal
(>=)
Returns all records that are less than or equal to the value that you specify.Less than or
equal (<=)
Returns all records that contain the value that you specify. Using the like op-
erator, you can specify the optional % wild-card character. If, for example,
Like
you want to return all records that end with the string "ert", you enter the
value %ert. If you want to return all records that begin with the string "ert",
you enter the value ert%. If you don't specify the % wild-card character, the
program searches for the exact value that you specify.
Returns all records that match a set of values that you specify. If, for example,
you are searching for an employee record but are not sure if the name is
In
Construct Simple Queries | 1899
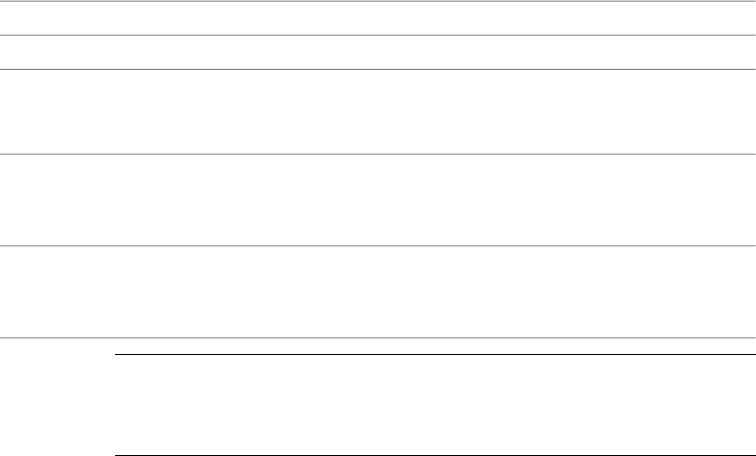
Query Operators
DescriptionOperator
spelled Smith or Smythe, you could issue the in operator and provide both
spelling values to return all records spelled either Smith or Smythe. The two
values must be separated by a comma.
Returns all records that do not have values specified for the field that you're
querying. This operator is useful for locating records in your database table
that are missing data.
Is null
Returns all records that have values specified for the field that you're querying.
This operator is useful for excluding from your query any records in your
database table that are missing data.
Is not null
NOTE All operators can be applied to both numeric and text-based fields. For
example, you can search for all records greater than "c", which would return all
records ranging from "ca..." through "z...". It is important to realize that query
searches are case sensitive: "ROOM" is not equivalent to "room".
The Range Query Tab
Like the Quick Query tab, the Range Query tab is designed to assist users who
are new to working with database queries. Using the Range Query tab, you
can specify a range of values for the query to return: for example, all rooms
that are greater than or equal to 80 square feet but are less than or equal to
100 square feet. The interface is similar to that of the Quick Query tab, except
the Operator field has been removed and the Value field has been replaced
with two fields: a From field and a Through field. All other interface features
are available and work as they do on the Quick Query tab.
To construct a quick query
1Open the Query Editor as described in To open the Query Editor.
1900 | Chapter 39 Access External Databases
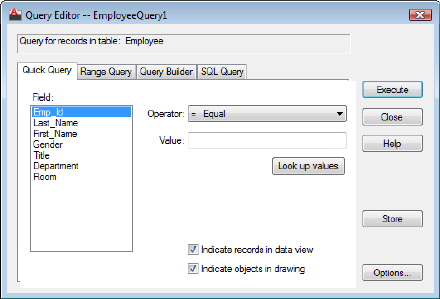
2On the Quick Query tab, select a field from the Field list.
3Select an operator from the Operator list.
4Enter a value in the Value field, or click Look Up Values.
Look Up Values returns a list of all values for the specified field from the
database table, so you can select the value that you want. After selecting
a value, click OK.
5Select one or both of the following:
■Indicate Records in Data View. Highlights records that match your
query in the Data View window.
■Indicate Objects in Drawing. Highlights objects that match your query
in the current drawing.
6If you want to save the query in the current drawing for future use, click
Store.
7Click Execute to execute the query and close the dialog box.
A subset of records that match your query criterion are displayed in the
Data View window. To return to the Query Editor to refine your query,
click the Return to Query button.
To construct a range query
1Open the Query Editor as described inTo open the Query Editor.
Construct Simple Queries | 1901
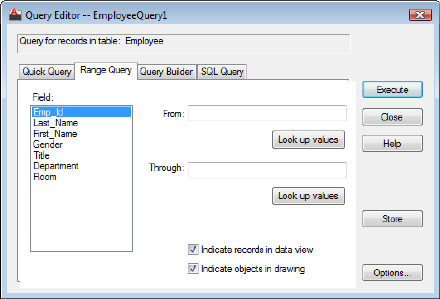
2On the Range Query tab, select a field from the Field list.
3Enter a value in From, or click Look Up Values (From).
Look Up Values displays a list of all values for the specified field from the
database table, so you can select the value that you want. After selecting
a value, click OK.
The query searches for all values greater than or equal to the value that
you specify.
4Enter a value in Through, or click Look Up Values (Through).
The query searches for all values less than or equal to the value that you
specify.
5If you want to save the query in the current drawing for future use, click
Store.
6Click Execute to execute the query and close the dialog box.
Quick Reference
Commands
DBCONNECT
Provides an interface to external database tables.
1902 | Chapter 39 Access External Databases
Use the Query Builder
Boolean operators and parenthetical grouping are used to create queries with
two or more search criteria.
The Query Builder tab is the primary query environment. Unlike the Quick
Query and Range Query tabs, the Query Builder can be used to create queries
based on multiple criteria. You can also parenthetically group criteria and
specify what fields are displayed and how they are sorted when the query is
returned in the Data View window.
The Query Builder tab introduces Boolean operators and parenthetical grouping,
which are used to create compound queries based on two or more search
criteria. For example, using Boolean operators, you can generate a query that
returns a list of all light fixtures of a given type that were installed after a
specific date.
■And Operator. Constructs a query based on multiple criteria, returning a
set of records that meet all specified criteria. For example, search for all
rooms that are offices and are currently unoccupied. The query returns
records for all rooms that are both offices and unoccupied.
■Or Operator. Constructs a query based on multiple criteria, returning a set
of records that meet any of the specified criteria. For example, search for
all rooms that are offices or are currently unoccupied. The query returns
records for all rooms that are either offices or unoccupied.
■Parenthetical Grouping. Groups a series of search criteria by bracketing
them within parentheses. For example, search for
(All rooms that are offices and are currently unoccupied)
or
(All rooms that are cubicles and are currently unoccupied)
This query returns a list of all unoccupied offices and cubicles.
You can nest up to four sets of parentheses within a statement.
Use the Query Builder | 1903
To construct a query with a single parameter on the Query Builder tab
1Open the Query Editor as described in To open the Query Editor.
2On the Query Builder tab, select a field from the drop-down list in the
Field cell.
3Select an operator from the Operator cell drop-down list.
4Enter a value in the Value cell, or click the [...] button.
The [...] button returns a list of all values for the specified field from the
database table, allowing you to select the value you want. After selecting
a value, click OK.
5If you want to save the query in the current drawing for future use, click
Store.
6Click Execute to execute the query and close the dialog box.
To construct a query with multiple parameters on the Query Builder tab
1Enter the first parameter of your query as described in To construct a
query with a single parameter on the Query Builder tab.
2Select the appropriate And or Or operator from the Logical field.
Clicking in the Logical field inserts an And operator. Clicking the cell
again changes the value to Or.
3Enter additional query parameters on subsequent rows of the Query grid.
1904 | Chapter 39 Access External Databases
4Repeat step 2 for each additional parameter except the final query
parameter.
5Apply any parenthetical grouping, if appropriate. Click the cell to the
left of the Field cell that begins the phrase that you want to group. A
single left parenthesis is inserted. Click the cell to the right of the Value
cell that ends the phrase that you want to group. A single right parenthesis
is inserted.
6If you want to save the query in the current drawing for future use, click
Store.
7Click Execute to execute the query and close the dialog box.
To specify what fields appear in your returned query
1Construct your query as described in To construct a query with a single
parameter on the Query Builder tab and To construct a query with
multiple parameters on the Query Builder tab.
2Select the first field that you want to appear in the Fields in Table list.
3Above the Show Fields list, click Add.
4Repeat steps 2 and 3 for any additional fields you want to display.
To specify a sort order for your returned query
1Construct your query as described in To construct a query with a single
parameter on the Query Builder taband To construct a query with multiple
parameters on the Query Builder tab.
2Select the first field that you want to sort on from the Show Fields list.
3Above the Sort By list, click Add.
By default, the selected field is sorted in ascending order. Click the Sort
button to sort in descending order.
4Repeat steps 2 and 3 for any additional fields that you want to sort on.
Use the Query Builder | 1905
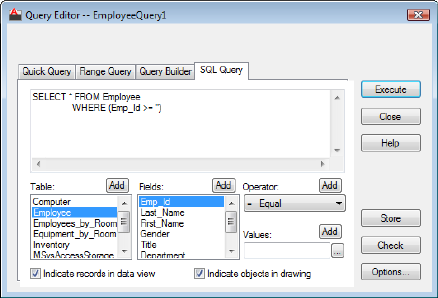
Quick Reference
Commands
DBCONNECT
Provides an interface to external database tables.
Use SQL Queries
If your database is fully compliant with the SQL 92 standard, you can use SQL
statements to query more than one database table at a time.
The SQL Query tab provides you with both a query editor box where you can
enter a free-form SQL query and a set of tools to assist you in constructing a
query. You can issue any valid SQL statement that conforms with Microsoft's
implementation of the SQL 92 protocol from this tab. Because not all database
management systems are fully compliant with the SQL 92 standard, you should
review your system's documentation to see what SQL commands are valid for
your particular database.
Unlike the other tabs in the Query Editor, the SQL Query tab can be used to
construct a query that performs relational operations on multiple database
tables using the SQL join operator. Because joins are a relatively advanced
SQL operation, refer to your database system documentation or to the SQL
92 protocol for information about working with joins.
1906 | Chapter 39 Access External Databases
The following additional interface elements are introduced on the SQL Query
tab:
■Table List. Lists all database tables available in the current data source. You
can add tables to the SQL query editor by double-clicking them, by selecting
them and choosing Add, or by typing their names directly in the SQL query
editor.
■Check. Checks your SQL query for proper syntax without actually executing
it. This function helps you isolate syntax errors before you issue your query.
To construct an SQL query
1Open the Query Editor as described in To open the Query Editor.
2Click the SQL Query tab.
3Enter your query in the Query Editor, or select query components from
the interface as described in Use the Query Builder on page 1903.
4If you want to save the query in the current drawing for future use, click
Store.
5Click Execute to execute the query and close the dialog box.
Quick Reference
Commands
DBCONNECT
Provides an interface to external database tables.
Combine Queries
An advanced type of query uses operators on successive selection sets to return
a new set of objects or records, which then can be further refined by the same
process.
Link Select is an advanced implementation of the Query Editor that constructs
iterative selection sets of graphical objects and database records.
Link Select creates an ongoing selection set that you refine with additional
information through a running iterative process. You begin either by
constructing a query or by selecting graphical objects. This initial selection
set is referred to as set A. You can now select additional graphical objects or
Combine Queries | 1907
issue a query to further refine your selection set. This second selection set is
referred to as set B. You must establish a relationship between set A and set B
to further refine the selection set. The following relationships or set operations
are available:
■Select. Creates an initial query or selection set. This selection set can be
refined through subsequent Link Select operations.
■Union. Adds the results of the new query or selection set to the running
selection set. This operation returns all records or objects that are members
of set A or set B.
■Intersect. Returns the intersection of the existing running selection and
the results of the new query or drawing selection. This operation returns
all records or objects that are members of set A and set B.
■Subtract A - B. Subtracts the results of the new query or drawing selection
from the existing running selection.
■Subtract B - A. Subtracts the existing running selection from the results of
the new query or drawing selection.
After you apply one of the set operations, the returned results become the
new running selection and are assigned to set A. You can continue the iterative
process by creating additional B sets to further refine your Link Select set.
To use Link Select
1Click Toolsmenu ➤ Palettes ➤ DbConnect.
2In the dbConnect Manager, in the tree view, right-click a link template.
Click Link Select.
1908 | Chapter 39 Access External Databases
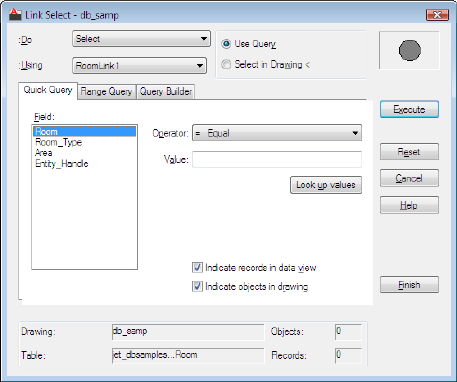
3Select the Select option from the Do list.
4Select a link template from Using.
5Select one of the following options:
■Use Query. Constructs a query using one of the tabs in the Query
Editor.
■Select in Drawing. Closes the dialog box temporarily so that you can
select graphical objects in the drawing. When you select the Select in
Drawing option, the Execute button changes to Select.
6Click either Execute or Select to add your query or graphical object
selection set to the Link Select operation.
7Select a Link Select operation from the Do list: Union, Intersect, Subtract
A-B, or Subtract B-A.
8Repeat steps 3 through 5 to add set B to the Link Select operation.
9Select one or both of the following options and click Finish to complete
the Link Select operation:
■Indicate Records in Data View. Returns the results of the current Link
Select operation in the Data View window when you click Finish. You
can perform further Link Select iterations by clicking the Return to
Link Select button in the Data View window.
Combine Queries | 1909

■Indicate Objects in Drawing. Creates a selection set of linked graphical
objects in the drawing area when you click Finish. You can perform
further Link Select iterations by pressing Enter at the command
prompt.
NOTE It is recommended that you turn off the Indicate Records in Data View
option if you are performing a Link Select operation on links from more than one
database table. Link Select only displays records from the table that the current
link template references. This limitation can cause misleading results to be returned
to the Data View window.
Quick Reference
Commands
DBCONNECT
Provides an interface to external database tables.
Save and Reuse Queries
When you save a query, you can later edit it, rename it, and copy it into other
drawings.
You can save queries that you plan on using more than once with a drawing.
Queries that you save are listed in the dbConnect Manager under the drawing
node of the drawing that they were created in. You can edit and rename stored
queries or copy them to other drawings.
To execute a stored query
1Click Toolsmenu ➤ Palettes ➤ DbConnect.
2In the dbConnect Manager, in the tree view, right-click a stored query.
Click Execute.
To edit a stored query
1Click Toolsmenu ➤ Palettes ➤ DbConnect.
2In the dbConnect Manager, in the tree view, right-click a stored query.
Click Edit.
1910 | Chapter 39 Access External Databases
3Use the Query Editor dialog box to make the necessary changes. Click
Store to save the edited query with the current drawing.
To rename a stored query
1Click Toolsmenu ➤ Palettes ➤ DbConnect.
2In the dbConnect Manager, right-click the query you want to rename.
Click Rename.
3Enter a new name for the query. Press Enter.
To delete a stored query
1Click Toolsmenu ➤ Palettes ➤ DbConnect.
2In the dbConnect Manager, in the tree view, right-click a stored query.
Click Delete.
To copy a stored query to another drawing
1Click Toolsmenu ➤ Palettes ➤ DbConnect.
2In the dbConnect Manager, select the query that you want to copy.
3Drag the query to the node of the drawing that you want to copy it to.
To automatically store new queries with the current drawing
1Click Toolsmenu ➤ Palettes ➤ DbConnect.
2In the dbConnect Manager, in the tree view, open a database table by
double-clicking it.
3In the Data View window, click the Query button.
4In the New Query dialog box, click Continue.
5In the Query Editor dialog box, click Options.
6In the Data View and Query Options dialog box, Query options area,
select Automatically Store. Click OK.
Save and Reuse Queries | 1911
Quick Reference
Commands
DBCONNECT
Provides an interface to external database tables.
Share Link and Label Templates and Queries with Other
Users
You can export and import links and link templates, labels and label templates,
and queries.
Occasionally you may want to make templates or queries that you have
developed available to other users, or use templates or queries that others have
developed. This is particularly useful when developing a set of common tools
that can be shared by all of the team members on a project, and it eliminates
the need to replicate the work of template and query development on each
team member's workstation. The program can import and export all the link
and label templates and queries that are associated with a drawing.
To import a set of templates into the current drawing
1Click Toolsmenu ➤ Palettes ➤ DbConnect.
2In the dbConnect Manager, in the tree view, right-click a drawing file.
Click Import Template Set.
3In the Import Template Set dialog box, select a template set.
4Click Open to import the template set into the current drawing.
If there is a link or label template with the same name already associated
with the current drawing, an alert box is displayed that you can use to
provide a unique name for the template.
To export a set of templates from the current drawing
1Click Toolsmenu ➤ Palettes ➤ DbConnect.
2In the dbConnect Manager, in the tree view, right-click a drawing file.
Click Export Template Set.
3In the Export Template Set dialog box, in the Save In list, select the
directory you want to save the template set to.
1912 | Chapter 39 Access External Databases
4Under File Name, specify a name for the template set. Click Save.
To import a set of queries into the current drawing
1Click Toolsmenu ➤ Palettes ➤ DbConnect.
2In the dbConnect Manager, in the tree view, right-click a drawing file.
Click Import Query Set.
3In the Import Query Set dialog box, select the query set.
4Click Open to import the query set into the current drawing.
If there is a query with the same name already associated with the current
drawing, an alert box is displayed that you can use to provide a unique
name for the query.
To export a set of queries from the current drawing
1Click Toolsmenu ➤ Palettes ➤ DbConnect.
2In the dbConnect Manager, in the tree view, right-click a drawing file.
Click Export Query Set.
3In the Export Query Set dialog box, in the Save In list, select the directory
where you want to save the query set.
4Under File Name, specify a name for the query set. Click Save.
Quick Reference
Commands
DBCONNECT
Provides an interface to external database tables.
Work with Links in Files from Earlier Releases
You can convert ASE links in drawings from Releases 12, 13, and 14 to
AutoCAD 2000 or later format. You can save AutoCAD 2000 links in Release
13 and Release 14 format.
Because AutoCAD 2000 and later releases store links in a different format than
previous releases, you need to convert your links if you plan on using them
with AutoCAD 2000 and later. Note the changes in terminology: key value
Work with Links in Files from Earlier Releases | 1913

replaces key column in Release 14; link template replaces link path name; and label
replaces displayable attribute. You also need to create a configuration file that
points to the data source referenced by the legacy links.
When you open a drawing that contains legacy links, the program attempts
to perform an automatic conversion of the legacy information. If, for example,
you open a Release 14 drawing that contains links that point to a data source
with the structure db3.ase.db3sample.computer(com), the program attempts to
establish an exact, one-to-one mapping of the data source components.
In some cases, the legacy data source might not match exactly how the data
source is configured. For example, the legacy data source might specify a
catalog that isn't specified in the data source. If the automatic link conversion
is unsuccessful, you can use the Link Conversion dialog box to establish a
mapping between the legacy and new data sources. You can also use the Link
Template Properties dialog box to specify new data source parameters for a
selected link template.
During the conversion process, the data source mapping information is written
to a file called asi.ini. You can manually edit the conversion mapping
information specified in this file, if necessary.
NOTE The program attempts to automatically convert legacy links only for data
sources that don't have mapping values specified in the asi.ini file. Once you have
specified conversion mappings for a particular data source, the program uses the
settings specified in the asi.ini file for any additional legacy drawings you open
that contain links that reference this data source.
Save Links to Earlier Formats
Links that you have created in AutoCAD 2000 and later can be converted to
Release 13 or Release 14 links. AutoCAD 2000 and later links cannot be
converted to Release 12 format. When you use SAVEAS to save a drawing in
the current format that contains links to Release 13 or Release 14 format, the
links are automatically converted to the appropriate drawing format. You
must specify a conversion mapping as described above.
To convert Release 13 and Release 14 links
1Click Toolsmenu ➤ Palettes ➤ DbConnect.
2Click DbConnect menu ➤ Link Conversion.
3In Old Link Format, do all of the following:
■Select R13/R14 Link Format.
1914 | Chapter 39 Access External Databases
■In Environment, enter the name of the Release 13 or Release 14
environment for the link that you want to convert.
■In Catalog, enter the name of the Release 13 or Release 14 catalog for
the link that you want to convert.
■In Schema, enter the name of the Release 13 or Release 14 schema for
the link that you want to convert.
■In Table, enter the name of the Release 13 or Release 14 database table
for the link that you want to convert .
■In Link Path Name, enter the link path name for the link that you
want to convert.
4In New Link Format, do all of the following:
■Select the appropriate data source from the Data Source list.
■Select the appropriate catalog from the Catalog list.
■Select the appropriate schema from the Schema list.
■Select the appropriate table from the Table list.
■Select the appropriate link template from the Link Template list.
5Click OK.
6Open the drawing whose links you want to convert, and save it.
Work with Links in Files from Earlier Releases | 1915
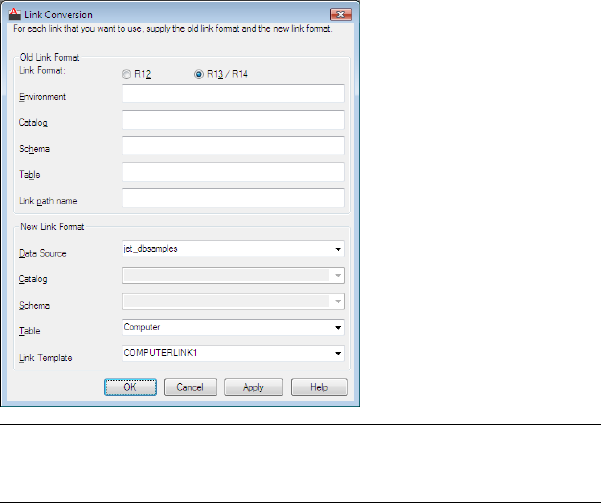
NOTE You must specify an environment, database table, and link path name
for all links that you convert. Catalog and schema are optional parameters
that are not required by all database management systems.
To convert Release 12 links
1Click Toolsmenu ➤ Palettes ➤ DbConnect.
2Click DbConnect menu ➤ Link Conversion.
3In Old Link Format, do all of the following:
■Select R12 Link Format.
■In DBMS, enter the name of the Release 12 database management
system for the link that you want to convert.
■In Database, enter the name of the Release 12 database for the link
that you want to convert.
■In Table, enter the name of the Release 12 database table for the link
that you want to convert.
4In New Link Format, do all of the following:
■Select the appropriate data source name from the Data Source list.
1916 | Chapter 39 Access External Databases

■Select the appropriate catalog from the Catalog list.
■Select the appropriate schema from the Schema list.
■Select the appropriate table from the Table list.
■Select the appropriate link template from the Link Template list.
5Click OK.
6Open the drawing whose links you want to convert, and then save it.
Once you have specified a link conversion mapping, when you
subsequently open and save in AutoCAD 2000 or later format a drawing
that contains links that are specified in the mapping, the links are
converted to the new format.
Quick Reference
Commands
DBCONNECT
Provides an interface to external database tables.
Manage Files with Autodesk Vault
Autodesk Vault gives you more power to manage files and track changes.
Versioned copies of master files are maintained, allowing you to easily revert
to earlier versions of files.
For information about using the Vault, refer to the Vault Help system.
NOTE The main components for the Autodesk Vault can be downloaded from
the Autodesk Subscription site.
See also:
■Access Subscription Center on page 7
Manage Files with Autodesk Vault | 1917
1918
Part 12: Collaborate with
Others
1919
1920
Protect and Sign Drawings
You can collaborate on design projects using passwords and digital signatures. When a drawing
has a password, it cannot be viewed until the password is entered. When a drawing is signed,
the signature identifies an individual or an organization through a digital ID (certificate).
You can provide a safe environment for sending and receiving data, and maintain the
authenticity of drawings. A password protects a drawing with encryption, and a digital signature
identifies an individual or an organization through a digital ID (certificate).
Drawing Encryption
When a password is attached to a drawing, the password encrypts the drawing
and prevents unauthorized people from viewing it.
Overview of Encryption
Password-based encryption helps secure drawing data when you collaborate on
projects. Specifically, when you maintain a password for a drawing, you can
help prevent unauthorized viewing of the drawing when it is sent to others.
When a password is attached to a drawing, the password encrypts the drawing
and prevents unauthorized people from viewing it. You can choose the level of
encryption used. Passwords help you collaborate on projects by helping to keep
your data safe when the data is sent to others.
The drawing encryption password is different from other types of drawing
passwords, such as the password you use with eTransmit, because you can specify
the encryption level.
The primary use of encryption is to help prevent drawing data from being stolen.
Encryption can also be used to help keep data confidential.
40
1921

For example, if a company creates a valuable, confidential design for an engine
factory, the company can help protect the drawings with a password (or phrase)
before sending the drawings out for review by the builders. Password protection
could be one of the many measures the company could take, in addition to
measures such as a secure intranet and rules about information disclosure,
that would help keep the factory design confidential.
Passwords work only on AutoCAD 2004® and later drawing files (DWG, DWS,
and DWT files).
NOTE If you want to attach a password and a digital signature to a drawing file,
attach the password first. Modifications to files, including the adding of passwords,
invalidate their digital signatures.
Quick Reference
Commands
SECURITYOPTIONS
Specifies password or digital signature options for a drawing file.
Protect Drawings with Encryption
If you add a password to a drawing and save the drawing, the drawing is
encrypted and cannot be reopened until the password is entered.
Add a Password to a Drawing
A password can be a single word, or a phrase. It is recommended that you use
common characters. The more characters you use, the harder it is for an
unauthorized program, or “password cracker,” to determine the password.
When you add a password to a drawing, you can choose whether to encrypt
drawing properties, and you can specify an encryption type and key length.
After you add a password to a drawing and save the drawing, the password is
required before any program or part of a program can read the data in the
drawing, even if the drawing is an external reference. A specific password
generally is required to be entered once per session.
You can attach a password to a file while modifying the file or when you save
the file. You must individually add a password to each drawing you want to
encrypt.
1922 | Chapter 40 Protect and Sign Drawings

WARNING If you lose a password, your drawing file is lost. Before you add a
password to a drawing, you should create a backup that is not protected with a
password.
If you encrypt drawing properties, such as the title, author, subject, and
keywords, then a password is required to view the properties and thumbnail
preview of the drawing. If you decide to specify an encryption type and key
length, you can select them from the ones available on your computer.
NOTE Settings for a password apply only to the current drawing.
To add a password while modifying a drawing
1Click Tools menu ➤ Options.
2In the Options dialog box, Open and Save tab, click Security Options.
3In the Security Options dialog box, Password tab, enter a password.
4To encrypt drawing properties, such as the title, author, subject, and
keywords, click Encrypt Drawing Properties.
5Click OK.
6In the Confirm Password dialog box, enter the password you used. Click
OK.
WARNING If you lose a password, it is not recoverable. Before you add a
password to a drawing, you should create a backup that is not protected
with a password.
To add a password before saving a drawing
1Click File menu ➤ Save As.
2In the Save Drawing As dialog box, before saving the file, click Tools
menu ➤ Security Options.
3In the Security Options dialog box, Password tab, enter a password.
4To encrypt drawing properties, such as the title, author, subject, and
keywords, click Encrypt Drawing Properties.
5Click OK.
6In the Confirm Password dialog box, enter the password you used. Click
OK.
Protect Drawings with Encryption | 1923

WARNING If you lose a password, it is not recoverable. Before you add a
password to a drawing, you should create a backup that is not protected
with a password.
To remove a password from a drawing
1Click Tools menu ➤ Options.
2In the Options dialog box, Open and Save tab, click Security Options.
3In the Security Options dialog box, Password tab, clear the Password or
Phrase to Open This Drawing option.
4Click OK.
Quick Reference
Commands
SECURITYOPTIONS
Specifies password or digital signature options for a drawing file.
Choose the Type of Encryption
You can choose an advanced encryption level to protect your drawing.
A default encryption level, supplied by your operating system, is used unless
you choose an advanced level. If you decide to choose an advanced level, you
can choose from RC4 encryption providers supplied by your operating system.
You also can choose a key length (the higher the length, the higher the
protection). An RC4 encryption provider is a standard form of encryption,
and the RC4 encryption providers vary in the type of protection they provide.
Before using an advanced encryption level (provider, type, and key length),
confirm that any computer that needs to decrypt the drawing has the
cryptography service provider you plan to use. For more information on
cryptography providers, encryption types, and encryption key lengths, search
the Internet for these terms.
To choose the encryption provider and key length for a drawing
1Click Tools menu ➤ Options.
1924 | Chapter 40 Protect and Sign Drawings
2In the Options dialog box, Open and Save tab, click Security Options.
3In the Security Options dialog box, Password tab, enter a password or
phrase to open the drawing. Click Advanced Options.
4In the Advanced Options dialog box, choose an encryption provider, key
length, or both. Click OK.
5In the Security Options dialog box, click OK.
Quick Reference
Commands
SECURITYOPTIONS
Specifies password or digital signature options for a drawing file.
View Password-Protected Drawings
To view the data in a password-protected drawing, you must first obtain and
enter the password. After you enter the password, it stays with the drawing,
even if you modify and save the drawing, unless you remove the password.
Enter a Password to View a Drawing
To view data in a password-protected drawing, you open the drawing in a
standard way and enter the password. Passwords are not case-sensitive.
Unless a drawing's properties, such as the title, author, subject, and keywords,
were encrypted when the password was attached, you can view the properties
in Properties dialog box in Microsoft® Windows Explorer.
A password-protected drawing may contain external references (xrefs) to
password-protected drawings. If you open a password-protected drawing that
contains xrefs, you are prompted to enter the password for the current drawing.
Then you are prompted to enter the passwords of any xrefs whose passwords
are different from a password you have entered in the current session. A specific
password that applies to a drawing or xref generally is required to be entered
once per session.
A drawing and its external references remain password-protected until the
passwords are removed. You generally should remove passwords before
performing batch operations on files, unless you are signing files.
View Password-Protected Drawings | 1925
If data in a password-protected drawing is read for any reason by the program,
the password must be entered at least once per session of program use.
To view a password-protected drawing
1Click File menu ➤ Open.
2In the Select File dialog box, select a file. Click Open.
3In the Password dialog box, enter a password.
4Click OK.
Quick Reference
Commands
SECURITYOPTIONS
Specifies password or digital signature options for a drawing file.
View Password-Protected Xrefs
You can view drawings that contain xrefs to password-protected drawings.
If you open a password-protected drawing that contains xrefs, you must enter
a password for any xref whose password is different from the current drawing's
password.
You are only prompted to enter passwords that you have not yet entered. For
example, if an xref shares a password with a drawing you have accessed in the
current program session, such as an open drawing or an xref, you do not need
to continue entering the same password.
To view a drawing with password-protected xrefs
1Click File menu ➤ Open.
2In the Select File dialog box, select a file. Click Open.
3If prompted to enter passwords in the Password dialog box, enter any
necessary passwords. Click OK.
1926 | Chapter 40 Protect and Sign Drawings
Quick Reference
Commands
SECURITYOPTIONS
Specifies password or digital signature options for a drawing file.
View Properties of an Encrypted Drawing
You can view drawing properties, such as the title, author, subject, and
keywords, unless they were encrypted when a password was attached to the
drawing.
If drawing properties were not encrypted when a password was attached, you
can view the properties in your operating system's Properties dialog box.
To view properties of an encrypted drawing
1In Windows Explorer, locate the file whose properties you want to view.
2Right-click the file name. Click Properties.
Quick Reference
Commands
SECURITYOPTIONS
Specifies password or digital signature options for a drawing file.
Sign Drawings
Digital signatures maintain authenticity and provide a safe environment for
sending and receiving data. You can work on collaborative projects, transmit
files over the Internet, and help guarantee that the files have not been altered.
Overview of Digital Signatures
With a digital signature, you can collaborate more easily with others on
projects. Recipients of drawings are provided with reliable information about
who created a set of drawings and whether they were modified since they
were digitally signed.
Sign Drawings | 1927

Specifically, digital signatures provide the following benefits:
■Recipients of digitally signed files can be sure that the organizations or
individuals who sent the files are who they claim to be.
■A digital signature guarantees that a file has not changed since the file was
signed.
■A signed file cannot be rejected as invalid. The signer of a file cannot
disown the file later by claiming the signature was forged.
A digital signature is not the same as a digitized signature. While a digital
signature helps prove your identity and a drawing's authenticity, a digitized
signature is nothing more than an electronic version of your own signature.
It can be forged and copied, and has no real security value.
Digital IDs use two keys—a public key, which anyone can use to validate a
digital signature, and a private key, which is known only by the originator of
the digital ID. The private key is used to create the digital signature. To learn
more about digital IDs, digital signatures, and public and private keys, search
the Internet for these terms.
You can attach signatures to files that are compatible with AutoCAD 2000
and later file formats, including files generated by the eTransmit feature. To
attach a signature to multiple files at once, or to attach a signature to a file
compatible with the AutoCAD 2000 or later drawing-file format, see “Attach
Digital Signatures Dialog Box” in the Command Reference.
NOTE Once you attach a digital signature to a drawing file, it will either be valid
or invalid. You cannot remove the digital signature from the drawing file. If a
digital signature was attached to a drawing in error, save the drawing in DXF
format, open the DXF file, and then save it in DWG format.
Quick Reference
Commands
SECURITYOPTIONS
Specifies password or digital signature options for a drawing file.
SIGVALIDATE
Displays information about the digital signature attached to a drawing file.
1928 | Chapter 40 Protect and Sign Drawings
System Variables
SIGWARN
Controls whether a warning is presented when a file with an attached digital
signature is opened.
Utilities
Attach Digital Signatures
Attaches a digital signature to files.
Personally Sign Drawings
When you attach a digital signature to a file, anyone who views the file is
notified if modifications were made after you signed it. Modifications invalidate
a digital signature.
Obtain a Digital ID
To attach a digital signature to a file, you must have a digital ID (certificate),
which is issued by a certificate authority. A digital ID identifies either an
individual or an organization.
A digital ID contains a name, serial number, expiration date, and other
information that certifies the digital signature. From a certificate authority,
you can obtain digital IDs with a security level of Low, Medium, or High.
■Low. Use a Low security level if you want to sign multiple files quickly. A
digital signature is automatically attached to all file types that are valid for
a digital signature.
■Medium. Use a Medium security level if you want to be informed when
an application is trying to create a signature with your digital ID. You are
notified each time a digital signature containing your digital ID is attached
to a file.
■High. Use a High security level if the signature is very sensitive and you
do not want your computer to be misused in the signing of a file. You are
prompted for a password each time you sign a file.
You can set an option to automatically attach your signature to a drawing
whenever you save it. You also can sign many drawings at once, in a batch,
and you can sign transmittal packages of drawings.
Personally Sign Drawings | 1929

NOTE To prevent changes to the drawing, applying a digital signature to a drawing
automatically sets the FIELDEVAL system variable to 0 (manual update).
To obtain a digital ID on the Internet
1Open a search engine in your Internet browser and search for the term
“digital certificate.”
2Click a search result to find out more about a digital ID vendor and how
to obtain a digital ID.
Quick Reference
Commands
SECURITYOPTIONS
Specifies password or digital signature options for a drawing file.
SIGVALIDATE
Displays information about the digital signature attached to a drawing file.
System Variables
SIGWARN
Controls whether a warning is presented when a file with an attached digital
signature is opened.
Utilities
Attach Digital Signatures
Attaches a digital signature to files.
Attach a Signature to a Single File
When you attach a digital signature to a file, you are helping to ensure that
recipients of the file are notified of modifications.
You can set an option for a signature to be attached after you save a file. A
single digital signature can be attached per file.
If you plan to protect a set of drawings with a password and a signature, first
add the passwords, and then sign the files in a batch. Adding a password to
1930 | Chapter 40 Protect and Sign Drawings

a signed drawing, or otherwise changing a signed drawing, invalidates the
signature.
NOTE Unless you use the Attach Digital Signatures utility, you must individually
sign each drawing.
To set an option for a signature to be attached after you save a file
1Do one of the following:
■Click Tools menu ➤ Options. In the Options dialog box, Open and
Save tab, click Security Options.
■Click File menu ➤ Save As. In the Save Drawing As dialog box, click
Tools ➤ Security Options.
2In the Security Options dialog box, Digital Signature tab, select Attach
Digital Signature After Saving Drawing.
3Click OK.
NOTE In the Security Options dialog box, you can attach digital signatures
only to files that are compatible with the AutoCAD 2000 and later drawing-file
formats.
Quick Reference
Commands
SECURITYOPTIONS
Specifies password or digital signature options for a drawing file.
SIGVALIDATE
Displays information about the digital signature attached to a drawing file.
System Variables
SIGWARN
Controls whether a warning is presented when a file with an attached digital
signature is opened.
Personally Sign Drawings | 1931

Utilities
Attach Digital Signatures
Attaches a digital signature to files.
Attach Digital Signatures to Multiple Files
When you attach a digital signature to a set of files, you are helping to ensure
that anyone viewing the files knows about any changes that are made to the
files after you signed them.
You can attach a digital signature to the following file types:
■EXE and ZIP files generated by eTransmit
■DWS files
■DWG and DWT files that are compatible with AutoCAD 2000 and later
drawing-file formats
When you attach a digital signature to a set of files, you can select the files
individually from within the signing utility or drag them into the utility from
Windows Explorer.
To attach a digital signature to multiple files
1Click Start menu (Windows), ➤ All Programs ➤ Autodesk ➤ AutoCAD
2011 ➤ Attach Digital Signatures.
2In the Attach Digital Signatures dialog box, click Add Files.
3In the Select File dialog box, select the files you want to attach a digital
signature to. Click Open.
NOTE In the Attach Digital Signatures dialog box, you can attach digital
signatures to files that are compatible with AutoCAD 2000 and later
drawing-file formats.
4In the Attach Digital Signatures dialog box, in the Select a Digital ID
(Certificate) box, select a digital ID to attach to the files you selected in
the Files to Be Signed list.
5In the Get Time Stamp From box, select a time service if you want to add
a time stamp to the signed files. If you do not want to add a time stamp,
use the default option No Time Stamp.
1932 | Chapter 40 Protect and Sign Drawings

6In the Comment box, add any information that is relevant to the files
you are signing.
7Click Sign Files.
8If the file you want to sign is read-only, the Read-only File dialog box is
displayed. Do one of the following:
■To sign a read-only file, click Yes.
■To sign all read-only files, select Use the Same Answer for All Read-only
Files in This Batch. Click Yes.
■To cancel the application of the digital signature to a single read-only
file, click No.
■To cancel the application of the digital signature to all of the read-only
files, click Cancel.
NOTE If you chose either a Medium or High security level when you obtained
your digital ID, a message is displayed each time you try to attach a digital
signature to a file.
9When all files have been signed, the Signing Complete message displays
the number of files that were signed. Click OK.
Files that were successfully signed display the text “Signed” in the Status
column of the Files to Be Signed list.
10 Click Close.
NOTE When you sign multiple files at once, the files become read-only files to
help prevent someone from accidentally invalidating a digital signature.
Quick Reference
Commands
SECURITYOPTIONS
Specifies password or digital signature options for a drawing file.
SIGVALIDATE
Displays information about the digital signature attached to a drawing file.
Personally Sign Drawings | 1933

System Variables
SIGWARN
Controls whether a warning is presented when a file with an attached digital
signature is opened.
Utilities
Attach Digital Signatures
Attaches a digital signature to files.
Add a Comment and Time Stamp
You can add a comment and time stamp to a digital signature.
Servers are used to obtain the current time when adding a time stamp to a
digital signature. When you send drawing files over the Internet or work on
collaborative projects, you can use a specific server to create an accurate,
consistent time stamp.
Several government operations (such as the National Institute of Standards
and Technology, or the US Naval Observatory) and public systems (such as
California Institute of Technology) offer accurate time values. You can also
use your own server to create a time stamp by modifying the timesrvr.txt file
or creating a custom text file that contains the servers you want to use when
adding a time stamp to a digital signature.
The timesrvr.txt file is located in the program’s install directory. By default the
install directory for the program is located at \Program Files\AutoCAD 2011.
To add a new server, open the timesrvr.txt file with a text editor like Notepad
and add the required information for the server. The information that you
need to add to the timesrvr.txt file when you want to added your own server
is a description and the name of the server. The description that is provided
is the value that appears in the drop-down and the name of the server is the
URL (Uniform Resource Locator) to the server. The information for each server
listed in the timesrvr.txt file must be in the following format:
Description (server_name)
For example:
National Institute of Standards and Technology (time.nist.gov)
NOTE Each server that you add needs to be on a separate line in the text file used.
.
1934 | Chapter 40 Protect and Sign Drawings

To use a file different from the timesrvr.txt file that contains the available time
servers to use when creating a time stamp for a digital signature, change the
setting of the ADSKSIGTIMESRVR environment variable. For example, change
the variable to c:\temp\mytimelist.txt
To choose a time server and add a comment
1Do one of the following:
■Click Tools menu ➤ Options. In the Options dialog box, Open and
Save tab, click Security Options.
■Click File menu ➤ Save As. In the Save Drawing As dialog box, click
Tools ➤ Security Options.
2In the Security Options dialog box, Digital Signature tab, select Attach
Digital Signature After Saving Drawing.
3In the Get Time Stamp From box, click a time server.
4In the Comment box, add a comment.
5Click OK.
To add a time server to the Time Server list
1Locate and open the timesrvr.txt file.
The timesrvr.txt file contains time service information.
2In the timesrvr.txt file, add the time service you want to use. Use the
following format:
Description (server_name)
For example:
National Institute of Standards and Technology (time.nist.gov)
3Save the file.
NOTE To use a file different from the timesrvr.txt file that contains the available
time servers to use when creating a time stamp for a digital signature, change the
setting of the ADSKSIGTIMESRVR environment variable. For example, change the
variable to c:\temp\mytimelist.txt.
Personally Sign Drawings | 1935
Quick Reference
Commands
SECURITYOPTIONS
Specifies password or digital signature options for a drawing file.
SIGVALIDATE
Displays information about the digital signature attached to a drawing file.
System Variables
SIGWARN
Controls whether a warning is presented when a file with an attached digital
signature is opened.
Utilities
Attach Digital Signatures
Attaches a digital signature to files.
Digitally Sign an Encrypted Drawing
You can attach a password and a digital signature to a drawing file. The
password must be attached first.
Modifications to files, including the adding of passwords, invalidate their
digital signatures.
Quick Reference
Commands
SECURITYOPTIONS
Specifies password or digital signature options for a drawing file.
SIGVALIDATE
Displays information about the digital signature attached to a drawing file.
1936 | Chapter 40 Protect and Sign Drawings
System Variables
SIGWARN
Controls whether a warning is presented when a file with an attached digital
signature is opened.
Utilities
Attach Digital Signatures
Attaches a digital signature to files.
View Drawings with Digital Signatures
Digital signatures provide an electronic means of verifying the authenticity
of signatures that are attached to drawing files.
Overview of Drawings with Digital Signatures
A digital signature identifies an individual or an organization through a digital
ID (certificate), and enables you to validate the file. Validating a file is especially
important when you are working on collaborative projects or transmitting
files over the Internet. You can validate a digital signature in either the program
or Windows Explorer.
Using the digital signatures feature, you can obtain the following information
about signed files:
■Whether the file was changed since signed.
■Whether the signers are who they claim to be.
■Whether the signers can be traced (thus preventing forgery).
A digital signature is determined to be invalid for the following reasons:
■The file was corrupted when the digital signature was attached.
■The file was corrupted in transit.
■The digital ID is no longer valid.
View Drawings with Digital Signatures | 1937

NOTE If you want to retain valid digital signature status, do not add a password
or otherwise modify or save a file that already has a digital signature attached.
Make modifications, such as adding passwords, before signing the file. Signature
information does not remain intact if you modify, save, or export drawing data.
View Digital Signature Details
When you receive a file that contains a digital signature, you can check
whether the file was modified since it was signed, and other information.
An icon is displayed in the status bar when a file contains digital signature
information. When you click the icon, you can verify the following
information:
■Validity of the file
■Whether the file was modified since it was signed
■Individual or organization that signed the file
■Time stamp and comments attached to the file
■Issuer (certificate authority) of the digital ID
■“Valid to” and “valid from” dates for the digital ID
Digital signatures work on files that are compatible with AutoCAD 2000 and
later drawing-file formats. If you receive a signed file and save the file, it is
considered modified, and the signature is invalidated. However, you generally
can still view information about it. If you receive a signed drawing-file and
save the file, the signature information can be lost.
NOTE If the SIGWARN system variable is on and you open a file with a valid
signature, the digital signature status is displayed. If SIGWARN is off and you open
a file, the digital signature status is displayed only if a signature is invalid.
You can also view the properties of a drawing file in Windows Explorer to
examine and validate a digital signature. Some operating systems display a
modified icon for a drawing that has a valid digital signature attached. If the
modified icon is displayed, your computer may slow down (depending on
processor speed and file size), so you can turn off the display.
To validate a signature when opening an file
1Click Tools menu ➤ Options.
1938 | Chapter 40 Protect and Sign Drawings
2In the Options dialog box, Open and Save tab, select Display Digital
Signature Information.
3Click OK.
4Open a signed file.
In the Digital Signature Contents dialog box, in the Other Fields list,
select details of the digital signature, such as the issuer, beginning and
expiration dates of the digital ID, and the serial number.
5Click Close.
To validate a signature using the Validate Digital Signatures icon
1Open a signed file.
2On the status bar, click the Validate Digital Signatures icon.
3In the Validate Digital Signatures dialog box, if the file has a valid digital
signature, click View Base Signature.
The Digital Signature Contents dialog box displays details of the digital
signature such as the signer, expiration date of the digital ID, serial
number, comments about the digital signature, time stamp, and time
service.
4Click Close.
5If the file contains an external reference (xref) that contains a digital
signature, select View Xref Drawings in the Validate Digital Signatures
dialog box. Click View Xref Signature to view the external references
associated with the file.
6Click Close.
To validate a signature in Windows Explorer
1In Windows Explorer, locate a file whose digital signature you want to
check.
Some operating systems display a modified icon for a drawing that has
a valid digital signature attached.
2Right-click the file name. Click Properties.
3In the Properties dialog box, if the file contains a digital signature, the
Digital Signature tab is displayed. Click the Digital Signatures tab to view
the digital signature details.
View Drawings with Digital Signatures | 1939

A Valid Signature icon is displayed if a digital signature is valid, and an
Invalid Signature icon is displayed if the digital signature is not valid.
4In the Other Fields list, select an option from the list to view details of
the digital signature, such as the issuer, description, and expiration date
of the digital ID. You can also view the time stamp and time service.
5When you have finished viewing the digital signature information, click
OK.
To identify a signed file in Windows Explorer
■In Windows Explorer, locate files that you want to check for a digital
signature. Signed files are displayed with the Digital Signatures icon.
To turn on or off the Digital Signatures icon display in Windows Explorer
1In Windows Explorer, locate a file that has a digital signature icon.
2Right-click the file name. Click Enable/Disable Digital Signature Icons.
3Click the check box next to Validate Digital Signatures and Display Special
Icons to turn on the icon display in Windows Explorer, or clear the check
box to turn off the icon display.
4Click OK. Log out of Windows, and then log back in.
To prevent signature status from being displayed for valid signatures
1Click Tools menu ➤ Options.
2In the Options dialog box, Open and Save tab, clear the Display Digital
Signature Information option.
3Click OK.
1940 | Chapter 40 Protect and Sign Drawings
Quick Reference
Commands
SECURITYOPTIONS
Specifies password or digital signature options for a drawing file.
SIGVALIDATE
Displays information about the digital signature attached to a drawing file.
System Variables
SIGWARN
Controls whether a warning is presented when a file with an attached digital
signature is opened.
Utilities
Attach Digital Signatures
Attaches a digital signature to files.
Install a Root Certificate
When you receive a file that contains a digital signature from a certificate
authority that is not recognized by your operating system, you may need to
obtain the root certificate (the highest level of certificate in a certificate chain)
before you can determine if the digital ID in the digital signature is valid.
Digital IDs work on the basis of a trust hierarchy. In a trust hierarchy, the root
certificate is the digital ID of the issuing certificate authority. Popular browsers
such as Microsoft Internet Explorer already include the root certificates of the
major certificate vendors, making those digital IDs automatically trusted.
When you receive a file that is signed with a digital ID issued by someone
other than a major vendor (for example, your company's internal IT
department), you cannot validate the digital ID until you receive the root
certificate.
To obtain a root certificate
1To request the root certificate, contact the organization or individual
who attached a digital signature to the current file.
View Drawings with Digital Signatures | 1941
2When you receive the root certificate, click Start menu (Windows) ➤
Settings ➤ Control Panel ➤ Internet Options.
3In the Internet Properties dialog box, Content tab, click Certificates.
4In the Certificate Manager, click Import to run the Certificate Manager
Import Wizard.
5Follow the on-screen instructions to obtain a root certificate for the
current file.
Quick Reference
Commands
SECURITYOPTIONS
Specifies password or digital signature options for a drawing file.
SIGVALIDATE
Displays information about the digital signature attached to a drawing file.
System Variables
SIGWARN
Controls whether a warning is presented when a file with an attached digital
signature is opened.
Utilities
Attach Digital Signatures
Attaches a digital signature to files.
1942 | Chapter 40 Protect and Sign Drawings
Use the Internet for
Collaboration
You can access and store drawings and related files on the Internet.
Get Started with Internet Access
To use the Internet features with this program, you must have Internet or
intranet access and Microsoft Internet Explorer 6.1 Service Pack 1 (or a later
version).
In this text, the term Internet is used to refer to both the Internet and an intranet.
To save files to an Internet location, you must have sufficient access rights to
the directory where the files are stored. Contact your network administrator or
Internet service provider (ISP) to receive access rights for you and anyone else
who needs to work with the files.
If you connect to the Internet through your company's network, you might
have to set up a proxy server configuration. Proxy servers act as security barriers
by shielding information on your company's network from potential security
risks due to external Internet access. See the Internet applet in the Windows®
Control Panel or contact your network administrator for details about how to
configure a proxy server in your network environment.
Quick Reference
Commands
BROWSER
Launches the default web browser defined in your system's registry.
41
1943
HYPERLINK
Attaches a hyperlink to an object or modifies an existing hyperlink.
System Variables
HYPERLINKBASE
Specifies the path used for all relative hyperlinks in the drawing.
INETLOCATION
Stores the Internet location used by the BROWSER command and the Browse
the Web dialog box.
Add Hyperlinks to a Drawing
You can add hyperlinks that provide jumps in your drawings to specific files
or websites.
Overview of Using Hyperlinks in a Drawing
Hyperlinks provide a simple and powerful way to quickly associate a variety
of documents (such as other drawings, bills of materials, or project schedules)
with a drawing.
Hyperlinks are pointers you create in your drawings that provide jumps to
associated files. For example, you can create a hyperlink that launches a word
processing program and opens a specific file, or a hyperlink that activates your
web browser and loads a particular HTML page. You can also specify a named
location to jump to in a file, such as a view in a drawing file or a bookmark
in a word processing program. You can attach hyperlinks to any graphical
object in an AutoCAD drawing. Hyperlinks provide a simple and powerful
way to quickly associate a variety of documents (such as other drawings, bills
of materials, or project schedules) with an AutoCAD drawing.
You can create both full and relative hyperlinks in your drawings. Full hyperlinks
store the fully specified path to a file location. Relative hyperlinks store a
partial path to a file location, relative to a default URL or directory you specify
using theHYPERLINKBASE system variable.
1944 | Chapter 41 Use the Internet for Collaboration
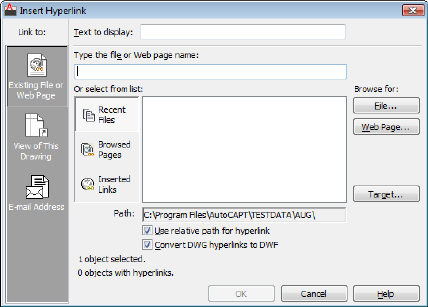
Quick Reference
Commands
ATTACHURL
Attaches hyperlinks to objects or areas in a drawing.
DETACHURL
Removes hyperlinks in a drawing.
GOTOURL
Opens the file or web page associated with the hyperlink attached to an
object.
HYPERLINK
Attaches a hyperlink to an object or modifies an existing hyperlink.
System Variables
HYPERLINKBASE
Specifies the path used for all relative hyperlinks in the drawing.
Use a Hyperlink to Access a File or a Web Page
Hyperlinks can point to files that are stored locally, on a network drive, or on
the Internet, or to named locations in drawings, such as views.
Use a Hyperlink to Access a File or a Web Page | 1945
By default, the hyperlink cursor and tooltip are displayed when the crosshairs
are positioned over an object that has an attached hyperlink. You can then
hold down the CTRL key and click (CTRL+click) to follow the link.
NOTE The PICKFIRST system variable must be set to 1 to open files associated
with hyperlinks. You can turn off the hyperlink cursor, tooltips, and shortcut menu
in the Options dialog box on the User Preferences tab.
When you create a hyperlink to a drawing and specify a named view to jump
to, that view is restored when the hyperlink is opened. You can also create a
hyperlink that opens a drawing in a specific layout.
Use Relative and Full (Absolute) Paths in Hyperlinks
Relative paths provide greater flexibility and are easier to edit than full
hyperlinks. With relative hyperlinks, you can update the relative path for all
the hyperlinks in your drawing at the same time, rather than editing each
hyperlink individually.
You must use a full hyperlink when you create a link to a document that is
not contained in the same file or whose relative path you don't know. For
example, you would use a full hyperlink to link to a drawing on a different
network drive. If you subsequently move the files referenced by full hyperlinks
to a different directory, editing the hyperlink paths can be time consuming.
To create a full hyperlink to another file
1In the drawing area, select one or more graphical objects to attach the
hyperlink to.
2Click Blocks & References tab ➤ Data panel ➤ Hyperlink.
3Do one of the following:
■Under Type the File or Web Page Name, enter the path and name of
the file that you want to associate with the hyperlink.
■Click the File button. Navigate to the location of the file that you
want to associate with the hyperlink. Click Open.
1946 | Chapter 41 Use the Internet for Collaboration

4(Optional) If you are creating a hyperlink to a drawing, select Target to
specify a named location in the drawing to jump to and do the following:
■Select a named location to jump to.
■Click OK.
5(Optional) Enter a description for the hyperlink in Text to Display.
6Click OK.
To create a hyperlink to a named location
1Create a hyperlink (see To create a full hyperlink to another file on page
1946).
2Click Blocks & References tab ➤ Data panel ➤ Hyperlink.
3Select the graphical object that the hyperlink is associated with.
4In Type the File or Web Page Name, enter a pound sign (#) after the name
of the file that the hyperlink is linked to, and then enter the named
location. Do not include any spaces between the name of the file that
the hyperlink is linked to, the pound sign (#), and the named location.
5Click OK.
To edit a hyperlink attached to a graphical object
1Click Blocks & References tab ➤ Data panel ➤ Hyperlink.
2In the drawing area, select one or more graphical objects that use the
same hyperlink.
3Specify new values in the Edit Hyperlink dialog box. Click OK.
To remove a hyperlink from a graphical object
1In the drawing area, select one or more graphical objects that use the
same hyperlink.
2Click Blocks & References tab ➤ Data panel ➤ Hyperlink.
Use a Hyperlink to Access a File or a Web Page | 1947
3In the drawing area, select one or more graphical objects that use the
same hyperlink.
4Click Remove Hyperlink. Click OK.
To open a file associated with a hyperlink
1In the drawing area, select a graphical object with an attached hyperlink.
2Use one of the following methods to follow the link:
■Hold down the CTRL key and click.
■Right-click. Click Hyperlink. Select the name of the hyperlink you
want. Each hyperlink has either a description or the full URL to the
referenced file.
NOTE If you have turned off display of the hyperlink cursor, Hyperlink options
are not available on the shortcut menu. You can turn on the hyperlink cursor,
tooltips, and shortcut menu in the Options dialog box on the User Preferences
tab. The PICKFIRST system variable must be set to 1 to open files associated
with hyperlinks.
To turn the hyperlink cursor display on or off
1Click Tools menu ➤ Options.
2In the Options dialog box, User Preferences tab, select or clear Display
Hyperlink Cursor, Tooltip, and Shortcut Menu.
3Click Apply or click OK.
To set the relative path for all hyperlinks in a drawing
1Click Tools tab ➤ Drawing Utilities panel ➤ Drawing Properties.
2On the Summary tab, enter a relative path in Hyperlink Base.
3Click OK.
To create a relative hyperlink
1Click Blocks & References tab ➤ Data panel ➤ Hyperlink.
1948 | Chapter 41 Use the Internet for Collaboration
2In the drawing area, select one or more graphical objects to attach the
hyperlink to.
3Enter the name of the file to attach in Type the File or Web Page Name.
Do not enter any path information with the file name, or you will create
a full hyperlink.
4Click OK.
Quick Reference
Commands
ATTACHURL
Attaches hyperlinks to objects or areas in a drawing.
DETACHURL
Removes hyperlinks in a drawing.
DWGPROPS
Sets and displays the file properties of the current drawing.
GOTOURL
Opens the file or web page associated with the hyperlink attached to an
object.
HYPERLINK
Attaches a hyperlink to an object or modifies an existing hyperlink.
HYPERLINKOPTIONS
Controls the display of the hyperlink cursor, tooltips, and shortcut menu.
OPTIONS
Customizes the program settings.
System Variables
HYPERLINKBASE
Specifies the path used for all relative hyperlinks in the drawing.
Use a Hyperlink to Access a File or a Web Page | 1949

PICKFIRST
Controls whether you select objects before (noun-verb selection) or after you
issue a command.
Use a Hyperlink to Create an Email Message
Typically you use hyperlinks in a drawing to associate graphical objects with
related documents. In some cases, however, it might be useful to insert a
hyperlink that creates an email message when the hyperlink is activated.
For example, consider a design project with several drafters responsible for
updating different components of a drawing. As drafters add new components
to the drawing, they can associate hyperlinks that include their email addresses
with the components. This provides a convenient way to identify who created
various drawing components and to send that person an email message with
any design-related issues.
To create an email hyperlink
1In the drawing area, select one or more graphical objects to attach the
hyperlink to.
2Click Blocks & References tab ➤ Data panel ➤ Hyperlink.
3In the Insert Hyperlink dialog box, under Link To, click E-mail Address.
4Enter the recipient's address in E-mail Address.
5(Optional) Specify a subject for the email message in Subject.
6Click OK.
When you open an email hyperlink, your default email application creates
a new email message with the address and subject (if specified) filled out.
You can then enter message text and send it by email.
Quick Reference
Commands
HYPERLINK
Attaches a hyperlink to an object or modifies an existing hyperlink.
1950 | Chapter 41 Use the Internet for Collaboration
System Variables
PICKFIRST
Controls whether you select objects before (noun-verb selection) or after you
issue a command.
Use Hyperlinks in Blocks
Hyperlinks can be associated with blocks, including nested objects contained
within blocks. If the blocks contain any relative hyperlinks, the relative
hyperlinks adopt the relative base path of the current drawing when you insert
them.
When you select a block element in the drawing area that contains multiple
hyperlinks, the available hyperlinks are listed in the Hyperlink shortcut menu.
You can activate any hyperlink associated with the currently selected block
element, and edit or remove a hyperlink associated with a particular block
instance.
For example, suppose you have a block that contains a line and a circle. The
line has an attached hyperlink named line, and the circle has an attached
hyperlink named circle. This particular instance of the block has a hyperlink
named block, which you attached after the block was inserted. When you select
an element in the block, you can open the hyperlink associated with that
element, or any hyperlink associated with that particular instance of the block.
If, for example, you select the line block element, you can open the line
hyperlink or the block hyperlink. If you select the circle block element, you
can open the circle hyperlink or the block hyperlink. In both cases, you can
edit or detach only the block hyperlink associated with this instance of the
block.
To edit or remove hyperlinks nested in a block, you must first explode the
block or use the REFEDIT command.
To open a file associated with a hyperlink contained in a block
1In the drawing area, select a block with attached hyperlinks.
2Use one of the following methods to follow the link:
■Hold down the CTRL key and click.
■Right-click. Click Hyperlink. Select the name of the hyperlink you
want. Each hyperlink has either a description or the full URL to the
referenced file.
Use Hyperlinks in Blocks | 1951
Quick Reference
Commands
ATTACHURL
Attaches hyperlinks to objects or areas in a drawing.
DETACHURL
Removes hyperlinks in a drawing.
GOTOURL
Opens the file or web page associated with the hyperlink attached to an
object.
HYPERLINK
Attaches a hyperlink to an object or modifies an existing hyperlink.
Use a Hyperlink to Start a New Drawing
When you activate a hyperlink that points to a drawing template (DWT) file,
a new drawing file is created based on the template rather than opening the
actual template file.
This provides a convenient mechanism for creating a set of standardized
drawing templates that you can share with others. Because the hyperlinked
template files open a new drawing, there is no risk of others accidentally
overwriting the original template.
To open a drawing template (DWT) file associated with a hyperlink
1In the drawing area, select a graphical object with an attached hyperlink
to a DWT file.
2Use one of the following methods to follow the link:
■Hold down the CTRL key and click.
■Right-click. Click Hyperlink. Select the name of the hyperlink you
want. Each hyperlink has either a description or the full URL to the
referenced file.
A new drawing opens based on the hyperlinked DWT file.
1952 | Chapter 41 Use the Internet for Collaboration

NOTE If you have turned off display of the hyperlink cursor, Hyperlink options
are not available on the shortcut menu. You can turn on the hyperlink cursor,
tooltips, and shortcut menu in the Options dialog box on the User Preferences
tab.
Quick Reference
Commands
GOTOURL
Opens the file or web page associated with the hyperlink attached to an
object.
HYPERLINK
Attaches a hyperlink to an object or modifies an existing hyperlink.
System Variables
PICKFIRST
Controls whether you select objects before (noun-verb selection) or after you
issue a command.
Work with Drawing Files over the Internet
You can open and save drawings to an Internet location, attach externally
referenced drawings stored on the Internet, use i-drop to insert blocks by
dragging drawings from a website, and create a transmittal package of drawings
that automatically includes all related files.
Open and Save Drawing Files from the Internet
The file input and output commands recognize any valid Uniform Resource
Locator (URL) path to a DWG file.
You can use AutoCAD to open and save files from the Internet. The AutoCAD
file input and output commands (OPEN, EXPORT, and so on) recognize any
valid URL path to an AutoCAD file. The drawing file that you specify is
downloaded to your computer and opened in the AutoCAD drawing area.
You can then edit the drawing and save it, either locally or back to any Internet
or intranet location for which you have sufficient access privileges.
Work with Drawing Files over the Internet | 1953
If you know the URL to the file you want to open, you can enter it directly in
the Select File dialog box. You can also browse defined FTP sites or web folders
in the Select File dialog box, use the Browse the Web dialog box to navigate
to the Internet location where the file is stored, or access project collaboration
sites hosted by Autodesk® Buzzsaw® using the Buzzsaw icon in the Select File
or Save Drawing As dialog box.
Use the Browse the Web Dialog Box
With the Browse the Web dialog box, you can navigate quickly to a specific
Internet location to open or save a file. You can specify a default Internet
location that is loaded each time you open the Browse the Web dialog box.
Using the Browse the Web dialog box to access files is particularly useful when
you don't know the correct URL, or when you want to avoid entering a long
URL each time you access an Internet location.
To open an file from the Internet by entering a URL
1Click File menu ➤ Open.
2In the Select File dialog box, enter the URL to the file in File Name. Click
Open.
You must enter the Hypertext Transfer Protocol or File Transfer Protocol
(for example, http:// or ftp://) and the extension (for example, .dwg or
.dwt) of the file you want to open.
To open an file from the Internet by browsing an FTP site
1Click File menu ➤ Open.
2In the Select File dialog box, click Tools ➤ Add/Modify FTP Locations.
3In the Add/Modify FTP Locations dialog box, under Name of FTP Site,
enter the site name for the FTP location (for example, ftp.autodesk.com).
4Under Log On As, select one of the following:
■Anonymous. Logs on to the FTP site as an anonymous user. If the FTP
site does not allow anonymous logons, select User and enter a valid
user name.
■User. Logs on to the FTP site using the specified user name.
5Enter a password if required by the FTP site.
6Click Add. Click OK.
1954 | Chapter 41 Use the Internet for Collaboration
7In the Select File dialog box, select FTP from the Places list.
8Double-click one of the FTP sites and select a file.
9Click Open.
To open an file from the Internet by browsing a web folder
1Click File menu ➤ Open.
2In the Select File dialog box, under Look In, select Web Folders (or My
Network Places, depending on your version of Microsoft® Windows® ).
3Double-click one of the web folders and select a file.
You can create new web folders in Windows Explorer. Consult your
system administrator or Windows Explorer Help for more information
about web folders.
4Click Open.
To save an file to the Internet by entering a URL
1Click File menu ➤ Save As.
2Enter the URL to the file in File Name.
You must enter the File Transfer Protocol or Hypertext Transfer Protocol
(for example, ftp:// or http://) and the extension (for example, .dwg or
.dwt) of the file you want to save. You must have access rights to save
files to the specified location.
3Select a file format from the Files of Type list. Click Save.
To save an file to the Internet by browsing an FTP site
1Click File menu ➤ Save As.
2In the Save Drawing As dialog box, select FTP from the Places list.
3If you have not yet added the FTP site to the available FTP locations, click
Tools ➤ Add/Modify FTP Locations and define the FTP location as
described in To open an AutoCAD file from the Internet by browsing an
FTP site.
4Double-click one of the FTP sites, and select a file.
5Select a file format from the Files of Type list. Click Save.
Open and Save Drawing Files from the Internet | 1955
To save an file to the Internet by browsing a web folder
1Click File menu ➤ Save As.
2In the Select File dialog box, under Look In, select Web Folders (or My
Network Places, depending on your version of Windows).
3Double-click one of the web folders.
You can create new web folders in Windows Explorer. Consult your
system administrator or Windows Explorer Help for more information
about web folders.
4Specify a file name and select a file format from the Files of Type list.
5Click Save.
You must have access rights to save files to the specified location.
To specify the default Internet location used by the Browse the Web dialog
box
1Click Tools menu ➤ Options.
2On the Files tab, click the plus sign next to Help and Miscellaneous File
Names.
3Select the Default Internet Location option. Click Browse.
4In the Select a File dialog box, do one of the following:
■Enter the URL to an Internet location. Click Open.
■Click the Search the Web button and enter the Internet address in
the Look In box.
5Click OK.
To open an file from the Internet with the Browse the Web dialog box
1Click File menu ➤ Open.
2Click the Search the Web button.
Many Internet connections require you to enter a valid user name and
password before accessing the Internet. AutoCAD prompts you to enter
this information.
3In the Browse the Web dialog box, do one of the following:
■Click a hyperlink on the HTML page that is displayed.
1956 | Chapter 41 Use the Internet for Collaboration
■Enter a full or partial URL in Look In, and then press ENTER.
4Repeat step 3 until you locate the file that you want to open.
5Click Open.
To save an file to an Internet location with the Browse the Web dialog box
1Click File menu ➤ Save As.
2Click the Search the Web button.
Many Internet connections require you to enter a valid user name and
password before accessing the Internet. AutoCAD prompts you to enter
this information.
3In the Browse the Web dialog box, do one of the following:
■Click a hyperlink on the HTML page that is displayed.
■Enter a full or partial URL in Look In, and then press ENTER.
4Repeat step 3 until you navigate to the location where you want to save
the file.
5Click Save.
Quick Reference
Commands
APPLOAD
Loads and unloads applications and defines which applications to load at
startup.
EXPORT
Saves the objects in a drawing to a different file format.
HYPERLINK
Attaches a hyperlink to an object or modifies an existing hyperlink.
OPEN
Opens an existing drawing file.
Open and Save Drawing Files from the Internet | 1957

Share Drawing Files Internationally
Beginning with AutoCAD 2007-based products, drawing files and most files
associated with drawing files use the Unicode standard. This lets you maintain
both the visual fidelity and data integrity of international characters when
you save and open drawing files.
NOTE AutoCAD 2006, AutoCAD LT 2006, and prior versions were not Unicode
applications. When sharing drawings with earlier, non-Unicode, versions, use ASCII
characters to ensure compatibility when you save files, insert xrefs, and specify
folder paths.
Overview of Unicode
All characters are processed numerically by the computer operating system,
which assigns a number to each character. Various numeric encoding systems
have been used in the past, however these encoding systems often conflicted.
As a result, operating systems and applications relied on code pages with specific
character sets and numbering assigned to countries or regions.
To facilitate international compatibility, the Unicode standard was adopted
by major industry leaders and is being maintained by the Unicode Consortium.
Drawing File Impact
Language-specific characters can be used in file names and text within drawing
files, or files associated with drawing files. The following are common
examples:
■Drawing file names
■Folder path names
■Sheet set data files
■Named objects such as layers and blocks within a drawing
■Linetype and hatch pattern file names and their contents
■Text used in notes and dimensions within a drawing
■DWF or DWFx markup files
This means that drawings can be opened, worked on, and saved worldwide
regardless of language-specific characters. The only requirement is that the
appropriate language pack must be installed first.
1958 | Chapter 41 Use the Internet for Collaboration

When you save text files such as linetype (LIN), hatch pattern (PAT), and script
(SCR) files using an application such as Notepad, it is recommended that you
specify Unicode encoding at the bottom of the Save As dialog box to ensure
compatibility.
Limitations
Most international drawing projects can be completed within the current
product environment. However, there are several file types and features that
are not supported yet between countries and regions that use different
Windows code pages. These features include the following:
■eTransmit
■Round trip file and data compatibility with non-Unicode products
■Block attributes
■Visual LISP files
NOTE You can still use eTransmit to convey transmittal sets to countries and
regions that use the same code page.
Quick Reference
Commands
OPEN
Opens an existing drawing file.
SAVE
Saves the drawing under the current file name or a specified name.
SAVEAS
Saves a copy of the current drawing under a new file name.
System Variables
TEXTOUTPUTFILEFORMAT
Provides Unicode options for plot and text window log files.
Share Drawing Files Internationally | 1959
Access Buzzsaw for Project Collaboration
Using Autodesk® Buzzsaw® you can store, manage, and share documents that
populate a Buzzsaw site.
Buzzsaw is a secure, online project collaboration service in which members
in different locations can post files to and access files from a centralized site.
You can save files, send transmittal sets, and publish sheets to Buzzsaw.
You can get a free 30-day trial subscription when you follow the procedures
to access Buzzsaw, or from the Autodesk website. Your Buzzsaw subscription
includes user licenses to access Buzzsaw. When you invite your consultants
and contractors to your site, the Buzzsaw software is automatically downloaded.
Prepare to Use Buzzsaw
To use Buzzsaw, you must already have a project hosting account or be given
access to a subscriber's Buzzsaw site. The subscriber will provide you with the
Buzzsaw URL, user name, and password so that you can log in, access, and
post files.
Use Buzzsaw
You can access Buzzsaw from several standard file selection dialog boxes (such
as New or Open). The Buzzsaw icon is displayed in the Places list for quick
access.
Support for Autodesk Buzzsaw services includes the following features:
■Sheet Set Manager Support. Stores information necessary to publish sheet
sets and transmittal sets. For more information about the Sheet Set
Manager, see Work with Sheets in a Sheet Set on page 431.
■Publish Support. Publish DWF or DWFx files directly to Autodesk Buzzsaw
locations. For more information about publishing to an Autodesk Buzzsaw
location, see Set Publish Options on page 1646.
■eTransmit Support. You can send a transmittal set of DWG files to a
Buzzsaw site and you can create and send a transmittal set using the Sheet
Set Manager.
If you plan to use Buzzsaw for project collaboration, set up some shortcuts so
you can navigate to frequently used sites more quickly. Using the Buzzsaw
icon in the Places list, you can specify a shortcut to an existing project
collaboration site from the list or create a new shortcut using the Add a Buzzsaw
Location Shortcut.
1960 | Chapter 41 Use the Internet for Collaboration

You can right-click in the Location area of a dialog box that supports Buzzsaw
to display a shortcut menu that provides options to add, manage, or delete
Autodesk Buzzsaw locations. Changes you make to locations get stored in the
registry.
To access a Buzzsaw site for the first time
1In a file navigation dialog box, such as the Select File dialog box, in the
Places list, click the Buzzsaw icon.
NOTE The first time you select Buzzsaw, Internet Explorer is launched and
the Autodesk Buzzsaw web page is displayed.
Buzzsaw Location Shortcuts is displayed in the Look In box.
2Double-click Add a Buzzsaw Location Shortcut.
3In the Log In To Buzzsaw Site dialog box, under Buzzsaw Site, enter the
location name for the Buzzsaw site you want to access.
4Under Login, Buzzsaw User Name, enter a login name.
This name is provided by the person granting you access to the Buzzsaw
site.
5In the Password box, enter a password. Click OK.
AutoCAD verifies that you have access to the site specified. If access is
granted, the Create a Buzzsaw Location Shortcut is displayed. If access is
not granted, an error message is displayed.
NOTE Select the Save Login Name and Password check box, if you want to
save your login name and password for future use.
6In the Create a Buzzsaw Location Shortcut dialog box, under Select a
Buzzsaw Folder, Project, or Document Set, click Browse.
7In the Select a Buzzsaw Location dialog box, navigate to a project or folder
you want to access. Click OK.
The path is displayed in the Select a Buzzsaw Folder, Project, or Document
Set box.
8Under Enter a Name for This Buzzsaw Location Shortcut, enter a name
for the shortcut. Click OK.
You are returned to the File navigation dialog box; the shortcut has been
created. You can double-click the shortcut to access the Buzzsaw location
Access Buzzsaw for Project Collaboration | 1961

specified by the shortcut. You can create as many Buzzsaw shortcuts as
needed.
To access a Buzzsaw site
1In a file navigation dialog box that supports Buzzsaw, in the Places list,
click the Buzzsaw icon.
Buzzsaw Location Shortcuts is displayed in the Look In box along with
any configured Buzzsaw shortcuts.
2Double-click a Buzzsaw shortcut.
If you have not logged in to the site, the Log In To Buzzsaw dialog box
is displayed. After logging in, you go to the location defined by that
shortcut.
To add a Buzzsaw location shortcut
1In a file navigation dialog box that supports Buzzsaw, in the Places list,
click the Buzzsaw icon.
Buzzsaw Location Shortcuts is displayed in the Look In box along with
any configured Buzzsaw shortcuts.
2Right-click a Buzzsaw shortcut. Click Add a Buzzsaw Location Shortcut.
3In the Log In To Buzzsaw Site dialog box, under Buzzsaw Site, select the
location for the Buzzsaw site to access.
4Under Login, Buzzsaw User Name, enter a login name, if necessary.
(The user name is provided to you by the person granting you access to
the Buzzsaw site.)
5Under Login, Password, enter a password. Click OK.
NOTE Check the box, Save Login Name and Password, if you want to save
your login name and password on this computer for future use.
6In the Create a Buzzsaw Location Shortcut dialog box, under Select a
Buzzsaw Folder, Project, or Document Set, click the Browse button to
navigate to the location of the project or folder.
7In the directory tree of the Select a Buzzsaw Location dialog box, click
the site name to view the contents and navigate to either a project or
folder. Click OK.
1962 | Chapter 41 Use the Internet for Collaboration
The path is now displayed in the Create a Buzzsaw Location Shortcut
dialog box, under Select a Buzzsaw Folder, Project, or Document Set.
8Under Enter a Name for This Buzzsaw Location Shortcut, enter a name.
Click OK.
This folder name is added to the Site list in the navigation dialog box.
To rename a Buzzsaw location shortcut
1In a file navigation dialog box that supports Buzzsaw, in the Places list,
click the Buzzsaw icon.
Buzzsaw Location Shortcuts is displayed in the Look In box along with
any configured Buzzsaw shortcuts.
2Right-click a Buzzsaw shortcut. Click Manage Buzzsaw Location Shortcuts.
3In the Buzzsaw Location Shortcuts dialog box, select a shortcut. Click
Rename.
4Enter a new name for the Buzzsaw location shortcut. Click Close.
To modify a Buzzsaw location shortcut
1In a file navigation dialog box that supports Buzzsaw, in the Places list,
click the Buzzsaw icon.
Buzzsaw Location Shortcuts is displayed in the Look In box along with
any configured Buzzsaw shortcuts.
2Right-click a Buzzsaw shortcut. Click Manage Buzzsaw Location Shortcuts.
3In the Buzzsaw Location Shortcuts dialog box, select a shortcut. Click
Modify.
4In the Log In To Buzzsaw Site dialog box, click to log in to the Buzzsaw
site.
5In the Edit a Buzzsaw Location Shortcut dialog box, modify the shortcut
location or the shortcut name.
6Click OK. Click Close.
To delete a Buzzsaw location shortcut
1In a file navigation dialog box that supports Buzzsaw, in the Places list,
click the Buzzsaw icon.
Access Buzzsaw for Project Collaboration | 1963
Buzzsaw Location Shortcuts is displayed in the Look In box along with
any configured Buzzsaw shortcuts.
2Right-click a Buzzsaw shortcut. Click Manage Buzzsaw Location Shortcuts.
3In the Buzzsaw Location Shortcuts dialog box, select a shortcut. Click
Delete.
The selected shortcut is deleted.
4Click Close.
To save a file opened in a Buzzsaw site to a different Buzzsaw site
1Click File menu ➤ Save.
2In the Save Drawing As dialog box, under File Name, the entire path to
the drawing file is displayed. Click Save.
To save a file opened outside of Buzzsaw to a Buzzsaw site
1Click File menu ➤ Save As.
2In the Save Drawing As dialog box, in the Places list, click the Buzzsaw
icon.
3Double-click an existing shortcut or create a new shortcut.
NOTE If you have not logged into the site, the Log In To Buzzsaw dialog box
is displayed. After logging in, you go to the location defined by that shortcut.
4Enter a file name and click Save.
To send a transmittal set to Buzzsaw
1Click Output tab ➤ Send panel ➤ eTransmit.
2In the Create Transmittal dialog box, click OK.
3In the Specify Zip File dialog box, in the Places list, click the Buzzsaw
icon.
Buzzsaw Location Shortcuts is displayed in the Save In box. Existing
Buzzsaw shortcuts are displayed in the Site column.
4Double-click an existing shortcut or create a new shortcut.
1964 | Chapter 41 Use the Internet for Collaboration

NOTE If you have not logged into the site, the Log In To Buzzsaw dialog box
is displayed. After logging in, you go to the location defined by that shortcut.
5Click Save.
The transmittal package is created.
To send a transmittal set to Buzzsaw from the Sheet Set Manager
1In the Sheet Set Manager, Sheet List tab, right-click. Click ETransmit.
The program gathers the information to create the transmittal package.
2In the Create Transmittal dialog box, click OK.
3In the Specify Zip File dialog box, in the Places list, click the Buzzsaw
icon.
Buzzsaw Location Shortcuts is displayed in the Look In box along with
any configured Buzzsaw shortcuts.
4Double-click an existing shortcut or create a new shortcut.
NOTE If you have not logged in to the site, the Log In To Buzzsaw dialog
box is displayed. After logging in, you go to the location defined by that
shortcut.
5Click Save.
The transmittal package is created.
To publish a file to Buzzsaw
1In a drawing, click File menu ➤ Publish.
2In the Publish dialog box, under Publish To, select one of the following
options and click Publish Options.
■Plotter Named in Page Setup
■DWF Format (DWF File or DWFx File)
3In the Publish Options dialog box, under Default Output Location, click
Location. Click the [...] button.
4In the Select a Folder for Generated Files dialog box, in the Places list,
click the Buzzsaw icon.
Access Buzzsaw for Project Collaboration | 1965

Buzzsaw Location Shortcuts is displayed in the Look In box along with
any configured Buzzsaw shortcuts.
5Double-click an existing shortcut or create a new shortcut.
NOTE If you have not logged into the site, the Log In To Buzzsaw dialog box
is displayed. After logging in, you go to the location defined by that shortcut.
6Click Select.
7In the Publish Options dialog box, click OK
8In the Publish dialog box, click Publish.
9In the Specify DWF File dialog box, click Select.
Publishing begins. A status box indicates when publishing is complete.
To publish a sheet set to Buzzsaw
1In the Sheet Set Manager, Sheet List tab, click the arrow next to Publish.
Select Publish Dialog Box.
2In the Publish dialog box, click Sheet Set Publish Options.
3In the Sheet Set Publish Options dialog box, under Default Output
Location, click Location. Click the [...] button.
4In the Select a Folder for Generated Files dialog box, in the Places list,
click the Buzzsaw icon.
Buzzsaw Location Shortcuts is displayed in the Look In box along with
any configured Buzzsaw shortcuts.
5Double-click an existing shortcut or create a new shortcut.
NOTE If you have not logged into the site, the Log In To Buzzsaw dialog box
is displayed. After logging in, you go to the location defined by that shortcut.
6Click Select.
7In the Sheet Set Publish Options dialog box, click OK.
8In the Publish dialog box, click Publish.
9In the Specify DWF File dialog box, click Select.
Publishing begins. A status box indicates when publishing is complete.
1966 | Chapter 41 Use the Internet for Collaboration

Quick Reference
Commands
OPEN
Opens an existing drawing file.
Work with Xrefs over the Internet
You can attach externally referenced drawings stored on the Internet or an
intranet to drawings stored locally on your system.
For example, you might have a set of construction drawings that are modified
daily by a number of contractors. These drawings are stored in a project
directory on the Internet. You can maintain a master drawing on your
computer, and attach the Internet drawings to the master drawing as external
references (xrefs). When any of the Internet drawings are modified, the changes
are included in your master drawing the next time you open it. This is a
powerful mechanism for developing accurate, up-to-date composite drawings
that can be shared by a design team.
NOTE If you have a slow Internet connection or are working with a master drawing
that has many xrefs attached, the download of the xrefs to your system might
take a long time.
To attach an xref to a drawing stored on the Internet
1Click Insert menu ➤ External References.
2In the Select Reference File dialog box, do one of the following:
■Under File Name, enter the URL to the file that you want to attach.
You must include the transfer protocol (for example, http:// or ftp://)
in the URL.
■Click the Search the Web button, and then use the Browse the Web
dialog box to navigate to the file you want to attach.
If your network or ISP requires a user name and password, you are
prompted to enter this information.
3Click Open.
4In the External Reference dialog box, click OK.
5Specify an insertion point for the xref.
Work with Xrefs over the Internet | 1967
Quick Reference
Commands
HYPERLINK
Attaches a hyperlink to an object or modifies an existing hyperlink.
Insert Content from a Website
With the Autodesk® i-drop® functionality, you can use a drag-and-drop method
to insert web content into your drawing.
Overview of i-drop
i-drop is a drag-and-drop method of inserting content from the Web into your
current drawing. Using i-drop, you can easily insert content such as drawings
and catalog items into an open drawing. Specific examples of i-drop content
that you can insert include a block of a chair or window or a bitmap of a
linoleum sample.
You can use the Publish to Web wizard to create a web page that has
i-drop-enabled content for a drawing file. For details about other ways to create
a web page that has i-drop content, see the information about i-drop on the
Autodesk website at the following URL:
http://www.autodesk.com/idrop
Quick Reference
Commands
SETIDROPHANDLER
Specifies the default type of i-drop content for the current Autodesk
application.
Use i-drop
To use i-drop, you simply drag a representative i-drop content image from a
web page into your drawing area. You can also specify the type of i-drop
content for your application.
1968 | Chapter 41 Use the Internet for Collaboration
The representative i-drop content image will usually be a visual representation
of what will appear in your drawing.
i-drop also offers the following functionality:
■Set the default type of i-drop content accepted. You can set the default
type of i-drop content accepted by the program. The setting you select
determines the type of content that is inserted in your drawing when you
drag a representative i-drop content image from the Web. For example, if
you select Block, the inserted content is a block.
■Use right-click and drag to select the type of i-drop content. You can select
the type of i-drop content to insert in your drawing when you right-click
and drag a representative i-drop content image.
■Use right-click and drag to specify associated data files to download. You
can specify which associated data files to download when using right-click
to drag i-drop content into a drawing.
■Specify the location of downloaded associated data files. You can specify
where you want to download the data files that are associated with i-drop
content.
■View a log file of i-drop content. You can view a log file of i-drop content
for each drawing. This log file is saved in the same folder as the drawing.
To insert i-drop content into a drawing
1Open the drawing in which you want to insert i-drop content.
2Drag a representative i-drop content image from a web page into your
current drawing.
When you move your cursor over a representative i-drop content image
on a website, the cursor changes to a dropper image.You are now in
Insertion mode.
3In your current drawing, click where you want the i-drop content inserted.
The i-drop content is inserted into your drawing.
To specify options for data files associated with inserted i-drop content
You can specify the transfer and location of associated data files when you
insert i-drop content into a drawing.
1Right-click a representative i-drop content image and drag it from a web
page into your current drawing.
Insert Content from a Website | 1969
When you move your cursor over a representative i-drop content image
on a website, the cursor changes to a dropper image.
2On the shortcut menu, click Insert As ➤ Block.
3In the i-drop Options Dialog box, Choose Associated File area, select the
associated data files you want to download with your i-drop content.
4In the Choose Destination Path area, the default destination path is
displayed. You can enter a different path or click the [...] button to locate
a different folder.
5Click OK.
6In the drawing, click where you want your content inserted.
To specify the default type of i-drop content
1At the Command prompt, enter setidrophandler.
2In the Set Default i-drop Content Type dialog box, in the Choose Default
i-drop Content Type list, select a type of i-drop content.
The only i-drop content types that are listed are those for installed
Autodesk products that provide this type of i-drop functionality.
If the representative i-drop content image you drag into your drawing
points to more than one type of content, this setting specifies which type
of content is actually inserted. Selecting Block specifies that a block is
inserted. You can drop a block into a drawing that was created in any
AutoCAD-based product.
To view a log file of i-drop content in your drawing
■In the folder where your drawing is stored, double-click the file named
<drawing name>_idrop.txt.
The log file displays the name of the drawing file (target file), the name of
the i-drop content file inserted in your drawing (located at the end of the
source URL), the date and time it was inserted, the source URL of each
associated data file, and the destination (location) of any associated data
files.
To view the URL hyperlink for the source of an inserted i-drop content image
1In your drawing, select the i-drop content image.
2Move your cursor over the selected i-drop content image.
1970 | Chapter 41 Use the Internet for Collaboration
The URL hyperlink is displayed in a tooltip.
Quick Reference
Commands
SETIDROPHANDLER
Specifies the default type of i-drop content for the current Autodesk
application.
Package a Set of Files for Internet Transmission
With eTransmit, you can package a set of files for Internet transmission.
Drawing files in the transmittal package automatically include all related
dependent files such as xrefs and font files.
A common problem when sending drawing files to someone is neglecting to
include related dependent files such as xrefs and text fonts. In some cases, not
including these files can make the drawing files unusable by the recipient.
With eTransmit, dependent files are included automatically in the transmittal
package, reducing the possibility of error.
Choose the Files to Package
The Create Transmittal dialog box displays two tabs for individual drawing
files, or three tabs for sheet sets and drawing files that are referenced by sheet
sets. Using these tabs, you can view and change the files to be included in the
transmittal package.
■Sheets. This tab is available only when a sheet set is open. It displays a
hierarchical list of sheets in the current sheet set. When you check a sheet,
all dependent files are automatically included in the transmittal package.
■Files Tree. This tab displays a list of files. You can expand or collapse each
drawing file in the list to display its dependent files. By default, dependent
files are automatically included in the transmittal package unless you
uncheck them.
■Files Table. This tab displays a table of files, their folder locations, and file
details. Each file can be checked or unchecked, providing the most direct
control over the contents of the transmittal package. Files are not
automatically checked or unchecked.
Package a Set of Files for Internet Transmission | 1971

The following table lists the common file types that are automatically added
to a transmittal package. You can choose to remove any of the files
automatically added and you can manually add additional files that you want
included in the transmittal package.
File Types Automatically Added to a Transmittal Package
DescriptionFile Type
Root drawing file and any attached extern-
al references
*.dwg
Raster image files that are attached extern-
ally to the root drawing or external refer-
enced drawings, or as part of a material
Various image file types
DGN files that are attached externally to
the root drawing or external referenced
drawings
*.dgn
Design Web Format files that are attached
externally to the root drawing or external
referenced drawings
*.dwf
DWF file with XPS information that is at-
tached externally to the root drawing or
an externally referenced drawing
*.dwfx
PDF files that are attached externally to the
root drawing or external referenced draw-
ings
*.pdf
Data extraction files that contain extraction
settings and data link information
*.dxe
Microsoft Excel spreadsheet files that are
linked to data extraction tables
*.xls
Font Mapping File used for the In-Place
Text Editor when working with Multiline
Text objects
*.fmp
Color-dependent plot style files used to
control the appearance of the objects in
*.ctb
1972 | Chapter 41 Use the Internet for Collaboration

File Types Automatically Added to a Transmittal Package
DescriptionFile Type
the drawings of the transmittal set when
plotting
Named plot style files used to control the
appearance of the objects in the drawings
of the transmittal set when plotting
*.stb
Plotter configuration files used to control
the device and settings for the device when
*.pc3
plotting the layouts of the drawings in the
transmittal set
Drawing template file that is associated
with a sheet set
*.dwt
Sheet set file*.dst
Drawing standards file that is associated
to a drawing for standards checking
*.dws
The following table lists the common file types that are not automatically
added to a transmittal package. Many of these files include information that
are specific to applications that run with the product, or contains information
that were originally used to format objects in the drawing and are not longer
needed to properly view the drawing when sent to another user.
File Types Not Automatically Added to a Transmittal Package
DescriptionFile Type
Custom application files (ObjectARX, Ob-
jectDBX, AutoLISP, Visual LISP, VBA and
.NET)
*.arx, *.dbx, *.lsp, *.vlx, *.dvb, *.dll
Compiled shape files used for text styles
or complex linetypes
*.shx
True Type font files used for text styles*.ttf
PostScript Type 1 font files*.pfa, *.pfb
Package a Set of Files for Internet Transmission | 1973

File Types Not Automatically Added to a Transmittal Package
DescriptionFile Type
Hatch pattern files*.pat
Linetype definition files*.lin
Multiline definition files*.mln
Plotter model parameter files, used to store
configuration information specific to a
plotter such as custom paper sizes
*.pmp
Unit conversion file, used by QuickCalc and
the CVUNIT AutoLISP function
*.unt
Plot stamp settings files*.pss
OLE objects that are linked to files in the
drawing are not included in the transmittal
package
OLE objects (linked files)
Text files that are referenced by the RTEXT
object are not included in the transmittal
package
Rtext objects (linked files)
Microsoft Excel spreadsheet files that are
linked to data extraction tables are not in-
cluded in the transmittal package
*.xls (Microsoft Excel files)
Include Instructions to the Recipient
A report file is automatically generated that includes a list of files in the
transmittal package. The report also includes instructions describing what
must be done with drawing-dependent files such as xrefs and font files so that
they are usable with the included drawing files. You can also add your own
notes to the report file.
Save Transmittal Setups
You will probably send transmittal packages multiple times during a project.
The eTransmit feature provides a method to name and save your transmittal
settings as transmittal setups. The Transmittal Setups dialog box displays a list
1974 | Chapter 41 Use the Internet for Collaboration

of saved transmittal setups from which you can select each time you transmit
a set of files. The default transmittal setup is named Standard.
Choose Transmittal Options
Several options are available for the transmittal package using transmittal
setups. With these options, you can
■Package the transmittal package in a ZIP file, in a self-extracting EXE file,
or in a folder that is copied to a specified location.
■Specify that the folder structure of the transmitted files be organized in a
logical hierarchy, flattened into a single folder, or copied “as is” to the
recipient's computer. If you specify an FTP or HTTP destination, the
transmittal package uses the single folder option.
■Add password protection to the transmittal package, bind xrefs
automatically, set the default plotter to “none,” and other options.
After you create the transmittal package, you can post it to an Internet location
or send it to others as an email attachment. If you want to send the transmittal
package in an email, you can use an option in the Modify Transmittal Setup
dialog box that automatically launches your default system email application.
When the transmittal package is created, the transmittal package and
transmittal report file are automatically attached to a new email.
NOTE Regardless of which folder structure option you select for the transmittal
package, any fully specified (absolute) paths of dependent files are converted to
relative paths or “no path” to ensure that the dependent files can be located by
the drawing file.
Transmit Sheet Sets
In the Sheet Set Manager, you can create a transmittal package conveniently
from a sheet set, a sheet subset, or a sheet. Use the Sheet Set Manager to specify
what you want to transmit.
NOTE In the Sheet Set Manager, on the Sheet List tab, right-click a sheet set node,
a sheet subset node, or a sheet node on the sheet tree. On the shortcut menu,
the eTransmit option will assemble the correct sheets depending on the node that
you selected. Use named sheet selections to restore large or complex selections
of sheets.
Package a Set of Files for Internet Transmission | 1975

The tabs in the Create Transmittal dialog box control which files are included
in the transmittal package.
■On the Sheet List tab, you can easily control which of the listed sheets are
to be transmitted by selecting or clearing the boxes next to the sheet names.
■On the Files Tree tab and the Files Table tab, you can add or remove
drawing files and dependent files that are listed. You can also add or remove
any other files.
NOTE If several sheets come from the same drawing file, only the first sheet
associated with the drawing can be selected with a check mark or cleared of its
selection on the Sheet List tab. The other sheets will not be available. For this
reason, it is recommended that you create only one layout tab in each drawing
file.
How Transmittal Packages Work with AutoCAD LT or Previous Versions of
AutoCAD
When transmittal packages are sent between different people and
organizations, it is possible that AutoCAD LT or previous versions of AutoCAD
are involved in the transmittals.
You can transmit packages between users of different AutoCAD-based products,
and you can use eTransmit to convert files to several previous DWG file
formats. In addition, transmittal packages created in AutoCAD 2005 and later
can contain sheet sets, which are not available in AutoCAD LT and earlier
versions of AutoCAD. The files in these sheet sets can still be sent and received
by AutoCAD LT and previous versions of AutoCAD, however, if you want a
more powerful, convenient method of transmitting files, the best solution is
to use sheet sets in transmittal packages.
When you convert drawings to a legacy drawing file format (AutoCAD 2007
or earlier), drawings containing objects that exceed the legacy large object size
limits are reported as errors in the Conversion Error Encountered dialog box
and are not converted.
Transmit Files Internationally
Beginning with AutoCAD 2007, the names of the files generated by
AutoCAD-based products use Unicode standards and can be shared
internationally. However, eTransmit uses WinZip technology to create
1976 | Chapter 41 Use the Internet for Collaboration

transmittal packages. Because WinZip currently is not a Unicode-compliant
application, it is recommended that you use one of the following alternatives:
■Transmit files individually.
■Use eTransmit to create a folder containing the files to be transmitted and
copy the folder to a shared server.
■Package the files using a commercial Unicode-compliant application.
■Make sure all file names use hexidecimal values below 80 before using
eTransmit.
To create a transmittal package in a folder you specify
1Click Output tab ➤ Send panel ➤ eTransmit.
2In the Create Transmittal dialog box, Files Tree or Files Table tab, click
Add File.
3(Optional) In the Add File to Transmittal dialog box, locate and select
the files that you want to include. Click Open. Repeat this step for
additional files, if necessary.
4In the Create Transmittal dialog box, in the tree or table of files, click to
clear the check marks beside any files that you do not want to include.
You can click any drawing file node to expand it and display its dependent
files.
5Click Transmittal Setups. Click Modify.
6In the Modify Transmittal Setup dialog box, click the arrow to display
the list under Transmittal Package Type, and then select Folders (Set of
Files). Also, specify any additional transmittal options that you want to
use.
7Under Transmittal File Folder, click Browse to specify the folder where
the transmittal package should be created. A standard file selection dialog
box is displayed.
8Locate the folder where you want to create the transmittal package. Click
Open.
9Click OK to close the Modify Transmittal Setup dialog box.
10 Click Close to close the Transmittal Setups dialog box.
Package a Set of Files for Internet Transmission | 1977
11 (Optional) In the Create Transmittal dialog box, in the area for notes,
specify any additional comments to include with the report file.
12 Click OK to create the transmittal package in the folder you specified.
To create a transmittal package that is a self-extracting executable or ZIP
file
1Click Output tab ➤ Send panel ➤ eTransmit.
2In the Create Transmittal dialog box, Files Tree or Files Table tab, click
Add File.
3(Optional) In the Add File to Transmittal dialog box, locate and select
the files that you want to include. Click Open. Repeat this step for
additional folder locations, if necessary.
4In the Create Transmittal dialog box, in the tree or table of files, click to
clear the check marks beside any files that you do not want to include.
On the Files Tree tab, you can click any drawing file node to expand it
and display its dependent files.
5Click Transmittal Setups. Click Modify.
NOTE It is recommended that you create and save several transmittal setups.
Then, when you need to create a transmittal package, you can select a
transmittal setup rather than following steps 5 through 11.
6In the Modify Transmittal Setup dialog box, click the arrow to display
the list under Transmittal Package Type. Select either Zip (*.zip) or
Self-Extracting Executable (*.exe). Also, specify any additional transmittal
options that you want to use.
7Under Transmittal File Folder, click Browse to specify the folder where
the transmittal package should be created. A standard file selection dialog
box is displayed.
8Locate the folder where you want to create the transmittal package. Click
Open.
9Click OK to close the Modify Transmittal Setup dialog box.
10 Click Close to close the Transmittal Setups dialog box.
1978 | Chapter 41 Use the Internet for Collaboration

11 (Optional) In the Create Transmittal dialog box, in the area for notes,
specify any additional comments to include with the report file.
12 Click OK to create the transmittal package in the folder you specified.
To create a transmittal package from a sheet set
1Open the sheet set that you want to transmit.
2In the Sheet Set Manager, Sheet List tab, right-click one of the following
types of nodes from the Sheets-Tree list:
■Sheet set (top-level node). To transmit an entire sheet set.
■Sheet subset (lower-level node). To transmit a sheet subset or selected
portion of a sheet set.
■Sheet (lowest level node). To transmit a selected sheet or a selected
portion of a sheet set.
3On the shortcut menu, click ETransmit.
In the Create Transmittal dialog box, on the Sheets tab, sheets are shown
indented underneath another sheet when the indented sheets belong to
the same drawing file. Selecting or clearing a sheet automatically selects
or clears any indented sheets because transmitting a sheet transmits the
entire drawing.
NOTE It is recommended that you create and save several transmittal setups.
Then, when you need to create a transmittal package, you can select a
transmittal setup rather than following steps 4-11.
4In the Create Transmittal dialog box, click Transmittal Setups. Click
Modify.
5In the Modify Transmittal Setup dialog box, click the arrow to display
the list under Transmittal Package Type, and select the type of transmittal
package that you want to create. Also, specify any additional transmittal
options that you want to use. Under Transmittal Options, the first option,
Use Organized Folder Structure, is usually recommended. Source root
folder is the folder where the Drawing Set file (.dst) is stored. Use the Keep
Files and Folders As Is option for AutoCAD 2007 eTransmit behavior.
6Under Transmittal File Folder, click Browse to specify the folder where
the transmittal package should be created. A standard file selection dialog
box is displayed.
Package a Set of Files for Internet Transmission | 1979
7Locate the folder where you want to create the transmittal package. Click
Open.
8Click OK to close the Modify Transmittal Setup dialog box.
9Click Close to close the Transmittal Setups dialog box.
10 (Optional) In the Create Transmittal dialog box, in the area for notes,
specify any additional comments to include with the report file.
11 Click OK to create the transmittal package in the folder you specified.
To unpack a self-extracting executable transmittal package
1In Windows Explorer, double-click the transmittal package file.
2In the eTransmit dialog box, click Browse to specify the folder where you
want to unpack the transmittal files.
3Click OK.
4If the transmittal package is password protected, you are prompted to
enter the password.
5Click OK to close each dialog box.
Quick Reference
Commands
ARCHIVE
Packages the current sheet set files for archive.
ETRANSMIT
Packages a set of files for Internet transmission.
HYPERLINK
Attaches a hyperlink to an object or modifies an existing hyperlink.
Review and Markup Files with Design Review
Autodesk® Design Review is a free program used for creating and reviewing
DWF files. An open, published, and secure file format developed by Autodesk,
DWF enables you to combine and publish rich 2D- and 3D-design data and
share it with others.
1980 | Chapter 41 Use the Internet for Collaboration

Design Review enables your entire project or product team to view, print,
measure, and markup DWF, DWG, DXF, PDF and raster files containing 2D
and 3D content. Fully integrated with AutoCAD®, Inventor®, and Revit®,
Design Review helps you easily share drawings, models, maps, and design data
with team members, clients, consultants, contractors, partners, suppliers, and
other reviewers who may not own or know how to use design software.
You can share designs for use with Design Review by email, websites, intranets,
and physical media, such as DVDs. Download Design Review for free
(http://www.autodesk.com/designreview-download). You can redistribute it on
your internal network or deploy it as part of your corporate PC image (as long
as it is distributed in its entirety, per the terms of the license agreement).
About DWF and DWFx
A DWF file can be used to organize sheet sets, models, animations, finite
element analyses (FEA), and map information, as well as other project-related
files, into a single, highly compressed file. Together with Design Review, DWF
files help you enhance collaboration by clearly communicating information,
such as design changes or corrections, all while reducing the printing and
shipping costs associated with distributing paper copies to your extended
team.
Much like Adobe® PDF files, DWF files are no more alterable than printed
paper copies. Unlike PDF files, however, DWF files retain detailed design
information and scale, and are therefore more suitable for architects, engineers,
and designers.
The newest version of the DWF file format, DWFx, is based on the XML Paper
Specification (XPS) from Microsoft. DWFx makes it easier to share design data
with reviewers who cannot install software.
DWFx files can be opened and printed instantly using the free Microsoft XPS
Viewer, which comes pre-installed on computers using the Microsoft Windows
Vista® operating system. (For the Windows XP operating system, the Microsoft
XPS Viewer can be downloaded directly from Microsoft.) Unlike DWF files,
DWFx files include additional information to display design data in the
Microsoft XPS Viewer. As such, DWFx files are larger than corresponding DWF
files.
TIP In Design Review, you can choose between DWFx and DWF as the default file
format on the General tab in the Options dialog box.
Currently, the Microsoft XPS Viewer does not support sheets containing 3D
content, password-protected content, object properties, restricted content, or
georeferenced map coordinates. In the Microsoft XPS Viewer, when attempting
Review and Markup Files with Design Review | 1981

to view sheets DWFx files containing any of these unsupported features, a
warning directs you to download and view the DWFx file in Design Review.
NOTE All references to DWF in this documentation implicitly include DWFx, unless
specified.
A Digital Design Workflow
Most DWF files begin as a drawing or model created in such Autodesk programs
as AutoCAD, Inventor, and Revit. Before a DWF file is published, the person
publishing the DWF file determines which features (model, layouts, layers,
blocks, named views, and so on) are included in the published DWF file. Once
the content has been determined, the designer publishes the file from its
original format to a DWF file and sends the DWF file to the review team to
begin the digital design review process.
■Receive. Reviewers get the DWF file from the publisher and open it in
Design Review to verify the content (a 2D drawing, 3D model, or image).
■Review. Reviewers add digital comments and markup to the DWF file using
callouts, text, shapes, dimensions, stamps, and custom symbols, saving
changes to the DWF file.
■Return. Reviewers send the marked-up DWF file back to the original
publisher.
■Revise. The designer uses the publishing software to import the marked-up
DWF file, referring to comments in context to revise the original design
quickly.
■Republish. After revising the original content in the publishing software,
the designer republishes an updated DWF file, a new sheet set, or model,
to begin the digital design workflow again.
The digital workflow can be repeated indefinitely to support the iterative
nature of the design and review process.
Use the Publish to Web Wizard to Create Web Pages
The Publish to Web wizard simplifies the process of creating DWF or DWFx
files and formatting them for display in HTML pages.
1982 | Chapter 41 Use the Internet for Collaboration
The Publish to Web wizard provides a simplified interface for creating
formatted web pages that include DWF, DWFx, JPEG, or PNG images of
drawings.
■DWF or DWFx format does not compress the drawing file.
■JPEG format uses lossy compression; that is, some data is deliberately
discarded to greatly reduce the size of the compressed file.
■PNG (Portable Network Graphics) format uses lossless compression; that
is, no original data is sacrificed to reduce the size of the file.
Using Publish to Web, you can quickly and easily create an attractively
formatted web page, even if you are not familiar with HTML coding. After
creating a web page, you can post it to an Internet or intranet location.
Following are some examples of ways in which you can use the Publish to
Web wizard to create a web page:
■Templates. You can select one of four templates for the layout of your web
page or customize your own template.
■Themes. You can apply a theme to the template you've chosen. With
themes, you can modify the colors and fonts in your web page.
■i-drop. You can activate drag-and-drop capability on your web page. Visitors
to your page can drag drawing files into a program session. i-drop files are
ideally suited for publishing block libraries to the Internet.
For information about using i-drop to create an i-drop handle on a website,
see the i-drop documentation on the Autodesk website at
http://www.autodesk.com/idrop.
NOTE You can also customize the template you use for your web page. For more
information about customizing templates, see Customize a Publish to Web
Template in the Customization Guide.
See also:
■DesignCenter on page 91
To use the Publish to Web wizard
1Click Output tab ➤ Publish panel ➤ Publish to Web.
Use the Publish to Web Wizard to Create Web Pages | 1983
2Follow the instructions to generate a web page.
Quick Reference
Commands
PUBLISHTOWEB
Creates HTML pages that include images of selected drawings.
Use Autodesk Seek to Add and Share Drawings
With Autodesk Seek, you can share, search, and reuse digital design content.
With Autodesk® Seek you can find and share product design information with
the online design community to enhance designs and to meet specific customer
needs. It allows designers to search for, download, and integrate generic or
manufacturer-specific building products or components and associated design
information.
When you are working in a design program, you may want to include products
that, for example, meet design standards for Leadership in Energy and
Environmental Design (LEED) or the Americans with Disabilities Act (ADA).
Autodesk Seek can help you locate such information and products, and get
them into your design.
■For more information about LEED green building certification, visit the
U.S. Green Building Council website: http://www.usgbc.org.
■For more information about ADA standards for accessible design, visit U.S.
Department of Justice website: http://www.usdoj.gov/crt/ada/.
You can access Autodesk Seek in the following ways:
■From the Autodesk Seek home page http://seek.autodesk.com
■On the ribbon Insert tab (to search) or the Output tab (to share)
■Click Application menu ➤ Publish ➤ Share with Autodesk Seek
■Click Share with Autodesk Seek from a selected block shortcut menu
■From the menu bar, click File ➤ Share with Autodesk Seek
■From the menu bar, click Tools menu ➤ Toolbars ➤ Autodesk Seek
1984 | Chapter 41 Use the Internet for Collaboration
■From the Autodesk Seek toolbar, click Autodesk Seek
■Click Autodesk Seek Design Content from DesignCenter (ADCENTER)
■At the Command prompt, enter SHAREWITHSEEK to share and SEEK to
search
With Autodesk Seek, you can upload AutoCAD drawing files and blocks under
the categories Architecture, Civil Engineering, and Structural Engineering.
This facilitates searching that results in significant time savings during
production.
Blocks and drawings are uploaded with their attribute values to the Autodesk
Seek website.
The host drawing file uploaded to the Autodesk Seek website does not include
any external images, external references (xref), or underlay file references.
NOTE Autodesk Seek is currently available in US English only.
To upload a block or drawing to Autodesk Seek
1Click Output tab ➤ Autodesk Seek panel ➤ Share with Autodesk Seek.
2In the Share with Autodesk Seek dialog box, select a block from the list
of blocks, or select the current drawing.
3Click OK.
The block or drawing is saved as a temporary file, which is packaged with
additional information such as a thumbnail image, and sent to the
Autodesk Seek website.
If the drawing is new or contains unsaved changes, you are prompted to
save the file.
4If prompted, enter a new file name and save the file.
A progress bar is displayed while the file is prepared and uploaded.
5Your web browser displays the Autodesk Seek website, after the file is
uploaded.
Follow the prompts on the web page and enter all required, and any
optional information, to complete the Share with Autodesk Seek process.
Use Autodesk Seek to Add and Share Drawings | 1985

To search for blocks and drawings in Autodesk Seek
1Click Insert tab ➤ Content panel ➤ Seek Design Content.
2Type one or more terms in the text box and click the Search button.
The Autodesk Seek website is displayed with the results for the terms you
searched.
Quick Reference
Commands
SEEK
Opens a web browser and displays the Autodesk Seek home page.
SHAREWITHSEEK
Uploads blocks or drawings to the Autodesk Seek website.
1986 | Chapter 41 Use the Internet for Collaboration
Use Markups for Design
Review
When you are in the final stages of a design, you can publish drawings for review, and receive
corrections and comments electronically. You can then implement and respond to these
comments and republish your drawings. Doing all this electronically streamlines
communication, shortens review cycles, and results in a more efficient design process.
Overview of Using Markups for Design Review
You can use only Autodesk Design Review to mark up DWF or DWFx files for
review. You can then view these markups in AutoCAD and make changes to
your drawings and change the status of the markups.
When you want to submit designs for review, you can publish a DWF or DWFx
file, and then send it to your client or anyone you want to review your designs.
The reviewer can open the DWF or DWFx file in Autodesk Design Review, mark
up the file electronically, and then send it back to you. For more information
on Autodesk Design Review, see Review and Markup Files with Design Review
on page 1980.
When you open the marked-up DWF or DWFx file in AutoCAD®, you can view
the redline markups in the AutoCAD drawing area, turn them off, make your
changes, change the status of the markups, and republish the DWF or DWFx
file to send out for another review.
See also:
■Review and Markup Files with Design Review on page 1980
42
1987
Quick Reference
Commands
MARKUP
Opens the Markup Set Manager.
MARKUPCLOSE
Closes the Markup Set Manager.
OPENDWFMARKUP
Opens a DWF or DWFx file that contains markups.
Publish Drawings for Review
Publish drawings for review at the end of the design cycle.
You should publish drawings for review at the end of the design cycle. In order
for electronic markups created in Autodesk Design Review to align with the
original drawing geometry, it is important not to change elements in your
drawing file that can affect this alignment after you have published the DWF
or DWFx file for review.
These elements include the following:
■Layers and layer states
■Layers to which objects are tied
■Number and placement of viewports in layouts
■Position and scale of objects within viewports
■View rotation
■Most drawing elements
See also:
■Review and Markup Files with Design Review on page 1980
1988 | Chapter 42 Use Markups for Design Review
Quick Reference
Commands
PUBLISH
Publishes drawings to electronic sheet sets (DWF, DWFx, or PDF files) or
plotters.
Insert Markups
Use Autodesk Design Review to insert markups into a DWF or DWFx file. A
markup is a single comment or a redline geometry correction inserted into a
DWF or DWFx file.
Using Autodesk Design Review, you can add markups electronically, just as
you would mark up a paper version of the drawing. You can also assign a
status to the markup and add comments.
The markups and their status are saved in the DWF or DWFx file.
For more information about creating markups in Autodesk Design Review,
see the Autodesk Design Review Help documentation.
See also:
■Review and Markup Files with Design Review on page 1980
View Markups
Use the Markup Set Manager to view and manage markups. To view the
markups in your designs, load the markup set into the Markup Set Manager.
A markup set is a group of markups contained within a single DWF or DWFx
file. When you load a markup set into the Markup Set Manager, the tree view
displays each marked-up drawing sheet and its associated markups.
In the Markup Set Manager, you can select individual markups, and you can
view their status and other details, such as the creator of the markup, the date
and time that it was created, and any comments associated with the markup.
You can create other types of markups that will also appear in the DWF or
DWFx file: text blocks, redline geometry, dimensions, and stamps. However,
only comments have a status and are shown in the Markup Set Manager.
Insert Markups | 1989

With Autodesk Design Review, you can modify DWF or DWFx files in the
following ways:
■Reorder sheets within a DWF or DWFx file
■Add sheets to a DWF or DWFx file
NOTE Markup Set Manager displays the Sheet status (in Detail view) as “File
is missing”, if you add sheets using Autodesk Design Review. The reason is that
the newly added sheets are not listed in the DSD file.
■Delete sheets from a DWF or DWFx file
Markup Set Manager will reflect the new order for every markup set that has
sheets added to, deleted from, or rearranged from within Autodesk Design
Review.
Any sheets that were added to the DWF or DWFx file in Autodesk Design
Review are listed in italics. When you double-click either a sheet that was
added in Autodesk Design Review or a markup for that sheet, that sheet in
the DWF or DWFx file will open in the DWF file viewer.
If you try to load a markup set by opening a DWF or DWFx file that does not
contain markups, you will not be able to open the DWF or DWFx file in
AutoCAD. You can, however, open the DWF or DWFx file in the DWF file
viewer. While loading a DWFx file, if the file is digitally signed you will be
notified that making changes to the file will invalidate the attached digital
signature.
When you double-click a model space markup in the Markup Set Manager,
the original drawing file opens in model space and reverts to the view rotation
that was current when the drawing was published. If you then change the
view rotation, the markups will not be shown in the drawing until you
double-click a model space markup and revert to the published view.
Using the Markup Set Manager, you can specify what is displayed in the
drawing area. You can show or hide the originating drawing file, the reviewed
DWF or DWFx file geometry, and the redline geometry. This allows you to
view the redline geometry, turn it off to make the changes in your drawing
file, and then view the redline geometry again in AutoCAD to check your
corrections.
Following are some recommendations for viewing markups:
■Change the drawing’s model space background color to a light shade of a
color other than black. This action enables you to view the DWF or DWFx
1990 | Chapter 42 Use Markups for Design Review
geometry in AutoCAD when the marked-up DWF or DWFx file is returned
to you.
■Put the drawing files you used to publish the DWF or DWFx file in the
search path. This action ensure that you can load the corresponding
drawing sets for a marked-up DWF or DWFx file.
Set the search path using the Files tab in the Options dialog box.
NOTE You can view markups in AutoCAD only if the marked-up DWF or DWFx
file was originally created in AutoCAD 2005 or later. You must also have the original
drawing file to view its markups in AutoCAD. Marked-up DWF or DWFx files
originally created from earlier versions of AutoCAD can be opened in Autodesk
Design Review.
See also:
■Review and Markup Files with Design Review on page 1980
To open the Markup Set Manager
■Click View tab ➤ Palettes panel ➤ Markup Set Manager.
To open a markup set
1To open a markup set, do one of the following:
■Click File menu ➤ Load Markup Set.
■In the Markup Set Manager, click the Markup Set list control. Click
Open.
2In the Open Markup DWF dialog box, select a DWF or DWFx file that
contains markups. Click Open.
NOTE If you open a digitally signed DWFx file, click Open File in the DWFx
- Digital Signature Warning dialog box.
The Markup Set Manager displays the markup set in the tree view.
Use Autodesk Design Review to open a DWF or DWFx file that does not
contain markups, as AutoCAD will not load non-marked up files.
View Markups | 1991

To view details of an individual markup in the Markup Set Manager
1Click File menu ➤ Load Markup Set.
2In the Open Markup DWF dialog box, select a DWF or DWFx file that
contains markups. Click Open.
NOTE If you open a digitally signed DWFx file, click Open File in the DWFx
- Digital Signature Warning dialog box.
The Markup Set Manager displays the markup set in the tree view.
3In the Markup Set Manager, click an individual markup node.
The Markup Details area in the lower portion of the Markup Set Manager
displays details for the selected markup.
To open a drawing sheet with markups from the Markup Set Manager
1Click File menu ➤ Load Markup Set.
2In the Open Markup DWF dialog box, select a DWF or DWFx file that
contains markups. Click Open.
NOTE If you open a digitally signed DWFx file, click Open File in the DWFx
- Digital Signature Warning dialog box.
The Markup Set Manager displays the markup set in the tree view.
3In the Markup Set Manager, double-click a drawing sheet or markup node.
If you double-click a markup node, the drawing sheet that corresponds
to the markup opens in the drawing area. You must have the original
DWG file from which the marked-up DWF or DWFx file was created to
view the associated drawing sheet.
NOTE To view markups in the drawing area — visual style and SHADEMODE
must be set to 2D Wireframe.
To show or hide DWG geometry for drawing sheets with associated markups
1Click File menu ➤ Load Markup Set.
2In the Open Markup DWF dialog box, select a DWF or DWFx file that
contains markups. Click Open.
1992 | Chapter 42 Use Markups for Design Review

NOTE If you open a digitally signed DWFx file, click Open File in the DWFx
- Digital Signature Warning dialog box.
The Markup Set Manager displays the markup set in the tree view.
3In the Markup Set Manager, double-click a drawing sheet node to open
the original DWG file.
4Click the View DWG Geometry button to hide the DWG geometry. You
can click the same button again to show the DWG geometry.
NOTE If you open a DWG file that does not have associated markups or the
markup set has not been loaded into the Markup Set Manager, you will not
be able to use the following buttons in the Markup Set Manager: Republish
All Markup Sets, View DWG Geometry, View DWF or DWFx Geometry, View
Redline Geometry.
To show or hide DWF file geometry in the drawing area
1Click File menu ➤ Load Markup Set.
2In the Open Markup DWF dialog box, select a DWF or DWFx file that
contains markups. Click Open.
NOTE If you open a digitally signed DWFx file, click Open File in the DWFx
- Digital Signature Warning dialog box.
The Markup Set Manager opens and displays the markup set in the tree
view.
3In the Markup Set Manager, double-click a drawing sheet node to open
the original DWG file.
4In the Markup Set Manager, click the View DWF Geometry button to
show the DWF or DWFx geometry. You can click the same button again
to hide the DWF or DWFx geometry.
To show or hide redline geometry (markups) in the drawing area
1Click File menu ➤ Load Markup Set.
2In the Open Markup DWF dialog box, select a DWF or DWFx file that
contains markups. Click Open.
View Markups | 1993

NOTE If you open a digitally signed DWFx file, click Open File in the DWFx
- Digital Signature Warning dialog box.
The Markup Set Manager opens and displays the markup set in the tree
view.
3In the Markup Set Manager, click a markup node to view the redline
geometry in the drawing area.
4Click the View Redline Geometry button to hide the redline geometry.
You can click the same button again to show the redline geometry.
To print a drawing with markups
■In Windows Explorer, double-click a DWF or DWFx file that contains
markups. The DWF or DWFx file opens in Autodesk Design Review. You
can then print the marked-up DWF or DWFx file.
To close the Markup Set Manager
■With the Markup Set Manager open, click Tools menu ➤ Palettes ➤
Markup Set Manager.
Quick Reference
Commands
MARKUP
Opens the Markup Set Manager.
MARKUPCLOSE
Closes the Markup Set Manager.
OPENDWFMARKUP
Opens a DWF or DWFx file that contains markups.
Respond to Markups
Once you have reviewed markups, you can change their status and add
comments that are saved with the markup.
1994 | Chapter 42 Use Markups for Design Review

In the Markup Set Manager, when you select an individual markup in the tree
view, the Markup Details area displays information about the markup. You
can change the status of the markup in this area, or you can right-click a
markup and click an option on the Markup Status shortcut menu.
The default status for new markups is <None>. You can change a markup's
status to Question, For Review, or Done.
In the Markup Set Manager, in the Notes area under Markup Details, you can
add comments or notes for the selected markup.
Changes in markup status and added comments are automatically saved in
the DWF or DWFx file and included when you republish it. You can also save
markup changes by right-clicking the markup set node and clicking Save
Markup History Changes on the shortcut menu.
WARNING Saving changes to a digitally signed DWFx file will invalidate the digital
signature.
See also:
■Review and Markup Files with Design Review on page 1980
To change the status of a markup
1Click File menu ➤ Load Markup Set.
2In the Open Markup DWF dialog box, select a DWF or DWFx file that
contains markups. Click Open.
The Markup Set Manager displays the markup set in the tree view.
3Right-click a markup node. Click Markup Status and click a status to select
it.
Added comments are automatically saved in the DWF or DWFx file and
included when you republish the DWF or DWFx file. You can also save
markup changes by right-clicking the markup set node. Click Save Markup
History Changes.
To add comments to a markup
1Click File menu ➤ Load Markup Set.
2In the Open Markup DWF dialog box, select a DWF or DWFx file that
contains markups. Click Open.
The Markup Set Manager displays the markup set in the tree view.
Respond to Markups | 1995
3In the Markup Set Manager, click a markup node.
4In the Details pane, click the Notes text box. Add your comments.
Comments are saved in the DWF or DWFx file and are included in the
file when you republish it.
You can also save markup changes by right-clicking the markup set node.
Click Save Markup History Changes.
To save changes to markups
1Click File menu ➤ Load Markup Set.
2In the Open Markup DWF dialog box, select a DWF or DWFx file that
contains markups. Click Open.
The Markup Set Manager opens and displays the markup set in the tree
view.
3In the Markup Set Manager, click a markup node and change its status
or add comments.
4Right-click the markup set node. Click Save Markup History Changes.
Changes to Markup status and any additional comments are also saved
in the DWF or DWFx file when you close the drawing or when you
republish it.
Quick Reference
Commands
MARKUP
Opens the Markup Set Manager.
MARKUPCLOSE
Closes the Markup Set Manager.
OPENDWFMARKUP
Opens a DWF or DWFx file that contains markups.
1996 | Chapter 42 Use Markups for Design Review
Republish a Markup Set
After you have viewed a markup set and made changes to your drawings, you
can republish the markup set for another review.
When you republish the markup set, the markups and any changes that have
been made to them are saved in the DWF or DWFx file. When anyone reviews
the republished DWF or DWFx file in Autodesk Design Review, the changes
made to the drawings are visible as well as any changes made to the status
and the details of the markups.
If you republish a DWF or DWFx file that has had sheets deleted from it or
rearranged within it in Autodesk Design Review, the new order of sheets will
be reflected in the republished DWF or DWFx file; however, if any sheets were
added to the DWF or DWFx file in Autodesk Design Review, those sheets will
not be included in the republished DWF or DWFx file.
See also:
■Review and Markup Files with Design Review on page 1980
To republish a marked-up drawing set
1Click File menu ➤ Load Markup Set.
2In the Open Markup DWF dialog box, select a DWF or DWFx file that
contains markups. Click Open.
The Markup Set Manager opens and displays the markup set in the tree
view.
3In the Markup Set Manager, double-click a markup node or drawing sheet
node to open your original DWG file.
4In the drawing area, make the required changes to your DWG file.
5In the Markup Set Manager, click markup nodes and change the status
or add comments as necessary.
6Click the Republish Markup DWF button at the top of the Markup Set
Manager.
7Click one of the following:
■Republish All Sheets. Clicking this option republishes all sheets in the
marked-up DWF or DWFx file.
Republish a Markup Set | 1997
■Republish Markup Sheets. Clicking this option republishes only those
sheets in the marked-up DWF or DWFx file that have associated
markups.
8In the Specify DWF File dialog box, select a DWF or DWFx file or enter
a name for the file. Click Select.
By default, the previously created marked-up file name is displayed and
is overwritten with a file of the same name that contains the drawing
and markup changes.
Quick Reference
Commands
MARKUP
Opens the Markup Set Manager.
MARKUPCLOSE
Closes the Markup Set Manager.
OPENDWFMARKUP
Opens a DWF or DWFx file that contains markups.
1998 | Chapter 42 Use Markups for Design Review
Part 13: Render Drawings
1999
2000
Draw 2D Isometric Views
The Isometric Snap/Grid mode helps you create 2D isometric images that represent 3D objects.
The Isometric Snap/Grid mode helps you create 2D images that represent 3D objects. By
setting the Isometric Snap/Grid, you can easily align objects along one of three isometric
planes; however, although the isometric drawing appears to be 3D, it is actually a 2D
representation. Therefore, you cannot expect to extract 3D distances and areas, display objects
from different viewpoints, or remove hidden lines automatically.
Set Isometric Grid and Snap
Simulate a 3D object from a particular viewpoint by aligning along three major
axes.
Isometric drawings simulate a 3D object from a particular viewpoint by aligning
along three major axes.
By setting the Isometric Snap/Grid, you can easily align objects along one of
three isometric planes; however, although the isometric drawing appears to be
3D, it is actually a 2D representation. Therefore, you cannot expect to extract
3D distances and areas, display objects from different viewpoints, or remove
hidden lines automatically.
If the snap angle is 0, the axes of the isometric planes are 30 degrees, 90 degrees,
and 150 degrees. Once you set the snap style to Isometric, you can work on any
of three planes, each with an associated pair of axes:
■Left. Aligns snap and grid along 90- and 150-degree axes.
■Top. Aligns snap and grid along 30- and 150-degree axes.
■Right. Aligns snap and grid along 30- and 90-degree axes.
43
2001
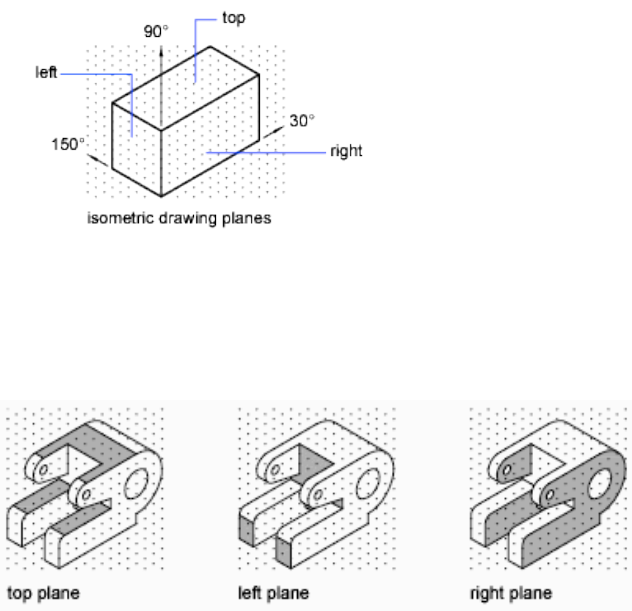
Choosing one of the three isometric planes causes Ortho and the crosshairs
to be aligned along the corresponding isometric axes. For example, when
Ortho is on, the points you specify align along the simulated plane you are
drawing on. Therefore, you can draw the top plane, switch to the left plane
to draw another side, and switch to the right plane to complete the drawing.
To turn on an isometric plane
1Click Tools menu ➤ Drafting Settings.
2In the Drafting Settings dialog box, Snap and Grid tab, under Snap Type,
select Isometric Snap.
3Click OK.
Alternately, you can cycle through the three isometric planes by pressing F5.
To change to a different isometric plane quickly
■Press F5 or CTRL+E to select a different isometric plane.
The program cycles through the Isoplane Top, Isoplane Right, and Isoplane
Left settings.
2002 | Chapter 43 Draw 2D Isometric Views
Quick Reference
Commands
DSETTINGS
Sets grid and snap, polar and object snap tracking, object snap modes,
Dynamic Input, and Quick Properties.
GRID
Displays a grid pattern in the current viewport.
ISOPLANE
Specifies the current isometric plane.
ORTHO
Constrains cursor movement to the horizontal or vertical direction.
SNAP
Restricts cursor movement to specified intervals.
System Variables
ISOLINES
Specifies the number of contour lines per surface on objects.
SNAPISOPAIR
Controls the isometric plane for the current viewport.
SNAPSTYL
Sets the snap style for the current viewport.
Draw Isometric Circles
Represent circles on isometric planes using ellipses.
If you are drawing on isometric planes, use an ellipse to represent a circle
viewed from an oblique angle. The easiest way to draw an ellipse with the
correct shape is to use the Isocircle option of ELLIPSE. The Isocircle option is
available only when the Style option of Snap mode is set to Isometric (see
DSETTINGS).
Draw Isometric Circles | 2003

NOTE To represent concentric circles, draw another ellipse with the same center
rather than offsetting the original ellipse. Offsetting produces an oval-shaped spline
that does not represent foreshortened distances as you would expect.
To draw an isometric circle
1Click Tools menu ➤ Drafting Settings.
2In the Drafting Settings dialog box, Snap and Grid tab, select Isometric
Snap.
3Click OK.
4Click Draw ➤ Ellipse ➤ Axis, End.
5Enter i (Isocircle).
6Specify the center of the circle.
7Specify the radius or diameter of the circle.
Quick Reference
Commands
ELLIPSE
Creates an ellipse or an elliptical arc.
ISOPLANE
Specifies the current isometric plane.
2004 | Chapter 43 Draw 2D Isometric Views
Add Lighting to Your
Model
Lighting can be added to a scene to create a more realistic rendering.
Overview of Lighting
Lighting adds the finishing touch to the scene.
Default Lighting
When there are no lights in a scene, the scene is shaded with default lighting.
Default lighting is derived from two distant sources that follow the viewpoint
as you move around the model. All faces in the model are illuminated so that
they are visually discernible. You can control brightness and contrast, but you
do not need to create or place lights yourself.
When you insert custom lights or add sunlight, you can disable the default
lighting. You can apply default lighting to the viewport only; at the same time,
you can apply custom lights to the rendering.
Standard Lighting Workflow
You add lights to give the scene a realistic appearance. Lighting enhances the
clarity and three-dimensionality of a scene. You can create point lights,
spotlights, and distant lights to achieve the effects you want. You can move or
rotate them with grip tools, turn them on and off, and change properties such
as color and attenuation. The effects of changes are visible in the viewport in
real time.
Spotlights and point lights are each represented by a different light glyph (a
symbol in the drawing showing the location of the light). Distant lights and
the sun are not represented by glyphs in the drawing because they do not have
44
2005
a discrete position and affect the entire scene. You can turn the display of
light glyphs on or off while you work. By default, light glyphs are not plotted.
Photometric Lighting Workflow
For more precise control over lighting, you can use photometric lights to
illuminate your model. Photometric lights use photometric (light energy)
values that enable you to define lights more accurately as they would be in
the real world. You can create lights with various distribution and color
characteristics, or import specific photometric files available from lighting
manufacturers.
Photometric lights can use manufacturers' IES standard file format. By using
manufacturers’ lighting data, you can visualize commercially available lighting
in your model. Then you can experiment with different fixtures, and by varying
the light intensity and color temperature, you can design a lighting system
that produces the results you want.
Sun and Sky
The sun is a special light similar to a distant light. The angle of the sun is
defined by the geographic location that you specify for the model and by the
date and time of day that you specify. You can change the intensity of the
sun and the color of its light. The sun and sky are the primary sources of
natural illumination. With the sun and sky simulation on page 2056, you can
adjust their properties.
In the photometric workflow, the sun follows a more physically accurate
lighting model in both the viewport and the rendered output. In the
photometric workflow, you can also enable sky illumination (through the sky
2006 | Chapter 44 Add Lighting to Your Model
background feature), which adds soft, subtle lighting effects caused by the
lighting interactions between the sun and the atmosphere.
Click the Play arrow to start the animation.
Luminaire Objects
Light fixtures can be represented by embedding photometric lights in blocks
that also contain geometry. A luminary assembles a set of light objects into a
light fixture.
See also:
■Receive Product Updates and Announcements on page 8
Quick Reference
Commands
CONVERTOLDLIGHTS
Converts lights created in previous drawing file formats to the current format.
DISTANTLIGHT
Creates a distant light.
Overview of Lighting | 2007
GEOGRAPHICLOCATION
Specifies the geographic location information for a drawing file.
LIGHT
Creates a light.
LIGHTLIST
Turns on and off the Lights in Model palette that lists all lights in the model.
FREESPOT
Creates free spotlight which is similar to a spotlight without a specified target.
FREEWEB
Creates a free web light which is similar to a web light without a specified
target.
POINTLIGHT
Creates a point light that radiates light in all directions from its location.
RENDEREXPOSURE
Provides settings to adjust the global lighting for the most recently rendered
output.
SPOTLIGHT
Creates a spotlight that emits a directional cone of light.
SUNPROPERTIES
Displays the Sun Properties window.
TARGETPOINT
Creates a target point light.
WEBLIGHT
Creates a web light.
System Variables
3DCONVERSIONMODE
Used to convert material and light definitions to the current product release.
DEFAULTLIGHTING
Turns on and off default lighting in place of other lighting.
2008 | Chapter 44 Add Lighting to Your Model
DEFAULTLIGHTINGTYPE
Specifies the type of default lighting, old or new.
LIGHTGLYPHDISPLAY
Turns on and off the display of light glyphs.
LIGHTINGUNITS
Controls whether generic or photometric lights are used, and specifies the
lighting units for the drawing.
LIGHTSINBLOCKS
Controls whether lights contained in blocks are used when rendering.
LINEARBRIGHTNESS
Controls the brightness level of the viewport when using default lighting or
generic lights.
LINEARCONTRAST
Controls the contrast level of the viewport when using default lighting or
generic lights.
LOGEXPBRIGHTNESS
Controls the brightness level of the viewport when using photometric
lighting.
LOGEXPCONTRAST
Controls the contrast level of the viewport when using photometric lighting.
LOGEXPDAYLIGHT
Controls if the exterior daylight flag is enabled when using photometric
lighting.
LOGEXPMIDTONES
Controls the mid tones level of the viewport when using photometric lighting.
RENDERUSERLIGHTS
Controls whether to override the setting for viewport lighting during
rendering.
SUNSTATUS
Turns on and off the lighting effects of the sun in the current viewport.
Overview of Lighting | 2009
Standard and Photometric Lighting Workflow
Types of lighting selected globally affect a drawing.
Set the Type of Lighting
AutoCAD offers three choices for lighting units: standard (generic),
International (SI), and American. The standard (generic) lighting workflow is
equivalent to the lighting workflow in AutoCAD prior to AutoCAD 2008. The
default lighting workflow for drawings created in AutoCAD 2008 and later is
a photometric workflow based on International (SI) lighting units. This choice
results in physically correct lighting. The American lighting unit provides
another option. American differs from International in that illuminance values
are formatted in foot-candles rather than lux.
In previous versions of AutoCAD, standard lighting was the default. You can
change the type of lighting with the LIGHTINGUNITS system variable. The
LIGHTINGUNITS system variable set to 0 represents standard (generic) lighting;
set to 1 represents photometric lighting in American units; set to 2 represents
photometric lighting in International SI units.
Photometric Lights
Photometric lights are physically correct lights. Physically correct lights
attenuate as the square of the distance. Photometric properties can be added
to both artificial lights and natural lights. Natural lights are the sun and the
sky. The natural lighting is represented interactively by a viewport background
type.
You can create lights with various distribution and color characteristics, or
import specific photometric files available from lighting manufacturers.
Photometric lights always attenuate using an inverse-square falloff, and rely
on your scene to use realistic units.
Tone Mapping
Generally with photometric lights and especially the sun you need to perform
tone mapping. Tone mapping can be adjusted with the RENDEREXPOSURE
command. The Adjust Rendered Exposure dialog box provides a preview and
controls to adjust the tone mapping.
2010 | Chapter 44 Add Lighting to Your Model
To set the drawing for standard lighting workflow
Do one of the following:
■Click Render tab ➤ Lights panel ➤ Lighting Units drop-down ➤ Generic
Lighing Units.
No lighting units are used and standard (generic) lighting is enabled.
■At the command prompt, enter LIGHTINGUNITS and set the value to 0
for standard lighting.
As each light is added it will have standard lighting properties.
To set the drawing for photometric workflow
Do one of the following:
■Click Render tab ➤ Lights panel ➤ Lighting Units drop-down ➤
International Lighing Units.
International lighting units are used and photometric lighting is enabled.
■Click Render tab ➤ Lights panel ➤ Lighting Units drop-down ➤
American Lighing Units.
American lighting units are used and photometric lighting is enabled.
■At the command prompt, enter LIGHTINGUNITS and set the value to 1
(American units) or 2 (International SI units) for photometric lighting.
As each light is added it will have photometric lighting properties.
Quick Reference
System Variables
LINEARBRIGHTNESS
Controls the brightness level of the viewport when using default lighting or
generic lights.
LINEARCONTRAST
Controls the contrast level of the viewport when using default lighting or
generic lights.
Standard and Photometric Lighting Workflow | 2011
LOGEXPBRIGHTNESS
Controls the brightness level of the viewport when using photometric
lighting.
LOGEXPCONTRAST
Controls the contrast level of the viewport when using photometric lighting.
LOGEXPDAYLIGHT
Controls if the exterior daylight flag is enabled when using photometric
lighting.
LOGEXPMIDTONES
Controls the mid tones level of the viewport when using photometric lighting.
LOGEXPPHYSICALSCALE
Controls the relative brightness of self-illuminated materials in a photometric
environment.
Illuminate a Scene
You can add point lights, spotlights, and distant lights and set the location
and photometric properties of each.
You can use a command to create a light, or you can use a button on the
Lights toolbar or the Lights panel on the ribbon. You can use the Properties
palette to change the color of a selected light or other properties. You can also
store a light and its properties on a tool palette and use it again in the same
drawing or another drawing.
Guidelines for Lighting
The guidelines for lighting used by photographers, filmmakers, and stage
designers can help you set up the lighting for scenes.
Your choice of lighting depends on whether your scene simulates natural or
artificial illumination. Naturally lit scenes, such as daylight or moonlight, get
their most important illumination from a single light source. Artificially lit
scenes, on the other hand, often have multiple light sources of similar
intensity.
2012 | Chapter 44 Add Lighting to Your Model
Natural Light
For practical purposes at ground level, sunlight has parallel rays coming from
a single direction. The direction and angle vary depending on the time of day,
the latitude, and the season.
In clear weather, the color of sunlight is a pale yellow: for example, RGB values
of 250, 255, 175 (HSV 45, 80, 255). Cloudy weather can tint sunlight blue,
shading into dark gray for stormy weather. Particles in the air can give sunlight
an orange or brownish tint. At sunrise and sunset, the color can be more
orange or red than yellow.
Shadows are more distinct the clearer the day is, and can be essential for
bringing out the three-dimensionality of a naturally lit scene.
A directional light can also simulate moonlight, which is white but dim
compared to the sun.
Artificial Light
A scene illuminated by point lights, spotlights, or distant lights is artificially
illuminated. Therefore, it can be helpful to know how light behaves.
When light rays strike a surface, the surface reflects them, or at least some of
them, enabling us to see the surface. The appearance of a surface depends on
the light that strikes it combined with the properties of the surface material,
such as color, smoothness, and opacity.
Other factors, such as a light’s color, intensity, attenuation, and angle of
incidence also play a role in how objects in a scene appear.
Quick Reference
Commands
DISTANTLIGHT
Creates a distant light.
LIGHT
Creates a light.
LIGHTLIST
Turns on and off the Lights in Model palette that lists all lights in the model.
FREESPOT
Creates free spotlight which is similar to a spotlight without a specified target.
Guidelines for Lighting | 2013
POINTLIGHT
Creates a point light that radiates light in all directions from its location.
RENDEREXPOSURE
Provides settings to adjust the global lighting for the most recently rendered
output.
SPOTLIGHT
Creates a spotlight that emits a directional cone of light.
TARGETPOINT
Creates a target point light.
System Variables
DEFAULTLIGHTING
Turns on and off default lighting in place of other lighting.
DEFAULTLIGHTINGTYPE
Specifies the type of default lighting, old or new.
LIGHTGLYPHDISPLAY
Turns on and off the display of light glyphs.
LIGHTINGUNITS
Controls whether generic or photometric lights are used, and specifies the
lighting units for the drawing.
LINEARBRIGHTNESS
Controls the brightness level of the viewport when using default lighting or
generic lights.
LINEARCONTRAST
Controls the contrast level of the viewport when using default lighting or
generic lights.
RENDERUSERLIGHTS
Controls whether to override the setting for viewport lighting during
rendering.
2014 | Chapter 44 Add Lighting to Your Model
Use Point Lights
A point light radiates light in all directions from its location.
Point Lights
A point light radiates light in all directions from its location. A point light
does not target an object. Use point lights for general lighting effects. You can
create a point light by entering the POINTLIGHT command or by selecting a
point light from the Lights panel on the ribbon.
You create a target point light with the TARGETPOINT command. The
difference between the target point light and a point light is the additional
target properties that are available. A target light can be pointed to an object.
A target point light can also be created from a point light by changing the
target property of the point light from No to Yes.
In the standard lighting workflow, you can set a point light manually so its
intensity diminishes with respect to distance either linearly, according to the
inverse square of the distance, or not at all. By default, the attenuation is set
to None.
Point Lights in Photometric Workflow
A free point light can have photometric distribution properties. The attenuation
for a photometric point light is always set to inverse square.
When the LIGHTINGUNITS system variable is set to 1 (American units) or 2
(International SI units) for photometric lighting, additional properties are
Use Point Lights | 2015

available for a point light. On the Properties palette, photometric properties
are
■Lamp Intensity. Specifies the inherent brightness of the light. Specifies the
intensity, flux or illuminance of the lamp.
■Resulting Intensity. Gives the final brightness of the light. (Product of lamp
intensity and intensity factor. Read-only.)
■Lamp Color. Specifies the inherent color of the light in Kelvin temperature
or standard.
■Resulting Color. Gives the final color of the light. This is determined by a
combination of the lamp color and the filter color. (Product of lamp color
and filter color. Read-only.)
NOTE When the drawing lighting units are photometric, the attenuation type
property becomes disabled. Photometric lights have fixed, inverse-square
attenuation.
The additional information about these properties are available under Lighting
Properties. The following image is an example of a photometric point light
and lighting properties palette with the photometric properties outlined:
2016 | Chapter 44 Add Lighting to Your Model
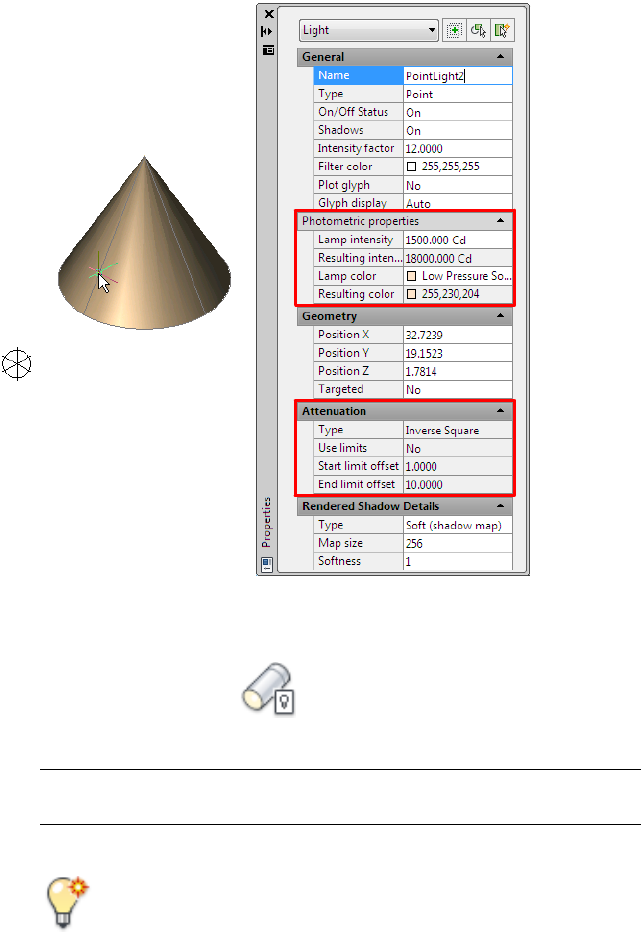
To create a point light in standard lighting workflow
1Click Render tab ➤ Lights panel ➤ Lighting Units drop-down ➤
Generic Lighing Units.
No lighting units are used and standard (generic) lighting is enabled.
NOTE Alternatively, you can enter lightingunits at the Command prompt
and set the value to 0 for standard (generic) lighting.
2Click Render tab ➤ Lights panel ➤ Create Light drop-down ➤ Point.
3Click in the drawing to specify a location for the light.
Use Point Lights | 2017
4At the Command prompt, enter n and enter a name. This name will
appear in the properties and in the Lights in Model window (LIGHTLIST).
You can continue to specify properties by entering options, or you can
exit and set properties interactively. When you use the interactive method,
you can see the results of your changes as you work.
5Press Enter twice to exit the command.
Select the light and use grip tools to change the light. You can also
right-click the light and then click Properties. The Lighting Properties
window can be used to change its properties.
To create a point light in photometric workflow and change photometric
properties
1Click Render tab ➤ Lights panel ➤ Lighting Units drop-down ➤
International Lighing Units.
International lighting units are used and photometric lighting is enabled.
NOTE Alternatively, you can enter lightingunits at the Command prompt
and set the value to 2 for international SI lighting.
2Click Render tab ➤ Lights panel ➤ Create Light drop-down ➤ Point.
3Click in the drawing to specify a location for the light.
4At the Command prompt, enter n and enter a name. This name will
appear in the properties and in the Lights in Model window (LIGHTLIST).
You can continue to specify properties by entering options, or you can
exit and set properties interactively. When you use the interactive method,
you can see the results of your changes as you work.
5Press Enter twice to exit the command.
Select the light and use grip tools to change the light.
6Right-click the light. Click Properties. You can use the Lighting Properties
window to change the photometric properties.
2018 | Chapter 44 Add Lighting to Your Model
To create a target point light in standard lighting workflow
1Click Render tab ➤ Lights panel ➤ Lighting Units drop-down ➤
Generic Lighing Units.
No lighting units are used and standard (generic) lighting is enabled.
NOTE Alternatively, you can enter lightingunits at the Command prompt
and set the value to 0 for standard (generic) lighting.
2At the command prompt, enter targetpoint.
3Click in the drawing to specify a location for the light.
4Click to specify a target point.
5At the Command prompt, enter n and enter a name. This name will
appear in the properties and in the Lights in Model window (LIGHTLIST).
You can continue to specify properties by entering options, or you can
exit and set properties interactively. When you use the interactive method,
you can see the results of your changes as you work.
6Press Enter twice to exit the command.
Right-click the light. Click Properties. You can use the Lighting Properties
palette to change the light. Note that compared to the point light there
are additional target positioning properties available.
To create a target point light from a point light
1Click Render tab ➤ Lights panel ➤ Lighting Units drop-down ➤
Generic Lighing Units.
No lighting units are used and standard (generic) lighting is enabled.
NOTE Alternatively, you can enter lightingunits at the Command prompt
and set the value to 0 for standard (generic) lighting.
2Click Render tab ➤ Lights panel ➤ Create Light drop-down ➤ Point.
3Click in the drawing to specify a location for the light.
Use Point Lights | 2019
4At the Command prompt, enter n and enter a name. This name will
appear in the properties and in the Lights in Model window (LIGHTLIST).
You can continue to specify properties by entering options, or you can
exit and set properties interactively. When you use the interactive method,
you can see the results of your changes as you work.
5Press Enter twice to exit the command.
6Right-click the light and click Properties on the Lighting Properties palette.
Change the Targeted property to Yes.
Additional target properties become available: Target X, Target Y, and
Target Z.
NOTE When changing a point light to target light, the name of the light
remains the same. If it still says point light, you might want to change the
name to target light.
To create a point light tool
1Click Veiw tab ➤ Palettes panel ➤ Tool Palettes.
2In the drawing, select a point light whose properties you want to use for
the tool.
3Drag the light to the active tool palette.
The new light tool retains all of the properties of the light except its
location properties.
Quick Reference
Commands
LIGHT
Creates a light.
LIGHTLIST
Turns on and off the Lights in Model palette that lists all lights in the model.
POINTLIGHT
Creates a point light that radiates light in all directions from its location.
2020 | Chapter 44 Add Lighting to Your Model
RENDEREXPOSURE
Provides settings to adjust the global lighting for the most recently rendered
output.
TARGETPOINT
Creates a target point light.
System Variables
DEFAULTLIGHTING
Turns on and off default lighting in place of other lighting.
DEFAULTLIGHTINGTYPE
Specifies the type of default lighting, old or new.
LIGHTGLYPHDISPLAY
Turns on and off the display of light glyphs.
LIGHTINGUNITS
Controls whether generic or photometric lights are used, and specifies the
lighting units for the drawing.
LIGHTSINBLOCKS
Controls whether lights contained in blocks are used when rendering.
LINEARBRIGHTNESS
Controls the brightness level of the viewport when using default lighting or
generic lights.
LINEARCONTRAST
Controls the contrast level of the viewport when using default lighting or
generic lights.
LOGEXPBRIGHTNESS
Controls the brightness level of the viewport when using photometric
lighting.
LOGEXPCONTRAST
Controls the contrast level of the viewport when using photometric lighting.
Use Point Lights | 2021
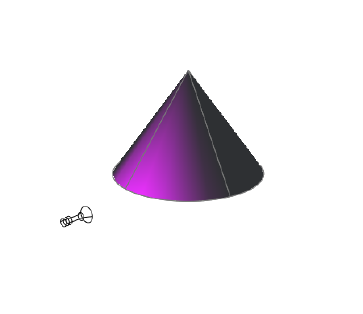
LOGEXPDAYLIGHT
Controls if the exterior daylight flag is enabled when using photometric
lighting.
LOGEXPMIDTONES
Controls the mid tones level of the viewport when using photometric lighting.
RENDERUSERLIGHTS
Controls whether to override the setting for viewport lighting during
rendering.
Use Spotlights
A spotlight can be directed towards an object.
Spotlights
A spotlight distribution casts a focused beam of light like a flashlight, a follow
spot in a theater, or a headlight. A spotlight emits a directional cone of light.
You can control the direction of the light and the size of the cone. Like a point
light, a spot light can be manually set to attenuate its intensity with distance.
However, a spotlight's intensity will also always attenuate based on the angle
relative to the spot's target vector. This attenuation is controlled by the hotspot
and falloff angles of the spotlight. Spotlights are useful for highlighting specific
features and areas in your model. A free spotlight (FREESPOT) is similar to
spotlight. A spotlight has target properties.
2022 | Chapter 44 Add Lighting to Your Model

Spotlights in Photometric Workflow
In photometric workflow, the hotspot intensity falls to 50 percent. The hotspot
for standard lighting is at 100 percent. At its falloff angle, intensity of the
spotlight falls to zero. Additional properties become available for a point light
when LIGHTINGUNITS is set to 1 (American units) or 2 (International SI units)
for photometric lighting:
■Lamp Intensity. Specifies the inherent brightness of the light. Specifies the
intensity, flux, or illuminance of the lamp.
■Resulting Intensity. Gives the final brightness of the light. (Product of lamp
intensity and intensity factor. Read-only.)
■Lamp Color. Specifies the inherent color of the light in Kelvin temperature
or standard.
■Resulting Color. Gives the final color of the light. This is determined by a
combination of the lamp color and the filter color. (Product of lamp color
and filter color. Read-only.)
NOTE When the drawing lighting units are photometric, the attenuation type
property becomes disabled. Photometric lights have fixed, inverse-square
attenuation. The hotspot falloff attenuation in the rendered image varies from
standard lighting, as it uses a different mathematical basis.
The additional information about these properties are available under Lighting
Properties. The following image is an example of a photometric spotlight and
lighting properties palette with the photometric properties outlined:
Use Spotlights | 2023
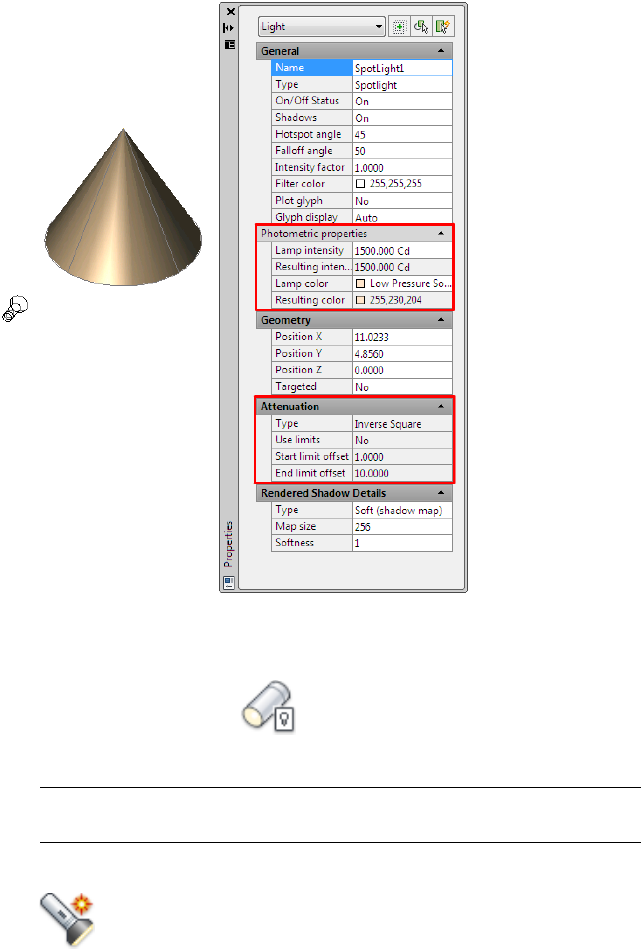
To create a spotlight
1Click Render tab ➤ Lights panel ➤ Lighting Units drop-down ➤
Generic Lighing Units.
No lighting units are used and standard (generic) lighting is enabled.
NOTE Alternatively, you can enter lightingunits at the Command prompt
and set the value to 0 for standard (generic) lighting.
2Click Render tab ➤ Lights panel ➤ Create Light drop-down ➤ Spot.
3Click in the drawing to specify a location for the light.
2024 | Chapter 44 Add Lighting to Your Model
4Click to specify a target for the spotlight.
5At the Command prompt, enter n and enter a name. This name will
appear in the properties and in the Lights in Model window (LIGHTLIST).
You can continue to specify properties by entering options, or you can
exit and set properties interactively. When you use the interactive method,
you can see the results of your changes as you work.
6Press Enter twice to exit the command.
Select the light and use grip tools to change the light. You can also
right-click the light and then click Properties. Use Lighting Properties
palette to change its properties.
To create a photometric spotlight and change photometric properties
1Click Render tab ➤ Lights panel ➤ Lighting Units drop-down ➤
Generic Lighing Units.
No lighting units are used and standard (generic) lighting is enabled.
NOTE Alternatively, you can enter lightingunits at the Command prompt
and set the value to 0 for standard (generic) lighting.
2Click Render tab ➤ Lights panel ➤ Create Light drop-down ➤ Spot.
3Click in the drawing to specify a location for the light.
4Click to specify a target for the spotlight.
5At the Command prompt, enter n and enter a name. This name will
appear in the properties and in the Lights in Model window (LIGHTLIST).
You can continue to specify properties by entering options, or you can
exit and set properties interactively. When you use the interactive method,
you can see the results of your changes as you work.
6Press Enter twice to exit the command.
Select the light and use grip tools to change the light.
7To change properties, right-click the light. Click Properties. Use the
Lighting Properties palette to change the photometric properties.
Use Spotlights | 2025

To create a free spot light in photometric lighting workflow
1At the Command prompt, enter lightingunits and set the value to 1
(American units) or 2 (International SI units) for photometric lighting.
2At the command prompt, enter freespot.
3Click in the drawing to specify a location for the light.
4At the Command prompt, enter n and enter a name. This name will
appear in the properties and in the Lights in Model window (LIGHTLIST).
You can continue to specify properties by entering options, or you can
exit and set properties interactively. When you use the interactive method,
you can see the results of your changes as you work.
5Press Enter twice to exit the command.
Select the light and use grip tools to change the light.
6To change properties, right-click the light. Click Properties. Use the
Lighting Properties window to change the photometric properties.
To create a spotlight tool
1Click Veiw tab ➤ Palettes panel ➤ Tool Palettes.
2In the drawing, select a spotlight whose properties you want to use for
the tool.
3Drag the light to the active tool palette.
The new light tool retains all of the properties of the light except its
location properties.
Quick Reference
Commands
LIGHT
Creates a light.
LIGHTLIST
Turns on and off the Lights in Model palette that lists all lights in the model.
2026 | Chapter 44 Add Lighting to Your Model
FREESPOT
Creates free spotlight which is similar to a spotlight without a specified target.
RENDEREXPOSURE
Provides settings to adjust the global lighting for the most recently rendered
output.
SPOTLIGHT
Creates a spotlight that emits a directional cone of light.
System Variables
DEFAULTLIGHTING
Turns on and off default lighting in place of other lighting.
DEFAULTLIGHTINGTYPE
Specifies the type of default lighting, old or new.
LIGHTGLYPHDISPLAY
Turns on and off the display of light glyphs.
LIGHTINGUNITS
Controls whether generic or photometric lights are used, and specifies the
lighting units for the drawing.
LIGHTSINBLOCKS
Controls whether lights contained in blocks are used when rendering.
LINEARBRIGHTNESS
Controls the brightness level of the viewport when using default lighting or
generic lights.
LINEARCONTRAST
Controls the contrast level of the viewport when using default lighting or
generic lights.
LOGEXPBRIGHTNESS
Controls the brightness level of the viewport when using photometric
lighting.
LOGEXPCONTRAST
Controls the contrast level of the viewport when using photometric lighting.
Use Spotlights | 2027
LOGEXPDAYLIGHT
Controls if the exterior daylight flag is enabled when using photometric
lighting.
LOGEXPMIDTONES
Controls the mid tones level of the viewport when using photometric lighting.
RENDERUSERLIGHTS
Controls whether to override the setting for viewport lighting during
rendering.
Use Weblights
Weblights are photometric lights with customized, real-world light
distributions.
Overview of Weblights
Weblights are photometric lights with customized, real-world light
distributions.
A weblight (web) is a 3D representation of the light intensity distribution of
a light source. Weblights can be used to represent anisotropic (non-uniform)
light distributions derived from data provided by manufacturers of real-world
lights. This gives a far more precise representation of the rendered light than
either spot or point lights are capable of.
This directional light distribution information is stored in a photometric data
file in the IES format using the IES LM-63-1991 standard file format for
photometric data. You can load photometric data files provided by various
manufacturers under the Photometric Web panel in the Properties palette for
the light. The light icon represents the photometric web you select.
A light that uses a photometric web can be added to a drawing by entering
the commands WEBLIGHT and FREEWEB at the command prompt. The
WEBLIGHT command creates a targeted weblight, whereas the FREEWEB
command creates a weblight without an explicit target.
To describe the directional distribution of the light emitted by a source,
AutoCAD approximates the source by a point light placed at its photometric
center. With this approximation, the distribution is characterized as a function
of the outgoing direction only. The luminous intensity of the source for a
predetermined set of horizontal and vertical angles is provided, and the system
2028 | Chapter 44 Add Lighting to Your Model
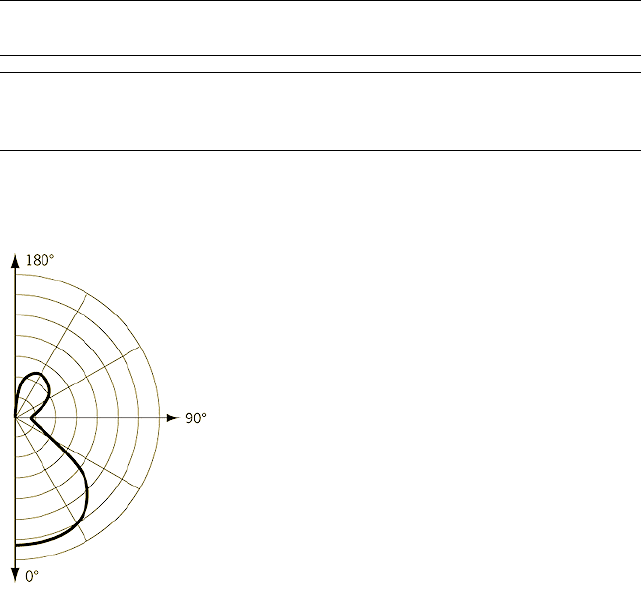
can compute the luminous intensity along an arbitrary direction by
interpolation.
NOTE Web distribution is used only in rendered images. Weblights are
approximated as point lights in the viewport.
NOTE You can control the size of a web glyph from Tools menu > Options >
Drafting > Light Glyph Settings. Some web glyphs may appear very small on screen
and may need to be adjusted.
Goniometric Diagrams
Photometric data is often depicted using a goniometric diagram.
Goniometric diagram of a web distribution
This type of diagram visually represents how the luminous intensity of a source
varies with the vertical angle. However, the horizontal angle is fixed and,
unless the distribution is axially symmetric, more than one goniometric
diagram may be needed to describe the complete distribution.
Photometric Webs
The photometric web is a three dimensional representation of the light
distribution. It extends the goniometric diagram to three dimensions, so that
the dependencies of the luminous intensity on both the vertical and horizontal
angles can be examined simultaneously. The center of the photometric web
represents the center of the light object.
Use Weblights | 2029
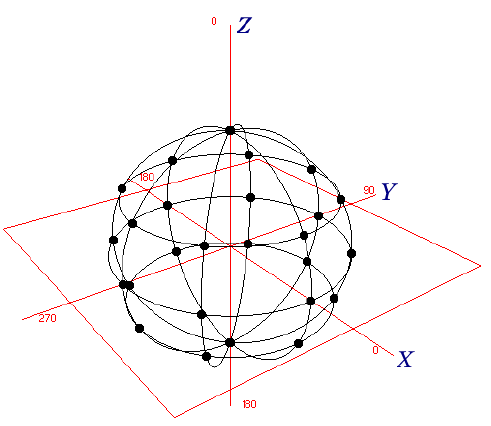
The luminous intensity in any given direction is proportional to the distance
between this web and the photometric center, measured along a line leaving
the center in the specified direction.
Example of Isotropic distribution
A sphere centered around the origin is a representation of an isotropic
distribution. All the points in the diagram are equidistant from the center and
therefore light is emitted equally in all directions.
2030 | Chapter 44 Add Lighting to Your Model
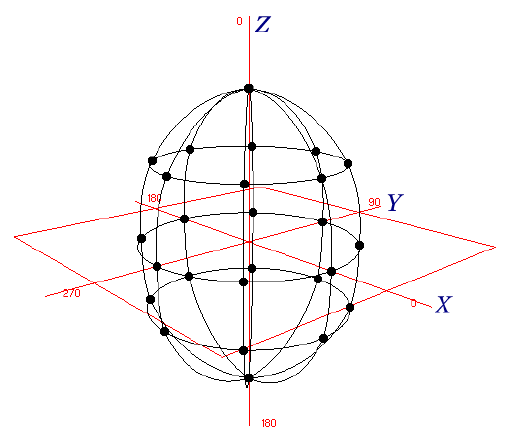
Example of Ellipsoidal distribution
In this example, the points in the negative Z direction are the same distance
from the origin as the corresponding points in the positive Z direction, so the
same amount of light shines upward and downward. No point has a very large
X or Y component, either positive or negative, so less light is cast laterally
from the light source.
To create a web distribution with a manufacturer’s IES file
1At the command prompt, enter lightingunits and set the value to 1
(American units) or 2 (International SI units) for photometric lighting.
2At the Command prompt, enter properties to activate the Properties
palette.
3Enter spotlight at the Command prompt.
4In the drawing, select the light. The properties for the spotlight are
displayed in the Properties palette.
5Under the General panel, change the lighting Type from spotlight to
web.
6Under the Photometric Web panel, select the blank text box.
7Click the browse button and then select an IES file.
Use Weblights | 2031
The light has been changed to have a web distribution with the web
settings from the IES file.
Quick Reference
Commands
LIGHT
Creates a light.
LIGHTLIST
Turns on and off the Lights in Model palette that lists all lights in the model.
FREEWEB
Creates a free web light which is similar to a web light without a specified
target.
RENDEREXPOSURE
Provides settings to adjust the global lighting for the most recently rendered
output.
WEBLIGHT
Creates a web light.
System Variables
DEFAULTLIGHTING
Turns on and off default lighting in place of other lighting.
DEFAULTLIGHTINGTYPE
Specifies the type of default lighting, old or new.
LIGHTGLYPHDISPLAY
Turns on and off the display of light glyphs.
LIGHTINGUNITS
Controls whether generic or photometric lights are used, and specifies the
lighting units for the drawing.
LIGHTSINBLOCKS
Controls whether lights contained in blocks are used when rendering.
2032 | Chapter 44 Add Lighting to Your Model
LINEARBRIGHTNESS
Controls the brightness level of the viewport when using default lighting or
generic lights.
LINEARCONTRAST
Controls the contrast level of the viewport when using default lighting or
generic lights.
LOGEXPBRIGHTNESS
Controls the brightness level of the viewport when using photometric
lighting.
LOGEXPCONTRAST
Controls the contrast level of the viewport when using photometric lighting.
LOGEXPDAYLIGHT
Controls if the exterior daylight flag is enabled when using photometric
lighting.
LOGEXPMIDTONES
Controls the mid tones level of the viewport when using photometric lighting.
RENDERUSERLIGHTS
Controls whether to override the setting for viewport lighting during
rendering.
SUNSTATUS
Turns on and off the lighting effects of the sun in the current viewport.
IES Standard File Format
IES standard file formats can be created and modified.
You can create a photometric data file in the IES format using the IES
LM-63-1991 standard file format for photometric data. (IES stands for
Illuminating Engineering Society.) However, only the information relevant
to AutoCAD is described here. For a complete description of the IES standard
file format, see IES Standard File Format for Electronic Transfer of Photometric
Data and Related Information, prepared by the IES Computer Committee
(http://www.iesna.org).
The luminous intensity distribution (LID) of a luminaire is measured at the
nodes of a photometric web for a fixed set of horizontal and vertical angles.
Use Weblights | 2033
The poles of the web lie along the vertical axis, with the nadir corresponding
to a vertical angle of zero degrees. The horizontal axis corresponds to a
horizontal angle of zero degrees and is oriented parallel to the length of the
luminaire. This type of photometric web is generated by a Type C goniometer
and is the most popular in North America; other types of goniometry are
supported by the IES standard file format but are not discussed here.
The photometric data is stored in an ASCII file. Each line in the file must be
less than 132 characters long and must be terminated by a carriage
return/line-feed character sequence. Longer lines can be continued by inserting
a carriage return/line-feed character sequence.
Each field in the file must begin on a new line and must appear exactly in the
following sequence:
1IESNA91
2[TEST] The test report number of your data
3[MANUFAC] The manufacturer of the luminaire
4TILT=NONE
51
6The initial rated lumens for the lamp used in the test or -1 if absolute
photometry is used and the intensity values do not depend on different
lamp ratings.
7A multiplying factor for all the candela values in the file. This makes it
possible to easily scale all the candela values in the file when the
measuring device operates in unusual units—for example, when you
obtain the photometric values from a catalog using a ruler on a
goniometric diagram. Normally the multiplying factor is 1.
8The number of vertical angles in the photometric web.
9The number of horizontal angles in the photometric web.
10 1
11 The type of unit used to measure the dimensions of the luminous opening.
Use 1 for feet or 2 for meters.
12 The width, length, and height of the luminous opening. It is normally
given as 0 0 0.
13 1.0 1.0 0.0
2034 | Chapter 44 Add Lighting to Your Model
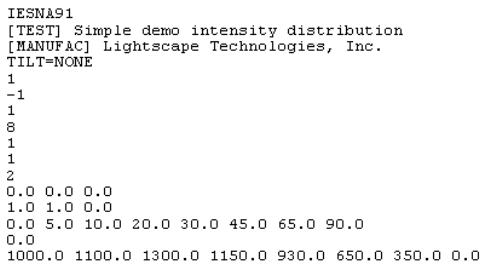
14 The set of vertical angles, listed in increasing order. If the distribution
lies completely in the bottom hemisphere, the first and last angles must
be 0° and 90°, respectively. If the distribution lies completely in the top
hemisphere, the first and last angles must be 90° and 180°, respectively.
Otherwise, they must be 0° and 180°, respectively.
15 The set of horizontal angles, listed in increasing order. The first angle
must be 0°. The last angle determines the degree of lateral symmetry
displayed by the intensity distribution. If it is 0°, the distribution is axially
symmetric. If it is 90°, the distribution is symmetric in each quadrant. If
it is 180°, the distribution is symmetric about a vertical plane. If it is
greater than 180° and less than or equal to 360°, the distribution exhibits
no lateral symmetries. All other values are invalid.
16 The set of candela values. First, all the candela values corresponding to
the first horizontal angle are listed, starting with the value corresponding
to the smallest vertical angle and moving up the associated vertical plane.
Then, the candela values corresponding to the vertical plane through the
second horizontal angle are listed, and so on until the last horizontal
angle. Each vertical slice of values must start on a new line. Long lines
may be broken between values as needed by following the instructions
given earlier.
Example of Photometric Data File
The following is an example of a photometric data file.
Use Weblights | 2035
Quick Reference
Commands
CONVERTOLDLIGHTS
Converts lights created in previous drawing file formats to the current format.
DISTANTLIGHT
Creates a distant light.
GEOGRAPHICLOCATION
Specifies the geographic location information for a drawing file.
LIGHT
Creates a light.
LIGHTLIST
Turns on and off the Lights in Model palette that lists all lights in the model.
FREESPOT
Creates free spotlight which is similar to a spotlight without a specified target.
FREEWEB
Creates a free web light which is similar to a web light without a specified
target.
POINTLIGHT
Creates a point light that radiates light in all directions from its location.
RENDEREXPOSURE
Provides settings to adjust the global lighting for the most recently rendered
output.
SPOTLIGHT
Creates a spotlight that emits a directional cone of light.
SUNPROPERTIES
Displays the Sun Properties window.
TARGETPOINT
Creates a target point light.
2036 | Chapter 44 Add Lighting to Your Model
WEBLIGHT
Creates a web light.
System Variables
3DCONVERSIONMODE
Used to convert material and light definitions to the current product release.
DEFAULTLIGHTING
Turns on and off default lighting in place of other lighting.
DEFAULTLIGHTINGTYPE
Specifies the type of default lighting, old or new.
LIGHTGLYPHDISPLAY
Turns on and off the display of light glyphs.
LIGHTINGUNITS
Controls whether generic or photometric lights are used, and specifies the
lighting units for the drawing.
LIGHTSINBLOCKS
Controls whether lights contained in blocks are used when rendering.
LINEARBRIGHTNESS
Controls the brightness level of the viewport when using default lighting or
generic lights.
LINEARCONTRAST
Controls the contrast level of the viewport when using default lighting or
generic lights.
LOGEXPBRIGHTNESS
Controls the brightness level of the viewport when using photometric
lighting.
LOGEXPCONTRAST
Controls the contrast level of the viewport when using photometric lighting.
LOGEXPDAYLIGHT
Controls if the exterior daylight flag is enabled when using photometric
lighting.
Use Weblights | 2037
LOGEXPMIDTONES
Controls the mid tones level of the viewport when using photometric lighting.
RENDERUSERLIGHTS
Controls whether to override the setting for viewport lighting during
rendering.
SUNSTATUS
Turns on and off the lighting effects of the sun in the current viewport.
Common Lamp Values for Photometric Lights
Lists of commonly used lamps for defining photometric lights are available
on the Lighting tool palette.
Commonly used lamps values are available on the Lighting tool palette:
Fluorescent; Low Pressure Sodium; Incandescent, and High Intensity Discharge.
Quick Reference
Commands
LIGHT
Creates a light.
LIGHTLIST
Turns on and off the Lights in Model palette that lists all lights in the model.
FREEWEB
Creates a free web light which is similar to a web light without a specified
target.
RENDEREXPOSURE
Provides settings to adjust the global lighting for the most recently rendered
output.
WEBLIGHT
Creates a web light.
2038 | Chapter 44 Add Lighting to Your Model
System Variables
LIGHTGLYPHDISPLAY
Turns on and off the display of light glyphs.
LIGHTINGUNITS
Controls whether generic or photometric lights are used, and specifies the
lighting units for the drawing.
LIGHTSINBLOCKS
Controls whether lights contained in blocks are used when rendering.
LINEARBRIGHTNESS
Controls the brightness level of the viewport when using default lighting or
generic lights.
LINEARCONTRAST
Controls the contrast level of the viewport when using default lighting or
generic lights.
LOGEXPBRIGHTNESS
Controls the brightness level of the viewport when using photometric
lighting.
LOGEXPCONTRAST
Controls the contrast level of the viewport when using photometric lighting.
LOGEXPDAYLIGHT
Controls if the exterior daylight flag is enabled when using photometric
lighting.
LOGEXPMIDTONES
Controls the mid tones level of the viewport when using photometric lighting.
RENDERUSERLIGHTS
Controls whether to override the setting for viewport lighting during
rendering.
Use Distant Lights
Distant lights are useful for lighting objects or as a backdrop.
Use Distant Lights | 2039
Distant Lights in Standard Lighting Workflow
A distant light emits uniform parallel light rays in one direction only. You
specify a FROM point and a TO point anywhere in the viewport to define the
direction of the light. Spotlights and point lights are each represented by a
different light glyph. Distant lights are not represented by glyphs in the
drawing because they do not have a discrete position and affect the entire
scene.
The intensity of a distant light does not diminish over distance; it is as bright
at each face it strikes as it is at the source. Distant lights are useful for lighting
objects or for lighting a backdrop uniformly.
NOTE It is recommended that you do not use distant lights in blocks.
Distant Lights in Photometric Workflow
Distant lights are not physically accurate. It is recommended that you do not
use them in a photometric workflow.
To create a distant light
1Click Render tab ➤ Lights panel ➤ Lighting Units drop-down ➤
Generic Lighing Units.
No lighting units are used and standard (generic) lighting is enabled.
NOTE Alternatively, you can enter lightingunits at the command prompt
and set the value to 0 for standard (generic) lighting.
2Click Render tab ➤ Lights panel ➤ Create Light drop-down ➤ Distant.
3Click in the drawing to specify a location for the light.
4Click to specify a direction.
5At the command prompt, enter n and enter a name. This name will appear
in the properties and in the Lights in Model window (LIGHTLIST).
You can continue to specify properties by entering options, or you can
exit and set properties interactively. When you use the interactive method,
you can see the results of your changes as you work.
2040 | Chapter 44 Add Lighting to Your Model
6Press Enter twice to exit the command. A distant light is not displayed
as a light glyph.
To change the properties of a distant light. Enter lightlist at the command
prompt. In the Lights in Model window, double click on the distant light
name from the light list and use the Lighting Properties palette to change
its color and other properties.
Assigning a Shape to a Light
Assigning a shape to a light modifies the illumination of a scene.
Area and Linear Lights
The "area" parameter on the light is a property of a light. Just as a light can
have a color, it can also be assigned a shape. For example, you can shape it
like a rectangle so that it acts like panel lighting in a ceiling. Or you can shape
it like a line, so it acts like a narrow fluorescent light tube. The area light is a
way to assign a shape to the light. The shape affects the rendering and shadows
in the same way that a panel light casts different light than a tube light in the
real world.
The shape property is available in the Lighting Properties palette. This property
is displayed on the palette based on the type of property selected. Under the
Render Shadow Detail panel, there is a Type property. This specifies the type
of shadow cast by the light. The following types are available: Soft (shadow)
map, Sharp (default), Soft (sampled). By selecting the Soft (sampled) option,
the Shape property becomes available.
The available shapes depend on the type of light. You can select the Type
property for the light distribution under the General panel in the Lighting
Properties palette. If Spotlight and Soft (sampled) are selected, then the Shape
types available are Rectangular and Disk. If Point and Soft (sampled) are
selected, then the following shapes are available: Linear, Rectangular, Disk,
Cylinder, and Sphere. If Web and Soft (sampled) are selected, then the
following shapes are available: Linear, Rectangular, Disk, Cylinder, and Sphere.
You can use the samples property on the area light to control the trade-off
between rendering time and shadow accuracy.
The Visible Render property found under the Rendered Shadows Details panel
controls the visibility of the shape in the rendering of the scene.
Assigning a Shape to a Light | 2041

To create a point light in photometric workflow and assign a rectangular
shape to the light
1At the command prompt, enter lightingunits and set the value to 1
(American units) or 2 (International SI units) for photometric lighting.
2Click Render tab ➤ Lights panel ➤ Create Light drop-down ➤ Point.
3Click in the drawing to specify a location for the light.
4At the Command prompt, enter n and enter a name. This name will
appear in the properties and in the Lights in Model window (LIGHTLIST).
You can continue to specify properties by entering options, or you can
exit and set properties interactively. When you use the interactive method,
you can see the results of your changes as you work.
5Press Enter twice to exit the command.
Select the light and use grip tools to change the light.
6In the drawing, right-click the light and click Properties. Use the Lighting
Properties palette to change its properties.
7On the Lighting Properties palette, under the General panel, verify that
the distribution type for the light is Point.
8Scroll down the Lighting Properties palette to the Rendered Shadow
details.
9Change the Type property to Soft (sampled).
10 Change the Shape property to Rectangular. Add dimensions to the Length
and Width properties.
11 Change the Visible Render property to Yes.
12 Render the image. The light is represented as a rectangle in the drawing.
Adjust and Manipulate Lights
You can add point lights, spotlights, and distant lights and set the location
and properties of each.
2042 | Chapter 44 Add Lighting to Your Model
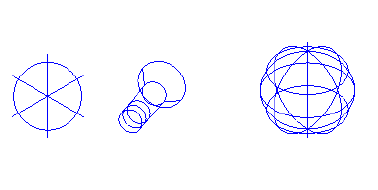
Control the Display of Lights
The display of lights can be turned on and off in the drawing.
The display of lights can be controlled several ways. In the Options dialog
box, on the Drafting tab, the Lights Glyph settings control the display of light
glyphs in the drawing.
A light glyph is a graphic representation of a light. Point lights and spotlights
can be placed in a drawing with a light glyph. Distant lights, such as sunlight,
are not represented with a light glyph.
Displaying light glyphs in the plotted drawing is optional; light glyph display
is controlled with the plot glyph property setting. With the plot glyph property,
you specify light glyph to display one light at a time. The plot glyph setting
for a viewport affects all the lights globally.
To control the appearance of light glyphs
1Click Tools menu ➤ Options.
2In the Options dialog box, Drafting tab, click Lights Glyph Settings.
3In the Light Glyph Appearance dialog box, click Point or Spot to display
a point light or spotlight glyph in Glyph Preview.
4To change colors, click Edit Glyph Colors to open the Drawing Window
Colors dialog box.
For more information, see Set Interface Options on page 109
5To change the size of the glyph in the drawing, use the Glyph Size slider.
6Click OK to exit each dialog box.
Control the Display of Lights | 2043
To show or hide light glyphs
➤ Click Render tab ➤ Lights panel ➤ Light Glyph Display.
Turns on and off the display of glyphs that represents lights in the current
viewport.
NOTE The display setting does not control plotting of light glyphs.
To plot light glyphs
1Click View tab ➤ Palettes panel ➤ Properties.
2Select a point light or a spotlight.
3In the Properties palette, change the Plot Glyph property to Yes.
Quick Reference
Commands
DISTANTLIGHT
Creates a distant light.
LIGHT
Creates a light.
LIGHTLIST
Turns on and off the Lights in Model palette that lists all lights in the model.
LIGHTLISTCLOSE
Closes the Lights in Model window.
OPTIONS
Customizes the program settings.
POINTLIGHT
Creates a point light that radiates light in all directions from its location.
2044 | Chapter 44 Add Lighting to Your Model

SPOTLIGHT
Creates a spotlight that emits a directional cone of light.
System Variables
LIGHTGLYPHDISPLAY
Turns on and off the display of light glyphs.
LIGHTLISTSTATE
Indicates whether the Lights in Model window is open or closed.
Adjust Light Placement
After a light has been placed in a scene the position and target can be modified.
The light, which is represented by a light glyph, can be repositioned after it
is placed in the drawing. The light can be moved and rotated; the target can
be modified. When the light glyph is selected, grips are displayed.
By selecting the light with a right-click, a shortcut menu is displayed that
provides the following options for adjusting the placement of a light:
■Move. Activates the MOVE command. Used to change the position of the
light.
■Rotate. Activates the ROTATE command. Used to change the orientation
of lights. In addition to shortcut menu access, you can use ROTATE,
3DROTATE, and ROTATE3D commands.
■Flip. Rotates the target of the light in the opposite direction.
NOTE Rotating a targeted light is useful for aligning the area shadow region
appropriately. Also, the orientation of the area shadow light is reset when the
position or the target of the light is changed.
Location (Point Lights and Spotlights)
You can use the grip labeled Position to move a point light or a spotlight, or
you can set the location in the Properties palette. The Position grip moves the
light but does not change the target. To move both the light and its target,
drag the light glyph itself.
Adjust Light Placement | 2045
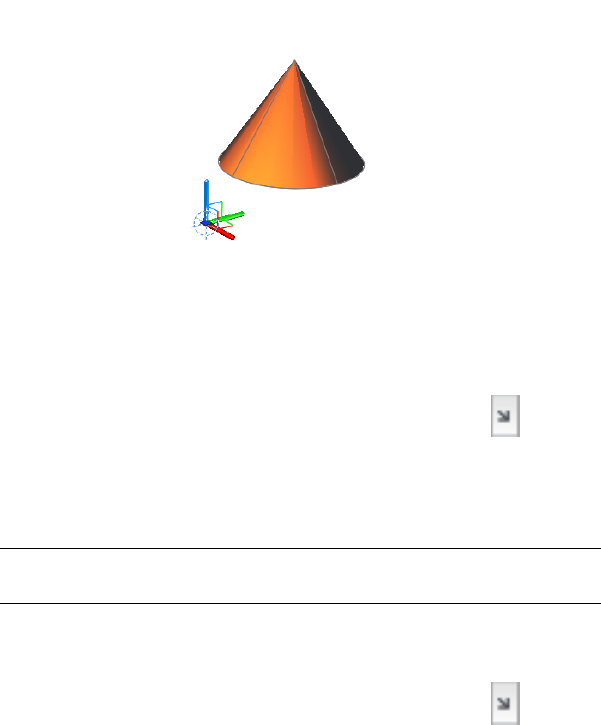
To select a light using the light list
1Click Render tab ➤ Lights panel ➤ Dialog box launcher.
2In the Lights in Model window, select the light name.
If the light has a light glyph, the light displays as selected. By double
clicking the name of the light, the Lighting Properties palette is displayed.
NOTE Distant lights do not display a glyph in the drawing. Use the Lights
in Model window to select a distant light.
To delete a light
1Click Render tab ➤ Lights panel ➤ Dialog box launcher.
2Select one or more lights to delete.
3Right-click the selection. Click Delete Light or Delete Lights.
To move a point light or a spotlight
1Select the light glyph, or select the light in the Lights in Model window.
2Select the Position grip.
The Position grip is at the bottom of a spotlight and at the center of a
point light.
2046 | Chapter 44 Add Lighting to Your Model

3Drag the light to the new location and click to place it there.
NOTE A spotlight rotates as it moves to maintain its aim at the target. If you
want to move both source and target, drag the light glyph itself, not the
Position grip.
Quick Reference
Commands
CONVERTOLDLIGHTS
Converts lights created in previous drawing file formats to the current format.
DISTANTLIGHT
Creates a distant light.
GEOGRAPHICLOCATION
Specifies the geographic location information for a drawing file.
LIGHT
Creates a light.
LIGHTLIST
Turns on and off the Lights in Model palette that lists all lights in the model.
FREESPOT
Creates free spotlight which is similar to a spotlight without a specified target.
FREEWEB
Creates a free web light which is similar to a web light without a specified
target.
POINTLIGHT
Creates a point light that radiates light in all directions from its location.
RENDEREXPOSURE
Provides settings to adjust the global lighting for the most recently rendered
output.
SPOTLIGHT
Creates a spotlight that emits a directional cone of light.
Adjust Light Placement | 2047
SUNPROPERTIES
Displays the Sun Properties window.
TARGETPOINT
Creates a target point light.
WEBLIGHT
Creates a web light.
System Variables
DEFAULTLIGHTING
Turns on and off default lighting in place of other lighting.
DEFAULTLIGHTINGTYPE
Specifies the type of default lighting, old or new.
LIGHTGLYPHDISPLAY
Turns on and off the display of light glyphs.
LIGHTINGUNITS
Controls whether generic or photometric lights are used, and specifies the
lighting units for the drawing.
LIGHTSINBLOCKS
Controls whether lights contained in blocks are used when rendering.
LINEARBRIGHTNESS
Controls the brightness level of the viewport when using default lighting or
generic lights.
LINEARCONTRAST
Controls the contrast level of the viewport when using default lighting or
generic lights.
LOGEXPBRIGHTNESS
Controls the brightness level of the viewport when using photometric
lighting.
LOGEXPCONTRAST
Controls the contrast level of the viewport when using photometric lighting.
2048 | Chapter 44 Add Lighting to Your Model
LOGEXPDAYLIGHT
Controls if the exterior daylight flag is enabled when using photometric
lighting.
LOGEXPMIDTONES
Controls the mid tones level of the viewport when using photometric lighting.
RENDERUSERLIGHTS
Controls whether to override the setting for viewport lighting during
rendering.
SUNSTATUS
Turns on and off the lighting effects of the sun in the current viewport.
Control Light Properties
Each light you add to the drawing is listed by name and type in the Lights in
Model palette (LIGHTLIST). Lights in blocks and xrefs, the sun, and default
lighting are not included.
When a light is selected in the list, it is selected in the drawing and vice versa.
The properties of the lights in the list are saved per drawing. All properties
can be changed in the Properties palette. When a light is selected in the
drawing, you can use grip tools to move or rotate the light and change some
other properties, for example, the hotspot and falloff cone in spotlights. You
can see the effect on the model as you change the properties of a light.
General Properties
The following properties are common to all lights and are located in the
General panel of the Lighting Properties palette. Full descriptions of the
controls are located under the Properties command in Lighting Properties:
■Name. Specifies the name assigned to the light.
■Type. Specifies the type of light: point light, spotlight, distant light, or
web.
■On/Off Status. Controls whether the light is turned on or off.
■Shadows. Controls whether the light casts shadows. To be displayed,
shadows must be turned on in the visual style applied to the current
viewport. Turn shadows off to increase performance.
Control Light Properties | 2049
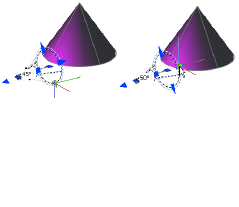
■Intensity factor. Sets a multiplier that controls brightness. Intensity is not
related to attenuation.
■Filter color. Sets the color of the light emitted.
■Plot glyph. Allows the ability to plot the drawing with the light glyphs on.
Spotlight Hotspot and Falloff Under General Properties
When light from a spotlight falls on a surface, the area of maximum
illumination is surrounded by an area of lesser intensity.
■Hotspot cone angle. Defines the brightest part of a light beam. Also known
as the beam angle.
■Falloff cone angle. Defines the full cone of light. Also known as the field
angle.
■Rapid decay area. Consists of the region between the hotspot and falloff
angles.
The greater the difference between the hotspot and falloff angles, the softer
the edge of the light beam. If the hotspot and falloff angles are near equal,
the edge of the light beam is sharp. Both values can range from 0 to 160
degrees. You can adjust these values directly with the Hotspot and Falloff
grips.
Photometric Properties
Photometric lighting offers additional properties that make the lighting
different than standard lighting. The following properties are under the
Photometric properties panel:
■Lamp intensity. Specifies the inherent brightness of the light. Specifies the
intensity, flux, or illuminance of the lamp.
2050 | Chapter 44 Add Lighting to Your Model
■Resulting intensity. Gives the final brightness of the light. (Product of lamp
intensity and intensity factor. Read-only.)
■Lamp color. Specifies the inherent color of the light in Kelvin temperature
or standard.
■Resulting color. Gives the final color of the light. This is determined by a
combination of the lamp color and the filter color. (Product of lamp color
and filter color. Read-only.)
If you select Web in the Type property for a photometric light, additional
properties are offered in the Photometric Web and Web offsets panel in the
Lighting Properties palette.
■Web file. Specifies the data file describing the intensity distribution of the
light.
■Web preview. Displays a 2D slice through goniometric data.
■Rotation of X. Specifies a rotational offset of the web about the optical X
axis.
■Rotation of Y. Specifies a rotational offset of the web about the optical Y
axis.
■Rotation of Z. Specifies a rotational offset of the web about the optical Z
axis.
Geometry Including Target Properties
The Geometry panel provides controls for the location of the light. If the light
is a target point light, spotlight, or weblight additional target point properties
are available. A light can be changed to a light with target properties or changed
from a light with target properties to one without by selecting either Yes or
No in the Targeted property.
Attenuation (Point Lights and Spotlights)
Attenuation controls how light diminishes over distance. The farther away
an object is from a light, the darker the object appears. You can specify no
attenuation, inverse linear, or inverse squared (POINTLIGHT, SPOTLIGHT).
Attenuation is not active for photometric lights.
Another way to control the start point and end point of light is to use limits.
Limits work like clipping planes to control where light is first emitted and
where it stops. Using limits can increase performance by removing the need
Control Light Properties | 2051
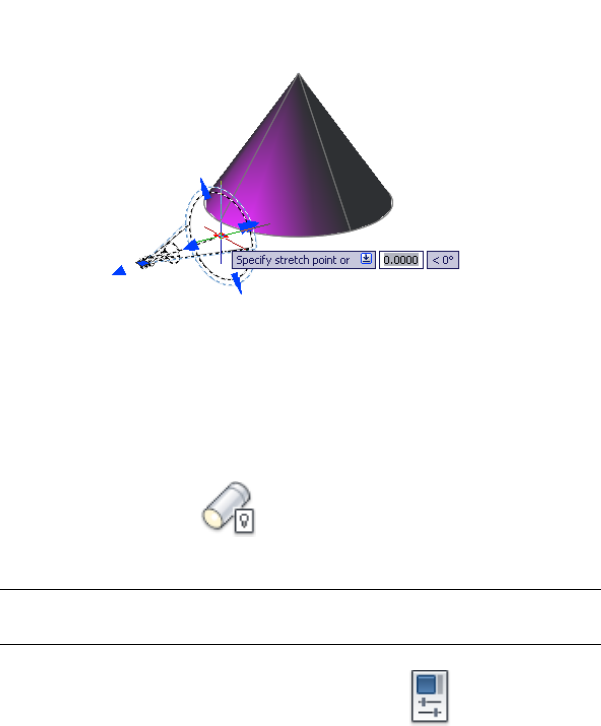
for the program to calculate light levels where the light is already practically
invisible.
To set attenuation in a point light or a spotlight
1Click Render tab ➤ Lights panel ➤ Lighting Units drop-down ➤
Generic Lighing Units.
No lighting units are used and standard (generic) lighting is enabled.
NOTE Alternatively, you can enter lightingunits at the command prompt
and set the value to 0 for standard (generic) lighting.
2Click View tab ➤ Palettes panel ➤ Properties.
3In the drawing, click the light glyph.
4In the Properties palette, under Attenuation, set Use Limits to Yes, or
select a type of attenuation:
■None. Sets no attenuation. Objects far from the point light are as
bright as objects close to the light.
■Inverse Linear. Sets attenuation to be the inverse of the linear distance
from the light. For example, at a distance of 2 units, light is half as
2052 | Chapter 44 Add Lighting to Your Model
strong as at the point light; at a distance of 4 units, light is one quarter
as strong. The default value for inverse linear is half the maximum
intensity.
■Inverse Square. Sets attenuation to be the inverse of the square of the
distance from the light. For example, at a distance of 2 units, light is
one quarter as strong as at the point light; at a distance of 4 units,
light is one sixteenth as strong.
5If you set Use Limits to Yes, enter the following values in the properties
palette or use the grip tool in the drawing to set the limits:
■Start Limit Offset. Specifies the point where light starts as an offset
from the center of the light. The default is 0.
■End Limit Offset. Specifies the point where light ends as an offset from
the center of the light. No light is cast beyond this point.
To specify a source vector for a distant light
1Click Render tab ➤ Lights panel ➤ Lighting Units drop-down ➤
Generic Lighing Units.
No lighting units are used and standard (generic) lighting is enabled.
NOTE Alternatively, you can enter lightingunits at the command prompt
and set the value to 0 for standard (generic) lighting.
2Click Render tab ➤ Lights panel ➤ Lights In Model.
3In the Lights in Model palette, select the distant light.
4Click View tab ➤ Palettes panel ➤ Properties.
5In the Properties palette, under Geometry, use one of the following
methods to change a value:
■Enter a value in a cell.
■Click the Calculator button to use QuickCalc.
Control Light Properties | 2053

■Click the Select in Drawing button and specify a From point and a To
point with the pointing device. The line displayed in the drawing
represents the vector.
When you change From Vector and To Vector values, the Source Vector
values are updated. When you change Source Vector values directly, the
From Vector and To Vector values are updated.
To change the color of a light
1Click View tab ➤ Palettes panel ➤ Properties.
2In the drawing, select the light glyph.
3In the Properties palette, click in the Color cell and select a color. Click
Select Color to open the Select Color dialog box.
Quick Reference
Commands
CONVERTOLDLIGHTS
Converts lights created in previous drawing file formats to the current format.
DISTANTLIGHT
Creates a distant light.
GEOGRAPHICLOCATION
Specifies the geographic location information for a drawing file.
LIGHT
Creates a light.
LIGHTLIST
Turns on and off the Lights in Model palette that lists all lights in the model.
FREESPOT
Creates free spotlight which is similar to a spotlight without a specified target.
2054 | Chapter 44 Add Lighting to Your Model
FREEWEB
Creates a free web light which is similar to a web light without a specified
target.
POINTLIGHT
Creates a point light that radiates light in all directions from its location.
RENDEREXPOSURE
Provides settings to adjust the global lighting for the most recently rendered
output.
SPOTLIGHT
Creates a spotlight that emits a directional cone of light.
SUNPROPERTIES
Displays the Sun Properties window.
TARGETPOINT
Creates a target point light.
WEBLIGHT
Creates a web light.
System Variables
DEFAULTLIGHTING
Turns on and off default lighting in place of other lighting.
DEFAULTLIGHTINGTYPE
Specifies the type of default lighting, old or new.
LIGHTGLYPHDISPLAY
Turns on and off the display of light glyphs.
LIGHTINGUNITS
Controls whether generic or photometric lights are used, and specifies the
lighting units for the drawing.
LIGHTSINBLOCKS
Controls whether lights contained in blocks are used when rendering.
Control Light Properties | 2055
LINEARBRIGHTNESS
Controls the brightness level of the viewport when using default lighting or
generic lights.
LINEARCONTRAST
Controls the contrast level of the viewport when using default lighting or
generic lights.
LOGEXPBRIGHTNESS
Controls the brightness level of the viewport when using photometric
lighting.
LOGEXPCONTRAST
Controls the contrast level of the viewport when using photometric lighting.
LOGEXPDAYLIGHT
Controls if the exterior daylight flag is enabled when using photometric
lighting.
LOGEXPMIDTONES
Controls the mid tones level of the viewport when using photometric lighting.
RENDERUSERLIGHTS
Controls whether to override the setting for viewport lighting during
rendering.
SUNSTATUS
Turns on and off the lighting effects of the sun in the current viewport.
Sun and Sky Simulation
The sun is a light that simulates the effect of sunlight and can be used to show
how the shadows cast by a structure affect the surrounding area.
Sun and sky are the primary sources of natural illumination in AutoCAD.
Whereas the rays of the sun are parallel and of a yellowish hue, the light cast
from the atmosphere comes from all directions and is distinctly bluish in
color. When the LIGHTINGUNITS system variable is set to photometric, more
sun properties are available.
When the workflow is photometric (the LIGHTINGUNITS system variable is
set to 1 or 2) the sun properties have more properties available and are rendered
using a more physically accurate sunlight model. The sun color is disabled for
2056 | Chapter 44 Add Lighting to Your Model

the photometric sun; the color is computed automatically based on the time,
date, and location specified in the drawing. The color is determined based on
the position in the sky. When the workflow is generic or standard lighting
(the LIGHTINGUNITS system variable is set to 0), the additional sun and sky
properties are unavailable.
The properties of the sun can be modified by using the SUNPROPERTIES
command. The Sun Properties window is displayed. The details of the settings
are located under SUNPROPERTIES in the Command Reference.
The rays of the sun are parallel and have the same intensity at any distance.
Shadows can be on or off. To improve performance, turn off shadows when
you don’t need them. All settings for the sun except geographic location are
saved per viewport, not per drawing. Geographic location is saved per drawing.
The angle of the light from the sun is controlled by the geographic location
you specify for your model and by the date and time of day. These are
properties of the sun and can be changed in the Sun Properties window and
the Geographic Location dialog box. The time zone used is based on the
location, but you can adjust it independently (TIMEZONE system variable).
Sky Background
The option to choose the sky background is only available when the lighting
unit is photometric (the LIGHTINGUNITS system variable is set to 1 or 2). If
you choose the sky background and change the lighting to standard (generic)
lighting (the LIGHTINGUNITS system variable is set to 0), the sky background
is disabled.
The sun and sky background can be interactively adjusted in a view that can
be activated in the Sun Properties window by clicking the first button in the
title bar of the Sky Properties. This button activates the Adjust Sun & Sky
Background dialog box. Here you can change properties and preview the
changes to the background.
Show Me: Adjust Sky Properties
Click the Play arrow to start the animation.
Sky Illumination
The view can have a sky background or a sky background and illumination.
This option is in the Sky Properties Status drop-down list in the Sun Properties
Sun and Sky Simulation | 2057
window. Additional sky illumination adds extra light to the scene, simulating
the effect of light scattered by the atmosphere throughout the scene. This
additional light is only visible in rendered output when final gather is enabled.
This can be found in the Advanced Render Settings palette.
NOTE The default final gather setting of Auto enables final gather in rendering
when sky illumination is turned on.
View
The VIEW command provides a mechanism for creating and managing named
views. The sun and sky background can be assigned to a new named view
under Background. The sky background relies on the sun data in the named
view.
You can adjust sun and sky background interactively in a view in the Adjust
Sun & Sky Background dialog box. Click the first button in the title bar of the
Sky Properties. This button activates the Adjust Sun & Sky Background dialog
box. Here you can change properties and preview the changes to the
background.
To turn the sun on and off in a drawing
1Click Render tab ➤ Lights panel ➤ Lighting Units drop-down ➤
Generic Lighing Units.
No lighting units are used and standard (generic) lighting is enabled.
NOTE Alternatively, you can enter lightingunits at the command prompt
and set the value to 0 for standard (generic) lighting.
2Click Render tab ➤ Sun & Location panel ➤ ➤ Sun Properties.
3In the General settings, click the Status setting, and select On or Off.
To change the brightness of the sun
1Click Render tab ➤ Lights panel ➤ Lighting Units drop-down ➤
Generic Lighing Units.
No lighting units are used and standard (generic) lighting is enabled.
2058 | Chapter 44 Add Lighting to Your Model
NOTE Alternatively, you can enter lightingunits at the command prompt
and set the value to 0 for standard (generic) lighting.
2Click Render tab ➤ Sun & Location panel ➤ ➤ Sun Properties.
3In the General settings, click the Intensity Factor setting, and select a
new value.
To change the geographic location of your model
1Click Render tab ➤ Sun & Location panel ➤ Set Location.
2In the Location Already Exists task dialog box, click Edit Current
Geographic Location.
3In the Geographic Location dialog box, enter the appropriate values.
4Click OK.
To change the angle of the sun
1Click Render tab ➤ Sun & Location panel ➤ ➤ Sun Properties.
2In the Sun Angle Calculator settings, click the Date setting, and select a
new date.
3Click the Time setting, and select a new time.
Use the Daylight Saving setting if necessary.
To change the color of the sun
1Click Render tab ➤ Sun & Location panel ➤ ➤ Sun Properties.
2In the General settings, click the Color setting, and select a color.
Click Select Color to open the Select Color dialog box.
To create a new view with the sun and sky background
1At the command prompt, enter lightingunits and set the value to 1
(American units) or 2 (International SI units) for photometric lighting.
Sun and Sky Simulation | 2059

2Click View tab ➤ Views panel ➤ Named Views.
3Click New.
4In the New View dialog box, enter a name for the new view.
5In the Background drop-down list, change the default to Sun & Sky.
6In the Adjust Sun & Sky Background dialog box, make any adjustments
to the background.
7Click OK.
Quick Reference
Commands
GEOGRAPHICLOCATION
Specifies the geographic location information for a drawing file.
SUNPROPERTIES
Displays the Sun Properties window.
SUNPROPERTIESCLOSE
Closes the Sun Properties window.
System Variables
LATITUDE
Specifies the latitude of the drawing model in decimal format.
LONGITUDE
Specifies the longitude of the drawing model in decimal format.
NORTHDIRECTION
Specifies the angle of the sun from north.
SUNPROPERTIESSTATE
Indicates whether the Sun Properties window is open or closed.
SUNSTATUS
Turns on and off the lighting effects of the sun in the current viewport.
2060 | Chapter 44 Add Lighting to Your Model
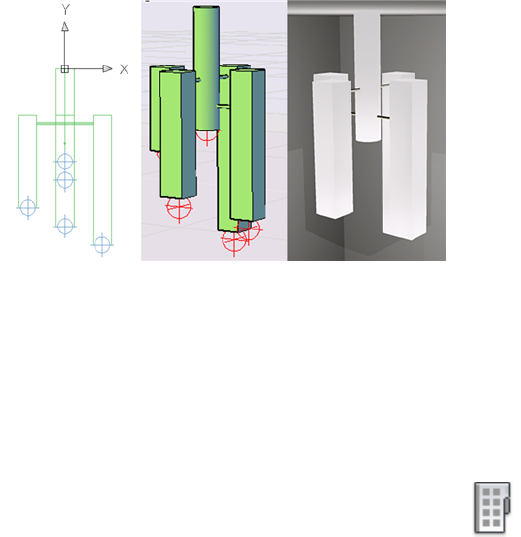
TIMEZONE
Sets the time zone for the sun in the drawing.
Incorporate Luminaire Objects
A luminaire object is a helper object that assembles a set of objects into a light
fixture.
A luminaire object groups and manages the components of a light as a whole.
Light fixtures can be represented by embedding photometric lights in blocks
that also contain geometry. A luminaire object assembles a set of light objects
into a light fixture.
Tool palettes of photometric lights are available to provide easy access to create
a luminaire object. Luminaire objects are offered through plug-ins.
An example of a luminaire object.
To add a photometric light to be used in a luminaire
1Click Render tab ➤ Lights panel ➤ .Lights drop-down ➤ At the
command prompt, enter lightingunits.
2Set the value to 1 (American lighting units) or 2 (International lighting
units) for photometric lighting.
3Click View tab ➤ Palettes panel ➤ Tool Palettes.
4Right-click the Tool palette title bar. Click Photometric Lights.
5Drag a light from the palette to the drawing.
Incorporate Luminaire Objects | 2061
6Drag another light from the palette to the drawing.
7At the command prompt, enter block to create a light fixture with the
lights placed in the drawing.
Quick Reference
Commands
GEOGRAPHICLOCATION
Specifies the geographic location information for a drawing file.
SUNPROPERTIES
Displays the Sun Properties window.
SUNPROPERTIESCLOSE
Closes the Sun Properties window.
System Variables
LATITUDE
Specifies the latitude of the drawing model in decimal format.
LONGITUDE
Specifies the longitude of the drawing model in decimal format.
NORTHDIRECTION
Specifies the angle of the sun from north.
SUNPROPERTIESSTATE
Indicates whether the Sun Properties window is open or closed.
SUNSTATUS
Turns on and off the lighting effects of the sun in the current viewport.
TIMEZONE
Sets the time zone for the sun in the drawing.
2062 | Chapter 44 Add Lighting to Your Model
Converting Lights
Properties of lights converting from previous releases of AutoCAD and other
products.
Work with Lights in Drawings from Previous Versions of
AutoCAD
Converting lights from previous versions.
With AutoCAD 2008, you can choose either standard (generic) lighting or
photometric lighting. Prior to AutoCAD 2008, the only option was standard
(generic) lighting. There is no explicit conversion required for lights from
AutoCAD 2007 to AutoCAD 2008. Drawings from AutoCAD 2007 will open
by default in AutoCAD 2008 in the standard (generic) lighting workflow. The
additional photometric properties in AutoCAD 2008 are available as soon as
you turn on the photometric lighting workflow in your drawing.
There is a conversion process required when opening drawings with lights
from versions prior to AutoCAD 2007. The 3DCONVERSIONMODE system
variable is set by default to convert drawings with lighting from previous
versions to the AutoCAD 2007 and AutoCAD 2008 lighting format. The system
variable has three settings. If the variable is set to 0, no automatic conversion
takes place. If it is set to a value of 1, the default value, the conversion takes
place automatically. If the value is set to 2, you are prompted when lights
need to be converted and have the option to convert or not to convert.
You can use the CONVERTOLDLIGHTS command to convert the old lighting
manually.
Quick Reference
Commands
CONVERTOLDLIGHTS
Converts lights created in previous drawing file formats to the current format.
System Variables
3DCONVERSIONMODE
Used to convert material and light definitions to the current product release.
Converting Lights | 2063
Import Drawings into 3ds Max or VIZ
Drawing can be opened in 3ds Max or VIZ.
Please review the 3ds Max or VIZ DWG import documentation for information
regarding the import of the DWG format.
Quick Reference
Commands
CONVERTOLDLIGHTS
Converts lights created in previous drawing file formats to the current format.
System Variables
3DCONVERSIONMODE
Used to convert material and light definitions to the current product release.
2064 | Chapter 44 Add Lighting to Your Model
Materials and Textures
Materials define the shininess, bumpiness, and transparency of object’s surfaces to give them
a realistic appearance.
Overview of Materials
Add materials to objects in your drawings to provide a realistic effect in any
rendered view.
Autodesk provides a large library of predefined materials for you to use. Use the
Materials Browser to browse materials and apply them to objects in your drawing.
Use the Materials Editor to create and modify materials.
Textures add complexity and realism to a material. For example, to replicate
the bumps in a paved road, you could apply a Noise texture to an object
representing a road in a drawing. To replicate a brick and mortar pattern, you
could use a Tile texture. Use the Texture Editor to define a texture’s appearance
and how it is applied to an object.
See also:
■Receive Product Updates and Announcements on page 8
Quick Reference
Commands
MATBROWSERCLOSE
Closes the Materials Browser.
45
2065
MATBROWSEROPEN
Opens the Materials Browser.
MATEDITORCLOSE
Closes the Materials Editor.
MATEDITOROPEN
Opens the Materials Editor.
MATERIALATTACH
Associates materials with layers.
MATERIALMAP
Displays a material mapping gizmo to adjust the mapping on a face or an
object.
MATERIALS
Opens the Materials Browser.
MATERIALSCLOSE
Closes the Materials Browser.
System Variables
3DCONVERSIONMODE
Used to convert material and light definitions to the current product release.
CMATERIAL
Sets the material of new objects.
MATBROWSERSTATE
Controls the state of the Materials Browser.
MATEDITORSTATE
Indicates whether the Materials Editor is open or closed.
Create and Modify Materials
Use the Materials Editor to modify materials or create your own.
2066 | Chapter 45 Materials and Textures
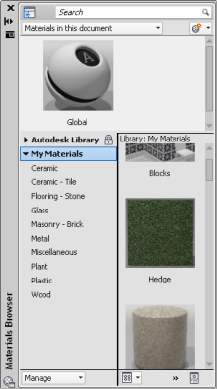
Browse Material Libraries
Browse, create, or open existing libraries from the Materials Browser.
Materials Browser
Use the Materials Browser to navigate and manage your materials. You can
organize, sort, search, and select materials for use in your drawing.
The Autodesk library and user-defined libraries are accessible in the Materials
Browser. The browser contains the following main components:
■Browser toolbar. Contains the Show or Hide Library Tree button and the
search box.
■Materials in the document. Displays all the materials saved in the current
drawing. You can sort the materials by name, type, swatch form, and color.
■Material library tree. Displays the Autodesk library, which contains the
predefined Autodesk materials and other libraries, which contain
user-defined materials.
■Library details. Displays previews of the materials in the selected categories.
■Browser bottom bar. Contains the Manage menu which provides options
for adding, removing, and editing libraries and library categories. It also
contains a button for controlling the display options for the library details.
Browse Material Libraries | 2067
Materials Libraries
The Autodesk library, with over 700 materials and over 1000 textures, is
included with the product. The library is read-only, but you can copy Autodesk
materials into the drawing, edit them, and save them to your own library.
There are three types of libraries:
■Autodesk Library. Contains predefined materials provided by Autodesk for
use by all applications that support materials. It contains material-related
resources, such as textures, thumbnails, and so on. You cannot edit the
Autodesk library. All user-defined or modified materials are placed in user
libraries.
■User Library. Contains all materials, except those in the Autodesk library,
that you intend to share between drawings. You can copy, move, rename,
or delete user libraries.
■Embedded Library. Contains a cache of materials used or defined in a
drawing and available only to that drawing. This library is created
automatically when the first Autodesk application using Autodesk materials
is installed. You cannot rename this type of library. It is stored in the
drawing.
Open a Library
You can access and open existing user libraries created locally or on a network
and add them to your defined libraries in the Materials Browser. You can
preview and select materials from multiple libraries.
The libraries are stored in a single document and can be shared with other
users. However, any custom texture files used by the materials in a user library
must be manually bundled with the user library.
Once connected to a library, you can browse and view its contents. Materials
are categorized by type.
Create and Modify a Library
Add your materials to one of your libraries. To modify Autodesk materials,
first copy them to your drawing.
Use the Manage drop-down list in the Materials Browser to add, rename, or
remove libraries. You can also add categories and regroup library materials in
the Materials Browser. Locked libraries cannot be edited and only unlocked
libraries can be removed.
2068 | Chapter 45 Materials and Textures
NOTE When you remove a library from the Materials Browser, the library file
remains on the hard disk. You must manually delete the library file to reclaim hard
disk space.
To access the Materials Browser
■Click Render tab ➤ Materials panel ➤ Materials Browser.
To manage a library
1Click Render tab ➤ Materials panel ➤ Materials Browser.
2In the Materials Browser, Manage drop-down, you can do the following:
■Open existing library. Displays the Add Library dialog box (a standard
file selection dialog box) where you can select any existing library.
■Create new library. Displays the Create Library dialog box (a standard
file selection dialog box) where you can save the new library.
■Remove library. Select the library and click Remove Library.
■Create category. Select the library and click Create Category.
■Delete category. Select the category and click Delete Category.
■Rename. Select the library or category and specify the new name.
To add a material to a tool palette
1Click Render tab ➤ Materials panel ➤ Materials Browser.
2Click View tab ➤ Palettes panel ➤ Tool Palettes.
3Click a tool palette tab that you want to add a material tool to make it
active.
4In the Materials Browser, select a swatch.
5Drag a material swatch from the Materials Browser to the tool palette.
Browse Material Libraries | 2069

A material tool is added the active tool palette, where it is easily accessible
when you are working in a drawing.
NOTE If you change the properties of the material in the Materials Editor later,
the material tool is not automatically updated. Delete the old material tool. Drag
the updated swatch to create a new one.
Quick Reference
Commands
MATBROWSERCLOSE
Closes the Materials Browser.
MATBROWSEROPEN
Opens the Materials Browser.
MATEDITORCLOSE
Closes the Materials Editor.
MATEDITOROPEN
Opens the Materials Editor.
MATERIALATTACH
Associates materials with layers.
MATERIALMAP
Displays a material mapping gizmo to adjust the mapping on a face or an
object.
MATERIALS
Opens the Materials Browser.
MATERIALSCLOSE
Closes the Materials Browser.
System Variables
3DCONVERSIONMODE
Used to convert material and light definitions to the current product release.
2070 | Chapter 45 Materials and Textures
MATBROWSERSTATE
Controls the state of the Materials Browser.
MATEDITORSTATE
Indicates whether the Materials Editor is open or closed.
Create New Materials
A material is defined by a number of properties. The available properties
depend on the selected material type.
Create a new material in the Materials Browser or the Materials Editor. Select
the type of material to create, or duplicate and modify an existing material.
After you set properties, you can further modify materials even more by using
maps, such as texture or procedural maps.
In the Materials Editor, define the following properties:
■Appearance. Defines the material’s appearance. The appearance properties
are unique to each material. Use the Texture Editor to edit texture or
procedural maps assigned to the material. You can also rename the material.
■Information. Defines or displays the keywords and descriptions associated
with a given material. Some information is read-only.
One material is always available in a new drawing, GLOBAL. This material is
applied to all objects by default until another is applied.
Materials Editor
The material type, Generic, has the following properties to refine your material.
Color
The color of a material on an object is different in different areas of the object.
For example, when you look at a red sphere, it does not appear to be uniformly
red. The sides away from the light appear to be a darker red than the sides
facing the light. The reflection highlight appears the lightest red. In fact, if
the red Sphere is very shiny, its highlight may appear to be white.
You can assign a color or a custom texture which can be either an image or a
procedural texture to the material.
Create New Materials | 2071
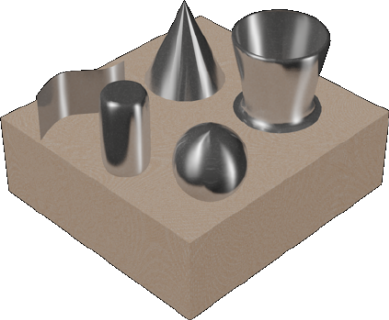
Image
Controls the base diffuse color map of the material. The diffuse color is the
color that an object reflects when illuminated by direct daylight or artificial
light.
Image Fade
Controls the composite between the base color and the diffuse image. The
image fade property is only editable if an image is used.
Glossiness
The reflective quality of the material defines the degree of glossiness or
dullness. To simulate a glossy surface, the material has a small highlight, and
its specular color is lighter, perhaps even white. A duller material has a larger
highlight that is closer to the main color of the material.
Highlights
This controls the means for deriving specular highlights of the material.
Metallic highlights disperses light in an anisotropic way. Anisotropic refers to
properties of material which depends on the direction. Metallic highlights are
the color of the material while non-metallic are the color of the lights hitting
the material.
2072 | Chapter 45 Materials and Textures

Other Properties
The following properties can be used to create specific effects:
■Reflectivity. The Direct and Oblique sliders control the level of reflections
and the intensity of the specular highlight on surfaces.
■Transparency. The Transparency check box controls the level of
transparency of the material. A completely transparent object allows the
passage of light through it. The transparency value is a percentage: at 1.0,
the material is completely transparent; at lower values, the material is
partly opaque; and at 0.0, the material is completely opaque.
The Translucency and Index of Refraction properties becomes editable
only when the Transparency value is greater than 0. A translucent object
lets some light pass through and scatters some light within the object; for
example, frosted glass. The translucency value is a percentage: at 0.0, the
material is not translucent; at 1.0, the material is as translucent as possible.
The Index of Refraction controls the degree to which light rays are bent
as they pass through the material and thus distort objects that are seen on
the other side of the object. For example, at 1.0, the object behind the
transparent object is not distorted. At 1.5, the object is distorted greatly,
as if it were seen through a glass marble.
Index of RefractionMaterial
1.00Air
1.33Water
1.36Alcohol
1.46Quartz
1.52Glass
2.30Diamond
0.00 - 5.00Custom
■Cutouts. The Cutouts check box controls the perforation effects of the
material based on a grayscale interpretation of a texture. Lighter areas of
of the map render as opaque and darker areas render as transparent.
Create New Materials | 2073

■Self illumination. The object appears to be emitting its own light. For
example, to simulate neon without using a light source, you could set a
self illumination value greater than zero. No light is cast on other objects.
The Self Illumination check box infers changing values. This control filters
color, luminance, and color temperature of the material. The Filter Color
creates the effect of a color filter over the illuminated surface.
Luminance causes a material to simulate being lit within a photometric
light source. How much light is emitted is a selected value in photometric
units. No light is cast on other objects.
Luminance (candelas per square
meter)
Material
10Dim Glow
100LED Panel
140LED Screen
200Cell Phone Screen
250CRT Television
1300Lamp Shade Exterior
2500Lamp Shade Interior
10000Desk Lamp Lens
10000Halogen Lamp Lens
210000Frosted Bulb
unclampedCustom
The color temperature sets the color of the self illumination.
Color Temperature (degrees Kelvin)Material
1850Candle
2800Incandescent Bulb
3400Flood Light
2074 | Chapter 45 Materials and Textures
Color Temperature (degrees Kelvin)Material
4100Moonlight
5000Daylight Warm
6000Daylight Cool
6420Xenon Arc Lamp
9320TV Screen
unclampedCustom
■Bump. The Bump check box turns on or off the use of the relief patterns
of the material. The object appears to have a bumpy or irregular surface.
When you render an object with a bump-mapped material, the lighter
areas of the map appear to be raised and the darker areas appear to be low.
The Amount adjusts the height of the bump. Higher values render as higher
relief and low values render as low relief. Grayscale images make effective
bump maps.
To create a new material
1Click Render tab ➤ Materials panel ➤ Materials Browser.
2In the Materials Browser, browser toolbar, click Create Material.
3Select a material template.
4In the Materials Editor, enter a name.
5Specify the material color options.
6Use the sliders to set the properties for the shininess, opacity, refraction,
translucency, and so on.
7(Optional) Select a map channel and a procedural map type. (See Use
Map Channels for Added Texture Realism on page 2084 and Understand
Map Types on page 2087.)
Create New Materials | 2075
Quick Reference
Commands
CONVERTOLDMATERIALS
Converts materials created in previous drawing file formats to the current
format.
MATBROWSERCLOSE
Closes the Materials Browser.
MATBROWSEROPEN
Opens the Materials Browser.
MATEDITORCLOSE
Closes the Materials Editor.
MATEDITOROPEN
Opens the Materials Editor.
MATERIALASSIGN
Uses the current material defined in the CMATERIAL system variable.
MATERIALATTACH
Associates materials with layers.
MATERIALMAP
Displays a material mapping gizmo to adjust the mapping on a face or an
object.
MATERIALS
Opens the Materials Browser.
MATERIALSCLOSE
Closes the Materials Browser.
MIGRATEMATERIALS
Finds any legacy materials in Tool Palettes and converts them to generic
type.
2076 | Chapter 45 Materials and Textures
System Variables
3DCONVERSIONMODE
Used to convert material and light definitions to the current product release.
CMATERIAL
Sets the material of new objects.
LOGEXPPHYSICALSCALE
Controls the relative brightness of self-illuminated materials in a photometric
environment.
MATBROWSERSTATE
Controls the state of the Materials Browser.
MATEDITORSTATE
Indicates whether the Materials Editor is open or closed.
MATERIALSPATH
Specifies the path of the materials libraries.
VSMATERIALMODE
Controls the display of materials in the current viewport.
Manage and Organize Materials
Duplicate materials to different libraries to create your own organization.
When a material is moved, a copy is created and it is added to the new
category. If the material is copied into the root node, its original category is
maintained and recreated in the new library. There are two ways to move
materials:
■Drag and drop. You can drag swatches or materials from a library to the
Materials in This Document section in the Materials Browser. You can also
drag materials from a library to another library. A new copy of the material
is created and saved with the drawing.
■Shortcut menu. You can use the shortcut menu to copy a material to a
new library. Use the Add To option and then select, for example, material
in the library copied to the document or a library material copied to another
library.
Manage and Organize Materials | 2077

Any in-document and unlocked material can be renamed in-place using the
materials shortcut menu.
You can search the materials in all open libraries based on the material’s name,
description, and keyword information entered in the Materials Editor. All the
materials are filtered to show only those matching the search string. Only the
materials that have a match for the search string are displayed. Click the X
button in the search box to clear the search and return to viewing the
unfiltered library.
The search results depend on the library you have selected in the tree view.
For example, if you select the Library root node, it displays the search results
for all matching materials in the selected library. But if you select a category,
it searches only within that category.
You can delete a selected and unlocked material by using the shortcut menu
or with the Delete key. Locked materials cannot be deleted from the Materials
Browser or from the shortcut menu.
To add a material to a library
1Click Render tab ➤ Materials panel ➤ Materials Browser.
2In the Materials Browser, right-click the material and click Add To.
3Select the library where you want the material to be added. You can add
the material to multiple libraries.
To search the objects using a material
1Click Render tab ➤ Materials panel ➤ Materials Browser.
2In the Materials Browser, Materials in This Document, right-click a
material and click Select Objects Using This Material.
Objects using the material are highlighted in the drawing.
To search for a material in the library
1Click Render tab ➤ Materials panel ➤ Materials Browser.
2In the Materials Browser, browser toolbar, type the name of the material.
2078 | Chapter 45 Materials and Textures
Library nodes containing the materials matching the entered characters
are displayed.
Quick Reference
Commands
MATBROWSERCLOSE
Closes the Materials Browser.
MATBROWSEROPEN
Opens the Materials Browser.
MATEDITORCLOSE
Closes the Materials Editor.
MATEDITOROPEN
Opens the Materials Editor.
MATERIALATTACH
Associates materials with layers.
MATERIALMAP
Displays a material mapping gizmo to adjust the mapping on a face or an
object.
MATERIALS
Opens the Materials Browser.
MATERIALSCLOSE
Closes the Materials Browser.
System Variables
3DCONVERSIONMODE
Used to convert material and light definitions to the current product release.
MATBROWSERSTATE
Controls the state of the Materials Browser.
Manage and Organize Materials | 2079
MATEDITORSTATE
Indicates whether the Materials Editor is open or closed.
Modify Materials
After a material has been added to the drawing, you can modify it in the
Materials Editor.
The material swatches that are available in the drawing are displayed in the
Materials in This Document section in the Materials Browser. When you
double-click a material swatch, the properties for the material become active
in the Materials Editor sections.
As you modify the settings, they are saved with the material. The changes are
displayed in the material swatch preview. By holding down the button below
the swatch preview window, a set of flyout buttons display different geometry
options for the material preview.
To change the name of a material
1Click Render tab ➤ Materials panel ➤ Materials Browser.
2In the Materials Browser, select the material and right-click. Click Rename.
3Change the name and description of the material in place.
To change the material preview shape
1Click Render tab ➤ Materials panel ➤ ➤ Materials Editor.
2In the Materials Editor, click and hold down the button below the swatch
preview.
3Select a different geometry for the material swatch.
2080 | Chapter 45 Materials and Textures
Quick Reference
Commands
MATBROWSERCLOSE
Closes the Materials Browser.
MATBROWSEROPEN
Opens the Materials Browser.
MATEDITORCLOSE
Closes the Materials Editor.
MATEDITOROPEN
Opens the Materials Editor.
MATERIALATTACH
Associates materials with layers.
MATERIALMAP
Displays a material mapping gizmo to adjust the mapping on a face or an
object.
MATERIALS
Opens the Materials Browser.
MATERIALSCLOSE
Closes the Materials Browser.
System Variables
3DCONVERSIONMODE
Used to convert material and light definitions to the current product release.
MATBROWSERSTATE
Controls the state of the Materials Browser.
MATEDITORSTATE
Indicates whether the Materials Editor is open or closed.
Modify Materials | 2081
Convert Materials
Upgrade legacy materials from older files to the new format.
When a legacy material, any material created in AutoCAD 2010 or earlier
releases, is shown in the Materials Editor, you have the option to convert the
material into an editable format. After the conversion, the Materials Editor
controls are enabled and editable.
Legacy materials are rendered but not editable in the application. It is
recommended to convert these materials to their Generic equivalent. The new
materials provide better results and can be shared across Autodesk applications.
Apply Materials to Objects and Faces
You can apply materials to objects, layers, or faces.
To apply a material to an object or a face (a triangular or quadrilateral portion
of a surface object), first select the object and select the material from the
Materials Browser. The material is added to the drawing, and it is also displayed
as a swatch in the Materials Browser.
When you create or modify a material in the Materials Browser, you can
■Click a material in the library and the material is applied to any selected
objects in your drawing.
■Drag the material swatch directly onto objects in your drawing.
■Assign a material to an object by clicking the Assign to Selection in the
shortcut menu on the material swatch in the Materials Browser.
NOTE AutoCAD 2011 supports per-face color for all materials and textures. If an
object has per-face color and a diffuse (color) texture, the per-face colors are shown
when the texture is faded.
To apply a material to an object from a tool palette
1Click View tab ➤ Palettes panel ➤ Tool Palettes.
2Click a tool palette tab to make it active.
3Drag the material from the tool palette onto the object.
2082 | Chapter 45 Materials and Textures
To apply a material to an object from the Materials Browser
1Click Render tab ➤ Materials panel ➤ Materials Browser.
2Right-click the material you want to apply.
3Click Assign to Selection.
4Select the object.
The material is applied to each object as you select it.
To apply a material by layer
1At the Command prompt, enter materialattach.
2In the Material Attachment Options dialog box, drag a material onto a
layer.
The material is applied to all objects on the layer whose Material property
is set to BYLAYER. BYLAYER is the default for the Material property when
you create an object.
Quick Reference
Commands
MATBROWSERCLOSE
Closes the Materials Browser.
MATBROWSEROPEN
Opens the Materials Browser.
MATEDITORCLOSE
Closes the Materials Editor.
MATEDITOROPEN
Opens the Materials Editor.
MATERIALATTACH
Associates materials with layers.
Apply Materials to Objects and Faces | 2083
MATERIALS
Opens the Materials Browser.
MATERIALSCLOSE
Closes the Materials Browser.
System Variables
MATBROWSERSTATE
Controls the state of the Materials Browser.
MATEDITORSTATE
Indicates whether the Materials Editor is open or closed.
Use Maps for Added Realism
Mapping is a way of increasing the visual complexity of a material.
Overview of Maps
The images you assign to materials are called maps. You use maps to improve
the appearance and realism of materials. Materials that contain one or more
images are called mapped materials.
Maps can simulate textures, reflections, refractions, and other effects. When
used with materials, maps add details without adding complexity to the
geometry of an object.
Use Map Channels for Added Texture Realism
Textures add the realism of details to a material.
Overview of Map Channels
Map channels assign a texture to a material's color. The colors of the map
replace the material's diffuse color when a map channel is selected. For
transparency, the texture is a multiplier.
After selecting a map channel you can use any image map, or one of the
procedural maps, such as wood and marble. For example, if you want a wall
2084 | Chapter 45 Materials and Textures

to be made out of brick, you can choose a texture map with an image of bricks.
This is the most common kind of mapping. You can also use a procedural
map, such as tiles or wood. The procedural maps have properties you can
adjust for the effect you want; for example, the tiling size and mortar spacing
for a brick patterned material or the spacing of the grain in a wood material.
The map you add to a material can be scaled. The pattern can be tiled or
rotated.
Maps are also available for other purposes. You can use more than one map
for the same material and can create nested maps.
After you apply the map, you can adjust it to fit on the face or object by using
material mapping.
NOTE When Texture Compression is turned on, the amount of video memory
required to open a drawing that contains materials with images is decreased. By
using texture compression, the amount of video memory necessary to display the
drawing is reduced, but the time it takes to load the images the first time that
they are accessed is increased. Also, there is a reduction in the quality of the images
when they are displayed in the viewport or plotted. When you create a rendering,
there is no loss in image quality.
Reflectivity Map
Reflectivity maps simulate a scene reflected on the surface of a shiny object.
Use a reflectivity map to simulate a scene reflected on the surface of a shiny
object. For reflectivity maps to render well, the material should be shiny, and
the reflection image itself should have a high resolution (at least 512 by 480
pixels).
Transparency Map
Transparency maps create the effect of transparency and opacity.
You can specify areas of transparency and opacity by using the transparency
map channel. The effect of transparency is best previewed against a pattern
background.
Cutouts Map
Cutouts maps make the material partially transparent.
Use Map Channels for Added Texture Realism | 2085
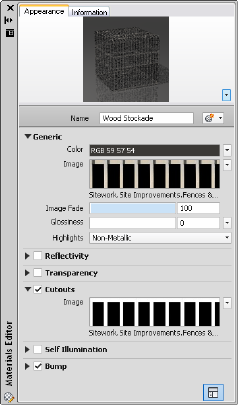
You can select an image file to use for cutouts mapping. Transparent areas are
fully transparent.
When you use transparency for frosting or translucent effects, reflectivity is
maintained. Use a cutout in addition to make the material take a particular
shape or pattern. Cutout areas do not reflect.
Self Illumination Map
Self illumination maps make portions of an object appear to glow.
White areas of the map render as fully self illuminating. Black areas render
with no self illumination. Gray areas render as partially self illuminating,
depending on the grayscale value. Self illumination means that the glowing
area is not affected by lights in the drawing (its ambient color component
goes away), and does not receive shadows.
Bump Map
A bump map simulates a bumpy or irregular surface.
You can select an image file or procedural maps to use for mapping. Bump
mapping makes an object appear to have a bumpy or irregular surface. When
you render an object with a bump-mapped material, lighter (whiter) areas of
the map appear to be raised and darker (blacker) areas appear to be low. If the
2086 | Chapter 45 Materials and Textures
image is in color, the gray-scale value of each color is used. Bump mapping
increases rendering time significantly but adds to the realism.
Use bump maps when you want to take the smoothness off a surface, or to
create an embossed look. Keep in mind, however, that the depth effect of a
bump map is limited because it does not affect the profile of the object and
cannot be self-shadowing. If you want extreme depth in a surface, you should
use modeling techniques instead. The bumps are a simulation created by
perturbing face normals before the object is rendered. Because of this, bumps
do not appear on the silhouette of bump-mapped objects.
The Bump map slider adjusts the degree of bumpiness. Higher values render
as higher relief and negative values inverses the relief.
Understand Map Types
You can select texture or procedural maps within each map channel
(Reflectivity, Transparency, Cutouts, Self Illumination, and Bump) to increase
the complexity of a material.
Overview of Map Types
Each map type has its own specific set of map controls. Within each map
channel, you can control settings, such as disable a map, delete a map, or
synchronize a map.The Nested Map Navigation display is quick reference for
the nested maps assigned to a material. To display the nested maps, click the
drop-down arrow next to the name of the material. After you apply a map
type, you can adjust it to fit on a face or object using material mapping.
Image Map
You can select texture or procedural maps within each map channel
(Reflectivity, Transparency, Cutouts, Self Illumination, and Bump) to increase
the complexity of a material.
Understand Map Types | 2087
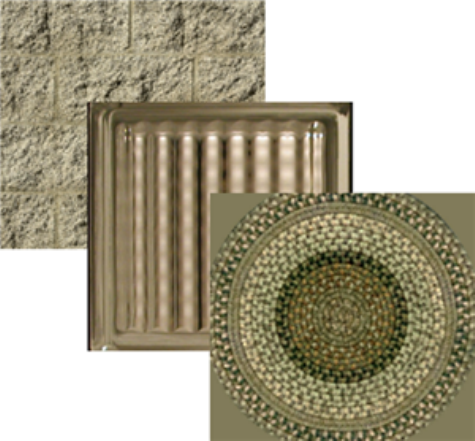
You can use the following file types to create texture maps:
■BMP, RLE, or DIB
■GIF
■JFIF, JPG, or JPEG
■PCX
■PNG
■TGA
■TIFF
Procedural Maps
Procedural maps add further realism to a material.
Overview of Procedural Maps
Unlike bitmap images, which are produced by a fixed matrix of colored pixels,
a procedural map is generated by a mathematical algorithm. Consequently,
2088 | Chapter 45 Materials and Textures
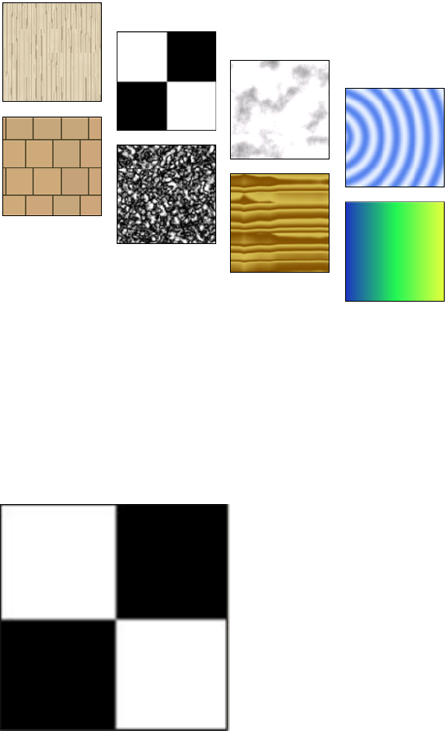
the types of controls you find for a procedural map vary depending on the
capabilities of the procedure. A procedural map can be generated in either
two or three dimensions. You can also nest texture or procedural maps within
another procedural map to add depth and complexity to the material.
Checker
Applies a two-color checkerboard pattern to the material.
The default checker map is a pattern of black and white squares. The
component checks can be either colors or maps. You can preview this map
in the swatch preview.
See also:
■Checker Property Settings
Understand Map Types | 2089
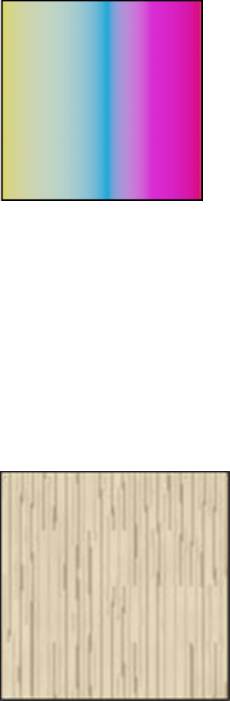
Gradient
Creates gradients using colors, and blends.
You can make highly customized gradients with the Gradient procedural map.
Gradient uses several colors to create shades or ramps from one to another.
See also:
■Gradient Property Settings
Marble
Applies a stone and vein color pattern.
You can use the Marble map to specify stone and vein color. You can modify
the vein spacing and vein width.
See also:
■Marble Property Settings
2090 | Chapter 45 Materials and Textures
Noise
Creates random perturbation of a surface based on the interaction of two
colors, texture maps or a combination.
You can use Noise to attenuate the repetitiveness aspect of bitmap and tiles.
The noise procedural map uses two colors, sub-procedural maps or a
combination of both to create a random pattern.
See also:
■Noise Property Settings
Speckle
Generates a speckled surface pattern.
The Speckle map is useful for diffuse mapping and bump mapping to create
granite-like and other patterned surfaces.
See also:
■Speckle Property Settings
Understand Map Types | 2091
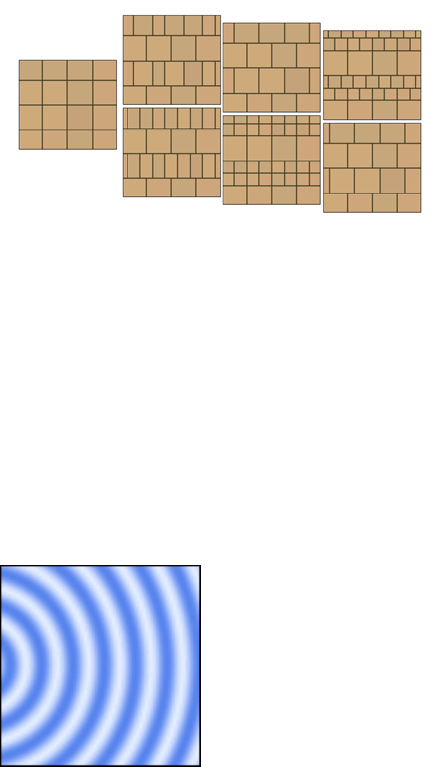
Tiles
Applies a brick or stacked tiling of colors or material mappings.
You can apply an image and repeat the image as a pattern using Tiles. The
Materials Browser provides commonly defined architectural brick patterns,
which you can select and modify in the Materials Editor.
See also:
■Tiles Property Settings
Waves
Simulates water or wave effects.
You can use the Bump map to simulate the surface of a body of water. The
Waves map generates a number of spherical wave centers and randomly
distributes them over a sphere. You can control the number of wave sets, the
amplitude, and the speed of the waves. This map works effectively as both a
diffuse and bump map at the same time, or combined with an opacity map.
2092 | Chapter 45 Materials and Textures
See also:
■Waves Property Settings
Wood
Creates the color and grain pattern of wood.
Use the Wood map to create the realistic color and grain properties of wood.
See also:
■Wood Property Settings
Modify Map Properties
Map properties can be modified to create complex patterns by changing the
map settings.
The map property settings displayed on the Texture Editor depend on the
selected map type.
The Texture Editor, which is a modeless inspector panel, allows you to modify
texture properties. This is displayed when you click on a texture swatch for a
procedural or image-based texture.
Texture Preview
A preview of the texture swatch is displayed and any changes to the settings
is reflected in the preview. You can enlarge or reduce the preview of the image
in order to accurately manipulate the texture.
Modify Map Properties | 2093
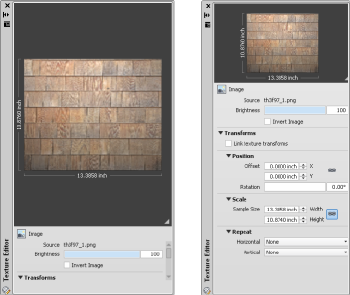
Appearance
The Appearance settings are only available for procedural-based textures.
Transformations
Linkable attributes are specific attributes of the same type that have been
identified in the content design resulting from synchronization. Rotation is
an example of a linkable attribute.When the Link Texture Transforms is
enabled, all edits to all linkable attributes between all texture sockets are
published. If it is disabled, the edits affect only the specific texture socket
where the edit is made.Linked properties, such as Offset: X,Y and Sample Size:
Width, Height, are not related to the concept of linkable attributes.
2094 | Chapter 45 Materials and Textures
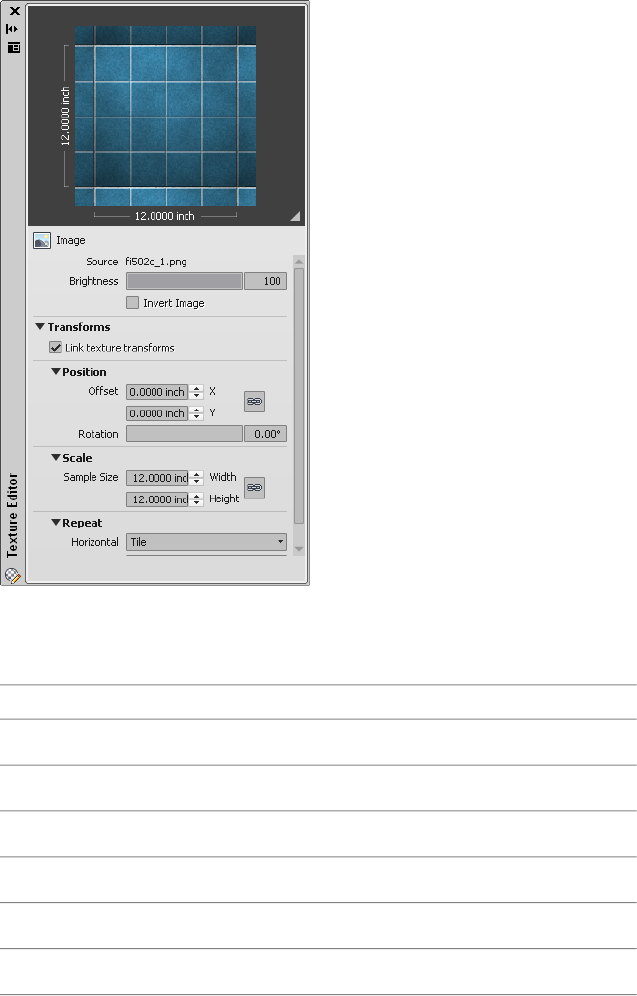
The Position, Scale, and Repeat are three standard transformations used in
various texture sockets. The following identifies the type of texture (image
and procedurals) where linkable attributes exist:
RepeatScalePositionTexture Type
YesYesYesImage
YesYesYesTiles
YesYesYesGradient
YesYesYesChecker
NoNoYesNoise
NoNoYesWaves
Modify Map Properties | 2095
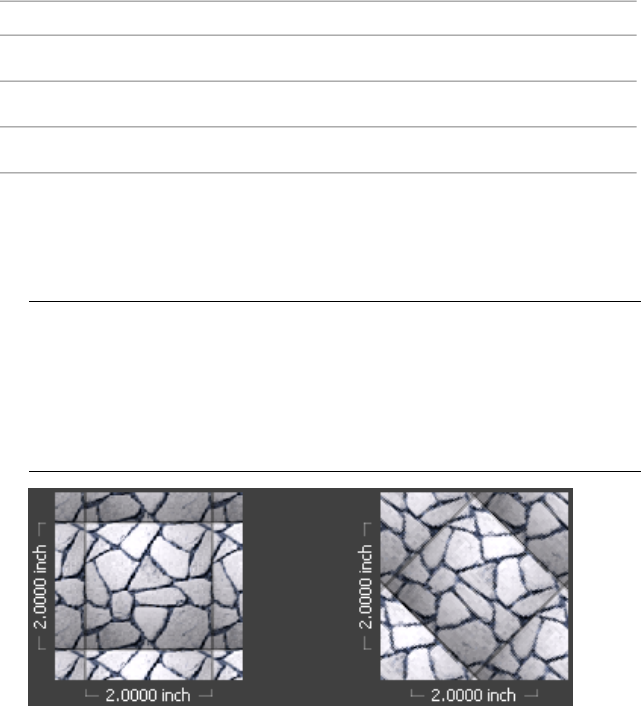
RepeatScalePositionTexture Type
NoNoYesWood
NoNoYesSpeckle
NoNoYesMarble
■Position. Each map has its own material offset and rotation factors. You
can control the coordinates of the material on a swatch. You can also rotate
the image around the W axis of the UVW coordinate system. As these
settings are changed, a preview is displayed in the Texture Editor.
NOTE UVW stands for the three axes of the texture space, similar to XYZ in
world, object, camera, and other coordinate systems. Because of the way
textures use the UV coordinates to project a bitmap on to a surface, coordinates
with values above 1 cause the texture to repeat (or “tile”), virtually warping
back to the same coordinate space from 0,0,0 to 1,1,1. This does not mean
that UV coordinates have to be limited to values between 0 and 1. They can
contain arbitrary values, both positive and negative.
rotated map
■Scale. You can specify real-world units to use in scaling. Click Scale to Fit
to fit the image to the face or object.
2096 | Chapter 45 Materials and Textures
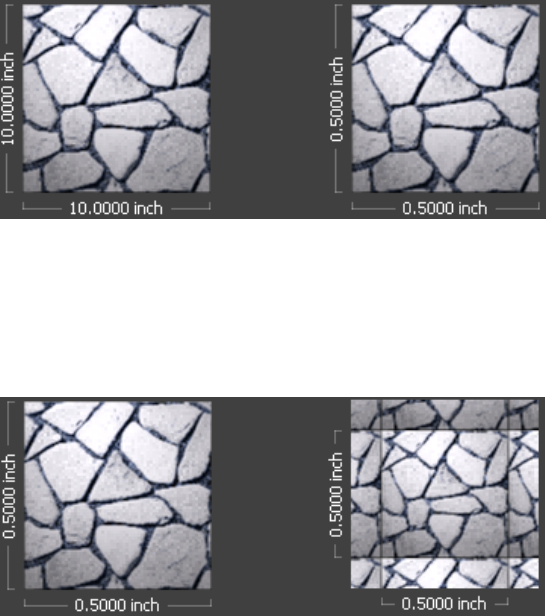
scaled map
■Repeat. You can tile or mirror a material to create a pattern, or select None
for no modification to the map pattern.
You can apply an image and repeat the image as a pattern using Tile. This
effect is used to represent a tiled floor or fountain.
repeated map
Tiling wraps the selected object with the map image. In default mapping,
tiling is active. Because the map is scaled to fit the object, you must offset
the UV coordinates or rotate the map to see the tiling effect. The portions
of the surface from which the image has moved away are filled by other
portions of the map.
Modify Map Properties | 2097
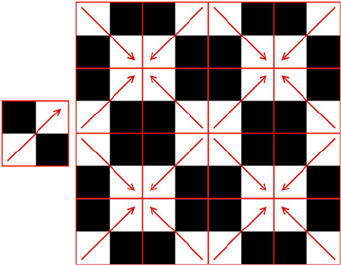
Mirrored Map
Mirroring doubles the map and flips the doubled copy. As with tiling, you
can mirror in the U dimension, the V dimension, or both.
Adjust Mapping On Objects and Faces
After you apply a texture to a material, you can adjust the orientation of the
texture map on objects or faces.
When materials are mapped, you can adjust the material to fit the shape of
the object. Applying the appropriate type of material mapping to an object
improves the fit.
■Planar mapping. Maps the image onto the object as if you were projecting
it from a slide projector onto a 2D surface. The image is not distorted from
the direction of projection but is distorted if projected onto a curved surface
and viewed at from the side. The image is not scaled to the object. This
mapping is most commonly used for faces.
■Box mapping. Maps an image onto a boxlike solid. The image is repeated
on each side of the object.
■Spherical mapping. Maps an image onto a spherical object. The top edge
of the map is compressed to a point at the “north pole” of the sphere, as
is the bottom edge at the “south pole.”
■Cylindrical mapping. Maps an image onto a cylindrical object; the
horizontal edges are wrapped together but not the top and bottom edges.
The height of the image is scaled along the cylinder’s axis.
2098 | Chapter 45 Materials and Textures
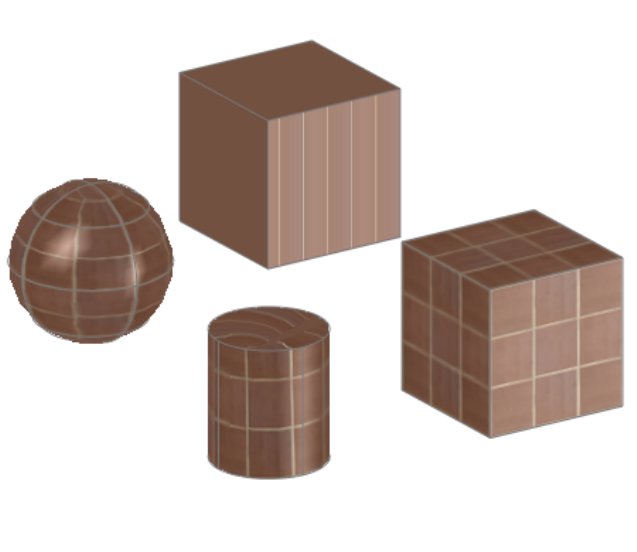
Mapping Gizmo
If you need to make further adjustments, you can use the mapping gizmo that
is displayed on the object to move or rotate the map on the object.
The mapping gizmos are viewport tools that let you quickly choose one or
two axes when transforming a selection with the mouse. You choose an axis
by placing the mouse over any axis of the icon, then drag the mouse to
transform the selection along that axis. When moving or scaling an object,
you can use other areas of the gizmo to perform transforms along any two
axes simultaneously. Using a gizmo lets you switch quickly and easily between
different transform axes and planes.
Quick Reference
Commands
MATBROWSERCLOSE
Closes the Materials Browser.
Adjust Mapping On Objects and Faces | 2099
MATBROWSEROPEN
Opens the Materials Browser.
MATEDITORCLOSE
Closes the Materials Editor.
MATEDITOROPEN
Opens the Materials Editor.
MATERIALMAP
Displays a material mapping gizmo to adjust the mapping on a face or an
object.
MATERIALS
Opens the Materials Browser.
MATERIALSCLOSE
Closes the Materials Browser.
System Variables
MATBROWSERSTATE
Controls the state of the Materials Browser.
MATEDITORSTATE
Indicates whether the Materials Editor is open or closed.
2100 | Chapter 45 Materials and Textures
Render 3D Objects for
Realism
A realistic rendering of a model can often give a product team or prospective client a clearer
vision of a conceptual design than a plotted drawing.
Most drafting time is spent working on line representations of a model. On occasion, however,
you might need to see a more realistic image involving color and perspective—for example,
when verifying your design or when presenting a final design.
Overview of Rendering
Rendering creates a 2D image based on your 3D scene. It shades the scene's
geometry using the lighting you've set up, the materials you've applied, and
environmental settings such as background and fog.
46
2101
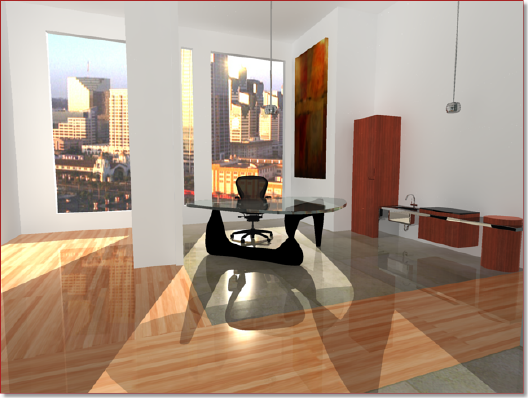
The renderer is a general-purpose renderer that generates physically correct
simulations of lighting effects, including ray-traced reflections and refractions,
and global illumination.
A range of standard rendering presets, reusable rendering parameters, are
available. Some of the presets are tailored for relatively quick preview
renderings while others are for higher quality renderings.
See also:
■Receive Product Updates and Announcements on page 8
Quick Reference
Commands
RENDER
Creates a photorealistic or realistically shaded image of a 3D solid or surface
model.
RENDERCROP
Renders a specified rectangular area, called a crop window, within a viewport.
RENDERENVIRONMENT
Controls visual cues for the apparent distance of objects.
2102 | Chapter 46 Render 3D Objects for Realism
RENDERPRESETS
Specifies render presets, reusable rendering parameters, for rendering an
image.
RENDERWIN
Displays the Render window without starting a rendering operation.
RPREF
Displays or hides the Advanced Render Settings palette for access to advanced
rendering settings.
RPREFCLOSE
Closes the Render Settings palette.
SAVEIMG
Saves a rendered image to a file.
Prepare a Model for Rendering
The way a model is built plays an important role in optimizing rendering
performance and image quality.
Understand Face Normals and Hidden Surfaces
In order to minimize the time it takes to render a model, it is common practice
to remove hidden surfaces or hide objects that are positioned off camera.
Furthermore, ensuring that all face normals orient in the same direction can
also speed up the rendering process.
Every surface that you model is made up of faces. Faces are either triangular
or quadrilateral and each face has an inward and outward oriented side. The
direction in which a face is pointing is defined by a vector called a normal.
The direction of the normal indicates the front, or outer surface of the face.
Prepare a Model for Rendering | 2103
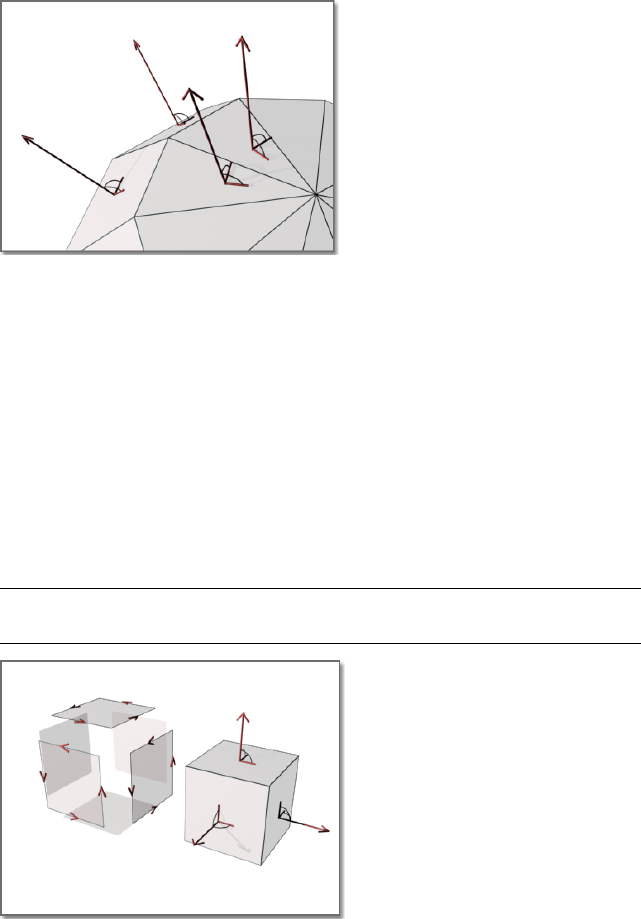
When normals are unified and point in the same outward direction, the
renderer processes each face and renders the model. If any normals are flipped,
facing inward, the renderer skips them and leaves triangular or quadrilateral
“holes” in the rendered image.
In instances where you see a hole, it usually means one of two things: Force
2-Sided is turned off in the Render Settings palette or the face is physically
missing from the model.
If the face is actually missing, you’ll need to manually reconstruct it. The
direction of normals is determined by the way a face is drawn in a right-handed
coordinate system: if you draw the face counter-clockwise, the normals point
outward; if you draw the face clockwise, the normals point inward. You should
draw faces consistently.
NOTE Solid objects have meshes and normals correctly oriented, which can be
an aid to creating models for rendering.
When rendering, the renderer searches for all normals that point away from
the viewpoint and removes the associated faces from the scene. This removal
2104 | Chapter 46 Render 3D Objects for Realism
step is called back-face culling and is controlled by the Force 2-Sided option on
the Render Settings palette.
After the back faces have been removed, the renderer uses a Z buffer to compare
relative distances along the Z axis. If the Z buffer indicates that one face
overlaps another, the renderer removes the face that would be hidden.
The time saved is in proportion to the number of faces discarded out of the
total number of faces.
Sometimes you may want to skip the back-face culling step and leave back
faces in (for example, if an object is transparent, if you can see two sides of it
because of its shape and orientation, or if an open object will be rendered
with a view angle that lets you see inside). Transparency also affects whether
one face should hide another. In this situation, make sure Force 2-Sided is
active and all faces are rendered no matter which direction their normal is
pointing.
If you're rendering a drawing that wasn't created with rendering in mind or
if the model was created with another product, you should keep Force 2-Sided
active. This ensures that all surfaces render correctly.
NOTE The rendering performance is only marginally affected when Force 2-Sided
is active.
Every object in a scene is processed by the renderer, even objects that are “off
camera” and are not going to be present in the rendered view. A model that
is built with the intent of rendering benefits from good layer management.
By turning off layers containing objects that are not in the view, you can
optimize rendering speed substantially.
See also:
■Use Models with Other Applications on page 2145
■Use a Visual Style to Display Your Model on page 257
To make sure both normals of a face get rendered
1Click Render tab ➤ Render panel ➤ ➤ Advanced Render Settings.
Understand Face Normals and Hidden Surfaces | 2105
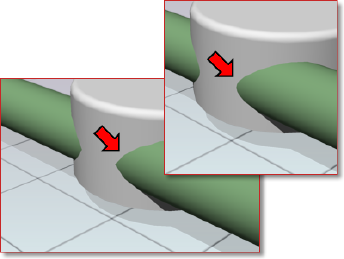
2In the Materials section of the Advanced Render Settings palette, make
sure Force 2-Sided in set to On.
3Render the scene.
Quick Reference
Commands
RPREF
Displays or hides the Advanced Render Settings palette for access to advanced
rendering settings.
Minimize Intersecting and Coplanar Faces
Certain kinds of geometry create special rendering problems.
The complexity of an object relates to the number of its vertices and faces.
The more faces a model has, the longer it takes to render. Keep the geometry
of your drawing simple to keep rendering time to a minimum. Use the fewest
faces possible to describe a surface.
Intersecting Faces
Intersecting faces in a model occur when two objects pass through one other.
For conceptual design situations, simply placing one object through another
is a fast way to visualize how something will look. However, the edge created
where the two objects intersect can exhibit a rippled appearance.
In the following example, the edge appears rippled in the left image and much
cleaner after a Boolean union.
2106 | Chapter 46 Render 3D Objects for Realism
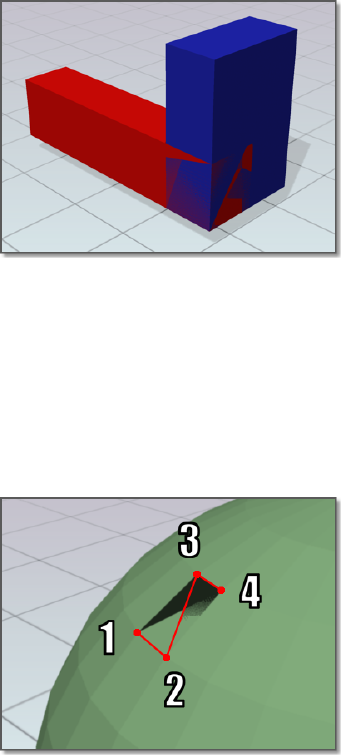
When edges do not appear to be as precise as you want, use Boolean operations
like union, intersect, and subtract. A much cleaner and precise edge is created
to better reflect the object’s appearance.
Coplanar Faces
Faces that overlap and lie in the same plane, coplanar faces, can produce
ambiguous results, especially if the materials applied to the two faces differ.
In the following example, artifacts appear when faces occupy the same location.
Moving an object so its faces no longer occupy the same plane as another
object will fix this situation.
Twisted Faces
Faces that self-overlap due to a 180-degree twist can also produce ambiguous
results, because the normal for the face is not well defined.
In the following example, artifacts appear where the face is twisted due to
crossing the second and third corner points.
Minimize Intersecting and Coplanar Faces | 2107
This situation is often encountered when trying to fix a model that has a hole
in its surface. For example, when corner points are selected for the new face,
the points are crossed instead of being placed around the hole in a
counter-clockwise direction. Avoid this problem by choosing corner points
in the proper order.
Quick Reference
Commands
RENDER
Creates a photorealistic or realistically shaded image of a 3D solid or surface
model.
Balance Mesh Density for Smooth Geometry
When you render a model, the density of the mesh affects the smoothness of
surfaces.
Mesh components are comprised of vertices, faces, polygons, and edges.
■A vertex is a point that forms the corner of a face or polygon.
■A face is a triangular portion of a surface object.
■A polygon is a quadrilateral portion of a surface object.
■An edge is the boundary of a face or polygon.
In a drawing, all faces have three vertices, except faces in polyface meshes,
which are treated as adjoining triangles. For rendering purposes, each
quadrilateral face is a pair of triangular faces that share one edge.
Smoothing of an object is handled automatically by the renderer. Two types
of smoothing occur during the rendering process. One smoothing operation
interpolates the face normals across a surface. The other operation takes into
account the number of faces, the face count, that make up the geometry; greater
face counts result in smoother surfaces but longer processing times.
While you cannot control the interpolation of face normals, you can control
the display accuracy of curved objects by using the VIEWRES command and
the FACETRES system variable.
2108 | Chapter 46 Render 3D Objects for Realism
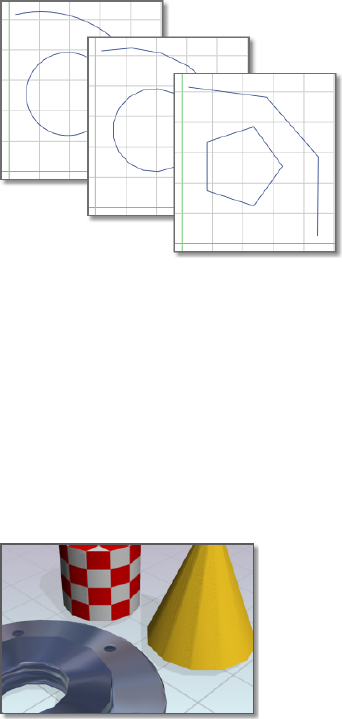
Control Display of Circles and Arcs
The VIEWRES command controls the display accuracy of curved 2D linework
like circles and arcs in the current viewport.
In the following example, line segments are more apparent as VIEWRES
decreases - Upper left = 1000, Middle = 100, Lower right = 10.
These objects are drawn on the screen using many short straight line segments.
Smoother arcs and circles display with higher VIEWRES settings, but they take
longer to regenerate. To increase performance while you're drawing, set a low
VIEWRES value.
Control Display of Curved Solids
FACETRES controls the mesh density and smoothness of shaded and rendered
curved solids.
In the following example, facets display on curved geometry when FACETRES
is low. FACETRES = .25.
When FACETRES is set to 1, there is a one-to-one correlation between the
viewing resolution of circles and arcs and the tessellation, a means of
subdividing the faces of solid objects. For example, when FACETRES is set to
2, the tessellation will be twice the tessellation set by VIEWRES. The default
value of FACETRES is 0.5. The range of possible values is 0.01 to 10.
Balance Mesh Density for Smooth Geometry | 2109
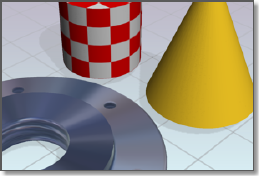
When you raise and lower the value of VIEWRES, objects controlled by both
VIEWRES and FACETRES are affected. When you raise and lower the value of
FACETRES, only solid objects are affected.
In the following example, smoother geometry is displayed when FACETRES
is set to higher values. FACETRES = 5.
See also:
■Create Meshes on page 1044
To alter the render resolution of solid geometry
1At the Command prompt, enter facetres.
2Do one of the following:
■Enter a value greater than .5 to increase the smoothness of curved
surfaces.
■Enter a value lower than .5 to decrease the smoothness of curved
surfaces.
To alter the display resolution of arcs and circles
1At the Command prompt, enter viewres.
2Ignore the prompt about fast zooms if you only want to make circles and
arcs in the drawing look better for your rendering.
3At the Circle Zoom Percent prompt, do one of the following:
■Enter a value greater than 1000 to increase the smoothness of arcs
and circles.
■Enter a value lower than 1000 to decrease the smoothness of arcs and
circles.
2110 | Chapter 46 Render 3D Objects for Realism
Quick Reference
Commands
VIEWRES
Sets the resolution for objects in the current viewport.
System Variables
FACETRES
Set Up the Renderer
You can control many of the settings that affect how the renderer processes
a rendering task, especially when rendering higher quality images.
Use the Render Settings Palette
The Render Setting palette contains the main controls for the renderer. You
can choose from predefined render settings or make custom settings.
The RPREF command opens the Render Settings palette, where you set the
parameters for rendering.
Set Up the Renderer | 2111
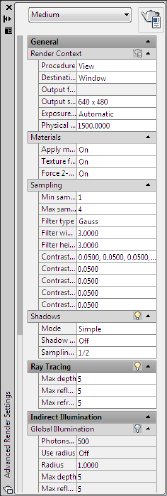
The palette is separated into several sections ranging from basic to advanced
settings. The General sections contain settings that affect how your model
gets rendered, how materials and shadows are handled, and how anti-aliasing
is performed. (Anti-aliasing smooths the stairstep effect at the edge of curved
lines or edges.) The Raytracing section controls how shading occurs. The
Indirect Illumination section controls lighting properties, how your scene is
illuminated, and if global illumination and final gathering are processed. There
are also diagnostic controls that can be useful in helping you understand why
an image isn’t getting rendered as expected.
Render Presets
A drop-down list provides a collection of predefined render settings called
render presets. Render presets store groups of settings that allow the renderer
to produce varying quality images. The standard presets range from Draft
quality, for quick test images, up to Presentation quality, which provides
photorealistic images. You can also open the Render Presets Manager where
you can create custom presets.
See also:
■Create Custom Render Presets on page 2113
2112 | Chapter 46 Render 3D Objects for Realism
To create a custom render preset from the Advanced Render Settings palette
1At the Command prompt, enter rpref.
2In the Advanced Render Settings palette, select an existing standard or
custom preset.
3Make changes to the settings that you’d like to use for your rendering.
Notice the original render preset has an ‘*’ prefix indicating that it has
been changed.
4Render the model.
5To save the render settings you made as a new, custom render preset, do
one of the following:
■Click in the preset name field at the top of the Advanced Render
Settings palette and enter a new name.
■Click in the render preset field on the Render panel of the ribbon and
enter a new name.
Quick Reference
Commands
RPREF
Displays or hides the Advanced Render Settings palette for access to advanced
rendering settings.
RPREFCLOSE
Closes the Render Settings palette.
RENDERPRESETS
Specifies render presets, reusable rendering parameters, for rendering an
image.
Create Custom Render Presets
When you specify a collection of render settings that give you the results you
want, saving them as a custom preset lets you quickly reuse the settings.
Create Custom Render Presets | 2113
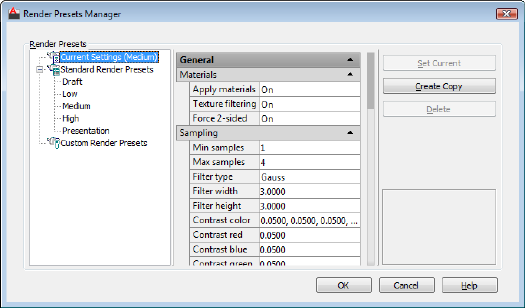
Using a standard preset as a base, you can experiment with settings and see
how the rendered images look. Once you’re satisfied with the results, you can
create a new, custom preset.
You can review and change the render settings for any preset in your drawing
in the following ways:
■Manage and organize existing render presets.
■Change parameters of standard or existing custom presets.
■Create, update, or delete custom render presets.
■Set a render preset to be used by the renderer.
The tree view pane shows all the presets that are stored with the current
drawing. The tree view is split between the standard render presets and any
custom presets you’ve created. You can change the order of standard and
custom presets by dragging one above the other in the tree view. When you
create a new preset, it is always added to the Custom Render Presets branch.
It will also appear in the Render Presets lists in the Render panel on the ribbon
and the Render Settings palette.
Many of the render settings found on the Render Settings palette can also be
set in the Render Presets Manager. Using a standard preset as a base, you can
make adjustments to the settings and see how the rendered images look. Once
you’re satisfied with the results, you can create a new, custom preset.
Only custom render presets can be deleted. If you’ve selected a standard preset,
the Delete button is inactive.
2114 | Chapter 46 Render 3D Objects for Realism
In order for a render preset to be used by the renderer, it must be made current.
While working in the Render Presets Manager, you select presets you want to
edit, but in order for the renderer to use them, you have to click the Set Current
button. Otherwise, the preset chosen on the Render panel on the ribbon or
the Advanced Render Settings palette is used.
If you make changes to a standard render preset, its name is prefaced with an
asterisk to indicate that a change has been made to its original settings. If the
rendered results are acceptable, you can save the preset by entering a new
name in the presets list on the Render panel on the ribbon or on the Render
Settings palette.
If you change the settings of a custom render preset, you can enter a new
name to create a new, custom render preset or choose to update the preset
from the presets list on the Render panel on the ribbon or on the Render
Settings palette.
To create a custom render preset from the Render Presets Manager
1Click Render tab ➤ Render panel ➤ Render Presets drop-down ➤ Render
Presets Manager.
2In the Render Presets Manager, select an existing standard or custom
preset.
3Click the Create Copy button and specify a name for your new preset.
Click OK.
The new preset appears in the tree view under the Custom Render Presets
branch.
To edit a custom render preset
1Click Render tab ➤ Render panel ➤ Render Presets drop-down ➤ Render
Presets Manager.
2In the Render Presets Manager, select an existing custom preset.
3Make adjustments from the render settings section.
The preset name is prefaced with an asterisk to show it has been changed.
4Click the Set Current button and render the scene.
If the results are good, you can choose to update the current preset or
re-open the Render Preset Manager and create a new, custom preset.
Create Custom Render Presets | 2115
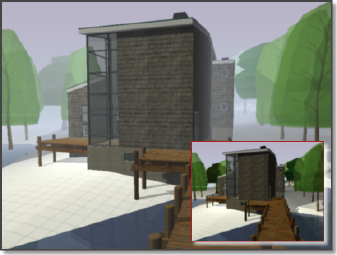
Quick Reference
Commands
RPREF
Displays or hides the Advanced Render Settings palette for access to advanced
rendering settings.
RENDERPRESETS
Specifies render presets, reusable rendering parameters, for rendering an
image.
Control the Rendering Environment
You can use environmental features to set up atmospheric effects or
background images.
You can enhance a rendered image by means of atmospheric effects like fog
and depth cueing or by adding a bitmap image as a background.
Fog / Depth Cue Effects
Fog and depth cueing are very similar atmospheric effects that cause objects
to appear to fade as they increase in distance from the camera. Fog uses a
white color while depth cueing uses black.
The RENDERENVIRONMENT command is used to set up fog or depth cue
parameters. The key parameters you’ll set are the color of the fog or depth
cueing, the near and far distances, and the near and far fog percentages.
Fog and depth cueing are based on the front or back clipping planes of your
camera coupled with the near and far distance settings on the Render
2116 | Chapter 46 Render 3D Objects for Realism
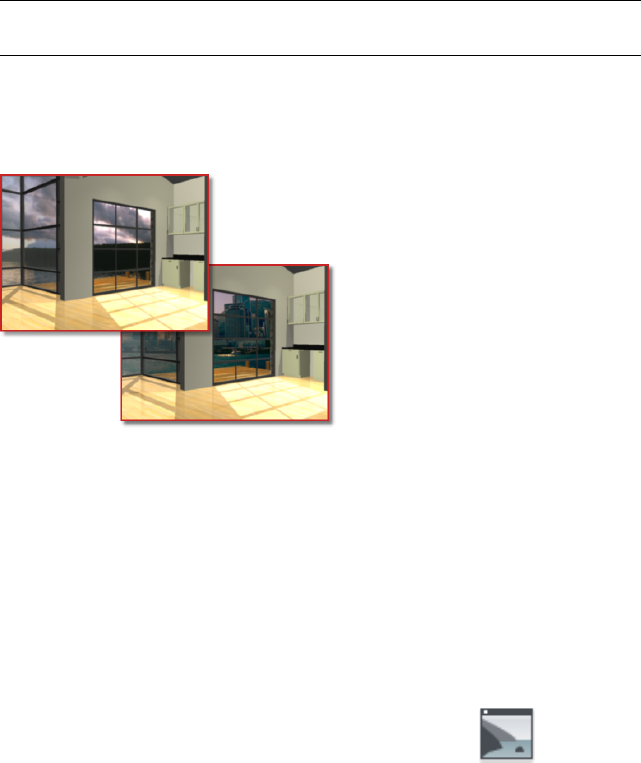
Environment dialog box. For example, the back clipping plane of a camera is
active and located 30 feet from the camera location. If you want fog to start
15 feet from the camera and spread away indefinitely, you set the Near Distance
to 50 and the Far Distance to 100.
The density of the fog or depth cueing is controlled by the Near and Far Fog
Percentages. These settings have a range of 0.0001 to 100. Higher values mean
the fog or depth cueing is more opaque.
TIP For smaller scale models, the Near and Far Fog Percentage setting may need
to be set below 1.0 to see the desired effect.
Backgrounds
A background is basically a backdrop that displays behind your model.
Backgrounds can be a single color, a multi-color gradient, or a bitmap image.
Backgrounds work best when you are rendering still images, or animations in
which the view doesn’t change or the camera doesn't move. You set
backgrounds from the View Manager. Once set, the background is associated
with the named view or camera and is saved with the drawing.
To use fog / depth cueing
1Select a camera and open its Property palette.
2Turn on its front or back clipping plane.
3Set the clipping plane offset value.
4Click Visualize tab ➤ Render panel ➤ Environment.
5Turn on Enable Fog and set the color of the fog or depth cueing.
Control the Rendering Environment | 2117
Light colors are typically used for fog while dark colors are used for depth
cueing.
6Set the Near and Far Distance values to specify where the fog starts and
ends.
7Set the fog or depth cue opacity with the Near and Far Fog Percentage
values. Click OK.
8Render the model.
To set a background for a named view
1At the Command prompt, enter view.
2In the View Manager, select an existing named view from the Model
Views list.
3On the General panel, click the Background Override list and select Solid,
Gradient, or Image.
4In the Background dialog box, set the colors or choose a bitmap image
to use for the background. Click OK.
5Click OK to close the View Manager.
6On the ribbon, select the named view from the drop-down list on the
View tab ➤ Viewports panel.
7Render the scene.
To edit a background for a named view
1At the Command prompt, enter view.
2In the View Manager, select an existing named view from the Model
Views list.
3On the General panel, click the Background Override list and select Edit.
4In the Background dialog box, set the new colors or choose a new bitmap
image to use for the background. Click OK.
5Click OK to close the View Manager.
6On the ribbon, select the named view from the drop-down list on the
View tab ➤ Viewports panel
7Render the scene.
2118 | Chapter 46 Render 3D Objects for Realism
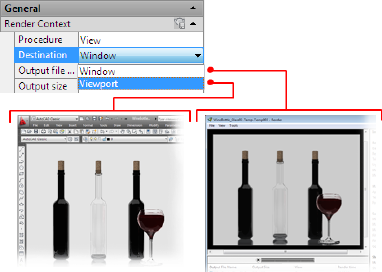
Quick Reference
Commands
RENDERENVIRONMENT
Controls visual cues for the apparent distance of objects.
VIEW
Basics of Rendering
While the final goal is to create a photorealistic, presentation-quality image
that illustrates your vision, you create many renderings before you reach that
goal.
At a basic level, you can use the RENDER command to render your model
without applying any materials, adding any lights, or setting up a scene. When
you render a new model, the renderer automatically uses a virtual
“over-the-shoulder” distant light. You cannot move or adjust this light.
Set the Render Destination
Rendered images appear either in a viewport or get displayed in the Render
Window.
When you render a scene, the image can be displayed in either the viewport
or the Render Window. This is the render destination.
The render destination is set in the Advanced Render Settings palette in the
Render Context section. The default setting is Window.
Basics of Rendering | 2119
When the render destination is set to Window, the renderer automatically
opens the Render Window and the image is processed. Upon completion, the
image is displayed and a history entry is created. As more renderings occur,
they are added to the render history so you can quickly look at previous images
and compare to see which have the desired results. Images that you want to
keep can be saved from the Render Window.
If you choose to set the render destination to Viewport, the generated image
is rendered and displayed directly in the active viewport. In essence, this is a
one-time rendering because there is no render history entry that you can
compare with later images. If you want to keep the image that you rendered
to the viewport, you can use the SAVEIMG command to save the images.
Rendering to a viewport always renders against the background color you set
for the drawing area. The Render Window background color matches the
background color. Use the REGEN command to refresh the display.
See also:
■Render Window
To set the render destination
1At the Command prompt, enter rpref.
2In the Advanced Render Settings palette, scroll to the top of the palette.
Under General, open the Render Context rollout, if necessary.
3Open the Destination list and select Window or Viewport.
4Render the scene.
Quick Reference
Commands
RENDER
Creates a photorealistic or realistically shaded image of a 3D solid or surface
model.
RPREF
Displays or hides the Advanced Render Settings palette for access to advanced
rendering settings.
2120 | Chapter 46 Render 3D Objects for Realism
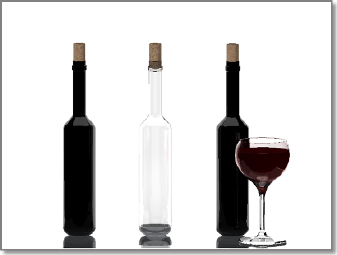
SAVEIMG
Saves a rendered image to a file.
Render Views, Selected Objects, or Cropped Content
You can render an entire view, a set of selected objects, or a portion of what
you see in the viewport.
Render a View
The default rendering procedure is to render all objects in the current view in
the drawing. If you haven’t opened a named view or a camera view, the current
view is rendered. While the rendering process is faster when you render key
objects or smaller portions of a view, rendering the entire view lets you see
how all objects are oriented to one another.
If your current drawing contains named views or if you’ve added cameras to
your model, you can quickly display them by using the VIEW command.
The following example shows a rendering of a named view.
Depending on the rendering destination you’ve chosen, the rendered view is
displayed in the Render Window or directly in the viewport. For a complete
description of the Render Window, see RENDER in the Command Reference.
Render Selected Objects
If you’re adding detail to specific objects, you don’t want to waste time
rendering an entire viewport. By changing the rendering procedure to Selected,
you are prompted to pick the objects that you want rendered.
The following example shows a rendered selection of the first bottle, its cork,
and the wine glass.
Render Views, Selected Objects, or Cropped Content | 2121
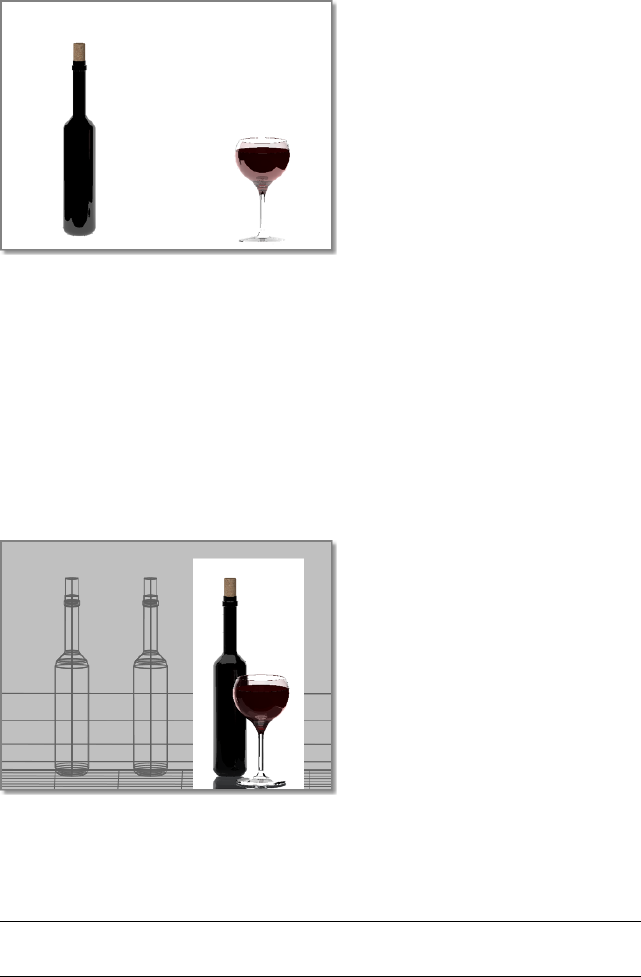
Rendering a selection set of objects is very efficient when testing different
materials, especially when the materials include texture mapping. By rendering
a selected object, you can quickly verify how the material looks and if its
texture coordinates must be altered.
Render a Cropped Region
Sometimes you need to render only a portion of what is displayed in the
viewport but you still want to see some of the surrounding environment.
In the following example, only the region surrounding the third bottle and
the wine glass is rendered.
By setting the rendering procedure to Crop, you can specify a smaller region
of the viewport to be rendered. Similar to selecting objects by window, you
can set a rectangular region in the viewport. Any objects that appear in the
region are rendered. Everything outside the region is ignored by the renderer.
NOTE A cropped rendering only displays in the viewport. Use the REGEN command
to refresh the display.
2122 | Chapter 46 Render 3D Objects for Realism
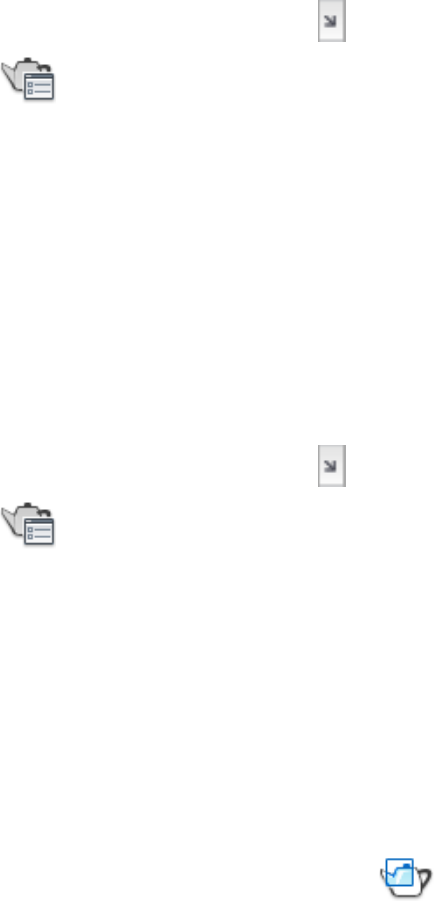
To render a view
1Display a 3D view of your model.
2Click Render tab ➤ Render panel ➤ ➤ Advanced Render Settings.
3Choose a render preset to control the quality and speed of the rendered
output.
The Draft preset is very fast but its quality is low. Presentation generates
a high quality image but takes substantially longer to render.
4Set the Destination to Window or Viewport to specify where you want
the rendered image to be displayed.
If you set an image target, the image is saved directly to a file as well as
appearing on screen.
5Render the scene.
To render a selection set of objects
1Click Render tab ➤ Render panel ➤ ➤ Advanced Render Settings.
2Choose a render preset to control the quality and speed of the rendered
output.
The Draft preset is very fast but its quality is low. Presentation generates
a high quality image but takes substantially longer to render.
3Set the render procedure to Selected.
4Select the objects in the model that you want to render.
5Render the scene.
To render a cropped view
1At the Command prompt, enter rendercrop.
Render Views, Selected Objects, or Cropped Content | 2123
2Specify a window in the viewport that you want to render.
3Render the scene.
Quick Reference
Commands
RENDER
Creates a photorealistic or realistically shaded image of a 3D solid or surface
model.
RENDERCROP
Renders a specified rectangular area, called a crop window, within a viewport.
RPREF
Displays or hides the Advanced Render Settings palette for access to advanced
rendering settings.
Set Output Resolution
Set the resolution of the rendered image by specifying the width and the
height of the image, in pixels.
There are three resolution settings that control how a rendered image appears;
the width, the height, and the image aspect ratio.
The width and height settings control the size of the rendered image, measured
in pixels. A pixel (short for Picture Element) is a single point in a graphic image.
The default output resolution is 640 x 480 and can be set as high as 4,096 x
4,096. Higher resolution settings result in smaller pixels and finer detail. High
resolution images also take longer to render.
Output resolutions are set from the Output Size Dialog Box. You can enter
values directly into the width and height fields, or you can use the spinner
controls to increase or decrease the resolution.
When you set an output resolution, it gets stored with the current drawing
and is added to the output resolution list found in the Render panel of the
ribbon. Most often, as you test how objects look in the model, you will find
yourself using lower resolution settings, around 320 x 200 or lower. As you
add more detail and materials, you’ll shift to mid-range settings, such as 640
x 480. The final rendering will always use the highest resolution required by
2124 | Chapter 46 Render 3D Objects for Realism
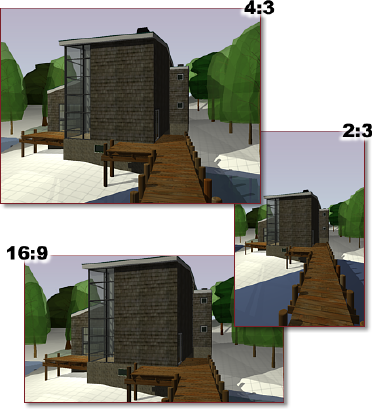
the project, 1024 x 768 or greater, since this is the image that is presented to
the customer or submitted for print.
Aspect ratio describes the proportions of a still image or the frames in an
animation, expressed as the ratio of width to height, regardless of the image's
resolution. The aspect ratio of an image is controlled by the Image Aspect
setting. Aspect ratio is usually expressed either as a ratio of width over height
(for example, 4:3) or as a multiplier (such as, 1.333). Changing this value
changes the Height value to maintain the correct dimensions for the output
resolution.
The following example shows various aspect ratios.
If you choose to lock the image aspect, the width and height are tied together;
changing one automatically changes the other while maintaining the aspect
ratio.
Quick Reference
Commands
RENDER
Creates a photorealistic or realistically shaded image of a 3D solid or surface
model.
Set Output Resolution | 2125

RPREF
Displays or hides the Advanced Render Settings palette for access to advanced
rendering settings.
Material Adjustments
Adding materials to objects greatly increases the realism of a model.
In the context of rendering, materials describe how an object reflects or
transmits light. Within a material, maps can simulate textures, bump effects,
reflections, or refractions.
From the Advanced Render Settings palette, you can turn materials on or off,
turn material filtering on or off, and affect how the surfaces of an object are
rendered.
Materials that you’ve created and attached to objects in the model are normally
turned on when you start the rendering process. If you turn them off, all the
objects in the model assume the characteristics of the GLOBAL material.
Texture Filtering
You can control whether texture filtering, pixel averaging used in anti-aliasing,
occurs when the model is rendered.
When texture filtering is turned on, the renderer uses a pyramidal filtering
methods, which applies filtering as a function of distance.
NOTE Irregular anti-aliasing might occur on detailed texture maps that are applied
to a surface that recedes into the distance.
There is a slight rendering cost when texture filtering is active. Pyramidal
filtering requires memory allocation equal to approximately 133% of the size
of a texture map. Compared to the detail and realism provided by texture
mapped materials, rendering performance is not impacted that much.
When texture filtering is turned off, no anti-aliasing occurs to texture maps
when the renderer processes the model.
2-Sided Rendering
Since you have no control over the direction that faces, normals are pointing,
you may encounter a model that has flipped normals. The back sides of faces
are invisible to the renderer. This means that the face appears to be missing
when viewed from the back. Objects are usually created with the surface
normals facing outward, but it is possible to create objects with the faces
2126 | Chapter 46 Render 3D Objects for Realism
flipped or to import complex geometry in which the face normals are not
properly unified.
When Force 2-Sided is active, both sides of faces are raytraced as shaded. While
this incurs a slight increase in rendering time, it is often faster than trying to
fix multiple instances of flipped faces.
Quick Reference
Commands
MATERIALATTACH
Associates materials with layers.
MATERIALMAP
Displays a material mapping gizmo to adjust the mapping on a face or an
object.
MATERIALS
Opens the Materials Browser.
RENDER
Creates a photorealistic or realistically shaded image of a 3D solid or surface
model.
RPREF
Displays or hides the Advanced Render Settings palette for access to advanced
rendering settings.
System Variables
LOGEXPPHYSICALSCALE
Controls the relative brightness of self-illuminated materials in a photometric
environment.
Adjust Sampling to Improve Image Quality
You can use several standard render presets to remove the jagged effect from
the display of diagonal lines and curved edges.
Adjust Sampling to Improve Image Quality | 2127
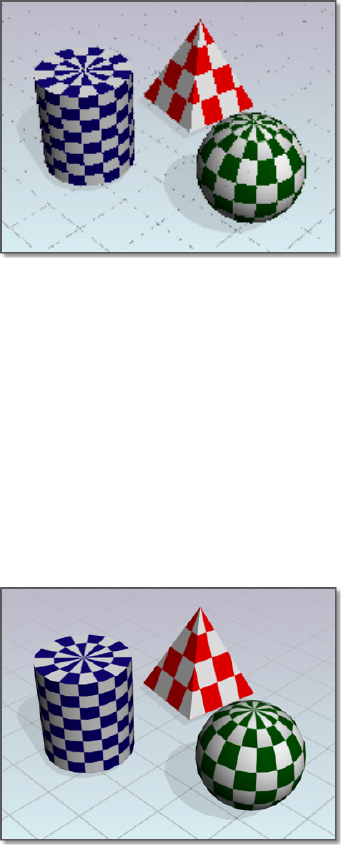
Because the image on a monitor is made up of discrete pixels on a fixed grid,
scenes rendered using the Draft or Low render presets produce jagged and
inaccurate images.
In the following example, image quality is highly degraded - Min. Samples =
1/64; Max. Samples = 1/4.
The greater the resolution (and thus the smaller the pixels), the less apparent
aliasing is. However, it is often best to reduce the effect further by using
anti-aliasing techniques. The anti-aliasing technique used by the renderer is
called sampling. Sampling is controlled by the sample and filter settings on
the Advanced Render Settings palette.
Sampling provides a "best guess" color for each rendered pixel. The renderer
first samples the scene color at locations within the pixel or along the pixel's
edge, then uses a filter to combine the samples into a single pixel color.
Increasing the minimum and maximum sample ranges greatly improves the
quality of a rendering.
In the following example, increased sampling smooths edges - Min. Samples
= 1; Max. Samples = 16.
2128 | Chapter 46 Render 3D Objects for Realism
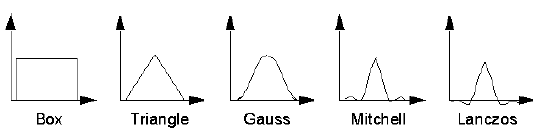
There are five filter methods: Box, Gauss, Triangle, Mitchell, or Lanczos. Box,
the default, is the quickest. Mitchell is often the most accurate. The Box filter
combines samples evenly, without weighting them. Each of the other filters
uses a particular curve to weight samples before combining them.
Anti-aliasing techniques involve at least two trade-offs.
■Extra calculation. Pixels in the offending line or boundary and neighboring
pixels in the background must be analyzed so that intermediate shades
can be added.
■Thicker lines. Although an anti-aliased line appears smoother, it must be
thicker than a jagged one.
You have to decide how much time you want to spend rendering and how
good you want the final rendering to be. These trade-offs will depend partly
on the hardware you're using and partly on the audience for your work.
The standard render presets offer five levels of anti-aliasing. Draft is set to use
the lowest level of anti-aliasing, but it provides the fastest rendering speed.
Each successive level is slower to compute. The anti-aliasing algorithm makes
the process more efficient by allowing the program to decide for any given
pixel that fewer samples need to be computed.
Quick Reference
Commands
RENDER
Creates a photorealistic or realistically shaded image of a 3D solid or surface
model.
RPREF
Displays or hides the Advanced Render Settings palette for access to advanced
rendering settings.
Adjust Sampling to Improve Image Quality | 2129
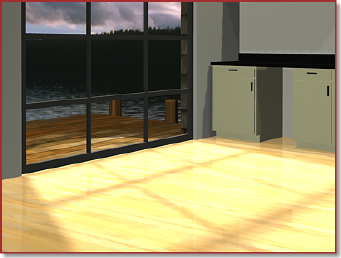
Use Shadows in Rendering
With shadows, you can create rendered images that have greater depth and
realism.
The renderer can generate shadows by shadow mapping or by ray tracing.
Shadow mapped shadows rely on a bitmap that the renderer generates during
a pre-rendering pass of the scene. Shadow mapping provide softer edges and
can require less calculation time than ray-traced shadows, but are less accurate.
Ray tracing traces the path of rays sampled from the light source. Shadows
appear where rays have been blocked by objects. Ray-traced shadows have
more accurate, hard edges and require more calculation time.
Shadow-Mapped Shadows
Shadow maps are the only way to generate soft-edged shadows, but they do
not show the color cast by transparent or translucent objects. Shadow-mapped
shadows are calculated faster than ray-traced shadows.
The following example shows how shadow maps produce softer, less precise
shadows that are processed faster than raytraced shadows.
During a pre-rendering pass, a shadow map bitmap is created. Shadow quality
can be controlled by increasing or decreasing the size of the shadow map. The
default shadow map size is 256 x 256 pixels. If the shadow appears to be too
grainy, increasing the map size will give you better quality. Shadow mapped
shadows should not be used if you have a light shining through a transparent
surface (for example, a multi-pane window where you want the the frame and
mullions to cast shadows). You’d have to remove the glass in order for the
mullions to cast shadows.
2130 | Chapter 46 Render 3D Objects for Realism
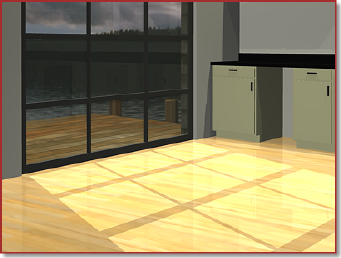
Ray-traced Shadows
Ray-traced shadows (like other ray-traced effects of reflection and refraction)
are generated by tracing the path of light beams or rays sampled from a light
source. Ray-traced shadows are more accurate than shadow-mapped shadows.
The following example shows that while ray tracing takes longer to process,
it produces more realistic, precise shadows.
Ray-traced shadows have hard edges and accurate outlines; they also transmit
color from transparent and translucent objects. Therefore, shadows of the
frame and mullions of a multi-pane window will render. Because ray-traced
shadows are calculated without a map, you don't have to adjust resolution as
you do for shadow-mapped shadows.
Shadow Modes
You can select one of three shadow mode settings when shadows are turned
on. The shadow mode can be set to Simple, Sort, or Segment.
■Simple. The renderer calls shadow shaders in a random order. This is the
default mode state for shadows.
■Sorted. The renderer calls shadow shaders in order, from the object to the
light.
■Segment. The renderer calls shadow shaders in order along the light ray
from the volume shaders to the segments of the light ray between the
object and the light.
Displaying Shadows
In order for shadows to be cast in a model, lighting must be established. A
light source needs to be added to the scene and you need to specify if that
Use Shadows in Rendering | 2131
light source will cast shadows. For shadows to display in the viewport as you
set up the scene, you need to turn on shadows for the visual style. If you want
shadows to appear in the rendered image, you need to turn on shadows and
choose the type of shadows to render on the Advanced Render Settings palette.
To view shadows in the viewport
1Click View tab ➤ 3D Palettes panel ➤ Visual Styles.
2In the Visual Style Manager, select either Conceptual or Realistic.
Shadow display has no effect for 3D Hidden or 3D Wireframe styles.
3Set Shadow Display to Ground Shadows or Full Shadows.
4Close the Visual Style Manager.
To generate shadow mapped shadows in the rendered image
1Click Render tab ➤ Render panel ➤ ➤ Advanced Render Settings.
2In the Advanced Render Settings palette, make sure Shadows is turned
on.
3Select the shadow mode you want to use.
4Turn on Shadow Map.
5Render the model.
To generate ray-traced shadows in the rendered image
1Click Render tab ➤ Render panel ➤ ➤ Advanced Render Settings.
2In the Advanced Render Settings palette, make sure Shadows is turned
on.
3Select the shadow mode you want to use.
2132 | Chapter 46 Render 3D Objects for Realism
4Turn off Shadow Map.
5Render the model.
Quick Reference
Commands
RENDER
Creates a photorealistic or realistically shaded image of a 3D solid or surface
model.
RPREF
Displays or hides the Advanced Render Settings palette for access to advanced
rendering settings.
VISUALSTYLES
Creates and modifies visual styles and applies a visual style to a viewport.
Advanced Rendering
Advanced rendering techniques allow you to render highly detailed and
photorealistic images.
Ray-traced Reflections and Refractions
Ray tracing traces the path of rays sampled from the light source. Reflections
and refractions generated this way are physically accurate.
To reduce the time required to generate reflections and refractions, rays are
limited by trace depth. Trace depth limits the number of times a ray can be
reflected, refracted, or both. You set the maximum trace depth, the maximum
number of reflections, and the maximum number of refractions in the
Advanced Render Settings palette.
The following example shows how ray-traced reflections and refractions greatly
increase the realism of a scene. Max Depth = 8; Max Reflections and Refractions
= 4.
Advanced Rendering | 2133
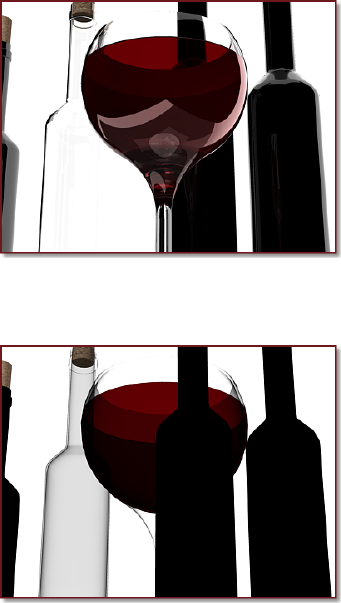
When ray tracing is turned off, no reflection or refraction occurs.
The following example shows the same model with ray tracing turned off.
Trace depth controls the number of times a light ray can be reflected or
refracted. Increasing these values can increase the complexity and realism of
a rendered image, at a cost of greater rendering time.
The following example shows how increasing the trace depth improves the
rendering. Max Depth = 4; Max Reflections and Refractions = 2.
2134 | Chapter 46 Render 3D Objects for Realism
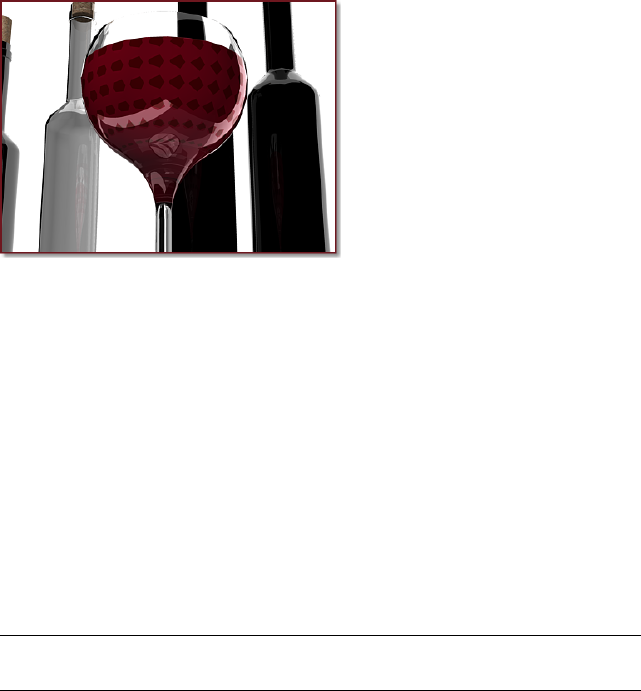
Ray-tracing Controls
The Max Depth setting limits the combination of reflection and refraction.
Tracing of a ray stops when the total number of reflections and refractions
reaches the maximum depth. For example, if Max Depth equals 3 and Max
Reflections and Max Refractions are both set to 2, a ray can be reflected twice
and refracted once, or vice versa, but the ray cannot be reflected and refracted
four times.
The Max Reflections setting specifies the number of times a ray can be reflected.
At 0, no reflection occurs. At 1, the ray can be reflected once only. At 2, the
ray can be reflected twice, and so on.
The Max Refractions setting specifies the number of times a ray can be
refracted. At 0, no refraction occurs. At 1, the ray can be refracted once only.
At 2, the ray can be refracted twice, and so on.
NOTE As you increase the number of reflections and refractions, you will also
increase the amount of processing time required by the renderer.
Quick Reference
Commands
RENDER
Creates a photorealistic or realistically shaded image of a 3D solid or surface
model.
RPREF
Displays or hides the Advanced Render Settings palette for access to advanced
rendering settings.
Ray-traced Reflections and Refractions | 2135

Benefits of Indirect Illumination
Indirect illumination techniques, like global illumination and final gathering,
enhance the realism of a scene by simulating radiosity, or the interreflection
of light in a scene.
Global illumination (GI) provides effects such as color bleeding. For example,
if a red countertop is next to a white wall, the white wall gets a slightly pink
tint. You might also think it’s a minor detail, but if the pink tint is missing
from the image, the image looks fake, even though it might be hard to point
out precisely why. This effect is not possible with ordinary ray-tracing
calculations.
To calculate global illumination, the renderer uses photon maps, a technique
to generate the indirect illumination effects and global illumination. A side
effect of using a photon map is rendering artifacts such as dark corners and
low-frequency variations in the lighting. You can reduce or eliminate these
artifacts by turning on final gathering, which increases the number of rays
used to calculate global illumination.
When preparing for a finished rendering, make sure you have specified the
drawing units you want to use before you make any GI settings. Changing
drawing units after you’re satisfied with the global illumination will adversely
affect the rendering results.
The accuracy and intensity of global illumination is controlled by the number
of photons generated, the sampling radius, and its trace depth. This example
shows the effects of a low number of photons and a sampling radius set too
small.
2136 | Chapter 46 Render 3D Objects for Realism
Photons and Sampling Radius
The intensity of global illumination is computed by the number of photons
you’ve specified. Increased numbers of photons makes global illumination
less noisy but also more blurry. When the number of photons are decreased,
global illumination is more noisy but less blurry. The greater the number of
photons, the longer the rendering time.
TIP To preview global illumination, give settings such as Photons/Sample or
Photons/Light lower values, then increase the values for the final rendering.
The sampling radius sets the size of photons. In many cases, the default photon
size (Use Radius=Off) of one-tenth the scene size gives useful results. In other
cases, the default photon size might be too large or too small.
The size of the sampling radius (Radius) determines if photons overlap. When
photons overlap, the renderer smooths them together. Increasing the radius
increases the amount of smoothing and can create more natural-looking
illumination. When photons have a small radius and don't overlap, no
smoothing occurs. Ideally, photons should overlap. To get good results, you
would want to turn on Use Radius and increase the Radius size.
Global Illumination Trace Depth
The Trace Depth controls are similar to those for calculating reflections and
refractions, but they refer to the photons used by global illumination rather
than to light rays used in ray-traced reflection and refraction.
The maximum depth limits the combination of reflection and refraction.
Reflection and refraction of a photon stops when the total number of both
equals the maximum depth. For example, if Max Depth equals 3 and Max
Reflections and Max Refractions are both set to 2, a photon can be reflected
Benefits of Indirect Illumination | 2137
twice and refracted once, or vice versa, but it can’t be reflected and refracted
four times.
The Max Reflections setting specifies the number of times a photon can be
reflected. At 0, no reflection occurs. At 1, the photon can be reflected once
only. At 2, the photon can be reflected twice, and so on.
The Max Refractions setting specifies the number of times a photon can be
refracted. At 0, no refraction occurs. At 1, the photon can be refracted once
only. At 2, the photon can be refracted twice, and so on.
Quick Reference
Commands
RPREF
Displays or hides the Advanced Render Settings palette for access to advanced
rendering settings.
Final Gathering
Final gathering is an optional, additional step used to improve global
illumination (GI). It increases the number of rays used to calculate GI to
smooth out and eliminate adverse lighting artifacts.
Because global illumination is calculated from a photon map, rendering
artifacts such as dark corners and low-frequency variations in the lighting
may occur.
By activating final gathering, you increase the number of rays used to calculate
global illumination, which reduces or eliminates these artifacts.
2138 | Chapter 46 Render 3D Objects for Realism
There is a catch when deciding to use final gathering. Final gathering can
greatly increase rendering time. It is most useful for scenes with overall diffuse
lighting.
TIP Leave final gathering off to preview the scene, then turn it on for the finished
rendering. (Increasing the number of photons used to calculate global illumination
can also improve global illumination.)
You activate and adjust final gathering in the Advanced Render Settings palette.
Quick Reference
Commands
RPREF
Displays or hides the Advanced Render Settings palette for access to advanced
rendering settings.
Rendered Image Histories
The render history maintains a list of recently rendered images generated from
the currently loaded model.
Each image that is rendered to a file or the Render Window is recorded with
the drawing as a history entry.
Understand History Entries
History entries store data pertaining to renderings made from the current
drawing.
Rendered Image Histories | 2139

Each history entry contains information about the images that have been
recently rendered. The information stored in history entries includes
■Date and time of the rendering task
■Statistics for the rendering task
■Current view or the name of a stored view
■Active render preset name
■Active render settings, such as output resolution
■Size of a cropped region, if crop was used for the render task
NOTE Rendered images are not stored in the history entry, only a link to the image
location.
History Entry Information
Aside from the statistics, history entries contain five pertinent pieces of
information.
Output File Name Holds two pieces of information: the name of the rendering
and its state. If you specify an output file, that name is listed in the field. If
you have not specified an output file, the drawing name is listed with a
temporary suffix.
Output Size Tells you the output resolution for the rendered image.
View Is always the current view unless you’ve chosen to render a saved view.
In that case, the view name is displayed.
Render Time Shows the date when the image was rendered and the amount
of time it took to render.
Render Preset Displays whatever render preset was used by the renderer to
generate the image.
History Entry Creation
There are some rules that delegate when a history entry is created and if that
history entry is stored with the current drawing. The destination setting is the
primary factor that determines if a history entry is created. The following table
2140 | Chapter 46 Render 3D Objects for Realism
outlines the circumstances of when a history entry is created and when it is
saved.
Entry saved with drawing?History entry created?Destination
YesYesFile
Only if the Render Window view is savedYesRender Window
Not applicableNoViewport
Any history entries that are generated, but not saved with the drawing only
exist for the duration of the current drawing session. Once you close the file
or exit the program, unsaved history entries are lost.
History Entry States
There are four states in which a history entry can appear in the Render
Window.
Normal When you specify an output location and file name for a rendering,
the history entry is created and saved with the drawing. This history entry is
in a normal state and the file name you specified is displayed in the File Name
column of the render history section of the Render Window.
Temporary A temporary history entry occurs when you render an image only
to the Render Window without specifying an output file. This history entry
remains in memory until the drawing session ends. Temporary history entries
have a -TempXXX suffix appended to their Output File Name listing.
Empty When you specify an output location and file name for a rendering,
the history entry is created and saved with the drawing. This history entry is
in a normal state and the file name you specified is displayed in the Output
File Name column of the render history section of the Render Window.
Quick Reference
Commands
RENDER
Creates a photorealistic or realistically shaded image of a 3D solid or surface
model.
Rendered Image Histories | 2141
RENDERWIN
Displays the Render window without starting a rendering operation.
RPREF
Displays or hides the Advanced Render Settings palette for access to advanced
rendering settings.
Save and Redisplay Rendered Images
You can save a rendering and then redisplay it later. Redisplaying is much
faster than rendering again.
Save a Rendered Image
You can render directly to a file or save a temporary history entry to one of
several different file formats.
After creating a rendering, you can save the image for redisplay at a later time.
Depending on the render settings and render preset you’ve chosen, rendering
can be a time-consuming process. However, redisplaying a previously rendered
image is instantaneous.
To save a rendered image, you can render directly to a file, you can render to
the viewport and then save the image, or you can render to the Render Window
and save or save a copy of the image. Once an image is saved, you can view
your images at any time. Saved images can also be used as texture maps for
materials that you’ve created.
Render Directly to a File
No matter how your display is configured, you can bypass the screen and
redirect your rendering to a file. An advantage of not rendering to the screen
is that you can render to higher resolutions than your current display
configuration permits. You can then view that image on other systems with
higher-resolution displays. You set the file location and file name by setting
the Image Target in the Advanced Render Settings palette or on the Render
panel of the ribbon. Rendered images are saved to one of several file formats,
such as BMP, TGA, TIF, PCX, JPG, and PNG.
Save a Viewport Rendering
You can choose to render to a viewport. After rendering a model to a viewport,
you use SAVEIMG to save the displayed image to one of the following file
2142 | Chapter 46 Render 3D Objects for Realism
formats: BMP, TGA, TIF, PCX, JPG, or PNG. You can save the file to an
assortment of different grayscale or color depths that are offered by the file
format you’ve selected.
Save a Render Window Rendering
If you’ve chosen the render destination to be the render window, you can
save the image or save a copy of the image to one of the following file formats:
BMP, TGA, TIF, PCX, JPG, or PNG. Depending upon the file format you’ve
selected, you can choose to save grayscale or color depths ranging from 8 bits
to 32 bits per pixel (bpp).
To render an image directly to a file
1Click Render tab ➤ Render panel ➤ ➤ Advanced Render Settings.
2In the Advanced Render Settings palette, turn on Save Rendering to File.
3Click the [...] button next to the Output File Name field.
4In the Save As dialog box, select a file type and the location where you
want the image saved. Click Save.
5Click Render.
As the rendering is completed, the image appears in the Render Window.
It is also saved to the drive location you chose with the name you
specified.
To save an image that is rendered to the viewport
1After the image is rendered to the viewport, at the Command prompt,
enter saveimg.
2In the Render Output File dialog box, browse to a folder where you want
to store the image.
3Enter a name for the image and an output file format.
4Click Save.
To save a rendered image from the Render Window
1Select a history entry from the Render Window.
Save a Rendered Image | 2143
2Click File menu ➤ Save.
3In the Render Output File dialog box, select a file format, and enter a
storage location and file name. Click Save.
The image is saved in the selected file format.
Quick Reference
Commands
RENDER
Creates a photorealistic or realistically shaded image of a 3D solid or surface
model.
RENDERWIN
Displays the Render window without starting a rendering operation.
RPREF
Displays or hides the Advanced Render Settings palette for access to advanced
rendering settings.
SAVEIMG
Saves a rendered image to a file.
Redisplay a Rendered Image
Having saved your rendered image, you can redisplay that rendering at any
time.
Having saved your rendered image, you can view that rendering at any time
by opening it in the Windows Image Viewer.
If you don’t want to use an external program, you can also view the image by
inserting it into the drawing with the IMAGEATTACH command.
Quick Reference
Commands
IMAGEATTACH
Inserts a reference to an image file.
2144 | Chapter 46 Render 3D Objects for Realism
RENDER
Creates a photorealistic or realistically shaded image of a 3D solid or surface
model.
Save Copies of Rendered Images
You can save copies of images that are part of a drawing’s render history.
With the Save Copy option, located in the Render Window, you can save a
rendered image to a new location even though an output path may already
be set. This is useful if you want to re-render a history entry and compare the
new image with the previous.
To save a rendered image from the Render Window
1Select a history entry from the Render Window.
2Click File menu ➤ Save Copy.
3In the Render Output File dialog box, select a file format, and enter a
storage location and file name. Click Save.
The image is saved in the selected file format.
Quick Reference
Commands
RENDER
Creates a photorealistic or realistically shaded image of a 3D solid or surface
model.
RENDERWIN
Displays the Render window without starting a rendering operation.
RPREF
Displays or hides the Advanced Render Settings palette for access to advanced
rendering settings.
Use Models with Other Applications
You can use other Autodesk products to further enhance the quality of your
models.
Save Copies of Rendered Images | 2145
Autodesk® products continually improve their ability to share drawings and
models, including 3ds Max®, Autodesk® VIZ, AutoCAD® Architecture, and
AutoCAD® Mechanical.
3ds Max or Autodesk VIZ
With these products, you can make greater improvements on your models.
You have the option of opening DWG or DXF files without converting or you
can use the File Link Manager to create a live link with a drawing file. 3ds Max
or Autodesk VIZ offers expanded animation, lighting, material, and rendering
capabilities that add further polish to your presentation graphics.
AutoCAD Architecture
AutoCAD geometry can be opened in AutoCAD Architecture, no conversion
is necessary. Once the model is open you can use architectural related features,
such as architectural objects, schedules or integrated rendering, to streamline
your architectural design and documentation process.
AutoCAD Mechanical
If you want to use AutoCAD geometry and rendering data with AutoCAD
Mechanical, you can export and import files using the following methods:
■To export a drawing, click File menu ➤ Export.
■To import a file, click Insert menu ➤ Drawing Exchange Binary.
Quick Reference
Commands
3DSIN
Imports an Autodesk 3ds MAX (3DS) file.
AMECONVERT
Converts AME solid models to AutoCAD solid objects.
Update Legacy Drawings
When you open drawings created with earlier versions of AutoCAD, content
is converted to be usable in rendering.
2146 | Chapter 46 Render 3D Objects for Realism
Lights, Materials, and Cameras
Lights, materials, and cameras have been improved but some older drawings
may contain AutoShade information, such as lights, scene blocks, and camera
blocks.
Lights and materials used in older drawings can be converted. AutoCAD 2008
introduced the 3DCONVERSIONMODE system variable. With the system
variable set to the default value of 1, lighting and materials are automatically
converted for older drawings. Additional information about converting
drawings can be found under the topics Converting Lights on page 2063 and
Converting Materials.
Quick Reference
Commands
RENDER
Creates a photorealistic or realistically shaded image of a 3D solid or surface
model.
Update Legacy Drawings | 2147
2148
Glossary
Commands associated with definitions are shown in parentheses at the end
of the definition.
3D mesh primitive Basic mesh forms such as boxes, cones, cylinders,
pyramids, wedges, spheres, and tori.
3D view Any view where the UCS icon appears in rendered colored form;
current visual style is not 2D Wireframe, and the model is being viewed from
an isometric view.
3Dconnexion Set of navigation tools used to reorient the current view of a
model with a 3Dconnexion device.
absolute coordinates Coordinate values measured from a coordinate system's
origin point. See also origin, relative coordinates, user coordinate system (UCS),
world coordinates, and world coordinate system (WCS).
acquired point In the tracking or object snap tracking methods of locating
a point, an intermediate location used as a reference.
acquisition marker During tracking or object snap tracking, the temporary
plus sign displayed at the location of an acquired point.
action The smallest task or user interaction that can be recorded with the
Action Recorder.
Action bar Toolbar-like UI that displays the actions associated with a parameter
object.
action macro A series of recorded actions that can be played back in the active
drawing.
action macro file A file that stores all the actions contained in an action
macro. Action macro files have the file extension .actm.
Action tree A control used to display the recorded actions in an action macro.
activate Part of the Autodesk software registration process. It allows you to
run a product in compliance with the product's end-user license agreement.
Glossary | 2149
adaptive degradation A method of controlling performance that turns off
features in a certain order when performance falls below a specified level.
adaptive sampling A method to accelerate the anti-aliasing process within
the bounds of the sample matrix size. See also anti-aliasing.
adjacent cell selection A selection of table cells that share at least one
boundary with another cell in the same selection.
affine calibration A tablet calibration method that provides an arbitrary linear
transformation in two-dimensional space. Affine calibration requires three
calibration points to allow a tablet transformation that combines translation,
independent X and Y scaling, rotation, and some skewing. Use affine calibration
if a drawing has been stretched differently in the horizontal or vertical
direction. (TABLET)
alias A shortcut for a command. For example, CP is an alias for COPY, and Z
is an alias for ZOOM. You define aliases in the acad.pgp file.
aliasing The effect of discrete picture elements, or pixels, aligned as a straight
or curved edge on a fixed grid appearing to be jagged or stepped. See also
anti-aliasing.
aligned dimension A dimension that measures the distance between two
points at any angle. The dimension line is parallel to the line connecting the
dimension's definition points. (DIMALIGNED)
alpha channel Alpha is a type of data, found in 32-bit bitmap files, that
assigns transparency to the pixels in the image.
A 24-bit truecolor file contains three channels of color information: red, green,
and blue, or RGB. Each channel of a truecolor bitmap file is defined by 8 bits,
providing 256 levels of intensity. The intensity of each channel determines
the color of the pixel in the image. Thus, an RGB file is 24-bit with 256 levels
each of red, green, and blue.
By adding a fourth, alpha channel, the file can specify the transparency, or
opacity, of each of the pixels. An alpha value of 0 is transparent, an alpha
value of 255 is opaque, and values in between are semi-transparent. An RGBA
file (red, green, blue, alpha) is 32-bit, with the extra 8 bits of alpha providing
256 levels of transparency.
To output a rendered image with alpha, save in an alpha-compatible format
such as PNG, TIFF, or Targa.
ambient color A color produced only by ambient light. Ambient color is the
color of an object where it is in shadow. This color is what the object reflects
when illuminated by ambient light rather than direct light.
2150 | Glossary
ambient light Light that illuminates all surfaces of a model with equal
intensity. Ambient light has no single source or direction and does not
diminish in intensity over distance.
angular dimension A dimension that measures angles or arc segments and
consists of text, extension lines, and leaders. (DIMANGULAR)
angular unit The unit of measurement for an angle. Angular units can be
measured in decimal degrees, degrees/minutes/seconds, grads, and radians.
annotation scale A setting that is saved with model space, layout viewports,
and model views. When you create annotative objects, they are scaled based
on the current annotation scale setting and automatically displayed at the
correct size.
annotational constraint Dimensional constraint used to control the size of
the geometry as well as annotate the drawing.
See also parameter constraint, and dynamic constraint
annotations Text, dimensions, tolerances, symbols, notes, and other types
of explanatory symbols or objects that are used to add information to your
model.
annotative A property that belongs to objects that are commonly used to
annotate drawings. This property allows you to automate the process of scaling
annotations. Annotative objects are defined at a paper height and display in
layout viewports and model space at the size determined by the annotation
scale set for those spaces.
anonymous block An unnamed block created by a number of features,
including associative and nonassociative dimensions.
anti-aliasing A method that reduces aliasing by shading the pixels adjacent
to the main pixels that define a line or boundary. See also aliasing.
application button The button that is displayed in the top-left corner of the
application. If you click the application button, the application menu is
displayed.
application menu The menu that is displayed when you click the application
button. The application menu contains common tools for creating, saving,
and publishing a file.
approximation points Point locations that a B-spline must pass near, within
a fit tolerance. See also fit points and interpolation points.
array 1. Multiple copies of selected objects in a rectangular or polar (radial)
pattern. (ARRAY) 2. A collection of data items, each identified by a subscript
Glossary | 2151
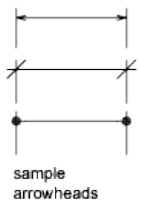
or key, arranged so a computer can examine the collection and retrieve data
with the key.
arrowhead A terminator, such as an arrowhead, slash, or dot, at the end of a
dimension line showing where a dimension begins and ends.
aspect ratio Ratio of display width to height.
associative dimension A dimension that automatically adapts as the associated
geometry is modified. Controlled by the DIMASSOC system variable. See also
nonassociative dimension and exploded dimension.
associative hatch Hatching that conforms to its bounding objects such that
modifying the bounding objects automatically adjusts the hatch. (BHATCH)
associative surfaces Associative surfaces automatically adjust their location
and shape when the geometric objects associated with them are modified.
Controlled by the SURFACEASSOCIATIVITY system variable.
attenuation The diminishing of light intensity over distance.
attribute definition An object that is included in a block definition to store
alphanumeric data. Attribute values can be predefined or specified when the
block is inserted. Attribute data can be extracted from a drawing and inserted
into external files. (ATTDEF)
attribute extraction file A text file to which extracted attribute data is written.
The contents and format are determined by the attribute extraction template
file. See also attribute extraction template file.
attribute extraction template file A text file that determines which attributes
are extracted and how they are formatted when written to an attribute
extraction file. See also attribute extraction file.
attribute prompt The text string displayed when you insert a block with an
attribute whose value is undefined. See also attribute definition, attribute tag,
and attribute value.
2152 | Glossary
attribute tag A text string associated with an attribute that identifies a
particular attribute during extraction from the drawing database. See also
attribute definition, attribute prompt, and attribute value.
attribute value The alphanumeric information associated with an attribute
tag. See also attribute definition, attribute prompt, and attribute tag.
AutoCAD library search path The order in which looks for a support file:
current directory, drawing directory, directory specified in the support path,
and directory containing the executable file, acad.exe.
AutoCAD window The drawing area, its surrounding menus, and the
command line.
axis tripod Icon with X, Y, and Z coordinates that is used to visualize the
viewpoint (view direction) of a drawing without displaying the drawing.
(VPOINT)
B-spline curve A blended piecewise polynomial curve passing near a given
set of control points. See also Bezier curve. (SPLINE)
back face The opposite side of a front face. Back faces are not visible in a
rendered image. See also front faces.
base point 1. In the context of editing grips, the grip that changes to a solid
color when selected to specify the focus of the subsequent editing operation.
2. A point for relative distance and angle when copying, moving, and rotating
objects. 3. The insertion base point of the current drawing. (BASE) 4. The
insertion base point for a block definition. (BLOCK)
baseline An imaginary line on which text characters appear to rest. Individual
characters can have descenders that drop below the baseline. See also baseline
dimension.
baseline dimension Multiple dimensions measured from the same baseline.
Also called parallel dimensions. See also baseline.
basic tooltip Displays a brief description for the tooltip.
basic wheels A reference to the View Object wheel and Tour Building wheel.
Bezier curve A polynomial curve defined by a set of control points,
representing an equation of an order one less than the number of points being
considered. A Bezier curve is a special case of a B-spline curve. See also B-spline
curve.
big wheels The large version of the SteeringWheels. Labels are displayed on
each wheel wedge and they are larger than the size of the cursor.
Glossary | 2153
bitmap The digital representation of an image having bits referenced to pixels.
In color graphics, a different value represents each red, green, and blue
component of a pixel.
blips Temporary screen markers displayed in the drawing area when you
specify a point or select objects. (BLIPMODE)
block A generic term for one or more objects that are combined to create a
single object. Commonly used for either block definition or block reference.
See also block definition and block reference. (BLOCK)
block action Defines how the geometry of a dynamic block reference will
move or change when the custom properties of a block reference are
manipulated in a drawing. A dynamic block definition usually contains at
least one action that is associated with a parameter. (BACTION)
block authoring object A dimensional constraint, parameter, or action that
adds intelligence to a block definition.
block authoring palettes Tool palettes used in the Block Editor to add actions
and parameters to dynamic block definitions.
block authoring tools Actions, parameters, and parameter sets on the tabs
of the Block Authoring Palettes window. Used in the Block Editor to create
dynamic blocks.
block constraint parameter A dimensional constraint that has block authoring
information associated with it.
See also: dynamic constraint
See also: annotational constraint
block definition The name, base point, and set of objects that are combined
and stored in the symbol table of a drawing. See also block and block reference.
block definition table The nongraphical data area of a drawing file that stores
block definitions. See also named object.
block instance See block reference.
block properties table A table that enables users to define different values
for a set of properties for the block definition. Replacement for lookup
properties in the future.
block reference A compound object that is inserted in a drawing and displays
the data stored in a block definition. Also called instance. See also block and
block definition. (INSERT)
2154 | Glossary
bounded area A closed area that consists of a single object (such as a circle)
or of multiple, coplanar objects that overlap. You can insert hatch fills within
bounded areas.
Bounded areas are also used to create 3D objects through extrusion by using
the PRESSPULL command.
bulge magnitude The amount of curvature where two surfaces meet. This
only applies to surfaces that have G1 or G2 continuity.
bump map A map in which brightness values are translated into apparent
changes in the height of the surface of an object.
button menu The menu for a pointing device with multiple buttons. Each
button on the pointing device (except the pick button) can be defined in the
customization file (acad.cui).
BYBLOCK A special object property used to specify that the object inherits
the color or linetype of any block containing it. See also BYLAYER.
BYLAYER A special object property used to specify that the object inherits
the color or linetype associated with its layer. See also BYBLOCK.
callout block A block used as symbol to reference another sheet. Callout
blocks have many industry-specific terms, such as reference tags, detail keys,
detail markers, and so on. See also label block.
camera Defines the current eye-level position in a 3D model. A camera has a
location XYZ coordinate, a target XYZ coordinate, and a field of view or lens
length, which determines the magnification or zoom factor.
camera target Defines the point you are viewing by specifying the coordinate
at the center of the view.
candela The SI unit of luminous intensity (perceived power emitted by a
light source in a particular direction) (Symbol: cd). Cd/Sr
category See view category.
cell The smallest available table selection.
cell boundary The four gridlines surrounding a table cell. An adjacent cell
selection can be surrounded with a cell boundary.
cell style A style that contains specific formatting for table cells.
chain actions In a dynamic block definition, a property of point, linear, polar,
XY, and rotation parameters. When set to Yes, a change in an action that
contains the parameter in the action's selection set triggers any actions
Glossary | 2155
associated with that parameter, just as if you had edited the parameter in the
block reference through a grip or custom property.
circular external reference An externally referenced drawing (xref) that
references itself directly or indirectly. The xref that creates the circular
condition is ignored.
clamp curve A smooth, closed curve such as a circle. Because it has a vertex
that is tangent to the object, if the curve is reshaped, it may create kinks. See
also periodic curve.
clamp surface A smooth, closed surface such as a cylinder. Because as a vertex
that is tangent to the object, if the surface is reshaped, it may create kinks.
See also periodic surface.
clipping planes The boundaries that define or clip the field of view.
CMYK For cyan, magenta, yellow, and key color. A system of defining colors by
specifying the percentages of cyan, magenta, yellow, and the key color, which
is typically black.
Color bleed scale Increases or decreases the saturation of the reflected color
from the material.
color map A table defining the intensity of red, green, and blue (RGB) for
each displayed color.
column A vertically adjacent table cell selection spanning the height of the
table. A single column is one cell in width.
command line A text area reserved for keyboard input, prompts, and
messages.
compass
A visual aid that indicates the directions North, South, East, and West in the
current model.
composite solid A solid created from two or more individual solids. (UNION,
SUBTRACT, INTERSECT)
constraint bar Displays the geometric constraints associated with objects or
with points on objects.
constraint point Point on an object that can be geometrically and/or
dimensionally constrained (for example, an endpoint or an insertion point).
constraints Form of parametric design.
2156 | Glossary
Rules that govern the position, slope, tangency, dimensions, and relationships
among objects in a geometry.
construction plane See workplane.
contextual ribbon tab
A ribbon tab that is displayed only when a particular type of object or when
a particular command is executed. For example, selecting a hatch or table, or
executing the mtext command brings up the corresponding contextual menu.
continued dimension A type of linear dimension that uses the second
extension line origin of a selected dimension as its first extension line origin,
breaking one long dimension into shorter segments that add up to the total
measurement. Also called chain dimension. (DIMCONTINUE)
continuity A measure of how smoothly two curves or surfaces flow into each
other where they are joined. Continuity is measured as G0-Position,
G1-Tangency, and G2-Curvature.
■G0 (Position) - The curves or surfaces join in the same location (position
only); they touch. But the tangency and curvature do not match.
■G1 (Tangent) - The position and tangency between the surfaces match.
This indicates G1 (position + tangency) continuity between the surfaces.
■G2 (Curvature) - The position, tangency, and curvature between the surfaces
match. This indicates G2 (position + tangency + curvature) continuity
between the two surfaces.
control frame A series of point locations used as a mechanism to control the
shape of a B-spline. These points are connected by a series of line segments
for visual clarity and to distinguish the control frame from fit points. The
CVSHOW and CVHIDE commands must be turned on to display and hide
control frames.
control point See control frame.
control vertices (CVs) The most basic way to shape a NURBS surface or spline.
These points act as grips that can be dragged to reshape the object.
Coons patch In 3D surface meshes, the bicubic surface (one curved in the M
direction and another in the N direction) interpolated between four edges.
coordinate filters Functions that extract individual X, Y, and Z coordinate
values from different points to create a new, composite point. Also called X,Y,Z
point filters.
Glossary | 2157

crease A sharpened ridge that defines one or more edges of a mesh face
subobject. (MESHCREASE)
cross sections Generally, curves or lines that define the profile (shape) of a
lofted solid or surface. Cross sections can be open or closed. A lofted solid or
surface is drawn in the space between the cross sections. (LOFT)
crosshairs A type of cursor consisting of two lines that intersect.
crossing selection A rectangular area drawn to select objects fully or partly
within its borders.
CTB file SA color-dependent plot style table.
ctrl-cycle Method for cycling between different behaviors while editing
geometry, either in a command or when grip-editing. Pressing and releasing
the CTRL key cycles the behavior. For constrained geometry, CTRL-cycling
switches between enforcing and relaxing constraints.
current drawing A drawing file that is open in the program, and receives any
command or action that you enter.
cursor See pointer and crosshairs.
cursor menu See shortcut menu.
curve-fit A smooth curve consisting of arcs joining each pair of vertices. The
curve passes through all vertices of the polyline and uses any tangent direction
you specify.
custom grips In a dynamic block reference, used to manipulate the geometry
and custom properties.
custom object A type of object that is created by an ObjectARX application
and that typically has more specialized capabilities than standard objects.
Custom objects include parametric solids (AutoCAD Mechanical Desktop),
intelligently interactive door symbols (AutoCAD Architecture), polygon objects
(AutoCAD Map 3D), and associative dimension objects (AutoCAD and
AutoCAD LT). See also proxy object and object enabler.
customization (CUI) file An XML-based file that stores customization data.
You modify a customization file through the Customize User Interface dialog
box. CUI files replace MNU, MNS, and MNC files that were used to define
menus in earlier releases.
2158 | Glossary
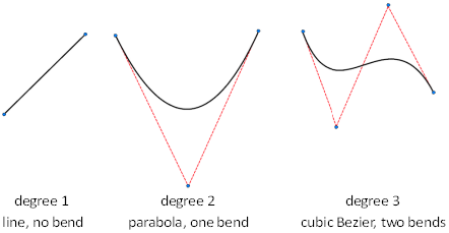
CV hull A NURBS surface is modified through its control vertices (CV) hull.
It consists of the control vertices and the lines that connect them in the U
and V directions The hull sits outside of (not on) the surface. NURBS curves
do not have a CV hull; they only have control vertices.
data link A connection between a table and an external source of data.
decimal degrees A notation for specifying latitude and longitude. For example,
35.1234°, 100.5678°.
Latitude always precedes longitude
default drawing See initial environment.
default lighting The lighting in a shaded viewport when the sun and user
lights are turned off. Faces are lighted by two distant light sources that follow
the viewpoint as you move around the model.
default value The value that is accepted when you press ENTER at a
sub-prompt. The default value is displayed in angle brackets <>. See also default.
definition points Points for creating a dimension. The program refers to the
points to modify the appearance and value of a nonassociative dimension
when the dimensioned object is modified. Also called defpoints and stored on
the special layer DEFPOINTS.
definition table The nongraphical data area of a drawing file that stores block
definitions.
degree A mathematical property of a curve or a surface that controls how
many control vertices per span are available for modeling.
The higher the degree, the more control points and the more complex shape.
But it is also harder to use, because each control point still influences the
entire curve.
Glossary | 2159
dependency highlighting In a dynamic block definition, how associated
objects are displayed when you select a parameter, grip, or action.
dependent named objects (in xrefs) Named objects brought into a drawing
by an external reference. See also named object and symbol table.
dependent symbols See dependent named objects (in xrefs).
DGN underlay See underlay.
DIESEL For Direct Interpretively Evaluated String Expression Language. A macro
language for altering the status line with the MODEMACRO system variable
and for customizing menu items.
diffuse color An object's predominant color.
dimension line arc An arc (usually with arrows at each end) spanning the
angle formed by the extension lines of an angle being measured. The
dimension text near this arc sometimes divides it into two arcs. See also angular
dimension.
dimension style A named group of dimension settings that determines the
appearance of the dimension and simplifies the setting of dimension system
variables. (DIMSTYLE)
dimension text The measurement value of dimensioned objects.
dimension variables A set of numeric values, text strings, and settings that
control dimensioning features. (DIMSTYLE)
dimensional constraint Parametric dimensions that control the size, angle,
or position of geometry relative to the drawing or other objects.When
dimensions are changed, the object resizes.
direct distance entry A method to specify a second point by first moving the
cursor to indicate direction and then entering a distance.
dithering Combining color dots to give the impression of displaying more
colors than are actually available.
dockable window A user interface element that can be either docked,
anchored, or floating in the drawing area. Dockable windows include the
command window, tool palettes, Properties Palette, and so on.
drawing area The area in which your drawings are displayed and modified.
The size of the drawing area varies, depending on the size of the AutoCAD
window and on how many toolbars and other elements are displayed. See also
AutoCAD window.
2160 | Glossary
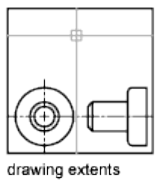
drawing extents The smallest rectangle that contains all objects in a drawing,
positioned on the screen to display the largest possible view of all objects.
(ZOOM)
drawing limits See grid limits.
drawing set A collection of drawings assembled using the Publish dialog box.
drawing state A collection of known settings that define the behavioral
properties of the drawing environment and/or drawing at a known period of
time, such as when an action macro was recorded or before the playback of
an action macro.
drawing template A drawing file with preestablished settings for new drawings
such as acad.dwtand acadiso.dwt however, any drawing can be used as a
template. See also initial environment.
driven constraint A non-parametric dimension enclosed in parentheses that
shows the current value of geometry. The value is updated when the geometry
changes size, but it does not control geometry.
driving dimension A parametric dimension that determines the size of
geometry and resizes the object when its value changes.
driving property A lookup property is considered invertible when a manual
change in the lookup value for a block reference causes other properties values
change.
DSD For drawing set descriptions. A file format for saving a description of a
drawing set that has been assembled using the Publish dialog box.
DST For sheet set data. The XML file format used to store the associations and
information that define a sheet set.
DWF
An open, published, and secure file format developed by Autodesk, DWF
enables you to combine and publish rich 2D- and 3D-design data and share
it with others.
Glossary | 2161
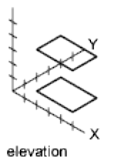
DWF underlay See underlay.
DWFx
A version of DWF based on the XML Paper Specification (XPS) from Microsoft.
DWFx enables DWF files to be viewed using the free Microsoft XPS Viewer.
Generically referred to as DWF.
DWG Standard file format for saving vector graphics. See also DWF and DXF.
DXF For drawing interchange format. An ASCII or binary file format of a drawing
file for exporting drawings to other applications or for importing drawings
from other applications. See also DWF and DWG.
dynamic constraint Dimensional constraint (Constraint Form property =
"dynamic") that displays the constraints only when you select the constrained
object.
See also: parameter constraint
See also: annotational constraint
dynamic dimension Temporary dimensions that appear on objects, including
dynamic block references, when they are grip edited.
edge The boundary of a face.
edge modifiers Effects such as overhang and jitter that control how edges are
displayed in a shaded model.
electronic drawing set The digital equivalent of a set of plotted drawings.
You create an electronic drawing set by publishing drawings to a DWF file.
elevation The default Z value above or below the XY plane of the current user
coordinate system, which is used for entering coordinates and digitizing
locations. (ELEV)
embed To use object linking and embedding (OLE) information from a source
document in a destination document. An embedded object is a copy of the
information from a source document that is placed in the destination
document and has no link to the source document. See also link.
2162 | Glossary
empty selection set A selection set that contains no objects.
enterprise customization file A CUI file that is typically controlled by a CAD
manager. It is often accessed by many users and is stored in a shared network
location. The file is read-only to users to prevent the data in the file from
being changed. A CAD manager creates an enterprise CUI file by modifying
a main CUI file and then saving the file to the support location defined in
the Options dialog box, Files tab.
environment map A bitmap that is used to simulate reflections in materials
that have reflective properties. The map is “wrapped” around the scene and
any reflective object will show the appropriate portion of the map in the
reflective parts of its material.
environment variable A setting stored in the operating system that controls
the operation of a program.
expanded panel
An area on the ribbon associated with a ribbon panel. An expanded panel
contains additional tools and controls. See also ribbon panel and ribbon.
explode To disassemble a complex object, such as a block, dimension, solid,
or polyline, into simpler objects. In the case of a block, the block definition
is unchanged. The block reference is replaced by the components of the block.
See also block, block definition, and block reference. (EXPLODE)
exploded dimension Independent objects that have the appearance of a
dimension but are not associated with the dimensioned object or each other.
Controlled by the DIMASSOC system variable. See also associative dimension,
nonassociative dimension, and explode. (EXPLODE)
extended tooltips When hovered over the tooltip for a period of time, displays
additional information.
extents See drawing extents.
external reference (xref) A drawing file referenced by another drawing. (XREF)
extrusion A 3D solid created by sweeping an object that encloses an area
along a linear path.
face A triangular or quadrilateral portion of a surface object.
face color mode A setting in the visual style that controls how color is
displayed on a face.
face style A setting in the visual style that defines the shading on a face.
Glossary | 2163
facet The underlying structure of the face of a 3D solid, surface, or mesh.
Facets can be quadrilateral or triangular. Smoothing a mesh object increases
the number of facets for each face.
feature control frame The tolerance that applies to specific features or
patterns of features. Feature control frames always contain at least a geometric
characteristic symbol to indicate the type of control and a tolerance value to
indicate the amount of acceptable variation.
fence A multisegmented line specified to select objects it passes through.
field A specialized text object set up to display data that may change during
the life cycle of the drawing. When the field is updated, the latest value of the
field is displayed. (FIELD)
fill A solid color covering an area bounded by lines or curves. (FILL)
filters See coordinate filters.
final gathering Final gathering is an optional, additional step to calculating
global illumination. Using a photon map to calculate global illumination can
cause rendering artifacts such as dark corners and low-frequency variations
in the lighting. You can reduce or eliminate these artifacts by turning on final
gathering, which increases the number of rays used to calculate global
illumination.
Final gathering can greatly increase rendering time. It is most useful for scenes
with overall diffuse lighting, less useful for scenes with bright spots of indirect
illumination.
You turn on final gathering on the Advanced Render Settings palette. See also
global illumination.
First Contact balloon The interactive graphical tooltip that is displayed when
the SteeringWheel is pinned during startup.
fit points Locations that a B-spline must pass through exactly or within a fit
tolerance. See also interpolation points and approximation points.
fit tolerance The setting for the maximum distance that a B-spline can pass
for each of the fit points that define it.
floating panel
A ribbon panel that is not attached to the rest of the ribbon or file window.
floating viewports See layout viewports.
font A character set, made up of letters, numbers, punctuation marks, and
symbols of a distinctive proportion and design.
2164 | Glossary
footcandle The American unit of illuminance (symbol: fc). Lm/ft^2.
footcandle The American unit of illuminance (symbol: fc). Lm/ft^2
frame An individual, static image in an animated sequence. See also motion
path.
freeze A setting that suppresses the display of objects on selected layers. Objects
on frozen layers are not displayed, regenerated, or plotted. Freezing layers
shortens regenerating time. See also thaw. (LAYER)
front faces Faces with their normals pointed outward.
G0 continuity See continuity on page 2157.
G1 continuity See continuity on page 2157.
G2 continuity See continuity on page 2157.
general property Properties that are common between a selection of objects.
These include Color, Layer, Linetype, Linetype scale, Plot style, Lineweight,
Hyperlink, and Thickness.
generic surface A 3D surface object with no control vertices, history, or
analytic information. Generic surfaces cannot be associative and they are
created when associative analytic surfaces are separated or by using the BREP
command. See also procedural surface and NURBS surface.
geographic elevation The relative height along the specified up-direction
defined for a geographic marker.
geographic marker Visual representation of geographic location information.
geometric constraint Rules that define the geometric relationships of objects
(or points of objects) elements and control how an object can change shape
or size.
Geometric constraints are coincident, collinear, concentric, equal, fix,
horizontal, parallel, perpendicular, tangent, and vertical.
geometry All graphical objects such as lines, circles, arcs, polylines, and
dimensions. Nongraphical objects, such as linetypes, lineweights, text styles,
and layers are not considered geometry. See also named object.
gizmo A tool that permits you to manipulate a 3D object uniformly or along
a specified axis or plane. Examples of gizmos include the 3D Move, 3D Rotate,
and 3D Scale gizmos. They are displayed when you select a 3D object.
Glossary | 2165
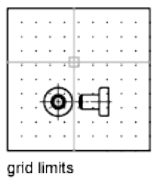
global illumination An indirect illumination technique that allows for effects
such as color bleeding. As light hits a colored object in the model, photons
bounce to adjacent objects and tint them with the color of the original object.
Gooch shading A type of shading that uses a transition from cool to warm
colors rather than from dark to light.
graphics area See drawing area.
graphics window See AutoCAD window and drawing area.
grid An area covered with regularly spaced dots or lines to aid drawing. The
grid spacing is adjustable. The grid dots are never plotted. See also grid limits.
(GRID)
grid limits The user-defined rectangular boundary of the drawing area covered
by dots when the grid is turned on. Also called drawing limits. (LIMITS)
grip modes The editing capabilities activated when grips are displayed on an
object: stretching, moving, rotating, scaling, and mirroring.
grip tool An icon that you use in a 3D view to easily constrain the movement
or rotation of a selection set of objects to an axis or a plane. (3DMOVE,
3DROTATE)
grips Small squares and triangles that appear on objects you select. After
selecting the grip, you edit the object by dragging it with the pointing device
instead of entering commands.
ground plane The XY plane of the user coordinate system when perspective
projection is turned on. The ground plane displays with a color gradient
between the ground horizon (nearest to the horizon) and the ground origin
(opposite the horizon). See also sky and underground.
guide curves Lines or curves that intersect each cross section of a lofted solid
or surface and that define the form by adding additional wireframe information
to the object. (LOFT)
handle A unique alphanumeric tag for an object in the program's database.
2166 | Glossary

HDI For Heidi Device Interface. An interface for developing device drivers that
are required for peripherals to work with the program and other Autodesk
products.
heads-up display (HUD) The process of transparently displaying user interface
elements on top of or over the drawing area without obscuring the view of
the objects drawn on the drawing area.
helix An open 2D or 3D spiral. (HELIX)
Help menu The legacy way to access online Help. In the current version of
AutoCAD, you can find Help on the InfoCenter toolbar or by pressing F1.
HLS For hue, lightness, and saturation. A system of defining color by specifying
the amount of hue, lightness, and saturation.
Home view A special view saved with the drawing that is controlled through
the ViewCube tool. The Home view is similar in concept to the default, initial
view presented when a drawing is first opened.
horizontal landing An optional line segment connecting the tail of a leader
line with the leader content.
horizontal ribbon
The ribbon, when it is oriented across the top of the file window.
i-drop A method by which a drawing file can be dragged from a Web page
and inserted into another drawing.
IGES For Initial Graphics Exchange Specification. A standard format for digital
representation and exchange of information between CAD/CAM systems. In
AutoCAD-based products, the commands to import and export IGES files are
available only in AutoCAD Mechanical.
Illuminance In photometry, illuminance is the total luminous flux incident
on a surface per unit area.
indirect bump scale Scales the effect of the base material’s bump mapping
in areas lit by indirect light.
indirect illumination Illumination techniques such as global illumination
and final gathering, that enhance the realism of a scene by simulating radiosity,
or the interreflection of light between objects in a scene.
Glossary | 2167
initial environment The variables and settings for new drawings as defined
by the default drawing template, such as acad.dwg or acadiso.dwg. See also
template drawing.
input property In a dynamic block definition, a parameter property other
than that of a lookup, alignment, or base point parameter that you can add
as a column to a lookup table. When the parameter values in a dynamic block
reference match a row of input property values, the corresponding lookup
property values in that table row are assigned to the block reference.
(BLOOKUPTABLE)
interface element A user interface object that can be customized, such as a
toolbar, pull-down menu, shortcut key, dockable window, and so on.
interpolation points Defining points that a B-spline passes through. See also
approximation points and fit points.
island An enclosed area within another enclosed area. Islands may be detected
as part of the process of creating hatches, polylines, and regions. (BHATCH,
BOUNDARY)
ISO For International Standards Organization. The organization that sets
international standards in all fields except electrical and electronics.
Headquarters are in Geneva, Switzerland.
isoline Gridlines that appear on regular and NURBS surfaces. They show the
shape of the surface.
isometric snap style A drafting option that aligns the cursor with two of three
isometric axes and displays grid, making 2D isometric drawings easier to create.
isoparm Lines of constant U or V values that run along a NURBS surface. They
show the shape of the surface as defined by the control vertices.
key point In a dynamic block definition, the point on a parameter that drives
its associated action when edited in the block reference.
knot The knot parameterization setting affects the shape of a fit point spline.
The different settings affect the shape of the curve as it passes through the fit
points.
label block A block used to label views and details. Labels contain data, such
as a title, view number, and scale, that is associated with the referenced view.
See also callout block.
landing The portion of a leader object that acts as a pointer to the object
being called out. A landing can either be a straight line or a spline curve.
2168 | Glossary
landing gap An optional space between a leader tail and the leader content.
layer A logical grouping of data that are like transparent acetate overlays on
a drawing. You can view layers individually or in combination. (LAYER)
layer index A list showing the objects on each layer. A layer index is used to
locate what portion of the drawing is read when you partially open a drawing.
Saving a layer index with a drawing also enhances performance when you
work with external references. The INDEXCTL system variable controls whether
layer and spatial indexes are saved with a drawing.
layer translation mappings Assignments of a set of layers to another set of
layers that defines standards. These standards include layer names and layer
properties. Also called layer mappings.
layout The environment in which you create and design paper space layout
viewports to be plotted. Multiple layouts can be created for each drawing.
layout viewports Objects that are created in paper space that display views.
See also paper space. (VPORTS)
leader tail The portion of a leader line that is connected to the annotation.
lens length Defines the magnification properties of a camera's lens. The greater
the lens length, the narrower the field of view.
level of smoothness The property assigned to a mesh object to control how
much the edges of the object are smoothed. Level 0 (zero) represents the least
rounded shape for a specified mesh object. Higher levels result in increased
smoothness.
light glyph The graphic representation of a point light or a spotlight.
limits See drawing limits.
line font See linetype.
linetype How a line or type of curve is displayed. For example, a continuous
line has a different linetype than a dashed line. Also called line font. (LINETYPE)
lineweight A width value that can be assigned to all graphical objects except
TrueType® fonts and raster images.
link To use object linking and embedding (OLE) to reference data in another
file. When data is linked, any changes to it in the source document are
automatically updated in any destination document. See also embed.
LL84 coordinate system Common latitude longitudinal-based coordinate
system where latitude and longitude are both measured from -90 to 90 degrees.
Glossary | 2169
Longitude begins at 0 degrees at the Prime Meridian in Greenwich, England
and is measured from -180 to 180.
Latitude is 0 degrees at the equator and is measured from -90 to 90.
lofted solid/surface A solid or surface that is drawn through a set of two or
more cross-section curves. The cross sections define the profile (shape) of the
resulting solid or surface. Cross sections (generally, curves or lines) can be
open or closed. (LOFT)
lookup property In a dynamic block definition, a lookup parameter that you
add to a lookup table. The lookup parameter label is used as the property
name. When the parameter values in a dynamic block reference match a row
of input property values, the corresponding lookup property values in that
table row are assigned to the block reference. (BLOOKUPTABLE)
lookup table Defines properties for and assigns property values to a dynamic
block. Assigns property values to the dynamic block reference based on how
the block is manipulated in a drawing. (BLOOKUPTABLE)
lumen The SI unit of luminous flux (Symbol: lm). Cd * Sr
luminaire This refers to the aggregation of a lamp or lamps and its fixture.
The fixture may be a simple can or a complex armature with constrained
joints.
luminance Luminance is the value of light reflected off a surface. It is a
measure of how bright or dark we perceive the surface.
luminous flux The perceived power in per unit of solid angle. The total
luminous flux for a lamp is the perceived power emitted in all directions.
lux The SI unit of illuminance (symbol: lx). Lm/m^2
macro-derived selection A selection set of all the objects that have been
created during the playback of an action macro up to the command that is
requesting a selection set.
magnitude See bulge magnitude.
main customization file A writable CUI file that defines most of the user
interface elements (including the standard menus, toolbars, keyboard
accelerators, and so on). The acad.cui file (the default main CUI file) is
automatically loaded when you start AutoCAD.
markup A single comment or a redline geometry correction inserted into a
DWF file using Autodesk Design Review.
markup set A group of markups contained within a single DWF file.
2170 | Glossary
merge In tables, an adjacent cell selection that has been combined into a
single cell.
mesh A tessellated, or subdivided object type that is defined by faces, edges,
and vertices. Mesh can be smoothed to achieve a more rounded appearance
and creased to introduce ridges. Before AutoCAD 2010, only the less modifiable
polygon and polyface mesh was available.
mini wheels The small version of SteeringWheels. No labels are displayed on
any of the wedges and they are often the size of the cursor.
mirror To create a new version of an existing object by reflecting it
symmetrically with respect to a prescribed line or plane. (MIRROR)
mode A software setting or operating state.
model A two- or three-dimensional representation of an object.
model space One of the two primary spaces in which objects reside. Typically,
a geometric model is placed in a three-dimensional coordinate space called
model space. A final layout of specific views and annotations of this model is
placed in paper space. See also paper space. (MSPACE)
model viewports A type of display that splits the drawing area into one or
more adjacent rectangular viewing areas. See also layout viewports, TILEMODE,
and viewport. (VPORTS)
motion path Defines the path or target of a camera. A path can be a line, arc,
elliptical arc, circle, polyline, 3D polyline, or spline.
multi-sheet DWF A DWF file that contains multiple sheets.
multileader A leader object that creates annotations with multiple leader
lines.
named object Describes the various types of nongraphical information, such
as styles and definitions, stored with a drawing. Named objects include
linetypes, layers, dimension styles, text styles, block definitions, layouts, views,
and viewport configurations. Named objects are stored in definition (symbol)
tables.
named objects, dependent See dependent named objects (in xrefs).
named path A saved motion path object that is linked to a camera or target.
named range A tool in Microsoft Excel that provides a method to assign a
meaningful name to a single cell or a range of cells.
named view A view saved for restoration later. (VIEW)
Glossary | 2171
navigation bar Navigation tools that are common across multiple Autodesk
programs. The unified navigation tools include Autodesk® ViewCube®,
SteeringWheels®, ShowMotion®, and 3Dconnexion®.
node An object snap specification to locate points, dimension definition
points, and dimension text origins.
nonassociative dimension A dimension that does not automatically change
as the associated geometry is modified. Controlled by the DIMASSOC system
variable. See also associative dimension and exploded dimension.
normal A normal is a vector that defines which way a face is pointing. The
direction of the normal indicates the front, or outer surface of the face.
noun-verb selection Selecting an object first and then performing an operation
on it rather than entering a command first and then selecting the object.
NURBS For nonuniform rational B-spline curve. A B-spline curve or surface defined
by a series of weighted control points and one or more knot vectors. See also
B-spline curve.
NURBS surface Surfaces that are have control vertices in the U and V
directions. NURBS surfaces cannot be associative. See also procedural surface
and generic surface.
object One or more graphical elements, such as text, dimensions, lines, circles,
or polylines, treated as a single element for creation, manipulation, and
modification. Formerly called entity.
object enabler A tool that provides specific viewing and standard editing
access to a custom object when the ObjectARX application that created the
custom object is not present. See also custom object and proxy object.
Object Snap mode Methods for selecting commonly needed points on an
object while you create or edit a drawing. See also running object snap and
object snap override.
object snap override Turning off or changing a running Object Snap mode
for input of a single point. See also Object Snap mode and running object snap.
ObjectARX (AutoCAD Runtime Extension) A compiled-language
programming environment for developing AutoCAD applications.
OLE For object linking and embedding. An information-sharing method in which
data from a source document can be linked to or embedded in a destination
document. Selecting the data in the destination document opens the source
application so that the data can be edited. See also embed and link.
2172 | Glossary
opacity map Projection of opaque and transparent areas onto objects, creating
the effect of a solid surface with holes or gaps.
origin The point where coordinate axes intersect. For example, the origin of
a Cartesian coordinate system is where the X, Y, and Z axes meet at 0,0,0.
Ortho mode A setting that limits pointing device input to horizontal or
vertical (relative to the current snap angle and the user coordinate system).
See also snap angle and user coordinate system (UCS).
orthogonal Having perpendicular slopes or tangents at the point of
intersection.
output property A lookup property whose value is determined by input
properties (other parameter properties) through the use of a lookup table.
page setup A collection of plot device and other settings that affect the
appearance and format of the final output. These settings can be modified
and applied to other layouts.
pan To shift the view of a drawing without changing magnification. See also
zoom. (PAN)
paper space One of two primary spaces in which objects reside. Paper space
is used for creating a finished layout for printing or plotting, as opposed to
doing drafting or design work. You design your model using the Model tab.
See also model space and viewport. (PSPACE)
parameter In a dynamic block definition, defines custom properties for the
dynamic block by specifying positions, distances, and angles for geometry in
the block.
parameter set A tool on the Parameter Sets tab of the Block Authoring Palettes
window that adds one or more parameters and one or more associated actions
to the dynamic block definition.
parametric design Ability to establish relationships between objects, to drive
the size and orientation of geometry with model and user-defined parameters.
parametric drawing Feature in AutoCAD that assigns constraints to objects,
establishing the distance, location, and orientation of objects with respect to
other objects.
partial customization file Any CUI file that is not defined as the main CUI
file. You can load and unload partial CUI files as you need them during a
drawing session.
Glossary | 2173
path curve Defines the direction and length that a profile curve is lofted,
swept, or extruded to create a solid or surface. (SWEEP, LOFT, EXTRUDE)
PC2 file Complete plotter configuration file. PC2 files contain all plot settings
and device-specific settings that were saved in previous versions. See also PCP
file and PC3 file.
PC3 file Partial plotter configuration file. PC3 files contain plot settings
information such as the device driver and model, the output port to which
the device is connected, and various device-specific settings, but do not include
any custom plotter calibration or custom paper size information. See also PMP
file, STB file, and CTB file.
PCP file Partial plotter configuration file. PCP files contain basic plot
specifications and pen parameters that were saved in previous versions. Plot
settings that are stored in a PCP file include pen assignments, plotting units,
paper size, plot rotation, plot origin, scale factor, and pen optimization level.
See also PC2 file and PC3 file.
performance tuning A method of optimizing 3D graphics performance. The
performance tuner examines your graphics card and 3D display driver and
decides whether to use software or hardware implementation for features that
support both.
periodic curve A smooth, closed curve such as a circle. Because its control
vertices are not tangent to the object, if the curve is reshaped, it stays smooth
and does not create kinks. See also clamp curve.
periodic surface A smooth, closed surface such as a cylinder. Because its
control vertices are not tangent to the object, if the surface is reshaped, it stays
smooth and does not create kinks. See also clamp surface.
personalization Customizes the executable file during installation with the
user name, company, and other information.
perspective view Objects in 3D seen by an observer positioned at the
viewpoint looking at the view center. Objects appear smaller when the distance
from the observer (at the view point) to the view center increases. Although
a perspective view appears realistic, it does not preserve the shapes of objects.
Parallel lines seemingly converge in the view. The program has perspective
view settings for VPORTS table entries as well as viewport objects.
photometric lights Photometric lights are physically-correct lights. Physically
correct lights attenuate as the square of the distance. Photometry is the science
of measurement of visible light in terms of its perceived brightness.
2174 | Glossary
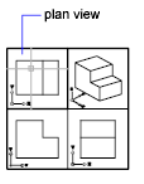
photon map A technique to generate the indirect illumination effects of
global illumination used by the renderer. When it calculates indirect
illumination, the renderer traces photons emitted from a light. The photon
is traced through the model, being reflected or transmitted by objects, until
it strikes a diffuse surface. When it strikes a surface, the photon is stored in
the photon map.
photorealistic rendering Rendering that resembles a photograph.
pick button The button on a pointing device that is used to select objects or
specify points on the screen. For example, on a two-button mouse, it is the
left button by default.
pick points Clicking and acquiring a point on an object in the drawing.
pick-first The selection of objects before an action macro or command is
issued.
pick-first set A selection set of objects that are selected prior to the execution
of an action macro or a command. See also pre-selection set.
plan view A view orientation from a point on the positive Z axis toward the
origin (0,0,0). (PLAN)
planar face A flat face that can be located anywhere in 3D space.
planar projection Mapping of objects or images onto a plane.
planar surface A flat surface that can be located anywhere in 3D space.
(PLANESURF)
playback The process of executing the actions stored in a previously recorded
action macro.
pline See polyline.
plot style An object property that specifies a set of overrides for color,
dithering, gray scale, pen assignments, screening, linetype, lineweight,
endstyles, joinstyles, and fill styles. Plot styles are applied at plot time.
Glossary | 2175
plot style table A set of plot styles. Plot styles are defined in plot style tables
and apply to objects only when the plot style table is attached to a layout or
viewport.
plug-ins Plug-ins are libraries of reuseable content that extend the functionality
of AutoCAD. Plug-ins are created by third party developers and can be accessed
from the Featured Technologies and Content channel of the Communications
Center on page 8.
PMP file Plot Model Parameter. File containing custom plotter calibration and
custom paper size information associated with plotter configuration file.
point 1. A location in three-dimensional space specified by X, Y, and Z
coordinate values. 2. An object consisting of a single coordinate location.
(POINT)
point filters See coordinate filters.
pointer A cursor on a video display screen that can be moved around to place
textual or graphical information. See also crosshairs.
polar array Objects copied around a specified center point a specified number
of times. (ARRAY)
Polar Snap A precision drawing tool used to snap to incremental distances
along the polar tracking alignment path. See also polar tracking on page 2176.
polar tracking A precision drawing tool that displays temporary alignment
paths defined by user-specified polar angles. See also Polar Snap.
polyface and polygon mesh Legacy mesh types that were available before
AutoCAD 2010. Although you can continue to create polygonal and polyface
mesh (for example, by setting MESHTYPE to 0), the newer, more modifiable
mesh type is recommended.
polygon window selection A multisided area specified to select objects in
groups. See also crossing selection and window selection.
polyline An object composed of one or more connected line segments or
circular arcs treated as a single object. Also called pline. (PLINE, PEDIT)
polysolid A swept solid that is drawn the same way you draw a polyline or
that is based on an existing line. By default, a polysolid always has a rectangular
profile. You can specify the height and width of the profile. (POLYSOLID)
pre-playback drawing environment The drawing state prior to the playback
of an action macro.
2176 | Glossary
pre-selection set A selection set of objects that is defined prior to the execution
of an action macro.
primary table fragment The fragment of a broken table that contains the
beginning set of rows up to the first table break.
primitive Basic 3D forms such as boxes, cones, cylinders, pyramids, wedges,
spheres, and tori. You can create primitive meshes and primitive 3D solid
objects.
procedural materials Materials that generate a 3D pattern in two or more
colors, and apply it to an object. These include marble and wood. Also called
template materials.
procedural surface A 3D surface object that has history and analytic
information, but no control vertices. Procedural surfaces are the only type of
surface that can be associative. See also generic surface and NURBS surface.
profile curve An object that is swept, extruded, or revolved and defines the
shape of the resulting solid or surface. (SWEEP, EXTRUDE, REVOLVE)
prompt A message on the command line or in a tooltip that asks for
information or requests action such as specifying a point.
proxy object A substitute for a custom object when the ObjectARX application
that created the custom object is not available. See also custom object and
object enabler.
push pin A push pin-shaped button used on the ribbon and in the application
menu. On the ribbon, push pins are used to keep a ribbon panel expanded.
In the application menu, push pins keep an item in the list of recently opened
items.
PWT A template file format used to publish drawings to the Web.
Quick View image A thumbnail image of a drawing, layout or model space
that is displayed using Quick View tools.
Quick View tool A tool to preview and switch between open drawings and
layouts in a drawing.
ray tracing The renderer can generate reflections and refractions. Ray tracing
traces the path of rays sampled from the light source. Reflections and
refractions generated this way are physically accurate.
You turn on ray tracing on the Advanced Render Settings palette.
Glossary | 2177
ray-traced shadows A way that the renderer can generate shadows. Ray tracing
traces the path of rays sampled from the light source. Shadows appear where
rays have been blocked by objects. Ray-traced shadows have sharp edges.
Ray-traced shadows are active when Shadow Map is turned off on the Advanced
Render Settings palette.
recorded value The input captured during the recording of an action macro
for a sub-prompt of a command.
rectangular break To break a table into multiple parts that are evenly spaced
and set at a user-specified height using the table breaking grips.
redraw To quickly refresh or clean up blip marks in the current viewport
without updating the drawing's database. See also regenerate. (REDRAW)
reference A definition, known as an external reference or block reference,
that is used and stored in the drawing. See also block (BLOCK) and external
reference (xref). (XREF)
refine To quadruple the number of faces in a mesh object as you reset the
baseline level of smoothness. (You cannot make a mesh courser than its
baseline level.) You can also refine specified mesh faces without resetting the
baseline level of smoothness for the object. (MESHREFINE)
reflectance scale Increases or decreases the amount of energy the material
reflects.
reflection color The color of a highlight on shiny material. Also called specular
color.
reflection line In a dynamic block reference, the axis about which a flip
action's selection set flips when the associated parameter is edited through a
grip or the Properties palette.
reflection mapping Creates the effect of a scene reflected on the surface of
a shiny object.
refraction How light distorts through an object.
regenerate To update a drawing's screen display by recomputing the screen
coordinates from the database. See also redraw. (REGEN)
region Two-dimensional enclosed areas that have physical properties such as
centroids or centers of mass. You can create regions from objects that form
closed loops. They area commonly created in order to apply hatching and
shading. (REGION)
relative coordinates Coordinates specified in relation to previous coordinates.
2178 | Glossary
relax constraints Ability to temporarily ignore constraints while editing
geometry. After the geometry is edited, the constraints are either removed or
retained based on whether the constraint is still valid for the edited geometry.
request user input An item that is assigned to an action node that pauses the
playback of an action macro so a user can provide some form of input before
playback resumes.
reverse lookup Adds a lookup grip to a dynamic block reference. When you
click this grip, a drop-down list of the lookup values for that lookup property
(column in the lookup table) is displayed. When you select a value from the
list, the corresponding input property values are assigned to the block reference.
Depending on how the block was defined, this usually results in a change in
the block reference's geometry. (BLOOKUPTABLE)
rewind Restores the previous view or movement path created by the Autodesk®
ViewCube® navigation tool, SteeringWheels, and other navigation tools.
RGB For red, green, and blue. A system of defining colors by specifying
percentages of red, green, and blue.
ribbon A palette that displays buttons and controls used for both 2D drawing
and annotation and 3D modeling, viewing, and rendering. See also ribbon tab
and ribbon panel and slide-out panel. (RIBBON)
ribbon panel
A set of labeled controls, related to a task, grouped together in a ribbon.
Multiple ribbon panels, belonging to one workflow, are grouped together
under a ribbon tab.
ribbon tab
Highest level of ribbon grouping, based on an action. A ribbon tab contains
groups of multiple ribbon panels, each belonging to one workflow. A ribbon
panel contains buttons and controls, related to a task.
roll arrows Curved arrows located above the ViewCube tool with which you
can rotate the current view 90 degrees clockwise or counterclockwise.
roughness Value to simulate how light hitting a face is reflected back to the
user. A high roughness value simulates a non-shiny or rough object
(sandpaper/carpet). A low roughness value simulates a very shiny object
(metals, some plastics.)
row A horizontally adjacent table cell selection spanning the width of the
table. A single row is one cell in height.
Glossary | 2179
RSS feed Information published by a website to which you subscribe. Usually
allows users to receive notifications when new content (articles) are posted.
RSS stands for Rich Site Summary (or Really Simple Syndication).
rubber-band line A line that stretches dynamically on the screen with the
movement of the cursor. One endpoint of the line is attached to a point in
your drawing, and the other is attached to the moving cursor.
running object snap Setting an Object Snap mode so it continues for
subsequent selections. See also Object Snap mode and object snap override.
(OSNAP)
sampling Sampling is an antialiasing technique. It provides a "best guess"
color for each rendered pixel. The renderer first samples the scene color at
locations within the pixel or along the pixel's edge, then uses a filter to
combine the samples into a single pixel color.
save back To update the objects in the original reference (external or block
reference) with changes made to objects in a working set during in-place
reference editing.
scale representation The display of an annotative object based on the
annotation scales that the object supports. For example, if an annotative object
supports two annotations scales, it has two scale representations
script file A set of commands executed sequentially with a single SCRIPT
command. Script files are created outside the program using a text editor,
saved in text format, and stored in an external file with the file extension .scr.
search tag A user-defined keyword used to search for commands in the menu
browser.
secondary table fragment Any fragment of a broken table that does not
contain the beginning set of rows.
selection node A specific type of action tree node that is used to handle
selection activities.
selection sensitivity The ability to define the pivot point for reorienting a
model based on the current selection.
selection set One or more selected objects that a command can act upon at
the same time.
In a dynamic block definition, the geometry associated with an action.
shadow maps A shadow map is a bitmap that the renderer generates during
a pre-rendering pass of the scene. Shadow maps don't show the color cast by
2180 | Glossary
transparent or translucent objects. On the other hand, shadow maps can have
soft-edged shadows, which ray-traced shadows cannot.
Shadow mapped shadows provide softer edges and can require less calculation
time than ray-traced shadows, but are less accurate. On the Advanced Render
Settings palette, shadow mapped shadows are active when Shadow Map is
turned on.
ShapeManager ShapeManager is the Autodesk technology that provides 3D
solid modeling to AutoCAD and other products.
sheet A layout selected from a drawing file and assigned to a sheet set. See
also sheet set.
sheet list table A table listing all sheets in a sheet set. A sheet list table can
be generated automatically with the Sheet Set Manager.
sheet selection A named selection of sheets in a sheet set that can be
conveniently recalled for archiving, transmitting, and publishing operations.
sheet set An organized and named collection of sheets from several drawing
files. See also sheet. (SHEETSET)
shortcut keys Keys and key combinations that start commands; for example,
CTRL+S saves a file. The function keys (F1, F2, and so on) are also shortcut
keys. Also known as accelerator keys.
shortcut menu The menu displayed at your cursor location when you
right-click your pointing device. The shortcut menu and the options it provides
depend on the pointer location and other conditions, such as whether an
object is selected or a command is in progress.
shot A saved view that can later be restored by name or with ShowMotion. A
shot can contain a static thumbnail of the saved view or camera motion that
can be played back as an animation.
ShowMotion User interface element where you can access named views (shots)
that are stored in the current drawing. The named views (shots) are organized
by sequences and can contain movements.
sky The background color of the drawing area when perspective projection
is turned on. The sky displays with a color gradient between the sky horizon
(nearest to the horizon) and the sky zenith (opposite the horizon). See also
ground plane.
slide file A file that contains a raster image or snapshot of the objects displayed
in the drawing area. Slide files have the file extension .sld. (MSLIDE, VSLIDE)
Glossary | 2181
slide library A collection of slide files organized for convenient retrieval and
display. Slide library names have the extension .slb and are created with the
slidelib.exe utility.
slide-out panel An area on the ribbon associated with a ribbon panel. A
slide-out panel contains additional tools and controls. See also ribbon panel
and ribbon.
smooth shading Smoothing of the edges between polygon faces.
smoothness A property of mesh objects that controls the roundness of the
object. Objects with higher levels of smoothness have more faces, or
tessellations.
snap angle The angle that the snap grid is rotated.
snap grid The invisible grid that locks the pointer into alignment with the
grid points according to the spacing set by Snap. Snap grid does not necessarily
correspond to the visible grid, which is controlled separately by GRID. (SNAP)
Snap mode A mode for locking a pointing device into alignment with an
invisible rectangular grid. When Snap mode is on, the screen crosshairs and
all input coordinates are snapped to the nearest point on the grid. The snap
resolution defines the spacing of this grid. See also Object Snap mode. (SNAP)
snap resolution The spacing between points of the snap grid.
solid history A property of a solid that allows you to see and modify the
original forms of the solid.
solid object An object that represents the entire volume of an object, for
example a box.
solid primitive A basic solid form. Solid primitives include: box, wedge, cone,
cylinder, sphere, torus, and pyramid.
spatial index A list that organizes objects based on their location in space. A
spatial index is used to locate what portion of the drawing is read when you
partially open a drawing. Saving a spatial index with a drawing also enhances
performance when working with external references. The INDEXCTL system
variable controls whether layer and spatial indexes are saved with a drawing.
specular reflection The light in a narrow cone where the angle of the
incoming beam equals the angle of the reflected beam.
spline-fit Uses the vertices of the selected polyline as the control points, or
frame, of a curve approximating a B-spline. This curve, called a spline-fit
2182 | Glossary
polyline, passes through the first and last control points unless the original
polyline was closed.
split face A mesh face that has been subdivided along a specified vector.
STB file For plot style table file. Contains plot styles and their characteristics.
SteeringWheels Tool set that provides access to 2D and 3D navigation tools.
stretch frame In a dynamic block definition that contains a stretch action or
a polar stretch action, determines how the objects within or crossed by the
frame are edited in the block reference.
sub-prompt A command prompt that instructs for a form of input to complete
a command or alter a property.
subdivision A division, or tessellation in a mesh object. As a mesh object is
smoothed, the number of subdivisions increases.
subobject A part of a composite object.
Subscription Center Subscription members can access the latest releases of
Autodesk software, incremental product enhancements, personalized web
support, and self-paced e-Learning in InfoCenter. To access Subscription
Center, go to the InfoCenter toolbar and click the Key button.
subset A named collection of sheets in a sheet set that is often organized by
discipline or workflow stage. See also view category.
surface A surface is a 3D object that is a thin shell. Surfaces do not have mass
or volume as 3D solids do. There are 3 types of surfaces: analytic, generic, and
NURBS.
surface associativity See associative surfaces
surface normal Positive direction perpendicular to the surface of an object.
swept solid/surface A solid or surface created in the shape of the specified
profile (the swept object) swept along the specified path. (SWEEP)
symbol A representation of an item commonly used in drawings. Symbols
are inserted in drawings as blocks.
symbol library A collection of block definitions stored in a single drawing
file.
symbol table See definition table and block definition table.
system variable A name that is recognized as a mode, size, or limit. Read-only
system variables, such as DWGNAME, cannot be modified directly by the user.
Glossary | 2183
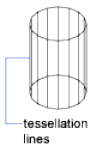
table A rectangular array of cells that contain annotation, primarily text but
also blocks. In the AEC industry, tables are often referred to as “schedules”
and contain information about the materials needed for the construction of
the building being designed. In the manufacturing industry, they are often
referred to as “BOM” (bills of materials). (TABLE)
table break The point at the bottom of a table row where the table will be
split into a supplementary table fragment.
table style A style that contains a specific table format and structure. A table
style contains at least 3 cell styles.
temporary files Data files created during an program session. The files are
deleted by the time you end the session. If the session ends abnormally, such
as during a power outage, temporary files might be left on the disk.
tessellation lines Lines that help you visualize a curved surface.
In a 3D mesh object, tessellations indicate the boundaries of the mesh faces.
text style A named, saved collection of settings that determines the appearance
of text characters—for example, stretched, compressed, oblique, mirrored, or
set in a vertical column.
texture map The projection of an image (such as a tile pattern) onto an object
(such as a chair).
thaw A setting that displays previously frozen layers. See also freeze. (LAYER)
thickness The distance certain objects are extruded to give them a 3D
appearance. (PROPERTIES, CHPROP, ELEV, THICKNESS)
tiled viewports See model viewports.
TILEMODE A system variable that controls whether viewports can be created
as movable, resizable objects (layout viewports), or as nonoverlapping display
elements that appear side-by-side (model viewports). See also viewport.
tool message
2184 | Glossary
A small instructional message that appears over the drawing window and is
specific to the active navigation tool from the SteeringWheels.
toolbar Part of the interface containing icons that represent commands.
tooltip A small box of text that identifies or explains an object or interface
element when the cursor hovers near or over it.
tracking A way to locate a point relative to other points on the drawing.
tracking menu
A cluster of buttons that follows the cursor as you move it over the window.
translucency How light is scattered through an object.
transmittance scale Increases or decreases the amount of energy a transparent
material transmits out to the scene.
transparency A quantity defining how much light is let through an object.
transparent command A command started while another is in progress.
Precede transparent commands with an apostrophe.
two sided material The positive and negative normal of the material will be
considered during the rendering process.
UCS See user coordinate system (UCS).
UCS icon An icon that indicates the orientation of the UCS axes. (UCSICON)
underconstrained geometry Objects with unsolved degrees of freedom are
underconstrained.
underground The XY plane of the user coordinate system when perspective
projection is turned on and when viewed from below ground. The underground
plane displays with a color gradient between the earth horizon (nearest to the
horizon) and the earth azimuth (opposite the horizon). See also ground plane
and sky.
underlay A DWF, or DGN file used to provide visual context in a drawing
file. Underlays cannot be edited, and do not provide the full range of
Glossary | 2185
notification. Underlays cannot be bound to a drawing. See also external
reference (xref).
up direction A vector defining what direction is Up. By default this is the
positive Z – axis (0,0,+1).
The up direction and the north direction are always constrained such that
they are perpendicular to each other.
user coordinate system (UCS) A user-defined coordinate system that defines
the orientation of the X, Y, and Z axes in 3D space. The UCS determines the
default placement of geometry in a drawing. See also world coordinate system
(WCS).
user parameter Named user-defined variable (real number or an expression)
that can be used in expressions for dimensional constraints or other user
parameters.
UVW The material’s coordinate space. Used instead of XYZ because that is
usually reserved for the world coordinate system (WCS). Most material maps
are a 2D plane assigned to a 3D surface. The U, V, and W coordinates parallel
the relative directions of X, Y, and Z coordinates. If you look at a 2D map
image, U is the equivalent of X, and represents the horizontal direction of the
map. V is the equivalent of Y, and represents the vertical direction of the map.
W is the equivalent of Z and represents a direction perpendicular to the UV
plane of the map.
value node A specific type of action node that is used to handle requests for
user input and hold the recorded value that was captured during the recording
of an action macro.
value set In a dynamic block definition, a range or list of values specified for
a linear, polar, XY, or rotation parameter.
vector A mathematical object with precise direction and length but without
specific location.
vertex A location where edges or polyline segments meet.
vertical ribbon
The ribbon when it is oriented vertically, usually on the left or right of the
file window.
view A graphical representation of a model from a specific location (viewpoint)
in space. See also viewpoint and viewport. (3DORBIT, VPOINT, DVIEW, VIEW)
view category A named collection of views in a sheet set that is often
organized by function. See also subset.
2186 | Glossary
ViewCube User interface element that displays the current orientation of a
model, and allows you to interactively rotate the current view or restore a
preset view.
viewpoint The location in 3D model space from which you are viewing a
model. See also view and viewport. (3DORBIT, DVIEW, VPOINT)
viewport A bounded area that displays some portion of the model space of a
drawing. The TILEMODE system variable determines the type of viewport
created. 1. When TILEMODE is off (0), viewports are objects that can be moved
and resized on a layout. (MVIEW) 2. When TILEMODE is on (1), the entire
drawing area is divided into nonoverlapping model viewports. See also
TILEMODE, view, and viewpoint. (VPORTS)
viewport configuration A named collection of model viewports that can be
saved and restored. (VPORTS)
virtual screen display The area in which the program can pan and zoom
without regenerating the drawing.
visibility mode Displays or does not display geometry (in a dimmed state)
that is invisible for a visibility state. (BVMODE)
visibility state In a dynamic block, a custom property that allows only
specified geometry to display in the block reference. (BVSTATE)
visual style A collection of settings that control the display of edges and
shading in a viewport.
volumetric shadows A photorealistically rendered volume of space cast by
the shadow of an object.
watertight A closed 3D solid or mesh that has no gaps.
WCS See world coordinate system (WCS).
wheel
A reference to one of the individual user interface elements that make up
SteeringWheels. See also SteeringWheels.
wheel surface
Area of a SteeringWheels that is used to organize wedges and other buttons.
wheel wedge
A section on the surface of a SteeringWheels that is designated for a specific
navigation or orientation tool.
Glossary | 2187
window selection A rectangular area specified in the drawing area to select
multiple objects at the same time. See also crossing selection, polygon window
selection.
wipeout object A polygonal area that masks underlying objects with the
current background color. This area is bounded by the wipeout frame, which
you can turn on for editing and turn off for plotting.
wireframe model The representation of an object using lines and curves to
represent its boundaries.
working drawing A drawing for manufacturing or building purposes.
working set A group of objects selected for in-place reference editing.
workplane Another name for the XY plane of the user coordinate system. See
also elevation and user coordinate system (UCS).
workspace A set of menus, toolbars and dockable windows (such as the
Properties palette, DesignCenter, and the Tool palettes window) that are
grouped and organized so that you can work in a custom, task-oriented drawing
environment.
world coordinate system (WCS) A coordinate system used as the basis for
defining all objects and other coordinate systems. See also user coordinate
system (UCS).
world coordinates Coordinates expressed in relation to the world coordinate
system (WCS).
wrap around
Behavior where the cursor wraps around the window and appears on the
opposite side to allow the continuation of a drag operation instead of stopping
at the edge of the drawing area.
X,Y,Z point filters See coordinate filters.
xref See external reference (xref).
zoom To reduce or increase the apparent magnification of the drawing area.
(ZOOM)
2188 | Glossary
Index
2D Cartesian coordinates 549
coordinate filters 606
entering 552
2D coordinates
Cartesian 549
entering 552
polar 549
2D Drafting & Annotation
workspace 148
2D isometric views 2001
2D Navigation wheel 316
2D objects
flattened views of 3D objects 1218
sectioning 1213
simplified display 540
simulating 3D 2001
2D polar coordinates 549, 554
2D UCS icon 576
2D wireframe visual style 257
3D arrays 754
3D Cartesian coordinates
coordinate filters 606
defining 3D views 254
entering 556
3D coordinates
Cartesian coordinates 556
cylindrical coordinates 559
entering 556
spherical coordinates 560
3D DWF files 1652
3D DWFx files 1652
3D meshes
about 1044
best practices 1189
converting objects to 1074
converting to 3D solids 1193
creases 1177–1178, 1190
creating 1044
creating from other objects 1067
custom meshes 1078
density 1173
editing 1168
extruding 1181, 1192
faces 1168
facets 1169
gizmos 1191
grip editing 1170
legacy meshes 1078
merging faces 1170
mesh modeling 1169
predefined meshes 1081
primitives 1049
properties 1146
refining 1176–1177, 1190
repairing holes 1170
selection filters 1191
self-intersections 1194
smoothness 1172
spinning edges 1170
splitting faces 1181, 1190
tessellation 1045, 1172
types of 1067
3D Modeling workspace 148
3D models
3D solids 983
3D surfaces 1014
3D views 285
about 961, 1091
advantages 963
backgrounds 267
cameras and 348
converting to meshes 1091
converting to objects 1091
cross sections 1197
dynamic views 293
edge display 272
editing 1091
flattened views of 1218
gizmos 1109
grips 1109
history 1144
interference problems in 1012
live sectioning 1206
meshes 1168, 1189
2189 | Index
motion path animations 359
navigating views 287
outputting physical models 1660
parallel views 247
performance issues and 277, 279,
282
perspective views 118, 247
preview animations 356
properties 1144
rendering 2101
shadows 267
subobjects 1119
sun and sky 2057
thickness 1087
types of 961
viewing 1092
visual styles 257
weblights 2028
wireframes 1083
3D mouse devices 369
3D Move gizmo 1093, 1099
3D objects
aligning 749
arrays 754
AutoCAD LT functionality 1826
Block Editor and 904
coordinates 556
edge display 272
exporting 1815
extending 766
FBX files and 1734, 1807
filleting 777
flattened views of 1218
live sectioning 1206
lofting 1117
mirroring 762
modifying 1091
motion path animations and 359
outputting physical models 1660
rendering 2101
rotating 747
shadows 267
simulating in 2D 2001
smoothness 2109
subobjects 1119
surfaces 1014
sweeping 1116
thickness 1087
trimming 766
visual styles 257
wireframes 1083
3D Orbit tool 287
3D point clouds
about 1736
AutoCAD LT functionality 1828
editing 1738
inserting data 1737
locking 1737
3D printing 1816
3D printing services 1660
3D Rotate gizmo 1093, 1102
3D Scale gizmo 1104
3D solid edges
imprinting objects on 1142
modifying 1119, 1126
redundant edges 1139
3D solid faces
imprinting objects on 1142
modifying 1119, 1122
redundant faces 1139
rendering 2103
3D solid vertices
modifying 1119, 1132
redundant vertices 1139
3D solids
calculating geometric data for 623
chamfering 1128
cleaning 1139
colors 1124
composite solids 1008, 1134
converting meshes to 1193
converting objects to 966, 1003
converting surfaces to 1005
converting to objects 1091
coordinates 556
creating 983
edges on 272, 1119
exporting 1816
extruding 969, 1116
faces 1119
filleting 1128
flattened views of 1218
2190 | Index
gizmos 1109
grips 1109, 1115
history 1134, 1144
imprinting objects on 1142
interferences 1012
lofting 976, 1117
mass properties 625
meshes 1067, 1081
modifying 1091
polysolids 1000
pressing or pulling areas 1141
primitives 1144
properties 1144
revolving 980, 1117
separating into original shapes 1137
shells 1138
slicing 1010
smoothness 2109
solid primitives 983, 987
subobjects 1119
surfaces 1014
sweeping 972, 1116
types 987
types of 967
validating 1139
vertices 1119
wireframes 1083
3D space
3D models 961
coordinates 556
elevations 569
object snaps 586
UCSs 566
workplanes 566
3D Studio files 1733
3D surfaces 1014, 1091
composite solids 1134
composite surfaces 1136
edges 1126, 1142
editing 1149
extending 1154
faces and 1122
filletting 1154
modifying 1119
NURBS surfaces 1155
properties 1145
reconstructing 1157
separating into original shapes 1137
surface analysis 1158
trimming 1151
vertices 1132
3D UCS icon 576
3D views
architectural design
conventions 254
cameras in 348
changing viewpoints 255
defining 254
dynamic viewing 293
flying through models 291
gizmos in 1095
interactive 3D views 285
isometric views 253
mechanical design conventions 254
motion path animations 359
moving objects in 1099
multiple UCSs 574
navigation tools 287
preset views 253
preview animations 356
rotating 254
rotating objects in 1102
scaling objects in 1104
UCS orientation 255
walking through models 291
3Dconnexion 3D mouse 369
3ds Max 2064, 2146
3ds MAX files 1733
A
absolute coordinates
2D coordinates 552
3D coordinates 557
entering 549
absolute hyperlinks 1944, 1946
absolute xref paths 1674
ACB files 519
Access databases
accessing 1870
exporting extracted data to 1856
ACI colors 514
Index | 2191
ACIS files 1739, 1815
Acrobat PDF files
layers and 1760
plotting 1615
underlays 1749–1750
action macros
playback 157
action parameters 859
actions
dependencies 922
actions (dynamic blocks)
about 925
array actions 932
Block Authoring palettes 907
Block Editor display 920
Chain Actions property 937
flip actions 931
grips and 948
lookup tables and 933
move actions 926
overriding 947
parameter sets and 907
polar stretch actions 930
properties 940
rotate actions 930
scale actions 927
selection sets 925
stretch actions 929
types 925
actions (user)
redoing 719
undoing 719
adaptive degradation 277
adaptive grid display 595
adaptive plot style adjustments 1603
Add-a-Plotter wizard 1554
ADI DXB driver 1612
Adjust Distance tool 287
ADN (Autodesk Developer Network) 17
Adobe Acrobat PDF files
layers and 1760
plotting 1615
underlays 1749–1750
Adobe PostScript driver
plotting with 1616
ADSKSIGTIMESRVR environment
variable 1935
Aerial View window
panning with 240
zooming with 240
aggregators 105
aliases
entering commands with 54
aligned constraints 826
aligned dimensions 1467
alignment
AutoTrack feature 608
dimension text 1441, 1504
dimensions 1497
displaying paths for 601
equal intervals 615–616, 618
hatches 1278, 1290
isometric planes 2001
lateral tolerances 1457
multileaders 1340
multiline text 1314
object snaps 585
objects 749
previous release formats and 1819
single-line text 1304
text 1348
viewport objects 420
alignment grips 859, 948
allocating memory 277, 282
alternative fonts 1371
altitude 176
American lighting units 2010
anchored palettes 76
anchored windows 134
angle coordinate display 550
angle offset property 947
angles
angle overrides 605
calculating 620
constraints 826
defining 3D views with 254
polar angles 602
polar coordinates 554
QuickCalc display units 633
rotating objects by 746
snap angle 596
2192 | Index
spotlights 2050
sunlight 2057
unit types 550
angular constraints 826
angular dimensions
breaks in 1492
creating 1480
definition points 1509
spacing between 1497
angular units 170
animations
motion path animation 359
preview animations 356
ShowMotion 340
anisotropic light distributions 2028
annotation objects
annotative styles 1233
blocks as 1247
creating 1229
data extraction and 1844
defined 1225
dimensions as 1239, 1461
hatches as 1250
leaders as 1244
model space and 385
multileaders as 1244
orientation 1256
previous release formats and 1818
scale representations 1253
scaling 386, 1225, 1227
text 1235, 1300
tolerances as 1239
types of 1223
updating 1227
updating scale 1253
visibility 1251
visual fidelity 198, 1231, 1817
workflow overview 1226
annotational constraints 831, 835
annotative dimensions 1461
Annotative property 1225, 1229
anti-aliasing 2126, 2128
aperture box (AutoSnap) 589
append extend surfaces 1154
application status bar 50
application window
display fonts in 129
applications
database applications 1870
exporting files to 1802
importing files from 1733
ObjectARX 1829
OLE sources and destinations 1717,
1729
opening attribute extraction
files 887
RealDWG-based applications 183
rendered images and 2146
arc length dimensions 1485, 1492
architectural units 633
archiving
drawings with xrefs 1685
sheet sets 454
arcs
dimensioning 1473, 1480, 1485
drawing 663
fillet arcs 776
joining to polylines 789
linetypes 521
modifying 695
polyline arcs 670
PostScript rendering 1814
rendering 2109
revision cloud segments 692
tangent to lines 666
areas
calculating 622, 687
combining calculations 623
subtracting 624
array actions 932
arrays of objects
3D objects 754
creating 753
polar 754
rectangular 753
arrowheads
customizing 1435
dimension arrowheads 1420, 1433
leader styles 1346
artifical lighting 2013
ARX applications 154
Index | 2193
ASE links 1913
Asian fonts 1369, 1376
aspect ratio
OLE objects 1729
rendering 2125
association points of dimensions 1511
associative dimensions
about 1421
annotation objects and 1240
association points 1511
changing associativity 1512
leader objects and 1340
limitations 1422
modifying 1508, 1511
previous release formats and 1823
updating 1422
associative hatches
creating 1267
defined 1260
exploding 786
extents 1291
associative surfaces
about 1014
creating 968, 1036
associative text 1337
atmospheric rendering effects 2116
attached xrefs
demand loading and 1683
Internet-based xrefs 1967
notification of 1669
relocated xrefs 1675
updating 1682
attaching
block attributes 876, 879
DGN underlays 1750
digital signatures 1928–1930, 1932,
1936
DWF underlays 1750
DWFx underlays 1749–1750
files to drawings 1733
passwords 1921, 1923, 1936
PDF underlays 1750
raster images 1783
xrefs 1668, 1680
attenuation of lights 2051
attribute definitions 878
attribute extraction templates 883
attribute tags 878
attributes of blocks 876
auditing drawings
Batch Standards Checker 223
examples 208
standards violations 218, 222
Auto-hide option 134
auto-hiding palettes 76
Auto-list feature 1318
AutoCAD
previous releases 1817
working in AutoCAD and AutoCAD
LT 1825
AutoCAD Classic workspace 148
Autodesk 3D Printing website 1660
Autodesk 3ds MAX files 1733
Autodesk Authorized Training
Centers 16
Autodesk Channels 11
Autodesk Consulting 17
Autodesk Design Review
about 1981, 1987
publishing for 1622
viewing drawing sets in 1645
viewing DWF files 1610
viewing DWFx files 1611
Autodesk Developer Network (ADN) 17
Autodesk e-learning program 17
Autodesk Official Training
Courseware 17
Autodesk products
information resources 16
late-breaking information about 17
Autodesk Reference Manager 1676
Autodesk Seek 1984
Autodesk Subscription Services 7
Autodesk Vault 1917
Autodesk VIZ 2064, 2146
AutoFill feature 1412
AutoLISP (LSP) applications
tools for 74
automatic saves 211
AutoSnap 585, 589
AutoStack feature 1329
AutoTrack feature 608
2194 | Index
axes
coloring 109
constraining movement to 1099
constraining rotation to 1103
constraining scale to 1104
positive direction of 566
reflection lines 931
right-hand rule 566
WCS 562
B
B-splines 1031
back faces of 3D solids 2103
back-face culling 2104
back, moving objects to 545
background colors
drawings 109
hatches 1273
text 1309
background publishing 1622
backgrounds
rendering effects 2116
underlays 1766
visual styles and 267
backup files
restoring drawings from 211
saving 197
sheet set data 437
base points
snap base point 596
baseline dimensions 1469
basic dimensions 1456
batch plots
publishing drawing sets 1644
Batch Standards Checker 223
beam angle (spotlights) 2050
beveled corners 778
Big Fonts
properties 1369
bills of materials (BOM) 1397, 1833
binding
dependent named objects to
drawings 1704
object definitions 1704
xrefs to drawings 1685
bisecting objects with construction
lines 685
bitcodes 57
bitmaps (BMP images)
exporting 1811
importing 1781
pasting 725
plotting to 1613
rendering 2128
bitonal raster images 1792
blending surfaces 1023
blips 721
BLK files 1647
Block Attribute Manager
duplicate tags 894
reordering prompts 879
block attributes
about 876
annotative 1229
attaching 879
attribute definitions 878
attribute extraction templates 883
attribute tags 878, 884, 894
attribute values 894
constant 876
definitions 893
editing 879
error handling 888
exporting data 882
extracting data from 882, 1833,
1841
invisible 876
modifying 892
nested blocks 887
removing 894
stand-alone 880
updating 882, 894
variable 876
Block Authoring palettes 907
block definitions
about 865
actions 920
annotations 1223, 1247
base points 865
block attributes 876
Block Editor 903
Index | 2195
block libraries 873
colors 870
copying 873
creating 865
cross sections as 1213
database links in 1881
dependencies 922
descriptions 890
drawing files as 853, 867
dynamic block definitions 901
fields in 1352, 1358
hyperlinks in 1951
in-place editing 1692
inserting blocks 853
linetypes 870
lineweights 870
model space settings 386
modifying 889, 1691–1692
object properties 870
OLE objects in 1700
publishing 3D files and 1653
removing 863
saving 910
tool palettes 874
updating 98, 890
Block Editor
about 904
Block Authoring palettes 907
correcting block definitions 910
custom block authoring tools 921
custom properties 939
dependency highlighting 922
dynamic block constraints 912
fully constrained objects 919
Parameters Manager 915
saving block definitions 910
testing blocks 909
block libraries
creating 873
inserting blocks 854
updating block definitions 890
block references
action parameters 859
annotations and 1247
associative dimensions and 1422
block attributes 876
clipping 1686
colors 871
constraints 805
database links in 1881
descriptions 890
dynamic blocks 901
editing 785, 889, 1692
exploding 786, 898
extracting data from 1833, 1841
grips 741
groups compared to 714
hyperlinks in 1951
inserting 853
layers and 852
leader objects and 1348
linetypes 871
model space settings 386
nested 872
non-uniform scaling 1843
OLE objects and 1700, 1720
orientation 1256
paper space and 868
pasted objects as 725
pasted text as 1335
properties 870
publishing 3D files and 1653
saving changes to 1698
scaling 853
table cells and 1407
updating 894
visibility 861
xrefs vs. 868
block template files 1647
blocks 865
BMP files (bitmaps)
exporting 1811
importing 1781
pasting 725
plotting to 1613
BOM (bills of materials) 1397, 1833
Boolean operators
database queries 1903
borders (table cells) 1404
boundaries
boundary edges 763
gaps in 688, 1269
2196 | Index
layout viewports 407
polylines 650, 672
recreating 1293
regions 688
zooming to 236
boundary sets
defined 650
hatches 1269
polylines 672
bounded areas 1141
bounded hatches 1260
boxes
3D solids 987
mesh boxes 1049
modifying 1144
BP3 files 1644
breaking
objects 783
OLE links 1722
breaks in dimensions 1492
brightness 1791
bringing objects to front 545
building queries 1897, 1903
bulge magnitude 1016
bulleted lists 1317
bullets 1317
bump maps 2086
bumpy surfaces 2075
Buzzsaw location shortcuts 1960
Buzzsaw project collaboration
service 1960
Buzzsaw sites 1960
BYBLOCK setting
block definitions 871
properties 468
BYLAYER setting 468
C
CAD Manager Control utility
DesignCenter Online and 103
InfoCenter and 12
CAD standards 217
calculating
angles 620
areas 622
circumferences 622
command prompt calculator 642
converting measurement units 636
distances 620
model space scale factors 387
perimeters 622
point coordinates 620
QuickCalc calculator 627
calculator variables in QuickCalc 638
calculators
command prompt calculator 642
QuickCalc 627
callout blocks
annotations 1223, 1244
sheet sets 444
CALS files 1613, 1781
Camera Properties palette 353
cameras
about 348–349
clipping planes 349
creating 350
lens length 349
linking to paths 359
locations 349
motion path animations 359
properties 351
recording animations 363
section objects and 1212
targets 349
canceling commands 55, 719
candelas 2034
caps 1485
catalogs in databases 1869
catalogs of parts 101, 105
categories
data extraction properties 1842
DesignCenter Online content 102
sheet set views 439
CDF files (comma delimited) 886
cell libraries (MicroStation) 1742
cells (data extraction tables) 1864
cells (databases) 1867
cells (tables)
address format 1412
AutoFill feature 1412
blocks in 1407
Index | 2197
cell ranges 1412
formulas in 1412
merging 1399
modifying 1398
text in 1407
center location overrides 1475
center marks in dimensions 1420, 1474
Center tool 323
centerlines in dimensions 1420, 1474
centers of gravity 625
certificate authorities 1929, 1941
certification of hardware and
software 280
Chain Actions property 937
chamfering
3D solids 1128
hatch boundaries 779
objects 778
characters
formatting 1315, 1364
height 1374
international 1368
password characters 1922
PostScript rendering 1813
query operators 1899
stacking 1329
Unicode text 1958
checkerboard patterns 2089
checking interferences 1012
checking spelling 1387
CIP (Customer Involvement Program) 19
circles
calculating geometric data for 622
dimensioning 1474, 1480
donuts 675
drawing 668
grips on 731
isometric circles 677, 2003
modifying 695
PostScript rendering 1814
rendering 2109
circular references between xrefs 1703
circumferences 622
clamp curves 1035
classic menu bar 47
Classic workspace 148
cleaning
3D solids 1139
clearing screen 110
screen display 721
clearing screen 110
Clipboard (Windows) 724
clipping
blocks 1686
layout viewport boundaries 407
underlays 1769
xrefs 1686, 1711
clipping boundaries
blocks 1686
layout viewports 407
raster images 1787–1788
underlays 1769
xrefs 1670, 1686
clipping planes
3D views and 294
cameras and 349
closed areas 1141
closed curves 1035
closed meshes 1078
closed polylines 671
code pages 1958
coincident grips 789
collaborative drawing standards 217,
222
collaborative sheet set use 459
collaborative web sites 1960
collected leader lines 1340
collections of content 102, 105–106
color books 519
color libraries 513
color mapping tables 1595
color palettes 513
color-dependent plot style tables 1555
about 1588
color mapping tables 1595
plot styles in 1581
switching to named 1582
color-dependent plot styles 1581–1582
colors
3D solids 1124
ACI colors 514
application window elements 109
2198 | Index
applying 513
backgrounds 1766
blocks 870–871
changing 516
color books 519
color intensity 1598
color palettes 513
converting to grayscale 1598
current color 513–514
defaults 474
DIC color guide 514
dimension elements 1427
display speed and 1800
dithering 1598
edges 1128
filtering selection sets by 703
gradients 2090
grid elements 594
grips 859
layer property overrides 488
layers and 471, 474, 483
lighting 2013, 2015, 2023, 2049–
2050
masking objects with 1295
materials 2071
names 514
NURBS surfaces 1165
Pantone color books 514
pasted objects 725
plot styles 1598
RAL color sets 514
raster images 1781, 1792
rendered image backgrounds 2120
screening 416, 1598
shades 1272
table elements 1404
tints 1272
True Colors 514
underlays 1766
visual styles and 264
xref layer properties 1670
columns (data extraction tables)
adding 1863
organizing 1845
columns (multiline text) 1331
columns (tables)
adding or deleting 1399
formatting 1405
modifying 1397
combining
database queries 1907
joining objects 784
regions 688
solids 1008, 1134
comma-delimited files (CDF) 886
comma-separated files (CSV) 1856
linking to tables 1401
command line
colors in 109
entering commands on 53
entering system variables on 56
hiding 63
prompts on 61
switches 154
switching between dialog boxes
and 61
syntax 156
command line switches
customizing program startup 154
command prompt calculator 642
command window
about 53
hiding 63
moving and resizing 62
navigating in 58
commands
adding to toolbars 35
aliases 54
canceling 55, 719
command history 58
command line 53
command prompt calculator 642
creating tools for 73
Dynamic Input and 578
executing 55
options 54
performing calculations in 630
prompts for 61
repeating 55, 58
searching for 27
shortcut menus 58, 65
Index | 2199
SQL queries 1906
text window 58
transparent commands 55
comments
digital signatures and 1934
markups and 1995
committing edits 1877
Communication Center
about 9
receiving announcements 10
settings 11
compass (ViewCube) 296
composite regions 688
composite solids
3D solids 1008, 1134
history 1134
modifying 1136
modifying original
components 1136
selecting subobjects 1110
separating into original shapes 1137
composite surfaces 1136
composite tolerances 1518
compound objects 786
compression
JPEG files 1812
textures 2085
Conceptual visual style 257
conditional operators 1899
cones
3D solids 990
mesh cones 1052
modifying 1144
configuring
external databases 1869
Render 2111
conflicting CAD standards 220
conflicting xref names 1704
conical helixes 682
connecting
objects 784
queries 1906
constant block attributes 876
constants 638
Constrained Orbit tool 287
constraining
object movement 1099
object rotation 1103
object scaling 1104
constraint bars 817
constraint icons 816
constraint parameters
about 912
blocks 862
user variables 914
constraint points 811
constraints
annotational constraints 831
applying 829
applying automatically 824
AutoCAD LT functionality 1826
constraint bars 817
construction geometry and 874
contraint points 811
dimensional constraints 826, 912
displaying 816, 834
dynamic blocks 862, 901, 912
dynamic constraints 830
editing 814, 837
editing constrained objects 820, 837
fix constraints 813
formulas 840
fully constrained drawings 804
fully constrained objects 919
geometric constraints 808, 810
identifying 919
inferring 823
multiple constraints 813
object snaps and 823
parameters 840
Parameters Manager 842, 862, 915
parametric constraints 803
reference parameters 831
relaxing 806
removing 806
surfaces 1039
unconstrained drawings 804
underconstrained drawings 804
Constraints palette 907
construction geometry 874
2200 | Index
construction lines
drawing 684
modifying 695
context menus 65
contextual fields 1358
continued dimensions 1469
continuity (surfaces) 1016, 1158, 1162
Continuous Orbit tool 287
contrast in raster images 1766, 1791
control points on splines 680, 794, 1035
control vertices 1155, 1157
conversion units 1810
converting
3D models to objects 1091
colors to grayscale 1598
database links in older files 1913
DGN files to DWG 1741
dimension units 1449
dimensions to annotations 1240
drawing units 167
drawings to other formats 1802
files to AutoCAD LT 1825
fonts 1371
layers to drawing standards 230
legacy materials 2082
lights in older drawings 2063
LMAN layer states 511
meshes to 3D solids 1193
nonassociative dimensions to
associative 1512
objects to 3D solids 1003
objects to meshes 1074
objects to surfaces 1030
older files 1820
pasted objects to block
references 725
plot style tables 1582
surfaces to 3D solids 1005
text in model or paper space 1385
text to annotations 1235
units of measurement 636
Coons surface patch meshes 1071
coordinate filters 606
coordinate systems
origin 549
Tablet mode and 661
types of 549
UCS (user coordinate system) 561
WCS (world coordinate system) 562
coordinates
2D coordinates 552
3D coordinates 556
absolute values 549
calculating 620
camera locations 349, 352
coordinate filters 606
cursor location 550
displaying values 627
Dynamic Input and 579
geographic locations 176
relative values 549
types of 549
unit types 550
coplanar faces 2107
copying
arrays of objects 753
block definitions 873
demand loading and 1714
dragging objects 752
edges 1128
faces 1124
formulas to table cells 1412
grip modes and 737
hatch properties 1289
layers 480
materials 2077
multiple copies of objects 752
object properties 470
objects 724, 751
objects to other drawings 196
offsetting objects 759
rendered images 2145
corners
beveled 778
chamfering 778
filleting 774
correcting
dynamic block definitions 910
mistakes 719
spelling 1387
CPolygon selection 699
crashes, recovering from 212
Index | 2201
creases
limiting distortion 1190
mesh objects 1177–1178
Create Layout wizard 398, 1543
Create Sheet Set wizard 436
cropped regions 2122
cross sectioning
2D and 3D sections 1213
live sectioning 1206
lofting objects and 976, 1117
section objects 1197
crosshairs
coloring 109
crossing selections 699
CSV files (comma-separated) 1401
exporting extracted data to 1856
CTB files 1555, 1581, 1588
current viewports 376
cursor
coordinate display 550
Dynamic Input and 579
locking movement 605
moving in tables 1407
polar tracking 601
rubber-band line 600, 612
curved objects
analyzing 1165
clamp curves 1035
closed curves 1035
drawing 663
modifying 695
open curves 1035
rendering 2109
CUS files 1388
custom block authoring tools 921
custom grips 859
custom objects 1829
custom properties
grips and 859
sheets and sheet sets 451
Customer Involvement Program 19
customizing
arrowheads 1435
dimension text 1446
hatches 1272
navigation bar 368
object selection 707
paper size 1527, 1563
profiles 152
render presets 2114
ribbon panels 44
spelling dictionaries 1388
tool palettes 83
visual styles 261
workspaces 148
cutaway views 294
cutouts (lighting) 2073
cutouts maps 2086
cutting
cutting edges 763
objects 724
slicing 1010
cutting edges 763
cutting planes
live sectioning 1206
section objects 1197
slicing solids 1010
Cycling property 950
cylinders
3D solids 993
mesh cylinders 1055
modifying 1144
cylindrical coordinates 559
cylindrical helixes 682
D
damaged drawing files 207
data extraction
about 1833
block attributes and 882
converting older files and 1820
Data Extraction wizard 1835
drawing units and 1843
editing settings 1860
exporting data 1855
formulas 1845
including spreadsheet data in 1845
linking to Excel spreadsheets 1851
matching data 1852–1853
monitoring drawings for
updates 1839, 1862
2202 | Index
non-uniform scaling and 1843
notifications 1862
overview 1833
saving settings 1836
selecting objects for 1841
updating data 1858
validation 1853
data extraction tables
about 1833
block attributes 882
converting older files and 1820
exporting 1855
formatting 1863
inserting in drawings 1855
modifying 1863, 1866
notifications 1862
organizing data in 1844
table styles 1850
updating 1858
Data Extraction wizard
data extraction process 1835
extracting block attributes 882
data links
database links 1880
defined 1401
locking linked spreadsheets 1403
updating 1402
data matching 1852
data sources
configuring 1869
converting older files and 1914
Data Extraction wizard 1835
dBConnect Manager 1871
linking to spreadsheets 1851–1852
selecting 1839
updating extracted data 1858
data types in tables 1405
Data View window 1870, 1872
database objects 1870
database records
about 1867
accessing 1869
committing changes 1877
finding 1877
linking to objects 1868, 1880
querying 1897
restoring original values 1877
tracking changes 1878
updating 1877
viewing 1872
viewing links 1885
database tables
accessing 1867
querying 1897
databases
about 1867
block attribute data in 883
configuring 1869
converting links in older files 1913
editing records 1877
error correction 1889
exporting extracted data to 1856
exporting link information 1889
links 1868, 1880
querying 1897
sample files 1870
selecting links 1885
synchronizing 1889
types of 1869
viewing tables 1870, 1872
views 1874
dates
angle of sun and 2057
datum
composite tolerances 1518
geometric tolerances 1516
ordinate dimensions 1483
dBase databases 1870
dbConnect Manager
editing database records 1870
DBX applications 154
DC Online tab (DesignCenter) 103
deleting
3D solid history 1134
back faces 2103
block attributes 894
block definitions 863
clipping boundaries 1789
color mapping tables 1596
constraints 806
creases 1179
data extraction elements 1860
Index | 2203
data extraction tables 1866
dimension breaks 1494
edges 1127
faces 1124
fillets 776
geometric constraints 810
group definitions 717
hidden surfaces 2103
hyperlinks 1951
layer property overrides 490
layers 480, 483
linetypes 523
multiline vertices 799
objects 721, 724
objects from groups 717
passwords 1925
points in splines 794
sheets 443
table elements 1399
text styles 1364
tools and palettes 84
unused named objects 721
vertices 1132
demand loading (xrefs)
about 1709
saving xrefs with indexes 1711–
1712
temporary xref file copies 1714
updating xrefs 1683
density of mesh objects 1173
dependencies
dependency highlighting 922
depth cueing 2116
deselecting objects 696, 699
Design Review
about 1981
publishing for 1622
design review process 1982
DesignCenter
about 91
accessing content 94
adding content from 97
attaching xrefs 1668
blocks in 873
copying block definitions 890
creating tools 98
DesignCenter Online 101
display options 92
file metadata 174
inserting blocks from 855
layouts in 427
raster images in 1783
toolbar 93
tree view 94
updating block definitions 98
DesignCenter Online
about 101
downloading content 105
searching for content 105
types of content 104
detaching
raster images 1787
underlays 1749, 1758
xrefs 1679
deviation tolerances 1456
DGN files
editing 1762
exporting 1808
importing 1741
layers and 1760
MicroStation and AutoCAD
terminology 1754
seed files 1810
translation mapping 1743
types of 1749
underlays 1749–1750
DGN seed files 1810
dialog boxes
calculations in 630, 644
display options 61
suppressing display 61
transparent commands and 56
diameter constraints 826
diameter dimensions 1473
creating 1473
definition points 1509
text 1438
DIC color guide 514
dictionaries 1388
Did You Know balloon messages 12
diffuse color maps 2072
digital design workflow 1982
2204 | Index
digital IDs
about 1929
certificate authorities 1929, 1941
obtaining 1929
root certificates 1941
digital signatures
about 1927
attaching to files 1930, 1932, 1936
comments in 1934
digital IDs 1929
encryption and 1936
file types supported 1932
invalidation of 1929–1930, 1936–
1937
keys 1928
root certificates 1941
signed file information 1938
time stamps 1934
validating 1937–1938
digitized signatures 1928
digitizing coordinates 557
digitizing tablets
Tablet mode 661
dimension lines
angular dimensions 1480
defined 1420
leader objects vs. 1337
linear dimensions 1464
Dimension Style Manager
creating styles 1424
dimension values 1449
fractions 1460
text options 1437
text styles 1446
dimension styles 1424
about 1424
applying 1500
listing 1425
modifying 1427
overriding 1501
system variables 1425
dimension text 1437
Dimensional CALS format 1613
dimensional constraints
about 826, 912
annotational constraints 831
applying 829
displaying 834
dynamic constraints 830
editing 837
editing constrained objects 837
illustrated 803
Parameters Manager 842
reference parameters 831
surfaces 1040
user variables 914
dimensional input 579
dimensions 1417
about 1417
alignment 1441, 1497
angular 1480
annotations 1223, 1239, 1461
arc length 1485
arrowheads 1420
associative 1421, 1508, 1511
basic 1456
breaks in 1492
converted DGN files 1742
creating 1417, 1464
customizing contents 1446
dimension lines 1420, 1427
dimensional constraints 826
elements of 1420
exploded 786, 1421, 1510
extension lines 1420
grips 1508
inspection 1490
jog lines 1487
lateral 1456
linear 1464
model space settings 386
modifying 785, 1486–1487
nonassociative 1421, 1508, 1512
ordinate 1483
previous release formats and 1818,
1823
radial 1473
scale 1461
spacing between 1497
styles 1424, 1500
text 1420, 1437, 1504
text styles 1446
Index | 2205
types 1417, 1464
units of measurement 1446, 1449
values 1448
direct distance entry 550, 613
direction
axes 566
disassociated dimensions 1508
discontinuities 1157
display drivers 279
display performance 540, 1800
displaying
3D files 1652
3D solid history 1134
alignment paths 610
annotative objects 1251
constrained objects 919
constraints 816
database links 1885
database tables 1872
dimensional constraints 834
draw order 545
drawing properties 175
drawing units 385
gizmos 1093, 1095
grip tools (gizmos) 1093
grips 731
Help 16
isolated objects 547
layers 473, 494
lights 2043
linetypes 531
lineweights 535
OLE objects 1729
originals in composite solids 1134
overlapping objects 545
plot areas 1532
plot styles 1597
published files 1645
Quick View images 188–189, 193
raster images 1800
rendered images 2142, 2144
shadows 267
simplifying 540
toolbars 49
underlay frames 1772
unreconciled layers 501
distance coordinate display 550
distance multiplier property 947
distances
calculating 620
coordinate display 550
equal intervals 615
fuzz distance 789
polar distances 603
specifying 613
distant lights 2013, 2040, 2119
distributing
dimensions 1497
leader lines 1340
dithering 1598
dividing
objects into equal segments 615–
616, 618
objects into original shapes 1137
docked palettes 76
docked toolbars 49
docked windows 62, 134
doglegs 1336, 1473
donuts
drawing 675
exploding 786
simplified display 540
double click actions
editing 727
downloading
DesignCenter Online content 103,
105
draft analysis 1159, 1166
draft quality display of raster
images 1800
dragging objects 752
draw order
changing 545
hatches 1288
OLE objects 1720
drawing
3D solids 987
arcs 663
boxes 987
circles 668
cones 990
construction lines 684
2206 | Index
curved objects 663
cylinders 993
direct distance entry 613
donuts 675
ellipses 677
helixes and spirals 682
isometric circles 677, 2003
layout viewports and 401
lines 647
multilines 657
object properties 465
objects 647
Ortho mode 600
parametric drawing 803
polygons 654, 671
polyline arcs 670
polylines 649
polysolids 1000
precision 549
pyramids 997
rays 684
rectangles 654
reference points 683
revision clouds 691
spheres 995
splines 680
squares 654
tangent arcs and lines 666
tori 999
triangles 654
viewports and 377
wedges 989
wide polylines 671
drawing extents 236, 1532, 1561
drawing files (DWG)
backups 210
converting other files to 1740
file locations 204
finding 174, 203
inserting as blocks 853
markups 1987
metadata 174
opening 181
previous release formats 1817
repairing 207
saving 197–198
TrustedDWG 183
drawing interchange format (DXF files)
converting to DWG 1740
exporting 1806
drawing orientation 1542, 1567
drawing properties
adding 174
displaying 175
encryption and 1922, 1927
finding files with 174, 203
metadata 174
Drawing Recovery Manager
recovering work 212
drawing sets
plotting 1628
publishing 1621, 1624, 1631
republishing 1644
sheet sets 1636
viewing published files 1645
drawing status bar 52
drawing templates
creating 172
DGN seed files 1810
hyperlinks to 1952
opening 172
saving 198
starting drawings with 172
startup routines and 154
web page templates 1983
drawing units
about 167
angular units 170
converted DGN files 1742
converting 168
data extraction and 1843
linear units 170
model space settings 385
precision 170
rounding off 170
drawings
2D sections of 3D models 1197
3D views 285
annotations in 1223
archiving 1685
background colors 109
colors 513
Index | 2207
converting to AutoCAD LT 1825
copying between 196
counting objects in 22
creating tools from 98
cross sectioning 1197
DesignCenter drawings 98
digital signatures 1927
encryption 1921
exporting 1802
extents 236
extracting data from 1833
file formats 198
file locations 184, 204
finding 174, 203
fitting on paper 1565, 1569
fully constrained drawings 804
geographic location 176
i-drop content in 1969
importing files into 1733
incremental saves 199
information about 21
inserting as blocks 867
international files 199
Internet-based 1953
layers 471
layouts 391, 393
lighting 2005
linking to databases 1867
markups 1987
measurement units 167
metadata 174
model space 383
monitoring for updates 1839
multiple open drawings 188
naming 199
object properties 465
opening 181, 1953
orientation 1542, 1567
page setups 1523
partial saves 198
partially opening 186
passwords 1921
plot settings 1523
plotting 1553
previewing 188, 1608
previous release formats 1822
publishing 1621, 1960
rendering 2101
repairing damaged drawings 207
saving 197, 1953
saving as templates 172
scaling 385
sharing 1943
sheet sets 431
sheets 431
standards violations 218, 222
starting 165
switching between 189
templates 172
text in 1300
transmittal packages 1971
TrustedDWG drawings 183
unconstrained drawings 804
underconstrained drawings 804
underlays 1749–1750
viewports 373
views 235
xrefs 1665
drivers 280
DSD files (drawing set descriptions) 1647
DST files (sheet set data)
creating 436
team member access to 459
duplicating objects 751
duration of animation 361
DWF files (Design Web Format)
3D DWF files 1652
about 1981
exporting 1802
layers 1760
markups 1987
metadata 1647
multi-sheet files 1647
plotting to 1610
publishing 1621, 1631
publishing to Buzzsaw
locations 1960
security options 1647
sheet sets and 1636
underlays 1749–1750
viewers 1610, 1645
web page images 1983
2208 | Index
DWF Viewer 1981
DWFx files
3D DWFx files 1652
about 1981
exporting 1802
layers 1760
markups 1987
metadata 1647
plotting to 1611
publishing 1621, 1631
security options 1647
sheet set properties in 454
sheet sets and 1636
underlays 1749–1750
viewers 1611, 1645
viewing 1645
web page images 1983
DWG files
saving underlays as 1778
DWG to PDF driver 1615
DWS files 220
DWT files
saving layouts as 426
sheet creation templates 455
starting drawings 172
DXB files
converting to DWG 1740
plotting 1612
DXE files 882, 1836
DXF files (drawing interchange format)
converting to DWG 1740
exporting 1806
exporting block attribute data 886
saving 198
DXX files 886
dynamic block definitions
about 858, 901
actions 920, 925
assigning data to 933
AutoCAD LT functionality 1827
block attributes 876
Block Editor 903
constraints 912
construction geometry 874
correcting 910
creating 902
dependencies 922
designing 902
grips and 948
inserting blocks 853
lookup tables 933
parameter sets 907
parameters 916, 948
properties 939
saving 910
testing 909–910
value sets 944
visibility states 953
workflow 902
dynamic block references
about 858, 901
actions 925
block attributes 876
constraints 805
grips 859
modifying 862
restoring 862
dynamic blocks
action parameters 859
dynamic constraints 830, 834
dynamic coordinate display 550
dynamic panning 235
dynamic prompts 580
dynamic UCSs 572
dynamic viewing 293
E
e-learning program (Autodesk) 17
earlier versions of AutoCAD 1822
edge-defined meshes 1071
edges
3D solid edges 1119
boundary edges 763
colors 1128
copying 1128
creases 1178
customizing 272
cutting edges 763
deleting 1127
imprinting objects on 1142
mesh edges 1071
Index | 2209
modifying 1126
redundant edges 1139
rendering 2108
surfaces 1142
trimming to 1151
editing
3D models 1091
3D solids 1091, 1122, 1132
block attribute definitions 879
block attributes 892–893
block definitions 889, 1691
block references 889, 1692
cameras 353
columns of text 1331
complex objects 785
composite solids 1136
constrained objects 820, 837
constraints 814, 837
custom objects 1829
data extraction settings 1860
data extraction tables 1863
database records 1877
dictionaries 1388
dimension styles 1427
dimensions 1486–1487
dynamic blocks 862
edges 1126
faces 1122
fields in text 1353
fills 1289
gizmos 1093
grip modes 729
grip tools (gizmos) 1093
groups 717
hatches 1289
helixes 797
hyperlinks 1946, 1951
label templates 1892
labels 1893
layer objects 475
layers 483, 507
leader objects 1338
link templates 1881
maps 2093
markups 1990, 1997
materials 2080
meshes 1168
multiline styles 800
multilines 799
objects 695, 727
OLE objects 1729
paper size 1566
plot style tables 1586, 1592
plot styles 1596
point clouds 1738
polylines 787
printable areas 1566
queries 1910
revision clouds 692
separating solids into shapes 1137
sheet and sheet set properties 451
sheets 442
ShowMotion shots 343
spirals 797
splines 794
surfaces 1091, 1119, 1122, 1136,
1149
tables 1397, 1407
text 1377, 1391
text styles 1364
underlays 1762
vertices 1132
visual styles 258
xrefs 1691–1692
educational products 1670
electronic drawing sets
plotting 1628
publishing 1621, 1624, 1631
republishing 1644
sheet sets 1636
viewing published files 1645
elevation 569
ellipses
calculating geometric data for 623
drawing 677
grips on 731
modifying 695
PostScript rendering 1814
elliptical arcs
modifying 695
PostScript rendering 1814
email hyperlinks 1950
2210 | Index
embedded libraries 2068
embedded objects (OLE) 725, 1717, 1724
encryption
about 1921
advanced levels 1924
digital signatures and 1936
drawing properties and 1922, 1927
keys 1924, 1928
environments in databases 1869
EPS files
exporting 1813
plotting to 1616
equations
parametric constraints 840
erasing objects 721
errors
block attribute extraction files 888
correcting 719
dynamic block definitions 910
reporting 213
synchronizing database links 1889
xref error messages 1701
eTransmit feature
Buzzsaw sites and 1960
creating transmittal packages 1971
prior versions and 1976
saved transmittal settings 1974
underlays and 1779
evaluating new layers in drawings 500,
504
Excel spreadsheets
accessing data from 1401
database connectivity 1870
extracting data to 1833, 1856
including in data extractions 1845,
1851
opening attribute extraction
files 887
exploded dimensions 1421, 1510
exploding
blocks 898
compound objects 786
objects 786
exporting
3D files 1652
3D solids 1815–1816
animations 361
block attribute data 882–883
database links 1889
drawings 1802
export file formats 1802
extracted data 1833, 1855
FBX files 1734, 1807
label templates 1912
layer states 511
layout objects to model space 403
link templates 1912
OLE objects 1727
plot files 1609
profiles 152
queries 1912
rendered images 2142, 2146
tool palettes 89
Express Tools 18
expressions 632, 642
Parameters Manager 843
parametric constraints 840
extending
3D objects 766
chamfered objects 780
filleted objects 775
objects 763
extension lines
angular dimensions 1480
appearance 1430
arc length dimensions 1485
arcs and 1473
breaks in 1492
defined 1420
oblique 1471
origins of 1464
properties 1430
text on 1437, 1442
external data
exporting to files 1855
linking to spreadsheets 1851
matching 1852
updating 1858
external databases 1867
external queries 1874
external references (xrefs)
about 1665
Index | 2211
archiving drawings with 1685
attaching 1668, 1680
Autodesk Educational Products 1670
binding 1685, 1699
blocks and 854, 868
circular references 1703
clipping 1686, 1711
constraints 805
copying 1711
database links in 1881
defined 1665
demand loading 1683, 1711–1712,
1714
DesignCenter and 1668
detaching 1679
editing 1691–1692
error messages 1701
exploding 786
External References palette 1669
fields in 1358
freezing layers of 1711
icons 1669
Internet-based xrefs 1967
layer properties 1670
layer states and 507
log files 1706
missing 182, 1702
name conflicts 1704
nested 1680
notifications about 1669, 1675,
1682
OLE objects and 1700, 1720
overlays 1680
password-protected 1925–1926
paths 1674, 1681, 1714
project names and 1675
properties 1699
Reference Manager 1676
reloading 1682
relocated xrefs 1675
saving changes to 1698
saving with indexes 1711–1712
sheet sets and 442
temporary file copies 1714
underlays as 1749–1750, 1780
unloading 1710
updating 1665, 1682
xref tools 70
External References palette
displaying 1669
loading or unloading images 1799
raster image information 1794
underlay information 1774
externally referenced dimension
styles 1426
extracting
block attribute data 882–883
drawing property data 1833
geometric data 620
extruding
faces 1192
mesh faces 1181
objects 1116, 1141
extruding objects 969
F
face counts 2108
face normals 2103
face views 302
faces of 3D solids
colors 1124
coplanar faces 2107
copying 1124
creases 1178
edge display 272
extruding 1181, 1192
face styles 261
imprinting objects on 1142
intersecting faces 2106
materials 2082
mesh faces 1177, 2108
mesh objects 1168
modifying 1119, 1122
redundant faces 1139
rendering 2103
splitting 1181, 1190
facet edges 272
faceted lighting 262
faceted mesh objects 1169
faceted surfaces 1067
2212 | Index
fade settings
raster images 1791
underlays 1766
xref objects 1693
falloff angle of spotlights 2050
Favorites links (DesignCenter) 95
Favorites links (InfoCenter) 10
FBX files
about 1734, 1807
feature classifications 1830
field angle of spotlights 2050
fields (databases)
about 1867
attribute extraction and 883
labels 1891
links 1880
fields (text)
about 1352
AutoCAD LT functionality 1825
hyperlinks in 1361
previous releases of AutoCAD
and 1359
file formats
animations 361
attribute extraction files 886
data extraction 1836, 1856
digital signatures and 1932
drawing interchange formats 1612
export file formats 1802
importable files 1733
pasted objects 724
plot files 1609
plottable formats 1610–1613, 1615–
1616
PostScript formats 1813
publishing drawing sets 1621
Quick View images 189
raster formats 1781, 1811
rendered images 2142
saving drawings 197
saving in older formats 1822
trusted formats 183
web page publishing 1983
file input and output commands 1953
file management 1917
file-based databases 1869
files
backups 210
block attribute data 882
Buzzsaw sites and 1960
creating 29
currently open 32
default locations 184
digital signatures and 1929
encryption 1921
exporting 1802
extracting data to 1833
finding 174
importing 1733
large objects in 183
markups 1987
metadata 174
migrating 160
navigating to 1954
opening 29, 181, 1952
pinned 30
plotting to 1628
previewing 34
publishing 29, 1621, 1631, 1960
recently used 29
repairing damaged files 207
saving 197
search paths 204
sheets and sheet sets 431
validating 1937–1938
Fill mode 540
filleting
3D solids 1128
objects 774
surfaces 1154
fills
boundaries 1267, 1293
gradient fills 1272
modifying 1289
plot styles 1606
PostScript rendering 1814
properties 1283
solid fills 1260, 1272
turning off display 540
wipeout objects 1295
filter colors of lighting 2049
Index | 2213
filtering
data extraction properties 1842
dimension types 1422
files for data extraction 1840
layers 479, 494
object selection 22, 703
objects for data extraction 1841
paramenters 847
subobject selection filters 1113,
1191
texture filtering 2126
unreconciled new layers 501, 504
viewport overrides and 487
final gathering 2138
finding
commands 27
database records 1877
DesignCenter Online content 102,
105
drawing files 174, 203
files for data extraction
updates 1840
InfoCenter information 4–5, 11
materials 2078
paramenters 847
raster images 1798
text 1383
underlay files 1777
fit points in splines 794
fit points on splines 680, 1035
fitting
dimension text 1437
Fix constraints 813
fixed-length extension lines 1431
fixtures (lighting) 2006–2007, 2061
flat lighting 262
flatshot objects 1218
flattened views of 3D objects 1218
FLIC files 1781
flip actions 931
flip grips 859, 948
flipped normals 2126
flipping
arrowheads 1433
blocks 931
lights 2045
objects 761
floating properties 870
floating toolbars 49
floating windows 62, 134
FLS files 1736
flying through models 291
flyouts
tool palettes 70
FMP files (font mapping) 1371
fog effects 2116
folders
file locations 184
monitoring for updates 1839
font mapping files 1371
fonts 1366
alternative fonts 1371
assigning 1366
Big Fonts 1369
converting 1371
display settings 129
file locations 204
international sets 1368
mapping 1371
PostScript 1371
previous release file formats
and 1821
proxy fonts 1367, 1371
publishing 3D files and 1655
substitute fonts 1371
TrueType 1367
types of 1366
Unicode 1368
forcing internal lines 1438
foreshortened radius dimensions 1475
form tolerances 1513
formatting text
character formatting 1364
codes for 1391
data extraction tables 1863
fields 1352
multiline text 1309, 1315
stacked text 1328
table cells 1405, 1407
formulas
copying 1412
data extraction tables 1845
2214 | Index
inserting in table cells 1412
parametric constraints 840
Forward tool 325
FoxPro databases 1870
fractions 1309, 1328, 1460
frame rates in animations 361
frames
underlay frames 1772
Free Orbit tool 287
free weblights 2028
freezing
layers 473
layers in layout viewports 413
xref layers 1711
front views 254
front, moving objects to 545
FTP sites
opening Internet drawings 1954
saving drawings to 1954
full hyperlinks 1944, 1946
Full Navigation wheels 321
full xref paths 1674
fully constrained drawings 804
fully constrained objects 919
functions 638, 844
fuzz distance 789
FWS files 1736
G
G0 and G1 continuity 1017, 1162
G2 curvature 1017, 1163
gaps between objects 784
gaps in boundaries 1269
Gaussian curvature 1165
Geo SPOT files 1781
geographic locations
about 176
angle of sun 2057
defining 176
displaying location 176
geographic markers 176
geometric calculators 627
geometric constraints
about 808
applying 810
applying automatically 824
constraint points 811
creating 912
displaying 816
editing 814
editing constrained objects 820
fix constraints 813
illustrated 803
inferring 823
multiple constraints 813
relaxing 806
removing 806, 810
surfaces 1039
geometric tolerances 1513
composite tolerances 1518
datum reference frames 1516
lateral tolerances 1456
material conditions 1516
projected tolerances 1517
geometry
authoring blocks with
constraints 874
extracting data from 1842
object geometric data 620
partially opened drawings 186
projecting 1151
rendering 2106
trimming edges with 1151
GI (global illumination) 2136, 2138
gizmos
3D meshes 1170
3D models 1109
about 1093
displaying 1095
mesh objects and 1191
moving objects with 1099
rotating objects with 1102
scaling objects with 1104
settings 1096
switching 1095
global constants 638
global illumination (GI) 2136, 2138
global linetype scale factor 529
glossy materials 2072
goniometers 2033
goniometric diagrams 2029
Index | 2215
Gooch face style 261
Google Earth 176
gradient fills
creating 1272
materials maps 2090
simplified display 540
graphics cards 279
grayscale 1598
grid
displaying 593
snapping to 593
grid limits
calculating 387
overriding 594
zooming to 236
grip modes 729
grip tools (gizmos) 1093
grips
3D meshes 1170
3D solids 1109, 1115
Block Editor display 924
blocks 741
camera grips 352
coincident 789
constrained objects 820, 837
copying objects with 737
dependencies 922
dimension text 1504
dimensional input 580
dimensions 1508
display options 731
dynamic blocks 948
editing objects with 729
gizmos 1093
grip tools (gizmos) 1093
hatches 1292
helixes 798
insertion cycling 950
jog lines 1487
multi-functional 735, 787
non-associative hatch objects 735
OLE objects 1729
parameters 924
polylines 735
quadrant grips 731
section objects 1208
selecting 731
splines 735, 794
surfaces 1109, 1115
tables 1398
text objects 1378, 1380
tooltips 950
types of 859, 1109
underlay files 1762–1764
ground plane 118
ground plane grid 118
groups
about 714
adding objects to 717
creating 713–714
editing groups 717
editing objects 717
layer group filters 494
parameter groups 847
removing group definition 717
removing objects from 717
reordering objects in 717
selecting 715
tool palette groups 86
guide curves 968, 1117
gutters between text columns 1332
H
handdrawn effects 272
handles (i-drop) 1969
hanging indents 1324
hardware
acceleration 279
linetypes and 522
hatches
alignment 1290
annotations and 1223, 1250
associative 1260, 1267
background colors 1273
boundaries 1267, 1293
bounded hatches 1260
chamfering boundaries 779
customizing 1272
density 1281
draw order 1288
editing 785
2216 | Index
exploding 786
file locations 204
filleting boundaries 774
gradient fills 1272
islands within 1267–1268
ISO patterns 1272
large or complex drawings and 1269
model space settings 386
modifying 1289
nonassociative 1268
orientation 1256
origin point 1278
pattern libraries 1272
pre-defined 1272
properties 1283, 1289
rotating 1290
scaling patterns 1280, 1290
simplified display 540
solid fills 1260
styles 1267–1268
transparency 1283
unbounded hatches 1259, 1286
hats 1485
height
table rows 1397
text 1315, 1385
helixes
drawing 682
modifying 797
Help
displaying 16
late-breaking product
information 17
New Features Workshop 16
Readme topic 17
searching multiple Help sources 4–
5
hexagons 654
hidden objects 1540, 1572
hidden surfaces 2103
Hidden visual style 257
hiding
annotative objects 1252
columns in extracted data 1845
dynamic block visibility states 953
hatch boundaries 1286
image boundaries 1787
isolating objects 547
layers 473
palettes 76
paper space objects 1575
raster images 1800
toolbars 49
underlay frames 1772
highlighted materials 2072
highlighting
dependencies 922
objects 709
suppressing 1801
visual styles and 263
histories of 3D solids 1134, 1144
history entries 2139
holes in 3D solids 1141
holes in meshes 1170
hollow objects 1138
Home view 306
hook lines 1336, 1473
horizontal dimension text 1442
horizontal dimensions 1466
horizontal ribbon 38
horizontal text 1376
hotspot angle of spotlights 2050
hyperlinks
about 1944
absolute 1944, 1946
blocks and 1951
creating 1946
cursor display options 1946
editing 1946, 1951
email hyperlinks 1950
fields and 1361
full 1944, 1946
opening files with 1952
relative 1944, 1946
removing 1951
starting drawings with 1952
template files and 1952
I
i-drop content
about 1968
Index | 2217
functionality 1969
handles 1983
resources 1968
types of 1969
icons
tool palette icons 76
tools 79
IES photometric data files 2028, 2033
IG4 files 1781
ignoring standards violations 223
image maps 2088
imperial units
converting to metric 167
linetype definition file for 523
QuickCalc display 633
importing
3D point cloud files 1736
FBX files 1734, 1807
files into drawings 1733
label templates 1912
layer states 511
layouts as sheets 442
link templates 1912
named page setups 1545
OLE objects 1720
plotter configuration settings 1544
profiles 152
queries 1912
text 1335
tool palettes 89
imprinting objects on 3D solids 1142
in-place reference editing
about 1692
inheritance and 1699
saving changes 1698
undoing changes 1698
In-Place Text Editor
columns 1331
fonts in 1367
indents and 1324
multiline text 1308
table text and 1399, 1412
incremental saves 199
indenting paragraphs 1324
Index of Refraction 2073
indexing point cloud data 1736
indirect illumination
benefits 2136
final gathering 2138
inferring constraints 823
infinite lines 684
InfoCenter
about 3
favorite links 10
search wildcards 5
searching for information 4–5
settings 11
inheritance
blocks 870
in-place reference editing and 1699
joined objects 789
Initial Setup
about 160
default profiles 152
initializing layouts 1554
input
QuickCalc calculator variables 638
input properties 933
inserting
blocks 853, 1407
content with tools 70
data extraction tables 1833
DesignCenter content 97
drawing files as blocks 853
fields in text 1352
formulas 1412
i-drop content 1969
markups 1989
objects at equal intervals 615
OLE objects 1717
insertion point for blocks 950
inspection dimensions 1490
inspection rates 1490
installation
color books 519
Express Tools 18
intensity of light 2049
Interactive Graphics System DGN
files 1749–1750
interferences 1012
Intergraph MicroStation DGN
files 1749–1750, 1754, 1760
2218 | Index
International (SI) lighting units 2010
international character sets 199, 1368,
1958
Internet
attaching xrefs from 1967
Buzzsaw sites 1960
DesignCenter Online 101
FTP sites 1954
navigating to specific
locations 1954
network access 1943
opening drawings from 1953
raster images from 1784
saving drawings to 1953
sharing drawings on 1943
transmittal packages 1971
Internet-based drawings 1953
interrupting commands 55
intersecting objects
composite solids and 1008
dimension breaks 1495
edges 272
interferences 1012
multilines 799
regions 688
rendering intersecting objects 2106
self-intersections 1194
trimming 763
intervals on objects 615–616, 618
inverting
layer filters 496
invisible block attributes 876
invisible objects in blocks 953
islands
hatch patterns and 1267
island detection styles 1268
ISO 8859 Latin 1 character set 1813
ISO hatch patterns 1272
ISO pen widths 523
isolating objects 547
isoline edges 272
isometric circles 677, 2003
isometric drawings 2001
isometric planes 2001
Isometric Snap/Grid mode 2001
isometric views
2D views 2001
3D views 253
Isotropic distribution of lights 2029
iterative selection sets 1907
J
JFIF files 1781
jitter edge effect 272
jog lines in dimensions 1487
jogged radius dimensions 1475
jogged segments in section objects 1204
join operator 1906
joining
line join styles 1605
objects 784, 789
queries 1906
JPEG files
attaching 1781
exporting 1811
plotting to 1613
web page images 1983
justified text
defined 1309
dimension text 1441
modifying 1386
settings 1314
K
key points
about 925
parameters 924, 948
key values 1882
keyboard shortcuts 53
keys (digital IDs) 1924, 1928
keytips 53
keywords 174
KML files 176
KMZ files 176
L
L symbol (least material condition) 1516
Index | 2219
label blocks
annotations 1223, 1235
sheet sets 443
label templates
creating 1891
exporting 1912
importing 1912
labels (data labels)
attaching 1868
creating 1891
updating 1896
labels (parameters) 940
labels (text) 1300
lamp color 2015, 2023, 2050
lamp intensity 2015, 2023, 2050
landings
dimension text 1473
multileader leader lines 1336, 1340
landscape orientation 1542, 1567
languages
dictionaries 1388
previous release file formats 1821
Unicode text 1958
working internationally 1958
large objects 183, 200, 1976
LAS files (cloud data) 1736
LAS files (layer states) 511
lateral tolerances
displaying 1456
stacked text in 1328
latitude 176
layer group filters 494
layer indexes 1711–1712
layer properties
blocks and 870
converting to drawing
standards 230
filters 495
tool overrides 80
xref properties 1670
Layer Properties Manager
filtering layers 494
layer names 479
modifying layers 483
property overrides 487
sorting layers 494
unreconciled new layers and 504
layer property filters 495
layer states 505, 511
Layer States Manager
LMAN layer states 511
restoring layer states 506
xrefs and 507
Layer Translator 230
layers
about 471
block elements and 852
colors 474, 483, 516
converting to drawing
standards 230
copying 480
creating 479
current 480
default properties 474
deleting 480, 483
displaying 494
exporting layer states 511
filtering 479, 494
freezing 413, 473
hiding 473
importing layer states 511
inverting filters 496
LAS files 511
layer 0 472
layer states 505
layout viewports and 413
linetypes 474, 483, 527, 1670
lineweights 474, 483, 532, 538
live sectioning and 1207
LMAN Express Tool 511
locking 473
materials 2082
metadata 1647
modifying 483, 507
modifying objects on 475
moving objects to another 483,
516, 527, 538
naming 479, 483
new layer notification 500
OLE objects and 1720
overriding properties 474, 487
plot styles 474, 1589
2220 | Index
preventing selection 701
previous release formats and 1818
properties 482–483
reconciled 501, 504
referenced 480
restoring layer states 506
saving 505
selecting 480
settings 482
sorting 494
thawing 473
transparency 474, 543
turning on or off 473
underlays and 1751, 1760
undoing changes 483
unlocking 473
unreconciled 501, 504
unused 480
visibility 401, 473
xrefs and 507, 1670, 1711
layout templates 426
layout viewports
about 391
accessing model space from 401
aligning views in 420
annotations and 1225, 1227
creating 406
drawing in 401
freezing layers in 413
linetypes in 419
magnifying 401
modifying views in 401
multiple 406
plotting 1540
resizing 408
rotating views in 423
scale 401
screening objects in 416
shaded 1540
turning on or off 417
views in 410
visibility in 413
Layout Wizard
creating layouts 1543
layouts
adding 398
dimensioning in 1462
display options 123
exporting objects to model
space 403
importing plotter configuration
files 1544
initializing 1525, 1554
inserting from DesignCenter 427
layer visibility 401, 474
layout tabs 391
layout templates 426
layout viewports 391
Layout Wizard 398, 1543
lineweights in 535, 1536
opening 188
orientation 1256, 1542, 1567
page setups 1524
paper size 1527, 1562
plot scale 1535
plot settings 1524, 1561, 1568
plot style tables 1584
plotting 1553
previewing 188
settings 398
shaded viewports 1571
sheet sets and 436, 442
switching to model space 193
work process 397
leaders (leader lines)
annotations 1223, 1244
associativity and 1337, 1340
automatically creating 1438
blocks in 1348
breaks in 1492
creating 1338
defined 1336
landings 1340
modifying 1338
multileaders 1338
multiline text in 1348
ordinate dimensions and 1484
styles 1346
leading (line spacing) 1326
least material condition values 1516
legacy mesh types 1074, 1078
lengthening objects 769
Index | 2221
lens length of cameras 349
lettered lists 1317
LID (luminous intensity
distribution) 2033
light glyphs
displaying 2005
plotting 2049
settings 2043
lighting
about 2005
assigning shapes to 2041
colors 2013, 2015, 2023, 2049–2050
converting older versions of 1820,
2063
default 2005
display options 2043
distant lights 2040, 2051
distribution 2031, 2051
face styles and 262
final gathering 2138
fixtures 2006
guidelines 2012
highlights 263
illuminating scenes 2012
importing 2064
indirect illumination 2136
lamp values 2038
light glyphs 2005, 2043
light intensity 2028
luminaire objects 2061
luminous intensity distribution
(LID) 2033
materials 2072
photometric lighting 2006, 2010
placement and location 2045
point lights 2015
properties 2049
sky and 2056
spotlights 2022
Standard lighting 2005, 2010
sunlight 2056
visual styles and 258
weblights 2028
workflow 2010
limits
arrays 754
lighting 2051
tolerances 1456
LIN files (linetype library) 523
line end styles 1605
line spacing
dimension text 1504
previous release formats and 1819
text 1309, 1326
linear constraints 826
linear dimensions
breaks in 1492
creating 1465
definition points 1509
jog lines 1487
spacing between 1497
types of 1464
linear grips 859, 948
linear parameters
grip numbers 948
values 944
linear units 170
lines
dimension lines 1427
direct distance entry 613
drawing 647
end styles 1605
extension lines 1430
filleting 776
freehand lines 661
join styles 1605
joining to polylines 789
linear constraints 826
linetypes 521
linetypes on short segments 531
lineweights 532
modifying 695
multilines 657
occluded 272
Ortho mode 600
polyline arcs 670
table gridlines 1404
tangent to arcs 666
Linetype Manager
scale settings 529
linetypes
about 521
2222 | Index
applying 526
blocks 870–871
converted DGN files 1742
current 526
defaults 474
deleting 523
displaying on short segments 531
file locations 204
filtering selection sets by 703
freehand sketches 661
hardware linetypes 522
layers and 471, 483, 527
layout viewports and 419
loading 523
model space settings 386
plot style linetypes 1603
polylines 531
reapplying 527
scaling 419, 529, 1603
lineweights
about 532
applying 532
block properties 870
current 537
defaults 474
dimension elements 1427
displaying 535, 537
filtering selection sets by 703
layers and 471, 483, 538
model space and 533
objects not displaying 532
overriding 538
plot settings 1540
plot style lineweights 1603
plotting 533, 1575
previous releases and 537
reassigning 538
regenerating drawings and 535
scale 533, 1536
turning on or off 535, 541
Link Manager
editing database links 1882
Link Select feature 1907
link templates (database links)
creating 1880
exporting 1912
importing 1912
linkable attributes 2094
linked objects (OLE) 1717, 1721
linking
cameras to paths 359
database links 1868, 1880
extracted data to
spreadsheets 1844, 1851
pasted objects 725
views to other applications 1727
links (databases) 1868, 1880, 1885, 1913
listing
dimension styles 1425
dimension system variables 1425
layers 494
raster images 1794
rendered images 2139
underlays 1775
xrefs 1706
lists in multiline text 1317
live sectioning
about 1197, 1206
cameras and 1212
LMAN Express Tool 511
LMC symbol (least material
condition) 1516
loading
color books 519
linetypes 523
partially opened drawings 186
raster images 1799
location
cameras 349, 352
default drawing folder 184
geographic 176
locked tool palettes 85
locking
cursor movements 600, 605
layers 473
layout viewport scale 401, 411
point cloud data 1737
sheets and sheet sets 459
table data links 1403
toolbars 142
windows 142
Index | 2223
lofting objects
3D objects 976, 1117
surfaces 1117
log files
i-drop content 1969
xrefs 1706
logo startup screen 155
longitude 176
Look tool 326
lookup actions 907, 933
lookup grips 859, 933, 948
lookup parameters 907
lookup properties 933
lookup tables
about 933
properties 933
reverse lookup 934
values 934
lumens 2034
luminaire objects 2007, 2033, 2061
luminous intensity distribution
(LID) 2033
LZW compression 1784
M
M symbol (maximum material
condition) 1516
magnet snapping 589
magnifying views 235
major grid lines 594
manufacturer data
DesignCenter 104
IES lighting data files 2028, 2033
lighting fixtures 2006
map channels
about 2084
map types 2084, 2087
mapping
fonts 1371
layers to standard layers 230
map properties 2093
map types 2087
materials 2084
marble maps 2090
markers
equal segments on objects 615–616,
618
geographic 176
object snaps 589
point markers 616, 618
tracking points 609
Markup Set Manager
responses to markups 1995
viewing markups 1989
markups 1987
inserting 1989
markup sets 1989
publishing 1988
republishing 1997
responding to 1995
revision clouds 691
status 1995
viewing 1989
masking objects 1295
mass properties 625
master drawings 1665
matching data 1853
material condition symbols 1516
materials
adding to libraries 2068
applying 2082
converting previous versions
of 1820, 2082
copying 2077
creating 2071
editing 2080
map channels 2084
Materials Browser 2067
Materials Editor 2071
materials libraries 2068
properties 2071
publishing 3D files and 1652
rendering 2126
updating 2082
Materials Browser 2067
Materials Editor 2071
materials libraries 2068
mathematical calculators 627
MaxArray system registry variable 754
2224 | Index
maximum material condition
values 1516
MDB files (Access) 1856, 1870
measurement units
about 167
converting 636
coordinates 550
data extraction and 1843
dimension text 1446
dimensions 1449
model space 385
plot scale 1569
QuickCalc display 632
measurements
dimensions 1417
equal intervals 615–616, 618
tolerances 1513
memory (RAM)
allocating 277
memory tuning 282
menus
classic menu bar 47
shortcut menus 65
workspace arrangements 148
merge extend surfaces 1154
merging
cells in tables 1399
extracted data 1852
mesh faces 1170
mesh models 963
meshes
about 1044, 1067
best practices 1189
boxes 1049
cones 1052
converting objects to 1074, 1091
converting to 3D solids 1003, 1092,
1193
creases 1177–1178, 1190
creating 1044, 1067
custom 1078
cylinders 1055
density 1173
editing 1168
extruding 1192
extruding faces 1181
faces 1168
facets 1169
gizmos 1191
grip editing 1170
legacy mesh types 1074, 1078
merging faces 1170
mesh modeling 1169
predefined meshes 1081
primitives 1049
properties 1146
pyramids 1058
refining 1176–1177, 1190
rendering 2108
repairing holes 1170
selection filters 1191
self-intersections 1194
smoothness 1172
spheres 1061
splitting faces 1181, 1190
tessellation 1045, 1172
tori 1065
types 1067
wedges 1062
metadata
entering 174
publishing options 1647
metric units
converting to imperial 167
linetype definition file for 523
Microsoft Access databases
accessing 1870
exporting extracted data to 1856
Microsoft Excel spreadsheets
accessing data from 1401
database connectivity 1870
extracting data to 1833, 1856
including in data extractions 1845,
1851
opening attribute extraction
files 887
Microsoft ODBC 1869
Microsoft SQL commands 1906
Microsoft SQL Server 1869
Microsoft Visual FoxPro databases 1870
Microsoft Windows Clipboard 724
Microsoft XPS Viewer 1981
Index | 2225
MicroStation DGN files 1760
attaching 1749–1750
exporting 1808
importing 1741
terms 1754
migrating
Initial Setup 160
minor grid lines 594
mirroring
grip methods for 730
lights 2045
objects 729, 761
text 761, 1377
textures 2097
misspellings 1387
MMC symbol (maximum material
condition) 1516
model space
accessing from layout viewports 401
annotations and 385, 1225, 1227
cameras in 348
defined 391
DGN file conversions and 1742
dimensioning in 1461
display options 123
drawing process in 383, 396
exporting layout objects to 403
layer states and 507
layer visibility settings 401
lineweight display in 533, 535
live sectioning and 1206
markups and 1990
moving objects to paper space 397
plot scale 1568
plotting from 386, 1562, 1575
switching to layouts 193
text in 1385
viewports 373
model space viewports
Aerial View window and 241
assigning UCSs to 574
creating 373
UCSs in 568
modifying
3D models 1091
3D solids 1091, 1122, 1132
block attribute definitions 879
block attributes 892–893
block definitions 889, 1691
block references 889, 1691–1692
cameras 353
colors 516
columns of text 1331
complex objects 785
composite solids 1136
constrained objects 820, 837
constraints 837
data extraction settings 1860
data extraction tables 1863
database records 1877
dictionaries 1388
dimension styles 1427
dimensions 1486–1487
dynamic blocks 862
edges 1126
faces 1122
fields in text 1353
fills 1289
gizmos 1093
grip tools (gizmos) 1093
hatches 1289
helixes and spirals 797
hyperlinks 1946, 1951
label templates 1892
labels 1893
layer objects 475
layers 483, 507
layout viewports 406, 410
leader objects 1338
lineweights 538
link templates 1881
maps 2093
markups 1990, 1997
materials 2080
meshes 1168
multiline styles 800
multilines 799
objects 695, 727
OLE objects 1729
paper size 1566
plot style tables 1586, 1592
plot styles 1596
2226 | Index
point clouds 1738
polylines 787
printable areas 1566
queries 1910
revision clouds 692
separating objects into shapes 1137
sheet and sheet set properties 451
sheets 442
splines 794
surfaces 1091, 1119, 1122, 1136,
1149
tables 1397, 1407
text 1377, 1391
text styles 1364
tools 71, 84
vertices 1132
visual styles 258
xrefs 1691–1692
molds 1166
moments of inertia 625
monitoring
data source changes 1862
drawings for updates 1839
monochrome settings
underlays 1766
moonlight 2013
motion path animation
about 359
linking cameras to paths 359
recording 363
settings 361
mouse devices 369
move actions 926
moving
3D Move gizmo 1093, 1099
3D subobjects 1119
blocks 926
constraining movement 1099
dimension text 1504
dragging objects 752
edges 1126
faces 1122
grip methods for 730
jog lines 1487
layer objects to other layers 483
leader objects 1339
lights 2045
navigation bar 366
objects 729, 742, 759
objects between model and paper
space 397
referenced drawings 1675
sheets to other sets 443
stretch-moves 743
text 1378, 1380
toolbars 36
tools on palettes 84
UCSs 562
vertices 1132
mtext (multiline text) 1308
multi-functional grips 735, 787
multileaders (leader lines)
annotations 1223, 1244
blocks in 1348
breaks in 1492
creating 1338
landings 1340
modifying 1338
previous release file formats
and 1819
styles 1346
text in 1348
multiline styles 800
multiline text
about 1308
aligning 1314
annotations 1223
columns 1331
creating 1308
database labels 1891
editing 1380
finding 1383
formatting 1315
height 1315, 1374
indenting 1324
justification 1314, 1386
leader objects and 1336
line spacing 1326
lists in 1317
obliquing angle 1375
orientation 1376
Index | 2227
previous release file formats
and 1819
properties 1309
replacing 1383
stacked 1328
styles 1315, 1363
tabs 1324
text editors 1391
text wrap 1309
Multiline Text Editor 1391
multilines
drawing 657
editing commands 800
intersections 799
modifying 799
styles 657, 800
vertices 799
multiple drawings
opening 188
switching between 196
multiple hot grip selection 731
multiple-view drawing layouts 391
My Documents folder 184, 204
N
named layer states
saving 506
named objects
CAD standards 217
partially open drawings and 186
standards violations 224
xref name conflicts 1704
named page setups
applying 1523
creating 1545
sheet sets and 1549
named plot style tables
about 1555, 1581
color mapping tables 1595
Plot Style Table Editor 1592
plot styles in 1589
switching to color-dependent 1582
named plot styles
about 1581, 1589
creating 1592
predefined styles 1595
switching to color-dependent 1582
named ranges in Excel 1851
named views
saving 243
section objects and 1212
naming
layer states 505
layers 479, 483
lights 2049
raster images 1797
selection filters 703
text styles 1364
viewports 378
views 243
naming conventions
imported files 1734
international 199
natural lighting 2010
navigating
3D views 287
command window keys 58
navigation bar 364
SteeringWheels 311
ViewCube 295
navigation bar 364
nested blocks
block attributes 887
clipped 1688
creating 872
nested OLE objects 1719
nested xrefs
clipped 1688
defined 1680
editing 1700
paths 1681, 1702
network surfaces 1020, 1022
New Features Workshop 16
noise maps 2091
Non-Uniform Rational B-Splines surfaces
(NURBS) 1031
nonassociative dimensions 1421, 1508,
1512
nonassociative hatches 1268, 1292
nonrectangular layout viewports 407
2228 | Index
nonsystem plotter drivers
DXB driver 1612
PDF output 1615
plotting to 1609
PostScript driver 1616
raster driver 1613
nonuniform rational B-spline curves 680
nonuniform scaling 1843
normals of 3D faces
about 2103
flipped normals 2126
Not Found raster images 1795
notes
annotations 1223, 1235
creating text 1300
markups 1995
notification
attached xrefs 1669
changed xrefs 1682
data extraction updates 1835, 1862
new layers added 500
relocated xrefs 1675
standards violations 224
Number of Grips property 948
numbered lists 1317
numeric values
block attribute data 886
data extraction 1843
dimensions 1448
rounding 1452
suppressing zeros 1453
NURBS curves 680, 1157, 1159
NURBS surfaces
about 1014
analyzing 1165
creating 962, 1031
editing 1149, 1155
rebuilding 1157
O
object enablers 1829
object linking and embedding
(OLE) 1717
object properties
about 465
assigning 465
blocks 870
colors 513, 516
copying 470
extracting data 1833
inheritance 1699
layer defaults 474
linetypes 521
lineweights 533
xrefs 1699
object snap tracking 608
object snaps
3D space 586
about 585
angles of 596
AutoSnap 589
base points 596
constraints and 823
grid snap 593
isometric drawings 2001
object snap tracking 608
overriding 591
point clouds 1739
PolarSnap feature 601
running object snaps 586
shortcut menu 585, 588
underlays 1764
ObjectARX applications
custom and proxy objects 1829
objects
3D objects 961
aligning 749
arrays of 753
assigning to other layers 516, 527,
538
breaking 783
chamfering 778
colors 513
converting to meshes 1074
converting to revision clouds 691
copying 724, 737, 751
counting 22
creating 3D solids from 1003
creating meshes from 1067
creating solids or surfaces from 966,
1030
Index | 2229
cross sectioning 1197
custom objects 1829
cutting 724
deleting 724
deselecting 696, 699
draw order 545
drawing 647
editing 695, 727
equal intervals on 615
erasing 721
extracting data from 1833
feature classifications 1830
filleting 774
filtering 703
fully-constrained 919
geometric data 620
grouping 713
highlighting 709
isolating 547
joining 784
large objects 183, 200, 1976
layers 471
layout viewports and 401
linetypes 521
lineweights 532
linking to databases 1868, 1880
magnifying 236
masking 1295
mass properties 625
materials 2065
mirroring 761
moving 742
offsetting 737, 759
OLE objects 1717
overlapping 545
paper space and 397
pasting 724
plotting 1575
proxy objects 1829
rendering 2121
reshaping 769
resizing 769
rotating 746
saving 198
scaling 770
section objects 1197
selecting 695
separating into original shapes 1137
simplified display 540
snapping 585
stretching 770
subobjects 1119
textures 2065
transparency 543
visibility 413
oblique extension lines 1471
oblique text 1375
obscured edges 272
occluded lines 272
ODBC (Microsoft) 1869
offset snaps 737
offsetting
construction lines 685
copying objects 737
labels 1892
objects 759
plot offsets 1533, 1567
surfaces 1027
temporary reference points 614
textures 2096
OLE (object linking and
embedding) 1717
OLE DB (Microsoft) 1869
OLE objects
attached xrefs 1700
breaking links 1722
display options 1729
editing 1729
embedding 1717, 1724
exporting 1727
linking 1718, 1721
nested 1719
opacity 1720
pasted text as 1335
pasting 725
plot quality of 1718
reconnecting 1722
resizing 1729
text in 1720
updating 1721
opacity
transparency settings 543
2230 | Index
visual styles 263
open curves 1035
Open Database Connectivity 1869
Open Documents list 32
open meshes 1078
opening
attribute extraction files 887
dbConnect Manager 1870
DesignCenter drawings 98
drawings 181, 1953
files 29
files in other formats 1733
files with hyperlinks 1952
files with large objects 183, 200
layouts 188
multiple drawings 188
older files 1817
sheets and sheet sets 442
source applications for OLE
objects 1729
templates 1952
operators
Boolean operators 1903
calculations 632
database queries 1899, 1907
Parameters Manager 843
Oracle databases 1869
Orbit tool 328
ordinate dimensions 1483, 1492, 1509
orientation
annotations 1256
drawings 1542, 1567
text 1376
origin
coordinate systems 549, 562
displaying UCS icon at 576
hatches 1278
ordinate dimensions 1483
Ortho mode 600
orthographic projection view 305
orthographic sectioning 1201
orthographic views 253
overhang edge effect 272
overlapping objects
3D solids 1012
draw order 545
rendering 2107
selecting 695, 1112
overlaying xrefs 1680
overlays 471
overrides
angle overrides 605
center locations of dimensions 1475
dimension styles 1425, 1501
dynamic block actions 947
grid spacing 596
identifying 488
layer property overrides 474, 487,
506
linetypes 527
lineweights 538
object snaps 591
previous release formats and 1818
removing 490
sheet set page setups 436, 455
snap spacing 596
tool properties 80
overshoot of extension lines 1430
P
Page Setup Manager
creating page setups 1523
page setup override files 436, 455
page setups 1523
Create Layout Wizard 1543
importing plotter configuration
settings 1544
named page setups 1523, 1525,
1545
overriding 436, 455
Page Setup Manager 1523
plot settings 1559
settings 1524
sheet sets 436, 454, 1549, 1636
pages
page setups 1523
sheets in sheet sets 431
Pan tool 287, 331
panning
3D views 287
about 235
Index | 2231
Aerial View window 240
dynamic 235
layout viewports 401
Pantone color books 514
paper drawing sets 1628
paper size
fitting drawings on 1569
layout settings 1527
modifying 1566
plot scale and 1568
scaling drawings to fit 1535
settings 1562
paper space 391
about 391
blocks and 868
dimensioning in 1462
drawing in 391
exporting objects from 403
hiding objects 1575
layer states and 507
layout work process 397
lineweight display in 535–536
moving objects to model space 397
navigation tools 365
object visibility 413
plotting options 1541, 1575
text in 1385
UCS limitations 569
paper-saving features 1566
Paradox databases 1870
paragraphs (multiline text) 1308
parallel dimensions 1497
parallel lines
construction lines 685
filleting 776
parallel projections
about 247
creating 251
parameter groups 847
Parameter Manager 847
parameter sets 907
parameters
adding actions to 920, 925
Block Authoring palettes 907
Chain Actions property 937
constraint parameters 912
custom properties 939
defined 924
dependencies 922
dynamic blocks 916, 948
grips and 948
groups 847
key points 925
labels 940
lookup tables and 933
parameter sets 907
Parameters Manager 915
parametric constraints 840
user variables 914
values 944
visibility parameters 953
Parameters Manager 842, 862, 915
parametric constraints
about 803
annotational constraints 831
applying 829
dimensional constraints 826
displaying 816, 834
dynamic constraints 830
editing constrained objects 820, 837
formulas 840
geometric constraints 808, 810
parameters 840
reference parameters 831
relaxing 806
removing 806
parametric drawing
about 803
parametric constraints 803
paramters
Parameters Manager 842
parenthetical grouping 1903
partial saves 198
partially open drawings 186
Partner Products and Services
(Autodesk) 17
parts
DesignCenter Online content 102,
104
inspection dimensions 1490
parts lists 883, 1833
2232 | Index
passwords
case sensitivity 1925
characters in 1922
DWF files 1752
encryption passwords 1921, 1923,
1936
entering 1925
password-protected xrefs 1925–1926
published files 1647
removing 1925
viewing passworded drawings 1925
pasting
converting data while pasting 725
lists 1319
objects 724
objects from other drawings 196
text 1335
patching surfaces 1025
paths
default file locations 184
extruding 1116
linking to cameras 359
lofting 1117
motion path animations 359
raster image files 1798
support files 204
sweeping 972
underlay files 1777
xrefs 1676
patterns
converted DGN files 1742
hatches 1272, 1280
libraries 1272
PC2 files (legacy plotter
configuration) 1544
PC3 files (plotter configuration)
about 1554
PCP files (legacy plotter
configuration) 1544
PCX files
attaching 1781
plotting to 1613
PDF files
exporting 1804
layers and 1760
plotting 1615
underlays 1749–1750
pen plotters
pen assignments 1601
pen settings
color mapping tables 1595
importing into layouts 1545
plot style assignments 1601
raster plotters 1601
virtual pens 1601
penless plotters 1601
performance improvement
3D display and 277
adaptive degradation 277
adaptive sampling 2129
Aerial View dynamic updating 242
arrays and 754
demand loading xrefs 1711–1712
fills display 540
groups and 715
hardware acceleration 279
incremental saves 199
layers and 473
lineweights and 535, 541
memory and 277, 282
performance tuning 279
publishing 3D files and 1653
raster image display 1799
resolution 2109
shadow display and 267, 2049
software acceleration 279
text display 540
texture compression 2085
performance tuner 279
perimeters 622
perpendicular lines 600
perspective view 305
perspective views
about 247
defining 248
settings 118
photometric lights
distant lights and 2040
goniometric diagrams 2029
IES data files 2028, 2033
lamp values 2038
Index | 2233
luminous intensity distribution
(LID) 2033
overview 2010
point lights 2015
properties 2015, 2050
sky settings 2057
spotlights 2023
sun properties and 2056
weblights 2028, 2051
workflow 2006
photon maps 2136, 2138
photorealistic rendering 2101
physical models 1660
pickbox cursor 695
PICT files 1781
pinned files 30
pivot points 328
pixels
raster images 1781
removing strays on display 721
placeholder fields 1352
plan views
changing viewpoints 255
defined 254
planar closed spline curves 623
planar surfaces 1020
planes
constraining movement to 1100
constraining scale to 1105
workplanes 549
playing action macros 157
playing shots 346
plot areas
printable areas 1566
setting 1532, 1561
plot files 1553
plot settings
objects 1575
orientation 1567
page setups and 1559
scale 1568
transparency 1575
plot stamps
about 1555
turning on 1575
Plot Style Manager 1586
Plot Style Table Editor
editing plot styles 1596
managing plot style tables 1592
plot style tables
assigning to layouts 1537, 1584
color mapping tables 1595
creating 1586
editing 1596
modifying 1586
Plot Style Manager 1586
Plot Style Table Editor 1592
predefined 1588, 1595
shaded viewport plotting options
and 1571
switching types 1582
types 1555, 1581, 1588–1589
plot styles
about 1579
layers and 474, 483
modifying 1596
NORMAL style 1592
object plot styles 1589
plot style tables 1537, 1581
selecting 1575
settings 1596
types 1555, 1580
Plotter Configuration Editor
paper size 1527
plotter configuration files
about 1554
Plotter Manager
about 1554
plotters
configuration files 1554
offsetting plots 1567
paper size 1562
paper-saving features 1566
pen assignments 1601
raster plotters 1601
selecting 1526, 1560
plotting
about 1554
draw order and 545
drawing sets 1628
exporting files 1609
file formats 1609
2234 | Index
fit options 1535
hardware linetypes 522
layout process and 393
light glyphs 2049
lineweights 533, 536, 1575
model space settings 386
new layer notification and 501
offsets 1533
OLE objects 1718
orientation 1542, 1567
page setups 1523, 1559
paper size 1562
paper space objects 1575
plot scale 1568
plot style tables 1537
plot styles 1575, 1579
positioning image on paper 1565
previewing 1608
publishing 1621
quick start 1553
resolution 1574
scaling drawings for 1535
screened objects 416
section objects 1217
selecting output devices 1560
terminology 1554
test plot performance 540
text frames 540
transparent objects 544, 1575
underlays 1778
wipeout objects 1295
plug-ins (CAD standards) 218, 220
PNG files (Portable Network Graphics)
exporting 1811
importing 1781
plotting to 1613
web page images 1983
point clouds
about 1736
AutoCAD LT functionality 1828
editing 1738
inserting data 1737
locking 1737
point lights
artifical lighting 2013
attenuation rates 2051
location 2045
overview 2015
target points 2015
point markers 616, 618
pointer input 579
points
block base points 865
control points 794
coordinates 620
direct distance entry 613
drawing 683
equal intervals between 615–616,
618
fit points 794
geometric data 620
key points 924–925
offsetting objects from 614
point markers 616, 618
specifying 612
tracking points 609
polar angles 602
polar arrays 754
polar coordinates
2D coordinates 554
about 549
cylindrical coordinates 559
spherical coordinates 560
polar parameters
grip numbers 948
values 944
polar stretch actions 930
polar tracking 601, 608
PolarSnap feature 601
polyface meshes
about 1078
creating 1080
rendering 2108
polygon meshes 1078, 1080
polygons
calculating geometric data for 623
drawing 654, 671
polyface meshes 1080
polyline arcs 670
polylines
calculating geometric data for 623
chamfering 780
Index | 2235
closed 671
drawing 649
editing 785
exploding 786
filleting 776
grips 735, 787
joining 789
linetypes 531
modifying 695, 787
offsetting 759
polyline arcs 670
PostScript rendering 1814
revision clouds 691
simplifying display 540
subobjects 788
wide polylines 650, 671
polysolids
drawing 1000
portrait orientation 1542, 1567
PostScript driver
plotting with 1617
PostScript files
exporting 1813
plotting to 1616
PostScript fonts 1371
precedence in calculations 632
precision
calculators 627
coordinate systems 549
cursor movements 593
distances 613
drawing units 170
Dynamic Input 578
geometric data 620
numeric values 1452
object snaps 585
offset locations 606
point locations 606
predefined 3D meshes 1081
preset 3D views 253
pressing areas of 3D solids 1141
preview animations 356
previewing
animations 356, 363
drawings 188, 203
files 34
layouts 188
object selections 709
online content 103
plotted drawings 1608
textures 2093
weblights 2051
previous releases
converting database links 1913
converting files 1817
converting lighting 2063
fields and 1359
legacy materials 2082
lineweights and 537
rendering and 2147
saving drawings as 1822
underlays and 1778
primitive solids
about 987
grips 1115
modifying 1144
spheres 995
primitives
mesh primitives 1049
solids 987
printable areas 1524, 1526, 1533, 1561,
1566
printers
offsetting plots 1567
selecting 1526, 1560
printing
3D DWF files 1652
3D physical models 1660
page setups 1523
privacy 7, 9, 103
private keys 1928
procedural maps 2088
procedural surfaces
about 1014
converting objects to 1030
creating 962, 1019
editing 1149
product updates 9
profile tolerances 1513
profiles (objects)
extruding 1116
geometric objects used as 968
2236 | Index
lofting 976
profiles (user)
about 152
default profiles 152
Initial Setup 152
workspaces and 150
project lines 1430
project sites
accessing Buzzsaw sites 1960
creating 1960
projected geometry 1151
projected tolerances 1517
projects
currently active 1676
naming 1675
xrefs and 1675
prompts
command line 61
dynamic prompts 580
properties
3D solids 1144
blocks 870, 916
cameras 350–351
colors 513
copying 470
dimension lines 1427
dynamic blocks 916
extracting data 1833
fills 1283
floating properties 870
hatches 1283, 1289
layer property filters 494
layers 471, 482
lighting 2049
linetypes 521
lineweights 532
lookup tables 933
maps 2093
mass properties 625
materials 2071
meshes 1046, 1146
metadata 1647
multiline properties 657
objects 465
OLE objects 1729
overriding 487
plot styles 1579
section objects 1210
selecting objects by filtering 703
sheets and sheet sets 451
simplifying display 540
surfaces 1017, 1145
tables 1397
text 1309, 1380
tool overrides 80
tool properties 78
views 243
Properties palette
object properties 467
performing calculations in 630
table properties 1397
proxy fonts 1367
proxy objects 1829
proxy servers 1943
PS files (PostScript)
exporting 1813
plotting to 1616
public keys 1928
Publish to Web wizard
about 1983
publishing
about 1621
background processing 1622
Buzzsaw sites and 1960
drawing sets 1621, 1624
drawings for review 1988
DWF files 1960
files 29
markups 1997
page setups 1523
section objects 1217
sheet sets 454
underlays and 1778
web pages 1983
pulling areas of 3D solids 1141
purging
block definitions 863
named objects 721
unreferenced linetypes 523
unused layers 480
pyramids
3D solids 997
Index | 2237
mesh pyramids 1058
modifying 1144
Q
quadrant grips 731
quadrants in dimensioning 1481
Query Builder 1898, 1903
Query Editor 1897
query operators 1899, 1903, 1907
querying
block attribute data 882
databases 1874, 1897
Quick Access toolbar 48
Quick Properties palette 467
quick queries 1897, 1899
Quick Text mode 540
Quick View tools 188–189, 193
QuickCalc calculator 627
displaying coordinate values 627
R
radial dimensions 1473, 1492
radius (fillet) 774
radius dimensions 1473, 1509
RAL color sets 514
RAM
allocating 277
memory tuning 282
range queries 1898, 1900
rapid decay area of spotlights 2050
Rapid prototyping 1816
raster driver
plotting with 1613
raster images
about 1781
attaching 1783
bitonal 1792
clipping boundaries 1787
display options 1791
display speed 1799–1800
file formats 1781
file paths 1783
file size 1613
finding files 1798
hiding 1800
image information 1794
Internet-based files 1784
loading 1799
missing 1798
naming 1797
pixels 1781
plotting to 1613
preview images 203
resolution 1785
ribbon contextual tab 1782
scaling 1785
tiled images 1800
transparency 1782
unloading 1799
raster plotters 1601
ray-tracing
ray-traced reflections 2133
ray-traced shadows 2131
trace depth 2133
rays
drawing 684
filleting 776
modifying 695
RC4 encryption providers 1924
read-only tool palettes 85
Readme help topic 17
Real face style 261
RealDWG files 183
realistic rendering 2101
Realistic visual style 257
realtime panning 235
rearranging
objects in groups 717
reassociating dimensions 1511
rebuilding surfaces 1157
Recent Documents list 29
reconciled layers
about 504
marking 501
reconnecting OLE links 1722
reconstructing surfaces 1157
recording
animations 356, 363
history of composite solids 1134
records (database) 1867
2238 | Index
recovering
after system failures 212
damaged drawings 207
sheet set data 437
recovery audits 208
rectangles
drawing 654
modifying 695
rectangular arrays 753
rectangular meshes 1079
redline markups 1987
redoing actions 35, 719
redrawing screen display 721
redundant edges 1139
redundant faces 1139
redundant vertices 1139
Refedit toolbar 1694
Reference Manager
about 1676
underlays and 1780
reference parameters 831
reference points
drawing 683
offsetting from 614
referenced layers 480
references (xrefs) 1665
refinement
mesh objects 1176, 1190
tessellation 1045
reflection lines 931
reflective materials 2073, 2133
reflectivity maps 2085
refraction
material highlights 2073
rendering 2133
refreshing screen display 721
regardless of feature size values 1516
regenerating
drawings 535
layer display 473
raster image display and 1800
screen display 541
regions
calculating geometric data for 623
composite 688
creating 687
cross sections 1201
relational databases 1868
relative coordinates
2D coordinates 552
3D coordinates 557
copying objects with 751
cylindrical coordinates 559
entering 549
moving objects with 743
spherical coordinates 561
relative hyperlinks 1944, 1946
relative paths
hyperlinks 1946
xrefs 1674, 1681
relaxing constraints 806
relocated xrefs 1675
removing
3D solid history 1134
back faces 2103
blips 721
block attributes 894
block definitions 863
color mapping tables 1596
constraints 806
creases 1179
data extraction elements 1860
data extraction tables 1866
dimension breaks 1494
edges 1127
faces 1124
fillets 776
geometric constraints 810
group definition 717
hidden surfaces 2103
hyperlinks 1951
layer property overrides 490
multiline vertices 799
objects 724
objects from groups 717
passwords 1925
points in splines 794
sheets 443
stray pixels 721
table elements 1399
text styles 1364
tools and palettes 84
Index | 2239
unreferenced linetypes 523
unused named objects 721
vertices 1132
renaming
layers 483
sheets and sheet sets 443
Render (renderer) 2111
render destinations 2119
render history 2139
render presets
about 2112
customizing 2114
Render Settings palette 2111
rendering
about 2101
advanced techniques 2133
atmospheric effects 2116
background effects 2116
basic techniques 2119
configuring Renderer 2111
displaying images 2144
exporting images 2146
flipped normals 2126
image quality 2128
legacy drawings and 2147
plotting rendered objects 1572
preparing models for 2103
render history 2139
render presets 2112, 2114
Render Settings palette 2111
saving images 2142, 2145
section objects 1217
shaded viewport objects 1540, 1571
simplifying geometry for 2106
texture maps 2126
two-sided 2126
renumbering sheets in sheet sets 443
repairing
damaged drawing files 207
repeating commands 55, 58
repeating patterns 2097
replacing
dimension text 1504
text 1383
reports 223
republishing drawing sets 1644
reshaping
objects 769, 1141
resizing
3D solid faces 1122
Aerial View image 241
annotations 1225, 1227, 1253
arrowheads 1435
columns in text 1332
data extraction tables 1863
dimension breaks 1495
dimensions 1461
edges 1126
extending objects 763
fitting drawings on paper 1535
layout viewports 408
leader objects 1339
object grips and 730
objects 769
OLE objects 1729
tables 1398
text 1378, 1380, 1385
textures 2096
toolbars 49
trimming objects 763
windows 134
resolution
animations 361
PDF files 1615
plotting 1574
raster images 1785
rendering and 2109, 2124
restoring
backup files 210
damaged drawings 210
layer settings 506
previous view 235
UCSs 563, 569
viewports 378
views 243
resulting color 2015, 2023, 2050
resulting intensity 2015, 2023, 2050
reverse lookup 934
reversing actions 719
reviewing
drawings 1988
new layers in drawings 500
2240 | Index
revision clouds 691
revision clouds 691
revolved meshes 1070
revolving
solids 1117
surfaces 1117
revolving objects 980
Rewind tool 332
RFS symbol (regardless of feature
size) 1516
ribbon
about 37
contextual tabs 1750, 1782
customizing 44
displaying and organizing 38
right-click menus 65
right-hand rule 566
RLC files 1781
root certificates for digital IDs 1941
rotate actions 930
rotated dimensions 1470
rotating
3D objects 747
3D Rotate gizmo 1093, 1102
3D subobjects 1119
3D views 254
block insertion prompts 854
blocks 930
constraining rotation 1103
dimension text 1504
dimensions 1470
edges 1126
faces 1122
grip methods for 731
hatches 1290
lights 2045
objects 729, 746
snap angles 596
textures 2096
UCSs 562
underlays 1762
vertices 1132
views in layout viewports 423
rotation grips 859, 948
rotation parameters 944
rotation snaps 737
rounding
corners 774
edges 1128
rounding off
dimension values 1452
drawing units 170
roundtripping 1982
rows (data extraction tables) 1863
rows (tables)
adding or deleting 1399
formatting 1405
modifying 1397
RSS feeds 11
RTF files 1335
rubber-band lines
locking 600
tracking 612
ruled meshes 1069
running object snaps 586, 591
S
S (regardless of feature size symbol) 1516
sampling in rendered images 2128
sampling radius 2137
SAT format files 1739, 1815
saving
animations 363
automatic saves 197, 211
backup files 197, 211
block definitions 910
cross sections 1213
data extraction settings 1836
database links in older formats 1914
drawings 197, 1953
files in older formats 1817, 1822
files with underlays 1778
incremental saves 199
layer indexes 1711
layer property overrides 506
layer settings 506
layer states 505–506
layout templates 426
markups 1995
objects 198
page setups 1545
Index | 2241
partial saves 198
preview images 203
profiles 152
publish options 1647
queries 1910
rendered images 2142, 2145
selection filters 703
sheet selections 455
sheet sets 460
spatial indexes 1711
standards files 220
tool palettes 84, 89
UCSs 569
unreconciled layers and 502
viewports 378
views 243
visual fidelity and 198, 1231, 1817
workspaces 150
xref editing changes 1698
scale
annotations 1225, 1227, 1253
data extraction and 1843
dimensions 1449, 1461
drawing units 168
drawings 385
layout viewports 410
linetypes 529
multilines 657
plot scale 1535, 1568
scale factors 770
scale actions 927
scale factors
layout viewports 410
model space settings 386
raster images 1785
scaling objects 770
scale locking in layout viewports 401
scaling
3D Scale gizmo 1093, 1104
3D subobjects 1119
annotations 1225, 1227, 1253
arrowheads 1435
blocks 853, 927
constraining scale 1104
drawings 386
drawings to fit paper 1535
edges 1126
faces 1122
grip methods for 730
hatch patterns 1280, 1290
linetypes 419, 529, 1603
lineweights 1536
model space settings 385–386
objects 729, 770
OLE objects 1729
plot scale 1568
raster images 1785
scaling by reference 771
tables 1397–1398
text 1378, 1380, 1385
text scale ratios 387
textures 2096
underlays 1762
vertices 1132
views in layout viewports 410
scenes
lighting 2012
rendering 2121
schedules
extracting data for 1833
tables 1397
schemas in databases 1869
scientific calculators 627
screen display
cleaning up 721
clearing 110
performance 540
quality 1800
updating 541
screening
layout viewports 416
plot settings 1598
scripts
customizing program startup 154
suppressing dialog boxes 61
tools for 74
SDF files (space-delimited format) 886
search paths
default file locations 184
projects and 1675
referenced drawings 1674
specifying 204
2242 | Index
searching
database querying 1897
files for data extraction
updates 1840
finding commands 27
finding database records 1877
finding DesignCenter Online
content 102, 105
finding drawing files 174, 203
finding materials 2078
finding paramenters 847
finding raster images 1798
InfoCenter 4–5, 11
text search and replace 1383
underlay files 1777
section lines 1198
section objects
about 1197
cameras and 1212
creating 1199
grips 1208
jogged segments 1204
live sectioning 1206
object states 1209
plotting 1217
properties 1210
publishing 1217
rendering 1217
saving 1213
viewing 1217
views and 1212
section planes 1197
sectioning
2D sections 1213
3D objects 1213
3D views and 294
cameras and 1212
jogged segments 1204
live sectioning 1197, 1199, 1206
lofting objects and 976, 1117
publishing or plotting cross
sections 1217
section objects 1197
views and 1212
security of files
about 1921
digital ID levels 1929
Seek utility 1984
selecting
3D solid subobjects 1109
classification properties and 703
CP and WP selection 699
customizing object selection 707
database records 1907
default options for 709
deselecting 696
groups 715
highlighted objects 709
irregularly shaped selection
areas 699
layers 480
methods for 699
multiple objects 698
objects 695
output devices 1526, 1560
overlapping objects 1112
preventing object selection 701
previewing selections 709
selection fences 699
selection windows 698
subobject selection filters 1113
suppressing highlighting 1801
tables or table elements 1399
selection fences 699
selection filters 1113, 1191
selection preview 696
selection sets
defined 925
iterative 1907
selection windows 698
self-extracting executable files 1975
self-illuminated materials 2074
self-illumination maps 2086
self-intersections 1194
sending objects to back 545
servers
proxy servers 1943
server-based databases 1869
setting up pages 1524
shaded images
AutoCAD LT functionality 1826
customizing shading 261
Index | 2243
edge display 272
rendering 2109
visual styles 257
shaded UCS icon 576
shaded viewports
plotting options 1540, 1571–1572,
1575
resolution settings 1574
Shaded visual style 257
Shaded with Edges visual style 258
shades (colors) 1272
Shades of Gray visual style 258
shadows
hardware acceleration and 267
lighting and 2013, 2049
raytraced shadows 2131
rendering 2130
shadow mapping 2130
shadow mode settings 2131
visual styles 267
sheet creation templates 436, 454
sheet list tables 444
Sheet Set Manager
about 431
Buzzsaw sites and 1960
eTransmit and 1975
features 433
locking and unlocking sheets 459
publishing options 1636
shortcut menus 434
team collaboration 459
sheet sets
archiving 454
backing up and recovering 437
basing on drawing files 437
creating and modifying sheets 442
creating sets 436
defined 431
DST files 436
eTransmit and 1975
example sheet sets 437
label and callout blocks 443
locking and unlocking 459
metadata 1647
named page setups and 1549
opening drawings within 442
organizing 439
overrides 455
page setups 436, 454
placeholder fields in 1352
properties 451
publishing 454, 1636
reassociating moved sheets 443
saving 460
saving sheet selections 455
sheet names and numbers 443
Sheet Set Manager 433
status 460
subsets and categories 439
team collaboration 459
titles and tables of content 444
transmitting 454
updating 459
views 443
working without Sheet Set
Manager 461
sheets in sheet sets
defined 431
layouts and 436
modifying 442
named page setups and 1549
names and numbers 443
opening 442
page setups 454
placeholder fields in 1352
properties 451
saving sheet selections 455
Sheet Set Manager 433
status 460
subsets 439
templates 436, 454
title sheets 444
views 443
working with 442
shelling solids 1138
shortcut menus
about 65
shortcuts
keytips 53
shots (ShowMotion) 340, 343, 346
ShowMotion 340
SHX fonts 1368–1369, 1371, 1376
2244 | Index
SI lighting units 2010
signatures, digital 1927
silhouette edges 272
single-line text
creating 1304
editing 1378
height 1374
obliquing angle 1375
orientation 1376
styles 1363
sketching freehand lines 661
Sketchy visual style 258
sky
background settings 2057
display options 118
illumination 2057
lighting overview 2006
natural lighting and 2010
slanted text 1375
slicing solids 1010
smooth lighting 262
smooth rendering 1653, 2108
smoothing
mesh objects 1172, 1176, 1189
tessellation 1045
snapping (object snaps) 585
software acceleration 279
solid fills
creating 1260, 1272
overlapping objects 545
PostScript rendering 1814
turning off 540
solid primitives
about 983
boxes 987
cones 990
creating 987
cylinders 993
pyramids 997
tori 999
wedges 989
solids
3D solids 1003
composite solids 1008
converting objects to 966
converting to meshes 1074
creating 983
extruding 969
grips 1115
interferences 1012
lofting 976
modifying 1091
polysolids 1000
revolving 980
separating into original shapes 1137
solid modeling 961
solid primitives 987
sweeping 972
types of 967
sorting
extracted data 1845
layers 494
source vectors for distant lights 2051
space-delimited format files (SDF) 886
spacing
dimension elements 1427
dimensions 1497
equal intervals 615
grid lines 594
previous release formats and 1819
spatial indexes 1711–1712
special characters
block attribute extraction files 886
bullets in lists 1317
file names 199
filtering layers by 495
fractions 1329
inserting 1309
passwords 1922
query operators 1899
tolerance stacks 1329
Unicode text 1958
wildcard characters 5
xref symbols 1704
speckled patterns 2091
speed 277
spelling check 1387
spheres
3D solids 995
mesh spheres 1061
modifying 1144
spherical coordinates 560
Index | 2245
spinning mesh edges 1170
spirals
drawing 682
modifying 797
spline-fit polylines
extending 766
trimming 766
splines
B-splines 1031
calculating geometric data for 623
control points 794
drawing 680
editing 794
fit points 794
grips 735, 794
modifying 695
NURBS splines 1035
offsetting 759
splitting
faces 1190
mesh faces 1181
spotlights
artifical lighting 2013
attenuation rates 2051
beam angle 2050
falloff angle 2050
field angle 2050
hotspot angle 2050
location 2045
overview 2022
rapid decay area 2050
spreadsheets
accessing data from 1401
attribute extraction data files 887
extracting data to 1833, 1856
including in data extractions 1845,
1851
SQL (Structured Query Language) 1897,
1906
SQL Server 1869
squares 654, 695
stacked text (multiline text) 1328
standard DesignCenter parts 104
standard grips 859, 948
Standard lighting workflow
about 2010
converting lights in older
drawings 2063
distant lights 2040
standards (CAD)
about 217
Batch Standards Checker 223
checking for violations 222
converting layers and properties 230
defining 220
plug-ins 218, 220
violations reports 223
standards audits 218, 222
standards check files 223
standards files
about 217
associating with drawings 220
creating 220
standards plug-ins 218, 220
standards violations 218, 222
starting
customizing program startup 154
drawings 165, 1952
starting tables 1404
static coordinate display 550
status bars 50
STB files 1555, 1581, 1595
SteeringWheels 311
Stereolithograph (STL) files 1816
Stereolithography Apparatus (SLA) 1816
STL files 1816
stone textures 2090
stray pixels 721
stretch actions 929–930
stretch-moves 743
stretching
blocks 929
grip methods for 730
objects 770
stretch-moves 743
styles
annotations 1233
data extraction tables 1850
dimensions 1424
leader objects 1346
multiline styles 657
reference points 683
2246 | Index
text 1363
visual 257
subobjects 788, 1119
Subscription Center 7
subsets of sheet sets 439
substitute fonts 1367, 1371
subtracing
composite solids 1008
subtracting
areas 624
objects 1008
regions 688
sunlight
about 2006, 2056
geographic locations 176
natural lighting 2010, 2013
support files
search paths 204
surface models 962
surfaces
3D surfaces 1014
about 1014
associative 968, 1036
blending 1023
bulge magnitude 1016
chamfering 1128
composite solids 1134
composite surfaces 1136
constraints 1039
continuity 1016
converting meshes to 1193
converting objects to 966, 1030
converting to 3D solids 1003, 1005
converting to meshes 1074
creating 1015
edges 1126, 1142
editing 1149
extending 1154
extruding 967, 969, 1116
faces and 1122
filleting 1128, 1154
grips 1115
hidden 2103
interferences 1012
lighting and 2013
lofting 976, 1117
meshes 1067
modifying 1091, 1119
network surfaces 1020, 1022
NURBS surfaces 962, 1014, 1031,
1155
offsetting 1027
patching 1025
planar surfaces 1020
procedural surfaces 962, 1014,
1019, 1030
properties 1017, 1145
reconstructing 1157
rendering 2103, 2108
revolving 980, 1117
separating into original shapes 1137
smoothness 2109
surface analysis 1158
surface models 962
sweeping 972, 1116
trimming 1151
vertices 1132
swap files 282
sweeping objects 972, 1116
switches
customizing startup with 154
switching
dictionaries 1388
drawings 189
gizmos 1095
workspaces 149
Swivel tool 287
symbol libraries
creating 873
inserting blocks 854
updating block definitions 890
symbols
arcs 1485
block attribute extraction data 886
bullets in lists 1317
file names 199
inserting 1309
material conditions 1516
passwords 1922
projected tolerances 1517
query operators 1899
symbols of termination 1420
Index | 2247
tolerances 1456
wildcard characters 5
xref symbols 1704
symmetrical tolerances 1456
synchronizing
database links 1889
syntax
command line switches 156
QuickCalc 632
SQL 1897
system variables
bitcodes and 57
command line changes and 56
command line entry 56
dialog box display and 61
T
tab-delimited text files 1856
table styles 1404
Table toolbar 1399
tables (data extraction)
about 1833
block attributes in 882
detaching 1866
exporting 1855
inserting in drawings 1855
modifying 1863
notifications 1862
organizing data in 1844
previous release formats and 1820
table styles 1850
updating 1858
tables (inserted)
adding rows or columns 1399
annotations 1223
AutoFill feature 1412
breaking into parts 1398
cell styles 1404
column width 1398
creating 1397
data links 1401
defined 1397
deleting rows or columns 1399
editing 1398
fields in 1352
formatting 1405
formulas in 1412
gridlines 1404
grips 1398
inserting blocks in 1407
merging cells 1399
previous release formats and 1820
row height 1398
selecting elements 1399
table styles 1404
text in 1407
title rows 1405
updating linked data 1402
tables (lookup tables) 933
tables of contents 444
Tablet mode 661
tabs in text 1324
tabulated meshes 1070
tangential objects
arcs and lines 666
circles 668
tapering
polylines 671
TARGA files 1613, 1781
target point lights 2015, 2051
targeted weblights 2028
targets of cameras 349, 359
teams
drawing standards 217, 222
master drawings 1665
shared tool palettes 89
sheet sets and 459
templates
attribute extraction templates 883
block template files 1647
database link templates 1880
drawing templates 172
hyperlinks to 1952
label templates 1891
layout templates 426
new layer notification and 502
saving 198
sheet creation templates 436
sheet sets 454
startup routines and 154
web page templates 1983
2248 | Index
temporary files 204
tessellation
about 1045
curved solids 2109
mesh objects 1172
refinement 1045
smoothing 1045
test plots 540
testing
dynamic blocks 909–910
part dimensions 1490
text
alignment 1304, 1348
annotations 1223, 1235
checking spelling 1387
columns in 1331
creating 1300
database labels 1891
dimension text 1437, 1504
editing 1377, 1391
fields 1352
finding and replacing 1383
fonts 1366
height 1374
hyperlinks 1361, 1944
importing 1335
justification 1386
leader objects 1336
mirroring 761, 1377
model space settings 386
model vs. paper space 1385
moving 1378, 1380
multline text (mtext) 1308
obliquing angle 1375
OLE object text 1720
orientation 1256, 1376
overlapping 545
pasting 1335
plotting 540
PostScript rendering 1813
previous release file formats
and 1819
properties 1380
publishing 3D files and 1655
Quick Text mode 540
resizing 1385
scale ratios 387
scaling 1378, 1380
simplified display 540
single-line 1304
tables 1397, 1405, 1407
text editors 1391
text styles 1363
types 1300
text editors 1391
text files
exporting block attribute data
to 883
exporting extracted data to 1856
importing 1335
text styles 1363
about 1363
creating 1364
dimension text 1446
fields 1352
fonts 1366
height 1374
modifying 1364
multiline text 1309, 1315
obliquing angle 1375
orientation in 1376
single-line text 1304
tables 1405
text window 129
text wrap 1309
Texture Editor 2093
textures
compression 2085
map channels 2084
map types 2087
materials libraries 2068
previewing 2093
publishing 3D files and 1652
rendering 2126
scaling 2096
transformations 2094
TGA files
plotting to 1613
thawing layers
layout viewports 413
regenerating drawings 473
themes for web pages 1983
Index | 2249
thickness of objects 1005, 1087
thumbnail previews 34
thumbnails 189
tick marks for dynamic blocks 859
TIFF files
attaching 1781
exporting 1811
plotting to 1613
tiling 1800
tiling
images 1800
simulating 2092
time
angle of sun and 2057
time services 1934
time stamps
digital signatures 1934
tints 1272
title sheets 444
titles
tables 1405
title blocks 1543
tolerances
alignment 1457
annotations 1223, 1239
composite tolerances 1518
datum reference frames 1516
deviation tolerances 1456
geometric tolerances 1513
inspection dimensions 1490
lateral tolerances 1456
limits 1456
material conditions 1516
multiline text 1328
projected tolerances 1517
rounding values 1452
suppressing zeros 1457
symbols 1456
symmetrical tolerances 1456
tone mapping 2010
tool palettes
about 69
adding tools 83
block palettes 874
customizing 83
deleting 84
exporting or importing 89
grouping 86
locked 85
saving 84, 89
settings and options 76
tools 69
toolbars
about 48
display options 142
Quick Access toolbar 48
workspace arrangements 148
tools
adding to palettes 83
adding to toolbars 35
block tools 70
classic menu bar 47
command tools 73
creating 69
creating from DesignCenter
items 98
deleting 84
drawings as 98
modifying 71, 84
precision drawing tools 549
properties 78
rearranging 84
tool flyouts 70
tooltips
AutoSnap 589
Dynamic Input 578
dynamic prompts 580
grips 950
settings 110
tori
3D solids 999
mesh tori 1065
modifying 1144
torus objects
3D solids 999
mesh tori 1065
modifying 1144
Tour Building wheels 319
trace depth 2133, 2137
tracking
object snap tracking 608
polar tracking 602
2250 | Index
specifying points 612
tracking points 609
training 16
transformations (textures) 2094
translating data from DGN files 1741
translation mapping setup 1743
transmittal packages
Buzzsaw sites and 1960
creating 1971
sheet sets 454
underlays and 1779
transmittal setups (saved transmittal
settings) 1974
transparency
back faces and 2105
hatches 1283
layers 474, 543
materials 2073
objects 543
palettes 76
plot options 544, 1540, 1575
raster images 1782, 1792
section planes 1210
visual styles 263
windows 134
transparency maps 2085
transparent commands 55
triangles 654
trimming
3D objects 766
chamfered objects 780
filleted objects 775
hatches 1286
objects 763
replacing trimmed areas 1157
surfaces 1151
True Color colors 514
TrueType fonts
about 1367
PostScript font equivalents 1371
proxy fonts 1372
text height 1374
vertical text 1377
trust hierarchy for digital IDs 1941
TrustedDWG files 183
TXT files
exporting extracted data to 1856
importing 1335
Type C goniometers 2033
typefaces 1366
U
UCS icon
Block Editor 904
coloring 109
display options 576
UCSs (user coordinate systems
ViewCube and 308
UCSs (user coordinate systems)
3D settings 568
3D space and 566
about 561
assigning to viewports 574
AutoCAD LT functionality 1826
Block Editor 904
defining 562
dynamic UCSs 572
elevations 569
multiple viewports 568
paper space and 569
preset systems 569
restoring 569
saving 569
UCS icon 576
workplanes 566
unbounded hatches 1259, 1286
unconstrained drawings 804
underconstrained drawings 804
underground (3D modeling) 118
underlays
about 1749
backgrounds 1766
clipping boundaries 1769
colors 1766
contrast 1766
detaching 1758
DGN files 1749–1750
display settings 1766
DWF files 1749
DWFx files 1749–1750
Index | 2251
External References palette 1774
fade settings 1766
finding files 1777
grips 1763–1764
layers and 1760
listing 1775
monochrome settings 1766
object snaps 1764
PDF files 1749–1750
previous release formats and 1818
Reference Manager and 1780
ribbon contextual tabs 1750
unloading 1759
undoing actions
correcting mistakes 719
layer changes 483
Quick Access toolbar 35
Unicode fonts 1368
Unicode text 1309, 1821, 1958
unions
3D solids 1008
regions 688
separating into original shapes 1137
units of measurement
about 167
converting 636
coordinate unit types 550
data extraction and 1843
dimensions 1446, 1449
model space 385
plot scale 1569
QuickCalc display 632
unloaded raster images 1795
unloading
raster images 1799
underlays 1759
xrefs 1710
unlocking
data extraction tables 1864
layers 473
unreconciled layers
about 504
displaying 501
unreferenced linetypes 523
untrimming surfaces 1151
unused layers 480
up direction 329
Up/Down tool 334
updating
Aerial View images 242
annotations 1227, 1253
associative dimensions 1422
block attributes 882, 894
block definitions 98, 890
block references 894
Communication Center updates 9
data extraction tables 1858, 1862
database records 1877
display 541
fields 1358
labels 1896
legacy materials 2082
linked external data 1852
lookup tables 933
monitoring drawings for
updates 1839
older files for rendering 2147
OLE objects 1718, 1721
Quick View images 191
sheet sets 459
table data 1402
xrefs 1665, 1682
URLs (Uniform Resource Locators)
opening drawings with 1954
saving drawings to 1954
user coordinate system (UCS) 561
user libraries 2068
user parameters 914
user profiles 151
user variables 914
V
validating
3D solids 1139
digital IDs 1941
digital signatures 1937–1938
extracted data 1853
files 1938
surfaces 1158
values
data extraction and 1843
2252 | Index
dimension values 1448
dynamic block parameters 944
key values 1882
lookup tables 934
QuickCalc display 632
suppressing zeros 1453
text fields 1353
variable block attributes 876
variables 638
Vault 1917
VBA macros
tools for 74
vector expressions 642
verifying constraints 816
versions of AutoCAD 160, 1822
vertex editing 1132
vertical dimension text 1443
vertical dimensions 1466
vertical ribbon 38
vertical text 1376
vertices
3D solid vertices 1119
creases 1178
deleting 1132
modifying 1132
multilines 799
redundant vertices 1139
rendering 2108
surface control vertices 1155, 1157
video animations 361
video cards 279
View Object wheels 317
view transitions 110
ViewCube 295
viewers
3D files 1652
DWF and DWFx files 1645
published files 1645
viewpoints in 3D space 254, 293
Viewport Overrides filter 487
viewports
Aerial View window and 241
aligning views in 420
annotations in 1225, 1227
arranging 374, 378
backgrounds in 267
creating 373
current 376
drawing in 377
layer property overrides and 487,
507
layers and 487
layout viewports 406
lighting modes 2005
plot options 1540, 1571
plotting 1575
rendered images in 2119, 2142
rendering 2121
restoring layer states and 506
shadows in 267
UCSs and 568, 574
visual styles in 258, 488
views
2D isometric 2001
3D projection styles 247
3D views 285
Aerial View window 240
aligning in viewports 420
cameras in 348
changing 235
cross sections 1197
database views 1874
flattened 3D objects 1218
layout viewports 410
live sectioning 1212
model space 3D views 251
modifying 401
multiple-view drawing layouts 391
OLE links and 1727
panning 235
partially opened drawings 186
performance issues and 277
plot options 1532
plotting 1561
preset 3D views 253
properties 243
rendering 2121
restoring 243
rotating 423
saving 243
scaling 410
settings 110
Index | 2253
sheet set views 443
startup routines and 154
sun and sky lighting in 2058
viewports 373
zooming 235
virtual memory 282
virtual pens 1601
visibility
annotations 1251
dynamic blocks 953
layers 401, 473
layout viewports and 413
transparency 543
xref layers 1670
visibility parameters 953
visual fidelity
annotative objects and 1231
exporting layout objects and 405
previous release file formats
and 1817
saving files and 198
Visual FoxPro databases 1870
visual styles
animations 361
AutoCAD LT functionality 1826
backgrounds 267
customizing 261
default styles 257
defined 257
edge display 272
face styles 261
layer property overrides and 488
lighting 258
modifying 258
performance issues and 277
plotting 1572
shading 261
shadows 267
Visual Styles Manager 257
VIZ 2064, 2146
volumes 625
W
Walk tool 335
walking through models 291
walls
drawing 1000
water 2092
waves 2092
WCS (world coordinate system)
about 562
weather 2013
web folders
opening drawings from 1954
saving drawings to 1954
web pages
creating 1968, 1983
i-drop content and 1968
templates 1983
themes 1983
weblights
about 2028
distribution in photometric
webs 2029
free weblights 2028
goniometric diagrams 2029
luminous intensity distribution
(LID) 2033
properties 2051
websites
3D physical model printing
services 1660
Buzzsaw sites 1960
DesignCenter Online 101
i-drop content 1983
online content aggregators 105
wedges
3D solids 989
mesh wedges 1062
modifying 1144
wide polylines
drawing 650, 671
extending 766
simplified display 540
tapering segments 671
trimming 766
width
table columns 1397
wildcard characters
filtering layers by 495
searching with 5
2254 | Index
windows
anchored 134
docking 134
interface options 109
resizing 134
selection windows 698
transparency 134
zooming to 236
Windows Clipboard 724
wipeout objects 1295
Wireframe visual style 257
wireframes
about 1083
plot options 1540
plotting 1572
witness lines 1430
WMF files
exporting 1811
importing 1747
pasting 725
wood patterns 2093
workflows
digital design 1982
surface modeling 1156
working sets of reference objects 1693,
1696
workplanes 549, 566
workspaces
about 148
profiles and 150
samples 149
startup routines and 156
switching 149
world coordinate system (WCS) 562
WPolygon selection 699
wrinkled surfaces 1157
X
X axis 109
X-ray visual style 258
X, Y coordinates 549
XGP files 89
xlines 684
filleting 776
modifying 695
XLS files (spreadsheets) 1852, 1856
XPS compatible files 1611
xrefs (external references) 1665
XTP files 89
XY parameters 944
XY planes (workplanes) 255, 549
XYB files 1736
Y
Y axis 109
yellow alert icons 910
Z
Z axis 109
zebra analysis 1162
zero suppression
dimensions 1453
tolerances 1457
ZIP files 1975
Zoom tool 287, 338
zooming
3D views 287
about 235
Aerial View window 240
controlling zooming 236
grid display and 595
layout viewports 401
lineweight display and 535
Index | 2255
2256
