Autodesk Auto CAD Map 3D 2011 Instruction Manual Autocad En
User Manual: autodesk AutoCAD Map 3D - 2011 - Instruction Manual Free User Guide for Autodesk AutoCAD Software, Manual
Open the PDF directly: View PDF ![]() .
.
Page Count: 2180 [warning: Documents this large are best viewed by clicking the View PDF Link!]
- Contents
- Getting Started Guide
- Overview of AutoCAD Map 3D Concepts
- Overview of AutoCAD Map 3D Features
- Create and Assign Geographic Coordinate Systems
- Combine Geospatial Features and Drawing Objects
- Create and Edit Features and Drawing Objects
- Search and Filter Data
- View and Edit Attribute Data
- Use Metadata
- Organize Data
- Style Data
- Theme and Analyze Data
- Manage Data
- Share and Publish Data
- Customize Your Working Environment
- Extend Functionality Using Open Source and API
- Finding Information
- AutoCAD Map 3D Sample Data and Templates
- User's Guide
- Setting Up
- Overview of Setting Up
- Setting Up AutoCAD Map 3D
- Overview of Setting Up AutoCAD Map 3D
- Setting Up Users and Assigning Rights
- Customizing Your Work Environment
- Creating New Coordinate Systems
- Defining Coordinate Systems
- Overview of Creating New Coordinate Systems
- Defining a Global Coordinate System
- Defining a New Datum
- Defining an Ellipsoid
- Creating a Coordinate System Category
- Modifying or Deleting a Global Coordinate System
- Modifying or Deleting a Datum
- Modifying or Deleting an Ellipsoid
- Modifying or Deleting a Coordinate System Category
- Grid Data Files and Datum Shifts
- Overview of Grid Data Files and Datum Shift Issues
- Grid Data Catalog (GDC) Files
- Grid Data Files for the United States
- Grid Data Files for France
- Grid Data Files for Australia and New Zealand
- Australian Datum Transformation and Coordinate System Changes
- Datum Shift Issues for North American Users
- Coordinate System Files
- Defining Coordinate Systems
- Setting Up Object Classification
- Setting Up for Digitizing
- Setting Up Your Map File
- Overview of Setting Up Your Map File
- Logging Into AutoCAD Map 3D
- Assigning Coordinate Systems
- Overview of Coordinate Systems
- Assigning a Coordinate System to a Source Drawing
- Assigning a Coordinate System to the Current Drawing
- Using a Geodetic Coordinate System
- Removing an Assigned Coordinate System
- Viewing the Assigned Coordinate System for a Source Drawing
- Transforming the Coordinate System of a Drawing
- Attaching Drawings
- Setting Up a Query Library
- Setting Up Annotation Templates
- Setting Up Object Data
- Using Data from Feature Sources
- Setting Up Data Sources for Drawings
- Setting Options
- Overview of Setting Options
- Setting Task Pane Options
- Setting Drawing Options
- Setting Multi-user Options
- Setting System Options
- Setting Coordinate System Options
- Setting Coordinate Tracker Options
- Setting Coordinate Geometry Options
- Setting Data Source Options for Drawings
- Setting Data View Options
- Setting Geospatial Feature Editing Options
- Setting Metadata Options
- Setting InfoCenter Options
- Associating Database Versions with File Extensions
- Setting Query Options (DWG)
- Using Associative Hatch
- Saving Option Settings
- Setting Raster Image Options
- Customizing and Automating Import and Export
- Setting Up and Running Workflows
- Bringing In Data
- Overview of Bringing In Data
- Before You Bring In Data
- Bringing in GIS Features
- Overview of Bringing In GIS Features
- Filtering Features When You Add Them to a Map
- Changing Coordinate Systems
- Bringing In Features from Oracle
- Bringing In Features from ArcSDE
- Bringing In Features from SQL Server
- Bringing In Features from SQL Server Spatial
- Bringing In Features From SQLite
- Bringing In Features from MySQL
- Bringing In Features from SHP
- Bringing In Features from SDF
- Bringing in Features from PostgreSQL/PostGIS
- Accessing Data from ODBC
- Bringing In Features from WFS
- Repairing Broken Feature Connections
- Bringing In Drawing Data From DWG Files
- Overview of Bringing in Drawing Data From DWG Files
- Bringing In Drawing Objects from AutoCAD Layers
- Bringing In Drawing Objects by Object Class
- Bringing In Drawing Objects by Location
- Bringing In Drawing Objects by Property
- Bringing In Drawing Objects Based on Attached Data
- Bringing In Drawing Objects Based on Topology
- Combining Conditions
- Bringing in Survey Data
- Converting Data From Other Formats to Drawing Objects
- Overview of Converting Geospatial Data to Drawing Objects
- Styling Drawing Data Converted From a Geospatial Data Store
- Supported Import Formats
- Importing Autodesk SDF (Spatial Data Files)
- Importing Autodesk SDF 2
- Importing DXF Files
- Importing From ESRI ArcSDE
- Importing ESRI Arc/INFO Coverages
- Importing ESRI Shape Files
- Importing MapInfo MIF/MID Files
- Importing MapInfo TAB Files
- MicroStation Design (DGN) Versions 7 and 8
- Importing From Oracle
- Importing Geographic Markup Language (GML) Files
- Importing SDTS (Spatial Data Transfer Standard) Files
- Importing SQLite Files
- Importing VPF (Vector Product Format) Files
- Specifying an Area to Import
- Specifying an AutoCAD Layer During Import
- Assigning an Object Class During Import
- Performing a Coordinate Conversion During Import
- Importing Attribute Data
- Specifying How to Import Points
- Importing Polygons
- Creating Centroids for Polygons
- Importing Objects with Links to an External Database
- Displaying Attribute Data as Text
- Adding Rasters and Surfaces
- Overview of Adding Rasters and Surfaces
- Adding Raster-Based Surfaces to Your Map
- Adding 2D Rasters
- Adding an Image from a WMS (Web Map Service)
- Making an Image Transparent
- Specifying Image Insertion Point
- Using Other Raster Image Formats
- Inserting Raster Images
- Managing Raster Images
- Hiding, Unloading, Detaching, and Erasing Images
- Modifying Raster Images
- Overview of Modifying Raster Images
- Selecting an Image
- Displaying Image Frames
- Changing Image Alignment
- Adjusting Image Brightness, Contrast, and Fade
- Changing Image Display Quality and Speed
- Making an Image Transparent
- Modifying the Correlation Settings for an Image
- Modifying Other Image Properties
- Clipping an Image
- Joining Data to GIS Features
- Adding Attributes to Drawing Objects
- Storing Attribute Data in the Drawing (Object Data)
- Overview of Linking Database Records to Objects
- Creating a Link Template
- Opening a Linked Database Table
- Manually Linking Database Records to Objects
- Automatically Linking Database Records to Objects
- Converting Object Data to Database Links
- Editing Database Links
- Editing a Link Template
- Using Open Source FDO Providers
- Bringing In AutoCAD Civil 3D Data
- Managing Data
- Overview of Managing Data
- About Geospatial Feature Classes, Data Stores, and Schemas
- Overview of Geospatial Data
- Working with FDO Schemas
- Working with Oracle Data
- Working with SQL Server Data
- Working with SQL Server Spatial Data
- Working with SQLite Data
- Working with MySQL Data
- Working with SDF Data
- Working with SHP Data
- Working with PostgreSQL/PostGIS Data
- Working with ODBC Data
- Working with ESRI ArcSDE Data
- Working with WFS Data
- Working with Feature Sources
- Working with Schemas
- Migrating Data
- Visualization and Styling
- Creating and Editing Data
- Overview of Creating and Editing Data
- Working with Features
- Working with Drawing Objects
- Overview of Working with Drawing Objects
- Editing Data in Attached Drawings
- Sharing Attached Drawings
- Editing and Saving Objects in Attached Drawings
- Overview of Editing and Saving Objects in Attached Drawings
- Zooming to the Extents of Selected Drawings
- Viewing All Objects in Selected Attached Drawings
- Editing Objects in Attached Drawings
- Adding an Object to the Save Set
- Viewing Objects in the Save Set
- Saving Queried Objects Back to Attached Drawings
- Saving New Objects to Attached Drawings
- Saving Objects to the Current Drawing
- Saving Objects to a New Drawing
- Removing an Object from the Save Set
- Solving Problems When Saving Back to Attached Drawings
- Setting Save Back Options
- Cleaning Up Drawing Data
- Creating, Editing, and Managing Topologies
- Creating Topologies
- Editing Topologies
- Overview of Editing a Topology
- Editing a Node
- Editing a Link
- Editing a Polygon
- Changing the Appearance of Points
- Editing the Direction for a Link
- Editing the Resistance for a Link or Node
- Adding a Node
- Adding a Link
- Adding a Polygon
- Creating Centroids for Polygons
- Deleting Links, Nodes, and Polygons
- Updating a Topology
- Editing a Partial Topology
- Creating Closed Polylines from a Polygon Topology
- Managing Topologies
- Overview of Managing Topologies
- Loading or Unloading Topologies
- Highlighting and Identifying Topology
- Viewing Topology Data
- Viewing Topology Statistics
- Saving Topology to Source Drawings
- Correcting or Completing a Topology
- Saving and Loading Settings Using Profiles
- Renaming Topologies and Changing Their Descriptions
- Deleting Topologies
- Using Map Editing Tools
- Overview of Using the Map Editing Tools
- Moving, Rotating, and Scaling an Object
- Rubber Sheeting Two Maps
- Defining the Text Insertion Point
- Filling a Closed Polyline
- Breaking Objects at a Closed Boundary
- Creating an Enlarged Map Section
- Trimming Objects at a Boundary
- Manually Editing Objects
- Creating Centroids for Polylines
- Matching Map Edges
- Digitizing Points Using Coordinates
- Working with Polygon Objects
- Adding and Deleting Annotation
- Using Object Classification
- Working with Survey Data
- Working With Point Cloud Data
- Entering Coordinate Geometry
- Overview of Coordinate Geometry Commands
- Using Angle and Distance to Specify a Point
- Using Bearing and Distance to Specify a Point
- Using Bearings from Two Points to Specify a Point
- Using Deflection and Distance to Specify a Point
- Using Distances from Two Points to Specify a Point
- Using Azimuth and Distance to Specify a Point
- Using Distance and Offset from a Line to Specify a Point
- Creating an Inverse Report
- Working with Attribute Data and Object Data
- Digitizing Objects
- Annotating Maps
- Analyzing Data
- Overview of Analyzing Data
- Getting Information About Features and Objects
- Getting Information about Features
- Overview of the Data Table
- Using Expressions to Select Feature Data
- Creating Calculated Properties
- Viewing Data for a Selected Layer, Join, Unfiltered Feature Class, or Non-Spatial Data Table
- Highlighting Features Using the Data Table
- Highlighting Data Table Rows Using the Map
- Zooming to a View Using the Data Table
- Exporting Data from the Data Table
- Getting Information About Drawing Objects
- Getting Information about Features
- Measuring and Tracking Coordinates
- Creating Themes
- Analyzing Raster-Based Surfaces
- Finding and Selecting Data
- Finding and Selecting Features
- Finding and Querying Drawing Objects
- Overview of Finding and Querying Drawing Objects
- Using Quick Select to Select Drawing Objects
- Finding Records in a Database Linked to Drawing Objects
- Querying Objects from Attached Drawings
- Overview of Queries
- Finding All Drawing Objects in a Specified Location
- Finding All Drawing Objects Containing a Specific Property
- Finding All Drawing Objects Containing Specific Data
- Finding All Drawing Objects Containing Specific SQL Information
- Combining Drawing Query Conditions
- Editing a Drawing Query Condition
- Altering the Properties of Queried Drawing Objects
- Overview of Altering the Properties of Queried Drawing Objects
- Altering All Drawing Objects in the Same Way
- Altering Properties Using Object Properties
- Altering Object Properties Using Object Data
- Altering Object Properties Using Linked Data
- Creating a Range Table
- Defining an Expression
- Adding Text to Queried Drawing Objects
- Modifying the Text Insertion Point for a Drawing Object
- Filling Queried Drawing Objects with a Hatch Pattern
- Changing the Color of Blocks
- Modifying a Property Alteration Definition
- Executing Drawing Queries
- Improving Drawing Query Performance
- Troubleshooting Drawing Queries
- Analyzing Feature Classes
- Analyzing Drawing Topologies
- Publishing and Sharing Maps
- Overview of Publishing and Sharing
- Publishing Maps
- Overview of Publishing Maps
- Adding a Reference Grid to a Map
- Publishing a Map to a Plotter
- Publishing to DWF
- Publishing to PDF
- Publishing to a Web Page
- Using eTransmit
- Publishing to MapGuide
- Viewing Publish to MapGuide Results
- Publishing Map Books
- Converting and Exporting
- Overview of Converting and Exporting
- Supported Objects
- Supported Formats
- Exporting To Autodesk SDF (Spatial Data File)
- Exporting DWG Data to SDF2 Format
- Exporting To ESRI Arc/INFO Coverages
- Exporting to ESRI ArcSDE
- Exporting to ESRI SHP
- Exporting To Geographic Markup Language (GML)
- Exporting To MapInfo MIF/MID
- Exporting To MapInfo TAB
- Exporting To MicroStation Design (DGN) Versions 7 and 8
- Exporting to Multiple Classes
- Exporting To Shape Multiclass
- Exporting To SQLite
- Exporting To VML (Vector Markup Language)
- Exporting Point Cloud Data
- Mapping Drawing Attributes to Feature Class Properties
- Exporting Text Enclosed in a Polyline
- Exporting Polygons from a Polygon Topology
- Saving Drawing Objects to a DXF File
- Exporting Maps to DWG Format
- Exporting DWG Data to an FDO Data Store
- Exporting DWG Data to an Image Format
- Moving DWG Data to a Spatial Data Store and Back Again
- Saving or Exporting a Display Manager Layer
- Exporting Survey Points to a LandXML File
- Exporting and Printing Attribute Data
- Working with Metadata
- Setting Up
- Reference Guide
- Command Reference
- Expression Evaluator
- Expression Builder
- Dialog Boxes
- Analyzing Data Dialog Boxes
- Annotation Dialog Boxes
- Autodesk MapGuide Dialog Boxes
- Cleaning Up Maps Dialog Boxes
- Coordinate Systems Dialog Boxes
- Data Connect Dialog Boxes
- Create a Join / Edit a Join dialog box
- Create Data Store dialog box
- Edit Spatial Contexts
- Feature Information dialog box
- Feature Source Scope
- Feature Source Administration dialog box
- Feature Source Connection dialog box
- Manage Layer Data dialog box
- Save Features dialog box
- Select Coordinate System dialog box
- User Credentials dialog box
- View/Create Query Statement dialog box
- Data Table Dialog Box
- Digitizing Dialog Boxes
- Display Manager Dialog Boxes
- MAPDISPLAYLIBRARY (Display Library command)
- MAPDISPLAYMANAGER (Display Manager command)
- Alter Block Insertion dialog box
- Alter Line Format dialog box
- Alter Linetype dialog box
- Alter Lineweight dialog box
- Alter Plotstyle dialog box
- Copy Scale dialog box
- Define Hatch dialog box
- Define Text dialog box
- Edit Text Instance dialog box
- Import Old Theme dialog box
- New Scale dialog box
- Range of Values dialog box
- Select Display Element dialog box
- Source Drawing Scope dialog box
- Style Band dialog box
- Style Label dialog box
- Style Line dialog box
- Style Point dialog box
- Style Polygon dialog box
- Style Text Layer dialog box
- Thematic Mapping dialog box
- Thematic Values dialog box
- Theme dialog box
- Editing Maps Dialog Boxes
- ADEFILLPOLYG (Fill Closed Polyline command)
- ADERSHEET (Rubber Sheet command)
- ADETRANSFORM (Transform command)
- MAPCOGO
- MAPFEATUREMERGE
- MAPFEATURESPLIT
- MAPIGNORESPLITMERGERULES
- MAPLINESTRINGCREATE
- MAPLINESTRINGEDIT
- MAPMULTILINESTRINGCREATE
- MAPMULTILINESTRINGEDIT
- MAPMULTIPOINTCREATE
- MAPMULTIPOINTEDIT
- MAPMULTIPOLYGONCREATE
- MAPMULTIPOLYGONEDIT
- MAPPOINTCREATE
- MAPPOLYGONCREATE
- MAPPOLYGONEDIT
- Break Objects at Boundary dialog box
- COGO Input dialog box
- Split and Merge Rules dialog box
- Trim Objects At Boundary dialog box
- External Databases Dialog Boxes
- Associate Database Versions dialog box
- Column dialog box
- Column Values dialog box
- Configure Data Source dialog box
- Connect Data Source dialog box
- Convert Object Data to Database Links dialog box
- Define Link Template dialog box (MAPOD2ASE)
- Define Link Template dialog box (MAPDEFINELT)
- Source dialog box
- Disconnect Data Source dialog box
- Header/Footer dialog box
- Link Template Properties dialog box
- Page Setup dialog box
- Select Database Version dialog box
- Select Existing Link Template dialog box
- Select Link Template dialog box
- Select Link Templates dialog box
- Select Query dialog box
- Select Table dialog box (MAPBROWSETBL)
- Sort dialog box
- Table Filter dialog box
- Table Filter History dialog box
- Table Properties dialog box
- Zoom Scale dialog box
- Import Export Dialog Boxes
- Attribute Data dialog box
- Block Mapping dialog box
- Conflict Resolution dialog box
- Coordinate System Translation dialog box
- Define Link Template dialog box (MAPIMPORT4)
- Export dialog box
- Export to LandXML dialog box
- Object Class Attribute Mapping dialog box
- Import dialog box
- Import Data Options dialog box (MAPIMPORT4)
- Import ASCII Points dialog box
- LandXML Coordinate System dialog box
- Layer Mapping dialog box (MAPIMPORT4)
- Layer Mapping dialog box (Import)
- Link Template to Export dialog box
- Map Data Elements to Block Name dialog box (MAPIMPORT4)
- Map Data Elements to Layers dialog box (MAPIMPORT4)
- Map Data Elements to SQL dialog box (MAPIMPORT4)
- Map Export dialog box
- Map Export Options dialog box
- New Property Data Type dialog box
- Feature Class Property Mapping dialog box
- Property Value Mapping
- Select Attributes dialog box
- Map Import dialog box
- New Layer dialog box
- Object Data Table dialog box (Export)
- Object Data Table dialog box (Import)
- Object Data/External Database Mapping dialog box
- Point Mapping dialog box
- Design File Input Settings
- Design File Output Settings
- Managing Data Dialog Boxes
- Metadata Dialog Boxes
- Metadata Viewer
- Metadata Editor
- Attribute Editor
- Metadata Options dialog box
- Import Metadata Options dialog box
- Export Metadata dialog box
- Create Metadata Template dialog box
- Compound Element Metadata Editors
- Citation Information Editor (FGDC Metadata)
- Time Period Information Editor (FGDC Metadata)
- Contact Information Editor (FGDC Metadata)
- Spatial Data Organization Information Editor (FGDC Metadata)
- Horizontal Coordinate System Definition Editor (FGDC Metadata)
- Attribute Domain Values Editor (FGDC Metadata)
- Standard Order Process Editor (FGDC Metadata)
- Responsible Party Editor (ISO Metadata)
- The Citation Editor (ISO Metadata)
- Object Classification Dialog Boxes
- MAPSELECTCLASSIFIED (Select Classified Objects command)
- MAPSELECTUNCLASSIFIED (Select Unclassified Objects command)
- MAPSELECTUNDEFINED (Select Undefined Objects command)
- Attach Object Class Definition File dialog box
- Classified Property List dialog box
- Classify dialog box
- Classify Objects dialog box
- Color Range Editor dialog box
- Define Object Classification dialog box
- Layer Range Editor dialog box
- Linetype Range Editor dialog box
- Lineweight Range Editor dialog box
- New Object Class Definition File dialog box
- New Property dialog box
- Plotstyle Range Editor dialog box
- Object Data Dialog Boxes
- Polygon Object Dialog Boxes
- Printing and Publishing Dialog Boxes
- Query Dialog Boxes
- Alternate Font dialog box
- Change Category dialog box
- Data Condition dialog box
- Define New Category dialog box
- Define Query dialog box
- Define Range Table dialog box
- Define Text dialog box
- Hatch Options dialog box
- Load Internal Query dialog box
- Location Condition dialog box
- New Range Table dialog box
- Output Report Options dialog box
- Property Condition dialog box
- Query Library Administration dialog box
- Rename Category dialog box
- Rename Range Table dialog box
- Run Library Query dialog box
- Save Current Query dialog box
- Set Property Alterations dialog box
- SQL Condition History dialog box
- SQL Link Condition dialog box
- Type SQL Condition dialog box
- Raster Image Dialog Boxes
- Saving Objects Dialog Boxes
- Survey Dialog Boxes
- Setting Map Options Dialog Boxes
- MAPABOUT (About AutoCAD Map 3D command)
- MAPAUTOCHECKOUT
- MAPDOCKWSPACE (Dock Task Pane command)
- MAPEDITSETAUTO
- MAPFEATUREEDITTOOLS
- MAPWSFOCUS
- MAPWSPACE (Task Pane command)
- MAPWSREFRESH
- AutoCAD Map Options dialog box
- Coordinate Geometry Setup dialog box
- Define/Modify Drawing Set dialog box
- Drawing Maintenance dialog box
- Drawing Set Display Filter dialog box
- Drawing Settings dialog box
- Drawing Statistics dialog box
- Drive Alias Administration dialog box
- Feature Editing Options dialog box
- Generate Object Data Index dialog box
- Index Maintenance dialog box
- Remove Object Data Index dialog box
- Select Alias dialog box
- Undefined Alias Referenced dialog box
- User Administration dialog box
- User Information dialog box
- User Login dialog box
- Topology Dialog Boxes
- MAPEDITDIR (Edit Direction command)
- MAPEDITRES1 (Edit Direct Resistance command)
- MAPEDITRES2 (Edit Reverse Resistance command)
- MAPLINKADD (Add Topology Link command)
- MAPLINKDEL (Delete Topology Link command)
- MAPLINKEDIT (Edit Topology Link command)
- MAPLINKREV (Reverse Direction of Topology Link command)
- MAPLINKUPD (Update Topology Link command)
- MAPNODADD (Add Topology Node command)
- MAPNODDEL (Delete Topology Node command)
- MAPNODEDIT (Edit Topology Node command)
- MAPNODINS (Insert Topology Node command)
- MAPNODUPD (Update Topology Node command)
- MAPPOLYADD (Add Topology Polygon command)
- MAPPOLYDEL (Delete Topology Polygon command)
- MAPPOLYUPD (Update Topology Polygon command)
- AutoCAD Map Confirmation dialog box - MAPTOPOADMIN Delete
- AutoCAD Map Confirmation dialog box - MAPTOPOEDIT
- AutoCAD Map Confirmation dialog box - MAPTOPOADMIN Rename
- Centroid Objects dialog box
- Create Closed Polylines dialog box
- Create Network Topology - Create New Nodes dialog box
- Create Network Topology - Select Links dialog box
- Create Network Topology - Select Nodes dialog box
- Create Node Topology - Select Nodes dialog box
- Create Polygon Topology - Create New Centroids dialog box
- Create Polygon Topology - Create New Nodes dialog box
- Create Polygon Topology - Select Centroids dialog box
- Create Polygon Topology - Select Links dialog box
- Create Polygon Topology - Select Nodes dialog box
- Create Polygon Topology - Set Error Markers dialog box
- Create Topology - Select Topology dialog box
- Create Topology Warning dialog box
- Delete Topology dialog box
- Edit Direct Resistance dialog box
- Edit Direction dialog box
- Edit Reverse Resistance dialog box
- Edit Topology dialog box
- Link Objects dialog box
- Load Topology Conflict dialog box
- Load Topology dialog box
- Load Topology From Source Drawing dialog box
- Network Topology Analysis - Choose Locations dialog box
- Network Topology Analysis - Output dialog box
- Network Topology Analysis - Resistance and Direction dialog box
- Network Topology Analysis - Select Method dialog box
- Node Objects dialog box - Network and Polygon Topologies)
- Node Objects dialog box (Node topology)
- Rename Topology dialog box
- Select Data dialog box - Topology Overlay
- Topology Buffer - Create New Centroids and Nodes dialog box
- Topology Buffer - New Topology dialog box
- Topology Buffer - Set Buffer Distance dialog box
- Topology Dissolve - Create New Centroids and Nodes dialog box
- Topology Dissolve - Create Nodes dialog box
- Topology Dissolve - New Topology dialog box
- Topology Dissolve - Object Data dialog box
- Topology Dissolve - Set Parameter dialog box
- Topology Overlay Analysis - Analysis Type dialog box
- Topology Overlay Analysis - Create New Centroids and Nodes dialog box
- Topology Overlay Analysis - Create Nodes dialog box
- Topology Overlay Analysis - Output Topology dialog box
- Topology Overlay Analysis - Output Attributes dialog box
- Topology Overlay Analysis - Select Overlay Topology dialog box
- Topology Query dialog box
- Topology Query Result dialog box
- Topology Selection dialog box
- Topology Statistics dialog box
- Viewing Dialog Boxes
- Workflow Designer
- MAPWORKFLOWOPEN
- MAPWORKFLOWRUN
- Workflow Designer
- Workflow Activity Input dialog boxes
- Add Feature Layer
- Add Group
- Add Map
- Change Feature Layer Properties
- Change Feature Layer Symbol
- Change Group Properties
- Connect To Data Store
- Create Buffer Layer
- Display Feature Attributes
- Highlight Features/Remove Highlighting
- List Current Connections
- List Feature Classes
- List Feature Layer Properties
- Load Layer File
- Perform Overlay
- Remove Connection
- Remove Feature Layer
- Remove Group
- Remove Map
- Rename Map
- Run AutoCAD Command
- Run Workflow
- Save Layer File
- Select Features
- Switch Map
- Zoom To Extents
- Programming Interfaces
- Glossary
- Index

AutoCAD® Map 3D 2011
User's Guide
April 2010
©2010 Autodesk, Inc. All Rights Reserved. Except as otherwise permitted by Autodesk, Inc., this publication, or parts thereof, may not be
reproduced in any form, by any method, for any purpose.
Certain materials included in this publication are reprinted with the permission of the copyright holder.
Trademarks
The following are registered trademarks or trademarks of Autodesk, Inc., and/or its subsidiaries and/or affiliates in the USA and other countries:
3DEC (design/logo), 3December, 3December.com, 3ds Max, Algor, Alias, Alias (swirl design/logo), AliasStudio, Alias|Wavefront (design/logo),
ATC, AUGI, AutoCAD, AutoCAD Learning Assistance, AutoCAD LT, AutoCAD Simulator, AutoCAD SQL Extension, AutoCAD SQL Interface,
Autodesk, Autodesk Envision, Autodesk Intent, Autodesk Inventor, Autodesk Map, Autodesk MapGuide, Autodesk Streamline, AutoLISP, AutoSnap,
AutoSketch, AutoTrack, Backburner, Backdraft, Built with ObjectARX (logo), Burn, Buzzsaw, CAiCE, Civil 3D, Cleaner, Cleaner Central, ClearScale,
Colour Warper, Combustion, Communication Specification, Constructware, Content Explorer, Dancing Baby (image), DesignCenter, Design
Doctor, Designer's Toolkit, DesignKids, DesignProf, DesignServer, DesignStudio, Design Web Format, Discreet, DWF, DWG, DWG (logo), DWG
Extreme, DWG TrueConvert, DWG TrueView, DXF, Ecotect, Exposure, Extending the Design Team, Face Robot, FBX, Fempro, Fire, Flame, Flare,
Flint, FMDesktop, Freewheel, GDX Driver, Green Building Studio, Heads-up Design, Heidi, HumanIK, IDEA Server, i-drop, ImageModeler, iMOUT,
Incinerator, Inferno, Inventor, Inventor LT, Kaydara, Kaydara (design/logo), Kynapse, Kynogon, LandXplorer, Lustre, MatchMover, Maya,
Mechanical Desktop, Moldflow, Moonbox, MotionBuilder, Movimento, MPA, MPA (design/logo), Moldflow Plastics Advisers, MPI, Moldflow
Plastics Insight, MPX, MPX (design/logo), Moldflow Plastics Xpert, Mudbox, Multi-Master Editing, Navisworks, ObjectARX, ObjectDBX, Open
Reality, Opticore, Opticore Opus, Pipeplus, PolarSnap, PortfolioWall, Powered with Autodesk Technology, Productstream, ProjectPoint, ProMaterials,
RasterDWG, RealDWG, Real-time Roto, Recognize, Render Queue, Retimer,Reveal, Revit, Showcase, ShowMotion, SketchBook, Smoke, Softimage,
Softimage|XSI (design/logo), Sparks, SteeringWheels, Stitcher, Stone, StudioTools, ToolClip, Topobase, Toxik, TrustedDWG, ViewCube, Visual,
Visual LISP, Volo, Vtour, Wire, Wiretap, WiretapCentral, XSI, and XSI (design/logo).
All other brand names, product names or trademarks belong to their respective holders.
Disclaimer
THIS PUBLICATION AND THE INFORMATION CONTAINED HEREIN IS MADE AVAILABLE BY AUTODESK, INC. "AS IS." AUTODESK, INC. DISCLAIMS
ALL WARRANTIES, EITHER EXPRESS OR IMPLIED, INCLUDING BUT NOT LIMITED TO ANY IMPLIED WARRANTIES OF MERCHANTABILITY OR
FITNESS FOR A PARTICULAR PURPOSE REGARDING THESE MATERIALS.
Published by:
Autodesk, Inc.
111 McInnis Parkway
San Rafael, CA 94903, USA
Contents
Chapter 1 Getting Started Guide . . . . . . . . . . . . . . . . . . . . . . . 1
Overview of AutoCAD Map 3D Concepts . . . . . . . . . . . . . . . . . 1
The AutoCAD Map 3D Window . . . . . . . . . . . . . . . . . . . 2
Map Files and Data Sources . . . . . . . . . . . . . . . . . . . . . . 3
Map Files and Display Maps . . . . . . . . . . . . . . . . . . . . . 7
Geospatial Features and Drawing Objects . . . . . . . . . . . . . . 9
Overview of AutoCAD Map 3D Features . . . . . . . . . . . . . . . . . 10
Create and Assign Geographic Coordinate Systems . . . . . . . . 11
Combine Geospatial Features and Drawing Objects . . . . . . . . 12
Create and Edit Features and Drawing Objects . . . . . . . . . . . 19
Search and Filter Data . . . . . . . . . . . . . . . . . . . . . . . . 24
View and Edit Attribute Data . . . . . . . . . . . . . . . . . . . . 27
Use Metadata . . . . . . . . . . . . . . . . . . . . . . . . . . . . 30
Organize Data . . . . . . . . . . . . . . . . . . . . . . . . . . . . 31
Style Data . . . . . . . . . . . . . . . . . . . . . . . . . . . . . . 34
Theme and Analyze Data . . . . . . . . . . . . . . . . . . . . . . 37
Manage Data . . . . . . . . . . . . . . . . . . . . . . . . . . . . 43
Share and Publish Data . . . . . . . . . . . . . . . . . . . . . . . 46
Customize Your Working Environment . . . . . . . . . . . . . . 49
Extend Functionality Using Open Source and API . . . . . . . . . 51
Finding Information . . . . . . . . . . . . . . . . . . . . . . . . . . . 51
Watching Videos . . . . . . . . . . . . . . . . . . . . . . . . . . 51
Using InfoCenter . . . . . . . . . . . . . . . . . . . . . . . . . . 55
Using the Help . . . . . . . . . . . . . . . . . . . . . . . . . . . 57
iii
Watching the Welcome Screen Videos . . . . . . . . . . . . . . . 57
Navigating the User's Guide . . . . . . . . . . . . . . . . . . . . . 57
Using the Tutorials . . . . . . . . . . . . . . . . . . . . . . . . . 58
Getting Help with AutoCAD . . . . . . . . . . . . . . . . . . . . 58
New in This Release . . . . . . . . . . . . . . . . . . . . . . . . . 59
Using Other Sources of Information . . . . . . . . . . . . . . . . 59
Participating in Autodesk Training . . . . . . . . . . . . . . . . . 60
Printing This Documentation . . . . . . . . . . . . . . . . . . . . 61
AutoCAD Map 3D Sample Data and Templates . . . . . . . . . . . . . 62
Sample Real-World Data . . . . . . . . . . . . . . . . . . . . . . 63
Templates for Maps and Map Books . . . . . . . . . . . . . . . . 66
Symbols for Water, Gas, Electric, and Emergency Response . . . . 69
Symbols for General Use . . . . . . . . . . . . . . . . . . . . . . 70
North Arrows, Scale Bars, and Other Map Elements . . . . . . . . 71
Geospatial Data Available for Purchase . . . . . . . . . . . . . . . 72
Tutorial Sample Files . . . . . . . . . . . . . . . . . . . . . . . . 73
AutoCAD Samples . . . . . . . . . . . . . . . . . . . . . . . . . . 73
User's Guide . . . . . . . . . . . . . . . . . . . . . . . . . 75
Chapter 2 Setting Up . . . . . . . . . . . . . . . . . . . . . . . . . . . . . 77
Overview of Setting Up . . . . . . . . . . . . . . . . . . . . . . . . . . 77
Setting Up AutoCAD Map 3D . . . . . . . . . . . . . . . . . . . . . . . 80
Overview of Setting Up AutoCAD Map 3D . . . . . . . . . . . . . 81
Setting Up Users and Assigning Rights . . . . . . . . . . . . . . . 82
Customizing Your Work Environment . . . . . . . . . . . . . . . 84
Creating New Coordinate Systems . . . . . . . . . . . . . . . . . 89
Setting Up Object Classification . . . . . . . . . . . . . . . . . 116
Setting Up for Digitizing . . . . . . . . . . . . . . . . . . . . . . 130
Setting Up Your Map File . . . . . . . . . . . . . . . . . . . . . . . . 139
Overview of Setting Up Your Map File . . . . . . . . . . . . . . 139
Logging Into AutoCAD Map 3D . . . . . . . . . . . . . . . . . . 141
Assigning Coordinate Systems . . . . . . . . . . . . . . . . . . . 142
Attaching Drawings . . . . . . . . . . . . . . . . . . . . . . . . 154
Setting Up a Query Library . . . . . . . . . . . . . . . . . . . . 173
Setting Up Annotation Templates . . . . . . . . . . . . . . . . . 185
Setting Up Object Data . . . . . . . . . . . . . . . . . . . . . . 198
Using Data from Feature Sources . . . . . . . . . . . . . . . . . 204
Setting Up Data Sources for Drawings . . . . . . . . . . . . . . . 204
Setting Options . . . . . . . . . . . . . . . . . . . . . . . . . . . . . 216
Overview of Setting Options . . . . . . . . . . . . . . . . . . . . 217
Setting Task Pane Options . . . . . . . . . . . . . . . . . . . . . 220
Setting Drawing Options . . . . . . . . . . . . . . . . . . . . . 223
Setting Multi-user Options . . . . . . . . . . . . . . . . . . . . . 226
Setting System Options . . . . . . . . . . . . . . . . . . . . . . 228
iv | Contents
Setting Coordinate System Options . . . . . . . . . . . . . . . . 230
Setting Coordinate Tracker Options . . . . . . . . . . . . . . . . 232
Setting Coordinate Geometry Options . . . . . . . . . . . . . . 233
Setting Data Source Options for Drawings . . . . . . . . . . . . 235
Setting Data View Options . . . . . . . . . . . . . . . . . . . . . 237
Setting Geospatial Feature Editing Options . . . . . . . . . . . . 239
Setting Metadata Options . . . . . . . . . . . . . . . . . . . . . 241
Setting InfoCenter Options . . . . . . . . . . . . . . . . . . . . 242
Associating Database Versions with File Extensions . . . . . . . 242
Setting Query Options (DWG) . . . . . . . . . . . . . . . . . . . 244
Using Associative Hatch . . . . . . . . . . . . . . . . . . . . . . 246
Saving Option Settings . . . . . . . . . . . . . . . . . . . . . . . 248
Setting Raster Image Options . . . . . . . . . . . . . . . . . . . 249
Customizing and Automating Import and Export . . . . . . . . 260
Setting Up and Running Workflows . . . . . . . . . . . . . . . . . . . 274
Overview of Workflows . . . . . . . . . . . . . . . . . . . . . . 275
Running Workflows . . . . . . . . . . . . . . . . . . . . . . . . 278
Editing or Creating Workflows . . . . . . . . . . . . . . . . . . 281
Changing the Workflow Designer Display . . . . . . . . . . . . 289
Chapter 3 Bringing In Data . . . . . . . . . . . . . . . . . . . . . . . . . 291
Overview of Bringing In Data . . . . . . . . . . . . . . . . . . . . . . 291
Before You Bring In Data . . . . . . . . . . . . . . . . . . . . . . . . . 296
Creating a Map . . . . . . . . . . . . . . . . . . . . . . . . . . . 296
Organizing Layers in Your Map . . . . . . . . . . . . . . . . . . 300
Bringing in GIS Features . . . . . . . . . . . . . . . . . . . . . . . . . 303
Overview of Bringing In GIS Features . . . . . . . . . . . . . . . 305
Filtering Features When You Add Them to a Map . . . . . . . . 309
Changing Coordinate Systems . . . . . . . . . . . . . . . . . . 311
Bringing In Features from Oracle . . . . . . . . . . . . . . . . . 312
Bringing In Features from ArcSDE . . . . . . . . . . . . . . . . . 316
Bringing In Features from SQL Server . . . . . . . . . . . . . . . 323
Bringing In Features from SQL Server Spatial . . . . . . . . . . . 326
Bringing In Features From SQLite . . . . . . . . . . . . . . . . . 330
Bringing In Features from MySQL . . . . . . . . . . . . . . . . 332
Bringing In Features from SHP . . . . . . . . . . . . . . . . . . . 335
Bringing In Features from SDF . . . . . . . . . . . . . . . . . . . 337
Bringing in Features from PostgreSQL/PostGIS . . . . . . . . . . 340
Accessing Data from ODBC . . . . . . . . . . . . . . . . . . . . 342
Bringing In Features from WFS . . . . . . . . . . . . . . . . . . 346
Repairing Broken Feature Connections . . . . . . . . . . . . . . 349
Bringing In Drawing Data From DWG Files . . . . . . . . . . . . . . . 350
Overview of Bringing in Drawing Data From DWG Files . . . . . 351
Bringing In Drawing Objects from AutoCAD Layers . . . . . . . 355
Bringing In Drawing Objects by Object Class . . . . . . . . . . . 356
Bringing In Drawing Objects by Location . . . . . . . . . . . . . 358
Contents | v
Bringing In Drawing Objects by Property . . . . . . . . . . . . . 361
Bringing In Drawing Objects Based on Attached Data . . . . . . 363
Bringing In Drawing Objects Based on Topology . . . . . . . . . 367
Combining Conditions . . . . . . . . . . . . . . . . . . . . . . 368
Bringing in Survey Data . . . . . . . . . . . . . . . . . . . . . . . . . 370
Bringing in LandXML Data . . . . . . . . . . . . . . . . . . . . 371
Bringing in ASCII Point Data . . . . . . . . . . . . . . . . . . . 372
Bringing in LiDAR Data . . . . . . . . . . . . . . . . . . . . . . 374
Bringing in Point Cloud Data . . . . . . . . . . . . . . . . . . . 375
Converting Data From Other Formats to Drawing Objects . . . . . . 377
Overview of Converting Geospatial Data to Drawing
Objects . . . . . . . . . . . . . . . . . . . . . . . . . . . . . . 378
Styling Drawing Data Converted From a Geospatial Data
Store . . . . . . . . . . . . . . . . . . . . . . . . . . . . . . . 384
Supported Import Formats . . . . . . . . . . . . . . . . . . . . . 387
Specifying an Area to Import . . . . . . . . . . . . . . . . . . . 417
Specifying an AutoCAD Layer During Import . . . . . . . . . . . 419
Assigning an Object Class During Import . . . . . . . . . . . . . 421
Performing a Coordinate Conversion During Import . . . . . . . 423
Importing Attribute Data . . . . . . . . . . . . . . . . . . . . . 425
Specifying How to Import Points . . . . . . . . . . . . . . . . . 427
Importing Polygons . . . . . . . . . . . . . . . . . . . . . . . . 429
Creating Centroids for Polygons . . . . . . . . . . . . . . . . . . 431
Importing Objects with Links to an External Database . . . . . . 433
Displaying Attribute Data as Text . . . . . . . . . . . . . . . . . 435
Adding Rasters and Surfaces . . . . . . . . . . . . . . . . . . . . . . . 437
Overview of Adding Rasters and Surfaces . . . . . . . . . . . . . 437
Adding Raster-Based Surfaces to Your Map . . . . . . . . . . . . 441
Adding 2D Rasters . . . . . . . . . . . . . . . . . . . . . . . . . 443
Adding an Image from a WMS (Web Map Service) . . . . . . . . 445
Making an Image Transparent . . . . . . . . . . . . . . . . . . . 449
Specifying Image Insertion Point . . . . . . . . . . . . . . . . . 451
Using Other Raster Image Formats . . . . . . . . . . . . . . . . 453
Joining Data to GIS Features . . . . . . . . . . . . . . . . . . . . . . . 507
Overview of Joins . . . . . . . . . . . . . . . . . . . . . . . . . 507
Creating a Join . . . . . . . . . . . . . . . . . . . . . . . . . . . 509
Modifying or Removing Joins . . . . . . . . . . . . . . . . . . . 514
Editing Joined Data . . . . . . . . . . . . . . . . . . . . . . . . 515
Using Joins with Calculated Properties . . . . . . . . . . . . . . 518
Sharing Joined Data with Others . . . . . . . . . . . . . . . . . 519
Adding Attributes to Drawing Objects . . . . . . . . . . . . . . . . . . 521
Storing Attribute Data in the Drawing (Object Data) . . . . . . . 521
Overview of Linking Database Records to Objects . . . . . . . . 522
Creating a Link Template . . . . . . . . . . . . . . . . . . . . . 525
Opening a Linked Database Table . . . . . . . . . . . . . . . . . 527
Manually Linking Database Records to Objects . . . . . . . . . . 528
vi | Contents
Automatically Linking Database Records to Objects . . . . . . . 530
Converting Object Data to Database Links . . . . . . . . . . . . 533
Editing Database Links . . . . . . . . . . . . . . . . . . . . . . . 536
Editing a Link Template . . . . . . . . . . . . . . . . . . . . . . 538
Using Open Source FDO Providers . . . . . . . . . . . . . . . . . . . 540
Bringing In AutoCAD Civil 3D Data . . . . . . . . . . . . . . . . . . . 543
Chapter 4 Managing Data . . . . . . . . . . . . . . . . . . . . . . . . . 547
Overview of Managing Data . . . . . . . . . . . . . . . . . . . . . . . 547
About Geospatial Feature Classes, Data Stores, and Schemas . . . . . . 551
Overview of Geospatial Data . . . . . . . . . . . . . . . . . . . 551
Working with FDO Schemas . . . . . . . . . . . . . . . . . . . . 553
Working with Oracle Data . . . . . . . . . . . . . . . . . . . . . 554
Working with SQL Server Data . . . . . . . . . . . . . . . . . . 559
Working with SQL Server Spatial Data . . . . . . . . . . . . . . 561
Working with SQLite Data . . . . . . . . . . . . . . . . . . . . . 565
Working with MySQL Data . . . . . . . . . . . . . . . . . . . . 567
Working with SDF Data . . . . . . . . . . . . . . . . . . . . . . 569
Working with SHP Data . . . . . . . . . . . . . . . . . . . . . . 572
Working with PostgreSQL/PostGIS Data . . . . . . . . . . . . . . 574
Working with ODBC Data . . . . . . . . . . . . . . . . . . . . . 576
Working with ESRI ArcSDE Data . . . . . . . . . . . . . . . . . . 579
Working with WFS Data . . . . . . . . . . . . . . . . . . . . . . 581
Working with Feature Sources . . . . . . . . . . . . . . . . . . . . . . 582
Overview of Working with Feature Sources . . . . . . . . . . . . 582
Setting Up Database Users . . . . . . . . . . . . . . . . . . . . . 584
Creating a Data Store . . . . . . . . . . . . . . . . . . . . . . . 586
Creating FDO-Enabled SQL Server Spatial Data Stores . . . . . . 590
Deleting a Feature Source . . . . . . . . . . . . . . . . . . . . . 593
Working with Schemas . . . . . . . . . . . . . . . . . . . . . . . . . . 593
Overview of Working with Schemas . . . . . . . . . . . . . . . . 594
Creating a Schema . . . . . . . . . . . . . . . . . . . . . . . . . 596
Setting Up Constraints in the Schema Editor . . . . . . . . . . . 599
Exposing a Native Database View in a Schema . . . . . . . . . . 603
Importing and Exporting a Schema . . . . . . . . . . . . . . . . 606
Viewing a Schema . . . . . . . . . . . . . . . . . . . . . . . . . 608
Editing a Schema . . . . . . . . . . . . . . . . . . . . . . . . . . 610
Deleting Schemas . . . . . . . . . . . . . . . . . . . . . . . . . 613
Undoing Schema Changes . . . . . . . . . . . . . . . . . . . . . 614
Migrating Data . . . . . . . . . . . . . . . . . . . . . . . . . . . . . . 615
Overview of Migrating Data . . . . . . . . . . . . . . . . . . . . 616
Migrating GIS Data (Bulk Copy) . . . . . . . . . . . . . . . . . . 617
Understanding How Bulk Copy Converts Data Types . . . . . . 623
Fixing Geometry Issues After a Bulk Copy . . . . . . . . . . . . 625
Reviewing the Bulk Copy Log Information . . . . . . . . . . . . 626
Migrating DWG Data to GIS . . . . . . . . . . . . . . . . . . . . 628
Contents | vii
Chapter 5 Visualization and Styling . . . . . . . . . . . . . . . . . . . . . 631
Overview of Visualization and Styling . . . . . . . . . . . . . . . . . . 631
Controlling the Display of Your Map . . . . . . . . . . . . . . . . . . 633
Overview of the Display Manager . . . . . . . . . . . . . . . . . 634
Controlling Display Order . . . . . . . . . . . . . . . . . . . . . 636
Setting Map Scale . . . . . . . . . . . . . . . . . . . . . . . . . 638
Creating Multiple Display Maps . . . . . . . . . . . . . . . . . . 638
Styling Features . . . . . . . . . . . . . . . . . . . . . . . . . . . . . 639
Overview of Styling Features . . . . . . . . . . . . . . . . . . . . 640
Defining Scale Ranges . . . . . . . . . . . . . . . . . . . . . . . 643
Styling Point Features . . . . . . . . . . . . . . . . . . . . . . . 645
Styling Line Features . . . . . . . . . . . . . . . . . . . . . . . . 648
Styling Area Features . . . . . . . . . . . . . . . . . . . . . . . . 650
Labeling Features . . . . . . . . . . . . . . . . . . . . . . . . . . 651
Saving and Loading Styled Feature Layers . . . . . . . . . . . . . 651
Styling Drawing Layers . . . . . . . . . . . . . . . . . . . . . . . . . . 652
Overview of Styling Drawing Layers . . . . . . . . . . . . . . . . 652
Styling a Drawing Layer . . . . . . . . . . . . . . . . . . . . . . 657
Creating a Style . . . . . . . . . . . . . . . . . . . . . . . . . . 658
Combining Styles . . . . . . . . . . . . . . . . . . . . . . . . . 661
Modifying a Style . . . . . . . . . . . . . . . . . . . . . . . . . 662
Saving a Display Style in the Library . . . . . . . . . . . . . . . 664
Referencing a Library Style . . . . . . . . . . . . . . . . . . . . 666
Creating and Modifying a Display Manager Scale
Threshold . . . . . . . . . . . . . . . . . . . . . . . . . . . . 667
Viewing Styles at All Scale Thresholds . . . . . . . . . . . . . . . 669
Styling Raster Images . . . . . . . . . . . . . . . . . . . . . . . . . . . 671
Overview of Styling Raster Images . . . . . . . . . . . . . . . . . 671
Changing Brightness, Color, or Transparency for Raster
Images . . . . . . . . . . . . . . . . . . . . . . . . . . . . . . 672
Viewing Raster Images . . . . . . . . . . . . . . . . . . . . . . . 674
Styling Point Clouds . . . . . . . . . . . . . . . . . . . . . . . . . . . 675
Chapter 6 Creating and Editing Data . . . . . . . . . . . . . . . . . . . . 681
Overview of Creating and Editing Data . . . . . . . . . . . . . . . . . 681
Working with Features . . . . . . . . . . . . . . . . . . . . . . . . . . 683
Overview of Working with Features . . . . . . . . . . . . . . . . 684
Creating New Features . . . . . . . . . . . . . . . . . . . . . . . 686
Checking In Features . . . . . . . . . . . . . . . . . . . . . . . . 693
Checking Out Features . . . . . . . . . . . . . . . . . . . . . . . 695
Canceling Checkout . . . . . . . . . . . . . . . . . . . . . . . . 697
Updating Edits Automatically . . . . . . . . . . . . . . . . . . . 698
Editing Features . . . . . . . . . . . . . . . . . . . . . . . . . . 701
Working Offline . . . . . . . . . . . . . . . . . . . . . . . . . . 721
Managing Versions . . . . . . . . . . . . . . . . . . . . . . . . . 723
viii | Contents
Working with Drawing Objects . . . . . . . . . . . . . . . . . . . . . 727
Overview of Working with Drawing Objects . . . . . . . . . . . 727
Editing Data in Attached Drawings . . . . . . . . . . . . . . . . 729
Cleaning Up Drawing Data . . . . . . . . . . . . . . . . . . . . 765
Creating, Editing, and Managing Topologies . . . . . . . . . . . 820
Using Map Editing Tools . . . . . . . . . . . . . . . . . . . . . . 926
Working with Polygon Objects . . . . . . . . . . . . . . . . . . 954
Adding and Deleting Annotation . . . . . . . . . . . . . . . . . 980
Using Object Classification . . . . . . . . . . . . . . . . . . . . 981
Working with Survey Data . . . . . . . . . . . . . . . . . . . . . . . . 996
Overview of Working with Survey Data . . . . . . . . . . . . . . 997
Working with Survey Data Stores . . . . . . . . . . . . . . . . . 999
Working with Projects . . . . . . . . . . . . . . . . . . . . . . 1001
Working with Surveys . . . . . . . . . . . . . . . . . . . . . . 1002
Working with Point Groups . . . . . . . . . . . . . . . . . . . 1004
Working with Survey Points . . . . . . . . . . . . . . . . . . . 1005
Creating Surfaces From Survey Data . . . . . . . . . . . . . . . 1009
Working With Point Cloud Data . . . . . . . . . . . . . . . . . . . . 1012
Overview of Point Clouds . . . . . . . . . . . . . . . . . . . . 1012
Overview of LiDAR Data . . . . . . . . . . . . . . . . . . . . . 1012
Overview of Point Cloud Files and Objects . . . . . . . . . . . 1013
Managing LiDAR Data . . . . . . . . . . . . . . . . . . . . . . 1015
Using LiDAR Data to Create a Point Cloud Data Store . . . . . 1019
Creating Surfaces From Point Cloud Data . . . . . . . . . . . . 1021
Filtering Point Cloud Data . . . . . . . . . . . . . . . . . . . . 1024
Entering Coordinate Geometry . . . . . . . . . . . . . . . . . . . . 1026
Overview of Coordinate Geometry Commands . . . . . . . . . 1027
Using Angle and Distance to Specify a Point . . . . . . . . . . 1032
Using Bearing and Distance to Specify a Point . . . . . . . . . 1034
Using Bearings from Two Points to Specify a Point . . . . . . . 1036
Using Deflection and Distance to Specify a Point . . . . . . . . 1037
Using Distances from Two Points to Specify a Point . . . . . . . 1040
Using Azimuth and Distance to Specify a Point . . . . . . . . . 1042
Using Distance and Offset from a Line to Specify a Point . . . . 1044
Creating an Inverse Report . . . . . . . . . . . . . . . . . . . . 1045
Working with Attribute Data and Object Data . . . . . . . . . . . . . 1047
Viewing External Data Sources for Drawing Object Data . . . . 1047
Entering and Editing Object Data . . . . . . . . . . . . . . . . 1061
Digitizing Objects . . . . . . . . . . . . . . . . . . . . . . . . . . . . 1073
Overview of Digitizing Maps . . . . . . . . . . . . . . . . . . . 1073
Overview of Digitizing Objects . . . . . . . . . . . . . . . . . . 1079
Digitizing Using MAPDIGITIZE . . . . . . . . . . . . . . . . . 1081
Attaching Object Data As You Digitize . . . . . . . . . . . . . . 1082
Linking Database (SQL) Records as You Digitize . . . . . . . . . 1084
Chapter 7 Annotating Maps . . . . . . . . . . . . . . . . . . . . . . . . 1089
Contents | ix
Overview of Annotating Maps . . . . . . . . . . . . . . . . . . . . . 1089
Adding Labels . . . . . . . . . . . . . . . . . . . . . . . . . . . . . . 1091
Adding Labels to Features . . . . . . . . . . . . . . . . . . . . 1091
Allowing Labels to Obscure Points . . . . . . . . . . . . . . . . 1096
Displaying Fixed Labels at Point Locations . . . . . . . . . . . 1098
Annotating Drawing Objects . . . . . . . . . . . . . . . . . . . . . . 1100
Overview of Annotation . . . . . . . . . . . . . . . . . . . . . 1100
Attaching Annotation to Objects . . . . . . . . . . . . . . . . 1103
Refreshing Annotation . . . . . . . . . . . . . . . . . . . . . . 1105
Updating Annotation . . . . . . . . . . . . . . . . . . . . . . . 1106
Deleting Annotation from Drawings . . . . . . . . . . . . . . . 1108
Working with Text Layers . . . . . . . . . . . . . . . . . . . . . . . 1109
Creating Text Layers . . . . . . . . . . . . . . . . . . . . . . . 1109
Styling a Text Layer . . . . . . . . . . . . . . . . . . . . . . . . 1111
Adding Text to a Text Layer . . . . . . . . . . . . . . . . . . . 1113
Editing an Instance on a Text Layer . . . . . . . . . . . . . . . 1115
Adding a Legend . . . . . . . . . . . . . . . . . . . . . . . . . . . . 1116
Annotating with AutoCAD Text Objects . . . . . . . . . . . . . . . . 1119
Chapter 8 Analyzing Data . . . . . . . . . . . . . . . . . . . . . . . . . 1121
Overview of Analyzing Data . . . . . . . . . . . . . . . . . . . . . . 1121
Getting Information About Features and Objects . . . . . . . . . . . 1124
Getting Information about Features . . . . . . . . . . . . . . . 1125
Getting Information About Drawing Objects . . . . . . . . . . 1143
Measuring and Tracking Coordinates . . . . . . . . . . . . . . . . . 1147
Overview of Measuring and Tracking . . . . . . . . . . . . . . 1148
Tracking Coordinates . . . . . . . . . . . . . . . . . . . . . . . 1149
Measuring Geodetic Distance . . . . . . . . . . . . . . . . . . 1152
Measuring Coordinate Geometry . . . . . . . . . . . . . . . . 1153
Creating Themes . . . . . . . . . . . . . . . . . . . . . . . . . . . . 1162
Overview of Creating Themes . . . . . . . . . . . . . . . . . . 1163
Theming Features . . . . . . . . . . . . . . . . . . . . . . . . . 1165
Theming Drawing Data . . . . . . . . . . . . . . . . . . . . . . 1176
Analyzing Raster-Based Surfaces . . . . . . . . . . . . . . . . . . . . 1186
Overview of Analyzing Raster-Based Surfaces . . . . . . . . . . 1187
Adding and Modifying Contour Lines . . . . . . . . . . . . . . 1189
Draping Map Data Over 3D Surfaces . . . . . . . . . . . . . . . 1192
Viewing Surfaces in 3D . . . . . . . . . . . . . . . . . . . . . . 1194
Using Hillshading and Vertical Exaggeration . . . . . . . . . . 1199
Theming Surfaces to Analyze Height, Slope, and Aspect . . . . 1202
Changing Colors in a Themed Surface . . . . . . . . . . . . . 1204
Finding and Selecting Data . . . . . . . . . . . . . . . . . . . . . . . 1206
Finding and Selecting Features . . . . . . . . . . . . . . . . . . 1206
Finding and Querying Drawing Objects . . . . . . . . . . . . . 1218
Analyzing Feature Classes . . . . . . . . . . . . . . . . . . . . . . . 1301
Overview of Analyzing Feature Classes . . . . . . . . . . . . . 1302
x | Contents
Buffering Features in Your Map . . . . . . . . . . . . . . . . . 1306
Overlaying Two Feature Sources . . . . . . . . . . . . . . . . . 1309
Analyzing Drawing Topologies . . . . . . . . . . . . . . . . . . . . . 1318
Overview of Analyzing Drawing Topologies . . . . . . . . . . . 1319
Performing a Shortest Path Trace . . . . . . . . . . . . . . . . . 1324
Performing a Best Route Analysis . . . . . . . . . . . . . . . . 1328
Performing a Flood Trace . . . . . . . . . . . . . . . . . . . . . 1333
Overlaying Two Topologies . . . . . . . . . . . . . . . . . . . . 1336
Dissolving a Composite Topology . . . . . . . . . . . . . . . . 1342
Buffering a Topology . . . . . . . . . . . . . . . . . . . . . . . 1345
Querying a Topology . . . . . . . . . . . . . . . . . . . . . . . 1348
Saving a Temporary Topology . . . . . . . . . . . . . . . . . . 1354
Chapter 9 Publishing and Sharing Maps . . . . . . . . . . . . . . . . . 1357
Overview of Publishing and Sharing . . . . . . . . . . . . . . . . . . 1357
Publishing Maps . . . . . . . . . . . . . . . . . . . . . . . . . . . . 1360
Overview of Publishing Maps . . . . . . . . . . . . . . . . . . 1360
Adding a Reference Grid to a Map . . . . . . . . . . . . . . . . 1362
Publishing a Map to a Plotter . . . . . . . . . . . . . . . . . . 1363
Publishing to DWF . . . . . . . . . . . . . . . . . . . . . . . . 1364
Publishing to PDF . . . . . . . . . . . . . . . . . . . . . . . . 1373
Publishing to a Web Page . . . . . . . . . . . . . . . . . . . . . 1373
Using eTransmit . . . . . . . . . . . . . . . . . . . . . . . . . 1376
Publishing to MapGuide . . . . . . . . . . . . . . . . . . . . . 1376
Viewing Publish to MapGuide Results . . . . . . . . . . . . . . 1379
Publishing Map Books . . . . . . . . . . . . . . . . . . . . . . 1381
Converting and Exporting . . . . . . . . . . . . . . . . . . . . . . . 1403
Overview of Converting and Exporting . . . . . . . . . . . . . 1405
Supported Objects . . . . . . . . . . . . . . . . . . . . . . . . 1411
Supported Formats . . . . . . . . . . . . . . . . . . . . . . . . 1412
Exporting To Autodesk SDF (Spatial Data File) . . . . . . . . . . 1413
Exporting DWG Data to SDF2 Format . . . . . . . . . . . . . . 1417
Exporting To ESRI Arc/INFO Coverages . . . . . . . . . . . . . 1419
Exporting to ESRI ArcSDE . . . . . . . . . . . . . . . . . . . . 1422
Exporting to ESRI SHP . . . . . . . . . . . . . . . . . . . . . . 1424
Exporting To Geographic Markup Language (GML) . . . . . . . 1429
Exporting To MapInfo MIF/MID . . . . . . . . . . . . . . . . . 1431
Exporting To MapInfo TAB . . . . . . . . . . . . . . . . . . . . 1433
Exporting To MicroStation Design (DGN) Versions 7 and 8 . . . 1435
Exporting to Multiple Classes . . . . . . . . . . . . . . . . . . 1439
Exporting To Shape Multiclass . . . . . . . . . . . . . . . . . . 1443
Exporting To SQLite . . . . . . . . . . . . . . . . . . . . . . . 1447
Exporting To VML (Vector Markup Language) . . . . . . . . . . 1449
Exporting Point Cloud Data . . . . . . . . . . . . . . . . . . . 1451
Mapping Drawing Attributes to Feature Class Properties . . . . 1452
Exporting Text Enclosed in a Polyline . . . . . . . . . . . . . . 1455
Contents | xi
Exporting Polygons from a Polygon Topology . . . . . . . . . . 1457
Saving Drawing Objects to a DXF File . . . . . . . . . . . . . . 1458
Exporting Maps to DWG Format . . . . . . . . . . . . . . . . . 1459
Exporting DWG Data to an FDO Data Store . . . . . . . . . . . 1461
Exporting DWG Data to an Image Format . . . . . . . . . . . . 1465
Moving DWG Data to a Spatial Data Store and Back Again . . . 1465
Saving or Exporting a Display Manager Layer . . . . . . . . . . 1469
Exporting Survey Points to a LandXML File . . . . . . . . . . . 1471
Exporting and Printing Attribute Data . . . . . . . . . . . . . . . . . 1472
Overview of Exporting Attribute Data . . . . . . . . . . . . . . 1472
Exporting from the Data Table . . . . . . . . . . . . . . . . . . 1473
Printing from the Data View . . . . . . . . . . . . . . . . . . . 1474
Creating a Drawing Object Report (DWG) . . . . . . . . . . . . 1477
Chapter 10 Working with Metadata . . . . . . . . . . . . . . . . . . . . 1481
Overview of Working with Metadata . . . . . . . . . . . . . . . . . . 1481
Setting Metadata Options . . . . . . . . . . . . . . . . . . . . . . . 1484
Creating and Viewing Metadata . . . . . . . . . . . . . . . . . . . . 1486
Working with Metadata Style Sheets . . . . . . . . . . . . . . . . . . 1488
Working with Metadata Templates . . . . . . . . . . . . . . . . . . . 1490
Overview of Metadata Templates . . . . . . . . . . . . . . . . . 1490
Using Metadata Templates . . . . . . . . . . . . . . . . . . . . 1491
Previewing Metadata Templates . . . . . . . . . . . . . . . . . 1493
Setting a Default Metadata Template . . . . . . . . . . . . . . . 1494
Deactivating Metadata Templates . . . . . . . . . . . . . . . . 1495
Exporting Metadata Templates . . . . . . . . . . . . . . . . . . 1496
Removing Metadata Templates . . . . . . . . . . . . . . . . . . 1497
Editing Metadata . . . . . . . . . . . . . . . . . . . . . . . . . . . . 1498
Overview of Editing Metadata . . . . . . . . . . . . . . . . . . 1498
Updating Metadata . . . . . . . . . . . . . . . . . . . . . . . . 1503
Copying and Pasting Metadata . . . . . . . . . . . . . . . . . . 1504
Adding and Deleting Records in the Metadata Editor . . . . . . 1504
Working with Compound Metadata Elements . . . . . . . . . . 1505
Using the Record Navigator . . . . . . . . . . . . . . . . . . . 1506
Auditing Metadata . . . . . . . . . . . . . . . . . . . . . . . . 1509
Sharing Metadata . . . . . . . . . . . . . . . . . . . . . . . . . . . . 1510
Overview of Sharing Metadata . . . . . . . . . . . . . . . . . . 1510
Importing Metadata . . . . . . . . . . . . . . . . . . . . . . . 1510
Exporting Metadata . . . . . . . . . . . . . . . . . . . . . . . . 1512
Publishing and Printing Metadata . . . . . . . . . . . . . . . . 1514
Reference Guide . . . . . . . . . . . . . . . . . . . . . 1517
Chapter 11 Command Reference . . . . . . . . . . . . . . . . . . . . . . 1519
xii | Contents
Mapping Commands . . . . . . . . . . . . . . . . . . . . . . . . . . 1519
Discontinued Commands . . . . . . . . . . . . . . . . . . . . . . . 1533
Wildcard Characters . . . . . . . . . . . . . . . . . . . . . . . . . . 1537
Improving Performance . . . . . . . . . . . . . . . . . . . . . . . . 1538
Chapter 12 Expression Evaluator . . . . . . . . . . . . . . . . . . . . . . 1541
Functions . . . . . . . . . . . . . . . . . . . . . . . . . . . . . . . . 1541
Arithmetic Functions . . . . . . . . . . . . . . . . . . . . . . . 1541
String-Handling Functions . . . . . . . . . . . . . . . . . . . . 1543
Equality and Conditional Functions . . . . . . . . . . . . . . . 1543
Symbol-Handling Functions . . . . . . . . . . . . . . . . . . . 1544
Conversion Functions . . . . . . . . . . . . . . . . . . . . . . 1544
Other Functions . . . . . . . . . . . . . . . . . . . . . . . . . 1545
Variables . . . . . . . . . . . . . . . . . . . . . . . . . . . . . . . . 1546
Dot Variables . . . . . . . . . . . . . . . . . . . . . . . . . . . 1546
Object Data Variables . . . . . . . . . . . . . . . . . . . . . . . 1549
Block Attribute Variables . . . . . . . . . . . . . . . . . . . . . 1549
SQL Variables and Expressions . . . . . . . . . . . . . . . . . . 1549
Object Classification Variables . . . . . . . . . . . . . . . . . . 1551
AutoLISP Variables . . . . . . . . . . . . . . . . . . . . . . . . 1551
EED Expressions . . . . . . . . . . . . . . . . . . . . . . . . . 1551
Using Color in Expressions . . . . . . . . . . . . . . . . . . . . . . . 1552
Tips and Suggestions for the Expression Evaluator . . . . . . . . . . 1553
Chapter 13 Expression Builder . . . . . . . . . . . . . . . . . . . . . . . 1555
Using the Expression Builder . . . . . . . . . . . . . . . . . . . . . . 1555
Dialog Boxes . . . . . . . . . . . . . . . . . . . . . . . 1557
Chapter 14 Analyzing Data Dialog Boxes . . . . . . . . . . . . . . . . . . 1559
Create Buffer dialog box . . . . . . . . . . . . . . . . . . . . . . . . 1559
Buffer Warning dialog box . . . . . . . . . . . . . . . . . . . . . . . 1560
Generate Contour dialog box . . . . . . . . . . . . . . . . . . . . . 1561
Hillshade Settings dialog box . . . . . . . . . . . . . . . . . . . . . . 1562
Overlay Analysis dialog box . . . . . . . . . . . . . . . . . . . . . . 1563
Chapter 15 Annotation Dialog Boxes . . . . . . . . . . . . . . . . . . . . 1569
Annotation Delete dialog box . . . . . . . . . . . . . . . . . . . . . 1569
Annotation Refresh dialog box . . . . . . . . . . . . . . . . . . . . . 1569
Annotation Text dialog box . . . . . . . . . . . . . . . . . . . . . . 1570
Annotation Update dialog box . . . . . . . . . . . . . . . . . . . . . 1571
Define Annotation Template dialog box . . . . . . . . . . . . . . . . 1572
Edit Expression dialog box . . . . . . . . . . . . . . . . . . . . . . . 1574
Contents | xiii
Insert Annotation dialog box . . . . . . . . . . . . . . . . . . . . . . 1574
New Annotation Template Name dialog box . . . . . . . . . . . . . 1576
Chapter 16 Autodesk MapGuide Dialog Boxes . . . . . . . . . . . . . . . 1577
Publish to MapGuide dialog box . . . . . . . . . . . . . . . . . . . . 1577
Publish to MapGuide Results dialog box . . . . . . . . . . . . . . . . 1578
Define New Object Data Field dialog box . . . . . . . . . . . . . . . 1578
New Layer dialog box . . . . . . . . . . . . . . . . . . . . . . . . . . 1579
Autodesk MapGuide Export dialog box . . . . . . . . . . . . . . . . 1580
Autodesk MapGuide Import dialog box . . . . . . . . . . . . . . . . 1582
Chapter 17 Cleaning Up Maps Dialog Boxes . . . . . . . . . . . . . . . . 1585
Cleanup Methods Page . . . . . . . . . . . . . . . . . . . . . . . . . 1585
Error Markers Page . . . . . . . . . . . . . . . . . . . . . . . . . . . 1587
Select Actions Page . . . . . . . . . . . . . . . . . . . . . . . . . . . 1588
Drawing Cleanup . . . . . . . . . . . . . . . . . . . . . . . . . . . . 1591
Drawing Cleanup Errors dialog box . . . . . . . . . . . . . . . . . . 1593
Select Objects Page . . . . . . . . . . . . . . . . . . . . . . . . . . . 1595
Chapter 18 Coordinate Systems Dialog Boxes . . . . . . . . . . . . . . . 1597
MAPDIST . . . . . . . . . . . . . . . . . . . . . . . . . . . . . . . . 1597
Assign Global Coordinate System dialog box . . . . . . . . . . . . . 1598
Select Drawings to Assign Coordinate System dialog box . . . . . . . 1599
Coordinate Tracker Options Dialog Box . . . . . . . . . . . . . . . . 1600
Track Coordinates Dialog Box . . . . . . . . . . . . . . . . . . . . . 1601
Create Reference System Dialog Box . . . . . . . . . . . . . . . . . . 1602
Chapter 19 Data Connect Dialog Boxes . . . . . . . . . . . . . . . . . . 1603
Create a Join / Edit a Join dialog box . . . . . . . . . . . . . . . . . . 1603
Create Data Store dialog box . . . . . . . . . . . . . . . . . . . . . . 1604
Edit Spatial Contexts . . . . . . . . . . . . . . . . . . . . . . . . . . 1605
Feature Information dialog box . . . . . . . . . . . . . . . . . . . . 1606
Feature Source Scope . . . . . . . . . . . . . . . . . . . . . . . . . . 1606
Feature Source Administration dialog box . . . . . . . . . . . . . . . 1606
Feature Source Connection dialog box . . . . . . . . . . . . . . . . . 1607
Manage Layer Data dialog box . . . . . . . . . . . . . . . . . . . . . 1607
Save Features dialog box . . . . . . . . . . . . . . . . . . . . . . . . 1608
Select Coordinate System dialog box . . . . . . . . . . . . . . . . . . 1609
User Credentials dialog box . . . . . . . . . . . . . . . . . . . . . . 1610
View/Create Query Statement dialog box . . . . . . . . . . . . . . . 1610
Chapter 20 Data Table Dialog Box . . . . . . . . . . . . . . . . . . . . . 1613
Data Table dialog box . . . . . . . . . . . . . . . . . . . . . . . . . . 1613
xiv | Contents
Chapter 21 Digitizing Dialog Boxes . . . . . . . . . . . . . . . . . . . . . 1615
MAPDIGITIZE (Digitize command) . . . . . . . . . . . . . . . . . . 1615
Data to Attach dialog box . . . . . . . . . . . . . . . . . . . . . . . 1616
Digitize Setup dialog box . . . . . . . . . . . . . . . . . . . . . . . . 1617
Link Template Data Entry dialog box . . . . . . . . . . . . . . . . . 1619
Link Template Key Column Entry dialog box . . . . . . . . . . . . . 1620
Chapter 22 Display Manager Dialog Boxes . . . . . . . . . . . . . . . . . 1621
MAPDISPLAYLIBRARY (Display Library command) . . . . . . . . . . 1621
MAPDISPLAYMANAGER (Display Manager command) . . . . . . . . 1621
Alter Block Insertion dialog box . . . . . . . . . . . . . . . . . . . . 1622
Alter Line Format dialog box . . . . . . . . . . . . . . . . . . . . . . 1622
Alter Linetype dialog box . . . . . . . . . . . . . . . . . . . . . . . . 1623
Alter Lineweight dialog box . . . . . . . . . . . . . . . . . . . . . . 1624
Alter Plotstyle dialog box . . . . . . . . . . . . . . . . . . . . . . . . 1624
Copy Scale dialog box . . . . . . . . . . . . . . . . . . . . . . . . . 1624
Define Hatch dialog box . . . . . . . . . . . . . . . . . . . . . . . . 1625
Define Text dialog box . . . . . . . . . . . . . . . . . . . . . . . . . 1626
Edit Text Instance dialog box . . . . . . . . . . . . . . . . . . . . . . 1627
Import Old Theme dialog box . . . . . . . . . . . . . . . . . . . . . 1628
New Scale dialog box . . . . . . . . . . . . . . . . . . . . . . . . . . 1629
Range of Values dialog box . . . . . . . . . . . . . . . . . . . . . . . 1629
Select Display Element dialog box . . . . . . . . . . . . . . . . . . . 1631
Source Drawing Scope dialog box . . . . . . . . . . . . . . . . . . . 1633
Style Band dialog box . . . . . . . . . . . . . . . . . . . . . . . . . . 1633
Style Label dialog box . . . . . . . . . . . . . . . . . . . . . . . . . 1634
Style Line dialog box . . . . . . . . . . . . . . . . . . . . . . . . . . 1636
Style Point dialog box . . . . . . . . . . . . . . . . . . . . . . . . . 1637
Style Polygon dialog box . . . . . . . . . . . . . . . . . . . . . . . . 1639
Style Text Layer dialog box . . . . . . . . . . . . . . . . . . . . . . . 1640
Thematic Mapping dialog box . . . . . . . . . . . . . . . . . . . . . 1642
Thematic Values dialog box . . . . . . . . . . . . . . . . . . . . . . 1644
Theme dialog box . . . . . . . . . . . . . . . . . . . . . . . . . . . . 1645
Chapter 23 Editing Maps Dialog Boxes . . . . . . . . . . . . . . . . . . . 1647
ADEFILLPOLYG (Fill Closed Polyline command) . . . . . . . . . . . 1647
ADERSHEET (Rubber Sheet command) . . . . . . . . . . . . . . . . . 1648
ADETRANSFORM (Transform command) . . . . . . . . . . . . . . . 1649
MAPCOGO . . . . . . . . . . . . . . . . . . . . . . . . . . . . . . . 1651
MAPFEATUREMERGE . . . . . . . . . . . . . . . . . . . . . . . . . . 1651
MAPFEATURESPLIT . . . . . . . . . . . . . . . . . . . . . . . . . . . 1652
MAPIGNORESPLITMERGERULES . . . . . . . . . . . . . . . . . . . 1653
MAPLINESTRINGCREATE . . . . . . . . . . . . . . . . . . . . . . . 1654
MAPLINESTRINGEDIT . . . . . . . . . . . . . . . . . . . . . . . . . 1655
Contents | xv
MAPMULTILINESTRINGCREATE . . . . . . . . . . . . . . . . . . . . 1656
MAPMULTILINESTRINGEDIT . . . . . . . . . . . . . . . . . . . . . 1658
MAPMULTIPOINTCREATE . . . . . . . . . . . . . . . . . . . . . . . 1659
MAPMULTIPOINTEDIT . . . . . . . . . . . . . . . . . . . . . . . . . 1659
MAPMULTIPOLYGONCREATE . . . . . . . . . . . . . . . . . . . . . 1660
MAPMULTIPOLYGONEDIT . . . . . . . . . . . . . . . . . . . . . . . 1662
MAPPOINTCREATE . . . . . . . . . . . . . . . . . . . . . . . . . . . 1663
MAPPOLYGONCREATE . . . . . . . . . . . . . . . . . . . . . . . . . 1663
MAPPOLYGONEDIT . . . . . . . . . . . . . . . . . . . . . . . . . . 1665
Break Objects at Boundary dialog box . . . . . . . . . . . . . . . . . 1666
COGO Input dialog box . . . . . . . . . . . . . . . . . . . . . . . . 1668
Split and Merge Rules dialog box . . . . . . . . . . . . . . . . . . . . 1669
Trim Objects At Boundary dialog box . . . . . . . . . . . . . . . . . 1672
Chapter 24 External Databases Dialog Boxes . . . . . . . . . . . . . . . . 1675
Associate Database Versions dialog box . . . . . . . . . . . . . . . . 1675
Column dialog box . . . . . . . . . . . . . . . . . . . . . . . . . . . 1676
Column Values dialog box . . . . . . . . . . . . . . . . . . . . . . . 1678
Configure Data Source dialog box . . . . . . . . . . . . . . . . . . . 1679
Connect Data Source dialog box . . . . . . . . . . . . . . . . . . . . 1679
Convert Object Data to Database Links dialog box . . . . . . . . . . 1680
Define Link Template dialog box (MAPOD2ASE) . . . . . . . . . . . 1682
Define Link Template dialog box (MAPDEFINELT) . . . . . . . . . . 1683
Source dialog box . . . . . . . . . . . . . . . . . . . . . . . . . . . . 1684
Disconnect Data Source dialog box . . . . . . . . . . . . . . . . . . 1684
Header/Footer dialog box . . . . . . . . . . . . . . . . . . . . . . . . 1685
Link Template Properties dialog box . . . . . . . . . . . . . . . . . . 1686
Page Setup dialog box . . . . . . . . . . . . . . . . . . . . . . . . . 1686
Select Database Version dialog box . . . . . . . . . . . . . . . . . . . 1688
Select Existing Link Template dialog box . . . . . . . . . . . . . . . 1689
Select Link Template dialog box . . . . . . . . . . . . . . . . . . . . 1690
Select Link Templates dialog box . . . . . . . . . . . . . . . . . . . . 1690
Select Query dialog box . . . . . . . . . . . . . . . . . . . . . . . . . 1691
Select Table dialog box (MAPBROWSETBL) . . . . . . . . . . . . . . 1691
Sort dialog box . . . . . . . . . . . . . . . . . . . . . . . . . . . . . 1692
Table Filter dialog box . . . . . . . . . . . . . . . . . . . . . . . . . 1693
Table Filter History dialog box . . . . . . . . . . . . . . . . . . . . . 1696
Table Properties dialog box . . . . . . . . . . . . . . . . . . . . . . . 1696
Zoom Scale dialog box . . . . . . . . . . . . . . . . . . . . . . . . . 1697
Chapter 25 Import Export Dialog Boxes . . . . . . . . . . . . . . . . . . 1699
Attribute Data dialog box . . . . . . . . . . . . . . . . . . . . . . . . 1699
Block Mapping dialog box . . . . . . . . . . . . . . . . . . . . . . . 1701
Conflict Resolution dialog box . . . . . . . . . . . . . . . . . . . . . 1701
Coordinate System Translation dialog box . . . . . . . . . . . . . . . 1703
xvi | Contents
Define Link Template dialog box (MAPIMPORT4) . . . . . . . . . . . 1704
Export dialog box . . . . . . . . . . . . . . . . . . . . . . . . . . . . 1704
Export to LandXML dialog box . . . . . . . . . . . . . . . . . . . . 1709
Object Class Attribute Mapping dialog box . . . . . . . . . . . . . . 1710
Import dialog box . . . . . . . . . . . . . . . . . . . . . . . . . . . 1711
Import Data Options dialog box (MAPIMPORT4) . . . . . . . . . . . 1715
Import ASCII Points dialog box . . . . . . . . . . . . . . . . . . . . 1716
LandXML Coordinate System dialog box . . . . . . . . . . . . . . . 1717
Layer Mapping dialog box (MAPIMPORT4) . . . . . . . . . . . . . . 1718
Layer Mapping dialog box (Import) . . . . . . . . . . . . . . . . . . 1719
Link Template to Export dialog box . . . . . . . . . . . . . . . . . . 1720
Map Data Elements to Block Name dialog box (MAPIMPORT4) . . . 1720
Map Data Elements to Layers dialog box (MAPIMPORT4) . . . . . . . 1721
Map Data Elements to SQL dialog box (MAPIMPORT4) . . . . . . . . 1722
Map Export dialog box . . . . . . . . . . . . . . . . . . . . . . . . . 1723
Map Export Options dialog box . . . . . . . . . . . . . . . . . . . . 1725
New Property Data Type dialog box . . . . . . . . . . . . . . . . . . 1726
Feature Class Property Mapping dialog box . . . . . . . . . . . . . . 1727
Property Value Mapping . . . . . . . . . . . . . . . . . . . . . . . . 1728
Select Attributes dialog box . . . . . . . . . . . . . . . . . . . . . . . 1729
Map Import dialog box . . . . . . . . . . . . . . . . . . . . . . . . . 1729
New Layer dialog box . . . . . . . . . . . . . . . . . . . . . . . . . . 1730
Object Data Table dialog box (Export) . . . . . . . . . . . . . . . . . 1730
Object Data Table dialog box (Import) . . . . . . . . . . . . . . . . . 1731
Object Data/External Database Mapping dialog box . . . . . . . . . . 1732
Point Mapping dialog box . . . . . . . . . . . . . . . . . . . . . . . 1733
Design File Input Settings . . . . . . . . . . . . . . . . . . . . . . . 1734
Design File Output Settings . . . . . . . . . . . . . . . . . . . . . . . 1736
Chapter 26 Managing Data Dialog Boxes . . . . . . . . . . . . . . . . . 1739
Schema Editor . . . . . . . . . . . . . . . . . . . . . . . . . . . . . 1739
Bulk Copy . . . . . . . . . . . . . . . . . . . . . . . . . . . . . . . . 1744
Create Data Store Dialog Box . . . . . . . . . . . . . . . . . . . . . . 1747
Manage Versions dialog box . . . . . . . . . . . . . . . . . . . . . . 1748
Resolve Feature Conflicts dialog box . . . . . . . . . . . . . . . . . . 1750
Chapter 27 Metadata Dialog Boxes . . . . . . . . . . . . . . . . . . . . . 1751
Metadata Viewer . . . . . . . . . . . . . . . . . . . . . . . . . . . . 1751
Metadata Editor . . . . . . . . . . . . . . . . . . . . . . . . . . . . . 1754
Attribute Editor . . . . . . . . . . . . . . . . . . . . . . . . . . . . . 1756
Metadata Options dialog box . . . . . . . . . . . . . . . . . . . . . . 1756
Import Metadata Options dialog box . . . . . . . . . . . . . . . . . 1757
Export Metadata dialog box . . . . . . . . . . . . . . . . . . . . . . 1757
Create Metadata Template dialog box . . . . . . . . . . . . . . . . . 1758
Compound Element Metadata Editors . . . . . . . . . . . . . . . . . 1758
Contents | xvii
Chapter 28 Object Classification Dialog Boxes . . . . . . . . . . . . . . . 1779
MAPSELECTCLASSIFIED (Select Classified Objects command) . . . . 1779
MAPSELECTUNCLASSIFIED (Select Unclassified Objects
command) . . . . . . . . . . . . . . . . . . . . . . . . . . . . . . 1780
MAPSELECTUNDEFINED (Select Undefined Objects command) . . . 1780
Attach Object Class Definition File dialog box . . . . . . . . . . . . . 1781
Classified Property List dialog box . . . . . . . . . . . . . . . . . . . 1782
Classify dialog box . . . . . . . . . . . . . . . . . . . . . . . . . . . 1782
Classify Objects dialog box . . . . . . . . . . . . . . . . . . . . . . . 1783
Color Range Editor dialog box . . . . . . . . . . . . . . . . . . . . . 1783
Define Object Classification dialog box . . . . . . . . . . . . . . . . 1785
Layer Range Editor dialog box . . . . . . . . . . . . . . . . . . . . . 1789
Linetype Range Editor dialog box . . . . . . . . . . . . . . . . . . . 1789
Lineweight Range Editor dialog box . . . . . . . . . . . . . . . . . . 1790
New Object Class Definition File dialog box . . . . . . . . . . . . . . 1790
New Property dialog box . . . . . . . . . . . . . . . . . . . . . . . . 1791
Plotstyle Range Editor dialog box . . . . . . . . . . . . . . . . . . . 1792
Chapter 29 Object Data Dialog Boxes . . . . . . . . . . . . . . . . . . . 1793
Attach Object Data dialog box . . . . . . . . . . . . . . . . . . . . . 1793
Attach/Detach Object Data dialog box . . . . . . . . . . . . . . . . . 1794
Edit Object Data dialog box . . . . . . . . . . . . . . . . . . . . . . 1795
Rename Table dialog box . . . . . . . . . . . . . . . . . . . . . . . . 1797
Select Link Template Key dialog box . . . . . . . . . . . . . . . . . . 1797
Chapter 31 Polygon Object Dialog Boxes . . . . . . . . . . . . . . . . . 1817
MAPPOLYLINETOPOLYGON (Convert Polylines to Polygons
command) . . . . . . . . . . . . . . . . . . . . . . . . . . . . . . 1817
MAPUSEMPOLYGON . . . . . . . . . . . . . . . . . . . . . . . . . . 1818
MAPMPEDIT (Edit Polygon command) . . . . . . . . . . . . . . . . 1818
MPSPLIT (Split Polygon command) . . . . . . . . . . . . . . . . . . 1821
Create Polygons From Topology dialog box . . . . . . . . . . . . . . 1823
Polygon Fill Properties dialog box . . . . . . . . . . . . . . . . . . . 1824
Chapter 32 Printing and Publishing Dialog Boxes . . . . . . . . . . . . . 1827
Create Map Book/Edit Map Book dialog box . . . . . . . . . . . . . . 1827
Identify Map Book Template Placeholders dialog box . . . . . . . . . 1829
Map Book Properties dialog box . . . . . . . . . . . . . . . . . . . . 1830
Tile Properties dialog box . . . . . . . . . . . . . . . . . . . . . . . . 1831
Select Plot Set to Convert dialog box . . . . . . . . . . . . . . . . . . 1831
Map Information dialog box . . . . . . . . . . . . . . . . . . . . . . 1832
Plot Map Set dialog boxes . . . . . . . . . . . . . . . . . . . . . . . 1833
xviii | Contents
Chapter 33 Query Dialog Boxes . . . . . . . . . . . . . . . . . . . . . . . 1835
Alternate Font dialog box . . . . . . . . . . . . . . . . . . . . . . . 1835
Change Category dialog box . . . . . . . . . . . . . . . . . . . . . . 1835
Data Condition dialog box . . . . . . . . . . . . . . . . . . . . . . . 1836
Define New Category dialog box . . . . . . . . . . . . . . . . . . . . 1838
Define Query dialog box . . . . . . . . . . . . . . . . . . . . . . . . 1838
Define Range Table dialog box . . . . . . . . . . . . . . . . . . . . . 1842
Define Text dialog box . . . . . . . . . . . . . . . . . . . . . . . . . 1846
Hatch Options dialog box . . . . . . . . . . . . . . . . . . . . . . . 1847
Load Internal Query dialog box . . . . . . . . . . . . . . . . . . . . 1848
Location Condition dialog box . . . . . . . . . . . . . . . . . . . . . 1849
New Range Table dialog box . . . . . . . . . . . . . . . . . . . . . . 1852
Output Report Options dialog box . . . . . . . . . . . . . . . . . . . 1852
Property Condition dialog box . . . . . . . . . . . . . . . . . . . . . 1855
Query Library Administration dialog box . . . . . . . . . . . . . . . 1858
Rename Category dialog box . . . . . . . . . . . . . . . . . . . . . . 1860
Rename Range Table dialog box . . . . . . . . . . . . . . . . . . . . 1860
Run Library Query dialog box . . . . . . . . . . . . . . . . . . . . . 1861
Save Current Query dialog box . . . . . . . . . . . . . . . . . . . . . 1862
Set Property Alterations dialog box . . . . . . . . . . . . . . . . . . 1863
SQL Condition History dialog box . . . . . . . . . . . . . . . . . . . 1866
SQL Link Condition dialog box . . . . . . . . . . . . . . . . . . . . 1866
Type SQL Condition dialog box . . . . . . . . . . . . . . . . . . . . 1870
Chapter 34 Raster Image Dialog Boxes . . . . . . . . . . . . . . . . . . . 1873
MAPIFRAME (Image Frame command) . . . . . . . . . . . . . . . . 1873
Image Correlation dialog box . . . . . . . . . . . . . . . . . . . . . 1873
Image Information dialog box . . . . . . . . . . . . . . . . . . . . . 1875
Image Management dialog box . . . . . . . . . . . . . . . . . . . . . 1875
Image Management Layout dialog box . . . . . . . . . . . . . . . . 1877
Image Select dialog box . . . . . . . . . . . . . . . . . . . . . . . . . 1877
Insert Image dialog box . . . . . . . . . . . . . . . . . . . . . . . . . 1878
Raster Extension Options dialog box . . . . . . . . . . . . . . . . . . 1879
Transparency Color dialog box . . . . . . . . . . . . . . . . . . . . . 1883
Chapter 35 Saving Objects Dialog Boxes . . . . . . . . . . . . . . . . . . 1885
ADEREMOBJS (Remove Objects from Save Set command) . . . . . . 1885
ADESELOBJS (Select Objects for Save Back command) . . . . . . . . 1886
ADESHOWOBJS (Show Objects in Save Set command) . . . . . . . . 1887
Save Objects to Source Drawings dialog box . . . . . . . . . . . . . . 1887
Who Has It Information dialog box . . . . . . . . . . . . . . . . . . 1889
Chapter 36 Survey Dialog Boxes . . . . . . . . . . . . . . . . . . . . . . 1891
New Data Store dialog box . . . . . . . . . . . . . . . . . . . . . . . 1891
Contents | xix
Project Properties dialog box . . . . . . . . . . . . . . . . . . . . . . 1892
Survey Properties dialog box . . . . . . . . . . . . . . . . . . . . . . 1893
Point Group Properties dialog box . . . . . . . . . . . . . . . . . . . 1894
Field Note Editor . . . . . . . . . . . . . . . . . . . . . . . . . . . . 1894
Create Surface dialog box . . . . . . . . . . . . . . . . . . . . . . . . 1895
Source Data dialog box . . . . . . . . . . . . . . . . . . . . . . . . . 1897
Point Cloud Manager . . . . . . . . . . . . . . . . . . . . . . . . . . 1897
Surface Manager . . . . . . . . . . . . . . . . . . . . . . . . . . . . 1898
Filter Point Cloud dialog box . . . . . . . . . . . . . . . . . . . . . . 1900
Grid Parameters dialog box . . . . . . . . . . . . . . . . . . . . . . . 1901
Point Cloud Style dialog box . . . . . . . . . . . . . . . . . . . . . . 1902
Chapter 37 Setting Map Options Dialog Boxes . . . . . . . . . . . . . . 1905
MAPABOUT (About AutoCAD Map 3D command) . . . . . . . . . . 1905
MAPAUTOCHECKOUT . . . . . . . . . . . . . . . . . . . . . . . . . 1905
MAPDOCKWSPACE (Dock Task Pane command) . . . . . . . . . . . 1906
MAPEDITSETAUTO . . . . . . . . . . . . . . . . . . . . . . . . . . . 1906
MAPFEATUREEDITTOOLS . . . . . . . . . . . . . . . . . . . . . . . 1906
MAPWSFOCUS . . . . . . . . . . . . . . . . . . . . . . . . . . . . . 1907
MAPWSPACE (Task Pane command) . . . . . . . . . . . . . . . . . . 1908
MAPWSREFRESH . . . . . . . . . . . . . . . . . . . . . . . . . . . . 1908
AutoCAD Map Options dialog box . . . . . . . . . . . . . . . . . . . 1908
Coordinate Geometry Setup dialog box . . . . . . . . . . . . . . . . 1917
Define/Modify Drawing Set dialog box . . . . . . . . . . . . . . . . 1918
Drawing Maintenance dialog box . . . . . . . . . . . . . . . . . . . 1920
Drawing Set Display Filter dialog box . . . . . . . . . . . . . . . . . 1922
Drawing Settings dialog box . . . . . . . . . . . . . . . . . . . . . . 1923
Drawing Statistics dialog box . . . . . . . . . . . . . . . . . . . . . . 1926
Drive Alias Administration dialog box . . . . . . . . . . . . . . . . . 1928
Feature Editing Options dialog box . . . . . . . . . . . . . . . . . . 1929
Generate Object Data Index dialog box . . . . . . . . . . . . . . . . 1931
Index Maintenance dialog box . . . . . . . . . . . . . . . . . . . . . 1931
Remove Object Data Index dialog box . . . . . . . . . . . . . . . . . 1933
Select Alias dialog box . . . . . . . . . . . . . . . . . . . . . . . . . 1933
Undefined Alias Referenced dialog box . . . . . . . . . . . . . . . . 1934
User Administration dialog box . . . . . . . . . . . . . . . . . . . . 1934
User Information dialog box . . . . . . . . . . . . . . . . . . . . . . 1936
User Login dialog box . . . . . . . . . . . . . . . . . . . . . . . . . 1937
Chapter 38 Topology Dialog Boxes . . . . . . . . . . . . . . . . . . . . . 1939
MAPEDITDIR (Edit Direction command) . . . . . . . . . . . . . . . 1939
MAPEDITRES1 (Edit Direct Resistance command) . . . . . . . . . . . 1939
MAPEDITRES2 (Edit Reverse Resistance command) . . . . . . . . . . 1940
MAPLINKADD (Add Topology Link command) . . . . . . . . . . . . 1941
MAPLINKDEL (Delete Topology Link command) . . . . . . . . . . . 1942
xx | Contents
MAPLINKEDIT (Edit Topology Link command) . . . . . . . . . . . . 1943
MAPLINKREV (Reverse Direction of Topology Link command) . . . . 1943
MAPLINKUPD (Update Topology Link command) . . . . . . . . . . 1944
MAPNODADD (Add Topology Node command) . . . . . . . . . . . . 1944
MAPNODDEL (Delete Topology Node command) . . . . . . . . . . . 1945
MAPNODEDIT (Edit Topology Node command) . . . . . . . . . . . . 1946
MAPNODINS (Insert Topology Node command) . . . . . . . . . . . 1947
MAPNODUPD (Update Topology Node command) . . . . . . . . . . 1948
MAPPOLYADD (Add Topology Polygon command) . . . . . . . . . . 1948
MAPPOLYDEL (Delete Topology Polygon command) . . . . . . . . . 1949
MAPPOLYUPD (Update Topology Polygon command) . . . . . . . . 1949
AutoCAD Map Confirmation dialog box - MAPTOPOADMIN
Delete . . . . . . . . . . . . . . . . . . . . . . . . . . . . . . . . . 1950
AutoCAD Map Confirmation dialog box - MAPTOPOEDIT . . . . . . 1951
AutoCAD Map Confirmation dialog box - MAPTOPOADMIN
Rename . . . . . . . . . . . . . . . . . . . . . . . . . . . . . . . . 1951
Centroid Objects dialog box . . . . . . . . . . . . . . . . . . . . . . 1952
Create Closed Polylines dialog box . . . . . . . . . . . . . . . . . . . 1953
Create Network Topology - Create New Nodes dialog box . . . . . . 1955
Create Network Topology - Select Links dialog box . . . . . . . . . . 1956
Create Network Topology - Select Nodes dialog box . . . . . . . . . . 1957
Create Node Topology - Select Nodes dialog box . . . . . . . . . . . 1959
Create Polygon Topology - Create New Centroids dialog box . . . . . 1960
Create Polygon Topology - Create New Nodes dialog box . . . . . . . 1961
Create Polygon Topology - Select Centroids dialog box . . . . . . . . 1962
Create Polygon Topology - Select Links dialog box . . . . . . . . . . 1964
Create Polygon Topology - Select Nodes dialog box . . . . . . . . . . 1965
Create Polygon Topology - Set Error Markers dialog box . . . . . . . 1967
Create Topology - Select Topology dialog box . . . . . . . . . . . . . 1969
Create Topology Warning dialog box . . . . . . . . . . . . . . . . . 1971
Delete Topology dialog box . . . . . . . . . . . . . . . . . . . . . . 1971
Edit Direct Resistance dialog box . . . . . . . . . . . . . . . . . . . . 1972
Edit Direction dialog box . . . . . . . . . . . . . . . . . . . . . . . . 1972
Edit Reverse Resistance dialog box . . . . . . . . . . . . . . . . . . . 1973
Edit Topology dialog box . . . . . . . . . . . . . . . . . . . . . . . . 1973
Link Objects dialog box . . . . . . . . . . . . . . . . . . . . . . . . 1975
Load Topology Conflict dialog box . . . . . . . . . . . . . . . . . . 1976
Load Topology dialog box . . . . . . . . . . . . . . . . . . . . . . . 1976
Load Topology From Source Drawing dialog box . . . . . . . . . . . 1978
Network Topology Analysis - Choose Locations dialog box . . . . . . 1978
Network Topology Analysis - Output dialog box . . . . . . . . . . . . 1980
Network Topology Analysis - Resistance and Direction dialog
box . . . . . . . . . . . . . . . . . . . . . . . . . . . . . . . . . . 1981
Network Topology Analysis - Select Method dialog box . . . . . . . . 1983
Node Objects dialog box - Network and Polygon Topologies) . . . . . 1985
Node Objects dialog box (Node topology) . . . . . . . . . . . . . . . 1987
Contents | xxi
Rename Topology dialog box . . . . . . . . . . . . . . . . . . . . . . 1988
Select Data dialog box - Topology Overlay . . . . . . . . . . . . . . . 1989
Topology Buffer - Create New Centroids and Nodes dialog box . . . . 1990
Topology Buffer - New Topology dialog box . . . . . . . . . . . . . . 1991
Topology Buffer - Set Buffer Distance dialog box . . . . . . . . . . . 1992
Topology Dissolve - Create New Centroids and Nodes dialog box . . 1994
Topology Dissolve - Create Nodes dialog box . . . . . . . . . . . . . 1995
Topology Dissolve - New Topology dialog box . . . . . . . . . . . . . 1996
Topology Dissolve - Object Data dialog box . . . . . . . . . . . . . . 1997
Topology Dissolve - Set Parameter dialog box . . . . . . . . . . . . . 1998
Topology Overlay Analysis - Analysis Type dialog box . . . . . . . . 1999
Topology Overlay Analysis - Create New Centroids and Nodes dialog
box . . . . . . . . . . . . . . . . . . . . . . . . . . . . . . . . . . 2002
Topology Overlay Analysis - Create Nodes dialog box . . . . . . . . . 2003
Topology Overlay Analysis - Output Topology dialog box . . . . . . . 2004
Topology Overlay Analysis - Output Attributes dialog box . . . . . . 2006
Topology Overlay Analysis - Select Overlay Topology dialog box . . . 2007
Topology Query dialog box . . . . . . . . . . . . . . . . . . . . . . . 2008
Topology Query Result dialog box . . . . . . . . . . . . . . . . . . . 2010
Topology Selection dialog box . . . . . . . . . . . . . . . . . . . . . 2011
Topology Statistics dialog box . . . . . . . . . . . . . . . . . . . . . 2011
Chapter 39 Viewing Dialog Boxes . . . . . . . . . . . . . . . . . . . . . 2013
Quick View Drawings dialog box . . . . . . . . . . . . . . . . . . . . 2013
Zoom Drawing Extents dialog box . . . . . . . . . . . . . . . . . . . 2014
Define Document View dialog box . . . . . . . . . . . . . . . . . . . 2015
Define Key View dialog box . . . . . . . . . . . . . . . . . . . . . . 2017
Document View dialog box . . . . . . . . . . . . . . . . . . . . . . . 2019
Key View dialog box . . . . . . . . . . . . . . . . . . . . . . . . . . 2019
Chapter 40 Workflow Designer . . . . . . . . . . . . . . . . . . . . . . . 2021
MAPWORKFLOWOPEN . . . . . . . . . . . . . . . . . . . . . . . . 2021
MAPWORKFLOWRUN . . . . . . . . . . . . . . . . . . . . . . . . . 2021
Workflow Designer . . . . . . . . . . . . . . . . . . . . . . . . . . . 2022
Workflow Activity Input dialog boxes . . . . . . . . . . . . . . . . . 2025
Add Feature Layer . . . . . . . . . . . . . . . . . . . . . . . . . . . . 2028
Add Group . . . . . . . . . . . . . . . . . . . . . . . . . . . . . . . 2029
Add Map . . . . . . . . . . . . . . . . . . . . . . . . . . . . . . . . 2030
Change Feature Layer Properties . . . . . . . . . . . . . . . . . . . . 2030
Change Feature Layer Symbol . . . . . . . . . . . . . . . . . . . . . 2031
Change Group Properties . . . . . . . . . . . . . . . . . . . . . . . . 2033
Connect To Data Store . . . . . . . . . . . . . . . . . . . . . . . . . 2034
Create Buffer Layer . . . . . . . . . . . . . . . . . . . . . . . . . . . 2036
Display Feature Attributes . . . . . . . . . . . . . . . . . . . . . . . 2037
Highlight Features/Remove Highlighting . . . . . . . . . . . . . . . 2038
xxii | Contents
List Current Connections . . . . . . . . . . . . . . . . . . . . . . . . 2039
List Feature Classes . . . . . . . . . . . . . . . . . . . . . . . . . . . 2039
List Feature Layer Properties . . . . . . . . . . . . . . . . . . . . . . 2040
Load Layer File . . . . . . . . . . . . . . . . . . . . . . . . . . . . . 2040
Perform Overlay . . . . . . . . . . . . . . . . . . . . . . . . . . . . 2041
Remove Connection . . . . . . . . . . . . . . . . . . . . . . . . . . 2043
Remove Feature Layer . . . . . . . . . . . . . . . . . . . . . . . . . 2044
Remove Group . . . . . . . . . . . . . . . . . . . . . . . . . . . . . 2044
Remove Map . . . . . . . . . . . . . . . . . . . . . . . . . . . . . . 2045
Rename Map . . . . . . . . . . . . . . . . . . . . . . . . . . . . . . 2045
Run AutoCAD Command . . . . . . . . . . . . . . . . . . . . . . . 2046
Run Workflow . . . . . . . . . . . . . . . . . . . . . . . . . . . . . 2047
Save Layer File . . . . . . . . . . . . . . . . . . . . . . . . . . . . . 2048
Select Features . . . . . . . . . . . . . . . . . . . . . . . . . . . . . 2049
Switch Map . . . . . . . . . . . . . . . . . . . . . . . . . . . . . . . 2050
Zoom To Extents . . . . . . . . . . . . . . . . . . . . . . . . . . . . 2050
Chapter 41 Programming Interfaces . . . . . . . . . . . . . . . . . . . . 2053
Glossary . . . . . . . . . . . . . . . . . . . . . . . . . . . . . 2055
Index . . . . . . . . . . . . . . . . . . . . . . . . . . . . . . 2081
Contents | xxiii
xxiv
Getting Started Guide
This section provides the following:
■An introduction to the main concepts and features of AutoCAD Map 3D
■A description of resources for learning more about the program
■An overview of the available sample data and templates
For a tutorial that provides a tour of the application and leads you through the basic steps of
creating a map, see Introducing AutoCAD Map 3D 2011.
For a general overview of working with geospatial data, see Best Practices for Managing Geospatial
Data.
Overview of AutoCAD Map 3D Concepts
AutoCAD Map 3D is the leading engineering solution for creating and managing
spatial data. AutoCAD Map 3D bridges the gap between Computer Aided Design
(CAD) and Geographic Information Systems (GIS). AutoCAD Map 3D provides
direct access to the leading data formats used in design and GIS. Use AutoCAD®
tools to maintain a broad variety of geospatial information. Integrate GIS
functions in your design processes in a single environment for more efficient
workflows. The results are better designs, increased productivity, and better data
quality.
1
1
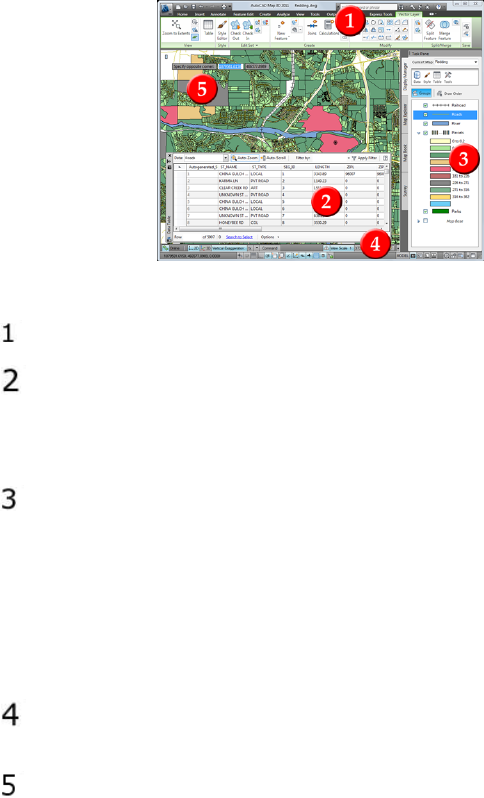
The AutoCAD Map 3D Window
The main elements of the AutoCAD Map 3D product window
The Ribbon. The commands for your mapping tasks.
Data Table and Data View. Display attribute data in a table format. Use
the Data Table (page 2059) for viewing spatial data and attribute data for
geospatial features; use the Data View for viewing attribute data linked to
drawing objects.
The Task Pane. Use the Task Pane (page 2076) tabs for the following:
■Managing maps and map data
■Displaying and styling data layers
■Bringing in and managing survey data
■Publishing multi-page map books
Status Bars. Check the current cursor location, change exaggeration and
scale settings, switch between 2D and 3D, and use common tools.
Dynamic input. Launch commands and respond to prompts at the cursor
location. For experienced AutoCAD users, the command interface allows for
efficient editing using keyboard entry.
2 | Chapter 1 Getting Started Guide
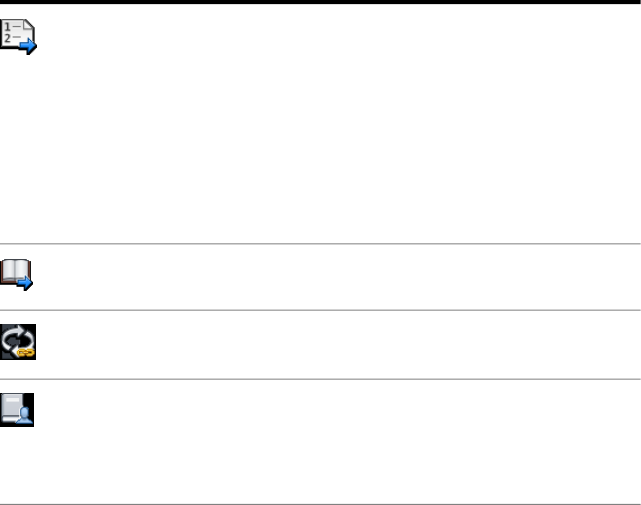
Tell me more
Procedures
■To switch between Tool-based, Task-based, and Map
Classic workspaces (page 86)
■To access the Data Table (page 1127)
■To use the Data View (page 1047)
■To set Task Pane options (page 221)
■To add an item to the status bar
■To use dynamic input
Tutorial
■Lesson 2: Take a Quick Tour of AutoCAD Map 3D
Workflow
■Set Up Your Work Environment
Related topics
■Customizing Your Work Environment (page 84)
■Workspaces
■Setting Options (page 216)
Map Files and Data Sources
What is a map?
An AutoCAD Map 3D map file is a window onto your information. It has links
to all the data and images you include in your map:
■Standard AutoCAD objects
■Spatial data from a database or file
■Raster images
■Attribute data
You can use multiple sources in a single map file. For example, attach a DWG
file to your map file, query in some of its layers, and add them as Display
Manager layers. Then, connect to a SHP file that becomes another layer in
Map Files and Data Sources | 3
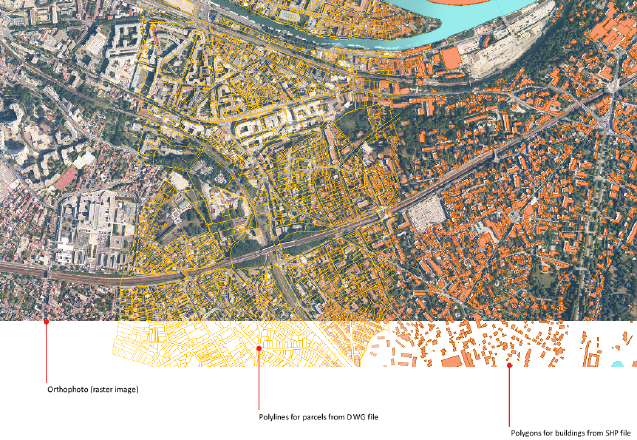
your display map, or add features from a geospatial database. The map file
remembers all the connections and which objects you added to the map file.
This map contains a photo raster image, building data stored in a SHP file, and parcel
data stored in a DWG file.
What is the Display Manager?
You coordinate the data in your map using the Display Manager.
Each set of data is a Display Manager layer. For example, a raster layer can
display an aerial photograph of a city. An SDF layer can display an SDF file
representing parcels within the city. A drawing layer can display objects from
the current drawing or from an attached drawing file.
Display Manager layers are not the same as AutoCAD layers.
In the Display Manager, you can style each layer separately, change the order
of the layers, and view and plot the result. You can specify line styles, color,
and weights; fill colors and styles; labels; and more.
What is in a map file?
Each AutoCAD Map 3D map file contains the information for connecting to
the data sources, drawings, raster images, and attribute data for its contents.
4 | Chapter 1 Getting Started Guide
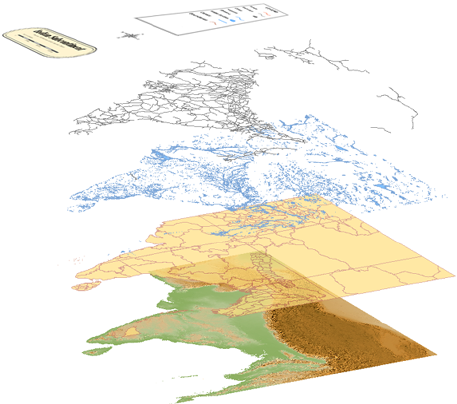
It also stores queries, object data, styling information, printing layouts, and
any customized settings.
Each data set is a layer in the map.
Whenever you open a map file, all this information is immediately available
to you.
What is a data source?
A data source is any source of information that can be used in a map. It can
be any of the following:
■A spatial database created with Oracle, SQL Server, or another relational
database management system
■A file-based spatial data store, such as Autodesk SDF or ESRI SHP
■An AutoCAD drawing file
■A spreadsheet or other ODBC source that contains attribute data
■A raster image, such as a TIFF or DEM file
The relationship between the sources and the map file is dynamic. If the data
in the source file changes, those changes are updated in your map file. When
you change the objects in your map file, you can save those changes back to
their original sources.
Map Files and Data Sources | 5
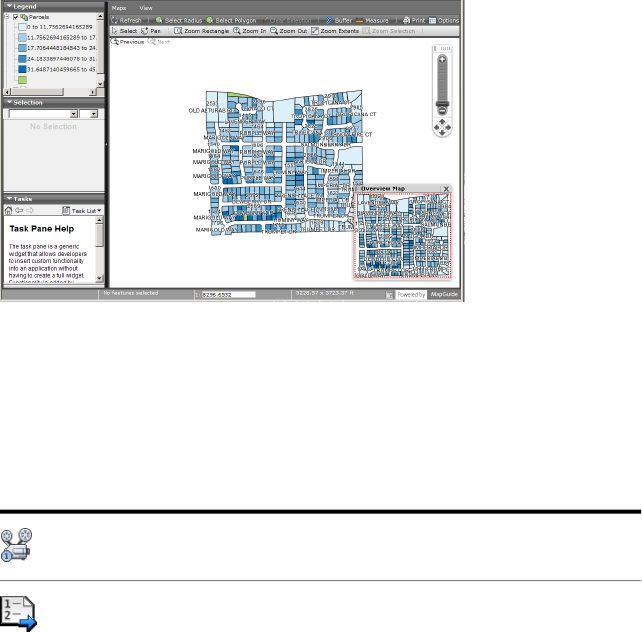
What can you do with a finished map?
You can share maps even with viewers who do not have access to AutoCAD
Map 3D. For example, you can share maps in the following ways:
■Print maps
■Save maps as DWFs (which can be viewed with Autodesk Design Review,
available from the Autodesk web site)
■Publish maps to MapGuide
■Convert all the data to AutoCAD DWG data
■Post maps on the web
Publish to a MapGuide server to share a map on the web.
AutoCAD cannot read some information in an AutoCAD Map 3D file, such
as links to external spatial data. To share a map with an AutoCAD user, convert
all the data in your map to DWG format, including data from spatial data
stores.
Tell me more
Video
■Show me how to publish a map to a MapGuide server.
Procedures
■To access data through FDO (page 308)
■To bring drawing objects into your map (page 354)
■To create a map with styled feature layers (page 641)
6 | Chapter 1 Getting Started Guide
■To create a map with styled drawing layers (page 654)
■To publish your map (page 1361)
Tutorial
■Lesson 3: Get Started
Workflow
■Create a Map Start to Finish
GIS Skills
■Bring in data from multiple image files to a single layer.
■Publish a completed map to a MapGuide server.
Related topics
■Overview of the Display Manager (page 634)
■Overview of Publishing and Sharing (page 1357)
■Converting and Exporting (page 1403)
Map Files and Display Maps
A map file is a drawing that connects to all the sources for your map: geospatial
features, drawing objects, raster images, and attribute data.
Each map file can contain multiple display maps (for printing or for online
distribution), in which you can selectively hide or show items in your map.
Maps exist only as conceptual structures, and are not separate entities or files.
You can apply styles to the items in a display map, based on data, layers, and
other criteria. Changes that you make to the appearance of items in a map do
not affect the actual data in your map file.
Map Files and Display Maps | 7
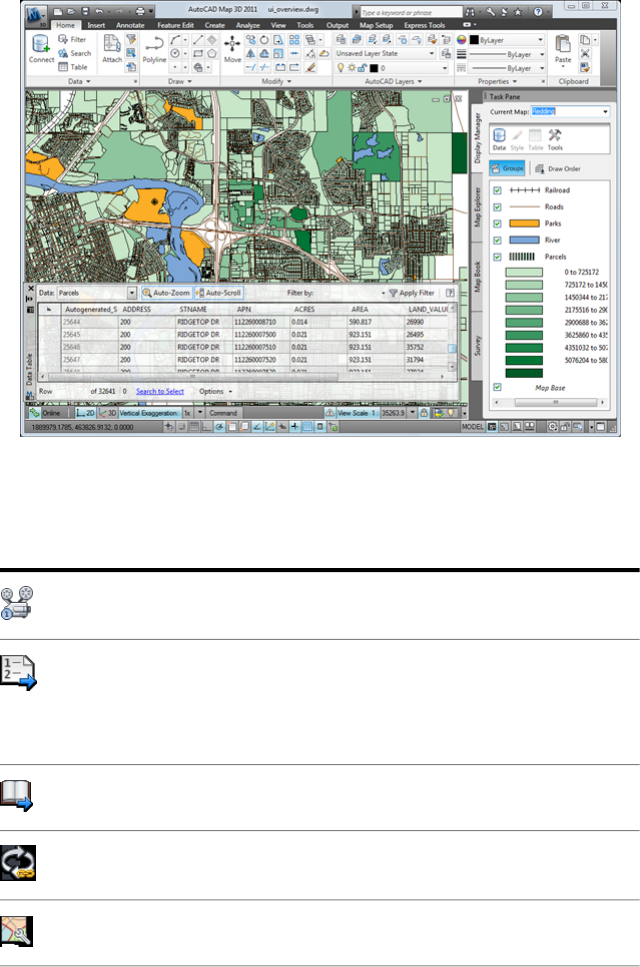
This map has Display Manager layers for railroads, roads, parks, the river, and
parcels. Each is styled differently. For an introduction to the parts of the AutoCAD
Map 3D window, see Lesson 2: Take a Quick Tour of AutoCAD Map 3D.
Tell me more
Video
■Show me how to theme a parcels layer.
Procedures
■To create multiple display maps (page 639)
■To create a map with styled feature layers (page 641)
■To create a map with styled drawing layers (page 654)
Tutorial
■Lesson 3: Get Started
Workflow
■Use Themes to Reveal Patterns in Data
GIS Skills
■Choose the right type of theme to suit your data.
8 | Chapter 1 Getting Started Guide
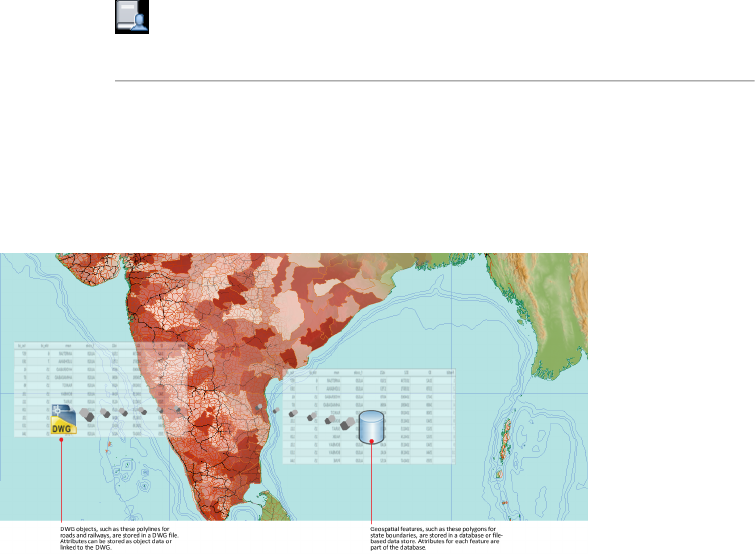
Related topics
■Overview of the Display Manager (page 634)
■Creating Multiple Display Maps (page 638)
Geospatial Features and Drawing Objects
Use AutoCAD Map 3D to work with both CAD objects and geospatial features.
You can combine them in your map, edit either type of data, and move data
from one format to the other.
Combine data from drawing files and geospatial data stores.
Geospatial Features
A feature is the spatial description of a real-world entity such as a road or a
utility pole. Features are stored in a spatial database or in file formats such as
Oracle, ArcSDE, SDF, or SHP. The spatial database or file is referred to as a
feature source.
Using Open Source FDO Data Access Technology, AutoCAD Map 3D natively
accesses spatial data. To work with features, connect to the database or file
and then select the sets of features (feature classes) to include in your map.
Drawing Objects
A drawing object is any object in a DWG file, such as a line, circle, or closed
polyline.
Create and store drawing objects in the current map, or attach a DWG file to
the current map and query in its objects. AutoCAD Map 3D remembers the
Geospatial Features and Drawing Objects | 9
original location of the objects and saves edited objects back to their original
file.
Tell me more
Video
■Show me how to bring in objects from a set of attached DWG
files.
■Show me how to bring in features from a feature class.
■Show me how to bring in data from AutoCAD Civil 3D.
Procedures
■To access data through FDO (page 308)
■To bring drawing objects into your map (page 354)
Tutorial
■Tutorial: Building a Map
Workflow
■Create a Map Start to Finish
GIS Skills
■Bring in data from multiple image files to a single layer.
■Bring in a subset of features using a query.
Related topics
■Overview of Bringing In Data (page 291)
■Overview of Creating and Editing Data (page 681)
Overview of AutoCAD Map 3D Features
AutoCAD Map 3D is built on the latest release of AutoCAD® software and is
enhanced with a suite of geospatial tools. It has all the features and
functionality of AutoCAD, which is automatically installed with AutoCAD
Map 3D.
10 | Chapter 1 Getting Started Guide
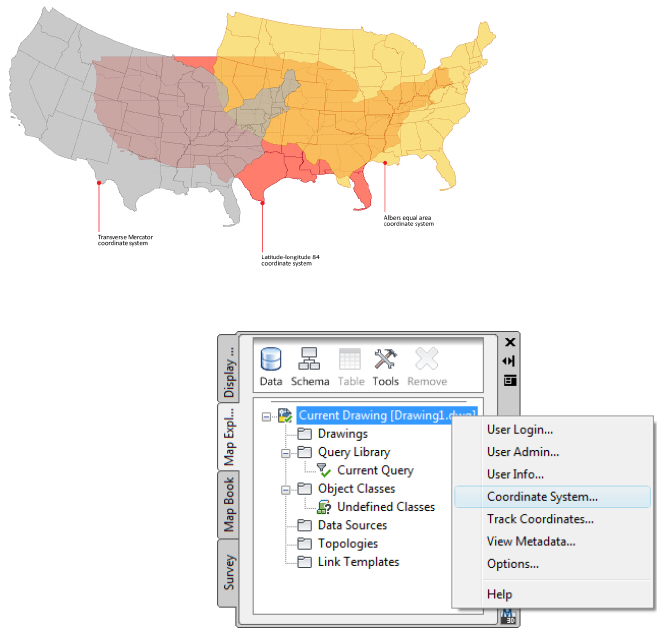
Create and Assign Geographic Coordinate Systems
Work with more than 4,000 real-world coordinate systems or define your own
custom coordinate system. Use tools such as transform, rubber sheeting, and
track coordinates to georeference your AutoCAD design data accurately.
Coordinate systems determine how your map is projected in two dimensions.
Assign a coordinate system to the drawing to locate it in
real space.
Create and Assign Geographic Coordinate Systems | 11
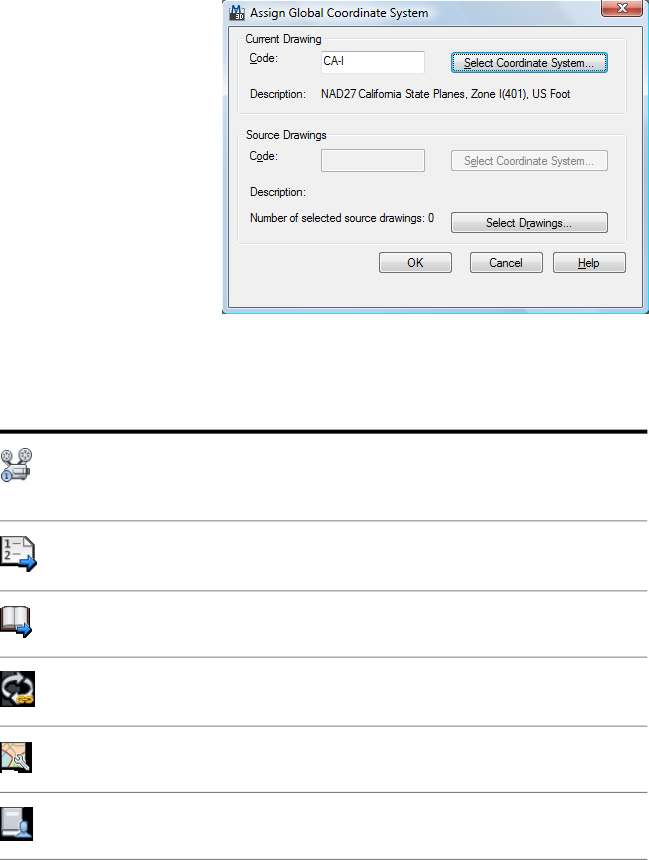
You can enter or select the appropriate coordinate system
for the map.
Tell me more
Video
■Show me how to set a map to the coordinate system of
the data.
Procedures
■To assign coordinate systems (page ?)
Tutorial
■Exercise 1: Create a map
Workflow
■Work with Coordinate Systems
GIS Skills
■Reproject incoming data to a new coordinate system.
Related topics
■Overview of Coordinate Systems (page 143)
Combine Geospatial Features and Drawing Objects
AutoCAD Map 3D software integrates computer-aided design (CAD) and
geographic information system (GIS) data. After working with the data, you
12 | Chapter 1 Getting Started Guide
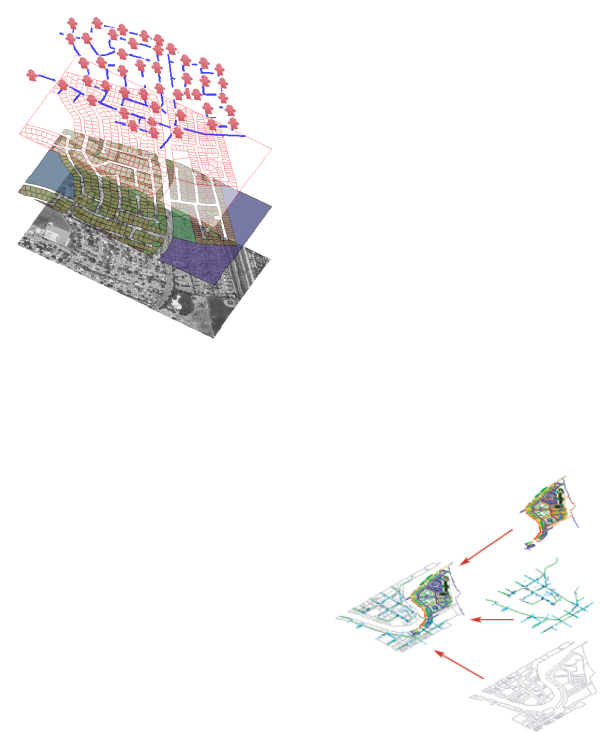
can maintain it in a DWG™ file, convert it to an external file, or move it into
a spatial database.
DWG Data
Maps are saved in DWG format. Open an AutoCAD drawing directly, or attach
drawings and query in just the objects you want.
■Combine feature data from a spatial
database with objects from CAD
drawings, raw geometry from a
spreadsheet, and raster images.
■Features and objects are automatically
transformed to the coordinate system
used in the map.
Spatial Data
Connect to the data to include.
■Directly access and edit spatial data in
files and databases.
■Without data translations, data integ-
rity is ensured.
■Connect to publicly available web ser-
vices such as Web Map Services (WMS)
and Web Feature Services (WFS).
Combine Geospatial Features and Drawing Objects | 13
Raster Images
Add aerial photos, contour maps, and DEM surfaces.
■Georeferenced images are displayed
in the correct location.
■Surface rasters are draped over your
elevations.
Connect to the data from the Task pane.
■Select the data source.
■Select the feature classes to add to
your map.
■Each feature class you add becomes a
layer in the Display Manager.
14 | Chapter 1 Getting Started Guide
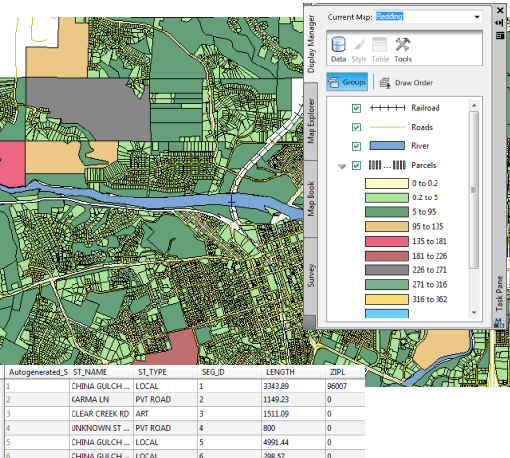
The layers in Display Manager (page 2060) represent the data
sources to which this map is connected. The Data Table (page
2059) lets you edit the information for individual items in a layer.
Import Data
You can import data, rather than connecting to it. Importing breaks the
connection to the source and adds a “snapshot” of the data to your map. If
the data changes after that, you will not see any changes in your map unless
you import the data again. There is no way to update imported data in its
source. Similarly, when you export data, you export the current data only.
The connection to the live data is lost.
Combine Geospatial Features and Drawing Objects | 15

When you import data, you can structure it in your map. Assign data to layers
or object classes. Add attribute data to object data tables. Assign a coordinate
system. Specify that points come in as points, text, or blocks.
You can read, write, and convert data between standard formats. For a list of
supported formats, see the following topics:
■Bringing in GIS Features (page 303)
■Supported Import Formats (page 387)
■Supported Export Formats (page 1412)
Integrate Database Information
Join CAD objects to commonly used databases using link templates. Join
geospatial data to ODBC data stores and databases using joins.
16 | Chapter 1 Getting Started Guide
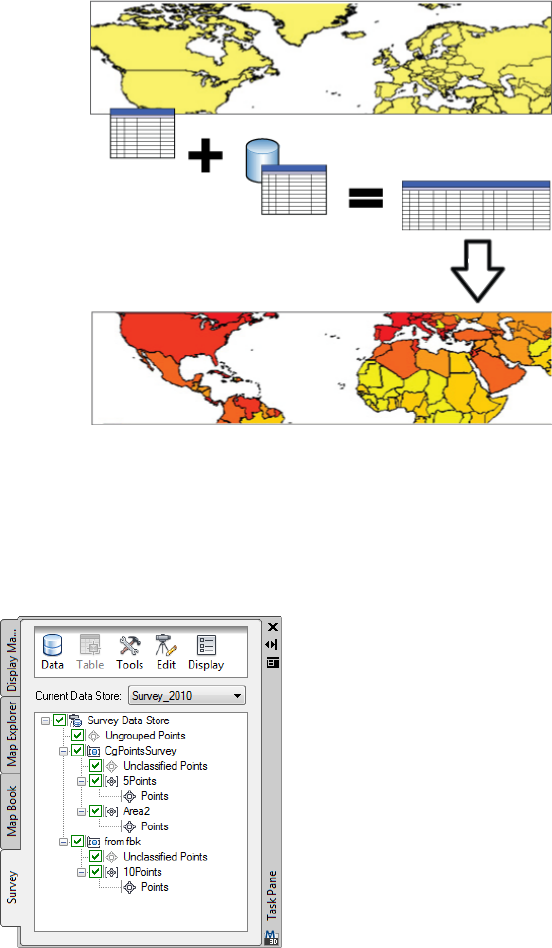
When you join a database to a feature layer, the properties
from both data stores are available to that layer for theming
and other purposes.
Add Survey Data
Bring in points you exported from Autodesk Civil 3D (LandXML) or ASCII
data from a GPS device.
Use the Survey tab to import and
organize survey data
Combine Geospatial Features and Drawing Objects | 17
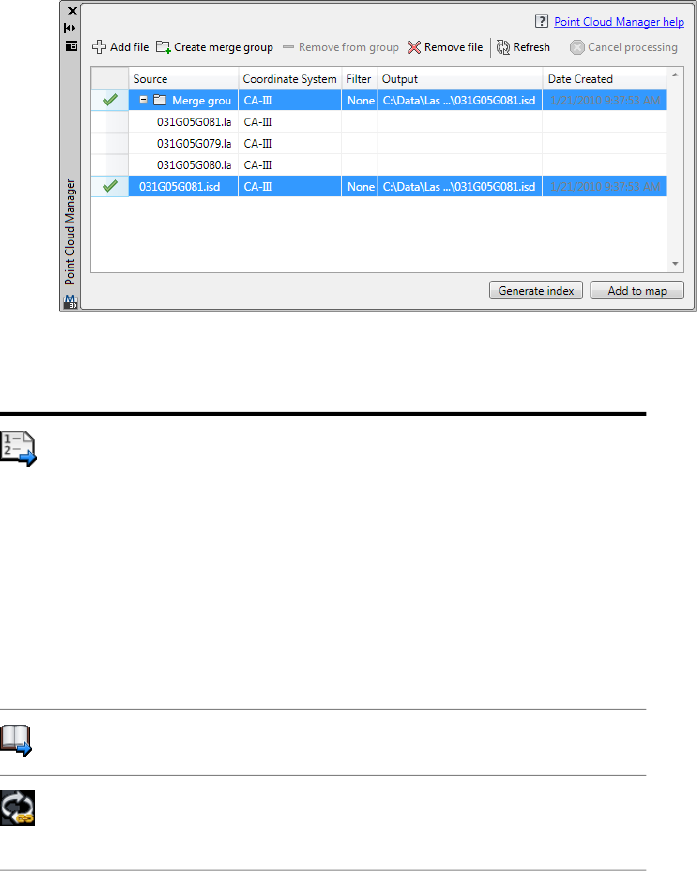
Add Point Cloud Data
Bring in point cloud (page 2071) data from LiDAR (page 2066) Aerial Survey (.LAS)
files or ASCII (.XYZ) files.
Use the Point Cloud Manager to bring in point cloud data
Tell me more
Procedures
■To access data through FDO (page 308)
■To bring drawing objects into your map (page 354)
■To add a raster image to the map (page 440)
■To import data from other formats (page 381)
■To bring LandXML data into a Survey Data Store (page
371)
■To bring ASCII point data into a Survey Data Store (page
373)
■To bring LiDAR data into your map (page 374)
Tutorial
■Tutorial: Building a Map
Workflow
■Create a Feature Map
■Create a CAD Map
18 | Chapter 1 Getting Started Guide

GIS Skills
■Bring in data from multiple image files to a single layer.
■Access data published on a public web server.
■Bring in point data from a Microsoft Access database.
■Bring in a subset of features using a query.
Related topics
■Bringing in GIS Features (page 303)
■Bringing In Drawing Data From DWG Files (page 350)
■Converting Data From Other Formats to Drawing Objects
(page 377)
■Joining Data to GIS Features (page 507)
■Adding Attributes to Drawing Objects (page 521)
■Adding Rasters and Surfaces (page 437)
■Bringing in Survey Data (page 370)
■Bringing in LiDAR Data (page 374)
Create and Edit Features and Drawing Objects
When you connect to a feature source, your map is a window onto the data.
Your edits are made directly to the source. The data remains in its source
location. Any changes you make appear in the source. Any changes in the
source are immediately reflected in your map.
When you edit objects from attached drawings, AutoCAD Map 3D tracks the
original location of each object and saves them back to their original source.
Use AutoCAD Tools to Edit All Data
Use the full set of AutoCAD editing tools and commands to add or change
map objects. It does not matter what the object source is. Editing does not
convert the data. AutoCAD Map 3D includes all the AutoCAD editing tools
as well as tools designed for creating maps, such as using coordinate geometry
to specify a point. View and style with the ease of GIS, edit with the power of
CAD.
Create and Edit Features and Drawing Objects | 19
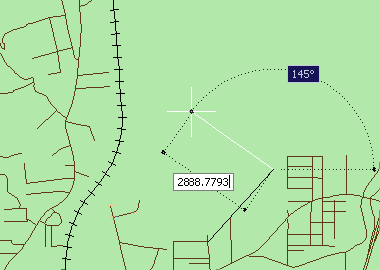
Use the powerful, high-precision AutoCAD tools to
edit a feature, then save your changes back to the
data source.
Lock Data for Secure Editing
For geospatial features, you can choose how to save your changes. Set an
option to save changes to the original source automatically, or work offline
and update the feature source when you finish editing. Check out a feature
to lock it for other users (if the feature source supports this option). Check it
back in to make it available again.
For drawing objects, you can lock the source drawings so no one else can use
them. You can use save set options to control whether your changes are saved
back to the original drawings or affect the current map only.
20 | Chapter 1 Getting Started Guide
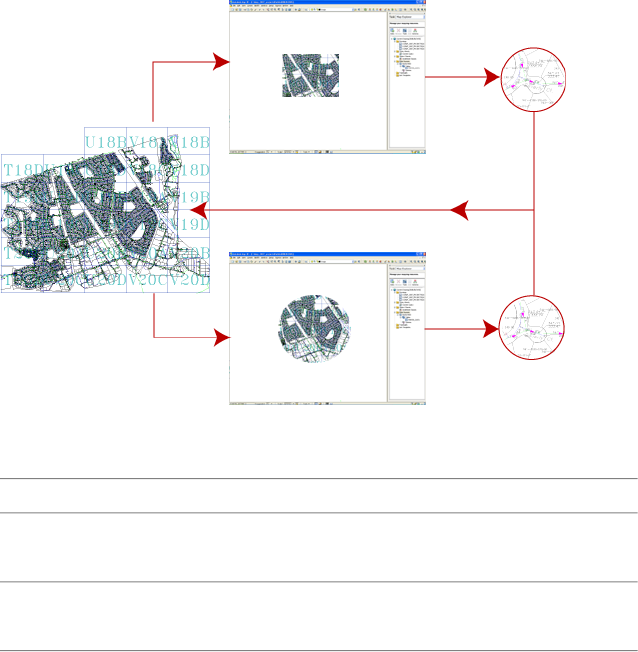
Drawing objects selected for editing in a save set (the red circle in the
illustration) are locked so others cannot edit them.
Locking CapabilitySpatial Data Type
Individual features are locked when you
check them out.
Oracle and ArcSDE
Individual objects are locked when you
query them into the map.
Attached drawings (DWG)
Clean Up Drawings
Using Drawing Cleanup tools, you can automate the correction of common
drafting and digitizing errors. Delete duplicates, correct undershoots and
dangling objects, and more.
Create and Edit Features and Drawing Objects | 21
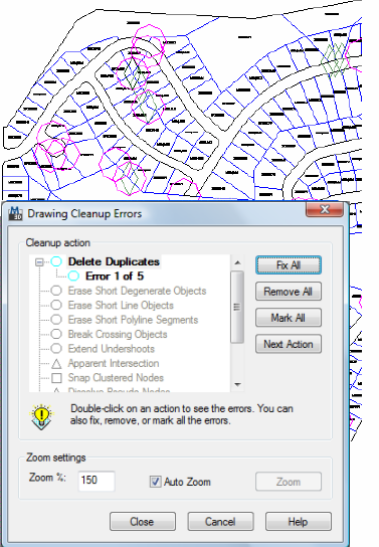
Review, mark, and correct errors interactively.
Use Coordinate Geometry Commands
Create and measure simple coordinate geometry (COGO) for lines, curves,
closed polylines, and polygons. When drawing plats and existing conditions,
input geometry in terms of bearing, direction, deflection, and azimuth angle.
22 | Chapter 1 Getting Started Guide
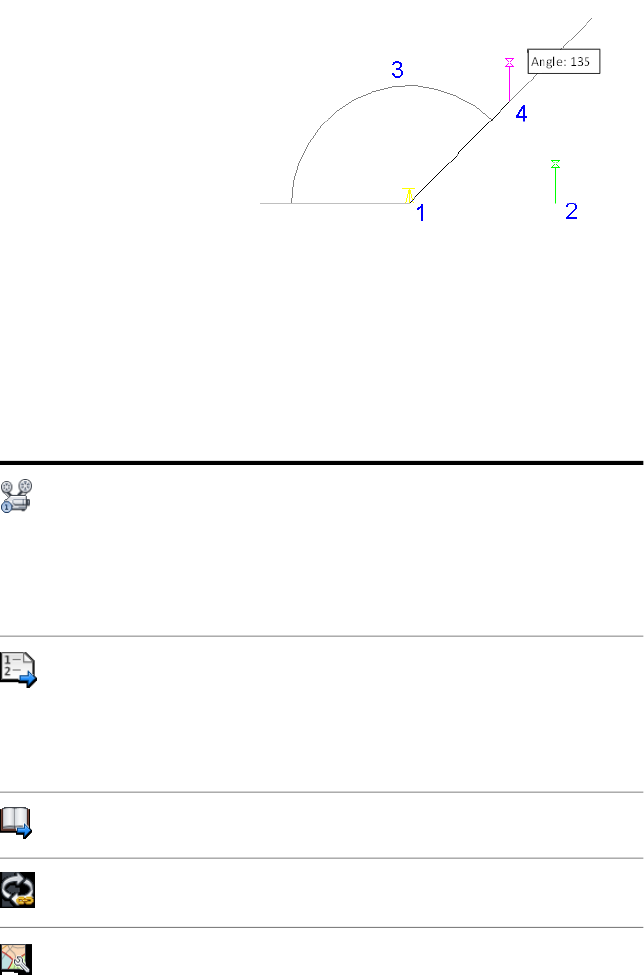
Use the Deflection And Distance COGO command to
specify a point by supplying a deflection angle and a
distance from another point.
Use the COGO Input dialog box to enter coordinates manually or select them
in the drawing or in the Data Table. The Inverse Report option gives you
information about the relationship between existing points.
Tell me more
Video
■Show me how multi-user editing of drawing files works.
■Show me how to edit features stored in a database or data
store.
■Show me how to create new features from existing AutoCAD
objects.
Procedures
■To work with features (page 683)
■To work with drawing objects (page 727)
■To clean up drawing data (page 765)
■To enter coordinate geometry (page 1026)
Tutorial
■Tutorial: Building a Map
Workflow
■Create and Edit Data
GIS Skills
■Edit DWG files in a multi-user environment.
■Edit feature geometry directly in a SHP file using CAD tools.
Create and Edit Features and Drawing Objects | 23
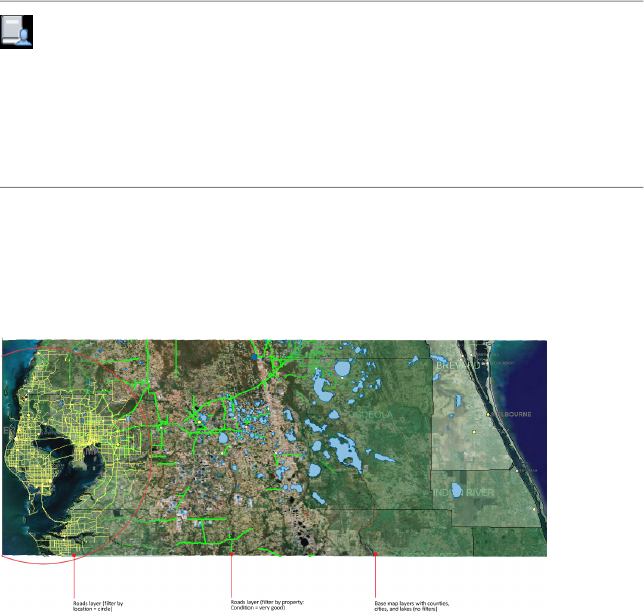
■Create new features from existing AutoCAD objects.
Related topics
■Working with Features (page 683)
■Working with Drawing Objects (page 727)
■Overview of Sharing Attached Drawings (page 730)
■Cleaning Up Drawing Data (page 765)
■Overview of Coordinate Geometry Commands (page 1027)
Search and Filter Data
Using DWG query functionality, multiple users can access, search, and edit
the same sets of DWG files or base maps simultaneously.
Use a property filter and a location filter to view the condition of roads in a circular
area.
24 | Chapter 1 Getting Started Guide
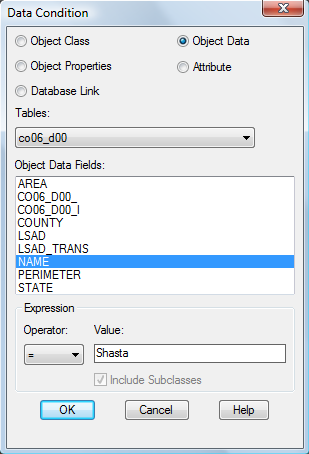
Use queries to filter data as you add it to
your map. You can also filter data after you
add it to your map. For example, use a
query to select a subset of data.
Use geospatial and DWG queries to find a feature or object based on its
location, its properties, or attribute data linked to it from another source.
Search and Filter Data | 25
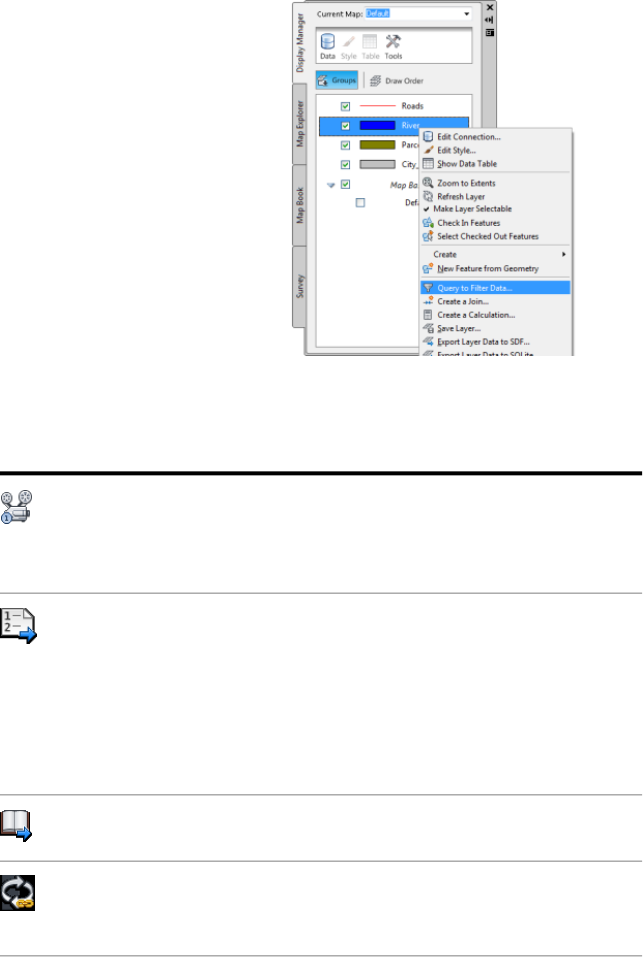
Apply a query to any feature layer in the
Display Manager.
Tell me more
Video
■Show me how to run a query on a set of attached DWG
files.
■Show me how to run a query on a feature class.
Procedures
■To filter feature data when you add it to a map (page
310)
■To find and filter features (page 1209)
■To filter drawing data when you add it to your map
(page 354)
■To find and select drawing objects (page 1219)
Tutorial
■Lesson 5: Find and Edit Features
Workflow
■Find and Edit Objects in Attached Drawings
■Edit Features in a Geospatial Feature Source
26 | Chapter 1 Getting Started Guide
GIS Skills
■Bring in a subset of features using a query.
Related topics
■Filtering Features When You Add Them to a Map
(page 309)
■Overview of Bringing in Drawing Data From DWG
Files (page 351)
■Finding and Selecting Features (page 1206)
■Finding and Querying Drawing Objects (page 1218)
View and Edit Attribute Data
Attribute data is non-geometry data about a drawing object or feature. For
example, a drawing of parcels can have attribute data that lists the owner and
improvements for each parcel.
For drawing objects, you can do the following:
■Import attribute data.
■Attach drawing objects with links to external data.
■Link database entries to the data already associated with drawing objects.
■Create and manage attribute data within AutoCAD Map 3D using Data
View.
■Use attribute data as the basis of queries.
■Display attribute data on your map as text.
■View attribute data linked to drawing objects using the Data View.
For geospatial feature data, you can do the following:
■Join an attribute data store to an existing feature class.
■Create and manage attribute data within AutoCAD Map 3D.
■Use attribute data as the basis of queries.
View and Edit Attribute Data | 27
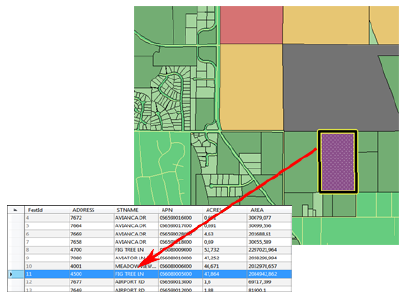
■Display attribute data on your map as text.
■View and edit attribute data for features using the Data Table.
Data Table
Use the Data Table to highlight data for specific features in your map. AutoCAD
Map 3D maintains the link between spatial data and attribute data; when you
update the attribute data, the updates are dynamically reflected in your
drawing.
The Data Table displays geometry and attribute data for a feature. You can search and
theme features based on any data in the feature source.
Data View
To link attribute data to drawing objects, attach the database to the current
map. Then use a link template to connect the data to the objects.
28 | Chapter 1 Getting Started Guide
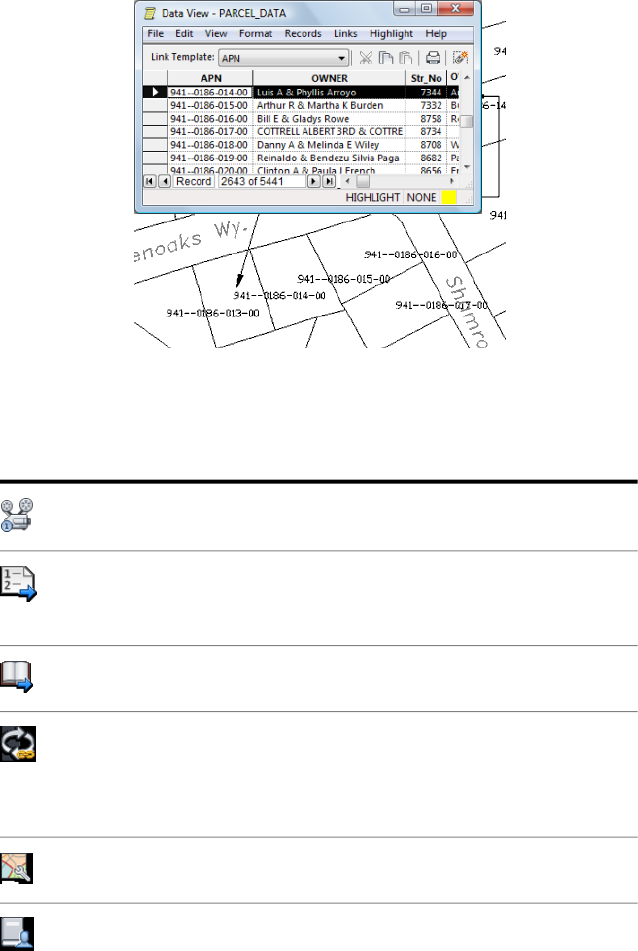
Link attribute data to drawing objects, then highlight
objects in your map by selecting the linked data in
the table.
Tell me more
Video
■Show me how to view the contents of an SDF file.
Procedures
■To display the Data Table
■To use the Data View
Tutorial
■Data Table and Data View
Workflow
■Attach Attribute Data to Drawing Objects
■Add Attribute Data Based on Constraints
■Join Attribute Data to a Geospatial Feature
GIS Skills
■Convert styled DWG objects to features.
Related topics
■Viewing Data for a Selected Layer, Join, Unfiltered Fea-
ture Class, or Non-Spatial Data Table (page 1134)
■Setting Up Data Sources for Drawings (page 204)
View and Edit Attribute Data | 29
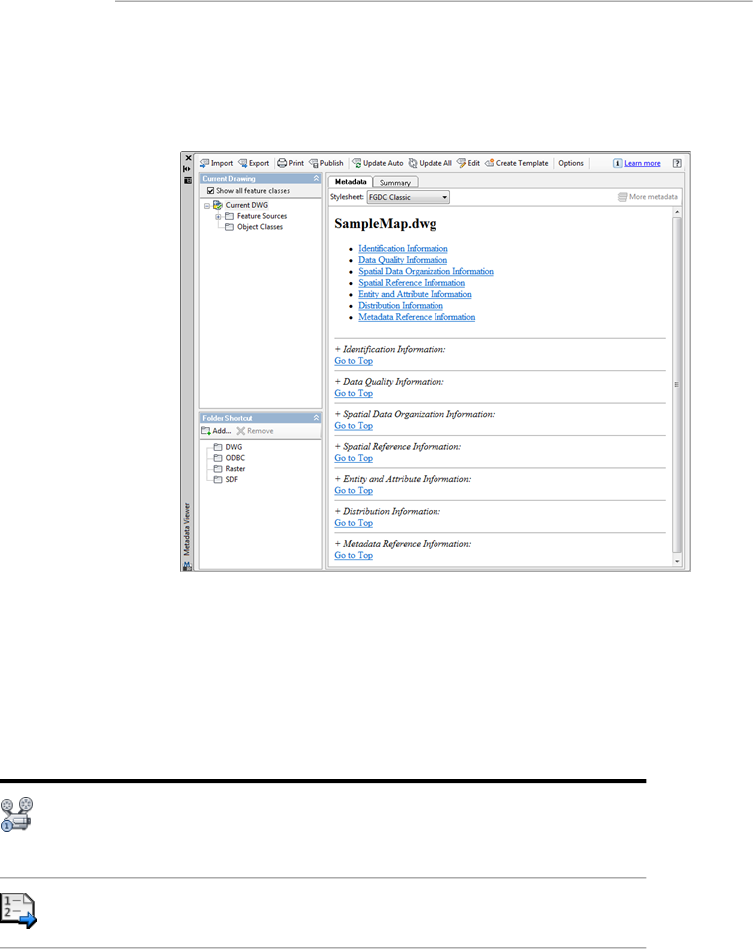
■Adding Attributes to Drawing Objects (page 521)
Use Metadata
View, create, and edit metadata (the who, what, when, where, why, and how)
about your spatial information.
View and edit metadata.
Publish metadata in standard formats including International Organization
for Standardization (ISO) (19115 and 19139) and Federal Geographic Data
Committee (FGDC). Share your data with other people in your organization
or externally with contractors and regulatory agencies.
Tell me more
Video
■Show me how to view and interpret metadata.
■Show me how to create and edit metadata.
Procedure
■To work with metadata (page 1487)
30 | Chapter 1 Getting Started Guide
Tutorial
■Lesson 6: Generate Metadata for a Classified Drawing
Workflow
■Create a Feature Map
■Create a CAD Map
GIS Skill
■View and interpret metadata.
■Create metadata for your map.
Related topics
■Creating and Viewing Metadata (page 1486)
■Overview of Sharing Metadata (page 1510)
Organize Data
Organize objects in your drawing by the real-world features that they represent
(for example, roads, parcels, cables, or water pipes).
Object Classification for Drawing Objects
When you create an object using object classification, the object automatically
takes its properties and values from its object class. Classification maintains
consistency and establishes standards in your drawing.
Organize Data | 31
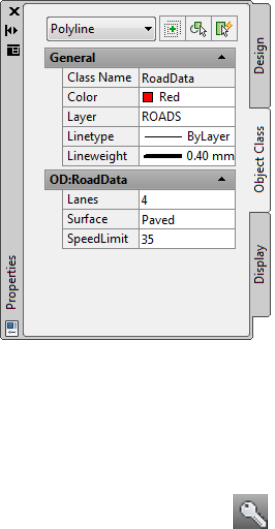
The Object Class tab of the Properties
palette displays the properties
associated with the class of the
selected object.
If you are an AutoCAD Map 3D subscriber, you can download free
industry-specific toolkits. These toolkits fast-track the classification process.
To enroll in or visit the Subscription Center, click in the InfoCenter area
at the top right of the application window.
Feature Classes for Geospatial Data
FDO features use schemas to define their feature classes and feature properties.
A schema is a set of feature classes. Each feature class has properties that
describe its members.
You can do the following with feature classes:
■Define schemas (databases and files)
■Create a data store and add a schema to it
■Load data models with XML Metadata Interchange (XMI) from industry
standard modeling programs
■Edit a schema (for spatial data formats that support editing)
32 | Chapter 1 Getting Started Guide
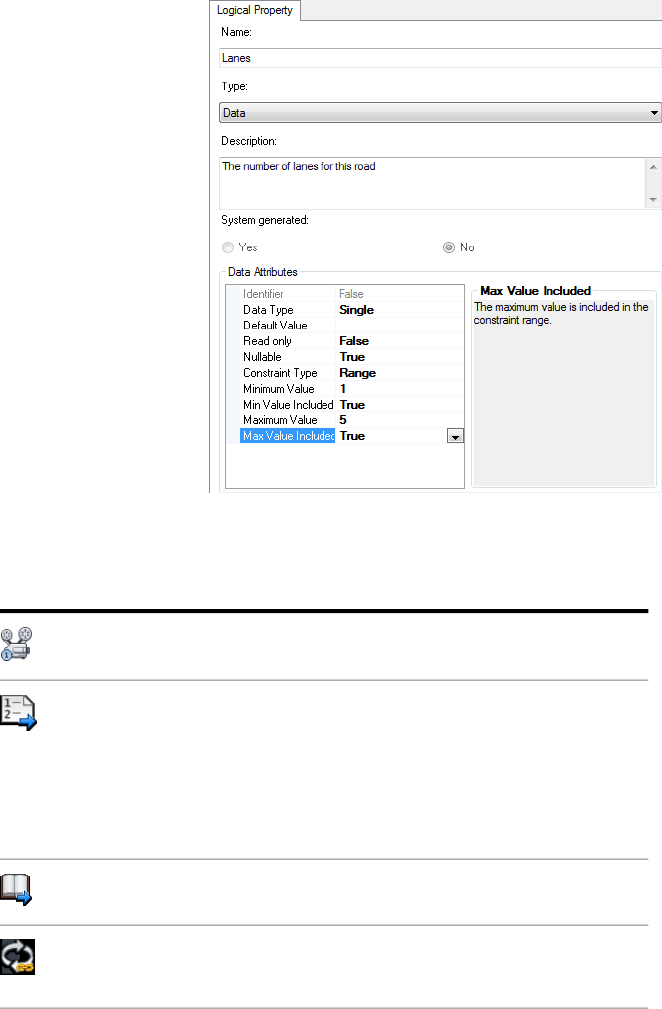
Use the Schema Editor to create or edit properties in a feature
class.
Tell me more
Video
■Show me how to append a feature class to an SDF file.
Procedure
■To set up object classification (page 118)
■To use object classification (page 981)
■To work with feature schemas (page 595)
■To enroll as a subscriber or visit the Subscription
Center (page 56)
Tutorial
■Tutorial: Classifying Drawing Objects
Workflow
■Set Up Your DWG Data
■Move CAD Data to GIS
Organize Data | 33
GIS Skills
■Edit a schema (SDF)
Related topics
■Overview of Setting Up Object Classification (page
117)
■Overview of Object Classification (page 981)
■Overview of Working with Schemas (page 594)
Style Data
Use styles to change the appearance of objects and features in your map.
■Assign visual properties to object groups, or to objects that match certain
criteria.
■Create complex styles, such as roads with a thick black line with a double
yellow stripe down the middle. Use specific colors and line types for
different features.
■Call out details with attribute-driven labels that provide text along a curve
and segment-stitching functionality.
■Blend data using transparency.
■Save and reuse styles in any project, saving time and streamlining map
production.
■Save display layer definitions (which include styling information and
pointers to the data source) for reuse.
■Export styles to share with others.
■Use special formatting options for raster images to show hillshade, contours,
and more.
34 | Chapter 1 Getting Started Guide
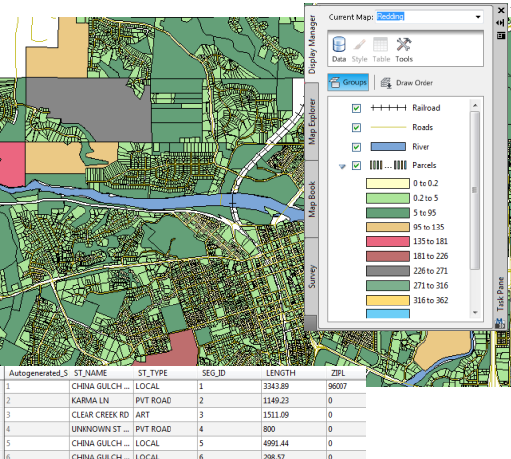
Style Drawing Objects and Features
Style layers in Display Manager (page 2060) to change the
appearance of your map.
Style Surfaces
Visualize and analyze large-scale topographic information—digital elevation
models (DEM) and ESRI GRID files.
■Show elevation, slope, and aspect.
■Create contours.
■Perform sunlight studies with hill shading.
■Drape aerial photographs and vector data on topography data.
■Publish the results to 3D DWF files for viewing in free Autodesk® Design
Review software. No experience with AutoCAD Map 3D is required.
Style Data | 35
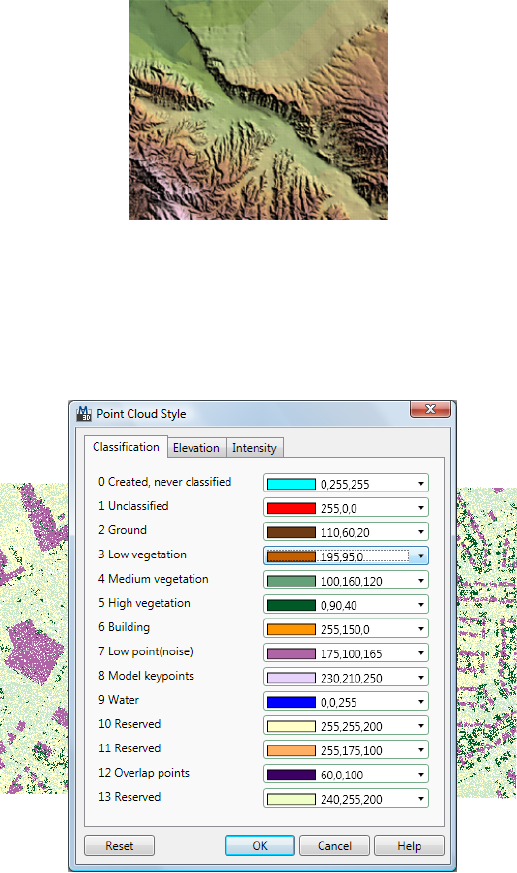
Tell me more
Video
Procedure
■To apply styles to points (page 646)
■To apply styles to areas (page 650)
■To apply styles to lines (page 649)
■To style point data by classificationIn the Display Manager,
right-click the point cloud layer or gr... (page 677)
Tutorial
■Lesson 2: Style Map Features
Workflow
■Style and Label a Linear Feature
GIS Skills
■Hide and show features as you zoom in and out.
■Replace points in the map with symbols.
■Set transparency for parcels or other features.
Related topics
■Styling Features (page 639)
■Styling Drawing Layers (page 652)
■Creating Themes (page 1162)
■Overview of Styling Raster Images (page 672)
■Styling Point Clouds (page 675)
Theme and Analyze Data
Answer questions about your data and make decisions.
■Sort, filter, and edit information about map items in a tabular format.
■Temporarily join data from external data stores to features in your map
and use that data to theme the features.
Theme and Analyze Data | 37
■Locate specific coordinate points and measure the geodetic distance
between points.
■Visually communicate relative values and scale with themed displays.
■Create contour maps to help you analyze 3D terrain.
■Use raster-based theming to analyze elevation, slope, and aspect, drape
map data over surfaces and view the data in 3D, and more.
■Create buffer zones based on feature properties and select objects based
on their proximity to a buffer. Save the buffer as its own feature class, for
future reuse.
■Overlay two geospatial layers to compare their data. Save the resulting data
as a separate layer, which you can join to attribute data or theme.
38 | Chapter 1 Getting Started Guide
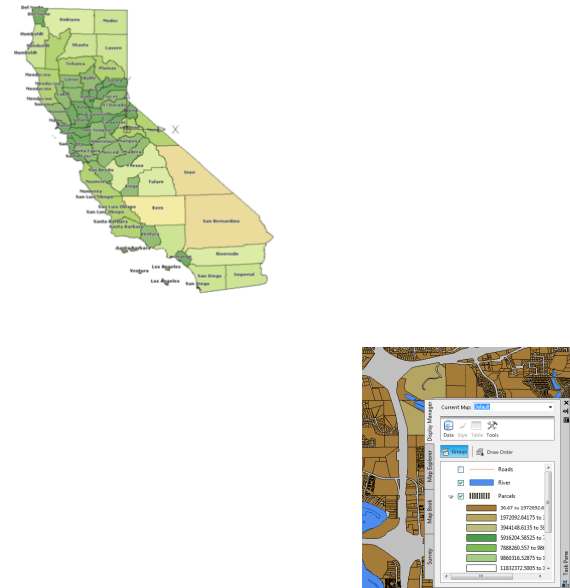
Theme Data
Use color themes to show the elevation of terrain or illustrate the population
density of counties.
The colors give the viewer an immediate
sense of the population distribution in
California
Create themes by varying the style based
on an attribute of the feature; for example,
change the color of parcels based on their
size.
Theme and Analyze Data | 39
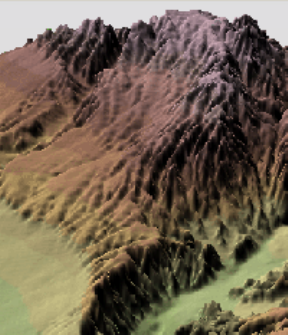
Analyze Surfaces
Create contour maps and analyze geospa-
tial data by exaggerating elevations or
looking at maps in different light condi-
tions.
Create Buffers
Use buffers to analyze features by proximity.
40 | Chapter 1 Getting Started Guide

The buffer in this map defines an area within 1000 feet of the river.
You can use the buffer to see which parcels lie within the flood zone.
Overlay Two Feature Layers
Use overlays to compare two feature classes or layers.
Theme and Analyze Data | 41
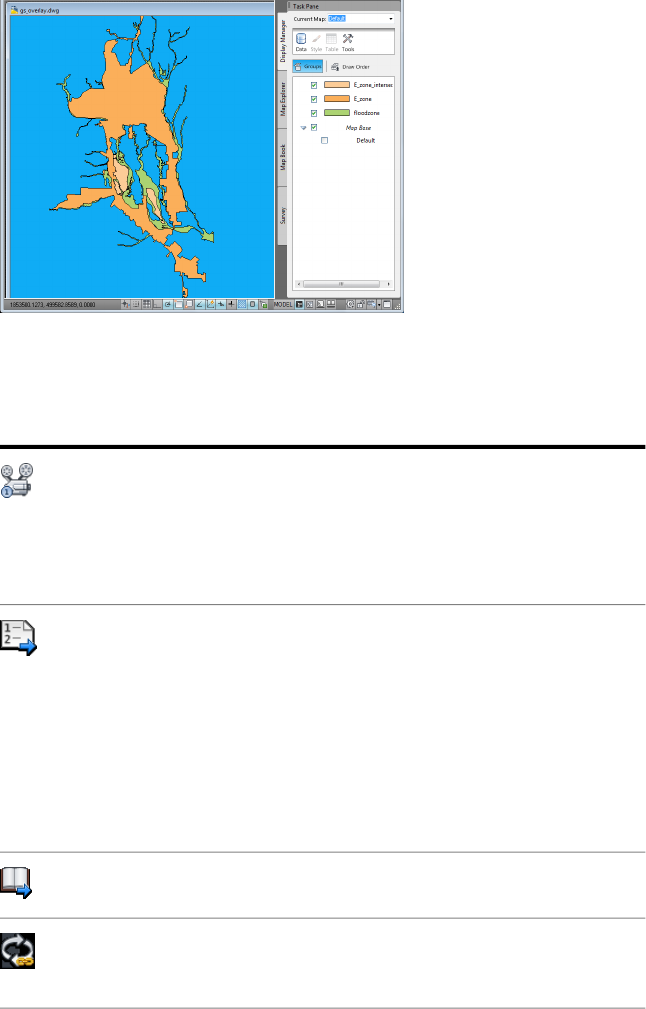
This map overlays two layers (a flood zone and an enterprise zone). You can use the
overlay to see where the two intersect. That area becomes a new layer, which you can
style and save out to a file and use as a separate data store.
Tell me more
Video
■Show me how to color surfaces based on elevation.
■Show me how to theme a parcels layer.
■Show me how to create a buffer zone around a parcel.
■Show me how to join attribute data to features.
Procedures
■To get information about features and objects (page 1125)
■To find, filter, and query data (page 1206)
■To measure and track coordinates (page 1147)
■To create themes (page 1163)
■To analyze raster-based surfaces (page 1186)
■To create a buffer (page 1308)
■To perform an Overlay operation (page 1316)
Tutorial
■Tutorial: Analyzing Data
Workflow
■Analyze Data
■Analyze Data with Overlays
42 | Chapter 1 Getting Started Guide

GIS Skills
■Join attribute data to features.
■Color a surface by elevation and adjust hill shading.
■Change the elevation ranges for a surface.
■Analyze the slope and aspect of a site.
■Select features by location using a buffer.
Related topics
■Getting Information about Features (page 1125)
■Getting Information About Drawing Objects (page 1143)
■Joining Data to GIS Features (page 507)
■Measuring and Tracking Coordinates (page 1147)
■Adding and Modifying Contour Lines (page 1189)
■Creating Themes (page 1162)
■Analyzing Raster-Based Surfaces (page 1186)
■Buffering Features in Your Map (page 1306)
■Overlaying Two Feature Sources (page 1309)
Manage Data
AutoCAD Map 3D acts as a hub for managing large amounts of spatial data.
■Use Schema Editor to create new schemas.
■Add and delete features and properties in existing schemas.
■Use Data Connect to create a data store from within AutoCAD Map 3D.
■Export DWG data to Oracle format, ESRI ArcSDE format (page 1461), or
Autodesk SDF (page 44).
■Export your entire map to DWG format.
■Use Bulk Copy to copy data from one data store to another.
Manage Data | 43
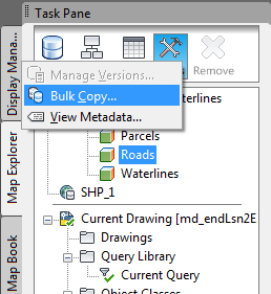
Use Bulk Copy to convert data from
one geospatial format to another.
The Spatial Data File (SDF)
The spatial data file (SDF) format lets you store geometry and attribute
information in a file-based geospatial format.
SDF can hold more information and has faster performance than DWG. SDF
supports rich geometry, multiple tables, and spatial indexing.
44 | Chapter 1 Getting Started Guide
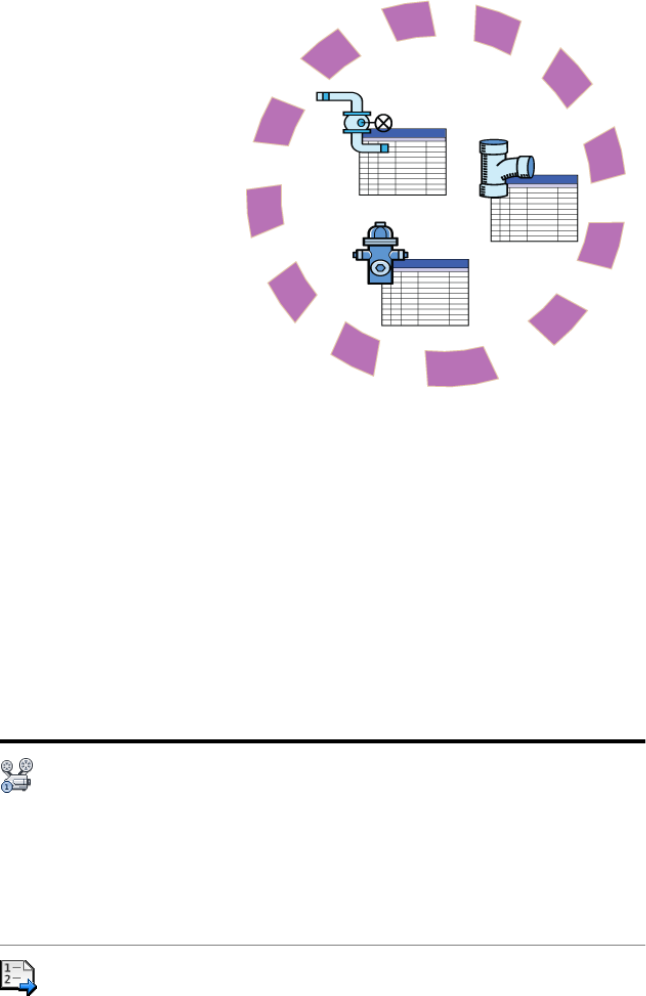
The circle represents an SDF file with a single
schema that defines three feature classes: valves,
pipes, and hydrants.
■Use Data Connect to connect directly to an SDF file. Any edits you make
are made to the SDF file.
■If you import data from SDF, the imported data becomes drawing objects
in your map and the live connection to the SDF file is broken. Importing
is one way to convert the data from SDF to DWG.
■You can copy data to SDF format from other geospatial formats, and from
SDF to those formats, using Bulk Copy.
Tell me more
Video
■Show me how to create an SDF file and import a
schema.
■Show me how to copy data from one data store to an-
other.
■Show me how to append a feature class to an SDF file.
■Show me how to limit what can be entered in a field.
Procedure
■To create a data store for a file-based data provider
(page 589)
Manage Data | 45
■To create a schema (page 598)
■Other ways to move data into SDF format (page 1417)
■To copy data from one feature source to another
(page 621)
■To import data from other formats (page 381)
Tutorial
■Tutorial: Managing Data From Different Sources
Workflow
■Manage Data
GIS Skill
■Create a GIS data store (SDF) to be populated from
various sources
■Bulk copy data from a SHP file to an SDF file
■Edit a schema (SDF)
■Limit what can be entered in a field
Related topics
■About Geospatial Feature Classes, Data Stores, and
Schemas (page 551)
■Overview of Geospatial Data (page 551)
■Importing Autodesk SDF (Spatial Data Files) (page
387)
■Working with Schemas (page 593)
■Exporting DWG Data to an FDO Data Store (page
1461)
■Bringing In Features from SDF (page 337)
■Migrating Data (page 615)
■Overview of Converting Geospatial Data to Drawing
Objects (page 378)
■Overview of Converting and Exporting (page 1405)
Share and Publish Data
Distribute your geospatial data, maps, and designs in various ways.
46 | Chapter 1 Getting Started Guide
Share Data
AutoCAD Map 3D makes it easy to share data, both within and outside your
organization.
When you edit data in the original source,
your changes are immediately visible to
others in your organization.
Send Maps to the Field
The original map in AutoCAD Map 3D is at the top. On the lower left, the map appears
in Autodesk MapGuide Studio. On the right, the map is displayed in a web browser.
■Plot/print single-page or multi-page maps to paper or to a file.
Share and Publish Data | 47

■Use map books to divide a large map into tiles, which are rendered on
separate pages. You can include a legend, title, and other information on
each page.
You can produce maps with insets using map books.
■Publish maps to the internet using Autodesk MapGuide® Enterprise
software.
All layers, layer definitions, dynamic labels, queries, filters, and styles
(including point, line, raster, and other styles) in your map are published.
If you set up styles for different zoom levels, the appearance of the map
changes as the end-user zooms in our out in a web browser. Zooming
changes the appearance based on the styling rules you established in
AutoCAD Map 3D.
■Publish your map as a single HTML page. The result is a “snapshot” of the
map that anyone can view in a web browser.
■Save maps in Autodesk DWF format to use with Autodesk Design Review
(a free, downloadable viewer). Distribute or post the results on the web or
on an intranet. You can create map books in DWF format.
If you assigned a coordinate system to all the maps in your DWF file, the
publishing operation automatically converts the coordinate information
to latitude/longitude coordinates. Autodesk Design Review 2008 can
automatically navigate to a specific location when you enter coordinates.
It displays coordinates of any location in the map when you move your
mouse over that location.
■Export to another format, such as DGN or SHP.
■Create comma-separated reports as text files, listing information about
objects in attached drawing files. You can import the report files into a
spreadsheet, database, or document.
■Use eTransmit to package all the files your map uses and send them to
another AutoCAD Map 3D user.
Tell me more
Video
■Show me how to publish a map to a MapGuide server.
■Show me how to create a map book.
■Show me how to publish a map book with attributes to a
DWF file.
48 | Chapter 1 Getting Started Guide
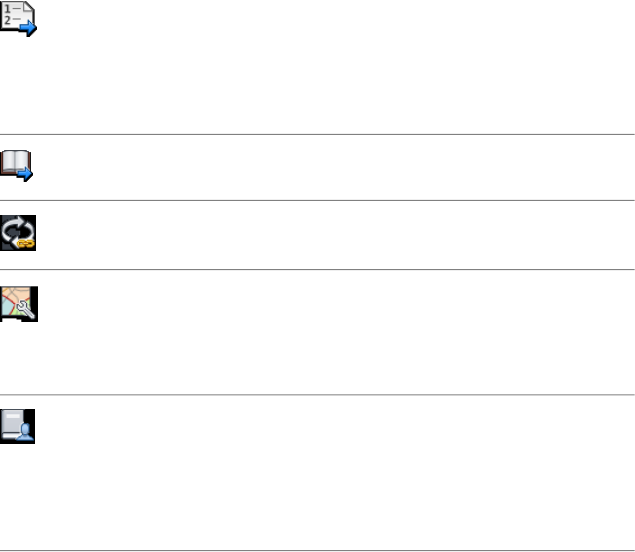
Procedures
■To publish your map (page 1361)
■To export drawing objects to other file formats (page
1408)
■To print and export attribute data (page 1472)
Tutorials
■Lesson 7: Publish Your Map
Workflow
■Print and Publish Data
GIS Skills
■Publish a completed map to a MapGuide server.
■Create a map book with appropriate-scale tiling for a city.
■Produce a multi-sheet DWF file for a map book.
Related topics
■Overview of Publishing and Sharing (page 1357)
■Overview of Converting and Exporting (page 1405)
■Overview of Exporting Attribute Data (page 1472)
■Creating a Drawing Object Report (DWG) (page 1477)
Customize Your Working Environment
Customize AutoCAD Map 3D
The layout of the ribbon, toolbars, and dockable windows is saved in a
workspace.
You can customize an existing workspace or create a new one. You can save
different workspaces for different tasks, use them to help you streamline
common tasks, or set up best practices for mapping tasks and workflow.
For example, you can set up a map creation workspace to streamline acquiring,
integrating, and building maps. Set up another workspace for creating and
publishing map books and atlases.
Customize Your Working Environment | 49
Within a session, you can switch between
workspaces.
Customize Your Maps
Customize map settings and optionally save the resulting map as a template.
For each map, you can do the following:
■Set the coordinate system
■Attach drawing files
■Save and organize drawing queries in a library
■Define annotation templates
■Set up object data
■Attach external data and link it to drawing objects
Create and Use Automated Workflows
Automate a task that involves multiple activities with workflows. For each
activity, you can specify input parameters and settings.
You can use the properties of one activity as the input parameter for a later
activity in the workflow. For example, set up an overlay workflow that specifies
the feature classes to compare and the type of overlay to perform.
You can also specify that some settings can be changed at run time. For
example, use the same overlay workflow for any pair of feature classes, selecting
the feature classes when you run the workflow.
See also:
■Overview of Setting Up AutoCAD Map 3D (page 81)
■Customizing Your Work Environment (page 84)
■Overview of Setting Up Your Map File (page 139)
50 | Chapter 1 Getting Started Guide
■Overview of Setting Options (page 217)
■Overview of Workflows (page 275)
Extend Functionality Using Open Source and API
Extensibility Using Open Source
With the power of FDO Data Access Technology, you can take advantage of
the open source world. FDO extends data access. Third party and open source
FDO providers support data stores not currently supported by Autodesk. (For
example, there are FDO providers for ESRI Personal Geodatabase and PostGIS).
To make it easier for developers to extend capabilities of FDO, Autodesk
released FDO as an open source project. Check the http://fdo.osgeo.org site. The
open source project is under the Open Source Geospatial Foundation (OSGeo)
http://www.osgeo.org. This initiative enables developers all over the world to
tap into powerful geospatial data access technology.
Robust API
AutoCAD Map 3D comes with robust .NET application programming interfaces
(APIs) that organizations can use to create custom tools and automate common
procedures. AutoCAD Map 3D and Autodesk MapGuide Enterprise software
share a unified geospatial API, as well as unified FDO data access technology.
Use these tools to build custom applications that share business logic and
common code.
Finding Information
Watching Videos
The GIS Skills file contains nearly one hundred videos that show how to use
the features of AutoCAD Map 3D. The tutorial “Building a Map” also contains
videos for each exercise.
This page lists the GIS Skills videos by category.
Extend Functionality Using Open Source and API | 51
Data Preparation
Data Conversion
Data Access
Show me how to bring multiple image files onto a single layer
Show me how to run a query on a feature class
Data Editing
Show me how to draft a new feature for an existing feature class
Show me how to edit features stored in a database or data store
Show me how to edit features using automatic check-out
Show me how to add a point using distance/distance
Show me how to add a point using bearing/bearing
Show me how to split a parcel feature
Show me how to create new features from existing AutoCAD objects
Show me how to check out features for editing in the field
Show me how to check in features after editing in the field
Show me how to make the Data Table transparent
Show me how automatic zoom works
Show me how automatic scroll works
Show me how to export records for selected features
Data Management
Show me how to create a new SDF file and import a schema
Show me how to copy data from one data store to another
Show me how to append a feature class to an SDF file
Show me how to delete properties in the Schema Editor
Show me how to limit what can be entered in a field
Show me how to join attribute data to features
Show me how to manage joins
52 | Chapter 1 Getting Started Guide
Show me how to create a calculated field
Styling and Theming Features
Show me how to make a layer visible only at a certain scale range
Show me how to create a second scale range for a road layer
Show me how to replace points with symbols
Show me how to label features
Show me how to label features with automatic resizing
Show me how to set the number of decimal places for labels
Show me how to create a text layer and add text
Show me how to edit text
Show me how to rotate text
Show me how to make the features on a layer semi-transparent
Show me how to theme a parcels layer
Show me how to manually adjust the ranges of a theme
Show me how to exclude zero values and change colors for the ranges
Show me how to theme based on individual values
Analysis
Show me how to color surfaces based on elevation
Show me how to adjust the settings for hillshading
Show me how to delete elevation ranges and change the color of a range
Show me how to add a new elevation range
Show me how to view and navigate in 3D
Show me how to exaggerate the vertical dimension of a surface
Show me how to drape layers on a surface
Show me how to perform a slope analysis of a surface
Show me how to create a contour layer from a surface
Show me how to create a network topology
Show me how to load a topology
Watching Videos | 53
Show me how to find the shortest path between two points
Show me how to do an overlay analysis using two topologies
Show me how to create an overlay analysis for features
Show me how to create a buffer zone around a parcel
Show me how to use a buffer zone to select parcels
Show me how to create overlapping buffer zones
Show me how to use a location query with multiple buffers
Sharing Data with Others
Show me how to export a layer to SDF
Show me how to import a layer from SDF
Show me how to save a layer to a .layer file
Show me how to drag .layer files into an existing map
Map Layout and Cartography
Show me how to manage layers with draw order and folders
Show me how to include an AutoCAD layer in the Display Manager
Show me how to place a legend in the map and specify its contents
Show me how to edit the table style for the legend
Printing, Plotting, and Publishing
Show me how to create a map book.
Show me how to publish a map book with attributes to a DWF file
Show me how to plot to a PDF file
54 | Chapter 1 Getting Started Guide
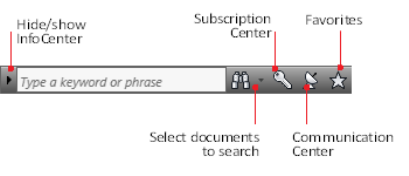
Using InfoCenter
InfoCenter connects you to Help files and online
resources.
To look up information
1Type a word or phrase in the InfoCenter field.
2To add a location (file or document) to search, click the arrow next to
Search (the magnifying glass) and select Add Search Location.
For example, search the Help, the New Features Workshop, and specified
files at one time.
You can also search a single file or location.
3Click Search.
The results are displayed as links on the InfoCenterSearch Results panel.
Click any link to display the topic, article, or document. To find a
command, click the Find A Command On The Ribbon entry.
You can change some settings for InfoCenter. See Setting InfoCenter
Options (page 242).
To hide InfoCenter
■Click the arrow to the left of the InfoCenter field. Click it again to redisplay
InfoCenter.
Subscription Center
With Autodesk Subscription, you get the latest releases of Autodesk software,
incremental product enhancements, personalized web support from Autodesk
technical experts, and self-paced e-Learning.
Subscription services are available to subscription members only (available in
countries/regions where Autodesk subscriptions are offered).
Using InfoCenter | 55

Subscription resources provide interactive product features over the Internet.
Each time you access subscription resources from Subscription Center in an
Autodesk product, product information (such as the serial number, version,
language, and the subscription contract ID) is sent to Autodesk for verification
that your product is on subscription.
Autodesk compiles statistics using the information sent to subscription
resources to monitor how they are being used and how they can be improved.
Autodesk maintains the information provided by or collected from you in
accordance with Autodesk's published privacy policy, which is available at
http://www.autodesk.com/privacy.
To enroll as a subscriber or visit the Subscription Center
■Click .
Communication Center
The online Autodesk Communication Center gives you access to the AutoCAD
Map 3D knowledge base and other user groups discussing AutoCAD Map 3D.
To check the Autodesk Communication Center
■Click .
Favorites
You can define favorite entries in the InfoCenter results list panel, the
Subscription Center panel, or the Communication Center.
To add a topic to the Favorites list
1Use InfoCenter, Subscription Center, or Communication Center to display
a list of results.
2Click the Add To Favorites icon next to the entry to add.
Entries that display a yellow star have been added to the Favorites list.
To view a topic in the Favorites list
■Click and select the topic.
56 | Chapter 1 Getting Started Guide

See also:
■Setting InfoCenter Options (page 242)
■Using the Help (page 57)
■Getting Help with AutoCAD (page 58)
■Using Other Sources of Information (page 59)
Using the Help
AutoCAD Map 3D Help contains the AutoCAD Help, AutoCAD Map 3D User’s
Guide, Reference Guide, Getting Started Guide, and additional information.
To display Help
■Click .
Click the question mark to display the User’s Guide. Click the down arrow
to select a document to view.
Watching the Welcome Screen Videos
The Welcome screen displays when you start AutoCAD Map 3D. It contains
links that launch videos explaining how to get started with AutoCAD Map
3D. It also has links to further information.
If you turn off the display of the Welcome screen, type welcomescreen at the
command prompt to see it again.
Navigating the User's Guide
The User’s Guide contains chapters for each major task area of AutoCAD Map
3D.
The User’s Guide displays related information on three tabs:
■Concept — Conceptual information about performing the task and hints
to help you use the feature.
■Procedure — Step-by-step instructions to perform the task.
Using the Help | 57

■Quick Reference — The commands you need for this task, and where to
find them on the menus and toolbars.
Use the tabs in the left pane to find information:
The Contents groups topics by subject. Browse by selecting and
expanding topics. If you use the Index or Search tabs to find a
topic, the Contents tab updates to show you where that topic is.
Contents
Both AutoCAD Map 3D and AutoCAD Help topics are listed in the
Contents.
In the alphabetical list of keywords, look up the name of a feature,
command, or operation, or an action you want the program to
perform.
Index
You can look up topics for both AutoCAD Map 3D and AutoCAD.
Create your own list of favorite topics. To add a topic to the list,
open the Favorites tab and click Add.
Favorites
Find information using a question phrased in everyday language.
The search ranks resulting topics by relevance.
Search
NOTE Search technology varies by language version of the product.
The Search tab provides either the traditional Microsoft® search
that locates keywords and exact phrases, or a natural-language
search that analyzes phrases or questions.
Using the Tutorials
Try the tutorials to get started or to learn advanced functionality in AutoCAD
Map 3D. Click Help ➤ Learning Resources ➤ Tutorials.
Getting Help with AutoCAD
AutoCAD Map 3D includes the complete functionality of AutoCAD, including
all the AutoCAD commands and system variables. Help for the two programs
is integrated into a single Help file. For help with AutoCAD commands, search
for the command name in the Help.
58 | Chapter 1 Getting Started Guide
New in This Release
■The Readme contains updates about this release of AutoCAD Map 3D,
including late-breaking product news and known software issues. View the
Readme.
■New Features Workshop — View a series of graphical topics designed to help
you learn about the new features in AutoCAD Map 3D and AutoCAD. Click
Help ➤ New Features Workshop.
Using Other Sources of Information
To see the resources available to help you learn AutoCAD Map 3D, see Learning
Resources.
Geospatial Guidelines
■Best Practices for Managing Geospatial Data— Learn the key concepts of
working with geospatial data and the best way to use AutoCAD Map 3D
to achieve your goals.
■GIS Skills for Engineers— See over 90 animations that help you take your
skills to the next level.
Developer Documentation
■Developer Documentation (page 2053) — Learn how to use the AutoCAD
Map 3D Application Programming Interfaces (APIs), including ObjectARX,
ObjectARX Managed Wrappers, ActiveX, and AutoLISP. Click Help ➤
Developer Resources ➤ AutoCAD Map 3D Developer Help.
■FDO Developer Help — Extend the functionality of the feature source
providers. See FDO Developer’s Guide, The Essential FDO, and the API
references for each provider:
■FDO Provider for Oracle API Reference
■FDO Provider for ArcSDE API Reference
■FDO Provider for SQL Server API Reference
■FDO Provider for MYSQL API Reference
■FDO Provider for SHP API Reference
■FDO Provider for SDF API Reference
New in This Release | 59
■FDO Provider for ODBC API Reference
■FDO Provider for Raster API Reference
■FDO Provider for WMS API Reference
Specialized AutoCAD Manuals
■Some AutoCAD manuals, such Build Your World and Getting Started, are
available on the product CD. For information on printing these manuals,
see Printing This Documentation (page 61).
Online Resources
■Product Support Resources— Get answers quickly and efficiently through
email or get Product Support phone numbers.
■AutoCAD Map 3D Discussion Groups— Share product information, ideas,
and solutions with other AutoCAD Map 3D and other Autodesk product
users.
■Training Resources— Learn about the training resources available for
AutoCAD Map 3D and other Autodesk products.
■Developer Center— Learn about programming and development tools to
help customize AutoCAD Map 3D or build your own applications.
■Subscription Center — Access your subscription services including support
and training through the InfoCenter Communication Center. For more
information, see Using InfoCenter (page 55).
■Communication Center — Receive Autodesk company news and product
announcements, breaking news from Autodesk Product Support, new
article notifications, tips, and more. For more information, see Using
InfoCenter (page 55).
Participating in Autodesk Training
Training programs and products from Autodesk help you learn the key
technical features of your Autodesk software and improve your productivity.
For the latest information about Autodesk training, visit
http://www.autodesk.com/autocadarchitecture-training or contact your local
Autodesk office.
60 | Chapter 1 Getting Started Guide

For information on custom training, authorized Autodesk training centers,
how-to tips, and learning tools (such as Autodesk Courseware), go to Training
Resources.
e-Learning
With Autodesk Subscription, you get the latest releases of Autodesk software,
incremental product enhancements, personalized web support from Autodesk
technical experts, and self-paced e-Learning.
Subscription services are available to subscription members only (available in
countries/regions where Autodesk subscriptions are offered).
For more information about subscription, see Subscription Center (page 55).
Printing This Documentation
You can print the Help and other manuals.
Printing PDF Versions of the Help
Most of the Help, including the AutoCAD Map 3D User’s Guide (the help system),
are available in PDF format.
NOTE You must have Adobe® Acrobat Reader™ installed to view and print PDF
documents.
To print the AutoCAD Map 3D Users Guide
1Open the AutoCAD Map 3D User’s Guide.
2Click Print.
WARNING The User’s Guide is over 1000 pages long! To save paper, print
only the chapters you need.
To print the other manuals
1Insert the AutoCAD Map 3D CD or DVD into the drive.
2When the CD browser starts, click the Documentation tab. If the CD
browser does not start automatically, double-click the Setup.exe file.
3On the Documentation tab, select the book to print.
Printing This Documentation | 61
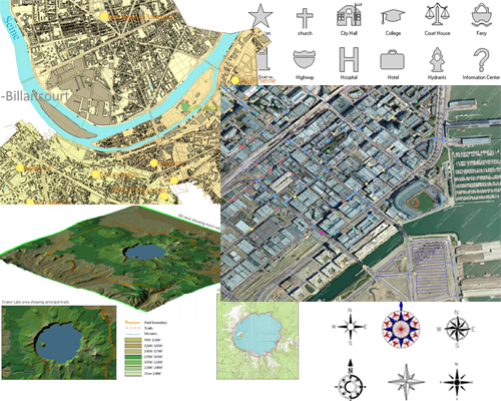
4Click Print.
AutoCAD Map 3D Sample Data and Templates
Use sample data to experiment with map techniques before deploying your
own data.
AutoCAD Map 3D sample data includes the following:
■Symbol sets
■Templates
■Map elements, such as north arrows, scale bars, and legends
Use these elements to create maps quickly and easily, enhance new and existing
maps, promote standards, and improve consistency. They can also serve as
the basis for developing your own templates and data.
© IGN - 2007, NAVTEQ, DigitalGlobe, Intermap Technologies
AutoCAD Map 3D sample data, symbols, and templates
62 | Chapter 1 Getting Started Guide
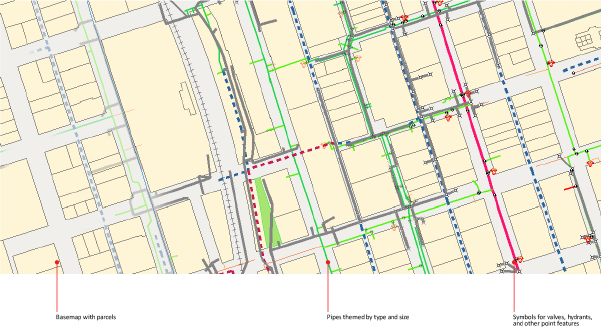
Sample Real-World Data
With Autodesk Subscription, you get any new upgrades of your Autodesk
software and any incremental product enhancements, if these are released
during your subscription term. Product enhancements may include extensions,
bonus packs or other rich content for AutoCAD Map 3D software. To learn
more, visit http://www.autodesk.com/subscription.
For all data connections to be correct and connected automatically, copy your
sample data to this location: C:\AutoCAD Map 3D 2011 Sample Data. If you
put it in a different location, you must fix data connections.
The sample data includes the following:
■Redding, California
A real-world data set from the city of Redding, California, in the United
States. The set includes parcel data, soil drawings, water data, metadata,
and more.
■Haute-de-Seine
The Institut Geographique National (the national mapping agency of
France) provides data covering “department 92.” Departments are French
administrative units, roughly analogous to English counties. Department
92 includes several cities near Paris, in an area called Haute-de-Seine.
Sample Real-World Data | 63
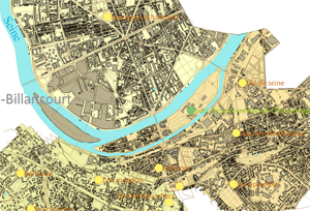
© IGN - 2007
Institut Geographique National (IGN)
provides a comprehensive set of sample
data for Haute-de-Seine.
■NAVTEQ data
NAVTEQ provides data sets for 3-km x 3-km areas of seven sample cities
from around the world. NAVTEQ data is used in a broad range of
location-based applications, navigation products, and mapping sites. The
sets include vector data, street centerline map data, and much more. Use
the sample data to get an idea of what NAVTEQ can provide and how to
use it to enhance your maps in AutoCAD Map 3D.
■DigitalGlobe imagery
DigitalGlobe provides imagery for the seven sample cities. DigitalGlobe is
a provider of high resolution aerial and satellite imagery.
■Intermap 3D elevation data
Intermap Technologies provides Digital Elevation Models (DEMs) for the
seven sample cities. Intermap provides high-quality, precise, 3D
digital-elevation data and images.
64 | Chapter 1 Getting Started Guide
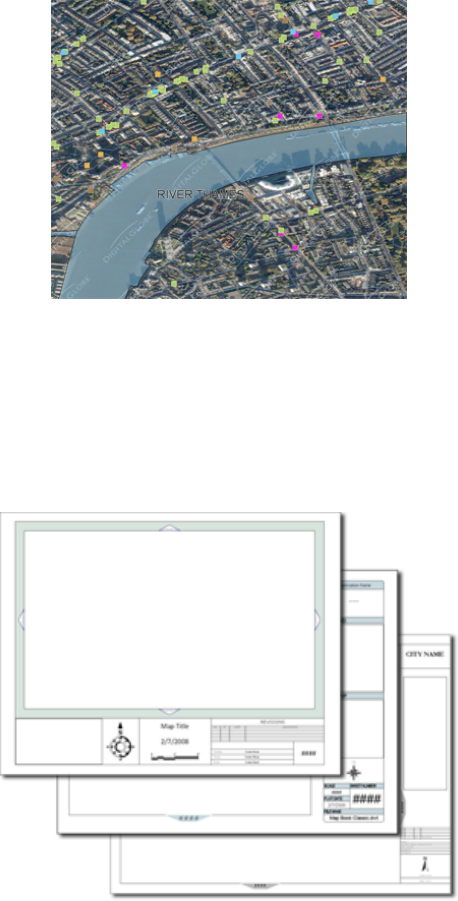
■DigitalGlobe ImageConnect
ImageConnect is a plug-in you can install on top of AutoCAD Map 3D. It
allows you to bring in georeferenced satellite and aerial photos from the
DigitalGlobe online image server. ImageConnect is a quick, cost-effective
way to add high-resolution imagery to your maps.
■Map Book Templates
These templates are installed with AutoCAD Map 3D.
These map book templates are installed with AutoCAD Map
3D.
Sample Real-World Data | 65
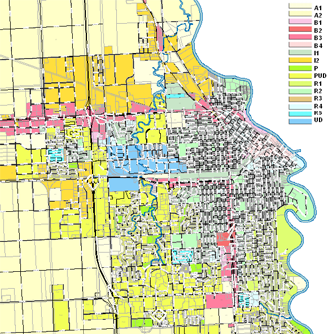
■More 3D elevation data
AutoCAD Map 3D sample data includes additional DEMs to experiment
with.
■Sample maps
These maps use sample data from NAVTEQ, Intermap Technologies, and
DigitalGlobe. There are also real-world maps from Redding, Grand Forks,
Crater Lake, and more.
■Symbols
The sample data includes a copy of the symbol sets, north arrows, and
scale bars that are installed with AutoCAD Map 3D.
When you download these files to the AutoCAD Map 3D 2011 Sample Data
folder, documentation for their use is also downloaded.
■Additional sample data and maps, including Crater Lake, US Geology, and
Grand Forks, North Dakota are installed here:
\Program Files\AutoCAD Map 3D 2011\Sample\Maps
Templates for Maps and Map Books
Templates allow you to reuse or standardize map settings, layouts, layer
definitions and settings, block definitions, data connections, coordinate system
information, and more.
Instead of manually reproducing the settings and common parts of your maps,
you save them in a template file (.dwt). Then you can use the template as you
create new files.
66 | Chapter 1 Getting Started Guide
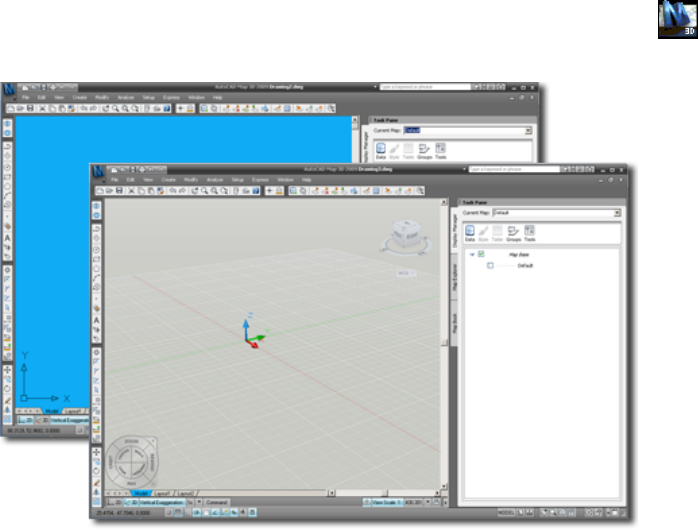
When you create a series of maps, templates save time and improve
consistency.
AutoCAD Map 3D comes with two types of templates:
■Templates for creating new maps
There are four templates available to choose from: map2d.dwt, map2diso.dwt,
map3d.dwt, map3diso.dwt. The templates settings optimize 2D and 3D
display for metric (ISO) and imperial (ANSI) units, respectively. Click
➤ New ➤ Drawing. Select a template from the list.
Templates provided with AutoCAD Map 3D include
map2d.dwt
and
map3d.dwt
.
■Templates for creating map books and tiled DWFs
These templates help you create attractive printed map books or tiled DWFs
with a minimal amount of layout work. There are three designs available,
each with numerous paper sizes, both metric (ISO) and imperial (ANSI).
Each design has its own navigation arrows, layout settings, title blocks,
and more.
Templates for Maps and Map Books | 67
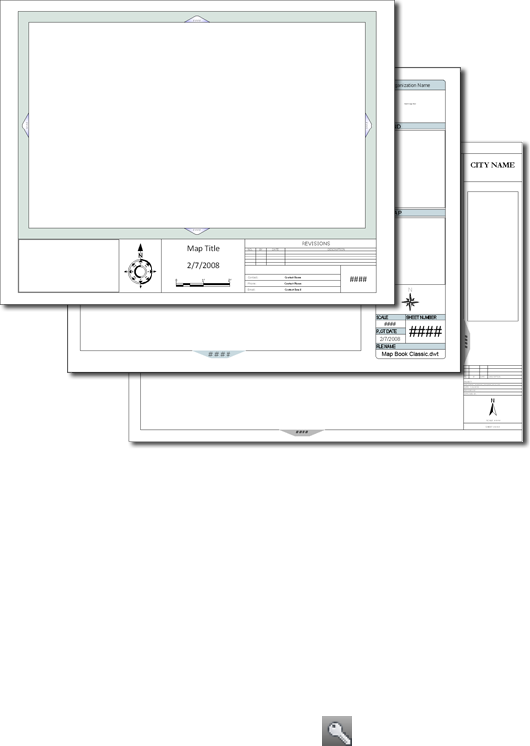
Map book templates provided with AutoCAD Map 3D include Elegant,
Classic, and original designs.
You can use both types of templates as-is or adapt them to suit your needs.
Templates are available in \Documents and Settings\<user name>\Local
Settings\Application Data\Autodesk\ AutoCAD Map 3D
2011\R17.2\enu\Templates
If you are an AutoCAD Map 3D subscriber, you can download free
industry-specific toolkits. These toolkits include specialized templates. To
enroll in or visit the Subscription Center, click in the InfoCenter area at
the top right of the application window.
See also:
■Lesson 2: Customize a Map Book Template
68 | Chapter 1 Getting Started Guide
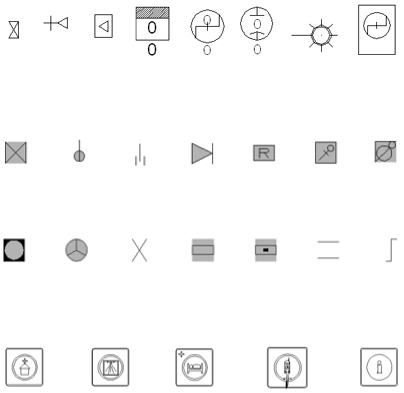
Symbols for Water, Gas, Electric, and Emergency
Response
AutoCAD Map 3D comes with sample symbol sets customized for water
networks, gas utilities, electric utilities (North America), and emergency
response planning. You can use the sample symbols as-is or as a basis for
developing your own symbols.
Using symbols can promote standardization and consistency in your
organization, and can also improve communication by using familiar
symbology.
Each set of symbols comes in a separate DWG file. For example, there is Map
- Water.dwg, Map - Electric.dwg, and so on. There are several files for Emergency
Response.
These electric symbols are examples from
Map -
Electric.dwg
.
These gas symbols are examples from
Map - Gas.dwg
.
These water symbols are examples from
Map -
Water.dwg
.
These emergency response symbols are examples from
Map - ER Incident Centers.dwg
.
The symbols are available in \Program Files\AutoCAD Map 3D
2011\Sample\Symbols.
The symbols are in dynamic block format, making them easy to rotate, resize,
and color. They have block color properties, which optimizes them for use in
DWGs. You can also use them in the Style Editor when styling points.
Symbols for Water, Gas, Electric, and Emergency Response | 69
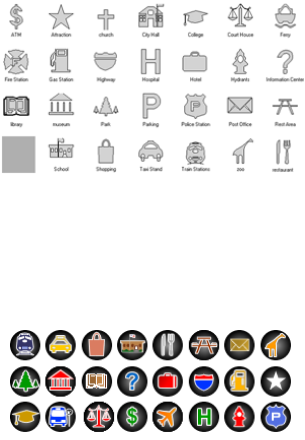
To set up the symbols for easy drag-and-drop into your maps, you can add
them to a Tool Palette.
Symbols for General Use
AutoCAD Map 3D has sample symbols for general-purpose use, such as points
of interest, transportation, and local government.
Like the industry symbols (page 69), general-purpose symbols are usable as-is,
or as a basis for developing new symbols.
Using symbols can help promote standardization and consistency in your
organization, and can improve communication by using familiar symbology.
The symbols come in two formats:
■Dynamic block versions (Map - Points of Interest.DWG) are in dynamic block
format so you can scale and rotate them easily. You can control outline
and fill colors separately in the Style Editor. The symbols are black by
default when viewed in the DWG.
These general-use symbols are examples
from
Map - Points of Interest.dwg
.
■Bitmap versions in .png format lend a more graphical representation to
your points.
These bitmap symbols are examples
from
Map - Points of Interest.dwg
.
70 | Chapter 1 Getting Started Guide
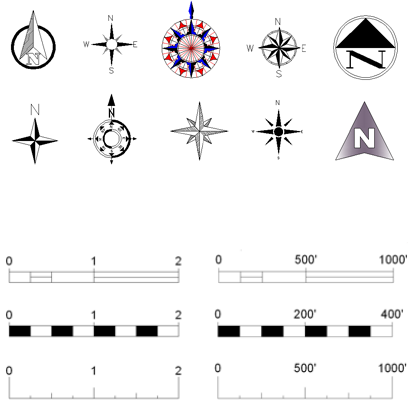
The general-use symbols are available in \Program Files\AutoCAD Map 3D
2011\Sample\Symbols.
North Arrows, Scale Bars, and Other Map Elements
Sample north arrows and scale bars (both metric and imperial) are available
as dynamic blocks for you to insert into your maps.
These north arrows are examples from the
Symbols
folder.
These scale bars are examples from the
Symbols
folder.
Because they are in dynamic block format, these symbols are easy to scale,
rotate, and color. Use the scale bar attributes to set the correct scale.
The samples are available in \Program Files\AutoCAD Map 3D
2011\Sample\Symbols.
A modern, easy-to-read legend style is automatically available when you add
a legend to a map.
North Arrows, Scale Bars, and Other Map Elements | 71
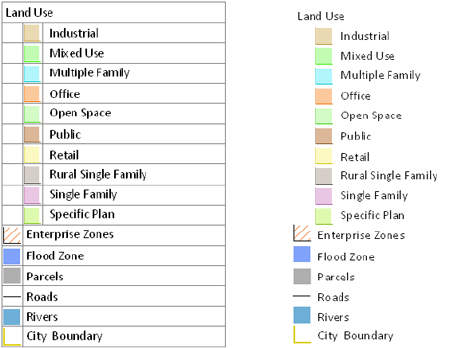
The legend style on the left appears in your onscreen map.
The legend style on the right appears in the published version.
Geospatial Data Available for Purchase
You can add raster elevation data to 3D maps, vector data, such as land plots
or points of interest, or satellite imagery.
Autodesk partners with leading geospatial data providers to provide a geodata
portal with high-resolution, precision, geospatial data. Get data quickly, easily,
and at lower cost.
Visit the geodata portal at http://www.autodesk.com/geodata.
The following types of data are available on the portal:
■Aerial and satellite imagery from DigitalGlobe
■3D raster elevation data from Intermap Technologies
■Vector data, such as roads and land parcels, from NAVTEQ
■Weather data from WeatherBug
72 | Chapter 1 Getting Started Guide

This data is from Intermap Technologies, NAVTEQ, and DigitalGlobe.
Tutorial Sample Files
The tutorials are accessible from the Help menu.
After installation, the tutorial sample files are located in Program Files\AutoCAD
Map 3D 2011\Help\Map 3D Tutorials. The tutorials advise you to copy the
sample files to your My Documents folder so you do not modify the original
files.
AutoCAD Samples
AutoCAD provides sample drawings, sheet sets, blocks, VBA examples, and
more.
After installation, the files are located in C:\Program Files\AutoCAD Map 3D
2011\Sample.
Tutorial Sample Files | 73
74
User's Guide
This section explains AutoCAD Map 3D’s features by introducing concepts, providing
step-by-step procedures, and providing quick reference information.
For information on AutoCAD commands, refer to the AutoCAD Help.
75
76
Setting Up
Overview of Setting Up
You can customize AutoCAD Map 3D and set up each map file you create to
make your work easier and more productive.
The following tables summarize your setup options on a product-wide and
map-wide basis.
To get this result...Use this method...On a product-wide
level...
The system administrator assigns
login names and passwords to
Click Map Setup tab ➤ Map panel ➤
➤ User Administration.
Set up user access.
users, and specifies what each
user can do within the product.
See Setting Up Users and Assign-
ing Rights (page 82).
Customize the ribbons, menus,
toolbars, and dockable windows.
See Customizing Your Work En-
vironment (page 84).
In the Tool-based Ribbon Workspace,
click Tools tab ➤ Customization panel
➤ User Interface.
Set up your workspace.
Create a new coordinate system
or use a predefined coordinate
Click Map Setup tab ➤ Coordinate
System panel ➤ Define Global Coordin-
ate System.
Create new coordinate
systems.
system as a basis for creating
your own.
See Defining Coordinate Systems
(page 89).
2
77

To get this result...Use this method...On a product-wide
level...
Define a set of standard objects
for your organization so that new
Set up object classifica-
tion.
1Select a sample object for the
object class.
drawing objects of that type use
the properties you defined.
See Overview of Setting Up Ob-
ject Classification (page 117).
2Attach an object definition file.
3On the Map Explorer tab of the
Task Pane, right-click Object
Classes. Click Define Object Class.
Convert paper-based graphical
information into a digital format
Set up for digitizing 1Configure the digitizer in the
AutoCAD Options dialog box.
using drawing commands to
2Register the map using the TAB-
LET command. trace data from the paper map
into a DWG file.
See Setting Up for Digitizing
(page 130) and Overview of Digit-
izing Objects (page 1079).
3Set digitizing specifications in the
Digitize Setup dialog box.
4Use the MAPDIGITIZE command
to digitize the objects.
Change settings that affect the
work environment, how the
In the Tool-based Ribbon Workspace,
click Map Setup tab ➤ Map pan-
el ➤ angle-arrow.
Set default values and set-
tings.
program starts up, whether users
must log in, and settings for your
current drawings, data sources,
and more.
See Setting Options (page 216).
Changes settings related to the
Raster Extension, such as where
In the Tool-based Ribbon Workspace,
click Insert tab ➤ Image panel ➤ angle-
arrow.
Set options related to im-
ages you added with Ras-
ter Extension. image-related files are stored,
how images display in maps, and
memory usage options. These
options do not affect images you
added with Data Connect.
Setting Raster Image Options
(page 249)
78 | Chapter 2 Setting Up
To get this result...Use this method...On a product-wide
level...
Modify the .ini files that specify
import and export settings.
See Customizing the Import and
Export .ini Files (page 264).
Edit the mapexport.ini file using a text
editor such as WordPad.
Customize and automate
import and export opera-
tions.
To get this result...Use this method...On a map-wide basis...
Specify the coordinate system used for at-
tached drawings and for the current
drawing.
See Assigning Coordinate Systems (page
142)
Click Map Setup tab ➤ Co-
ordinate System panel ➤ As-
sign.
Assign a coordinate system.
Work with objects from other drawings by
attaching those drawings to the current
map and querying in the objects.
See Overview of Attaching Drawings (page
154)
Drag a drawing file from
Windows Explorer to the
Map Explorer tab of the
Task Pane.
Attach drawings.
Specify how attached drawings work with
the current drawing and view information
about attached drawings.
See Modifying Attached Drawing Settings
(page 163).
At the Command prompt,
enter adedrawings.
Modify the settings for at-
tached drawings.
Save and reuse drawing queries in a library.
See Overview of Using the Query Library
(page 174).
Set up queries. 1To save the current
query, click Home
tab ➤ Data pan-
el ➤ Define Query.
2To run a saved query,
click Create
tab ➤ Object Query
panel ➤ Run.
Overview of Setting Up | 79
To get this result...Use this method...On a map-wide basis...
Define the information to display in a
drawing object annotation and the layout
Click Annotate tab ➤ Map
Annotation panel ➤ Define
Template.
Define annotation tem-
plates.
of that information. Then you can attach
instances of the annotation to drawing
objects in your drawing.
See Defining Annotation Templates (page
190)
Create tables with fields for text and numer-
ical information. Attach records from the
table to drawing objects.
See Creating an Object Data Table (page
200).
Click Map Setup tab ➤ At-
tribute Data panel ➤ Define
Object Data.
Set up object data.
Attach a database to your map and link
records from that table to objects in your
map.
See Attaching a Data Source (page 208).
Drag the database file from
Windows Explorer to the
Map Explorer tab of the
Task Pane.
Set up data sources for
drawings.
Setting Up AutoCAD Map 3D
See also:
■Overview of Setting Up Your Map File (page 139)
■Setting Options (page 216)
■To add a new user (page 83)
■To create a new workspace (page 85)
■To add ribbon, menu, and toolbar options (page 85)
■To add entire ribbon tabs, menus, or toolbars to a workspace (page 86)
■To switch between Tool-based, Task-based, and Map Classic workspaces
(page 86)
■To restore the default colors (page 86)
■To show the command line interface for a particular workspace (page 87)
■To hide the map status bar (page 87)
■To enable Update Edits Automatically by default (page 88)
■To disable connection pooling by default (page 88)
■To turn file selection dialog boxes on or off (page 88)
■To turn other dialog boxes on or off (page 88)
80 | Chapter 2 Setting Up
Overview of Setting Up AutoCAD Map 3D
You can customize AutoCAD Map 3D to make your work easier and more
productive. Your changes affect all future sessions of AutoCAD Map 3D.
See also:
■Overview of Setting Up Your Map File (page 139)
■Setting Options (page 216)
The following table summarizes your customization options.
To get this result...Use this method...To do this...
Specify the coordinate system used for at-
tached drawings and for the current
drawing.
See Assigning Coordinate Systems (page
142)
Click Map Setup tab ➤ Co-
ordinate System panel ➤ As-
sign.
Assign a coordinate system.
Work with objects from other drawings by
attaching those drawings to the current
map and querying in the objects.
See Overview of Attaching Drawings (page
154)
Drag the drawing file from
Windows Explorer to the
Map Explorer tab of the
Task Pane.
Attach drawings.
Specify how attached drawings work with
the current drawing and view information
about attached drawings.
See Modifying Attached Drawing Settings
(page 163).
At the Command prompt,
enter adedrawings.
Modify the settings for at-
tached drawings.
Save and reuse queries in a library.
See Overview of Using the Query Library
(page 174).
Set up queries. 1To save the current
query, click Home
tab ➤ Data pan-
el ➤ Define Query.
2To run a saved query,
click Create
Overview of Setting Up AutoCAD Map 3D | 81
To get this result...Use this method...To do this...
tab ➤ Object Query
panel ➤ Run.
Define the information to display in an
annotation and the layout of that informa-
Click Annotate tab ➤ Map
Annotation panel ➤ Define
Template.
Define annotation tem-
plates.
tion. Then you can insert instances of the
annotation into your drawing.
See Defining Annotation Templates (page
190)
Create tables with fields for text and numer-
ical information. Attach records from the
table to objects.
See Creating an Object Data Table (page
200).
Click Map Setup tab ➤ At-
tribute Data panel ➤ Define
Object Data.
Set up object data.
Attach a database to your map and link
records from that table to objects in your
map.
See Attaching a Data Source (page 208).
Drag the database file from
Windows Explorer to the
Map Explorer tab of the
Task Pane.
Set up data sources for
drawings.
Setting Up Users and Assigning Rights
The system administrator controls who has access to AutoCAD Map 3D by
assigning login names and passwords to users. Also, the system administrator
can specify the privileges or operations available to each user.
AutoCAD Map 3D stores the settings for several AutoCAD Map 3D options
with your login name, which means that these option settings are in effect
whenever you log in under that name to that copy of AutoCAD Map 3D on
that machine. After you log in, AutoCAD Map 3D sets up your user
environment, including user privileges and user-specific options, such as Task
Pane options and Data Source options.
See also:
■Setting Task Pane Options (page 221)
■Setting Data Source Options (page 236)
82 | Chapter 2 Setting Up

To add a new user
1Click Map Setup tab ➤ Map panel ➤ ➤ User Administration.
2In the User Administration dialog box (page 1934), under User Profile, in
the Login Name box, enter a name for the user.
The login name must be unique. It is not case sensitive. Use any characters
except the following: " / \ [ ] : ; | = , + * ? < >
3In the Password box, enter a password for the user. Passwords are case
sensitive.
4Under Privileges, specify the operations available to the user by selecting
one or more of the following:
■Superuser — User can perform user administration tasks, set system
options, and perform any other AutoCAD Map 3D operation.
The default superuser login name is SuperUser (not case sensitive) and
the password is SUPERUSER (case sensitive). If security is an issue,
make sure that you change the default superuser login and password.
■Alter Drawing Set — User can attach and detach drawings. If this
option is not selected, the user can activate and deactivate drawings,
but cannot attach and detach them.
■Alter Object Class — User can define and edit object class definitions.
If this option is not selected, users can only assign object classes and
change the current object classification file.
■Edit Drawing — User can edit objects and save them back to source
drawings. If this option is not selected, the user can edit objects but
cannot save them back to source drawings.
■Draw Query — User can execute Draw mode queries, which copy
objects into the current drawing. If this option is not selected, users
can do Preview and Report mode queries only.
5Click Add.
6Click OK.
To edit a user profile, select the name in the User List and modify the settings
you want. Click Update.
Setting Up Users and Assigning Rights | 83
Quick Reference
MAPUSERADMIN
Performs administrative functions
Setup menu ➤ User Administration
Menu
MAPUSERADMINCommand Line
In Map Explorer, right-click Current Drawing ➤ User
Admin
Task Pane
User Administration dialog boxDialog Box
Customizing Your Work Environment
Your work environment – that is, the way the ribbon, menus, toolbars, and
dockable windows are laid out – is saved in a workspace.
You can customize a workspace to look and function just the way you want,
or create a workspace. You can save different workspaces for different tasks,
use them to help you streamline common tasks, or set up best practices for
mapping tasks and workflow.
For example, you can set up a map creation workspace to streamline acquiring,
integrating, and building maps, and another workspace for creating and
publishing map books and atlases.
Within a session, you can easily switch between workspaces.
AutoCAD Map 3D includes three predefined workspaces:
■Tool-based Ribbon Workspace
■Task-based Ribbon Workspace
■Map Classic Workspace
You can customize any of these workspaces and easily switch between them.
See also:
■Workspaces
■To create a new workspace (page 85)
84 | Chapter 2 Setting Up
■To add ribbon, menu, and toolbar options (page 85)
■To add entire ribbon tabs, menus, or toolbars to a workspace (page 86)
■To switch between Tool-based, Task-based, and Map Classic workspaces
(page 86)
■To restore the default colors (page 86)
■To show the command line interface for a particular workspace (page 87)
■To hide the map status bar (page 87)
■To enable Update Edits Automatically by default (page 88)
■To disable connection pooling by default (page 88)
To create a new workspace
1In the Tool-based Ribbon Workspace, click Tools tab ➤ Customization
panel ➤ User Interface.
2In the Customize User Interface dialog box, under Customizations In All
CUI FILES, right-click the Workspaces node and select New Workspace,
or right-click an existing workspace and select duplicate.
3Select the new workspace.
4Under Workspace Contents, click Customize Workspace.
5In the Customizations In All CUI Files tree, check the items you want to
include.
6Click Done.
7Click OK.
To add ribbon, menu, and toolbar options
1In the Customize User Interface dialog box, under Customizations In All
CUI Files, select the workspace you want to modify.
2Under Customizations In All CUI Files, expand the item you want to
customize so that you can see all the items underneath it.
For example, expand the Topology menu to see the topology options
underneath.
Customizing Your Work Environment | 85

3Under Command List, click and drag the tool you want to include to the
item in Customizations In All CUI Files.
4Click Apply.
5Click OK.
To add entire ribbon tabs, menus, or toolbars to a workspace
1In the Customize User Interface dialog box, under Customizations In All
CUI Files, select the workspace you want to modify.
2Under Workspace Contents, click Customize Workspace.
3In the Customizations In All CUI Files tree, check the items you want to
include.
4Click Done.
5Click OK.
To switch between Tool-based, Task-based, and Map Classic workspaces
1Click the Workspace Switching button in the bottom-right corner of the
application window.
A floating toolbar opens with all workspace options available. You can
either dock this toolbar, leave it floating or close it.
2In the toolbar, use the drop-down list to select the workspace you want.
Unless you specify otherwise, AutoCAD Map 3D opens with the Tool-based
workspace.
For more information, see Workspaces.
To restore the default colors
1Click ➤ Options.
2In the Options dialog box, click the Display tab, and then click Colors.
3In the Drawing Window Colors dialog box, select the element you want
to change by clicking the images for the Model tab or Layout tabs.
As you click areas of the images, the selection is displayed in the Window
Element list. You can also change an attribute by selecting it from the
86 | Chapter 2 Setting Up
Window Element list. For example, for the Map background, select Model
Tab Background.
4From the Color list, click Select Color.
5In the Select Color dialog box, click the Color Books tab, and then select
AutoCAD Map 3D Colors from the Color Book list.
The AutoCAD Map 3D color book displays the default colors used in the
application. You can select a color or use the color book as a reference.
It does do not control the defaults in the application; do not attempt to
modify it.
6Select a color by clicking a color chip.
For example, click the blue Map Background chip to use the new map
background color (model tab).
7Click OK.
8In the Color Options dialog box, click Apply and Close to record the
current option settings in the system registry and close the dialog box.
9In the Options dialog box, click OK.
To show the command line interface for a particular workspace
1In the Tool-based Ribbon Workspace, click Tools tab ➤ Customization
panel ➤ User Interface.
2In the Customize User Interface dialog box, select a workspace.
3In the Workspace Contents area, expand Palettes, scroll to the bottom
of the list, and then click Command Line.
4In the Properties area under Appearance, click Show, and then select Yes
from the drop-down list.
5Under Workspace Contents, click the Customize Workspace button.
6Click OK.
To hide the map status bar
1At the Command prompt, enter mapstatusbar.
2Enter hide.
Customizing Your Work Environment | 87
To enable Update Edits Automatically by default
1At the Command prompt, enter mapeditsetautodefault
2Enter active.
To disable connection pooling by default
1At the Command prompt, enter mapconnectionpooling.
2Enter deactive.
To turn file selection dialog boxes on or off
NOTE If you use scripts to automate some AutoCAD Map 3D functions, you may
find it useful to turn off dialog boxes .
1At the Command prompt, enter filedia.
2To turn on dialog boxes , enter 1. To turn off dialog boxes , enter 0.
To turn other dialog boxes on or off
1At the Command prompt, enter cmddia.
2To turn on dialog boxes , enter 1. To turn off dialog boxes , enter 0.
Quick Reference
MAPOPTIONS
Sets AutoCAD Map 3D options
Setup menu ➤ Autodesk Map Options
Menu
Options
Icon
MAPOPTIONSCommand Line
In Map Explorer, right-click Current
Drawing ➤ Options
Task Pane
AutoCAD Map Options dialog boxDialog Box
OPTIONS
88 | Chapter 2 Setting Up
Customizes the AutoCAD settings
Setup menu ➤ AutoCAD Options
Menu
OPTIONSCommand Line
Right-click in the drawing area ➤ Options
Task Pane
MAPEDITSETAUTODEFAULT
Specifies the default setting for updating edits to the feature source
automatically
MAPEDITSETAUTODEFAULTCommand Line
MAPSTATUSBAR
Toggles the Map status bar on and off
MAPSTATUSBARCommand Line
MAPCONNECTIONPOOLING
Toggles connection pooling on and off
MAPCONNECTIONPOOLINGCommand Line
Creating New Coordinate Systems
AutoCAD Map 3D comes with an extensive library of coordinate systems. If
no suitable coordinate system exists, you can define a customized coordinate
system.
See also:
■Overview of Coordinate Systems (page 143)
■Overview of Grid Data Files and Datum Shift Issues (page 103)
■To define coordinate systems (page 90)
■To work with grid data files and datum shifts (page 102)
Defining Coordinate Systems
You can define customized coordinate systems in AutoCAD Map 3D.
Creating New Coordinate Systems | 89
See also:
■Overview of Coordinate Systems (page 143)
■Assigning a Coordinate System to the Current Drawing (page 147)
To define coordinate systems
■To define a coordinate system (page 92)
■To define a datum (page 94)
■To define an ellipsoid (page 95)
■To create a coordinate system category (page 97)
■To modify or delete a coordinate system (page 98)
■To modify or delete a datum (page 99)
■To modify or delete an ellipsoid (page 100)
■To edit or delete a coordinate system category (page 101)
Overview of Creating New Coordinate Systems
You can create acompletely new global coordinate system (page 2065) or use a
predefined coordinate system as a basis for creating your own. You can also
modify or delete any coordinate systems that you define. You cannot delete
any of the predefined coordinate systems supplied with AutoCAD Map 3D.
When you define a coordinate system you must specify the following
parameters:
■map projection (page 2068) — Used to convert points from latitude and
longitude to Cartesian coordinates.
and one of the following:
■datum (page 2059) — Reference point, line, or surface for mapping.
■ellipsoid (page 2062) — Geometric surface whose plane sections are all circles
or ellipses.
See also:
■Overview of Coordinate Systems (page 143)
■Overview of Grid Data Files and Datum Shift Issues (page 103)
90 | Chapter 2 Setting Up

Define, delete, or modify using this
method...
For this item...
To define a coordinate system (page 92)
To modify or delete a coordinate system
(page 98)
global coordinate system (page 2065)
To define a datum (page 94)
To modify or delete a datum (page 99)
Datum
To define an ellipsoid (page 95)
To modify or delete an ellipsoid (page 100)
Ellipsoid
To create a coordinate system category
(page 97)
To edit or delete a coordinate system cat-
egory (page 101)
Coordinate system category
Quick Reference
ADEDEFCRDSYS
Defines a global coordinate system
Setup menu ➤ Define Global Coordinate System
Menu
ADEDEFCRDSYSCommand Line
Global Coordinate System Manager Dialog BoxDialog Box
Defining a Global Coordinate System
You can define a new global coordinate system (page 2065) based on your own
data or use a predefined coordinate system as a basis for creating your own.
Depending on the projection you use to define a custom coordinate system,
you must provide certain information. For example, if you use the Transverse
Mercator projection, you must specify a longitude value called the central
meridian.
Creating New Coordinate Systems | 91

False Origin
When defining a custom coordinate system, you may want to enter a false
origin, with northing and easting values. For example, if you are using the
Transverse Mercator projection, and the central meridian bisects the mapping
region, half of the X coordinates are negative values. Coordinate system
definitions usually include an offset called the false origin that is added to all
coordinates to make them positive. The X coordinate of this offset is called
the false origin easting. The Y coordinate of this offset is called the false origin
northing.
Scale Reduction Factor
To produce the smallest possible distance between the projection surface and
any point in the region you are mapping, you must specify a scale reduction
factor. This is particularly important when you are mapping large regions. For
the Transverse Mercator projection, you enter this value in the Scale Reduction
field in the Define Global Coordinate System dialog box.
See also:
■Overview of Coordinate Systems (page 143)
■Overview of Grid Data Files and Datum Shift Issues (page 103)
To define a coordinate system
1Click Map Setup tab ➤ Coordinate System panel ➤ Define Global
Coordinate System.
2In the Global Coordinate System Manager dialog box, select a category.
3Do one of the following:
■To create a new coordinate system, click Define.
■To create a new coordinate system based on an existing, predefined
coordinate system, select the coordinate system from the Coordinate
Systems In Category list. Click Modify.
4On the General tab of the Define Coordinate System dialog box, enter a
unique code in the Code box.
The code must be unique within a category and across all coordinate
systems and must not contain spaces. Only the following characters are
valid: A-Z (upper or lower case), 0-9, dash, and underscore.
92 | Chapter 2 Setting Up
If you are creating a new coordinate system based on an existing
coordinate system, you must change the code before you can change any
of the other information.
5Enter a description.
AutoCAD Map 3D displays the description in the Coordinate Systems In
Category list of the Global Coordinate System Manager dialog box.
6In the Units box, select the units to use for this coordinate system.
7Under Coordinate System Type, select one of the following:
■To base the coordinate system on a datum (page 2059), select Geodetic.
Click Select to specify the datum.
■To base the coordinate system on an ellipsoid (page 2062), select
Non-Geodetic. Click Select to specify the ellipsoid.
8On the Projection tab, select a projection.
The projection you choose determines how many projection parameters
you must enter and the units you can use.
9Optionally, under False Origin, enter Northing and Easting values.
10 Under Projection Parameters, enter values for the remaining fields in the
dialog box. Click OK.
These fields vary according to the projection you select.
Quick Reference
ADEDEFCRDSYS
Defines a global coordinate system
Setup menu ➤ Define Global Coordinate System
Menu
ADEDEFCRDSYSCommand Line
Global Coordinate System Manager Dialog BoxDialog Box
Defining a New Datum
You can define a new datum based on your own data or use a predefined
datum (page 2059) as a basis for creating your own.
Creating New Coordinate Systems | 93

When defining a custom datum, select the conversion technique, either
Molodensky, Bursa/Wolfe, or Seven Parameter Transformation. After choosing
the conversion technique, specify the appropriate conversion parameters for
the technique you chose.
See also:
■Overview of Coordinate Systems (page 143)
■Overview of Grid Data Files and Datum Shift Issues (page 103)
■Defining an Ellipsoid (page 95)
To define a datum
1Click Map Setup tab ➤ Coordinate System panel ➤ Define Global
Coordinate System. Select Define or Modify.
2On the General tab of the Define Global Coordinate System dialog box
or the Modify Global Coordinate System dialog box, select Geodetic.
Click Define.
3In the Datum Manager dialog box, click Define.
4On the General tab of the Define Datum dialog box, enter a code and
description for the datum (page 2059).
The code must be unique within a category and across all coordinate
systems and must not contain spaces. Only the following characters are
valid: A-Z (upper or lower case), 0-9, dash, and underscore.
AutoCAD Map 3D displays the description in the Datums list of the
Datum Manager dialog box.
5Under Ellipsoid, select or define an ellipsoid (page 2062) to use for the new
datum.
For information about defining ellipsoids, see Defining an Ellipsoid (page
95).
6On the Datum Conversion tab, select a conversion technique from the
Datum Conversion Technique list.
7Enter the appropriate conversion parameters for the conversion technique
you selected.
Under Conversion Parameters, under Vector Component Deltas To
WGS-84 In Meters, enter the vector component deltas to WGS-84.
94 | Chapter 2 Setting Up

If you use the Bursa/Wolfe or Seven Parameter Transformation conversion
method, fill in all four edit boxes under Rotation Angle From WGS-84 In
Arc Seconds.
Quick Reference
ADEDEFCRDSYS
Defines a global coordinate system
Setup menu ➤ Define Global Coordinate System
Menu
ADEDEFCRDSYSCommand Line
Global Coordinate System Manager Dialog BoxDialog Box
Defining an Ellipsoid
You can define a new ellipsoid (page 2062) based on your own data or use a
predefined ellipsoid as a basis for creating your own.
When defining a custom ellipsoid, you must specify the calculation method
and values used to determine the dimensions of the ellipsoid. After choosing
the calculation method, you supply two of the required values, and AutoCAD
Map 3D determines the remaining two values for you.
See also:
■Overview of Coordinate Systems (page 143)
■Overview of Grid Data Files and Datum Shift Issues (page 103)
■Defining a New Datum (page 93)
To define an ellipsoid
1Do one of the following:
■On the General tab of the Define Datum dialog box or the Modify
Datum dialog box, under Ellipsoid, click Define.
Click Map Setup tab ➤ Coordinate System panel ➤ Define Global
Coordinate System. Select Define or Modify.
Creating New Coordinate Systems | 95
■Under Coordinate System Type on the General tab of the Define
Global Coordinate System dialog box, select Non-Geodetic. Click
Define.
2In the Ellipsoid Manager dialog box, click Define.
3In the Define Ellipsoid dialog box, enter a code and description for the
ellipsoid (page 2062).
The code must be unique within a category and across all coordinate
systems and must not contain spaces. Only the following characters are
valid: A-Z (upper or lower case), 0-9, dash, and underscore.
AutoCAD Map 3D displays the description in the Available Ellipsoids list.
4Under Ellipsoid Dimensions, do the following:
5Select a calculation method.
6Enter values for the two parameters that correspond to the calculation
method you chose. AutoCAD Map 3D computes the other two values
based on the ones you enter.
7Click OK.
Quick Reference
ADEDEFCRDSYS
Defines a global coordinate system
Setup menu ➤ Define Global Coordinate System
Menu
ADEDEFCRDSYSCommand Line
Global Coordinate System Manager Dialog BoxDialog Box
Creating a Coordinate System Category
You can organize your coordinate systems by creating categories and moving
coordinate systems into those categories.
See also:
■Overview of Coordinate Systems (page 143)
96 | Chapter 2 Setting Up

■Overview of Creating New Coordinate Systems (page 90)
■Overview of Grid Data Files and Datum Shift Issues (page 103)
To create a coordinate system category
1Click Map Setup tab ➤ Coordinate System panel ➤ Define Global
Coordinate System.
2In the Global Coordinate System Manager dialog box, click Category
Manager.
3In the Coordinate System Category Manager, click New.
4Type a name in the Category Name box.
5From the Available Categories list, select a category that contains
coordinate systems to include in the new category.
6In the Coordinate Systems In Category list, select the coordinate systems
to include in the new category.
7Click Add.
You can select any number of coordinate systems from existing categories
to include in the new category.
8When you have finished adding coordinate systems, click OK.
Quick Reference
ADEDEFCRDSYS
Defines a global coordinate system
Setup menu ➤ Define Global Coordinate System
Menu
ADEDEFCRDSYSCommand Line
Global Coordinate System Manager Dialog BoxDialog Box
Creating New Coordinate Systems | 97

Modifying or Deleting a Global Coordinate System
You can modify or delete any coordinate systems that you define. You cannot
modify or delete predefined coordinate systems supplied with AutoCAD Map
3D.
See also:
■Overview of Coordinate Systems (page 143)
■Overview of Creating New Coordinate Systems (page 90)
■Creating a Coordinate System Category (page 96)
To modify or delete a coordinate system
1Click Map Setup tab ➤ Coordinate System panel ➤ Define Global
Coordinate System.
2In the Global Coordinate System Manager dialog box, select the category
that contains the global coordinate system to modify or delete.
3Select the coordinate system from the Coordinate Systems In Category
list.
4To modify the coordinate system, click Modify.
To delete the coordinate system, click Remove. Click OK.
5If you are modifying the coordinate system, in the Modify Global
Coordinate System dialog box, change information as necessary.
To modify a predefined coordinate system, you must change the code
on the General tab before you can change the other coordinate system
properties.
Quick Reference
ADEDEFCRDSYS
Defines a global coordinate system
Setup menu ➤ Define Global Coordinate System
Menu
ADEDEFCRDSYSCommand Line
98 | Chapter 2 Setting Up

Global Coordinate System Manager Dialog BoxDialog Box
Modifying or Deleting a Datum
You can modify or delete any datum (page 2059) that you define. You cannot
modify or delete predefined datums supplied with AutoCAD Map 3D.
If you modify or delete a datum that you have defined, you must also modify
or delete any coordinate systems that reference that datum.
See also:
■Overview of Coordinate Systems (page 143)
■Overview of Creating New Coordinate Systems (page 90)
■Overview of Grid Data Files and Datum Shift Issues (page 103)
■To define an ellipsoid (page 95)
To modify or delete a datum
1On the General tab of the Define Global Coordinate System dialog box
or the Modify Global Coordinate System dialog box, select Geodetic.
Click Define.
Click Map Setup tab ➤ Coordinate System panel ➤ Define Global
Coordinate System. Select Define or Modify.
2In the Datum Manager dialog box, select a datum (page 2059).
3To modify the datum, click Modify.
To remove the datum, click Remove.
4If you are modifying the datum, on the General tab of the Define Datum
dialog box, change the code and description for the datum.
To modify a predefined datum, you must change the code on the General
tab before you can change the other datum properties.
5Under Ellipsoid, select or define an ellipsoid (page 2062) to use for the datum.
For information about defining ellipsoids, see Defining an Ellipsoid (page
95).
6On the Datum Conversion tab, select a conversion technique from the
Datum Conversion Technique list.
Creating New Coordinate Systems | 99

7Enter the appropriate conversion parameters for the conversion technique
you selected.
Quick Reference
ADEDEFCRDSYS
Defines a global coordinate system
Setup menu ➤ Define Global Coordinate System
Menu
ADEDEFCRDSYSCommand Line
Global Coordinate System Manager Dialog BoxDialog Box
Modifying or Deleting an Ellipsoid
You can modify or delete any ellipsoid (page 2062) that you define. You cannot
modify or delete predefined ellipsoids supplied with AutoCAD Map 3D.
If you modify or delete an ellipsoid (page 2062) that you have defined, you must
also modify or delete any coordinate systems that reference that ellipsoid.
See also:
■Overview of Coordinate Systems (page 143)
■Overview of Creating New Coordinate Systems (page 90)
■To define an ellipsoid (page 95)
To modify or delete an ellipsoid
1On the General tab of the Define Datum dialog box or the Modify Datum
dialog box, under Ellipsoid, click Define.
2In the Ellipsoid Manager dialog box, select an ellipsoid (page 2062).
Click Map Setup tab ➤ Coordinate System panel ➤ Define Global
Coordinate System. Select Define or Modify.
3To modify the ellipsoid, click Modify.
To delete the ellipsoid, click Remove.
100 | Chapter 2 Setting Up

4If you are modifying an ellipsoid, enter a code and description for the
ellipsoid.
To modify a predefined ellipsoid, you must change the code before you
can change the other ellipsoid properties.
5Under Calculation Method, select a calculation method.
6Enter the appropriate ellipsoid dimension parameters for the calculation
method you selected.
Quick Reference
ADEDEFCRDSYS
Defines a global coordinate system
Setup menu ➤ Define Global Coordinate System
Menu
ADEDEFCRDSYSCommand Line
Global Coordinate System Manager Dialog BoxDialog Box
Modifying or Deleting a Coordinate System Category
You can modify categories by adding or removing coordinate systems, or
moving coordinate systems from one category to another. You can also delete
categories.
See also:
■Overview of Coordinate Systems (page 143)
■Overview of Creating New Coordinate Systems (page 90)
■Creating a Coordinate System Category (page 96)
To edit or delete a coordinate system category
1Click Map Setup tab ➤ Coordinate System panel ➤ Define Global
Coordinate System.
2In the Global Coordinate System Manager dialog box, click Category
Manager.
Creating New Coordinate Systems | 101
3In the Coordinate System Category Manager, select a category.
4To modify the category, click Edit.
To delete the category, click Remove.
5If you are modifying the category, do one or more of the following:
■To remove coordinate systems from the category, click the coordinate
system names in the list under the Category Name box. Click Remove.
■To add coordinate systems to the category, click the coordinate system
names in the list under the Available Categories list. Click Add.
■To add coordinate systems from different categories, select the category
name in the Available Categories list.
Quick Reference
ADEDEFCRDSYS
Defines a global coordinate system
Setup menu ➤ Define Global Coordinate System
Menu
ADEDEFCRDSYSCommand Line
Global Coordinate System Manager Dialog BoxDialog Box
Grid Data Files and Datum Shifts
AutoCAD Map 3D uses grid data files to specify datum (page 2059) shift
information and Grid Data Catalog files to determine the order for those files
when converting from one datum to another.
See also:
■Creating New Coordinate Systems (page 89)
■Overview of Coordinate Systems (page 143)
To work with grid data files and datum shifts
■To set up a new grid data file (page 105)
■To set up a new grid data file for the United States (page 108)
102 | Chapter 2 Setting Up
■To set up a new grid data file for France (page 109)
■To set up a new grid data file for Australia or New Zealand (page 110)
■To use the new high accuracy GDA94 datum (page 111)
■To use version 2 of the Canadian National Transformation (page 112)
■To use version 1 of the Canadian National Transformation (page 113)
■To modify a coordinate system definition file (page 116)
Overview of Grid Data Files and Datum Shift Issues
When converting between certain coordinate systems in North America,
France, Australia, and New Zealand, AutoCAD Map 3D uses grid-based data
files called grid data files to obtain datum (page 2059) shift information.
For the United States, France, Australia, and New Zealand geography, the grid
data files are in the public domain and are distributed with AutoCAD Map
3D. The grid data files which cover Canadian geography are not in the public
domain and must be obtained from the proper authorities in Canada.
AutoCAD Map 3D uses Grid Data Catalog (GDC) files to determine the order
in which grid data files are used in areas of overlap when converting from one
datum (page 2059) to another.
See also:
■Creating New Coordinate Systems (page 89)
■Datum Shift Issues for North American Users (page 112)
■Grid Data Files for Australia and New Zealand (page 109)
■Grid Data Files for the United States (page 105)
■Coordinate System Files (page 113)
■Australian Datum Transformation and Coordinate System Changes (page
110)
You can do the following with grid data files
See this topic...To do this...
Grid Data Catalog (GDC) Files (page 104)Set up a new grid data file
Grid Data Files for the United States (page
105)
Specify a new grid data file for the United
States
Creating New Coordinate Systems | 103
See this topic...To do this...
Grid Data Files for Australia and New Zeal-
and (page 109)
Specify a new grid data file for Australia or
New Zealand
Australian Datum Transformation and Co-
ordinate System Changes (page 110)
Use the high accuracy GDA94 datum for
Australia
Datum Shift Issues for North American
Users (page 112)
Specify a grid data version to resolve differ-
ences between source and destination co-
ordinate systems for Canada
Coordinate System Files (page 113)Modify a coordinate system file
Grid Data Catalog (GDC) Files
AutoCAD Map 3D uses Grid Data Catalog (GDC) files to determine the order
in which grid data files are used in areas of overlap when converting from one
datum (page 2059) to another in certain parts of the world, such as North
America, France, Australia, and New Zealand.
If there is an overlapping coverage, AutoCAD Map 3D selects the grid data file
with the smallest grid cell in the region of the conversion. If the grid cell sizes
are the same, AutoCAD Map 3D selects the grid data file that appears first in
the GDC file.
Grid Data Catalog files are ASCII text files with a .gdc extension that are stored,
by default, in the C:\Documents and Settings\All Users\Application
Data\Autodesk\Geospatial Coordinate Systems folder. The base name of
a GDC file is based on the transformation with which it is associated. For
example, the GDC file for the NAD27 to NAD83 transformation is
Nad27toNad83.gdc.
Each line in a GDC file points to a grid data file (also known as a datum shift
data file). GDC files also often include comments that are preceded by a pound
sign (#) and a fallback datum definition that is used when none of the grid
data files provide coverage for a point being converted.
See also:
■Datum Shift Issues for North American Users (page 112)
■Coordinate System Files (page 113)
104 | Chapter 2 Setting Up

■Overview of Grid Data Files and Datum Shift Issues (page 103)
■Grid Data Files for the United States (page 105)
■Grid Data Files for Australia and New Zealand (page 109)
■Australian Datum Transformation and Coordinate System Changes (page
110)
To set up a new grid data file
1When you obtain a new grid data file, copy it into the appropriate folder
under the Autodesk shared coordinate system folder, by default
C:\Documents and Settings\All Users\Application Data\Autodesk\Geospatial
Coordinate Systems.
2Open the appropriate GDC file in any text editor or word processor that
can produce an ASCII file, such as Notepad or Wordpad.
NOTE Back up GDC files before you edit them, so you can restore them to
their previous state, if necessary.
3Edit the file to point to the name and location of your new grid data file.
4Make other changes needed, such as rearranging or replacing grid data
files, changing the fallback datum (page 2059) definition, or adding
comments.
Grid Data Files for the United States
AutoCAD Map 3D uses North American Datum Conversion (NADCON) grid
data files from the National Geodetic Survey to obtain latitude and longitude
shift information for converting between coordinate systems within the United
States. A pair of grid data files is required for each area or state covered: a .las
file is required for latitude shift values (latitude seconds) and a .los file for
longitude shift values (longitude seconds).
The NADCON files include grid data files for transformations between NAD83
and state readjustments to HARN (High Accuracy Resolution Network) projects.
The .las and .los files are in the public domain and are distributed with
AutoCAD Map 3D. The files are stored in the Autodesk shared coordinate
system folder, by default C:\Documents and Settings\All Users\Application
Data\Autodesk\Geospatial Coordinate Systems\Usa\Nadcon.
Creating New Coordinate Systems | 105
The following is a list of NADCON grid data files.
Area/StateNADCON (North American
Datum Conversion)
Files (.las and
.los)
United States (USA) - lower 48 states including
EEZ
NAD27 to NAD83conus
AlaskaAlaska to NAD83alaska
HawaiiOld Hawaiian to NAD83hawaii
Puerto Rico, Virgin IslandsPuerto Rico to NAD83prvi
St Lawrence: off the coast of AlaskaSt. Lawrence Island to NAD83stlrnc
St Paul: Pribiloff Islands off the coast of AlaskaSt. Paul Island to NAD83stpaul
St George: Pribiloff Islands off the coast of
Alaska
St. George Island to NAD83stgeorge
HARN Readjust-
ments
AlabamaNAD83 to NAD83 (HARN)alhpgn
ArizonaNAD83 to NAD83 (HARN)azhpgn
California, south of 38 degrees NorthNAD83 to NAD83 (HARN)cahpgn
California, north of 38 degrees NorthNAD83 to NAD83 (HARN)cnhpgn
ColoradoNAD83 to NAD83 (HARN)cohpgn
Idaho and Montana, east of 113 degrees WestNAD83 to NAD83 (HARN)emhpgn
Texas, east of 100 degrees WestNAD83 to NAD83 (HARN)ethpgn
FloridaNAD83 to NAD83 (HARN)flhpgn
GeorgiaNAD83 to NAD83 (HARN)gahpgn
KentuckyNAD83 to NAD83 (HARN)kyhpgn
106 | Chapter 2 Setting Up

Area/StateNADCON (North American
Datum Conversion)
Files (.las and
.los)
LouisianaNAD83 to NAD83 (HARN)lahpgn
Maryland and DelawareNAD83 to NAD83 (HARN)mdhpgn
MaineNAD83 to NAD83 (HARN)mehpgn
MichiganNAD83 to NAD83 (HARN)mihpgn
MississippiNAD83 to NAD83 (HARN)mshpgn
NebraskaNAD83 to NAD83 (HARN)nbhpgn
North DakotaNAD83 to NAD83 (HARN)ndhpgn
New England (Connecticut, Massachusetts,
New Hampshire, Rhode Island, and Vermont)
NAD83 to NAD83 (HARN)nehpgn
New MexicoNAD83 to NAD83 (HARN)nmhpgn
New YorkNAD83 to NAD83 (HARN)nyhpgn
OklahomaNAD83 to NAD83 (HARN)okhpgn
Puerto Rico, Virgin IslandsNAD83 to NAD83 (HARN)pvhpgn
South DakotaNAD83 to NAD83 (HARN)sdhpgn
TennesseeNAD83 to NAD83 (HARN)tnhpgn
Virginia, excluding West VirginiaNAD83 to NAD83 (HARN)vahpgn
WisconsinNAD83 to NAD83 (HARN)wihpgn
Idaho and Montana, west of 113 degrees WestNAD83 to NAD83 (HARN)wmhpgn
Washington and OregonNAD83 to NAD83 (HARN)wohpgn
Texas, west of 100 degrees WestNAD83 to NAD83 (HARN)wthpgn
WyomingNAD83 to NAD83 (HARN)wyhpgn
Creating New Coordinate Systems | 107

For more information about NADCON grid data files, refer to the National
Geodetic Survey web site.
See also:
■Datum Shift Issues for North American Users (page 112)
■Coordinate System Files (page 113)
■Overview of Grid Data Files and Datum Shift Issues (page 103)
■Grid Data Files for Australia and New Zealand (page 109)
■Australian Datum Transformation and Coordinate System Changes (page
110)
To set up a new grid data file for the United States
1When you obtain a new grid data file, copy it into the appropriate folder
under the Autodesk shared coordinate system folder, by default
C:\Documents and Settings\All Users\Application Data\Autodesk\Geospatial
Coordinate Systems\Usa\Nadcon.
2Open the appropriate GDC file in any text editor or word processor that
can produce an ASCII file, such as Notepad or Wordpad.
NOTE Back up GDC files before you edit them, so you can restore them to
their previous state, if necessary.
3Edit the file to point to the name and location of your new grid data file.
4Make other changes needed, such as rearranging or replacing grid data
files, changing the fallback datum (page 2059) definition, or adding
comments.
Grid Data Files for France
AutoCAD Map 3D comes with a grid data catalog file (RgfToNtf.gdc) and a
national grid data file (gr3df97a.txt )for France. This file is installed in a folder
under the Autodesk shared coordinate system folder, by default C:\Documents
and Settings\All Users\Application Data\Autodesk\Geospatial Coordinate Systems.
Several French municipalities have developed local grid data files that allow
for more precise transformations within their respective regions. You can
obtain municipal grid data files from the local GIS or Survey department. If
108 | Chapter 2 Setting Up

you add references to such municipal grid data files to the French grid data
catalog file, AutoCAD Map 3D will automatically use them as appropriate.
Points within the boundaries of the municipal grids will be transformed using
the local grid data, and points outside those boundaries will be transformed
using national grid data.
To set up a new grid data file for France
1When you obtain a new grid data file, copy it into the appropriate folder
under the Autodesk shared coordinate system folder, by default
C:\Documents and Settings\All Users\Application Data\Autodesk\Geospatial
Coordinate Systems.
2Open RgfToNtf.gdc in any text editor or word processor that can produce
an ASCII file, such as Notepad or Wordpad.
NOTE Back up GDC files before you edit them, so you can restore them to
their previous state, if necessary.
3Edit the file to point to the name and location of your new grid data file.
4Make other changes needed, such as rearranging or replacing grid data
files, changing the fallback datum (page 2059) definition, or adding
comments.
Grid Data Files for Australia and New Zealand
AutoCAD Map 3D comes with grid data files for Australia and New Zealand.
These files are installed in folders under the Autodesk shared coordinate system
folder, by default C:\Documents and Settings\All Users\Application
Data\Autodesk\Geospatial Coordinate Systems.
Following is a table of the grid data files and GDC files used for Australia and
New Zealand.
GDC FileGrid Data File (GSB)TransformationArea
Agd84ToGda94.gdcQLD_1299.gsbAGD84 to GDA94Australia
Agd66ToGda94.gdcvic_0799.gsbAGD66 to GDA94Victoria
Agd66ToGda94.gdctas_1098.gsbAGD66 to GDA94Tasmania
Agd66ToGda94.gdcNt_0599.gsbAGD66 to GDA94Northern Territory
Creating New Coordinate Systems | 109
GDC FileGrid Data File (GSB)TransformationArea
Nzgd49ToNzgd2K.gdcnzgd2kgrid9911.gsbNew ZealandNew Zealand
For more information about Australia and New Zealand coordinate systems,
go to http://www.ga.gov.au.
See also:
■Australian Datum Transformation and Coordinate System Changes (page
110)
■Datum Shift Issues for North American Users (page 112)
■Coordinate System Files (page 113)
■Overview of Grid Data Files and Datum Shift Issues (page 103)
■Grid Data Files for the United States (page 105)
To set up a new grid data file for Australia or New Zealand
1When you obtain a new grid data file, copy it into the appropriate folder
under the Autodesk shared coordinate system folder, by default
C:\Documents and Settings\All Users\Application Data\Autodesk\Geospatial
Coordinate Systems.
2Open the appropriate GDC file in any text editor or word processor that
can produce an ASCII file, such as Notepad or Wordpad.
NOTE Back up GDC files before you edit them, so you can restore them to
their previous state, if necessary.
3Edit the file to point to the name and location of your new grid data file.
4Make other changes needed, such as rearranging or replacing grid data
files, changing the fallback datum (page 2059) definition, or adding
comments.
Australian Datum Transformation and Coordinate System
Changes
The Geocentric Datum of Australia (GDA) is the new Australian coordinate
system, replacing the Australian Geodetic Datum (AGD). GDA is part of a
110 | Chapter 2 Setting Up
global coordinate reference frame and is directly compatible with the Global
Positioning System (GPS).
Due to differences in the way the two datums were created, the GDA94
coordinates of a point appear to be about 200 meters northeast of the AGD
coordinates of the same point. The precise size and orientation of the difference
varies from place to place. For more technical information on the GDA, go to
http://www.icsm.gov.au/icsm/gda/
The new implementation of GDA94 and the associated datum (page 2059)
transformations are available by using the coordinate system files supplied in
AutoCAD Map 3D.
See also:
■Grid Data Files for Australia and New Zealand (page 109)
■Coordinate System Files (page 113)
■Overview of Grid Data Files and Datum Shift Issues (page 103)
To use the new high accuracy GDA94 datum
1Reassign one of the following coordinate systems to your drawing:
■AMG66-49-Grid through AMG66-57-Grid
■AMG-49-Grid through AMG-57-Grid
■MGA-48-Grid through MGA-58-Grid
■ISG_54-2-Grid through ISG_56-2-Grid
■SGC-Grid
■VICT-Grid
■LL-AGD84-Grid
For example, if you have a drawing that uses AM666-49, reassign it to
AM666-49-Grid before using GDA94.
2Do one of the following:
■To define a new coordinate system using high accuracy datum (page
2059) transformations, use ASTRLA66-Grid and ASTRLA84-Grid.
■To define a new coordinate system using the 3-Dimensional Similarity
Transformations, use ASTRLA66-7P, STRLA66-Tasm-7P,
ASTRLA66-VictNSW-7P, ASTRLA66-ACT-7P, and ASTRLA84-7P.
Creating New Coordinate Systems | 111

Datum Shift Issues for North American Users
If the source and destination coordinate systems use different datums,
AutoCAD Map 3D automatically performs a datum (page 2059) shift. Within
North America, this is most often a shift between the NAD27 and NAD83
datums.
For United States users, AutoCAD Map 3D uses the freely distributable
NADCON grid data files (page 105) supplied by USGS.
Canadian users can use either version 1 or version 2 of the Canadian National
Transformation supplied by Geomatics Canada. If both versions of the
Canadian National Transformation are present, AutoCAD Map 3D uses version
2.
WARNING Geomatics Canada no longer supports version 1, and many Canadian
provinces do not consider it to produce valid results. If you are in Canada and
doing NAD Shifts, it is recommended that you use version 2.
See also:
■Creating New Coordinate Systems (page 89)
■Grid Data Files for Australia and New Zealand (page 109)
■Grid Data Files for the United States (page 105)
■Coordinate System Files (page 113)
■Australian Datum Transformation and Coordinate System Changes (page
110)
To use version 2 of the Canadian National Transformation
1Obtain a copy of the data file.
Contact Information Services, Geodetic Survey Division, Geomatics
Canada
615 Booth Street
Ottawa, Ontario, K1A 0E9
(613) 995-4410
http://www.geod.nrcan.gc.ca
2Once you have the file, copy it into the Autodesk shared coordinate
system folder, by default C:\Documents and Settings\All Users\Application
112 | Chapter 2 Setting Up
Data\Autodesk\Geospatial Coordinate Systems\Canada, and give it the
name Ntv2_0.gsb.
3Using a text editor such as Notepad, open Nad27ToNad83.gdc (located
by default in the C:\Documents and Settings\All Users\Application
Data\Autodesk\Geospatial Coordinate Systems folder).
4Delete the initial pound sign (#) from the line that begins:
#.\Canada\Ntv2_0.gsb.
To use version 1 of the Canadian National Transformation
1Obtain a copy of the data file.
2Copy it into the C:\Documents and Settings\All Users\Application
Data\Autodesk\Geospatial Coordinate Systems\Canada folder, and give it
the name grid11.dac.
3Open Nad27ToNad83.gdc.
4Delete the initial pound sign (#) from the line that begins:
#.\Canada\grid11.dac.
For more information on editing GDC files, see Grid Data Catalog (GDC) Files
(page 104).
Coordinate System Files
AutoCAD Map 3D uses certain files for storing coordinate system definitions
and defining datum (page 2059) transformation information.
Following is a list of these files. Files that should not be modified are marked
with an asterisk (*).
DescriptionFile
Grid Data Catalog file for transformations
within Australia. Default grid data files:
Agd66ToGda94.gdc
Vic_0799.gsb, nt_0599.gsb, and
TAS_1098.gsb. Default fallback datum
(page 2059): ASTRLA66.
Grid Data Catalog file for transformations
within Australia. Default grid data file:
Agd84ToGda94.gdc
Creating New Coordinate Systems | 113

DescriptionFile
QLD_1299.gsb. Default fallback datum:
ASTRLA84-7P.
Grid Data Catalog file for determining the
geoid height for any position in the United
GeoidHeight.gdc
States. Default data files are
GEO96AN.GEO, GEO96AS.GEO,
GEO96HW.GEO, GEO96NC.GEO,
GEO96NE.GEO, GEO96NW.GEO,
GEO96PR.GEO, GEO96SC.GEO,
GEO96SE.GEO, and GEO96SW.GEO. Fall-
back datum definition is not recommen-
ded.
Grid Data Catalog file for transformations
within North America. Default data files:
Nad27ToNad83.gdc
Conus.l?s, Alaska.l?s, PrVi.l?s, Hawaii.l?s,
STGEORGE.l?s, STLRNC.l?s, and ST-
PAUL.l?s. Default fallback datum: NAD27-
48.
Grid Data Catalog file for transformations
within North America. Default grid data
Nad83ToHarn.gdc
files: alhpgn.l?s, azhpgn.l?s, cnhpgn.l?s,
cohpgn.l?s, cshpgn.l?s, emhpgn.l?s, ethp-
gn.l?s, flhpgn.l?s, gahpgn.l?s, hihpgn.l?s,
kshpgn.l?s, kyhpgn.l?s, lahpgn.l?s, mdhp-
gn.l?s, mehpgn.l?s, mihpgn.l?s, mshp-
gn.l?s, nbhpgn.l?s, ndhpgn.l?s, nehpgn.l?s,
nmhpgn.l?s, nvhpgn.l?s, nyhpgn.l?s, ohh-
pgn.l?s, okhpgn.l?s, pvhpgn.l?s, sdhp-
gn.l?s, tnhpgn.l?s, uthpgn.l?s, vahpgn.l?s,
wihpgn.l?s, wmhpgn.l?s, wohpgn.l?s,
wthpgn.l?s, wvhpgn.l?s, and wyhpgn.l?s.
Fallback datum definition is not recommen-
ded.
Grid Data Catalog file for transformations
within New Zealand. Default grid data file:
Nzgd49ToNzgd2K.gdc
nzgd2kgrid9911.gsb. Default fallback
datum: NZGD49-7P.
114 | Chapter 2 Setting Up

DescriptionFile
Grid Data Catalog file for transformations
between the RGF93 and NTF datums used
Rgf93ToNtf.gdc
within France. Default grid data file:
gr3df97a.txt. Default fallback datum: NTF-
G.
Grid Data Catalog file for computing the
modeled difference in orthometric height
Vertcon.gdc
between the North American Vertical
Datum of 1988 (NAVD 88) and the Nation-
al Geodetic Vertical Datum of 1929 (NGVD
29) for a given location specified by latit-
ude and longitude. Default grid data files:
VERTCONC.94, VERTCONE.94, and VERT-
CONW.94. Fallback datum definition is not
recommended.
A binary compiled file used for storing co-
ordinate system category definitions. Also
called a dictionary file.
Category.csd *
Coordinate systems dictionary file.Coordsys.csd *
Datums dictionary file.Datums.csd *
Ellipsoids dictionary file.Elipsoid.csd *
Multiple Regression Transformation binary
files that store the coefficients required for
.mrt files *
multiple regression analysis. The base name
of the file is the same as the key name of
the datum with which it is associated.
Grid data files used by Vertcon.gdc..94 files *
Data files for determining the geoid height
for any position in the United States. These
.geo files *
are in GEOID96 format and are used by
GeoidHeight.gdc.
Creating New Coordinate Systems | 115

DescriptionFile
Grid data files for Canada, Australia, and
New Zealand. Both latitude and longitude
.gsb files *
shifts (as well as accuracy values) are incor-
porated into a single .gsb file. The file
structure also supports the concept of
multiple grids, and subgrids within a major
grid.
Grid data files for United States geography..las and .los files *
See also:
■Overview of Grid Data Files and Datum Shift Issues (page 103)
■Grid Data Catalog (GDC) Files (page 104)
■Grid Data Files for Australia and New Zealand (page 109)
■Grid Data Files for the United States (page 105)
To modify a coordinate system definition file
1Find the file to modify in the Autodesk shared coordinate system folder,
by default C:\Documents and Settings\All Users\Application
Data\Autodesk\Geospatial Coordinate Systems.
2Make a backup copy of the file before modifying it.
NOTE Files that should not be modified are marked with an asterisk (*) in
the table on the Concept tab of this topic.
3Edit the file in a text editor.
Setting Up Object Classification
■Overview of Setting Up Object Classification (page 117)
■Defining an Object Class (page 119)
■Using Base Object Classes (page 122)
■Specifying Ranges and Defaults (page 124)
■Modifying an Object Class Definition (page 127)
■Creating an Object Classification File (page 128)
116 | Chapter 2 Setting Up

See also:
■Overview of Setting Up Object Classification (page 117)
■Attaching an Object Class Definition File (page 995)
■To set up object classification (page 118)
■To define an object class (page 120)
■To base a new object class on an existing class (page 123)
■To specify that an object class can be used only as a base class (page 124)
■To specify a default value and a range for a property (page 125)
■To modify an object class definition (page 127)
■To create a new object classification file (page 129)
See also:
■Overview of Setting Up Object Classification (page 117)
Overview of Setting Up Object Classification
Object classes define a set of standard objects for your organization. When a
user adds one of these standard objects to a drawing that uses object
classification, the object is created using the properties you have defined and
is a “classified” object.
NOTE Object classification affects drawing objects only. For information about
classification methods for geospatial feature data, see Overview of Geospatial Data
(page 551)
A classified object is created using the appropriate object type. It has the object
data, external data, and topology data that you have defined for the object
class, and all properties included in the object class definition have values
that fall within the range you specified for the property.
When users edit the properties of classified objects, they can enter only values
that fall within the ranges you have specified for the property.
NOTE To define an object class, you must have Alter Object Class privileges (page
82).
See also:
■Using Object Classification (page 981)
Setting Up Object Classification | 117

■Understanding Object Classification (page 983)
NOTE Object classification affects drawing objects only. For information about
classification methods for geospatial feature data, see Overview of Geospatial Data
(page 551)
To set up object classification
■Determine the standard objects for your organization.
■Determine the hierarchy of object classes.
You can create categories of object classes and have all object classes in a
category inherit certain settings from the base object class for that category.
■Create a sample object that has all the data and properties that to include
in the object class definition file.
■Attach (page 995) an existing object definition file or create (page 129) a new
object class definition file.
■Define (page 120) the new object class.
To use this object class as a base class (page 123), set the default value and
the range of allowable values (page 125) for each object that you include.
■Store the object class definition file in a location that is accessible to all
the people in your organization who need it.
■You can attach the object class definition file to your drawing template so
it is attached to all new drawings.
Quick Reference
ATTACHDEF
Changes the current feature definition file
Click Setup ➤ Classification Tools ➤ Attach Definition
File.
Menu
ATTACHDEFCommand Line
In Map Explorer, under Current Drawing, right-click
Object Classes ➤ Attach Definition File
Task Pane
Attach Object Class Definition File dialog boxDialog Box
118 | Chapter 2 Setting Up

FEATUREDEF
Defines a new object class based on an example in thecurrent drawing
Click Setup ➤ Classification Tools ➤ Define Object
Class.
Menu
Define Object Class
Icon
FEATUREDEFCommand Line
In Map Explorer, under Current Drawing, right-click
Object Classes ➤ Define Object Class
Task Pane
Define Object Classification dialog boxDialog Box
NEWDEF
Creates a new object class definition file
Click Setup ➤ Classification Tools ➤ New Definition
File.
Menu
NEWDEFCommand Line
In Map Explorer, under Current Drawing, right-click
Object Classes ➤ New Definition File
Task Pane
New Object Class Definition File dialog boxDialog Box
Defining an Object Class
Define an object class by selecting a sample object in your drawing, choosing
which of its properties to include in the definition, and specifying the allowable
settings.
For example, if you want to define an object class for maintenance hole covers,
select an existing maintenance hole cover in your drawing.
If you do not have a sample object in your drawing, create an object with the
data and property settings that you want to include in the object class
definition.
For each object class, AutoCAD Map 3D stores information on how to create
the object, what properties it should have, what data should be attached, and
what topology information should be associated with it. All objects you create
using this object class definition have the selected properties and values.
Setting Up Object Classification | 119

NOTE Object classification affects drawing objects only. For information about
classification methods for geospatial feature data, see Overview of Geospatial Data
(page 551)
Editing Object Class Definitions
To define an object class, you must have Alter Object Class Privileges (page
82).
WARNING Only one person should edit object class definitions at a time. If two
people edit at the same time, one set of edits may be lost.
If someone has recently edited the definition file, quit AutoCAD Map 3D and
restart to get the updated definitions.
Renaming an Object Class
When you rename an object class, you change the name only in the object
class definition file. Any objects tagged with the object class name are
unchanged. Since these objects point to a name that no longer exists in the
object class definition file, the objects become undefined. You can search for
these undefined objects and update their object class name.
See also:
■Using Base Object Classes (page 122)
■Modifying an Object Class Definition (page 127)
■Attaching an Object Class Definition File (page 995)
NOTE To define an object class, you must have Alter Object Class privileges (page
82).
NOTE Object classification affects drawing objects only. For information about
classification methods for geospatial feature data, see Overview of Geospatial Data
(page 551)
To define an object class
1Select a sample object for the object class.
The sample object must have the properties, links, and attributes that
you want to include in the definition of the object class.
120 | Chapter 2 Setting Up

2If an object definition file is not attached, enter attachdef at the command
prompt and attach the file.
3On the Map Explorer tab of the Task Pane, right-click Object Classes.
Click Define Object Class.
4When prompted to select a sample object, select the sample object. Press
Enter.
5In the Define Object Classification dialog box (page 1785), enter a name
and a description.
6To base this object class on an existing object class (page 123), select the
existing object class from the Based On list.
To use this object class as a base only, select Use As Base Object
Classification Only.
7On the Applies To tab, select the object type for this object class.
You must select the object type before you can select properties on the
Properties List tab.
For best results, select the most specific object type that applies to all
objects in this class.
NOTE If you plan to use this object class with objects from a drawing source,
do not select more than one object type.
8On the Properties List tab, select each of the properties you want to
include in the definition. For each property, enter a default value and a
range of possible values (page 125).
To specify a line weight, enter the decimal value as an integer. For
example, to specify a line weight of 0.13, enter 13.
To define a new property, click New Property. In the New Property dialog
box (page 1791), specify the category and name for the new property.
9On the Class Settings tab, select the object to use to create the feature.
For example, if you are defining an object class for roads, select Polyline
as the creation method.
NOTE You can select only objects that match the object type you selected
on the Applies To tab.
You can also specify the icon to display for the object class and whether
you want the object class to appear on the Map Explorer tab of the Task
Pane.
Setting Up Object Classification | 121
Quick Reference
FEATUREDEF
Defines a new object class based on an example in thecurrent drawing
Click Setup ➤ Classification Tools ➤ Define Object
Class.
Menu
Define Object Class
Icon
FEATUREDEFCommand Line
In Map Explorer, under Current Drawing, right-click
Object Classes ➤ Define Object Class
Task Pane
Define Object Classification dialog boxDialog Box
Using Base Object Classes
You can create hierarchies of object classes. When you base a new object class
on an existing object class, the new object class has all the properties of the
base class.
You cannot change base properties, but you can modify their attributes,
including the default value and the range of allowable values, and you can
include additional properties.
NOTE Object classification affects drawing objects only. For information about
classification methods for geospatial feature data, see Overview of Geospatial Data
(page 551)
NOTE To define an object class, you must have Alter Object Class privileges (page
82).
Sample Use
1Define an object class called Roads with the basic properties that you
want to assign to all roads.
2Define object classes called Primary Roads, Local Roads, and Fire Roads,
and base each of them on Roads.
Because the new object classes are based on Roads, they include all the
properties selected for Roads.
122 | Chapter 2 Setting Up

When you select all objects in a base class, objects in object classes based
on that class are also selected.
Using Object Classes as Base Classes Only
Sometimes when you create a base class, you intend to use it only as a base
for other object classes and not to create objects in drawings. For example,
you may not want the to use the Roads object class to create roads. You want
people to create roads using the Primary Roads and Secondary Roads classes
that are based on the Roads class. You can specify that an object class can be
used only as a base class.
Editing Base Classes
To edit a definition for an object class, you must have a sample object in the
drawing. However, if you use an object class as a base class only, you will not
have any example objects. For these object classes, you must edit the .xml
definition file directly.
See also:
■Defining an Object Class (page 119)
■Setting Up Object Classification (page 116)
NOTE To define an object class, you must have Alter Object Class privileges (page
82).
NOTE Object classification affects drawing objects only. For information about
classification methods for geospatial feature data, see Overview of Geospatial Data
(page 551)
To base a new object class on an existing class
1Define the object class (page 120).
2For Based On, select the object class on which you want to base this new
object class.
The selected properties of the base object class appear in the list.
3You cannot clear any of the properties of the base object class, but you
can edit the property attributes, including the default and the range of
allowable values.
Setting Up Object Classification | 123
4Add any additional properties you want, and finish defining the object
class.
To specify that an object class can be used only as a base class
1Define the object class (page 120).
2In the Define Object Classification dialog box (page 1785), select Use As
Base Object Classification Only.
Users can select objects using the base object class, but they cannot create
objects using it.
Quick Reference
FEATUREDEF
Defines a new object class based on an example in thecurrent drawing
Click Setup ➤ Classification Tools ➤ Define Object
Class.
Menu
Define Object Class
Icon
FEATUREDEFCommand Line
In Map Explorer, under Current Drawing, right-click
Object Classes ➤ Define Object Class
Task Pane
Define Object Classification dialog boxDialog Box
Specifying Ranges and Defaults
When you define an object class, you can specify a range of allowable values
and a default value for new objects created using the object class.
NOTE Object classification affects drawing objects only. For information about
classification methods for geospatial feature data, see Overview of Geospatial Data
(page 551)
When someone creates a new object using this object class, AutoCAD Map
3D creates the object using the current settings for the property. If the current
124 | Chapter 2 Setting Up
settings do not match the range, the object is created using the specified
default value.
When users edit the values for properties associated with the object class, they
can only values that are within the allowable range. (This applies only if you
edit the properties using the Object Class Data tab of the Properties palette.)
When users classify existing objects, they can skip objects whose values are
not within the specified range. If they do not skip these objects, the objects
are assigned the default values.
NOTE To define an object class, you must have Alter Object Class privileges (page
82).
See also:
■Defining an Object Class (page 119)
■Setting Up Object Classification (page 116)
NOTE To define an object class, you must have Alter Object Class privileges (page
82).
NOTE Object classification affects drawing objects only. For information about
classification methods for geospatial feature data, see Overview of Geospatial Data
(page 551)
To specify a default value and a range for a property
1Create the object class and select the object type (page 120) on the Applies
To tab of the Define Object Classification dialog box (page 1785).
2On the Properties List tab, select a property.
3Under Property Attributes, for Default, enter the default value for this
property.
4For Range, specify the range of allowable values.
Click … to select from a list of properties if available, otherwise, enter
the values.
■To enter a list of values, separate them with commas, for example:
1,5,9
Setting Up Object Classification | 125

■To enter a range of numbers, enclose the first and last numbers in
square brackets and separate the numbers with a comma, for example:
[3,7]
■You can combine a range with additional values, for example: 1,[3,7],9
■To delete a range, enter two dashes ( "--" ).
Range values are case sensitive. For example, if you specify "Road" as an
allowable value in the range, "ROAD" will not match this value and will be
considered outside of the range.
See also:
■Color Range Editor dialog box (page 1783)
■Layer Range Editor dialog box (page 1789)
■Linetype Range Editor dialog box (page 1789)
■Lineweight Range Editor dialog box (page 1790)
■Plotstyle Range Editor dialog box (page 1792)
Quick Reference
FEATUREDEF
Defines a new object class based on an example in thecurrent drawing
Click Setup ➤ Classification Tools ➤ Define Object
Class.
Menu
Define Object Class
Icon
FEATUREDEFCommand Line
In Map Explorer, under Current Drawing, right-click
Object Classes ➤ Define Object Class
Task Pane
Define Object Classification dialog boxDialog Box
126 | Chapter 2 Setting Up

Modifying an Object Class Definition
To add properties to an object class definition, you must have a sample object
that includes the properties you want to add.
NOTE Object classification affects drawing objects only. For information about
classification methods for geospatial feature data, see Overview of Geospatial Data
(page 551)
Notes and Warnings
When you rename an object class, you change the name only in the object
classification file. Any objects tagged with the object class name are unchanged.
Since these objects point to an object class name that no longer exists in the
object classification file, the objects become undefined. You can search for
these undefined objects and update their object class name.
NOTE To modify an object class, you must have Alter Object Class privileges
(page 82).
See also:
■Defining an Object Class (page 119)
■Setting Up Object Classification (page 116)
NOTE To modify an object class definition, you must have Alter Object Class
privileges (page 82).
NOTE Object classification affects drawing objects only. For information about
classification methods for geospatial feature data, see Overview of Geospatial Data
(page 551)
To modify an object class definition
1Open a drawing that contains an object classified with the object class
you want to modify.
To add properties to the object class definition, the sample object must
have the properties you want to add to the object class definition.
2If an object classification file is not attached, enter attachdef at the
command prompt and attach the file.
Setting Up Object Classification | 127

3On the Map Explorer tab of the Task Pane, right-click the object class
whose definition you want to modify. Click Define Object Class.
4Select the sample object. This object must be classified with the object
class you want to modify.
5In the Define Object Classification dialog box (page 1785), modify
properties.
■You cannot change the object type used for the feature.
■On the Properties List tab, select or clear properties you want to include
in the definition. For each new property, enter a default value and a
range of possible values (page 125).
To specify a line weight, enter the decimal value as an integer. For
example, to specify a line weight of 0.13, enter 13.
■On the Class Settings tab, specify the icon to display for the feature
and whether the data appears on the Map Explorer tab of the Task
Pane.
Quick Reference
FEATUREDEF
Defines a new object class based on an example in thecurrent drawing
Click Setup ➤ Classification Tools ➤ Define Object
Class.
Menu
Define Object Class
Icon
FEATUREDEFCommand Line
In Map Explorer, under Current Drawing, right-click
Object Classes ➤ Define Object Class
Task Pane
Define Object Classification dialog boxDialog Box
Creating an Object Classification File
The object classification file contains information on object classes you have
defined. You can create a new object classification file.
128 | Chapter 2 Setting Up

NOTE Object classification affects drawing objects only. For information about
classification methods for geospatial feature data, see Overview of Geospatial Data
(page 551)
As a general rule, you want to use the same object classification file across all
your drawings. This ensures that you have the same object class definitions
for all source drawings attached to a drawing. You may want to attach the
object classification file to the drawing template, and make sure that everyone
has the same alias to the path.
If users in your organization share the object classification file, store it on the
network in a place accessible to all users.
To use object classification, users attach the object classification file to their
drawing. They can then create standard objects using the object class
definitions.
Only the object classes defined in the object classification file attached to a
drawing can be assigned to objects or used to create new objects.
NOTE To create a new object classification file, you must have Alter Object Class
privileges (page 83).
See also:
■Attaching an Object Class Definition File (page 995)
■Setting Up Object Classification (page 116)
NOTE Object classification affects drawing objects only. For information about
classification methods for geospatial feature data, see Overview of Geospatial Data
(page 551)
To create a new object classification file
1On the Map Explorer tab of the Task Pane, right-click Object Classes.
Click New Definition File.
2In the New Object Class Definition File dialog box (page 1790), specify a
name for the new object classification file. Click OK.
NOTE To create a new object classification file, you must have Alter Object Class
privileges (page 83).
Setting Up Object Classification | 129
Quick Reference
NEWDEF
Creates a new object class definition file
Click Setup ➤ Classification Tools ➤ New Definition
File.
Menu
NEWDEFCommand Line
In Map Explorer, under Current Drawing, right-click
Object Classes ➤ New Definition File
Task Pane
New Object Class Definition File dialog boxDialog Box
Setting Up for Digitizing
■Overview of Digitizing (page 130)
■Configuring the Digitizer (page 131)
■Registering the Map (page 133)
■Setting Digitizing Specifications (page 136)
See also:
■Digitizing Objects (page 1073)
■Overview of Digitizing Maps (page 1073)
■To prepare for digitizing (page 131)
■To configure the digitizer (page 132)
■To register the map (page 136)
■To set digitizing specifications (page 138)
Overview of Digitizing
Digitizing is the process of converting paper-based graphical information into
a digital format. When you digitize a map, you use drawing commands to
trace data from the paper map into a DWG file.
See also:
■Digitizing Objects (page 1073)
130 | Chapter 2 Setting Up
■Configuring the Digitizer (page 131)
■Registering the Map (page 133)
■Setting Digitizing Specifications (page 136)
To prepare for digitizing
1Configure the digitizer. (page 132)
2Register the map. (page 136)
3Set the digitizing specifications. (page 138)
Quick Reference
OPTIONS
Customizes the AutoCAD settings
Setup menu ➤ AutoCAD Options
Menu
OPTIONSCommand Line
Right-click in the drawing area ➤ Options
Task Pane
TABLET
Calibrates, configures, and turns on and off an attached digitizing table
TABLETCommand Line
MAPDIGISETUP
Sets up user options for digitizing nodes and linear objects
Click Map ➤ Data Entry ➤ Digitize Setup.
Menu
MAPDIGISETUPCommand Line
Digitize Setup dialog boxDialog Box
Configuring the Digitizer
You must configure the digitizer so a movement on the digitizing tablet can
be recorded directly into an existing drawing file as you digitize.
Setting Up for Digitizing | 131
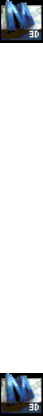
To configure the digitizing tablet, you define screen pointing areas. A screen
pointing area is a rectangular region on the digitizer surface within which the
digitizer acts like a mouse and can access windows, menus, and dialog boxes.
You can configure two screen pointing areas, one fixed and one floating.
When you digitize, the fixed screen pointing area is disabled. To access the
menus from the digitizer, use the floating screen pointing area.
You can toggle between the fixed and floating screen pointing areas with the
F12 key.
See also:
■Registering the Map (page 133)
■Setting Digitizing Specifications (page 136)
■Digitizing Objects (page 1073)
■Overview of Digitizing Maps (page 1073)
To configure the digitizer
1Click ➤ Options. In the Options dialog box, click the System tab.
2Select your digitizer in the Current Pointing Device list.
3Start the TABLET command, and use the CFG option to configure the
tablet. Specify the fixed screen pointing area and a floating screen pointing
area in a corner of your tablet area.
4Mark the floating screen area on your tablet with a marker or piece of
paper.
When you complete the configuration, two new options appear on the
status bar at the bottom of the AutoCAD Map 3D window. Tablet and
FLOAT let you toggle the two modes.
Use the Options dialog box to disable the mouse while you are digitizing.
1Click ➤ Options. In the Options dialog box, click the System tab.
2Under Accept Input From, select Digitizer Only.
3Click OK.
132 | Chapter 2 Setting Up
When you complete digitizing, return to the Options dialog box and select
the Digitizer And Mouse option to use both input devices.
Quick Reference
OPTIONS
Customizes the AutoCAD settings
Setup menu ➤ AutoCAD Options
Menu
OPTIONSCommand Line
Right-click in the drawing area ➤ Options
Task Pane
TABLET
Calibrates, configures, and turns on and off an attached digitizing table
TABLETCommand Line
Registering the Map
Registration is the process of making a map's coordinate system correspond to
the Cartesian coordinate system used by AutoCAD Map 3D.
You select specific calibration and control points for each map that you digitize.
Setting Up for Digitizing | 133
The crosses in this illustration mark the digitizer calibration points.
Choosing the Number of Calibration Points
Selecting a maximum of nine points is a good rule; specifying more only
increases computation time with little increase in precision. If the original is
not badly distorted, four corner points and some intermediate points are
sufficient. It is more important to distribute the points evenly around the
whole map than to concentrate more points in an area.
Calibration Options
To complete the calibration, select one of the following transformation options:
■Orthogonal — Needs only two digitized and specified calibration points
to create a transformation consisting of arbitrary translation, uniform
scaling, and rotation. This method is not recommended unless only two
control points can be found.
■Affine — Requires three calibration points. Allows a tablet transformation
combining translation, independent X and Y scaling, rotation, and some
skewing. Provides an arbitrary linear transformation in two-dimensional
space. This is the preferred method for registering paper maps drawn in a
Cartesian coordinate system.
■Projective — Needs at least four calibration points. Makes a transformation
equivalent to a perspective projection of any plane onto another plane.
Allows for some stretching of an original paper drawing by different
134 | Chapter 2 Setting Up
amounts along a perspective projection. This is the best option for
orthophotos.
The TABLET command calculates the errors associated with the available
transformation options, depending on how many points you digitized. When
the calculations are complete, or when you cancel the calculations, a table
showing the results of your calibration appears.
There are four possible responses from the calibration calculations for each
transformation type:
■Exact — Number of points specified is correct for this type of
transformation.
■Success — More points specified than needed. For a Success, the RMS error
and standard deviation are reported.
■Impossible — Not enough points specified to define a transformation.
■Failure — Points specified are colinear or coincidental. The transformation
may not have a valid definition.
If you get either Impossible or Failure, do not use that transformation. If all
the results are Impossible or Failure, check the calibration on the digitizer,
recalibrate, and digitize the map again.
RMS error, Standard Deviation, and Residual Values
The RMS error indicates how uniform or extreme the required transformation
is: the lower the value, the better the calibration.
Standard deviation is reported at all calibration points. The residual error is
the difference between the actual calibration point and the computed
transformation point. A large difference indicates a procedural error. You may
have entered the wrong coordinates or digitized a wrong point.
If the RMS and standard deviation values seem high, you might have made
an error when entering location values or the map might have slipped during
calibration. In this case, restart the procedure to calibrate the digitizer.
See also:
■Configuring the Digitizer (page 131)
■Setting Digitizing Specifications (page 136)
■Digitizing Objects (page 1073)
Setting Up for Digitizing | 135
■Overview of Digitizing Maps (page 1073)
To register the map
1Tape the map on the tablet. The map on the tablet should be flat, with
no bumps or wrinkles, and securely fastened.
2Start the TABLET command and use the CAL option.
3Digitize the control points of the map, and enter X and Y coordinate
values for the locations.
4When you complete the control points, press Enter. Wait for the
calculations to complete.
5At the prompt, enter the calibration option to use. Select the
transformation that gave an Exact outcome. If all the transformations
were a Success, select the option with the lowest RMS and standard
deviation errors.
Quick Reference
TABLET
Calibrates, configures, and turns on and off an attached digitizing table
TABLETCommand Line
Setting Digitizing Specifications
To use the options provided by the MAPDIGITIZE command, you must
configure the digitizer and register the map.
Attaching Data
You can link data to objects as you digitize. Although you can store data in
AutoCAD Map 3D as block attributes, you can perform more sophisticated
analysis of the data if you use one of the following methods:
■Data linked to an object is stored as object data in the drawing.
■Data linked to an object is stored in an external database.
136 | Chapter 2 Setting Up
Label Point
A label point is the point used to insert text to describe the digitized object.
You can specify a label point for each object as you digitize.
Layer
Plan the layers you will use in your drawing. A layer is a logical grouping of
data, which simplifies organizing and viewing data. For more information,
look up "layers, creating" in the help index.
Each object that represents a different type of map data should go on a separate
layer. For example, a polyline representing a coastline could go on a layer
named COASTLINE, interstate highways on a layer named INTERSTATE, land
boundaries on a layer named LOTS.
If you have not established a scheme for layer names, you can create one using
the numeric feature-classification code found in some digital source data. For
example, major roads might be on a layer named "170-201". A better naming
convention combines names that suggest their function and a structure that
allows selection with wild cards and groups of layer names. For example, you
might decide that all topographic objects should go on layers beginning with
the letters TP. So you might put rivers on a layer named TP_RIVERS, and
contours on a layer named TP_CONTOURS. To freeze, thaw, lock, or unlock
all layers with topographic data, you use the expression TP*. For more
information on wild-card characters, look up "wild-card characters" in the
help index.
Block Name or Linetype
To represent nodes using blocks available in the current drawing, select a block
name or ACAD_POINT for the block name.
Choosing ACAD_POINT places a point object at each node position. For
information about changing the appearance of this point object, look up
DDPTYPE in the help index.
Wherever possible, use the linetypes supplied with AutoCAD Map 3D to
indicate different types of boundaries, road types, and waterways. Using
standard linetypes ensures consistency across maps and helps you keep track
of what you have digitized. Associate each linetype with a different layer.
Object Snap
Use object snap to tie nodes or segments to linear objects that are already in
place. For example, always use object snap to position junctions of pipes,
roads, or railways.
Setting Up for Digitizing | 137
Width
Linear objects that contain three-dimensional information cannot have a
width.
See also:
■Registering the Map (page 133)
■Configuring the Digitizer (page 131)
■Digitizing Objects (page 1073)
■Overview of Digitizing Maps (page 1073)
To set digitizing specifications
1At the command prompt, enter mapdigisetup.
2In the Digitize Setup dialog box (page 1617), select an object type.
Select Nodes to digitize points or blocks. Select Linear to digitize polylines.
3To attach data to objects as you digitize them, select Attach Data.
Click Data To Attach and select the table to use for the data. As you
digitize the objects, you are prompted for the data to attach to the object.
4To change the label point for objects as you digitize them, select Prompt
For Label Point.
5Specify the layer for new objects.
6Specify the block (for nodes) or the linetype (for linear objects) to use
when creating the new objects.
7Specify whether to snap to the closest endpoint (for nodes) or insertion
point (for linear objects).
8For nodes, select whether to specify the rotation and scale of each node
block.
For linear objects, select whether the objects are 2D or 3D. For 2D objects,
specify a width.
9Click OK to close the dialog box and save your settings.
138 | Chapter 2 Setting Up
Quick Reference
MAPDIGISETUP
Sets up user options for digitizing nodes and linear objects
Click Map ➤ Data Entry ➤ Digitize Setup.
Menu
MAPDIGISETUPCommand Line
Digitize Setup dialog boxDialog Box
Setting Up Your Map File
See also:
■Setting Up AutoCAD Map 3D (page 80)
■Setting Options (page 216)
■To log in to AutoCAD Map 3D (page 142)
■To assign coordinate systems (page 143)
■To attach drawings (page 154)
■To set up a query library (page 173)
■To set up annotation templates (page 186)
■To set up object data (page 198)
■To set up data sources for drawings (page 205)
Overview of Setting Up Your Map File
You can set up each map file you create to make your work easier and more
productive.
See also:
■Setting Up AutoCAD Map 3D (page 80)
■Setting Options (page 216)
Setting Up Your Map File | 139
The following table summarizes your customization options for a map file.
To get this result...Use this method...To do this...
Specify the coordinate system used for at-
tached drawings and for the current
drawing.
See Assigning Coordinate Systems (page
142)
Click Map Setup tab ➤ Co-
ordinate System panel ➤ As-
sign.
Assign a coordinate system.
Work with objects from other drawings by
attaching those drawings to the current
map and querying in the objects.
See Overview of Attaching Drawings (page
154)
Drag the drawing file from
Windows Explorer to the
Map Explorer tab of the
Task Pane.
Attach drawings.
Specify how attached drawings work with
the current drawing and view information
about attached drawings.
See Modifying Attached Drawing Settings
(page 163).
In the Tool-based Ribbon
Workspace, click Home tab
➤ Data panel ➤ Define
Drawing Set.
Modify the settings for at-
tached drawings.
Save and reuse queries in a library.
See Overview of Using the Query Library
(page 174).
Set up queries. 1To save the current
query, click Home
tab ➤ Data pan-
el ➤ Define Query.
2To run a saved query,
click Create
tab ➤ Object Query
panel ➤ Run.
Define the information to display in an
annotation and the layout of that informa-
Click Annotate tab ➤ Map
Annotation panel ➤ Define
Template.
Define annotation tem-
plates.
tion. Then you can insert instances of the
annotation into your drawing.
See Defining Annotation Templates (page
190)
140 | Chapter 2 Setting Up
To get this result...Use this method...To do this...
Create tables with fields for text and numer-
ical information. Attach records from the
table to objects.
See Creating an Object Data Table (page
200).
Click Map Setup tab ➤ At-
tribute Data panel ➤ Define
Object Data.
Set up object data.
Attach a database to your map and link
records from that table to objects in your
map.
See Attaching a Data Source (page 208).
Drag the database file from
Windows Explorer to the
Map Explorer tab of the
Task Pane.
Set up data sources for
drawings.
Logging Into AutoCAD Map 3D
When you log into AutoCAD Map 3D, your work environment is automatically
set up as it was last saved, including user privileges and user-specific options.
Depending on your organization, you may be required to log in. System
Administrators can set this AutoCAD Map 3D multi-user option.
If user login is not required, you can work with AutoCAD Map 3D without
logging in. However, you can log in at anytime to restore settings that you
have saved to your user name or to use privileges associated with your user
name.
User Privileges
To perform some AutoCAD Map 3D commands, you must be logged in as a
user with the appropriate privileges.
Example: To change Multi-user settings in the AutodCAD Map Options dialog
box, you must have Superuser privileges.
The default superuser name is SuperUser (not case sensitive), and the default
superuser password is SUPERUSER (case sensitive).
TIP You can customize many AutoCAD Map 3D settings. Some of these
customizations are saved to your user name. To customize the settings differently
for each drawing, set up multiple user names and log in with the appropriate
name for each drawing.
Logging Into AutoCAD Map 3D | 141

See also:
■Setting Multi-user Options (page 226)
■Setting Up Users and Assigning Rights (page 82)
To log in to AutoCAD Map 3D
1Click Map Setup tab ➤ Map panel ➤ ➤ User Login.
2In the User Login dialog box (page 1937), for Login Name, enter the login
name provided to you by your system administrator.
3In the Password box, enter your password.
The default superuser login name is SuperUser (case insensitive) and the
password is SUPERUSER (case sensitive). If security is an issue, make sure
that you change the default superuser login and password. See To add a
new user (page 83).
4Click OK.
Quick Reference
MAPLOGIN
Allows you to log in as an AutoCAD Map 3D user
Setup menu ➤ User Login
Menu
MAPLOGINCommand Line
In Map Explorer, right-click Current Drawing ➤ User
Login
Task Pane
User Login dialog boxDialog Box
Assigning Coordinate Systems
With AutoCAD Map 3D, you can combine data from maps that use different
coordinate systems.
142 | Chapter 2 Setting Up
See also:
■Defining Coordinate Systems (page 89)
■Grid Data Files and Datum Shifts (page 102)
To assign coordinate systems
■To use coordinate systems with maps (page 145)
■To assign a coordinate system to a source drawing (page 146)
■To assign a coordinate system to the current drawing (page 147)
■To determine if a coordinate system is geodetic (page 149)
■To turn off a global coordinate system (page 150)
■To see the assigned coordinate system for a source drawing (page 151)
■To transform the coordinate system of a drawing (page 152)
Overview of Coordinate Systems
With AutoCAD Map 3D, you can combine data from maps using different
coordinate systems. To do this, you specify the coordinate system used for
attached drawings and for the current drawing. When you bring objects from
attached drawings into the current drawing, the objects are transformed to
the coordinate system of the current drawing.
The coordinate system you assign to your drawing specifies the system that
was used when creating the drawing. For example, if you created a map using
Universal Transverse Mercator, Zone 27, US Survey Feet, you assign the code
UTM-27F to the map.
You specify the coordinate system used for the current drawing and for
attached source drawings before querying any items from the source drawings.
When you query objects from source drawings, AutoCAD Map 3D
automatically converts them to the coordinate system of the current drawing.
This operation is called coordinate transformation. When you save objects back
to source drawings, AutoCAD Map 3D reverses the conversion.
The coordinate system code and definition are stored in the drawing file. You
can share the drawing with anyone using Autodesk Map 2000 Release 4 or
later, and they will have the correct coordinate system.
When the coordinate system you select is assigned to the selected attached
drawings, a backup file, with a .bak extension, is made of each source drawing
before assigning the coordinate system information.
Assigning Coordinate Systems | 143
The coordinate systems supplied with AutoCAD Map 3D include the Universal
Transverse Mercator System and the State Plane coordinate systems used in
the USA, as well as many international coordinate systems used around the
world. For a complete listing of supported systems, see the Global Coordinate
System Manager dialog box.
Tell me more
Video
■Show me how to assign a coordinate
system to my map.
■Show me how to set a map to the co-
ordinate system of the data.
Procedure
■To assign a coordinate system to the
current drawing (page 147)
■To assign a coordinate system to a
source drawing (page 146)
■To turn off a global coordinate system
(page 150)
Tutorial
■Exercise 1: Create a map
Workflow
■Transform a DWG File to a Different
Coordinate System
■Combine Data with Different Coordin-
ate Systems
GIS Skill
■Reproject incoming data to a new co-
ordinate system
Related topics
■Overview of Creating New Coordinate
Systems (page 90)
■Overview of Grid Data Files and Datum
Shift Issues (page 103)
144 | Chapter 2 Setting Up

To use coordinate systems with maps
■Assign a coordinate system (page 145) to your current drawing and to the
source drawings.
■Set Coordinate System Options (page 230)
■Define a coordinate system (page 91)
Quick Reference
ADEDEFCRDSYS
Defines a global coordinate system
Setup menu ➤ Define Global Coordinate System
Menu
ADEDEFCRDSYSCommand Line
Global Coordinate System Manager Dialog BoxDialog Box
ADESETCRDSYS
Assigns a global coordinate system code for the current drawing or attached
drawings
Setup menu ➤ Assign Global Coordinate System
Menu
Assign Coordinate System
Icon
ADESETCRDSYSCommand Line
In Map Explorer, right-click Current
Drawing ➤ Coordinate System
Task Pane
Assign Global Coordinate System dialog boxDialog Box
Assigning a Coordinate System to a Source Drawing
You must specify a coordinate system for each attached source drawing to
take advantage of the coordinate transformation capabilities in AutoCAD Map
3D.
Assigning Coordinate Systems | 145

See also:
■Overview of Coordinate Systems (page 143)
■Transforming the Coordinate System of a Drawing (page 152)
■Viewing the Assigned Coordinate System for a Source Drawing (page 151)
■Removing an Assigned Coordinate System (page 150)
■Overview of Creating New Coordinate Systems (page 90)
■Overview of Grid Data Files and Datum Shift Issues (page 103)
To assign a coordinate system to a source drawing
1Click Map Setup tab ➤ Coordinate System panel ➤ Assign.
2In the Assign Global Coordinate System dialog box (page 1598), under
Source Drawings, click Select Drawings.
3In the Select Drawings to Assign Coordinate System dialog box (page 1599),
select the source drawings. You cannot assign a coordinate system to a
source drawing that currently has queried objects in the current drawing.
4Under Source Drawings, enter the coordinate system code for the selected
source drawings.
If you do not know the code, click Select Coordinate System. In the Select
Global Coordinate System dialog box, select a category. Select from a list
of available coordinate systems. You can also search for coordinate systems
by code or description using the Search box. Click Properties to view the
properties of the selected coordinate system.
To remove an assigned coordinate system, in the Code box in the Assign
Global Coordinate System dialog box, type a period.
5Click OK.
Quick Reference
ADESETCRDSYS
Assigns a global coordinate system code for the current drawing or attached
drawings
146 | Chapter 2 Setting Up

Setup menu ➤ Assign Global Coordinate System
Menu
Assign Coordinate System
Icon
ADESETCRDSYSCommand Line
In Map Explorer, right-click Current
Drawing ➤ Coordinate System
Task Pane
Assign Global Coordinate System dialog boxDialog Box
Assigning a Coordinate System to the Current Drawing
You must specify a coordinate system for the current drawing to take advantage
of the coordinate transformation capabilities in AutoCAD Map 3D.
After you bring objects into the current drawing, do not change the coordinate
transformation options if you plan to save changes back to source drawings.
The save-back process uses the original settings to determine whether
adjustments are necessary to restore objects to the correct coordinate system.
See also:
■Overview of Coordinate Systems (page 143)
■Transforming the Coordinate System of a Drawing (page 152)
■Assigning a Coordinate System to a Source Drawing (page 145)
■Removing an Assigned Coordinate System (page 150)
■Overview of Creating New Coordinate Systems (page 90)
■Overview of Grid Data Files and Datum Shift Issues (page 103)
To assign a coordinate system to the current drawing
1Click Map Setup tab ➤ Coordinate System panel ➤ Assign.
2In the Assign Global Coordinate System dialog box (page 1598), under
Current Drawing, enter the coordinate system code for the current
drawing.
If you do not know the code, click Select Coordinate System. In the Select
Global Coordinate System dialog box, select a category. Select from a list
Assigning Coordinate Systems | 147

of available coordinate systems. You can also search for coordinate systems
by code or description using the Search box. Click Properties to view the
properties of the selected coordinate system.
3Click OK.
Quick Reference
ADESETCRDSYS
Assigns a global coordinate system code for the current drawing or attached
drawings
Setup menu ➤ Assign Global Coordinate System
Menu
Assign Coordinate System
Icon
ADESETCRDSYSCommand Line
In Map Explorer, right-click Current
Drawing ➤ Coordinate System
Task Pane
Assign Global Coordinate System dialog boxDialog Box
Using a Geodetic Coordinate System
All geographic data is created in some coordinate system, and in the context
of some datum (page 2059). A datum includes ellipsoid (page 2062) information
and a datum definition. For example, the Gauss-Kruger Conformal projection
system used in Germany uses the Bessel ellipsoid and Potsdam datum
definition. Some coordinate systems only specify the ellipsoid; these are
non-geodetic. Coordinate systems that specify the complete datum are
geodetic.
Most of the coordinate systems supplied with AutoCAD Map 3D are geodetic,
but about ten percent are non-geodetic. Therefore, you should determine
whether the coordinate systems you use are geodetic or non-geodetic before
you assign a coordinate system to a drawing. If you have data in a drawing
that uses a non-geodetic coordinate system, but do not know what datum the
data came from, you might introduce errors if you convert the drawing to a
geodetic coordinate system.
148 | Chapter 2 Setting Up

See also:
■Overview of Coordinate Systems (page 143)
■Transforming the Coordinate System of a Drawing (page 152)
■Overview of Creating New Coordinate Systems (page 90)
■Defining a New Datum (page 93)
■Defining an Ellipsoid (page 95)
To determine if a coordinate system is geodetic
1Click Map Setup tab ➤ Coordinate System panel ➤ Assign.
2In the Assign Global Coordinate System dialog box (page 1598), under
Current Drawing or Source Drawings, click Select Coordinate System.
3In the Category list, select the category that contains the coordinate
system you want.
4In the Coordinate Systems In Category list, select a coordinate system.
5Click Properties.
The type of coordinate system is displayed under Coordinate System Type on
the General tab of the Global Coordinate Systems Properties dialog box. If the
coordinate system is geodetic, the datum (page 2059) is displayed in the Datum
box.
Quick Reference
ADESETCRDSYS
Assigns a global coordinate system code for the current drawing or attached
drawings
Setup menu ➤ Assign Global Coordinate System
Menu
Assign Coordinate System
Icon
ADESETCRDSYSCommand Line
Assigning Coordinate Systems | 149

In Map Explorer, right-click Current
Drawing ➤ Coordinate System
Task Pane
Assign Global Coordinate System dialog boxDialog Box
Removing an Assigned Coordinate System
For ADE data, using the AutoCAD Map 3D coordinate systems requires many
complex calculations that can decrease performance when querying objects
from attached drawings and saving back the objects. With FDO data these
calculations are unnecessary, so there is no performance impact.
You can turn off a coordinate system while working in a particular drawing.
See also:
■Overview of Coordinate Systems (page 143)
To turn off a global coordinate system
1Click Map Setup tab ➤ Coordinate System panel ➤ Assign.
2In the Assign Global Coordinate System dialog box (page 1598), in the Code
box under Current Drawing, enter a period (.). Press Enter.
3Click OK.
Quick Reference
ADESETCRDSYS
Assigns a global coordinate system code for the current drawing or attached
drawings
Setup menu ➤ Assign Global Coordinate System
Menu
Assign Coordinate System
Icon
ADESETCRDSYSCommand Line
In Map Explorer, right-click Current
Drawing ➤ Coordinate System
Task Pane
150 | Chapter 2 Setting Up
Assign Global Coordinate System dialog boxDialog Box
Viewing the Assigned Coordinate System for a Source Drawing
If the current drawing has an assigned coordinate system, you can view the
code in the Drawing Settings dialog box.
See also:
■Overview of Coordinate Systems (page 143)
■Transforming the Coordinate System of a Drawing (page 152)
■Assigning a Coordinate System to a Source Drawing (page 145)
■Removing an Assigned Coordinate System (page 150)
To see the assigned coordinate system for a source drawing
1In the Tool-based Ribbon Workspace, click Home tab ➤ Data panel ➤
Define Drawing Set.
2Click Drawing Settings.
AutoCAD Map 3D displays the global coordinate system code for the active
drawing to the right of the drawing name.
Quick Reference
ADEDWGSTAT
Displays drawing statistics
Setup menu ➤ More DWG Options ➤ Drawing
Statistics
Menu
ADEDWGSTATCommand Line
In Map Explorer, right-click Drawings ➤ Statistics
Task Pane
Drawing Statistics dialog boxDialog Box
Assigning Coordinate Systems | 151
Transforming the Coordinate System of a Drawing
You can transform an existing map from one coordinate system to another
by querying the objects from the attached source drawing into the current
drawing.
The original source drawing is unchanged, but the objects in the current
drawing use the new coordinate system.
See also:
■Overview of Coordinate Systems (page 143)
■Assigning a Coordinate System to a Source Drawing (page 145)
■Assigning a Coordinate System to the Current Drawing (page 147)
■Querying Objects from Attached Drawings (page 1235)
To transform the coordinate system of a drawing
1Open a new drawing.
2Attach the drawing whose coordinate system you want to transform. See
Attaching Drawings (page 154).
3In the new drawing, assign the new coordinate system to the current
drawing. See Assigning a Coordinate System to the Current Drawing (page
147).
4If you have not already assigned a coordinate system to the original
drawing, do that now. Assign the coordinate system that was used to
create the original drawing. See Assigning a Coordinate System to a Source
Drawing (page 146).
5Define a query to bring in all objects from the source drawing. The easiest
way to do this is to define a location condition and use the Boundary
Type "All." This retrieves all objects in the source drawing. See Finding
All Objects in a Specified Location (page 1241).
As the objects are retrieved from the source drawing into the current drawing,
they are transformed from the coordinate system of the source drawing to the
coordinate system of the current drawing.
Once the objects are in the new drawing, you can detach the source drawing
and save the new drawing. The objects are unchanged in the source drawing,
but they use the new coordinate system in the new drawing.
152 | Chapter 2 Setting Up

Quick Reference
ADEDRAWINGS
Manages the drawing set
In the Classic workspace, click Setup menu ➤
Define/Modify Drawing Set
Menu
Define/Modify Drawing Set
Icon
ADEDRAWINGSCommand Line
In Map Explorer, right-click
Drawings ➤ Define/Modify Drawing Set
Task Pane
Define/Modify Drawing Set dialog boxDialog Box
ADEQUERY
Controls defining, modifying, saving, loading, and executing a query
In the Classic workspace, click Setup menu ➤ More
DWG Options ➤ Define Query
Menu
Define Query
Icon
ADEQUERYCommand Line
In Map Explorer, right-click Current Query ➤ Define
-or- Right-click a query ➤ Edit
Task Pane
Define Query dialog boxDialog Box
ADESETCRDSYS
Assigns a global coordinate system code for the current drawing or attached
drawings
Setup menu ➤ Assign Global Coordinate System
Menu
Assign Coordinate System
Icon
ADESETCRDSYSCommand Line
Assigning Coordinate Systems | 153

In Map Explorer, right-click Current
Drawing ➤ Coordinate System
Task Pane
Assign Global Coordinate System dialog boxDialog Box
Attaching Drawings
When you attach a drawing to the current drawing, you can work with any
objects and data in that drawing, edit them, and save them back to the attached
drawing.
NOTE To attach a geospatial feature source to the current drawing and bring in
its features, use Data Connect. See Overview of Bringing In GIS Features (page
305).
See also:
■Overview of Bringing in Drawing Data From DWG Files (page 351)
To attach drawings
■To create a drawing set (page 156)
■To attach drawings (page 158)
■To activate a drawing (page 160)
■To activate a group of drawings (page 160)
■To create a drive alias (page 161)
■To open an active attached drawing (page 163)
Overview of Attaching Drawings
You can work with objects from other drawings by attaching the other drawings
to the current drawing. The group of drawings attached to the current drawing
is called a drawing set.
Example: You have separate drawings for each quadrant of a town. You attach
those drawings to the current drawing, and then view all the quadrants
simultaneously.
NOTE To attach a geospatial feature source to the current drawing and bring in
its features, use Data Connect. See Overview of Bringing In GIS Features (page
305).
154 | Chapter 2 Setting Up
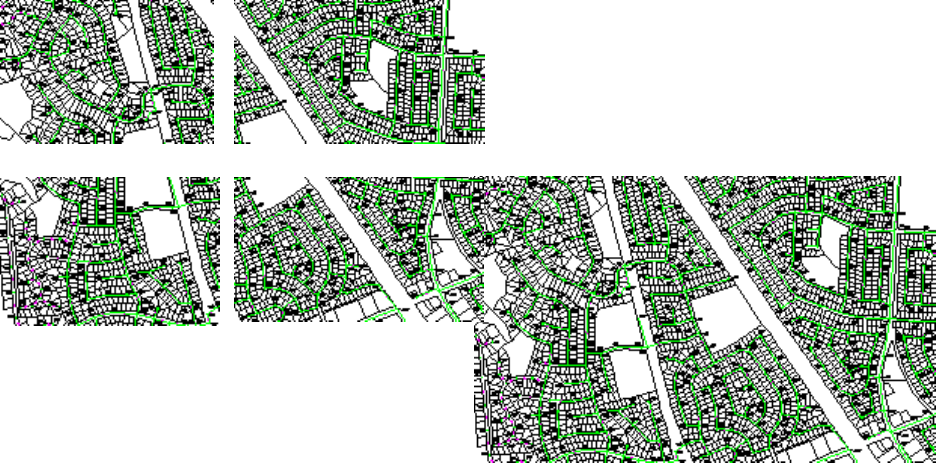
Aligning Attached Drawings
If an attached drawing has a global coordinate system assigned to it, objects
from that drawing are automatically converted to their appropriate size and
location in the current drawing.
If an attached drawing does not have a global coordinate system assigned to
it, you can specify how to align objects from that drawing when they are
copied into the current drawing.
Current DrawingAttached Drawings
Tile drawings by specifying the drawing offset for each attached drawing, as
shown above.
For each attached drawing, you can specify a drawing offset. You can also
specify how objects from the attached drawings are scaled or rotated when
they are brought into the current drawing.
For information about passwords and security, see AutoCAD help.
See also:
■Setting Transformation Options (page 167)
Attaching Drawings | 155

■Viewing Information about Attached Drawings (page 171)
■Viewing Objects in the Save Set (page 752)
NOTE To attach a geospatial feature source to the current drawing and bring in
its features, use Data Connect. See Overview of Bringing In GIS Features (page
305).
To create a drawing set
1If necessary, create a drive alias (page 161).
2Attach the drawings (page 157) you plan to use with the project.
3Activate the drawings (page 160) to query.
If you no longer use an attached drawing with the current drawing, you can
remove the drawing from the drawing set.
To modify the settings for attached drawings, such as the offset, scale, or save
back extents, see Modifying Attached Drawing Settings (page 163).
Quick Reference
ADEDRAWINGS
Manages the drawing set
In the Classic workspace, click Setup menu ➤
Define/Modify Drawing Set
Menu
Define/Modify Drawing Set
Icon
ADEDRAWINGSCommand Line
In Map Explorer, right-click
Drawings ➤ Define/Modify Drawing Set
Task Pane
Define/Modify Drawing Set dialog boxDialog Box
156 | Chapter 2 Setting Up

Attaching a Drawing
NOTE To attach a geospatial feature source to the current drawing and bring in
its features, use Data Connect. See Overview of Bringing In GIS Features (page
305).
Nested Drawings
If you attach a drawing that has other drawings already attached to it, those
other drawings appear in the list as nested drawings.
You can query objects from nested drawings. If a top-level drawing is not
active, you cannot see or activate nested drawings. However, if the top-level
drawing is active, you can deactivate a nested drawing.
Working with Xrefs
To query data in an external reference, delete the external reference from the
attached drawing and attach the reference drawing to the current drawing
The Order of Attached Drawings
The order in which you attach drawings can affect the properties of objects
retrieved by queries.
If two drawings use the same name for a block, layer, group, or text style,
AutoCAD Map 3D uses the definition from the first retrieved object that uses
that item.
For example, if you create a query to retrieve objects on LAYER_A, and LAYER_A
does not exist in the current drawing, AutoCAD Map 3D uses the definition
of LAYER_A in the first active attached drawing that contains objects on
LAYER_A. Objects retrieved from LAYER_A in other drawings acquire the color
and linetype that is defined for LAYER_A in this drawing. This change also
applies when you save changes back to attached drawings.
TIP To maintain consistency between drawings, define blocks, layers, groups,
and text styles in the current drawing. For example, if you define a LAYER_A in
the current drawing, AutoCAD Map 3D applies the current drawing definition of
LAYER_A to objects retrieved from LAYER_A in all attached drawings, and when
you save back, applies the current drawing layer definition to the saved objects.
For information about passwords and security, see AutoCAD help.
Attaching Drawings | 157

See also:
■Overview of Attaching Drawings (page 154)
■Viewing Information about Attached Drawings (page 171)
■Viewing Objects in the Save Set (page 752)
■Modifying Attached Drawing Settings (page 163)
NOTE To attach a geospatial feature source to the current drawing and bring in
its features, use Data Connect. See Overview of Bringing In GIS Features (page
305).
To attach drawings
■Drag the file from Windows Explorer to the Map Explorer tab of the Task
Pane.
- or -
1Open the drawing to which you want to attach another drawing.
2In the Tool-based Ribbon Workspace, click Home tab ➤ Data panel ➤
Define Drawing Set.
To specify separate filters for file names and for descriptions, click Filter
and use the Drawing Set Display Filter dialog box (page 1922).
To change the drawing description, specify simple transformation settings,
or define save back extents, click Drawing Settings and use the Drawing
Settings dialog box (page 1923).
3In the Define/Modify Drawing Set dialog box (page 1918), click Attach.
4In the Select Drawings to Attach dialog box, select the drawings to attach.
Click Add.
To modify the settings for attached drawings, such as the offset, scale, or save
back extents, see Modifying Attached Drawing Settings (page 163).
For information on viewing the attached drawings, see Viewing All Objects
in Selected Attached Drawings (page 745).
158 | Chapter 2 Setting Up
Quick Reference
ADEDRAWINGS
Manages the drawing set
In the Classic workspace, click Setup menu ➤
Define/Modify Drawing Set
Menu
Define/Modify Drawing Set
Icon
ADEDRAWINGSCommand Line
In Map Explorer, right-click
Drawings ➤ Define/Modify Drawing Set
Task Pane
Define/Modify Drawing Set dialog boxDialog Box
Activating a Drawing
When you run a query to retrieve objects from attached drawings, AutoCAD
Map 3D retrieves objects only from active drawings.
You cannot make a drawing active or inactive when there are locked objects
in the drawing.
NOTE If an attached drawing is active in the current drawing, you cannot open
that drawing directly.
NOTE To attach a geospatial feature source to the current drawing and bring in
its features, use Data Connect. See Overview of Bringing In GIS Features (page
305).
See also:
■Overview of Attaching Drawings (page 154)
■Overview of Bringing in Drawing Data From DWG Files (page 351)
■Modifying Attached Drawing Settings (page 163)
NOTE To attach a geospatial feature source to the current drawing and bring in
its features, use Data Connect. See Overview of Bringing In GIS Features (page
305).
Attaching Drawings | 159

To activate a drawing
➤ In the Map Explorer tab of the Task Pane, right-click the drawing name.
Click Activate.
NOTE To activate a nested drawing, you must first activate the drawing to which
it is attached.
To activate a group of drawings
1In the Tool-based Ribbon Workspace, click Home tab ➤ Data panel ➤
Define Drawing Set.
2Select the drawings to activate.
3Click Activate.
Quick Reference
ADEDRAWINGS
Manages the drawing set
In the Classic workspace, click Setup menu ➤
Define/Modify Drawing Set
Menu
Define/Modify Drawing Set
Icon
ADEDRAWINGSCommand Line
In Map Explorer, right-click
Drawings ➤ Define/Modify Drawing Set
Task Pane
Define/Modify Drawing Set dialog boxDialog Box
Creating a Drive Alias
If you plan to share drawings with other users, use drive aliases to specify the
location of attached drawings.
Example: You connect to the drawing server as drive J, but another user
connects as drive K. This makes it difficult to share drawings, since your
drawing specifies J as the location for the attached files. However, if you both
160 | Chapter 2 Setting Up
assign the same drive alias to the server, such as ProjectMaps, you can specify
the location of the attached drawings by this drive alias.
AutoCAD Map 3D provides a default drive alias called C. To store drawings
in a location other than drive C, create a drive alias for the location.
NOTE To attach a geospatial feature source to the current drawing and bring in
its features, use Data Connect. See Overview of Bringing In GIS Features (page
305). Geospatial connections do not require drive aliases.
See also:
■Overview of Attaching Drawings (page 154)
■Overview of Bringing in Drawing Data From DWG Files (page 351)
■Modifying Attached Drawing Settings (page 163)
NOTE To attach a geospatial feature source to the current drawing and bring in
its features, use Data Connect. See Overview of Bringing In GIS Features (page
305). Geospatial connections do not require drive aliases.
To create a drive alias
1In the Tool-based Ribbon Workspace, click Home tab ➤ Data panel ➤
Define Drawing Set.
2In the Define/Modify Drawing Set dialog box, click Attach.
3In the Select Drawings to Attach dialog box, click .
4In the Drive Alias Administration dialog box (page 1928), type a name for
the alias.
The name must use only alphanumeric characters (including hyphen
and underscore), contain no spaces or colons, and start with a character.
NOTE If you are creating a drive alias for a drawing with an undefined alias,
type that alias name exactly.
5Specify a path for the new alias.
6Click Add.
Attaching Drawings | 161

Quick Reference
ADEDEFCRDSYS
Defines a global coordinate system
Setup menu ➤ Define Global Coordinate System
Menu
ADEDEFCRDSYSCommand Line
Global Coordinate System Manager Dialog BoxDialog Box
ADEDRAWINGS
Manages the drawing set
In the Classic workspace, click Setup menu ➤
Define/Modify Drawing Set
Menu
Define/Modify Drawing Set
Icon
ADEDRAWINGSCommand Line
In Map Explorer, right-click
Drawings ➤ Define/Modify Drawing Set
Task Pane
Define/Modify Drawing Set dialog boxDialog Box
Opening an Active Attached Drawing
You cannot directly open an attached drawing that is activated in the current
drawing. You must first deactivate it in the current drawing.
NOTE To attach a geospatial feature source to the current drawing and bring in
its features, use Data Connect. See Overview of Bringing In GIS Features (page
305).
See also:
■Overview of Attaching Drawings (page 154)
■Overview of Bringing in Drawing Data From DWG Files (page 351)
■Modifying Attached Drawing Settings (page 163)
162 | Chapter 2 Setting Up
NOTE To attach a geospatial feature source to the current drawing and bring in
its features, use Data Connect. See Overview of Bringing In GIS Features (page
305).
To open an active attached drawing
1Do one of the following:
■Deactivate (page 160) the attached drawing.
■Close the drawing containing the attached drawing.
2To open the drawing, click ➤ Open ➤ Drawing.
Quick Reference
ADEDRAWINGS
Manages the drawing set
In the Classic workspace, click Setup menu ➤
Define/Modify Drawing Set
Menu
Define/Modify Drawing Set
Icon
ADEDRAWINGSCommand Line
In Map Explorer, right-click
Drawings ➤ Define/Modify Drawing Set
Task Pane
Define/Modify Drawing Set dialog boxDialog Box
Modifying Attached Drawing Settings
■Overview of Modifying Attached Drawing Settings (page 164)
■Creating a Drawing Description (page 166)
■Setting Transformation Options (page 167)
■Setting Save Back Extents (page 170)
■Viewing Information about Attached Drawings (page 171)
Attaching Drawings | 163
See also:
■Overview of Attaching Drawings (page 154)
■Overview of Bringing in Drawing Data From DWG Files (page 351)
■To create a drawing description (page 166)
■To set transformation options (page 169)
■To set save back extents (page 170)
■To view information about attached drawings (page 172)
Overview of Modifying Attached Drawing Settings
You can specify how attached drawings work with the current drawing. You
can also view information about attached drawings.
NOTE You cannot specify drawing settings for nested drawings.
NOTE To attach a geospatial feature source to the current drawing and bring in
its features, use Data Connect. See Overview of Bringing In GIS Features (page
305).
See also:
■Overview of Attaching Drawings (page 154)
■Overview of Bringing in Drawing Data From DWG Files (page 351)
Use this method...To do this...
In the Tool-based Ribbon Workspace, click
Home tab ➤ Data panel ➤ Define
Create a drawing description
Drawing Set. Click the Drawing Settings
tab.
See Creating a Drawing Description (page
166).
In the Tool-based Ribbon Workspace, click
Home tab ➤ Data panel ➤ Define
Specify how to adjust the scale, rotation,
and XY offset of objects retrieved from an
attached drawing. Drawing Set.Click the Drawing Settings
tab.
See Setting Transformation Options (page
167).
164 | Chapter 2 Setting Up
Use this method...To do this...
In the Tool-based Ribbon Workspace, click
Home tab ➤ Data panel ➤ Define
Specify save back extents that are different
from the drawing extents.
Drawing Set.Click the Drawing Settings
tab.
See Setting Save Back Extents (page 170).
In the Map Explorer tab of the Task Pane,
right-click Drawings. Click Statistics.
See Viewing Information about Attached
Drawings (page 171).
Vew information about attached drawings
such as the number and type of objects,
symbol tables, object data tables, and ob-
ject classes.
NOTE To attach a geospatial feature source to the current drawing and bring in
its features, use Data Connect. See Overview of Bringing In GIS Features (page
305).
Quick Reference
ADEDRAWINGS
Manages the drawing set
In the Classic workspace, click Setup menu ➤
Define/Modify Drawing Set
Menu
Define/Modify Drawing Set
Icon
ADEDRAWINGSCommand Line
In Map Explorer, right-click
Drawings ➤ Define/Modify Drawing Set
Task Pane
Define/Modify Drawing Set dialog boxDialog Box
ADEDWGSTAT
Displays drawing statistics
Setup menu ➤ More DWG Options ➤ Drawing
Statistics
Menu
ADEDWGSTATCommand Line
Attaching Drawings | 165

In Map Explorer, right-click Drawings ➤ Statistics
Task Pane
Drawing Statistics dialog boxDialog Box
Creating a Drawing Description
Providing a description for an attached drawing helps you and other users
identify the drawing more easily.
TIP You can filter a drawing list by the drawing description. For example, when
you are selecting drawings to Quick View, you could display only drawings with
the word 'sewer' in their description.
NOTE Drawing descriptions apply to drawings only. there is no equivalent for
geospatial feature sources.
See also:
■Overview of Attaching Drawings (page 154)
■Overview of Bringing in Drawing Data From DWG Files (page 351)
To create a drawing description
1In the Tool-based Ribbon Workspace, click Home tab ➤ Data panel ➤
Define Drawing Set.
2Click Drawing Settings.
3In the Drawing Settings dialog box (page 1923), select the drawing for which
you want to add a description.
4In the Drawing Description box, enter a description.
5Click Apply.
If you later want to modify the description, return to the Drawing Settings
dialog box and enter a new description.
Quick Reference
ADEDRAWINGS
166 | Chapter 2 Setting Up
Manages the drawing set
In the Classic workspace, click Setup menu ➤
Define/Modify Drawing Set
Menu
Define/Modify Drawing Set
Icon
ADEDRAWINGSCommand Line
In Map Explorer, right-click
Drawings ➤ Define/Modify Drawing Set
Task Pane
Define/Modify Drawing Set dialog boxDialog Box
Setting Transformation Options
Set simple transformation options to specify how to adjust the scale, rotation,
and XY offset of objects retrieved from an attached drawing. Use these settings
to make items from the attached drawings appear at the proper orientation,
size, and placement in the current drawing.
AutoCAD Map 3D stores this information with the current drawing. The
attached drawing does not change, which is useful for overlaying drawings
or tiling them.
NOTE This functionality applies to drawing objects only. There is no equivalent
for geospatial feature data.
Attaching Drawings | 167
You can rotate objects from attached drawings so they
match the rotation of the current drawing.
Example: You have individual maps for each square-mile sector. You create a
drawing that encompasses a 5-square mile area, and you attach each of the
square-mile maps. You set the appropriate offset for each attached map so it
appears correctly in the current drawing.
If you save edited objects back to attached drawings, the objects are restored
to their original rotation, scale, and offset.
NOTE If you have set a global coordinate system code, these simple transformation
options are unavailable.
Use these simple transformation settings to temporarily adjust objects from
attached drawings so they align correctly in the current drawing. You can also
permanently edit the location, rotation, or scale of an object.
See also:
■Overview of Attaching Drawings (page 154)
■Overview of Bringing in Drawing Data From DWG Files (page 351)
■Moving, Rotating, and Scaling an Object (page 931)
168 | Chapter 2 Setting Up

NOTE This procedure applies to drawing objects only. There is no equivalent for
geospatial feature data.
To set transformation options
1In the Tool-based Ribbon Workspace, click Home tab ➤ Data panel ➤
Define Drawing Set.
2Click Drawing Settings.
3In the Drawing Settings dialog box (page 1923), select the drawing whose
objects you want to transform.
4Under Simple Transformation, select On/Off.
5In the Scale box, enter the scale factor to scale the objects.
A value of 2 doubles the size of objects; a value of 0.5, halves the size of
objects.
6In the Rotation box, enter the angle in degrees to rotate the objects.
7In the Offset (X,Y) boxes, enter the amount to offset objects using the
drawing units from the attached drawing.
8To select coordinates manually, click Pick.
When prompted, specify the points on which to base the simple
transformation. AutoCAD Map 3D calculates the scale, rotation, and
offset based on the four points you specify; the base point for the rotation
is 0,0.
9Click Apply.
This procedure transforms objects from the attached drawing as they are
queried into the current drawing. When objects are saved back to the attached
drawing, the transformation is undone. To permanently transform selected
objects, use the ADETRANSFORM (page 931)command.
Quick Reference
ADEDRAWINGS
Manages the drawing set
In the Classic workspace, click Setup menu ➤
Define/Modify Drawing Set
Menu
Attaching Drawings | 169
Define/Modify Drawing Set
Icon
ADEDRAWINGSCommand Line
In Map Explorer, right-click
Drawings ➤ Define/Modify Drawing Set
Task Pane
Define/Modify Drawing Set dialog boxDialog Box
Setting Save Back Extents
For an attached drawing, you can specify save back extents that are different
from the drawing extents.
This is useful if you save objects back to attached drawings based on their
location. If you do not specify save back extents, AutoCAD Map 3D uses the
attached drawing extents as the save back extents.
NOTE This functionality applies to drawing objects only. There is no equivalent
for geospatial feature data.
See also:
■Overview of Attaching Drawings (page 154)
■Overview of Bringing in Drawing Data From DWG Files (page 351)
■Viewing Objects in the Save Set (page 752)
NOTE This procedure applies to drawing objects only. There is no equivalent for
geospatial feature data.
To set save back extents
1In the Tool-based Ribbon Workspace, click Home tab ➤ Data panel ➤
Define Drawing Set.
2Click Drawing Settings.
3In the Drawing Settings dialog box (page 1923), select the drawing for which
you want to define save back extents.
4Under Save Back Extents, click Define <.
170 | Chapter 2 Setting Up
5Specify the boundary by using your pointing device or by entering
coordinates on the command line. When you finish specifying the
boundary, press Enter.
6Click Apply.
TIP To view the save back extents, click Show <.
NOTE Simple transformations modify the default save back extents but do not
affect user-defined save back extents.
Quick Reference
ADEDRAWINGS
Manages the drawing set
In the Classic workspace, click Setup menu ➤
Define/Modify Drawing Set
Menu
Define/Modify Drawing Set
Icon
ADEDRAWINGSCommand Line
In Map Explorer, right-click
Drawings ➤ Define/Modify Drawing Set
Task Pane
Define/Modify Drawing Set dialog boxDialog Box
Viewing Information about Attached Drawings
Vew information about attached drawings such as the number and type of
objects, symbol tables, object data tables, and object classes:
■Object Counts — The number and type of objects in the attached drawing.
■Symbol Tables — Displays information stored in symbol tables, for example,
block names, layer names, linetypes, and registered applications (regapps).
NOTE Regapps are registered applications that contain extended data (Xdata).
■Object Data — Displays information stored in object data.
Attaching Drawings | 171

■Object Classes — Displays object classes used in the selected drawings and
the number of objects in each object class.
NOTE This functionality applies to drawing objects only. To view information for
geospatial feature data, see Getting Information about Features (page 1125).
See also:
■Overview of Attaching Drawings (page 154)
■Overview of Bringing in Drawing Data From DWG Files (page 351)
■Editing Data in Attached Drawings (page 729)
NOTE This procedure applies to drawing objects only. To view information for
geospatial feature data, see Getting Information about Features (page 1125).
To view information about attached drawings
1In the Map Explorer tab of the Task Pane, right-click Drawings. Click
Statistics.
2In the Drawing Statistics dialog box (page 1926), select drawings from the
Active Drawings list.
3Click a button:
■Object Counts displays the number of each type of object in the
selected drawings.
■Symbol Tables displays all symbol tables in the selected drawings.
■Object Data displays all link templates, object data tables, and
attributes.
■Object Classes displays objects used in the selected drawings and the
type of data in each object class.
Quick Reference
ADEDWGSTAT
Displays drawing statistics
172 | Chapter 2 Setting Up

Setup menu ➤ More DWG Options ➤ Drawing
Statistics
Menu
ADEDWGSTATCommand Line
In Map Explorer, right-click Drawings ➤ Statistics
Task Pane
Drawing Statistics dialog boxDialog Box
Setting Up a Query Library
You can save and organize your drawing queries in the query library.
NOTE This functionality applies to drawing objects only. To filter geospatial feature
data whn you add it to your map, see Filtering Features When You Add Them to
a Map (page 309).
See also:
■Defining Queries (page 1218)
■Executing Queries (page 1287)
To set up a query library
NOTE This functionality applies to drawing objects only. To filter geospatial feature
data whn you add it to your map, see Filtering Features When You Add Them to
a Map (page 309).
■To use the query library (page 174)
■To save a query (page 177)
■To run a query from the Query Library (page 178)
■To run a query from Map Explorer (page 179)
■To run an external query (page 179)
■To reference an external query in the query library (page 180)
■To add a category to the query library (page 182)
■To edit a query saved with the current drawing (page 184)
■To edit an external query (page 184)
Setting Up a Query Library | 173

Overview of Using the Query Library
If you plan to run a query more than once, you can save it. Once you have
saved a query, you can run it anytime.
■Saving a Query (page 176)— Save the current query to the query library or
to an external file.
■Running a Saved Query (page 178)— Run a query saved in the query library.
Each drawing has a query library where you can organize your saved queries
into categories.
■Adding an External Query to Your Library (page 180)
■Using Query Library Categories (page 181)
■Editing a Saved Query (page 183)
NOTE This functionality applies to drawing objects only. To filter geospatial feature
data whn you add it to your map, see Filtering Features When You Add Them to
a Map (page 309).
See also:
■Defining Queries (page 1237)
■Executing Queries (page 1287)
NOTE This procedure applies to drawing objects only. To filter geospatial feature
data whn you add it to your map, see Filtering Features When You Add Them to
a Map (page 309).
To use the query library
1On the Map Explorer of the Task Pane, right-click Query Library. Click
Administration.
2In the Query Library Administration dialog box (page 1858), under Category,
select the category for the query you want, or click New to create a new
category (page 182).
3Under Available Queries, select the query.
174 | Chapter 2 Setting Up

You can assign the query to a different category, change the name,
description, or location of the query, or add an external query to the
library.
4If you have modified the settings for an existing query, click Update. If
you have added a new query, click Add.
5Click OK.
Quick Reference
ADEQUERYLIB
Maintains the library of queries
Setup menu ➤ More DWG Options ➤ Query Library
Menu
Query Library
Icon
ADEQUERYLIBCommand Line
In Map Explorer, right-click Query
Library ➤ Administration
Task Pane
Query Library Administration dialog boxDialog Box
ADERUNQUERY
Runs queries in the Query Library
Click Map ➤ Query ➤ Run Topology Query.
Menu
Run Query
Icon
ADERUNQUERYCommand Line
In Map Explorer, right-click Current Query ➤ Execute
As Preview-or- Right-click Current Query ➤ Execute
Task Pane
As Defined-or- Right-click a query ➤ Execute As
Preview-or- Right-click a query ➤ Execute As Defined
Run Library Query dialog boxDialog Box
ADERUNXQUERY
Setting Up a Query Library | 175

Runs externally saved queries
Edit menu ➤ More DWG Querying Options ➤ Run
External Query
Menu
ADERUNXQUERYCommand Line
Saving a Query
If you plan to use a query more than once, you can save it.
You can save the query with the current drawing, or you can save it to an
external file. Saving to an external file is useful if you want to share a query
with another user or use it in another drawing.
If you save the query to an external file you can specify several additional
settings:
■Save List Of Active Drawings — Sets the drawing status to Active for
drawings involved in the saved query.
■Save Location Coordinates — Stores the coordinates used for location
queries. If you do not save the location query coordinates, AutoCAD Map
3D prompts you for them when you execute the query.
■Keep Reference In Library — Maintains a list of the external queries in the
Query Library. If you plan to reference the query in the Query Library, you
must provide a name and description for it.
■Save Alter Properties — Saves the property alteration definition with the
query.
■Auto Execute — Executes the query in addition to loading it. If you do not
select Auto Execute, AutoCAD Map 3D displays the query in the Define
Query dialog box and waits for you to click Execute Query. Do not select
this option if you want to modify a query before you run it.
NOTE This functionality applies to drawing objects only. To filter geospatial feature
data whn you add it to your map, see Filtering Features When You Add Them to
a Map (page 309).
See also:
■Overview of Queries (page 1235)
■Executing Drawing Queries (page 1287)
176 | Chapter 2 Setting Up
■Adding an External Query to Your Library (page 180)
NOTE This procedure applies to drawing objects only. To filter geospatial feature
data whn you add it to your map, see Filtering Features When You Add Them to
a Map (page 309).
To save a query
1Click Home tab ➤ Data panel ➤ Define Query.
2Make sure the query to save is the current query. If it is not, modify the
current query or click load a different query.
3Click Save Query.
4In the Save Current Query dialog box (page 1862), select a category for the
query.
5Enter a name and description for the query.
6Select any other query options you want.
7To save the query to an external file, select Save To External File and
specify a file name.
To display the external query in the Run Library Query dialog box and
the Query Library Administration dialog box, select Keep Reference In
Library.
8Click OK.
Quick Reference
ADEQUERY
Controls defining, modifying, saving, loading, and executing a query
In the Classic workspace, click Setup menu ➤ More
DWG Options ➤ Define Query
Menu
Define Query
Icon
ADEQUERYCommand Line
Setting Up a Query Library | 177
In Map Explorer, right-click Current Query ➤ Define
-or- Right-click a query ➤ Edit
Task Pane
Define Query dialog boxDialog Box
Running a Saved Query
After you save queries, you can load, revise, and execute them.
NOTE If you plan to modify an externally saved query before executing it, do
not set Auto Execute in the Save Current Query dialog box. That way, when you
run the query, AutoCAD Map 3D displays the query in the Define Query dialog
box but does not execute it.
NOTE This functionality applies to drawing objects only. To filter geospatial feature
data whn you add it to your map, see Filtering Features When You Add Them to
a Map (page 309).
See also:
■Overview of Queries (page 1235)
■Executing Drawing Queries (page 1287)
■Adding an External Query to Your Library (page 180)
NOTE This procedure applies to drawing objects only. To filter geospatial feature
data whn you add it to your map, see Filtering Features When You Add Them to
a Map (page 309).
■To run a query from the Query Library (page 178)
■To run a query from Map Explorer (page 179)
■To run an external query (page 179)
To run a query from the Query Library
1Click Create tab ➤ Object Query panel ➤ Run.
2In the Run Library Query dialog box (page 1861), select the category for
the query.
178 | Chapter 2 Setting Up
3Select the query in the Available Queries list.
4Click Execute Query.
To run a query from Map Explorer
1On the Map Explorer of the Task Pane, right-click the query name.
2Do one of the following:
■Click Execute As Preview to execute the query as a preview query,
regardless of whether it was defined as a preview, draw, or report mode
query.
■Click Execute As Defined to execute the query using the query mode
with which it was defined.
To run an external query
1Click Create tab ➤ Object Query panel ➤ External.
2In the Run External Query dialog box, select the query.
3Click OK.
If you turned off the Auto Execute option when you saved the query, the
query loads but does not execute. To execute the query, click Home tab ➤ Data
panel ➤ Define Query. In the Define Query dialog box, click Execute
Query.
Quick Reference
ADERUNQUERY
Runs queries in the Query Library
Click Map ➤ Query ➤ Run Topology Query.
Menu
Run Query
Icon
ADERUNQUERYCommand Line
Setting Up a Query Library | 179
In Map Explorer, right-click Current Query ➤ Execute
As Preview-or- Right-click Current Query ➤ Execute
Task Pane
As Defined-or- Right-click a query ➤ Execute As
Preview-or- Right-click a query ➤ Execute As Defined
Run Library Query dialog boxDialog Box
ADERUNXQUERY
Runs externally saved queries
Edit menu ➤ More DWG Querying Options ➤ Run
External Query
Menu
ADERUNXQUERYCommand Line
Adding an External Query to Your Library
You can list an external query in the query library. By adding a reference to
the external query to the library, you can organize the query with your other
queries. In addition, you can give the query a name and a description to help
you identify it.
You can add an external query to the Query Library for more than one drawing.
NOTE This functionality applies to drawing objects only. To filter geospatial feature
data whn you add it to your map, see Filtering Features When You Add Them to
a Map (page 309).
See also:
■Overview of Queries (page 1235)
■Executing Drawing Queries (page 1287)
NOTE This procedure applies to drawing objects only. To filter geospatial feature
data whn you add it to your map, see Filtering Features When You Add Them to
a Map (page 309).
To reference an external query in the query library
1Click Create tab ➤ Object Query panel ➤ Library.
180 | Chapter 2 Setting Up
2In the Query Library Administration dialog box (page 1858), select a
category.
3Under Selected Query, make sure that the Query Type is set to External.
4Click Browse. Select the file that contains the external query.
5Specify a name and description for the query.
6Click OK.
To execute the query, click Create tab ➤ Object Query panel ➤ Run.
Quick Reference
ADEQUERYLIB
Maintains the library of queries
Setup menu ➤ More DWG Options ➤ Query Library
Menu
Query Library
Icon
ADEQUERYLIBCommand Line
In Map Explorer, right-click Query
Library ➤ Administration
Task Pane
Query Library Administration dialog boxDialog Box
Using Query Library Categories
The Query Library lets you organize your queries into categories.
You can move a query to a new category, or change the name or description
of a query. If you move an external query, you can specify the new location
for the query.
NOTE This functionality applies to drawing objects only. To filter geospatial feature
data whn you add it to your map, see Filtering Features When You Add Them to
a Map (page 309).
Setting Up a Query Library | 181
See also:
■Overview of Queries (page 1235)
■Executing Drawing Queries (page 1287)
■Adding an External Query to Your Library (page 180)
NOTE This procedure applies to drawing objects only. To filter geospatial feature
data whn you add it to your map, see Filtering Features When You Add Them to
a Map (page 309).
To add a category to the query library
1Click Create tab ➤ Object Query panel ➤ Library.
2In the Query Library Administration dialog box (page 1858), do one of the
following:
■To add a category, under Category, click New.
Enter a name for the category. Click OK. Do not include spaces in the
name.
■To assign a query to a different category, under Category, select the
current category of the query.
From the Available Queries list, select the query. Click Category.
In the Change Category dialog box (page 1835), under New Category,
select the new category for the query. Click OK.
■To change the name or description of a query, under Category, select
the category for the query.
Under Available Queries, select the query.
Under Selected Query, edit the name or description of the query . For
external queries, you can specify a new location for the query.
Click Update.
■To delete a category, select the category and click Remove.
You cannot remove a category that contains queries. You must first
delete the queries or move the queries to a different category and then
remove the empty category.
■To rename a category, select the category and click Rename.
All queries assigned to the previous category name are assigned to the
new name. The old category name no longer exists.
182 | Chapter 2 Setting Up
3Click OK.
Quick Reference
ADEQUERYLIB
Maintains the library of queries
Setup menu ➤ More DWG Options ➤ Query Library
Menu
Query Library
Icon
ADEQUERYLIBCommand Line
In Map Explorer, right-click Query
Library ➤ Administration
Task Pane
Query Library Administration dialog boxDialog Box
Editing a Saved Query
Once you have saved a query to the query library, you can reload the query
at any time to review it or revise it.
If you save the query to an external file, it is saved as an AutoLISP script. Using
a text editor, you can modify an external query file and include AutoLISP API
commands. For more information, refer to "Editing Query Files", under "Using
Interface Functions" in the online AutoCAD Map 3D AutoLISP Reference.
NOTE This functionality applies to drawing objects only. To filter geospatial feature
data whn you add it to your map, see Filtering Features When You Add Them to
a Map (page 309).
See also:
■Overview of Queries (page 1235)
■Executing Drawing Queries (page 1287)
■Adding an External Query to Your Library (page 180)
Setting Up a Query Library | 183
NOTE This procedure applies to drawing objects only. To filter geospatial feature
data whn you add it to your map, see Filtering Features When You Add Them to
a Map (page 309).
To edit a query saved with the current drawing
1On the Map Explorer of the Task Pane, right-click a query name. Click
Edit. The Define Query dialog box (page 1838) appears with the selected
query loaded.
2Modify any conditions (page 1258).
3Modify any property alterations (page 1286).
4In the Define Query dialog box, click Save.
To save the changes to a new query, enter a new name and description.
Click OK.
5In the Define Query dialog box, click OK to save your changes without
running the query.
To edit an external query
1Click Create tab ➤ Object Query panel ➤ External.
2In the Run External Query dialog box, select the query.
3Click OK.
The external query runs and becomes the current query.
4Click Home tab ➤ Data panel ➤ Define Query.
5Modify any conditions (page 1258).
6Modify any property alterations (page 1286).
7Click Save.
NOTE To be able to edit an external query before you execute it, do not set Auto
Execute in the Save Current Query dialog box. That way, when you execute the
query, AutoCAD Map 3D loads the query in the Define Query dialog box but does
not execute it.
184 | Chapter 2 Setting Up
Quick Reference
ADEQUERY
Controls defining, modifying, saving, loading, and executing a query
In the Classic workspace, click Setup menu ➤ More
DWG Options ➤ Define Query
Menu
Define Query
Icon
ADEQUERYCommand Line
In Map Explorer, right-click Current Query ➤ Define
-or- Right-click a query ➤ Edit
Task Pane
Define Query dialog boxDialog Box
Setting Up Annotation Templates
NOTE Annotation templates are for drawing objects only. To label geospatial
features, see Adding Labels to Features (page 1091).
Tell me more
Video
■Show me how to label features.
■Show me how to label features with
automatic resizing.
■Show me how to place a legend in the
map and specify its contents.
■Show me how to edit the table style for
a legend.
Procedure
■To label features (page 1093)
■To insert annotation (page 1103)
■To create a legend (page 1118)
Tutorial
■Tutorial: Annotating Your Map
Setting Up Annotation Templates | 185
■Exercise 3: Add labels
■Lesson 6: Create a Legend
Workflow
■Style and Label a Linear Feature
GIS Skill
■Label features and optimize placement.
■Create and edit a legend.
Related topics
■Styling Features (page 639)
■Setting Up Annotation Templates
(page 185)
To set up annotation templates
NOTE Annotation templates are for drawing objects only. To label geospatial
features, see Adding Labels to Features (page 1091).
■To set up annotation (page 189)
■To make an XREFed drawing with annotation templates available in the
current drawing (page 189)
■To define an annotation template (page 192)
■To change an annotation template (page 196)
■To delete all references to a selected annotation template (page 197)
■To delete an annotation template (page 197)
Overview of Annotation Templates
In an annotation template, you define the information to display in the
annotation and the layout of that information. Annotation templates are
stored as specially named blocks within your drawing.
After you create an annotation template, you can insert instances of the
annotation into your drawing. Creating annotation templates and inserting
annotation is like creating and inserting blocks.
NOTE Annotation templates are for drawing objects only. To label geospatial
features, see Adding Labels to Features (page 1091).
186 | Chapter 2 Setting Up

Labeling Objects Using Annotation Templates
Use annotation to label drawing objects with data values, such as the following:
■Attributes, such as object data (page 2070) or linked external data (page 2062)
■Display properties, such as line weight
■Geometric values, such as line direction
■Graphics, such as arrows, static text, or other geometry, added with
standard AutoCAD drawing commands
NOTE Annotation templates are for drawing objects only. To label geospatial
features, see Adding Labels to Features (page 1091).
You create one “tag” for each item in the annotation template. For example,
one tag might contain the static text, “Area:” followed by a tag containing
the property .AREA. You use the Block Editor to position the tags relative to
each other. When you attach the annotation to an object, the values appear
in the same position as their tags.
Annotation templates are stored in the drawing as blocks. Unlike regular
blocks, annotation templates have the following characteristics:
■The block name is prefixed with "ACMAP_ANN_TEMPLATE_" followed by
the annotation template name as specified in the Define Annotation
Template dialog box (page 1572).
■The extension dictionary of the block contains special table objects.
Using Expressions in Annotation Templates
You can insert static text in the annotation template. It will appear on each
object to which you attach annotation.
You can also specify properties or define values using expressions. The values
of the properties or expressions are determined when the annotation is
inserted.
For example, create an annotation template that specifies the text “Diameter”
followed by an expression that calculates the diameter of a circle. Then insert
instances of the annotation template on several circle objects. Each one will
display “Diameter,” followed by that circle’s diameter.
When you change the text, properties, or expressions in an annotation
template, existing annotations based on that template do not change. Use the
Setting Up Annotation Templates | 187
Refresh or Update command to apply your changes to the annotations that
use the template you changed.
Using Annotation Templates from XREFs
To use an annotation template stored in another drawing, use the XBIND
command to attach that drawing as an XREF.
Block names in the XREFed drawing have a prefix that consists of the XREF
drawing file name followed by a vertical bar. Because the annotation
commands identify annotation templates by looking for the
"ACMAP_ANN_TEMPLATE_" at the beginning of the block name, you must
rename the templates in the XREFed drawing to make them available in the
current drawing.
For more information, see Bind External References in the AutoCAD help.
Tell me more
Video
■Show me how to label features.
■Show me how to label features with
automatic resizing.
■Show me how to place a legend in the
map and specify its contents.
■Show me how to edit the table style for
a legend.
Procedure
■To label features (page 1093)
■To insert annotation (page 1103)
■To create a legend (page 1118)
Tutorial
■Tutorial: Annotating Your Map
■Exercise 3: Add labels
■Lesson 6: Create a Legend
Workflow
■Style and Label a Linear Feature
GIS Skill
■Label features and optimize placement.
188 | Chapter 2 Setting Up
■Create and edit a legend.
Related topics
■Styling Features (page 639)
■Setting Up Annotation Templates
(page 185)
See also:
■Overview of Annotation (page 1100)
NOTE Annotation templates are for drawing objects only. To label geospatial
features, see Adding Labels to Features (page 1091).
To set up annotation
1Define an annotation template. (page 192)
2Attach annotation to objects. (page 1103)
3If you BIND an XREFed drawing containing annotation templates, remove
the prefix from the XREFed annotation template block names to make
them available in the current drawing.
To make an XREFed drawing with annotation templates available in the
current drawing
1Using the RENAME command, select Blocks from the Named Objects list.
2Select the annotation template from the list of blocks in the Items list.
You will find blocks with names like
xrefdwgname$0$ACMAP_ANN_TEMPLATE_templatename.
3Remove xrefdwgname$0$ from the name of each template you want.
Quick Reference
MAPANNTEMPLATE
Defines and modifies annotation templates
Click Setup ➤ Define Annotation Template‚Ķ.
Menu
Setting Up Annotation Templates | 189
Define Annotation Template
Icon
MAPANNTEMPLATECommand Line
Define Annotation Template dialog boxDialog Box
MAPANNTEXT
Creates and edits annotation text
Edit Annotation Text
Icon
MAPANNTEXTCommand Line
Annotation Text dialog boxDialog Box
Defining Annotation Templates
An annotation template can include text and graphics.
NOTE Annotation templates are for drawing objects only. To label geospatial
features, see Adding Labels to Features (page 1091).
You create one “tag” for each item in the annotation template. For example,
one tag might contain the static text, “Area:” followed by a tag containing
the property .AREA. You use the Block Editor to position the tags relative to
each other. When you attach the annotation to an object, the values appear
in the same position as their tags.
You can add graphics by drawing them in the Block Editor. You determine
the text contents using static text, properties, and expressions.
The specific values of the properties and expressions are determined when
you attach an annotation template to drawing objects.
For example, you can define the annotation template to include a static label
(such as “Area:”), followed by a property (for example, .AREA). You can specify
the label location as .CENTER. When you attach the annotation template to
a drawing object, the annotation appears in the center of that object and
displays the word Area, followed by the area of that object.
When you change the text, properties, or expressions in an annotation
template, the existing annotations based on that template do not change. Use
the Refresh or the Update command to apply the changes.
190 | Chapter 2 Setting Up
Tell me more
Video
■Show me how to label features.
■Show me how to label features with
automatic resizing.
■Show me how to place a legend in the
map and specify its contents.
■Show me how to edit the table style for
a legend.
Procedure
■To label features (page 1093)
■To insert annotation (page 1103)
■To create a legend (page 1118)
Tutorial
■Tutorial: Annotating Your Map
■Exercise 3: Add labels
■Lesson 6: Create a Legend
Workflow
■Style and Label a Linear Feature
GIS Skill
■Label features and optimize placement.
■Create and edit a legend.
Related topics
■Styling Features (page 639)
■Setting Up Annotation Templates
(page 185)
See also:
■Attaching Annotation to Objects (page 1103)
■Refreshing Annotation (page 1105)
■Updating Annotation (page 1106)
Setting Up Annotation Templates | 191
NOTE Annotation templates are for drawing objects only. To label geospatial
features, see Adding Labels to Features (page 1091).
To define an annotation template
1Click Annotate tab ➤ Map Annotation panel ➤ Define Template.
2In the Define Annotation Template dialog box (page 1572), click New.
You can change the other settings in this dialog box later in the procedure.
3In the New Annotation Template Name dialog box (page 1576), type a name
for the template, and click OK.
The ribbon changes to show the Block Editor tab. You use the Block Editor
to define the annotation template, which is a special type of block.
4Click Block Editor tab ➤ Annotation panel ➤ Edit Annotation Text
Then press Enter to create a new annotation tag.
A single annotation template can contain multiple tags, as well as graphic
elements.
5In the Annotation Text dialog box (page 1570), specify the text to include
in this annotation tag.
■For Attribute, enter a Tag name and Value for the annotation text.
For the value, enter static text or click to use the Expression
Chooser to specify an expression whose value varies depending on
the object being annotated.
The Expression Chooser lists the properties, object data, block
attributes, and other data associated with the current drawing.
NOTE Each tag name must be unique within the template.
■Specify the Object Properties and Text Options for the annotation
text.
For most of the options, you can choose a static value from the
dropdown list or specify an expression that is evaluated against the
object when you insert the annotation.
192 | Chapter 2 Setting Up
Click to create an expression. Within the Edit Expression dialog
box, click to select from a list of available properties and attributes.
Click to use a value from within the Block Editor.
If you select ByBlock for Color or Lineweight, the settings in the Define
Annotation Template dialog box will be used.
■Click OK to return to the Block Editor.
6In the Block Editor, click a location for this tag.
Since an annotation template can have multiple tags, you need to specify
their locations relative to each other. Clicking a location here allows you
to position this tag relative to any others in the template. When you
insert an annotation, it appears at the Insertion Point specified in the
Define Annotation Template dialog box (page 1572), with all its tags shown
in their relative locations, as defined in the template.
7Optionally, to include graphical elements as a part of the annotations,
create them in the Block Editor.
Use AutoCAD drawing commands to create geometry or insert graphical
elements.
8When you finish adding elements to the template, click Close Block
Editor on the Block Editor toolbar.
You are prompted to save your changes. When you do, the Define
Annotation Template dialog box is redisplayed.
9In the Define Annotation Template dialog box (page 1572), specify default
properties and insertion options.
These settings control the appearance of the annotation template block.
If you selected ByBlock for Color or Lineweight in the Annotation Text
dialog box, these are the settings that will be used.
10 Click OK.
The Block Editor closes and your drawing is redisplayed. You can now
attach the annotation template to a drawing object or objects (page 1103).
When you do, the annotation (showing the appropriate values and
settings for the selected object) will appear.
Setting Up Annotation Templates | 193
Quick Reference
MAPANNTEMPLATE
Defines and modifies annotation templates
Click Setup ➤ Define Annotation Template‚Ķ.
Menu
Define Annotation Template
Icon
MAPANNTEMPLATECommand Line
Define Annotation Template dialog boxDialog Box
MAPANNTEXT
Creates and edits annotation text
Edit Annotation Text
Icon
MAPANNTEXTCommand Line
Annotation Text dialog boxDialog Box
Changing Annotation Templates
You can change the contents of an existing template. For example, you can
change the expression that determines the value or location of the text
element. You can add or remove text or graphics.
If you change only the graphic elements in the template, the elements update
automatically. However, if you change text elements, refresh or update the
annotations associated with that template to see the changes in your drawing.
NOTE Annotation templates are for drawing objects only. To label geospatial
features, see Adding Labels to Features (page 1091).
Tell me more
Video
■Show me how to label features.
■Show me how to label features with
automatic resizing.
194 | Chapter 2 Setting Up

■Show me how to place a legend in the
map and specify its contents.
■Show me how to edit the table style for
a legend.
Procedure
■To label features (page 1093)
■To insert annotation (page 1103)
■To create a legend (page 1118)
Tutorial
■Tutorial: Annotating Your Map
■Exercise 3: Add labels
■Lesson 6: Create a Legend
Workflow
■Style and Label a Linear Feature
GIS Skill
■Label features and optimize placement.
■Create and edit a legend.
Related topics
■Styling Features (page 639)
■Setting Up Annotation Templates
(page 185)
See also:
■Overview of Annotation (page 1100)
■Refreshing Annotation (page 1105)
■Updating Annotation (page 1106)
NOTE Annotation templates are for drawing objects only. To label geospatial
features, see Adding Labels to Features (page 1091).
Setting Up Annotation Templates | 195

To change an annotation template
1Click Annotate tab ➤ Map Annotation panel ➤ Define Template.
2In the Template Name list, click the template to change.
3Do one or more of the following:
■Click Copy to make a copy of the template.
■Click Rename to rename the template.
■Click Edit Template Contents to modify the text or graphical elements
of the template.
■Change any properties or insertion options.
See Defining Annotation Templates (page 190) for information about
changing the contents, properties, or options for an annotation template.
4If you changed any text elements, use Refresh (page 1105) or Update (page
1106) to apply your changes to existing annotations that use this template.
Quick Reference
MAPANNTEMPLATE
Defines and modifies annotation templates
Click Setup ➤ Define Annotation Template‚Ķ.
Menu
Define Annotation Template
Icon
MAPANNTEMPLATECommand Line
Define Annotation Template dialog boxDialog Box
MAPANNTEXT
Creates and edits annotation text
Edit Annotation Text
Icon
MAPANNTEXTCommand Line
196 | Chapter 2 Setting Up
Annotation Text dialog boxDialog Box
Deleting Annotation Templates
You can delete an annotation template only if you first delete all references
to that template from the drawing.
NOTE Annotation templates are for drawing objects only. To label geospatial
features, see Adding Labels to Features (page 1091).
See also:
■Overview of Annotation (page 1100)
■Deleting Annotation from Drawings (page 1108)
NOTE Annotation templates are for drawing objects only. To label geospatial
features, see Adding Labels to Features (page 1091).
To delete all references to a selected annotation template
1Delete all references to the annotation template you plan to delete.
2Click Annotate tab ➤ Map Annotation panel ➤ Delete Annotation.
3Select an annotation template. Click OK.
All annotation based on the selected template is deleted.
To delete an annotation template
1Click Annotate tab ➤ Map Annotation panel ➤ Define Template.
2Select the annotation template to delete from the Template Name list.
3Click Delete.
The selected annotation template is deleted.
Setting Up Annotation Templates | 197

Quick Reference
MAPANNTEMPLATE
Defines and modifies annotation templates
Click Setup ➤ Define Annotation Template‚Ķ.
Menu
Define Annotation Template
Icon
MAPANNTEMPLATECommand Line
Define Annotation Template dialog boxDialog Box
Setting Up Object Data
Object data is attribute data that is attached to individual objects and stored
in tables in the drawing. To use object data, first define the format for the
table, and then create each record as you attach it to an object.
NOTE Object data is for drawing objects only. For information about the attributes
(properties) of geospatial features, see Overview of the Data Table (page 1125). To
set up new feature sources for geospatial features, see Overview of Working with
Feature Sources (page 582).
See also:
■Entering and Editing Object Data (page 1061)
■Finding All Drawing Objects Containing Specific Data (page 1245)
■Altering Object Properties Using Object Data (page 1267)
To set up object data
NOTE Object data is for drawing objects only. For information about the attributes
(properties) of geospatial features, see Overview of the Data Table (page 1125). To
set up new feature sources for geospatial features, see Overview of Working with
Feature Sources (page 582).
■To set up object data (page 199)
■To create an object data table (page 201)
■To modify an object data table (page 203)
198 | Chapter 2 Setting Up

■To rename or remove an object data table (page 203)
Overview of Setting Up Object Data
Object data tables store text and numerical information related to an object.
NOTE Object data is for drawing objects only. For information about the attributes
(properties) of geospatial features, see Overview of the Data Table (page 1125). To
set up new feature sources for geospatial features, see Overview of Working with
Feature Sources (page 582).
See also:
■Creating an Object Data Table (page 200)
■Entering and Editing Object Data (page 1061)
■Finding All Drawing Objects Containing Specific Data (page 1245)
■Altering Object Properties Using Object Data (page 1267)
NOTE Object data is for drawing objects only. For information about the attributes
(properties) of geospatial features, see Overview of the Data Table (page 1125). To
set up new feature sources for geospatial features, see Overview of Working with
Feature Sources (page 582).
To set up object data
1Specify a set of fields for the table. (page 200)
2Assign a name, description, data type, and default value to each field.
3Use a separate procedure (page 1064) to attach a record from the table to
an object.
Quick Reference
ADEDEFDATA
Defines object data
Setup menu ➤ Define Object Data
Menu
Setting Up Object Data | 199
Define Object Data
Icon
ADEDEFDATACommand Line
Define Object Data dialog boxDialog Box
Creating an Object Data Table
You can create multiple object data tables in a single drawing. For example,
you can create one table with pipe flow information and a separate table with
inspection information.
NOTE Object data is for drawing objects only. For information about the attributes
(properties) of geospatial features, see Overview of the Data Table (page 1125). To
set up new feature sources for geospatial features, see Overview of Working with
Feature Sources (page 582).
Using the Same Table Name in Other Drawings
Take care when naming your tables. If you use the same table name in more
than one source drawing, be sure that all tables with same name have the
same fields and field types. If your current drawing has more than one source
drawing with the same object data table name, AutoCAD Map 3D uses the
object table definition (or structure) for the first drawing that you activate. If
the other source drawings have tables with the same name but with different
fields, you cannot use those tables in the current drawing. If necessary, you
can rename or redefine an object data table.
See also:
■Entering and Editing Object Data (page 1061)
■Finding All Drawing Objects Containing Specific Data (page 1245)
■Altering Object Properties Using Object Data (page 1267)
NOTE Object data is for drawing objects only. For information about the attributes
(properties) of geospatial features, see Overview of the Data Table (page 1125). To
set up new feature sources for geospatial features, see Overview of Working with
Feature Sources (page 582).
200 | Chapter 2 Setting Up

To create an object data table
1Click Map Setup tab ➤ Attribute Data panel ➤ Define Object Data.
2In the Define Object Data dialog box (page 1805), select a table to modify,
or click New Table to create a new table.
■If you select an existing table, the Object Data Fields list displays fields
already defined for the table.
■If you click New Table, enter a name for the new table.
3To create a new data field, fill in the Field Definition area:
■Enter a name and description for the field.
■Select the field type. The type specifies what kind of information can
be entered in the field. For example, if you specify a numeric type,
you cannot enter letters in the field.
■Specify the default value for the field. This value is attached to the
object unless you change it.
4Click Add to add the new field to the table.
5Add any additional fields to the table.
Quick Reference
ADEDEFDATA
Defines object data
Setup menu ➤ Define Object Data
Menu
Define Object Data
Icon
ADEDEFDATACommand Line
Define Object Data dialog boxDialog Box
Setting Up Object Data | 201

Modifying an Object Data Table
You can add, modify, and delete fields in newly defined object data tables
until you perform a save operation (either saving objects back to source
drawings or saving the current drawing). Once you perform a save operation,
only a Superuser can modify the table. Also, if you have already queried any
object from a source drawing, you cannot modify an object data table.
When you modify an object data field, AutoCAD Map 3D updates all instances
of the field attached to objects. If the object data table is large, this process
can take a long time.
NOTE Object data is for drawing objects only. For information about the attributes
(properties) of geospatial features, see Overview of the Data Table (page 1125). To
set up new feature sources for geospatial features, see Overview of Working with
Feature Sources (page 582).
Renaming and Deleting Tables
If you have Superuser privileges, you can rename or delete object data tables.
if you have already queried any object from a source drawing, you cannot
rename or delete an object data table .
If you rename a table, the new name must not duplicate an existing table
name.
WARNING When you delete an object data table from a drawing, the table is
deleted from all attached, active source drawings.
See also:
■Creating an Object Data Table (page 200)
■Entering and Editing Object Data (page 1061)
■Finding All Drawing Objects Containing Specific Data (page 1245)
■Altering Object Properties Using Object Data (page 1267)
Use the MAPLOGIN command to log in as a Superuser, or contact your system
administrator.
202 | Chapter 2 Setting Up
NOTE Object data is for drawing objects only. For information about the attributes
(properties) of geospatial features, see Overview of the Data Table (page 1125). To
set up new feature sources for geospatial features, see Overview of Working with
Feature Sources (page 582).
To modify an object data table
1Click Map Setup tab ➤ Attribute Data panel ➤ Define Object Data.
2In the Define Object Data dialog box (page 1805), for Table, select the object
data table to modify.
3Click Modify.
4In the Define New Object Data Table dialog box (page 1803), delete, add,
or update the fields:
■To add a field, under Field Definition, enter a name, type, description,
and default value for the field. Click Add.
■To modify a field, under Object Data Fields, select the field to modify.
Under Field Definition, change any information. Click Update.
AutoCAD Map 3D updates the object data field and all instances of
it attached to objects. If you change the data type of a field from Real
to Integer, AutoCAD Map 3D drops everything to the right of the
decimal point, leaving only the value to the left of the decimal point.
■To delete a field, under Object Data Fields, select the field to delete.
Click Delete.
To rename or remove an object data table
1Click Map Setup tab ➤ Attribute Data panel ➤ Define Object Data.
2In the Define Object Data dialog box, under Table, select the object data
table you want to rename or remove.
3To rename the table, click Rename. In the Rename Table dialog box (page
1797), enter a new table name and click OK.
To delete the table, click Delete. The table and its object data fields and
field values are deleted from every object to which they are attached.
Setting Up Object Data | 203
NOTE When you delete an object data table from a drawing, the table is
deleted from all attached, active source drawings.
Quick Reference
ADEDEFDATA
Defines object data
Setup menu ➤ Define Object Data
Menu
Define Object Data
Icon
ADEDEFDATACommand Line
Define Object Data dialog boxDialog Box
Using Data from Feature Sources
A feature is the spatial description of a real-world entity such as a road, a utility
pole, or a river. Features are stored in a spatial database or file. The spatial
database or file is referred to as a feature source. You can bring feature source
data into your map using Data Connect. For detailed information about using
feature sources, see Working with Feature Sources (page 582).
Setting Up Data Sources for Drawings
You can attach a database to your drawing and link records from that table
to objects in your drawing.
NOTE This functionality is for drawing objects only. For information about joining
an external database to a geospatial feature class, see Joining Data to GIS Features
(page 507).
204 | Chapter 2 Setting Up

To set up data sources for drawings
NOTE This functionality is for drawing objects only. For information about joining
an external database to a geospatial feature class, see Joining Data to GIS Features
(page 507).
■To use a database in a drawing (page 206)
■To display information about a database table (page 206)
■To open a table or database query (page 206)
■To open a linked table or query (page 206)
■To attach a data source by dragging the database file to the Task Pane
(page 209)
■To attach a data source by right-clicking the Data Sources folder in the
Task Pane (page 209)
■To configure a data source automatically (page 213)
■To configure a data source manually (page 213)
■To modify an existing data link file (page 213)
■To connect a data source (page 215)
■To disconnect a data source (page 215)
Overview of Attaching Data Sources to Drawings
A data source is a database table or a set of tables.
When you attach a data source to a drawing, the data source is listed on the
Map Explorer tab of the Task Pane. You can view and edit data in the data
source or link records from the data source to objects in the drawing.
While keeping the data source attached, you can disconnect the data source
to save resources and reconnect when you are ready to work with the data.
TIP You can work with an external database table without using the database
application itself.
NOTE This functionality is for drawing objects only. For information about joining
an external database to a geospatial feature class, see Joining Data to GIS Features
(page 507).
See also:
■Overview of Linking Database Records to Objects (page 522)
■Viewing External Data Linked to Drawing Objects (page 1146)
Setting Up Data Sources for Drawings | 205
NOTE This functionality is for drawing objects only. For information about joining
an external database to a geospatial feature class, see Joining Data to GIS Features
(page 507).
■To use a database in a drawing (page 206)
■To display information about a database table (page 206)
■To open a table or database query (page 206)
■To open a linked table or query (page 206)
To use a database in a drawing
Do one of the following:
■From Windows Explorer, drag a database file to the Map Explorer tab of
the Task Pane.
If the Map Explorer tab does not immediately display the data source,
right-click a blank space in the Map Explorer tab. Click Refresh.
■Right-click the Data Sources folder on the Map Explorer tab and select
Attach.
AutoCAD Map 3D automatically creates the files it needs to communicate
with the database application. However, for some database types, you must
configure these files yourself.
■Click Map Setup tab ➤ Attribute Data panel ➤ Attach Data Source.
To display information about a database table
■Right-click the table name in the Map Explorer tab. Click Properties.
You can see information such as column names and types.
To open a table or database query
■Double-click the item.
To open a linked table or query
■Double-click the link template name.
206 | Chapter 2 Setting Up

NOTE If you connect your database using the dbConnect command, the
instructions in this section of the Help will not work . For information on using the
dbConnect command and features, look up "dbconnect" in the help index.
Quick Reference
MAPATTACHDB
Attaches a data source to the current drawing
File menu ➤ Attach/Detach ➤ Attach External
Records
Menu
MAPATTACHDBCommand Line
Drag a data source onto the Map Explorer tabTask Pane
MAPCONFIGDB
Configures the connection to an external data source
Click Setup ➤ Create/Edit a Source of Data ➤ External
Records.
Menu
MAPCONFIGDBCommand Line
In Map Explorer, right-click Data Sources ➤ Configure
Task Pane
Configure Data Source dialog boxDialog Box
MAPCONNECTDB
Connects to an attached data source
File menu ➤ Connect/Disconnect ➤ Connect To
External Records
Menu
MAPCONNECTDBCommand Line
In Map Explorer, right-click a data source or a link
template ➤ Connect-or- To connect all data sources:
Right-click Data Sources ➤ Connect All
Task Pane
Connect Data Source dialog boxDialog Box
MAPDETACHDB
Detaches a data source from the current drawing
Setting Up Data Sources for Drawings | 207
File menu ➤ Attach/Detach ➤ Detach External
Records
Menu
MAPDETACHDBCommand Line
In Map Explorer, right-click a data source ➤ Detach
Task Pane
Source dialog boxDialog Box
MAPDISCONNECTDB
Disconnects an attached, connected database
File menu ➤ Connect/Disconnect ➤ Disconnect
From External Records
Menu
MAPDISCONNECTDBCommand Line
In Map Explorer, right-click a data
source ➤ Disconnect-or- To disconnect all data
sources: Right-click Data Sources ➤ Disconnect All
Task Pane
Disconnect Data Source dialog boxDialog Box
Attaching a Data Source
To use data from an external data source, attach the data source to the drawing.
When you attach a data source, it appears in the Map Explorer tab of the Task
Pane along with the tables and database queries associated with it.
For the following data sources, AutoCAD Map 3D automatically creates the
files it needs to communicate with the data source:
■.dbf
■.db
■.mdb
■.xls (must have at least one named range)
■.udl
For other data sources, you must manually create the files (page 210) before
you can attach the data source.
208 | Chapter 2 Setting Up

NOTE This functionality is for drawing objects only. For information about joining
an external database to a geospatial feature class, see Joining Data to GIS Features
(page 507).
Tips
You can set an option (page 235) to have AutoCAD Map 3D prompt you for
the database version each time you attach a data source or you can specify a
default version.
AutoCAD Map 3D stores the UDL (Universal Data Link) (page 2078) files in a
specific directory. If it does not find a UDL file in this directory, it creates a
new UDL file. You can change the directory used for UDL files.
See also:
■Configuring a Data Source (page 210)
■Associating Database Versions with File Extensions (page 242)
■Setting Data Source Options for Drawings (page 235)
■Overview of Linking Database Records to Objects (page 522)
■Viewing External Data Linked to Drawing Objects (page 1146)
NOTE This functionality is for drawing objects only. For information about joining
an external database to a geospatial feature class, see Joining Data to GIS Features
(page 507).
To attach a data source by dragging the database file to the Task Pane
1Using Explorer or My Computer, select the database file and drag it to
the Map Explorer tab of the Task Pane.
You can drag and drop databases with the following extensions: .udl, .db,
.dbf, .mdb, and .xls.
2If prompted, select a version and click OK.
3If prompted, enter your user name and password.
To attach a data source by right-clicking the Data Sources folder in the Task
Pane
1Right-click the Data Sources folder on the Map Explorer tab of the Task
Pane and select Attach.
Setting Up Data Sources for Drawings | 209
2In the Attach Data Source dialog box, select the file location and type.
You can attach databases with the following extensions: .udl, .db, .dbf,
.mdb, and .xls.
3Click Attach.
AutoCAD Map 3D creates the necessary configuration files and attaches the
database.
For information on using specific database types with AutoCAD Map 3D, see
the AutoCAD help.
Quick Reference
MAPATTACHDB
Attaches a data source to the current drawing
File menu ➤ Attach/Detach ➤ Attach External
Records
Menu
MAPATTACHDBCommand Line
Drag a data source onto the Map Explorer tabTask Pane
MAPDETACHDB
Detaches a data source from the current drawing
File menu ➤ Attach/Detach ➤ Detach External
Records
Menu
MAPDETACHDBCommand Line
In Map Explorer, right-click a data source ➤ Detach
Task Pane
Source dialog boxDialog Box
Configuring a Data Source
Microsoft Windows uses UDL (Universal Data Link) (page 2078) files to point to
specific data sources. The UDL file lists the location of the data, the type of
database, the version of the database, and the appropriate database driver.
For each data source that you use with AutoCAD Map 3D, you must have a
UDL file in the AutoCAD Map 3D data source directory. Once the UDL file
210 | Chapter 2 Setting Up

exists in the data source directory, you can attach the data source to any
drawing.
For most data sources, AutoCAD Map 3D creates the UDL file automatically
when you attach a database. However, for some database types, you must
create the UDL file manually.
When you edit or create a UDL file, you use the Microsoft Windows Data Link
Properties dialog box. For more information on using this dialog box, refer to
your Microsoft Windows documentation.
NOTE This functionality is for drawing objects only. For information about joining
an external database to a geospatial feature class, see Joining Data to GIS Features
(page 507).
Drivers
To read external data files, AutoCAD Map 3D uses drivers that translate the
data to a standard format. The first time you use a data source with AutoCAD
Map 3D, AutoCAD Map 3D determines the appropriate driver for the data
source. It stores this information in the UDL file.
AutoCAD Map 3D supports these drivers:
■Jet provider, which works with Microsoft Access database files
■SQL Server provider
■Oracle provider
■ODBC driver, which works with ODBC-compliant databases
These drivers are installed with AutoCAD Map 3D.
Because the ODBC provider works with many different database types, it
requires additional information about each specific database type. It gets this
information from a Data Source Name (DSN) that registers information about
the database type. You need only one DSN for each database type.
For the following ODBC-compliant databases, AutoCAD Map 3D creates a
DSN for you when you attach the database:
■Microsoft Access
■dBase
■Microsoft Excel
■Paradox
Setting Up Data Sources for Drawings | 211

■Microsoft Visual FoxPro
By default, AutoCAD Map 3D connects to Microsoft Access using the Jet
provider, which does not require a DSN. If you want to connect to Microsoft
Access using the ODBC driver, you must create a DSN.
For information on creating a DSN, refer to your Microsoft Windows
documentation.
Displaying Configuration Dialog Boxes
When you attach a data source that does not already have a UDL file, AutoCAD
Map 3D creates the UDL file and determines the settings for Windows data
source configuration.
If the Expert variable is set to 3 or more, AutoCAD Map 3D determines the
settings, and displays the data source configuration dialog boxes so you can
review or modify the settings.
NOTE If you are using the ODBC provider, before you manually create the data
link file, you must have a DSN (Data Source Name) for the database software.
Windows may have created this file when you installed your database software.
See also:
■Accessing Data from ODBC (page 342)
■Setting Data Source Options for Drawings (page 235)
■Overview of Linking Database Records to Objects (page 522)
■Viewing External Data Linked to Drawing Objects (page 1146)
NOTE This functionality is for drawing objects only. For information about joining
an external database to a geospatial feature class, see Joining Data to GIS Features
(page 507).
■To configure a data source automatically (page 213)
■To configure a data source manually (page 213)
■To modify an existing data link file (page 213)
212 | Chapter 2 Setting Up

To configure a data source automatically
➤ Drag and drop one of the following database types onto the Map Explorer
tab of the Task Pane:
■Microsoft Access
■dBASE
■Microsoft Excel (must have at least one named range; do not use
DATABASE or other reserved words as a range name)
■Paradox
■Microsoft Visual FoxPro
To configure a data source manually
1At the command prompt, enter mapconnectdb.
2Type a name for the data source and click OK. The data link file will have
the same name.
3On the Provider tab of the Data Link Properties dialog box, select the
database provider. If you are using the ODBC provider, select the name
of the DSN.
4Enter additional information as needed and click OK. The Data Link
Properties dialog box is a Microsoft Windows dialog box.
For help on database configuration, see the AutoCAD help. Additional
information is available by clicking Help in the Data Link Properties dialog
box.
To modify an existing data link file
1At the command prompt, enter mapconnectdb.
2Select the data source and click OK.
3Make the modifications and click OK. The Data Link Properties dialog
box is a Microsoft Windows dialog box.
NOTE If you modify a data link file for a data source that is currently attached
and connected, the changes will not take effect until the next time you connect
the data source.
Setting Up Data Sources for Drawings | 213

NOTE If you have more than one copy of a UDL file, be sure to edit the copy in
the AutoCAD Map 3D data links directory.
Quick Reference
EXPERT
Controls whether certain prompts are issued (system variable)
EXPERTCommand Line
MAPCONFIGDB
Configures the connection to an external data source
Click Setup ➤ Create/Edit a Source of Data ➤ External
Records.
Menu
MAPCONFIGDBCommand Line
In Map Explorer, right-click Data Sources ➤ Configure
Task Pane
Configure Data Source dialog boxDialog Box
Connecting a Data Source
To free up memory or database connections, you can disconnect a data source
but keep it attached to the current drawing. When you want to use the data
source again, reconnecting is a one-step process.
TIP You can set an option to automatically connect (page 235) to all attached data
sources each time you open a drawing.
NOTE This functionality is for drawing objects only. For information about joining
an external database to a geospatial feature class, see Joining Data to GIS Features
(page 507).
See also:
■Setting Data Source Options for Drawings (page 235)
■Overview of Attaching Data Sources to Drawings (page 205)
■Overview of Linking Database Records to Objects (page 522)
214 | Chapter 2 Setting Up

■Viewing External Data Linked to Drawing Objects (page 1146)
NOTE This functionality is for drawing objects only. For information about joining
an external database to a geospatial feature class, see Joining Data to GIS Features
(page 507).
To connect a data source
■On the Map Explorer tab of the Task Pane, double-click the data source.
To disconnect a data source
■Right-click the data source. Click Disconnect.
Quick Reference
MAPCONNECTDB
Connects to an attached data source
File menu ➤ Connect/Disconnect ➤ Connect To
External Records
Menu
MAPCONNECTDBCommand Line
In Map Explorer, right-click a data source or a link
template ➤ Connect-or- To connect all data sources:
Right-click Data Sources ➤ Connect All
Task Pane
Connect Data Source dialog boxDialog Box
MAPDISCONNECTDB
Disconnects an attached, connected database
File menu ➤ Connect/Disconnect ➤ Disconnect
From External Records
Menu
MAPDISCONNECTDBCommand Line
In Map Explorer, right-click a data
source ➤ Disconnect-or- To disconnect all data
sources: Right-click Data Sources ➤ Disconnect All
Task Pane
Disconnect Data Source dialog boxDialog Box
Setting Up Data Sources for Drawings | 215
Setting Options
You can change many settings that affect the work environment, how the
program starts up, whether users must log in, and settings for your current
drawings, data sources, and more.
See also:
■Setting Raster Image Options (page 249)
■Setting Data Source Options for Drawings (page 235)
■Setting AutoCAD Options (look up “interface options, setting” in the help
index)
■To use the AutoCAD Map Options dialog box (page 218)
■To set Task Pane options (page 221)
■To hide or display the Task Pane at startup (page 221)
■To hide or display the Task Pane within your current session (page 221)
■To refresh Map Explorer (page 221)
■To adjust the transparency of the Task Pane (page 222)
■To set drawing options (page 225)
■To set multi-user options (page 227)
■To set system options (page 229)
■To specify coordinate system options (page 231)
■To specify coordinate tracker options (page 232)
■To set coordinate geometry options (page 234)
■To change the azimuth bearing quickly (page 234)
■To set data source options (page 236)
■To change the expert setting (page 236)
■To change the default data link file directory (page 236)
■To set Data View options (page 238)
■To specify Feature Edit Options (page 240)
■To set metadata options (page 241)
■To associate database versions with files extensions (page 243)
■To set query options (page 245)
■To have hatch created by property alteration be associative (page 247)
■To set AutoCAD Map 3D options (page 249)
216 | Chapter 2 Setting Up

Overview of Setting Options
The following table summarizes the options you can set and where these
settings are located.
Go to...To change settings for...
AutoCAD Map Options dialog box ➤ Task
Pane (page 1909) tab.
Default display of the Task Pane
AutoCAD Map Options dialog box ➤
Current Drawing (page 1909) tab.
The current drawing
AutoCAD Map Options dialog box ➤
Multi-User (page 1915) tab
Login and object locking
AutoCAD Map Options dialog box ➤
System (page 1916) tab
Log files and data sources
AutoCAD Map Options dialog box ➤
Current Drawing (page 1909) tab
Coordinate systems
Coordinate Geometry Setup dialog box
(page 1917)
Coordinate geometry
AutoCAD Map Options dialog box ➤
Data Source (page 1914) tab
Data sources for drawings (and file exten-
sion associations for them) and the Data
View window
Metadata Options dialog box (page 1484)Metadata
AutoCAD Map Options dialog box ➤
Query (page 1911)tab
NOTE There are also query-related settings
on the following tabs:
■Save Back (page 1913)
■System (page 1916)
■Task Pane (page 1909)
Queries
AutoCAD Map Options dialog box ➤
Query (page 1911)tab
Associative hatch for drawing objects with
boundaries
Overview of Setting Options | 217

Go to...To change settings for...
Raster Extension Options dialog box (page
1879)
Raster images
mapimport.ini (page 271) and mapforeign-
fileproperties.ini (page 274)
Import defaults
mapexport.ini (page 269)Export defaults
To use the AutoCAD Map Options dialog box
1In the Tool-based Ribbon Workspace, click Map Setup tab ➤ Map
panel ➤ angle-arrow.
2Click a tab.
3In the AutoCAD Map Options dialog box (page 1908), modify options.
4Click OK to save the settings.
Quick Reference
MAPOPTIONS
Sets AutoCAD Map 3D options
Setup menu ➤ Autodesk Map Options
Menu
Options
Icon
MAPOPTIONSCommand Line
In Map Explorer, right-click Current
Drawing ➤ Options
Task Pane
AutoCAD Map Options dialog boxDialog Box
OPTIONS
Customizes the AutoCAD settings
Setup menu ➤ AutoCAD Options
Menu
OPTIONSCommand Line
218 | Chapter 2 Setting Up

Right-click in the drawing area ➤ Options
Task Pane
MAPDOCKWSPACE
Docks and undocks the Task Pane
MAPDOCKWSPACECommand Line
Double-click the title bar (floating) or the double bar
at the top of the pane (docked)
Task Pane
MAPDOCKWSPACE (Dock Task Pane command)Dialog Box
MAPWSPACE
Shows or hides the Task Pane
View menu ➤ Task Pane
Menu
MAPWSPACECommand Line
Right-click a blank area ➤ Close
Task Pane
MAPWSPACE (Task Pane command)Dialog Box
MAPWSREFRESH
Redisplays the Task Pane
MAPWSREFRESHCommand Line
Right-click a blank area ➤ Refresh
Task Pane
MAPWSREFRESHDialog Box
MAPCGAZBASE
Sets the azimuth base
MAPCGAZBASECommand Line
MAPCGSETUP
Specifies coordinate geometry settings
At the Command prompt, enter mapcgsetup.Menu
COGO Options
Icon
MAPCGSETUPCommand Line
Overview of Setting Options | 219

Setting Coordinate Geometry OptionsDialog Box
MAPIOPTIONS
Specifies default image correlation settings, display options, detach options,
paths, and memory settings
Setup menu ➤ Raster Options
Menu
MAPIOPTIONSCommand Line
Raster Extension Options dialog boxDialog Box
Setting Task Pane Options
You can specify what to display in the Task Pane and what displays when you
start the program.
■Map Explorer Categories To Display — Lets you select which categories
(nodes) you want to display on the Map Explorer tab of the Task Pane.
The visibility of some nodes is dependent on the visibility of others. For
example, the Tables node is visible in the Map Explorer tab of Task Pane
only when you select both Data Sources and Tables.
NOTE When you attach drawings with the Topologies node visible, AutoCAD
Map 3D creates a list of all the topologies to display under Topologies in Map
Explorer. If you attach a large number of drawings containing topologies at
the same time, the creation of the topology list increases the processing time.
To reduce processing time, hide the Topologies node before attaching the
drawings.
■Show Task Pane On Startup — Specifies whether to display the Task Pane
when you start AutoCAD Map 3D.
■Show Properties Palette On Startup — Specifies whether to display the
Properties palette when you start AutoCAD Map 3D.
See also:
■The Task Pane
■Getting Information About Drawing Objects (page 1143)
■To set Task Pane options (page 221)
220 | Chapter 2 Setting Up
■To hide or display the Task Pane at startup (page 221)
■To hide or display the Task Pane within your current session (page 221)
■To refresh Map Explorer (page 221)
■To adjust the transparency of the Task Pane (page 222)
To set Task Pane options
1In the Tool-based Ribbon Workspace, click Map Setup tab ➤ Map
panel ➤ angle-arrow.
2In the AutoCAD Map Options dialog box (page 1908), select the Task Pane
tab.
3Modify the options you want:
■Under Map Explorer Categories To Display, select the categories to
display on the Map Explorer tab of the Task Pane.
■Select which palettes you want to show at startup.
4Click OK.
To hide or display the Task Pane at startup
1In the Tool-based Ribbon Workspace, click Map Setup tab ➤ Map
panel ➤ angle-arrow.
2In the AutoCAD Map Options dialog box (page 1908), click the Task Pane
(page 1909) tab.
3Select Show Task Pane On Startup.
To hide or display the Task Pane within your current session
■In the Tool-based Ribbon Workspace, click View tab ➤ Palettes panel ➤ Map
Task Pane
To refresh Map Explorer
■Right-click a clear area in Map Explorer, and click Refresh; or enter
mapwsrefresh at the Command prompt.
Setting Task Pane Options | 221

To adjust the transparency of the Task Pane
1Right-click the title bar of the Task Pane and choose Transparency.
2In the Transparency dialog box, adjust the transparency level.
3Click OK.
Quick Reference
MAPOPTIONS
Sets AutoCAD Map 3D options
Setup menu ➤ Autodesk Map Options
Menu
Options
Icon
MAPOPTIONSCommand Line
In Map Explorer, right-click Current
Drawing ➤ Options
Task Pane
AutoCAD Map Options dialog boxDialog Box
MAPDOCKWSPACE
Docks and undocks the Task Pane
MAPDOCKWSPACECommand Line
Double-click the title bar (floating) or the double bar
at the top of the pane (docked)
Task Pane
MAPDOCKWSPACE (Dock Task Pane command)Dialog Box
MAPWSPACE
Shows or hides the Task Pane
View menu ➤ Task Pane
Menu
MAPWSPACECommand Line
Right-click a blank area ➤ Close
Task Pane
MAPWSPACE (Task Pane command)Dialog Box
MAPWSREFRESH
222 | Chapter 2 Setting Up

Redisplays the Task Pane
MAPWSREFRESHCommand Line
Right-click a blank area ➤ Refresh
Task Pane
MAPWSREFRESHDialog Box
Setting Drawing Options
You can specify general settings and coordinate transformation options for
the current drawing. If you are working with drawings that use different global
coordinate systems, AutoCAD Map 3D standardizes the drawings based on
the global coordinate system of the the current drawing.
NOTE Once you bring objects into the current drawing, do not change the
coordinate transformation options if you plan to save changes back to source
drawings. The save-back process determines whether adjustments are necessary
to restore objects to the correct coordinate system when you save them back to
source drawings.
NOTE These options affect drawing files that you attach to the current map
drawing. They do not affect geospatial feature sources.
Activate Attached Source Drawings
Set any of the following options:
■From Last Session At Startup — Activates the drawings that were active the
last time you quit AutoCAD Map 3D. If you do not select this option, all
drawings are inactive on startup.
■After Attaching — Sets the status of a drawing to Active when you attach
it. If you do not select this option, all drawings are inactive when you
attach them.
Coordinate Transformation Adjustments: Adjust Sizes And Scales area
Set any of the following options:
■For Changes In Units — Use this option when you are working with text
and block objects from a source drawing that uses different coordinate
system units than the current drawing. For example, if your source drawing
uses meters and the current drawing uses U.S. Survey Feet, you can scale
Setting Drawing Options | 223
text and blocks so that their size or scale measures in feet rather than
meters.
If you do not select this option, AutoCAD Map 3D does not adjust the size
or scale of text and block objects. For example, if you have a block that is
5 meters long in the source drawing, it will be 5 feet long when you bring
it into the current drawing.
Do not change this setting after you bring objects into the current drawing,
or you might introduce unintended changes to text and blocks when you
save them back to their source drawings.
■For Map Distortion — Use this option to adjust the size and scale of text
and blocks to correct for map distortion introduced when you represent
a spherical object (earth) in a Cartesian coordinate system.
For example, two objects, located at the northern and southern extremes
of a map, of equal length in coordinate system X remain the same length
when transformed to coordinate system Y.
If you do not select this option, AutoCAD Map 3D scales the two objects
to different lengths in coordinate system Y according to the relative map
distortion (or grid scale factor).
For Map Distortion in the Adjust Sizes And Scales area is available only if
you selected the previous option, For Changes In Units.
Coordinate Transformation Adjustments: Adjust Rotations area
Set any of the following options:
■For Map Distortion — Adjusts the angle of text and blocks to correct for
map distortion due to the convergence angle (the deviation of the Y axis
of a Cartesian coordinate system from true north).
■For Zero-Rotation Objects — Specifies that text and blocks that have a
rotation value of zero in the source drawing are adjusted to correct
distortion due to the convergence angle.
If you select this option, AutoCAD Map 3D calculates the convergence
angle for text and blocks with a zero rotation value. If you do not select
this option, AutoCAD Map 3D does not rotate text and blocks with a zero
rotation value, even if there is a convergence angle.
For Zero-Rotation Objects is available only if you selected the previous
option, For Map Distortion, in the Adjust Rotations area.
224 | Chapter 2 Setting Up
Select Adjust Elevations to adjust the elevation (Z axis) of objects when you
select For Changes In Units and For Map Distortion under Adjust Sizes And
Scales.
Data Source Options
Set any of the following options:
■Select Reconnect Data Source When Drawing Opens to reconnect the
databases that were connected the last time you quit AutoCAD Map 3D.
■In the Number Of SQL Conditions To Keep In History List box, enter the
number of SQL conditions to store in the SQL condition history list.
Reducing the size of this list saves memory and reduces the number of
conditions you must scroll through when you search for a particular
condition. The first condition added to the list is the first one dropped
when AutoCAD Map 3D reaches the maximum number you specify.
See also:
■Activating a Drawing (page 159)
■Overview of Coordinate Systems (page 143)
■Setting Data Source Options for Drawings (page 235)
To set drawing options
1In the Tool-based Ribbon Workspace, click Map Setup tab ➤ Map
panel ➤ angle-arrow.
2In the AutoCAD Map Options dialog box (page 1908), select the Current
Drawing (page 1909) tab.
3Modify the options you want. For information on each option, see the
Concept tab of this topic.
4Click OK.
Quick Reference
MAPOPTIONS
Sets AutoCAD Map 3D options
Setting Drawing Options | 225

Setup menu ➤ Autodesk Map Options
Menu
Options
Icon
MAPOPTIONSCommand Line
In Map Explorer, right-click Current
Drawing ➤ Options
Task Pane
AutoCAD Map Options dialog boxDialog Box
Setting Multi-user Options
You can specify options that affect how AutoCAD Map 3D operates for all
users, across all drawings. For example, you can set login or object locking
options. The system administrator controls these settings.
These options apply to all AutoCAD Map 3D users in a single installation and
are set by the system administrator. The settings affect all drawings and, in
network installations, are common to all users.
Force User Login
You must have Superuser privilege to set this option.
If Force User Login is enabled, users are required to log in at AutoCAD Map
3D startup. If a user attempts to halt log in by pressing the Escape key,
AutoCAD Map 3D assigns view-only privileges, and the user cannot alter the
drawing set, edit drawings, or perform queries. Once logged in, a user may
log in under a different login name, even while working in a drawing with
active source drawings.
If Force User Login is not enabled and the user does not log in, AutoCAD Map
3D uses the user's operating system login name to identify the user when
locking objects, creating the .DWK file, and restoring options. A user may log
in using his or her login name while working in drawings, including drawings
with attached source drawings.
Enable Object Locking
Protects objects that are being edited from modification by other AutoCAD
Map 3D users.
NOTE Object locking affects drawing files only. For information on using geospatial
feature data in a multi-user environment, see Overview of Working with Features
(page 684).
226 | Chapter 2 Setting Up

You cannot change the Enable Object Locking option while drawings are
attached. If this option is not selected, only one user at a time can attach a
drawing.
Object locking is recommended on networked systems to avoid conflicts when
querying and editing. If you are working on a stand-alone system, you do not
need object locking.
See also:
■Logging Into AutoCAD Map 3D (page 141)
■Sharing Attached Drawings (page 731)
NOTE Object locking affects drawing files only. For information on using geospatial
feature data in a multi-user environment, see Overview of Working with Features
(page 684).
To set multi-user options
1In the Tool-based Ribbon Workspace, click Map Setup tab ➤ Map
panel ➤ angle-arrow.
2In the AutoCAD Map Options dialog box (page 1908), select the Multi-User
(page 1915) tab.
3Modify the options you want. For information on each option, see the
Concept tab of this topic.
4Click OK.
Quick Reference
MAPOPTIONS
Sets AutoCAD Map 3D options
Setup menu ➤ Autodesk Map Options
Menu
Options
Icon
MAPOPTIONSCommand Line
In Map Explorer, right-click Current
Drawing ➤ Options
Task Pane
Setting Multi-user Options | 227

AutoCAD Map Options dialog boxDialog Box
Setting System Options
You can specify options that affect the operation of a single installation of
AutoCAD Map 3D.
NOTE If you have enabled Force User Login (page 226) on the Multi-User Options
tab, you must log in as a Superuser to set System Options. The default superuser
login name is SuperUser (not case sensitive) and the password is SUPERUSER (case
sensitive).
Log File Options
■Select Log File Active to create a log file for AutoCAD Map 3D messages.
■In the File Name box, provide the path and name for a log file in which
to record error, warning, and diagnostic messages. The default name is
acadmap.log. Optionally, you can click Browse to search your file system
for an existing file. AutoCAD Map 3D appends messages to the file you
select.
■Specify one of the following under Message Level:
Level 0: Error Messages — The log file contains error messages that describe
potential problems you may encounter. For example, if you attempt to
attach a drawing that is already attached, AutoCAD Map 3D produces an
error message that is stored in the log file.
Level 1: Error And Warning Messages — The log file contains warning
messages in addition to error messages. Warning messages alert you to
potential problems. For example, if you use duplicate link template names,
AutoCAD Map 3D produces a warning message that is stored in the log
file.
Level 2: Error, Warning And Diagnostic Messages — The log file contains
status messages as well as error and warning messages.
Number of Drawings Loaded Into Memory At Once
When you attach and activate drawings, AutoCAD Map 3D opens them in
memory. You do not see the open drawings, but AutoCAD Map 3D must open
them to perform operations.
228 | Chapter 2 Setting Up

The number of drawings that AutoCAD Map 3D can open in memory at the
same time depends on several factors. These include the size of the drawings,
amount of memory, and your system setup.
The number you specify here does not limit the number of active drawings.
AutoCAD Map 3D opens and closes files in memory as it needs them. If your
system has a lot of memory, you can enter a larger number (up to 200) to
make queries go faster.
Default Directories
To specify a default directory for externally saved queries or cache files, enter
the path in the appropriate box. Or click Browse to locate an existing directory.
NOTE These options affect drawing files only. They do not affect geospatial feature
sources.
See also:
■Editing Data in Attached Drawings (page 729)
■Overview of Using the Query Library (page 174)
To set system options
1In the Tool-based Ribbon Workspace, click Map Setup tab ➤ Map
panel ➤ angle-arrow.
2In the AutoCAD Map Options dialog box (page 1908), select the System
(page 1916) tab.
3Modify the options you want. For information on each option, see the
Concept tab of this topic.
4To enhance the performance of AutoCAD Map 3D, click Clear Cache.
5Click OK.
NOTE If you have enabled Force User Login (page 226) on the Multi-User
Options tab, you must log in as a Superuser to set System Options. The default
superuser login name is SuperUser (not case sensitive) and the password is
SUPERUSER (case sensitive).
Setting System Options | 229

Quick Reference
MAPOPTIONS
Sets AutoCAD Map 3D options
Setup menu ➤ Autodesk Map Options
Menu
Options
Icon
MAPOPTIONSCommand Line
In Map Explorer, right-click Current
Drawing ➤ Options
Task Pane
AutoCAD Map Options dialog boxDialog Box
Setting Coordinate System Options
You can set several options to determine how AutoCAD Map 3D performs
coordinate system transformations and responds when you open drawings
with embedded coordinate system definitions.
These options apply only to the current drawing. Each time you open a
drawing, these settings take effect, but they do not affect other drawings.
Coordinate Transformation Adjustments
Coordinate transformation allows the manipulation of the coordinate
geometry. Use the Coordinate Transformation Adjustment options to specify
how AutoCAD Map 3D performs coordinate transformations through
adjustments for size, scale, rotation, and elevation.
After you query objects into a drawing from source drawings, do not change
the coordinate transformation options if you plan to save changes back to the
source drawings.
NOTE The AutoCAD Map 3D simple transformation options, available in the
Drawing Settings dialog box, cannot be used with coordinate transformations.
Storing Coordinate Systems in the Drawing
When you open a drawing that has a coordinate system that is not in your
dictionary, AutoCAD Map 3D can add that coordinate system definition to
230 | Chapter 2 Setting Up
your dictionary. You can choose to always add the definitions, never add the
definitions, or have AutoCAD Map 3D prompt you each time.
Units
Specify the units to use when displaying geodetic distance.
See also:
■Overview of Coordinate Systems (page 143)
■Defining Coordinate Systems (page 89)
■Overview of Bringing in Drawing Data From DWG Files (page 351)
■Setting Drawing Options (page 223)
To specify coordinate system options
1In the Tool-based Ribbon Workspace, click Map Setup tab ➤ Map
panel ➤ angle-arrow.
2In the AutoCAD Map Options dialog box (page 1908), click the Current
Drawing (page 1909) tab.
3Under Coordinate Transformation Adjustments, specify how you want
AutoCAD Map 3D to perform coordinate transformations.
4Click the Coordinate Systems tab (page 1916).
■Under Coordinate System Definitions Stored In Drawing, specify how
you want AutoCAD Map 3D to respond when you open drawings
with embedded coordinate system definitions.
■Under Geodetic Distance, select the units to use when displaying
geodetic distance.
5Click OK.
Quick Reference
MAPOPTIONS
Sets AutoCAD Map 3D options
Setup menu ➤ Autodesk Map Options
Menu
Setting Coordinate System Options | 231
Options
Icon
MAPOPTIONSCommand Line
In Map Explorer, right-click Current
Drawing ➤ Options
Task Pane
AutoCAD Map Options dialog boxDialog Box
Setting Coordinate Tracker Options
You can track multiple coordinate systesm in your map using the Track
Coordinates Dialog Box (page 1601). The Track Coordinates dialog box contains
one or more Coordinate Trackers that display the coordinates of the cursor as
you move around your map. You can specify how much information the
tracker coordinates displays, and the precision of the coordinates.
See also:
■Tracking Coordinates (page 1149)
To specify coordinate tracker options
1In the Tool-based Ribbon Workspace, click Analyze tab ➤ Geo Tools
panel ➤ Coordinate Track.
2In the Track Coordinates dialog box, click . The Coordinate Tracker
Options Dialog Box (page 1600) appears.
3In the Coordinate Tracker Options dialog box, set any of the following
options:
■Display coordinate system descriptions: view a description of the
coordinate system in the Track Coordinates dialog box.
■Format Lat/Long as D,M,S: display lat/long coordinates in
degrees/minutes/seconds format.
■Include Square ID: view the MGRS square ID when tracking MGRS
coordinates.
■Precision Level: specify the precision level of MGRS coordinates.
232 | Chapter 2 Setting Up

■Lettering Scheme: specify the lettering scheme for MGRS coordinates.
Use AA (MGRS-New) for the WSG84 datum. Use AL (MGRS-Old) for
older datums.
■Digitization Location: For the digitization location within a given
MGRS square, specify left top, center top, right top, left center, center,
right center, left bottom, center bottom, or right bottom.
4Click OK.
Quick Reference
MAPTRACKCS
Tracks the coordinates of the cursor in any coordinate system
Analyze menu ➤ Track Coordinate Sytem.
Menu
Track Coordinates
Icon
MAPTRACKCSCommand Line
In Map Explorer, right-click Current Drawing ➤ Track
Coordinates
Task Pane
Setting Coordinate Geometry Options
You can set the following coordinate geometry options:
■If North on your map is not aligned with the Y axis, specify the angle for
North.
■If your COGO information sometimes includes elevation information, set
the COGO commands to prompt for 3D data. If you never include 3D data,
you can turn off this prompt.
■Specify units of measure for your coordinate geometry input. For Linear
Units, select US Feet, International Feet, Meters, or Chains. For Angle
Format, select Decimal Degrees, Degrees/Minutes/Seconds, Grads, Radians,
or Surveyor’s Units.
■If azimuth bearings on your map are measured relative to South, set the
azimuth base to South. Otherwise, leave it set to North.
Setting Coordinate Geometry Options | 233
■Create a text log for coordinate geometry entered through the COGO Input
dialog box (page 1668).
See also:
■Overview of Coordinate Geometry Commands (page 1027)
To set coordinate geometry options
1In the Tool-based Ribbon Workspace, click Home tab ➤ Draw
panel ➤ COGO drop-down ➤ COGO Options.
2In the Coordinate Geometry Setup dialog box (page 1917), set any of the
following options.
■To change the setting for North, under Set North Direction, specify
the direction from the Y axis to North on your map. Enter a number
that represents the angular distance measured clockwise from the Y
axis.
■To have AutoCAD Map 3D always prompt for elevation, grade, or
slope, select Prompt For 3D Data Input.
■Specify units of measure for Linear Units and Angle Format.
■Specify whether bearings in your map are relative to North or South.
■To have AutoCAD Map 3D write a text log for coordinate geometry
entered through the COGO Input dialog box (page 1668) to the AutoCAD
Text Window, check Create Text Log.
3Click OK to save your settings.
To change the azimuth bearing quickly
1At the command prompt, enter mapcgazbase.
2Enter n for North or s for South and press Enter.
Quick Reference
MAPCGAZBASE
Sets the azimuth base
234 | Chapter 2 Setting Up

MAPCGAZBASECommand Line
MAPCGSETUP
Specifies coordinate geometry settings
At the Command prompt, enter mapcgsetup.Menu
COGO Options
Icon
MAPCGSETUPCommand Line
Setting Coordinate Geometry OptionsDialog Box
Setting Data Source Options for Drawings
You can specify several options for attaching data sources for drawing objects.
NOTE These options affect drawing data only. They do not affect geospatial feature
data sources.
■Specify whether data sources, tables, database queries, and link templates
appear on the Map Explorer tab of the Task Pane.
■Specify whether AutoCAD Map 3D automatically reconnects the data
sources that were connected the last time you closed this drawing.
■Specify the default driver to use when you drop an MDB file onto the Map
Explorer tab.
■Specify the default database version for files with a .db, .dbf, or .xls file
extension that you drop on the Map Explorer tab.
■Change the Expert setting to display or hide the data source configuration
dialog boxes. An Expert setting of 3 or above displays the configuration
dialog boxes. An Expert setting of 2 or less hides the dialog boxes.
■Change the default location for UDL (Universal Data Link) (page 2078) files.
See also:
■Overview of Attaching Data Sources to Drawings (page 205)
■Overview of Linking Database Records to Objects (page 522)
■To set Data View options (page 238)
Setting Data Source Options for Drawings | 235

NOTE These options affect drawing data only. They do not affect geospatial feature
data sources.
■To set data source options (page 236)
■To change the expert setting (page 236)
■To change the default data link file directory (page 236)
To set data source options
1In the Tool-based Ribbon Workspace, click Map Setup tab ➤ Map
panel ➤ angle-arrow.
2In the AutoCAD Map Options dialog box (page 1908):
■On the Task Pane (page 1909) tab, select the items to display on the
Map Explorer tab.
■On the Current Drawing (page 1909) tab, specify whether to
automatically connect to attached data sources when you open a
drawing and how many filters or conditions should be stored in the
History List.
■On the Data Source (page 1914) tab, specify the default driver to use
when you drop an MDB file on the Map Explorer tab of the Task Pane.
Click Associate to specify the default database version
To change the expert setting
1At the command prompt, enter expert.
2Enter an expert setting.
For information on the Expert system variable, look up "system variables" in
the help index.
To change the default data link file directory
1Click ➤ Options.
2On the Files tab of the Options dialog box, specify the Data Sources
Location.
236 | Chapter 2 Setting Up

Quick Reference
OPTIONS
Customizes the AutoCAD settings
Setup menu ➤ AutoCAD Options
Menu
OPTIONSCommand Line
Right-click in the drawing area ➤ Options
Task Pane
MAPOPTIONS
Sets AutoCAD Map 3D options
Setup menu ➤ Autodesk Map Options
Menu
Options
Icon
MAPOPTIONSCommand Line
In Map Explorer, right-click Current
Drawing ➤ Options
Task Pane
AutoCAD Map Options dialog boxDialog Box
Setting Data View Options
Data View options apply to a single user's AutoCAD Map 3D environment.
All drawings opened by a particular user display these settings, but they do
not affect others who open the same drawings.
NOTE Data View is for drawing data only. For options related to the Data Table,
which displays the properties of geospatial feature data, see Overview of the Data
Table (page 1127).
Display Of Multiple Tables
You can specify the number of Data Views to use when displaying tables.
■Show Each Table In A Separate Data View: Opens a new Data View window
for each open table. Move between tables by clicking the window you
want.
Setting Data View Options | 237

■Show All Tables In One Data View: Opens only one Data View window.
When you open a new table, the previous table is automatically closed.
Data Views
You can specify the behavior of the Data View.
■Open In Read-Only Mode: Opens the Data View in read-only mode. When
this option is selected, you cannot edit data in the Data View.
■Save Format And Style Changes With Drawing: Saves all formatting
changes, such as column width, font, color, or borders, that you make in
the Data View.
■Keep On Top: Specifies whether the Data View window remains on top of
all other windows, even when it is not the active window.
See also:
■Overview of Viewing External Data Sources for Drawing Objects (page 1048)
■Overview of Linking Database Records to Objects (page 522)
NOTE Data View is for drawing data only. For options related to the Data Table,
which displays the properties of geospatial feature data, see Overview of the Data
Table (page 1127).
To set Data View options
1In the Tool-based Ribbon Workspace, click Map Setup tab ➤ Map
panel ➤ angle-arrow.
2In the AutoCAD Map Options dialog box (page 1908), select the Data Source
(page 1914) tab.
3Modify the options you want.
4To change the number of filters that AutoCAD Map 3D displays in the
Table Filter History dialog box, select the Current Drawing (page 1909) tab.
Enter a new number.
5Click OK.
238 | Chapter 2 Setting Up

Quick Reference
OPTIONS
Customizes the AutoCAD settings
Setup menu ➤ AutoCAD Options
Menu
OPTIONSCommand Line
Right-click in the drawing area ➤ Options
Task Pane
MAPOPTIONS
Sets AutoCAD Map 3D options
Setup menu ➤ Autodesk Map Options
Menu
Options
Icon
MAPOPTIONSCommand Line
In Map Explorer, right-click Current
Drawing ➤ Options
Task Pane
AutoCAD Map Options dialog boxDialog Box
Setting Geospatial Feature Editing Options
You can specify options for editing geospatial features.
NOTE These options affect geospatial feature data only. For options related to
editing drawing objects, see Setting Multi-user Options (page 226).
■Automatic Checkout: You must check out geospatial features before editing
them. This option allows you check out features automatically when you
edit them.
■Automatic Edit Update: When you edit geospatial features in AutoCAD
Map 3D you can also update the original data resources. This option allows
you to automate updating your feature source.
Setting Geospatial Feature Editing Options | 239

■Feature Checkout Options: You can check out geospatial features with as
drawing objects or geospatial features.
Features checked out as geospatial
features
Features checked out as AutoCAD
drawing objects
Allows you to use some common ACAD
editing commands in addition to geospa-
Allows you to use many common ACAD
editing commands
tial feature-specific editing commands (for
example, MAPFEATURESPLIT (page 1652)
and MAPFEATUREMERGE (page 1651))
Edited features are represented as geospa-
tial geometries (for example, MAPPOLY-
GONS).
Edited features represented as AutoCAD
geometries (for example, closed polylines
are used to represent polygonal features)
Supports multipart (multipolygons, mul-
tilines, and multipoints) geospatial features
and editing, such as the Hawaiian islands.
Most existing custom or third-party editing
applications (LISP, VB, or ObjectARX)
should continue to work. Some may re-
quire minor updates.
Preserves and allows you to edit M and Z
values.
Some existing AutoCAD Map 3D editing
commands will continue to work on fea-
tures (for example, rubber sheeting [ADER-
SHEET (page 1648)]).
Allows you to use feature styling.Allows you to use feature styling.
■Split Prompt Options: Specify defaults for the prompts displayed when
you split a polygonal feature. Specify whether to display the prompts during
a split operation.
■Checkin Prompt Timer: This option allows you to set a recurring check-in
prompt.
See also:
■Editing Features (page 701)
■Splitting Features (page 705)
NOTE These options affect geospatial feature data only. For options related to
editing drawing objects, see Setting Multi-user Options (page 226).
To specify Feature Edit Options
1In the Tool-based Ribbon Workspace, click Map Setup tab ➤ Feature
Data panel ➤ angle-arrow.
240 | Chapter 2 Setting Up

2In the Feature Editing Options dialog box (page 1929), select the options
you want. If you select the checkin prompt, specify the prompt interval
in minutes.
3Click OK.
Quick Reference
MAPFEATUREEDITOPTIONS
Specifies options for editing features
Feature Edit Options
Icon
MAPFEATUREEDITOPTIONSCommand Line
Feature Editing Options dialog boxDialog Box
Setting Metadata Options
AutoCAD Map 3D 2011 supports FGDC metadata down to the feature source
and object class levels. You can set options for your metadata on the Metadata
Options dialog box. Options for metadata include metadata template import
and export, latitude/longitude precision, and automatic updating.
See also:
■Setting Metadata Options (page 1484)
To set metadata options
1Launch the Metadata Viewer (page 1487).
2On the Metadata Viewer toolbar, click Options.
3In the Metadata Options dialog box (page 1756), do any of the following:
■To use a metadata template, click the Template tab and select Use
Template and select the template you want from the list. If no
templates appear, click Import and import an FGDC-compliant
template.
Setting Metadata Options | 241
■To set Latitude/longitude precision, click the Preference tab and set
the number of digits that display after the decimal point for your
reported latitude and longitude values from 0 to 10. Both values are
6 by default.
4Click OK.
Quick Reference
MAPMETADATAOPTIONS
Displays the Metadata Options dialog box
MAPMETADATAOPTIONSCommand Line
Metadata OptionsDialog Box
Setting InfoCenter Options
The InfoCenter, located at the top of the application window, helps you find
information about AutoCAD Map 3D 2011 quickly. When you type a question
into its text-entry box, the InfoCenter searches the AutoCAD Map 3D
documentation as well as any documents you add to the search settings.
Using the InfoCenter, you can:
■Search a custom set of the documents, such as all the User Guides and
Tutorials. If you are a developer, you can set InfoCenter to search your
favorite developer Help.
■Search a specific document.
■Add your own documents to the search.
■Keep up-to-date on your favorite RSS feeds, such as the Knowledge Base
and the Discussion Boards.
For details about the InfoCenter, see the AutoCAD help.
Associating Database Versions with File Extensions
This information applies only to drawing objects.
242 | Chapter 2 Setting Up
When you drag and drop a database onto the Map Explorer tab of the Task
Pane, you can select the version of the database used to create the database.
By default, AutoCAD Map 3D prompts you each time to specify the version
that was used. If you created all your databases with a specific version of the
software, you can set an option to select that version automatically.
See also:
■Attaching a Data Source (page 208)
■Configuring a Data Source (page 210)
■Setting Data Source Options for Drawings (page 235)
■Overview of Linking Database Records to Objects (page 522)
■Viewing External Data Linked to Drawing Objects (page 1146)
To associate database versions with files extensions
1In the Tool-based Ribbon Workspace, click Map Setup tab ➤ Map
panel ➤ angle-arrow.
2In the AutoCAD Map Options dialog box (page 1908), select the Data Source
(page 1914) tab.
3Under Associate Database Versions With File Extensions, select Associate.
4In the Associate Database Versions dialog box (page 1675), under each
database name, do one of the following:
■To be prompted each time you drag and drop a database file onto the
Map Explorer tab of the Task Pane, select Always Prompt.
■To associate a database file extension with a specific version of the
database software, select Always Use. Select the correct version.
When you drop a database file onto the Map Explorer tab, AutoCAD
Map 3D checks the file extension and uses the specified version of
the database software.
Quick Reference
MAPOPTIONS
Sets AutoCAD Map 3D options
Associating Database Versions with File Extensions | 243
Setup menu ➤ Autodesk Map Options
Menu
Options
Icon
MAPOPTIONSCommand Line
In Map Explorer, right-click Current
Drawing ➤ Options
Task Pane
AutoCAD Map Options dialog boxDialog Box
Setting Query Options (DWG)
You can set several options that determine how queries run, how they appear
onscreen, and how they are saved.
NOTE These options affect drawing queries only. For information about filtering
geospatial feature data when you add it to your map, see Filtering Features When
You Add Them to a Map (page 309).
On the Task Pane Tab
You can hide or display the query node on the Map Explorer tab of the Task
Pane.
NOTE The Queries option that appears under the Data Sources category is for
database queries.
Options you set on the Task Pane tab apply to a single user's AutoCAD Map
3D environment. All drawings opened by a particular user display these
settings, but they do not affect others who open the same drawings.
On the Query Tab
You can set specific query options, including the default joining operator,
display parameters for preview queries, and options for location conditions.
Options you set on the Query tab apply only to the current drawing. Each
time you open this drawing, these settings take effect, but they do not affect
other drawings.
On the Save Back Tab
You can set options that determine if queried objects are added to the save
set.
244 | Chapter 2 Setting Up
Options you set on the Save Back tab apply only to the current drawing. Each
time you open this drawing, these settings take effect, but they do not affect
other drawings.
On the System Tab
You can specify a default directory for externally saved queries.
See also:
■The Task Pane
■Overview of Queries (page 1235)
NOTE These options affect drawing queries only. For information about filtering
geospatial feature data when you add it to your map, see Filtering Features When
You Add Them to a Map (page 309).
To set query options
1In the Tool-based Ribbon Workspace, click Map Setup tab ➤ Map
panel ➤ angle-arrow.
2Click the Task Pane (page 1909) tab to hide or display the query node on
the Map Explorer tab of the Task Pane.
3Click the Query (page 1911) tab to set specific query options.
4Click the Save Back (page 1913) tab set options that determine if queried
objects are added to the save set.
5Click the System (page 1916) tab to specify a default directory for externally
saved queries.
6Click OK.
Quick Reference
MAPOPTIONS
Sets AutoCAD Map 3D options
Setup menu ➤ Autodesk Map Options
Menu
Options
Icon
Setting Query Options (DWG) | 245
MAPOPTIONSCommand Line
In Map Explorer, right-click Current
Drawing ➤ Options
Task Pane
AutoCAD Map Options dialog boxDialog Box
Using Associative Hatch
You can set an option to specify whether hatch objects created by property
alteration queries and thematic mapping are associative.
NOTE This option affects drawing objects only.
Hatch patterns used in thematic maps.
Associative hatch maintains a link between a hatch object and its boundary:
if the boundary is modified, the hatch updates automatically. However, if the
boundary if modified so that it no longer encloses the hatch or if any of the
boundary objects are deleted, the association between the hatch and the
boundary is lost.
When querying multiple files, it is easy to lose the association between a hatch
object and its boundary. If you want associative hatch, the easiest solution
may be to delete the old hatch object and recreate the associative hatch after
you finish modifying the attached drawings.
To maintain an existing association, keep in mind these points:
■If you modify an object that is part of a hatch boundary, be sure that your
changes do not break the boundary. That is, you can enlarge a circle, but
do not trim it. You can extend the corner of a square, but do not open it
up.
■To save a new associative hatch object to an attached drawing, all the
boundary objects must be in the same attached drawing. In addition, all
objects must be saved to the attached drawing at the same time. If any of
the boundary objects are saved to a different file or are saved at a different
time, the association is lost.
246 | Chapter 2 Setting Up
■When you add an associative hatch object to the save set, all its boundary
objects are added automatically. If any of the boundary objects are locked,
the hatch is not added to the save set.
■When you remove an associative hatch object from the save set, boundary
objects are removed from the save set automatically.
■When you add a boundary object to the save set, hatch objects associated
with that boundary are not added to the save set automatically. To maintain
the association, add the hatch object to the save set.
■When combining solid hatch with text, use the DRAWORDER command
to make the text visible on top of the hatch.
See also:
■Overview of Altering the Properties of Queried Drawing Objects (page 1259)
■Setting Polygon Options (page 977)
NOTE This option affects drawing objects only.
To have hatch created by property alteration be associative
1In the Tool-based Ribbon Workspace, click Map Setup tab ➤ Map
panel ➤ angle-arrow.
2Select the Query (page 1911) tab.
3Under Query Options, select Create Associative Hatch Objects.
Quick Reference
MAPOPTIONS
Sets AutoCAD Map 3D options
Setup menu ➤ Autodesk Map Options
Menu
Options
Icon
MAPOPTIONSCommand Line
In Map Explorer, right-click Current
Drawing ➤ Options
Task Pane
Using Associative Hatch | 247

AutoCAD Map Options dialog boxDialog Box
Saving Option Settings
AutoCAD Map 3D saves your options in one of three places, depending on
the option type.
■Drawing options are saved in the drawing.
■User and installation options are saved in the acadmap.ini file. On startup,
AutoCAD Map 3D searches for the acadmap.ini file first in the current
directory, then in all the directories listed in the AutoCAD Map 3D path,
and finally in the AutoCAD Map 3D executable directory. If it does not
find the acadmap.ini file, the program creates the file in the current working
directory.
■Multi-user options are saved in the binary acadmap.sys file. The acadmap.sys
file is located in the AutoCAD Map 3D executable directory. After setting
the multi-user options, the system administrator should make the file read
only to prevent users from modifying or deleting it.
NOTE When you uninstall AutoCAD Map 3D, acadmap.ini is also uninstalled. If
you have modified the settings in this file, you should save acadmap.ini prior to
uninstalling. If you uninstall and then reinstall AutoCAD Map 3D, you can simply
replace the newly installed acadmap.ini with the saved one. Note that Map release
4 and earlier saved option settings in the ade.ini file. If you uninstall release 4 or
earlier and then install a newer release of AutoCAD Map 3D, you cannot replace
the newly installed acadmap.ini with the saved ade.ini. Instead, you will need to
reset your options in the AutoCAD Map 3D Options dialog box.
See also:
■Setting Drawing Options (page 223)
■Setting Task Pane Options (page 220)
■Setting System Options (page 228)
■Setting Multi-user Options (page 226)
■Setting Data Source Options for Drawings (page 235)
■Setting Up Users and Assigning Rights (page 82)
248 | Chapter 2 Setting Up

To set AutoCAD Map 3D options
1In the Tool-based Ribbon Workspace, click Map Setup tab ➤ Map
panel ➤ angle-arrow.
2In the AutoCAD Map Options dialog box (page 1908), modify the options
you want.
3Click OK.
Quick Reference
OPTIONS
Customizes the AutoCAD settings
Setup menu ➤ AutoCAD Options
Menu
OPTIONSCommand Line
Right-click in the drawing area ➤ Options
Task Pane
MAPOPTIONS
Sets AutoCAD Map 3D options
Setup menu ➤ Autodesk Map Options
Menu
Options
Icon
MAPOPTIONSCommand Line
In Map Explorer, right-click Current
Drawing ➤ Options
Task Pane
AutoCAD Map Options dialog boxDialog Box
Setting Raster Image Options
or raster images inserted with Raster Extension, set options in the Raster
Extension Options dialog box.
■To change options for images inserted with Raster Extension (page 250)
■To set the resource file directory (page 251)
■To change how image frames are displayed (page 253)
Setting Raster Image Options | 249
■To change the image display quality (page 254)
■To choose an image detach method (page 255)
■To turn on Shift + left-click (page 256)
■To set the correlation defaults (page 257)
■To configure memory for images (page 259)
Overview of Setting Raster Image Options
Raster image options are available for images you insert using the Raster
Extension. You can connect to many raster image files using Data Connect,
but you may still use the Raster Extension to insert and correlate raster images
with formats that Data Connect does not support, or to specify correlation
information for images that do not contain this information within their files.
See also:
■Overview of Adding Rasters and Surfaces (page 437)
■Using Other Raster Image Formats (page 453)
■Modifying Raster Images (page 489)
To change options for images inserted with Raster Extension
■Set the resource file directory. (page 251)
■Change how frames are displayed. (page 253)
■Change image display quality. (page 254)
■Choose a method for detaching images. (page 255)
■Use Shift + Left-click to select raster images. (page 256)
■Set correlation defaults. (page 257)
■Configure image-related memory options. (page 259)
Quick Reference
MAPIOPTIONS
Specifies default image correlation settings, display options, detach options,
paths, and memory settings
250 | Chapter 2 Setting Up
Setup menu ➤ Raster Options
Menu
MAPIOPTIONSCommand Line
Raster Extension Options dialog boxDialog Box
Setting the Resource Files Directory
Resource files store information about the insertion point, scale, rotation, and
density of an image. The Resource File Directory indicates where AutoCAD
Map 3D searches for resource files for images you insert with Raster Extension
(not those you add with Data Connect). Resource files have the same base
name as the raster image with a .res extension.
When you insert an image, AutoCAD Map 3D looks for associated correlation
sources, such as world files, resource files, and tab files. By default, AutoCAD
Map 3D looks in the directory containing the image. However, for resource
files, you can specify an additional location. The additional location applies
only to resource files (.res). It does not apply to other correlation sources.
See also:
■Overview of Adding Rasters and Surfaces (page 437)
■Using Other Raster Image Formats (page 453)
■Modifying Raster Images (page 489)
■Viewing Image Information (page 474)
■Creating a Search Path for Raster Images (page 479)
To set the resource file directory
1In the Tool-based Ribbon Workspace, click Insert tab ➤ Image
panel ➤ angle-arrow.
2In the Raster Extension Options dialog box (page 1879), select the Paths
tab.
3Under Resource File Directory, type the directory path for the resource
files or click Browse to select a directory.
4If you want AutoCAD Map 3D to search the Resource File Directory before
searching the image directory, select Use Resource File Directory Before
Using Image Directory.
Setting Raster Image Options | 251

5Click OK to save your changes.
Quick Reference
MAPIOPTIONS
Specifies default image correlation settings, display options, detach options,
paths, and memory settings
Setup menu ➤ Raster Options
Menu
MAPIOPTIONSCommand Line
Raster Extension Options dialog boxDialog Box
Changing How Image Frames Are Displayed
For images you insert with Raster Extension, you can choose to display the
image frame in front of an image, behind an image, or you can hide the frame.
When the frame is behind the image, you can still select the image by selecting
the frame. However, if you hide the frame, you cannot select the image by
selecting the frame.
These options do not apply to images you add with Data Connect.
NOTE If you use the Toggle Frames command to hide frames, and then redisplay
them, the frames appear in front of the images.
See also:
■Overview of Adding Rasters and Surfaces (page 437)
■Using Other Raster Image Formats (page 453)
■Manually Adjusting the Image Frame During Insertion (page 465)
■Selecting an Image (page 493)
■Displaying Image Frames (page 494)
■Using Shift + Left-click to Select Images (page 256)
252 | Chapter 2 Setting Up

To change how image frames are displayed
1In the Tool-based Ribbon Workspace, click Insert tab ➤ Image
panel ➤ angle-arrow.
2In the Raster Extension Options dialog box (page 1879), select the General
tab.
3Under Display Preferences, select an option from the Image Frame list.
■Frame Drawn Above Image displays the frame above the image.
■Frame Drawn Below Image hides the frame behind the image. You
can still select the image by selecting the frame.
■Frames Off hides the frame. If frames are hidden, you select images
by pressing Shift + left-click select method (page 493).
4Click OK.
Quick Reference
MAPIOPTIONS
Specifies default image correlation settings, display options, detach options,
paths, and memory settings
Setup menu ➤ Raster Options
Menu
MAPIOPTIONSCommand Line
Raster Extension Options dialog boxDialog Box
Changing Image Display Quality
For images you insert with Raster Extension, you can choose high quality or
draft quality display. High quality dithers the pixels so that the areas between
shading appear more gradual. Draft quality can speed up the performance of
your system, but may reduce the quality of how some color and grayscale
images appear onscreen. These options do not affect images you add with
Data Connect.
NOTE The display quality setting affects only how AutoCAD Map 3D displays the
image onscreen. It does not alter the contents of the image file.
Setting Raster Image Options | 253
See also:
■Overview of Adding Rasters and Surfaces (page 437)
■Using Other Raster Image Formats (page 453)
■Modifying Raster Images (page 489)
■Changing Image Display Quality and Speed (page 498)
■Adjusting Image Brightness, Contrast, and Fade (page 496)
To change the image display quality
1In the Tool-based Ribbon Workspace, click Insert tab ➤ Image
panel ➤ angle-arrow.
2In the Raster Extension Options dialog box (page 1879), select the General
tab.
3Under Display Preferences, select a Display Quality option:
■High dithers the pixels, making differences in shading more gradual.
If you are using a 256 color palette to display images, dithering helps
make an image that has more than 256 shades appear more realistic.
■Draft does not dither the pixels. This setting is recommended for
bitonal images.
4Click OK.
Quick Reference
MAPIOPTIONS
Specifies default image correlation settings, display options, detach options,
paths, and memory settings
Setup menu ➤ Raster Options
Menu
MAPIOPTIONSCommand Line
Raster Extension Options dialog boxDialog Box
254 | Chapter 2 Setting Up

Choosing an Image Detach Method
When you delete images you added with Raster Extension, from a map,
information about that image is still stored in the map file. To delete this
information, detach the image. You can choose whether images are detached
automatically when you remove the last instance of the image from the map.
This option does not affect images you added with Data Connect.
See also:
■Overview of Adding Rasters and Surfaces (page 437)
■Using Other Raster Image Formats (page 453)
■Modifying Raster Images (page 489)
■Hiding, Unloading, Detaching, and Erasing Images (page 482)
To choose an image detach method
1In the Tool-based Ribbon Workspace, click Insert tab ➤ Image
panel ➤ angle-arrow.
2In the Raster Extension Options dialog box (page 1879), select the General
tab.
3Under Image Detach Preferences, select one of the following methods:
■Ask Before Detach prompts you to detach an image when you erase
all image frames that reference that image.
■Always Detach automatically detaches an image when you erase all
image frames that reference that image.
■Never Detach does not detach an image when you erase all image
frames that reference that image.
4Click OK.
NOTE You can manually detach an image by using the IMAGE command.
Quick Reference
MAPIOPTIONS
Setting Raster Image Options | 255
Specifies default image correlation settings, display options, detach options,
paths, and memory settings
Setup menu ➤ Raster Options
Menu
MAPIOPTIONSCommand Line
Raster Extension Options dialog boxDialog Box
Using Shift + Left-click to Select Images
For images you insert with Raster Extension, you can change your selection
method. This is useful when you are zoomed in on the image and you cannot
see the image frame. This option does not affect images you add with Data
Connect.
See also:
■Overview of Adding Rasters and Surfaces (page 437)
■Using Other Raster Image Formats (page 453)
■Selecting an Image (page 493)
■Modifying Raster Images (page 489)
To turn on Shift + left-click
1In the Tool-based Ribbon Workspace, click Insert tab ➤ Image
panel ➤ angle-arrow.
2In the Raster Extension Options dialog box (page 1879), select the General
tab.
3Select Shift + Left-click Image Select to be able to select images (page 493)
by pressing Shift and clicking the left mouse button.
Clear if you do not want to use this feature.
4Click OK.
Quick Reference
MAPIOPTIONS
256 | Chapter 2 Setting Up

Specifies default image correlation settings, display options, detach options,
paths, and memory settings
Setup menu ➤ Raster Options
Menu
MAPIOPTIONSCommand Line
Raster Extension Options dialog boxDialog Box
Setting Correlation Defaults
Most images have correlation data that is stored in the image file header or
in a correlation source file. However, some images may not have any
correlation data. For those cases, you can specify default correlation data. In
addition, if the correlation source does not contain information on scale or
density, AutoCAD Map 3D uses the default settings for those items.
NOTE If you have multiple images that require the same insertion point, scale,
rotation, and density, setting default correlation data can save you time .
See also:
■Overview of Adding Rasters and Surfaces (page 437)
■Using Other Raster Image Formats (page 453)
■Correlating a Raster Image During Insertion (page 462)
■Setting Image Density (page 467)
■Viewing Image Information (page 474)
■Modifying the Correlation Settings for an Image (page 501)
To set the correlation defaults
1In the Tool-based Ribbon Workspace, click Insert tab ➤ Image
panel ➤ angle-arrow.
2In the Raster Extension Options dialog box (page 1879), select the Image
Defaults tab.
3Under Insertion Point, type default insertion point coordinates in the X
and Y boxes. The precision of these points depends on the precision value
in the Drawing Units dialog box. For more information about the
AutoCAD UNITS command, see the AutoCAD help.
Setting Raster Image Options | 257
4To set an elevation for image frames, type the elevation in the Z insertion
point box.
This value is useful to establish the elevation of a floor plan image, for
example.
5In the Rotation box, type a default rotation angle for images. The unit
of measurement depends on the selected value in the Drawing Units
dialog box.
6In the Scale box, type a default scale for images. Image scale does not
change the scale of the vector drawing.
7In the Density box, type a default density for images. Usually this is the
scanned resolution. For example, if the majority of your images were
scanned at 300 dots per inch, then type 300 in this box.
8In the Units box, select the default unit for the insertion point and density
of images. For example, if the majority of your images were scanned at
300 dots per inch, then select Inch as the default.
9Click OK.
Quick Reference
MAPIOPTIONS
Specifies default image correlation settings, display options, detach options,
paths, and memory settings
Setup menu ➤ Raster Options
Menu
MAPIOPTIONSCommand Line
Raster Extension Options dialog boxDialog Box
Configuring Memory Use
AutoCAD Map 3D reserves 25% of the total physical memory (RAM) on your
system for inserting images with the Raster Extension. If you increase the
default amount, more of the physical memory is used for images and less is
available for other operations in AutoCAD Map 3D and for other applications
you might be running.
258 | Chapter 2 Setting Up

If you require additional memory for your images, the Raster Extension uses
a temporary swap file. For example, if you insert a 100 MB file, and the Memory
Limit is 8 MB, AutoCAD Map 3D stores the remaining 92 MB in a temporary
file. You can specify where the swap file is created.
You can change the following Raster Extension memory settings:
■Temporary File Location — The default directory for the temporary swap
files is the Windows temp directory.
TIP For best performance, use a local drive for your temporary swap file. It is
recommended that you do not use the drive where the operating system is
installed as the drive for the swap file unless this is your only local drive.
■Memory Limit — Specify the maximum amount of computer memory that
AutoCAD Map 3D can use to store image files.
NOTE The more physical RAM you have, the higher you can make your Memory
Limit. The higher the Memory Limit, the less swapping to hard disk occurs and
the faster your images load and display. However, do not allocate all available
physical RAM because doing so slows overall performance.
NOTE Close and restart AutoCAD Map 3D after adjusting these settings.
See also:
■Overview of Adding Rasters and Surfaces (page 437)
■Using Other Raster Image Formats (page 453)
■Unloading an Image (page 486)
To configure memory for images
1In the Tool-based Ribbon Workspace, click Insert tab ➤ Image
panel ➤ angle-arrow.
2In the Raster Extension Options dialog box (page 1879), select the Memory
tab.
3To locate a drive for your temporary swap file location, click Browse under
Temporary File Location, and locate a drive.
Setting Raster Image Options | 259

4To change the amount of memory reserved for inserting images, type a
new value in the Memory Limit box. Be careful that you do not use all
of your system resources.
NOTE You can click Default to return this setting to the recommended value.
5Click OK to accept the changes.
You must quit and restart AutoCAD Map 3D for these settings to take effect.
Quick Reference
MAPIOPTIONS
Specifies default image correlation settings, display options, detach options,
paths, and memory settings
Setup menu ➤ Raster Options
Menu
MAPIOPTIONSCommand Line
Raster Extension Options dialog boxDialog Box
Customizing and Automating Import and Export
Use profiles and .ini files to customize and automate import and export.
■To create a profile (page 263)
■To use a profile (page 263)
■To export to SHP as folder-based rather than file-based (page 269)
■To export to SHP as file-based rather than folder-based (page 269)
■To change the segmentation size for splines, polylines with bulges, arcs,
and ellipses (page 270)
■To change the default seed file for exporting DGN files (page 270)
■To export DGN files in imperial units rather than metric (page 270)
■To import Shapefiles, MIF/MID, TAB, or VPF as folder-based, multi-select,
or file-based (page 271)
■To specify DGN cell import options (page 272)
■To import objects using RGB (True Color) colors (page 272)
■To specify language encoding settings for GML in Asian languages (page
273)
■To specify object properties (page 274)
260 | Chapter 2 Setting Up
Overview of Customizing Import and Export
Use profiles and .ini files to customize and automate import and export.
Use this method...To customize or automate this...
Save a profile in the Export dialog box.
See Using Profiles (page 262)
Export settings
Save a profile in the Import dialog box.
See Using Profiles (page 262)
Import settings
Edit the mapexport.ini file.
See Customizing the Import and Export
.ini Files (page 264)
Export defaults
Edit the mapimport.ini file.
See Customizing the Import and Export
.ini Files (page 264)
Import defaults
Quick Reference
MAPEXPORT
Exports drawing objects and their attribute data to an external file format
Click File ➤ Convert DWG To ➤ Map 3D Export.
Menu
Export Map File
Icon
MAPEXPORTCommand Line
Export dialog boxDialog Box
MAPIMPORT
Imports an external file format into AutoCAD Map 3D
Click File ➤ Create DWG From ➤ Map 3D Import.
Menu
Import Map File
Icon
MAPIMPORTCommand Line
Customizing and Automating Import and Export | 261
Import dialog boxDialog Box
Using Profiles
To reuse or share your settings, save them as a profile.
Export Profiles
When you save an export profile, it does not store the current file name or
the current selection set.
When you load an export profile, if the specified data source doesn't exist,
Include Table Data is set to No.
Import Profiles
When you save an import profile, it does not store the current file name.
When you load an import profile, the table settings are reset for any input
layers that match an input layer name in the saved profile. Layers that do not
match an input layer in the saved profile are not reset.
■If the specified coordinate system code is not in the dictionary, the
coordinate system is set to <None>.
■If the data field name for a layer does not exist, the drawing layer is set to
Layer 0. If the specified drawing layer does not exist, it will be created.
■If the data field name to use for the block name does not exist, or if the
specified block does not exist, the block is set to ACAD_POINT.
When you load an import profile containing object class settings, AutoCAD
Map 3D checks for potential problems and handles them as follows:
■If the appropriate object classification file is not attached to the drawing,
the object class settings are ignored.
■If the object class settings for a layer contradict the import file, the object
class settings are not applied.
■If the specified object class does not exist, the object class assignment is
set to <None>.
■If the object class attribute settings conflict with the import file, AutoCAD
Map 3D displays the Conflict Resolution dialog box (page 1701).
262 | Chapter 2 Setting Up

Compatibility with Previous Releases
■Profiles saved with AutoCAD Map 3D 2004-2007 and versions 4.5, 5, and
6 are compatible with this release.
■Profiles saved with Autodesk Map 2000 Release 4 or earlier cannot be used
with this release.
■Profiles created in this release may contain additional information that
cannot be used with previous releases. Such incompatible profile
information is ignored when a profile is used in a previous release.
See also:
■Overview of Converting Geospatial Data to Drawing Objects (page 378)
■Overview of Converting and Exporting (page 1405)
To create a profile
1In the Import dialog box (page 1711) or Map Export dialog box (page 1723),
specify the settings to save.
2Click Save.
3Enter a name for the profile.
To use a profile
1In the Import dialog box (page 1711) or Map Export dialog box (page 1723),
click Load.
2Select the profile.
Quick Reference
MAPEXPORT
Exports drawing objects and their attribute data to an external file format
Click File ➤ Convert DWG To ➤ Map 3D Export.
Menu
Export Map File
Icon
MAPEXPORTCommand Line
Customizing and Automating Import and Export | 263

Export dialog boxDialog Box
MAPIMPORT
Imports an external file format into AutoCAD Map 3D
Click File ➤ Create DWG From ➤ Map 3D Import.
Menu
Import Map File
Icon
MAPIMPORTCommand Line
Import dialog boxDialog Box
Customizing the Import and Export .ini Files
Some of the defaults for import and export settings are stored in .ini
(initialization) files. When you use a new format with AutoCAD Map 3D, the
information about that format is added automatically to the .ini files. However,
in some instances, you may want to modify these files yourself. In addition,
you can set some formatting options in these files.
You can modify the following .ini files:
■mapexport.ini — Set options to export a file-based format as a folder based
format (which is especially useful for Shapefiles); to specify how to segment
arcs and circles; to define the default seed file for exporting DGN files
(which determines defaults such as units of measure and 2D vs. 3D); and
to specify language encoding settings for exporting GML data in Asian
languages.
■mapimport.ini — Set options to use for file or folder selection; to set default
import options for DGN; to import object colors to their RGB (True Color)
equivalent; and to specify language encoding settings for importing GML
data in Asian languages.
■mapforeignfileproperties.ini — Set options to specify linetype, line weight,
font, and justification.
264 | Chapter 2 Setting Up
Exporting to ArcView Shape Files
If you are exporting to ArcView Shape files, you can treat it as a folder-based
format. To do this, you must modify the following items in the MapExport.ini
file:
■Specify that it requires a folder rather than a file.
■Specify that it requires a prefix name.
■Specify that it no longer requires a type (point/line/polyline/text).
If you modify these items, be sure to modify them only for a driver that
supports this change.
Segmenting Certain Entity Types When Exporting
When you export Splines and polylines with bulges, they are broken into
polyline segments. The SegmentationDegrees option determines the number
of degrees used for segmentation. By default, SegmentationDegrees is 2 degrees.
In addition, when you exporting to a file format that does not support arcs
or ellipses, such as Shape or Coverage, or does not support ellipses that have
axes at an angle, such as MIF/MID, you can further modify the segmentation
by changing the value for FME_ARC_DEGREES_PER_EDGE. By default,
FME_ARC_DEGREES_PER_EDGE is 5 degrees.
You can change SegmentationDegrees and FME_ARC_DEGREES_PER_EDGE
to be larger or smaller.
Exporting to MicroStation DGN Files
When exporting to DGN files, AutoCAD Map 3D reads a seed file to determine
default information, such as whether the destination DGN file is be in imperial
units or metric and whether the file is 2D or 3D. There are separate seed files
for DGn version 7 and version 8. For more information about seed files, see
MicroStation Design (DGN) Versions 7 and 8 (page 405).
To change the default units of measure (or other defaults), you must change
the default seed files specified in the MapExport.ini file.
Specifying the File and Folder Selection Options to Use for Import
By default, when you import ArcView Shape files, MapInfo MIF/MID, MapInfo
TAB, or VPF files, you can select one or more files in a folder to import. This
is called multi-select.
Customizing and Automating Import and Export | 265
If you want, you can change the settings in the mapimport.ini file so that these
formats are considered folder-based formats (you select a folder and all the
files in the folder are imported) or single-select formats (only one file can be
selected for import). Note that VPF can be folder-based or multi-select only.
Importing DGN Cells
When you import data from a DGN file, you can specify many of the DGN
import options available in Driver Options.
Importing Object Colors as RGB (True Color) Colors
By default, objects are imported using the ACI (AutoCAD Color Index) color.
When you import from DGN or MIF/MID, you can specify that objects
maintain their RGB color values.
Even if you import using RGB colors, white objects are always imported to
the ACI White, which displays white on a black background and black on a
white background. Black objects are assigned the ByLayer color. If you want
to export objects to MIF/MID as black, change the layer color to black before
exporting.
Note that if your Model Tab Background color is something other than Black
or White and you import using RGB colors, you may not be able to see objects
whose color is close to the background color.
Language Encoding Settings for Importing and Exporting GML Data
When exporting GML data in Asian languages, you must verify that
mapexport.ini contains the language encoding settings needed to export valid
GML data for the language you want.
Using Fixed schema mode when exporting is recommended, as it can recognize
certain multi-byte characters that can be problematic in Create mode.
When importing GML data in Asian languages, you must verify that the
language encoding settings specified in AutoCAD Map 3D’s mapimport.ini
file match the settings in your incoming file. The settings must match for the
import to be successful.
Adding Custom Tags
If you are familiar with the options for a driver, you can add custom tags. Use
the format:
Driver:XXX
266 | Chapter 2 Setting Up
Where XXX is the code you want to send to the driver. Add the line to the
appropriate section of the MapExport.ini file. Incorrect tags will have
unpredictable results.
Location of the .ini File
When exporting, AutoCAD Map 3D looks first for the .ini file in the current
directory. If no .ini file is there, it uses the .ini file in the C:\Documents and
Settings\All Users\Application Data\Autodesk\AutoCAD Map 3D 2011\R18.1
folder. To always use the same settings, do not create additional .ini files.
Changing Font, Line Style, Line Weight, or Justification
You can set several formatting options in the mapforeignfileproperties.ini file.
Use the [DGN_V7_FieldMappping] or [DGN_V8_FieldMapping] section to
enable a particular formatting option:
■igds_font=MapFont
■igds_justification=MapJustification
■igds_weight=MapLineWeight
■igds_style=MapLineStyle
DGN Fonts
Use the [DGN_V7_Font] section or [DGN_V8_Font] section to map DGN font
numbers to textstyles that you've defined.
DGN Line Styles
Use the [DGN_V7_LineStyle] or [DGN_V8_LineStyle] section to map DGN line
styles to line styles loaded in the AutoCAD Map 3D drawing.
DGN Line Weight
Use the [DGN_V7_LineWeight] or [DGN_V8_LineWeight] section to map
DGN lineweights to allowable AutoCAD Map 3D lineweight values.
The DGN line weight range is 0-31. AutoCAD Map 3D line weights are in
100ths of a millimeter and only the following values are supported: 0, 5, 9,
13, 15, 18, 20, 25, 30, 35, 40, 50, 53, 60, 70, 80, 90, 100, 106, 120, 140, 158,
200, 211, -1, -2 and -3. The AutoCAD Map 3D values -1, -2, and -3 indicate
ByLayer, ByBlock, and by line weight default respectively.
DGN Justification
Customizing and Automating Import and Export | 267
Use the [DGN_V7_Justification] or [DGN_V8_Justification] section to map the
DGN justification to AutoCAD vertical and horizontal modes or AutoCAD
attachment.
DGN justification values range from 0-14:
0 is Left/Top, 8 is Center/Bottom, 1 is Left/Center, 9 is Right Margin/Top, 2
is Left/Bottom, 10 is Right Margin/Center, 3 is Left Margin/Top, 11 is Right
Margin/Bottom, 4 is Left Margin/Center, 12 is Right/Top, 5 is Center/Bottom,
13 is Right/Center, 6 is Center/Top, 14 is Right/Bottom, 7 is Center/Center,
Default is 5
The following values are supported for AutoCAD Map 3D justifications:
TopLeft, TopCenter, TopRight, MiddleLeft, MiddleCenter, MiddleRight,
BottomLeft, BottomCenter, BottomRight, BaseLeft, BaseCenter, BaseRight,
BaseAlign, BottomAlign, MiddleAlign, TopAlign, BaseFit, BottomFit, MiddleFit,
TopFit, BaseMid, BottomMid, MiddleMid, TopMid
MIF Justification
Use the [MIF_Justification] section to set justification for MIF. Allowed MIF
Justifications are left, center, and right.
When importing from MIF to AutoCAD Map 3D, the last mapping in the table
is used.
Arc/INFO and E00 Justification
Use the [ARCINFO_Justification] and [E00_Justification] sections to set
justification for Arc/INFO and E00.
When importing from Arc/INFO or E00 to AutoCAD Map 3D, the last mapping
in the table is used.
See also:
■Overview of Converting Geospatial Data to Drawing Objects (page 378)
■Overview of Converting and Exporting (page 1405)
■Supported Formats (page 1412)
■To export to SHP as folder-based rather than file-based (page 269)
■To export to SHP as file-based rather than folder-based (page 269)
■To change the segmentation size for splines, polylines with bulges, arcs,
and ellipses (page 270)
268 | Chapter 2 Setting Up
■To change the default seed file for exporting DGN files (page 270)
■To export DGN files in imperial units rather than metric (page 270)
■To specify DGN cell import options (page 272)
■To import Shapefiles, MIF/MID, TAB, or VPF as folder-based, multi-select,
or file-based (page 271)
■To import objects using RGB (True Color) colors (page 272)
■To specify language encoding settings for GML in Asian languages (page
273)
■To specify object properties (page 274)
To export to SHP as folder-based rather than file-based
1Open the mapexport.ini file using a text editor such as WordPad.
This file is located in the C:\Documents and Settings\All Users\Application
Data\Autodesk\AutoCAD Map 3D 2011\R18.1 folder
2Find the [SHP] section.
3Specify File=False.
4Specify Rootname=True.
5Specify EntTypes=All.
6Save and close the ..ini file.
To export to SHP as file-based rather than folder-based
1Open the mapexport.ini file using a text editor such as WordPad.
This file is in the C:\Documents and Settings\All Users\Application
Data\Autodesk\AutoCAD Map 3D 2011\R18.1 folder.
2Find the [SHP] section.
3Specify File=True.
4Specify Rootname=False.
5Specify EntTypes=Types.
6Save and close the .ini file.
Customizing and Automating Import and Export | 269

To change the segmentation size for splines, polylines with bulges, arcs, and
ellipses
1Open the mapexport.ini file using a text editor such as WordPad.
This file is in the C:\Documents and Settings\All Users\Application
Data\Autodesk\AutoCAD Map 3D 2011\R18.1 folder.
2Find the [Options] section.
3To change the segmentation of splines and polylines with bulges, edit
the SegmentionDegrees value to the number you want.
By default, the value is two degrees.
4To change the segmentation of arcs and ellipses, find the File section
pertaining to one of the following file formats: Arc/INFO, E00, MIF,
MapInfo, or Shape.
5Delete the semicolon at the beginning of the following line:
Driver:FME_ARC_DEGREES_PER_EDGE=5
6Change the FME_ARC_DEGREES_PER_EDGE value to the number you
want.
7Save and close the .ini file.
To change the default seed file for exporting DGN files
1Open the mapexport.ini file using a text editor such as WordPad.
This file is in the C:\Documents and Settings\All Users\Application
Data\Autodesk\AutoCAD Map 3D 2011\R18.1 folder.
2Find the [DGCN_V7] or [DGN_V8]section . This is where the default seed
file is specified.
3Change the default seed file to the seed file you want.
NOTE Make sure to choose a seed file for the appropriate version of DGN.
If you export to DGN version 7 using a DGN version 8 seed file, the operation
will fail.
4Save and close the .ini file.
To export DGN files in imperial units rather than metric
1Open the mapexport.ini file using a text editor such as WordPad.
270 | Chapter 2 Setting Up

2Find the [DGN_V7] or [DGN_V8]section.
3Change the default seed file to the seed file you want.
For example, change the default seed file to one that specifies imperial
units rather than metric:
Driver:RUNTIME_MACROS=_SEED,"C:\Program Files\Common
Files\Autodesk Shared\GIS\ImportExport\4.0\design\seed3d_ft.dgn"
NOTE Make sure to choose a seed file for the appropriate version of DGN.
If you export to DGN version 7 using a DGN version 8 seed file, the operation
will fail.
4Save and close the .ini file.
To import Shapefiles, MIF/MID, TAB, or VPF as folder-based, multi-select, or
file-based
1Open the mapimport.ini file using a text editor such as WordPad.
This file is located in the C:\Documents and Settings\All Users\Application
Data\Autodesk\AutoCAD Map 3D 2011\R18.1 folder
2Find the File section pertaining to one of the following file formats:
ShapeFile, MIF/MID, TAB, or VPF.
The File section is preceded by a comment such as, "This section
determines how you want to Import MIF/MID files" and has several lines
containing the word File.
3Delete the semicolon at the beginning of the line for the option you
want:
■File=MultiSelect
The format will be considered a multi-select, file-based format. This
means that you will be able to select one or more individual files in
the Import Location dialog box to include in the import process.
■File=SingleSelect
The format will be considered a single-select, file-based format. This
means that you will be able to select one file only in the Import
Location dialog box. Note that this is not a valid option for VPF.
■File=False
The format will be considered a folder-based format and all files in
the selected folder will be included in the import process.
Customizing and Automating Import and Export | 271

4Make sure there is a semicolon at the beginning of the line for the options
you do not want to use. The semicolon tells AutoCAD Map 3D to ignore
the line.
5Save and close the .ini file.
To specify DGN cell import options
1Open the mapimport.ini file using a text editor such as WordPad.
This file is in the C:\Documents and Settings\All Users\Application
Data\Autodesk\AutoCAD Map 3D 2011\R18.1 folder.
2Find the [DGN_V7_V8] section.
NOTE You can also use the Cell Expansion options in the Import dialog box
(page 405) to expand cells as blocks or points, or to explode them.
3Find Driver:DGN_XPAND_CELL.
4Change this to CELLS2BLOCKS, EXPLODECELLS, or CELLS2POINTS.
5Save and close the .ini file.
To import objects using RGB (True Color) colors
1Open the mapimport.ini file using a text editor such as WordPad.
This file is in the C:\Documents and Settings\All Users\Application
Data\Autodesk\AutoCAD Map 3D 2011\R18.1 folder.
2Find the Color section for either DGN_V7-V8 or MIF (MapInfo).
3Delete the semicolon at the beginning of the line for the option you
want:
■Color=Closest ACI only
The RGB values from the file will be converted to the closest ACI
value.
■Color=RGB only
The RGB values from the file will be preserved. Objects whose color
is black (0,0,0) will be assigned the color ByLayer. Objects whose color
is white (255,255,255) will be assigned the color ACI White.
■Color=Equivalent ACI and RGB
272 | Chapter 2 Setting Up

For any RGB value that exactly matches an ACI, the objects will be
imported using the ACI color value. All other objects will use their
RGB values.
4Make sure there is a semicolon at the beginning of the line for the options
you do not want to use. The semicolon tells AutoCAD Map 3D to ignore
the line.
5Save and close the .ini file.
To specify language encoding settings for GML in Asian languages
1Open the mapimport.ini or mapexport.ini file using a text editor such as
WordPad.
2Find the [GML2] section.
3Delete the semicolon at the beginning of the lines for the language
encoding settings you want to use. For example, for mapimport.ini, here
are the settings you can use for Japanese.
Driver:GML2_FEATURE_ENCODING=Shift-JIS
Driver:GML2_MAPPING_FILE_ENCODING=Shift-JIS
For mapexport.ini you can use:
Driver:GML2_FEATURE_ENCODING=Shift-JIS
Driver:GML2_OUTPUT_ENCODING=Shift-JIS
Driver:GML2_MAPPING_FILE_ENCODING=Shift-JIS
Below, is a summary of some of the specific settings you can use.
Possible SettingsLanguage
Big5Chinese
GB2312
GB18030
GBK
EUC-JPJapanese
Shift-JIS
EUC-KR
KSC5601
Korean
4Save and close the .ini file.
Customizing and Automating Import and Export | 273
To specify object properties
1Open the mapforeignfileproperties.ini file using a text editor such as
WordPad.
This file is in the C:\Documents and Settings\All Users\Application
Data\Autodesk\AutoCAD Map 3D 2011\R18.1 folder.
2For information on each of the settings, refer to the instructions in the
file.
Quick Reference
MAPEXPORT
Exports drawing objects and their attribute data to an external file format
Click File ➤ Convert DWG To ➤ Map 3D Export.
Menu
Export Map File
Icon
MAPEXPORTCommand Line
Export dialog boxDialog Box
MAPIMPORT
Imports an external file format into AutoCAD Map 3D
Click File ➤ Create DWG From ➤ Map 3D Import.
Menu
Import Map File
Icon
MAPIMPORTCommand Line
Import dialog boxDialog Box
Setting Up and Running Workflows
Use workflows to automate a set of activities.
■To use workflows (page 276)
■To run a workflow (page 278)
■To edit a workflow (page 284)
274 | Chapter 2 Setting Up
■To create a workflow (page 287)
■To change the display of the Workflow Designer window (page 289)
Overview of Workflows
Use workflows to automate a set of activities, such as the steps involved in an
overlay analysis (page 1309).
A workflow specifies the activities to perform and the parameters for those
activities. For example, in an overlay, the workflow specifies the feature classes
or layers to compare. You can specify that workflows prompt at run time for
the values of the parameters. If you prefer, you can specify the parameters in
the workflow itself and turn off the prompts. You can edit an existing workflow
or create one.
You can run built-in or custom workflows. The built-in workflows include:
■Overlay: Connect to (and create layers for) two data stores. Perform an
intersection overlay. Use the result of that overlay operation to erase the
portions of the layers that were within the intersection.
■Connect and Edit: Connect to SDF, SHP, and WMS data stores and add
the connected data to AutoCAD Map 3D. Execute the AutoCAD command
Pedit (pausing for user input), and then check in all features.
■Batch-save .Layer Files: Connect to each SDF file in a specified directory
and add it to AutoCAD Map 3D. Save each resulting Display Manager layer
as a .layer file.
■Connect, Analyze, and Print: Connect to a data store, add its data to
AutoCAD Map 3D as a Display Manager layer, and change the symbol for
that layer. Select a set of features for buffer analysis, create the buffer, and
change the symbol for the resulting buffer layer. Select the features on the
buffer layer and display their attributes. Plot the map.
■Select, Zoom, and Display Features: Load two .layer files. Prompt the person
running the workflow to select some features manually. Zoom to the
extents of the selected features and highlight them. Display the attributes
for the highlighted features. Select a different set of features by location.
Zoom to the extents of the selected features and highlight them. Display
the attributes for the highlighted features.
Overview of Workflows | 275
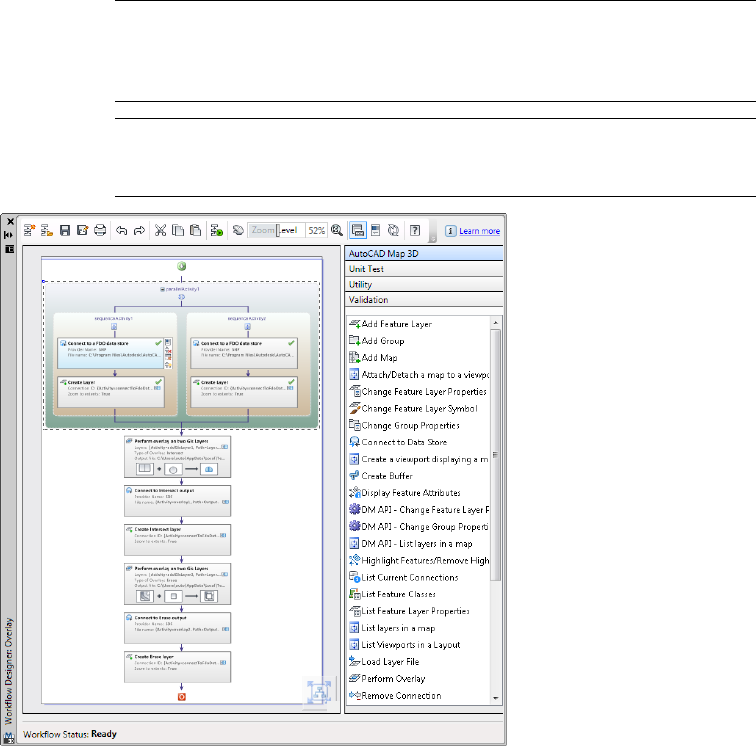
NOTE If you do not see the built-in workflows in the drop-down list of workflows,
click Open Workflow From File in that list and navigate to the Program
Files\Autodesk\AutoCAD Map 3D 2011\Sample\Workflow folder. Select the .xoml
file for the workflow to open.
NOTE If you use Windows 7, you must have write access to run a workflow. If
you have limited access, AutoCAD Map 3D cannot save the workflow. The workflow
must be saved before it is run.
Use the Workflow Designer to create or edit the sequence and parameters for the
activities in the workflow.
To use workflows
■To run a workflow (page 278)
■To edit a workflow (page 284)
■To create a workflow (page 287)
■To change the display of the Workflow Designer window (page 289)
276 | Chapter 2 Setting Up

Quick Reference
MAPWORKFLOWOPEN
Allows you to use a saved workflow
Click Setup menu ➤ Workflow Designer.
Menu
Open Workflow
Icon
MAPWORKFLOWOPENCommand Line
MAPWORKFLOWRUN
Runs a workflow
In the Classic workspace, click Setup menu ➤
Workflow Designer.
Menu
Run Workflow
Icon
MAPWORKFLOWRUNCommand Line
MAPWORKFLOWCREATE
Creates a workflow
Click Setup menu ➤ Workflow Designer.
Menu
MAPWORKFLOWCREATECommand Line
MAPWORKFLOWEDIT
Edits a workflow
Click Setup menu ➤ Workflow Designer.
Menu
Edit Workflow
Icon
MAPWORKFLOWEDITCommand Line
Overview of Workflows | 277
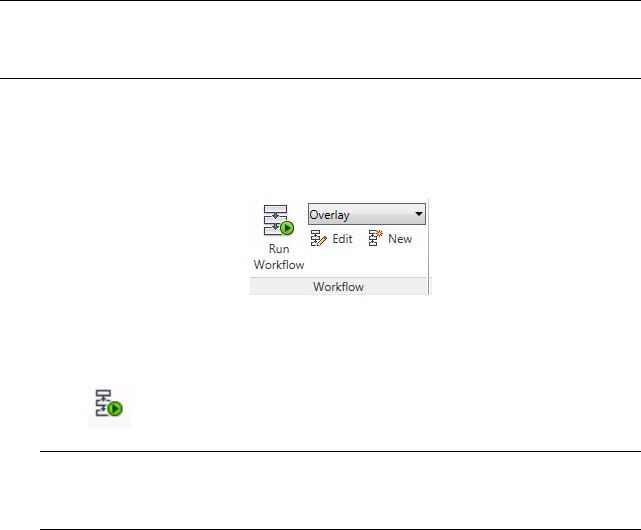
Running Workflows
A workflow automates a set of activities. A workflow can include activities
such as the following:
■Connecting to data
■Creating a Display Manager layer for a geospatial data store
■Performing an overlay analysis (page 1309)
■Chaining to another workflow
You can run any workflow, even if you did not create it. Recently used
workflows are listed on the Workflow drop-down list, which also contains an
option for opening any saved workflow. If the workflow requires information
from you (for example, the location of a file or data store), it prompts you
during run-time. For a list of the sample workflows provided with AutoCAD
Map 3D, see Overview of Workflows (page 275).
NOTE If you use Windows 7, you must have write access to run a workflow. If
you have limited access, AutoCAD Map 3D cannot save the workflow. The workflow
must be saved before it is run.
To run a workflow
1In the Tool-based Ribbon Workspace, on the Tools tab ➤ Workflow
panel, select a workflow from the list.
If the workflow you want is not in the list, click Open Workflow From
File at the bottom of the list.
2Click .
NOTE If you use Windows 7, you must have write access to run a workflow.
If you have limited access, AutoCAD Map 3D cannot save the workflow. The
workflow must be saved before it is run.
278 | Chapter 2 Setting Up
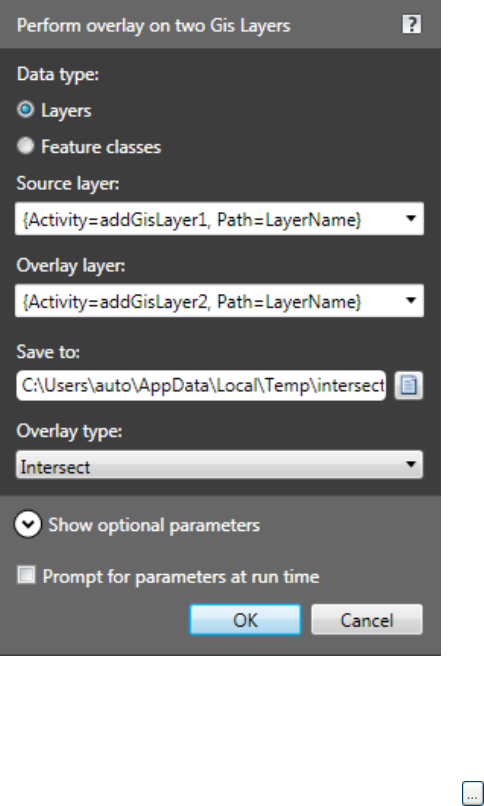
3If prompted, specify the values for the parameters of the workflow.
For example, the Overlay workflow requires you to specify the data store
to connect to.
If the workflow requires parameters for any of its activities,
it displays a prompt.
■To connect to database, specify login credentials.
■To connect to a file, select the appropriate provider and click and
navigate to the file.
■To connect to a SHP folder instead of a file, select the SHP provider
and click the folder icon to specify the folder.
Running Workflows | 279
The workflow performs the activities in its definition and displays the
result.
For example, the built-in Overlay workflow connects to the specified data
stores, performs the overlay, and displays the resulting layers in your
map. The overlay itself is saved to the specified SDF file. AutoCAD Map
3D Connects to that SDF file and adds a Display Manager layer for it. The
connections appear in Map Explorer and in the Data Connect window.
NOTE If the workflow fails, an error message displays. Open the Workflow
Designer to find the error. The activity that failed displays a red X or an
exclamation mark.
4If you changed any parameters in response to a prompt, you can save or
discard the changes when the workflow is complete.
Quick Reference
MAPWORKFLOWOPEN
Allows you to use a saved workflow
Click Setup menu ➤ Workflow Designer.
Menu
Open Workflow
Icon
MAPWORKFLOWOPENCommand Line
MAPWORKFLOWRUN
Runs a workflow
In the Classic workspace, click Setup menu ➤
Workflow Designer.
Menu
Run Workflow
Icon
MAPWORKFLOWRUNCommand Line
280 | Chapter 2 Setting Up
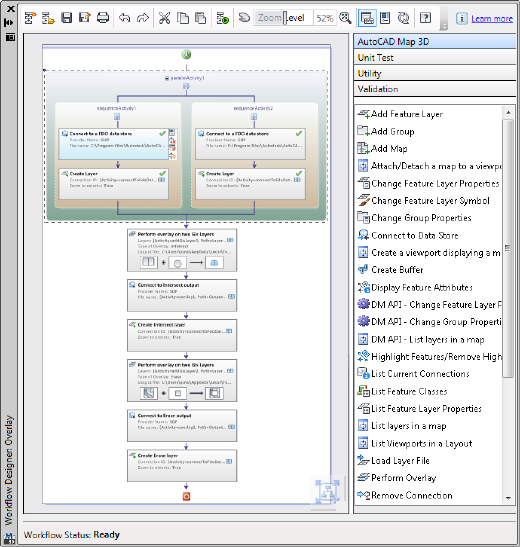
Editing or Creating Workflows
A workflow automates a set of activities. You can change any existing workflow
or create one from scratch. For example, change the predefined Overlay
workflow to perform a Union, rather than an Intersect. Create a workflow to
connect to a set of data stores and add Display Manager layers for them.
Use the Workflow Designer to edit or create workflows.
Activities in the workflow appear as a diagram in the Workflow Designer.
Utility and AutoCAD Map 3D Activities
The Activity panel on the right side of the Workflow Designer contains two
categories of activities. AutoCAD Map 3D activities are specific to AutoCAD
Map 3D (including an activity that runs AutoCAD commands).
Utility activities are generic, and are based on C# syntax. They include the
following types of activities:
■Directory commands (such as listing the contents of a folder)
Editing or Creating Workflows | 281

■Logical commands (such as If/Else and For Each)
■Workflow structure commands (such as Parallel, Sequence, and Prompt
User).
For information about the available activities, see Workflow Activity Input
dialog boxes (page 2025).
Parallel and Sequence Activities
In a workflow, parallel activities are independent of one another. For example,
when connecting to two data stores, parallel connections ensure that the
second connection executes even if the first one fails.
A sequence activity depends on previous activities. For example, within the
parallel activity at the top of the overlay workflow are two sets of sequence
activities. Each one connects to a particular data store and then creates a layer
for that data store. If the connection fails, the layer cannot be created.
Setting Activity Parameters
Each workflow activity has a set of parameters. Optionally, you can set default
parameters and specify that the workflow display a prompt at run-time. The
person running the workflow can then substitute other values. For example,
you can set default data stores for an overlay, but allow others to substitute
different data stores when they run the workflow.
Some parameters are required. For example, a Connect To Data Store activity
requires the name of the provider and the location of the data store to connect
to. Some parameters are optional, for example, the Display Name for the
activity. All optional parameters have default values you can change.
NOTE Although Display Name is optional, it is a good idea to name all activities.
If activities are not named, you can confuse them when you bind a parameter of
one activity to the output of a previous one. See the following section.
Binding Parameters
Often, a sequence activity is bound to a preceding activity. When you bind an
activity, you set its parameter to be the result of a previous activity. For
example, you can use the output of an activity that creates a layer as the source
layer for a subsequent overlay operation.
282 | Chapter 2 Setting Up
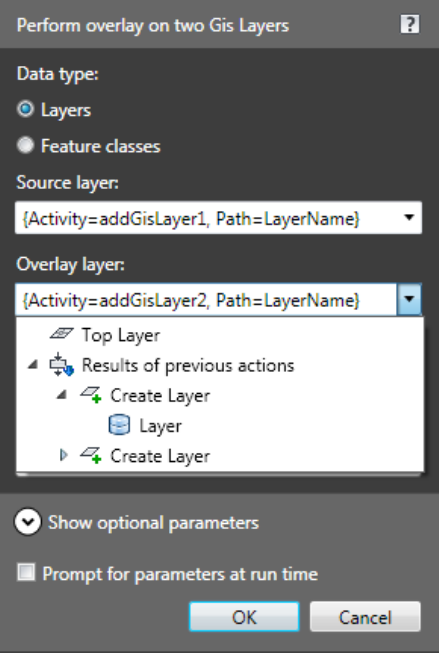
Bind the parameter for an activity to a property from a
previous activity.
Adding Activities to Workflows
If you can write simple code in a .NET-compliant language, you can add
activities to the Workflow Designer. Workflow activities perform predetermined
functions based on predetermined sets of inputs.
Use the sample activity set (Automation) as a model. Automation contains
activities for running AutoCAD Map 3D in an automated fashion, without
using the actual application. The files for this sample activity are installed
with the ObjectARX SDK.
Editing or Creating Workflows | 283
Build your activities in a .NET class library (a .dll file). Place this .dll file in the
\Program Files\AutoCAD Map 3D 2011\PlugIns\Workflow\Activities folder and
restart AutoCAD Map 3D. The activities then appear in the Workflow Designer.
For more information on creating custom workflow activities, see the
sdk.doc.main.chm.
■To edit a workflow (page 284)
■To create a workflow (page 287)
To edit a workflow
1In the Tool-based Ribbon Workspace, click Tools tab ➤ Workflow panel.
Select a workflow from the drop-down list.
If the workflow you want is not in the list, click Open Workflow From
File at the bottom of the list. After you open a workflow, select it from
the list.
NOTE If you use Windows 7, you must have write access to run a workflow.
If you have limited access, AutoCAD Map 3D cannot save the workflow. The
workflow must be saved before it is run.
2In the Tool-based Ribbon Workspace, click Tools tab ➤ Workflow
panel ➤ Edit.
3In the Workflow Designer (page 2022), pan or zoom (page 289) as needed.
4If necessary, expand the activity to edit.
For example, to change the settings for activities inside the Parallel
Activity at the top of the workflow, click its plus sign. The Parallel Activity
contains activities for the feature classes that are compared in the Overlay
workflow and creates the Display Manager layers for these feature classes.
NOTE To set parameters for some utility activities (For Each, If/Else, and
While), click in the Workflow Designer toolbar. In the Properties palette
that displays, click the cell for the parameter to set. Click the browse button
that appears to select parameters from a list, if available.
5To set the parameters for an activity (page 2025), do any of the following:
■Double-click the activity box.
■Click .
284 | Chapter 2 Setting Up
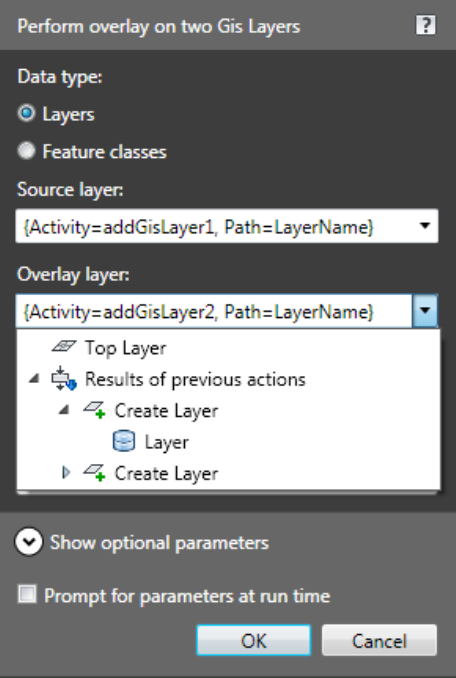
■Right-click the activity and click Set Up Parameters.
For information about the available activities and their parameters, see
Workflow Activity Input dialog boxes (page 2025). For a tutorial on
workflows, see Lesson 5: Edit a Predefined Workflow.
6To bind an activity to the output of a previous activity from the input
editor, do the following:
■In the activity input dialog box for the activity, click the down arrow
next to the parameter to bind.
■Under Results Of Previous Actions, click the property to bind to.
To use a layer created by a previous activity, select it from the
list under Results Of Previous Actions.
Editing or Creating Workflows | 285
NOTE There is a shortcut for adding an activity and automatically binding
it to the previous activity. Right-click an activity and click the activity to add.
For example, right-click an Overlay activity and click Add Feature Layer to
create a new Display Manager layer that stores the output of the Overlay
operation.
7Optionally, do any of the following:
■To add another activity, drag it from the Activities panel to the desired
position in the workflow diagram, or right-click the activity that
precedes the new one.
When you right-click, the list contains activities that would logically
follow the current one. When you add an activity in this way, you
can automatically bind it to the one you right-clicked. For example,
right-click an Overlay activity and click Add Feature Layer to create a
new Display Manager layer that stores the output of the Overlay
operation.
■To delete an activity, click on its box.
■To turn the run-time prompt for an activity on or off, click on its
box.
When the run-time prompt is on, anyone running this workflow must
provide the input for this activity. For example, the person running
the workflow must provide data store connection information for a
Connect To Data Store activity.
■To disable or enable the activity, click on its box.
Disable an activity temporarily to resolve problems with a workflow.
If you are not sure which activity is causing the problem, disable them
one at a time when you run the workflow. This can isolate the issue.
■Undo or redo any changes during this editing session using
8Save any changes to the workflow by clicking at the top of the
Workflow Designer window.
To save your changes as a new workflow, click instead.
Workflows saved in AutoCAD Map 3D 2011 format cannot be opened
in AutoCAD Map 3D 2010. To use your workflow with AutoCAD Map
3D 2010, make sure that the workflow contains only activities that were
286 | Chapter 2 Setting Up

supported in that version. Then use Save As and change Save As Type to
Map 3D 2010 Workflow File. To maintain the version formatting, you
must continue to use the 2010 Save As option each time you save the
workflow
9Click to run the workflow from within the Workflow Designer,
which validates the activities.
As each activity executes successfully, a green check mark appears at the
top right corner of the activity box. If an exclamation mark appears
instead of the check mark, the activity is missing parameter values. Click
the exclamation point to see what is missing and correct the problem. If
a red X appears instead of the check mark, the activity failed.
Click the status link in the Workflow Status area (at the bottom of the
Workflow Designer window) to see the log.
In the log window, find the row for the activity that failed. The description
column explains the error.
10 Optionally, click to print the workflow.
To create a workflow
1In the Tool-based Ribbon Workspace, click Tools tab ➤ Workflow
panel ➤ New.
2To create a workflow that uses multiple data connections, add a Parallel
activity.
■In the Workflow Designer (page 2022), click the System panel header
on the right side of the window.
■Drag the Parallel activity to the diagram area in the Workflow Designer
(where you see Drag And Drop Map Activities Here).
Use a separate Sequence activity for each connection. By default, the
Parallel activity has two Sequence activities. If you need more, drag
them into the Parallel activity.
■For each connection, drag a Connect To Data Store activity into a
Sequence activity.
■To create a layer for these connections, use an Add Feature Layer
activity. Drag this activity just below each Connect To Data Store
activity (within the Sequence activity for that connection).
Editing or Creating Workflows | 287
3To create a workflow that uses a single data store, do the following:
■Drag the Connect To Data Store activity to the diagram area in the
Workflow Designer (where you see Drag And Drop Map Activities
Here).
■Optionally, create a layer for the connection by dragging a Create
Feature Layer activity just below it.
4Add any other desired activities.
For information about the available activities and their parameters, see
Workflow Activity Input dialog boxes (page 2025). For a tutorial on
workflows, see Lesson 5: Edit a Predefined Workflow.
NOTE To set parameters for some utility activities (For Each, If/Else, and
While), click in the Workflow Designer toolbar. In the Properties palette
that displays, click the cell for the parameter to set. Click the browse button
that appears to select parameters from a list, if available.
5Save the workflow by clicking at the top of the Workflow Designer
window.
Workflows saved in AutoCAD Map 3D 2011 format cannot be opened
in AutoCAD Map 3D 2010. To use your workflow with AutoCAD Map
3D 2010, make sure that the workflow contains only activities that were
supported in that version. Then use Save As and change Save As Type to
Map 3D 2010 Workflow File. To maintain the version formatting, you
must continue to use the 2010 Save As option each time you save the
workflow
6Click to run the workflow from within the Workflow Designer,
which validates the activities.
As each activity executes successfully, a green check mark appears at the
top right corner of the activity box. If an exclamation mark appears
instead of the check mark, the activity is missing a parameter. If a red X
appears, the activity failed. Click the link in the Workflow Status area (at
the bottom of the Workflow Designer window) to see the log.
7Optionally, click to print the workflow.
288 | Chapter 2 Setting Up

Quick Reference
MAPWORKFLOWCREATE
Creates a workflow
Click Setup menu ➤ Workflow Designer.
Menu
MAPWORKFLOWCREATECommand Line
MAPWORKFLOWEDIT
Edits a workflow
Click Setup menu ➤ Workflow Designer.
Menu
Edit Workflow
Icon
MAPWORKFLOWEDITCommand Line
Changing the Workflow Designer Display
As you work in the Workflow Designer, you can do the following:
■Adjust the magnification and focus of the design area
■Refresh the display
■Hide or show the Settings and Activities panels
The Settings panel displays the parameters for the selected activity in an
editable table. The Activities panel displays the list of activities you can add
to a workflow.
To change the display of the Workflow Designer window
■To pan or zoom, use these techniques:
■To move to a different part of the workflow, use the scroll bars or click
Pan.
■To zoom in or out, adjust the magnification slider.
■To zoom to the extents of the workflow, click Show The Entire
Workflow.
Changing the Workflow Designer Display | 289
Pan, zoom, or show
the entire workflow.
■To show or hide the activities panel, click
■To show or hide the Settings panel for the selected activity, click .
In the Settings panel, you can view and edit values for the parameters of
the current activity. Click the cell for the parameter to set. Click the browse
button that appears to select parameters from a list, if available.
NOTE To set parameters for some utility activities (For Each, If/Else, and While),
you must use the Properties palette (instead of the input editor).
■To refresh the display, click .
290 | Chapter 2 Setting Up
Bringing In Data
Overview of Bringing In Data
A map file in AutoCAD Map 3D is a specialized drawing (DWG) file in which
you can combine data from many sources. A map file holds all the information
required to create, edit, view, and publish your map, including the following:
■AutoCAD drawing objects and information about attached drawing files
■Attribute or point data stored in a spreadsheet or database that can be linked
to drawing objects
■Information required to connect to databases like Oracle and ArcSDE
■Information required to connect to geospatial features stored in a relational
database, such as Microsoft® SQL Server, SQL Server Spatial, Oracle® Spatial,
PostgreSQL/PostGIS, and MySQL
■Information required to connect to geospatial features stored in a geospatial
data file format, such as an ESRI® SHP, Microsoft® SQLite, or Autodesk® SDF
file
■Information required to connect to geospatial features stored in middleware,
such as ESRI® ArcSDE®
■Information required to connect to web-based resources such as WFS (Web
Feature Service) sites and WMS (Web Map Service) sites
■Information needed to connect to raster images, including DEM (page 2059)
surfaces that show elevation
■Metadata
■Styling information
3
291

■Map layouts
■Data from third-party providers, leveraging the power of Open Source
AutoCAD Map 3D is your window onto all this data. You have two ways to
access data: you can connect to drawing files, geospatial files, or other data
sources and view and edit entities in their original sources, saving your changes
in the native format; or you can convert the data to DWG format, breaking
any connection to the original source.
To get this result...Use this method...To do this...
All features in the selected feature
class appear in the map. Any edits
Edit features from the
following sources in
their native format:
1In Display Manager,
click Data ➤ Connect
To Data. you make are saved back to the
original source.
■ArcSDE (page 316) 2Select the data source
and feature classes.
■Autodesk SDF
(page 337)
■ESRI SHP (page
335)
■MySQL (page 332)
■ODBC (page 342)
■Oracle (page 312)
■PostgreSQL/Post-
GIS (page 340)
■SQL Server (page
323)
■SQL Server Spatial
(page 323)
■SQLite (page 323)
■WFS (page 346)
If you use a provider to connect
to the data, you can edit it dir-
Use formats that are
not listed in the Data
■To connect to the data,
use an open-source or
Connect window
(page 540)
ectly in its native format. If you
convert and import it, you edit a
copy of the data in DWG format.
third-party provider
(page 540).
■To use a copy of the data
(page 378), Click Insert
292 | Chapter 3 Bringing In Data
To get this result...Use this method...To do this...
tab ➤ Import pan-
el ➤ Map Import .
Both the original data for the fea-
ture layer and the joined data ap-
pear in the Data Table.
Join attribute data to
features from Oracle,
SDF, etc. (page 507)
1Connect to the source
of attribute data (for
example, connect to an
ODBC source such as a
Microsoft Access table)
from the Task Pane.
Click Data ➤ Connect
To Data.
2Right-click a layer and
click Create A Join.
3Specify the connected
attribute data source.
Only the objects that match your
query are added to the map.
Add DWG objects
from the current
drawing (page 350)
1In Display Manager,
click Data ➤ Add
Drawing Data ➤
Query Current Draw-
ing.
2Define a query to re-
trieve objects.
Only the objects that match your
query are added to the map.
Add drawing objects
from other drawings
1Attach the drawings to
the current drawing.
(page 154). When you edit the objects, you
can choose to update the original
drawings or not.
2In Display Manager,
click Data ➤ Add
Drawing Data ➤
Query Source Drawing.
3Define a query to re-
trieve objects. See
Bringing In Drawing
Data From DWG Files
(page 350).
Overview of Bringing In Data | 293
To get this result...Use this method...To do this...
A copy of the data is added to the
map in DWG format. The connec-
Convert geospatial
data to drawing data
(page 378)
■Click Insert tab ➤ Import
panel ➤ Map Import .
tion to the original source is
broken, and changes are not
saved back to that source.
A copy of the data is added to the
map in DWG format. The connec-
Convert SDF files to
drawing data (page
387)
■Click Insert tab ➤ Import
panel ➤ Map Import .
Use this method
tion to the original source is
broken, and changes are not
saved back to that source.
for the current version of
SDF. See Overview of
Converting Geospatial
Data to Drawing Objects
(page 378).
■In the Tool-based Ribbon
Workspace, click Insert
tab ➤ Import panel ➤
SDF2. Use this method
for the version supported
by MapGuide 6.5 and
earlier. See Importing
Autodesk SDF 2 (page
389).
You can view or edit the data by
double-clicking the table name in
Map Explorer.
Add attribute data to
use with drawing ob-
jects
1Add the data source to
the map. See Setting
Up Data Sources for
Drawings (page 204).
2Define a link template
for the data. See Creat-
ing a Link Template
(page 525).
3Link records to drawing
objects. See Manually
Linking Database Re-
cords to Objects (page
528).
294 | Chapter 3 Bringing In Data
To get this result...Use this method...To do this...
The image appears in your map,
where you can style it or move it
behind other features.
Add raster images
(page 437) in the follow-
ing formats:
DEM, ESRI Grid, DTED,
JPEG and JPEG2K ,
1In Display Manager,
click Data ➤ Connect
To Data.
2Specify the folder that
contains the raster and
select the raster.
PNG, MrSID, TIFF,
ECW
The image appears in your map,
where you can clip it (page 504)
Add raster images in
other formats (page
454)
1Click Home tab ➤ Data
panel ➤ Insert An Im-
age.
or change its transparency (page
499), brightness and other settings
(page 489).
2Select the image and
specify the image
placement and settings.
For ECW and MrSID formats,
you must download the free
raster object enabler available
from autodesk.com
The data appears in your map like
any other SDF or DEM data.
Connect to data from
Civil 3D (page 543)
1From Civil 3D, export
feature data (such as
parcels and alignments)
in SDF format and save
surfaces in DEM format.
2Connect to the result-
ing files in AutoCAD
Map 3D.
The survey points appear in your
map and are stored in a new sur-
vey data store.
Add survey data (page
370)
■Add LandXML files (page
371).
■Add ASCII point data
(page 373).
See also:
■Creating a Map (page 296)
Overview of Bringing In Data | 295

Before You Bring In Data
Creating a Map
When you create a new map file, you do the following:
■Choose a template.
The map2d.dwt template contains the optimal display settings, tools, and
views for 2D maps, while the map3d.dwt template is optimized for 3D
maps. You can also create your own templates. For information on this,
see the AutoCAD Help topic called “Use a Template File to Start a Drawing.”
■Assign a coordinate system.
Data you add to your map file is transformed to use the coordinate system
assigned to your map. When you save it back to its source, it is transformed
back to its original coordinate system.
■Add data.
You can combine data from many sources.
■Geospatial data
For many geospatial formats, such as Oracle and ArcSDE, you can
connect to the source to add data using FDO (page 2062) Data Access
Technology. You access data live, in its native format. You can extend
your data access capabilities by adding an open source or third-party
FDO provider (page 2063).
You can also convert data from most of these formats to DWG format.
To do this, you import the data (rather than connect to it). However,
this method adds only a snapshot of the data and your changes do not
update the data at its source.
For other formats, such as MicroStation Design (DGN) and Arc/INFO,
you must import the data.
■Drawing (DWG) data
You can attach AutoCAD drawing files to your map and query in objects
from those drawings, or import data from non-drawing sources to add
it as drawing data.
NOTE When you import data, you make a copy of the data and bring that
copy into your map as drawing objects. When you edit the data, you are
editing the copy. The original data is unchanged.
■Raster data
296 | Chapter 3 Bringing In Data
Connect to raster images and surfaces, or use the Raster Extension
feature.
■Attribute data
Join additional attributes to GIS features, or add attributes to drawing
objects using database linking or object data.
■Data from AutoCAD Civil 3D
Export Civil 3D feature data, such as parcels and alignments, in SDF
format. Connect to the resulting SDF file in AutoCAD Map 3D. You
can also save surfaces as DEMs in Civil 3D and connect to the resulting
DEM files in AutoCAD Map 3D. You can also bring in LandXML files
using the Survey feature.
■Survey Data
Create a new survey data store and then bring in LandXML or ASCII point
data.
■Create Display Manager layers.
Geospatial data that you add to your map is automatically organized into
display layers by feature class. You can also add drawing data to layers.
Layers give you control over draw order (Z-order), styling, and more.
See also:
■Assigning a Coordinate System to the Current Drawing (page 147)
■Bringing in GIS Features (page 303)
■Overview of Bringing in Drawing Data From DWG Files (page 351)
■Converting Data From Other Formats to Drawing Objects (page 377)
■Joining Data to GIS Features (page 507)
■Adding Attributes to Drawing Objects (page 521)
■Adding Rasters and Surfaces (page 437)
■Using Open Source FDO Providers (page 540)
■Bringing In AutoCAD Civil 3D Data (page 543)
■Bringing in Survey Data (page 370)
■Organizing Layers in Your Map (page 300)
■Overview of Visualization and Styling (page 631)
Creating a Map | 297

■Overview of Creating Themes (page 1163)
■Overview of Creating New Features (page 686)
■Getting Help with AutoCAD (page 58)
To create a map
1Start a new drawing, choosing either the map2d.dwt or map3d.dwt
template, or a custom map template you created.
2Assign a coordinate system to the map. (page 147)
NOTE If you do not assign a coordinate system to the map, data that you
bring into the map will appear using its native coordinate system. If you bring
in data from more than one coordinate system, entities may not align correctly
in the map.
3Add features (page 308) and drawing objects (page 354)to the map.
To add geospatial data to a map
■Drag and drop file-based sources into your map.
■Use Data Connect to connect to any non-DWG data source and add
the feature classes you want.
■Use data-based queries to add a subset of data from the data source
to your map.
To add AutoCAD drawing data to a map
■Use data-based queries to add objects from a drawing (find all objects
on a particular layer, all objects of a certain size, all objects with certain
properties).
■Define areas to add (draw a selection window).
■Add specific drawing layers.
4Optionally, add attribute data to features (page 507) and drawing objects
(page 521).
5Optionally, To add a raster-based surface to your map (page 442).
298 | Chapter 3 Bringing In Data
6Optionally, add open-source or third-party providers (page 540) to access
additional data formats, add data from AutoCAD Civil 3D (page 543), or
add survey data (page 370).
7Organize the layers (page 300) that comprise your map.
8Change the appearance of the map using styles (page 631) and themes
(page 1163).
NOTE You can create multiple display maps from the same data. See Creating
Multiple Display Maps (page 638).
9Optionally, create new features (page 688) or drawing objects. You can
use many AutoCAD commands (page 58).
Quick Reference
ADESETCRDSYS
Assigns a global coordinate system code for the current drawing or attached
drawings
Setup menu ➤ Assign Global Coordinate System
Menu
Assign Coordinate System
Icon
ADESETCRDSYSCommand Line
In Map Explorer, right-click Current
Drawing ➤ Coordinate System
Task Pane
Assign Global Coordinate System dialog boxDialog Box
ADEATTACHDATA
Attaches object data to objects
Create menu ➤ Attach/Detach Object Data
Menu
Attach/Detach Object Data
Icon
ADEATTACHDATACommand Line
Attach/Detach Object Data dialog boxDialog Box
Creating a Map | 299
Connect Feature Source
Connects a feature source
Click File ➤ Connect To Data.
Menu
Connect
Icon
MAPCONNECTCommand Line
In Display Manager click Data ➤ Connect to Data.
Task Pane
Organizing Layers in Your Map
Display Manager organizes the data in your map into layers, which you can
display and style independently. Each layer contains one type of data. For
example, you might have a layer of drawing objects, a layer that represents a
feature class from Oracle, a DEM surface layer, and a raster image layer. When
you use FDO (page 2062) to connect to a data source (via Data Connect), each
feature class or image in that data source becomes a separate layer
automatically. You can create drawing layers for drawing objects, and these
objects can be members of multiple layers.
NOTE Display Manager layers are different from the classic “AutoCAD layers” you
see in the Layer Properties Manager. AutoCAD users cannot see Display Manager
layers unless they use AutoCAD Map 3D. You use different techniques to style the
two different layer types.
View the layers in Display Manager in two ways:
■Groups organizes the list of layers. For example, you can create a group
for as-built data and a separate group for proposed changes.
■Draw Order determines the draw order of the layers. Items at the top of
the draw order are drawn on top of items below them on the list.
If an object is a member of more than one layer, it inherits the style of each
layer of which it is a member. For example, if a line is in both the
Transportation layer and the Roads layer, it inherits the styles of both layers.
If the layers specify conflicting style or visibility settings, the object uses the
style and visibility settings of whichever layer is higher in the Display Manager
list.
300 | Chapter 3 Bringing In Data
You can specify a thumbnail icon for drawing layers, which is used in Display
Manager and in any legends you create for this map. This affects drawing
layers only, and is not available for feature layers.
See also:
■Overview of the Display Manager (page 634)
■Controlling Display Order (page 636)
■Bringing in GIS Features (page 303)
■Bringing In Drawing Data From DWG Files (page 350)
■Adding Rasters and Surfaces (page 437)
■Converting Data From Other Formats to Drawing Objects (page 377)
■To add a feature layer using FDO (Oracle, ArcSDE, SDF, SHP, WFS) (page
301)
■To add a drawing layer (page 301)
■To add a raster-based surface to your map (page 442)
■To create a group (page 301)
■To change the draw order (page 302)
■To change the thumbnail style for a drawing layer (page 302)
To add a feature layer using FDO (Oracle, ArcSDE, SDF, SHP, WFS)
■Connect to the FDO source. (page 303)
To add a drawing layer
■Attach a drawing and query in objects (page 350)
To add a raster or surface layer
■Connect to the raster or surface file or folder. (page 437)
To create a group
1In Display Manager (page 2060), click Groups.
Organizing Layers in Your Map | 301
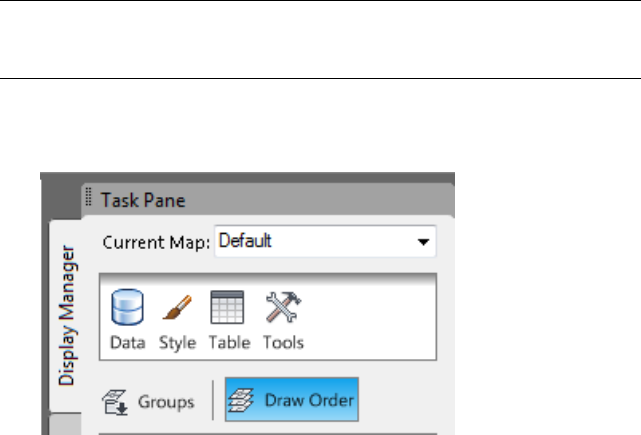
2In Display Manager (page 2060), click Data ➤ New Group.
3To change the group name, select the group then click the existing name.
Type a new name and press Enter.
4Drag layers into the group.
NOTE Until you use the Draw Order view to specify a draw order, AutoCAD Map
3D uses the Groups order as a default draw order for the map. Once you use the
Draw Order view, changes in the Groups view do not affect the draw order.
To change the draw order
1In Display Manager (page 2060), click Draw Order if needed.
2Drag layers up or down to change their display order.
Items at the top of the draw order are drawn on top of items below them on
the list.
To change the thumbnail style for a drawing layer
1Select the layer.
2In Display Manager (page 2060), click the Style button.
3On the Display tab of the Properties palette, next to Thumbnail Preview,
select the style of thumbnail to use.
For example, select the polyline icon to display an icon of a wavy line,
or choose the polygon icon to display hatch or fill.
302 | Chapter 3 Bringing In Data

This setting affects both the Display Manager layer and the legend for this
map.
Quick Reference
Change the display order of Display Manager layers
Control which layers appear on top (or behind) other layers
In Display Manager, drag an item up or down in the
list
Task Pane
New Display Manager Group
Creates a new Display Manager group
In Display Manager, click Data ➤ New Group
Task Pane
Sort Layers in Display Manager
Sorts the map layers alphabetically
In Display Manager, click the thin down arrow next
to the Map list and choose Sort Contents
Task Pane
Bringing in GIS Features
NOTE This topic applies to geospatial data. To bring in drawing (DWG) objects,
see Overview of Bringing in Drawing Data From DWG Files (page 351).
When you access data through FDO (page 2062), you use an FDO provider (page
2063) to connect directly to a data source, such as SDF, SHP, Oracle, SQL Server,
or ArcSDE, and work in its native format.
For FDO data sources with geometry, you select the feature classes to include
in your map.
A feature is the spatial description of a real-world entity, such as a road, a
utility pole, or a river. Features are organized into collections, called feature
classes, and are stored in a spatial database or file. The spatial database or file
is sometimes referred to as a feature source (page 2063).
Bringing in GIS Features | 303
See also:
■Filtering Features When You Add Them to a Map (page 309)
■Overview of Geospatial Data (page 551)
■Working with FDO Schemas (page 553)
■To access data through FDO (page 308)
■To filter feature data when you add it to a map (page 310)
■To change the coordinate system assigned to the data you are adding to a
map (page 311)
■To bring in features from Oracle (page 314)
■To use AutoCAD Map 3D 2011 to access FDO data stores that were created
in AutoCAD Map 3D 2007 and earlier (page 315)
■To set up your system for ArcSDE 9.2 (or if you use the 9.1 client and you
access the ArcSDE 9.2 server) (page 318)
■To set up your system for ArcSDE 9.1 (or if you use the 9.2 client and you
access the ArcSDE 9.1 server) (page 318)
■To bring in features from ESRI ArcSDE (page 319)
■To set up a direct connection to the underlying database (page 320)
■For an Oracle database: (page 320)
■For a SQL Server database: (page 321)
■For an Oracle database, copy the following DLL files: (page 321)
■For a SQL Server database, copy the following DLL files: (page 321)
■For an Oracle database, set the following parameters: (page 322)
■For a SQL Server database, set the following parameters: (page 322)
■To bring in features from SQL Server (page 324)
■To use AutoCAD Map 3D 2011 to access FDO data stores that were created
in AutoCAD Map 3D 2007 and earlier (page 325)
■To bring in features from SQL Server Spatial (page 328)
■To bring in features from SQLite (page 331)
■To bring in features from MySQL (page 333)
■To use AutoCAD Map 3D 2011 to access FDO data stores that were created
in AutoCAD Map 3D 2007 and earlier (page 334)
■To bring in features from SHP (page 336)
■To bring in features from SDF (page 338)
■To bring in features from PostgreSQL/PostGIS (page 341)
■To access ODBC data (page 344)
■To create a DSN in Windows XP (page 345)
■To define the table ranges required to access Excel data (page 346)
■To bring in features from WFS (page 348)
■To reconnect to feature data without losing styling information (page 350)
304 | Chapter 3 Bringing In Data
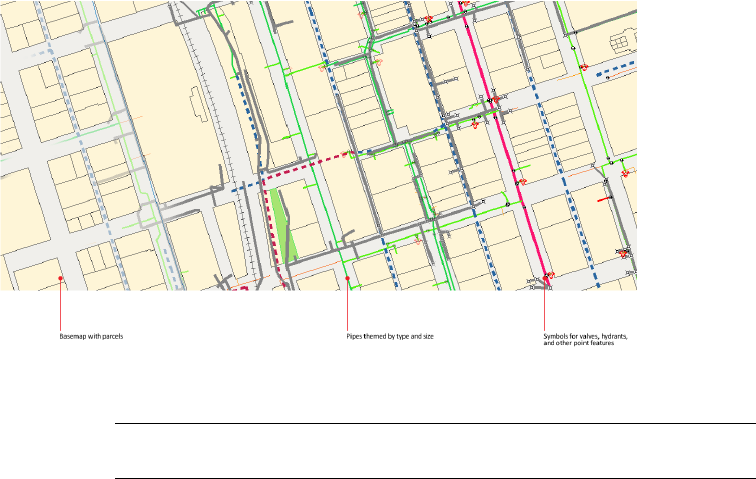
Overview of Bringing In GIS Features
This map of a water distribution system is made up of features stored in a set of SDF
files.
NOTE This topic applies to geospatial data. To bring in drawing (DWG) objects,
see Overview of Bringing in Drawing Data From DWG Files (page 351).
A feature is the spatial description of a real-world entity such as a road, a utility
pole, or a river. Features are stored in a spatial database or file. The spatial
database or file is referred to as a feature source (page 2063).
The feature source could be a database (such as Oracle, ArcSDE, SQL Server,
or MySQL), a file-based feature source (such as SDF or SHP), a web server (such
as WFS), or a table of feature geometry data (such as Microsoft Access).
Once you connect to a feature source, you select the types of features to include
in your map. Each type of feature is called a feature class (page 2063). AutoCAD
Map 3D displays all the features from the selected features classes in your map,
and each feature class becomes a layer in Display Manager. For example, a
feature class called Roads contains individual streets and appears on a layer
called Roads in Display Manager. You can apply a single style to this layer,
and all the streets in the layer will use that style.
A schema (page 2073) is the definition of multiple feature classes and the
relationships between them. It determines the criteria an individual feature
must meet in order to be a member of a particular feature class. For some
feature sources, you can add and edit a schema and its feature classes and
Overview of Bringing In GIS Features | 305
properties. For more information about editing schemas, see Working with
Schemas (page 593).
NOTE WMS and Raster are used to access images, not features. You cannot edit
or lock these images, and they do not use schemas.
Tell me more
Video
■Show me how to bring in data from a
web server using WMS.
■Show me how to bring in point data
from an ODBC database.
■Show me how to bring in a subset of
features using a query.
Procedure
■To access data through FDO (page 308)
■To filter feature data when you add it
to a map (page 310)
Tutorial
■Exercise 2: Use Data Connect to add
data to your map
Workflow
■Create a Feature Map
GIS Skills
■Access data published on a public web
server
■Bring in point data from a Microsoft Ac-
cess database
■Bring in a subset of features using a
query
Related topics
■About Geospatial Feature Classes, Data
Stores, and Schemas (page 551)
■Overview of Geospatial Data (page 551)
■Working with FDO Schemas (page 553)
306 | Chapter 3 Bringing In Data

FDO Provider Capabilities
You use FDO (page 2062) to connect directly to a data source and work in its
native format. Each data source type uses its own FDO provider (page 2063), and
each provider has different capabilities.
For example, Oracle and ArcSDE support locking on the feature level. When
you check out a feature, other users cannot edit it, even though they can view
your edits and edit other features in the feature source. Oracle and ArcSDE
also support persistent locking, so the object stays locked until you check it
back in.
SHP feature sources, on the other hand, support locking on the file level.
When you check out a feature, its entire SHP file is locked. Other users cannot
edit features from that file until you close the map, which releases your lock
(even if you still have features checked out at the time). Be careful to check
in your changes before you close the map.
Versioning (page 2078) allows multiple copies of a spatial dataset to be stored
and tracked by date of creation, date of change, and so on. Not every FDO
provider supports versioning.
The following table lists the level of locking, versioning, and schema editing
supported by each feature source type.
Edit
Schema
Persistent
Locking
VersionsLock LevelFeature Source
Type
YesNoNoNoneArcSDE (page
316)
YesNoNoNoneMySQL (page
332)
NoNoNoFileODBC (page 342)
YesYesYesFeatureOracle (page 312)
YesYesYesFeaturePostgreSQL/Post-
GIS (page 340)
YesNoNoNoneSDF (page 337)
YesNoNoFileSHP (page 335)
Overview of Bringing In GIS Features | 307

Edit
Schema
Persistent
Locking
VersionsLock LevelFeature Source
Type
YesNoNoNoneSQL Server (page
323)
SQL Server Spa-
tial (page 326)
YesNoNoFileSQLite (page 330)
NoNoN/AN/AWFS (page 346)
N/AN/AN/AN/AWMS (page 445)
N/AN/AN/AN/ARaster (page 437)
To access data through FDO
NOTE This topic applies to geospatial data. To bring in drawing (DWG) objects,
see the procedures for bringing in drawing objects. (page 354).
1Make sure that your feature source is set up correctly. If you have
questions, refer to the Readme file.
2Find out your user name and password, if required.
Your CAD Manager or Database Administrator can help you with this.
3Open or create (page 296) the map that will include the data from this
feature source.
4If you are working with data from various coordinate systems, assign a
coordinate system to the current map. See Assigning a Coordinate System
to the Current Drawing (page 147).
AutoCAD Map 3D converts all the data you bring into this map to the
assigned coordinate system. If you edit the data and save it back to its
source, AutoCAD Map 3D converts it back to the original coordinate
system.
5In Display Manager (page 2060), click Data ➤ Connect To Data.
6In the left pane of the Data Connect window, select the feature source.
7In the right pane, enter a name for this connection and specify the
information required to connect to the feature source. Click Connect.
308 | Chapter 3 Bringing In Data
8In the Add Data To Map section, under Schema, select the feature classes
to include in your map.
If this feature source contains only a single feature class, that feature class
is selected automatically. If it contains multiple feature classes, you can
right-click any of them and select Select All or Select None.
9If necessary, click Edit Coordinate Systems to specify the coordinate
system for the incoming data (page 311).
10 Click Add To Map.
To bring in a subset of the data, click the down arrow and select Add To
Map With Query. See Filtering Features When You Add Them to a Map
(page 309). To filter data after you have added the data to your map, see
Filtering Feature Layers (page 1216).
Features from the selected feature classes appear in your map. You can style,
theme, and edit the features.
If you need additional properties related to this data, you can connect
additional data to a feature source layer using a join (page 507).
Quick Reference
Connect Feature Source
Connects a feature source
Click File ➤ Connect To Data.
Menu
Connect
Icon
MAPCONNECTCommand Line
In Display Manager click Data ➤ Connect to Data.
Task Pane
Filtering Features When You Add Them to a Map
NOTE This topic applies to geospatial data. To filter drawing (DWG) objects, see
Overview of Bringing in Drawing Data From DWG Files (page 351).
When you connect to a geospatial data store, you can choose Add To Map
With Query to filter the data you bring into your map.
Filtering Features When You Add Them to a Map | 309

You can filter a single layer or multiple layers at one time. You can filter the
data by its location in the map or by property conditions that you define. For
example, you can add only streets that cross a circle you draw on the map, or
only parcels on a particular street.
See also:
■Filtering Feature Layers (page 1216)
■Creating Expressions - Reference
To filter feature data when you add it to a map
NOTE This topic applies to geospatial data. To bring in drawing (DWG) objects,
see the procedures for bringing in drawing objects. (page 354).
1Connect to the data source (page 308) in the Data Connect window.
2Under Add Data To Map, check the layers to add.
If this feature source contains only a single feature class, that feature class
is selected automatically. If it contains multiple feature classes, you can
right-click any of them and select Select All or Select None.
3Click the Add To Map down arrow and select Add To Map With Query
to create your expression.
In the View/Create Query Statement dialog box (page 1610), the list of
layers at the top of the window shows any existing filters for the selected
layers. If the layers use a common query (specifying a property that all
the layers have in common), that query is listed separately. Any query
you create applies to all selected layers.
4Create the expression for your query.
For help with any expression element, see Creating Expressions -
Reference.
■To filter the layer based on one of its properties (for example, to add
only the parcels whose Address property specifies a particular street),
create a query that evaluates a property.
If multiple layers are selected, only the properties they have in
common are available.
■To filter the layer based on location (for example, to bring in only
roads within a circle you define by drawing it on the map), create a
location-based query.
310 | Chapter 3 Bringing In Data

Quick Reference
Connect Feature Source
Connects a feature source
Click File ➤ Connect To Data.
Menu
Connect
Icon
MAPCONNECTCommand Line
In Display Manager click Data ➤ Connect to Data.
Task Pane
Changing Coordinate Systems
If necessary, you can change the coordinate system of data you add to your
map.
You must specify the original coordinate system for the data. Do not specify
the coordinate system for the current map—AutoCAD Map 3D transforms the
data to the target coordinate system when it adds it to your map. Hold your
cursor over the entry in the Data Connect window to see its coordinate system
and spatial context information.
To change the coordinate system assigned to the data you are adding to a
map
1In Display Manager (page 2060), click Data ➤ Connect To Data.
2In the Data Connect window, select the appropriate data provider in the
Data Connections By Provider list.
3Navigate to the data store and select it.
4Click Connect.
5Hold your cursor over the name of the data store to see a pop-up window
that displays its coordinate system, for example, UTM27-10.
When you add data to your map, you must specify its original coordinate
system. AutoCAD Map 3D automatically converts the data from that
coordinate system to the one specified for your map.
6Click Edit Coordinate Systems and, in the Edit Spatial Contexts (page 1605)
dialog box, click the entry.
Changing Coordinate Systems | 311

Select the entry and click Edit to specify the coordinate system for the surface
NOTE To copy the spatial context information to the clipboard (for example,
to check against your records or for use with a Technical Support specialist),
right-click the entry and click Copy Coordinate System.
7Click Edit.
8In the Select Coordinate System dialog box (page 1609), select the coordinate
system you saw in the pop-up window.
Select the appropriate category from the pulldown list, and then scroll
through the entries until you find the one you want.
9Click OK twice to return to the Data Connect window.
Bringing In Features from Oracle
You can bring features from an Oracle data source into your map, creating a
feature layer (page 2063) in Display Manager. When you do this, you can:
■Select the feature classes to include in your map.
■Set conditions to limit the features in your map.
■View and edit the features
■Style, theme, and edit the features.
■Lock individual features when you check then out for editing.
■Keep features checked out and locked even when you close your drawing.
Features are not checked back in and unlocked until you specify.
■Automatically update the data source with any edits you make. Your edits
are immediately visible to anyone else using the data source.
312 | Chapter 3 Bringing In Data

■Create versions of your data. Versioning (page 2078) creates a copy of the
data in the data source. Your changes are made to the new version of the
data. Versioning is useful for proposed changes or changes that need
approval. When the changes are final, you can make your version the
current one.
■Use a data source set up for AutoCAD Map 3D. If your data source schema
is not set up to work with AutoCAD Map 3D, AutoCAD Map 3D creates a
custom mapping so you can use the data in your map.
■View and edit the schema definition.
■Create an Oracle data source.
■Move SHP data into Oracle to take advantage of better data sharing.
■Bring in a static copy of Oracle data as drawing objects.
■Customize the Oracle FDO provider (page 2063).
NOTE Functionality for OSE (the Oracle Spatial OO40, which is similar to OLE DB)
is not available in a 64-bit environment. The Oracle library that OSE is built on
(Oracle Object for OLE) is 32-bit only. There is no 64-bit version.
In the 2008 release of AutoCAD Map 3D, a new column called geometrytype
was added to the table named F_AttributeDefinition. To use AutoCAD Map
3D 2011 to access FDO data stores that were created in AutoCAD Map 3D
2007 and earlier, you must first connect to the data store containing this table
and run a SQL script. Instructions for this are on the Procedure tab of this
topic. To do this, you must have the privileges required to execute the ALTER
TABLE request. In the command line, enter the following:
sqlplus <datastorename>/<yourpassword>@<tnsServiceName>
@<MapInstallDir>/Fdo/bin/com/AlterSchemaOracle.sql; exit;
NOTE For information on customizing this provider, refer to the FDO API Reference
and the FDO Provider for Oracle API Reference. The API has custom commands for
gathering information about a provider, transmitting client services exceptions,
getting lists of accessible data stores, creating connection objects, and creating
and dropping spatial indexes.
See also:
■Working with Oracle Data (page 554)
Bringing In Features from Oracle | 313

■Creating a Data Store (page 586)
■Migrating Data (page 615)
■Importing From Oracle (page 409)
■Styling Features (page 639)
■To create a map with styled feature layers (page 641)
■To edit a feature using feature editing commands (page 705)
To bring in features from Oracle
1Make sure that your feature source is set up correctly.
2In Display Manager (page 2060), click Data ➤ Connect To Data.
3In the Data Connect window, select Add Oracle Connection in the Data
Connections By Provider list.
4In the Feature Source Connection dialog box (page 1607), under Connection
Name, type a name for this connection.
You can give the connection any name you like. This name appears in
Map Explorer as the name of the feature source.
5Under Service Name, enter the service name for the Oracle data store. If
you do not know this name, check with your System Administrator.
6Click Login.
7In the User Credentials dialog box (page 1610), enter your Oracle user name
and password. If your organization uses Windows authentication to log
in to Oracle, select Use Windows Authentication.
Optionally, select Remember Password if you want AutoCAD Map 3D to
log you in whenever you open this drawing.
8Under Data Store, enter the data store name. If you do not know this
name, check with your System Administrator.
To select from a list of data stores, click the down arrow.
NOTE If the data store is not in the list, it may not use a AutoCAD Map 3D
schema. Select Show All Data Stores to add these to the list. AutoCAD Map
3D creates a mapping to use these data stores with AutoCAD Map 3D.
9Optionally, select a version of the data store.
314 | Chapter 3 Bringing In Data

10 Click Connect.
11 In the feature class list, select the feature classes to include in the map.
If this feature source contains only a single feature class, that feature class
is selected automatically. If it contains multiple feature classes, you can
right-click any of them and select Select All or Select None.
12 Click Add To Map.
To bring in a subset of the data, click the down arrow and select Add To
Map With Query (page 309). To filter data after you’ve added the data to
your map, see Filtering Feature Layers (page 1216).
Features from the selected feature classes appear in your map. You can style,
theme, and edit the features.
If you need additional properties related to this data, you can connect
additional data to a feature source layer using a join (page 507).
To use AutoCAD Map 3D 2011 to access FDO data stores that were created
in AutoCAD Map 3D 2007 and earlier
1Verify that you have the privileges required to execute the ALTER TABLE
request.
2In the command line, enter the following:
sqlplus <datastorename>/<yourpassword>@<tnsServiceName>
@<MapInstallDir>/Fdo/bin/com/AlterSchemaOracle.sql;
exit;
Quick Reference
Connect Feature Source
Connects a feature source
Click File ➤ Connect To Data.
Menu
Connect
Icon
MAPCONNECTCommand Line
In Display Manager click Data ➤ Connect to Data.
Task Pane
Bringing In Features from Oracle | 315

Bringing In Features from ArcSDE
When you view and edit features from an ArcSDE data source, you can do the
following:
■If you use SQL Server or Oracle as the underlying relational database
management system for ArcSDE, you can use either Windows or ArcSDE
authentication.
■Select the feature classes to include in your map.
■Set conditions to limit the features in your map.
■Style, theme, and edit the features.
■Lock individual features when you check them out for editing.
■Keep features checked out and locked even when you close your drawing.
Features are not checked back in and unlocked until you specify.
■Automatically update the data source with any edits you make.
Your edits are immediately visible to anyone else using the data source.
■Create versions of your data. Versioning (page 2078) creates a copy of the
data in the data source. Your changes are made to the new version of the
data. Versioning is useful for proposed changes or changes that need
approval. When the changes are final, you can make your version the
current one. To use this feature, you must have versioning support turned
on in your database. To use versioning, you must enable versions for the
ArcSDE table.
NOTE Long transactions must be set in the data store to be available in
AutoCAD Map 3D.
■View the schema definition.
■Bring in a static copy of ArcSDE data as drawing objects.
Supported Versions
AutoCAD Map 3D supports ArcSDE 9.1, 9.2, 9.3, and 9.3.1. The 9.3.1 version
is available as either a 32-bit or 64-bit provider on Windows. (For previous
versions, and on Linux, it is available in 32-bit only.) The 64 bit support is
available only with the 64-bit ESRI ArcSDE 9.3.1 client libraries.
316 | Chapter 3 Bringing In Data

Setting Up ArcSDE for Use with AutoCAD Map 3D
To use ArcSDE, install the following DLL files on the computer on which you
run AutoCAD Map 3D:
For version 9.2 through 9.3.1For version 9.1
pe.dllpe91.dll
sde.dllsde91.dll
sg.dllsg91.dll
The provider for this data store checks for the latest versions of the DLL files
first, and uses them if they are found. If they are not found, it checks for (and
uses) the 9.1 versions. The client DLL version should match the server version
that is being used.
If the client and server versions of ArcSDE do not match (for example if you
use the 9.1 client and you access the ArcSDE 9.3.1 server), set up your system
for the server version you are using.
Set up the services and hosts files for the appropriate version, and then use
these names when you connect to the data in the Data Connect dialog box.
For example, specify arcsdehost\esri_sde_nv, and not the values. Setup
instructions are on the Procedure tab of this topic.
You can copy these DLL files into the FDO/bin directory of AutoCAD Map 3D.
Alternatively, you can set the PATH environment variable to reference the
local folder containing these DLL files. To accomplish this, you can install an
ArcGIS 9.1 Desktop application or the ArcSDE SDK. For more information
about ArcGIS 9.1 Desktop applications and the ArcSDE SDK, refer to the ESRI
documentation.
Connecting Directly to the Database
ArcSDE provides a direct connection option. This option connects the client
directly to the Oracle or SQL Server database engine, rather than through the
separate ArcSDE process used in a normal connection. See the Procedure tab
of this topic for instructions on setting up this option.
NOTE For information on customizing this provider, refer to the FDO API Reference
and the FDO Provider for ArcSDE API Reference.
Bringing In Features from ArcSDE | 317
See also:
■Working with ESRI ArcSDE Data (page 579)
■Importing ESRI ArcSDE Data (page 391)
■Styling Features (page 639)
■To create a map with styled feature layers (page 641)
■To edit a feature using feature editing commands (page 705)
To set up your system for ArcSDE 9.2 (or if you use the 9.1 client and you
access the ArcSDE 9.2 server)
1Install the following DLL files on the computer on which you run
AutoCAD Map 3D.
Copy the files to the directory in which the ArcSDE provider is installed.
Usually, the directory is C:\Program Files\AutoCAD Map 3D 2011\FDO\bin
pe.dll
sde.dll
sg.dll
2Add entries in your C:\Windows\system32\drivers\etc\services file.
The entries look like this:
esri_92ora 6161/tcp #ArcSDE 9.2 - Oracle
esri_92sql 6161/tcp #ArcSDE 9.2 - SQLServer 2005
esri_sde 5151/tcp #ArcSDE 9.1- Oracle
esri_sde_ss 5152/tcp #ArcSDE 9.2 - SQLServer
3If you have trouble connecting, add a new line in your
C:\Windows\system32\drivers\etc\hosts file.
The line looks like this:
192.168.0.100 arcsdehost
To set up your system for ArcSDE 9.1 (or if you use the 9.2 client and you
access the ArcSDE 9.1 server)
1Install the following DLL files on the computer on which you run
AutoCAD Map 3D.
Copy the files to the directory in which the ArcSDE provider is installed.
Usually, the directory is C:\Program Files\AutoCAD Map 3D 2011\FDO\bin
318 | Chapter 3 Bringing In Data
pe91.dll
sde91.dll
sg91.dll
2Add entries in your C:\Windows\system32\drivers\etc\services file.
The entries look like this:
esri_92ora 6161/tcp #ArcSDE 9.2 - Oracle
esri_92sql 6161/tcp #ArcSDE 9.2 - SQLServer 2005
esri_sde 5151/tcp #ArcSDE 9.1- Oracle
esri_sde_ss 5152/tcp #ArcSDE 9.2 - SQLServer
3If you have trouble connecting, add a new line in your
C:\Windows\system32\drivers\etc\hosts file.
The line looks like this:
192.168.0.100 arcsdehost
To bring in features from ESRI ArcSDE
1Make sure your feature source is set up correctly. For a list of issues, refer
to the Readme.
2In Display Manager (page 2060), click Data ➤ Connect To Data.
3In the Data Connect window, select Add ArcSDE Connection in the Data
Connections By Provider list.
4Under Connection Name, type a name for this connection.
You can give the connection any name you like. This name appears in
Map Explorer as the name of the feature source.
5Under Server Name and Instance Name, enter the information for the
ArcSDE database. If you do not know the name, check with your System
Administrator.
6Click Login.
7In the User Credentials dialog box (page 1610), specify the login credentials
to use to log into this data store.
■If you use SQLServer as your underlying relational database
management system and want to use your Windows Authentication
credentials, select Windows Authentication and click Login.
Bringing In Features from ArcSDE | 319
■To use your ArcSDE login credentials, enter your user name and
password and click Login. (If you use SQL Server, ArcSDE will pass
your credentials to SQL Server.)
8Click OK.
9In Data Connect, under Data Store, enter the database name. If you do
not know this name, check with your System Administrator.
To select from a list of databases, click the down arrow. AutoCAD Map
3D connects to the specified server and instance and lists the available
databases. If you set up your hosts and services files as described, use
these names. For example, specify arcsdehost\esri_sde_nv, and not the
values.
10 Optionally, select a version of the database.
11 Click Connect.
12 In the feature class list, select the feature classes to include in the map.
If this feature source contains only a single feature class, that feature class
is selected automatically. If it contains multiple feature classes, you can
right-click any of them and select Select All or Select None.
13 Click Add To Map.
To bring in a subset of the data, click the down arrow and select Add To
Map With Query (page 309). To filter data after you’ve added the data to
your map, see Filtering Feature Layers (page 1216).
Features from the selected feature classes appear in your map.
If you need additional properties related to this data, you can connect
additional data to a feature source layer using a join (page 507).
To set up a direct connection to the underlying database
1Set up connections to the underlying databases.
For an Oracle database:
■Install the Oracle client software on the client machine where you
run AutoCAD Map 3D.
■Open the Oracle port (for example, 1521) on the database machine
firewall.
320 | Chapter 3 Bringing In Data
■Use the Oracle Net Manager tool to set up a tnsnames entry for the
target database (or update tnsnames.ora manually).
■Test your connection to the target database using SQL Plus.
For a SQL Server database:
■Install the SQL Native client software on the client machine where
you run AutoCAD Map 3D.
■Open the SQL Server port (for example, 1433) on the database machine
firewall.
■Set the target SQL Server database to support remote connect.
■Test your connection to the target database using SQL Server
Management Studio.
2Copy additional DLL files into the fdo\bin directory.
Because the connection does not use the separate ArcSDE server process,
the client needs additional ArcSDE libraries. These DLL files are available
in the ArcSDE SDK.
For an Oracle database, copy the following
DLL
files:
■gsrvrora11g93.dll or gsrvrora10g93.dll, depending on whether the
Oracle client is 10gr2 or 11g. (This depends on the Oracle client version
and not the Oracle server version.)
■sdeora11gsrvr93.dll or sdeora10gsrvr93.dll
■xerces-c_2_7.dll
■icuuc22.dll
■icudt22l.dll
For a SQL Server database, copy the following
DLL
files:
■gsrvrsql93.dll
■sdesqlsrvr93.dll
■xerces-c_2_7.dll
■icuuc22.dll
Bringing In Features from ArcSDE | 321
■icudt22l.dll
3Adjust the connection parameters.
For an Oracle database, set the following parameters:
■Server name: Specify the server name or the IP address.
■Instance name: Enter sde:oracle10g or sde:oracle11g, depending
on the version of Oracle on the client.
■User name: Specify the user name that is valid on the Oracle server.
■Password: Enter <password>@<OracleSID> where OracleSID is the SID
configured in the client in step 1.
■Datastore: Enter the datastore name manually, for example, sde.
■Version: Enter the version manually. It defaults to the root version if
you do not specify the version.
For a SQL Server database, set the following parameters:
■Server name: Specify the server name or the IP address.
■Instance name: If you use the default instance of MSSQLSERVER, enter
sde:sqlserver:<servername>. Otherwise, enter
sde:sqlserver:<servername>\<instance_name>.
■User name/password: Specify the user name that is valid for the SQL
Server database.
■Datastore: Enter the datastore name manually, for example, sde.
■Version: Enter the version manually. It defaults to the root version if
you do not specify the version.
For more information and other options, see the ESRI documentation for
ArcSDE connection syntax.
Quick Reference
Connect Feature Source
Connects a feature source
322 | Chapter 3 Bringing In Data

Click File ➤ Connect To Data.
Menu
Connect
Icon
MAPCONNECTCommand Line
In Display Manager click Data ➤ Connect to Data.
Task Pane
Bringing In Features from SQL Server
AutoCAD Map 3D supports both SQL Server and SQL Server Spatial (page 326).
For SQL Server, both the 2008 version (using the native spatial support that
Microsoft added in that version) and the 2005 version (with custom spatial
support added by Autodesk) are supported. If you use SQL Server 2008 or later,
we recommend moving to the new SQL Server Spatial provider. While the
SQL Server Spatial provider does not read datastores created by the old SQL
Server provider, you can use Bulk Copy (page 617) to move the data into that
format.
When you view and edit features from a SQL Server data source, you can do
the following:
■Select the feature classes to include in your map.
■Set conditions to limit the features in your map.
■Style, theme, and edit the features.
■Automatically update the data source with any edits you make.
Your edits are immediately visible to anyone else using the data source.
■View and edit the schema definition.
■Create a SQL Server data source.
■Move other geospatial data (for example, SHP data) into SQL Server, to
take advantage of better data sharing.
NOTE You can customize the SQL Server FDO provider (page 2063). The API has
custom commands to support schema read/write and geospatial and
non-geospatial data read/write. For more information, refer to the FDO API Reference
and the FDO Provider for SQL Server API Reference.
Bringing In Features from SQL Server | 323
See also:
■Working with SQL Server Data (page 559)
■Bringing In Features from SQL Server Spatial (page 326)
■Creating a Data Store (page 586)
■Migrating Data (page 615)
■Styling Features (page 639)
■To create a map with styled feature layers (page 641)
■To edit a feature using feature editing commands (page 705)
To bring in features from SQL Server
1In Display Manager (page 2060), click Data ➤ Connect To Data.
2In the Data Connect window, select Add SQL Server Connection in the
Data Connections By Provider list.
3Under Connection Name, type a name for this connection.
You can give the connection any name you like. This name appears in
Map Explorer as the name of the feature source.
4Under Service Name, enter the information for the SQL Server data source.
If you do not know the name, check with your System Administrator.
5Click Login.
6In the User Credentials dialog box (page 1610), enter your user name and
password.
Optionally, select Remember Password if you want AutoCAD Map 3D to
log you in whenever you open this drawing.
7Click OK.
8In Data Connect, under Data Store, enter the data store name. If you do
not know this name, check with your System Administrator.
To select from a list of data stores, click the down arrow. AutoCAD Map
3D connects to the specified server and instance and lists the available
data stores.
9Click Connect.
10 In the feature class list, select the feature classes to include in the map.
324 | Chapter 3 Bringing In Data

If this feature source contains only a single feature class, that feature class
is selected automatically. If it contains multiple feature classes, you can
right-click any of them and select Select All or Select None.
11 Click Add To Map.
To bring in a subset of the data, click the down arrow and select Add To
Map With Query (page 309). To filter data after you’ve added the data to
your map, see Filtering Feature Layers (page 1216).
Features from the selected feature classes appear in your map. You can style,
theme, and edit the features.
If you need additional properties related to this data, you can connect
additional data to a feature source layer using a join (page 507).
To use AutoCAD Map 3D 2011 to access FDO data stores that were created
in AutoCAD Map 3D 2007 and earlier
1Verify that you have the privileges required to execute the ALTER TABLE
request.
2In the command line, enter the following:
cd <MapInstallDir>/Fdo/bin/com
3Do one of the following:
■For SQL Server 2005, enter sqlcmd -UMyUserName -P MyPassword -S
SQLServerHostName -d MyDatastore -i AlterSchemaSQLServer.sql
■For SQL Server 2000, enter isql -UMyUserName -P MyPassword -S
SQLServerHostName -d MyDatastore -i AlterSchemaSQLServer.sql
Quick Reference
Connect Feature Source
Connects a feature source
Click File ➤ Connect To Data.
Menu
Connect
Icon
MAPCONNECTCommand Line
Bringing In Features from SQL Server | 325

In Display Manager click Data ➤ Connect to Data.
Task Pane
Bringing In Features from SQL Server Spatial
AutoCAD Map 3D supports both SQL Server (page 323) and SQL Server Spatial.
For SQL Server Spatial, AutoCAD Map 3D supports native SQL Server Spatial
data with SQL Server 2008 SP1. If you are using SQL Server 2008, we
recommend using the SQL Server Spatial provider. While the SQL Server Spatial
provider does not read datastores created by the older SQL Server provider,
you can use Bulk Copy (page 617) to move the data into that format.
When you view and edit features from a SQL Server Spatial data source, you
can do the following:
■Use either Windows or SQL Server authentication.
■Select the feature classes to include in your map.
■Set conditions to limit the features in your map.
■Style, theme, and edit the features.
■Automatically update the data source with any edits you make.
Your edits are immediately visible to anyone else using the data source.
■View and edit the schema definition.
■Create a SQL Server Spatial data source.
A geographic type column is created for the geodetic coordinate system.
For other systems, a geometric type column is created. Spatial indexes are
created automatically for these geometry properties using default spatial
index parameters. You can override the defaults using the API.
You can include FDO metadata when you create a SQL Server data store.
■Move other geospatial data (for example, SHP data) into SQL Server Spatial,
to take advantage of better data sharing.
NOTE If you close a drawing that uses a SQLServerSpatial connection and then
reopen that drawing, you will need to first reconnect to the SQLServerSpatial
connection and provide your user name and password. This information is not
remembered once the drawing is closed.
326 | Chapter 3 Bringing In Data

NOTE You can customize the SQL Server Spatial FDO provider (page 2063). The
API has custom commands to support schema read/write and geospatial and
non-geospatial data read/write. For more information, refer to the FDO API Reference
and the FDO Provider for SQL Server API Reference.
Dealing With Invalid Geometry
SQL Server Spatial validates geometry objects that are added to the database.
It validates the values of geometry columns after they are added. As a result,
some geometries are flagged as invalid, even though they are saved. This
usually affects polygons (for example, polygons that are not closed) and spikes
in geometry. Validation is based on OGC rules.
Querying invalid geometries using a spatial filter (for example, using an
expression) generates an error and the query fails. This affects SQL Server
geometry (but not SQL Server geography).
NOTE The FDO Provider for SQL Server Spatial uses the geography data type for
latitude/longitude coordinate systems and the geometry data type for all others.
The geography data type does not retain invalid geometry values and rejects them
right away. It does not support the STIsValid() or IsValid(geometry) functions
described below.
How Invalid Geometry is Handled
The FDO Provider for SQL Server Spatial recognizes that invalid geometries
may exist in a table that is being processed. The provider includes code to
avoid having queries fail, using the following strategies:
■A query with no spatial filter returns all data.
■A query with a spatial filter skips invalid geometries so that the query does
not fail altogether. Valid geometries matching the spatial filter are returned.
■A query using the FDO EnvelopeIntersects filter does not skip invalid
geometries if a spatial index is included on the geometry column. In this
special-case combination, SQL Server Spatial does not fail on the query
because it doesn’t process the details of the geometry. MapGuide uses this
type of filter as its default selection filter.
AutoCAD Map 3D and MapGuide can draw these invalid geometries without
a problem.
Bringing In Features from SQL Server Spatial | 327
Using Expressions to Find Invalid Geometry
SQL Server provides a function called STIsValid() that returns 1 for valid
geometries and 0 for invalid geometries. FDO exposes access to that function
using a function called IsValid(geometry) at the FDO level. You can use this
function in AutoCAD Map 3D and MapGuide when you create an expression
to filter or select data. If you select data using no filter or using just the
EnvelopeIntersects filter, you can create a calculated property in the Data
Table using the IsValid function to see which geometries are valid or invalid.
Correcting Invalid Geometry
SQL Server Spatial also provides a function you can use to correct invalid
geometries on the server. You cannot use this function from within AutoCAD
Map 3D and MapGuide, but you can use it directly against SQL Server, for
instance, using Management Studio. Here is an example of this method:
update dbo.road set geom = geom.MakeValid() where geom.STIsValid()
= 0;
This operation makes the geometry valid by modifying its invalid parts. You
may prefer to edit the geometry yourself, rather than use a default correction
with uncertain results.
For more information on the STIsValid() and MakeValid() functions, as well
as other aspects of SQL Server Spatial, consult the SQL Server Spatial online
documentation.
See also:
■Working with SQL Server Spatial Data (page 561)
■Bringing In Features from SQL Server (page 323)
■Creating FDO-Enabled SQL Server Spatial Data Stores (page 590)
■Migrating Data (page 615)
■Styling Features (page 639)
■To create a map with styled feature layers (page 641)
■To edit a feature using feature editing commands (page 705)
To bring in features from SQL Server Spatial
1In Display Manager (page 2060), click Data ➤ Connect To Data.
328 | Chapter 3 Bringing In Data
2In the Data Connect window, select Add SQL Server Spatial Connection
in the Data Connections By Provider list.
3Under Connection Name, type a name for this connection.
You can give the connection any name you like. This name appears in
Map Explorer as the name of the feature source.
4Enter the Service Name and click Login.
The service name is set when you install SQL Server Spatial itself.
5In the User Credentials dialog box (page 1610), specify the login credentials
to use to log into this data store.
■To use your Windows Authentication credentials, select Windows
Authentication and click Login.
■To use your SQL Server login credentials, enter your user name and
password and click Login.
6In Data Connect, under Data Store, enter the data store name. If you do
not know this name, check with your System Administrator.
To select from a list of data stores, click the down arrow. AutoCAD Map
3D connects to the specified server and instance and lists the available
data stores.
7Click Connect.
8In the feature class list, select the feature classes to include in the map.
If this feature source contains only a single feature class, that feature class
is selected automatically. If it contains multiple feature classes, you can
right-click any of them and select Select All or Select None.
9Click Add To Map.
To bring in a subset of the data, click the down arrow and select Add To
Map With Query (page 309). To filter data after you’ve added the data to
your map, see Filtering Feature Layers (page 1216).
Quick Reference
Connect Feature Source
Connects a feature source
Click File ➤ Connect To Data.
Menu
Bringing In Features from SQL Server Spatial | 329

Connect
Icon
MAPCONNECTCommand Line
In Display Manager click Data ➤ Connect to Data.
Task Pane
Bringing In Features From SQLite
When you view and edit features from a SQLite file, you can do the following:
■Select the feature classes to include in your map.
■Set conditions to limit the features in your map.
■Style, theme, and edit the features.
■Automatically update the data source with any edits you make.
Your edits are visible as soon as another person views the saved data file.
■View and edit the schema definition.
■Move data from other geospatial sources (for example, SHP data) into
SQLite, to take advantage of better data sharing.
You can bring SQLite data into your map in two ways:
■Use Data Connect to view and edit the data directly in the SQLite file. Use
this method to edit geometry and attributes or to style and theme the data.
For information, click the Procedure tab at the top of this Help topic.
■Import the data into the current map, which converts the SQLite data to
drawing objects. Use this method to clean the data or to create a DWG
file. You can export the objects back to SQLite.
See also:
■Working with SQLite Data (page 565)
■Styling Features (page 639)
■To create a map with styled feature layers (page 641)
■To edit a feature using feature editing commands (page 705)
■Converting Data From Other Formats to Drawing Objects (page 377)
330 | Chapter 3 Bringing In Data
■Converting and Exporting (page 1403)
■Migrating Data (page 615)
■Editing a Schema (page 610)
To bring in features from SQLite
1In the Display Manager (page 2060), click Data ➤ Connect To Data.
2In the Data Connect window, select Add SQLite Connection in the Data
Connections By Provider list.
3Under Connection Name, type a name for this connection.
You can give the connection any name you like. This name appears in
Map Explorer as the name of the feature source.
4Under Source File, specify the file.
5Click Connect.
6In the feature class list, select the feature classes to include in the map.
If this feature source contains only a single feature class, that feature class
is selected automatically. If it contains multiple feature classes, you can
right-click any of them and select Select All or Select None.
7Verify that the coordinate systems are correct. You can change an incorrect
coordinate system if necessary (page 311).
8Click Add To Map.
To bring in a subset of the data, click the down arrow. Select Add To Map
With Query (page 309). To filter data after you’ve added the data to your
map, see Filtering Feature Layers (page 1216).
Features from the selected feature classes appear in your map. You can style,
theme, and edit the features.
If you need additional properties related to this data, you can use a join (page
507).
Bringing In Features From SQLite | 331

Bringing In Features from MySQL
When you view and edit features from a MySQL data source, you can do the
following:
■Select the feature classes to include in your map.
■Set conditions to limit the features in your map.
■Style, theme, and edit the features.
■Automatically update the data source with any edits you make.
Your edits are immediately visible to anyone else using the data source.
■Use a data store set up for AutoCAD Map 3D or in other applications. If
your data source schema is not set up to work with AutoCAD Map 3D, for
example, AutoCAD Map 3D creates a custom mapping so you can use the
data in your map.
■View and edit the schema definition.
■Create a MySQL data source.
■Move data from other geospatial sources (for example, SHP data) into
MySQL, to take advantage of better data sharing.
For AutoCAD Map 3D 2011, the recommended version of MySQL is 5.0.27.
In the 2008 release of AutoCAD Map 3D, a new column called geometrytype
was added to the table named F_AttributeDefinition. To use AutoCAD Map
3D 2011 to access FDO data stores that were created in AutoCAD Map 3D
2007 and earlier, you must first connect to the data store containing this table
and run a SQL script. Instructions for this are on the Procedure tab of this
topic.
NOTE The MySQL architecture supports different storage engines, each with
varying characteristics and capabilities. The API has custom commands for gathering
information, transmitting exceptions, getting lists of accessible data stores, and
creating connection objects. There is support for spatial data types and spatial
query operations. For more information, refer to the FDO API Reference and the
FDO Provider for MYSQL API Reference.
See also:
■Working with MySQL Data (page 567)
■Creating a Data Store (page 586)
332 | Chapter 3 Bringing In Data

■Migrating Data (page 615)
■Styling Features (page 639)
■To create a map with styled feature layers (page 641)
■To edit a feature using feature editing commands (page 705)
To bring in features from MySQL
1Before connecting to a MySQL database, install the library file libmysql.dll.
2In Display Manager (page 2060), click Data ➤ Connect To Data.
3In the Data Connect window, select Add MySQL Connection in the Data
Connections By Provider list.
4Under Connection Name, type a name for this connection.
You can give the connection any name you like. This name appears in
Map Explorer as the name of the feature source.
5Under Service Name, enter the information for the MySQL data source.
If you do not know the name, check with your System Administrator.
6Click Login.
7In the User Credentials dialog box (page 1610), enter your user name and
password.
Optionally, select Remember Password if you want AutoCAD Map 3D to
log you in whenever you open this drawing.
8Click OK.
9In Data Connect, under Data Store, enter the data store name. If you do
not know this name, check with your System Administrator.
To select from a list of data stores, click the down arrow. AutoCAD Map
3D connects to the specified server and instance and lists the available
data stores.
NOTE If the data store is not in the list, it may not use a AutoCAD Map 3D
schema. Select Show All Data Stores to add these to the list. AutoCAD Map
3D creates a mapping to use these data stores with AutoCAD Map 3D.
10 Click Connect.
11 In the feature class list, select the feature classes to include in the map.
Bringing In Features from MySQL | 333

If this feature source contains only a single feature class, that feature class
is selected automatically. If it contains multiple feature classes, you can
right-click any of them and select Select All or Select None.
12 Click Add To Map.
To bring in a subset of the data, click the down arrow and select Add To
Map With Query (page 309). To filter data after you’ve added the data to
your map, see Filtering Feature Layers (page 1216).
Features from the selected feature classes appear in your map. You can style,
theme, and edit the features.
If you need additional properties related to this data, you can connect
additional data to a feature source layer using a join (page 507).
To use AutoCAD Map 3D 2011 to access FDO data stores that were created
in AutoCAD Map 3D 2007 and earlier
1Verify that you have the privileges required to execute the ALTER TABLE
request.
2In the command line, enter the following:
cd <MapInstallDir>/Fdo/bin/com
mysql --user=MyUserName --password=MyPasswordMyDatabase
<AlterSchemaMySQL.sql> MyLogFile
quit
Quick Reference
Connect Feature Source
Connects a feature source
Click File ➤ Connect To Data.
Menu
Connect
Icon
MAPCONNECTCommand Line
In Display Manager click Data ➤ Connect to Data.
Task Pane
334 | Chapter 3 Bringing In Data

Bringing In Features from SHP
You can access existing spatial and attribute data in ESRI SHP files, which store
both geometry and attributes (data) for features. A single shape can have
several separate files: SHP (shape geometry), SHX (shape index), PRJ (projection
information), CPG (code page files), IDX (spatial index), and DBF (shape
attributes in dBASE format). AutoCAD Map 3D treats each SHP and associated
DBF file as a feature class with a single geometry property.
When you connect to or import SHP polygon data, AutoCAD Map 3D checks
the geometry to see if there are multiple closed outer loops. If so, it treats the
geometry as multi-polygon (a polygon with multiple exterior rings). It does
not treat unclosed outer loops as multi-polygon.
When you create a multi-polygon in AutoCAD Map 3D and then save or
export it to SHP format, it will appear in its native SHP file as a multi-polygon.
If you brought in this type of geometry in a previous release and added styling,
you may need to update the style definitions.
When you view and edit features from a SHP data source, you can do the
following:
■Select the feature classes to include in your map.
■Set conditions to limit the features in your map.
■Style, theme, and edit the features.
■Lock the file when you connect to it.
■Automatically update the data source with any edits you make.
■View and edit the schema definition.
You can bring SHP data into your map in two ways:
■Use Data Connect to view and edit the data directly in the SHP file. Use
this method to edit geometry and attributes or to style and theme the data.
For information, click the Procedure tab at the top of this Help topic.
■Import the data into this drawing, which converts it to drawing objects.
Use this method to clean the data or to create a DWG file. You can export
the objects back to SHP format.
NOTE For information on customizing the SHP FDO provider (page 2063), refer to
the FDO API Reference and the FDO Provider for SHP API Reference.
Bringing In Features from SHP | 335

See also:
■Converting Data From Other Formats to Drawing Objects (page 377)
■Converting and Exporting (page 1403)
■Working with SHP Data (page 572)
■Styling Features (page 639)
■To create a map with styled feature layers (page 641)
■To edit a feature using feature editing commands (page 705)
To bring in features from SHP
1In Display Manager (page 2060), click Data ➤ Connect To Data.
2In the Data Connect window, select Add SHP Connection in the Data
Connections By Provider list.
3Under Connection Name, type a name for this connection.
You can give the connection any name you like. This name appears in
Map Explorer as the name of the feature source.
4Under Source File Or Folder, specify the location of the file. To include
multiple files in a group, specify a folder.
Click to browse to a file. Click the folder icon to browse to a folder.
5Click Connect.
6In the feature class list, select the feature classes to include in the map.
If this feature source contains only a single feature class, that feature class
is selected automatically. If it contains multiple feature classes, you can
right-click any of them and select Select All or Select None.
7Verify that the coordinate systems are correct. You can change an incorrect
coordinate system if necessary (page 311).
8Click Add To Map.
To bring in a subset of the data, click the down arrow and select Add To
Map With Query (page 309). To filter data after you’ve added the data to
your map, see Filtering Feature Layers (page 1216).
Features from the selected feature classes appear in your map. You can style,
theme, and edit the features.
336 | Chapter 3 Bringing In Data

If you need additional properties related to this data, you can connect
additional data to a feature source layer using a join (page 507).
Quick Reference
Connect Feature Source
Connects a feature source
Click File ➤ Connect To Data.
Menu
Connect
Icon
MAPCONNECTCommand Line
In Display Manager click Data ➤ Connect to Data.
Task Pane
Bringing In Features from SDF
You can access spatial and attribute data in an Autodesk Spatial Data File (SDF).
SDF supports spatial indexing and can store geometric and non-geometric
data with minimum overhead.
When you view and edit features from an SDF data source, you can do the
following:
■Select the feature classes to include in your map.
■Set conditions to limit the features in your map.
■Style, theme, and edit the features.
■Automatically update the data source with any edits you make.
■View and edit the schema definition.
■Move SDF data into other geospatial formats, to take advantage of better
data sharing
NOTE The procedures here apply to the current version of SDF (SDF3). For SDF
2 files (created for MapGuide version 6.5 or earlier), you cannot use these
procedures. Instead, import (page 389) the file.
Bringing In Features from SDF | 337

You can bring SDF data into your map in three ways:
■Use Data Connect to view and edit the data directly in the SDF file. Use
this method to edit geometry and attributes or to style and theme the data.
For information, click the Procedure tab at the top of this Help topic.
■Import the data into the current map, which converts the SDF data to
drawing objects. Use this method to clean the data or to create a DWG
file. You can export the objects back to SDF.
■For SDF 2 files (created for MapGuide version 6.5 or earlier), use the separate
SDF 2 Import (page 389) and SDF 2 Export (page 1417) commands.
NOTE For information on customizing this provider, refer to the FDO API Reference
and the FDO Provider for SDF API Reference.
See also:
■Editing a Schema (page 610)
■Importing Autodesk SDF 2 (page 389)
■Converting Data From Other Formats to Drawing Objects (page 377)
■Converting and Exporting (page 1403)
■Working with SDF Data (page 569)
■Migrating Data (page 615)
■Styling Features (page 639)
■To create a map with styled feature layers (page 641)
■To edit a feature using feature editing commands (page 705)
To bring in features from SDF
1In the Display Manager (page 2060), click Data ➤ Connect To Data.
2In the Data Connect window, select Add SDF Connection in the Data
Connections By Provider list.
3Under Connection Name, type a name for this connection.
You can give the connection any name you like. This name appears in
Map Explorer as the name of the feature source.
4Under Source File, specify the file.
338 | Chapter 3 Bringing In Data
5Click Connect.
6In the feature class list, select the feature classes to include in the map.
If this feature source contains only a single feature class, that feature class
is selected automatically. If it contains multiple feature classes, you can
right-click any of them and select Select All or Select None.
7Verify that the coordinate systems are correct. You can change an incorrect
coordinate system if necessary (page 311).
8Click Add To Map.
To bring in a subset of the data, click the down arrow and select Add To
Map With Query (page 309). To filter data after you’ve added the data to
your map, see Filtering Feature Layers (page 1216).
Features from the selected feature classes appear in your map. You can style,
theme, and edit the features.
If you need additional properties related to this data, you can connect
additional data to a feature source layer using a join (page 507).
NOTE For SDF files created for MapGuide version 6.5 or earlier, you cannot use
this procedure. Instead, import (page 389) the file.
Quick Reference
Connect Feature Source
Connects a feature source
Click File ➤ Connect To Data.
Menu
Connect
Icon
MAPCONNECTCommand Line
In Display Manager click Data ➤ Connect to Data.
Task Pane
Bringing In Features from SDF | 339
Bringing in Features from PostgreSQL/PostGIS
The OSGeo FDO provider for PostgreSQL/PostGIS has 32-bit and 64-bit versions
on Windows and Linux. For AutoCAD Map 3D, it is certified for PostGIS 1.4.0
with PostgreSQL 8.4.
PostGIS adds support for geographic objects to the PostgreSQL object-relational
database so that the PostgreSQL server can be used as a back end spatial
database for GIS. When you view and edit features from a PostgreSQL data
source, you can do the following:
■Select the feature classes to include in your map.
■Set conditions to limit the features in your map.
■Style, theme, and edit the features.
■Automatically update the data source with any edits you make.
Your edits are immediately visible to anyone else using the data source.
■View and edit the schema definition.
■Create a PostgreSQL data source.
■Move other geospatial data (for example, SHP data) into PostgreSQL, to
take advantage of better data sharing.
Setting Up PostgreSQL for Use with AutoCAD Map 3D
For a 32-bit environment
When you install AutoCAD Map 3D, the following DLL files are installed in
the AutoCAD Map 3D\FDO\BIN directory on the computer on which you run
AutoCAD Map 3D:
■comerr32.dll
■krb5_32.dll
■libeay32.dll
■libiconv-2.dll
■libintl-2.dll
■libpq.dll
■ssleay32.dll
340 | Chapter 3 Bringing In Data

■gssapi32.dll
■iconv.dll
■k5sprt32.dll
If you need to replace these files, copy them from the server bin directory
(C:\Program Files\PostgreSQL\8.4\bin) into the path or the AutoCAD Map
3D\FDO\BIN directory on the computer on which you run AutoCAD Map
3D.
For a 64-bit environment
For a 64-bit client, the following DLL files are installed in the AutoCAD Map
3D\FDO\BIN directory on the computer on which you run AutoCAD Map
3D:
■libeay32.dll
■libpq.dll
■ssleay32.dll
NOTE You must install the 64-bit client DLL on 64-bit machines. You cannot
install the 32-bit client.
See also:
■Working with PostgreSQL/PostGIS Data (page 574)
■Creating a Data Store (page 586)
■Migrating Data (page 615)
■Styling Features (page 639)
■To create a map with styled feature layers (page 641)
■To edit a feature using feature editing commands (page 705)
To bring in features from PostgreSQL/PostGIS
1In Display Manager (page 2060), click Data ➤ Connect To Data.
2In the Data Connect window, select Add PostgreSQL Connection in the
Data Connections By Provider list.
Bringing in Features from PostgreSQL/PostGIS | 341
3Under Connection Name, type a name for this connection.
You can give the connection any name you like. This name appears in
Map Explorer as the name of the feature source.
4Enter the Service Name and click Login.
The service name is set when you install the PostgreSQL server.
5In the User Credentials dialog box (page 1610), specify the login credentials
to use to log into this data store.
6In Data Connect, under Data Store, enter the data store name. If you do
not know this name, check with your System Administrator.
To select from a list of data stores, click the down arrow. AutoCAD Map
3D connects to the specified server and instance and lists the available
data stores.
7Click Connect.
8In the feature class list, select the feature classes to include in the map.
If this feature source contains only a single feature class, that feature class
is selected automatically. If it contains multiple feature classes, you can
right-click any of them and select Select All or Select None.
9Click Add To Map.
To bring in a subset of the data, click the down arrow and select Add To
Map With Query (page 309). To filter data after you’ve added the data to
your map, see Filtering Feature Layers (page 1216).
Accessing Data from ODBC
Use an ODBC connection to access attribute or point data in Microsoft Access,
Microsoft Excel, or dBASE.
Attribute data allows you to join information from a non-geometry source to
a geometric feature. For example, you can join assessor data to a parcel layer.
For information about joins, see Joining Data to GIS Features (page 507).
Point data can include survey points, LiDAR (page 2066) data, or GPS data, which
is typically specified either by Latitude and Longitude columns or by XY
coordinates.
By default, AutoCAD Map 3D maps each table in the database to a “feature
class” while each column becomes a “property.”
342 | Chapter 3 Bringing In Data
When you view and edit data from an ODBC database, you can do the
following:
■Select the feature classes to include in your map.
■Set conditions to limit the features in your map.
■Style, theme, and edit the features.
■Lock the file when you connect to it.
■Automatically update the data source with any edits you make.
Your edits are immediately visible to anyone else using the data source.
■Define feature classes for any relational database table with X, Y (and,
optionally, Z) columns. Object locations are stored in separate properties
in the object definition of a feature, which is accessible through the
Geometry class property. You cannot create or delete feature schemas.
Microsoft Excel Data
To access Microsoft Excel data, you must define table ranges in Excel. These
named ranges in the worksheet can then be treated as separate ODBC tables,
with each one mapping to an FDO (page 2062) feature class. If you do not define
named ranges, no feature classes are available to add to your map. Instructions
for defining a table range are on the Procedure tab of this topic.
Microsoft Access Data
Some Microsoft Access databases have autogenerated primary keys. You can
load data from Microsoft Access databases without these primary keys and
use that data for joins, and so on, However, without a primary key you cannot
create and update data.
To perform a AutoCAD Map 3D location query in a Microsoft Access database
that contains long integer values (longs), use the tools in Access to remove
the indexes from location-based x/y columns.
NOTE For information on customizing this provider, refer to the FDO API Reference
and the FDO Provider for ODBC API Reference.
Tell me more
Video
■Show me how to bring in point data
from an ODBC database.
Accessing Data from ODBC | 343
Procedure
■To create a DSN in Windows XP (page
345)
■To access ODBC data (page 344)
Tutorial
■Lesson 2: Analyze Data With External
Information Using Joins
Workflow
■Join Attribute Data to a Geospatial
Feature
GIS Skill
■Bring in point data from a Microsoft Ac-
cess database
Related topics
■About Geospatial Feature Classes, Data
Stores, and Schemas (page 551)
■Working with ODBC Data (page 576)
■To access ODBC data (page 344)
■To create a DSN in Windows XP (page 345)
■To define the table ranges required to access Excel data (page 346)
To access ODBC data
1In the Display Manager (page 2060), click Data ➤ Connect To Data.
2In the Data Connect window, select Add ODBC Connection in the Data
Connections By Provider list.
3Under Connection Name, type a name for this connection.
You can give the connection any name you like. This name appears in
Map Explorer as the name of the feature source.
4Under Source Type, select one of the following:
■Data Source Name (DSN) — Use a DSN you have defined in your
Windows Control Panel. See the following.
344 | Chapter 3 Bringing In Data
■Connection String — The connection string specifies the driver and
path to use.
5Under source, specify the table.
■Data Source Name (DSN) — Click the browse button and select the
DSN.
■Connection String — Specify the driver and path. For a Microsoft
Access database, use the format:
Driver={Microsoft Access Driver
(*.mdb)};DBQ=pathname\filename.mdb
Where pathname\filename.mdb is the complete path and filename of
the Microsoft Access database. Note the curly braces and the space
before “(*.mdb)” For more information, see the ODBC documentation
on the Microsoft Web site.
6If required by the table, enter your user name and password.
7Click Connect.
8Under Add Data To Map, select the tables.
9For each table, specify the coordinate system.
10 Specify the columns to use for point geometry. This can be
latitude/longitude or X, Y, and Z Coordinates. To specify the column
name, click in the field, then click the down arrow to choose from a list
of column names.
11 Click Add To Map.
If Add To Map is grayed out, check that you have specified the coordinate
system and X and Y columns for the table.
To create a DSN in Windows XP
1From your Windows desktop, click Start menu ➤ Settings ➤ Control
Panel and open the Administrative Tools control panel.
2Double-click Data Sources (ODBC).
3In the ODBC Data Source Administrator, click User DSN or System DSN.
A User DSN is visible only to you. A System DSN is visible to all users on
the current machine.
4Click Add and select the driver to use.
Accessing Data from ODBC | 345
For example, to create a DSN for an Access database, select Microsoft
Access Driver.
5In the ODBC Microsoft Access dialog box enter information about the
data. When you finish, click OK. Click OK again to close the ODBC Data
Source Administrator dialog box.
The DSN you defined appears in the DSN list in the Data Connect window.
To define the table ranges required to access Excel data
1In Excel, open the Excel worksheet.
2Select all the data.
3Define a named range.
4Enter a name for the feature class, for example, Country_Literacy.
5Close Excel.
Quick Reference
Connect Feature Source
Connects a feature source
Click File ➤ Connect To Data.
Menu
Connect
Icon
MAPCONNECTCommand Line
In Display Manager click Data ➤ Connect to Data.
Task Pane
Bringing In Features from WFS
You can bring in web-based features that have been published to a public web
server using the WFS (Web Feature Service) open standard developed by the
Open GIS Consortium (OGC).
NOTE This topic applies to geospatial data. To bring in drawing (DWG) objects,
see Overview of Bringing in Drawing Data From DWG Files (page 351).
346 | Chapter 3 Bringing In Data

Once you have located the WFS data you want, determine the URL of the page
that serves the published layers. Often, this is not a standard web page that
you can open in a browser, but a page that has been programmed using a
scripting language such as CGI, PHP, or ASP. See the following for some
examples. You paste the address into the Data Connect window in AutoCAD
Map 3D to access the data on that page.
When you bring in features from a WFS data source, you can do the following:
■Select the feature classes to include in your map.
■Set conditions to limit the features in your map.
■Reproject the data to the coordinate system of your map. Attribute data
may also be available for the WFS layers.
■Style and theme features. You cannot edit features from a WFS data source.
Example WFS Data Sources
DescriptionWFS Data Source
Data layers such as boundaries, terrains,
physiography, utilities, and more.
http://demo.cubewerx.com/demo/cube-
serv/cubeserv.cgi?datastore=Foundation
Virginia, USA Census tracts, Congressional
districts, counties, interstates, POI, and
places.
http://regis.inter-
graph.com/wfs/dcmetro/request.asp?
NOTE For information on customizing this provider, refer to the FDO API Reference
and The Essential FDO.
Tell me more
Video
■Show me how to bring in data from a
web server using WMS
Procedure
■To bring in features from WFS (page
348)
■To work with WFS data (page 582)
GIS Skill
■Access data published on a public web
server
Bringing In Features from WFS | 347
Related topics
■Working with WFS Data (page 581)
■Adding an Image from a WMS (Web
Map Service) (page 445)
■Styling Features (page 639)
To bring in features from WFS
NOTE This topic applies to geospatial data. To bring in drawing (DWG) objects,
see Overview of Bringing in Drawing Data From DWG Files (page 351).
1In the Display Manager (page 2060), click Data ➤ Connect To Data.
2In the Data Connect window, select Add WGS Connection in the Data
Connections By Provider list.
3Under Connection Name, type a name for this connection.
You can give the connection any name you like. This name appears in
Map Explorer as the name of the feature source.
4Under server name, specify the URL for the WFS server. Click the down
arrow to choose from a list of recently used URLs.
5If necessary, enter your user name and password.
6Click Connect.
7In the Add Data To Map area, select the feature classes to include.
If this feature source contains only a single feature class, that feature class
is selected automatically. If it contains multiple feature classes, you can
right-click any of them and select Select All or Select None.
8For each feature class you select, verify the coordinate system. You can
change an incorrect coordinate system if necessary (page 311).
9Click Add To Map.
To bring in a subset of the data, click the down arrow and select Add To
Map With Query (page 309). To filter data after you’ve added the data to
your map, see Filtering Feature Layers (page 1216).
Features from the selected feature classes appear in your map. If you need
additional properties related to this data, you can connect additional data to
a feature source layer using a join (page 507).
348 | Chapter 3 Bringing In Data
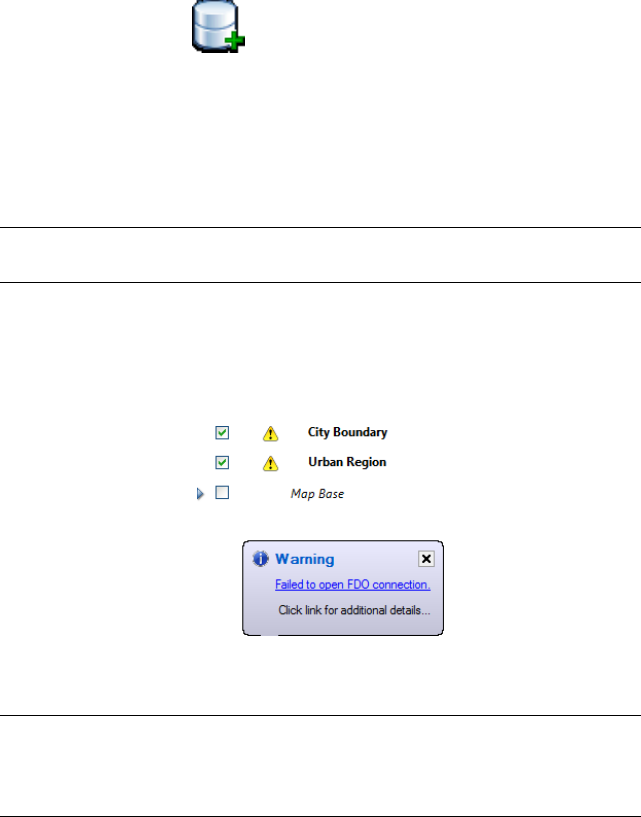
Quick Reference
Connect Feature Source
Connects a feature source
Click File ➤ Connect To Data.
Menu
Connect
Icon
MAPCONNECTCommand Line
In Display Manager click Data ➤ Connect to Data.
Task Pane
Repairing Broken Feature Connections
NOTE This topic applies to geospatial data. To bring in drawing (DWG) objects,
see Overview of Bringing in Drawing Data From DWG Files (page 351).
If a data file moves from its original location, you may get an error when you
open the map that references that data. For example, someone else might
create a map using an SDF file. That person then sends the map and SDF file
to you. If you store the SDF file with a different path name than the one used
by the original map creator, AutoCAD Map 3D displays an error.
To resolve this problem, you must reconnect the data using the correct path.
By doing so, you maintain styling information.
TIP To avoid this problem, use eTransmit to package and transfer files for a map.
Although this method does not work for database data (such as Oracle or SQL
Server data stores), it preserves the connections of all file-based data, such as SDF
and SHP.
Repairing Broken Feature Connections | 349
See also:
■Using eTransmit (page 1376)
To reconnect to feature data without losing styling information
NOTE This topic applies to geospatial data. To bring in drawing (DWG) objects,
see Overview of Bringing in Drawing Data From DWG Files (page 351).
1In Data Connect, select the data connection that is broken.
For example, select SDF_1, if the first SDF connection is broken.
2For Source File Or Folder, type or browse to the correct data store location.
3Click Connect, but do not click Add.
Clicking Add creates a new layer in your map, without the styling
information from the original layer.
Bringing In Drawing Data From DWG Files
NOTE This topic applies to AutoCAD drawing objects. To bring in geospatial data,
see Overview of Bringing In GIS Features (page 305).
Your map can include drawing objects from the current drawing or from other
drawings. To include objects from other drawings, you must first attach those
drawings to your map.
NOTE To open a DWG file that was created with, or contains, feature source
provider data, do not double-click the icon that represents the file. Click ➤
Open ➤ Drawing.
Each set of objects you select is stored in a layer in Display Manager. A layer
that includes drawing objects is a drawing layer (page 2060).
Drawing layers in Display Manager are different from “classic” AutoCAD layers
that you see in the AutoCAD Layer Properties Manager. AutoCAD users who
do not have AutoCAD Map 3D do not have Display Manager and so cannot
see Display Manager layers.
You style AutoCAD layers using the Layer Properties Manager. When you
bring in data by object class, location, property, or query, and store that data
in a Display Manager drawing layer, you can style and theme the layer using
350 | Chapter 3 Bringing In Data
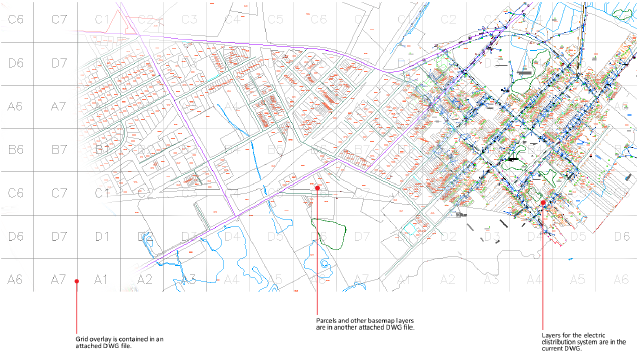
Display Manager tools, and use the mapping and GIS tools available in
AutoCAD Map 3D.
See also:
■Attaching a Drawing (page 157)
■Use these procedures to bring drawing objects into your map (page 354)
■To bring in drawing objects from AutoCAD layers in the current drawing
(page 356)
■To bring in drawing objects based on object classes in the current drawing
(page 357)
■To bring in drawing objects based on location (page 359)
■To bring in drawing objects based on object properties (page 362)
■To bring in drawing objects based on object data or external (SQL) data
(page 364)
■To bring in drawing objects based on object data (page 364)
■To bring in drawing objects based on external (SQL) data (page 365)
■To bring in drawing objects based on topology (page 367)
■To bring in drawing objects by combining query conditions (page 369)
Overview of Bringing in Drawing Data From DWG Files
This map of an electrical distribution system is based on several attached DWG files.
Overview of Bringing in Drawing Data From DWG Files | 351

NOTE This topic applies to AutoCAD drawing objects. To bring in geospatial data,
see Overview of Bringing In GIS Features (page 305).
You can include drawing objects in your map so you can view, edit, style, and
theme them.
You can select objects from the current drawing and from attached drawings.
For information about attached drawings, see Attaching Drawings (page 154).
Each set of objects you select is stored in a drawing layer (page 2060) in Display
Manager.
From...It includes...When you create a
drawing layer based
on...
The current drawingAll the objects on the selected
AutoCAD layer
AutoCAD Layer (page
355)
The current drawingAll the objects in the selected object
class
Object class (page 356)
The current drawingAll the objects in the selected topo-
logy
Topology (page 367)
The current drawing, at-
tached source drawings,
or a selected topology
All the objects in the specified loca-
tion
Location (page 358)
The current drawing, at-
tached source drawings,
or a selected topology
All objects that have the selected
property, such as elevation, layer,
or area
Object property (page
361)
The current drawing, at-
tached source drawings,
or a selected topology
All objects with the specified data,
such as object data or linked records
from an external database
Attached data (page 363)
352 | Chapter 3 Bringing In Data
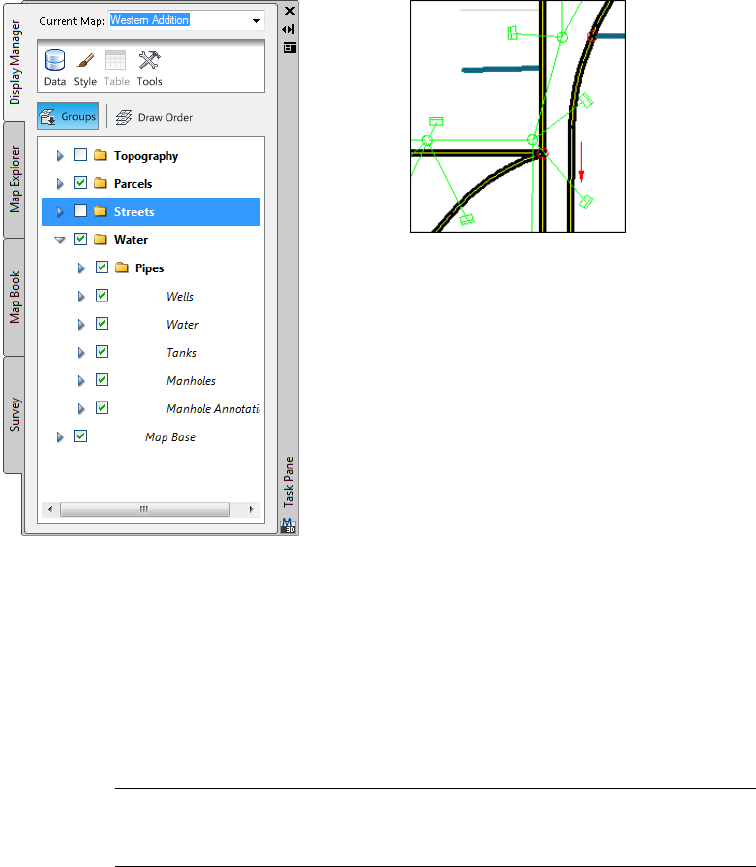
In this city map example, there are separate drawing layers for each set of
entities comprising the water system.
Use the Display Manager check boxes to turn off layers, which hides the objects
on that layer, or to turn off styles, which displays the drawing objects on that
layer without styles. For more information on styling drawing layers, see
Overview of Styling Drawing Layers (page 652).
Map Base
Objects in the current drawing that are not included in any layer are included
in the Map Base layer. You can hide all objects on this layer.
NOTE Objects from attached drawings that you have queried into the current
drawing using a standard query are added to the Map Base layer. To style these
objects separately in your map, create a query to bring them into the display.
Overview of Bringing in Drawing Data From DWG Files | 353
Tell me more
Video
■Show me how to run a query on a set of
attached DWG files.
■Show me how to include an AutoCAD
layer in Display Manager.
Procedure
■To bring drawing objects into your
map (page 354)
■To bring in drawing objects from
AutoCAD layers in the current drawing
(page 356)
Tutorial
■Exercise 2: Attach a drawing file
Workflow
■Create a CAD Map
GIS Skills
■Include AutoCAD layers in the Display
Manager
■Bring in a subset of features using a
query
Related topics
■Attaching Drawings (page 154)
Use these procedures to bring drawing objects into your map
NOTE This topic applies to AutoCAD drawing objects. To bring in geospatial data,
see procedures for bringing in geospatial data. (page 308).
■To bring in drawing objects from AutoCAD layers in the current drawing
(page 356)
■To bring in drawing objects based on object classes in the current drawing
(page 357)
■To bring in drawing objects based on location (page 359)
■To bring in drawing objects based on object properties (page 362)
354 | Chapter 3 Bringing In Data
■To bring in drawing objects based on object data or external (SQL) data
(page 364)
■To bring in drawing objects based on topology (page 367)
Quick Reference
ADEQUERY
Controls defining, modifying, saving, loading, and executing a query
In the Classic workspace, click Setup menu ➤ More
DWG Options ➤ Define Query
Menu
Define Query
Icon
ADEQUERYCommand Line
In Map Explorer, right-click Current Query ➤ Define
-or- Right-click a query ➤ Edit
Task Pane
Define Query dialog boxDialog Box
Bringing In Drawing Objects from AutoCAD Layers
NOTE This topic applies to AutoCAD drawing objects. To bring in geospatial data,
see Overview of Bringing In GIS Features (page 305).
In your map, you can create a drawing layer (page 2060) in Display Manager that
includes all the objects from selected AutoCAD layers in the current drawing.
For example, you can create a layer that includes all the fire hydrants by
selecting the HYDRANT AutoCAD layer.
You can organize layers into groups. Grouping layers lets you quickly turn off
the display of all the objects in the group.
TIP To select just some of the objects on an AutoCAD layer, use a query to add
the objects to your map and combine several conditions. For example, select only
the fire hydrants within 1000 meters of a corporation yard.
Bringing In Drawing Objects from AutoCAD Layers | 355
To bring in drawing objects from AutoCAD layers in the current drawing
NOTE This topic applies to AutoCAD drawing objects. To bring in geospatial data,
see procedures for bringing in geospatial data. (page 308).
1In Display Manager (page 2060), click Data ➤ Add Drawing Data ➤ Drawing
Layer.
2In the Select Layers dialog box (page 1631), select the AutoCAD layers that
include the objects to display.
AutoCAD Map 3D creates a layer in Display Manager for each AutoCAD
layer you select.
3To group the layers, select Group Selection.
If you combine the layers in a group, you can turn the display of the
group on or off.
4Click OK.
The new layer appears in Display Manager. All objects on the selected AutoCAD
layer are included in this layer. If you selected multiple AutoCAD layers,
multiple layers are created in your map. To see the objects, you may need to
zoom to the drawing extents. Click Map Setup tab ➤ Map panel ➤ Zoom
Drawing Extents.
Quick Reference
New Display Manager Layer - AutoCAD Layer
Creates a new layer from AutoCAD layers in Display Manager
In Display Manager, click Data ➤ Add Drawing
Data ➤ Drawing Layer
Task Pane
Select Display Element dialog boxDialog Box
Bringing In Drawing Objects by Object Class
NOTE This topic applies to AutoCAD drawing objects. To bring in geospatial data,
see Overview of Bringing In GIS Features (page 305).
356 | Chapter 3 Bringing In Data

In your map, you can create a drawing layer (page 2060) in Display Manager that
includes all the objects in an object class in the current drawing.
For example, to create a layer that includes all the primary roads, select the
PRIMARY_ROADS object class.
You can organize layers into groups. Grouping layers lets you quickly turn off
the display of all the objects in the group.
TIP To select just some of the objects in an object class, use a query to add the
objects to your map and combine conditions. For example, you can select only
the primary roads in the West quadrant of the county.
See also:
■Combining Conditions (page 368)
■Bringing In Drawing Objects from AutoCAD Layers (page 355)
■Bringing In Drawing Objects Based on Topology (page 367)
■Bringing In Drawing Objects by Location (page 358)
■Bringing In Drawing Objects by Property (page 361)
■Bringing In Drawing Objects Based on Attached Data (page 363)
■Bringing in GIS Features (page 303)
To bring in drawing objects based on object classes in the current drawing
NOTE This topic applies to AutoCAD drawing objects. To bring in geospatial data,
see procedures for bringing in geospatial data. (page 308).
1In Display Manager (page 2060), click Data ➤ Add Drawing Data ➤ Object
Class.
2In the Select Classes dialog box (page 1631), select the object classes that
include the objects to display.
AutoCAD Map 3D creates a layer in Display Manager for each object class
you select.
3To group the object class layers, select Group Selection.
If you combine the layers in a group, you can turn the display of the
group on or off.
4Click OK.
Bringing In Drawing Objects by Object Class | 357

The new layer appears in Display Manager. All objects in the selected object
class are included in this layer. If you selected multiple object classes, multiple
layers are created. To see the objects, you may need to zoom to the drawing
extents. Click Map Setup tab ➤ Map panel ➤ Zoom Drawing Extents.
Quick Reference
New Display Manager Layer - Object Class
Creates a new object class layer in the Display Manager
In Display Manager, click Data ➤ Add Drawing
Data ➤ Object Class
Task Pane
Select Object Classes dialog boxDialog Box
Bringing In Drawing Objects by Location
NOTE This topic applies to AutoCAD drawing objects. To bring in geospatial data,
see Overview of Bringing In GIS Features (page 305).
In your map, you can create a drawing layer (page 2060) in Display Manager that
includes the objects in a specified location. You can select from objects in the
current map, in attached drawings, or in a topology.
For example, you can select all utility poles within 100 feet of a specified road
or all parks within a specified quadrant of the city.
TIP You can use a query to combine a location condition with other conditions.
For example, you can find all parcels that are zoned residential and are within 500
meters of a contaminated well.
Tell me more
Video
■Show me how to run a query on a set of
attached DWG files.
Procedure
■To bring in drawing objects based on
location (page 359)
358 | Chapter 3 Bringing In Data
■To bring in drawing objects by combin-
ing query conditions (page 369)
Tutorial
■Exercise 3: Query in data from the
drawing
Workflow
■Create a CAD Map
GIS Skill
■Bring in a subset of features using a
query
Related topics
■Attaching Drawings (page 154)
■Combining Conditions (page 368)
■Bringing In Drawing Objects by Object
Class (page 356)
■Bringing In Drawing Objects from
AutoCAD Layers (page 355)
■Bringing In Drawing Objects by Prop-
erty (page 361)
■Bringing In Drawing Objects Based on
Attached Data (page 363)
To bring in drawing objects based on location
NOTE This topic applies to AutoCAD drawing objects. To bring in geospatial data,
see procedures for bringing in geospatial data. (page 308).
1Do one of the following:
■In Display Manager (page 2060), click Data ➤ Add Drawing Data ➤
Query Current Drawing.
■In Display Manager, click Data ➤ Add Drawing Data ➤ Query Source
Drawing. Be sure you have attached (page 154) the DWG files to query.
■In Display Manager, click Data ➤ Add Drawing Data ➤ Query
Topology.
Bringing In Drawing Objects by Location | 359

2In the Define Query dialog box (page 1838), click Location.
3In the Location Condition dialog box (page 1849), select a boundary to
determine the type of area to query.
Select Fence to specify a new polyline; select Polyline to use an existing
polyline.
4Choose a selection type:
■Inside includes only objects that are completely inside the boundary.
■Crossing includes all objects that are inside the boundary or crossing
the boundary.
5If you select the Polyline boundary, specify a polyline mode.
6To define the coordinates of the boundary, click Define and use any
AutoCAD Map 3D selection method to define the boundary.
7Click OK.
8Optionally, define another condition. See Combining Conditions (page
369).
9In the Define Query dialog box, click OK.
The new layer appears in Display Manager. Objects that meet the conditions
of the query are included in this layer. To see the objects, you may need to
zoom to the drawing extents. Click Map Setup tab ➤ Map panel ➤ Zoom
Drawing Extents.
Quick Reference
New Display Manager Layer - Query
Creates a new query layer in Display Manager
In Display Manager, click Data ➤ Add Drawing Data
and then select a query type
Task Pane
Define Query dialog boxDialog Box
360 | Chapter 3 Bringing In Data

Bringing In Drawing Objects by Property
NOTE This topic applies to AutoCAD drawing objects. To bring in geospatial data,
see Overview of Bringing In GIS Features (page 305).
In your map, you can create a drawing layer (page 2060) in Display Manager that
includes objects that have a specific property. You can select from objects in
the current map, or from objects in attached drawings.
For example, you can select all roads with a dashed linetype.
TIP You can combine a property condition with other conditions to create specific
queries. For example, you could find all parcels that are zoned Residential and
have an elevation lower than 50.
Additional Information
■If an object has the property set to BYLAYER, it will be selected only if you
set the search value to BYLAYER.
For example, if you search for a DASHED linetype, you will get only objects
that have the linetype set to DASHED; you will not get objects that have
that linetype because they reside on a layer with a DASHED linetype. To
get these objects, you must set the search value to BYLAYER.
■Custom objects do not appear in the Object Type values list until you load
the DBX module for the object.
■Because topology information is stored in object data, use a data condition
to search for the following properties of topology objects: area, length,
perimeter, direction, direct resistance, and reverse resistance.
See also:
■Attaching Drawings (page 154)
■Combining Conditions (page 368)
■Bringing In Drawing Objects from AutoCAD Layers (page 355)
■Bringing In Drawing Objects by Object Class (page 356)
■Bringing In Drawing Objects Based on Topology (page 367)
■Bringing In Drawing Objects by Location (page 358)
■Bringing In Drawing Objects Based on Attached Data (page 363)
Bringing In Drawing Objects by Property | 361

■Bringing in GIS Features (page 303)
To bring in drawing objects based on object properties
NOTE This topic applies to AutoCAD drawing objects. To bring in geospatial data,
see procedures for bringing in geospatial data. (page 308).
1Do one of the following:
■In Display Manager (page 2060), click Data ➤ Add Drawing Data ➤ Query
Current Drawing.
■In Display Manager, click Data ➤ Add Drawing Data ➤ Query Source
Drawing. Be sure you have attached (page 154) the DWG files to query.
■In Display Manager, click Data ➤ Add Drawing Data ➤ Query
Topology.
2In the Define Query dialog box (page 1838), click Property.
3In the Property Condition dialog box (page 1855), select a property.
4Select an operator.
For some properties, such as layer, the only available operator is = (equal).
5Enter a value for the property.
To select from a list of values, click Values. For example, if you select the
layer property, click Values to display a list of layers in the drawings.
You can use wild-card characters to enter values for the following
properties: Block Name, Color, Text Style, Object Type, Group, Layer,
Feature Class, Linetype, and Plotstyle.
6Click OK.
7Optionally, define another condition. See Combining Conditions (page
369).
8In the Define Query dialog box, click OK.
The new layer appears in Display Manager. Objects that meet the conditions
of the query are included in this layer. To see the objects, you may need to
zoom to the drawing extents. Click Map Setup tab ➤ Map panel ➤ Zoom
Drawing Extents.
362 | Chapter 3 Bringing In Data

Quick Reference
New Display Manager Layer - Query
Creates a new query layer in Display Manager
In Display Manager, click Data ➤ Add Drawing Data
and then select a query type
Task Pane
Define Query dialog boxDialog Box
Bringing In Drawing Objects Based on Attached Data
NOTE This topic applies to AutoCAD drawing objects. To bring in geospatial data,
see Overview of Bringing In GIS Features (page 305).
In your map, you can add a drawing layer (page 2060) in Display Manager that
contains objects based on attribute data associated with the object, for example,
object data or data in a linked external database. Select from objects in the
current map, or from objects in attached drawings.
For example, if you have a linked database that lists pavement surfaces, you
can select all objects with a gravel pavement surface.
TIP Combine a data condition with other conditions to create specific queries.
For example, you could find all parcels that are zoned Residential and are within
500 yards of a contaminated well.
Notes
■You cannot retrieve objects based on constant block attributes.
■For Data queries, the Database Link option tests the link data stored on
the object, not the data in the database table. To retrieve objects based on
data in the linked database table, create a SQL condition.
■Because topology information is stored in object data, use a data condition
to search for the following properties of topology objects: area, length,
perimeter, direction, direct resistance, and reverse resistance.
See also:
■Attaching Drawings (page 154)
Bringing In Drawing Objects Based on Attached Data | 363

■Combining Conditions (page 368)
■Bringing In Drawing Objects from AutoCAD Layers (page 355)
■Bringing In Drawing Objects by Object Class (page 356)
■Bringing In Drawing Objects Based on Topology (page 367)
■Bringing In Drawing Objects by Location (page 358)
■Bringing In Drawing Objects by Property (page 361)
■Bringing in GIS Features (page 303)
■To bring in drawing objects based on object data or external (SQL) data
(page 364)
■To bring in drawing objects based on object data (page 364)
■To bring in drawing objects based on external (SQL) data (page 365)
To bring in drawing objects based on object data or external (SQL) data
■To select objects based on object data (page 364)
■To select objects based on external (SQL) data (page 365)
To bring in drawing objects based on object data
NOTE This topic applies to AutoCAD drawing objects. To bring in geospatial data,
see procedures for bringing in geospatial data. (page 308).
1Do one of the following:
■In Display Manager (page 2060), click Data ➤ Add Drawing Data ➤ Query
Current Drawing.
■In Display Manager, click Data ➤ Add Drawing Data ➤ Query Source
Drawing. Be sure you have attached (page 154) the DWG files to query.
■In Display Manager, click Data ➤ Add Drawing Data ➤ Query
Topology.
2In the Define Query dialog box (page 1838), click Data.
3In the Data Condition dialog box (page 1836), select the type of data to
use.
364 | Chapter 3 Bringing In Data

4Specify the location of the data.
■To retrieve objects based on object class, in the Class list, select the
object class of the objects to retrieve. Under Properties, select the
specific properties to query.
■To retrieve objects based on object data, select the table and field to
query.
If two attached drawings have a table with the same name, AutoCAD
Map 3D recognizes only the fields defined in the first drawing you
activate.
■To retrieve objects based on database link data, in the Link Template
list, select the link template associated with the objects to retrieve.
Under Key Columns, select the key column to query.
To search for objects in attached drawings, only link templates defined
in your attached drawing are displayed in the list.
■To retrieve objects based on block attribute information, in the Blocks
list, select the block that contains the attribute tag information to
query. Under Attribute Tags, select the attribute tag to query, or select
* in the Blocks list to see a list of all the attribute tags of all the blocks
in the active drawing.
5Select an operator.
When you query database link data, only the = operator is available.
6Enter the data value.
You can use wild-card characters for Value. For more information about
wild cards, see Wildcard Characters (page 1537).
7Click OK.
8In the Define Query dialog box, click OK.
NOTE Before you execute a query with a SQL condition, verify that the appropriate
data source is attached and connected.
To bring in drawing objects based on external (SQL) data
1Do one of the following:
■In Display Manager (page 2060), click Data ➤ Add Drawing Data ➤ Query
Current Drawing.
Bringing In Drawing Objects Based on Attached Data | 365

■In Display Manager (page 2060), click Data ➤ Add Drawing Data ➤ Query
Source Drawing. Be sure you have attached (page 154) the DWG files
to query.
■In Display Manager (page 2060), click Data ➤ Add Drawing Data ➤ Query
Topology.
2In the Define Query dialog box (page 1838), click SQL.
3In the SQL Link Condition dialog box (page 1866), select the link template
for the table to search.
If you chose Attached Drawings in Step 1, the link template list includes
only link templates for active attached drawings. If the link template is
not listed, verify that it is defined in the attached drawing.
4Create a SQL condition by selecting a column, an operator, and a value.
To type the condition, click Type Condition.
5Click Add Condition to add the condition to the Current SQL Condition
list.
6To add more conditions, select And or Or. Create another condition.
7When you finish building the SQL condition, click OK.
8Optionally, define another condition. See Combining Conditions (page
369).
9In the Define Query dialog box, click OK.
The new layer appears in Display Manager. Objects that meet the conditions
of the query are included in this layer. To see the objects, you may need to
zoom to the drawing extents. Click Map Setup tab ➤ Map panel ➤ Zoom
Drawing Extents.
Quick Reference
New Display Manager Layer - Query
Creates a new query layer in Display Manager
In Display Manager, click Data ➤ Add Drawing Data
and then select a query type
Task Pane
366 | Chapter 3 Bringing In Data

Define Query dialog boxDialog Box
Bringing In Drawing Objects Based on Topology
NOTE This topic applies to AutoCAD drawing objects. To bring in geospatial data,
see Overview of Bringing In GIS Features (page 305).
You can create a drawing layer (page 2060) in Display Manager that includes all
the objects in a topology.
For example, to create a layer that includes all the objects in the Streets
topology, select the STREETS topology.
You can organize layers into groups. Grouping layers lets you quickly turn off
the display of all the objects in the group.
TIP To select just some of the objects in a topology, combine conditions. For
example, you could find only the streets with four or more lanes.
See also:
■Attaching Drawings (page 154)
■Combining Conditions (page 368)
■Bringing In Drawing Objects from AutoCAD Layers (page 355)
■Bringing In Drawing Objects by Object Class (page 356)
■Bringing In Drawing Objects by Location (page 358)
■Bringing In Drawing Objects by Property (page 361)
■Bringing In Drawing Objects Based on Attached Data (page 363)
■Creating Topologies (page 821)
To bring in drawing objects based on topology
NOTE This topic applies to AutoCAD drawing objects. To bring in geospatial data,
see procedures for bringing in geospatial data. (page 308).
1In Display Manager (page 2060), click Data ➤ Add Drawing Data ➤ Topology.
Bringing In Drawing Objects Based on Topology | 367

2In the Select Display Element dialog box (page 1631), select the topologies
that include the objects to display.
AutoCAD Map 3D creates a layer in Display Manager for each topology
you select.
3To group topology layers, select Group Selection.
If you combine the layers in a group, you can turn the display of the
group on or off.
4Click OK.
The new layer appears in Display Manager. All objects in the selected topology
are included in this layer. If you selected multiple topologies, multiple layers
are created. To see the objects, you may need to zoom to the drawing extents.
Click Map Setup tab ➤ Map panel ➤ Zoom Drawing Extents.
Quick Reference
New Display Manager Layer - Topology
Creates a new topology layer in Display Manager
In Display Manager, click Data ➤ Add Drawing
Data ➤ Topology
Task Pane
Select Display Element dialog boxDialog Box
Combining Conditions
NOTE This topic applies to AutoCAD drawing objects. To bring in geospatial data,
see Overview of Bringing In GIS Features (page 305).
You can combine query conditions to select specific drawing objects for a new
drawing layer (page 2060) in Display Manager.
For example, you can combine a layer condition with a location condition to
find utility lines in the West quadrant of a city.
You can select from objects in the current map, in attached drawings, or in a
topology.
368 | Chapter 3 Bringing In Data

See also:
■Attaching Drawings (page 154)
■Bringing In Drawing Objects from AutoCAD Layers (page 355)
■Bringing In Drawing Objects by Object Class (page 356)
■Bringing In Drawing Objects Based on Topology (page 367)
■Bringing In Drawing Objects by Location (page 358)
■Bringing In Drawing Objects by Property (page 361)
■Bringing In Drawing Objects Based on Attached Data (page 363)
To bring in drawing objects by combining query conditions
NOTE This topic applies to AutoCAD drawing objects. To bring in geospatial data,
see procedures for bringing in geospatial data. (page 308).
1Do one of the following:
■In Display Manager (page 2060), click Data ➤ Add Drawing Data ➤ Query
Current Drawing.
■In Display Manager, click Data ➤ Add Drawing Data ➤ Query Source
Drawing. Be sure you have attached (page 154) the DWG files to query.
■In Display Manager, click Data ➤ Add Drawing Data ➤ Query
Topology.
2In the Define Query dialog box (page 1838), create the first condition by
clicking Query Type.
■Location — Selects objects based on their location. Click Zoom Ext
to zoom to the extents of all active attached drawings.
■Property — Selects objects based on an object property, such as layer,
color, or area.
■Data — Selects objects based on object class, object properties, database
links, object data, or attributes.
■SQL — Selects objects based on linked external data.
When you finish defining the condition, you return to the Define Query
dialog box with the condition listed in the Current Query area.
Combining Conditions | 369

3Before you create the next condition, select a joining operator.
■And — Finds objects only if both conditions are true.
■Or — Finds objects if either condition is true.
■And Not — Finds objects only if the first condition is true and the
second condition is false.
■Or Not — Finds objects if either the first condition is true or the second
condition is false.
4Create the next condition by clicking Query Type.
5Continue to create conditions.
6To group conditions, select the first and last condition in the group. Click
Group. Conditions inside the parentheses are evaluated first.
7When you finish defining conditions, click OK.
The new layer appears in Display Manager. Objects that meet the conditions
of the query are included in this layer. To see the objects, you may need to
zoom to the drawing extents. Click Map Setup tab ➤ Map panel ➤ Zoom
Drawing Extents.
Quick Reference
New Display Manager Layer - Query
Creates a new query layer in Display Manager
In Display Manager, click Data ➤ Add Drawing Data
and then select a query type
Task Pane
Define Query dialog boxDialog Box
Bringing in Survey Data
AutoCAD Map 3D allows you to manage survey point data. You can import
survey points in LandXML or ASCII format, view point data in the Point Table
(a survey-point specific version of the Data Table (page 1613)), edit survey points,
add points using coordinate geometry commands, and export points to
370 | Chapter 3 Bringing In Data
LandXML format. Using the bulk copy feature, you can also export points to
another data store to create geospatial features.
Before you import survey data, create (page 1000) or connect to (page 1000) a
Survey Data Store.
See also:
■Working with Survey Data (page 996)
■To bring LandXML data into a Survey Data Store (page 371)
■To bring ASCII point data into a Survey Data Store (page 373)
■To bring LiDAR data into your map (page 374)
■To add a point cloud to your map (page 376)
■To add a point cloud to your map using the Point Cloud Manager (page
376)
■To create a point cloud layer for point cloud objects already in your map
(page 376)
■To adjust the display density point clouds in your map (page 377)
Bringing in LandXML Data
You can bring in survey point data in LandXML format. AutoCAD Map 3D
supports LandXML versions 1.0, 1.1, and 1.2.
When you import a LandXML file into AutoCAD Map 3D, it appears in the
survey tree as a Project. Projects are the primary organizational group within
a survey data store.
See also:
■Overview of Working with Survey Data (page 997)
■Working with Survey Data Stores (page 999)
■Working with Projects (page 1001)
■Exporting Survey Points to a LandXML File (page 1471)
To bring LandXML data into a Survey Data Store
1Create (page 1000) or connect to (page 1000) a Survey Data Store.
2On the Survey tab of the Task Pane, click Data ➤ Import LandXML. The
Import LandXML dialog box appears.
Bringing in LandXML Data | 371
3Browse to and select the LandXML file you want to import.
4Click Open.
■If AutoCAD Map 3D cannot recognize the coordinate system of your
LandXML data,the LandXML Coordinate System dialog box (page 1717)
appears. Assign a coordinate system by entering the appropriate
coordinate system code or selecting one from a list, then click OK.
5The LandXML file is brought into your Survey Data Store.
Quick Reference
Import LandXML Data
Import LandXML data to a survey data store.
On the Survey tab, right-click a survey data store ➤
Import LandXML -or- On the Survey tab, click Data
➤ Import LandXML
Task Pane
Bringing in ASCII Point Data
You can bring in survey point data in a variety of ASCII formats. ASCII survey
point data can be brought in to any node in the survey tree.
Select the format of the source data using the Format drop-down list in the
Import ASCII Points dialog box (page 1716). Formats describe the layout of the
data in your source files using the following convention:
■P is point ID
■E is Easting, or longitudinal values
■N is Northing or latitudinal values
■Z is elevation values
■D is description
Make sure that you select the correct format plus delimiter type (comma or
space) for your data source.
372 | Chapter 3 Bringing In Data

The Autodesk Uploadable File format is as follows: PNEZD (Point Identification,
Y, X, Z, Description). It is a comma-separated format, and uses the # character
for comment text.
See also:
■Overview of Working with Survey Data (page 997)
■Working with Survey Data Stores (page 999)
To bring ASCII point data into a Survey Data Store
1Create (page 1000) or connect to (page 1000) a Survey Data Store.
2Right-click any node in the Survey Tree on the Survey tab of the Task
Pane.
3Select Import ASCII Points. The Import ASCII Points dialog box (page 1716)
appears.
4In the File Location section, click . The Import ASCII File dialog box
appears.
5Browse to and select the ASCII file you want to import, then click Open.
6In the Formatting section, select the data format and Z-Unit (elevation
unit) for the file. Valid elevation units are meters, US feet, international
feet, and chains.
7The Preview section will show a sample of the data you are about to
import. Check the preview to verify that you have selected the correct
file and formatting.
8In the Coordinate System Assignment section, enter the coordinate system
of the file you are importing. Click to select the coordinate system
from a list.
9Click OK. The ASCII point data is brought into your Survey Data Store.
Quick Reference
Import ASCII Point Data
Bringing in ASCII Point Data | 373
Import ASCII point data to a survey data store.
On the Survey tab, right-click a survey data store ➤
Import ASCII Points.
Task Pane
Import ASCII Points dialog boxDialog Box
Bringing in LiDAR Data
You can bring LiDAR (page 2066) point cloud (page 2071) data into your map using
the Point Cloud Manager (page 1897). Point clouds are large data sets composed
of 3D point data.Geographic LiDAR data is most commonly available in LAS
(page 2066) (LiDAR Aerial Survey) or ASCII (.xyz) format. AutoCAD Map 3D
2011 accepts LiDAR data in either LAS version 1.2 or space-delimited ASCII
text (.xyz) format.
See also:
■Overview of Point Clouds (page 1012)
■Overview of LiDAR Data (page 1012)
■Using LiDAR Data to Create a Point Cloud Data Store (page 1019)
■Managing LiDAR Data (page 1015)
■Exporting Point Cloud Data (page 1451)
To bring LiDAR data into your map
1Click Create tab ➤ Point Cloud panel ➤ Index File.
2In the Point Cloud Manager (page 1897), click Add File. The Open dialog
box appears.
3Select the file or files to bring in.
4Click Open.
The files appear in the Point Cloud Manager.
Quick Reference
MAPPOINTCLOUDMANAGER
374 | Chapter 3 Bringing In Data
Creates and manages indexed point cloud data stores.
MAPPOINTCLOUDMANAGERCommand Line
Point Cloud ManagerDialog Box
Bringing in Point Cloud Data
You can bring point cloud data into your map from an indexed point cloud
data store or from a point cloud drawing object. Point clouds appear as layers
in the Display Manager and as AutoCAD drawing objects in your map. For
more information on working with AutoCAD drawing objects, see Working
with Drawing Objects (page 727).
You can add point clouds from indexed point cloud data stores created in
AutoCAD Map 3D or in AutoCAD. Index files created in AutoCAD Map 3D
have the .ISD file extension. Index files created in AutoCAD have the .PCG
file extension.
If you are using a point cloud drawing object in your map that was created
using AutoCAD Civil 3D, you will not be able to view the point cloud styling
applied by AutoCAD Civil 3D unless you download and install the AutoCAD
Civil 2010 object enabler. You can get the AutoCAD Civil 2010 object enabler
from the Autodesk website:
http://usa.autodesk.com/adsk/servlet/ps/dl/item?siteID=123112&id=13084151&linkID=9240858.
You can add, merge, and filter indexed point cloud data store files using the
Point Cloud Manager (page 1897).
After you add point clouds to your map, you can adjust the density of the
points displayed in your map using the Points Display slider. The density
setting of the Points Display slider applies to all point clouds in your map.
You do not need to set the display density for each point cloud individually.
See also:
■Overview of Point Clouds (page 1012)
■Overview of LiDAR Data (page 1012)
■Overview of Point Cloud Files and Objects (page 1013)
■Bringing in LiDAR Data (page 374)
■Using LiDAR Data to Create a Point Cloud Data Store (page 1019)
■Creating Surfaces From Point Cloud Data (page 1021)
Bringing in Point Cloud Data | 375

■Filtering Point Cloud Data (page 1024)
■Exporting Point Cloud Data (page 1451)
To add a point cloud to your map
1In the Display Manager, click Data ➤ Add Point Cloud Data ➤ From
Index File.
2In the Select Point Cloud Index dialog box, select the index file for the
point cloud data store to add to your map
3Click Open.
AutoCAD Map 3D adds a point cloud layer to the Display Manager, and
add the point cloud drawing object to your map.
To add a point cloud to your map using the Point Cloud Manager
NOTE You cannot add point cloud index files created in AutoCAD (.PCG files)
using the Point Cloud Manager.
1In the Point Cloud ribbon tab, click Index File to display the Point Cloud
Manager (page 1897), or enter mappointcloudmanager at the command
prompt.
2Click Add File. The Open dialog box appears.
3Select the .ISD files you want to bring in.
4Click Open.
The files are added to the Point Cloud Manager. You can now create
merge files and filter your point cloud data the same way you work with
LiDAR data. (page 1015)
To create a point cloud layer for point cloud objects already in your map
1Click Data ➤ Add Drawing Data ➤ Point Cloud.
2In the Select Point Cloud dialog box, select the point cloud object or
objects.
3To add point cloud objects to a Display Manager group, select Group
Selection.
4Click OK.
376 | Chapter 3 Bringing In Data
AutoCAD Map 3D adds a point cloud layer to the Display Manager.
To adjust the display density point clouds in your map
1Click Create ribbon tab ➤ Point Cloud Panel ➤ Point Cloud drop-down
list.
2Adjust the Point Cloud Density slider to the right to increase the display
density of your point cloud objects. Adjust the slider to the left to decrease
the display density.
3Alternately, at the command prompt enter pointclouddensity, then enter
a value from 1 through 100.
Quick Reference
MAPPOINTCLOUDMANAGER
Creates and manages indexed point cloud data stores.
MAPPOINTCLOUDMANAGERCommand Line
Point Cloud ManagerDialog Box
Converting Data From Other Formats to Drawing
Objects
You can import maps from other formats into AutoCAD Map 3D. The imported
data is brought into the current drawing and the geometry is converted to
drawing objects. The attribute data and display options associated with the
objects can also be imported.
In addition, you can specify an area of the map to import, assign incoming
objects to existing object classes, and automatically perform a coordinate
conversion on the objects as they are imported.
When you directly access data through FDO (using Data Connect), you make
all edits and changes directly to the source. When you import data, you bring
in a copy of the data and you cut the connection to the data source. Your
changes are made only to the copy in your map.
Converting Data From Other Formats to Drawing Objects | 377

NOTE Data you import becomes AutoCAD drawing objects in your map. To
connect to the data in its original format, see Overview of Bringing In GIS Features
(page 305). To convert the drawing objects to a geospatial format, see Overview
of Converting and Exporting (page 1405).
See also:
■Supported Import Formats (page 387)
■Bringing in GIS Features (page 303)
■Converting and Exporting (page 1403)
■Digitizing Maps (page 1617)
NOTE Data you import becomes AutoCAD drawing objects in your map. To
connect to the data in its original format, see Overview of Bringing In GIS Features
(page 305). To convert the drawing objects to a geospatial format, see Overview
of Converting and Exporting (page 1405).
■To import data from other formats (page 381)
■To style drawing data on import (page 385)
■To specify an area to import (page 418)
■To specify an AutoCAD layer during import (page 419)
■To assign an object class to an input layer (page 421)
■To perform a coordinate conversion (page 424)
■To specify the data to import (page 426)
■To specify how to import points (page 428)
■To import polygons (page 430)
■To create centroids for polygons and closed polylines (page 433)
■To import objects with links to an external database (page 434)
■To import a file with attribute data and display the data as text (page 435)
Overview of Converting Geospatial Data to Drawing Objects
During import, AutoCAD Map 3D copies data from the input file into the
active AutoCAD Map 3D drawing and converts the data to drawing objects.
Connecting to Data Directly vs. Importing
You can work with your data using Data Connect or by importing it.
378 | Chapter 3 Bringing In Data
When you use Data Connect (from Display Manager), you view and edit data
in its source. Edits are saved back to the source. The data stays in its original
location.
When you import data, you make a copy of the data and bring that copy into
your map. When you edit the data, you are editing the copy. The original data
is unchanged.
For some formats, such as MicroStation Design (DGN), Arc/INFO, and SDF 2
(Autodesk MapGuide 6.5 and earlier), you can only import and export the
data. For most other formats, you can either connect directly to the data or
use import and export.
For more information, see Overview of Bringing In GIS Features (page 305).
Before You Import a File
Before you import a file, determine the following:
■Determine whether to limit the import to the current display area or to
an area that you define.
■Decide where to put objects: on an existing layer in the map, on a new
layer, or on a layer specified in the file you are importing.
■Determine which incoming data values to use to populate the object class
data fields, and decide how to handle data values that do not fall within
the acceptable object class range (keep them as-is or assign them default
object class values).
■Assign a coordinate system to the current AutoCAD Map 3D drawing. You
need to know which coordinate system is used with the input files.
■Determine whether to import the data as object data or as external data,
and whether to use an existing table or create a new one.
■Import point objects as points, text, or blocks. When you import as blocks,
be sure you have copied the block you want into the AutoCAD Map 3D
drawing.
Supported Formats
For information on importing specific formats, see the following:
■Importing Autodesk SDF (Spatial Data Files) (page 387) (version 3, MapGuide
Enterprise)
■Importing Autodesk SDF 2 (page 389)
Overview of Converting Geospatial Data to Drawing Objects | 379
■Importing DXF Files (page 391)
■Importing ESRI Arc/INFO Coverages (page 394)
■Importing From ESRI ArcSDE (page 391)
■Importing ESRI Shape Files (page 397)
■Importing Geographic Markup Language (GML) Files (page 412)
■Importing MapInfo MIF/MID Files (page 400)
■Importing MapInfo TAB Files (page 402)
■MicroStation Design (DGN) Versions 7 and 8 (page 405)
■Oracle (page 409)
■Importing SDTS (Spatial Data Transfer Standard) Files (page 413)
■Importing VPF (Vector Product Format) Files (page 416)
Tell me more
Procedure
■To bring in drawing objects from
AutoCAD layers in the current drawing
(page 356)
■To bring in drawing objects based on
object classes in the current drawing
(page 357)
■To bring in drawing objects based on
location (page 359)
■To bring in drawing objects based on
object properties (page 362)
■To bring in drawing objects based on
object data or external (SQL) data
(page 364)
■To bring in drawing objects based on
topology (page 367)
Tutorial
■Lesson 4: Import SDF Files as DWG
Layers
380 | Chapter 3 Bringing In Data
Workflow
■Send GIS Data to AutoCAD
Related topics
■Converting and Exporting (page 1403)
■Bringing in GIS Features (page 303)
NOTE Data you import becomes AutoCAD drawing objects in your map. To
connect to the data in its original format, see Overview of Bringing In GIS Features
(page 305). To convert the drawing objects to a geospatial format, see Overview
of Converting and Exporting (page 1405).
To import data from other formats
1Do one of the following:
■Import data from an Oracle or ArcSDE data source. Click Insert
tab ➤ Import panel ➤ Map Import.
You cannot use the rest of this procedure. Instead, see Importing From
Oracle (page 409) or Importing From ESRI ArcSDE (page 391).
■Import an SDF file. Click Insert tab ➤ Import panel ➤ Map Import .
■If you are importing an Autodesk SDF 2 file, click Insert tab ➤ Import
panel ➤ SDF2.
Do not follow the rest of this procedure. Instead, see Importing
Autodesk SDF 2 (page 389).
■Import a DXF file. Click ➤ Open ➤ Drawing. Change Files
of Type to DXF.
Select the file you want and click Open. Do not follow the rest of this
procedure.
■Import any other file type. Click Insert tab ➤ Import panel ➤ Map
Import .
Continue with the following steps.
Overview of Converting Geospatial Data to Drawing Objects | 381

2In the Import Location dialog box, under Files Of Type, select the format
of the map to import.
3Select the file or folder to import. Click OK.
4For formats with additional options, in the Import dialog box, click Driver
Options.
For more information about the formats with additional options and
their associated driver options, see one of the following:
■Importing ESRI Shape Files (page 397)
■Importing ESRI Arc/INFO Coverages (page 394)
■Importing Geographic Markup Language (GML) Files (page 412)
■Importing MapInfo MIF/MID Files (page 400)
■Importing MapInfo MIF/MID Files (page 400)
■MicroStation Design (DGN) Versions 7 and 8 (page 405)
■Importing SDTS (Spatial Data Transfer Standard) Files (page 413)
■Importing VPF (Vector Product Format) Files (page 416)
NOTE Change any driver options before you modify other settings in the
Import options dialog box. Changing driver options can invalidate other
changes you have made in this dialog box.
5In the Import dialog box (page 1711), under Spatial Filter, specify whether
to limit the area where data will be imported:
■None — Place no area limits on the incoming file.
■Current Display — Limit the import to the current drawing area.
■Define Window — Limit the import to an area you define. To use this
option, click Select. Respond to the prompts to define the area.
6Specify the import settings for each input layer (sometimes called a theme,
level, or file).
■Drawing Layer (page 419)— Select a target layer for each layer in the
incoming file.
■Object Class (page 421)— Assign incoming objects to an existing object
class and map incoming attribute data to the data fields in the object
class. The Object Class fields are available only if you have object
382 | Chapter 3 Bringing In Data

classes defined in your map. For more information about setting up
object classes, see Setting Up Object Classification (page ?).
■Input Coordinate System (page 424)— Specify the coordinate system
of the incoming file. If the AutoCAD Map 3D drawing has a coordinate
system assigned to it, incoming objects are converted to the coordinate
system of the drawing.
■Data (page 426)— For each layer, specify how to import data.
■Points (page 428)— For each layer, specify how to treat incoming point
objects.
NOTE If you import points that you assigned to an object class with a
creation method of Blocks, use the Points column to convert the points to
blocks so the objects can be classified. Object classification does not
automatically convert points to blocks.
7By default, polygons are imported as polygon objects. To import them
as closed polylines, select Import Polygons As Closed Polylines.
8If you assigned incoming objects to object classes and want to use the
object class defaults for any incoming data that is out of the defined
object class range, select Use Class Defaults For Out Of Range Values.
If you do not select this option, incoming data will be imported as is,
which may include some out of range values. If you later view the data
on the Object Class tab of the Properties palette, AutoCAD Map 3D
automatically modifies the data, using defaults as needed, so that the
data is in range and properly classified.
9To save your settings as a profile, click Save. Saved profiles can be loaded
when you import other files, and they can be used to automate
command-line scripts.
10 Click OK to begin the import process.
If you cancel the Import operation, all objects imported prior to canceling
will remain in the AutoCAD Map 3D drawing. You can delete these objects
and any associated data.
Notes and Warnings
■To copy the contents of a field, right-click in the field to copy and click
Copy. Right-click in the target field and click a Paste option. To copy the
Overview of Converting Geospatial Data to Drawing Objects | 383

contents of a field to all other layers, right-click in the field to copy and
click Paste To All Layers.
■When pasting into Object Class fields, the object class name and the data
mappings are pasted separately. The paste data mappings options are
available only if the same fields exist in the incoming data for all mapped
fields.
■You cannot copy a "By Data" or "ACAD_TEXT" setting.
Quick Reference
MAPIMPORT
Imports an external file format into AutoCAD Map 3D
Click File ➤ Create DWG From ➤ Map 3D Import.
Menu
Import Map File
Icon
MAPIMPORTCommand Line
Import dialog boxDialog Box
MAPIMPORTFDO
Import FDO data.
Click File ➤ Create DWG From ➤ FDO Connection.
Menu
MAPIMPORTFDOCommand Line
Styling Drawing Data Converted From a Geospatial Data Store
When you convert data from a geospatial format to DWG format, you can set
up appropriate DWG layers and styling information for the incoming data
automatically. This allows you to send out appropriately styled drawing files
to AutoCAD users.
You use AutoCAD layers to set up the styles. You can also create blocks,
linetypes, and other elements you need for styling. You save these items in a
drawing template, and then create a new map using that template to hold the
imported data.
384 | Chapter 3 Bringing In Data
NOTE Data you import becomes AutoCAD drawing objects in your map. To
connect to the data in its original format, see Overview of Bringing In GIS Features
(page 305). To convert the drawing objects to a geospatial format, see Overview
of Converting and Exporting (page 1405).
To style drawing data on import
1Create a drawing file in AutoCAD Map 3D that defines all the coordinate
system, layers, blocks, linetypes, and other elements you need for styling.
■In Map Explorer, right-click Current Drawing ➤ Coordinate System
and specify the coordinate system.
■Create layers. At the Command prompt, enter layer.
For information about creating block and other elements, see the
AutoCAD Help.
2Change the properties of the layer to reflect the styling you want.
For more information about styling layers, see Overview of Styling
Drawing Layers (page 652).
3Save the resulting drawing as a template (DWT) file.
■Click ➤ Save As ➤ AutoCAD Drawing Template.
■In the Files Of Type list, choose AutoCAD Drawing Template (*.dwt).
■Name and save the file.
■Set the template options (English or Metric and New Layer
Notification) and click OK. For more information about these options,
see the AutoCAD Help.
4When you are ready to import the data, create a new map using the
template you created.
■Click ➤ New ➤ Drawing.
■Select the template you created and click OK.
5Import the data into the new file.
■Click Insert tab ➤ Import panel ➤ Map Import .
Styling Drawing Data Converted From a Geospatial Data Store | 385
■Specify the file to import and click OK.
6In the Import dialog box (page 1711), under Import Properties For Each
Layer Imported, specify the import settings for each input layer
(sometimes called a theme, level, or file).
■Drawing Layer (page 419)— Select a target layer for each layer in the
incoming file.
■Object Class (page 421)— Assign incoming objects to an existing object
class and map incoming attribute data to the data fields in the object
class. The Object Class fields are available only if you have object
classes defined in your map. For more information about setting up
object classes, see Setting Up Object Classification (page ?).
■Input Coordinate System (page 424)— Specify the coordinate system
of the incoming file. If the AutoCAD Map 3D drawing has a coordinate
system assigned to it, incoming objects are converted to the coordinate
system of the drawing.
■Data (page 426)— For each layer, specify how to import data.
■Points (page 428)— For each layer, specify how to treat incoming point
objects.
NOTE If you import points that you assigned to an object class with a
creation method of Blocks, use the Points column to convert the points to
blocks so the objects can be classified. Object classification does not
automatically convert points to blocks.
7Click OK.
8Click Map Setup tab ➤ Map panel ➤ Zoom Drawing Extents.
The imported objects use the styling information specified in your
template.
Quick Reference
MAPIMPORT
Imports an external file format into AutoCAD Map 3D
386 | Chapter 3 Bringing In Data

Click File ➤ Create DWG From ➤ Map 3D Import.
Menu
Import Map File
Icon
MAPIMPORTCommand Line
Import dialog boxDialog Box
Supported Import Formats
Importing Autodesk SDF (Spatial Data Files)
SDF is a native Autodesk file-based geospatial format that is optimized for
storing large, classified data sets. You can connect to SDF files (page 338) to
edit the original data in its source, or import it to convert the data into
AutoCAD drawing objects. Once you import data, the connection to the
original source is lost. If you update the source, your changes will not appear
in the imported copy.
SDF is similar to SHP format in that it contains both spatial data and attribute
data. However, unlike SHP, it stores both types of data in a single file rather
than a set of files.
When drawing data is stored as SDF, you can use Autodesk MapGuide
Enterprise 2007 to style and publish the data to the Internet. You can also
publish map data directly to MapGuide (page 1376), without exporting to SDF.
Versions
The current version, which works with AutoCAD Map 3D and Autodesk
MapGuide Enterprise, is SDF version 3. AutoCAD Map 3D refers to this version
as “SDF.”
SDF version 2 is still supported by MapGuide 6.5 (and earlier releases), and
AutoCAD Map 3D can import and export SDF 2 using a separate import/export
interface.
Advantages
SDF has the following advantages over DWG:
■It stores and manages an order of magnitude more data than DWG
Supported Import Formats | 387

■It is very fast, allowing Autodesk applications, such as AutoCAD Map 3D
and MapGuide, to read and display tens of thousands of features per second.
■It provides the power of a database without the overhead and cost of a full
relational database management system (RDBMS) such as SQL Server or
Oracle.
■An SDF file can store a single feature class, or it can store multiple feature
classes.
■It is easy to manage, providing access to the database schema.
Importing
When importing SDF, you can import each feature class in the SDF to a separate
layer. You can specify how you want to bring in attribute data and points.
You can also set an option to import polygons as closed polylines.
Driver Options
SDF has no import driver options.
See also:
■Customizing the Import and Export .ini Files (page 264)
NOTE Data you import becomes AutoCAD drawing objects in your map. To
connect to the data in its original format, see Overview of Bringing In GIS Features
(page 305). To convert the drawing objects to a geospatial format, see Overview
of Converting and Exporting (page 1405).
To import an SDF file
■Import from SDF (page 381) – Imports from SDF (version 3).
■Import from SDF 2 (page 389)– Imports from SDF (version 2).
To access and work with SDF
■Connect to SDF (page 338)– Allows you to view and edit the SDF data live
in its native format (SDF version 3).
388 | Chapter 3 Bringing In Data
Quick Reference
MAPIMPORT
Imports an external file format into AutoCAD Map 3D
Click File ➤ Create DWG From ➤ Map 3D Import.
Menu
Import Map File
Icon
MAPIMPORTCommand Line
Import dialog boxDialog Box
Importing Autodesk SDF 2
While importing SDF 2 files (Autodesk MapGuide 6.5 and earlier), you can
perform coordinate conversions, create object data tables from the key, name,
and URL fields, and create hyperlinks on imported objects. Import a selected
portion of the SDF by specifying four corner points of an area.
NOTE SDF 2 files can only be imported (and exported). They cannot be accessed
using Data Connect. However, SDF 3 files, using the new MapGuide technology,
use Data Connect. For information, see To bring in features from SDF (page 338).
See also:
■Importing Autodesk SDF (Spatial Data Files) (page 387)
■Exporting DWG Data to SDF2 Format (page 1417)
■Bringing In Features from SDF (page 337)
NOTE Data you import becomes AutoCAD drawing objects in your map. To
convert the drawing objects to a geospatial format, see Overview of Converting
and Exporting (page 1405).
To import SDF 2 files
1In the Tool-based Ribbon Workspace, click Insert tab ➤ Import
panel ➤ SDF2.
Supported Import Formats | 389
2In the Autodesk MapGuide Import dialog box, select a file. Click Open.
3In the Autodesk MapGuide Import dialog box (page 1582), under Import
Layer, select the target AutoCAD layer for the SDF information.
To create a new AutoCAD layer, click Create New Layer. In the New Layer
dialog box (page 1579), specify a name for the new layer.
4Under Coordinate Conversion, select Convert From. Enter a coordinate
system code.
To select the code from a list, click Select Coordinate System.
5Under Data Elements, select Assign To Object Data Table. Specify the
object data table and fields.
To create a new table or field, click Create New Table or Create New Field.
In the Define New Object Data Table dialog box (page 1803) or Define New
Object Data Field dialog box (page 1578), specify the information for the
new table or field.
6Optionally, under Data Elements, select Create Hyperlinks From URL.
7Under Import By Location, select Define An Area To Import From The
SDF File and enter the coordinates for the area to import.
The coordinates must be in the coordinate system of the SDF file.
8To save your settings as a profile, click Save.
9Click OK.
The objects in the SDF file are imported into the drawing.
Quick Reference
MAPSDFIN
Imports an SDF 2 format file from Autodesk MapGuide 6.5 or earlier
Click File ➤ Create DWG From ➤ Autodesk SDF 2
(MapGuide 6.x).
Menu
MAPSDFINCommand Line
Autodesk MapGuide Import dialog boxDialog Box
390 | Chapter 3 Bringing In Data
Importing DXF Files
You can use DXF files created by other applications to bring information into
AutoCAD Map 3D. When you import objects from DXF files, they do not have
links to other objects or to data. For example, a polygon that encloses a parcel
ID is not linked to the parcel ID except visually. Data imported from a DXF
file does not have any links to object data or external databases.
You cannot attach a source drawing to a DXF file or attach DXF files to another
drawing.
See also:
■Saving Drawing Objects to a DXF File (page 1458)
To import a DXF file
1Click ➤ Open ➤ Drawing.
2In the Select File dialog box, under Files Of Type, select DXF (*.dxf).
3Select the file. Click Open.
Quick Reference
OPEN
Opens an existing drawing file
File menu ➤ Open
Menu
Open Drawing
Icon
OPENCommand Line
Importing From ESRI ArcSDE
You can import data from a connected ESRI ArcSDE database into your map
DWG. Using this option, your data will be imported as drawing objects. The
data will be a snapshot of your ArcSDE data. Once you import data, the
connection to the original source is lost. If you update the source, your changes
will not appear in the imported copy.
Supported Import Formats | 391

You can also connect to a live ArcSDE database (page 319) to edit the original
data in its source (edits will go into the database).
See also:
■Bringing In Features from ArcSDE (page 316)
To import data from an ESRI ArcSDE data source
NOTE You can also connect to a live ArcSDE database (page 319)to edit the original
data in its source (edits will go into the database).
1Before moving ArcSDE data into your map, assign a coordinate system
to the map. This lets you position your data accurately in a real-world
geographic location and align imported survey or GPS point data.
2In Display Manager (page 2060), click Data ➤ Connect To Data.
For more information, see Bringing In Features from ArcSDE (page 316)
NOTE Follow the steps up until clicking Connect; then stop. Do not add the
features to your map.
3At the Command prompt, enter mapimportfdo.
4In the Map Import From FDO dialog box, select the ArcSDE data source
connection from which to import data.
5Click OK.
6In the Import dialog box (page 1711), review the Current Drawing
Coordinate System to make sure it is correct.
7Under Spatial Filter, specify whether to limit the area where data will be
imported:
■None — Place no area limits on the incoming file.
■Current Display — Limit the import to the current drawing area.
■Define Window — Limit the import to an area you define. To use this
option, click Select. Respond to the prompts to define the area.
8Specify the import settings for each input layer:
■Drawing Layer (page 419)— Select a target layer for each layer in the
incoming file.
392 | Chapter 3 Bringing In Data

■Object Class (page 421)— Assign incoming objects to an existing object
class and map incoming attribute data to the data fields in the object
class. The Object Class fields are available only if you have object
classes defined in your map. For more information about setting up
object classes, see Setting Up Object Classification (page ?).
■Input Coordinate System (page 424)— Specify the coordinate system
of the incoming file. If the AutoCAD Map 3D drawing has a coordinate
system assigned to it, incoming objects are converted to the coordinate
system of the drawing.
■Data (page 426)— For each layer, specify how to import data.
■Points (page 428)— For each layer, specify how to treat incoming point
objects.
NOTE If you are importing points and have assigned them to an object class
with a creation method of Blocks, you must use the Points column to convert
the points to blocks so that the objects can be classified. Object classification
does not convert points to blocks for you.
9By default, polygons are imported as polygon objects. To import them
as closed polylines, select Import Polygons As Closed Polylines.
10 If you assigned incoming objects to object classes and want to use the
object class defaults for any incoming data that's out of the defined object
class range, select Use Class Defaults For Out Of Range Values.
If you do not select this option, incoming data will be imported as is,
which may include some out of range values. If you later view the data
on the Object Class tab of the Properties palette, AutoCAD Map 3D
automatically modifies the data, using defaults as needed, so that the
data is in range and properly classified.
11 To save your settings as a profile, click Save. These saved profiles can be
loaded when you import other files, and they can be used to automate
command-line scripts.
12 Click OK to begin the import process.
If you cancel the import operation, all objects imported prior to canceling
will remain in the AutoCAD Map 3D drawing. You can delete these objects
and any associated data.
Supported Import Formats | 393
Quick Reference
MAPIMPORTFDO
Import FDO data.
Click File ➤ Create DWG From ➤ FDO Connection.
Menu
MAPIMPORTFDOCommand Line
Importing ESRI Arc/INFO Coverages
ESRI Arc/INFO coverages can only be imported (and exported). They cannot
be accessed using Data Connect. AutoCAD Map 3D supports Arc/INFO version
7.2, 7.3, and 8.x, and E00.
Importing
Arc/INFO stores coverages on your hard disk as a directory of files.
In the coverage directory, each file contains specific data pertaining to the
coverage. For example, ARC files contain coordinates for arcs and LAB files
contain the coordinates for label points.
NOTE ARC files also contain TIC and Bounds settings. For import, these are driver
options, and are not imported or displayed by default. Tics are points with known
real-world coordinates. Coverages use tics to ensure that stacked coverages and
adjoining tiled coverages align accurately.
The following table shows how coverage features are translated to drawing
objects on import:
Drawing ObjectCoverage Feature
Point on _point layer, PAT attributes in object data
or in an external database.
Point
Sketch on _arc layer, AAT attributes in object data
or in an external database.
Arc
Closed polyline on _poly layer, PAT in object data
attached to polyline. In addition, all segments are
duplicated as sketches on the _arc layer.
Polygon
394 | Chapter 3 Bringing In Data
Drawing ObjectCoverage Feature
Geometry converted as above, attribute in object
data.
Point, Arc, and Polygon with FAT
(feature allocation table) in dBASE
Text on _text layer. Text arrows on _textarrow layer.Annotation
Points on _tic layer, attributes in object data.Tics
Importing Restrictions
The following features are not supported when importing an ARC/INFO
coverage into a drawing:
■feature attribute tables
■text attributes
■route systems
■address files
■turntables
■LOG files
■fonts
■symbols
■linetypes
■shades
If a coverage has a field that describes Z values, commonly SPOT or
ELEVATION, the field is treated only as an attribute. It is not translated into
a Z value. You may be able to use a property alteration query to change the
elevation of the resulting drawing objects. (This will depend on the object
type. Elevation is not supported for all object types.)
When importing polygon coverages, polygon areas may be imported as closed
polylines. If you plan to recreate the topology in AutoCAD Map 3D, use the
MAPCREATECENTROIDS command to create centroids and move any attribute
data from the polyline or polygon to the centroids. Use the _arc layer to create
the topology using the topology commands.
In addition, AutoCAD Map 3D supports the coverage exchange format E00.
Supported Import Formats | 395
Driver Options
You can set the following options when importing ARC/INFO coverages or
E00 files:
DescriptionOption
Select Follow, Fit, or Ignore.Text Curves
Select Extract Bounds, or Extract Tics.Optional Feature Types
See also:
■Customizing the Import and Export .ini Files (page 264)
■Exporting To ESRI Arc/INFO Coverages (page 1419)
NOTE Data you import becomes AutoCAD drawing objects in your map. To
convert the drawing objects to a geospatial format, see Overview of Converting
and Exporting (page 1405).
■To import from Arc/INFO (page 396)
■To recreate an Arc/INFO topology in AutoCAD Map 3D (page 396)
To import from Arc/INFO
■Use the Import instructions. (page 381)
To recreate an Arc/INFO topology in AutoCAD Map 3D
1Use the MAPCREATECENTROIDS command to create centroids. (page
885)
2Move any attribute data from the polyline or polygon to the centroids
(page 885)
3Use the _arc layer to create the topology using the topology commands.
Quick Reference
MAPIMPORT
Imports an external file format into AutoCAD Map 3D
396 | Chapter 3 Bringing In Data

Click File ➤ Create DWG From ➤ Map 3D Import.
Menu
Import Map File
Icon
MAPIMPORTCommand Line
Import dialog boxDialog Box
Importing ESRI Shape Files
AutoCAD Map 3D supports up to ArcView version 3.2 and 8.x.
About SHP Files
ESRI SHP files store both geometry and attributes (data) for features. A single
shape can have as many as five physical files with the same filename, but
different file extensions:
■.shp— Geometric data. Data for multiple points, polylines, and polygons
can be stored in one SHP file, but each SHP file can store only one type of
geometry. For example, a line SHP file can contain data for rivers, roads,
and pipes.
■.shx — A geometric index to the map features, which can be used by some
applications to find features in disparate sections of a large map.
■.dbf— Attribute data associated with the map features.
■.prj—Projection and coordinate system data. This file is created only if your
map has an assigned coordinate system.
■.idx—Identifies the index field for the related SHP file, which is the unique
identifier for each entity in the SHP file.
Importing
You can connect to SHP files (page 336)to edit the original data in its source,
or import it to convert the data into AutoCAD drawing objects. Once you
import data, the connection to the original source is lost. If you update the
source, your changes will not appear in the imported copy.
By default, AutoCAD Map 3D considers SHP files a multi-select, file-based
format, that is, you select one or more individual .shp files during a single
import process. You can change the default in the mapimport.ini file so that
AutoCAD Map 3D considers SHP files a folder-based format (all files in the
Supported Import Formats | 397
folder are included in the import) or a single-select format (only one file can
be selected for import).
When you connect to or import SHP data, AutoCAD Map 3D checks the
geometry to see if there are multiple closed outer loops. If so, it treats the
geometry as multi-polygon (a polygon with multiple exterior rings). It does
not treat unclosed outer loops as multi-polygon.
When you create a multi-polygon in AutoCAD Map 3D and then save or
export it to SHP format, it will appear in its native SHP file as a multi-polygon.
When importing SHP files, it is important that you have the complete set of
.shp, .shx, and .dbf in the same folder. The import operation will work if you
have only the .shp file, but only the geometries will be imported. To import
data with its geometry, you need the full set of files.
The link to the data stored in the .dbf file can be maintained during the import
operation, or the data can be imported into object data in the AutoCAD Map
3D drawing.
You can import TEXTSTRING information from SHP classes you bring back
into AutoCAD Map 3D by importing points as text.
Import Restrictions
SHP files do not include color information. Imported objects have the same
color as the AutoCAD Map 3D layer.
Point symbols, line styles, and fill styles are not maintained when importing
from SHP files. Before the translation, put these items into one or more fields
in the associated database so you can reassign the display properties of the
graphical objects using these values in the drawing file.
Driver Options
SHP does not have import driver options.
See also:
■Customizing the Import and Export .ini Files (page 264)
■Specifying How to Import Points (page 427)
■Exporting to ESRI SHP (page 1424)
398 | Chapter 3 Bringing In Data

NOTE Data you import becomes AutoCAD drawing objects in your map. To
connect to the data in its original format, see Overview of Bringing In GIS Features
(page 305). To convert the drawing objects to a geospatial format, see Overview
of Converting and Exporting (page 1405).
■To import SHP data (page 399)
■To change the single file/folder default setting for SHP files (page 399)
■To access and work with SHP files (page 399)
To import SHP data
■Use the Import instructions. (page 381)
To change the single file/folder default setting for SHP files
■Modify the settings in the mapimport.ini file.
For more information, see To export to SHP as folder-based rather than
file-based (page 269)
To access and work with SHP files
■Connect to SHP (page 335) – Allows you to view and edit the SHP live in
its native format
■Bulk Copy (page 615) – Move data to and from SHP to other geospatial data
stores.
To import TEXTSTRING information from SHP classes you bring back into
AutoCAD Map 3D
■Select the import option to import points as text. See Specifying How to
Import Points (page 427).
Quick Reference
MAPIMPORT
Imports an external file format into AutoCAD Map 3D
Click File ➤ Create DWG From ➤ Map 3D Import.
Menu
Supported Import Formats | 399

Import Map File
Icon
MAPIMPORTCommand Line
Import dialog boxDialog Box
Importing MapInfo MIF/MID Files
MIF/MID is a file standard used by MapInfo, a desktop mapping system.
AutoCAD Map 3D supports MapInfo up to version 7 MIF/MID files.
About MapInfo MIF/MID Files
MapInfo MIF/MID format stores both geometry and attributes (data) for
features, and is a set of two physical files that work together:
■.mif— Vector geometric data. A single .mif file can contain many different
types of geometry.
■.mid— Attributes for the geometric data.
Importing
MapInfo MIF/MID files can only be imported (and exported). They cannot be
accessed using Data Connect. By default, AutoCAD Map 3D considers MapInfo
MIF/MID a multi-select, file-based format, that is, you select one or more
individual .mif files during a single import process. To change the default so
that AutoCAD Map 3D considers MIF/MID a folder-based format (all files in
the folder are included in the import) or a single-select format (only one file
can be selected for import), modify the settings in the mapimport.ini file.
When you import MapInfo MIF/MID files, it is important that you have both
the .mif and .mid files in the same folder.
Symbol types are similar to AutoCAD Map 3D point objects. You cannot
import MIF/MID symbol types directly. However, if you store the symbol type
information in a column in a MID file, you can map each symbol type to a
block in the current AutoCAD Map 3D drawing. To do this, prepare the MIF
file by putting the name of the symbol type into a field in the database. Prepare
the AutoCAD Map 3D drawing by creating similar symbols as blocks in the
AutoCAD Map 3D drawing. Then, during import, perform a point-block
mapping and select the check box to get the block name from data and select
the symbol type field you created.
400 | Chapter 3 Bringing In Data

In MapInfo, polygons are represented as closed areas. When you import
polygons into AutoCAD Map 3D, they appear as polygons unless you select
Import Polygons As Closed Polylines in the Import dialog box.
By default, object colors are imported to their closest ACI (AutoCAD Color
Index) color. To import object colors using RGB (True Color), edit the
mapimport.ini file.
To change the default text justification setting for MIF/MID, edit the
mapforeignfileproperties.ini file.
Driver Options
MapInfo MIF/MID has no import driver options.
See also:
■Customizing the Import and Export .ini Files (page 264)
■Exporting To MapInfo MIF/MID (page 1431)
NOTE Data you import becomes AutoCAD drawing objects in your map. To
convert the drawing objects to a geospatial format, see Overview of Converting
and Exporting (page 1405).
■To import from MapInfo MIF/MID (page 401)
■To change import settings for MapInfo MIF/MID (page 401)
■To import object colors using RGB (True Color) (page 401)
■To change the default text justification setting for MIF/MID (page 402)
To import from MapInfo MIF/MID
■Use the Import instructions. (page 381)
To change import settings for MapInfo MIF/MID
■Edit the mapimport.ini file.
For more information, see To edit the .ini file (page 271).
To import object colors using RGB (True Color)
■Edit the mapimport.ini file.
For more information, see To edit the .ini file (page 272).
Supported Import Formats | 401

To change the default text justification setting for MIF/MID
■Edit the mapforeignfileproperties.ini file.
Use the [MIF_Justification] section to set justification for MIF. Allowed MIF
Justifications are left, center, and right. For more information, see To edit
the .ini file (page 274).
Quick Reference
MAPIMPORT
Imports an external file format into AutoCAD Map 3D
Click File ➤ Create DWG From ➤ Map 3D Import.
Menu
Import Map File
Icon
MAPIMPORTCommand Line
Import dialog boxDialog Box
Importing MapInfo TAB Files
MapInfo TAB, also referred to as the MapInfo native format, is a
two-dimensional format that stores both feature geometry and attributes (data)
in a set of physical files that have the following file extensions:
About MapInfo TAB Files
■.tab— The main file for a MapInfo table. It is associated with the appropriate
.dat, .id, .map, and .ind files.
■.dat— Tabular data for a table in MapInfo's native format.
■.id— An index to a MapInfo graphical objects .map() file.
■.map— Contains geographic information describing map objects.
■.ind— An index to a MapInfo tabular (.dat) file.
With AutoCAD Map 3D, you can import and export MapInfo TAB up to version
7.
402 | Chapter 3 Bringing In Data
Importing
MapInfo TAB files can only be imported (and exported). They cannot be
accessed using Data Connect. By default, AutoCAD Map 3D considers MapInfo
TAB a multi-select, file-based format, that is, you select one or more individual
.tab files during a single import process. To change the default so that AutoCAD
Map 3D considers MapInfo TAB a folder-based format (all files in the folder
are included in the import) or a single-select format (only one file can be
selected for import), modify the settings in the mapimport.ini file.
When you import MapInfo TAB files, it is important that you have the
complete set of physical files (.tab, .dat, .id, .map, and .ind) in the same folder.
Symbol types are similar to AutoCAD Map 3D point objects. You cannot
import TAB symbol types directly. However, if you store the symbol type
information in a column in a DAT file, you can map each symbol type to a
block in the current AutoCAD Map 3D drawing. To do this, prepare the TAB
file by putting the name of the symbol type into a field in the database. Prepare
the AutoCAD Map 3D drawing by creating similar symbols as blocks in the
AutoCAD Map 3D drawing. Then, during import, perform a point-block
mapping and select the check box to get the block name from data and select
the symbol type field you created.
In MapInfo, polygons are represented as closed areas. When you import
polygons, the polygons appear as polygons in AutoCAD Map 3D unless you
select Import Polygons As Closed Polylines in the Import dialog box.
By default, object colors are imported to their closest ACI (AutoCAD Color
Index) color. To import object colors using RGB (True Color), you must edit
the mapimport.ini file.
To change the default text justification setting for TAB, edit the
mapforeignfileproperties.ini file.
Driver Options
MapInfo TAB has no import driver options.
See also:
■Customizing the Import and Export .ini Files (page 264)
■Exporting To MapInfo TAB (page 1433)
Supported Import Formats | 403

NOTE Data you import becomes AutoCAD drawing objects in your map. To
convert the drawing objects to a geospatial format, see Overview of Converting
and Exporting (page 1405).
■To import from MapInfo TAB (page 404)
■To import object colors using RGB (True Color) (page 404)
■To change the default text justification setting for MapInfo TAB (page 404)
To import from MapInfo TAB
■Use the Import instructions. (page 381)
To import object colors using RGB (True Color)
■Edit the mapimport.ini file.
For more information, see To edit the .ini file (page 272).
To change the default text justification setting for MapInfo TAB
■Edit the mapforeignfileproperties.ini file.
Use the [MAPINFO_Justification] section to set justification for TAB.
Allowed TAB Justifications are left, center, and right. For more information,
see Customizing the Import and Export .ini Files (page 264).
Quick Reference
MAPIMPORT
Imports an external file format into AutoCAD Map 3D
Click File ➤ Create DWG From ➤ Map 3D Import.
Menu
Import Map File
Icon
MAPIMPORTCommand Line
Import dialog boxDialog Box
404 | Chapter 3 Bringing In Data

MicroStation Design (DGN) Versions 7 and 8
You can import and export Microstation DGN version 7 and 8. Bentley Systems,
Inc., and MicroStation programs use the DGN format. Like DWG, a single
DGN file can contain points, lines, areas, text, and other object types.
Importing
Microstation DGN files can only be imported (and exported). They cannot be
accessed using Data Connect. Data-element information is stored in an external
database file and linked to graphic objects. AutoCAD Map 3D imports database
link information so you can maintain the linkage during import (page 433).
By default, object colors are imported to their closest ACI (AutoCAD Color
Index) color. To import object colors using RGB (True Color), edit the
mapimport.ini file.
For DGN8, the Input Layer column lists the model name. To see the layers
for a specific model, you may need to scroll the list.
Driver Options for DGN 7
You can set the following options when importing DGN 7 files:
DescriptionOption
Choose Geometry to group incoming objects by entity type.
Choose Level to group them by their DGN level or level name.
Only levels that contain elements will be imported.
Group Elements By
Allows you to extract MSLinks and FRAMME attribute linkage
values from the DGN 7 file. If you select MSLinks, AutoCAD
Linkage Extraction
Map 3D imports up to three links per object for DGN 7. For
each link, two fields are added to the object data table:
mslinks_n, which specifies the key value, and entity_num_n,
which specifies the table. If you select FRAMME, the following
fields are added to the object data table: comp_count,
comp_num, dgnfile, feat_num, state_num, and ufid.
Each DGN 7 file defines a UOR (unit of resolution); in addition,
it can define Sub units and Master units. Select Master or Sub
Coordinate Units
to specify which of these units in the DGN 7 file matches the
default unit in the AutoCAD Map 3D map. For example, if
the default unit in your AutoCAD Map 3D map is meters, and
meters are the Sub unit in the imported file, select Sub. If you
Supported Import Formats | 405

DescriptionOption
select Sub or Master, the UORs in the DGN 7 file are conver-
ted to Sub or Master units according to the conversion factor
in the DGN file header.
When you import the file, one Master or Sub unit (whichever
you choose) will become one drawing unit in your AutoCAD
Map 3D map. The Unit Ratio value indicates the ratio between
the Master and Sub units. For example, if the ratio is 1:12 (as
it would be for Feet/Inches), imported object coordinates will
be scaled 12 times bigger if you select Sub.
NOTE When you import or export a DGN file with a master
unit of Imperial feet, AutoCAD Map 3D converts the master
unit from feet to meters. In addition, it does not recognize
any subunit selection during the import or export process.
Select the options to use during import. For example, select
Explode Complex Strings to return each component of a
Element Expansion
complex chain as its own feature (no feature will be returned
for the complex chain as a whole). Otherwise, all elements
of the complex chain merge into a single linear feature, any
arcs in the complex chain become linestrings, and any link-
ages on the component elements themselves are lost. Select
Propagate Member Linkages to return the linkages attached
to the first component of the complex chain to supplement
any existing linkages. Otherwise, any linkages on the compon-
ent elements themselves are lost and only linkages attached
to the complex chain itself are returned.
By default, cells are converted into blocks, maintaining the
cell grouping. You can choose to convert the cells to points
Cell Expansion
instead. You can also explode the contents of the cells into
their component parts, but the explosion is one level deep
only.
Select Create DWG to read all external reference files (xrefs)
attached to the source data set. If the reference file has nested
Reference Files
references, they are also imported, but circular references are
not. If you select this option, you specify a location for the
folder for these files. If the folder already exists, you can
choose to replace it (overwrite its contents) or cancel and
specify a different location. The default folder location is the
same as the selected DGN file location.
406 | Chapter 3 Bringing In Data

DescriptionOption
If you select Ignore, reference files are not imported and you
cannot change the location of the folder.
Driver Options for DGN 8
You can set the following options when importing DGN 8 files:
DescriptionOption
Choose Geometry to group incoming objects by entity type.
Choose Level or Level Names to group them by their DGN
Group Elements By
level or level name. Only levels that contain elements will be
imported.
By default, cells are converted into blocks, maintaining the
cell grouping. You can choose to convert the cells to points
Cell Expansion
instead. You can also explode the contents of the cells into
their component parts, but the explosion is one level deep
only.
Each DGN 8 file can define Sub units and Master units. Specify
which of these units in the DGN 8 file matches the default
Coordinate Units
unit in the AutoCAD Map 3D map. For example, if the default
unit in your AutoCAD Map 3D map is meters, and meters are
the Sub unit in the imported file, select Sub.
When you import the file, one Master or Sub unit (whichever
you choose) will become one drawing unit in your AutoCAD
Map 3D map. The Unit Ratio value indicates the ratio between
the Master and Sub units. For example, if the ratio is 1:12 (as
it would be for Feet/Inches), imported object coordinates will
be scaled 12 times bigger if you select Sub.
NOTE When you import or export a DGN file with a master
unit of Imperial feet, AutoCAD Map 3D converts the master
unit from feet to meters. In addition, it does not recognize
any sub-unit selection during the import or export process.
Select the options to use during import. For example, select
Explode Complex Strings to return each component of a
Element Expansion
complex chain as its own feature (no feature will be returned
for the complex chain as a whole). Otherwise, all elements
of the complex chain merge into a single linear feature, any
Supported Import Formats | 407

DescriptionOption
arcs in the complex chain become linestrings, and any link-
ages on the component elements themselves are lost.
Allows you to extract MSLinks and FRAMME attribute linkage
values from the DGN 8 file. For each link, two fields are added
Linkage Extraction
to the object data table: mslinks_n, which specifies the key
value, and entity_num_n, which specifies the table. If you
select FRAMME, the following fields are added to the object
data table: comp_count, comp_num, dgnfile, feat_num,
state_num, and ufid.
Select Create DWG to read all external reference files (xrefs)
attached to the source data set. If the reference file has nested
Read Reference Files
references, they are also imported, but circular references are
not. If you select this option, you specify a location for the
folder for these files. If the folder already exists, you can
choose to replace it (overwrite its contents) or cancel and
specify a different location. The default folder location is the
same as the selected DGN file location.
If you select Ignore, reference files are not imported and you
cannot change the location of the folder.
Other Import Options
You can set several options in the MapForeignFileProperties.ini file. See
Customizing and Automating Import and Export (page 260).
See also:
■Customizing the Import and Export .ini Files (page 264)
■Importing Objects with Links to an External Database (page 433)
■Exporting To MicroStation Design (DGN) Versions 7 and 8 (page 1435)
NOTE Data you import becomes AutoCAD drawing objects in your map. To
convert the drawing objects to a geospatial format, see Overview of Converting
and Exporting (page 1405).
■To import object colors using RGB (True Color) (page 409)
■To maintain a link to external data when you import DGN files (page 409)
408 | Chapter 3 Bringing In Data

■To import DGN files (page 409)
To import object colors using RGB (True Color)
■Edit the mapimport.ini file.
For more information, see To edit the .ini file (page 272).
To maintain a link to external data when you import DGN files
■Use a link template to maintain the linkage during import (page 433).
To import DGN files
■Use the Import instructions. (page 381)
For driver options, see Design File Input Settings (page 1734).
Quick Reference
MAPIMPORT
Imports an external file format into AutoCAD Map 3D
Click File ➤ Create DWG From ➤ Map 3D Import.
Menu
Import Map File
Icon
MAPIMPORTCommand Line
Import dialog boxDialog Box
Importing From Oracle
You can import data from a connected Oracle database into your map. Using
this option, your data will be imported as drawing objects. The data will be a
snapshot of your Oracle data. You can also make a live connection with Oracle
(one where edits will go into the database).
See also:
■Bringing In Features from Oracle (page 312)
■Exporting DWG Data to an FDO Data Store (page 1461)
Supported Import Formats | 409

NOTE Data you import becomes AutoCAD drawing objects in your map. To
connect to the data in its original format, see Overview of Bringing In GIS Features
(page 305). To convert the drawing objects to a geospatial format, see Overview
of Converting and Exporting (page 1405).
To import data from an Oracle data source
1Before moving Oracle data into your map, assign a coordinate system to
the map. This lets you position your data accurately in a real-world
geographic location and align imported survey or GPS point data.
2In Display Manager (page 2060), click Data ➤ Connect To Data.
For more information, see Bringing In Features from Oracle (page 312)
NOTE Follow the steps through clicking Connect, then stop. Do not add the
features to your map.
3At the Command prompt, enter mapimportfdo.
4In the Map Import From FDO dialog box, select the Oracle data source
connection from which to import data.
5Click OK.
6In the Import dialog box (page 1711), review the Current Drawing
Coordinate System to make sure it is correct.
7Under Spatial Filter, specify whether to limit the area where data will be
imported:
■None — Place no area limits on the incoming file.
■Current Display — Limit the import to the current drawing area.
■Define Window — Limit the import to an area you define. To use this
option, click Select. Respond to the prompts to define the area.
8Specify the import settings for each input layer:
■Drawing Layer (page 419)— Select a target layer for each layer in the
incoming file.
■Object Class (page 421)— Assign incoming objects to an existing object
class and map incoming attribute data to the data fields in the object
class. The Object Class fields are available only if you have object
classes defined in your Map drawing. For more information about
410 | Chapter 3 Bringing In Data

setting up object classes, see Setting Up Object Classification (page
?).
■Input Coordinate System (page 424)— Specify the coordinate system
of the incoming file. If the AutoCAD Map 3D drawing has a coordinate
system assigned to it, incoming objects are converted to the coordinate
system of the drawing.
■Data (page 426)— For each layer, specify how to import data.
■Points (page 428)— For each layer, specify how to treat incoming point
objects.
NOTE If you are importing points and have assigned them to an object class
with a creation method of Blocks, you must use the Points column to convert
the points to blocks so that the objects can be classified. Object classification
does not convert points to blocks for you.
9By default, polygons are imported as polygon objects. To import them
as closed polylines, select Import Polygons As Closed Polylines.
10 If you assigned incoming objects to object classes and want to use the
object class defaults for any incoming data that is out of the defined
object class range, select Use Class Defaults For Out Of Range Values.
If you do not select this option, incoming data will be imported as is,
which may include some out of range values. If you later view the data
on the Object Class tab of the Properties palette, AutoCAD Map 3D
automatically modifies the data, using defaults as needed, so that the
data is in range and properly classified.
11 To save your settings as a profile, click Save. These saved profiles can be
loaded when you import other files, and they can be used to automate
command-line scripts.
12 Click OK to begin the import process.
If you cancel the import operation, all objects imported prior to canceling
will remain in the AutoCAD Map 3D drawing. You can delete these objects
and any associated data.
Quick Reference
MAPIMPORTFDO
Supported Import Formats | 411
Import FDO data.
Click File ➤ Create DWG From ➤ FDO Connection.
Menu
MAPIMPORTFDOCommand Line
Importing Geographic Markup Language (GML) Files
GML (Geography Markup Language) is an OpenGIS® Implementation
specification that defines an XML encoding for the transport and storage of
geographic information. The specification can be found on the OpenGIS
Consortium web site.
You can import GML into and export it out of AutoCAD Map 3D.
Importing
With AutoCAD Map 3D, you can import GML version 2 or version 3. There
is a separate drop-down option that also allows you to import Ordnance Survey
of Great Britain MasterMap GML version 2 files.
Because the GML format is flexible and allows you to specify your own
schemas, semantics, and options, there are many variations of the format.
AutoCAD Map 3D reads many of these, but some may not be compatible with
the AutoCAD Map 3D GML driver.
In addition, before importing GML data in Asian languages, you must verify
that the language encoding settings specified in the AutoCAD Map 3D
mapimport.ini file match the settings in your incoming file. The settings must
match for the import to be successful. For more information, see Customizing
the Import and Export .ini Files (page 264).
Driver Options
GML has no import driver options.
See also:
■Customizing the Import and Export .ini Files (page 264)
■Exporting To Geographic Markup Language (GML) (page 1429)
412 | Chapter 3 Bringing In Data
NOTE Data you import becomes AutoCAD drawing objects in your map. To
convert the drawing objects to a geospatial format, see Overview of Converting
and Exporting (page 1405).
■To verify language encoding settings for import from GML (page 413)
■To import GML files (page 413)
To verify language encoding settings for import from GML
■Make sure the language encoding settings in the mapimport.ini file match
the settings in your incoming file.
For more information, see Customizing the Import and Export .ini Files
(page 264).
To import GML files
■Use the Import instructions. (page 381)
Quick Reference
MAPIMPORT
Imports an external file format into AutoCAD Map 3D
Click File ➤ Create DWG From ➤ Map 3D Import.
Menu
Import Map File
Icon
MAPIMPORTCommand Line
Import dialog boxDialog Box
Importing SDTS (Spatial Data Transfer Standard) Files
AutoCAD Map 3D supports SDTS (Spatial Data Transfer Standard). SDTS is an
import-only format. You cannot export to this format.
Supported Import Formats | 413
Importing
When you select an SDTS catalogue file, AutoCAD Map 3D imports objects
and attributes from the dataset specified in the catalogue file. Typically, a
dataset is a group of .ddf files with the same filename prefix.
AutoCAD Map 3D imports only one record per object. If an object has multiple
records attached, only one of the records will be imported.
Driver Options
SDTS has no import driver options.
NOTE Data you import becomes AutoCAD drawing objects in your map. To
convert the drawing objects to a geospatial format, see Overview of Converting
and Exporting (page 1405).
To import SDTS files
■Use the Import instructions. (page 381)
Quick Reference
MAPIMPORT
Imports an external file format into AutoCAD Map 3D
Click File ➤ Create DWG From ➤ Map 3D Import.
Menu
Import Map File
Icon
MAPIMPORTCommand Line
Import dialog boxDialog Box
Importing SQLite Files
SQLite is a file-based geospatial format. You can connect to SQLite files (page
331) to edit the original data in its source, or import it to convert the data into
AutoCAD drawing objects. Once you import data, the connection to the
original source is lost. If you update the source, your changes do not appear
in the imported copy.
414 | Chapter 3 Bringing In Data

SQLite is like SHP format in that it contains both spatial data and attribute
data. However, unlike SHP, it stores both types of data in a single file rather
than a set of files.
Advantages
SQLite has the following advantages over DWG:
■It stores and manages an order of magnitude more data than DWG
■It provides the power of a database without the overhead and cost of a full
relational database management system (RDBMS) such as SQL Server or
Oracle.
■A SQLite file can store a single feature class, or it can store multiple feature
classes.
■It is easy to manage, providing access to the database schema.
Importing
When importing SQLite, you can import each feature class in the file to a
separate layer. You can specify how you want to bring in attribute data and
points. You can also set an option to import polygons as closed polylines.
Driver Options
SQLite has no import driver options.
See also:
■Customizing the Import and Export .ini Files (page 264)
NOTE Data you import becomes AutoCAD drawing objects in your map. To
connect to the data in its original format, see Overview of Bringing In GIS Features
(page 305). To convert the drawing objects to a geospatial format, see Overview
of Converting and Exporting (page 1405).
To import a SQLite file
■Import a SQLite file (page 381)– Converts the current contents of the file
to drawing objects and inserts them in your map.
Supported Import Formats | 415

To access and work with SQLite
■Connect to SQLite (page 331)– Allows you to view and edit the SQLite data
live in its native format.
Quick Reference
MAPIMPORT
Imports an external file format into AutoCAD Map 3D
Click File ➤ Create DWG From ➤ Map 3D Import.
Menu
Import Map File
Icon
MAPIMPORTCommand Line
Import dialog boxDialog Box
Importing VPF (Vector Product Format) Files
You can import Vector Product Format (VPF) files into AutoCAD Map 3D. You
cannot export to this format.
VPF is a standard format, structure, and organization for large geographic
databases that are based on a georelational data model. It is commonly used
by military departments and defense agencies.
The VPF specification is available on the National Imaging and Mapping Agency
(NIMA) web site
Importing
By default, AutoCAD Map 3D considers Vector Product Format (VPF) a
multi-select, file-based format, that is, you select one or more individual files
during a single import process. You can edit the mapimport.ini file to specify
that all files in the folder are included in the import or that only one file can
be selected for import.
NOTE VPF data sets can be very large. You can use a spatial filter to limit the size
of the DWG you create from VPF data. See Specifying an Area to Import (page
417).
416 | Chapter 3 Bringing In Data

Driver Options
VPF has no import driver options.
See also:
■Customizing the Import and Export .ini Files (page 264)
NOTE Data you import becomes AutoCAD drawing objects in your map. To
convert the drawing objects to a geospatial format, see Overview of Converting
and Exporting (page 1405).
To change the default so that AutoCAD Map 3D considers VPF a folder-based
format
■Modify the settings in the mapimport.ini file.
For more information, see To import Shapefiles, MIF/MID, TAB, or VPF as
folder-based, multi-select, or file-based (page 271).
To import from VPF
■Use the Import instructions. (page 381)
Quick Reference
MAPIMPORT
Imports an external file format into AutoCAD Map 3D
Click File ➤ Create DWG From ➤ Map 3D Import.
Menu
Import Map File
Icon
MAPIMPORTCommand Line
Import dialog boxDialog Box
Specifying an Area to Import
When importing data from another file format, you can specify (or limit) the
area into which incoming objects will be imported.
Specifying an Area to Import | 417
You can import objects into the current drawing area, into an area you define
in the map, or import the entire file.
NOTE Data you import becomes AutoCAD drawing objects in your map. To
connect to the data in its original format, see Overview of Bringing In GIS Features
(page 305). To filter the data to specify the area to add to your map, see Filtering
Features When You Add Them to a Map (page 309).
See also:
■Converting Data From Other Formats to Drawing Objects (page 377)
To specify an area to import
1Click Insert tab ➤ Import panel ➤ Map Import .
2In the Import dialog box (page 1711), under Spatial Filter, specify whether
to limit the area into which data will be imported:
■None — Place no area limits on the incoming file.
■Current Display — Limit the import to the current drawing area.
■Define Window — Limit the import to a rectangular area you define.
To use this option, click Select. Drag your cursor from right to left to
define the area. Objects within the rectangular window are imported.
■AutoCAD Map 3D does not display a preview of the incoming data.
■If the coordinate system assigned to the Map drawing differs from the
coordinate system specified in the Coordinate System column, AutoCAD
Map 3D will perform a reverse transformation to determine the correct
coordinate space (area) for the incoming data.
Quick Reference
MAPIMPORT
Imports an external file format into AutoCAD Map 3D
Click File ➤ Create DWG From ➤ Map 3D Import.
Menu
418 | Chapter 3 Bringing In Data
Import Map File
Icon
MAPIMPORTCommand Line
Import dialog boxDialog Box
Specifying an AutoCAD Layer During Import
When you import data (as opposed to using Data Connect (page 303)), the
imported material is converted to AutoCAD drawing objects. By default,
AutoCAD Map 3D imports data to an AutoCAD layer with the same name as
the layer (sometimes called a schema, level, or file) in the input file. If an
AutoCAD layer with this name already exists, objects are copied to that layer.
Otherwise, a new AutoCAD layer is created and objects are copied to the new
layer.
If you assign the input layer to an object class with a layer property, the default
will instead be the default AutoCAD layer defined by the object class, and the
Drawing Layer field displays <By Class>.
You can specify one of the following layer options:
■Put objects on an existing AutoCAD layer.
■Put objects on a new AutoCAD layer.
■Put objects on an AutoCAD layer based on data attached to the objects.
■Put objects on the AutoCAD layer specified by the assigned object class
(available only if you assigned the input layer to an object class with a
layer property).
See also:
■Converting Data From Other Formats to Drawing Objects (page 377)
■Bringing In Drawing Objects from AutoCAD Layers (page 355)
To specify an AutoCAD layer during import
1Click Insert tab ➤ Import panel ➤ Map Import .
Specifying an AutoCAD Layer During Import | 419

2In the Import dialog box (page 1711), review the target drawing layer for
each input layer (sometimes called a schema, level, or file) in the incoming
file.
3To change the AutoCAD layer, click in the Drawing Layer field for the
input layer to change. In the Layer Mapping dialog box (Import) (page
1719), do one of the following:
■To import objects to an existing AutoCAD layer, click Create on
Existing Layer. Click the down arrow and select the layer.
■To import objects to a new AutoCAD layer, click Create On New Layer.
Click in the cell and enter a layer name.
■To import objects to an AutoCAD layer whose name is specified in
data stored on the imported object, click Use Data Field For Layer
Name. Select the data field to use. Click OK to close the Layer Mapping
dialog box.
During import, AutoCAD Map 3D reads the specified data value for
each object. If the data value specifies a layer that already exists, the
object is imported to that layer. If the data value specifies a layer that
does not exist, the layer is created. If an object does not have a data
value attached, the object is imported to Layer 0.
■To import objects to a layer with the same name as the input layer,
right-click the Drawing Layer column heading in the table. Click Use
Input Layer Names.
■To import objects to the layer specified by the assigned object class,
verify that <By Class>; is displayed in the Drawing Layer field. If it is
not, type <By Class>; into the field.
NOTE If the layer specified in the Drawing Layer column is different from the one
specified in Object Class, AutoCAD Map 3D uses the Drawing Layer setting unless
it violates the range specified by the Object Class.
Quick Reference
MAPIMPORT
Imports an external file format into AutoCAD Map 3D
Click File ➤ Create DWG From ➤ Map 3D Import.
Menu
420 | Chapter 3 Bringing In Data
Import Map File
Icon
MAPIMPORTCommand Line
Import dialog boxDialog Box
Assigning an Object Class During Import
When you import data (as opposed to using Data Connect (page 303)), the
imported material is converted to AutoCAD drawing objects. As you import
objects, you can assign them to an existing object class in the AutoCAD Map
3D drawing and map the incoming attribute data to the object class definition.
For example, objects being imported from a SHP input layer can be classified
and included in the "LAND USE" object class, and data values from the SHP
file can be mapped to the "LAND USE" object class definition.
Because some of the incoming data values may conflict with data ranges
defined in the object class, AutoCAD Map 3D gives you the option of using
the object class default values instead of the incoming data values for values
that are not within the acceptable range. This ensures that incoming data is
accurately classified but may require changing incoming data values.
To assign an object class, you must first define object classes in your AutoCAD
Map 3D drawing. For more information, see Setting Up Object Classification
(page 116).
See also:
■Converting Data From Other Formats to Drawing Objects (page 377)
■Setting Up Object Classification (page 116)
To assign an object class to an input layer
1Click Insert tab ➤ Import panel ➤ Map Import .
2In the Import dialog box (page 1711), review the settings in the Object Class
column.
Assigning an Object Class During Import | 421

NOTE To make selections in the Object Class column, first define object
classes in the AutoCAD Map 3D drawing. If there are no object classes defined,
the fields in the Object Class column are grayed-out. For more information,
see Setting Up Object Classification (page 116).
3For each layer in the incoming file, click in the Object Class field.
4Select an object class.
5Click to map incoming attribute data to the AutoCAD Map 3D object
class definition.
6In the Object Class Attribute Mapping dialog box (page 1710), verify that
the object class you just selected is highlighted in the Select An Object
Class list.
7On the right, review the Input Fields list, which displays the incoming
attribute data fields that are available to be mapped to Target Fields in
the object class definition.
8For each Input Field to map, click the down-arrow under Target Fields,
and select a target field in the object class definition. The syntax used for
the target field is:
CATEGORY:TABLE:FIELD
■CATEGORY — Type of data, for example "OD" for object data, or "LT"
for link template (linked external database).
■TABLE — Object data table name or database table name.
■FIELD — Data field name.
After you map a target field, it no longer appears in the Target Fields list.
This ensures that each target field is mapped to only one incoming data
field.
9Map as many of the Target Fields as needed. If there are no more target
fields in the Target Fields list, you've mapped them all. If you do not map
a target field, the default object class value is used.
10 Click OK to close the Object Class Attribute Mapping dialog box.
11 To use object class default values for incoming data values that are not
within the specified object class range, select Use Class Defaults For Out
Of Range Values. Properties such as Layer and Color are also enforced.
422 | Chapter 3 Bringing In Data

This ensures that incoming data will be accurately classified but may
require AutoCAD Map 3D to change some of the incoming data values.
■If you are importing points and have assigned them to an object class with
a creation method of Blocks, use the Points column to convert the points
to blocks so that the objects can be classified. Object classification does
not convert points to blocks for you. For more information, see To specify
how to import points (page 428).
■To copy the object class names and attribute mapping settings from one
layer to another, right-click in the Object Class field to copy. Click Copy.
Then right-click in the field in the target layer and choose whether to paste
the object class name or attribute mapping. To copy to all other layers,
right-click and choose whether to paste the name or the attribute mapping
to all layers. If attribute mapping conflicts are detected, the paste attribute
mappings options is not available.
Quick Reference
MAPIMPORT
Imports an external file format into AutoCAD Map 3D
Click File ➤ Create DWG From ➤ Map 3D Import.
Menu
Import Map File
Icon
MAPIMPORTCommand Line
Import dialog boxDialog Box
Performing a Coordinate Conversion During Import
As you import objects, you can convert them from the coordinate system of
the input file to the coordinate system of the AutoCAD Map 3D drawing.
To perform this conversion, you must first assign a coordinate system to the
current drawing (page 147). Then, for each layer that you import, you must
specify the appropriate coordinate system.
Performing a Coordinate Conversion During Import | 423
NOTE Data you import becomes AutoCAD drawing objects in your map. To
connect to the data in its original format, see Overview of Bringing In GIS Features
(page 305). To change the coordinate system when you connect to the data, see
Changing Coordinate Systems (page 311).
See also:
■Converting Data From Other Formats to Drawing Objects (page 377)
■Overview of Coordinate Systems (page 143)
To perform a coordinate conversion
1Click Insert tab ➤ Import panel ➤ Map Import .
2In the Import dialog box (page 1711), note the coordinate system assigned
to the current drawing.
NOTE If the current drawing does not have a coordinate system assigned,
click Assign Global Coordinate System and select the coordinate system for
the current drawing.
3For each layer in the incoming file, click in the Input Coordinate System
field.
4Enter a new global coordinate system code, or click to select from a
list of global coordinate systems.
5In the Select Global Coordinate System dialog box, select the category
and coordinate system for the incoming layer.
6Click OK to close the Select Global Coordinate System dialog box.
You can copy the settings from one layer to another. Right-click in the field
to copy. Click Copy. Then right-click in the field in the target layer. Click
Paste. To copy the setting to all other layers, click Paste To All Layers.
Quick Reference
MAPIMPORT
Imports an external file format into AutoCAD Map 3D
424 | Chapter 3 Bringing In Data

Click File ➤ Create DWG From ➤ Map 3D Import.
Menu
Import Map File
Icon
MAPIMPORTCommand Line
Import dialog boxDialog Box
Importing Attribute Data
When you import data (as opposed to using Data Connect (page 303)), the
imported material is converted to AutoCAD drawing objects. As you import
objects, you can import the attribute data attached to the objects.
You can import the data to one of the following:
■Existing object data table — By default, incoming fields are imported into
object data fields with the same name. If no object data field exists with
the same name, the incoming field is not imported. If you don't want to
do this, use Object Data Mapping to map incoming fields manually to
object data fields with other names or to create new fields.
Incoming data is converted to the data type of the existing object data
field. If this conversion fails (for example, if you import characters to an
integer field), AutoCAD Map 3D uses 0 for integers, 0.0 for real numbers,
and "" for text.
■New object data table — By default, the fields in the new object data table
match the fields you've chosen to import. If you do not want to do this,
use Object Data Mapping to select the fields to import or to change the
names of the object data fields.
When the data is imported, it will be converted to the following object
data types:
■Integer32, Integer16, and Boolean data types are converted to the
Integer data type. For Boolean data, False is converted to 0 and True is
converted to 1.
■Float, Double, and Decimal data types are converted to the Real data
type.
■Char and Date data types are converted to the Character data type.
Data is imported only if it is attached to an incoming object. If no objects
are found for an input layer, then the object data table will not be created.
Importing Attribute Data | 425
■External database — Imported data is added to the external database table
as new records.
■External database, link only — If you do not need to add the data to the
external database, you can import just the links to the data. When you
import links only, the link from the object to the external data are
maintained, but the external database is not modified. This is much faster
than importing the entire record. This is a good option when importing
SHP data.
See also:
■Converting Data From Other Formats to Drawing Objects (page 377)
■To import objects with links to an external database (page 434)
■Setting Up Object Data (page 198)
To specify the data to import
1Click Insert tab ➤ Import panel ➤ Map Import .
2In the Import dialog box (page 1711), review the settings in the Data
column.
3To change the setting for a layer, click in the Data field for the layer to
change. Click .
4In the Attribute Data dialog box (page 1699), select an option:
■If you do not want to import data, click Do Not Import Attribute Data
and close the dialog box.
■To import data as object data, click Create Object Data and enter a
name for the object data table or select an existing object data table.
Select Add Unique Key Field to create a unique key for each incoming
record automatically.
Click Select Fields. In the Object Data/External Database Mapping
dialog box (page 1732), map incoming fields to object data fields.
■To import data to an external database, click Add To Database Table
and select a link template.
To import only the link data, select Create Link Only.
426 | Chapter 3 Bringing In Data
Click Select Fields to map incoming fields to fields in the external
database table.
5Click OK to close the Attribute Data dialog box.
■To import data to object data tables with the same name as the input layer
names, right-click the Data column header in the table. Click Use Input
Layer Name For Table Name.
■To import data to an external database, attach the data source and define
the link template before you start the import process.
■If conflicts are found between the settings made in the Data column and
an assigned object class definition, AutoCAD Map 3D displays the Conflict
Resolution dialog box (page 1701), where you can resolve the conflicts before
proceeding with the import.
Quick Reference
MAPIMPORT
Imports an external file format into AutoCAD Map 3D
Click File ➤ Create DWG From ➤ Map 3D Import.
Menu
Import Map File
Icon
MAPIMPORTCommand Line
Import dialog boxDialog Box
Specifying How to Import Points
When you import data (as opposed to using Data Connect (page 303)), the
imported material is converted to AutoCAD drawing objects. As you import
point data, you can choose how the points are treated.
NOTE If you are importing survey points, see Bringing in Survey Data (page 370).
■Import points as points, using ACAD_POINT.
■Import points as text, using text specified in data attached to the objects.
Specifying How to Import Points | 427
■Import points as blocks, using a specified block definition.
■Import points as blocks, using a block name specified in data attached to
the objects.
If you import points as blocks, you can choose to import the attribute data
with the objects. If an attribute name on the block that is being created
matches a field name on the incoming point, the data for that attribute will
be imported with the point.
NOTE If the attribute data includes the values used to link the object to an external
database, you can recreate these links (page 530) in the AutoCAD Map 3D drawing
using the ADEGENLINK command.
See also:
■Converting Data From Other Formats to Drawing Objects (page 377)
■Accessing Data from ODBC (page 342)
To specify how to import points
NOTE If you are importing survey points, see Bringing in Survey Data (page 370).
1Click Insert tab ➤ Import panel ➤ Map Import .
2In the Import dialog box (page 1711), review the settings in the Points
column.
3To change the setting for a layer, click in the Points field for that layer.
Do one of the following:
■To import points as points, click the down arrow and select
ACAD_POINT.
■To import points as mtext, click in the Import dialog box (page
1711), click Create As Text From Data, and select the data field to use.
If an object does not have a value in the selected data field, the point
is imported using ACAD_POINT.
Text uses the text style for the current drawing. To change the text
style for the current drawing, click Text Style and select a style.
■To import points to a specific block, click the down arrow and select
the block name.
428 | Chapter 3 Bringing In Data
■To import points to a block whose name is specified in data stored
on the imported objects, click in the Point Mapping dialog box,
click Get Block Name From Data, and select the data field to use.
During import, AutoCAD Map 3D reads the specified data value for
each object. If the data value stored on the object specifies a valid
block name, the object is imported to that block. If the data value
stored on the object specifies a block name that does not exist or if
the object does not have a data value attached, the point is imported
using ACAD_POINT.
4To fill attributes with values from fields in the input file, select Get
Attribute Values From Fields. This works with either the Create As Blocks
or the Get Block Name From Data option.
NOTE This option works only if incoming field names match the block
attribute tags. If they do not match, you can map specific incoming fields to
specific block attributes using the Object class column.
5Click OK to close the Point Mapping dialog box.
Quick Reference
MAPIMPORT
Imports an external file format into AutoCAD Map 3D
Click File ➤ Create DWG From ➤ Map 3D Import.
Menu
Import Map File
Icon
MAPIMPORTCommand Line
Import dialog boxDialog Box
Importing Polygons
When you import data (as opposed to using Data Connect (page 303)), the
imported material is converted to AutoCAD drawing objects. By default,
polygons are imported as polygon objects. However, to use the polygons in a
topology, you must import them as polylines and create centroids for them.
Importing Polygons | 429
If a polygon has attribute data attached, the data is initially attached to the
polyline. You must move the attribute data from the polyline to the centroid.
See also:
■Converting Data From Other Formats to Drawing Objects (page 377)
■Creating Centroids for Polygons (page 431)
To import polygons
1Click Insert tab ➤ Import panel ➤ Map Import . Then import the
attribute data as object data (page 426).
2If you plan to use the polygons in a polygon topology, in the Import
dialog box (page 1711), select the option to Import Polygons As Closed
Polylines.
NOTE To set the default state of this option, use the MAPUSEMPOLYGON
command.
3Run To create centroids for polygons and closed polylines (page 887) to
create centroids in the polygons and move the data from each closed
polyline or polygon to its centroid.
Quick Reference
MAPCREATECENTROIDS
Creates a centroid in a polygon and moves data to the centroid
Create menu ➤ Centroids
Menu
Create Centroids
Icon
MAPCREATECENTROIDSCommand Line
Create Centroids dialog boxDialog Box
MAPIMPORT
Imports an external file format into AutoCAD Map 3D
430 | Chapter 3 Bringing In Data
Click File ➤ Create DWG From ➤ Map 3D Import.
Menu
Import Map File
Icon
MAPIMPORTCommand Line
Import dialog boxDialog Box
Creating Centroids for Polygons
If you have polygon objects or closed polylines with data attached to them,
you can create centroids and move the data to the centroid. This is useful:
■After you import or digitize objects.
■Before using editing commands such as Drawing Cleanup, Boundary Break,
or Boundary Trim.
■When working with topology.
NOTE This functionality applies only to drawing objects. It does not apply to
features from a feature source.
Creating Centroids for Polygons | 431

Object data attached to closed polylines (top) and object data moved to
centroids (bottom).
AutoCAD Map 3D checks that the lines do not intersect each other, and that
the area is greater than 0. It then creates a centroid inside each selected polygon
or closed polyline and moves any object data or SQL link data to the centroid.
For an object shaped like a figure eight, AutoCAD Map 3D creates one centroid.
Centroids are created with a Z value of 0.
See also:
■Overview of Converting Geospatial Data to Drawing Objects (page 378)
■Importing Polygons (page 429)
432 | Chapter 3 Bringing In Data

NOTE This procedure applies only to drawing objects. It does not apply to features
from a feature source.
To create centroids for polygons and closed polylines
1Click Create tab ➤ Drawing Object panel ➤ Create Centroids.
2In the Create Centroids dialog box (page 1801), specify whether to create
centroids for all closed objects or only for selected closed objects. If only
for selected closed objects, select the polygons and closed polylines.
TIP Click the Quick Select tool to view and filter the object type as you select
objects.
3Specify the layer on which the centroids should be created.
4Specify the block to use for centroids, or use ACAD_POINT.
5Click OK.
Quick Reference
MAPCREATECENTROIDS
Creates a centroid in a polygon and moves data to the centroid
Create menu ➤ Centroids
Menu
Create Centroids
Icon
MAPCREATECENTROIDSCommand Line
Create Centroids dialog boxDialog Box
Importing Objects with Links to an External Database
When you import data (as opposed to using Data Connect (page 303)), the
imported material is converted to AutoCAD drawing objects. If objects in a
file you are importing have links to attribute data in a separate database, you
can maintain those links.
Importing Objects with Links to an External Database | 433
See also:
■Converting Data From Other Formats to Drawing Objects (page 377)
■Importing Attribute Data (page 425)
■Overview of Linking Database Records to Objects (page 522)
To import objects with links to an external database
1Make sure you have created a link template (page 526) for the external
database, and that the database is attached (page 209) and connected.
2Click Insert tab ➤ Import panel ➤ Map Import .
3In the Import dialog box (page 1711), click in a field in the Data column.
Click .
4In the Attribute Data dialog box (page 1699), select Add To Database Table.
5Select the link template to use.
6Select Create Link Only.
7Click OK to close the Attribute Data dialog box.
When you import objects, the attribute data on the objects will be converted
to link data for the selected link template.
Quick Reference
MAPIMPORT
Imports an external file format into AutoCAD Map 3D
Click File ➤ Create DWG From ➤ Map 3D Import.
Menu
Import Map File
Icon
MAPIMPORTCommand Line
Import dialog boxDialog Box
MAPOD2ASE
434 | Chapter 3 Bringing In Data
Converts object data tables to linked external database tables
Click Setup ➤ Convert Object Data to Database Links.
Menu
MAPOD2ASECommand Line
Convert Object Data to Database Links dialog boxDialog Box
Displaying Attribute Data as Text
When you import data (as opposed to using Data Connect (page 303)), the
imported material is converted to AutoCAD drawing objects. If you have
attribute data attached to the objects you import, you can display that data
as text next to the object. This works whether you import the data as object
data, external data linked to the object, or block attributes.
TIP If you are importing points, you can import the points directly as attribute
data. See Specifying How to Import Points (page 427).
See also:
■Converting Data From Other Formats to Drawing Objects (page 377)
■Adding Annotation (page 1103)
To import a file with attribute data and display the data as text
1Click Insert tab ➤ Import panel ➤ Map Import . Then import the
attribute data as object data (page 426). Save and close the file.
2Open a drawing and attach the drawing file (page 154) containing the
imported objects.
3Define a query that includes the objects you want. If you have only one
file attached, define a Location condition (page 1241) to find all objects in
the source drawing.
4As part of the query, define a property alteration that displays the object
data as text (page 1278). When specifying the text, click Expression and
choose the object data table that contains the imported attribute data.
5Optionally, save the changes (page 754) back to the attached (source) file.
Displaying Attribute Data as Text | 435

Quick Reference
ADEDRAWINGS
Manages the drawing set
In the Classic workspace, click Setup menu ➤
Define/Modify Drawing Set
Menu
Define/Modify Drawing Set
Icon
ADEDRAWINGSCommand Line
In Map Explorer, right-click
Drawings ➤ Define/Modify Drawing Set
Task Pane
Define/Modify Drawing Set dialog boxDialog Box
ADEQUERY
Controls defining, modifying, saving, loading, and executing a query
In the Classic workspace, click Setup menu ➤ More
DWG Options ➤ Define Query
Menu
Define Query
Icon
ADEQUERYCommand Line
In Map Explorer, right-click Current Query ➤ Define
-or- Right-click a query ➤ Edit
Task Pane
Define Query dialog boxDialog Box
ADESAVEOBJS
Saves objects in the save set back to source drawings
In the Classic workspace, click File menu ➤ Save
Source Drawing Save Set
Menu
Save to Source Drawings
Icon
ADESAVEOBJSCommand Line
Save Objects to Source Drawings dialog boxDialog Box
436 | Chapter 3 Bringing In Data

MAPIMPORT
Imports an external file format into AutoCAD Map 3D
Click File ➤ Create DWG From ➤ Map 3D Import.
Menu
Import Map File
Icon
MAPIMPORTCommand Line
Import dialog boxDialog Box
Adding Rasters and Surfaces
■To add a raster image to the map (page 440)
■To add a raster-based surface to your map (page 442)
■To add 2D rasters to your map (page 444)
■To add a WMS-based image to your map (page 447)
■To make a raster image transparent (page 450)
■To specify an image insertion point (page 451)
■To insert the image manually (page 452)
■To enter the coordinates for the image insertion point (page 452)
Overview of Adding Rasters and Surfaces
When creating a map, you can add raster images and surfaces to the display.
Adding Rasters and Surfaces | 437

Adding one or more images in the background of your map adds context and gives
the map visual appeal.
Use the following raster image and surface types in your map.
FormatsRaster Type
DEM (Digital Elevation Model), ESRI Grid, or Digital Terrain El-
evation Data (DTED)
Raster-based surfaces
(page 441)
JPEG and JPEG2K (Joint Photographic Experts Group), PNG
(Portable Network Graphic), MrSID (Multi-Resolution Seamless
2D raster (page 443)
Image Database), TIFF (Tagged Image File Format), ECW (En-
hanced Compressed Wavelet)
Maps on a serverWMS raster (page
445)
BMP, CALS-I, ECW, FLIC, GeoSPOT, IG4, IGS, IKONOS, JFIF,
LANDSAT FAST, L7A, NITF, PCX, PICT, Quickbird TIFF, RLC 1
and 2 , TARGA
Other raster formats
(page 453)
NOTE Layers in the map are rendered based on the draw order of the layers in
Display Manager. To display drawing objects in front of the raster image, put the
raster image layer at the bottom of the list.
438 | Chapter 3 Bringing In Data
Tell me more
Video
■Show me how to bring multiple images
onto a single layer.
■Show me how to insert an image using
a guide.
■Show me how to bring in data from a
web server using WMS.
Procedure
■To add raster images using Data Con-
nect (page 442)
■To add raster images that use formats
unsupported by Data Connect (page
459)
Tutorial
■Exercise 5: Add a raster image
Workflow
■Style Surfaces
GIS Skills
■Bring in data from multiple image files
to a single layer
■Transform an image so that it is correctly
aligned
■Access data published on a public web
server
Related topics
■Organizing Layers in Your Map (page
300)
■Specifying Image Insertion Point (page
451)
■Using Other Raster Image Formats
(page 453)
■Adding an Image from a WMS (Web
Map Service) (page 445)
Overview of Adding Rasters and Surfaces | 439
To add a raster image to the map
1In Display Manager (page 2060), click Data ➤ Connect To Data.
2In the Data Connect window, select Add Raster Image or Surface
Connection in the Data Connections By Provider list.
If you are adding a WMS image, see Adding an Image from a WMS (Web
Map Service) (page 445). If you are adding an image whose format does
not appear in the Data Connect window, see Using Other Raster Image
Formats (page 453).
3Under Connection Name, type a name for this connection.
You can give the connection any name you like. This name appears in
Map Explorer as the name of the feature source.
4Click the folder icon to browse to the folder containing multiple images,
or click the image icon to specify a single image.
5Click Connect.
6In the Add Data To Map area, select the images to include.
If this source contains only a single image, that image is selected
automatically. If it contains multiple images, you can right-click any of
them and select Select All or Select None.
7For each image you select, make sure the Coordinate System and Vertical
Units entries are correct.
■Hold your cursor over an image name to see its native coordinate
system. The Coordinate System entry should match this.
■Scroll the table if necessary to see all the columns.
■To change the coordinate system, click Edit Coordinate Systems and
choose the appropriate coordinate system.
■To change the vertical units, click the current entry to display a down
arrow that lets you choose a different one.
8To combine all the images on one map layer, select Combine Into One
Layer. This is useful for combining a series of images to create a single
layer; for example, you can combine GeoTIFs of each county to create a
state map.
9Click Add To Map.
10 If prompted, specify the location, scale, and rotation (page 451) for each
image.
440 | Chapter 3 Bringing In Data
Some image files contain placement information and are placed
automatically in your map. For images that do not contain placement
information, you are prompted for the location, scale, and insertion
point.
11 In Display Manager, make sure that the image layer is in the correct
display order.
You can move the raster layer below objects and features.
■In Display Manager, click Groups ➤ Draw Order. (If this button is
already labeled Draw Order, you can omit this step.)
■Drag the raster layer down in the list. Layers at the bottom of the list
appear behind the ones above them.
NOTE You must use a different process (page 453) to insert an image whose format
is not available in Data Connect, or to specify correlation information for an image
whose file does not specify it.
Quick Reference
Connect Feature Source
Connects a feature source
Click File ➤ Connect To Data.
Menu
Connect
Icon
MAPCONNECTCommand Line
In Display Manager click Data ➤ Connect to Data.
Task Pane
Adding Raster-Based Surfaces to Your Map
You can add 3D raster-based surfaces to your map. For example, add DEM
(Digital Elevation Model), ESRI Grid, or Digital Terrain Elevation Data (DTED)
surfaces.
After you add raster-based surfaces to your map, you can create contour maps
to help you analyze 3D terrain. You can use raster-based theming to analyze
Adding Raster-Based Surfaces to Your Map | 441
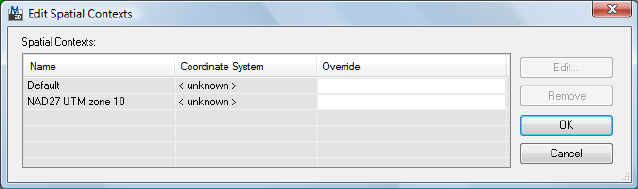
elevation, slope, and aspect, and drape map data over surfaces. You can view
the data in 3D with walkthrough and flythrough options.
See also:
■Analyzing Raster-Based Surfaces (page 1186)
■Adding an Image from a WMS (Web Map Service) (page 445)
To add a raster-based surface to your map
1In Display Manager (page 2060), click Data ➤ Connect To Data.
2In the Data Connect window, select Add Raster Image or Surface
Connection in the Data Connections By Provider list.
3Under Connection Name, type a name for this connection.
You can give the connection any name you like. This name appears in
Map Explorer as the name of the feature source.
4Specify the folder that contains your surface. Click the folder icon to
browse to the folder.
5Click Connect.
6Hold your cursor over the name of the surface file to see a pop-up window
that displays its coordinate system, for example, UTM27-10.
When you add data to your map, you must specify its original coordinate
system. AutoCAD Map 3D automatically converts the data from that
coordinate system to the one specified for your map.
7Click Edit Coordinate Systems and, in the Edit Spatial Contexts (page 1605)
dialog box, click the entry and click Edit.
Select the entry and click Edit to specify the coordinate system for the surface
442 | Chapter 3 Bringing In Data

8Select the coordinate system you saw in the pop-up window. Click OK
twice to return to the Data Connect window.
9In the Add Data To Map area, select the surfaces to include.
If this source contains only a single surface, that surface is selected
automatically. If it contains multiple surfaces, you can right-click any of
them and select Select All or Select None.
10 To combine all the images on one map layer, select Combine Into One
Layer. This is useful for combining a series of images to create a single
layer.
11 Click Add To Map.
The surface is added to your map.
Quick Reference
Connect Feature Source
Connects a feature source
Click File ➤ Connect To Data.
Menu
Connect
Icon
MAPCONNECTCommand Line
In Display Manager click Data ➤ Connect to Data.
Task Pane
Adding 2D Rasters
You can add a two-dimensional image to your map. For example, add an aerial
photograph, an artist’s sketch, or your company logo.
Use the steps on the Procedure tab to add images in these formats:
■JPEG and JPEG2K (Joint Photographic Experts Group)
■PNG (Portable Network Graphic)
■MrSID (Multi-Resolution Seamless Image Database)
■TIFF (Tagged Image File Format)
Adding 2D Rasters | 443

■ECW (Enhanced Compressed Wavelet)
You can also add surface-based rasters (page 441)such as DEM and ESRI Grid
files.
NOTE You must use a different process (page 453) to insert an image whose format
is not available in Data Connect, or to specify correlation information for an image
whose file does not specify it.
See also:
■Adding Raster-Based Surfaces to Your Map (page 441)
■Using Other Raster Image Formats (page 453)
■Adding an Image from a WMS (Web Map Service) (page 445)
To add 2D rasters to your map
1In Display Manager (page 2060), click Data ➤ Connect To Data.
2In the Data Connect window, select Add Raster Image or Surface
Connection in the Data Connections By Provider list.
3Under Connection Name, type a name for this connection.
You can give the connection any name you like. This name appears in
Map Explorer as the name of the feature source.
4Click the folder icon to browse to the folder containing multiple images,
or click the image icon to specify a single image.
5Click Connect.
6In the Add Data To Map area, select the images to include.
If this source contains only a single image, that image is selected
automatically. If it contains multiple images, you can right-click any of
them and select Select All or Select None.
7For each image you select, make sure the Coordinate System and Vertical
Units entries are correct.
■Hold your cursor over an image name to see its native coordinate
system. The Coordinate System entry should match this.
■Scroll the table if necessary to see all the columns.
444 | Chapter 3 Bringing In Data

■To change the coordinate system, click Edit Coordinate Systems and
choose the appropriate coordinate system.
■To change the vertical units, click the current entry to display a down
arrow that lets you choose a different one.
8To combine all the images on one map layer, select Combine Into One
Layer. This is useful for combining a series of images to create a single
layer.
9Click Add To Map.
10 If prompted, specify the location, scale, and rotation (page 451) for each
image.
Some image files contain placement information and are placed
automatically in your map. For images that do not contain placement
information, you are prompted for the location, scale, and insertion
point.
The image is added to your map.
Quick Reference
Connect Feature Source
Connects a feature source
Click File ➤ Connect To Data.
Menu
Connect
Icon
MAPCONNECTCommand Line
In Display Manager click Data ➤ Connect to Data.
Task Pane
Adding an Image from a WMS (Web Map Service)
You can incorporate web-based raster image data (such as satellite photographs)
that have been published to a public web server using the WMS (Web Map
Service) open standard developed by the Open GIS Consortium (OGC).
AutoCAD Map 3D supports WMS versions 1.1.0, 1.1.1, and 1.3.
Adding an Image from a WMS (Web Map Service) | 445
Data from WMS web services can be used to provide background layers for
your map. With WMS data, you take the data as it is; you cannot reproject it.
The number of Web Map Services (WMS) that implement OpenGIS interfaces
on the Internet is increasing all the time, as more organizations adopt the
open standards.
Once you have located some WMS data, determine the URL of the page that
serves the published layers. Often, this is not a standard web page that you
can open in a browser, but a page that has been programmed using a scripting
language such as CGI, PHP, or ASP. A typical web server address looks like
this:
http://wms.jpl.nasa.gov/wms.cgi
Paste the address into the Data Connect window in AutoCAD Map 3D.
NOTE Websites that host web services appear and disappear or are under
construction. Not all sites that you find will work perfectly (or at all).
You can also bring in web-based feature data (page 346).
Example WMS Image Sources
DescriptionWMS Image Source
Weather datahttp://maps.customweather.com/image
Global SRTM and DTED datahttp://wms.jpl.nasa.gov/wms.cgi?
All types of data for the globe - soils, tem-
perature, land cover, boundaries, etc.
http://globe.digitalearth.gov/viz-
bin/wmt.cgi
USGS orthographic and topographic mapshttp://terraservice.net/ogccapabilities.ashx
Source of different types of data layers,
such as boundaries, terrains, physiography,
utilities, SRTM, etc.
http://demo.cubewerx.com/demo/cube-
serv/cubeserv.cgi?
Various orthographic images for USA cities,
for example, San Francisco, Reno, and
Chattanooga.
http://edcw2ks51.cr.usgs.gov/ser-
vlet/com.esri.wms.Es-
rimap?WMTVER=1.1.0&Service-
Name=133urban&
Various Canadian features - provincial
boundaries, lakes, railroads, and more.
http://www2.dmsolutions.ca/cgi-
bin/mswms_gmap
446 | Chapter 3 Bringing In Data
DescriptionWMS Image Source
Geospatial data from NGA (U.S.), Inteva-
tion (Germany) and OGC (U.S.)
http://demo.deegree.org:8080/dee-
gree/wms?
Geoscience Australia national geoscience
datasets
http://www.ga.gov.au/bin/getmap.pl?data-
set=national&
Tell me more
Video
■Show me how to bring in data from a
web server using WMS
Procedure
■To add a WMS-based image to your
map (page 447)
GIS Skill
■Access data published on a public web
server
Related topics
■Creating and Viewing Metadata (page
1486)
■Bringing In Features from WFS (page
346)
■Styling Features (page 639)
To add a WMS-based image to your map
1In Display Manager (page 2060), click Data ➤ Connect To Data.
2In the Data Connect window, select Add WMS Connection in the Data
Connections By Provider list.
3Under Connection Name, type a name for this connection.
You can give the connection any name you like. This name appears in
Map Explorer as the name of the feature source.
4Specify the URL for the WMS server. Click the down arrow to choose
from a list of recently-used URLs.
5Specify the WMS version of the data you want.
Adding an Image from a WMS (Web Map Service) | 447
The Open GIS Consortium updates the WMS format periodically, so there
are multiple versions. AutoCAD Map 3D requests the highest version
(currently 1.3.0) by default. If you do not change this setting, the server
will provide the highest version it supports. Some servers support multiple
WMS versions, each corresponding to a different set of capabilities and
resulting layers. If you must use a specific version of the image, select it
from the list. The server may or may not support the version you request.
6Click Connect.
7If necessary, enter your user name and password.
8In the Add Data To Map area, select the images to include.
If this source contains only a single image, that image is selected
automatically. If it contains multiple images, you can right-click any of
them and select Select All or Select None.
9For each image you select, do the following:
■Click the Image Format entry to the right of the image name to choose
the format for the image you add to your map.
The available format types include PNG, TIF, JPG, and BMP.
■Click the Server CS Code entry for the image and choose from the
available coordinate systems for the server (the EPSG codes).
A WMS layer can support multiple coordinate systems. AutoCAD Map
3D may not recognize all the EPSG codes the WMS server provides.
If this occurs, you can choose the EPSG code that best serves your
purposes.
WMS layers inherit supported EPSG values from their parent objects,
so a child layer (one indented below a parent layer in the list) may
have both its own EPSG setting and the setting of its parent.
■Click the Layer CS Code entry to choose the coordinate system for
the layer.
Unless you know the coordinate system of the source image, do not
change the default. AutoCAD Map 3D will automatically convert the
image to the coordinate system for your map when it adds the image.
■Click the Style entry to choose one of the available styles.
■Click the Background entry to specify a transparent background for
the layer or choose a background color from the list.
10 To combine all the images on one map layer, select Combine Into One
Layer. This is useful for combining a series of images to create a single
448 | Chapter 3 Bringing In Data
layer; for example, you can combine images of each county to create a
state map.
If you combine the images, you must specify a single Image Format, Server
CS Code, and Background for the resulting layer.
When you select Combine Into One Layer, an Order entry appears next
to each selected layer. Click the entry to change the order of the selected
images within the combined layer.
11 Click Add To Map.
The image is added to your map.
Quick Reference
Connect Feature Source
Connects a feature source
Click File ➤ Connect To Data.
Menu
Connect
Icon
MAPCONNECTCommand Line
In Display Manager click Data ➤ Connect to Data.
Task Pane
Making an Image Transparent
When you add a raster image to a map using Data Connect, it appears in a
Display Manager layer. You can edit the properties of this layer to add an
“opacity” property, and then set that opacity property to a value below 1 to
change the transparency of the layer.
To do this, you must save the layer to a file and edit the file in a text editor,
such as Notepad.
NOTE The transparency will not appear in printed versions of the map.
See also:
■Adding Raster-Based Surfaces to Your Map (page 441)
Making an Image Transparent | 449
■Adding 2D Rasters (page 443)
■Adding an Image from a WMS (Web Map Service) (page 445)
To make a raster image transparent
1Add the raster (page 437) to AutoCAD Map 3D.
You can use any type of raster, including a WMS image. The image does
not need to be transparent or have an opacity setting already.
2Right-click the layer containing the image and choose Save Layer.
Save the layer to a .layer file.
3Open the resulting .layer file in a text editor, such as Notepad, and find
the <FeatureName> entry.
4Just under the <FeatureName> entry, add the opacity setting, using the
following syntax:
<Opacity>0.6</Opacity>
An opacity setting of 1 makes the layer completely opaque. A setting of
.1 makes it virtually transparent.
5Save the .layer file.
6In AutoCAD Map 3D, switch the Task Pane to Display Manager (page 2060)
and remove the original raster layer.
7Add any other entities to your map that will appear on layers beneath
the translucent image, and theme or style those layers.
8Click Data ➤ Load Layer and select the .layer file you edited.
The translucent raster image overlays the opaque layers, and they appear
beneath it.
Quick Reference
Connect Feature Source
Connects a feature source
Click File ➤ Connect To Data.
Menu
450 | Chapter 3 Bringing In Data

Connect
Icon
MAPCONNECTCommand Line
In Display Manager click Data ➤ Connect to Data.
Task Pane
Specifying Image Insertion Point
If an image does not contain location information, you can specify its insertion
point and rotation so the image is inserted correctly in relation to other data.
You can also adjust the scale so it matches the scale of the other data.
AutoCAD Map 3D saves the insertion-point setting with the drawing. The
changes are not saved back to the image file or to the correlation source file.
To modify the settings stored in the image file, use an image-editing application
such as Autodesk Raster Design. If you modify the original settings in the
image, reinsert the image to see the changes in your map.
See also:
■Adding Rasters and Surfaces (page 437)
■To specify an image insertion point (page 451)
■To insert the image manually (page 452)
■To enter the coordinates for the image insertion point (page 452)
To specify an image insertion point
1In the Display Manager (page 2060), click Data ➤ Connect To Data.
2In the Data Connect window, select Add Raster Image or Surface
Connection in the Data Connections By Provider list.
3Under Connection Name, type a name for this connection.
You can give the connection any name you like. This name appears in
Map Explorer as the name of the feature source.
4Under Source File Or Folder, click the folder icon and browse to the folder
than contains your image. Click Connect.
5Select the image to insert and click Add To Map.
Specifying Image Insertion Point | 451
6In the Image Insertion dialog box specify where to insert the image. You
can enter X,Y coordinates for the image, or manually specify the insertion
point in the drawing. Each option is described below.
To insert the image manually
1In the Image Insertion dialog box, on the Insertion tab, click Pick.
2Pick the base point for the frame.
You can also type coordinates at the command prompt.
3Type a rotation angle or pick a point to define the rotation angle.
Rotation is in degrees or in the units set by the AUNITS variable. The
image is rotated around the insertion point.
4Pick the second corner point to define the size of the frame.
The Image Insertion dialog box displays the new coordinates, rotation,
and scale.
5Click OK to insert the image into the specified frame.
To enter the coordinates for the image insertion point
1Specify the insertion point for the lower-left corner of the image frame.
The insertion point values on the Source tab use the unit specified at the
bottom of the Source tab. The insertion point values on the Insertion tab
are translated to the current AutoCAD Map 3D drawing unit.
2Specify the rotation.
Use current drawing angle units. This value uses the lower-left corner as
the base point.
3Specify the scale.
If the image you insert contains correlation information, the image is
inserted at the scale specified by that information. Otherwise, the image
is inserted at a scale factor of 1 image unit of measurement to 1 AutoCAD
Map 3D unit of measurement.
A scale factor greater than 1 enlarges the image, while a scale factor less
than 1 makes the image smaller. For example, to make the image twice
as large, type 2 in the Scale box.
You can change the scale to align the image with the vector geometry in
the drawing. For example, if your raster image has a scale of 1 inch equals
452 | Chapter 3 Bringing In Data

50 feet or 1:600, and your AutoCAD Map 3D drawing has a scale of 1
unit equals 1 inch, enter 600 as the scale.
4Specify the units for insertion point and density.
For bitmaps, the density unit used in the image may be in dots per inch.
For satellite photos, the density may be in miles. This unit is also used
for the insertion point.
For example, if your image was scanned at 300 dpi, then select Inches as
the unit.
Quick Reference
Connect Feature Source
Connects a feature source
Click File ➤ Connect To Data.
Menu
Connect
Icon
MAPCONNECTCommand Line
In Display Manager click Data ➤ Connect to Data.
Task Pane
MAPIINSERT
Inserts a raster image
Create menu ➤ Insert An Image
Menu
MAPIINSERTCommand Line
Insert Image dialog boxDialog Box
Using Other Raster Image Formats
Use this feature to connect to raster image formats that are not supported by
Data Connect, or to specify correlation information for images that do not
contain this information within their files. Images attached using the following
methods support a limited set of styles.
Using Other Raster Image Formats | 453

NOTE To use this technique to insert some raster image formats, such as ECW
and SID, you must first download the free Raster Object Enabler from autodesk.com.
NOTE If the image you are inserting is supported, connect to it and add it to your
map using Data Connect (page 437). This gives you more control over styling and
other options.
■To insert raster images (page 455)
■To manage raster images (page 473)
■To manage the appearance of raster images (page 482)
■To modify raster images (page 490)
Inserting Raster Images
Use the Raster Extension features to insert and correlate raster images with
formats that are not supported by Data Connect, or to specify correlation
information for images that do not contain this information within their files.
To use this technique to insert some raster image formats, such as ECW and
SID, you must first download the free Raster Object Enabler from autodesk.com.
■Overview of Inserting Raster Images Outside Data Connect (page 455)
■Inserting a Raster Image (page 459)
■Correlating a Raster Image During Insertion (page 462)
■Manually Adjusting the Image Frame During Insertion (page 465)
■Setting Image Density (page 467)
■Adding an Image in a Drawing to a Display Manager Layer (page 470)
■Inserting an Image from the Command Line (page 470)
NOTE If you are inserting large images or multiple images at once, you can set
Raster Extension memory options.
NOTE If the image you are inserting is supported, connect to it and add it to your
map using Data Connect (page 437). This gives you more control over styling and
other options.
See also:
■Configuring Memory Use (page 258)
■Overview of Adding Rasters and Surfaces (page 437)
454 | Chapter 3 Bringing In Data

To insert raster images
■To insert a raster image (overview) (page 459)
■To insert a raster image (page 460)
■To correlate an image during insertion (page 464)
■To adjust the image frame manually during insertion (page 465)
■To change the density unit when inserting an image (page 469)
■To set the default density value and density unit (page 469)
■To add an image to a new Display Manager layer (page 470)
■To insert an image from the Command prompt (page 471)
Overview of Inserting Raster Images Outside Data Connect
You can connect to many raster image files using Data Connect. Use the Raster
Extension features to insert and correlate raster images with formats that are
not supported by Data Connect, or to specify correlation information for
images that do not contain this information within their files.
Some image-editing applications, such as Autodesk® Raster Design, store
information about image location in an associated correlation source file.
When you insert a raster image using the Insert An Image command (Click
Home tab ➤ Data panel ➤ Insert An Image. ), AutoCAD Map 3D reads
coordinate correlation information and places the image in the precise
coordinate location in the drawing.
Using Other Raster Image Formats | 455
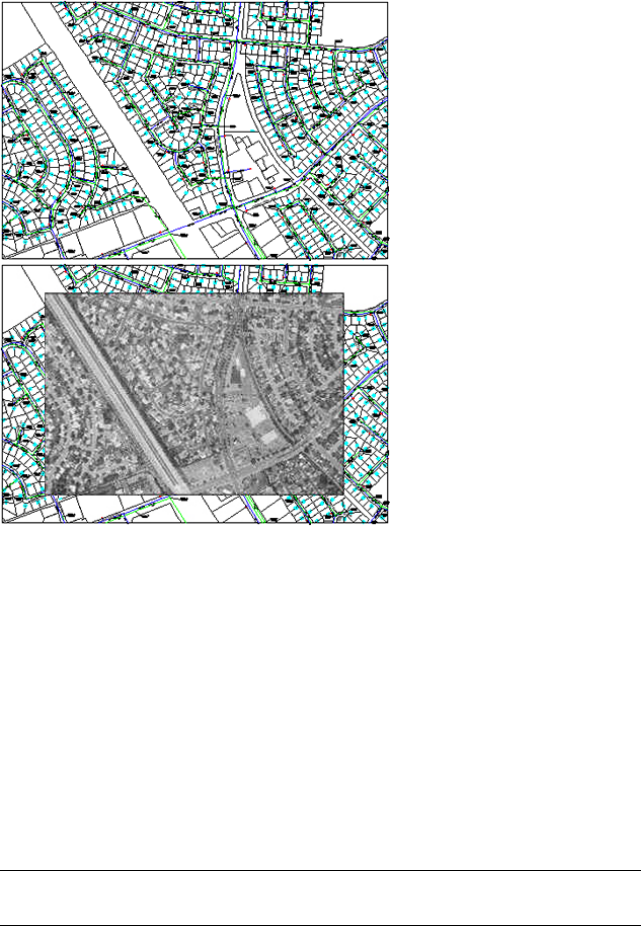
Inserting a raster image into a city map. Move your
cursor over the image to see the results.
After you insert the image, you can change the image display order (page 475)
to have the features and drawing objects display on top of the image.
When you insert an image, AutoCAD Map 3D links the image to the drawing
file through a path name or a data-management document ID. When you
update a linked image, the updates appear in the drawing. Because the image
itself is not included in the drawing, the image does not increase drawing size.
Once you have inserted an image, you can reinsert it multiple times treating
it as if it were a block. Each insertion has its own clip boundary and its own
settings for brightness, contrast, fade, and transparency. A single image can
be cut into multiple pieces that can be rearranged in your drawing.
NOTE If you are inserting large images or multiple images at once, you can set
Raster Extension memory options. See Configuring Memory Use (page 258).
456 | Chapter 3 Bringing In Data

Supported Image Formats
AutoCAD Map 3D supports the most common image file formats used in
computer graphics, document management, mapping, and geographic
information systems (GIS). Images can be bitonal, 8-bit gray (grayscale), 8-bit
color (indexed color), or 24-bit color (true color).
Several image file formats support images with transparent pixels. When image
transparency is on, AutoCAD Map 3D recognizes those transparent pixels and
allows graphics on the AutoCAD Map 3D screen to show through those pixels.
(In bitonal images, background pixels can be treated as transparent.)
Transparent images can be grayscale or color.
In addition, you can select the transparent color for grayscale or color images,
and you can set the opacity for raster images.
AutoCAD Map 3D supports the following raster file formats. Some formats,
such as SID and ECW, are supported as OLE objects and not as image files.
AutoCAD Map 3D determines the file format from the file contents, not from
the file extension.
File extensionDescription and versionType
.bmp, .rle, .dibWindows and OS/2 bitmap formatBMP
.rst, .gp4, .mil, .cal, .cg4Computer Aided Acquisition and Logist-
ics Support
CALS-I
.doqDigital orthophoto quadrangle raster
image format (used for aerial photos
that are processed to remove distortion)
DOQ
.ecwEnhanced Compressed Wavelet (a
highly compressed multiresolution im-
age format from ER Mapper
ECW
.flc, .fliAutodesk digital animation formatFLIC
.bilSPOT Image Corporation format with
georeferencing information
GeoSPOT
.tifTIFF with georeferencing informationGeoTIFF
Graphics Interchange Format (a raster
image format from CompuServe)
GIF
Using Other Raster Image Formats | 457
File extensionDescription and versionType
.ig4Image Systems Group 4IG4
.igsImage Systems Gray ScaleIGS
8- or 16-bit satellite imageryIKONOS
.jpgJPEG File Interchange FormatJFIF
.jpgJoint Photographics Expert GroupJPEG and JPEG
2000
Multispectral image format used by the
Landsat 7 satellite
LANDSAT FAST
L7A
National Imaging Transmission Format
(a multiframe image format commonly
used by US federal agencies and NATO)
NITF
.pcxPC Paintbrush ExchangePCX
.pctMacintosh PICT1, PICT2PICT
.pngPortable Network GraphicsPNG
Multispectral image format from Digit-
alGlobe’s Quickbird Satellite
Quickbird TIFF
.rlcRun Length Encoding format (version
1 has no header; version 2 has IST
headers)
RLC 1 and 2
.sidMulti-Resolution Seamless Image Data-
base (a highly compressed LizardTech
format)
SID (MrSID)
.tgaTrueVision image file formatTARGA
.tifTagged Image File FormatTIFF
NOTE You can also use Data Connect (page 437)to add JPEG, PNG, MrSID, and
TIFF images.
458 | Chapter 3 Bringing In Data

See also:
■Overview of Adding Rasters and Surfaces (page 437)
To insert a raster image (overview)
1To insert an ECW or SID file, you must first download the free Raster
Object Enabler from autodesk.com.
2Locate the image (page 460) to insert.
3Specify correlation settings (page 464) for the image.
4Specify image density (page 469).
5Add the image to a Display Manager layer (page 470).
Quick Reference
MAPIINSERT
Inserts a raster image
Create menu ➤ Insert An Image
Menu
MAPIINSERTCommand Line
Insert Image dialog boxDialog Box
Inserting a Raster Image
When you insert an image into a drawing using the Insert An Image command,
you can preview the image, modify the image frame (also referred to as a
boundary, a frame is a vector object that encloses the image) and image density,
and correlate the image (page 462) with existing vector information or with a
previously correlated image. You can use correlation settings from an external
file, or you can enter the settings manually. You can also modify the correlation
settings after you insert the image (page 501).
After you insert several images, use REGEN to display the correct draw order
of the images. See Changing Image Draw Order (page 475).
NOTE If the image you are inserting is supported, connect to it and add it to your
map using Data Connect (page 437). This gives you more control over styling and
other options.
Using Other Raster Image Formats | 459

Tell me more
Video
■Show me how to insert an image using
a guide.
■Show me how to transform an image.
Procedure
■To add raster images that use formats
unsupported by Data Connect (page
459)
GIS Skill
■Transform an image so that it is correctly
aligned
Related topics
■Overview of Adding Rasters and Sur-
faces (page 437)
■Specifying Image Insertion Point (page
451)
■Using Other Raster Image Formats
(page 453)
To insert a raster image
1To insert an ECW or SID file, you must first download the free Raster
Object Enabler from autodesk.com.
2Click Home tab ➤ Data panel ➤ Insert An Image.
3In the Insert Image dialog box (page 1878), select the drive and folder that
contains the image(s).
4In the Files Of Type box, select the file format of the image(s) to insert.
NOTE To insert more than one image type at a time, select All Images.
5In the list of images, select the images to insert.
TIP For information about an image, click Information to display the file
size, creation date, and other information, as well as a preview of the image.
460 | Chapter 3 Bringing In Data

6To view or modify the image correlation data, select Modify Correlation.
7Click Open.
If Modify Correlation is not selected or if you are inserting more than
one image, the Image Correlation dialog box does not appear and the
images are inserted using their default correlation information. AutoCAD
Map 3D searches in this order for correlation information:
■World file
■Resource file (.res extension)
■Tab file (.tab file)
■Image file
■Settings from the Raster Extension Options dialog box
If you selected Modify Correlation, the Image Correlation dialog box
displays. The image frame, which indicates where the image will be
inserted, is displayed in your drawing.
TIP If you cannot see the image frame, use the ZOOM or PAN commands
to bring it into view while leaving the Image Correlation dialog box open.
8Do one of the following:
■To insert the image using the current settings, click OK.
■To use a different correlation source (page 464), select the correlation
source from the Correlation Source list.
■To change the insertion point, rotation, or scale, type the appropriate
values. For more information, see To correlate an image during
insertion (page 464).
■To resize or orient the image to existing vectors or images, click the
image frame while the Image Correlation dialog box is open.
■To define the insertion point, rotation, and scale onscreen, select the
Insertion tab. Click Pick. For more information, see To adjust the
image frame manually during insertion (page 465).
■To specify the density units for the image, select the Source tab. Select
Units (page 469).
9Click OK.
Using Other Raster Image Formats | 461

The image is inserted on the current AutoCAD layer and its correlation data
is saved in the drawing file. The next time you open the drawing, the image
is displayed automatically using these settings.
Quick Reference
MAPIINSERT
Inserts a raster image
Create menu ➤ Insert An Image
Menu
MAPIINSERTCommand Line
Insert Image dialog boxDialog Box
Correlating a Raster Image During Insertion
When you insert an image using the Insert An Image command, you can
correlate the image with your existing vectors or a previously correlated image.
You can change the insertion point and rotation of the image so that it is
inserted correctly in relation to other data. You can also adjust the scale so
that it matches the scale of the other data.
NOTE If the image you are inserting is supported, connect to it and add it to your
map using Data Connect (page 440). This gives you more control over styling and
other options.
You can set the following options when inserting an image:
■Correlation source
■Insertion point (georeferencing correlation information)
■Rotation
■Scale
■Density
■Units for insertion point and density
■Color
462 | Chapter 3 Bringing In Data

If you modify the correlation settings, AutoCAD Map 3D saves the changes
with the drawing. The changes are not saved back to the image file or to the
correlation source file.
NOTE To modify the settings stored in the image file, use an image-editing
application such as . If you modify the original settings in the image, you must
reinsert the image to see the changes.
Correlation Settings
■Correlation Source — Displays available correlation sources. (See the
Correlation Sources section, following.) If a source is not listed, it may not
be in the same directory as the image file or, if it is a resource (.res) file, it
may not be on the specified resource file path.
NOTE To specify the path for resource (.res) files, at the Command prompt,
enter mapioptions. Select the Paths tab.
■Insertion Point — The insertion point is the lower left corner of the image
before any rotation is applied.
The insertion point values on the Source tab of the Image Insertion dialog
box use the unit specified at the bottom of the Source tab. The insertion
point values on the Insertion tab are translated to the current AutoCAD
Map 3D drawing unit.
You can edit the settings or select an insertion point in the drawing by
clicking Pick on the Insertion tab and then picking a location in the
drawing.
■Rotation — Rotation is in degrees or in the units set by the AUNITS variable.
The image is rotated around the insertion point.
■Scale — If the image you insert contains correlation information, the image
is inserted at the scale specified by that information. Otherwise, the image
is inserted at a scale factor of 1 image unit of measurement to 1 AutoCAD
Map 3D unit of measurement. You can change the scale to align the image
with the vector geometry in the drawing. For example, if your raster image
has a scale of 1 inch equals 50 feet or 1:600, and your AutoCAD Map 3D
drawing has a scale of 1 unit equals 1 inch, enter 600 as the scale on the
Insertion tab.
■Density — For bitmaps, the density unit used in the image may be in dots
per inch. For satellite photos, the density may be in miles. This unit is also
used for the insertion point.
Using Other Raster Image Formats | 463

To see how your correlation settings translate to AutoCAD Map 3D units,
select the Insertion tab. To preview the settings in the drawing, click Apply.
NOTE To modify correlation settings after you insert an image use the Properties
palette.
Correlation Sources
When you insert an image, AutoCAD Map 3D searches for correlation files
for the image and displays them in the Correlation Source list of the Image
Correlation dialog box. You may see the following sources listed.
■World File (Various file extensions)
■Resource File (.res) — You can specify an alternate location for resource
files. See Setting the Resource Files Directory (page 251).
■Tab File (.tab)
■Image File — For certain types of images, correlation data can be saved as
part of the image file. These file types include RLC, IG4, IGS, GeoTags in
GeoTIFF, or HDR File in GeoSPOT.
■Default — The values that you set on the Image Defaults tab of the Raster
Extension Options dialog box.
See also:
■Modifying the Correlation Settings for an Image (page 501)
To correlate an image during insertion
1Insert an image (page 460)
2In the Image Correlation dialog box (page 1873), do one or more of the
following:
■Select a correlation source.
■Type new coordinates for the image frame. The insertion point
represents the lower-left corner of the frame.
■Scale the image.
For example, to make the image twice as large, type 2 in the Scale box.
■Rotate the image. The units of the rotation value depend on the setting
of the AUNITS system variable.
464 | Chapter 3 Bringing In Data
NOTE You can click the frame while the Insert An Image dialog box is
open and use the grips to move, scale, or rotate the frame.
3Click Apply to see your changes.
4Click OK to insert the image.
AutoCAD Map 3D inserts the image on the current layer and saves its
correlation data in the drawing file. The next time you open the drawing, the
image displays using these settings.
TIP If your image is not visible, zoom to the drawing extents. Click Map Setup
tab ➤ Map panel ➤ Zoom Drawing Extents.
Quick Reference
MAPIINSERT
Inserts a raster image
Create menu ➤ Insert An Image
Menu
MAPIINSERTCommand Line
Insert Image dialog boxDialog Box
Manually Adjusting the Image Frame During Insertion
If you do not know the exact coordinates for the image, you can specify the
insertion point, rotation angle, and scale of the image by adjusting the frame
at the time of insertion. As you draw the frame onscreen, the program
maintains the aspect ratio of the image that you are inserting.
See also:
■Modifying the Correlation Settings for an Image (page 501)
To adjust the image frame manually during insertion
1Insert an image (page 460).
Using Other Raster Image Formats | 465

2In the Image Correlation dialog box (page 1873), on the Insertion tab, click
Pick.
An outline of the frame appears onscreen. This outline reflects the aspect
ratio of the image that you are inserting.
3Pick the base point for the frame.
You can also type coordinates at the Command prompt, or, if there is
already correlation data for the image, press Enter to accept the existing
coordinates.
4Type a rotation angle or pick a point to define the rotation angle.
5Pick the second corner point to define the size of the frame.
TIP You can use UNDO to undo a point.
The Image Correlation dialog box is redisplayed with the new coordinates,
rotation, and scale.
6Click OK to insert the image into the specified frame.
AutoCAD Map 3D inserts the image on the current layer and saves its
correlation data in the drawing file. The next time you open the drawing,
the image displays using these settings.
TIP You can select the frame and use the grips or standard AutoCAD Map 3D
commands to size, move, or rotate the image while the Image Correlation dialog
box is open.
Quick Reference
MAPIINSERT
Inserts a raster image
Create menu ➤ Insert An Image
Menu
MAPIINSERTCommand Line
Insert Image dialog boxDialog Box
466 | Chapter 3 Bringing In Data

Setting Image Density
For some images, the density value and units are already stored in the image
file or correlation source. When you use the Insert An Image command to add
an image that does not have correlation information, AutoCAD Map 3D uses
the settings from the Image Defaults tab in the Raster Extension Options dialog
box.
NOTE If the image you are inserting is supported, connect to it and add it to your
map using Data Connect (page 440). This gives you more control over styling and
other options.
You can change the density unit when you insert an image but not the density
value. You must set the default density value from the Raster Extension Options
dialog box.
■Density — Shows the dots (or pixels) per unit for the image. If this
information was not stored with the image or the correlation source, then
AutoCAD Map 3D uses the default density from the Raster Extension
Options dialog box.
■Units — Select the units for the density from the Units list. For example,
if your image was scanned at 300 dots per inch, then select Inch as the
density unit.
Some image formats, such as GeoTIFF, GeoSPOT, and any image with a World
file for correlation source, have density units that are in real-world coordinates.
For example, a satellite photo can be based on dots-per-mile. In this case,
select Mile as the density unit.
The density unit that you specify can vary depending on what type of image
you are inserting. The following two examples explain the difference between
inserting an image that was scanned using dots per inch, and an aerial
photo/satellite photo that was saved in real-world units.
Setting Density Units for an Image That Is Not Georeferenced
The following example shows the relationship between paper scale, density
units, and insertion scale for an image that is not georeferenced (an image
that was not saved with real-world unit data). Any image that is drawn using
a scale (such as a floor plan) and captured with a scanner will likely fall into
this category.
The image in the following example was drawn at a paper scale of 1" = 48",
scanned at 300 dots per inch, then inserted into a drawing using 300 as the
Using Other Raster Image Formats | 467
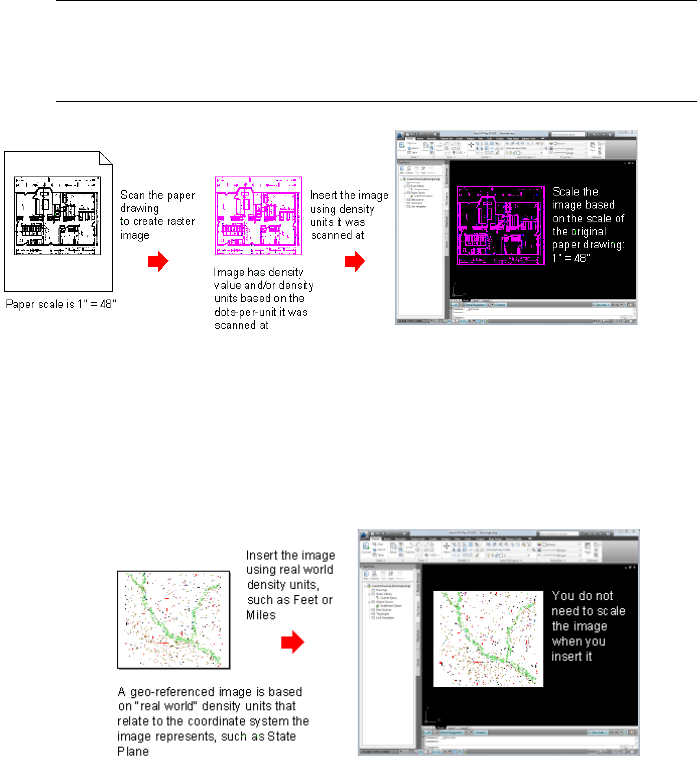
density value and Inches as the density unit. Then it was scaled based on its
paper scale of 1" = 48".
The density units that you select when you insert an image that is not
georeferenced should match the units at which the image was scanned. In
this case, the units are inches because the image was scanned in dots per inch.
NOTE Remember that the scale must be based on the same units. For example,
if the scale in the original floor plan is 1" = 4', you must convert both sides to the
same unit. In this case, convert the 4 feet to inches, which is why you use 1" = 48"
as the scale factor.
Setting Density Units for an Image That Is Georeferenced
The following example shows the relationship between density units and a
georeferenced image. Because there is no paper scale to consider, you can
insert the image using the units that the image represents, such as feet or
miles, and you do not have to scale the image when you insert it.
Georeferenced images include GeoSPOT and GeoTIFF file types, and images
that use World files as their correlation source.
468 | Chapter 3 Bringing In Data

See also:
■Overview of Adding Rasters and Surfaces (page 437)
■Using Other Raster Image Formats (page 453)
To change the density unit when inserting an image
1Click Home tab ➤ Data panel ➤ Insert An Image.
2In the Insert Image dialog box (page 1878), select the image(s) to insert.
3Select Modify Correlation.
4Click Open.
5Select the Source tab. Select the units.
To set the default density value and density unit
1In the Tool-based Ribbon Workspace, click Insert tab ➤ Image
panel ➤ angle-arrow.
2In the Import dialog box (page 1711), select the Image Defaults tab.
3In the Density box, type a default density for images. This should be the
scanned resolution (page 2072). For example, if the majority of your images
were scanned at 300 dots per inch, type 300.
4In the Units box, select the default unit for the insertion point and density
of images. For example, if the majority of your images were scanned at
300 dots per inch, then select Inch.
5Click OK.
Quick Reference
MAPIINSERT
Inserts a raster image
Create menu ➤ Insert An Image
Menu
MAPIINSERTCommand Line
Insert Image dialog boxDialog Box
Using Other Raster Image Formats | 469

Adding an Image in a Drawing to a Display Manager Layer
You can move an image you inserted directly into the current drawing with
the Insert An Image command to a new Display Manager (page 2060) layer. This
allows you to position it relative to other Display Manager layers.
See also:
■Overview of Adding Rasters and Surfaces (page 437)
■Using Other Raster Image Formats (page 453)
To add an image to a new Display Manager layer
1Insert the image using the Insert An Image command. Click Home
tab ➤ Data panel ➤ Insert An Image.
2In Display Manager, click Data ➤ Add Drawing Data ➤ Raster Image.
3In the Select Image dialog box, select the image.
4To group the image layers, select Group Selection.
If you combine the image layers in a group, you can turn the display of
the group on or off.
5Click OK.
Quick Reference
MAPIINSERT
Inserts a raster image
Create menu ➤ Insert An Image
Menu
MAPIINSERTCommand Line
Insert Image dialog boxDialog Box
Inserting an Image from the Command Line
You can insert an image at the Command prompt by setting the FILEDIA
variable to <0>. This feature is useful if you already have correlation data stored
470 | Chapter 3 Bringing In Data

with your images or to use an AutoLISP routine to insert images into your
drawing.
NOTE If the image you are inserting is supported, connect to it and add it to your
map using Data Connect (page 440). This gives you more control over styling and
other options.
AutoCAD Map 3D uses correlation data if available, searching for a correlation
source in the following order:
■world file
■resource file
■tab file
■image file
AutoCAD Map 3D uses the correlation information from the first source that
it locates. If it cannot find a correlation file, then the image is inserted using
the default insertion point information that you defined in the Raster
Extension Options dialog box. You can specify a default location for resource
files, and you can specify that AutoCAD Map 3D search for correlation
information in the resource directory before checking the image directory. If
the correlation source does not include information on scale or density,
AutoCAD Map 3D uses the scale and density specified on the Image Defaults
tab of the Raster Extension Options dialog box.
See also:
■Setting the Resource Files Directory (page 251)
■Setting Correlation Defaults (page 257)
To insert an image from the Command prompt
1Set the FILEDIA system variable to 0.
Consult the AutoCAD Command Reference if you need more information.
2At the Command prompt, enter mapiinsert.
3Do one of the following:
■Type the name of the image to insert including its file extension.
If you do not specify a path to the image, then AutoCAD Map 3D
searches for the image using the Project Files Search Path set in the
Files tab of the AutoCAD Options dialog box.
Using Other Raster Image Formats | 471

■Type the path to the image, the image name, and the file extension,
for example: c:\Projects\Images\contour.rlc
AutoCAD Map 3D searches for the image on the path that you specify.
If it cannot locate the image on this path, then it searches for the
image using the Project Files Search Path.
NOTE When FILEDIA is set to <0>, you can display the Insert Image dialog box
by typing a tilde (~) in response to a command prompt.
When AutoCAD Map 3D locates the image, it inserts it into your drawing. If
there is correlation data stored with the image, then AutoCAD Map 3D inserts
the image using this data.
TIP If you cannot see the image after you insert it, zoom to the extents of the
drawing or use the Image Management dialog box to zoom to the image (page
481).
Quick Reference
MAPIINSERT
Inserts a raster image
Create menu ➤ Insert An Image
Menu
MAPIINSERTCommand Line
Insert Image dialog boxDialog Box
MAPIOPTIONS
Specifies default image correlation settings, display options, detach options,
paths, and memory settings
Setup menu ➤ Raster Options
Menu
MAPIOPTIONSCommand Line
Raster Extension Options dialog boxDialog Box
472 | Chapter 3 Bringing In Data
Managing Raster Images
You can view and modify information about images you inserted using the
Insert An Image command.
To manage raster images
■To display the Image Management dialog box (page 474)
■To display the Image Information dialog box (page 475)
■To display the Properties palette (page 475)
■To change the draw order of images (page 477)
■To change the draw order of images and objects (page 477)
■To change an image name (page 479)
■To create a search path (page 480)
■To zoom to an image (page 481)
Overview of Managing Raster Images
When you insert an image into a drawing using the Insert An Image command,
only information about the image is stored in the drawing, along with a
pointer to the actual image.
You can view and modify this stored information.
Use this method...To do this...
Display the Image Management or Image
Information dialog box, or the Properties
palette.
See Viewing Image Information (page 474).
View information about images in maps.
Click Insert tab ➤ Image panel ➤ Image
Management.
See Changing Image Draw Order (page
475).
Change the draw order of raster images
and vector objects you inserted using the
Insert An Image command.
Click Insert tab ➤ Image panel ➤ Image
Management.
See Changing an Image Name (page 478).
Change the name of an image you inserted
using the Insert An Image command.
Using Other Raster Image Formats | 473
Use this method...To do this...
Click ➤ Options. On the Files tab,
select Project Files Search Path. Click Add.
See Creating a Search Path for Raster Im-
ages (page 479).
Specify the location of an image you inser-
ted using the Insert An Image command,
if it has been moved or deleted.
Click Insert tab ➤ Image panel ➤ Image
Management.
See Zooming to an Image (page 481).
Zoom to images you inserted using the
Insert An Image command.
Viewing Image Information
You can view information about images in maps in the following ways:
■The Image Management dialog box displays information about the number
of instances of an image in the map, the draw order of images, and other
image information.
■The Image Information dialog box displays information about the file, the
image, properties, and correlation information.
■The Properties palette provides access to image properties.
NOTE These options work for all images, no matter how they were added to your
map.
See also:
■Overview of Adding Rasters and Surfaces (page 437)
■Using Other Raster Image Formats (page 453)
To display the Image Management dialog box
■Click Insert tab ➤ Image panel ➤ Image Management.
You can click Layout to modify the columns in the Image Management dialog
box. You can hide or display topic columns, or change the order of topic
columns.
474 | Chapter 3 Bringing In Data

To display the Image Information dialog box
1Click the frame of the image to select it.
NOTE If you are zoomed in and cannot see the image frame, press Shift +
left-click (page 493) to select the image.
2Right-click the image ➤ Image ➤ Information.
To display the Properties palette
1In the drawing, select the image to modify.
2Right-click the image. Click Properties.
Quick Reference
MAPIINFO
Displays file, image, object property, and correlation information about
selected images
View menu ➤ Imaging Tools ➤ Information
Menu
MAPIINFOCommand Line
Image Information dialog boxDialog Box
MAPIMANAGE
Allows you to view a list of images in the current drawing, change drawing
order, erase or zoom to selected images
Click Setup ➤ Image Management.
Menu
MAPIMANAGECommand Line
Image Management dialog boxDialog Box
Changing Image Draw Order
When you insert raster images, the images draw in the order in which you
insert them. You can change the draw order of:
■Raster images.
Using Other Raster Image Formats | 475
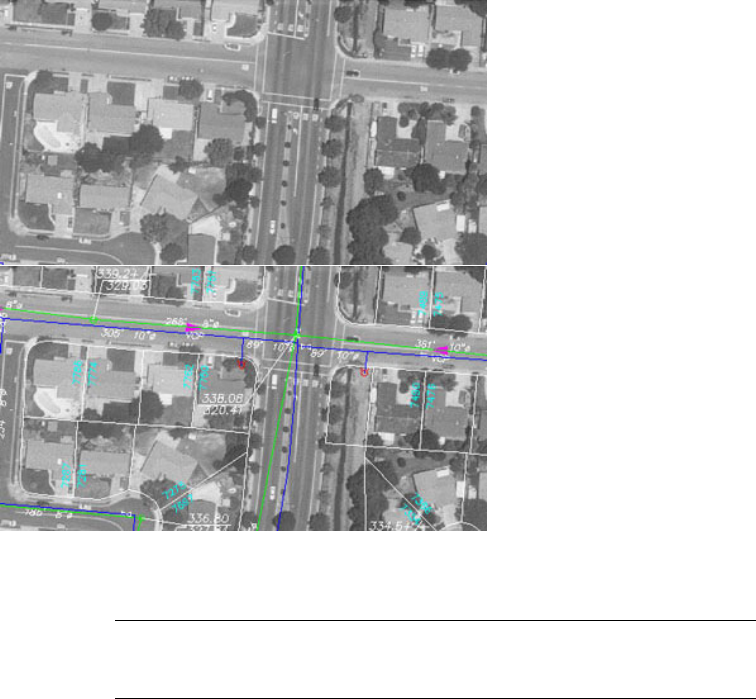
■Raster images and vector objects.
You can change the draw order of images and vector objects. By sending an image to
the back, the vector objects display on top of the image. Move your cursor over the
image to see the results.
NOTE If you change the draw order and then undo the change, images may not
appear in the correct draw order. Use the REGEN command to display the correct
draw order of the images.
The following conditions affect the image draw order:
■Image insertion order
AutoCAD Map 3D uses image insertion order first. For example, if you
insert images A, B, C in that order, and then reorder them so that they are
arranged as B, C, A, use REGEN when you open that drawing again to
restore the order to B, C, A.
476 | Chapter 3 Bringing In Data
AutoCAD Map 3D always uses this optimization feature and applies it to
the draw order of all objects, not just to images.
■Image selection
You can set an option to draw hatch marks over a selected image. Click
➤ Options. Select the Display tab. Under Display Performance, set
Highlight Raster Image Frame Only to off.
If Highlight Raster Image Frame Only is off, when you select an image, it
rises to the top of the display order, obscuring any vectors that cross it.
Use the REGEN command to restore the proper display order.
NOTE For images you added with Data Connect (page 2059), use Display Manager
(page 2060) to change the draw order. See Organizing Layers in Your Map (page
300).
See also:
■Overview of Adding Rasters and Surfaces (page 437)
■Using Other Raster Image Formats (page 453)
NOTE For images you added with Data Connect (page 2059), use Display Manager
(page 2060) to change the draw order. See Organizing Layers in Your Map (page
300).
To change the draw order of images
1Click Insert tab ➤ Image panel ➤ Image Management.
2In the Image Management dialog box (page 1875), select an image name
and drag it up or down in the Image column.
The current draw order is indicated in the Image column. The top image
in the list is drawn on top of all the other images and is the last drawn.
The last image in the list is drawn beneath any images that may overlap
it.
To change the draw order of images and objects
1Select the image.
Using Other Raster Image Formats | 477

2Do one of the following:
■Click Home tab ➤ Modify panel ➤ Bring To Front drop-down ➤ Bring
To Front
■Click Home tab ➤ Modify panel ➤ Bring To Front drop-down ➤ Send
To Back
If necessary, use REGEN.
NOTE Changes made using Draw Order are reflected in the Image Management
dialog box.
Quick Reference
REGEN
Regenerates the drawing and refreshes the current viewport
View menu ➤ Regen
Menu
REGENCommand Line
MAPIMANAGE
Allows you to view a list of images in the current drawing, change drawing
order, erase or zoom to selected images
Click Setup ➤ Image Management.
Menu
MAPIMANAGECommand Line
Image Management dialog boxDialog Box
Changing an Image Name
Image names are not necessarily the same as image file names. When you
attach an image to a drawing using the Insert An Image command, AutoCAD
Map 3D uses the file name without the file extension as the image name. You
can change the image name without affecting the name of the file.
NOTE This command does not affect images you added using Data Connect
(page 440).
478 | Chapter 3 Bringing In Data
See also:
■Overview of Adding Rasters and Surfaces (page 437)
■Using Other Raster Image Formats (page 453)
To change an image name
1Click Insert tab ➤ Image panel ➤ Image Management.
2In the Image Manager dialog box, select the image name.
3Click the image name again to edit it.
4Enter the new name.
5Click OK.
TIP You can also change the image name by pressing F2 while in the Image
Manager dialog box and editing the name.
Quick Reference
IMAGE
Manages images
Setup menu ➤ Image Management
Menu
Manage Images
Icon
IMAGECommand Line
Select an image. Right-click in drawing
area ➤ Image ➤ Image Manager
Task Pane
Creating a Search Path for Raster Images
When you insert an image with the Insert An Image command, AutoCAD
Map 3D stores the location of the image in the drawing file. When you open
a drawing, AutoCAD Map 3D searches this stored location for the file. If the
image has been moved or deleted, AutoCAD Map 3D searches the Project Files
Search Path.
Using Other Raster Image Formats | 479
NOTE This command does not affect images you added using Data Connect
(page 440).
See also:
■Overview of Adding Rasters and Surfaces (page 437)
■Using Other Raster Image Formats (page 453)
To create a search path
1Click ➤ Options.
2On the Files tab, select Project Files Search Path. Click Add.
A folder named Projectx (where x indicates the next available number)
appears under Project Files Search Path.
3Enter a name for the project.
The project name cannot contain leading spaces or terminating spaces.
4Click Apply.
5With the project name selected, click Set Current.
6Click Add.
A path entry is created under the project name.
7Enter the search path or click Browse to select a directory.
8Click OK.
For more information about using project files and alternate search paths,
refer to PROJECTNAME in the online AutoCAD Command Reference.
Quick Reference
OPTIONS
Customizes the AutoCAD settings
Setup menu ➤ AutoCAD Options
Menu
OPTIONSCommand Line
480 | Chapter 3 Bringing In Data
Right-click in the drawing area ➤ Options
Task Pane
Zooming to an Image
You can zoom to images you inserted with the Insert An Image command.
NOTE This command does not affect images you added using Data Connect
(page 440).
See also:
■Overview of Adding Rasters and Surfaces (page 437)
■Using Other Raster Image Formats (page 453)
To zoom to an image
1Click Insert tab ➤ Image panel ➤ Image Management.
2In the Image Management dialog box (page 1875), select an image.
3Right-click the image. Click Zoom To.
Quick Reference
MAPIMANAGE
Allows you to view a list of images in the current drawing, change drawing
order, erase or zoom to selected images
Click Setup ➤ Image Management.
Menu
MAPIMANAGECommand Line
Image Management dialog boxDialog Box
Using Other Raster Image Formats | 481

Hiding, Unloading, Detaching, and Erasing Images
You can increase redrawing speed by hiding or unloading images you inserted
using the Insert An Image command that you do not need in the current
drawing session.
■Overview of Hiding, Unloading, Detaching, and Erasing Images (page 482)
■Hiding an Image (page 485)
■Unloading an Image (page 486)
■Erasing an Image (page 487)
■Detaching an Image (page 488)
See also:
■Overview of Adding Rasters and Surfaces (page 437)
■Using Other Raster Image Formats (page 453)
To manage the appearance of raster images
■To hide an image (page 485)
■To unload an image (page 486)
■To erase an image (page 487)
■To detach an image (page 489)
Overview of Hiding, Unloading, Detaching, and Erasing Images
When you insert an image using the Insert An Image command, AutoCAD
Map 3D stores information about the image in the drawing, loads the image
into memory, displays it onscreen, and locks the image file on the disk.
NOTE This command does not affect images you added using Data Connect
(page 440).
You can increase redrawing speed by hiding or unloading images you do not
need in the current drawing session. Hidden images are not displayed or
plotted; only their drawing boundaries are displayed. You can choose to hide
an image regardless of the current viewport coordinate system. If you no longer
need the image in the drawing, you can erase a single instance of the image
or you can detach the image to erase all instances of the image and the image
information.
Aside from locking the image file, none of these actions modify the original
image file itself.
482 | Chapter 3 Bringing In Data
See also:
■Overview of Adding Rasters and Surfaces (page 437)
■Using Other Raster Image Formats (page 453)
Use this method...To do this...
Select and right-click the image frame ➤
Image ➤ Show Image.
See Hiding an Image (page 485).
Hide an image you added using the Insert
An Image command.
At the command prompt, enter extern-
alreferences. Right-click the image and click
Unload.
See Unloading an Image (page 486).
Remove an image you added using the
Insert An Image command from memory
(unload it).
Select the image. Click Home
tab ➤ Modify panel ➤ Erase.
See Erasing an Image (page 487).
Erase an image you added using the Insert
An Image command from the map.
Click Insert tab ➤ Image panel ➤ Image
Management. Click the image and
click Detach.
See Detaching an Image (page 488).
Remove all instances of an image you ad-
ded using the Insert An Image command
from the map (detach it).
Quick Reference
PROPERTIES
Displays the Properties palette, which allows you to edit the properties of
objects
Analyze ➤ Properties
Menu
Properties
Icon
PROPERTIESCommand Line
Select object. Right-click in drawing area ➤ Properties
Task Pane
MAPISHOWIMAGE
Using Other Raster Image Formats | 483

Hides or displays a raster image
Right-click a selected image frame ➤ Image ➤ Show
Image
Menu
MAPISHOWIMAGECommand Line
ERASE
Removes objects from a drawing
Modify menu ➤ Erase
Menu
Erase
Icon
ERASECommand Line
Select objects to erase. Right-click in drawing
area ➤ Erase
Task Pane
MAPIOPTIONS
Specifies default image correlation settings, display options, detach options,
paths, and memory settings
Setup menu ➤ Raster Options
Menu
MAPIOPTIONSCommand Line
Raster Extension Options dialog boxDialog Box
IMAGE
Manages images
Setup menu ➤ Image Management
Menu
Manage Images
Icon
IMAGECommand Line
Select an image. Right-click in drawing
area ➤ Image ➤ Image Manager
Task Pane
484 | Chapter 3 Bringing In Data

Hiding an Image
When you hide an image, the image does not display onscreen, nor does it
plot. Only the image boundary displays onscreen. However, the image is still
loaded in memory, and the image file is still locked on the disk. It cannot be
deleted or modified. Hiding images is a convenient way to speed regeneration
time. You can redisplay the image when you are ready to plot.
This command is not available if you have selected more than one image. To
show or hide multiple images, use the Properties palette.
NOTE This command does not affect images you added using Data Connect
(page 440).
NOTE You can also control the display of images by using the LAYER command.
When you insert an image, it is inserted on the current layer, but you can move
it to another layer. You can then use the LAYER command to control the layer
visibility.
The images are also affected by other layer attributes such as whether a layer
is locked or frozen. If you are working with several images and you do not
want to modify certain images, then move those images to a separate layer
and lock the layer.
See also:
■Overview of Adding Rasters and Surfaces (page 437)
■Using Other Raster Image Formats (page 453)
To hide an image
1Select the image frame.
2Right-click the image ➤ Image ➤ Show Image.
To show a hidden image, follow the same steps.
NOTE You can also modify this setting on the Properties palette.
Quick Reference
PROPERTIES
Using Other Raster Image Formats | 485
Displays the Properties palette, which allows you to edit the properties of
objects
Analyze ➤ Properties
Menu
Properties
Icon
PROPERTIESCommand Line
Select object. Right-click in drawing area ➤ Properties
Task Pane
MAPISHOWIMAGE
Hides or displays a raster image
Right-click a selected image frame ➤ Image ➤ Show
Image
Menu
MAPISHOWIMAGECommand Line
Unloading an Image
To conserve memory and enhance performance, unload images that you do
not need to view and/or plot.
NOTE This command does not affect images you added using Data Connect
(page 440).
When you unload an image, you remove the image from memory. It does not
display onscreen, nor does it plot, and it is no longer locked on the disk. Only
the image boundary displays onscreen. Information about the image, such as
its path and scale, remains in the drawing. Before you can plot the image, you
must reload it into memory.
See also:
■Changing Image Display Quality and Speed (page 498)
■Overview of Adding Rasters and Surfaces (page 437)
■Using Other Raster Image Formats (page 453)
To unload an image
1At the command prompt, enter externalreferences.
486 | Chapter 3 Bringing In Data

2In the External References palette, right-click the image.
3Click Unload.
This status is saved with the drawing when you close the drawing.
Quick Reference
IMAGE
Manages images
Setup menu ➤ Image Management
Menu
Manage Images
Icon
IMAGECommand Line
Select an image. Right-click in drawing
area ➤ Image ➤ Image Manager
Task Pane
Erasing an Image
When you erase an image, that instance of the image is erased from the
document. Erasing an image does not delete the image information. You can
set an option so that when the last instance of an image is erased from the
drawing, AutoCAD Map 3D detaches the image, deleting the image
information.
NOTE This command does not affect images you added using Data Connect
(page 440).
See also:
■Choosing an Image Detach Method (page 255)
■Overview of Adding Rasters and Surfaces (page 437)
■Using Other Raster Image Formats (page 453)
To erase an image
1Select the image.
Using Other Raster Image Formats | 487
2Click Home tab ➤ Modify panel ➤ Erase.
If you erase all instances of an image within a drawing, you may be
prompted to detach the image (page 489) from the drawing.
Quick Reference
ERASE
Removes objects from a drawing
Modify menu ➤ Erase
Menu
Erase
Icon
ERASECommand Line
Select objects to erase. Right-click in drawing
area ➤ Erase
Task Pane
MAPIOPTIONS
Specifies default image correlation settings, display options, detach options,
paths, and memory settings
Setup menu ➤ Raster Options
Menu
MAPIOPTIONSCommand Line
Raster Extension Options dialog boxDialog Box
Detaching an Image
When you detach an image, all instances of the image are removed from the
drawing, the image information is deleted, and the image file is unlocked.
Detach images that you no longer need in the drawing.
NOTE This command does not affect images you added using Data Connect
(page 440).
See also:
■Choosing an Image Detach Method (page 255)
488 | Chapter 3 Bringing In Data
■Overview of Adding Rasters and Surfaces (page 437)
■Using Other Raster Image Formats (page 453)
To detach an image
1Click Insert tab ➤ Image panel ➤ Image Management.
2In the Image Manager dialog box, select the image name.
3Click Detach.
The image is no longer linked to the drawing file, and all instances of the
image are removed from the drawing.
Quick Reference
IMAGE
Manages images
Setup menu ➤ Image Management
Menu
Manage Images
Icon
IMAGECommand Line
Select an image. Right-click in drawing
area ➤ Image ➤ Image Manager
Task Pane
Modifying Raster Images
You can modify an image with grip modes, adjust an image for contrast, clip
the image with a rectangle or polygon, or use an image as a cutting edge for
a trim.
■Overview of Modifying Raster Images (page 490)
■Selecting an Image (page 493)
■Displaying Image Frames (page 494)
■Changing Image Alignment (page 495)
■Adjusting Image Brightness, Contrast, and Fade (page 496)
■Changing Image Display Quality and Speed (page 498)
Using Other Raster Image Formats | 489
■Making an Image Transparent (page 499)
■Modifying the Correlation Settings for an Image (page 501)
■Modifying Other Image Properties (page 503)
■Clipping an Image (page 504)
To modify raster images
■To select an image by pressing Shift + left-click (page 493)
■To turn on the Shift + left-click option (page 494)
■To display image frames (page 495)
■To change image alignment (page 496)
■To adjust brightness, contrast, and fade (page 497)
■To change image display quality (page 498)
■To hide a drawing or show clipped images (page 498)
■To make an image transparent (page 500)
■To change the color that is transparent (page 500)
■To modify the correlation settings for an image (page 502)
■To modify image properties (page 503)
■To clip an image (page 506)
Overview of Modifying Raster Images
You can copy, move, or clip raster images. You can modify an image with grip
modes, adjust an image for contrast, clip the image with a rectangle or polygon,
or use an image as a cutting edge for a trim.
NOTE This command does not affect images you added using Data Connect
(page 440).
Image Frames
AutoCAD Map 3D inserts images into frames. A frame is a rectangular vector
object that encloses the image. When you select the frame, you create a
selection set that you can manipulate using any editing command. You can
copy, move, stretch, rotate, and scale images.
Use this method...To do this...
Press Shift while you click the image.
See Selecting an Image (page 493).
Select an image you added with the Insert
An Image command.
490 | Chapter 3 Bringing In Data
Use this method...To do this...
Click Insert tab ➤ Image panel ➤ Toggle
Frames.
See Displaying Image Frames (page 494).
Display frames for images you added with
the Insert An Image command.
At the Command prompt, enter align.
See Changing Image Alignment (page 495).
Change the alignment and scale of an im-
age you added with the Insert An Image
command.
At the Command prompt, enter imagead-
just.
See Adjusting Image Brightness, Contrast,
and Fade (page 496).
Adjust the brightness, contrast, and fade
of an image you added with the Insert An
Image command.
At the Command prompt, enter imagequal-
ity.
See Changing Image Display Quality and
Speed (page 498).
Adjust the image display quality of an im-
age you added with the Insert An Image
command.
Right-click the image. Click Properties. In
the Properties palette, select Transparency.
See Making an Image Transparent (page
499).
For an image you added with the Insert An
Image command, make all pixels of a spe-
cific color in a grayscale or color image
transparent.
Right-click the image. Click Properties. In
the Properties palette, change the position
or rotation of the image.
See Modifying the Correlation Settings for
an Image (page 501).
Specify a precise location for an image you
added with the Insert An Image command
Right-click the image. Click Properties. In
the Properties palette, change the color,
layer, or linetype.
See Modifying Other Image Properties
(page 503).
For an image you added with the Insert An
Image command, modify frame properties.
At the Command prompt, enter imageclip.
See Clipping an Image (page 504).
Display only a portion of an image you
added with the Insert An Image command.
Using Other Raster Image Formats | 491
Quick Reference
MAPIOPTIONS
Specifies default image correlation settings, display options, detach options,
paths, and memory settings
Setup menu ➤ Raster Options
Menu
MAPIOPTIONSCommand Line
Raster Extension Options dialog boxDialog Box
MAPIFRAME
Makes frames enclosing raster images visible or invisible
View menu ➤ Imaging Tools ➤ Toggle Frames
Menu
MAPIFRAMECommand Line
MAPIFRAME (Image Frame command)Dialog Box
ALIGN
Aligns objects with other objects in 2D and 3D
ALIGNCommand Line
PROPERTIES
Displays the Properties palette, which allows you to edit the properties of
objects
Analyze ➤ Properties
Menu
Properties
Icon
PROPERTIESCommand Line
Select object. Right-click in drawing area ➤ Properties
Task Pane
IMAGECLIP
Creates new clipping boundaries for an image object
Clip Image
Icon
492 | Chapter 3 Bringing In Data
IMAGECLIPCommand Line
Select an image. Right-click in drawing
area ➤ Image ➤ Clip
Task Pane
Selecting an Image
If an image frame is visible, you can select the image by clicking the frame or
by drawing a crossing window around a frame edge. When you select an image
by selecting its frame, grips are displayed.
NOTE This command does not affect images you added using Data Connect
(page 440).
You can also select an image by placing your cursor over the image and pressing
Shift + left-click. This feature is useful when you are zoomed in to the image
and you cannot see the image frame or if the image frames are turned off.
After you select an image frame, you can:
■Right-click to display the Raster Extension shortcut menu.
■Select a grip. Right-click to display the AutoCAD Map 3D shortcut menu.
■Manipulate the image using AutoCAD Map 3D commands.
NOTE You can set an option to draw hatch marks over a selected image. Click
➤ Options. Select the Display tab. Under Display Performance, set Highlight
Raster Image Frame Only to off. If Highlight Raster Image Frame Only is off, when
you select an image, it rises to the top of the display order, obscuring any vectors
that cross it. Use the REGEN command to restore the proper display order.
See also:
■Overview of Adding Rasters and Surfaces (page 437)
■Using Other Raster Image Formats (page 453)
To select an image by pressing Shift + left-click
1Position your pointer so that it is over the image or images to select.
2Press Shift and click the left mouse button.
Using Other Raster Image Formats | 493

If you clicked more than one image, the Image Select dialog box (page
1877) appears. This dialog box displays the names of all the images that are
inserted into your drawing. The image or images that are already selected
are highlighted (not just the images that you selected by pressing Shift
+ left-click).
3Click the images in the list to select. Click OK. To select all the images
in your drawing, click Select All. To clear the selection set, click Select
None.
NOTE If Shift + left-click is not working, you may need to load the Raster Extension
by using an image command such as Insert An Image, or you may need to turn
on the option.
To turn on the Shift + left-click option
1In the Tool-based Ribbon Workspace, click Insert tab ➤ Image
panel ➤ angle-arrow.
2In the Raster Extension Options dialog box, select the General tab.
3Select Shift + Left Click Image Select.
4Click OK to exit the dialog box.
Quick Reference
MAPIOPTIONS
Specifies default image correlation settings, display options, detach options,
paths, and memory settings
Setup menu ➤ Raster Options
Menu
MAPIOPTIONSCommand Line
Raster Extension Options dialog boxDialog Box
Displaying Image Frames
An image frame is a vector object that encloses each image you insert.
494 | Chapter 3 Bringing In Data
NOTE This command does not affect images you added using Data Connect
(page 440).
Hiding an image frame ensures that the image cannot be moved or modified
accidentally by a single- or double-click and prevents the frame from being
plotted or displayed. When image frames are hidden, clipped images are still
displayed to their specified frame limits; only the frame is affected. Showing
and hiding image frames affects all images attached to your drawing.
When you attach an image to a drawing, the image frame inherits the current
color, layer, linetype, and linetype scale.
See also:
■Changing How Image Frames Are Displayed (page 252)
■Modifying Other Image Properties (page 503)
To display image frames
■Click Insert tab ➤ Image panel ➤ Toggle Frames.
NOTE If frames are invisible or an image is on a locked or frozen layer or a layer
that is turned off, then you cannot select the image by clicking the frame. However,
if frames are hidden but the image is on an editable layer, then you can select the
image using Shift + left-click (page 493).
Quick Reference
MAPIFRAME
Makes frames enclosing raster images visible or invisible
View menu ➤ Imaging Tools ➤ Toggle Frames
Menu
MAPIFRAMECommand Line
MAPIFRAME (Image Frame command)Dialog Box
Changing Image Alignment
You can change the alignment and scale of an image. You can reference two
points in vector space and two points on a raster image to move, scale, and
Using Other Raster Image Formats | 495
rotate the image to the vector coordinates. This process performs a simple
transformation but does not rubber sheet the image.
See also:
■Moving, Rotating, and Scaling an Object (page 931)
To change image alignment
1At the Command prompt, enter align.
2Select the image and press Enter.
3Specify a first source point on the image and a first destination point in
the drawing.
4Specify a second source point on the image and a second destination
point in the drawing.
5Press Enter.
6To scale the image, type y (Yes) and press Enter.
The image aligns with the drawing according to the reference points you
specified.
Quick Reference
ALIGN
Aligns objects with other objects in 2D and 3D
ALIGNCommand Line
Adjusting Image Brightness, Contrast, and Fade
When you adjust image brightness, contrast, and fade in AutoCAD Map 3D,
the changes you make affect the display of the image as well as the plotted
output, but do not affect the original raster image file. Adjust brightness to
darken or lighten an image. Adjust contrast to make poor-quality images easier
to read. Adjust fade to make vectors easier to see over images or to create a
watermark effect in your plotted output.
496 | Chapter 3 Bringing In Data

NOTE This command does not affect images you added using Data Connect
(page 440).
NOTE Bitonal images cannot be adjusted for brightness, contrast, or fade. Bitonal
images fade to the current screen background when displayed, and fade to white
(the color of most paper) when plotted.
See also:
■Overview of Adding Rasters and Surfaces (page 437)
■Using Other Raster Image Formats (page 453)
To adjust brightness, contrast, and fade
1At the Command prompt, enter imageadjust.
2Select the image to modify. Press Enter.
3In the Image Adjust dialog box, specify settings:
■To adjust brightness or contrast, use the Brightness or Contrast slider
bar.
■To adjust image fade, use the Fade slider bar.
4Click OK.
Quick Reference
PROPERTIES
Displays the Properties palette, which allows you to edit the properties of
objects
Analyze ➤ Properties
Menu
Properties
Icon
PROPERTIESCommand Line
Select object. Right-click in drawing area ➤ Properties
Task Pane
Using Other Raster Image Formats | 497

Changing Image Display Quality and Speed
Changing Image Display Quality
You can change image display quality. Draft-quality images may be grainier,
but they display more quickly than high-quality images. Changing the image
display quality setting affects all images attached to your drawing with the
Insert An Image command.
NOTE This command does not affect images you added using Data Connect
(page 440).
Hiding Images
You can hide an image. Hidden images are not displayed or plotted; only the
drawing frame is displayed. You can choose to hide an image regardless of the
current viewport coordinate system.
Clipping Images
You can clip the image so that only the parts of the image you want visible
are displayed. To display more than one piece of the image, create additional
insertions of the image, each with a different clip boundary.
NOTE This command does not affect images you added using Data Connect
(page 440).
See also:
■Hiding, Unloading, Detaching, and Erasing Images (page 482)
■Changing Image Display Quality (page 253)
To change image display quality
1At the Command prompt, enter imagequality.
2Type d (draft) or h (high). Press Enter.
To hide a drawing or show clipped images
1Click the frame of the image or images to change.
498 | Chapter 3 Bringing In Data
NOTE If you are zoomed in and cannot see the image frames, press Shift +
left-click to select the image or images.
2Right-click the image. Click Properties.
3In the Properties palette, select one of the display options.
■Select Show Image and set it to No if you do not want to display the
image.
■Select Show Clipped and set it to Yes to display any clip boundaries
you have made on an image using the imageclip command.
Quick Reference
PROPERTIES
Displays the Properties palette, which allows you to edit the properties of
objects
Analyze ➤ Properties
Menu
Properties
Icon
PROPERTIESCommand Line
Select object. Right-click in drawing area ➤ Properties
Task Pane
Making an Image Transparent
You can make all pixels of a specific color in a grayscale or color image
transparent. (The transparency color of a bitonal image is always the
background color of the image.) This is useful for overlaying two images or
placing an image in front of objects.
NOTE This command does not affect images you added using Data Connect
(page 440).
This option is not available if the image is currently unloaded or if the Raster
Extension is not loaded. To load the Raster Extension, use an image command,
such as Insert An Image.
Using Other Raster Image Formats | 499

NOTE The transparency color is stored in the drawing as an AutoCAD Map 3D
custom object. If you send the drawing to other users, they can see the
transparency color only by opening the drawing in AutoCAD Map 3D or Autodesk
Raster Design. If they open the drawing in AutoCAD, they see a message that
AutoCAD cannot reference the custom object and will not display the transparent
color.
You can also change the opacity of an entire raster image, so that the image
is translucent and items below it are visible.
See also:
■Overview of Adding Rasters and Surfaces (page 437)
■Using Other Raster Image Formats (page 453)
To make an image transparent
1Select the image.
2Right-click the image. Click Properties.
3In the Properties palette, select Transparency.
4Click the down arrow at the right of the box and select Yes.
Specify which color will be transparent.
To change the color that is transparent
1Zoom in close to the image so that you can accurately select the color.
2Click the image frame.
NOTE If you are zoomed so you cannot see the image frame, press Shift +
left-click to select the image.
3Right-click the image. Click Properties.
4In the Properties palette, select Transparency Color.
If Transparency Color does not appear in the Properties palette, the image
may not be loaded or the Raster Extension may not be loaded. To load
the image, select the image. Right-click the image ➤ Image ➤ Show
Image. To load the Raster Extension, choose an image command such as
Insert An Image.
500 | Chapter 3 Bringing In Data
NOTE You can choose the transparency color for grayscale and color images.
In bitonal images, the transparency color is always the background color of
the image.
5Click to display the Transparency Color dialog box (page 1883).
6Click Select and pick the desired color on the image. Click OK.
7To turn on transparency, select Transparency in the Properties palette
and set it to Yes.
Quick Reference
PROPERTIES
Displays the Properties palette, which allows you to edit the properties of
objects
Analyze ➤ Properties
Menu
Properties
Icon
PROPERTIESCommand Line
Select object. Right-click in drawing area ➤ Properties
Task Pane
Modifying the Correlation Settings for an Image
You can specify a precise location for an image.
NOTE This command does not affect images you added using Data Connect
(page 440).
NOTE When you change the insertion point values, AutoCAD Map 3D repositions
the image in the drawing and saves the settings in the drawing. However, these
correlation changes are saved only in the drawing and are not saved back to the
original image file. To change the original correlation information in the image
file, use an image-editing application such as Autodesk Raster Design.
See also:
■Overview of Adding Rasters and Surfaces (page 437)
Using Other Raster Image Formats | 501
■Using Other Raster Image Formats (page 453)
To modify the correlation settings for an image
1Select the image.
2Right-click the image. Click Properties.
3In the Properties palette, do one of the following:
■To move the image, type new coordinates in the Position X, Y, and
Z boxes. This insertion point represents the lower-left corner of the
image frame before any rotation is applied.
■To rotate the image, type a new value in the Rotation box. The units
of the rotation value depend on the units that the drawing is using.
AutoCAD Map 3D rotates the image around the insertion point.
■To scale the image, type a new value in the Scale box. For example,
to make the image twice as large, type 2 in the Scale box.
4Close the Properties palette.
TIP You can also click the Pick icon to adjust the frame (page 465) location and
size.
Quick Reference
PROPERTIES
Displays the Properties palette, which allows you to edit the properties of
objects
Analyze ➤ Properties
Menu
Properties
Icon
PROPERTIESCommand Line
Select object. Right-click in drawing area ➤ Properties
Task Pane
502 | Chapter 3 Bringing In Data

Modifying Other Image Properties
Use the Properties palette to modify image properties such as the following:
■Frame color, layer, linetype, and linetype scale
■Image brightness, contrast, and fade
■Location
■Rotation, width, height, and scale
■Image transparency and transparency color
The settings apply only to the selected images.
NOTE This command does not affect images you added using Data Connect
(page 440).
Rotation is in degrees (or the units set by the AUNITS system variable); scale,
width, and height are based on the unit of measurement used in the drawing.
When you insert an image, it is inserted on the current AutoCAD layer. Since
AutoCAD Map 3D controls the visibility and behavior of the layers, you can
move an image to another AutoCAD layer to take advantage of the layer
properties. For example, to display images, but not edit them, move the images
to an AutoCAD layer and lock the layer.
See also:
■Overview of Adding Rasters and Surfaces (page 437)
■Using Other Raster Image Formats (page 453)
To modify image properties
1Click the frame or frames of the image or images to change.
NOTE If you are zoomed in and cannot see the image frames, press Shift +
left-click to select the image or images.
2Right-click the image. Click Properties.
3In the Properties palette, select the property to modify. For example:
■Color — Select a color or click Select Color to display the Select Color
dialog box.
Using Other Raster Image Formats | 503

Select the desired color or select ByLayer to set the frame color of the
image to the color of the layer it is on. The frame color is also the
foreground color for bitonal images.
Click OK to apply the new color to the selected image or images.
■Layer — Select the target AutoCAD layer for the image or images.
■Linetype — Select a linetype for the image frame or frames. Select any
linetype that is loaded in your drawing or select ByLayer to use the
linetype defined for that layer.
Quick Reference
PROPERTIES
Displays the Properties palette, which allows you to edit the properties of
objects
Analyze ➤ Properties
Menu
Properties
Icon
PROPERTIESCommand Line
Select object. Right-click in drawing area ➤ Properties
Task Pane
Clipping an Image
By clipping an image, you can display and plot only a portion of the image.
The clipping boundary can be a rectangle or a two-dimensional polygon with
vertices constrained to lie within the boundaries of the image. Multiple
instances of the same image can have different clipping boundaries.
504 | Chapter 3 Bringing In Data
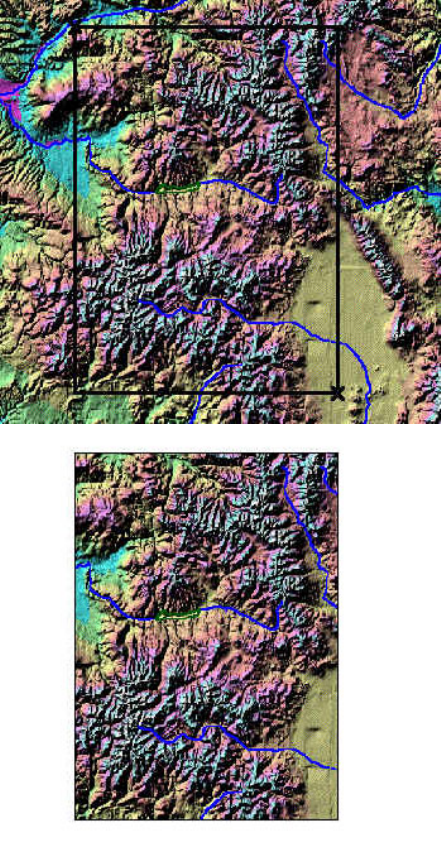
Image Clip lets you show only the part of an image you require. Move your cursor over
the image to see the clipped portion of the image.
You can display a clipped image using the clipping boundary, or you can hide
the clipping boundary and display the original image boundaries.
Using Other Raster Image Formats | 505

NOTE To clip an image, the image boundary must be visible. See Displaying
Image Frames (page 494).
A clip boundary is a display-only feature that you can use for viewing and
plotting purposes. It does not permanently change image data. When you
delete a clipping boundary, the original image boundary is restored. To clip
the image permanently, use an image-editing application such as Autodesk
Raster Design.
NOTE This command does not affect images you added using Data Connect
(page 440).
See also:
■Displaying Image Frames (page 494)
■Overview of Adding Rasters and Surfaces (page 437)
■Using Other Raster Image Formats (page 453)
To clip an image
1At the Command prompt, enter imageclip.
2Select the image (page 493) to clip. You can clip one image at a time.
3Press Enter or type n to create a new clip boundary.
4Type r to create a rectangular boundary, or type p to create a polygonal
boundary.
5Pick the points to define the clip boundary. You must pick at least three
points to define a polygonal boundary.
To restore the image, use these steps: At the Command prompt, enter
imageclip. Type off.
You can modify the clip boundary by defining a new boundary for the image
or by using object grips.
You can also choose to show or hide clip boundaries by changing the image
display properties (page 498) in the Properties palette.
506 | Chapter 3 Bringing In Data
Quick Reference
IMAGECLIP
Creates new clipping boundaries for an image object
Clip Image
Icon
IMAGECLIPCommand Line
Select an image. Right-click in drawing
area ➤ Image ➤ Clip
Task Pane
Joining Data to GIS Features
You can add properties from a different data source to GIS features in your
map using joins. For example, you can join employment rates stored in a
Microsoft Access database file to city features stored in an SDF file, or to
counties stored in an Oracle database. Once you join the two data sources,
you can use the joined information to style the feature, the same way you use
its native information. For example, you can theme the city features based on
the employment rates you joined.
NOTE These options are available for geospatial data only, and not for drawing
objects. To join attribute data to drawing objects, see Overview of Linking Database
Records to Objects (page 522).
Overview of Joins
Use joins to add extra data to GIS features in your map. For example, join
income data to a parcel layer to add that information to those features. You
can join data from the Internet, other organizations you work with, or GIS
data repositories.
NOTE Joins are available for geospatial data only, and not for drawing objects.
To join attribute data to drawing objects, see Overview of Linking Database Records
to Objects (page 522).
After you create the join, you can use the additional properties the same way
you use the native properties of the feature class: to label, theme, style, and
analyze the features of the layer.
Joining Data to GIS Features | 507
For example, after you join a table of voter turnout data to a map of regions
in your area, you can create a theme that varies in appearance, depending on
the number of participating voters in each region.
With joins, you can keep your data in separate tables, focused on specific
topics, instead of in one large database or file. This can ease administration
and reduce complexity.
Typically, a join connects a separate table of data (a secondary table) to a
feature class layer (the primary table). The most common type of join is a
one-to-one join, which connects one record in a table of data to one feature
in a feature class.
Typically, you join data tables from an application such as Microsoft Access
to FDO layers from SDF, SHP, Oracle, and ArcSDE data. However, you can also
join feature sources such as SHP to other feature sources.
Tell me more
Video
■Show me how to join attribute data to
features.
■Show me how to manage joins.
Procedure
■Create a join. (page 512)
Tutorial
■Lesson 2: Analyze Data With External
Information Using Joins
Workflow
■Join Attribute Data to a Geospatial
Feature
GIS Skill
■Join attribute data to features
Related topics
■Overview of the Data Table (page 1125)
■Create a join. (page 512)
■Modify joins. (page 515)
508 | Chapter 3 Bringing In Data

■Edit joined data. (page 517)
■Export data from the Data Table. (page 520)
Creating a Join
A join adds the properties from a data table (secondary table) to an existing
Feature Class layer (primary table). The original data remains unchanged in
its source—the join exists only within your map.
The secondary table can be an actual table, such as a named range in an Excel
spreadsheet, or the tabular data contained in a feature source, such as an Oracle
database or an SDF file.
NOTE Joins are available for geospatial data only, and not for drawing objects.
To join attribute data to drawing objects, see Overview of Linking Database Records
to Objects (page 522).
One-to-One Joins
The most common type of join is a one-to-one join, in which one feature is
matched to one secondary record, and any additional secondary records are
ignored. For example, if you are joining a table of income data to a layer
representing parcels, you may have more than one income value for a particular
property (if there are multiple residences on that parcel, for instance, or
multiple earners in a residence). In a one-to-one join, the first income value
found for a parcel is matched to that parcel, and any other income information
is ignored.
One-to-Many Joins
You can also create a one-to-many join. In this case, when there are multiple
secondary records for a single feature, additional features are generated to
represent the extra values. Using the same example as above, a parcel that
matches multiple income values will result in multiple Data Table entries for
that parcel, each with a separate income value (even though there is still only
one actual feature). If you style the parcel layer based on income values, only
one is visible in your display map. You can still edit the feature in your map
(for example, to resize it). The real feature in your data will be updated.
NOTE Adding features to your map can have performance implications; some
operations take longer when there is more feature data.
Creating a Join | 509

Join Keys
To be joined, the primary and secondary tables must contain matching fields
with common values. These matching fields are the join keys.
For example, when joining a data table containing employment rates to a
layer representing counties, the join key might be County_Name, if that field
is common to both tables.
A join key does not need to have the same name in both data sources, but it
must have the same data type (numeric, string, Boolean, and so on). For
example, you can match the Parcel_ID field in one table to the Lot_Number
field in the second table, so long as Parcel_ID and Lot_Number use the same
data type.
NOTE Joins that use String fields are case-sensitive. The values in the fields must
match exactly. Jones will not match JONES.
Advanced Joining
You can join multiple secondary tables to a feature layer There are several
ways to do this.
You can join a new table to the joined secondary table to create a “chain” of
joins. For example, you can begin by joining income information to a layer
of parcel features, using the Parcel_ID as the common join key. Then you can
add a join to a table of employment data, using Job_Title as a common join
key between the income table and the employment table. Even though the
parcel feature does not contain a property for Job_Title, you can style the
parcels by job type after you complete both joins.
You can join multiple tables to a single feature using the same join key. For
example, you can join a table of traffic information to a roads layer, using the
Road_Name field as the join key. You can then join a second table of
maintenance schedules to the roads layer, using the same join key.
You can also join multiple tables to a single feature using different join keys.
For example, you can join population information to a layer representing
counties, using the County_Name field as the join key. Then you can join
flood-zone data to the same layer using Elevation as the join key.
In all cases, you can use all of the joined data when styling or theming the
feature layer.
510 | Chapter 3 Bringing In Data
Using Joins for Calculated Fields
You can create a calculated field that uses native data and joined data. For
example, if you join assessor data to parcel data, you can create a field that
represents the cost per acre for each parcel. You create a calculated field using
an expression.
Non-matching Data
When you create a join, you can specify how to deal with features in the
primary table that do not find a match in the secondary table. For example,
if you are joining assessor data to a parcel layer, you can decide what to do
with parcels that have no assessment data. The choices are as follows:
■Keep All Records On The Left – Keeps all features, even if there is no match
in the secondary table (a left outer join).
■Keep Only Left-Side Records With A Match – Hides features if there is no
matching record in the secondary table (an inner join).
Tell me more
Video
■Show me how to join attribute data to
features.
Procedure
■Create a join. (page 512)
Tutorial
■Lesson 2: Analyze Data With External
Information Using Joins
Workflow
■Join Attribute Data to a Geospatial
Feature
GIS Skill
■Join attribute data to features
Related topics
■Modifying or Removing Joins (page
514)
■Editing Joined Data (page 515)
Creating a Join | 511

■Using Joins with Calculated Properties
(page 518)
■Accessing Data from ODBC (page 342)
■Overview of the Data Table (page 1125)
NOTE Joins are available for geospatial data only, and not for drawing objects.
To join attribute data to drawing objects, see Overview of Linking Database Records
to Objects (page 522).
To create a join
1Prepare to create a join by doing the following:
■Ensure the primary and secondary sources share one or more common
fields, for example Parcel_ID or County_Name. These fields do not
have to have the same name in both sources, but they must use the
same data type.
■Simplify your secondary table data as much as possible. For example,
remove unnecessary records or tables.
■Connect to both the primary and secondary sources using one of the
FDO Providers in Data Connect. When you connect to a secondary
source that has no geometry data, you need not add anything to the
map—you can just establish the connection and close the Data
Connect window.
NOTE If your secondary source is a Microsoft Access or Microsoft Excel
table, connect to it using an ODBC connection. For information about
setting up ODBC sources, see Accessing Data from ODBC (page 342).
2In Display Manager, right-click a feature layer ➤ Create A Join.
NOTE Once you create a join, this command changes to Joins ➤ Manage
Joins and displays the Manage Layer Data dialog box (page 1607). In that dialog
box, you can add, edit, or delete joins.
The layer you right-click is the primary source.
3In the Table (Or Feature Class) To Join To list in the Create a Join / Edit
a Join dialog box (page 1603), select the table or feature class whose data
you will to join to the layer.
512 | Chapter 3 Bringing In Data

Your selection is the secondary source. If this source contains multiple
tables, choose the one to use for the join.
4In the This Column From The Left Table list, select the join key (the
common field or property) for the primary source, for example, Parcel_ID
or County_Name.
5In the Matches This Column From The Right Table list, select the
matching field or property in the secondary source.
Only fields with matching data types are displayed in the right-hand list.
The fields need not have the same name in both data sources, but they
must have the same data type (numeric, string, Boolean, and so on). For
example, you can match the Parcel_ID field in one table to the
Lot_Number field in the second table, so long as Parcel_ID and
Lot_Number use the same data type.
6Under Type Of Joins, select the type of join to create:
■Keep All Records On The Left (a left outer join)
■Keep Only Left-Side Records With A Match (an inner join)
7Under Relationship With Secondary Records (Cardinality), choose one
of the following:
■One-To-One matches one secondary source record to each primary
source item. Any extra secondary source records are ignored.
■One-To-Many creates a new feature for each extra record in the
secondary source.
8Click OK.
In the Data Table (page 1125) for the primary source (the feature layer to which
you joined the data), the newly joined properties are appended to the right
of the native feature data. The joined properties are gray, to indicate that they
are read-only. In the column title, the name of the table you joined precedes
the property name.
NOTE To edit joined data, you must edit the secondary source itself, and not the
layer to which it is joined. See Editing Joined Data (page 515).
Quick Reference
MAPDEFINEJOIN
Creating a Join | 513
Defines a join for feature data.
MAPDEFINEJOINCommand Line
In the Task Pane, right-click a layer ➤ Create Join.
Task Pane
Modifying or Removing Joins
After you create a join, you can change the settings you specified when you
created it. You can remove one (of multiple) joins from a feature layer, or
remove all joins from the feature layer at once, restoring the properties for
that layer to its native data only.
NOTE Joins are available for geospatial data only, and not for drawing objects.
To join attribute data to drawing objects, see Overview of Linking Database Records
to Objects (page 522).
Tell me more
Video
■Show me how to manage joins.
Procedure
■To modify a join (page 515)
Tutorial
■Lesson 2: Analyze Data With External
Information Using Joins
Workflow
■Join Attribute Data to a Geospatial
Feature
GIS Skill
■Join attribute data to features
Related topics
■Overview of Joins (page 507)
■Creating a Join (page 509)
■Editing Joined Data (page 515)
■Using Joins with Calculated Properties
(page 518)
514 | Chapter 3 Bringing In Data

NOTE Joins are available for geospatial data only, and not for drawing objects.
To join attribute data to drawing objects, see Overview of Linking Database Records
to Objects (page 522).
To modify a join
1In Display Manager, right-click the feature layer with the join to modify,
and select Manage Joins.
2In the Manage Layer Data dialog box (page 1607), select the join to modify,
and click Edit.
3In the Edit A Join dialog box, change any settings.
The settings are the same ones you used when you created the join (page
512). For example, you can change this join from One-To-Many to
One-To-One to get rid of extra features created by the original join.
4To delete one (or multiple) joins for this feature layer, click the join to
delete (use Ctrl or Shift to select multiple joins). Click Delete.
5When you are finished, click OK.
Changes can affect the styles, themes, and labels you set up in your map, if
they were based on the joined data.
Quick Reference
MAPDEFINEJOIN
Defines a join for feature data.
MAPDEFINEJOINCommand Line
In the Task Pane, right-click a layer ➤ Create Join.
Task Pane
Editing Joined Data
You can edit the records in joined geospatial data.
NOTE Joins are available for geospatial data only, and not for drawing objects.
To join attribute data to drawing objects, see Overview of Linking Database Records
to Objects (page 522).
Editing Joined Data | 515

To help you maintain the integrity of your original data, a few limitations
apply when editing joined data:
■When you edit a feature layer that has a one-to-one join (page 2070) in the
Data Table, you can change the native feature data (from the primary table)
but you cannot change the joined properties (from the secondary table).
To edit the joined data, display Map Explorer, expand the data source
containing the table to edit, select that table, and click Table.
NOTE You cannot add or delete records from an ODBC data source using the
Data Table. Use the source application, for example Microsoft Access, to do
this.
■For one-to-one joins, you can delete records from the primary source only.
You cannot edit one-to-one inner joins.
■You can insert records in the primary source for a left outer join (page 2066).
You cannot do so for an inner join (page 2065), because the lack of a matching
secondary record would make the feature disappear.
■You cannot edit inner joins or one-to-many joins. To make changes, you
must open the table itself from Map Explorer.
■In general, you cannot edit primary keys.
Each feature class has a property whose value uniquely identifies each
feature within that class. This is called the primary key. Many feature classes
use a single property for this purpose, for example, FeatureId. However, a
feature class could have a list of properties such as street number, street
name, and street type to uniquely identify a house address.
An FDO provider (page 2063) may also support the concept of autogenerated
ID values. When you add objects to your map using such a provider, the
identity property will not have a value, but it is still the primary key.
■When working offline (page 721), the above rules apply, and you cannot
insert records at all.
See also:
■Viewing Data for a Selected Layer, Join, Unfiltered Feature Class, or
Non-Spatial Data Table (page 1134)
■Editing Features using the Data Table (page 711)
516 | Chapter 3 Bringing In Data

NOTE Joins are available for geospatial data only, and not for drawing objects.
To join attribute data to drawing objects, see Overview of Linking Database Records
to Objects (page 522).
To edit joined data
DeleteInsertEditFor this type of
join or data...
You can delete only re-
cords only in the
primary table.
You cannot insert
data for an inner
join (page 2065)
You can edit the
primary table (the
native feature data)
when you display the
One-to-One
because it might
Data Table for the cause the new
feature layer. To edit primary record to
the secondary table “disappear” when
(joined data) open there is no match-
the table in Map Ex- ing secondary re-
plorer. You cannot cord. For a left
edit the primary key outer join (page
(page 2071), but you
can edit the join key.
2066), you can insert
records only in the
primary table.
Not available.Not available.You cannot edit the
primary table (the
One-to-Many
native feature data)
or the secondary
table (joined data) in
the Data Table from
Display Manager. In-
stead, open the tables
in Map Explorer.
You can delete only re-
cords only in the
primary table.
Not available.You can edit (as
above) while you
work offline, but you
cannot insert records.
Offline
You can delete data
from read/write feature
sources.
You can insert data
for read/write fea-
ture sources.
You can edit
read/write feature
sources.
Feature data
Editing Joined Data | 517

DeleteInsertEditFor this type of
join or data...
Not available. Use the
source application, such
Not available. Use
the source applica-
You can edit records
in Data Table.
ODBC data table
as Microsoft Access, to
delete records.
tion, such as Mi-
crosoft Access, to
insert records.
Quick Reference
MAPDEFINEJOIN
Defines a join for feature data.
MAPDEFINEJOINCommand Line
In the Task Pane, right-click a layer ➤ Create Join.
Task Pane
Using Joins with Calculated Properties
Calculated properties combine information in existing properties using
expressions. The existing fields can be native to the current feature layer, or
they can be joined to that feature layer. For example, you can join an assessor
database to a parcel layer and create a calculated property to determine value
per acre based on the parcel value in the assessor data and the parcel area in
the parcel layer.
NOTE Joins are available for geospatial data only, and not for drawing objects.
To join attribute data to drawing objects, see Overview of Linking Database Records
to Objects (page 522).
See also:
■Creating Calculated Properties (page 1132)
■Creating a Calculation
■Creating Expressions - Reference
518 | Chapter 3 Bringing In Data

NOTE Joins are available for geospatial data only, and not for drawing objects.
To join attribute data to drawing objects, see Overview of Linking Database Records
to Objects (page 522).
To create a calculated property based on joined data
1Connect to both data sources and join them, based on a common
property. (page 509)
2In the Display Manager, select the primary source (the feature layer to
which you joined the data) and click Table.
3In the Data Table, click Options ➤ Create A Calculation.
NOTE If a calculation already exists, click Options ➤ Manage Calculations.
4Create the expression for the calculation.
The available properties and values reflect both the source layer and the
joined data.
For help with any expression element, see Creating Expressions -
Reference.
Quick Reference
MAPDEFINEJOIN
Defines a join for feature data.
MAPDEFINEJOINCommand Line
In the Task Pane, right-click a layer ➤ Create Join.
Task Pane
Sharing Joined Data with Others
Use these techniques to share joined data and join definitions with others:
■Export layer(s) to an SDF file (page 1469) – When you export feature layers
to an SDF version 3 file, joined properties are included. The SDF file can
be reused or shared with other AutoCAD Map 3D, Civil 3D, and MapGuide
customers or other programs that support SDF. The resulting file does not
contain styling data.
Sharing Joined Data with Others | 519

■Save a layer to a .LAYER file (page 1469) – When you save a layer to a .layer
file, it retains its styling information and pointers to the data source that
defines its geometry and attributes (including joined data). You can drag
and drop saved layers into any map to reuse them, or use them with
MapGuide Enterprise.
■Copy or export data from the Data Table (page 1473) – When you copy
selected features in the Data Table and past them into other programs like
Microsoft Access or Excel, joined properties are included. You can also
export selected data to a comma-separated file for use in other programs.
NOTE Joins are available for geospatial data only, and not for drawing objects.
To join attribute data to drawing objects, see Overview of Linking Database Records
to Objects (page 522).
NOTE Joins are available for geospatial data only, and not for drawing objects.
To join attribute data to drawing objects, see Overview of Linking Database Records
to Objects (page 522).
To save layer and joined properties to an SDF file (page 1470)
To export layer connections and joins to a .LAYER file (page 1471)
To export data from the Data Table (page 1474)
Quick Reference
MAPEXPORT
Exports drawing objects and their attribute data to an external file format
Click File ➤ Convert DWG To ➤ Map 3D Export.
Menu
Export Map File
Icon
MAPEXPORTCommand Line
Export dialog boxDialog Box
MAP2SDF
Exports an SDF 2 format file for use with Autodesk MapGuide, versions 6.5
and earlier.
520 | Chapter 3 Bringing In Data

Click File ➤ Convert DWG To ➤ Autodesk SDF2
(MapGuide6.x...).
Menu
MAP2SDFCommand Line
Autodesk MapGuide Export dialog boxDialog Box
Adding Attributes to Drawing Objects
Link attribute data to objects in your drawing.
See also:
■Setting Up Data Sources for Drawings (page 204)
To add attribute data to drawing objects
■To store attribute data in the drawing (page 522)
■To link records to objects (page 523)
■To create a link template (page 526)
■To open a linked database table (page 527)
■To link a record to an object manually (page 529)
■To link records to objects using object data automatically (page 531)
■To link records to objects using text or block attribute data automatically
(page 532)
■To convert object data to a linked database table (page 534)
■To edit or delete a database link (page 537)
■To delete links for a group of objects (page 537)
■To edit the database path in a link template (page 539)
■To delete a link template (page 539)
Storing Attribute Data in the Drawing (Object Data)
Object data is attribute data that is attached to individual objects and stored
in tables in the drawing. To use object data, first define the format for the
table, and then create each record as you attach it to an object.
NOTE Object data applies to drawing objects only. For information on viewing
and editing geospatial attributes, see Overview of the Data Table (page 1125).
See also:
■Setting Up Object Data (page 198)
Adding Attributes to Drawing Objects | 521

■Entering and Editing Object Data (page 1061)
■Bringing In Drawing Objects Based on Attached Data (page 363)
NOTE Object data applies to drawing objects only. For information on viewing
and editing geospatial attributes, see Overview of the Data Table (page 1125).
To store attribute data in the drawing
■To create an object data table (page 201)
■To attach data to an object (page 1064)
■To bring in drawing objects based on object data (page 364)
Overview of Linking Database Records to Objects
You can create a link between a record in an external database and an object
in your drawing. Once the link exists, use the information in the database to
help you analyze, select, and display objects in your drawing.
For example, you can link property ownership data to a map of a housing
development. Select records based on property value and highlight all objects
linked to those records. Alternately, select all the houses in a specified area
and highlight records that are linked to the selected houses.
Linking records takes two steps:
■Create a link template for each database. The link template specifies which
column in the database table to use as a key column.
■Link specific objects to specific records in the table.
When you link a record from a database to an object in your drawing, AutoCAD
Map 3D stores link data on the object.
NOTE Link templates apply to drawing objects only. For information on viewing
and editing geospatial attributes, see Overview of the Data Table (page 1125). For
information on joining data to a geospatial feature class, see Overview of Joins
(page 507).
522 | Chapter 3 Bringing In Data
Tell me more
Procedure
■To link records to objects (page 523)
Workflow
■Attach Attribute Data to Drawing Ob-
jects
Related topics
■Setting Up Data Sources for Drawings
(page 204)
■Creating a Link Template (page 525)
NOTE Link templates apply to drawing objects only. For information on viewing
and editing geospatial attributes, see Overview of the Data Table (page 1125). For
information on joining data to a geospatial feature class, see Overview of Joins
(page 507).
To link records to objects
1Before you can link a database record to an object, you must attach the
data source to the drawing (page 209) and create a link template for the
table (page 526).
2Create links using one of the following methods:
■Manually link a specific record to a specific object (page 529).
■Link objects automatically based on text or blocks in the drawing
(page 532).
■Convert existing object data to a linked database table (page 534).
3If necessary you can edit the link (page 537).
Quick Reference
ADEGENLINK
Automatically links objects to object data or external database records
In the Classic workspace, click Setup menu ➤ More
Link Template Options ➤ Generate Links
Menu
Overview of Linking Database Records to Objects | 523

ADEGENLINKCommand Line
In Map Explorer, right-click a link
template ➤ Generate Links
Task Pane
Generate Data Links dialog boxDialog Box
(Data View) Link Records to Objects
Links the selected records to objects in your drawing
In the Data View: Links ➤ Link Records To Objects
Menu
Link Records to Objects
Icon
MAPDELETELINKS
Deletes database links from objects
Setup menu ➤ More Link Template Options ➤
Delete Links
Menu
MAPDELETELINKSCommand Line
In Map Explorer, right-click a link template ➤ Delete
Links
Task Pane
Select Link Templates dialog boxDialog Box
MAPLINKMANAGER
Edits the link data attached to an object
Setup menu ➤ More Link Template Options ➤ Link
Manager
Menu
MAPLINKMANAGERCommand Line
MAPOD2ASE
Converts object data tables to linked external database tables
Click Setup ➤ Convert Object Data to Database Links.
Menu
MAPOD2ASECommand Line
Convert Object Data to Database Links dialog boxDialog Box
524 | Chapter 3 Bringing In Data
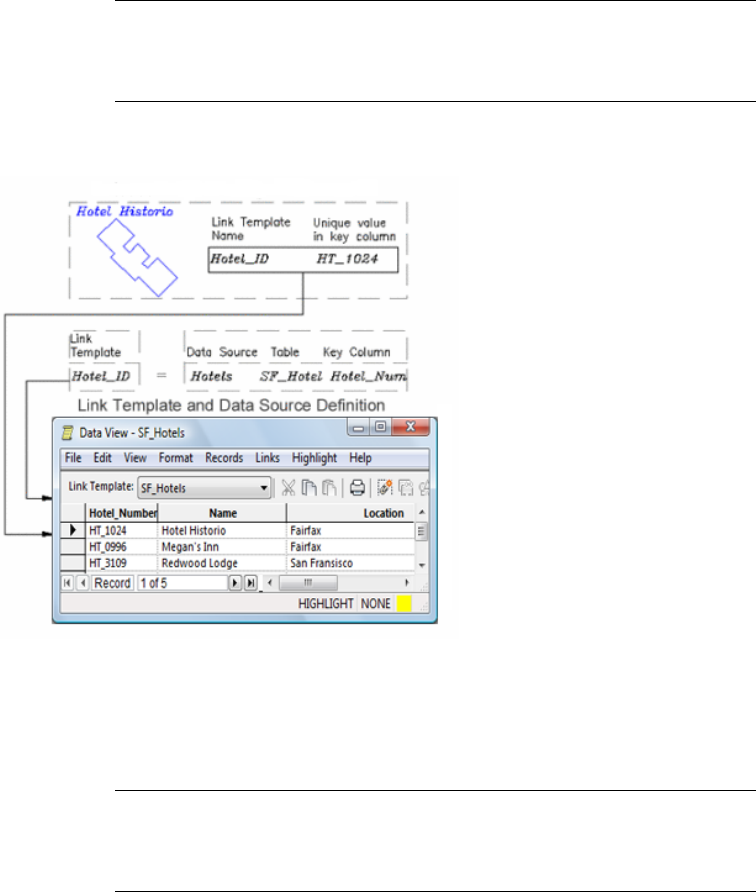
Creating a Link Template
A link template specifies how to link objects in a drawing to records in a
specific database table.
NOTE Link templates apply to drawing objects only. For information on viewing
and editing geospatial attributes, see Overview of the Data Table (page 1125). For
information on joining data to a geospatial feature class, see Overview of Joins
(page 507).
A link template specifies the name of the database table and the key columns
to use to uniquely identify each record.
The link template is stored in the current drawing.
See also:
■Overview of Linking Database Records to Objects (page 522)
NOTE Link templates apply to drawing objects only. For information on viewing
and editing geospatial attributes, see Overview of the Data Table (page 1125). For
information on joining data to a geospatial feature class, see Overview of Joins
(page 507).
Creating a Link Template | 525
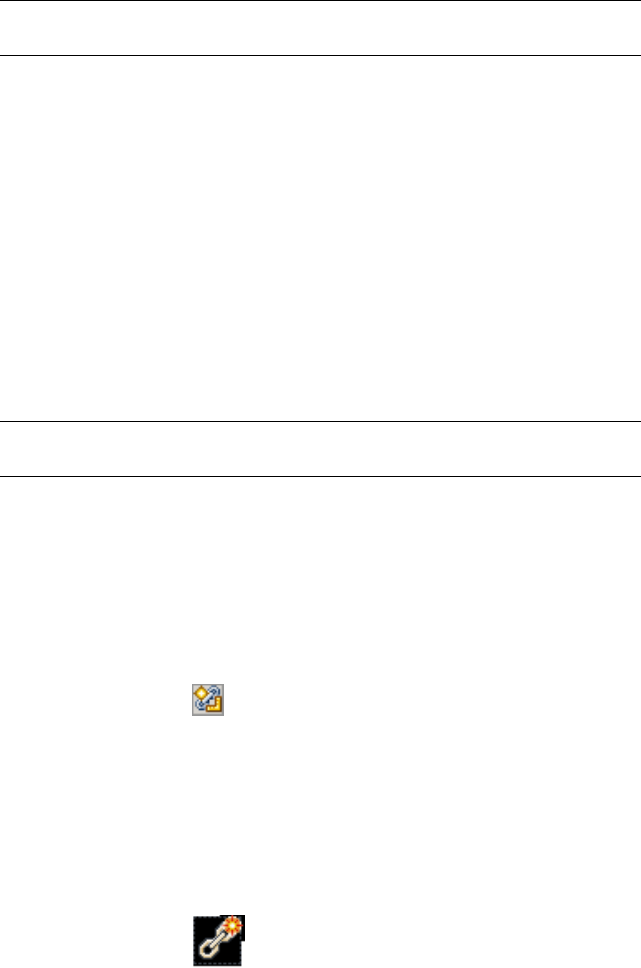
NOTE Before you create a link template, make sure the data source for the table
is currently attached (page 209) and connected (page 215).
To create a link template
1In Map Explorer (page 2068), right-click the table and click Define Link
Template.
2In the Define Link Template dialog box (MAPDEFINELT) (page 1683), type
a name for the link template.
3Under Key Selection, select the column to use as the key by clicking the
check box in the Key column.
AutoCAD Map 3D uses the value in the key column to uniquely identify
a record, so select a column or a combination of columns that contains
a unique value for each record in the database.
4Click OK.
NOTE If the link template does not immediately appear on the Map Explorer tab
of the Task Pane, right-click a blank space in Map Explorer. Click Refresh.
Quick Reference
(Data View) Define Link Template
Creates a new link template
In the Data View: Links ➤ Define Link Template
Menu
Define Link Template
Icon
Define Link Template dialog box (MAPDEFINELT)Dialog Box
MAPDEFINELT
Defines a link template for a database table
Click Setup ➤ More Link Template Options ➤ Delete
Link Template.
Menu
Define Link Template
Icon
526 | Chapter 3 Bringing In Data

MAPDEFINELTCommand Line
In Map Explorer, right-click a data source table or
query ➤ Define Link Template
Task Pane
Define Link Template dialog box (MAPDEFINELT)Dialog Box
Opening a Linked Database Table
Once you have a defined a link template for a table, you can open the table
as a linked table. When a table is opened as a linked table, AutoCAD Map 3D
tracks the relationship between the records in the table and the objects in
your drawing.
NOTE Link templates apply to drawing objects only. For information on viewing
and editing geospatial attributes, see Overview of the Data Table (page 1125). For
information on joining data to a geospatial feature class, see Overview of Joins
(page 507).
See also:
■Viewing External Data Linked to Drawing Objects (page 1146)
■Finding Records in a Database Linked to Drawing Objects (page 1221)
NOTE Link templates apply to drawing objects only. For information on viewing
and editing geospatial attributes, see Overview of the Data Table (page 1125). For
information on joining data to a geospatial feature class, see Overview of Joins
(page 507).
To open a linked database table
■In Map Explorer (page 2068), double-click a link template. Depending on the
data source option setting, the linked table opens in either Edit mode or
View mode. If the table is write-protected, it opens in View mode. Queries
always open in View mode.
■To open a table in View mode, right-click the link template. Click View
Linked Table.
In the Select Link Template Key dialog box (page 1797), select a link template
for the database table containing the data matching your object data table
and a validation option.
Opening a Linked Database Table | 527
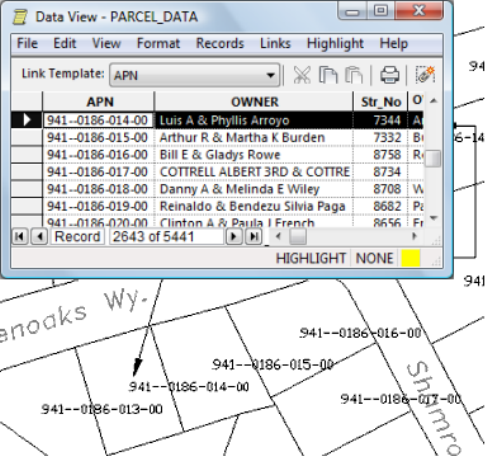
Quick Reference
MAPVIEWLINK
Opens a database table associated with a specific link template to view in the
Data View
Click Map ➤ Database ➤ View Data ➤ View Linked
Table.
Menu
MAPVIEWLINKCommand Line
In Map Explorer, right-click a link template ➤ View
Linked Table
Task Pane
Select Link Template dialog boxDialog Box
Manually Linking Database Records to Objects
You can create a link between an object in the drawing and a record in a
database table.
You cannot create links for non-graphical objects, such as layers and linetypes.
528 | Chapter 3 Bringing In Data

NOTE You can link records to drawing objects. You cannot link records to features
from a feature source. For information on viewing and editing geospatial attributes,
see Overview of the Data Table (page 1125). For information on joining data to a
geospatial feature class, see Overview of Joins (page 507).
Link Data
When you create a link, link data is stored on the object. The link data has
two parts: the name of the link template to use, and the actual value to search
for in the key column. The record with the matching key value is linked to
the object.
See also:
■Overview of Linking Database Records to Objects (page 522)
■Setting Up Data Sources for Drawings (page 204)
■Creating a Link Template (page 525)
■Automatically Linking Database Records to Objects (page 530)
NOTE You can link records to drawing objects. You cannot link records to features
from a feature source. For information on viewing and editing geospatial attributes,
see Overview of the Data Table (page 1125). For information on joining data to a
geospatial feature class, see Overview of Joins (page 507).
NOTE To link records to objects, you must first define a link template for the table
(page 525), and you must open the table as a linked table (page 527).
To link a record to an object manually
1Open a linked database table in the Data View (page 1052).
2In the Data View window, select a record.
3In the Data View, click Links menu ➤ Link Records To Objects.
4Select the objects in your drawing. Press Enter.
NOTE If you are linking data to a polygon and plan to use the data with
topology functions, be sure to link the data to the centroid of the polygon.
Topology functions do not use data linked to the polygon border.
Manually Linking Database Records to Objects | 529
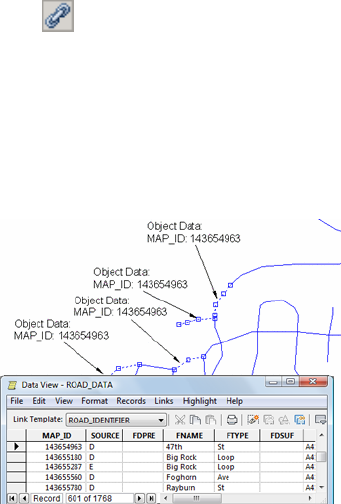
Quick Reference
(Data View) Link Records to Objects
Links the selected records to objects in your drawing
In the Data View: Links ➤ Link Records To Objects
Menu
Link Records to Objects
Icon
Automatically Linking Database Records to Objects
If information in your drawing, such as object data, text, or block attribute
data, matches information in a database table, you can automatically create
links from each selected object to a matching record in the database table.
For example, if each parcel in a parcel map has attached object data that
contains the parcel ID, you can automatically link each parcel to the correct
record in a database of parcel information.
Or if you have district code stored as block attribute data and also have a table
that has a column for district codes, you can automatically link each code in
the map to the corresponding record in the table.
If no matching record is found in the database table, you can set an option
to create the record.
If you are using block or text, you can set an option to use the insertion point
point of the block or text as the label point for the object.
530 | Chapter 3 Bringing In Data

NOTE You can link records to drawing objects. You cannot link records to features
from a feature source. For information on viewing and editing geospatial attributes,
see Overview of the Data Table (page 1125). For information on joining data to a
geospatial feature class, see Overview of Joins (page 507).
See also:
■Overview of Linking Database Records to Objects (page 522)
■Creating a Link Template (page 525)
■Setting Up Data Sources for Drawings (page 204)
■Defining the Text Insertion Point (page 936)
■Converting Object Data to Database Links (page 533)
■Manually Linking Database Records to Objects (page 528)
Before you begin, be sure you have defined a link template (page 526) for the
database you will use, and the objects to link to are accessible. You cannot
create links to objects on layers that are locked, frozen, or turned off.
NOTE You can link records to drawing objects. You cannot link records to features
from a feature source. For information on viewing and editing geospatial attributes,
see Overview of the Data Table (page 1125). For information on joining data to a
geospatial feature class, see Overview of Joins (page 507).
To link records to objects using object data automatically
1At the Command prompt, enter mapod2ase.
2In the Convert Object Data to Database Links dialog box (page 1680), under
Source Object Data Table, select an object data table.
3Select Remove Data From Objects Processed to delete the object data after
creating the link.
4Under Target Link Template, select Link Object Data To Database.
5Click Define to specify the link template.
6In the Select Existing Link Template dialog box (page 1689), under Link
Template, select an available link template.
7For each key field in the link template, select a field in the object data
table.
Automatically Linking Database Records to Objects | 531

8Select a Database Validation option:
■None — Creates links without checking to see if a matching record
exists in the table
■Link Must Exist — Creates a link only if the value in the drawing
matches the key field value of an existing record. If no record has a
matching value, a link is not created for that object.
■Create If New — Creates a new record in the table if no existing record
has a matching value.
9Click OK.
10 In the Convert Object Data To Database Links dialog box, specify how
to select objects with attached object data.
You can select objects automatically or manually, and you can use a filter
to restrict selection to specified layers.
11 Click Proceed.
To link records to objects using text or block attribute data automatically
1Click Map Setup tab ➤ Attribute Data panel ➤ ➤ Generate Links.
2In the Generate Data Links dialog box, select a linkage type.
3Under Data Links, select Create Database Links.
4Select a link template.
If you are creating links to enclosed text, select a link template that has
only one key field.
5If you are creating links to blocks or enclosed blocks, select the name of
the block.
For each key field in the link template, select a tag from the block
attribute. You can assign a tag to only one key field.
6Select a Database Validation option.
7Optionally, select Use Insertion Point As Label Point.
8Click OK.
532 | Chapter 3 Bringing In Data

9Enter a to use all blocks or text objects, or enter s to select block or text
objects.
Quick Reference
MAPOD2ASE
Converts object data tables to linked external database tables
Click Setup ➤ Convert Object Data to Database Links.
Menu
MAPOD2ASECommand Line
Convert Object Data to Database Links dialog boxDialog Box
ADEGENLINK
Automatically links objects to object data or external database records
In the Classic workspace, click Setup menu ➤ More
Link Template Options ➤ Generate Links
Menu
ADEGENLINKCommand Line
In Map Explorer, right-click a link
template ➤ Generate Links
Task Pane
Generate Data Links dialog boxDialog Box
Converting Object Data to Database Links
You can convert object data into linked records in an external database table.
You can do one of the following
■Create a new table in an existing data source. For the new link template,
you can use an existing field as the key field, or you can have AutoCAD
Map 3D create a new field and assign a unique value to each record.
■Add the data to an existing database table.
NOTE Object data is available for drawing objects only. For information on viewing
and editing geospatial attributes, see Overview of the Data Table (page 1125).
Converting Object Data to Database Links | 533

Field Names in the New Table
By default, the fields in the new database table have the same names as the
fields in the object data table. AutoCAD Map 3D resolves any conflicts in the
following ways:
■Truncates fields that are too long and adds an incremental digit to the
resulting duplicate field names
■Replaces unsupported characters in a field name with an underscore (_)
■Converts unsupported field types to character
■Converts point fields to a character string and separates coordinates with
commas
In addition, if you have object data that matches information in a database
table, you can automatically create links from each selected object to a
matching record in the database table.
See also:
■Overview of Linking Database Records to Objects (page 522)
■Creating a Link Template (page 525)
■Setting Up Data Sources for Drawings (page 204)
■Automatically Linking Database Records to Objects (page 530)
NOTE Object data is available for drawing objects only. For information on viewing
and editing geospatial attributes, see Overview of the Data Table (page 1125).
If you plan to create a new table in an existing data source, make sure the
appropriate data source is currently attached (page 209) and connected (page
215).
NOTE During the conversion, field names in the object data table become field
names in the database table. Make sure that the field names in your object data
table are not SQL reserved words such as DATE, SELECT, or CURRENT. If necessary,
rename the fields in your object data table before you convert it.
To convert object data to a linked database table
1At the Command prompt, enter mapod2ase.
534 | Chapter 3 Bringing In Data
2In the Convert Object Data to Database Links dialog box (page 1680), under
Source Object Data Table, select an object data table.
3Select Remove Data From Objects Processed to delete the object data after
creating the link.
4Under Target Link Template, select Convert Object Data To Database.
5Click Define to specify the link template.
6In the Define Link Template dialog box (MAPOD2ASE) (page 1682), select
an available data source. Click Connect.
7Enter a table name.
8In the Link Template Key Column Entry dialog box (page 1620), specify
the fields to use as key fields (columns). To enter more than one field
name, separate names with a comma.
To select from a list of field names in the object data table, or to rename
the fields, click Select to display the Select Link Template Key(s) dialog
box.
You can use an existing object data field as the key column or create a
new field. If you select Generate Key Field, specify a name for the field
in the Generate Key area. AutoCAD Map 3D sets the first record in the
database table to 1, and increments each subsequent record by 1. Click
OK to close the Select Link Template Key(s) dialog box.
9In the Define Link Template dialog box, enter a name for the link template
and click OK.
The link template stores the address of the database table and the name
of the key field. Accept the default or enter a new unique name.
10 In the Convert Object Data To Database Links dialog box, specify how
to select objects with attached object data.
You can select objects automatically or manually, and you can use a filter
to restrict selection to specified layers.
11 Click Proceed.
AutoCAD Map 3D converts the object data into linked database tables.
Quick Reference
MAPOD2ASE
Converting Object Data to Database Links | 535

Converts object data tables to linked external database tables
Click Setup ➤ Convert Object Data to Database Links.
Menu
MAPOD2ASECommand Line
Convert Object Data to Database Links dialog boxDialog Box
Editing Database Links
To link an object to a different record in a database table, you can either delete
the old link and create a new link, or you can edit the link data stored on the
object.
The link data specifies the following:
■the link template for the database table
■the link value for the record
The object is linked to the record in the database table where the value in the
key column matches the link value on the object. If you edit the link value,
you link the object to a different record in the table.
For example, a database has a record for each piece of equipment. The link
template for the database table specifies the serial number column as the key
column. If you replace a piece of equipment, you must edit the link value on
the object in the drawing to reflect the new serial number. This links the object
to the record with the new serial number.
NOTE You can link records to drawing objects. You cannot link records to features
from a feature source. For information on viewing and editing geospatial attributes,
see Overview of the Data Table (page 1125). For information on joining data to a
geospatial feature class, see Overview of Joins (page 507).
Editing Linked Objects
If you move, copy, or delete a linked object, the link data is moved, copied,
or deleted with it. Deleting the object and its link data does not affect the data
in the database table.
You can also delete the link from the object.
See also:
■Overview of Linking Database Records to Objects (page 522)
536 | Chapter 3 Bringing In Data
■Creating a Link Template (page 525)
■Setting Up Data Sources for Drawings (page 204)
NOTE You can link records to drawing objects. You cannot link records to features
from a feature source. For information on viewing and editing geospatial attributes,
see Overview of the Data Table (page 1125). For information on joining data to a
geospatial feature class, see Overview of Joins (page 507).
To edit or delete a database link
1Click Map Setup tab ➤ Attribute Data panel ➤ ➤ Link Manager.
2Select the object with the link to edit.
3In the Link Manager dialog box, review or edit the link data.
4To modify link data, click the value to edit. Type a new value, or click…
to select from a list of values in the database.
5To delete a link, click the link template and click Delete.
6When you finish, click OK.
To delete links for a group of objects
1Click Map Setup tab ➤ Attribute Data panel ➤ ➤ Delete Links.
2Select the object or objects with the links to delete.
3In the Select Link Templates dialog box, select the link templates whose
links you will delete from the objects.
4Click OK.
Quick Reference
MAPDELETELINKS
Deletes database links from objects
Editing Database Links | 537

Setup menu ➤ More Link Template Options ➤
Delete Links
Menu
MAPDELETELINKSCommand Line
In Map Explorer, right-click a link template ➤ Delete
Links
Task Pane
Select Link Templates dialog boxDialog Box
MAPLINKMANAGER
Edits the link data attached to an object
Setup menu ➤ More Link Template Options ➤ Link
Manager
Menu
MAPLINKMANAGERCommand Line
Editing a Link Template
If you rename a database table or change the location of the database, you
must edit the link template associated with that database table.
When you edit a link template, all objects in the drawing that reference the
link template use the new information.
If you no longer use a link template in a drawing, you can delete the link
template from the current drawing. When you delete a link template, all links
that reference that link template are deleted from the drawing.
NOTE You can link records to drawing objects. You cannot link records to features
from a feature source. For information on viewing and editing geospatial attributes,
see Overview of the Data Table (page 1125). For information on joining data to a
geospatial feature class, see Overview of Joins (page 507).
See also:
■Overview of Linking Database Records to Objects (page 522)
■Creating a Link Template (page 525)
■Setting Up Data Sources for Drawings (page 204)
538 | Chapter 3 Bringing In Data
NOTE You can link records to drawing objects. You cannot link records to features
from a feature source. For information on viewing and editing geospatial attributes,
see Overview of the Data Table (page 1125). For information on joining data to a
geospatial feature class, see Overview of Joins (page 507).
NOTE The following procedure edits the link template in the active drawing. It
does not update the asi.ini file (which stores data source mapping information),
source drawings, or other drawings that use this link template.
To edit the database path in a link template
1Click Map Setup tab ➤ Attribute Data panel ➤ ➤ Edit Link Template
Properties.
2Select the link template. Click OK.
3In the Link Template Properties dialog box (page 1686), select a new data
source, catalog, schema, or table.
4Click OK.
5Right-click the Map Explorer tab of the Task Pane. Click Refresh.
To delete a link template
1Click Map Setup tab ➤ Attribute Data panel ➤ ➤ Delete Link
Template.
2In the Select Link Template dialog box, select the link template. Click
OK.
Quick Reference
MAPDELETELT
Deletes a link template
Setup menu ➤ More Link Template Options ➤
Delete Link Template
Menu
Editing a Link Template | 539
MAPDELETELTCommand Line
In Map Explorer, right-click a link template ➤ Delete
Link Template
Task Pane
Select Link Template dialog boxDialog Box
MAPPROPSLT
Edits the database table name or location in a link template
Setup menu ➤ Edit Link Template Properties
Menu
MAPPROPSLTCommand Line
Using Open Source FDO Providers
To make it easier to extend the capabilities of FDO Data Access Technology
used within AutoCAD Map 3D, Autodesk has released FDO as an open source
project under the Open Source Geospatial Foundation™ (OSGeo™).
This has enabled developers from all over the world to tap into powerful web
mapping and geospatial data access technology and develop additional FDO
data providers that work with AutoCAD Map 3D.
Often, developers make the providers they develop available for free. They
can be integrated into AutoCAD Map 3D and then used to access additional
data formats not included in the box.
DescriptionExamples of Third Party and Open
Source Providers Available
Open source, available on http://fdo.os-
geo.org
OGR Provider (supports vector formats
such as ESRI Personal Database, GRASS,
and SDTS).
Open source, available on http://fdo.os-
geo.org
GDAL Provider (supports raster formats
such as NITF, Imagine, PCIDSK, and HDF).
Available on ht-
tp://usa.autodesk.com/adsk/ser-
vlet/item?siteID=123112&id=8824908
SL-King Oracle Provider.
Available on ht-
tp://usa.autodesk.com/adsk/ser-
vlet/item?siteID=123112&id=8824908
Safe Software FME Provider for FDO.
540 | Chapter 3 Bringing In Data

Check http://fdo.osgeo.org and
http://usa.autodesk.com/adsk/servlet/item?siteID=123112&id=8824908 periodically
for additional providers.
If you are a developer, you can also create your own data providers. The open
source version of FDO Data Access Technology and developer documentation
is available on http://fdo.osgeo.org .
NOTE FDO Providers from sources other than Autodesk are not supported or
warrantied by Autodesk.
■To download a third party or open source FDO Provider (page 541)
■To integrate a new FDO Provider into AutoCAD Map 3D (page 541)
■To develop a new FDO Provider (page 542)
To download a third party or open source FDO Provider
■Go to http://usa.autodesk.com/adsk/servlet/item?siteID=123112&id=8824908
or http://fdo.osgeo.org to see the providers available for download.
To integrate a new FDO Provider into AutoCAD Map 3D
1Close AutoCAD Map 3D if it is running.
2In Windows Explorer, navigate to \AutoCAD Map 3D 2011\FDO\bin.
3Make a backup copy of providers.xml. Give the back up a new name such
as providers_backup.xml.
4In WordPad, open \AutoCAD Map 3D 2011\FDO\bin\providers.xml.
NOTE Do not use Notepad.
5Copy a section for an existing provider, for example the section OSGEO
WMS, and paste it to a new location in the XML file.
Be sure that you copy the entire section, from <Feature Provider> to
</FeatureProvider>.
6Modify the following elements in the new section as needed:
■Name – Name of your new provider.
■Display Name – Name that will be displayed in the Data Connect
window in AutoCAD Map 3D
Using Open Source FDO Providers | 541

■Description – Description that will be displayed in the Data Connect
window
■IsManaged – False if the provider was developed using unmanaged
code like C++; True if uses managed code.
■Version – The DLL version number. The version number must match
the version number of the DLLs.
■FeatureDataObjectsVersion – FDO version number
■LibraryPath - Path to the DLLs for the new provider
7Save and close providers.xml.
8Start AutoCAD Map 3D.
9In Display Manager, click Data ➤ Connect to Data.
The provider you added should appear under Data Connections By
Provider.
10 In the Data Connect window, under Data Connections By Provider, select
the new provider. For example, select “Add OGR Connection”.
11 Enter the connection information.
NOTE For the OGR provider, you need to enter the complete path to the
geodatabase for Data Source.
12 The ReadOnly field indicates whether you can edit the data. TRUE means
the data is read-only. FALSE means it will be read / write.
13 Click Login.
14 Click Connect to bring the data into your map.
To develop a new FDO Provider
■Go to http://fdo.osgeo.org to download the API and access the
documentation needed to develop a provider.
542 | Chapter 3 Bringing In Data

Bringing In AutoCAD Civil 3D Data
You can bring in the following types of data from AutoCAD Civil 3D projects:
■Features (Alignments, points, parcels, and pipe networks)
■Surfaces
To bring in Civil 3D data, you must first export it from Civil 3D to formats
that can be read by AutoCAD Map 3D.
The following table lists the AutoCAD Civil 3D features and attributes that
are exported to the SDF file.
Exported AttributesAutoCAD Civil 3D Feature
Alignment ■Alignment Name
■Length
■Design Speed
■Starting Station
■Ending Station
Point ■Point Number
■Point Name
■Elevation
■Description
■Raw Description
■Latitude
■Longitude
Parcel ■Parcel Name
■Parcel Number
■Area
■Perimeter
Pipe ■Network Name
■Length
Bringing In AutoCAD Civil 3D Data | 543
■Slope
■Inside Diameter
■Outside Diameter
■Shape
■Elevation at Start
■Elevation at End
■Structure Start
■Structure End
Structure ■Network Name
■Rim Elevation
■Structure Name
Tell me more
Video
■Show me how to bring in data from
AutoCAD Civil 3D.
Procedure
■To export features from AutoCAD Civil
3D to SDF (page 545)
■To export surfaces from AutoCAD Civil
3D to DEM (page 545)
■To access the DEM from a map (page
545)
GIS Skill
■Bring in parcel data from AutoCAD Civil
3D
Related topics
■Bringing In Features from SDF (page
337)
■Adding Raster-Based Surfaces to Your
Map (page 441)
544 | Chapter 3 Bringing In Data

■To export features from AutoCAD Civil 3D to SDF (page 545)
■To access the SDF file from a map (page 545)
■To export surfaces from AutoCAD Civil 3D to DEM (page 545)
■To access the DEM from a map (page 545)
To export features from AutoCAD Civil 3D to SDF
1Open the project in AutoCAD Civil 3D. In AutoCAD Civil 3D, export the
project to SDF.
2In the Export To SDF dialog box, specify a name for the SDF file.
3Specify the coordinate system.
NOTE If the drawing already has a coordinate system specified, it is used
automatically and the Select Coordinate System controls in the Export To
SDF dialog box are grayed.
4Click OK to export the file.
To access the SDF file from a map
1In Display Manager (page 2060), click Data ➤ Connect To Data.
2In the Data Connect window, under Data Connections By Provider, select
Add SDF Connection.
3Specify information to connect to the SDF file. For more information,
see To bring in features from SDF (page 338).
To export surfaces from AutoCAD Civil 3D to DEM
1Open the project in AutoCAD Civil 3D.
2In AutoCAD Civil 3D, export the surface as a DEM file.
To access the DEM from a map
1In Display Manager (page 2060), click Data ➤ Connect To Data.
2In the Data Connect window, under Data Connections By Provider, select
Add Raster Image Or Surface Connection.
Bringing In AutoCAD Civil 3D Data | 545

3Specify information to connect to the DEM file. For more information,
see To add a raster-based surface to your map (page 442).
Quick Reference
Connect Feature Source
Connects a feature source
Click File ➤ Connect To Data.
Menu
Connect
Icon
MAPCONNECTCommand Line
In Display Manager click Data ➤ Connect to Data.
Task Pane
546 | Chapter 3 Bringing In Data
Managing Data
Overview of Managing Data
Different geospatial data formats have different capabilities. Use the following
table to determine the options available for your data stores.
NOTE WMS and raster data providers are not covered here. For information about
those providers, see Adding an Image from a WMS (Web Map Service) (page 445)
and Overview of Adding Rasters and Surfaces (page 437).
NOTE This functionality affects geospatial feature data only. For information about
managing drawing objects and drawing files, see Overview of Setting Up Your Map
File (page 140).
WFSESRI
ArcSDE
SHPSDFODBCMySQLSQLiteSQL Serv-
er Spatial
SQL Serv-
er
Postgr-
eSQL
Oracle
Set up
users
(page 584)
Set up
users
(page 584)
Set up
users
(page 584)
Set up
users
(page 584)
Set up
users
(page 584)
Create
data
Create
data
Set up
data
Create
data stores
(page 586)
Create
data stores
(page 586)
Create
data stores
(page 590)
Create
data stores
(page 586)
Create
data stores
(page 586)
Create
data stores
(page 586) storesstoresstores
(page
586)
(page
586)
(page
576)
Add
data to
Add
data to
Add
data to
Add
data to
Add data
to your
Add data
to your
Add data
to your
Add data
to your
Add data
to your
Add data
to your
Add data
to your
youryouryouryourmapmap
(page 332)
map
(page 330)
map
(page 326)
map (page
323)
map (page
340)
map (page
312) mapmapmapmap
4
547

WFSESRI
ArcSDE
SHPSDFODBCMySQLSQLiteSQL Serv-
er Spatial
SQL Serv-
er
Postgr-
eSQL
Oracle
(page
337)
(page
342)
(page
346)
(page
316)
(page
335)
Style
data
Style
data
Style
data
Style
data
Style data
(page 639)
Style data
(page 639)
Style data
(page 639)
Style data
(page 639)
Style data
(page 639)
Style data
(page 639)
(page
639)
(page
639)
(page
639)
(page
639)
Examine
or edit
Exam-
ine or
Examine
or edit
Examine
or edit
Examine
or edit at-
Examine
or edit at-
Examine
or edit at-
Examine
or edit at-
Examine
or edit at-
Examine
or edit at-
attributeedit at-attributeattributetributetributetributetributetributetribute
datatributedatadatadata (page
711)
data (page
711)
data (page
711)
data (page
711)
data (page
711)
data (page
711) (page
711)
data
(page
711)
(page
711)
(page
711)
Join
data to
Join
data to
Join
data to
Join data
to a dif-
Join data
to a dif-
Join data
to a differ-
Join data
to a differ-
Join data
to a differ-
Join data
to a differ-
Join data
to a differ-
Join data
to a differ-
a WFSa differ-a differ-ferentferentent fea-ent fea-ent fea-ent fea-ent fea-ent fea-
feature.ent fea-ent fea-feature.feature.ture.
(page 509)
ture.
(page 509)
ture.
(page 509)
ture. (page
509)
ture. (page
509)
ture. (page
509) (page
509)
ture.
(page
509)
ture.
(page
509)
(page
509)
(page
509)
Create
a
Create a
schema
Create a
schema
(page 596)
Create a
schema
(page 596)
Create a
schema
(page 596)
Create a
schema
(page 596)
Create a
schema
(page 596)
Create a
schema
(page 596) schema(page
596) (page
596)
View a
schema
View a
schema
View a
schema
View a
schema
View a
schema
(page 608)
View a
schema
(page 608)
View a
schema
(page 608)
View a
schema
(page 608)
View a
schema
(page 608)
View a
schema
(page 608) (page
608)
(page
608)
(page
608)
(page
608)
Edit a
schema
Edit a
schema
(page 610)
Edit a
schema
(page 610)
Edit a
schema
(page 610)
Edit a
schema
(page 610)
Edit a
schema
(page 610)
Edit a
schema
(page 610) (page
610)
548 | Chapter 4 Managing Data

WFSESRI
ArcSDE
SHPSDFODBCMySQLSQLiteSQL Serv-
er Spatial
SQL Serv-
er
Postgr-
eSQL
Oracle
Delete a
schema
Delete a
schema
(page 613)
Delete a
schema
(page 613)
Delete a
schema
(page 613)
Delete a
schema
(page 613)
Delete a
schema
(page 613)
Delete a
schema
(page 613) (page
613)
Copy
data
Copy
data
Copy
data
Copy
data
Copy data
to/from a
Copy data
to/from a
Copy data
to/from a
Copy data
to/from a
Copy data
to/from a
Copy data
to/from a
to/fromto/fromto/fromto/fromdifferentdifferentdifferentdifferentdifferentdifferent
a differ-a differ-a differ-a differ-datadatadatadatadatadata
ent dataentent dataent dataformat
(page 615)
format
(page 615)
format
(page 618)
format
(page 615)
format
(page 615)
format
(page 615) formatdataformatformat
(page
615)
NOTE You
can
copy
data in-
to an
ArcSDE
schema
if the
data
store
and
schema
are
already
defined
in the
target.
format
(page
615)
(page
615)
(page
615)
Overview of Managing Data | 549

WFSESRI
ArcSDE
SHPSDFODBCMySQLSQLiteSQL Serv-
er Spatial
SQL Serv-
er
Postgr-
eSQL
Oracle
NOTE You
can use
Bulk
Copy to
copy
ODBC
data to a
different
provider,
such as
Oracle,
MySQL,
SQL Serv-
er, SDF,
and SHP.
You can
copy
data to
an
ODBC
data
store,
but you
must
define
the tar-
get
schema
properly,
and have
write per-
missions.
550 | Chapter 4 Managing Data

About Geospatial Feature Classes, Data Stores, and
Schemas
Overview of Geospatial Data
Geospatial data is organized as follows:
■Feature: The spatial representation of a real-world entity, such as a specific
road or an individual utility pole, that specifies the geometry and other
properties of the feature.
■Feature class: A category of features with rules that define the allowable
data types, default values, and constraints for its member features. For
example, you might have feature classes for a set of roads, utility poles,
and so on.
■Schema: A collection of related feature classes.
■Data store: A collection of feature data in a single storage location.
SDF data stores allow only one schema per file, but database stores such
as Oracle or SQL Server can have multiple schemas. (SHP files can include
only one geometry type per file, but you can be store and copy multiple
SHP files in a folder. You can use a configuration file to support multiple
schemas when you establish your connection to a SHP file.)
NOTE This functionality affects geospatial feature data only. For information about
managing drawing objects and drawing files, see Overview of Setting Up Your
Map File (page 140)
The data hierarchy
Geospatial data is stored in a hierarchical fashion, like a set of tables: each
row within a table is an individual feature, and each column is a property
(page 2071) of that feature. The entire table (including its name, column names,
data types, default values, and constraints) represents a feature class. The set
of related tables is called a schema, and the entire collection of data resides
in a data store.
For example, you might use a data store such as Oracle, which can encompass
multiple schemas. The database might define the utilities for a town, with
schemas for different types of utilities, such as electrical and water. The
electrical schema would include feature classes for utility poles and boxes,
while the water schema would include feature classes for pipes and hydrants.
About Geospatial Feature Classes, Data Stores, and Schemas | 551
Properties
Each feature class has properties that define it. The Pole feature class would
have properties such as identification number, name, model, material, height,
installation date, and so on. The properties that define a feature class can have
data types, default values, and constraints. These can help ensure that a feature
meets certain criteria in order to be included in a particular feature class. For
example, the “Large Roads” feature class can include a field called “Lanes.”
The constraint for “Lanes” can specify that its value must be six or higher in
order for a road to be included in the “Large Roads” feature class.
Data stores
Features can be stored in a spatial database (such as Oracle, MySQL,
PostgreSQL/PostGIS, or SQLServer), or in the ESRI ArcSDE data store, which
can use either an Oracle- or SQL Server-based spatial database. Features can
be stored in a file (such as SQLite, SHP, or SDF). Related SHP files might be
stored in a folder.
Features can be accessed from a web-based service (such as WFS or WMS).
AutoCAD Map 3D also supports ODBC (Open Database Connectivity), a
standardized interface for accessing a database from a program.
A data store usually contains a spatial context, which describes the spatial
metadata or parameters within which geometry for a collection of features
resides. The spatial context can specify the coordinate system, extents, and
tolerance. A data store can include multiple spatial contexts, for example, one
context for ground-based data and another context for schematic data.
For more information about features, feature classes, and schemas (including
diagrams that illustrate these concepts), see “What Are Features?” and “What
is a Schema?” in Best Practices for Managing Geospatial Data, available from the
Help menu in AutoCAD Map 3D.
Working with features in your map
To add a feature to your map, you connect to its data store and select the
feature classes to include. After you connect to a data store in AutoCAD Map
3D, that data store is a feature source (page 2063) for the current map. Feature
sources are listed by provider (for example, all SDF feature sources are listed
together in Data Connect). Each feature class you add becomes a feature layer
(page 2063) in your map. You can apply filters and spatial queries to the layers
to show only some of the features within that layer. Filters are based on
attributes, and queries are based on spatial location.
552 | Chapter 4 Managing Data

See also:
■Overview of Bringing In GIS Features (page 305)
■Editing Features using the Data Table (page 711)
■Styling Features (page 639)
■Viewing a Schema (page 608)
■Migrating Data (page 615)
To work with geospatial data
NOTE This functionality affects geospatial feature data only. For information about
managing drawing objects and drawing files, see Overview of Setting Up Your
Map File (page 140)
■Set up users for database data stores (page 585)
■Create data stores (page 588), if your data source supports that option.
■Add data to your map (page 308)
■Style the data (page 641)
■Examine or edit attribute data for any feature (page 712)
■View the schema (page 609) for any data source.
■Create a schema (page 598), if your data source supports that option.
■Edit a schema (page 612), if your data source supports that option.
■Delete a schema (page 614), if your data source supports that option.
■Copy data to/from a different data format (page 621), if your data source
supports that option.
Working with FDO Schemas
You can view a schema (page 2073), feature class (page 2063), or property (page 2071)
from any FDO provider (page 2063), but the ability to change them depends on
the provider and your access rights. You cannot edit or delete any schema,
feature class, or property if there are existing features that use it.
Working with FDO Schemas | 553

You can create schemas within AutoCAD Map 3D, or import existing FDO
schemas into your maps.
NOTE This functionality affects geospatial feature data only. For information about
managing drawing objects and drawing files, see Overview of Setting Up Your
Map File (page 140)
See also:
■Overview of Geospatial Data (page 551)
■Viewing a Schema (page 608)
■Creating a Schema (page 596)
■Editing a Schema (page 610)
■Deleting Schemas (page 613)
To work with FDO schemas
NOTE This functionality affects geospatial feature data only. For information about
managing drawing objects and drawing files, see Overview of Setting Up Your
Map File (page 140)
■View the schema (page 609) for any data source.
■Create a schema (page 598), if your data source supports that option.
■Import (page 608) existing FDO schemas into a map.
■Edit a schema (page 612), if your data source supports that option.
■Delete a schema (page 614), if your data source supports that option.
Working with Oracle Data
AutoCAD Map 3D, supports Oracle versions 10gr2, 11g, and XE. You can
create and edit an Oracle data store (page 2059) and schema (page 2073), and you
can access existing spatial schemas in Oracle that were created by other
applications. Oracle has comprehensive support for all the data types and
operations that AutoCAD Map 3D supports, including spatial index (page 2075),
long transaction (page 2067), and persistent locking (page 2070).
554 | Chapter 4 Managing Data

NOTE Functionality for OSE (the Oracle Spatial OO40, which is similar to OLE DB)
is not available in a 64-bit environment. The Oracle library that OSE is built on
(Oracle Object for OLE) is 32-bit only. There is no 64-bit version.
Before you add features to an Oracle data store, make sure your user privileges
for that Oracle data store are adequate and appropriate, and that the data in
that data store is accurate and current.
You can add a user for an Oracle data store using a utility (page 584) provided
with AutoCAD Map 3D.
NOTE This functionality affects geospatial feature data only. For information about
linking records in an external database to objects in a drawing, see Overview of
Linking Database Records to Objects (page 522). For information about moving
data between DWG and Oracle, see Migrating DWG Data to GIS (page 628).
What Oracle Schemas Support
An Oracle schema can support the following:
■Inheritance
■Multiple schemas
■Object properties (with limitations)
■Association properties (with limitations)
■Schema overrides
■Auto ID generation
■Data store scope unique ID generation
■Default values
■Inclusive value range constraints
■Exclusive value range constraints
■Value constraints list
■Null value constraints
■Unique value constraints
■Composite unique value constraints
■Spatial contexts
Working with Oracle Data | 555

■These geometry types: point, line string, polygon, multi-point, multi-line
string, multi-polygon, curve string, curve polygon, multi-curve string,
multi-curve polygon, linear ring, line string segment, circular arc segment,
and ring
■Multi-geometry
Restrictions of Oracle Schemas
When you create an Oracle schema, the following restrictions apply:
■A feature class (page 2063) must define or inherit at least one identity property
(page 2071).
■You cannot add a non-nullable data property to a class that already has
data.
■Identity properties cannot be nullable.
■Read-only identity properties must be auto-generated.
■The length for string properties must be between 1 byte and 4000 bytes,
inclusive.
■For decimal properties, precision must be between 1 and 38, inclusive, and
scale must be between -84 and 127, inclusive.
■A feature class can have multiple geometric properties. Although it is not
mandatory, having a main geometry as an attribute of the feature class
can help you to identify which geometry property to use as the default for
queries and rendering. Both HasMeasure and HasElevation are supported.
Version Enabling
The Autodesk FDO Provider for Oracle included with AutoCAD Map 3D 2011
creates tables in the FDO data store (page 2059) that are not automatically
version-enabled. Therefore, when you create a new Oracle data store using
the default options, the resulting table is not version-enabled, so persistent
locking (page 2070) and long transaction (page 2067) are not supported. (This differs
from previous releases.)
Oracle Workspace Manager (OWM) is used for versioning and persistent
locking support.
NOTE Versioning and persistent locking are not available with the Oracle XE
version.
556 | Chapter 4 Managing Data
See also:
■Overview of Geospatial Data (page 551)
■Setting Up Database Users (page 584)
■Creating a Data Store (page 586)
■Bringing In Features from Oracle (page 312)
■Creating a Join (page 509)
■Editing Features using the Data Table (page 711)
■Creating a Schema (page 596)
■Viewing a Schema (page 608)
■Editing a Schema (page 610)
■Migrating Data (page 615)
To enable versioning for an Oracle data store
1You enable versioning with the Oracle SQL*Plus tool, which you use to
execute the scripts. Before executing the scripts, make sure that the
following conditions are true:
■You connect directly to the Oracle user (or FDO data store) to be
processed.
■The Oracle user executing the script has sufficient privileges (has been
granted the Workspace Manager role WM_ADMIN_ROLE).
■The Oracle user executing the script is the only user processing or
accessing the current Oracle user (or FDO data store) during the
execution of the script. Otherwise, a script failure may result from a
session conflict.
2To create a script log file, execute the spool <log file name>; command
before invoking the scripts and the spool off; command after the
invoked script finishes. The log file can help you resolve any issues
encountered by the scripts.
3Read the documentation contained within the script files themselves to
determine what privileges are required for each script, how to run the
scripts, and what errors may occur.
Working with Oracle Data | 557

Problems can occur if you respond incorrectly to errors you encounter
while running a script.
4Execute the EnableVersioning.sql script in the /FDO/bin/com folder in your
AutoCAD Map 3D folder.
This will enable the tables for OWM.
NOTE The DisableVersioning.sql script in the same folder provides the opposite
functionality.
5If you create a data store in AutoCAD Map 3D 2011 that you want to use
with the 2007 version of AutoCAD Map 3D, you must set the value of
the lock and long transaction options in the table F_Options in the
generated data store to 2. You can do this with the supplied SQL script
EnableVersioning.sql, which also enables versioning for all tables and allows
the creation of conditional data. Do not make this change to F_Options
in the database if you do not plan to use it with the previous version of
AutoCAD Map 3D.
To work with Oracle data
NOTE This functionality affects geospatial feature data only. For information about
linking records in an external database to objects in a drawing, see Overview of
Linking Database Records to Objects (page 522). For information about moving
data between DWG and SDF format, see Migrating DWG Data to GIS (page 628).
■Set up users (page 584)
■Create data stores (page 586)
■Add Oracle features to your map (page 312)
■Style Oracle features (page 639)
■Join Oracle data to a different feature (page 509)
■Examine or edit attribute data (page 711)
■Create an Oracle schema (page 596)
■View an Oracle schema (page 608)
■Edit an Oracle schema (page 610)
■Copy data to/from a different data format (page 615)
558 | Chapter 4 Managing Data

Working with SQL Server Data
AutoCAD Map 3D supports SQL Server version 2005 and SQL Server Spatial
(page 561). Both provide comprehensive data support, along with spatial
indexing, optimistic concurrency, and read-committed transaction isolation.
It uses a revision number for optimistic concurrency.
AutoCAD Map 3D supports SQL Server authentication for SQL Server data
stores. The FDO (page 2062) User is mapped to the SQL Server login. Grant access
to the databases whose data you want to use.
NOTE This functionality affects geospatial feature data only. For information about
linking records in an external database to objects in a drawing, see Overview of
Linking Database Records to Objects (page 522).
What SQL Server Schemas Support
A SQL Server schema (page 2073) can support the following:
■Inheritance
■Multiple schemas
■Object properties (with limitations)
■Association properties (with limitations)
■Schema overrides
■Auto ID generation
■Default values
■Inclusive value range constraints
■Exclusive value range constraints
■Value constraints list
■Null value constraints
■Unique value constraints
■Composite unique value constraints
■Spatial contexts
Working with SQL Server Data | 559
■The following geometry types:
■Polygons: polygon, multi-polygon, curve polygon, multi-curve polygon,
circular arc segment
■Points: point, multi-point
■Rings: ring, linear ring
■Line strings: line string, line string segment, multi-line string, curve
string, multi-curve string
■Multi-geometry
Restrictions of SQL Server Schemas
When you create a SQL Server schema, the following restrictions apply:
■A feature class (page 2063) must define or inherit at least one identity property
(page 2071).
■Identity properties cannot be nullable.
■Read-only identity properties must be auto-generated.
■A feature class can have multiple geometric properties. Although it is not
mandatory, having a main geometry as an attribute of the feature class
can help you to identify which geometry property to use as the default for
queries and rendering. Both HasMeasure and HasElevation are supported.
■The maximum length of a string is 8000 characters.
■For decimal properties, the precision must be between 1 and 38, inclusive,
and the scale must be between 0 and 38, inclusive.
See also:
■Overview of Geospatial Data (page 551)
■Setting Up Database Users (page 584)
■Creating a Data Store (page 586)
■Bringing In Features from SQL Server (page 323)
■Styling Features (page 639)
■Creating a Join (page 509)
560 | Chapter 4 Managing Data

■Editing Features using the Data Table (page 711)
■Creating a Schema (page 596)
■Viewing a Schema (page 608)
■Editing a Schema (page 610)
■Deleting Schemas (page 613)
■Migrating Data (page 615)
To work with SQL Server data
NOTE This functionality affects geospatial feature data only. For information about
linking records in an external database to objects in a drawing, see Overview of
Linking Database Records to Objects (page 522).
■Set up users (page 584)
■Create data stores (page 586)
■Add SQL Server features to your map (page 323)
■Style SQL Server features (page 639)
■Join SQL Server data to a different feature (page 509)
■Examine or edit attribute data (page 711)
■Create a SQL Server schema (page 596)
■View a SQL Server schema (page 608)
■Edit a SQL Server schema (page 610)
■Delete a SQL Server schema (page 613)
■Copy data to/from a different data format (page 615)
Working with SQL Server Spatial Data
AutoCAD Map 3D supports SQL Server Spatial through version 2008 SP1. Use
SQL Server Spatial for the following:
■To connect to Microsoft® SQL Server™ Spatial data stores
Working with SQL Server Spatial Data | 561

■To read, create, and edit schemas for SQL Server Spatial data stores.
AutoCAD Map 3D supports SQL Server authentication and Windows
authentication for SQL Server Spatial data stores. The FDO (page 2062) User is
mapped to the SQL Server login. Grant access to the databases whose data you
want to use.
SQL Server Spatial includes two spatial data types: geometry and geography.
Geography is used for geodetic data, such as latitude/longitude data. Geometry
is meant for all other spatial data. The two spatial data types support similar
operations.
Geometric properties have a Geometry or Geography column, depending on
the coordinate system of the associated spatial context for the property. If the
coordinate system is geodetic, it has a Geography column. Otherwise, it has
a Geometry column. A coordinate system is Geodetic if its “well known text”
(WKT) starts with GEOGCS.
NOTE This functionality affects geospatial feature data only. For information about
linking records in an external database to objects in a drawing, see Overview of
Linking Database Records to Objects (page 522).
What SQL Server Spatial Schemas Support
A SQL Server schema (page 2073) can support the following:
■Inheritance
■Multiple schemas
■Object properties (with limitations)
■Association properties (with limitations)
■Schema overrides
■Auto ID generation
■Default values
■Inclusive value range constraints
■Exclusive value range constraints
■Value constraints list
■Null value constraints
562 | Chapter 4 Managing Data
■Unique value constraints
■Composite unique value constraints
■Spatial contexts
■The following geometry types:
■Polygons: polygon, multi-polygon
■Points: point, multi-point
■Line strings: line string, multi-line string
■Multi-geometry
Restrictions of SQL Server Spatial Schemas
When you create a SQL Server schema, the following restrictions apply:
■A feature class (page 2063) must define or inherit at least one identity property
(page 2071).
■M and Z dimensions are not supported.
■Identity properties cannot be nullable.
■Read-only identity properties must be auto-generated.
■A feature class can have multiple geometric properties. It is not mandatory,
but using a main geometry as an attribute of the feature class can help
identify the geometry property to use as the default for queries and
rendering.
■The maximum length of a string is 4000 characters.
■For decimal properties, the precision must be from 1 through 38, inclusive,
and the scale must be from 0 through 38, inclusive.
■Long transactions and persistent locking are not supported.
See also:
■Overview of Geospatial Data (page 551)
■Setting Up Database Users (page 584)
■Creating FDO-Enabled SQL Server Spatial Data Stores (page 590)
Working with SQL Server Spatial Data | 563

■Bringing In Features from SQL Server (page 323)
■Styling Features (page 639)
■Creating a Join (page 509)
■Editing Features using the Data Table (page 711)
■Creating a Schema (page 596)
■Viewing a Schema (page 608)
■Editing a Schema (page 610)
■Migrating Data (page 615)
To work with SQL Server Spatial data
NOTE This functionality affects geospatial feature data only. For information about
linking records in an external database to objects in a drawing, see Overview of
Linking Database Records to Objects (page 522).
■Set up users (page 584)
■Create data stores (page 590)
A geographic type column is created for the geodetic coordinate system.
For other systems, a geometric type column is created.
You can include FDO metadata when you create a SQL Server data store.
Spatial indexes are created automatically for geometry properties (Microsoft
SQL Server Spatial geometry types), using default spatial index parameters.
You can override the defaults using the API.
■Connect to SQL Server Spatial data stores. (page 326)
Use either Windows or SQL Server authentication.
■Style SQL Server features (page 639)
■Join SQL Server data to a different feature (page 509)
■Examine or edit attribute data (page 711)
■Create a SQL Server schema (page 596)
■View a SQL Server schema (page 608)
■Edit a SQL Server schema (page 610)
■Copy data to/from a different data format (page 615)
564 | Chapter 4 Managing Data
Working with SQLite Data
The OSGeo FDO provider for SQLite is an open-source, file-based provider
developed by Autodesk. This read/write provider supports one update user at
a time with any number of read users.
You can do the following in AutoCAD Map 3D:
■Create a SQLite data store
■Connect to a SQLite data store
■Import from SQLite
■Export to SQLite
■Save a Display Manager layer to SQLite
Each SQLite data store can contain one schema and a single spatial context.
The name of the schema must be "Default.”
What SQLite Schemas Support
A SQLite schema (page 2073) can support the following:
■All FDO property types except raster, object, association, and LOB properties
■Auto-generated properties for int32 and int64 properties
■All FDO geometry and geometry component types, including arc segments
■2D, 3D, and measure (M)
■Single and composite primary keys
■Null value constraints
■Unique value constraints
■Range and list constraints
■Default values
■Select, Select Aggregate, Insert, Update, and Delete commands
■SQL commands
■Transactions with commit and rollback
■All FDO spatial operators except distance
Working with SQLite Data | 565

■Standard FDO expressions and filters
■Parameter binding for all commands (at the API level)
Restrictions of SQLite Schemas
When you create or modify a SQLite schema, the following restrictions apply:
■SQLite native data supports only the following base property types: int64,
double, string and Geometry.
■If there is data in the class, you cannot modify the primary key or
constraints.
■Persistent locking and long transactions are not supported.
■You cannot change the schema name for a SQLite data store. The schema
name must be “Default.”
■You cannot add comments in the Schema or Feature Class Description
fields.
To work with SQLite data
NOTE This functionality affects geospatial feature data only. For information about
linking records in an external database to objects in a drawing, see Overview of
Linking Database Records to Objects (page 522).
■Create data stores (page 586).
■Connect to SQLite data. (page 330)
■Style SQLite features (page 639).
■Join SQLite data to a different feature (page 509).
■Examine or edit attribute data (page 711).
■View a SQLite schema (page 608)
■Edit a SQLite schema (page 610)
■Export drawing data to SQLite (page 1447).
■Save a Display Manager layer as an SQLite file. (page 1469)
■Copy data to/from a different data format (page 615)
566 | Chapter 4 Managing Data

Working with MySQL Data
AutoCAD Map 3D supports MySQL 5.0.27 In AutoCAD Map 3D, you can
create, edit, and delete a MySQL data store (page 2059) or schema (page 2073). You
can also use MySQL to access databases created by other applications. AutoCAD
Map 3D supports native MySQL geometry, indexing, two-dimensional
geometry (compatible with the OGC Simple Feature specification), and spatial
query operations, but not transactions. Auto-generated properties are
automatically incremented (auto-incremented). MySQL uses a revision number
for optimistic concurrency.
NOTE If you cannot connect to your MySQL data source, you may see an error
message: "Specified credentials are not valid or the provider is unable to establish
a connection." To resolve the issue, copy the libmySQL.dll file into the AutoCAD
Map 3D\FDO\bin folder and try again.
NOTE This functionality affects geospatial feature data only. For information about
linking records in an external database to objects in a drawing, see Overview of
Linking Database Records to Objects (page 522).
What MySQL Schemas Support
A MySQL schema can support the following:
■Inheritance
■Multiple schemas
■Object properties (with limitations)
■Association properties (with limitations)
■Schema overrides
■Auto ID generation
■Default values
■Null value constraints
■Unique value constraints
■Composite unique value constraints
■Spatial contexts
Working with MySQL Data | 567
■The following geometry types:
■Polygons: polygon, multi-polygon, curve polygon, multi-curve polygon,
circular arc segment
■Points: point, multi-point
■Rings: ring, linear ring
■Line strings: line string, line string segment, multi-line string, curve
string, multi-curve string
■Multi-geometry
Restrictions of MySQL Schemas
When you create a MySQL schema, the following restrictions apply:
■A feature class (page 2063) must define or inherit at least one identity property
(page 2071).
■Inclusive value range constraints are not supported.
■Identity properties cannot be nullable.
■Read-only identity properties must be auto-generated.
■A feature class can have multiple geometric properties. It is not mandatory,
but using a main geometry as an attribute of the feature class can help
identify the geometry property to use as the default for queries and
rendering. Both HasMeasure and HasElevation are supported.
■The maximum length of a string is 65,535 bytes.
■For decimal properties, the precision must be from 1 through 65, inclusive,
and the scale must be from 0 through 30, inclusive.
See also:
■Overview of Geospatial Data (page 551)
■Setting Up Database Users (page 584)
■Creating a Data Store (page 586)
■Bringing In Features from MySQL (page 332)
■Styling Features (page 639)
568 | Chapter 4 Managing Data

■Creating a Join (page 509)
■Editing Features using the Data Table (page 711)
■Creating a Schema (page 596)
■Viewing a Schema (page 608)
■Editing a Schema (page 610)
■Deleting Schemas (page 613)
■Migrating Data (page 615)
To work with MySQL data
NOTE This functionality affects geospatial feature data only. For information about
linking records in an external database to objects in a drawing, see Overview of
Linking Database Records to Objects (page 522).
■Set up users (page 584)
■Create data stores (page 586)
■Add MySQL features to your map (page 332)
■Style MySQL features (page 639)
■Join MySQL data to a different feature (page 509)
■Examine or edit attribute data (page 711)
■Create a MySQL schema (page 596)
■View a MySQL schema (page 608)
■Edit a MySQL schema (page 610)
■Delete a MySQL schema (page 613)
■Copy data to/from a different data format (page 615)
Working with SDF Data
The Autodesk SDF file format is a standalone, file-based spatial database format.
It supports multiple features classes and properties in a single file. SDF provides
spatial indexing, interoperability, and high performance for large data sets.
Working with SDF Data | 569

NOTE This functionality affects geospatial feature data only. For information about
linking records in an external database to objects in a drawing, see Overview of
Linking Database Records to Objects (page 522). For information about moving
data between DWG and SDF format, see Migrating DWG Data to GIS (page 628).
Characteristics of the SDF File Format
The SDF file format has the following characteristics:
■SDF files can be read on different platforms.
■One schema (page 2073) in a single SDF file supports multiple feature classes
(page 2063).
■SDF files have their own spatial indexing.
■SDF files can store geometric and non-geometric data with minimal
overhead.
■The SDF file format supports a single writer at any time, with multiple
readers.
What SDF Schemas Support
An SDF schema can support the following:
■Auto ID generation
■Default values
■Exclusive and inclusive value range constraints
■Value list constraints
■Null value constraints
■Spatial contexts
■The following geometry types:
■Polygons: polygon, multi-polygon, curve polygon, multi-curve polygon,
circular arc segment
■Points: point, multi-point
■Rings: ring, linear ring
■Line strings: line string, line string segment, multi-line string, curve
string, multi-curve string
570 | Chapter 4 Managing Data

■Multi-geometry
See also:
■Overview of Geospatial Data (page 551)
■Setting Up Database Users (page 584)
■Creating a Data Store (page 586)
■Bringing In Features from SDF (page 337)
■Styling Features (page 639)
■Creating a Join (page 509)
■Editing Features using the Data Table (page 711)
■Creating a Schema (page 596)
■Viewing a Schema (page 608)
■Editing a Schema (page 610)
■Deleting Schemas (page 613)
■Migrating Data (page 615)
To work with SDF data
NOTE This functionality affects geospatial feature data only. For information about
linking records in an external database to objects in a drawing, see Overview of
Linking Database Records to Objects (page 522). For information about moving
data between DWG and SDF format, see Migrating DWG Data to GIS (page 628).
■Create data stores (page 586)
■Add SDF features to your map (page 337)
■Style SDF features (page 639)
■Join SDF data to a different feature (page 509)
■Examine or edit attribute data (page 711)
■Create an SDF schema (page 596)
■View an SDF schema (page 608)
Working with SDF Data | 571

■Edit an SDF schema (page 610)
■Delete an SDF schema (page 613)
■Copy data to/from a different data format (page 615)
Working with SHP Data
The standalone ESRI SHP file format supports GIS data using the following
file types:
■SHP (shape geometry)
■SHX (shape index)
■PRJ (projection information)
■CPG (code page files)
■IDX (spatial index)
■DBF (shape attributes in dBASE format)
You must have either a SHP or DBF file present to connect to data or work
with schemas (page 2073). Otherwise, these files are optional. If they do not
exist initially, the system creates files with empty records.
NOTE This functionality affects geospatial feature data only. For information about
linking records in an external database to objects in a drawing, see Overview of
Linking Database Records to Objects (page 522).
Characteristics of the SHP File Format
The Schema Editor treats each SHP file, and its associated DBF file, as a feature
class (page 2063) with a single geometry property (page 2071) and, optionally, data
attribute properties. The SHP file format supports a single writer at any time,
but can have multiple readers.
SHP files can include only one geometry type per file, but you can store and
copy multiple SHP files in a folder. You can use a configuration file to support
multiple schemas when you establish your connection to a folder containing
SHP files.
572 | Chapter 4 Managing Data

What SHP Schemas Support
A SHP schema can support the following:
■A single geometry type per file
■Spatial contexts (determined by coordinate system information in the PRJ
file)
■Auto ID generation
■Null value constraints
■The following geometry types:
■Polygons: polygon, multi-polygon
NOTE When you connect to or import SHP polygon data, AutoCAD Map
3D checks the geometry to see if there are multiple closed outer loops. If
so, it treats the geometry as multi-polygon (a polygon with multiple exterior
rings). It does not treat unclosed outer loops as multi-polygon. You can
create a multi-polygon in AutoCAD Map 3D and then save or export it to
SHP format. It then appears in its native SHP file as a multi-polygon.
■Points: point, multi-point
■Rings: linear ring
■Line strings: line string, line string segment, multi-line string
See also:
■Overview of Geospatial Data (page 551)
■Setting Up Database Users (page 584)
■Creating a Data Store (page 586)
■Bringing In Features from SHP (page 335)
■Styling Features (page 639)
■Creating a Join (page 509)
■Editing Features using the Data Table (page 711)
■Viewing a Schema (page 608)
■Migrating Data (page 615)
Working with SHP Data | 573

To work with SHP data
NOTE This functionality affects geospatial feature data only. For information about
linking records in an external database to objects in a drawing, see Overview of
Linking Database Records to Objects (page 522).
■Create data stores (page 586)
■Add SHP features to your map (page 335)
■Style SHP features (page 639)
■Join SHP data to a different feature (page 509)
■Examine or edit attribute data (page 711)
■View a SHP schema (page 608)
■Copy data to/from a different data format (page 615)
Working with PostgreSQL/PostGIS Data
AutoCAD Map 3D uses the OSGeo FDO Provider for PostgreSQL/PostGIS,
which accesses Postgres and PostGIS databases and is certified with PostGIS
1.4.0 with PostgreSQL 8.4. PostGIS adds support for geographic objects to the
PostgreSQL object-relational database so that the PostgreSQL server can be
used as a back end spatial database for GIS.
What PostgreSQL/PostGIS Schemas Support
A PostgreSQL/PostGIS schema (page 2073) can support the following:
■Reading and writing data with database transaction support
■Creation and modification of schemas
■Feature classes and regular classes
■All basic FDO data types except for BLOB and Byte types
■All geometry types except curve types. Circular arcs are not supported
■2D geometry
■Multiple schemas
■Auto-ID generation for int32 and int64 data types
574 | Chapter 4 Managing Data

■Null value constraints
■Unique value constraints
■Range constraints
■List constraints
■Default values
■All spatial filters
■All FDO expression functions
Restrictions of PostgreSQL/PostGIS Schemas
When you create a PostgreSQL/PostGIS schema, the following restrictions
apply:
■Object properties and association properties are not supported
■Inheritance is not supported
■The Byte data type is not supported. Byte properties are converted to Int16.
■Z and M values are not supported.
To work with PostgreSQL/PostGIS data
NOTE This functionality affects geospatial feature data only. For information about
linking records in an external database to objects in a drawing, see Overview of
Linking Database Records to Objects (page 522).
■Set up users (page 584)
■Create data stores (page 586)
■Add PostgreSQL/PostGIS features to your map (page 340)
■Style PostgreSQL/PostGIS features (page 639)
■Join PostgreSQL/PostGIS data to a different feature (page 509)
■Examine or edit attribute data (page 711)
■Create a PostgreSQL/PostGIS schema (page 596)
■View a PostgreSQL/PostGIS schema (page 608)
Working with PostgreSQL/PostGIS Data | 575

■Edit a PostgreSQL/PostGIS schema (page 610)
■Delete a PostgreSQL/PostGIS schema (page 613)
■Copy data to/from a different data format (page 615)
Working with ODBC Data
To set up a Data Source Name (DSN) for your ODBC data store, you add a DSN
in Windows. The configuration options you specify depend on the type of
ODBC data store you use. The login ID and password you enter when setting
up your DSN are used only for defining the DSN. These credentials are not
when you connect with the ODBC provider through FDO.
NOTE For MySQL, be sure to install the MySQL driver from MyODBC 3.51 at
http://dev.mysql.com/downloads/connector/odbc/3.51.html.
NOTE This functionality affects geospatial feature data only. For information about
linking records in an external database to objects in a drawing, see Overview of
Linking Database Records to Objects (page 522).
What ODBC Schemas Support
For ODBC, AutoCAD Map 3D supports point geometry, with X, Y, and
optionally, Z columns for defining points. Although the default column names
are X, Y, and Z, when you select the columns to represent these points, you
must override the defaults. This information is stored in the map file itself. If
you perform the same steps in another map, you must override the settings
again.
In some cases, ODBC schemas support default values.
Restrictions of ODBC Schemas
■There is no spatial indexing.
■Geometry points are stored as separate properties in the object definition.
■The existing schema (page 2073) is used; you cannot edit or delete it. You
cannot add a new schema or add FDO (page 2062) metadata to the data store
(page 2059).
576 | Chapter 4 Managing Data

See also:
■Overview of Geospatial Data (page 551)
■Accessing Data from ODBC (page 342)
■Creating a Join (page 509)
■Editing Features using the Data Table (page 711)
NOTE This functionality affects geospatial feature data only. For information about
linking records in an external database to objects in a drawing, see Overview of
Linking Database Records to Objects (page 522).
■To set up an ODBC data store for use with AutoCAD Map 3D (page 577)
■To set up a database range for Excel (page 578)
■To work with ODBC data (page 578)
To set up an ODBC data store for use with AutoCAD Map 3D
1From your Windows desktop, click Start menu ➤ Settings ➤ Control
Panel and open the Administrative Tools control panel.
2Double-click Data Sources (ODBC).
3Click Add.
4Select a driver.
■For a SQL Server data store, use the SQL Server or SQL Native Client
driver. Specify either Windows NT or SQL Server, and select the default
database that matches yours.
■For an Oracle provider, do not use the Microsoft ODBC for Oracle
driver because it is incompatible with AutoCAD Map 3D. Instead, use
the driver installed with the Oracle client.
5Click Finish.
6Specify the DSN information.
■For a MySQL Server data store, specify the Data Source Name, Server,
User, Password, and Database.
■For an Oracle provider, specify the following:
■Data Source Name
Working with ODBC Data | 577
■TNS Service Name (the service to which you are connecting)
■User ID (the database to access).
The User ID predefines the tables available in AutoCAD Map 3D.
It is the equivalent of the OWNER field in an Oracle metaschema.
If you do not specify it here, the entire schema of the Oracle
instance (based on your user privileges) is used. It is case sensitive
and must match the value in the Oracle instance (all uppercase is
the usual case). This process can take several minutes, depending
on your Oracle instance.
7Under Database, click Select and select the data store to use.
8Click OK in the Select Database and ODBC Microsoft Access Setup dialog
boxes.
9In the ODBC Data Source Administrator dialog box, select the new data
source and click Configure.
10 Specify the appropriate configuration options for your data store type:
■For SQL Server, some column data types (for example, nchar) can cause
a failure when connecting to the SQL Server. They are converted to
unsupported formats by the ODBC driver.
■For a MySQL Server data store, some column types can return the
wrong length and prevent the ODBC provider from reporting the
column. To resolve this issue, check Don't Optimize Column Width.
■For a Microsoft Excel schemas, specify at least one named range. You
can then expose different named ranges in the worksheet as different
ODBC tables. Also, the ODBC tables map to FDO classes.
To set up a database range for Excel
1Open the Excel worksheet.
2Select all the data in the worksheet.
3Define a named range for all the data in the table.
Do not use DATABASE or any other reserved word as a range name.
To work with ODBC data
■Add data to your map (page 342)
578 | Chapter 4 Managing Data

■Join ODBC data to a different feature (page 509)
■Examine or edit attribute data (page 711)
Working with ESRI ArcSDE Data
You can connect through ArcSDE to an underlying Oracle or SQL Server
database. You can insert, select, update, and delete feature data in existing
ArcSDE schemas (page 2073). You cannot create or modify an ArcSDE schema
in AutoCAD Map 3D.
AutoCAD Map 3D supports ArcSDE 9.1, 9.2, 9.3, and 9.3.1.
The 9.3.1 version is available as either a 32-bit or 64-bit provider on Windows.
(For previous versions, and on Linux, it is available in 32-bit only.) The 64-bit
support is available only with the 64-bit ESRI ArcSDE 9.3.1 client libraries.
(The 64-bit client libraries were not available before version 9.3.1.)
Both 32-bit and 64-bit ArcSDE servers are supported for the 9.3.1 version. You
can access either server type with a 32-bit or 64-bit client. For example, if you
are using AutoCAD Map 3D in a 32-bit environment, you can access a 64-bit
ArcSDE server.
To work with ArcSDE, you must install ArcSDE 9.3.1 and a supported data
source (page 2059), such as Oracle 11g, in the network.
Install the following DLL files on the computer on which you run AutoCAD
Map 3D:
For version 9.2 through 9.3.1For version 9.1
pe.dllpe91.dll
sde.dllsde91.dll
sg.dllsg91.dll
For instructions on installing the DLL files and setting up your hosts and
services files for ArcSDE, see Bringing In Features from ArcSDE (page 316).
The PATH environment variable must reference the local folder containing
these DLLs. To accomplish this, you can install an ArcGIS 9.1 Desktop
application or the ArcSDE SDK. For more information about ArcGIS 9.1 Desktop
applications and the ArcSDE SDK, refer to the ESRI documentation.
Working with ESRI ArcSDE Data | 579

NOTE This functionality affects geospatial feature data only. For information about
linking records in an external database to objects in a drawing, see Overview of
Linking Database Records to Objects (page 522). For information about moving
data between DWG and ArcSDE format, see Migrating DWG Data to GIS (page
628).
What ESRI ArcSDE Schemas Support
AutoCAD Map 3D uses facilities provided by ArcSDE for long transaction (page
2067) versioning (page 2078) and persistent locking (page 2070). (ArcSDE supports one
or the other, but not both, on the same class). AutoCAD Map 3D uses the
standard ArcSDE API and ArcSDE-supported storage on both the Oracle and
SQL Server platforms. AutoCAD Map 3D does not use FDO (page 2062) metadata
for ArcSDE schema—it uses existing metadata only.
Restrictions of ArcSDE Schemas
If ArcSDE encounters curved segments, it converts them to a series of line
segments that approximate the original arc segment (an approximation of
the original geometry).
See also:
■Overview of Geospatial Data (page 551)
■Editing Features using the Data Table (page 711)
■Bringing In Features from ArcSDE (page 316)
■Styling Features (page 639)
■Creating a Join (page 509)
■Editing Features using the Data Table (page 711)
■Viewing a Schema (page 608)
■Migrating Data (page 615)
NOTE This functionality affects geospatial feature data only. For information about
linking records in an external database to objects in a drawing, see Overview of
Linking Database Records to Objects (page 522). For information about moving
data between DWG and ArcSDE format, see Migrating DWG Data to GIS (page
628).
580 | Chapter 4 Managing Data

To work with ESRI ArcSDE data
■Add ArcSDE features to your map (page 316)
■Style ArcSDE features (page 639)
■Join ArcSDE data to a different feature (page 509)
■Examine or edit attribute data (page 711)
■View an ArcSDE schema (page 608)
Working with WFS Data
An OGC Web Feature Service (WFS) provides access to geographic features
that are stored in an opaque data store (page 2059) in a client/server environment.
A client uses WFS to retrieve geospatial data that is encoded in Geography
Markup Language (GML) from a single or multiple WFS. The communication
between client and server is encoded in XML. If the WFS response includes
feature geometries, it is encoded in Geography Markup Language (GML),
which is specified in the OpenGIS Geographic Markup Language
Implementation Specification. WFS is a read-only provider.
NOTE This functionality affects geospatial feature data only.There is no equivalent
for drawing data.
What WFS Schemas Support
A WFS schema (page 2073) can support the following:
■Inheritance
■Multiple schemas
■Object properties
■Association properties
■These geometry types: point, line string, polygon, multi-point, multi-line
string, multi-polygon, multi-geometry, curve string, curve polygon,
multi-curve string, multi-curve polygon, linear ring, line string segment,
circular arc segment, and ring
■Multi-geometry
Working with WFS Data | 581

See also:
■Overview of Geospatial Data (page 551)
■Bringing In Features from WFS (page 346)
■Styling Features (page 639)
■Creating a Join (page 509)
NOTE This functionality affects geospatial feature data only. There is no equivalent
for drawing objects.
To work with WFS data
■Add WFS features to your map (page 346)
■Style WFS features (page 639)
■Join data to a WFS feature (page 509)
Working with Feature Sources
After you connect to a data store in AutoCAD Map 3D, that data store is a
feature source (page 2063) for the current map.
NOTE This functionality affects geospatial feature data only. For information about
linking records in an external database to objects in a drawing, see Overview of
Linking Database Records to Objects (page 522).
Overview of Working with Feature Sources
After you connect to a data store in AutoCAD Map 3D, that data store is a
feature source (page 2063) for the current map. Feature sources are listed by
provider (for example, all SDF feature sources are listed together in Data
Connect (page 2059)).
NOTE This functionality affects geospatial feature data only. For information about
linking records in an external database to objects in a drawing, see Overview of
Linking Database Records to Objects (page 522). For information about managing
drawing objects and drawing files, see Overview of Setting Up Your Map File (page
140).
582 | Chapter 4 Managing Data
Tell me more
Video
■Show me how to create a new SDF file
and import a schema.
Procedure
■To create a data store for a database
provider (page 588)
■To create a data store for a file-based
data provider (page 589)
■To create a schema (page 598)
■To import an XML or XMI schema
(page 608)
Tutorial
■Exercise 3: Edit the schema
Workflow
■Prepare an Existing Oracle Database
for Use with AutoCAD Map 3D
GIS Skill
■Create a GIS data store (SDF) to be
populated from various sources
Related topics
■About Geospatial Feature Classes, Data
Stores, and Schemas (page 551)
■Overview of Geospatial Data (page 551)
■Overview of Bringing In GIS Features
(page 305)
NOTE This functionality affects geospatial feature data only. For information about
linking records in an external database to objects in a drawing, see Overview of
Linking Database Records to Objects (page 522). For information about managing
drawing objects and drawing files, see Overview of Setting Up Your Map File (page
140).
To set up a feature source (page 2063)
1Set up database users for the feature source, if necessary. (page 585)
Overview of Working with Feature Sources | 583

2Do one of the following:
■Create a database datastore. (page 588)
■Create an SDF or SHP data store. (page 589)
NOTE You can also delete a data store. (page 593)
Setting Up Database Users
You can use the FDO User Manager utility that comes with AutoCAD Map 3D
to set up database users for Oracle, SQL Server, PostgreSQL/PostGIS, and
MySQL.
NOTE This functionality affects geospatial feature data only. For information about
linking records in an external database to objects in a drawing, see Overview of
Linking Database Records to Objects (page 522). For information about managing
drawing objects and drawing files, see Overview of Setting Up Your Map File (page
140).
For an Oracle data store (page 2059), AutoCAD Map 3D separates the concept
of the Oracle user who owns the schema (page 2073) from the Oracle user who
accesses the schema.
When you create a new Oracle data store in AutoCAD Map 3D (page 586),
AutoCAD Map 3D automatically creates a new corresponding Oracle user who
is the owner of that data. For example, creating a data store called mycitydb
creates an Oracle user called mycitydb. However, you must also create separate
Oracle users for the purpose of accessing the data store. These Oracle users
match the end users who will access the data. For example, if an end-user
named JSmith will be connecting to the new data store, you create an Oracle
user with that name and grant him access to the new data store. This allows
different users who access the same data to have different privileges.
To access data that resides in a relational database, AutoCAD Map 3D requires
that database users have certain privileges. Use FDO User Manager to add a
new user with the appropriate roles. FDO User Manager is a command-line
utility that lets you manage database users and accounts consistently across
database management systems.
When you create users for an Oracle instance with the FDO User Manager
tool, those users have the privileges that support data access operations for
that data store. If you access the data store as an Oracle user who was not
created using FDO User Manager, the Database Administrator must ensure
584 | Chapter 4 Managing Data

that the user has sufficient privileges to work with the data. If you use Oracle
Workspace Manager, you must use separate users to create the data store and
to access the data store, because locking is tracked by individual user and will
not be effective if everyone connects as the same data store user.
In FDO User Manager, you choose an FDO provider (page 2063) and connection
and then perform provider-specific tasks, including:
■Adding, dropping, or listing users
■Assigning, revoking, or listing roles and privileges
■Granting, revoking, or listing access to data stores
NOTE Database users are not the same as AutoCAD Map 3D users, which are
managed separately (page 82).
See also:
■Overview of Geospatial Data (page 551)
■Setting Up Users and Assigning Rights (page 82)
■Creating a Data Store (page 586)
NOTE This functionality affects geospatial feature data only. For information about
linking records in an external database to objects in a drawing, see Overview of
Linking Database Records to Objects (page 522). For information about managing
drawing objects and drawing files, see Overview of Setting Up Your Map File (page
140).
To manage database users and accounts
1Start FDO User Manager.
By default, FDO User Manager is located in \Program Files\AutoCAD Map
3D\FDO\bin\. To start it, either double-click FdoUserManager.exe in
Windows Explorer or enter FdoUserManager at a command prompt. (To
invoke FdoUserManager from any prompt, add its directory to your path.)
2At the Choose a Provider menu, enter the digit that corresponds to your
FDO Provider and press Enter.
3Enter each connection parameter when prompted and press Enter.
For example, enter the required service name and username/password.
For more information, contact your database administrator.
Setting Up Database Users | 585

4After you are connected, follow the instructions on the screen.
If you are adding a user, enter the user name and password.
New users you create with this utility automatically have the roles and
privileges required by the AutoCAD Map 3D FDO functionality. However,
FDO User Manager allows you to grant some additional privileges. Use
commas to separate the role names, with no spaces. You can enter ? to
see a list of roles. To verify the roles after you add them, select List All
Roles And Privileges Of A User.
5When you finish, enter 0 (a zero) to exit FDO User Manager.
Creating a Data Store
Features are stored in a data store (page 2059), which is a collection of feature
classes in a single data storage location. To add a feature to your map, you
connect to its data store and select each feature class (page 2063) to include.
The main reason to create a new data store is to migrate existing data (page
615) to the new FDO provider (page 2063), or to create new data in that provider
format.
NOTE This functionality affects geospatial feature data only. For information about
linking records in an external database to objects in a drawing, see Overview of
Linking Database Records to Objects (page 522). For information about moving
data between DWG and geospatial formats, see Migrating DWG Data to GIS (page
628).
You can create new data stores for database FDO Providers (Microsoft SQL
Server, SQL Server Spatial, MySQL, PostgreSQL/PostGIS, or Oracle) and
file-based FDO Providers (SDF, SHP, or SQLite) from within AutoCAD Map 3D
if you have the necessary privileges for the target database or directory. After
you create a data store, you can define or import a schema for it, which
specifies the feature classes available in that data store and their properties.
Before creating a database data store, make sure you have created a user for
the data store with the proper privileges (page 584).
To overwrite an existing data store, you must first delete the old one. For data
stores from database FDO Providers, use DBMS-specific tools to drop existing
tables.
After you create a data store and define a schema (page 596) for it, AutoCAD
Map 3D users can create, store, and access (page 303) geospatial data in that
data store.
586 | Chapter 4 Managing Data
If you have DWG data that you want to move to a feature source (page 2063),
see Migrating DWG Data to GIS (page 628).
When you create a data store, you specify the minimum and maximum X
and Y spatial extents for new data store in the Create Data Store Dialog Box
(page 1747). This is especially important if you later use Bulk Copy (page 615) to
move data to that data store. You must make sure that the data you are moving
are inside the extents of the destination data store. MySQL and Oracle support
expanding the extents automatically if incoming data are beyond the scope
of the extents.
Tell me more
Video
■Show me how to create a new SDF file
and import a schema.
Procedure
■To create a data store for a database
provider (page 588)
■To create a data store for a file-based
data provider (page 589)
■To create a schema (page 598)
■To import an XML or XMI schema
(page 608)
Tutorial
■Exercise 3: Edit the schema
Workflow
■Prepare an Existing Oracle Database
for Use with AutoCAD Map 3D
GIS Skill
■Create a GIS data store (SDF) to be
populated from various sources
Related topics
■About Geospatial Feature Classes, Data
Stores, and Schemas (page 551)
■Overview of Geospatial Data (page 551)
■Setting Up Database Users (page 584)
Creating a Data Store | 587

■Importing and Exporting a Schema
(page 606)
■Migrating Data (page 615)
■Migrating DWG Data to GIS (page 628)
Instructions for creating a data store are different for database data stores and
for file-based data stores.
NOTE This functionality affects geospatial feature data only. For information about
linking records in an external database to objects in a drawing, see Overview of
Linking Database Records to Objects (page 522). For information about moving
data between DWG and geospatial formats, see Migrating DWG Data to GIS (page
628).
■To create a data store for a database provider (page 588)
■To create a data store for a file-based data provider (page 589)
To create a data store for a database provider
1On the Task Pane, click either the Map Explorer (page 2068) or Display
Manager (page 2060) tab.
2Click Data ➤ Connect To Data.
3In the Data Connections By Provider list in the Data Connect window,
select the appropriate choice (for example, Add Oracle Connection).
4In the right-hand pane, enter a connection name (the name you will call
this data store in AutoCAD Map 3D) and the information required to
connect to the data store, for example, a service name.
NOTE Do not use the same name you used when you created a user for the
data store (page 584).
5Log into the service for the store.
6In the Data Store list, select Add New Data Store (or type a name that
does not appear in the list already) and press Enter.
You are asked if you want to create a new data store. Click Yes.
7In the Create Data Store Dialog Box (page 1747) for this provider, enter the
settings for the new data store.
588 | Chapter 4 Managing Data

If you are creating an FDO-enabled data store for SQL Server Spatial, see
Creating FDO-Enabled SQL Server Spatial Data Stores (page 590).
8Click OK.
If the data store is created successfully, you see a confirmation message
prompting you to edit its schema. Use the Schema Editor to create (page
596) or import (page 606) the schema for the data store.
You are connected to the new data store automatically.
To create a data store for a file-based data provider
1In Map Explorer, do one of the following:
■Click Schema ➤ Create SDF.
■Click Schema ➤ Create SHP.
■Click Schema ➤ Create SQLite.
2In the Create File dialog box, specify the path and file name of the data
store to create.
3Enter the coordinate system code for the new data store.
If you do not know the code, follow these steps to select a coordinate
system:
■Click .
■In the Assign Global Coordinate System dialog box (page 1598), select
a category.
■Select from a list of available coordinate systems.
Select a coordinate system that both the provider and AutoCAD Map
3D support.
■Click Properties to view the properties of the selected coordinate
system.
■Click OK.
4Click OK.
You must define a schema for the new data store. A confirmation message
prompts you to use the Schema Editor (page 1739) to create (page 596) or
import (page 606) the schema for the data store.
Creating a Data Store | 589

The new data store is created when you click Apply in the Schema Editor.
You are connected to it automatically.
Creating FDO-Enabled SQL Server Spatial Data Stores
You can create a SQL Server data store in native SQL Server format (page 559)
and you can create an extended SQL Server Spatial data store (page 561) with
FDO metadata.
NOTE This functionality affects geospatial feature data only. For information about
linking records in an external database to objects in a drawing, see Overview of
Linking Database Records to Objects (page 522). For information about moving
data between DWG and geospatial formats, see Migrating DWG Data to GIS (page
628).
FDO-enabled Data Stores
You specify whether the new data store will be FDO-enabled or not by selecting
Use FDO Enabled Schema when you create a data store.
FDO-enabled data stores include additional FDO metadata, but otherwise use
native SQL Server schema capabilities.
■Such metadata provides a mechanism for ensuring that class and property
names are maintained when you use Bulk Copy to move the data to a
different format and back again. For SQL Server, the cases where class and
property names are not maintained are rare, since SQL Server can handle
names with any Unicode characters. The names cannot be longer than
128 characters, which is not usually a problem.
■FDO data stores maintain class inheritance, while non-FDO data stores do
not. ApplySchema for non_FDO data stores maintains the inherited
properties for sub-classes but not the relationships between classes and
sub-classes.
■Object and object collection properties are supported only with FDO
metadata.
■Revision number support for optimistic concurrency is included only with
FDO metadata.
■If you select Use FDO Enabled Schema when you create a data store, some
columns or tables may be renamed in the SQL Server database to avoid
590 | Chapter 4 Managing Data

limitations in SQL Server. The data itself is not altered and can still be
queried by an external application. You can later delete the metadata table.
NOTE It is recommended that you use FDO-enabled schemas only if you need
their additional capabilities. Otherwise, choose the default, non-FDO-enabled
schema.
Selecting a Coordinate System for a Spatial Context
Once you create a data store, you create and apply a schema to it. The schema
defines the table and columns into which you will put data. For FDO geometry
properties, there are two possible SQL Server Spatial column types: geometry
and geography. The geography type is used for geodetic (lat/long) coordinate
systems and the geometry type is used for non-geodetic coordinate systems.
For both, a spatial index with default parameters is created automatically.
SQL Server Spatial includes a catalog of geodetic coordinate systems, but not
non-geodetic coordinate systems. Both geometry and geography column types
save SRID values, but only geography type columns reference an entry in the
catalog, and in this case the SRID numbers are EPSG numbers.
In AutoCAD Map 3D, when you define a spatial context, you select a
coordinate system from the Mentor catalog. To use this coordinate system
with SQL Server Spatial, AutoCAD Map 3D must translate the coordinate
system information from Mentor into an SRID. SRID is the only identifier that
SQL Server can use for both geodetic and non-geodetic coordinate systems.
AutoCAD Map 3D uses the EPSG code of the coordinate system as the SRID.
The spatial context creation can fail if either of the following is true:
■The coordinate system does not have an EPSG code.
■The coordinate system is in the SQL Server catalog but its SQL Server WKT
definition is not recognized by Mentor.
To resolve these situations, use a translation table in the file
ExtendedCoordSys.txt. By default, this file is stored in FDO\bin\com in the
AutoCAD Map 3D installation folder.
If the coordinate system does not have an EPSG code, add it to
ExtendedCoordSys.txt and specify an SRIDfor it. Choose an SRID number that
is not an EPSG code. The ExtendedCoordSys.txt file contains instructions for
doing this.
If the SQL Server WKT definition is not recognized by mentor, add the
coordinate system to ExtendedCoordSys.txt (if it is not already there) and set
Creating FDO-Enabled SQL Server Spatial Data Stores | 591

the WKT to the Mentor version. The WKT specified in the file takes precedence
over the WKT in the SQL Server catalog.
NOTE This functionality affects geospatial feature data only. For information about
linking records in an external database to objects in a drawing, see Overview of
Linking Database Records to Objects (page 522). For information about moving
data between DWG and geospatial formats, see Migrating DWG Data to GIS (page
628).
To create a data store for SQL Server Spatial
1On the Task Pane, click either the Map Explorer (page 2068) or Display
Manager (page 2060) tab.
2Click Data ➤ Connect To Data.
3In the Data Connections By Provider list in the Data Connect window,
select Add SQL Server Spatial Connection).
4In the right-hand pane, enter a connection name (the name you will call
this data store in AutoCAD Map 3D) and the information required to
connect to the data store, for example, a service name.
NOTE Do not use the same name you used when you created a user for the
data store (page 584).
5Log into the service for the store, using either Windows authentication
or SQL Server authentication.
6In the Data Store list, select Add New Data Store (or type a name that
does not appear in the list already) and press Enter.
You are asked if you want to create a new data store. Click Yes.
7In the Create Data Store Dialog Box (page 1747) for this provider, enter the
settings for the new data store.
Specify whether the new data store will be FDO-enabled or not by selecting
or clearing Use FDO Enabled Schema. FDO-enabled data stores include
additional FDO metadata, but otherwise use native SQL Server schema
capabilities.
8Click OK.
If the data store is created successfully, a confirmation message prompts
you to edit its schema. Use the Schema Editor to create (page 596) or import
(page 606) the schema for the data store.
592 | Chapter 4 Managing Data

The Concept tab for this topic describes issues concerning geometric and
geogra[hic properties, as well as issues with coordinate systems for SQL
Server Spatial data stores.
You are connected to the new data store automatically.
Deleting a Feature Source
When you delete a feature source (page 2063), you remove all of its data and
stylization information from layers in the current map that reference its data
store. The data store (page 2059) itself is unaffected.
To delete a feature source, you must first disconnect from it.
NOTE This functionality affects geospatial feature data only. For information about
deleting the templates that link records in an external database to objects in a
drawing, see Editing a Link Template (page 538).
See also:
■Overview of Geospatial Data (page 551)
■Creating a Data Store (page 586)
■Overview of Bringing In Data (page 291)
To delete a feature source
1In Map Explorer, click Data ➤ Connect to Data.
2In the Data Connections By Provider list in the Data Connect window,
right-click the feature source (page 2063) to delete and click Disconnect.
Feature source entries display page icons. Each entry below a feature
source is a feature class within that feature source.
3Right-click the feature source again and click Delete.
Working with Schemas
Use the Schema Editor to work with schemas
Deleting a Feature Source | 593
NOTE This functionality affects geospatial feature data only. For information about
linking records in an external database to objects in a drawing, see Overview of
Linking Database Records to Objects (page 522). For information about moving
data between DWG and geospatial data stores, see Migrating DWG Data to GIS
(page 628).
Overview of Working with Schemas
Geospatial data is stored in a hierarchical fashion, like a set of tables: each
row within a table is an individual feature, and each column is a property
(page 2071) of that feature. The entire table (including its name, column names,
data types, default values, and constraints) represents a feature class (page 2063).
The set of related tables is called a schema, and the entire collection of data
resides in a data store.
NOTE This functionality affects geospatial feature data only. For information about
linking records in an external database to objects in a drawing, see Overview of
Linking Database Records to Objects (page 522). For information about moving
data between DWG and geospatial data stores, see Migrating DWG Data to GIS
(page 628).
Tell me more
Video
■Show me how to create a new SDF file
and import a schema.
■Show me how to delete properties from
a schema.
■Show me how to append a feature class
to an SDF file.
■Show me how to limit what can be
entered in a field.
Procedure
■To edit a schema (page 612)
Tutorial
■Exercise 3: Edit the schema
Workflow
■Add a Property to an SDF Schema
594 | Chapter 4 Managing Data
■Add a New Feature Class to an FDO
Data Source
GIS Skill
■Create a GIS data store (SDF) to be
populated from various sources
■Edit an existing schema (SDF)
■Limit what can be entered in a field
Related topics
■About Geospatial Feature Classes, Data
Stores, and Schemas (page 551)
■Overview of Geospatial Data (page 551)
■Creating a Data Store (page 586)
NOTE This functionality affects geospatial feature data only. For information about
linking records in an external database to objects in a drawing, see Overview of
Linking Database Records to Objects (page 522). For information about moving
data between DWG and geospatial data stores, see Migrating DWG Data to GIS
(page 628).
Use this method...To do this...
In the Schema Editor, select Schemas in
the Schema tree. Click New Schema on
the Schema Editor toolbar.
See Creating a Schema (page 596)
Create a schema
In the Schema Editor, select Schemas in
the Schema tree. Click Import Schema on
the Schema Editor toolbar.
See Importing and Exporting a Schema
(page 606)
Import a schema
In the Schema Editor, select Schemas in
the Schema tree. Click Export Schema on
the Schema Editor toolbar.
See Importing and Exporting a Schema
(page 606)
Export a schema
Overview of Working with Schemas | 595

Use this method...To do this...
In the Schema Editor, click any schema
(page 2073), feature class (page 2063), or
property (page 2071).
See Viewing a Schema (page 608)
View a schema
In the Schema Editor, click any schema,
feature class, or property. Change any set-
tings.
See Editing a Schema (page 610)
Edit a schema
In the Schema Editor, right-click any
schema, feature class, or property. Click
Delete.
See Deleting Schemas (page 613)
Delete a schema
See also:
■Schema Editor (page 1739)
Creating a Schema
Use the Schema Editor to define a new schema (page 2073) in a new (page 586)
or existing feature source (page 2063) for a database FDO provider (page 2063)
(Microsoft SQL Server, MySQL, or Oracle) or for an SDF data store. You cannot
create a schema for an existing SHP feature source, but you can create a new
file-based data store (page 586) and create a schema for it during the creation
process. You must use ESRI tools to create an ArcSDE schema—you cannot
use AutoCAD Map 3D to create a schema for ArcSDE.
NOTE This functionality affects geospatial feature data only. For information about
linking records in an external database to objects in a drawing, see Overview of
Linking Database Records to Objects (page 522). For information about moving
data between DWG and geospatial data stores, see Migrating DWG Data to GIS
(page 628).
Some FDO Providers allow the client to override the default logical and physical
mapping specified in their schema. You can use the Schema Editor to override
classes, physical table names (to create a new table), Oracle tablespace names,
MySQL storage engines, table-type mapping (base or concrete), properties,
596 | Chapter 4 Managing Data

and column names when you define a new schema. You cannot map to an
existing table.
If you are mapping to an existing table or view in another data store (page
2059), make sure all column overrides correctly map to existing columns. If you
map to a table or view with a different owner, have the owner of that table
grant access to the FDO data store. You can create a local view that selects
from the other table, and map to the local view, but this may not be necessary.
The local view is created automatically if it is not present when you apply
your changes.
If you are mapping to a table and column in the current data store that does
not yet exist, make sure that the column name is valid for your database.
You must create schema elements hierarchically: create the schema first, then
its feature classes (page 2063), and then its properties.
For feature sources from some FDO Providers, you can create multiple schemas
within the same feature source and change (page 610) the schemas after you
define and save them the first time.
You can view (page 608) a schema from any FDO Provider, but you cannot edit
or delete it if there are existing features that use it.
See also:
■Schema Editor (page 1739)
■Overview of Geospatial Data (page 551)
■Creating a Data Store (page 586)
■Setting Up Constraints in the Schema Editor (page 599)
■Importing and Exporting a Schema (page 606)
■Viewing a Schema (page 608)
■Editing a Schema (page 610)
■Deleting Schemas (page 613)
NOTE This functionality affects geospatial feature data only. For information about
linking records in an external database to objects in a drawing, see Overview of
Linking Database Records to Objects (page 522). For information about moving
data between DWG and geospatial data stores, see Migrating DWG Data to GIS
(page 628).
Creating a Schema | 597
To create a schema
1Connect (page 303) to the feature source in which you want to create the
schema (page 2073).
2In Map Explorer, select the feature source (page 2063) in the connection
tree (at the top of the pane) and click Schema ➤ Edit Schema.
3In the Schema Editor (page 1739), expand the Schema tree and do one of
the following:
■To create a schema, select Schemas (the top-most node in the Schema
tree) and click New Schema on the Schema Editor toolbar.
■To create a feature class (page 2063), select the parent schema in the
Schema tree and click New Feature Class on the Schema Editor toolbar.
■To create a property (page 2071), select the parent feature class in the
Schema tree and click New Property on the Schema Editor toolbar.
4Specify the settings for the new schema element (page 1739) in the
right-hand pane.
See Setting Up Constraints in the Schema Editor (page 599) for information
on limiting the valid values for a property.
5Repeat the preceding two steps as required to create other schema
elements.
6Click Apply to apply your changes and leave the Schema Editor open.
When you click Apply or OK, your changes are submitted to the data
store. You can add feature classes and properties, but you cannot edit
your previous work.
7Click OK to apply any unsaved changes and close the Schema Editor.
598 | Chapter 4 Managing Data

Setting Up Constraints in the Schema Editor
When you create a schema, you can limit the values that are valid for particular
properties. The types of constraints supported by AutoCAD Map 3D are
described in the following table.
Data Table BehaviorDescriptionType of Con-
straint
Any value outside the specified
range generates an error and you
must enter a different value.
Valid values must be
within the range spe-
cified. You can include or
Range
exclude the minimum
and maximum values. For
example, you can specify
1-10 inclusive, and then
1 and 10 are both valid.
Click the down-arrow to display the
list, and then choose one of the
items as a value for the property.
You supply the list entries
that are valid for the
property.
List
If you leave the property value
empty when you close the Data
The value of the property
cannot be empty.
Not null
Table, an error message prompts
you to enter a value.
If you enter a value that is used by
any other feature in this feature
The value of the property
must be unique within
Unique
class, an error message prompts youthe feature class. If you
to change it. You will not see thedefine the property as an
error message until you check in the
feature.
If the table has two columns that
together must be unique (like
auto-generated field, or
if it is defined in the data
store as a key field, it will
have this constraint.
"Lastname" and "Firstname"), a
message appears on each column
involved in the paired uniqueness
constraint.
Setting Up Constraints in the Schema Editor | 599
NOTE This functionality affects geospatial feature data only. For information about
linking records in an external database to objects in a drawing, see Overview of
Linking Database Records to Objects (page 522). For information about moving
data between DWG and geospatial data stores, see Migrating DWG Data to GIS
(page 628).
When you edit the properties (page 711) in the Data Table, you can enter only
the values allowed by the constraint. For example, for a Roads feature, you
can specify that the values for the Number_Of_Lanes property be within the
range 1 through 8. If you enter 9 lanes, you will receive an error message.
You will see an error message as soon as you enter the invalid value. When
you check the feature in, your edits are validated again against the data store
and you may be notified of further errors, depending on the capabilities of
the data provider.
You cannot edit a schema to convert an existing field to use a different
constraint type if the table already contains data. The table must be empty.
Not every data provider supports all constraints. The following table shows
supported constraints by provider.
UniqueNot NullListRangeProvider
YesYesYesYesOracle
YesYesYesYesPostgr-
eSQL/PostGIS
YesYesYesYesSQL Server
YesYesYesYesSQL Server
Spatial
YesYesYesYesSQLite
YesYesNoNoMySQL
NoYesYesYesSDF
YesYesNoNoArcSDE
NoYesNoNoSHP
600 | Chapter 4 Managing Data
The Schema Editor checks the provider capability and allows only the
constraints supported by that provider.
A property that uses constraints can have any data type, except for Boolean
(which can have not-null constraints only). You cannot constrain properties
with BLOB or CLOB data types.
Tell me more
Video
■Show me how to limit what can be
entered in a field.
Procedure
■To create a constrained property (page
601)
Tutorial
■Exercise 4: Add a property
GIS Skill
■Limit what can be entered in a field
Related topics
■About Geospatial Feature Classes, Data
Stores, and Schemas (page 551)
■Overview of Geospatial Data (page 551)
■Creating a Data Store (page 586)
See also:
■Schema Editor (page 1739)
NOTE This functionality affects geospatial feature data only. For information about
linking records in an external database to objects in a drawing, see Overview of
Linking Database Records to Objects (page 522). For information about moving
data between DWG and geospatial data stores, see Migrating DWG Data to GIS
(page 628).
To create a constrained property
1In the Schema Editor (page 1739), expand the Schema tree and select the
property to constrain.
Setting Up Constraints in the Schema Editor | 601

2Ensure that the data type for the property allows the constraint you want.
For example, Boolean properties can have not-null constraints only.
3Do one of the following:
■To specify a range for the property, set Constraint Type to Range and
specify the range values.
In the Constraint Type field, click the down-arrow and click Range.
Enter a minimum and maximum value for the range and, for each
one, specify whether the range is inclusive or exclusive of that value.
For example, if the range is 1-10, specify whether 1 and 10 are included
or not.
■To specify a list of possible values, set Constraint Type to List and
specify the list values.
In the Constraint Type field, click the down-arrow and click List. Click
Value List and click . Type the list, pressing Enter after each item.
If the data type for this property is String , specify the maximum
length of the string before entering values in the list.
If the data type for this property is Decimal , define the precision and
scale before entering values in the list. If you enter values in the list
that exceed the precision or scale, those values are rounded.
If the data type for this property is DateTime, the list editor displays
a calendar from which you can select specific dates. Once you choose
the first date, the list creates a new entry and you can choose the next
date.
When you click OK, AutoCAD Map 3D checks the values in the list.
If the values are not valid, for example, if they do not match the data
type or they exceed the length of the string definition, you will see
an error message.
■To ensure that the property is not allowed to have an empty value,
set Nullable to False.
In the Nullable field, click the down-arrow and click True or False. If
you set Nullable to False, you can enter a Default Value to ensure that
new features have an entry for this property.
4To specify a “uniqueness” constraint, select the appropriate feature class
in the tree on the left.
You can specify a single-property uniqueness constraint or a
composite-property uniqueness constraint. A single-property uniqueness
constraint ensures that the value for that property is unique within the
feature class. A composite-property uniqueness constraint (sometimes
602 | Chapter 4 Managing Data

called a “paired constraint”) specifies multiple properties whose combined
values are unique. For example, you can constrain the combined
Street_Number, Street_Name, and City fields to uniquely identify a
building address.
■Click New (under Specify Constraints (And The Order)).
■Select the boxes for the properties that must have unique values.
The properties designated as unique appear in the list at the bottom
of the dialog box.
■If desired, use the up and down arrows for the list to change the order
of the properties.
5Click Apply.
Exposing a Native Database View in a Schema
A database view is a virtual or logical table composed of the result set of a
query. Unlike ordinary tables in a relational database, a view is not part of the
physical schema. It is a dynamic, virtual table computed from data in the
database. Changing the data in a table alters the data shown in the view.
Views can provide advantages over tables:
■You can use a view to make a subset of data available to certain users.
■A view can join and simplify multiple tables into a single virtual table.
■Views can aggregate data (using a sum, average, or other function) to
calculate and present data.
NOTE This functionality affects geospatial feature data only. For information about
linking records in an external database to objects in a drawing, see Overview of
Linking Database Records to Objects (page 522). For information about moving
data between DWG and geospatial data stores, see Migrating DWG Data to GIS
(page 628).
Exposing a Native Database View in a Schema | 603
Mapping Existing Views to Feature Classes
AutoCAD Map 3D automatically displays as classes existing database views
that are defined in their native databases. If the view includes geometry, it is
displayed as a feature class. The following restrictions apply:
■You cannot create or modify the view definition within AutoCAD Map
3D.
■In the Data Table, you can edit data in views only if you have permissions
to do so and only if the data store supports editing of view-based data.
■The ability to insert, update, and delete data in the view depends on how
the view is defined in its native data store.
■For existing Oracle schemas, geometry that is included in a view needs a
separate entry in the user_sdo_geom_metadata table. This allows AutoCAD
Map 3D to determine the correct spatial context to use when for that view
when displaying it as a feature class.
If you plan to use a database view with AutoCAD Map 3D, keep in mind the
following points :
■Your native view must contain a primary key.
■Your native view must use a spatial index.
In the Schema Editor, the columns defined for the view appear as properties,
but you cannot edit them. However, you can use the Schema Editor to create
feature classes and properties that mimic database views.
For example, although you have an Oracle table, Rivers, with 20 properties,
you may want certain people to see only six of those properties. You can use
the Schema Editor to create a new feature class based on the existing Rivers
table, and add the six properties you want to expose.
Schema Editor allows mapping directly into the physical database objects
(tables or views).
Accessing Views from Native Schema
In addition to mapping feature classes to existing views in a FDO-enabled
datastore, you can “reverse-engineer” views in native, existing,
non-FDO-enabled datastores into feature classes.
To do this, the following must be true:
■The primary key or unique index columns must be exposed in the view.
604 | Chapter 4 Managing Data

If the view contains a join, columns that identify each row uniquely must
also be exposed.
If a class has no primary key, you can still expose it in AutoCAD Map 3D,
but it will be read only.
■For Oracle data stores, if there is geometry in the view, there must be an
entry in user_sdo_geom_metadata for that geometry. This will provide the
spatial context and coordinate system information.
■For Oracle non-simple views, you can specify which columns to use for a
primary key for the resulting feature class. Provide this information with
the view, as shown in this example:
alter view <viewname> add constraint <constraintname> primary key
(columnnames) disable novalidate;
NOTE This procedure is needed only for FDO (page 2062)-enabled schemas. For
existing schema data stores, AutoCAD Map 3D automatically displays the view as
a feature class, with no further action on your part.
NOTE This functionality affects geospatial feature data only. For information about
linking records in an external database to objects in a drawing, see Overview of
Linking Database Records to Objects (page 522). For information about moving
data between DWG and geospatial data stores, see Migrating DWG Data to GIS
(page 628).
To create a feature class that maps to a database view
1Create an FDO-enabled data store.
You can use the Schema Editor to do this. See Creating a Schema (page
596)
2Create a database view using the native tools for your database.
For Oracle, use sqlplus. For SQL Server, use sqlcmd. For MySQL, use
mysql.
3Reconnect to the data store in AutoCAD Map 3D.
4In the Schema Editor (page 1739), select the target schema Name and click
New Feature Class.
For information about creating feature classes and properties, see Editing
a Schema (page 610).
5If the Logical Feature Class tab is displayed, click the Physical
Configurations tab.
Exposing a Native Database View in a Schema | 605

6For Table Name, type the name of the view you created in step 1. Click
OK.
7Switch back to the Logical Feature Class tab and type the name, class
type, and other required information.
8Click New Property to add a property.
9Switch to the Physical Configuration tab.
10 Type the name of the view column (from the view you created in step 1)
to map to the new property. Click OK.
11 Switch back to the Logical Property tab and set the property attributes.
Attributes such as data type, length, scale, precision, nullability,
uniqueness, and other constraints must match the corresponding column
attributes. For example, you cannot create a property that has the string
data type and map it to a column that uses the number data type.
12 Repeat steps 8 through 11 to create the remaining properties.
13 Be sure to fill in the Primary Key column for the new view record before
you check it in (if it is not defined to be auto-generated).
Importing and Exporting a Schema
You can export a schema (page 2073) as an XML file to do any of the following:
■Share a schema you created in the Schema Editor with other AutoCAD
Map 3D or GIS-software users.
■Back up a schema you created in the Schema Editor as an XML file.
■Save your work in progress if the original data source or directory becomes
unavailable.
You can import an XML schema that you exported, and use it to define a new
schema for another data store. This is useful for creating multiple data stores
based on the same schema.
NOTE This functionality affects geospatial feature data only. For information about
linking records in an external database to objects in a drawing, see Overview of
Linking Database Records to Objects (page 522). For information about moving
data between DWG and geospatial data stores, see Migrating DWG Data to GIS
(page 628).
606 | Chapter 4 Managing Data
The AutoCAD Map 3D XML schema format is a subset of the Geography
Markup Language (GML). For information about GML, go to
http://www.opengis.net/gml. GML was standardized by the Open Geospatial
Consortium (OGC). For information about OGC, go to
http://www.opengeospatial.org. You can also consult the FDO API Reference and
The Essential FDO.
Tell me more
Video
■Show me how to create a new SDF file
and import a schema.
Procedure
■To create a data store for a database
provider (page 588)
■To create a data store for a file-based
data provider (page 589)
■To create a schema (page 598)
■To import an XML or XMI schema
(page 608)
Tutorial
■Exercise 3: Edit the schema
Workflow
■Prepare an Existing Oracle Database
for Use with AutoCAD Map 3D
GIS Skill
■Create a GIS data store (SDF) to be
populated from various sources
Related topics
■About Geospatial Feature Classes, Data
Stores, and Schemas (page 551)
■Overview of Geospatial Data (page 551)
■Creating a Data Store (page 586)
■Setting Up Database Users (page 584)
■Creating a Schema (page 596)
■Working with Schemas (page 593)
Importing and Exporting a Schema | 607

See also:
■Schema Editor (page 1739)
NOTE This functionality affects geospatial feature data only. For information about
linking records in an external database to objects in a drawing, see Overview of
Linking Database Records to Objects (page 522). For information about moving
data between DWG and geospatial data stores, see Migrating DWG Data to GIS
(page 628).
To import an XML or XMI schema
1Connect to the feature source into which you want to import the schema.
2In Map Explorer, select the feature source in the connection tree (at the
top of the pane) and click Schema ➤ Edit Schema.
3In the Schema Editor (page 1739), select Schemas (the top-most node in
the Schema tree) and click Import Schema on the Schema Editor toolbar.
4In the Open dialog box, choose the file format for the file you are
importing (XML or XMI). Navigate to the file you want and click Open.
The Schema tree displays the imported schema.
5Click Apply to make the changes permanent.
To export an XML schema
1Connect to the feature source whose schema you want to export.
2In Map Explorer, select the feature source in the connection tree (at the
top of the pane) and click Schema ➤ Edit Schema.
3In the Schema Editor, select Schemas (the top-most node in the Schema
tree) and click Export Schema on the Schema Editor toolbar.
4In the Save dialog box, navigate to the desired directory and enter a name
for the file.
5Click Save.
Viewing a Schema
You can inspect a schema (page 2073) for any feature source (page 2063), including
those of FDO providers (page 2063) that don't support updateable schemas. When
608 | Chapter 4 Managing Data

you open an updateable schema, you can edit (page 610) it. If you change an
updateable schema mistakenly, click Cancel to undo (page 614) the changes.
Providers that support updateable schemas include Microsoft SQL Server,
MySQL, SDF, and Oracle.
When you open a non-updateable schema, you cannot edit it.
NOTE This functionality affects geospatial feature data only. For information about
linking records in an external database to objects in a drawing, see Overview of
Linking Database Records to Objects (page 522). For information about moving
data between DWG and geospatial data stores, see Migrating DWG Data to GIS
(page 628).
See also:
■Schema Editor (page 1739)
■Overview of Geospatial Data (page 551)
■Creating a Data Store (page 586)
■Creating a Schema (page 596)
■Importing and Exporting a Schema (page 606)
■Editing a Schema (page 610)
■Deleting Schemas (page 613)
NOTE This functionality affects geospatial feature data only. For information about
linking records in an external database to objects in a drawing, see Overview of
Linking Database Records to Objects (page 522). For information about moving
data between DWG and geospatial data stores, see Migrating DWG Data to GIS
(page 628).
To view a schema
1Connect to the feature source whose schema you want to view.
2In Map Explorer, select the feature source in the connection tree (at the
top of the pane) and click Schema ➤ Edit Schema.
3In the Schema Editor (page 1739), expand the Schema tree and then click
any schema, feature class, or property to view its settings in the right-hand
pane.
Viewing a Schema | 609

4When you finish inspecting the schema, click Cancel to close the Schema
Editor.
Editing a Schema
You can edit a schema (page 2073), feature class (page 2063), or property (page 2071)
if the FDO provider (page 2063) supports updateable schemas (for example,
Microsoft SQL Server, SQL Server Spatial, MySQL, Oracle, and SDF all support
updateable schemas). For more information about data types and supported
functionality, see Schema Editor (page 1739).
If you open a non-updateable schema in the Schema Editor you can view
(page 608) its settings, but you cannot change them.
You cannot edit or delete any schema, feature class, or property if there are
existing features that use it.
NOTE This functionality affects geospatial feature data only. For information about
linking records in an external database to objects in a drawing, see Overview of
Linking Database Records to Objects (page 522). For information about moving
data between DWG and geospatial data stores, see Migrating DWG Data to GIS
(page 628).
Z and M Dimensions
The FDO Provider for SQL Server Spatial does not support Z and M dimensions,
due to limitations of their support by SQL Server 2008. When you define new
geometry properties for feature classes in the AutoCAD Map 3D Schema Editor,
the options to include Z and M will not be available.
Naming Restrictions
You can use the Schema Editor to import a feature schema collection from an
XML file. When importing, you can modify these schemas to conform to the
restrictions of the current provider connection.
For example, if you are connected to an Oracle data store, feature class names
may be limited to 22 characters. If you import a feature schema collection
that includes feature class names that are longer, you will need to rename
those feature classes during import to meet the restrictions of the Oracle
connection.
610 | Chapter 4 Managing Data
If you import an FDO-enabled SQL Server Spatial schema collection into a
non-FDO schema connection, Schema Editor will display error messages that
tell you which names need to be adjusted.
NOTE If you try to set a physical override (for example, name a property column
to something other than the property name), you'll see an error message about
accessing protected memory.
Tell me more
Video
■Show me how to delete properties from
a schema.
■Show me how to append a feature class
to an SDF file.
Procedure
■To edit a schema (page 612)
Tutorial
■Exercise 3: Edit the schema
Workflow
■Add a Property to an SDF Schema
■Add a New Feature Class to an FDO
Data Source
GIS Skill
■Edit an existing schema (SDF)
Related topics
■About Geospatial Feature Classes, Data
Stores, and Schemas (page 551)
■Overview of Geospatial Data (page 551)
■Creating a Data Store (page 586)
■Creating a Schema (page 596)
■Setting Up Constraints in the Schema
Editor (page 599)
■Importing and Exporting a Schema
(page 606)
■Viewing a Schema (page 608)
Editing a Schema | 611

See also:
■Schema Editor (page 1739)
NOTE This functionality affects geospatial feature data only. For information about
linking records in an external database to objects in a drawing, see Overview of
Linking Database Records to Objects (page 522). For information about moving
data between DWG and geospatial data stores, see Migrating DWG Data to GIS
(page 628).
To edit a schema
NOTE If you edit the schema for a survey data store, make sure that you do not
inadvertently remove existing fields or classes. Doing so may affect the performance
of the survey data store.
1Connect to the feature source whose schema you want to edit.
2In Map Explorer, select the feature source in the connection tree (at the
top of the pane) and click Schema ➤ Edit Schema.
3In the Schema Editor (page 1739), expand the Schema tree and click the
schema, feature class, or property to edit.
The current settings appear in the right-hand pane.
4Edit the settings for the schema element. (page 1739)
The settings you can change depend on what the provider supports and
which settings are editable. For example, the long transaction (page 2067)
section does not appear or is unavailable if the provider does not support
versioning.
5To add a new feature class, select the schema entry on the right and click
New Feature Class at the top of the window. Specify the information for
the new feature class on the left side of the window.
6To add a new property, select the feature class entry for that property on
the right and click New Property at the top of the window. Specify the
information for the property on the left side of the window.
See Setting Up Constraints in the Schema Editor (page 599) for information
on limiting the valid values for a property.
7For a feature class and property, click the Physical Configurations tab
and edit the physical settings if necessary.
612 | Chapter 4 Managing Data

Each provider maps a correspondence between a schema element and a
physical object in a feature source. The physical structure of feature sources
varies by provider, as do the types of schema mappings and default
settings. Oracle, for example, maps each feature class onto a table in the
Oracle database where the feature source resides, giving the class and
table the same name. You can override these defaults by changing the
settings on the Physical Configurations tab. The settings on this tab vary
by provider. The tab is unavailable for providers whose defaults cannot
be changed.
8Click Apply.
9Repeat the preceding four steps as required to edit other schema elements.
10 Click OK to make all the changes permanent.
Deleting Schemas
When you delete a schema (page 2073), feature class (page 2063), or property (page
2071) in the Schema Editor, its icon disappears from the Schema tree, along with
the icons of its child elements (if any). However, the changes are not transferred
to the underlying feature source (page 2063) until you apply them. If you delete
a feature class, for example, the class and its properties are removed from the
Schema tree, but its table remains in the feature source until you click Apply.
You can undo (page 614) changes until you click Apply.
NOTE You cannot delete a schema, feature class, or property if feature data exist
for that item.
NOTE This functionality affects geospatial feature data only. For information about
linking records in an external database to objects in a drawing, see Overview of
Linking Database Records to Objects (page 522). For information about moving
data between DWG and geospatial data stores, see Migrating DWG Data to GIS
(page 628).
See also:
■Schema Editor (page 1739)
■Overview of Geospatial Data (page 551)
■Creating a Data Store (page 586)
■Creating a Schema (page 596)
Deleting Schemas | 613

■Importing and Exporting a Schema (page 606)
■Viewing a Schema (page 608)
■Editing a Schema (page 610)
NOTE This functionality affects geospatial feature data only. For information about
linking records in an external database to objects in a drawing, see Overview of
Linking Database Records to Objects (page 522). For information about moving
data between DWG and geospatial data stores, see Migrating DWG Data to GIS
(page 628).
To delete schema elements
1Connect to the feature source containing the schema elements to delete.
2In Map Explorer, right-click the desired connection in the connection
tree and select Edit Schema.
3In the Schema Editor (page 1739), expand the Schema tree to see its feature
classes and properties.
4Right-click the schema, feature class, or property to delete, and click
Delete for that schema element.
5When prompted, click Yes to confirm the deletion.
The Schema tree updates to show the deletion.
6Repeat the preceding two steps as required to delete other schema
elements.
7Click OK to make all the deletions permanent.
Undoing Schema Changes
When you make changes in the Schema Editor, the Schema tree and right-hand
pane reflect your changes. However, the changes are not applied to the
underlying feature source until you click Apply. If you click Cancel before you
click Apply, all changes you made since the last Apply are canceled.
614 | Chapter 4 Managing Data

NOTE This functionality affects geospatial feature data only. For information about
linking records in an external database to objects in a drawing, see Overview of
Linking Database Records to Objects (page 522). For information about moving
data between DWG and geospatial data stores, see Migrating DWG Data to GIS
(page 628).
See also:
■Schema Editor (page 1739)
■Overview of Geospatial Data (page 551)
■Creating a Data Store (page 586)
■Creating a Schema (page 596)
■Importing and Exporting a Schema (page 606)
■Viewing a Schema (page 608)
■Editing a Schema (page 610)
■Deleting Schemas (page 613)
NOTE This functionality affects geospatial feature data only. For information about
linking records in an external database to objects in a drawing, see Overview of
Linking Database Records to Objects (page 522). For information about moving
data between DWG and geospatial data stores, see Migrating DWG Data to GIS
(page 628).
To discard all Schema Editor changes since the last Apply
■In the Schema Editor, click Cancel.
Migrating Data
Use Bulk Copy to copy data from one feature source (page 2063) to another,
either in the same format or in a different one.
NOTE For information about moving data between DWG and geospatial data
stores, see Migrating DWG Data to GIS (page 628).
Migrating Data | 615
Overview of Migrating Data
You can use Bulk Copy to copy data from one feature source (page 2063) to
another, either in the same format or in a different one.
You can move DWG objects and their attributes to a variety of geospatial
formats and, in some cases, move the data back into AutoCAD drawings.
Tell me more
Video
■Show me how to copy data from one
data store to another.
Procedure
■To copy data from one feature source
to another (page 621)
■To fix a Bulk Copy geometry problem
in the original data store (page 626)
■To fix a Bulk Copy geometry problem
in the resulting data store (page 626)
Tutorial
■Lesson 3: Move SDF Data to a Different
Geospatial Format
Workflow
■Copy SHP File Data to Microsoft SQL
Server, MySQL, or Oracle
■Create ArcSDE Features from Unclassi-
fied Drawings
GIS Skill
■Bulk copy data from a SHP file to an SDF
file
Related topics
■About Geospatial Feature Classes, Data
Stores, and Schemas (page 551)
■Overview of Geospatial Data (page 551)
■Creating a Data Store (page 586)
■Migrating DWG Data to GIS (page 628)
616 | Chapter 4 Managing Data
Use this method...To move data...
In the Tool-based Ribbon Workspace, click
Output tab ➤ Map Data Transfer panel
➤ Map 3D Export.
See Migrating DWG Data to GIS (page 628).
From DWG format to SDF
Click Output tab ➤ Map Data Transfer
panel ➤ As SDF 2.
See Exporting DWG Data to SDF2 Format
(page 1417).
From DWG format to SDF 2 (an earlier
version of SDF)
In the Display Manager, right-click a layer
➤ Export Layer Data To SDF.
See Saving or Exporting a Display Manager
Layer (page 1469).
From a Display Manager layer to SDF
In Map Explorer, click Tools ➤ Bulk Copy.
See Migrating GIS Data (Bulk Copy) (page
617).
From one geospatial format to another
Migrating GIS Data (Bulk Copy)
You can use Bulk Copy to copy data from one feature source (page 2063) to
another, either in the same format or in a different one.
NOTE For information about moving data between DWG and geospatial data
stores, see Migrating DWG Data to GIS (page 628).
Using Bulk Copy, you can copy the complete feature source (page 2063) or a
subset based on a specified schema (page 2073), feature class (page 2063), or property
(page 2071). You can also filter a Display Manager layer using an expression,
and then use Bulk Copy to create a data store that contains only the filtered
data.
What You Can Do With Bulk Copy
Use Bulk Copy to do the following:
■Make your own copy of data owned by another department.
Migrating GIS Data (Bulk Copy) | 617
■Upgrade from file-based (SDF or SHP) data storage to multi-user database
storage (Microsoft SQL Server, MySQL, or Oracle), which provides advanced
features, such as versioning (page 2078) and long transaction (page 2067).
■Move joined data and calculated fields into a new data store.
■Transform coordinate systems easily. For example, you can do any of the
following:
■Assign a coordinate system to a data store that does not have one.
■Create a new data store whose coordinate system is different from the
source. The target class uses the override coordinate system as the
projection for the spatial context.
■Convert a foreign schema to a native format.
Bulk Copying To SDF Format
If you create a new SDF file (page 589) in AutoCAD Map 3D, you can use it as
a target for Bulk Copy. However, you must delete the default schema (page
614) before copying data to the new SDF file.
Bulk Copying to SHP Format
A single SHP file can hold only one class. To copy multiple classes, to an empty
folder through the FDO SHP provider. When you copy to that connection,
Bulk Copy creates a new SHP file for each class you copy. Do not create a new
SHP file in Schema Editor and use the new SHP as your Bulk Copy target.
A SHP schema cannot be modified once it is applied.To avoid this limitation
when you copy SDF data to SHP, export the SDF schema. Then, when you
create the target SHP schema, delete its default schema and import the SDF
schema. This way, you can fix any errors in the schema. During the Bulk Copy,
select the feature class and property names in the To column and match them
exactly to the From column.
Depending on the size of the file, you can also import the SDF data and export
it as SHP.
Bulk Copying To or From SQL Server Spatial
When you copy data from an FDO-enabled SQL Server Spatial data store to a
non-FDO data store, class and property names may not be accepted by the
destination data store because naming rules vary between providers. You can
618 | Chapter 4 Managing Data
use schema mappings to rename schema elements that you copy, to be sure
they meet the naming rules of the destination data store.
You can also pass in a set of schema capabilities to the target data store, so
the cloned schemas conform to the capabilities of that data store.
When you copy geodetic polygons with clockwise rings to SQL Server Spatial,
check Unmatched Data Or Geometric Type Errors as an error type to ignore.
For geography, SQL Server Spatial considers the inside of a polygon to be to
the left of the outer boundary. If a polygon with a clockwise boundary is
inserted, the polygon actually covers the rest of the world, excluding what
appears to be inside the polygon from an onscreen perspective. If you ignore
unmatched geometry type errors when using Bulk Copy, the geometry and
orientation are adjusted when the target is SQL Server Spatial. If you do not
check this option and you copy a polygon with the wrong orientation to SQL
Server Spatial, that object will fail to copy.
Also, SQL Server Spatial does not currently support such polygons that are
bigger than one hemisphere.
Other Ways to Migrate Data
If you are moving data from DWG format to any other format, you cannot
use Bulk Copy. Instead, see Migrating DWG Data to GIS (page 628).
If you are moving geospatial data into SDF format, it may be easier to save or
export its Display Manager layer to SDF, without going through Bulk Copy.
See Saving or Exporting a Display Manager Layer (page 1469).
Things to Remember
When using Bulk Copy, keep in mind the following points :
■The copied schema is created if it does not exist in the destination feature
source.
■The names of schemas, feature classes (page 2063), and properties in the
source feature source do not need to match the names in the destination
feature source.
■You can save or load an XML mapping file to set up the mapping between
the source and destination feature sources.
■You can copy geometry with no transformation of the coordinates.
■You must make sure that the data you are moving are inside the extents
of the destination data store. (When you create a data store (page 586), you
Migrating GIS Data (Bulk Copy) | 619
specify the minimum and maximum X and Y spatial extents for the new
data store.) MySQL and Oracle support expanding the extents automatically
if incoming data are beyond the scope of the extents.
■If you do not have adequate rights to the target data store, you must either
create a new, empty data store as the target or ask your administrator to
grant you the rights required to insert data in the target tables.
Tell me more
Video
■Show me how to copy data from one
data store to another.
Procedure
■To copy data from one feature source
to another (page 621)
■To fix a Bulk Copy geometry problem
in the original data store (page 626)
■To fix a Bulk Copy geometry problem
in the resulting data store (page 626)
Tutorial
■Lesson 3: Move SDF Data to a Different
Geospatial Format
Workflows
■Copy SHP File Data to Microsoft SQL
Server, MySQL, or Oracle
■Create ArcSDE Features from Unclassi-
fied Drawings
GIS Skill
■Bulk copy data from a SHP file to an SDF
file
Related topics
■About Geospatial Feature Classes, Data
Stores, and Schemas (page 551)
■Overview of Geospatial Data (page 551)
■Understanding How Bulk Copy Con-
verts Data Types (page 623)
620 | Chapter 4 Managing Data

■Fixing Geometry Issues After a Bulk
Copy (page 625)
■Reviewing the Bulk Copy Log Informa-
tion (page 626)
■Migrating DWG Data to GIS (page 628)
■Saving or Exporting a Display Manager
Layer (page 1469)
NOTE For information about moving data between DWG and geospatial data
stores, see Migrating DWG Data to GIS (page 628).
To copy data from one feature source to another
1Connect (page 308) to the source and destination feature source (page 2063)
using Data Connect.
NOTE To copy data to SHP, connect to an empty folder through the FDO
SHP provider and use that connection as your Bulk Copy target. Do not create
a new SHP file in Schema Editor and use the new SHP as the target.
NOTE If you are copying data to a new SDF file that you created in AutoCAD
Map 3D, delete the default schema before you use Bulk Copy. See Deleting
Schemas (page 613).
2If necessary, use Data Connect to specify a new coordinate system for
the data stores you plan to use as the source and target in Bulk Copy.
For example, you can assign a coordinate system to a data store that does
not specify one, or change the coordinate system for a data store that has
one.
3Add any desired joins, calculated fields, or filters to the Display Manager
layers you plan to copy.
Bulk Copy will copy the resulting data to the target data store.
4In Map Explorer, click Tools ➤ Bulk Copy.
5In the Bulk Copy (page 1744) dialog box, under From, select a feature source
in the Connection Name list. This is the source, from which the data will
be copied.
Select from all Display Manager layers and connected feature sources.
Filtered layers display a filter icon in the list.
Migrating GIS Data (Bulk Copy) | 621
If you select a survey data store, you can select only a survey point group
as the source. To copy multiple point groups, copy them one by one.
You can also drag the originating feature source onto the target source
in the Data Connect dialog box to initiate a Bulk Copy. The item you
drag becomes the From entry and the item you drop it on becomes the
To entry.
6If the selected feature source supports versioning, select a version in its
Version list.
7Under To, select the destination feature source in the top list.
8If the destination feature source supports versioning, select a version in
its Version list.
The schema trees in Bulk Copy update automatically as you make your
choices.
9Under Select Items To Copy, check the boxes for the individual schemas,
features classes, and properties to copy to the destination feature source.
Selecting any schema element automatically selects all its child elements
(for example, selecting a feature class also selects all its properties). A
square (instead of a check) in a check box means that some of the children
of the element are not selected.
Calculated fields are appended after the native properties. If there are
joined fields, they are grouped under a node representing the join. If
there are multiple joins, they appear as they do in the Manage Layer Data
dialog box (page 1607).
In the right-hand tree, AutoCAD Map 3D displays a default name for the
item. Select the default name and enter a different one if you want.
The Info area displays the Class (or Connection), Source Coordinate
System, Filter Info, and Target Coordinate System. If there are multiple
coordinate systems for the classes under the selected connection, the
coordinate system field displays “VARIES.”
10 Select the error types to ignore during processing. For any error types
whose boxes are not selected, Bulk Copy stops processing and reports
errors when they occur.
If the coordinate system is unknown, it is best to select Coordinate System
under Ignore the Following Errors During the Copy Process. For more
information about these options, see Bulk Copy (page 1744).
When you copy geodetic polygons with clockwise rings to SQL Server
Spatial, check Unmatched Data Or Geometric Type Errors under Ignore
622 | Chapter 4 Managing Data

the Following Errors During the Copy Process to adjust the geometry and
orientation properly.
11 To save the current settings in an XML mapping file, click Save under
Schema Mapping. Click Load to open a saved mapping file.
NOTE Before loading a mapping file, connect to the source and destination
feature sources.
12 To begin the Bulk Copy operation, click Copy Now.
The data for the specified schema elements is copied from the source
feature source to the destination feature source.
Bulk Copy displays the progress of the operation. If you click Cancel
during the operation, the copying process stops but the data does not
return to its original state. There is no way to roll back the data from
within AutoCAD Map 3D once the process is initiated.
When the operation is complete, Bulk Copy reports the results. Click
View Log in the Bulk Copy Results dialog box to see details (page 626).
Understanding How Bulk Copy Converts Data Types
During copying, Bulk Copy retains the same data type when possible but
performs a conversion if needed. For example, if you are copying data from
a source that uses a Boolean data type and that data type is not available in
the target, Bulk Copy converts the data to byte values, if available. If byte is
not available, Int16 is used, and so on. The following table illustrates how
conversion is performed (for each source data type, Bulk Copy tries to create
target data type 1, but if that is not possible it tries data type 2, and so on):
NOTE This functionality affects geospatial feature data only. For information about
moving data between DWG and geospatial data stores, see Migrating DWG Data
to GIS (page 628).
Target data
type 4
Target data
type 3
Target data
type 2
Target data
type 1
Source data
type
Int64Int32Int16ByteBoolean
Int64Int32Int16Byte
Int64Int32Int16
Understanding How Bulk Copy Converts Data Types | 623

Target data
type 4
Target data
type 3
Target data
type 2
Target data
type 1
Source data
type
Int64Int32
Int32Int64
SingleDoubleDecimal
DecimalDoubleSingle
SingleDecimalDouble
The following FDO providers (page 2063) support the following data types:
SQL Serv-
er and
SQL Serv-
er Spatial
WFSSHPSDFODBCMySQLArc-
SDE
Oracle
YYYYYYYBoolean
YYYYYYByte
YYYYYYYYDate/Time
YYYYYYYInt16
YYYYYYYYInt32
YYYYYYInt64
YYYYYYYDecimal
YYYYYYYSingle
YYYYYYYDouble
YYYYYYYYString
Bulk Copy copies geometry properties as is, except that it will convert an arc
to line segments if the destination does not support arcs.
624 | Chapter 4 Managing Data

Bulk Copy uses the following rules when copying an auto-generated identifier
from the source feature source (page 2063):
■If the identifier exists in the destination schema (page 2073) and is not
auto-generated, the identifier is copied from the source feature source.
■If the identifier exists in the destination schema and is auto-generated, the
identifier is generated by the destination provider.
■If the identifier does not exist in the destination schema and the destination
schema does not support auto-generated identifiers, the schema is created
with a non-auto-generated identifier and the identifier is copied from the
source feature source.
■If the identifier does not exist in the destination schema and the destination
schema supports auto-generated identifiers, the schema is created with an
auto-generated identifier and the identifier is generated by the destination
provider.
See also:
■Migrating GIS Data (Bulk Copy) (page 617)
■Reviewing the Bulk Copy Log Information (page 626)
■Migrating DWG Data to GIS (page 628)
To copy data from one feature source to another (page 621)
NOTE This functionality affects geospatial feature data only. For information about
moving data between DWG and geospatial data stores, see Migrating DWG Data
to GIS (page 628).
Fixing Geometry Issues After a Bulk Copy
For foreign schemas, the Bulk Copy operation uses the first geometry it finds
to create the geometry in the target data store. If there are multiple spatial
indexes for the geometry properties in the original data store, the geometry
property in the resulting data store’s schema will be different from the order
in the original data store. As a result, the geometry in the new data store may
not match the geometry in the source.
You can fix this problem in the original data store or in the resulting data
store. If you fix the problem in the resulting data store, you modify the XML
file schema and import the modified version into the data store.
Fixing Geometry Issues After a Bulk Copy | 625

NOTE This functionality affects geospatial feature data only. For information about
moving data between DWG and geospatial data stores, see Migrating DWG Data
to GIS (page 628).
NOTE This functionality affects geospatial feature data only. For information about
moving data between DWG and geospatial data stores, see Migrating DWG Data
to GIS (page 628).
To fix a Bulk Copy geometry problem in the original data store
■Remove the unwanted spatial indexes from the geometric properties in
the original data store.
If only one geometric property is indexed, it is chosen as the main geometry
for the feature class.
To fix a Bulk Copy geometry problem in the resulting data store
1Connect to the new data store before you perform the Bulk Copy
operation.
2Using the Schema Editor (page 610), save the source data store to an XML
file (page 608).
3Edit the XML file and add the following to the <xs:complexType> entry
for the feature class in question, where {geom_prop_name} is the name of
the geometric property to use:
fdo:geometryName="{geom_prop_name}"
4Import the modified XML file (page 608) into the target data store and
apply the changes.
5Bulk Copy the data from the source to the target data store, making sure
to map the geometry properties properly before executing the Bulk Copy.
Reviewing the Bulk Copy Log Information
When you perform a Bulk Copy operation, AutoCAD Map 3D creates a log
file that displays information about the source and target of the Bulk Copy
operation. It lists any schemas (page 2073) you created, information about feature
classes (page 2063), the number of objects that were copied, and how much time
the operation took. Here is an example:
626 | Chapter 4 Managing Data

“Source ConnectionProperty: 'File', Value: 'C:\San
Francisco\County\SDF\bayarea_county.sdf'
Property: 'ReadOnly', Value: 'false'Target ConnectionProperty: 'File',
Value: 'C:\old_version.sdf'
Property: 'ReadOnly', Value: 'false'Creating schema 'My_Schema'
Property My_Schema:bayarea_county.COUNTY: String length is 0, setting
to 255
Property My_Schema:bayarea_county.FIPSSTCO: String length is 0,
setting to 255
Inserting class 'My_Schema:bayarea_county'
9 objects inserted
Elapsed Time: 0.000110 seconds
Total: 9 objects inserted”
NOTE This functionality affects geospatial feature data only. For information about
moving data between DWG and geospatial data stores, see Migrating DWG Data
to GIS (page 628).
See also:
■Migrating GIS Data (Bulk Copy) (page 617)
■Understanding How Bulk Copy Converts Data Types (page 623)
■Migrating DWG Data to GIS (page 628)
NOTE This functionality affects geospatial feature data only. For information about
moving data between DWG and geospatial data stores, see Migrating DWG Data
to GIS (page 628).
To view the Bulk Copy log
1Run the Bulk Copy operation. (page 615)
2Click View Log in the Bulk Copy Results dialog box to see the log file.
NOTE The Bulk Copy operation stores its log files under %temp%, using the naming
convention bulkcopyxxxxx.log, where the x characters are replaced by numbers.
Reviewing the Bulk Copy Log Information | 627
Migrating DWG Data to GIS
You can move DWG objects and their attributes to a variety of geospatial
formats and, in some cases, move the data back into AutoCAD drawings.
NOTE When you export AutoCAD drawing data from AutoCAD Map 3D to a
geospatial data store, attributes remain with the geometry data but any visual
stylization you applied is lost, due to the different ways that the two environments
deal with stylization.
You can do the following:
■Export DWG data to the file-based SDF format (page 387)
■Export DWG data to Oracle (page 1461)
■Export the current map to DWG format (page 1459)
■Perform a round-trip data migration (page 1465) from DWG to SDF or Oracle
and back again.
Tell me more
Video
■Show me how to export DWG objects to
SDF
■Show me how to export styled DWG ob-
jects
■Show me how to convert the current
map to DWG format.
Procedure
■To export drawing objects to other file
formats (page 1408)
■To move drawing data to a spatial data
store and back using the import
method (page 1467)
■To move drawing data to a spatial data
store and back using the Data Connect
method (page 1467)
Tutorial
■Lesson 1: Convert Drawing Layers to
Feature Classes
628 | Chapter 4 Managing Data
Workflow
■Create ArcSDE Features from Unclassi-
fied Drawings
GIS Skill
■Convert styled DWG objects to features
Related topics
■About Geospatial Feature Classes, Data
Stores, and Schemas (page 551)
■Exporting DWG Data to an FDO Data
Store (page 1461)
■Moving DWG Data to a Spatial Data
Store and Back Again (page 1465)
To move DWG data to a geospatial format
1Decide whether you will move the data to an existing data store, or create
a new data store for it.
2Decide whether you will use an existing schema or a new schema for the
data.
3Query the data from the DWG into your map. (page 354)
4Export the data to SDF (page 1417), or to an FDO data store (Oracle or ESRI
ArcSDE) (page 1462).
5After the drawing data has been moved to a GIS format, add new data to
it (page 687) by right-clicking one of its feature class layers and creating
a new feature.
Migrating DWG Data to GIS | 629
630
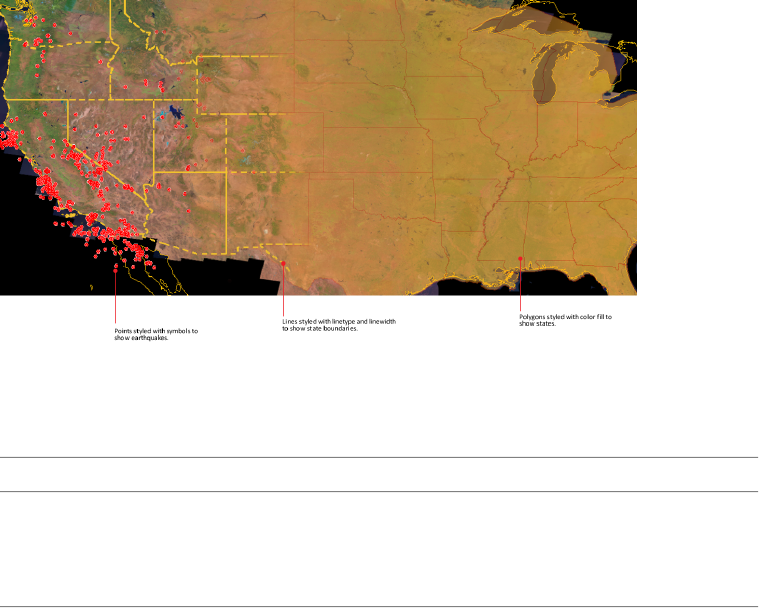
Visualization and Styling
Overview of Visualization and Styling
Style both drawing objects and GIS features to enhance the content of a map and
make it easy to read.
The methods for styling features and drawing objects are different.
DescriptionFor FeaturesFor Drawing Objects
Use the Display Manager to
style features and drawing ob-
Show or hide the Display Manager
(page 635)
Show or hide the Display Man-
ager (page 635)
jects in your maps, and to adjust
the draw order.
5
631

DescriptionFor FeaturesFor Drawing Objects
A layer is a set of objects. When
you add objects to your map,
Create a feature layer (page 308).Create a drawing layer (page ?).
you add them to a Display
Manager layer. Each layer can
have its own style.
Add a subset of objects from a
drawing or feature source to a
Display Manager layer.
Use the Add To Map With Query
option to filter the data from the
feature source (page 308).
Query the current drawing (page
1291) or attached drawings (page
1235) to bring in objects that
match certain criteria.
Change color, linetype, linetype
scale, line weight, or plotstyle.
Create a feature style. (page 641)Create a drawing style (page 660).
You can choose the symbol
used to represent point objects.
For drawing objects, add hatch,
text, or annotation. For features,
add labels.
A theme varies the style based
on data associated with the ob-
ject.
Create a feature theme (page 1168).Create a drawing theme (page
1181).
Use scale thresholds or ranges
to change the style as you zoom
Use scale ranges. (page 643)Use scale thresholds. (page 668)
in or out, for example, to turn
off text as you zoom out.
Specify a symbol style for a
point drawing layer. Use the
Style a point layer. (page 646)Style points (page 660).
Point Style area of the Style Edit-
or to create a style for a point
feature layer.
Specify an entity style for a line
drawing layer. Use the Line Style
Style a line layer. (page 649)Style lines. (page 660)
area of the Style Editor to create
a style for a line feature layer.
Specify an entity or hatch style
for a polygon drawing layer. Use
Style areas or polygons. (page 650)Style polygons. (page 660)
632 | Chapter 5 Visualization and Styling

DescriptionFor FeaturesFor Drawing Objects
the Area Style area of the Style
Editor to create a style for a
polygon feature layer.
Layers are drawn from the bot-
tom up. Objects in the layer at
Change the display order of layers
(page 302).
Change the display order of lay-
ers (page 302).
the top of the Display Manager
are drawn last and appear on
top of other objects. If an object
is a member of more than one
layer, it is drawn based on the
highest layer to which it be-
longs. The Draw Order view
takes precedence over the order
in the Layers By Group view.
If a layer is turned off, objects
from that layer are hidden.
Hide layers or styles (page ?).Hide layers or styles (page ?).
When a style is turned off,
drawing objects are displayed
without styles.
The legend lists the styles used
in the map.
Add a legend. (page 1118)Add a legend. (page 1118)
See also:
■Overview of Creating and Editing Data (page 681)
■Overview of the Display Manager (page 634)
■Styling Features (page 639)
■Styling Drawing Layers (page 652)
■Styling Raster Images (page 671)
Controlling the Display of Your Map
Use the Display Manager (page 2060) to determine which layers appear in your
map and the order of those layers. Use the scale control to set your current
stylization scale.
Controlling the Display of Your Map | 633
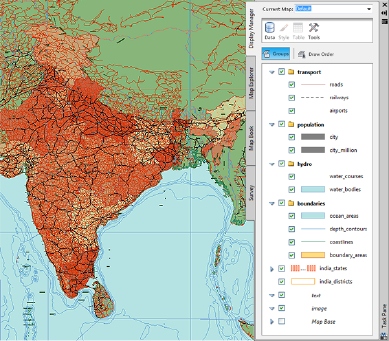
Overview of the Display Manager
The Display Manager (page 2060) displays styles for feature layers and drawing
object layers. The styles you create for the map do not affect the actual objects
in your map or in their original sources.
Drawing object layers are listed in italic text. Different operations are available
for feature and drawing layers. Right-click a layer to see the available
commands.
If a feature layer contains multiple geometry types, the Display Manager lists
each one under the feature class that contains them. You cannot hide
individual geometries from the Display Manager itself, but you can use the
Style Editor to turn them on or off in the layer list (page 641). Only layers that
are turned on in Display Manager will appear in a legend.
You can also use the Display Manager to change the display order and assign
different styles to different views based on scale.
Although Display Manager updates data automatically, you can update it
manually if things get out of synch. You can update the entire map or an
individual layer to reread attribute data, re-evaluate expressions for styles and
themes, and requery layers. You sometimes must refresh the items in the
Display Manager. This operation does not affect the drawing.
Use the Display Manager to apply styles to features
and drawing objects.
634 | Chapter 5 Visualization and Styling
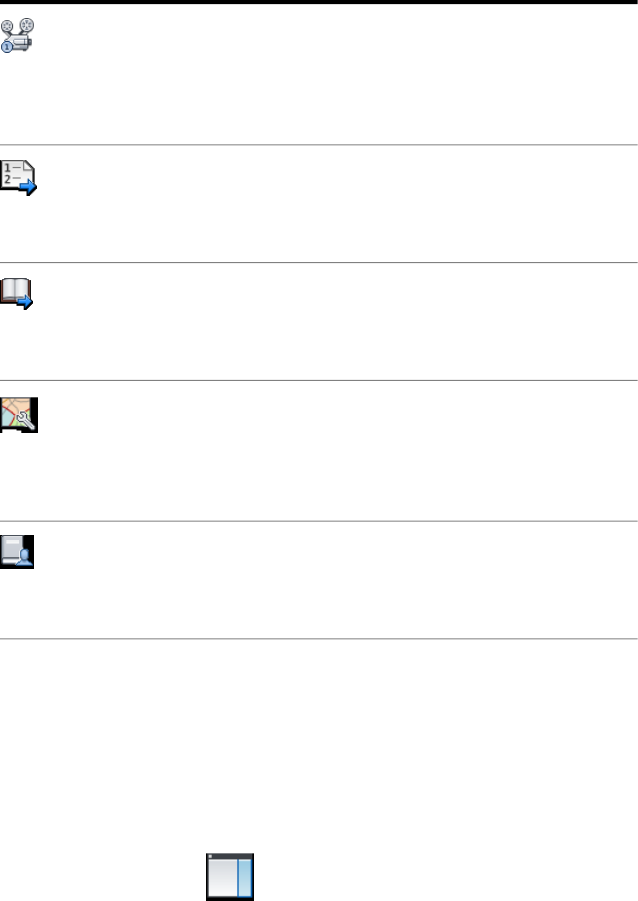
Tell me more
Video
■Show me how to manage layers with
draw order and folders.
■Show me how to include AutoCAD layers
in the Display Manager.
Procedure
■To change the order of layers (page
637)
■To change the draw order (page 302)
Tutorial
■Exercise 2: Change the order of items
in the legend
■The Task Pane
GIS Skill
■Hide and show features as you zoom in
and out
■Include AutoCAD layers in the Display
Manager
Related topics
■Organizing Layers in Your Map (page
300)
■Setting Task Pane Options (page 220)
■To display the Display Manager (page 635)
■To update the map or a single layer (page 636)
■To refresh the Display Manager (page 636)
To display the Display Manager
1In the Tool-based Ribbon Workspace, click View tab ➤ Palettes panel
➤ Map Task Pane.
2In the Task Pane, click Display Manager.
Overview of the Display Manager | 635
To update the map or a single layer
1Right-click the Display Manager or an individual layer.
2Click Update.
To refresh the Display Manager
■On the command line, enter mapwsrefresh.
Controlling Display Order
Layers in the map are displayed in the order in which they appear in the
Display Manager (page 2060) draw order view: layers higher in the list are drawn
in front of layers lower down.
You can change the display order by moving layers up or down in the list.
For example, to display drawing objects in front of a raster image, put the
raster layer at the bottom of the list.
Tell me more
Video
■Show me how to manage layers with
draw order and folders.
636 | Chapter 5 Visualization and Styling
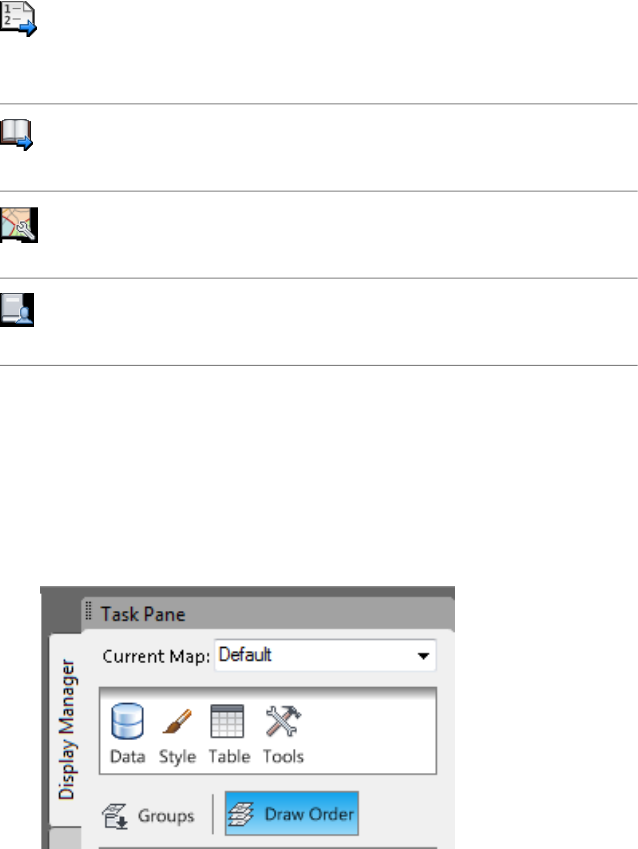
Procedure
■To change the order of layers (page
637)
■To change the draw order (page 302)
Tutorial
■Exercise 2: Change the order of items
in the legend
GIS Skill
■Hide and show features as you zoom in
and out
Related topics
■Organizing Layers in Your Map (page
300)
■To change the order of layers (page 637)
■To hide or show layers (page 638)
■To hide or show styles (page 638)
To change the order of layers
1In Display Manager (page 2060), make sure Draw Order is selected.
2Click the layer to move.
3Drag the layer up or down in the list.
Drawing objects from layers higher in the list are drawn on top of drawing
objects from layers lower in the list.
Controlling Display Order | 637
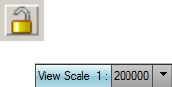
To hide or show layers
■In Display Manager (page 2060), select or clear the check box next to the layer
name.
To hide or show styles
■In Display Manager (page 2060), select or clear the check box next to the style
name.
Setting Map Scale
The scale control indicates and sets your current stylization scale. The list
includes all the scale ranges (for feature data) and thresholds (for drawing
data) defined in the current map. If you link scale to zoom, styles update
appropriately as you adjust the zoom, and zoom updates when you select a
scale. If you use the custom scale box, the correct style is applied based on
where the custom value lands within the scale ranges and thresholds.
See also:
■Defining Scale Ranges (page 643)
To set the map scale
1To link style to scale, close the lock icon on the Status Bar.
2On the Status Bar, select a scale from the list or click
Custom and enter a value in the Scale box.
Creating Multiple Display Maps
Each map file can contain multiple display maps. Each one has its own set of
layers, which are styled independently. For example, you can connect to a
data store that contains parcels and then create one display map that themes
the parcels by area and another that themes them by population.
If you use the same data store for multiple display maps, you connect to that
data store only once, but you add it to each display map separately. You can
copy a layer from one map to another and then change its styling.
638 | Chapter 5 Visualization and Styling

NOTE If your map file contains data on its base layer, that data appears on all
display maps you create in that file. You can clear the check box for the base layer
to hide its data.
All display maps in a map file use the same coordinate system.
See also:
■Overview of the Display Manager (page 634)
To create multiple display maps
1Connect (page 291) to the data stores to include in the various maps.
You can attach drawings and connect to geospatial feature sources.
2Create a new display map in the Display Manager by clicking Data ➤
New Map.
3Type a name for the new map in the Current Map box at the top of the
Display Manager.
4To copy a layer from another display map, follow these steps:
■Switch to the display map containing the layer you want by choosing
its name in the Current Map box.
■Right-click the layer and click Copy.
■Switch to the target display map.
■Right-click a blank area in the Display Manager and choose Paste.
5Style (page 631) each layer in the new display map.
Styling Features
■To create a map with styled feature layers (page 641)
■To define scale ranges (page 644)
■To apply styles to points (page 646)
■To apply styles to lines (page 649)
■To apply styles to areas (page 650)
■To load a LAYER file (page 652)
Styling Features | 639
Overview of Styling Features
Styles control how features appear on a map. Default styles are applied to
features. When you add point and polygon features to the map, they appear
with default symbol, line, and fill styles. Polylines are given a default line
style. Each layer is given a distinctive color. For example, polygons are filled
with a color that is different from other polygon layers that are already in the
map. Change the default styles as needed.
For example, you can specify the scale ranges at which a feature is visible, set
line color, and add labels. To specify styles for a layer, you define a style for
a scale range. 0 - Infinity is the default scale range. Add narrower scale ranges
as you define styles to define how the data appears at various scales. For
example, you could create one scale range that displays roads with thick lines
when you zoom in, and create a second scale range that displays roads with
thin lines when you zoom out.
You can also create a theme that displays data in varying styles to indicate
different values.
NOTE This functionality is for geospatial features only. If you are styling a drawing
layer, see Styling Drawing Layers (page 652).
Tell me more
Video
■Show me how to make a layer visible
only at a certain scale range.
■Show me how to create a scale range for
roads.
■Show me how to replace points with
symbols.
■Show me how to label features.
■Show me how to label features with
automatic resizing.
■Show me how to make the features on
a layer semi-transparent.
Procedure
■To apply styles to points (page 646)
■To apply styles to areas (page 650)
■To apply styles to lines (page 649)
640 | Chapter 5 Visualization and Styling
■To label features (page 1093)
Tutorial
■Lesson 2: Style Map Features
Workflow
■Style and Label a Linear Feature
GIS Skills
■Hide and show features as you zoom in
and out.
■Replace points in the map with symbols.
■Set transparency for parcels or other
features.
■Label features and optimize placement.
Related topics
■Defining Scale Ranges (page 643)
■Setting Map Scale (page 638)
■Styling Point Features (page 645)
■Styling Line Features (page 648)
■Styling Area Features (page 650)
■Adding Labels to Features (page 1091)
■Creating Themes (page 1162)
NOTE This procedure is for geospatial features only. If you are styling a drawing
layer, see Styling Drawing Layers (page 652).
To create a map with styled feature layers
1In the Display Manager (page 2060), click Data ➤ New Map.
2In the Current Map box, enter a name for the new display map.
3Assign a coordinate system (page 147) to the map.
4Connect (page 308) to the features you want and add them to the current
display map. Attach drawings and query in (page ?) the drawing objects
you want.
5Define the scale ranges. (page 643)
Overview of Styling Features | 641
6Click a layer in Display Manager and click Style to display the Style Editor.
If the feature layer you are styling contains multiple geometry types, each
one has its own Style Editor section.
7Specify a point (page 645), line (page 648), or polygon (page 650) style or
define a theme.
8Optionally:
■Change the display order (page 637) of layers. Layers at the top of the
list appear on top of other layers.
■Display or hide a geometry in Display Manager. Select or clear the
box labeled Show In Layer List for that geometry.
Only the displayed geometries appear in Display Manager and in any
legend you insert.
■Create a legend (page 1118).
DescriptionUse this method...To do this...
Use the Display Manager to
style features and drawing ob-
In the Tool-based Ribbon Work-
space, click View tab ➤ Palettes
Show or hide the Display Man-
ager
jects in your maps, and to adjust
the draw order.
panel ➤ Map Task Pane.
In the Task Pane, click Display
Manager.
When you connect to a feature
from your map, you add the
Add a feature to the map using
Data Connect. (page 308)
Create a feature layer.
objects in that feature to a Dis-
play Manager layer. Each layer
can have its own style.
Add a subset of objects from a
feature source to a Display
Manager layer.
Use the Add To Map With Query
option to filter the data from the
feature source (page 308).
Include only objects that match
certain criteria.
Options vary, depending on
whether you are styling points,
lines, or polygons.
Use the Style Editor (page 641).Create a style.
642 | Chapter 5 Visualization and Styling

DescriptionUse this method...To do this...
A theme varies the style based
on data associated with the ob-
ject.
Use the Style Editor (page 1168).Create a theme.
You can define multiple styles
and assign each one to a differ-
ent scale range.
Use scale ranges. (page 643)Change the style as you zoom in
or out.
For each feature, the property
you assign for the style appears
at the scale ranges you specify.
Include labels as part of a style and
assign a property for the labels.
(page 1093)
Label individual features.
Layers are drawn from the bot-
tom up. Objects in the layer at
Use Display Manager to change
the Draw Order (page 302).
Change the display order of lay-
ers.
the top of the Display Manager
are drawn last and appear on
top of other objects.
If a layer is hidden, objects from
that layer are hidden. When a
Check the boxes in the Display
Manager for the layers or styles to
show (page ?).
Hide layers or styles.
style is hidden, drawing objects
are displayed without styles.
The legend lists the styles used
in the map.
Use the Display Manager to in-
clude and style the legend. (page
1118)
Add a legend.
Defining Scale Ranges
The first step in creating styles for geospatial features is to define your scale
ranges.
NOTE This functionality is for geospatial features only. If you are defining ranges
for a drawing layer, see Creating and Modifying a Display Manager Scale Threshold
(page 667).
A scale range specifies the zoom level at which a particular style is applied to
the display of your features. When the zoom level of the map is within the
specified scale range, AutoCAD Map 3D redraws the features using the style
associated with the scale range.
Defining Scale Ranges | 643
The style is applied when the zoom level is greater than or equal to the From
value and less than the To value. When setting up adjacent scale ranges, use
the same To value as the next range's From value. For example, if one range
is 0 - 20,000 set the next range to 20,000 - 40,000.
NOTE When setting up multiple scale ranges for a map, make sure that they do
not overlap. For example, the ranges 500,000 - 5,000,000 and 2,000,000 -
10,000,000 overlap. In such cases, when the zoom level is within the overlapping
scale range, AutoCAD Map 3D displays the features using the style of the first scale
range listed.
Tell me more
Video
■Show me how to make a layer visible
only at a certain scale range.
■Show me how to create a second scale
range.
Procedure
■To define scale ranges (page 644)
Tutorial
■Lesson 3: Change the Display by Zoom
Level
Workflow
■Style and Label a Linear Feature
Related topics
■Setting Map Scale (page 638)
■Overview of Visualization and Styling
(page 631)
NOTE This procedure is for geospatial features only. If you are styling a drawing
layer, see Creating and Modifying a Display Manager Scale Threshold (page 668).
To define scale ranges
1In Display Manager (page 2060), right-click a feature layer.
2Click Edit Style to display the Style Editor.
644 | Chapter 5 Visualization and Styling
3In the Style Editor, in the Scale Ranges area, under From, enter the lower
end of the scale range. Under To, enter the upper end of the scale range.
For example, to make a style visible when the map is zoomed anywhere
between 1:250,000 and 1:5,000,000, enter 250000 for From and enter
5000000 for To.
4To add a new scale range, click Add A Scale Range.
5Specify From and To values.
6When working with scale ranges:
■To copy a scale range, select the range and click Duplicate.
■To delete a scale range, select the range and click Delete.
■To change the position of a scale in the list, select the range and click
Move Up or Move Down.
Quick Reference
Update Display Manager
Refreshes the current display
Right-click the Display Manager. Click UpdateTask Pane
Styling Point Features
Use symbols to represent and display point features.
NOTE This functionality is for geospatial features only. If you are styling a drawing
layer, see Creating a Style (page 658).
If precise placement of labels is important, you can display labels instead of
symbols at feature point locations. You can also specify whether other labels
on other layers obscure symbols on the current layer.
Tell me more
Video
■Show me how to replace points with
symbols.
Styling Point Features | 645
■Show me how to label features.
■Show me how to label features with
automatic resizing.
Procedure
■To apply styles to points (page 646)
■To label features (page 1093)
■To place fixed labels at points (page
1099)
■To allow labels to obscure points on
the selected layer (page 1097)
Tutorial
■Exercise 4: Try out the sample data
GIS Skills
■Replace points in the map with symbols.
■Label features and optimize placement.
Related topics
■Defining Scale Ranges (page 643)
■Adding Labels to Features (page 1091)
■Displaying Fixed Labels at Point Loca-
tions (page 1098)
■Allowing Labels to Obscure Points
(page 1096)
NOTE This procedure is for geospatial features only. If you are styling a drawing
layer, see Creating a Style (page 658).
To apply styles to points
1In Display Manager (page 2060), right-click a feature layer that contains
points.
2Click Edit Style.
3In the Style Editor, under Scale Ranges, select the scale range to style.
4In the Point Style area for the selected scale range, click the box under
Style.
646 | Chapter 5 Visualization and Styling

5In the Style Point dialog box (page 1637), select the Style A Point Symbol
check box.
6For Symbol, click .
7In the Select A Symbol dialog box, specify a symbol library and a symbol.
Click OK.
NOTE When creating a block for use as a symbol the Edge color applies to
any entities that are defined as ByBlock. The Fill color applies to any entities
that are defined as ByLayer.
8For Size Context, specify the type of units:
■Select Device Space to specify symbol widths and heights in screen
units. Available units are Points, Inches, Millimeters, or Centimeters.
■Select Map Space to specify symbol widths and heights in Mapping
Coordinate System (MCS) units. Available units are Inches, Feet, Yards,
Miles, Millimeters, Centimeters, Meters, and Kilometers.
9For Units, select the type of units to use.
10 For Width, enter the symbol width or specify the width using a number
expression.
For more information, see the Creating Numeric Expressions.
11 For Height, enter the symbol height or specify the height using a number
expression.
For more information, see the Creating Numeric Expressions.
12 To maintain width-to-height proportions when you change the width
or height of the symbol, select the Maintain Aspect Ratio check box.
13 To change the fill and edge colors of the symbol, use the Fill Color and
Edge Color lists.
If you do not change the colors, the default colors from the symbol are
used.
14 For Rotation, do one of the following:
■Select a value from the drop-down list.
■Click Any Angle. Specify the angle using the slider or enter an angle
in the box. Click OK.
Styling Point Features | 647
■Click Expression. Specify the rotation using a number expression.
For more information, see the Creating Numeric Expressions.
15 Click OK.
Styling Line Features
Specify the thickness, color, and pattern of polyline features. Style a single
line or build a composite line with several components and then style each
component. For example, to illustrate a highway, create a thick black line and
add a thinner, dashed, yellow line.
NOTE This functionality is for geospatial features only. If you are styling a drawing
layer, see Creating a Style (page 658).
Tell me more
Video
■Show me how to create a scale range for
roads.
■Show me how to label features.
■Show me how to label features with
automatic resizing.
Procedure
■To apply styles to lines (page 649)
■To label features (page 1093)
■To use expressions in labels
Tutorial
■Exercise 1: Use a composite style for
roads
GIS Skill
■Hide and show features as you zoom in
and out.
■Label features and optimize placement.
Related topics
■Defining Scale Ranges (page 643)
■Adding Labels to Features (page 1091)
648 | Chapter 5 Visualization and Styling
■Allowing Labels to Obscure Points
(page 1096)
NOTE This procedure is for geospatial features only. If you are styling a drawing
layer, see Creating a Style (page 658).
To apply styles to lines
1In Display Manager (page 2060), right-click a feature layer that contains
lines.
2Click Edit Style.
3In the Style Editor, under Scale Ranges, select the scale range to style.
For more information about scale ranges, see Defining Scale Ranges (page
643).
4In the Line Style area for the selected scale range, click the box under
Style.
5In the Style Line dialog box (page 1636), select the Apply Styles To The Line
check box.
6To style a single line, do the following:
■For Units (Device Space), select the type of units to measure line
thickness.
Lines are specified in Device Space units.
■Use the lists to specify polyline thickness, color, and pattern.
NOTE Select 0 thickness to draw the line as thinly as possible.
7To build a composite line, do the following:
■Click Create Composite Lines to expand the Style Line dialog box.
■Style the first line in the composite.
■Click New to add a new component to the line.
■Style the new component as desired.
■Control the position of the selected component in the overall
composite line by clicking the up and down arrows.
8Click OK.
Styling Line Features | 649

Styling Area Features
Specify the fill style and color, background color, edge style and color, and
line thickness used to draw area (polygon) features.
NOTE This functionality is for geospatial features only. If you are styling a drawing
layer, see Creating a Style (page 658).
See also:
■Defining Scale Ranges (page 643)
■Adding Labels to Features (page 1091)
■Allowing Labels to Obscure Points (page 1096)
NOTE This procedure is for geospatial features only. If you are styling a drawing
layer, see Creating a Style (page 658).
To apply styles to areas
1In Display Manager (page 2060), right-click a feature layer that contains
polygons.
2Click Edit Style.
3In the Style Editor, under Scale Ranges, select the scale range to style.
For more information about scale ranges, see Defining Scale Ranges (page
643).
4In the Area Style area for the selected scale range, click the box under
Style.
5To fill polygons, in the Style Polygon dialog box (page 1639), select the
Apply Fill To The Area check box.
6For Fill Pattern, select Solid or a pattern.
■If you specified Solid fill, specify Foreground Transparency and
Foreground Color.
■If you specified a pattern fill, specify colors for Foreground Color and
Background Color. If you do not want a background color for the
pattern, click Transparent for Background Color.
650 | Chapter 5 Visualization and Styling

NOTE In polygons with transparent backgrounds, the colors you see on
the map may differ from the colors displayed in the preview frame because
the preview frame always uses a white background, which may differ from
the color beneath the transparent objects in your map.
7add borders to polygons, select the Apply A Border To The Area check
box and then do the following:
■For Line Pattern, specify the pattern for the area border.
■For Units (Device Space), select the type of units to use to measure
border thickness.
■For Line Thickness, specify a thickness for the area border.
NOTE Select 0 thickness to draw the border as thin as possible.
■For Line Color, specify a color for the area border.
8Click OK.
Labeling Features
You can label features on feature layers. For more information, see Adding
Labels (page 1091).
Saving and Loading Styled Feature Layers
After you have styled feature layers, you can save the connection and styling
information to LAYER files that you can share with other users. A LAYER file
contains connection and style information only, no feature data.
NOTE This functionality is for geospatial features only. To save drawing layer
styles, see Saving a Display Style in the Library (page 664).
When you load a LAYER file, AutoCAD Map 3D adds the source file to the
Map Explorer, creates the connection, adds the feature layer to the Display
Manager (page 2060), and styles the layer correctly. Drag and drop the LAYER
file from Windows Explorer to the Display Manager.
Labeling Features | 651

See also:
■Saving or Exporting a Display Manager Layer (page 1469)
NOTE This procedure is for geospatial features only. To save drawing layer styles,
see Saving a Display Style in the Library (page 664).
To load a LAYER file
■Drag and drop the LAYER file from Windows Explorer to the Display
Manager (page 2060).
Styling Drawing Layers
When you define a style for a drawing layer, you specify how AutoCAD Map
3D displays drawing objects on that layer.
■To create a map with styled drawing layers (page 654)
■To style a drawing layer (page 657)
■To create a display style (page 660)
■To add a display style to a layer (page 662)
■To modify a display style (page 663)
■To hide the drawing objects in a layer (page 664)
■To save a style to the Display Library (page 665)
■To create a new category in the Display Library (page 665)
■To reference a style from the Display Library (page 666)
■To turn off style referencing (page 667)
■To create or modify a scale threshold (page 668)
■To view a layer's styles at all scale thresholds (page 670)
Overview of Styling Drawing Layers
When you define a style for a layer, you specify how to display drawing objects
on that layer.
NOTE This functionality is for drawing objects only. If you are styling a geospatial
feature layer, see Overview of Styling Features (page 640).
Style the drawing objects in your map by creating layers and then applying
one or more styles to the selected layer.
652 | Chapter 5 Visualization and Styling
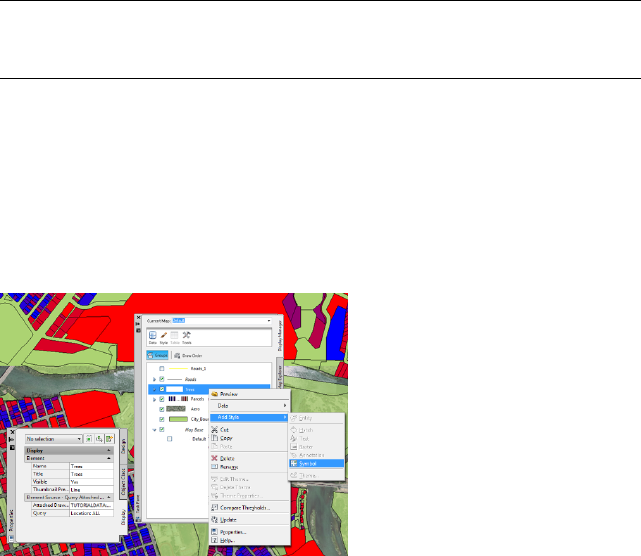
TIP For better performance, create a new display map rather than modifying the
default map. There are circumstances when the default map is automatically
displayed, and if this map has a lot of objects, it could take a while to display.
■A single map can have many drawing layers.
■You can specify a different style for each drawing layer in your map, and
combine multiple styles for a single layer.
■You can create a theme for a drawing layer. A theme varies the style based
on data associated with the object, for example, a darker color to represent
a higher traffic volume.
You can apply one or more styles to layers in
your map.
If a drawing object is a member of more than one drawing layer, it inherits
the style of each layer of which it is a member. For example, if a line is in both
the Transportation layer and the Roads object class layer, it inherits the styles
of both layers. If the layers specify conflicting style or visibility settings, the
drawing object uses the style and visibility settings of whichever layer is higher
in the Display Manager list.
Style objects by changing one or more of the following:
■Color
■Linetype
■Linetype scale
■Lineweight
■Plot style
Overview of Styling Drawing Layers | 653

■Symbol or image used to represent objects
■Adding hatch
■Adding text
■Adding annotation
See also:
■Bringing In Drawing Data From DWG Files (page 350)
■Creating Multiple Display Maps (page 638)
■Setting Map Scale (page 638)
■Theming Drawing Data (page 1176)
NOTE This procedure is for drawing objects only. If you are styling a geospatial
feature layer, see Overview of Styling Features (page 640).
To create a map with styled drawing layers
1In the Display Manager (page 2060), click Data ➤ New Map.
2In the Current Map box, enter a name for the new map.
3Select the objects to style. (page 350)
Each set of drawing objects is a drawing layer.
4For each layer, specify a style (page 658) or a theme (page 1178).
5Optionally:
■Change the display order (page 636) of drawing layers. Layers at the
top of the list appear on top of other layers.
■Specify different styles at different view scales.
■Create a legend (page 1118).
DescriptionClickTo Do This
Use the Display Manager to style features and
drawing objects in your maps, and to update
In the Tool-based Ribbon
Workspace, click View tab
Display the Display Man-
ager
the display for different drawing scale
thresholds.
➤ Palettes panel ➤
654 | Chapter 5 Visualization and Styling
DescriptionClickTo Do This
Map Task Pane. In
the Task Pane, click Dis-
play Manager.
A drawing layer is a set of objects. Each layer
can have its own style. See Bringing In Drawing
Data From DWG Files (page 350).
In the Display Manager,
click Data ➤ Add Draw-
ing Data. Click the type
of layer to create.
Create a drawing layer
A query lets you define conditions to select
specific objects. See Bringing In Drawing Data
From DWG Files (page 350).
In the Display Manager,
click Data ➤ Add Draw-
ing Data ➤ Query Cur-
rent Drawing.
Query objects in the cur-
rent drawing
A query lets you define conditions to select
specific objects. See Bringing In Drawing Data
From DWG Files (page 350).
In the Display Manager,
click Data ➤ Add Draw-
ing Data ➤ Query Source
Drawings.
Query objects in attached
drawings
Change color, linetype, linetype scale, line
weight, or plotstyle; change the symbol used
Right-click a layer. Click
Add Style, and then
Create a style
to represent the objects; or add hatch, text, orchoose the type of style
to create. annotation for objects using this style. See
Creating a Style (page 660).
A theme varies the style based on data associ-
ated with the object. See Overview of Theme
Styles (page 1181).
In the Display Manager,
right-click a layer ➤ Add
Style ➤ Theme.
Create a theme style
You can import a theme or map you created
in a previous version of AutoCAD Map 3D.
To import a theme: In the
Display Manager, click
Import a theme or map
from a previous version of
AutoCAD Map 3D Data ➤ Add Drawing
Data ➤ Import Old
Theme.
To import a map: In the
Display Manager, click
Data ➤ Add Drawing
Data ➤ Import Old Map.
Overview of Styling Drawing Layers | 655

DescriptionClickTo Do This
When a style is turned off, drawing objects are
displayed without styles.
Select or clear the check
box next to the style
Turn a style on or off
name in the Display
Manager.
Use scale thresholds to change drawing layer
styles as you zoom in or out, for example, turn
In the Display Manager,
click Tools ➤ Show
Create a new scale
threshold
text off as you zoom out. Close the lock icon
on the Status Bar to link scale and style.
NOTE This functionality applies to drawing
layers only. Feature layers use scale ranges. For
more information, see Defining Scale Ranges
(page 643).
Thresholds. Click the thin
down arrow next to the
Threshold list, and then
click Duplicate. Enter the
new threshold and click
OK.
Layers are drawn from the bottom up. Objects
in the layer at the top of the Display Manager
In the Display Manager,
click Draw Order so it is
Change the display order
of layers
are drawn last and appear on top of other ob-active and drag the layer
up or down. jects. If an object is a member of more than
one layer, it is drawn based on the highest
layer to which it belongs. The Draw Order view
is useful for defining a display order that differs
from the layer organization in the Display
Manager or the legend.
If a layer is turned off, objects from that layer
are hidden.
Clear the check box next
to the layer name
Hide objects in a layer
The legend lists the styles used in the map. See
Adding a Legend (page 1116).
In the Display Manager,
click Tools ➤ Create Le-
gend.
Add a legend
Reloads the entire drawing, including rereading
attribute data, reevaluating expressions for
Right-click the Display
Manager. Click Update.
Update the drawing
styles and themes, and requerying layers. To
update a single layer, right-click the layer. Click
Update.
You sometimes must refresh the items in the
Display Manager. This operation does not affect
the drawing.
On the command line,
enter mapwsrefresh.
Refresh the Display Man-
ager
656 | Chapter 5 Visualization and Styling

Quick Reference
Update Display Manager
Refreshes the current display
Right-click the Display Manager. Click UpdateTask Pane
Styling a Drawing Layer
When you define a style for a layer, you specify how objects on that layer
appear in the current display map.
NOTE This functionality is for drawing objects only. If you are styling a geospatial
feature layer, see Overview of Styling Features (page 640).
See also:
■Creating Multiple Display Maps (page 638)
■Creating Themes for Drawing Layers (page 1178)
■Creating a Style (page 658)
■Combining Styles (page 661)
■Saving a Display Style in the Library (page 664)
NOTE This procedure is for drawing objects only. If you are styling a geospatial
feature layer, see Overview of Styling Features (page 640).
To style a drawing layer
1Select the layer.
2Do one of the following:
■Create a new style. (page 660)
■Copy an existing style. (page 665)
■Reference a library style. (page 666)
■Create a theme (page 1181).
3If you want, add another style to the layer (page 662).
Styling a Drawing Layer | 657
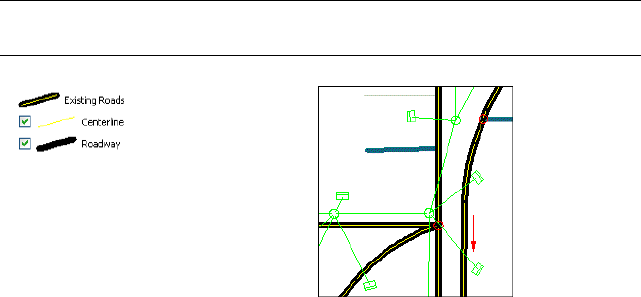
Symbol styles can be combined only with other symbol styles. Themes
cannot be combined with any other styles.
4You can save your style (page 665) in the Display Library.
5If your map does not look exactly as desired, modify the style (page 663).
Quick Reference
New Display Manager Style
Creates a new Display Manager style
In Display Manager, right-click a layer ➤ Add Style ➤
(select a style type)
Task Pane
Creating a Style
You can define a style for a drawing layer in a map. All the drawing objects
on this layer display using the style.
NOTE This functionality is for drawing objects only. If you are styling a geospatial
feature layer, see Overview of Styling Features (page 640).
658 | Chapter 5 Visualization and Styling

You can create more than one style for a drawing layer. The styles overlay
each other.
Style Types
Specifies color, linetype, linetype scale, line
weight, and plotstyle for drawing objects
using this style.
Entity
Adds annotation, such as text, blocks, im-
ages, and information based on object
Annotation
properties, to drawing objects using this
style.
Adds hatch to drawing objects using this
style.
Hatch
Uses symbols such as blocks or annotation
to represent drawing objects using this
Symbol
style. Can be combined with other symbol
styles only.
Adds text to drawing objects using this
style.
Text
Specifies brightness, contrast, and fade for
images using this style.
Raster Image
Displays the Thematic Mapping dialog
box, where you can create a theme style.
Theme
Creating a Style | 659
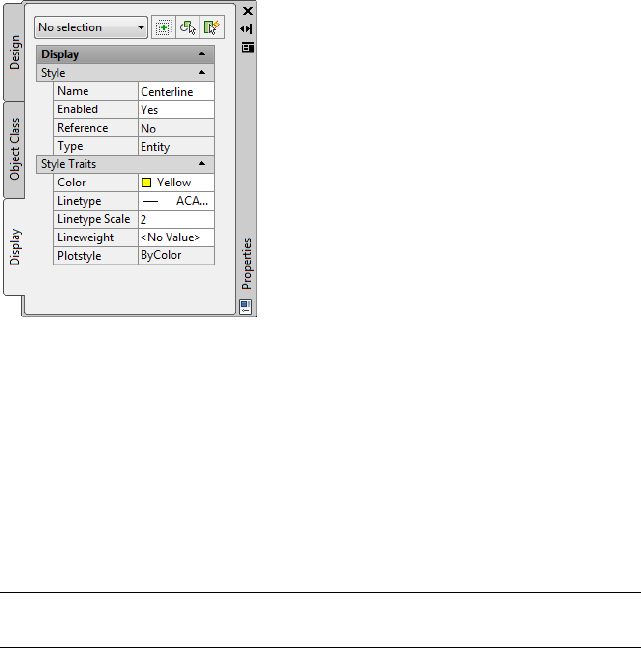
All the properties of the style are
displayed on the Display tab of the
Properties palette, where you can
view or modify them.
See also:
■Saving a Display Style in the Library (page 664)
■Referencing a Library Style (page 666)
■Creating Themes for Drawing Layers (page 1178)
NOTE This procedure is for drawing objects only. If you are styling a geospatial
feature layer, see Overview of Styling Features (page 640).
To create a display style
1In Display Manager (page 2060), right-click the layer to style. Click Add
Style, and then choose the type of style to create.
■Entity Style
■Hatch Style
■Text Style
■Raster Image Style
■Annotation Style
■Symbol Style
660 | Chapter 5 Visualization and Styling
2Select the style.
3If the Properties palette is not already visible, right-click the layer and
select Properties.
4On the Display tab of the Properties palette, specify style settings.
NOTE When entering an expression, you may need to select an item from
the list first. Click to display the Edit Expression dialog box (page 1574).
NOTE Some drawing objects might not be styled. The Display Manager does not
style drawing objects that have been queried into the current drawing using a
standard Query. To style drawing objects from attached drawings, see Overview
of Bringing in Drawing Data From DWG Files (page 351).
Quick Reference
New Display Manager Style
Creates a new Display Manager style
In Display Manager, right-click a layer ➤ Add Style ➤
(select a style type)
Task Pane
Combining Styles
You can combine styles for a single drawing layer.
Style roads by combining a thick continuous black line with a thin dotted yellow line.
Styles are rendered from bottom to top. That is, the bottom style in the list is
rendered first.
NOTE Symbol styles can only be combined with other symbol styles. Themes
cannot be combined with any other styles.
NOTE This functionality is for drawing objects only. If you are styling a geospatial
feature layer, see Overview of Styling Features (page 640).
Combining Styles | 661

See also:
■Creating a Style (page 658)
NOTE If the layer has a symbol style applied, you can only combine it with other
symbol styles. You cannot combine a theme with any other styles.
NOTE This procedure is for drawing objects only. If you are styling a geospatial
feature layer, see Overview of Styling Features (page 640).
To add a display style to a layer
1Select the layer.
2Do one of the following:
■Create a new style. (page 660)
■Copy (page 665) an existing style.
■Reference a library style. (page 666)
Quick Reference
New Display Manager Style
Creates a new Display Manager style
In Display Manager, right-click a layer ➤ Add Style ➤
(select a style type)
Task Pane
Modifying a Style
The properties of the style are displayed on the Display tab of the Properties
palette. Modify the settings as desired.
662 | Chapter 5 Visualization and Styling
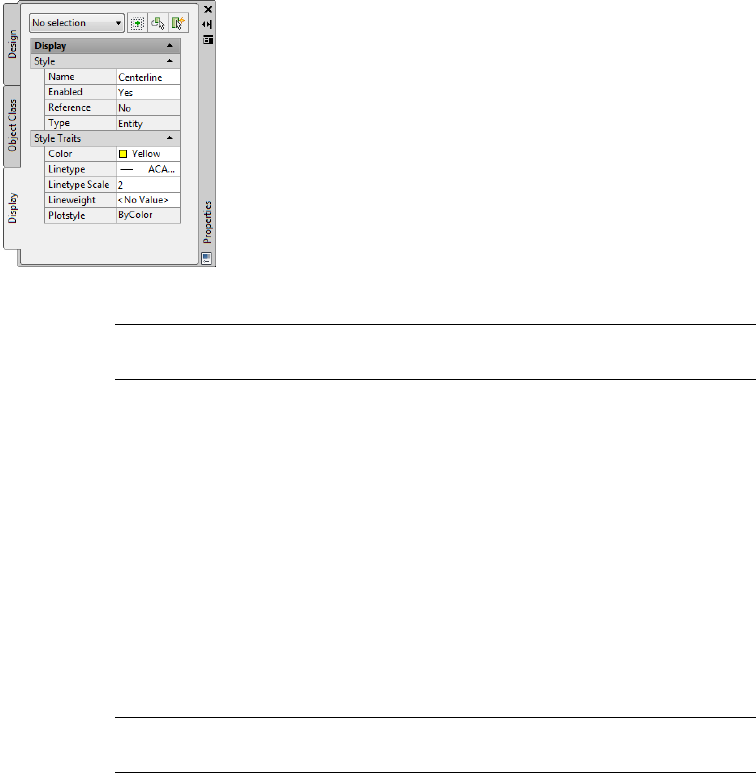
Modify style settings on the Properties palette.
NOTE This functionality is for drawing objects only. If you are styling a geospatial
feature layer, see Overview of Styling Features (page 640).
Style Referencing
If a style references another style, any changes to the style in one location are
automatically reflected in any other locations where the style is used. If you
turn off referencing for a style, any additional changes you make to that style
do not affect the other locations.
See also:
■Creating a Style (page 658)
■Referencing a Library Style (page 666)
■Creating and Modifying a Display Manager Scale Threshold (page 667)
NOTE This procedure is for drawing objects only. If you are styling a geospatial
feature layer, see Overview of Styling Features (page 640).
To modify a display style
1In Display Manager (page 2060), click the style.
2If the Properties palette is not already visible, click the Style button.
3On the Display tab of the Properties palette, modify style settings.
Modifying a Style | 663
To hide the drawing objects in a layer
■Clear the check box next to the layer name in Display Manager.
Quick Reference
PROPERTIES
Displays the Properties palette, which allows you to edit the properties of
objects
Analyze ➤ Properties
Menu
Properties
Icon
PROPERTIESCommand Line
Select object. Right-click in drawing area ➤ Properties
Task Pane
Saving a Display Style in the Library
If you plan to use a style more than once, you can save it in the Display Library.
NOTE This functionality is for drawing objects only. To save and reuse styles for
geospatial features, see Saving and Loading Styled Feature Layers (page 651).
Once a style is saved in the library, you can drag it to a drawing layer.
NOTE If you drag a style from the Display Library to a drawing layer, the style is
referenced. If you copy and paste the style, a new style is created.
When you drag a style from the library, you can reference the library style.
When a style references a library style, any changes to the style in one location
are automatically reflected in the other location.
TIP To have a layer look the same at all scale thresholds, store the style in the
Display Library. Then, at every scale threshold, reference the Display Library style.
This way, you can automatically modify the style at every scale threshold by
updating the style in the Display Library.
See also:
■Creating a Style (page 658)
664 | Chapter 5 Visualization and Styling

■Referencing a Library Style (page 666)
NOTE This procedure is for drawing objects only. To save and reuse styles for
geospatial features, see Saving and Loading Styled Feature Layers (page 651).
To save a style to the Display Library
1In the Display Manager (page 2060), right-click the style to save ➤ Copy.
2If the Display Library is not already displayed, in the Display Manager,
click Tools ➤ Show Library.
3On the Display Styles tab of the Display Library, right-click, and choose
Paste.
Note that the style is not referenced. Only dragging from the Display Library
to the drawing layer creates a referenced style.
TIP You can also create styles from within the Display Library. Right-click in the
Display Library. Click Add Style, and define the style. For more information on
creating styles, see Creating a Style (page 660).
To create a new category in the Display Library
1If the Display Library is not already displayed, in Display Manager (page
2060), click Tools ➤ Show Library.
2On the Display Library palette, right-click the Display Styles tab. Click
Add Category.
NOTE You must right-click the tab and not in the palette.
3To change the name of the tab, right-click the tab name. Click Rename.
Enter a name for the tab.
Quick Reference
Display Library Palette
Turns the Display Library palette on and off
MAPDISPLAYLIBRARYCommand Line
Saving a Display Style in the Library | 665

In Display Manager, click Tools ➤ Show Library or
Hide Library
Task Pane
Copy Display Manager Style
Copies a Display Manager style
In Display Manager, right-click the style ➤ Copy
Task Pane
Referencing a Library Style
When you use a style from the library, the style in the layer references the style
in the Display Library.
Example: The Display Library has a style called "Pipes" that colors drawing
objects blue. Reference this style from any pipe layer.
NOTE This functionality is for drawing objects only. To save and reuse styles for
geospatial features, see Saving and Loading Styled Feature Layers (page 651).
If a style references a library style, any changes to the style in one location are
automatically reflected in any other locations where the style is used. That is,
if you modify the style in the Display Manager, the style in the Display
Libraryis automatically updated, as are any other styles that reference the style
in the Display Library.
If you turn off referencing for a style, any additional changes you make to
that style do not affect the other locations.
NOTE Once you turn off referencing for a style, you cannot turn it back on.
See also:
■Creating a Style (page 658)
■Saving a Display Style in the Library (page 664)
NOTE This procedure is for drawing objects only. To save and reuse styles for
geospatial features, see Saving and Loading Styled Feature Layers (page 651).
To reference a style from the Display Library
1If the Display Library is not already displayed, in Display Manager (page
2060), click Tools ➤ Show Library.
666 | Chapter 5 Visualization and Styling

2Select the style in the Display Library.
3Drag it onto the drawing layer to style in the Display Manager.
To turn off style referencing
1In Display Manager (page 2060), click the style for which to turn off
referencing.
2If the Properties palette is not already displayed, right-click the style.
Click Properties.
3On the Display tab of the Properties palette, under Style, click the box
next to Reference and select No.
NOTE Once you turn off referencing for a style, you cannot turn it back on.
Creating and Modifying a Display Manager Scale Threshold
You can define different styles at different scale thresholds.
Example: Turn on the display of road names only when the drawing scale
factor is below 1:5000
NOTE This functionality is for drawing objects only. To use scale ranges with
geospatial features, see Defining Scale Ranges (page 643).
Referenced Styles
To display a layer the same way at multiple scale thresholds, save the styles
to the Library. For each new scale threshold, reference the style in the Library.
Any changes you make to the style at one scale threshold are reflected at the
other scale thresholds.
Turn off referencing for the styles that change from one scale threshold to the
next.
Example: Reference the Library Style for the Road layer at all scale thresholds
except when you are zoomed out. For that scale threshold, turn off referencing
so you can change the display of roads when you zoom out.
See also:
■Setting Map Scale (page 638)
Creating and Modifying a Display Manager Scale Threshold | 667
■Viewing Styles at All Scale Thresholds (page 669)
■Bringing In Drawing Data From DWG Files (page 350)
NOTE This procedure is for drawing objects only. To use scale ranges with
geospatial features, see Defining Scale Ranges (page 643).
To create or modify a scale threshold
1Zoom the drawing to the scale factor for which you want to create or
modify the threshold.
2To display the Threshold list, in the Display Manager, click Tools ➤ Show
Thresholds.
3Click the thin down arrow next to the Threshold list and click Duplicate.
4In the New Threshold dialog box, enter the new threshold value. Click
OK.
5Modify any of the styles for this new scale threshold.
If the styles reference a Library Style, turn off referencing for the selected
style before you modify it. To turn off style referencing, select the style.
On the Display tab of the Properties palette, next to Reference, select No.
If you do not turn off Reference, any changes you make to the style in
this scale threshold are automatically reflected in any styles that reference
this style.
NOTE hen creating and modifying styles, you can specify how you want to display
styles as you change scale thresholds.
■Close the lock icon on the Status Bar to update the drawing window
using the appropriate styles for each drawing scale threshold. Styles change
as you adjust the scale threshold.
■Open the lock icon on the Status Bar to update the drawing window
using the styles for the current scale threshold. Styles do not change as
you zoom.
668 | Chapter 5 Visualization and Styling

Quick Reference
New Display Manager Scale Threshold
Creates a new Display Manager scale threshold
In Display Manager, click Tools ➤ Show Thresholds.
Click the thin down arrow next to the Threshold list
and choose Duplicate.
Task Pane
Compare Display Manager Scale Thresholds
For the selected layer, lists the Display Manager styles for each scale threshold
In Display Manager, right-click the layer and choose
Compare Thresholds
Task Pane
PROPERTIES
Displays the Properties palette, which allows you to edit the properties of
objects
Analyze ➤ Properties
Menu
Properties
Icon
PROPERTIESCommand Line
Select object. Right-click in drawing area ➤ Properties
Task Pane
Viewing Styles at All Scale Thresholds
You can view a layer's styles for each scale threshold in the map.
Viewing Styles at All Scale Thresholds | 669
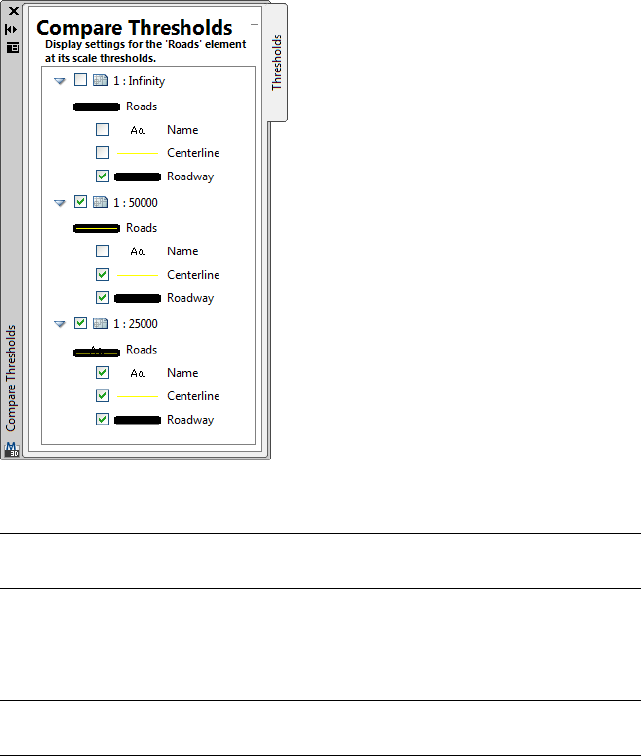
For the layer Roads, the drawing layer styles display
more information as you zoom in.
NOTE This functionality is for drawing objects only. To use scale ranges with
geospatial features, see Defining Scale Ranges (page 643).
See also:
■Creating and Modifying a Display Manager Scale Threshold (page 667)
NOTE This procedure is for drawing objects only. To use scale ranges with
geospatial features, see Defining Scale Ranges (page 643).
To view a layer's styles at all scale thresholds
1In the Display Manager (page 2060), right-click the layer ➤ Show Thresholds.
For the selected layer, the Compare Thresholds palette lists the styles for
each scale threshold defined in the map.
2To view the styles for a different layer, select the layer in Display Manager.
The Compare Thresholds palette displays the styles for the new layer.
670 | Chapter 5 Visualization and Styling

TIP You can add a style to a layer by dragging and dropping it from the Display
Library or another scale threshold.
Quick Reference
Compare Display Manager Scale Thresholds
For the selected layer, lists the Display Manager styles for each scale threshold
In Display Manager, right-click the layer and choose
Compare Thresholds
Task Pane
Styling Raster Images
You can style and view rasters brought into your map with Data Connect.
Overview of Styling Raster Images
For raster images you add to your map with Data Connect, you can do the
following:
■Adjust brightness and contrast.
■Display the image in grayscale or color.
■Make a single color in the raster transparent.
■Zoom to the raster image extents.
■Requery the raster at a different zoom level.
See also:
■Adding Rasters and Surfaces (page 437)
■Using Other Raster Image Formats (page 453)
■Analyzing Raster-Based Surfaces (page 1186)
■Modifying Raster Images (page 489)
Styling Raster Images | 671

Use this method...To do this...
Select the raster and, in the Style Editor
under Raster Style, do one of the following:
Adjust brightness and contrast for images
you added with Data Connect.
■To adjust brightness, enter a value
between -50 and 50 in the Brightness
box.
■To adjust contrast, enter a value
between -50 and 50 in the Contrast
box.
See Changing Brightness, Color, or Trans-
parency for Raster Images (page 672)
Select the raster and, in the Style Editor
under Raster Style, click the Style drop-
down box. Select Color or Greyscale.
See Changing Brightness, Color, or Trans-
parency for Raster Images (page 672)
Display an image you added with Data
Connect in grayscale or color.
Select the raster and, in the Style Editor
under Raster Style, click Transparent.
See Changing Brightness, Color, or Trans-
parency for Raster Images (page 672)
Make a single color transparent in a raster
you added with Data Connect.
Right-click the image layer. Click Zoom To
Extents.
See Viewing Raster Images (page 674)
Zoom to the extents of a raster you added
with Data Connect.
Right-click the image layer. Click Resample
Raster.
See Viewing Raster Images (page 674)
Requery a raster you added with Data
Connect at a different zoom level.
Changing Brightness, Color, or Transparency for Raster Images
You can use the Style Editor to modify the appearance of raster images brought
in to your map using Data Connect. You can adjust the brightness and contrast,
set transparency for a single color, and display the image in color or grayscale.
NOTE If you added an image using the Insert An image command, you cannot
use this functionality. See Modifying Raster Images (page 489) instead.
672 | Chapter 5 Visualization and Styling

See also:
■Adding Rasters and Surfaces (page 437)
■Using Other Raster Image Formats (page 453)
■Analyzing Raster-Based Surfaces (page 1186)
■Modifying Raster Images (page 489)
NOTE If you added an image using the Insert An image command, you cannot
use this procedure. See Modifying Raster Images (page 489) instead.
■To adjust brightness and contrast in a raster image (page 673)
■To set transparency for a single color. (page 673)
■To display your image in color or grayscale (page 674)
To adjust brightness and contrast in a raster image
1In the Display Manager (page 2060), right-click the layer ➤ Edit Style.
2In the Style Editor, under Raster Style, do one of the following:
■To adjust brightness, enter a value between -50 and 50 in the
Brightness box.
■To adjust contrast, enter a value between -50 and 50 in the Contrast
box.
3Click Apply.
To set transparency for a single color.
1In the Display Manager (page 2060), right-click the layer ➤ Edit Style.
2In the Style Editor, under Raster Style, click Transparent.
3In the Transparency Color dialog box, click Select.
4Select a color on your map, then click OK.
5Click Apply.
AutoCAD Map 3D displays all parts of the raster image that match the
selected color with 100% transparency.
Changing Brightness, Color, or Transparency for Raster Images | 673

To display your image in color or grayscale
1In the Display Manager (page 2060), right-click the layer ➤ Edit Style.
2In the Style Editor, under Raster Style, click the Style drop-down box.
3Select Color or Grayscale.
4If you select grayscale, adjust the range for grayscale mapping with the
Cell Minimum and Cell Maximum values.
5Click Apply.
Viewing Raster Images
When you zoom in on a raster image AutoCAD Map 3D automatically requeries
the image from the source to improve the display. You can also use the
Resample Raster tool to improve the display of raster feature data if necessary
(if you are using server-based raster images, for example). This tool requeries
just the displayed portion of the image. When you zoom out, use the Zoom
To Extents tool for the feature layer to display the full extents for the zoom
position.
NOTE If you added an image using the Insert An image command, you cannot
use this functionality. See Modifying Raster Images (page 489) instead.
See also:
■Overview of the Display Manager (page 634)
■Overview of Adding Rasters and Surfaces (page 437)
NOTE If you added an image using the Insert An image command, you cannot
use this procedure. See Modifying Raster Images (page 489) instead.
To requery a raster image
1Display the raster image at the desired zoom level.
2In the Display Manager (page 2060), right-click the image layer. Click
Resample Raster.
To zoom to image extents
1Zoom out as desired.
674 | Chapter 5 Visualization and Styling

2Right-click the image layer. Click Zoom To Extents.
Quick Reference
ZOOM
Increases or decreases the apparent size of objects in the current viewport
View menu ➤ Realtime
Menu
Zoom
Icon
ZOOMCommand Line
Styling Point Clouds
You can style point cloud (page 2071)s based on Classification, Elevation,
Intensity, and RGB color values. AutoCAD Map 3D has default settings for
each style category except RGB. You can modify or change the style settings
in the Point Cloud Style dialog box (page 1902).
Styling Point Clouds | 675
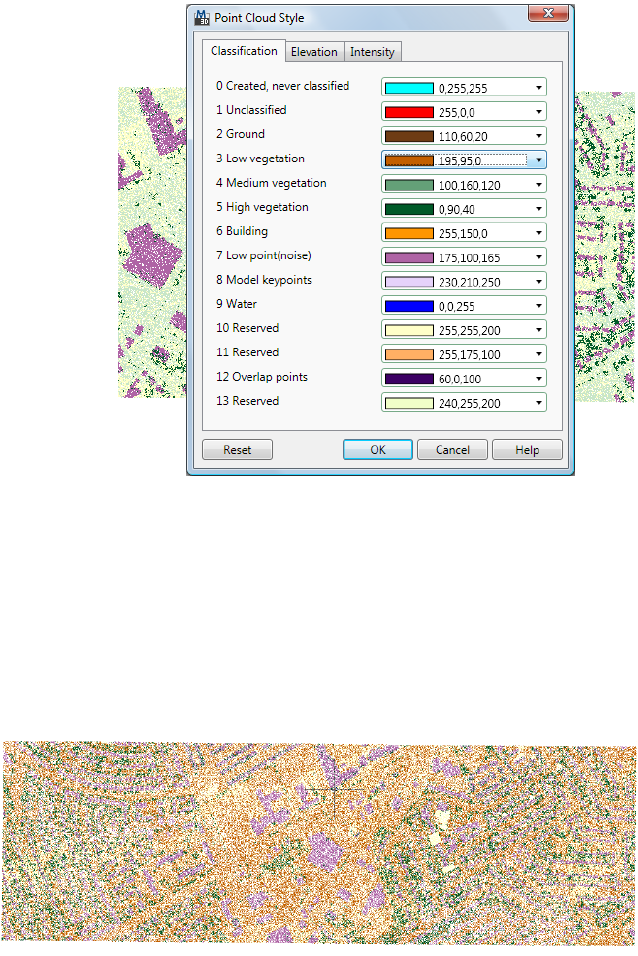
The Point Cloud Style dialog box
LAS (page 2066) is an industry standard file format defined by the American
Society of Photogrammetry and Remote Sensing that includes a system of
point classification. A processed LAS file may have points classified as bare
earth, high or low vegetation, building, and so on. LAS files may also contain
LiDAR intensity values (laser pulse return intensity) and Red/Green/Blue color
values (if there is ancillary color data from a camera accompanying the LiDAR
scan). Your LAS files may include classification, intensity, and color values,
or it may contain only elevation data.
A point cloud styled by classification
676 | Chapter 5 Visualization and Styling

NOTE If you are working with a point cloud index created using AutoCAD
commands (.PCG file), you can only style by elevation and RGB values.
See also:
■Overview of Point Clouds
■Overview of LiDAR DataLiDAR: data: overviewLiDAR: file types; LiDAR:
LAS file format; LiDAR: ASCII format
■Overview of Point Cloud Files and Objects (page 1013)
■Bringing in LiDAR Data (page 374)
■Using LiDAR Data to Create a Point Cloud Data Store (page 1019)
■Creating Surfaces From Point Cloud Data (page 1021)
■Managing LiDAR Data (page 1015)
■Filtering Point Cloud Data (page 1024)
■Exporting Point Cloud Data (page 1451)
To style point data by classification
1In the Display Manager, right-click the point cloud layer to style, then
select Style By ➤ Classification.
AutoCAD Map 3D applies the default Classification styling to your point
cloud.
2To change the default Classification style, right-click the point cloud
layer, then select Set Style.
3In the Point Cloud Style dialog box (page 1902), on the Classification tab,
select a new color for each class to change using the drop-down list.
4If you do not see the color that you want in the drop-down list, click
More Colors, then select an Index Color, True Color, or Color Book in
the Select Color dialog box.
5When you have made all the style changes, click OK.
To style point data by elevation
1In the Display Manager, right-click the point cloud layer to style, then
select Style By ➤ Elevation.
Styling Point Clouds | 677
AutoCAD Map 3D applies the default Elevation styling to your point
cloud.
2To change the default Elevation style, right-click the point cloud layer,
then select Set Style.
3In the Point Cloud Style dialog box (page 1902), on the Elevation tab, select
the number of rules to include in the style range.
By default, AutoCAD Map 3D uses five rules. The style range rules are
distributed evenly across the range of elevation values in your point cloud.
4To change the colors used for the style range, select new colors using the
drop-down lists.
5If you do not see the color that you want in the drop-down list, click
More Colors, then select an Index Color, True Color, or Color Book in
the Select Color dialog box.
6When you have made all the style changes, click OK.
To style point data by intensity
1In the Display Manager, right-click the point cloud layer you want to
style, then select Style By ➤ Intensity.
AutoCAD Map 3D applies the default Intensity styling to your point
cloud.
2To change the default Intensity style, right-click the point cloud layer,
then select Set Style.
3In the Point Cloud Style dialog box (page 1902), on the Intensity tab, select
the number of rules to include in the style range.
By default, AutoCAD Map 3D uses five rules. The style range rules are
distributed evenly across the range of intensity values in your point cloud.
4If you want to change the colors used for the style range, select new colors
using the drop-down lists.
5If you do not see the color that you want in the drop-down list, click
More Colors, then select an Index Color, True Color, or Color Book in
the Select Color dialog box.
6When you have made all the style changes, click OK.
678 | Chapter 5 Visualization and Styling
To style point data by RGB values
■In the Display Manager, right-click the point cloud layer you want to style,
then select Style By ➤ RGB.
Styling Point Clouds | 679
680
Creating and Editing Data
Overview of Creating and Editing Data
AutoCAD Map 3D works on two types of objects: features and drawing objects.
■Features are GIS objects stored in external files and databases. Display and
edit them in your map and then save the changes back to the original source.
Use the options described in Working with Features (page 683).
■Drawing objects are AutoCAD objects stored within a map or retrieved from
attached drawings using queries. Save changes to drawing objects in the
current map or back to the attached source drawing depending on the source
of each object. Use the options described in Working with Drawing Objects
(page 727) and Working with Attribute Data and Object Data (page 1047).
Use both AutoCAD Map 3D and AutoCAD to edit features and drawing objects.
Many AutoCAD commands work on both types of objects. Some AutoCAD
commands can only be performed on a feature after you extract its geometry
and edit it as a drawing object. You can then save your changes back to the
original data store with no loss of precision.
Most AutoCAD Map 3D operations are specific to one type of object or the
other. Use the right-click menus to see the commands that are available for the
selected feature or drawing object.
For drawing objects...For features...
Add drawing objects to your map by at-
taching drawings and querying in objects.
See Overview of Bringing in Drawing Data
From DWG Files (page 351).
Add features to your map using Data
Connect.
See Overview of Bringing In GIS Features
(page 305).
6
681

For drawing objects...For features...
Query in drawing objects that match spe-
cified criteria and store them on a separate
Use a query to filter one or more layers.
See Filtering Feature Layers (page 1216).
drawing layer (page 368). Other objects
become part of the Map Base layer.
Edit objects directly with AutoCAD and
AutoCAD Map 3D commands.
See Overview of Using the Map Editing
Tools (page 927).
Edit features by checking them out and
using AutoCAD and AutoCAD Map 3D
commands.
See Checking Out Features (page 695), Us-
ing Feature Editing Commands (page 704),
and Using AutoCAD Commands on Fea-
tures (page 713).
Create objects with AutoCAD and Auto-
CAD Map 3D commands.
See Working with Drawing Objects (page
727).
Create new features using Display Man-
ager.
See Creating New Features (page 686).
Create drawing objects from features.
See Extracting Feature Geometry (page
715) and Exporting Maps to DWG Format
(page 1459).
Create features from drawing objects.
See Creating a New Feature from a Draw-
ing Object (page 691).
Lock or unlock objects or drawings. See
Sharing Attached Drawings (page 729)
Maintain data security. Use versioning (for
data stores that support it) and check out
data to lock it while you use it. See Man-
aging Versions (page 723)
Save drawing objects back to their sources
by adding them to a save set.
See Editing and Saving Objects in Attached
Drawings (page 737).
Save features back to their sources by
checking them in.
See Checking In Features (page 693).
Use Object Classification to group objects
by their properties or data. See Using Ob-
ject Classification (page 981).
Organize data in feature classes. Use
Schema Editor to create and edit these
classes. See Overview of Working with
Schemas (page 594)
682 | Chapter 6 Creating and Editing Data

For drawing objects...For features...
Work with object data in an object data
table.
See Entering and Editing Object Data
(page 1061).
Work with attribute data in the Data Table.
See Editing Features using the Data Table
(page 711).
Work with linked external data in Data
View.
See Overview of Viewing External Data
Sources for Drawing Objects (page 1048).
Work with joined external data in the Data
Table.
See Editing Joined Data (page 515).
Use special commands available only for
drawing objects.
See Cleaning Up Drawing Data (page 765),
Creating, Editing, and Managing Topolo-
Use special commands available only for
features.
See Using Feature Editing Commands
(page 704).
gies (page 820), Using Map Editing Tools
(page 926), Digitizing Points Using Coordin-
ates (page 953), Working with Polygon
Objects (page 954), and Annotating Draw-
ing Objects (page 1100).
Save drawing objects back to their original
drawings (page 737) or export to a variety
Save features back to their original data
store (page 693), copy them to a different
of drawing and geospatial data formats
(page 1465).
spatial data format (page 617), or export to
DWG (page 1405).
Working with Features
■Overview of Working with Features (page 684)
■Creating New Features (page 686)
■Checking In Features (page 693)
■Checking Out Features (page 695)
■Canceling Checkout (page 697)
■Updating Edits Automatically (page 698)
■Editing Features (page 701)
■Working Offline (page 721)
■Managing Versions (page 723)
To work with features
■To edit features (page 686)
Working with Features | 683

■To create new features (page 686)
■To check in features (page 694)
■To check out features automatically (page 696)
■To check out features (page 696)
■To cancel check out (page 698)
■To update edits automatically (page 700)
■To edit features (page 701)
■To work offline (page 722)
■To return online (page 722)
■To clear the cache (page 723)
■To rebuild the cache (page 723)
■To create a new version (page 725)
■To activate a version (page 725)
■To commit changes back to the data store (page 726)
■To discard a version (page 726)
■To address errors (page 726)
Overview of Working with Features
When you connect to a geospatial data source and add it to your map, you
can see and edit the feature data. Features must be checked out to be edited.
By default, features are automatically checked out upon editing.
NOTE This functionality is for geospatial features only. For information about
working with drawing objects, see Working with Drawing Objects (page 727).
You can use most AutoCAD editing commands to edit feature data. For some
of the more advanced commands, you can use Update Feature Geometry (page
716) to convert a GIS feature to pure AutoCAD geometry. Once you have done
this, you can use these other AutoCAD commands, and then update the feature
without losing or affecting any of its attributes.
You can also create features from AutoCAD geometry (page 691). This gives
you the same functionality as Update Feature Geometry, but it creates a new
feature rather than changing an existing one.
Working in a Multiuser Environment
If you share data in a multiuser environment, be aware of the locking status
of the following providers.
■Oracle and ArcSDE support feature level locking that is persistent when
the connection with the source is closed and you go offline.
684 | Chapter 6 Creating and Editing Data
■MySQL and SQL Server do not support feature level locking or persistent
locking. Locks are released when the connection is closed.
■SDF does not support locking. Be very careful when working in a multiuser
environment.
■SHP supports file locking only as long as you are connected to the data.
When you close your map, break the connection, or go offline, the file is
unlocked.
Tell me more
Video
■Show me how to draft a new feature for
an existing feature class.
■Show me how to edit features stored in
a database or data store.
■Show me how to check out features for
editing in the field.
Procedure
■To create new features (page 686)
■To edit features (page 701)
Tutorial
■Exercise 2: Check out and edit a fea-
ture
Workflow
■Edit Features in a Geospatial Feature
Source
■Add Features to an Existing ArcSDE
Feature Class
■Work Offline from an Enterprise Data-
base
GIS Skill
■Draft new features for an existing feature
class.
■Edit feature geometry directly in a SHP
file using CAD tools.
■Check out features to edit in the field and
update the database later.
Overview of Working with Features | 685

Related topics
■Bringing in GIS Features (page 303)
■Checking Out Features (page 695)
NOTE These procedures are for geospatial features only. For information about
working with drawing objects, see To work with drawing objects (page 727).
To edit features
1Attach the data source. (page 308)
2If you do not have Auto Checkout turned on, check out the feature. (page
696)
3Do one or both of the following:
■Use feature-editing commands to make your changes. (page 705)
■Use AutoCAD commands to make your changes. (page 713)
4Check the feature back in. (page 694)
Creating New Features
To create new features
■To create new features (page 687)
■To create a new Point or MultiPoint feature (page 688)
■To create a new Polygon or MultiPolygon feature (page 689)
■To create a new LineString or MultiLineString feature (page 691)
■To create a new feature from geometry (page 692)
Overview of Creating New Features
You can create new features using feature-creation commands or by creating
a feature from a drawing object’s geometry.
NOTE This functionality is for geospatial features only. For information about
creating drawing objects, see the AutoCAD Help.
686 | Chapter 6 Creating and Editing Data
NOTE If the feature class for a layer does not provide automatically generated IDs
for new features, AutoCAD Map 3D will not create new features on the layer. To
create new features in this case, turn off Update Edits Automatically (page 698) .
AutoCAD Map 3D will hold the features in a queue instead of attempting to save
them to the source immediately. Feature IDs are generated in the queue.
Tell me more
Video
■Show me how to draft a new feature for
an existing feature class.
■Show me how to create new features
from existing AutoCAD objects.
Procedure
■To create new features (page 686)
Tutorial
■Lesson 4: Create Map Features
Workflow
■Add Features to an Existing ArcSDE
Feature Class
GIS Skill
■Draft new features for an existing feature
class.
Related topics
■Updating Edits Automatically (page
698)
■Checking Out Features (page 695)
NOTE This procedure is for geospatial features only. For information about creating
drawing objects, see the AutoCAD Help.
To create new features
■Use Display Manager to create Point or MultiPoint (page 688) features,
Polygon or MultiPolygon (page 689) features, and LineString or
MultiLineString (page 690) features.
If the provider supports curves, the arc option is available in the LineString,
MultiLineString, Polygon, and MultiPolygon creation commands.
Creating New Features | 687

■Create a new feature from a drawing object’s geometry (page 691).
Creating New Point and MultiPoint Features
If you have point feature layers in your drawing, you can create new point
and multipoint features. Multipoint features are multiple points that behave
like a single point feature.
NOTE This functionality is for geospatial features only. For information about
creating drawing objects, see the AutoCAD Help.
Use OSNAP to snap to any graphic within a block definition that is used to
symbolize a point. You can also use OSNAP Node to snap to the insertion
point of of an attribute, a block, a shape, or text. OSNAP Node is turned off
by default.
NOTE The feature creation commands available for a feature layer depend on the
capabilities of the feature class represented by the layer. Feature geometry follows
OGC specifications.
See also:
■Creating a New Feature from a Drawing Object (page 691)
■Using AutoCAD Commands on Features (page 713)
■OSNAP
NOTE This procedure is for geospatial features only. For information about creating
drawing objects, see the AutoCAD Help.
To create a new Point or MultiPoint feature
1Do one of the following:
■In the Display Manager (page 2060), right-click the feature layer for the
new feature ➤ Create ➤ New Point feature_name.
■In the Display Manager (page 2060), right-click the feature layer for the
new feature ➤ Create ➤ New MultiPoint feature_name.
Here, feature_name is the name of the Point or MultiPoint feature layer.
2At the MAPPOINTCREATE (page 1663) or MAPMULTIPOINTCREATE (page
1659) prompt, specify the location for the new Point or MultiPoint feature.
688 | Chapter 6 Creating and Editing Data

For MultiPoint features, specify the location of each point.
3For MultiPoint operations, press Enter to complete the operation.
The new feature is added to the Data Table. To add information to the
feature, see Editing Features using the Data Table (page 711).
4Check in the new features.
For more information, see Checking In Features (page 693).
Creating New Polygon and MultiPolygon Features
If you have polygon feature layers in your drawing, you can create new Polygon
and MultiPolygon features. MultiPolygon features behave like a single Polygon
feature. You cannot create a non-planar polygon. Every ring of a polygon must
be planar and all parts and all rings must be in the same plane.
NOTE This functionality is for geospatial features only. For information about
creating drawing objects, see the AutoCAD Help.
NOTE The feature creation commands available for a feature layer depend on the
capabilities of the feature class represented by the layer. Feature geometry follows
OGC specifications.
A polygon has one outer ring and can have one or more inner rings. A ring
within a polygon is considered a hole. To create polygons with multiple outer
and inner rings, create a MultiPolygon feature.
See also:
■Creating a New Feature from a Drawing Object (page 691)
■Using AutoCAD Commands on Features (page 713)
NOTE This procedure is for geospatial features only. For information about creating
drawing objects, see the AutoCAD Help.
To create a new Polygon or MultiPolygon feature
1Do one of the following:
■In the Display Manager (page 2060), right-click the feature layer for the
new feature ➤ Create ➤ New Polygon feature_name.
Creating New Features | 689

■In the Display Manager (page 2060), right-click the feature layer for the
new feature ➤ Create ➤ New MultiPolygon feature_name.
Here, feature_name is the name of the Polygon or MultiPolygon feature
layer.
2When prompted, specify the location for the new Polygon or
MultiPolygon feature.
3Use the command line or right-click to complete the new feature.
For more information, see MAPPOLYGONCREATE (page 1663) and
MAPMULTIPOLYGONCREATE (page 1660).
4Press Enter to complete the operation.
The new feature is added to the Data Table. To add information to the
feature, see Editing Features using the Data Table (page 711).
5Check in the new features.
For more information, see Checking In Features (page 693).
Creating New LineString and MultiLineString Features
If you have line feature layers in your drawing, you can create new LineString
and MultiLineString features. MultiLineString features are multiple lines that
behave like a single Line feature.
NOTE This functionality is for geospatial features only. For information about
creating drawing objects, see the AutoCAD Help.
NOTE The feature creation commands available for a feature layer depend on the
capabilities of the feature class represented by the layer. Feature geometry follows
OGC specifications.
See also:
■Creating a New Feature from a Drawing Object (page 691)
■Using AutoCAD Commands on Features (page 713)
NOTE This procedure is for geospatial features only. For information about creating
drawing objects, see the AutoCAD Help.
690 | Chapter 6 Creating and Editing Data
To create a new LineString or MultiLineString feature
1Do one of the following:
■In Display Manager (page 2060), right-click the feature layer for the new
feature ➤ Create ➤ New LineString feature_name.
■In Display Manager (page 2060), right-click the feature layer for the new
feature ➤ Create ➤ New MultiLineString feature_name.
Here, feature_name is the name of the LineString or MultiLineString feature
layer.
2When prompted, specify the location for the new LineString or
MultiLineString feature.
3Use the command line or right-click to complete the new feature.
For more information, see MAPLINESTRINGCREATE (page 1654) and
MAPMULTILINESTRINGCREATE (page 1656).
4Press Enter to complete the operation.
The new feature is added to the Data Table. To add information to the
feature, see Editing Features using the Data Table (page 711).
5Check in the new features.
For more information, see Checking In Features (page 693).
Creating a New Feature from a Drawing Object
You can create new features using drawing object geometry.
NOTE This functionality is for geospatial features only. For information about
creating drawing objects, see the AutoCAD Help.
Tell me more
Video
■Show me how to create new features
from existing AutoCAD objects.
Procedure
■To create a new feature from geometry
(page 692)
Creating New Features | 691
Workflow
■Add DWG Data to an Existing Feature
Source
GIS Skill
■Create new features from existing Auto-
CAD objects.
Related topics
■Overview of Working with Features
(page 684)
■Checking In Features (page 693)
■Using AutoCAD Commands on Fea-
tures (page 713)
NOTE This procedure is for geospatial features only. For information about creating
drawing objects, see the AutoCAD Help.
To create a new feature from geometry
1In the Display Manager (page 2060), right-click the layer to which you want
to add the feature. Click New Feature from Geometry.
2When prompted, select the object or objects to convert to features. Press
Enter.
All selected objects are converted into a single feature. To create multiple
features, perform this operation on one object at a time.
3When prompted to erase the drawing object, do one of the following:
■Click Yes to erase the original drawing object.
■Click No to keep the drawing object in the drawing.
Keep the object if you plan to use it to create other features. You can
store drawing objects on a separate layer and turn off visibility for the
layer.
To add information to the feature, see Editing Features using the Data
Table (page 711).
4Check in the new features.
For more information, see Checking In Features (page 693).
692 | Chapter 6 Creating and Editing Data
Quick Reference
New Feature from Geometry
Creates a new feature from drawing object geometry
Click Create ➤ New Feature from Geometry.
Menu
New Feature From Geometry
Icon
MAPCREATEFEATUREFROMGEOMETRYCommand Line
In Display Manager, right-click the feature layer. Click
New Feature from Geometry
Task Pane
Checking In Features
Checking in features saves your changes and additions to the feature source
and releases any locks. Check in features before giving a map to someone else
to edit. If you and the other person have different versions of AutoCAD Map
3D, some features may not be recognized unless they are checked in.
You can update the source automatically as you edit or wait until you check
in the features. If you update the source with edits automatically, be sure to
check in features when you are finished working.
NOTE This functionality is for geospatial features only. For information about
locking and unlocking drawing files, see Overview of Sharing Attached Drawings
(page 730).
Tell me more
Video
■Show me how to check in features after
editing in the field.
Procedure
■To check in features (page 694)
Tutorial
■Exercise 3: Update information for the
edited feature
Checking In Features | 693
Workflow
■Edit Features in a Geospatial Feature
Source
GIS Skill
■Draft new features for an existing feature
class.
■Check out features to edit in the field and
update the database later.
Related topics
■Overview of Working with Features
(page 684)
■Updating Edits Automatically (page
698)
NOTE This procedure is for geospatial features only. For information about locking
and unlocking drawing files, see Methods for Object Locking (page 731).
To check in features
1Select the features to check in using one of the following methods:
■Click a feature or features.
■Right-click the feature layer in the Display Manager (page 2060). Click
Select Checked-Out Features.
2Right-click the drawing. Click Check-In Feature.
Quick Reference
Check In Feature
Checks in features, saves your changes and additions to the feature source,
and releases locks
Click Edit ➤ Check-In.
Menu
Check-In Features
Icon
MAPCHECKINCommand Line
694 | Chapter 6 Creating and Editing Data
Select Checked-Out Features
Selects features that have been checked out to edit
Click Edit ➤ Select Checked-Out Features.
Menu
Select Checked-Out Features
Icon
MAPSELECTCHECKEDOUTCommand Line
In Display Manager, right-click the feature layerTask Pane
Checking Out Features
Checking out features makes them available to edit. By default, features are
checked out automatically when you edit them. Check in features before
giving a map to someone else to edit. If you and the other person have different
versions of AutoCAD Map 3D, some features may not be recognized unless
they are checked in.
If the data source supports locking, features or files will be locked. Checking
in or canceling a checkout operation unlocks locked features.
If you plan to work offline, check out the features that you want to edit before
going offline.
NOTE This functionality is for geospatial features only. For information about
locking and unlocking drawing files, see Overview of Sharing Attached Drawings
(page 730).
Tell me more
Video
■Show me how to check out features for
editing in the field.
Procedure
■To check out features automatically
(page 696)
Tutorial
■Exercise 2: Check out and edit a fea-
ture
Checking Out Features | 695
Workflow
■Edit Features in a Geospatial Feature
Source
GIS Skill
■Check out features to edit in the field and
update the database later.
Related topics
■Overview of Working with Features
(page 684)
■Updating Edits Automatically (page
698)
■Working Offline (page 721)
NOTE This procedure is for geospatial features only. For information about locking
and unlocking drawing files, see Methods for Object Locking (page 731).
To check out features automatically
■In the Tool-based Ribbon Workspace, click Feature Edit tab ➤ Edit Set
panel ➤ Auto Checkout.
To check out features
NOTE Use this procedure if you do not have Auto Checkout turned on.
1Click a feature or features.
2Right-click the drawing. Click Check-Out Feature.
Grips are displayed on the checked-out feature. If you do not edit using
grips you can turn them off. For more information, see Use Grip Modes
in the AutoCAD Help.
Quick Reference
MAPAUTOCHECKOUT
Automatically checks-out features that are edited
Not available on the menu in the current workspaceMenu
696 | Chapter 6 Creating and Editing Data
MAPAUTOCHECKOUTCommand Line
Check Out Feature
Checks out selected features and makes them available for editing
Click Edit ➤ Check-Out.
Menu
Check-Out Features
Icon
MAPCHECKOUTCommand Line
MAPFEATUREEDITOPTIONS
Specifies options for editing features
Feature Edit Options
Icon
MAPFEATUREEDITOPTIONSCommand Line
Feature Editing Options dialog boxDialog Box
Canceling Checkout
You can cancel the checkout of all, selected, or erased features. You can also
cancel the checkout of features by layer. When you cancel check out, locks
are released and your changes are discarded.
NOTE If Update Edits Automatically is on, edits are made in the feature source
immediately. Canceling checkout will not discard changes or restore erased features.
NOTE This functionality is for geospatial features only. For information about
locking and unlocking drawing files, see Overview of Sharing Attached Drawings
(page 730).
See also:
■Overview of Working with Features (page 684)
■Working Offline (page 721)
■Updating Edits Automatically (page 698)
Canceling Checkout | 697
NOTE This procedure is for geospatial features only. For information about locking
and unlocking drawing files, see Methods for Object Locking (page 731).
To cancel check out
1Click Feature Edit tab ➤ Edit Set panel ➤ Cancel Feature Check-out.
2When prompted, click one of the following options:
DescriptionOption
Cancels check out of all featuresAll
Cancels check out of all erased featuresErased
Prompts for a layer and cancels check out
of all features on the selected layer. This
Layer
option is the same as All if there is only one
layer.
Prompts for features or cancels check out
of selected features
Select Objects
Quick Reference
Cancel Checkout
Cancels a checkout operation. If you have Update Edits Automatically
enabled, cancelling the checkout does not undo changes.
Click Edit ➤ Cancel Check-Out.
Menu
Cancel Feature Check-Out
Icon
MAPCANCELCHECKOUTCommand Line
Updating Edits Automatically
You can queue your edits and save them to the source all at once, or you can
save them as you work.
698 | Chapter 6 Creating and Editing Data

NOTE This functionality is for geospatial features only. For information about
saving changes back to attached drawing files, see Setting Save Back Options
(page 763).
When Update Edits Automatically is off (the default), your changes remain
local until you check them in.
If you turn on Update Edits Automatically, AutoCAD Map 3D immediately
attempts to save any edits you have made to checked-out features back to the
feature source. If updating fails for any reason, the setting remains off. You
can reverse the changes you made (so your version matches the one that is
checked in), or check out the drawing, re-enter your edits and then check it
in.
NOTE Undo does not reverse this command. Canceling a checkout will not discard
changes or restore features to their state before the checkout.
You can change the default setting (page 84) for Update Edits Automatically.
When you create layers for SHP and SDF data, AutoCAD Map 3D may create
a local cache the first time you edit those layers. For large files this may be
time-consuming. To avoid this, turn on Update Edits Automatically for large
SDF and SHP files.
Persistent Locking
If the feature source provider supports persistent locking (page 2070), and Update
Edits Automatically is on, checking out a feature locks that feature; checking
in a feature unlocks it. You can release locks on features by checking them
out (if you are the user who locked them) and then checking them back in.
If the feature source provider supports persistent locking and Update Edits
Automatically is off, use Cancel Checkout to unlock features without saving
your changes to them. When you do this, you synchronize the state of the
feature you checked out with those in the feature source. That is, you delete
new features created locally, and replace locally modified or deleted features
with the versions from the feature source.
Revision Numbers
Some providers (for example, Oracle, SQL Server, and MySQL) support revision
numbers, which increment a numeric value in the feature every time you
commit a change to that feature in the feature source. This allows AutoCAD
Map 3D to see if a feature has been edited by another user. If another user
modifies a feature while you have it checked out, a revision-number conflict
can occur. This might happen if you check out the feature while you are
Updating Edits Automatically | 699

offline, or if the feature source provider does not support persistent locking.
In such cases, you cannot overwrite the other user’s changes to the features.
Instead, turn Update Edits Automatically off and choose Cancel Checkout for
the features that have conflicts.
See also:
■Customizing Your Work Environment (page 84)
■Working Offline (page 721)
■Canceling Checkout (page 697)
NOTE This procedure is for geospatial features only. For information about saving
changes back to attached drawing files, see To set editing and save back options
(page 764).
To update edits automatically
■In the Tool-based Ribbon Workspace, click Feature Edit tab ➤ Edit Set
panel ➤ Automatic Update
NOTE To change the default setting for Automatic Update, at the Command
prompt, type MAPEDITSETAUTODESFAULT and specify Active (checked) or Deactive
(unchecked) as the default.
Quick Reference
MAPEDITSETAUTO
Turns on and off the setting for updating edits to the feature source
automatically
Click Edit ➤ Update Edits Automatically.
Menu
MAPEDITSETAUTOCommand Line
MAPEDITSETAUTODEFAULT
Specifies the default setting for updating edits to the feature source
automatically
MAPEDITSETAUTODEFAULTCommand Line
700 | Chapter 6 Creating and Editing Data

Check In Feature
Checks in features, saves your changes and additions to the feature source,
and releases locks
Click Edit ➤ Check-In.
Menu
Check-In Features
Icon
MAPCHECKINCommand Line
Editing Features
To edit features
■To edit a feature using feature editing commands (page 705)
■To split a feature (page 708)
■To turn Ignore Split And Merge Rules on or off (page 708)
■To set split prompt options (page 709)
■To merge features (page 710)
■To edit features using the Data Table (page 712)
■To use AutoCAD commands on features (page 713)
■To edit feature properties in the Properties palette (page 719)
Overview of Editing Features
Edit features in any of the following ways:
■Use AutoCAD commands
Most common AutoCAD editing commands (such as PEDIT, ROTATE, and
TRIM) are available to use with features. To perform an AutoCAD operation
that is not available for features, extract the geometry from the feature,
modify it using AutoCAD, and then update the feature geometry.
NOTE To use common AutoCAD editing commands on features, make sure
you have selected Check Out Features As AutoCAD Drawing Objects in the
Feature Checkout Options area of the Feature Editing Options dialog box (page
1929)
■Use specialized AutoCAD Map 3D commands for certain geometry types
Editing Features | 701
■Change entries in the Data Table
■Change entries in the Properties palette
Edit the same feature properties in the Data Table or Properties palette.
Edits in the Properties palette apply to all selected features in the selected
layer.
NOTE This functionality is for geospatial features only. For information about
editing native drawing objects, see the AutoCAD Help.
Use this method...To edit this...
Use PEDIT for all features except MultiPoint
features.
■Point features
■MultiPoint features You can also use geospatial feature editing
commands for all features except Point
features:
■LineString features
■MultiLineString features
■Specify that features will be checked
out as geospatial features. (page 239)
■Polygon features
■MultiPolygon features
■Then change the geometry directly.
(page 705)
Modify a feature in the Data Table to
change its data. (page 712)
Change property values for all selected
features on the selected layer in the Prop-
erties palette. (page 719)
Feature properties
Specify that features will be checked out
as AutoCAD drawing objects. (page 239)
Feature geometry as AutoCAD drawing
objects
Then use any available AutoCAD com-
mands. (page 713)
NOTE In some cases, when feature geo-
metry is checked out as AutoCAD drawing
objects, geospatial feature editing com-
mands may still be available to use on the
geometry.
702 | Chapter 6 Creating and Editing Data
Tell me more
Video
■Show me how to edit features stored in
a database or data store.
■Show me how to check out features for
editing in the field.
Procedure
■To edit features (page 701)
Tutorial
■Lesson 5: Find and Edit Features
Workflow
■Edit Features in a Geospatial Feature
Source
■Work Offline from an Enterprise Data-
base
GIS Skill
■Edit feature geometry directly in a SHP
file using CAD tools.
■Check out features to edit in the field and
update the database later.
Related topics
■Extracting Feature Geometry (page 715)
■Updating Feature Geometry (page 716)
■Using Feature Editing Commands
(page 704)
■Editing Features using the Data Table
(page 711)
■Using AutoCAD Commands on Fea-
tures (page 713)
■Viewing and Editing Feature Properties
(page 718)
Editing Features | 703
Quick Reference
MAPDATATABLE
Allows you to view, edit, and filter feature data
Click Edit ➤ Data Table.
Menu
Table
Icon
MAPDATATABLECommand Line
In Map Explorer or Display Manager, click the Table
button
Task Pane
Data Table Dialog BoxDialog Box
PROPERTIES
Displays the Properties palette, which allows you to edit geometry, direction,
and resistance for selected topology objects
Click Modify ➤ Properties.
Menu
Properties
Icon
PROPERTIESCommand Line
Select objects. Right-click in drawing area ➤ Properties
Task Pane
Using Feature Editing Commands
Feature editing commands are available for Point, MultiPoint, LineString,
MultiLineString, Polygon, or MultiPolygon features. If you do not have Auto
Checkout turned on, check out a feature to use the feature editing command
specific to the geometry of that feature.
You cannot perform edits that would create a non-planar polygon. Every ring
of a polygon must be planar and all parts and all rings must be in the same
plane.
NOTE To improve performance when editing features, turn Update Edits
Automatically off.
704 | Chapter 6 Creating and Editing Data

NOTE This functionality is for geospatial features only. For information about
editing native drawing objects, see the AutoCAD Help.
See also:
■Updating Edits Automatically (page 698)
■Editing Features (page 701)
■Checking Out Features (page 695)
■Checking In Features (page 693)
NOTE This functionality is for geospatial features only. For information about
editing native drawing objects, see the AutoCAD Help.
To edit a feature using feature editing commands
1Make sure that you have specified that features will be checked out as
geospatial features in the Feature Editing Options dialog box (page 1929)
by selecting Geospatial Features in the Feature Checkout Options area.
2Check out the feature. (page 696)
For more information, see Checking Out Features (page 695).
3Right-click the feature. Click Edit Feature.
The appropriate feature editing command for the geometry will apply to
the feature.
4Edit the Point, MultiPoint, LineString, MultiLineString, Polygon, or
MultiPolygon features.
For more information about editing these features see
MAPMULTIPOINTEDIT (page 1659), MAPLINESTRINGEDIT (page 1655),
MAPMULTILINESTRINGEDIT (page 1658), MAPPOLYGONEDIT (page 1665),
and MAPMULTIPOLYGONEDIT (page 1662).
5Check in the revised features.
For more information, see Checking In Features (page 693).
Splitting Features
To split a feature into two parts, for example a parcel, use the
MAPFEATURESPLIT (page 1652) command. The resulting feature property values
Editing Features | 705

are determined by the rules specified in the Split and Merge Rules dialog box
(page 1669).
You can choose to ignore the rules specified in the Split and Merge Rules dialog
box (page 1669) by turning on Ignore Split and Merge Rules.
NOTE This functionality is for geospatial features only. For information about
splitting drawing objects, see Splitting Polygon Objects (page 968).
Split Prompt Options
When you split a feature, you are prompted during the operation. You can
set defaults for some of these options (page 1929) and specify whether to display
those prompts during the split operation or not.
■Create New/Create Multi-part: Click Create New to split the feature into
two pieces. To creating more pieces, click Create Multi-part.
■Generate New Feature ID/Use Existing: Click New to auto-generate a
unique identifier for the new features. Click Existing to assign the ID of
the original feature to all resulting features.
■Would You Like To Draw Or Select The Line For The Split: Click Draw to
draw a line through the original feature where the split should occur. Click
Select to select an existing line or polygon in the original feature that
indicates the location of the split.
Splitting Features with Polygons
If you use a polygon (or mpolygon) to split a feature, the output is divided
into two groups (inside and outside). The groups are collected into as few
multipart types as possible without creating heterogeneous geometric types.
A multipart feature is created for each distinct geometric type (point, line,
polygon) that was in the input.
In the following example, a polygon was used to split a line. The lines outside
the polygon become a multiline feature.
706 | Chapter 6 Creating and Editing Data
The line segment inside the polygon becomes a
line feature (shown in blue on the right). The line
segments outside the polygon become a multiline
feature (shown in red).
Tell me more
Video
■Show me how to split a parcel feature.
Procedure
■To create split/merge rules using ex-
pressions
■To set split prompt options (page 709)
■To turn Ignore Split And Merge Rules
on or off (page 708)
■To split a feature (page 708)
Tutorial
■Lesson 2: Split a Polygon Feature
Workflow
■Split a Feature
GIS Skill
■Split a parcel in two and divide attrib-
utes.
Related topics
■Editing Features (page 701)
■Using Expressions In Split/Merge Rules
■Creating Calculated Properties (page
1132)
Editing Features | 707

NOTE This procedure is for geospatial features only. For information about splitting
drawing objects, see To split a polygon object (page 969).
To split a feature
1Optionally, specify split rules.
NOTE To set these rules (page 1669), in the Data Table click Options ➤ Set
Split and Merge Rules.
2Optionally, specify split prompts.
NOTE To set these options (page 1929), in the Tool-based Ribbon Workspace,
click Feature Edit tab ➤ Edit Set Panel ➤ angle arrow.
3Select the feature.
4If you do not have Auto Checkout turned on, check out the feature.
For more information, see Checking Out Features (page 695).
5Feature Edit tab ➤ Split/Merge panel ➤ Split Feature
6Follow the MAPFEATURESPLIT (page 1652) prompts to specify whether the
resulting feature will be a new or a multipart feature.
NOTE If you specified these options in the Feature Editing Options dialog
box (page 1929) and selected Do Not Show These Prompts When Executing
Split, you will not see the first two prompts.
7Follow the prompts to specify whether the resulting feature will use a
new or existing feature ID.
8Follow the prompts to select or draw a split line.
9Check in the revised features.
For more information, see Checking In Features (page 693).
To turn Ignore Split And Merge Rules on or off
■In the Tool-based Ribbon Workspace, click Feature Edit tab ➤ Split/Merge
panel ➤ Ignore Rules .
708 | Chapter 6 Creating and Editing Data

NOTE To change the default setting for Ignore Split And Merge Rules, at the
Command prompt, type MAPIGNORESPLITMERGERULES (page 1653) and specify
Yes or No as the default.
To set split prompt options
1In the Tool-based Ribbon Workspace, click Feature Edit tab ➤ Edit Set
Panel ➤ angle arrow, or enter mapfeatureeditoptions at the Command
prompt.
2In the Feature Editing Options dialog box (page 1929), select the Split
Prompt Options you want.
3Click OK.
Quick Reference
MAPFEATURESPLIT
Splits features and assigns feature property values for resulting features
Modify menu ➤ Split
Menu
Split
Icon
MAPFEATURESPLITCommand Line
MAPIGNORESPLITMERGERULES
Determines whether or not the rules for split and merge are used
Not available on the menu in the current workspaceMenu
MAPIGNORESPLITMERGERULESCommand Line
MAPIGNORESPLITMERGERULESDialog Box
Merging Features
When you want to merge two or more features, for example separate line
segments that represent the same road, use the MAPFEATUREMERGE (page
1651) command. The resulting feature property values are determined by the
rules specified in the Split and Merge Rules dialog box (page 1669). To ignore
Editing Features | 709

rules specified in this dialog box, turn on Ignore Split and Merge rules (see To
turn Ignore Split And Merge Rules on or off (page 708)).
You can merge two or more features of the same class into one feature. You
can also merge features with drawing objects. You can specify a new or existing
feature ID for the resulting feature.
NOTE This functionality is for geospatial features only. For information about
working with drawing objects, see the AutoCAD Help.
Tell me more
Procedure
■To create split/merge rules using ex-
pressions
■To turn Ignore Split And Merge Rules
on or off (page 708)
■To merge features (page 710)
Workflow
■Merge Features
Related topics
■Editing Features (page 701)
■Using Expressions In Split/Merge Rules
■Creating Calculated Properties (page
1132)
NOTE This procedure is for geospatial features only. For information about working
with drawing objects, see the AutoCAD Help.
To merge features
1Optionally, specify merge rules (page 1669).
NOTE To set these rules (page 1669), in the Data Table click Options ➤ Set
Split and Merge Rules.
2If you do not have Auto Checkout turned on, check out the feature(s).
For more information, see Checking Out Features (page 695).
3Select at least two objects, including at least one feature.
710 | Chapter 6 Creating and Editing Data
4Click Feature Edit tab ➤ Split/Merge panel ➤ Merge Feature .
5Follow the MAPFEATUREMERGE (page 1651) prompts to specify whether
the resulting feature will use a new or existing feature ID.
6Check in the merged feature.
For more information, see Checking In Features (page 693).
Quick Reference
MAPFEATUREMERGE
Merges features and assigns feature property values for the resulting feature
Click Feature Edit tab ➤ Split/Merge panel ➤ Merge
Feature.
Menu
Merge
Icon
MAPFEATUREMERGECommand Line
MAPIGNORESPLITMERGERULES
Determines whether or not the rules for split and merge are used
Not available on the menu in the current workspaceMenu
MAPIGNORESPLITMERGERULESCommand Line
MAPIGNORESPLITMERGERULESDialog Box
Editing Features using the Data Table
Use the Data Table to view and edit features. Select data in the Data Table
window or select areas of your map to see their data in the table.
NOTE When you edit feature data in the Data Table, the corresponding geometry
is checked out and locked, if possible. You must check in the geometry when you
are finished editing.
Editing Features | 711
NOTE This functionality is for geospatial features only. For information about
editing attributes associated with drawing objects, see Working with Attribute
Data and Object Data (page 1047).
See also:
■Overview of the Data Table (page 1125)
■Setting Up Constraints in the Schema Editor (page 599)
■Checking Out Features (page 695)
■Checking In Features (page 693)
■Updating Edits Automatically (page 698)
■Editing Features (page 701)
■Viewing and Editing Feature Properties (page 718)
NOTE This procedure is for geospatial features only. For information about editing
attributes associated with drawing objects, see To use attribute data and object
data (page 1047).
To edit features using the Data Table
1In Map Explorer (page 2068), expand the Data Source entry and select the
feature layer to edit.
2Click .
The Data Table window opens, displaying the feature data contained in
your map. If you have joined data (page 507) to a layer in your map, the
joined data is displayed, but it is gray. You cannot edit it in the Data
Table. Instead, select the original data source and update that in the Data
Table. Your changes will appear the next time you display this data as
joined data.
3Select and edit cells in the Data Table window.
When you edit data related to a feature, that feature is checked out
automatically (and the Update Edits Automatically setting is turned on).
Non-feature data cannot be checked out, so all edits to that type of data
are written back to their underlying sources immediately. You cannot
edit non-feature data unless you are connected to its source. See Updating
Edits Automatically (page 698).
712 | Chapter 6 Creating and Editing Data
Some data fields are “constrained” to allow only certain values. When
you enter values for constrained fields, you are prompted to enter only
valid values. For example, the prompt might tell you to enter only values
between one and ten.
4Check in the revised features.
For more information, see Checking In Features (page 693).
5Close the Data Table window when you are finished.
Quick Reference
MAPDATATABLE
Allows you to view, edit, and filter feature data
Click Edit ➤ Data Table.
Menu
Table
Icon
MAPDATATABLECommand Line
In Map Explorer or Display Manager, click the Table
button
Task Pane
Data Table Dialog BoxDialog Box
Using AutoCAD Commands on Features
To use AutoCAD commands on features
■To edit features with AutoCAD commands (page 715)
■To extract feature geometry (page 716)
■To update feature geometry (page 717)
Editing Features with AutoCAD Commands
By default, many common AutoCAD editing commands (such as PEDIT, JOIN,
ROTATE, and TRIM) can be used on features directly.
NOTE You can use these commands, as well as all other AutoCAD commands,
on drawing objects in AutoCAD Map 3D.
Editing Features | 713
Use PEDIT on a single or multipart feature. You can edit polygonal features
and linear features (with or without M or Z values), but not point features.
You can use the Join option to connect linear features. For single linear features,
the feature ID for the first feature you selected is used for the resulting feature.
For multipart linear features, you can join only features whose end points
touch; the first selected feature is updated using the current Merge rules.
You can use the JOIN command on non-closed linear features with or without
M or Z values. If the features are all on the same layer, the geometry and
attributes of the source feature are updated, using the current Merge rules.
The joined feature is removed.
You can use the AutoCAD OSNAP modes when editing features. Snap to any
graphic within a block definition that is used to symbolize a point. You can
also use OSNAP Node to snap to the insertion point of of an attribute, a block,
a shape, or text. OSNAP Node is turned off by default.
If there is an AutoCAD operation you cannot perform on a feature, you can
extract the feature geometry (page 715), edit it using AutoCAD commands, and
then update the feature geometry (page 716). Feature data and rules are
preserved.
You can also merge AutoCAD geometry with existing features directly, without
extracting feature geometry first.
NOTE When you use EXPLODE on features, they are converted to AutoCAD
drawing objects.
Tell me more
Video
■Show me how to edit features using
automatic check-out.
Procedure
■To edit features with AutoCAD com-
mands (page 715)
Workflow
■Edit Features in a Geospatial Feature
Source
GIS Skill
■Edit feature geometry directly in a SHP
file using CAD tools.
■Edit features as polylines using PEDIT.
714 | Chapter 6 Creating and Editing Data
Related topics
■Extracting Feature Geometry (page 715)
■Updating Feature Geometry (page 716)
■Checking Out Features (page 695)
■Checking In Features (page 693)
■Updating Edits Automatically (page
698)
NOTE You can use these commands, as well as all other AutoCAD commands,
on drawing objects in AutoCAD Map 3D.
To edit features with AutoCAD commands
1If you do not have Auto Checkout turned on, check out the feature.
For more information, see Checking Out Features (page 695).
2Do one of the following:
■Enter an AutoCAD command and follow the prompts to select and
edit the feature.
■Select the feature and use its grips to edit the feature.
■Select the feature and then enter an AutoCAD command and follow
its prompts.
NOTE For help with AutoCAD commands, search for the command name
in the Help file or press F1 while you are using the command.
3Check in the revised features.
For more information, see Checking In Features (page 693).
Extracting Feature Geometry
Extract the geometry from a feature to use AutoCAD commands that are not
available for features.
NOTE This functionality is for geospatial features only. There is no equivalent for
drawing objects.
Editing Features | 715
See also:
■Editing Features (page 701)
■Checking Out Features (page 695)
■Checking In Features (page 693)
■Updating Feature Geometry (page 716)
NOTE This procedure is for geospatial features only. There is no equivalent for
drawing objects.
To extract feature geometry
1Check out the feature.
For more information, see Checking Out Features (page 695).
2Right-click the feature. Click Extract Geometry From Feature.
After you make your changes, you can merge the updated geometry back into
the feature.
Quick Reference
Extract Feature Geometry
Creates new drawing objects from the selected feature geometry
Click Modify ➤ Advanced Feature Editing ➤ Extract
Geometry from Feature.
Menu
Extract Feature Geometry
Icon
MAPEXTRACTFEATUREGEOMETRYCommand Line
Updating Feature Geometry
You can merge new or existing drawing object geometry with a feature. If you
have extracted the geometry from a feature to edit it using AutoCAD, you
must update the feature geometry when you are finished editing.
716 | Chapter 6 Creating and Editing Data

You can use this command to combine spatially connected entities. For
example, you can use a line and an arc to update the geometry of a single
feature (resulting in one linestring or polyline). If the data store of a feature
does not support curves, this command transforms the curves into line
segments.
For polygons, this command allows you to work on the boundary geometry
instead of the polygon itself.
NOTE This functionality is for geospatial features only. There is no equivalent for
drawing objects.
See also:
■Editing Features (page 701)
■Checking Out Features (page 695)
■Checking In Features (page 693)
■Extracting Feature Geometry (page 715)
NOTE This procedure is for geospatial features only. There is no equivalent for
drawing objects.
To update feature geometry
1Right-click the feature you want to merge with a drawing object. Click
Update Feature From Geometry.
2When prompted, select the drawing object to merge. Press Enter.
3When prompted to erase the drawing object, do one of the following:
■Click Yes to erase the original drawing object.
■Click No to keep the drawing object in the drawing.
Keep the object if you plan to use it to create other features. You can
store drawing objects on an AutoCAD layer and turn off visibility of
the layer.
4Check in the edited feature.
For more information, see Checking In Features (page 693).
Editing Features | 717
Quick Reference
Update Feature from Geometry
Merges new or existing drawing object geometry with a feature
Click Modify ➤ Advanced Feature Editing ➤ Update
Feature from Geometry.
Menu
Update Feature Geometry
Icon
MAPUPDATEFEATUREGEOMETRYCommand Line
Viewing and Editing Feature Properties
View and edit the properties for one or more selected features in the Properties
palette. The properties are the same as those you can edit in the Data Table.
Your edits apply to all selected features in the selected layer. The feature source
is updated immediately if Update Edits Automatically is on.
You can select both drawing objects and geospatial features at the same time.
Use the drop-down list at the top of the Properties palette to switch between
viewing the properties of all selected entities, viewing feature properties only,
or viewing the properties for drawing objects by geometry type.
NOTE For more information about viewing properties for drawing objects, see
Properties Palette.
You can view the properties for up to 2000 features. If you select more features
than that, all of them will be selected in your map and in Data Table. However,
only the first 2000 features selected will be shown in the Properties palette.
When you select features on multiple layers, the drop-down list at the top of
the Properties palette indicates how many checked-out features are selected.
(If the features you selected are not checked out, the list shows only a single
selection for each layer.)
The General properties indicate whether the Feature Class shown is for one
or more layers, and whether the Feature ID is for one or more features. For
multiple layers or features, these fields contain the text “VARIES.”
Properties for all selected layers are shown. You can change the Filter By Layer
entry to see the properties for a single selected layer, or to switch between
718 | Chapter 6 Creating and Editing Data

selected layers. For example, if you selected features that are stored on four
different layers, select one of those layers to see its properties only. However,
any features that were selected on the other layers remain selected.
To set the value for a property to “NULL,” click in the value field and select
<NULL> from the drop-down list in that field. If <NULL> does not appear in
the list, the property cannot have a null value.
NOTE Do not enter the text string “Null.” This will not produce a null value, but
will be treated as a text string.
See also:
■Editing Features using the Data Table (page 711)
■Properties Palette
■Updating Edits Automatically (page 698)
■Setting Up Constraints in the Schema Editor (page 599)
■Displaying and Editing Object Data for a Drawing Object (page 1068)
NOTE For more information about viewing properties for drawing objects, see
Properties Palette.
To edit feature properties in the Properties palette
1Select the features and objects to edit.
To change a single value for multiple features (for example, to change
the zoning type for multiple parcels to Commercial), select only those
features.
NOTE You can select both features and drawing objects. However, you must
select either features or drawing object types to see any properties.
2Right-click any selected feature or object and click Properties on the menu
that appears.
3In the Properties palette, do any of the following:
■To view only features, or only a particular type of drawing object,
change the selection in the drop-down list at the top of the Properties
palette.
To see only features, select Map Features from the list.
Editing Features | 719

Drawing objects are listed by their geometry type. For example, to see
only the properties for the line objects you selected, select Lines from
the list.
■To see the properties for a single selected layer, or to switch between
selected layers, click the entry for Layer under Filter By Layer. Select
a layer.
For example, if you selected features that are stored on four different
layers, select one of those layers to see its properties only. Any features
that were selected on the other layers remain selected.
■To change a value, click in its field and enter a new value.
If you enter a value that uses the wrong data type (for example, if you
enter text in a field that allows only numerals), the value reverts back
to the last valid value. If you specify a invalid date value in a date
field, you will see an error message.
For properties that have value constraints, click in the field to see a
list with the available values. If you enter an invalid value for a
constrained property, you will see an error message.
For other fields, hover over the property name to see information on
the acceptable values.
To set the value for a property to “NULL,” click in the value field and
select <NULL> from the drop-down list in that field. If <NULL> does
not appear in the list, the property cannot have a null value.
NOTE Do not enter the text string “Null.” This will not produce a null
value, but will be treated as a text string.
Your edits apply to all selected features in the selected layer. The
feature source is updated immediately if Update Edits Automatically
is on.
For more information on changing drawing object properties, see
Displaying and Editing Object Data for a Drawing Object (page 1068).
Quick Reference
PROPERTIES
Displays the Properties palette, which allows you to edit geometry, direction,
and resistance for selected topology objects
720 | Chapter 6 Creating and Editing Data

Click Modify ➤ Properties.
Menu
Properties
Icon
PROPERTIESCommand Line
Select objects. Right-click in drawing area ➤ Properties
Task Pane
Working Offline
When you work offline, AutoCAD Map 3D caches all your feature data
connections.
NOTE This functionality is for geospatial features only. For information about
working with shared drawing files, see Overview of Sharing Attached Drawings
(page 730).
Clear the cache periodically to improve performance. To be sure that you are
working with the most current data for a data source, rebuild its cache by
refreshing its layer.
Tell me more
Video
■Show me how to check out features for
editing in the field.
■Show me how to edit features stored in
a database or data store.
■Show me how to check in features after
editing in the field.
Procedure
■To work offline (page 722)
Workflow
■Edit Features in a Geospatial Feature
Source
■Work Offline from an Enterprise Data-
base
Working Offline | 721
GIS Skill
■Check out features to edit in the field and
update the database later.
Related topics
■Bringing in GIS Features (page 303)
■Editing Features (page 701)
■Checking Out Features (page 695)
■Checking In Features (page 693)
NOTE These procedures are for geospatial features only. For information about
working with shared drawing files, see Use these techniques for object locking.
(page 731)
■To work offline (page 722)
■To return online (page 722)
■To clear the cache (page 723)
■To rebuild the cache (page 723)
To work offline
1Click Edit Feature tab ➤ Edit Set panel ➤ Automatic Update.
2Check out the features you plan to use.
For more information, see Checking Out Features (page 695).
3Click the Online/Offline toggle on the Status Bar.
NOTE AutoCAD Map 3D caches the feature source. This can take some time.
You can still check out and edit features while you are offline. When you
return online, AutoCAD Map 3D attempts to lock features that you checked
out while you were offline. Non-feature data cannot be checked out, so you
cannot edit it unless you are connected to its source.
To return online
1Click the Offline/Online toggle on the Status Bar.
722 | Chapter 6 Creating and Editing Data
2Check in the checked out features.
For more information, see Checking In Features (page 693).
To clear the cache
1Click Map Setup tab ➤ Map panel ➤ angle-arrow.
2In the AutoCAD Map Options dialog box (page 1908), click the System tab.
3Click Clear Cache. Click OK.
To rebuild the cache
➤ Right-click a feature layer in Display Manager ➤ Refresh Layer.
Quick Reference
MAPWORKOFFLINE
Caches all checked-out features so you can work without being connected.
Online/Offline toggle on the Status Bar
Icon
_MAPWORKOFFLINECommand Line
Managing Versions
For feature sources that support versioning, you can create a version, edit
objects in that version, and then merge (commit) changes from the child
version back to the parent version.
NOTE This functionality is for geospatial features only. For information about
working with shared drawing files, see Overview of Sharing Attached Drawings
(page 730).
Managing Versions | 723
Support for versioning depends on the feature source. However, the following
guidelines apply to most feature sources that support versioning:
■Features queried from one version of the feature source can be saved back
to that version only. If you plan to edit features, be sure to query the
features from the version where you plan to save the edits.
■Objects locked in one version of the feature source are automatically locked
in all versions (if the feature source supports locking). This reduces the
chance of a conflict where an object is edited in two versions of the feature
source.
Conflicts can still occur, for example if one version is edited offline. In
these cases, you must specify how to resolve the conflicts before you save
the version.
■You must be working online and be connected to the data store to manage
versions.
■You cannot save or discard a version if it has children.
■You cannot save or discard a version if it has checked out features. You
must first unlock the objects by either checking them in or canceling check
out.
■When you save or discard a version, all features in the drawing that were
queried from that version are removed from the drawing.
■When you discard a version, all edits saved to that version are discarded.
■You cannot undo saving or discarding a version.
Error handling
Errors can occur when you add, activate, drop, or merge versions. Some errors
may be caused by actions within the Manage Versions dialog box (page 1748),
while others may be the result of activity within the data store itself.
The affected item in the dialog box displays an error indicator. To see the
cause of the error, hold your cursor over this indicator. If you create a version
and the operation fails, you will see a new version with an error indicator.
The version has not really been created. It is a placeholder to display the error.
Errors remain visible until you close the dialog box, fix the errors, and redisplay
the dialog box.
724 | Chapter 6 Creating and Editing Data

See also:
■Overview of Bringing In GIS Features (page 305)
■Overview of Working with Features (page 684)
■To create a new version (page 725)
■To activate a version (page 725)
■To commit changes back to the data store (page 726)
■To discard a version (page 726)
NOTE These procedure are for geospatial features only. For information about
working with shared drawing files, see Use these techniques for object locking.
(page 731).
To create a new version
1In Map Explorer (page 2068), right-click the feature source and click Manage
Versions.
This command is available only for feature sources that support
versioning.
2In the Manage Versions dialog box (page 1748), select a version under
Version (in the lower half of the dialog box) and click Add.
3Enter a name for the new version and an optional comment.
4Click Close.
To activate a version
1In Map Explorer (page 2068), right-click the feature source and click Manage
Versions.
2In the Manage Versions dialog box (page 1748), select the version and click
Activate.
All queries are performed on the active version of the feature source.
Switching versions can take some time to execute, because the data store
may need to flush and reload the feature cache.
3Click Close.
Managing Versions | 725
To commit changes back to the data store
1Check in all features, or cancel checkout for them.
2In Map Explorer (page 2068), right-click the feature source and click Manage
Versions.
3In the Manage Versions dialog box (page 1748), select the version and click
Merge.
This option is available for child versions only. If you merge the active
version, its parent version is activated and then the selected version is
merged and removed from the Version tree.
You cannot merge a version if it has children.
4Click Close.
To discard a version
1Check in any checked out features, or cancel checkout for them.
2Make sure that the parent version is not connected in any other drawing.
3In Map Explorer (page 2068), right-click the feature source and click Manage
Versions.
4In the Manage Versions dialog box (page 1748), select the version and click
Drop.
All edits saved to the version are discarded. This option is available for
child versions only. If you drop the active version, its parent version is
activated and then the selected version is dropped and removed from the
Version list.
You cannot drop a version if it has children.
5Click Close.
To address errors
If an error occurs during version management, the affected item in the dialog
box displays an error indicator.
1To see the cause of the error, hold your cursor over the error indicator.
If you create a version and the operation fails, you will see a new version
with an error indicator. The version has not really been created. It is a
placeholder to display the error.
726 | Chapter 6 Creating and Editing Data
2If necessary, close the Manage Versions dialog box (page 1748) and correct
the error.
3Redisplay the dialog box to make sure that the error has been cleared.
Working with Drawing Objects
To work with drawing objects
■To edit data in attached drawings (page 729)
■To clean up drawing data (page 765)
■To create, edit, and manage topologies (page 821)
■To use Map editing tools (page 927)
■To work with polygon objects (page 954)
■To use object classification (page 981)
Overview of Working with Drawing Objects
Create and edit drawing objects using AutoCAD and AutoCAD-based
commands.
NOTE This functionality is for drawing objects only. However, you can use many
AutoCAD commands to edit geospatial features as well. See Using AutoCAD
Commands on Features (page 713).
Tell me more
Video
■Show me how multi-user editing works.
■Show me how to clean up errors in my
data.
■Show me how to create a network topo-
logy.
Procedure
■Use the following techniques to work
with drawing data. (page 728)
Tutorial
■Exercise 2: Attach a drawing file
Working with Drawing Objects | 727
■Exercise 3: Query in data from the
drawing
Workflow
■Find and Edit Objects in Attached
Drawings
GIS Skill
■Edit DWG files in a multi-user environ-
ment.
■Clean up duplicates, gaps, and other
accuracy problems in DWG files.
■Create a network topology to show how
lines are connected.
Related topics
■Editing Data in Attached Drawings
(page 729)
■Cleaning Up Drawing Data (page 765)
■Creating, Editing, and Managing Topo-
logies (page 820)
■Using Map Editing Tools (page 926)
■Working with Polygon Objects (page
954)
■Using Object Classification (page 981)
NOTE These procedures are for drawing objects only. However, you can use many
AutoCAD commands to edit geospatial features as well. See To use AutoCAD
commands on features (page 713).
Use the following techniques to work with drawing data.
Use this method...To do this...
Work in a multiuser environment. ■Turn on object locking. (page 733)
■Find out who locked an object. (page
735)
■Release locked objects for use by oth-
ers. (page 736)
728 | Chapter 6 Creating and Editing Data

Use this method...To do this...
Query objects from attached drawings into
the current map, or edit objects from at-
Edit and save objects in attached drawings.
tached drawings and save them back.
(page 737)
Use drawing cleanup. (page 767)Correct common map errors resulting from
surveying, digitizing, and scanning errors,
and remove unnecessary detail.
Create node, network, or polygon topolo-
gies. (page 824)
Use topology to analyze a set of objects
and data and their relationship.
Use map editing tools. (page 927)Edit map-related data.
Specify the exact coordinates of the points.
(page 953)
Digitize new points in existing maps with
precision.
Use specialized polygon options. (page 954)Work with polygon objects.
Use annotation. (page ?)Indicate textual values on an object.
Use object classification. (page 1101)Organize drawing objects based on the
real-world features that they represent.
Editing Data in Attached Drawings
NOTE These procedures are for drawing objects only. However, you can use many
AutoCAD commands to edit geospatial features as well. See To use AutoCAD
commands on features (page 713).
To edit data in attached drawings
■To use object locking (page 730)
■To edit and save objects (page 737)
Sharing Attached Drawings
■Overview of Sharing Attached Drawings (page 730)
Editing Data in Attached Drawings | 729
■Turning On Object Locking (page 733)
■Finding Out Who Locked an Object (page 734)
■Releasing All Locked Objects for a Specific User (page 736)
See also:
■Editing and Saving Objects in Attached Drawings (page 737)
NOTE These procedures are for drawing objects only. For information about
locking geospatial feature data, see Checking Out Features (page 695).
To use object locking
■To turn on object locking (page 733)
■To find out who locked an object (page 735)
■To release all locked objects (page 736)
Overview of Sharing Attached Drawings
Object locking lets multiple network users simultaneously retrieve, edit, and
save back different objects while working in the same attached drawing. If
object locking is not selected, only one user can have write access to an active
drawing.
NOTE This functionality is for drawing objects only. For information about locking
geospatial feature data, see Checking Out Features (page 695).
Tell me more
Video
■Show me how multi-user editing works.
Procedure
■To edit data in attached drawings
(page 729)
Tutorial
■Exercise 2: Attach a drawing file
■Exercise 3: Query in data from the
drawing
730 | Chapter 6 Creating and Editing Data
Workflow
■Find and Edit Objects in Attached
Drawings
GIS Skill
■Edit DWG files in a multi-user environ-
ment.
Related topics
■Turning On Object Locking (page 733)
■Finding Out Who Locked an Object
(page 734)
■Releasing All Locked Objects for a
Specific User (page 736)
NOTE These procedures are for drawing objects only. For information about
locking geospatial feature data, see Checking Out Features (page 696).
Use these techniques for object locking.
Use this method...To do this...
Click Map Setup tab ➤ Map pan-
el ➤ angle-arrow.
See Turning On Object Locking (page 733).
Turn on object locking.
Click Home tab ➤ Data panel ➤
➤ Show Who Has It.
See Finding Out Who Locked an Object
(page 734)
Find out who has locked an object.
Click Map Setup tab ➤ Map panel ➤
➤ Drawing Maintenance.
See Releasing All Locked Objects for a
Specific User (page 736).
Release locked objects.
Editing Data in Attached Drawings | 731
Quick Reference
MAPOPTIONS
Sets AutoCAD Map 3D options
Setup menu ➤ Autodesk Map Options
Menu
Options
Icon
MAPOPTIONSCommand Line
In Map Explorer, right-click Current
Drawing ➤ Options
Task Pane
AutoCAD Map Options dialog boxDialog Box
ADEWHOHASIT
Displays the current owner of a selected locked object
Click File ➤ Drawing Save Set Options ➤ Who Has
It?.
Menu
Show Who Has It
Icon
ADEWHOHASITCommand Line
Who Has It Information dialog boxDialog Box
ADEDWGMAINT
Removes locks from objects
Setup menu ➤ More DWG Options ➤ Drawing
Maintenance
Menu
ADEDWGMAINTCommand Line
In Map Explorer, right-click Drawings ➤ Maintenance
Task Pane
Drawing Maintenance dialog boxDialog Box
732 | Chapter 6 Creating and Editing Data

Turning On Object Locking
If object locking is enabled, two network AutoCAD Map 3D users can edit
different objects in the same drawing at the same time, but cannot edit the
same object at the same time.
NOTE This functionality is for drawing objects only. For information about locking
geospatial feature data, see Checking Out Features (page 695).
Any objects that you add to the save set are locked. Other users can view these
objects, but cannot save modifications back to the attached drawings until
you unlock the objects.
When you finish editing the objects, save them back to their attached drawings.
The objects are automatically unlocked.
Only a superuser (page 2075) can change object locking settings. See Setting Up
Users and Assigning Rights (page 82).
See also:
■Logging Into AutoCAD Map 3D (page 141)
■Sharing Attached Drawings (page 729)
NOTE You must have superuser (page 2075) privileges to change the Enable Object
Locking setting. See Setting Up Users and Assigning Rights (page 82).
NOTE These procedures are for drawing objects only. For information about
locking geospatial feature data, see Checking Out Features (page 696).
To turn on object locking
1In the Tool-based Workspace, click Map Setup tab ➤ Map panel ➤
angle-arrow.
2In the AutoCAD Map Options dialog box (page 1908), select the Multi User
tab.
3Under Multi User Options, select Enable Object Locking.
4Click OK.
Editing Data in Attached Drawings | 733
Quick Reference
MAPOPTIONS
Sets AutoCAD Map 3D options
Setup menu ➤ Autodesk Map Options
Menu
Options
Icon
MAPOPTIONSCommand Line
In Map Explorer, right-click Current
Drawing ➤ Options
Task Pane
AutoCAD Map Options dialog boxDialog Box
Finding Out Who Locked an Object
Use the Who Has It operation at any time to find out who locked an object.
NOTE If the DWK file has been deleted, the user names are no longer available.
When this happens, AutoCAD Map 3D displays user names and drawing names
as *UNKNOWN*.
NOTE This functionality is for drawing objects only. For information about locking
geospatial feature data, see Checking Out Features (page 695).
Tell me more
Video
■Show me how multi-user editing works.
Procedure
■To edit data in attached drawings
(page 729)
Tutorial
■Exercise 2: Attach a drawing file
■Exercise 3: Query in data from the
drawing
734 | Chapter 6 Creating and Editing Data
Workflow
■Find and Edit Objects in Attached
Drawings
GIS Skill
■Edit DWG files in a multi-user environ-
ment.
Related topics
■Turning On Object Locking (page 733)
■Sharing Attached Drawings (page 729)
■Releasing All Locked Objects for a
Specific User (page 736)
NOTE This procedure is for drawing objects only. For information about locking
geospatial feature data, see Checking Out Features (page 696).
To find out who locked an object
1Home tab ➤ Data panel ➤ ➤ Show Who Has It
2Select the object.
The Who Has It Information dialog box (page 1889) displays the name of the
user who has the object locked, the drawing that the object comes from, the
name of the current drawing, and the date and time the object was locked.
Quick Reference
ADEWHOHASIT
Displays the current owner of a selected locked object
Click File ➤ Drawing Save Set Options ➤ Who Has
It?.
Menu
Show Who Has It
Icon
ADEWHOHASITCommand Line
Who Has It Information dialog boxDialog Box
Editing Data in Attached Drawings | 735
Releasing All Locked Objects for a Specific User
If a system failure occurs while objects are locked, you must manually release
the object locks. However, only a superuser (page 2075) can remove locks set by
other users.
NOTE If a drawing is activated in another user's drawing, you will not be able to
release locks in that drawing.
When you remove locks, the object is also removed from the save set. You
can restore the locks by adding the objects to the save set again.
NOTE This functionality is for drawing objects only. For information about locking
geospatial feature data, see Checking Out Features (page 695).
See also:
■Logging Into AutoCAD Map 3D (page 141)
■Turning On Object Locking (page 733)
■Sharing Attached Drawings (page 729)
NOTE This procedure is for drawing objects only. For information about locking
geospatial feature data, see Checking Out Features (page 696).
To release all locked objects
1Click Map Setup tab ➤ Map panel ➤ ➤ Drawing Maintenance.
2In the Drawing Maintenance dialog box (page 1920), under Active Drawings,
select the drawing that contains the locks to release.
3Select User List.
The names of the users responsible for the locks appear under User Name.
The number of objects locked by each user appears under Number of
Objects Locked.
4Select Remove Locks.
If you do not have superuser (page 2075) privileges, you can remove only the
locks that you have set. AutoCAD Map 3D removes the objects from the save
set.
736 | Chapter 6 Creating and Editing Data

If you have superuser privileges, you can select a user name and remove all
the locks set by that user.
Quick Reference
ADEDWGMAINT
Removes locks from objects
Setup menu ➤ More DWG Options ➤ Drawing
Maintenance
Menu
ADEDWGMAINTCommand Line
In Map Explorer, right-click Drawings ➤ Maintenance
Task Pane
Drawing Maintenance dialog boxDialog Box
Editing and Saving Objects in Attached Drawings
■Overview of Editing and Saving Objects in Attached Drawings (page 738)
■Zooming to the Extents of Selected Drawings (page 743)
■Viewing All Objects in Selected Attached Drawings (page 745)
■Editing Objects in Attached Drawings (page 747)
■Adding an Object to the Save Set (page 750)
■Viewing Objects in the Save Set (page 752)
■Saving Queried Objects Back to Attached Drawings (page 753)
■Saving New Objects to Attached Drawings (page 754)
■Saving Objects to the Current Drawing (page 756)
■Saving Objects to a New Drawing (page 758)
■Removing an Object from the Save Set (page 759)
■Solving Problems When Saving Back to Attached Drawings (page 760)
■Setting Save Back Options (page 763)
NOTE These procedures are for drawing objects only. For information about saving
geospatial feature data back to its source, see Checking In Features (page 694).
To edit and save objects
■To zoom to the extents of selected drawings (page 745)
■To view objects in source drawings (page 746)
■To edit objects in attached drawings (page 748)
Editing Data in Attached Drawings | 737
■To save the edited objects back to their attached source drawings (page
749)
■To add objects to the save set and lock the objects (page 751)
■To view objects in the save set (page 752)
■To save queried objects back to attached source drawings (page 754)
■To save new objects to attached drawings (page 756)
■To save objects to the current drawing (page 757)
■To save objects to a new drawing (page 758)
■To remove objects from the save set and unlock the objects (page 759)
■To redefine block definitions on save back (page 761)
■To save back individual block components (page 762)
■To check that the hatch pattern is in the save set (page 762)
■To set editing and save back options (page 764)
Overview of Editing and Saving Objects in Attached Drawings
When you use AutoCAD Map 3D with multiple drawings, you can query
objects from attached drawings into the current drawing and create new
drawings, or you can edit the objects from the attached drawings and then
save them back.
NOTE This functionality is for drawing objects only. For information about saving
geospatial feature data back to its source, see Checking In Features (page 693).
Tell me more
Video
■Show me how multi-user editing works.
Procedure
■To edit and save objects (page 737)
Tutorial
■Exercise 2: Attach a drawing file
■Exercise 3: Query in data from the
drawing
Workflow
■Find and Edit Objects in Attached
Drawings
738 | Chapter 6 Creating and Editing Data
GIS Skill
■Edit DWG files in a multi-user environ-
ment.
Related topics
■Overview of Queries (page 1235)
■Editing Data in Attached Drawings
(page 729)
■Cleaning Up Drawing Data (page 765)
■Using Map Editing Tools (page 926)
■Working with Polygon Objects (page
954)
NOTE These procedures are for drawing objects only. For information about saving
geospatial feature data back to its source, see Checking In Features (page 694).
Use this method...To do this...
In Map Explorer, right-click Drawings. Click
Zoom Extents.
See Zooming to the Extents of Selected
Drawings (page 743)
Zoom to the extents of selected drawings
In Map Explorer, right-click Drawings. Click
Quick View.
See Viewing All Objects in Selected At-
tached Drawings (page 745)
View objects in source drawings
Edit objects in attached drawings 1Run a query (page 1235) to retrieve the
objects to edit.
2Click Home tab ➤ Data panel ➤
➤ Add To Save Set. Select
the objects to edit.
See Editing Objects in Attached Drawings
(page 747)
Editing Data in Attached Drawings | 739
Use this method...To do this...
Click Home tab ➤ Data panel ➤
➤ Add To Save Set.
See Adding an Object to the Save Set
(page 750)
Add objects to the save set and lock the
objects
Click Home tab ➤ Data panel ➤
➤ Show Objects In Save Set.
See Viewing Objects in the Save Set (page
752)
View objects in the save set
Add objects to the save set. Click Home
tab ➤ Data panel ➤ ➤ Save To
Source.
See Saving Queried Objects Back to At-
tached Drawings (page 753) and Saving
Save objects back to attached source
drawings
New Objects to Attached Drawings (page
754)
Click ➤ Save.
Save objects to the current drawing or a
new drawing.
Click ➤ Save As ➤ AutoCAD
Drawing.
See Saving Objects to the Current Drawing
(page 756) and Saving Objects to a New
Drawing (page 758).
Click Map Setup tab ➤ Map pan-
el ➤ angle-arrow.
See Setting Save Back Options (page 763)
Set editing and save back options
740 | Chapter 6 Creating and Editing Data

Quick Reference
ADEZEXTENTS
Zooms to display the drawing extents
Click Map ➤ Drawings ➤ Zoom Drawing Extents.
Menu
Zoom Drawing Extents
Icon
ADEZEXTENTSCommand Line
In Map Explorer, right-click Drawings ➤ Zoom Extents
Task Pane
Zoom Drawing Extents dialog boxDialog Box
ADEQVIEWDWGS
Performs a quick display of active drawings
View menu ➤ Quick View Drawings
Menu
ADEQVIEWDWGSCommand Line
In Map Explorer, right-clickDrawings ➤ Quick
View-or- Right-click a drawing ➤ Quick View
Task Pane
Quick View Drawings dialog boxDialog Box
ADEQUERY
Controls defining, modifying, saving, loading, and executing a query
In the Classic workspace, click Setup menu ➤ More
DWG Options ➤ Define Query
Menu
Define Query
Icon
ADEQUERYCommand Line
In Map Explorer, right-click Current Query ➤ Define
-or- Right-click a query ➤ Edit
Task Pane
Define Query dialog boxDialog Box
ADESELOBJS
Editing Data in Attached Drawings | 741

Creates a set of objects to be saved to source drawings
File menu ➤ Drawing Save Set Options ➤ Add Items
To Save Set
Menu
Add Objects to Save Set
Icon
ADESELOBJSCommand Line
ADESELOBJS (Select Objects for Save Back command)Dialog Box
ADEREMOBJS
Removes objects from the save set so they aren't saved to source drawings
File menu ➤ Drawing Save Set Options ➤ Remove
Items From Save Set
Menu
Remove Objects from Save Set
Icon
ADEREMOBJSCommand Line
ADEREMOBJS (Remove Objects from Save Set
command)
Dialog Box
ADESAVEOBJS
Saves objects in the save set back to source drawings
In the Classic workspace, click File menu ➤ Save
Source Drawing Save Set
Menu
Save to Source Drawings
Icon
ADESAVEOBJSCommand Line
Save Objects to Source Drawings dialog boxDialog Box
SAVE
Saves the drawing under the current file name or a specified name
File menu ➤ Save
Menu
SAVECommand Line
742 | Chapter 6 Creating and Editing Data

SAVEAS
Saves an unnamed drawing with a file name or renames the current drawing
File menu ➤ Save As
Menu
SAVEASCommand Line
MAPOPTIONS
Sets AutoCAD Map 3D options
Setup menu ➤ Autodesk Map Options
Menu
Options
Icon
MAPOPTIONSCommand Line
In Map Explorer, right-click Current
Drawing ➤ Options
Task Pane
AutoCAD Map Options dialog boxDialog Box
Zooming to the Extents of Selected Drawings
Use Zoom Extents to zoom the current drawing to the extents of the selected
source drawings. Adjust the current drawing extents to view all objects after
you execute a query.
Editing Data in Attached Drawings | 743
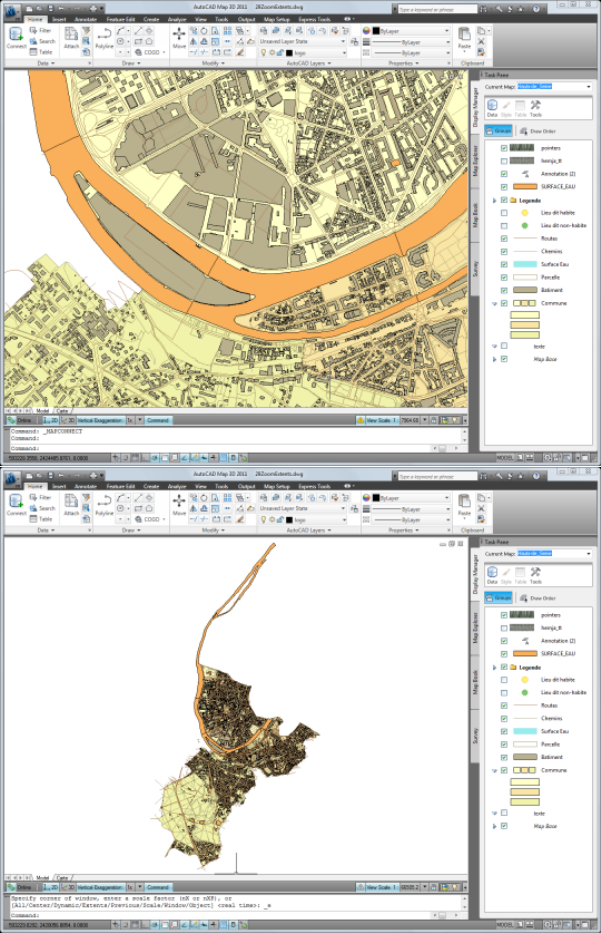
The drawing coordinates in the lower-left corner of the screen reflect the new
extents of the current drawing.
744 | Chapter 6 Creating and Editing Data
NOTE You can also zoom to the extents of a particular geospatial feature layer in
the Display Manager. Right-click the layer and click Zoom To Extents.
See also:
■Setting Save Back Extents (page 170)
To zoom to the extents of selected drawings
1In Map Explorer, right-click Drawings. Click Zoom Extents.
2In the Zoom Drawing Extents dialog box (page 2014), select the drawings
to view.
3Click OK.
The command zooms the current drawing to the extents of the selected source
drawings. The drawing coordinates in the lower-left corner of your screen
reflect the new extents of the current drawing.
NOTE You can also zoom to the extents of a particular geospatial feature layer in
the Display Manager. Right-click the layer and click Zoom To Extents.
Quick Reference
ADEZEXTENTS
Zooms to display the drawing extents
Click Map ➤ Drawings ➤ Zoom Drawing Extents.
Menu
Zoom Drawing Extents
Icon
ADEZEXTENTSCommand Line
In Map Explorer, right-click Drawings ➤ Zoom Extents
Task Pane
Zoom Drawing Extents dialog boxDialog Box
Viewing All Objects in Selected Attached Drawings
Use Quick View to preview the contents of one or more active source drawings.
Editing Data in Attached Drawings | 745
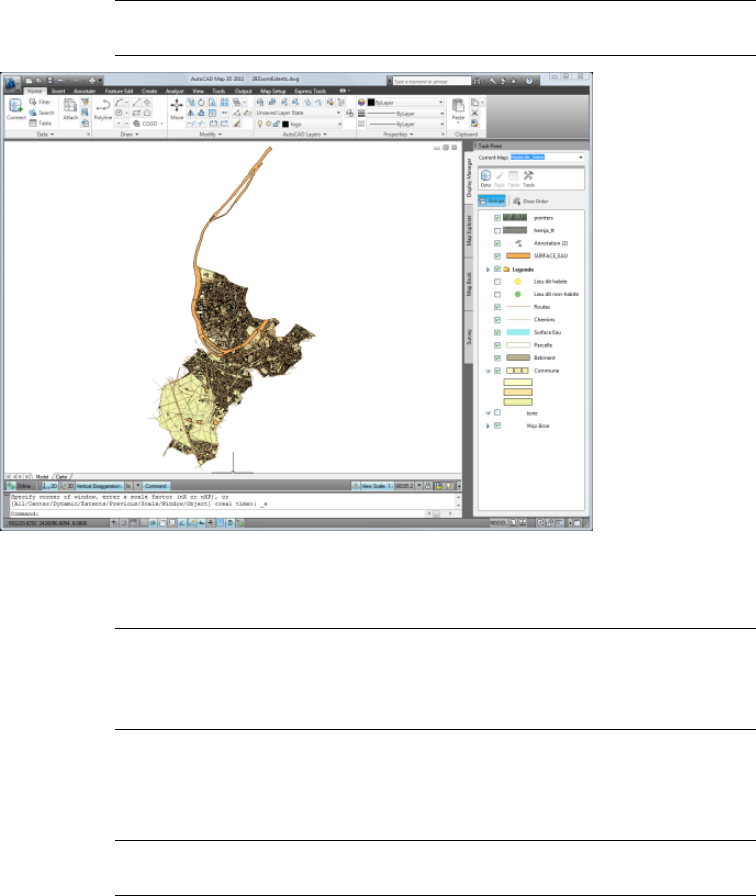
NOTE This functionality is for drawing objects only. There is no equivalent for
geospatial feature data.
Quick View shows all objects in the selected source drawings.
You can plot the results of a Quick View.
NOTE Quick View displays objects but does not bring them into the drawing. The
display contains one selectable picture for each source drawing. To bring objects
into the current drawing, define a query that copies the objects from the source
drawing into the current drawing. Quick View does not display shapes.
See also:
■Overview of Queries (page 1235)
NOTE This procedure is for drawing objects only. There is no equivalent for
geospatial feature data.
To view objects in source drawings
1In Map Explorer, right-click Drawings. Click Quick View.
746 | Chapter 6 Creating and Editing Data
2In the Quick View Drawings dialog box (page 2013), select the drawings to
quick view.
To control the display of nested drawings, select them individually.
3To filter the list of active drawings on the basis of file names, descriptions,
or both, click Filter, specify the filter, and click OK. Then select Filter.
4Select Zoom To The Extents Of Selected Drawings to see the extents of
all the drawings to review with Quick View.
5Click OK.
The objects in the active source drawing appear. Although you see many
objects, each set of objects appears as a single object from each drawing.
If you attempt to select several objects, AutoCAD Map 3D reports “one
object found” for each of the source drawings.
You can zoom and pan, but you cannot select or edit individual objects. When
you regenerate or redraw, the pictures are cleared from the current drawing.
To edit the objects, define a query that copies the objects from the source
drawing into the current drawing. For more information, see Overview of
Queries (page 1235).
Quick Reference
ADEQVIEWDWGS
Performs a quick display of active drawings
View menu ➤ Quick View Drawings
Menu
ADEQVIEWDWGSCommand Line
In Map Explorer, right-clickDrawings ➤ Quick
View-or- Right-click a drawing ➤ Quick View
Task Pane
Quick View Drawings dialog boxDialog Box
Editing Objects in Attached Drawings
To view and edit objects in attached drawings, create a query that specifies
the objects you want. When you run the query, AutoCAD Map 3D finds all
the objects in the attached drawings that match the query criteria, and copies
those objects to the current drawing.
Editing Data in Attached Drawings | 747
Example: You have separate drawings for each quadrant of a town. You create
a main drawing and attach the other drawings, and then view all water mains
in the town or all emergency routes.
NOTE This functionality is for drawing objects only. To filter geospatial feature
data with a query, see Filtering Features When You Add Them to a Map (page
309).
You can save the queried objects back to their attached drawings by adding
them to the save set before you edit them. When you save the current drawing,
AutoCAD Map 3D prompts you to save the objects in the save set back to their
attached drawings. If you do not add modified objects to the save set, you can
save the modifications to the current drawing or to a new drawing, but the
changes are not saved back to the attached drawings.
Markup objects are not added to the save set. To copy them from the current
drawing to an attached drawing, open the attached drawing directly. Copy
the markup objects in the current drawing and paste them into the other
drawing.
WARNING If you work with an attached drawing from a previous release and
save back your changes, AutoCAD Map 3D updates the attached drawing to the
current format. To retain the attached drawing in the previous drawing format,
do not save back your changes.
See also:
■Overview of Queries (page 1235)
■Editing and Saving Objects in Attached Drawings (page 737)
NOTE This procedure is for drawing objects only. To filter geospatial feature data
with a query, see Filtering Features When You Add Them to a Map (page 310).
To edit objects in attached drawings
1Run a query (page 1235) to retrieve the objects to edit.
2Click Home tab ➤ Data panel ➤ ➤ Add To Save Set. Select
the objects to edit.
AutoCAD Map 3D locks the objects in the attached drawings so no other
users can modify them.
748 | Chapter 6 Creating and Editing Data
3Edit the objects.
To save the edited objects back to their attached source drawings
➤ Click Home tab ➤ Data panel ➤ ➤ Save To Source.
Quick Reference
ADEQUERY
Controls defining, modifying, saving, loading, and executing a query
In the Classic workspace, click Setup menu ➤ More
DWG Options ➤ Define Query
Menu
Define Query
Icon
ADEQUERYCommand Line
In Map Explorer, right-click Current Query ➤ Define
-or- Right-click a query ➤ Edit
Task Pane
Define Query dialog boxDialog Box
ADESAVEOBJS
Saves objects in the save set back to source drawings
In the Classic workspace, click File menu ➤ Save
Source Drawing Save Set
Menu
Save to Source Drawings
Icon
ADESAVEOBJSCommand Line
Save Objects to Source Drawings dialog boxDialog Box
Editing Data in Attached Drawings | 749

Adding an Object to the Save Set
If you modify an object that was queried from an attached drawing, AutoCAD
Map 3D prompts you to add the object to the save set, which locks the object.
If an object is locked, other users cannot modify the object.
TIP Lock the objects before you edit them. This ensures that other users are not
modifying the same objects. To lock an object before editing, manually add the
object to the save set.
When you save changed objects back to attached drawings, only objects in
the save set are saved back.
NOTE You can set an option (page 763) to automatically add modified objects to
the save set without prompting, or you can turn the prompt off.
New objects are not automatically added to the save set. You must manually
add them to the save set.
NOTE This functionality is for drawing objects only. To save edits back to geospatial
feature sources, see Checking In Features (page 693) and Updating Edits
Automatically (page 698).
Additional Information
Keep these points in mind as you modify objects and add them to the save
set:
■If an object is on a locked layer in the attached drawing or you are working
in the Layout tab, you cannot add the object to the save set.
■If your system administrator has enabled object locking (page 729), AutoCAD
Map 3D locks the objects in the attached drawing when you add the objects
to the save set.
■By breaking a queried object into two pieces using the BREAK, TRIM,
FILLET, CHAMFER, or EXPLODE commands, you create both an altered
queried object and a new object. When you save back the objects, the
queried object is automatically saved back to its attached source drawing,
and the new object is automatically added to the save set. However, the
new object does not have an associated attached drawing; you must specify
the drawing to which it will be saved.
■If you experience a system failure while objects are locked, use the Drawing
Maintenance command to release the object locks (page 736).
750 | Chapter 6 Creating and Editing Data
■AutoCAD Map 3D cannot save edits back to a detached drawing. If you
query and edit objects from an attached drawing, do not detach that
drawing from the current drawing before you perform the save back
operation.
■If you decide you do not want to save changes to an object back to the
attached source drawing, remove the object from the save set. The changes
are maintained in the current drawing, but are not saved back to the
attached drawing.
■If you delete an object after adding it to the save set, you can restore it by
removing erased objects from the save set. AutoCAD Map 3D restores all
erased objects in the save set.
■After you add objects to the save set, you can undo the operation using
the UNDO command.
See also:
■Removing an Object from the Save Set (page 759)
■Releasing All Locked Objects for a Specific User (page 736)
■Sharing Attached Drawings (page 729)
■Setting Save Back Options (page 763)
■Solving Problems When Saving Back to Attached Drawings (page 760)
NOTE This procedure is for drawing objects only. To save edits back to geospatial
feature sources, see Checking In Features (page 694)and Updating Edits
Automatically (page 700).
To add objects to the save set and lock the objects
1Click Home tab ➤ Data panel ➤ ➤ Add To Save Set.
2At the ADESELOBJS (Select Objects for Save Back command) (page
1886)prompt, enter n to add all new objects to the save set, or enter s and
select the objects to add.
Editing Data in Attached Drawings | 751
Quick Reference
ADESELOBJS
Creates a set of objects to be saved to source drawings
File menu ➤ Drawing Save Set Options ➤ Add Items
To Save Set
Menu
Add Objects to Save Set
Icon
ADESELOBJSCommand Line
ADESELOBJS (Select Objects for Save Back command)Dialog Box
Viewing Objects in the Save Set
Objects that you have added to the save set are locked. You can highlight
these locked objects in your drawing.
NOTE This functionality is for drawing objects only. For information about editing
geospatial feature data, see Checking Out Features (page 695).
See also:
■Adding an Object to the Save Set (page 750)
■Removing an Object from the Save Set (page 759)
■Turning On Object Locking (page 733)
NOTE This procedure is for drawing objects only. For information about editing
geospatial feature data, see Checking Out Features (page 696).
To view objects in the save set
1Click Home tab ➤ Data panel ➤ ➤ Show Objects In Save Set.
2All locked objects are highlighted.
To remove the highlighting, press Enter.
752 | Chapter 6 Creating and Editing Data
Quick Reference
ADESHOWOBJS
Displays the objects in the save set
File menu ➤ Drawing Save Set Options ➤ Show
Items In Drawing Save Set
Menu
Show Objects in Save Set
Icon
ADESHOWOBJSCommand Line
ADESHOWOBJS (Show Objects in Save Set command)Dialog Box
Saving Queried Objects Back to Attached Drawings
Objects saved back to their attached drawings replace the original objects.
AutoCAD Map 3D lets you save objects to attached drawings in read-only
directories.
You cannot undo a Save To Source Drawings operation. Once you perform a
Save DWG Save Set operation, attached drawings contain the modified objects.
WARNING If you work with an attached drawing from a previous release and
save back your changes, AutoCAD Map 3D updates the attached drawing to the
current format. To retain the attached drawing in the previous drawing format,
do not save back your changes.
See also:
■Adding an Object to the Save Set (page 750)
■Removing an Object from the Save Set (page 759)
■Sharing Attached Drawings (page 729)
■Solving Problems When Saving Back to Attached Drawings (page 760)
Editing Data in Attached Drawings | 753
To save queried objects back to attached source drawings
1To make sure that objects are in the save set, click Home tab ➤ Data
panel ➤ ➤ Show Objects In Save Set.
Click Home tab ➤ Data panel ➤ ➤ Add To Save Set. Select
the objects to save.
2Click Home tab ➤ Data panel ➤ ➤ Save To Source.
3In the Save Objects to Source Drawings dialog box (page 1887), select Save
Queried Objects.
4Click OK.
Quick Reference
ADESAVEOBJS
Saves objects in the save set back to source drawings
In the Classic workspace, click File menu ➤ Save
Source Drawing Save Set
Menu
Save to Source Drawings
Icon
ADESAVEOBJSCommand Line
Save Objects to Source Drawings dialog boxDialog Box
Saving New Objects to Attached Drawings
To add new objects to attached drawings, select save order options for the new
objects.
■Selective — Prompts you to select the objects to save to each attached
drawing.
■Area — Saves new objects in to the attached drawing within whose save
back extents the objects lie. By default, the save back extents correspond
754 | Chapter 6 Creating and Editing Data

to the drawings extents. You can change the save back extents of attached
drawings.
The newly created arc crosses three tiled attached drawings. It is saved to the first
drawing in the list of attached drawings. Drawings are listed in the order in which you
attach them.
■Layer — Saves new objects to attached drawing layers that use the same
names as the current drawing layers on which the objects lie. If more than
one active drawing contains a given layer name, AutoCAD Map 3D saves
the object to the first drawing that contains that layer.
■None — Disables all other save back options. For example, to specify the
objects to save and the attached drawing in which to save them manually,
set the first save back option to Selective, and set the other two options to
None.
If AutoCAD Map 3D is unable to save new objects using option 1, it uses the
setting for save order option 2, and so forth.
You can save objects to attached drawings located in read-only directories.
NOTE This functionality is for drawing objects only. To save edits back to geospatial
feature sources, see Checking In Features (page 693) and Updating Edits
Automatically (page 698).
See also:
■Adding an Object to the Save Set (page 750)
■Removing an Object from the Save Set (page 759)
■Sharing Attached Drawings (page 729)
NOTE This procedure is for drawing objects only. To save edits back to geospatial
feature sources, see Checking In Features (page 694)and Updating Edits
Automatically (page 700).
Editing Data in Attached Drawings | 755
To save new objects to attached drawings
1To add the objects to the save set, click Home tab ➤ Data panel ➤
➤ Add To Save Set. Enter n to add all new objects to the save set,
or enter s and select the objects to add.
2Click Home tab ➤ Data panel ➤ ➤ Save To Source.
3In the Save Objects to Source Drawings dialog box (page 1887), select Save
Newly Created Objects.
4Specify the Save Order.
5Select the drawings to save objects to.
6Click OK.
When you use the Selective save method, select the objects to save to
each attached drawing.
Quick Reference
ADESAVEOBJS
Saves objects in the save set back to source drawings
In the Classic workspace, click File menu ➤ Save
Source Drawing Save Set
Menu
Save to Source Drawings
Icon
ADESAVEOBJSCommand Line
Save Objects to Source Drawings dialog boxDialog Box
Saving Objects to the Current Drawing
When you query objects from attached drawings into the current drawing,
AutoCAD Map 3D creates an association between the original object in the
attached drawing and the copy of the object in the current drawing.
756 | Chapter 6 Creating and Editing Data
If you edit one of these queried objects, you can save the edited object back
to the attached drawing, or you can save the edited object to the current
drawing. If you save an object to the current drawing, the original object is
unchanged in the attached drawings.
TIP When you close the current drawing, the association between queried objects
and their attached drawings is removed. If you want to save changes back to the
original drawing, you must save back before you close the current drawing.
NOTE This functionality is for drawing objects only. To save edits back to geospatial
feature sources, see Checking In Features (page 693) and Updating Edits
Automatically (page 698).
See also:
■Adding an Object to the Save Set (page 750)
■Editing and Saving Objects in Attached Drawings (page 737)
■Removing an Object from the Save Set (page 759)
NOTE This procedure is for drawing objects only. To save edits back to geospatial
feature sources, see Checking In Features (page 694)and Updating Edits
Automatically (page 700).
To save objects to the current drawing
1Click ➤ Save.
2If prompted to save objects to attached source drawings, do not do so at
this time, since this removes them from the current drawing.
To save the objects to both the current drawing and attached drawings, first
clear Erase Saved Back Objects on the Save Back tab (page 764) of the AutoCAD
Map Options dialog box (page 1908).
Quick Reference
SAVE
Saves the drawing under the current file name or a specified name
Editing Data in Attached Drawings | 757
File menu ➤ Save
Menu
SAVECommand Line
Saving Objects to a New Drawing
When you save objects to a new drawing, you create a copy of the current
drawing, including objects, options, queries, and attached drawings. If you
queried objects from attached drawings, the original objects are unchanged
in the attached drawings.
NOTE This functionality is for drawing objects only. To save geospatial feature
edits to a new data store, see Migrating GIS Data (Bulk Copy) (page 617).
See also:
■Overview of Queries (page 1235)
■Editing and Saving Objects in Attached Drawings (page 737)
NOTE This procedure is for drawing objects only. To save geospatial feature edits
to a new data store, see Migrating GIS Data (Bulk Copy) (page 621).
To save objects to a new drawing
1Run a query to retrieve the objects. Use Draw mode to copy the retrieved
objects to the current drawing.
2Click ➤ Save As ➤ AutoCAD Drawing.
3Enter a name for the new drawing.
4If prompted to save objects to attached source drawings, do not do so at
this time, since this removes them from the current drawing.
To save the objects to both a new drawing and to attached drawings, first clear
Erase Saved Back Objects on the Save Back tab (page 764) of the AutoCAD Map
Options dialog box (page 1908).
Quick Reference
SAVEAS
758 | Chapter 6 Creating and Editing Data
Saves an unnamed drawing with a file name or renames the current drawing
File menu ➤ Save As
Menu
SAVEASCommand Line
Removing an Object from the Save Set
Manually removing an object from the save set releases the lock on the object.
Generally, when you edit an object that was queried in from an attached
drawing, that object is locked so no one else can edit it. When you save objects
back to attached drawings, the locks are automatically removed. (To change
this default setting, use the Map Options command.)
NOTE This functionality is for drawing objects only. To save edits back to geospatial
feature sources, see Checking In Features (page 693) and Updating Edits
Automatically (page 698).
See also:
■Adding an Object to the Save Set (page 750)
■Editing and Saving Objects in Attached Drawings (page 737)
NOTE This procedure is for drawing objects only. To save edits back to geospatial
feature sources, see Checking In Features (page 694)and Updating Edits
Automatically (page 700).
To remove objects from the save set and unlock the objects
1Click Home tab ➤ Data panel ➤ ➤ Remove Objects From Save Set.
2Enter s to select the objects to remove, or enter e to remove objects that
have been erased from the current drawing.
If you enter s, select the objects to remove from the save set. Press Enter
when you finish selecting objects.
3Click OK.
Editing Data in Attached Drawings | 759
Quick Reference
ADEREMOBJS
Removes objects from the save set so they aren't saved to source drawings
File menu ➤ Drawing Save Set Options ➤ Remove
Items From Save Set
Menu
Remove Objects from Save Set
Icon
ADEREMOBJSCommand Line
ADEREMOBJS (Remove Objects from Save Set
command)
Dialog Box
Solving Problems When Saving Back to Attached Drawings
Several issues can arise when you save queried objects back to attached
drawings.
NOTE This functionality is for drawing objects only. There is no equivalent for
geospatial feature data.
Redefining Blocks on Save Back
When you retrieve a block, you can use the EXPLODE command to break the
block into its component elements. Edit the separate objects and then use the
BLOCK command to redefine the block.
To save the redefined block definition back to the attached source drawing,
select the Redefine Block Definitions On Save Back option on the Save Back
tab of the AutoCAD Map Options dialog box (page 1908). AutoCAD Map 3D
sets this option by default.
Exploding Blocks and Save Back
If you explode a block, the block definition is deleted and you are prompted
to add the separate objects to the save set. If you answer Yes and use the default
settings, the block components are erased and are not saved back. To save the
individual objects back to the attached source drawings, you must add the
individual components of the block to the save set.
760 | Chapter 6 Creating and Editing Data

Saving Back Dimensions
If you set a global coordinate system or use the Transform editing tool, you
might have problems saving back dimensions. If you use a location query to
retrieve one or more dimensions and save the dimension back to the attached
source drawings, you might find that another location query will not retrieve
the dimension. In this case, you should detach the source drawing and reattach
it before repeating the location query.
Saving Back Hatch Patterns
When you create an associative hatch pattern, information is written to the
boundary objects. When you add such a hatch pattern to a save set, the
boundary is also added to ensure data integrity.
When you modify a queried hatch boundary object, the geometry is modified
and AutoCAD Map 3D automatically updates the hatch pattern. You are
prompted to add the boundary to the save set. Even if you answer Yes, the
hatch pattern might not be added to the save set. Check that the hatch pattern
is in the save set before you save back the changed objects.
When you add an associative hatch pattern to the save set, AutoCAD Map 3D
attempts to add the boundary objects that define the hatch pattern. If all
boundary objects are not available, you cannot add the hatch pattern to the
save set.
See also:
■Saving Queried Objects Back to Attached Drawings (page 753)
■Saving New Objects to Attached Drawings (page 754)
■Adding an Object to the Save Set (page 750)
■Removing an Object from the Save Set (page 759)
NOTE This procedure is for drawing objects only. There is no equivalent for
geospatial feature data.
To redefine block definitions on save back
1Click Map Setup tab ➤ Map panel ➤ angle-arrow.
2In the AutoCAD Map Options dialog box (page 1908), click the Save Back
tab.
Editing Data in Attached Drawings | 761
3Under Save Back To Source Drawings, select Redefine Block Definitions
On Save Back.
4Click OK.
To save back individual block components
1Click Home tab ➤ Data panel ➤ ➤ Add To Save Set.
2Select all the block components.
3Press Enter.
To check that the hatch pattern is in the save set
1Click Home tab ➤ Data panel ➤ ➤ Show Objects In Save Set.
2If the hatch pattern is not highlighted, make sure that all boundary objects
are added to the save set.
Quick Reference
ADESELOBJS
Creates a set of objects to be saved to source drawings
File menu ➤ Drawing Save Set Options ➤ Add Items
To Save Set
Menu
Add Objects to Save Set
Icon
ADESELOBJSCommand Line
ADESELOBJS (Select Objects for Save Back command)Dialog Box
ADESHOWOBJS
Displays the objects in the save set
File menu ➤ Drawing Save Set Options ➤ Show
Items In Drawing Save Set
Menu
762 | Chapter 6 Creating and Editing Data
Show Objects in Save Set
Icon
ADESHOWOBJSCommand Line
ADESHOWOBJS (Show Objects in Save Set command)Dialog Box
MAPOPTIONS
Sets AutoCAD Map 3D options
Setup menu ➤ Autodesk Map Options
Menu
Options
Icon
MAPOPTIONSCommand Line
In Map Explorer, right-click Current
Drawing ➤ Options
Task Pane
AutoCAD Map Options dialog boxDialog Box
Setting Save Back Options
A number of options affect how queried objects are saved back to attached
drawings or feature sources. These options apply to the current drawing.
NOTE This functionality is for drawing objects only. For information on Automatic
Update options for geospatial feature data, see Updating Edits Automatically (page
698).
Save Set and Edit Set Options
■Don't Add Objects Automatically — Edited objects are not added to the
save set, and you are not prompted to add them.
Use this option if you are creating a new drawing and are not planning to
save changes back to attached drawings. You can still manually add objects
to the save set (page 750).
■Prompt To Add Objects — When you edit an object that was retrieved
from an attached drawing or a feature source, you are prompted to add
the object to the save set.
Editing Data in Attached Drawings | 763

Use this option if you plan to save some edited objects, but not others,
back to attached drawing or feature source.
■Add Objects Automatically Without Prompting — When you edit an object
that was retrieved from an attached drawing or feature source, the object
is automatically added to the save set.
Use this option if you plan to save most modified objects back to attached
drawings and feature sources.
NOTE To add new objects to attached drawings, add them to the save set
manually. AutoCAD Map 3D does not prompt you to add them.
See also:
■Adding an Object to the Save Set (page 750)
■Saving Objects to the Current Drawing (page 756)
■Saving New Objects to Attached Drawings (page 754)
■Saving Queried Objects Back to Attached Drawings (page 753)
■Saving Objects to a New Drawing (page 758)
■AutoCAD Map Options dialog box (page 1908)
NOTE This procedure is for drawing objects only. For information on Automatic
Update options for geospatial feature data, see Updating Edits Automatically (page
700).
To set editing and save back options
1Click Map Setup tab ➤ Map panel ➤ angle-arrow.
2In the AutoCAD Map Options dialog box (page 1908), select the Save Back
tab.
3Set the options you want.
■Use the Save Set options to specify settings for saving objects to
attached drawings.
■Use the Edit Set options to specify settings for saving objects to feature
sources.
764 | Chapter 6 Creating and Editing Data
4Click OK.
Quick Reference
MAPOPTIONS
Sets AutoCAD Map 3D options
Setup menu ➤ Autodesk Map Options
Menu
Options
Icon
MAPOPTIONSCommand Line
In Map Explorer, right-click Current
Drawing ➤ Options
Task Pane
AutoCAD Map Options dialog boxDialog Box
Cleaning Up Drawing Data
Use Drawing Cleanup to correct common map errors resulting from surveying,
digitizing, and scanning errors. You can also remove unnecessary detail from
complex maps.
NOTE This functionality is for drawing objects only. There is no equivalent for
geospatial feature data.
NOTE These procedures are for drawing objects only. There are no equivalents
for geospatial feature data.
To clean up drawing data
■To clean up objects in a map (page 767)
■To select and anchor objects for drawing cleanup (page 770)
■To select cleanup actions and set options (page 773)
■To specify how to convert the objects after cleanup (page 776)
■To set up markers for interactive mode (page 779)
■To save Drawing Cleanup settings as a profile (page 781)
■To load an existing drawing cleanup profile (page 781)
■To edit a drawing cleanup profile (page 781)
■To select a correction method (page 782)
Cleaning Up Drawing Data | 765

■To select cleanup actions and set options (page 787)
Overview of Cleaning Up Maps
Use Drawing Cleanup to correct common geometry errors resulting from
surveying, digitizing, and scanning before you define a topology, perform a
map analysis, plot a map, or export to a geospatial data format.
You can also remove unnecessary detail from complex maps.
Example: You digitized paper maps and now some street intersections do not
align correctly. You want clean the maps before you create a topology.
NOTE This functionality is for drawing objects only. There is no equivalent for
geospatial feature data.
You can perform the following cleanup actions:
■delete duplicate objects
■erase short objects
■break crossing objects
■extend undershoots
■extend to apparent intersections
■snap clustered nodes
■dissolve pseudo nodes
■erase dangling objects (overshoots)
■simplify objects
■delete zero-length objects
■weed 3D polyline vertices
WARNING To edit topologies, use the topology editing commands (page 851).
Drawing Cleanup can make a topology invalid. In addition, when a cleanup action
creates a new object or breaks an object into multiple segments, classification
information remains with the segment that contains the start point of the original
object. Classify other segments manually.
766 | Chapter 6 Creating and Editing Data
Tell me more
Video
■Show me how to clean up errors in my
data
Tutorial
■Lesson 2: Clean Up Your Drawings
Procedure
■To clean up drawing data (page 765)
Workflow
■Add DWG Data to an Existing Feature
Source
GIS Skill
■Clean up duplicates, gaps, and other
accuracy problems in DWG files.
Related topics
■Correction Methods (page 782)
■Cleanup Actions (page 787)
■Overview of Editing a Topology (page
852)
WARNING To edit topologies, use the topology editing commands (page 851).
Drawing Cleanup can make a topology invalid.
NOTE This procedure is for drawing objects only. There is no equivalent for
geospatial feature data.
To clean up objects in a map
1Open the drawing containing the objects to clean or query the objects
into the current drawing.
2Because your map may be altered during the cleanup operation, back up
your data before starting.
3Click Tools tab ➤ Map Edit panel ➤ Clean Up.
Cleaning Up Drawing Data | 767
4In the Drawing Cleanup (page 1591) dialog box, follow these steps:
■Selecting and Anchoring Objects (page 770). Select the objects to
include in the cleanup operation and the objects to anchor. Click
Next.
■Setting Cleanup Options (page 773). Select cleanup actions and set the
parameters for each action you select. Specify whether to correct errors
automatically or to review and confirm each correction. Click Next.
■Converting Objects After Cleanup (page 776). Specify how to treat the
original objects after the cleanup operation is complete. Click Next.
■Setting Markers for Interactive Mode (page 777). If you selected
Interactive mode in Setting Cleanup Options to review error
corrections, specify the error markers to use. Click Next.
■Saving Cleanup Settings (page 781). To save your settings as a profile,
click Save.
5Click Finish.
AutoCAD Map 3D performs the cleanup with the options and values you
specified.
6Depending on whether you selected Interactive or Automatic, AutoCAD
Map 3D does one of the following:
■If you selected Interactive mode (page 783), AutoCAD Map 3D displays
a list of detected errors. You can review the errors and decide how to
handle them. For example, you can place markers on the errors, correct
them, or ignore them.
■If you selected Automatic mode (page 782), AutoCAD Map 3D corrects
all detected errors automatically and reports a summary of the results
on the command line.
You can run the operation again to verify that you corrected all existing errors.
Cleaning up geometry in a drawing creates new geometry and new
relationships between the objects. You may need to repeat the cleanup
operation.
Quick Reference
MAPCLEAN
768 | Chapter 6 Creating and Editing Data
Performs drawing cleanup operations
Modify menu ➤ Drawing Cleanup
Menu
Drawing Cleanup
Icon
MAPCLEANCommand Line
Drawing CleanupDialog Box
Step 1: Selecting and Anchoring Objects
Start by selecting the objects to include in the cleanup. You can automatically
select all objects or select objects manually.
You also select the objects to anchor. Anchored objects are reference points
and are not altered or moved; objects being cleaned are moved towards
anchored objects.
In addition, you can filter object selection by layer and object class so that
only objects that belong to the specified layers and object classes are selected.
Example: Select all objects on the Roads layer for cleanup, and anchor survey
points in the Monuments object class so that they maintain their accuracy.
NOTE In general, you can clean up linear objects only (lines, arcs, circles, and
polylines), although a few cleanup actions support additional object types, including
points, blocks, text, and mtext. Anchoring supports these additional object types.
Any unsupported object types are not cleaned up or anchored.
NOTE This functionality is for drawing objects only. There is no equivalent for
geospatial feature data.
See also:
■Overview of Cleaning Up Maps (page 766)
■Select Objects Page (page 1595)
■Overview of Cleanup Actions (page 788)
NOTE This procedure is for drawing objects only. There is no equivalent for
geospatial feature data.
Cleaning Up Drawing Data | 769

To select and anchor objects for drawing cleanup
1Click Tools tab ➤ Map Edit panel ➤ Clean Up.
2On the Select Objects Page (page 1595), under Objects To Include In Drawing
Cleanup, select the objects to clean up.
■Choose the method to use for selecting objects. Click Select All to
select all objects. Click Select Manually to select individual objects.
■To limit object selection to objects on specific layers or in specific
object classes, specify the layers and object classes to include.
■If you chose Select Manually, click Select Objects To Be Included to
select objects in the drawing area. Press Enter to return to the Select
Objects page.
In general, you can clean up linear objects only (lines, arcs, circles, and
polylines). A few cleanup actions support additional object types, such
as points, blocks, text, and mtext. Unsupported object types are not
cleaned up.
The status line shows how many objects are selected and how many have
been filtered out.
3Under Objects To Anchor In Drawing Cleanup, select the objects to use
as reference points during the drawing cleanup. These points are not
altered. You can anchor linear objects, points, blocks, text, and mtext.
■To limit object selection to objects on specific layers or in specific
object classes, specify the layers and object classes to include.
■Click Select Objects To Be Anchored. Select the objects to anchor.
Press Enter to return to the Select Objects page.
4Click Next.
5Continue with To select cleanup actions and set options (page 773).
Quick Reference
MAPCLEAN
Performs drawing cleanup operations
Modify menu ➤ Drawing Cleanup
Menu
770 | Chapter 6 Creating and Editing Data

Drawing Cleanup
Icon
MAPCLEANCommand Line
Drawing CleanupDialog Box
Step 2: Setting Cleanup Options
As you clean up a map, you select one or more cleanup actions to perform.
Each cleanup action detects a different type of map error, for example,
duplicate objects, undershoots, or zero-length objects.
NOTE This functionality is for drawing objects only. There is no equivalent for
geospatial feature data.
For best results, run Simplify Objects and Weed Polylines individually. Run
other cleanup actions individually or with a minimum of other actions.
Cleanup Actions
You can perform the following cleanup actions:
■Delete Duplicates (page 793)
■Erase Short Objects (page 795)
■Break Crossing Objects (page 797)
■Extend Undershoots (page 799)
■Apparent Intersection (page 802)
■Snap Clustered Nodes (page 804)
■Dissolve Pseudo Nodes (page 807)
■Erase Dangling Objects (page 809)
■Simplify Objects (page 811)
■Zero-Length Objects (page 815)
■Weed Polylines (page 816)
Cleaning Up Drawing Data | 771
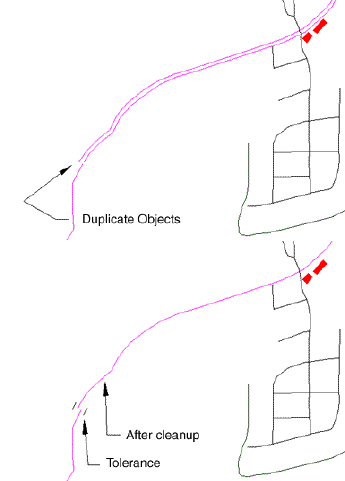
Order of Cleanup Actions
The order of cleanup actions can produce different results. Specify the order
by moving cleanup actions up or down in the list. The action at the top of
the list is performed first.
Setting Cleanup Options
Set the options for each cleanup action individually. For more information,
see the individual help topics about each cleanup action.
Understanding the Tolerance Setting
Tolerance is the minimum distance allowed between linear objects or nodes.
If two linear objects or nodes are separated by a distance less than the tolerance,
AutoCAD Map 3D corrects the error.
If you set the tolerance too low, AutoCAD Map 3D might miss some errors.
If you set the tolerance too high, AutoCAD Map 3D might correct linear objects
that are not errors. Decide if the data constitutes an error and choose a suitable
tolerance to eliminate errors.
772 | Chapter 6 Creating and Editing Data

For example, a tolerance of 10 would eliminate dangles less than 10 meters
long; but in some cases, such dangles might be the correct mapping of a short
pipe or street.
See also:
■Overview of Cleaning Up Maps (page 766)
■Select Actions Page (page 1588)
■Overview of Cleanup Actions (page 788)
NOTE This procedure is for drawing objects only. There is no equivalent for
geospatial feature data.
To select cleanup actions and set options
1On the Select Actions Page (page 1588), select the cleanup actions to perform
by adding them to the Selected Actions list.
To add a cleanup action to the Selected Actions list, select the action in
the Cleanup Actions (page 787) list, and click Add.
For best results, run Simplify Objects and Weed Polylines individually.
Run other cleanup actions individually or with a minimum of other
actions.
2In the Selected Actions list, specify the order of cleanup actions. The order
can affect results. The first action in the list is performed first. To change
the order, highlight an action and click the up or down arrow.
3In the Selected Actions list, select the action for which you want to specify
settings.
4Under Cleanup Parameters, specify the settings to use for the selected
action. For more information about each cleanup action, click one of the
following links:
■Delete Duplicates (page 793)
■Erase Short Objects (page 795)
■Break Crossing Objects (page 797)
■Extend Undershoots (page 799)
■Apparent Intersection (page 802)
■Snap Clustered Nodes (page 804)
Cleaning Up Drawing Data | 773

■Dissolve Pseudo Nodes (page 807)
■Erase Dangling Objects (page 809)
■Simplify Objects (page 811)
■Zero-Length Objects (page 815)
■Weed Polylines (page 816)
5To review detected errors before correcting them, under Options, select
Interactive. To have AutoCAD Map 3D correct all detected errors without
further input from you, select Automatic.
NOTE Simplify Objects and Weed Polylines are not interactive operations.
AutoCAD Map 3D makes these changes automatically during cleanup.
6Click Next.
7Continue with Step 3: Specifying How to Convert Objects After Cleanup
(page 775).
Quick Reference
MAPCLEAN
Performs drawing cleanup operations
Modify menu ➤ Drawing Cleanup
Menu
Drawing Cleanup
Icon
MAPCLEANCommand Line
Drawing CleanupDialog Box
774 | Chapter 6 Creating and Editing Data

Step 3: Specifying How to Convert Objects After Cleanup
As you clean up a map, you can specify how to treat the original objects after
the cleanup operation is complete.
■Modify Original Objects — Uses the original layer and as much of the
original data as possible. For example, linear objects are extended where
necessary.
■Retain Original And Create New Objects — Keeps the original objects and
creates new objects on a layer you specify. For example, to extend an
undershoot, new linear objects are created on the specified layer for the
undershoot and target linear objects, and the originals are retained.
■Delete Original And Create New Objects — Deletes all the original objects
and creates new objects on a layer you specify. For example, the original
undershoot is deleted, and a new linear object is created that extends to
the required location.
NOTE This functionality is for drawing objects only. There is no equivalent for
geospatial feature data.
NOTE When you create new objects, existing object data and database links are
copied to the new objects. All created objects are assigned the current value of
the ELEVATION system variable.
Converting Objects to Polylines
You can specify whether to convert lines, arcs, and 3D polylines to 2D
polylines, and convert circles to arcs or 2D polylines. If you convert arcs to
polylines, the polyline is created using a true arc, not a set of straight line
segments. If you convert a circle to a polyline, the polyline is created using
two true arcs, not a set of straight line segments. Use these conversion options
in the following cases:
■You plan to use the results of the drawing cleanup operation in another
program that accepts only polylines.
■You want to modify the line width of the arcs, circles, or lines so you can
use them in a thematic map. You can assign line width only to polylines.
NOTE If you convert objects to different entity types during the cleanup process,
classified objects may be modified so that they no longer meet the object class
definition and will be unclassified.
Cleaning Up Drawing Data | 775
See also:
■Overview of Cleaning Up Maps (page 766)
■Overview of Setting Up Object Classification (page 117)
■Cleanup Methods Page (page 1585)
NOTE This procedure is for drawing objects only. There is no equivalent for
geospatial feature data.
To specify how to convert the objects after cleanup
1On the Cleanup Methods Page (page 1585), under Cleanup Method, specify
how to treat the objects after the conversion process is complete.
NOTE Creating new objects may increase file size significantly.
2If you are creating new objects, select the layer to use.
3Under Convert Selected Objects, specify whether to convert lines, arcs,
and 3D polylines to 2D polylines, and convert circles to arcs or 2D
polylines.
4To save your settings as a profile, click Save.
5Do one of the following:
■If you selected Interactive (page 783) on the Select Actions page, click
Next to continue with To set up markers for interactive mode (page
779).
■If you selected Automatic (page 782) on the Select Actions page, click
Finish to start the cleanup process.
Quick Reference
MAPCLEAN
Performs drawing cleanup operations
Modify menu ➤ Drawing Cleanup
Menu
Drawing Cleanup
Icon
776 | Chapter 6 Creating and Editing Data

MAPCLEANCommand Line
Drawing CleanupDialog Box
Step 4: Setting Up Markers for Interactive Mode
When you review errors interactively, AutoCAD Map 3D places error markers
on detected errors to help you locate the errors more quickly and evaluate
whether they need correction.
NOTE This functionality is for drawing objects only. There is no equivalent for
geospatial feature data.
If you correct an error, the marker is removed. If you do not correct the error,
you can remove the marker and skip the error, or leave the marker in the map
for later reference.
You can mark each error with a different shape and color marker to indicate
each type of operation.
If you clean up a map multiple times, you can remove or maintain markers
from earlier operations. You can also remove or maintain markers after the
current operation.
Cleaning Up Drawing Data | 777
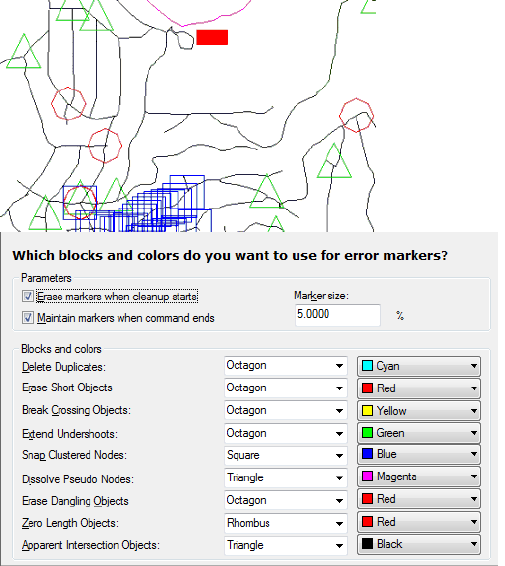
Set the type and color of markers used to mark errors.
■If you correct errors automatically, errors are not marked.
■The markers used in drawing cleanup are the same as those used when
creating a polygon topology. Before beginning either operation, existing
markers are removed.
See also:
■Overview of Cleaning Up Maps (page 766)
■Using Interactive Mode to Review and Confirm Corrections (page 783)
■Error Markers Page (page 1587)
■Creating a Polygon Topology (page 833)
778 | Chapter 6 Creating and Editing Data
NOTE The Error Markers page is available only if you select Interactive in Step 2
(page 773).
NOTE This procedure is for drawing objects only. There is no equivalent for
geospatial feature data.
To set up markers for interactive mode
1To remove markers placed by an earlier cleanup operation, on the Error
Markers Page (page 1587), select Erase Markers When Cleanup Starts. This
is useful if you repeat the cleanup process to catch errors missed in the
first pass.
2To leave markers after this cleanup operation, select Maintain Markers
When Command Ends.
3In the Marker Size box, specify a marker size. A value between 3% and
7% is usually suitable.
4Under Blocks And Colors, select the marker shape and color for each type
of error.
5To save your settings as a profile, click Save.
6Click Finish.
The Drawing Cleanup Errors dialog box (page 1593) appears, where you
review errors before correcting them (page 785).
You can run the operation again to verify that you corrected all existing errors.
Cleaning up geometry in a drawing creates new geometry and new
relationships between the objects. You may need to repeat the cleanup
operation.
Quick Reference
MAPCLEAN
Performs drawing cleanup operations
Modify menu ➤ Drawing Cleanup
Menu
Drawing Cleanup
Icon
Cleaning Up Drawing Data | 779

MAPCLEANCommand Line
Drawing CleanupDialog Box
Saving Cleanup Settings as a Profile
Once you have specified the settings for drawing cleanup, you can save them
as a profile for later use. Profiles are also useful when you automate the drawing
cleanup process with scripts. Drawing cleanup profiles are saved as *.dpf files.
NOTE This functionality is for drawing objects only. There is no equivalent for
geospatial feature data.
Saving Drawing Cleanup Settings as a Profile
Drawing Cleanup profiles include all the options specified in the drawing
cleanup dialog boxes, including the layer names used for object selection and
anchoring, cleanup actions and settings, cleanup methods, and error marker
settings (if any). Drawing Cleanup profiles do not include the actual objects
selected and anchored on the specified layers.
Loading Drawing Cleanup Profiles
Load a profile to make the saved settings current. Settings that are loaded
include the object selection and anchoring criteria, cleanup actions and
settings, cleanup methods, and error marker settings.
Editing Drawing Cleanup Profiles
You can edit Drawing Cleanup profiles in AutoCAD Map 3D and save your
changes, either replacing an existing profile or saving it as a new profile.
WARNING Do not edit Drawing Cleanup profiles outside of AutoCAD Map 3D.
Doing so may produce unexpected results.
See also:
■Overview of Cleaning Up Maps (page 766)
NOTE This procedure is for drawing objects only. There is no equivalent for
geospatial feature data.
780 | Chapter 6 Creating and Editing Data

To save Drawing Cleanup settings as a profile
1Click Tools tab ➤ Map Edit panel ➤ Clean Up.
2Specify the settings to save.
3Click Save.
4In the Save Drawing Cleanup Profile dialog box, enter a name for the
profile. Click Save.
To load an existing drawing cleanup profile
1Click Tools tab ➤ Map Edit panel ➤ Clean Up.
2Click Load.
3In the Select Drawing Cleanup Profile dialog box, select the profile to
load.
4Click Open.
The settings from the selected profile are made current.
To edit a drawing cleanup profile
1Load the profile as described above.
2Make changes to the Drawing Cleanup settings.
3Save the profile.
Quick Reference
MAPCLEAN
Performs drawing cleanup operations
Modify menu ➤ Drawing Cleanup
Menu
Drawing Cleanup
Icon
MAPCLEANCommand Line
Cleaning Up Drawing Data | 781

Drawing CleanupDialog Box
Correction Methods
You can correct errors automatically or review each error and decide how to
fix it.
NOTE This functionality is for drawing objects only. There is no equivalent for
geospatial feature data.
See also:
■Overview of Cleaning Up Maps (page 766)
■Step 3: Specifying How to Convert Objects After Cleanup (page 775)
■Step 4: Setting Up Markers for Interactive Mode (page 777)
NOTE This procedure is for drawing objects only. There is no equivalent for
geospatial feature data.
To select a correction method
■To correct errors automatically (page 783)
■To review errors before correcting them (page 785)
Using Automatic Mode to Correct Errors
You can configure AutoCAD Map 3D so that it cleans up detected errors
automatically. The results of the cleanup are displayed on the command line.
NOTE This functionality is for drawing objects only. There is no equivalent for
geospatial feature data.
See also:
■Overview of Cleaning Up Maps (page 766)
■Step 3: Specifying How to Convert Objects After Cleanup (page 775)
■Using Interactive Mode to Review and Confirm Corrections (page 783)
782 | Chapter 6 Creating and Editing Data
NOTE This procedure is for drawing objects only. There is no equivalent for
geospatial feature data.
To correct errors automatically
1Click Tools tab ➤ Map Edit panel ➤ Clean Up.
2On the Drawing Cleanup - Select Objects Page (page 1595), select the objects
to clean and the objects to anchor. Click Next.
3In the Select Actions Page, select cleanup actions by adding them to the
Selected Actions list. Specify the cleanup parameters for each action.
4In the Options area, select Automatic.
5Click Next to go to the Cleanup Methods Page where you specify how
you want to treat the objects after the cleanup process is complete.
6Click Finish.
AutoCAD Map 3D corrects the errors and displays a summary of the
results on the command line.
Quick Reference
MAPCLEAN
Performs drawing cleanup operations
Modify menu ➤ Drawing Cleanup
Menu
Drawing Cleanup
Icon
MAPCLEANCommand Line
Drawing CleanupDialog Box
Using Interactive Mode to Review and Confirm Corrections
Use the Interactive option in the Select Actions Page if you want to review
the list of errors detected by the Drawing Cleanup command, place error
markers showing their location in the map, and zoom to and highlight errors
Cleaning Up Drawing Data | 783
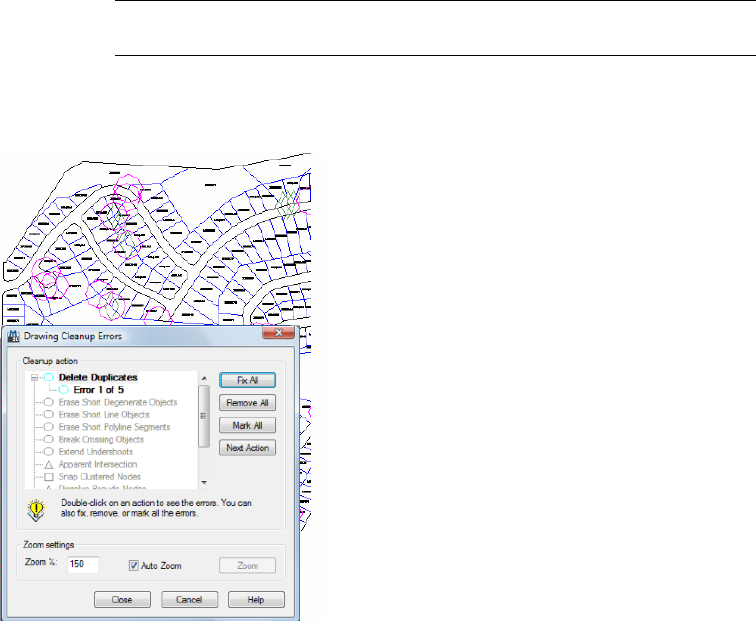
to better examine them. Correct errors one at a time or correct all the errors
detected for a selected cleanup action as a single action.
NOTE This functionality is for drawing objects only. There is no equivalent for
geospatial feature data.
You can configure error markers (page 777) on the Drawing Cleanup - Error
Markers Page (page 1587). You can also indicate whether to maintain markers
both from earlier cleanup operations and after the current cleanup operation.
Review, mark, and correct errors interactively.
■All cleanup actions are represented in the Drawing Cleanup Errors dialog
box (page 1593), except for Simplify Objects, which is not an interactive
operation.
■If you are cleaning up short objects, AutoCAD Map 3D divides the detected
errors into three groups: Short Degenerate Objects, Short Line Objects, and
Short Polyline Objects so you can evaluate and correct these types of errors
separately. If you are cleaning up zero length objects, AutoCAD Map 3D
divides the errors into two groups: Zero Length Line Objects and Zero
Length Polyline Objects.
784 | Chapter 6 Creating and Editing Data

■When you fix an error or group of errors, it may affect the errors further
down the list. For example, if you break two crossing objects and create
four new, shorter objects, the new objects may be shorter than the tolerance
specified for Erase Short Objects tolerance. Drawing Cleanup would detect
these as new, additional errors and add them to the list.
■Objects are not updated visually until you close the dialog box. When you
review the new errors, objects will not appear in their corrected state.
See also:
■Overview of Cleaning Up Maps (page 766)
■Step 3: Specifying How to Convert Objects After Cleanup (page 775)
■Step 4: Setting Up Markers for Interactive Mode (page 777)
■Using Automatic Mode to Correct Errors (page 782)
NOTE This procedure is for drawing objects only. There is no equivalent for
geospatial feature data.
To review errors before correcting them
1Click Tools tab ➤ Map Edit panel ➤ Clean Up.
2On the Drawing Cleanup - Select Objects Page (page 1595), select the objects
to clean and the objects to anchor. Click Next.
3In the Select Actions Page, select the cleanup actions to perform by adding
them to the Selected Actions list. Specify the cleanup parameters for each
action.
4To review errors before correcting them, in the Options area, select
Interactive.
5On the left side of the dialog box, click Error Markers in the list.
You can also continue clicking Next to set all the parameters for the
cleanup operation. After you click Next on the Cleanup Methods page,
you can set the markers.
6In the Error Markers Page, specify the size, shape, and color of the error
markers to use for each cleanup action. Also specify whether to remove
markers from earlier operations or remove markers after this cleanup.
Cleaning Up Drawing Data | 785

7To save your settings in a profile (page 781), click Save.
8Click Finish to run the cleanup process and review the list of detected
errors in the Drawing Cleanup Errors dialog box (page 1593).
In the Drawing Cleanup Errors dialog box (page 1593), the first cleanup
action with detected errors is selected. All other actions are shaded.
Cleanup actions are listed in the order specified on the Drawing Cleanup
- Select Actions Page (page 1588). The icons to the left of the action name
show you what the error marker for that action looks like.
All cleanup actions are represented in the Drawing Cleanup Errors dialog
box (page 1593), with the exception of Simplify Objects, which is not an
interactive operation. For short objects, AutoCAD Map 3D divides the
detected errors into three groups: Short Degenerate Objects, Short Line
Objects, and Short Polyline Objects. If you are cleaning up zero length
objects, AutoCAD Map 3D divides the errors into two groups: Zero Length
Line Objects and Zero Length Polyline Objects.
9You can address all errors for each cleanup action as follows:
■To correct all errors for the selected action, click Fix All.
NOTE Corrections are made after you finish reviewing and correcting
all errors.
■To display error markers for all errors for the selected action, making
them easily visible in the map, click Mark All.
■To ignore all errors for a selected action and remove any error markers,
click Remove All.
■To go to the next cleanup action in the list without correcting errors,
click Next Action.
10 To address errors one at a time, click the plus (+) next to the cleanup
action. Select Error 1 of... and choose an option:
■To correct the current error and go to the next one, click Fix.
NOTE Corrections appear after you finish reviewing and correcting all
errors.
■To leave a marker on the current error, click Mark.
■To go to the next error in the list without making a correction and
remove any error marker, click Remove.
786 | Chapter 6 Creating and Editing Data

■To skip an error, click Next.
11 You can highlight and zoom to errors in the map by setting the following
options under Zoom Settings:
■To zoom to selected errors dynamically, select Auto Zoom.
■To indicate the percent of the drawing display that selected error
occupies, enter a value in the Zoom % box. For example, specify 100%
to zoom the display to the extents of the selected error, or specify
60% to display more of the drawing outside the selected error. Specify
0 to maintain the current zoom level.
■To zoom to the selected error, clear the Auto Zoom check box and
click Zoom.
12 Click Close to make the corrections to your map.
Quick Reference
MAPCLEAN
Performs drawing cleanup operations
Modify menu ➤ Drawing Cleanup
Menu
Drawing Cleanup
Icon
MAPCLEANCommand Line
Drawing CleanupDialog Box
Cleanup Actions
Drawing Cleanup actions detect map errors (for example, duplicate objects,
undershoots, or zero length objects), simplify complex 2D maps, and weed
and supplement 3D polylines.
To select cleanup actions and set options
■To select cleanup actions and set options (page 791)
■To delete duplicate objects (page 794)
■To erase short linear objects (page 796)
Cleaning Up Drawing Data | 787
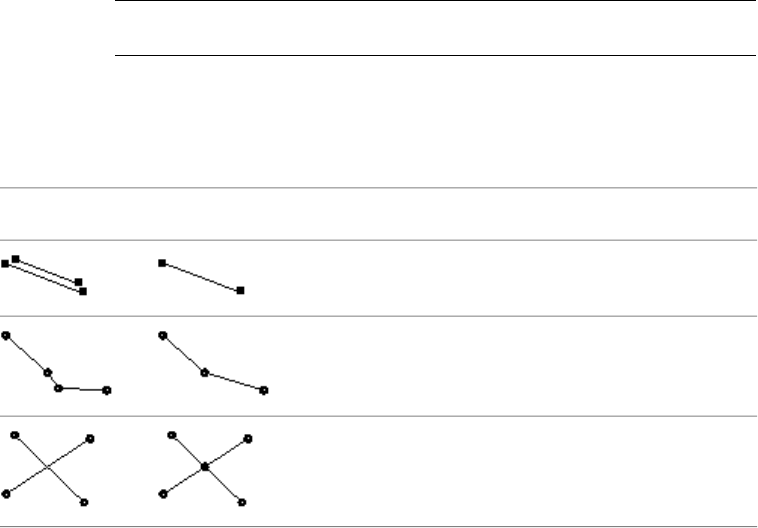
■To break crossing objects (page 799)
■To extend undershoots (page 801)
■To extend objects to their apparent intersection (page 803)
■To snap clustered nodes (page 806)
■To dissolve pseudo nodes (page 808)
■To erase dangling objects (page 810)
■To simplify objects (page 814)
■To identify zero-length objects (page 815)
■To weed or add vertices to a 3D polyline (page 819)
Overview of Cleanup Actions
Drawing Cleanup actions can be used to detect map errors (for example,
duplicate objects, undershoots, or zero length objects), simplify complex 2D
maps, and to weed and supplement 3D polylines. Because Drawing Cleanup
can alter your data, make a backup of your data before cleaning up a map.
NOTE This functionality is for drawing objects only. There is no equivalent for
geospatial feature data.
For best results, run cleanup actions individually or with a minimum of other
actions.
The following table shows examples of problems that Drawing Cleanup can
correct.
Cleanup ActionDescription of
Problem
After Drawing
Cleanup
Before Drawing
Cleanup
Delete Duplicates (page 793)Duplicate objects
Erase Short Objects (page 795)Short objects
Break Crossing Objects (page 797)Crossing objects
788 | Chapter 6 Creating and Editing Data
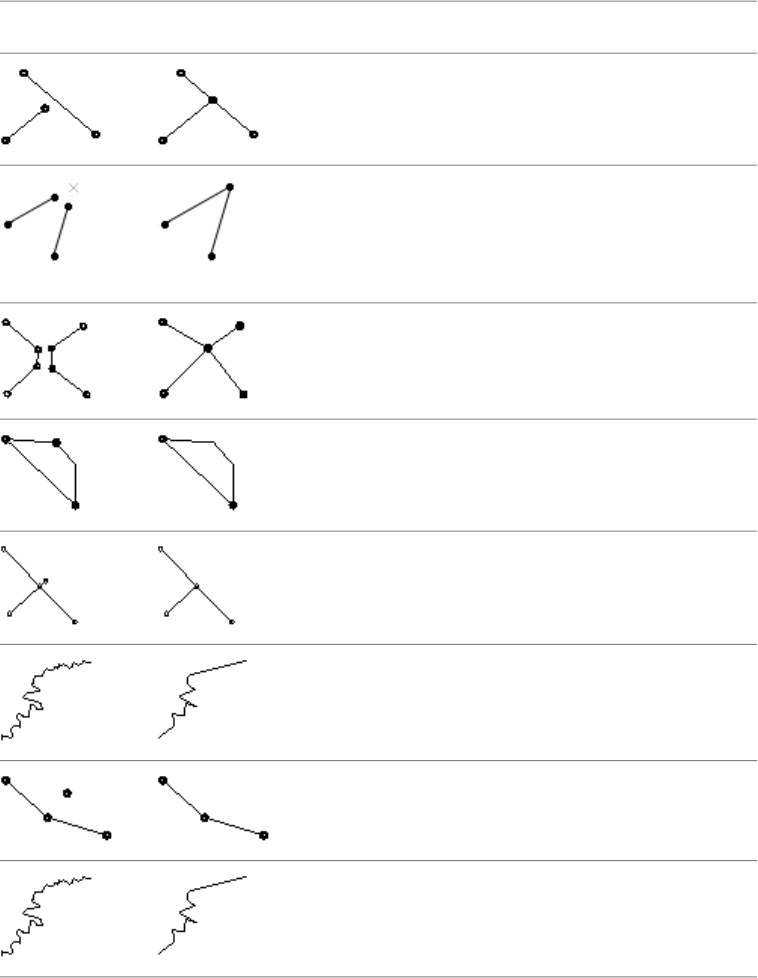
Cleanup ActionDescription of
Problem
After Drawing
Cleanup
Before Drawing
Cleanup
Extend Undershoots (page 799)Undershoots
Apparent Intersection (page 802)Objects could be ex-
tended along their
natural paths to inter-
sect at a projected
point
Snap Clustered Nodes (page 804)Node cluster
Dissolve Pseudo Nodes (page 807)Pseudo-nodes
Erase Dangling Objects (page 809)Dangles or over-
shoots
Simplify Objects (page 811)2D linear object sim-
plification
Zero-Length Objects (page 815).Zero-length objects
Weed Polylines (page 816)Too many or too few
vertices in a 3D poly-
line
Cleaning Up Drawing Data | 789
Order of Cleanup Actions
The order of cleanup actions can produce different results. Specify the order
by moving cleanup actions up or down in the list. The action at the top of
the list is performed first.
Setting Cleanup Options
Set the options for each cleanup action individually. For more information,
see the individual help topics about each cleanup action.
Cleaning for Topology
Some types of errors should be fixed before you create a topology. The
following table indicates data errors that should be considered when you are
creating a network or polygon topology. Node topologies do not usually
require cleanup.
Polygon TopologyNetwork TopologyError
Must removeMust removeDuplicates
Can removeCan removeShort Linear Objects
Must removeCheck for validity. See Creating a
Network Topology (page 829).
Crossing Linear Objects
Must removeMust removeUndershoots
Must removeMust removeNode Cluster
Can removeCan removePseudo Nodes
Must removeCheck for validity. Can removeDangles or overshoots
Can applyCan applySimplify Linear Objects
Must removeMust removeZero-Length Objects
In addition, if you have closed polylines (polygons) that may be missing
centroids, you should create centroids (page 885) for them before using them
in topology.
790 | Chapter 6 Creating and Editing Data

Notes
■Drawing Cleanup affects objects on layers that are OFF. It does not affect
objects on layers that are FROZEN. It is recommended that you use drawing
cleanup on a layer-by-layer basis, or on selective sets of layers. Avoid using
automatic cleanup for all objects on all layers.
■All tools except Weed Polylines work in two dimensions only, ignoring
Z-values. When you use the 2D tools, Z data (indicating elevations) might
be lost when processing objects at different elevations.
See also:
■Overview of Cleaning Up Maps (page 766)
■Step 2: Setting Cleanup Options (page 771)
■Overview of Editing a Topology (page 852)
NOTE This procedure is for drawing objects only. There is no equivalent for
geospatial feature data.
To select cleanup actions and set options
1Click Tools tab ➤ Map Edit panel ➤ Clean Up.
2On the Select Actions page, select the cleanup actions to perform by
adding them to the Selected Actions list.
To add an action to the Selected Actions list, select the action in the
Cleanup Actions list. Click Add.
■To delete duplicate objects (page 794)
■To erase short linear objects (page 796)
■To break crossing objects (page 799)
■To extend undershoots (page 801)
■To extend objects to their apparent intersection (page 803)
■To snap clustered nodes (page 806)
■To dissolve pseudo nodes (page 808)
■To erase dangling objects (page 810)
Cleaning Up Drawing Data | 791
■To simplify objects (page 814)
■To identify zero-length objects (page 815)
■To weed or add vertices to a 3D polyline (page 819)
3In the Selected Actions list, specify the order in which to perform the
cleanup actions. The order is important and can affect your results. The
first action in the list will be performed first. To change the order,
highlight an action and click the up or down arrow.
NOTE For best results, run Simplify Objects and Weed Polylines individually.
If you run one of these with other actions, it will always be run before other
actions, regardless of its position in the list. In addition, these actions will only
be run once, regardless of how many times they are listed.
4In the Selected Actions list, select an action.
Each action has its own set of options. Set up each one individually. For
information about the settings for an action, click one of the preceding
links.
5Under Cleanup Parameters, enter the settings for the selected action.
6To review detected errors before correcting them, under Options, select
Interactive. To have AutoCAD Map 3D automatically correct all detected
errors, select Automatic.
NOTE Simplify Objects and Weed Polylines are not interactive operations.
AutoCAD Map 3D makes these changes automatically during cleanup.
7Continue specifying Drawing Cleanup settings.
Quick Reference
MAPCLEAN
Performs drawing cleanup operations
Modify menu ➤ Drawing Cleanup
Menu
Drawing Cleanup
Icon
792 | Chapter 6 Creating and Editing Data

MAPCLEANCommand Line
Drawing CleanupDialog Box
Delete Duplicates
Delete Duplicates locates objects that share the same start and end points as
well as all other points within the tolerance distance. You can delete one of
the objects.
You can include the following object types:
■Linear objects
■Points
■Blocks
■Text
■Mtext
WARNING Do not use Delete Duplicates with polygon topology because it deletes
important topology data.
NOTE This functionality is for drawing objects only. There is no equivalent for
geospatial feature data.
■The coordinate locations of objects and the number of vertices (i.e., object
geometry) are considered when checking for duplicates, therefore, objects
with different directions, objects of different types (for example, lines and
polylines), and objects with different properties (for example, linetype and
color) can be considered as duplicates.
■You can choose to consider Z-value (elevation) when checking for
duplicates. For blocks, text, and mtext, you can also choose whether to
consider object rotation.
■Objects with the same geometry, but on different layers, are considered
duplicates. Use the Select Objects page to select objects on one layer at a
time.
Cleaning Up Drawing Data | 793
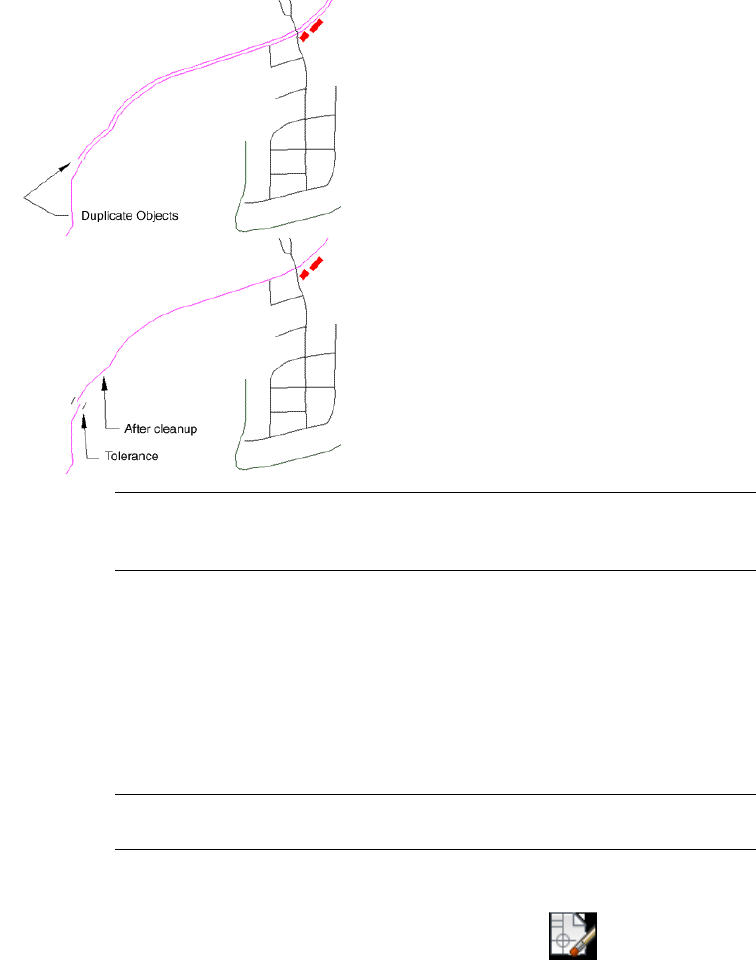
NOTE When deleting duplicate edges that are polyline segments, the command
deletes lines and arcs before breaking polylines. The command removes only
objects with the same geometry, even if the objects are on different layers.
See also:
■Overview of Cleaning Up Maps (page 766)
■Step 2: Setting Cleanup Options (page 771)
■Overview of Cleanup Actions (page 788)
■Overview of Editing a Topology (page 852)
NOTE This procedure is for drawing objects only. There is no equivalent for
geospatial feature data.
To delete duplicate objects
1Click Tools tab ➤ Map Edit panel ➤ Clean Up.
794 | Chapter 6 Creating and Editing Data

2On the Select Actions page, in the Cleanup Actions list, click Delete
Duplicates. Click Add.
3In the Select Actions list, click Delete Duplicates to display the cleanup
parameters for this action.
4Under Cleanup Parameters, set Tolerance to a value slightly higher than
the distance between the objects.
Enter a value in the Tolerance box or click Pick to select two points that
define the tolerance.
5Select the object types to include in the Delete Duplicates calculation.
6To include rotation in the delete duplicates calculation for Blocks, Text,
or Mtext, select Rotation.
7To include z-values (elevation) in the delete duplicates calculation, select
Z-values.
8Continue specifying Drawing Cleanup settings.
Quick Reference
MAPCLEAN
Performs drawing cleanup operations
Modify menu ➤ Drawing Cleanup
Menu
Drawing Cleanup
Icon
MAPCLEANCommand Line
Drawing CleanupDialog Box
Erase Short Objects
Using the Erase Short Objects cleanup action, you can locate any objects
shorter than the specified tolerance and erase them. This removes short isolated
linear objects and short linear objects that are part of a polyline.
NOTE This functionality is for drawing objects only. There is no equivalent for
geospatial feature data.
Cleaning Up Drawing Data | 795
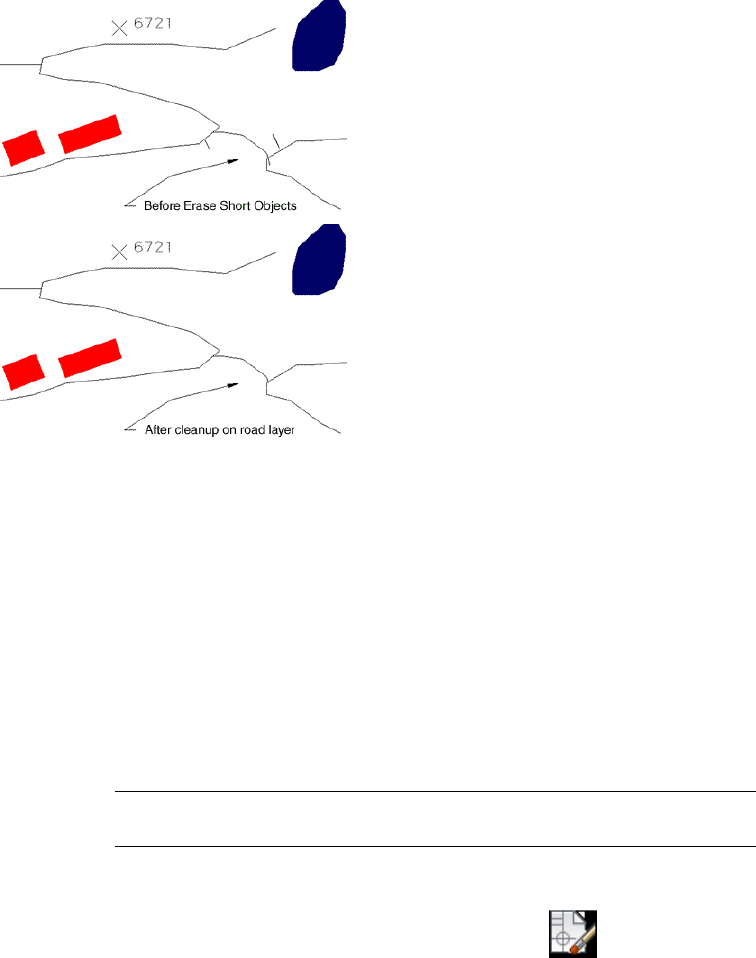
This action is like the Dissolve Pseudo-Nodes action, except Erase Short Objects
removes both the linear object and associated nodes.
Depending on your data, use Snap Clustered Nodes next, to correct errors that
might result from the Erase Short Objects option.
See also:
■Overview of Cleaning Up Maps (page 766)
■Step 2: Setting Cleanup Options (page 771)
■Overview of Cleanup Actions (page 788)
■Dissolve Pseudo Nodes (page 807)
NOTE This procedure is for drawing objects only. There is no equivalent for
geospatial feature data.
To erase short linear objects
1Click Tools tab ➤ Map Edit panel ➤ Clean Up.
796 | Chapter 6 Creating and Editing Data

2On the Select Actions page, in the Cleanup Actions list, click Erase Short
Objects. Click Add.
3In the Select Actions list, click Erase Short Objects to display the cleanup
parameters for this action.
4Under Cleanup Parameters, set Tolerance to a value slightly smaller than
the shortest length you want to retain.
You can enter a value into the Tolerance box or click Pick to go to the
map and select two points that define the tolerance to use.
5Continue specifying Drawing Cleanup settings.
Quick Reference
MAPCLEAN
Performs drawing cleanup operations
Modify menu ➤ Drawing Cleanup
Menu
Drawing Cleanup
Icon
MAPCLEANCommand Line
Drawing CleanupDialog Box
Break Crossing Objects
Use Break Crossing Objects to locate objects that cross each other and have
no node at the crossing, break the crossing objects, and create a node at the
crossing. This action takes a complex system of lines, arcs, circles, and polylines
and breaks them at intersections into individual, unambiguous objects.
NOTE This functionality is for drawing objects only. There is no equivalent for
geospatial feature data.
This action is important when you are establishing network topology or
working with topographic contours. The first example shows four linear objects
in a network topology that were digitized as two linear objects; after you use
Break Crossing Objects, the linear objects are four separate objects that intersect
at a common point.
Cleaning Up Drawing Data | 797
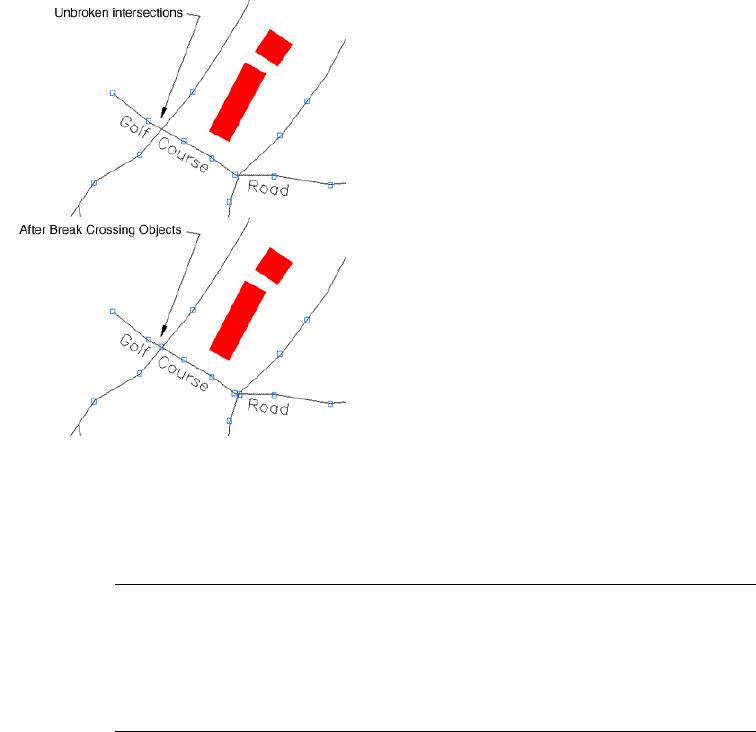
Closed objects, such as contours and lakes, can be cleaned up with the Break
Crossing Objects and Erase Dangling Objects actions. Use Break Crossing
Objects to create separate objects, and then use Erase Dangling Objects (page
809) or the ERASE command. Verify that the shape created after editing reflects
the intended shape and that a distorted, closed area is not created.
NOTE AutoCAD Map 3D does not refer to a tolerance value when breaking crossing
objects. The Break Crossing Objects action corrects apparent problems across
layers and may break lines meant to indicate separate objects, such as rivers and
roads. Use Break Crossing Objects with one layer at a time to avoid this problem.
Using the Break Crossing Objects action on an arc whose endpoints are very close
may result in the duplication or extension of the arc.
See also:
■Overview of Cleaning Up Maps (page 766)
■Step 2: Setting Cleanup Options (page 771)
■Overview of Cleanup Actions (page 788)
■Erase Dangling Objects (page 809)
■Overview of Editing a Topology (page 852)
798 | Chapter 6 Creating and Editing Data
NOTE This functionality is for drawing objects only. There is no equivalent for
geospatial feature data.
To break crossing objects
1Click Tools tab ➤ Map Edit panel ➤ Clean Up.
2On the Select Actions page, in the Cleanup Actions list, click Break
Crossing Objects. Click Add.
3Continue specifying Drawing Cleanup settings.
■Break Crossing Objects does not use a tolerance value or other cleanup
parameters.
■Using the Break Crossing Objects action on an arc whose endpoints are
very close may result in the duplication or extension of the arc.
Quick Reference
MAPCLEAN
Performs drawing cleanup operations
Modify menu ➤ Drawing Cleanup
Menu
Drawing Cleanup
Icon
MAPCLEANCommand Line
Drawing CleanupDialog Box
Extend Undershoots
Undershoots are often caused by inaccurate digitizing or when converting
scanned data. Using the Extend Undershoots cleanup action, you can locate
objects that come within the specified tolerance radius of each other, but do
not meet.
NOTE This functionality is for drawing objects only. There is no equivalent for
geospatial feature data.
Cleaning Up Drawing Data | 799
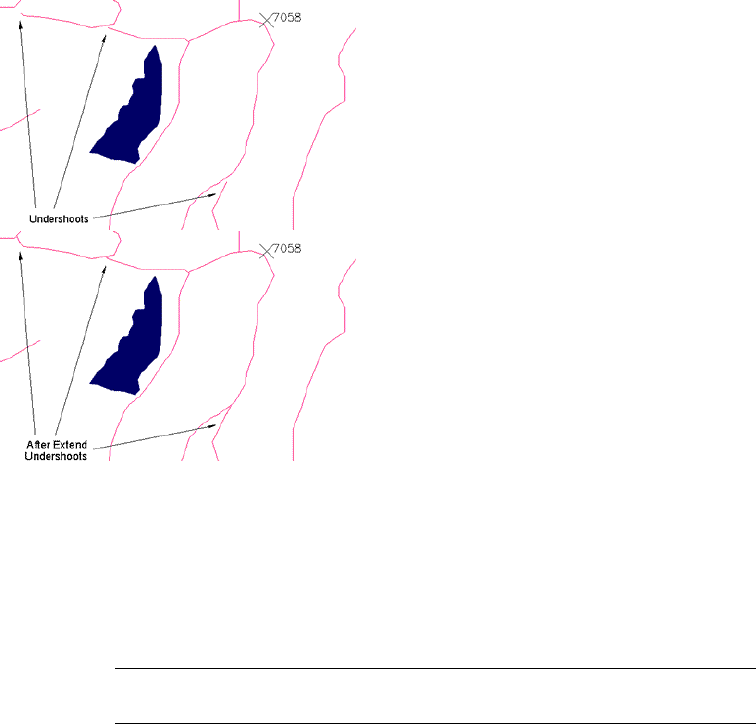
If one object can be extended to cross the other, it will be extended (while
maintaining the same direction) and snapped to a point on the object. If no
node exists, one will be created at the intersection.
If two objects pass within the specified tolerance and can be snapped without
changing their direction, they will be snapped together. If no node exists at
that point, one will be created.
Undershoots are often found in the same drawing as dangles. Dangles, or
overshoots, occur when a linear object goes beyond an intersection with a
target linear object. See Erase Dangling Objects (page 809).
The Extend Undershoots action works in the same way as Break Crossing
Objects (page 797) works with undershoots, except that with Extend
Undershoots, you must select the Break Target option to break the target linear
objects at the intersections.
NOTE Using the Extend Undershoots action on an arc whose endpoints are very
close may result in the duplication or extension of the arc.
See also:
■Overview of Cleaning Up Maps (page 766)
800 | Chapter 6 Creating and Editing Data
■Step 2: Setting Cleanup Options (page 771)
■Overview of Cleanup Actions (page 788)
■Erase Dangling Objects (page 809)
■Break Crossing Objects (page 797)
NOTE This procedure is for drawing objects only. There is no equivalent for
geospatial feature data.
To extend undershoots
1Click Tools tab ➤ Map Edit panel ➤ Clean Up.
2On the Select Actions page, in the Cleanup Actions list, click Extend
Undershoots. Click Add.
3In the Select Actions list, click Extend Undershoots to display the cleanup
parameters for this action.
4Under Cleanup Parameters, set Tolerance to a value slightly larger than
the largest gap.
You can enter a value into the Tolerance box or click Pick to go to the
map and select two points that define the tolerance to use.
5To break target linear objects at the intersections during the Extend
Undershoots operation, select Break Target.
6Continue specifying Drawing Cleanup settings.
NOTE Using the Extend Undershoots option on an arc whose endpoints are very
close may result in the duplication or extension of the arc.
Quick Reference
MAPCLEAN
Performs drawing cleanup operations
Modify menu ➤ Drawing Cleanup
Menu
Cleaning Up Drawing Data | 801
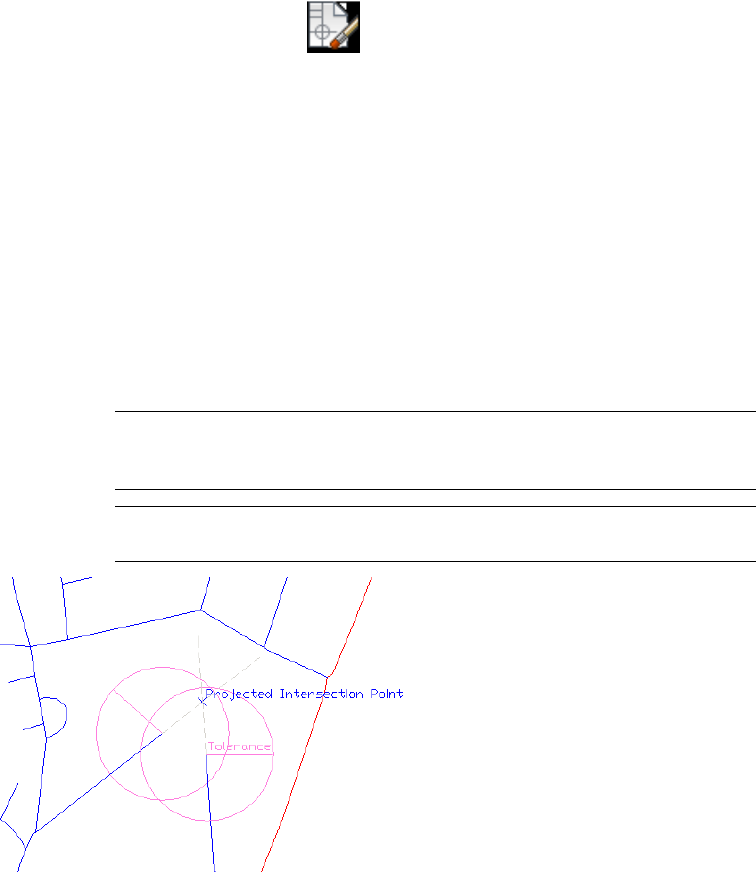
Drawing Cleanup
Icon
MAPCLEANCommand Line
Drawing CleanupDialog Box
Apparent Intersection
With Apparent Intersection, you can locate two objects that do not intersect
but that could be extended (within a specified tolerance radius) along their
natural paths to intersect at a projected point.
The tolerance is used as a radius distance from the end of the two links. If the
endpoints of the objects and the apparent intersection fall within the specified
tolerance radius distance, and the objects can be extended without changing
their direction, they will be extended to the apparent intersection.
NOTE Apparent Intersection is based on the AutoCAD EXTEND command and
uses its Edge and Extend options. For more information, see EXTEND in the
AutoCAD Help.
NOTE This functionality is for drawing objects only. There is no equivalent for
geospatial feature data.
802 | Chapter 6 Creating and Editing Data
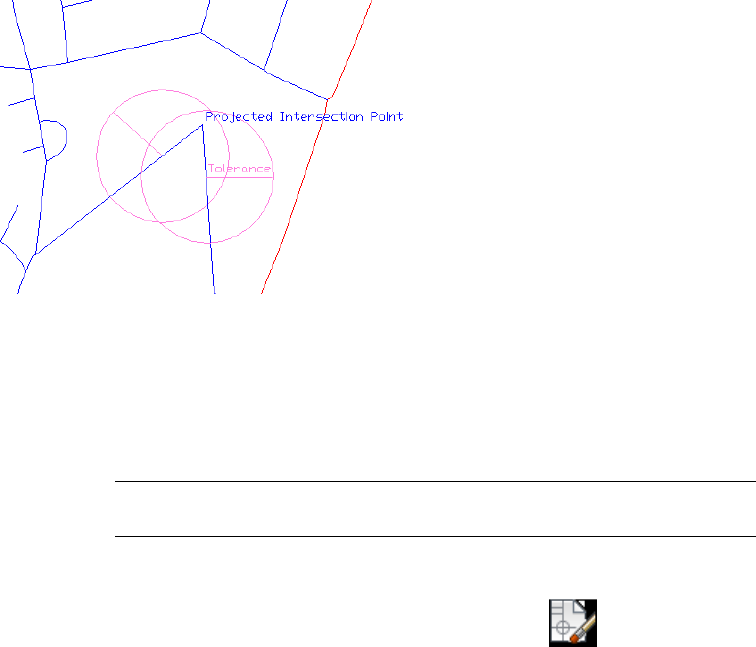
See also:
■Overview of Cleaning Up Maps (page 766)
■Step 2: Setting Cleanup Options (page 771)
■Overview of Cleanup Actions (page 788)
NOTE This procedure is for drawing objects only. There is no equivalent for
geospatial feature data.
To extend objects to their apparent intersection
1Click Tools tab ➤ Map Edit panel ➤ Clean Up.
2On the Select Actions page, in the Cleanup Actions list, click Apparent
Intersection. Click Add.
3In the Select Actions list, click Apparent Intersection to display the cleanup
parameters for this action.
4Under Cleanup Parameters, set the Tolerance to a value slightly higher
than the radius of a circle that includes the endpoints of the objects and
their projected intersection point. (Imagine a point where the objects
would intersect if they extended along their natural paths).
You can enter a value into the Tolerance box or click Pick to go to the
map and select two points that define the tolerance to use.
If AutoCAD Map 3D does not find an apparent intersection, try increasing
the Tolerance value.
Cleaning Up Drawing Data | 803
5Continue specifying Drawing Cleanup settings.
Quick Reference
MAPCLEAN
Performs drawing cleanup operations
Modify menu ➤ Drawing Cleanup
Menu
Drawing Cleanup
Icon
MAPCLEANCommand Line
Drawing CleanupDialog Box
Snap Clustered Nodes
Use Snap Clustered Nodes to correct multiple nodes near the same point. With
Snap Clustered Nodes, you locate nodes within a specified tolerance radius
distance of each other and snap them to a single location. Nodes at the ends
of lines and polylines are automatically included in this cleanup action. You
can also include stand-alone nodes (points and blocks).
NOTE This functionality is for drawing objects only. There is no equivalent for
geospatial feature data.
The snap point will be one of the existing nodes, and you can choose whether
you want it to be one of the link endpoints or one of the stand-alone nodes.
Based on your settings, AutoCAD Map 3D determines the best snap point,
calculating which point has the most weight based on its relative location to
the other nodes. Also considered are anchored nodes. While anchored nodes
are not altered or moved during the Snap Clustered Nodes operation, they are
included in the calculation that determines the snap point.
804 | Chapter 6 Creating and Editing Data
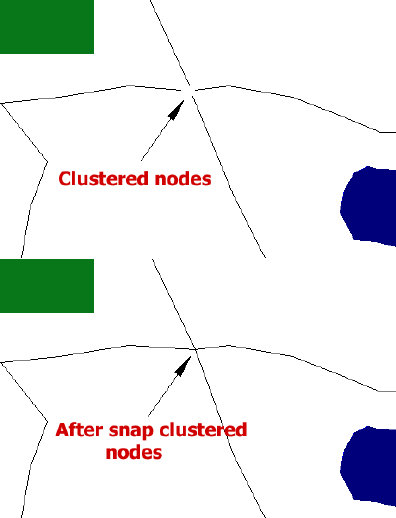
When using Snap Clustered Nodes, keep in mind the following:
■Nodes are moved to a single location but are not deleted, which can result
in multiple objects at the same location. Use Delete Duplicates to remove
duplicate objects.
■You can anchor objects during object selection so they do not change
during the snap operation. Note, however, anchored objects are included
in the selection set and will affect the snap point.
■As the endpoints of the links move, the direction of the links can also
change.
■Text and MText are excluded from the Snap Clustered Nodes operation.
See also:
■Overview of Cleaning Up Maps (page 766)
■Step 2: Setting Cleanup Options (page 771)
■Overview of Cleanup Actions (page 788)
Cleaning Up Drawing Data | 805

NOTE This functionality is for drawing objects only. There is no equivalent for
geospatial feature data.
To snap clustered nodes
1Click Tools tab ➤ Map Edit panel ➤ Clean Up.
2On the Select Actions page, in the Cleanup Actions list, click Snap
Clustered Nodes. Click Add.
3In the Select Actions list, click Snap Clustered Nodes to display the cleanup
parameters for this action.
4Under Cleanup Parameters, set Tolerance to a value slightly higher than
the radius of a circle that includes the link endpoints and nodes to snap
together.
You can enter a value into the Tolerance box or click Pick to go to the
map and select two points that define the tolerance to use.
5The endpoints of lines and polylines are automatically included in the
Snap Clustered Nodes operation. To include stand-alone nodes in the
calculation as well, select the types to include:
■Points
■Blocks
Text and Mtext are automatically excluded.
6Select the snap behavior to use:
■Snap To Node – Snaps to an existing node.
■Snap To Link – Snaps to an existing link endpoint.
7Continue specifying Drawing Cleanup settings.
Quick Reference
MAPCLEAN
Performs drawing cleanup operations
Modify menu ➤ Drawing Cleanup
Menu
806 | Chapter 6 Creating and Editing Data
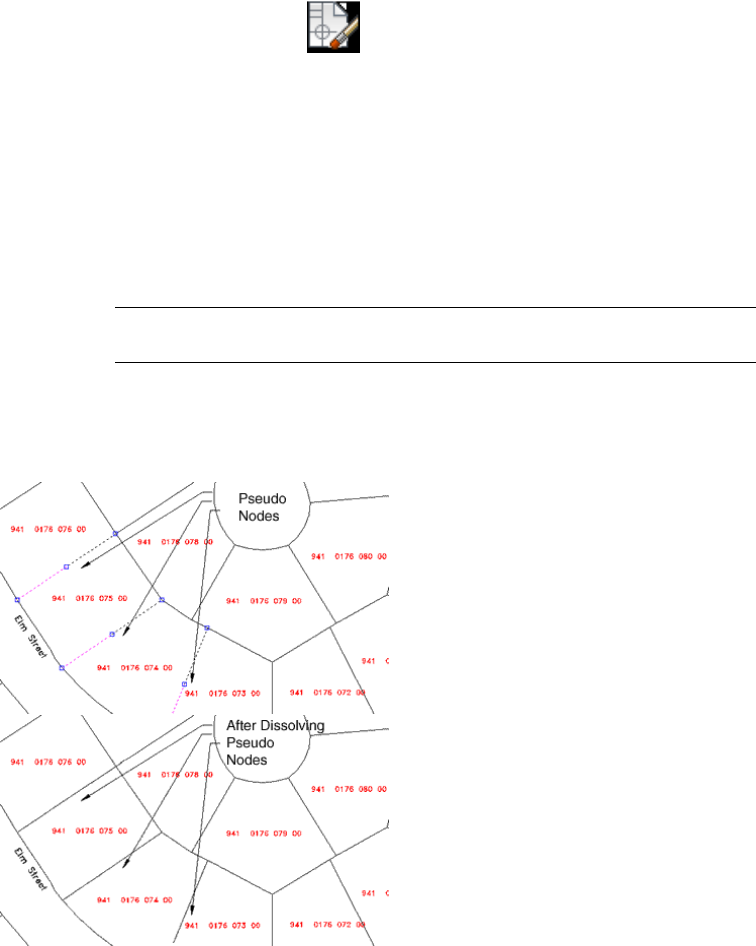
Drawing Cleanup
Icon
MAPCLEANCommand Line
Drawing CleanupDialog Box
Dissolve Pseudo Nodes
A pseudo-node is an unnecessary node in a geometric link that is shared by
only two objects. For example, a long link might be divided unnecessarily
into many, smaller links by pseudo-nodes.
NOTE This functionality is for drawing objects only. There is no equivalent for
geospatial feature data.
Using the Dissolve Pseudo-Nodes cleanup action, you can locate any
pseudo-nodes, dissolve the node, and join the two objects. This option removes
nodes that are at the intersection of two linear objects, but leaves the vertex
in place.
Cleaning Up Drawing Data | 807
NOTE AutoCAD Map 3D does not refer to a tolerance value when dissolving
pseudo nodes.
When you dissolve a pseudo node on a 2D polyline with different Z values,
the first Z-value on the object is used. On a 3D polyline, the Z-value on the
first vertex is used. The object remains a 3D polyline. For all other properties,
the values on the first object are used.
WARNING Using Dissolve Pseudo-Nodes may result in the loss of certain types
of data. For example, if two lines have object data attached, the resulting single
polyline retains object data from only one of the lines. Similarly, if two lines on
different layers share an end point, the resulting polyline will reside on only one
of the layers.
See also:
■Overview of Cleaning Up Maps (page 766)
■Step 2: Setting Cleanup Options (page 771)
■Overview of Cleanup Actions (page 788)
■Erase Short Objects (page 795)
■Snap Clustered Nodes (page 804)
■Simplify Objects (page 811)
NOTE This procedure is for drawing objects only. There is no equivalent for
geospatial feature data.
To dissolve pseudo nodes
1Click Tools tab ➤ Map Edit panel ➤ Clean Up.
2On the Select Actions page, in the Cleanup Actions list, click Dissolve
Pseudo Nodes. Click Add.
3Continue specifying Drawing Cleanup settings.
NOTE Dissolve Pseudo Nodes does not use a tolerance value or other cleanup
parameters.
808 | Chapter 6 Creating and Editing Data
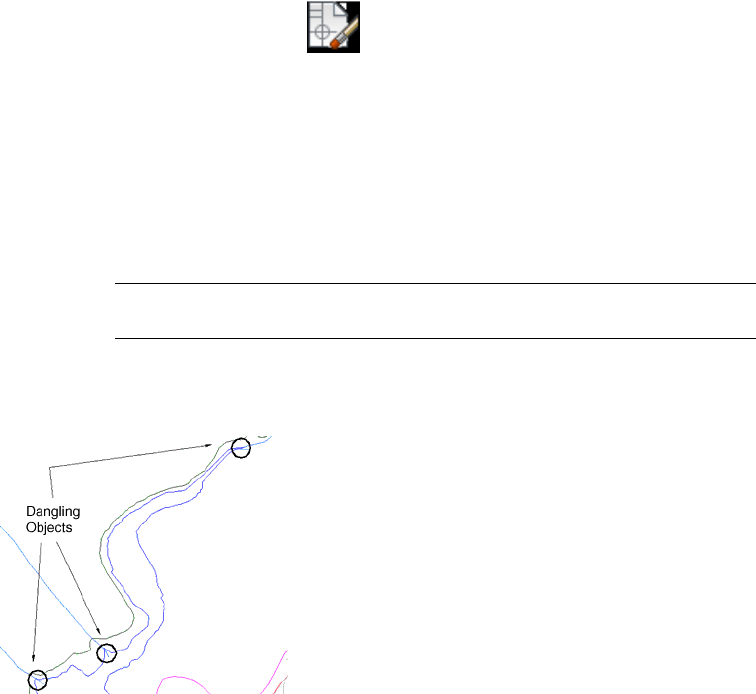
Quick Reference
MAPCLEAN
Performs drawing cleanup operations
Modify menu ➤ Drawing Cleanup
Menu
Drawing Cleanup
Icon
MAPCLEANCommand Line
Drawing CleanupDialog Box
Erase Dangling Objects
Use Erase Dangling Objects to locate an object with at least one end point
that is not shared by another object, and erase the object.
NOTE This functionality is for drawing objects only. There is no equivalent for
geospatial feature data.
The Erase Dangling Objects action searches for and deletes all line, arc, and
polyline dangling edges, and nodes. Dangling objects do not include closed
polylines.
Cleaning Up Drawing Data | 809
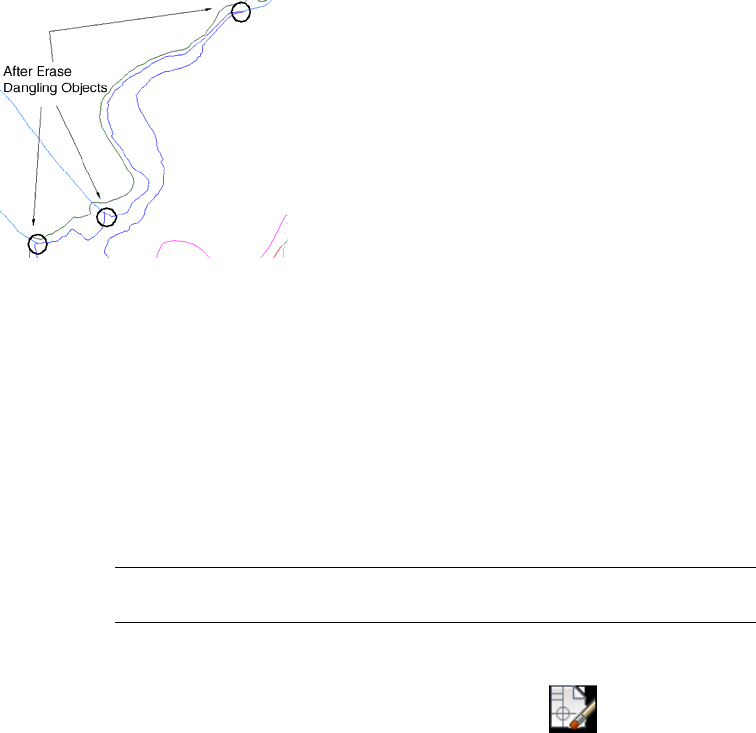
A dangle is often caused by inaccurate digitizing where an object extends
beyond its intended intersection with a target object. Use Break Crossing
Objects (page 797) before using Erase Dangling Objects.
See also:
■Overview of Cleaning Up Maps (page 766)
■Step 2: Setting Cleanup Options (page 771)
■Overview of Cleanup Actions (page 788)
■Break Crossing Objects (page 797)
NOTE This procedure is for drawing objects only. There is no equivalent for
geospatial feature data.
To erase dangling objects
1Click Tools tab ➤ Map Edit panel ➤ Clean Up.
2On the Select Actions page, in the Cleanup Actions list, click Erase
Dangling Objects. Click Add.
3In the Select Actions list, click Erase Dangling Objects to display the
cleanup parameters for this action.
4Under Cleanup Parameters, set Tolerance to a value slightly larger than
the longest dangle to erase.
Enter a value into the Tolerance box or click Pick to go to the map and
select two points that define the tolerance to use.
810 | Chapter 6 Creating and Editing Data

5Continue specifying Drawing Cleanup settings.
Quick Reference
MAPCLEAN
Performs drawing cleanup operations
Modify menu ➤ Drawing Cleanup
Menu
Drawing Cleanup
Icon
MAPCLEANCommand Line
Drawing CleanupDialog Box
Simplify Objects
When maps are digitized, edges may be defined with more detail than
necessary. Use Simplify Objects to reduce unnecessary complexity in contour
lines, rivers, and coastlines. Simplifying objects, also known as generalizing
or weeding, reduces the number of points on a complex line.
NOTE This functionality is for drawing objects only. There is no equivalent for
geospatial feature data.
Simplify Objects works in two dimensions, ignoring Z-values. For information
about how to add and remove vertices from 3D polylines, see Weed Polylines
(page 816).
When you use Simplify Objects, you simplify complex polylines by removing
all interior nodes that fall within the specified tolerance width. Polyline
segments falling within the same corridor are generalized into a single polyline.
Branching points, dead ends, and endpoints of polylines are not generalized.
Cleaning Up Drawing Data | 811
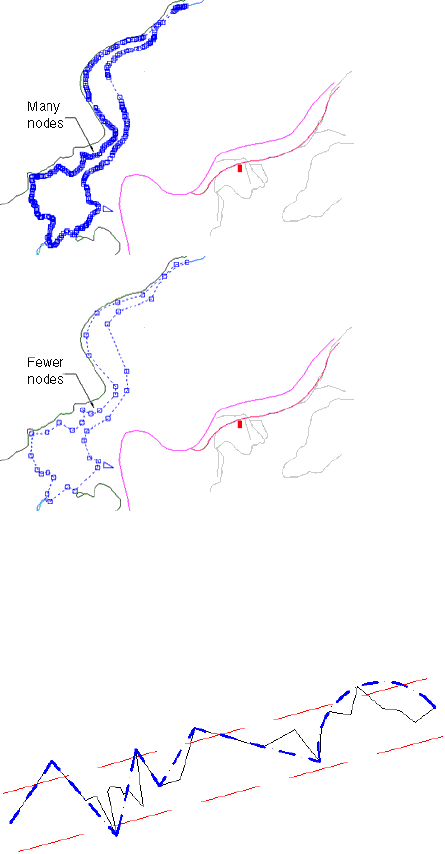
Setting the Tolerance
AutoCAD Map 3D converts a set of connected polyline segments within the
same tolerance into a single polyline. You specify the tolerance corridor width.
The corridor values vary according to the scale of the map; maps with
coordinate values of millions use larger values than those using hundreds.
Simplifying linear objects removes as many points as possible from a polyline
while keeping it within the original tolerance corridor.
812 | Chapter 6 Creating and Editing Data
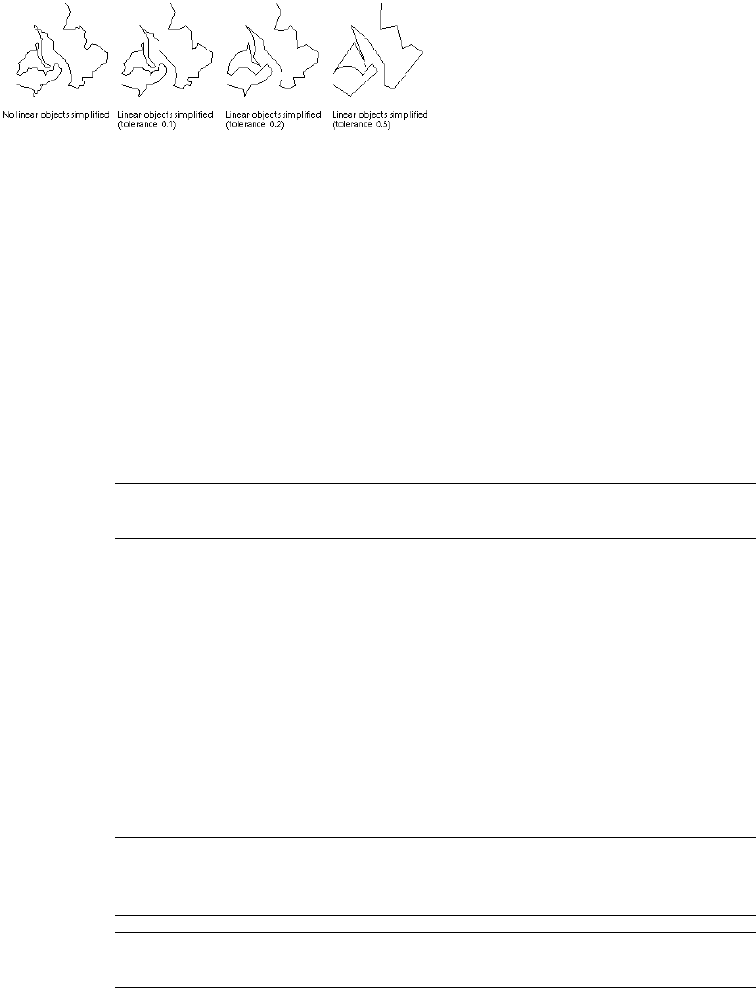
A coastline simplified at different tolerance settings
For best results, follow these guidelines:
■Run Simplify Objects individually. If you perform Simplify Objects with
other cleanup actions, AutoCAD Map 3D performs Simplify Objects first,
regardless of its position in the Selected Actions list.
■Use deleting duplicates (page 793) before simplifying linear objects.
■If your objects are lines, not plines, use Dissolve Pseudo Nodes to create a
single pline.
■Simplify Objects removes width from polylines. Save your map before you
simplify linear objects, so you can return to the original lines if necessary.
NOTE Simplify Objects is not an interactive operation. AutoCAD Map 3D makes
the changes automatically during cleanup.
See also:
■Overview of Cleaning Up Maps (page 766)
■Step 2: Setting Cleanup Options (page 771)
■Overview of Cleanup Actions (page 788)
■Weed Polylines (page 816)
■Delete Duplicates (page 793)
■Using Interactive Mode to Review and Confirm Corrections (page 783)
NOTE Simplify Objects works in two dimensions, ignoring Z-values. For
information about how to add and remove vertices from 3D polylines, see Weed
Polylines (page 816).
NOTE This procedure is for drawing objects only. There is no equivalent for
geospatial feature data.
Cleaning Up Drawing Data | 813
To simplify objects
1Click Tools tab ➤ Map Edit panel ➤ Clean Up.
2On the Select Actions page, in the Cleanup Actions list, click Simplify
Objects. Click Add.
NOTE For best results, run Simplify Objects individually. If you run Simplify
Objects with other actions, AutoCAD Map 3D runs Simplify Objects first,
regardless of its position in the Selected Actions list.
3In the Select Actions list, click Simplify Objects to display the cleanup
parameters for this action.
4Under Cleanup Parameters, set Tolerance to an appropriate value.
You can enter a value into the Tolerance box or click Pick to go to the
map and select two points that define the tolerance to use.
5To allow the introduction of arcs during the Simplify Objects operation,
select Create Arcs.
6Accept all other defaults.
AutoCAD Map 3D automatically simplifies objects. Do not use the
Interactive option.
7Continue specifying Drawing Cleanup settings.
Quick Reference
MAPCLEAN
Performs drawing cleanup operations
Modify menu ➤ Drawing Cleanup
Menu
Drawing Cleanup
Icon
MAPCLEANCommand Line
Drawing CleanupDialog Box
814 | Chapter 6 Creating and Editing Data
Zero-Length Objects
Use Zero-Length Objects to locate lines, arcs, and polylines that have a start
point and an end point but have zero-length, or are missing an end point,
and erase them. The Zero-Length Objects cleanup action does not evaluate
closed polylines.
Zero-length objects can be introduced inadvertently when importing data
from other applications or when digitizing map data.
NOTE AutoCAD Map 3D does not refer to a tolerance value when identifying
zero-length objects.
NOTE This functionality is for drawing objects only. There is no equivalent for
geospatial feature data.
See also:
■Overview of Cleaning Up Maps (page 766)
■Step 2: Setting Cleanup Options (page 771)
■Overview of Cleanup Actions (page 788)
NOTE This procedure is for drawing objects only. There is no equivalent for
geospatial feature data.
To identify zero-length objects
1Click Tools tab ➤ Map Edit panel ➤ Clean Up.
2On the Select Actions page, in the Cleanup Actions list, click Zero Length
Objects. Click Add.
3Continue specifying Drawing Cleanup settings.
NOTE Zero Length Objects does not use a tolerance value or other cleanup
parameters.
Quick Reference
MAPCLEAN
Cleaning Up Drawing Data | 815
Performs drawing cleanup operations
Modify menu ➤ Drawing Cleanup
Menu
Drawing Cleanup
Icon
MAPCLEANCommand Line
Drawing CleanupDialog Box
Weed Polylines
Use Weed Polylines to add and remove vertices on 3D polylines. This is helpful
to control the drawing file size and contour appearance, or to remove
redundant information.
NOTE This functionality is for drawing objects only. There is no equivalent for
geospatial feature data.
Enter Weeding Factors and Supplementing Factors to determine if a vertex
should be added or removed from the 3D polyline.
Weeding Factors
Use Weeding Factors to reduce the number of points generated along 3D
polylines. Weeding factors ignore vertices that are closer together than the
Distance factor and that deflect less than the Angle factor. A larger distance
and deflection angle weeds a greater number of points. The distance factor is
measured in linear units and the angle factor is measured in angular units.
Weeding Factors must be less than Supplementing Factors.
A point on the 3D polyline is weeded by calculating its location in relation
to the vertices before and after it. If the length between these three points is
less than the weeding length value, and the deflection angle is less than the
weeding angle value, then the middle point is not added to the contour data
file.
816 | Chapter 6 Creating and Editing Data
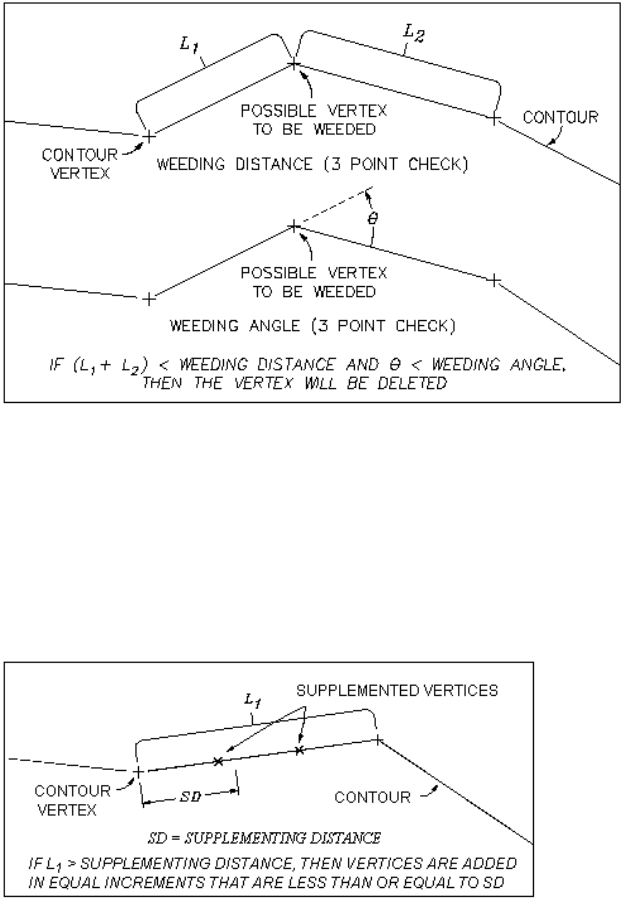
Weeding factor parameters
Supplementing Factors
Use Supplementing Factors to supplement or add vertices along 3D polylines.
The supplementing distance is the maximum distance between vertices. If the
distance between vertices on a contour is greater than the Supplementing
Factors, then points are added along the contour at equal intervals that are
less than or equal to the supplementing distance. The smaller the distance,
the greater the number of supplemented points.
Supplementing Factors parameters
Cleaning Up Drawing Data | 817
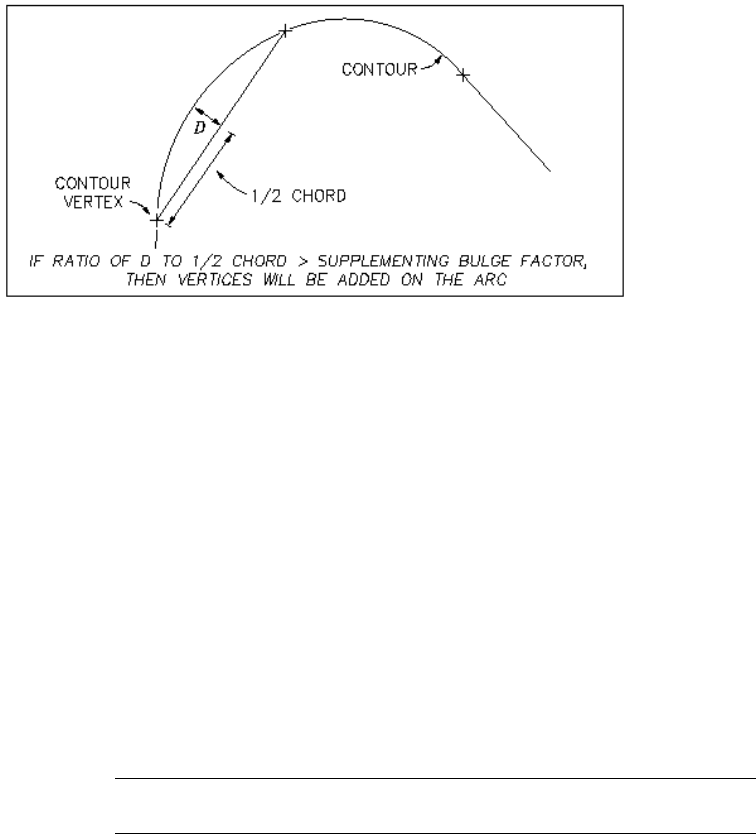
Bulge
For curves, the bulge value is a ratio of the distance from the arc to the chord
divided by half the length of the chord. The bulge factor adds vertices to a
polyline curve, creating an approximation of the curve using straight line
segments. The length of these segments varies depending on the bulge factor
and the degree of curvature.
Bulge factor parameters
■Notes
Run Weed Polylines individually. If you run it with other operations, it
will always be run before other actions, regardless of its position in the
list. In addition, it will only be run once, regardless of how many times it
is listed.
■Weed Polylines is not an interactive operation. AutoCAD Map 3D makes
the changes automatically during cleanup.
See also:
■Overview of Cleaning Up Maps (page 766)
■Step 2: Setting Cleanup Options (page 771)
■Overview of Cleanup Actions (page 788)
■Using Interactive Mode to Review and Confirm Corrections (page 783)
NOTE This procedure is for drawing objects only. There is no equivalent for
geospatial feature data.
818 | Chapter 6 Creating and Editing Data
To weed or add vertices to a 3D polyline
1Click Tools tab ➤ Map Edit panel ➤ Clean Up.
2On the Select Objects page, select the 3D polylines from which to remove
extra vertices or add vertices. Click Next.
3On the Select Actions page, in the Cleanup Actions list, click Weed
Polylines. Click Add >.
NOTE Run Weed Polylines by itself (without other cleanup actions). If you
run it with other actions, Weed Polylines runs only once, regardless of how
many times it is listed in the Selected Actions list, and it always runs before
other actions, regardless of its position in the list.
4In the Select Actions list, click Weed Polylines to display the Cleanup
Parameters for this action.
5Under Weeding Factors, enter the weeding distance in the Distance box,
or click Pick and use your pointing device to specify distance by selecting
two locations in the drawing.
6For Angle, enter the deflection angle, or click Pick to specify the angle
by selecting a starting point, a vertex, and an ending point.
■A point on a 3D polyline is weeded by calculating its location in
relation to the vertices before and after it. If the length between these
three points is less than the weeding Distance value, and the deflection
angle is less than the weeding Angle value, then the middle point is
weeded out.
■A larger distance and deflection angle weeds a greater number of
points.
■The weeding distance must be less than the supplementing distance.
■When using Pick to specify measurements, measurements are displayed
dynamically using a tooltip. The format and precision of the
measurements are determined by the UNITS command.
7Under Supplementing Factors, enter the supplementing Distance, or click
Pick to specify distance in the drawing.
The supplementing distance is the maximum distance between vertices.
If the distance between vertices on a contour is greater than the
supplementing factor, then points are added along the contour at equal
Cleaning Up Drawing Data | 819
intervals that are less than or equal to the supplementing distance. The
smaller the distance, the greater the number of supplemented points.
8For Bulge, enter the bulge factor value, or click Pick to specify it in the
drawing.
The bulge factor adds vertices to a polyline curve, creating an
approximation of the curve using straight line segments. The bulge value
is a ratio of the distance from the arc to the chord divided by half the
length of the chord.
9Continue specifying Drawing Cleanup settings. Click Finish.
When the operation is complete, the total number of original vertices, the
total number of vertices removed, and the number of new vertices is reported
on the command line.
Quick Reference
MAPCLEAN
Performs drawing cleanup operations
Modify menu ➤ Drawing Cleanup
Menu
Drawing Cleanup
Icon
MAPCLEANCommand Line
Drawing CleanupDialog Box
Creating, Editing, and Managing Topologies
A topology is defined by a set of objects and data and their relationship. Use
the information in these sections to create, analyze, edit, and manage
topologies.
NOTE This functionality is for drawing objects only. There is no equivalent for
geospatial feature data. However, you can use buffers to analyze features by
proximity and perform overlay analysis on two geospatial feature layers. See
Buffering Features in Your Map (page 1306) and Overlaying Two Feature Sources
(page 1309).
820 | Chapter 6 Creating and Editing Data

NOTE This procedure is for drawing objects only. There is no equivalent for
geospatial feature data. However, you can use buffers to analyze features by
proximity and perform overlay analysis on two geospatial feature layers. See
Buffering Features in Your Map (page 1308)and Overlaying Two Feature Sources
(page 1316).
To create, edit, and manage topologies
■To create a topology (page 822)
■To edit a topology (page 851)
■To manage topologies (page 899)
Creating Topologies
Topology defines how map features represented by points, lines, and polygons
are connected and how to account for their adjacency. For example, topology
can show that parcels do not overlap, or that delivery routes follow roads.
Using AutoCAD Map 3D, you can create node, network, or polygon topologies.
For network topologies, you can specify the direction of movement allowed
for links and the resistance for links and nodes.
NOTE This functionality is for drawing objects only. There is no equivalent for
geospatial feature data. However, you can use buffers to analyze features by
proximity and perform overlay analysis on two geospatial feature layers. See
Buffering Features in Your Map (page 1306) and Overlaying Two Feature Sources
(page 1309).
■Overview of Creating Topologies (page 822)
■Creating a Node Topology (page 826)
■Creating a Network Topology (page 829)
■Creating a Polygon Topology (page 833)
■Cleaning Data for a Polygon Topology (page 838)
■Creating Topologies for a Land Use Map (page 839)
■Sliver Polygons (page 841)
■Specifying the Direction for a Link (page 845)
■Specifying the Resistance for a Link or Node (page 849)
NOTE This procedure is for drawing objects only. There is no equivalent for
geospatial feature data. However, you can use buffers to analyze features by
proximity and perform overlay analysis on two geospatial feature layers. See
Buffering Features in Your Map (page 1308)and Overlaying Two Feature Sources
(page 1316).
Creating, Editing, and Managing Topologies | 821
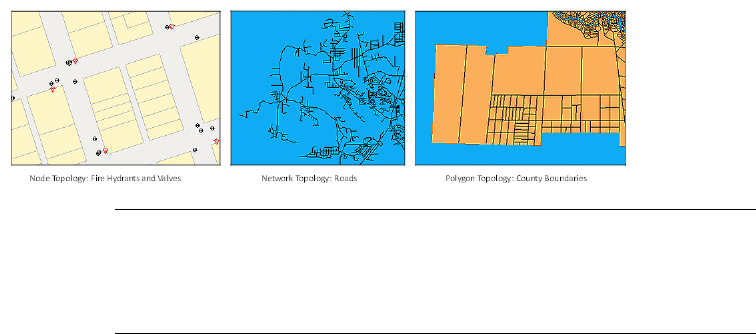
To create a topology
■To create a topology (page 825)
■create a node topology (page 827)
■To create a network topology (page 831)
■To fix crossing objects (page 839)
■To create a topology for a land use and land cover map (page 840)
■To find sliver polygons when you create a polygon topology (page 843)
■To find sliver polygons when overlaying two topologies (page 843)
■To specify the direction for a link (page 847)
■To edit the resistance of a link or node in a network topology (page 850)
Overview of Creating Topologies
Using AutoCAD Map 3D, you can create node, network, or polygon topologies.
NOTE This functionality is for drawing objects only. There is no equivalent for
geospatial feature data. However, you can use buffers to analyze features by
proximity and perform overlay analysis on two geospatial feature layers. See
Buffering Features in Your Map (page 1306) and Overlaying Two Feature Sources
(page 1309).
Node Topologies
■Define the interrelation of nodes (point objects).
■Are often used in conjunction with other topologies in analysis.
Network Topologies
■Connect links (lines) to form a linear network.
■Links can connect nodes.
822 | Chapter 6 Creating and Editing Data
An example of network topology is a water-distribution application that traces
the flow of water from a pumping station to residences. A street network is
another example. For network topologies, you can specify the direction for a
link and specify the resistance for a link or node.
Polygon Topologies
■Define polygons that represent enclosed areas such as land parcels and
census tracts. A single link defines the common boundary between adjacent
areas.
Uses of polygon topology include tax assessment and land planning in which
parcels of land are represented by polygons. Political boundaries, such as
voting districts, city, state, or provincial boundaries, special districts, and
school districts, are other examples of the use of polygon topology.
Notes
When you create a topology, keep the following points in mind:
■Before you create network or polygon topologies, use the drawing cleanup
tools to clean up your map (page 765). Node topologies do not usually
require cleanup.
■Before you create a topology, freeze all layers containing objects in paper
space (Layout tab). Otherwise, these objects are included in the topology
creation when you use the Select All objects option.
■MAPTOPOCREATE can create topologies on layers that are turned off. It
does not affect layers that are frozen.
■When creating network or polygon topologies, if you enable the Create
New Nodes option, AutoCAD Map 3D detects where lines are connected
and assigns nodes to end points. It creates physical or explicit node objects
at all link end points where no objects exist. If the layer you specify does
not exist already, AutoCAD Map 3D creates the layer with a color of 7 and
a CONTINUOUS linetype.
■You can create nodes using ACAD_POINT. To change their appearance
and size, at the Command prompt, enter ddptype.
■When you create a topology, information is stored as object data on each
element of the topology and is saved with the map. Each node, link, or
polygon is automatically given a unique identification (ID) number. Each
ID is automatically processed when you use any topology command.
Creating, Editing, and Managing Topologies | 823
WARNING Using the BREAK command affects topology. If you use BREAK, you
must use MAPTOPOCREATE again to recreate the topology. You might also need
to clean up the geometry in the drawing again.
Tell me more
Video
■Show me how to create a network topo-
logy.
■Show me how to load a topology.
■Show me how to find the shortest path
between two points.
■Show me how to do an overlay analysis
using two topologies.
Procedure
■To create a topology (page 825)
GIS Skill
■Create a network topology to show how
lines are connected.
■Find the shortest path through a net-
work.
■Find which lines are within a particular
polygon (overlay analysis.
Related topics
■Cleaning Up Drawing Data (page 765)
■Editing Topologies (page 851)
■Managing Topologies (page 898)
NOTE This procedure is for drawing objects only. There is no equivalent for
geospatial feature data. However, you can use buffers to analyze features by
proximity and perform overlay analysis on two geospatial feature layers. See
Buffering Features in Your Map (page 1308)and Overlaying Two Feature Sources
(page 1316).
824 | Chapter 6 Creating and Editing Data

To create a topology
1Bring the nodes or links into the current drawing:
■Attach the drawings containing the objects, then query the objects
into the current drawing.
■Open the drawing containing the objects.
2Click Create tab ➤ Topology panel ➤ New.
3In the Create Topology - Select Topology dialog box (page 1969), enter a
name and description for the new topology.
4Under Topology Type, select the topology to create. Follow the steps for
that topology:
■create a node topology (page 827)
■To create a network topology (page 831)
■To create a polygon topology (page 836)
5When you are done specifying settings, click Finish to create the topology.
6If appropriate, save the topology information back to source drawings.
As you create the topology, if AutoCAD Map 3D finds errors, it gives a warning
message and highlights the errors. Correct any errors; then create the topology
over again.
Quick Reference
MAPTOPOCREATE
Creates a new topology
Click Map ➤ Topology ➤ Create.
Menu
Create Topology
Icon
MAPTOPOCREATECommand Line
In Map Explorer, right-click Topologies ➤ Create
Task Pane
Create Topology dialog boxDialog Box
Creating, Editing, and Managing Topologies | 825
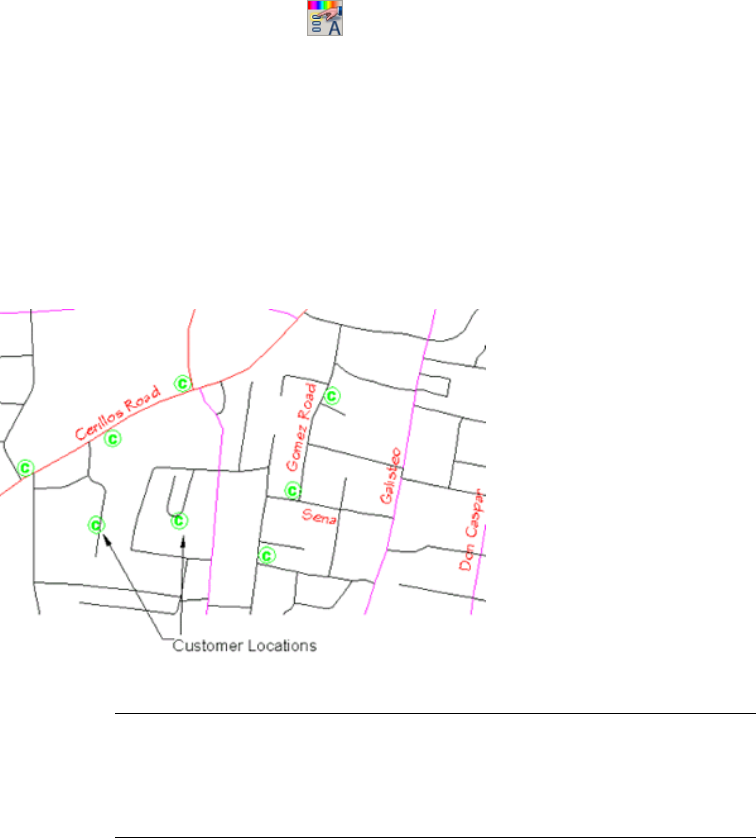
PROPERTIES
Displays the Properties palette, which allows you to edit the properties of
objects
Analyze ➤ Properties
Menu
Properties
Icon
PROPERTIESCommand Line
Select object. Right-click in drawing area ➤ Properties
Task Pane
Creating a Node Topology
You can create a node topology with point objects, blocks, or text. A node
topology used in association with a network or polygon topology can hold
information about junctions and intersections between elements of the
topology.
Customer locations can be used as the basis for a node topology.
NOTE This functionality is for drawing objects only. There is no equivalent for
geospatial feature data. However, you can use buffers to analyze features by
proximity and perform overlay analysis on two geospatial feature layers. See
Buffering Features in Your Map (page 1306) and Overlaying Two Feature Sources
(page 1309).
826 | Chapter 6 Creating and Editing Data

Object Data for Node Topology
Information about a node topology is held in an object data table as shown
in this table.
Object Data FieldObject Data TableTopology Name
IDTPMNODE_SAMPLE_NODESAMPLE_NODE
See also:
■Overview of Creating Topologies (page 822)
■Changing the Appearance of Points (page 869)
■Creating a Network Topology (page 829)
■Creating a Polygon Topology (page 833)
NOTE This procedure is for drawing objects only. There is no equivalent for
geospatial feature data. However, you can use buffers to analyze features by
proximity and perform overlay analysis on two geospatial feature layers. See
Buffering Features in Your Map (page 1308)and Overlaying Two Feature Sources
(page 1316).
create a node topology
1Do one of the following to bring nodes into the current drawing:
■Attach the drawings containing the nodes. Query the nodes into the
current drawing.
■Open the drawing containing the nodes.
■Import nodes from another file format.
2Click Create tab ➤ Topology panel ➤ New.
3In the Create Topology - Select Topology dialog box (page 1969):
■Click Node to specify the type of topology to create.
■Enter a name and description for the new topology.
Names can contain letters, numbers, and the underscore, hyphen,
and dollar characters. Names cannot include spaces.
■Click Next.
Creating, Editing, and Managing Topologies | 827

4In the Create Node Topology - Select Nodes dialog box (page 1959), specify
the nodes to include in the topology:
■To include all nodes in the map, click Select All.
■To manually select the nodes to include, click Select Manually. Click
Select Nodes to select the nodes in the map. When you finish selecting
nodes, press Enter.
■To filter (restrict) node selection by layer (only the nodes that are on
specified layers will be selected), specify those layers in the Layers box.
To select from a list of layers in the map, click Select Layers. If the
layer is not listed, it may be Frozen, Locked, or Off. To use all layers,
enter an asterisk (*).
■To use only selected blocks as node objects, specify those blocks in
the Blocks box. To use points as nodes, select the ACAD_POINT block.
■To filter node selection by object class, specify those object classes in
the Object Classes box. Only nodes that belong to the specified object
classes will be included in the topology.
The layer, block, and object class filters apply to both automatic and
manual selection of nodes.
5Click Finish to create the topology.
6If appropriate, save the topology information back to source drawings.
Quick Reference
MAPTOPOCREATE
Creates a new topology
Click Map ➤ Topology ➤ Create.
Menu
Create Topology
Icon
MAPTOPOCREATECommand Line
In Map Explorer, right-click Topologies ➤ Create
Task Pane
Create Topology dialog boxDialog Box
828 | Chapter 6 Creating and Editing Data
Creating a Network Topology
Network topology defines the interconnection of links and, optionally, nodes
at link junctions. Networks may contain loops. Network segments have a
specified direction. Links can be lines, open polylines, or arcs. You can use
information from different layers to define a network topology.
NOTE This functionality is for drawing objects only. There is no equivalent for
geospatial feature data. However, you can use buffers to analyze features by
proximity and perform overlay analysis on two geospatial feature layers. See
Buffering Features in Your Map (page 1306) and Overlaying Two Feature Sources
(page 1309).
If you plan to use the network topology for direction analysis, you can use
PEDIT to join a series of objects with the same flow direction into one object
with nodes at each vertex. The directions derived from arc objects might be
arbitrary; to control and edit these directions easily, use PEDIT to join segments
with the same direction.
When you create the network topology with nodes at each intersection, the
nodes do not significantly increase file size. You can use the nodes for path
traces (page 1324), best route analysis (page 1328), and flood traces (page 1333).
Object Data for Network Topology
Network topology information is stored on the links and nodes as object data.
Each element of the network topology has different object data values.
Object Data FieldObject Data TableTopology Name
IDTPMLINK_SAMPLE_NETSAMPLE_NET
START_NODE
END_NODE
DIRECTION
DIRECT_RESISTANCE
REVERSE_RESISTANCE
By default, each link is bidirectional. Both resistance and direction are stored
as object data. You can edit both direction (page 845) and resistance (page 849)
values.
Creating, Editing, and Managing Topologies | 829
If you create nodes when you create the network topology, the object data
table for each node has the following information.
Object Data FieldObject Data TableTopology Name
IDTPMNODE_SAMPLE_NETSAMPLE_NET
RESISTANCE
Tell me more
Video
■Show me how to create a network topo-
logy.
■Show me how to load a topology.
■Show me how to find the shortest path
between two points.
■Show me how to do an overlay analysis
using two topologies.
Procedure
■To create a network topology (page
831)
GIS Skill
■Create a network topology to show how
lines are connected.
■Find the shortest path through a net-
work.
■Find which lines are within a particular
polygon (overlay analysis.
Related topics
■Overview of Creating Topologies (page
822)
■Creating a Node Topology (page 826)
■Changing the Appearance of Points
(page 869)
■Creating a Polygon Topology (page
833)
■Performing a Shortest Path Trace (page
1324)
830 | Chapter 6 Creating and Editing Data
■Performing a Best Route Analysis (page
1328)
■Performing a Flood Trace (page 1333)
NOTE This procedure is for drawing objects only. There is no equivalent for
geospatial feature data. However, you can use buffers to analyze features by
proximity and perform overlay analysis on two geospatial feature layers. See
Buffering Features in Your Map (page 1308)and Overlaying Two Feature Sources
(page 1316).
To create a network topology
1Do one of the following to bring the linework into the current drawing:
■Attach the drawings containing the linework. Query the linework
into the current drawing.
■Open the drawing containing the linework.
■Import the linework from another file format.
2Click Create tab ➤ Topology panel ➤ New.
3In the Create Topology - Select Topology dialog box (page 1969), do the
following:
■Click Network to specify the type of topology to create.
■Enter a name and description for the new topology.
Names can contain letters, numbers, and the underscore, hyphen,
and dollar characters. Names cannot include spaces.
■Click Next.
4In the Create Network Topology - Select Links dialog box (page 1956),
specify the links to include in the topology:
■To include all links in the map, click Select All.
■To manually select the links to include, click Select Manually. Click
Select Links to select the links in the map. When you finish selecting
links, press Enter.
■To filter (restrict) link selection by layer (only links on the specified
layers will be selected), specify the layers in the Layers box. To select
Creating, Editing, and Managing Topologies | 831
from a list of layers in the map, click Select Layers. If the layer is not
listed, it may be Frozen, Locked, or Off. To use all layers, enter an
asterisk (*).
■To filter link selection by object class, specify the object classes in the
Object Classes box. Only links that belong to the specified object
classes will be included in the topology.
Layer and object class filters apply to both the automatic and manual
selection of links.
■Click Next.
5In the Create Network Topology - Select Nodes dialog box (page 1957),
select the nodes to include:
■To include all nodes, click Select All.
■To select nodes manually, click Select Manually. Click Select Nodes
to select the nodes.
■To filter (restrict) node selection by layer (only the nodes on the
specified layers are selected), specify the layers in the Layers box.
■To use only selected blocks as node objects, specify the blocks in the
Blocks box. To use points as nodes, select the ACAD_POINT block.
■To filter node selection by object class, specify the object classes in
the Object Classes box. Only nodes that belong to the specified object
classes are included in the topology.
■To have AutoCAD Map 3D create node objects at the endpoint of
links, click Next. Otherwise, go to step 7.
6In the Create Network Topology - Create New Nodes dialog box (page
1955), do the following:
■To create new nodes, select Create New Nodes.
■Select a layer for the new nodes.
■Select a block to use for the nodes. To use a point object, select
ACAD_POINT. Modify the appearance of a point object using the
PDMODE and PDSIZE system variables. For more information, see
POINT in the AutoCAD Help.
7Click Finish to create the topology.
8If appropriate, save the topology information back to source drawings.
832 | Chapter 6 Creating and Editing Data

For information about adding direction and resistance, see the following
topics:
Specifying the Direction for a Link (page 845)
Specifying the Resistance for a Link or Node (page 849)
Quick Reference
MAPTOPOCREATE
Creates a new topology
Click Map ➤ Topology ➤ Create.
Menu
Create Topology
Icon
MAPTOPOCREATECommand Line
In Map Explorer, right-click Topologies ➤ Create
Task Pane
Create Topology dialog boxDialog Box
Creating a Polygon Topology
Polygon topology is an extension of network topology and focuses on
area-based relationships. Every area forms a polygon; and each polygon in a
topology consists of a set of links. A polygon in a topology has a centroid,
which is a point or block element within the polygon, and contains
information about the area it encloses.
NOTE This functionality is for drawing objects only. There is no equivalent for
geospatial feature data. However, you can use buffers to analyze features by
proximity and perform overlay analysis on two geospatial feature layers. See
Buffering Features in Your Map (page 1306) and Overlaying Two Feature Sources
(page 1309).
Creating, Editing, and Managing Topologies | 833
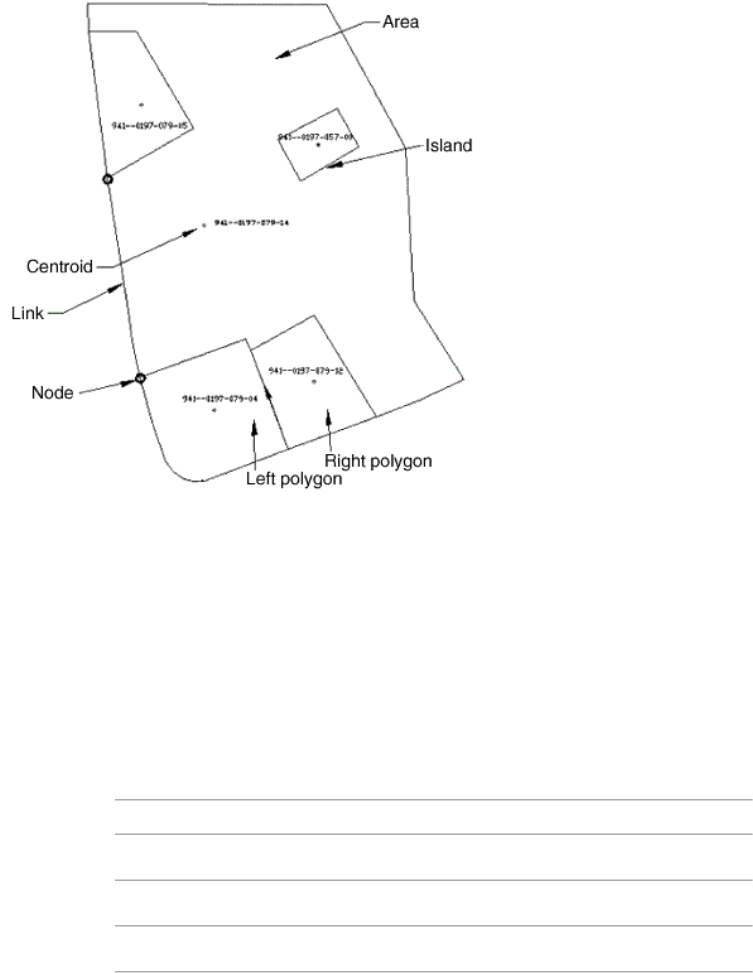
A polygon in a topology consists of a centroid containing information about the
surrounding links. Intersecting links can have nodes. A polygon can contain one or
more islands.
You cannot create a polygon topology from ellipses or from closed polylines
that share an edge or intersection with other polygons. You must explode a
closed polyline before you create the topology. You can use information from
different layers to define a polygon topology.
Object Data for Polygon Topology
Information about a polygon topology is held in the centroids and links. The
object data table for each centroid has the following information.
Object Data FieldObject Data TableTopology Name
IDTPMCNTR_SAMPLE_POLYSAMPLE_POLY
AREA
PERIMETER
834 | Chapter 6 Creating and Editing Data

Object Data FieldObject Data TableTopology Name
LINKS_QTY
The object data table for each link in a polygon topology has the following
information.
Object Data FieldObject Data TableTopology Name
IDTPMLINK_SAMPLE_POLYSAMPLE_POLY
START_NODE
END_NODE
DIRECTION
DIRECT_RESISTANCE
REVERSE_RESISTANCE
LEFT_POLYGON
RIGHT_POLYGON
If you create nodes when you create the polygon topology, the object data
table for each node has the following information.
Object Data FieldObject Data TableTopology Name
IDTPMNODE_SAMPLE_POLYSAMPLE_POLY
RESISTANCE
See also:
■Overview of Creating Topologies (page 822)
■Creating a Node Topology (page 826)
■Creating a Network Topology (page 829)
■Sliver Polygons (page 841)
■Cleaning Up Drawing Data (page 765)
Creating, Editing, and Managing Topologies | 835
■Querying a Topology (page 1348)
NOTE This procedure is for drawing objects only. There is no equivalent for
geospatial feature data. However, you can use buffers to analyze features by
proximity and perform overlay analysis on two geospatial feature layers. See
Buffering Features in Your Map (page 1308)and Overlaying Two Feature Sources
(page 1316).
To create a polygon topology
1Do one of the following to bring linework into the current drawing:
■Attach the drawings containing the linework. Query the linework
into the current drawing.
■Open the drawing containing the linework.
■Import the linework from another file format.
2Click Create tab ➤ Topology panel ➤ New.
3In the Create Topology - Select Topology dialog box (page 1969):
■Under Topology Type, click Polygon to indicate that you want to
create a polygon topology.
■Enter a Topology Name and Topology Description for your new
topology.
Names can contain letters, numbers, and the underscore, hyphen,
and dollar characters. Names cannot include spaces.
■Click Next.
4Follow the on-screen instructions to specify the objects to use to create
the topology. You can also have AutoCAD Map 3D create any missing
nodes and centroids.
■Use the Create Polygon Topology - Select Links dialog box (page 1964)
to select the linear objects to use to generate polygons for the topology.
To use a closed polyline to create polygon topology, you must first
explode the closed polyline.
■Use the Create Polygon Topology - Select Nodes dialog box (page 1965)
to select the node objects to include in the topology.
836 | Chapter 6 Creating and Editing Data

■Use the Create Polygon Topology - Create New Nodes dialog box (page
1961) to have AutoCAD Map 3D create node objects where needed.
Specify the layer and block to use for the new node objects.
■Use the Create Polygon Topology - Select Centroids dialog box (page
1962) to select the centroids to use.
■Use the Create Polygon Topology - Create New Centroids dialog box
(page 1960) to create centroids where needed. Specify the layer and block
to use for the new centroids.
5In the Create Polygon Topology - Set Error Markers dialog box (page 1967),
indicate whether to highlight and/or mark detected errors with blocks.
AutoCAD Map 3D automatically checks for Missing Centroids and
Intersections. Additionally, you can choose to have AutoCAD Map 3D
check for Duplicate Centroids, Incomplete Areas, and Sliver Polygons.
■To highlight errors with red Xs, select Highlight Errors.
■To mark errors with blocks of the shape and color you specify, select
Mark Errors With Blocks.
■In the Marker Size box, specify the marker size as a percent of the
screen size. A value between 3% and 7% is usually suitable.
■If you chose the Mark Errors With Blocks option, specify the shape
and color of the block to use to mark each error.
6Click Finish to create the polygon topology.
To remove highlighting, use the REDRAW, REGEN, or SAVE command.
To remove an error marker, select it and press Delete.
7If appropriate, save the topology information back to source drawings.
Quick Reference
MAPTOPOCREATE
Creates a new topology
Click Map ➤ Topology ➤ Create.
Menu
Create Topology
Icon
Creating, Editing, and Managing Topologies | 837

MAPTOPOCREATECommand Line
In Map Explorer, right-click Topologies ➤ Create
Task Pane
Create Topology dialog boxDialog Box
Cleaning Data for a Polygon Topology
Clean up your data before creating polygon topology; eliminate gaps,
intersections, or overlaps between any of the linework in a polygon topology.
In addition, eliminate zero length objects or areas with missing centroids.
NOTE This functionality is for drawing objects only. There is no equivalent for
geospatial feature data. However, you can use buffers to analyze features by
proximity and perform overlay analysis on two geospatial feature layers. See
Buffering Features in Your Map (page 1306) and Overlaying Two Feature Sources
(page 1309).
If AutoCAD Map 3D cannot create a polygon topology because the links in
the polygons that cross over do not have a node where they meet, the
intersections are highlighted with an X or marked with an error marker (block)
that you configure. Missing centroids are also highlighted or marked in the
same way.
NOTE The markers used to mark polygon topology errors are the same as those
used to mark drawing cleanup errors. Before creating a polygon topology, AutoCAD
Map 3D removes any markers present from previous drawing cleanup operations.
Conversely, when you run a drawing cleanup operation, AutoCAD Map 3D removes
any markers present from creating a polygon topology.
See also:
■Overview of Creating Topologies (page 822)
■Creating a Polygon Topology (page 833)
■Cleaning Up Drawing Data (page 765)
■Sliver Polygons (page 841)
838 | Chapter 6 Creating and Editing Data
NOTE This procedure is for drawing objects only. There is no equivalent for
geospatial feature data. However, you can use buffers to analyze features by
proximity and perform overlay analysis on two geospatial feature layers. See
Buffering Features in Your Map (page 1308)and Overlaying Two Feature Sources
(page 1316).
To fix crossing objects
1Use drawing cleanup (page 765) to break the crossing objects.
2Optionally, detect duplicate centroids, incomplete areas, and sliver
polygons (page 841).
3Create the topology again.
You can ensure there are no missing centroids by selecting the Create
Missing Centroids option on the Create Polygon Topology - Create New
Centroids screen.
Quick Reference
MAPCLEAN
Performs drawing cleanup operations
Modify menu ➤ Drawing Cleanup
Menu
Drawing Cleanup
Icon
MAPCLEANCommand Line
Drawing CleanupDialog Box
Creating Topologies for a Land Use Map
You can create a specialized polygon topology for a land use or land cover
map.
NOTE This functionality is for drawing objects only. There is no equivalent for
geospatial feature data. However, you can use buffers to analyze features by
proximity and perform overlay analysis on two geospatial feature layers. See
Buffering Features in Your Map (page 1306) and Overlaying Two Feature Sources
(page 1309).
Creating, Editing, and Managing Topologies | 839
See also:
■Overview of Creating Topologies (page 822)
■Creating a Polygon Topology (page 833)
NOTE This procedure is for drawing objects only. There is no equivalent for
geospatial feature data. However, you can use buffers to analyze features by
proximity and perform overlay analysis on two geospatial feature layers. See
Buffering Features in Your Map (page 1308)and Overlaying Two Feature Sources
(page 1316).
To create a topology for a land use and land cover map
1Create areas for each type.
2Add text or a block to each area to identify the type.
3Create one topology named LAND_USE.
■In the Create Polygon Topology - Select Centroids dialog box (page
1962), click Select Manually.
■Click Select Objects .
■Select the text or block objects.
4Query (page 1348) the centroid value from the polygon topology with the
topology query command.
Quick Reference
MAPTOPOCREATE
Creates a new topology
Click Map ➤ Topology ➤ Create.
Menu
Create Topology
Icon
MAPTOPOCREATECommand Line
In Map Explorer, right-click Topologies ➤ Create
Task Pane
Create Topology dialog boxDialog Box
840 | Chapter 6 Creating and Editing Data

Sliver Polygons
A sliver polygon is very long and thin; its perimeter is very large compared to
its area. When overlaying two topologies, AutoCAD Map 3D checks for sliver
polygons. When creating a new polygon topology, checking for sliver polygons
is optional.
NOTE This functionality is for drawing objects only. There is no equivalent for
geospatial feature data. However, when you perform overlay analysis (page 1309)on
two geospatial feature layers, you can check for sliver polygons (page 1565).
If a sliver polygon is detected, AutoCAD Map 3D highlights its centroid with
an X. To clear the Xs, use the REGEN command.
Though sliver polygons are not considered errors by AutoCAD Map 3D and
your topology can still be considered correct and complete, the sliver polygons
may be unintentional, for example, the result of digitizing errors. If you see
sliver polygons, you may want to double-check your data to make sure it is
correct and that the sliver polygons are expected.
For example, imagine you digitize two adjacent polygons, such as a parcel
and a flood plain, and there are slight overlaps between the two. Then, you
create topologies for each, overlay the topologies, and the resulting topology
contains sliver polygons. These may be correct or not, depending on your
data. If the boundaries between the adjacent polygons are meant to be the
same, then the sliver polygons are incorrect and you must correct your data.
If the boundaries are not meant to be the same, then sliver polygons are
correct.
Creating, Editing, and Managing Topologies | 841
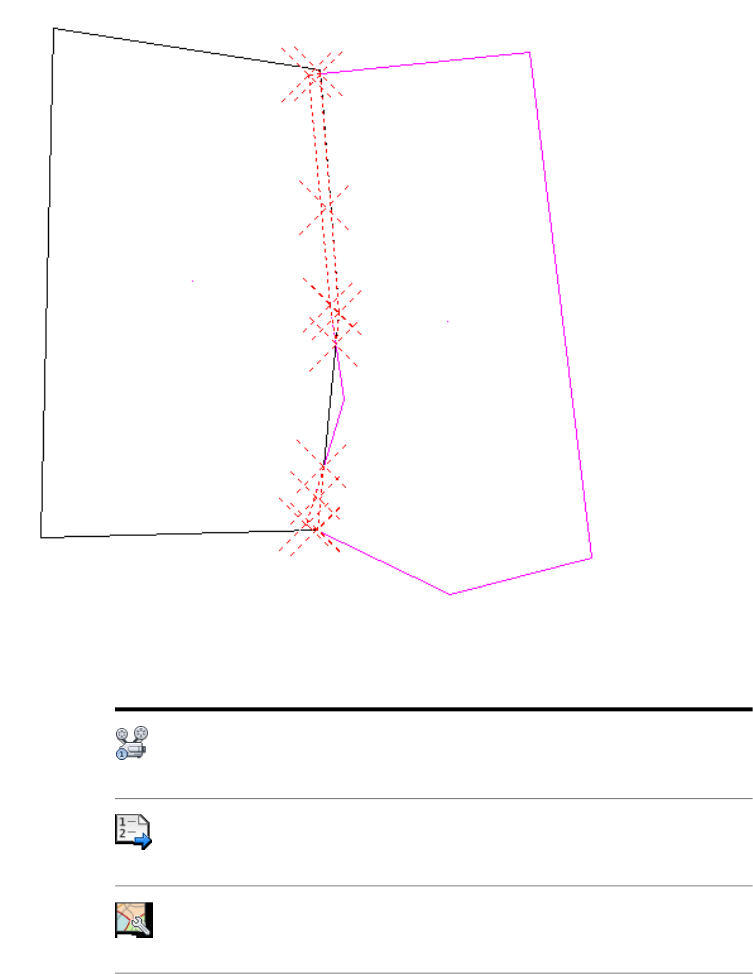
Sliver polygons detected during an overlay (the Xs indicate the sliver polygons).
Tell me more
Video
■Show me how to do an overlay analysis
using two topologies.
Procedure
■To find sliver polygons when overlay-
ing two topologies (page 843)
GIS Skill
■Find which lines are within a particular
polygon (overlay analysis.
842 | Chapter 6 Creating and Editing Data

Related topics
■Overview of Creating Topologies (page
822)
■Overlaying Two Topologies (page 1336)
■Creating a Polygon Topology (page
833)
■Correcting or Completing a Topology
(page 918)
■To find sliver polygons when you create a polygon topology (page 843)
■To find sliver polygons when overlaying two topologies (page 843)
NOTE This procedure is for drawing objects only. There is no equivalent for
geospatial feature data. However, when you perform overlay analysis (page 1316)on
two geospatial feature layers, you can check for sliver polygons (page 1565).
To find sliver polygons when you create a polygon topology
1Follow the basic steps to create a polygon topology (page 833).
2In the Create Polygon Topology - Set Error Markers dialog box (page 1967),
select the option for checking for Sliver Polygons.
3Do one of the following:
■To highlight errors with red Xs, select Highlight Errors.
■To mark errors with blocks of the shape and color you specify, select
Mark Errors With Blocks.
In the Marker Size box, specify the marker size as a percent of the
screen size. A value between 3% and 7% is usually suitable. Specify
the shape and color of the block to use to mark each error.
4Click Finish to create the polygon topology and locate sliver polygons.
To remove highlighting, use the REDRAW, REGEN, or SAVE command.
To remove an error marker, select it and press Delete.
To find sliver polygons when overlaying two topologies
1In Map Explorer (page 2068), under Current Drawing, right-click the source
topology ➤ Analysis ➤ Overlay.
Creating, Editing, and Managing Topologies | 843

2In Topology Overlay Analysis - Analysis Type dialog box (page 1999), select
Identity as the type of overlay analysis to perform. Click Next.
The result topology includes areas that appear in the source topology and
areas in the overlay topology that are within the source topology
boundary.
3In the Topology Overlay Analysis - Select Overlay Topology dialog box
(page 2007), select the polygon topology to use as the overlay topology.
Click Next.
4In the Topology Overlay Analysis - New Topology dialog box, do the
following:
■Select Highlight to highlight the resulting topology on screen. Select
the highlight color.
■Enter a name and description for the new topology, and specify the
layer to place it on.
■Click Next.
5If desired, specify how to copy data to the result topology, whether to
create new nodes to complete the resulting topology, and the block to
use for centroids.
6Click Finish.
Quick Reference
MAPTOPOCREATE
Creates a new topology
Click Map ➤ Topology ➤ Create.
Menu
Create Topology
Icon
MAPTOPOCREATECommand Line
In Map Explorer, right-click Topologies ➤ Create
Task Pane
Create Topology dialog boxDialog Box
MAPCLEAN
844 | Chapter 6 Creating and Editing Data
Performs drawing cleanup operations
Modify menu ➤ Drawing Cleanup
Menu
Drawing Cleanup
Icon
MAPCLEANCommand Line
Drawing CleanupDialog Box
MAPANOVERLAY
Overlays one topology with another, and creates a new topology
Click Map ➤ Topology ➤ Overlay.
Menu
Overlay Topology
Icon
MAPANOVERLAYCommand Line
In Map Explorer, right-click a
topology ➤ Analysis ➤ Overlay
Task Pane
Topology Overlay Analysis - Analysis Type dialog boxDialog Box
Specifying the Direction for a Link
You can specify the direction of movement allowed for a link in a network
topology. AutoCAD Map 3D uses this direction when tracing through network
topology for path traces, best route analysis, and flood traces.
NOTE This functionality is for drawing objects only. There is no equivalent for
geospatial feature data.
Creating, Editing, and Managing Topologies | 845
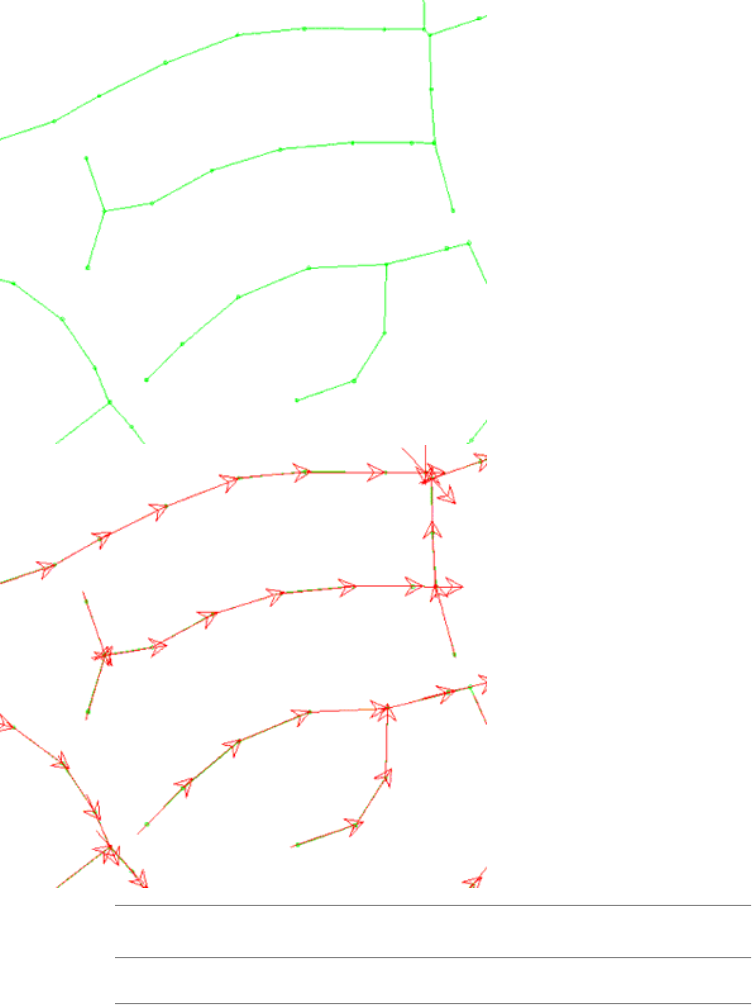
Object data
value
Property in the
Properties palette
Direction
0Bi-DirectionalBi-Directional (two-way)
846 | Chapter 6 Creating and Editing Data

Object data
value
Property in the
Properties palette
Direction
1ForwardSame as created. Movement along the link
is allowed only in the direction that the
link was created.
-1ReverseReverse of created direction. Movement
along the link is allowed only in the oppos-
ite direction that the link was created.
The default direction of an arc, or a two-point polyline with an arc segment,
is counterclockwise. Set the value to Bi-Directional (0) or Forward (1) for
counterclockwise, and to Reverse (-1) for clockwise.
To reverse the direction of selected links, right-click a network topology in
Map Explorer. Click Reverse Link Direction. You can also use the MAPRL
command.
See also:
■Overview of Creating Topologies (page 822)
■Creating a Network Topology (page 829)
■Performing a Shortest Path Trace (page 1324)
■Performing a Best Route Analysis (page 1328)
■Performing a Flood Trace (page 1333)
■Specifying the Resistance for a Link or Node (page 849)
■Editing the Direction for a Link (page 870)
■Updating a Topology (page 891)
NOTE This procedure is for drawing objects only. There is no equivalent for
geospatial feature data.
To specify the direction for a link
1Verify that the network topology containing the link is loaded. You can
specify link direction for network topologies only.
2In the map, double-click the link for which you want to specify direction.
Creating, Editing, and Managing Topologies | 847

If more than one topology contains the same link, select one of the
topologies. Update the other topologies (page 891) later.
3In the Properties palette, under the Topo properties, choose a setting for
the Flow Direction property:
■Bi-Directional — Movement is allowed in both directions.
■Forward — Movement is allowed only in the direction that the link
was created.
■Reverse — Movement is allowed only in the opposite direction of the
direction that the link was created.
The new direction setting is assigned to the link.
NOTE You can also store a direction value in an object data table or an external
database table. When you run a shortest path trace, best route analysis, or flood
trace, you can specify the location of this data. When storing this data, use 0 for
Bi-Directional, 1 for Forward, and -1 for Reverse.
Quick Reference
MAPEDITDIR
Edits the direction of a link in a network topology
MAPEDITDIRCommand Line
MAPEDITDIR (Edit Direction command)Dialog Box
MAPRL
Reverses a link in a topology
MAPRLCommand Line
In Map Explorer, right-click a topology ➤ Reverse
Link Direction
Task Pane
PROPERTIES
Displays the Properties palette, which allows you to edit the properties of
objects
Analyze ➤ Properties
Menu
848 | Chapter 6 Creating and Editing Data

Properties
Icon
PROPERTIESCommand Line
Select object. Right-click in drawing area ➤ Properties
Task Pane
Specifying the Resistance for a Link or Node
Direct Resistance is the resistance to travel in the direction that a link was
created, while Reverse Resistance is the resistance in the opposite direction
along a link.
For both types, you can specify a resistance for any link in the network
topology. This resistance specifies the difficulty in traversing the link. The
default resistance is the length of the link.
AutoCAD Map 3D uses this resistance when doing a shortest path trace, best
route analysis, or flood trace. For an example of using resistance to show travel
times, see Performing a Flood Trace (page 1333).
You can also specify the Resistance of a node in a network topology, such as
setting resistance for a valve in a pipe network, or a junction in a road network.
NOTE This functionality is for drawing objects only. There is no equivalent for
geospatial feature data.
See also:
■Overview of Creating Topologies (page 822)
■Creating a Network Topology (page 829)
■Performing a Shortest Path Trace (page 1324)
■Performing a Best Route Analysis (page 1328)
■Performing a Flood Trace (page 1333)
■Editing the Resistance for a Link or Node (page 874)
■Specifying the Direction for a Link (page 845)
NOTE This procedure is for drawing objects only. There is no equivalent for
geospatial feature data.
Creating, Editing, and Managing Topologies | 849

To edit the resistance of a link or node in a network topology
1Verify that the network topology containing the link or node is loaded.
Be sure to load the topology from the current drawing. You can specify
resistance for network topologies only.
2In the map, double-click the link or node for which you want to specify
resistance.
If more than one topology contains the same link or node, select one of
the topologies. Update the other topologies (page 891) later.
3In the Properties palette, under the group of Topo properties, enter new
values for resistance. You must enter a numeric value.
■For a node, enter a value for Resistance, which is the resistance to
cross the node.
■For a link, enter values for Direct Resistance and Reverse Resistance.
Direct resistance is the resistance to travel in the direction that a link
was created, while reverse resistance is the resistance in the opposite
direction along a link. The default value is the length of the link.
The new resistance values are assigned to the objects.
NOTE You can also store a resistance value in object data or an external database.
When you run a flood trace, path trace, or best route analysis, specify the location
of this data.
If you are entering the commands on the command line, use the MAPEDITRES1
command to edit the Direct Resistance of links and the Resistance of nodes;
use the MAPEDITRES2 command to edit the Reverse Resistance of links.
Quick Reference
MAPEDITRES1
Edits the direct resistance of a node or link in a network topology
MAPEDITRES1Command Line
MAPEDITRES1 (Edit Direct Resistance command)Dialog Box
MAPEDITRES2
Edits the reverse resistance of a link in a network topology
850 | Chapter 6 Creating and Editing Data
MAPEDITRES2Command Line
MAPEDITRES2 (Edit Reverse Resistance command)Dialog Box
PROPERTIES
Displays the Properties palette, which allows you to edit the properties of
objects
Analyze ➤ Properties
Menu
Properties
Icon
PROPERTIESCommand Line
Select object. Right-click in drawing area ➤ Properties
Task Pane
Editing Topologies
Use the topology editing commands, which are accessible from Map Explorer
or the command line, to make changes to a topology without losing the
integrity of the topology.
NOTE This functionality is for drawing objects only. There is no equivalent for
geospatial feature data.
NOTE These procedures are for drawing objects only. There are no equivalents
for geospatial feature data.
To edit a topology
■To edit a topology (page 854)
■To edit a node (page 860)
■To reposition a node at the end point of a link (page 863)
■To reposition a link (page 863)
■To join two links, break a link, or reverse a link's direction (page 864)
■To modify the resistance or direction of a link (page 864)
■To divide a polygon into two smaller polygons (page 867)
■To merge two polygons into one polygon (page 868)
■To change the appearance of points (page 870)
■To edit the direction of a link (page 873)
■To edit the resistance of a link or node in a network topology (page 875)
■To create a node on an existing link (page 878)
■To add an existing node to a topology (page 878)
Creating, Editing, and Managing Topologies | 851
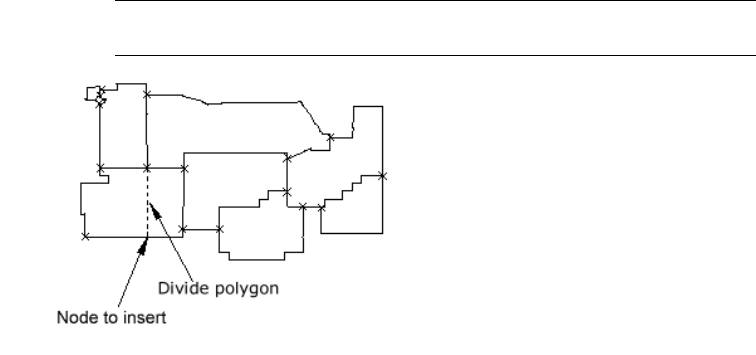
■To create a link and add it to a topology (page 880)
■To add an existing link to a topology (page 881)
■To add a polygon to a polygon topology using existing linework (page 884)
■To add a polygon to a polygon topology by creating new linework (page
884)
■To create centroids for polygons and closed polylines (page 887)
■To delete a link, node, or polygon (page 889)
■To update a topology (page 892)
■To retrieve objects to edit (page 894)
■To edit the objects (page 895)
■To create closed polylines from a polygon topology (page 898)
Overview of Editing a Topology
Use topology editing commands to make changes to a topology without losing
the integrity of the topology. If you use object-editing commands such as
ERASE or STRETCH to modify a topology, important data may be lost. To
repair a topology edited with these commands, use the Update option (page
891).
NOTE This functionality is for drawing objects only. There is no equivalent for
geospatial feature data.
Edits to this polygon topology consist of adding a node (page 877) and then
dividing the polygon (page 866) with a link.
To edit a topology, the topology data and geometry must be loaded in the
current drawing. You can edit only one topology at a time, and multi-user
editing of a topology is not permitted. When you load a topology, an audit
checks topology integrity. This audit is only concerned with topology data,
852 | Chapter 6 Creating and Editing Data
not with geometry. Any incomplete objects are registered, because only
complete objects can be edited.
To add or insert objects into a topology, the current drawing must be where
the topology was created. If the topology was created in a source drawing, you
must open that drawing to add objects to the topology. Make the layer
containing the topology objects current so new objects have the same
properties as objects already in the topology.
If you edit a topology and then use the Undo command, the altered geometry
is restored to its former state but the altered topology remains current. To
perform further editing on the topology, unload and reload (page 906) the
topology. This applies to all topology functions.
Editing Topologies from More than One Drawing
To edit a topology that spans more than one drawing, you must edit the
topology in the drawing where it was created. The other drawings will be
attached to this drawing. First, query the topology into the drawing, then
unload (page 906) the topology from the source drawings and retrieve the
topology into the current drawing. You can edit part of a topology by querying
just the part you want, but the topology editing commands do not allow you
to edit the edges of a topology or an incomplete topology.
The safest option is to use a query to retrieve the entire topology. However,
if the topology is large, it may impair performance. With large topologies,
query the area to edit plus enough of an area around the edit area to ensure
that the objects to be edited are complete.
Editing a Network Topology
To modify a network topology, for example, adding a new pipe to a water
network, you can add nodes and links to an existing network topology, and
then update (page 891) the topology to include the new pipes.
Before you edit a topology object, make sure the layer containing the topology
objects is the current layer.
See also:
■Loading or Unloading Topologies (page 906)
■Querying a Topology (page 1348)
■Correcting or Completing a Topology (page 918)
■Creating a Network Topology (page 829)
Creating, Editing, and Managing Topologies | 853

NOTE To edit a topology, use the AutoCAD Map 3D topology edit commands.
When you edit a topology, the topology must be loaded from the current drawing.
To add an object to a topology, the current drawing must be the drawing where
the topology was created.
NOTE This procedure is for drawing objects only. There is no equivalent for
geospatial feature data.
To edit a topology
■To edit a node (page 860)
■To reposition a node at the end point of a link (page 863)
■To divide a polygon into two smaller polygons (page 867)
■To change the appearance of points (page 870)
■To specify the direction for a link (page 847)
■To edit the resistance of a link or node in a network topology (page 850)
■To create a node on an existing link (page 878)
■To create a link and add it to a topology (page 880)
■To add a polygon to a polygon topology using existing linework (page 884)
■To create centroids for polygons and closed polylines (page 887)
■To delete a link, node, or polygon (page 889)
■To update a topology (page 892)
■To retrieve objects to edit (page 894)
Quick Reference
DDPTYPE
Specifies the display mode and size of point objects
Setup menu ➤ More Formatting Options ➤ Point
Style
Menu
DDPTYPECommand Line
854 | Chapter 6 Creating and Editing Data

MAPAL
Adds a link to a topology
MAPALCommand Line
In Map Explorer, right-click a network
topology ➤ Add New Links
Task Pane
MAPAN
Adds a node to a topology
MAPANCommand Line
In Map Explorer, right-click a node topology ➤ Add
Node
Task Pane
MAPAP
Adds a polygon to a polygon topology
MAPAPCommand Line
In Map Explorer, right-click a polygon
topology ➤ Add Polygon
Task Pane
MAPBL
Breaks a link in a topology at a specified point
MAPBLCommand Line
In Map Explorer, right-click a network
topology ➤ Break Link
Task Pane
MAPCREATECENTROIDS
Creates a centroid in a polygon and moves data to the centroid
Create menu ➤ Centroids
Menu
Create Centroids
Icon
MAPCREATECENTROIDSCommand Line
Create Centroids dialog boxDialog Box
Creating, Editing, and Managing Topologies | 855
MAPDL
Deletes a link in a topology
MAPDLCommand Line
In Map Explorer, right-click a network
topology ➤ Delete Links
Task Pane
MAPDN
Deletes a node in a topology
MAPDNCommand Line
In Map Explorer, right-click a node topology ➤ Delete
Node
Task Pane
MAPDP
Deletes a polygon from a polygon topology
MAPDPCommand Line
In Map Explorer, right-click a polygon
topology ➤ Delete Polygon
Task Pane
MAPDVP
Divides a polygon in a polygon topology by allowing you to add a link
MAPDVPCommand Line
In Map Explorer, right-click a polygon
topology ➤ Divide Polygon
Task Pane
MAPEDITDIR
Edits the direction of a link in a network topology
MAPEDITDIRCommand Line
MAPEDITDIR (Edit Direction command)Dialog Box
MAPEDITRES1
Edits the direct resistance of a node or link in a network topology
MAPEDITRES1Command Line
856 | Chapter 6 Creating and Editing Data
MAPEDITRES1 (Edit Direct Resistance command)Dialog Box
MAPEDITRES2
Edits the reverse resistance of a link in a network topology
MAPEDITRES2Command Line
MAPEDITRES2 (Edit Reverse Resistance command)Dialog Box
MAPIL
Inserts a link in a topology
MAPILCommand Line
In Map Explorer, right-click a network
topology ➤ Insert New Link
Task Pane
MAPIN
Inserts a node in a topology
MAPINCommand Line
In Map Explorer, right-click a node topology ➤ Insert
Node
Task Pane
MAPJL
Joins two links in a topology
MAPJLCommand Line
In Map Explorer, right-click a network
topology ➤ Join Links
Task Pane
MAPMEL
Repositions an end point of a link in a topology
MAPMELCommand Line
In Map Explorer, right-click a network
topology ➤ Move End Of Link
Task Pane
MAPML
Creating, Editing, and Managing Topologies | 857

Moves a link in a topology
MAPMLCommand Line
In Map Explorer, right-click a network
topology ➤ Move Links
Task Pane
MAPMN
Moves a node in a topology or moves a node at the end of a link in network
or polygon topologies
MAPMNCommand Line
In Map Explorer, right-click a node topology ➤ Move
Node
Task Pane
MAPMP
Merges polygons in a polygon topology
MAPMPCommand Line
In Map Explorer, right-click a polygon
topology ➤ Merge Polygon
Task Pane
MAPRL
Reverses a link in a topology
MAPRLCommand Line
In Map Explorer, right-click a topology ➤ Reverse
Link Direction
Task Pane
PROPERTIES
Displays the Properties palette, which allows you to edit the properties of
objects
Analyze ➤ Properties
Menu
Properties
Icon
PROPERTIESCommand Line
Select object. Right-click in drawing area ➤ Properties
Task Pane
858 | Chapter 6 Creating and Editing Data
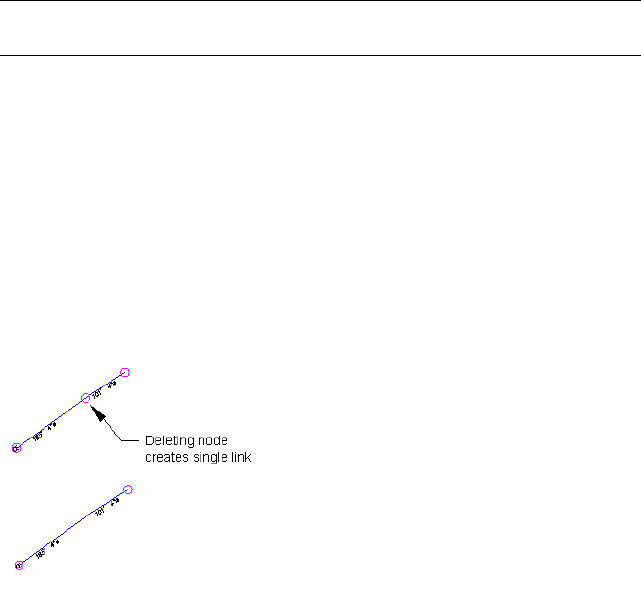
Editing a Node
You can move a node in a node topology, or move a node at the end point
of a link in a network or polygon topology. Moving the node at the end point
of a link also moves that end of the chosen link. Edits to nodes and links in
a polygon topology change the centroid, the area, and perimeter values.
NOTE This functionality is for drawing objects only. There is no equivalent for
geospatial feature data.
When you move a node, AutoCAD Map 3D checks its new location.
■In node topologies, if there is an existing node in the same location, you
must specify which node to keep.
■In network or polygon topologies, you must specify whether to join the
links and which node to use to join them.
You can also delete nodes. For more information, see Deleting Links, Nodes,
and Polygons (page 888).
If you're working with a network topology, you can also modify the resistance
(page 850) of nodes.
Deleting one node that indicates adjoining links creates
a single link.
To turn an explicit node into an implicit node, unload the topology, delete
the point or block representing the explicit node, and then reload the topology.
To turn an implicit node into an explicit node, first insert a block or point at
the implicit node point (use an Intersection or End snap to position the block
accurately). Then, if you are working with a node topology, right-click the
topology name in Map Explorer. Click Add Node. You cannot use the Insert
Creating, Editing, and Managing Topologies | 859

Node option. If you are working with a network or polygon topology, use the
MAPAN command.
If you retrieve the nodes of a network or polygon topology, but not the
connecting links, you can still move the nodes. However, the current topology
knows nothing about the connecting links because all the link information
is stored on the links, and saving any edited nodes back to the source drawings
will create an incorrect topology.
See also:
■Loading or Unloading Topologies (page 906)
■To create a node on an existing link (page 878)
■To delete a link, node, or polygon (page 889)
■To edit the resistance of a link or node in a network topology (page 850)
NOTE This procedure is for drawing objects only. There is no equivalent for
geospatial feature data.
To edit a node
1Open the drawing where the topology was created and load the topology.
2Do one of the following:
■For a node topology, in Map Explorer, right-click the topology name.
Click Move Nodes.
■For a network or polygon topology, type mapmn at the command
line.
3When prompted, click the nodes to move.
4Press Enter when you finish selecting nodes.
5Specify the base point or displacement.
6Specify the second point of displacement.
The two points you specify define a displacement vector that indicates
how far the selected objects are to be moved and in what direction. If
you press Enter at the Specify Second Point of Displacement prompt, the
first point is interpreted as relative X,Y,Z displacement. For example, if
you specify 2,3 for the base point and press Enter at the next prompt,
860 | Chapter 6 Creating and Editing Data

the object moves 2 units in the X direction and 3 units in the Y direction
from its current position.
In a node topology, if the node's new location is the same as an existing node,
specify which node to keep. In a network topology, specify whether to join
the links and which node to keep.
Quick Reference
MAPMN
Moves a node in a topology or moves a node at the end of a link in network
or polygon topologies
MAPMNCommand Line
In Map Explorer, right-click a node topology ➤ Move
Node
Task Pane
MAPNODEDIT
Edits a node in a topology
MAPNODEDITCommand Line
MAPNODEDIT (Edit Topology Node command)Dialog Box
PROPERTIES
Displays the Properties palette, which allows you to edit the properties of
objects
Analyze ➤ Properties
Menu
Properties
Icon
PROPERTIESCommand Line
Select object. Right-click in drawing area ➤ Properties
Task Pane
Editing a Link
There are several ways you can edit links in a network or polygon topology.
Creating, Editing, and Managing Topologies | 861

NOTE This procedure is for drawing objects only. There is no equivalent for
geospatial feature data.
You can do any of the following:
■Move a link to a new location.
■Reposition one of the nodes at the end point of a link. Moving the node
at the end point of a link moves that end of the chosen link.
If you move an end point to the same location as an existing end point,
AutoCAD Map 3D prompts you to join the links and specify which node
to keep. If you select a line or arc when moving links or end points of links,
it is converted to a polyline.
■Join two links in a network or polygon topology by removing an
intersection or pseudo-node.
■Break a link at a specified break point. AutoCAD Map 3D inserts a node at
the break point.
■Reverse the direction of a link in a network topology.
■Specify the resistance, reverse resistance, and direction of a link.
Edits to links in a polygon topology change the centroid, the area, and the
perimeter values.
See also:
■Loading or Unloading Topologies (page 906)
■To create a node on an existing link (page 878)
■Editing a Node (page 859)
■To delete a link, node, or polygon (page 889)
■Specifying the Direction for a Link (page 845)
■Specifying the Resistance for a Link or Node (page 849)
■Adding a Link (page 880)
NOTE This procedure is for drawing objects only. There is no equivalent for
geospatial feature data.
■To reposition a node at the end point of a link (page 863)
862 | Chapter 6 Creating and Editing Data
■To reposition a link (page 863)
■To join two links, break a link, or reverse a link's direction (page 864)
■To modify the resistance or direction of a link (page 864)
To reposition a node at the end point of a link
1Open the drawing where the topology was created and load the topology.
2Do one of the following:
■For a network topology, in Map Explorer, right-click the topology
name. Click Move End Of Link.
■For a polygon topology, type MAPMEL on the command line.
3When prompted, click the node (end point) to move.
4When prompted, click the location of the new end point.
If the new location is the same as an existing end point in the topology,
specify whether to join the links and which node to keep.
To reposition a link
1Open the drawing where the topology was created and load the topology.
2Do one of the following:
■For a network topology, in Map Explorer, right-click the topology
name. Click Move Links.
■For a polygon topology, type MAPML on the command line.
3When prompted, click the link to reposition.
4When prompted, click any additional links to reposition.
5Press Enter when you finish selecting links.
6Specify the base point or displacement.
7Specify the second point of displacement.
The two points define a displacement vector that indicates how far the
selected objects are moved and in what direction. If you press Enter at
the Specify Second Point of Displacement prompt, the first point is
interpreted as relative X,Y,Z displacement. For example, if you specify
2,3 for the base point and press Enter at the next prompt, the object
Creating, Editing, and Managing Topologies | 863
moves 2 units in the X direction and 3 units in the Y direction from its
current position.
To join two links, break a link, or reverse a link's direction
1Open the drawing where the topology was created and load the topology.
2Do one of the following:
■For a network topology, in Map Explorer, right-click the topology
name. Click a menu option.
■To join two links in a polygon topology, type MAPJL on the command
line. To break a link in a polygon topology, type MAPBL on the
command line. You cannot reverse a link's direction in a polygon
topology.
Follow the command line prompts.
To modify the resistance or direction of a link
■For information about specifying values for resistance, see To edit the
resistance of a link or node in a network topology (page 850).
■For information about specifying direction, To specify the direction for a
link (page 847).
Quick Reference
MAPBL
Breaks a link in a topology at a specified point
MAPBLCommand Line
In Map Explorer, right-click a network
topology ➤ Break Link
Task Pane
MAPEDITDIR
Edits the direction of a link in a network topology
MAPEDITDIRCommand Line
MAPEDITDIR (Edit Direction command)Dialog Box
864 | Chapter 6 Creating and Editing Data
MAPEDITRES1
Edits the direct resistance of a node or link in a network topology
MAPEDITRES1Command Line
MAPEDITRES1 (Edit Direct Resistance command)Dialog Box
MAPEDITRES2
Edits the reverse resistance of a link in a network topology
MAPEDITRES2Command Line
MAPEDITRES2 (Edit Reverse Resistance command)Dialog Box
MAPJL
Joins two links in a topology
MAPJLCommand Line
In Map Explorer, right-click a network
topology ➤ Join Links
Task Pane
MAPMEL
Repositions an end point of a link in a topology
MAPMELCommand Line
In Map Explorer, right-click a network
topology ➤ Move End Of Link
Task Pane
MAPML
Moves a link in a topology
MAPMLCommand Line
In Map Explorer, right-click a network
topology ➤ Move Links
Task Pane
MAPRL
Reverses a link in a topology
MAPRLCommand Line
Creating, Editing, and Managing Topologies | 865

In Map Explorer, right-click a topology ➤ Reverse
Link Direction
Task Pane
PROPERTIES
Displays the Properties palette, which allows you to edit the properties of
objects
Analyze ➤ Properties
Menu
Properties
Icon
PROPERTIESCommand Line
Select object. Right-click in drawing area ➤ Properties
Task Pane
Editing a Polygon
You can divide a polygon into two smaller polygons by drawing a link between
two nodes that define the polygon. You can also remove a boundary between
two polygons and combine them into one polygon. You can specify the
centroid to remove. Splitting and combining polygons change the centroid,
the area, and perimeter values.
You can also use the commands for editing nodes (page 859) and editing links
(page 861) to edit a polygon topology. When you do, AutoCAD Map 3D changes
the centroid, the area, and perimeter values of the polygons automatically.
NOTE This functionality is for drawing objects only. There is no equivalent for
geospatial feature data.
866 | Chapter 6 Creating and Editing Data
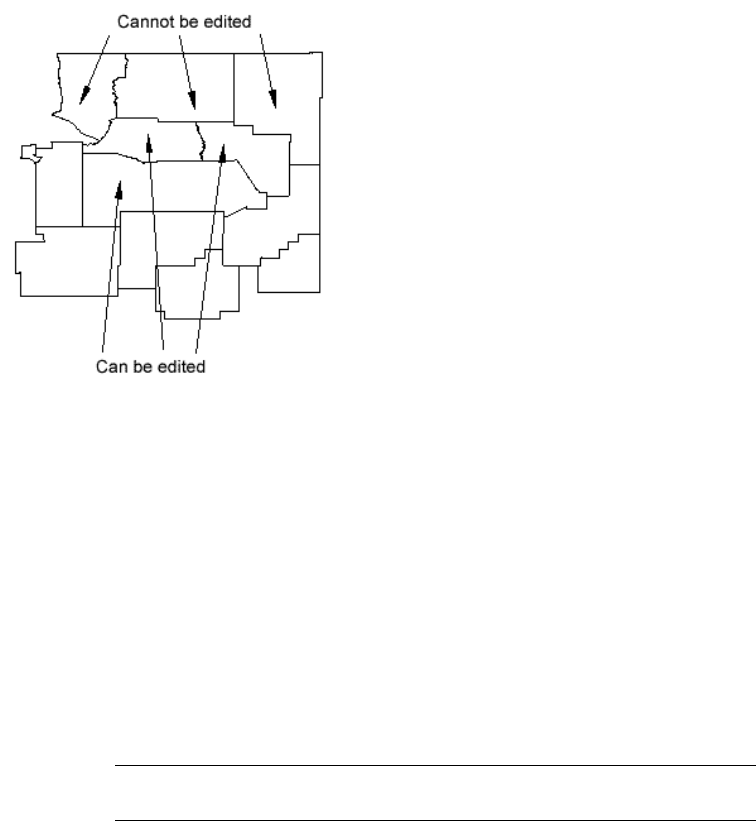
Polygons at the edge of a queried polygon topology cannot be edited.
See also:
■Overview of Creating Topologies (page 822)
■Creating a Polygon Topology (page 833)
■Querying a Topology (page 1348)
■Adding a Polygon (page 882)
■To delete a link, node, or polygon (page 889)
■Editing a Link (page 861)
■Editing a Node (page 859)
NOTE This procedure is for drawing objects only. There is no equivalent for
geospatial feature data.
To divide a polygon into two smaller polygons
1Open the drawing where the polygon topology was created and load the
topology.
2In Map Explorer, right-click the topology name. Click Divide Polygon.
3Specify a node for the first divide point.
Creating, Editing, and Managing Topologies | 867

4Specify the node for the second divide point.
To merge two polygons into one polygon
1Open the drawing where the polygon topology was created and load the
topology.
2In Map Explorer, right-click the topology name. Click Merge Polygon.
3Specify the link (boundary between two polygons) to remove.
4Specify the centroid to remove.
5On the command line, type Y to merge the polygons.
Quick Reference
MAPDVP
Divides a polygon in a polygon topology by allowing you to add a link
MAPDVPCommand Line
In Map Explorer, right-click a polygon
topology ➤ Divide Polygon
Task Pane
MAPMP
Merges polygons in a polygon topology
MAPMPCommand Line
In Map Explorer, right-click a polygon
topology ➤ Merge Polygon
Task Pane
PROPERTIES
Displays the Properties palette, which allows you to edit the properties of
objects
Analyze ➤ Properties
Menu
Properties
Icon
PROPERTIESCommand Line
Select object. Right-click in drawing area ➤ Properties
Task Pane
868 | Chapter 6 Creating and Editing Data
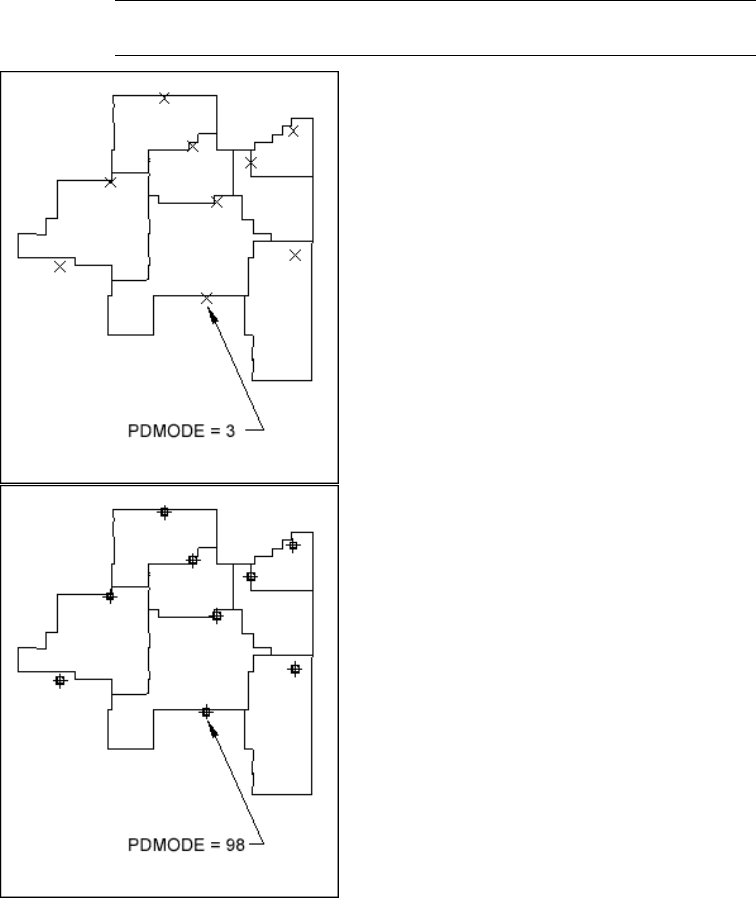
Changing the Appearance of Points
If you create nodes as ACAD_POINT, you can change their appearance.
NOTE This functionality is for drawing objects only. There is no equivalent for
geospatial feature data.
Creating, Editing, and Managing Topologies | 869

See also:
■Overview of Creating Topologies (page 822)
■Creating a Node Topology (page 826)
■Adding a Node (page 877)
NOTE This procedure is for drawing objects only. There is no equivalent for
geospatial feature data.
To change the appearance of points
1At the Command prompt, enter ddptype.
2In the Point Style dialog box, select any of the point modes.
You can also change the Point Size to improve the visibility of the points.
3Click OK.
4On the command line, enter regen.
Nodes you created using ACAD_POINT appear in the point style you selected.
To reset the node display, use the Point Style dialog box to reset the point
style. Then enter regen on the command line.
Quick Reference
DDPTYPE
Specifies the display mode and size of point objects
Setup menu ➤ More Formatting Options ➤ Point
Style
Menu
DDPTYPECommand Line
Editing the Direction for a Link
You can specify the direction of movement allowed for a link in a network
topology. AutoCAD Map 3D uses this direction when tracing through network
topology for path traces, best route analysis, and flood traces.
870 | Chapter 6 Creating and Editing Data
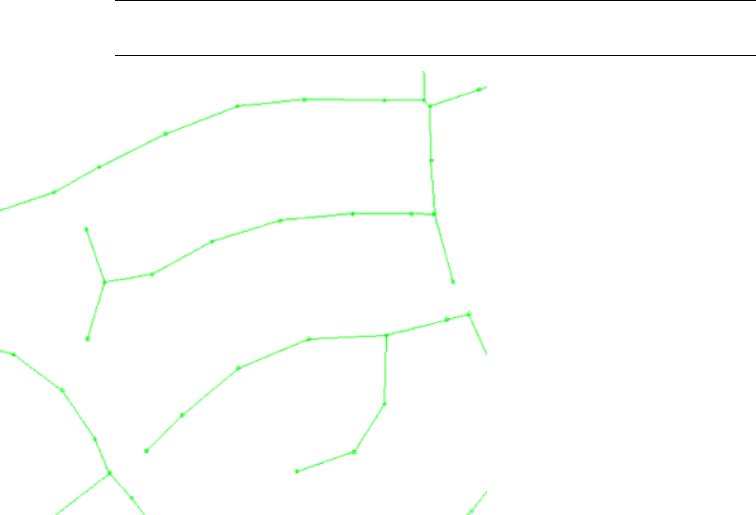
NOTE This functionality is for drawing objects only. There is no equivalent for
geospatial feature data.
Creating, Editing, and Managing Topologies | 871
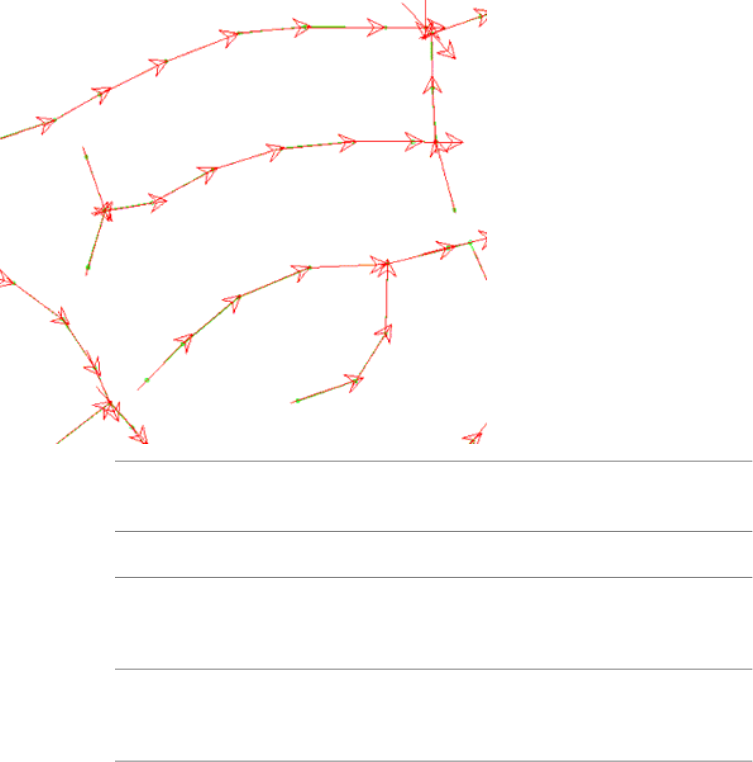
Object data
value
Property in the
Properties
palette
Direction
0Bi-DirectionalBi-Directional (two-way)
1ForwardSame as created. Movement along the link is al-
lowed only in the direction that the link was
created.
-1ReverseReverse of created direction. Movement along
the link is allowed only in the opposite direction
that the link was created.
The default direction of an arc, or a two-point polyline with an arc segment,
is counterclockwise. Set the value to Bi-Directional (0) or Forward (1) for
counterclockwise, and to Reverse (-1) for clockwise.
To reverse the direction of selected links, right-click a network topology in
Map Explorer. Click Reverse Link Direction. You can also use the MAPRL
command.
872 | Chapter 6 Creating and Editing Data

See also:
■Loading or Unloading Topologies (page 906)
■Adding a Link (page 880)
■To delete a link, node, or polygon (page 889)
■Specifying the Direction for a Link (page 845)
■Specifying the Resistance for a Link or Node (page 849)
■Performing a Shortest Path Trace (page 1324)
■Performing a Best Route Analysis (page 1328)
■Performing a Flood Trace (page 1333)
NOTE This procedure is for drawing objects only. There is no equivalent for
geospatial feature data.
To edit the direction of a link
1Verify that the network topology containing the link is loaded. You can
specify link direction for network topologies only.
2In the map, double-click the link.
If more than one topology contains the same link, select one of the
topologies. Update the other topologies (page 891) later.
3In the Properties palette, under the Topo properties, choose a setting for
the Flow Direction property:
■Bi-Directional — Movement is allowed in both directions.
■Forward — Movement is allowed only in the direction that the link
was created.
■Reverse — Movement is allowed only in the opposite direction of the
direction that the link was created.
The new direction setting is assigned to the link.
NOTE You can also store a direction value in an object data table or an external
database table. When you run a shortest path trace, best route analysis, or flood
trace, you can specify the location of this data. When storing this data, use 0 for
Bi-Directional, 1 for Forward, and -1 for Reverse.
Creating, Editing, and Managing Topologies | 873
Quick Reference
MAPEDITDIR
Edits the direction of a link in a network topology
MAPEDITDIRCommand Line
MAPEDITDIR (Edit Direction command)Dialog Box
MAPRL
Reverses a link in a topology
MAPRLCommand Line
In Map Explorer, right-click a topology ➤ Reverse
Link Direction
Task Pane
PROPERTIES
Displays the Properties palette, which allows you to edit the properties of
objects
Analyze ➤ Properties
Menu
Properties
Icon
PROPERTIESCommand Line
Select object. Right-click in drawing area ➤ Properties
Task Pane
Editing the Resistance for a Link or Node
Direct Resistance is the resistance to travel in the direction that a link was
created, while Reverse Resistance is the resistance in the opposite direction
along a link.
NOTE This functionality is for drawing objects only. There is no equivalent for
geospatial feature data.
For both types, you can specify a resistance for any link in the network
topology. This resistance specifies the difficulty in traversing the link. The
default resistance is the length of the link.
874 | Chapter 6 Creating and Editing Data

AutoCAD Map 3D uses this resistance when doing a shortest path trace, best
route analysis, or flood trace. For an example of using resistance to show travel
times, see Performing a Flood Trace (page 1333).
You can also specify the Resistance of a node in a network topology, such as
setting resistance for a valve in a pipe network, or a junction in a road network.
See also:
■Loading or Unloading Topologies (page 906)
■Adding a Link (page 880)
■To delete a link, node, or polygon (page 889)
■Specifying the Direction for a Link (page 845)
■Specifying the Resistance for a Link or Node (page 849)
■Performing a Shortest Path Trace (page 1324)
■Performing a Best Route Analysis (page 1328)
■Performing a Flood Trace (page 1333)
NOTE This procedure is for drawing objects only. There is no equivalent for
geospatial feature data.
To edit the resistance of a link or node in a network topology
1Verify that the network topology containing the link or node is loaded.
Be sure to load the topology from the current drawing. You can specify
resistance for network topologies only.
2In the map, double-click the link or node.
If more than one topology contains the same link or node, select one of
the topologies. Update the other topologies (page 891) later.
3In the Properties palette, under the group of Topo properties, enter new
values for resistance. You must enter a numeric value.
■For a node, enter a value for Resistance, which is the resistance to
cross the node.
■For a link, enter values for Direct Resistance and Reverse Resistance.
Direct resistance is the resistance to travel in the direction that a link
was created, while reverse resistance is the resistance in the opposite
direction along a link. The default value is the length of the link.
Creating, Editing, and Managing Topologies | 875
The new resistance values are assigned to the objects.
NOTE You can also store a resistance value in object data or an external database.
When you run a flood trace, path trace, or best route analysis, specify the location
of this data.
If you are entering the commands on the command line, use the MAPEDITRES1
(Edit Direct Resistance command) (page 1939) to edit the Direct Resistance of
links and the Resistance of nodes; use the MAPEDITRES2 (Edit Reverse
Resistance command) (page 1940) to edit the Reverse Resistance of links.
Quick Reference
MAPEDITRES1
Edits the direct resistance of a node or link in a network topology
MAPEDITRES1Command Line
MAPEDITRES1 (Edit Direct Resistance command)Dialog Box
MAPEDITRES2
Edits the reverse resistance of a link in a network topology
MAPEDITRES2Command Line
MAPEDITRES2 (Edit Reverse Resistance command)Dialog Box
PROPERTIES
Displays the Properties palette, which allows you to edit the properties of
objects
Analyze ➤ Properties
Menu
Properties
Icon
PROPERTIESCommand Line
Select object. Right-click in drawing area ➤ Properties
Task Pane
876 | Chapter 6 Creating and Editing Data
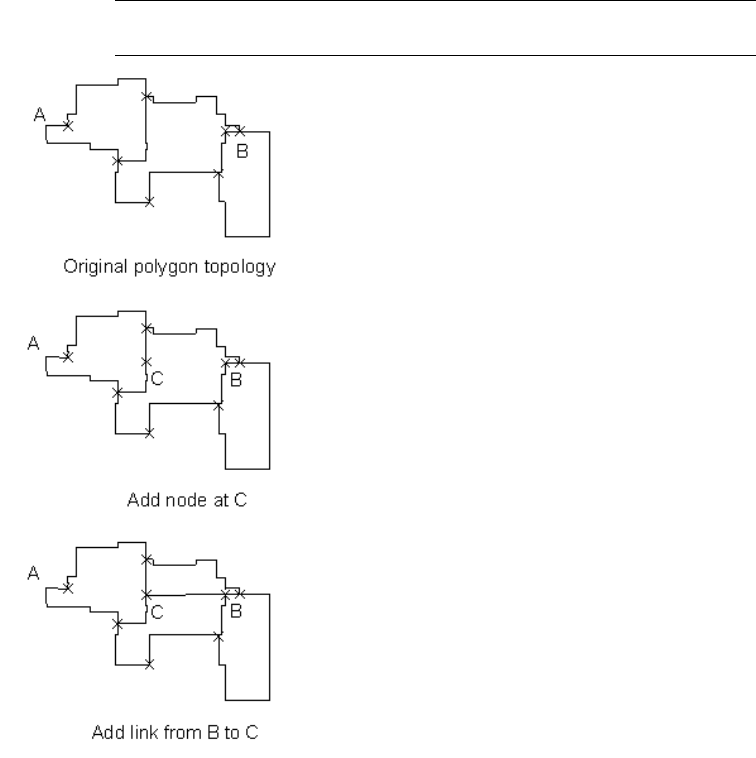
Adding a Node
You can add nodes to an existing topology. To add nodes, the current drawing
must be where the topology was created and the geometry (point, block, or
text object) must already exist. You can add a node to the end of a link or a
vertex in network or polygon topologies.
NOTE This functionality is for drawing objects only. There is no equivalent for
geospatial feature data.
Adding a node to an existing topology.
Creating, Editing, and Managing Topologies | 877

See also:
■Overview of Creating Topologies (page 822)
■Loading or Unloading Topologies (page 906)
■Deleting Links, Nodes, and Polygons (page 888)
■Updating a Topology (page 891)
■Adding a Link (page 880)
NOTE This procedure is for drawing objects only. There is no equivalent for
geospatial feature data.
To create a node on an existing link
1Open the drawing where the topology was created and load the topology.
To create a node and add it to a topology, the current drawing must be
the drawing where the topology was created.
NOTE To add the same point to more than one topology, select one of the
topologies. Update the other topologies (page 891) later.
2Do one of the following:
■To add a node to a node topology, in Map Explorer, right-click the
topology name. Click Insert Node.
■To add a node to a network or polygon topology, type mapin on the
command line.
3When prompted, select the block to use for the node.
4When prompted, specify the location for the node. You can use an object
snap such as Midpoint. Enter any other node information.
To add an existing node to a topology
1Open the drawing where the topology was created and load the topology.
2Create the point, block, or text object that you will use as the node.
3Be sure to load the topology you want to add the node to from the current
drawing.
878 | Chapter 6 Creating and Editing Data

4Do one of the following:
■To add a node to a node topology, in Map Explorer, right-click the
topology name. Click Add Node.
■To add a node to a network or polygon topology, type mapan on the
command line.
5When prompted, select the object to use as the node.
Quick Reference
MAPAN
Adds a node to a topology
MAPANCommand Line
In Map Explorer, right-click a node topology ➤ Add
Node
Task Pane
MAPIN
Inserts a node in a topology
MAPINCommand Line
In Map Explorer, right-click a node topology ➤ Insert
Node
Task Pane
PROPERTIES
Displays the Properties palette, which allows you to edit the properties of
objects
Analyze ➤ Properties
Menu
Properties
Icon
PROPERTIESCommand Line
Select object. Right-click in drawing area ➤ Properties
Task Pane
Creating, Editing, and Managing Topologies | 879

Adding a Link
You can add a new or existing link to a network or polygon topology. The
current drawing must be where the topology was created.
NOTE This functionality is for drawing objects only. There is no equivalent for
geospatial feature data.
Create new links between existing nodes. Add nodes (page 877) as needed. New
links cannot cross other links. If you draw a line or arc, it is converted to a
polyline.
When adding links to polygon topologies, AutoCAD Map 3D updates the
centroid, the area, and perimeter values of the polygons. You can also divide
a polygon using the MAPDVP command.
You cannot add links to node topologies.
See also:
■Adding a Node (page 877)
■Editing a Link (page 861)
■Editing a Polygon (page 866)
■Editing the Direction for a Link (page 870)
■Editing the Resistance for a Link or Node (page 874)
NOTE This procedure is for drawing objects only. There is no equivalent for
geospatial feature data.
To create a link and add it to a topology
1Open the drawing where the topology was created and load the topology.
2Do one of the following:
■To create a new link in a network topology, in Map Explorer,
right-click the topology name. Click Insert New Link.
■To create a link in a polygon topology, type MAPIL on the command
line.
3At the prompt, click the start point for the new link.
4When prompted, click the next point(s).
880 | Chapter 6 Creating and Editing Data
5To finish entering points, press Enter.
6Optionally, modify the values for resistance (page 850) and direction (page
847).
To add an existing link to a topology
1Open the drawing where the network or polygon topology was created
and load the topology.
2Do one of the following:
■To add a link to a network topology, in Map Explorer, right-click the
topology name. Click Add New Links.
■To add a link to a polygon topology, type MAPAL on the command
line.
3At the prompt, click the link to add to the topology.
4Click any additional links to add.
5When you finish selecting links, press Enter.
6Optionally, modify the values for resistance (page 850) and direction (page
847).
Quick Reference
MAPAL
Adds a link to a topology
MAPALCommand Line
In Map Explorer, right-click a network
topology ➤ Add New Links
Task Pane
MAPIL
Inserts a link in a topology
MAPILCommand Line
In Map Explorer, right-click a network
topology ➤ Insert New Link
Task Pane
Creating, Editing, and Managing Topologies | 881

PROPERTIES
Displays the Properties palette, which allows you to edit the properties of
objects
Analyze ➤ Properties
Menu
Properties
Icon
PROPERTIESCommand Line
Select object. Right-click in drawing area ➤ Properties
Task Pane
Adding a Polygon
You can add a polygon using existing objects or new linework as a perimeter.
To add a polygon to a polygon topology, the current drawing must be where
the topology was created.
NOTE This functionality is for drawing objects only. There is no equivalent for
geospatial feature data.
882 | Chapter 6 Creating and Editing Data
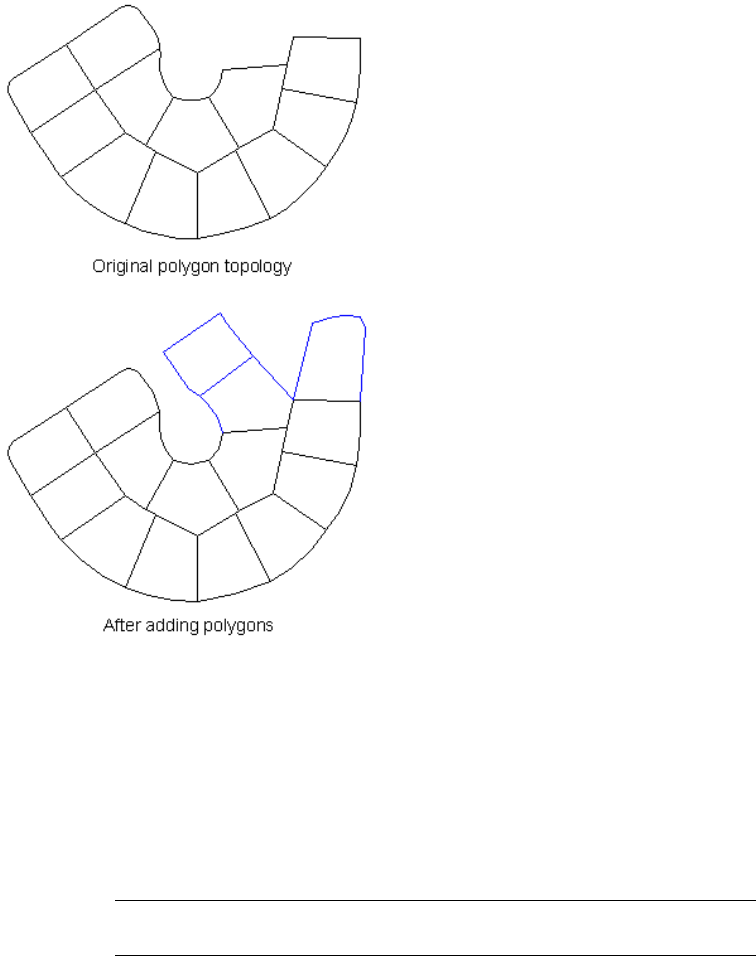
New polygons can be added to an existing polygon topology.
See also:
■Overview of Creating Topologies (page 822)
■Creating a Polygon Topology (page 833)
■Loading or Unloading Topologies (page 906)
NOTE This procedure is for drawing objects only. There is no equivalent for
geospatial feature data.
Creating, Editing, and Managing Topologies | 883
To add a polygon to a polygon topology using existing linework
1Open the drawing where the polygon topology was created and load the
topology.
To add a polygon to a polygon topology, the current drawing must be
the drawing where the topology was created.
2Do one of the following:
■In Map Explorer, right-click the topology name. Click Add Polygon.
■Type mapap on the command line.
3In the map, select the border objects of the polygons to add.
4Press Enter when you finish selecting polygons.
5If you have blocks defined in the drawing, you are prompted to specify
a block to use for the centroid. Press Enter to use ACAD_POINT, or type
a block name and press Enter.
To add a polygon to a polygon topology by creating new linework
1Open the drawing where the polygon topology was created and load the
topology.
2On the command line, type MAPIL.
3When prompted, specify the location for a new link. The link must define
a polygon.
Quick Reference
MAPAP
Adds a polygon to a polygon topology
MAPAPCommand Line
In Map Explorer, right-click a polygon
topology ➤ Add Polygon
Task Pane
MAPIL
Inserts a link in a topology
884 | Chapter 6 Creating and Editing Data

MAPILCommand Line
In Map Explorer, right-click a network
topology ➤ Insert New Link
Task Pane
Creating Centroids for Polygons
If you have polygon objects or closed polylines with data attached to them,
you can create centroids and move the data to the centroid. This is useful:
■After you import or digitize objects.
■Before using editing commands such as Drawing Cleanup, Boundary Break,
or Boundary Trim.
■When working with topology.
NOTE This functionality is for drawing objects only. There is no equivalent for
geospatial feature data.
Creating, Editing, and Managing Topologies | 885
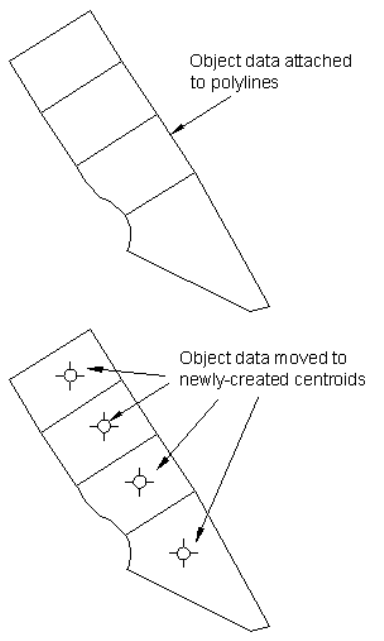
Object data attached to closed polylines (above) and object data moved to centroids
(below).
AutoCAD Map 3D checks that the lines do not intersect each other, and that
the area is greater than 0. It then creates a centroid inside each selected polygon
or closed polyline and moves any object data or SQL link data to the centroid.
For an object shaped like a figure eight, AutoCAD Map 3D creates one centroid.
Centroids are created with a Z value of 0.
See also:
■Overview of Creating Topologies (page 822)
■Creating a Polygon Topology (page 833)
■Loading or Unloading Topologies (page 906)
886 | Chapter 6 Creating and Editing Data
■Importing Polygons (page 429)
■Defining the Text Insertion Point (page 936)
NOTE This procedure is for drawing objects only. There is no equivalent for
geospatial feature data.
To create centroids for polygons and closed polylines
1Click Create tab ➤ Drawing Object panel ➤ Create Centroids.
2In the Create Centroids dialog box (page 1801), specify whether to create
centroids for all closed objects or only for selected closed objects. If only
for selected closed objects, select the polygons and closed polylines.
TIP Click the Quick Select tool to view and filter the object type as you select
objects.
3Specify the layer on which the centroids should be created.
4Specify the block to use for centroids, or use ACAD_POINT.
5Click OK.
Quick Reference
MAPCREATECENTROIDS
Creates a centroid in a polygon and moves data to the centroid
Create menu ➤ Centroids
Menu
Create Centroids
Icon
MAPCREATECENTROIDSCommand Line
Create Centroids dialog boxDialog Box
Creating, Editing, and Managing Topologies | 887

Deleting Links, Nodes, and Polygons
You can delete a node in a node, network, or polygon topology; a link in a
network or polygon topology; or a polygon in a polygon topology. When you
delete nodes, links, or polygons, object data and external database links may
be lost.
WARNING Both the topology information and associated objects are deleted.
NOTE This functionality is for drawing objects only. There is no equivalent for
geospatial feature data.
■Deleting a node shared by two links joins the links together. First and last
point information on the resulting link is updated.
■Deleting a dangling link deletes the dangling end node.
■Deleting a link deletes any associated nodes, unless the link is also part of
another topology or the nodes are referenced by another link.
■Deleting a polygon deletes the centroid and all references to it in
surrounding links, unless objects are part of another topology or are
referenced by another polygon.
888 | Chapter 6 Creating and Editing Data
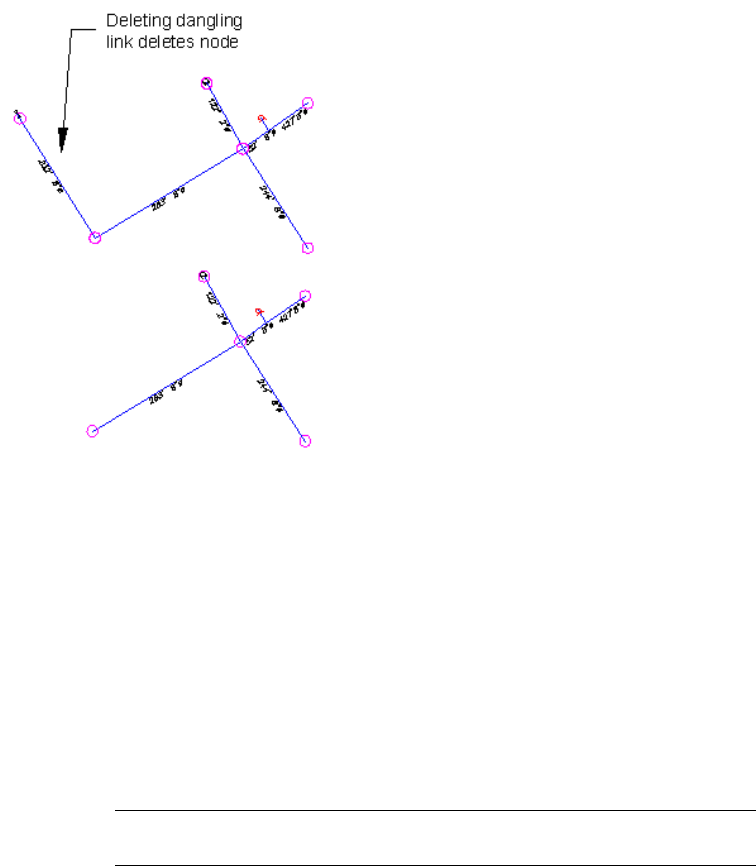
When you remove a link, any nodes that are not connected to other links are also
removed.
See also:
■Overview of Creating Topologies (page 822)
■Loading or Unloading Topologies (page 906)
■Adding a Node (page 877)
■Adding a Link (page 880)
■Editing a Node (page 859)
■Editing a Link (page 861)
NOTE This procedure is for drawing objects only. There is no equivalent for
geospatial feature data.
To delete a link, node, or polygon
1Open the drawing where the topology was created and load the topology.
Creating, Editing, and Managing Topologies | 889
2Do one of the following:
■To delete a node from a node topology, in Map Explorer, right-click
the topology. Click Delete Node. To delete a node from a network or
polygon topology, type MAPDN on the command line.
■To delete a link from a network topology, in Map Explorer, right-click
the topology. Click Delete Links. To delete a link from a polygon
topology, type MAPDL on the command line.
■To delete a polygon from a polygon topology, in Map Explorer,
right-click the topology. Click Delete Polygon.
3Select the object(s) to delete. To select a polygon, click near its centroid.
Quick Reference
MAPDL
Deletes a link in a topology
MAPDLCommand Line
In Map Explorer, right-click a network
topology ➤ Delete Links
Task Pane
MAPDN
Deletes a node in a topology
MAPDNCommand Line
In Map Explorer, right-click a node topology ➤ Delete
Node
Task Pane
MAPDP
Deletes a polygon from a polygon topology
MAPDPCommand Line
In Map Explorer, right-click a polygon
topology ➤ Delete Polygon
Task Pane
PROPERTIES
890 | Chapter 6 Creating and Editing Data
Displays the Properties palette, which allows you to edit the properties of
objects
Analyze ➤ Properties
Menu
Properties
Icon
PROPERTIESCommand Line
Select object. Right-click in drawing area ➤ Properties
Task Pane
Updating a Topology
Objects in a topology have relationship data stored in an object data table. If
you modify the objects using the topology editing commands (page 852), the
topology data on the objects is updated. However, you must manually update
the topology data in the following circumstances:
■If you modify the objects using standard AutoCAD commands, such as
Move.
■If the object is referenced by more than one topology. (Only the selected
topology is updated when you modify the object. Use the Update option
to update the remaining topologies that reference the object.)
NOTE If the update options cannot restore integrity, try using Recreate. In Map
Explorer, right-click a topology ➤ Administration ➤ Recreate. When you recreate
a topology, the topology is completely recreated. Any editing changes you made
to the topology object data are erased.
NOTE This functionality is for drawing objects only. There is no equivalent for
geospatial feature data.
See also:
■Overview of Creating Topologies (page 822)
■Loading or Unloading Topologies (page 906)
NOTE This procedure is for drawing objects only. There is no equivalent for
geospatial feature data.
Creating, Editing, and Managing Topologies | 891
To update a topology
1Verify that the topology containing the objects to update is loaded (page
907).
■To update nodes in a node topology, in Map Explorer, right-click the
topology name. Click Update. To update nodes in a network or
polygon topology, type MAPNODUPD on the command line.
■To update links in a network topology, in Map Explorer, right-click
the topology name. Click Update. To update links in a polygon
topology, type MAPLINKUPD on the command line.
■To update polygons links in a polygon topology, in Map Explorer,
right-click the topology name. Click Update. You can also type
MAPPOLYUPD on the command line.
2Select the objects to update. Press Enter
The topology data for the object is updated in the topology.
If you delete an object from one topology, and the object belongs to another
topology, the physical object is not removed from the drawing. The second
topology is not changed and no update is necessary for the deleted object.
Quick Reference
MAPLINKUPD
Updates links in a network topology
MAPLINKUPDCommand Line
In Map Explorer, right-click a topology ➤ Update
Task Pane
MAPLINKUPD (Update Topology Link command)Dialog Box
MAPNODUPD
Updates nodes in a topology
MAPNODUPDCommand Line
In Map Explorer, right-click a topology ➤ Update
Task Pane
MAPNODUPD (Update Topology Node command)Dialog Box
MAPPOLYUPD
892 | Chapter 6 Creating and Editing Data

Updates a polygon topology
MAPPOLYUPDCommand Line
In Map Explorer, right-click a topology ➤ Update
Task Pane
MAPPOLYUPD (Update Topology Polygon command)Dialog Box
PROPERTIES
Displays the Properties palette, which allows you to edit the properties of
objects
Analyze ➤ Properties
Menu
Properties
Icon
PROPERTIESCommand Line
Select object. Right-click in drawing area ➤ Properties
Task Pane
Editing a Partial Topology
In general, when editing a topology, you should retrieve the entire topology.
However, if the topology is large, it may impair performance. With large
topologies, you can query in just a part of the topology.
NOTE This functionality is for drawing objects only. There is no equivalent for
geospatial feature data.
Topology editing tools (page 851) do not allow you to edit incomplete objects
at the edges of the queried area. Your query must retrieve enough of an area
around the edit area to ensure that the objects to be edited are complete.
Creating, Editing, and Managing Topologies | 893
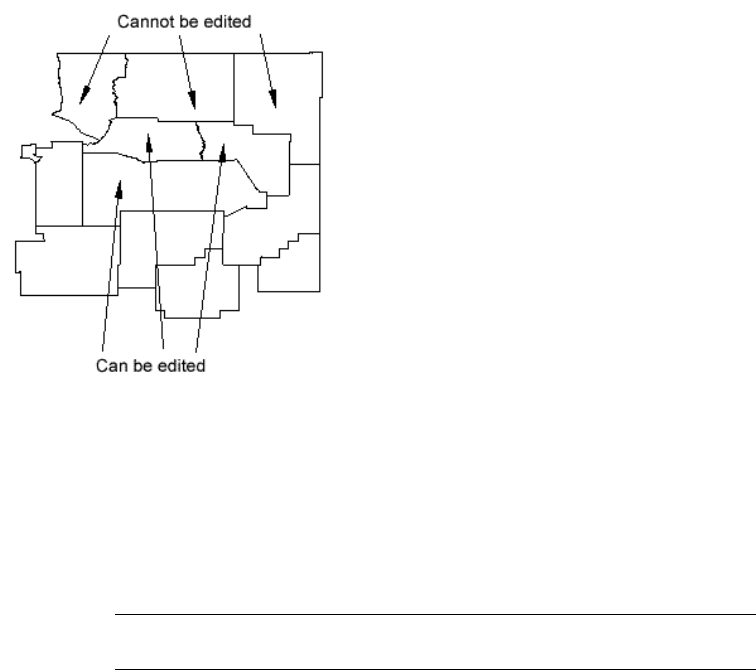
Polygons at the edge of a queried polygon topology cannot be edited.
See also:
■Correcting or Completing a Topology (page 918)
■Overview of Creating Topologies (page 822)
■Loading or Unloading Topologies (page 906)
NOTE This procedure is for drawing objects only. There is no equivalent for
geospatial feature data.
To retrieve objects to edit
1Open a drawing, attach the source drawings that contain the topology
you wish to edit, and make those source drawings active. Zoom to the
extents of the active source drawings.
2In Display Manager, click Data menu ➤ Add Drawing Data ➤ Query
Topology.
3In the Topology Query dialog box (page 2008), click Load.
4In the Topology Selection dialog box (page 2011), select the topology to
query. Click OK.
894 | Chapter 6 Creating and Editing Data

5In the Load Topology From Source Drawing dialog box (page 1978), make
sure that both the Topology Objects options are not selected. Click OK.
6In the Topology Query dialog box (page 2008), select or define a query.
■To load an existing query, click Load Query and select the query.
■To define a new query, click Define Query, and then define a query
(page 1353) to retrieve the topology geometry you require.
7Select Draw mode and execute the query.
Now that the objects are in the current drawing, you can edit them.
To edit the objects
1Unload (page 907) the topology from the source drawings. Load the
topology in the current drawing.
2Make any edits to the topology with the editing topology tools (page 851).
3Add the changes to the save set.
4Save back the changes to the source drawings (page 754). Do not save the
current drawing.
Quick Reference
ADESAVEOBJS
Saves objects in the save set back to source drawings
In the Classic workspace, click File menu ➤ Save
Source Drawing Save Set
Menu
Save to Source Drawings
Icon
ADESAVEOBJSCommand Line
Save Objects to Source Drawings dialog boxDialog Box
MAPTOPOLOAD
Loads a topology
Creating, Editing, and Managing Topologies | 895

Click Analyze ➤ More Topology Options ➤ Load
Topology.
Menu
Load Topology
Icon
MAPTOPOLOADCommand Line
In Map Explorer, right-click a
topology ➤ Administration ➤ Load Topology
Task Pane
Topology Selection dialog boxDialog Box
MAPTOPOQUERY
Queries topologies
Click Setup ➤ More DWG Options ➤ Define Topology
Query.
Menu
Query Topology
Icon
MAPTOPOQUERYCommand Line
In Map Explorer, right-click a
topology ➤ Analysis ➤ Topology Query
Task Pane
Topology Query dialog boxDialog Box
MAPTOPOUNLOAD
Unloads a topology
Click Map ➤ Topology ➤ Administration ➤ Unload.
Menu
Unload Topology
Icon
MAPTOPOUNLOADCommand Line
In Map Explorer, right-click a
topology ➤ Administration ➤ Unload Topology
Task Pane
Topology Selection dialog boxDialog Box
PROPERTIES
896 | Chapter 6 Creating and Editing Data
Displays the Properties palette, which allows you to edit the properties of
objects
Analyze ➤ Properties
Menu
Properties
Icon
PROPERTIESCommand Line
Select object. Right-click in drawing area ➤ Properties
Task Pane
Creating Closed Polylines from a Polygon Topology
You can create closed polylines from a polygon topology. This is useful if you
want to give data to an AutoCAD user so the user can hatch polygonal areas.
NOTE This functionality is for drawing objects only. There is no equivalent for
geospatial feature data.
While creating closed polylines from polygon topology, you can create a group
containing all the elements of complex areas, such as islands. If the islands
themselves have nested islands or other polygons, these nested polygons will
form a separate grouping automatically, creating different levels of grouping.
If two or more inner polygons are not nested but share the same outer
boundary, they will be treated as one group.
You can manipulate grouped data with the GROUP command. For more
information, see GROUP in the AutoCAD Help.
You can also copy the object data and the external database links held in the
centroids to the closed polylines.
See also:
■Overview of Creating Topologies (page 822)
■Creating a Polygon Topology (page 833)
■Loading or Unloading Topologies (page 906)
■Exporting Polygons from a Polygon Topology (page 1457)
NOTE This procedure is for drawing objects only. There is no equivalent for
geospatial feature data.
Creating, Editing, and Managing Topologies | 897

To create closed polylines from a polygon topology
1Click Create tab ➤ Topology panel ➤ Create Closed Polylines.
2In the Create Closed Polylines dialog box (page 1953), click Load to load
the polygon topology or select from the Name list.
All polygons in the selected topology are automatically selected.
3Under How To Close, specify the layer to create the polylines.
4Select Group Complex Polygons if you want to create a group containing
all the elements of complex areas, such as islands.
5Select Copy Object Data From Centroid To Pline and Copy Database
Links From Centroid To Pline if you want to copy the object data and
external database links held in the centroids to the closed polylines.
6Click OK.
Quick Reference
MAPCLPLINE
Creates polylines from a polygon topology
Create menu ➤ Create Closed Polylines
Menu
MAPCLPLINECommand Line
Create Closed Polylines dialog boxDialog Box
Managing Topologies
■Overview of Managing Topologies (page 899)
■Loading or Unloading Topologies (page 906)
■Highlighting and Identifying Topology (page 909)
■Viewing Topology Data (page 913)
■Viewing Topology Statistics (page 915)
■Saving Topology to Source Drawings (page 916)
■Correcting or Completing a Topology (page 918)
■Saving and Loading Settings Using Profiles (page 922)
■Renaming Topologies and Changing Their Descriptions (page 924)
■Deleting Topologies (page 925)
898 | Chapter 6 Creating and Editing Data

NOTE These procedures are for drawing objects only. There are no equivalents
for geospatial feature data.
To manage topologies
■To load a topology (page 907)
■To unload a topology (page 908)
■To highlight all objects in a selected topology (page 911)
■To highlight and identify the topologies associated with an object (page
911)
■To change the color used for highlighting (page 912)
■To remove highlighting and restore objects to their original color (page
912)
■To view topology object data (page 914)
■To view and edit the properties of topology objects in the Properties palette
(page 914)
■To view topology statistics (page 916)
■To save topology to source drawings (page 917)
■To audit, recreate, or complete a topology (page 920)
■To test the integrity of a network topology (page 920)
■To save topology analysis settings in a profile (page 922)
■To load an existing topology profile (page 923)
■To rename or delete profiles (page 923)
■To change the name, description, or both of a topology (page 925)
■To delete a topology (page 926)
Overview of Managing Topologies
Using topology administration tools, you can do the following:
■Load or unload an existing topology
■Rename or delete a topology
■Audit or check the status of a topology to ensure its integrity
■Recreate a topology that was edited with commands other than the
topology editing tools
■Get statistics on the topologies in the current drawing
■Highlight all objects in a topology, and all topologies for a selected object.
Creating, Editing, and Managing Topologies | 899
When you use these tools, all source drawings associated with a named
topology must be attached and active.
NOTE This functionality is for drawing objects only. There is no equivalent for
geospatial feature data.
Tell me more
Video
■Show me how to load a topology.
Procedure
■To manage topologies (page 899)
GIS Skill
■Create a network topology to show how
lines are connected.
■Find the shortest path through a net-
work.
Related topics
■Overview of Creating Topologies (page
822)
■Saving Topology to Source Drawings
(page 916)
■Editing Topologies (page 851)
■Saving New Objects to Attached
Drawings (page 754)
NOTE This procedure is for drawing objects only. There is no equivalent for
geospatial feature data.
Use this method...To do this...
In Map Explorer, right-click the topology
name ➤ Administration ➤ Load Topo-
logy.
See Loading or Unloading Topologies
(page 906)
Load an existing topology.
900 | Chapter 6 Creating and Editing Data
Use this method...To do this...
In Map Explorer, right-click the topology
name ➤ Administration ➤ Unload Topo-
logy.
See Loading or Unloading Topologies
(page 906)
Unload an existing topology.
In Map Explorer, right-click the topology
name ➤ Administration ➤ Rename.
See Renaming Topologies and Changing
Their Descriptions (page 924)
Rename a topology.
In Map Explorer, right-click the topology
name. Click an option from the Administra-
tion submenu.
See Correcting or Completing a Topology
(page 918)
Audit or recreate a topology
Click Analyze tab ➤ Drawing Object pan-
el ➤ Network Analysis.
See Correcting or Completing a Topology
(page 918)
Test the integrity of a topology
In Map Explorer, right-click the topology
name ➤ Statistics.
See Viewing Topology Statistics (page 915)
Get statistics on the topologies in the cur-
rent drawing
Click View tab ➤ Palettes panel ➤
Properties. Select the object. In the Proper-
View the properties of topology objects
ties palette, under the Topo group, view
the topology properties.
See Viewing Topology Data (page 913)
Click Tools tab ➤ Map Edit panel ➤ Edit
Object Data. Select the object.
See Viewing Topology Data (page 913)
View topology object data
Creating, Editing, and Managing Topologies | 901
Use this method...To do this...
In Map Explorer, right-click the topology
name ➤ Show Geometry.
See Highlighting and Identifying Topology
(page 909)
Highlight all objects in a topology.
In Map Explorer, right-click the Topologies
folder ➤ Show Topology. Click an object
in the map.
See Highlighting and Identifying Topology
(page 909)
Highlight the topologies associated with
an object.
In Map Explorer, right-click the topology
name ➤ Administration ➤ Delete.
See Deleting Topologies (page 925)
Delete a topology
Quick Reference
MAPTOPOLOAD
Loads a topology
Click Analyze ➤ More Topology Options ➤ Load
Topology.
Menu
Load Topology
Icon
MAPTOPOLOADCommand Line
In Map Explorer, right-click a
topology ➤ Administration ➤ Load Topology
Task Pane
Topology Selection dialog boxDialog Box
MAPTOPOUNLOAD
Unloads a topology
Click Map ➤ Topology ➤ Administration ➤ Unload.
Menu
Unload Topology
Icon
902 | Chapter 6 Creating and Editing Data
MAPTOPOUNLOADCommand Line
In Map Explorer, right-click a
topology ➤ Administration ➤ Unload Topology
Task Pane
Topology Selection dialog boxDialog Box
MAPSHOWGEOM
Highlights and identifies topologies for the selected object
At the Command prompt, enter mapshowgeom.Menu
Show Geometry
Icon
MAPSHOWGEOMCommand Line
In Map Explorer, right-click Topologies ➤ Show
Geometry
Task Pane
MAPSHOWTOPO
Highlights objects in the selected topology
Click Map ➤ Topology ➤ Show Topology Geometry.
Menu
Show Topology
Icon
MAPSHOWTOPOCommand Line
In Map Explorer, right-click a topology ➤ Show
Topology
Task Pane
MAPTOPOSTATS
Displays detailed information about a topology
Click Map ➤ Topology ➤ Administration ➤ Statistics.
Menu
MAPTOPOSTATSCommand Line
In Map Explorer, right-click a topology ➤ Statistics
Task Pane
Topology Statistics dialog boxDialog Box
ADESAVEOBJS
Saves objects in the save set back to source drawings
Creating, Editing, and Managing Topologies | 903

In the Classic workspace, click File menu ➤ Save
Source Drawing Save Set
Menu
Save to Source Drawings
Icon
ADESAVEOBJSCommand Line
Save Objects to Source Drawings dialog boxDialog Box
ADESELOBJS
Creates a set of objects to be saved to source drawings
File menu ➤ Drawing Save Set Options ➤ Add Items
To Save Set
Menu
Add Objects to Save Set
Icon
ADESELOBJSCommand Line
ADESELOBJS (Select Objects for Save Back command)Dialog Box
MAPTOPOAUDIT
Checks that a topology is complete and contains no errors
Click Map ➤ Topology ➤ Administration ➤ Audit.
Menu
MAPTOPOAUDITCommand Line
In Map Explorer, right-click a
topology ➤ Administration ➤ Audit
Task Pane
MAPTOPOCOMP
Completes a network or polygon topology
Click Map ➤ Topology ➤ Administration ➤ Complete.
Menu
Complete Topology
Icon
MAPTOPOCOMPCommand Line
In Map Explorer, right-click a
topology ➤ Administration ➤ Complete
Task Pane
904 | Chapter 6 Creating and Editing Data

MAPTOPORECR
Reestablishes a topology that was edited with nontopology editing commands
such as STRETCH, PEDIT, and MOVE
Click Map ➤ Topology ➤ Administration ➤ Recreate.
Menu
Recreate Topology
Icon
MAPTOPORECRCommand Line
In Map Explorer, right-click a
topology ➤ Administration ➤ Recreate
Task Pane
Topology Selection dialog boxDialog Box
MAPANOVERLAY
Overlays one topology with another, and creates a new topology
Click Map ➤ Topology ➤ Overlay.
Menu
Overlay Topology
Icon
MAPANOVERLAYCommand Line
In Map Explorer, right-click a
topology ➤ Analysis ➤ Overlay
Task Pane
Topology Overlay Analysis - Analysis Type dialog boxDialog Box
MAPANTOPONET
Traces through a network topology (shortest path, best route, or flood trace)
Click Map ➤ Topology ➤ Network Analysis.
Menu
Network Analyze
Icon
MAPANTOPONETCommand Line
In Map Explorer, right-click a network
topology ➤ Analysis ➤ Network Analysis
Task Pane
Network Topology Analysis - Select Method dialog
box
Dialog Box
Creating, Editing, and Managing Topologies | 905
MAPTOPOREN
Changes the name and description of a topology
Click Map ➤ Topology ➤ Administration ➤ Rename.
Menu
MAPTOPORENCommand Line
In Map Explorer, right-click a
topology ➤ Administration ➤ Rename
Task Pane
Rename Topology dialog boxDialog Box
MAPTOPODEL
Removes topology data from objects and optionally deletes the objects
Click Map ➤ Topology ➤ Administration ➤ Delete.
Menu
MAPTOPODELCommand Line
In Map Explorer, right-click a
topology ➤ Administration ➤ Delete
Task Pane
Topology Selection dialog boxDialog Box
Loading or Unloading Topologies
When you load a topology, AutoCAD Map 3D loads topologies in the current
drawing and retrieves topologies from attached drawings into the current
drawing. If you save a drawing with a topology and later open the drawing,
reload the topology to use it.
NOTE This functionality is for drawing objects only. There is no equivalent for
geospatial feature data.
In Map Explorer, topologies with colorful icons are loaded. Topologies with
grayed-out icons are unloaded.
When loading a topology from a source drawing, select Create Objects When
Loaded to create the topology in the current drawing. Otherwise, the topology
is loaded without retrieving the topology geometry.
Tell me more
Video
■Show me how to load a topology.
906 | Chapter 6 Creating and Editing Data

Procedure
■To load a topology (page 907)
GIS Skill
■Create a network topology to show how
lines are connected.
■Find the shortest path through a net-
work.
Related topics
■Overview of Creating Topologies (page
822)
■Saving Topology to Source Drawings
(page 916)
■Adding an Object to the Save Set
(page 750)
■Saving New Objects to Attached
Drawings (page 754)
■Saving Objects to the Current Drawing
(page 756)
NOTE This procedure is for drawing objects only. There is no equivalent for
geospatial feature data.
To load a topology
1In Map Explorer, right-click the topology name ➤ Administration ➤
Load Topology.
2If the topology is stored in a source drawing, the Load Topology From
Source Drawing dialog box (page 1978) appears, where you can specify the
following:
■Create Topology Objects When Loaded — Select this check box to
copy the topology objects into the current drawing as the topology
is loaded. If this option is not selected, the objects are loaded but are
not copied into the current drawing.
■Select Topology Objects For Save Back — Select this option to add
objects in the current drawing to the save back set if they are
referenced by the selected topology. This means that the objects will
be saved back to their source drawings and replace the original objects.
Creating, Editing, and Managing Topologies | 907

■Audit Geometry of Topology Objects — Select this option to verify
that objects for the selected topology are geometrically correct. Any
objects that are not correct are highlighted.
In Map Explorer, the icon for the topology becomes colorful, indicating
that the topology is loaded.
To unload a topology
➤ In Map Explorer, right-click the topology name ➤ Administration ➤
Unload Topology.
In Map Explorer, the icon for the topology is shaded to indicate it has
been unloaded.
Quick Reference
MAPTOPOLOAD
Loads a topology
Click Analyze ➤ More Topology Options ➤ Load
Topology.
Menu
Load Topology
Icon
MAPTOPOLOADCommand Line
In Map Explorer, right-click a
topology ➤ Administration ➤ Load Topology
Task Pane
Topology Selection dialog boxDialog Box
MAPTOPOUNLOAD
Unloads a topology
Click Map ➤ Topology ➤ Administration ➤ Unload.
Menu
Unload Topology
Icon
MAPTOPOUNLOADCommand Line
908 | Chapter 6 Creating and Editing Data

In Map Explorer, right-click a
topology ➤ Administration ➤ Unload Topology
Task Pane
Topology Selection dialog boxDialog Box
Highlighting and Identifying Topology
Using the topology highlighting and identification tools, you can do the
following:
■Show Geometry–Highlight the objects in a topology.
Use Show Geometry to show the location and extent of a topology.
■Show Topology–Identify and highlight the topologies associated with an
object.
Use Show Topology to show the location and extent of all the topologies
associated with an object. AutoCAD Map 3D identifies the topologies by
name on the command line.
The color used for highlighting is the Selected Grip Color, which you can
specify in the AutoCAD Options dialog box.
These tools work only with topologies that have been loaded in the current
drawing.
NOTE This functionality is for drawing objects only. There is no equivalent for
geospatial feature data.
Creating, Editing, and Managing Topologies | 909
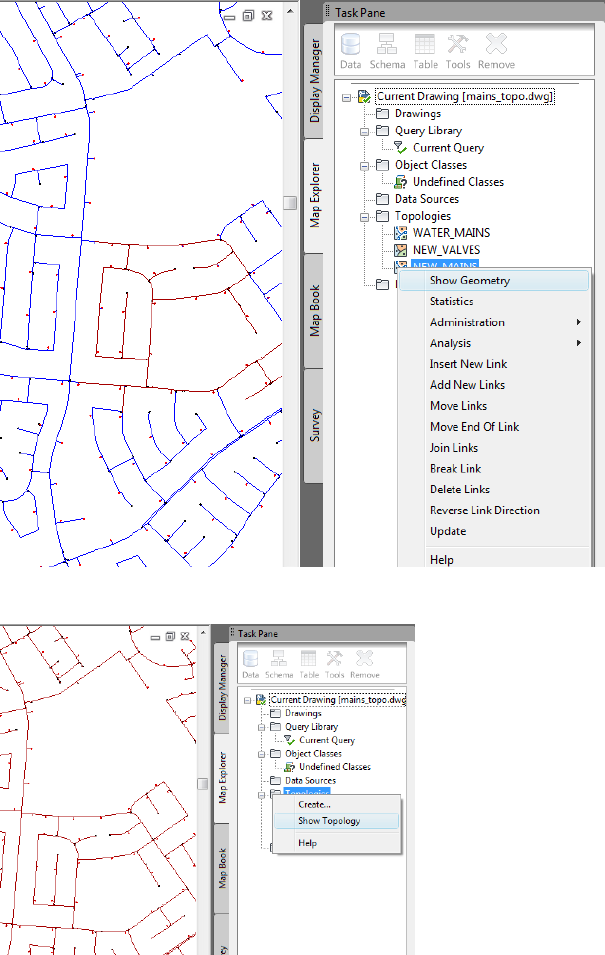
Highlight objects in the selected topology.
Highlights and identifies topologies for the selected object.
910 | Chapter 6 Creating and Editing Data

See also:
■Overview of Creating Topologies (page 822)
■Loading or Unloading Topologies (page 906)
NOTE This procedure is for drawing objects only. There is no equivalent for
geospatial feature data.
■To highlight all objects in a selected topology (page 911)
■To highlight and identify the topologies associated with an object (page
911)
■To change the color used for highlighting (page 912)
■To remove highlighting and restore objects to their original color (page
912)
To highlight all objects in a selected topology
1In Map Explorer, verify that the topology you want to highlight is loaded
(page 907). A topology must be loaded before it can be highlighted.
2Right-click the topology name. Click Show Geometry.
In the drawing, AutoCAD Map 3D highlights all objects in the selected
topology. To return objects to their original color, press ESC.
To highlight and identify the topologies associated with an object
1In Map Explorer, right-click the Topologies folder. Click Show Topology.
2In the map, click the object.
If the object belongs to one or more topologies, AutoCAD Map 3D
highlights all objects that belong to those topologies and lists the topology
names on the command line. If the object does not belong to a topology,
AutoCAD Map 3D reports that on the command line.
NOTE Only topologies that are loaded are considered.
3Select another object to highlight and identify, or press ESC to end the
command.
Creating, Editing, and Managing Topologies | 911
To change the color used for highlighting
1Click ➤ Options.
2In the Options dialog box, click the Selection tab.
3From the Selected Grip Color list, select the color to use for highlighting
topologies.
4Click OK.
To remove highlighting and restore objects to their original color
■Press Esc.
Quick Reference
MAPSHOWGEOM
Highlights and identifies topologies for the selected object
At the Command prompt, enter mapshowgeom.Menu
Show Geometry
Icon
MAPSHOWGEOMCommand Line
In Map Explorer, right-click Topologies ➤ Show
Geometry
Task Pane
MAPSHOWTOPO
Highlights objects in the selected topology
Click Map ➤ Topology ➤ Show Topology Geometry.
Menu
Show Topology
Icon
MAPSHOWTOPOCommand Line
In Map Explorer, right-click a topology ➤ Show
Topology
Task Pane
912 | Chapter 6 Creating and Editing Data
Viewing Topology Data
Information about each topology you create is stored in an object data table
in the current drawing as shown in this table.
NOTE This functionality is for drawing objects only. There is no equivalent for
geospatial feature data.
Information StoredObject Data FieldObject Data TableTopology Name
Topology typeTYPETPMDESC_EXAMPLEEXAMPLE
Setting of VIEWRES when
created or edited
TOLERANCE
Layer for linksLINK_LAYER
Color of linksLINK_COLOR
Nodes in topology; 0=No,
1=Yes
CREATE_NODE
Layer for nodesNODE_LAYER
Type of nodesNODE_TYPE
Block used for nodesNODE_BLOCK
Centroids in topology; 0=No,
1=Yes
CREATE_CNTR
Layer for centroidsCNTR_LAYER
Color of centroidsCNTR_COLOR
Type of centroidsCNTR_TYPE
Block used for centroidsCNTR_BLOCK
This information can be used in a topology query. Depending on the type of
topology, other object data tables are created and attached to the elements of
the topology.
Creating, Editing, and Managing Topologies | 913
You can also view and edit data associated with the objects in a topology using
the Properties palette. For example, for a link in a network topology, you can
view general information about the link, such as the ID of the start and end
nodes, and you can edit specific information such as the direction, direct
resistance, and reverse resistance of a link.
See also:
■Overview of Creating Topologies (page 822)
■Loading or Unloading Topologies (page 906)
■Querying a Topology (page 1348)
■Displaying and Editing Object Data for a Drawing Object (page 1068)
■Viewing Properties and Attributes of Drawing Objects (page 1145)
■Viewing Topology Statistics (page 915)
NOTE This procedure is for drawing objects only. There is no equivalent for
geospatial feature data.
To view topology object data
1Click Tools tab ➤ Map Edit panel ➤ Edit Object Data.
2Select the object.
3In the Edit Object Data dialog box (page 1795), view the topology data.
If the topology data is not displayed, select a topology table from the
Table list. The topology tables start with the letters "TPM."
To view and edit the properties of topology objects in the Properties palette
1Click View tab ➤ Palettes panel ➤ Properties.
2Select the object.
3In the Properties palette, under the Topo group, view the topology
properties.
For example, if you choose a link in a network topology, you can see the
type object you selected, information about the start and end nodes, flow
direction, direct resistance, and reverse resistance.
914 | Chapter 6 Creating and Editing Data
4To view the properties of another object, select it in the map.
Quick Reference
ADEEDITDATA
Edits attached object data
Modify menu ➤ Edit Object Data
Menu
Edit Object Data
Icon
ADEEDITDATACommand Line
Edit Object Data dialog boxDialog Box
PROPERTIES
Displays the Properties palette, which allows you to edit the properties of
objects
Analyze ➤ Properties
Menu
Properties
Icon
PROPERTIESCommand Line
Select object. Right-click in drawing area ➤ Properties
Task Pane
Viewing Topology Statistics
You can view information about a topology, including:
■Basic Information — name, description, and type (node, network, or
polygon).
■Extents — coordinates of the lower-left corner and upper-right corner of
the bounding rectangle for the topology.
■Object Counts — number of nodes, links, and polygons in the topology.
■Details — about area, perimeter, and length, including totals, averages,
minimum values, maximum values, variance, and deviation. These apply
to network and polygon topologies only.
Creating, Editing, and Managing Topologies | 915

Variance is the average of the squares of any given area, perimeter, or
length minus the square of the average. Deviation is the square root of
variance.
NOTE This functionality is for drawing objects only. There is no equivalent for
geospatial feature data.
See also:
■Overview of Creating Topologies (page 822)
■Loading or Unloading Topologies (page 906)
■Viewing Topology Data (page 913)
NOTE This procedure is for drawing objects only. There is no equivalent for
geospatial feature data.
To view topology statistics
1In Map Explorer, right-click the topology name ➤ Statistics.
2Review statistics in the Topology Statistics dialog box (page 2011).
3Click OK.
Quick Reference
MAPTOPOSTATS
Displays detailed information about a topology
Click Map ➤ Topology ➤ Administration ➤ Statistics.
Menu
MAPTOPOSTATSCommand Line
In Map Explorer, right-click a topology ➤ Statistics
Task Pane
Topology Statistics dialog boxDialog Box
Saving Topology to Source Drawings
You can save the topology in the current drawing or save it back to the attached
source drawings.
916 | Chapter 6 Creating and Editing Data
NOTE This functionality is for drawing objects only. There is no equivalent for
geospatial feature data.
If you retrieved data from source drawings, you can save back the topology
information to the source drawings, and also save the current drawing. Future
work with the topology should be done in the current drawing with the source
drawings active and attached. This method ensures that complete and correct
object data associated with the topology is available.
See also:
■Loading or Unloading Topologies (page 906)
■Adding an Object to the Save Set (page 750)
■Saving New Objects to Attached Drawings (page 754)
■Saving Objects to the Current Drawing (page 756)
NOTE This procedure is for drawing objects only. There is no equivalent for
geospatial feature data.
To save topology to source drawings
1Click Home tab ➤ Data panel ➤ ➤ Add To Save Set.
2Use any selection method to add the topology objects to the save set.
3Click Home tab ➤ Data panel ➤ ➤ Save To Source.
4In the Save Objects to Source Drawings dialog box (page 1887), under What
To Save, make sure Save Queried Objects is selected.
If you created new node or centroid objects, or if you added objects to a
topology, also select Save Newly Created Objects.
5If you are saving new objects, select a save order.
6Click OK.
Quick Reference
ADESAVEOBJS
Creating, Editing, and Managing Topologies | 917
Saves objects in the save set back to source drawings
In the Classic workspace, click File menu ➤ Save
Source Drawing Save Set
Menu
Save to Source Drawings
Icon
ADESAVEOBJSCommand Line
Save Objects to Source Drawings dialog boxDialog Box
ADESELOBJS
Creates a set of objects to be saved to source drawings
File menu ➤ Drawing Save Set Options ➤ Add Items
To Save Set
Menu
Add Objects to Save Set
Icon
ADESELOBJSCommand Line
ADESELOBJS (Select Objects for Save Back command)Dialog Box
Correcting or Completing a Topology
If parts of the topology are incomplete (not closed or only part of a polygon),
they are marked and excluded from editing. Two examples of incomplete
topologies created by queries are shown in the following illustration. The
outer polygons in the grid are incomplete because their outside links are parts
of polygons not included in the query.
NOTE This functionality is for drawing objects only. There is no equivalent for
geospatial feature data.
918 | Chapter 6 Creating and Editing Data
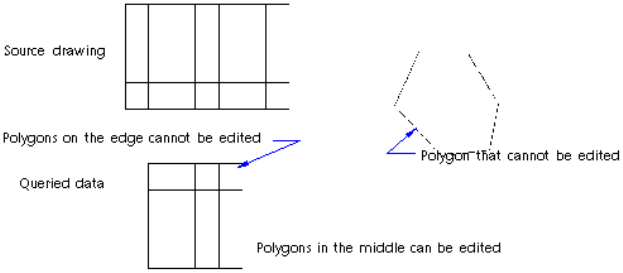
If you use a location query to retrieve polygons, make sure that you use a
Crossing window. If you are using data that is shared with other users, be sure
that you load the topology to ensure that you are using current data.
Completing a Topology
When you complete a topology, AutoCAD Map 3D looks at the objects and
object data in a drawing, and attempts to complete a network or polygon
topology by retrieving further drawing objects, such as links and centroids
referenced by the topology object data tables. Complex polygons, with one
or more islands, must be fully represented, and all internal islands referenced
by a polygon must be present for the option to work.
This option completes dangling edges in a network topology, and all
incomplete areas in polygon topologies; however, it might fill islands as well.
Auditing and Recreating a Topology
When you audit a topology, AutoCAD Map 3D checks that a topology is
complete and contains no errors. Any errors found are marked but are not
fixed. Errors in a node topology are not marked.
To reestablish a topology that was edited with nontopology editing commands
such as STRETCH and PEDIT, you recreate the topology; however, topology
data might be lost. You can only recreate a topology in the current drawing;
to recreate topology in an attached drawing, use a query to retrieve the
geometry first. Load the topology before using recreate.
To modify the geometry of a topology (the nodes, links, or polygons), use the
topology editing tools explained in Editing Topologies (page 851).
To create closed polylines for a non-AutoCAD Map 3D user, click Create tab
➤ Topology panel ➤ Create Closed Polylines (page 897). This also works
Creating, Editing, and Managing Topologies | 919
when you are exporting data to an external file format that does not support
topologies.
See also:
■Overview of Analyzing Drawing Topologies (page 1319)
■Querying a Topology (page 1348)
■Creating a Network Topology (page 829)
■Editing a Partial Topology (page 893)
■Sliver Polygons (page 841)
NOTE This procedure is for drawing objects only. There is no equivalent for
geospatial feature data.
To audit, recreate, or complete a topology
➤ In Map Explorer, right-click the topology name. Click an option from
the Administration submenu.
To test the integrity of a network topology
1Click Analyze tab ➤ Drawing Object panel ➤ Network Analysis.
2Select the network the topology to test.
3In the Network Topology Analysis - Select Method dialog box (page 1983),
click Flood Trace (page 1334). Click Next.
4Select select a starting point for the analysis. Click Next.
5Set the Maximum Resistance to a value so that all links will be flooded.
Click Next.
6Select Highlight. Choose a color that is different from the color of the
links.
7Click Finish.
If some links are not flooded, the topology may be incorrect. Use the topology
editing tools (page 852) to correct the topology.
920 | Chapter 6 Creating and Editing Data

Quick Reference
MAPTOPOAUDIT
Checks that a topology is complete and contains no errors
Click Map ➤ Topology ➤ Administration ➤ Audit.
Menu
MAPTOPOAUDITCommand Line
In Map Explorer, right-click a
topology ➤ Administration ➤ Audit
Task Pane
MAPTOPOCOMP
Completes a network or polygon topology
Click Map ➤ Topology ➤ Administration ➤ Complete.
Menu
Complete Topology
Icon
MAPTOPOCOMPCommand Line
In Map Explorer, right-click a
topology ➤ Administration ➤ Complete
Task Pane
MAPTOPORECR
Reestablishes a topology that was edited with nontopology editing commands
such as STRETCH, PEDIT, and MOVE
Click Map ➤ Topology ➤ Administration ➤ Recreate.
Menu
Recreate Topology
Icon
MAPTOPORECRCommand Line
In Map Explorer, right-click a
topology ➤ Administration ➤ Recreate
Task Pane
Topology Selection dialog boxDialog Box
Creating, Editing, and Managing Topologies | 921
Saving and Loading Settings Using Profiles
You can save your topology overlay analysis or network analysis (path trace,
best route analysis, or flood trace) settings in a profile and use them again
later. This can save time if you plan to use the same settings more than once.
Profiles are also useful when you automate topology analysis with scripts.
Topology profiles are saved as *.tpf files.
You can edit topology profiles in AutoCAD Map 3D and then save your
changes, choosing either to replace an existing profile or save it as a new
profile.
NOTE You cannot use profiles to save settings for creating topologies, buffering
topologies, or dissolving topologies. Topology profiles can be used to save topology
overlay analysis or network topology analysis (path trace, best route analysis, or
flood trace) settings only.
NOTE This functionality is for drawing objects only. There is no equivalent for
geospatial feature data.
WARNING Do not edit topology profiles outside of AutoCAD Map 3D. Doing so
may produce unexpected results.
See also:
■Performing a Shortest Path Trace (page 1324)
■Performing a Best Route Analysis (page 1328)
■Performing a Flood Trace (page 1333)
■Overlaying Two Topologies (page 1336)
NOTE This procedure is for drawing objects only. There is no equivalent for
geospatial feature data.
To save topology analysis settings in a profile
1Do one of the following:
■Click Analyze tab ➤ Drawing Object panel ➤ Object Overlay.
922 | Chapter 6 Creating and Editing Data

■Click Analyze tab ➤ Drawing Object panel ➤ Network Analysis.
2Specify the settings to save. For more information, see Analyzing Drawing
Topologies (page 1318).
3Click Save.
4In the Save Topology Profile dialog box, enter a name for the profile.
Click Save.
To load an existing topology profile
1In any of the Topology Overlay Analysis or Network Topology Analysis
dialog boxes, click Load.
2In the Select Topology Profile dialog box, select the profile to load.
Topology profiles are saved as *.tpf files.
3Click Open.
The settings from the selected profile become current.
To rename or delete profiles
■Right-click the profile in the Select Topology Profile or Save Topology
Profile dialog box. Click Rename or Delete.
Quick Reference
MAPANOVERLAY
Overlays one topology with another, and creates a new topology
Click Map ➤ Topology ➤ Overlay.
Menu
Overlay Topology
Icon
MAPANOVERLAYCommand Line
In Map Explorer, right-click a
topology ➤ Analysis ➤ Overlay
Task Pane
Topology Overlay Analysis - Analysis Type dialog boxDialog Box
Creating, Editing, and Managing Topologies | 923

MAPANTOPONET
Traces through a network topology (shortest path, best route, or flood trace)
Click Map ➤ Topology ➤ Network Analysis.
Menu
Network Analyze
Icon
MAPANTOPONETCommand Line
In Map Explorer, right-click a network
topology ➤ Analysis ➤ Network Analysis
Task Pane
Network Topology Analysis - Select Method dialog
box
Dialog Box
Renaming Topologies and Changing Their Descriptions
You can change the name, description, or both of a complete, loaded topology.
When you rename a topology, AutoCAD Map 3D renames the object data
table containing the topology relationship data.
NOTE This functionality is for drawing objects only. There is no equivalent for
geospatial feature data.
Before you rename a topology or change its description, do the following:
■Attach all source drawings that are referenced by the topology. If the source
drawings are not attached, you could corrupt your data set.
■Load the topology from the current drawing.
■To rename a topology or change its description without creating a backup
of an attached drawing, disable the Create Backup File Of Source Drawing
option of the Save Back tab of the AutoCAD Map Options dialog box.
NOTE You cannot undo this operation using the UNDO command.
See also:
■Loading or Unloading Topologies (page 906)
■Overview of Attaching Drawings (page 154)
■Setting Save Back Options (page 763)
924 | Chapter 6 Creating and Editing Data

NOTE This procedure is for drawing objects only. There is no equivalent for
geospatial feature data.
To change the name, description, or both of a topology
1In Map Explorer, right-click the topology name ➤ Administration ➤
Rename.
You can only rename topologies that are loaded and completely
represented.
2In the Rename Topology dialog box (page 1988), edit the name or
description. Click OK.
Names can contain letters, numbers, and the underscore and hyphen
characters. Names cannot contain spaces.
Quick Reference
MAPTOPOREN
Changes the name and description of a topology
Click Map ➤ Topology ➤ Administration ➤ Rename.
Menu
MAPTOPORENCommand Line
In Map Explorer, right-click a
topology ➤ Administration ➤ Rename
Task Pane
Rename Topology dialog boxDialog Box
Deleting Topologies
When you delete a topology, the topology relationship data (object data) is
deleted from objects referenced by the selected topology. You can choose to
delete the referenced objects as well.
NOTE This functionality is for drawing objects only. There is no equivalent for
geospatial feature data.
Load a topology and verify that it is completely represented before deleting
it. This ensures that all pieces of the topology are deleted, including pieces in
attached source drawings. If you delete an incomplete topology, the corrupt
topology still exists in the source drawings that were not attached.
Creating, Editing, and Managing Topologies | 925

See also:
■Loading or Unloading Topologies (page 906)
■Overview of Creating Topologies (page 822)
NOTE This procedure is for drawing objects only. There is no equivalent for
geospatial feature data.
To delete a topology
1In Map Explorer, right-click the topology name ➤ Administration ➤
Delete.
NOTE Load a topology and verify that it is completely represented before
deleting it.
2In the Delete Topology dialog box (page 1971), select Delete Geometry to
delete the referenced objects from the current drawing. The topology
relationship data is automatically deleted when you delete a topology.
3Click OK to delete the topology.
Quick Reference
MAPTOPODEL
Removes topology data from objects and optionally deletes the objects
Click Map ➤ Topology ➤ Administration ➤ Delete.
Menu
MAPTOPODELCommand Line
In Map Explorer, right-click a
topology ➤ Administration ➤ Delete
Task Pane
Topology Selection dialog boxDialog Box
Using Map Editing Tools
You can use the AutoCAD Map 3D editing tools to edit your maps and spatial
data. For information about editing objects and design data, see the AutoCAD
Help.
926 | Chapter 6 Creating and Editing Data
To use Map editing tools
■To use the AutoCAD Map 3D editing tools (page 928)
■To move, rotate, or scale an object (page 931)
■To rubber sheet two maps (page 935)
■To define text location (page 937)
■To fill a closed polyline with a solid-looking hatch (page 939)
■To break objects at a boundary (page 941)
■To save the data back to the source drawings after a boundary break (page
942)
■To create an enlarged map section (page 943)
■To trim objects inside a boundary (page 945)
■To use grips (page 947)
■To create centroids for polygons and closed polylines (page 950)
■To match map edges (page 951)
■To save the edited objects back to the source drawings (page 952)
■To digitize points using coordinates (page 953)
Overview of Using the Map Editing Tools
AutoCAD Map 3D provides special editing tools for editing maps and spatial
data, as well as AutoCAD editing tools for editing drawing objects and design
data.
Examples: Stretching a new subdivision map into a preexisting parcel map
and aligning the two maps geographically, breaking a large city map into three
tiled sections, or creating a seamless join across two or more maps.
WARNING If you use these methods on a topology, they can make it invalid and
impossible to re-create. Use topology editing commands (page 851) instead.
NOTE These commands work on drawing objects only. For information about
editing geospatial feature data, see Using Feature Editing Commands (page 704)
and Using AutoCAD Commands on Features (page 713). For information about
AutoCAD commands, see the AutoCAD Help.
Tell me more
Video
■Show me how to georeference parcels
by rubbersheeting.
Using Map Editing Tools | 927
Procedure
■To use Map editing tools (page 927)
Workflow
■Find and Edit Objects in Attached
Drawings
GIS Skill
■Georeference parcels by rubbersheeting.
Related topics
■Overview of Bringing in Drawing Data
From DWG Files (page 351)
■Editing Topologies (page 851)
NOTE These commands work on drawing objects only. For information about
editing geospatial feature data, see Using Feature Editing Commands (page 704)
and Using AutoCAD Commands on Features (page 713). For information about
AutoCAD commands, see the AutoCAD Help.
To use the AutoCAD Map 3D editing tools
1Open the drawing containing the objects you want to edit or query the
objects into the current drawing.
2Use one or more of the following AutoCAD Map 3D editing commands:
■Transform (page 931)
■Rubber Sheet (page 935)
■Define Text Location (page 937)
■Fill Closed Polylines (page 939)
■Fill Polygons (page 963)
■Boundary Break (page 941)
■Create an Enlarged Map Section (page 942)
■Boundary Trim (page 945)
■Manually Edit (page 947)
■Creating Centroids for Polylines (page 948)
928 | Chapter 6 Creating and Editing Data

■Match Map Edges (page 951)
Notes and Warnings
■To perform general and object-specific editing operations, use the AutoCAD
editing commands. For more information, see the AutoCAD Help.
■Do not use any of the methods described above to edit topologies; you
might not be able to recreate the topology. Use the topology editing
commands (page 851) instead.
Quick Reference
ADEFILLPOLYG
Fills a selected polygon
ADEFILLPOLYGCommand Line
ADEFILLPOLYG (Fill Closed Polyline command)Dialog Box
ADERSHEET
Performs rubber sheeting on selected objects
Modify menu ➤ Rubber Sheet
Menu
ADERSHEETCommand Line
ADERSHEET (Rubber Sheet command)Dialog Box
ADETEXTLOC
Specifies a new label point for an object
Create menu ➤ Map Labelpoint Location
Menu
Map Labelpoint Location
Icon
ADETEXTLOCCommand Line
ADETEXTLOC (Map Labelpoint Location command)Dialog Box
ADETRANSFORM
Using Map Editing Tools | 929

Moves, scales, and rotates a set of objects
Modify menu ➤ Transform
Menu
ADETRANSFORMCommand Line
ADETRANSFORM (Transform command)Dialog Box
MAPBREAK
Breaks objects along a selected or defined boundary
Modify menu ➤ Boundary Break
Menu
Boundary Break
Icon
MAPBREAKCommand Line
Break Objects at Boundary dialog boxDialog Box
MAPCREATECENTROIDS
Creates a centroid in a polygon and moves data to the centroid
Create menu ➤ Centroids
Menu
Create Centroids
Icon
MAPCREATECENTROIDSCommand Line
Create Centroids dialog boxDialog Box
MAPTRIM
Trims objects to a set of edges
Modify menu ➤ Boundary Trim
Menu
Boundary Trim
Icon
MAPTRIMCommand Line
Trim Objects At Boundary dialog boxDialog Box
930 | Chapter 6 Creating and Editing Data
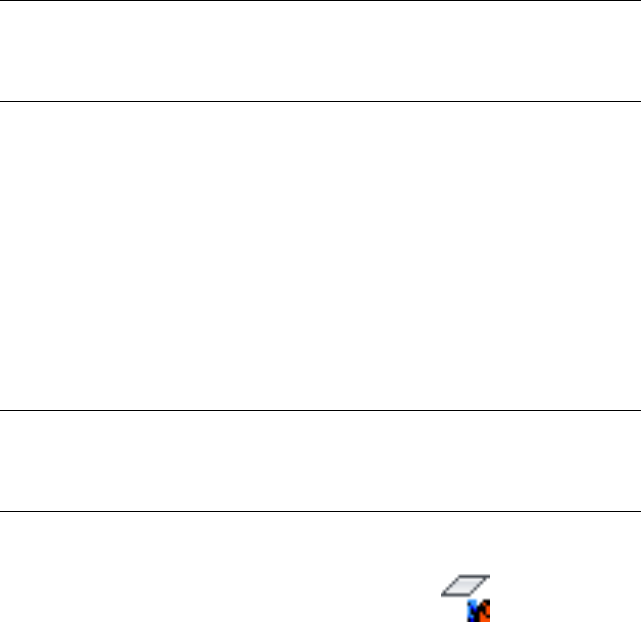
Moving, Rotating, and Scaling an Object
You can simultaneously move, rotate, and scale a group of objects using the
Transform editing tool.
NOTE This command works on drawing objects only. For information about
editing geospatial feature data, see Using Feature Editing Commands (page 704)
and Using AutoCAD Commands on Features (page 713). For information about
AutoCAD commands, see the AutoCAD Help.
Differences From Simple Transformation Settings
The Transform editing tool works very differently from the Simple
Transformation settings (page 167) in the Drawing Settings dialog box (page
1923). The Simple Transformation settings temporarily adjust the position of
objects as they are retrieved during the query process. AutoCAD Map 3D
reverses these transformations during save back. The Transform editing tool
permanently scales, moves, and rotates objects within the current drawing.
See also:
■ADETRANSFORM (Transform command) (page 1649)
NOTE This command works on drawing objects only. For information about
editing geospatial feature data, see Using Feature Editing Commands (page 704)
and Using AutoCAD Commands on Features (page 713). For information about
AutoCAD commands, see the AutoCAD Help.
To move, rotate, or scale an object
1Click Tools tab ➤ Map Edit panel ➤ Transform.
2At the ADETRANSFORM (Transform command) (page 1649) prompt, specify
whether you want to select objects or use all objects on a specified layer.
3Select the objects you want to transform, or select a layer.
4Define the base point.
The rotation and scaling occur around this point.
5Specify a base rotation and scale, separated by a comma. For a simple
transformation, set the base rotation to 0 and the base scale to 1.
6Define a new zero point.
Using Map Editing Tools | 931

Selected objects are offset by the difference between the original base
point and the new point.
7Define a new rotation and scale, separated by a comma.
Selected objects are rotated the difference between the new rotation and
the old rotation. They are scaled based on the ratio of the new scale to
the old scale.
Quick Reference
ADETRANSFORM
Moves, scales, and rotates a set of objects
Modify menu ➤ Transform
Menu
ADETRANSFORMCommand Line
ADETRANSFORM (Transform command)Dialog Box
Rubber Sheeting Two Maps
Rubber sheeting is a nonuniform adjustment of a data set based on the
movement of known control points to new locations. For example, data
collected by aerial survey may be inaccurate because of flight alignment and
camera inaccuracies. By comparing this data with accurate ground survey data,
the aerial data can be stretched or rubber sheeted over the accurate data using
control points and monuments common to both data sets.
NOTE This command works on drawing objects only. For information about
editing geospatial feature data, see Using Feature Editing Commands (page 704)
and Using AutoCAD Commands on Features (page 713). For information about
AutoCAD commands, see the AutoCAD Help.
Use rubber sheeting when you want two or more different data sets from
different sources to align geographically: for example, when stretching a new
subdivision map into a preexisting parcel map.
932 | Chapter 6 Creating and Editing Data
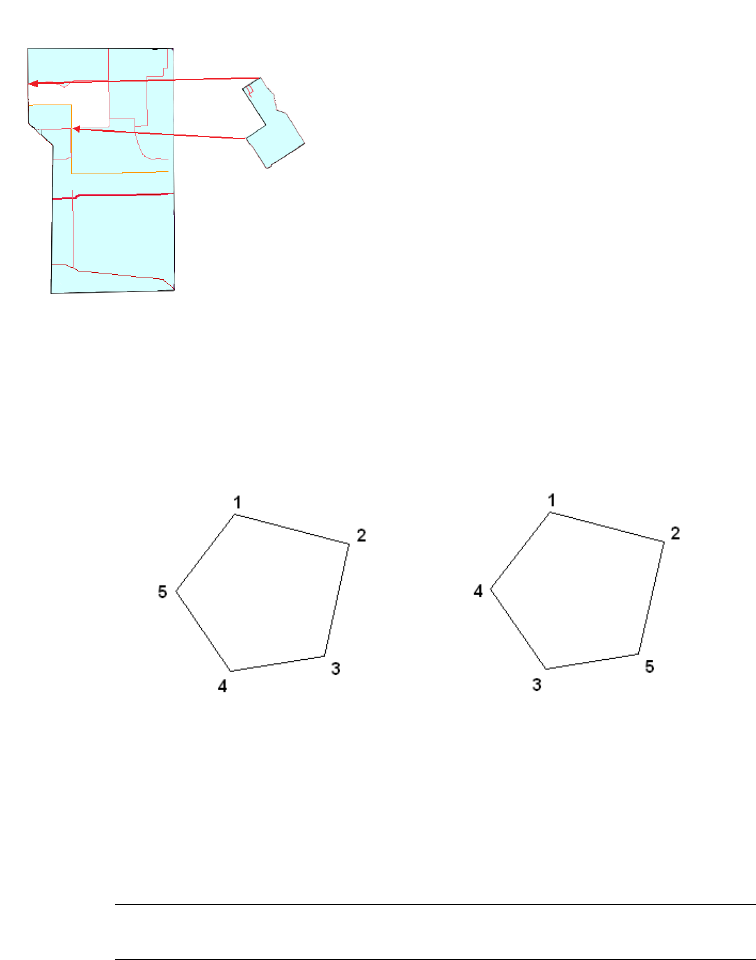
The reference map is correct, but the map with new details is severely distorted. By
running the Rubber Sheeting command and selecting common control points, the
two maps can be correctly aligned.
When selecting points for rubber sheeting, select points in order around the
perimeter of the object or region to be rubber sheeted.
incorrect
correct
The selected points are treated as the vertices of a polygon, so you will get
better results if you select the points sequentially around the perimeter.
Objects that have a given shape, such as circles, arcs, and ellipses, retain their
original shape.
WARNING Use rubber sheeting only when absolutely necessary because it can
severely compromise the accuracy of your data.
Using Map Editing Tools | 933
Because rubber sheeting is not a linear transformation, it is difficult to reverse
the effects of the transformation and return a drawing to its original state.
You should save your drawing before you perform a rubber sheeting operation.
Changing Scale
Do not rubber sheet two maps drawn at different scales. If you do, the
command matches objects and changes the original scaling of text and blocks
to match the new scaling, which can change data significantly. You should
use rubber sheeting as a last resort after exhausting other methods of object
editing and coordinate adjustment.
If you are working with two maps that have different scales and coordinate
systems, first decide which coordinate system to use for the reference map.
Then set the coordinate systems for the current and source maps.
Tell me more
Video
■Show me how to georeference parcels
by rubbersheeting.
Procedure
■To rubber sheet two maps (page 935)
Workflow
■Find and Edit Objects in Attached
Drawings
GIS Skill
■Georeference parcels by rubbersheeting.
Related topics
■ADERSHEET (Rubber Sheet command)
(page 1648)
■Overview of Coordinate Systems (page
143)
Rubber sheet the less accurate data to fit the more accurate data. Perform a
query to bring in the source drawing and apply rubber sheeting to the two
maps. If you have set up a system of control points, or monuments, use this
data as the reference to which you rubber sheet other maps.
934 | Chapter 6 Creating and Editing Data
NOTE This command works on drawing objects only. For information about
editing geospatial feature data, see Using Feature Editing Commands (page 704)
and Using AutoCAD Commands on Features (page 713). For information about
AutoCAD commands, see the AutoCAD Help.
To rubber sheet two maps
1Click Tools tab ➤ Map Edit panel ➤ Rubber Sheet.
2At the ADERSHEET (Rubber Sheet command) (page 1648) prompt, for Base
point 1, specify the first common feature on map 2, the warped map.
3When prompted on the command line for Reference point 1, specify the
corresponding feature on map 1, the accurate map.
4Follow the prompts on the command line and continue specifying base
and reference points. When you are done, press Enter.
The order in which you select the points and the spread of the points
will affect the results. For complex curved figures, the more vertices you
enter, the more accurate the proportionate stretching.
5Select the objects to rubber sheet. Enter a to select objects by area, or s
to select objects individually. If you queried all objects in the warped
map onto their own layer, select that layer.
6Press Enter to complete the process.
Quick Reference
ADERSHEET
Performs rubber sheeting on selected objects
Modify menu ➤ Rubber Sheet
Menu
ADERSHEETCommand Line
ADERSHEET (Rubber Sheet command)Dialog Box
Using Map Editing Tools | 935
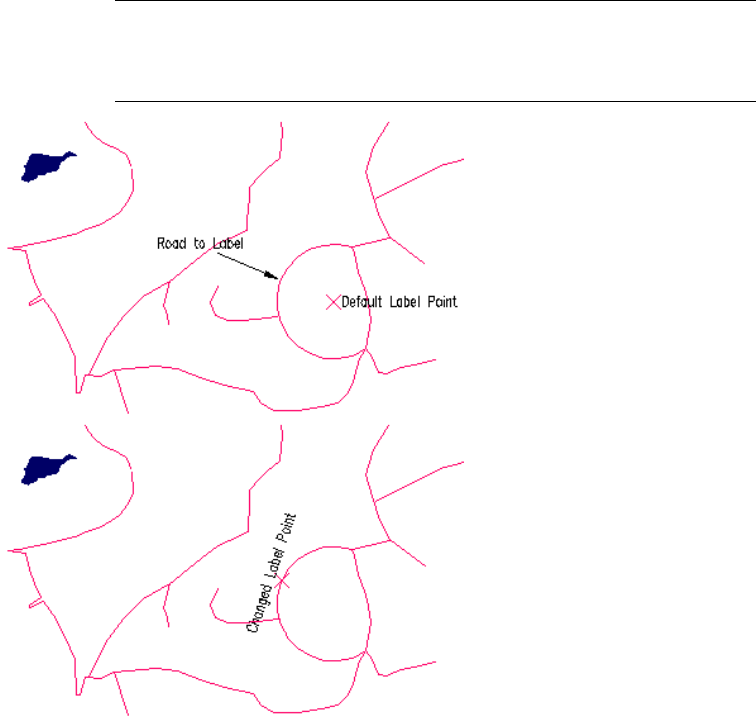
Defining the Text Insertion Point
You can add text to objects using the Alter Properties feature in the Define
Query dialog box (page 1838). By default, AutoCAD Map 3D positions the text
at the centroid of the object.
NOTE This command works on drawing objects only. For information about
editing geospatial feature data, see Using Feature Editing Commands (page 704)
and Using AutoCAD Commands on Features (page 713). For information about
AutoCAD commands, see the AutoCAD Help.
The text position relative to the object is called the label point. You can redefine
the label point using the Map Labelpoint Location option.
To use the label point, choose the .LABELPT dot variable in the Define Text
dialog box (page 1846) when you create the Property Alteration definition in
the Define Query dialog box (page 1838).
936 | Chapter 6 Creating and Editing Data
See also:
■Adding Text to Queried Drawing Objects (page 1276)
■Dot Variables (page 1546)
NOTE This command works on drawing objects only. For information about
editing geospatial feature data, see Using Feature Editing Commands (page 704)
and Using AutoCAD Commands on Features (page 713). For information about
AutoCAD commands, see the AutoCAD Help.
The label point of an object specifies the starting point for text added during
a query property alteration. To define the label point for an object, do the
following:
To define text location
1Click Annotate tab ➤ Map Annotation panel ➤ Define Text Location.
2Select the object.
3Click the place on the object where you want the label point to be located.
To use this label point as the text insertion point during a property alteration
(page 1278), choose LABELPT as the insert point.
Quick Reference
ADETEXTLOC
Specifies a new label point for an object
Create menu ➤ Map Labelpoint Location
Menu
Map Labelpoint Location
Icon
ADETEXTLOCCommand Line
ADETEXTLOC (Map Labelpoint Location command)Dialog Box
Using Map Editing Tools | 937
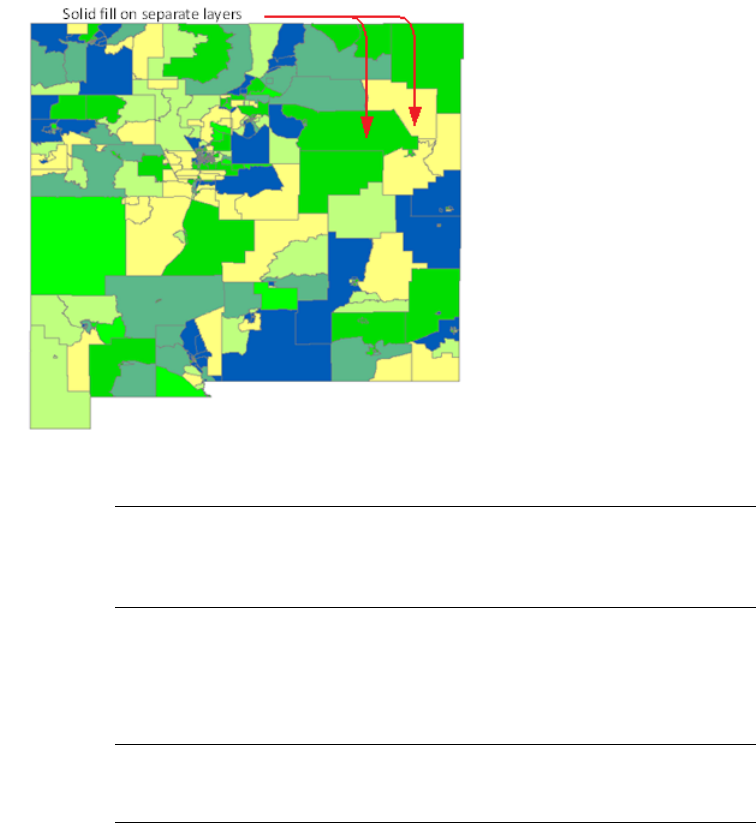
Filling a Closed Polyline
You can fill closed polylines in your drawing with solid fills and hatch patterns.
For example, you can use one color to show counties with a population over
10,000 and another color to show counties under 10,000.
Filling closed polylines
NOTE This command works on drawing objects only. For information about
editing geospatial feature data, see Using Feature Editing Commands (page 704)
and Using AutoCAD Commands on Features (page 713). For information about
AutoCAD commands, see the AutoCAD Help.
The ADEFILLPOLYG command always creates a hatch object with the solid
fill hatch style.
You can also use the BHATCH command to fill closed polylines. Use the
MPFILL command to fill polygon objects.
NOTE If you move closed polylines that you filled using ADEFILLPOLYG, you must
move the hatch object as well. AutoCAD Map 3D considers the closed polyline
and the hatch object as separate objects.
938 | Chapter 6 Creating and Editing Data

To fill closed polylines automatically with hatch patterns or solid fills when
performing queries, use the Alter Properties feature in the Define Query dialog
box (page 1838).
If you set the Create Associative Hatch Objects option on the Query tab of
the AutoCAD Map Options dialog box (page 1908), AutoCAD Map 3D creates
associative hatch objects for hatch objects created by the ADEFILLPOLYG
command, the ADEQUERY command (using Alter Properties), and the
MAPTHEMATIC command (using a fill).
See also:
■Using Associative Hatch (page 246)
■Altering the Properties of Queried Drawing Objects (page 1259)
■Modifying Polygon Objects (page 962)
■Altering the Properties of Queried Drawing Objects (page 1259)
NOTE This command works on drawing objects only. For information about
editing geospatial feature data, see Using Feature Editing Commands (page 704)
and Using AutoCAD Commands on Features (page 713). For information about
AutoCAD commands, see the AutoCAD Help.
To fill a closed polyline with a solid-looking hatch
1On the command line, enter adefillpolyg.
2At the ADEFILLPOLYG (Fill Closed Polyline command) (page 1647) prompt,
specify whether you want to select objects or fill all objects on a specified
layer.
3Select the objects or specify a layer.
4Specify the color for the fill.
Quick Reference
ADEFILLPOLYG
Fills a selected polygon
ADEFILLPOLYGCommand Line
ADEFILLPOLYG (Fill Closed Polyline command)Dialog Box
Using Map Editing Tools | 939
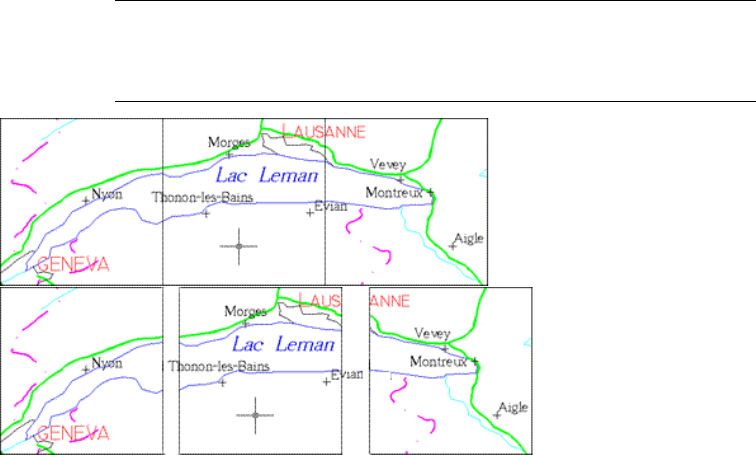
Breaking Objects at a Closed Boundary
Using the Boundary Break option, you can break any objects that cross a given
line. This capability lets you save maps back to source drawings with clean
edges or plot maps without overlapping borders. It functions like the AutoCAD
BREAK command for a selected set of objects and a polyline boundary.
NOTE This command works on drawing objects only. For information about
editing geospatial feature data, see Using Feature Editing Commands (page 704)
and Using AutoCAD Commands on Features (page 713). For information about
AutoCAD commands, see the AutoCAD Help.
The text Thonon-les-Bains remains in the central map because the text has a
MiddleCenter justification and insertion point.
The Boundary Break option
■Breaks vectors and edge objects with start and end points that straddle a
cutting edge.
■Does not break objects such as blocks, text, hatch patterns, and other
objects with a single insertion point that do not form edges; the insertion
point determines which map contains the object.
Specifying the Boundary Edge
When breaking objects, you can draw a boundary, choose one or more existing
objects that form a closed boundary, or use the save back extents of the active
940 | Chapter 6 Creating and Editing Data
source drawings as the boundary. Using save back extents combines the extents
of all active source drawings as the boundary.
The edges of the boundary do not have to form a rectilinear shape. If you are
breaking using lines of latitude and longitude, the edges form a trapezoidal
shape.
Retaining Object Data
You can also choose to retain existing attached object data and links to external
database records on the objects created by the break.
Once the objects are broken, you can save the data back to the source drawings.
See also:
■Editing and Saving Objects in Attached Drawings (page 737)
■Defining the Text Insertion Point (page 936)
■Overview of Polygons (page 955)
NOTE This command works on drawing objects only. For information about
editing geospatial feature data, see Using Feature Editing Commands (page 704)
and Using AutoCAD Commands on Features (page 713). For information about
AutoCAD commands, see the AutoCAD Help.
To break objects at a boundary
1Open a drawing and attach the maps you want.
2Define and execute a query to retrieve the objects to break.
3Click Tools tab ➤ Map Edit panel ➤ Boundary Break.
4In the Break Objects at Boundary dialog box (page 1666), under Boundaries,
choose how to specify the boundaries for breaking:
■Use Save Back Extents Of Active Source Drawings — Uses the combined
extents of all active source drawings as the boundary.
■Select Boundaries — Allows you to choose existing objects in the
current drawing. These objects need to form a closed area but do not
need to be single objects. Click Select and select the objects to use.
■Define Boundary — Allows you to draw a single closed boundary on
screen. Click Define and specify the boundary.
Using Map Editing Tools | 941
5Under Objects To Break, specify whether to select objects manually or
automatically, and whether to use only objects on selected layers.
6Under Break Method, specify whether to exclude topology objects, and
whether to retain object data on the objects.
7Click OK.
8In the Confirm Save Back dialog box, click Yes.
The objects are broken according to the location of the save back extents.
To save the data back to the source drawings after a boundary break
1Click Home tab ➤ Data panel ➤ ➤ Save To Source.
2Under What To Save, make sure that both Save Queried Objects and Save
Newly Created Object are selected.
3Under Save Order For Newly Created Objects, select Area. Click OK.
Quick Reference
MAPBREAK
Breaks objects along a selected or defined boundary
Modify menu ➤ Boundary Break
Menu
Boundary Break
Icon
MAPBREAKCommand Line
Break Objects at Boundary dialog boxDialog Box
Creating an Enlarged Map Section
You can use Boundary Break to show an enlargement of a selected area.
942 | Chapter 6 Creating and Editing Data
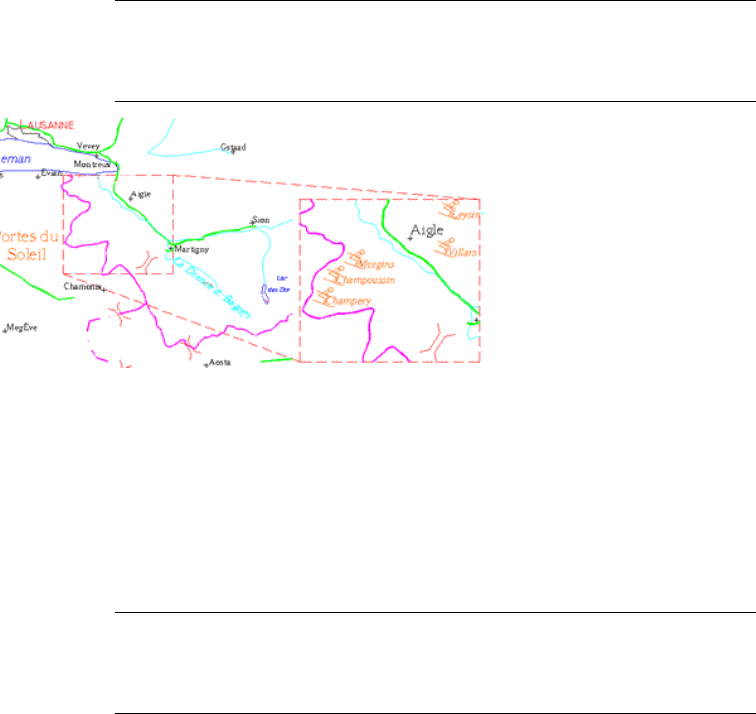
NOTE This command works on drawing objects only. For information about
editing geospatial feature data, see Using Feature Editing Commands (page 704)
and Using AutoCAD Commands on Features (page 713). For information about
AutoCAD commands, see the AutoCAD Help.
Use Boundary Break to isolate an area, then move and scale up the selected area. This
is useful for map inserts.
Adding an inset to a map communicates the focus of the map better.
See also:
■Breaking Objects at a Closed Boundary (page 940)
■Trimming Objects at a Boundary (page 944)
NOTE This command works on drawing objects only. For information about
editing geospatial feature data, see Using Feature Editing Commands (page 704)
and Using AutoCAD Commands on Features (page 713). For information about
AutoCAD commands, see the AutoCAD Help.
To create an enlarged map section
1Draw a rectangle around the area you want to enlarge.
2Break the boundaries (page 941) inside the rectangle.
3Copy objects from the rectangle to a new location.
4Rescale the objects to a larger size.
Using Map Editing Tools | 943
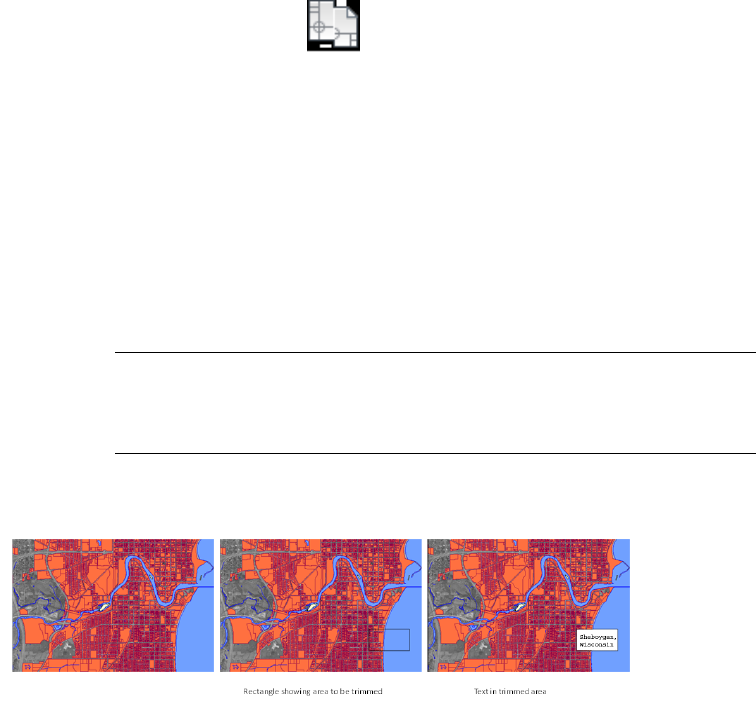
Quick Reference
MAPBREAK
Breaks objects along a selected or defined boundary
Modify menu ➤ Boundary Break
Menu
Boundary Break
Icon
MAPBREAKCommand Line
Break Objects at Boundary dialog boxDialog Box
Trimming Objects at a Boundary
Using the Boundary Trim command, you can specify a closed boundary as a
trimming edge for a selected set of objects. You can use this option to trim
objects inside or outside a boundary. Use Boundary Trim to quickly clear a
circular or rectilinear area in a complex map in order to insert a legend or
label.
NOTE This command works on drawing objects only. For information about
editing geospatial feature data, see Using Feature Editing Commands (page 704)
and Using AutoCAD Commands on Features (page 713). For information about
AutoCAD commands, see the AutoCAD Help.
You can use this command to enhance plotted maps. After trimming objects
inside an area, you can add text that will not be obscured.
You can use a boundary to trim all objects inside the boundary or outside the boundary.
944 | Chapter 6 Creating and Editing Data
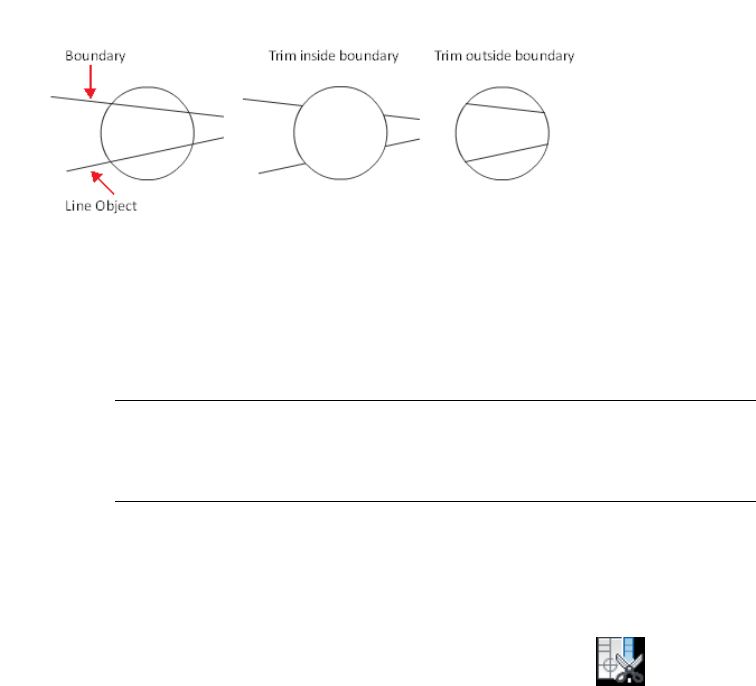
See also:
■Overview of Creating Topologies (page 822)
■Overview of Polygons (page 955)
NOTE This command works on drawing objects only. For information about
editing geospatial feature data, see Using Feature Editing Commands (page 704)
and Using AutoCAD Commands on Features (page 713). For information about
AutoCAD commands, see the AutoCAD Help.
To trim objects inside a boundary
1Open a drawing and attach the maps you want.
2Define and execute a query to retrieve the objects to trim.
3Click Tools tab ➤ Map Edit panel ➤ Boundary Trim.
4In the Trim Objects At Boundary dialog box (page 1672), under Boundary,
select how to specify the boundary:
■Reference Last Query Boundary — Use the boundary you used in the
last query.
■Select Boundary — Use an object in the current drawing as the
boundary. Click Select and select the object to use. The object needs
to form a closed area.
■Define Boundary — Use a boundary you define. Click Define and
specify the boundary.
Using Map Editing Tools | 945

5Under Objects To Trim, specify whether to select objects manually or
automatically, and whether to use only objects on selected layers.
6Under Trim Method, specify whether to trim inside or outside the
boundary. Specify whether to exclude topology objects, and whether to
retain object data on the objects.
If you select Retain Object Data, object data and external link data is
duplicated on each piece of a trimmed object. If data is not retained, it
remains attached only to the original location.
7Under Objects That Cannot Be Trimmed, specify what to do with text,
hatch patterns, and blocks that cross the boundary.
8Click OK.
9To save the trim with your topology, save your changes back to the source
drawings.
To save the trim results without modifying the original topology, save
the changes to a new drawing.
Quick Reference
MAPTRIM
Trims objects to a set of edges
Modify menu ➤ Boundary Trim
Menu
Boundary Trim
Icon
MAPTRIMCommand Line
Trim Objects At Boundary dialog boxDialog Box
Manually Editing Objects
Although the automatic AutoCAD Map 3D editing tools can correct many
problems, you may need to edit a drawing manually. Use commands such as
FILLET, TRIM, and EXTEND to correct situations like those shown in the
following illustration.
946 | Chapter 6 Creating and Editing Data
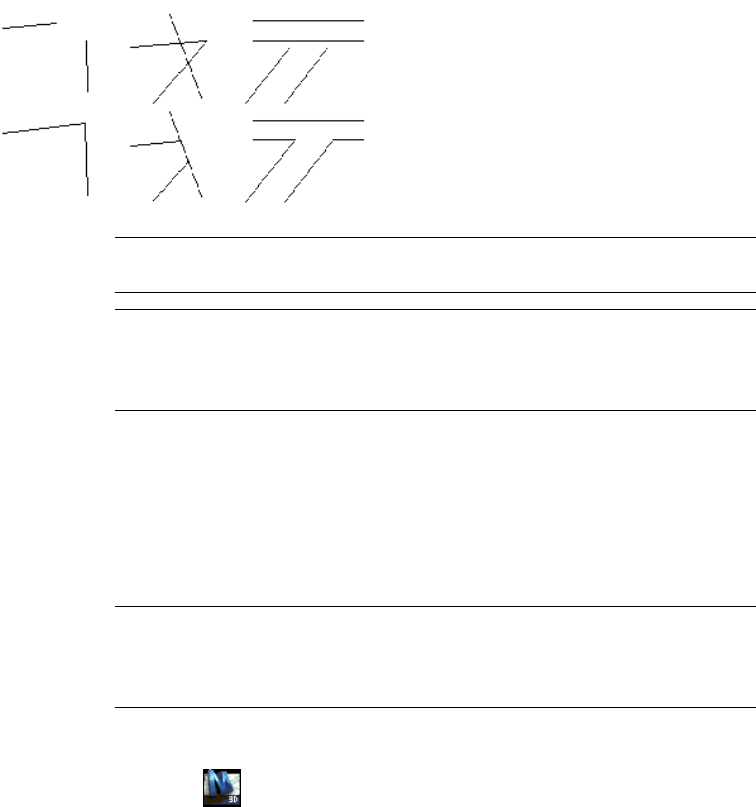
WARNING Using these editing commands to edit a topology can corrupt the
topology. Instead, use the Editing topologies (page 851) commands.
NOTE This command works on drawing objects only. For information about
editing geospatial feature data, see Using Feature Editing Commands (page 704)
and Using AutoCAD Commands on Features (page 713). For information about
AutoCAD commands, see the AutoCAD Help.
You can also use object grips to correct errors. Using grips, you can quickly
correct overlaps of coincident boundaries, such as county lines and roads or
geological boundaries and fault lines.
See also:
■Overview of Editing a Topology (page 852)
NOTE This command works on drawing objects only. For information about
editing geospatial feature data, see Using Feature Editing Commands (page 704)
and Using AutoCAD Commands on Features (page 713). For information about
AutoCAD commands, see the AutoCAD Help.
To use grips
1Click ➤ Options. Click the Selection tab.
2Make sure that Enable Grips is selected and click OK.
You can also edit the size and color of the grips. Once grips are enabled,
squares appear on objects when you select them without starting a
command. These squares are the object grips.
3Select an object so its grips appear.
4Select an object grip.
Using Map Editing Tools | 947

To select more than one grip, hold down the Shift key as you select each
grip.
5Select a new point. The grip you selected is relocated to the selected point,
stretching the rest of the objects associated with that grip.
As you move the cursor, it snaps or locks onto an object grip when it
moves into the square zone representing the grip. You can use this feature
instead of using an object snap such as Endpoint or Midpoint.
Quick Reference
OPTIONS
Customizes the AutoCAD settings
Setup menu ➤ AutoCAD Options
Menu
OPTIONSCommand Line
Right-click in the drawing area ➤ Options
Task Pane
Creating Centroids for Polylines
If you have polygon objects or closed polylines with data attached to them,
you can create centroids and move the data to the centroid.
NOTE This command works on drawing objects only. For information about
editing geospatial feature data, see Using Feature Editing Commands (page 704)
and Using AutoCAD Commands on Features (page 713). For information about
AutoCAD commands, see the AutoCAD Help.
This is useful in the following situations:
■After you import or digitize objects.
■Before using editing commands such as Drawing Cleanup, Boundary Break,
or Boundary Trim.
■When working with topology.
948 | Chapter 6 Creating and Editing Data
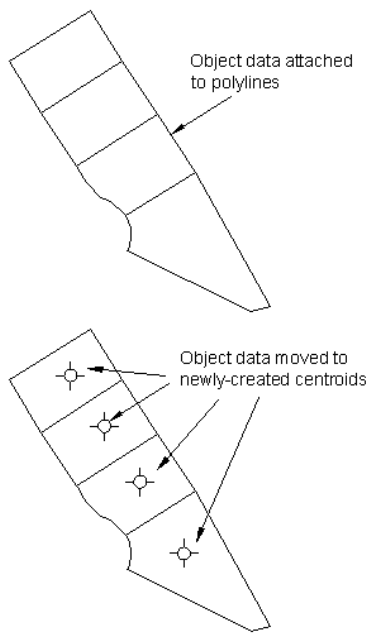
Object data attached to closed polylines (above) and object data moved to centroids
(below).
AutoCAD Map 3D checks that the lines do not intersect each other, and that
the area is greater than 0. It then creates a centroid inside each selected polygon
or closed polyline and moves any object data or SQL link data to the centroid.
For an object shaped like a figure eight, AutoCAD Map 3D creates one centroid.
Centroids are created with a Z value of 0.
See also:
■Creating a Polygon Topology (page 833)
■Creating Centroids for Polygons (page 885)
Using Map Editing Tools | 949
NOTE This command works on drawing objects only. For information about
editing geospatial feature data, see Using Feature Editing Commands (page 704)
and Using AutoCAD Commands on Features (page 713). For information about
AutoCAD commands, see the AutoCAD Help.
To create centroids for polygons and closed polylines
1Click Create tab ➤ Drawing Object panel ➤ Create Centroids.
2In the Create Centroids dialog box (page 1801), specify whether to create
centroids for all closed objects or only for selected closed objects. If only
for selected closed objects, select the polygons and closed polylines.
TIP Click the Quick Select tool to view and filter the object type as you select
objects.
3Specify the layer on which the centroids should be created.
4Specify the block to use for centroids, or use ACAD_POINT.
5Click OK.
Quick Reference
MAPCREATECENTROIDS
Creates a centroid in a polygon and moves data to the centroid
Create menu ➤ Centroids
Menu
Create Centroids
Icon
MAPCREATECENTROIDSCommand Line
Create Centroids dialog boxDialog Box
Matching Map Edges
Maps that are digitized at different times or that use different coordinate
systems can appear distorted at their edges. Edge matching creates a seamless
join across two or more maps.
950 | Chapter 6 Creating and Editing Data
NOTE This command works on drawing objects only. For information about
editing geospatial feature data, see Using Feature Editing Commands (page 704)
and Using AutoCAD Commands on Features (page 713). For information about
AutoCAD commands, see the AutoCAD Help.
Use the edge-matching process on one layer at a time. You might edge match
the roads on the two maps first.
You can avoid using edge matching by digitizing a complete map in one
session, rather than breaking the map into smaller sections. If you must digitize
a map in sections, allow a 3-5% overlap along the edges of a map tile and
digitize both linear and point features on each tile that are common to both
tiles of the map.
See also:
■Overview of Digitizing Maps (page 1073)
■Digitizing Points Using Coordinates (page 953)
NOTE This command works on drawing objects only. For information about
editing geospatial feature data, see Using Feature Editing Commands (page 704)
and Using AutoCAD Commands on Features (page 713). For information about
AutoCAD commands, see the AutoCAD Help.
To match map edges
1Open a drawing and attach the maps you want to match at edges.
2Define a query to retrieve the objects to match:
■Click Home tab ➤ Data panel ➤ Define Query.
■Define a location condition with a buffer fence option. When defining
the buffer fence, select the edge to match and specify a suitable buffer
fence width.
■You can also add a property condition to select objects on a specific
layer.
3Click Tools tab ➤ Map Edit panel ➤ Clean Up.
Using Map Editing Tools | 951

4On the Drawing Cleanup - Select Objects Page (page 1595), click Select All.
You can specify the layer(s) you want to use, for example, the layer
containing road data, and anchor objects as needed. Click Next.
5On the Select Actions Page (page 1588), in the Cleanup Actions list, click
Snap Clustered Nodes and then click Add.
6In the Selected Actions list, click Snap Clustered Nodes. Under Cleanup
Parameters, set Tolerance to a value just greater than the offset distance
between objects. You can type a value in the Tolerance box or click Pick
to specify the tolerance in the drawing.
7Under Options, choose Automatically. Click Next.
8In the Cleanup Methods Page, under Cleanup Method, select Modify
Original Objects.
9You can save your settings in a profile (page 781) to use again later.
10 Click Finish to start the drawing cleanup operation.
11 In the Confirm Save Back dialog box, click Yes.
The objects are now contiguous across the map edges. Repeat steps 4 -
11 for all other layers and objects in the edge matching part of the maps.
To save the edited objects back to the source drawings
1Click Home tab ➤ Data panel ➤ ➤ Save To Source.
2Under What To Save, make sure Save Queried Objects is selected. Click
OK.
All the objects are now matched at their edges.
Quick Reference
MAPCLEAN
Performs drawing cleanup operations
Modify menu ➤ Drawing Cleanup
Menu
Drawing Cleanup
Icon
952 | Chapter 6 Creating and Editing Data

MAPCLEANCommand Line
Drawing CleanupDialog Box
Digitizing Points Using Coordinates
You can digitize new points in existing maps with precision by using the Track
Coordinates feature to specify the exact coordinates of the points.
NOTE This command works on drawing objects only. For information about
editing geospatial feature data, see Using Feature Editing Commands (page 704)
and Using AutoCAD Commands on Features (page 713). For information about
AutoCAD commands, see the AutoCAD Help.
See also:
■Tracking Coordinates (page 1149)
■Matching Map Edges (page 950)
NOTE This command works on drawing objects only. For information about
editing geospatial feature data, see Using Feature Editing Commands (page 704)
and Using AutoCAD Commands on Features (page 713). For information about
AutoCAD commands, see the AutoCAD Help.
To digitize points using coordinates
1In Map Explorer, right-click the current drawing. Click Track Coordinates.
2In the Track Coordinates pane, click Select Coordinate System.
3In the Assign Global Coordinate System dialog box (page 1598), choose the
coordinate system.
4Click OK.
The Track Coordinates pane displays the code and description of the
coordinate system you chose.
5Start the command for which you want to enter coordinates.
6In the X and Y text boxes, type the coordinates of the point to digitize.
7Do one of the following:
■Click Digitize.
Using Map Editing Tools | 953
■Press Enter.
The appropriate coordinates are entered on the command line. You can
continue to enter coordinates.
Quick Reference
MAPTRACKCS
Tracks the coordinates of the cursor in any coordinate system
Analyze menu ➤ Track Coordinate Sytem.
Menu
Track Coordinates
Icon
MAPTRACKCSCommand Line
In Map Explorer, right-click Current Drawing ➤ Track
Coordinates
Task Pane
Working with Polygon Objects
A polygon is a closed area that stores information about its inner and outer
boundaries, and about other polygons nested or grouped with it. The polygon
object (called the mpolygon) allows accurate translation of data between
AutoCAD Map 3D and other GIS packages.
NOTE This functionality is for drawing objects only. For information about
polygonal geospatial feature data, see Overview of Editing Features (page 701)and
Creating New Polygon and MultiPolygon Features (page 689).
NOTE This procedure is for drawing objects only. For information about polygonal
geospatial feature data, see Overview of Editing Features (page 701)and Creating
New Polygon and MultiPolygon Features (page 689).
To work with polygon objects
■To work with polygons (page 957)
■To create a polygon object (page 960)
■To set the Fill property for polygon objects (page 961)
■To add boundaries (page 963)
954 | Chapter 6 Creating and Editing Data
■To delete boundaries (page 964)
■To move boundaries (page 964)
■To edit nodes on a boundary (page 965)
■To change the boundary type (page 965)
■To rebalance the polygon object (page 965)
■To edit the fill property for the polygon object (page 966)
■To specify a different color for the polygon fill and outline (page 967)
■To set the default fill pattern for polygons (page 967)
■To split a polygon object (page 969)
■To convert polylines to polygons (page 971)
■To convert a polygon topology to polygons (page 974)
■To create centroids for polygons and closed polylines (page 977)
■To change the default setting for importing polygons (page 978)
■To change the default fill for polygons (page 978)
■To change the display of polygon edges (page 979)
Overview of Polygons
A polygon is an object type with closed boundaries. Polygons store information
about their inner and outer boundaries, and about other polygons nested
within them or grouped with them.
NOTE This functionality is for drawing objects only. For information about
polygonal geospatial feature data, see Overview of Editing Features (page 701) and
Creating New Polygon and MultiPolygon Features (page 689).
Polygons can represent areas such as city limits, county boundaries, state
borders, buildings, and parcels, as well as more complex objects, such as islands.
Example: A state map could be composed of a single polygon with an outer
boundary representing the state, interior boundaries representing lakes, and
boundaries within those boundaries representing islands. A country map could
be composed of individual polygons representing each state.
The following table defines common terms used to describe the structure of
polygons.
DefinitionTerm
Closed boundaries that make up a polygon. Polygons can have
multiple non-intersecting boundaries, or boundaries nested
within boundaries.
Boundaries
Working with Polygon Objects | 955
DefinitionTerm
Process of recalculating which boundaries are outer or inner.
Nested boundaries are alternately classified as outer and inner.
Balancing
That is, the outermost boundary is classified as an outer
boundary. A boundary nested within this boundary is an inner
boundary. A boundary nested within the inner boundary is
classified as an outer boundary.
Nested boundary that is totally within an outer boundary.Inner boundary
The outermost boundary for any discreet set of boundaries that
define the polygon, or a boundary residing within an inner
Outer boundary
boundary. A polygon can have several unnested outer boundaries
and several nested outer boundaries.
Understanding Boundaries
The figure below shows two polygon objects, each with three boundaries. The
one on the left has two discrete outer boundaries and one inner boundary.
The inner boundary is nested within the second discrete outer boundary. The
polygon on the right also has two outer boundaries and one inner boundary.
However, the second outer boundary is nested within the inner boundary.
Polygon objects maintain a tree structure to keep track of the boundaries and
identify nesting levels. The illustration below shows the different tree structures
for the two objects shown above. The first polygon tree contains two branches,
while the second polygon tree contains a single branch.
956 | Chapter 6 Creating and Editing Data
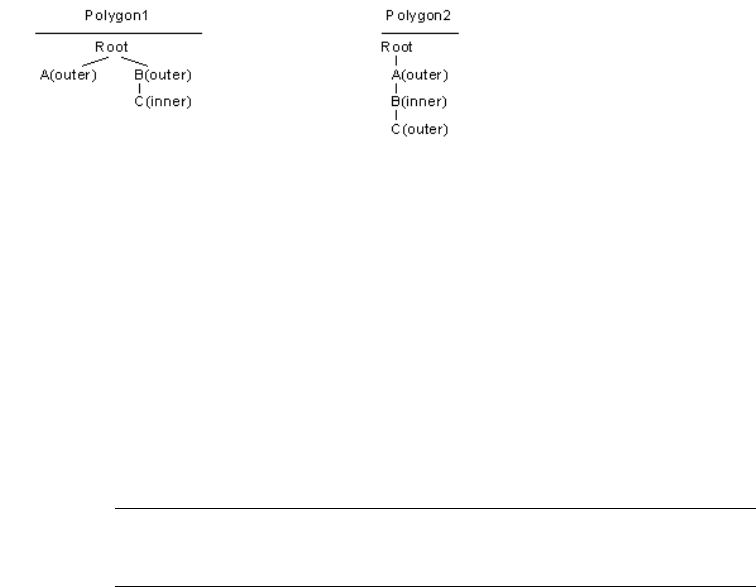
In addition to outer and inner boundaries, there is an Annotation boundary
type. This boundary has the characteristics of an inner boundary, but only
affects the display of the pattern fill and is ignored when calculating the area
or interior of the polygon object. Its primary purpose is to allow you to
annotate your drawings without the fill pattern of the polygon obscuring the
annotations. The annotation will typically consist of text or blocks.
See also:
■Creating Polygon Objects (page 960)
■Modifying Polygon Objects (page 962)
■Setting Polygon Options (page 977)
NOTE This procedure is for drawing objects only. For information about polygonal
geospatial feature data, see Overview of Editing Features (page 701)and Creating
New Polygon and MultiPolygon Features (page 689).
To work with polygons
■To create a polygon object (page 960)
■To add boundaries (page 963)
■To convert polylines to polygons (page 971)
■To convert a polygon topology to polygons (page 974)
■To create centroids for polygons and closed polylines (page 977)
■To change the default setting for importing polygons (page 978)
Quick Reference
MAPCREATECENTROIDS
Working with Polygon Objects | 957

Creates a centroid in a polygon and moves data to the centroid
Create menu ➤ Centroids
Menu
Create Centroids
Icon
MAPCREATECENTROIDSCommand Line
Create Centroids dialog boxDialog Box
MAPPOLYLINETOPOLYGON
Converts closed polylines to polygons
At the Command prompt, enter
mappolylinetopolygon.
Menu
Convert Polylines to Polygons
Icon
MAPPOLYLINETOPOLYGONCommand Line
MAPTOPOLOGYTOPOLYGONS
Converts an existing polygon topology to polygons
At the Command prompt, enter
maptopologytopolygons.
Menu
Convert Topology to Polygons
Icon
MAPTOPOLOGYTOPOLYGONSCommand Line
Create Polygons From Topology dialog boxDialog Box
MAPUSEMPOLYGON
Turns on and off the ability to use mapping polygons
MAPUSEMPOLYGONCommand Line
MAPUSEMPOLYGONDialog Box
MAPMPEDIT
Edits polygons
958 | Chapter 6 Creating and Editing Data

Click Modify ➤ Edit MPolygon.
Menu
Edit Polygon
Icon
MAPMPEDITCommand Line
MAPMPEDIT (Edit Polygon command)Dialog Box
MPFILL
Sets the default fill for polygons
At the Command prompt, enter mpfill.Menu
Polygon Fill Settings
Icon
MPFILLCommand Line
Polygon Fill Properties dialog boxDialog Box
MPOLYGON
Create polygon
Create ➤ Mpolygon
Menu
MPolygon
Icon
MPOLYGONCommand Line
MPSPLIT
Splits an existing polygon into two new polygons
At the Command prompt, enter mpsplit.Menu
Split Polygon
Icon
MPSPLITCommand Line
MPSPLIT (Split Polygon command)Dialog Box
Working with Polygon Objects | 959

Creating Polygon Objects
Create polygon objects by selecting existing closed polyline objects and circles,
or by specifying points.
NOTE This functionality is for drawing objects only. For information about
polygonal geospatial feature data, see Creating New Polygon and MultiPolygon
Features (page 689).
The boundaries of a polygon object can overlap or touch, but they cannot
cross. When you pick points to draw a boundary, a point will be rejected if it
causes the boundary to cross itself or if it crosses a previous boundary created
by the command.
You select the fill color and pattern used to fill polygon objects. For color, you
can choose from a variety of colors including true colors and colors from
imported color books. For pattern, you can choose a predefined hatch pattern,
a simple line pattern of your own design, a more complex hatch pattern, or
a solid color. You can also create a gradient fill, which uses a transition between
shades of one color or between two colors. Gradient fills can be used to give
the appearance of light reflecting on an object.
See also:
■Converting Polylines to Polygons (page 970)
■Converting Polygon Topology to Polygons (page 972)
■Modifying Polygon Objects (page 962)
■Setting Polygon Options (page 977)
NOTE This procedure is for drawing objects only. For information about polygonal
geospatial feature data, see Creating New Polygon and MultiPolygon Features
(page 689).
To create a polygon object
1Click Home tab ➤ Draw panel ➤ Creates Polygons.
2Click in the drawing to specify a start point, or select an existing object
to include in the polygon.
3Optionally, enter a to draw an arc as part of the polygon.
4Repeat Step 2 to add objects or specify more points.
960 | Chapter 6 Creating and Editing Data

5Enter c to close the polygon.
To set the Fill property for polygon objects
1On the command line, enter mpfill. Press Enter.
2Enter f.
3In the Polygon Fill Properties dialog box (page 1824), set the polygon fill
properties.
These properties are applied to the polygon that you are drawing and all
new polygons you create or convert.
Do this in the Polygon Fill Properties dialog
box...
To fill with...
Solid ■Click the Hatch tab.
■For Pattern Type, select Predefined.
■For Pattern Name, select Solid.
■For Fill Color, select the fill color. Click Select Color
to select from a large palette of colors.
Predefined hatch pattern ■Click the Hatch tab.
■For Pattern Type, select Predefined.
■For Pattern Name, select a pattern.
User defined hatch pattern ■Click the Hatch tab.
■For Pattern Type, select User Defined.
■Specify the angle and spacing of the hatch pattern.
One or two color gradient ■Click the Gradient tab.
■Select the number of colors to use for the gradient
fill.
■Select the colors.
■Use the Shade/Tint slider to adjust the color.
■Click a pattern.
■Select Center to create a symmetrical fill, or clear
Center to move the "highlight" up and to the left.
■Specify an angle for the "highlighted" area.
Working with Polygon Objects | 961

4Continue creating the polygon by following the steps in the previous
procedure.
Quick Reference
MPOLYGON
Create polygon
Create ➤ Mpolygon
Menu
MPolygon
Icon
MPOLYGONCommand Line
Modifying Polygon Objects
You can edit a polygon by editing its boundaries (adding, deleting, moving,
or disconnecting them), changing its fill properties, moving nodes in a
boundary, changing individual boundary types to Inner or Outer, or
rebalancing the polygon. For explanations of these terms, see Overview of
Polygons (page 955).
NOTE This functionality is for drawing objects only. For information about editing
polygonal geospatial feature data, see MAPPOLYGONEDIT (page 1665).
Rebalancing Polygons
If you add or delete boundaries, be sure to rebalance the polygon. A polygon
becomes unbalanced when it does not have correct information about which
is an inner boundary and which is an outer boundary. When you rebalance
the polygon, the nesting order follows an alternating outer/inner/outer order.
Area of a Polygon
The area between an inner and outer boundary is filled or not filled in an
alternating manner. In a balanced polygon, the filled area represents the total
area of the polygon object. The total area of the polygon is calculated by
subtracting the sum of the area of all inner boundaries from the sum of the
area of all outer boundaries.
962 | Chapter 6 Creating and Editing Data

Filling a Polygon
You can change the default fill color and pattern assigned to polygons. For
color, you can choose from a variety of colors including true colors and colors
from imported color books. For fill pattern, you can select a predefined hatch
pattern, define your own hatch pattern, choose a solid color, or define a one-
or two-color gradient fill.
To style polygons to use one color for the fill and a different color for the
outline, create a Display Manager layer for the polygons. For that layer, create
both a hatch style and an entity style. The hatch style will control the polygon
fill; the entity style will control the polygon outline. However, the entity style
must appear above the hatch style in Display Manager for the polygon to
appear correctly in the drawing.
See also:
■Creating Polygon Objects (page 960)
■Setting Polygon Options (page 977)
■Overview of Polygons (page 955)
NOTE This procedure is for drawing objects only. For information about editing
polygonal geospatial feature data, see To edit a feature using feature editing
commands (page 705).
■To add boundaries (page 963)
■To delete boundaries (page 964)
■To move boundaries (page 964)
■To edit nodes on a boundary (page 965)
■To change the boundary type (page 965)
■To rebalance the polygon object (page 965)
■To edit the fill property for the polygon object (page 966)
■To specify a different color for the polygon fill and outline (page 966)
■To set the default fill pattern for polygons (page 967)
To add boundaries
1At the Command prompt, enter mapmpedit (page 1818).
Working with Polygon Objects | 963
2In the drawing area, select the polygon to edit.
3Enter a.
4Select the polygon or closed polyline to add to the polygon.
The boundary is added to the polygon and assigned an inner or outer
boundary type based on its relationship to the rest of the object
5Repeat Step 2 to add any other boundaries.
6When the selection is completed, you can rebalance the polygon by
entering r.
To delete boundaries
1At the Command prompt, enter mapmpedit (page 1818).
2Select the polygon to edit.
3Enter d to delete the boundary, or enter c to delete the boundary from
the polygon but preserve it as an object.
4Click a boundary object to delete from the polygon.
The boundary is removed from the polygon.
5Repeat Step 2 to delete any other boundaries.
6When the selection is completed, you can enter r to rebalance the
polygon.
To move boundaries
1At the Command prompt, enter mapmpedit (page 1818).
2Select the polygon to edit.
3Enter m.
4Click a boundary object to move within the polygon.
Any nested boundaries within the boundary are also selected.
5Click in the drawing to specify the base point.
6Click in the drawing to specify the displacement point.
7Repeat these steps to move any other boundaries.
964 | Chapter 6 Creating and Editing Data

To edit nodes on a boundary
1At the Command prompt, enter mapmpedit (page 1818).
2Select the polygon to edit.
3Enter e.
4Click a boundary object to edit.
5Click the node to edit.
TIP Press the Spacebar to move to the next node.
Enter r to remove the node, m to move the node, or i to insert a new
node.
You can not modify the boundary in a way that would make it cross
another boundary in the polygon. For example, you cannot delete a node
if that would make the current boundary cross an inner boundary.
6When you finish editing nodes, press x to exit node-editing mode.
To change the boundary type
1At the Command prompt, enter mapmpedit (page 1818).
2Select the polygon to edit.
3Enter b.
4Click the boundary object for which you want to change the type.
5Enter o, i, or a (Outer/Inner/Annotation).
Annotation boundaries behave the same as inner boundaries, but have
no effect on area calculations.
To rebalance the polygon object
1At the Command prompt, enter mapmpedit (page 1818).
2Select the polygon to edit.
3Enter r.
The Rebalance option recalculates the polygon tree and reassigns the
Inner/Outer property of all the boundaries based on their nesting level.
Working with Polygon Objects | 965

To edit the fill property for the polygon object
1At the Command prompt, enter mapmpedit (page 1818).
2Select the polygon to edit.
3Enter f.
4In the Polygon Fill Properties dialog box (page 1824), edit the polygon fill
properties. These properties are applied to the polygon that you are
editing.
Do this in the Polygon Fill Properties dialog box...To fill with...
Solid ■Click the Hatch tab.
■For Pattern Type, select Predefined.
■For Pattern Name, select Solid.
■For Fill Color, select the fill color. Click Select Color
to select from a large palette of colors.
Predefined hatch pattern ■Click the Hatch tab.
■For Pattern Type, select Predefined.
■For Pattern Name, select a pattern.
User defined hatch pattern ■Click the Hatch tab.
■For Pattern Type, select User Defined.
■Specify the angle and spacing of the hatch pattern.
One or two color gradient ■Click the Gradient tab.
■Select the number of colors to use for your gradient
fill.
■Select the colors.
■Use the Shade/Tint slider to adjust the color.
■Click a pattern.
■Select Center to create a symmetrical fill, or clear
Center to move the "highlight" up and to the left.
■Specify an angle for the "highlighted" area.
966 | Chapter 6 Creating and Editing Data

To specify a different color for the polygon fill and outline
1Create a Display Manager layer for the polygons. In Display Manager,
click Data ➤ Add Drawing Data ➤ Drawing Layer.
2Right-click the new layer and click Add Style ➤ Entity.
3Right-click the Entity Style entry and click Properties.
4Change the Color for the Entity to the desired outline color.
5Right-click the layer again and click Add Style ➤ Hatch.
6Right-click the Hatch Style entry and click Properties.
7Change the Color for the Hatch to the desired fill color.
8At the Command prompt, enter Regen.
To set the default fill pattern for polygons
1At the Command prompt, enter mpfill. Press Enter.
2Select the fill pattern and properties.
All polygons you create or convert will use the new default fill.
Editing Using Grips
In addition to the options described above, you can edit a polygon object
using grips in the same way that you edit a polyline object (stretch a vertex,
move, rotate, scale, and so on).
Quick Reference
MAPMPEDIT
Edits polygons
Click Modify ➤ Edit MPolygon.
Menu
Edit Polygon
Icon
MAPMPEDITCommand Line
MAPMPEDIT (Edit Polygon command)Dialog Box
Working with Polygon Objects | 967
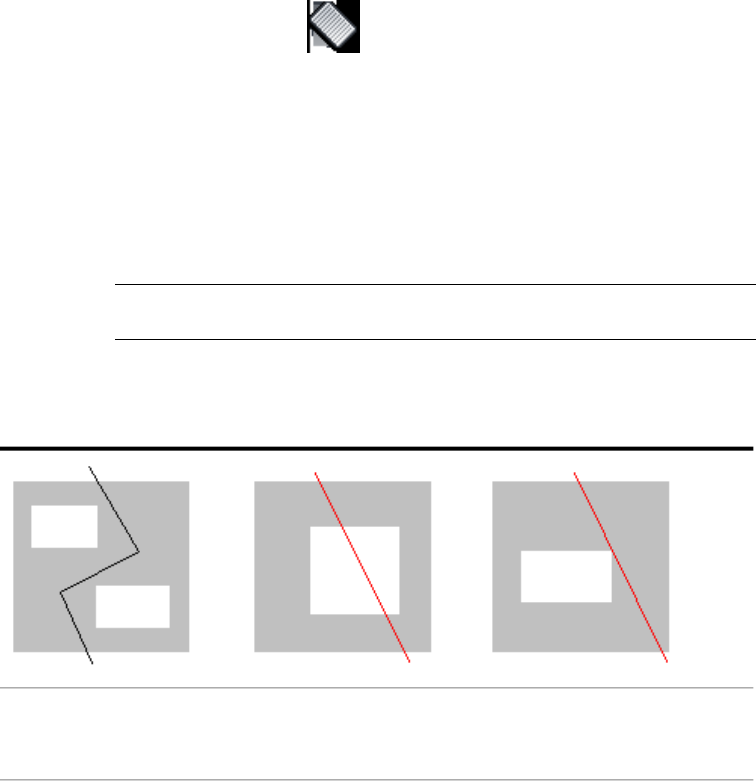
MPFILL
Sets the default fill for polygons
At the Command prompt, enter mpfill.Menu
Polygon Fill Settings
Icon
MPFILLCommand Line
Polygon Fill Properties dialog boxDialog Box
Splitting Polygon Objects
You can split an existing polygon into two new polygons. The existing polygon
is deleted.
NOTE This functionality is for drawing objects only. For information about splitting
polygonal geospatial feature data, see Splitting Features (page 705).
Example: If a parcel is subdivided, you can split the existing parcel.
When you split a polygon, the split line cannot cross itself or cross an internal
boundary of the polygon.
This split is not allowed because it
touches one of the vertices of the
internal boundary.
This split is not allowed because
it crosses an internal boundary.
This split is allowed.
When you split the polygon, you can choose to copy any existing data from
the original polygon to both of the new polygons.
968 | Chapter 6 Creating and Editing Data

See also:
■Modifying Polygon Objects (page 962)
■Setting Polygon Options (page 977)
NOTE This procedure is for drawing objects only. For information about splitting
polygonal geospatial feature data, see To split a feature (page 708).
To split a polygon object
1On the command line, enter mpsplit (page 1821). Press Enter.
2Select the polygon to split.
3Specify the line to split the polygon:
■To split the polygon by drawing a line, enter d.
Click in the drawing to specify the first point for the line.
Click to specify the next point, or enter a to draw an arc. For more
information on drawing arcs, see ARC in the AutoCAD Help.
■To split the polygon by using an existing line, enter s. Select the line
or lines.
4To copy attached data from the original polygon to the two new polygons,
enter y.
Otherwise, the data is deleted.
Quick Reference
MPSPLIT
Splits an existing polygon into two new polygons
At the Command prompt, enter mpsplit.Menu
Split Polygon
Icon
MPSPLITCommand Line
MPSPLIT (Split Polygon command)Dialog Box
Working with Polygon Objects | 969
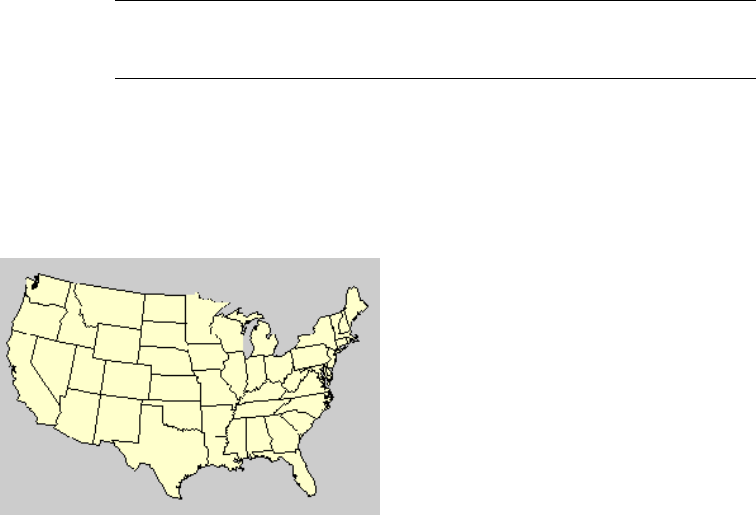
Converting Polylines to Polygons
You can convert all, or a selection of, the closed polylines in an existing
drawing to polygon objects. When you convert a closed polyline, the original
polyline is erased and is replaced with a polygon object.
NOTE This functionality is for drawing objects only. For information about
converting polygonal geospatial feature data to polygons, see Importing Polygons
(page 429).
When exporting objects to other formats, use polygons to preserve information
about islands, holes, or discontinuous polygons.
Here are some typical situations in which you may want to convert polylines
to polygons.
Converting Polylines to Polygons
This illustration shows a map made of polylines. Every closed polyline is converted to
a polygon.
970 | Chapter 6 Creating and Editing Data
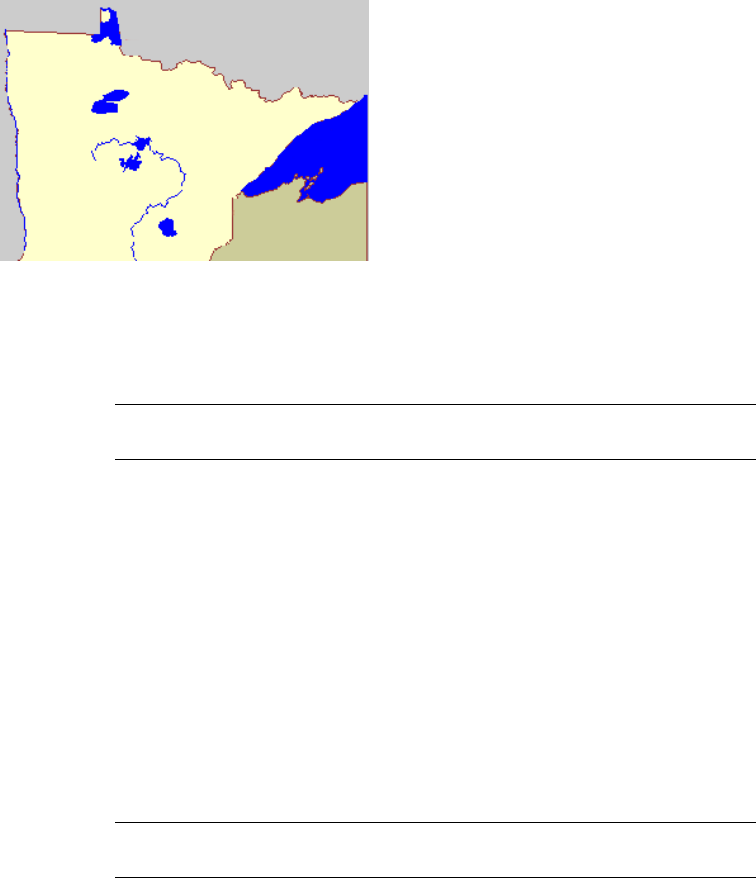
Converting Nested Polylines to Polygons
This illustration shows a state with lakes as closed polylines.
To create a complex polygon with islands, holes, or discontinuous polygons,
first use the GROUP command to group the objects that you want to include
in the polygon. Then use the MAPPOLYLINETOPOLYGON command.
WARNING When you group objects, only the data from the outermost boundary
is maintained. The data from nested objects is lost.
To preserve nested data, you may want to convert your polylines in steps. For
example, in the illustration above, you could first query in the state and lake
boundaries, group all these objects, and create a polygon. The resulting polygon
will show the state with holes for the lakes, and will maintain only the state
data. Next, query in the lake polylines, do not group them, and then convert
the lake polylines to polygons. Each of the polygons representing the lakes
will have its data attached.
See also:
■Converting Polygon Topology to Polygons (page 972)
■Overview of Polygons (page 955)
■Setting Polygon Options (page 977)
NOTE This procedure is for drawing objects only. For information about converting
polygonal geospatial feature data to polygons, see To import polygons (page 430).
To convert polylines to polygons
1Set the PROXYGRAPHICS system variable to 0.
Working with Polygon Objects | 971

2On the command line, enter mappolylinetopolygon (page 1817). Press
Enter.
3If you already had a selection set, the selected closed polylines are
converted. If you did not have a selection set, select the polylines to
convert. Press Enter.
Each closed polyline in the selection set is converted. If the polyline
belongs to a group, only the first (outermost) polyline is converted. Other
polylines in the group are copied into the polygon as additional
boundaries and the polygon is rebalanced.
When objects are converted to polygons, they use the color or hatch set by
the MPFILL command (page 978).
Quick Reference
MAPPOLYLINETOPOLYGON
Converts closed polylines to polygons
At the Command prompt, enter
mappolylinetopolygon.
Menu
Convert Polylines to Polygons
Icon
MAPPOLYLINETOPOLYGONCommand Line
Converting Polygon Topology to Polygons
You can create polygons from a polygon topology. The polygon topology is
not changed.
NOTE This functionality is for drawing objects. There is no equivalent for geospatial
feature data.
When exporting objects to other formats, use polygons to preserve information
about islands, holes, or discontinuous polygons.
Here are some typical situations in which you may want to create polygons
from a polygon topology.
972 | Chapter 6 Creating and Editing Data
This illustration shows a polygon topology. You can create polygons for each polygon
in the polygon topology, which is useful when exporting to other formats.
This illustration shows lakes as part of a state topology. To create a polygon for the
state with "holes" in it for the lakes, select the Group Complex Polygons option.
Converting Polygon Topology with Nested Boundaries
When you have nested polygons in your topology, you have several options
on how to convert them.
If you select the Group Complex Polygons option and all the polygons have
centroids, AutoCAD Map 3D will create a single balanced polygon.
If you do not select the Group Complex Polygons option, AutoCAD Map 3D
will create separate polygons, one for each centroid.
To create a single polygon from polygons nested within each other, each
nested polygon must have a centroid. For example, if you have three polygons
nested one within another, and the middle polygon does not have a centroid,
AutoCAD Map 3D will create separate polygons for the inner polygon and the
outer polygon.
Working with Polygon Objects | 973

See also:
■Converting Polylines to Polygons (page 970)
■Overview of Polygons (page 955)
■Setting Polygon Options (page 977)
NOTE This procedure is for drawing objects. There is no equivalent for geospatial
feature data.
To convert a polygon topology to polygons
1On the command line, enter maptopologytopolygons. Press Enter.
2In the Create Polygons From Topology dialog box (page 1823), for Name,
select the topology to convert.
Click Load Topology to select and load the topology.
3For Layer, select the layer on which you want to place the converted
polygons.
Click Layer Settings to create a new layer and set its properties.
4Optionally, select Group Complex Polygons to create a single polygon
from nested polygons in the topology.
If one polygon is inside another, they both become boundaries in the
resulting polygon object. There is no specific limit to the nesting level of
polygons grouped with this option, but in some conditions the resulting
inner/outer type of individual boundaries may not be what you
anticipated. You can use the MAPMPEDIT (page 963) command to correct
this.
5Optionally, select Copy Object Data From Centroid to copy object data
from the polygons to the new polygon objects.
If you selected Group Complex Polygons, the object data is copied only
from the outermost polygon.
6Optionally, select Copy Database Links From Centroid to copy database
links from the polygons to the new polygon objects.
If you selected Group Complex Polygons, the database links are copied
only from the outermost polygon.
7Click OK.
974 | Chapter 6 Creating and Editing Data

When objects are converted to polygons, they use the color or hatch set by
the MPFILL command (page 978).
Quick Reference
MAPTOPOLOGYTOPOLYGONS
Converts an existing polygon topology to polygons
At the Command prompt, enter
maptopologytopolygons.
Menu
Convert Topology to Polygons
Icon
MAPTOPOLOGYTOPOLYGONSCommand Line
Create Polygons From Topology dialog boxDialog Box
Creating Centroids for Polygons
If you have data attached to polygon objects or closed polylines, you can
create centroids for the polygons or closed polylines and move the data to the
centroid.
NOTE This functionality is for drawing objects only. For information about
converting polygonal geospatial feature data to polygons and creating centroids
for them, see Importing Polygons (page 429).
This is useful after you import or digitize objects, before using editing
commands such as Drawing Cleanup, Map Break, or Map Trim, or when
working with topology.
Working with Polygon Objects | 975

Object data attached to closed polylines (above) and object data moved to centroids
(below).
When you use this feature, AutoCAD Map 3D checks that the selected polygons
or closed polylines are clean; that is, that the lines do not intersect each other,
and that the area is greater than 0.
It creates a centroid inside each selected polygon or closed polyline and moves
any object data or SQL link data to the centroid. For a 'figure eight' object,
AutoCAD Map 3D creates one centroid.
Centroids are created with a Z value of 0.
See also:
■Creating Polygon Objects (page 960)
976 | Chapter 6 Creating and Editing Data
■Overview of Polygons (page 955)
NOTE This functionality is for drawing objects only. For information about
converting polygonal geospatial feature data to polygons and creating centroids
for them, see To import polygons (page 430).
To create centroids for polygons and closed polylines
1Click Create tab ➤ Drawing Object panel ➤ Create Centroids.
2In the Create Centroids dialog box (page 1801), specify whether to create
centroids for all closed objects or only for selected closed objects. If only
for selected closed objects, select those polygons and closed polylines.
TIP Use Quick Select to view and filter the object type as you select objects.
3Specify the layer on which the centroids should be created.
4Specify the block to use for centroids, or use ACAD_POINT.
5Click OK.
Quick Reference
MAPCREATECENTROIDS
Creates a centroid in a polygon and moves data to the centroid
Create menu ➤ Centroids
Menu
Create Centroids
Icon
MAPCREATECENTROIDSCommand Line
Create Centroids dialog boxDialog Box
Setting Polygon Options
AutoCAD Map 3D uses polygons by default for import and export. If you do
not want to use polygons, for example, for compatibility with an older drawing,
Working with Polygon Objects | 977
you can select the option to import polygons as polylines. You can also change
the default setting for this option.
When objects are imported as polygons, they use the default fill color and
pattern set by the MPFILL command. Boundaries come in as usual, using the
default layer color unless another color is specified in the imported file.
You can change the default fill color and pattern assigned to polygons. For
color, you can choose from a variety of colors including true colors and colors
from imported color books. For fill pattern, you can select a predefined hatch
pattern, define your own hatch pattern, choose a solid color, or define a one-
or two-color gradient fill.
You can also change the display of polygon boundaries to display just the
edges, just the fill, or both.
See also:
■Importing Polygons (page 429)
■Creating Polygon Objects (page 960)
■Overview of Polygons (page 955)
■To change the default setting for importing polygons (page 978)
■To change the default fill for polygons (page 978)
■To change the display of polygon edges (page 979)
To change the default setting for importing polygons
1On the command line, enter MAPUSEMPOLYGON (page 1818).
You are asked whether you want to use polygons.
2Type off or on. Press Enter.
If you turn off mpolygons, AutoCAD Map 3D creates closed polylines for
polygon objects that it imports.
To change the default fill for polygons
1On the command line, enter mpfill. Press Enter.
978 | Chapter 6 Creating and Editing Data

2In the Polygon Fill Properties dialog box (page 1824), select the polygon
fill properties.
Do this in the Polygon Fill Properties dialog box...To fill with...
Solid ■Click the Hatch tab.
■For Pattern Type, select Predefined.
■For Pattern Name, select Solid.
■For Fill Color, select the fill color. Click Select Color to
select from a large palette of colors.
Predefined hatch pattern ■Click the Hatch tab.
■For Pattern Type, select Predefined.
■For Pattern Name, select a pattern.
User defined hatch pattern ■Click the Hatch tab.
■For Pattern Type, select User Defined.
■Specify the angle and spacing of the hatch pattern.
One or two color gradient ■Click the Gradient tab.
■Select the number of colors to use for your gradient
fill.
■Select the colors.
■Use the Shade/Tint slider to adjust the color.
■Click a pattern.
■Select Center to create a symmetrical fill, or clear
Center to move the "highlight" up and to the left.
■Specify an angle for the "highlighted" area.
All polygons you create or convert will use the new default fill. You can change
the fill for an existing polygon with MAPMPEDIT (Edit Polygon command)
(page 1818).
To change the display of polygon edges
1On the command line, enter polydisplay.
Working with Polygon Objects | 979

2Enter e to view edges only, f to view fill only, or b to view both edges
and fill.
3On the command line, enter regen.
Quick Reference
MAPUSEMPOLYGON
Turns on and off the ability to use mapping polygons
MAPUSEMPOLYGONCommand Line
MAPUSEMPOLYGONDialog Box
MPFILL
Sets the default fill for polygons
At the Command prompt, enter mpfill.Menu
Polygon Fill Settings
Icon
MPFILLCommand Line
Polygon Fill Properties dialog boxDialog Box
POLYDISPLAY
Specifies whether to display edges only, fill only, or both for polygons
At the Command prompt, enter polydisplay.Menu
Polygon Display Mode
Icon
POLYDISPLAYCommand Line
Adding and Deleting Annotation
Use annotation to quickly and easily label objects with their attribute values,
display properties, and geometric values. For more information see Annotating
Drawing Objects (page 1100).
980 | Chapter 6 Creating and Editing Data

Using Object Classification
Use object classification to organize drawing objects in your map based on
the real-world objects that they represent. When you create an object using
object classification, the object automatically has properties and values assigned
to it based on its classification.
NOTE This functionality applies to drawing objects only. For information about
the classification systems used by geospatial feature data, see About Geospatial
Feature Classes, Data Stores, and Schemas (page 551).
■Overview of Object Classification (page 981)
■Creating Classified Drawing Objects (page 987)
■Assigning an Object Class (page 988)
■Editing Object Class Data (page 991)
■Selecting Objects by Object Class (page 992)
■Attaching an Object Class Definition File (page 995)
See also:
■Overview of Object Classification (page 981)
■Setting Up Object Classification (page 116)
To use object classification
■To use object classification (page 983)
■To create a classified drawing object (page 988)
■To assign an object class to an existing object (page 989)
■To unclassify an object (page 990)
■To edit object class data for an object (page 991)
■To select objects in your current map, based on their object class (page 993)
■To select objects in source drawings, based on their object class (page 993)
■To attach an object class definition file (page 995)
Overview of Object Classification
Object classification helps organize and select objects in your drawings.
NOTE This functionality applies to drawing objects only. For information about
the classification systems used by geospatial feature data, see About Geospatial
Feature Classes, Data Stores, and Schemas (page 551).
Using Object Classification | 981
Use object classification to organize objects in your drawing based on the
real-world features that they represent, for example, roads or manholes. When
you create an object using object classification, the object automatically has
properties and values assigned to it based on its object classification. In
addition, you can find or select all objects in an object class.
Setting Up Object Classification
■Start by determining the standard objects you use in your organization.
For example, if your organization produces road maps, you may want a
set of standard road objects, such as Primary Road and Secondary Road.
■Determine the set of properties and data for each standard object type. For
each one, define an object class that specifies the properties and data for
that object type. All object class definitions are stored in an object class
definition file.
For example, you may want all Primary Roads to be use a polyline with a
thick line weight, be on the Primary Roads layer, and have object data
associated with them that lists values for speed limit and number of lanes.
Similarly, Secondary Roads might go on the Secondary Roads layer, use a
thin line weight, and include information on surface type.
■Use object class definitions to create objects with a standard set of properties
and data assigned to them.
For example, if you use the Create Classified Object command to create a
Primary Road, it is created with a polyline, a thick line weight, on the
Primary Roads layer, and with object data that lists values for speed limit
and number of lanes. When you create a secondary road, it is on the
Secondary Roads layer, with a thinner line weight, and different values for
surface type and number of lanes.
When you select an object that was created using object classification, the
properties that are associated with that object class are displayed on the Object
Class tab of the Properties palette. For example, when you select a road, the
Properties palette shows you the layer, line weight, surface type, and number
of lanes. Edit properties by entering new values in the window.
982 | Chapter 6 Creating and Editing Data
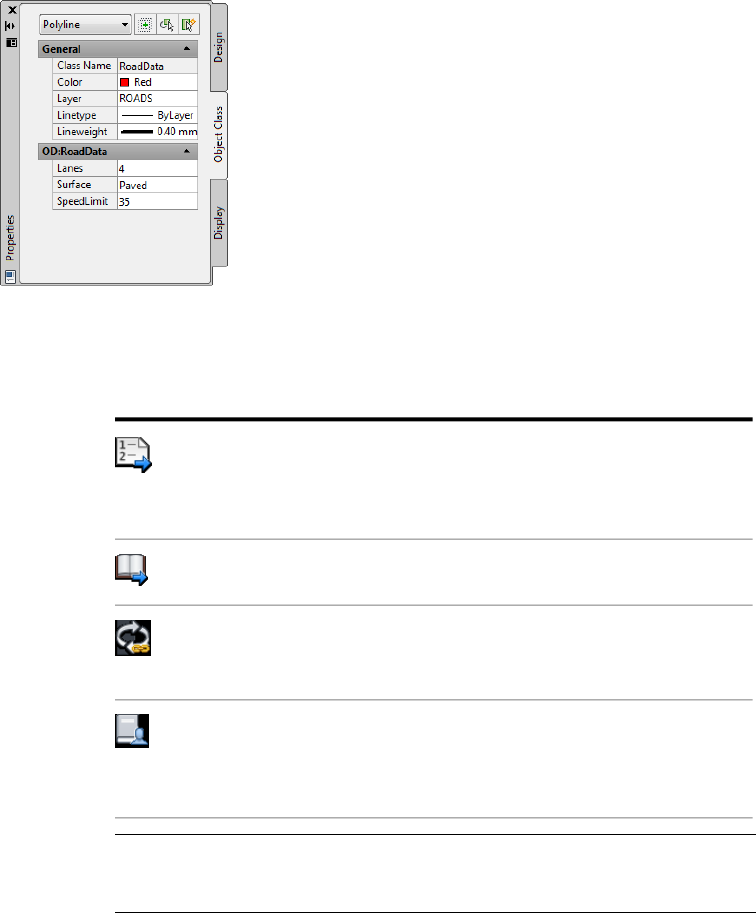
When you select a road in your drawing, the Object Class tab shows all the properties
associated with the object class Road. Edit a value by clicking in the box and selecting
an item from the list.
Tell me more
Procedure
■To set up object classification (page
118)
■To use object classification (page 981)
Tutorial
■Tutorial: Classifying Drawing Objects
Workflow
■Set Up Your DWG Data
■Move CAD Data to GIS
Related topics
■Setting Up Object Classification (page
116)
■Checking Out Features (page 695)
NOTE This functionality applies to drawing objects only. For information about
the classification systems used by geospatial feature data, see About Geospatial
Feature Classes, Data Stores, and Schemas (page 551).
To use object classification
1Attach an object class definition file (page 995).
Using Object Classification | 983

2Define an object class (page 120).
This step is often performed by the CAD Manager in your organization.
3Use object classification to standardize the objects in your drawings.
■Create new objects using object classification (page 987).
These new objects are created using the standard properties specified
for the object class.
■Assign an object class to an existing object (page 989).
The properties and data associated with the object are changed to
match the standards specified for the object class.
Once you have drawing objects in your drawing, you can do the following:
■Edit object class data for an object (page 991).
■Select objects by object class (page 993).
■Query objects from source drawings by object class name (page 1244).
■Query objects from source drawings by object class properties (page 1248).
■Modify objects based on their object class (page 1267).
■Add text to objects based on object class values (page 1278).
■Create a report that lists the object class properties of selected objects (page
1477).
■View information about attached drawings (page 172).
Quick Reference
PROPERTIES
Displays the Properties palette, which allows you to edit the properties of
objects
Analyze ➤ Properties
Menu
Properties
Icon
PROPERTIESCommand Line
Select object. Right-click in drawing area ➤ Properties
Task Pane
984 | Chapter 6 Creating and Editing Data

CLASSIFY
Classifies existing objects
Click Map ➤ Feature Classification ➤ Classify Objects.
Menu
Classify Objects
Icon
CLASSIFYCommand Line
In Map Explorer, under Current Drawing, right-click
Object Classes ➤ Select Classified Objects
Task Pane
Classify dialog boxDialog Box
Create Classified Object
Creates a new object based on the object classification definition
In Map Explorer, under Current Drawing, right-click
an object class ➤ Create Classified Object
Task Pane
FEATUREDEF
Defines a new object class based on an example in thecurrent drawing
Click Setup ➤ Classification Tools ➤ Define Object
Class.
Menu
Define Object Class
Icon
FEATUREDEFCommand Line
In Map Explorer, under Current Drawing, right-click
Object Classes ➤ Define Object Class
Task Pane
Define Object Classification dialog boxDialog Box
MAPSELECTCLASSIFIED
Selects all classified objects
Click Map ➤ Feature Classification ➤ Select Features.
Menu
Select Classified Objects
Icon
Using Object Classification | 985
MAPSELECTCLASSIFIEDCommand Line
In Map Explorer, under Current Drawing,
right-clickObject Classes ➤ Select Classified Objects
Task Pane
MAPSELECTCLASSIFIED (Select Classified Objects
command)
Dialog Box
MAPSELECTUNCLASSIFIED
Selects all objects that have no classification assigned to them
Click Map ➤ Feature Classification ➤ Select
Unclassified.
Menu
MAPSELECTUNCLASSIFIEDCommand Line
In Map Explorer, under Current Drawing, right-click
Object Classes ➤ Select Unclassified
Task Pane
MAPSELECTUNCLASSIFIED (Select Unclassified
Objects command)
Dialog Box
MAPSELECTUNDEFINED
Selects all objects whose classification is not defined in the current object
class definition file
Click Map ➤ Feature Classification ➤ Select
Undefined.
Menu
MAPSELECTUNDEFINEDCommand Line
In Map Explorer, under Current Drawing, right-click
Object Classes ➤ Select Undefined
Task Pane
MAPSELECTUNDEFINED (Select Undefined Objects
command)
Dialog Box
NEWDEF
Creates a new object class definition file
Click Setup ➤ Classification Tools ➤ New Definition
File.
Menu
NEWDEFCommand Line
In Map Explorer, under Current Drawing, right-click
Object Classes ➤ New Definition File
Task Pane
986 | Chapter 6 Creating and Editing Data
New Object Class Definition File dialog boxDialog Box
UNCLASSIFY
Removes classification from an object
Click Modify ➤ Unclassify Objects.
Menu
Unclassify Objects
Icon
UNCLASSIFYCommand Line
In Map Explorer, under Current Drawing, right-click
Object Classes ➤ Select Classified Objects
Task Pane
Creating Classified Drawing Objects
Use object classes to create new objects with a predefined set of properties and
values.
NOTE This functionality applies to drawing objects only. For information about
the classification systems used by geospatial feature data, see About Geospatial
Feature Classes, Data Stores, and Schemas (page 551).
When you create a drawing object using object classification, properties are
set to allowable values and data is attached. In addition, the object is tagged
with the name of its object class.
For example, if you create a road using a Road object class, you are prompted
to create a normal polyline. The polyline is created on the Roads layer, has
the default properties for a road, and has the data values specified for a road
feature.
After you create a classified object, you can use the Object Class tab of the
Properties palette to edit the data associated with the object class.
To create classified objects, you must have an object class definition file
attached to your drawing. For information on the location of the object class
definition file, consult your CAD Manager.
NOTE If an object class was defined with a create method of None, or if it was
defined as a base class only, you cannot create an object using that object class.
Using Object Classification | 987

See also:
■Overview of Object Classification (page 981)
■Editing Object Class Data (page 991)
■Attaching an Object Class Definition File (page 995)
NOTE This functionality applies to drawing objects only. For information about
the classification systems used by geospatial feature data, see About Geospatial
Feature Classes, Data Stores, and Schemas (page 551).
To create a classified drawing object
1In Map Explorer, right-click an object class. Click Create Classified Object.
If no object classes are listed in Map Explorer, attach an object class
definition file (page 995). For information on the location of the object
class definition file, consult your CAD Manager.
2Create the object as prompted.
When you create the object, object data, external data, and topology data
are attached. Other properties included in the object class definition are
set to the current drawing setting. If this setting is not within the range
of allowable values for this property, the default value is used.
3If necessary, edit the properties (page 991) for this object.
Quick Reference
Create Classified Object
Creates a new object based on the object classification definition
In Map Explorer, under Current Drawing, right-click
an object class ➤ Create Classified Object
Task Pane
Assigning an Object Class
Classify existing objects by assigning object classes to them. When you classify
an object, the properties and data of the selected object class (page 2069) are
assigned to the object.
988 | Chapter 6 Creating and Editing Data

NOTE This functionality applies to drawing objects only. For information about
the classification systems used by geospatial feature data, see About Geospatial
Feature Classes, Data Stores, and Schemas (page 551).
Before you assign an object class, make sure that the properties specified in
the object class definition are available in the drawing. For example, if the
object class definition specifies a linetype, make sure the specified linetype is
loaded into the drawing. Any properties that are not available are not updated
for the classified objects.
To classify objects, you must have an object class definition file attached to
your drawing. For information on the location of the object class definition
file, consult your CAD Manager.
See also:
■Attaching an Object Class Definition File (page 995)
■Overview of Object Classification (page 981)
NOTE This functionality applies to drawing objects only. For information about
the classification systems used by geospatial feature data, see About Geospatial
Feature Classes, Data Stores, and Schemas (page 551).
To assign an object class to an existing object
1In Map Explorer, right-click the object class to assign to the object. Click
Classify Objects.
If no object classes are listed in Map Explorer, attach an object class
definition file (page 995). For information on the location of the object
class definition file, consult your CAD Manager.
2In the Classify Objects dialog box (page 1783), select the options you want
and click OK.
■Select Include Objects to classify objects even if the values for
properties associated with the object class are not within the range of
allowable values specified for the feature.
For these objects, the values that are outside the allowable range will
be reset to the default value.
■Select Exclude Objects to ensure that you do not overwrite an object
class already assigned to an object.
3Select the objects to classify.
Using Object Classification | 989

If objects do not match the object type of the object class, they are filtered
out of the selection set and are not classified.
To unclassify an object
1In Map Explorer, right-click Object Classes. Click Unclassify Objects.
2Select the objects to unclassify.
3When you finish selecting objects, press Enter.
The object classification tag is removed from the selected objects.
Quick Reference
CLASSIFY
Classifies existing objects
Click Map ➤ Feature Classification ➤ Classify Objects.
Menu
Classify Objects
Icon
CLASSIFYCommand Line
In Map Explorer, under Current Drawing, right-click
Object Classes ➤ Select Classified Objects
Task Pane
Classify dialog boxDialog Box
UNCLASSIFY
Removes classification from an object
Click Modify ➤ Unclassify Objects.
Menu
Unclassify Objects
Icon
UNCLASSIFYCommand Line
In Map Explorer, under Current Drawing, right-click
Object Classes ➤ Select Classified Objects
Task Pane
990 | Chapter 6 Creating and Editing Data

Editing Object Class Data
Edit object class (page 2069) data for the selected object from the Object Class
tab of the Properties palette.
NOTE This functionality applies to drawing objects only. For information about
the classification systems used by geospatial feature data, see About Geospatial
Feature Classes, Data Stores, and Schemas (page 551).
If you enter values on the Object Class tab that are outside the allowable range
for this property, the value resets to the default value. If you edit this data
elsewhere, such as on the Categories tab of the Properties palette, you can
enter values that are outside the range.
See also:
■Assigning an Object Class (page 988)
■Creating Classified Drawing Objects (page 987)
■Overview of Object Classification (page 981)
NOTE This functionality applies to drawing objects only. For information about
the classification systems used by geospatial feature data, see About Geospatial
Feature Classes, Data Stores, and Schemas (page 551).
To edit object class data for an object
1Select the object.
2If the Properties palette is not already displayed, right-click the object.
Click Properties.
3In the Properties palette, select the Object Class tab.
4Review and edit any information.
You must enter a value that is within the allowable range for this object
class.
Quick Reference
PROPERTIES
Using Object Classification | 991
Displays the Properties palette, which allows you to edit the properties of
objects
Analyze ➤ Properties
Menu
Properties
Icon
PROPERTIESCommand Line
Select object. Right-click in drawing area ➤ Properties
Task Pane
Selecting Objects by Object Class
In your current map, you can create a selection set of objects, based on their
object class (page 2069). For example, you could select all Roads.
NOTE This functionality applies to drawing objects only. For information about
the classification systems used by geospatial feature data, see About Geospatial
Feature Classes, Data Stores, and Schemas (page 551).
When you select all objects in a base class, objects in object classes based on
that class are also selected.
You can use Quick Select to select objects with specific properties, such as all
two-line roads. You can also select all objects that have not been assigned to
any object class
In addition, you can use queries to select objects by object class in your source
drawing and query them into the current drawing.
See also:
■Assigning an Object Class (page 988)
■Creating Classified Drawing Objects (page 987)
■Editing Object Class Data (page 991)
■Using Object Classification (page 981)
NOTE This functionality applies to drawing objects only. For information about
the classification systems used by geospatial feature data, see About Geospatial
Feature Classes, Data Stores, and Schemas (page 551).
992 | Chapter 6 Creating and Editing Data

To select objects in your current map, based on their object class
Use this method...To select this...
In Map Explorer, right-click the object class
name ➤ Select Classified Objects
(MAPSELECTCLASSIFIED (page 1779)).
Objects assigned to a specific object class
In Map Explorer, right-click Object Classes
➤ Select Classified Objects (MAPSELECT-
CLASSIFIED (page 1779)).
Objects assigned to any object class (all
classified objects)
In Map Explorer, right-click Object Classes
➤ Select Unclassified (MAPSELECTUN-
CLASSIFIED (page 1780)).
Objects that have not been assigned to
any object class (all unclassified objects)
In Map Explorer, right-click Object Classes
➤ Select Undefined ((MAPSELECTUN-
DEFINED (page 1780)).
All undefined objects
An undefined object was assigned to an
object class, but that object class is not
defined in the definition file attached to
the drawing.
Objects based on a property value 1Right-click in the map.
2Click Quick Select.
3In the Quick Select dialog box, under
Object Type, select the object class.
4Under Properties, select the object
class property.
5Select an operator and a value.
To select objects in source drawings, based on their object class
See...To select this...
To retrieve drawing objects based on their
properties (page 1244)
Objects in source drawings based on the
object class name or a specific value of an
object class property
To retrieve drawing objects based on their
object data (page 1248)
Objects in source drawings based on the
value of specific object class data
Using Object Classification | 993

Quick Reference
MAPSELECTCLASSIFIED
Selects all classified objects
Click Map ➤ Feature Classification ➤ Select Features.
Menu
Select Classified Objects
Icon
MAPSELECTCLASSIFIEDCommand Line
In Map Explorer, under Current Drawing,
right-clickObject Classes ➤ Select Classified Objects
Task Pane
MAPSELECTCLASSIFIED (Select Classified Objects
command)
Dialog Box
MAPSELECTUNCLASSIFIED
Selects all objects that have no classification assigned to them
Click Map ➤ Feature Classification ➤ Select
Unclassified.
Menu
MAPSELECTUNCLASSIFIEDCommand Line
In Map Explorer, under Current Drawing, right-click
Object Classes ➤ Select Unclassified
Task Pane
MAPSELECTUNCLASSIFIED (Select Unclassified
Objects command)
Dialog Box
MAPSELECTUNDEFINED
Selects all objects whose classification is not defined in the current object
class definition file
Click Map ➤ Feature Classification ➤ Select
Undefined.
Menu
MAPSELECTUNDEFINEDCommand Line
In Map Explorer, under Current Drawing, right-click
Object Classes ➤ Select Undefined
Task Pane
MAPSELECTUNDEFINED (Select Undefined Objects
command)
Dialog Box
994 | Chapter 6 Creating and Editing Data
Attaching an Object Class Definition File
The object class definition (page 2069) file includes information on how to create
each object class you have defined. You can change the object class definition
file that is associated with the current map. Only definitions in the associated
definition file can be assigned to objects or used to create new features.
NOTE For information on the location of the object class definition file, consult
your CAD Manager.
NOTE This functionality applies to drawing objects only. For information about
the classification systems used by geospatial feature data, see About Geospatial
Feature Classes, Data Stores, and Schemas (page 551).
See also:
■Overview of Object Classification (page 981)
■Creating an Object Classification File (page 128)
NOTE This functionality applies to drawing objects only. For information about
the classification systems used by geospatial feature data, see About Geospatial
Feature Classes, Data Stores, and Schemas (page 551).
To attach an object class definition file
1In Map Explorer, right-click Object Class Definition ➤ Attach Object
Class Definition File.
2Select the object class definition file. Click Open.
Quick Reference
ATTACHDEF
Changes the current feature definition file
Click Setup ➤ Classification Tools ➤ Attach Definition
File.
Menu
ATTACHDEFCommand Line
In Map Explorer, under Current Drawing, right-click
Object Classes ➤ Attach Definition File
Task Pane
Using Object Classification | 995

Attach Object Class Definition File dialog boxDialog Box
Working with Survey Data
■Overview of Working with Survey Data (page 997)
■Working with Survey Data Stores (page 999)
■Working with Projects (page 1001)
■Working with Surveys (page 1002)
■Working with Point Groups (page 1004)
■Working with Survey Points (page 1005)
■Creating Surfaces From Survey Data (page 1009)
NOTE Survey data is a particular type of geospatial data. You cannot use survey
functionality for drawing objects.
To work with survey data
■To create a survey data store (page 1000)
■To connect to a survey data store (page 1000)
■To view points in the active data store only (page 1000)
■To add a point group to a project (page 1001)
■To rename a project (page 1002)
■To remove a project from a survey data store (page 1002)
■To view or edit project properties (page 1002)
■To add a point group to a survey (page 1003)
■To remove a point group from a survey (page 1003)
■To rename a survey (page 1003)
■To remove a survey from a project (page 1003)
■To view or edit survey properties (page 1004)
■To rename a point group (page 1004)
■To remove a point group from a project or survey (page 1005)
■To view or edit point group properties (page 1005)
■To create survey points (page 1006)
■To create survey points using coordinate geometry (page 1006)
■To move points from one point group to another (page 1006)
■To remove points from a point group (page 1007)
■To delete survey points (page 1007)
■To view and edit survey point data in the Point Table (page 1008)
■To zoom to survey points on the map (page 1008)
■To create geospatial features from survey points (page 1008)
■To create a surface from a source file (page 1009)
■To create a surface from a data connection (page 1010)
996 | Chapter 6 Creating and Editing Data
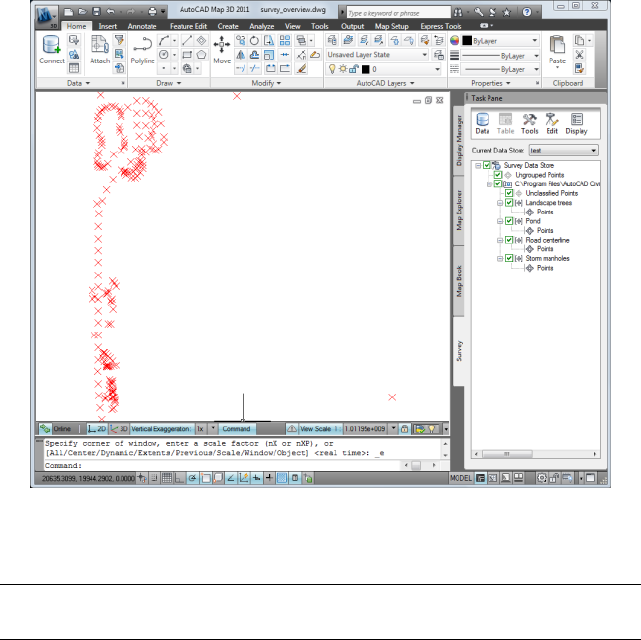
■To create a surface from points in your drawing (page 1011)
Overview of Working with Survey Data
You can manage survey data on the Survey tab of the Task Pane
AutoCAD Map 3D allows you to manage survey point data.
NOTE Survey data is a particular type of geospatial data. You cannot use survey
functionality for drawing objects.
You can do the following with survey data:
■Import survey points in LandXML or ASCII format
■View point data in the Point Table (a survey-point specific version of the
Data Table (page 1613))
■Edit survey points
■Add points using coordinate geometry commands
Overview of Working with Survey Data | 997
■Export points to LandXML format
■Use the Bulk Copy feature to export points to another data store to create
geospatial features.
For example, if each survey point represents a telephone pole, you can
export the points to an SDF file called Telephone_poles.sdf. You can then
add Telephone_poles.sdf to your map using Data Connect and work with
the point data as geospatial features.
Survey data is kept in a dedicated SDF data store. You can add new properties
and classes to the survey data store schema, but be careful not to alter or
remove the existing properties and classes.
Points in a survey data store are in read-only mode until you click Edit at the
top of the Task Pane. Clicking Edit puts AutoCAD Map 3D into direct edit
mode, which means that any changes you make to the points in AutoCAD
Map 3D are immediately applied to the data store. You can reorganize survey
points without entering Edit mode (for example, you can move points between
point groups).
When working with survey data, you must work online. If you work offline,
AutoCAD Map 3D disconnects from the survey data store, and the survey tree
disappears.
NOTE Survey data is a particular type of geospatial data. You cannot use survey
functionality for drawing objects.
Use the following methods to work with survey data.
Use this method...To do this...
Create or connect to a new survey data
store.
■Create a Survey Data Store (page 1000)
■Connect to a Survey Data Store (page
1000)
Bring in survey point data. ■Bring in LandXML Data. (page 371)
■Bring in ASCII Point Data. (page 373)
Manage survey point data. ■Create Survey Points (page 1006)
■Create Survey Points Using Coordinate
Geometry (page 1006)
998 | Chapter 6 Creating and Editing Data
Use this method...To do this...
■View and Edit Survey Point Data in the
Point Table (page 1008)
Create Geospatial Features from Survey
Points (page 1008)
Create geospatial features from survey
points.
Export Survey Points to LandXML (page
1471)
Export survey point data to LandXML.
Working with Survey Data Stores
Survey data is kept in a dedicated SDF data store. You can add new properties
and classes to the survey data store schema, but be careful not to alter or
remove the existing properties and classes. Within a survey data store, survey
points are organized into projects, surveys, point groups, and unclassified
points. Before you import any survey data, you must connect to or create a
survey data store.
NOTE Survey data is a particular type of geospatial data. You cannot use survey
functionality for drawing objects.
NOTE If you connect to two separate survey data stores with different coordinate
systems, you may not be able to view the survey points contained in both data
stores. AutoCAD Map 3D transforms the coordinate systems of the data stores to
the coordinate system of the map for display. If the coordinate systems of the data
stores are incompatible with the coordinate system of the map, AutoCAD Map
3D cannot display both data stores. For example, AutoCAD Map 3D is not able
to display a data store in a New York state plane coordinate system and a California
state plane coordinate system in a single drawing. If you use data stores with such
disparate coordinate systems, best practice dictates that you use separate drawings
for each data store.
Working with Ungrouped Points
All points that do not fall into one of the survey data store categories (project,
survey, or point group) are grouped together in the Ungrouped Points node
under the Data Store node. You can edit, delete, or move ungrouped points
to other point groups. For more information on working with ungrouped
points, see Working with Survey Points (page 1005).
Working with Survey Data Stores | 999
NOTE Survey data is a particular type of geospatial data. You cannot use survey
functionality for drawing objects.
To create a survey data store
1On the Survey tab of the Task Pane, click Data ➤ New Survey Data Store.
2In theNew Data Store dialog box (page 1891) , click in the File Location
section.
3In the Create New Survey Data Store dialog box, enter a name for and
select a location to which to save your file, then click Save.
4In the New Data Store dialog box, enter a coordinate system for your
survey data store in the Coordinate System assignment section. To select
a coordinate system from a list, click .
5Click OK.
To connect to a survey data store
1On the Survey tab of the Task Pane, click Data ➤ Connect to Survey Data
Store.
2In the Connect to Survey Data Store dialog box, browse to and select the
desired survey data store.
3Click Open.
To view points in the active data store only
You can view only the points for the active data store by clicking the Display
button in the Survey Task Pane toolstrip. When you click Display, AutoCAD
Map 3D hides the objects and features in all other Display Manager layers.
1Select the survey data store for which you would like to view points from
the Current Data Store drop-down list.
2Click the Display button on the Survey Task Pane toolstrip.
1000 | Chapter 6 Creating and Editing Data

Quick Reference
Survey Data Store
Store survey point data in an SDF file.
On the Survey tab, click Data ➤ New Survey Data
Store to create a new data store. Click Data ➤ Connect
Task Pane
to Survey Data Store to connect to an existing survey
data store.
New Data Store dialog boxDialog Box
Working with Projects
When you import a LandXML file into AutoCAD Map 3D, it appears in the
Survey Tree as a Project. Projects are the primary organizational group within
a survey data store.
NOTE Survey data is a particular type of geospatial data. You cannot use survey
functionality for drawing objects.
Projects contain point groups and surveys. Any points that are not assigned
to a point group appear in the Unclassified Points group. For more information
on working with ungrouped points, see Working with Survey Points (page
1005).
You can add a new point group to a project, rename a project, or remove a
project from a survey data store. You can also view and edit project properties
in the Project Properties dialog box (page 1892).
NOTE Survey data is a particular type of geospatial data. You cannot use survey
functionality for drawing objects.
To add a point group to a project
1Right-click a project in the survey data store.
2Select New Point Group. The new point group appears in the survey data
tree.
3Enter a name for the new point group.
Working with Projects | 1001

To rename a project
1Right-click the project you want to rename.
2Select Rename Project.
3Enter the new name for the project, then press Enter.
To remove a project from a survey data store
1Right-click the project you want to remove.
2Select Remove Project.
3Click Yes in the Confirm Remove Project message box to remove the
project from the survey data store.
To view or edit project properties
1Right-click the project and select Properties. The Project Properties dialog
box (page 1892) appears.
2To edit project properties, click the field you wish to edit and enter your
data. Fields with constrained values will display a drop-down list.
Quick Reference
Survey Project Properties
View or edit survey project properties.
On the Survey tab, right-click a project ➤ Properties.
Task Pane
Project Properties dialog boxDialog Box
Working with Surveys
Surveys are organizational groups within a project. Surveys contain point
groups.
NOTE Survey data is a particular type of geospatial data. You cannot use survey
functionality for drawing objects.
1002 | Chapter 6 Creating and Editing Data

Any points that are not assigned to a point group appear in the Unclassified
Points group. For more information on working with ungrouped points, see
Working with Survey Points (page 1005).
You can add a new point group to a survey, remove a point group from a
survey, rename a survey, or remove a survey from a project. You can also view
and edit survey properties in the Survey Properties dialog box (page 1893). You
cannot create a new survey in AutoCAD Map 3D. Surveys are created by
external surveying hardware and software, and must be imported to your
survey data store in a LandXML file.
NOTE Survey data is a particular type of geospatial data. You cannot use survey
functionality for drawing objects.
To add a point group to a survey
1Right-click a survey in the project.
2Select New Point Group. The new point group appears in the survey data
tree.
3Enter a name for the new point group.
To remove a point group from a survey
➤ Right-click the point group you wish to remove, then select Remove Point
Group.
To rename a survey
1Right-click the survey you want to rename.
2Select Rename Survey.
3Enter the new name for the survey, then press Enter.
To remove a survey from a project
1Right-click the survey you want to remove.
2Select Remove Survey.
3Click Yes in the Confirm Remove Survey message box to remove the
survey from the project.
Working with Surveys | 1003

To view or edit survey properties
1Right-click the survey and select Properties. The Survey Properties dialog
box (page 1893) appears.
2To edit survey properties, click the field to edit and enter your data in
the Field Note Editor (page 1894). Fields with constrained values will display
a drop-down list.
Quick Reference
Survey Properties
View or edit survey properties.
On the Survey tab, right-click a survey ➤ Properties.
Task Pane
Survey Properties dialog boxDialog Box
Working with Point Groups
Point groups are included in projects and surveys. Point groups contain survey
points. Groups typically define some common set of survey points, such as a
road centerline.
You can rename point groups or remove them from the survey data store. You
can also view and edit point group properties in the Point Group Properties
dialog box (page 1894)
NOTE Survey data is a particular type of geospatial data. You cannot use survey
functionality for drawing objects.
NOTE Survey data is a particular type of geospatial data. You cannot use survey
functionality for drawing objects.
To rename a point group
1Right-click the point group you want to rename.
2Select Rename Point Group.
3Enter the new name for the point group, then press Enter.
1004 | Chapter 6 Creating and Editing Data

To remove a point group from a project or survey
1Right-click the point group you want to remove.
2Select Remove Point Group.
3Click Yes in the Confirm Remove Point Group message box to remove
the point group from the project.
To view or edit point group properties
1Right-click the point group and select Properties. The Point Group
Properties dialog box (page 1894) appears.
2To edit point group properties, click the field you wish to edit and enter
your data. Fields with constrained values will display a drop-down list.
Quick Reference
Survey Point Group Properties
View or edit survey point group properties.
On the Survey tab, right-click a point group ➤
Properties.
Task Pane
Point Group Properties dialog boxDialog Box
Working with Survey Points
AutoCAD Map 3D allows you to create, manage, export, and migrate survey
points. You can view and edit survey point data in the drawing window and
Point Table, export survey points to LandXML, and create geospatial features
from survey points using Bulk Copy.
NOTE Survey data is a particular type of geospatial data. You cannot use survey
functionality for drawing objects.
To create, edit, or delete survey points, you must first click the Edit button on
the Survey Task Pane toolstrip. When you click Edit, AutoCAD Map 3D enters
direct edit mode. In direct edit mode, all changes you make in AutoCAD Map
3D are immediately made to the source data in the survey data store.
Working with Survey Points | 1005

For information on exporting survey points to a LandXML file, see Exporting
Survey Points to a LandXML File (page 1471).
NOTE Survey data is a particular type of geospatial data. You cannot use survey
functionality for drawing objects.
To create survey points
1Click Edit in the Survey Task Pane toolstrip.
2Right-click the project, survey, or point group to which you want to add
a point.
3Select Create New Point.
4Specify the location of the new point on the map.
5AutoCAD Map 3D creates the point and displays the Point Table.
To create survey points using coordinate geometry
1Click Edit in the Survey Task Pane toolstrip.
2Right-click the project, survey, or point group to which you want to add
a point.
3Select Create COGO Point. The COGO Input dialog box (page 1668) appears.
4Select the desired coordinate geometry routine and enter the appropriate
information. For more information on entering coordinate geometry, see
Overview of Coordinate Geometry Commands (page 1027).
5Click Create Point.
To move points from one point group to another
You can move points between point groups with standard copy and paste
commands. You can also CTRL-Drag points from one group to another. Note
that when you copy points from one group to another, you are not duplicating
those points. Rather, you are creating references to those points and adding
them to the new point group. You can move points between point groups
without entering direct edit mode.
1Right-click the Points node in the point group you want to move.
2Select Copy.
1006 | Chapter 6 Creating and Editing Data
3Right-click the Points node in the point group to which you want to
move the copied points.
4Select Paste.
You can also copy and paste individual points, or a selection of points, using
the Point Table.
1In the Point Table, select the rows containing the points you wish to
copy.
2Right-click the row header (the grey row selection button to the left of
the object ID number) for that data and select Copy Points.
3In the Data drop-down list, select the node to which you wish to paste
the copied points.
4Right-click any row header in the Data Table and select Paste Points. If
you are pasting points to an empty point group, right-click the left-most
column header (the Sort row header) and select Paste Points.
To remove points from a point group
You can remove selected points from a point group using the Point Table.
When you remove a point from a point group, you are not deleting the point
data. Rather, you are removing the reference to that point from the point
group.
1In the Point Table, select the rows containing the points you wish to
remove.
2Right-click the row header (the grey row selection button to the left of
the object ID number) for the selected points and select Remove Points.
3In the Confirm Remove Points dialog box, click Yes.
To delete survey points
You can delete survey points from your survey data store. You must work in
direct edit mode to delete survey points. Deleting survey points removes them
from your survey data store and from the connected data source.
1Click Edit in the Survey Task Pane toolstrip.
2Right-click the points node and select Delete Points.
3In the Confirm Delete All Points dialog box, click Yes.
Working with Survey Points | 1007
You can also delete selected points from a point group using the Point Table.
1Click Edit in the Survey Task Pane toolstrip.
2In the Point Table, select the rows containing the points you wish to
delete.
3Right-click the row header (the grey row selection button to the left of
the object ID number) for the selected points and select Delete Points.
4In the Confirm Delete Points dialog box, click Yes.
To view and edit survey point data in the Point Table
1Click Edit in the Survey Task Pane toolstrip if you want to edit the point
data. You do not need to enter direct edit mode if you only want to view
the data in the Point Table.
2Select the project, survey, or point group you want to view or edit, then
click Table in the Survey Task Pane toolstrip. The Point Table appears.
3View the survey point data in the Point Table. To edit data, click the
desired field and edit the data as appropriate. Fields with constrained
values will display a drop-down list. Uneditable fields will be shaded.
To zoom to survey points on the map
You can zoom to any collection of points in the survey data store.
1Right-click the Survey Data Store, Project, Survey, or Point Group for
which you want to view points.
2Select Zoom to... to zoom to the selected points.
To create geospatial features from survey points
1Right-click the project, survey, or point group from which you want to
create geospatial features.
2Select Export Points. The Bulk Copy (page 1744) dialog box appears.
3Follow the instructions for Migrating GIS Data (Bulk Copy) (page 617) to
create point features from your survey points.
1008 | Chapter 6 Creating and Editing Data
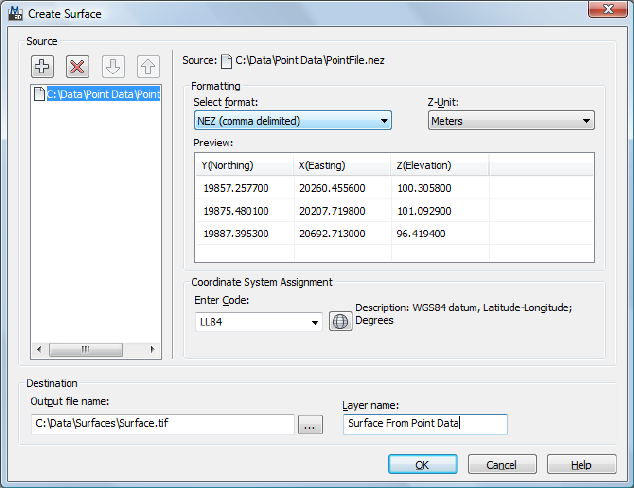
Creating Surfaces From Survey Data
AutoCAD Map 3D 2011 allows you to create GeoTIFF raster surfaces from
point data. You can enter point data in a variety of text formats as well as
from AcDb point data and block references in your drawing. AutoCAD Map
3Dalso supports LandXML data sources that include a surface element; you
cannot use a LandXML data source that contains only points.
If you are adding data from an ASCII point file and your text file contains
lines that do not represent point data, enter a # character at the beginning of
such lines. AutoCAD Map 3D ignores all text lines that begin with the #
character.
AutoCAD Map 3D creates a raster surface in GeoTIFF format from the data
you enter and adds it to your map as a feature layer. You can then style your
surface using all of the visualization and styling tools of the Display Manager.
You will also see a new Raster connection in the Data Connect window.
To create a surface from a source file
1In the Tool-based Ribbon Workspace, click Create tab > Surface panel >
3D Surface or enter MAPCREATESURFACE at the command line.
Creating Surfaces From Survey Data | 1009
2In the Create Surface dialog box (page 1895), click and select File.
3In the Select a Point File dialog box, select the file format and navigate
to your point file.
4Click Open.
5In the Formatting section, specify the formatting and vertical (Z) unit of
your data file.
6In the Output File Name field, click and enter a file name and save
location. If you do not specify a save location, the raster file will be saved
to My Documents.
7In the Layer Name field, enter a name for the new Display Manager raster
layer.
8In the Coordinate System Assignment section, specify the coordinate
system of the source data. You can either enter the code in the text field,
or click to choose from a list. You must specify the coordinate system for
each data source you use.
9Click OK. AutoCAD Map 3D generates a raster surface in GeoTIFF format
and adds it to a new feature layer in your map. You can also see the new
raster connection in Data Connect.
To create a surface from a data connection
You can create a surface using point data stored in a database or geospatial
file format (such as Autodesk SDF).
1If you are using an ODBC data source, specify the coordinate columns
and add the data to your map as a vector layer before creating a surface.
2In the Tool-based Ribbon Workspace, click Create tab > Surface panel >
3D Surface or enter MAPCREATESURFACE at the command line.
3In the Create Surface dialog box (page 1895), click and select
Connection.
4In the Source Data dialog box (page 1897), select the data source.
5Click OK.
1010 | Chapter 6 Creating and Editing Data
6In the Output File Name field, click and enter a file name and save
location. If you do not specify a save location, the raster file will be saved
to My Documents.
7In the Layer Name field, enter a name for the new Display Manager raster
layer.
8In the Coordinate System Assignment section, specify the coordinate
system of the source data. You can either enter the code in the text field,
or click to choose from a list. You must specify the coordinate
system for each data source you use.
9Click OK. AutoCAD Map 3D generates a raster surface in GeoTIFF format
and adds it to a new feature layer in your map. You can also see the new
raster connection in Data Connect.
To create a surface from points in your drawing
1In the Tool-based Ribbon Workspace, click Create tab > Surface panel >
3D Surface or enter MAPCREATESURFACE at the command line.
2In the Create Surface dialog box (page 1895), click and select Points
In Drawing.
3Select the points in your drawing from which to create the surface. These
points must include elevation data.
4In the Output File Name field, click and enter a file name and save
location. If you do not specify a save location, the raster file will be saved
to My Documents.
5In the Layer Name field, enter a name for the new Display Manager raster
layer.
6Click OK. AutoCAD Map 3D generates a raster surface in GeoTIFF format
and adds it to a new feature layer in your map. You can also see the new
raster connection in Data Connect.
Quick Reference
MAPCREATESURFACE
Creating Surfaces From Survey Data | 1011
Creates a 3D raster surface from point data.
MAPCREATESURFACECommand Line
Create Surface dialog boxDialog Box
Working With Point Cloud Data
The following sections describe how to work with point cloud data.
Overview of Point Clouds
Point clouds (page 2071) are large data sets composed of 3D point data. Aerial
LiDAR (page 2066) (Light Detection And Ranging) laser scanners are the most
common instruments used to collect geographic point cloud data.
AutoCAD Map 3D 2011 includes features for working with point cloud data.
You can create highly accurate digital elevation models (DEM (page 2059)s) using
point cloud data. Because point cloud data sets are so large (commonly
containing millions, and occasionally billions, of points), AutoCAD Map 3D
must create an indexed point cloud data store before it can effectively work
with the data. Once the data is indexed, AutoCAD Map 3D brings the point
cloud into your map as an AutoCAD drawing object (AcDb entity) and adds
a point cloud layer to the Display Manager. You can filter the indexed point
cloud data by classification, elevation, intensity, or location on your map.
You can also group and style you point cloud data using the Display Manager.
To create a raster-based surface from your point cloud data, use the Surface
Manager (page 1898).
Overview of LiDAR Data
Geographic LiDAR data is most commonly available in LAS (page 2066)(LiDAR
Aerial Survey) or ASCII (.xyz) format. LAS is an industry standard file format
defined by the American Society of Photogrammetry and Remote Sensing that
includes a system of point classification. A processed LAS file may have points
classified as bare earth, high or low vegetation, building, and so on.
Because LAS files are produced from aerial surveys, they tend to contain long
swaths or strips of terrain data. The survey planes generally fly a long distance
in one direction collecting data, then fly back collecting data along a parallel
path. This process is often repeated many times. You may need to combine
1012 | Chapter 6 Creating and Editing Data
these survey swaths and filter them by location to get the point cloud data
relevant to your map.
To use LiDAR data
■Bring in LiDAR data (page 374)
■Manage LiDAR data (page 1015)
■Use LiDAR data to create a point cloud data store (page 1019)
Quick Reference
MAPPOINTCLOUDMANAGER
Creates and manages indexed point cloud data stores.
MAPPOINTCLOUDMANAGERCommand Line
Point Cloud ManagerDialog Box
MAPSURFACEMANAGER
Creates a 3D raster surface from point cloud data.
MAPSURFACEMANAGERCommand Line
Surface ManagerDialog Box
Overview of Point Cloud Files and Objects
AutoCAD Map 3D uses the data contained in point cloud data stores to create
point clouds. These point clouds are standard AutoCAD drawing objects (AcDb
entities). Point clouds appear in the Display Manager as drawing object layers.
Most commands for working with point clouds are available on the right click
menu in the Display Manager as well as on the contextual Point Cloud ribbon
tab. To view the Point Cloud ribbon tab, select a point cloud layer in the
Display Manager. This guide primarily documents the right-click menu options.
You can filter and style point clouds, use them to create surfaces, and export
them to LAS, ASCII, or SDF format.
To use point clouds in your map
■Bring point cloud data into your map (page 375)
Overview of Point Cloud Files and Objects | 1013
■Filter point cloud data (page 1024)
■Create surfaces from point cloud data (page 1021)
■Style point cloud data (page 675)
■Export point cloud data (page 1451)
Quick Reference
MAPPOINTCLOUDMANAGER
Creates and manages indexed point cloud data stores.
MAPPOINTCLOUDMANAGERCommand Line
Point Cloud ManagerDialog Box
MAPSURFACEMANAGER
Creates a 3D raster surface from point cloud data.
MAPSURFACEMANAGERCommand Line
Surface ManagerDialog Box
1014 | Chapter 6 Creating and Editing Data
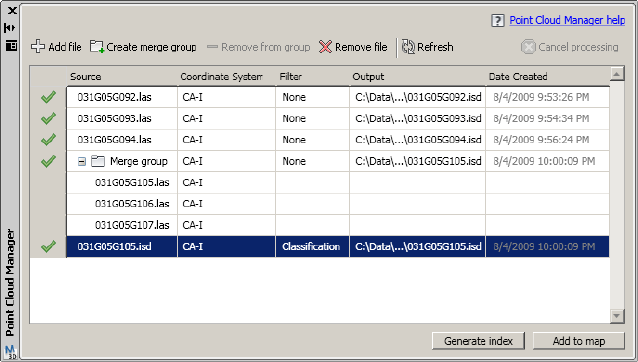
Managing LiDAR Data
The Point Cloud Manager
After you have brought files into the Point Cloud Manager (page 1897), you can
gather them into merge groups, specify coordinate systems for your point
cloud data store files, and apply filters to control what data will be included
in their associated point cloud data store.
When you create a Merge Group, AutoCAD Map 3D assigns several LiDAR
source files to a single point cloud data store. You might want to create a
merge group to apply a spatial filter across several source files, for example.
You can also create a group of point clouds in Display Manager that uses
separate point cloud data stores for each LiDAR source file.
AutoCAD Map 3D assigns a default name and save location for the point cloud
data store index file. You can view the default output name and location in
the Output field in the Point Cloud Manager.
In most cases, AutoCAD Map 3D automatically determines the coordinate
system of your LiDAR data based on information in the LAS file and displays
it in the Coordinate System field of the Point Cloud Manager. When you
create a point cloud data store, AutoCAD Map 3D assigns the source coordinate
system to it by default. If you are using an ASCII data source, or if AutoCAD
Map 3D cannot determine the appropriate coordinate system, you can specify
the coordinate system for your point cloud data store in this field.
Managing LiDAR Data | 1015

When you remove a merge group from the Point Cloud Manager, the files
contained within the group remain. To remove files from the Point Cloud
Manager, select the file and click Remove File. All files added to the Point
Cloud Manager appear there until you explicitly remove them.
You can apply a filter to your LiDAR source data to control what points are
included in your point cloud data store. You can also filter point cloud data
after it has been added to your map. If you are considering creating a filtered
point cloud data store from your LiDAR data, try filtering the point cloud data
in Display Manager first. This allows you to experiment with various filters
before applying them to your source files.
See also:
■Overview of Point Clouds (page 1012)
■Overview of LiDAR Data (page 1012)
■Overview of Point Cloud Files and Objects (page 1013)
■Bringing in LiDAR Data (page 374)
■Using LiDAR Data to Create a Point Cloud Data Store (page 1019)
■Creating Surfaces From Point Cloud Data (page 1021)
■Filtering Point Cloud Data (page 1024)
■Exporting Point Cloud Data (page 1451)
To specify a coordinate system for your point cloud data store
1In the Point Cloud Manager (page 1897), click the Coordinate System field.
2Do one of the following:
■If you know the coordinate system code, enter it into the Coordinate
System field.
■To choose the coordinate code from a list, click . Select the
appropriate coordinate system from the list, then click OK.
To specify an output file name and save location
1Click the Output field in the Point Cloud Manager (page 1897), then click
. The Save As dialog box appears.
1016 | Chapter 6 Creating and Editing Data

2Enter a new file name and save location, then click Save.
To create a merge group
1In the Point Cloud Manager (page 1897), click Create Group.
A new merge group appears in the Point Cloud Manager.
2To rename the merge group, click in the Source field and enter a new
name.
3Shift-click or control-click to select the source files in the Point Cloud
Manager, then drag them into the merge group.
4To specify an output file name and save location other than the one
assigned by default, click the Output field, then click .
5In the Save As dialog box, enter the file name and save location, then
click Save.
6To add another file to a merge group, click the file in the Point Cloud
Manager and drag it into the merge group.
You can also right click the merge group and select Add Files to bring in
additional files from your LiDAR data repository.
7To remove files from a merge group, select the file or files, then click
Remove From Group in the Point Cloud Manager.
When you remove files from a merge group, they remain in the Point
Cloud Manager. To remove files from the Point Cloud Manager, select
the file or files and click Remove File.
To remove a merge group from the Point Cloud Manager
1Select the merge group in the Point Cloud Manager (page 1897).
2Click Remove Group.
To filter LiDAR data
1In the Point Cloud Manager (page 1897), click the Filter field. appears.
Managing LiDAR Data | 1017
2In the Filter Point Cloud dialog box (page 1900)in the Filter By drop-down
box, select one of the following filters:
■Classification: if your LiDAR data has been classified, you can select
which point classes to include in your point cloud data store.
Shift-click or control-click to select multiple classes.
■Elevation: type the elevation ranges you want to include in your point
cloud data store. Use hyphens to define ranges and commas to separate
them; for example, 150-200, 350-400, 1200-2000.
■Intensity: you can use LiDAR intensity values to filter data. Use
hyphens to define ranges and commas to separate them; for example,
0.25-2.00, 3.50-4.00, 120.00-200.00.
■Spatial: click the Locate on Map button to apply a spatial filter for
your point cloud data store. You can make a spatial selection using a
circle, rectangle, polygon, or proximity to an object on your map.
Click Apply Filter.
AutoCAD Map 3D displays the filter type in the Filter field.
To remove a filter from your LiDAR data
1In the Point Cloud Manager (page 1897), click the Filter field. The Filter
Point Cloud dialog box (page 1900)appears.
2In the Filter By drop-down box, select the filter type you want to remove.
3Click Clear Filter.
To remove a file from the Point Cloud Manager
1Select the file in the Point Cloud Manager (page 1897).
2Click Remove File.
Quick Reference
MAPPOINTCLOUDMANAGER
Creates and manages indexed point cloud data stores.
MAPPOINTCLOUDMANAGERCommand Line
Point Cloud ManagerDialog Box
1018 | Chapter 6 Creating and Editing Data

Using LiDAR Data to Create a Point Cloud Data Store
Once you have brought your LiDAR data into the Point Cloud Manager (page
1897), you are ready to create a point cloud data store. A point cloud data store
is an index file (.ISD) that AutoCAD Map 3D refers to when it creates point
cloud objects. These index files can be very large, up to ten times as large as
their LAS source files. AutoCAD Map 3D may take a long time to generate
these index files, and you must ensure that you have sufficient disk space to
store them.
NOTE You can also create a point cloud index file using AutoCAD commands.
Point cloud index files created using AutoCAD commands have the .PCG file
extension. For information on creating point cloud index files using AutoCAD
commands, see the AutoCAD Help.
See also:
■Overview of Point Clouds (page 1012)
■Overview of LiDAR Data (page 1012)
■Overview of Point Cloud Files and Objects (page 1013)
■Bringing in LiDAR Data (page 374)
■Creating Surfaces From Point Cloud Data (page 1021)
■Managing LiDAR Data (page 1015)
■Filtering Point Cloud Data (page 1024)
■Exporting Point Cloud Data (page 1451)
To create a point cloud data store
1In the Point Cloud Manager (page 1897), select the source file or merge
group for which you want to create a point cloud data store.
2Check the Output field to confirm the file name and save location of
your index file.
3Click Generate Index.
4To cancel the indexing process, click Cancel Processing.
Using LiDAR Data to Create a Point Cloud Data Store | 1019

5When AutoCAD Map 3D is done creating the index file, a green check
mark appears next to the file or merge group name. You can now take
one of the following actions:
■To add the point cloud to your map, click Add to Map. AutoCAD Map
3D adds the point cloud drawing object to your map, and adds a point
cloud layer to the Display Manager.
■To add a group of point clouds to your map, shift-click or control-click
to select a group of files, then click Add to Map.
AutoCAD Map 3D adds the point cloud drawing object to your map,
and adds a point cloud layer to the Display Manager.
NOTE You can also create a group of point clouds in the Display Manager.
Right-click in Display Manager and select Data ➤ New Group, then click
and drag point cloud layers into the new group.
See also:
■Overview of Point Cloud Files and Objects (page 1013)
■Bringing in LiDAR Data (page 374)
■Creating Surfaces From Point Cloud Data (page 1021)
■Managing LiDAR Data (page 1015)
■Filtering Point Cloud Data (page 1024)
■Exporting Point Cloud Data (page 1451)
Quick Reference
MAPPOINTCLOUDMANAGER
Creates and manages indexed point cloud data stores.
MAPPOINTCLOUDMANAGERCommand Line
Point Cloud ManagerDialog Box
1020 | Chapter 6 Creating and Editing Data
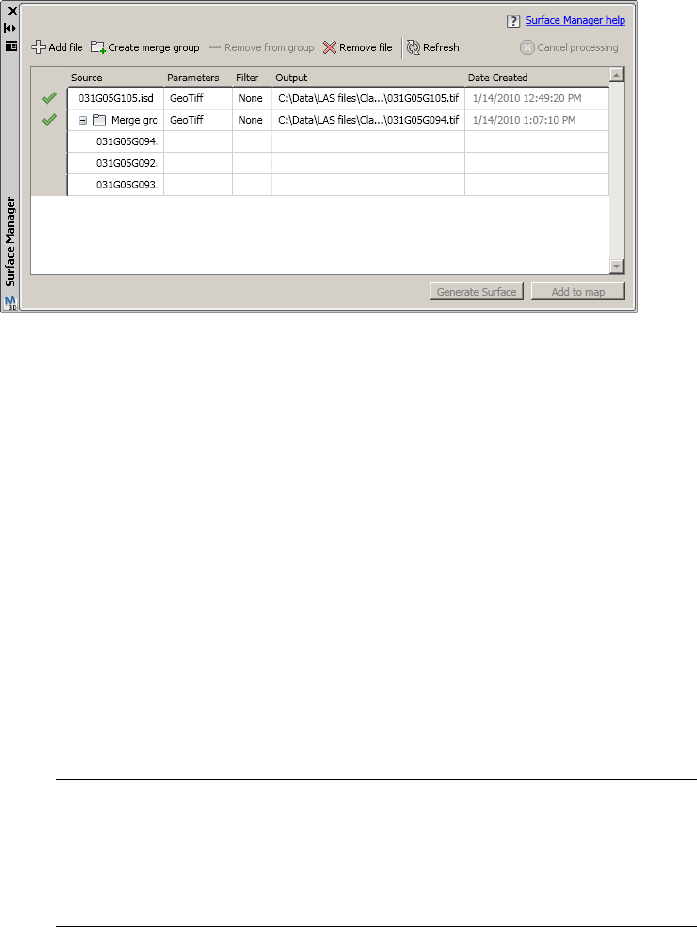
Creating Surfaces From Point Cloud Data
The Surface Manager
You can create a raster-based surface (page 2076) from point cloud data in either
GeoTIFF or ESRI ASC format. After you have created your surface, you can
view, theme, and analyze it like any other raster-based surface in AutoCAD
Map 3D. For more information on working with raster-based surfaces, see
Adding Rasters and Surfaces (page 437), Analyzing Raster-Based Surfaces (page
1186), and Styling Raster Images (page 671).
The Surface Manager (page 1898) also allows you to assign multiple input files
to a single surface file using merge groups. You might want to create a merge
group in order to apply a spatial filter across several input files, for example.
The source files for a merge group must use the same coordinate system.
Before you create a surface from point cloud data, ensure that the data is
projected in a local coordinate system that uses feet or meters for vertical
units. If the source data is not in a local coordinate system, you can either
assign a local system to it in the Point Cloud Manager (page 1897), or assign a
local system to your drawing. Assigning a local coordinate system to the point
cloud data using the Point Cloud Manager will give you better performance.
NOTE AutoCAD Map 3D automatically resamples the raster-based surfaces when
you zoom in and out in your map. However, surfaces do not display well at some
zoom levels, especially at small view scales. To improve the appearance of the
surface in your map, you can resample the raster image by right-clicking the raster
layer in the Display Manager and selecting Resample Raster. If resampling the
surface does not improve the image quality, view the grid at a larger view scale.
Creating Surfaces From Point Cloud Data | 1021
See also:
■Overview of Point Clouds (page 1012)
■Overview of LiDAR Data (page 1012)
■Overview of Point Cloud Files and Objects (page 1013)
■Bringing in LiDAR Data (page 374)
■Using LiDAR Data to Create a Point Cloud Data Store (page 1019)
■Managing LiDAR Data (page 1015)
■Filtering Point Cloud Data (page 1024)
■Exporting Point Cloud Data (page 1451)
To create a surface from a point cloud
1In the Display Manager, right-click a point cloud layer and select Create
Surface. The Surface Manager (page 1898) appears.
2To create a merge group, click Create Group in the Create Surface dialog
box (page 1895), then shift-click or control-click and drag the desired source
files into the group.
3To filter the points used to create the surface, click the Filter field. The
Filter Point Cloud dialog box (page 1900) appears.
4In the Filter By drop-down box, select one of the following filters:
■Classification: if your point cloud data has been classified, you can
select which point classes to use when creating the surface. Shift-click
or control-click to select multiple classes.
■Elevation: type the elevation ranges you want to use to create the
surface. Use hyphens to define ranges and commas to separate them;
for example, 150-200, 350-400, 1200-2000.
■Intensity: you can use LiDAR intensity values to filter data. Use
hyphens to define ranges and commas to separate them; for example,
0.25-2.00, 3.50-4.00, 120.00-200.00.
■Spatial: click the Locate on Map button to apply a spatial filter to your
point cloud. You can make a spatial selection using a circle, rectangle,
polygon, or proximity to an object on your map.
1022 | Chapter 6 Creating and Editing Data
5To specify what type of surface to create, click the Parameters field. The
Grid Parameters dialog box (page 1901) appears. You can:
■Specify a GeoTIFF or ESRI ASC surface.
■Specify a file name and save location for the grid file.
■Specify parameters for cell size, cell units (meters, US feet, Survey feet,
International feet), and search radius. These settings affect the
resolution of the grid file only.
■Fill gaps: when you check the Fill Gaps check box, you can select how
AutoCAD Map 3D fills gaps in your surface. Choose a fill method from
the drop-down list: Nearest Neighbor, Normal Distribution, Normal
Distribution Smooth, Square Distance, or Square Distance Smooth.
6To specify an output file name and save location other than the one
assigned by default, click the Output field, then click . The Save As
dialog box appears. Enter the file name and save location, then click Save.
7Click Generate Surface. AutoCAD Map 3D begins to create the surface.
8To cancel the surface creation process, click Cancel Processing.
9When AutoCAD Map 3D is done creating the surface, a green check mark
appears next to the file or merge group name. Do one of the following:
■To add the surface to your map, click Add to Map. AutoCAD Map 3D
adds the surface to your map, and a raster layer to the Display
Manager. It also creates a raster connection in Data Connect.
■To add a surface group to your map, shift-click or control-click to
select a group of files, then click Add to Map. AutoCAD Map 3D adds
a new raster connection to Data Connect. Select the new raster
connection, then select the surfaces you would like to include and
click Add to Map. If your surfaces are all the same file type, you can
select Combine Into One Layer and specify a layer name.
NOTE You can also connect to surfaces created from point cloud data using
Data Connect as you would for any other raster data. For more information
on connecting to raster data through Data Connect, see Adding Raster-Based
Surfaces to Your Map (page 441).
Creating Surfaces From Point Cloud Data | 1023

Quick Reference
MAPSURFACEMANAGER
Creates a 3D raster surface from point cloud data.
MAPSURFACEMANAGERCommand Line
Surface ManagerDialog Box
Filtering Point Cloud Data
You can filter point clouds by point classification, elevation, LiDAR intensity,
and location on your map. You can also create a new point cloud data store
from your filtered point cloud data.
Filters applied in the Display Manager or Point Cloud Ribbon only control
the display of points in your map. They do not remove any of the points from
the point cloud. To create a new point cloud containing a subset of your source
data, use the filter in the Point Cloud Manager. For more information on
filtering point cloud data, see Lesson 4: Work with Point Cloud Data.
NOTE If you are working with a point cloud created using AutoCAD commands
(.PCG file), you can only filter by elevation and location on map.
See also:
■Overview of Point Clouds (page 1012)
■Overview of LiDAR Data (page 1012)
■Overview of Point Cloud Files and Objects (page 1013)
■Bringing in LiDAR Data (page 374)
■Using LiDAR Data to Create a Point Cloud Data Store (page 1019)
■Creating Surfaces From Point Cloud Data (page 1021)
■Managing LiDAR Data (page 1015)
■Exporting Point Cloud Data (page 1451)
1024 | Chapter 6 Creating and Editing Data

To filter point cloud data
1In the Display Manager, right-click a point cloud layer and select Filter
Point Cloud.
2In the Filter Point Cloud dialog box (page 1900), in the Filter By drop-down
box, select one of the following filters:
■Classification: if your point cloud data has been classified, you can
select which point classes to display. Shift-click or control-click to
select multiple classes.
■Elevation: type the elevation ranges you want to display in your map.
Use hyphens to define ranges and commas to separate them; for
example, 150-200, 350-400, 1200-2000.
■Intensity: you can use LiDAR intensity values to filter data. Use
hyphens to define ranges and commas to separate them; for example,
0.25-2.00, 3.50-4.00, 120.00-200.00.
■Spatial: click the Locate on Map button to apply a spatial filter to your
point cloud. You can make a spatial selection using a circle, rectangle,
polygon, or proximity to an object on your map.
3Click Apply Filter.
The filtered points are displayed in your map.
To create a new point cloud data store from filtered point cloud data
1In the Display Manager, right-click the filtered point cloud layer from
which you want to create a new point cloud data store, then select Data
➤ Add Point Cloud Data ➤ Create New Index.
The Point Cloud Manager (page 1897) appears with a row for your new
point cloud data store highlighted, and with the filter type displayed in
the Filter field.
NOTE You cannot create a new index from an AutoCAD point cloud index
(.PCG file).
2In the Point Cloud Manager, select a file name and save location for your
new point cloud data store, then click Generate Index.
AutoCAD Map 3D begins to create the index file.
Filtering Point Cloud Data | 1025

NOTE By default, AutoCAD Map 3D gives the new index file the same name
as the source file. Be sure that you specify a new name for your filtered point
cloud data store to avoid overwriting your source file.
3To cancel the indexing process, click Cancel Processing.
4When AutoCAD Map 3D is done creating the index file, a green check
mark appears next to the file or merge group name. Do one of the
following: To add the point cloud to your map, click Add to Map.
AutoCAD Map 3D adds the point cloud drawing object to your map, and
adds a point cloud layer to the Display Manager.
To remove a filter from your point cloud data
1In the Display Manager, right-click a point cloud layer and select Filter
Point Cloud.
2In the Filter Point Cloud dialog box (page 1900), in the Filter By drop-down
box, select the filter type you want to remove.
3Click Clear Filter.
Quick Reference
MAPPOINTCLOUDMANAGER
Creates and manages indexed point cloud data stores.
MAPPOINTCLOUDMANAGERCommand Line
Point Cloud ManagerDialog Box
Entering Coordinate Geometry
Use coordinate geometry to enter accurate geometry when creating objects.
For example, you can create parcel boundaries from legal documents or survey
data.
To enter coordinate geometry
■To create a point using the COGO Input dialog box (page 1028)
1026 | Chapter 6 Creating and Editing Data

■To create a point using the COGO Input dialog box transparently (page
1028)
■To use COGO commands (page 1029)
■To specify a point using angle and distance (page 1032)
■To specify a point using bearing and distance (page 1034)
■To specify a point using bearings from two existing points (page 1036)
■To specify a point using a deflection angle and a distance (page 1038)
■To specify a point using distances from two existing points (page 1040)
■To specify a point using azimuth and distance (page 1042)
■To specify a point using distance and offset from a line (page 1044)
■To create an inverse report (page 1046)
Overview of Coordinate Geometry Commands
Use the coordinate geometry (COGO) input commands to enter accurate
geometry when creating objects. For example, you can create parcel boundaries
from legal documents or survey data.
You can access COGO commands from the COGO Input dialog box (page
1668). The COGO Input dialog box is available on the ribbon as well as on the
tool bar of the Task Pane Survey tab. You can also enter COGO data
“transparently” (while running other commands) by entering ‘mapcogo at
the command prompt.
For example, start the Polyline (PLINE) command. When prompted for the
next point in the polyline, enter ‘mapcogo. The COGO Input dialog box
appears. Select a COGO routine, and enter the COGO data to calculate the
new point. When you finish specifying the point, the Polyline command
prompts you to enter the next point. You can enter the point normally, or
you can start another transparent command to specify the point.
NOTE You can still access most COGO commands transparently by typing an
apostrophe (‘) plus the command name (AD, BB, BD, DD, DDIST, ZD).
Orthogonal/Offset and Inverse Report are only available from the COGO Input
dialog box.
It can be very helpful to enable node object snapping when specifying points
using coordinate geometry. Node object snapping allows you to snap to point
objects in the drawing window, which makes selecting points much easier.You
can enable this option in the AutoCAD Drafting Settings dialog box. See the
AutoCAD help for more information.
Overview of Coordinate Geometry Commands | 1027
See also:
■Using Angle and Distance to Specify a Point (page 1032)
■Using Bearing and Distance to Specify a Point (page 1034)
■Using Bearings from Two Points to Specify a Point (page 1036)
■Using Deflection and Distance to Specify a Point (page 1037)
■Using Distances from Two Points to Specify a Point (page 1040)
■Using Azimuth and Distance to Specify a Point (page 1042)
■Using Distance and Offset from a Line to Specify a Point (page 1044)
■Creating an Inverse Report (page 1045)
■Setting Coordinate Geometry Options (page 233)
■Tutorial: Working with Survey Data
To create a point using the COGO Input dialog box
1Click Home tab ➤ Draw panel ➤ COGO drop-down ➤ COGO Input.
2In the COGO Input dialog box (page 1668), select the routine to use.
3Enter the appropriate data in the Input section.
4Click Calculate. AutoCAD Map 3D calculates the new point, and previews
it on your map. Click Pan to pan to the new point.
5Click Create Point.
To create a point using the COGO Input dialog box transparently
1Start a command, such as PLINE.
2When prompted for input, instead of specifying the input, enter ‘mapcogo
at the command prompt.
3In the COGO Input dialog box (page 1668), select the routine you want to
use.
4Enter the appropriate data in the Input section.
5Click Calculate. AutoCAD Map 3D calculates the new point, and previews
it on your map. Click the Pan button to pan to the new point.
6Click Create Point.
1028 | Chapter 6 Creating and Editing Data
7When the transparent command finishes, continue responding to the
prompts for the original command.
To use COGO commands
Use this method...To do this...
Use COGO to enter angle and distance to
specify a point. (page 1032)
Use an angle and a distance from another
point to create an object.
Use COGO to enter bearing and distance
to specify a point. (page 1034)
Use a bearing and a distance from another
point to create an object.
Use COGO to enter two bearings to specify
a point. (page 1036)
Use bearings from two points to create a
point.
Use COGO to enter deflection angle and
distance to specify a point. (page 1038)
Use a deflection angle and a distance from
another point to create an object.
Use COGO to enter two distances to spe-
cify a point. (page 1040)
Use distances from two points to create a
point.
Use COGO to enter azimuth and distance
to specify a point. (page 1042)
Use azimuth and distance from another
point to create an object.
Use COGO to enter distance and offset to
specify a point. (page 1044)
Use an offset distance from a line to create
a point.
Use COGO to create an inverse report.
(page 1045)
Generate an inverse report to determine
the relationship between two points.
Quick Reference
MAPCOGO
Specifies data for coordinate geometry calculations and reports
Click Home tab ➤ Draw panel ➤ COGO
Drop-down ➤ COGO Input.
Menu
MAPCOGOCommand Line
COGO Input dialog boxDialog Box
Overview of Coordinate Geometry Commands | 1029

AD
Specifies a point based on angle and distance from a given point
Angle/Distance
Icon
'ADCommand Line
COGO Input dialog boxDialog Box
BB
Specifies a coordinate geometry point using two points and two bearings
Click Home tab ➤ Draw panel ➤ COGO
Drop-down ➤ COGO Input.
Menu
Bearing/Bearing
Icon
'BBCommand Line
COGO Input dialog boxDialog Box
BD
Specifies a point based on bearing and distance from a given point
Click Home tab ➤ Draw panel ➤ COGO
Drop-down ➤ COGO Input.
Menu
Bearing/Distance
Icon
'BDCommand Line
COGO Input dialog boxDialog Box
DD
Specifies a point based on deflection and distance from a given point
Click Home tab ➤ Draw panel ➤ COGO
Drop-down ➤ COGO Input.
Menu
1030 | Chapter 6 Creating and Editing Data

Deflection/Distance
Icon
'DDCommand Line
COGO Input dialog boxDialog Box
DDIST
Specifies a coordinate geometry point using two points and two distances
Click Home tab ➤ Draw panel ➤ COGO
Drop-down ➤ COGO Input.
Menu
Distance/Distance
Icon
'DDISTCommand Line
COGO Input dialog boxDialog Box
ZD
Specifies a point based on azimuth and distance from a given point
Click Home tab ➤ Draw panel ➤ COGO
Drop-down ➤ COGO Input.
Menu
Azimuth Distance
Icon
'ZDCommand Line
COGO Input dialog boxDialog Box
MAPCGSETUP
Specifies coordinate geometry settings
At the Command prompt, enter mapcgsetup.Menu
COGO Options
Icon
MAPCGSETUPCommand Line
Setting Coordinate Geometry OptionsDialog Box
Overview of Coordinate Geometry Commands | 1031
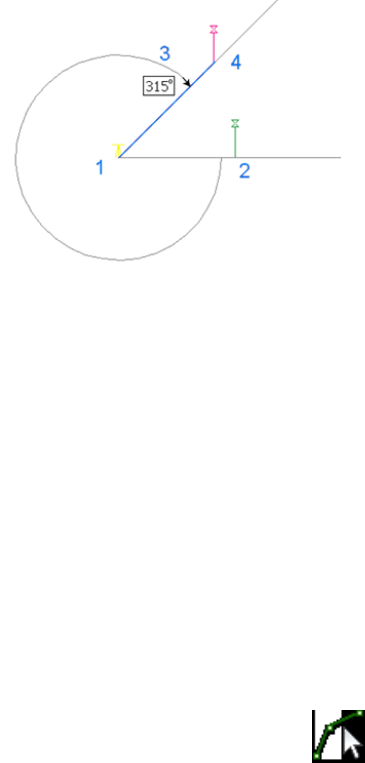
Using Angle and Distance to Specify a Point
When creating an object, such as a line or an arc, you can specify a point by
specifying an angle and a distance from another point.
Select the line from which to measure the
angle by selecting an existing line in your
drawing, or by specifying a starting and
ending point (1 and 2) for the line. Then
specify the angle (3) and the distance from
the starting point (4).
See also:
■Overview of Coordinate Geometry Commands (page 1027)
To specify a point using angle and distance
1Click Home tab ➤ Draw panel ➤ COGO drop-down ➤ COGO Input.
■To use the Angle/Distance routine transparently, start a command,
such as PLINE or ARC, then enter ‘mapcogo.
2In the COGO Input dialog box (page 1668), select the Angle/Distance
routine.
3Specify the line to use to measure the angle. Click to select the
line on the map.
■For the first point of an object, specify a starting point and ending
point for the line, or select an existing line in the drawing.
1032 | Chapter 6 Creating and Editing Data
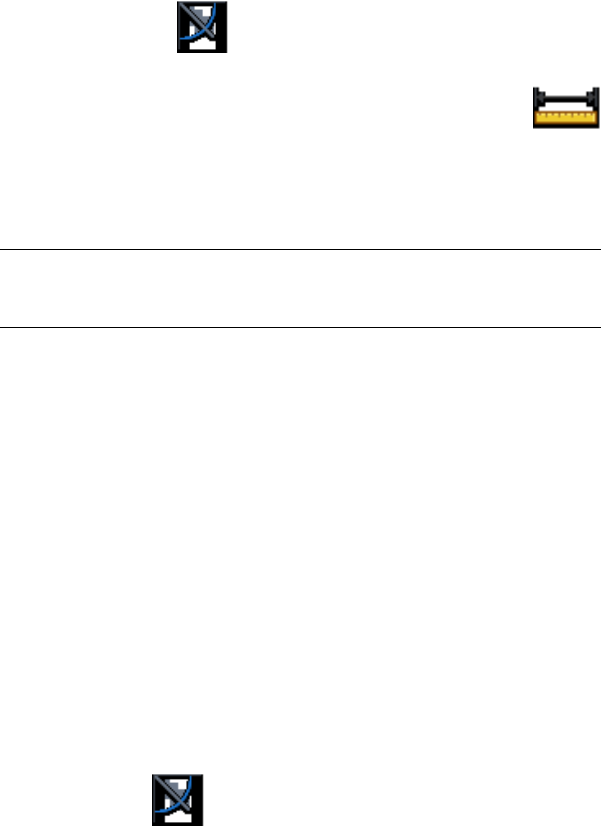
■For a later point in the object, specify just the ending point for the
line. The previous point of the object is the starting point of the line.
4Enter the angle from the line you just specified to the line that specifies
the new point. Click to select the angle on the map.
5Enter the distance from the starting point to the new point. Click
to select the distance on the map.
6Click Calculate. AutoCAD Map 3D calculates the new point, and previews
it on your map. Click the Pan button to pan to the new point.
NOTE If you turn on the Prompt For 3D Data Input option in the Coordinate
Geometry Setup dialog box (page 1917), you can enter an elevation value in
the Result section of the COGO Input dialog box (page 1668).
7Click Create Point.
Quick Reference
MAPCOGO
Specifies data for coordinate geometry calculations and reports
Click Home tab ➤ Draw panel ➤ COGO
Drop-down ➤ COGO Input.
Menu
MAPCOGOCommand Line
COGO Input dialog boxDialog Box
AD
Specifies a point based on angle and distance from a given point
Angle/Distance
Icon
'ADCommand Line
COGO Input dialog boxDialog Box
Using Angle and Distance to Specify a Point | 1033
Using Bearing and Distance to Specify a Point
When creating an object, such as a line or an arc, you can specify a point by
specifying a bearing and a distance from another point.
Select a starting point (1) and a
quadrant (2). Then specify the bearing
angle (3) and the distance from the
starting point (4).
See also:
■Overview of Coordinate Geometry Commands (page 1027)
To specify a point using bearing and distance
1Click Home tab ➤ Draw panel ➤ COGO drop-down ➤ COGO Input.
■To use the Bearing/Distance routine transparently, start a command,
such as PLINE or ARC, then enter ‘mapcogo.
2In the COGO Input dialog box (page 1668), select the Bearing/Distance
routine.
3For the first point of an object, specify a starting point. For a later point
in the object, the previous point for the object is the starting point. Click
to select the point on the map.
4Enter the quadrant (NE, SE, SW, NW). If you are entering surveyor’s units,
quadrant entry will be disabled.
5Enter the angle. Click to specify the angle on the map.
1034 | Chapter 6 Creating and Editing Data
Use the current angular units setting, decimal values, such as 45.1111,
or surveyor’s units, such as N 45d3'55" E.
6Enter the distance from the starting point. Click to select the
distance on the map.
7Click Calculate. AutoCAD Map 3D calculates the new point, and previews
it on your map. Click the Pan button to pan to the new point.
NOTE If you turn on the Prompt For 3D Data Input option in the Coordinate
Geometry Setup dialog box (page 1917), you can enter an elevation value in
the Result section of the COGO Input dialog box (page 1668).
8Click Create Point.
Quick Reference
MAPCOGO
Specifies data for coordinate geometry calculations and reports
Click Home tab ➤ Draw panel ➤ COGO
Drop-down ➤ COGO Input.
Menu
MAPCOGOCommand Line
COGO Input dialog boxDialog Box
BD
Specifies a point based on bearing and distance from a given point
Click Home tab ➤ Draw panel ➤ COGO
Drop-down ➤ COGO Input.
Menu
Bearing/Distance
Icon
'BDCommand Line
COGO Input dialog boxDialog Box
Using Bearing and Distance to Specify a Point | 1035
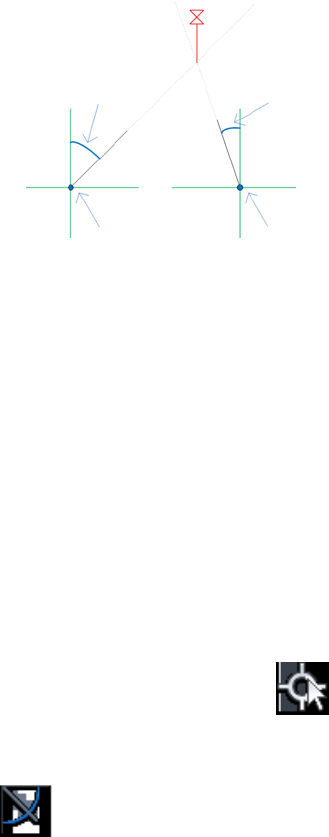
Using Bearings from Two Points to Specify a Point
The bearing/bearing command allows you to specify a point using the
projections from two existing lines or points and two bearings.You can also
enter the data in segments (point, bearing).
Specify the two points and bearings
from those points to calculate the
location of a third point.
See also:
■Overview of Coordinate Geometry Commands (page 1027)
■Tutorial: Working with Survey Data
To specify a point using bearings from two existing points
1Click Home tab ➤ Draw panel ➤ COGO drop-down ➤ COGO Input.
■To use the Bearing/Bearing routine transparently, start a command,
such as PLINE or ARC, then enter ‘mapcogo.
2In the COGO Input dialog box (page 1668), select the Bearing/Bearing
routine.
3Enter the coordinates for the first point, or click to select the point
on the map or in the data table.
4Select the quadrant for the bearing, then specify the bearing direction in
degrees. Click to specify the bearing on the map.
1036 | Chapter 6 Creating and Editing Data
5Repeat steps 3-5 for the second point and bearing.
6Click Calculate. AutoCAD Map 3D calculates the new point, and previews
it on your map. Click the Pan button to pan to the new point.
NOTE If you turn on the Prompt For 3D Data Input option in the Coordinate
Geometry Setup dialog box (page 1917), you can enter an elevation value in
the Result section of the COGO Input dialog box (page 1668).
7Click Create Point.
Quick Reference
MAPCOGO
Specifies data for coordinate geometry calculations and reports
Click Home tab ➤ Draw panel ➤ COGO
Drop-down ➤ COGO Input.
Menu
MAPCOGOCommand Line
COGO Input dialog boxDialog Box
BB
Specifies a coordinate geometry point using two points and two bearings
Click Home tab ➤ Draw panel ➤ COGO
Drop-down ➤ COGO Input.
Menu
Bearing/Bearing
Icon
'BBCommand Line
COGO Input dialog boxDialog Box
Using Deflection and Distance to Specify a Point
When creating an object, such as a line or an arc, you can specify a point by
specifying a deflection angle and a distance from another point.
Using Deflection and Distance to Specify a Point | 1037
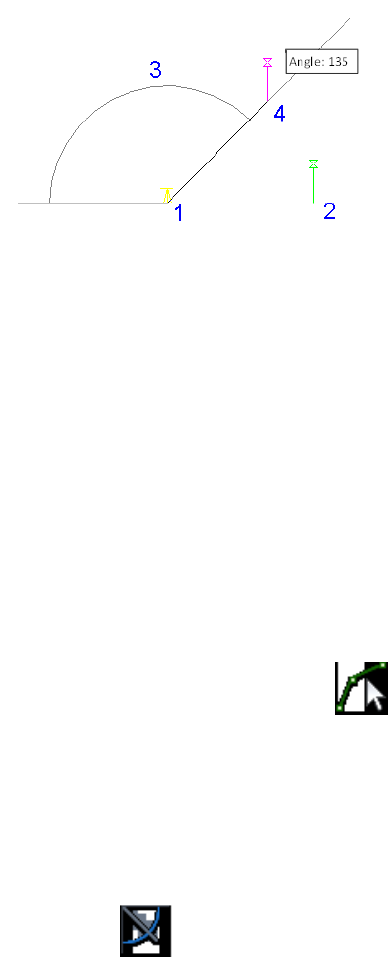
Select the line from which to measure the deflection
angle by either selecting an existing line in your
drawing, or by specifying a starting and ending point
(1 and 2) for the line. Then specify the deflection angle
(3) and the distance from the starting point (4).
See also:
■Overview of Coordinate Geometry Commands (page 1027)
To specify a point using a deflection angle and a distance
1Click Home tab ➤ Draw panel ➤ COGO drop-down ➤ COGO Input.
■To use the Deflection/Distance routine transparently, start a command,
such as PLINE or ARC, then enter ‘mapcogo.
2In the COGO Input dialog box (page 1668), select the Deflection/Distance
routine.
3Specify the line to use to measure the angle. Click to select the
line on the map.
■For the first point of an object, specify a starting point and ending
point for the line, or select an existing line in the drawing.
■For a later point in the object, specify just the ending point for the
line. The previous point of the object is the starting point of the line.
4Enter the deflection angle from the line you just specified to the line of
the new direction. Click to specify the angle on the map.
1038 | Chapter 6 Creating and Editing Data

Use the current angular units setting, decimal values, such as 45.1111,
or surveyor’s units, such as N 45d3'55" E.
5Enter the distance from the starting point. Click to select the
distance on the map.
6Click Calculate. AutoCAD Map 3D calculates the new point, and previews
it on your map. Click the Pan button to pan to the new point.
NOTE If you turn on the Prompt For 3D Data Input option in the Coordinate
Geometry Setup dialog box (page 1917), you can enter an elevation value in
the Result section of the COGO Input dialog box (page 1668).
7Click Create Point.
Quick Reference
MAPCOGO
Specifies data for coordinate geometry calculations and reports
Click Home tab ➤ Draw panel ➤ COGO
Drop-down ➤ COGO Input.
Menu
MAPCOGOCommand Line
COGO Input dialog boxDialog Box
DD
Specifies a point based on deflection and distance from a given point
Click Home tab ➤ Draw panel ➤ COGO
Drop-down ➤ COGO Input.
Menu
Deflection/Distance
Icon
'DDCommand Line
COGO Input dialog boxDialog Box
Using Deflection and Distance to Specify a Point | 1039
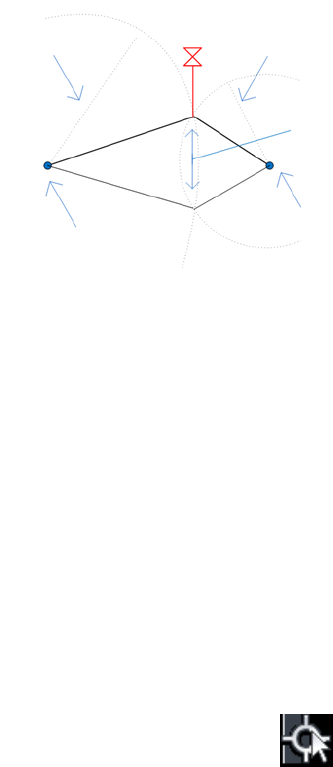
Using Distances from Two Points to Specify a Point
The distance/distance command allows you to calculated a new point using
two points and two distances to the new point. You can only select one of
the calculated points.
Select the first point and distance, then the
second point and distance. Choose one of
the two intersections to create your new
point.
See also:
■Overview of Coordinate Geometry Commands (page 1027)
■Tutorial: Working with Survey Data
To specify a point using distances from two existing points
1Click Home tab ➤ Draw panel ➤ COGO drop-down ➤ COGO Input.
■To use the Distance/Distance routine transparently, start a command,
such as PLINE or ARC, then enter ‘mapcogo.
2In the COGO Input dialog box (page 1668), select the Distance/Distance
routine.
3Enter the coordinates for the first point, or click to select the point
on the map or in the data table.
1040 | Chapter 6 Creating and Editing Data
4Select the distance from the first point. Click to specify the
distance on the map.
5Repeat steps 3-5 for the second point and distance.
6Click Calculate. AutoCAD Map 3D calculates the new point, and previews
it on your map. Click the Pan button to pan to the new point. If there is
no intersection, the Result box will be shaded, and will display “No
intersection found!”
NOTE If you turn on the Prompt For 3D Data Input option in the Coordinate
Geometry Setup dialog box (page 1917), you can enter an elevation value in
the Result section of the COGO Input dialog box (page 1668).
7Select the intersection you want, then click Create Point.
Quick Reference
MAPCOGO
Specifies data for coordinate geometry calculations and reports
Click Home tab ➤ Draw panel ➤ COGO
Drop-down ➤ COGO Input.
Menu
MAPCOGOCommand Line
COGO Input dialog boxDialog Box
DDIST
Specifies a coordinate geometry point using two points and two distances
Click Home tab ➤ Draw panel ➤ COGO
Drop-down ➤ COGO Input.
Menu
Distance/Distance
Icon
'DDISTCommand Line
COGO Input dialog boxDialog Box
Using Distances from Two Points to Specify a Point | 1041
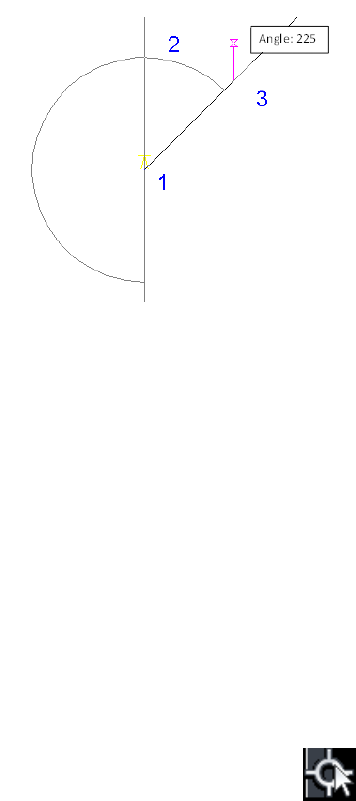
Using Azimuth and Distance to Specify a Point
When creating an object, such as a line or an arc, you can specify a point by
specifying azimuth and distance from another point. Azimuth is the clockwise
angle from the North (or South) meridian.
Select a starting point (1). Then specify the azimuth
angle (2) and the distance from the starting point
(3).
See also:
■Overview of Coordinate Geometry Commands (page 1027)
To specify a point using azimuth and distance
1Click Home tab ➤ Draw panel ➤ COGO drop-down ➤ COGO Input.
■To use the Azimuth/Distance routine transparently, start a command,
such as PLINE or ARC, then enter ‘mapcogo.
2In the COGO Input dialog box (page 1668), select the Azimuth/Distance
routine.
3For the first point of an object, specify a starting point for the
measurement. For a later point in the object, the previous point you
specified for the object is the starting point. Click to select a point
on the map.
1042 | Chapter 6 Creating and Editing Data
4Enter the azimuth, which is the clockwise angle from the North (or South)
meridian to the line of the new direction. Click to specify the angle
on the map.
Enter the angle using the current angular units setting, decimal values,
such as 45.1111, or surveyor’s units, such as N 45d3'55" E.
5Enter the distance from the starting point to the new point. Click
to select the distance on the map.
6Click Calculate. AutoCAD Map 3D calculates the new point, and previews
it on your map. Click the Pan button to pan to the new point.
NOTE If you turn on the Prompt For 3D Data Input option in the Coordinate
Geometry Setup dialog box (page 1917), you can enter an elevation value in
the Result section of the COGO Input dialog box (page 1668).
7Click Create Point.
Quick Reference
MAPCOGO
Specifies data for coordinate geometry calculations and reports
Click Home tab ➤ Draw panel ➤ COGO
Drop-down ➤ COGO Input.
Menu
MAPCOGOCommand Line
COGO Input dialog boxDialog Box
ZD
Specifies a point based on azimuth and distance from a given point
Click Home tab ➤ Draw panel ➤ COGO
Drop-down ➤ COGO Input.
Menu
Azimuth Distance
Icon
Using Azimuth and Distance to Specify a Point | 1043
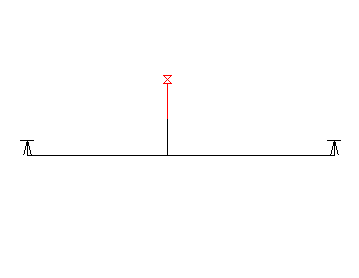
'ZDCommand Line
COGO Input dialog boxDialog Box
Using Distance and Offset from a Line to Specify a Point
You can specify a point using distance and offset from an existing line. You
select the line, enter a distance from the start point, and an offset on either
side of the line. This command is called Orthogonal/Offset, and it is accessible
only from the COGO Input dialog box (page 1668).
Select a line, a distance from the start point of
the line, and an offset distance.
See also:
■Overview of Coordinate Geometry Commands (page 1027)
To specify a point using distance and offset from a line
The Orthogonal/Offset command does not work as a transparent command.
It is only accessible from the COGO Input dialog box (page 1668).
1Click Home tab ➤ Draw panel ➤ COGO drop-down ➤ COGO Input.
■To use the Orthogonal/Offset routine transparently, start a command,
such as PLINE or ARC, then enter ‘mapcogo.
2In the COGO Input dialog box (page 1668), select the Orthogonal/Offset
routine.
1044 | Chapter 6 Creating and Editing Data
3Enter the coordinates for the start and end points of the line, or click
to select the line on the map.
4Enter the distance from the start point, or click to specify the
distance on the map.
5Repeat steps 3-4 for the second point and distance.
6Click Calculate. AutoCAD Map 3D calculates the new point, and previews
it on your map. Click the Pan button to pan to the new point.
NOTE If you turn on the Prompt For 3D Data Input option in the Coordinate
Geometry Setup dialog box (page 1917), you can enter an elevation value in
the Result section of the COGO Input dialog box (page 1668).
7Click Create Point.
Quick Reference
MAPCOGO
Specifies data for coordinate geometry calculations and reports
Click Home tab ➤ Draw panel ➤ COGO
Drop-down ➤ COGO Input.
Menu
MAPCOGOCommand Line
COGO Input dialog boxDialog Box
Creating an Inverse Report
An inverse report gives you information about the relationship between two
points. The inverse report command is only accessible from the COGO Input
dialog box (page 1668).
The inverse report gives you the following information about the relationship
between the two points:
■Bearing
Creating an Inverse Report | 1045

■Quadrant
■Horizontal Distance
■Vertical Distance
■Slope Distance
■Vertical Angle
■Percent Slope
See also:
■Overview of Coordinate Geometry Commands (page 1027)
To create an inverse report
1Click Home tab ➤ Draw panel ➤ COGO drop-down ➤ COGO Input.
2In the COGO Input dialog box (page 1668), select the Inverse Report routine.
3Enter the coordinates for the first point, or click to select the point
on the map or in the data table.
4Enter the coordinates for the second point, or click to select the
point on the map or in the data table.
5View the report in the Report area of the COGO Input dialog box (page
1668).
Quick Reference
MAPCOGO
Specifies data for coordinate geometry calculations and reports
Click Home tab ➤ Draw panel ➤ COGO
Drop-down ➤ COGO Input.
Menu
MAPCOGOCommand Line
COGO Input dialog boxDialog Box
1046 | Chapter 6 Creating and Editing Data

Working with Attribute Data and Object Data
To use attribute data and object data
■To use the Data View (page 1047)
■To enter and edit object data (page 1061)
Viewing External Data Sources for Drawing Object Data
Use the Data View to view and edit external database tables that are linked to
drawing objects. If you have joined data to geospatial features (page 507), use
the Data Table to view that information.
■Overview of Viewing External Data Sources for Drawing Objects (page 1048)
■Opening a Database Table (page 1052)
■Editing a Database (page 1055)
■Changing the Look of the Data View (page 1057)
■Freezing and Hiding Data View Columns (page 1059)
See also:
■Finding Records in a Database Linked to Drawing Objects (page 1221)
■Editing Features using the Data Table (page 711)
NOTE This procedure is for drawing objects only. If you have joined data to
geospatial features (page 507), use the Data Table to view that information.
To use the Data View
■To use the Data View to view and edit external database tables (page 1048)
■To open a table using the Task Pane (page 1053)
■To edit a database record that is linked to a drawing object (page 1056)
■To turn off AutoCommit (page 1056)
■To save changes manually when AutoCommit is off (page 1056)
■To change the width of a column in Data View (page 1058)
■To change the formatting of cells in a column in Data View (page 1058)
■To freeze columns in the Data View (page 1059)
■To hide columns in the Data View (page 1060)
Working with Attribute Data and Object Data | 1047
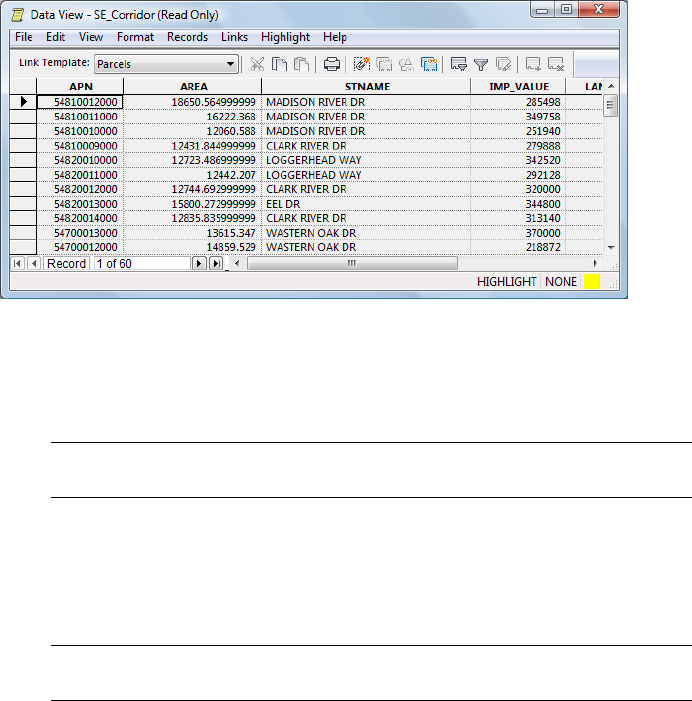
Overview of Viewing External Data Sources for Drawing Objects
Use the Data View to view and edit external database tables that are linked to
drawing objects.
The Data View shows records in an attached database table.
Using the Data View, you can sort and filter the records in the table. In
addition, if you open the table in Edit mode, you can edit the data in the
database table.
NOTE This functionality is for drawing objects only. If you have joined data to
geospatial features (page 507), use the Data Table to view that information.
See also:
■Finding Records in a Database Linked to Drawing Objects (page 1221)
■Overview of the Data Table (page 1125)
NOTE This procedure is for drawing objects only. If you have joined data to
geospatial features (page 507), use the Data Table to view that information.
To use the Data View to view and edit external database tables
■To open a table using the Task Pane (page 1053)
■To edit a database record that is linked to a drawing object (page 1056)
■To find a database record in the Data View (page 1225)
1048 | Chapter 6 Creating and Editing Data

■To print a database table (page 1475)
Quick Reference
AutoCommit
Automatically saves database changes when the cursor leaves the record
In Map Explorer, right-click a data source ➤ Auto
Commit
Task Pane
Commit
Manually saves changes when AutoCommit is turned off
In Map Explorer, right-click a data source ➤ Commit
Task Pane
(Data View) Append
Adds a new, blank record to the bottom of a database table
In the Data View: Records ➤ Append
Menu
Append Record
Icon
(Data View) Find
Finds specified text
In the Data View:Edit ➤ Find
Menu
(Data View) Format Column
Changes the formatting of cells in a column
In the Data View: Format ➤ Column
Menu
Column dialog boxDialog Box
(Data View) Freeze Column
Freezes the selected column to the left of the Data View window
In the Data View: View ➤ Freeze Column
Menu
Viewing External Data Sources for Drawing Object Data | 1049

(Data View) Header and Footer
Specifies header and footer for printing in the Data View
In the Data View: File ➤ Header and Footer
Menu
Header/Footer dialog boxDialog Box
(Data View) Format Column
Changes the formatting of cells in a column
In the Data View: Format ➤ Column
Menu
Column dialog boxDialog Box
(Data View) Page Setup
Sets the print options for Data View
In the Data View: File ➤ Page Setup
Menu
Page Setup dialog boxDialog Box
(Data View) Print
Prints the current view of the database table
In the Data View: File ➤ Print
Menu
Print
Icon
(Data View) Sort
Sorts records in ascending or descending order based on the selected column,
or specifies a sort order based on more than one column
In the Data View: View ➤ Sort ➤ Multiple Columns
Menu
(Data View) Undo
Reverses the most recent operation
In the Data View:Edit ➤ Undo
Menu
(Data View) Unfreeze All Columns
1050 | Chapter 6 Creating and Editing Data

Unfreezes all columns
In the Data View: View ➤ Unfreeze All Columns
Menu
(Data View) Unfreeze All Columns
Unfreezes all columns
In the Data View: View ➤ Unfreeze All Columns
Menu
MAPBROWSELINK
Opens a database table associated with a specific link template to edit in the
Data View
Click Map ➤ Database ➤ View Data ➤ Edit Linked
Table.
Menu
MAPBROWSELINKCommand Line
Double-click a link templateTask Pane
Select Link Template dialog boxDialog Box
MAPBROWSETBL
Opens a database table to edit in the Data View
Click Map ➤ Database ➤ View Data ➤ Edit Table.
Menu
MAPBROWSETBLCommand Line
Double-click a tableTask Pane
Select Table dialog box (MAPBROWSETBL)Dialog Box
MAPOPTIONS
Sets AutoCAD Map 3D options
Setup menu ➤ Autodesk Map Options
Menu
Options
Icon
MAPOPTIONSCommand Line
In Map Explorer, right-click Current
Drawing ➤ Options
Task Pane
AutoCAD Map Options dialog boxDialog Box
Viewing External Data Sources for Drawing Object Data | 1051
MAPRUNDBQUERY
Runs a database query and opens a database table displaying the results of
the query in the Data View
Click Map ➤ Database ➤ View Data ➤ Execute Query.
Menu
MAPRUNDBQUERYCommand Line
Double-click the database query.Task Pane
Select Query dialog boxDialog Box
MAPVIEWLINK
Opens a database table associated with a specific link template to view in the
Data View
Click Map ➤ Database ➤ View Data ➤ View Linked
Table.
Menu
MAPVIEWLINKCommand Line
In Map Explorer, right-click a link template ➤ View
Linked Table
Task Pane
Select Link Template dialog boxDialog Box
MAPVIEWTBL
Opens a database table to view in the Data View
Click Map ➤ Database ➤ View Data ➤ View Table.
Menu
MAPVIEWTBLCommand Line
Right-click a table ➤ View Table
Task Pane
Select Table dialog box (MAPBROWSETBL)Dialog Box
Opening a Database Table
The Data View (which displays external data linked to drawing objects)
provides two modes for opening tables:
■View mode: You can change the way the table looks on screen by
formatting columns, sorting records, or filtering records, and you can create
links between the data and objects in your drawing. You cannot edit the
contents of the database table.
1052 | Chapter 6 Creating and Editing Data

■Edit mode: In addition to formatting the table on screen, you can edit the
data in the table and add or delete records.
Database queries or views are always opened in View mode.
NOTE This functionality is for drawing objects only. If you have joined data to
geospatial features (page 507), use the Data Table to view that information.
See also:
■Viewing External Data Linked to Drawing Objects (page 1146)
■Overview of Linking Database Records to Objects (page 522)
■Creating a Link Template (page 525)
■Overview of Attaching Data Sources to Drawings (page 205)
NOTE This procedure is for drawing objects only. If you have joined data to
geospatial features (page 507), use the Data Table to view that information.
To open a table using the Task Pane
■To view or edit a table, double-click it in Map Explorer.
■To create or edit links to a table, double-click its link template.
■To run a query, double-click the database query name.
The table opens in either Edit mode or View mode, depending on the setting
on the Data Source (page 1914) tab of the AutoCAD Map Options dialog box
(page 1908). If the table is write-protected, it opens in View mode. Queries always
open in View mode.
Quick Reference
MAPBROWSELINK
Opens a database table associated with a specific link template to edit in the
Data View
Click Map ➤ Database ➤ View Data ➤ Edit Linked
Table.
Menu
Viewing External Data Sources for Drawing Object Data | 1053
MAPBROWSELINKCommand Line
Double-click a link templateTask Pane
Select Link Template dialog boxDialog Box
MAPBROWSETBL
Opens a database table to edit in the Data View
Click Map ➤ Database ➤ View Data ➤ Edit Table.
Menu
MAPBROWSETBLCommand Line
Double-click a tableTask Pane
Select Table dialog box (MAPBROWSETBL)Dialog Box
MAPRUNDBQUERY
Runs a database query and opens a database table displaying the results of
the query in the Data View
Click Map ➤ Database ➤ View Data ➤ Execute Query.
Menu
MAPRUNDBQUERYCommand Line
Double-click the database query.Task Pane
Select Query dialog boxDialog Box
MAPVIEWLINK
Opens a database table associated with a specific link template to view in the
Data View
Click Map ➤ Database ➤ View Data ➤ View Linked
Table.
Menu
MAPVIEWLINKCommand Line
In Map Explorer, right-click a link template ➤ View
Linked Table
Task Pane
Select Link Template dialog boxDialog Box
MAPVIEWTBL
Opens a database table to view in the Data View
Click Map ➤ Database ➤ View Data ➤ View Table.
Menu
1054 | Chapter 6 Creating and Editing Data

MAPVIEWTBLCommand Line
Right-click a table ➤ View Table
Task Pane
Select Table dialog box (MAPBROWSETBL)Dialog Box
Editing a Database
Data View displays external data linked to drawing objects. You can edit a
table in the Data View as you would any database table. You can add or delete
records, or edit a record's values. You can also search a particular column for
occurrences of a specific value.
NOTE This functionality is for drawing objects only. If you have joined data to
geospatial features (page 507), use the Data Table to view that information.
To edit values in a table in Data View, you must have the proper user
authorizations, and you must open the table in Edit mode. See Opening a
Database Table (page 1052).
You can add records only to the end of a table. You cannot insert a record
elsewhere in a table.
Undoing an Edit
While you are still in the record, use Undo and Redo to affect the last change
you made to the current record.
WARNING Be careful when deleting records. Undo does not restore a deleted
record. Your data is deleted permanently.
AutoCommit
AutoCAD Map 3D automatically saves (commits) your changes to the database
as soon as your cursor leaves the record.
If you do not want edits saved automatically, turn off AutoCommit for this
data source.
When AutoCommit is off, you can manually commit your changes. If you do
not manually commit your changes, AutoCAD Map 3D commits the changes
when you close all Data View windows for that data source or disconnect the
data source.
To use Replace, you must open the table in Edit mode and turn AutoCommit
off.
Viewing External Data Sources for Drawing Object Data | 1055

The AutoCommit setting applies to all tables in the selected data source.
See also:
■Viewing External Data Linked to Drawing Objects (page 1146)
■Overview of Linking Database Records to Objects (page 522)
■Creating a Link Template (page 525)
■Overview of Attaching Data Sources to Drawings (page 205)
■Setting Up Users and Assigning Rights (page 82)
NOTE This procedure is for drawing objects only. If you have joined data to
geospatial features (page 507), use the Data Table to view that information.
To edit a database record that is linked to a drawing object
1Open a database table in the Data View in Edit mode.
2Click the data to edit.
3Type the new value.
You can undo changes to the current cell. In the Data View, click Edit
menu ➤ Undo. To undo all changes to a record, before leaving the record,
choose Undo Record.
To paste text from the Windows clipboard into a cell, click in the cell where
you want to paste the text. In the Data View, click Edit menu ➤ Paste.
WARNING You cannot use Undo Record after you move off the record you're
editing.
To turn off AutoCommit
■In Map Explorer, right-click a data source. Click AutoCommit.
If the command is not on the menu, you may have clicked a single table
or you may have clicked the data sources node. Be sure to right-click a data
source.
To save changes manually when AutoCommit is off
■In Map Explorer, right-click a data source. Click Commit.
1056 | Chapter 6 Creating and Editing Data

Quick Reference
AutoCommit
Automatically saves database changes when the cursor leaves the record
In Map Explorer, right-click a data source ➤ Auto
Commit
Task Pane
Commit
Manually saves changes when AutoCommit is turned off
In Map Explorer, right-click a data source ➤ Commit
Task Pane
(Data View) Append
Adds a new, blank record to the bottom of a database table
In the Data View: Records ➤ Append
Menu
Append Record
Icon
(Data View) Sort
Sorts records in ascending or descending order based on the selected column,
or specifies a sort order based on more than one column
In the Data View: View ➤ Sort ➤ Multiple Columns
Menu
(Data View) Undo
Reverses the most recent operation
In the Data View:Edit ➤ Undo
Menu
Changing the Look of the Data View
Data View displays external data linked to drawing objects. You can change
Data View, for example, to make a column narrower to fit better on your
screen or to widen a column to display all the text.
You can change the font, color, and alignment of text in the column. You
can also change the width and color of the column borders.
Viewing External Data Sources for Drawing Object Data | 1057

NOTE To preserve your formatting changes, be sure the Save Format And Style
Changes With Drawing option is selected on the Data Source tab of the AutoCAD
Map Options dialog box (page 1908). If this option is not selected, formatting
information for the table is removed from the current drawing when you close
the Data View.
When you detach a data source, AutoCAD Map 3D erases Data View formatting
information for all tables in that data source.
NOTE This functionality is for drawing objects only. If you have joined data to
geospatial features (page 507), use the Data Table to view that information.
See also:
■Viewing External Data Linked to Drawing Objects (page 1146)
■Overview of Linking Database Records to Objects (page 522)
■Creating a Link Template (page 525)
■Overview of Attaching Data Sources to Drawings (page 205)
NOTE This procedure is for drawing objects only. If you have joined data to
geospatial features (page 507), use the Data Table to view that information.
To change the width of a column in Data View
1Move the cursor to the divider line next to the title of the column.
2When the cursor becomes the double arrow, click and drag the column
to the desired width.
To change the formatting of cells in a column in Data View
1Click the title of the column to select the column.
2In the Data View, click Format menu ➤ Column.
3In the Column dialog box (page 1676), select the font, cell colors, text
colors, border, and alignment options you want.
4Click OK.
1058 | Chapter 6 Creating and Editing Data

Quick Reference
(Data View) Format Column
Changes the formatting of cells in a column
In the Data View: Format ➤ Column
Menu
Column dialog boxDialog Box
Freezing and Hiding Data View Columns
You can freeze and hide columns in the Data View.
■Freeze columns to make them visible at all times. The selected columns
become the left-most columns in the Data View. They are frozen in that
position and do not scroll off the screen. For example, freeze the parcel
owner's name to have it remain on screen as you scroll through the rest
of the record.
■Hide columns that you do not want to display or print. The columns
remain part of the database, and you can redisplay them at any time. For
example, hide maintenance comments when you print the table.
NOTE This functionality is for drawing objects only. If you have joined data to
geospatial features (page 507), use the Data Table to view that information.
See also:
■Viewing External Data Linked to Drawing Objects (page 1146)
■Overview of Linking Database Records to Objects (page 522)
■Creating a Link Template (page 525)
■Overview of Attaching Data Sources to Drawings (page 205)
NOTE This procedure is for drawing objects only. If you have joined data to
geospatial features (page 507), use the Data Table to view that information.
To freeze columns in the Data View
1Open the database table in the Data View.
Viewing External Data Sources for Drawing Object Data | 1059
2Select one or more columns.
3In the Data View, click View menu ➤ Freeze Column.
To release frozen columns, in the Data View, select the columns and click
View menu ➤ Unfreeze All Columns.
To hide columns in the Data View
1In the Data View, select the column header of the column that you want
to hide.
2Right-click the column header. Click Hide.
To redisplay all hidden columns, right-click the grid header in the Data View.
Click Unhide All.
Quick Reference
(Data View) Format Column
Changes the formatting of cells in a column
In the Data View: Format ➤ Column
Menu
Column dialog boxDialog Box
(Data View) Format Column
Changes the formatting of cells in a column
In the Data View: Format ➤ Column
Menu
Column dialog boxDialog Box
(Data View) Unfreeze All Columns
Unfreezes all columns
In the Data View: View ➤ Unfreeze All Columns
Menu
(Data View) Unfreeze All Columns
Unfreezes all columns
In the Data View: View ➤ Unfreeze All Columns
Menu
1060 | Chapter 6 Creating and Editing Data
Entering and Editing Object Data
To enter and edit object data
■To attach data to an object (page 1064)
■To attach multiple records to an object (page 1066)
■To attach data to objects automatically (page 1067)
■To display and edit data for a drawing object (page 1069)
■To delete object data from a drawing object (page 1069)
■To convert object data to a linked database table (page 1071)
Overview of Entering and Editing Object Data
Object data is attribute data that is attached to individual objects and stored
in tables in the drawing. Object data tables store text and numerical
information related to an object.
NOTE This functionality is for drawing objects only. To view attribute data for
geospatial features, use the Data Table (page 711).
To use object data, first define the format for the table, and then create each
record as you attach it to an object.
After you define an object data table, you can associate it with one or more
drawing objects. When you attach object data to a drawing object, AutoCAD
Map 3D creates a new record in the selected table and attaches the record to
the object. You can create more than one record for each object, and you can
attach records from more than one table to an object.
NOTE This procedure is for drawing objects only. To view attribute data for
geospatial features, use the Data Table (page 711).
Use this method...To do this...
At the Command prompt, type adedef-
data.
See Creating an Object Data Table (page
200).
Create an object data table.
Do any of the following:Attach object data to objects
■Attach object data manually to selec-
ted objects (page 1064) by specifying
the data values for each object.
Entering and Editing Object Data | 1061
Use this method...To do this...
■Automatically create and attach object
data (page 1066) based on existing block
attributes or text.
■Attach object data as you digitize ob-
jects (page 1082).
See Specifying Object Data for a Drawing
Object (page 1063)
Right-click the object ➤ Properties.
See Displaying and Editing Object Data for
a Drawing Object (page 1068)
View or edit object data.
Click Tools tab ➤ Map Edit panel ➤ Edit
Object Data.
See Displaying and Editing Object Data for
a Drawing Object (page 1068)
Delete object data.
At the Command prompt, enter ma-
pod2ase.
See Converting Object Data to a Linked
Database Table (page 1070)
Convert object data to a linked database
table.
Quick Reference
ADEATTACHDATA
Attaches object data to objects
Create menu ➤ Attach/Detach Object Data
Menu
Attach/Detach Object Data
Icon
ADEATTACHDATACommand Line
Attach/Detach Object Data dialog boxDialog Box
ADEEDITDATA
1062 | Chapter 6 Creating and Editing Data

Edits attached object data
Modify menu ➤ Edit Object Data
Menu
Edit Object Data
Icon
ADEEDITDATACommand Line
Edit Object Data dialog boxDialog Box
ADEGENLINK
Automatically links objects to object data or external database records
In the Classic workspace, click Setup menu ➤ More
Link Template Options ➤ Generate Links
Menu
ADEGENLINKCommand Line
In Map Explorer, right-click a link
template ➤ Generate Links
Task Pane
Generate Data Links dialog boxDialog Box
MAPOD2ASE
Converts object data tables to linked external database tables
Click Setup ➤ Convert Object Data to Database Links.
Menu
MAPOD2ASECommand Line
Convert Object Data to Database Links dialog boxDialog Box
Specifying Object Data for a Drawing Object
After you define an object data table, you can associate it with one or more
drawing objects. When you attach object data to a drawing object, AutoCAD
Map 3D creates a new record in the selected table and attaches the record to
the object. You can create more than one record for each object, and you can
attach records from more than one table to an object.
NOTE This functionality is for drawing objects only. To view attribute data for
geospatial features, use the Data Table (page 711).
Entering and Editing Object Data | 1063
You can attach object data in these ways:
■Attach object data manually to selected objects (page 1064) by specifying
the data values for each object.
■Automatically create and attach object data (page 1066) based on existing
block attributes or text.
■Attach object data as you digitize objects (page 1082).
When you attach object data to queried objects, AutoCAD Map 3D prompts
you to add the object to the save set.
See also:
■Creating an Object Data Table (page 200)
■Running a Drawing Query in Draw Mode (page 1290)
Before you attach data to objects, create the object data table and execute a
Draw mode query to copy the objects into the current drawing.
NOTE You cannot attach data to geospatial features, but you can join external
data to geospatial features. (page 507)
To attach data to an object
1Click Create tab ➤ Drawing Object panel ➤ Attach/Detach Object Data.
2In the Attach/Detach Object Data dialog box (page 1794), select a table.
3To change the value for a field in the table, select the data field and type
a new value in the Value box. Press Enter.
4To overwrite any values for this table already attached to the object, select
Overwrite.
If cleared, the object will have both the old and the new values attached.
5Click Attach To Objects.
6Select the objects.
1064 | Chapter 6 Creating and Editing Data
NOTE If you are attaching data to a polygon and plan to use the data with
topology functions, be sure to attach the data to the centroid of the polygon.
Topology functions do not use data attached to the polygon border.
A record with the specified values is attached to each selected object.
Quick Reference
ADEATTACHDATA
Attaches object data to objects
Create menu ➤ Attach/Detach Object Data
Menu
Attach/Detach Object Data
Icon
ADEATTACHDATACommand Line
Attach/Detach Object Data dialog boxDialog Box
Specifying Multiple Records for an Object
By adding multiple records to the same object, you can keep track of historical
information related to the object. For example, if you have a table called
PipeMaintenance, with fields called Inspector, InspectionDate, and Condition,
you might attach a record to a pipe object each time the pipe is inspected.
NOTE You cannot attach data to geospatial features, but you can join external
data to geospatial features. (page 507)
See also:
■Creating an Object Data Table (page 200)
■Entering and Editing Object Data (page 1061)
NOTE You cannot attach data to geospatial features, but you can join external
data to geospatial features. (page 507)
Entering and Editing Object Data | 1065

To attach multiple records to an object
1Click Tools tab ➤ Map Edit panel ➤ Edit Object Data.
2Select the object to which you want to add a record.
3In the Edit Object Data dialog box (page 1795), select the attached table to
which you want to add a record.
4Click Insert Record.
Record # changes from 1 of 1 to 2 of 2 as AutoCAD Map 3D advances to
the newly created record.
5For each field in the record, update the value as necessary.
Select the field in the object data field list. Enter the new value in the
Value box. Press Enter. Repeat this process for each field in the record.
6Click OK.
The new record is attached to the selected object.
Quick Reference
ADEEDITDATA
Edits attached object data
Modify menu ➤ Edit Object Data
Menu
Edit Object Data
Icon
ADEEDITDATACommand Line
Edit Object Data dialog boxDialog Box
Automatically Specifying Object Data for Objects
You can automatically attach object data records to objects in a drawing. For
example, you can convert block attribute data to object data and attach it to
objects in one operation.
1066 | Chapter 6 Creating and Editing Data
First, you must create the object data table to use for the new data. Then when
you perform the Generate Links operation, AutoCAD Map 3D automatically
records the existing data in the new object data table.
NOTE You cannot create links to objects on layers that are locked, frozen, or
turned off.
NOTE You cannot attach data to geospatial features, but you can join external
data to geospatial features. (page 507)
See also:
■Creating an Object Data Table (page 200)
■Entering and Editing Object Data (page 1061)
NOTE You cannot attach data to geospatial features, but you can join external
data to geospatial features. (page 507)
NOTE Create the object data table before you begin this procedure.
To attach data to objects automatically
1Click Map Setup tab ➤ Attribute Data panel ➤ ➤ Generate Links.
2In the Generate Data Links dialog box (page 1807), select a linkage type:
■Blocks — Create links from block attribute data. The records are
attached to the blocks themselves.
■Text — Create links from text. The records are attached to the text
objects.
■Enclosed Blocks — Create links from block attribute data. The records
are attached to the polyline that encloses the block. Blocks that are
not enclosed by a polyline are not linked.
■Enclosed Text — Create links from text that lies within a closed
polyline. The records are attached to the closed polyline that encloses
the text. Text that is not enclosed by a polyline is not linked.
3Under Data Links, select Create Object Data Records.
Entering and Editing Object Data | 1067

4Select a table.
If you are creating links for enclosed text, select a table that has only one
field.
5If you are creating links for blocks or enclosed blocks, select the name of
the block.
6Click OK.
7Enter s to select blocks or text objects, or enter a to use all blocks with
the specified name or all text objects.
Quick Reference
ADEGENLINK
Automatically links objects to object data or external database records
In the Classic workspace, click Setup menu ➤ More
Link Template Options ➤ Generate Links
Menu
ADEGENLINKCommand Line
In Map Explorer, right-click a link
template ➤ Generate Links
Task Pane
Generate Data Links dialog boxDialog Box
Displaying and Editing Object Data for a Drawing Object
After you attach object data to a drawing object, you can edit the object data
record or delete a record from an object. You must have Edit Drawing privilege
to edit object data.
For information on changing user privileges, see Setting Up Users and Assigning
Rights (page 82).
NOTE This functionality is for drawing objects only. To display and edit the
attribute data for a geospatial feature, see Editing Features using the Data Table
(page 711).
See also:
■Creating an Object Data Table (page 200)
1068 | Chapter 6 Creating and Editing Data
■Entering and Editing Object Data (page 1061)
NOTE This procedure is for drawing objects only. To display and edit the attribute
data for a geospatial feature, see Editing Features using the Data Table (page 711).
To display and edit data for a drawing object
1Select the object in your drawing.
TIP If the drawing contains more than one object in the same location, press
Ctrl while you select the object. This turns on the AutoCAD Map 3D cycle
feature, which allows you to select each object at that location, one by one,
as you click. Click until you select the object you want. Press Enter.
2If the Properties palette is not open, right-click the object. Click Properties.
3In the Properties palette, scroll to view the object data information.
4To edit data, click the data to change and enter the new data.
NOTE If the object is a member of an object class, select the Object Class
tab in the Properties palette and see if the object data is listed on that tab. If
it is, edit the data using the Object Class tab. This tab checks that the values
you enter to make sure they meet the standards set for the object class.
To delete object data from a drawing object
1Click Tools tab ➤ Map Edit panel ➤ Edit Object Data.
2Select the object in your drawing.
3To delete the current record from the selected object, click Delete Record.
4If the object has more than one record from the selected table, click Next
or Last to view a different record. If the object has records attached from
more than one table, select a table from the Table list to view object data
from that table. To delete object data for a different object, click Select
Object and select the object.
Entering and Editing Object Data | 1069

Quick Reference
ADEEDITDATA
Edits attached object data
Modify menu ➤ Edit Object Data
Menu
Edit Object Data
Icon
ADEEDITDATACommand Line
Edit Object Data dialog boxDialog Box
Converting Object Data to a Linked Database Table
Object data is an efficient method for storing small amounts of attribute data
that you want to associate with drawing objects, but external databases store
larger amounts of data more efficiently, and allow for more complex queries.
NOTE You cannot attach data to geospatial features, but you can join external
data to geospatial features. (page 507)
With AutoCAD Map 3D, you can convert object data into a linked database
table that has the same data structure as the object data table. For each object
containing object data in the specified table, AutoCAD Map 3D does the
following:
■Reads the object data
■Creates a new record in the external database table
■Attaches link data to the object that links the object to the record
When AutoCAD Map 3D converts the data, it creates a new table in an existing
data source. It also creates a link template for the new table. In the link
template, you can choose to use an existing field as the key field, or you can
have AutoCAD Map 3D create a new field and assign a unique value to each
record.
1070 | Chapter 6 Creating and Editing Data

Field Names in the New Table
By default, the fields in the new database table have the same names as the
fields in the object data table. AutoCAD Map 3D resolves any conflicts in the
following ways:
■Truncates fields that are too long and adds an incremental digit to the
resulting duplicate field names
■Replaces unsupported characters in a field name with an underscore (_)
■Converts unsupported field types to character
■Converts point fields to a character string and separates coordinates with
commas
See also:
■Creating an Object Data Table (page 200)
■Entering and Editing Object Data (page 1061)
■Overview of Attaching Data Sources to Drawings (page 205)
■Overview of Linking Database Records to Objects (page 522)
NOTE You cannot attach data to geospatial features, but you can join external
data to geospatial features. (page 507)
This procedure creates a new table in an existing data source. Make sure that
the appropriate data source is attached.
NOTE During the conversion, field names in the object data table become field
names in the database table. Make sure that the field names in your object data
table are not SQL reserved words such as DATE, SELECT, or CURRENT. If necessary,
rename the fields in your object data table before you convert it.
To convert object data to a linked database table
1At the Command prompt, enter mapod2ase.
2In the Convert Object Data to Database Links dialog box (page 1680), under
Source Object Data Table, select an object data table.
3Select Remove Data From Objects Processed to delete the object data after
creating the link.
Entering and Editing Object Data | 1071
4Under Target Link Template, click Define to specify the link template.
5In the Define Link Template dialog box (MAPOD2ASE) (page 1682), select
an available data source. Click Connect.
6Enter a table name.
7Specify the fields to use as key fields (columns). To enter more than one
field name, separate names with a comma.
To select from a list of field names in the object data table, or to rename
the fields, click Select to display the Select Link Template Key(s) dialog
box.
You can use an existing object data field as the key column or create a
new field. If you select Generate Key Field, specify a name for the field
in the Generate Key area. AutoCAD Map 3D sets the first record in the
database table to 1, and increments each subsequent record by 1. Click
OK to close the Select Link Template Key(s) dialog box.
8In the Define Link Template dialog box, enter a name for the link template
and click OK.
The link template stores the address of the database table and the name
of the key field. Accept the default or enter a new unique name.
9In the Convert Object Data to Database Links dialog box (page 1680), specify
how to select objects with attached object data.
You can select objects automatically or manually, and you can use a filter
to restrict selection to specified layers.
10 Click Proceed.
AutoCAD Map 3D converts the object data into linked database tables.
Quick Reference
MAPOD2ASE
Converts object data tables to linked external database tables
Click Setup ➤ Convert Object Data to Database Links.
Menu
MAPOD2ASECommand Line
Convert Object Data to Database Links dialog boxDialog Box
1072 | Chapter 6 Creating and Editing Data

Digitizing Objects
To attach attribute data to objects as you digitize them, use the MAPDIGITIZE
command.
■Overview of Digitizing Maps (page 1073)
■Overview of Digitizing Objects (page 1079)
■Digitizing Using MAPDIGITIZE (page 1081)
■Attaching Object Data As You Digitize (page 1082)
■Linking Database (SQL) Records as You Digitize (page 1084)
See also:
■Overview of Digitizing Maps (page 1073)
■Setting Up for Digitizing (page 130)
■Cleaning Up Maps (page 767)
■Converting Data From Other Formats to Drawing Objects (page 377)
To digitize objects
■To digitize a map (page 1078)
■To digitize the objects (page 1080)
■To digitize links and nodes (page 1081)
■To attach object data as you digitize (page 1083)
■To link database records as you digitize (page 1085)
Overview of Digitizing Maps
Digitizing is the process of converting paper-based graphical information into
a digital format. When you digitize a map, you use drawing commands to
trace data from the paper map into a DWG file.
NOTE This process creates drawing objects. To convert the drawing objects into
geospatial feature data, see Overview of Publishing and Sharing (page 1357).
Digitizing Objects | 1073
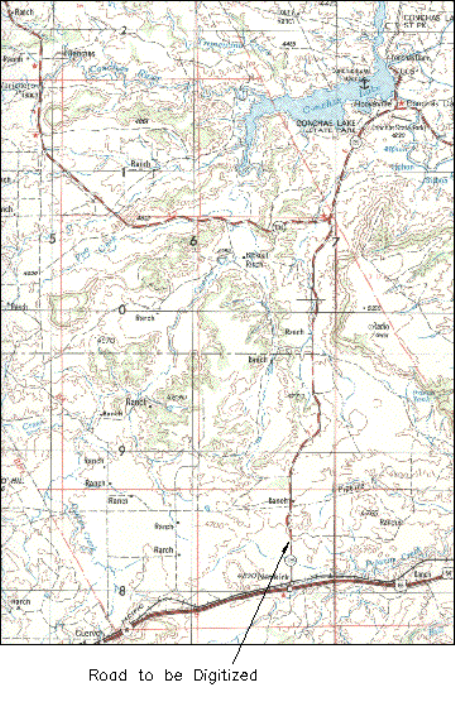
1074 | Chapter 6 Creating and Editing Data
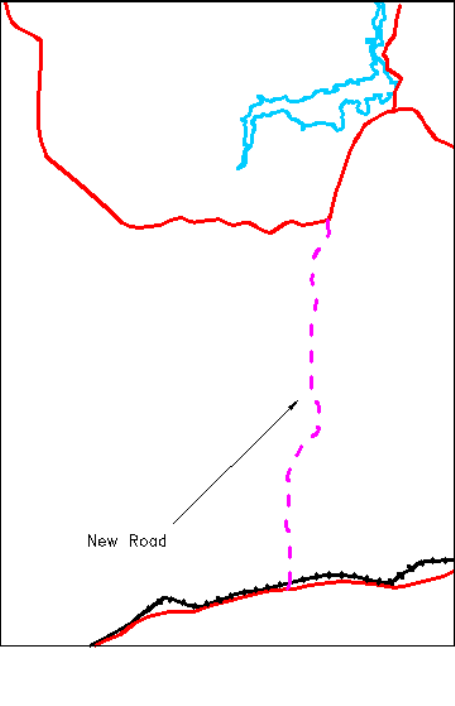
Planning for Digitizing
Before you begin to digitize, consider the following:
■Suitability of source maps
■Global coordinate system
■Tiling maps
■Layer organization
■Data storage: internal or external
Overview of Digitizing Maps | 1075
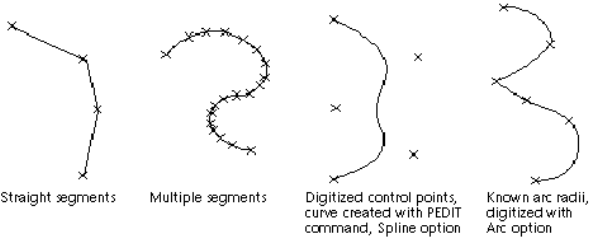
■Representation of node, network, and polygon topologies
If possible, plan on completing all digitizing for one map in one session because
the map media may distort over time.
Digitizing Linear Objects
Linear objects are objects such as lines, arcs, and polylines.
■If you plan to use topography later to generate 3D views from digital terrain
models, place linear objects at the elevations (Z- values) they represent.
■If you use the SKETCH command to trace an irregular line, make sure the
variable SKETCHINC is set to a reasonable value, because each line segment
ends at the interval set by SKETCHINC. The SKETCH command can create
huge files for one small line when SKETCHINC is set to a small value.
■When digitizing irregular curves with PLINE or MAPDIGITIZE (page 1081),
the spacing of the selected vertex points should depend on the curvature
of the line. Straighter segments require fewer points.
Examples of digitized curves
■However accurately you work, you lose data when you digitize a curve.
You need to digitize more points when you create sharp curves to ensure
that the line is as accurate as possible; however, while you reduce the data
loss, you increase file size and complexity. If you know the parameters
used to define a regular curve, such as the radius or length, use the Arc
option of the PLINE and MAPDIGITIZE (page 1081) commands for digitizing.
Irregular lines, such as topography contours, should be continuous
polylines. They can be smoothed with the Fit option of PEDIT if necessary.
Set the PLINEGEN system variable to 1 (on) before digitizing, so that any
dashed linetypes are evaluated correctly.
1076 | Chapter 6 Creating and Editing Data
■When you finish digitizing a segment, mark it on the paper map so you
do not repeat the digitizing. Double digitizing increases file size.
Digitizing Topology
When digitizing data that will be used to create a topology, follow these
principles to achieve the most accurate results.
■Boundaries (or other polylines) should be completed with the Near,
Intersection, or Endpoint object snaps to ensure that closed areas such as
parcels, buildings, and water bodies are in fact complete polygons.
■Line segments should be snapped to existing end points where they
intersect.
■When you are digitizing data for network topology, do not duplicate
objects. For example, do not double-digitize boundary lines separating
adjacent polygons. It's better to digitize adjacent polygons on the same
layer with common lines defining common boundaries. If one edge serves
two or more purposes, digitize the line once, then use the COPY and
CHPROP commands to put a duplicate line on a different layer.
After you digitize the linear elements that form the basis of the topology, you
should clean up any problems (page 767) before you create the topology.
Digitizing Control Data Points and Monuments
When you are trying to match digitized maps with existing digital maps, you
can use some known-to-be-accurate points common to both maps.
■Control Data Points — A system of geodetic control points covers the
entire United States. The latitude and longitude, and often elevation, are
established for these points. Similar systems exist for other countries, such
as Bench Marks and Trigonometry Points throughout the United Kingdom.
■Monuments — If you are working with maps for a city or county, points
used for establishing locations for all maps probably already exist: these
points can include features such as public buildings, hill summits, and
parts of highways.
When you are digitizing a map, use the following procedures to establish
known control points:
■Create a layer called REFERENCE. On it, digitize at least four points
corresponding to real-world coordinates such as the coordinate intersections
Overview of Digitizing Maps | 1077

of latitude and longitude lines. These points should either appear at the
corners of your map sheet or surround the map features to be digitized.
Be careful to note on the drawing the location of these reference points
and their real-world coordinates. Use these points to register the map with
the TABLET command, as described in Registering the Map (page 133).
■To ensure accuracy, you can also digitize other points such as control
points and monument locations that have known positions. Digitizing
more control points is important for Matching Map Edges (page 950) or
Rubber Sheeting Two Maps (page 932) operations.
Placing Annotation
While you are digitizing, you can add text to indicate nodes or important
locations on a map. Use the STYLE command to define a text style that uses
a simple font, such as isocp.shx, with a fixed text height so that you do not
have to enter a text height each time you enter text. You can modify the text
style and height when you finish digitizing.
Use the TEXT command to enter text as you digitize. Text should be single-line
entries on the same layer as the feature it describes. If required, enter complex
or lengthy text with the MTEXT command after you finish digitizing. For
more information, look up "text" in the Help index.
Try to avoid overlaying the insertion point of the text and end points of the
objects you are annotating.
See also:
■Setting Up for Digitizing (page 130)
■Digitizing Objects (page 1073)
NOTE This process creates drawing objects. To convert the drawing objects into
geospatial feature data, see Overview of Publishing and Sharing (page 1357).
To digitize a map
1Set up for digitizing (page 131).
2Digitize the objects (page 1081).
1078 | Chapter 6 Creating and Editing Data

Quick Reference
OPTIONS
Customizes the AutoCAD settings
Setup menu ➤ AutoCAD Options
Menu
OPTIONSCommand Line
Right-click in the drawing area ➤ Options
Task Pane
MAPDIGISETUP
Sets up user options for digitizing nodes and linear objects
Click Map ➤ Data Entry ➤ Digitize Setup.
Menu
MAPDIGISETUPCommand Line
Digitize Setup dialog boxDialog Box
MAPDIGITIZE
Digitizes nodes and linear objects with settings from mapdigisetup
Click Map ➤ Data Entry ➤ Digitize.
Menu
MAPDIGITIZECommand Line
MAPDIGITIZE (Digitize command)Dialog Box
Overview of Digitizing Objects
To digitize objects, use one of the following methods:
■To attach attribute data as you digitize objects, use the MAPDIGITIZE
command. You can also specify the label point, layer, block or linetype,
rotation and scale, 2D or 3D, and snap options.
■To digitize objects without attaching attribute data or specifying other
settings as you digitize, use the drawing commands.
NOTE These processes create drawing objects. To convert the drawing objects
into geospatial feature data, see Overview of Publishing and Sharing (page 1357).
Overview of Digitizing Objects | 1079

Digitizing Using the MAPDIGITIZE Command
Use the MAPDIGITIZE command if you want to use the special options it
provides, such as attaching object data as you digitize.
NOTE Before you begin digitizing, be sure that you have configured the digitizer,
registered the map, and set the digitizing specifications. See Setting Up for
Digitizing (page 130).
For detailed information on digitizing linear objects, topologies, and control
points, or on placing annotations, see Overview of Digitizing Maps (page 1073).
Digitizing Using Drawing Commands
You can also digitize using drawing commands. However, you should avoid
commands such as CIRCLE, RECTANGLE, and 3DFACE. Instead, use ARC,
LINE, and PLINE to represent map features in the simplest possible forms.
This usage simplifies map cleanup.
See also:
■Overview of Digitizing Maps (page 1073)
■Setting Up for Digitizing (page 130)
■Converting Data From Other Formats to Drawing Objects (page 377)
NOTE Before you begin digitizing, be sure you have configured your digitizer
(page 132) and registered your map (page 136).
To digitize the objects
1Check that TABLET is enabled in the status line. If not, double-click
TABLET to enable Tablet mode.
2To use the MAPDIGITIZE command, set the digitizing options (page 130).
3Digitize lines by starting the LINE, PLINE, or MAPDIGITIZE (page 1081)
command as appropriate.
Press F12 to access menus and dialog boxes in the floating screen area
you defined.
4Continue to add lines and arc segments until you are done. Press Enter.
When you finish digitizing, use Drawing Cleanup (page 765) to clean the
linework and fix errors.
1080 | Chapter 6 Creating and Editing Data

NOTE These processes create drawing objects. To convert the drawing objects
into geospatial feature data, see Overview of Publishing and Sharing (page 1357).
Quick Reference
MAPDIGITIZE
Digitizes nodes and linear objects with settings from mapdigisetup
Click Map ➤ Data Entry ➤ Digitize.
Menu
MAPDIGITIZECommand Line
MAPDIGITIZE (Digitize command)Dialog Box
Digitizing Using MAPDIGITIZE
The MAPDIGITIZE command lets you attach object data or external data as
you digitize.
NOTE Before you begin digitizing, be sure that you have configured the digitizer,
registered the map, and set the digitizing specifications. See Setting Up for
Digitizing (page 130).
Press F12 for access to the menus and any dialog boxes in the floating screen
area you defined.
NOTE These processes create drawing objects. To convert the drawing objects
into geospatial feature data, see Overview of Publishing and Sharing (page 1357).
See also:
■Attaching Object Data As You Digitize (page 1082)
■Linking Database (SQL) Records as You Digitize (page 1084)
Before you use the MAPDIGITIZE command, set the digitizing specifications
(page 138).
To digitize links and nodes
1On the command line, enter MAPDIGITIZE. Press Enter.
Digitizing Using MAPDIGITIZE | 1081

2At the MAPDIGITIZE (Digitize command) (page 1615) prompt, specify the
first point or polyline to digitize.
3If you selected Attach Data in the Digitize Setup dialog box (page 1617),
enter object data for the new object.
4If you selected Prompt For Label Point in the Digitize Setup dialog box
(page 1617), specify a label point for the new object.
5If you selected Prompt For Rotation, enter the rotation in degrees for the
node block. If you selected Prompt For Scale, enter the change in scale.
For example, enter 90 to rotate the block 90 degrees. Enter 2 to double
the size of the block.
6Continue to specify points or polylines.
Data created by digitizing is not complete until you have cleaned up and
verified the data. See Overview of Cleaning Up Maps (page 767).
NOTE These processes create drawing objects. To convert the drawing objects
into geospatial feature data, see Overview of Publishing and Sharing (page 1357).
Quick Reference
MAPDIGITIZE
Digitizes nodes and linear objects with settings from mapdigisetup
Click Map ➤ Data Entry ➤ Digitize.
Menu
MAPDIGITIZECommand Line
MAPDIGITIZE (Digitize command)Dialog Box
Attaching Object Data As You Digitize
You can attach object data to nodes and links (linear objects) as you digitize
them. You can specify one object data table for nodes and another for links.
See also:
■Linking Database (SQL) Records as You Digitize (page 1084)
■Overview of Digitizing Maps (page 1073)
1082 | Chapter 6 Creating and Editing Data

Before you set up for digitizing, the object data table must already exist. See
Creating an Object Data Table (page 200).
To attach object data as you digitize
1On the command line, enter MAPDIGISETUP. Press Enter.
2Under Object Type, select the object type to digitize.
3Select Attach Data. Click Data To Attach.
4In the Data to Attach dialog box (page 1616), select the object data table
to use. Click OK.
5For information on completing the other options in the Digitize Setup
dialog box (page 1617), see To set digitizing specifications (page 138).
6Click OK.
7On the command line, enter MAPDIGITIZE to begin digitizing.
As you digitize each object, AutoCAD Map 3D prompts you to enter object
data values for each field in the selected object data table.
Quick Reference
ADEDEFDATA
Defines object data
Setup menu ➤ Define Object Data
Menu
Define Object Data
Icon
ADEDEFDATACommand Line
Define Object Data dialog boxDialog Box
MAPDIGISETUP
Sets up user options for digitizing nodes and linear objects
Click Map ➤ Data Entry ➤ Digitize Setup.
Menu
MAPDIGISETUPCommand Line
Digitize Setup dialog boxDialog Box
Attaching Object Data As You Digitize | 1083
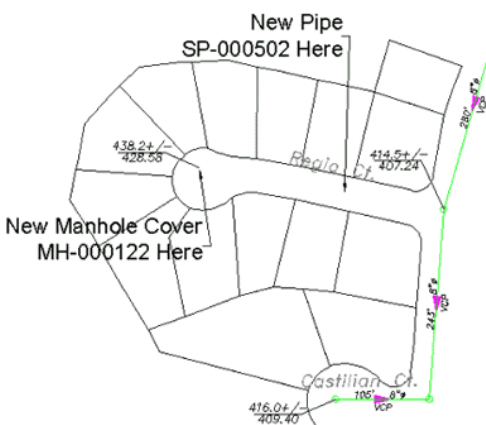
MAPDIGITIZE
Digitizes nodes and linear objects with settings from mapdigisetup
Click Map ➤ Data Entry ➤ Digitize.
Menu
MAPDIGITIZECommand Line
MAPDIGITIZE (Digitize command)Dialog Box
Linking Database (SQL) Records as You Digitize
You can attach data in an external database to objects as you digitize. You can
select one link template for nodes and another for links (linear objects). Before
you begin this process, be sure that the link templates already exist.
1084 | Chapter 6 Creating and Editing Data
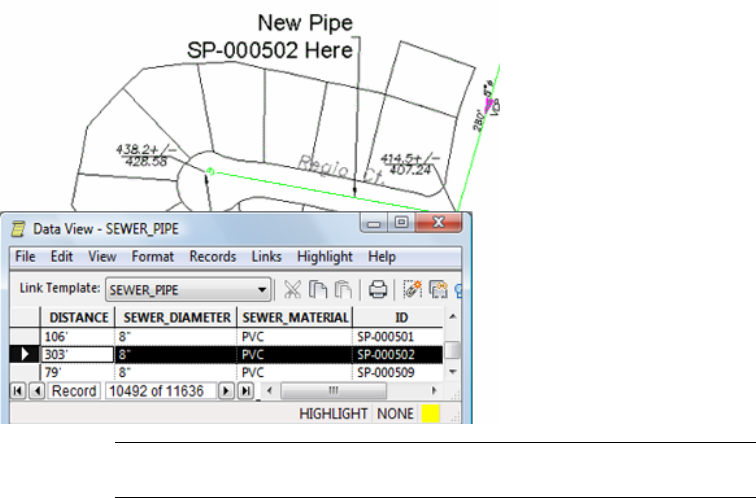
NOTE These processes create drawing objects. To convert the drawing objects
into geospatial feature data, see Overview of Publishing and Sharing (page 1357).
See also:
■Attaching Object Data As You Digitize (page 1082)
■Overview of Digitizing Maps (page 1073)
To link database records as you digitize
1On the command line, enter MAPDIGISETUP. Press Enter.
2Under Object Type, select the object type to digitize.
3Select Attach Data. Click Data To Attach.
4In the Data to Attach dialog box (page 1616), under Object Data Type, select
Database Link.
5For Link Template, select the link template to use.
6Specify a Record Validation method. Click OK.
7For information on completing the other options in the Digitize Setup
dialog box (page 1617), see To set digitizing specifications (page 138).
Linking Database (SQL) Records as You Digitize | 1085
8Click OK.
9On the command line, enter MAPDIGITIZE to begin digitizing.
AutoCAD Map 3D prompts you for a key value for each object. The database
validation option you select here determines what happens as you enter a
value for each digitized object:
■Validate —AutoCAD Map 3D checks whether the value you enter exists
in the database table. If the value exists, the link data is attached to the
object; if the value does not exist, AutoCAD Map 3D requests a new value.
Use this option to link each object to an existing record in the table.
■Validate and Create —AutoCAD Map 3D checks whether the value you
enter exists in the database table. If the value exists, the link data is attached
to the object; if the value does not exist, AutoCAD Map 3D creates a new
record in the database table with this value in the key column, and attaches
the link data to the object. Use the Link Template Data Entry dialog box
(page 1619) to enter values for the other columns in the new record.
■No Validation —AutoCAD Map 3D attaches the link data to the object
without checking that the value exists in the table. Use this option if you
do not have a corresponding database record and do not want to create
one at this time.
NOTE These processes create drawing objects. To convert the drawing objects
into geospatial feature data, see Overview of Publishing and Sharing (page 1357).
Quick Reference
MAPDEFINELT
Defines a link template for a database table
Click Setup ➤ More Link Template Options ➤ Delete
Link Template.
Menu
Define Link Template
Icon
MAPDEFINELTCommand Line
In Map Explorer, right-click a data source table or
query ➤ Define Link Template
Task Pane
1086 | Chapter 6 Creating and Editing Data
Define Link Template dialog box (MAPDEFINELT)Dialog Box
MAPDIGISETUP
Sets up user options for digitizing nodes and linear objects
Click Map ➤ Data Entry ➤ Digitize Setup.
Menu
MAPDIGISETUPCommand Line
Digitize Setup dialog boxDialog Box
MAPDIGITIZE
Digitizes nodes and linear objects with settings from mapdigisetup
Click Map ➤ Data Entry ➤ Digitize.
Menu
MAPDIGITIZECommand Line
MAPDIGITIZE (Digitize command)Dialog Box
Linking Database (SQL) Records as You Digitize | 1087
1088
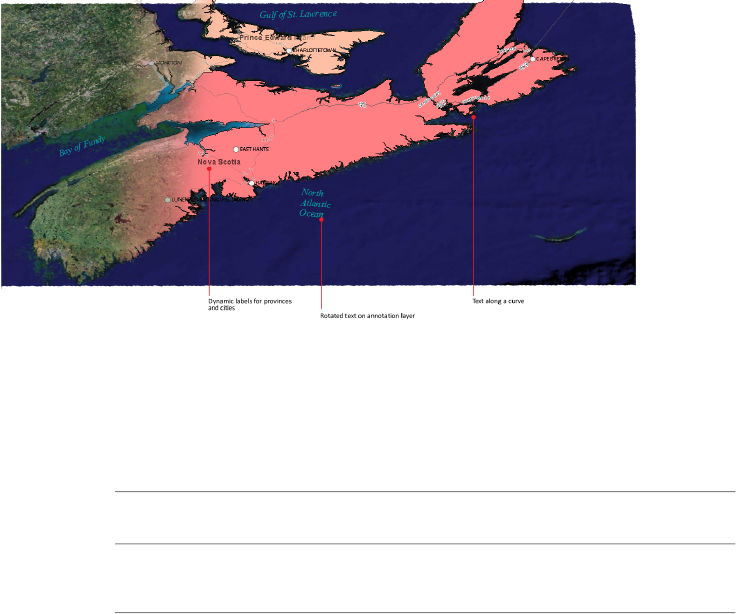
Annotating Maps
Overview of Annotating Maps
Dynamic labels and drawing object annotations are placed automatically next to each
feature or drawing object on the related layer. Use Mtext or annotation layers to add
text that is not linked to a feature or object.
Annotations are notes or other types of explanatory symbols or objects that are
commonly used to add information to your map. The following types of
annotation can be added to your map:
More InformationDescriptionWorks withAnnota-
tion Type
Adding Labels (page
1091)
Displays selected properties
on each feature
Individual
Features
Labels
7
1089
More InformationDescriptionWorks withAnnota-
tion Type
Annotating Drawing
Objects (page 1100)
Displays selected properties,
object data, or linked data on
each drawing object
Drawing
objects
Drawing
object an-
notation
Creating Text Layers
(page 1109)
Displays freestanding text
features (not related to a
Maps with
feature lay-
ers
Annotation
layers
specific feature) and is stored
in a data table
Annotating with Auto-
CAD Text Objects
(page 1119)
Displays freestanding objects
(not related to a specific ob-
ject) created with the TEXT
and MTEXTcommands
Any mapAutoCAD
text ob-
jects
Adding a Legend (page
1116)
Provides a key to feature
styles in your map
Maps with
feature lay-
ers
Legends
Tell me more
Video
■Show me how to label features.
■Show me how to label features with
automatic resizing.
■Show me how to place a legend in the
map and specify its contents.
■Show me how to edit the table style for
a legend.
Procedure
■To label features (page 1093)
■To insert annotation (page 1103)
■To create a legend (page 1118)
Tutorial
■Tutorial: Annotating Your Map
■Exercise 3: Add labels
■Lesson 6: Create a Legend
1090 | Chapter 7 Annotating Maps
Workflow
■Style and Label a Linear Feature
GIS Skill
■Label features and optimize placement.
■Create and edit a legend.
Related topics
■Styling Features (page 639)
■Setting Up Annotation Templates
(page 185)
Adding Labels
Labels mark each feature in the specified Display Manager feature layer. They
are defined as part of the feature layer style.
NOTE This functionality is for geospatial features only. To label drawing objects,
see Annotating Drawing Objects (page 1100).
You can specify a property to display in the label. For example, you can label
roads with their names. You can also use expressions in labels. For example,
you can label parcels with an expression that determines the net value of the
property, or use an expression to concatenate two properties, such as address
and street name.
See also:
■Theming Features (page 1165)
■Styling Features (page 639)
Adding Labels to Features
Add labels to features on feature layers.
NOTE This functionality is for geospatial features only. To label drawing objects,
see Annotating Drawing Objects (page 1100).
Adding Labels | 1091
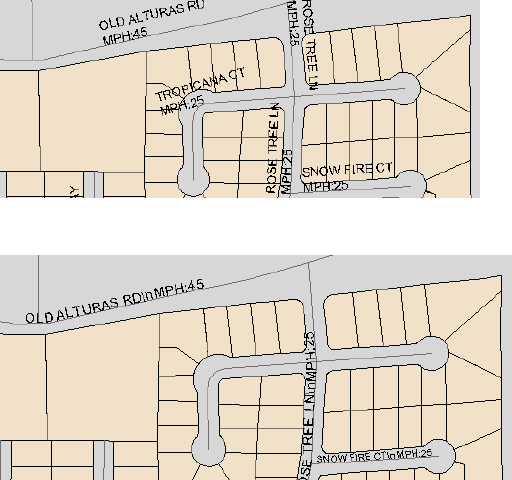
For linear features (such as roads or rivers), you can specify one of the
following:
■Multiline (Specifies that the label can have multiple lines of text, but no
advanced placement functionality.)
■Advanced placement (specifies a single-line label which follows a path and
shrinks to fit. A single label is used for feature segments that have the same
property value.)
Multiline labels
Advanced placement labels
If a feature does not have linear geometry, only multiline labels are available.
For all features, you can specify the label text, font, size, format, color,
background style and color, alignment, and rotation. These settings affect the
entire label. For example, if you specify a color, all lines in the label use that
color.
For polyline features, you can specify horizontal and vertical label placement.
For point features, you can specify a fixed location for the label (page 1098).
If a feature label obscures another label, it is not displayed. Feature labels are
drawn on top of point symbols, lines, and polygons. By default, feature labels
1092 | Chapter 7 Annotating Maps
do not obscure point symbols. You can allow feature labels to obscure point
symbols (page 1096).
NOTE For performance reasons, the maximum number of labels drawn is 2000.
If there are so many labels that geometry would be obscured if they were drawn,
AutoCAD Map 3D does not draw them.
Tell me more
Video
■Show me how to label features.
■Show me how to label features with
automatic resizing.
Procedure
■To label features (page 1093)
■To use expressions in labels
Tutorial
■Tutorial: Annotating Your Map
■Exercise 3: Add labels
Workflow
■Style and Label a Linear Feature
GIS Skill
■Label features and optimize placement.
Related topics
■Displaying Fixed Labels at Point Loca-
tions (page 1098)
■Allowing Labels to Obscure Points
(page 1096)
NOTE This procedure is for geospatial features only. To label drawing objects, see
Annotating Drawing Objects (page 1100).
To label features
1In Display Manager (page 2060) right-click the feature layer to label.
2Click Edit Style.
Adding Labels to Features | 1093
3In the Style Editor, under Scale Ranges, select the scale range to style.
For more information about scale ranges, see Defining Scale Ranges (page
643).
4In the geometry styling area for the selected scale range, click the box
under Feature Label.
5In the Style Label dialog box (page 1634), make sure the Create A Label
check box is selected.
6For linear features, select Multiline or Advanced Placement. (For all other
feature geometries, these choices are grayed and Multiline is used.)
Multiline specifies that the label can have multiple lines of text, but no
advanced placement functionality.
Advanced Placement specifies a single-line label which follows a path
and shrinks to fit. A single label is used for linear feature segments that
have the same property value.
7For Property To Display, do one of the following:
■Select a property.
■Select Expression (at the bottom of the list) to use an expression to
specify label text.
For more information, see the Using Expressions to Label Features.
8For Font, select a font from the list.
9For Size Context, specify the type of units and then select the appropriate
Units:
■Select Device Space to specify symbol widths and heights in screen
units. Available units are Points, Inches, Millimeters, Centimeters, or
Meters.
■Select Map Space to specify symbol widths and heights in Mapping
Coordinate System (MCS) units. Available units are Inches, Feet, Yards,
Miles, Millimeters, Centimeters, Meters, and Kilometers.
10 For Size, enter the text size or specify the size using a number expression.
For more information, see the Creating Numeric Expressions.
11 To apply bold, italic, or underlining, click one or more of the Format
options.
12 For Text Color, click a color.
1094 | Chapter 7 Annotating Maps

13 From the Background Style list, select one of the following:
■Ghosted: Draws an opaque border around each character. Use
Background Color to specify a color for the outline.
■Opaque: Draws a background behind the labels. They are displayed
as rectangles with text inside. Use Background Color to specify a color
for the rectangles.
■Transparent: No background is applied to the labels, which are
displayed only as text on the map.
14 Specify the label’s horizontal and vertical position, relative to the feature.
You can select one of the available positions or select a layer property
that contains alignment information for each feature. Your options
depend on the type of geometry you are styling.
Alignment OptionsGeometry
Horizontal and VerticalPoints that display fixed labels instead of
symbols. For more information, see Display-
ing Fixed Labels at Point Locations (page
1098).
NoneOther points
Vertical onlyLine
NonePolygon (area)
15 For Rotation, do one of the following:
■Select a value from the list.
■Click Any Angle. Specify the angle using the slider or enter an angle
in the box. Click OK.
■Click Expression. Specify the rotation using a numeric expression. See
Creating Numeric Expressions.
16 Click OK in the Style Label dialog box and close the Style Editor to see
the results.
Adding Labels to Features | 1095
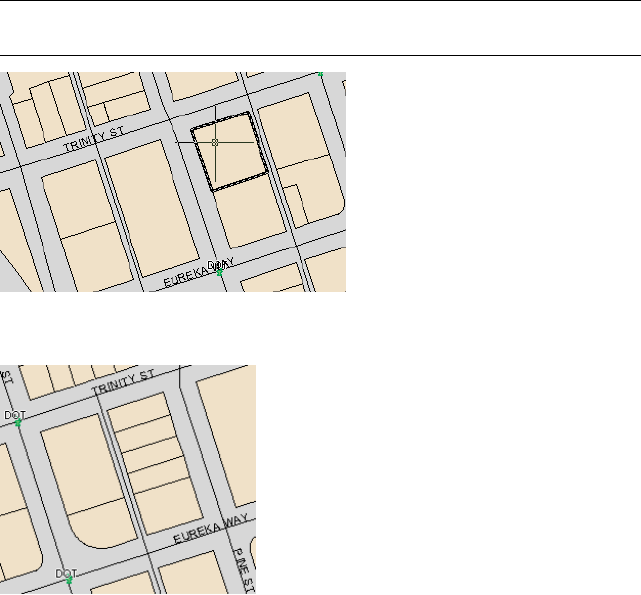
Allowing Labels to Obscure Points
By default, AutoCAD Map 3D does not draw a label (page 1091) if doing so would
block a point symbol on another layer. The appearance of the label is evaluated
each time you change the zoom level. When you zoom in far enough to allow
sufficient space for the label, it is displayed.
NOTE This functionality is for geospatial features only. To label drawing objects,
see Annotating Drawing Objects (page 1100).
You can specify that labels for a different layer
obscure points on the current layer.
If you specify that labels cannot
obscure points, AutoCAD Map 3D
moves the labels out of the way.
You can specify that labels on other layers be allowed to obscure points on
the selected layer, regardless of the zoom level.
1096 | Chapter 7 Annotating Maps
Tell me more
Video
■Show me how to label features.
■Show me how to label features with
automatic resizing.
Procedure
■To allow labels to obscure points on
the selected layer (page 1097)
■To use expressions in labels
Tutorial
■Tutorial: Annotating Your Map
■Exercise 3: Add labels
Workflow
■Style and Label a Linear Feature
GIS Skill
■Label features and optimize placement.
Related topics
■Displaying Fixed Labels at Point Loca-
tions (page 1098)
■Adding Labels to Features (page 1091)
NOTE This procedure is for geospatial features only. To label drawing objects, see
Annotating Drawing Objects (page 1100).
To allow labels to obscure points on the selected layer
1In the Display Manager (page 2060), select the point layer. Click the Style
button.
2In the Style Editor, click Allow Other Labels To Obscure Feature Symbols
On This Layer.
Allowing Labels to Obscure Points | 1097
Displaying Fixed Labels at Point Locations
If exact placement of labels is important for a point layer, disable the point
layer style and place fixed labels at feature locations.
NOTE Fixed labels are always displayed, even if they obscure other labels or
features. While feature labels are drawn after all layer features have been drawn,
fixed labels are drawn according to the draw order of their layer within a map,
and may be obscured by features from other layers.
NOTE This functionality is for geospatial features only. To label drawing objects,
see Annotating Drawing Objects (page 1100).
Tell me more
Video
■Show me how to label features.
■Show me how to label features with
automatic resizing.
Procedure
■To place fixed labels at points (page
1099)
■To use expressions in labels
Tutorial
■Tutorial: Annotating Your Map
■Exercise 3: Add labels
Workflow
■Style and Label a Linear Feature
GIS Skill
■Label features and optimize placement.
Related topics
■Defining Scale Ranges (page 643)
■Styling Point Features (page 645)
■Adding Labels to Features (page 1091)
■Allowing Labels to Obscure Points
(page 1096)
1098 | Chapter 7 Annotating Maps

NOTE This procedure is for geospatial features only. To label drawing objects, see
Annotating Drawing Objects (page 1100).
To place fixed labels at points
1In Display Manager, right-click the point layer to label and click Edit
Style.
2In the Style Editor, under Scale Ranges, select the scale range to style.
For more information about scale ranges, see Defining Scale Ranges (page
643).
3Select the Labels Are Fixed (Not Dynamic) check box.
4In the style geometry area for the selected scale range, click the box under
Style.
5To remove the point symbol, at the top of the Style Point dialog box
(page 1637), clear the Style a Point Symbol check box. Click OK.
6In the style geometry area for the selected scale range, click the box under
Feature Label.
7To turn on and style the label, in the Style Label dialog box, select the
Create A Label check box.
8Specify the label text and style.
For more information about feature labels, see Adding Labels to Features
(page 1091).
9Use the Horizontal Alignment and Vertical Alignment lists to specify the
position of the label relative to the feature.
You can select one of the available positions or select a layer property
that contains alignment information for each feature. The alignment
values in the property must be specified as follows:
■Horizontal: Left, Center, or Right.
■Vertical: Baseline, Bottom, Capline, Halfline, or Top.
10 Click OK and close the Style Editor to see the results.
Displaying Fixed Labels at Point Locations | 1099

Annotating Drawing Objects
Use annotation to label drawing objects with their properties and geometric
values. If you have created object data (page 2070) for the objects, or linked
external data (page 2062) to them, you can display these attributes in annotation
as well.
NOTE This functionality is for drawing objects only. To label geospatial features,
see Adding Labels to Features (page 1091).
See also:
■Setting Up Annotation Templates (page 185)
■Theming Drawing Data (page 1176)
NOTE This procedure is for drawing objects only. To label geospatial features, see
Adding Labels to Features (page 1091).
To add and delete annotation
■To use annotation (page 1101)
■To insert annotation (page 1103)
■To refresh annotation based on a specific template (page 1105)
■To update annotation based on a specific template (page 1107)
■To delete all annotation based on a selected annotation template (page
1108)
Overview of Annotation
Use annotation to display related values on a drawing object.
NOTE This functionality is for drawing objects only. To label geospatial features,
see Adding Labels to Features (page 1091).
Annotation can include the following:
ExampleType of information
Object data or linked data in an external
database
Attributes
Line weight, line type, etc.Display properties
1100 | Chapter 7 Annotating Maps
ExampleType of information
Dimensions, line direction, etc.Geometric values
Arrows, static text, or other geometryGraphics
You define the contents of annotation in an annotation template (page 2055).
You can specify values, link them to data sources (such as object data tables
or link templates) or define them with expressions. The actual values defined
by expressions are determined when the annotation is inserted.
When you add or remove elements in an annotation template, or change its
properties or expressions, existing annotations based on that template do not
refresh automatically. Use the Refresh (page 1105) or the Update (page 1106)
command to see those changes.
See also:
■Overview of Annotation Templates (page 186)
■Setting Up Annotation Templates (page 185)
NOTE This procedure is for drawing objects only. To label geospatial features, see
Adding Labels to Features (page 1091).
To use annotation
■Define an annotation template (page 190)
■Attach annotation to objects (page 1103)
■Refresh annotation (page 1105)
■Update annotation (page 1106)
■Delete annotation from drawings (page 1108)
■Delete annotation templates (page 197)
Quick Reference
MAPANNDELETE
Deletes all annotation based on the selected template
Overview of Annotation | 1101

Setup menu ➤ More Annotation Options ➤ Delete
Menu
Delete
Icon
MAPANNDELETECommand Line
Annotation Delete dialog boxDialog Box
MAPANNINSERT
Adds annotation to objects based on the selected annotation template
Create menu ➤ Insert Annotation
Menu
Insert Annotation
Icon
MAPANNINSERTCommand Line
Insert Annotation dialog boxDialog Box
MAPANNREFRESH
Refreshes existing annotation
Setup menu ➤ More Annotation Options ➤ Refresh
Menu
Refresh
Icon
MAPANNREFRESHCommand Line
Annotation Refresh dialog boxDialog Box
MAPANNTEMPLATE
Defines and modifies annotation templates
Click Setup ➤ Define Annotation Template‚Ķ.
Menu
Define Annotation Template
Icon
MAPANNTEMPLATECommand Line
Define Annotation Template dialog boxDialog Box
MAPANNTEXT
1102 | Chapter 7 Annotating Maps
Creates and edits annotation text
Edit Annotation Text
Icon
MAPANNTEXTCommand Line
Annotation Text dialog boxDialog Box
MAPANNUPDATE
Updates existing annotation
Setup menu ➤ More Annotation Options ➤ Update
Menu
Update
Icon
MAPANNUPDATECommand Line
Annotation Update dialog boxDialog Box
Attaching Annotation to Objects
After you have defined an annotation template (page 2055), use the
MAPANNINSERT command to attach annotation to selected objects in your
drawing.
NOTE This functionality is for drawing objects only. To label geospatial features,
see Adding Labels to Features (page 1091).
See also:
■Defining Annotation Templates (page 190)
■Changing Annotation Templates (page 194)
NOTE This procedure is for drawing objects only. To label geospatial features, see
Adding Labels to Features (page 1091).
To insert annotation
1Click Annotate tab ➤ Map Annotation panel ➤ Insert.
Attaching Annotation to Objects | 1103
2In the Insert Annotation dialog box (page 1574), select the check box for
the annotation template (page 2055) to use.
To insert annotations based on multiple templates, select the check box
for each template.
3Optionally, click Advanced to change the default options and properties
for the annotation.
The information from the Advanced section is applied only to the
highlighted template.
NOTE If you subsequently update (page 1107) this annotation template, select
the Retain option to maintain these settings.
4Click Insert.
5Select the objects to annotate. Press Enter.
Quick Reference
MAPANNINSERT
Adds annotation to objects based on the selected annotation template
Create menu ➤ Insert Annotation
Menu
Insert Annotation
Icon
MAPANNINSERTCommand Line
Insert Annotation dialog boxDialog Box
MAPANNTEMPLATE
Defines and modifies annotation templates
Click Setup ➤ Define Annotation Template‚Ķ.
Menu
Define Annotation Template
Icon
MAPANNTEMPLATECommand Line
Define Annotation Template dialog boxDialog Box
1104 | Chapter 7 Annotating Maps
Refreshing Annotation
When you change the expressions in an annotation template (page 2055), you
can refresh all existing annotations using that annotation template to apply
those changes. The expressions in existing annotations do not update
automatically.
When you refresh the annotations, you can choose whether to update the
string values only or whether to update all properties of the annotation (for
example, its position and layer location).
NOTE This functionality is for drawing objects only. To label geospatial features,
see Adding Labels to Features (page 1091).
See also:
■Attaching Annotation to Objects (page 1103)
■Defining Annotation Templates (page 190)
■Changing Annotation Templates (page 194)
NOTE This procedure is for drawing objects only. To label geospatial features, see
Adding Labels to Features (page 1091).
To refresh annotation based on a specific template
1Click Annotate tab ➤ Map Annotation panel ➤ Refresh Annotation.
2In the Annotation Refresh dialog box (page 1569), select an annotation
template and click OK.
TIP You can select more than one template at a time.
3On the command line, select Full Annotation or Strings Only.
■Strings Only — Reevaluates only the expression-based text in the
annotation, but changes nothing else.
For example, if you use the expression .AREA as the value of the
annotation text, the annotation displays the area of the circle. If you
change the diameter of the circle, and refresh the annotation with
the Strings Only option, the text changes to reflect the new area of
the circle.
Refreshing Annotation | 1105

■Full Annotation — Reevaluates any expression-based text, as well as
other properties of the annotation (for example, the insertion point
and the layer on which the annotation resides).
For example, if you use the expression .CENTER to specify the insertion
point of the text, the annotation is displayed in the center of the
circle. If you resize and move the circle, the Strings Only option
changes the text to reflect the new size, but does not change the
position of the text. The annotation text is longer centered in the
circle. The Full Annotation option updates the text to reflect the new
size and moves the annotation to the center of the relocated, resized
circle.
4Press Enter.
Quick Reference
MAPANNREFRESH
Refreshes existing annotation
Setup menu ➤ More Annotation Options ➤ Refresh
Menu
Refresh
Icon
MAPANNREFRESHCommand Line
Annotation Refresh dialog boxDialog Box
Updating Annotation
When you add or remove text in an annotation template (page 2055), you can
update all existing annotations using that annotation template to apply those
changes. The text in existing annotations does not update automatically.
The Update command completely erases and regenerates all annotation based
on a specified annotation template.
When you update the annotations, you can choose whether to retain or discard
any advanceds settings you specified when you inserted the original
annotation.
1106 | Chapter 7 Annotating Maps
NOTE This functionality is for drawing objects only. To label geospatial features,
see Adding Labels to Features (page 1091).
See also:
■Attaching Annotation to Objects (page 1103)
■Defining Annotation Templates (page 190)
■Changing Annotation Templates (page 194)
NOTE This procedure is for drawing objects only. To label geospatial features, see
Adding Labels to Features (page 1091).
To update annotation based on a specific template
1Click Annotate tab ➤ Map Annotation panel ➤ Update Annotation.
2In the Annotation Update dialog box (page 1571), select an annotation
template (page 2055), and click OK.
TIP You can select more than one template at a time.
3On the command line, choose Retain or Discard.
■Retain — Regenerates all annotation that uses the selected template,
maintaining any advanced settings from the original annotation. Text
you added or removed in the annotation template is changed in the
existing annotations, and any modifications you made to specific
annotations remain.
For example, if you changed the insert point or rotation in the Insert
Annotation dialog box (page 1574) when you created the annotations,
the Retain option regenerates them using those overrides.
■Discard — Regenerates all annotation that uses the selected template,
using the default values in the template. Text you added or removed
in the annotation template is changed in the existing annotations,
but any overrides are lost.
For example, if you changed the insert point or rotation when you
created the annotations, the Discard option regenerates the annotation
using the annotation template values for these settings, instead of
your overrides.
4Press Enter.
Updating Annotation | 1107
Quick Reference
MAPANNUPDATE
Updates existing annotation
Setup menu ➤ More Annotation Options ➤ Update
Menu
Update
Icon
MAPANNUPDATECommand Line
Annotation Update dialog boxDialog Box
Deleting Annotation from Drawings
You can delete all annotation based on a selected annotation template (page
2055).
NOTE This functionality is for drawing objects only. To label geospatial features,
see Adding Labels to Features (page 1091).
See also:
■Attaching Annotation to Objects (page 1103)
■Defining Annotation Templates (page 190)
■Changing Annotation Templates (page 194)
NOTE This procedure is for drawing objects only. To label geospatial features, see
Adding Labels to Features (page 1091).
To delete all annotation based on a selected annotation template
1Click Annotate tab ➤ Map Annotation panel ➤ Delete Annotation.
2In the Annotation Delete dialog box (page 1569), select an annotation
template (page 2055).
TIP You can select more than one template at a time.
1108 | Chapter 7 Annotating Maps

3Click OK.
Quick Reference
MAPANNDELETE
Deletes all annotation based on the selected template
Setup menu ➤ More Annotation Options ➤ Delete
Menu
Delete
Icon
MAPANNDELETECommand Line
Annotation Delete dialog boxDialog Box
Working with Text Layers
Creating Text Layers
Text layers allow you to control the placement and appearance of text very
precisely. The labels that are generated automatically for features on the map
(page 1091) are placed dynamically and shift position as you zoom in and out.
This is useful for maps that are intended for viewing on the web using Autodesk
MapGuide (page 1376). For plotted or printed map sheets, text layers may be
more appropriate.
Each text layer is its own feature class, and is stored in its own SDF file in a
particular coordinate system. A single text layer can contain multiple text
features. For example, you might create features that represent individual lines
in a map title.
Once you add and check in text features, you can use the text again in another
map. You connect to a text layer SDF file as you would to any SDF file.
You can edit existing text features to change their contents or style. Text layer
style settings (which apply to the entire layer) are stored with the layer. Style
overrides (which apply only to a specific text feature) are stored with that
feature in the SDF file.
Working with Text Layers | 1109
NOTE The text layer uses expressions to generate text features from corresponding
entries in the data store (which you can view using the Data Table (page 2059)).
Most users need not modify these expressions, though they offer advanced
capabilities for specific uses.
Tell me more
Video
■Show me how to create a text layer and
add text.
■Show me how to edit text on a text layer.
■Show me how to rotate text.
Procedure
■To create a text layer (page 1110)
■To add text to a text layer (page 1114)
■To style a text layer (page 1112)
GIS Skill
■Add a text layer and edit text
Tutorial
■Tutorial: Annotating Your Map
Related topics
■Annotating with AutoCAD Text Ob-
jects (page 1119)
■Adding Labels to Features (page 1091)
■Annotating Drawing Objects (page 1100)
To create a text layer
1In the Display Manager (page 2060), click Data ➤ New Text Layer.
2In the Choose Spatial Database File dialog box, provide a name and
location for the SDF file that will store the layer information. Click Save.
NOTE If you specify an existing file, the new layer overwrites the existing
layer.
1110 | Chapter 7 Annotating Maps
3In the Specify Coordinate System dialog box, set the coordinate system
for the layer. Click OK.
The new text layer is added to the Display Manager. The default layer
name is Annotation, but you can select that name and type a new one.
Quick Reference
MAPTEXTLAYERCREATE
Creates an annotation layer for freestanding text features
MAPTEXTLAYERCREATECommand Line
In the Display Manager, click Data ➤ New Text Layer
Task Pane
Styling a Text Layer
After you have added the text layer, specify the text style. The layer style is
the base style for any text features you add, but you can override the styling
for any feature, or for individual characters within features.
Tell me more
Video
■Show me how to create a text layer and
add text.
■Show me how to edit text on a text layer.
■Show me how to rotate text.
Procedure
■To create a text layer (page 1110)
■To add text to a text layer (page 1114)
■To style a text layer (page 1112)
GIS Skill
■Add a text layer and edit text.
Tutorial
■Tutorial: Annotating Your Map
Styling a Text Layer | 1111
Related topics
■Annotating with AutoCAD Text Ob-
jects (page 1119)
■Adding Labels to Features (page 1091)
■Annotating Drawing Objects (page 1100)
To style a text layer
1In the Display Manager (page 2060), select the text layer.
2Click Style .
3In the Style Editor, under Style click .
4In the Style Text Layer dialog box (page 1640), for Size Context, specify the
type of units and then select the appropriate Units.
■Select Device to specify symbol widths and heights in screen units.
Available units are Points, Inches, Millimeters, or Centimeters.
■Select Map to specify symbol widths and heights in Mapping
Coordinate System (MCS) units. Available units are Inches, Feet, Miles,
Millimeters, Centimeters, Meters, and Kilometers.
5For Text Type, select one of the following:
■Plain—Formats text uniformly, using the settings specified in this
dialog box. The text has no formatting information itself.
■Mtext—Formats text as multiline. The settings you specify in this
dialog box are used by default, but you can override them when you
insert individual text features.
The Edit Expression button lets you specify an expression for this setting
for advanced use cases. We recommend that you do not use expressions
for Text Type.
6For Text, leave the "LABEL_TEXT" value unchanged.
This is the name of a property in the feature class. It specifies that the
text for each text feature is whatever you specify in the Edit Text Instance
dialog box (page 1627) when you create the text feature. The Delete
Expression button lets you replace this expression for advanced use cases.
1112 | Chapter 7 Annotating Maps
For more information on inserting text features, see Adding Text to a
Text Layer (page 1113).
7For Font Name, specify the font to use on the text layer.
The Edit Expression button lets you specify an expression for this setting
for advanced use cases.
8For Font Size, leave the "NullValue(SIZE,number)" expression.
The initial setting for font height is in mapping units and is based on the
existing view. We recommend that you try the suggested height and
adjust the number as needed. If individual instances require a different
height, adjust the value in the SIZE column in the Data Table after you
insert the text instances.
9Specify other font styling using the drop downs.
If you select MText for Text Type, you can override some of these settings
using controls in the Edit Text Instance dialog box (page 1627) when you
insert the text features.
10 For Horizontal Alignment, Vertical Alignment, and Rotation, leave the
"HORIZONTAL_ALIGNMENT", "VERTICAL_ALIGNMENT", and
"ORIENTATION" expression values unchanged. These are the names of
properties in the feature class.
The Delete Expression buttons let you replace the expressions for these
settings for advanced use cases. If necessary, you can modify these values
in the Data Table after you insert the text features.
11 Click OK and close the Style Editor.
Adding Text to a Text Layer
After you have created the text layer (page 1109) and specified its style settings
(page 1111), you can add specific text instances.
Tell me more
Video
■Show me how to create a text layer and
add text.
■Show me how to edit text on a text layer.
■Show me how to rotate text.
Adding Text to a Text Layer | 1113
Procedure
■To create a text layer (page 1110)
■To add text to a text layer (page 1114)
■To style a text layer (page 1112)
GIS Skill
■Add a text layer and edit text.
Tutorial
■Tutorial: Annotating Your Map
Related topics
■Annotating with AutoCAD Text Ob-
jects (page 1119)
■Adding Labels to Features (page 1091)
■Annotating Drawing Objects (page 1100)
To add text to a text layer
1In the Display Manager (page 2060), right-click the text layer. Click Create
➤ Create New Annotation.
2Click in the map to specify a location for the text feature.
3In the Edit Text Instance dialog box (page 1627), enter the desired text.
4To change the appearance of the text, select the characters to change and
specify a different font, style, or size.
Style overrides to apply to this particular text instance only. If you do
not specify overrides, the style you assigned to the layer (page 1112) is
applied.
NOTE You cannot undo style overrides, but you can reset the attributes to
match the base style.
5Click OK.
6Deselect the text feature to see the styling changes.
7When you have finished adding text features, click Check-in Features.
1114 | Chapter 7 Annotating Maps
Quick Reference
MAPTEXTCREATE
Adds text features to an annotation layer
MAPTEXTCREATECommand Line
In the Display Manager, right-click an annotation
layer, and click Create ➤ Create New Annotation
Task Pane
Edit Text Instance dialog boxDialog Box
Editing an Instance on a Text Layer
Each text instance is a feature. Check out text features to modify them. Check
in text features when you are finished editing.
Tell me more
Video
■Show me how to create a text layer and
add text.
■Show me how to edit text on a text layer.
■Show me how to rotate text.
Procedure
■To create a text layer (page 1110)
■To add text to a text layer (page 1114)
■To style a text layer (page 1112)
Tutorial
■Tutorial: Annotating Your Map
GIS Skill
■Add a text layer and edit text.
Related topics
■Annotating with AutoCAD Text Ob-
jects (page 1119)
■Adding Labels to Features (page 1091)
■Annotating Drawing Objects (page 1100)
Editing an Instance on a Text Layer | 1115
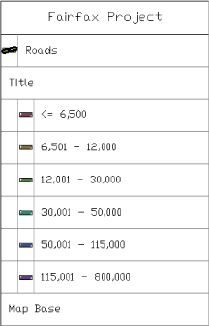
To edit a text instance
1Right-click the text instance and click Edit Text Instance.
2In the Edit Text Instance dialog box (page 1627), select the text to modify.
3Change the text or apply different styles to the selected characters.
4Click OK.
Quick Reference
MAPTEXTEDIT
Allows you to edit text features on an annotation layer
MAPTEXTCREATECommand Line
Edit Text Instance dialog boxDialog Box
Adding a Legend
A legend lists the styles in your map.
The legend helps viewers
understand the color-coding
in a map.
The legend includes all visible layers in the Display Manager (both drawing
layers and geospatial feature layers). To show the ranges for a theme, make
1116 | Chapter 7 Annotating Maps
sure that the layer with the theme is expanded so that the ranges are visible.
To ensure that a layer does not appear in the legend, clear its check box before
generating the legend.
The legend is always placed in the model view. To include a legend in a layout
view for plotting or publishing, create a viewport for the legend and place it
at the appropriate location in your layout
Legend Style
The legend is displayed in a table. By default, legends use the Legend table
style. You can modify the Legend table style, or define and apply a different
table style, using the TABLESTYLE command. The Table Style Editor is the
standard AutoCAD dialog box, which links to the Text Style Editor. For more
information, see the AutoCAD Help.
Tell me more
Video
■Show me how to place a legend in the
map and specify its contents.
■Show me how to edit the table style for
a legend.
Procedure
■To create a legend (page 1118)
Tutorial
■Lesson 6: Create a Legend
Workflow
■Use Themes to Reveal Patterns in Data
GIS Skill
■Create and edit a legend.
Related topics
■Overview of the Display Manager
(page 634)
■Getting Help with AutoCAD (page 58)
To create and modify the legend, do any of the following operations.
■To create a legend (page 1118)
Adding a Legend | 1117

■To change the icon used for thumbnails (page 1118)
■To edit titles or text in the legend (page 1118)
■To edit the Legend table style (page 1119)
■To update the Legend (page 1119)
To create a legend
1Zoom the drawing to the desired scale threshold.
The default legend size is based on the window size when the legend is
created.
2In the Display Manager (page 2060), click Groups ➤ Draw Order.
3Drag the Display Manager layers into the order in which you want them
to appear in the legend.
4Clear the check box for any layer that should not appear in the legend.
For example, if there are no objects on the Base Layer, clear its check box.
5In Display Manager, click Tools ➤ Create Legend.
6Click a spot in the drawing to place the legend.
To change the icon used for thumbnails
1In the Display Manager (page 2060), right-click a drawing layer. Click
Properties.
NOTE You can change the thumbnail for drawing layers only, not feature
layers.
2On the Display tab of the Properties palette, next to Thumbnail Preview,
select the style of thumbnail to use.
For example, select the polyline icon to display an icon of a wavy line,
or choose the polygon icon to display hatch or fill.
The thumbnail settings affect both the legend and the Display Manager.
To edit titles or text in the legend
1To change the titles for layers in the legend, select the layer names in the
Display Manager and enter new ones.
1118 | Chapter 7 Annotating Maps

2In the Display Manager (page 2060), click Tools ➤ Update Legend.
3To change text in the legend itself (for example, the legend title),
double-click the cell containing the text to change and enter new text.
NOTE Your changes are discarded if you update the legend again.
To edit the Legend table style
1At the Command prompt, enter tablestyle.
2In the Table Style dialog box, do one of the following:
■Select the Legend style and click Modify.
■Click New to create a table style and specify a name for the style.
3In the Modify Table Style dialog box, specify the settings.
To update the Legend
➤ In the Display Manager (page 2060), click Tools ➤ Update Legend.
Quick Reference
Display Manager Legend
Creates a Display Manager legend
In Display Manager, click Tools ➤ Create Legend
Task Pane
Annotating with AutoCAD Text Objects
You can create and modify several types of AutoCAD text objects. You can
control most text style settings by defining text styles. For more information
see Overview of Creating Textand Overview of Text Styles.
For more information about all types of AutoCAD annotation, see Annotate
Drawings.
Annotating with AutoCAD Text Objects | 1119
1120
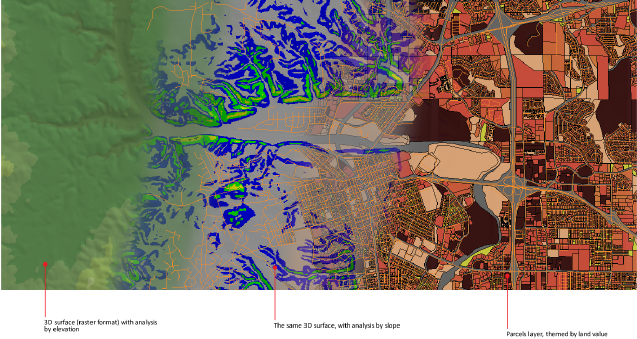
Analyzing Data
Overview of Analyzing Data
This map shows some of the various types of analysis available for raster surfaces and
features.
The analysis tools in AutoCAD Map 3D help turn your raw map data into useful
information that can help you answer questions, support decisions, test
hypotheses, and reveal patterns that may not be immediately obvious.
8
1121

Tools and methods for analysis vary, depending on whether you are using
drawing data or geospatial feature data.
DescriptionFor FeaturesFor Drawing Objects
Drill down to get detailed in-
formation about features and
objects you want to focus on.
View feature source and attribute
data. (page 1125)
View native data and data joined
to features from a separate source.
(page 1134)
View object properties and attrib-
utes. (page 1145)
View external data linked to ob-
jects. (page 1146)
Find the data you need.
Create buffers around features
based on distance and identify
Find and select features (page 1206)
Use buffers to filter data. (page
1306)
Find, search, filter and query
drawing data (page 1218)
features within that bufffer to
see how areas are affected by
conditions. For example, find
parcels within a certain distance
from planned construction, or
roads close to flood plains.
Take real-world measurements
based on coordinate geometry
Track coordinates and measure
geodetic distances. (page 1147)
Track coordinates and measure
geodetic distances. (page 1147)
Use inquiry commands to ex-
tract geometric information
Use themes to analyze height,
slope, and aspect. (page 1202)
Add distances, display continuous
distance, display angles between
from drawing objects such aspoints in the map, display co-
lines, curves, closed polylines,
and polygons.
For supported raster formats,
analyze surface slope, aspect,
and elevation.
ordinate geometry for lines and
arcs, and determine slope and
grade (page 1153).
Use themes to highlight data
distribution and patterns.
Theme geospatial features. (page
1165)
Theme drawing data. (page 1176)
For drawing objects, use topo-
logy to analyze spatial relation-
ships between drawing objects.
For supported raster formats,
view data in 3D for more real-
Drape 2D data onto 3D surfaces
(page 1192)
Add contour lines. (page 1189)
Analyze features bgy proximity,
using buffers (page 1306)
Analyze topology (page 1318)
world analysis, including walk-Overlay feature sources (page 1309)
throughs and recorded anima-
1122 | Chapter 8 Analyzing Data
DescriptionFor FeaturesFor Drawing Objects
tions. Use contour lines to help
you analyze terrain.
Compare features that are re-
lated spatially using buffer zones
and overlays.
Tell me more
Video
■Show me how to join attribute data to
features.
■Show me how to color surfaces based on
elevation.
■Show me how to view and navigate in
3D.
■Show me how to theme a parcels layer.
■Show me how to create a network topo-
logy.
■Show me how to create a buffer zone
around a parcel.
Procedures
■To get information about features and
objects (page 1125)
■To measure and track coordinates
(page 1147)
■To create themes (page 1163)
■To analyze raster-based surfaces (page
1186)
■To find, filter, and query data (page
1206)
■To analyze drawing topologies (page
1319)
Tutorial
■Tutorial: Analyzing Data
Overview of Analyzing Data | 1123

Workflow
■Analyze Data
GIS Skills
■Join attribute data to features.
■Color a surface by elevation and adjust
hillshading.
■Change the elevation ranges for a sur-
face.
■View a site in 3D.
■Drape vector and raster layers over a
surface.
■Analyze the slope and aspect of a site.
■Create a network topology to show how
lines are connected.
■Select features by location using a buffer.
Related topics
■Styling Features (page 639)
Getting Information About Features and Objects
Information about features and drawing objects can be stored within the
feature or object source, as well as in an external source, such as a spreadsheet
application.
For geospatial features, attribute data is part of the feature itself. Additionally,
you can join external data to any feature. Using the Data Table, you can view
and edit all the feature source data included in your map.
For drawing objects, you can create object tables within the drawing itself to
store object attribute data. You can also link to external data using link
templates. You view and edit attribute or object class data using the Properties
palette or the Display Manager.
See also:
■Joining Data to GIS Features (page 507)
■Storing Attribute Data in the Drawing (Object Data) (page 521)
1124 | Chapter 8 Analyzing Data

■Overview of Linking Database Records to Objects (page 522)
To get information about features and objects
■To get information about features (page 1125)
■To get information about drawing objects (page 1143)
Getting Information about Features
To get information about features
■To access the Data Table (page 1127)
■To search to select data (page 1131)
■To create a calculated property (page 1133)
■To view data for a selected layer (page 1135)
■To view joined data (page 1135)
■To view unfiltered feature class data (page 1135)
■To view non-spatial data (page 1136)
■To highlight features using the Data Table (page 1137)
■To remove highlighting (page 1138)
■To highlight rows of data (page 1139)
■To zoom to a view (page 1141)
■To export from the Data Table (page 1142)
Overview of the Data Table
Use the Data Table to access, view and edit data for multiple feature sources
in a single window. The Data Table displays the data for all the features you
have added to your map.
NOTE The Data Table displays attribute data for geospatial features only. To
display attribute data for drawing objects, see Overview of Drawing Object
Information. (page 1144)
NOTE Before you can access the Data Table, you must connect to the feature
sources you want to view or edit and add the data to the map.
You can isolate layers of data, sort, zoom to and edit data directly while
connected to a “live” feature source, or view, attach and edit attribute data
by linking to a spreadsheet application.
Getting Information about Features | 1125
Some data fields are “constrained” to allow only certain values. When you
enter values for constrained fields, you are prompted to enter only valid values.
For example, the prompt might tell you to enter only values between 1 and
10.
You can join attribute data from a separate data source to a layer in the Data
Table. You can use native and joined data to form the basis of the new,
calculated field. Calculated fields are available only within AutoCAD Map 3D.
They are not saved back to the original data store.
NOTE The Data Table uses your system’s default decimal separator for both display
and exporting to CSV files. You can specify the default decimal separator in your
Regional and Language Options in the Windows Control Panel.
Tell me more
Video
■Show me how to make the Data Table
transparent.
■Show me how automatic zoom works.
■Show me how automatic scroll works.
■Show me how to create a calculated
field.
Procedures
■To access the Data Table (page 1127)
■To search to select data (page 1131)
■To view data for a selected layer (page
1135)
■To highlight features using the Data
Table (page 1137)
■To create a calculated property (page
1133)
■To export from the Data Table (page
1142)
Tutorial
■Lesson 5: Find and Edit Features
■Lesson 2: Analyze Data With External
Information Using Joins
1126 | Chapter 8 Analyzing Data
Workflow
■Edit Features in a Geospatial Feature
Source
■Join Attribute Data to a Geospatial
Feature
GIS Skills
■Zoom to features by selecting rows in
the Data Table (and vice-versa).
■Calculate fields in the Data Table.
■Generate a report by exporting records
to a spreadsheet.
■Theme based on individual values.
Related topics
■Editing Features using the Data Table
(page 711)
■Viewing Data for a Selected Layer, Join,
Unfiltered Feature Class, or Non-Spatial
Data Table (page 1134)
■Joining Data to GIS Features (page 507)
■Setting Up Constraints in the Schema
Editor (page 599)
■Creating Calculated Properties (page
1132)
To access the Data Table
1Connect (page 303) to the geospatial data to view or edit.
2In the Display Manager (page 2060), select the layer whose data you want
to view.
3Click .
Getting Information about Features | 1127
4The Data Table window displays the properties for the layer you selected.
For more information,
see...
Use this method...To do this...
Viewing Data for a Selected
Layer, Join, Unfiltered Feature
View data for a feature in
your map.
1Select a layer in Display
Manager.
Class, or Non-Spatial Data
Table (page 1134)
2Click .
Viewing Data for a Selected
Layer, Join, Unfiltered Feature
View non-spatial data 1In the Data Table, click
the Data menu.
Class, or Non-Spatial Data
Table (page 1134)
2Select the non-spatial
table to view.
Data Table Dialog Box (page
1613)
Dock the Data Table 1Right-click the Data
Table title bar and se-
lect Allow Docking.
2Drag the Data Table by
its title bar to the top or
bottom of the applica-
tion window.
Make the Data Table
transparent.
1Right-click the title bar
of the Data Table and
choose Transparency.
2In the Transparency
dialog box, adjust the
transparency level and
click OK.
Right-click the title bar of the
Data Table and choose Auto-
Hide.
Minimize the Data Table
automatically when you
click outside it.
Using Expressions to Select
Feature Data (page 1130)
Click Search to Select at the
bottom of the Data Table.
Find data that meets con-
ditions that you specify.
1128 | Chapter 8 Analyzing Data

For more information,
see...
Use this method...To do this...
Viewing Data for a Selected
Layer, Join, Unfiltered Feature
In the Data Table, select the
row or rows of data to high-
light.
Highlight areas in your
map.
Class, or Non-Spatial Data
Table (page 1134)
Highlighting Features Using
the Data Table (page 1136)
From the Options list in the
Data Table, select Select
None.
Remove highlighting
Zooming to a View Using the
Data Table (page 1140)
Zoom to related areas in
your map.
1In the Data Table, click
Auto-Zoom (unless it is
already on).
2Select the rows of data
to view.
Editing Features using the
Data Table (page 711)
Edit information in the
Data Table
1Select and edit cells in
the Data Table.
2Check in the feature
when you are finished.
Exporting from the Data
Table (page 1473)
Export information from
the Data Table.
1Select the rows of data
to export.
2From the Options list in
the Data Table, select
Export.
3Specify a name and
location for the expor-
ted .csv file.
Quick Reference
MAPDATATABLE
Allows you to view, edit, and filter feature data
Click Edit ➤ Data Table.
Menu
Getting Information about Features | 1129
Table
Icon
MAPDATATABLECommand Line
In Map Explorer or Display Manager, click the Table
button
Task Pane
Data Table Dialog BoxDialog Box
Using Expressions to Select Feature Data
You can use the Data Table to find geospatial feature data that meets conditions
that you specify. For example, you can search for all parcels with an area
greater than five acres. When AutoCAD Map 3D completes the search, it
highlights the data rows in the Data Table and the associated features on your
map.
NOTE The Data Table displays attribute data for geospatial features only. To
display attribute data for drawing objects, see Overview of Drawing Object
Information. (page 1144)
NOTE To search multiple layers at one time, use Home tab ➤ Data panel ➤
Search.
Tell me more
Video
■Show me how automatic zoom works.
■Show me how automatic scroll works.
Procedures
■To search to select data (page 1131)
Tutorial
■Lesson 5: Find and Edit Features
Workflow
■Edit Features in a Geospatial Feature
Source
GIS Skills
■Zoom to features by selecting rows in
the Data Table (and vice-versa).
1130 | Chapter 8 Analyzing Data

Related topics
■Searching For and Selecting Features
(page 1214)
■Viewing Data for a Selected Layer, Join,
Unfiltered Feature Class, or Non-Spatial
Data Table (page 1134)
■Highlighting Features Using the Data
Table (page 1136)
■Highlighting Data Table Rows Using
the Map (page 1138)
■Zooming to a View Using the Data
Table (page 1140)
■Creating Expressions - Reference
To search to select data
1Select the geospatial feature layer in Display Manager that contains the
data to view.
2To select data based on its location in the map, zoom the drawing window
to the extents of the selected feature class.
3Click on the toolstrip to open the Data Table window.
4Click Search to Select at the bottom of the Data Table.
5Create the expression for your search:
■Locate On Map — Selects all features in a location you specify. You
can specify whether to select features completely within the selection
area, within or crossing the selection area, or within a specified
distance of the selection area. See Filtering by Location.
For example, use a location condition to find all manholes in one
section of town, or all parcels that touch a road, or all water pipes
within 100 meters of a road.
■Property Evaluation — Selects all features that have the property value
you specify. Insert a property, an operator, and a value. See Evaluating
Properties.
For example, to select all pipes with a diameter greater than 10, specify
Diameter > 10.
You can view and insert available values for a property from a list.
Getting Information about Features | 1131

6To create a complex property evaluation, insert an AND or OR operator,
and then insert another property, operator, and value combination.
Every operator must be preceded by a property. For example, to find
parcels whose last purchase date is after 1990 and before 2005, the
expression must look like this:
Purchase_Date > 1990 AND Purchase_Date < 2005
7Validate your expression.
8To reuse your expression in the future, from the Options list in the Data
Table, select Save Expression.
9When the expression is complete and valid, click OK.
AutoCAD Map 3D highlights both the selected rows in the Data Table
and the associated features on your map.
Quick Reference
MAPDATATABLE
Allows you to view, edit, and filter feature data
Click Edit ➤ Data Table.
Menu
Table
Icon
MAPDATATABLECommand Line
In Map Explorer or Display Manager, click the Table
button
Task Pane
Data Table Dialog BoxDialog Box
Creating Calculated Properties
You can calculate a new property for any feature, based on its existing native
properties and any joined data for that feature layer. You can use the resulting
property to filter or select data. For example, you can calculate the area of
parcels and then select parcels whose areas are above a certain area value.
You can store the resulting calculation as a new property in the Data Table.
It will be available whenever you open the map in which you created it, but
1132 | Chapter 8 Analyzing Data
it is not saved back to the original data store. Calculated properties are gray
in the Data Table, because you cannot edit them.
NOTE The Data Table displays attribute data for geospatial features only. To
display attribute data for drawing objects, see Overview of Drawing Object
Information. (page 1144)
There are two special calculations you can perform: finding the area of a
polygon and finding the length of a linear feature (or the perimeter of a
polygon feature).
Tell me more
Video
■Show me how to create a calculated
field.
Procedures
■To create a calculated property (page
1133)
Tutorial
■Lesson 2: Analyze Data With External
Information Using Joins
GIS Skills
■Calculate fields in the Data Table.
Related topics
■Creating a Calculation
■Creating Expressions - Reference
To create a calculated property
1In the Display Manager, right-click the feature layer for which you want
to create a calculated property. Click Create A Calculation.
NOTE Once you create a calculation, this menu command changes to
Manage Calculations and displays the Manage Layer Data dialog box (page
1607). In that dialog box, you can add, edit, or delete calculations.
Getting Information about Features | 1133
NOTE You can also create a calculated property from within the Data Table
by clicking Options ➤ Create A Calculation. Once you create a calculation,
click Options ➤ Manage Calculations to add, edit, or delete calculations.
2Create the calculation.
3Click on the toolstrip to open the Data Table window.
The column representing the calculated property appears at the far right
side of the Data Table.
Quick Reference
MAPDATATABLE
Allows you to view, edit, and filter feature data
Click Edit ➤ Data Table.
Menu
Table
Icon
MAPDATATABLECommand Line
In Map Explorer or Display Manager, click the Table
button
Task Pane
Data Table Dialog BoxDialog Box
Viewing Data for a Selected Layer, Join, Unfiltered Feature Class,
or Non-Spatial Data Table
You can use the Data Table to view data for selected layers, joins, unfiltered
feature classes, or non-spatial data tables.
NOTE The Data Table displays attribute data for geospatial features only. To
display attribute data for drawing objects, see Overview of Drawing Object
Information. (page 1144)
1134 | Chapter 8 Analyzing Data

See also:
■Zooming to a View Using the Data Table (page 1140).
■Highlighting Features Using the Data Table (page 1136)
■Highlighting Data Table Rows Using the Map (page 1138)
■To view data for a selected layer (page 1135)
■To view joined data (page 1135)
■To view unfiltered feature class data (page 1135)
■To view non-spatial data (page 1136)
To view data for a selected layer
1Select the layer in Display Manager that contains the geospatial feature
class data to display.
2Click on the toolstrip to open the Data Table window.
3Select the row or rows of data to view in your map.
Specific areas of your map are highlighted based on the data you select.
To view joined data
1Select the layer in Display Manager that contains the geospatial feature
class data to view.
2Click to open the Data Table.
The Data Table displays the data in joined tables in read-only format:
you cannot edit data in joined tables from the primary table. For more
information about joins, see Overview of Joins (page 507)
To view unfiltered feature class data
1Select the layer in Display Manager that contains the geospatial feature
class data you want to view.
2Click to open the Data Table window.
3From the Data drop-down list, select the Feature Class data source.
Getting Information about Features | 1135
Selecting the Feature Class data source displays all records, including any
that are not associated with feature attributes. The selection and
highlighting options are not available when viewing this table.
To view non-spatial data
1On the top toolbar, click to open the Data Table window.
2In the Data drop-down list, select the non-spatial table you want to view.
The Data drop-down list will display all non-spatial data for a given
connected data source.
Quick Reference
MAPDATATABLE
Allows you to view, edit, and filter feature data
Click Edit ➤ Data Table.
Menu
Table
Icon
MAPDATATABLECommand Line
In Map Explorer or Display Manager, click the Table
button
Task Pane
Data Table Dialog BoxDialog Box
Highlighting Features Using the Data Table
You can select specific features in the Data Table and highlight them
automatically in your map. For example, you can select the Data Table rows
that represent parcels on one or two streets to see those parcels highlighted
in the map. If Auto-Zoom is on, the map will also zoom to the extents of the
selected features.
NOTE The Data Table displays attribute data for geospatial features only. To
display attribute data for drawing objects, see Overview of Drawing Object
Information. (page 1144)
1136 | Chapter 8 Analyzing Data
Tell me more
Video
■Show me how automatic zoom works.
■Show me how automatic scroll works.
Procedures
■To highlight features using the Data
Table (page 1137)
Tutorial
■Lesson 5: Find and Edit Features
Workflow
■Edit Features in a Geospatial Feature
Source
GIS Skills
■Zoom to features by selecting rows in
the Data Table (and vice-versa).
Related topics
■Searching For and Selecting Features
(page 1214)
■Highlighting Data Table Rows Using
the Map (page 1138)
■Zooming to a View Using the Data
Table (page 1140)
■Viewing Data for a Selected Layer, Join,
Unfiltered Feature Class, or Non-Spatial
Data Table (page 1134)
To highlight features using the Data Table
1In Display Manager, select the layer containing the geospatial feature set
to view.
2Click to open the Data Table window.
3Select a row or rows of data to highlight the corresponding features in
your map.
Getting Information about Features | 1137
To remove highlighting
➤ From the Options list in the Data Table, select Select None.
The highlighting is removed from the Data Table and your map.
Quick Reference
MAPDATATABLE
Allows you to view, edit, and filter feature data
Click Edit ➤ Data Table.
Menu
Table
Icon
MAPDATATABLECommand Line
In Map Explorer or Display Manager, click the Table
button
Task Pane
Data Table Dialog BoxDialog Box
Highlighting Data Table Rows Using the Map
You can select features in your map to highlight the corresponding rows of
data in the Data Table.
NOTE The Data Table displays attribute data for geospatial features only. To
display attribute data for drawing objects, see Overview of Drawing Object
Information. (page 1144)
Tell me more
Video
■Show me how automatic zoom works.
■Show me how automatic scroll works.
Procedures
■To highlight rows of data (page 1139)
Tutorial
■Lesson 5: Find and Edit Features
1138 | Chapter 8 Analyzing Data
Workflow
■Edit Features in a Geospatial Feature
Source
GIS Skills
■Zoom to features by selecting rows in
the Data Table (and vice-versa).
Related topics
■Searching For and Selecting Features
(page 1214)
■Highlighting Data Table Rows Using
the Map (page 1138)
■Highlighting Features Using the Data
Table (page 1136)
■Zooming to a View Using the Data
Table (page 1140)
■Viewing Data for a Selected Layer, Join,
Unfiltered Feature Class, or Non-Spatial
Data Table (page 1134)
To highlight rows of data
1In Display Manager, select the layer containing the geospatial feature set
to view.
2Click to open the Data Table window.
3Click Auto-Scroll (if it is not already on) to turn on the automatic scroll
feature in the Data Table.
4Select any area or feature in your map.
The Data Table scrolls and highlights the corresponding rows of data.
Quick Reference
MAPDATATABLE
Allows you to view, edit, and filter feature data
Click Edit ➤ Data Table.
Menu
Getting Information about Features | 1139
Table
Icon
MAPDATATABLECommand Line
In Map Explorer or Display Manager, click the Table
button
Task Pane
Data Table Dialog BoxDialog Box
Zooming to a View Using the Data Table
You can select rows of data in the Data Table to zoom in directly to data in
your map.
NOTE The Data Table displays attribute data for geospatial features only. To
display attribute data for drawing objects, see Overview of Drawing Object
Information. (page 1144)
Tell me more
Video
■Show me how automatic zoom works.
■Show me how automatic scroll works.
Procedures
■To zoom to a view (page 1141)
Tutorial
■Lesson 5: Find and Edit Features
Workflow
■Edit Features in a Geospatial Feature
Source
GIS Skills
■Zoom to features by selecting rows in
the Data Table (and vice-versa).
Related topics
■Searching For and Selecting Features
(page 1214)
■Highlighting Features Using the Data
Table (page 1136)
1140 | Chapter 8 Analyzing Data
■Highlighting Data Table Rows Using
the Map (page 1138)
■Viewing Data for a Selected Layer, Join,
Unfiltered Feature Class, or Non-Spatial
Data Table (page 1134)
To zoom to a view
1In Display Manager, select the layer containing the geospatial feature set
to view.
2Click to open the Data Table window.
3In the Data Table, click Auto-Zoom (unless it is already on).
4Select the rows of data to view. AutoCAD Map 3D automatically zooms
to the corresponding data.
Quick Reference
MAPDATATABLE
Allows you to view, edit, and filter feature data
Click Edit ➤ Data Table.
Menu
Table
Icon
MAPDATATABLECommand Line
In Map Explorer or Display Manager, click the Table
button
Task Pane
Data Table Dialog BoxDialog Box
Exporting Data from the Data Table
You can export the data in the Data Table to a .csv (comma-separated text file)
that can be opened in most spreadsheet applications.
Getting Information about Features | 1141
NOTE The Data Table displays attribute data for geospatial features only. To
display attribute data for drawing objects, see Overview of Drawing Object
Information. (page 1144)
Tell me more
Video
■Show me how to export records for selec-
ted features.
Procedure
■To export from the Data Table (page
1142)
Tutorial
■Exercise 5: Export the data to CSV for
use in a report
GIS Skills
■Generate a report by exporting records
to a spreadsheet.
Related topics
■Editing Features using the Data Table
(page 711)
■Overview of the Data Table (page 1125)
■Exporting and Printing Attribute Data
(page 1472).
To export from the Data Table
1In the Data Table, select the rows of data to export.
2From the Options list in the Data Table, select Export.
3Save the .csv file to the specified name and folder.
Quick Reference
MAPDATATABLE
Allows you to view, edit, and filter feature data
1142 | Chapter 8 Analyzing Data
Click Edit ➤ Data Table.
Menu
Table
Icon
MAPDATATABLECommand Line
In Map Explorer or Display Manager, click the Table
button
Task Pane
Data Table Dialog BoxDialog Box
Getting Information About Drawing Objects
You can store information about drawing objects in object data tables or in
linked external sources.
NOTE Object data and linked external sources are available for drawing objects
only. For information about storing information for geospatial features, see
Overview of the Data Table (page 1125).
See also:
■Storing Attribute Data in the Drawing (Object Data) (page 521)
■Overview of Linking Database Records to Objects (page 522)
To get information about drawing objects
■To view properties and attributes for a drawing object (page 1146)
■To view external data linked to drawing objects (page 1147)
Overview of Drawing Object Information
You can associate drawing objects with properties and attributes contained
in your map, as well as data contained in common spreadsheet application
databases. Within your map, you can view and edit this data.
NOTE Object data and linked external sources are available for drawing objects
only. For information about storing information for geospatial features, see
Overview of the Data Table (page 1125).
Getting Information About Drawing Objects | 1143

You can get information about drawing objects in the following ways.
For more information,
see...
Use this method...To do this...
Displaying and Editing Ob-
ject Data for a Drawing Ob-
ject (page 1068)
View and edit object data 1Right-click a drawing
object in the map.
2Click Properties.
Editing Object Class Data
(page 991)
View and edit object class
data.
1Right-click a classified
drawing object in the
map.
2Click Properties.
3Click the Object Class
tab.
Editing a Database (page 1055)Edit external data linked
to drawing objects
1Open a database table
in the Data View.
2Click the data to edit.
3Enter the new value.
Finding Records in a Data-
base Linked to Drawing Ob-
jects (page 1221)
Find data in the Data
View.
1Open a database table
in the Data View.
2Position the cursor in
the column to search.
3In the Data View win-
dow, click Edit menu
➤ Find.
4Enter the characters to
find.
5Click Find Next.
Highlighting Drawing Ob-
jects Linked to a Database
Record (page 1225)
Highlight drawing objects
in your map that are
linked to a database re-
cord.
1Open a linked database
table in the Data View.
2In the Data View win-
dow, select a record.
1144 | Chapter 8 Analyzing Data

For more information,
see...
Use this method...To do this...
3In the Data View, click
Highlight menu ➤
Highlight Objects.
Highlighting Drawing Ob-
jects Linked to a Database
Record (page 1225)
At the Command prompt,
enter regen.
Remove highlighting
Highlighting Records Linked
to a Selected Object (page
1228)
Highlight records linked
to a selected drawing ob-
ject
1Open a linked database
table in the Data View.
2In the Data View, click
Highlight menu ➤
Highlight Records ➤
Select Object. Select the
objects in your drawing.
3Press Enter.
Printing from the Data View
(page 1474)
Print information from the
Data View.
1In the Data View, spe-
cify print options,
header, footer, or filters.
2In the Data View, click
File menu ➤ Print.
3Click OK.
Viewing Properties and Attributes of Drawing Objects
View object data and object class data for drawing objects in the Properties
palette.
NOTE Object data is available for drawing objects only. To view information for
geospatial features, see Overview of the Data Table (page 1125).
See also:
■Entering and Editing Object Data (page 1061)
Getting Information About Drawing Objects | 1145
■Editing Object Class Data (page 991)
To view properties and attributes for a drawing object
■Right-click an object and click Properties.
The Properties palette opens showing all the information contained in the
object data of your drawing layer.
NOTE Object data is available for drawing objects only. To view information
for geospatial features, see Overview of the Data Table (page 1125).
Quick Reference
PROPERTIES
Displays the Properties palette, which allows you to edit the properties of
objects
Analyze ➤ Properties
Menu
Properties
Icon
PROPERTIESCommand Line
Select object. Right-click in drawing area ➤ Properties
Task Pane
Viewing External Data Linked to Drawing Objects
You can view the external data contained in your map by linking to an external
database, usually a common spreadsheet application.
NOTE Linked external data is available for drawing objects only. To link geospatial
features to external data sources, see Overview of Joins (page 507).
See also:
■Overview of Linking Database Records to Objects (page 522)
■Viewing External Data Sources for Drawing Object Data (page 1047)
1146 | Chapter 8 Analyzing Data
To view external data linked to drawing objects
1In Map Explorer (page 2068), expand Link Templates and right-click a link
template.
2Click View Linked Table.
The Data View window opens.
3Click the Highlight Linked Objects icon.
4In your map, select the objects whose data you want to view and press
Enter.
The Data View window reappears. The records that are linked to the
selected objects are highlighted.
5Use the navigation buttons to move between highlighted records.
Quick Reference
(Data View) Highlight Objects
Highlights objects linked to the selected records
In the Data View: Highlight ➤ Highlight Objects
Menu
Highlight Objects
Icon
Measuring and Tracking Coordinates
To measure and track coordinates
■To track coordinates (page 1150)
■To add a coordinate tracker to the Track Coordinates pane (page 1150)
■The new coordinate tracker displays the code and description of the
coordinate system you selected. (page 1151)
■To create a feature using the coordinate tracker (page 1151)
■To measure geodetic distance (page 1153)
■To measure coordinate geometry (page 1154)
Measuring and Tracking Coordinates | 1147

Overview of Measuring and Tracking
Once you have assigned coordinate systems to your map, you can locate
specific coordinate points and measure the geodetic distance between points.
For example, you can determine the coordinates of a maintainance hole or
the centerline of a new road.
For drawing objects in your map, there are additional coordinate geometry
commands you can use to do the following:
■Add the distances between multiple points
■Determine the total distance between a series of points
■Display angle information for points or intersecting lines
■Display coordinate geometry for lines and arcs
■Determine the slope, grade, and horizontal distance between two points
In addition, you can use AutoCAD commands, such as DIST, AREA,
PROPERTIES, and PERIMETER, to obtain information about drawing objects,
which can help you do useful calculations. For more information, refer to the
AutoCAD Help.
See also:
■Overview of Coordinate Systems (page 143)
■Assigning a Coordinate System to the Current Drawing (page 147)
■Theming Surfaces to Analyze Height, Slope, and Aspect (page 1202)
Use the following methods to measure and track coordinates.
DescriptionFor drawing objects onlyFor all map objects
As you move the cursor around in a
drawing window, display the cursor
Tracking Coordinates
(page 1149)
location in a specific coordinate sys-
tem.
Measure the geodetic distance (which
takes into account the curvature of
Measuring Geodetic
Distance (page 1152)
the Earth) between points in your
map.
1148 | Chapter 8 Analyzing Data

DescriptionFor drawing objects onlyFor all map objects
Calculate the total of several disjunct
distances between points in your
map.
Adding Distances (page 1156)
Add and display the distance between
one point and several other points,
Displaying Continuous Dis-
tance (page 1158)
or between a series of points. in a
drawing.
Display the acute and obtuse angle
between points or intersecting lines.
Displaying Angle Information
(page 1160)
Display coordinate geometry for lines
and arcs, including line and curve
details, area, and coordinates.
Displaying COGO Informa-
tion for Lines and Arcs (page
1161)
Display the slope, grade, and horizont-
al distance between two points.
Displaying Slope (page 1161)
Tracking Coordinates
As you move the cursor around in a drawing window, you can display the
cursor location in the coordinate systems you choose.
For example, if an attached drawing uses one coordinate system and the
current drawing uses another, you can track the source drawing's coordinates
as you move the cursor around in the current drawing. You can track multiple
coordinate systems in the Track Coordinates pane.
The coordinate tracker automatically converts coordinate data from the
coordinate system of the map to any coordinate system you select. If you
move your cursor outside the extents of the converted coordinate system, you
will see null values in the tracker. However, if you are tracking coordinates
using the same coordinate system as your map, the tracker will continue to
display coordinates even beyond the boundaries of the coordinate system.
Because you are tracking coordinates in the same coordinate system as the
map, no conversion in performed, and AutoCAD Map 3D will always return
coordinate values.
You can also use the coordinate tracker to create features using the Digitize
button.
Tracking Coordinates | 1149
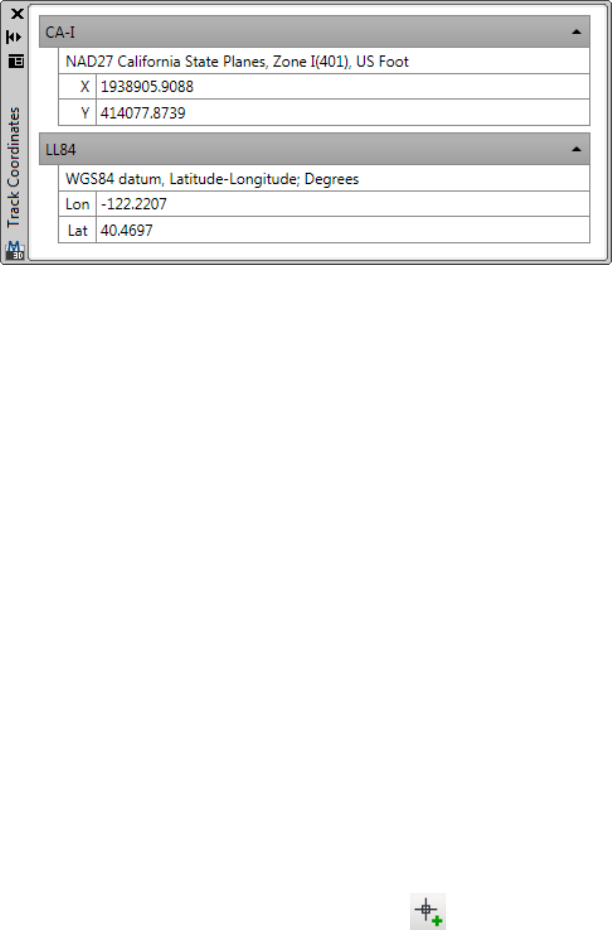
Track Coordinates pane
See also:
■Overview of Coordinate Systems (page 143)
■Attaching Drawings (page 154)
■Setting Coordinate Tracker Options (page 232)
To track coordinates
1Click Analyze tab ➤ Geo Tools panel ➤ Coordinate Track.The Track
Coordinates pane appears.
2Click the coordinate tracker toolbar.
3Choose the coordinate system to track in the coordinate tracker
drop-down list. If you know the code of the coordinate system you want,
you can type the code.
4The Track Coordinates pane displays the code and description of the
coordinate system.
As you move the cursor over the drawing window, the coordinate tracker
updates the cursor's coordinates in the selected coordinate system.
To add a coordinate tracker to the Track Coordinates pane
1In the coordinate tracker toolbar, click . A new coordinate tracker
appears in the Track Coordinates pane.
2Click the coordinate tracker toolbar.
1150 | Chapter 8 Analyzing Data
3Choose the coordinate system to track in the coordinate tracker
drop-down list. If you know the code of the coordinate system you want,
you can type the code. The new coordinate tracker displays the code and
description of the coordinate system you selected.
4Repeat steps 1-3 to add more coordinate trackers to the Track Coordinates
pane.
The new coordinate tracker displays the code and description of the coordinate
system you selected.
■In the coordinate tracker toolbar, click . The selected coordinate tracker
is removed from the Track Coordinates pane.
To create a feature using the coordinate tracker
1Start a command, such as LINE or MPOLYGON.
2Enter the coordinates for the geometric point in the coordinate tracker,
then click .
3Continue as appropriate for the feature you are creating.
Tips
■If the coordinate tracker remains empty as you move the cursor in the
drawing window, either there is no coordinate system assigned to the
current drawing or the cursor is in a region of the window that is not valid
for the specified coordinate system. You cannot track coordinates in layout
space.
■You can track coordinates using the coordinate system of a specific attached
drawing. In Map Explorer, right-click the attached drawing ➤ Track
Drawing's Coordinates. The Track Coordinates pane opens, preset to the
specified attached drawing's coordinate system. If Track Drawing's
Coordinates is not available, there is no coordinate system assigned to the
attached drawing.
Quick Reference
MAPTRACKCS
Tracking Coordinates | 1151
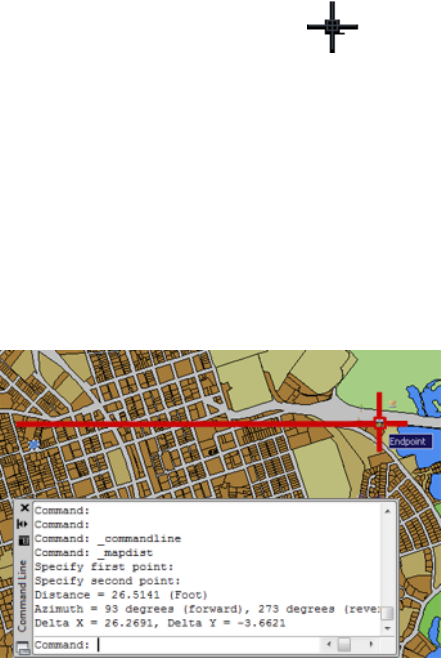
Tracks the coordinates of the cursor in any coordinate system
Analyze menu ➤ Track Coordinate Sytem.
Menu
Track Coordinates
Icon
MAPTRACKCSCommand Line
In Map Explorer, right-click Current Drawing ➤ Track
Coordinates
Task Pane
Measuring Geodetic Distance
You can measure the geodetic distance between points in your map. Geodetic
distance takes into account the curvature of the Earth. Therefore, the geodetic
distance between any two points is longer than the straight line distance
between the same two points.
Measure geodetic distance between points in your map
See also:
■Measuring and Tracking Coordinates (page 1147)
■Overview of Coordinate Systems (page 143)
■To track coordinates (page 1150)
1152 | Chapter 8 Analyzing Data
To measure geodetic distance
1Click Analyze tab ➤ Geo Tools panel ➤ Geo Distance.
2At the MAPDIST (page 1597) prompt, specify the starting point by clicking
in the map or typing the coordinates of the point.
3At the second prompt, specify the end point by clicking in the map or
typing the coordinates of the point.
The results of the calculation are displayed on the command line. If you
do not see the command line, press Ctrl + 9 to display it.
Notes
■If the map file does not have an assigned coordinate system (page 147), the
result is a simple straight line distance calculation.
■You can change the units (page 1150)in which the distance is displayed.
Quick Reference
MAPDIST
Measures the geodetic distance between points
Analyze menu ➤ Geodetic Distance
Menu
Geodetic Distance
Icon
MAPDISTCommand Line
MAPDISTDialog Box
Measuring Coordinate Geometry
Use the inquiry commands to extract geometric information from drawing
objects.
NOTE You cannot use these commands for geospatial features.
Measuring Coordinate Geometry | 1153
To measure coordinate geometry
■To add distances (page 1157)
■To display the distance between points (page 1159)
■To display angle information (page 1160)
■To display COGO information for lines and arcs (page 1161)
■To display the slope between two points (page 1162)
Overview of Measuring Coordinate Geometry
Use the inquiry commands to extract geometric information from drawing
objects such as lines, curves, closed polylines, and polygons. This can help
you verify the accuracy of your data, or send the data to the field.
NOTE Inquiry commands are specific to drawing objects. They do not work on
geospatial features.
NOTE The COGO inquiry commands use the World Coordinate System (WCS)
and ignore current User Coordinate System (UCS) settings. Therefore, north is
always considered to point along the WCS positive Y axis, and inquiry results are
reported in WCS coordinates.
See also:
■Measuring and Tracking Coordinates (page 1147)
■Setting Coordinate Geometry Options (page 233)
■Overview of Coordinate Systems (page 143)
NOTE You cannot use these commands for geospatial features.
Use this method...To do this...
Click Analyze tab ➤ Inquiry panel ➤ Add
Distances.
See Adding Distances (page 1156)
Add distances.
1154 | Chapter 8 Analyzing Data
Use this method...To do this...
Click Analyze tab ➤ Inquiry panel ➤ Con-
tinuous Distance.
See Displaying Continuous Distance (page
1158)
Display the distance between points.
Click Analyze tab ➤ Inquiry panel ➤ Angle
Information.
See Displaying Angle Information (page
1160)
Display angle information.
Click Analyze tab ➤ Inquiry panel ➤ Line
& Arc Information.
See Displaying COGO Information for Lines
and Arcs (page 1161)
Display coordinate geometry information
for lines and arcs.
Click Analyze tab ➤ Inquiry panel ➤ List
Slope.
See Displaying Slope (page 1161)
Display the slope between points.
Quick Reference
MAPCGADIST
Adds the distances between points
Analyze menu ➤ Inquiry ➤ Add Distances
Menu
Add Distances
Icon
MAPCGADISTCommand Line
MAPCGCDIST
Measuring Coordinate Geometry | 1155
Displays the distance between points
Analyze menu ➤ Inquiry ➤ Continuous Distance
Menu
Continuous Distance
Icon
MAPCGCDISTCommand Line
MAPCGANG
Displays the angle between lines or points
Analyze menu ➤ Inquiry ➤ Angle Information
Menu
Angle Information
Icon
MAPCGANGCommand Line
MAPCGLIST
Displays coordinate geometry information for lines and arcs
Analyze menu ➤ Inquiry ➤ Line and Arc
Information
Menu
Line and Arc Information
Icon
MAPCGLISTCommand Line
Adding Distances
You can calculate the total of several disjunct distances by selecting points in
your map, entering distances on the command line, or selecting numeric text,
such as measurements, in your map.
NOTE You can perform this operation only on drawing objects. It is not available
for geospatial features.
1156 | Chapter 8 Analyzing Data
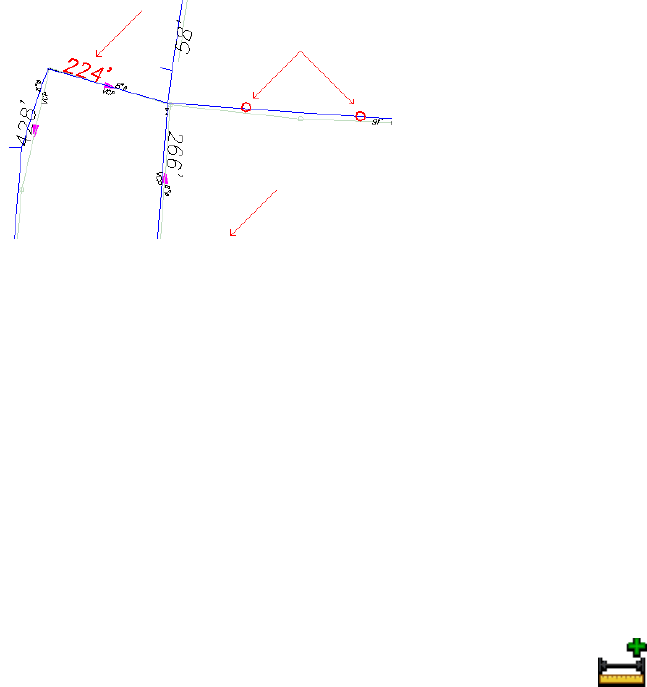
You are prompted to enter a number, specify a distance, or select text. Select
all the distances you want to add. You can select numeric text in your drawing,
click the start and end points of the distance you want to measure, or enter
the number directly on the command line. When you press Enter, AutoCAD
Map 3D displays the total of all the distances.
See also:
■Measuring and Tracking Coordinates (page 1147)
■Setting Coordinate Geometry Options (page 233)
■Overview of Coordinate Systems (page 143)
■Displaying Continuous Distance (page 1158)
To add distances
1Click Analyze tab ➤ Inquiry panel ➤ Add Distances.
2Specify the first distance by doing one of the following:
■Enter the distance on the command line.
■Select two locations in the map.
■Enter s. Select numeric text in the map, such as a measurement.
3Enter as many additional distances as you want.
4When you finish selecting distances, press Enter to view the total of the
distances.
The results of the calculation are displayed on the command line. If you
do not see the command line, press Ctrl + 9 to display it.
Measuring Coordinate Geometry | 1157
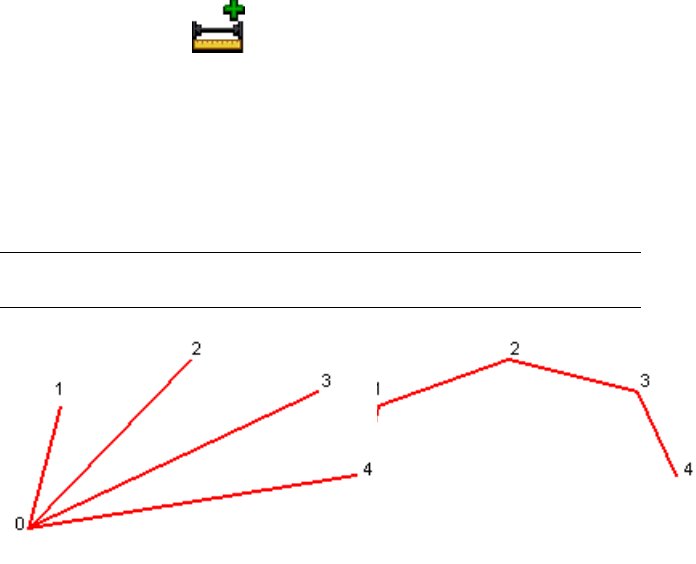
Quick Reference
MAPCGADIST
Adds the distances between points
Analyze menu ➤ Inquiry ➤ Add Distances
Menu
Add Distances
Icon
MAPCGADISTCommand Line
Displaying Continuous Distance
You can add and display the distance between one point and several other
points, or between a series of points in a drawing.
NOTE You can perform this operation only on drawing objects. It is not available
for geospatial features.
The Continuous option measures the dis-
tance from the starting point to the next
The Base option measures the distance from
the starting point to each of the points you
select, like the spokes of a wheel. point and from that point to the next point,
in a continuous line.
See also:
■Adding Distances (page 1156)
■Measuring and Tracking Coordinates (page 1147)
1158 | Chapter 8 Analyzing Data

■Setting Coordinate Geometry Options (page 233)
■Overview of Coordinate Systems (page 143)
To display the distance between points
1Click Analyze tab ➤ Inquiry panel ➤ Continuous Distance.
2Select Base or Continuous.
■Base: Always measures the distance from the first point you select to
each of the additional points you select.
■Continuous: Measures the distance from one point to the next.
3Select two points to display the distance between the points.
4Select another point. If you selected Base, AutoCAD Map 3D displays the
distance from first (or base) point to the new point. If you selected
Continuous, AutoCAD Map 3D displays the distance from the last point
to the new point.
5When you finish selecting points, press Enter to view the total of the
distances.
The results of the calculation are displayed on the command line. If you
do not see the command line, press Ctrl + 9 to display it.
Quick Reference
MAPCGCDIST
Displays the distance between points
Analyze menu ➤ Inquiry ➤ Continuous Distance
Menu
Continuous Distance
Icon
MAPCGCDISTCommand Line
Measuring Coordinate Geometry | 1159
Displaying Angle Information
You can display the acute and obtuse angle between points or intersecting
lines in a drawing.
NOTE You can perform this operation only on drawing objects. It is not available
for geospatial features.
See also:
■Measuring and Tracking Coordinates (page 1147)
■Setting Coordinate Geometry Options (page 233)
■Overview of Coordinate Systems (page 143)
■Displaying Continuous Distance (page 1158)
To display angle information
1Click Analyze tab ➤ Inquiry panel ➤ Angle Information.
2Select two lines, or enter p to specify points.
3If you entered p, specify a starting point, a vertex, and an ending point.
The results of the calculation are displayed on the command line. If you
do not see the command line, press Ctrl + 9 to display it.
Quick Reference
MAPCGANG
Displays the angle between lines or points
Analyze menu ➤ Inquiry ➤ Angle Information
Menu
Angle Information
Icon
MAPCGANGCommand Line
1160 | Chapter 8 Analyzing Data
Displaying COGO Information for Lines and Arcs
You can display coordinate geometry for lines and arcs. This information
includes line and curve details, area, and coordinates.
NOTE You can perform this operation only on drawing objects. It is not available
for geospatial features.
See also:
■Setting Coordinate Geometry Options (page 233)
■Overview of Coordinate Systems (page 143)
To display COGO information for lines and arcs
1Click Analyze tab ➤ Inquiry panel ➤ Line & Arc Information.
2Select the line or arc, or enter p to specify the points for a line.
3If you entered p, specify a starting point and an ending point for the line.
The results of the calculation are displayed on the command line. If you
do not see the command line, press Ctrl + 9 to display it.
Quick Reference
MAPCGLIST
Displays coordinate geometry information for lines and arcs
Analyze menu ➤ Inquiry ➤ Line and Arc
Information
Menu
Line and Arc Information
Icon
MAPCGLISTCommand Line
Displaying Slope
You can display the slope, grade, and horizontal distance between two points.
Measuring Coordinate Geometry | 1161
NOTE You can perform this operation only on drawing objects. It is not available
for geospatial features.
See also:
■Setting Coordinate Geometry Options (page 233)
■Overview of Coordinate Systems (page 143)
■Theming Surfaces to Analyze Height, Slope, and Aspect (page 1202)
To display the slope between two points
1Click Analyze tab ➤ Inquiry panel ➤ List Slope.
2Select a line or an arc, or enter p to specify points.
3If you entered p, specify a starting point and an ending point for the line.
The results of the calculation are displayed on the command line. If you
do not see the command line, press Ctrl + 9 to display it.
Quick Reference
MAPCGSLIST
Displays the slope between points
Analyze menu ➤ Inquiry ➤ List Slope
Menu
List Slope
Icon
MAPCGSLISTCommand Line
Creating Themes
Themes vary the display of your data based on properties or attributes of the
data. For example, instead of styling the lakes so they are all the same shade
of blue, you can create a theme to vary the color based on the depth of the
lake.
1162 | Chapter 8 Analyzing Data
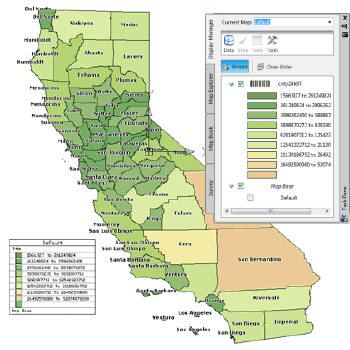
To create themes
■To create a theme for a feature layer (page 1168)
■To theme drawing data (page 1176)
Overview of Creating Themes
A theme varies the display of data based on properties or attributes of the data,
for example area, length, pavement type, assessed value, temperature, or land
use.
You can use themes to change colors, line types, symbols, text, or other
properties that can help you present map information and tell a story. Themes
can help make information more visible, illustrate how data is distributed,
make data easier to analyze and interpret, and reveal patterns.
For example, you can use darker colors for areas with more rainfall, a larger
dot to display cities with a larger population, or a wider line to draw roads
with high traffic volume.
A theme showing counties by area
You can theme on specific values or a range of values. For example, an
agricultural theme might show different crops in different colors. Each crop
is a specific value. Temperature, however, can be any number along a
continuum. When you display this type of data, you define ranges for the
values. For example, you could divide temperature values into three ranges:
below 30, 30 - 60, and over 60.
Overview of Creating Themes | 1163
You can add labels to a theme to label features or drawing objects. You can
also add a legend that lists the conditions of the theme and explains the colors,
symbols, line patterns, shadings, and annotation used.
Tell me more
Video
■Show me how to theme a parcels layer.
■Show me how to manually adjust the
ranges of a theme.
■Show me how to theme based on indi-
vidual values.
Procedures
■To create themes (page 1163)
■To create a theme for a feature layer
(page 1168)
■To create a theme for a drawing layer
(page 1181)
Tutorial
■Lesson 2: Style Map Features
Workflow
■Analyze Data
GIS Skills
■Choose the right type of theme to suit
your data.
■Manually adjust the ranges of a theme.
■Theme based on individual values.
Related topics
■Styling Features (page 639)
■Overview of Creating and Editing Data
(page 681)
■Adding Labels to Features (page 1091)
■Adding a Legend (page 1116)
■Defining Scale Ranges (page 643)
1164 | Chapter 8 Analyzing Data

The method you use to theme data depends on the type of layer on which
the data is stored.
DescriptionSee...To theme this type
of data...
Display Manager layers from feature
sources such as SDF or Oracle that have
been added using Data Connect.
Theming Features (page
1165)
Feature layers
AutoCAD layers containing drawing objects
from DWG files.
Theming Drawing Data
(page 1176)
Drawing layers
Raster-based surfaces, such Digital Eleva-
tion Models (DEMs), ESRI Grid files, and
Theming Surfaces to
Analyze Height, Slope,
and Aspect (page 1202)
Surface layers
Digital Terrain Elevation Data (DTED) that
have been added using Data Connect.
Theming Features
You can use the theming tool to create themes for layers from feature sources
such as SDF, SHP, Oracle Spatial, or ArcSDE. Themes vary the display of features
on the feature layer based on properties or attributes associated with that layer.
For example, a theme for a point layer might display retail store locations with
a different symbol for each type of store. A polygon layer theme might display
each land use classification with a different color or shading.
Theming Features | 1165
A theme showing roads themed by type
NOTE For information about theming drawing objects, see Overview of Theming
Drawing Data (page 1178).
Theme Rules
A theme for a feature layer has a set of scale ranges and a rule that corresponds
to each one. For example, if you are theming by parcel size, the scale ranges
would indicate different parcel sizes. The first range might comprise parcels
between 1000 square feet and 5000 square feet, the second range might
comprise parcels 5001 square feet to 10,000 square feet, and so on. The first
rule would describe how the first range appears on the map. For example, the
smallest parcels might be lightest in color, and the colors might get darker as
the parcel size goes up.
Rules can include a visual style, a legend label, and a feature label.
■Visual style options vary, depending on the type of geometry on the layer.
Polygon style options include fill and border options; line style options
include line thickness, color, and pattern; point style options include a
symbol, size specifications, and color.
■Legend labels can provide a description of the condition of a rule. For
example, you can edit the default legend label so it reads “Small parcels,”
instead of “1000...2000.”
1166 | Chapter 8 Analyzing Data
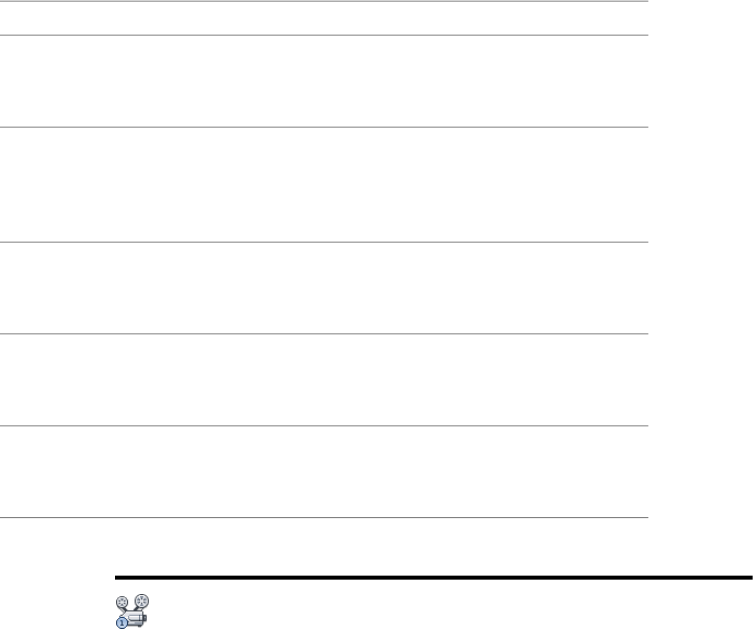
■Feature labels display the values of a property. For example, you can label
parcels with their address or area values.
As a layer is drawn, each feature is compared to the rules in the order that
they are listed. The first rule for which the feature meets the condition is used
to specify the style and legend label for that feature. A default or empty
condition applies to all features and defines the style for features that do not
meet any of the preceding rules. A well-constructed theme contains only one
default rule and it is last in the list.
Distribution Methods
When you create a range of conditions for a feature theme, you must specify
the distribution method. The following methods are available:
DescriptionMethod
The difference between the high and low values is the
same for every range. This method is easy to interpret
Equal
and is useful for showing continuous data such as rainfall.
Features are placed in ranges based on how much their
values vary from the mean. AutoCAD Map 3D calculates
Standard Deviation
the mean and then adds or subtracts the standard devi-
ation to or from the mean to create the ranges.
Each range contains an equal number of features. This
method is useful for showing data in which values are
evenly distributed.
Quantile
Ranges are based on natural groupings of data values.
Features with similar values are grouped. This method
shows the natural groupings in the data.
Jenks (Natural Breaks)
Features are not grouped. This distribution is useful if
values are not continuous, there is a fixed number of
values, and many features have the same value.
Individual Values
Tell me more
Video
■Show me how to theme a parcels layer.
■Show me how to manually adjust the
ranges of a theme.
Theming Features | 1167
■Show me how to theme based on indi-
vidual values.
Procedure
■To create a theme for a feature layer
(page 1168)
Tutorial
■Lesson 2: Style Map Features
Workflow
■Analyze Data
GIS Skills
■Choose the right type of theme to suit
your data.
■Manually adjust the ranges of a theme.
■Theme based on individual values.
Related topics
■Styling Features (page 639)
■Adding Labels to Features (page 1091)
■Overview of Creating and Editing Data
(page 681)
■Creating Themes for Drawing Layers
(page 1178)
■Theming Surfaces to Analyze Height,
Slope, and Aspect (page 1202)
■Adding a Legend (page 1116)
■Defining Scale Ranges (page 643)
NOTE For information about theming drawing objects, see Overview of Theming
Drawing Data (page 1178).
To create a theme for a feature layer
1In Display Manager (page 2060), select a feature layer. Click the Style icon
in the toolstrip.
For information about creating a new feature layer, see Bringing in GIS
Features (page 303).
1168 | Chapter 8 Analyzing Data

2In the Style Editor, under Scale Ranges, select the scale range to theme.
For more information about scale ranges, see Defining Scale Ranges (page
643).
3In the Polygon Style, Point Style, or Line Style area, click New Theme.
4To analyze features based on values that fall into various numerical ranges,
do the following in the Theme dialog box (page 1645):
■For Property, select the property on which to base the theme.
■For properties with numeric values, specify the Minimum Value and
Maximum Value for the range.
■For properties with numeric values, select a Distribution method. For
more information about distribution methods, see the Concepts tab
of this topic.
The first rule includes the Minimum Value and the last rule includes
the Maximum Value. Styles are interpolated across the range.
You can specify the number of rules to create if Distribution method
is Equal, Quantile, or Jenks (Natural Breaks). Properties containing
strings use an Individual Values distribution that does not allow the
number of rules to be edited. Adjust the number of rules to control
the granularity of the theme.
■If you are editing an existing theme, you can replace any existing
rules by selecting Replace existing rules.
5The default Style Range shows the styles that will be used for each rule.
Your options depend on the type of geometry stored on this feature layer.
■For polygon features, see To set styling options for polygon features
(page 1172).
■For line features, see To set styling options for line features (page 1174).
■For point features, see To set styling options for point features (page
1175).
6To add labels to features in the theme, do the following:
■Select the Create Feature Labels check box.
■Next to Label Ramp, click
■Select Create A Label and specify the criteria for the labels.
Theming Features | 1169
For more information about creating feature labels, see Adding Labels
to Features (page 1091). To use expressions for labels, see Using
Expressions to Label Features.
7To create legend labels for the theme, do the following:
■Select the Create Legend Labels check box.
■For Legend Text, enter the text to appear next to each rule in the
legend.
For example, if you are theming by size, you could change the legend
text to “Square Acreage.”
■For Label Format, specify how to display the legend label.
If you theme a layer on a property that contained area information
and you used the label text Area:, the label formats might look like
the following examples:
<Label Text> <Min> to <Max>
Area: 100 to 200
<Label Text> <Min> - <Max>
Area: 100 - 200
<Min> <= <Label Text> <<Max>
100 <= Area < 200
For information on inserting a legend into your map, see Adding a
Legend (page 1116).
Quick Reference
Theme Feature Layer in Display Manager
Creates a theme for a feature layer in Display Manager
In Display Manager, right-click a feature layer. Select
Edit Style. In the Style Editor, click the New Theme
button.
Task Pane
Theme dialog boxDialog Box
1170 | Chapter 8 Analyzing Data
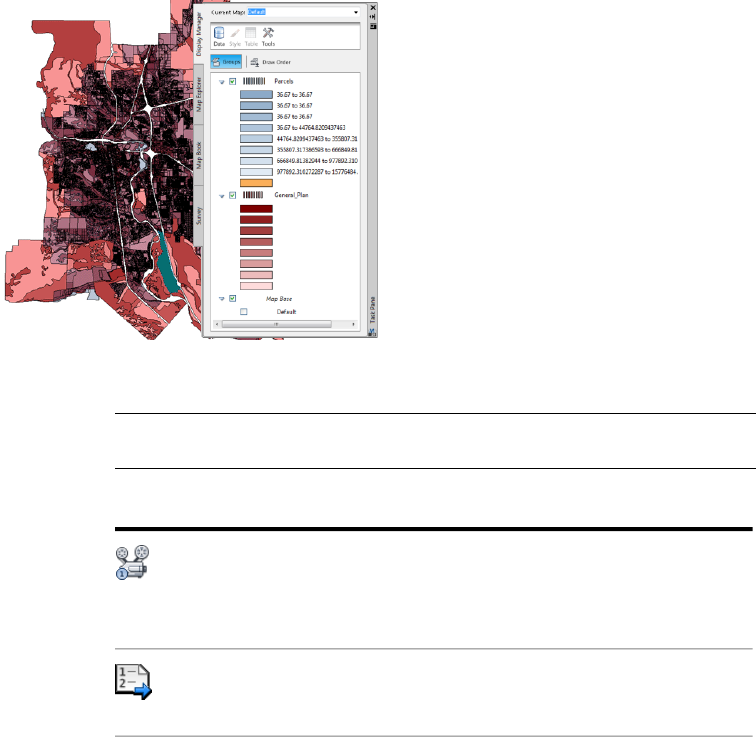
Theme Options for Polygon Feature Layers
When you create a theme for a feature layer whose geometry consists of
polygons, the Style Polygon dialog box provides options for changing the
visual appearance of the features in the theme. You can change options relating
to the fill and border.
A polygon feature theme can be transparent so that other map data shows
through, for example, another theme or another layer of map data. The
transparency option is available only when working with themes involving
a solid fill.
Blue parcel theme made partially transparent so you can see the red planning theme
underneath
NOTE For information about theming drawing objects, see Overview of Theming
Drawing Data (page 1178).
Tell me more
Video
■Show me how to theme a parcels layer.
■Show me how to make the features on
a layer semi-transparent.
Procedure
■To set styling options for polygon fea-
tures (page 1172)
Theming Features | 1171
Tutorial
■Exercise 6: Display the raster image
behind other features
Workflow
■Analyze Data
GIS Skills
■Set transparency for parcels or other
features.
Related topics
■Styling Features (page 639)
■Overview of Creating Themes (page
1163)
■Theming Features (page 1165)
■Theming Surfaces to Analyze Height,
Slope, and Aspect (page 1202)
NOTE For information about theming drawing objects, see Overview of Theming
Drawing Data (page 1178).
To set styling options for polygon features
1Create a theme for a polygon feature layer (page 1165).
2In the Theme Polygons dialog box, the default Style Range shows the
colors that will be used for each rule. To change them, click
3In the Style Area dialog box, change any of the following:
■Select Apply Fill To The Polygons and choose a Fill Pattern from the
list. To use transparency, choose Solid.
■If you chose Solid, for Foreground Transparency, specify a value from
0 through 100, where 0 is solid and 100 is transparent.
■For Foreground Color, select Generated Between Two Colors or Color
Palette.
For Generated Between Two Colors, specify the beginning and ending
colors for the theme. The intermediate colors will be calculated
automatically, but you can adjust them.
For Color Palette, choose a palette from the list.
1172 | Chapter 8 Analyzing Data
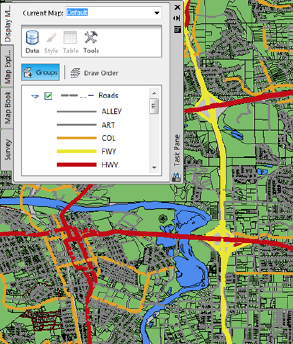
■Specify a Background Color, if appropriate.
■If you want a border, select Apply A Border To The Polygons and
choose a line pattern, thickness, and color.
4Click OK twice.
Quick Reference
Theme Feature Layer in Display Manager
Creates a theme for a feature layer in Display Manager
In Display Manager, right-click a feature layer. Select
Edit Style. In the Style Editor, click the New Theme
button.
Task Pane
Theme dialog boxDialog Box
Theme Options for Line Feature Layers
When you create a theme for a feature layer whose geometry consists of linear
features, the Style Line dialog box provides options for changing the visual
appearance of the features in the theme. You can change options relating to
the thickness, color, and pattern.
A theme showing roads by road type
Theming Features | 1173
NOTE For information about theming drawing objects, see Overview of Theming
Drawing Data (page 1178).
NOTE For information about theming drawing objects, see Overview of Theming
Drawing Data (page 1178).
To set styling options for line features
1Create a theme for a line feature layer (page 1165).
2In the Theme Lines dialog box, the default Style Range shows the styles
that will be used for each rule. To change them, click
3In the Style Line dialog box, change any of the following:
■For Units (Device Space), select the type of units to measure line
thickness. Lines are specified in Device Space units.
■For Thickness Range, specify the narrowest and widest line thicknesses
to use for the style.
■For Color Range, specify the beginning and ending colors for the
theme. The intermediate colors will be calculated automatically, but
you can adjust them.
■Choose a Pattern for the lines from the list.
4Click OK twice.
Quick Reference
Theme Feature Layer in Display Manager
Creates a theme for a feature layer in Display Manager
In Display Manager, right-click a feature layer. Select
Edit Style. In the Style Editor, click the New Theme
button.
Task Pane
Theme dialog boxDialog Box
1174 | Chapter 8 Analyzing Data
Theme Options for Point Feature Layers
When you create a theme for a feature layer whose geometry consists of point
features, the Style Line dialog box provides options for changing the visual
appearance of the features in the theme. You can change options relating to
the symbol, color, and size of the points.
NOTE For information about theming drawing objects, see Overview of Theming
Drawing Data (page 1178).
See also:
■Overview of Creating Themes (page 1163)
■Theming Features (page 1165)
■Theming Surfaces to Analyze Height, Slope, and Aspect (page 1202)
NOTE For information about theming drawing objects, see Overview of Theming
Drawing Data (page 1178).
To set styling options for point features
1Create a theme for a point feature layer (page 1165).
2In the Theme Points dialog box, the default Style Range shows the styles
that will be used for each rule. To change them, click
3In the Style Point dialog box, change any of the following:
■For Symbol, click and choose a symbol or browse to a symbol file.
■For Size Context, choose Device Space or Map Space and then select
the type of units to measure the point symbols.
In Device Space, you specify symbol widths and heights in screen
units. Available units are Points, Inches, Millimeters, or Centimeters.
In Map Space, you specify symbol widths and heights in Mapping
Coordinate System(MCS) units. Available units are Inches, Feet, Yards,
Miles, Millimeters, Centimeters, Meters, and Kilometers.
If you choose Device Space, symbols remain the same size during a
zoom. If you choose Map Space, symbols remain the same size relative
to the map. For example, if you make a symbol .1 miles in map units,
it will measure .1 miles no matter what zoom level you set.
Theming Features | 1175
■Set the size range for the point symbols (width and height). The
smallest size will be used for the objects in the lowest scale range and
the largest size will be used for the objects in the highest scale range.
You can enter a number or use an expression to set size.
■For Fill Color Range and Edge Color Range, specify the beginning and
ending colors for the theme. The intermediate colors will be calculated
automatically, but you can adjust them.
■Choose a Rotation Range for the symbols from the list, or use an
expression to set rotation.
4Click OK twice.
Quick Reference
Theme Feature Layer in Display Manager
Creates a theme for a feature layer in Display Manager
In Display Manager, right-click a feature layer. Select
Edit Style. In the Style Editor, click the New Theme
button.
Task Pane
Theme dialog boxDialog Box
Theming Drawing Data
To theme drawing data
■To create a theme for a drawing layer (page 1181)
■To edit a theme for drawing data (page 1182)
■To change the thumbnail used in the Display Manager (page 1183)
■To add a legend to your drawing (page 1183)
■To apply annotation to a theme for a drawing layer (page 1186)
Overview of Theming Drawing Data
Themes for drawing layers vary the stylization of drawing objects based on
object properties or data associated with the objects.
1176 | Chapter 8 Analyzing Data
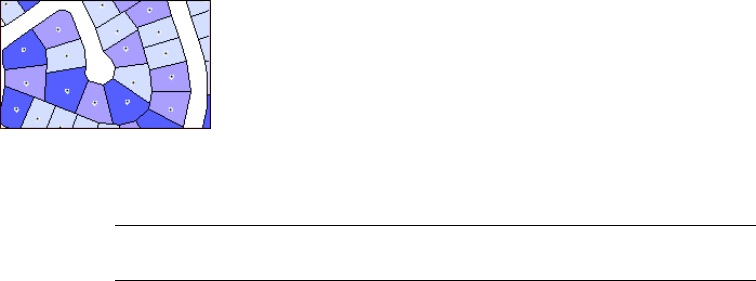
For example, you can vary the shade of blue used for parcels, depending on
the assessed property value of each parcel.
Change the color of each parcel based on assessed property value.
You can also use predefined themes, called ramps (page 1183).
NOTE For information about theming geospatial features, see Theming Features
(page 1168).
Theme Data
A theme for a drawing layer can be based on any of the following:
■A property of the objects, such as area or length
■Data stored in an object data table, such as pipe diameters
■Data stored in a linked external database, such as parcel values
The data used for a theme on a drawing layer can be specific values, such as
pipe material, land use, or pavement type, or a range of values, such as property
value, temperature, or population.
If the data is a set of specific values, select which values you want. For example,
an agricultural theme might show different crops in different colors. Each
crop is a specific value. You can omit some crops.
If the data is ranges of values, select how many ranges you want and how to
divide the data. For example, temperature can be any number along a
continuum. You could divide temperature values into three ranges: below 30,
30 - 60, and over 60.
You can add a legend that lists the conditions of the theme and explains the
colors, symbols, line patterns, shadings, and annotation used.
See also:
■Adding a Legend (page 1116)
■Theming Features (page 1165)
Theming Drawing Data | 1177
■Theming Surfaces to Analyze Height, Slope, and Aspect (page 1202)
NOTE For information about theming geospatial features, see Theming Features
(page 1168).
Use this method...To do this...
In Display Manager (page 2060) right-
click a drawing layer ➤ Add Style ➤
Theme.
See Theming Drawing Data (page 1176)
Create a theme for a drawing layer.
In Display Manager (page 2060) right-
click a drawing layer ➤ Edit Theme.
See Theming Drawing Data (page 1176)
Edit a theme for a drawing layer.
On the Display tab of the Properties palette
for a drawing layer, select the thumbnail
preview.
See Theming Drawing Data (page 1176)
Change the thumbnail image for the
theme in Display Manager.
In the Display Manager, click Tools ➤
Create Legend.
See Theming Drawing Data (page 1176)
Add a legend
Quick Reference
Theme Drawing Layer in Display Manager
Creates a theme for a drawing layer in Display Manager
In Display Manager, right-click a drawing layer. Click
Add Style ➤ Theme.
Task Pane
Thematic Mapping dialog boxDialog Box
Creating Themes for Drawing Layers
The following table shows data themed using different styling options and
offers some guidance on using those options.
1178 | Chapter 8 Analyzing Data
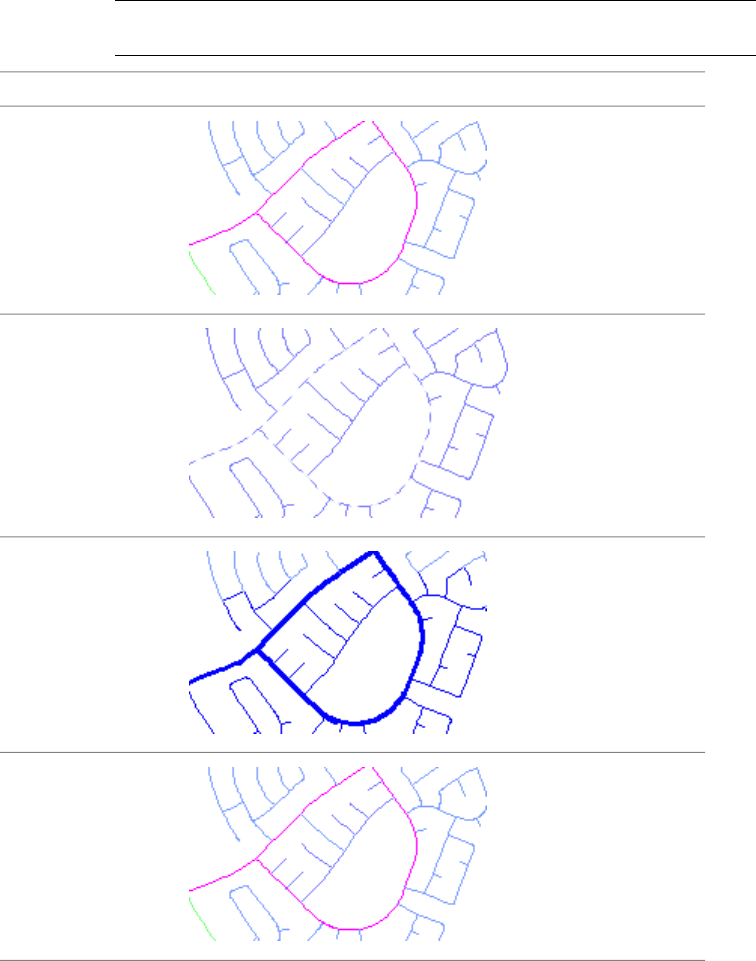
NOTE For information about theming geospatial features, see Theming Features
(page 1168).
More InformationExampleTheme Style
Alter color
To assign line width to circles,
arcs, or lines, convert the ob-
Alter linetype
jects to polylines with the
drawing cleanup tools. See
Cleaning Up Drawing Data
(page 765).
To assign line width to circles,
arcs, or lines, convert the ob-
Alter line weight
jects to polylines with the
drawing cleanup tools. See
Cleaning Up Drawing Data
(page 765).
Changes to plot styles appear
only in previews and in pub-
lished drawings.
Alter plot style
Theming Drawing Data | 1179
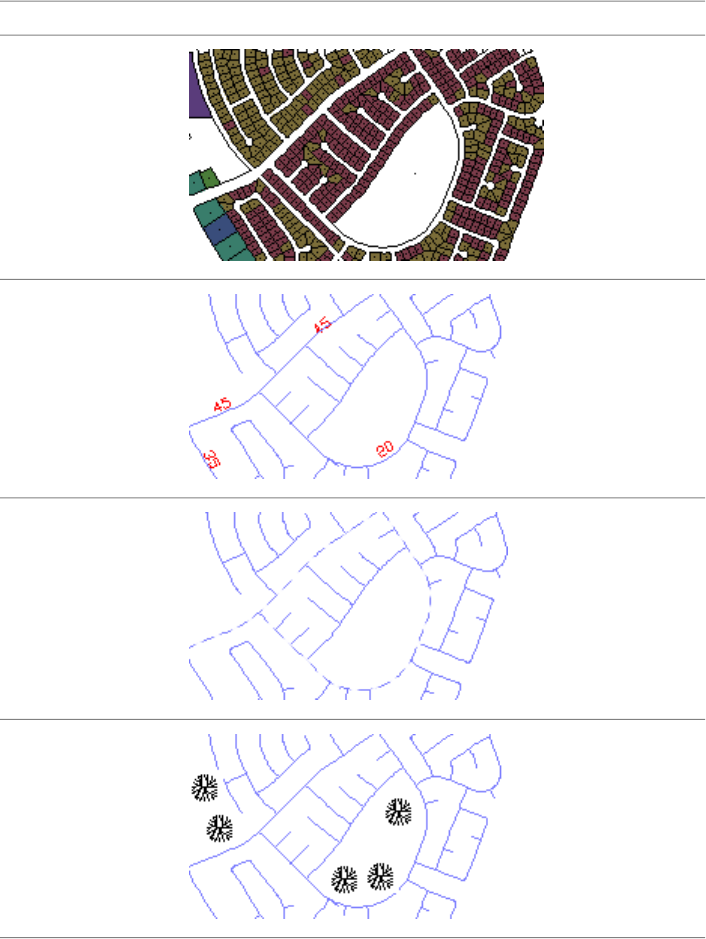
More InformationExampleTheme Style
Tips for Drawing Layer
Themes: Hatch Scale (page
1184)
Add hatch/fill
Tips for Drawing Layer
Themes: Text Height (page
1185)
Add text
To assign line width to circles,
arcs, or lines, convert the ob-
Alter line style
jects to polylines with the
drawing cleanup tools. See
Cleaning Up Drawing Data
(page 765).
Scale factors for blocks vary
according to the plot scale
Alter block insertion
and the size of the block. For
a map plotted at 1:2000, a
unit block (size 1 unit by 1
unit) appears clearly with a
scale of 2000.
1180 | Chapter 8 Analyzing Data
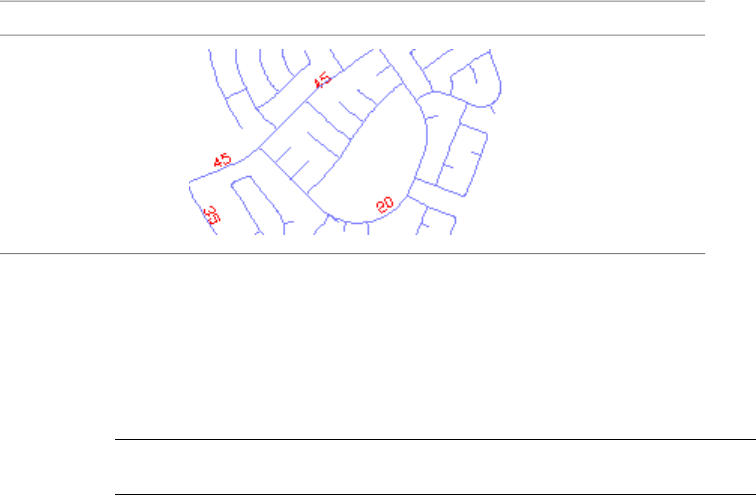
More InformationExampleTheme Style
Tips for Drawing Layer
Themes: Annotation (page
1185)
Tips for Drawing Layer
Themes: Text Height (page
1185)
Add annotation
See also:
■Adding a Legend (page 1116)
■Theming Features (page 1165)
■Theming Surfaces to Analyze Height, Slope, and Aspect (page 1202)
NOTE For information about theming geospatial features, see Theming Features
(page 1168).
■To create a theme for a drawing layer (page 1181)
■To edit a theme for drawing data (page 1182)
■To change the thumbnail used in the Display Manager (page 1183)
■To add a legend to your drawing (page 1183)
To create a theme for a drawing layer
1In Display Manager (page 2060) right-click a drawing layer ➤ Add Style ➤
Theme.
For information on creating a layer, see Bringing In Drawing Data From
DWG Files (page 350).
2In the Thematic Mapping dialog box (page 1642), in the Theme Type list,
choose the type of theme to create.
■A Set Of Specific Values — Select this option if the data has a few
distinct values, such as pipe material, land use, or pavement type.
■A Range Of Numeric Values — Select this option if the data can be
any value along a continuum, such as property value, temperature,
Theming Drawing Data | 1181

or population. When you display this type of data, you define ranges
for the values.
3Next to the Theme Type list, click Values to specify the data to use for
the theme.
4In the Thematic Values dialog box (page 1644), under Data Values, specify
the data to use. For Obtain From, click to choose from a list of data
sources.
5To ignore or exclude certain values in the data, specify them in the Ignore
box.
These values, while present in the data, may be inappropriate for use in
the theme. Examples include null or empty data values.
6To normalize the data relative to some other data value, for Normalize
By, enter a value or an expression. Click to choose from a list of data
sources.
7Click Read Data.
AutoCAD Map 3D reads the values in the selected data source.
If there is no data, verify that there are objects in the layer. The Display
Manager does not work with civil objects or objects from attached
drawings that have been queried into the current drawing using a standard
Query. To use objects from attached drawings with the Display Manager,
create a Query layer.
8If you are not working with ranges, select the values to include in your
map.
9If you are creating a theme with ranges, under Data Ranges (page 1629),
choose how to divide the values into ranges.
10 Click OK to close the dialog box.
11 Under Thematic Details (page 1643), specify how to style objects in the
theme, and the text labels to use in the legend.
12 Click Done.
To edit a theme for drawing data
■In Display Manager, right-click the drawing theme to edit and choose Edit
Theme.
1182 | Chapter 8 Analyzing Data
To change the thumbnail used in the Display Manager
1Select the layer.
2Click Display to open Properties palette.
3On the Display tab of the Properties palette, select the thumbnail preview.
For example, choose the polygon icon for parcels or the arc icon for pipes.
To add a legend to your drawing
■In the Display Manager, click Tools ➤ Create Legend.
See also:
■Overview of Theming Drawing Data (page 1176)
■Tips for Drawing Layer Themes: Ramps (page 1183)
■Thematic Mapping dialog box (page 1642)
■Thematic Values dialog box (page 1644)
■Range of Values dialog box (page 1629)
■Adding a Legend (page 1116)
Quick Reference
Theme Drawing Layer in Display Manager
Creates a theme for a drawing layer in Display Manager
In Display Manager, right-click a drawing layer. Click
Add Style ➤ Theme.
Task Pane
Thematic Mapping dialog boxDialog Box
Tips for Drawing Layer Themes: Ramps
For stylizations, you can choose from pre-defined sets of stylizations, called
ramps.
Theming Drawing Data | 1183
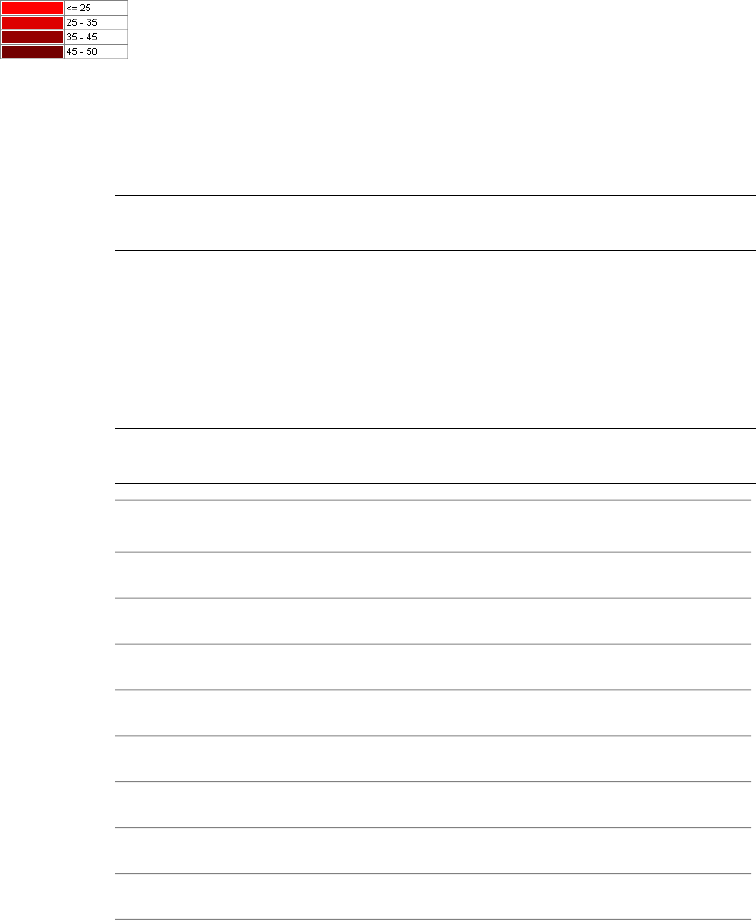
A ramp is a pre-built sequence of styles, such as a set of color gradations or a set of
line types.
The information required to create the ramp is stored in a separate file in XML
format. AutoCAD Map 3D supplies several ramp files that you can use.
NOTE For information about theming geospatial features, see Theming Features
(page 1168).
Tips for Drawing Layer Themes: Hatch Scale
For standard-scale hatch patterns (those that do not have an AR- prefix), the
density of the hatching varies according to the hatch scale and plot scale you
use.
NOTE For information about theming geospatial features, see Theming Features
(page 1168).
ResultHatch ScalePlot, Display, or
View Scale
Solid1 to 5001:2000
Lines clearly visible2000
Sparse, occasional lines15000
No hatch or one line only20000
Solid1 to 25001:10000
Lines clearly visible10000
Sparse, occasional lines75000
No hatch or one line only100000
You can use solid fills at any scale to fill an enclosed area.
1184 | Chapter 8 Analyzing Data
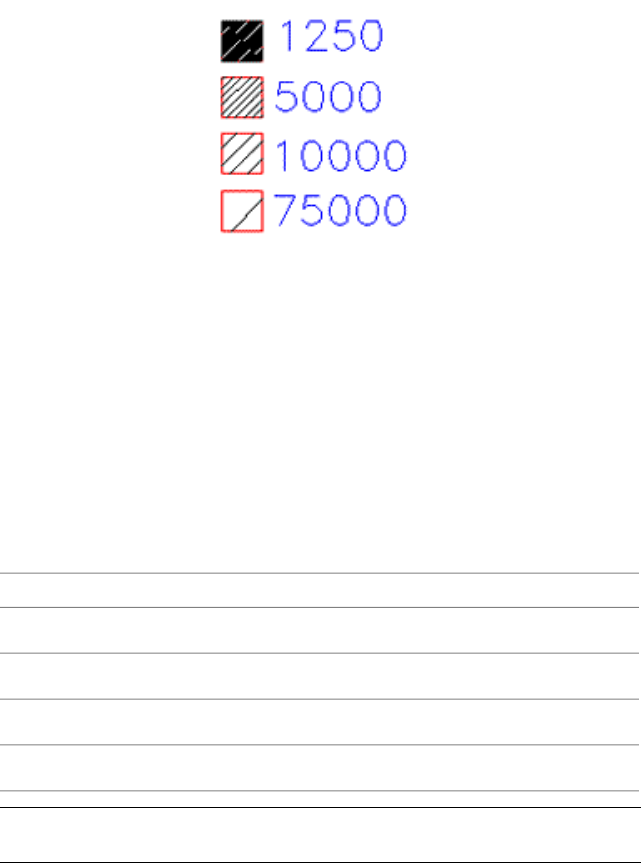
Examples of hatch patterns with
different scales on a map plotted
at 1:10000
Using too low a scale for hatch patterns can seriously impair results. For a
listing of standard hatch patterns, look up "standard libraries" in the help
index.
Tips for Drawing Layer Themes: Text Height
Scale and height values for fill patterns, text height, and symbol size vary
according to the plotting scale you intend to use. The following table shows
suitable text heights for different plot scales.
(Text Height)Required Text Height on PlotPlot Scale
200011:2000
10000.5
1000011:10000
50000.5
NOTE For information about theming geospatial features, see Theming Features
(page 1168).
Tips for Drawing Layer Themes: Annotation
Use an annotation template to add annotation to a theme. You define the
annotation templates in your map. They are stored as specially named blocks
Theming Drawing Data | 1185

within your drawing and define what kind of information you want to be
displayed in the annotation, as well as the layout of that information.
Annotation templates can include textual values, such as values from object
data or object properties such as a line weight, and graphics, such as images
and arrows.
NOTE For information about theming geospatial features, see Theming Features
(page 1168).
See also:
■Overview of Annotating Maps (page 1089)
To apply annotation to a theme for a drawing layer
1Select the annotation template you want to use.
2Specify the insertion information, such as insertion point, scale, rotation,
linetype, and color.
Analyzing Raster-Based Surfaces
AutoCAD Map 3D includes tools to help you view and analyze raster-based
3D surfaces, such as Digital Elevation Models (DEMs), ESRI Grid files, and
Digital Terrain Elevation Data (DTED).
For example, you can create contour maps to help you analyze 3D terrain, use
raster-based theming to analyze elevation, slope, and aspect, drape map data
over surfaces and view the data in 3D, and more.
To add a raster-based surface, you use Data Connect. For more information,
see Overview of Adding Rasters and Surfaces (page 440).
To analyze raster-based surfaces
■To create contour lines (page 1190)
■To edit the line styles and labels used for the contour lines (page 1191)
■To delete a layer of contour lines (page 1191)
■To drape 2D map data over a 3D surface (page 1193)
■To switch between 2D and 3D (page 1193)
■To switch between 2D and 3D (page 1196)
■To use 3D Zoom (page 1196)
■To use 3D Pan (page 1196)
1186 | Chapter 8 Analyzing Data

■To use Constrained Orbit or Swivel (page 1196)
■To use walk (page 1196)
■To change the Visual Style (page 1197)
■To specify hillshading settings (page 1200)
■To turn hillshading on or off (page 1201)
■To change the vertical exaggeration (page 1201)
■To theme a surface to analyze height, slope or aspect (page 1203)
■To change colors in a themed surface (page 1205)
Overview of Analyzing Raster-Based Surfaces
After you add a raster-based surface to your map (such as a Digital Elevation
Model or ESRI Grid file), you can analyze it in various ways.
Tell me more
Video
■Show me how to color surfaces based on
elevation.
■Show me how to view and navigate in
3D.
■Show me how to exaggerate the vertical
dimension of a surface.
■Show me how to drape layers on a sur-
face.
■Show me how to perform a slope analys-
is of a surface.
■Show me how to create a contour layer
from a surface.
Procedures
■To analyze raster-based surfaces (page
1186)
Tutorial
■Tutorial: Analyzing Data
Workflow
■Style Surfaces
Overview of Analyzing Raster-Based Surfaces | 1187
GIS Skills
■Color a surface by elevation and adjust
hillshading.
■Change the elevation ranges for a sur-
face.
■View a site in 3D.
■Drape vector and raster layers over a
surface.
■Analyze the slope and aspect of a site.
■Create a contour layer from a surface.
Related topics
■Adding Raster-Based Surfaces to Your
Map (page 441)
Analyze a raster-based surface (such as a Digital Elevation Model or ESRI Grid
file) in the following ways.
Add contour lines (page 1189) to a surface to make a contour map, also
referred to as a topographic map.
Drape 2D map data on 3D surfaces (page 1192) to view all the data as a
3D texture map.
View, navigate, and walk or fly through (page 1194) a 3D map to view
the map from different perspectives.
Use hillshading (page 1199) to cast real-world shadows on a surface to
make it look more realistic and easier to analyze.
Change the vertical exaggeration (page 1199) to control how extreme
the elevation changes appear.
Use theming and change colors (page 1202) to analyze elevation, slope,
aspect, and more.
1188 | Chapter 8 Analyzing Data
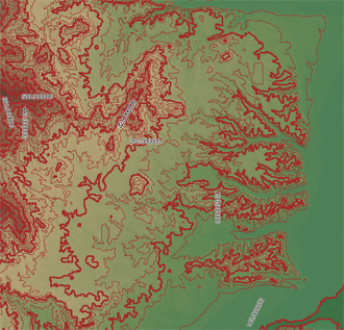
Adding and Modifying Contour Lines
You can can add contour lines to a raster-based surface in your map to create
a contour or topographic map. You add contour lines to surface layers in
Display Manager.
With contour lines, each line connects points of equal elevation on the surface.
The lines can help you determine the elevation at a specific location on the
surface, help clarify and analyze the 3D surface terrain, and help with things
like navigation.
Contour lines added to a DEM surface
Contour lines are stored as new polyline or polygon features in an SDF file,
and as a new layer in Display Manager.
You can edit and style the contour lines as you do any other feature layer.
You can also delete contour lines and recreate them.
When you add contour lines, you specify the following:
■Name of the new contour layer
■Contour elevation interval
■Units (meters or feet) used to measure elevation
■Major contour interval
■Contour labels
■Whether to create contours as polylines or polygons
Adding and Modifying Contour Lines | 1189
■File name of the SDF that will store the contour features
Tell me more
Video
■Show me how to create a contour layer
from a surface.
Procedures
■To create contour lines (page 1190)
Tutorial
■Lesson 1: Analyze Data Visually, Using
Surfaces
Workflow
■Style Surfaces
GIS Skills
■Create a contour layer from a surface.
Related topics
■Adding Raster-Based Surfaces to Your
Map (page 441)
■Draping Map Data Over 3D Surfaces
(page 1192)
■Viewing Surfaces in 3D (page 1194)
■To create contour lines (page 1190)
■To edit the line styles and labels used for the contour lines (page 1191)
■To delete a layer of contour lines (page 1191)
To create contour lines
1In Display Manager (page 2060), right-click a surface layer, and select Create
Contour Layer.
For information about adding a surface layer, see Adding Raster-Based
Surfaces to Your Map (page 441).
2In the Generate Contour dialog box (page 1561), enter a name for the new
Display Manager layer that will contain the contour lines.
1190 | Chapter 8 Analyzing Data
3In the Contour Elevation Interval list, select the difference in elevation
between contour lines, for example, 10, 20, or 50.
4Select the units (meters or feet) used to measure the elevation in your
surface.
AutoCAD Map 3D attempts to get this unit from the surface itself, but
you can change it.
5In the Major Contour Every list, select the interval between major (bold)
contour lines.
For example, if you choose 5, every fifth contour line will be bolded.
6To label the major contour lines with the elevations they represent, select
the Label The Elevation check box.
7For Create Contour As, select the type of feature to use when creating
contour lines (polyline or polygon).
8For Save Contours Into Filename, enter a name for the new SDF file that
will store your contour line features.
9Click OK.
The new contour line features are added to your map. They are placed on a
new Display Manager layer with the layer name you specified, and stored in
an SDF file.
To edit the line styles and labels used for the contour lines
1In Display Manager, click the contour layer and click Style in the toolstrip.
2In the Style Editor, modify the line styles and labels, as you would for
other features. For more information, see Editing Features (page 701).
To change other contour settings, such as elevation interval and units,
you must remove the contour layer and recreate it using the settings you
want.
To delete a layer of contour lines
1In Display Manager, select the contour layer.
2Click Remove.
Adding and Modifying Contour Lines | 1191
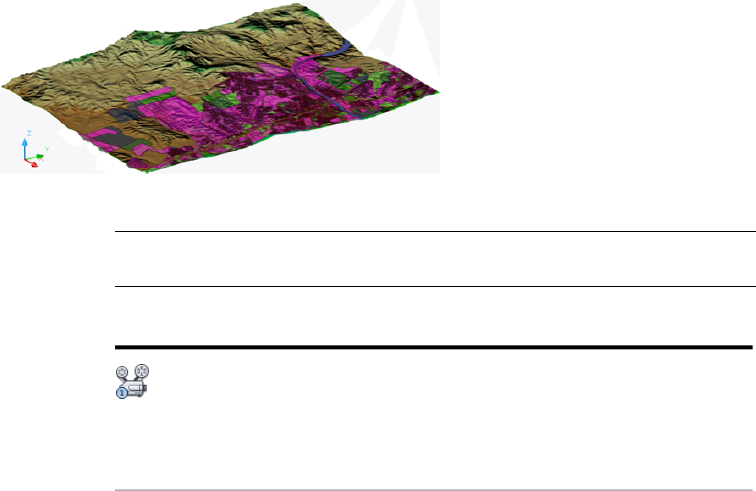
Quick Reference
Create Contours
Creates contour lines for 3D raster-based surfaces
In Display Manager, right-click a surface layer, and
select Create Contour Layer.
Task Pane
Generate Contour dialog boxDialog Box
Draping Map Data Over 3D Surfaces
To drape 2D map data over a surface in your map, switch to a 3D view.
AutoCAD Map 3D automatically drapes 2D map data and displays everything
in 3D, creating a texture map.
For example, if you have a map with 2D raster satellite images, a 2D parcel
layer, and a 3D Digital Elevation Model (DEM), you can switch to 3D to drape
the satellite images and parcels over the DEM.
2D parcels and roads draped over a 3D DEM surface
NOTE You cannot edit 2D data while it is draped in a 3D view. Switch back to
2D.
Tell me more
Video
■Show me how to drape layers on a sur-
face.
■Show me how to view and navigate in
3D.
1192 | Chapter 8 Analyzing Data
Procedure
■To drape 2D map data over a 3D sur-
face (page 1193)
Tutorials
■Lesson 1: Analyze Data Visually, Using
Surfaces
■Exercise 4: Try out the sample data
Workflow
■Style Surfaces
GIS Skills
■Drape vector and raster layers over a
surface.
■View a site in 3D.
Related topics
■Adding Raster-Based Surfaces to Your
Map (page 441)
■Viewing Surfaces in 3D (page 1194)
To drape 2D map data over a 3D surface
1In Display Manager (page 2060), verify that you have a surface layer in your
map.
For information about adding a surface layer, see Adding Raster-Based
Surfaces to Your Map (page 441).
2On the status bar, click to switch to 3D.
The 3D Navigation toolbar appears, and display driver acceleration is
turned on to enhance 3D display performance.
3Use the 3D Navigation tools to move around. For more information, see
Viewing Surfaces in 3D (page 1194).
4To switch back to 2D, click on the status bar.
To switch between 2D and 3D
➤ On the status bar, click to switch to 3D or to switch to 2D.
Draping Map Data Over 3D Surfaces | 1193

Quick Reference
Drape 2D Data Over a Surface
Switch to a 3D view and 2D data is automatically draped over surfaces in
your map
Switch to 3D
Icon
Viewing Surfaces in 3D
When working with maps that include 3D data such as raster-based surfaces,
display different views in 3D to explore, examine, and analyze the surface
from different perspectives.
Use any of the following options to view your 3D map interactively:
■Switch to 3D view—Displays the 3D Navigation toolbar, which contains
the commands you need to change the 3D view (for example 3D Orbit)
and turns on display driver acceleration to enhance 3D performance.
■3D Zoom—Simulates the effect of a camera's zoom lens by making objects
appear closer or farther away.
■3D Pan—Changes the view to match where you move the cursor.
■Constrained Orbit —Moves the surface map around a target.
■Swivel—Simulates panning with a camera in the direction that you drag.
■Walk or Fly—Simulates walking or flying through a 3D model.
■Motion Path Animation—Records and plays back a walk-through or
fly-through of a model to visually demonstrate a surface map.
■Other AutoCAD commands—Allow you to view and navigate in 3D. For
example, you can use the VISUALSTYLES to hide or show lines and shade
3D data or Camera to place a camera so that you can manipulate and save
3D perspective views.
For more information about the above commands, refer to the AutoCAD Help.
1194 | Chapter 8 Analyzing Data
TIP To improve the display of a surface after zooming in, use the Resample Raster
option. This resamples / requeries the data so it is as clear as possible, getting rid
of things like pixelation. For more information, see Viewing Raster Images (page
674).
Tell me more
Video
■Show me how to view and navigate in
3D.
Procedure
■To switch between 2D and 3D (page
1196)
Workflow
■Style Surfaces
GIS Skills
■View a site in 3D.
Related topics
■Adding Raster-Based Surfaces to Your
Map (page 441)
■Draping Map Data Over 3D Surfaces
(page 1192)
■Viewing Raster Images (page 674)
NOTE The following procedures are intended for maps that include 3D raster-based
surfaces, which have been added using Data Connect. See Adding Raster-Based
Surfaces to Your Map (page 441).
■To switch between 2D and 3D (page 1196)
■To use 3D Zoom (page 1196)
■To use 3D Pan (page 1196)
■To use Constrained Orbit or Swivel (page 1196)
■To use walk (page 1196)
■To change the Visual Style (page 1197)
Viewing Surfaces in 3D | 1195
To switch between 2D and 3D
■On the status bar, click to switch to 3D or to switch to 2D.
To use 3D Zoom
1On the 3D Navigation toolbar, click 3D Zoom .
The 3D Navigation toolbar opens when you are in 3D viewing mode.
2Press ENTER, press ESC, or right-click to exit.
To use 3D Pan
1On the 3D Navigation toolbar, click 3D Pan .
2When the hand cursor appears, hold down the button on your pointing
device as you move.
3If you are using a wheel mouse, hold down the wheel button and move
the mouse.
4Press ENTER, press ESC, or right-click to exit.
To use Constrained Orbit or Swivel
1On the 3D Navigation toolbar, click 3D Constrained Orbit or Swivel.
2Click and drag the cursor to rotate the view.
3To exit, press ENTER or ESC, or right-click and click Exit.
To use walk
1Verify that the “step size”, or distance you move with each step, is large
enough for walking through a surface. Enter the STEPSIZE command and
make sure it is set to 80 - 1500 or more. The number you want to use may
depend on your zoom level.
2On the 3D Navigation toolbar, click Walk .
3A window appears describing the keyboard control you use for the walk.
Using the arrow keys is one of the convenient options. Click OK.
1196 | Chapter 8 Analyzing Data

4Wait briefly as the Position Locator palette appears. Review, change
settings as needed, and then minimize or close it.
5Use the keyboard buttons to walk through your surface. For example, use
the up arrow key to move forward.
6Press ENTER or ESC when you are done.
To change the Visual Style
1Enter the VISUALSTYLES command.
2In the Visual Styles Manager, double-click the sample image of the visual
style.
The selected visual style is applied to your surface.
To improve the display of surfaces after a zoom operation (for example to get
rid of pixelation), see Viewing Raster Images (page 674).
For information about walk and fly mode, 3D swivel, motion path animation,
and other AutoCAD commands that can help you view data in 3D, please
refer to the AutoCAD Help.
Quick Reference
3DPAN
Starts the interactive 3D view and enables you to drag the view horizontally
and vertically
3D Pan
Icon
3DPANCommand Line
3DZOOM
Zooms in and out on a view of your drawing
3D Zoom
Icon
3DZOOMCommand Line
3DORBIT
Viewing Surfaces in 3D | 1197

Controls the interactive viewing of objects in 3D
3D Constrained Orbit
Icon
3DORBITCommand Line
3DFORBIT
Controls the interactive viewing of objects in 3D, using an unconstrained
orbit
3D Free Orbit
Icon
3DFORBITCommand Line
3DCORBIT
Starts an interactive 3D view and sets the objects into continuous motion
3D Continuous Orbit
Icon
3DCORBITCommand Line
3DWALK
Interactively changes the view of a 3D drawing so that you appear to be
walking through the model
3D Walk
Icon
3DWALKCommand Line
3DSWIVEL
Changes the target of the view in the direction that you drag
3D Swivel
Icon
3DSWIVELCommand Line
3DDISTANCE
Starts the interactive 3D view and makes objects appear closer or farther away
1198 | Chapter 8 Analyzing Data
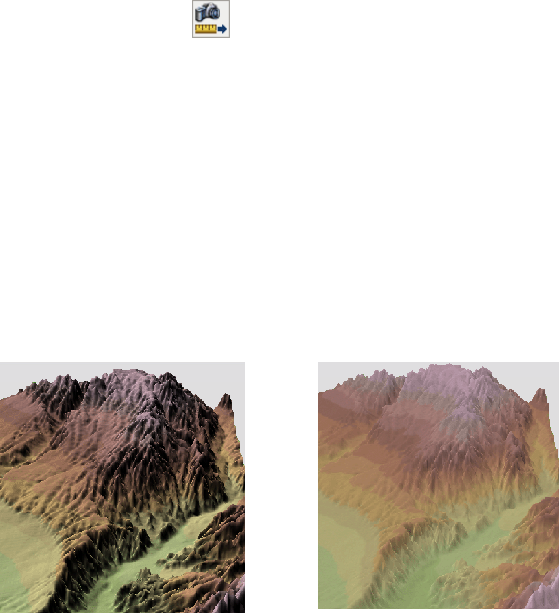
3D Adjust Distance
Icon
3DDISTANCECommand Line
Using Hillshading and Vertical Exaggeration
Hillshading adds shading to 3D surface layers by casting the sun's light across
a surface from the direction and angle you specify.
Hillshading produces a more realistic image and helps you better understand
the magnitude and relationships of the various elevation changes (that is, the
bumps and valleys) on the surface.
Surface without hillshadingSurface with hillshading
Hillshading is on by default for each surface layer in your map, however, you
can choose to turn it off (or on again) at any time on a per layer basis.
You can change the sun settings that AutoCAD Map 3D uses to apply
hillshading. These settings are used throughout AutoCAD Map 3D and are
applied to all surface layers that have hillshading turned on.
You can also control the appearance of the elevation changes, making them
appear more or less extreme, using the vertical exaggeration setting. Increasing
the vertical exaggeration intensifies the hillshading, making the elevation
changes appear more extreme. The vertical exaggeration setting is applied to
all surfaces you are viewing.
In addition to these settings, you can use AutoCAD commands to change the
appearance of surfaces. For example, you can use the VISUALSTYLES command
to display the surface in 3D Wireframe, 3D Hidden, Realistic, and Conceptual.
For more information, refer to the AutoCAD Help.
Using Hillshading and Vertical Exaggeration | 1199
Tell me more
Video
■Show me how to color surfaces based on
elevation.
■Show me how to adjust the settings for
hillshading.
Procedures
■To specify hillshading settings (page
1200)
Workflow
■Style Surfaces
GIS Skills
■Color a surface by elevation and adjust
hillshading.
Related topics
■Adding Raster-Based Surfaces to Your
Map (page 441)
■To specify hillshading settings (page 1200)
■To turn hillshading on or off (page 1201)
■To change the vertical exaggeration (page 1201)
To specify hillshading settings
1Click Analyze tab ➤ Feature panel ➤ Surface Hillshade.
2In the Hillshade Settings dialog box (page 1562), specify the Direction and
Angle of the sun you want to use for hillshading by doing one of the
following:
■Enter the direction and angle of the sun manually:
■For Direction, specify the direction from which the light should
come, for example, East or West. Enter a direction value into the
edit box, drag the yellow disk in the compass to the position you
want, or use Settings.
1200 | Chapter 8 Analyzing Data
■For Angle, specify how high in the sky the light is located, such
as near the horizon, directly overhead, or somewhere in between.
Enter an angle into the edit box, drag the yellow disk to specify
an angle, or use Settings
■Click Settings to specify sun settings in the Sun Properties palette
using date, time, and location. Then, redisplay the Hillshade Settings
dialog box and click Import.
3Click OK.
To turn hillshading on or off
1In the Display Manager (page 2060), right-click a surface layer, and click
Edit Display Style.
2Do one of the following:
■To turn off hillshading, set the Hillshade Band to 0.
■To turn on hillshading, set the Hillshade Band to 1 and verify that
the Elevation Band is set to 1.
To change the vertical exaggeration
■In the status bar, for Exaggeration, select a vertical exaggeration value from
the list. Select Custom to specify a value that is not in the list.
A higher number makes the elevation changes appear more extreme. A lower
number or a decimal value makes it appear less extreme.
Quick Reference
MAPHILLSHADE
Specifies settings to use when shading 3D raster-based surfaces
Click Setup ➤ Hillshade Settings.
Menu
MAPHILLSHADECommand Line
Hillshade Settings dialog boxDialog Box
Using Hillshading and Vertical Exaggeration | 1201
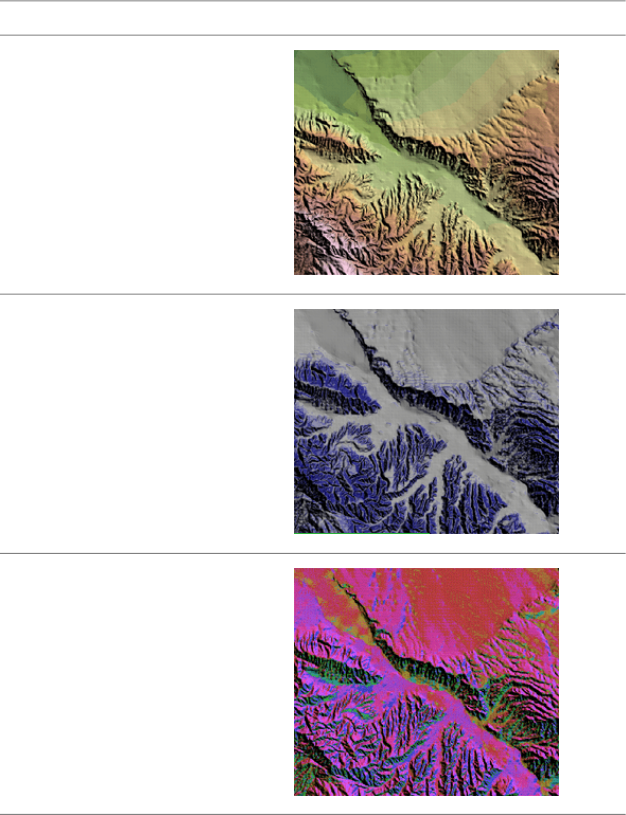
Theming Surfaces to Analyze Height, Slope, and Aspect
You can create a theme to change the display of a surface based on height
(elevation), slope, or aspect (direction of slope).
IllustrationSurface Theme Type
Height - Changes the display based on
elevation.
Slope - Changes the display based on
ground slope or steepness.
For example, you can use gray to show
areas with a slope of less than 10%.
Aspect - Varies the display based on the
direction of ground slope.
Create a theme on height to analyze the elevation data, a theme on slope to
help you determine which areas are flat enough for developing houses, or a
theme on aspect to help you find the best drainage routes.
1202 | Chapter 8 Analyzing Data
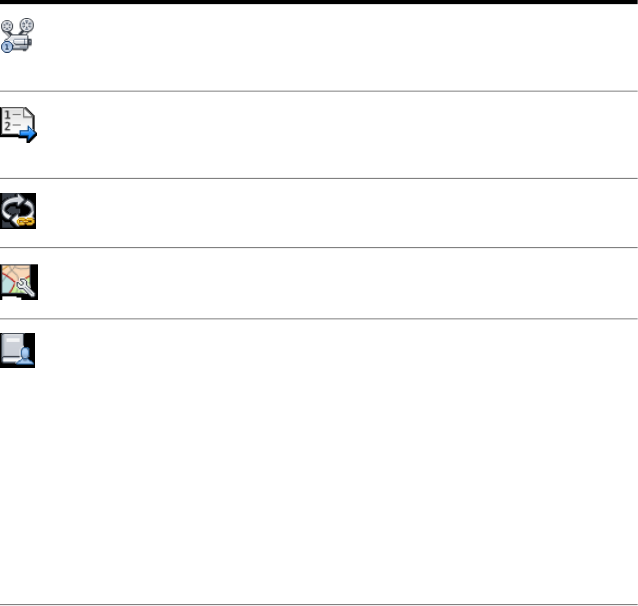
Tell me more
Video
■Show me how to perform a slope analys-
is of a surface.
Procedures
■To theme a surface to analyze height,
slope or aspect (page 1203)
Workflow
■Style Surfaces
GIS Skills
■Analyze the slope and aspect of a site.
Related topics
■Adding Raster-Based Surfaces to Your
Map (page 441)
■Changing Colors in a Themed Surface
(page 1204)
■Theming Features (page 1165)
■Using Hillshading and Vertical Exagger-
ation (page 1199)
■Adding a Legend (page 1116)
■Defining Scale Ranges (page 643)
To theme a surface to analyze height, slope or aspect
1In Display Manager (page 2060), click a surface layer. Click the Style icon
in the toolstrip.
For information about adding a surface layer, see Adding Raster-Based
Surfaces to Your Map (page 441).
2In the Style Editor, under Scale Range, specify the scale threshold to use.
For more information, see Defining Scale Ranges (page 643).
3In the Band area, for Band 1, select Theme from the Style drop-down list.
4In the Theme dialog box, for Property, select the property to theme on:
Height, Slope, or Aspect.
Theming Surfaces to Analyze Height, Slope, and Aspect | 1203
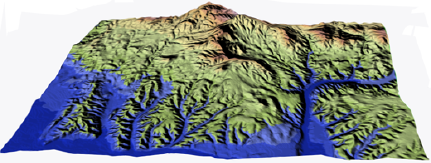
5Specify the other theming option, for example the palette to use. For
more information, see Theme dialog box (page 1645).
6In the Theme dialog box, click OK.
7In the Style Editor, click Apply.
Quick Reference
Theme Surface Layer in Display Manager
Creates a theme for a surface layer in Display Manager. You can theme on
height, slope, or aspect.
In Display Manager, right-click a surface layer. Select
Edit Display Style. In the Style Editor, in the Style list,
select Theme.
Task Pane
Theme dialog boxDialog Box
Changing Colors in a Themed Surface
After you have created a theme for a surface, you can change one or more
colors to make the image more realistic or to highlight a specific area or
characteristic of the surface to help with further analysis.
For example, you might want to change the color of the lowest elevation in
a canyon to blue to show that a river runs through it in the spring, or change
a group of low elevations to red to highlight an area susceptible to flooding.
Colors of lowest elevations changed to blue
1204 | Chapter 8 Analyzing Data
Tell me more
Video
■Show me how to color surfaces based on
elevation.
Procedure
■To change colors in a themed surface
(page 1205)
Workflow
■Style Surfaces
GIS Skills
■Color a surface by elevation and adjust
hillshading.
■Change the elevation ranges for a sur-
face.
Related topics
■Theming Surfaces to Analyze Height,
Slope, and Aspect (page 1202)
■Adding Raster-Based Surfaces to Your
Map (page 441)
To change colors in a themed surface
1In Display Manager (page 2060), click a surface layer. Click the Style icon
in the toolstrip.
For information about adding a surface layer, see Adding Raster-Based
Surfaces to Your Map (page 441).
2In the Style Editor, click Band Detail.
3Click the band to change.
For example, for a theme on height, you can select the first band to
change the color of the lowest elevation
4Click the down arrow in the band color cell, and choose a new color.
5Click All Bands.
6Click Apply.
Changing Colors in a Themed Surface | 1205

Quick Reference
Theme Feature Layer in Display Manager
Creates a theme for a feature layer in Display Manager
In Display Manager, right-click a feature layer. Select
Edit Style. In the Style Editor, click the New Theme
button.
Task Pane
Theme dialog boxDialog Box
Finding and Selecting Data
You can find, select, and filter features and drawing objects in your maps, but
the methods you use for features and drawing objects are different.
To find and select features, you can use Filter or Search to Select in the Data
Table (page 2059), the Search interface, or Query To Filter in Display Manager.
To find and select drawing objects, you can use Quick Select, the Data View,
or drawing queries.
To find, filter, and query data
■To find and select features (page 1206)
■To find and query drawing objects (page 1218)
Finding and Selecting Features
AutoCAD Map 3D provides a few different ways to find, filter, and select just
the features you need to work with.
NOTE For information about finding, filtering, and selecting drawing objects,
seeOverview of Finding and Querying Drawing Objects (page 1219).
NOTE For information about finding, filtering, and selecting drawing objects,
seeOverview of Finding and Querying Drawing Objects (page 1219).
To find and select features
■To find a subset of data in the Data Table (page 1212)
■To clear the filter and display all records (page 1212)
1206 | Chapter 8 Analyzing Data
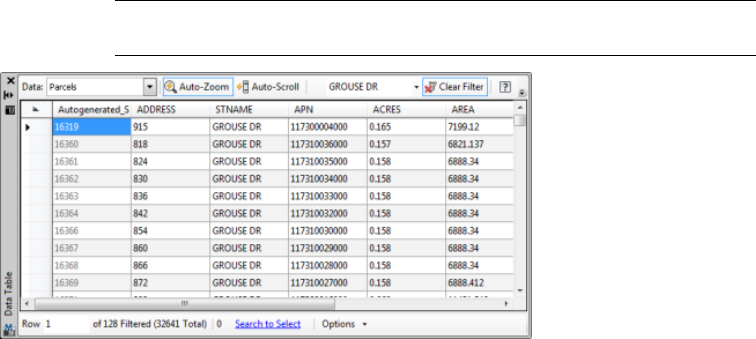
■To search to select data (page 1212)
■To search for and select features (page 1214)
■To filter feature layers (page 1217)
Overview of Finding and Selecting Features
You can find and focus on a specific subset of features so you do not have to
review the entire set of data manually to find what you need.
NOTE For information about finding and selecting drawing objects, see Overview
of Queries (page 1235) and Using Quick Select to Select Drawing Objects (page 1219).
Use Filter By in the Data Table to filter a feature class using criteria based on a column
of data.
Finding and Selecting Features | 1207
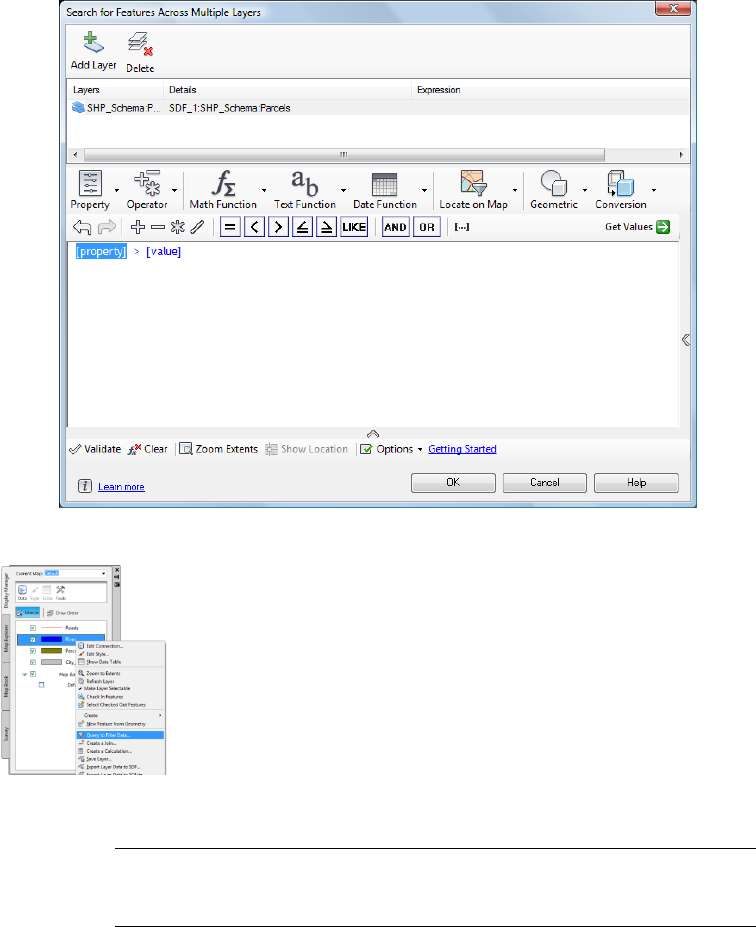
Use Search when you need a more comprehensive way to find features in map.
A query is like Search. You define the set of criteria to find and bring in just the data
you want.
TIP Using a filter can help you improve performance when working with large
sets of feature data. You can filter data after you bring it into your map, or you
can use Add To Map With Query to apply a filter while you bring in the data.
1208 | Chapter 8 Analyzing Data
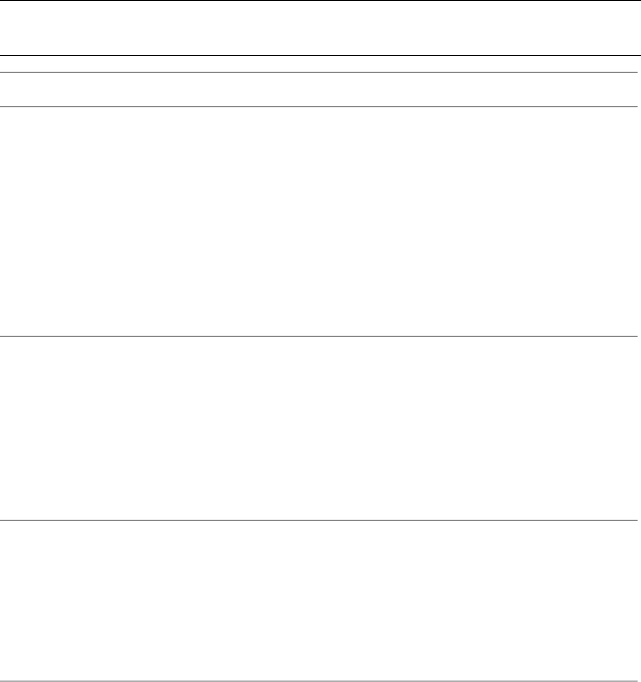
See also:
■Editing Features using the Data Table (page 711)
■Bringing in GIS Features (page 308)
■Overview of Creating Expressions
Use these techniques to find and focus on a specific subset of features to work
with.
NOTE For information about finding and selecting drawing objects, see Overview
of Queries (page 1235) and Using Quick Select to Select Drawing Objects (page 1219).
DescriptionMethod
Limit the number of records displayed in
the Data Table to those that match the
Filter (Data Table) (page 1210)
criteria you specify. You can zoom to, se-
lect, save, or print the filtered results in the
map.
For example, find the rows of Road data
in which Type = Major Road or Address =
GROUSE DR, and highlight those features
in the map.
Find data that meets conditions that you
specify. When AutoCAD Map 3D com-
Search to Select (Data Table) (page 1210)
pletes the search query, it highlights the
data rows in the Data Table and the associ-
ated features on your map.
For example, search for all parcels with an
area greater than five acres.
Define attribute and spatial search criteria,
combine multiple criteria to create com-
Search (in map) (page 1214)
plex searches, and search across multiple
feature classes in your map. Features that
meet your Search criteria are selected in
the map.
Finding and Selecting Features | 1209

DescriptionMethod
To reduce the scope of feature layers in
your map, you can edit the query that
brings in the data.
For example, if your map has an SDF layer
containing all the parcels in California and
Filter Feature Layers (Data Connect or Dis-
play Manager) (page 1216)
you want only the parcels in San Francisco,
you can edit the query so that the layer
displays only the parcels you want.
Finding and Filtering Data in the Data Table
Use a filter in the Data Table to display only the features or records you want
to work with.
NOTE For information about filtering drawing objects, see Overview of Queries
(page 1235) and Overview of Finding Records in a Linked Database (page 1222).
NOTE When viewing joined data, the Data Table filter function is disabled. You
cannot use a filter on joined data.
Start by identifying the column whose values determine whether a feature or
record will be included in the results. Then specify the value or string to look
for in that column.
The records that match your criteria are selected in the Data Table and
highlighted in your map.
For example, to find only the telephone poles with transformers, your filter
would specify PoleAttachments equal to Transformer; or to find only the
commercial districts in a city, you would specify Land Use equal to
Commercial.
1210 | Chapter 8 Analyzing Data
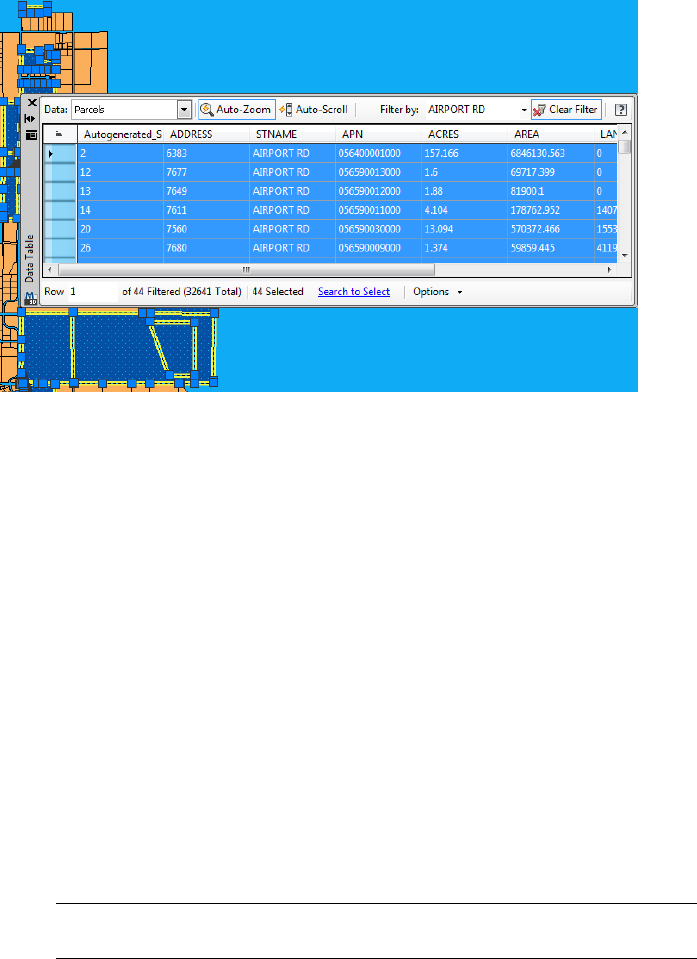
Finding and selecting parcel features with STNAME = AIRPORT RD
Use Filter with Auto-Zoom to magnify the resulting features in the map.
To remove a filter, specify another one, or click Clear Filter in the Data Table.
Searching to Select Data in the Data Table
Use Search To Select in the Data Table to find data that meets conditions that
you specify. For example, you can search for all parcels with an area greater
than five acres. When AutoCAD Map 3D completes the search, it highlights
the data rows in the Data Table and the associated features on your map.
Search supports more advanced criteria, and lets you combine multiple criteria
and search across multiple feature classes in your map.
See also:
■Overview of the Data Table (page 1125)
■Zooming to a View Using the Data Table (page 1141)
■Exporting and Printing Data from the Data Table (page 1142)
NOTE For information about filtering drawing objects, see Overview of Queries
(page 1235) and Overview of Finding Records in a Linked Database (page 1222).
■To find a subset of data in the Data Table (page 1212)
Finding and Selecting Features | 1211
■To clear the filter and display all records (page 1212)
■To search to select data (page 1212)
To find a subset of data in the Data Table
1In Display Manager, select the feature layer to search.
For information about creating a new feature layer, see Bringing in GIS
Features (page 303).
2Click .
3In the Data Table dialog box (page 1613), change the data source in the
Data list if necessary.
4For Filter By, select the column to search, for example, City or Owner
Name.
5The label changes to show your column selection.
6In the Filter By box, enter the value to look for.
For example, to find all parcels in the city of Bonn, enter BONN. The
string you enter must exactly match the data in the column to be included
in the results.
7To zoom to the features in your map, click Auto-Zoom.
8Click Apply Filter.
9The features or records that match your criteria are displayed in the Data
Table.
10 Select a row in the Data Table to see that feature highlighted in your map.
If Auto-Zoom is on, you will zoom to the selected features.
To clear the filter and display all records
➤ In the Data Table, click Clear Filter , or create a different filter.
To search to select data
1Select the layer in Display Manager that contains the feature class data
you want to view.
2Click on the toolstrip to open the Data Table window.
1212 | Chapter 8 Analyzing Data

3On the lower bar of the Data Table dialog box (page 1613), click Search To
Select.
4Create an expression for your search. You can create the following types
of expressions:
■Property Evaluation expressions compare the value of a property to
a value you specify. For example, you can find parcels with an area
greater than a value you specify, or streets with a particular number
of lanes.
■Location Conditions find data based on its location in the map. For
example, you can draw a circle to find all parcels within that circle.
You can save your expression for reuse.
5To create a complex property evaluation, insert an AND or OR operator,
and then insert another property, operator, and value combination.
Every operator must be preceded by a property. For example, to find
parcels whose last purchase date is after 1990 and before 2005, the
expression must look like this:
Purchase_Date > 1990 AND Purchase_Date < 2005
6Validate your expression.
7To reuse your expression in the future, from the Options list in the Search
To Select dialog box, select Save Expression.
8When the expression is complete and valid, click OK.
When AutoCAD Map 3D has completed the search, it highlights both
the selected rows in the Data Table and the associated features on your
map.
Quick Reference
MAPDATATABLE
Allows you to view, edit, and filter feature data
Click Edit ➤ Data Table.
Menu
Table
Icon
MAPDATATABLECommand Line
Finding and Selecting Features | 1213

In Map Explorer or Display Manager, click the Table
button
Task Pane
Data Table Dialog BoxDialog Box
Searching For and Selecting Features
Use the Search command in AutoCAD Map 3D to find and select features in
your map based on their location or properties.
NOTE For information about searching for and selecting drawing objects, see
Overview of Queries (page 1235).
A search specifies a set of conditions (also referred to as criteria or rules) that
must be true for a feature to be found and selected. A Search can have one or
more sets of conditions. You can search the entire map (for example, across
multiple feature classes).
For example, you can find just the roads in Shanghai within a circular area
you specify. To do this, you specify criteria that limits the results to road
features whose City field is "Shanghai" and within the a circle you define.
NOTE To find data in a single feature class based on a single property, you can
also search to select (page 1210)in the Data Table.
See also:
■Finding and Filtering Data in the Data Table (page 1210)
■Overview of Finding and Selecting Features (page 1207)
■Overview of Creating Expressions
NOTE For information about searching for and selecting drawing objects, see
Overview of Queries (page 1235).
To search for and select features
1Make sure that you are connected to the feature sources for the feature
layers you are searching.
For more information, see Bringing in GIS Features (page 303).
2Click Home tab ➤ Data panel ➤ Search.
1214 | Chapter 8 Analyzing Data

3In the Search dialog box, click Add Layer to select the layers to search.
4If you are creating a location condition, click Zoom Extents to zoom the
drawing window to the extents of the selected feature classes.
5Create an expression for your search. You can create the following types
of expressions:
■Property Evaluation expressions compare the value of a property to
a value you specify. For example, you can find parcels with an area
greater than a value you specify, or streets with a particular number
of lanes.
■Location Conditions find data based on its location in the map. For
example, you can draw a circle to find all parcels within that circle.
You can save your expression for reuse.
6To create a complex property evaluation, insert an AND or OR operator,
and then insert another property, operator, and value combination.
Every operator must be preceded by a property. For example, to find
parcels whose last purchase date is after 1990 and before 2005, the
expression must look like this:
Purchase_Date > 1990 AND Purchase_Date < 2005
7Validate your expression.
8When the expression is complete and valid, click OK.
When AutoCAD Map 3D has completed the search, it highlights both
the selected rows in the Data Table dialog box (page 1613) and the associated
features on your map.
Quick Reference
MAPSEARCH
Searches and selects features in your map based on the location and attribute
criteria you specify
Click Edit ➤ Search.
Menu
Search
Icon
MAPSEARCHCommand Line
Finding and Selecting Features | 1215
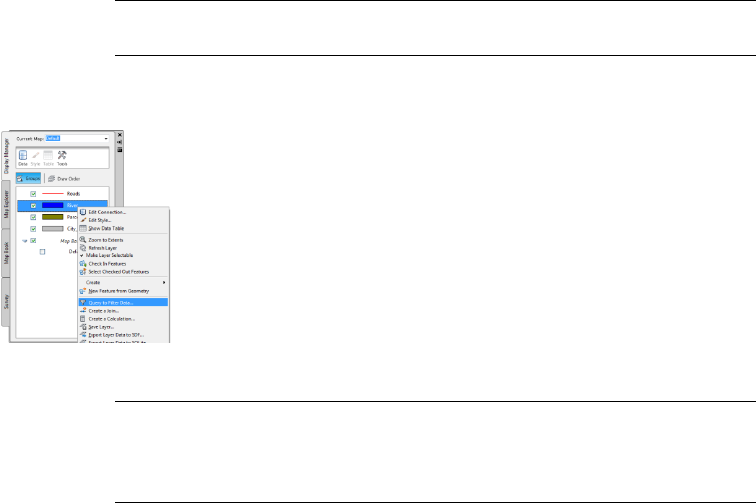
Searching to Select Feature LayersDialog Box
Filtering Feature Layers
Filter one or more feature source layers so that only some of the features appear
in your map.
NOTE For information about filtering drawing objects, see Overview of Queries
(page 1235).
To filter the layers, define a query condition or a set of conditions that specify
which features you want. The procedure is like performing a search.
Apply a query to layers so that only some features appear in your map
TIP Using the filter can help you improve performance when working with large
sets of feature data. You can filter data after you bring it into your map, or you
can use the Add To Map With Query option while bringing it in and then use edit
query to apply a filter.
You can create a single filter for multiple layers from different data sources,
as long as they share the property you are filtering on. For example, if you
have an SDF layer of parcels, a SHP layer of parks, and an Oracle layer of
hospitals, and they all share a STREET_NAME property, you can filter by street
name. You can filter by location for any layers that overlap in space.
You can also create a filter for a group, as long as all the layers in that group
are feature layers (not drawing layers) and all the feature layers contain features
(that is, none of them are empty).
See also:
■Filtering Features When You Add Them to a Map (page 309)
1216 | Chapter 8 Analyzing Data

■Searching For and Selecting Features (page 1214)
■Bringing in GIS Features (page 308)
■Creating Expressions - Reference
NOTE For information about searching for and selecting drawing objects, see
Overview of Queries (page 1235).
To filter feature layers
1Make sure that you are connected to the feature sources for the feature
layers or groups to filter.
For more information, see Bringing in GIS Features (page 303).
2In the Display Manager, select the layer, layers, or group to filter.
Use Ctrl-click or Shift-click to select multiple layers.
3Right-click any layer or group in the selection and click Query To Filter
Data.
NOTE Once you use this command, the command name for the affected
layers changes to Layer Filter, with options for Edit Layer Filter and Delete
Layer Filter.
4To add more feature layers to the data being searched by the expression,
click Add Layer and select the layer to add. To delete a layer, select it in
the list and click Delete.
The list of layers at the top of the window shows any existing filters for
the selected layers. If the layers use a common query (specifying a property
that all the layers have in common), that query is listed separately.
5If you are creating a location condition, click Zoom Extents to zoom the
drawing window to the extents of the selected feature class.
6Create an expression for your filter. You can create the following types
of expressions:
■Property Evaluation expressions compare the value of a property to
a value you specify. For example, you can find parcels with an area
greater than a value you specify, or streets with a particular number
of lanes.
■Location Conditions find data based on its location in the map. For
example, you can draw a circle to find all parcels within that circle.
Finding and Selecting Features | 1217

You can save your expression for reuse.
7To create a complex property evaluation, insert an AND or OR operator,
and then insert another property, operator, and value combination.
Every operator must be preceded by a property. For example, to find
parcels whose last purchase date is after 1990 and before 2005, the
expression must look like this:
Purchase_Date > 1990 AND Purchase_Date < 2005
8Validate your expression.
9When the expression is complete and valid, click OK.
When AutoCAD Map 3D has completed the search, it highlights both
the selected rows in the Data Table and the associated features on your
map.
Finding and Querying Drawing Objects
AutoCAD Map 3D provides a few different ways to find, filter, and select just
the drawing objects you need to work with.
NOTE For information on finding, filtering, and selecting geospatial features, see
Overview of Finding and Selecting Features (page 1209).
NOTE For information on finding, filtering, and selecting geospatial features, see
Overview of Finding and Selecting Features (page 1209).
To find and query drawing objects
■To select drawing objects using Quick Select (page 1220)
■To find records in a database linked to drawing objects (page 1221)
■To query objects from attached drawings (page 1235)
Overview of Finding and Querying Drawing Objects
Use Quick Select, Data View, and queries to find drawing objects that match
a set of criteria. These methods work for drawing objects only.
NOTE For information on finding, filtering, and selecting geospatial features, see
Overview of Finding and Selecting Features (page 1209).
1218 | Chapter 8 Analyzing Data
Use these methods to find and select drawing objects.
NOTE For information on finding, filtering, and selecting geospatial features, see
Overview of Finding and Selecting Features (page 1209).
DescriptionMethod
Select drawing objects based on their ob-
ject properties (such as color), object types,
Quick Select (page 1219)
or object classification, or to exclude
drawing objects from a selection set.
For example, you can select all of the red
road objects in a drawing without selecting
any other object, or you can select all ob-
jects except the red roads.
Find records in an attached database. If
database records are linked to objects in a
Data View (page 1221)
drawing, you can highlight records linked
to objects you select.
Use queries to retrieve drawing objects and
transform them if needed.
Queries (page 1235)
Using Quick Select to Select Drawing Objects
You can use Quick Select (QSELECT) to select drawing objects based on their
object properties (such as color), object types, or object classification. You can
also use Quick Select to exclude drawing objects from a selection set.
NOTE For information on selecting geospatial features, see Searching For and
Selecting Features (page 1214).
For example, you can select all of the red road objects in a drawing without
selecting any other object, or you can select all objects except the red roads.
When using Quick Select to select drawing objects based on color, linetype,
or line weight, first consider whether these properties are set to BYLAYER in
the AutoCAD layer definition. For example, an object may appear red because
its color is set to BYLAYER and the layer color is red.
Finding and Querying Drawing Objects | 1219

See also:
■Finding Records in a Database Linked to Drawing Objects (page 1221)
■Querying Objects from Attached Drawings (page 1235)
For more information about AutoCAD layer definitions, please refer to the
AutoCAD Help.
NOTE This procedure applies only to drawing objects. For information on selecting
geospatial features, see Searching For and Selecting Features (page 1214).
To select drawing objects using Quick Select
1Verify that you have drawing objects in your map.
2Enter the QSELECT command.
3In the Quick Select dialog box, under Apply To, select Entire Drawing or
the current selection set (if one exists).
To select a group of objects to which you want to apply the filtering
criteria, click Select Objects.
4Under Object Type, select a single object type if the objects you want are
all one type. Otherwise, select Multiple.
5Under Properties, select the property to use for selection.
For example, to find red objects, select Color.
6Under Operator, select the appropriate operator.
For example, to find red objects, select Equals.
7Under Value, select the appropriate value.
For example, to find red objects, select Red.
8Under How to Apply, select Include in New Selection Set to create a new
selection set composed only of objects that match the filtering criteria.
Select Exclude From New Selection Set to create a new selection set
composed only of objects that do not match the filtering criteria..
9Click OK.
In this example, all red objects in the drawing are selected. Objects that
are set to BYLAYER and are red because the layer color is red are not
included in the selection set.
1220 | Chapter 8 Analyzing Data

For more information about using Quick Select to select or exclude
drawing objects, please refer to the AutoCAD Help.
Finding Records in a Database Linked to Drawing Objects
Using the Data View, you can find records in an attached database. If database
records are linked to objects in a drawing, you can highlight records linked
to objects you select.
NOTE This functionality applies only to drawing objects. For information about
working with records for geospatial features, see Finding and Filtering Data in the
Data Table (page 1210)
■Overview of Finding Records in a Linked Database (page 1222)
■Finding a Database Record (page 1224)
■Highlighting Drawing Objects Linked to a Database Record (page 1225)
■Highlighting Records Linked to a Selected Object (page 1228)
■Finding Records in the Data View Based on Record Data (SQL Queries)
(page 1230)
■Finding Data View Records Based on Object Location (page 1233)
You can also bring in drawing data based on attached data and find all drawing
objects containing specific SQL information.
See also:
■Overview of Finding and Querying Drawing Objects (page 1218)
■Bringing In Drawing Objects Based on Attached Data (page 363)
■Finding All Drawing Objects Containing Specific SQL Information (page
1249)
■Altering the Properties of Queried Drawing Objects (page 1259)
■Finding and Selecting Features (page 1206)
NOTE These procedures apply only to drawing objects. For information about
working with feature data, see Finding and Selecting Features (page 1206).
To find records in a database linked to drawing objects
■To find a database record in the Data View (page 1225)
■To highlight drawing objects linked to a database record (page 1227)
Finding and Querying Drawing Objects | 1221

■To set other Data View highlighting options (page 1227)
■To highlight records linked to drawing objects (page 1229)
■To set the record highlight color (page 1229)
■To use a SQL filter in the Data View (page 1231)
■To use a spatial filter in the Data View (page 1234)
Overview of Finding Records in a Linked Database
After you create a link between a record in the database table and an object
in a drawing, you can use the information in the database table to help you
analyze, select, and display objects in your drawing. For example, you can use
data from a linked database table to find all pipes installed before 1965.
NOTE These procedures apply only to drawing objects. To join external data to
geospatial features, see Overview of Joins (page 507). To use the Data Table to
search that data, see Finding and Filtering Data in the Data Table (page 1210).
See also:
■Overview of Linking Database Records to Objects (page 522)
■Viewing External Data Linked to Drawing Objects (page 1146)
■Overview of Queries (page 1235)
■Altering the Properties of Queried Drawing Objects (page 1259)
■Joining Data to GIS Features (page 507)
NOTE These procedures apply only to drawing objects. To join external data to
geospatial features, see Overview of Joins (page 507). To use the Data Table to
search that data, see Finding and Filtering Data in the Data Table (page 1210).
Use database links to do the following:
Use this method...To do this...
Use Data View to search the linked data-
base. (page 1225)
Find a database record
Use Data View to highlight the objects.
(page 1227)
Highlight objects in the drawing that are
linked to selected records in the database
table.
1222 | Chapter 8 Analyzing Data
Use this method...To do this...
Use Data View to highlight the records.
(page 1229)
See which records are linked to selected
objects.
Use a SQL filter in Data View. (page 1231)Display only records whose data matches
the conditions you specify.
Use a spatial filter in Data View. (page 1234)Display only records that are linked to
drawing objects you select in the drawing.
Print the current contents of Data View.
(page 1475)
Print linked data.
NOTE These procedures apply only to drawing objects.
See also:
■Highlighting Features Using the Data Table (page 1136)
Quick Reference
(Data View) AutoHighlight
When records are selected, automatically highlights objects in the drawing
linked to the records
In the Data View: Highlight ➤ Auto Highlight
Menu
(Data View) AutoZoom
When records are selected or deselected, automatically adjusts the zoom so
that the objects linked to the selected records fill the percent of the screen
specified by the Zoom Scale command
In the Data View: Highlight ➤ Auto Zoom
Menu
(Data View) Link Records to Objects
Links the selected records to objects in your drawing
In the Data View: Links ➤ Link Records To Objects
Menu
Finding and Querying Drawing Objects | 1223
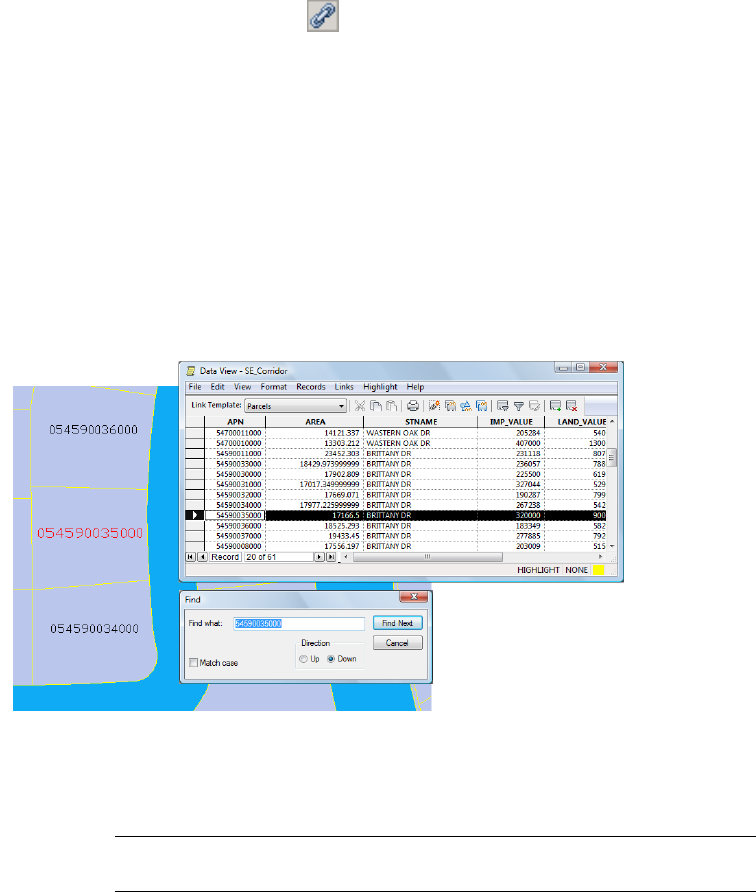
Link Records to Objects
Icon
(Data View) Zoom Scale
Specifies the percent of the drawing display that the selected objects will
occupy
In the Data View: Highlight ➤ Zoom Scale
Menu
Zoom Scale dialog boxDialog Box
Finding a Database Record
Using the Data View, you can search for text strings in a database table.
The entered text must match the record exactly.
To use Replace, the table must be open in Edit mode and AutoCommit must
be turned off.
NOTE Data View is for drawing objects. Use the Data Table (page 1210) for geospatial
feature data.
See also:
■Opening a Database Table (page 1052)
1224 | Chapter 8 Analyzing Data
■Editing a Database (page 1055)
■Changing the Look of the Data View (page 1057)
■Finding and Selecting Features (page 1206)
To find a database record in the Data View
1Open a database table in the Data View. See Opening a Database Table
(page 1052).
2Position the cursor in the column you want to search.
3Do one of the following:
■In the Data View, click Edit menu ➤ Find.
■In the Data View, click Edit menu ➤ Replace.
4In the dialog box, enter the characters to find. For Replace, enter the
replacement text.
5For Find, click Find Next.
For Replace, click Replace to replace this instance and find the next
instance. Click Replace All to replace all instances automatically.
Quick Reference
(Data View) Find
Finds specified text
In the Data View:Edit ➤ Find
Menu
Highlighting Drawing Objects Linked to a Database Record
After you link database records to objects in a drawing, you can highlight
objects in the drawing that are linked to selected records in the database table.
Finding and Querying Drawing Objects | 1225
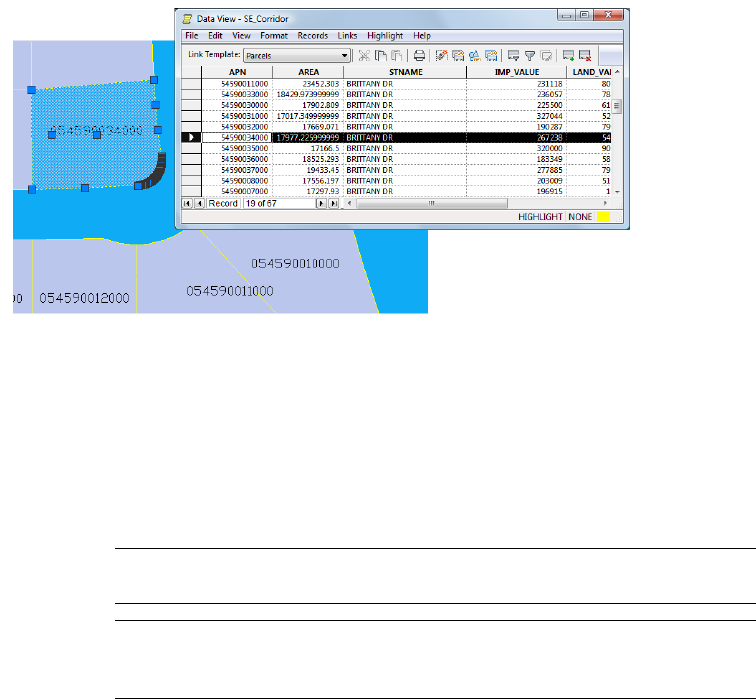
Highlight parcels that are linked to selected records in a database table.
You can set the following options:
■Automatically highlight objects linked to the records you select
■Automatically zoom in on highlighted objects
■Automatically create a selection set of highlighted objects
NOTE Once you set AutoZoom, Zoom Scale, and AutoHighlight, these settings
stay in effect for every drawing until you change them.
NOTE Use the Data Table to highlight features. See Highlighting Features Using
the Data Table (page 1136), Highlighting Data Table Rows Using the Map (page
1138), and Zooming to a View Using the Data Table (page 1140).
See also:
■Opening a Database Table (page 1052)
■Editing a Database (page 1055)
■Changing the Look of the Data View (page 1057)
■Finding and Selecting Features (page 1206)
1226 | Chapter 8 Analyzing Data

To highlight drawing objects linked to a database record
1Open a linked database table in the Data View. See Opening a Database
Table (page 1052).
2In the Data View window, select a record.
3In the Data View, click Highlight menu ➤ Highlight Objects.
NOTE This command is available only if you selected a link template for the
table.
Objects that are linked to the selected record are highlighted.
To clear the highlighting, enter regen on the Command line.
To set other Data View highlighting options
■Dynamically highlight linked objects – In the Data View, click Highlight
menu ➤ AutoHighlight. When you select a record in the table, AutoCAD
Map 3D automatically highlights linked objects.
■Dynamically zoom to linked objects – Make sure AutoHighlight is on. In
the Data View, click Highlight menu ➤ AutoZoom. When you select a
record in the table, AutoCAD Map 3D zooms to linked objects. You can
change the zoom scale so that the linked objects take up more or less of
the screen. In the Data View, click Highlight menu ➤ Zoom Scale and
enter a value.
■Dynamically add highlighted objects to the selection set – In the Data
View, click Highlight menu ➤ AutoSelect.
Quick Reference
(Data View) AutoHighlight
When records are selected, automatically highlights objects in the drawing
linked to the records
In the Data View: Highlight ➤ Auto Highlight
Menu
(Data View) AutoZoom
Finding and Querying Drawing Objects | 1227
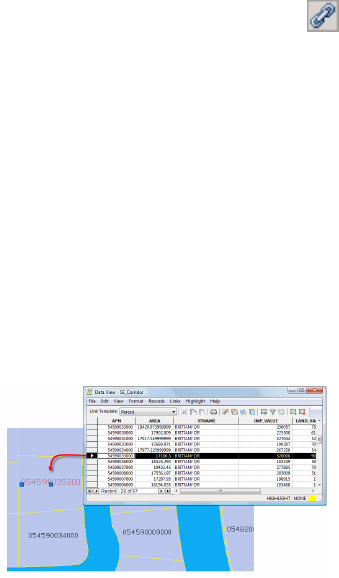
When records are selected or deselected, automatically adjusts the zoom so
that the objects linked to the selected records fill the percent of the screen
specified by the Zoom Scale command
In the Data View: Highlight ➤ Auto Zoom
Menu
(Data View) Link Records to Objects
Links the selected records to objects in your drawing
In the Data View: Links ➤ Link Records To Objects
Menu
Link Records to Objects
Icon
(Data View) Zoom Scale
Specifies the percent of the drawing display that the selected objects will
occupy
In the Data View: Highlight ➤ Zoom Scale
Menu
Zoom Scale dialog boxDialog Box
Highlighting Records Linked to a Selected Object
If objects in a drawing are linked to records in a database table, you can use
the Data View to see which records are linked to selected objects.
When you select an object in the drawing, linked records are highlighted in the Data
View.
See also:
■Opening a Database Table (page 1052)
■Editing a Database (page 1055)
1228 | Chapter 8 Analyzing Data
■Changing the Look of the Data View (page 1057)
■Finding Records in the Data View Based on Record Data (SQL Queries)
(page 1230)
■Finding Data View Records Based on Object Location (page 1233)
■Finding and Selecting Features (page 1206)
To highlight records linked to drawing objects
1Open a linked database table in the Data View. See Opening a Database
Table (page 1052).
2In the Data View, click Highlight menu ➤ Highlight Records ➤ Select
Object.
3Select the objects in your drawing. Press Enter.
4Use the highlighted records toolbar to move to the first, previous, next,
or last highlighted record.
5Optionally, show only highlighted records. In the Data View, click
Highlight menu ➤ Show Highlighted Records Only.
TIP To improve performance, create a filter (page 1231) to display only relevant
records.
To clear the highlighting, click on the highlight toolbar.
To set the record highlight color
1Do one of the following:
■In the Data View, click Highlight menu ➤ Highlight Color.
■In the status bar, double-click the highlight color.
2In the Select Color dialog box, specify a color. Click OK.
Quick Reference
(Data View) Clear Highlight
Removes the highlighting from records in the table
Finding and Querying Drawing Objects | 1229
In the Data View: Highlight ➤ Highlight
Records ➤ Clear Highlight
Menu
Clear Highlight
Icon
(Data View) Highlight Color
Selects the color to use to highlight records with the Highlight Records
command
In the Data View: Highlight ➤ Highlight Color
Menu
(Data View) Highlight Records
Highlights records that match objects you select in the drawing
In the Data View: Highlight ➤ Highlight
Records ➤ Select Objects
Menu
Highlight Records
Icon
(Data View) Show Highlighted Records Only
Displays only the currently highlighted records
In the Data View: Highlight ➤ Show Highlighted
Records Only
Menu
Finding Records in the Data View Based on Record Data (SQL
Queries)
Use a SQL filter in the Data View to display only records whose data matches
the conditions you specify. For example, view only records with a specific
street name or records where the property value is over a specific amount.
NOTE This functionality applies only to drawing objects. For information on
filtering geospatial feature data, see Using Expressions to Select Feature Data (page
1131).
Filters can improve performance in scrolling through records or in highlighting
records.
1230 | Chapter 8 Analyzing Data
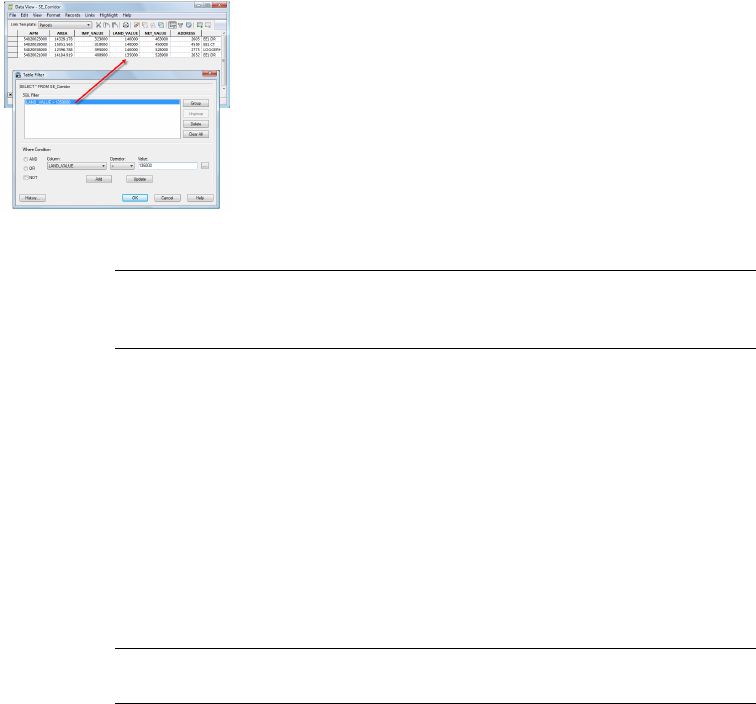
Use a SQL filter to view only records whose data matches specified conditions.
NOTE You can also filter records based on the location of linked objects. If both
a SQL filter and a spatial filter are defined, the Data View displays only those records
that match both filters.
You can set an option to determine how many filters AutoCAD Map 3D stores.
See also:
■Opening a Database Table (page 1052)
■Editing a Database (page 1055)
■Setting Data View Options (page 237)
■Changing the Look of the Data View (page 1057)
■Finding Data View Records Based on Object Location (page 1233)
NOTE This procedure applies only to drawing objects. For information on filtering
geospatial feature data, see Using Expressions to Select Feature Data (page 1131).
To use a SQL filter in the Data View
1Open a database table in the Data View. See Opening a Database Table
(page 1052).
2In the Data View, click Records menu ➤ SQL Filter.
3In the Table Filter dialog box (page 1693), define the condition for the filter.
To select from a list of conditions previously defined for this table, click
History and select the condition.
To define a new condition:
■Under Where Condition, select the column to use as a filter.
Finding and Querying Drawing Objects | 1231

■Select an operator.
To use wild-card characters, select the LIKE operator. For example, to
list only those streets that begin with the letter C, select the LIKE
operator and enter C% in the Value box. Wild-card characters can be
used only with string values. For information on wild-card characters,
refer to the documentation for your database system software.
■Enter a value or click… to select from the list of possible values.
■After setting your criteria, click Add.
The conditions you set appear in the SQL Filter list.
4To add additional conditions, select AND or OR. Create and add the new
condition.
5Click OK.
The Data View displays only those records that match the filter.
You can clear all filters. In the Data View, click Records menu ➤ Clear Filter.
Quick Reference
(Data View) Clear Filter
Eliminates all current filters and requeries the database
In the Data View: Records ➤ Clear Filter
Menu
Clear Filter
Icon
(Data View) SQL Filter
Displays only records that match conditions you specify
In the Data View: Records ➤ SQL Filter
Menu
SQL Filter
Icon
Table Filter dialog boxDialog Box
1232 | Chapter 8 Analyzing Data
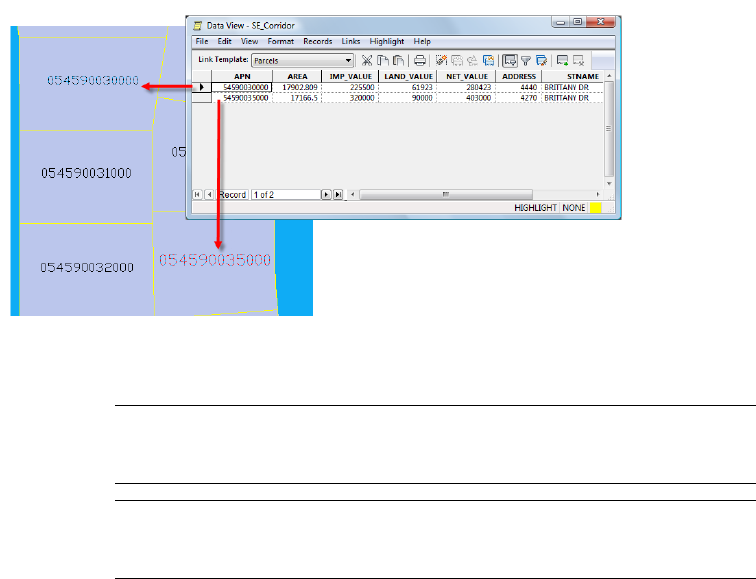
Finding Data View Records Based on Object Location
Use a spatial filter to display only records that are linked to drawing objects
you select in the drawing.
When you apply a spatial filter, the Data View displays only those records that are
linked to selected objects in the drawing.
NOTE You can also filter records based on the data in the record. If both a SQL
filter and a spatial filter are defined, the Data View displays only those records that
match both filters.
NOTE This functionality applies only to drawing objects. For information on
filtering geospatial feature data by location, see Using Expressions to Select Feature
Data (page 1131).
See also:
■Opening a Database Table (page 1052)
■Editing a Database (page 1055)
■Setting Data View Options (page 237)
■Changing the Look of the Data View (page 1057)
■Finding Records in the Data View Based on Record Data (SQL Queries)
(page 1230)
Finding and Querying Drawing Objects | 1233

NOTE The following procedure applies only to drawing objects. For information
about feature data, see Using Expressions to Select Feature Data (page 1131). In
addition, the Spatial Filter command is available only if you have a selected a link
template for the table. See Overview of Linking Database Records to Objects (page
522).
To use a spatial filter in the Data View
1Open a database table in the Data View. See Opening a Database Table
(page 1052).
2Do one of the following:
■In the Data View, click Records menu ➤ Spatial Filter.
■From the toolbar, click .
3Select objects.
4Click OK.
The Data View displays only those records that are linked to the selected
objects.
To clear all filters in the Data View – In the Data View, click Records
menu ➤ Clear Filter.
See also:
■To create a link template (page 526)
■Overview of Linking Database Records to Objects (page 522)
■Finding Records in the Data View Based on Record Data (SQL Queries)
(page 1230)
Quick Reference
(Data View) Clear Filter
Eliminates all current filters and requeries the database
In the Data View: Records ➤ Clear Filter
Menu
Clear Filter
Icon
1234 | Chapter 8 Analyzing Data

(Data View) Spatial Filter
Displays only records attached to objects that you select
In the Data View: Records ➤ Spatial Filter
Menu
Spatial Filter
Icon
Querying Objects from Attached Drawings
To query objects from attached drawings
■To create a query to retrieve information from attached drawings (page
1237)
■To retrieve drawing objects based on their location (page 1241)
■To retrieve drawing objects based on their properties (page 1244)
■To retrieve drawing objects based on their object data (page 1248)
■To retrieve drawing objects based on linked SQL data (page 1253)
■To combine query conditions in drawing queries (page 1256)
■To edit a drawing query condition (page 1258)
■To modify objects as they are retrieved by a query (page 1259)
■To execute a drawing query (page 1287)
■To improve performance (page 1292)
■To set options for drawing queries (page 1300)
Overview of Queries
Use queries to retrieve the drawing objects you need from attached drawings.
When you define a query, you specify the criteria for selecting objects in one
or more drawings. You can use four types of criteria: location, property, data,
and SQL. A query searches the active attached drawings, selects the objects
that match the conditions you specify, and copies the objects to the current
drawing.
Only objects in the Model Tab (model space) are queried. Objects from the
Layout Tab (paper space) are ignored.
You can view and edit the objects, then save them to a new drawing or save
them back to their original drawing.
Finding and Querying Drawing Objects | 1235
NOTE This functionality applies only to drawing objects. For information on
filtering geospatial feature data, see Using Expressions to Select Feature Data (page
1131).
Markup Objects
Because markup objects are not stored in the drawing file, you cannot query
these objects. To copy them from an attached drawing to the current drawing,
open the other drawing directly and copy the markup objects. Then paste
them into the current drawing.
Tell me more
Video
■Show me how to run a query on a set of
attached DWG files.
Procedures
■To find and select drawing objects
(page 1219)
GIS Skills
■Bring in a subset of features using a
query.
Tutorial
■Exercise 3: Query in data from the
drawing
Workflow
■Find and Edit Objects in Attached
Drawings
Related topics
■Attaching Drawings (page 154)
■Activating a Drawing (page 159)
■To save a query (page 177)
■Editing and Saving Objects in Attached
Drawings (page 737)
NOTE This procedure applies only to drawing objects. For information on filtering
geospatial feature data, see Using Expressions to Select Feature Data (page 1131).
1236 | Chapter 8 Analyzing Data
To create a query to retrieve information from attached drawings
1Open a drawing.
2In Map Explorer (page 2068), under Current Drawing, right-click the
Drawings folder. Click Define/ModifyDrawing Set.
3Make sure that the drawings you want to query are attached and active.
4In Map Explorer (page 2068), under Current Drawing, right-click Current
Query, and then click Define.
5To zoom to the extents of all active drawings, click Zoom Ext in the
Define Query Of Attached Drawings dialog box.
6In the Define Query dialog box (page 1838), select a Query Type to define
a condition for your query based on:
■Location (page 1241)— such as inside a window you define.
■Property (page 1244)— such as color, layer, or elevation.
■Data (page 1248)— information stored with the object
■SQL (page 1253)— information stored in external databases
7To add conditions (page 1256), choose And or Or, and choose a query type.
To group conditions, select the first and last condition in the group. Click
Group. Conditions inside the parentheses are evaluated first.
8If you want, specify how to alter the properties of the objects retrieved
by the query (page 1260).
9Select a Query Mode to specify how to view the objects (page 1287).
10 If you plan to use the query again, save the query (page 176).
11 Click Execute Query.
You can view and edit the objects, then save them to a new file or save them
back to their original file.
Quick Reference
ADEQUERY
Controls defining, modifying, saving, loading, and executing a query
Finding and Querying Drawing Objects | 1237
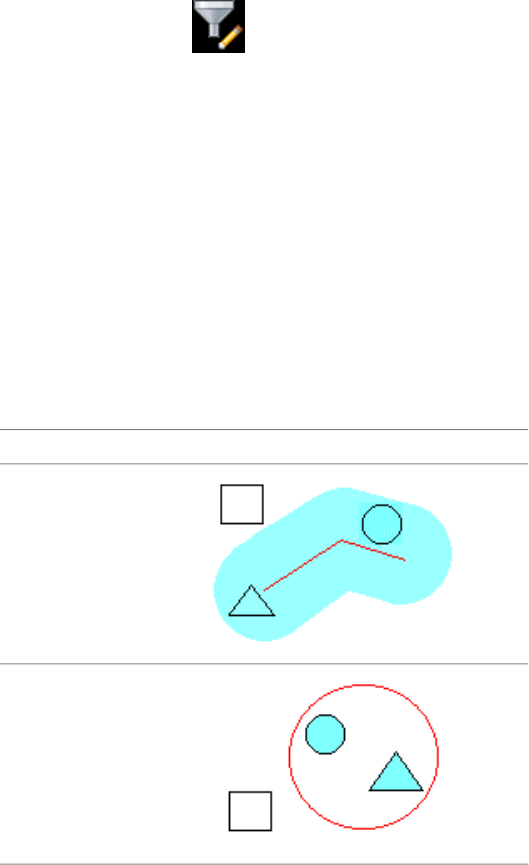
In the Classic workspace, click Setup menu ➤ More
DWG Options ➤ Define Query
Menu
Define Query
Icon
ADEQUERYCommand Line
In Map Explorer, right-click Current Query ➤ Define
-or- Right-click a query ➤ Edit
Task Pane
Define Query dialog boxDialog Box
Finding All Drawing Objects in a Specified Location
Location conditions retrieve drawing objects from a specified location in the
drawings.
Example: Find all roads within 100 meters of a power line or all parcels within
a specific section of the drawing.
In the following illustrations, the objects that are retrieved are highlighted.
Location Types
Buffer fence
Circle
1238 | Chapter 8 Analyzing Data
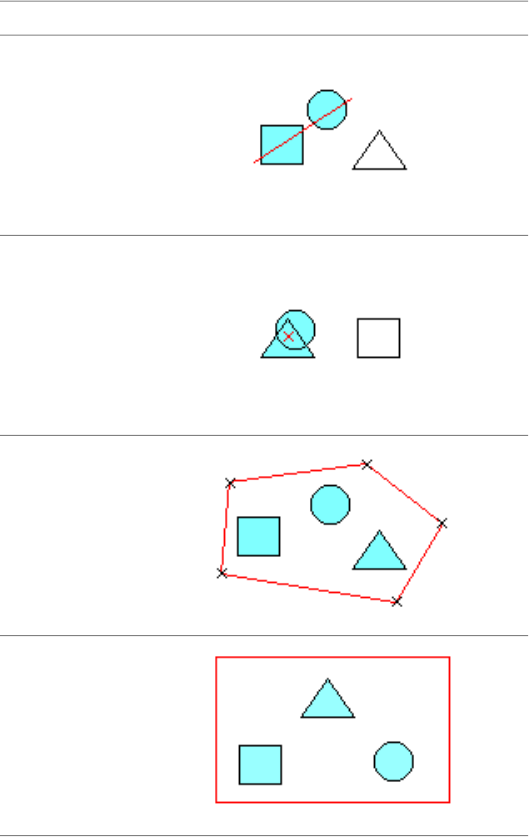
Location Types
Fence
Point
Polygon
Window
Finding and Querying Drawing Objects | 1239
Location Types
All
NOTE This functionality applies only to drawing objects. For information on
filtering geospatial feature data by location, see Using Expressions to Select Feature
Data (page 1131).
Tell me more
Video
■Show me how to run a query on a set of
attached DWG files.
Procedure
■To retrieve drawing objects based on
their location (page 1241)
GIS Skills
■Bring in a subset of features using a
query.
Tutorial
■Exercise 3: Query in data from the
drawing
Workflow
■Find and Edit Objects in Attached
Drawings
Related topics
■Finding All Drawing Objects Contain-
ing a Specific Property (page 1242)
■Finding All Drawing Objects Contain-
ing Specific Data (page 1245)
■Finding All Drawing Objects Contain-
ing Specific SQL Information (page 1249)
1240 | Chapter 8 Analyzing Data
■Combining Drawing Query Conditions
(page 1255)
NOTE This procedure applies only to drawing objects. For information on filtering
geospatial feature data by location, see Using Expressions to Select Feature Data
(page 1131).
To retrieve drawing objects based on their location
1In Map Explorer (page 2068), under Current Drawing, right-click Current
Query, and then click Define.
2To zoom to the extents of all active drawings, click Zoom Ext.
3Click Location.
4In the Location Condition dialog box (page 1849), select a boundary and
a selection type.
5Click Define. Specify the boundary.
6In the Define Query Of Attached Drawings dialog box, select a query
mode.
7Click Execute Query.
See also:
■Altering the Properties of Defined Queries (page 1260)
■Executing Queries (page 1288)
■To save a query (page 177)
Quick Reference
ADEQUERY
Controls defining, modifying, saving, loading, and executing a query
In the Classic workspace, click Setup menu ➤ More
DWG Options ➤ Define Query
Menu
Finding and Querying Drawing Objects | 1241

Define Query
Icon
ADEQUERYCommand Line
In Map Explorer, right-click Current Query ➤ Define
-or- Right-click a query ➤ Edit
Task Pane
Define Query dialog boxDialog Box
Finding All Drawing Objects Containing a Specific Property
Property conditions retrieve drawing objects based on AutoCAD Map 3D object
properties such as color, elevation, layer, or linetype
Example: Search for objects on a given layer or of a specified color.
You can use more than one object property in a query, but you must define
them one condition at a time.
NOTE This functionality applies only to drawing objects. For information on
filtering geospatial feature data by property, see Using Expressions to Select Feature
Data (page 1131).
Object Properties vs. Layer Properties
Some properties, such as Color or Linetype, are often specified BYLAYER, that
is, the attribute is set based on the value of the layer rather than the object
itself. These objects are not retrieved if you specify a particular color, for
instance, in the property query. Instead, you must specify BYLAYER in the
property query to retrieve these objects.
For example, querying objects with a DASHED linetype retrieves only objects
that have that explicit property, not objects that have that property because
they reside on a layer with a DASHED linetype.
If the current drawing does not have a matching layer, queried objects will
be displayed according to the characteristics of the layer in the attached
drawing. If the active drawing has a matching layer, the queried objects will
be displayed according to the characteristics of the layer in the current drawing.
Defining Numeric Range Property Queries
To define a numeric range property condition, combine condition statements
that define the upper and lower limit of the range. For example, to retrieve
1242 | Chapter 8 Analyzing Data
objects with an elevation between 21.0 and 47.0, use the following condition
statements:
Property: ELEVATION > 21
AND Property: ELEVATION < 47
Notes
■If you query against Object Type and IMAGE is not listed even though you
have a raster image in an attached drawing, exit the query dialog boxes.
Click Insert tab ➤ Image panel ➤ Image Management. In the Image
Management dialog box, click OK. Then define the query again.
■If the property query you define uses text values, you can set an option to
specify case-sensitive text. See Setting Query Options (DWG) (page 244).
Tell me more
Video
■Show me how to run a query on a set of
attached DWG files.
Procedure
■To retrieve drawing objects based on
their properties (page 1244)
GIS Skills
■Bring in a subset of features using a
query.
Tutorial
■Exercise 3: Query in data from the
drawing
Workflow
■Find and Edit Objects in Attached
Drawings
Related topics
■Finding All Drawing Objects in a Spe-
cified Location (page 1238)
■Finding All Drawing Objects Contain-
ing Specific Data (page 1245)
Finding and Querying Drawing Objects | 1243
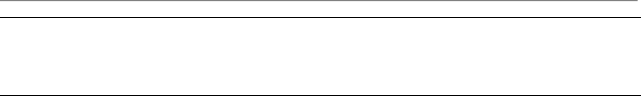
■Finding All Drawing Objects Contain-
ing Specific SQL Information (page 1249)
■Combining Drawing Query Conditions
(page 1255)
NOTE This procedure applies only to drawing objects. For information on filtering
geospatial feature data by property, see Using Expressions to Select Feature Data
(page 1131).
To retrieve drawing objects based on their properties
1In Map Explorer (page 2068), under Current Drawing, right-click Current
Query, and then click Define.
2Click Property.
3In the Property Condition dialog box (page 1855), select a property.
4Select an operator.
5Enter a value for the property.
To select from a list of available values, click Values. For example, if you
select the property "layer," clicking Values displays a list of all layers in
the active attached drawings.
You can use wild-card characters to enter values for the following
properties: Block Name, Color, Text Style, Object Type, Group, Layer,
Object Class, Linetype, and Plotstyle.
6Click OK.
7In the Define Query of Attached Drawings dialog box, select a query
mode.
8Click Execute Query.
See also:
■Altering the Properties of Defined Queries (page 1260)
■Executing Queries (page 1288)
■To save a query (page 177)
1244 | Chapter 8 Analyzing Data

Quick Reference
ADEQUERY
Controls defining, modifying, saving, loading, and executing a query
In the Classic workspace, click Setup menu ➤ More
DWG Options ➤ Define Query
Menu
Define Query
Icon
ADEQUERYCommand Line
In Map Explorer, right-click Current Query ➤ Define
-or- Right-click a query ➤ Edit
Task Pane
Define Query dialog boxDialog Box
Finding All Drawing Objects Containing Specific Data
Data conditions retrieve drawing objects based on nongraphic information
associated with the objects.
Finding and Querying Drawing Objects | 1245
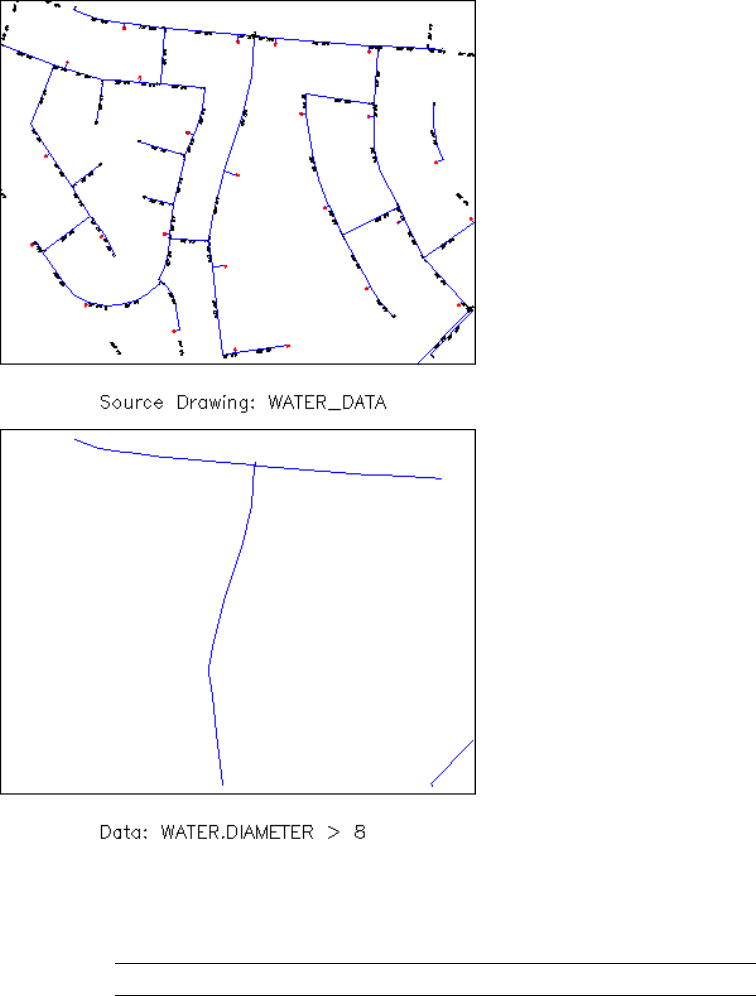
If you store pipe diameter information in an object data table, you can use a data
condition to retrieve pipe objects based on the diameter information attached to each
pipe object. In this case, all pipes with a diameter of 8 or greater are retrieved. Move
your cursor over the image to see the results.
NOTE You cannot retrieve objects based on constant block attributes.
1246 | Chapter 8 Analyzing Data
NOTE This functionality applies only to drawing objects. For information on
filtering geospatial feature data by property, see Using Expressions to Select Feature
Data (page 1131).
Keep in mind the following :
■You must define and attach the data to objects before you can use a data
condition.
■The Database Link option tests the link data stored on the object, not the
data in the database table. You can retrieve objects based on data in the
linked database table (page 1249).
Tell me more
Video
■Show me how to run a query on a set of
attached DWG files.
Procedure
■To retrieve drawing objects based on
their object data (page 1248)
GIS Skills
■Bring in a subset of features using a
query.
Tutorial
■Exercise 3: Query in data from the
drawing
■Tutorial: Classifying Drawing Objects
Workflow
■Find and Edit Objects in Attached
Drawings
Related topics
■Bringing In Drawing Objects Based on
Attached Data (page 363)
■Bringing In Drawing Objects by Object
Class (page 356)
■Finding All Drawing Objects Contain-
ing Specific SQL Information (page 1249)
Finding and Querying Drawing Objects | 1247

■Finding All Drawing Objects in a Spe-
cified Location (page 1238)
■Combining Drawing Query Conditions
(page 1255)
NOTE This procedure applies only to drawing objects. For information on filtering
geospatial feature data by property, see Using Expressions to Select Feature Data
(page 1131).
To retrieve drawing objects based on their object data
1In Map Explorer (page 2068), under Current Drawing, right-click Current
Query, and then click Define.
2Click Data.
3In the Data Condition dialog box (page 1836), select the type of data to
query.
4Specify the specific data to query.
■For object class, select the object class of the objects to retrieve. Then,
under Properties, select the specific properties to query.
■For object data, select the table and field to query.
Note that if two attached drawings have a table with the same name,
AutoCAD Map 3D recognizes only the fields defined in the first
drawing you activate.
■For database link data, select the link template associated with the
objects you want to retrieve. Under Key Columns, select the key
column to query.
Because a query retrieves objects from attached drawings, only link
templates defined in your attached drawing are displayed in the list.
■For block attributes, select the block to query. Under Attribute Tags,
select the attribute tag to query, or select * from the Blocks list to see
a list of all the attribute tags of all the blocks in the active drawing.
5Specify the condition that the data must match by selecting an operator
and entering a value in the Value field.
For example, to find all values greater than 8, select the > operator and
enter 8 in the Value field.
For information on using wild cards, see Wildcard Characters (page 1537).
1248 | Chapter 8 Analyzing Data

6Click OK.
7In the Define Query Of Attached Drawings dialog box, select a query
mode.
8Click Execute Query.
See also:
■Altering the Properties of Defined Queries (page 1260)
■Executing Queries (page 1288)
■To save a query (page 177)
Quick Reference
ADEQUERY
Controls defining, modifying, saving, loading, and executing a query
In the Classic workspace, click Setup menu ➤ More
DWG Options ➤ Define Query
Menu
Define Query
Icon
ADEQUERYCommand Line
In Map Explorer, right-click Current Query ➤ Define
-or- Right-click a query ➤ Edit
Task Pane
Define Query dialog boxDialog Box
Finding All Drawing Objects Containing Specific SQL Information
A SQL condition checks information in an external database and retrieves
drawing objects that are linked to records that match the condition.
Example: If a database table stores information on supplier, owner, and cost
of furniture in a set of drawings, you can define a query to show all chairs
purchased from a specific supplier.
Finding and Querying Drawing Objects | 1249
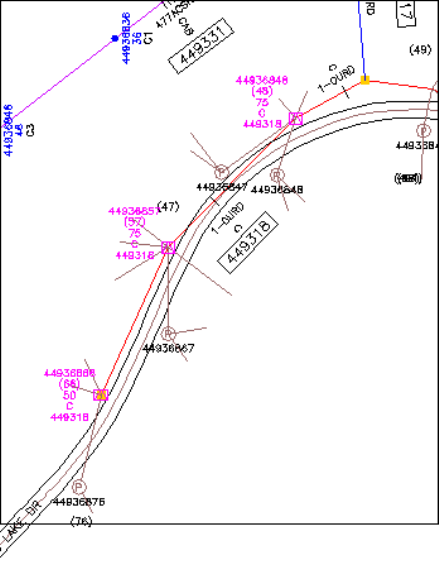
1250 | Chapter 8 Analyzing Data
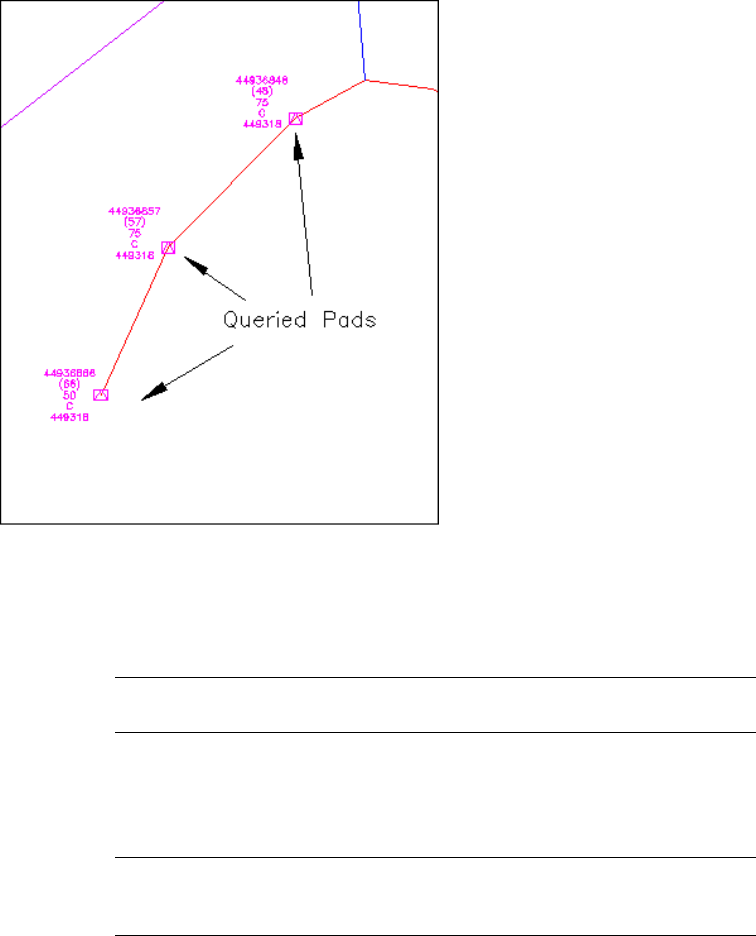
Use a query with a SQL condition to retrieve objects based on the value in a linked
data base record. In this example, all pads with a phase type of 'C' are retrieved. Move
your cursor over the image to see the results.
NOTE If you are retrieving objects from attached drawings, you must have the
same data base attached in both the attached drawing and the current drawing.
You must link SQL data to objects before you can use a SQL query. For more
information about connecting to external databases and linking records to
objects in your drawings, see Setting Up Data Sources for Drawings (page 204)
and Overview of Linking Database Records to Objects (page 522).
NOTE This functionality applies only to drawing objects. For information on
filtering geospatial feature data by property, see Using Expressions to Select Feature
Data (page 1131).
Finding and Querying Drawing Objects | 1251
Specifying a Value
The operator and the value define the condition that the value in the table
must match. For example, if you select the operator < (less than) and enter a
value of 5, the condition retrieves all objects linked to records in which the
value in the table is less than five.
■The value must match the data type of the column. For example, if the
column requires a name, enter a text string.
■Enclose string values in single quotes. If the string contains a single
quotation mark, precede the single quotation mark with a single quotation
mark.
■For dates, use the format TIMESTAMP'YYYY-MM-DD 00:00:00', for example
"Date" > TIMESTAMP`1990-05-30 11:45:00'
Troubleshooting
Because a SQL condition relies on the ability to connect to a data source, the
condition will not work if any part of the connection is broken:
■The query must specify a valid link template.
■The data source must be attached and connected.
■The data source must be in the same directory as when you connected to
it. (You must not have moved it after connecting.)
■Links must exist between drawing objects and records in the specified data
source.
Tell me more
Video
■Show me how to run a query on a set of
attached DWG files.
Procedure
■To retrieve drawing objects based on
linked SQL data (page 1253)
GIS Skills
■Bring in a subset of features using a
query.
1252 | Chapter 8 Analyzing Data
Tutorial
■Exercise 3: Query in data from the
drawing
Workflow
■Find and Edit Objects in Attached
Drawings
Related topics
■Setting Up Data Sources for Drawings
(page 204)
■Overview of Linking Database Records
to Objects (page 522)
■Bringing In Drawing Objects Based on
Attached Data (page 363)
■Finding All Drawing Objects Contain-
ing a Specific Property (page 1242)
■Finding All Drawing Objects in a Spe-
cified Location (page 1238)
■Finding All Drawing Objects Contain-
ing Specific Data (page 1245)
■Combining Drawing Query Conditions
(page 1255)
To retrieve drawing objects based on linked SQL data
1Before you execute a query with a SQL condition, be sure that the
appropriate data source is attached and connected.
2In Map Explorer (page 2068), under Current Drawing, right-click Current
Query, and then click Define.
3Click SQL.
4In the SQL Link Condition dialog box (page 1866), select the link template
for the table you want to search.
If you are querying attached drawings, the link template list includes
only link templates defined in the active attached drawings.
5Create a SQL condition by selecting a column, an operator, and a value.
To enter a condition, click Type It. In the Type SQL Condition dialog
box (page 1870), enter the condition.
Finding and Querying Drawing Objects | 1253

To reuse a condition you defined previously, click History. Select the
condition.
6Click Add Condition to add the condition to the Current SQL Condition
list.
7To add more conditions, select And or Or and create another condition.
8When you finish building the SQL condition, click OK.
9In the Define Query Of Attached Drawings dialog box, select a query
mode.
10 Click Execute Query.
See also:
■Altering the Properties of Defined Queries (page 1260)
■Executing Queries (page 1288)
■To save a query (page 177)
Quick Reference
ADEQUERY
Controls defining, modifying, saving, loading, and executing a query
In the Classic workspace, click Setup menu ➤ More
DWG Options ➤ Define Query
Menu
Define Query
Icon
ADEQUERYCommand Line
In Map Explorer, right-click Current Query ➤ Define
-or- Right-click a query ➤ Edit
Task Pane
Define Query dialog boxDialog Box
1254 | Chapter 8 Analyzing Data
Combining Drawing Query Conditions
You can combine query conditions when creating a query to retrieve drawing
objects.
Example: Combine a property condition with a location condition to find all
utility poles within 100 meters of a road.
When you combine conditions, use Or to specify the union of the conditions,
use And to specify the intersection of the condition, use Not to exclude specific
objects from the query.
■And — Finds objects only if both conditions are true. For example,
Property: LAYER = First Floor
AND Property: COLOR = BLUE
finds only blue objects on the First Floor layer.
■Or — Finds objects if either condition is true. For example,
Property: LAYER = First Floor
OR Property: COLOR = BLUE
finds all objects on the First Floor layer (of any color) and all blue objects
on any layer.
■And Not — Finds objects only if the first condition is true and the second
condition is false. For example,
Property: LAYER = First Floor
AND NOT Property: COLOR = BLUE
finds objects on the First Floor layer that are any color except blue.
■Or Not — Finds objects if the first condition is true or the second condition
is false. For example,
Property: LAYER = First Floor
OR NOT Property: COLOR = BLUE
finds all objects on the First Floor layer (of any color) and all objects on
other layers that are not blue.
You can use Not by itself to retrieve all except a specific set of objects. For
example, the query definition, Not Property: Layer = Furniture retrieves all
objects except those on the Furniture layer.
If you use more than two or three conditions, it is a good idea to group the
conditions. Conditions inside the group are evaluated first.
Finding and Querying Drawing Objects | 1255

If conditions are not grouped, Not conditions are evaluated first, then And,
and last Or.
NOTE This functionality applies only to drawing objects. For information on
filtering geospatial feature data conditionally, see Using Expressions to Select
Feature Data (page 1131).
See also:
■Finding All Drawing Objects in a Specified Location (page 1238)
■Finding All Drawing Objects Containing a Specific Property (page 1242)
■Finding All Drawing Objects Containing Specific Data (page 1245)
■Finding All Drawing Objects Containing Specific SQL Information (page
1249)
To combine query conditions in drawing queries
1In Map Explorer (page 2068), under Current Drawing, right-click Current
Query, and then click Define.
2Choose a Query Type to define a condition for your query (page 1237).
3In the Define Query dialog box (page 1838), under Query Type, select a
joining operator:
■And — Finds objects only if both conditions are true.
■Or — Finds objects if either condition is true.
■And Not — Finds objects only if the first condition is true and the
second condition is false.
■Or Not — Finds objects if either the first condition is true or the second
condition is false.
4Choose a Query Type to define the next condition for your query.
5To group conditions, select the first and last condition in the group. Click
Group. Conditions inside the parentheses are evaluated first.
6Select a Query Mode.
7Click Execute Query.
1256 | Chapter 8 Analyzing Data

See also:
■Altering the Properties of Defined Queries (page 1260)
■Executing Queries (page 1288)
■To save a query (page 177)
Quick Reference
ADEQUERY
Controls defining, modifying, saving, loading, and executing a query
In the Classic workspace, click Setup menu ➤ More
DWG Options ➤ Define Query
Menu
Define Query
Icon
ADEQUERYCommand Line
In Map Explorer, right-click Current Query ➤ Define
-or- Right-click a query ➤ Edit
Task Pane
Define Query dialog boxDialog Box
Editing a Drawing Query Condition
When you edit a drawing query, you can modify a condition but you cannot
change its type (location, property, data, or SQL). If you want a different query
condition type, you must delete the existing condition and define a new one.
You can also change the joining operator (And, Or, Not) for a condition.
NOTE This functionality applies only to drawing objects. For information on
filtering geospatial feature data conditionally, see Using Expressions to Select
Feature Data (page 1131).
See also:
■Finding All Drawing Objects in a Specified Location (page 1238)
■Finding All Drawing Objects Containing a Specific Property (page 1242)
■Finding All Drawing Objects Containing Specific Data (page 1245)
Finding and Querying Drawing Objects | 1257

■Finding All Drawing Objects Containing Specific SQL Information (page
1249)
■Altering the Properties of Defined Queries (page 1260)
■Executing Queries (page 1288)
■To save a query (page 177)
NOTE This procedure applies only to drawing objects. For information on filtering
geospatial feature data conditionally, see Using Expressions to Select Feature Data
(page 1131).
To edit a drawing query condition
1In Map Explorer (page 2068), under Current Drawing, right-click Current
Query, and then click Define.
2To modify a saved query, in the Define Query dialog box (page 1838), click
Load. Select the query.
3In the Define Query Of Attached Drawings dialog box, under Current
Query, select the query condition you want to edit. Click Edit.
To change the joining operator, select the new joining operator before
you click Edit.
4Make any changes.
For example, if you select a location condition and click Edit, the Location
Condition dialog box appears. Click Show to view or change the boundary
of the location condition and press Enter to return to the Location
Condition dialog box.
5Click OK.
The revised query appears under Current Query.
Quick Reference
ADEQUERY
Controls defining, modifying, saving, loading, and executing a query
In the Classic workspace, click Setup menu ➤ More
DWG Options ➤ Define Query
Menu
1258 | Chapter 8 Analyzing Data

Define Query
Icon
ADEQUERYCommand Line
In Map Explorer, right-click Current Query ➤ Define
-or- Right-click a query ➤ Edit
Task Pane
Define Query dialog boxDialog Box
Altering the Properties of Queried Drawing Objects
Use the property alteration feature to modify drawing objects as they are
retrieved by a query.
NOTE These procedures apply only to drawing objects. For information on altering
geospatial feature data, see Editing Features Using the Data Table (page 712).
To modify objects as they are retrieved by a query
■To alter the properties of queried drawing objects (page 1261)
■To alter all retrieved drawing objects in the same way (page 1263)
■To alter retrieved objects based on their properties (page 1265)
■To alter the properties of drawing objects based on their object data (page
1267)
■To alter retrieved drawing objects based on linked SQL data (page 1270)
■To define an expression (page 1275)
■To add text to retrieved drawing objects (page 1278)
■To define the label point for a drawing object (page 1280)
■To fill queried drawing objects with a hatch pattern (page 1283)
■To change the block color in your current drawing (page 1285)
■To modify a property alteration definition (page 1286)
Overview of Altering the Properties of Queried Drawing Objects
Use the property alteration feature to modify the properties of queried drawing
objects as they are queried into the current drawing.
You can modify object properties such as color, linetype, or polyline width,
or add text.
Example: You have a set of city maps that show roads as black polylines of
the same width. You can plot a map for a contractor that shows the roads to
Finding and Querying Drawing Objects | 1259

be repaired in red and roads to be inspected in blue. You can alter the width
of the polylines to show road widths. You can also add text to identify elements
of your drawing.
Property alteration involves the following three general steps:
■Define a query that retrieves the objects you want to alter.
■Create a property alteration definition that specifies how to alter the
retrieved objects.
■Execute the query in Draw mode. You cannot use property alteration in
Preview or Report mode queries.
AutoCAD Map 3D performs the query, applies the property alteration definition
to the queried objects, and displays the modified objects in the current
drawing.
NOTE This functionality applies only to drawing objects. For information on
altering geospatial feature data, see Editing Features Using the Data Table (page
712).
See also:
■Overview of Queries (page 1235)
■Executing Queries (page 1288)
■To save a query (page 177)
■Altering All Drawing Objects in the Same Way (page 1262)
■Altering Properties Using Object Properties (page 1264)
■Altering Object Properties Using Object Data (page 1267)
■Altering Object Properties Using Linked Data (page 1269)
■Filling Queried Drawing Objects with a Hatch Pattern (page 1281)
■Changing the Color of Blocks (page 1284)
■Modifying a Property Alteration Definition (page 1285)
NOTE This procedure applies only to drawing objects. For information on altering
geospatial feature data, see Editing Features Using the Data Table (page 712).
1260 | Chapter 8 Analyzing Data
To alter the properties of queried drawing objects
1In Map Explorer (page 2068), under Current Drawing, right-click Current
Query, and then click Define.
2In the Define Query dialog box (page 1838), load or create a query.
3Under Options, click Alter Properties.
4In the Set Property Alterations dialog box (page 1863), select the property
to alter.
For example, to change the color of queried objects, select Color.
5In the Expression area, specify how to alter the property.
■To modify every queried object in the same way, select the new value
for the property.
For example, if you are altering the color of objects and you want to
change the color of all queried objects to red, click Values and select
Red.
■To modify each object using a value that is stored in an associated
data source, select the data source, such as Property (page 1265), Data
(page 1267), or SQL (page 1270), and specify the location of the data.
For example, if you store color values in an object data table, click
Data and select the table and column that contains the color values.
Use this method only if the data values stored in the data source
exactly specify the value to use. For example, to alter the color of
objects, the data source must specify a valid color value.
■To modify each object based on other properties or on associated data,
select the data source and define a range table (page 1272).
For example, if you store installation dates in an associated data source,
you can modify the color of objects based on their installation date.
To do this, first select the data source for the installation dates, then
define a range table that specifies which colors to use for each range
of installation dates.
■You can add text to queried objects (page 1278) or add a hatch pattern
to objects (page 1283).
6Click Add to add the property alteration to the Current Property
Alterations list.
7When you finish defining the property alteration, click OK.
8Make sure that Alter Properties is selected when you execute the query.
Finding and Querying Drawing Objects | 1261

9Under Query Mode, select Draw. You cannot use property alteration in
Preview mode or Report mode.
10 Click Execute Query.
AutoCAD Map 3D performs the query, applies the property alteration definition
to the queried objects, and displays the altered objects in the current drawing.
Quick Reference
ADEQUERY
Controls defining, modifying, saving, loading, and executing a query
In the Classic workspace, click Setup menu ➤ More
DWG Options ➤ Define Query
Menu
Define Query
Icon
ADEQUERYCommand Line
In Map Explorer, right-click Current Query ➤ Define
-or- Right-click a query ➤ Edit
Task Pane
Define Query dialog boxDialog Box
Altering All Drawing Objects in the Same Way
A simple property alteration modifies all queried drawing objects in the same
way.
Here are some examples of using simple property alterations:
■Add a hatch pattern to all water pipes older than 50 years.
■Find every property lot touching a line that represents the path of the new
highway. Outline the lots in red and add a hatch pattern.
NOTE This functionality applies only to drawing objects. For information on
altering geospatial feature data, see Editing Features Using the Data Table (page
712).
1262 | Chapter 8 Analyzing Data

See also:
■Overview of Queries (page 1235)
■Executing Queries (page 1288)
■Altering Properties Using Object Properties (page 1264)
■Altering Object Properties Using Object Data (page 1267)
■Altering Object Properties Using Linked Data (page 1269)
■Filling Queried Drawing Objects with a Hatch Pattern (page 1281)
■Changing the Color of Blocks (page 1284)
■Modifying a Property Alteration Definition (page 1285)
NOTE This procedure applies only to drawing objects. For information on altering
geospatial feature data, see Editing Features Using the Data Table (page 712).
To alter all retrieved drawing objects in the same way
1In Map Explorer (page 2068), under Current Drawing, right-click Current
Query, and then click Define.
2In the Define Query Of Attached Drawings dialog box, load or create a
query that retrieves the objects you want to alter.
3Under Options, click Alter Properties.
4In the Set Property Alterations dialog box (page 1863), select the property
to alter.
5In the Expression area, specify how to alter the property.
For example, to change the color of all queried object to red, enter either
red or 1 (the numerical equivalent of red), or click Values to select from
a list of colors.
6Click Add to add the property alteration to the Current Property
Alterations list.
7When you finish defining the property alteration, click OK.
8Make sure that Alter Properties is selected when you execute the query.
9Under Query Mode, select Draw. You cannot use property alteration in
Preview mode or Report mode.
Finding and Querying Drawing Objects | 1263

10 Click Execute Query.
Quick Reference
ADEQUERY
Controls defining, modifying, saving, loading, and executing a query
In the Classic workspace, click Setup menu ➤ More
DWG Options ➤ Define Query
Menu
Define Query
Icon
ADEQUERYCommand Line
In Map Explorer, right-click Current Query ➤ Define
-or- Right-click a query ➤ Edit
Task Pane
Define Query dialog boxDialog Box
Altering Properties Using Object Properties
You can define a property alteration that modifies a property of queried
drawing objects based on another property of the objects.
Example: If the layers in your attached drawings are named using numbers,
you could color objects based on the layer they are on. To do this, under Select
Property, select Color as the property to alter. In the expression area, click
Property and choose Layer as the new value to use for the color.
The property you specify in the Expression area must have a value that can
be used for the property you are altering. For example, if your layers are not
named using numbers but instead use names such as Roads and Pipes, the
previous example would not work. (To create a modification based on these
layer names, use a range table, where you can specify that objects on the layer
named Roads be colored red, and objects on the layer named Pipes be colored
blue. For more information, see Creating a Range Table (page 1271).)
You can also modify a property based on the same property. For example, to
double the scale of selected objects, select Scale in the Select Property area as
the property to change. In the Expression area, select Scale as the property to
base the change on and multiply it by two. The expression would look like
this:
1264 | Chapter 8 Analyzing Data

(* x.scale 2)
NOTE This functionality applies only to drawing objects. For information on
altering geospatial feature data, see Editing Features Using the Data Table (page
712).
Dot Variables
■Use the .Dwgname dot variable to get the drawing name for a queried
object.
■Use the .Elevation dot variable to get the Z-values for objects.
■Use the .Height dot variable to get the text height for objects.
For a full listing of the dot variables that you can use for property alteration,
see Dot Variables (page 1546).
See also:
■Overview of Queries (page 1235)
■Executing Queries (page 1288)
■Altering Object Properties Using Object Data (page 1267)
■Altering Object Properties Using Linked Data (page 1269)
■Filling Queried Drawing Objects with a Hatch Pattern (page 1281)
■Changing the Color of Blocks (page 1284)
■Modifying a Property Alteration Definition (page 1285)
NOTE This procedure applies only to drawing objects. For information on altering
geospatial feature data, see Editing Features Using the Data Table (page 712).
To alter retrieved objects based on their properties
1In Map Explorer (page 2068), under Current Drawing, right-click Current
Query, and then click Define.
2In the Define Query Of Attached Drawings dialog box, load or create a
query that retrieves the objects you want to alter.
3In the Define Query Of Attached Drawings dialog box, click Alter
Properties.
Finding and Querying Drawing Objects | 1265

4In the Set Property Alterations dialog box (page 1863), under Select Property,
select the property to change.
For example, if you have color-coded the objects in your drawing and
you now want to move objects to layers based on their color, you would
select Layer as the property to change.
5In the Expression area, click Properties and select the property that you
want to base the change on.
In this example, we want to move objects based on their current color,
so select Color.
Click OK to close the Select Property dialog box.
6Click Add to add the property alteration to the Current Property Alteration
list.
See also:
■Overview of Queries (page 1235)
■Executing Queries (page 1288)
■To save a query (page 177)
Quick Reference
ADEQUERY
Controls defining, modifying, saving, loading, and executing a query
In the Classic workspace, click Setup menu ➤ More
DWG Options ➤ Define Query
Menu
Define Query
Icon
ADEQUERYCommand Line
In Map Explorer, right-click Current Query ➤ Define
-or- Right-click a query ➤ Edit
Task Pane
Define Query dialog boxDialog Box
1266 | Chapter 8 Analyzing Data

Altering Object Properties Using Object Data
You can define a property alteration that modifies queried drawing objects
based on data that is stored on the objects, such as object data, attribute data,
or link data.
NOTE The value stored on the object must be a valid value for the property that
you are altering. For example, if you have selected to alter the property Color, the
value stored on the object must be a valid color name or number. If the values do
not match, use a range table (page 1272).
NOTE This functionality applies only to drawing objects. For information on
altering geospatial feature data, see Editing Features Using the Data Table (page
712).
See also:
■Overview of Queries (page 1235)
■Executing Queries (page 1288)
■Altering Properties Using Object Properties (page 1264)
■Altering Object Properties Using Linked Data (page 1269)
■Filling Queried Drawing Objects with a Hatch Pattern (page 1281)
■Changing the Color of Blocks (page 1284)
■Modifying a Property Alteration Definition (page 1285)
NOTE This procedure applies only to drawing objects. For information on altering
geospatial feature data, see Editing Features Using the Data Table (page 712).
To alter the properties of drawing objects based on their object data
1In Map Explorer (page 2068), under Current Drawing, right-click Current
Query, and then click Define.
2In the Define Query Of Attached Drawings dialog box, load or create a
query that retrieves the objects you want to alter.
3In the Define Query Of Attached Drawings dialog box, click Alter
Properties.
Finding and Querying Drawing Objects | 1267

4In the Set Property Alterations dialog box (page 1863), under Select Property,
select the property to change.
For example, if you store pipe diameters as object data, you can display
each pipe with a polyline width that matches the pipe diameter. In this
example, you would select Width as the property to change.
5In the Expression area, click Data.
6Select one of the following:
■Attribute — Select a block attribute tag. This will appear in the
Expression box as @BlockTagName.
■Database Link — Select a link template and key column. These will
appear in the Expression box as &KeyColumn@LinkTemplate.
■Object Data — Select an object data table and field. These will appear
in the Expression box as :FIELD@TABLENAME.
7Click OK.
8Click Add.
The property alteration definition is displayed in the Current Property
Alterations list. When you execute the query with Alter Properties selected,
AutoCAD Map 3D changes the selected property of queried objects based
on the value stored in the specified data field.
Quick Reference
ADEQUERY
Controls defining, modifying, saving, loading, and executing a query
In the Classic workspace, click Setup menu ➤ More
DWG Options ➤ Define Query
Menu
Define Query
Icon
ADEQUERYCommand Line
In Map Explorer, right-click Current Query ➤ Define
-or- Right-click a query ➤ Edit
Task Pane
Define Query dialog boxDialog Box
1268 | Chapter 8 Analyzing Data
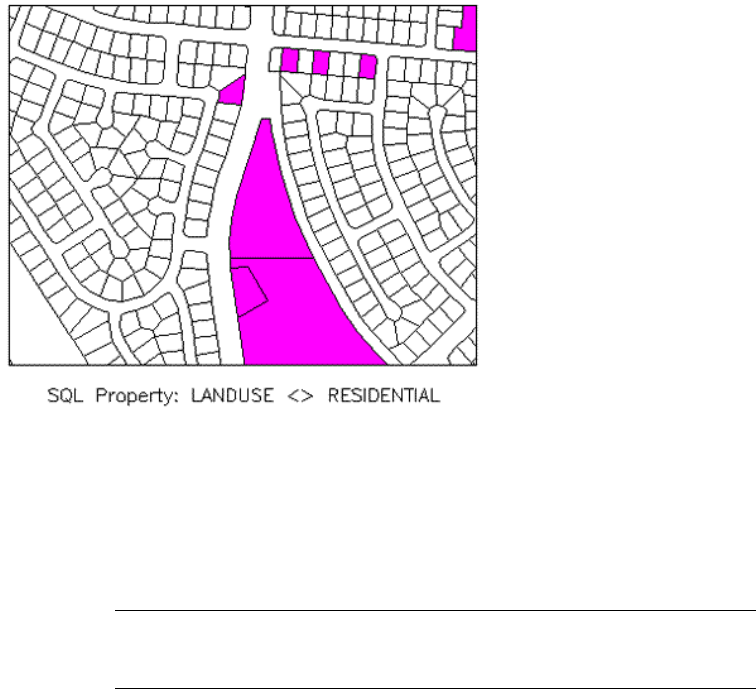
Altering Object Properties Using Linked Data
You can define a property alteration that modifies queried drawing objects
based on data stored in a linked database.
Using Property Alteration, parcels not zoned for residential are displayed with a
magenta solid fill, based on an external database record value.
For example, you could retrieve a set of pipes and display each pipe in a color
based on the diameter of the pipe.
For information on creating and using a link template, see Overview of Linking
Database Records to Objects (page 522).
NOTE This functionality applies only to drawing objects. For information on
altering geospatial feature data, see Editing Features Using the Data Table (page
712).
See also:
■Overview of Queries (page 1235)
■Executing Queries (page 1288)
■Altering Properties Using Object Properties (page 1264)
■Altering Object Properties Using Object Data (page 1267)
Finding and Querying Drawing Objects | 1269

■Filling Queried Drawing Objects with a Hatch Pattern (page 1281)
■Changing the Color of Blocks (page 1284)
■Modifying a Property Alteration Definition (page 1285)
NOTE This functionality applies only to drawing objects. For information on
altering geospatial feature data, see Editing Features Using the Data Table (page
712).
To alter retrieved drawing objects based on linked SQL data
1In Map Explorer (page 2068), under Current Drawing, right-click Current
Query, and then click Define.
2In the Define Query Of Attached Drawings dialog box, load or create a
query that retrieves the objects you want to alter.
3In the Define Query Of Attached Drawings dialog box, click Alter
Properties.
4In the Set Property Alterations dialog box (page 1863), under Select Property,
select the property to change.
For example, to modify the color of retrieved objects, select Color as the
property to change.
5Click SQL.
6Select a link template.
7Select the external database column whose value you want to use as a
value in the expression.
8Click OK.
The SQL column and link template are displayed under Expression in
the Set Property Alterations dialog box, preceded by an ampersand (&).
The link template is preceded by an at (@) symbol, for example,
&Diameter@PIPES.
You can also enter the SQL data variable directly in the Expression box.
9Click Add.
The property alteration definition is added to the Current Property
Alterations list.
1270 | Chapter 8 Analyzing Data

When you execute the query with Alter Properties selected, AutoCAD
Map 3D changes the queried objects based on the value stored in the
external database.
For more information on connecting to and using external databases, see
External Databases (Object Data) (page 206).
Quick Reference
ADEQUERY
Controls defining, modifying, saving, loading, and executing a query
In the Classic workspace, click Setup menu ➤ More
DWG Options ➤ Define Query
Menu
Define Query
Icon
ADEQUERYCommand Line
In Map Explorer, right-click Current Query ➤ Define
-or- Right-click a query ➤ Edit
Task Pane
Define Query dialog boxDialog Box
Creating a Range Table
A range table specifies a range of actions to take depending on the value of
the specified data or property.
■You can change the color of drawing objects based on their elevation
■If you have a street map and use object data to store information about
pavement quality, you can move each street to a layer that corresponds
to the pavement quality.
■If you have a county map showing cities, and you use an external database
to store population data for each city, you can modify the block symbol
for each city based on its population size.
The procedure tab for this topic includes general instructions for creating a
range table and specific instructions for creating a sample range table.
Finding and Querying Drawing Objects | 1271

NOTE This functionality applies only to drawing objects.
See also:
■Overview of Queries (page 1235)
■Executing Queries (page 1288)
■Altering Properties Using Object Properties (page 1264)
■Altering Object Properties Using Object Data (page 1267)
■Altering Object Properties Using Linked Data (page 1269)
■Filling Queried Drawing Objects with a Hatch Pattern (page 1281)
■Changing the Color of Blocks (page 1284)
■Modifying a Property Alteration Definition (page 1285)
■To create a range table (page 1272)
■To create a sample range table (page 1273)
To create a range table
1In Map Explorer (page 2068), under Current Drawing, right-click Current
Query, and then click Define.
2In the Define Query Of Attached Drawings dialog box, click Alter
Properties.
3If you are creating a range table for a property alteration, in the Set
Property Alterations dialog box (page 1863), select the property to alter.
4Move the cursor to the Expression box and specify the location of the
value on which to base the alteration.
Enter a dot variable, a field name, or other valid expression. For example,
to modify the color of an object based on its elevation, enter .ELEVATION
in the Expression box.
5Click Range.
6In the Define Range Table dialog box (page 1842), click New to create a new
range table.
7Enter a name for the range table and click OK.
1272 | Chapter 8 Analyzing Data

8In the Define Range Table dialog box, select an operator and a value for
the first condition.
These determines which objects fall in this range.
9Specify the return value for the first condition.
The return value specifies how to modify the selected property. For
example, if you are modifying the color of an object based on its elevation,
enter the color in the Return Value box.
NOTE In the Expression Value box and Return Value box, you can enter only
simple expressions. You cannot enter compound expressions.
10 Click Add to add the condition to the Current Range Table Definition.
When you run the property alteration, each object that has the specified
expression value (for example, elevation > 200) will be modified according
to the specified return value (for example, it will be colored red).
11 Specify the remaining conditions.
12 Click OK to close the Set Property Alteration dialog box.
13 Make sure that Alter Properties is selected.
14 Click Execute Query to retrieve the objects and alter them.
Creating an Example Range Table
The following example creates a range table for a property alteration. The
example range table colors lots larger than 6000 red and lots 6000 or smaller
blue.
To create a sample range table
1In Map Explorer (page 2068), under Current Drawing, right-click Current
Query, and then click Define.
2In the Define Query of Attached Drawings dialog box, click Set Property
Alteration.
3In the Set Property Alterations dialog box (page 1863), select the property
Color.
4In the Expression area, click Property and select Area. Click OK.
5Click Ranges.
Finding and Querying Drawing Objects | 1273

6In the Define Range Table dialog box (page 1842), click New.
7Enter the name Color and click OK to close the New Range Table dialog
box.
8Enter the description Color areas over 6000.
9In the Condition area, choose the <= operator.
10 In the Expression Value area, enter 6000.
11 In the Return Value area, enter Blue.
12 Click Add.
13 In the Condition area, choose the > operator.
14 In the Expression Value area, leave the 6000 alone.
15 In the Return Value area, enter Red.
16 Click Add.
17 Click OK to close the Define Range Table dialog box.
18 Make sure that the Color range table is selected.
19 Click Add to add the color property alteration to the Current Property
Alterations list.
20 Click OK to close the Set Property Alteration dialog box.
21 Make sure that Alter Properties is selected.
22 Click Execute Query to retrieve the objects and alter them.
Quick Reference
ADEQUERY
Controls defining, modifying, saving, loading, and executing a query
In the Classic workspace, click Setup menu ➤ More
DWG Options ➤ Define Query
Menu
Define Query
Icon
ADEQUERYCommand Line
1274 | Chapter 8 Analyzing Data

In Map Explorer, right-click Current Query ➤ Define
-or- Right-click a query ➤ Edit
Task Pane
Define Query dialog boxDialog Box
Defining an Expression
Use Expression Evaluator (page 1541) when you want AutoCAD Map 3D to
evaluate drawing data from different sources, or to evaluate data that is
different for each object, such as object properties, block attributes, or object
data attached to the object.
NOTE This functionality applies only to drawing objects. For information on
expressions for geospatial feature data, see Using Expressions to Select Feature
Data (page 1131).
See also:
■Overview of Queries (page 1235)
■Executing Queries (page 1288)
■Altering Properties Using Object Properties (page 1264)
■Altering Object Properties Using Object Data (page 1267)
■Altering Object Properties Using Linked Data (page 1269)
■Filling Queried Drawing Objects with a Hatch Pattern (page 1281)
■Changing the Color of Blocks (page 1284)
■Modifying a Property Alteration Definition (page 1285)
NOTE This procedure applies only to drawing objects. For information on
expressions for geospatial feature data, see Using Expressions to Select Feature
Data (page 1131).
To define an expression
1In Map Explorer (page 2068), under Current Drawing, right-click Current
Query, and then click Define.
2In the Define Query Of Attached Drawings dialog box, load or create a
query.
Finding and Querying Drawing Objects | 1275

3Under Options, click Alter Properties.
4In the Set Property Alterations dialog box (page 1863), select the property
to alter.
For example, to change the color of queried objects, select Color.
5In the Expression area, enter an expression (page 1541).
6Click Add to add the property alteration to the Current Property
Alterations list.
7When you finish defining the property alteration, click OK.
8Make sure Alter Properties is selected when you execute the query.
9Under Query Mode, select Draw. You cannot use property alteration in
Preview mode or Report mode.
10 Click Execute Query.
Quick Reference
ADEQUERY
Controls defining, modifying, saving, loading, and executing a query
In the Classic workspace, click Setup menu ➤ More
DWG Options ➤ Define Query
Menu
Define Query
Icon
ADEQUERYCommand Line
In Map Explorer, right-click Current Query ➤ Define
-or- Right-click a query ➤ Edit
Task Pane
Define Query dialog boxDialog Box
Adding Text to Queried Drawing Objects
You can add text to queried objects during the property alteration process.
Example: For all retrieved pipes, print the pipe type and diameter.
1276 | Chapter 8 Analyzing Data
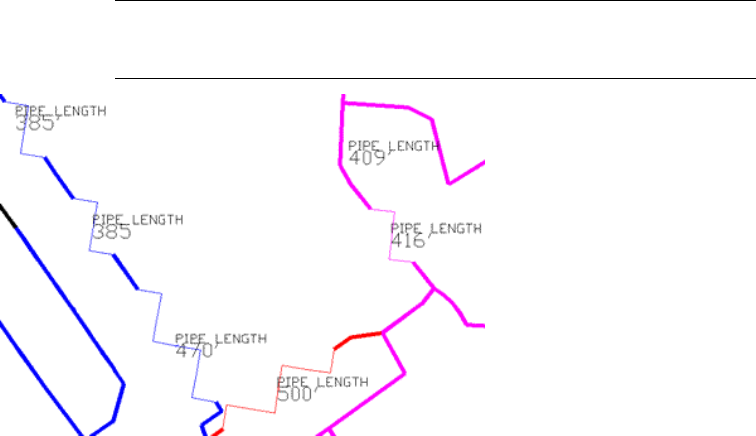
You can control the text, text height, insertion point, justification, text style,
layer, color, and rotation for each text object.
NOTE This functionality applies only to drawing objects. For information on
expressions for geospatial feature data, see Using Expressions to Select Feature
Data (page 1131).
Selected pipes are labeled with their length.
See also:
■Overview of Queries (page 1235)
■Executing Queries (page 1288)
■Altering Properties Using Object Properties (page 1264)
■Altering Object Properties Using Object Data (page 1267)
■Altering Object Properties Using Linked Data (page 1269)
■Filling Queried Drawing Objects with a Hatch Pattern (page 1281)
■Changing the Color of Blocks (page 1284)
■Modifying a Property Alteration Definition (page 1285)
Finding and Querying Drawing Objects | 1277

To add text to retrieved drawing objects
NOTE This procedure applies only to drawing objects. For information on
expressions for geospatial feature data, see Using Expressions to Select Feature
Data (page 1131).
1In Map Explorer (page 2068), under Current Drawing, right-click Current
Query, and then click Define.
2Create or load a query that will retrieve the objects you want to add text
to.
3In the Define Query Of Attached Drawings dialog box, click Alter
Properties.
4In the Set Property Alterations dialog box (page 1863), click Text.
5In the Define Text dialog box (page 1846), specify the text.
Enter text in the Text Value box, or specify the data to use for the text
by clicking Expression. For example, click Expression and select Layer to
display the name of the layer on each object found by the query.
6Set other text options, such as the size, location, color, layer, and rotation.
7Click OK to close the Define Text dialog box.
8Click OK to close the Property Alteration dialog box.
9Make sure that Alter Properties is selected.
10 Click Execute Query to retrieve the objects and alter them.
Quick Reference
ADEQUERY
Controls defining, modifying, saving, loading, and executing a query
In the Classic workspace, click Setup menu ➤ More
DWG Options ➤ Define Query
Menu
Define Query
Icon
ADEQUERYCommand Line
1278 | Chapter 8 Analyzing Data
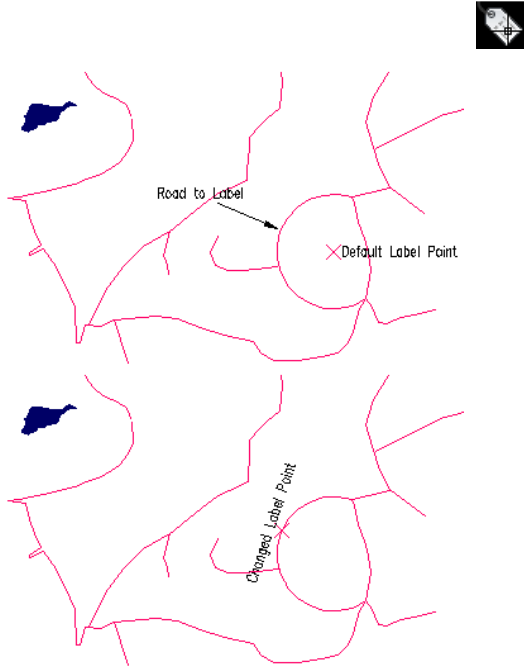
In Map Explorer, right-click Current Query ➤ Define
-or- Right-click a query ➤ Edit
Task Pane
Define Query dialog boxDialog Box
Modifying the Text Insertion Point for a Drawing Object
The label point of a drawing object specifies the starting point for text added
during a query property alteration. The default label point is the centroid of
the object. You can redefine the label point. Click Annotate tab ➤ Map
Annotation panel ➤ Define Text Location.
Move the label point from its default location at the center of the arc to a different
location. Move your cursor over the image to see the results.
Finding and Querying Drawing Objects | 1279
NOTE To use the label point, choose the .LABELPT dot variable in the Define Text
dialog box when you create the Property Alteration definition in the Define Query
Of Attached Drawings dialog box.
NOTE This functionality applies only to drawing objects. For information on
labelling geospatial feature data, see Adding Labels to Features (page 1091).
See also:
■Adding Text to Queried Drawing Objects (page 1276)
■Overview of Queries (page 1235)
■Executing Queries (page 1288)
■Altering Properties Using Object Properties (page 1264)
■Altering Object Properties Using Object Data (page 1267)
■Altering Object Properties Using Linked Data (page 1269)
■Filling Queried Drawing Objects with a Hatch Pattern (page 1281)
■Changing the Color of Blocks (page 1284)
■Modifying a Property Alteration Definition (page 1285)
To define the label point for a drawing object
NOTE This procedure applies only to drawing objects. For information on labelling
geospatial feature data, see To label features (page 1093).
1Click Annotate tab ➤ Map Annotation panel ➤ Define Text Location.
2Select the object.
3Click the place on the object where you want to locate the label point.
To use this label point as the text insertion point during a property alteration
(page 1278), choose LABELPT as the insert point.
1280 | Chapter 8 Analyzing Data

Quick Reference
ADETEXTLOC
Specifies a new label point for an object
Create menu ➤ Map Labelpoint Location
Menu
Map Labelpoint Location
Icon
ADETEXTLOCCommand Line
ADETEXTLOC (Map Labelpoint Location command)Dialog Box
Filling Queried Drawing Objects with a Hatch Pattern
You can specify a hatch pattern to fill closed polylines and circles during the
property alteration process. This applies only to drawing objects.
Example: Create a query that retrieves all land parcels valued above $450,000
and displays them with a distinguishing pattern.
NOTE If you set the Create Associative Hatch Objects option on the Query tab
of the AutoCADMap Options dialog box, AutoCAD Map 3D creates associative
hatch objects (page 246).
Finding and Querying Drawing Objects | 1281
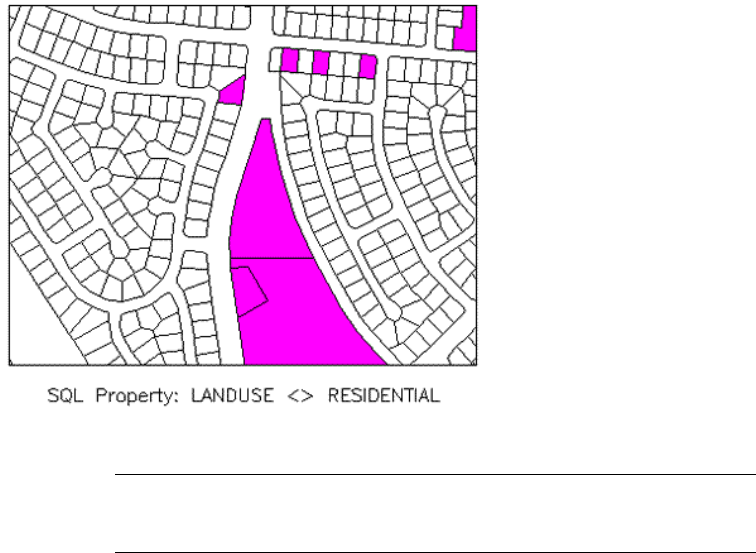
Closed polylines retrieved by a query are filled with a magenta solid hatch pattern.
NOTE This functionality applies only to drawing objects. For information on
changing the fill for geospatial feature data, see Overview of Styling Features (page
640).
See also:
■Using Associative Hatch (page 246)
■Overview of Queries (page 1235)
■Executing Queries (page 1288)
■Altering Properties Using Object Properties (page 1264)
■Altering Object Properties Using Object Data (page 1267)
■Altering Object Properties Using Linked Data (page 1269)
■Changing the Color of Blocks (page 1284)
■Modifying a Property Alteration Definition (page 1285)
1282 | Chapter 8 Analyzing Data

To fill queried drawing objects with a hatch pattern
NOTE This procedure applies only to drawing objects. For information on changing
the fill for geospatial feature data, see To apply styles to areas (page 650).
1In Map Explorer (page 2068), under Current Drawing, right-click Current
Query, and then click Define.
2Create or load a query that will retrieve the objects you want to fill.
3In the Define Query Of Attached Drawings dialog box, click Alter
Properties.
4In the Set Property Alterations dialog box (page 1863), click Hatch.
5In the Hatch Options dialog box (page 1847), enter a pattern name, click
Pattern to select a pattern from the set of hatch patterns, or click
Expression to select a data value specifies the hatch name (for example,
select a field in an object data table).
AutoCAD Map 3D displays the selected hatch pattern. ISO hatch patterns
are not displayed.
If you do not enter a pattern, AutoCAD Map 3D uses a fill that appears
solid.
6Enter a scale, rotation, layer, and color for the hatch pattern.
7Click OK to close the Hatch Options dialog box.
Closed polylines and circles that are retrieved during the query are filled
with the specified hatch pattern.
8Click OK to close the Property Alteration dialog box.
9Make sure that Alter Properties is selected.
10 Under Query Mode, select Draw.
11 Click Execute Query to retrieve the objects and alter them.
Quick Reference
ADEQUERY
Controls defining, modifying, saving, loading, and executing a query
Finding and Querying Drawing Objects | 1283

In the Classic workspace, click Setup menu ➤ More
DWG Options ➤ Define Query
Menu
Define Query
Icon
ADEQUERYCommand Line
In Map Explorer, right-click Current Query ➤ Define
-or- Right-click a query ➤ Edit
Task Pane
Define Query dialog boxDialog Box
Changing the Color of Blocks
When you use the Color option of the Set Property Alterations dialog box,
the colors of objects change to the color you specify. However, if the queried
objects include blocks whose color is set to BYLAYER, the objects in the block
retain their original color. To have them use the color you specify, change the
block color to BYBLOCK.
NOTE This functionality applies only to drawing objects. For information on
changing the color of geospatial feature data, see Overview of Styling Features
(page 640).
See also:
■Overview of Queries (page 1235)
■Executing Queries (page 1288)
■Altering Properties Using Object Properties (page 1264)
■Altering Object Properties Using Object Data (page 1267)
■Altering Object Properties Using Linked Data (page 1269)
■Filling Queried Drawing Objects with a Hatch Pattern (page 1281)
■Modifying a Property Alteration Definition (page 1285)
1284 | Chapter 8 Analyzing Data

To change the block color in your current drawing
NOTE This procedure applies only to drawing objects. For information on changing
the color of geospatial feature data, see To apply styles to areas (page 650).
1Use the INSERT command to add another instance of the block.
2Explode the new block.
3At the Command prompt, enter chprop
Select objects: Select the objects in the exploded block
Enter property to change (Color/LAyer/LType/ltScale/LWeight/Thickness)?
C
Enter new color <varies>: BYBLOCK
Enter property to change (Color/LAyer/LType/ltScale/LWeight/Thickness)?
Press Enter
4Redefine the block with the BLOCK command and select the objects in
the exploded block.
This procedure redefines all instances of the block. The blocks then show the
color you defined in the Set Property Alterations dialog box (page 1863).
Quick Reference
CHPROP
Changes the color, layer, linetype, linetype scale factor, lineweight, thickness,
and plot style of an object
CHPROPCommand Line
Modifying a Property Alteration Definition
After you have run a query, you may decide to modify a property alteration
definition. Or you may want to create a new property alteration based on an
existing query.
After you modify the definition, you can save the changes to the current query,
or you can save the changes to a new query.
Finding and Querying Drawing Objects | 1285
See also:
■Overview of Queries (page 1235)
■Executing Queries (page 1288)
■Altering Properties Using Object Properties (page 1264)
■Altering Object Properties Using Object Data (page 1267)
■Altering Object Properties Using Linked Data (page 1269)
■Filling Queried Drawing Objects with a Hatch Pattern (page 1281)
■Changing the Color of Blocks (page 1284)
To modify a property alteration definition
1In Map Explorer (page 2068), under Current Drawing, right-click Current
Query, and then click Define.
2In the Define Query Of Attached Drawings dialog box, load the query to
modify.
3Click the Alter Properties button.
4In the Set Property Alterations dialog box (page 1863), under Current
Property Alterations, select the property alteration definition to change.
5Double-click the definition.
The value for the property alteration definition appears in the Expression
box and the appropriate property is selected.
6Edit or insert a new value and click Update.
The revised property alteration definition appears under Current Property
Alterations. If you click Add instead of Update, the revised expression is
added to the existing expression in the list.
7Click OK.
8In the Define Query Of Attached Drawings dialog box, click Save.
To save the changes to a new query, enter a new name and description.
Click OK.
9In the Define Query Of Attached Drawings dialog box, click OK to save
your changes without running the query.
1286 | Chapter 8 Analyzing Data

Quick Reference
ADEQUERY
Controls defining, modifying, saving, loading, and executing a query
In the Classic workspace, click Setup menu ➤ More
DWG Options ➤ Define Query
Menu
Define Query
Icon
ADEQUERYCommand Line
In Map Explorer, right-click Current Query ➤ Define
-or- Right-click a query ➤ Edit
Task Pane
Define Query dialog boxDialog Box
Executing Drawing Queries
After you define a query to retrieve drawing objects, you can execute it in
Preview, Draw, or Report mode.
To execute a drawing query
■To select a query mode for retrieving drawing objects (page 1288)
■To run a drawing query in Preview mode (page 1290)
■To run a drawing query in Draw mode (page 1291)
Overview of Executing Queries
After you define a query to retrieve drawing objects, you can execute it in one
of three modes:
■Preview mode — Displays the objects on screen, but does not retrieve them.
When you change the screen, the objects disappear.
Use Preview to test your query.
■Draw Mode — Retrieves objects (copies them into the current drawing).
You can manipulate and edit them, save them back to their attached
drawings, save them to the current drawing, or save them to a new drawing.
The objects are not changed in the attached drawings unless you save your
changes back to the attached drawings.
Finding and Querying Drawing Objects | 1287

■Report Mode — Writes specified information about the objects to a separate
file.
Once AutoCAD Map 3D copies the objects that meet the query criteria into
the current drawing, it does not duplicate those objects if you run the query
again. If an object meets the criteria of more than one query, AutoCAD Map
3D retrieves only one copy of that object. Therefore, you will never have
multiple copies of the same object in a drawing.
See also:
■Overview of Queries (page 1235)
■Overview of Finding and Querying Drawing Objects (page 1218)
To select a query mode for retrieving drawing objects
1In Map Explorer (page 2068), under Current Drawing, right-click Current
Query, and then click Define.
2Define or load a query.
3Under Query Mode, select Preview (page 1290), Draw (page 1291), or Report
(page 1477).
If you select Report mode, click Options to define a report template (page
1479).
4Click Execute Query.
Quick Reference
ADEQUERY
Controls defining, modifying, saving, loading, and executing a query
In the Classic workspace, click Setup menu ➤ More
DWG Options ➤ Define Query
Menu
Define Query
Icon
ADEQUERYCommand Line
1288 | Chapter 8 Analyzing Data

In Map Explorer, right-click Current Query ➤ Define
-or- Right-click a query ➤ Edit
Task Pane
Define Query dialog boxDialog Box
Running a Drawing Query in Preview Mode
Preview mode provides a quick preview of the drawing objects the query will
display in the current drawing. You can run a query in Preview mode and
check the objects the query produces. If there are too few or too many objects,
or objects are displayed in the wrong location, revise the query as necessary.
NOTE You can plot the results of a Preview query. If you assigned colors to
different pen widths in your plotter setup, plotting the results of a Preview query
recognizes those plotter assignments for different pen widths.
Queries in Preview mode show objects on layers that are locked; however,
Preview mode does not show objects on layers that are Off or Frozen. Although
you see many elements in the current drawing following a Preview query,
AutoCAD Map 3D treats each set of objects as a single object from each
drawing. If you attempt to select several objects, AutoCAD Map 3D reports
“one object found” for each of the attached drawings queried. The display of
objects is temporary and disappears when you redraw or regenerate. You can
zoom and pan to examine the queried objects, but you cannot edit them.
NOTE You can set the Query option (page 245)Show Insertion Point Only to
display blocks as insertion points instead of entire objects for Preview queries.
When referencing blocks or images with the same name but with different
paths, a Preview query shows both blocks or images. In Draw mode, the
geometry or image displayed is based on the first definition processed.
See also:
■Overview of Queries (page 1235)
■Setting Query Options (DWG) (page 244)
■Altering the Properties of Queried Objects (page 1260)
■Saving a Query (page 177)
■Running a Drawing Query in Draw Mode (page 1290)
Finding and Querying Drawing Objects | 1289

To run a drawing query in Preview mode
1In Map Explorer (page 2068), under Current Drawing, right-click Current
Query, and then click Define.
2Define or load a query.
3Under Query Mode, select Preview.
4Click Execute Query.
To clear objects queried with Preview mode, use the REDRAW or REGEN
commands. You can also click Redraw in the Define Query Of Attached
Drawings dialog box.
Quick Reference
ADEQUERY
Controls defining, modifying, saving, loading, and executing a query
In the Classic workspace, click Setup menu ➤ More
DWG Options ➤ Define Query
Menu
Define Query
Icon
ADEQUERYCommand Line
In Map Explorer, right-click Current Query ➤ Define
-or- Right-click a query ➤ Edit
Task Pane
Define Query dialog boxDialog Box
Running a Drawing Query in Draw Mode
Draw mode retrieves drawing objects from attached drawings and copies them
into the current drawing. You can save the objects in your current drawing,
or you can edit the objects and save them back to the attached drawings. If
you decide to edit the queried objects and you have set object locking in
System Options, AutoCAD Map 3D locks the individual objects so other users
cannot edit them.
Queries in Draw mode retrieve objects from layers that are Off, Locked, or
Frozen. Whether the objects remain on layers that are Off, Locked, or Frozen
1290 | Chapter 8 Analyzing Data

when they are brought into the current drawing depends on the layers in the
current drawing: if the layers exist in the current drawing, the objects take on
the characteristics of the existing layers; if the layers do not exist, AutoCAD
Map 3D creates new layers with the characteristics of the attached drawing
layers.
AutoCAD Map 3D preserves the status of objects on locked layers when it
copies them into the current drawing. When you retrieve objects that are on
locked layers you cannot save changes back to the attached drawing. If you
want to save changes back, open the attached drawing and unlock the layer
before performing the query.
AutoCAD Map 3D does not place duplicate copies of objects in the current
drawing. Once an object is in the drawing, subsequent queries will not retrieve
that object again. See Sharing Attached Drawings (page 729)
NOTE In Draw mode, if text is queried into the current drawing and the font is
missing, AutoCAD Map 3D substitutes another font. The font used is set by the
FONTALT system variable.
NOTE When referencing blocks or images with the same name but with different
paths, the geometry or image displayed is based on the first definition processed.
A Preview query displays both blocks or images.
See also:
■Overview of Queries (page 1235)
■Altering the Properties of Queried Objects (page 1260)
■Saving a Query (page 177)
■Sharing Attached Drawings (page 729)
■Running a Drawing Query in Preview Mode (page 1289)
To run a drawing query in Draw mode
1In Map Explorer (page 2068), under Current Drawing, right-click Current
Query, and then click Define.
2Define or load a query.
3Under Query Mode, select Draw.
4Click Execute Query.
Finding and Querying Drawing Objects | 1291

AutoCAD Map 3D copies the queried objects from the attached drawings to
the current drawing.
AutoCAD Map 3D does not duplicate objects that have already been queried
into the current drawing.
Quick Reference
ADEQUERY
Controls defining, modifying, saving, loading, and executing a query
In the Classic workspace, click Setup menu ➤ More
DWG Options ➤ Define Query
Menu
Define Query
Icon
ADEQUERYCommand Line
In Map Explorer, right-click Current Query ➤ Define
-or- Right-click a query ➤ Edit
Task Pane
Define Query dialog boxDialog Box
Improving Drawing Query Performance
You can improve the performance of a drawing query by creating an index
or by removing an assigned coordinate system.
NOTE The following apply only to drawing data. There is no equivalent for
geospatial feature data.
To improve performance
■To create a drawing index (page 1294)
■To remove a drawing index (page 1294)
■To remove an assigned coordinate system (page 1296)
1292 | Chapter 8 Analyzing Data

Creating a Drawing Index
To reduce the amount of time it takes to perform a drawing query, create an
index. Instead of searching all location, property, object data, or database links
to find matching data, AutoCAD Map 3D searches only the relevant index.
NOTE Whenever you open a drawing that includes database links, AutoCAD Map
3D automatically creates a database link index and keeps it in memory. To save
this database index to the drawing, select the Store Links Index In Drawing File
option. To set this option, select AutoCAD Options from the Application menu.
Select the System tab. This feature is especially useful when you edit your attached
drawings directly.
You can create the following kinds of index:
■Location index — Divides drawings into regions. AutoCAD Map 3D targets
just the regions included in the Location query.
■Property index — Organizes object properties. AutoCAD Map 3D targets
only the objects with the properties you specify.
■SQLLinks index — Organizes the link templates and key fields of the
drawing. AutoCAD Map 3D targets only the objects with the link templates
and key field values you specify.
■EED index — Organizes Extended Entity Data (EED) attached to objects
in drawings created in AutoCAD Data Extension (ADE) 1.0. You cannot
create EED in the current release of AutoCAD Map 3D.
■Object Data index — Organizes object data. AutoCAD Map 3D targets only
the objects with the object data you specify. After you generate an object
data index, a status message appears beside each indexed field name. The
status "Current" means that the object data index on that field is valid and
consistent with the attached object data. The status "Out-of-Date" means
that the object data index on that field is not consistent with the attached
object data. An index could become out-of-date if you modify objects
without first loading AutoCAD Map 3D.
See also:
■Finding All Drawing Objects in a Specified Location (page 1238)
■Finding All Drawing Objects Containing a Specific Property (page 1242)
■Finding All Drawing Objects Containing Specific Data (page 1245)
Finding and Querying Drawing Objects | 1293

■Finding All Drawing Objects Containing Specific SQL Information (page
1249)
■Entering and Editing Object Data (page 1061)
To create a drawing index
1In Map Explorer (page 2068), right-click Drawings. Click Maintenance.
2In the Drawing Maintenance dialog box (page 1920), under Active Drawings,
select the drawings for which you want to create indexes.
If another user has activated the drawing, you cannot create an index for
it.
3Click Drawing Index.
If the selected drawing does not have an index or the index is out of date,
the check box beside the index type under Generate Index is selected.
4In the Drawing Statistics dialog box (page 1926), under Generate Index,
select the type of index to create.
To generate an object data index, click Object Data. Select the object data
table and fields. Click OK.
5Click OK.
6Click OK to confirm.
AutoCAD Map 3D creates the type of index you specified for each of the
selected drawings.
7Click Close.
NOTE When you create an index, you may receive a warning message that
AutoCAD Map 3D cannot calculate object extents. This indicates that a
third-party application might have created the object and that the application
is not loaded or the object may not support the geometric extents
methodology of AutoCAD Map 3D.
To remove a drawing index
1In Map Explorer (page 2068), right-click Drawings. Click Maintenance.
2In the Drawing Maintenance dialog box (page 1920), under Active Drawings,
select the drawings for which you want to remove indexes.
3Click Drawing Index.
1294 | Chapter 8 Analyzing Data
4In the Index Maintenance dialog box (page 1931), under Remove Index,
select the type of index to remove. To remove an object data index, click
Object Data.
5In the Remove Object Data Index dialog box (page 1933), select the object
data table and fields. Click OK.
6Click OK to confirm.
AutoCAD Map 3D removes the index you specified for each of the selected
drawings.
7Click Close.
Quick Reference
ADEDWGMAINT
Removes locks from objects
Setup menu ➤ More DWG Options ➤ Drawing
Maintenance
Menu
ADEDWGMAINTCommand Line
In Map Explorer, right-click Drawings ➤ Maintenance
Task Pane
Drawing Maintenance dialog boxDialog Box
Removing an Assigned Coordinate System
When you retrieve data from an attached drawing, the data is automatically
transformed if the attached drawing uses one coordinate system and the
current drawing uses a different system. When data is saved back to the
attached drawing, the data is automatically transformed to match the
coordinate system of the attached drawing.
Performing these transformations can decrease performance when querying
objects. To speed up querying, you can remove an assigned coordinate system.
See also:
■Assigning Coordinate Systems (page 142)
Finding and Querying Drawing Objects | 1295
To remove an assigned coordinate system
1In Map Explorer (page 2068), right-click Current Drawing, and then click
Coordinate System.
2In the Assign Global Coordinate System dialog box, under Current
Drawing or under Source Drawings, replace the code with a period (.) in
the Code box.
Quick Reference
ADESETCRDSYS
Assigns a global coordinate system code for the current drawing or attached
drawings
Setup menu ➤ Assign Global Coordinate System
Menu
Assign Coordinate System
Icon
ADESETCRDSYSCommand Line
In Map Explorer, right-click Current
Drawing ➤ Coordinate System
Task Pane
Assign Global Coordinate System dialog boxDialog Box
Troubleshooting Drawing Queries
Issues can arise when you retrieve blocks, text, externally referenced drawings
(xrefs), groups, and hatch patterns from drawings. The following information
helps you deal with these issues.
NOTE Query functionality applies to drawing objects only. For information about
filtering geospatial feature data, see Overview of Finding and Selecting Features
(page 1207).
Block Queries in Preview Mode
In Preview mode, you can display a queried block as a block or simply as an
"X" that signifies the block's insertion point. On the Query tab of the AutoCAD
Map Options dialog box under Options, select or deselect Show Preview Block
1296 | Chapter 8 Analyzing Data

As Point Only. To set this and other query options, see Setting Query Options
(page 245).
Block Attributes and Property Queries
When performing Property queries, you can query using block attributes, but
not constant attributes. You can define constant attributes that have the same
value for every occurrence of the block that contains them. However, Property
queries do not recognize constant attributes. Instead, use the block name in
the query.
You can, however, specify invisible attributes. An invisible attribute is not
displayed or plotted but is stored in the drawing file. For detailed information
on attributes, look up attributes in the index of the online help.
See also:
■Finding All Drawing Objects Containing Specific Data (page 1245)
Queries with Blocks of the Same Name
When queries reference blocks with the same name that lie in two different
attached drawings, a Draw query references the block definition first queried
into the current drawing; a Preview query references the block definition in
the attached drawing.
For example, if a Draw query retrieves a block named parcel1 (a rectangular
parcel) from drawing one, and then a block named parcel1 (a square parcel)
from drawing two, the current drawing displays the rectangular parcel. The
block definition for parcel1 is already in the current drawing. A Preview query
displays both the rectangular parcel and the square parcel. Preview queries
create temporary objects referenced from the attached drawings.
NOTE The same considerations apply when referencing raster images with the
same name but with different paths. A Preview query displays both images. A
Draw query, displays the image based on the first definition processed.
See also:
■Running a Drawing Query in Preview Mode (page 1289)
■Running a Drawing Query in Draw Mode (page 1290)
Finding and Querying Drawing Objects | 1297
Queries and Raster Images
Raster images attached to drawings using the IMAGEATTACH or MAPIINSERT
commands are objects that are part of the drawing. When queried, raster
images behave like blocks. Raster images resulting from a paste operation, that
is, an OLE frame, are not recognized as objects in queries.
When a raster image is queried during a Preview query that includes a
coordinate conversion or transformation, the image is not displayed.
When a raster image is queried during a Draw query that includes a coordinate
conversion or transformation, the object is transformed like a block insert,
around the insertion point.
See also:
■Running a Drawing Query in Preview Mode (page 1289)
■Running a Drawing Query in Draw Mode (page 1290)
Blocks and Property Alteration (Color)
When using Property Alteration to change the color of retrieved blocks, the
color of the components of the attached drawing block must be BYBLOCK.
Otherwise, no matter what color change you specify for the Property Alteration,
the block retains its original colors when queried.
See also:
■Overview of Altering the Properties of Queried Drawing Objects (page 1259)
■Changing the Color of Blocks (page 1284)
Blocks and Property Alteration (Scale)
To set the scale of all the blocks retrieved by the current query to a scale of 2,
use Property Alteration and set Scale to 2. This sets the scale of all queried
blocks to 2 no matter what their current scale is.
To scale all blocks retrieved by the current query by a factor of 2, use Property
Alteration and set Scale to (* .XSCALE 2). This multiplies the existing scale of
each queried block by a factor of 2. Make sure that you leave a space between
the * and .XSCALE 2.
See also:
■Overview of Altering the Properties of Queried Drawing Objects (page 1259)
1298 | Chapter 8 Analyzing Data

■Altering Properties Using Object Properties (page 1264)
Property Alteration (Scale and Rotate)
In the Property Alteration dialog box, the Scale option applies only to blocks,
the Rotate option applies only to text and blocks.
See also:
■Overview of Altering the Properties of Queried Drawing Objects (page 1259)
■Altering Properties Using Object Properties (page 1264)
Thickness, Width, and Property Queries
You can use a Property query to query on extruded polyline thickness using
the Thickness option in the Property Condition dialog box. You cannot query
on polyline width. AutoCAD Map 3D supports queries on Thickness for the
following kinds of objects: line, arc, text, circle, point, solid, 2D polyline, light
weight polyline, trace, and shape.
See also:
■Overview of Altering the Properties of Queried Drawing Objects (page 1259)
Querying Drawings with Xrefs
When you query attached drawings that contain xrefs, AutoCAD Map 3D does
not copy the objects in the xref drawing into the current drawing. Instead,
only the name of the xref drawing appears at the xref insertion point in the
current drawing. To query the xref drawing, attach the drawing separately.
NOTE Queries in Preview mode do not display the xref drawing name, but queries
in Draw mode do.
See also:
■Overview of Attaching Drawings (page 154)
■Running a Drawing Query in Preview Mode (page 1289)
■Running a Drawing Query in Draw Mode (page 1290)
Finding and Querying Drawing Objects | 1299
Retrieving Groups of Objects
When you retrieve a group of objects, AutoCAD Map 3D treats them as separate
and independent objects and then restores the group when you save the
objects back to the attached drawings, even if you edit the objects in the group.
However, if you create a new object in the current drawing, you cannot
associate it with the group to be saved back to the attached drawing.
See also:
■Saving Queried Objects Back to Attached Drawings (page 753)
Retrieving Hatched Areas
By default, AutoCAD Map 3D retrieves hatched areas, solid objects, and raster
images using the bounding box, not the insertion point. To change the default,
use the Reference Entire Bounding Area For Objects option on the AutoCAD
Map Options dialog box.
If you hatch objects that are formed by retrieving objects from multiple
attached drawings, the hatch associativity is lost when you save back.
Associative hatching is designed to work in a single drawing environment.
We recommend against querying, editing, and saving back associative hatches.
In most cases, hatch associativity is not maintained.
See also:
■Setting Query Options (DWG) (page 244)
To set options for drawing queries
■In the Tool-based Ribbon Workspace, click Map Setup tab ➤ Map
panel ➤ angle-arrow.
■Click the tab you want.
Quick Reference
ADEQUERY
Controls defining, modifying, saving, loading, and executing a query
1300 | Chapter 8 Analyzing Data
In the Classic workspace, click Setup menu ➤ More
DWG Options ➤ Define Query
Menu
Define Query
Icon
ADEQUERYCommand Line
In Map Explorer, right-click Current Query ➤ Define
-or- Right-click a query ➤ Edit
Task Pane
Define Query dialog boxDialog Box
Analyzing Feature Classes
Use buffers and overlays to analyze feature classes.
NOTE These topics apply only to geospatial feature data. For information about
using buffers and overlays for drawing objects, see Overlaying Two Topologies
(page 1336) and Buffering a Topology (page 1345).
To analyze feature classes
NOTE These procedures apply only to geospatial feature data. For information
about using buffers and overlays for drawing objects, see To overlay two topologies
(page 1339)and To buffer a topology (page 1347).
■To create a buffer (page 1308)
■To change your selection or merge options after receiving a buffer warning
(page 1309)
■To perform an Overlay operation (page 1316)
Quick Reference
MAPFDOBUFFERCREATE
Creates a buffer zone around features in your map
Click Analyze ➤ Buffer.
Menu
MAPFDOBUFFERCREATECommand Line
Analyzing Feature Classes | 1301

Create Buffer dialog boxDialog Box
MAPGISOVERLAY
Performs overlay analysis of feature classes
Click Analyze menu ➤ GIS Overlay.
Menu
Icon
MAPGISOVERLAYCommand Line
Overview of Analyzing Feature Classes
Use buffers and overlays to analyze feature classes.
NOTE This functionality applies only to geospatial feature data. For information
about using buffers and overlays for drawing objects, see Overlaying Two
Topologies (page 1336) and Buffering a Topology (page 1345).
Buffers identify areas at a specified distance from a geographic feature. Once
you specify a feature and generate a buffer around it, you can identify or select
features that fall inside or outside the boundary of the buffer.
1302 | Chapter 8 Analyzing Data
Use buffers to analyze features by proximity.
Overlays compare two feature classes or layers that are spatially related. Once
you select the feature classes to compare and the type of overlay to perform,
AutoCAD Map 3D creates a new layer and data store containing the results of
the comparison. You can connect to the comparison data store as you would
to any other data store.
Overview of Analyzing Feature Classes | 1303
Use overlays to compare two layers that are
related spatially.
Tell me more
Video
■Show me how to create a buffer zone
around a parcel.
■Show me how to use a buffer zone to
select parcels.
■Show me how to create overlapping
buffer zones.
1304 | Chapter 8 Analyzing Data
■Show me how to use a location query
with multiple buffers.
■Show me how to create an overlay ana-
lysis for features
Tutorial
■Lesson 3: Analyze Data by Proximity
Using Buffers
■Lesson 4: Perform a Flood Analysis with
Overlay
■Lesson 5: Edit a Predefined Workflow
Workflow
■Find and Select Features Within a Buf-
fer Zone
Procedures
■To create a buffer (page 1308)
■To perform an Overlay operation (page
1316)
GIS Skills
■Select features by location using a buffer.
■Create overlapping buffer zones around
points.
Related topics
■Buffering a Topology (page 1345)
To analyze feature classes
NOTE These procedures apply only to geospatial feature data. For information
about using buffers and overlays for drawing objects, see To overlay two topologies
(page 1339)and To buffer a topology (page 1347).
■To create a buffer (page 1308)
■To change your selection or merge options after receiving a buffer warning
(page 1309)
■To perform an Overlay operation (page 1316)
Overview of Analyzing Feature Classes | 1305

Quick Reference
MAPFDOBUFFERCREATE
Creates a buffer zone around features in your map
Click Analyze ➤ Buffer.
Menu
MAPFDOBUFFERCREATECommand Line
Create Buffer dialog boxDialog Box
MAPGISOVERLAY
Performs overlay analysis of feature classes
Click Analyze menu ➤ GIS Overlay.
Menu
Icon
MAPGISOVERLAYCommand Line
Buffering Features in Your Map
Use buffers to analyze features by proximity. Select a geospatial feature in your
map and specify the distance for the buffer. AutoCAD Map 3D creates a
polygon around the feature or features you have selected at the distance you
specify.
NOTE This functionality applies only to geospatial feature data. For information
about using buffers for drawing objects, see Buffering a Topology (page 1345).
You can output the buffer to a new layer in your map or append it to an
existing buffer layer. If you are buffering multiple features, you can specify
whether AutoCAD Map 3D should merge all the buffers into a single buffer,
merge only the overlapping buffers, or leave the buffers separate. AutoCAD
Map 3D saves buffer data in SDF format.
You can use buffers to select features within the specified buffer distance of
other features. For example, if you created a one-mile buffer around a
construction zone, you could use this buffer to find all parcels within one
mile of the construction area.
1306 | Chapter 8 Analyzing Data
Buffer Warnings
If you select a very large number of features to buffer, AutoCAD Map 3D will
display a warning and give you the option of reducing the number of features
in your selection. AutoCAD Map 3D will also display this warning if you have
selected features with very complex geometry, or if you have selected merge
options for too many features or features with complex geometry.
NOTE When creating buffers around objects with complicated geometries, such
as islands, the buffer might not display correctly. If you use the merge option to
merge the buffers for all the geometries of a feature, it will display correctly.
Tell me more
Video
■Show me how to create a buffer zone
around a parcel.
■Show me how to use a buffer zone to
select parcels.
■Show me how to create overlapping
buffer zones.
■Show me how to use a location query
with multiple buffers.
Tutorial
■Lesson 3: Analyze Data by Proximity
Using Buffers
Workflow
■Find and Select Features Within a Buf-
fer Zone
Procedures
■To create a buffer (page 1308)
GIS Skills
■Select features by location using a buffer.
■Create overlapping buffer zones around
points.
Related topics
■Buffering a Topology (page 1345)
Buffering Features in Your Map | 1307
To create a buffer
NOTE Thise procedure applies only to geospatial feature data. For information
about using buffers for drawing objects, see To buffer a topology (page 1347).
1Click Analyze tab ➤ Feature panel ➤ Feature Buffer.
2In the Create Buffer dialog box (page 1559), if you have not already selected
the feature or features to buffer, click Select Features to select the features
interactively on your map.
3To set the buffer distance, enter a value for Distance or click to enter
a distance interactively on your map. Use the measurement units specified
by the coordinate system assigned to your map, or choose a different unit
from the list.
NOTE If you change the units after you specify the distance, the Distance
entry updates to show that measurement in the new units.
4For Output To Layer, specify the Display Manager layer to contain the
buffer. If you created other buffers in this map, you can choose one of
their layers from the list. By default, AutoCAD Map 3D creates a new
layer for your buffer.
5Specify the name of the SDF file to store the buffered features. By default,
the buffer file is saved in the current drawing’s saved location.
6Select a Merge Results option:
■No Merging: Overlapping buffers are not merged. The number of
resulting buffers is equal to the number of features being buffered.
■Merge All Buffers: All overlapping buffers are merged into a single
buffer and then combined into a single polygon.
■Merge Overlapping Buffers: Only the overlapping buffers are merged.
7Click OK.
You can style the buffer as you would any other Display Manager layer.
All buffers you append to this buffer layer will use the same style. For
more information on styling features, see Styling Features (page 639).
1308 | Chapter 8 Analyzing Data

To change your selection or merge options after receiving a buffer warning
1In the Buffer Warning dialog box (page 1560), click Change.
Proceeding after receiving a buffer warning may take a very long time.
2In the Create Buffer dialog box (page 1559), do one or both of the following:
■Click Select Features, then click the features to buffer on your map.
■Select a new Merge Results option.
3Click OK.
Quick Reference
MAPFDOBUFFERCREATE
Creates a buffer zone around features in your map
Click Analyze ➤ Buffer.
Menu
MAPFDOBUFFERCREATECommand Line
Create Buffer dialog boxDialog Box
Overlaying Two Feature Sources
Use Overlay to compare two feature classes or layers that are spatially related.
One class or layer is designated the Source and one is designated the Overlay.
The Overlay operation produces an output layer that is also saved as a separate
SDF feature store. The contents and attributes of the new layer vary, depending
on the type of Overlay operation you perform.
NOTE This functionality applies only to geospatial feature data. For information
about using overlays for drawing objects, see Overlaying Two Topologies (page
1336).
You can overlay feature classes with up to a million features, depending on
the size and complexity of the features.
NOTE You can automate Overlay operations using Workflows. For more
information, see Setting Up and Running Workflows (page 274).
Overlaying Two Feature Sources | 1309
Tell me more
Video
■Show me how to create an overlay ana-
lysis for features
Tutorial
■Lesson 4: Perform a Flood Analysis with
Overlay
■Lesson 5: Edit a Predefined Workflow
Procedures
■To perform an Overlay operation (page
1316)
GIS Skills
■Create an overlay analysis for features.
Related topics
■Overlaying Two Topologies (page 1336)
Attributes in the Resulting Layer
Use the Split and Merge Rules dialog box (page 1669) to set attributes for layers
that are split as a result of an overlay operation. If you do not set these rules,
such features follow default rules. Merge rules do not apply. If you overlay
two feature sources that you used previously in a different map, you must
reset the rules for the new map.
In some cases, attributes from both the Source and Overlay are written to the
output. If this results in attributes that have the same name, each one will
have the original attribute name and a numeric suffix. For example, you can
overlay two layers called Cities and Parcels. If both have a Name attribute, the
resulting layer will have attributes called “Name_1” and “Name_2.”
Selecting Source and Overlay Geometries
The geometry in the feature classes or layers you select determines the other
choices in the dialog box. You can combine only certain types of geometries.
For example, Union and Symmetric Difference support polygon/polygon
comparisons only. Also, you cannot choose point geometries for both Source
and Overlay. If you select point geometry for Source, you can select only
polygon geometry for Overlay.
1310 | Chapter 8 Analyzing Data
The order of the geometries you select is important. To compare line and
polygon geometries, the line geometry must be the Source layer. If you select
a polygon geometry as the Source, line geometries are not available as the
Overlay.
The available choices for Type depend on the geometry in the Source and
Overlay. However, if the Source or Overlay is binding data, AutoCAD Map 3D
cannot determine the geometry types before it executes the operation. In that
case, all Type options are available, even if some of them are invalid. The
output might be empty if there are no valid geometry combinations.
If either the Source or the Overlay contains multiple geometries, you can select
any feature class or layer in Overlay and any overlay operation in Type.
However, the output might be empty if there are no valid geometry
combinations. Also, if the geometries include both polygons and lines, any
lines that intersect polygons will split those polygons, which may not be
desired.
Overlay Types
Overlay types include:
■Intersect (page 1311)
■Union (page 1312)
■Erase (page 1313)
■Identity (page 1313)
■Clip (page 1314)
■Paste (page 1315)
■Symmetric Difference (page 1315)
Intersect
Intersect determines the geometry that overlaps in the Source and Overlay
feature sources. Anything that does not overlap is discarded from the output,
so the resulting layer represents what the Source and Overlay have in common.
Use Intersect to find points or lines that lie within a polygon, or to determine
the places where two line features overlap. For example, find tree points that
are within park polygons.
The resulting layer has the attributes of both the Source and Overlay features.
Overlaying Two Feature Sources | 1311
Intersect supports the following geometry types:
■
Intersect: line/line
■
Intersect: line/polygon
■
Intersect: point/polygon
■
Intersect: polygon/polygon
Union
Union determines the geometry that exists in either the Source or Overlay
geometry. Where the geometry intersects, additional features are created. The
resulting layer is the sum of the two comparison layers. Use Union to combine
two related polygon features. For example, create a new feature source that
combines the business district and the theater district when these two areas
overlap.
The resulting layer has the attributes of both the Source and Overlay features.
Union supports polygon/polygon comparisons only.
Union: polygon/polygon
1312 | Chapter 8 Analyzing Data
Erase
Erase determines the geometry from the Source that does not intersect with
the Overlay. The intersecting pieces are discarded. Use Erase to subtract a
geometric section from a feature class. For example, find all roads that lie
outside the enterprise district, or all hospitals that are outside the flood zone.
The resulting layer has the attributes of the Source feature only.
Erase supports the following geometry types:
■
Erase: line/polygon
■
Erase: point/polygon
■
Erase: polygon/polygon
Identity
Identity creates new features where the Source and Overlay features intersect.
Use Identity to split features at the point where they intersect with another
feature class, and to create new features at that point. For example, divide
roads or parcels where they cross county borders.
Feature attributes from both the source and overlay are included in the
resulting features, but only the intersecting features will have the values from
both. If AutoCAD Map 3D splits an original feature to produce an output
feature, it uses the Split/Merge rules to determine how to assign the attributes.
When that occurs, attributes of the Overlay feature are appended to the
resulting features. Non-intersecting Source features retain their original
properties.
Overlaying Two Feature Sources | 1313
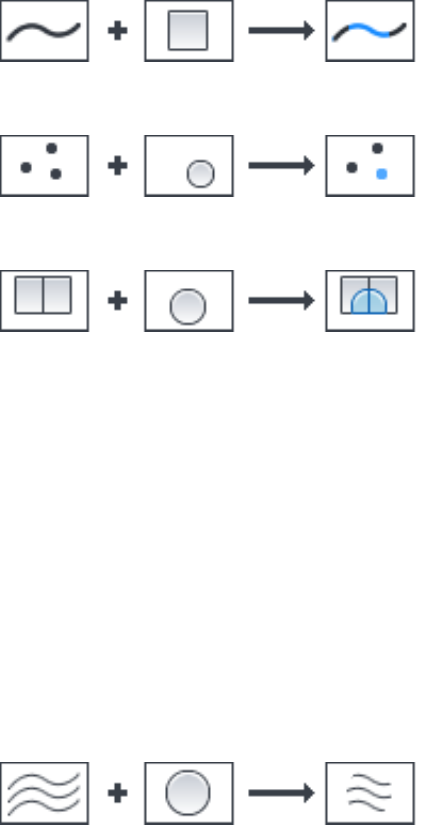
Identity supports the following geometry types:
■
Identity: line/polygon
■
Identity: point/polygon
■
Identity: polygon/polygon
Clip
Like Intersect, Clip creates features from the areas of the Source that overlap
with the Overlay.
Use Clip to find features that lie within a geometric area. For example, find
hydrants within a development, or road segments within a particular
neighborhood.
If AutoCAD Map 3D splits an original feature to produce an output feature,
it uses the Split/Merge rules to determine how to assign the attributes.
when you use Clip, only feature attributes from the Source are included in
the resulting layer.
Clip supports the following geometry types:
■
Clip: line/polygon
1314 | Chapter 8 Analyzing Data
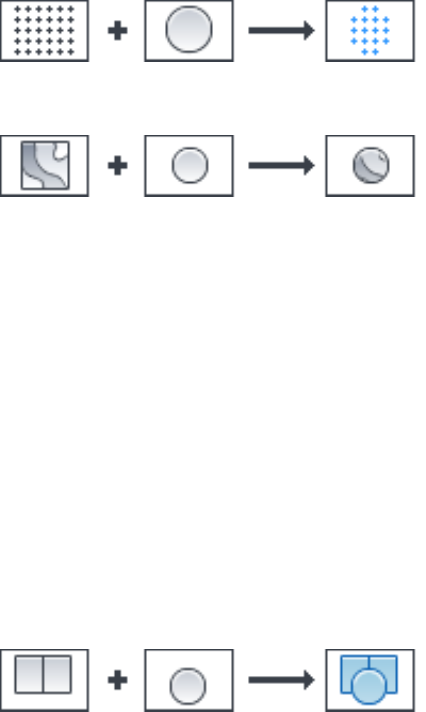
■
Clip: point/polygon
■
Clip: polygon/polygon
Paste
Paste creates new features by pasting the Overlay features onto the Source
features. All Overlay features become new features in the resulting layer. In
addition, areas of the Source that do not fall within the geometry of the
Overlay become features in the resulting layer. Use Paste to combine two
overlapping features. For example, add the attributes of city districts to the
developments they overlap.
The output layer has attributes from both the Source and Overlay. Features
resulting from the Source geometry have values for Source attributes, but their
Overlay attribute values are NULL. Features resulting from the Overlay
geometry have values for Overlay attributes, but their Source attribute values
are NULL.
Paste supports polygon/polygon comparisons only.
■
Paste: polygon/polygon
Symmetric Difference
Symmetric Difference determines geometry in the Source and Overlay that
does not overlap. Overlapping areas of the features are discarded in the output.
The non-overlapping areas become new features. Use Symmetric Difference
to find areas that are mutually exclusive in two feature classes. For example,
find new housing developments that are outside existing school districts.
Overlaying Two Feature Sources | 1315
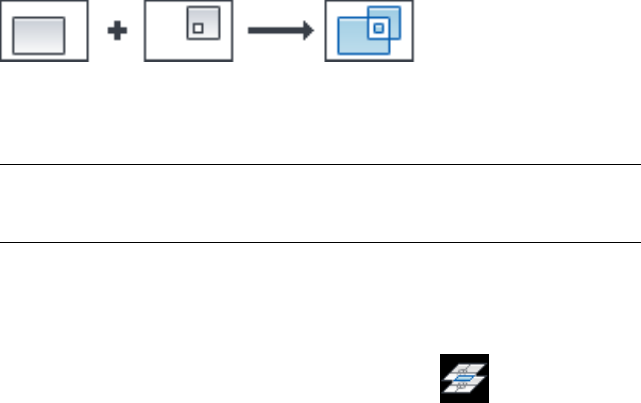
The output layer has attributes from both the Source and Overlay. Features
resulting from the Source geometry have values for Source attributes, but their
Overlay attribute values are NULL. Features resulting from the Overlay
geometry have values for Overlay attributes, but their Source attribute values
are NULL.
Symmetric Difference supports polygon/polygon comparisons only.
Symmetric difference: polygon/polygon
To perform an Overlay operation
NOTE This procedure applies only to geospatial feature data. For information
about using overlays for drawing objects, see To overlay two topologies (page
1339).
1Connect (page 308) to the features sources to compare.
To use a feature layer, you must add it to your map. To use a feature class,
you must connect to its data store, but you need not add it to the map.
2Analyze tab ➤ Feature panel ➤ Feature Overlay
3On the Overlay Analysis dialog box - Source and Overlay Type page (page
1563), specify the following:
■Source: Specify the feature layer or feature class to use as the source.
For information about considerations in selecting Source and Overlay
entries, see the Concept tab for this topic (page 1309).
■Overlay: Specify the feature layer or feature class to use as the overlay.
■Type: Select the type of overlay comparison to perform. For more
information on the available types, see the Concept tab for this topic
(page 1311).
4Click Next.
5On the Overlay Analysis dialog box - Set Output and Settings page (page
1565), specify the following:
■Output: Specify the name and location of the SDF file that will contain
the result of the Overlay operation.
1316 | Chapter 8 Analyzing Data

■Layer Name: Specify the name of the Display Manager layer that will
contain the result of the Overlay operation.
■Sliver Tolerance: Specify which slivers become separate features and
which are joined with a neighboring polygon. Set the units for the
tolerance setting, then set the maximum and minimum values.
To see recommended values, click Suggest. The default suggested
values for sliver tolerances are 1/10 of the smallest input area for the
Maximum and 1/100 of the smallest input area for the Minimum.
When the Overlay operation splits features to produce the output
layer, it eliminates polygons that are smaller than the specified
tolerance settings. Some such polygons were present in the sources,
and some are produced by the Overlay operation itself. The
elimination of slivers affects the output layers only.
Polygons whose areas are larger than the Maximum value become
separate features in the output layer.
Polygons whose areas are smaller than the Minimum (and have at
least one neighboring polygon) are considered slivers, and are merged
with the neighboring polygon that has the longest shared edge.
The Overlay operation checks polygons that fall between the two
values to see how wide they are. If they are very narrow, they are
merged with a neighboring polygon.
NOTE If the resulting polygons are not as desired, try adjusting the
tolerance values and repeating the Overlay operation.
To ignore slivers altogether, click Don’t Remove Slivers.
■Ordinate Tolerance: Specify how far apart two nodes or vertices of a
line or polygon must be to be treated as separate points in the output
layer. Set the units for the tolerance setting, then set the Length.
Any two points that are closer together than the Length value are
treated as a single point in the output layer.
■Output Properties: Specify which properties from the Source and (if
applicable) Overlay are included in the resulting layer.
“All” adds all properties to the resulting layer. “Identifiers” adds only
the primary identifiers (primary keys or unique fields, such as
Feature_ID). “Non-Identifiers” adds only the non-key attributes (such
as Land_Value or Speed_Limit, for example). If you add only
non-identifiers, the overlay operation generates primary identifiers
for the features in the resulting layer.
Overlaying Two Feature Sources | 1317

6Click Finish to perform the Overlay.
The Overlay operation creates a new layer representing the result of the
comparison. The new layer is displayed in the map and in Display
Manager. The same data is written to the SDF file you specified.
To see just the Overlay output, deselect the check boxes for the other
layers in Display Manager.
Quick Reference
MAPGISOVERLAY
Performs overlay analysis of feature classes
Click Analyze menu ➤ GIS Overlay.
Menu
Icon
MAPGISOVERLAYCommand Line
Analyzing Drawing Topologies
Topologies are defined by a set of drawing objects and their relationships.
(Features are not included in topologies.)
After you create a topology in a drawing, you can analyze it to get useful
information about the spatial relationships between drawing objects.
■Overview of Analyzing Drawing Topologies (page 1319)
■Performing a Shortest Path Trace (page 1324)
■Performing a Best Route Analysis (page 1328)
■Performing a Flood Trace (page 1333)
■Overlaying Two Topologies (page 1336)
■Dissolving a Composite Topology (page 1342)
■Buffering a Topology (page 1345)
■Querying a Topology (page 1348)
■Saving a Temporary Topology (page 1354)
Before you can use the topology analysis tools, you must create a topology
and make sure it is loaded.
1318 | Chapter 8 Analyzing Data

NOTE This functionality applies only to drawing objects. For information about
analyzing geospatial feature data, see Overview of Analyzing Feature Classes (page
1302).
See also:
■Creating Topologies (page 821)
■Loading or Unloading Topologies (page 906)
NOTE The following procedures apply only to drawing objects. For information
about analyzing geospatial feature data, see To analyze feature classes (page 1305).
To analyze drawing topologies
■To perform a shortest path trace (page 1326)
■To perform a best route analysis (page 1330)
■To perform a flood trace (page 1334)
■To overlay two topologies (page 1339)
■To dissolve a composite topology (page 1343)
■To buffer a topology (page 1347)
■To query a topology (page 1353)
■To convert a temporary topology to a permanent topology (page 1354)
Overview of Analyzing Drawing Topologies
After you have created a drawing topology, you can use it to analyze spatial
relationships between the drawing objects. You can:
■Extract or create new information about a set of objects
■Determine the distribution of an object, or objects, over a network or area
■Manage relationships between objects
■Analyze the location, proximity, and orientation of objects
■Evaluate suitability and capability, estimate, predict, and interpret
■Identify conditions at a geographic location, in a spatial area, or along a
linear network, and predict effects of future events on these items
Different topologies can contain information on different aspects of a map.
For example, a political map shows county lines or cities and towns. A
Overview of Analyzing Drawing Topologies | 1319

geological map shows soil types or contour lines. A social map might show
the locations of crimes or high-income areas.
Before you can analyze a topology, you must create the topology and make
sure it is loaded.
NOTE This functionality applies only to drawing objects. For information about
analyzing geospatial feature data, see Overview of Analyzing Feature Classes (page
1302).
Tell me more
Video
■Show me how to create a network topo-
logy.
■Show me how to load a topology.
■Show me how to find the shortest path
between two points.
■Show me how to do an overlay analysis
using two topologies.
Procedures
■To analyze drawing topologies (page
1319)
GIS Skills
■Create a network topology to show how
lines are connected.
■Find the shortest path through a net-
work.
■Find which lines are within a particular
polygon (overlay analysis).
Related topics
■Creating Topologies (page 821)
■Loading or Unloading Topologies
(page 906)
NOTE The following procedures apply only to drawing objects. For information
about analyzing geospatial feature data, see To analyze feature classes (page 1305).
1320 | Chapter 8 Analyzing Data

You can analyze drawing topologies in the following ways:
Use this method...To do this...
Perform a shortest path trace (page 1326)Calculate the shortest path between two
points in a drawing or determine the op-
timal route based on values of resistance
and direction.
Perform a best route analysis (page 1330)Calculate the best route from a starting
point in the drawing to one or more visit
points, and back to the starting point.
Perform a flood trace (page 1334)Determine how many links and nodes can
be traveled before the accumulated resist-
ance exceeds the specified maximum res-
istance.
Overlay two topologies (page 843)Compare two existing topologies and keep
only common geometry, remove common
geometry, or combine geometry in a spe-
cified way.
Dissolve a topology (page 1343)Create a new topology by combining
polygons that share the same data value
in a specified field.
Buffer a topology (page 1347)Identify objects within a specified offset of
elements in node, network, and polygon
topologies.
Query a topology (page 1353)Retrieve a loaded topology and its associ-
ated data from the current drawing or an
attached drawing, or query part of a topo-
logy in a source drawing and work on that
part of a topology without having to re-
trieve all its objects.
Save a temporary topology (page 1354)Save back the temporary information re-
trieved by a topology query to the draw-
ings from which it was queried.
Overview of Analyzing Drawing Topologies | 1321

Quick Reference
MAPANBUFFER
Creates a buffer around an existing topology
Click Analyze ➤ Buffer.
Menu
Buffer Topology
Icon
MAPANBUFFERCommand Line
In Map Explorer, right-click a
topology ➤ Analysis ➤ Buffer
Task Pane
Topology Buffer - Set Buffer Distance dialog boxDialog Box
MAPANDISSOLVE
Removes the boundaries between polygons in a topology or the nodes
between links that share a specific attribute
Click Analyze ➤ Dissolve.
Menu
Dissolve Topology
Icon
MAPANDISSOLVECommand Line
In Map Explorer, right-click a network or polygon
topology ➤ Analysis ➤ Dissolve
Task Pane
Topology Dissolve - Set Parameter dialog boxDialog Box
MAPANOVERLAY
Overlays one topology with another, and creates a new topology
Click Map ➤ Topology ➤ Overlay.
Menu
Overlay Topology
Icon
MAPANOVERLAYCommand Line
In Map Explorer, right-click a
topology ➤ Analysis ➤ Overlay
Task Pane
1322 | Chapter 8 Analyzing Data

Topology Overlay Analysis - Analysis Type dialog boxDialog Box
MAPANTOPONET
Traces through a network topology (shortest path, best route, or flood trace)
Click Map ➤ Topology ➤ Network Analysis.
Menu
Network Analyze
Icon
MAPANTOPONETCommand Line
In Map Explorer, right-click a network
topology ➤ Analysis ➤ Network Analysis
Task Pane
Network Topology Analysis - Select Method dialog
box
Dialog Box
MAPTOPOLOAD
Loads a topology
Click Analyze ➤ More Topology Options ➤ Load
Topology.
Menu
Load Topology
Icon
MAPTOPOLOADCommand Line
In Map Explorer, right-click a
topology ➤ Administration ➤ Load Topology
Task Pane
Topology Selection dialog boxDialog Box
MAPTOPOQUERY
Queries topologies
Click Setup ➤ More DWG Options ➤ Define Topology
Query.
Menu
Query Topology
Icon
MAPTOPOQUERYCommand Line
Overview of Analyzing Drawing Topologies | 1323
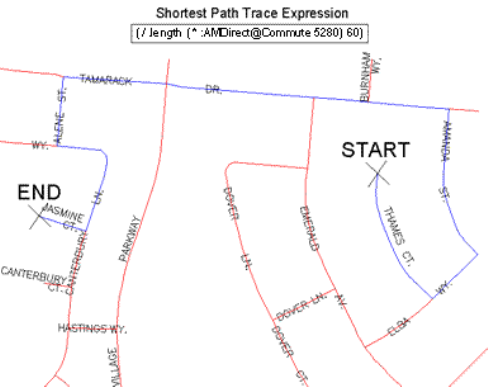
In Map Explorer, right-click a
topology ➤ Analysis ➤ Topology Query
Task Pane
Topology Query dialog boxDialog Box
Performing a Shortest Path Trace
Using a network topology, which is made up of drawing objects and their
relationship data, you can calculate the shortest path between two points in
a drawing or determine the optimal route based on values of resistance and
direction. This process is known as a shortest path trace analysis.
In a drawing of a street network, for example, you might find the shortest
path between a fire station and a school.
Shortest path trace based on resistance (time taken to traverse a segment).
You can specify a resistance for any link in the network. This resistance specifies
the difficulty in traversing the link. The default resistance is the length of the
link.
If a path has a total resistance lower than the Minimum Resistance value, the
path is ignored. Similarly, if a path has a total resistance greater than the
Maximum Resistance value, the path is ignored.
1324 | Chapter 8 Analyzing Data
Using SQL Data in Expressions
If you specify an expression that uses SQL data, the Link Template list includes
only link templates for the drawing where the topology is loaded:
■In the source drawing, if you loaded the topology from source drawings
■In the current drawing, if you loaded the topology from the current
drawing.
Travel Time in Network Topologies
To carry out network path trace analysis on a road network based on time
rather than distance, assign a speed or speed limit to each link using an object
data field or a field in a linked external database. You then set the Link Direct
Resistance property to an expression that uses this speed limit data, for
example:
(/ .length (* :speed@street_data 5280))
which divides the length of each link by the average speed per foot (where
5280 is the number of feet in a mile).
The resulting analysis shows the shortest route, in terms of time, not distance,
to get from the first point to the second.
Tell me more
Video
■Show me how to find the shortest path
between two points.
Procedures
■To perform a shortest path trace (page
1326)
GIS Skills
■Find the shortest path through a net-
work.
Related topics
■Creating Topologies (page 821)
■Specifying the Direction for a Link
(page 845)
■Specifying the Resistance for a Link or
Node (page 849)
Performing a Shortest Path Trace | 1325
■Expression Evaluator (page 1541)
■Expression dialog box (page 1807)
To perform a shortest path trace
1Verify that you have a network topology available and it is loaded. See
Creating Topologies (page 821) and To load a topology (page 907).
2In Map Explorer (page 2068), under Current Drawing, right-click a network
topology ➤ Analysis ➤ Network Analysis.
3In the Network Topology Analysis - Select Method dialog box (page 1983),
click Shortest Path. Click Next.
4In the Network Topology Analysis - Choose Locations dialog box, click
Start Point, and then click (Select Point) to select the starting point
in the map. Press Enter to return to the dialog box.
AutoCAD Map 3D uses the node closest to the location you clicked as
the start point. The coordinates of the point are shown in the list.
5Click End Point. To select the ending point, click (Select Point). Press
Enter to return to the dialog box.
AutoCAD Map 3D uses the node closest to the location you clicked as
the end point.
6Review the start and end points you have specified. The coordinates of
the points are shown in the list.
■To double-check the location of a point in the map, highlight the
coordinates in the list. Click Preview.
■To delete a point so that you can define a new one, highlight the
coordinates in the list. Click Delete.
7Click Next.
8In the Network Topology Analysis - Resistance and Direction dialog box,
select limits to put on the trace. For resistance and direction, you can
enter a constant or an expression that references an object data field or
1326 | Chapter 8 Analyzing Data

linked external database column. The expression will be evaluated for
each link. Click (Expression Evaluator) to select data from a list.
■Link Direction — Specify a direction for the trace. If you leave the
box blank, bi-directional (0) is used.
■Reverse — Select this option to use the reverse of the direction
indicated in the Link Direction box.
■Link Direct Resistance — Specify the resistance to travel in the
direction that a link was created. If you leave the box blank, the length
of the line (.LENGTH) is used.
■Link Reverse Resistance — Specify the resistance in the opposite
direction along a link. If you leave the box blank, the length of the
line (.LENGTH) is used.
■Node Resistance — Specify the resistance to cross the node, for
example, resistance for a valve in a pipe network, or a junction in a
road network. If you leave the box blank, zero (0) is used.
■Maximum Resistance and Minimum Resistance — Any path that has
a total resistance below the minimum or above the maximum is
ignored.
For example, if you stored the average speed limit for a link (in miles per
hour) in an object data table called street_data, you could find the fastest
route between two points by entering the expression (/ .length (*
:speed@street_data 5280) which divides the length of each link by the
average speed per foot (where 5280 is the number of feet in a mile).
9Click Next.
10 In the Network Topology Analysis - Output dialog box, indicate whether
or not to view the results of the trace onscreen and whether to save the
trace results as a new topology.
■To view your shortest path trace onscreen, select Highlight. Choose
a highlight color from the Color list.
You should use a highlight color that is different from the color of
the objects in your map.
■To save the shortest path trace as a new topology, select Create
Topology. Enter a name and description for the new topology. The
new topology will be created on the existing objects.
11 Click Finish to perform the shortest path trace.
Performing a Shortest Path Trace | 1327

Quick Reference
MAPANTOPONET
Traces through a network topology (shortest path, best route, or flood trace)
Click Map ➤ Topology ➤ Network Analysis.
Menu
Network Analyze
Icon
MAPANTOPONETCommand Line
In Map Explorer, right-click a network
topology ➤ Analysis ➤ Network Analysis
Task Pane
Network Topology Analysis - Select Method dialog
box
Dialog Box
Performing a Best Route Analysis
Using a network topology, which is made up of drawing objects and their
relationship data, you can calculate the best route from a starting point in the
drawing, to one or more visit points, and back to the starting point. AutoCAD
Map 3D determines the optimal route based on values of resistance and
direction. For example, in a street network, you can find the best route to
travel when visiting several customer sites from your hotel.
If a path has a total resistance lower than the Minimum Resistance value, the
path is ignored. Similarly, if a path has a total resistance greater than the
Maximum Resistance value, the path is ignored.
Using SQL Data in Expressions
If you specify an expression that uses SQL data, the Link Template list includes
only link templates defined in the drawing where the topology is loaded —
in the source drawing, if you loaded the topology from source drawings; in
the current drawing, if you loaded the topology from the current drawing.
Also, be sure that the appropriate data source is attached and connected in
the current drawing.
Travel Time in Network Topologies
To carry out a best route analysis on a road network based on time rather than
distance, assign a speed or speed limit to each link (page 849) using an object
1328 | Chapter 8 Analyzing Data
data field or a field in a linked external database. You then set the Link Direct
Resistance property to an expression that uses this speed limit data, for
example:
(/ .length (* :speed@street_data 5280))
which divides the length of each link by the average speed per foot (where
5280 is the number of feet in a mile).
The resulting analysis shows the best route, in terms of time, not distance.
Object Data Stored for a Best Route Topology
If you save the results of a best route analysis to a new topology, AutoCAD
Map 3D adds topology information, stored as object data, on each element
that makes up the best route topology. The object data table contains
information about the order of the links visited and the resistance used to
calculate the best route. The object data table added is like the one shown in
the following table.
Object Data FieldObject Data TableTopology Name
Path Link Visit OrderBR_SAMPLESAMPLE
Evaluated Link Forward Resistance
Evaluated Link Reverse Resistance
Evaluated Start Node Resistance
Evaluated End Node Resistance
Evaluated Link Direction
Displaying Visit Order Using Annotation
To display the order in which to visit points, you use AutoCAD Map 3D's
annotation feature to label the best route with the object data described above.
Editing a Best Route Topology
If you change the direction or resistance of an object in a best route topology,
the best route shown may no longer be the optimal route, and you should
recalculate the best route. For example, if you change the direction of a link
from bi-directional to forward or reverse, it may change the best route.
Performing a Best Route Analysis | 1329
NOTE The best route cannot be calculated if the network topology contains
negative resistance values or if all resistance values equal "0" (or use expressions
that evaluate to zero). In layman's terms, if all resistance values equal zero, every
possible route is as good as any other route, and there is no "best" route to travel.
See also:
■Specifying the Resistance for a Link or Node (page 849)
■Attaching Annotation to Objects (page 1103)
■Expression Evaluator (page 1541)
■Expression dialog box (page 1807)
■Renaming Topologies and Changing Their Descriptions (page 924)
■Deleting Topologies (page 925)
To perform a best route analysis
1Verify that you have a network topology available and it is loaded. See
Creating Topologies (page 821) and To load a topology (page 907).
2In Map Explorer (page 2068) under Current Drawing, right-click a network
topology ➤ Analysis ➤ Network Analysis.
3In the Network Topology Analysis - Select Method dialog box (page 1983),
click Best Route. Click Next.
4In the Network Topology Analysis - Choose Locations dialog box, click
Start Point. Click Select Point to select the starting point in the
drawing. Press Enter to return to the dialog box.
AutoCAD Map 3D uses the node closest to the location you clicked as
the start point. The coordinates of the point are shown in the list.
5Click Visit Point. Click (Select Point).
6In the drawing, click a point to visit during the best route analysis. It
does not matter which point you pick first, AutoCAD Map 3D calculates
the order in which to visit the sites as part of the calculation.
AutoCAD Map 3D uses the node closest to the location you clicked as
the visit point.
7Do one of the following:
■To accept the point and return to the dialog box, press Enter.
1330 | Chapter 8 Analyzing Data

■To discard the point and return to the dialog box, press Esc.
■To accept the point and specify another point, right-click in the
drawing. Click Next Point.
8In the dialog box, review the start points and visit points you have
specified.
■To double-check the location of a point in the map, highlight the
coordinates in the list. Click Preview.
■To delete a point so that you can define a new one, highlight the
coordinates in the list. Click Delete.
■To add another visit point, return to Step 5.
9Click Next.
10 In the Network Topology Analysis - Resistance and Direction dialog box,
select limits to put on the analysis. For resistance and direction, enter a
constant or an expression that references an object data field or linked
external database column. The expression will be evaluated for each link.
Click (Expression Evaluator) to select data from a list.
■Link Direction — Specifies a direction for the trace. If the box is blank,
bi-directional (0) is used.
■Reverse — Uses the reverse of the direction indicated in the Link
Direction box.
■Link Direct Resistance — Specifies the resistance to travel in the
direction that a link was created. If the box is blank, the length of the
line (.LENGTH) is used.
■Link Reverse Resistance — Specifies the resistance in the opposite
direction along a link. If the box is blank, the length of the line
(.LENGTH) is used.
■Node Resistance — Specifies the resistance to cross the node (for
example, resistance for a valve in a pipe network or a junction in a
road network). If the box is blank, zero (0) is used.
■Maximum Resistance and Minimum Resistance — Any path that has
a total resistance below the minimum or above the maximum is
ignored.
For example, if you stored the average speed limit for a link (in miles per
hour) in an object data table called street_data, you could find the fastest
Performing a Best Route Analysis | 1331

route between two points by entering the expression (/ .length (*
:speed@street_data 5280) which divides the length of each link by the
average speed per foot (where 5280 is the number of feet in a mile).
NOTE The best route cannot be calculated if the network topology contains
negative resistance values or if all resistance values equal "0" (or use
expressions that evaluate to zero). In layman's terms, if all resistance values
are all zero, every possible route is as good as any other route, and there is
no "best" route to travel.
11 Click Next.
12 In the Network Topology Analysis - Output dialog box, indicate whether
or not to view the results of the trace onscreen and whether to save the
trace results as a new topology.
■To view the best route analysis onscreen, select Highlight and choose
a highlight color.
Use a highlight color that is different from the color of the objects in
your map.
■To save the results of the best route analysis as a new topology, select
Create Topology and enter a name and description for the new
topology.
AutoCAD Map 3D adds topology information, stored as object data,
on each element that makes up the best route topology.
13 Click Finish to perform the best route analysis.
To display the order in which to visit points, use annotation to label the
best route with the object data stored on the best route topology objects.
For more information, see To insert annotation (page 1103).
Quick Reference
MAPANTOPONET
Traces through a network topology (shortest path, best route, or flood trace)
Click Map ➤ Topology ➤ Network Analysis.
Menu
Network Analyze
Icon
MAPANTOPONETCommand Line
1332 | Chapter 8 Analyzing Data

In Map Explorer, right-click a network
topology ➤ Analysis ➤ Network Analysis
Task Pane
Network Topology Analysis - Select Method dialog
box
Dialog Box
Performing a Flood Trace
An analysis that looks out from a point in all directions is called a network
flood trace. You can perform a flood trace on a network topology, which is
made up of drawing objects and their relationship data.
NOTE This functionality applies only to drawing objects. There is no equivalent
for geospatial feature data.
You specify the point where the network starts and the maximum distance
the network can traverse. The analysis determines how many links and nodes
can be traveled before the accumulated resistance exceeds the specified
maximum resistance. For example, you might want to find all restaurants
within a 10-minute walk of a hotel.
If you specify an expression that uses SQL data, the Link Template list includes
only link templates for the drawing where the topology is loaded:
■In the source drawing, if you loaded the topology from source drawings
■In the current drawing, if you loaded the topology from the current
drawing.
Using Flood Trace to Test Network Integrity
You can use flood trace analysis to check the integrity of a network topology.
If some links are not flooded, the topology is incomplete; you can use the
map editing tools to correct the geometry, and then recreate the topology.
Travel Time in Network Topologies
To carry out network flood trace analysis on a road network based on time
rather than distance, assign a speed or speed limit to each link (page 849) using
an object data field or a field in a linked external database. You then set the
Link Direct Resistance parameter to an AutoLISP expression that uses this
speed limit data.
For example, to determine a flood trace analysis based on a maximum travel
time, start a flood trace, select the start point for the analysis, enter the
Performing a Flood Trace | 1333
AutoLISP expression for the Link Direct Resistance, and specify the travel time
for Maximum Value. This analysis will show the streets that can be reached
from a start node within the specified period of time.
See also:
■Specifying the Direction for a Link (page 845)
■Specifying the Resistance for a Link or Node (page 849)
■Expression Evaluator (page 1541)
■Expression dialog box (page 1807)
NOTE This procedure applies only to drawing objects. There is no equivalent for
geospatial features.
To perform a flood trace
1Verify that you have a network topology available and it is loaded. See
Creating Topologies (page 821) and To load a topology (page 907).
2In Map Explorer (page 2068), under Current Drawing, right-click a network
topology ➤ Analysis ➤ Network Analysis.
3In the Network Topology Analysis - Select Method dialog box (page 1983),
click Flood Trace. Click Next.
4In the Network Topology Analysis - Choose Locations dialog box, click
Start Point. Click Select Point to select the starting point in the map.
Press Enter to return to the dialog box.
AutoCAD Map 3D uses the node closest to the location you clicked as
the start point. The coordinates of the point are shown in the list.
5Review the start point you have specified. The coordinates of the point
are shown in the list.
■To double-check the location of a point in the map, highlight the
coordinates in the list. Click Preview.
■To delete the point so that you can define a new one, highlight the
coordinates in the list. Click Delete.
6Click Next.
7In the Network Topology Analysis - Resistance and Direction dialog box,
select limits to put on the trace. For resistance and direction, you can
1334 | Chapter 8 Analyzing Data

enter a constant or an expression that references an object data field or
linked external database column. The expression will be evaluated for
each link. Click (Expression Evaluator) to select data from a list.
■Link Direction — Specify a direction for the trace. If you leave the
box blank, bi-directional (0) is used.
■Reverse — Select this option to use the reverse of the direction
indicated in the Link Direction box.
■Link Direct Resistance — Specify the resistance to travel in the
direction that a link was created. If you leave the box blank, the length
of the line (.LENGTH) is used.
■Link Reverse Resistance — Specify the resistance in the opposite
direction along a link. If you leave the box blank, the length of the
line (.LENGTH) is used.
■Node Resistance — Specify the resistance to cross the node, for
example, resistance for a valve in a pipe network, or a junction in a
road network. If you leave the box blank, zero (0) is used.
■Specify a maximum resistance for the trace. The analysis determines
how many links and nodes can be traveled before the accumulated
resistance exceeds the specified maximum resistance.
For example, to trace out to a maximum length of 5000, set the Link
Direct Resistance to .LENGTH and set the Maximum Resistance to 5000.
To trace out to the first node on each link, set the Link Direct Resistance
to 0, set the Node Resistance to 50 and set a Maximum Resistance of 45.
8Click Next.
9In the Network Topology Analysis - Output dialog box, indicate whether
to view the results of the trace onscreen and whether save the flood trace
results as a new topology.
■To view your flood trace onscreen, select Highlight. Select the highlight
color.
■To save the flood path trace as a new topology, select Create Topology.
Enter a name and description for the new topology. The new topology
is created on the existing objects.
10 Click Finish to perform the flood trace.
Performing a Flood Trace | 1335
Quick Reference
MAPANTOPONET
Traces through a network topology (shortest path, best route, or flood trace)
Click Map ➤ Topology ➤ Network Analysis.
Menu
Network Analyze
Icon
MAPANTOPONETCommand Line
In Map Explorer, right-click a network
topology ➤ Analysis ➤ Network Analysis
Task Pane
Network Topology Analysis - Select Method dialog
box
Dialog Box
Overlaying Two Topologies
A powerful form of analysis is possible when you overlay two or more
topologies. Topologies can be created only from drawing objects.
NOTE This functionality applies only to drawing objects. To use overlay analysis
on geospatial feature data, see Overlaying Two Feature Sources (page 1309).
There are three types of overlay analysis:
■Nodes with polygons
■Networks with polygons
■Polygons with polygons
To overlay topologies, both must be loaded into the current drawing.
Options for Overlaying Topologies
When you overlay two topologies, you choose the method in which the two
selected topologies interact. In some cases, the result varies according to which
topology is the source and which is the overlay.
1336 | Chapter 8 Analyzing Data
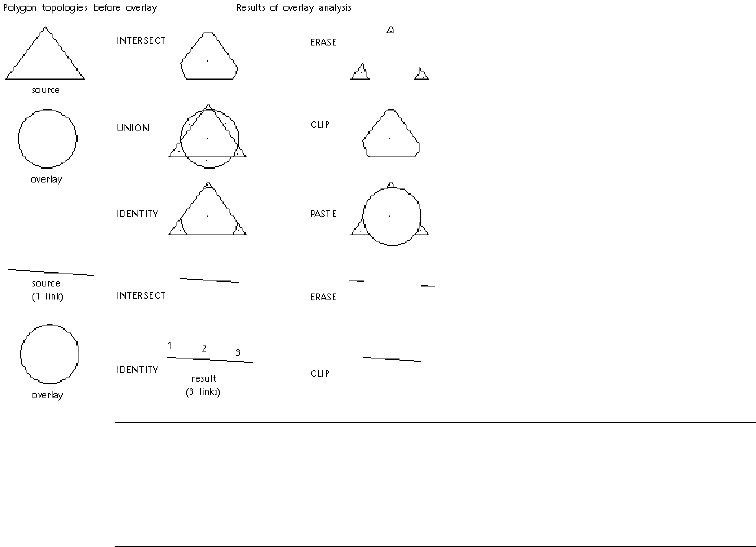
NOTE All the overlay analysis operators change arcs into a series of line segments;
for example, a complete circle consists of 32 segments. In the examples shown
above, the result topology is a tessellated (or jagged) circle after overlay analysis.
This may affect properties of the result topology, and gives different values, such
as area and perimeter.
Intersect
Intersect operations combine topologies and keep only the common geometry.
Intersect acts like the Boolean AND operation. The results are the same
whichever topology is chosen as the first or second. Object data is combined
for the two operations.
Here are some examples of using Intersect:
■Which parcels (polygons) fall within 100-year flood zones (polygons)?
Intersect shows only the flooded properties, not the whole property.
■Which crimes (nodes) fall within drug-free zones (polygons)?
■Which stream sections (networks) fall within the building area (polygons)
and need to be examined for potential negative environmental impact?
Overlaying Two Topologies | 1337
Union
Union operations combine polygons with polygons and keep all geometry.
Union acts like the Boolean OR operation and can be used only with polygons.
For example, you can combine parcels with soils information for property
assessment. Use Union to maintain both sets of geometry together and pull
them apart as needed.
Identity
Identity operations work like Union on the source topology and like Intersect
on the overlay topology. Use Identity to combine nodes, links, or polygons
with polygons and keep all the input geometry. Identity creates one topology
with one link where the link is crossed by the overlay topology.
When Identity is used with the question, Which parcels (polygons) fall within
100-year flood zones (polygons)?, all the properties in the flood zones are
shown intact.
Erase
Erase operations use the overlay polygon topology like a mask and erase
everything in the source polygon topology that is covered by the overlay
topology.
Clip
Clip operations use the overlay polygon topology as a boundary. The parts of
the source polygons outside the overlay polygons are clipped and discarded.
You can use this option to show polygons within a boundary polygon, such
as a city or state boundary.
Paste
Paste operations paste the overlay polygon topology on top of the source
polygons. The source polygons not covered by the overlay remain. The Paste
option can be used only with polygons.
Object Data in Overlay Analysis
You can copy selected object data and external database data from the source
and overlay topologies to a new object data table in the resulting topology.
You specify the name of the new object data table that will store the data in
the resulting topology. The object data table name should be a new name.
Data fields in the resulting topology look like this:
TOPONAME_FIELD
1338 | Chapter 8 Analyzing Data
In addition to any fields you select, overlay analysis creates these object data
fields in the resulting topology.
DataField Name
Polygon Identification NumberTOPOID
Object ID in source topology (TOPO-
NAME1 is name of Source)
TOPONAME1_ID
Object ID in overlay topology (TOPO-
NAME2 is name of Overlay)
TOPONAME2_ID
Percentage area of parent polygon in
source topology
TOPONAME1_PERCENTAREA
Percentage area of parent polygon in
overlay topology
TOPONAME2_PERCENTAREA
Tell me more
Video
■Show me how to do an overlay analysis
using two topologies.
Procedures
■To overlay two topologies (page 1339)
GIS Skills
■Find which lines are within a particular
polygon (overlay analysis).
Related topics
■Creating Topologies (page 821)
■Loading or Unloading Topologies
(page 906)
■Overview of Analyzing Drawing Topo-
logies (page 1319)
To overlay two topologies
1In Map Explorer (page 2068), under Current Drawing, right-click the source
topology ➤ Analysis ➤ Overlay.
Overlaying Two Topologies | 1339

2NOTE Most of the overlay analysis types work only with polygon topologies.
For more information about those that work with node or network topologies,
see the Concept tab for this topic (page 1336).
3In the Topology Overlay Analysis - Analysis Type dialog box (page 1999),
do the following:
■Select the type of overlay analysis to perform:
■Intersect — Only areas that appear in both the source and overlay
topologies are in the result topology.
■Union — Areas that appear in either the source or the overlay
topologies are in the result topology.
■Identity — The result topology includes areas that appear in the
source topology and areas in the overlay topology that are within
the source topology boundary.
■Erase — The result topology includes areas that appear in the source
topology except where it is covered by the overlay topology. The
area covered by the overlay polygons is erased from the source
polygon area.
■Clip — The result topology includes areas that appear in the source
topology except where they are outside the boundary of the overlay
topology. The source polygons are clipped to the outer boundary
of the overlay polygons.
■Paste — The overlay topology is "pasted" on the source topology.
The result topology includes the overlay topology and any areas
of the source topology that extend beyond the boundaries of the
overlay topology.
■Click Next.
4In the Select Overlay Topology dialog box, do the following:
■Select the polygon topology to use as the overlay topology.
■Click Next.
5In the Topology Overlay Analysis - New Topology dialog box, do the
following:
■Select Highlight to highlight the resulting topology onscreen. Select
the highlight color.
1340 | Chapter 8 Analyzing Data
■Enter a name and description for the new topology, and specify the
layer to place it on.
■Click Next.
6In the Topology Overlay Analysis - Output Attributes dialog box, do the
following to copy data to the result topology:
■For Source Attributes For New Topology, click (Expression
Evaluator) to select the data from the source topology that you want
to include in the resulting topology. You can include fields in an
object data table or columns in an external database.
■For Overlay Attributes For New Topology, click (Expression
Evaluator) to select the data from the overlay topology that you want
to include in the resulting topology.
■Enter a name and description for the object data table that will store
the data in the new topology.
Object data and external database records are attached to the centroids
of the result topology.
■Click Next.
7In the final dialog box, choose whether to create new nodes to complete
the resulting topology. If so, specify which a block to use:
■To use a point, leave the box blank or enter ACAD_POINT.
■To select from a list of block definitions, click the down arrow.
■To select a block saved as a DWG file, click Browse. Select the file to
use.
8For certain overlay operations, you also specify the block to use for
centroids.
9Click Finish.
Quick Reference
MAPANOVERLAY
Overlays one topology with another, and creates a new topology
Overlaying Two Topologies | 1341
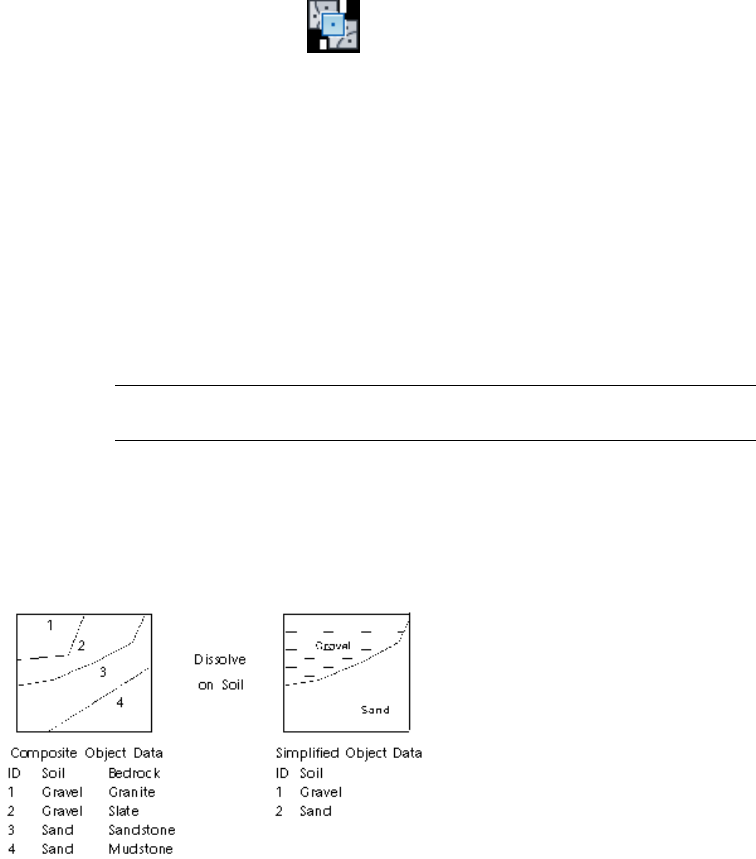
Click Map ➤ Topology ➤ Overlay.
Menu
Overlay Topology
Icon
MAPANOVERLAYCommand Line
In Map Explorer, right-click a
topology ➤ Analysis ➤ Overlay
Task Pane
Topology Overlay Analysis - Analysis Type dialog boxDialog Box
Dissolving a Composite Topology
If a topology contains many smaller polygons, you can create a new topology
by combining polygons that share the same data value in a specified field.
This field is called the dissolve field. The dissolve field can be an object data
field or a column in a linked external database.
NOTE This functionality applies only to drawing objects. There is no equivalent
for geospatial feature data.
Dissolving Polygons
When you dissolve a topology, AutoCAD Map 3D checks each boundary
between polygons to see if the dissolve field value is the same for both. If so,
the boundary and one of the centroids are removed. All object fields except
for the dissolve and any new topology fields are removed.
If adjacent polygons do not contain the dissolve field, the boundary is not
dissolved and the resulting polygon has a blank value for that field.
1342 | Chapter 8 Analyzing Data
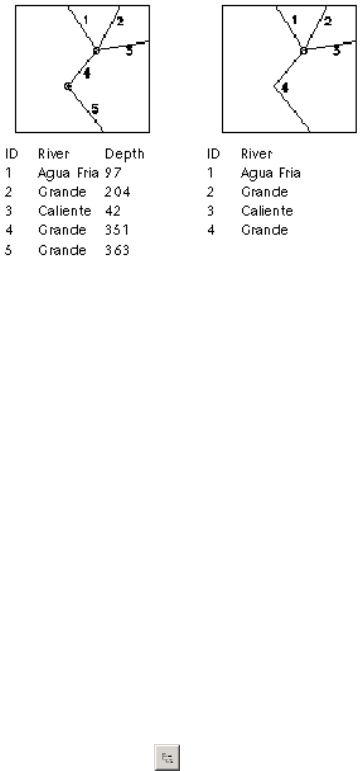
Dissolving Network Links
When you dissolve a network topology, AutoCAD Map 3D checks nodes
between lines to see whether two lines intersect at a specified node and whether
the dissolve field is the same. If so, the node is removed, and the two links
are joined to form one link. All object fields except for the dissolve and any
new topology fields are removed as shown in the following illustration.
If adjacent lines do not contain the dissolve field, the node is not dissolved
and the resulting polyline has a blank value for that field.
See also:
■Overview of Creating Topologies (page 822)
■To load a topology (page 907)
■Overview of Analyzing Drawing Topologies (page 1319)
To dissolve a composite topology
1In Map Explorer (page 2068), right-click the topology to dissolve ➤ Analysis
➤ Dissolve.
2Note that topologies must be loaded before you can work with them. See
To load a topology (page 907).
3In the Topology Dissolve - Set Parameter dialog box (page 1998), for Dissolve
By, specify the data element to use for the new topology. To select a field
from an object data table or a column from an external database, click
(Expression Evaluator).
Dissolving a Composite Topology | 1343
Any two adjacent polygons or connected lines that have the same value
for the specified field or column are combined into a single polygon or
line.
NOTE When dissolving a topology, AutoCAD Map 3D uses only data that
is attached or linked to the centroid of the polygon. It does not use data
attached to a polygon border.
4In the Topology Dissolve - New Topology dialog box, select Highlight to
highlight the resulting topology onscreen. Specify the highlight color.
5Enter a name and description for the new topology and specify the layer.
Click Next.
6In the Topology Dissolve - Output Attributes dialog box, do the following:
■Click (Expression Evaluator) to select the data to include in the
resulting topology. You can include fields in an object data table or
columns in an external database.
■Enter a name and description for the object data table that will store
the data in the new topology.
NOTE If you do not want to populate an Object Data Table with the
dissolve information, select the last (empty) item in the list. Selecting this
empty item will not copy data from the dissolve topology.
■Click Next.
7In the final dialog box, indicate whether to create new nodes to complete
the resulting topology. If so, specify which a block to use:
■To use a point, leave the box blank or enter ACAD_POINT.
■To select from a list of block definitions, click the down arrow.
■To select a block saved as a DWG file, click Browse. Select the file to
use.
If you are dissolving a polygon topology, you can also specify the block
to use for centroids.
8Click Finish to dissolve the topology.
1344 | Chapter 8 Analyzing Data
Quick Reference
MAPANDISSOLVE
Removes the boundaries between polygons in a topology or the nodes
between links that share a specific attribute
Click Analyze ➤ Dissolve.
Menu
Dissolve Topology
Icon
MAPANDISSOLVECommand Line
In Map Explorer, right-click a network or polygon
topology ➤ Analysis ➤ Dissolve
Task Pane
Topology Dissolve - Set Parameter dialog boxDialog Box
Buffering a Topology
A buffer analysis identifies objects within a specified offset of elements in
node, network, and polygon topologies. A buffer is a zone that is drawn around
a topology. For example, you might specify a buffer on either side of a river
to show the extent of a flood plain.
NOTE This functionality applies only to drawing objects. To perform buffer analysis
on geospatial feature data, see Buffering Features in Your Map (page 1306).
Buffering a Topology | 1345
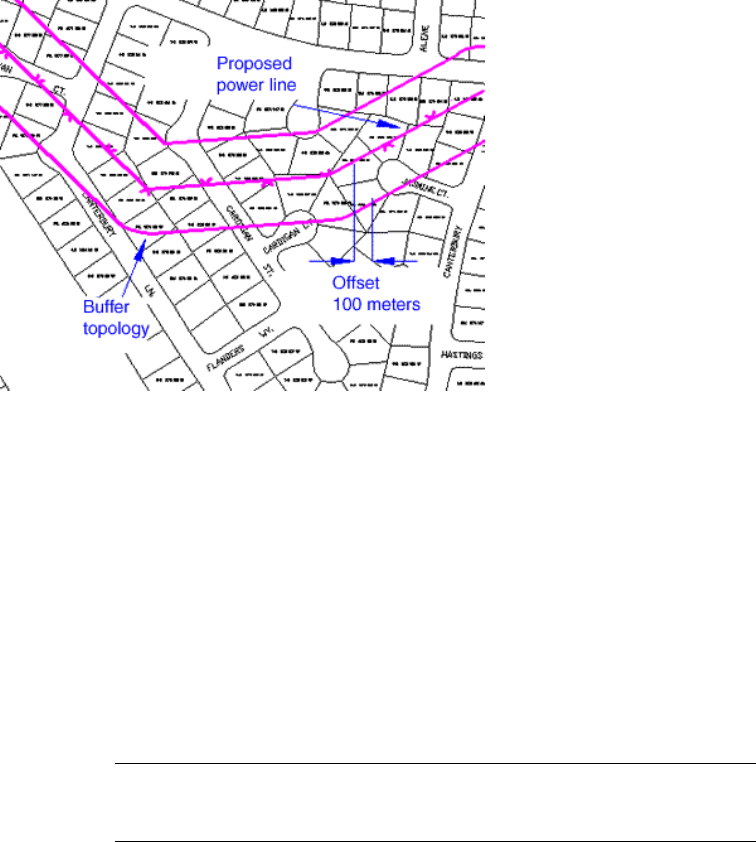
Use Buffer Analysis to show an area around an existing topology. In this case, the
buffer analysis of the power line network topology creates a new polygon topology.
For buffering, you create a new polygon topology from an existing node,
network, or polygon topology and specify a buffer offset.
The buffer offset can be:
■A positive or negative numeric value
■An expression
■A value specified by object data
■A value linked to an external database record
You can use negative offset values (page 1541) for polygon topologies only.
TIP You can improve the performance of buffering operations by increasing the
RAM to more than the recommended amount, or by increasing the virtual memory
on your system. This is recommended if you are buffering large topologies.
See also:
■Expression Evaluator (page 1541)
■Buffering Features in Your Map (page 1306)
1346 | Chapter 8 Analyzing Data
NOTE This procedure applies only to drawing objects. To perform buffer analysis
on geospatial feature data, see To create a buffer (page 1308).
To buffer a topology
1In Map Explorer (page 2068), under Current Drawing, right-click a topology
➤ Analysis ➤ Buffer.
2In the Topology Buffer - Set Buffer Distance dialog box (page 1992), enter
the buffer distance. Click Next. The buffer extends the specified distance
from the objects.
The buffer offset can be any of the following:
■Numeric value. To decrease the size of existing polygons, enter a
negative value.
■An expression that evaluates to a numeric value.
■A value in an object data table or a linked external database. Click
(Expression Evaluator) to select the table and field or the link
template and column from a list.
NOTE If you are creating a buffer around a polygon and want to use a
value in an object data table or an external database, the data must be
attached to the centroid of the polygon.
3In the Topology Buffer - New Topology dialog box, select Highlight to
highlight the resulting buffer topology onscreen. Specify a highlight color
that is different from the color of the objects.
4Enter a name and description for the new topology and specify the layer
to place it on. Click Next.
NOTE If you specify a locked layer, AutoCAD Map 3D can create the buffer
geometry but not the buffer topology.
5In the Topology Buffer - Create New Centroids and Nodes dialog box,
specify the blocks to use for centroids and node in the resulting buffer
topology.
■To use a point, select ACAD_POINT.
■To select from a list of block definitions, click the down arrow.
■To select a block saved as a DWG file, click Browse. Select the file.
Buffering a Topology | 1347
6Click Finish to create the buffer topology.
Quick Reference
MAPANBUFFER
Creates a buffer around an existing topology
Click Analyze ➤ Buffer.
Menu
Buffer Topology
Icon
MAPANBUFFERCommand Line
In Map Explorer, right-click a
topology ➤ Analysis ➤ Buffer
Task Pane
Topology Buffer - Set Buffer Distance dialog boxDialog Box
Querying a Topology
Use a topology query to retrieve a loaded topology and its associated data
from the current drawing or an attached drawing. You can also query part of
a topology in a source drawing and work on that part of a topology without
having to retrieve all the objects that make up a topology.
NOTE This functionality applies only to drawing objects. There is no equivalent
for geospatial feature data.
There are three differences between using standard queries and topology
queries:
■Topology queries work with only one topology; standard queries work
with all objects in the attached drawings.
■Because topology information is stored in object data, a Data condition
can be based on Area, Length, Perimeter, Direction, Direct Resistance, and
Reverse Resistance.
■Property alterations work differently with polygon topologies.
1348 | Chapter 8 Analyzing Data
Creating a Result Topology
When you use a topology query, you can hold the retrieved information in
the current drawing in three types of topology:
■None — No information is added to the geometry in the current drawing.
■Temporary — Information is retrieved and stored in memory as a topology
with a name preceded by an asterisk (*).
You cannot save back the temporary topology to the queried drawings.
However, you can save the temporary topology to make it permanent (page
1354), or you can retain the topology in the current drawing.
■Permanent — The query retrieves data and creates a topology in the current
drawing. You can save back this topology to the source drawings. The
topology name must not be preceded by an asterisk (*).
Location Queries
Location queries on network topology work in the same way as queries on
any other linear or point object.
Data Retrieved by Location QueryTopology
NodesNode
Links; also nodes if part of topologyNetwork
Polygons if links or centroid selected; also
links or nodes if part of polygon topology
Polygon
Polygons are handled as true areas, not just as boundaries. In the example
following, the polygon area crosses through the query boundary so the whole
polygon is retrieved, although none of the objects that make up the polygon
intersect any part of the query boundary.
Querying a Topology | 1349
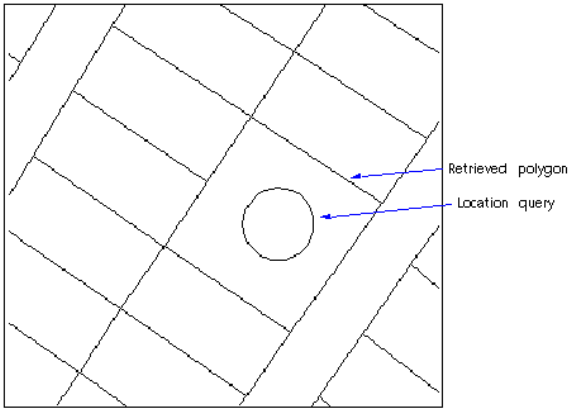
Point location queries also retrieve the polygon that includes the point.
Object Data Queries
Any topology object can be queried using object data, such as node, link, and
polygon identifiers; the "from" and "to" node information on links; the left
and right side information on links; polygons; and so on.
Topology queries can retrieve data such as areas, perimeters, numbers of links,
and more. For example, a query to retrieve objects with an area greater than
a specified value gives different results with the two query types:
■A query defined with a standard Define Query Of Attached Drawings
retrieves closed polylines with areas of the specified value.
■A Define Topology Query retrieves all polygons with areas of the specified
value, whatever the objects making up the polygon (lines, arcs, or open
polylines) are.
1350 | Chapter 8 Analyzing Data
Property Alteration with Topology Queries
When you define a property alteration for topology objects, only specific
elements of the topology are altered, as shown in the following table.
Modified ObjectsProperty Alteration
Nodes in node and network topologies Centroids in
polygon topology
Block Name
Nodes, links, and centroidsColor
Nodes, links, and centroidsElevation
Nodes in node and network topologies Centroids in
polygon topology
Height
Nodes, links, and centroidsLayer
Nodes, links, and centroidsLinetype
Nodes in node and network topologies. Centroids in
polygon topology
Rotation
Nodes, links, and centroidsScale
Nodes in node and network topologies Centroids in
polygon topology
Text Style
LinksWidth
Nodes in node and network topologies Centroids in
polygon topology (text appears at the centroid label
point)
Text Value
LinksThickness
Hatched polygonsHatch
Querying a Topology | 1351
Saving and Using Queries
If you plan to use a query more than once, you can save it with the current
drawing in the Query Library or to an external file, and edit the query or reuse
it. The following table shows the options available with topology queries.
CommandProcedureDescription
ADEQUERYIn the Define Query Of Attached Drawings
dialog box, click Save. See Saving Queries
(page 177).
Save a query
ADERUNQUERY
Create tab ➤ Object Query panel ➤ Run
See Running a Saved Query (page
178).
Run Query (internal)
ADERUNXQUERY
Create tab ➤ Object Query panel ➤ Extern-
al
Run External Query
ADEQUERYLIB
Create tab ➤ Object Query panel ➤ Library
See Setting Up a Query Library
(page 173).
Use the Query Lib-
rary
Report Mode
In addition to the dot variables available using the standard Define Query Of
Attached Drawings command, Define Topology Query has two extra dot
variables.
■.TOPONAME — Contains the topology name.
■.TOPOTYPE — Contains the topology type: NODE, NETWORK, or
POLYGON.
Three of the dot variables give different results in topology queries.
■.DRAWING — The drawing name that is the source of the geometry object
in the topology.
■.AREA — The value of the AREA object data field for each polygon.
1352 | Chapter 8 Analyzing Data
■.PERIMETER — The value of the PERIMETER object data field for each
polygon.
The Process Sub-Objects option in the Output Report Options dialog box
specifies the objects in a report.
Reported Data
Do not Process Sub-ObjectsProcess Sub-ObjectsTopology Type
NodesNodes, objects, and object dataNode
LinksLinks, start and end node dataNetwork
CentroidsCentroids, links, and nodesPolygon
To query a topology
1In Map Explorer (page 2068), under Current Drawing, right-click a topology
➤ Analysis ➤ Topology Query.
2In the Topology Query dialog box (page 2008), select the topology to query.
If the topology is not on the list, click Load and select the topology to
use.
3Under Result Topology, specify how to save the results of the query:
■None — Objects are retrieved into the current drawing, but no
topology data is created.
■Temporary — Objects are retrieved into the current drawing, and the
topology data is loaded into memory. This data is not saved to the
objects.
■Permanent — Objects are retrieved into the current drawing, and a
new topology is created.
If you create a temporary or permanent topology, specify a name and
description for the topology.
4To load an existing query, click Load Query and select the query.
To define a new query, click Define Query Of Attached Drawings and
define the conditions for the query.
To close the dialog box, but have AutoCAD Map 3D remember your
selections, click OK.
Querying a Topology | 1353
5When you click Define Query, the Define Query Of Attached Drawings
dialog box opens. Its operation and options are the same for topology
and AutoCAD Map 3D queries, except for some options you have in the
Property option in the Query Type area. For more information, see
Overview of Queries (page 1235).
Quick Reference
MAPTOPOQUERY
Queries topologies
Click Setup ➤ More DWG Options ➤ Define Topology
Query.
Menu
Query Topology
Icon
MAPTOPOQUERYCommand Line
In Map Explorer, right-click a
topology ➤ Analysis ➤ Topology Query
Task Pane
Topology Query dialog boxDialog Box
Saving a Temporary Topology
When you use a topology query, you can store the retrieved information in
a temporary topology. The topology name is preceded by an asterisk (*). To
save back the temporary topology to the queried drawings, first convert the
temporary topology to a permanent topology.
NOTE This functionality applies only to drawing objects. There is no equivalent
for geospatial feature data.
See also:
■Querying a Topology (page 1348)
To convert a temporary topology to a permanent topology
1In Map Explorer (page 2068), under Current Drawing, right-click the
temporary topology you want to convert ➤ Administration ➤ Rename.
1354 | Chapter 8 Analyzing Data
A temporary topology has a name preceded by an asterisk (*).
2In the Rename Topology dialog box (page 1988), enter a new name for the
topology.
To create a permanent topology, do not start the topology name with an
asterisk (*). Also note that topology names can contain letters, numbers,
and the underscore, hyphen, and dollar characters. Names cannot include
spaces.
3Optionally, enter a new description for the topology.
4Click OK to rename the topology, making it a permanent topology.
Quick Reference
MAPTOPOREN
Changes the name and description of a topology
Click Map ➤ Topology ➤ Administration ➤ Rename.
Menu
MAPTOPORENCommand Line
In Map Explorer, right-click a
topology ➤ Administration ➤ Rename
Task Pane
Rename Topology dialog boxDialog Box
Saving a Temporary Topology | 1355
1356
Publishing and Sharing
Maps
Overview of Publishing and Sharing
There are many ways to output and share map data. Use the following table to
determine which option to use for moving your data from one format to another:
Use this option...To this format...To move this
data...
In the Tool-based Ribbon Workspace,
click Output tab ➤ Plot panel ➤ Plot.
See Publishing a Map to a Plotter (page
1363) and Publishing Maps (page 1360)
Printer, plotter, or fileEntire map
See Publishing Map Books (page 1381)Map book (divides your map into a grid
of tiles and renders each tile on a separ-
Entire map
ate page, which can be published to a
plotter or a file)
In the Tool-based Ribbon Workspace,
click Output tab ➤ Map Data Transfer
panel ➤ Current Map As DWG.
See Exporting Maps to DWG Format
(page 1459)
DWG formatEntire map
Click ➤ Publish.
DWF (Design Web Format) to display in
Autodesk Design Review
Entire map
9
1357
Use this option...To this format...To move this
data...
See Publishing to DWF (page 1364)
In the Tool-based Ribbon Workspace,
click Output tab ➤ Export To DWF/PDF
panel ➤ Export ➤ PDF.
PDF fileEntire map
See Publishing to PDF (page 1373)
At the Command prompt, enter pub-
lishtoweb. See Publishing to a Web Page
(page 1373)
Web pageEntire map
Click ➤ Publish ➤ Publish To
MapGuide.
Autodesk MapGuide EnterpriseEntire map
See Publishing to MapGuide (page 1376)
In the Tool-based Ribbon Workspace,
click Output tab ➤ Map Data Transfer
panel ➤ As SDF2.
Autodesk MapGuide version 6.5 or
earlier
Entire map
Click ➤ Send ➤ eTransmit.
A transmittal packageEntire map and all its
dependent files (for
example, Xrefs) See Using eTransmit (page 1376)
In the Tool-based Ribbon Workspace,
click Output tab ➤ Map Data Transfer
panel ➤ Map 3D Export.
See Overview of Converting and Export-
ing (page 1405)
Autodesk SDF (Spatial Data File)
ESRI Arc/INFO Coverages
ESRI Shapefile
GML (Geographic Markup Language)
MapInfo MIF/MID
MapInfo TAB
MicroStation DGN
Drawing data
Shape Multiclass
VML (Vector Markup Language)
In the Tool-based Ribbon Workspace,
click Output tab ➤ Map Data Transfer
panel ➤ To FDO Connection.
Oracle
ESRI ArcSDE
Drawing data
See Exporting DWG Data to an FDO
Data Store (page 1461)
1358 | Chapter 9 Publishing and Sharing Maps
Use this option...To this format...To move this
data...
In the Tool-based Ribbon Workspace,
click Output tab ➤ Map Data Transfer
panel ➤ As Image.
Image formatsDrawing data
See Exporting DWG Data to an Image
Format (page 1465)
Click ➤ Save As ➤ Other
Formats
See Saving Drawing Objects to a DXF
File (page 1458)
DXFDrawing data
In Display Manager, right-click the layer
and choose Export Layer Data to SDF or
Save Layer.
See Saving or Exporting a Display Man-
ager Layer (page 1469)
Autodesk SDF (Spatial Data File)Geospatial data
In Map Explorer, click Tools ➤ Bulk
Copy
See Migrating Data (page 615)
Another geospatial formatGeospatial data
In the Data Table, choose Options ➤
Export.
See Exporting from the Data Table (page
1473)
A printer or a comma-separated fileData attached to
geospatial objects
At the Command prompt, enter ad-
equery.
See Creating a Drawing Object Report
(DWG) (page 1477)
A printer or a comma-separated fileData attached to
drawing objects
In the Data View, click File menu ➤
Print.
See (page 1474)
A printer or a comma-separated fileExternal data linked
to objects
See Publishing and Printing Metadata
(page 1514) and Sharing Metadata (page
1510)
A printer or a comma-separated fileMetadata
Overview of Publishing and Sharing | 1359
You can also use the following options to share map data:
■Export data to a GIS format and back into DWG format (page 1465).
■Convert Display Manager styles to object properties (page 1459). This allows
you to share styled maps with users who do not have Display Manager (for
example, users of AutoCAD or a previous version of AutoCAD Map 3D).
Publishing Maps
When you publish a map or map book (page 2067), AutoCAD Map 3D plots it
and sends it to an output format. For example, if you publish your map to a
plotter, you print a copy of the map. If you publish it to DWF, you create a
file containing the plotted map or map book.
Overview of Publishing Maps
You can publish a map to the following output formats:
■Plotters
■DWF (Design Web Format)
■PDF
■A web page
■A packaged format that includes all dependent files (eTransmit)
■MapGuide
■Map books
Tell me more
Video
■Show me how to publish a map to a
MapGuide server.
■Show me how to create a map book.
■Show me how to publish a map book
with attributes to a DWF file.
1360 | Chapter 9 Publishing and Sharing Maps
Procedures
■To publish your map (page 1361)
Tutorials
■Lesson 7: Publish Your Map
Workflow
■Print and Publish Data
GIS Skills
■Publish a completed map to a MapGuide
server.
■Create a map book with appropriate-
scale tiling for a city.
■Produce a multi-sheet DWF file for a map
book.
Related topics
■Overview of Publishing and Sharing
(page 1357)
■Overview of Converting and Exporting
(page 1405)
■Overview of Exporting Attribute Data
(page 1472)
Use the following methods to publish your map.
Use this methodTo publish to this format...
In the Tool-based Ribbon Workspace, click
Output tab ➤ Plot panel ➤ Plot
See Publishing a Map to a Plotter (page
1363).
Plotter
Click ➤ Publish.
DWF (Design Web Format)
See Publishing to DWF (page 1364).
In the Tool-based Ribbon Workspace, click
Output tab ➤ Export To DWF/PDF panel
➤ Export ➤ PDF.
PDF
Overview of Publishing Maps | 1361
Use this methodTo publish to this format...
See Publish a Sheet Set in the AutoCAD
Help.
At the Command prompt, enter pub-
lishtoweb.
A Web page
See Publishing to a Web Page (page 1373).
Click ➤ Send ➤ eTransmit.
See Package a Set of Files for Internet
Transmission in the online Help.
eTransmit
Click ➤ Publish ➤ Publish To
MapGuide.
See Publishing to MapGuide (page 1376).
Autodesk MapGuide Enterprise
In the Tool-based Ribbon Workspace, click
Output tab ➤ Map Data Transfer panel
➤ As SDF2.
Autodesk MapGuide version 6.5 or
earlier
See Publishing Map Books (page 1381).Map Books
Adding a Reference Grid to a Map
You can add a reference system to your map in paper space. Reference systems
include reference grids and graticules. A reference grid is a grid that overlays
a map. A graticule (page 2065) is a network of geographic lines, such as latitude
and longitude lines.
In AutoCAD Map 3D 2011, you can create a Military Grid Reference System
(MGRS) (page 2069) grid. You can define the lettering scheme, scale, and precision
of the grid. When you plot your map, the reference grid will be printed over
it.
When creating a reference grid, AutoCAD Map 3D will draw grid lines at the
precision level, and tick marks at the next level. For example, a 1000 meter
grid will have tick marks at every 100 meters.
1362 | Chapter 9 Publishing and Sharing Maps

To add a reference system to a map
1Switch to the layout tab.
2On the Layout Tools tab, click .
3Select the viewport for the reference system. The Create Reference System
Dialog Box (page 1602) appears.
NOTE You must select a non-rotated, rectangular viewport.
4In the Create Reference System dialog box, specify the following:
■Reference System: select a lettering scheme for your reference grid.
Use MGRS-AA (MGRS-New) with the WSG84 datum. Use MGRS-AL
(MGRS-Old) with older datums.
■Scale: select the view scale for the reference grid.
■Precision: select the precision of the grid lines. AutoCAD Map 3D will
draw grid lines at the precision level, and tick marks at the next level.
For example, a 1000 meter grid will have tick marks at every 100
meters.
5Click OK.
Quick Reference
MAPLAYOUTREFERENCESYSTEM
Creates a reference system for a selected viewport on the layout tab of your
map.
MAPLAYOUTREFERENCESYSTEMCommand Line
Create Reference System Dialog BoxDialog Box
Publishing a Map to a Plotter
You can publish to a plotter for a printed copy. The steps for publishing to a
plotter are slightly different for a map and for a map book (page 1401), but you
set plotting options the same way for both.
Publishing a Map to a Plotter | 1363

See also:
■Overview of Map Books (page 1381)
To publish to a plotter
1Save the map.
2In the Tool-based Ribbon Workspace, click Output tab ➤ Plot panel ➤ Plot
3Choose a printer or plotter and set any options needed.
For information, type “To plot a drawing” in the Search tab of the help.
4Click OK.
Quick Reference
PLOT
Plots a drawing to a plotter, printer, or file.
Click File menu ➤ Plot.
Menu
Plot a drawing.
Icon
PLOTCommand Line
Plot Dialog BoxDialog Box
Publishing to DWF
DWF (Design Web Format™) is an open, secure file format developed by
Autodesk for sharing engineering design data. DWF files are highly compressed,
so they are small and fast to transmit and view.
■To publish a map to DWF (page 1365)
■To publish attribute data to DWF (page 1367)
■To prepare a map for publishing to DWF (page 1369)
■To publish a map to DWF (page 1372)
1364 | Chapter 9 Publishing and Sharing Maps
Overview of Publishing to DWF
DWF (Design Web Format™) is an open, secure file format developed by
Autodesk for sharing engineering design data. DWF files are highly compressed,
so they are small and fast to transmit and view.
DWF files are useful for the following:
■Publishing complex maps that use a variety of feature sources to a compact
file that can be used in the field. All information from the original map,
including stylization, is represented.
■Sharing maps with people who do not have a copy of AutoCAD Map 3D.
These people can download the free viewer to see the maps.
All layers and styles are published, with no loss of information. If you have
joined data (page 507) to layers in your map, the joined data is published. You
can include graphical elements, including any draped raster files. You can
include attribute data.
If your map has a coordinate system assigned to it, AutoCAD Map 3D includes
that coordinate system for each sheet in the published DWF file.
See also:
■Joining Data to GIS Features (page 507)
■Publishing Attribute Data to DWF (page 1366)
■Preparing a Map for Publishing to DWF (page 1368)
■Publishing Map Books to DWF (page 1400)
To publish a map to DWF
1Specify attribute data to include with the published DWF. (page 1367)
2Prepare a map for DWF publishing and set publishing options (page 1369).
3Publish the map to DWF. (page 1372)
You can also do the following:
■Publish a map book to DWF (page 1400)
Publishing to DWF | 1365

Publishing Attribute Data to DWF
Before publishing maps to DWF™, you can specify which data to include from
the following categories:
DescriptionDWF Publishing Option
Data attached to drawing objectsobject data (page 198)
Information about drawing objects that have been
assigned to classes
classification data (page 117)
Spatial data objectsGIS feature sources (page 305)
Data from records that have been joined to the data
for spatial data objects
joins (page 507)
Data from records or fields that have been linked to
drawing objects
linked records (page 522) from
an external database
Table type, table name, record ID, and the delimiter.
This is useful if your viewer does o't automatically
display this information.
data table information (page
200)
For each category of data, you can choose the individual items to include
when you publish.
NOTE If your map has a coordinate system assigned to it, AutoCAD Map 3D
includes that coordinate system for each sheet in the published DWF file, using
the property name "Coordinate System." You cannot choose this as a DWF
Publishing Option, and you cannot change the property name. If you turn off all
publishing options (by clearing the Publish Map Information box), the coordinate
system is not included in the publish operation.
Tell me more
Video
■Show me how to publish a map book
with attributes to a DWF file.
Procedures
■To publish attribute data to DWF (page
1367)
1366 | Chapter 9 Publishing and Sharing Maps
Tutorials
■Lesson 7: Publish Your Map
Workflow
■Publish to a Georeferenced DWF
GIS Skills
■Produce a multi-sheet DWF file for a map
book.
Related topics
■Overview of Publishing and Sharing
(page 1357)
■Overview of Object Classification (page
981)
■Overview of Object Data (page 1047)
■Preparing a Map for Publishing to DWF
(page 1368)
■Publishing a Map to DWF (page 1371)
To publish attribute data to DWF
1In the Tool-based Ribbon Workspace, click Output tab ➤ Export To
DWF/PDF panel ➤ Export To DWF/PDF Options (MAPDWFOPTIONS).
2In the Map Information dialog box (page 1832), check Publish Map
Information.
3Select the properties to include in the DWF.
■To see specific properties, expand any categories that display a plus
sign.
■Check an item with subitems to select all its subitems.
To save these properties for future use, click the file icon and specify the
name and location of the file for the exported properties. You can reload
these settings again later by clicking the folder icon.
4Click OK.
Publishing to DWF | 1367

NOTE If you clear the Publish Map Information box, the options you checked
remain checked, but they are not included in the publish operation. When
you check Publish Map Information again, the options are included.
5Set up (page 1369) and publish the map to DWF (page 1372).
Quick Reference
MAPDWFOPTIONS
Sets AutoCAD Map 3D options for publishing to DWF
Click Map ➤ Tools ➤ DWF Publishing Options.
Menu
MAPDWFOPTIONSCommand Line
Preparing a Map for Publishing to DWF
For best results, use the following techniques to prepare your map before
publishing to DWF:
■Set the paper size larger than it is set for normal plotting and fit the map
to the paper size.
If you publish a detailed drawing to a small paper size, Autodesk Design
Review cannot display the detail. Zooming in does not help if the entities
in the map are smaller than the pen weight used to draw lines on the paper.
■Use virtual pens to display details.
To be sure that users can see all the available detail in a map, use
zero-weight pens. These allow users to zoom in without causing the lines
to get thicker. Zero-weight lines display as one pixel wide on screen.
Define pen settings (including weights) using AutoCAD Plot Style Tables,
which are stored in .CTB files. You can see a list of CTB files in the Plot
Style Manager. The .CTB files are used by page setups, which are stored in
.PC3 files. You can see a list of PC3 files in the AutoCAD Page Setup
Manager. The .PC3 files are used by several commands, including PLOT,
PUBLISH, and the Sheet Set Manager. For information about the Plot Style
Tables and the Plot Style Manager, see Manage Plot Style Tables in the
AutoCAD Help.
■Set a high display resolution.
1368 | Chapter 9 Publishing and Sharing Maps

By default, DWF files are produced with a vector grid of 1200 dots per inch
(DPI), which means the files have roughly the same precision and security
as paper.
Specify a DPI setting based on how small your objects are, relative to the
plot scale. The maximum number of virtual DWF dots allowed on a page
is 231 (2,147,483,647 in each dimension). To find the maximum allowed
DPI for your map, divide the maximum number of dots (231) by the
number of inches of the longest paper dimension. For example, for 42"x36"
paper, you can have a maximum DWF DPI of about 51 million
dots-per-inch. However, precision increases file size: a fifty-million-DPI
file is about twice the size of a 1200-DPI file (file size is not linear with
resolution). Set the DPI for DWF files using the DWF6 ePlot.PC3 settings.
See Set the DWF File Resolutionin the AutoCAD Help.
NOTE While it is safe to use very large DPI values for vectors, increasing
gradient or raster DPI increases your file size exponentially. This can cause
system failure.
■Assign a coordinate system (page 142) to the map.
Make sure that the coordinate system is valid for the data in the map. For
example, a coordinate system for Canada might not support converting
x,y values to latitude and longitude for a map of Thailand.
■Make sure that the graphics fall within the region of the coordinate system.
See also:
■Overview of Publishing to DWF (page 1365)
■Publishing Attribute Data to DWF (page 1366)
■Publishing a Map to DWF (page 1371)
To prepare a map for publishing to DWF
1Display and set up the layout you plan to use for your publishing job.
A layout is an AutoCAD paper space environment where you can specify
the size of your sheet, add a title block, display multiple views, and create
dimensions and notes for your map. For more information about creating
or editing a layout, see Create Multiple-View Drawing Layouts (Paper Space)
in the AutoCAD Help.
2Choose any attributes to include (page 1366) with the published DWF.
Publishing to DWF | 1369

3Save the map.
4Click ➤ Publish.
NOTE Do not choose an option from the Publish submenu. Click the word
Publish in the application menu.
5In the Publish dialog box, do any of the following:
■For each item in the Sheets to Publish list, click in the Page Setup/3D
DWF field and choose or import a layout from the drop-down list.
Make sure the Status column shows no errors. To exclude a sheet from
the publish operation, right-click it and choose Remove.
NOTE By default, the model space view and the two default layout views
are included in the list. You can change the settings for the sheets that
are automatically included by clearing the check boxes under Include
When Adding Sheets. You can also save the current sheet list and reload
it for future publishing jobs.
■To specify publishing options, click Publish Options.
To specify the attributes or object data to publish with this map, scroll
down to Map Options and click in the field. To use your DWF
Publishing settings, this field must be set to “Include.” To view or
change the settings (page 1366), click the button labeled “...” Make sure
that the Publish Map Information box in the DWF Publishing Options
dialog box is checked. Otherwise, the coordinate system is not included
in the publish operation.
To publish each display layer in your map to a separate layer in the
DWF, click in the Layer Information field under DWF Data Options
and change it to Include. Design Review can display each resulting
layer independently. Each DWF layer has the same name as its Display
Manager layer, but if multiple layers share the same name, the DWF
layer will have _1 appended to the first duplicate name, _2 to the
second, and so on.
■Click the DWF file option under Publish To.
■Change any other publishing options as desired. For information
about these options, click Help.
6Publish the map to DWF. (page 1372)
1370 | Chapter 9 Publishing and Sharing Maps

Quick Reference
PUBLISH
Publishes a drawing to DWF format
File menu ➤ More Plotting Options ➤ Publish to
DWF
Menu
Publish
Icon
PUBLISHCommand Line
Publishing a Map to DWF
When you publish to DWF, you create an electronic version of the map that
can be displayed using Autodesk® Design Review, which you can download
from the Autodesk Design Review page on the Autodesk website.
Autodesk Design Review includes the ability to measure, add redline markups,
define, and place custom stamps and symbols, convert DWG files to DWF,
convert raster image formats to DWF, add/remove/reorder DWF sheets to
create custom packages, define and save new 3D views, and more.
Publishing Georeferenced DWFs
As long as you have assigned a coordinate system to all the maps in your DWF
file, the publishing operation automatically converts the coordinate
information to latitude/longitude coordinates. Autodesk Design Review 2008
can automatically navigate to a specific location when you enter coordinates,
and displays coordinates of any location in the map when you move your
mouse over that location. When your computer is integrated with a GPS
device, field workers can center the map to the coordinates provided by the
integrated GPS device on your system, and display the “my coordinates” icon
within the map. GPS devices must use the NMEA 0183 protocol. Earlier versions
of the DWF Viewer do not support georeferenced DWFs. For product
information and a free trial version, refer to the Autodesk Design Review page
on the Autodesk website.
NOTE Use the Publish command from Model space to create a georeferenced
DWF file. Plotting to DWF will not work, and publishing from Layout space will
not work.
Publishing to DWF | 1371
See also:
■Overview of Publishing to DWF (page 1365)
■Publishing Attribute Data to DWF (page 1366)
■Preparing a Map for Publishing to DWF (page 1368)
To publish a map to DWF
1Save the map.
2Prepare the map for publishing to DWF. See Preparing a Map for
Publishing to DWF (page 1369).
3Click ➤ Publish.
NOTE Select the Publish command from Model space to create a
georeferenced DWF file. Publishing from Layout space will not work.
NOTE Do not choose an option from the Publish submenu. Click the word
Publish in the application menu.
4In the Publish dialog box, click the DWF file option under Publish To.
5Set publishing options and click Publish.
6In the Select DWF File dialog box, specify the name and location for the
DWF output and click Select.
7Indicate whether to save the current sheet set for future publishing
operations.
The status area shows the progress of the publishing operation. When it
is complete, a pop-up message lists the details of the job, including any
warnings or errors that occurred.
NOTE If you are creating a georeferenced DWF and want to use it with a
GPS-enabled device, set the GPS device for NMEA output and WGS84 coordinates.
If you are not sure how to do this, review the documentation that came with your
GPS device.
1372 | Chapter 9 Publishing and Sharing Maps

Quick Reference
PUBLISH
Publishes a drawing to DWF format
File menu ➤ More Plotting Options ➤ Publish to
DWF
Menu
Publish
Icon
PUBLISHCommand Line
Publishing to PDF
Recipients of PDF files can view and print them using Adobe® Reader versions
5 or later. You can publish a single PDF file or multiple PDF files containing
separate layouts.
See also:
■Overview of Publishing Maps (page 1360)
To publish to PDF
1Save the map.
2In the Tool-based Ribbon Workspace, click Output tab ➤ Export To
DWF/PDF panel ➤ Export ➤ PDF.
Publishing to a Web Page
You can save your map in HTML format for display as a static web page. The
result is a “snapshot” of the map that cannot be edited in AutoCAD Map 3D,
but can be viewed by any web browser.
You use a wizard to guide you through the publishing process. Once you have
created a web page with this wizard, you can update the information for the
web page if the map file changes.
For more information, see Use the Publish to Web Wizard to Create Web Pages
in the AutoCAD Help.
Publishing to PDF | 1373

NOTE You can also use the MapGuide technology to publish map-related data
on the web or on an intranet.
See also:
■Overview of Publishing Maps (page 1360)
■Publishing to MapGuide (page 1376)
To publish a map as a web page
1Save your map.
2At the Command prompt, enter publishtoweb.
3Click Create New Web Page and click Next.
NOTE Once you create a web page with this wizard, you can choose Edit
Existing Web Page. You select the web page to edit, and then you can change
any of the settings for that web page and republish it.
4Specify a name and location for the web page files.
■Type a name for the web page (without any file name extension).
■Specify the parent directory for the web page files by clicking the
button labeled “...” next to the default path. Choose or create a folder
for the files and click Open.
■Type a description for the web page in the space provided.
■Click Next.
5Choose an image type.
As you select an image type from the drop-down list, the description
provides information for that option. The last one you select will be used.
For JPEG and PNG, you can specify an image size.
■Review the image types and select the one you want.
■Select an image size (if appropriate).
■Click Next.
6Choose a page template.
1374 | Chapter 9 Publishing and Sharing Maps
As you select a template from the list, the preview and description update
for that option.
■Review the templates and select the one you want.
■Click Next.
7Choose a formatting theme for the web page.
As you select a theme from the drop-down list, the preview illustrates it.
■Review the themes and select the one you want.
■Click Next.
8Choose whether to use i-drop™ or not and click Next.
The i-drop option lets you post copies of the DWG files that comprise
your map so viewers can access those files.
9Choose the drawings for your web page.
■Specify the map file for the web page by clicking the button labeled
“...” next to the default file name. Choose the file and click Open.
■Choose a layout (model space or one of the layouts you’ve defined
for this map file).
■Type a label and a description to annotate the image on the resulting
web page
■Click Add.
If you need to change one of your entries, select it in the Image list,
make your changes in Image Settings, and click Update.
■Click Next.
10 Click Next on the Generate Images page of the wizard to create the web
page.
11 Preview and post the resulting web page.
■Click Preview to see how the web page will look.
If you need to change anything, close the browser window in which
the preview appears and click Back to make your changes.
■Click Post Now to post the web page.
Navigate to the location for the web page and click Save.
■Click Send Email to create an email message that contains a link to
your web page.
Publishing to a Web Page | 1375

12 Click Finish.
Using eTransmit
When you send a map file to another AutoCAD Map 3D user, it is easy to omit
some of the dependent files required to edit that map effectively. You can use
eTransmit to package all dependent files for a map (for example, SHP, SDF,
and MDB files to which you are connected) and ensure that the recipient has
all the required information. Then you can email the resulting file to the
recipient, along with a report explaining how to use the files.
The eTransmit feature also packages all local edits.
NOTE If your map includes data from a feature store such as an Oracle database,
that data will be available to the recipient, even if the recipient does not have
access to that data store.
For more information, see Package a Set of Files for Internet Transmission in the
online Help.
See also:
■Overview of Publishing Maps (page 1360)
To use eTransmit
1Save the map.
2Click ➤ Send ➤ eTransmit.
Publishing to MapGuide
The MapGuide technology lets you publish map-related data on the web or
on an intranet. The MapGuide technology is available as Autodesk MapGuide
Enterprise and under an open source license. For more information, see the
Mapping & GIS Solutions page on the Autodesk website.
When you publish to MapGuide, all layers, layer definitions, dynamic labels,
queries, filters, and styles (including point, line, raster, and other styles) in
your map are published in the format that MapGuide needs.
1376 | Chapter 9 Publishing and Sharing Maps
NOTE If you are using a previous release (Autodesk MapGuide 2008 or earlier),
you cannot use this command. Instead, export your map to SDF2 format (page
1469) and send the resulting file to your MapGuide server.
Metadata is not included when you publish to MapGuide. You can export
metdata from the Metadata Viewer (page 1510).
MapGuide and Joined Data
If you have joined data to layers that you are publishing, you cannot publish
the joined data with this command. The layer will be published, but the joined
data will not. To publish both, save the layer with the joined data to SDF
(which converts the joined data into a flat table) and then publish the resulting
SDF file. This publishes only the data that was on the server at the time you
created the SDF file. The features are no longer connected to the original
databases and data. For more information about saving a layer to SDF, see
Saving or Exporting a Display Manager Layer (page 1469).
MapGuide and SHP or SDF Layers
If your map includes SHP or SDF layers, AutoCAD Map 3D copies the source
files for those layers to the server. If your map includes layers that come from
a central database, AutoCAD Map 3D includes pointers to the original data
stores. If your map includes layers composed of objects from drawing files,
AutoCAD Map 3D copies those objects as high-fidelity DWF files.
Tell me more
Video
■Show me how to publish a map to a
MapGuide server.
■Show me how to export a layer to SDF
Procedures
■To publish a map for use with Map-
Guide (page 1378)
Workflow
■Publish to the Web
GIS Skills
■Publish a completed map to a MapGuide
server.
Publishing to MapGuide | 1377

Related topics
■Overview of Publishing and Sharing
(page 1357)
■Sharing Metadata (page 1510)
■Saving or Exporting a Display Manager
Layer (page 1469)
■Importing Autodesk SDF (Spatial Data
Files) (page 387)
■Saving or Exporting a Display Manager
Layer (page 1469)
■Importing ESRI Shape Files (page 397)
To publish a map for use with MapGuide
1Save the map.
2Click ➤ Publish ➤ Publish To MapGuide.
3In the Publish to MapGuide dialog box (page 1577), specify the URL for the
target website. If the site requires a password, a Connect to Site dialog
box appears. Enter your user name and password.
4Check Overwrite existing resources of the same name if you want to
overwrite such files.
5Check Show map in web browser after publishing if you want to review
the published map immediately.
6Choose a folder for the published files.
7Click Publish. You can monitor the progress and result of the operation
in the status bar.
Quick Reference
MAPPUBLISHTOMAPGUIDE
Publish to the new MapGuide technology (Autodesk MapGuide Enterprise
2007 or MapGuide Open Source)
1378 | Chapter 9 Publishing and Sharing Maps
File ➤ More Plotting Options ➤ Publish to Autodesk
MapGuide
Menu
MAPPUBLISHTOMAPGUIDECommand Line
Viewing Publish to MapGuide Results
When you publish to Autodesk MapGuide Enterprise, you can check the results
of the publish operation, including the number of layers that were published
and the number that failed. The following types of problems can occur:
■Layers without assigned coordinate systems may not display correctly in
MapGuide.
■Features from third-party data sources, such as Oracle databases or ArcSDE,
will cause problems if no corresponding data store exists on the MapGuide
server.
■If the program cannot determine the source type for data, or cannot open
the current map or configuration file, some data may not be published.
■Layers that are joined to external data sources are not published.
■If a map with the same name already exists on the server, the publish
operation will fail if you set the MapGuide publishing options to stop the
publish operation in this situation.
■If a folder name or its path contain invalid characters, the publish operation
will fail. Invalid characters are \, :, *, ?, ", <, >, |, &, %, =, and /.
■Situations like a session expiration, a timeout, or the inability of the server
to parse the XML can also cause the publish operation to fail.
To resolve MapGuide publishing errors
1In the Publish to MapGuide Results dialog box (page 1578), click View Log.
For information on publishing and viewing results, see Publishing to
MapGuide (page 1376).
2Examine the log file to see which layers failed and why.
3Resolve the publishing errors in the following ways:
■Errors due to joined data: You can detach the joined data from the
layers before publishing to omit that data but still publish the layers.
If you must include the joined data, save layers with joined data to
Viewing Publish to MapGuide Results | 1379

SDF format (which converts the join into a flat table), remove the
layers from the map (turning them off is not sufficient), and publish
the resulting map. Then copy the SDF containing the joined data layer
to the MapGuide server. This places a “static” copy of the data on the
server (the features no longer point to the original databases and data).
You must reconstruct the map on the server to add the SDF layer back
in. For information on how to save a layer to SDF, see Saving or
Exporting a Display Manager Layer (page 1469).
■Errors resulting from layers without assigned coordinate systems:
Display the Data Connect dialog box, select the data source whose
layers are missing a coordinate system, and click Edit Coordinate
Systems. Click Edit and select a coordinate system. Click OK in both
dialog boxes to apply your changes.
■ODBC DSN errors: If feature sources in the map use an ODBC DSN
(Data Source Name) on the local computer, the DSN must exist on
the machine where the server resides, and it must have the same name
as the DSN on the local machine.
■Errors related to missing provider components on the server: If you
publish a map layer from a provider that requires software or
components, such as an Oracle database, ArcSDE data source, SQL
server, or a third-party database provider you set up, you must install
that software on the MapGuide server and configure it correctly. For
example, if you publish a layer from an Oracle database, you must
install the Oracle client on the server.
NOTE MapGuide Enterprise installs some provider support automatically,
while the open source version does not. However, in both cases, you will
need to install components for some providers.
■Errors due to a failure to determine the source data type or read the
configuration file: These errors are usually the result of using data
from third-party FDO Providers. Contact Autodesk technical support,
or the support group for the FDO Provider you are using.
■Errors due to existing files on the server: If you specified that this
publish operation should stop if it encounters existing files with the
same names as new ones, and if those files exist, you can either remove
the existing files from the server or change the publishing options to
overwrite the existing files. For more information, see Publishing to
MapGuide (page 1376).
1380 | Chapter 9 Publishing and Sharing Maps
■Errors due to invalid characters: Rename the offending files or folders
to avoid invalid characters.
4Republish.
Quick Reference
MAPPUBLISHTOMAPGUIDE
Publish to the new MapGuide technology (Autodesk MapGuide Enterprise
2007 or MapGuide Open Source)
File ➤ More Plotting Options ➤ Publish to Autodesk
MapGuide
Menu
MAPPUBLISHTOMAPGUIDECommand Line
Publishing Map Books
■To create and publish a map book (page 1383)
■To set up a map book template (page 1386)
■To identify layout placeholders (page 1388)
■To create a map book (page 1390)
■To rebuild a map book (page 1391)
■To import a plot map set (page 1392)
Overview of Map Books
A map book divides your map into multiple “tiles” and displays each tile on
a separate page. Picture a grid overlaying your map. Each section of the grid
represents a tile. Once you create a map book, you can publish the entire map
or selected tiles to a plotter or to DWF.
Each map book is associated with an AutoCAD sheet set. For more information
about AutoCAD sheet sets, see Create and Manage a Sheet Set in the AutoCAD
Help.
Publishing Map Books | 1381
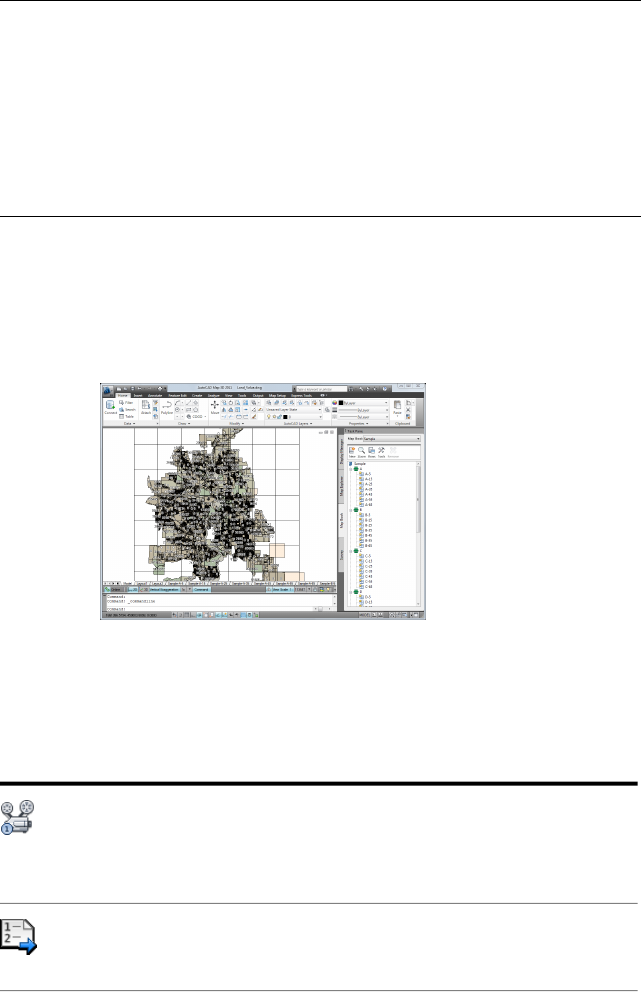
NOTE If a map book becomes dissociated from its sheet set (for example, if you
rename the map file after creating a map book), you will be prompted to regenerate
the sheet set when you select an existing map book or create a new map book.
You can choose the sheet set from the older version of the map file, or you can
create a new one. To regenerate the sheet set at any other time, right-click the
map book (on the Map Book tab of the Task Pane) and choose Rebuild Sheet Set.
When you package and send your map files to a recipient using eTransmit, the
sheet set is packaged with the map file and your recipient does not have to
regenerate it.
To create a map book, you must first set up a map book template. You can
start with a sample template and adapt it to your needs. When the template
is complete, you generate the map book. You can update the original map at
any time and regenerate the map book without changing the template, or
you can change the template and regenerate the map book. The new map
book will reflect your changes.
Map book with tiles listed by row and column
You can create more than one map book for a map, but only one can be
current at a time.
Tell me more
Video
■Show me how to create a map book.
■Show me how to publish a map book
with attributes to a DWF file.
Procedures
■To create and publish a map book
(page 1383)
1382 | Chapter 9 Publishing and Sharing Maps
Tutorials
■Tutorial: Creating a Map Book With an
Inset
Workflow
■Publish to a Map Book
GIS Skills
■Create a map book with appropriate-
scale tiling for a city.
■Produce a multi-sheet DWF file for a map
book.
Related topics
■Overview of Publishing and Sharing
(page 1357)
To create and publish a map book
1Set up a map book template (page 1385).
2Identify layout placeholders (page 1388).
3Create a map book (page 1389).
4View or edit the map book tiles (page 1397).
5Publish the map book (page 1400).
Quick Reference
MAPBOOKCREATE
Creates a map book to publish your data
In the Map Classic workspace, Click Map ➤ Map Book.
Menu
MAPBOOKCREATECommand Line
In the Map Book task pane, click New ➤ Map
Book.
Task Pane
Create Map Book/Edit Map Book dialog boxDialog Box
Publishing Map Books | 1383

MAPBOOKCREATEFROMSETTINGS
Creates a new map book from a previously saved map books settings file
MAPBOOKCREATEFROMSETTINGSCommand Line
In the Map Book task pane, click New ➤ Map
Book from Settings.
Task Pane
Select Map Book Settings dialog boxDialog Box
MAPBOOKEDITSETTINGS
Edits the settings of an existing map book
MAPBOOKEDITSETTINGSCommand Line
In the Map Book task pane, click Tools ➤ Edit Settings
and Rebuild Map Book.
Task Pane
Create Map Book/Edit Map Book dialog boxDialog Box
MAPBOOKIMPORTPLOTSET
Imports settings from a map plot set
MAPBOOKIMPORTPLOTSETCommand Line
In the Map Book task pane, click New ➤ Map
Book from Plot Set.
Task Pane
Select Plot Set to Convert dialog boxDialog Box
MAPBOOKPLACEHOLDER
Names the viewports and element placeholders in the layout template
MAPBOOKPLACEHOLDERCommand Line
On the Map Book tab, click Tools ➤ Identify
Template Placeholders.
Task Pane
Identify Map Book Template Placeholders dialog boxDialog Box
MAPBOOKSAVESETTINGS
1384 | Chapter 9 Publishing and Sharing Maps

Saves map book settings to an external file
MAPBOOKSAVESETTINGSCommand Line
On the Map Book tab, right-click a map book name
➤ Save Settings.
Task Pane
Save Map Book Settings dialog boxDialog Box
Setting Up a Map Book Template
Every map book requires a template that specifies printer settings (such as
paper size and the printer driver to use) and defines the size and position of
elements on the page (for example, the legend, title block, and map tiles).
A template can contain one or more layouts. If it contains multiple layouts,
you must specify the one to use for a particular map book.
Once you define the map book template and save your map, you can publish
the map book to a plotter or to a DWF file.
Viewports
In your map book template, each element appears within a viewport, which
is like a frame on a web page. A viewport has a shape and a position on the
page, and you specify the type of information that appears within it. You must
include a main viewport in your map book template. Other viewports are
optional and can include the following:
■Tileview viewport displays the corresponding tile, and determines the shape
of that tile. Templates for map books must include a tileview viewport.
■Keyview viewport displays a thumbnail view of the entire area included in
the map book. You can create a simplified view of the mapped area to use
in this viewport, save that view to a separate drawing file, and then link
the viewport to that drawing. You can display a different linked file in this
viewport, instead of the thumbnail. For example, you can save a detail of
the map in a separate file and use the keyview viewport to display it as an
inset. You can also display selected AutoCAD layers for the entire map.
NOTE When you generate the map book, you can choose any of the previous
alternatives, or you can choose to omit the keyview viewport altogether.
■Legend viewport displays a legend. and specifies where it appears in the map
book. If you created a display legend for your map, you can select it for
Publishing Map Books | 1385
this viewport, or you can select an area of your map to use as a legend.
This viewport is optional.
■Adjacent arrows are blocks at each edge of the tile that point to and identify
the adjacent tile. Each arrow has a property that specifies the adjacent tile
in that direction and displays the name of that tile within the arrow. You
can specify the text that appears within the arrowheads. When you generate
the map book, you can choose a drawing for an adjacent block. That
drawing replaces the original adjacent block defined in the template layout.
■Title block displays a defined DWG block that can include title information,
such as your company or group name and the name of the map. Many
organizations have standard title blocks to insert in this element. You can
define certain attributes of the title block from within your template. Title
blocks defined in the sample templates include a frame that surrounds the
entire tile. When you generate the map book, you can choose a drawing
for the title block. That drawing replaces the original title block contents
defined in the template layout.
Map book template
See also:
■Overview of Publishing and Sharing (page 1357)
■Overview of Map Books (page 1381)
To set up a map book template
1Open an existing map book template. Map book templates for a variety
of paper sizes are included in the Templates folder. Choose from 8.5x11,
8.5x14, 11x17, A3, or A4.
1386 | Chapter 9 Publishing and Sharing Maps

2Do the following:
■Right-click a layout tab and choose Rename. Type a new name for
this layout.
NOTE If you do not see the layout tabs, click ➤ Options ➤
Display tab, check Display Layout and Model Tabs, and create a new
layout.
■Right-click the renamed layout tab. Choose Page Setup Manager to
specify plotter and paper information.
NOTE This information will be used every time you publish your map
book to a plotter. You cannot change these settings at print time. For
more information about this dialog box, type “Page Setup Manager” in
the Search tab of the help.
3Resize the viewports on the layout as needed:
■To resize a viewport, click it to select it. Click and drag a corner grip.
■If you do not want to use one of the viewports that appear on the
template, select it and press the Delete key on your keyboard.
4Customize the viewports on the template as desired:
■Double-click the outside frame of the title block to change its attributes
or text properties. Items that display pound signs (###) are variables.
Right-click a variable to change its value.
■Double-click an arrow block to change its text properties.
5When the elements appear as you want them, you must Identify the
layout placeholders (page 1388).
6After identifying the placeholders, save the map file as a DWT (AutoCAD
Drawing Template) file.
NOTE You can also create a map book layout in an existing map, and use that
map as your map book template. Be sure to rename the layout tab that you plan
to use for map books. You can have multiple layout templates in a map.
Publishing Map Books | 1387
Quick Reference
PAGESETUP
Displays the Page Setup Manager for a layout
File menu ➤ More Plotting Options ➤ Page Setup
Manager
Menu
PAGESETUPCommand Line
Identifying Layout Placeholders
You must identify each element in your map book template as a placeholder
for a particular type of information. For example, you select the viewport
intended for the title and identify it as a title block placeholder.
See also:
■Setting Up a Map Book Template (page 1385)
■Overview of Map Books (page 1381)
To identify layout placeholders
1Select the layout tab you defined for the map book.
2On the Map Book tab of the Task Pane, click Tools ➤ Identify Template
Placeholders.
3In the Identify Map Book Template Placeholders dialog box (page 1829),
click an item in the Layout Placeholders list. For example, click Main
Viewport. Then click Select Placeholders.
4In your layout, click the outline of the viewport to use for the item you
selected. For example, for the Main viewport, click the viewport that will
display the map tile.
5Repeat steps 3 and 4 for each of the following elements in your layout:
■Main viewport
■Keyview viewport
■Legend viewport
■Adjacent arrow blocks
1388 | Chapter 9 Publishing and Sharing Maps
■Title block
6When you have identified all the elements, click Close.
Quick Reference
MAPBOOKPLACEHOLDER
Names the viewports and element placeholders in the layout template
MAPBOOKPLACEHOLDERCommand Line
On the Map Book tab, click Tools ➤ Identify
Template Placeholders.
Task Pane
Identify Map Book Template Placeholders dialog boxDialog Box
Creating a Map Book
You can create a map book from a map you styled in Display Manager or from
objects in model space.
By default, the map book uses the current map in the Display Manager,
whether you have saved it or not. If you specify the model space instead, the
map book shows the current contents of the model space. You can also choose
a map you saved in the Display Manager.
Tell me more
Video
■Show me how to create a map book.
■Show me how to publish a map book
with attributes to a DWF file.
Procedures
■To create a map book (page 1390)
Tutorials
■Tutorial: Creating a Map Book With an
Inset
Publishing Map Books | 1389

Workflow
■Publish to a Map Book
GIS Skills
■Create a map book with appropriate-
scale tiling for a city.
■Produce a multi-sheet DWF file for a map
book.
Related topics
■Overview of Publishing and Sharing
(page 1357)
■Overview of Map Books (page 1381)
■Setting Up a Map Book Template
(page 1385)
To create a map book
1On the Map Book tab of the Task Pane, click New ➤ Map Book.
2In the Create Map Book/Edit Map Book dialog box (page 1827), select an
option under each of the following and enter the required information:
■Source
■Sheet Template
■Tiling Scheme
■Naming Scheme
■Sheet Set
3Optionally, you can select options under the following:
■Key
■Legend
4Click Preview to see a preview of the tile outlines on the map.
5Click Generate.
1390 | Chapter 9 Publishing and Sharing Maps

Quick Reference
MAPBOOKCREATE
Creates a map book to publish your data
In the Map Classic workspace, Click Map ➤ Map Book.
Menu
MAPBOOKCREATECommand Line
In the Map Book task pane, click New ➤ Map
Book.
Task Pane
Create Map Book/Edit Map Book dialog boxDialog Box
Rebuilding a Map Book
If you make changes to a map book template, you must rebuild the map book
to apply the changes.
See also:
■Overview of Map Books (page 1381)
■Setting Up a Map Book Template (page 1385)
To rebuild a map book
1On the Map Book tab of the Task Pane, select the map book to rebuild.
2Right-click the map book name and click Rebuild.
Importing Plot Map Sets
You can import settings from plot map sets that you created in previous releases
of the software.
See also:
■Creating a Map Book (page 1389)
■Map Book Settings (page 1392)
Publishing Map Books | 1391

To import a plot map set
1Open the file that contains the plot map set.
2On the Map Book tab of the Task Pane, click New ➤ Map Book From
Plot Set.
3Select the plot map set to convert. Click OK.
4In the Create Map Book dialog box, edit the imported plot map set
information as desired. Click OK.
Quick Reference
MAPBOOKIMPORTPLOTSET
Imports settings from a map plot set
MAPBOOKIMPORTPLOTSETCommand Line
In the Map Book task pane, click New ➤ Map
Book from Plot Set.
Task Pane
Select Plot Set to Convert dialog boxDialog Box
Map Book Settings
■Overview of Map Book Settings (page 1392)
■Saving Map Book Settings (page 1394)
■Creating New Map Books from Saved Settings (page 1395)
■Editing Map Book Settings (page 1396)
■To save map book settings (page 1394)
■To create a new map book from saved settings (page 1395)
■To edit map book settings (page 1396)
Overview of Map Book Settings
You can save and reuse the settings you specified for a particular map book.
1392 | Chapter 9 Publishing and Sharing Maps

See also:
■Creating a Map Book (page 1389)
■Creating New Map Books from Saved Settings (page 1395)
■Editing Map Book Settings (page 1396)
Use this method...To do this...
On the Map Book tab of the Task Pane,
right-click the map book name. Click Save
Settings.
See Saving Map Book Settings (page 1394)
Save map book settings
On the Map Book tab of the Task Pane,
click New ➤ Map Book From Settings.
See Creating New Map Books from Saved
Settings (page 1395)
Use saved map book settings
On the Map Book tab of the Task Pane,
select a map book and click Tools ➤ Edit
Settings And Rebuild Map Book.
See Editing Map Book Settings (page 1396)
Edit saved map book settings
Quick Reference
MAPBOOKSAVESETTINGS
Saves map book settings to an external file
MAPBOOKSAVESETTINGSCommand Line
On the Map Book tab, right-click a map book name
➤ Save Settings.
Task Pane
Save Map Book Settings dialog boxDialog Box
MAPBOOKCREATEFROMSETTINGS
Creates a new map book from a previously saved map books settings file
MAPBOOKCREATEFROMSETTINGSCommand Line
Publishing Map Books | 1393

In the Map Book task pane, click New ➤ Map
Book from Settings.
Task Pane
Select Map Book Settings dialog boxDialog Box
MAPBOOKEDITSETTINGS
Edits the settings of an existing map book
MAPBOOKEDITSETTINGSCommand Line
In the Map Book task pane, click Tools ➤ Edit Settings
and Rebuild Map Book.
Task Pane
Create Map Book/Edit Map Book dialog boxDialog Box
Saving Map Book Settings
Map book settings are automatically saved in the map file as soon as you create
the map book. You can save these settings in a separate MBS (Map Book
Settings) file to use with other map books.
See also:
■Creating a Map Book (page 1389)
■Creating New Map Books from Saved Settings (page 1395)
To save map book settings
1On the Map Book tab of the Task Pane, select the map book whose settings
you want to use.
2Right-click the map book name. Click Save Settings.
3Give the file a unique name.
4Click Save.
Quick Reference
MAPBOOKSAVESETTINGS
1394 | Chapter 9 Publishing and Sharing Maps

Saves map book settings to an external file
MAPBOOKSAVESETTINGSCommand Line
On the Map Book tab, right-click a map book name
➤ Save Settings.
Task Pane
Save Map Book Settings dialog boxDialog Box
Creating New Map Books from Saved Settings
If you saved the settings for a map book in a Map Book Settings file, you can
use those settings for a new map book.
See also:
■Creating a Map Book (page 1389)
■Saving Map Book Settings (page 1394)
To create a new map book from saved settings
1On the Map Book tab of the Task Pane, click New ➤ Map Book From
Settings.
2Navigate to a map book settings (MBS) file and open it.
3In the Create Map Book dialog box, change the settings as desired.
4Click Generate.
Quick Reference
MAPBOOKCREATEFROMSETTINGS
Creates a new map book from a previously saved map books settings file
MAPBOOKCREATEFROMSETTINGSCommand Line
In the Map Book task pane, click New ➤ Map
Book from Settings.
Task Pane
Select Map Book Settings dialog boxDialog Box
Publishing Map Books | 1395
Editing Map Book Settings
You can edit the settings of an existing map book.
See also:
■Creating a Map Book (page 1389)
■Saving Map Book Settings (page 1394)
■Rebuilding a Map Book (page 1391)
To edit map book settings
1On the Map Book tab of the Task Pane, select the map book whose settings
you want to change, and click Tools ➤ Edit Settings And Rebuild Map
Book.
2In the Edit Map Book dialog box, change the settings as desired.
3Click Generate.
Quick Reference
MAPBOOKEDITSETTINGS
Edits the settings of an existing map book
MAPBOOKEDITSETTINGSCommand Line
In the Map Book task pane, click Tools ➤ Edit Settings
and Rebuild Map Book.
Task Pane
Create Map Book/Edit Map Book dialog boxDialog Box
Viewing and Editing Map Books
You can view or edit individual tiles and their corresponding layouts.
■Overview of Viewing and Editing Map Book Tiles (page 1397)
■Viewing a Map Book (page 1398)
■Viewing Map Book or Tile Properties (page 1398)
■Viewing Tiles in Model Space (page 1399)
■Viewing Layouts (page 1400)
1396 | Chapter 9 Publishing and Sharing Maps

■To view a map book (page 1398)
■To hide all map books (page 1398)
■To view map book or tile properties (page 1399)
■To view a tile (page 1399)
■To view several tiles (page 1399)
■To view all tiles (page 1399)
■To view a layout (page 1400)
Overview of Viewing and Editing Map Book Tiles
Map books divide a single map into a set of tiles and display each tile on a
separate map book page. You use a template to specify the layout of the pages.
You can view and change individual tiles or layouts for existing map books.
See also:
■Overview of Map Books (page 1381)
■Creating a Map Book (page 1389)
Use the following methods to view and edit map book tiles.
Use this method...To view or edit this...
On the Map Book tab of the Task Pane,
select the map book to view from the Map
An entire map book
Book list. See Viewing a Map Book (page
1398).
On the Map Book tab of the Task Pane,
right-click a map book or tile and click
Map book or tile properties
Properties. See Viewing Map Book or Tile
Properties (page 1398).
On the Map Book tab of the Task Pane,
right-click a map book or tile and click
Map book tiles in model space
Zoom Tiles. See Viewing Tiles in Model
Space (page 1399).
On the Map Book tab of the Task Pane,
right-click a tile and click Zoom Layout.
See Viewing Layouts (page 1400).
Map book tile layouts
Publishing Map Books | 1397

Viewing a Map Book
When you open a map containing one or more map books, none of the map
books is current until you select one. When you select a map book, you
automatically zoom to its extents and see the tile outlines. If the map book is
based on a display map, you will see the stylization associated with that display
map.
See also:
■Overview of Map Books (page 1381)
■Creating a Map Book (page 1389)
■Overview of Viewing and Editing Map Book Tiles (page 1397)
To view a map book
■On the Map Book tab of the Task Pane, select the map book to view from
the Map Book list.
To hide all map books
■On the Map Book tab of the Task Pane, select <None> from the Map Book
list.
NOTE If the map book is based on a display map, this will hide only the tile
outlines. To turn off stylization, use the Display Manager.
Viewing Map Book or Tile Properties
You can view basic properties about map books or tiles. In the Map Book
Properties dialog box (page 1830), you can view the map’s name, scale,
orientation, coordinate system, and number of tiles. In the Tile Properties
dialog box (page 1831), you can view a tile’s name and the numbers of its
adjacent tiles.
NOTE The map book properties are strings, for use as field values in sheets. They
do not change the actual properties of the map book.
See also:
■Overview of Map Books (page 1381)
1398 | Chapter 9 Publishing and Sharing Maps
■Creating a Map Book (page 1389)
■Overview of Viewing and Editing Map Book Tiles (page 1397)
To view map book or tile properties
1On the Map Book tab of the Task Pane, do one of the following:
■Right-click the map book name.
■Right-click a tile name.
2Click Properties.
3In the Map Book Properties dialog box (page 1830) or the Tile Properties
dialog box (page 1831), examine the properties.
Viewing Tiles in Model Space
You can view selected tiles in model space.
See also:
■Overview of Map Books (page 1381)
■Creating a Map Book (page 1389)
■Overview of Viewing and Editing Map Book Tiles (page 1397)
To view a tile
■On the Map Book tab of the Task Pane, right-click a tile name. Click Zoom
Tile.
To view several tiles
■Select multiple tile names. Right-click one of the selected tiles. Click Zoom
Tiles.
To view all tiles
■Right-click the map book containing the tiles. Choose Zoom Tiles.
Publishing Map Books | 1399
Viewing Layouts
You can view layouts for selected tiles, one at a time.
See also:
■Overview of Map Books (page 1381)
■Creating a Map Book (page 1389)
■Overview of Viewing and Editing Map Book Tiles (page 1397)
To view a layout
■On the Map Book tab of the Task Pane, right-click a tile name. Click Zoom
Layout.
Publishing Map Books
You can publish a map book to a DWF file for electronic distribution or to a
plotter for a printed map book based on the current plot settings.
■To publish a map book to DWF (page 1401)
■To publish a map book to a plotter (page 1402)
Publishing Map Books to DWF
The steps for publishing a map to DWF (page 1364) and publishing a map book
to DWF are slightly different, but you set DWF Publishing Options the same
way for both.
Tell me more
Video
■Show me how to publish a map book
with attributes to a DWF file.
Procedures
■To publish a map book to DWF (page
1401)
1400 | Chapter 9 Publishing and Sharing Maps
Tutorials
■Tutorial: Creating a Map Book With an
Inset
Workflow
■Publish to a Map Book
GIS Skills
■Produce a multi-sheet DWF file for a map
book.
Related topics
■Overview of Publishing and Sharing
(page 1357)
■Overview of Map Books (page 1381)
■Creating a Map Book (page 1389)
■Overview of Publishing to DWF (page
1365)
■Publishing Attribute Data to DWF
(page 1366)
■Publishing a Map to a Plotter (page
1363)
To publish a map book to DWF
1Save the map.
2Set up options for publishing attribute data (page 1366).
3On the Map Book tab of the Task Pane, select the map book to publish,
and click Tools ➤ Publish To DWF.
4In the Select DWF File dialog box, choose a name and location for the
DWF file and click Select.
Publishing Map Books to a Plotter
You can publish to a plotter for a printed copy.
The steps for publishing a map to a plotter (page 1363) and publishing a map
book to a plotter are slightly different. The plotter and plotting options are
Publishing Map Books | 1401
specified in your layout for this map book, so the map book is sent to the
plotter as soon as you choose the command.
See also:
■Overview of Map Books (page 1381)
■Creating a Map Book (page 1389)
■Publishing a Map to a Plotter (page 1363)
To publish a map book to a plotter
1Save the map.
2Make sure that you have set up the printer or plotter you want to use.
3On the Map Book tab of the Task Pane, select the map book to publish,
and click Tools ➤ Publish To Plotter.
Managing Map Books and Tiles
■To rename a map book or tile (page 1402)
■To delete a map book or tile (page 1403)
Rename Map Books or Tiles
You can rename entire map books or individual tiles.
See also:
■Overview of Map Books (page 1381)
■Creating a Map Book (page 1389)
■Delete Map Books or Tiles (page 1403)
To rename a map book or tile
1On the Map Book tab of the Task Pane, do one of the following:
■Right-click the map book to rename.
■Right-click the tile to rename.
1402 | Chapter 9 Publishing and Sharing Maps

2Click Rename.
3Type the new name.
4Press Enter.
NOTE Renaming a tile does not rename its associated layout.
Delete Map Books or Tiles
You can delete tiles from a map book or delete the entire map book.
See also:
■Overview of Map Books (page 1381)
■Creating a Map Book (page 1389)
■Rename Map Books or Tiles (page 1402)
To delete a map book or tile
1On the Map Book tab of the Task Pane, do one of the following:
■Right-click the map book to delete.
■Right-click the tile to delete.
2Click Delete.
3Click Yes.
WARNING You cannot undo the deletion.
Converting and Exporting
To convert or export drawing objects
■To prepare your data for export (page 1408)
■To export drawing objects to other file formats (page 1408)
■Before moving drawing data to SDF (page 1415)
■To export drawing objects to SDF (page 1416)
■To specify the name for the index property used in export (page 1417)
Converting and Exporting | 1403
■Other ways to move data into SDF format (page 1417)
■To export DWG data to SDF2 format (page 1418)
■To change the settings AutoCAD Map 3D uses for segmentation (page 1421)
■To export drawing objects to ESRI Arc/INFO (page 1421)
■To export DWG data to ESRI ArcSDE: (page 1423)
■To include all object types when exporting drawing objects to ESRI SHP
format (page 1427)
■To change the settings AutoCAD Map 3D uses for segmentation (page 1427)
■To export drawing objects to SHP (page 1428)
■To verify language encoding settings for export to GML (page 1429)
■To export drawing objects to GML (page 1430)
■To change the settings AutoCAD Map 3D uses for segmentation (page 1432)
■To export drawing objects to MapInfo (page 1432)
■To change the settings AutoCAD Map 3D uses for segmentation (page 1434)
■To export drawing objects to MapInfo TAB (page 1434)
■To change the seed file for a single file (page 1437)
■To change the default seed file (page 1438)
■To export drawing objects to MicroStation Design (DGN) (page 1438)
■To export multiple feature classes (page 1440)
■To combine multiple layers into one feature class (page 1442)
■To change the class names that are assigned automatically (page 1442)
■To change the settings AutoCAD Map 3D uses for segmentation (page 1445)
■To export drawing objects to Shape Multiclass (page 1445)
■To map fields when exporting to Shape Multiclass (page 1446)
■To create polygons when exporting to SHP Multiclass (page 1446)
■To export to a single feature class that uses all the items you specified on
the Data tab. (page 1446)
■Before moving drawing data to SQLite (page 1447)
■To export drawing objects to SQLite (page 1448)
■To move data into SQLite format (page 1449)
■To export drawing objects to Vector Markup Language (VML) (page 1450)
■To export point cloud data to LAS or ASCII formats (page 1452)
■To export point cloud data to Autodesk SDF format (page 1452)
■To map drawing attributes to feature class properties (page 1454)
■To map AutoCAD drawing attribute values to feature class property values
(page 1454)
■To export text enclosed in a polyline as attribute data (page 1455)
■To export polygons from a polygon topology (page 1458)
■To create a DXF file (page 1459)
■To save a styled map to DWG format (page 1460)
■To export DWG data to Oracle: (page 1462)
■To export DWG data to ESRI ArcSDE: (page 1463)
■To save drawing objects in an image format (page 1465)
1404 | Chapter 9 Publishing and Sharing Maps
■To move drawing data to a spatial data store and back using the import
method (page 1467)
■To move drawing data to a spatial data store and back using the Data
Connect method (page 1467)
■To export layers in SDF or SQLite format (page 1470)
■To save a layer’s styles and pointers to its data (page 1471)
■To export survey points to a LandXML file (page 1471)
Overview of Converting and Exporting
You can share all or some of the drawing objects in your map with users of
other software programs by exporting to another format. You can print or
export attribute data and metadata separately.
When you export DWG objects, geospatial feature data is ignored. However,
you can export a Display Manager layer (page 1469) containing geospatial data
to SDF format, or you can use Bulk Copy (page 615) to convert features from
one geospatial format to another. You can also export to an FDO data format
(page 1461), such as Oracle or ArcSDE
When you convert or export your drawing objects to other formats, you can
convert or export not only the objects themselves, but also data associated
with the objects. In addition, AutoCAD Map 3D can automatically perform a
coordinate conversion on the objects as they are converted or exported.
During conversion or export, AutoCAD Map 3D copies objects from the active
map to the specified file or location. To convert or export objects from a source
DWG file, query those objects into the active map before you begin the export.
Using Saved Settings
If you saved export settings (from Autodesk Map Release 4.5 or later), you can
reload those settings.
Selecting Drawing Objects
You can automatically select all drawing objects, or you can manually select
the ones you want. In addition, you can export drawing objects on selected
layers or in selected classes. You can also export drawing objects from a polygon
topology.
The status bar tells you how many objects are currently selected and how
many are filtered out. In addition, you can preview the objects that will be
exported.
Overview of Converting and Exporting | 1405

Data
You can export data associated with drawing objects, including object data,
block attributes, linked external data, object properties, and topology data.
You can also map drawing attributes to feature class properties during export.
Choose the data you want on the Data or Feature Class tab of the Export dialog
box.
NOTE You cannot export metadata using the Export dialog box. Instead, export
metadata from the Metadata Viewer. See Sharing Metadata (page 1510).
When you export external data, two options are available:
■If the external file format does not support external databases, export the
entire record associated with each linked object. The information from
the record is attached to the exported object as attribute data.
■If the external file format supports external database files, export only the
key field.
Text
DWG text elements are exported as points (using the insertion point of the
text). If your text elements are MTEXT objects, and you want to preserve the
actual text as well as text properties such as rotation and style, you must specify
the data attributes during export. If you then import the resulting file, you
will have AutoCAD points with AutoCAD Map 3D object data. You can use
the AutoCAD Map 3D ADE Query feature to alter the point objects and display
them as text, using the attributes to define the text value, rotation and style.
When you export to SDF or SHP and then connect to the resulting file in
Display Manager, you can display the point and label it using any of the
attributes that were defined.
Coordinate Conversion
If the active map has a coordinate system assigned to it, you can convert
objects from that coordinate system to a different coordinate system.
NOTE The settings specified in the UNITS command do not affect the export
process. The UNITS command affects only the way data is displayed; it does not
affect the coordinate values stored with the objects themselves.
1406 | Chapter 9 Publishing and Sharing Maps
Styled Objects
For maps saved or exported from the Display Manager, AutoCAD Map 3D
saves or exports original object properties regardless of any map stylizations,
except for text. Text entities created by text stylizations are saved or exported.
To avoid saving or exporting text entities, turn off any text stylization before
exporting your data. For more information, see Overview of the Display
Manager (page 634).
You can export styled objects to DWG format. See Exporting Maps to DWG
Format (page 1459).
Tell me more
Video
■Show me how to export DWG objects to
SDF.
■Show me how to export the current map
to DWG format.
■Show me how to export a layer to SDF
■Show me how to save a layer to a .layer
file.
Procedures
■To prepare your data for export (page
1408)
■To export drawing objects to other file
formats (page 1408)
Tutorials
■Lesson 1: Convert Drawing Layers to
Feature Classes
■Lesson 7: Use Object Classes When
Exporting
■Batch Exporting
Workflow
■Move CAD Data to GIS
GIS Skills
■Convert styled DWG objects to features.
■Export DWG objects to a GIS data store
(SDF).
Overview of Converting and Exporting | 1407
■Exchange data with other users by ex-
porting to SDF format.
■Share styles with other users of AutoCAD
Map 3D using .layer files.
Related topics
■Exporting DWG Data to SDF2 Format
(page 1417)
■Exporting DWG Data to an FDO Data
Store (page 1461)
■Migrating DWG Data to GIS (page 628)
■Mapping Drawing Attributes to Fea-
ture Class Properties (page 1452)
■Converting Data From Other Formats
to Drawing Objects (page 377)
To prepare your data for export
■To convert or export objects from source drawings, query those objects
into the current map.
■To perform a coordinate transformation during export, be sure that you
have assigned a coordinate system to the map.
NOTE When you export from a map, only drawing objects are exported. Geospatial
features are ignored. To move geospatial feature data to another format, use
Migrating GIS Data (Bulk Copy) (page 617).
To export drawing objects to other file formats
1In the Tool-based Ribbon Workspace, click Output tab ➤ Map Data
Transfer panel ➤ Map 3D Export.
NOTE To export to Oracle or ESRI ArcSDE, see Exporting DWG Data to an
FDO Data Store (page 1461).
2In the Export Location dialog box, select the file format and location for
the exported files. For information on the file format choices, see
Supported Formats (page 1412). Click OK.
1408 | Chapter 9 Publishing and Sharing Maps

3In the Export dialog box (page 1704), specify how to export objects. To use
settings that you stored previously, click Load and select the profile
containing the settings.
4On the Selection tab, specify the objects to export.
■To select a subset of objects, click Select manually and choose either
Select Objects or Quick Select.
■To filter the selection to export only objects on specific layers or in
specific classes, specify the layers and classes to include.
■To export polygons from a polygon topology, select the topology.
■To preview the objects that will be exported, click Preview Filtered
Selection.
5On the Data or Feature Class tab, click Select Attributes and select the
data to export with the objects.
TIP If you are exporting data from an external database, you can export the
entire record from the database or just the key fields. Because the key field
values are stored in the map, choosing the key field (listed under Link
Templates) makes the export faster.
6On the Feature Class or Options tab, select the options you want.
■To perform a coordinate conversion, you must have a coordinate
system assigned to the map (page 147).
■Check Treat closed polylines as polygons (if it is available) unless you
want only polygon objects to be exported as polygons.
■To create multiple classes, select Create Multiple Classes Based On A
Drawing Object.
If you are exporting to Oracle (page 1461), Autodesk SDF (page 1413), or
ESRI ArcSDE (page 1422), see Exporting to Multiple Classes (page 1439).
If you are exporting to Shape Multiclass (page 1443), your choices on
the Options tab and on the Data tab work together to determine how
attributes are assigned to the exported feature classes. See Exporting
To Shape Multiclass (page 1443).
■If you are exporting to DGN version 7 or 8 (page 1435), select Map Layers
To DGN Levels to map each layer in the current map to a level in the
DGN drawing. Specify the layers and the corresponding names for
the DGN levels. DGN version 7 names can be numbers or strings. For
DGN version 8, names must be strings. Closed polylines are always
Overview of Converting and Exporting | 1409

exported as polygons; they will be shapes in the DGN v8 file. You
cannot clear the Treat Closed Polylines as Polygons check box.
■Click Driver Options to set options specific to the export format you
specified. For information on driver options, see the following:
■Exporting To ESRI Arc/INFO Coverages (page 1419)
■Exporting to ESRI SHP (page 1424)
■Exporting To Geographic Markup Language (GML) (page 1429)
■Exporting To MicroStation Design (DGN) Versions 7 and 8 (page
1435)
■Exporting To Shape Multiclass (page 1443)
■Exporting To VML (Vector Markup Language) (page 1449)
While other formats are supported, they do not have driver options.
7Click OK to begin the export process.
Quick Reference
MAPEXPORT
Exports drawing objects and their attribute data to an external file format
Click File ➤ Convert DWG To ➤ Map 3D Export.
Menu
Export Map File
Icon
MAPEXPORTCommand Line
Export dialog boxDialog Box
MAPEXPORTFDO
Export to an FDO data store
Click File ➤ Convert DWG To ➤ FDO Connection.
Menu
MAPEXPORTFDOCommand Line
1410 | Chapter 9 Publishing and Sharing Maps
Supported Objects
When you export drawing data to another format, the following object types
are exported:
■Arc
■Attribute Definition
■Text
■Block Reference (exports as point)
■Circle
■Ellipse
■Face
■Hatch
■Line
■MLine
■MText
■Point
■Polygon
■Polyline
■2dPolyline
■3dPolyline
■Shape
■Solid
■Spline
■Trace
■Xref (exports as point)
Supported Objects | 1411
Unsupported Object Types
When you export drawing data to another format, the following object types
are not exported:
■Attribute
■Body
■Dimension
■Gradient fill for polygon objects (MPolygons)
■Image
■Leader
■OleFrame
■Ole2Frame
■Proxy objects (from other applications)
■Ray
■Region
■Viewport
■Xline
See also:
■Overview of Converting and Exporting (page 1405)
Supported Formats
When you export drawing data to another format, the following formats are
supported:
■Autodesk SDF (Spatial Data File) (page 1413)
■Autodesk SDF2 (page 1417) (MapGuide 6.5 and earlier)
■ESRI Arc/INFO Coverages (page 1419)
■ESRI ArcSDE (page 1422)
■ESRI ShapeFile (page 1424)
1412 | Chapter 9 Publishing and Sharing Maps

■GML (Geographic Markup Language) (page 1429) (version 3.1.1 )
■MapInfo MIF/MID (page 1431)
■MapInfo TAB (page 1433)
■MicroStation Design (DGN) Versions 7 and 8 (page 1435)
■Shape Multiclass (page 1443)
■VML (Vector Markup Language) (page 1449)
■Image Formats (page 1465)
See also:
■Overview of Converting and Exporting (page 1405)
■Exporting DWG Data to SDF2 Format (page 1417)
■Exporting DWG Data to an FDO Data Store (page 1461)
■Exporting Maps to DWG Format (page 1459)
Exporting To Autodesk SDF (Spatial Data File)
SDF is a native Autodesk file-based geospatial format that is optimized for
storing large, classified data sets.
SDF is like SHP format in that it contains both spatial data and attribute data.
However, unlike SHP, it stores both types of data in a single file rather than
a set of files.
When drawing data is stored as SDF, you can use Autodesk MapGuide
Enterprise to style and publish the data to the Internet. You can also publish
map data directly to MapGuide (page 1376), without exporting to SDF.
NOTE When you export from a map, only drawing objects are exported. Geospatial
features are ignored. To move geospatial feature data to another format, use
Migrating GIS Data (Bulk Copy) (page 617).
Versions
The current version, which works with AutoCAD Map 3D and Autodesk
MapGuide Enterprise, is SDF version 3. AutoCAD Map 3D refers to this version
as “SDF.”
Exporting To Autodesk SDF (Spatial Data File) | 1413

SDF version 2 is still supported by MapGuide 6.5 (and earlier releases), and
AutoCAD Map 3D can import and export SDF 2 using a separate import/export
interface.
Advantages
SDF has the following advantages over DWG:
■It stores and manages an order of magnitude more data than DWG
■It is very fast, allowing Autodesk applications, such as AutoCAD Map 3D
and MapGuide, to read and display tens of thousands of features per second.
■It provides the power of a database without the overhead and cost of a full
relational database management system (RDBMS) such as SQL Server or
Oracle.
■An SDF file can store a single feature class, or it can store multiple feature
classes.
■It is easy to manage, providing access to the database schema.
Exporting
If you export to an existing file, you can choose to overwrite that file or append
the new data to it. Overwriting destroys the existing file and creates a new
one. Appending adds the data in the current export operation to the existing
data without deleting any existing data.
When you append, any existing classes in the target file remain unchanged.
New feature classes and new properties for existing feature classes will be
added.
If the target file contains properties for which the source file has no values,
the resulting file may show those properties as being null or as having default
values, depending on what was specified in the schema.
If the source data contains classes that are not in the target file, those classes
will be created and will have the properties of the source data.
NOTE An index property is added to each feature class when you export. You can
specify the name for this property in the MapExport.ini file (page 264).
A message reports on the export results. Because some entities belong to
multiple feature classes, the number of entities exported may not match the
number of SDF entities created. The message tells you how many DWG entities
were exported more than once. If you base the exported feature classes on
1414 | Chapter 9 Publishing and Sharing Maps

object data or link templates, an entity may be exported more than once if
more than one data table is attached or linked to it.
Driver Options
SDF has no export driver options.
See also:
■Customizing the Import and Export .ini Files (page 264)
NOTE When you export from a map, only drawing objects are exported. Geospatial
features are ignored. To move geospatial feature data to another format, use
Migrating GIS Data (Bulk Copy) (page 617).
■Before moving drawing data to SDF (page 1415)
■To specify the name for the index property used in export (page 1417)
■Other ways to move data into SDF format (page 1417)
Before moving drawing data to SDF
■Clean up any geometry errors. (page 1591)
Use the AutoCAD Map 3D cleanup tools to correct any geometry errors
introduced during drafting, digitizing, or converting the data before you
export it.
■Add attribute data to objects (page 1047) or classify (page 981) the drawing
(DWG) objects you are exporting.
If you create object data tables within a map and add attribute information
or linked objects to data in an external data source, such as a database,
you can export those attributes. If you classify objects, you can use those
classes as the basis for your export.
■Decide how to export the data to SDF.
You can export to a single feature class that uses all the items you specified
on the Feature Class tab. To do this, click Create a single class from all
selected objects and type a name for that class.
You can export data to multiple classes at one time (page 1439) and combine
the data organization in your drawing with your selections on the Feature
Class tab to determine the attributes for each exported feature class.
Exporting To Autodesk SDF (Spatial Data File) | 1415

To export drawing objects to SDF
1In the Tool-based Ribbon Workspace, click Output tab ➤ Map Data
Transfer panel ➤ Map 3D Export.
2In the Export Location dialog box, select the Autodesk SDF file format
and a location for the exported files. Click OK.
3In the Export dialog box (page 1704), specify how to export objects. To use
settings that you stored previously, click Load and select the profile
containing the settings.
4On the Selection tab, specify the objects to export.
■To select a subset of objects, click Select manually and choose either
Select Objects or Quick Select.
■To filter the selection to export only objects on specific layers or in
specific classes, specify the layers and classes to include.
■To export polygons from a polygon topology, select the topology.
■To preview the objects that will be exported, click Preview Filtered
Selection.
5On the Feature Class tab, do the following:
■To create multiple classes, select Create Multiple Classes Based On A
Drawing Object.
See Exporting to Multiple Classes (page 1439).
■Click Select Attributes and select the data to export with the objects.
TIP If you are exporting data from an external database, you can export
the entire record from the database or just the key fields. Because the key
field values are stored in the map, choosing the key field (listed under
Link Templates) makes the export faster.
6On the Options tab, select the options you want.
■To perform a coordinate conversion, you must have a coordinate
system assigned to the map (page 147).
■Check Treat closed polylines as polygons (if it is available) unless you
want only polygon objects to be exported as polygons.
7Click OK to begin the export process.
1416 | Chapter 9 Publishing and Sharing Maps

To specify the name for the index property used in export
■Specify a different name in the MapExport.ini file (page 264), under the
FDO_SDF entry, where you see Driver:fdo_index_column.
Other ways to move data into SDF format
■Export to SDF 2 (page 1417) – Imports and exports the data in the previous
SDF format to and from DWG. MapGuide versions 6.5 and earlier require
this format.
■Bulk Copy (page 615) – Moves data to and from SDF (version 3) and other
geospatial data stores.
Exporting DWG Data to SDF2 Format
Export drawing objects to SDF 2 format to use as a map layer in Autodesk
MapGuide version 6.5 and earlier.
NOTE This format is not readable by the current release of Autodesk MapGuide
Enterprise or MapGuide Open Source. You can publish to Autodesk MapGuide
Enterprise fomat (page 1376).
NOTE When you export from a map, only drawing objects are exported. Geospatial
features are ignored. To move geospatial feature data to another format, use
Migrating GIS Data (Bulk Copy) (page 617).
Along with the objects, you can export data attached to the objects (such as
object data, external data, attribute data, or properties) to use for the following
SDF fields:
■SDF Name — the popup label
■Key — the link to an external database
■URL — the embedded web link that jumps to another web page
Export only one type of object — point, line, polygon, or annotation — to an
SDF file. The associated SIF file is a spatial index format (SIF) file.
Use the coordinate system set in AutoCAD Map 3D or export the file using a
different global coordinate system. You can also define your own coordinate
system for the translation.
Exporting DWG Data to SDF2 Format | 1417

After creating the SDF 2 file, you can use Autodesk MapGuide Author and
Autodesk MapGuide Server to produce the files required to create and deliver
web-viewable maps.
For information about Autodesk MapGuide SDF and SIF files, refer to the
Autodesk MapGuide SDF Loader Help.
See also:
■Publishing to MapGuide (page 1376)
■Importing Autodesk SDF (Spatial Data Files) (page 387)
■Overview of Converting and Exporting (page 1405)
■Importing Autodesk SDF 2 (page 389)
NOTE When you export from a map, only drawing objects are exported. Geospatial
features are ignored. To move geospatial feature data to another format, use
Migrating GIS Data (Bulk Copy) (page 617).
To export DWG data to SDF2 format
1In the Tool-based Ribbon Workspace, click Output tab ➤ Map Data
Transfer panel ➤ As SDF2.
2In the Export dialog box, specify a location and file name. Click Save.
3On the Selection tab of the Autodesk MapGuide Export dialog box (page
1580), under SDF Type, specify the type of data to export:
■Point — Points and inserts.
■Line — Lines, arcs (segmented), polylines, and plines with bulges
(segmented).
■Polygon — Closed polylines and circles.
■Annotation — Text and mtext (mtext exports a single point object).
4On the Selection tab, specify how to select objects for the export.
5On the Options tab, under SDF Description, type a description for the
SDF file to which you are exporting data.
1418 | Chapter 9 Publishing and Sharing Maps

6Under Data Expressions, you can create expressions as follows:
■Use the Key option to define an expression to act as the link between
the SDF file and a field in an external database.
■Use the Name option to define an expression for the SDF Name field.
■Use the URL option to define an expression to act as a URL (Uniform
Resource Locator).
To create an expression using data attached to the object, such as object
data, external data, attribute data, or property values, click… to select
from a list of available data and properties.
NOTE When exporting a map to SDF format, if you use an expression that
references a SQL value, the export process will require a large amount of
swap space. It may be necessary to partition your data into smaller sections.
7Under Coordinate Conversion, select Convert To. To specify a coordinate
conversion as part of the file export, enter the coordinate system code.
8Under Other, select Create Key Index File (KIF) to create a KIF file along
with the SDF file.
9To save your settings as a profile, click Save.
10 Click OK to begin exporting the data.
Quick Reference
MAP2SDF
Exports an SDF 2 format file for use with Autodesk MapGuide, versions 6.5
and earlier.
Click File ➤ Convert DWG To ➤ Autodesk SDF2
(MapGuide6.x...).
Menu
MAP2SDFCommand Line
Autodesk MapGuide Export dialog boxDialog Box
Exporting To ESRI Arc/INFO Coverages
AutoCAD Map 3D supports Arc/INFO version 7.2, 7.3, and 8.x, and E00.
Exporting To ESRI Arc/INFO Coverages | 1419

NOTE When you export from a map, only drawing objects are exported. Geospatial
features are ignored. To move geospatial feature data to another format, use
Migrating GIS Data (Bulk Copy) (page 617).
ESRI Arc/INFO stores coverages on your hard disk as a directory of files. The
main coverage directory, called the workspace, always includes one subdirectory
called INFO. Each coverage is written to its own subdirectory. If you do not
have a coverage workspace on your computer, AutoCAD Map 3D creates one
for you when you export to an ARC/INFO coverage.
Arc/INFO uses elevation values but they are stored in the coverage as a field
in the attribute table. Select the Elevation property to export elevation.
When exporting, the exported file is stored in memory before it is written to
the file. If you run into problems exporting a large drawing, increase the size
of your virtual memory.
PC coverages are single precision. UNIX coverages can be single or double
precision. AutoCAD Map 3D always exports double-precision coverages,
although it does import single- or double-precision coverages.
Map objects such as arcs, splines, and circles are segmented in the coverage.
You can change the settings used for segmentation by editing the mapimport.ini
file.
Exporting Restrictions
When specifying a coverage name, use fewer than 14 characters and do not
use periods in the name. If you use double-byte characters, you can use 6 or
fewer characters.
If you specify a directory name that already exists and it contains a log or text
file, those files may be overwritten.
Arc/INFO also supports a transfer format called E00 which writes all
information out to a single file, which can become quite large.
When exporting text or mtext to Arc/Info Coverages, the resulting objects in
the Coverage data are annotation. AutoCAD Map 3D does not support attribute
data for annotation. As a result any data linked to text objects will be lost
during the export process. The text value itself will be maintained.
1420 | Chapter 9 Publishing and Sharing Maps

Driver Options
When exporting to E00 or coverage format, you can set the following options:
DescriptionOption
Select Double or Single. The default is Double.Coverage Precision
Select None, Partial, or Full.Compression (available only for E00)
Select Create or Bypass. The default is Create.Linear Topology
See also:
■Customizing the Import and Export .ini Files (page 264)
NOTE When you export from a map, only drawing objects are exported. Geospatial
features are ignored. To move geospatial feature data to another format, use
Migrating GIS Data (Bulk Copy) (page 617).
■To change the settings used for segmentation (page 1427)
■To export drawing objects to ESRI Arc/INFO (page 1421)
To change the settings AutoCAD Map 3D uses for segmentation
■Edit the mapexport.ini file.
See To edit the .ini file (page 269).
To export drawing objects to ESRI Arc/INFO
1In the Tool-based Ribbon Workspace, click Output tab ➤ Map Data
Transfer panel ➤ Map 3D Export.
2In the Export Location dialog box, select the ESRI ArcInfo Coverage or
ESRI ArcInfo (E00) Export file format and a location for the exported files.
3In the Export dialog box (page 1704), specify how to export objects. To use
settings that you stored previously, click Load and select the profile
containing the settings.
4On the Selection tab, specify the objects to export.
■To select a subset of objects, click Select manually and choose either
Select Objects or Quick Select.
Exporting To ESRI Arc/INFO Coverages | 1421

■To filter the selection to export only objects on specific layers or in
specific classes, specify the layers and classes to include.
■To export polygons from a polygon topology, select the topology.
■To preview the objects that will be exported, click Preview Filtered
Selection.
5On the Data or Feature Class tab, click Select Attributes and select the
data to export with the objects.
TIP If you are exporting data from an external database, you can export the
entire record from the database or just the key fields. Because the key field
values are stored in the map, choosing the key field (listed under Link
Templates) makes the export faster.
6On the Options tab, select the options you want.
■To perform a coordinate conversion, you must have a coordinate
system assigned to the map (page 147).
■Check Treat closed polylines as polygons (if it is available) unless you
want only polygon objects to be exported as polygons.
■Click Driver Options to set the options described on the Concept tab
for this topic.
7Click OK to begin the export process.
Exporting to ESRI ArcSDE
You can export data from your DWG to a connected ESRI ArcSDE database.
NOTE When you export from a map, only drawing objects are exported. Geospatial
features are ignored. To move geospatial feature data to another format, use
Migrating GIS Data (Bulk Copy) (page 617).
Exporting
You cannot append data to an ESRI ArcSDE data store when exporting from
AutoCAD Map 3D. You must map your DWG data to the existing database
schemas.
1422 | Chapter 9 Publishing and Sharing Maps

Driver Options
ESRI ArcSDE has no export driver options.
See also:
■Bringing In Features from ArcSDE (page 316)
To export DWG data to ESRI ArcSDE:
1Query the data you want from the DWG drawing into your map.
2Connect to the ESRI ArcSDE data store (page 316) to which you want to
move the data.
3Before moving drawing data to ESRI ArcSDE, do the following to your
DWG drawing objects:
■Assign a coordinate system (page 142). This lets you position your data
accurately in a real-world geographic location and align imported
survey or GPS point data. Once you assign a coordinate system, you
can convert to a different system when you export.
■Clean up any geometry errors (page 765). Use the AutoCAD Map 3D
cleanup tools to correct any errors introduced during drafting,
digitizing, or converting the data.
4In the Tool-based Ribbon Workspace, click Output tab ➤ Map Data
Transfer panel ➤ To FDO Connection.
5In the dialog box that appears, choose the data source for the export and
click OK.
6On the Selection tab of the Map Export dialog box (page 1723), specify
which objects to export.
This tab determines how items are selected for export, and not how they
are organized in their exported form. You specify how to organize the
exported material on the Feature Class tab.
7On the Feature Class tab, specify which object properties and attributes
to export to feature class attributes. Note that you cannot create or modify
ArcSDE schemas. You can only map object properties and attributes to
existing feature class attributes.
Exporting to ESRI ArcSDE | 1423

All attributes you specify here are included in all the resulting features
you export to ESRI ArcSDE. For information on how the choices on this
tab determine the properties of the exported feature class, see Exporting
to Multiple Classes (page 1439).
8On the Options tab (page 1704), specify whether to convert the coordinate
system during the export process and choose the coordinate system.
Specify whether to treat closed polylines as polygons when you export.
9Click Save.
Exporting to ESRI SHP
AutoCAD Map 3D supports up to ArcView version 3.2 and 8.x.
NOTE When you export from a map, only drawing objects are exported. Geospatial
features are ignored. To move geospatial feature data to another format, use
Migrating GIS Data (Bulk Copy) (page 617).
About SHP Files
ESRI SHP files store both geometry and attributes (data) for features. A single
shape can have as many as five physical files with the same filename, but
different file extensions:
■.shp— Geometric data. Data for multiple points, polylines, and polygons
can be stored in one SHP file, but each SHP file can store only one type of
geometry. For example, a line SHP file can contain data for rivers, roads,
and pipes.
■.shx — A geometric index to the map features, which can be used by some
applications to find features in disparate sections of a large map.
■.dbf— Attribute data associated with the map features.
■.prj—Projection and coordinate system data. This file is created only if your
map has an assigned coordinate system.
■.idx—Identifies the index field for the related SHP file, which is the unique
identifier for each entity in the SHP file.
1424 | Chapter 9 Publishing and Sharing Maps

Exporting
DWG files can contain multiple geometry types, while SHP files contain only
one. Each ESRI SHP file stores a single type of spatial data: point, line, text, or
polygon. The text SHP files contain attribute text associated with points.
When you create a multi-polygon in AutoCAD Map 3D and then export it to
SHP format, it will appear in its native SHP file as a multi-polygon (a polygon
with multiple exterior rings).
When you export, AutoCAD Map 3D automatically filters the selected objects
and exports the correct type of object to the corresponding SHP file. The
filenames produced by the export operation use the name of the feature class
followed by the geometry type, for example, PARCELS_POLYGON.SHP.
NOTE You cannot name a SHP feature class FeatId. This is a reserved name.
Export Options
You can export a single object to a single file, or you can export multiple
objects to a set of files. There are two methods for multi-file export.
■The single-file option
Unless you have modified the MapExport.ini file, choosing ESRI Shapefile
from the drop-down list in the Export dialog box exports a single geometry
type to a single SHP file. You specify the geometry type on the Selection
tab of the Export dialog box.
■The MapExport.ini folder export option.
You can modify the initialization file (page 269) to include all object types
when exporting drawing objects to ESRI SHP format. This will remove the
object type options and display File Name Prefix field on the Options tab
of the Export dialog box, which lets you create a folder of SHP files using
this prefix, appended by each object type name.
This method is effective when you export all the geometry from a DWG
file and visual fidelity is more important than the preservation of classes
and attributes.
All objects of the same geometry type will be grouped in a single SHP. For
example, if pipes, roads, and streams are all represented by lines, you will
export one SHP containing the geometry and attributes for all three object
types. If streams have attributes that are not shared by pipes, those
attributes will have null values for pipes.
To create polygons in the SHP files using the folder option, you must select
the Treat Closed Polylines As Polygons option. To export closed polylines
as lines, select the Line object type. To export closed polylines as polygons,
Exporting to ESRI SHP | 1425
select the Polygon object type and select Treat Closed Polylines As Polygons
on the Options tab.
All new SHP classes that contain text entities will have a property called
TEXTSTRING. To bring this information back into AutoCAD Map 3D,
select the import option to import points as text.
■The Shape Multiclass (page 1443) export option.
This is a separate option on the drop-down list in the Export dialog box
that exports multiple drawing objects to a set of SHP files in a folder you
specify. Each resulting SHP contains the geometry and attributes for a
single geometry type, and is stored in files that indicate that type, for
example, PARCELS_POLYGON.SHP.
You can specify that the resulting files use a single feature class or multiple
feature classes based on layer, object classification, object data, or link
templates.
You can also export object data or external database links to the corresponding
SHP database (DBF) file.
Export Restrictions
SHP files do not support color; in ArcView, each theme is assigned a color that
is used when an item is drawn.
SHP files do not support circular arcs. During export, arcs, splines, and ellipses
are converted to segmented polylines. You can change the settings used for
segmentation.
Overwriting or Appending
If you export to an existing file, or to a folder containing files with the same
names as those that will be generated by the export, you can choose to
overwrite the existing data or append the new data to it. Overwriting can
destroy existing files when it creates new ones. Appending adds the data in
the current export operation to the existing data without deleting any existing
data.
If you append and you are transforming the coordinate system for the data,
the old data and the new data must both use the same source and target
coordinate systems.
You cannot use the append option to update existing data, but only to add
new data.
If you are using either the folder or the multi-file Shape option and you choose
to append, AutoCAD Map 3D checks the target folder for existing files that
1426 | Chapter 9 Publishing and Sharing Maps

use the same feature class name, even if those files do not have the appropriate
geometry indicator in their file names. For example, exporting parcels would
usually result in a file called PARCELS_POLYGON.SHP. However, if the folder
contains PARCELS.SHP, AutoCAD Map 3D checks its geometry type and
appends to it if it contains polygon information.
NOTE If your data meets these criteria but the export operation fails, try deleting
the .prj file in the target folder and then retrying the export operation.
Driver Options
When exporting to SHP, you can select two Dimension Shape Files or three
Dimension Shape Files from the driver options.
See also:
■Customizing the Import and Export .ini Files (page 264)
NOTE When you export from a map, only drawing objects are exported. Geospatial
features are ignored. To move geospatial feature data to another format, use
Migrating GIS Data (Bulk Copy) (page 617).
■To include all object types when exporting drawing objects to ESRI SHP
format (page 1427)
■To change the settings AutoCAD Map 3D uses for segmentation (page 1427)
■To export drawing objects to SHP (page 1428)
To include all object types when exporting drawing objects to ESRI SHP format
1Modify the initialization file, (page 269) MapExport.ini.
This removes the object type options and display File Name Prefix field
on the Options tab of the Export dialog box.
2Choose the ESRI Shapefile file option from the drop-down list in the
Export dialog box to export to a folder of files.
To change the settings AutoCAD Map 3D uses for segmentation
■Edit the mapexport.ini file.
See To edit the .ini file (page 269).
Exporting to ESRI SHP | 1427
To export drawing objects to SHP
NOTE If you are exporting multiple feature classes, see Exporting To Shape
Multiclass (page 1443).
1In the Tool-based Ribbon Workspace, click Output tab ➤ Map Data
Transfer panel ➤ Map 3D Export.
2In the Export Location dialog box, select the ESRI Shapefile format and
a location for the exported files. Click OK.
3In the Export dialog box (page 1704), specify how to export objects. To use
settings that you stored previously, click Load and select the profile
containing the settings.
4On the Selection tab, specify the objects to export.
■To select a subset of objects, click Select manually and choose either
Select Objects or Quick Select.
■To filter the selection to export only objects on specific layers or in
specific classes, specify the layers and classes to include.
■To export polygons from a polygon topology, select the topology.
■To preview the objects that will be exported, click Preview Filtered
Selection.
5On the Data tab, click Select Attributes and select the data to export with
the objects.
TIP If you are exporting data from an external database, you can export the
entire record from the database or just the key fields. Because the key field
values are stored in the map, choosing the key field (listed under Link
Templates) makes the export faster.
6On the Options tab, select the options you want.
■To perform a coordinate conversion, you must have a coordinate
system assigned to the map (page 147).
■Check Treat closed polylines as polygons (if it is available) unless you
want only polygon objects to be exported as polygons.
■Click Driver Options to select Two Dimension Shape Files or Three
Dimension Shape Files.
1428 | Chapter 9 Publishing and Sharing Maps

7Click OK to begin the export process.
Exporting To Geographic Markup Language (GML)
GML (Geography Markup Language) is an OpenGIS® Implementation
specification that defines an XML encoding for the transport and storage of
geographic information. The specification can be found on the Open GIS
Consortium web site.
You can import and export GML in and out of AutoCAD Map 3D.
NOTE When you export from a map, only drawing objects are exported. Geospatial
features are ignored. To move geospatial feature data to another format, use
Migrating GIS Data (Bulk Copy) (page 617).
Exporting
You can export GML version 3.1.1 files.
If you are exporting GML data in Asian languages, verify that mapexport.ini
contains the language encoding settings you need to export valid GML data
in the desired language.
Driver Options
GML has no export driver options.
See also:
■Customizing the Import and Export .ini Files (page 264)
NOTE When you export from a map, only drawing objects are exported. Geospatial
features are ignored. To move geospatial feature data to another format, use
Migrating GIS Data (Bulk Copy) (page 617).
■To verify language encoding settings for export to GML (page 1429)
■To export drawing objects to GML (page 1430)
To verify language encoding settings for export to GML
■Make sure the language encoding settings in the mapexport.ini file export
valid GML data in the desired language.
Exporting To Geographic Markup Language (GML) | 1429
For more information, see Customizing the Import and Export .ini Files
(page 264).
To export drawing objects to GML
1In the Tool-based Ribbon Workspace, click Output tab ➤ Map Data
Transfer panel ➤ Map 3D Export.
2In the Export Location dialog box, select the GML (Geography Markup
Language) file format and a location for the exported files.
3In the Export dialog box (page 1704), specify how to export objects. To use
settings that you stored previously, click Load and select the profile
containing the settings.
4On the Selection tab, specify the objects to export.
■To select a subset of objects, click Select manually and choose either
Select Objects or Quick Select.
■To filter the selection to export only objects on specific layers or in
specific classes, specify the layers and classes to include.
■To export polygons from a polygon topology, select the topology.
■To preview the objects that will be exported, click Preview Filtered
Selection.
5On the Data tab, click Select Attributes and select the data to export with
the objects.
TIP If you are exporting data from an external database, you can export the
entire record from the database or just the key fields. Because the key field
values are stored in the map, choosing the key field (listed under Link
Templates) makes the export faster.
6On the Options tab, select the options you want.
■To perform a coordinate conversion, you must have a coordinate
system assigned to the map (page 147).
■Check Treat closed polylines as polygons (if it is available) unless you
want only polygon objects to be exported as polygons.
7Click OK to begin the export process.
1430 | Chapter 9 Publishing and Sharing Maps

Exporting To MapInfo MIF/MID
MIF/MID is a file standard used by MapInfo, a desktop mapping system.
AutoCAD Map 3D supports MapInfo up to version 7 MIF/MID files.
NOTE When you export from a map, only drawing objects are exported. Geospatial
features are ignored. To move geospatial feature data to another format, use
Migrating GIS Data (Bulk Copy) (page 617).
About MapInfo MIF/MID Files
MapInfo MIF/MID format stores both geometry and attributes (data) for
features, and is a set of two physical files that work together:
■.mif— Vector geometric data. A single .mif file can contain many different
types of geometry.
■.mid— Attributes for the geometric data.
Exporting
The MIF/MID format does not support ellipses with an angled bounding box
(for example, ellipses whose axes are at an angle to the X and Y axes), so when
you export such ellipses from AutoCAD Map 3D to MIF/MID, they are
segmented. To change the settings AutoCAD Map 3D uses for segmentation,
edit the mapexport.ini file.
Driver Options
MapInfo MIF/MID has no export driver options.
See also:
■Customizing the Import and Export .ini Files (page 264)
NOTE When you export from a map, only drawing objects are exported. Geospatial
features are ignored. To move geospatial feature data to another format, use
Migrating GIS Data (Bulk Copy) (page 617).
■To change the settings AutoCAD Map 3D uses for segmentation (page 1432)
■To export drawing objects to MapInfo (page 1432)
Exporting To MapInfo MIF/MID | 1431

To change the settings AutoCAD Map 3D uses for segmentation
■Edit the mapexport.ini file.
See To edit the .ini file (page 269).
To export drawing objects to MapInfo
1In the Tool-based Ribbon Workspace, click Output tab ➤ Map Data
Transfer panel ➤ Map 3D Export.
2In the Export Location dialog box, select the MapInfo MIF/MID file format
and a location for the exported files.
3In the Export dialog box (page 1704), specify how to export objects. To use
settings that you stored previously, click Load and select the profile
containing the settings.
4On the Selection tab, specify the objects to export.
■To select a subset of objects, click Select manually and choose either
Select Objects or Quick Select.
■To filter the selection to export only objects on specific layers or in
specific classes, specify the layers and classes to include.
■To export polygons from a polygon topology, select the topology.
■To preview the objects that will be exported, click Preview Filtered
Selection.
5On the Data tab, click Select Attributes and select the data to export with
the objects.
TIP If you are exporting data from an external database, you can export the
entire record from the database or just the key fields. Because the key field
values are stored in the map, choosing the key field (listed under Link
Templates) makes the export faster.
6On the Options tab, select the options you want.
■To perform a coordinate conversion, you must have a coordinate
system assigned to the map (page 147).
■Check Treat closed polylines as polygons (if it is available) unless you
want only polygon objects to be exported as polygons.
1432 | Chapter 9 Publishing and Sharing Maps

7Click OK to begin the export process.
Exporting To MapInfo TAB
MapInfo TAB, also referred to as the MapInfo native format, is a
two-dimensional format that stores both feature geometry and attributes (data)
in a set of physical files that have the following file extensions:
NOTE When you export from a map, only drawing objects are exported. Geospatial
features are ignored. To move geospatial feature data to another format, use
Migrating GIS Data (Bulk Copy) (page 617).
About MapInfo TAB Files
■.tab— The main file for a MapInfo table. It is associated with the appropriate
.dat, .id, .map, and .ind files.
■.dat— Tabular data for a table in the MapInfo native format.
■.id— An index to a MapInfo graphical objects (.map) file.
■.map— Contains geographic information describing map objects.
■.ind— An index to a MapInfo tabular (.dat) file.
With AutoCAD Map 3D, you can import and export MapInfo TAB up to version
7.
Exporting
The TAB format does not support ellipses with an angled bounding box (for
example, ellipses whose axes are at an angle to the X and Y axes), so when
you export ellipses from AutoCAD Map 3D to TAB, they are segmented. You
can change the settings AutoCAD Map 3D uses for segmentation in the
mapexport.ini file.
Driver Options
MapInfo TAB has no export driver options.
See also:
■Customizing the Import and Export .ini Files (page 264)
Exporting To MapInfo TAB | 1433
NOTE When you export from a map, only drawing objects are exported. Geospatial
features are ignored. To move geospatial feature data to another format, use
Migrating GIS Data (Bulk Copy) (page 617).
■To change the default text justification setting for MapInfo TAB (page 404)
■To export drawing objects to MapInfo TAB (page 1434)
To change the settings AutoCAD Map 3D uses for segmentation
■Edit the mapexport.ini file.
See To edit the .ini file (page 269).
To export drawing objects to MapInfo TAB
1In the Tool-based Ribbon Workspace, click Output tab ➤ Map Data
Transfer panel ➤ Map 3D Export.
2In the Export Location dialog box, select the MapInfo TAB file format
and a location for the exported files.
3In the Export dialog box (page 1704), specify how to export objects. To use
settings that you stored previously, click Load and select the profile
containing the settings.
4On the Selection tab, specify the objects to export.
■To select a subset of objects, click Select manually and choose either
Select Objects or Quick Select.
■To filter the selection to export only objects on specific layers or in
specific classes, specify the layers and classes to include.
■To export polygons from a polygon topology, select the topology.
■To preview the objects that will be exported, click Preview Filtered
Selection.
5On the Data tab, click Select Attributes and select the data to export with
the objects.
TIP If you are exporting data from an external database, you can export the
entire record from the database or just the key fields. Because the key field
values are stored in the map, choosing the key field (listed under Link
Templates) makes the export faster.
1434 | Chapter 9 Publishing and Sharing Maps

6On the Options tab, select the options you want.
■To perform a coordinate conversion, you must have a coordinate
system assigned to the map (page 147).
■Check Treat closed polylines as polygons (if it is available) unless you
want only polygon objects to be exported as polygons.
7Click OK to begin the export process.
Exporting To MicroStation Design (DGN) Versions 7 and 8
You can import and export Microstation DGN version 7 and 8. Bentley Systems,
Inc., and MicroStation programs use the DGN format, which is like a DWG
file; points, lines, areas, text, and other object types can all be present in the
same file.
NOTE When you export from a map, only drawing objects are exported. Geospatial
features are ignored. To move geospatial feature data to another format, use
Migrating GIS Data (Bulk Copy) (page 617).
Exporting
There are two separate choices for Microstation DGN (version 7 and version
8) in the Export dialog box. You can map layers in the map to DGN levels
when you export. The default is to map layers to level names using the same
name as the layer.
Geometry in DGN 7 files is stored in fixed-point integers. When you export
map data with large coordinate values, you can overflow these values with
unpredictable results. The seed file you use for export has a dramatic effect
on the resulting DGN data.
Every DGN file requires a seed file to give it default information (like the
acad.dwg prototype or template file). The seed file controls working units,
global origin, the version to export, and so on. Several seed files ship with
AutoCAD Map 3D.
The default for a version 7 DGN file is lrgseed.dgn. The default for a version
8 DGN file is lrgseed3d_v8.dgn. Both of these are three-dimensional seed files.
To export to a two-dimensional DGN file, or to set a specific global origin or
specific working units, reference the file name of the desired seed file. The
global origin and units of resolution should be set in a seed file that is
appropriate to your AutoCAD Map 3D drawing coordinates.
Exporting To MicroStation Design (DGN) Versions 7 and 8 | 1435

The seed file you use significantly affects the outcome of the export process.
If the design plane coordinate bounds in the seed file do not fully contain the
extents of the AutoCAD Map 3D drawing, AutoCAD Map 3D repeats the export
operation automatically using the Compute Optimal Seed File option. If the
second export operation fails, manually choose a seed file that works for your
region and coordinate system.
Export Restrictions
Closed objects are not filled, even if they were filled originally.
Hatch patterns are not exported. If you export polygon data that is hatched
in AutoCAD Map 3D, the resulting data is not filled in MicroStation.
Driver Options for DGN 7
You can set the following options when exporting DGN 7 files:
DescriptionOption
Select the coordinate units of the features: Master or Sub.
Select the unit that matches the default unit in your Auto-
Coordinate Units
CAD Map 3D drawing. For example, if the default unit in
your AutoCAD Map 3D drawing is meters, and you are
using a seed file that defines meters as the Master unit,
then select Master. The default is the Master unit.
Select the seed file, which controls whether or not the
output DGN file is two-dimensional or three-dimensional,
Seed File
sets the coordinate units, sets global origin, and so on. You
must use a version 7 DGN seed file.
Select this option to override all seed file settings and have
AutoCAD Map 3D calculate the settings for you. AutoCAD
Compute Parameters
Map 3D determines the largest dimension for the set of
exported objects and sets the appropriate range and pre-
cision. It sets the UOR per Sub to 10, and sets the Global
Origin to the center of the bounding rectangle of the ex-
ported objects.
Select this option to override the global origin setting in
the seed file. Specify the global origin to use.
Override Global Origin
1436 | Chapter 9 Publishing and Sharing Maps
Driver Options for DGN 8
You can set the following options when exporting DGN 8 files:
DescriptionOption
Select the coordinate units of the features: Master or Sub.
Select the unit that matches the default unit in your Auto-
Coordinate Units
CAD Map 3D drawing. For example, if the default unit in
your AutoCAD Map 3D drawing is meters, and you are
using a seed file that defines meters as the Master unit,
then select Master. The default is the Master unit.
Select the seed file, which controls whether or not the
output DGN file is two-dimensional or three-dimensional,
sets the coordinate units, sets global origin, and so on.
Seed File
See also:
■Customizing the Import and Export .ini Files (page 264)
■Importing Objects with Links to an External Database (page 433)
NOTE When you export from a map, only drawing objects are exported. Geospatial
features are ignored. To move geospatial feature data to another format, use
Migrating GIS Data (Bulk Copy) (page 617).
■To change the seed file for a single file (page 1437)
■To change the default seed file (page 1438)
■To export drawing objects to MicroStation Design (DGN) (page 1438)
To change the seed file for a single file
1In the Export dialog box, click the Options tab.
2Click Driver Options.
3In the Design File Output Settings (page 1736), under Seed File, click .
NOTE If you are a limited rights user, be sure that the seed file is in a location
where you have access to it.
Exporting To MicroStation Design (DGN) Versions 7 and 8 | 1437
4In the Select Seed File dialog box, navigate to the location of the seed file
to use and select the file.
NOTE Be sure to specify a seed file designed for the version of DGN you
specified in the Export Location dialog box. You cannot use a DGN version
8 seed file when exporting to DGN version 7.
5Click Open.
To change the default seed file
1Open the mapexport.ini file using a text editor such as WordPad.
This file is in the C:\Documents and Settings\All Users\Application
Data\Autodesk\AutoCAD Map 3D\R17.2 folder.
2Find the section labeled [DGN_V7] or [DGN_V8]. This is where the default
seed file is specified.
3Specify the new default seed file.
For example: Driver:RUNTIME_MACROS=_SEED,"C:\Program Files\Common
Files\Autodesk Shared\GIS\ImportExport\4.0\design\seed3d_ft.dgn".
4Save and close the .ini file.
To export drawing objects to MicroStation Design (DGN)
1In the Tool-based Ribbon Workspace, click Output tab ➤ Map Data
Transfer panel ➤ Map 3D Export.
2In the Export Location dialog box, select the MicroStation File V7 or V8
file format and a location for the exported files.
3In the Export dialog box (page 1704), specify how to export objects. To use
settings that you stored previously, click Load and select the profile
containing the settings.
4On the Selection tab, specify the objects to export.
■To select a subset of objects, click Select manually and choose either
Select Objects or Quick Select.
■To filter the selection to export only objects on specific layers or in
specific classes, specify the layers and classes to include.
1438 | Chapter 9 Publishing and Sharing Maps

■To export polygons from a polygon topology, select the topology.
■To preview the objects that will be exported, click Preview Filtered
Selection.
5On the Data or Feature Class tab, click Select Attributes and select the
data to export with the objects.
TIP If you are exporting data from an external database, you can export the
entire record from the database or just the key fields. Because the key field
values are stored in the map, choosing the key field (listed under Link
Templates) makes the export faster.
6On the Options tab, select the options you want.
■To perform a coordinate conversion, you must have a coordinate
system assigned to the map (page 147).
■Check Treat closed polylines as polygons (if it is available) unless you
want only polygon objects to be exported as polygons.
■Select Map Layers To DGN Levels to map each layer in the current
map to a level in the DGN drawing. Specify the layers and the
corresponding names for the DGN levels. DGN version 7 names can
be numbers or strings. For DGN version 8, names must be strings.
Closed polylines are always exported as polygons; they will be shapes
in the DGN v8 file. You cannot clear the Treat Closed Polylines as
Polygons check box.
■Click Driver Options to set the options described on the Concept tab
of this dialog box.
7Click OK to begin the export process.
Exporting to Multiple Classes
You can export selected data to multiple feature classes during one export
operation for the following formats:
■Autodesk SDF (page 1413)
■Oracle (page 1461)
■ESRI ArcSDE (page 1422)
Exporting to Multiple Classes | 1439

■SQLite (page 1447)
NOTE When you export from a map, only drawing objects are exported. Geospatial
features are ignored. To move geospatial feature data to another format, use
Migrating GIS Data (Bulk Copy) (page 617).
Using the Feature Class Tab on the Export Dialog Box
Use the Feature Class tab for attributes that should be associated with all output
feature classes. For example, suppose you have created three sets of objects:
each set contains water lines, electrical lines, and sewer lines, but you have
color-coded them to represent different maintenance dates. You can select
objects based on color, and export them to multiple feature classes (water,
electrical, and sewer). You can select an attribute on the Feature Class tab
(maintenance date, for example), and apply it to all three feature classes when
you export them.
However, if the objects you are exporting already have associated attributes,
it may be best if you do not select any attributes on the Feature Class tab.
See also:
■Overview of Converting and Exporting (page 1405)
■Exporting DWG Data to an FDO Data Store (page 1461)
NOTE When you export from a map, only drawing objects are exported. Geospatial
features are ignored. To move geospatial feature data to another format, use
Migrating GIS Data (Bulk Copy) (page 617).
■To export multiple feature classes (page 1440)
■To combine multiple layers into one feature class (page 1442)
■To change the class names that are assigned automatically (page 1442)
To export multiple feature classes
1Click Create multiple classes based on a drawing property on the Feature
Class tab of the Export dialog box (page 1405).
2Specify the basis for the target feature classes by selecting an item from
the Drawing Object To Use list.
For example, select Layers or Object Data.
1440 | Chapter 9 Publishing and Sharing Maps

Only the methods relevant to your map are listed. For example, if you
did not classify objects in the map, you will not see the Object
Classification option.
The classification method you choose determines the resulting feature
class attributes, as shown in the following table:
End resultSelect Attributes
Dialog Box set-
tings
OutputMultiple class
export
classification
method
No attributes in the output
feature classes
Nothing selectedA feature class
for each expor-
ted layer
Layers
All feature classes contain all
attributes that were selected in
Attributes selectedA feature class
for each expor-
ted layer
Layers
the Select Attributes dialog
box.
Output feature classes inherit
their attributes from the Object
Nothing selectedA feature class
for each object
Object Data
(page 198) or Link
Data table or Link Template
definitions.
associated
with an object
Templates (page
522)
data table or
link template.
Output feature classes inherit
their attributes from the Object
Attributes selectedA feature class
for each object
Object data or
link templates
Data table or Link Templateassociated
definitions AND all attributeswith an object
selected in the Select Attributesdata table or
link template. dialog box are also assigned to
all output feature classes.
Output feature classes inherit
their attributes from the object
class.
Nothing selectedA feature class
for each expor-
ted object
class.
Object class
(page 116)
Output feature classes inherit
their attributes from the Object
Attributes selectedA feature class
for each expor-
Object class
Class AND all attributes selec-ted object
class. ted in the Select Attributes
Exporting to Multiple Classes | 1441
End resultSelect Attributes
Dialog Box set-
tings
OutputMultiple class
export
classification
method
dialog box are also assigned to
all output feature classes.
The grid automatically fills with the drawing objects and the names of
the feature classes to which they will be mapped. To remove any object
from the list, deselect its check box.
3To change the name of the target feature class for an object, click in its
Feature Class cell. Select the existing name and enter a new one.
4To change the properties for the feature class, click in its Feature Class
cell and then click within the cell. In the Feature Class Property
Mapping dialog box (page 1727), click Select Attributes to display the Select
Attributes dialog box (page 1729), where you can select the attributes to
map to the feature class.
5If you select .COLOR, .LINEWEIGHT, or .LINETYPE, specify the data type
for the target feature class property by clicking in the Drawing Attributes
cell. In the New Property Data Type dialog box (page 1726), select a data
type.
To combine multiple layers into one feature class
1On the Feature Class tab of the Export dialog box (page 1405), select Create
a single class from all selected objects.
2In the Feature Class column, give the new feature class an appropriate
name.
For example, if your DWG file has three layers called text_City,
text_County, and text_Region, you can name the combined feature class
“Text” in the Feature Class column.
To change the class names that are assigned automatically
1Click the Feature Class field.
2Edit the proposed class names as needed.
3Click OK.
1442 | Chapter 9 Publishing and Sharing Maps

Exporting To Shape Multiclass
Drawing (DWG) objects can contain multiple geometry types, while SHP files
contain only one. However, the Shape Multiclass option lets you export
multiple drawing objects to a set of SHP files in a folder you specify. Each
resulting SHP will contain the geometry and attributes for a single geometry
type. For example, if pipes, roads, and streams are all represented by lines,
you will export three sets of SHP files, each one containing the geometry and
attributes for one of those object types. For information about the set of files
produced for SHP and their naming conventions, see Importing ESRI Shape
Files (page 397).
NOTE There is also an MapExport.ini folder (page 397) export option.
NOTE When you export from a map, only drawing objects are exported. Geospatial
features are ignored. To move geospatial feature data to another format, use
Migrating GIS Data (Bulk Copy) (page 617).
Exporting
You can specify that the resulting files use a single feature class or multiple
feature classes based on layer, object classification, object data, or link
templates.
All new SHP classes that contain text entities will have a property called
TEXTSTRING. To bring this information back into AutoCAD Map 3D, select
the import option to import points as text.
To create polygons when you use this export option, select the Treat Closed
Polylines As Polygons option. When you create a multi-polygon in AutoCAD
Map 3D and then save or export it to SHP format, it will appear in its native
SHP file as a multi-polygon (a polygon with multiple exterior rings).
You can export to a single feature class that uses all the items you specified
on the Data tab. To do this, click One class and type a name for that class.
You can export data to multiple classes at one time (page 1439) and combine
the data organization in your drawing with your selections on the Data tab
to determine the attributes for each exported feature class.
Export Restrictions
SHP files do not support color; in ArcView, each theme is assigned a color that
is used when an item is drawn.
Exporting To Shape Multiclass | 1443

SHP files do not support circular arcs. During export, arcs, splines, and ellipses
are converted to segmented polylines. You can change the settings used for
segmentation in the mapexport.ini file.
You cannot map fields when you export to Shape Multiclass. If you need to
map fields, export your DWG data to SDF first, and then use Migrating Data
(page 615) Bulk Copy to export the data to SHP.
Overwriting and Appending
If you export to an existing folder containing files with the same names as
those that will be generated by the export, you can choose to overwrite the
existing data or append the new data to it. Overwriting can destroy the existing
files when it creates new ones. Appending adds the data in the current export
operation to the existing data without deleting any existing data. If you append
and you are transforming the coordinate system for the data, the old data and
the new data must both use the same source and target coordinate systems.
You cannot use the append option to update existing data, but only to add
new data.
NOTE If your data meets these criteria but the export operation fails, try deleting
the relevant .prj files in the target folder and then retry the export operation.
Driver Options
When exporting to SHP files, you can select 2 Dimension Shape Files or 3
Dimension Shape Files from the driver options.
See also:
■Customizing the Import and Export .ini Files (page 264)
■Importing ESRI Shape Files (page 397)
NOTE When you export from a map, only drawing objects are exported. Geospatial
features are ignored. To move geospatial feature data to another format, use
Migrating GIS Data (Bulk Copy) (page 617).
■To change the settings used for segmentation (page 1445)
■To export drawing objects to Shape Multiclass (page 1445)
■To map fields when exporting to Shape Multiclass (page 1446)
■To create polygons when exporting to SHP Multiclass (page 1446)
1444 | Chapter 9 Publishing and Sharing Maps

■To export to a single feature class that uses all the items you specified on
the Data tab. (page 1446)
To change the settings AutoCAD Map 3D uses for segmentation
■Edit the mapexport.ini file.
See To edit the .ini file (page 269).
To export drawing objects to Shape Multiclass
1In the Tool-based Ribbon Workspace, click Output tab ➤ Map Data
Transfer panel ➤ Map 3D Export.
2In the Export Location dialog box, select the Shape Multiclass file format
and a location for the exported files. Click OK.
3In the Export dialog box (page 1704), specify how to export objects. To use
settings that you stored previously, click Load and select the profile
containing the settings.
4On the Selection tab, specify the objects to export.
■To select a subset of objects, click Select manually and choose either
Select Objects or Quick Select.
■To filter the selection to export only objects on specific layers or in
specific classes, specify the layers and classes to include.
■To export polygons from a polygon topology, select the topology.
■To preview the objects that will be exported, click Preview Filtered
Selection.
5On the Data tab, click Select Attributes and select the data to export with
the objects.
TIP If you are exporting data from an external database, you can export the
entire record from the database or just the key fields. Because the key field
values are stored in the map, choosing the key field (listed under Link
Templates) makes the export faster.
6On the Options tab, select the options you want.
■To perform a coordinate conversion, you must have a coordinate
system assigned to the map (page 147).
Exporting To Shape Multiclass | 1445
■Check Treat closed polylines as polygons (if it is available) unless you
want only polygon objects to be exported as polygons.
■To create multiple classes, select Multiple Classes and specify what
the feature classes will be based on (for example, layer).
Your choices on the Options tab and on the Data tab work together
to determine how attributes are assigned to the exported feature
classes. See the Concept tab in this topic for more information.
■Click Driver Options to select Two Dimension Shape Files or Three
Dimension Shape Files.
7Click OK to begin the export process.
To map fields when exporting to Shape Multiclass
1Export your DWG data to SDF first. See Exporting To Autodesk SDF
(Spatial Data File) (page 1413).
2Use Bulk Copy (page 615) to export the data to SHP.
Bulk Copy allows you to map fields.
To create polygons when exporting to SHP Multiclass
1In the Map Export dialog box (page 1723), on the Options tab, select the
Treat Closed Polylines As Polygons option.
2Do one of the following:
■To export closed polylines as lines, select the Line object type.
■To export closed polylines as polygons, select the Polygon object type
and select Treat Closed Polylines As Polygons on the Options tab
To export to a single feature class that uses all the items you specified on the
Data tab.
1In the Map Export dialog box (page 1723), Options tab, select One class.
2Type a name for that class.
You can export data to multiple classes at one time (page 1439) and combine
the data organization in your drawing with your selections on the Data
tab to determine the attributes for each exported feature class.
1446 | Chapter 9 Publishing and Sharing Maps

Exporting To SQLite
SQLite is a file-based geospatial format.
SQLite is like SHP format in that it contains both spatial data and attribute
data. However, unlike SHP, it stores both types of data in a single file rather
than a set of files.
NOTE When you export from a map, only drawing objects are exported. Geospatial
features are ignored. To move geospatial feature data to another format, use
Migrating GIS Data (Bulk Copy) (page 617).
Exporting
You can specify that the resulting files use a single feature class or multiple
feature classes based on layer, object classification, object data, or link
templates. SQLite files can have a single schema only, but can contain multiple
feature classes.
To create polygons when you use this export option, select the Treat Closed
Polylines As Polygons option.
To export to a single feature class that uses all the items you specified on the
Data tab, click One class and type a name for that class.
You can export data to multiple classes at one time. (page 1439) Combine the
data organization in your drawing with your selections on the Data tab to
determine the attributes for each exported feature class.
Driver Options
There are no export driver options for SQLite
See also:
■Customizing the Import and Export .ini Files (page 264)
■Importing ESRI Shape Files (page 397)
NOTE When you export from a map, only drawing objects are exported. Geospatial
features are ignored. To move geospatial feature data to another format, use
Migrating GIS Data (Bulk Copy) (page 617).
Before moving drawing data to SQLite
■Clean up any geometry errors. (page 1591)
Exporting To SQLite | 1447

Use the AutoCAD Map 3D cleanup tools to correct any geometry errors
introduced during drafting, digitizing, or converting the data before you
export it.
■Add attribute data to objects (page 1047) or classify (page 981) the drawing
(DWG) objects you are exporting. You can export information with drawing
data in the following circumstances:
■If you create object data tables and add attribute information
■If you link objects to data in an external data source, such as a database
■If you classify objects, you can use those classes as the basis for your
export
■Decide how to export the data to SQLite.
You can export to a single feature class that uses all the items you specified
on the Feature Class tab. To do this, click Create a single class from all
selected objects and type a name for that class.
You can export data to multiple classes at one time (page 1439). Combine
the data organization in your drawing with your selections on the Feature
Class tab to determine the attributes for each exported feature class.
To export drawing objects to SQLite
1In the Tool-based Ribbon Workspace, click Output tab ➤ Map Data
Transfer panel ➤ Map 3D Export.
2In the Export Location dialog box, select the SQLite Spatial (sqlite) file
format and a location for the exported files. Click OK.
3In the Export dialog box (page 1704), specify how to export objects. To use
settings that you stored previously, click Load and select the profile
containing the settings.
4On the Selection tab, specify the objects to export.
■To select a subset of objects, click Select manually and choose either
Select Objects or Quick Select.
■To filter the selection to export only objects on specific layers or in
specific classes, specify the layers and classes to include.
■To export polygons from a polygon topology, select the topology.
1448 | Chapter 9 Publishing and Sharing Maps

■To preview the objects that will be exported, click Preview Filtered
Selection.
5On the Feature Class tab, do the following:
■To create multiple classes, select Create Multiple Classes Based On A
Drawing Object.
See Exporting to Multiple Classes (page 1439).
■Click Select Attributes and select the data to export with the objects.
TIP If you are exporting data from an external database, you can export
the entire record from the database or just the key fields. Because the key
field values are stored in the map, choosing the key field (listed under
Link Templates) makes the export faster.
6On the Options tab, select the options you want.
■To perform a coordinate conversion, you must have a coordinate
system assigned to the map (page 147).
■Check Treat closed polylines as polygons (if it is available) unless you
want only polygon objects to be exported as polygons.
7Click OK to begin the export process.
To move data into SQLite format
■Bulk Copy (page 615) – Moves data to and from SQLite and other geospatial
data stores.
Exporting To VML (Vector Markup Language)
AutoCAD Map 3D supports VML (Vector Markup Language). VML, which is
written using the XML syntax, is a text-based markup language used for
describing vector graphics. VML is an export-only format.
NOTE When you export from a map, only drawing objects are exported. Geospatial
features are ignored. To move geospatial feature data to another format, use
Migrating GIS Data (Bulk Copy) (page 617).
Exporting To VML (Vector Markup Language) | 1449
Exporting
When you export to VML format, AutoCAD Map 3D creates a single HyperText
Markup Language (HTML) file with the VML data contained in the <body>
region of the HTML.
When you export objects, be sure that the objects have a color that will be
visible on the target page. For example, if you are exporting to a page with a
white background, be sure that the objects themselves are not white.
You can specify the following attributes for VML objects:
DescriptionVML Attribute
The title of the feature that may be displayed by the VML
viewer. (The title appears as a ToolTip when the user places
their mouse over the feature. Range: string Default: none
vml_title
The URL to jump to if this feature is clicked. Range: string De-
fault: none
vml_url
The target frame in the URL. Range: string Default: nonevml_target
The z-index of the feature in the output VML file. Positive
numbers are in front of the screen; negative numbers are be-
vml_z_index
hind the screen. Features having a higher z-index obscure
features with a lower z-index. Range: integer Default: 0 for
vml_polygon features 10 for vml_polyline features 11 for
vml_point features 12 for vml_text features
Driver Options
VML has no export driver options.
NOTE When you export from a map, only drawing objects are exported. Geospatial
features are ignored. To move geospatial feature data to another format, use
Migrating GIS Data (Bulk Copy) (page 617).
To export drawing objects to Vector Markup Language (VML)
1In the Tool-based Ribbon Workspace, click Output tab ➤ Map Data
Transfer panel ➤ Map 3D Export.
1450 | Chapter 9 Publishing and Sharing Maps

2In the Export Location dialog box, select the Vector Markup Language
(VML) file format and a location for the exported files.
3In the Export dialog box (page 1704), specify how to export objects. To use
settings that you stored previously, click Load and select the profile
containing the settings.
4On the Selection tab, specify the objects to export.
■To select a subset of objects, click Select manually and choose either
Select Objects or Quick Select.
■To filter the selection to export only objects on specific layers or in
specific classes, specify the layers and classes to include.
■To export polygons from a polygon topology, select the topology.
■To preview the objects that will be exported, click Preview Filtered
Selection.
5On the Data tab, click Select Attributes and select the data to export with
the objects.
TIP If you are exporting data from an external database, you can export the
entire record from the database or just the key fields. Because the key field
values are stored in the map, choosing the key field (listed under Link
Templates) makes the export faster.
6On the Options tab, select the options you want.
■To perform a coordinate conversion, you must have a coordinate
system assigned to the map (page 147).
■Check Treat closed polylines as polygons (if it is available) unless you
want only polygon objects to be exported as polygons.
7Click OK to begin the export process.
Exporting Point Cloud Data
You can export point cloud data to LiDAR (LAS version 1.2) or space-delimited
ASCII (.xyz) formats. These formats can be shared with other applications that
read LiDAR data. To use this data in AutoCAD Map 3D, you must import and
index the data again. See Bringing in LiDAR Data (page 374).
Exporting Point Cloud Data | 1451

You can also export point cloud data to the Autodesk SDF format. You can
connect to a point cloud SDF file as you would to any SDF data store. Exporting
your point cloud data to SDF format is useful for creating geospatial features
from LiDAR data.
NOTE Because point clouds can contain millions or billions of points, SDF files
created from point clouds can be very large. Before you export your point cloud
to SDF format, filter the point cloud down to the smallest usable size. For best
performance, filter the point cloud down to one million points or fewer.
NOTE You cannot export point cloud data from an index file created using
AutoCAD commands (.PCG file).
To export point cloud data to LAS or ASCII formats
1Right click the point cloud or point cloud layer you want to export, then
select Export Point Cloud. The Export Point Cloud dialog box appears.
2Select the file type to which you want to export your point cloud data
in the File of Type field.
3Specify a file name and save location.
4Click Save.
To export point cloud data to Autodesk SDF format
Before you export point cloud data to SDF format, use the Point Cloud Manager
(page 1897) to create a filtered point cloud containing only the necessary points.
For best performance, filter your point cloud down to one million points or
fewer.
1Right click the point cloud or point cloud layer you want to export, then
select Export as SDF. The Export Point Cloud as SDF dialog box appears.
2Specify a file name and save location.
3Click Save.
Mapping Drawing Attributes to Feature Class Properties
You can map drawing attribute properties to feature class properties when
you export DWG data to the SDF format. You can also map specific values of
the AutoCAD drawing properties .COLOR, .LINETYPE, and .LINEWEIGHT to
specific feature class property values. For example, you could specify that all
1452 | Chapter 9 Publishing and Sharing Maps
pipes drawn with green lines are eight-inch pipes, or that all roads drawn with
.25 mm lines are two-lane roads.
NOTE When you export from a map, only drawing objects are exported. Geospatial
features are ignored. To move geospatial feature data to another format, use
Migrating GIS Data (Bulk Copy) (page 617).
Tell me more
Video
■Show me how to export styled DWG ob-
jects.
■Show me how to view the contents of
the SDF file.
Procedures
■To map drawing attributes to feature
class properties (page 1454)
■To map AutoCAD drawing attribute
values to feature class property values
(page 1454)
Tutorials
■Lesson 1: Convert Drawing Layers to
Feature Classes
■Batch Exporting
Workflow
■Move CAD Data to GIS
GIS Skills
■Convert styled DWG objects to features.
Related topics
■Overview of Publishing and Sharing
(page 1357)
■Exporting To Autodesk SDF (Spatial
Data File) (page 1413)
■Overview of Exporting Attribute Data
(page 1472)
Mapping Drawing Attributes to Feature Class Properties | 1453

NOTE When you export from a map, only drawing objects are exported. Geospatial
features are ignored. To move geospatial feature data to another format, use
Migrating GIS Data (Bulk Copy) (page 617).
To map drawing attributes to feature class properties
1In the Map Export dialog box (page 1723), click the Feature Class tab.
2Select the drawing objects you want to map to feature class properties.
3In the Feature Class column, click the [...] button.
4In the Feature Class Property Mapping dialog box, select or enter the
feature class property to which the drawing attributes should be mapped.
5You can select additional drawing objects and attributes to export by
clicking the Select Attributes button.
6Click OK.
To map AutoCAD drawing attribute values to feature class property values
1In the Map Export dialog box (page 1723), click the Feature Class tab.
2Select the drawing attributes you want to map to feature class properties.
3In the Feature Class column, click the [...] button.
4In the Feature Class Property Mapping dialog box, select the feature class
property to which the drawing attribute values should be mapped.
5You can select additional drawing properties and attributes to export by
clicking the Select Attributes button.
6In the Drawing Attributes column, click the [...] button in the field of the
attribute to be mapped to the feature class property.
7In the New Property Data Type dialog box, select the appropriate data
type from the drop-down list.
8Click OK.
9In the Property Value Mapping dialog box, map the drawing attribute
values to the specific feature class values.
10 Click OK.
1454 | Chapter 9 Publishing and Sharing Maps

Quick Reference
MAPEXPORT
Exports drawing objects and their attribute data to an external file format
Click File ➤ Convert DWG To ➤ Map 3D Export.
Menu
Export Map File
Icon
MAPEXPORTCommand Line
Export dialog boxDialog Box
MAPEXPORTFDO
Export to an FDO data store
Click File ➤ Convert DWG To ➤ FDO Connection.
Menu
MAPEXPORTFDOCommand Line
Exporting Text Enclosed in a Polyline
If your map includes text that is enclosed in a polyline, you can turn that text
into object data and export it as attribute data attached to the polyline.
NOTE When you export from a map, only drawing objects are exported. Geospatial
features are ignored. To move geospatial feature data to another format, use
Migrating GIS Data (Bulk Copy) (page 617).
See also:
■Overview of Converting and Exporting (page 1405)
■Setting Up Object Data (page 198)
NOTE When you export from a map, only drawing objects are exported. Geospatial
features are ignored. To move geospatial feature data to another format, use
Migrating GIS Data (Bulk Copy) (page 617).
To export text enclosed in a polyline as attribute data
1Create an object data table (page 201) with one field.
Exporting Text Enclosed in a Polyline | 1455
2Use the Generate Links (page 1067) command to automatically attach data
to objects.
In the Generate Data Links dialog box (page 1807), select the Enclosed Text
option. This option links the text data to the polyline enclosing the text.
Under Data Links, select Create Object Data Records and select the name
of the table you created in step 1.
Click OK and select the objects you want. For each selected object,
AutoCAD Map 3D creates a new record in the selected object data table
and fills the record with the enclosed text.
3In the Tool-based Ribbon Workspace, click Output tab ➤ Map Data
Transfer panel ➤ Map 3D Export.
4On the Data or Feature Class tab of the Map Export dialog box (page 1723),
select the table you created in step 1. Select any other export options you
want and export the objects.
Quick Reference
ADEDEFDATA
Defines object data
Setup menu ➤ Define Object Data
Menu
Define Object Data
Icon
ADEDEFDATACommand Line
Define Object Data dialog boxDialog Box
ADEGENLINK
Automatically links objects to object data or external database records
In the Classic workspace, click Setup menu ➤ More
Link Template Options ➤ Generate Links
Menu
ADEGENLINKCommand Line
In Map Explorer, right-click a link
template ➤ Generate Links
Task Pane
1456 | Chapter 9 Publishing and Sharing Maps
Generate Data Links dialog boxDialog Box
MAPEXPORT
Exports drawing objects and their attribute data to an external file format
Click File ➤ Convert DWG To ➤ Map 3D Export.
Menu
Export Map File
Icon
MAPEXPORTCommand Line
Export dialog boxDialog Box
Exporting Polygons from a Polygon Topology
Exporting polygons from a polygon topology is useful when you export data
to an external file format that supports polygons.
During this operation, you can create a group containing all the elements of
complex areas, such as islands. If the islands themselves have nested islands
or other polygons, these nested polygons will form a separate grouping
automatically, creating different levels of grouping. If two or more inner
polygons are not nested but share the same outer boundary, they are treated
as one group.
NOTE When you export from a map, only drawing objects are exported. Geospatial
features are ignored. To move geospatial feature data to another format, use
Migrating GIS Data (Bulk Copy) (page 617).
See also:
■Overview of Converting and Exporting (page 1405)
■Creating Closed Polylines from a Polygon Topology (page 897)
■Converting Polylines to Polygons (page 970)
■Converting Polygon Topology to Polygons (page 972)
NOTE When you export from a map, only drawing objects are exported. Geospatial
features are ignored. To move geospatial feature data to another format, use
Migrating GIS Data (Bulk Copy) (page 617).
Exporting Polygons from a Polygon Topology | 1457
To export polygons from a polygon topology
1In the Tool-based Ribbon Workspace, click Output tab ➤ Map Data
Transfer panel ➤ Map 3D Export.
2In the Map Export dialog box (page 1723), select the topology to export.
All complete polygons in the selected topology are automatically selected.
3Select Group Complex Polygons to group nested polygons into a single,
balanced polygon.
If you do not select the Group Complex Polygons option, AutoCAD Map
3D creates a separate polygon for each centroid.
To create a single polygon from nested polygons, each nested polygon
must have a centroid. For example, if three polygons are nested one
within another, and the middle polygon does not have a centroid,
AutoCAD Map 3D creates separate polygons for the inner polygon and
the outer polygon.
4Set any other export options.
Quick Reference
MAPEXPORT
Exports drawing objects and their attribute data to an external file format
Click File ➤ Convert DWG To ➤ Map 3D Export.
Menu
Export Map File
Icon
MAPEXPORTCommand Line
Export dialog boxDialog Box
Saving Drawing Objects to a DXF File
You can create DXF files for use with previous versions of AutoCAD or with
any other application that supports the DXF format.
1458 | Chapter 9 Publishing and Sharing Maps

NOTE All topology information, links to external databases, object data, and civil
objects are lost when you use this command. Only drawing objects are exported.
Geospatial features are ignored. To move geospatial feature data to another format,
use Migrating GIS Data (Bulk Copy) (page 617).
See also:
■Importing DXF Files (page 391)
NOTE All topology information, links to external databases, object data, and civil
objects are lost when you use this command. Only drawing objects are exported.
Geospatial features are ignored. To move geospatial feature data to another format,
use Migrating GIS Data (Bulk Copy) (page 617).
To create a DXF file
1Click ➤ Save As ➤ AutoCAD Drawing.
2Select a type of DXF from the Files of Type list.
3Specify a name and location for the file and click Save.
Quick Reference
SAVEAS
Saves an unnamed drawing with a file name or renames the current drawing
File menu ➤ Save As
Menu
SAVEASCommand Line
Exporting Maps to DWG Format
You can save both geospatial features and DWG objects to DWG format from
the Display Manager. This allows you to share styled maps with users who do
not have Display Manager(for example, users of AutoCAD or a previous version
of AutoCAD Map 3D).
In the output drawing, styling is preserved, but object attributes, labels, and
any joined data (page 507) are not. You can view the output drawing with
Exporting Maps to DWG Format | 1459
previous versions of AutoCAD Map 3D and with AutoCAD, and the output
drawing can be used by the Sheet Set Manager.
Each display layer in your map is saved to a corresponding layer in the target
drawing.
To output multiple maps based on different zoom scales, you must save
individual maps for each desired zoom scale.
Tell me more
Video
■Show me how to export the current map
to DWG format.
■Show me how the map looks after con-
version to DWG format
Procedures
■To save a styled map to DWG format
(page 1460)
Workflow
■Send GIS Data to AutoCAD
GIS Skills
■Save the current map in DWG format
with visual fidelity.
Related topics
■Moving DWG Data to a Spatial Data
Store and Back Again (page 1465)
■Migrating DWG Data to GIS (page 628)
■Geospatial Features and Drawing Ob-
jects (page 9)
■Converting Data From Other Formats
to Drawing Objects (page 377)
To save a styled map to DWG format
1Build your map, styling your feature, and drawing layers as desired.
2Display the map at the scale you want recipients to share.
1460 | Chapter 9 Publishing and Sharing Maps
3In the Tool-based Ribbon Workspace, click Output tab ➤ Map Data
Transfer panel ➤ Current Map As DWG.
4In the Save Current Map To DWG dialog box, specify a location and file
name for the exported map and click Save.
Exporting DWG Data to an FDO Data Store
You can move DWG (drawing object) data into any Oracle database to which
you have connected in AutoCAD Map 3D. You can also move DWG data into
existing ESRI ArcSDE data stores to which you have connected in AutoCAD
Map 3D.
NOTE Only drawing objects are exported. Geospatial features are ignored. To
move geospatial feature data to another format, use Migrating GIS Data (Bulk
Copy) (page 617).
Exporting DWG Data to Oracle
When you export to an existing Oracle table, you can use the data to populate
both new and existing classes.
You can export a single class at a time and use the Feature Class tab to match
your output fields to the existing fields. The left-hand column on the Feature
Class tab (on the Export dialog box) is an expression, which allows you to
concatenate fields or do calculations on them.
You can export data to multiple classes at one time (page 1439) and combine
the data organization in your drawing with your selections on the Feature
Class tab to determine the attributes for each exported feature class.
Object class property values are written to the feature class in Oracle if their
data types match. Otherwise, AutoCAD Map 3D attempts to convert to a
supported data type.
You can also use scripting to perform export operations. For single-class export,
the parameters for each export operation can be saved in a profile and you
can export multiple classes with a single script. This is helpful for the cases
where the same complex set of operations must be done frequently.
Exporting DWG Data to an FDO Data Store | 1461

Exporting DWG Data to ESRI ArcSDE
When you export data to ArcSDE format, you can export only to an existing
ArcSDE data store with a complete schema. You cannot create or modify
ArcSDE schemas using AutoCAD Map 3D.
See also:
■Overview of Converting and Exporting (page 1405)
■Exporting to Multiple Classes (page 1439)
■Bringing In Features from Oracle (page 312)
■Importing From ESRI ArcSDE (page 391)
■Migrating GIS Data (Bulk Copy) (page 617)
NOTE Only drawing objects are exported. Geospatial features are ignored. To
move geospatial feature data to another format, use Migrating GIS Data (Bulk
Copy) (page 617).
To export DWG data to Oracle:
1Connect to the Oracle data store (page 312) to which you want to move
the data.
2Before moving drawing data to Oracle, do the following to your DWG
drawing objects:
■Assign a coordinate system (page 142). This lets you position your data
accurately in a real-world geographic location and align imported
survey or GPS point data. Once you assign a coordinate system, you
can convert to a different system when you export.
■Clean up any geometry errors (page 765). Use the AutoCAD Map 3D
cleanup tools to correct any errors introduced during drafting,
digitizing, or converting the data.
3In the Tool-based Ribbon Workspace, click Output tab ➤ Map Data
Transfer panel ➤ To FDO Connection.
4In the dialog box that appears, choose the Oracle connection for the
export and click OK.
5On the Selection tab of the Map Export dialog box (page 1723), specify
which objects to export.
1462 | Chapter 9 Publishing and Sharing Maps
This tab determines how items are selected for export, and not how they
are organized in their exported form. You specify how to organize the
exported material on the Feature Class tab.
6On the Feature Class tab, specify which object properties and attributes
to export to feature class attributes.
All attributes you specify here will be included in all the resulting features
you create in Oracle. For information on how the choices on this tab
determine the properties of the exported feature class, see Exporting to
Multiple Classes (page 1439).
7On the Options tab (page 1704) specify whether to convert the coordinate
system during the export process and choose the coordinate system.
Specify whether to treat closed polylines as polygons when you export.
8Specify how to create classes in the Oracle data store.
■To create a single feature class containing all the items you selected
on the Selection tab, click Create a single class from all exported
objects and type a name for that class.
■To create multiple feature classes for the items you selected on the
Selection tab, click Create multiple classes based on a drawing object
and specify an “auto-classification” method
For information about these methods, see Exporting to Multiple
Classes (page 1439).
9To change the automatically assigned class names, click the Feature Class
field and edit the names as needed, then click OK.
10 Click Save.
To export DWG data to ESRI ArcSDE:
1Query the data you want from the DWG drawing into your map.
2Connect to the ESRI ArcSDE data store (page 316) to which you want to
move the data.
3Before moving drawing data to ESRI ArcSDE, do the following to your
DWG drawing objects:
■Assign a coordinate system (page 142). This lets you position your data
accurately in a real-world geographic location and align imported
survey or GPS point data. Once you assign a coordinate system, you
can convert to a different system when you export.
Exporting DWG Data to an FDO Data Store | 1463

■Clean up any geometry errors (page 765). Use the AutoCAD Map 3D
cleanup tools to correct any errors introduced during drafting,
digitizing, or converting the data.
4In the Tool-based Ribbon Workspace, click Output tab ➤ Map Data
Transfer panel ➤ To FDO Connection.
5In the dialog box that appears, choose the data source for the export and
click OK.
6On the Selection tab of the Map Export dialog box (page 1723), specify
which objects to export.
This tab determines how items are selected for export, and not how they
are organized in their exported form. You specify how to organize the
exported material on the Feature Class tab.
7On the Feature Class tab, specify which object properties and attributes
to export to feature class attributes. Note that you cannot create or modify
ArcSDE schemas. You can only map object properties and attributes to
existing feature class attributes.
All attributes you specify here are included in all the resulting features
you export to ESRI ArcSDE. For information on how the choices on this
tab determine the properties of the exported feature class, see Exporting
to Multiple Classes (page 1439).
8On the Options tab (page 1704), specify whether to convert the coordinate
system during the export process and choose the coordinate system.
Specify whether to treat closed polylines as polygons when you export.
9Click Save.
Quick Reference
MAPEXPORTFDO
Export to an FDO data store
Click File ➤ Convert DWG To ➤ FDO Connection.
Menu
MAPEXPORTFDOCommand Line
1464 | Chapter 9 Publishing and Sharing Maps

Exporting DWG Data to an Image Format
You can save the drawing objects in the current map to an image format, such
as BMP, JPEG, or PNG. The resulting image file will not contain geospatial
features.
NOTE Only drawing objects are exported. Geospatial features are ignored. If your
map includes geospatial features, convert it to DWG format (page 378) before you
use this feature.
When you export to an image format, you use the Render Output File Dialog
Box.
See also:
■Exporting Maps to DWG Format (page 1459)
To save drawing objects in an image format
1In the Tool-based Ribbon Workspace, click Output tab ➤ Map Data
Transfer ➤ As Image.
2In the dialog box that appears, choose the image format for the new file
from the Files of Type list.
3Specify a name and location for the image file and click Save.
4If the format you chose has any further options, specify them in the
dialog box that appears and click OK.
For information about these options, see the corresponding topic in the
AutoCAD Help. For example, for information about the JPEG options,
see the JPEG Image Options Dialog Box topic.
All drawing objects in your map are rendered and saved to the image file.
Moving DWG Data to a Spatial Data Store and Back Again
You can move AutoCAD drawing data from AutoCAD Map 3D to SDF or Oracle
and back into AutoCAD Map 3D. For example, you can export drawing objects
to an SDF file to give to someone who must change those objects. Once the
changes are made, you can incorporate them into your original drawing file.
Exporting DWG Data to an Image Format | 1465
Attributes
If you connect to the data, rather than import it, and extract the geometry
from the feature data, the attributes are lost.
Bringing the Data Back Into AutoCAD Map 3D
After changes have been made to the data, you can bring it back into AutoCAD
Map 3D in one of the following ways:
■Import the data in DWG format. If anyone changes the data after that,
those changes will not appear in your map unless you reimport. Import
gives you a "snapshot" of the data at the moment that you import. This
method is best for changes to many objects in one area of the map. It works
best if you classify the objects before you export them, and then map to
those object classes when you reimport.
■Connect to the data (using Data Connect) and then extract the geometry
from the changed features. You can then update your original DWG files
with the new information. The data remains in its original format, and
any further changes in its data store appear in your map. This method is
best for small changes.
If you plan to reimport SDF data using either method, you will get the best
results if you export only the properties you want edit to a multi-class SDF
file. You can then map the properties to separate layers when you import the
SDF file.
Preserving Visual Styles
When you export styled drawing data, the visual styling is lost. You can use
two alternative methods to preserve styling information:
■Set up a drawing template file (.dwt) that includes styling information for
the drawing objects you wish to include (layers, linetypes, blocks, and so
on). For more information on using drawing templates, see the AutoCAD
2009 User’s Guide.
■Publish your map to the DWF format., which preserves all styling. Use
Autodesk Design Review to examine and mark up the resulting map. You
can then update the original DWG data from those markups.
See also:
■Publishing to DWF (page 1364)
1466 | Chapter 9 Publishing and Sharing Maps
■Overview of Converting and Exporting (page 1405)
■Exporting DWG Data to an FDO Data Store (page 1461)
■Importing Autodesk SDF (Spatial Data Files) (page 387)
■Overview of Converting Geospatial Data to Drawing Objects (page 378)
■To move drawing data to a spatial data store and back using the import
method (page 1467)
■To move drawing data to a spatial data store and back using the Data
Connect method (page 1467)
To move drawing data to a spatial data store and back using the import
method
1Export the drawing data to an SDF file or to Oracle. See Overview of
Converting and Exporting (page 1405), Exporting DWG Data to an FDO
Data Store (page 1461), and Importing Autodesk SDF (Spatial Data Files)
(page 387).
If your drawing data has been styled, be sure to check the appropriate
properties on the Feature Class tab of the Export dialog box when you
export the data. Although the visual styling will not appear in the
resulting feature data, you can reconstruct the styling when you reimport
the data later.
2Once the feature data has been changed, open the original DWG file in
AutoCAD Map 3D to update it with those changes.
3Remove any objects that will be replaced with the imported data.
4Connect to the data store with the new data and import the data to add
it to your original drawing.
See Overview of Converting Geospatial Data to Drawing Objects (page
378). If your original drawing contains layers that specify visual styling,
import the data into the appropriate layer to restore its styling
information.
To move drawing data to a spatial data store and back using the Data Connect
method
1Export the drawing data to SDF or Oracle.
Moving DWG Data to a Spatial Data Store and Back Again | 1467
See Exporting DWG Data to an FDO Data Store (page 1461), Overview of
Converting and Exporting (page 1405), and Importing Autodesk SDF (Spatial
Data Files) (page 387).
If your drawing data has been styled, be sure to check the appropriate
properties on the Feature Class tab of the Export dialog box when you
export the data. Although the visual styling will not appear in the
resulting feature data, you can reconstruct the styling when you reimport
the data later.
Alternately, you can use a drawing template that includes all the styling
information you wish to include. For more information on using a
drawing template to preserve drawing data stylization, see Preserving
Visual Styles (page 1466)
2Once the feature data has been updated, open your original DWG file in
AutoCAD Map 3D to update it with those changes.
3Connect to the spatial data source containing the changed data.
See Bringing in GIS Features (page 303).
4Check out any new or changed features and use Extract Geometry From
Feature to convert them to drawing objects.
See Checking Out Features (page 695) and Extracting Feature Geometry
(page 715)
NOTE The resulting drawing objects will lose any attribute data that was
connected to them.
5Check the features back in and remove the display layers that use the
feature source data.
6Disconnect from the feature source.
7Click Create tab ➤ Drawing Object panel ➤ Attach/Detach Object Data.
8Attach any existing object data to the new geometry.
See Specifying Object Data for a Drawing Object (page 1063).
1468 | Chapter 9 Publishing and Sharing Maps

Saving or Exporting a Display Manager Layer
You can save or export information about geospatial layers in Display Manager
(including annotation layers) to separate files. Only geospatial features are
saved or exported. You can export to SDF or SQLite format.
This allows you to package data that is ordinarily stored in a central data store,
such as an Oracle database, into a geospatial data file. However, all connection
to the original data store is lost and changes you make to the SDF or SQLite
file will not update the central data store.
Saving vs. Exporting
If you use the export option, you can export a single layer to an Autodesk SDF
(version 3) or a SQLite file. The resulting file contains geometry and attribute
data, but no styling data.
If you have joined data (page 507) to the layers you are exporting, the joined
data is also exported. However, metadata is not exported with the layer. For
information about exporting metadata, see Sharing Metadata (page 1510).
If you use the save option, you can save one layer at a time. When you save
a layer, you save its styling information and pointers to the data source that
defines its geometry and attributes. You can drag and drop saved layers into
any map to reuse them.
You cannot use a saved layer and an exported layer together because saved
layers point to the current data for the layer while exported layers contain a
“snapshot” of the data at the time they were exported, and these data
definitions may differ.
Using Exported Layers
You can use exported layers for any of the following:
■As a map layer in Autodesk MapGuide Enterprise or MapGuide Open
Source.
NOTE This format is not readable by Autodesk MapGuide version 6.5 or earlier.
Instead, see Exporting DWG Data to SDF2 Format (page 1417).
■To package the layer contents as a personal geospatial data store. The
resulting SDF or SQLite file can be opened and edited in any application
that supports the format. However, once you export the layers, they lose
their connection to their original data store, and any changes you make
will not be updated in that data store.
Saving or Exporting a Display Manager Layer | 1469
NOTE You can also export all DWG objects to SDF3 or SQLite format, and
you can copy features from one geospatial format to another using Bulk Copy.
Tell me more
Video
■Show me how to export a layer to SDF.
■Show me how to save a layer to a .layer
file.
Procedures
■To export layers in SDF or SQLite
format (page 1470)
■To save a layer’s styles and pointers to
its data (page 1471)
GIS Skills
■Exchange data with other users by ex-
porting to SDF format.
■Share styles with other users of AutoCAD
Map 3D using .layer files.
Related topics
■Overview of Publishing and Sharing
(page 1357)
■Overview of the Display Manager
(page 634)
■Overview of Converting and Exporting
(page 1405)
■Importing Autodesk SDF (Spatial Data
Files) (page 387)
■Migrating Data (page 615)
To export layers in SDF or SQLite format
1In the Display Manager (page 2060), right-click a layer ➤ Export Layer Data
to SDF or Export Layer Data to SQLite.
2Specify a name and location for the file.
The resulting file will have the extension .sdf or .sqlite.
1470 | Chapter 9 Publishing and Sharing Maps

3Click Save.
To save a layer’s styles and pointers to its data
1In the Display Manager (page 2060), right-click the layer ➤ Save Layer.
2Specify a name and location for the file.
The resulting file will have the extension .layer .
3Click Save.
Exporting Survey Points to a LandXML File
You can export survey points from a survey data store to a LandXML file.
AutoCAD Map 3D supports LandXML versions 1.0, 1.1, and 1.2.
To export survey points to a LandXML file
1On the Survey tab of the Task Pane, click Data ➤ Export LandXML.
The Export to LandXML dialog box (page 1709) appears.
2Select the items to export in the left-hand selection window.
3In the File section, click FileName, then click . The
Export to LandXML dialog box (page 1709) appears.
4Enter a name and save location for the LandXML file, then click Save.
5Select the LandXML version in the Version field of the File section.
AutoCAD Map 3D supports LandXML version 1.0, 1.1, and 1.2.
6Confirm the information in the Project and Units section, and edit if
necessary.
7Confirm the coordinate system in the Coordinate System Assignment
section, and edit if necessary.
8Click OK.
Exporting Survey Points to a LandXML File | 1471
Exporting and Printing Attribute Data
To print and export attribute data
■To export from the Data Table (page 1474)
■To print a database table (page 1475)
■To set print options (page 1476)
■To specify the header and footer (page 1476)
■To apply a filter (page 1476)
■To create a drawing object report (page 1477)
Overview of Exporting Attribute Data
You can export attribute data in the following ways:
■From the Data Table: Attribute data for geospatial features appears in the
Data Table. You can export all or some of this data to a comma-separated
file, which you can then print from a supporting application.
■From the Data View: Data you linked to drawing objects from an external
source appears in the Data View. You can print some or all of this data, or
you can copy and paste it into another application.
■From the Metadata Viewer: Metadata is is structured information that
describes the content, quality, condition, and other characteristics of data.
In AutoCAD Map 3D, you can examine this data in the Metadata Viewer.
You can share metadata by exporting it from the Metadata Viewer.
■As a report: You can query objects in attached drawings to retrieve object
data and properties that match your criteria. You define a template to
specify which of that information to include in the resulting report, which
is written out to a comma-separated file.
See also:
■Exporting from the Data Table (page 1473)
■Overview of the Data Table (page 1125)
■Printing from the Data View (page 1474)
■Viewing External Data Sources for Drawing Object Data (page 1047)
■Sharing Metadata (page 1510)
1472 | Chapter 9 Publishing and Sharing Maps

■Creating a Drawing Object Report (DWG) (page 1477)
Use the following methods to export or print attribute data.
Use this methodTo export this type of data...
In the Data Table, select the desired data
and click Options ➤ Export.
See Exporting from the Data Table (page
1473).
Geospatial attribute data
In the Data View, specify print options and
click File menu ➤ Print.
See Printing from the Data View (page 1474).
External data linked to drawing objects
In the Tool-based Ribbon Workspace, click
Home tab ➤ Data panel ➤ Define
Drawing object data and properties (as a
report)
Query. Define and execute the query. Then
click Report in the same dialog box to cre-
ate a report template and specify a file
name for the report.
See Creating a Drawing Object Report
(DWG) (page 1477).
In the Metadata Viewer, click Export or
Publish. Select the source data type and
specify the location for the exported data.
See Sharing Metadata (page 1510).
Metadata
Exporting from the Data Table
Attribute data for geospatial features appears in the Data Table. You can export
all or some of this data to a comma-separated file. Exported data is stored in
a comma-separated file for use in other applications, such as Microsoft®
Access™ or Excel™.
If your data includes decimal values, the exported data uses the format for
your current user locale (the current setting in the Windows Regional Settings
control panel on your computer.) For this reason, the data may not actually
be separated by commas. For example, in a German locale, items are separated
by semicolons.
Exporting from the Data Table | 1473

If you have joined data (page 507) to geospatial features whose data you are
exporting, the exported data will include the joined properties.
NOTE You can also copy cells from the Data Table and paste them into a
spreadsheet program, such as Microsoft Excel.
See also:
■Overview of the Data Table (page 1125)
To export from the Data Table
1In Map Explorer (page 2068), click the feature layer whose data you want
to export.
2Click Table.
3Filter the display to see the data you want.
4Select the data to export. To select all the data currently displayed, click
Select in the upper right corner.
5Click Options ➤ Export (at the bottom of the Data Table window).
6Specify a name and location for the comma-separated file, and click Save.
Printing from the Data View
Data you linked to drawing objects from an external source appears in the
Data View. You can print all or part of the active table. If you have filters in
effect, only the records that match the filter are printed. You can set print
options for margins, titles, grid lines, header, and footer.
1474 | Chapter 9 Publishing and Sharing Maps
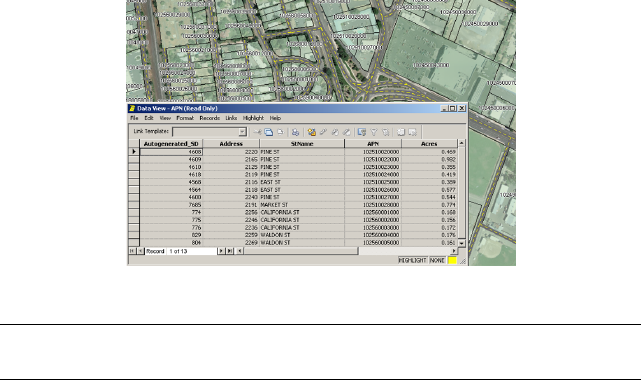
You can print from a Data View table.
NOTE You can also copy cells from the Data View and paste them into a
spreadsheet program, such as Microsoft Excel.
See also:
■Opening a Database Table (page 1052)
■Finding Records in the Data View Based on Record Data (SQL Queries)
(page 1230)
■Finding Data View Records Based on Object Location (page 1233)
■Freezing and Hiding Data View Columns (page 1059)
■To print a database table (page 1475)
■To set print options (page 1476)
■To specify the header and footer (page 1476)
■To apply a filter (page 1476)
To print a database table
1Open a database table in the Data View (page 1146).
2Specify print options, header, footer, or filters.
3In the Data View, click File menu ➤ Print.
4Click OK.
Printing from the Data View | 1475
To set print options
1In the Data View, click File menu ➤ Page Setup.
2In the Page Setup dialog box (page 1686), select the print options you want.
Click OK.
To specify the header and footer
1In the Data View, click File menu ➤ Header And Footer.
2In the Header/Footer dialog box (page 1685), set options for headers and
footers. Click OK.
If you have applied a filter to the table, only the filtered records print.
To apply a filter
■See Finding Records in the Data View Based on Record Data (SQL Queries)
(page 1230).
■See Finding Data View Records Based on Object Location (page 1233).
Quick Reference
(Data View) Header and Footer
Specifies header and footer for printing in the Data View
In the Data View: File ➤ Header and Footer
Menu
Header/Footer dialog boxDialog Box
(Data View) Page Setup
Sets the print options for Data View
In the Data View: File ➤ Page Setup
Menu
Page Setup dialog boxDialog Box
(Data View) Print
Prints the current view of the database table
In the Data View: File ➤ Print
Menu
1476 | Chapter 9 Publishing and Sharing Maps
Print
Icon
Creating a Drawing Object Report (DWG)
To create a drawing object report
■To run a query in Report mode (page 1477)
■To create a report template (page 1479)
Running a Query in Report Mode
You can run a special query on objects in attached drawings to retrieve
information about the object properties and object data. You can use Report
mode to save the results of the query to a comma-separated file, which you
can use in a spreadsheet program or database.
For example, you can create a list of pipes and their diameters (when the
diameters are stored in object data).
You use a report template to control the information that is included in the
report. Depending on your use of blocks, layers, object data, links to external
databases, block attributes, color, and other data, you can create various printed
reports.
NOTE Queries in Report mode retrieve objects from layers that are Off or Frozen.
See also:
■Defining Queries (page 1219)
■Altering Properties of Defined Queries (page 1259)
■Saving Queries (page 177)
■Creating a Report Template (page 1478)
To run a query in Report mode
1Click Home tab ➤ Data panel ➤ Define Query.
2Define or load a query.
Creating a Drawing Object Report (DWG) | 1477

3Under Query Mode, select Report.
4Click Options.
5In the Output Report Options dialog box (page 1852), To create a report
template (page 1479). Click OK.
6Click Execute Query.
Quick Reference
ADEQUERY
Controls defining, modifying, saving, loading, and executing a query
In the Classic workspace, click Setup menu ➤ More
DWG Options ➤ Define Query
Menu
Define Query
Icon
ADEQUERYCommand Line
In Map Explorer, right-click Current Query ➤ Define
-or- Right-click a query ➤ Edit
Task Pane
Define Query dialog boxDialog Box
Creating a Report Template
Control the information that is included in a report query by defining a report
template.
For example, you can create a report that displays pipe lengths and diameters
by querying the feature class PIPES, and defining a report template that
includes the property LENGTH and an object data field that contains pipe
diameter information.
A template can include variables that represent:
■object properties
■feature classification
■object data
1478 | Chapter 9 Publishing and Sharing Maps
■topology information
■SQL data in an external database table
■block attributes
For a complete listing of variables you can use in a template, see Variables
(page 1546).
TIP Objects that include several elements have multiple entries in the output file.
Use the .TYPE dot variable to identify such objects, and edit the output file to
remove duplicate references to the object.
The report template is saved when you save the query.
NOTE Report mode queries retrieve objects from layers that are Off or Frozen.
See also:
■Running a Query in Report Mode (page 1477)
■Altering Properties of Defined Queries (page 1259)
■Saving Queries (page 177)
If you run a Report query, the report template specifies the information to
write to an external file.
To create a report template
1Click Home tab ➤ Data panel ➤ Define Query.
2In the Define Query dialog box, under Query Mode, click Report.
3Click Options.
4In the Output Report Options dialog box (page 1852), specify the
information to include in the report.
Click Expression and select the item to include.
You can edit the expression box to add a calculation to the variable. For
example, you can edit an area dot variable to reflect the scale of a map.
5To associate a range with the expression, select the range table name
from the Range list. To define a range table (page 1272), click Ranges.
Creating a Drawing Object Report (DWG) | 1479

6Click Add to add each expression to the Report Template list.
7Select Process Sub-Objects to create a line in the report for each
component of an object, for example, polyline vertices or centroids, links,
and nodes in a polygon topology.
8Select Apply Transformation to apply a transformation to the values
displayed report.
If you have used either a coordinate system transformation or a simple
transformation in the current map, you must select this option to apply
the transformation to the values in the report.
9Specify a name and location for the output report file.
10 Click OK to close the dialog box.
Quick Reference
ADEQUERY
Controls defining, modifying, saving, loading, and executing a query
In the Classic workspace, click Setup menu ➤ More
DWG Options ➤ Define Query
Menu
Define Query
Icon
ADEQUERYCommand Line
In Map Explorer, right-click Current Query ➤ Define
-or- Right-click a query ➤ Edit
Task Pane
Define Query dialog boxDialog Box
1480 | Chapter 9 Publishing and Sharing Maps
Working with Metadata
Overview of Working with Metadata
Metadata is data about data. Geospatial metadata describes your GIS data
according to an established standard to help others who use your maps to
understand them. Organizing your data according to standards helps you manage
it more efficiently, enforces data quality, and facilitates data sharing. In AutoCAD
Map 3D, you can automatically generate metadata for DWGs; their resources
(page 2072), such as object or feature classes; and non-DWG files.
AutoCAD Map 3D currently supports two standards for geospatial metadata:
the FGDC CSDGM Standard (page 2063) and ISO 19139 (page 1483).
The FGDC Standard (United States)
In 1998, the Federal Geographic Data Committee (FGDC) released the Content
Standard for Digital Geospatial Metadata (the FGDC CSDGM Standard (page 2063)).
Its goal is to promote electronic, geospatial information-sharing between various
agencies and regions around the world. Some agencies in the United States may
be required to create geospatial metadata that complies with this standard.
The FGDC standard specifies seven major sections of GIS metadata. Each section
has several data elements, and compound elements (page 2057). Each element
must meet one of the following conditions:
■Mandatory
■Optional
■Conditional
Conditional elements are “mandatory if applicable.” For example, if a particular
data set does not have or need distribution information as defined by the FGDC,
10
1481

you need not complete any of the fields in the Distribution Information
section, even if some fields in that section are mandatory.
Related EditorRequirementDescriptionInformation Type
Contact Inform-
ation Editor
MandatoryBasic information about the dataIdentification Information
(FGDC
Metadata)
(page 1762)
Citation Inform-
ation Editor
ConditionalOverall quality of the dataData Quality Information
(FGDC
Metadata)
(page 1758)
Spatial Data
Organization
ConditionalHow spatial information is repres-
ented in the data
Spatial Data Organization Inform-
ation
Information Ed-
itor (FGDC
Metadata)
(page 1764)
Horizontal Co-
ordinate Sys-
ConditionalDetails about the spatial refer-
ence of the data, such as coordin-
ates
Spatial Reference Information
tem Definition
Editor (FGDC
Metadata)
(page 1768)
Attribute Do-
main Values Ed-
ConditionalThe features and constraints of
the data
Entity and Attribute Information
itor (FGDC
Metadata)
(page 1773)
Standard Order
Process Editor
ConditionalWho provides the data, and how
it can be obtained
Distribution Information
(FGDC
Metadata)
(page 1774)
1482 | Chapter 10 Working with Metadata
Related EditorRequirementDescriptionInformation Type
Time Period In-
formation Edit-
MandatoryHow current the metadata is, and
who maintains it
Metadata Reference Information
or (FGDC
Metadata)
(page 1761)
Because GIS data is so general, it remains usable outside the United States
when formatted with this standard. For example, the FGDC standard shares
many common fields with ISO 19139. To learn more about the FGDC and its
GIS metadata standard, visit http://www.fgdc.gov/metadata.
ISO 19139
AutoCAD Map 3D supports ISO 19139. If your version of AutoCAD Map 3D
is for any country except the United States, it is configured with ISO as the
default. If you need to switch to a different standard, you can do so in the
Metadata Options dialog box (page 1756).
Tell me more
Video
■Show me how to view and interpret
metadata.
■Show me how to create and edit
metadata.
Procedure
■To set metadata options (page 1485)
■To work with metadata (page 1487)
■To enter or edit metadata manually
(page 1499)
Tutorial
■Lesson 6: Generate Metadata for a
Classified Drawing
Workflow
■Create a Feature Map
■Create a CAD Map
Overview of Working with Metadata | 1483
GIS Skill
■View and interpret metadata.
■Create metadata for your map.
Related topics
■Creating and Viewing Metadata (page
1486)
■Editing Metadata (page 1498)
■Sharing Metadata (page 1510)
■Setting Metadata Options (page 1484)
■Working with Metadata Templates
(page 1490)
Setting Metadata Options
You can select the metadata (page 2069) standard you want to work with, set
template options, specify the precision to which the metadata measures your
map’s latitude/longitude values, and indicate whether or not you want the
metadata for a data source to be updated as soon as you select it in the
Metadata Viewer (page 1751).
Setting your metadata standard
The default standard is FGDC (page 2063) for AutoCAD Map 3D in the United
States, and ISO 19139 for all other countries. You can change the standard in
the Metadata Options dialog box (page 1756).
Keeping your metadata current
When Auto Update is selected, metadata for a data source is updated as soon
as you select it in the Metadata Viewer (page 1751). If you import (page 1511)
metadata from another AutoCAD Map 3D user, and remain connected to the
data source, the metadata is updated when the data is updated. For example,
if your organization keeps classified DWGs (page 2057) on a shared network, and
someone updates an object in a DWG, the metadata you have imported from
that object updates automatically.
If you do not always want to update your metadata automatically (for example,
if you want to check it for accuracy first), do not select the Auto Update check
box. Instead, click Update All each time you want to refresh your metadata.
1484 | Chapter 10 Working with Metadata
Saving time with metadata templates
Using metadata templates (page 1491) prevents repetitive data entry, saving time
do perform your other job functions. You can save frequently used metadata
in a template to reuse as often as necessary.
See also:
■Metadata Options dialog box (page 1756)
■Updating Metadata (page 1503)
To set metadata options
1Open the Metadata Viewer (page 1751).
2On the Metadata Viewer (page 1751) toolbar, click Options.
3In the Metadata Options dialog box (page 1756), on the Template tab, do
any of the following:
■Under Metadata Standard, select a standard.
■Import a template. (page 1492)
■Set a default template. (page 1494)
■Preview a template. (page 1494)
■Deactivate a template. (page 1495)
■Export a template. (page 1496)
■Rename a template. (page 1493)
■Remove a template. (page 1497)
4Click the Preference tab. Set the latitude and longitude precision.
Enter the number of digits (0 - 10) that display after the decimal point
for your reported latitude and longitude values. Both values are 6 by
default.
5If desired, select the Auto Update check box.
When Auto Update is selected, metadata is updated as soon as you select
it in the Metadata Viewer.
6Click OK.
Setting Metadata Options | 1485

Quick Reference
MAPMETADATAOPTIONS
Displays the Metadata Options dialog box
MAPMETADATAOPTIONSCommand Line
Metadata OptionsDialog Box
Creating and Viewing Metadata
When you open the Metadata Viewer (page 1751) for the first time, metadata
(page 2069) is automatically generated and displayed for the current drawing.
When you select a resource (page 2072) from the Current Drawing tree view, or
a file from the Folder Shortcut tree view, the available metadata for that
resource is displayed in the Metadata Viewer.
Some metadata information can be generated for the following resources:
Web ServicesFDO RDBMS-based
data
FDO file-based dataDWG files
WFSOracle SpatialSDF filesDWGs that contain
classified drawing
objects
WMSMySQL with spatialSHP filesDWGs that do not
contain classified
drawing objects
SDERaster files
SQL Server with spatial
Metadata for resources in the Current Drawing tree view are stored in the
drawing file. Metadata for resources in the Folder Shortcut tree view are stored
in an automatically generated MTD file. The MTD file is saved in the same
directory as the resource.
1486 | Chapter 10 Working with Metadata
Tell me more
Video
■Show me how to view and interpret
metadata.
■Show me how to create and edit
metadata.
Procedure
■To work with metadata (page 1487)
Tutorial
■Lesson 6: Generate Metadata for a
Classified Drawing
Workflow
■Create a Feature Map
■Create a CAD Map
GIS Skill
■View and interpret metadata.
■Create metadata for your map.
Related topics
■Overview of Object Classification (page
981)
■Updating Metadata (page 1503)
■Editing Metadata (page 1498)
■Sharing Metadata (page 1510)
■Setting Metadata Options (page 1484)
■Working with Metadata Templates
(page 1490)
Use this method...To do this...
In the Display Manager, select a layer. Click
Tools ➤ View Metadata.
Display the Metadata Viewer (page 1751)
In the Display Manager, right-click a layer
➤ View Metadata.
Create metadata for a drawing
Creating and Viewing Metadata | 1487

Use this method...To do this...
In the Metadata Viewer, select the DWG
or data source from the Current Drawing
tree view.
Create metadata for a resource (page
2072)
To create metadata for a non-DWG file 1In the Metadata Viewer, in the Folder
Shortcut area, click Add.
2Select the file.
To add your own style sheet 1Import the stylesheet. (page 1489)
2At the top of the Metadata tab (page
1753) click the Style sheet menu.
To display metadata in XML format 1At the top of the Metadata tab, click
the Stylesheet menu.
2Select XML.
Quick Reference
MAPMETADATAVIEWER
Displays the Metadata Viewer
MAPMETADATAVIEWERCommand Line
In Map Explorer, right-click the current drawing ➤
View Metadata.
Task Pane
Metadata ViewerDialog Box
Working with Metadata Style Sheets
The style of the metadata (page 2069) in the Metadata Viewer (page 1751) is
controlled by a style sheet. You can use the default style sheet (FGDC Classic
for FGDC (page 2063) metadata or ISO Classic for ISO metadata), one that you
import from elsewhere, or no style sheet (unformatted XML).
1488 | Chapter 10 Working with Metadata

To import a style sheet into the Metadata Viewer
1Obtain a style sheet in valid XML format.
NOTE The use of stylesheets supplied by parties other than Autodesk is subject
to the terms and conditions published by the provider of those stylesheets.
2Save it to the following location:
For FGDC
■C:\Program Files\AutoCAD Map 3D
2011\Support\Metadata\FGDC\Configuration\Style\
For ISO
■C:\Program Files\AutoCAD Map 3D
2011\Support\Metadata\ISO\Configuration\Style\
3Open the following file in any text or XML editor:
C:\Program Files\AutoCAD Map 3D
2011\Support\Metadata\MetadataConfiguration.xml.
4Inside the <MetadataStylesheetSet> tags, add a <MetadataStylesheet>
element. Use the following FGDC example as your guide:
<MetadataStandard>
<Name>FGDC</Name>
<MetadataProfile>
<MetadataStyleSheetSet>
<MetadataStylesheet>
<Name>Stylesheet1</Name>
<Path>Support\Metadata\FGDC\Configura
tion\Style\Stylesheet1.xsl</Path>
</MetadataStylesheet>
</MetadataStyleSheetSet>
</MetadataStandard>
5Open the Metadata Viewer (page 1751). (In the Display Manager, select a
layer. Click Tools ➤ View Metadata.)
6Select the new style sheet from the Stylesheet menu at the top of the
Metadata tab (page 1753).
Working with Metadata Style Sheets | 1489

NOTE If your style sheet does not appear in the Stylesheet menu after you perform
these steps, restart AutoCAD Map 3D, relaunch the Metadata Viewer, and click
Stylesheet again.
Quick Reference
MAPMETADATAVIEWER
Displays the Metadata Viewer
MAPMETADATAVIEWERCommand Line
In Map Explorer, right-click the current drawing ➤
View Metadata.
Task Pane
Metadata ViewerDialog Box
Working with Metadata Templates
Overview of Metadata Templates
Metadata templates allow you to reuse metadata (page 2069) such as the contact
information for your organization, or other common values that rarely change.
Templates can be especially useful if your organization must create metadata
for large numbers of legacy drawings. You can create new templates from
existing metadata, or import (page 1492) them from other sources to increase
your productivity.
See also:
■Overview of Editing Metadata (page 1498)
■Updating Metadata (page 1503)
To use metadata templates
1Create (page 1492) or import (page 1492) the template you want.
2Apply the template (page 1492).
3If desired, set a default template:
■Preview (page 1494) the templates to see which one you want.
1490 | Chapter 10 Working with Metadata
■Set a default template (page 1494) for all metadata you generate from
this point on.
Quick Reference
MAPMETADATAOPTIONS
Displays the Metadata Options dialog box
MAPMETADATAOPTIONSCommand Line
Metadata OptionsDialog Box
Using Metadata Templates
You can create or import (upload) an existing metadata (page 2069) template.
Metadata templates must be in an XML file, and must comply with the
structure of the standard with which you are working.
You can apply imported templates to your metadata. Applying a template
overwrites any existing values. However, if they overwrite any values in
forced-update fields (page 2064), those values will revert to the values from their
data sources once the metadata is refreshed.
Once you have created or imported templates, you can set the one you use
most often as a default.
See also:
■Setting Metadata Options (page 1484)
■To create a new template (page 1492)
■To import a template (page 1492)
■To set a default template (page 1494)
■To export a template (page 1496)
■To deactivate a template (page 1495)
■To remove a template (page 1497)
■To create a template (page 1492)
Using Metadata Templates | 1491
■To import a template (page 1492)
■To apply a template (page 1492)
■To rename a template (page 1493)
To create a template
1In the Metadata Viewer (page 1751), select the data source from which you
want to create a template.
2Click Create Template.
3In the Create Metadata Template dialog box (page 1758), enter a name for
your template.
4Click OK.
Your template is saved as an XML file. If you open the Metadata Options
dialog box (page 1756), your new template will be listed in the Use Template
window.
To import a template
1In the Metadata Viewer, click Options.
2In the Metadata Options dialog box (page 1756), click Import.
3Browse to and select a template (an XML file).
4Click Open.
The template is displayed in the Use Template window.
To apply a template
1In the Metadata Viewer, select the data source to which you want to apply
the template.
2Right-click the data source.
3Click Regenerate Metadata from Template.
An additional menu is displayed, listing all your saved metadata templates.
If you have a default template already set, it is checked with an orange
checkmark.
4Select the template you want to apply.
1492 | Chapter 10 Working with Metadata
The template is applied, and the Metadata tab refreshes with the updated
metadata.
To rename a template
1On the Metadata Viewer (page 1751) toolbar, click Options.
2Select a template from the Use Template window.
3Do one of the following:
■Click Rename. Enter the new name and press ENTER.
■Right-click a template in the Use Template window and rename it.
Quick Reference
MAPMETADATAOPTIONS
Displays the Metadata Options dialog box
MAPMETADATAOPTIONSCommand Line
Metadata OptionsDialog Box
Previewing Metadata Templates
You can preview a template to make sure it displays the intended metadata
before you select it as a default. The Metadata Preview window behaves
similarly to the Metadata tab in the Metadata Viewer (page 1751). The links are
live, and you can collapse and expand levels of metadata to focus on specific
areas.
See also:
■To create a template (page 1492)
■To import a template (page 1492)
■To set a default template (page 1494)
■To apply a template (page 1492)
■To deactivate a template (page 1495)
Previewing Metadata Templates | 1493
■To export a template (page 1496)
■To rename a template (page 1493)
■To remove a template (page 1497)
To preview a template
1On the Metadata Viewer (page 1751) toolbar, click Options.
2Select the template to preview from the Use Template window.
3Click Preview.
Setting a Default Metadata Template
Once you have created or imported templates, you can set the one you use
most often as a default.
See also:
■To create a template (page 1492)
■To import a template (page 1492)
■To preview a template (page 1494)
■To apply a template (page 1492)
■To deactivate a template (page 1495)
■To export a template (page 1496)
■To rename a template (page 1493)
■To remove a template (page 1497)
To set a default template
1On the Metadata Viewer (page 1751) toolbar, click Options.
2From the Use Template window, select the template to set as the default.
3Select the Use Template check box.
4Click OK.
The template you selected is set to be the default.
1494 | Chapter 10 Working with Metadata
Deactivating Metadata Templates
If you have applied a template to your metadata (page 2069), but decide you do
not want to use it, you can deactivate it. When you deactivate a metadata
template, values that had come from the template are overwritten by values
from the data source. Fields that are populated by values from the template,
but that do not have corresponding values in the data source are cleared.
See also:
■To create a template (page 1492)
■To import a template (page 1492)
■To apply a template (page 1492)
■To set a default template (page 1494)
■To export a template (page 1496)
■To remove a template (page 1497)
To deactivate a template
1In the Metadata Viewer (page 1751), click Options.
2If the Use Template check box is selected, clear it.
3Click OK.
4Select the data source.
5Click Update All.
6Click Yes in the warning message that is displayed.
The metadata is updated with values from the data source you selected.
Quick Reference
MAPMETADATAOPTIONS
Displays the Metadata Options dialog box
MAPMETADATAOPTIONSCommand Line
Metadata OptionsDialog Box
Deactivating Metadata Templates | 1495

Exporting Metadata Templates
Once you create a metadata (page 2069) template, you can export it as an XML
file to share with others in your organization.
See also:
■To create a template (page 1492)
■To import a template (page 1492)
■To apply a template (page 1492)
■To set a default template (page 1494)
■To deactivate a template (page 1495)
■To remove a template (page 1497)
To export a template
1In the Metadata Viewer (page 1751), click Options.
2In the Metadata Options dialog box (page 1756), select a template from the
Use Template window.
3Click Export.
4Browse to, and select the location to save the template.
5Optionally, rename the template in the File Name field.
NOTE If a file name is already displayed, rename it unless you are sure that
you want to overwrite the existing file with the one you are saving.
6Click Save.
Quick Reference
MAPMETADATAOPTIONS
Displays the Metadata Options dialog box
MAPMETADATAOPTIONSCommand Line
Metadata OptionsDialog Box
1496 | Chapter 10 Working with Metadata
Removing Metadata Templates
If you no longer want a metadata (page 2069) template to be available for use,
you can remove it. If you have applied the template to metadata, removing
the template does not cause any of the values in that metadata to change. To
remove metadata that came from a template, see Deactivating Metadata
Templates (page 1495).
See also:
■Editing Metadata (page 1498)
■To create a template (page 1492)
■To import a template (page 1492)
■To apply a template (page 1492)
■To set a default template (page 1494)
■To deactivate a template (page 1495)
■To export a template (page 1496)
To remove a template
1In the Metadata Viewer (page 1751), click Options.
2In the Metadata Options dialog box (page 1756), select the template to
remove in the Use Template window.
3Click Remove.
Quick Reference
MAPMETADATAOPTIONS
Displays the Metadata Options dialog box
MAPMETADATAOPTIONSCommand Line
Metadata OptionsDialog Box
Removing Metadata Templates | 1497
Editing Metadata
Overview of Editing Metadata
Although the best practices for creating most metadata (page 2069) are
auto-generation (page 2056), updating from the data source, using templates
(page 1492), copying and pasting, or importing (page 1510) from similar sources,
some data must be entered manually. Metadata Editor (page 1754) provides an
interface in which to enter and manage your metadata.
Tell me more
Video
■Show me how to view and interpret
metadata.
■Show me how to create and edit
metadata.
Procedure
■To enter or edit metadata manually
(page 1499)
Tutorial
■Lesson 6: Generate Metadata for a
Classified Drawing
Workflow
■Create a Feature Map
■Create a CAD Map
GIS Skill
■View and interpret metadata.
■Create metadata for your map.
Related topics
■Creating and Viewing Metadata (page
1486)
■Metadata Fields (page 1755)
■To enter or edit metadata manually (page 1499)
1498 | Chapter 10 Working with Metadata
■To add a new item to a drop-down menu in the Metadata Editor (page 1500)
■To select an item from a drop-down menu in the Metadata Editor (page
1501)
■To edit an item in a drop-down menu in the Metadata Editor (page 1501)
■To delete an item in a drop-down menu in the Metadata Editor (page 1501)
■To enter text into a free-form field in the Metadata Editor (page 1501)
■To edit text in a free-form field in the Metadata Editor (page 1502)
■To delete text in a free-form field (page 1502)
To enter or edit metadata manually
1In the Metadata Viewer (page 1751), select the file or resource to edit.
2Click Edit.
3On the left side of the Metadata Editor (page 1754), click the tab for the
section you want to edit. If all the tabs do not display on your screen, do
one of the following:
■Stretch the Metadata Editor vertically to make it longer.
■Click the edges of the lowest tab, and select the tab you want from
the menu that is displayed.
Overview of Editing Metadata | 1499
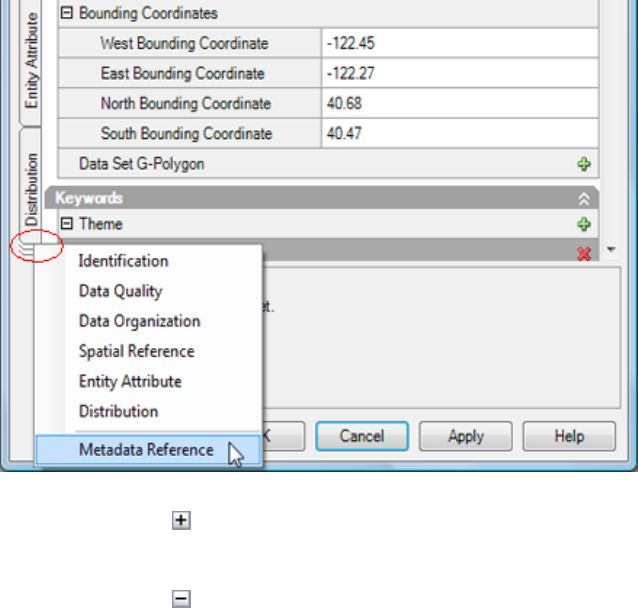
4Click ■
■to the left of a field group to reveal additional fields within that group.
■Click to contract a field group.
5Enter the required changes in the appropriate fields.
6Click Apply to save your changes and continue editing.
7Click OK to save your changes and close the Metadata Editor.
To add a new item to a drop-down menu in the Metadata Editor
1Click the field. A drop-down arrow is displayed.
2Click the drop-down arrow. A menu is displayed.
3Click New. A compound element metadata editor (page 1758) is displayed
with empty fields.
4Enter the new item.
1500 | Chapter 10 Working with Metadata
5Click OK. The item is saved, and will appear in the drop-down menu the
next time you click the arrow.
To select an item from a drop-down menu in the Metadata Editor
■Double-click the item.
To edit an item in a drop-down menu in the Metadata Editor
1Click the field. A drop-down arrow is displayed.
2Click the drop-down arrow. A menu is displayed.
3Select the item to edit.
4Click Edit. A compound element metadata editor (page 1758) is displayed,
showing the metadata from your selection.
5Edit the metadata.
6Click OK to save the edits.
To delete an item in a drop-down menu in the Metadata Editor
1Click the field. A drop-down arrow is displayed.
2Click the drop-down arrow. A menu is displayed.
3Select the item to delete.
4Click Delete.
To enter text into a free-form field in the Metadata Editor
1Click the field. A drop-down arrow is displayed.
2Click the arrow. The field expands.
3Select the bottom, right-hand corner of the field, and drag it outward
until it is the size and shape that you want.
4Enter text into the field, or paste it in from another source.
5When you are finished, click somewhere else on the screen. The field is
no longer displayed.
6Click OK to save the text.
Overview of Editing Metadata | 1501
To edit text in a free-form field in the Metadata Editor
1Click the field. A drop-down arrow is displayed.
2Click the arrow. The field expands.
3Select the bottom, right-hand corner of the field, and drag it outward
until it is the size and shape that you want.
4Edit the text like you would in a simple text editor.
5When you are finished, click somewhere else on the screen. The field is
no longer displayed.
6Click OK to save your edits.
To delete text in a free-form field
1Click the field. A drop-down arrow is displayed.
2Click the arrow. The field expands.
3Select the bottom, right-hand corner of the field, and drag it outward
until it is the size and shape that you want.
4Delete text like you would in a simple text editor.
5When you are finished, click somewhere else on the screen. The field is
no longer displayed.
6Click OK to save the deletion.
Quick Reference
MAPMETADATAVIEWER
Displays the Metadata Viewer
MAPMETADATAVIEWERCommand Line
In Map Explorer, right-click the current drawing ➤
View Metadata.
Task Pane
Metadata ViewerDialog Box
1502 | Chapter 10 Working with Metadata
Updating Metadata
You can specify that your metadata (page 2069) is updated automatically, or you
can update it manually.
Update Automatically
If you select the Auto Update check box in the Metadata Options dialog box
(page 1756), your metadata will be updated as soon as its data source is updated
if the drawing is connected to the data source. If the drawing is not connected,
the metadata will update the next time you connect to the source.
Update Manually
To update metadata manually, you can use Update Auto in the Metadata
Viewer (page 1751) or in the Metadata Editor (page 1754). This will update the
values for forced-update fields (page 2064). Forced-update fields are derived
directly from their data source. Any manual overrides to values in the fields
are updated to those from the data source when you click Update Auto.
The labels for forced-update fields are highlighted in turquoise if you click
Highlight in the Metadata Editor (page 1754).
Fields that are not forced-update fields maintain your manual overrides.
Use Update All to update all fields. This overrides any temporary fields or
values you entered manually.
To update metadata for all fields
■In the Metadata Viewer or Metadata Editor, click Update All.
To update metadata for forced-update fields only
■In the Metadata Viewer, click Update Auto.
Quick Reference
MAPMETADATAVIEWER
Displays the Metadata Viewer
MAPMETADATAVIEWERCommand Line
Updating Metadata | 1503
In Map Explorer, right-click the current drawing ➤
View Metadata.
Task Pane
Metadata ViewerDialog Box
Copying and Pasting Metadata
You can copy metadata (page 2069) from one source and paste it into another.
You can copy and paste all the metadata from a data source, but not select
parts. Because metadata standards require the metadata for forced-update fields
(page 1503) to come directly from their data sources, any pasted metadata that
differs from the values in these fields will not be saved.
To copy and paste metadata
1In the Metadata Viewer (page 1751), right-click the data source from which
you want to copy metadata.
2Click Copy Metadata to Clipboard.
3Right-click the data source to which you want to paste the metadata.
4Click Paste Metadata from Clipboard.
The pasted metadata is displayed in the Metadata Tab (page 1753).
Quick Reference
MAPMETADATAVIEWER
Displays the Metadata Viewer
MAPMETADATAVIEWERCommand Line
In Map Explorer, right-click the current drawing ➤
View Metadata.
Task Pane
Metadata ViewerDialog Box
Adding and Deleting Records in the Metadata Editor
Some metadata elements can have multiple records. You can add or delete
these records within the Metadata Editor.
1504 | Chapter 10 Working with Metadata

See also:
■Creating and Viewing Metadata (page 1486)
■Compound Element Metadata Editors (page 1758)
To add a new record to a metadata element
■Click .
To delete a record from a metadata element
■Click .
Quick Reference
MAPMETADATAVIEWER
Displays the Metadata Viewer
MAPMETADATAVIEWERCommand Line
In Map Explorer, right-click the current drawing ➤
View Metadata.
Task Pane
Metadata ViewerDialog Box
Working with Compound Metadata Elements
Some metadata elements consist of multiple elements. These are called
compound elements. Some compound elements (page 2057) have their own editors
within the Metadata Editor (page 1754). These compound element editors (page
1758) have more detailed field labels, as well as explanations of those fields.
A compound element that has its own editor displays an ellipsis on the
right side of the field when you click it.
See also:
■Using the Record Navigator (page 1506)
Working with Compound Metadata Elements | 1505

To edit a compound metadata element
1In the Metadata Editor (page 1754) click a field that displays an ellipsis
on the right side of the field.
2Click the ellipsis .
3In the compound element editor (page 1758), make the required edits.
4Click OK.
Quick Reference
MAPMETADATAVIEWER
Displays the Metadata Viewer
MAPMETADATAVIEWERCommand Line
In Map Explorer, right-click the current drawing ➤
View Metadata.
Task Pane
Metadata ViewerDialog Box
Using the Record Navigator
Some of the compound element editors (page 1505) have fields or field groups
that can save more than one entry. These fields have a small button with four
arrows on the right side of the field. If you hover over this button, the Record
Navigator is displayed. The Record Navigator is inactive until you enter values
into the field or fields for which it stores records. Once a value is saved, you
can keep entering values in the same field.
1506 | Chapter 10 Working with Metadata
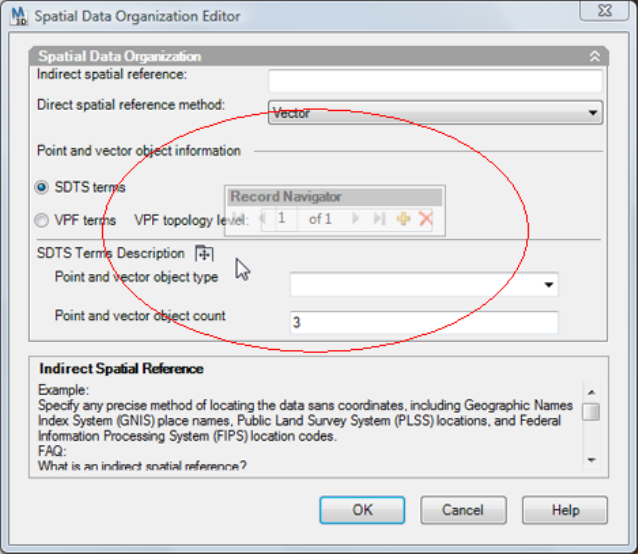
When you hover over the Record Navigator button, the Record Navigator is displayed.
Here, the Record Navigator is transparent because it is not yet storing any records.
See also:
■Creating and Viewing Metadata (page 1486)
■Editing Metadata (page 1498)
■To add records using the Record Navigator (page 1507)
■To locate a record in the Record Navigator (page 1508)
■To delete a record in the Record Navigator (page 1508)
To add records using the Record Navigator
1If the fields in the compound element editor (page 1758) are blank, enter
values into them as you normally would.
Using the Record Navigator | 1507

2If the fields are populated, and you want to add more values, hover over
the Record Navigator button. The Record Navigator is displayed.
3Click in the Record Navigator. The related fields in the editor are
cleared to accept new entries.
4Enter values into the fields.
5Click anywhere on the screen to hide the Record Navigator.
6Click OK to save the new records.
To locate a record in the Record Navigator
1Hover over the Record Navigator button. The Record Navigator is
displayed.
2Hover over the Record Navigator. It is no longer transparent.
■Click to go to the first record.
■Click to go to the last record.
■Click to move one record toward the first.
■Click to move one record toward the last.
To delete a record in the Record Navigator
1Locate the record you want to delete.
2Click .
Quick Reference
MAPMETADATAVIEWER
Displays the Metadata Viewer
MAPMETADATAVIEWERCommand Line
In Map Explorer, right-click the current drawing ➤
View Metadata.
Task Pane
Metadata ViewerDialog Box
1508 | Chapter 10 Working with Metadata
Auditing Metadata
The Metadata Editor (page 1754) has an auditor to help you comply with the
metadata (page 2069) standard you are using. The auditor marks empty required
fields with auditing symbols that look like caution signs .
These symbols also appear on the tabs along the left side of the Metadata
Editor to indicate errors in that section. If no auditing symbol is displayed on
a tab, the auditor found no errors in that section.
Once an acceptable value is entered into the field, or other fields in the same
field group, the auditing symbol will not be displayed the next time you click
Audit.
To audit metadata
■In the Metadata Editor (page 1754), click .
To view auditing descriptions
■Hover over an auditing symbol .
To clear an auditing symbol
■Enter a valid value into the field.
■Click .
Quick Reference
MAPMETADATAVIEWER
Displays the Metadata Viewer
MAPMETADATAVIEWERCommand Line
In Map Explorer, right-click the current drawing ➤
View Metadata.
Task Pane
Metadata ViewerDialog Box
Auditing Metadata | 1509
Sharing Metadata
Overview of Sharing Metadata
The best practice for sharing metadata (page 2069) within an organization is to
store the source data on a server. This ensures that any metadata that you
work with on your local machine remains current. If you save a file-based data
source to your local machine, the file that keeps the metadata linked to the
source data looks for that data on your machine. This can be problematic if
you want to share the metadata file. The linking mechanism attempts to locate
the data in the same place that you stored it. To work around this, send the
data source to the new user. They must either save everything in the exact
same locations as you did, or edit the FSD file to point to the new location of
the data source.
See also:
■Importing Metadata (page 1510)
■Exporting Metadata (page 1512)
Use this method...To do this...
Print metadata 1In the Metadata Viewer (page 1751),
select a style sheet.
2Click Print.
Export (page 1513) metadata ■In the Metadata Viewer, click Export.
Import (page 1511) metadata ■In the Metadata Viewer, click Import.
Publish (page 1515) metadata ■In the Metadata Viewer, click Publish.
Importing Metadata
One way to share metadata (page 2069) is by to import metadata created in
AutoCAD Map 3D.
1510 | Chapter 10 Working with Metadata
For Object Classes
When you import metadata for an object class (one type of resource (page
2072)), you can either open the DWG (page 2061) file containing that class (and
its metadata), or append the metadata for the object class to the metadata for
an existing object class in your current drawing. To do so, the metadata of
the object class you are importing must have the exact same name as the
existing object class.
For feature classes
When importing metadata for a feature class (another type of resource (page
2072)), AutoCAD Map 3D tries to connect to the feature source by launching
the Data Connect dialog box with its connection parameter fields filled.
In the Metadata Viewer (page 1751), you can import a metadata storage (MTD)
file.
Import metadata values
In the Metadata Editor (page 1754), you can import an XML file. As long as the
file is structured according to the standard, the metadata values in it overwrite
the current ones, except for the values in forced-update fields.
See also:
■Import Metadata Options dialog box (page 1757)
■Setting Up Object Classification (page 116)
■Editing Metadata (page 1498)
■Exporting Metadata (page 1513)
■Publishing Metadata (page 1515)
To import metadata for DWGs or their resources
1In the Metadata Viewer (page 1751), click Import.
2Browse to, and select the MTD file you want to import.
3Click Open.
4In the Import Metadata Options dialog box (page 1757)elect one of the
following:
■Open the original project DWG file
Importing Metadata | 1511
■Append the source metadata to the current metadata
5Click OK.
To import metadata for Non-DWG files
1In the Metadata Editor (page 1754), click Import.
2Browse to, and select the XML file you want to import.
3Click Open.
To import ESRI metadata
1In ESRI, use ArcCatalog to export metadata in an ESRI profile to the FGDC
or ISO standard in XML format.
2In the AutoCAD Map 3D Metadata Editor (page 1754), click Import Metadata
Values.
3In the Open dialog box, select the XML file you exported from ESRI, and
click Open.
Quick Reference
MAPMETADATAVIEWER
Displays the Metadata Viewer
MAPMETADATAVIEWERCommand Line
In Map Explorer, right-click the current drawing ➤
View Metadata.
Task Pane
Metadata ViewerDialog Box
Exporting Metadata
You can share your metadata (page 2069) with other AutoCAD Map 3D users by
exporting it. If you wish to share metadata with users of other products, see
Publishing and Printing Metadata (page 1514).
1512 | Chapter 10 Working with Metadata
For current drawing classified DWGs
For a classified DWG (page 2057) used as the current drawing, the metadata is
stored inside the DWG. Because the DWG file stores the location of the data
source, the metadata will be updated (page ?) with each data update, or each
time it connects to updated data.
When you export metadata from a current classified DWG, it is transferred to
an MTD file. Although the file has an .mtd extension, its format is XML. A
linking file is also created and placed in the same location as the MTD file. If
the following conditions are met, the linking file retains the location of the
data, and the exported metadata are kept current.
■The MTD file and the linking file are kept together
■The data source remains in the same location
■Auto update is selected in the Metadata Options dialog box (page 1756)
For non-DWG files and feature classes
An MTD file is also generated when you create metadata for a non-DWG file
or a feature class (which is one type of resource (page 2072)).
When you export metadata for a feature class, a feature source definition (FSD)
file is created in addition to the MTD. In this case, it is the FSD file that keeps
the metadata linked to its source data.
See also:
■Updating Metadata (page ?)
■Importing Metadata (page 1511)
■Publishing Metadata (page 1515)
■Setting Up Object Classification (page 116)
To export metadata
1In the Metadata Viewer (page 1751), click Export.
2In the Export Metadata dialog box (page 1757), do one of the following:
■For the current DWG file, click Selected Item.
■For resources, click All Items In, and select the applicable resources.
3Click Browse to select a location to save the files.
Exporting Metadata | 1513

4Click Export.
Quick Reference
MAPMETADATAVIEWER
Displays the Metadata Viewer
MAPMETADATAVIEWERCommand Line
In Map Explorer, right-click the current drawing ➤
View Metadata.
Task Pane
Metadata ViewerDialog Box
Publishing and Printing Metadata
Publishing metadata
You can publish metadata (page 2069) to the following file formats: XML, HTML,
and TXT.
If you publish metadata for an object class or feature source, AutoCAD Map
3D creates an XML file for each object or each feature. If you publish a DWG
containing feature sources and object classes, the XML file describes each
object and feature in the DWG, but not as thoroughly as it does if you publish
them separately.
NOTE It is possible to publish metadata that does not comply with the standard
with which you are working. Audit your metadata to check for errors (see Auditing
Metadata (page 1509)).
Printing metadata
When you print metadata (page 2069), the printout is formatted using the style
sheet that is currently selected in the Metadata Viewer (page 1751).
See also:
■Importing Metadata (page 1510)
■Exporting Metadata (page 1512)
1514 | Chapter 10 Working with Metadata
To publish metadata
1In the Metadata Viewer (page 1751), click Publish.
2Optionally, rename the file.
3Select a location to save the file.
4Under Save As Type, select a file type.
5Click OK.
To print metadata
1In the Metadata Viewer, select a style sheet.
2Click Print.
Quick Reference
MAPMETADATAVIEWER
Displays the Metadata Viewer
MAPMETADATAVIEWERCommand Line
In Map Explorer, right-click the current drawing ➤
View Metadata.
Task Pane
Metadata ViewerDialog Box
Publishing and Printing Metadata | 1515
1516
Reference Guide
This section provides comprehensive information about AutoCAD Map 3D commands,
expressions and variables, and the dialog boxes where many of the AutoCAD Map 3D settings
can be specified.
1517
1518
Command Reference
AutoCAD Map 3D adds its own unique mapping and spatial data management commands
to the AutoCAD command set. You get all the power and design capabilities of AutoCAD plus
the spatial context needed for mapping.
Commands can be accessed using a variety of methods:
■Enter a command in the drawing area or on the command line.
■Select the command from the menu.
■Click the toolbar icon for the command.
■Right-click an object in the drawing or an item in the Task Pane and select the command
from the shortcut menu
This section provides information about the mapping commands in AutoCAD Map 3D.
For information about AutoCAD commands, see the AutoCAD Help.
To learn more about the various ways you can use a command, click the Quick Reference tab
of a help topic.
■Mapping Commands (page 1519)
■Discontinued Commands (page 1533)
■MAPWSACTION (page 1536)
■REFEDIT (page 1536)
■Wildcard Characters (page 1537)
■Improving Performance (page 1538)
Mapping Commands
Following is a list of mapping commands. Click a command name for
information about how to use it.
11
1519

For information about AutoCAD commands, see the AutoCAD Help.
DescriptionCommand
Specifies a point based on angle and dis-
tance from a given point
AD (page 1033)
Attaches object data to objectsADEATTACHDATA (page 1065)
Defines a global coordinate systemADEDEFCRDSYS (page 93)
Defines object dataADEDEFDATA (page 201)
Manages the drawing setADEDRAWINGS (page 156)
Removes locks from objectsADEDWGMAINT (page 1920)
Displays drawing statisticsADEDWGSTAT (page 1926)
Edits attached object dataADEEDITDATA (page 1070)
Fills a selected polygonADEFILLPOLYG (page 939)
Automatically links objects to object data
or external database records
ADEGENLINK (page 523)
Controls defining, modifying, saving,
loading, and executing a query
ADEQUERY (page 1237)
Maintains the library of queriesADEQUERYLIB (page 183)
Performs a quick display of active drawingsADEQVIEWDWGS (page 747)
Removes objects from the save set so they
aren't saved to source drawings
ADEREMOBJS (page 1885)
Performs rubber sheeting on selected ob-
jects
ADERSHEET (page 935)
Runs queries in the Query LibraryADERUNQUERY (page 179)
Runs externally saved queriesADERUNXQUERY (page 181)
1520 | Chapter 11 Command Reference

DescriptionCommand
Saves objects in the save set back to source
drawings
ADESAVEOBJS (page 1887)
Creates a set of objects to be saved to
source drawings
ADESELOBJS (page 1886)
Assigns a global coordinate system code
for the current drawing
ADESETCRDSYS (page 148)
Displays the objects in the save setADESHOWOBJS (page 1887)
Redefines the default label point of an ob-
ject for text
ADETEXTLOC (page 937)
Moves, scales, and rotates a set of objectsADETRANSFORM (page 932)
Displays the current owner of a selected
locked object
ADEWHOHASIT (page 1889)
Performs a ZOOM command to display
the extents of selected active drawings
ADEZEXTENTS (page 745)
Changes the current object class definition
file
ATTACHDEF (page 995)
Specifies a point using bearings from two
given points.
BB (page 1037)
Specifies a point based on bearing and
distance from a given point
BD (page 1035)
Classifies existing objectsCLASSIFY (page 990)
Specifies a point based on deflection and
distance from a given point
DD (page 1039)
Specifies a point based on distances from
two other points.
DDIST (page 1041)
Defines a new object class based on an
example in the current drawing
FEATUREDEF (page 122)
Mapping Commands | 1521
DescriptionCommand
Exports an SDF 2 file for use with Autodesk
MapGuide 6.5 or earlier. Same as MAPEX-
PORTMAPGUIDE.
MAP2SDF (page 1419)
Adds a point cloud from an indexed point
cloud data store
NO LABEL (page 377)
Gives information about AutoCAD Map 3DMAPABOUT
Adds a link to a network topologyMAPAL (page 881)
Adds a node to a topologyMAPAN (page 879)
Creates a buffer around an existing topo-
logy
MAPANBUFFER (page 1348)
Dissolves a topology into constituent topo-
logies
MAPANDISSOLVE (page 1345)
Deletes all annotation based on selected
template
MAPANNDELETE (page 1109)
Adds annotation to objects based on selec-
ted annotation template
MAPANNINSERT (page 1574)
Refreshes existing annotationMAPANNREFRESH (page 1106)
Defines and modifies annotation templatesMAPANNTEMPLATE (page 194)
Creates and edits annotation textMAPANNTEXT (page 194)
Updates existing annotationMAPANNUPDATE (page 1108)
Overlays one topology with another, and
creates a new topology
MAPANOVERLAY (page 1341)
Traces through a network topology
(shortest path trace, best route analysis, or
flood trace)
MAPANTOPONET (page 1322)
Adds a polygon to a polygon topologyMAPAP (page 884)
1522 | Chapter 11 Command Reference
DescriptionCommand
Attaches a data source to a drawingMAPATTACHDB (page 210)
Automatically checks-out features that are
edited
MAPAUTOCHECKOUT (page 696)
Breaks a link in a topology at a specified
point
MAPBL (page 864)
Creates a map book to publish your dataMAPBOOKCREATE (page 1389)
Breaks objects along a selected or defined
boundary
MAPBREAK (page 942)
Opens a database table associated with a
specific link template to edit in the Data
View
MAPBROWSELINK (page 1053)
Opens a database table to edit in the Data
View
MAPBROWSETBL (page 1053)
Discards edits and unlocks the features in
the feature source. Edits are not discarded
if Update Edits Automatically is enabled
MAPCANCELCHECKOUT (page 698)
Adds the distances between pointsMAPCGADIST (page 1158)
Displays the angle between lines or pointsMAPCGANG (page 1160)
Sets the azimuth baseMAPCGAZBASE (page 234)
Displays the distance between pointsMAPCGCDIST (page 1159)
Displays coordinate geometry information
for lines and arcs
MAPCGLIST (page 1161)
Specifies coordinate geometry settingsMAPCGSETUP (page 234)
Displays the slope between pointsMAPCGSLIST (page 1162)
Mapping Commands | 1523
DescriptionCommand
Saves modified features back to their fea-
ture source and unlocks the features in the
feature source
MAPCHECKIN (page 694)
Makes feature available for editing and if
locking is available, sets locks on the source
MAPCHECKOUT (page 696)
Performs drawing cleanup operationsMAPCLEAN (page 768)
Creates polylines from a polygon topologyMAPCLPLINE (page 898)
Opens the COGO Input dialog box, which
allows you to enter coordinate geometry
data.
MAPCOGO (page 1029)
Configures the connection to an external
data source
MAPCONFIGDB (page 214)
Connects to a feature sourceMAPCONNECT (page 309)
Connects to an attached data sourceMAPCONNECTDB (page 215)
Toggles default connection pooling setting.MAPCONNECTIONPOOLING (page 89)
Creates a centroid in a polygon and moves
data to the centroid
MAPCREATECENTROIDS (page 887)
Converts drawing objects to features to
create new features.
MAPCREATEFEATUREFROMGEOMETRY
(page 693)
Opens the Data Table, which allows you
to view, edit and filter feature data
MAPDATATABLE (page 1129)
Defines a link template for a database tableMAPDEFINELT (page 526)
Deletes database links from objectsMAPDELETELINKS (page 537)
Deletes a link templateMAPDELETELT (page 539)
Detaches a data source from a drawingMAPDETACHDB (page 215)
1524 | Chapter 11 Command Reference

DescriptionCommand
Sets up user options for digitizing nodes
and linear objects
MAPDIGISETUP (page 133)
Digitizes nodes and linear objects with
settings from mapdigisetup
MAPDIGITIZE (page 1082)
Disconnects an attached, connected data-
base
MAPDISCONNECTDB (page 215)
Turns on and off the Display Library
palette.
MAPDISPLAYLIBRARY (page 1621)
Measures the geodetic distance between
points
MAPDIST (page 1153)
Deletes a link in a network topology.MAPDL (page 890)
Deletes a node in a topology.MAPDN (page 890)
Deletes a polygon from a polygon topo-
logy.
MAPDP (page 890)
Docks and undocks the Task PaneMAPDOCKWSPACE (page 1908)
Divides a polygon in a polygon topology
by allowing you to add a link
MAPDVP (page 868)
Sets AutoCAD Map 3D options for publish-
ing to DWF.
MAPDWFOPTIONS (page 1366)
Exports an SDFMAPDWGTOSDF
Edits direction of a link in a network topo-
logy
MAPEDITDIR (page 848)
Edits direct resistance of a node or link in
a network topology
MAPEDITRES1 (page 850)
Edits reverse resistance of a link in a net-
work topology
MAPEDITRES2 (page 850)
Mapping Commands | 1525

DescriptionCommand
Updates feature edits automaticallyMAPEDITSETAUTO (page 698)
Toggles default setting for Update Edits
Automatically
MAPEDITSETAUTODEFAULT (page 88)
Specifies options for editing featuresMAPFEATUREEDITOPTIONS (page 241)
Exports data from AutoCAD Map 3D to an
external file format
MAPEXPORT (page 1410)
Exports an SDF 2 file for use with Autodesk
MapGuide 6.5 and earlier. Same as
MAP2SDF
MAPEXPORTMAPGUIDE (page 1419) (Same
as MAP2SDF)
Extracts the geometry from a feature to
use AutoCAD commands that are not
available for features
MAPEXTRACTFEATUREGEOMETRY (page
716)
Creates a buffer zone around features in
your map
MAPFDOBUFFERCREATE (page 1309)
Edits a feature.MAPFEATUREEDIT (page 701)
Specifies options for editing featuresMAPFEATUREEDITOPTIONS (page 241)
Merges features and assigns feature prop-
erty values for the resulting feature
MAPFEATUREMERGE (page 711)
Splits features and assigns feature property
values for resulting features
MAPFEATURESPLIT (page 709)
Performs overlay analysis on feature classesMAPGISOVERLAY (page 1318)
Specifies the settings to use for shading 3D
raster-based surfaces
MAPHILLSHADE (page 1201)
Makes frames enclosing raster images, vis-
ible or invisible
MAPIFRAME (page 495)
Determines whether or not the rules for
split and merge are used
MAPIGNORESPLITMERGERULES (page 1653)
1526 | Chapter 11 Command Reference

DescriptionCommand
View file, image, object property, and cor-
relation information about selected images
MAPIINFO (page 475)
Inserts a raster imageMAPIINSERT (page 462)
Inserts a link in a topologyMAPIL (page 881)
View list of images in current drawing,
change drawing order, erase or zoom to
selected images
MAPIMANAGE (page 475)
Imports an external file format into Auto-
CAD Map 3D
MAPIMPORT (page 384)
Imports an SDF 2 file from Autodesk Map-
Guide 6.5 or earlier. Same as MAPSDFIN.
MAPIMPORTMAPGUIDE (page 390) (Same
as MAPSDFIN)
Inserts a node in a topology.MAPIN (page 879)
Specify default image correlation settings,
display options, detach options, paths, and
memory settings
MAPIOPTIONS (page 249)
Joins two links in a topologyMAPJL (page 864)
Creates a new LineString featureMAPLINESTRINGCREATE (page 1654)
Edits a LineString featureMAPLINESTRINGEDIT (page 1655)
Edits a link in a network topologyMAPLINKEDIT (page 864)
Edits the link data attached to an objectMAPLINKMANAGER (page 537)
Updates links in a network topologyMAPLINKUPD (page 892)
Log in as an AutoCAD Map 3D userMAPLOGIN (page 142)
Repositions an end point of a link in a net-
work topology
MAPMEL (page 864)
Moves a link in a network topologyMAPML (page 864)
Mapping Commands | 1527
DescriptionCommand
Moves a node in a node topology or moves
a node at the end of a link in network or
polygon topologies
MAPMN (page 861)
Merges polygons in a polygon topologyMAPMP (page 868)
Creates a new MultiLineString featureMAPMULTILINESTRINGCREATE (page 1656)
Edits a MultiLineString featureMAPMULTILINESTRINGEDIT (page 1658)
Creates a new MultiPoint featureMAPMULTIPOINTCREATE (page 1659)
Edits a MultiPoint featureMAPMULTIPOINTEDIT (page 1659)
Creates a new MultiPolygon featureMAPMULTIPOLYGONCREATE (page 1660)
Edits a MultiPolygon featureMAPMULTIPOLYGONEDIT (page 1662)
Edits a node in a topologyMAPNODEDIT (page 861)
Updates nodes in a topologyMAPNODUPD (page 892)
Converts object data tables to linked extern-
al database tables.
MAPOD2ASE (page 535)
Sets AutoCAD Map 3D optionsMAPOPTIONS (page 218)
Creates a new Point featureMAPPOINTCREATE (page 1663)
Creates a new Polygon featureMAPPOLYGONCREATE (page 1663)
Edits a polygon featureMAPPOLYGONEDIT (page 1665)
Converts closed polylines to polygonsMAPPOLYLINETOPOLYGON (page 972)
Updates a polygon topologyMAPPOLYUPD (page 892)
Edits the database table name or location
in a link template
MAPPROPSLT (page 539)
1528 | Chapter 11 Command Reference

DescriptionCommand
Publishes to the new MapGuide techno-
logy (Autodesk MapGuide Enterprise 2007
or MapGuide Open Source)
MAPPUBLISHTOMAPGUIDE (page 1378)
Reverses a link in a network topology.MAPRL (page 848)
Runs a database query and opens a data-
base table displaying the results of the
query in the Data View
MAPRUNDBQUERY (page 1049)
Imports an SDF format file from Autodesk
MapGuide
MAPSDFIN (page 390)
Searches for and selects features in your
map, based on the location and attribute
criteria you specify
MAPSEARCH (page 1215)
Highlights features in the drawing that are
from the selected feature source
MAPSELECTCHECKEDOUT (page 696)
Selects all classified objectsMAPSELECTCLASSIFIED (page 994)
Selects all objects that have no classifica-
tion assigned to them
MAPSELECTUNCLASSIFIED (page 994)
Selects all objects whose classification is
not defined in the object class definition
file
MAPSELECTUNDEFINED (page 994)
Highlights objects in the selected topologyMAPSHOWGEOM (page 912)
Highlights and identifies topologies for the
selected object
MAPSHOWTOPO (page 912)
Shows or hides the Map status bar.MAPSTATUSBAR (page 89)
Adds text features to an annotation layerMAPTEXTCREATE (page 1115)
Allows you to edit text features on an an-
notation layer
MAPTEXTEDIT (page 1116)
Mapping Commands | 1529

DescriptionCommand
Creates an annotation layer for freestand-
ing text features
MAPTEXTLAYERCREATE (page 1111)
Checks that a topology is complete and
contains no errors
MAPTOPOAUDIT (page 921)
Completes a network or polygon topologyMAPTOPOCOMP (page 921)
Creates a new topology.MAPTOPOCREATE (page 825)
Removes topology data from objects, and
optionally deletes the objects
MAPTOPODEL (page 926)
Loads a topologyMAPTOPOLOAD (page 908)
Converts an existing polygon topology to
polygons
MAPTOPOLOGY (page 975)
Queries topologiesMAPTOPOQUERY (page 1354)
Reestablishes a topology that was edited
with nontopology editing commands such
as STRETCH, PEDIT, and MOVE
MAPTOPORECR (page 921)
Changes the name, description, or both
of a topology
MAPTOPOREN (page 925)
Displays detailed information about a topo-
logy
MAPTOPOSTATS (page 916)
Unloads a topologyMAPTOPOUNLOAD (page 908)
Tracks the coordinates of the cursor in any
coordinate system
MAPTRACKCS (page 1151)
Trims objects to a set of edgesMAPTRIM (page 946)
Merges new or existing drawing object
geometry with a feature.
MAPUPDATEFEATUREGEOMETRY (page
718)
Enables/disables use of mapping polygonsMAPUSEMPOLYGON (page 980)
1530 | Chapter 11 Command Reference
DescriptionCommand
Performs administrative functionsMAPUSERADMIN (page 84)
Opens a database table associated with a
specific link template to view in the Data
View
MAPVIEWLINK (page 528)
Opens a database table to view in the Data
View
MAPVIEWTBL (page 1053)
Disconnects you from feature sources and
caches all your feature data connections,
MAPWORKOFFLINE (page 721)
allowing you to work with a local copy of
your feature data.
Reestablishes connections with your feature
sources so you are working live again and
can check in any changes.
MAPWORKONLINE (page 721)
Runs the specified workflow from the
command line. Use this in a script fileto
execute automated workflows.
MAPWORKFLOWBATCHRUN
Creates a workflow.MAPWORKFLOWCREATE (page 289)
Edits a workflow.MAPWORKFLOWEDIT (page 289)
Opens a workflow.MAPWORKFLOWOPEN (page 280)
Runs a workflow.MAPWORKFLOWRUN (page 280)
Saves a workflow.MAPWORKFLOWSAVE (page 277)
Saves a workflow.MAPWORKFLOWSAVEAS (page 277)
Indicates that a shortcut menu command
in the Task Pane has no link to an AutoCAD
Map 3D command
MAPWSACTION (page 1536)
Shows or hides the Task PaneMAPWSPACE (page 1908)
Redisplays the Task PaneMAPWSREFRESH (page 1908)
Mapping Commands | 1531
DescriptionCommand
Edits polygonsMAPMPEDIT (page 967)
Sets the default fill for polygonsMPFILL (page 980)
Creates polygonsMPOLYGON (page 962)
Splits an existing polygon object into two
new polygon objects
MPSPLIT (page 969)
Creates a new object class definition fileNEWDEF (page 130)
Changes the display of polygon edges and
fill
POLYDISPLAY (page 980)
Removes classification from an objectUNCLASSIFY (page 990)
Specifies a point based on azimuth and
distance from a given point
ZD (page 1043)
Changed or Replaced Commands
Some commands have been replaced or discontinued in this release. Some of
the commands still function, but they may not be available in future releases.
You should update any scripts you have to use new commands. For more
information, see Discontinued Commands (page 1533).
Using Wildcard Characters with Commands
Most AutoCAD Map 3D commands are wildcard character-enabled. For more
information, see Wildcard Characters (page 1537).
See also:
■REFEDIT (page 1536)
1532 | Chapter 11 Command Reference

Discontinued Commands
The following commands have been discontinued or replaced. Some may still
function in this release. However, you should update your scripts to use new
commands.
NotesDiscontinued Com-
mand
Category
Discontinued. Not used any
more.
FDOATTACHFeature Data Objects
(FDO)
Discontinued. Not used any
more.
FDOCONFIGURE
Discontinued. New command
is MAPCONNECT.
FDOCONNECT
Discontinued. Not used any
more.
FDODETACH
Discontinued. Not used any
more.
FDODISASSOCIATE
Discontinued. Not used any
more.
FDODISCONNECT
Discontinued. New command
is MAPCHECKOUT.
FDOEDITSETADD
Discontinued. New command
is MAPCANCELCHECKOUT.
FDOEDITSETREMOVE
Discontinued. New command
is MAPCHECKIN.
FDOEDITSETSAVE
Discontinued. New command
is MAPSELECTCHECKEDOUT.
FDOEDITSETSHOW
Discontinued. Not used any
more.
FDOLOCKS
Discontinued. Not used any
more.
FDOQUERY
Discontinued Commands | 1533

NotesDiscontinued Com-
mand
Category
DiscontinuedFDOREFRESH
Discontinued. Not used any
more.
FDOSCHEMA
Discontinued. Not used any
more.
FDOSHOWOWNER
DiscontinuedFDOSYSADMIN / SYSAD-
MIN
DiscontinuedMAPSKINMAPGeneral
DiscontinuedMAPPLOTTRANSPARENCY
DiscontinuedMAPDISPLAYMANAGER
DiscontinuedMAPIMPORT4Import Export (Release
4)
DiscontinuedMAPEXPORT4
Discontinued in Autodesk Map
6. New command is MAP-
CLEAN.
ADEDWGCLEANDrawing Cleanup
Discontinued. For information
about the new way, see Bring-
ORACONNECTOracle Spatial (Older
Method)
ing In Features from Oracle
(page 312).
DiscontinuedORADISCONNECT
DiscontinuedORAERUPDATE
DiscontinuedORAEXPORT
DiscontinuedORAIMPORT
DiscontinuedORAINDEX
1534 | Chapter 11 Command Reference

NotesDiscontinued Com-
mand
Category
DiscontinuedORAUPDATE
Discontinued. New command
is MAPANBUFFER
MAPBUFFERTopology
Discontinued. New command
is MAPTOPOCREATE
MAPCREATE
Discontinued. New command
is MAPANDISSOLVE
MAPDISSOLVE
Discontinued. New command
is MAPANTOPONET
MAPFLOOD
Discontinued. New command
is MAPAL
MAPLINKADD
Discontinued. New command
is MAPDL
MAPLINKDEL
Discontinued. New command
is MAPRL
MAPLINKREV
Discontinued. New command
is MAPAN
MAPNODADD
Discontinued. New command
is MAPDN
MAPNODDEL
Discontinued. New command
is MAPIN
MAPNODINS
Discontinued. New command
is MAPANOVERLAY
MAPOVERLAY
Discontinued. New command
is MAPAP
MAPPOLYADD
Discontinued. New command
is MAPDP
MAPPOLYDEL
Discontinued Commands | 1535
NotesDiscontinued Com-
mand
Category
Discontinued. There are several
new commands,for example,
MAPTOPOADMIN
MAPTOPOLOAD and MAPTO-
PODEL. For a complete list, see
Managing Topologies (page
898).
Discontinued. There are several
new commands, for example,
MAPTOPOEDIT
MAPAN, MAPDL, and MAPMP.
For a complete list, see Editing
Topologies (page 851).
Discontinued. New command
is MAPANTOPONET
MAPTRACE
MAPWSACTION
This text represents a shortcut menu command in the Task Pane that has no
link to an AutoCAD Map 3D command. For example, some topology
commands that you choose from the shortcut menu in the Task Pane do not
have corresponding AutoCAD Map 3D commands.
If you right-click in the drawing after completing such an action, you see
"Repeat MAPWSACTION" in the menu. If you click this item, nothing will
happen, by design. Likewise, if you right-click the command line, you see
MAPWSACTION as one of the Recent Commands, but clicking on it will do
nothing. The action that MAPWSACTION represents is not repeatable by
typing MAPWSACTION on the command line. You must repeat the action
from the Task Pane.
NOTE You cannot undo this operation using the UNDO command.
REFEDIT
Use the reference editing command to make modifications to Xrefs and blocks.
While in REFEDIT mode, the Task Pane and Data View are grayed-out and
some commands are unavailable. If you attempt to use one of these commands,
1536 | Chapter 11 Command Reference
AutoCAD Map 3D displays a message that the command is not allowed during
reference editing
Wildcard Characters
Most dialog boxes and command line entries support the following wildcard
characters.
These wildcard characters can be used in object data queries and property
queries. To use wildcard characters in SQL queries, refer to your database
software for a list of supported characters.
DescriptionWildcard
Matches any numeric digit.#(pound)
Matches any alphabetic character.@(at)
Matches any nonalphanumeric character..(period)
Matches any string, including the null string. It can be used
at the beginning, middle, or end of a string.
*(asterisk) or%(per-
cent)
Matches any single character.?(question mark)
Matches anything but the next pattern.~(tilde)
Matches any one of the characters enclosed.[ ] (brackets)
Matches any character not enclosed.[~ ] (tilde and brack-
ets)
Specifies a range for a single character when inside brackets.-(hyphen)
Escape character; reads the next character literally.'(reverse quote)
Enters a set when used between items.,(comma)
Wildcard Characters | 1537

NOTE Most AutoCAD Map 3D commands are wildcard character-enabled. To
use a wildcard character as a literal character, precede the wildcard character with
a back quote (`). For example, if you have a layer named "Floor Plan #1," from
which you want to query some objects, type Floor Plan `#1 when you create the
query. If you select the name from a list box, the back quote is added automatically
to the text that appears in any corresponding edit box. The wildcard characters
for which this is valid include #, @, .(period), ~.
Improving Performance
You can improve performance in many areas by taking a few steps in advance.
For example, creating indexes can greatly speed up queries and save back.
The following table lists some of the steps you can take to improve
performance. For more information on an item, click the link.
Feature Layers
You can filter a feature layer to reduce the number of features
in the layer and improve performace. You can filter data as
Filtering Feature Layers
(page 1216)
you bring it into your map (in Data Connect, click Add To
Map With Query), or after you bring it in (right-click the layer
and choose Query To Filter Data).
Query Attached
Drawings
Using the AutoCAD Map 3D global coordinate systems re-
quires many complex calculations and can decrease perform-
To turn off a global co-
ordinate system (page
150) ance for operations such as querying objects from attached
drawings and saving back objects.
To reduce the amount of time it takes to perform a query,
create an index. Instead of searching all locations, properties,
To create a drawing in-
dex (page 1294)
object data, or database links to find matching data, AutoCAD
Map 3D searches only the relevant index. If you created in-
dexes in a previous release of AutoCAD Map 3D, it may help
1538 | Chapter 11 Command Reference
Query Attached
Drawings
to recreate the indexes in this release to ensure that they in-
clude any new features, such as color book names.
Raster Images
When you hide an image, the image does not display on-
screen, nor does it plot. Only the image boundary displays
To hide an image (page
485)
onscreen. Hiding images is a convenient way to speed re-
generation time. You can easily redisplay the image when
you are ready to plot.
To conserve memory use and enhance performance, you
can unload images that you do not currently need to view
and/or plot.
To unload an image
(page 486)
Because memory management can be an issue when
working with large images, you can configure the Raster
To configure memory for
images (page 259)
Extension for best performance. Specify the amount of
memory reserved for the image swap file. The higher the
Memory Limit, the less swapping to hard disk occurs and
the faster your images load and display. For best perform-
ance, use a local drive for your temporary swap file.
Display your images in high quality or draft quality. High
quality dithers the pixels so that the areas between shading
To change the image
display quality (page 254)
appear more gradual. Draft quality can speed up the per-
formance of your system, but may reduce the quality of how
some color and gray scale images appear onscreen.
Topology
Improve the performance of buffering operations by increas-
ing the RAM to more than the recommended amount, or
Buffering a Topology
by increasing the virtual memory on your system. This is
recommended if you are buffering large topologies.
DataView
Filter, or limit, the data displayed in the Data View. Filters
let you view only the records you want. This can improve
To use a SQL filter in the
Data View (page 1231)
Improving Performance | 1539
DataView
performance in scrolling through many records or in high-
lighting records.
Other
Using the Erase Short Objects cleanup action, you can locate
any objects shorter than the specified tolerance and erase them.
To erase short linear
objects (page 796)
This action reduces the number of unnecessary linear objects
and nodes in a map.
Simplifying linear objects reduces file size and improves perform-
ance but also reduces the resolution of the data.
To simplify objects
(page 814)
When modifying or working with a large number of objects, you
can enhance performance by adding the objects to the EditSet
(locking them) prior to working with them.
To add objects to
the save set and lock
the objects (page
751)
1540 | Chapter 11 Command Reference
Expression Evaluator
Use expressions and variables to define data based on other information in your drawings or
in external databases.
Most places where you can enter an expression, you can use the Expression dialog box to
select from a list of available variables. You can combine expressions and variables to create
complex expressions.
■Functions (page 1541)
■Variables (page 1546)
■Using Color in Expressions (page 1552)
■Tips and Suggestions for the Expression Evaluator (page 1553)
Functions
Expressions can include many types of functions.
See also:
■Variables (page 1546)
Arithmetic Functions
The expression evaluator supports the following arithmetic functions. The words
in italics can be replaced by an actual value or a variable.
DescriptionExpression
Returns the sum of all numbers.(+ number number [number] ...)
12
1541
DescriptionExpression
Subtracts the second and following numbers from
the first and returns the difference.
(- number number [number] ...)
Returns the product of all numbers.(* number number [number] ...)
Divides the first number by the product of the remain-
ing numbers and returns the quotient.
(/ number number [number] ...)
Returns the absolute value of the number.(abs number)
Returns the arctangent of the number expressed in
radians.
(atan num1 [num2] )
Returns the cosine of the angle expressed in radians.(cos angle)
Returns the constant e (a real number) raised to a
specified power (the natural antilog).
(exp number)
Returns a number raised to a specified power.(expt basepower)
Returns the conversion of a real number into the
nearest smaller integer.
(fix number)
Returns the natural log of a number as a real number.(log number)
Returns the base 10 logarithm for a number.(log10 number)
Returns the sine of an angle as a real number ex-
pressed in radians.
(sin angle)
Returns the square root of a number as a real num-
ber.
(sqrt number)
Returns the tangent of an angle, measured in radians.(tan angle)
1542 | Chapter 12 Expression Evaluator

String-Handling Functions
The expression evaluator supports the following string-handling functions.
The words in italics can be replaced by an actual value or a variable.
DescriptionExpression
Returns a string where all alphabetic characters have
been converted to uppercase or lowercase.
(strcase string [which] )
Returns a string that is the concatenation of multiple
strings.
(strcat string1 [string2] ...)
Returns an integer that is the number of characters
in a string.
(strlen [string] ...)
Returns a substring of a string.(substr stringstart [length] )
Returns the conversion of an integer representing an
ASCII character code into a single-character string.
(chr integer)
ads the beginning of a string with spaces until the
string reaches the length specified.
(LPAD stringlength)
ads the end of a string with spaces until the string
reaches the length specified.
(RPAD stringlength)
Trims strings from the beginning, middle, or end of
a string based on the mode. Mode can be B (begin-
(trim string [mode] )
ning), M (middle), or E (end), or any combination.
If no mode is specified, BE is used.
Equality and Conditional Functions
The expression evaluator supports the following equality and conditional
functions. The words in italics can be replaced by an actual value or a variable.
DescriptionExpression
Returns T if all arguments are numerically equal, and
returns nil otherwise.
(= numstr [numstr] ...)
String-Handling Functions | 1543

DescriptionExpression
Returns T if the arguments are not numerically equal,
and nil if the arguments are numerically equal.
(/= numstr [numstr] ...) or (<>
numstr [numstr] ...)
Returns T if each argument is numerically less than
the argument to the right, and returns nil otherwise.
(< numstr [numstr] ...)
Returns T if each argument is numerically less than
or equal to the argument to the right, and returns
nil otherwise.
(<= numstr [numstr] ...)
Returns T if each argument is numerically greater
than the argument to the right, and returns nil oth-
erwise.
(> numstr [numstr] ...)
Returns T if each argument is numerically greater
than or equal to the argument to the right, and re-
turns nil otherwise.
(>= numstr [numstr] ...)
Returns the logical AND of a list of expressions.(and expr ...)
Returns the logical OR of a list of expressions.(or expr ...)
Symbol-Handling Functions
The expression evaluator supports the following symbol-handling function.
The words in italics can be replaced by an actual value or a variable.
DescriptionExpression
Verifies that the item evaluates to nil.(not item)
Conversion Functions
The expression evaluator supports the following conversion functions. The
words in italics can be replaced by an actual value or a variable.
DescriptionExpression
Converts an angular value in radians into a string.(angtos angle [mode [precision] ]
)
1544 | Chapter 12 Expression Evaluator

DescriptionExpression
Returns the conversion of the first character of a
string into its ASCII character code (an integer).
(ascii string)
Converts the lineweight (first argument) to a real.
If the optional second argument is non-nil, returns
(lwtof lineweight [metric] )
the lineweight as millimeters, otherwise returns it
as inches.
Converts a number into a string.(rtos number [mode [precision] ] )
Other Functions
The expression evaluator supports the following other functions. The words
in italics can be replaced by an actual value or a variable.
DescriptionExpression
Returns the value of the dot variable for the object as it
is stored in the drawing. If the object was queried from
entity .dotvariable
a source drawing, returns the value for the object in the
source drawing, before any transformations are applied.
Returns the value of the dot variable for the object as it
is stylized in the Display Manager.
style .dotvariable
Returns pi (approx. 3.1415926).PI
Returns the value of the expression after it has been
processed by the specified range table. The range table
must be defined in the current drawing.
(Range expression
range_table)
Returns the current viewport scale, expressed as the
apparent size of a screen pixel in drawing units.
(viewscale)
Returns the current twist angle for the current viewport.
This is equivalent to the viewtwist system variable.
(viewtwist)
Other Functions | 1545

Variables
Expressions can include many types of variables and expressions.
See also:
■Object Data Variables (page 1549)
Dot Variables
Use dot variables to represent object properties. For example, use the .LENGTH
variable in a property alteration to have AutoCAD Map 3D add text to all lines
specifying their length. In an output report, use the .TYPE variable to list the
type of objects in your report.
DescriptionExpression
For most objects, returns the angle in the XY plane.
For ellipse objects, returns the angle of the major axis; for point
objects, returns the ECS rotation; for trace objects, returns the
.ANGLE
angle between the middle points of the start and end edges;
for circle objects, returns the angle of the circle normal projec-
ted plus PI/2 onto the WCSmdash;if no ECS, returns 0; for ob-
jects with 1 or 0 grip points, returns 0; for attdef, text, mtext,
insert, shape, and raster images objects, returns rotation.
Area of a closed polyline or circle.
Topology queries only: Value of AREA object data field for each
polygon.
.AREA
Name of a block..BLOCKNAME
Bulge factor for a polyline segment..BULGE
Center point of an object's extents.
If the object is a polygon (a closed polyline), this coordinate is
always inside the closed area regardless of the area's dimension.
.CENTER
Center point of an object's extents; that is, the intersection of
the diagonals of its bounding rectangle.
.CENTROID
Object class name..CLASSNAME
1546 | Chapter 12 Expression Evaluator

DescriptionExpression
ACI color of an AutoCAD Map 3D object.Color BYLAYER evalu-
ates as 256.Color BYBLOCK evaluates as 0.
.COLOR
Name of the object's source drawing.
Topology queries only: Name of the geometry object's source
drawing.
.DWGNAME
Ending angle of an arc object, using radians, interpreted from
the coordinate space where the object exists.
.EANGLE
Handle of the queried object..EHANDLE
Value for the Z coordinate..ELEVATION
Ending width of a polyline. Does not adjust to the ending width
of individual polyline segments.
.EWIDTH
Height of a text object..HEIGHT
Location for text associated with an object..LABELPT
Layer of an object..LAYER
Length of a line, arc, polyline, or circle. Circle length is given
as the circle circumference.
.LENGTH
Linetype of an object..LINETYPE
Lineweight of an object..LINEWEIGHT
User responsible for the lock..LOCKSTAT
Topology queries only: Value of PERIMETER object data field
for each polygon.
.PERIMETER
Plotstyle of an object..PLOTSTYLE
Radius of a circle..RADIUS
Rotation angle of a block or text, using radians..ROTATION
Dot Variables | 1547
DescriptionExpression
Starting angle of an arc, using radians, interpreted from the
coordinate space where the object exists.
.SANGLE
Name of an AutoCAD Map 3D shape..SHAPENAME
Size of an AutoCAD Map 3D shape..SIZE
Value of a string (can be the value of an attribute or text)..STRING
Style of a text string or attribute..STYLE
Starting width of a polyline..SWIDTH
All AutoCAD Map 3D attribute tags for an object. Usually used
with .STRING to return an attribute tag and its string value
(that is, .TAG, .STRING).
.TAG
AutoCAD Map 3D thickness of an object..THICKNESS
Topology name (Topology queries only)..TOPONAME
Topology type: NODE, NETWORK, or POLYGON (Topology
queries only).
.TOPOTYPE
True color or color book value of an AutoCAD Map 3D object..TRUECOLOR
AutoCAD Map 3D object type..TYPE
URL information linked to an object.
An object with no URL link returns nil.
.URL
NOTE An object can take only one URL. URL data can be
entered in the following formats:
http://servername/pathname/filename.dwg
ftp://servername/pathname/filename.dwg
file://drive/pathname/filename.dwg
Components of a line's starting point--X, Y, or Z..X1, .Y1, .Z1
Components of a line's ending point--X, Y, or Z..X2, .Y2, .Z2
1548 | Chapter 12 Expression Evaluator
DescriptionExpression
Third definition point of a shape or three-dimensional face. If
used on any other object, returns nil.
.X3, .Y3, .Z3
Fourth definition point of a shape or three-dimensional face. If
used on any other object, returns nil.
.X4, .Y4, .Z4
Scale factor along the X axis, interpreted using the coordinate
space where the object exists.
.XSCALE
Scale factor along the Y axis, interpreted using the coordinate
space where the object exists.
.YSCALE
Scale factor along the Z axis, interpreted using the coordinate
space where the object exists.
.ZSCALE
All numeric return values are in decimals.
Object Data Variables
The syntax for using an object data variable in an expression is
:ObjectDataFieldName@ObjectDataTableName
For example, to retrieve the values in the Diameter field of the Pipes table,
enter :diameter@pipes.
Block Attribute Variables
The syntax for using a block attribute variable in an expression is
@BlockTagName
For example, the retrieve the values for the block attribute tag VALVETYPE,
enter @VALVETYPE.
SQL Variables and Expressions
The syntax for using a SQL variable in an expression is
&ColumnName@LinkTemplate
Object Data Variables | 1549
For example, to retrieve the values in the PRICE column in the table referenced
by the link template HOUSES, enter &PRICE@HOUSES.
To relate a second table to the table specified in the link template and return
a value from one of its fields, use this syntax
&[ [ [catalog. ] schema. ] colname@LT [.lnka1, lnka2, ..., lnkaN [.lnkb1, lnkb2, ...,
lnkbN ] ]
The expression must be entered on one line.
■The parameters preceding the @ symbol identify the related table. The LT
parameter identifies the primary table. If no schema or catalog is defined,
it is assumed the related table exists in the same schema as the primary
table.
■The lnk parameter (or lnk1,lnk2,...,lnkN parameter list) identifies the
column name (or names) to reference for the relation if you are not using
the key or keys identified in the link template. If no lnk column is defined
it is assumed that the columns identified in the link template exist in both
tables and are referenced for the relation.
■The lnka parameter (or lnka1,lnka2,...,lnkaN parameter list) identifies the
column name (or names) to use in the primary table.
■The lnkb parameter (or lnkb1,lnkb2,...,lnkbN parameter list) identifies the
column name (or names) to use in the related table if the column name
(or names) to reference for the relation are not the same in both tables.
The number of lnka parameters and lnkb parameters must be the same.
SQL Expressions and SQL Statements
The expression:
&catalog.schema.table.colname
@linktemplate.lnka1,lnka2,...,lnkaN.lnkb1,lnkb2,...,lnkbN
is equivalent to the following SQL statement:
SELECT catalog.schema.table.colname FROM catalog.schema.table WHERE
lnka1 = lnkb1 AND lnka2 = lnkb2 AND ... AND lnkaN = lnkbN AND
linktemplatekey1 = linktemplatevalue1 AND linktemplatekey2 =
linktemplatevalue2 AND ... AND linktemplatekeyN = linktemplatevalueN
where lnka1,...,lnkaN are columns from the primary table, lnkb1,...,lnkbN are
columns from the secondary table, linktemplatekey1,...,linktemplatekeyN are
link template key columns from the primary table, and
1550 | Chapter 12 Expression Evaluator
linktemplatevalue1,...,linktemplatevalueN are the key column values obtained
from the object.
Object Classification Variables
The syntax for using an object class property variable in an expression is
#ObjectClassName.Category.Property
For example, to retrieve the values in the Diameter field of the Pipes table in
the PipeRun object class, enter #Piperun.OD:Pipes.Diameter. To retrieve the
values in the layer property, which is in the General category, enter
#Piperun.General.Layer. To retrieve the values of the end node of the
LocalRoads topology in the Roads object class, enter
#Road.Topo:LocalRoads."end node". Use quotation marks so the space in the
name "end node" is interpreted correctly as part of the property name.
AutoLISP Variables
The syntax for using an AutoLISP variable is
!AutoLISPVariable
For example, to retrieve the values assigned to a variable defined as DIAMETER,
enter !DIAMETER.
EED Expressions
The syntax for using an EED expression is
$EEDFIELD@REGAPP (for string fields)
$#EEDFIELD@REGAPP (for numeric fields)
$&EEDFIELD@REGAPP (for SQL fields)
For example, to retrieve the values for the AGE field registed under the
application ADE, enter $#AGE@ADE.
Object Classification Variables | 1551
Using Color in Expressions
When specifying color in an expresssion, you can use any of the following:
■AutoCAD Color Index (ACI) number
■RGB triplet
■color book color
AutoCAD Color Index (ACI)
You can specify the color using an ACI color name (red, yellow, green, cyan,
blue, magenta and white), the ACI index number (0-256), BYLAYER (256), or
BYBLOCK (0).
Examples:
■(ade_qrydefine '("" "" "" "Property" ("color" "=" "blue")""))
■(ade_qrydefine '("" "" "" "Property" ("color" "=" "5")""))
■(ade_altpdefine "color" "red")
■(ade_altpdefine "color" "1")
RGB Triplet
An RGB triplet specifies the amount of red, green, and blue used to create the
color. The values represent the intensity of the red, green, and blue
components. The combination of these values can be manipulated to create
a wide range of colors. For each component, enter a value between 0 and 255.
To enter an RGB color, enter the value for each of the components separated
by commas. Enclose the three numbers in single quotation marks. For example,
enter the color Red as '255,0,0' and enter cyan as '0,255,255'.
Only the following operators are valid: = and < >.
Examples:
■(ade_qrydefine '("" "" "" "Property" ("color" "=" "\"255,0,0\"" )""))
■(ade_altpdefine "color" "255,0,0")
1552 | Chapter 12 Expression Evaluator
Color Book and Color Name
You can specify colors using third-party color books (such as Pantone) or
user-defined color books.
To specify a color book color, enter the name of the color book and the name
of the color separated by a comma. Enclose the entire string in single quotation
marks. For example, to specify the Pantone process coated cyan, enter
'Pantone(R) process coated, PANTONE Process Cyan C'. When you enter the
color book and color name, be sure to type them exactly.
If you are unsure of the color name or color book name, display the Select
Color dialog box. On the Color Books tab, look at the name of the color book
and the color name.
For information on adding color books, click Help in the Color Books tab of
the Select Color dialog box.
Only the following operators are valid: = and < >.
Examples:
■(ade_qrydefine '("" "" "" "Property" ("color" "=" "\"Pantone,Pantone 647
CVC\"")""))
■(ade_altpdefine "color" "Pantone,Pantone 647 CVC")
Combining Colors
When you specify the range of valid colors, you can combine any of the color
specifications. Separate each color with a comma. In addition, for ACI colors,
you can specify a continuous range. For example:
1,5,[7,11],'255,128,64','Pantone(R) process coated, PANTONE Process Cyan C'
Tips and Suggestions for the Expression Evaluator
■Not all operators are valid with all types of comparisons. When comparing
strings, If, =, /=, >=, <= are valid, but not <. No error results, but the accuracy
of the results can be affected.
■For strings, the standard wild-card characters listed in Wildcard Characters
(page 1537) are valid. For example, if the expression (IF (= .LAYER ELEC*)
EDISON) is placed in the condition, all objects in the query on layers
beginning with ELEC are displayed on the layer EDISON. In addition, the
operators = and /= are valid with wild cards.
Tips and Suggestions for the Expression Evaluator | 1553
■For real numbers less than one, enter all decimal values with a leading
zero; that is, enter .001 as 0.001.
■When nil is a possible parameter, AutoCAD Map 3D uses zero.
■The expression evaluator deals only in strings; it does not distinguish
between strings and numerics. The expression evaluator converts strings
to their numeric values for math operations and converts the results back
to strings.
■If you use variables set using AutoLISP, you must precede the variable with
an exclamation point (!).
■To keep a space within a string, enclose the string in quotation marks. For
example, "this string" evaluates as one string, with a space between the
two words. Without the quotation marks, this string evaluates as two
separate strings. The expression evaluator ignores quotation marks.
■You must enclose named objects with spaces in the name in parentheses
when used in evaluator functions. These objects include layers, blocks,
hatches, and linetypes.
■The following expressions handle a maximum of three arguments: +, –, *,
/, AND, OR, STRCAT, =, and /=. All other expressions handle one or two
arguments. If you use +, –, *, or /, you must supply more than one
argument. For example, (+ 5 6) evaluates to 11; (+ 5 3 2) evaluates to 10.
■An expression evaluates numbers with scientific notation in compound
simple expressions. For example, (+ 1e+001 1) evaluates to 11.0000; 1e+001
evaluates to 10.0.
■AutoCAD Map 3D evaluates pi only in compound expressions; the program
treats pi as a string in simple expressions. For example, (STRCAT pi "_%")
evaluates to 3.14%; pi by itself evaluates to "pi."
■You can specify color (page 1552) using ACI, True Color, or Color Book color
values.
1554 | Chapter 12 Expression Evaluator
Expression Builder
Use expressions to filter the geospatial information displayed in your map, to create calculated
fields, and to change the styles used for a feature layer based on certain conditions.
Using the Expression Builder
The Expression Builder is displayed when you are doing the following:
■Filtering the Layers You Add to a Map
■Filtering Feature Layers
■Filtering by Location
■Searching to Select Feature Layers
■Creating a Calculation
■Using Expressions to Label Features
■Using Expressions In Split/Merge Rules
Expressions you build with the Expression Builder affect geospatial data only
and cannot be used for drawing objects. For help with expressions that affect
drawing data, see the Expression Evaluator (page 1541) section.
13
1555
1556
Dialog Boxes
1557
1558
Analyzing Data Dialog
Boxes
Create Buffer dialog box
Use this dialog box to specify the buffer distance and merging options for
buffering features in AutoCAD Map 3D.
To create a buffer (page 1308)
Analyze tab ➤ Feature panel ➤ Feature Buffer
NOTE This functionality is for geospatial features only. To create a buffer for drawing
objects, see Buffering a Topology (page 1345).
The Create Buffer dialog box has the following options:
Select Features
If you have not already selected features to buffer, click to select the features
interactively on your map.
Buffer Distance
Enter a value, or click to enter a distance interactively on your map. If
you later change the Units setting, the Distance will update to reflect the new
units.
14
1559
Units
Use the measurement units specified by the coordinate system assigned to
your map, or choose a different unit from the list.
(Specify buffer distance)
Click to pick the buffer distance interactively on your map.
Output To Layer
Specify the Display Manager layer to contain the buffer. If you created other
buffers in this map, you can choose one of their layers from the list. By
default, AutoCAD Map 3D creates a new layer for your buffer.
Save To SDF
Specify the name of the SDF file to store the buffered features. By default,
the buffer file is saved in the current drawing’s saved location.
Merge Results
Select No Merging and overlapping buffers are not merged. Select Merge
All Buffers and all overlapping buffers are merged into a single buffer, then
combined into a single multi-polygon. Select Merge Overlapping Buffers
and only overlapping buffers are merged.
Buffer Warning dialog box
You may have selected too many features to buffer in a reasonable amount
of time. Use this dialog box to change your feature selection or merge options
to improve performance of the buffer task.
To change your selection or merge options after receiving a buffer warning
(page 1309)
Analyze tab ➤ Feature panel ➤ Feature Buffer
NOTE This functionality is for geospatial features only. To create a buffer for
drawing objects, see Buffering a Topology (page 1345).
Proceed
Click to use the current options and execute the buffer task. Proceeding
after receiving a buffer warning may take a very long time.
1560 | Chapter 14 Analyzing Data Dialog Boxes
Change
Click to change your feature selection or merge options.
Generate Contour dialog box
Use this dialog box to specify the settings for new contour lines for a
raster-based surface.
To create contour lines (page 1190)
In Display Manager (page 2060), right-click a surface layer, and select Create
Contour Layer
NOTE This functionality applies only to raster-based surface data brought into
AutoCAD Map 3D using Data Connect. You cannot create a surface from other
raster data.
The Contour dialog box has the following options:
New Contour Layer Name
Enter the name for the new Display Manager layer that will contain the
contour lines.
Contour Elevation Interval
Select the difference in elevation between contour lines, for example, 10,
20, or 50.
Units
Select the units (meters or feet) used to measure the elevation in your surface.
AutoCAD Map 3D attempts to get this data from the surface itself, but you
can change it.
Major Contour Every
Select the difference in elevation between major (bold) contour lines. For
example, if you select 5, every fifth contour line will be bolded.
Label the Elevation
Label the contour lines with the elevations they represent.
Generate Contour dialog box | 1561
Create Contours As
Select the type of feature to use when creating contour lines (polyline or
polygon).
Save Contours Into Filename
Enter a name for the new SDF file that will store your contour line features.
Hillshade Settings dialog box
Use this dialog box to specify the settings for shading applied to raster-based
surfaces in AutoCAD Map 3D.
To specify hillshading settings (page 1200)
Click Analyze tab ➤ Feature panel ➤ Surface Hillshade.
NOTE This functionality applies only to raster-based surface data brought into
AutoCAD Map 3D using Data Connect. You cannot create a surface from other
raster data.
The Hillshade Settings dialog box includes the following options:
Direction
Specify the direction from which the light should come, for example, East
or West. Enter a direction value into the edit box, drag the yellow disk in
the compass to the position you want, or use Settings.
Angle
Specify how high in the sky the light is located, such as near the horizon,
directly overhead, or somewhere in between. Enter an angle into the edit
box, drag the yellow disk to specify an angle, or use Settings.
Date, Time, Location Settings
Click to specify sun settings in the Sun Properties palette using date, time
and location. Then, redisplay the Hillshade Settings dialog box and click
Import.
Import
Click to import changes you made using Settings.
1562 | Chapter 14 Analyzing Data Dialog Boxes
Overlay Analysis dialog box
Use this dialog to perform spatial and data analysis by overlaying one set of
geospatial features with another set of geospatial features. Overlay results use
the split rules set in the Split and Merge Rules dialog box (page 1669).
To perform an Overlay operation (page 1316)
Analyze tab ➤ Feature panel ➤ Feature Overlay
NOTE This functionality is for geospatial features only. To overlay drawing
topologies, see Overlaying Two Topologies (page 1336).
Overlay Analysis dialog box - Source and Overlay Type page
Use this page of the Overlay Analysis dialog box to specify the Source and
Overlay features, as well as the type of overlay analysis to perform. Overlay
results use the split rules set in the Split and Merge Rules dialog box (page 1669).
To perform an Overlay operation (page 1316)
Analyze tab ➤ Feature panel ➤ Feature Overlay
NOTE This functionality is for geospatial features only. To overlay drawing
topologies, see Overlaying Two Topologies (page 1336).
The Source and Overlay Type page of the Overlay Analysis dialog box includes
the following options:
Source
Specify the feature layer or feature class to use as the source.
Overlay
Specify the feature layer or feature class to use as the overlay.
Overlay Analysis dialog box | 1563
To use a feature layer, you must add it to your map. To use a feature class,
you must connect to its data store, but you need not add it to the map.
The geometry in the feature classes or layers you select determines the other
choices in the dialog box. You can combine only certain types of geometries.
For example, Union, Paste, and Symmetric Difference support
polygon/polygon comparisons only. Also, you cannot choose point
geometries for both Source and Overlay. If you select point geometry for
Source, you can select only polygon geometry for Overlay.
The available choices for Type depend on the geometry in the Source and
Overlay.
If either the Source or the Overlay contains multiple geometries, you can
select any feature class or layer in Overlay and any overlay operation in
Type. However, the output may be empty if there are no valid geometry
combinations.
Type
Select the type of overlay comparison to perform. For more information on
the available types, see Overlaying Two Feature Sources (page 1309).
■Intersect: Determines the geometry that overlaps in the Source and
Overlay features. Anything that does not overlap is discarded from the
output.
■Union: Determines the geometry that exists in either the Source or
Overlay geometry. Where the geometry intersects, additional features
are created. The resulting layer is the sum of the two comparison layers.
■Erase: Determines the geometry from the Source that does not intersect
with the Overlay. The intersecting pieces are discarded.
■Identity: Creates new features where the Source and Overlay features
intersect.
■Clip: Like Intersect, Clip creates features from the areas of the Source
that overlap with the Overlay. However, with Clip, only feature attributes
from the Source are included in the resulting layer.
■Paste: Creates new features by pasting the Overlay features onto the
Source features. All Overlay features become new features in the resulting
layer. In addition, areas of the Source that do not fall within the geometry
of the Overlay become features in the resulting layer.
■Symmetric Difference: Determines geometry of the Source and Overlay
that do not overlap. Overlapping areas of the features are discarded in
the output, so the resulting layer represents the areas that are mutually
exclusive.
1564 | Chapter 14 Analyzing Data Dialog Boxes
Overlay Analysis dialog box - Set Output and Settings page
Use this page of the Overlay Analysis dialog box to specify the information
about the output layer, and to set tolerance levels for sliver polygons and the
evaluation of points. Overlay results use the split rules set in the Split and
Merge Rules dialog box (page 1669).
To perform an Overlay operation (page 1316)
Analyze tab ➤ Feature panel ➤ Feature Overlay
NOTE This functionality is for geospatial features only. To overlay drawing
topologies, see Overlaying Two Topologies (page 1336).
The Set Output And Settings page of the Overlay Analysis dialog box includes
the following options:
Output
Specify the name and location of the SDF file that will contain the result
of the Overlay operation.
Layer Name
Specify the name of the Display Manager layer that contains the result of
the Overlay operation.
Sliver Tolerance
When the Overlay operation splits features to produce the output layer, it
eliminates polygons that are smaller than the specified tolerance settings.
Some such polygons were present in the sources, and some are produced by
the Overlay operation itself. The elimination of slivers affects the output layers
only.
Polygons whose areas are larger than the Maximum value become separate
features in the output layer.
Polygons whose areas are smaller than the Minimum (and have at least one
neighboring polygon) are considered slivers, and are merged with the
neighboring polygon that has the longest shared edge.
Overlay Analysis dialog box - Set Output and Settings page | 1565

The Overlay operation checks polygons that fall between the two values to
see how wide they are. If they are very narrow, they are merged with a
neighboring polygon.
NOTE If the resulting polygons are not as desired, try adjusting the tolerance
values and repeating the Overlay operation.
Minimum
Specify a value in the current units. If a polygon is smaller than this value,
it merges with a neighboring polygon.
Maximum
Specify a value in the current units. If a polygon is larger than this value,
it becomes its own feature.
Suggest
Click to see recommendations for the Sliver Minimum and Sliver Maximum
values (if they are not already displayed).
To see recommended values, click Suggest. The default suggested values for
sliver tolerances are 1/10 of the smallest input area for the Maximum and
1/100 of the smallest input area for the Minimum. However, the sliver
tolerance values will round down to the next power of 10. So, if the smallest
polygon has an area of 50, the expected sliver tolerances should be 1 and
0.1 respectively, and not 0.5 and 5.
Units
Specify the units to use for the sliver Minimum and Maximum settings.
The available units depend on the Source coordinate system.
Don’t Remove Slivers
Select this check box to have the Overlay operation ignore sliver polygons.
Ordinate Tolerance
Specify how far apart two nodes or vertices of a line or polygon must be to be
treated as separate points.
Length
Enter a distance in the current units. Any two points that are closer together
than this value are treated as a single point in the output layer.
Units
Specify the units to use for the Ordinate Tolerance Lengthsetting. The
available units depend on the Source coordinate system.
1566 | Chapter 14 Analyzing Data Dialog Boxes
Output Properties
Specify which properties from the Source and (if applicable) Overlay are
included in the resulting layer. “All” adds all properties to the resulting
layer. “Identifiers” adds only the primary identifiers (primary keys or unique
fields, such as Feature_ID). “Non-Identifiers” adds only the non-key attributes
(such as Land_Value or Speed_limit, for example). If you add only
non-identifiers, the overlay operation generates primary identifiers for the
features in the resulting layer.
Overlay Analysis dialog box - Set Output and Settings page | 1567
1568
Annotation Dialog Boxes
Annotation Delete dialog box
Use this dialog box to delete one or more annotation templates from the list of
available templates.
To delete all annotation based on a selected annotation template (page 1108)
Click Annotate tab ➤ Map Annotation panel ➤ Delete Annotation.
NOTE This functionality is for drawing objects only. To add annotation to geospatial
features, see Adding Labels to Features (page 1091).
Annotation Refresh dialog box
Use this dialog box to select an annotation template to refresh.
To refresh annotation based on a specific template (page 1105)
Click Annotate tab ➤ Map Annotation panel ➤ Refresh Annotation.
15
1569
NOTE This functionality is for drawing objects only. To add annotation to
geospatial features, see Adding Labels to Features (page 1091).
The Annotation Refresh operation has two options:
Strings Only
Re-evaluate any expression-based text in the annotation, but change nothing
else.
Full Annotation
Re-evaluate any expression-based text in the annotation, as well as other
properties of the annotation, such as the insertion point or the layer on
which the annotation resides.
Annotation Text dialog box
Use this dialog box to specify each text element in an annotation template,
and set its entity properties and text options.
To define an annotation template (page 192)
To change an annotation template (page 196)
At the Command prompt, enter mapanntext.
NOTE This functionality is for drawing objects only. To add annotation to
geospatial features, see Adding Labels to Features (page 1091).
Attribute
Tag
Enter a name for the annotation text object.
Value
Enter the content of the annotation text. Click to specify an expression.
Object Properties
Layer
Select the layer for the annotation text. Click to specify an expression.
1570 | Chapter 15 Annotation Dialog Boxes
Color
Select the color for the annotation text. If you select ByBlock, the settings
in the Define Annotation Template dialog box will be used. Click to
specify an expression.
Lineweight
Select the lineweight. If you select ByBlock, the settings in the Define
Annotation Template dialog box will be used. Click to specify an
expression.
Text Options
Style
Select the style for the annotation text. Click to specify an expression.
Height
Specify the default height of the annotation text. Click to pick points
in the drawing, or click to specify an expression.
Rotation
Specify the rotation angle to use when inserting annotation. Click to
pick points in the drawing. These use the AUNITS system variable. Click
to specify an expression. The resulting values use radians. Your
expression can include a conversion from degrees to radians (divide the
degree value by 360/(2*pi)).
Justification
Specify the justification for the annotation text. Click to specify an
expression.
Annotation Update dialog box
Use this dialog box to update an annotation template from the list of available
templates.
To update annotation based on a specific template (page 1107)
Annotation Update dialog box | 1571
Click Annotate tab ➤ Map Annotation panel ➤ Update Annotation.
NOTE This functionality is for drawing objects only. To add annotation to
geospatial features, see Adding Labels to Features (page 1091).
The Annotation Update operation has two options:
Retain
Regenerates all annotation that uses the selected template, maintaining any
advanced settings from the original annotation. Text you added or removed
in the annotation template is changed in the existing annotations, and any
modifications you made to specific annotations remain.
Discard
Regenerates all annotation that uses the selected template, using the default
values in the template. Text you added or removed in the annotation
template is changed in the existing annotations, but any overrides are lost.
Define Annotation Template dialog box
Use this dialog to define or change the text and graphic elements, default
properties, and insertion options of annotation templates.
To define an annotation template (page 192)
To delete all annotation based on a selected annotation template (page 1108)
Click Annotate tab ➤ Map Annotation panel ➤ Define Template.
NOTE This functionality is for drawing objects only. To add annotation to
geospatial features, see Adding Labels to Features (page 1091).
Annotation Template
Template Name
Select an annotation template.
New
Create a new annotation template.
1572 | Chapter 15 Annotation Dialog Boxes
Copy
Copy the selected annotation template with a new name.
Rename
Rename the selected annotation template.
Delete
Delete the selected annotation template. You can delete an annotation
template only if you first delete all references to that template from the
drawing.
Default Properties
Layer
Select a layer for the annotation. Click to specify an expression.
Linetype
Select a linetype. Click to specify an expression.
Lineweight
Select a lineweight for the annotation. Click to specify an expression.
Color
Select a color for the annotation. Click to specify an expression.
Default Insertion Options
Insertion Point
Specify the annotation insertion location based on the selected template.
Click to pick a point in the drawing, or click to specify an expression.
Scale
Specify the scale to use when inserting annotation based on the selected
template. Click to pick points in the drawing, or click to specify an
expression.
Rotation
Specify the rotation angle to use. Click to pick points in the drawing.
These use the AUNITS system variable. Click to specify an expression.
Define Annotation Template dialog box | 1573
The resulting values use radians. Your expression can include a conversion
from degrees to radians (divide the degree value by 360/(2*pi)).
Edit Template Contents
Display the Block Editor, where you can specify the contents of the selected
annotation template.
Edit Expression dialog box
Use this dialog box to edit an expression. For information about the Expression
Evaluator, see Expression Evaluator (page 1541).
To define an annotation template (page 192)
Click Annotate tab ➤ Map Annotation panel ➤ Insert.
At the Command prompt, enter mapanntext.
Click Annotate tab ➤ Map Annotation panel ➤ Define Template.
NOTE This functionality is for drawing objects only. To add annotation to
geospatial features, see Adding Labels to Features (page 1091).
Enter an expression or click to select from a list of variables in your
drawing.
Insert Annotation dialog box
Use this dialog box to select an annotation template and specify insert
properties.
To insert annotation (page 1103)
Click Annotate tab ➤ Map Annotation panel ➤ Insert.
1574 | Chapter 15 Annotation Dialog Boxes
NOTE This functionality is for drawing objects only. To add annotation to
geospatial features, see Adding Labels to Features (page 1091).
Annotation Template
Select one or more annotation templates to use when inserting annotation
into your drawing.
Basic/Advanced
Click Advanced to override the insertion information specified in the
annotation template.
Insert Options
Insertion Point
Specify the annotation insertion location. Click to pick a point in the
drawing, or click to specify an expression.
Scale
Specify the scale to use when inserting annotation based on the selected
template. Click to pick points in the drawing, or click to specify an
expression.
Rotation
Specify the rotation angle to use when inserting annotation. Click to
pick points in the drawing. These use the AUNITS system variable. Click
to specify an expression. The resulting values use radians. Your
expression can include a conversion from degrees to radians (divide the
degree value by 360/(2*pi)).
Insert Properties
Layer
Select a layer for the annotation. Click to specify an expression.
Linetype
Select a linetype for the annotation. Click to specify an expression.
Lineweight
Select a lineweight for the annotation. Click to specify an expression.
Insert Annotation dialog box | 1575
Color
Select a color for the annotation. Click to specify an expression.
Match
Click to copy the insertion options and properties from an annotation
already in the drawing.
New Annotation Template Name dialog box
Use this dialog box to specify a name for an annotation template.
To define an annotation template (page 192)
Click Annotate tab ➤ Map Annotation panel ➤ Define Template.
NOTE This functionality is for drawing objects only. To add annotation to
geospatial features, see Adding Labels to Features (page 1091).
1576 | Chapter 15 Annotation Dialog Boxes
Autodesk MapGuide Dialog
Boxes
Publish to MapGuide dialog box
Use this dialog box to publish the current display map to Autodesk MapGuide
Enterprise 2007, a platform that lets you publish map-related data on the web
or on an intranet.
To publish a map for use with MapGuide (page 1378)
Click ➤ Publish ➤ Publish To MapGuide.
Connect To Site
Enter the URL for the target website. If the site requires a password, enter
your user name and password in the Connect To MapGuide Site dialog box.
Overwrite Existing Resources Of The Same Name
Select this option to overwrite old files of the same name that already exist
in the target folder. Clear this option to cancel the operation when such files
are encountered.
Show Map In Web Browser After Publishing
Select this option to review the published map immediately.
Select Destination Folder
Select a folder for the published files.
16
1577
Publish to MapGuide Results dialog box
Use this dialog box to resolve any errors that result from a Publish To
MapGuide operation.
To resolve MapGuide publishing errors (page 1379)
Click ➤ Publish ➤ Publish To MapGuide.
View Log
Examine the log file to see which layers failed and why.
Define New Object Data Field dialog box
Use this dialog box to create new fields in existing object data tables when
you are importing Autodesk MapGuide SDF 2 files into AutoCAD Map 3D.
To import SDF 2 files (page 389)
Click Insert tab ➤ Import panel ➤ SDF 2.
NOTE Data you import becomes AutoCAD drawing objects in your map. To
convert the drawing objects to a geospatial format, see Overview of Converting
and Exporting (page 1405).
Field Name
Enter a name for the new field. The name cannot contain any spaces. It
must start with an alphanumeric character.
Type
Specify the valid data type of the new field.
Integer
An integer between -2,147,483,648 and 2,147,483,647
1578 | Chapter 16 Autodesk MapGuide Dialog Boxes
Character
Any characters
Point
Three real numbers separated by commas representing the X, Y, and Z values
of a point
Real
A real number between -1.7E308 and 1.7E308
If you select Integer, numbers are rounded to the nearest whole number.
Description
Enter a description for the new field. This description appears in the Object
Data Fields list.
Default
Enter the value you will use most often when you assign this data field to
an object. The value must match the data type you selected above.
New Layer dialog box
Use this dialog box to create layers from imported SDF data.
To import SDF 2 files (page 389)
To create centroids for polygons and closed polylines (page 887)
Click Insert tab ➤ Import panel ➤ SDF 2.
Click Create tab ➤ Drawing Object panel ➤ Create Centroids.
NOTE Data you import becomes AutoCAD drawing objects in your map. To
convert the drawing objects to a geospatial format, see Overview of Converting
and Exporting (page 1405).
Enter a layer name. It cannot contain any of the following characters: < > / \
: ? * | , = " ` "
New Layer dialog box | 1579
Autodesk MapGuide Export dialog box
Use this dialog box to specify settings for exporting DWG data to Autodesk
MapGuide SDF 2 files for use with Autodesk MapGuide version 6.5 and earlier.
To export DWG data to SDF2 format (page 1418)
Click Output tab ➤ Map Data Transfer panel ➤ As SDF2.
NOTE Export affects drawing objects only. To convert geospatial data to a different
format, see Migrating GIS Data (Bulk Copy) (page 617).
If you previously saved your settings in this dialog box, click Load to reload
them. To save the current settings to use later or to use in a script, click Save.
Selection Tab
SDF Type
Select the type of data to export. Objects of other entity types will be filtered
out of the export. To export the other entity types, run this operation again.
Some objects in an AutoCAD Map 3D drawing may be exported as more
than one entity type.
Select Objects Automatically
Select all objects of the specified type. If Filter Selection By Layer is selected,
only objects on the specified layers are selected.
Select Objects Manually
Individually select the objects to export. To modify the selection set, click
or . Selected objects that do not match the filter will not be
exported.
Filter Selection
Filter the selected objects based on layer. Select Filter Selection By Layer,
click the button, and select from a list of all layers in the drawing. Objects
that are not on the selected layers are filtered out of the export. The status
line shows how many objects are selected and how many have been filtered
out.
1580 | Chapter 16 Autodesk MapGuide Dialog Boxes
Preview Filtered Objects
Preview the objects that will be exported. In the preview, objects that will
be exported are highlighted. To leave the preview and return to this dialog,
press Esc.
Options Tab
SDF Description
Enter a description for the SDF 2 file.
Data Expression
Key
Enter an expression for the Key field, or click to open the Expression
Chooser dialog box and select an attribute for the Key field.
Name
Enter an expression for the Name field, or click to open the Expression
Chooser dialog box and select an attribute for the Name field.
URL
Enter an expression for the URL field, or click to open the Expression
Chooser dialog box and select an attribute for the URL field.
Coordinate Conversion
To convert the exported objects to a different coordinate system, select
Convert To and enter the coordinate system code for the export file, or click
to select one.
If this option is greyed, your current map does not have an assigned
coordinate system. You can cancel this dialog box, assign a coordinate
system, and then retry this operation.
Create Key Index File
Create a corresponding Key Index File (KIF) for the SDF 2 file.
Autodesk MapGuide Export dialog box | 1581
Autodesk MapGuide Import dialog box
Use this dialog box to specify settings for importing Autodesk MapGuide SDF
2 files into AutoCAD Map 3D.
To import SDF 2 files (page 389)
Click Insert tab ➤ Import panel ➤ SDF 2.
NOTE Data you import becomes AutoCAD drawing objects in your map. To
convert the drawing objects to a geospatial format, see Overview of Converting
and Exporting (page 1405).
Import Layer
Import To Layer
Import SDF 2 data to a specified layer. Click the button to create a new layer
for the imported SDF 2 data.
Data Elements
Assign To Object Data Table
Assign data from the SDF 2 file to an object data table in the current drawing.
Table
Select the object data table for the imported SDF 2 data. Click the button
to define a new object data table for the SDF 2 data.
Key
Select the field in the object data table for the imported SDF 2 Key data.
Click the button to define a new field in the object data table for the SDF
2 data.
Name
Select the field in the object data table for the imported SDF 2 Name data.
Click the button to define a new field in the object data table for the SDF
2 data.
1582 | Chapter 16 Autodesk MapGuide Dialog Boxes

URL
Select the field in the object data table for the imported SDF 2 URL data.
Click the button to define a new field in the object data table for the SDF
2 data.
Create Hyperlinks From URL Field
Create hyperlinks from the URL expressions in the SDF 2 file.
Coordinate Conversion
Convert From
Enter the coordinate system of the SDF 2 file. This function is available only
if the current drawing has an assigned coordinate system. AutoCAD Map
3D converts the data from the SDF 2 coordinate system to the active drawing
coordinate system. Click to select the coordinate system of the SDF 2
file.
Import by Location
Define an Area to Import From The SDF File
Import a specific area of the SDF 2 file.
X Min
Enter the X coordinate of the lower left corner of the area to import.
Y Min
Enter the Y coordinate of the lower left corner of the area to import.
X Max
Enter the X coordinate of the upper right corner of the area to import.
Y Max
Enter the Y coordinate of the upper right corner of the area to import.
Import Profile
Load
Load previously saved SDF Import Profile (SIP) file containing import
settings.
Save
Save the current import settings as an SDF Import Profile (SIP) file.
Autodesk MapGuide Import dialog box | 1583
1584
Cleaning Up Maps Dialog
Boxes
Cleanup Methods Page
Use this dialog box to specify what to do with the original objects after the
cleanup process is complete.
To specify how to convert the objects after cleanup (page 776)
To save Drawing Cleanup settings as a profile (page 781)
Click Tools tab ➤ Map Edit panel ➤ Clean Up.
NOTE This functionality is for drawing objects only. There is no equivalent for
geospatial features.
Cleanup Method
Modify Original Objects
In the processed drawing, use the original layer and as much of the original
data as possible.
Retain Original Objects And Create New Objects
Keep the original objects and put the new objects on a layer you specify.
Delete Original Objects And Create New Objects
Copy existing object data and database links to the new objects.
17
1585

Use Original Layer
Place new objects on the same layer as the source objects.
Create On Layer
Enter the name of a layer. If the layer does not exist, it will be created. Click
Select Layers to select from existing layers.
Convert Selected Objects
Line To Polyline
Convert lines to 2D polylines so you can assign line width to them, use
them in thematic maps, or use them in programs that accept only polylines.
Arc To Polyline
Convert arcs to 2D polylines so you can assign line width to them, use them
in thematic maps, or use them in programs that accept only polylines. The
resulting polyline uses a true arc, not straight line segments.
3D Polyline To Polyline
Convert 3D polylines to 2D polylines so you can assign line width to them,
use them in thematic maps, or use them in programs that accept only
polylines.
Circle To Polyline
Convert circles to 2D polylines so you can assign line width to them, use
them in thematic maps, or use them in programs that accept only polylines.
The resulting polyline uses two true arcs, not straight line segments.
Circle To Arcs
Convert circles to arcs.
NOTE Converting objects changes them to different entity types. If classified
objects are modified so they no longer meet the object class definition, they will
be unclassified. You must re-classify them manually.
Other
Load
Load a profile file that contains drawing cleanup settings you saved
previously.
Save
Save your drawing cleanup settings in a profile file for later use.
Next
Move to the next drawing cleanup page.
1586 | Chapter 17 Cleaning Up Maps Dialog Boxes
Displays the Error Markers Page (page 1587) if you selected Interactive on the
previous Select Actions page.
Finish
Perform the drawing cleanup operation using the current settings.
Error Markers Page
Use this dialog box to specify the marker shape and color for each cleanup
action. Specify the marker size, and set options for erasing or maintaining
markers before and after cleanup.
To set up markers for interactive mode (page 779)
To save Drawing Cleanup settings as a profile (page 781)
Click Tools tab ➤ Map Edit panel ➤ Clean Up.
NOTE This functionality is for drawing objects only. There is no equivalent for
geospatial features.
This page is available only when you select Interactive on the Select Actions
page (page 1588).
In Interactive mode, AutoCAD Map 3D displays each error for you to accept
or reject the correction. You can place a markers at error locations to help you
find them more easily.
Parameters
Set options for removing markers before and after the drawing cleanup, and
specify the size of the markers, relative to the screen size.
Erase Markers When Cleanup Starts
Delete markers from an earlier operation before placing new markers. Clear
this check box to display both sets of markers.
Deleting old markers prevents confusion.
Maintain Markers When Command Ends
Keep markers in the drawing after the drawing cleanup operation.
Error Markers Page | 1587

Marker Size
Specify the marker size as a percent of the screen size, usually between 3%
and 7%.
Blocks And Colors
For each operation listed, select a marker shape and color.
Other
Load
Load a profile file that contains drawing cleanup settings you saved
previously.
Save
Save your drawing cleanup settings in a profile file for later use.
Finish
Perform the drawing cleanup operation using the current settings. You can
place markers, review errors, and make correction decisions.
This operation displays the list of detected errors in the Drawing Cleanup
Errors dialog box (page 1593).
Select Actions Page
Use this dialog box to select the cleanup actions to perform and the parameters
to use. Specify whether to review errors in Interactive mode or have AutoCAD
Map 3D automatically correct errors.
To select cleanup actions and set options (page 773)
To save Drawing Cleanup settings as a profile (page 781)
Click Tools tab ➤ Map Edit panel ➤ Clean Up.
NOTE This functionality is for drawing objects only. There is no equivalent for
geospatial features.
You can perform multiple cleanup actions simultaneously, but it is better to
perform only a few at a time so you can track changes. Run the Simplify
Objects and Weed Polylines actions by themselves—not with other actions.
1588 | Chapter 17 Cleaning Up Maps Dialog Boxes

Cleanup Actions list
Select a cleanup action and click Add to add it to the Selected Actions list.
For more information about each cleanup action, click one of the following
links:
Delete Duplicates (page 793)
Erase Short Objects (page 795)
Break Crossing Objects (page 797)
Extend Undershoots (page 799)
Apparent Intersection (page 802)
Snap Clustered Nodes (page 804)
Dissolve Pseudo Nodes (page 807)
Erase Dangling Objects (page 809)
Simplify Objects (page 811)
Zero-Length Objects (page 815)
Weed Polylines (page 816)
NOTE Some cleanup actions create a new object or break an object into multiple
segments (for example, when you break crossing objects or extend undershoots
with the break target option). If the original object was classified, the
classification information remains with only the segment that contains the start
point of the original object. You must classify the other segments manually.
Add
Add selected actions to the Selected Actions list.
Remove
Remove selected actions from the Selected Actions list.
Selected Actions list
Actions are performed in the order they appear in the list. If you include
Simplify Objects and Weed Polylines with other cleanup actions, AutoCAD
Map 3D automatically performs Simplify and Weed first, regardless of their
position.
Up arrow
Move the selected action up one position in the list.
Down arrow
Move the selected action down one position in the list.
Cleanup Parameters
Select an action in the Selected Actions list to set its parameters. Each action
has its own set of parameters. Some cleanup actions have none.
Select Actions Page | 1589
Tolerance
Specify the radial search distance for locating geometric errors. Enter a value
or click Pick to specify a distance in the drawing area.
For example, if you set the tolerance to 5 units, two nodes within 10 units
of each other are within the tolerance and will be corrected.
Rotation
Include rotation in the Delete Duplicates calculation for Blocks, Text, or
Mtext.
Z-Values
Include z-values (elevation) in the Delete Duplicates calculation.
Break Target
Break target linear objects at the intersections during the Extend Undershoots
operation.
Snap To Node
For Snap Clustered Nodes, snap to an existing node.
Snap To Link
For Snap Clustered Nodes, snap to an existing link endpoint.
Create Arcs
Allow the introduction of arcs during the Simplify Objects operation.
Weeding Distance
For Weed Polylines, enter a value or click Pick to select two locations in the
drawing. Weeding Factors reduce the number of points generated along 3D
polylines. A larger distance and deflection angle weeds a greater number of
points. The distance is measured in linear units and must be smaller than
the Supplemental Distance.
Weeding Angle
For Weed Polylines, enter the deflection angle, or click Pick to select a
starting point, a vertex, and an ending point in the drawing. A larger
distance and deflection angle weeds a greater number of points. The angle
factor is measured in angular units.
Supplemental Distance
For Weed Polylines, enter the maximum distance between vertices. If the
distance between vertices on a contour is greater, points are added along
the contour at equal intervals that are less than or equal to the Supplemental
Distance. The smaller the distance, the greater the number of supplemented
points.
1590 | Chapter 17 Cleaning Up Maps Dialog Boxes

Bulge
For Weed Polylines, enter a value, or click Pick to specify it in the drawing.
Bulge adds vertices to a polyline curve, creating an approximation of the
curve using straight line segments. Bulge is a ratio of the distance from the
arc to the chord divided by half the length of the chord.
Options
Interactive
Review errors and decide how to handle them. For example, you can correct
the errors, place marker blocks on them, or ignore them.
Automatic
Have AutoCAD Map 3D correct errors automatically. AutoCAD Map 3D
corrects Simplify Objects and Weed Polylines errors automatically, no matter
what you specify.
Other
Load
Load a profile file that contains drawing cleanup settings you saved
previously.
Save
Save your drawing cleanup settings in a profile file for later use.
Next
Move to the next drawing cleanup page.
Displays the Cleanup Methods page (page 1585).
Finish
Perform the drawing cleanup operation using the current settings.
Drawing Cleanup
Drawing cleanup helps you improve the accuracy of your maps, correct
common map errors (resulting from surveying, digitizing, scanning errors, for
example), and remove unnecessary detail from complex maps. This is essential
when you need accurate and complete maps suitable for defining topologies,
performing map analyses, or plotting and presentations.
To clean up objects in a map (page 767)
To save Drawing Cleanup settings as a profile (page 781)
Drawing Cleanup | 1591
Click Tools tab ➤ Map Edit panel ➤ Clean Up.
NOTE This functionality is for drawing objects only. There is no equivalent for
geospatial features.
Drawing Cleanup is a sequence of pages that guide you through specifying
the set of objects to include in a drawing cleanup operation, the objects to
anchor, the cleanup actions to perform and the settings to use, how to treat
the objects after cleanup, and the error marker settings (for interactive mode
only).
Drawing Cleanup includes the following pages:
Select Objects Page (page 1595)
Select Actions Page (page 1588)
Cleanup Methods Page (page 1585)
Error Markers Page (page 1587)
Other
Load
Load a profile file that contains drawing cleanup settings you saved
previously.
Save
Save your drawing cleanup settings in a profile file for later use.
Next
Move to the next drawing cleanup page.
Displays the Select Actions Page (page 1588).
NOTE Do not use Drawing Cleanup to correct topologies; you might make a
topology invalid and not be able to recreate it. To edit topologies, use the topology
editing commands (page 851).
1592 | Chapter 17 Cleaning Up Maps Dialog Boxes

Drawing Cleanup Errors dialog box
Use this dialog box to step through the errors, review them in the map, decide
whether to correct the errors, and place markers on errors that you want to
review later.
To set up markers for interactive mode (page 779)
To review errors before correcting them (page 785)
Click Tools tab ➤ Map Edit panel ➤ Clean Up.
NOTE This functionality is for drawing objects only. There is no equivalent for
geospatial features.
This dialog box displays the cleanup actions performed on the drawing and
the errors detected for each action. This dialog box is displayed only if you
select Interactive on the Drawing Cleanup - Cleanup Actions dialog box. If
you select Automatic, all errors are corrected automatically.
Cleanup Action
List of cleanup actions
Initially, the first cleanup action with detected errors is selected. The icons
next to the cleanup action show you what the error marker for that action
will look like (marker shape and color) if you mark errors in the map. Expand
a cleanup action to display the list of detected errors (Error 1 of...).
All cleanup actions performed, except Simplify Objects, are listed in the
Drawing Cleanup Errors dialog box. AutoCAD Map 3D automatically
performs Simplify Objects, even when you select Interactive.
For Erase Short Objects, AutoCAD Map 3D divides the detected errors into
three groups: Short Degenerate Objects, Short Line Objects, and Short
Polyline Objects. For Zero-Length Objects, AutoCAD Map 3D divides the
errors into two groups: Zero Length Line Objects and Zero Length Polyline
Objects.
To display the list of errors detected (Error 1 of...) for a cleanup action, click
the plus sign (+) next to the cleanup action's name.
Cleanup Action Options
To work with all errors for a cleanup action at once, select the action and click
any of the following:
Drawing Cleanup Errors dialog box | 1593
Fix All
Correct all errors for the selected action.
Mark All
Mark all errors for the selected action with error markers, making them
easily visible in the map.
Remove All
Skip all errors for the selected action without correcting them, remove any
error markers, and go to the next cleanup action in the list.
Next Action
Go to the next cleanup action in which errors are detected, without
correcting errors.
Individual Error Options
To step through the errors for a cleanup action one at a time, select its list of
errors (Error 1 of...), and then use any of the following:
Fix
Correct the selected error and go to the next error on the list.
Mark
Place an error marker on the selected error.
Remove
Skip the current error without correcting it, remove any error marker, and
go to the next error in the list.
Next
Go to the next error on the list without correcting the selected error.
Zoom Settings
Zoom %
Specify the percentage of the drawing that highlighted objects occupy. 100
zooms the display to the extents of the highlighted objects. Less than 100
displays more of the drawing outside the highlighted objects. 0 maintains
the current zoom level.
Auto Zoom
Automatically adjust the zoom so the selected error fills the percentage of
the screen specified for Zoom %.
Zoom
Zoom to the selected error. Clear Auto Zoom to use this option.
1594 | Chapter 17 Cleaning Up Maps Dialog Boxes
Select Objects Page
Use this dialog box to select the objects to include in the cleanup process and
the objects to anchor.
To select and anchor objects for drawing cleanup (page 770)
To save Drawing Cleanup settings as a profile (page 781)
Click Tools tab ➤ Map Edit panel ➤ Clean Up.
NOTE This functionality is for drawing objects only. There is no equivalent for
geospatial features.
If you have previously saved your drawing cleanup settings in a profile file,
click Load to reload those settings.
Objects To Include In Drawing Cleanup
Select objects to clean up. In general, you can clean up linear objects only
(lines, arcs, circles, and polylines), although a few cleanup actions also support
points, blocks, text, and mtext. Unsupported object types are ignored.
Select All
Select all objects.
Select Manually
Specify any layer or feature class filters, select this option, then click to
select objects in the drawing.
Layers
Select the layers used for object selection. Enter the layer names, or click
the button to select from a list. You can use wild-card characters. To use all
layers, enter an asterisk (*).
Objects that are not on the selected layers are filtered out during objection
selection. The status line shows how many objects are selected and how
many were filtered out.
Object Classes
Select the object classes used for object selection. Enter the class names, or
click the button to select from a list. You can use wild-card characters. To
use all object classes, enter an asterisk (*).
Select Objects Page | 1595
Objects that are not in the selected object classes are filtered out. The status
line shows how many objects are selected and how many have been filtered
out. If your map does not contain object classes, these options are not
available.
Objects To Anchor In Drawing Cleanup
Select the objects to anchor. Anchored objects are used as reference points
during cleanup and are not altered or moved; objects being cleaned will be
moved towards anchored objects. You can anchor linear objects, points, blocks,
text, and mtext.
Select Manually
Temporarily close the Select Objects page so you can select the objects to
anchor. Press Enter when you are finished.
Layers
Select the layers used for anchor selection. Enter the layer names, or click
the button to select from a list. You can use wild-card characters. To use all
layers, enter an asterisk (*).
Objects that are not on the selected layers are filtered out during objection
selection. The status line shows how many objects are selected and how
many were filtered out.
Object classes
Select the object classes used for anchor object selection. Enter the class
names, or click the button to select from a list. You can use wild-card
characters. To use all object classes, enter an asterisk (*).
Objects that are not in the selected object classes are filtered out. The status
line shows how many objects are selected and how many have been filtered
out. If your map does not contain object classes, these options are not
available.
Other
Load
Load a profile file that contains drawing cleanup settings you saved
previously.
Save
Save your drawing cleanup settings in a profile file for later use.
Next
Move to the next drawing cleanup page.
Displays the Select Actions page (page 1588).
1596 | Chapter 17 Cleaning Up Maps Dialog Boxes
Coordinate Systems Dialog
Boxes
MAPDIST
Use this command to measure the geodetic distance between points in your
map.
To measure geodetic distance (page 1153)
Click Analyze tab ➤ Geo Tools panel ➤ Geo Distance.
The geodetic distance is the actual distance along the ground, taking into account
the curvature of the Earth. For example, if you have a Mercator map of the
world, use this command to measure how many miles wide Greenland is.
This command is different from the DIST command, which measures the simple
Pythagorean distance between two points, not the underlying physical distance.
Map distortion (due to the coordinate system), makes the actual distance on
the ground considerably different from the distance on the surface of the map.
When prompted, specify the first point and the second point, either by entering
the coordinates or by clicking the mouse. AutoCAD Map 3D displays the
following information on the command line:
Distance
The geodetic distance from the first point to the second point, expressed in
units of the coordinate system assigned to the current drawing.
18
1597
Azimuth
The angle of the line from the first point to the second point, measured at
the first point, and expressed in degrees east of north.
Delta X, Delta Y
These are the same as the DIST command.
Assign Global Coordinate System dialog box
Use this dialog box to assign a coordinate system before you bring objects or
features into the current drawing.
To assign a coordinate system to the current drawing (page 147)
Click Map Setup tab ➤ Coordinate System panel ➤ Assign.
When you bring objects and features into the current drawing, AutoCAD Map
3D checks whether the coordinate system assigned to the object or feature
matches that of the current drawing. If it does not, AutoCAD Map 3D
transforms the object or feature to the current drawing’s coordinate system.
If you edit and save the object or feature back to its source, AutoCAD Map 3D
transforms it back to its original coordinate system.
Current Drawing
You cannot assign a coordinate system to the current drawing if it contains
any objects that have been queried from source drawings. If you are using the
Canadian National Transformation, you must copy the data files to the
Autodesk shared coordinate system directory.
Code
Enter the code for the current drawing, or click Select Coordinate System
to select from a list.
Select Coordinate System
Click to select from a list of available coordinate systems.
1598 | Chapter 18 Coordinate Systems Dialog Boxes
Source Drawings
Select the attached drawings, then enter the code for these drawings. Click
Select Coordinate System to select from a list of available coordinate systems.
To assign a different code to other source drawings, use this command again.
You cannot assign a coordinate system to a source drawing if that drawing
currently has queried objects in the current drawing.
NOTE For information on using custom coordinate systems you defined in a
previous release of AutoCAD Map 3D, look up “coordinate systems, updating” in
the help index.
Coordinate system transformations may not work as expected on raster objects.
Select Drawings to Assign Coordinate System dialog box
Use this dialog box to select the file names of drawings to which you want to
attach the coordinate system.
To assign a coordinate system to a source drawing (page 146)
Click Map Setup tab ➤ Coordinate System panel ➤ Assign.
NOTE This functionality is for drawing files only. To assign a coordinate system
to geospatial feature sources to which you are connecting, see Changing
Coordinate Systems (page 311).
Look In
Select a drive alias from the list. AutoCAD Map 3D creates a drive alias for
drive C. You must create drive aliases for all other drives that you use.
Create/Edit Aliases
If the drive or folder you want is not listed, click to define a new drive alias.
Preview
Click to display a preview of the selected drawing. If a drawing is locked,
the Preview window is blank.
Select Drawings to Assign Coordinate System dialog box | 1599

File List
Select a drawing in the current directory.
Filter
Use wild-card characters to filter the display of file names. For example,
enter t* to view only file names starting with the letter t.
Add
Add the selected drawing names to the Selected Drawings list. You can
change the drive or folder and continue to add files to the Selected Drawings
list.
Remove
Remove the selected drawing names from the Selected Drawings list.
Selected Drawings
When you have added all the drawings you want, click OK.
Coordinate Tracker Options Dialog Box
Use this dialog box to set options for the coordinate tracker.
To specify coordinate tracker options (page 232)
Click Analyze tab ➤ Geo Tools panel ➤ Coordinate Track.
General Options
Display Coordinate System Descriptions
View a description of the coordinate system in the Track Coordinates Dialog
Box (page 1601).
Format Lat/Long as D,M,S
Display lat/long coordinates in degrees/minutes/seconds format.
MGRS Options
Set options for Military Grid Reference Systems (MGRS).
Include Square ID
View the square ID when tracking coordinates.
1600 | Chapter 18 Coordinate Systems Dialog Boxes

Precision Level
Specify the level of precision to display.
Lettering Scheme
Specify the lettering scheme. AA (MGRS-New) is for use with the WGS84
datum. AL (MGRS-Old) is for use with older datums.
Digitization Location
Specify the digitization location within a given square: left top, center top,
right top, left center, center, right center, left bottom, center bottom, or
right bottom.
Track Coordinates Dialog Box
Use this dialog box to track coordinates in your map. You can add multiple
coordinate trackers to the Track Coordinates dialog box.
To track coordinates (page 1150)
Click Analyze tab ➤ Geo Tools panel ➤ Coordinate Track.
Coordinate Tracker toolbar
You can change the coordinate system of a coordinate tracker in the
drop-down list of the coordinate tracker toolbar.
Digitize: create a feature at the coordinates specified in the coordinate
tracker.
Options: specify coordinate tracker options.
Add Tracker: add another coordinate tracker to the Track Coordinates dialog
box.
Track Coordinates Dialog Box | 1601

Delete Tracker: remove a coordinate tracker form the Track Coordinates
dialog box.
Create Reference System Dialog Box
Use this dialog box to create a reference system for a viewport in paper space.
To track coordinates (page 1150)
Click Layout Tools tab ➤ Reference System panel ➤ Create.
Reference System
Select the reference system you want to create: MGRS-AA or MGRS-AL.
Current Map Coordinate System
The coordinate system of the current map.
Current Scale
The view scale of the current map.
Scale
Select or enter the view scale at which the reference system displays.
Precision
Select the precision for the reference system. AutoCAD Map 3D will draw
grid lines at the precision level, and tick marks at the next level. For example,
a 1000 meter grid will have tick marks at every 100 meters.
1602 | Chapter 18 Coordinate Systems Dialog Boxes

Data Connect Dialog Boxes
Create a Join / Edit a Join dialog box
Use this dialog box to join a table of attribute data to features in your map so
they have more properties. You can also edit an existing join.
To create a join (page 512)
In Display Manager, right-click a feature layer ➤ Create A Join.
If a join exists, right-click a feature layer ➤ Manage Joins.
NOTE This functionality is for geospatial features only. To connect drawing objects
to an external data source, see Overview of Linking Database Records to Objects
(page 522).
Select the primary table (the feature layer) and the secondary table (the data to
join to the primary table, for example, an Access database). Select the columns
of data to use to link the tables (often referred to as join keys). Specify the type
of join, and the relationship between the primary and secondary records.
Primary Table Initiating The Join
The table to which you are joining secondary data, for example, the layer of
features.
Table (Or Feature Class) To Join To
Select the secondary table of attributes to join to the primary table. You must
connect to the secondary table before you can join to it.
See Bringing in GIS Features (page 303)
19
1603

This Column From The Left Table
Select the column(s) from the primary table that will link the primary table
to the secondary table.
Matches This Column From The Right Table
Select the column(s) from the secondary table that will link the tables. This
column does not have to have the same name as the column on the left
side, but it must have the same data type. Only columns with matching
data types are listed.
Type of Join
Select one of the following join types:
Keep All Records On The Left
Display features from the primary table in the map, even if there is no
matching value in the secondary table (a left outer join).
Keep Only Left-Side Records With A Match
Do not display features from the primary table in the map if there is no
matching value in the secondary table (an inner join).
Relationship With Secondary Records (Cardinality)
Select one of the following:
One-To-One
Join one feature to one record in the secondary table, even if multiple records
in the secondary table exist.
One-To-Many
Allow one feature to have multiple secondary records associated with it.
Create Data Store dialog box
Use this dialog box to create a new data store, which is a collection of feature
classes in a single storage location.
To create a data store for a database provider (page 588)
In Display Manager, click Data ➤ Connect To Data.
1604 | Chapter 19 Data Connect Dialog Boxes

NOTE This functionality is for geospatial features only. To set up new data sources
for drawing objects, see Overview of Attaching Data Sources to Drawings (page
205).
Click OK to create the new data store with a default schema. You can edit the
resulting schema.
Data Store Name
Enter a name for the new data store.
Password
Enter a password.
Confirm Password
Enter your password again to confirm it.
Description
Enter a description for the new data store.
Data Store Coordinate System
Click [...] to select the coordinate system.
Data Store Extents
Enter the extents.
Storage Resolution
Enter the resolution.
Data Store Tablespace
Enter the tablespace.
Edit Spatial Contexts
Use this dialog box to change the spatial context for a data store, or to remove
any changes you made.
To change the coordinate system assigned to the data you are adding to a map
(page 311)
In Display Manager (page 2060), click Data ➤ Connect To Data.
Edit Spatial Contexts | 1605

NOTE This functionality is for geospatial feature data only. To change the
coordinate system for attached drawings, see Assigning a Coordinate System to
a Source Drawing (page 146).
Spatial Contexts
Select the entry to change.
Edit
Display the Select Coordinate System dialog box (page 1609), where you can
select a different coordinate system for your map.
Remove
Removes any overrides you applied to the selected entry.
Feature Information dialog box
Use this dialog box to view feature information for the selected object,
including feature source, schema, key value, and the current lock status.
Feature Source Scope
Use this dialog box to select the feature sources and classes to include in this
query or search.
For example, to limit the query or search to one class, select only that class.
Feature Source Administration dialog box
Use this dialog box to view and release feature source locks.
NOTE This functionality is for geospatial feature data only. To lock or unlock
drawings, see Overview of Sharing Attached Drawings (page 730).
Feature Source
Select the feature source whose locks you want to review.
Feature Locks
Lists locked objects in the selected feature source.
To release a lock, select the object in the list and click Release Selected.
You can release locks only if you have appropriate rights in the feature
source.
1606 | Chapter 19 Data Connect Dialog Boxes
NOTE This dialog does not display objects in the edit set for the current drawing.
To remove locks for these objects, remove the objects from the edit set.
Feature Source Connection dialog box
Use this dialog box to connect to an attached feature source.
To bring in features from Oracle (page 314)
In Display Manager (page 2060), click Data ➤ Connect To Data.
NOTE This functionality is for geospatial feature data only. To attach drawings to
the current drawing, see Overview of Attaching Drawings (page 154).
Feature Source
Select a feature source to connect. The lists displays feature sources attached
to the current drawing.
TIP If the feature source you want is not listed, click Define and attach it to the
current drawing.
Properties
In the Value column, enter any connection information required to connect
to the selected feature source. Press Enter.
If you do not know the values to enter, contact your database administrator.
Manage Layer Data dialog box
Use this dialog box to modify, edit, and delete joins and calculations for a
selected primary table (layer of features).
To modify a join (page 515)
Feature Source Connection dialog box | 1607
In Display Manager, right-click the feature layer with the join to modify
➤ Manage Joins or Manage Calculations.
In the Data Table, click Options ➤ Manage Joins or Manage Calculations .
NOTE This functionality is for geospatial features only. To connect drawing objects
to an external data source, see Overview of Linking Database Records to Objects
(page 522).
New
To create a new join, click New ➤ Join.
To create a new calculation, first select the layer whose properties will be
used for the calculation. Use Shift or Ctrl to select multiple layers. Then
click New ➤ Calculation.
Edit
Select the item to modify and click Edit. You can edit only one item at a
time.
Delete
Select the items to delete and click Delete. Use Shift or Ctrl to select multiple
layers.
Save Features dialog box
Use this dialog box to save modified features back to their feature source.
Objects in the edit set are saved back to their feature source.
If you right-clicked a single feature source and clicked Save, only objects in
the edit set for the selected feature source are saved. If you right-clicked the
Feature Sources node, all objects in the edit set are saved back to their feature
source.
Status
The number of objects that will be saved to the feature source. Click Show
to highlight the objects in the drawing.
Save Queried Features
Save edited objects back to the feature source.
Clear this check box to save only newly created objects to the feature source.
Save Newly Created Features
Save new objects to the feature source.
1608 | Chapter 19 Data Connect Dialog Boxes
TIP If the status does not list your newly created objects, be sure you have
added the objects to the edit set for this feature source.
Clear this check box to save only objects that were queried in from the
feature source.
Select Coordinate System dialog box
Use this dialog box to change the coordinate system of data you add to your
map. You must specify the original coordinate system for the data. AutoCAD
Map 3D automatically converts the data from that coordinate system to the
one specified for your map.
To change the coordinate system assigned to the data you are adding to a map
(page 311)
In Display Manager (page 2060), click Data ➤ Connect To Data.
NOTE This functionality is for geospatial feature data only. To change the
coordinate system for attached drawings, see Assigning a Coordinate System to
a Source Drawing (page 146).
Category
Select the set of coordinate systems in which the specific coordinate system
is stored.
Search
Search within the category for the coordinate system, using either its code
(for example, CA-I) or its description (for example, NAD27 California State
Planes, Zone I).
Coordinate Systems In Category
Scroll through the list or use Search to find and select a coordinate system
in the current category.
Properties
Display the datum, ellipsoid, projection, false origin, latitude and longitude
settings for the selected coordinate system.
Select Coordinate System dialog box | 1609
User Credentials dialog box
Use this dialog box to log in to data sources that require user credentials. If
you do not know your user name and password, check with your System
Administrator.
To access data through FDO (page 308)
In Display Manager (page 2060), click Data ➤ Connect To Data.
NOTE This functionality is for geospatial feature data only. For information about
a multi-user environment for drawings, see Overview of Sharing Attached Drawings
(page 730).
User Name
Enter your user name for this data source.
Password
Enter your password for this data source.
For SQL Server Spatial data stores, you can use either Windows or SQL Server
authentication. If you use Windows authentication, you do not need to
enter a user name or password. AutoCAD Map 3D uses your Windows
credentials.
Remember Password
Optionally, have AutoCAD Map 3D remember this user name and password
and log in whenever you open this map file.
View/Create Query Statement dialog box
Use this dialog box to view the current feature source filter statement.
To filter feature data when you add it to a map (page 310)
In Display Manager (page 2060), click Data ➤ Connect To Data.
1610 | Chapter 19 Data Connect Dialog Boxes

NOTE This functionality is for geospatial feature data only. For information about
queries for drawings, see Overview of Finding and Querying Drawing Objects
(page 1218).
Query Statement
Enter the expression to use for filtering the data to add to the map.
For information on queries, see Using the Expression Builder (page 1555)
View/Create Query Statement dialog box | 1611
1612
Data Table Dialog Box
Data Table dialog box
Use the Data Table (page 2059) much as you would a database spreadsheet.
To find and select features (page 1206)
In Display Manager or Map Explorer, click Table.
NOTE You can also access a specialized version of the Data Table from the
Survey tab on the Task Pane. For Survey data, the Data Table displays survey
point data, and is called the Points Table.
NOTE The Data Table displays geospatial feature data only. To view data connected
to drawing objects, see Viewing External Data Linked to Drawing Objects (page 1146).
■Columns — Resize columns by dragging left or right.
Sort columns by clicking the column header. Arrow pointing up or down
indicates sort order.
■Rows — Resize rows by dragging up or down.
Data
Select a feature source or data table to view or edit.
Auto-Zoom
Automatically zoom to the map to the selected rows.
20
1613
Auto-Scroll
Automatically scroll the Data Table to the current selection in your map.
Filter by
Select a property to use to filter the Data Table, then type a value to use for
the filter and click Apply Filter .
Clear Filter
Double-click to remove the active filter and show all data for this feature
layer.
Row
Enter a row number to scroll the Data Table to that row. Currently selected
row numbers appear in this field.
Search to Select
Select features using a query.
Options
■Export—Export the data from the selected row(s) to a text file (.csv).
■Select All—Select all rows in the Data Table.
■Select None—Deselect all rows in the Data Table.
■Zoom To—Zoom the map to the selected row.
■Create A Join/Manage Joins—Add, edit, or delete joins to external data
for the current feature layer.
NOTE You cannot create or manage joins for survey point data.
■Create A Calculation/Manage Calculations—Add, edit, or delete
calculated properties for this feature layer. A calculated property is based
on the current properties. The new property is not added to the original
data store, but is available in this map only.
NOTE You cannot create or manage calculations for survey point data.
■Set Split and Merge Rules—Specify how properties will be assigned when
you split or merge features.
■Help—Open the Data Table help topic.
1614 | Chapter 20 Data Table Dialog Box
Digitizing Dialog Boxes
MAPDIGITIZE (Digitize command)
Use this command to digitize nodes and linear objects with settings from
MAPDIGISETUP.
To digitize links and nodes (page 1081)
Click Create tab ➤ Drawing Object panel ➤ Digitize drop-down ➤ Digitize.
NOTE This command creates drawing objects. To convert the drawing objects into
geospatial feature data, see Overview of Publishing and Sharing (page 1357).
Digitizing Nodes
Respond to the prompts:
Specify Insertion Point
Specify the location of the first node. Continue to specify nodes. When you
finish, press Enter.
Digitizing Linear Objects
Respond to the prompts:
From Point
Specify the starting point of the linear object.
21
1615
Arc/Close/Halfwidth/Length/Undo/Width/<Endpoint Of Line>
For information on this prompt, look up PLINE command in the help index.
Continue to specify linear objects. When you finish, press Enter twice.
Digitizing Setup
The specified nodes or linear objects are digitized using the settings specified
in the Digitize Setup dialog box (page 1617).
Do this...If you selected this in the Digitize
Setup dialog box...
Enter the data values for each digitized
object.
Attach Data
Specify a label point for each digitized ob-
ject.
Prompt For Label Point
Enter a rotation in degrees. (Use the UNITS
command to view or change the current
direction.)
Prompt For Rotation
Enter a real number. For example, enter 2
to double the size of the block, or enter .5
to halve the size of the block.
Prompt For Scale
Data to Attach dialog box
Use this dialog box to select the type of data and the source for the data when
you attach data to node or linear objects as they are digitized.
To attach object data as you digitize (page 1083)
Click Create tab ➤ Drawing Object panel ➤ Digitize drop-down ➤ Digitize.
NOTE This process creates drawing objects. To convert the drawing objects into
geospatial feature data, see Overview of Publishing and Sharing (page 1357).
1616 | Chapter 21 Digitizing Dialog Boxes
Object Data Type
Select Object Datato use data in an object data table in the current drawing.
Select Database Link to use data in an external database.
Object Data Tables Name
If you are using data from an object data table, select the table.
Link Template
If you are using data from an external database, select the link template
associated with that database.
To associate databases to link templates, use the Define Link Template dialog
box (MAPDEFINELT) (page 1683).
Record Validation
As AutoCAD Map 3D digitizes your drawing, it prompts you for the key value
to associate with each object. Select the validation option to use.
NOTE To attach data to node or linear objects, make sure the Attach Data option
is selected on the Digitize Setup dialog box.
Validate
Check the database for the key value you specify. If AutoCAD Map 3D does
not find a match, it prompts you for a new key value.
Validate And Create
Check the database for the key value you specify. If AutoCAD Map 3D does
not find a match, it creates a new row in the database. You will be prompted
to enter information for all the columns in the new row.
No Validation
Associate the specified key value with the object whether or not the key
value matches a row in the database.
Digitize Setup dialog box
Use this dialog box to set options for digitizing nodes and linear objects.
To set digitizing specifications (page 138)
Digitize Setup dialog box | 1617
Click Create tab ➤ Drawing Object panel ➤ Digitize drop-down ➤ Digitize
Setup.
NOTE This process creates drawing objects. To convert the drawing objects into
geospatial feature data, see Overview of Publishing and Sharing (page 1357).
Object Type
Select whether to digitize nodes (points or blocks) or linear objects
(polylines).
Attach Data
Attach object data to the digitized objects. Click Data To Attach to select
the data source and location.
When you digitize objects, you are prompted for the data for each object.
Prompt For Label Point
Change the default location of the label point for digitized objects. The
label point determines the location of text associated with the object during
queries.
As the objects are digitized, you are prompted for the new label point.
Node Object Settings
Specify settings for the node objects that are created during the digitizing
process.
Create On Layer
Specify the layer for new node objects. To select from a list of layers in the
drawing set, click Layers. To create a new layer, enter the layer name.
Block Name
Specify the block to reference when creating node objects. To select from
a list of block definitions in the drawing set, click Blocks. To use point
objects, use ACAD_POINT.
Prompt For Rotation
Specify the rotation for each block as it is digitized. If this option is not
selected, objects are not rotated. ACAD_POINT objects cannot be rotated.
Prompt For Scale
Specify the scale for each block as it is digitized. If this option is not selected,
the scale is set to 1. ACAD_POINT objects cannot be scaled.
1618 | Chapter 21 Digitizing Dialog Boxes

Object Snap To End
Snap the location of the node object to the closest endpoint of an arc,
elliptical arc, line, mline, polyline segment or ray, or the closest corner of
a trace, solid, or 3D face.
For more information about the OSNAP command, see the AutoCAD help.
Linear Object Settings
Specify settings for the linear objects that are created during the digitizing
process.
Create on Layer
Specify the layer for new linear objects. To select from a list of layers in the
drawing set, click Layers. To create a new layer, enter the layer name.
Linetype
Specify the linetype for the linear objects. To select from a list of linetypes
in the drawing set, click Linetypes.
Elevation
Select 3D to have the linear objects support three dimensions.
Width
Enter the width of the polyline for 2D linear objects. You cannot specify a
width for 3D linear objects.
Object Snap To Insert
Snap the location of the new linear object to the insertion point of an
attribute, block, shape, or text.
For more information about the OSNAP command, see the AutoCAD help.
Link Template Data Entry dialog box
Use this dialog box to add information to your external database as you attach
external database information to digitized objects. This dialog box appears
only if you selected the Validate And Create validation method. The Link
Template area lists the full path and table associated with the link template.
To convert object data to a linked database table (page 534)
At the Command prompt, enter mapod2ase.
Link Template Data Entry dialog box | 1619
NOTE This process creates drawing objects. To convert the drawing objects into
geospatial feature data, see Overview of Publishing and Sharing (page 1357).
Link Template
To edit an entry, highlight it, enter new value in the Column Value box,
and press Enter. When you finish updating values for an object, click OK.
To attach no additional data to the current object, click Cancel.
Link Template Key Column Entry dialog box
Use this dialog box to review or modify the external data that is attached to
digitized objects. The Link Template area lists the full path and table associated
with the link template, as well as the current validation method.
To convert object data to a linked database table (page 534)
At the Command prompt, enter mapod2ase.
NOTE This process creates drawing objects. To convert the drawing objects into
geospatial feature data, see Overview of Publishing and Sharing (page 1357).
Link Template
To edit an entry, highlight it, enter new value in the Key Value box, and
press Enter. When you finish updating values for an entry, click OK. To
cancel the digitize operation, click Cancel.
1620 | Chapter 21 Digitizing Dialog Boxes
Display Manager Dialog
Boxes
MAPDISPLAYLIBRARY (Display Library command)
Use this command to turn on and off the display of the Display Library palette.
MAPDISPLAYMANAGER (Display Manager command)
Use this command to load a display map, update the display, or turn on and
off the stylization of maps.
Respond to the prompts:
Display Manager [?/Load/Update/Stylization/eXit]
Do one of the following:
Enter ? to display the current settings for the Display Manager.
Enter l to load a display map.
Enter u to update the display of the current map.
Enter s to turn stylization on/off.
Enter x to exit the command.
22
1621
Alter Block Insertion dialog box
Use this dialog box to control how blocks are inserted for a specific range of
entities or for a specific value in a theme.
To create a theme for a drawing layer (page 1181)
In Display Manager, right-click a drawing layer. Click Add Style ➤ Theme.
NOTE This functionality applies only to drawing objects. To theme geospatial
features, see Theming Features (page 1165).
Name
Select a block from those already defined in the current drawing or click
to go to the Select Drawing File dialog box.
Layer
Select a layer for the block, or click to go to the Layer Properties
Manager dialog box.
Scale
Specify the scale for the block. Use positive numbers. For example, 2 doubles
the size, 0.5 halves it.
Angle
Specify the angle to rotate the blocks.
Alter Line Format dialog box
Use this dialog box to control the line formatting for a specific range of entities
or for a specific value in a theme.
To create a theme for a drawing layer (page 1181)
1622 | Chapter 22 Display Manager Dialog Boxes
In Display Manager, right-click a drawing layer. Click Add Style ➤ Theme.
NOTE This functionality applies only to drawing objects. To theme geospatial
features, see Theming Features (page 1165).
Linetype
Select a line type to represent the data values or click to go to the Select
Linetype dialog box.
Layer
Select a layer for the new lines, or click to go to the Layer Properties Manager
dialog box.
Width
Specify the width of the polylines in the thematic map.
To assign line width to circles, arcs, or lines, convert the objects to polylines
with the drawing cleanup tools. See Cleaning Up Drawing Data (page 765).
Alter Linetype dialog box
Use this dialog box to select a linetype for a specific range of entities or for a
specific value in a theme.
To create a theme for a drawing layer (page 1181)
In Display Manager, right-click a drawing layer. Click Add Style ➤ Theme.
NOTE This functionality applies only to drawing objects. To theme geospatial
features, see Theming Features (page 1165).
Alter Linetype dialog box | 1623
Alter Lineweight dialog box
Use this dialog box to select a lineweight for a specific range of entities or for
a specific value in a theme.
To create a theme for a drawing layer (page 1181)
In Display Manager, right-click a drawing layer. Click Add Style ➤ Theme.
NOTE This functionality applies only to drawing objects. To theme geospatial
features, see Theming Features (page 1165).
Alter Plotstyle dialog box
Use this dialog box to select a plotstyle for a specific range of entities or for a
specific value in a theme from those already defined in the current drawing.
To create a theme for a drawing layer (page 1181)
In Display Manager, right-click a drawing layer. Click Add Style ➤ Theme.
NOTE This functionality applies only to drawing objects. To theme geospatial
features, see Theming Features (page 1165).
Copy Scale dialog box
Use this dialog box to copy all the styles from an existing scale.
To create a theme for a drawing layer (page 1181)
1624 | Chapter 22 Display Manager Dialog Boxes
In Display Manager, right-click a drawing layer. Click Add Style ➤ Theme.
NOTE This functionality applies only to drawing objects. To theme geospatial
features, see Theming Features (page 1165).
Define Hatch dialog box
Use this dialog box to control the addition of hatching for a specific range of
entities or for a specific value in a theme.
To create a theme for a drawing layer (page 1181)
In Display Manager, right-click a drawing layer. Click Add Style ➤ Theme.
NOTE This functionality applies only to drawing objects. To theme geospatial
features, see Theming Features (page 1165).
Pattern
Select a hatch pattern from those already defined in the current drawing
or click to go to the Select Pattern dialog box.
Layer
Select a layer for the new hatch, or click to go to the Layer Manager dialog
box.
Color
Specify the color of the hatch or click to go to the Select Color dialog box.
Scale
Specify the scale for the hatch pattern. Use positive numbers. For example,
2 doubles the size, 0.5 halves it.
Angle
Specify the angle to rotate hatch created for the thematic map.
Define Hatch dialog box | 1625
For standard-scale hatch patterns (those that do not have an AR- prefix), the
density of the hatching varies according to the hatch scale and plot scale you
use, as shown in the following table and figure
ResultHatch ScalePlot Scale
Solid1 to 5001:2000
Lines clearly visible2000
Sparse, occasional lines15000
No hatch or one line only20000
Solid1 to 25001:10000
Lines clearly visible10000
Sparse, occasional lines75000
No hatch or one line only100000
You can use solid fills at any scale to fill an enclosed area.
Define Text dialog box
Use this dialog box to control the addition of text for a specific range of entities
or for a specific value in a theme.
To create a theme for a drawing layer (page 1181)
In Display Manager, right-click a drawing layer. Click Add Style ➤ Theme.
NOTE This functionality applies only to drawing objects. To theme geospatial
features, see Theming Features (page 1165).
Style
Select a style for the text from those already defined in the current drawing
or click to go to the Text Style dialog box.
1626 | Chapter 22 Display Manager Dialog Boxes

Layer
Select a layer for the new text, or click to go to the Layer Manager dialog
box.
Insert Point
Select the point on objects to create new text. The default is labelpt.
Justification
Select the justification (left, right, center, middle) for text created for the
thematic map. The default is center.
Color
Specify the color of the text or click to go to the Select Color dialog box.
Height
Specify the height of the text.
Angle
Specify the angle to rotate text created for the theme.
Scale and height values for fill patterns, text height, and symbol size vary
according to the plotting scale you intend to use. The following table shows
suitable text heights for different plot scales.
(Text Height)Required Text Height on PlotPlot Scale
200011:2000
10000.5
1000011:10000
50000.5
Edit Text Instance dialog box
Specifies the text and style for individual text feature instances on annotation
layers.
To edit a text instance (page 1116)
Edit Text Instance dialog box | 1627
In the map, select the text feature, right-click it, and click Edit Text Instance.
NOTE This functionality applies only to drawing objects. To annotate geospatial
features, see Adding Labels to Features (page 1091).
Style changes made in this dialog box supersede the base style of the
annotation layer. To revert to the base style, you must remove the style
overrides. For more information about styling annotation layers, see Style
Text Layer dialog box (page 1640)
Specifies the text and the following text styles: font, bold, italic, underline,
overline, font size, and color.
Import Old Theme dialog box
Use this dialog box to import a theme or an entire thematic map definition
from the old thematic wizard into the Display Manager.
NOTE This functionality applies only to drawing objects. To theme geospatial
features, see Theming Features (page 1165).
Map
Select the map definition.
Themes
If you are importing a single theme, select the theme. The theme is imported
as an element in the current Display Manager map.
After you import a theme into the Display Manager, you can edit it:
■To edit the query used to select objects for the element, select the element
in the Display Manager. In the Properties palette, under Element Source,
select the Query field and click
■To edit the theme style, right-click an element in the Display Manager.
Click Edit Theme.
1628 | Chapter 22 Display Manager Dialog Boxes
New Scale dialog box
Use this dialog box to create a new scale.
To create a theme for a drawing layer (page 1181)
In Display Manager, right-click a drawing layer. Click Add Style ➤ Theme.
NOTE This functionality applies only to drawing objects. To define scale ranges
for geospatial features, see Defining Scale Ranges (page 643).
Range of Values dialog box
Use this dialog box to specify the source of thematic data and partition it into
ranges.
To create a theme for a drawing layer (page 1181)
In Display Manager, right-click a drawing layer. Click Add Style ➤ Theme.
NOTE This functionality applies only to drawing objects. To define scale ranges
for geospatial features, see Defining Scale Ranges (page 643).
Data Values area
Obtain From
Click . In the Choose Data Expression dialog box, select the data source
from the lists under Properties, Link Templates, Blocks, or Object Data.
Ignore
Select data values to exclude from the thematic display. These values, while
present in the data, may be inappropriate for use in the thematic map.
Examples include null or empty data values.
New Scale dialog box | 1629

Normalize By
Enter a value or an expression if you want to normalize the data values
relative to some other data value. Click to display the Choose Data
Expression dialog box.
Read Data
Reads the data from the data source according to the expression you defined.
Data Ranges area
Group Value By
Select a method for partitioning data values.
Optimal The optimal method groups data values based upon a determination
of the natural breaks in the data. Because the calculations are iterative, this
method quite literally finds the optimal sets of values in a group based upon
the position of values upon a number line. It is most useful for complex
non-uniform distributions where calculation time is less important than
the accuracy of grouping. This is the default method.
Quantile Divides the data so that each range contains an equal number of
values. Also known as equal count, this method is most appropriate where
the data values are linear (equally distributed).
Equal Interval Divides the data into a specified number of groups from the
minimum value to the maximum. Also known as equal step, this method
has the disadvantage that it may over generalize the data and place too
many values in one range and too few in another.
Standard Deviation This method calculates how far data values differ from
the arithmetic mean. It is most effective when the data approximates a
normal distribution (bell-shaped curve). This is rarely the case with
geographical data, but is fairly common when considering demographic
data. Because of this curve preference, standard deviations are best used
with an even number of groups. Standard deviations are often used to
emphasize how far a specific value is above or below the mean value.
Number
Select the number of ranges to create.
Precision
Specify the numeric precision. This option rounds the values up or down
to the decimal point you specify. Rounding only affects the range value
calculations and resulting range divisions. It does not affect the actual data
values stored in the data source. For more information, see Notes About
Precision below.
1630 | Chapter 22 Display Manager Dialog Boxes
Use Thousands Separator
Adds a punctuation mark to separate the thousands in values such as
population data.
Find Ranges
Divides the data into ranges according to the parameters you entered.
Ranges Area
This area displays the data divided into ranges according to the parameters
you entered.
Notes About Precision
When numeric data is read into the AutoCAD Map 3D as part of thematic
mapping, it is stored as an eight byte floating point number. You may fine-tune
the formatting of these numbers by selecting a decimal precision or integer
rounding up.
For instance, suppose you have a number that was originally entered into a
database or into an object data field with the value 12.34. This number could
be displayed in several ways depending upon the format specified. Formats
that contain a decimal point will generate the specified number of digits to
the right of the decimal point. Formats without a decimal point will round
up. The following table will make this more clear.
OuputExplanationFormat
12.34use two decimal points.01
12.4use one decimal point.1
13nearest whole number1
20nearest ten10
100nearest hundred100
Select Display Element dialog box
Use this dialog box to select drawing elements on the Display Manager.
To bring in drawing objects based on object classes in the current drawing
(page 357)
Select Display Element dialog box | 1631

To bring in drawing objects from AutoCAD layers in the current drawing (page
356)
To bring in drawing objects based on topology (page 367)
To add a raster image to the map (page 440)
To add a point cloud to your mapIn the Display Manager, click Data Add Point
Cloud Data From Index F... (page 376)
NOTE This functionality applies only to drawing objects. To work with geospatial
feature layers in the Display Manager, see Overview of the Display Manager (page
634).
When you select an item, such as a layer or a object class, a new layer is added
to the Display Manager and all objects in that item are added to the new layer.
If you select multiple items, for example two layers, then multiple layers are
added to the Display Manager.
List of Items
Select the items whose objects you will include in this element.
Feature Class
Lists all feature classes in the active Feature Definition file.
Layer
Lists all the layers in the current drawing. To select from layers in attached
drawings, create a property query (page 362).
Topology
Lists all topologies in the current drawing. If the selected topology is
unloaded when you view the display map, it will be loaded.
Image
Lists all images in the current drawing. If the selected image is unloaded
when you view the display map, it will be loaded.
Point Cloud
Lists all point cloud objects in the current drawing.
Group Selection
If you choose more than one item, you can select this option to group all
the new elements under one heading in the Display Manager. When
elements are grouped, you can easily turn off all the elements by turning
off the group.
1632 | Chapter 22 Display Manager Dialog Boxes
Source Drawing Scope dialog box
Use this dialog box to specify which drawings to include in the query.
To bring in drawing objects based on object data or external (SQL) data (page
364)
To bring in drawing objects based on location (page 359)
To bring in drawing objects based on object properties (page 362)
To create a drive alias (page 161)
Click Map Setup tab ➤ Map panel ➤ Attach.
NOTE This functionality applies only to drawing objects. To filter geospatial feature
layers when you add them to your map, see Filtering Features When You Add
Them to a Map (page 309).
Click a drawing to select it. The icon is grayed out for unselected drawings.
■If you select a nested drawing, its parent drawing is automatically selected.
■If you deselect a parent drawing, all nested drawings are automatically
deselected.
■You can select a parent drawing and deselect a child, but you cannot
deselect a parent and select a child.
■If the drawing is attached using a drive alias, the drive alias name appears
in the file path.
Style Band dialog box
Use this dialog box to specify the first and last color of the color ramp for
styling or theming your feature data. The color ramp will smoothly transition
from the first to last color.
To set styling options for polygon features (page 1172)
In Display Manager, right-click a feature layer ➤ Edit Style.
Source Drawing Scope dialog box | 1633
NOTE This functionality applies only to features. To style drawing objects, see
Creating a Style (page 658).
Style Label dialog box
Use this dialog box to add and style labels for features.
To label features (page 1093)
In Display Manager, right-click a feature layer ➤ Edit Style.
NOTE This functionality applies only to features. To add labels to drawing objects,
see Overview of Annotation (page 1100).
Create A Label
Select the check box to turn on the labels.
NOTE If you are creating a theme, this check box does not appear. Instead,
check the Create Feature Labels check box in the Theme dialog box.
Multiline
Specifies that the label can have multiple lines of text, but no advanced
placement functionality. For all geometry types but lines, this is the only
option available.
Advanced Placement
For line features, specifies a single-line label which follows a path and shrinks
to fit. A single label is used for feature segments that have the same property
value.
Property To Display
Select a property or select Expression to define an expression for the label
text. For more information, see Using the Expression Builder (page 1555).
Font
Select a font from the list.
1634 | Chapter 22 Display Manager Dialog Boxes
Size Context
Select Device Space to specify label widths and heights in screen units.
Available units are Points, Inches, Millimeters, or Centimeters.
Select Map Space to specify label widths and heights in Mapping Coordinate
System (MCS) units. Available units are Inches, Feet, Yards, Miles,
Millimeters, Centimeters, Meters, and Kilometers.
Units
Select the type of units to use.
Size
Enter the text size or specify the size using an expression.
For more information, see Using the Expression Builder (page 1555).
Format
To apply bold, italic, or underlining, click one or more of the Format options.
Text Color
Select a text color.
Background Style
Select one of the following background styles:
■Ghosted: Draws an opaque border around each character. Use
Background Color to specify a color for the outline.
■Opaque: Draws a background behind the labels. They are displayed as
rectangles with text inside. Use Background Color to specify a color for
the rectangles.
■Transparent: No background is applied to the labels, which are displayed
only as text on the map.
Background Color
For Ghosted and Opaque background styles, click a color in the Background
Color list.
Horizontal Alignment
Horizontal alignment is available for point layers with fixed labels instead
of symbols.
Vertical Alignment
Vertical alignment is available for labels on polyline layers.
Select one of the available positions or select a layer property that contains
alignment information for each feature.
Style Label dialog box | 1635
Rotation
Do one of the following:
■Enter the amount to rotate the text.
■Click Any Angle. Specify the angle using the slider or enter an angle in
the box. Click OK.
■Click Expression. Specify the rotation using an expression. For more
information, see Using the Expression Builder (page 1555).
NOTE Horizontal and vertical alignment settings are not available for area layers.
Only the vertical alignment setting is available for line layers. Horizontal and vertical
alignment settings are available for point layers that display fixed labels instead of
symbols. For more information, see Displaying Fixed Labels at Point Locations
(page 1098).
Style Line dialog box
Use this dialog box to create styles for line geometry.
To apply styles to lines (page 649)
In Display Manager, right-click a feature layer ➤ Edit Style.
NOTE This functionality applies only to features. To style drawing objects, see
Creating a Style (page 658).
Apply Styles To The Line
Select to apply styles to lines.
NOTE If you are creating a theme, this check box does not appear. Instead,
check the Theme The Lines check box in the Theme Lines dialog box.
Create Composite Lines/Reset To Single Line
Click to build up a composite line style. Style the first line in the composite.
Click New to add a new component to the line. Style the new component
as desired. Control the position of the selected component in the overall
1636 | Chapter 22 Display Manager Dialog Boxes
composite line by clicking the up and down arrows. Click Reset To Single
Line to style a single line.
Units (Device Space)
Select the type of units to measure line thickness. Lines are specified in
Device Space units.
Thickness
Specify polyline thickness. Select 0 thickness to draw the line as thinly as
possible.
Color
Select a color.
Pattern
Select a pattern.
Style Point dialog box
Use this dialog box to specify symbols to represent and display point features.
To apply styles to points (page 646)
To place fixed labels at points (page 1099)
To allow labels to obscure points on the selected layer (page 1097)
In Display Manager, right-click a feature layer ➤ Edit Style.
NOTE This functionality applies only to features. To style drawing objects, see
Creating a Style (page 658).
Style A Point Symbol
Select the check box to apply styles to points.
NOTE If you are creating a theme, this check box does not appear. Instead,
check the Create Feature Labels check box in the Theme Points dialog box.
Symbol
Symbols are AutoCAD blocks stored in dra wings. Click and navigate
to the drawing that contains the symbol to use.
Style Point dialog box | 1637
Size Context
Select Device Space to specify label widths and heights in screen units.
Available units are Points, Inches, Millimeters, or Centimeters.
Select Map Space to specify label widths and heights in Mapping Coordinate
System (MCS) units. Available units are Inches, Feet, Yards, Miles,
Millimeters, Centimeters, Meters, and Kilometers.
Units
Select the type of units to use.
Width
Enter the symbol width or specify the width using an expression. For more
information, see Using the Expression Builder (page 1555).
Height
Enter the symbol height or specify the height using an expression. For more
information, see Using the Expression Builder (page 1555).
Maintain Aspect Ratio checkbox
To maintain width-to-height proportions when you change the width or
height of the symbol, select the Maintain Aspect Ratio checkbox.
Fill Color
To override the fill color of the symbol, select a color. If you do not specify
an override, the default fill color from the symbol is used.
Edge Color
To override the edge color of the symbol, select a color. If you do not specify
an override, the default edge color from the symbol is used.
Rotation
Do one of the following:
■Enter the amount to rotate the text.
■Click Any Angle. Specify the angle using the slider or enter an angle in
the box. Click OK.
■Click Expression. Specify the rotation using an expression. For more
information, see Using the Expression Builder (page 1555).
1638 | Chapter 22 Display Manager Dialog Boxes
Style Polygon dialog box
Use this dialog box to create styles for polygon geometry.
To apply styles to areas (page 650)
In Display Manager, right-click a feature layer ➤ Edit Style.
NOTE This functionality applies only to features. To style drawing objects, see
Creating a Style (page 658).
Apply Fill To The Area
Apply Fill To The Area
Select this check box to fill polygons.
NOTE If you are creating a theme, this check box does not appear. Instead,
check the Theme The Polygons check box in the Theme Polygons dialog box.
Fill Pattern
Select Solid or a pattern.
Foreground Transparency
For solid fills, specify Foreground Transparency if desired.
Foreground Color
For a non-thematic style, specify the Foreground Color for solid or pattern
fills.
Foreground Color Range
For themes, instead of a single foreground color, select one of the following:
■Generated Between Two Colors: Select the first and last color for the
foreground. Intermediate colors are interpolated automatically.
■Color Palette: Select a set of predefined color ranges.
Background Color
For non-thematic pattern fills, specify Background Color. If you do not
want a background color for the pattern, click Transparent.
Style Polygon dialog box | 1639

NOTE In polygons with transparent backgrounds, the colors you see on the
map may differ from the colors displayed in the Preview frame because the
Preview frame uses a white background, which may differ from the color beneath
the transparent objects in your map.
Background Color Range
For themes, instead of a single background color, select the first and last
color for the background. Intermediate colors are interpolated automatically.
Apply A Border To The Polygons
Apply A Border To The Area
Select to apply a border to polygons.
Line Pattern
Specify the pattern for the area border
Units (Device Space)
Select the type of units to use to measure border thickness.
Line Thickness
Specify border thickness. Select 0 thickness to draw the border as thinly as
possible.
Line Color
Specify border color.
Style Text Layer dialog box
Specifies how text on the selected annotation is displayed.
To style a text layer (page 1112)
In Display Manager, right-click an annotation layer. Click Edit Style ➤ Style
field.
Size context
Select one of the following:
■Device Space. Symbol widths and heights are in screen units. Available
units are Points, Inches, Millimeters, or Centimeters.
1640 | Chapter 22 Display Manager Dialog Boxes
■Map Space. Symbol widths and heights are in Mapping Coordinate
System (MCS) units. Available units are Inches, Feet, Yards, Miles,
Millimeters, Centimeters, Meters, and Kilometers.
Units
Specify the units for the annotation layer.
Text Type
Select one of the following:
■Plain—Formats annotation text uniformly using the settings specified
for the layer in this dialog box. The text has no formatting information
itself.
■Mtext—Formats annotation text as multiline. The settings specified for
the layer in this dialog box define the base formatting style. You can
override this formatting when you insert individual annotative text
features.
Click Edit Expression to specify an expression for this setting. Do not use
expressions for Text Type.
Text
Displays the name of a property in the feature source. Text for the
annotation is what you specify in the Edit Text Instance dialog box (page
1627) when you create the annotation. Click Edit Expression to specify an
expression for this setting.
For more information on inserting annotations, see Adding Text to a Text
Layer (page 1113).
Font Name
Specify the font for the annotation layer.
Font Size
Specify the font size for the annotation layer. Leave the
"NullValue(SIZE,number)" expression. The initial setting for font height is
in mapping units and is based on the existing view. Try the suggested height
and adjust the number as needed. If individual instances need a different
height, adjust the value in the SIZE column in the Data Table after you
insert the annotation instances.
Horizontal Alignment
Specify the horizontal alignment of the text. Click the expression to edit
it. Click Delete Expression to choose a value from a drop-down list.
Style Text Layer dialog box | 1641
Vertical Alignment
Specify the vertical alignment of the text. Click the expression to edit it.
Click Delete Expression to choose a value from a drop-down list.
Rotation
Specify the rotation of the text. Click the expression to edit it. Click Delete
Expression to choose a value from a drop-down list.
Preview
Displays a preview of the text with the specified styles applied.
Thematic Mapping dialog box
Use this dialog box to specify the data you will use for the theme and the ways
in which you want to stylize the objects.
To create a theme for a drawing layer (page 1181)
In Display Manager, right-click a drawing layer. Click Add Style ➤ Theme.
NOTE This functionality applies only to drawing objects. To theme geospatial
features, see Theming Features (page 1165).
Data Values
Specify whether the data for this theme is a set of distinct, specific values, or
whether it is a set of values that can be broken into ranges. Then specify the
data to use.
Theme Type
Select one of the following:
■A Set of Specific Values: Choose this option if each item in this element
has a distinct value, for example, different types of pipe material or land
use designations. This option is appropriate for string and integer data.
■A Range of Numeric Values: Choose this option if the values can be
grouped into ranges, for example, property values, temperature, or
population. This is appropriate for numeric data only.
1642 | Chapter 22 Display Manager Dialog Boxes
Values
Displays either the Thematic Values dialog box (page 1644) or the Range of
Values dialog box (page 1629), where you specify the data source to use for
the values and the specific values to use.
Thematic Details
Specify the properties to style and the styles for each range or value in this
theme.
Table
Select ways to style the objects.
■In the column heading, select the check boxes for the properties to style.
■Click a cell in a style column to edit the style for a specific value.
■Click a cell in the Legend column to edit the text for each value in the
map legend.
■To reverse the order of rows in the selected column, right-click a column
heading and click Flip. Flip is available for all columns except Values
and Legend.
■To change the value of a particular range, click a cell in the Values
column and edit the number. To redefine all of the values, click the
Values button.
Hide Unused Columns
Hide any columns that are not selected.
Ramps
Select from a list of pre-built style sequences, for example a set of color
gradations, hatch patterns, or linestyles.
Scale Ramp to Fit
Divides the selected ramp sequence into equal intervals according to the
number of values. If you do not select this option, the ramp styles are applied
in sequence, up to the number of values that you have.
Thematic Mapping dialog box | 1643
Thematic Values dialog box
Use this dialog box (from the Thematic Mapping dialog box (page 1642)) to
specify the source of thematic data and then select one or more discrete values
from that data.
To create a theme for a drawing layer (page 1181)
In Display Manager, right-click a drawing layer. Click Add Style ➤ Theme.
NOTE This functionality applies only to drawing objects. To theme geospatial
features, see Theming Features (page 1165).
Data Values area
Obtain From
Click . In the Choose Data Expression dialog box, select the source of
the data to use.
Ignore
Select data values to exclude from the thematic display. These values, while
present in the data, may be inappropriate for use in the thematic map.
Examples include null or empty data values.
Normalize By
Enter a value or an expression if you want to normalize the data values
relative to some other data value. Click to display the Choose Data
Expression dialog box.
Read Data
Reads the data from the data source according to the expression you defined.
Select Specific Values area
Shows the values read from the data source, together with the number of
occurrences (Count). Select the value(s) to appear in the thematic map. To
quickly select all the values, right-click and choose Select All.
1644 | Chapter 22 Display Manager Dialog Boxes

Theme dialog box
Use this dialog box to create a theme for a feature source layer, based on a
range of conditions. The title of the dialog box changes, depending on the
type of geometry in the feature you are theming.
To create a theme for a feature layer (page 1168)
In Display Manager, right-click a feature layer ➤ Edit Style.
NOTE This functionality applies only to geospatial features. To theme drawing
objects, see Overview of Theming Drawing Data (page 1176).
A theme is a collection of rules. Each rule specifies a style and feature label
for the features that meet the specified condition. You can add a legend label
to provide a description of a rule’s condition.
Create Thematic Rules Based On A Property
Property
Select the property on which to base the theme.
Minimum Value
Specify the minimum value for the range.
Maximum Value
Specify the maximum value for the range.
The first rule includes the Minimum Value and the last rule includes the
Maximum Value. Styles are interpolated across the range.
Distribution
Select a method. For more information, see Theming Features (page 1165).
Number of Rules
Specify the number of ranges to create if Distribution Method is Equal,
Quantile, or Jenks (Natural Breaks). Properties containing strings use an
Individual Values distribution that does not allow the number of rules to
be edited. Adjust the number of rules to control the coarseness of the theme.
For more information about distribution methods, see Theming Features
(page 1165).
Theme dialog box | 1645

Replace Existing Rules
Specify whether new ranges replace existing rules (ranges) or are added
before or after existing rules.
Theme The Polygons/Lines/Points
Select the Theme The Polygons/Lines/Pointscheck box to use a different style
for each rule of the theme. The first rule uses the From style and the last rule
uses the To style. Styles are interpolated across the range.
Style Range
Click . The Style Point dialog box (page 1637), Style Line dialog box (page
1636), or Style Polygon dialog box (page 1639) is displayed, depending on the
type of data associated with the layer.
Create Legend Labels
Select the Create Legend Labels check box to label the theme in the legend.
Legend Text
Enter the text to appear next to each rule in the legend
Legend Format
Specify how to display the legend label.
If you theme a layer on a property that contained area information and you
used the label text Area:, the label formats might look like the following
examples:
<Label Text> <Min> to <Max>
Area: 100 to 200
<Label Text> <Min> - <Max>
Area: 100 - 200
<Min> <= <Label Text> <<Max>
100 <= Area < 200
Create Feature Labels
Select the Create Feature Labels check box to add labels to the features in your
theme. The label is placed near the line, point symbol, or polygon.
Label Ramp
Click to specify the property to display, font, size, format, color,
background style and color, alignment, and rotation of the labels. For more
information, see the Style Label dialog box (page 1634).
1646 | Chapter 22 Display Manager Dialog Boxes
Editing Maps Dialog Boxes
ADEFILLPOLYG (Fill Closed Polyline command)
Use this command to fill a closed polyline with a color.
To fill a closed polyline with a solid-looking hatch (page 939)
NOTE This command is for drawing objects only. To style polygonal geospatial
features, see Styling Area Features (page 650).
Respond to the prompts:
Select/<Layer>:
Enter s to select individual objects, or l to fill all objects on a layer.
Select objects/Layer to fill:
Select the individual objects you want to fill, or enter the name of a layer.
Color to fill <Bylayer>:
Enter the name of a color, such as RED.
The selected closed polylines are filled with a solid hatch. To display text or
other objects on top of the hatch, use the DRAWORDER command.
You can set an option to determine whether the hatch object created by this
command is associative.
23
1647
ADERSHEET (Rubber Sheet command)
Use this command to get two or more data sets from different sources to align
geographically: for example, when stretching a new subdivision map into a
preexisting parcel map.
To rubber sheet two maps (page 935)
Click Tools tab ➤ Map Edit panel ➤ Rubber Sheet.
WARNING Use rubber sheeting only when it is absolutely necessary because it
can severely compromise the accuracy of your data.
NOTE This command is for drawing objects only. To edit geospatial features, see
Extracting Feature Geometry (page 715).
Respond to the prompts:
Base point 1:
Specify a point.
Reference point 1:
Specify the new location for the first point.
Base point 2:
Specify another point. When you finish specifying points, press Enter. Keep
in mind that the more points you enter, the more accurate the results will
be.
Select objects by <Area>/Select:
Enter a to select all objects in the polygon, or enter s to select objects
individually.
Objects wholly within the original polygon are modified to fit the new shape
and location of the polygon.
1648 | Chapter 23 Editing Maps Dialog Boxes
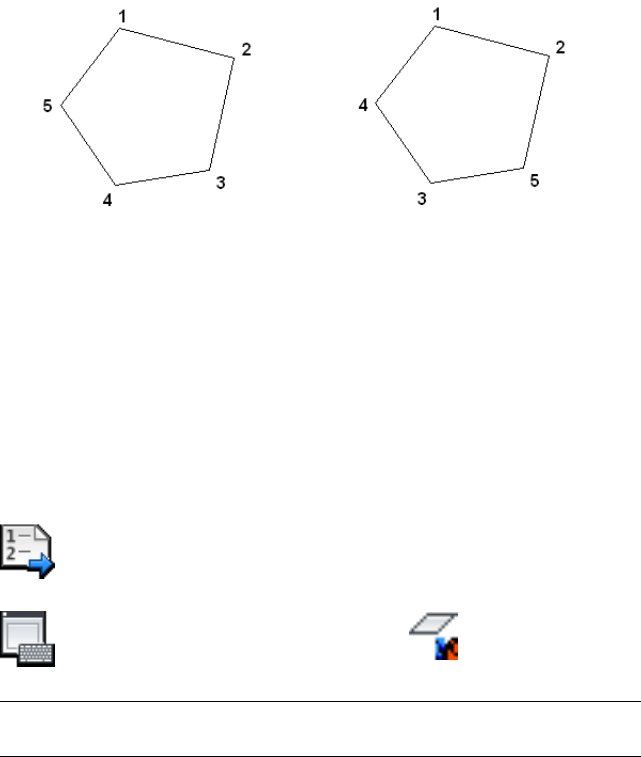
When selecting points for rubber sheeting, select points in order around the
perimeter of the object or region to be rubber sheeted.
incorrect
correct
The selected points are treated as the vertices of a polygon, so you will get
better results if you select the points sequentially around the perimeter.
ADETRANSFORM (Transform command)
Use this command to move, rotate, and scale a single object or a group of
objects. (To transform an entire source drawing while it is active, use the
transformation options in the Drawing Settings dialog box (page 1923).
To move, rotate, or scale an object (page 931)
Click Tools tab ➤ Map Edit panel ➤ Transform.
NOTE This command is for drawing objects only. To edit geospatial features, see
Extracting Feature Geometry (page 715).
Respond to the prompts:
Select/<Layer>:
Enter S to select objects or enter L to choose all objects on a layer.
ADETRANSFORM (Transform command) | 1649
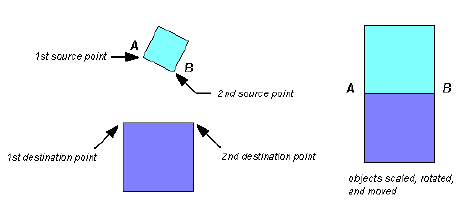
Select objects:
Use any AutoCAD selection method to select the objects you want to
transform. If you chose Layer, enter the names of the layers you want to
transform. You can use “wild-card characters” such as * and ? to select a set
of layers.
First source point:
Select a point in your drawing or enter the coordinates of the point.
First destination point:
Select a point in your drawing or enter the coordinates of the point. Objects
are translated the relative distance between the first source point and this
new point.
Second source point:
Select a point in your drawing or enter the coordinates of the point.
Second destination point:
Select a point in your drawing or enter the coordinates of the point.
Source and Destination Points
The difference between the first source point and the first destination point
is the offset for the selected objects.
The difference in angle between the two source points and the two destination
points is the rotation.
The ratio of the length between the two destination points to the length
between the two source points is the change in scale.
1650 | Chapter 23 Editing Maps Dialog Boxes
MAPCOGO
The MAPCOGO command calls the COGO Input dialog box (page 1668), which
allows you to create points using coordinate geometry data.
To create a point using the COGO Input dialog box (page 1028)
MAPFEATUREMERGE
NOTE This command must be used with at least one feature.
Use this command to merge features and assign feature property values for
resulting features.
When you merge features, the resulting feature property values are determined
by rules you specify in the Split and Merge Rules dialog box (page 1669).
To merge features (page 710)
Click Feature Edit tab ➤ Split/Merge panel ➤ Merge Feature.
NOTE This command is for geospatial features only. To edit polygonal drawing
objects, see Working with Polygon Objects (page 954).
Respond to the prompts:
Select features to merge:
Select at least two objects to merge, one of which must be a feature. Press
ENTER when you are done selecting the feature or features you want to
merge.
Specify Feature ID for use [Select/New] <Select>:
Specify whether you want to select the feature that has the feature ID you
want to use or you want to create a new feature ID.
Select
Select the feature that has the ID to use for the merged feature.
MAPCOGO | 1651
New
Create a new feature ID for the merged feature.
MAPFEATURESPLIT
Use this command to split geospatial features and assign feature property
values for resulting features.
When you split a feature, the resulting feature property values are determined
by rules you specify in the Split and Merge Rules dialog box (page 1669).
You can set defaults for the split prompts in the Feature Editing Options dialog
box (page 1929). You can also turn off two of the prompts, so that split operations
use the values set in that dialog box instead.
To split a feature (page 708)
Click Feature Edit tab ➤ Split/Merge panel ➤ Split Feature.
NOTE This command is for geospatial features only. To split polygonal drawing
objects, see Splitting Polygon Objects (page 968).
Respond to the prompts:
Select one or more linear or polygonal features to split:
Select one or more linear or polygonal features in your map to split. Press
ENTER when you are done selecting the feature or features you want to
split.
Create a new or multi-part [New/Multipart] feature:
Specify whether you want the feature or features split into two or more
than two features.
New
Creates two new features.
Multipart
Creates multiple features.
1652 | Chapter 23 Editing Maps Dialog Boxes
Generate new feature ID or use existing [New/Existing] <New>:
Specify whether you want the new feature to use the existing feature ID or
a new one.
Would you like to Draw or Select the line for split? [Select/Draw]:
Select or draw a split line. If you use a polyline as your split line, make sure
it intersects with feature geometry you are splitting. You can also used a
closed polyline.
If you use a polygon (or mpolygon) to split a feature, the part that falls
outside of the polygon becomes one feature, and the part that falls inside
the polygon becomes another feature.
MAPIGNORESPLITMERGERULES
Use this command to specify whether or not feature property values are
calculated based on the rules specified in the Split and Merge Rules dialog box
(page 1669).
To turn Ignore Split And Merge Rules on or off (page 708)
In the Data Table, click Options ➤ Set Split and Merge Rules.
Click Feature Edit tab ➤ Split/Merge panel ➤ Split Feature.
Click Feature Edit tab ➤ Split/Merge panel ➤ Merge Feature.
NOTE This command is for geospatial features only. To split polygonal drawing
objects, see Splitting Polygon Objects (page 968).
The rules affect the following commands:
■Split (MAPFEATURESPLIT (page 1652))
■Merge (MAPFEATUREMERGE (page 1651))
■Overlay (page 1563)
■JOIN
■Join option of PEDIT
MAPIGNORESPLITMERGERULES | 1653
■BREAK
■TRIM
Even when MAPIGNORESPLITMERGERULES is set to Yes, the following default
rules are applied when splitting or merging features. For more information
about these rules, see Split and Merge Rules dialog box (page 1669)
Default Merge RuleDefault Split RuleProperty Type
First SelectedCopyString
SumCopyInteger (Int)
SumCopyDouble
MAPLINESTRINGCREATE
Use this command to create a new LineString geospatial feature on a layer
that contains LineString feature data.
To create a new LineString or MultiLineString feature (page 691)
NOTE This command is for geospatial features only. To create linear drawing
objects, see Overview of Working with Drawing Objects (page 727).
The MAPLINESTRINGCREATE command is based on the PLINE command.
For more information about the prompts, see PLINE in the AutoCAD Help.
Respond to the prompts:
Specify start point:
Specify a starting point for the LineString.
Specify next point or [Arc/Length/Undo]:
Specify the next point or enter an option.
Next Point
Draws a line segment. The previous prompt is repeated.
Arc
Adds arc segments to the polyline.
1654 | Chapter 23 Editing Maps Dialog Boxes
Specify endpoint of arc or [Angle/CEnter/Direction/Line/Radius/Second pt/Undo]:
Specify the endpoint of the arc or enter an option. If you have already
created one arc, you have the option to close the LineString. For more
information about the prompts, see PLINE in the AutoCAD Help.
Length
Draws a line segment of a specified length at the same angle as the previous
segment. If the previous segment is an arc, the new line segment is drawn
tangent to that arc segment.
Specify length of line:
Specify a distance.
Undo
Removes the most recent segment added to the LineString.
MAPLINESTRINGEDIT
Use this command to edit a LineString geospatial feature.
To edit a feature using feature editing commands (page 705)
NOTE This command is for geospatial features only. To edit linear drawing objects,
see Overview of Working with Drawing Objects (page 727).
The MAPLINESTRINGEDIT command is based on the PEDIT command. For
more information about the prompts, see PEDIT.
Respond to the prompts:
Enter an option [Close/Join/Edit vertex/Undo/eXit] <eXit>:
Enter an option. For more information about the prompts, see PEDIT.
Close
Creates the closing segment of the LineString, connecting the last segment
with the first. The LineString is considered open unless you close it using the
Close option. If the LineString is closed the first option is Open.
MAPLINESTRINGEDIT | 1655

Open
Removes the closing segment of the polyline. The polyline is considered closed
unless you open it using the Open option. If the LineString is open the first
option is Closed.
Join
Joins two open LineStrings into one. The ends must be touching.
Select objects:
Select the two LineStrings to be joined.
Edit Vertex
Marks the first vertex of the LineString by drawing an X on the screen. If you
have specified a tangent direction for this vertex, an arrow is also drawn in
that direction.
Next/Previous/Insert/Move/eXit] <Next>:
Enter an option. For more information about the prompts, see PEDIT.
Undo
Reverses operations as far back as the beginning of the edit session.
Exit
Ends the MAPLINESTRINGEDIT command.
MAPMULTILINESTRINGCREATE
Use this command to create a new MultiLineString feature on a layer that
contains line feature data. A MultiLineString is a set of LineStrings that behave
as one feature. When you complete the first LineString you are prompted to
begin another one until you have created the set.
To create a new LineString or MultiLineString feature (page 691)
NOTE This command is for geospatial features only. To create linear drawing
objects, see Overview of Working with Drawing Objects (page 727).
The MAPMULTILINESTRINGCREATE command is based on the PLINE
command. For more information about the prompts, see PLINE.
Respond to the prompts:
1656 | Chapter 23 Editing Maps Dialog Boxes
Specify start point
Specify a starting point for the first LineString.
Specify next point or [Arc/Length/Undo]
Specify the next point or enter an option.
LineString/eXit <eXit>:
Create another LineString or exit the command.
Next Point
Draws a line segment. The previous prompt is repeated.
Arc
Adds arc segments to the polyline.
Specify endpoint of arc or [Angle/CEnter/Direction/Line/Radius/Second pt/Undo]:
Specify the endpoint of the arc or enter an option. If you have already
created one arc, you have the option to close the LineString. For more
information about the prompts, see PLINE.
Length
Draws a line segment of a specified length at the same angle as the previous
segment. If the previous segment is an arc, the new line segment is drawn
tangent to that arc segment.
Specify length of line:
Specify a distance.
Undo
Removes the most recent segment added to the LineString.
LineString
Begins the MAPLINESTRINGCREATE command so you can create another
LineString.
Exit
Ends the MAPMULTILINESTRINGCREATE command.
MAPMULTILINESTRINGCREATE | 1657

MAPMULTILINESTRINGEDIT
Use this command to edit a MultiLineString geospatial feature.
To edit a feature using feature editing commands (page 705)
NOTE This command is for geospatial features only. To edit linear drawing objects,
see Overview of Working with Drawing Objects (page 727).
The MAPMULTILINESTRINGEDIT command is based on the PEDIT command.
For more information about the prompts, see PEDIT in the AutoCAD Help.
Respond to the prompts:
Enter an option [Add/Delete/Move/Edit/Undo/eXit] <eXit>:
Enter an option.
Add
Adds a new LineString to the MultiLineString. For more information, see
MAPLINESTRINGCREATE (page 1654).
Delete
Deletes a LineString from the MultiLineString.
Move
Moves a LineString in the MultiLineString.
Select Objects:
Select the object to move.
Specify base point:
Specify a base point for the Move operation.
Specify second point:
Specify the second point for the Move operation. The two points you specify
define a vector that indicates how far the selected LineStrings are to be
moved and in what direction.
Edit
Edits a LineString in the MultiLineString. For more information, see
MAPLINESTRINGEDIT (page 1655).
1658 | Chapter 23 Editing Maps Dialog Boxes
Undo
Undoes the last step in the MAPMULTILINESTRINGEDIT operation.
Exit
Ends the MAPMULTILINESTRINGEDIT operation.
MAPMULTIPOINTCREATE
Use this command to create a new MultiPoint geospatial feature on a layer
that contains point feature data. A MultiPoint feature is a set of points that
behave as one feature. When you complete the first point you are prompted
to begin another one until you have created the set.
To create a new Point or MultiPoint feature (page 688)
NOTE This command is for geospatial features only. To create drawing objects,
see Overview of Working with Drawing Objects (page 727).
Respond to the prompts.
Specify a point:
Specify the location of the new MultiPoint feature.
Specify a point or [Undo]:
Specify the location of the next point or undo the last point.
MAPMULTIPOINTEDIT
Use this command to edit a MultiPoint geospatial feature.
To edit a feature using feature editing commands (page 705)
NOTE This command is for geospatial features only. To edit drawing objects, see
Overview of Working with Drawing Objects (page 727).
Respond to the prompts:
MAPMULTIPOINTCREATE | 1659
Add
Adds a new point to the MultiPoint feature. For more information, see
MAPPOINTCREATE (page 1663).
Delete
Deletes a point from the MultiPoint feature.
Move
Moves a point in the MultiPoint feature.
Select Objects:
Select the object to move.
Specify base point:
Specify a base point for the Move operation.
Specify second point:
Specify the second point for the Move operation. The two points you specify
define a vector that indicates how far the selected points are to be moved
and in what direction.
Undo
Undoes the last step in the MAPMULTIPOINTEDIT operation.
Exit
Ends the MAPMULTIPOINTEDIT operation.
MAPMULTIPOLYGONCREATE
Use this command to create a new MultiPolygon geospatial feature on a layer
that contains polygon feature data. A MultiPolygon is a set of polygons that
behave as one feature. When you complete the first polygon you are prompted
to begin another one until you have created the set.
NOTE You cannot create a non-planar polygon. Every ring of a polygon must be
planar and all parts and all rings must be in the same plane.
To create a new Polygon or MultiPolygon feature (page 689)
1660 | Chapter 23 Editing Maps Dialog Boxes

NOTE This command is for geospatial features only. To create drawing objects,
see Overview of Working with Drawing Objects (page 727) and Working with
Polygon Objects (page 954).
The MAPMULTIPOLYGONCREATE command is based on the PLINE command.
For more information about the prompts, see PLINE in the AutoCAD Help.
Respond to the prompts:
Specify start point:
Specify a starting point for the MultiPolygon.
Specify next point or [Arc/Length/Undo]:
Specify the next point or enter an option.
Next Point
Draws a line segment. The previous prompt is repeated.
Arc
Adds arc segments to the polygon.
Specify endpoint of arc or [Angle/CEnter/Direction/Line/Radius/Second pt/Undo]:
Specify the endpoint of the arc or enter an option. If you have already
created one arc, you have the option to close the polygon. For more
information about the prompts, see PLINE.
Length
Draws a line segment of a specified length at the same angle as the previous
segment. If the previous segment is an arc, the new line segment is drawn
tangent to that arc segment.
Specify length of line:
Specify a distance.
Undo
Removes the most recent segment added to the polygon.
Ring
Creates a polygon inside a polygon. This is considered a hole. Additional rings
are islands. Repeats the MAPPOLYGONCREATE command.
Polygon
Begins the MAPPOLYGONCREATE command so you can create another
polygon.
MAPMULTIPOLYGONCREATE | 1661
Exit
Ends the MAPMULTIPOLYGONCREATE command.
MAPMULTIPOLYGONEDIT
Use this command to edit a MultiPolygon feature.
NOTE You cannot perform edits that would create a non-planar polygon. Every
ring of a polygon must be planar and all parts and all rings must be in the same
plane.
To edit a feature using feature editing commands (page 705)
NOTE This command is for geospatial features only. To edit drawing objects, see
Overview of Working with Drawing Objects (page 727) and Working with Polygon
Objects (page 954).
The MAPMULTIPOLYGONEDIT command is based on the PEDIT command.
For more information about the prompts, see PEDIT.
Respond to the prompts:
Enter an option [Add/addRing/Delete/Move/Edit/Undo/eXit] <eXit>:
Enter an option.
Add
Adds a new polygon to the MultiPolygon. For more information, see
MAPPOLYGONCREATE (page 1663).
Addring
Creates a polygon inside a polygon. This is considered a hole. Additional rings
are islands. Specify the polygon to which you will add the ring. Repeats the
MAPPOLYGONCREATE command.
Delete
Deletes a polygon from the MultiPolygon.
Move
Moves a polygon in the MultiPolygon.
1662 | Chapter 23 Editing Maps Dialog Boxes

Select objects:
Select the polygon to move.
Specify base point:
Specify a base point for the Move operation.
Specify second point:
Specify the second point for the Move operation. The two points you specify
define a vector that indicates how far the selected polygons are to be moved
and in what direction.
Edit
Edits a polygon in the MultiPolygon. For more information, see
MAPPOLYGONEDIT (page 1665).
Undo
Undoes the last step in the MAPMULTIPOLYGONEDIT operation.
Exit
Ends the MAPMULTIPOLYGONEDIT operation.
MAPPOINTCREATE
Use this command to create a new point feature on a layer that contains point
feature data.
To create a new Point or MultiPoint feature (page 688)
NOTE This command is for geospatial features only. To create drawing objects,
see Overview of Working with Drawing Objects (page 727).
Respond to the prompt.
Specify a point:
Specify the location of the new point feature.
MAPPOLYGONCREATE
Use this command to create a new polygon feature on a layer that contains
polygon feature data.
MAPPOINTCREATE | 1663
NOTE You cannot create a non-planar polygon. Every ring of a polygon must be
planar and all parts and all rings must be in the same plane.
The MAPPOLYGONCREATE command is based on the PLINE command. For
more information about the prompts, see PLINE.
To create a new Polygon or MultiPolygon feature (page 689)
NOTE This command is for geospatial features only. To create drawing objects,
see Overview of Working with Drawing Objects (page 727) and Working with
Polygon Objects (page 954).
Respond to the prompts.
Specify start point:
Specify a starting point for the polygon.
Specify next point or [Arc/Length/Undo]:
Specify the next point or enter an option.
Next Point
Draws a line segment. The previous prompt is repeated.
Arc
Adds arc segments to the polygon.
Specify endpoint of arc or [Angle/CEnter/Direction/Line/Radius/Second pt/Undo]:
Specify the endpoint of the arc or enter an option. If you have already
created one arc, you have the option to close the polygon. For more
information about the prompts, see PLINE.
Length
Draws a line segment of a specified length at the same angle as the previous
segment. If the previous segment is an arc, the new line segment is drawn
tangent to that arc segment.
Specify length of line:
Specify a distance.
Undo
Removes the most recent segment added to the polygon.
1664 | Chapter 23 Editing Maps Dialog Boxes

Ring
Creates a polygon inside a polygon. This is considered a hole. Additional rings
are islands. Repeats the MAPPOLYGONCREATE command.
Exit
Ends the MAPPOLYGONCREATE command.
MAPPOLYGONEDIT
Use this command to edit a polygon geospatial feature.
NOTE You cannot perform edits that would create a non-planar polygon. Every
ring of a polygon must be planar and all parts and all rings must be in the same
plane.
To edit a feature using feature editing commands (page 705)
NOTE This command is for geospatial features only. To edit drawing objects, see
Overview of Working with Drawing Objects (page 727) and Working with Polygon
Objects (page 954).
The MAPPOLYGONEDIT command is based on the PEDIT command. For
more information about the prompts, see PEDIT.
Respond to the prompts:
Enter an option [Add/Delete/Move/Edit/Undo/eXit] <eXit>:
Enter an option.
Add
Adds an outer polygon or a ring or island to the selected polygon. For more
information, see MAPPOLYGONCREATE (page 1663).
Delete
Deletes the outermost polygon or rings or islands from the selected polygon.
Move
Moves the outermost polygon or rings or islands in the selected polygon.
Select objects:
Select the polygon to move.
MAPPOLYGONEDIT | 1665
Specify base point:
Specify a base point for the Move operation.
Specify second point:
Specify the second point for the Move operation. The two points you specify
define a vector that indicates how far the selected polygons are to be moved
and in what direction.
Edit
Edits a vertex on the outer ring or an island or hole. For more information,
see MAPLINESTRINGEDIT (page 1655).
Undo
Undoes the last step in the MAPPOLYGONEDIT operation.
Exit
Ends the MAPPOLYGONEDIT operation.
Break Objects at Boundary dialog box
Use this dialog box to create a clean map edge by cutting lines, 2D polylines,
arcs, and circles that cross a specified edge.
To break objects at a boundary (page 941)
Click Tools tab ➤ Map Edit panel ➤ Boundary Break.
NOTE This command is for drawing objects only. To split geospatial features, see
Splitting Features (page 705).
Before
1666 | Chapter 23 Editing Maps Dialog Boxes
After
Boundaries
Specify what to use as the boundary.
Use Save Back Extents Of Active Source Drawings
Use the save back extents specified by the drawing settings for the current
drawing. To change the save back extents, use the Drawing Settings dialog
box.
In Map Explorer, right-click Drawings ➤ Define/Modify Drawing Set. In
the Define/Modify Drawing Set dialog box (page 1918), click Drawing Settings.
Select Boundaries
Use existing objects as the boundary. Click Select to select the objects to
use.
Define Boundary
Use selected points to specify the boundary. Click Define to select points
to delineate the boundary.
Objects to Break
Select the objects to break.
Select Automatically
Use all objects within or crossing the boundary.
Select Manually
Use only selected objects. Click Select to select the objects to break.
Filter Selected Objects
Select only objects that are on the specified layers or blocks. These filters
are used for both automatic and manual selection of objects.
Filter On Layers
Break only objects on the selected layers. Click Layers to select from a list
of all available layers in the current drawing.
Break Method
Select the objects to skip or object data to retain during a break operation.
Break Objects at Boundary dialog box | 1667

Skip Topology Objects
Protect topology data. Objects with topology data are not broken.
Retain Object Data
Save object data from the original object. The data is duplicated on each
new piece.
COGO Input dialog box
The COGO Input dialog box allows you to create points using coordinate
geometry data. It also allows you to run an inverse report to determine the
relationship between two points.
To create a point using the COGO Input dialog box (page 1028)
Click Create tab ➤ Drawing Object panel ➤ COGO Input.
Routines
Select the COGO routine to use:
■Angle/Distance: specify a point by specifying an angle and a distance
from another point.
■Azimuth/Distance: specify a point by specifying azimuth and distance
from another point. Azimuth is the clockwise angle from the North(or
South) meridian.
■Bearing/Bearing: specify a point using the projections from two existing
lines or points and two bearings.
■Bearing/Distance: specify a point by specifying a bearing and a distance
from another point.
■Deflection/Distance: specify a point by specifying a deflection angle and
a distance from another point.
■Distance/Distance: calculated a new point using two points and two
distances to the new point. You must select one of the two calculated
points.
1668 | Chapter 23 Editing Maps Dialog Boxes

■Inverse Report: An inverse report gives you information about the
relationship between two points.
■Orthogonal/Offset: specify a point using distance and offset from an
existing line.
Input
Enter the required input for your chosen routine.
Calculate
Calculates the point based on the selected coordinate geometry routine and
input.
Result
Displays the coordinates of the new point.
Zoom to the created point in the drawing window.
Report
For Inverse Report only: view the results of the inverse report.
Create Point
Create the point and close the COGO Input dialog box.
OK
For Inverse Report only: close the COGO Input dialog box.
Cancel
Close the COGO Input dialog box without creating a point.
Split and Merge Rules dialog box
Use this dialog box to specify how class property values are calculated when
you use the following commands on features.
■Split (MAPFEATURESPLIT (page 1652))
■Merge (MAPFEATUREMERGE (page 1651))
■Overlay (page 1563)
■JOIN
Split and Merge Rules dialog box | 1669
■Join option of PEDIT
■BREAK
■TRIM
To create split/merge rules using expressions
In the Data Table, click Options ➤ Set Split And Merge Rules.
Click Feature Edit tab ➤ Split/Merge panel ➤ Merge Feature.
Click Feature Edit tab ➤ Split/Merge panel ➤ Split Feature.
NOTE This command is for geospatial features only. To split polygonal drawing
objects, see Splitting Polygon Objects (page 968).
Feature Properties
Click a property to see its attributes and set its rules. Right-click a property
to select multiple properties or property types. You cannot set rules for
properties that are read-only.
Property Attributes
Attribute information for the selected property or properties.
Split and Merge Rules
Specifies how class property values will be calculated when features are split
or merged.
Split Rule
Specify the rule for calculating class property values when you split features.
■Calculation. For numeric properties, set the property value based on a
custom calculation specified in the Expression field.
■Copy. Copy the property values to each new feature. (Default)
■Divide. Divide the property values equally into each new feature.
(Numeric properties only)
■Empty. Set the property values to “empty” or a default for new features.
The original feature retains the original property values.
1670 | Chapter 23 Editing Maps Dialog Boxes

■Expression. Specify an expression.
■Proportional. Distribute the property values proportionally into each
new feature based on the numeric value in the Based On field.
Expression
Specify a custom calculation. Enter the expression for the calculation, or
click to use the Split Rule Expression dialog box.
This option is displayed when the Split Rule is set to Calculation or when
the selected property is a string. For more information, see Overview of
Expressions for Geospatial Features.
Based On
Specify the value the Proportional rule uses to distribute the property values.
This option is displayed when Split Rule is set to Proportional.
Merge Rule
Specify the rule for calculating class property values when you merge
features.
■Average. Average the property values from the merged features. (Numeric
properties only)
■Calculation. Set the property value based on a custom calculation
specified in the Expression field.
■Concatenation. Join the values to form a single string separated by the
text in the Separator Text field.
■Count. Gives the property the value of the total number of features
merged to produce it. This option is for numeric values only.
■Empty. Set the property value to “empty” or a default for the merged
feature.
■Expression. Specify an expression.
■First Selected. Use the value of the first selected feature.
■Last Selected. Use the value of the last selected feature.
■Maximum.Use the maximum property value of the merged features.
■Median. Use the median value of the merged features.
■Minimum. Use the minimum value of the merged features
Split and Merge Rules dialog box | 1671
■Standard Deviation. Use the standard deviation of the merged features.
■Sum. Use the sum of the values of the merged features.
Expression
Specify a custom expression. Enter the expression, or click to use the
Split Rule Expression dialog box.
This option is displayed when the Merge Rule is set to Calculation or when
the selected property is a string. For more information, see Overview of
Expressions for Geospatial Features.
Separator Text
Specify the text that separates the property values when you select the
Concatenation merge rule.
Trim Objects At Boundary dialog box
Use this dialog box to trim objects at a specified boundary, excluding either
what is inside the boundary (Trim Inside Boundary), or what is outside (Trim
Outside Boundary). The trimmed objects are created new in the current drawing
and do not retain links to their source drawings.
To trim objects inside a boundary (page 945)
Click Tools tab ➤ Map Edit panel ➤ Boundary Trim.
NOTE This command is for drawing objects only. To edit geospatial features, see
Extracting Feature Geometry (page 715).
Trim Inside / Trim Outside
Given some drawing data...
1672 | Chapter 23 Editing Maps Dialog Boxes
Trim Inside / Trim Outside
And a trim boundary...
Trim Inside looks like this...
And Trim Outside looks like this...
Boundary
Specify what to use as the boundary.
Reference Last Query Boundary
Use the last spatial boundary that was referenced in a query.
Select Boundary
Use an existing object as the boundary. Click Select to select a closed polyline
or circle for the boundary.
Define Boundary
Use selected points to specify the boundary. Click Define to select at least
three points for the boundary. The boundary cannot cross itself.
Objects to Trim
Select the objects to trim.
Select Automatically
Trim all objects within or crossing the boundary.
Select Manually
Trim only selected objects. Click Select to select the objects to trim.
Filter Selected Objects
Select only objects that are on the specified layers or blocks. These filters
are used for both automatic and manual selection.
Trim Objects At Boundary dialog box | 1673
Filter On Layers
Trim only objects on selected layers. Click Layers to select from the layers
in the current drawing. If circle objects cross the selected boundary, they
are converted to arcs before they are trimmed.
Trim Method
Set rules for the trim operation.
Trim Inside/Outside Boundary
Specify whether to trim all objects inside the specified boundary and cut a
hole in the drawing, or whether to trim all objects outside the boundary
and create a neat border.
Skip Topology Objects
Protect topology data. Objects with topology data are not trimmed.
Retain Object Data
Duplicate object data and external database links on each piece of the
trimmed object. If you clear this option, the data remains attached only to
the original location.
Objects That Cannot Be Trimmed
Specify what to do with objects that cannot be trimmed, such as text.
Ignore
Do not delete the objects.
Delete
Delete the objects.
Reference Insertion Point
Delete an object only if its insertion point is inside the area to trim.
1674 | Chapter 23 Editing Maps Dialog Boxes
External Databases Dialog
Boxes
Associate Database Versions dialog box
Use this dialog box to set options related to database versions and file extensions.
To associate database versions with files extensions (page 243)
Click Map Setup tab ➤ Map panel ➤ angle-arrow.
NOTE This functionality applies only to an attribute data source that you use with
drawing objects. For information about attribute data for geospatial features, see
Overview of Joins (page 507).
You can associate a database file extension with the version of the database
software that you use to edit the file. When you drop a database file on the Map
Explorer tab of the Task Pane, AutoCAD Map 3D checks the file extension and
uses the specified version of the database software.
Always Prompt
Select this option if you use more than one type of database. Each time you
drop a database file onto the Map Explorer tab, AutoCAD Map 3D will prompt
for the version of the database software to use with the file.
24
1675

Always Use
Select this option if you akways use one type of database. When you drop
a database file onto the Map Explorer, AutoCAD Map 3D uses the specified
version of the database software.
For example, if all your dBASE files are in dBASE III format, select Always
Use, and then select dBASE III from the list. If you have files in both dBASE
III and dBASE IV format, select Always Prompt under dBASE/FoxPro.
For files created with Excel 95, select the Excel 7.0 driver.
Column dialog box
Use this dialog box to specify column display options for Data View.
To change the formatting of cells in a column in Data View (page 1058)
Click Map Setup tab ➤ Map panel ➤ angle-arrow.
NOTE Data View displays attribute data linked to drawing objects. For information
about viewing attribute data for geospatial features, see Overview of the Data
Table (page 1125).
By default, your formatting changes are saved with the current drawing.
Whenever you open this table from this drawing, the table uses the saved
formatting. If you do not want to save the formatting, clear the Save Format
And Style Changes With Drawing option on the Data Source tab of the
AutoCAD Map Options dialog box (page 1908). If this option is cleared, AutoCAD
Map 3D erases formatting information when you close a table. When you
detach a data source, AutoCAD Map 3D erases formatting information for all
tables in that data source.
If you modify table column order outside of the Data View, the Data View
formatting may no longer be correct. To clear the formatting for a single table,
close the table when the Save Format And Style Changes With Drawing option
is cleared. To clear the formatting for all tables in a data source, detach the
data source.
Use the Font tab to specify text options for the selected column.
Use the Interior Pattern tab to specify the background of cells in the selected
column.
1676 | Chapter 24 External Databases Dialog Boxes
Use the Borders tab to specify borders for the selected column.
Use the Align tab to specify text alignment for the selected column.
Font tab
Font
Select a font from the list of fonts installed on your system. Row height
adjusts automatically for the font size.
Outline
Select a font style. Available styles are determined by the selected font.
Size
Select a font size. Available sizes are determined by the selected font.
Effects
Select Strikeout to print hyphens through the text. Select Underline to
underline the text.
Text Color
Select a color for the text.
Preview
Preview your font options.
Color tab
Interior Pattern
Select a pattern. For no pattern, select the asterisks.
Foreground
Specify the color for the foreground of the pattern. Select a color that doesn't
hide the text.
Background
Specify the color for the background of the pattern. Select a color that
doesn't hide the text.
3D-Effect
Select a 3D effect for the cell.
Preview
Preview your pattern and 3D effects options.
Column dialog box | 1677
Borders tab
Border
Click in a box to select a border for the Left, Right, Top, or Bottom of each
cell in the column. The border uses the currently selected line type.
Type
Click a line type to select it.
Color
Select a color for the border.
Align tab
Horizontal
Align text on the left of the cell, the right of the cell, or in the horizontal
center of the cell. Select Standard to right-align numeric fields and left-align
all other fields.
Vertical
Align text with the top of the cell, the bottom of the cell, or in the vertical
center of the cell.
Wrap Text
Allow text to wrap in the cell. If this option is not selected, text that is too
long is not displayed or printed.
Allow Enter
Specify that pressing Enter clears the cell. If this option is not selected,
pressing Enter moves to the next cell.
Auto Size
Automatically adjust the column width to the longest value in the column.
Column Values dialog box
Use this dialog box to specify values for a SQL filter in the Data View.
To use a SQL filter in the Data View (page 1231)
Click Home tab ➤ Data panel ➤ Define Query.
1678 | Chapter 24 External Databases Dialog Boxes
NOTE Data View displays attribute data linked to drawing objects. For information
about viewing attribute data for geospatial features, see Overview of the Data
Table (page 1125).
Scroll through the list, select the value you want, and click OK. The new value
is inserted into the Value field.
Configure Data Source dialog box
Use this dialog box to enter a name for a new data source or select an existing
data source from the list.
To configure a data source automatically (page 213)
Click Map Setup tab ➤ Attribute Data panel ➤ Configure Data Source.
NOTE This functionality applies only to an attribute data source that you use with
drawing objects. For information about attribute data for geospatial features, see
Overview of Joins (page 507).
Click OK to define or modify a data link file for the data source in the Microsoft
Windows Data Link Properties dialog box. If the data source you want is not
listed, it may not be in the data sources folder.
For more information on configuring a data source, refer to your Microsoft
Windows documentation.
NOTE If you modify a data source that is currently connected, the changes will
not take effect until you reconnect the data source.
Connect Data Source dialog box
Use this dialog box to select a data source to connect.
To attach a data source by dragging the database file to the Task Pane (page
209)
Configure Data Source dialog box | 1679
Click Map Setup tab ➤ Attribute Data panel ➤ ➤ Connect To External
Records.
Click Map Setup tab ➤ Attribute Data panel ➤ ➤ Disconnect From Ex-
ternal Records.
NOTE This functionality applies only to an attribute data source that you use with
drawing objects. For information about attribute data for geospatial features, see
Overview of Joins (page 507).
These data sources are attached to the current drawing but are currently
disconnected. Select data sources from the list. Click Connect. If the data
source you want is not listed, it may not be attached to this drawing.
Convert Object Data to Database Links dialog box
Use this dialog box to convert object data in your drawing to external data.
To convert object data to a linked database table (page 534)
To link records to objects using object data automatically (page 531)
To attach a data source by dragging the database file to the Task Pane (page
209)
At the Command prompt, enter mapod2ase.
NOTE This functionality applies only to an attribute data source that you use with
drawing objects. For information about attribute data for geospatial features, see
Overview of Joins (page 507).
NOTE Before you run this command, you must attach the data source to the
current drawing. In Map Explorer, right-click Data Sources ➤ Attach.
Do either of the following:
■Create a database table from an existing object data table, using the same
structure.
1680 | Chapter 24 External Databases Dialog Boxes
AutoCAD Map 3D reads each selected object and creates a new record in
the external database table. If an object has multiple records from the
object data table, AutoCAD Map 3D creates multiple records in the external
database table. AutoCAD Map 3D also generates a database link to connect
the object to the record in the new database table.
■Use object data in your drawing that matches information in an external
database table and automatically create links based on the matched
information.
You can leave the object data in the drawing or remove the object data from
the objects as each record is created.
When you are finished with this dialog box, click Proceed.
Source Object Data Table
Select the object data table to convert or link. Select an object data table defined
in the current drawing. To work with object data tables in attached drawings,
open those drawings directly.
Name
Select the object data table from the list.
Remove Data From Objects Processed
Delete the object data currently associated with the object.
Target Link Template
Select an option and click Define to specify the link template.
Convert Object Data To Database
Convert object data to records in a database and link objects to the new
data.
Link Object Data To Database
Link objects with attached object data to records in a database table using
key fields.
Define
Specify the link template to identify the database table.
Object Selection
Specify how to select objects, and whether to select all objects or only objects
on specific AutoCAD layers.
Convert Object Data to Database Links dialog box | 1681

Select Automatically
Use all objects, unless Filter On Layers is selected.
Select Manually
Select individual objects. Click Select to pick them in the map.
Filter On Layers
Search all layers, or click Layers to select from a list of AutoCAD layers in
the current drawing.
Define Link Template dialog box (MAPOD2ASE)
Use this dialog box to specify the table name for the new database table and
to define the link template that identifies the database table.
To create a link template (page 526)
At the Command prompt, enter mapod2ase.
NOTE This functionality applies only to an attribute data source that you use with
drawing objects. For information about attribute data for geospatial features, see
Overview of Joins (page 507).
Data Source
Select a data source from the list. If it is checked, you are connected to the
data source. If you are not connected, click Connect.
Catalog/Schema
Select a catalog and schema from the list, if required by this data source.
Table Name
Specify a unique name for the link template.
Key Columns
Specify the columns to use as key columns. Separate multiple names with
commas. To select from a list of field names in the object data table, or to
rename the fields, click Select.
Clicking Select displays the Select Link Template Key dialog box (page 1797).
1682 | Chapter 24 External Databases Dialog Boxes
Link Template
Specify a unique link template name.
Define Link Template dialog box (MAPDEFINELT)
Use this dialog box to define the location of a table and the columns to use
as key columns for a link template.
To convert object data to a linked database table (page 534)
Click Map Setup tab ➤ Attribute Data panel ➤ Define Link Template.
NOTE This functionality applies only to an attribute data source that you use with
drawing objects. For information about attribute data for geospatial features, see
Overview of Joins (page 507).
If you use the same table and key columns for multiple drawings, specify a
consistent naming scheme for link templates.
Data Source list
Select one of the attached and connected data sources in the current
drawing. If you open the dialog box from an existing table, you can select
the data source for the table.
Table Name list
Select a table for the selected data source. If you open the dialog from an
existing table, you can select the table name.
Link Template box
Enter a new name. Link templates defined for the selected table are listed.
Key Selection area
To select a column as a key column, click a box in the Key column. The
values in the key column identify records in the table, so select a column
or set of columns that has a unique value for each record.
NOTE If the link template does not immediately appear on the Map Explorer tab
of the Task Pane, right-click a blank space in the Map Explorer tab. Click Refresh.
Define Link Template dialog box (MAPDEFINELT) | 1683
Source dialog box
Use this dialog box to view all data sources attached to the current drawing.
To attach a data source by dragging the database file to the Task Pane (page
209)
Click Map Setup tab ➤ Attribute Data panel ➤ Attach Data Source.
NOTE This functionality applies only to an attribute data source that you use with
drawing objects. For information about attribute data for geospatial features, see
Overview of Joins (page 507).
Select the data sources. Click Detach. The selected data sources are disconnected
and removed from the current drawing.
Disconnect Data Source dialog box
Use this dialog box to view data sources that are attached to the current
drawing and are currently connected.
To disconnect a data source (page 215)
Click Map Setup tab ➤ Attribute Data panel ➤ ➤ Disconnect From Ex-
ternal Records.
NOTE This functionality applies only to an attribute data source that you use with
drawing objects. For information about attribute data for geospatial features, see
Overview of Joins (page 507).
Select the data sources. Click Disconnect. Disconnected data sources remain
attached to the current drawing. If the data source you want is not listed, it
may not be attached to this drawing or it may not be currently connected.
1684 | Chapter 24 External Databases Dialog Boxes
Header/Footer dialog box
Use this dialog box to define the header and footer for a Data View report.
To specify the header and footer (page 1476)
In the Data View: File ➤ Header and Footer
NOTE Data View displays attribute data linked to drawing objects. For information
about viewing attribute data for geospatial features, see Overview of the Data
Table (page 1125).
Select the Header or Footer tab and enter the text. To change the font, select
a cell and click Font. In the Font dialog box, select formatting options for all
text in the cell.
You can also enter certain variables.
Replaced with at print timeVariable
Application name$A
Current page number$P
Total number of pages$N
Current date$D
Distance to Frame
Dimensions are in centimeters if your Windows system-wide measurement
system is set to Metric, in inches if it is set to U.S. To view or set the
measurement system, from the Windows Control Panel choose Regional
Settings ➤ Number tab ➤ Measurement System.
Header
Specify the distance from the top margin to the bottom of the header text.
Footer
Specify the distance from the bottom margin to the top of the footer text.
Header/Footer dialog box | 1685
First Page No.
Enter the starting page number. Additional pages are numbered
consecutively.
Link Template Properties dialog box
Use this dialog box to change the width of the Column Name or Data Type
columns.
To edit the database path in a link template (page 539)
Click Map Setup tab ➤ Attribute Data panel ➤ ➤ Edit Link Template
Properties.
NOTE This functionality applies only to an attribute data source that you use with
drawing objects. For information about attribute data for geospatial features, see
Overview of Joins (page 507).
Drag the column divider to the desired width.
Page Setup dialog box
Use this dialog box to specify margins, headers, grid, print order, and centering
options for printing from Data View.
To set print options (page 1476)
In the Data View: File ➤ Page Setup
NOTE Data View displays attribute data linked to drawing objects. For information
about viewing attribute data for geospatial features, see Overview of the Data
Table (page 1125).
1686 | Chapter 24 External Databases Dialog Boxes
Margins
Margin dimensions are in centimeters if your Windows system-wide
measurement system is set to Metric, in inches if it is set to U.S. To view or
set the measurement system, from the Windows Control Panel choose Regional
Settings ➤ Number tab ➤ Measurement System.
Left
Enter the distance from the left edge of the paper to the beginning of each
line.
Right
Enter the distance from the right edge of the paper to the end of the
printable area.
Top
Enter the distance from the top of the paper to the top of the first line.
Bottom
Enter the distance from the bottom of the paper to the bottom of the last
line.
Titles and Grid Lines
Row Headers
Print row headers.
Column Headers
Print column headers.
Print Frame
Print a frame around the table.
Vertical Lines
Print vertical lines between each column.
Horizontal Lines
Print horizontal lines between each row.
Only Black And White
Print using only black and white. Text that has a color assigned to it will
be printed using a pattern.
Page Order
If a table extends beyond the limits of a single page, it is divided into page-size
tiles. This setting governs the order of printing the tiles.
Page Setup dialog box | 1687
First Rows, Then Columns
Print tiles from left to right by rows, top row first.
First Columns, Then Rows
Print tiles from top to bottom by columns, left column first.
Center on Page
Vertical
Center the table between the specified top and bottom margins.
Horizontal
Center the table between the specified left and right margins.
Select Database Version dialog box
Use this dialog box to select the database to use with this file from the list of
available databases.
To set data source options (page 236)
Click ➤ Options.
Click Map Setup tab ➤ Map panel ➤ angle-arrow.
NOTE This functionality applies only to an attribute data source that you use with
drawing objects. For information about attribute data for geospatial features, see
Overview of Joins (page 507).
Always Use This Database For Files Of This Type
Use the selected database version for all databases with this extension. You
will not be prompted again. To turn prompting back on, change the setting
on the Data Source tab of the Autodesk Map Options dialog box.
To specify default database versions for other extensions, use the Data Source
tab of the AutoCAD Map Options dialog box (page 1908).
1688 | Chapter 24 External Databases Dialog Boxes

Select Existing Link Template dialog box
Use this dialog box to select the appropriate link template, specify the key
fields in the object data to use, and then select a database validation option.
To open a linked database table (page 527)
At the Command prompt, enter mapviewlink.
NOTE This functionality applies only to an attribute data source that you use with
drawing objects. For information about attribute data for geospatial features, see
Overview of Joins (page 507).
The list of link templates include those available for the current drawing.
Link Template
Select a link template for the database table containing the data matching
your object data table. In the OD Column, specify the fields in the object data
table to use for key fields.
Database Validation
Select a validation option.
None
Create links without checking the database.
Record Must Exist
Create a link only where the text or attribute tag value matches an existing
record's key field value.
Create If New
Create a new record in the table if no existing record matches. If you choose
this option, you can use the grid below to map data from fields in the object
data table to non-key fields in the database.
Select Existing Link Template dialog box | 1689
Select Link Template dialog box
Use this dialog box to select the appropriate data source and then select the
link template.
To open a linked database table (page 527)
At the Command prompt, enter mapviewlink.
NOTE This functionality applies only to an attribute data source that you use with
drawing objects. For information about attribute data for geospatial features, see
Overview of Joins (page 507).
Select from the data sources and link templates available for the current
drawing
Select Link Templates dialog box
Use this dialog box to select link templates to delete.
To delete links for a group of objects (page 537)
Click Map Setup tab ➤ Attribute Data panel ➤ ➤ Link Manager.
NOTE This functionality applies only to an attribute data source that you use with
drawing objects. For information about attribute data for geospatial features, see
Overview of Joins (page 507).
If you are deleting links or link templates for selected objects, the list includes
link templates for records linked to the selected objects. Once you select the
link templates and click OK, link data associated with the selected link
templates is removed from the selected objects.
1690 | Chapter 24 External Databases Dialog Boxes
Select Query dialog box
Use this dialog box to select the query whose records you want to view.
To open a table using the Task Pane (page 1053)
Click Map Setup tab ➤ Attribute Data panel ➤ ➤ Execute Query.
NOTE This functionality applies only to an attribute data source that you use with
drawing objects. For information about attribute data for geospatial features, see
Overview of Joins (page 507).
Select the appropriate data source and then select the query. A Data View
window displays the records that match the query.
NOTE You cannot edit the data resulting from a database query.
Data Source
Select from the data sources currently attached and connected to the current
drawing.
Query
Select from the queries associated with the selected data source. These
queries were defined in the external database program.
Select Table dialog box (MAPBROWSETBL)
Use this dialog box to select a data table to view or edit.
To open a table using the Task Pane (page 1053)
Click Map Setup tab ➤ Attribute Data panel ➤ ➤ Edit Table.
Select Query dialog box | 1691
NOTE This functionality applies only to an attribute data source that you use with
drawing objects. For information about attribute data for geospatial features, see
Overview of Joins (page 507).
Select the appropriate data source and then select the table.
Data Source
Select from data sources currently attached and connected to the current
drawing.
Table
Select from tables in the selected data source.
Sort dialog box
Use this dialog box to sort the Data View.
To use the Data View (page 1047)
In the Data View: View ➤ Sort ➤ Multiple Columns
NOTE Data View displays attribute data linked to drawing objects. For information
about viewing attribute data for geospatial features, see Overview of the Data
Table (page 1125).
Before you begin sorting, note the following:
■Records are sorted based on the value in the column selected in the Sort
By box.
If multiple records have the same value in this column, those records are
further sorted by the column specified in the first Then By box.
■If you do not specify a sort column, records are sorted in database order.
■To sort the table by additional columns, use the remaining Then By lists.
■You can sort up to five columns simultaneously.
You cannot sort columns that have binary or user-defined data types, and
these columns do not appear in the sort lists.
■To clear all the lists, click Reset.
1692 | Chapter 24 External Databases Dialog Boxes

Sort By
Click the down arrow and select the column in the table to sort by. Columns
with binary or user-defined data types are not listed.
Ascending
Sort from the beginning of the alphabet, the lowest number, or the earliest
date.
Descending
Sort from the end of the alphabet, the highest number, or the latest date.
Table Filter dialog box
Use this dialog box to select records from the database table.
To use a SQL filter in the Data View (page 1231)
In the Data View: Records ➤ SQL Filter
NOTE Data View displays attribute data linked to drawing objects. For information
about viewing attribute data for geospatial features, see Overview of the Data
Table (page 1125).
When you apply the filter, the Data View searches the current database table
and displays only records that match the specified conditions.
To edit an existing condition, select the line in the SQL Filter list. Edit the
information in the Where Condition area. When you finish editing, click
Update.
To add a new line, select a joining operator (And/Or/Not). Select a column
and an operator and specify a value. When you finish, click Add.
SQL Filter area
View the current filter. If lines in the filter were grouped, the group is
indented.
Group
Group the selected conditions. Conditions in the group are evaluated before
other conditions.
Table Filter dialog box | 1693

Ungroup
Delete the parentheses from the selected line and from the matching ending
or beginning line of the group.
Delete
Delete the selected condition.
Clear All
Delete all conditions.
Where Condition area
Use the Where Condition area to edit an existing condition in the filter or
to add a new condition.
And
Specify that both conditions must be met for the object to be included in
the query.
Or
Specify that either condition can be met for the object to be included in
the query.
Not
Specify And Not if the first condition must be met and the second condition
must not be met for the object to be included in the query. Specify Or Not
if either the first condition can be met or the second condition cannot be
met for the object to be included in the query.
For the very first condition in the list, do not specify And or Or. You can
select Not.
Column
View columns from the current table.
Operator
Specify how to test the values in the column.
DescriptionOperator
The value of the selected column is equal to the value you enter in
the Value box.
=
The value of the selected column is greater than the value you enter
in the Value box.
>
The value of the selected column is greater than or equal to the
value you enter in the Value box.
>=
1694 | Chapter 24 External Databases Dialog Boxes
DescriptionOperator
The value of the selected column is less than the value you enter
in the Value box.
<
The value of the selected column is less than or equal to the value
you enter in the Value box.
<=
The value of the selected column is not equal to the value you enter
in the Value box.
<>
The selected column is linked to the object and contains the spe-
cified value. If you specify multiple values, separate each value with
a comma. Enclose values in single quotes, for example, '1','2','3'.
IN
The selected column is linked to the object and is empty. Do not
enter a value in the Value box.
IS NULL
The selected column is linked to the object and contains part of
the value specified. Applies to string (character) data types only.
Use the percent sign (%) as a wild-card character in the Value box.
LIKE
For information on the wild-card characters supported by your database
system, refer to the documentation for your database system software.
Value
Specify the value to search for. To select from a list of existing values in the
column, click . To use wild-card characters for string values, select
LIKE.
For example, type B% to find all values that begin with the letter B.
Add
Add the condition line to the SQL Filter list.
Update
Replace the selected condition in the SQL Filter list with the new condition.
To use a filter you previously defined for this table, click History at the bottom
of the screen. Select the filter from the list.
Table Filter dialog box | 1695
Table Filter History dialog box
Use this dialog box to manage the filters you previously defined for this table.
To use a SQL filter in the Data View (page 1231)
In the Data View: Records ➤ SQL Filter
NOTE Data View displays attribute data linked to drawing objects. For information
about viewing attribute data for geospatial features, see Overview of the Data
Table (page 1125).
To use a filter, select it in the list and click OK, or double-click the filter. To
erase a filter, select it in the list and click Delete. To erase all filters, click Delete
All.
The maximum number of filters stored on this list is determined by the value
for Number Of SQL Conditions To Keep In History List on the Current Drawing
tab of the AutoCAD Map Options dialog box (page 1908).
Table Properties dialog box
Use this dialog box to view information about the selected table or query in
Data View.
To view external data linked to drawing objects (page 1147)
Click the Highlight Linked Objects icon.
NOTE Data View displays attribute data linked to drawing objects. For information
about viewing attribute data for geospatial features, see Overview of the Data
Table (page 1125).
To change the width of the Column Name or Column Type columns, drag
the column divider to the desired width.
1696 | Chapter 24 External Databases Dialog Boxes

Name
View the name of the selected table or query.
Structure
View the column name and column type for each column.
Zoom Scale dialog box
Use this dialog box to specify the percentage of the display area that
highlighted objects will fill.
To set other Data View highlighting options (page 1227)
In the Data View: Highlight ➤ Zoom Scale
NOTE Data View displays attribute data linked to drawing objects. For information
about viewing attribute data for geospatial features, see Overview of the Data
Table (page 1125).
Specify 100% to zoom the display to the extents of the selected objects. Specify
a smaller number to display more of the drawing outside the highlighted
objects.
Specify 0% to maintain the current zoom level.
Zoom Scale dialog box | 1697
1698

Import Export Dialog Boxes
Attribute Data dialog box
Use this dialog box to specify the attribute data to import for the selected input
layer. This is sometimes called a theme, level, or file.
To specify the data to import (page 426)
Click Home tab ➤ Data panel ➤ Import From Files.
NOTE Data you import becomes AutoCAD drawing objects in your map. To connect
to the data in its original format, see Overview of Bringing In GIS Features (page
305). To convert the drawing objects to a geospatial format, see Overview of
Converting and Exporting (page 1405).
Do Not Import Attribute Data
Do not add data attached to the objects in the source drawing.
Create Object Data
Import data attached to the objects in the source drawing into an object data
table.
Object Data Table To Use
Select an object data table or enter a name for a new one. A table name can
include the characters A-Z, a-z, 0-9, $ and _. It cannot include spaces. It must
start with an alphanumeric character.
25
1699
For a new object data table name, AutoCAD Map 3D creates a new object
data table with fields that match the fields you're importing. To change
these defaults, click Select Fields.
For an existing object data table, incoming fields are imported into object
data fields with the same name by default. If no object data field exists with
the same name, the incoming field is not imported. To change these defaults,
click Select Fields.
When the data is imported, it will be converted to the following object data
types:
■Integer32, Integer16, and Boolean data types are converted to the Integer
data type. For Boolean data, false is converted to 0 and true is converted
to 1.
■Float, Double, and Decimal data types are converted to the Real data
type.
■Char and Date data types are converted to the Character data type.
Incoming data is converted to the data type of the matching object data
field. If this conversion fails, AutoCAD Map 3D uses 0 for integers, 0.0 for
real numbers, and "" for characters.
Select Fields
Select the fields to import and specify names for the object data fields.
Add Unique Key Field
Automatically create a field with a unique entry for each imported object.
You can edit the field name.
The unique ID numbers increment within a single AutoCAD Map 3D session,
but restart when you restart AutoCAD Map 3D. To extend the unique key
across multiple imported files, import them all during the same AutoCAD
Map 3D session.
Add To Database Table
Append data attached to the objects in the source to an external database
table. The links to the data are imported with the objects. Select the link
template to use. Optionally, import only the link data.
If no link templates are defined in the current drawing, the option is not
available.
Link Template
Select a link template from the list.
1700 | Chapter 25 Import Export Dialog Boxes
Select Fields
Select fields to import from the source drawing. If you select only key fields,
they are imported as link data, and the database table is not updated.
Create Link Only
Import link data only. Links are maintained from the imported objects to
their appropriate row in the table, but no changes are made to the database
table.
If you import only the key field, this option is automatically selected.
Block Mapping dialog box
This dialog box was used to list all values in the import file for the specified
Control Data Element and the block name to which they were mapped. It has
been discontinued. Instead, use one of the following procedures or commands.
To import data from other formats (page 381)
To import from Arc/INFO (page 396)
To import from MapInfo MIF/MID (page 401)
To import SHP data (page 399)
Click Home tab ➤ Data panel ➤ Import From Files.
Conflict Resolution dialog box
Use this dialog box to resolve conflicts during import.
To specify the data to import (page 426)
Click Home tab ➤ Data panel ➤ Import From Files.
NOTE Data you import becomes AutoCAD drawing objects in your map. To
connect to the data in its original format, see Overview of Bringing In GIS Features
(page 305). To convert the drawing objects to a geospatial format, see Overview
of Converting and Exporting (page 1405).
Block Mapping dialog box | 1701

You can map incoming attribute data to target data fields in the AutoCAD
Map 3D drawing using both the Data and Object Class columns. This may
result in mapping two different incoming data fields to the same target data
field. Before proceeding with the import, you must resolve such conflicts.
For example, the Object Class field can specify that a AutoCAD Map 3D object
data field called “Wire_Data” stores an imported attribute “Voltage,” while
the Data column specifies that the same “Wire_Data” object data field stores
another imported attribute, “EMF.” You cannot store two data values in one
target field. The Conflict Resolution dialog box lets you specify which incoming
data values to use.
Conflicts Detected For Input Layer <Layer Name>
Conflicts between the attribute mapping specified in the Data and Object
Class columns have been found for the specified layer.
Conflict List
Specify which of the incoming attributes (the one defined in the Object Class
or the one specified in the Data column) should be stored in the AutoCAD
Map 3D data field.
Class Input Field
Click in this column to use the value specified by the Object Class.
Data Input Field
Click in this column to use the value specified by the Data column.
Target
View the target attribute data field in the AutoCAD Map 3D drawing. The
syntax used for the Target field is
CATEGORY:TABLE.FIELD
Where
Type of data, for example "OD" for object
data, or "LT" for link template (linked ex-
ternal database).
CATEGORY
Object data table name or database table
name.
TABLE
Data field name.FIELD
Use Class
Resolve all conflicts using the Class Input Field definitions.
1702 | Chapter 25 Import Export Dialog Boxes

Use Data
Resolve all conflicts using the Data Input Field definitions.
OK
Accept the current settings and return to the Import dialog box.
Coordinate System Translation dialog box
This dialog box was used to convert the file from one coordinate system to
another. It has been discontinued. Instead, use one of the following procedures
or commands.
To export drawing objects to MicroStation Design (DGN) (page 1438)
To export to MapInfo MIF/MID (page 1432)
To export drawing objects to SHP (page 1428)
To export drawing objects to ESRI Arc/INFO (page 1421)
In the Tool-based Ribbon Workspace, click Output tab ➤ Map Data Transfer
panel ➤ Map 3D Export.
If the coordinate system you want is not listed in any category, you can create
a new coordinate system (page 90).
Input Settings area
From the Coordinate System list, select the coordinate system code for the
existing file. This list displays all codes in the selected category. To display
the codes for a different category, select the new category from the Category
list.
Output Settings area
From the Coordinate System list, select the coordinate system code you
want for the new file. This list displays all codes in the selected category.
To display the codes for a different category, select the new category from
the Category list.
Coordinate System Translation dialog box | 1703
Define Link Template dialog box (MAPIMPORT4)
This dialog box was used to define a new link template when importing an
external map file into AutoCAD Map 3D format. It has been discontinued.
Instead, use one of the following procedures or commands.
To import data from other formats (page 381)
To import from Arc/INFO (page 396)
To import from MapInfo MIF/MID (page 401)
To import SHP data (page 399)
Click Home tab ➤ Data panel ➤ Import From Files.
OK
When you click OK, a link template is created for the table using the key
columns in the Key Selection area that have been set to On.
Table Specification Area
Select a data source, catalog, and schema. Enter the name of a table. To
select from a list of table names, click List.
Link Template Area
Enter a name for the link template. Link template names can be up to 31
alphanumeric characters.
Key Selection Area
Specify a key column by selecting the column and clicking On.
Export dialog box
Use this dialog box to select the drawing objects to export, and specify export
options. You cannot export feature data.
To export drawing objects to other file formats (page 1408)
In the Tool-based Ribbon Workspace, click Output tab ➤ Map Data Transfer
panel ➤ Map 3D Export.
1704 | Chapter 25 Import Export Dialog Boxes
NOTE Export affects drawing objects only. To convert geospatial data to a different
format, see Migrating GIS Data (Bulk Copy) (page 617).
If you have previously saved your settings in this dialog box, click Load to
reload those settings. To save the current settings for use later or to use in a
script, click Save.
The dialog box has the following tabs:
■Selection Tab (page 1705)
■Data Tab (page 1707)
■Options Tab (page 1708)
If you export to SDF, Oracle, or ArcSDE, the Export dialog box substitutes
Feature Class Tab (page 1706) for the Data Tab.
Selection Tab
Specify the objects to export.
Object Type
For some formats, select the object type to export. Objects of other types
are filtered out of the export. To export the other object types, run Export
again. Some objects may be exported as more than one type.
Select Objects To Export
Select the objects to export.
Select All
Select all objects.
Select Manually
Individually select the objects to export. To modify the selection set, click
Select Objects or Quick Select .
Filter Selection area
Filter the selected objects based on layer or object class. Enter the names of
the layers or object classes to include, or click the button to select from a
list. Objects that are not on the selected layers and in the selected object
classes are filtered out of the export. The status line shows how many objects
are selected and how many have been filtered out.
Export dialog box | 1705
Select Polygon Topology To Export
Name
Select the polygon topology to convert to polygon objects and export. These
objects are in addition to any objects selected above.
Group Complex Polygons
Group nested polygons into a single balanced polygon. Each nested polygon
must have a centroid.
If you do not select this option, AutoCAD Map 3D will create separate
polygons, one for each centroid.
Preview Filtered Selection
See which objects will be exported. Objects that will be exported are
highlighted. To leave the preview and return to this dialog, press ESC.
Feature Class Tab
Choose a method for organizing the selected drawing objects into logical
feature classes.
DWG to Feature Class Mapping
Specify how DWG objects map to FDO feature classes.
Create A Single Class From All Selected Objects
Create a single FDO feature class for all selected DWG objects. This is the
default selection.
Create Multiple Classes Based On A Drawing Object
Create multiple feature classes based on a drawing object. Select the drawing
object on which to base the feature classes from the Drawing Object To Use
list.
Select Attributes
Select specific attributes to export. You can select attributes for both
single-class and multiclass export operations. For multiclass export
operations, these attributes will be added to every feature class.
Drawing Object
Select the drawing objects to export.
Feature Class
The feature class to which you are exporting your data. If you are exporting
to an existing FDO data store, use the drop-down list to map your data to
existing fields. Existing feature classes are in blue text. You can map more
than one drawing object to a single feature class.
1706 | Chapter 25 Import Export Dialog Boxes
To map drawing properties to feature class properties, click in the Feature
Class field.
Geometry
Select the geometry data to export for each drawing property. Click in the
appropriate field, then click the down arrow. For pre-existing classes, this
field displays the geometry type already associated with that class.
Show Schema Names
Display the schemas of the feature class to which you are mapping your
data.
Data Tab
Data
To include data with the exported objects, select the data fields to export. The
selected fields appear in the table. You can also enter an expression.
NOTE If you are exporting to SHP format using object classification to create
feature classes, you may not want to specify attributes here, as all feature classes
will then receive all attributes you check on this tab. If you don’t select attributes
here, properties for those feature classes are defined by the original object classes.
Select Attributes
Select properties, object properties, topology information, object class
information, or fields from link template data, object data, or block
attributes.
TIP To export only key values, select the fields in the Link Templates section.
Since the key values are stored in the drawing as link data, selecting only key
fields improves performance.
In the list of attributes, Object Data is map-specific and includes the
attributes of any objects in the map that have object data tables associated
with them. Object Properties are the properties of each entity type. These
are the same attributes that appear in the Properties palette. Properties are
attributes that apply to every DWG object in the map.
Source Field
Lists the data you selected to export. Click Select Attributes to select
additional data, or enter an expression.
Export dialog box | 1707

Output Field
Enter a name for the field in the output file for the associated field. Output
field names can use any alpha-numeric character and the underscore symbol
("_").
Create Unique Key Field
Create a unique value for each exported object. You can specify a name for
this field.
The unique ID numbers increment within a single AutoCAD Map 3D session,
but restart when you restart AutoCAD Map 3D. To extend the unique key
across multiple files you are exporting, export all the files in the same
AutoCAD Map 3D session.
Options Tab
Coordinate Conversion
To convert the exported objects to a different coordinate system, check
Convert Coordinates To. Enter the coordinate system code for the export
file or click to select one from a list.
If the conversion controls are not available, there is no coordinate system
assigned to your current drawing. Click Cancel, assign a coordinate system
to the current drawing, and re-run Export.
Other
The options that appear in this section depend on your choice of export
format.
Treat Closed Polylines as Polygons
Export closed polylines as polygons. If this check box is not selected, only
polygon objects will be exported as polygons.
NOTE If you export a polygon topology that includes closed polylines and
those closed polylines are part of the selection set, selecting this check box may
create duplicate polygons in the exported file.
Additional Settings
The Options tab may include more settings for the format you chose. For
some formats, the Driver Options button is also available.
For information about the options for a particular format, see Supported
Formats (page 1412).
1708 | Chapter 25 Import Export Dialog Boxes
Additional Notes
■AutoCAD Map 3D exports original object properties regardless of any map
stylizations, except for some text. Text entities created by text stylizations
are exported. To avoid exporting text entities, turn off any text stylization
before exporting your data. To export stylized drawing objects, first save
the stylizations to a linked output drawing, and then export the linked
objects. You can export stylized feature layers using Display Manager. For
more information, see Saving or Exporting a Display Manager Layer (page
1469).
■Settings saved with the MAPEXPORT command from version 4.0 or earlier
of AutoCAD Map 3D cannot be loaded in this dialog box.
Export to LandXML dialog box
The Export to LandXML dialog box specifies settings for exporting a Survey
Data Store Project to LandXML. To select a specific element within the project,
check the appropriate checkbooks for that element.
To export survey points to a LandXML file (page 1471)
On the Survey tab of the Task Pane, click Data ➤ Export LandXML.
NOTE Export affects drawing objects only. To convert geospatial data to a different
format, see Migrating GIS Data (Bulk Copy) (page 617).
File
Displays the file name and LandXML version. Click in a field to edit the
file information. Constrained fields will displayed valid options in a
drop-down list.
Project
Displays information about the Project, such as Name, File Name, LandXML
version, and so on. Click in a field to edit the Project information.
Constrained fields will displayed valid options in a drop-down list.
Export to LandXML dialog box | 1709
Units
Displays information about a Project’s units of measure. Click in a field to
edit the measurement unit information. Constrained fields will displayed
valid options in a drop-down list.
Coordinate System Assignment
Enter the coordinate system code for your new Survey Data Store. Click
to select the coordinate system from a list.
Object Class Attribute Mapping dialog box
Use this dialog box to specify how to map attribute data from the incoming
file to object classes in the AutoCAD Map 3D drawing.
To assign an object class to an input layer (page 421)
Click Home tab ➤ Data panel ➤ Import From Files.
NOTE Data you import becomes AutoCAD drawing objects in your map. To
connect to the data in its original format, see Overview of Bringing In GIS Features
(page 305). To convert the drawing objects to a geospatial format, see Overview
of Converting and Exporting (page 1405).
Select An Object Class
Click an object class defined in the current drawing.
Input Fields
Click an incoming attribute data field to map to a Target Field in the object
class.
Target Fields
Click the attribute in the selected object class that the selected Input Field
wll map to. Map as many Target Fields as possible.
Once you map a target field, it no longer appears in the Target Fields list.
This ensures that each target field is mapped to only one incoming data
field.
If you don't map a target field, the default object class value will be used.
The syntax for the Target Field is
1710 | Chapter 25 Import Export Dialog Boxes
CATEGORY:TABLE.FIELD
Where
Type of data, for example "OD" for object data, or "LT"
for link template (linked external database).
CATEGORY
Object data table name or database table name.TABLE
Data field name.FIELD
Import dialog box
Use this dialog box to specify options and settings for imported files.
To import data from other formats (page 381)
To specify an area to import (page 418)
To specify an AutoCAD layer during import (page 419)
To assign an object class to an input layer (page 421)
To assign a coordinate system to the current drawing (page 147)
To specify the data to import (page 426)
To specify how to import points (page 428)
Click Home tab ➤ Data panel ➤ Import From Files.
NOTE Data you import becomes AutoCAD drawing objects in your map. To
connect to the data in its original format, see Overview of Bringing In GIS Features
(page 305). To convert the drawing objects to a geospatial format, see Overview
of Converting and Exporting (page 1405).
In the table, you can specify properties for each input layer (sometimes called
a schema, level, or file).
To import an input layer, select its check box. To change other settings for an
input layer, click in the field to change. Click the down arrow to choose from
a list of choices, or click for additional choices.
To sort on a specific column, right-click the column heading. Click Sort
Ascending or Sort Descending.
To copy the contents of a field, right-click in the field. Click Copy. Right-click
in the target field. Click one of the Paste options. To copy the contents of a
Import dialog box | 1711
field to all other layers, right-click in the field. Click one of the Paste To All
Layers options. When pasting into Object Class fields, the object class name
and data mappings are pasted separately, and if data mapping conflicts are
detected, the pasted data mappings options will not be available.
Current Drawing Coordinate System
Displays the global coordinate system for the current drawing. To change
this coordinate system, or to assign a coordinate system, click .
Driver Options
If Driver Options is available, click it to specify additional options. Some
formats do not have driver options. For more information about the options
for a format, see Supported Import Formats (page 387).
NOTE If you import from DGN Version 8, there may be more than one model
in the drawing. If so, you will see input layers reflecting each one. Each model
corresponds roughly to a model space in AutoCAD Map 3D (for example, Layout
1 or Layout 2). The input layers are named using the syntax
ModelName_LevelNumber, ModelName_LevelName, or
ModelName_GeometryType, depending on the settings you choose in Driver
Options.
Set driver options before you modify the table. Changing driver options
may reset settings in the table.
Spatial Filter
Specify the area to import data into.
None
Place no area limit on the incoming file and import the entire incoming
file.
Current Display
Limit the import to the area shown in the current drawing window.
Define Window
Limit the import to a rectangular area you define in the drawing. Click
. Drag your cursor from right to left to define the area. Objects that cross
or are enclosed by the rectangular window are imported.
Notes:
■AutoCAD Map 3D does not display a preview of the incoming data.
1712 | Chapter 25 Import Export Dialog Boxes
■If the coordinate system assigned to the current drawing differs from
the coordinate system specified in the Input Coordinate System column,
AutoCAD Map 3D will perform a reverse transformation to determine
the correct coordinate space (area) for the incoming data.
Import Properties Table
Input Layer
Select the check box for an input layer name to import objects from that
layer. All layers for the selected file or folder are listed.
Drawing Layer
Specify the target layer in the current drawing for the incoming objects.
Click the down arrow to select an existing layer. Click to select an existing
layer, create a new one, or use a layer stored in a data field.
Object Class
Specify the name of the object class to use for the incoming data. For
example, objects on an incoming Shapefile input layer can be classified and
included in the "LAND USE" object class in Map.
Click the down-arrow to select from a valid object class. Click to map
the incoming data attributes to the object class definition. If you don't map
the attributes, AutoCAD Map 3D populates the object class with the default
object class values.
NOTE This column is available only if you have object classes defined in your
map. For more information about setting up object classes, see Setting Up
Object Classification (page 116).
Input Coordinate System
Click to specify the coordinate system of the incoming layer. Objects
will be converted from the input coordinate system to the coordinate system
assigned to the current drawing.
NOTE This column is available only if the current drawing has an assigned
coordinate system. To assign a coordinate system to the current drawing, click
under Current Drawing Coordinate System.
Import dialog box | 1713
Data
Click to specify a name for the object data table or link template to
use for incoming data. Select the incoming fields to include in the object
data table.
Data is imported only if it is associated with an imported object. If no
imported objects are associated with the incoming data, the table is not
created.
Points
Select ACAD_POINT or a block name from the list to use for point objects.
To create text or get block names from incoming data, click and select
the data field.
Saved Profiles
To save your settings as a profile, click Save. To use settings that you've
previously saved, click Load. You can use your saved setting to help automate
scripts.
NOTE Settings saved with the MAPIMPORT command in version 4.0 or earlier
of AutoCAD Map 3D cannot be loaded in this dialog box.
Import Polygons As Closed Polylines
If this option is not selected, polygons are imported as polygon objects.
Importing polygons as closed polylines is useful if you plan to use the
polygons in a polygon topology. To change the default state of this option,
use the MAPUSEMPOLYGON command.
Use Class Defaults For Out Of Range Values
Use object class default values for incoming data values that are not within
the specified object class range. This ensures that the incoming data will be
accurately classified, but may require AutoCAD Map 3D to modify some of
the incoming data values.
1714 | Chapter 25 Import Export Dialog Boxes

Import Data Options dialog box (MAPIMPORT4)
This dialog box was used to specify how objects and data in the import file
are imported into AutoCAD Map 3D. It has been discontinued. Instead, use
one of the following procedures or commands.
To import data from other formats (page 381)
To import from Arc/INFO (page 396)
To import from MapInfo MIF/MID (page 401)
To import SHP data (page 399)
Click Home tab ➤ Data panel ➤ Import From Files.
Proceed
Convert the selected file.
OK
Close the dialog box but keep the current import options.
Import Graphics Area
Perform Coordinate Conversion
Convert the file from one coordinate system to another. Click Define to
display the Coordinate System Translation dialog box.
Map Data Element To Layers
Use the attribute data in the import file to determine the target layer for
the AutoCAD Map 3D objects that are created.
Click Layers to display the Map Data Elements to Layers dialog box, where
you can map the values for a selected data element to specific layers in the
output file.
Map Data Element To Block Name
Use the attribute data in the import file to determine the target block name
for point and polygon centroid objects that are created.
Click Blocks to display the Map Data Elements to Block Name dialog box,
where you can map the values for a selected data element to specific block
names in the output file.
Import Data Options dialog box (MAPIMPORT4) | 1715
Import Data Elements Area
Ignore Data Elements
Ignore attribute data in the import file (other than data that is used in layer
and block name mapping).
Select this option if you do not want to convert the attribute data to object
data or create links to SQL tables. Only the graphical objects in the file will
be converted.
Map Data Elements To Object Data
Convert the attribute data in the import file to object data.
Click Data to display the Object Data Table dialog box, where you can select
the name of an existing object data table or create a new one.
Map Data Elements To SQL Table
Use the attribute data in the import file to create links to existing SQL tables
or to create new tables.
Click SQL to display the Map Data Elements to SQL dialog box, where you
can map specific data elements to specific columns in an external database.
Options Area
Load
Use import settings that you previously saved.
Save
Save the current settings so you can use them again.
Import ASCII Points dialog box
The Import ASCII Points dialog box allows you to specify settings for bringing
in ASCII survey point data.
To bring ASCII point data into a Survey Data Store (page 373)
Right-click any node in the Survey Tree on the Survey tab of the Task Pane, then
click Import ASCII Points.
File Location
Click to select an ASCII file to import.
1716 | Chapter 25 Import Export Dialog Boxes

Select Formatting
Select the format of the source data using the Format drop-down list. Formats
describe the layout of the data in your source files using the following
convention:
■P is point ID
■E is Easting, or longitudinal values
■N is Northing or latitudinal values
■Z is elevation values
■D is description
Make sure that you select the correct format plus delimiter type (comma or
space) for your data source.
The Autodesk Uploadable File format is as follows: User-Defined (point ID,
description, or any other type of data), X, Y, Z. It is a comma-separated
format, and uses the # character for comment text.
Z-Unit
Select the unit of measure for elevation (US Feet, International Feet, Meters,
or Chains)
Preview
The Preview window shows you a sample of the ASCII data. You can use
the Preview to verify that you have selected the desired file.
Coordinate System Assignment
Enter the coordinate system code for your new Survey Data Store. Click
to select the coordinate system from a list.
LandXML Coordinate System dialog box
The LandXML Coordinate System dialog box allows you to view and assign
a coordinate system to LandXML data you are importing.
To bring LandXML data into a Survey Data Store (page 371)
LandXML Coordinate System dialog box | 1717
On the Survey tab of the Task Pane, click Data ➤ Import LandXML.
NOTE Data you import becomes AutoCAD drawing objects in your map. To
connect to the data in its original format, see Overview of Bringing In GIS Features
(page 305). To convert the drawing objects to a geospatial format, see Overview
of Converting and Exporting (page 1405).
LandXML Reports for Coordinate System
Displays any coordinate system information associated with the LandXML
file you are importing.
LandXML Coordinate System Assignment
Enter the coordinate system code for your new Survey Data Store. Click
to select the coordinate system from a list.
Layer Mapping dialog box (MAPIMPORT4)
This dialog box was used to specify all values in the import file for the specified
Control Data Element and the layer they are mapped to. It has been
discontinued. Instead, use one of the following procedures or commands.
To import data from other formats (page 381)
To import from Arc/INFO (page 396)
To import from MapInfo MIF/MID (page 401)
To import SHP data (page 399)
Click Home tab ➤ Data panel ➤ Import From Files.
1718 | Chapter 25 Import Export Dialog Boxes
Layer Mapping dialog box (Import)
Use this dialog box to specify a target layer in the current drawing for the
selected layer in the incoming file. This is sometimes called a schema, level,
or file.
To specify an AutoCAD layer during import (page 419)
Click Home tab ➤ Data panel ➤ Import From Files.
NOTE Data you import becomes AutoCAD drawing objects in your map. To
connect to the data in its original format, see Overview of Bringing In GIS Features
(page 305). To convert the drawing objects to a geospatial format, see Overview
of Converting and Exporting (page 1405).
Create on Existing Layer
Put incoming objects on an existing layer in the drawing. Click the down
arrow to select the layer.
If you assigned the incoming layer to an object class with a layer property,
the default is the layer specified in the object class.
Create on New Layer
Put incoming objects on a new layer. Enter a name for the new layer.
Use Data Field For Layer Name
Put incoming objects on a layer based on data attached to the objects. Click
the down arrow and select the field to use for layer names. For each object,
AutoCAD Map 3D will read the value in the specified field and put the
object on a layer with the same name. If the layer does not exist, it will be
created. If an object does not have a value in the specified field, it will go
on Layer 0.
AutoCAD Map 3D uses only the first 255 characters of the value in the field.
If the incoming file has longer field values, change the values before you
import the file.
NOTE If a conflict between the layer specified by the Drawing Layer setting
and an Object Class with a layer property is found, AutoCAD Map 3D uses the
Drawing Layer setting, except when Drawing Layer is set to <None>. In that
case, the Object Class setting is used. When Use Class Defaults is checked,
AutoCAD Map 3D forces the data to the correct Drawing Layer.
Layer Mapping dialog box (Import) | 1719
Link Template to Export dialog box
This dialog box was used to select the link template to use in the export
operation. It has been discontinued. Instead, use one of the following
procedures or commands.
To export drawing objects to MicroStation Design (DGN) (page 1438)
To export to MapInfo MIF/MID (page 1432)
To export drawing objects to SHP (page 1428)
To export drawing objects to ESRI Arc/INFO (page 1421)
In the Tool-based Ribbon Workspace, click Output tab ➤ Map Data Transfer
panel ➤ Map 3D Export.
If you select the Map SQL Data To Data Element option, the data from the
referenced table will be exported.
If you select the Map Database Link To Data Element option, the key column
value that links the object to the table will be exported.
Map Data Elements to Block Name dialog box (MAPIMPORT4)
This dialog box was used to specify which data element to use for determining
the block for points or polygon centroids. It has been discontinued. Instead,
use one of the following procedures or commands.
To import data from other formats (page 381)
To import from Arc/INFO (page 396)
To import from MapInfo MIF/MID (page 401)
To import SHP data (page 399)
Click Home tab ➤ Data panel ➤ Import From Files.
When the file is converted, the value of the selected data element for each
object determines the block to use.
To map a value to a block name, select the value in the Values Available list
and select a block from the Target Block Name list. Click >>.
1720 | Chapter 25 Import Export Dialog Boxes
Control Data Element area
Select the data element to use to determine the target block.
Values Available list
Displays all the values in the import file for the selected data element.
Target Block Name area
Select a block name. To load a block, click Load.
>>
Move the selected values from the Values Available list to the Values
Assigned list for the selected block name.
<<
Remove the selected values from the selected block name and return them
to the Values Available list.
Values Assigned list
Displays the values assigned to the current block name.
Auto Block
Assign each value to a block name of the same name.
List
Display the Block Mapping dialog box, which lists the block name
assignment for each value in the selected data element.
Map Data Elements to Layers dialog box (MAPIMPORT4)
This dialog box was used to specify the data element to use when determining
the target layer for objects. It has been discontinued. Instead, use one of the
following procedures or commands.
To import data from other formats (page 381)
To import from Arc/INFO (page 396)
To import from MapInfo MIF/MID (page 401)
To import SHP data (page 399)
Click Home tab ➤ Data panel ➤ Import From Files.
When the file is converted, the value of the selected data element for each
object will determine its layer.
Map Data Elements to Layers dialog box (MAPIMPORT4) | 1721

To map a value to a layer, select the value in the Values Available list and
select a layer from the Target Layer list. Click >>.
Control Data Element area
Select the data element to use to determine the target layer.
Values Available list
Displays all the values in the import file for the selected data element.
Target Layer area
Select a layer. To create a new layer, click New.
>>
Move the selected values from the Values Available list to the Values
Assigned list for the selected layer.
<<
Remove the selected values from the selected layer and return them to the
Values Available list.
Values Assigned list
Displays the values assigned to the current layer.
Auto Layer
Assign each value to a layer of the same name. If a layer does not exist, one
will be created.
List
Display the Layer Mapping dialog box, which lists the layer assignment for
each value in the selected data element.
Map Data Elements to SQL dialog box (MAPIMPORT4)
This dialog box was used to map data elements in the import file to specific
columns in external database tables. It has been discontinued. Instead, use
one of the following procedures or commands.
To import data from other formats (page 381)
To import from Arc/INFO (page 396)
To import from MapInfo MIF/MID (page 401)
To import SHP data (page 399)
1722 | Chapter 25 Import Export Dialog Boxes
Click Home tab ➤ Data panel ➤ Import From Files.
Database Link Method area
Specify whether to link objects to an existing database table or to create a
new database table and link objects to the new table.
When the file is imported, each object in the import file is linked to the
record in the external database table with the matching key column value.
Or a new table is created using the values from the data elements, and links
are created to the new table.
To link a data element to a key value, select the data element in the Import
Data Elements list and select the key value in the Link Template list. Click
>>.
Import Data Elements area
Displays all data elements in the import file.
Link Template area
Select a link template from the list.
To create a new link template, click Define to display the Define Link
Template dialog box.
>>
Link the selected import data element to the selected key in the link
template.
<<
Remove the selected link from the Link Template list and return the data
element to the Import Data Elements list.
Map Export dialog box
This dialog box was used to export data from AutoCAD Map 3D to an external
file format. It has been discontinued. Instead, use one of the following
procedures or commands.
To export drawing objects to MicroStation Design (DGN) (page 1438)
To export to MapInfo MIF/MID (page 1432)
To export drawing objects to SHP (page 1428)
To export drawing objects to ESRI Arc/INFO (page 1421)
Map Export dialog box | 1723
In the Tool-based Ribbon Workspace, click Output tab ➤ Map Data Transfer
panel ➤ Map 3D Export.
Proceed
When you have set options, click Proceed to display the Map Export Options
dialog box, where you can specify how to export graphics and data.
OK
Click OK to close the dialog box but keep the current import options.
Export File area
Format
Select the format to export to.
Name
Enter a name and location for the new file or directory.
If you are not sure of the location, click Browse to view existing files and
directories. If you are creating a coverage, the parent directory for the new
directory must be a "workspace" directory, containing only other coverage
directories, and the new directory must be empty of all files. The default
coverage format is UNIX ArcInfo. If the workspace directory contains an
existing PC ArcInfo coverage, the new coverage will be in PC ArcInfo format.
File Type area
Select the file type for the information you are exporting. This option is
not necessary for all file formats.
Object Selection area
Select Automatically
Use all objects on the specified layers and of the specified file type.
Select Manually
Select individual objects. Click Select to select objects.
Objects will be filtered for the specified layers and file type.
Filter Selected Objects
If this option is selected, only objects that are on the specified layers or
blocks are selected. The filters are used for both automatic and manual
selection of objects.
If this option is not selected, the filters are ignored.
1724 | Chapter 25 Import Export Dialog Boxes
Filter On Layers
Specify the layers to search. The default is all layers. To select from a list of
layers in the current drawing, click Layers.
Map Export Options dialog box
This dialog box was used to specify how objects and data in the current drawing
are exported. It has been discontinued. Instead, use one of the following
procedures or commands.
To export drawing objects to MicroStation Design (DGN) (page 1438)
To export to MapInfo MIF/MID (page 1432)
To export drawing objects to SHP (page 1428)
To export drawing objects to ESRI Arc/INFO (page 1421)
In the Tool-based Ribbon Workspace, click Output tab ➤ Map Data Transfer
panel ➤ Map 3D Export.
Proceed
Click Proceed to export to the selected file format.
OK
Click OK to close the dialog box but keep the current export options.
Export Geometry area
Select Perform Coordinate Conversion to convert the objects from one
coordinate system to another. Click Define to display the Coordinate System
Translation dialog box.
Export Object Properties area
Map Layer Name To Data Element
Transfer the layer name for each object to the specified data element name
in the export file.
Map Block Name To Data Element
Transfer the block name for each object to the specified data element name
in the export file.
Map Linetype To Data Element
Transfer the linetype name for each object to the specified data element in
the export file.
Map Export Options dialog box | 1725

Export Data Elements area
No Data Mapping
Export only graphical objects. No data is exported.
Map Object Data To Data Element
Export object data for each object.
Click Data to display the Object Data Table dialog box where you can select
the object data table to export.
Map SQL Data To Data Element
Export data from an external database that is linked to the objects.
Click SQL to display the Link Template To Export dialog box, where you
can select the link template that defines the external table.
Map Database Link To Data Element
Export information about the database link. This option exports the key
column value that links the object to the table.
Click Link to display the Link Template To Export dialog box, where you
can select the link template that defines the external table.
Options area
Load
Use export settings that you previously saved.
Save
Save your current export settings so you can use them again.
New Property Data Type dialog box
Use this dialog box to specify a property type for a new property when you
export data to a geospatial format.
For example, if you export the .COLOR property to a new feature class in the
target data store, you can specify the data type for that feature class as STRING.
Once the property type has been selected, it cannot be edited. To change the
property type, you must create a new property.
To export drawing objects to other file formats (page 1408)
1726 | Chapter 25 Import Export Dialog Boxes
In the Tool-based Ribbon Workspace, click Output tab ➤ Map Data Transfer
panel ➤ Map 3D Export.
NOTE Export affects drawing objects only. To convert geospatial data to a different
format, see Migrating GIS Data (Bulk Copy) (page 617).
New Property Data Type is available for only three AutoCAD properties:
.COLOR, LINETYPE, and LINEWEIGHT.
Data Type
Select the data type for the new class property from the drop-down list.
Feature Class Property Mapping dialog box
Use this dialog box to map data to existing feature classes in the target data
store when you export to a geospatial format.
To export drawing objects to other file formats (page 1408)
In the Tool-based Ribbon Workspace, click Output tab ➤ Map Data Transfer
panel ➤ Map 3D Export.
NOTE Export affects drawing objects only. To convert geospatial data to a different
format, see Migrating GIS Data (Bulk Copy) (page 617).
Drawing Attributes
Select the drawing attributes to map to FDO feature classes. This field is not
editable.
For .COLOR, LINETYPE, and LINEWEIGHT attributes, click to display
the Property Value Mapping dialog box.
Feature Class Properties
Enter or select the feature class property to which to map your drawing
attributes. If you are exporting to an existing FDO feature class, you can
select feature class properties from a drop-down list. Existing properties are
displayed in bold blue text.
Feature Class Property Mapping dialog box | 1727
Select Attributes
Select attributes to map to this feature class only.
Entries in this dialog box include both the global attributes selected from
the Export dialog box and the attributes that apply to this feature class only.
Property Value Mapping
Use this dialog box to map specific drawing attribute properties to specific
feature class properties when you export to a geospatial format. for example,
you could map the color RED to the string CLAY.
To export drawing objects to other file formats (page 1408)
In the Tool-based Ribbon Workspace, click Output tab ➤ Map Data Transfer
panel ➤ Map 3D Export.
NOTE Export affects drawing objects only. To convert geospatial data to a different
format, see Migrating GIS Data (Bulk Copy) (page 617).
Property value mapping is available for three AutoCAD properties only:
.COLOR, LINETYPE, and LINEWEIGHT.
... Value
The AutoCAD drawing attribute property value (left column) displays as
COLOR Value, LINETYPE Value, or LINEWEIGHT Value, as appropriate.
Select the check box next to each property value to map.
... Value
The target feature class property value (right column) displays the feature
class property name you entered in the Feature Class Property Mapping
dialog box.
1728 | Chapter 25 Import Export Dialog Boxes
Select Attributes dialog box
Use this dialog box to select attributes for Map Export.
To export drawing objects to other file formats (page 1408)
In the Tool-based Ribbon Workspace, click Output tab ➤ Map Data Transfer
panel ➤ Map 3D Export.
NOTE Export affects drawing objects only. To convert geospatial data to a different
format, see Migrating GIS Data (Bulk Copy) (page 617).
Expression
Check the attributes you wish to export in the tree view.
Map Import dialog box
This dialog box was used to translate an external map file into AutoCAD Map
3D format. It has been discontinued. Instead, use one of the following
procedures or commands.
To import data from other formats (page 381)
To import from Arc/INFO (page 396)
To import from MapInfo MIF/MID (page 401)
To import SHP data (page 399)
Click Home tab ➤ Data panel ➤ Import From Files.
You can import coverages in both UNIX ArcInfo and PC ArcInfo format. If
you are importing a coverage, you must have the coverage subdirectory and
the associated INFO subdirectory before using the MAPIMPORT4 command.
To set a text size for coverages, set the TEXTSIZE variable before using the
MAPIMPORT4 command.
Select Attributes dialog box | 1729
NOTE If a SHP file is located on a read-only drive or directory, you cannot import
the file if the name contains any of the following characters: pound sign (#),
exclamation point (!), comma (,), or accent grave (`). To import the file, either
rename the file or move it to a directory to which you have write access.
When you have set options, click Proceed to display the Import Data Options
dialog box, where you can specify how to import graphics and data.
Click OK to close the dialog box but keep the current import options.
Format
Select the format of the file to import.
Name
Enter the name of the existing file or coverage.
If you are not sure of the name or location, click Browse to view existing
file names and directories.
New Layer dialog box
This dialog box was used to specify a name for a new imported layer. It has
been discontinued. Instead, use one of the following procedures or commands.
To import data from other formats (page 381)
To import from Arc/INFO (page 396)
To import from MapInfo MIF/MID (page 401)
To import SHP data (page 399)
Click Home tab ➤ Data panel ➤ Import From Files.
New layers are created with color number 7 and the CONTINUOUS linetype.
Object Data Table dialog box (Export)
This dialog box was used to select the object data table to export. It has been
discontinued. Instead, use one of the following procedures or commands.
To export drawing objects to MicroStation Design (DGN) (page 1438)
To export to MapInfo MIF/MID (page 1432)
To export drawing objects to SHP (page 1428)
To export drawing objects to ESRI Arc/INFO (page 1421)
1730 | Chapter 25 Import Export Dialog Boxes
In the Tool-based Ribbon Workspace, click Output tab ➤ Map Data Transfer
panel ➤ Map 3D Export.
Click the down arrow to select from a list of object data tables in the current
drawing.
You can select only one object data table. To export data from multiple tables,
repeat the export command for each table.
Object Data Table dialog box (Import)
This dialog box was used to select the object data table to import data into.
It has been discontinued. Instead, use one of the following procedures or
commands.
To import data from other formats (page 381)
To import from Arc/INFO (page 396)
To import from MapInfo MIF/MID (page 401)
To import SHP data (page 399)
Click Home tab ➤ Data panel ➤ Import From Files.
To create a table, exit the import operation and use the ADEDEFDATA
command.
During the import operation, data elements in the import file are transferred
to a matching field name.
Table box
Displays the target object data table name. If you enter a value in this box
that does not reference an existing object data table, AutoCAD Map 3D
creates a new table that includes all data elements in the import file.
Tables
Display a list of all defined object data tables in the current drawing.
Selecting an existing table populates only fields whose names exactly match
the name of a data element.
Object Data Table dialog box (Import) | 1731

Object Data/External Database Mapping dialog box
Use these dialog boxes to specify which fields from the incoming file should
be mapped to fields in an object data table or external database when you
import.
To specify the data to import (page 426)
Click Home tab ➤ Data panel ➤ Import From Files.
NOTE Data you import becomes AutoCAD drawing objects in your map. To
connect to the data in its original format, see Overview of Bringing In GIS Features
(page 305). To convert the drawing objects to a geospatial format, see Overview
of Converting and Exporting (page 1405).
Input Fields
Select the fields to import from the incoming file.
Target Fields
Specify the fields in the object data table or external database to import the
input fields to.
■If you are importing to an external database:
To select a Target Field, click in its box. Click the down arrow to select
from a list of existing fields.
If you selected Create Link Only in the Attribute Data dialog box, or if
you select only the key field in this dialog box, AutoCAD Map 3D will
import the key field as link data and will not modify the external
database.
■If you are importing to an object data table:
To import into an existing field in the table, click in its box. Click the
down arrow to select from a list of existing fields.
To import into a new field, type the name of the new field in the box.
To change a target field, click in the box and select or type a field name.
1732 | Chapter 25 Import Export Dialog Boxes
Point Mapping dialog box
Use this dialog box to specify how to import points for the selected layer. This
is sometimes called a schema, level, or file.
To specify how to import points (page 428)
Click Home tab ➤ Data panel ➤ Import From Files.
NOTE Data you import becomes AutoCAD drawing objects in your map. To
connect to the data in its original format, see Overview of Bringing In GIS Features
(page 305). To convert the drawing objects to a geospatial format, see Overview
of Converting and Exporting (page 1405).
Create As Points
Convert points using ACAD_POINT.
Create As Text From Data
Convert points as text. Select the data field in the incoming file that contains
the value to use for the text. If an object does not have a value in the selected
data field, the point will be imported using ACAD_POINT.
Text will use the text style for the current drawing. To change the text style
for the current drawing, click Text Style.
Create As Blocks
Convert points as blocks. Select the block to use.
Get Block Name From Data
Convert points as blocks and uses a block name stored in attribute data.
Select the data field in the incoming file that contains the value to use for
the block name. If the block does not exist, the point will be imported using
ACAD_POINT.
Get Attribute Values From Fields
Import attribute values attached to the incoming points. If an attribute
name on the block that is being created matches a field name on the
incoming point, the data for that attribute will be imported with the point.
This option is available only if you select either Create As Blocks or Get
Block Name From Data.
Point Mapping dialog box | 1733
Design File Input Settings
Use this dialog box to set options when you import data from Microstation
Design. Options differ for importing DGN7 or DGN 8, and the order of the
items in the dialog may also change by version.
To import DGN files (page 409)
Click Home tab ➤ Data panel ➤ Import From Files.
NOTE Data you import becomes AutoCAD drawing objects in your map. To
convert the drawing objects to a geospatial format, see Overview of Converting
and Exporting (page 1405).
Group Elements By
Level
Group incoming objects by their DGN level. Only levels that contain
elements are imported.
Level Names
Group incoming objects by their DGN level name. Only levels that contain
elements are imported. This option is available for DGN 8 only.
Geometry
Group incoming objects by entity type.
Linkage Extraction
Extract MSLinks and FRAMME attribute linkage values from the DGN 7 file.
MSLink
Import up to three links per object for DGN 7. For each link, two fields are
added to the object data table: mslinks_n, which specifies the key value,
and entity_num_n, which specifies the table.
FRAMME
Add the following fields to the object data table: comp_count, comp_num,
dgnfile, feat_num, state_num, and ufid.
1734 | Chapter 25 Import Export Dialog Boxes
Coordinate Units
Master/Sub
Select Master or Sub to specify which of these units in the DGN 7 file
matches the default unit in the AutoCAD Map 3D map.
Each DGN 7 file defines a UOR (unit of resolution); in addition, it can define
Sub units and Master units. For example, if the default unit in your AutoCAD
Map 3D map is meters, and meters are the Sub unit in the imported file,
select Sub. If you select Sub or Master, the UORs in the DGN 7 file are
converted to Sub or Master units according to the conversion factor in the
DGN file header.
When you import the file, one Master or Sub unit (whichever you choose)
will become one drawing unit in your AutoCAD Map 3D map.
Unit Ratio
View the ratio between the Master and Sub units. For example, if the ratio
is 1:12 (as it would be for Feet/Inches), imported object coordinates will be
scaled 12 times bigger if you select Sub.
Element Expansion
Explode Multi Text
Explode multi-text objects into their component parts.
Create Text From Tags
Convert the contents of tags to text.
Explode Complex Chains
Return each component of a complex chain as its own feature (no feature
is returned for the complex chain as a whole). Otherwise, all elements of
the complex chain merge into a single linear feature, any arcs in the complex
chain become linestrings, and any linkages on the component elements
themselves are lost.
Cell Expansion
Create blocks From Cells
Expand cells into blocks, maintaining the cell grouping structure. This is
the default.
Explode Cells
Expand the contents of the DGN cells into their component parts. The
expansion is a single level deep. It does not expand all sublevels.
Design File Input Settings | 1735

Create As Points
Expand the contents of the DGN cells into points instead of blocks,
maintaining the cell grouping structure.
Reference Files
Ignore
Ignore all external reference files (xrefs) attached to the source data set.
Create DWG
Read all external reference files (xrefs) attached to the source data set. If the
reference file has nested references, they are also imported, but circular
references are not.
If you select this option, specify a location for the folder for these files. If
the folder already exists, you can replace it (overwrite its contents) or cancel
and specify a different location. The default folder location is the same as
the selected DGN file location.
Design File Output Settings
Use this dialog box to set options when you export data to Microstation Design
(DGN7).
To export drawing objects to MicroStation Design (DGN) (page 1438)
In the Tool-based Ribbon Workspace, click Output tab ➤ Map Data Transfer
panel ➤ Map 3D Export.
NOTE Export affects drawing objects only. To convert geospatial data to a different
format, see Migrating GIS Data (Bulk Copy) (page 617).
Coordinate Units
Master/Sub Select the coordinate units of the features: Master or Sub.
Select the unit that matches the default unit in your AutoCAD Map 3D
drawing. For example, if the default unit in your AutoCAD Map 3D drawing
is meters, and you are using a seed file that defines meters as the Master unit,
then select Master (the default).
1736 | Chapter 25 Import Export Dialog Boxes
Seed File
Select the seed file, which controls whether or not the output DGN file is
two-dimensional or three-dimensional, sets the coordinate units, sets global
origin, and more. For DGN version 7, you must use a version 7 DGN seed
file.
Override Global Origin (DGN 7 only)
Override the global origin setting in the seed file. Specify the global origin
to use.
Compute Parameters (DGN 7 only)
Override all seed file settings and have AutoCAD Map 3D calculate the
settings for you. AutoCAD Map 3D determines the largest dimension for
the set of exported objects and sets the appropriate range and precision. It
sets the UOR per Sub to 10, and sets the Global Origin to the center of the
bounding rectangle of the exported objects.
Design File Output Settings | 1737
1738

Managing Data Dialog
Boxes
Schema Editor
Use the Schema Editor to view or change settings for an entire schema hierarchy:
schemas, feature classes, and properties.
To create a schema (page 598)
To edit a schema (page 612)
In Map Explorer, select the feature source (page 2063) in the connection tree
(at the top of the pane) and click Schema ➤ Edit Schema.
NOTE This functionality is for geospatial feature data only. To structure data linked
to drawing objects, see Overview of Object Classification (page 981) and Overview
of Entering and Editing Object Data (page 1061).
You cannot control every aspect of a schema from the Schema Editor. For
example, you cannot create object or association properties, or specify that the
system auto-generate a value for a property. However, if you have set up these
attributes for a schema, the Schema Editor will display the current settings.
The settings you see depend on what the provider supports. For example, Long
Transactions will not appear if the provider doesn’t support versioning.
26
1739

Import Schema
Import an XML schema that you exported, and use it to define a new schema
for another data store. This is useful for creating multiple data stores based
on the same schema
Export Schema
Export the selected schema as an XML file to share a schema you created
in the Schema Editor with other AutoCAD Map 3D or GIS-software users;
to back up a schema you created in the Schema Editor as an XML file; or
to save your work in progress if the original data source or directory becomes
unavailable.
New Schema
Define a new schema in a new or existing feature source for a database FDO
provider (Microsoft SQL Server, MySQL, or Oracle) or for an SDF data store.
You cannot create a schema for an existing SHP feature source, but you can
create a new file-based data store and create a new schema for it during the
creation process. You must use ESRI tools to create an ArcSDE schema—you
cannot use AutoCAD Map 3D to create a schema for ArcSDE.
New Feature Class
Select a schema entry on the right and click New Feature Class, and specify
the information for the new feature class on the left side of the window.
New Property
Select the feature class entry for the property on the right and click New
Property. Specify the information for the property on the left side of the
window.
Schema Settings
Enter A Schema Name
Enter the name that will appear in the Schema tree. It must follow the
naming rules of the provider.
NOTE You cannot change the schema name for a SQLite data store. The schema
name must be “Default.” Also, for SQLite schemas, you cannot add comments
in the Schema or Feature Class Description fields.
Description
Enter an optional description of the schema.
1740 | Chapter 26 Managing Data Dialog Boxes
Feature Class Settings
Name
Enter the feature class name that will appear in the Schema tree. It must
follow the naming rules of the provider.
Description
Enter an optional description of the feature class.
Type
Select Feature Class for a class with associated geometry. Select Non-feature
Class for non-spatial data that can be used as a standalone or contained
class.
For most providers, a feature class requires a unique identifier to distinguish
it from other features (unless the feature class has a base class from which
it inherits an identifier).
A non-feature class has no association with another class and requires a
unique identifier. As a contained class, it defines a property of another
non-feature or feature class. For example, Sidewalk could be a property of
a Road feature class; the Sidewalk class defines the Road.Sidewalk property.
In this case, the Sidewalk class does not need an identity property, although
it could have one.
Base Feature Class
If this feature class inherits from another feature class, select that superclass;
otherwise select None. This setting applies only to feature classes (not
non-feature classes) and is available only if the provider supports inheritance.
Abstract
Click Yes if this feature class is an abstract class. You can’t create features
for an abstract class, but you can use it as a base class. This setting applies
only to features classes (not non-feature classes) and is available only if the
provider supports inheritance.
Specify Identifier Propert(ies) And The Order
Select the properties that comprise the unique identifier (for non-null
primary-key values) for this feature class. Select one property for a simple
identifier or multiple properties for a compound identifier. (Some providers
support only simple identifiers). Create these properties before you create
any others. Use the arrow buttons to reorder the properties.
You must specify a value for any non-null property of a feature before you
check that feature into the data store. If you do not, you will not be able
to check the feature in.
Ordinarily, identifier properties use an auto-generated integer. This means
that when you add new features to this feature class, they automatically
Schema Editor | 1741
receive an auto-generated, unique identifier. If you do not specify an
auto-generated integer for this property, you must manually enter a unique
identifier for each new feature that uses it.
Specify Unique Constraint(s) And The Order
Specify the criteria features must meet in order to be added to this feature
class. Enter a constraint for this feature class in the Constraints box and
click New to apply it. Create additional constraints if necessary. Use the
arrow buttons to reorder the constraints. To remove a constraint, select it
and click Delete. This setting is available only if the provider supports
constraints. Constraint syntax is provider-specific.
Locking
Specify whether the user who checks out a feature controls that feature to
the exclusion of other users, until it is checked back in. This setting applies
only to providers that support locking.
Long Transaction
Specify whether to enable long transactions. A long transaction groups
conditional changes to one or many features. Long transactions create
different versions of a feature or set of features. This setting applies only to
providers that support versioning.
Property settings
Name
Enter the name of the property that will appear in the Schema tree. It must
follow the naming rules of the provider.
Each property is a single attribute of a feature class. For example, a Road
feature class may have properties called Name, DateConstructed, and
Location.
Type
Select Data for non-spatial data. Select Geometry for a property that defines
an object’s shape.
A Data property data type is either boolean, byte, date/time, decimal, single,
double, Int16, Int32, Int64, or string. For example, a Road feature can have
a data property called DateConstructed whose data type is date/time.
The default Geometry property specifies one of four shapes: point (0
dimensions), curve/line (1 dimension), surface/polygon (2 dimensions),
and solid (3 dimensions). A feature class has one main geometry property,
but can have additional geometry properties. A geometry property is
associated with a spatial context. All instances of a geometric property must
have the same ordinate dimension. Not all providers support all geometry
types or all dimensionalities; SHP supports only XY points, for example,
1742 | Chapter 26 Managing Data Dialog Boxes

whereas Oracle supports XY, XYZ, XYZM, and XYM points. The default is
XY. Additionally, it can have attributes that describe elevation and measure:
HasElevation for Z and HasMeasure for M.
A feature class has one main geometry property, but can have additional
geometry properties. A geometry property is associated with a spatial context.
All instances of a geometric property must have the same ordinate
dimension. Not all providers support all geometry types or all
dimensionalities; SHP supports only XY points, for example, whereas Oracle
supports XY, XYZ, XYZM, and XYM points. The default is XY. Additionally,
it can have attributes that describe elevation and measure: HasElevation for
Z and HasMeasure for M.
The association property may appear in the list, but it is not supported by
AutoCAD Map 3D. Choose this property type only if existing data uses it
and you want to maintain that data after it is moved to a different data
store.
Description
Enter an optional description of the property.
System Generated
You cannot set this option, which indicates the current setting for this
property in an existing schema. Yes indicates that the system will
auto-generate values for this property. Generally, identifier properties whose
values identify each feature uniquely are auto-generated.
Data Attributes
Click an attribute name in the schema tree to display its description. If you
can change or specify the value for a property, a down-arrow or a blinking
cursor appears in its field and you can select or enter a value.
The list changes dynamically to show the different attributes that are
available for the selected property type.
NOTE The following caveats apply to certain providers:
■You can constrain the default length of a string property in a SQLite
schema. However, AutoCAD Map 3D will not generate an error if the
constraints are violated. Such validation slows down the performance
of the data store. For example, you can constrain a string field to 2
characters and enter 3 characters without producing an error message.
AutoCAD Map 3D maintains the constraint information so that, for
example, bulk copying to another data provider will product the desired
constraint.
■You cannot make SQLite properties read-only.
Schema Editor | 1743
■The Decimal data type actually uses a Double data type. For this reason,
many providers will not check the number of decimal places when the
data is checked in.
Bulk Copy
Use Bulk Copy to copy a Display Manager layer or a feature source. Bulk Copy
uses the current definition of the layer (including any filters you applied, any
joins you created, and any calculated properties). For feature sources, you can
specify a subset based on specified schemas, feature classes, or properties.
To copy data from one feature source to another (page 621)
In Map Explorer, click Tools ➤ Bulk Copy.
NOTE This functionality is for geospatial feature data only. To convert drawing
objects to a geospatial format, see Overview of Converting and Exporting (page
1405).
From
Connection Name
Select a Display Manager layer or connected feature source in the Connection
Name list as feature source from which the data will be copied. Filtered
layers display a filter icon in the list.
If you select a survey data store, you can select only a survey point group
as the source. To copy multiple point groups, copy them one by one.
Version
If the selected feature source supports versioning, select a version from the
list to use for copying.
Select Items To Copy
Select the individual schemas, features classes, and properties to copy to
the destination feature source.
Selecting any schema element automatically selects all its child elements
(selecting a feature class also selects all its properties, for example). A square
1744 | Chapter 26 Managing Data Dialog Boxes
(instead of a check) in a check box means that only some of that element’s
children are selected.
Calculated fields are appended after the native properties. If there are joined
fields, they are grouped under a node representing the join. If there are
multiple joins, they appear as they do in the Manage Layer Data dialog box
(page 1607).
To
Connection Name
Select a feature source in the top list as the destination feature source.
Version
If the destination feature source supports versioning, select a version from
the list as the version to use for copying.
Click On An Item To Select A Different Input Name
Click the arrow for each item whose counterpart you selected in the
left-hand tree to map the source item to its destination item.
Info
The Info area displays information about the selected connection or feature
class.
Connection (or Class)
If you select the schema node, this area is blank.
Source Coordinate System
If there are multiple coordinate systems for the classes under the selected
connection, this field displays “VARIES.”
Filter Info
If the selected item is a filtered layer, this area will display “Filter,” “Spatial
Filter,” “Property Filter,” or “Spatial And Property Filter.”
Target Coordinate System
If there are multiple coordinate systems for the classes under the selected
connection, this field displays “VARIES.”
Ignore The Following Errors During The Copy Process
Select the error types to ignore during processing. If you leave error types
unselected, Bulk Copy stops processing and reports these errors when they
occur.
Bulk Copy | 1745

Insert Errors
Select this option to continue Bulk Copy if there is an error inserting an
object. Objects that fail are skipped. Errors can occur if there are any
anomalies in the object data being copied.
Anomalies can include an unmatched feature ID, a value that is outside the
range allowed for a property, a constraint violation (for example, each item
must be unique and the source is trying to copy over an object that already
exists in the target), or an inappropriate value (for example, a string value
that is too long).
Unmatched Data Or Geometric Type Errors
Select this option to skip association and object properties that the target
data store does not support.
NOTE AutoCAD Map 3D does not support either association or object properties,
but they may be present in existing schemas created outside AutoCAD Map
3D.
Some dimension properties are also skipped. For example, if you copy 3D
data to a 2D target, the z-coordinate is silently removed. Some fields can
be converted, for example, from int32 to int64, from int32 to double, or
from int32 to string. However, if a target does not support a data type (for
example, blob or polygon geometry), the data cannot be converted and the
object is skipped.For information about how fields are converted, see
Understanding How Bulk Copy Converts Data Types (page 623).
When the geometry coordinate system is Lat/Long, SQL Server Spatial
considers the inside of a polygon to be to the left of the outer boundary. If
a polygon with a clockwise boundary is inserted, the polygon actually covers
the rest of the world, excluding what appears to be inside the polygon from
an onscreen perspective. If you check Unmatched Data Or Geometric Type
Errors as an error type to ignore, the geometry and orientation are adjusted
when the target is SQL Server Spatial. If you do not check this option and
you copy a polygon with the wrong orientation to SQL Server Spatial, that
object will fail to copy.
Coordinate System
Select this option to copy the geometry without performing a coordinate
system transformation, for example, if information for the source or target
coordinate systems is missing, but you are sure that the geometry coordinate
systems are the same. If you are not sure of one of the coordinate systems,
this option can produce undesired results.
For example, if you are missing the .PRJ file for the .SHP file you are copying,
but you know that the coordinate system is the same as the target, use this
option.
1746 | Chapter 26 Managing Data Dialog Boxes
Schema Mapping
Load/Save
To save the current settings in an XML mapping file, click Save. Click Load
to open a saved mapping file.
NOTE Before loading a mapping file, connect to the source and destination
feature sources.
Copy Now
Copy the data for the specified schema elements. Bulk Copy reports warnings
and errors depending on the data formats of the two feature sources, and
the copying options you selected.
Click View Log to see details (page 626).
Create Data Store Dialog Box
Use this dialog box to create a new data store in a database data source. The
available settings in the dialog box vary by provider.
To create a data store for a database provider (page 588)
To create a data store for a file-based data provider (page 589)
For a database data store, connect to and log into the data store in the Data
Connect window. In the Data Store list, select Add New Data Store (or type
a name that does not appear in the list already) and press Enter
For an SDF or SHP data store, in Map Explorer, click Schema ➤ Create SDF
or ➤ Create SHP.
NOTE This functionality is for geospatial feature data only. To link external attribute
data to drawing objects, see Overview of Linking Database Records to Objects
(page 522).
Data Store Name Enter the name of the new data store or accept the default
name. This name will appear in the Data Connections by Provider list in Data
Connect.
Password Enter the user password (Oracle only).
Confirm password Re-enter the user password (Oracle only).
Description Optionally enter a description of the new feature source.
Create Data Store Dialog Box | 1747

Data store coordinate system Enter the coordinate system code for the new
data store. If you don’t know the code, click to select a coordinate system.
In the Select Global Coordinate System dialog box, select a category. Select
from a list of available coordinate systems. Click Properties to view the
properties of the selected coordinate system. Click OK. Choose a coordinate
system that both the provider and AutoCAD Map 3D support.
Data store extents Enter the new data store’s minimum and maximum X
and Y spatial extents or accept the default values. You can’t add objects that
are outside these extents.
For SQL Server, you must specify the extents of the data store or Bulk Copy
will fail when copying data from any other provider source to SQL Server.
MySQL and Oracle support expanding the extents automatically if incoming
data are beyond the scope of the extents.
Storage resolution Enter the new data store’s X and Y tolerance or accept the
default value. If the distance between two points is smaller than the resolution,
the points are considered to be equivalent for most spatial tests.
Data store tablespace Enter the new data store’s tablespace name (Oracle
only).
Use FDO Enabled Schema Specify whether the new data store will be
FDO-enabled or not. FDO-enabled data stores include additional FDO metadata,
but otherwise use native SQL Server schema capabilities.
Manage Versions dialog box
Use this dialog box to add, activate, merge, or drop versions for a data store
to which you are currently connected. When you save or discard a version,
all features in the drawing that were queried from that version are removed
from the drawing. You cannot undo saving or discarding a version.
If an error occurs during a version-management operation, the affected item
in the dialog box displays an error indicator. To see the cause of the error,
hold your cursor over this indicator. If you create a version and the operation
fails, you will see a new version with an error indicator. The version has not
really been created. It is a placeholder to display the error. Errors remain visible
until you close the dialog box, fix the errors, and redisplay the dialog box.
1748 | Chapter 26 Managing Data Dialog Boxes
For more information about versions, see Managing Versions (page 723).
To create a new version (page 725)
To activate a version (page 725)
To commit changes back to the data store (page 726)
To discard a version (page 726)
In Map Explorer, right-click a connection that supports versioning and click
Manage Versions.
NOTE This functionality is for geospatial feature data only. To link external attribute
data to drawing objects, see Overview of Linking Database Records to Objects
(page 522).
Add
Create a new child version under the selected version in the Version tree.
Activate
Make the selected version the active one. Switching versions can take some
time to execute, because the data store may need to flush and reload the
feature cache.
Merge
Commit your edits to the selected version. This option is available for child
versions only. If you merge the active version, its parent version is activated
and then the selected version is merged and removed from the Version tree.
You cannot merge a version if it has children or if it has checked-out features.
Unlock any checked-out features by checking them in or cancelling check
out.
Drop
Discard the selected version. When you drop a version, all edits saved to
that version are discarded. This option is available for child versions only.
If you drop the active version, its parent version is activated and then the
selected version is dropped and removed from the Version tree.
You cannot drop a version if it has children or if it has checked-out features.
Unlock any checked-out features by checking them in or cancelling check
out.
Version Tree
View and select versions in the current data store. Each entry displays the
date and time it was created, its creator, and any comments entered at
Manage Versions dialog box | 1749

creation time. Right-click any version entry to add, activate, merge, or drop
it.
Resolve Feature Conflicts dialog box
Use this dialog box to specify how to handle changed objects when the object
has been changed in both the parent and the child version.
To commit changes back to the data store (page 726)
In Map Explorer, right-click the feature source and click Manage Versions.
NOTE This functionality is for geospatial feature data only. To link external attribute
data to drawing objects, see Overview of Linking Database Records to Objects
(page 522).
Choose The Parent Version
Keep the object in the parent version and discard changes in the child
version.
Choose The Child Version
Overwrite the object in the parent version with the changes from the child
version.
Cancel
Stop the Save operation. Determine which version of the objects to keep
and modify the child version accordingly.
1750 | Chapter 26 Managing Data Dialog Boxes

Metadata Dialog Boxes
Metadata Viewer
Use the Metadata Viewer to view metadata for the current drawing or for other
resources.
To view metadata (page 1487)
In the Display Manager, select a layer. Click Tools ➤ View Metadata.
From the Metadata Viewer you can also perform the following actions:
■Import metadata
■Export metadata
■Print metadata
■Publish metadata to an XML, HTML, or TXT file
■Update forced-update fields
■Update all fields
■Edit metadata (through the Metadata Editor (page 1754))
■Create a template from the current metadata
■Specify metadata options (page 1756)
27
1751
■Specify the metadata stylesheet
■Display additional metadata that is not part of the standard (FGDC or ISO)
specified in the Metadata Options dialog box
Metadata Viewer Toolbar
Use the Metadata Viewer toolbar to perform the following actions.
ActionToolbar Button
Imports metadata from another programImport
Exports metadata to be read by another
program
Export
Prints metadataPrint
Publishes metadata to an XML, HTML, or
TXT file
Publish
Updates forced-update fieldsUpdate Auto
Updates all fields (assumes that the auto-
matic update option is turned off)
Update All
Opens the Metadata EditorEdit
Creates a template from the currently-dis-
played metadata
Create Template
Opens the Metadata Options dialog boxOptions
Opens the New Features WorkshopLearn More
Displays help for the Metadata ViewerHelp
Current Drawing
The Current Drawing tree view lists the current drawing DWG (page 2061), and
any feature classes or object classes (resources (page 2072)) associated with it.
Show All Feature Classes
View metadata for all feature classes from connected feature sources.
1752 | Chapter 27 Metadata Dialog Boxes
Folder Shortcut
Use the Folder Shortcut tree view to display metadata for other files on your
local machine or on a server.
If you add or remove files from a folder that you uploaded to the Folder
Shortcut tree view, right-click in the tree view, and click Refresh.
Add
Create and view metadata for additional files.
Remove
Remove files you added to the Folder Shortcut tree view.
Metadata Tab
Display all the metadata related to the selected data source.
When you select a data source, AutoCAD Map 3D automatically identifies all
the relevant metadata that it can, categorizes it according to the selected
standard, and displays it in the Metadata Viewer. This tab is like a web browser,
with links and levels you can expand or contract.
The Summary tab
If the selected data source is a file, use this tab to view basic information such
as file type, size, and location.
Stylesheet
Control the display of the metadata.
FGDC Classic/ISO Classic
Specify a standard for displaying the metadata.
XML
Display the metadata in freeform XML format.
Text
Display the metadata as text.
More Metadata
View metadata that is not part of the standard (FGDC or ISO) specified in the
Metadata Options dialog box (page 1756).
Metadata Viewer | 1753
Metadata Editor
Edit and update metadata.
To edit metadata (page 1499)
In the Display Manager, select a layer. Click Tools ➤ View Metadata.
Metadata Editor Toolbar
Use the Metadata Editor toolbar to perform the following actions:
ActionToolbar Button
Apply a template (page 1492) to your
metadata.
Update (page ?) fields with values from
the current data source.
Audit (page ?) metadata for compliance
with the selected metadata standard.
Import (page 1511) metadata values from an
XML file that complies with the selected
metadata standard.
Highlight the field labels of forced-update
fields (page 2064).
Create a template (page 1492) from the
metadata you are working with.
1754 | Chapter 27 Metadata Dialog Boxes
Expand fields and field groups.
Collapse fields and field groups.
Metadata Fields
Enter metadata in the fields. A description and additional information are
displayed in the bottom area of the Metadata Editor when a field name or
field is selected.
Required fields are marked with a <Required> placeholder. Some fields accept
only certain types of data. For example, on the Identification tab, under Spatial
Domain, you cannot enter a text string in the North Bounding Coordinate
field because the domain (page 2060) of that field is a number.
Some fields store past entries. If a list of past entries is displayed, you can do
one of the following:
■Select (page ?) the entry
■Add (page 1500) a new entry
■Edit (page 1501) a past entry
■Delete (page 1501) an entry
For fields with predefined values, you can choose a value from the list or enter
a new one. However, your entries will not display the next time you click the
drop-down arrow.
NOTE For ISO date fields, use one of the following formats: YYYY-MM-DD,
YYYY-MM, or YYYY. For ISO date and time fields, use the following format:
YYYY-MM-DDThh:mm:ss.
Apply
Saves changes to the metadata without closing the Metadata Editor.
Metadata Editor | 1755

Attribute Editor
Edit ISO element attributes. The title and fields of the Attribute Editor change,
depending on the attribute.
To enter or edit metadata manually (page 1499)
In the Metadata Editor, right-click an element field name and select Edit Attribute.
Metadata Options dialog box
To set metadata options (page 241)
To import a template (page 1492)
To export a template (page 1496)
To remove a template (page 1497)
(page 1503)
Using Metadata Templates (page 1491)
In the Display Manager, select a layer. Click Tools ➤ View Metadata.
Template Tab
Metadata standard
Specify the metadata standard.
The default metadata standard depends on your version of AutoCAD Map
3D.
Use template
Use the selected metadata template in the window below as the default.
Import
Import a metadata template.
Export
Export a metadata template.
1756 | Chapter 27 Metadata Dialog Boxes
Rename
Rename the selected metadata template.
Remove
Remove the selected metadata template.
Preference Tab
Latitude/Longitude Precision
For latitude and longitude, set the number of digits to display after the
decimal point. The default is 6.
Auto Update
Update metadata as soon as the data source is updated (or as soon as the
metadata is reconnected to its updated data source).
Import Metadata Options dialog box
To import metadata for DWGs or their resources (page 1511)
In the Display Manager, select a layer. Click Tools ➤ View Metadata.
Open the original project DWG File
Open the original DWG as the current project. Any resources (page 2072) for
the imported DWG are displayed in the Current Drawing (page 1752) tree
view. Edit the metadata for those resources, or save the metadata as a
template.
Append the source metadata to the current metadata
Overwrite the current metadata with the source metadata.
Export Metadata dialog box
To export metadata (page 1513)
Import Metadata Options dialog box | 1757
In the Display Manager, select a layer. Click Tools ➤ View Metadata.
Select The Source Data Type For The Exported Metadata
Selected items
Export metadata only for the items selected in the Metadata Viewer (page
1751) .
All items in
Select Feature Source to export metadata for all features in the selected
source. Select Object Class to export metadata for all objects in the selected
class. Select both to include all features and objects.
Create Metadata Template dialog box
Create a template from the current metadata.
To create a template (page 1492)
In the Display Manager, select a layer. Click Tools ➤ View Metadata.
Template
The name of the template.
Compound Element Metadata Editors
Citation Information Editor (FGDC Metadata)
NOTE Information about each field is displayed at the bottom of the dialog box
when you click in the field.
1758 | Chapter 27 Metadata Dialog Boxes

Use the Citation Information Editor to enter information about published
geospatial data using the United States FGDC CSDGM Standard (page 2063) field
definitions.
To edit a compound metadata element (page 1506)
In the Display Manager, select a layer. Click Tools ➤ View Metadata.
The Citation Information Editor has the following sections:
General Information
Title
Enter a title. The NOAA Coastal Services Center suggests including a topic,
time period, and place. You can also include the file name, data source, and
data resolution (if applicable). AutoCAD Map 3D populates the field with
the name of the selected resource in the Metadata Viewer (page 1751).
Originator
Enter the originator, generally the organization that created the resource.
For example, specify a county planning department. You can include more
than one originator. Put “ed.” after the name of an editor, and “comp.”
after the name of a compiler. Use the Record Navigator (page 1506) to locate
a previous entry, delete an entry, or add a new one.
Publication date
Enter a date in one of the following formats:
■YYYYMMDD
■bcYYYYMMDD
■ccYYYYY
■cdYYYYY
If you do not know the date, select an option in the drop-down list.
Publication time
Enter a time in one of the following formats:
■HHMMSSSS
■HHMMSSSSshhmm
Citation Information Editor (FGDC Metadata) | 1759
■HHMMSSSSZ
Edition
Enter the version of the publication.
Geospatial data presentation form
Specify the format or media used to present the data. Select an option from
the drop-down list or enter an FGDC-approved alternative. If you enter an
alternative, it is saved in the current field but is not added to the list.
Other citation details
Enter additional information to help users access and use your data.
Online linkage
Specify the URL of the online resource where the data is published. Use
the Record Navigator (page 1506) to locate, add, or delete URLs.
Series Information
Series name
If the data is part of a series, enter the name of the series.
Issue identification
If the data is part of a series, enter the issue number.
Publication Information
Publication place
Enter the city in which the data was published. If the name is not unique,
include the state or province and country.
Publisher
Specify the person or organization that published the data.
Large Work Citation
Larger work citation
If the data is part of a larger work with several data sets that require their
own citation information, click Detail to launch an empty Citation
Information Editor. Do this for as many data sets as needed.
Data TypeShort NameField TitleFGDC Field ID
StringtitleTitle8.4
StringoriginOriginator8.1
1760 | Chapter 27 Metadata Dialog Boxes
Data TypeShort NameField TitleFGDC Field ID
Date/timepubdatePublication date8.2
Date/timepubtimePublication time8.3
StringeditionEdition8.5
StringgeoformGeospatial data
presentation
form
8.6
StringothercitOther citation
details
8.9
URLonlinkOnline linkage8.10
StringsernameSeries name8.71
StringissueIssue ID8.72
StringpubplacePublication place8.81
StringpublishPublisher8.82
VariouslworkcitLarger work cita-
tion
8.11
Time Period Information Editor (FGDC Metadata)
NOTE Information about each field is displayed at the bottom of the dialog box
when you click in the field.
To edit a compound metadata element (page 1506)
Time Period Information Editor (FGDC Metadata) | 1761
In the Display Manager, select a layer. Click Tools ➤ View Metadata.
Data TypeShort NameField TitleFGDC Field ID
CompoundsngdateSingle date/time9.1
DatecaldateCalendar date9.1.1
TimetimeTime of day9.1.2
CompoundmdattimMultiple
dates/times
9.2
CompoundrngdatesRange of
dates/times
9.3
DatebegdateBeginning date9.3.1
TimebegtimeBeginning time9.3.2
DateenddateEnding date9.3.3
TimeendtimeEnding time9.3.4
Contact Information Editor (FGDC Metadata)
NOTE Information about each field is displayed at the bottom of the dialog box
when you click in the field.
To edit a compound metadata element (page 1506)
In the Display Manager, select a layer. Click Tools ➤ View Metadata.
Contact information is part of the Distribution section of the FGDC
specification. The Distribution section is conditional (mandatory if applicable).
1762 | Chapter 27 Metadata Dialog Boxes

The requirements for individual elements and compound elements (page 2057)
assume you will include contact information in your metadata. It is mandatory
if you include contact information.
Data TypeShort NameField TitleFGDC Field ID
Select one of two
choices
cntperpPrimary contact10.1
StringcntperPerson name10.1.1
StringcntorgOrganization10.1.2
StringcntposContact position10.3
Menu choiceaddrtypeAddress type10.4.1
StringaddressAddress10.4.2
StringcityCity10.4.3
StringstateState or province10.4.4
StringpostalPostal code10.4.5
StringcountryCountry10.4.6
StringcntvoiceContact voice
phone
10.5
StringcnttddTDD/TTY tele-
phone
10.6
StringcntfaxFacsimile tele-
phone
10.7
StringcntemailE-mail address10.8
StringhoursHours of Service10.9
StringcntinstContact instruc-
tions
10.10
Contact Information Editor (FGDC Metadata) | 1763
Spatial Data Organization Information Editor (FGDC Metadata)
NOTE Information about each field is displayed at the bottom of the dialog box
when you click in the field.
Access the Spatial Data Organization Information Editor from the Metadata
Editor (page 1754). Describe the methods you used to represent spatial
information in the data set, and how the data is organized, including direct
and indirect spatial references. The fields in the Spatial Data Organization
Information Editor accept metadata about the number and type of objects in
your data set, the terminology set you use to describe the data, and other
information about the nature of the data.
To add records using the Record Navigator (page 1507)
To edit a compound metadata element (page 1506)
In the Display Manager, select a layer. Click Tools ➤ View Metadata.
Spatial Data Organization
Describe the methods you use for your data. Indirect data describes the location
of the spatial data, while direct data tells users how you visually represented
the data in your resource.
Indirect spatial reference
Specify the methods you used to identify geographic locations, for example,
formal methods (such as the Geographic Names Index system place names,
Public Land Survey System locations, or Federal Information Processing
System location codes); or less formal methods such as the name of a county,
or a street address. These references do not include coordinates.
Direct spatial reference method
Select the direct method you used to represent objects:
■Point
■Vector
■Raster
1764 | Chapter 27 Metadata Dialog Boxes

Point and vector object information
Specify the type of vector or non-gridded point objects used in the data set,
and how many there are. If the direct spatial reference method is either
Point or Vector, select whether you use SDTS terms or VPF terms.
If you select either Point or Vector, the following fields are displayed:
■SDTS Terms
■VPF Terms
■VPF Topology Level
■Point And vector Object Type
■Point And Vector Object Count
SDTS Terms/VPF Terms
This field name changes depending on the terminology set you select.
SDTS terms description
Select the appropriate point or vector information that uses terminology
and concepts from Spatial Data Concepts, Part 1, Chapter 2, in Department
of Commerce, 1992, Spatial Data Transfer Standard (SDTS) (Federal
Information Processing Standard 173): Washington, Department of
Commerce, National Institute of Standards and Technology. The reference
to the SDTS is used only as a name for the method used to describe the
point and vector objects. This method is selected by default in the dialog
box.
NOTE If you select one of the options, but later decide to select the other, close
the Spatial Data Organization Information Editor and re-open it to reset the
fields.
If you select SDTS terms, complete the following fields:
SDTS point and vector object type
Select the type of point or vector objects you use to identify zero-, one-,
and two-dimensional locations in the data set.
Point and vector object count
Specify the number of point or vector objects in your data set.
VPF terms description
If you select VPF terms, complete the following fields as many times as
necessary. Use the Record Navigator to add new fields.
Spatial Data Organization Information Editor (FGDC Metadata) | 1765
VPF topology level
Indicate how completely the topology is represented in the data set. This
field becomes available if you select VPF terms. These levels are defined in
the following publication: Department of Defense, 1992, Vector Product
Format (MIL-STD-600006): Philadelphia, Department of Defense, Defense
Printing Service Detachment Office. The reference to the VPF is used only
as a name for the method used to describe the point and vector objects.
VPF point and vector object type
Select one of the following:
■Node
■Edge
■Face
■Text
This is point or vector information that uses the terminology and concepts
defined in: Department of Defense, 1992, Vector Product Format
(MIL-STD-600006): Philadelphia, Department of Defense, Defense Printing
Service Detachment Office.
VPF point and vector object count
Specify the number of point or vector objects in your data set.
Raster object information
If you select Raster as the direct spatial reference method, the following
fields are displayed:
■Raster object type
■Row count
■Column count
■Vertical count
This describes the types of raster objects in the data set, and how many
rows and columns they have for flat, rectangular objects; or the number of
objects along the Z-axis (verticals) for three-dimensional, rectangular objects.
Raster object type
Select the type of raster objects you use to identify zero-, one-, and
two-dimensional locations in the data set.
If you selected Point, Pixel, or Grid Cell, complete the following fields:
1766 | Chapter 27 Metadata Dialog Boxes

Row count
Enter the number of object rows along the Y-axis of the raster.
Column count
Enter the number of object rows along the X-axis of the raster.
If you selected Point, Pixel, or Grid Cell and the data is three-dimensional,
complete the Vertical Count field.
Vertical count
Enter the number of objects along the vertical Z-axis.
Data TypeShort NameField TitleFGDC Field ID
StringindsprefIndirect spatial
reference
3.1
Menu choicedirectDirect spatial ref-
erence method
3.2
CompoundptvctinfPoint and vector
object informa-
tion
3.3
Menu choicesdtstypeSDTS point and
vector object
type
3.3.1.1
IntegerptvctcntPoint and vector
object count
3.3.1.2
CompoundvpftermVPF terms descrip-
tion
3.3.2
IntegervpflevelVPF topology
level
3.3.2.1
CompoundvpfinfoVPF point and
vector object in-
formation
3.3.2.2
IntegervpftypeVPF point and
vector object
type
3.3.2.2.1
Spatial Data Organization Information Editor (FGDC Metadata) | 1767
Data TypeShort NameField TitleFGDC Field ID
CompoundrastinfoRaster object in-
formation
3.4
StringrasttypeRaster object
type
3.4.1
IntegerrowcountRow count3.4.2
IntegercolcountColumn count3.4.3
IntegervrtcountVertical count3.4.4
Horizontal Coordinate System Definition Editor (FGDC
Metadata)
NOTE Information about each field is displayed at the bottom of the dialog box
when you click in the field.
The Horizontal Coordinate System Definition section is conditional overall.
The requirements for elements and compound elements (page 2057) within the
definition assume you will include it.
To edit a compound metadata element (page 1506)
In the Display Manager, select a layer. Click Tools ➤ View Metadata.
Data TypeShort NameField TitleFGDC Field ID
CompoundhorizsysHorizontal co-
ordinate system
4.1
CompoundgeographGeographic4.1.1
Real numberlatresLatitude resolu-
tion
4.1.1.1
1768 | Chapter 27 Metadata Dialog Boxes

Data TypeShort NameField TitleFGDC Field ID
Real numberlongresLongitude resolu-
tion
4.1.1.2
Menu choicegeogunitGeographic co-
ordinate units
4.1.1.3
CompoundplanarPlanar4.1.2
Menu choicemapprojnMap projection
name
4.1.2.1.1
Real numberstdparllStandard parallel4.1.2.1.23.1
Real numberlongcmLongitude of
central meridian
4.1.2.1.23.2
Real numberlatprjoLatitude of projec-
tion origin
4.1.2.1.23.3
Real numberfeastFalse easting4.1.2.1.23.4
Real numberfnorthFalse northing4.1.2.1.23.5
Real numbersfequatScale factor at
equator
4.1.2.1.23.6
Real numberheightptHeight of per-
spective point
above surface
4.1.2.1.23.7
Real numberlongpcLongitude of pro-
jection center
4.1.2.1.23.8
Real numberlatprjcLatitude of projec-
tion center
4.1.2.1.23.9
Real numbersfctrlinScale factor at
center line
4.1.2.1.23.10
CompoundobqlazimOblique line azi-
muth
4.1.2.1.23.11
Horizontal Coordinate System Definition Editor (FGDC Metadata) | 1769

Data TypeShort NameField TitleFGDC Field ID
Real numberazimanglAzimuthal angle4.1.2.1.23.11.1
Real numberazimptlAzimuth measure
point longitude
4.1.2.1.23.11.2
CompoundobqlptOblique line
point
4.1.2.1.23.12
Real numberobqllatOblique line latit-
ude
4.1.2.1.23.12.1
Real numberobqllongOblique line lon-
gitude
4.1.2.1.23.12.2
Real numbersvlongStraight vertical
longitude from
pole
4.1.2.1.23.13
Real numbersfprjorgScale factor at
projection origin
4.1.2.1.23.14
IntegerlandsatLandsat number4.1.2.1.23.15
IntegerpathnumPath number4.1.2.1.23.16
Real numbersfctrmerScale factor at
central meridian
4.1.2.1.23.17
CompoundgridsysGrid coordinate
system
4.1.2.2
Menu choicegridsysnGrid coordinate
system name
4.1.2.2.1
CompoundutmUniversal trans-
verse mercator
(UTM)
4.1.2.2.2
IntegerutmzoneUTM zone num-
ber
4.1.2.2.2.1
1770 | Chapter 27 Metadata Dialog Boxes

Data TypeShort NameField TitleFGDC Field ID
CompoundupsUniversal polar
stereographic
(UPS)
4.1.2.2.2.3
Menu choiceupszoneUPS zone identifi-
er
4.1.2.2.2.3.1
CompoundspcsState plane co-
ordinate system
(SPCS)
4.1.2.2.4
StringspcszoneSPCS zone identi-
fier
4.1.2.2.4.1
CompoundarcsysARC coordinate
system
4.1.2.2.5
IntegerarczoneARC system zone
identifier
4.1.2.2.5.1
StringothergrdOther grid sys-
tem’s definition
4.1.2.2.6
CompoundlocalpLocal planar4.1.2.3
StringlocalpdLocal planar de-
scription
4.1.2.3.1
StringlocalpgiLocal planar
georeference in-
formation
4.1.2.3.2
CompoundplanciPlanar coordinate
information
4.1.2.4
Choose one of
three
plancePlanar coordinate
encoding meth-
od
4.1.2.4.1
CompoundcoordrepCoordinate pair4.1.2.4.2
Horizontal Coordinate System Definition Editor (FGDC Metadata) | 1771

Data TypeShort NameField TitleFGDC Field ID
Real numberabsresAbscissa resolu-
tion
4.1.2.4.2.1
Real numberordresOrdinate resolu-
tion
4.1.2.4.2.2
Real numberdistbrepDistance and
bearing
4.1.2.4.3
Real numberdistresDistance resolu-
tion
4.1.2.4.3.1
Real numberbearresBearing resolu-
tion
4.1.2.4.3.2
Menu choicebearunitBearing units4.1.2.4.3.3
Menu choicebearrefdBearing reference
direction
4.1.2.4.3.4
Menu choicebearrefmBearing reference
meridian
4.1.2.4.3.5
Menu choiceplanduPlanar distance
units
4.1.2.4.4.
CompoundlocalLocal4.1.3
StringlocaldesLocal description4.1.3.1
StringlocalgeoLocal georefer-
ence information
4.1.3.2
CompoundgeodeticGeodetic model4.1.4
Menu choicehorizdnHorizontal datum
name
4.1.4.1
Menu choiceellipsEllipsoid name4.1.4.2
Real numbersemiaxisSemi-major axis4.1.4.3
1772 | Chapter 27 Metadata Dialog Boxes
Data TypeShort NameField TitleFGDC Field ID
Real numberdenflatDenominator of
flattening ratio
4.1.4.4
Attribute Domain Values Editor (FGDC Metadata)
NOTE Information about each field is displayed at the bottom of the dialog box
when you click in the field.
To edit a compound metadata element (page 1506)
In the Display Manager, select a layer. Click Tools ➤ View Metadata.
Data TypeShort NameField TitleFGDC Field ID
Choose one of
four
attrdomvAttribute domain
values
5.1.2.4
CompoundedomEnumerated do-
main
5.1.2.4.1
StringedomvEnumerated do-
main value
5.1.2.4.1.1
StringedomvdEnumerated do-
main value defini-
tion
5.1.2.4.1.2
StringedomvdsEnumerated do-
main value defini-
tion source
5.1.2.4.1.3
CompoundrdomRange domain5.1.2.4.2
StringrdomminRange domain
minimum
5.1.2.4.2.1
Attribute Domain Values Editor (FGDC Metadata) | 1773
Data TypeShort NameField TitleFGDC Field ID
StringrdommaxRange domain
maximum
5.1.2.4.2.2
StringattrunitAttribute units of
measure
5.1.2.4.2.3
RealattrmresAttribute meas-
urement resolu-
tion
5.1.2.4.2.4
CompoundcodesetdCodeset domain5.1.2.4.3
StringcodestnCodeset name5.1.2.4.3.1
StringcodesetsCodeset resource5.1.2.4.3.2
StringudomUnrepresentable
domain
5.1.2.4.4
Standard Order Process Editor (FGDC Metadata)
NOTE Information about each field is displayed at the bottom of the dialog box
when you click in the field.
To edit a compound metadata element (page 1506)
In the Display Manager, select a layer. Click Tools ➤ View Metadata.
Data TypeShort NameField TitleFGDC Field ID
StringfeesFees6.4.3
StringorderingOrdering instruc-
tions
6.4.4
1774 | Chapter 27 Metadata Dialog Boxes

Data TypeShort NameField TitleFGDC Field ID
StringturnaroundTurnaround6.4.5
Choose one of
two
stdorderStandard order
process
6.4
StringnondigNon-digital form
option
6.4.1
Menu choiceformnameFormat name6.4.2.1.1
StringformspecSpecification6.4.2.1.4
StringformvernFormat version
number
6.4.2.1.2
DateformverdFormat version
date
6.4.2.1.3
Real numbertransizeTransfer size6.4.2.1.7
CompoundonlinoptOnline option
collection
6.4.2.2.1
Choose one of
two
computerComputer con-
tact information
6.4.2.2.1.1
CompoundnetworkaNetwork address6.4.2.2.1.1.1
StringnetworkrNetwork resource
name
6.4.2.2.1.1.1.1
CompounddialinstDialup instruc-
tions
6.4.2.2.1.2
IntegerlowbpsLowest bps6.4.2.2.1.1.2.1
IntegerhighbpsHighest bps6.4.2.2.1.1.2.2
IntegernumdataNumber databits6.4.2.2.1.2.3
IntegernumstopNumber stopbits6.4.2.2.1.1.2.4
Standard Order Process Editor (FGDC Metadata) | 1775

Data TypeShort NameField TitleFGDC Field ID
Menu choiceparityParity6.4.2.2.1.1.2.5
Menu choicecompressCompression
support
6.4.2.2.1.1.2.6
StringdialtelDialup telephone6.4.2.2.1.1.2.7
StringdialfileDialup file name6.4.2.2.1.1.2.8
StringaccinstrAccess instruc-
tions
6.4.2.2.1.2
StringoncompOnline computer
and operating
system
6.4.2.2.1.3
CompoundoffoptnOffline option
collection
6.4.2.2.2
Menu choiceoffmediaOffline media6.4.2.2.2.1
Real numberrecdenRecording dens-
ity
6.4.2.2.2.2.1
StringrecdenuRecording dens-
ity units
6.4.2.2.2.2.2
StringrecfmtRecording format6.4.2.2.2.3
StringcompatCompatibility in-
formation
6.4.2.2.2.4
Responsible Party Editor (ISO Metadata)
Enter metadata for the Responsible Party compound element.
Related procedures:
■To edit a compound metadata element (page 1506)
1776 | Chapter 27 Metadata Dialog Boxes

1778
Object Classification
Dialog Boxes
MAPSELECTCLASSIFIED (Select Classified Objects command)
Use this command to select all drawing objects that were classified with specific
object classes.
To select objects in your current map, based on their object class (page 993)
Click Create tab ➤ Drawing Object panel ➤ Select Classified.
NOTE This functionality applies only to drawing objects. For information on the
classification systems used by geospatial feature data, see Overview of Geospatial
Data (page 551).
Respond to the prompts:
Select objects
Do one of the following:
■Press Enter to select all classified objects.
■Enter the name of the object class whose objects you want to select. You
can use wildcards to select multiple object classes. For example, enter r*
to specify all object classes whose name begins with "r". For more
information on using wildcards, see Wildcard Characters (page 1537).
28
1779
Objects classified with the specified object classes are selected.
MAPSELECTUNCLASSIFIED (Select Unclassified Objects
command)
Use this command to select all drawing objects that have not been classified.
To select objects in your current map, based on their object class (page 993)
Click Create tab ➤ Drawing Object panel ➤ Select Unclassified.
Unclassified objects are selected.
NOTE This functionality applies only to drawing objects. For information on the
classification systems used by geospatial feature data, see Overview of Geospatial
Data (page 551).
MAPSELECTUNDEFINED (Select Undefined Objects command)
Use this command to select all drawing objects that have been classified, but
whose object class definition is not included in the object class definition file
attached to the drawing.
To select objects in your current map, based on their object class (page 993)
Click Create tab ➤ Drawing Object panel ➤ Select Undefined.
NOTE This functionality applies only to drawing objects. For information on the
classification systems used by geospatial feature data, see Overview of Geospatial
Data (page 551).
An object can be classified but not included in the object class definition file
attached to the drawing if you classify the objects using one object class
1780 | Chapter 28 Object Classification Dialog Boxes
definition file, and then attach a different object class definition file that does
not include a definition for this object class.
Undefined objects are selected.
Attach Object Class Definition File dialog box
The object class definition file includes the set of object classes you will use
with this drawing.
NOTE If the FILEDIA variable is set to 0, then this dialog box is not displayed and
you can type the name of the file that you want to insert on the command line.
For more information, see the AutoCAD help.
To attach an object class definition file (page 995)
To use object classification (page 981)
Click Map Setup tab ➤ Object Class panel ➤ Attach Definition.
NOTE This functionality applies only to drawing objects. For information on the
classification systems used by geospatial feature data, see Overview of Geospatial
Data (page 551).
Look In
Select the drive and folder that contains the object class definition file.
File Name
Type or select the name of the object class definition file.
Files Of Type
Leave this set to Object Definition File.
Attach Object Class Definition File dialog box | 1781
Classified Property List dialog box
Use this dialog box to review the properties included in this object class
definition and the settings for those properties.
To define an object class (page 120)
Click Map Setup tab ➤ Object Class panel ➤ Define.
NOTE This functionality applies only to drawing objects. For information on the
classification systems used by geospatial feature data, see Overview of Geospatial
Data (page 551).
To change any settings, return to the Define Object Classification dialog box
(page 1785) and select the property you want to edit.
Classify dialog box
Assign an object class to selected objects.
To assign an object class to an existing object (page 989)
To create a classified drawing object (page 988)
Click Create tab ➤ Drawing Object panel ➤ Classify.
NOTE This functionality applies only to drawing objects. For information on the
classification systems used by geospatial feature data, see Overview of Geospatial
Data (page 551).
Classification Name
Lists the object classes and the object types to which they can be assigned.
Select the object class you want to assign to the objects.
Include Objects...
Classifies objects even if their property values do not meet the classification
rules for this object. Property values that are out of range will be reset to
1782 | Chapter 28 Object Classification Dialog Boxes
the default value for the property. If you clear this option, objects with
out-of-range values are not classified.
Exclude Objects...
Does not classify objects that have another object class already assigned. If
you clear this option, the existing object class is removed and the new one
is assigned.
Classify Objects dialog box
Apply the specified object class to the selected drawing objects.
To assign an object class to an existing object (page 989)
To create a classified drawing object (page 988)
In Map Explorer, under Current Drawing, right-click an object class ➤ Create
Classified Object.
NOTE This functionality applies only to drawing objects. For information on the
classification systems used by geospatial feature data, see Overview of Geospatial
Data (page 551).
Include Objects...
Classifies objects even if their property values do not meet the classification
rules for this object class. If you clear this option, objects with out-of-range
values are not classified.
Exclude Objects...
Does not classify objects that have another object class already assigned. If
you clear this option, the existing object class is removed and the new one
is assigned.
Color Range Editor dialog box
Use this dialog box to specify which colors to allow for this object class.
To specify a default value and a range for a property (page 125)
Classify Objects dialog box | 1783
Click Map Setup tab ➤ Object Class panel ➤ Define.
NOTE This functionality applies only to drawing objects. For information on the
classification systems used by geospatial feature data, see Overview of Geospatial
Data (page 551).
Click Add below the List Of Colors following your selection. All colors listed
in the List Of Colors are valid colors for this object class.
Color Range
Allow Any Color
Accepts any color as valid for this object class.
Add A Specific Color
Adds a specific color to the List Of Colors.
In the Color list, select the color to include, or choose Select Color to display
the Select Color dialog box, where you can select an index color, a true
color, or a color book color.
Add A Range Of Colors
Adds a range of colors to the List Of Colors.
In the First Color list, select the color at the beginning of the range. In the
Last Color list, select the color at the end of the range.
All colors whose index color number falls between the two selected colors
are considered valid for this object class.
List Of Colors
Lists the colors currently included in the object class.
■To delete a color from the list, select the color and click Remove.
■To add a color to the list, choose Add A Specific Color or Add A Range
Of Colors, and select the colors you want to add.
■To modify a color in the list, select the color in the list, choose Add A
Specific Color or Add A Range Of Colors, and select the colors you want
to add. Click Update.
1784 | Chapter 28 Object Classification Dialog Boxes
Define Object Classification dialog box
Use this dialog box to create a new object class definition or edit an existing
definition.
To define an object class (page 120)
To set up object classification (page ?)
Click Map Setup tab ➤ Object Class panel ➤ Define.
NOTE This functionality applies only to drawing objects. For information on the
classification systems used by geospatial feature data, see Overview of Geospatial
Data (page 551).
The new object class definition is added to the current object class definition
file. Users can use these object class definitions to create objects that
automatically have the properties you define in this dialog box.
Class Name
Specifies the name for the object class. The name can include spaces, and
is not case sensitive.
Description
Specifies the description for the object class.
Based On
Specifies that this object class will be based on an existing object class
definition. All of the settings for the base object class are automatically
included in this object class definition, and if you modify the base class,
the modifications are included in this object class definition. You can add
additional settings to this object class definition.
To select a base class, the base class must have the same create method as
the class you are defining.
Use As Base Object Classification Only
Specifies that the current class can be used only as a base class. You will not
be able to create an object using this object class.
The dialog box has the following tabs:
Applies To (page 1786)
Properties List (page 1786)
Define Object Classification dialog box | 1785

Class Settings (page 1788)
Feature Source Settings (page 1788)
Applies To
Object Types
Specifies the object types that may be tagged with this definition. Available
object types are determined by the base class, if there is one, and the selected
example objects.
TIP Select the most specific object type that applies to all objects in this object
class. For example, if all the objects will be circles, select AcDbCircle.
Properties List
Available Properties
Specifies the properties that will apply to all objects created with this object
class. Available properties are based on the objects selected in the drawing,
the base class, if one is selected, and the object types selected on the Applies
To tab.
If no properties appear, select an object type on the Applies To tab.
Select a check box to include the property in the object class. Highlight a
property to view or change its attribute values.
If this object class is based on another object class, you cannot clear a check
box for a property that is assigned in the "based on" class.
Property Attributes
Specifies the settings for each property.
To change the value for Type, Range, Default, Visible, or Read Only, click on
the value.
Type
For properties that you've created, set the data type. Specify Integer, Real,
Text String, 3D Point, or Yes/No. For other properties, the type is set
automatically and cannot be changed. (For information on creating a new
property, see New Property (page ?) below.)
Range
Specify the allowable values for this property. This allowable range is used
in the following situations:
■When users classify an existing object with this object class definition.
■When users use the Object Class tab of the Properties palette to edit
property values for an object classified with this object class definition.
1786 | Chapter 28 Object Classification Dialog Boxes
In each case, the value for the property must fall within this range.
For many properties, such as color, lineweight, line type, plot style, and
layer, you can select from a list of available values. To display the list, click
on the value you want to change. Click [...] to display a dialog where you
can specify the range.
When specifying the range values, keep these points in mind:
■To enter a list of values for the range, separate each value with a comma,
for example, 15,25,35, or Paved,Gravel,Dirt. To enter a continuous range,
use square brackets around the first and last value, for example, [2,8].
■When specifying integers, you can specify values between -2147483628
and +2147483627 (32-bit signed integer).
■To specify a lineweight, enter the decimals as integers. For example, to
specify a lineweight of 0.13, enter 13.
■To delete a range, enter two dashes ( "--" ).
Default
The default is used when an object has a value assigned that is out of the
range. This can happen if the value is assigned before the object is classified
or if the object is edited outside the Object Class tab. As soon as the object
is selected when the Object Class tab is active, the value will be reset to the
default.
When specifying the default for properties such as color, lineweight, line
type, plot style, and layer, you can select from a list of available values. To
display the list, click on the value you want to change. Click the down
arrow to display a list of available value, or click [...] to see additional choices.
Visible
Specify whether the property should appear on the Object Class tab of the
Properties palette. You may want to turn visibility off if you want a property
set to a single value that users can't edit. In this case, set both the range and
the default to the same value.
Read Only
Controls whether the property of a classified object is editable on the Object
Class tab. If this is set to Yes, the value is displayed in gray.
To view attribute settings for all selected properties, click Show List.
New Property
Displays the New Property dialog box (page 1791), where you can add a new
property to the Available Properties list.
Define Object Classification dialog box | 1787
The new property appears in the Properties palette and can be edited in the
same way as other properties.
Show List
Displays the Classified Property List dialog box (page 1782), which lists all the
selected properties and their attribute settings. This is a convenient way to
check your properties before you save the definition.
Class Settings
Show Object Class In Map Explorer
Displays the object class name in Map Explorer. When this option is cleared,
this object class name is hidden in Map Explorer.
Class Icon
Selects the bitmap to use for this object class in Map Explorer.
Be sure the location you specify is available to everyone who will use this
object class definition file. If you store the object class definition file on the
network, store the bitmaps in the same location.
Use Standard Icon
Displays the standard icon for the object class in Map Explorer. When this
option is cleared, choose the icon to display.
Create Method
Specifies the object to create when creating a new object in this object class.
You can select only objects that are appropriate for the object type you
selected on the Applies To tab.
Select None if you do not want to specify a create method for this object
class. This is useful for base classes, where each subclass may specify a
different create method.
In the Geometric Settings table, specify any additional parameters to set
when creating objects in this object class.
Feature Source Settings
Specify how to treat linked data when you add an object to a feature source.
Move my linked data to Feature Source
When you add an object with linked data to a feature source, the data from
the linked data source is copied to the feature source.
Keep my data linked in Feature Source
When you add an object with linked data to a feature source, the link is
copied to the feature source.
1788 | Chapter 28 Object Classification Dialog Boxes
Layer Range Editor dialog box
Use this dialog box to specify which AutoCAD layers to allow for this object
class.
To specify a default value and a range for a property (page 125)
Click Map Setup tab ➤ Object Class panel ➤ Define.
NOTE This functionality applies only to drawing objects. For information on the
classification systems used by geospatial feature data, see Overview of Geospatial
Data (page 551).
You can choose from a list of all AutoCAD layers in the current drawing.
Layer Range
Allow Any Layer
Accepts any AutoCAD layer as valid for this object class.
Choose Specific Layers
Accepts only specific AutoCAD layers for this object class. In the Layer list,
select the AutoCAD layers to include.
Linetype Range Editor dialog box
Use this dialog box to specify which linetypes to allow for this object class.
To specify a default value and a range for a property (page 125)
Click Map Setup tab ➤ Object Class panel ➤ Define.
NOTE This functionality applies only to drawing objects. For information on the
classification systems used by geospatial feature data, see Overview of Geospatial
Data (page 551).
Layer Range Editor dialog box | 1789
You can choose from a list of all linetypes in the current drawing.
Linetype Range
Allow Any Linetype
Accepts any linetype as valid for this object class.
Choose Specific Linetypes
Accepts only specific linetypes for this object class. In the Linetype list,
select the linetypes to include.
Lineweight Range Editor dialog box
Use this dialog box to specify which lineweights to allow for this object class.
To specify a default value and a range for a property (page 125)
Click Map Setup tab ➤ Object Class panel ➤ Define.
NOTE This functionality applies only to drawing objects. For information on the
classification systems used by geospatial feature data, see Overview of Geospatial
Data (page 551).
Lineweight Range
Allow Any Lineweight
Accepts any lineweight as valid for this object class.
Choose Specific Lineweights
Accepts only specific lineweights for this object class. In the Lineweight
list, select the lineweights to include.
New Object Class Definition File dialog box
Use this dialog box to create an object definition file.
To create a new object classification file (page 129)
To set up object classification (page 118)
1790 | Chapter 28 Object Classification Dialog Boxes
Click Map Setup tab ➤ Object Class panel ➤ New Definition.
NOTE This functionality applies only to drawing objects. For information on the
classification systems used by geospatial feature data, see Overview of Geospatial
Data (page 551).
The object class definition file includes information on how to create each of
the object classes you defined. Only definitions in the object class definition
file attached to a drawing can be assigned to objects in the drawing or used
to create new objects.
NOTE To create a new object class definition file, you must have Alter Object
Class privileges (page 83).
Look In
Select the drive and folder where you want to store the object class definition
file.
File Name
Type a name for the new object class definition file.
Files Of Type
Leave this set to Object Definition File.
NOTE If the FILEDIA variable is set to 0, then this dialog box is not displayed and
you can type the name of the object class definition file that you want to create
on the command line. For more information, see the AutoCAD help.
New Property dialog box
Use this dialog box to create a new property for the object class.
To define an object class (page 120)
Click Map Setup tab ➤ Object Class panel ➤ Define.
New Property dialog box | 1791
NOTE This functionality applies only to drawing objects. For information on the
classification systems used by geospatial feature data, see Overview of Geospatial
Data (page 551).
Property Heading Category
Specify a category for the new property.
Property Name
Specify a name for the new property.
When you close this dialog box, the new property will appear in the Properties
List of the Define Object Classification dialog box. If you add this new property
to the current object class definition file, the property will appear on the
Object Class tab of the Properties palette.
Plotstyle Range Editor dialog box
Use this dialog box to specify which plotstyles to allow for this object class.
To specify a default value and a range for a property (page 125)
Click Map Setup tab ➤ Object Class panel ➤ Define.
NOTE This functionality applies only to drawing objects. For information on the
classification systems used by geospatial feature data, see Overview of Geospatial
Data (page 551).
You can choose from a list of all plotstyles in the current drawing.
Plotstyle Range
Allow Any Plotstyle
Specify any plotstyle that is valid for this object class.
Choose Specific Plotstyles
Specify a specific plotstyle for this object class. In the plotstyle list, select
the plotstyles to include.
1792 | Chapter 28 Object Classification Dialog Boxes
Object Data Dialog Boxes
Attach Object Data dialog box
Use this dialog box to view the fields in the table and to view or edit the values
for those fields.
To attach data to an object (page 1064)
Click Create tab ➤ Drawing Object panel ➤ Attach/Detach Object Data.
NOTE This functionality applies only to attribute data that you use with drawing
objects. To see information about a feature source or attribute data you use with a
feature source, see Overview of the Data Table (page 1125) and Overview of Joins
(page 507).
The Object Data Field area lists the fields in the table and the values for those
fields. To change any value, highlight it in the Value box, type the new value,
and press Enter. When you finish updating values, click OK.
29
1793
Attach/Detach Object Data dialog box
Use this dialog box to add data to an object data table and attach that data to
an object, or to detach existing data from an object.
To attach data to an object (page 1064)
Click Create tab ➤ Drawing Object panel ➤ Attach/Detach Object Data.
NOTE This functionality applies only to attribute data that you use with drawing
objects. To see information about a feature source or attribute data you use with
a feature source, see Overview of the Data Table (page 1125) and Overview of Joins
(page 507).
Table
View all the tables in the current drawing. Select the table containing the
data fields to attach.
Object Data Field
View all the data fields in the selected table and the current value for each
field.
If two attached drawings have a table with the same name, AutoCAD Map
3D recognizes only the fields defined in the first drawing you activate.
To change the value to attach, highlight the field and type a new value in
the Value box.
Value
View the default value for the selected field.
To specify a different value, type a new one.
Attach to Objects <
Return to your map, where you can select the objects to attach the data to.
Detach from Objects
Return to your map, where you can select the objects to detach.
All data from the selected table is removed from the objects.
Overwrite
Overwrite any existing values for this table with the new values.
1794 | Chapter 29 Object Data Dialog Boxes

If the box is not selected, the object will have two values assigned for the
data fields in the table.
Select the box when you want only one set of values attached to the object,
as when specifying a pipe diameter or a desk height. Clear the box when
the object can have multiple sets of values assigned to it, as when specifying
software installed on a computer or types of plants in a landscape section.
Define
Display the Define Object Data dialog box, where you can create new tables
or modify existing tables.
To attach data to an object, select a table and review or change the default
values. Click Attach To Objects. When you finish selecting objects in your
drawing, AutoCAD Map 3D creates a record for each object and attaches the
records to the objects.
If you selected Overwrite, the new record replaces any existing record from
this table. If you don't select Overwrite, the object can have more than one
record from the table.
To detach data, select a table. Click Detach From Objects. When you return
to your map, select all the objects you want to detach the data from.
Edit Object Data dialog box
Use this dialog box to view and edit object data.
To modify an object data table (page 203)
Click Modify menu ➤ Edit Object Data.
NOTE This functionality applies only to attribute data that you use with drawing
objects. To see information about a feature source or attribute data you use with
a feature source, see Overview of the Data Table (page 1125) and Overview of Joins
(page 507).
■To view data from a different table, select the table from the list.
■To view data for a different object, click Select Object.
Edit Object Data dialog box | 1795
■To change a value, enter a new value in the box and press Enter. You must
have Edit Drawing privileges to edit object data. See User Administration
dialog box (page 1934)
Table
View all tables with data attached to the selected object.
Select a table to view or edit.
Object Data Field/Value
View the field values for the selected object.
If the object has more than one record from the selected table, use Next,
Prior, First, and Last to view the other records.
Nested Data
Determine whether the values displayed are for the nested object, or only
for its parent object.
■If the box is selected, the Object Data Field/Value list shows information
for just the selected object.
■If the box is not selected, the Object Data Field/Value list shows
information for the parent object. If the object has more than one parent
object, select one from the list.
Value
View the current value for the selected field.
To change the value, enter a new value in the box and press Enter.
Select Object
To view and edit data for another object, click Select Object and select a
new object.
Insert Record
Attach a new record from this table to the object. The record contains the
current values for each field.
Delete Record
Remove the record from the object.
1796 | Chapter 29 Object Data Dialog Boxes
Rename Table dialog box
Use this dialog box to rename the selected table.
To modify an object data table (page 203)
Click Map Setup tab ➤ Attribute Data panel ➤ Define Object Data.
NOTE This functionality applies only to attribute data that you use with drawing
objects. To see information about a feature source or attribute data you use with
a feature source, see Overview of the Data Table (page 1125) and Overview of Joins
(page 507).
The table name cannot include spaces.
Before you rename a table:
■All source drawings that use the table should be attached and active.
If a drawing is not attached and active, the table will not be renamed for
that drawing.
■Do not perform a Draw mode query.
If you have already performed a Draw mode query since you opened the
current drawing, you must save the objects back to their source drawings
or close the current drawing and reopen it.
If you change a table name, be sure to update any queries that reference the
table.
Select Link Template Key dialog box
Use this dialog box to select the fields from the current object data table to
use as key fields in the database table.
To open a linked database table (page 527)
Rename Table dialog box | 1797
At the Command prompt, enter mapviewlink.
NOTE This functionality applies only to attribute data that you use with drawing
objects. To see information about a feature source or attribute data you use with
a feature source, see Overview of the Data Table (page 1125) and Overview of Joins
(page 507).
Method area
Select the method for setting key fields.
Reference Existing Fields
Use existing fields as key fields.
If you select this option, select the fields to use in the Existing Fields area.
Generate Key Field
Create a new field to use as the key field.
If you select this option, specify a name for the field in the Generate Key
area. When the database table is created, this field will contain a unique
number for each record.
Existing Fields area
If you select Reference Existing Fields, select the fields to use as key fields.
■To specify a key field, select the field and click On.
■To deselect a key field, select the field and click Off.
■To change the name of a field, select the field, type a new name in the
Rename box. Click Rename.
Generate Key area
If you select Generate Key Field, specify a name for the new field. The name
must be different from other fields in the table.
1798 | Chapter 29 Object Data Dialog Boxes
Other Dialog Boxes
ADETEXTLOC (Map Labelpoint Location command)
Use this command to specify a new label point for an object.
An object's label point is used as the reference point when you add text to an
object during property alteration. By default, the label point is the centroid of
the object. Use this command to specify a different label point.
Respond to the prompts:
Select object:
Use any object selection method.
Pick new text location <X,Y>:
Enter new X and Y coordinates, separated by a comma.
To use this label point when inserting text during a property alteration, choose
LABELPT from the Insert Point list in the Define Text dialog box.
AutoCAD Map Messages dialog box
Use this dialog box to view information and error messages. To view additional
information about a message, select the message and click Show Log File.
The dialog box has the following windows:
Messages
View brief explanations of the error.
Message details
View additional details about the error, and the code associated with it.
30
1799
Browse/Search dialog box
Use this dialog box to display preview images of drawings, open drawings,
and search for files. Use the browser to search for files across multiple
directories on a single drive or on multiple drives.
The Browse tab displays small bitmap images of drawings in the specified
directory. You can sort the preview images by file type.
Browse tab
File Name
The name of the currently selected drawing.
Directories
The names of the directories on the current drive.
Drives
The names of the available drives.
List Files of Type
Select file types to browse for, including drawing files (DWG), drawing
interchange format files (DXF), and drawing template files (DWT).
Size
Change the size of the preview images. The options are Small, Medium,
and Large.
Network
Use the Map Network Drive dialog box (a Windows system window) to
connect to networked drives.
Search tab
Files
View a list of files that meet the search criteria.
Search Pattern
Enter a pattern to search for in file name, based on file type. For example,
enter floor* to search for all files that begin with "floor" and are of the file
type specified.
If you use wild-card characters, and if the search string does not contain
path separators, the search attempts to match either the full path or just
the file name portion of the path.
1800 | Chapter 30 Other Dialog Boxes
File Types
Select the types of files to search for.
Date Filter
Search forward or backward from the specified time or date.
Time
Enter the time from which the system searches forward or backward.
Date
Enter the date from which the system searches. The specified date must be
1/1/80 or later.
Search Location
Specify which drives and paths the system searches.
Drive
View all currently attached drives.
All Drives
View all local hard drives, including removable and network drives.
Path
View directories.
Open
Open the selected file.
Search
Begin searching for the named file according to the search location
information. This option changes to Stop Search once the search begins.
Create Centroids dialog box
Use the Create Centroids dialog box to create centroids in the middle of
selected closed polylines or polygons, and move any object data or SQL link
data from the closed object to the centroid.
When you use this feature, AutoCAD Map 3D checks that the selected polygons
and closed polylines are clean; that is, that the lines do not intersect each
other, and that the closed object has an area greater than 0. Centroids are
created with a Z value of 0.
Create Centroids dialog box | 1801
If the closed object has holes, the centroid will be placed in the center of the
enclosed area, regardless of whether it falls within a hole or not. For a 'figure
eight' polygon, AutoCAD Map 3D will create one centroid.
Create Centroids In
Select the polylines or polygons for which you want to create centroids.
All Closed Objects
Create centroids for all polygons and closed polylines.
Selected Only
Create centroids only for selected polygons and polylines. Click Select
Objects or Quick Select to select the polylines and polygons.
Creation Options
Specify where to create the centroids and what point or block to use for
centroids.
Create on Layer
Specify the layer for the new centroids. Click the down arrow to select from
a list of layers in the drawing. If the layer you want is not listed, it may be
frozen or locked. To create the centroids on a new layer, click Create On
Layer.
Create Using
To create centriods as points, select ACAD_POINT. To create centroids using
an existing block, click the down arrow and select the name of the block.
Related procedures:
■To create centroids for polygons and closed polylines (page 887)
Data Expression dialog box
Select a data location.
Attribute
To use data in an attribute, select Attribute. Select the attribute from the
Attributes list. To view attributes in a different block, select the block from
the Blocks list.
1802 | Chapter 30 Other Dialog Boxes

Object Data
To use data in an object data table, select Object Data. Select the field from
the Object Data Fields list. To view fields in a different table, select the table
from the Tables list.
Database Link
To use data in link data stored on an object, select Database Link. Select the
column from the Key Columns list. To view columns in a different link
template, select the link template from the list.
Define New Object Data Table dialog box
Use this dialog box to create a new object data table or to modify an existing
table.
■To add a data field, enter a new Field Name in the Field Definition section.
Enter the information for the new data field. When you finish, click Add.
■To edit an existing field, select it from the Object Data Fields list. Edit the
information in the Field Definition section. When you finish, click Update.
Table Name
If you are modifying an existing table, the name of the table appears in the
box.
If you are creating a new table, enter a name for the table. A table name
cannot include spaces. It must start with an alphanumeric character.
NOTE Do not use a table name that is already used in another drawing, unless
this table will have the same field definitions as that table. If two source drawings
have tables with the same name but different definitions, AutoCAD Map 3D
uses the table definition in the first drawing that is activated, and data from the
second table is not available.
Object Data Fields
Select a data field to update or to delete a field.
The Object Data Fields list displays all data fields in the selected table.
If two source drawings have a table with the same name, AutoCAD Map
3D recognizes only the fields defined in the first drawing you activate.
■To edit a data field, select its name in the list. Information about the
field appears in the Field Definition section. Change any information.
Click Update.
■To delete a field, select its name in the list. Click Delete.
Define New Object Data Table dialog box | 1803

■To delete all the fields in the list, click Delete All.
Field Definition
Change information about an existing field or specify information for a new
field.
To change information about an existing field, select its name in the Object
Data Fields list. Information about the field appears in the Field Definition
area. Change any information. Click Update.
To add a new field, enter a new name in the Field Name box. Enter information
about the field. Click Add.
NOTE Before you add a field to an existing object data table, be sure all drawings
that use this table are attached and active. Objects in active drawings are
automatically updated to include the new field and are assigned the default value
for the field. If an object that uses this table is not in an active drawing when the
table is modified, the data attached to the object is not modified.
Field Name
Enter a name for the data field.
The name cannot contain any spaces. It must start with an alphanumeric
character.
Type
Select a data type.
Integer
An integer between -2,147,483,648 and 2,147,483,647
Character
Any characters, up to 132 characters
Point
Three real numbers separated by commas representing the X, Y, and Z values
of a point
Real
A real number between -1.7E308 and 1.7E308
If you select Integer, numbers are rounded to the nearest whole number.
Description
Enter a description for the data field.
This description appears in the Object Data Fields list.
1804 | Chapter 30 Other Dialog Boxes
Default
Specify a default value for the data field.
The value must match the data type you selected above.
Enter the value you will use most often when you assign this data field to
an object.
Before you modify a table
■All source drawings that use the table should be attached and active.
If a drawing is not attached and active, the table definition will not be
updated for that drawing. If two source drawings have tables with the
same name but different definitions, this operation affects the table
definition in the first drawing that is activated, and data from the second
table is not available.
■Do not perform a Draw mode query.
If you have already performed a Draw mode query since you opened
the current drawing, you must save the objects back to their source
drawings or close the current drawing and reopen it.
You can modify newly defined tables until you perform a save operation
(either saving objects back to source drawings or saving the current drawing).
Once you perform a save operation, the table can be modified only by a
Superuser. Use the User Login dialog box (page 1937) command to log in as a
Superuser, or contact your system administrator.
Related procedures:
■To create an object data table (page 201)
Define Object Data dialog box
Use this dialog box to create object data tables and data fields. Object data
tables store information about the objects in your drawings.
Create an object data table by entering a name for the table and defining the
fields in the table.
Table list
View all tables in the current drawing.
To view the object data fields in a table, select the table name from the list.
Object Data Fields
View the fields in the selected table.
Define Object Data dialog box | 1805

If two source drawings have a table with the same name, AutoCAD Map
3D recognizes only the fields defined in the first drawing you activate.
To view Field Definition information for a field, select the field.
Field Definition
Displays the values for the selected field.
Field Name
The name of the field.
Data Type
The type of information that can be entered in the field.
Description
The description assigned to the field.
Default
The default value assigned to the field.
To change any values, click Modify.
New Table
Display the Define Object Data Table dialog box, where you can create a
new table and define new object data fields.
Modify
Display the Modify Object Data Table dialog box, where you can modify
the selected table and define or delete object data fields.
You can modify newly defined tables until you perform a save operation
(either saving objects back to source drawings or saving the current drawing).
Once you perform a save operation, the table can be modified only by a
Superuser. Use the MAPLOGIN command to log in as a Superuser, or contact
your system administrator.
Rename
Display the Rename Table dialog box, where you can enter a new name for
the selected table.
NOTE If you rename a table, be sure to update any queries that call that table.
Delete
Delete the selected table.
NOTE If any data from this table is attached to objects, the data is deleted
from those objects when you remove the table.
1806 | Chapter 30 Other Dialog Boxes

Before you delete a table
■All source drawings that use the table should be attached and active.
If a drawing is not attached and active, the object data from the table
is not removed from that drawing.
■Do not perform a Draw mode query.
If you have already performed a Draw mode query since you opened the
current drawing, you must save the objects back to their source drawings
or close the current drawing and reopen it.
This dialog box displays information about the tables in your drawing.
Some of the tables on this list contain information that AutoCAD Map 3D
needs. If you select one of these needed tables, you cannot change the
information or remove or rename the table. You can view the information.
Related procedures:
■To create an object data table (page 201)
Expression dialog box
Use this dialog box to add attributes to an expression.
To define an expression (page 1275)
Select an item from the list and click OK to add the item to your expression.
For example, expand Object Data Tables to see the list of tables in the current
drawing. Expand again to see the list of fields in the table. For more
information about expressions for drawing objects, see Expression Evaluator
(page 1541).
Generate Data Links dialog box
If you have text in your drawing that matches information in a table, use this
dialog to automatically create links based on the matched information. You
can create links to an external database table or to an object data table stored
with the current drawing.
Expression dialog box | 1807

Select a linkage type. Set options for that type. After you click OK, you are
prompted to select the blocks, text, enclosed blocks, or enclosed text.
NOTE You cannot create links to objects on layers that are locked, frozen, or
turned off.
Block
If you are creating links to blocks or enclosed blocks, select the name of the
block.
Keys and Tags
For each key field in the link template, select a tag from the block attribute.
You can assign a tag to only one key field. (If you are creating links to
enclosed text, skip this step.)
Use Insertion Point as Label Point
Use the insertion point of the text or block as the default label point for
the object.
Table/Link Template
Select the table or the link template for the database table containing the
matching data. The complete record is linked to the object.
■If you link data from blocks or enclosed blocks to an object data table,
the attribute data is linked only if attribute tags match field names in
the table.
■If you link data from blocks or enclosed blocks to an external table, use
the Data Links area to specify which attribute tags correspond to the
key fields.
■If you link data to text or enclosed text, you must select a table with
only one field or a link template with only one key field. The remaining
controls are grouped in the following areas:
Data Links
Specify whether you are linking to object data or an external database.
Create Object Data Records
Create records in an object data table stored with the current drawing. These
new records are attached to the objects.
1808 | Chapter 30 Other Dialog Boxes
Create Database Links
Create links to an external database table. Select a Database Validation
option to specify whether to link only to existing records or to create new
records.
Linkage Type
Select a linkage type.
After you click OK, you are prompted to select the blocks, text, enclosed blocks,
or enclosed text.
Blocks
Create links from block attribute data. The links are created on the blocks
themselves.
Text
Create links from text. The link data is stored on the text object.
Enclosed Blocks
Create links from block attribute data. The links are created on the polyline
that encloses the block. Blocks that are not enclosed by a polyline are not
linked.
Enclosed Text
Create links from text that lies within a closed polyline. The links are created
on the closed polyline that encloses the text. Text that is not enclosed by
a polyline is not linked.
Database Validation
If you are creating links to an external table, select a validation option.
None
Create links without checking the database.
Link Must Exist
Create a link only where the text or attribute tag value matches an existing
record's key field value. If you are creating links to an Excel spreadsheet,
the selected link template must point to a named range and not to a
worksheet.
Create If New
Create a new record in the table if no existing record matches. The new
record will have the key field values filled in, but other fields will be blank.
Generate Data Links dialog box | 1809
Related procedures:
■To attach data to objects automatically (page 1067)
■To link records to objects using text or block attribute data automatically
(page 532)
New Layer dialog box
The new layer name may not contain any of the following characters.
< > / \ : ? * | , = " ` "
Related procedures:
■To import SDF 2 files (page 389)
■To create centroids for polygons and closed polylines (page 887)
Select dialog box
■To select an item, click the item.
■To select a group of items, click the first one. Hold down the Shift key
while you click the last one.
■To select additional items, hold down the Ctrl key while you click each
item.
When you finish selecting items, click OK.
Select Block dialog box
Click the block to select it.
Click OK.
Select Blocks dialog box
Select the blocks you want by clicking them.
When you finish selecting blocks, click OK.
1810 | Chapter 30 Other Dialog Boxes
Select Data dialog box - Query
This dialog box lists data in the current drawing. Select the type of data to
include:
Attribute
The Attribute Tags list displays the attributes for the current block. To see
the attribute tags for a different block, select the block from the Block list.
Object Data
The Object Data Fields list displays the data fields for the current table. To
see the fields for a different table, select the table from the Table list.
If two source drawings have a table with the same name, AutoCAD Map
3D uses only the fields defined in the first drawing you activate.
Database Link
The Key Columns list displays the key columns for the current link template.
To see the key columns for a different link template, select the link template
from the link template list.
Select the data value and click OK.
Related procedures:
■To find sliver polygons when overlaying two topologies (page 843)
Select dialog box
Select from the list of available values.
Some types of values are available only if they are in an active drawing.
Related procedures:
■To retrieve drawing objects based on their properties (page 1244)
■To select an image by pressing Shift + left-click (page 493)
■To find sliver polygons when overlaying two topologies (page 843)
Select Drawings to Attach dialog box
Use this dialog box to add source drawings to your current drawing set.
Select Data dialog box - Query | 1811
Select the file names of drawings to attach. Click Add. You can change the
drive or folder and continue to add files to the Selected Drawings list. When
you finish, click OK.
Look In
Select a drive alias from the list. AutoCAD Map 3D creates a drive alias for
drive C. You must create drive aliases for all other drives that you use.
If the drive or folder you want is not listed, click Create/Edit Aliases
to display the Drive Alias Administration dialog box where you define a
new drive alias.
To open a preview window that displays a preview of the selected
drawing, click Preview. In some instances, such as if a drawing is locked,
the Preview window is blank.
File List
View all drawings in the current directory.
Filter
Use wild-card characters to filter the display of file names. For example,
enter t* to view only file names starting with the letter t.
Add
Add the selected drawing names to the Selected Drawings list.
Remove
Remove the selected drawing names from the Selected Drawings list.
Selected Drawings
To use these drawings, click OK.
You must have Alter Drawing Set privileges to attach and detach drawings.
Change privileges using the User Administration dialog box (page 1934).
Related procedures:
■Attaching Drawings (page 154)
Select Object Classes dialog box
Select the classes you want by clicking them.
1812 | Chapter 30 Other Dialog Boxes
When you finish selecting classes, click OK.
Select Classified Objects dialog box
Select the objects you want by clicking them.
When you finish selecting, click OK.
Select Layer dialog box
Select the layer you want by clicking it
Click OK.
Select Layers dialog box
Select the layers you want by clicking them.
Select Property dialog box
Select the property and click OK.
Related procedures:
■To alter retrieved objects based on their properties (page 1265)
Select SQL Column dialog box
To see the columns for a different link template, select the link template from
the list.
Select the column you want and click OK.
Select Classified Objects dialog box | 1813
Select Table Dialog Box (MAPIMPORT: Object Data)
This dialog box was used to select an object data table from the list of all object
data tables in the current drawing during an import procedure. It has been
discontinued. Instead, use one of the following procedures or commands.
■Related procedure:
To import data from other formats (page 381)
To import from Arc/INFO (page 396)
To import from MapInfo MIF/MID (page 401)
To import SHP data (page 399)
■Related command:
Click Home tab ➤ Data panel ➤ Import From Files.
Select Table Dialog Box (MAPIMPORT: Database Table)
This dialog box was used to select a database table from the list of all tables
in the current drawing during an import procedure. It has been discontinued.
Instead, use one of the following procedures or commands.
■Related procedure:
To import data from other formats (page 381)
To import from Arc/INFO (page 396)
To import from MapInfo MIF/MID (page 401)
To import SHP data (page 399)
■Related command:
Click Home tab ➤ Data panel ➤ Import From Files.
SQL Expression dialog box
Select a column in an external database.
To see columns from a different database table, select the link template for
the table from the Link Templates list.
1814 | Chapter 30 Other Dialog Boxes
In most cases, the Link Templates list includes only link templates for active
source drawings. If the link template you want is not listed, be sure it is defined
in the source drawing, and the appropriate data source is attached and
connected.
If you are using a command that involves topology, the Link Templates list
includes only link templates for the drawing where the topology is loaded. If
you loaded the topology from source drawings, the list displays link templates
defined in the source drawing; if you loaded the topology from the current
drawing, the list displays link templates in the current drawing.
SQL Expression dialog box | 1815
1816
Polygon Object Dialog
Boxes
MAPPOLYLINETOPOLYGON (Convert Polylines to Polygons
command)
Use this command to convert an existing closed polyline to a polygon.
To convert polylines to polygons (page 971)
Respond to the prompts:
Select objects:
Select the polylines to convert. Press Enter.
NOTE This functionality applies only to drawing objects. It does not apply to features
from a feature source.
Each closed polyline in the selection set is converted into a polygon. If the
polyline belongs to a group, only the first (outermost) polyline in the group is
converted. Other polylines in the group are copied into the polygon as additional
boundaries. The polygon is automatically rebalanced.
When objects are converted to polygons, they use the default color or hatch
set by the To change the default setting for importing polygons (page 978).
31
1817
MAPUSEMPOLYGON
Use this command to change the default setting for how polygon are imported.
To change the default setting for importing polygons (page 978)
NOTE This functionality applies only to drawing objects. It does not apply to
features from a feature source.
Respond to the prompts:
Enter new value for MAPUSEMPOLYGON:
Do one of the following:
■Enter ON to turn on the use of mpolygons. Polygons imported into
AutoCAD Map 3D are created using the polygon object.
■Enter OFF to turn off the use of mpolygons. Polygons imported into
AutoCAD Map 3D are creating using the polyline object.
MAPMPEDIT (Edit Polygon command)
Use this command to modify a polygon object.
To add boundaries (page 963)
To edit nodes on a boundary (page 965)
To edit the fill property for the polygon object (page 966)
To edit nodes on a boundary (page 965)
At the Command prompt, enter mapmpedit.
NOTE This functionality applies only to drawing objects. It does not apply to
features from a feature source.
You can add, delete, and move polygon boundaries, edit nodes, convert a
boundary to an object, change a boundary type, change the fill color or pattern,
and rebalance the polygon.
Respond to the prompts:
1818 | Chapter 31 Polygon Object Dialog Boxes
Select polygon:
Use any object selection method.
Enter an option [Add/Delete/Move/Edit/disConnect/Boundary
type/Fill/Rebalance/eXit]:
Enter the letter of the option you want.
Add
Enter a to add a boundary to the polygon. Respond to the prompt:
Select new boundary:
Select the object to use as the new boundary. The object can be a polygon,
rectangle, circle, or another mpolygon.
The new boundary is added to the polygon.
Delete
Enter d to delete a boundary from the polygon. Respond to the prompt:
Select boundary:
Select the boundary to delete from the current polygon. If it is a complex
polygon, you can select additional boundaries. When you finish, press
Enter.
The selected boundaries are deleted from the polygon. Enter r to rebalance
the polygon.
Move
Enter m to move a boundary. Respond to the prompts:
Select boundary:
Select the boundary to move. If it is a complex polygon, you can select
additional boundaries. When you finish selecting boundaries, press Enter.
Select Basepoint or displacement:
Select the starting point for the move.
Specify second point of displacement or <use first point as displacement>:
Select the ending point for the move.
The selected boundaries are moved according to the distance and direction
between the basepoint and the second point of displacement.
Edit
Enter e to edit a boundary. Respond to the prompts:
Select boundary:
Select the boundary to edit.
MAPMPEDIT (Edit Polygon command) | 1819
Enter a node editing option [Next/Previous/Remove/Insert/Move/eXit]:
Enter the letter of the option you want.
■Enter n to move to the next node.
■Enter p to move to the previous node.
■Enter r to remove the current node. You cannot remove a node if the
resulting new line would cross another boundary in the current polygon.
■Enter i to insert a node before the current node. Note that you cannot
insert a node if the resulting new line would cross another boundary in
the current polygon.
■Enter m to move the current node. You cannot move a node so that the
current boundary crosses another boundary in the current polygon.
■Enter x to exit node-editing mode.
disConnect
Enter c to disconnect a boundary from the polygon, but preserve the boundary
object. Respond to the prompt:
Select boundary:
Select the boundary to disconnect.
The boundary is deleted from the polygon, but remains in the drawing as
a polyline or circle object.
If you disconnect a boundary that has nested boundaries, all the nested
boundaries are also disconnected.
Boundary type
Enter b to change the boundary type for a boundary. Respond to the prompts:
Select boundary:
Select the boundary whose type you want to change.
Enter boundary type [Outer/Inner/Annotation] <Outer>:
Enter o to make the selected boundary an outer boundary, enter i to the
make it an inner boundary, or enter a to make it an annotation boundary.
Annotation boundaries behave the same as inner boundaries, but have no
effect on area calculations.
Fill
Enter f to change the fill for the polygon. This displays the Polygon Fill
Properties dialog box (page 1824), where you can select a hatch pattern or a
gradient fill.
1820 | Chapter 31 Polygon Object Dialog Boxes
Rebalance
Enter r to rebalance the polygon. The polygon is rebalanced so the nesting
order follows an alternating outer/inner/outer order.
Undo
Enter u to undo the last action.
eXit
Enter x to exit the mapmpedit command.
MPSPLIT (Split Polygon command)
Use this command to split an existing polygon object into two new polygon
objects. The original polygon object is deleted.
To split a polygon object (page 969)
NOTE This functionality applies only to drawing objects. To split a polygonal
geospatial feature, see Splitting Features (page 705).
You can draw a new line to split the polygon, or you can selecting an existing
line.
The existing polygon is split into two new polygons.
MPSPLIT (Split Polygon command) | 1821
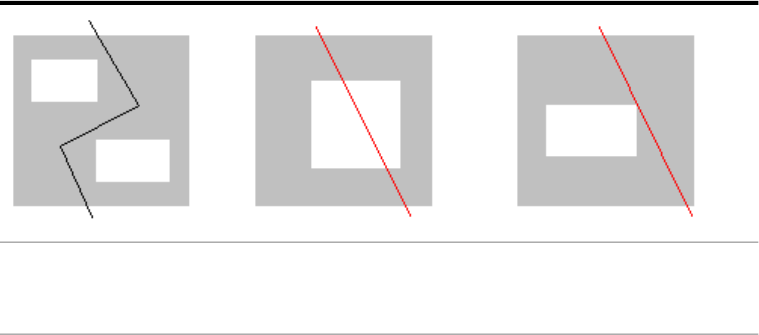
If the polygon has internal boundaries, your split line must not cross one of
the internal boundaries, nor can it touch one of the vertices of an internal
boundary.
This split is not allowed because
it touches one of the vertices of
the internal boundary.
This split is not allowed because it
crosses an internal boundary.
This split is allowed.
You can choose to copy data from the original mpolygon to the two new
mpolygons, or you can delete the data.
Respond to the prompts:
Select the mpolygon to split:
Use any object selection method.
Would you like to Draw or Select the line for split? [Draw/Select]:
Enter the letter of the option you want.
Draw
Enter d to draw the line. Respond to the prompts:
Specify start point or [eXit] <eXit>:
Select the starting point for the divider line.
Specify next point or [Arc/Undo]:
Do one of the following:
■Select the next point for the divider line.
■Enter a to draw an arc. For more information on drawing arcs, see the
AutoCAD help.
■Enter u to undo the last action.
When you finish drawing the line, press Enter.
1822 | Chapter 31 Polygon Object Dialog Boxes

Select
Enter s to select an existing polyline to use as the dividing line. Respond to
the prompts:
Select objects:
Select the polyline you want. When you finish selecting polylines, press
Enter.
Would you like to copy data from the original mpolygon to the split mpolygons?
[Yes/No]:
Do one of the following:
■Enter y to copy object data or external database links from the original
mpolygon to both of the new mpolygons.
■Enter n to delete the data.
Create Polygons From Topology dialog box
Use this dialog box to create polygons directly from a polygon topology.
To convert a polygon topology to polygons (page 974)
At the Command prompt, enter maptopologytopolygons.
NOTE This functionality applies only to drawing objects. It does not apply to
features from a feature source.
Name
Select the topology to convert. Click Load Topology to select and load the
topology if you need to.
Layer
Select the layer on which you want to place the converted polygon(s). Click
Layer Settings to create a new layer and set its properties.
Group Complex Polygons
Create a single polygon from nested polygons in the topology.
Create Polygons From Topology dialog box | 1823

Copy Object Data From Centroid
Copy object data from the topology polygons to the new polygon objects.
Copy Database Links From Centroid
Copy database links from the polygons to the new mpolygon objects.
Polygon Fill Properties dialog box
Use this dialog box to specify the fill color and pattern to use for polygon
objects. You can choose from a variety of colors including true colors and
colors from imported color books. You can also define the pattern type, pattern
properties, and attributes for hatch, solid, and gradient fill.
To edit the fill property for the polygon object (page 966)
At the Command prompt, enter mapmpedit.
NOTE This functionality applies only to drawing objects. To style polygonal
geospatial features, see Styling Area Features (page 650).
The dialog box has the following tabs:
The Hatch tab defines the appearance of the hatch pattern (or solid color) to
be used to fill polygons.
The Gradient tab defines the appearance of the gradient fill to be used to fill
polygons.
Hatch tab
Pattern Type
Select a pattern type from the following:
■Predefined — Specifies a predefined pattern.
■User Defined — Creates a pattern of lines based on the current linetype
in your drawing.
■Custom — Specifies a pattern that is defined in any custom PAT file that
you have added to the search path.
1824 | Chapter 31 Polygon Object Dialog Boxes
Pattern Name
Select from the available predefined patterns. AutoCAD Map 3D stores the
selected pattern in the HPNAME system variable. The Pattern Name option
is available only if you set Pattern Type to Predefined. Click to display
preview images for all predefined patterns at once.
Angle
Specify an angle for the hatch pattern relative to the X axis of the current
UCS.
Scale
Expand or contract a predefined or custom pattern.
Relative To Paper Space
Scale the hatch pattern relative to paper space units to display hatch patterns
at an appropriate scale for your layout. This option is available only from
a layout.
Fill Color
Click the down arrow to select from a list of colors. To choose from a greater
variety of colors, including true colors and colors from imported color books,
click Select Color.
Gradient tab
One Color
Specify a fill that uses a smooth transition between darker shades and lighter
tints of one color.
Two Color
Specify a fill that uses a smooth transition between two colors.
Color Swatch
Specify the color for the gradient fill. Click to display the Select Color
dialog box, where you can select an AutoCAD Index color, true color, or
color book color.
Shade and Tint Slider
Specify the tint (the selected color mixed with white) or shade (the selected
color mixed with black) of a color to be used for a gradient fill of one color.
Polygon Fill Properties dialog box | 1825
Centered
Specify a gradient configuration that is symmetrical. If this option is not
selected, the gradient fill is shifted up and to the left, creating the illusion
of a light source to the left of the object.
Angle
Specify the angle of the gradient fill. The specified angle is relative to the
current UCS.
Gradient Patterns
Select one of the nine fixed patterns for gradient fills.
For more information on setting hatch options, see the AutoCAD help.
1826 | Chapter 31 Polygon Object Dialog Boxes

Printing and Publishing
Dialog Boxes
Create Map Book/Edit Map Book dialog box
Use this dialog box to specify the data to use to create or edit a map book (page
2067).
To create a map book (page 1390)
To edit map book settings (page 1396)
On the Map Book tab of the Task Pane, click New ➤ Map Book.
Expand a node in the left pane of the dialog box to specify the necessary
information on the right
Source node
Create a map book from a display or model space. If your map contains
drawing objects, select Model Space to include all the objects, or Map Display
to include only objects you added in Display Manager.
■If you select Map Display, enter a name for the map book, select the display
map to use, and select a defined scale.
■If you select Model Space, enter a name for the map book.
32
1827

Sheet Template node
Click Settings to select a template file and layout to use. Indicate whether
to include a title block and adjacent sheet links. (You can include these
only if you defined placeholders for them.) By default, the scale factor is 1,
meaning a scale ratio of 1:1.
If you include a title block, specify its name. If it isn’t in the list, click
to find it. If you include adjacent sheet links, specify the name of the file
that represents the adjacent sheet.
Tiling Scheme node
Select how to specify the area to publish.
■Click By Area to calculate the number of tiles based on the map scale
and the size of the main viewport in the layout template. Select a layer
for the grid that forms the tile in your map book. If you defined a grid
layer, choose it in the list. Otherwise, enter a name for a new layer to
contain the grid. Click Select Area To Tile and draw a rectangle for the
area to include in the map book. Enter the percentage to overlap between
tiles, and specify whether to skip tiles with no contents.
■Click By Number to calculate the number of tiles based on the map scale,
the size of the main viewport in the layout template, and the specified
number of rows and columns. Specify the upper left corner and how
many columns and rows to create. Enter the percentage to overlap
between tiles, and specify whether to skip tiles with no contents. Preview
the map book to see how much of the map is included when you use
this tiling scheme.
■Click Custom to generate the tiles from the closed polylines you select.
Click Select Tiles and define the tiles. If you have already defined the
tiles in a separate layer, you can use the layer manager to turn off other
layers and window-select the tiles on your grid layer. Enter the percentage
to overlap between tiles, and specify whether to skip tiles with no
contents.
Naming Scheme node
Select how to name the tiles.
■Click Columns And Rows to name each tile with a column indicator
and a row indicator, for example, A1.
■Click Grid Sequential to number the first tile with a digit and augment
each subsequent tile number by the increment you enter. Specify the
order to go in and the increment between tile numbers.
1828 | Chapter 32 Printing and Publishing Dialog Boxes

■Click Sequential for custom tiling schemes. This option numbers only
the tiles you specified in your custom tiling scheme. Specify the order
to go in and the increment between tile numbers.
■Click Data Driven to choose an expression for your naming scheme
based on data in the map.
Key node
If you defined a keyview viewport, optionally specify what to display in it.
If you select Linked Drawing or External Reference, specify the drawing or
file to display in this viewport. If you select Layers, specify which layers will
appear in the keyview thumbnail. To use a new grid layer you created under
Tiling Scheme, click the layer icon at the top of the dialog box and type
that name in the list.
If you specify Layers, choose a small subset of layers that help the viewer
identify a specific area of the map. Too many layers will result in a crowded
and hard-to-read thumbnail.
Legend node
Optionally specify the source for a legend. If you created a display legend
in Display Manager, select Map Display. To use an area of your map as a
legend, select User Defined and click Select Modelspace Bounds to select
that area.
Sheet Set node
Create a new sheet set for this map book or make it a subset of an existing
sheet set.
Map book sheet sets are based on AutoCAD sheet sets. For more information
about AutoCAD sheet sets, type “create and manage a sheet set” on the
Search tab of the help.
Identify Map Book Template Placeholders dialog box
Use this dialog box to specify the viewport and element placeholders in the
sheet template layout for a map book (page 2067).
To identify layout placeholders (page 1388)
On the Map Book tab of the Task Pane, click Tools ➤ Identify Template
Placeholders.
Identify Map Book Template Placeholders dialog box | 1829
Layout Placeholders
Select the viewport or element to identify.
Select Placeholders
In your layout, select the viewport or element that corresponds to the item
you selected in the Layout Placeholders list.
Map Book Properties dialog box
Use this dialog box to view basic properties of a map book (page 2067).
To view map book or tile properties (page 1399)
On the Map Book tab of the Task Pane, right-click the map book name. Click
Properties.
NOTE Except for the name, these properties are strings used as field values in
sheets. They do not change the actual properties of the map book. For example,
if you change a property in this dialog box, the corresponding map book property
does not change. However, if your layout template contains a text element with
a field that references the property you changed, that text element will change.
Name
Enter a map book name.
Scale
Enter the scale used for the selected map book.
Orientation
Enter the rotation orientation of the selected map book.
Coordinate System
Enter the coordinate system, if one was specified.
Tile Count
The number of tiles in the selected map book.
1830 | Chapter 32 Printing and Publishing Dialog Boxes
Tile Properties dialog box
Use this dialog box to view basic properties of a map book (page 2067) tile.
To view map book or tile properties (page 1399)
On the Map Book tab of the Task Pane, right-click a tile name. Click Properties.
NOTE These properties are strings used as field values in sheets. They do not
change the actual properties of the tile. For example, if you change a property in
this dialog box, the corresponding tile property does not change. However, if your
layout template contains a text element with a field that references the property
you changed, that text element will change.
Name
Enter the tile name.
Adjacent Tiles
All tiles that are immediately adjacent to the selected tile.
Select Plot Set to Convert dialog box
Use this dialog box to select a plot map set to convert to a map book (page
2067).
To import a plot map set (page 1392)
On the Map Book tab of the Task Pane, click New ➤ Map Book From Plot Set.
Tile Properties dialog box | 1831
Map Information dialog box
Use this dialog box to specify the types of information to include when
publishing to DWF (page 2061)™.
To publish attribute data to DWF (page 1367)
In the Tool-based Ribbon Workspace, click Output tab ➤ Export To DWF/PDF
panel ➤ DWF/PDF Options (MAPDWFOPTIONS).
Publish Map Information
Select this option to include checked items in the list in the publish
operation. If you clear the Publish Map Information box, the options remain
checked, but they are not included in the publish operation.Check Publish
Map Information again to include them.
Properties tree
Select items to include in the publish operation. Expand a category to see
its layers, and expand a layer to see its objects. If you select an item with
sub-items, all the sub-items are automatically checked. Categories listed
here vary, depending on the contents of your map.
File icon
Specify the file for the properties.
Folder icon
Find a saved properties file to load.
NOTE If you assigned a coordinate system to your map, it is always included for
each sheet in your published DWF file, unless you clear the Export Map Properties
check box.
1832 | Chapter 32 Printing and Publishing Dialog Boxes

Plot Map Set dialog boxes
The Plot Map Set functionality has been replaced with the Map Books feature.
While you can continue to use your existing map plot sets, we recommend
that you import your plot sets into map books.
To import a plot map set (page 1392)
On the Map Book tab of the Task Pane, click New ➤ Map Book From Plot Set.
Plot Map Set dialog boxes | 1833
1834
Query Dialog Boxes
NOTE Query functionality applies only to drawing objects.
Alternate Font dialog box
Use this dialog box to specify a different font for the queried drawing object.
Use these procedures to bring drawing objects into your map (page 354)
Click Home tab ➤ Data panel ➤ Define Query.
The font specified for a queried drawing object cannot be found. Select an
alternate font to use.
Change Category dialog box
Use this dialog box to assign queries to categories.
To add a category to the query library (page 182)
Click Create tab ➤ Object Query panel ➤ Library.
33
1835
Current Category displays the name of the category the query is currently
assigned to. (If you are changing the category for multiple queries, this area
may be blank.) Select a category from the New Category list, and click OK.
The query is reassigned to the new category.
You can assign a query to only one category.
Data Condition dialog box
NOTE This functionality applies only to drawing objects.
Use this dialog box to create or modify a data condition in a query.
To retrieve drawing objects based on their object data (page 1248)
Click Home tab ➤ Data panel ➤ Define Query.
A data condition searches data that you have attached to drawing objects.
Object Class / Object Properties / Database Link / Object Data / Attribute options
Select the data to query.
■To search data associated with a object class, select Object Class. Select
an object class from the Class list. Select the property.
To search all subclasses of the selected object class, select Include
Subclasses. If this option is not selected, only data in objects tagged with
the selected object class is searched.
■To search data stored in custom objects, select Object Properties. When
selected, you can choose from a list of all object types and properties
defined either in all source drawings or in the current drawing,
depending on whether the source or current drawing is queried.
To search all subclasses of the selected object type and/or property, select
Include Subclasses. If this checkbox is cleared, the query will be limited.
Select Include Subclasses when running an Object Properties query.
■To search data in link data stored on an object, select Database Link.
Select the link template from the Link Templates list. Select the key
column. This option searches only the link data stored on objects. To
search the database table, use a SQL condition.
1836 | Chapter 33 Query Dialog Boxes

■To search data in an object data table, select Object Data. Select a table
from the Tables list. Select the object data field.
If two source drawings have a table with the same name, AutoCAD Map
3D recognizes only the fields defined in the first drawing you activate.
■To search data in a block attribute, select Attribute. Select a block from
the Blocks list. Select the attribute tag.
NOTE The lists you select from (for example the Link Templates list and the
Object Data list) display only the information available in the sources you are
querying. For example, if you are querying database links in your source
(attached) drawings, the Link Templates list displays only the link templates in
your source drawings.
Operator list
Select an operator from the list.
DescriptionOperator
The value of the selected property or data is equal to the
value you enter the Value box.
=
The value of the selected property or data is greater than
the value you enter the Value box.
>
The value of the selected property or data is greater than
or equal to the value you enter the Value box.
>=
The value of the selected property or data is less than the
value you enter the Value box.
<
The value of the selected property or data is less than or
equal to the value you enter the Value box.
<=
The value of the selected property or data is not equal to
the value you enter the Value box.
<>
NOTE If you are querying database link data, only the = (equals) operator is
available.
Value box
Specify the value to search for. You can use Wildcard Characters (page 1537).
Data Condition dialog box | 1837
To enter a value that includes a comma, such as an RGB color or a Colorbook
color, enclose the value in double quotes, for example, "255,255,255" or
"PANTONE(R) process coated,PANTONE Process Cyan C".
Define New Category dialog box
Use this dialog box to create a new category in the Query Library.
To add a category to the query library (page 182)
Click Create tab ➤ Object Query panel ➤ Library.
Enter a new name in the New Category Name box. Click OK. Category names
cannot contain any spaces.
Define Query dialog box
NOTE This functionality applies only to drawing objects.
Use this dialog box to define, modify, save, load, or execute queries.
To create a query to retrieve information from attached drawings (page 1237)
Click Home tab ➤ Data panel ➤ Define Query.
The dialog box settings reflect the properties of the current query. If you
change a setting, you modify the current query. If you load a query from the
query library or from a file, you replace the current query.
Press either Execute Query or OK:
Execute Query
Save dialog box settings and execute the current query.
1838 | Chapter 33 Query Dialog Boxes

OK
Save dialog box settings without executing. Click OK to create an element
for the Display Manager.
NOTE You can set several query options. See the Query tab of the AutoCAD
Map Options dialog box (page 1908).
Current Query
This area shows the conditions in your current query. You can edit, group, or
delete the conditions.
Current Query List
View all conditions in the current query. If conditions have been grouped,
the group is indented and enclosed within parentheses. (Conditions in a
group are evaluated before conditions outside the group.)
■To edit a condition, select it. Click Edit.
■To group conditions, select the first and last condition that you want
in the group. Click Group.
■To delete a condition, select it. Click Delete.
Edit
Edit the selected condition.
If you select more than one condition, Edit is unavailable.
You can also edit a condition by double-clicking it in the list.
Group
Group the selected conditions.
When you run the query, conditions inside the group are evaluated before
conditions outside the group.
The easiest way to specify a group is to select the first and last conditions
in the group and click Group. All conditions between the first and the last
selected conditions are included in the group and enclosed within
parentheses.
You can nest groups.
Ungroup
Ungroup the selected group.
To ungroup conditions, select the first or last condition in the group. Click
Ungroup.
Delete
Deletes the selected query condition.
Define Query dialog box | 1839
Clear Query
Delete all conditions in the list.
Clearing the query does not remove settings from the Set Property
Alterations dialog box or from the Output Report Options dialog box.
Query type
Use this area to create conditions for your query.
And/Or/Not options
Determine how the condition is combined with other conditions.
And specifies that both conditions must be met for the object to be included
in the query.
Or specifies that either condition can be met for the object to be included
in the query.
And Not specifies that the first condition must be met and the second
condition must not be met for the object to be included in the query.
Or Not specifies that either the first conditions can be met or the second
condition cannot be met for the object to be included in the query.
Location
Display the Location Condition dialog box (page 1849), where you can define
a condition based on the location of the object in relation to points you
specify.
For example, search for all objects that fall inside a circle or that cross a
line.
Property
Display the Property Condition dialog box (page 1855), where you can define
a condition based on the object's properties.
For example, search for all objects on a specified layer, all objects of a certain
color, or all text in a certain text style.
Data
Display the Data Condition dialog box (page 1836), where you can define a
condition based on object data attached to an object.
For example, if you attach a field named Pipe Diameter to several objects,
you can search for all objects where that field has a value of 10" or more.
For more information on defining and attaching data, see Creating an Object
Data Table (page 200) and Entering and Editing Object Data (page 1061).
SQL
Display the SQL Link Condition dialog box (page 1866), where you can define
a condition based on the external data linked to an object.
1840 | Chapter 33 Query Dialog Boxes

For example, if you are trying to determine the best location for a new park
and you have linked data from a table containing information about the
households, you can search for all parcels where the household has young
children.
NOTE Before you execute a query with a SQL condition, be sure the appropriate
data source is attached and connected.
Query mode
Specify the type of query to run. If you are creating an element for the Display
Manager, Draw is the only available option.
Preview
Preview the objects that match the query conditions, but don't actually pull
the objects into the current drawing.
When you redraw the screen, the objects will be gone. Property alterations
do not appear in a Preview mode query.
Draw
Get the objects that match the query and bring them into the current
drawing. If you are creating an element for the Display Manager, this option
gets the objects and adds them to the element.
If a property alteration has been defined, objects are modified as they are
copied into the current drawing.
You must have Draw Query privileges to perform a draw query. See To add
a new user (page 83).
Report
Execute the query and save the results in a report file.
To specify a template for the report, click Options to display the Output
Report Options dialog box (page 1852).
Property alterations are not reflected in the report.
Options
Display the Output Report Options dialog box (page 1852), where you specify
a template for the report. The Options button is available only if Report
query mode is selected.
NOTE For topology queries, the Options button is available with both Draw
and Report query modes.
Options
Set property alterations, save the query to execute later, load a query you
previously saved, redraw the screen, or set options.
Define Query dialog box | 1841

If you are creating a element for a display map, not all of the options are
available.
Alter Properties check box
Determines whether the query executes the property alteration. If this is
not selected, property alterations are ignored when you execute the query.
Alter Properties button
Display the Set Property Alterations dialog box (page 1863), where you specify
how to modify objects that are found by the query.
Save
Display the Save Current Query dialog box (page 1862), where you save the
current query so you can run it later.
Load
Display the Load Internal Query dialog box (page 1848), where you load a
query that you previously saved.
Redraw <
Redraw the screen to clear any previews.
Zoom Ext <
Display the Zoom Drawing Extents dialog box (page 2014), where you select
any active drawings in your drawing set. AutoCAD Map 3D then zooms the
screen to the extents of the selected drawings.
Drawings
Display the Define/Modify Drawing Set dialog box (page 1918), where you
can change which drawings are attached to the current drawing, and which
drawings are active for queries.
More
Display the Query tab of the AutoCAD Map Options dialog box (page 1908),
where you change query options such as whether searches are case sensitive
and whether to preview text as an insertion point.
Define Range Table dialog box
NOTE This functionality applies only to drawing objects.
1842 | Chapter 33 Query Dialog Boxes

Use this dialog box to create, rename, or delete range tables.
To create a range table (page 1272)
Click Home tab ➤ Data panel ➤ Define Query.
A range table specifies a range of actions to take depending on the actual value
of object data or properties associated with drawing objects.
■For property alteration, specify different alterations for a property
depending on the value of the property. For example, you could specify
that all buildings under two stories be colored blue, all buildings two stories
to ten stories be colored green, and all buildings above ten stories be colored
red.
■For an output report, specify different actions to take depending on the
value of the data. For example, you could specify that if a lot is valued at
less than $10,000, report the value in the Land Value A column of your
database; if the lot is valued at over $10,000, report the value in the Land
Value B column.
Create range tables and save them with the current drawing to use again.
Range Table area
Select an existing table, rename a table, create a new table, or delete a table.
Range Table list
View all tables in the current drawing.
To view tables, click the down arrow. Select a table.
Rename
Display the Rename Range Table dialog box (page 1860), where you can specify
a new name for the current range table.
New
Display the New Range Table dialog box, where you can save the current
table definitions to a new range table.
Remove
Remove the current range table.
Do not delete a range table used by your queries.
Define Range Table dialog box | 1843
Current Range Table Definition area
Use this area to view, edit, or delete rows in the range table.
Current Range Table Definition list
View all rows in the current range table.
To edit or delete a row, select the row and click Edit or Delete.
Edit
Copy the selected row to the Condition section of the dialog box, where
you can modify it.
When you finish modifying the condition, click Add To List to update the
row in the Current Range Table Definition list.
Delete
Delete the selected row.
Clear List
Delete all rows from the current range table.
Expressions in the Current Range Table Definition list are evaluated from
top to bottom, that is, in the order you enter them. As soon as one condition
is evaluated as TRUE, AutoCAD Map 3D stops evaluating, ignores the
remaining expressions, and returns the value associated with the TRUE
condition in the range table.
For example, assume you enter the following expressions:
If < 0 Return: Low
If < 15 Return: Medium
If < 30 Return: High
If < 45 Return: Very High
With a value of 20, the first condition evaluates to FALSE because 20 is not
less than 0. The second condition also evaluates to FALSE since 20 is not
less than 15. However, the third condition evaluates to TRUE since 20 is
less than 30, and the value returned by the range table is High. The last
condition, although TRUE, is ignored.
Condition area
Edit an existing row, or create a new one.
■To edit an existing row, select the row in the Current Range Table
Definition list and click Edit. When you finish, click Update.
■To create a new condition, select an operator, specify an expression and
a return value, and click Add.
1844 | Chapter 33 Query Dialog Boxes
Operator list
Select an operator from the list.
DescriptionOperator
The value of the selected property or data is equal to the value
you enter the Value box.
=
The value of the selected property or data is greater than the
value you enter the Value box.
>
The value of the selected property or data is greater than or equal
to the value you enter the Value box.
>=
The value of the selected property or data is less than the value
you enter the Value box.
<
The value of the selected property or data is less than or equal to
the value you enter the Value box.
<=
The value of the selected property or data is not equal to the value
you enter the Value box.
/=
Specify the action to take none of the preceding conditions are
met.If you include an OTHERWISE condition, it must be at the
end of the list.
OTHERWISE
Expression Value box
Enter a simple expression.
If an object matches the value of this expression, the object is affected by
the return value.
Return Value box
Specify a return value for this condition.
The return value specifies what happens if the object matches the expression.
Enter a value or a simple expression. Do not enter a compound expression.
Add
Add the current condition to the Current Range Table Definition list.
Update
Update the selected condition in the Current Range Table Definition list
with the current condition.
Define Range Table dialog box | 1845

Define Text dialog box
Use this dialog box to specify text to add to all drawing objects found by the
query.
To add text to retrieved drawing objects (page 1278)
Click Home tab ➤ Data panel ➤ Define Query.
Text Value
Specify the text to add.
Enter the text, or choose a variable by clicking Expression.
■If you enter text in the box, that text is added to each object.
■If you choose a variable, the text for each object is based on the value
of the variable.
For example, if you choose the property Elevation, the elevation is added
as text to each retrieved object.
If select a field from an object data table, the value in that field is added to
each object. If an object does not have a record attached from the selected
table, no text is added to the object.
Text Height
Specify a text height.
If none is specified, text uses the AutoCAD Map 3D default text height.
Insert Point
Specify an insertion point for the text.
Centroid
Insert text at the centroid of the object.
Labelpt
Insert text at the label point of the object.
The default location for the label point is the centroid of the object. To
change the location of the label point, use the ADETEXTLOC command.
1846 | Chapter 33 Query Dialog Boxes

Justification
Specify the justification for the text. The list displays options for center,
middle, and right, or combinations of these with top (T), middle (M), and
bottom (B).
Text Style
Enter a text style, or click Styles to select from a list of styles in the active
drawings.
Layer
Enter a layer for the text, or click Layers to select from a list of layers in the
active drawings. If you enter a new layer name, the layer is created. To easily
hide or delete text, insert it on its own layer.
Color
Specify a color for the text.
Enter a color name, or click Color Palette to select a color.
Rotation
Enter a rotation value. Enter 0 for no rotation.
For example, enter 90 to rotate objects 90 degrees in the current direction.
(Use the DDUNITS command to view or change the current direction.)
For each option, enter a value in the box, enter an expression or variable, or
select a value. For information on expressions and variables, see Expression
Evaluator (page 1541).
Hatch Options dialog box
Use this dialog box to add a hatch pattern to drawing objects found by the
query.
To fill queried drawing objects with a hatch pattern (page 1283)
Click Home tab ➤ Data panel ➤ Define Query.
Pattern
Enter a hatch pattern, click Patterns to select from a list of hatch patterns
defined in the active drawings, or click Expression to use an expression to
Hatch Options dialog box | 1847
specify the hatch pattern. If you leave the box empty, AutoCAD Map 3D
uses a solid fill.
The box displays the selected hatch option. ISO hatch patterns are not
displayed.
Scale
Specify a scale for the pattern. A small scale creates a smaller pattern and
takes longer to display and print.
Rotation
Enter the rotation. Enter 0 for no rotation.
For example, enter 90 to rotate objects 90 degrees in the current direction.
(Use the DDUNITS command to view or change the current direction.)
Layer
Enter a layer for the hatch, or click Layers to select from a list of layers in
the active drawings. If you enter a new layer name, the layer is created.
To easily hide or delete the hatch, insert it on its own layer.
Color
Specify a color for the hatch.
Enter a color name, or click Color Palette and select a color.
For each option, enter a value in the box or enter an expression or variable.
For example, to use a hatch pattern specified in the Hatch field of the Design
object data table, enter :hatch@design. For information on expressions and
variables, see Expression Evaluator (page 1541).
You can set an option to determine whether the hatch object created by this
command is associative. See the Query tab of the AutoCAD Map Options
dialog box (page 1908) and To have hatch created by property alteration be
associative (page 247).
NOTE Use the DRAWORDER command to display objects on top of the hatch.
Load Internal Query dialog box
NOTE This functionality applies only to drawing objects.
Use this dialog box to load a previously saved query.
To create a query to retrieve information from attached drawings (page 1237)
1848 | Chapter 33 Query Dialog Boxes
Click Home tab ➤ Data panel ➤ Define Query.
The definition of the loaded query appears in the Define Query dialog box.
Depending on the options you specified when you saved the query, it may
change the active drawings or load property alteration settings. You can modify
the query or click Execute Query to execute the query.
Category list
Select a category to save your query in.
Use categories to organize queries. (When you run a query, you first select
a category, and then see all the queries in that category.)
If you have only a few queries, you can save them all in the same category.
Queries list
View all the queries assigned to the selected category.
To load a query, choose it from the list. Click OK.
Selected Query display
View the name and description of the selected query.
Location Condition dialog box
NOTE This functionality applies only to drawing objects.
Use this dialog box to create or modify a location condition in a query.
To retrieve drawing objects based on their location (page 1241)
Click Home tab ➤ Data panel ➤ Define Query.
A location condition finds drawing objects based on location relative to a
specified boundary. You can specify whether objects must be completely inside
the boundary or have any part inside the boundary.
For blocks or text objects, you can specify if their location is determined by
their insertion point or their bounding box. For hatch, solid, and raster objects,
Location Condition dialog box | 1849
you can specify if their location is determined by their area or their boundary.
See the Query tab of the AutoCAD Map Options dialog box (page 1908).
Location Coordinates
View the coordinates for the current location condition.
Define <
View your current drawing, where you can specify the points to define the
boundary.
Show <
View the boundary of the condition you are editing.
To change the colors used to display the boundaries, use the Query tab on
the AutoCAD Map Options dialog box.
Boundary Type
Select a boundary type.
All
Retrieve all objects in the active drawings.
Buffer Fence
Retrieve all objects within a specified distance from a fence.
Select a selection type. Click Define to define the fence and the distance.
First Point Enter the X,Y coordinates of the first point of the buffer fence,
or select the point.
Next Point Enter the X,Y coordinates of the next point of the buffer fence,
or select the point. Press Enter when done entering points.
Bufferfence Width Enter the width of the buffer fence in the current unit.
Circle
Retrieve all objects in a defined circle.
Select a selection type. Click Define to define the circle.
Center point Enter the X,Y coordinates of the center of the circle, or select
the point.
Radius Enter a number in the current unit.
Fence
Retrieve all objects that cross a defined line.
Select a selection type. Click Define to define the fence.
A fence does not need to be closed and can cross itself.
First Point Enter the X,Y coordinates of the first point of the fence, or select
the point.
Next Point Enter the X,Y coordinates of the next point of the fence, or select
the point. Press Enter when done entering points.
1850 | Chapter 33 Query Dialog Boxes

Point
Retrieve all areas that surround a selected point.
Click Define to select the point.
Coordinates of Point Enter the X,Y coordinates of the point, or select the
point.
Polygon
Retrieve all objects in a defined polygon.
The polygon can be any shape, but cannot cross or touch itself. If you do
not close the polygon, AutoCAD Map 3D connects the final point to the
first point to create a closed polygon.
Select a selection type. Click Define to define the polygon.
First Point Enter the X,Y coordinates of the first point of the polygon, or
select the point.
Next Point Enter the X,Y coordinates of the next point of the polygon, or
select the point. Press Enter when done entering points.
Polyline
Retrieve all objects that cross an existing polyline.
Select a selection type, select a polyline mode. Click Define to select the
polyline.
Select Polyline Select a polyline, line, or arc. If you selected the Polygon
polyline mode, you can select only a polyline.
Bufferfence Width Enter the width of the buffer fence in the current unit.
(This prompt appears only if you select the Buffer Fence polyline mode.)
Window
Retrieve all objects in a specified window.
Select a selection type. Click Define to define the window.
First Corner Enter the X,Y coordinates of the first corner of the window, or
select the point.
Other Corner Enter the X,Y coordinates of the opposite corner of the
window, or select the point.
Selection Type
Inside
Find only objects that are completely within the boundary.
Crossing
Find objects that are completely within or crossing the boundary.
NOTE When you perform location queries close to blocks or text objects, be
aware that the bounding box for these objects can extend significantly beyond
the extents of the objects. You can set an option to retrieve objects based on
Location Condition dialog box | 1851
their bounding box or their insertion point. See AutoCAD Map Options dialog
box (page 1908).
Polyline Mode
If you select a polyline boundary, select the mode to define the polyline border.
Polygon
Close the polyline to create a polygon. If the polyline contains arcs,
AutoCAD Map 3D connects the ends of the arcs with a straight line.
Fence
Retrieve all objects that cross the polyline.
Buffer Fence
Retrieve all objects within a specified distance from the polyline.
New Range Table dialog box
Use this dialog box to name a new range table.
To create a range table (page 1272)
Click Home tab ➤ Data panel ➤ Define Query.
Enter a name for the new range table.
Output Report Options dialog box
NOTE This functionality applies only to drawing objects. Reports will include
information about drawing objects only.
Use this dialog box to specify the name for your report file, and to define a
template for the file.
To create a report template (page 1479)
1852 | Chapter 33 Query Dialog Boxes

Click Home tab ➤ Data panel ➤ Define Query.
An output report lists information about drawing objects that were found by
a query of an attached drawing file. This information can include properties
(such as layer, color, or object type), data attached to the object, or data linked
to the object from an external database. You set up expressions to limit the
objects found to those that match specific criteria. For example, you can create
a query that finds all structures larger than a certain size, and then prints a
report listing the object type and size. You can also include information from
sub-objects.
To specify which information you want in the report, create a template.
Report Template area
Report Template list
View all expressions in the current template. New expressions are added to
the bottom of the list, unless an expression in the list is selected, and then
the new expression is added above that expression.
Edit
Select an expression in the Report Template list and click Edit to copy it to
the Expression box, where you can modify it. When you finish modifying
the expression, click Update.
Delete
Select an expression in the Report Template list and click Delete to remove
it.
Clear List
Erase the entire report template.
Expression area
Create a new expression or modify an existing one.
Expression box
Enter an expression to add to the template or edit an existing expression.
To create an expression, specify the variable that represents the information
to include in the report and click Add.
To select from a list of available variables, click Expression.
Output Report Options dialog box | 1853

Expression
Display the Expression dialog box (page 1807), which lists all drawing object
properties, object classes, object data, and external data in the drawing you
are querying.
Range list
View the current range table.
To see a list of all range tables defined in the drawing you are querying,
click the down arrow.
Ranges
Display the Define Range Table dialog box (page 1842), where you can create
a new range table.
Add
Add the current expression to the Report Template list.
Update
Update the edited expression in the Report Template list.
Output File Name area
Enter the path and file name for the report or click Browse to choose one.
Unless you specify otherwise, the file name extension is .txt. The output
file is in text format regardless of the file name extension you use.
Process Sub-Objects
If you do not select this option, the output report contains information
about the selected object, but not its component parts.
For example, select this option to print information for all points in a
polygon. If the option is not selected, the output report will contain
information for only the first point.
The following table shows the information included in a topology query,
depending on whether you select Process Sub-Objects or not.
SelectedNot selectedTopology type
Nodes, objects, and object dataNodesNode topology
Links, start and end node dataLinksNetwork topology
Centroids, links, and nodesCentroidsPolygon topology
Apply Transformation
If objects from the drawing you are querying have been transformed using
a coordinate system transformation or a simple offset, scale, or rotate
1854 | Chapter 33 Query Dialog Boxes

transformation, check this option to have the report query evaluate the
transformed objects.
If you do not select this option, the report query evaluates only the
untransformed objects in the drawing.
Property Condition dialog box
NOTE This functionality applies only to drawing objects.
Use this dialog box to create or modify a property condition in a query.
To retrieve drawing objects based on their properties (page 1244)
Click Home tab ➤ Data panel ➤ Define Query.
A property condition finds drawing objects based on a property, such as color,
layer, length, or text style.
Select Property Area
Specify the property to search for.
Area
Retrieve objects based on their area.
Area only works on circles, ellipses, polylines, splines, regions, and solids.
It does not work on objects created from line segments. For example, Area
will not work on a rectangle created of four separate lines.
Block Name
Retrieve objects based on their block name.
To select from a list of block names in the active drawings, click Values.
Color
Retrieve objects based on their color.
To select a color, click Values.
Elevation
Retrieve objects based on their elevation.
Elevation is the Z value from the XY plane where the object is defined.
Property Condition dialog box | 1855

Object Type
Retrieve objects based on their type.
To select from a list of types in the active drawings, click Values.
If an object type, does not appear on the list, it may be a custom object. To
add a custom object to the list, run a command that will load the object's
dbx.
NOTE To specify a polyline object type, enter 2Dpolyline or 3Dpolyline.
Group
Retrieve objects based on the groups they are members of.
To select from a list of groups in the active drawings, click Values.
The group is not maintained in the current drawing.
Layer
Retrieve objects based on their layer.
To select from a list of layers in the active drawings, click Values.
Length
Retrieve objects based on their length.
Linetype
Retrieve objects based on their linetype.
To select from a list of linetypes, click Values.
If the linetype is not loaded in the current drawing, the objects will appear
with a CONTINUOUS linetype.
Text Style
Retrieve objects based on their text style.
To select from a list of text styles, click Values.
Text Value
Retrieve objects based on their text value.
To set an option for case-sensitive match for text values, use the Query tab
of the AutoCAD Map Options dialog box (page 1908).
Thickness
Retrieve objects based on their thickness.
Thickness is the distance an object is extruded above or below its elevation.
Object Class
Retrieve objects based on their object classification.
To select from a list of object classes, click Values.
Select Include Subclasses to return all objects tagged with the selected object
class and all objects tagged with any subclasses of the selected object class.
1856 | Chapter 33 Query Dialog Boxes
If the option is not selected, the query returns only objects tagged with the
selected object class.
Lineweight
Retrieve objects based on their lineweight.
To select from a list of lineweights, click Values.
Plotstyle
Retrieve objects based on their plot style.
To select from a list of plot styles, click Values.
Operator list
Select an operator from the list.
The value of the selected property or data is equal to the value you
enter the Value box.
=
The value of the selected property or data is greater than the value you
enter the Value box.
>
The value of the selected property or data is greater than or equal to
the value you enter the Value box.
>=
The value of the selected property or data is less than the value you
enter the Value box.
<
The value of the selected property or data is less than or equal to the
value you enter the Value box.
<=
The value of the selected property or data is not equal to the value you
enter the Value box.
<>
If you selected Layer, Object Classname, or Plotstyle as the property, =
(equal) is the only available operator.
Value box
Specify the value to find.
To specify more than one value, separate each value with a comma. The
query will find objects that match any of the values.
You can use wild-card characters for: Block Name, Object Type, Group,
Layer, Linetype, and Text Style.
To select values from a list, click Values.
Property Condition dialog box | 1857
Values
Display a list of values defined for the property in any of the active drawings
attached to this drawing.
Select values from the list.
NOTE For topology queries, some of the options are different. For more
information on querying a topology, see To query a topology (page 1353).
Query Library Administration dialog box
NOTE This functionality applies only to drawing objects.
Use this dialog box to rename, create, or delete query categories, to move a
query from one category to another, to change a query description, to attach
queries from external files, or to delete queries you no longer use.
To add a category to the query library (page 182)
Click Create tab ➤ Object Query panel ➤ Library.
Category
Use this area to select, rename, create, or delete a category.
Category list
View all query categories in the current drawing.
Select a category. The Available Queries list updates to show all queries in
the selected category.
Rename
Display the Rename Category dialog box (page 1860), where you rename the
current category.
New
Display the Define New Category dialog box (page 1838), where you create a
new category.
Remove
Delete the current category.
1858 | Chapter 33 Query Dialog Boxes
You can remove a category only if it has no queries assigned to it. To delete
a category that still has queries in it, you must first delete the queries or
assign them to new categories (by clicking Category).
Available Queries
Delete queries or assign them to new categories.
Available Queries list
View all queries in the current category.
To view additional queries, select a different category from the Category
list.
Delete
Delete the selected queries.
Select All
Highlight all queries in the list.
Clear All
Remove the highlighting from all queries in the list.
Category
Display the Change Category dialog box, where you move the query to a
different category.
A query can be assigned to only one category.
Selected Query
Use this area to add an external query to the current drawing, or to view
information about the selected query in the Available Queries list.
To add an external query, select External from the Query Type list. (You may
need to erase the query Name first.) Specify the path and file name for the
external query in the File Name box. Once the external query is found, you
can modify its name or description. Click Add to add the query to the current
category.
To modify information about an existing query, select it in the Available
Queries list and change any information you want. When you finish, click
Update. To assign a query to more than one category, copy the query by
selecting it in the Available Queries list. Enter a new name for the query, click
Add and assign the new query to a different category.
Name box
Specify a name for the query.
A query name must be unique in the current drawing.
Query Library Administration dialog box | 1859
Description box
Specify a query description.
File Name box
If the query is external, specify the path and file name for the file where
the query is stored.
Query Type list
Specify internal (the query is stored with the current drawing) or external
(the query is saved in a separate file).
Add
Add the query to the Available Queries list for the current category.
Update
Update the existing query in the Available Queries list.
Rename Category dialog box
Use this dialog box to rename a category in a Query Library.
To add a category to the query library (page 182)
Click Create tab ➤ Object Query panel ➤ Library.
The Current Category Name area displays the current name of the category.
Enter a new name and click OK. Category names cannot contain any spaces.
All queries assigned to the previous category name are assigned to the new
name. The old category name no longer exists.
Rename Range Table dialog box
Use this dialog box to rename a range table.
To create a range table (page 1272)
1860 | Chapter 33 Query Dialog Boxes
Click Home tab ➤ Data panel ➤ Define Query.
The Current Range Table Name area shows the current name for the range
table. Enter a new name in the New Range Table Name box.
NOTE If you have any queries that use the current table name, edit those queries
to use the new table name.
Run Library Query dialog box
Use this dialog box to run a query you saved to the Query Library.
To run a query from the Query Library (page 178)
Click Create tab ➤ Object Query panel ➤ Run.
Select a query from the query library. Click Run Query. To view queries from
a different category, select the category from the Category list. You can run
queries that have been saved with the current drawing or external queries that
have been added to the library.
Category list
Select a category to save your query in.
Use categories to organize queries. (When you run a query, you first select
a category, and then see all the queries in that category.)
If you have only a few queries, you can save them all in the same category.
Queries list
Lists all the queries assigned to the selected category.
To load a query, choose it from the list. Click OK.
Selected Query display
View the name and description of the selected query.
Run Library Query dialog box | 1861
Save Current Query dialog box
NOTE This functionality applies only to drawing objects.
Use this dialog box to save your current query. Once a query is saved, you can
run it again later.
To save a query (page 177)
Click Create tab ➤ Object Query panel ➤ Library.
Category List
Select a category to save your query in.
Use categories to organize queries. (When you run a query, you first select
a category, and then see all the queries in that category.)
If you have only a few queries, you can save them all in the same category.
New Category
Display the Define New Category dialog box where you can create a new
query category.
Name
Enter a name for the query. Query names cannot contain any spaces. Each
query name must be unique.
Description
Enter a description for the query. Use a description that will help you
remember the query when you look for it later.
Save to External File
Save the query to an external file instead of in the current drawing.
Specify a name for the file.
If you want the query description to appear in the current drawing query
library, select Keep Reference In Library.
File name
Specify a name for the external file where you want to save the query. To
select a different directory, click .
Each external query must be saved in a separate file.
1862 | Chapter 33 Query Dialog Boxes
Keep Reference In Library
If you save the query to an external file, select this check box to list the
query description along with other queries in this drawing's query library.
Save List of Active Drawings
If this box is selected, the saved query specifies which drawings in the
drawing set will be active when the query is executed.
If the box is not selected, the query searches whatever drawings are active
when you execute the query.
Save Location Coordinates
If this box is selected, the coordinates for any location conditions are saved
with the query.
If the box is not selected, you will need to specify the coordinates when
you execute the query.
Save Alter Properties
If this box is selected, property alteration specified in the Set Property
Alterations dialog box are saved with the query.
If the box is not selected, the property alterations are not saved with the
query.
Auto Execute
If this box is selected, when you run the saved query, it is automatically
executed.
If the box is not selected, the query is loaded as the active query, but is not
executed until you click Execute Query in the Define Query dialog box.
If you save the query to an external file and do not keep a reference in the
current drawing library, you do not need to provide a name or description for
the query.
Set Property Alterations dialog box
NOTE This functionality applies only to drawing objects.
Use this dialog box to specify how drawing objects found in a query will be
modified as they are brought into the current drawing.
To modify objects as they are retrieved by a query (page 1259)
Set Property Alterations dialog box | 1863
Click Home tab ➤ Data panel ➤ Define Query.
You can alter object properties such as color, layer, block name, or thickness,
or you can add text to objects. In addition, you can create a range table that
modifies objects in different ways based on where they fall in a range of values.
Property alteration is a fast way to modify a group of objects. For example,
make objects stand out in their source drawings by adding color or hatch,
move a group of objects to a new layer, or add informational text.
NOTE To have a property alteration take effect, execute a Draw mode query.
Property alterations do not work in Preview or Report mode queries.
To save property alterations back to source drawings, add the objects to the
save set.
Current Property Alterations list
View all expressions in the property alteration list.
Edit
Copy the selected expression to the expression section of the dialog box,
where you can modify it.
Delete
Delete the selected expression.
Clear List
Remove all expressions from the Current Property Alterations list.
Select Property area
Select the property to alter.
To change the color of retrieved blocks, the color of the components of the
source drawing block must be BYBLOCK. Otherwise, the block retains its
original colors.
Color alterations on a bitonal raster image affect both the image and the
boundary. On multiple color raster images, the alteration affects only the
boundary.
Properties
Select the property to alter.
1864 | Chapter 33 Query Dialog Boxes
Text
Display the Define Text dialog box, where you specify text to add, and its
height, insertion point, justification, text style, layer, color, and rotation.
Hatch
Display the Hatch Options dialog box, where you specify the hatch to add.
Expression area
Use this area to create or modify an expression that defines how you want
to alter a property on objects that are found by the query.
To modify an existing expression, select it in the Current Property Alterations
list. Click Edit. When you finish modifying the expression, click Update.
To create a new expression, enter the expression in the Expression box. Use
Values, Property, Data, and SQL to help you create the expression. When
you are done, click Add.
Each expression must list the property to modify, and how to modify it. To
modify objects based on where they fall in a range of values, select an
existing range table from the Range list, or create a new table using the
Ranges.
Expression box
Enter the expression to add to the Current Property Alterations list.
Range list
Display the current range table.
To see a list of all range tables defined in the current drawing, click the
down arrow.
Ranges
Display the Define Range Table dialog box (page 1842), where you can create
a new range table.
Add
Add the current expression to the Current Property Alterations list.
Update
Update the edited expression in the Current Property Alterations list.
Values
For the property selected in the Select Property area, display all values in
the active drawings.
Expression
Display the Expression dialog box (page 1807), which lists all properties, object
data fields, and SQL link template fields in the active source drawings.
Set Property Alterations dialog box | 1865
SQL Condition History dialog box
Use this dialog box to copy a condition to your current SQL query.
To retrieve drawing objects based on linked SQL data (page 1253)
Click Home tab ➤ Data panel ➤ Define Query.
This dialog box lists the SQL conditions specified in this drawing. Each line
includes the link template and the condition.
To copy a condition from this list to your current SQL query, select the
condition. Click OK.
Clear History
Remove all SQL conditions from the list.
To specify a maximum length for this list, use the Data Source tab of the
AutoCAD Map Options dialog box (page 1908).
SQL Link Condition dialog box
NOTE This functionality applies only to drawing objects.
Use this dialog box to create or modify a SQL condition in a query.
To retrieve drawing objects based on linked SQL data (page 1253)
Click Home tab ➤ Data panel ➤ Define Query.
A SQL condition searches for objects based on data in an external database.
(Use the Map Database commands to link external data to objects.)
NOTE Before you execute a query with a SQL condition, be sure the appropriate
data source is attached and connected.
1866 | Chapter 33 Query Dialog Boxes
To create a SQL condition, specify the link template. Specify the column to
check and the value for the column.
Build a SQL condition using this dialog box, or type a condition by choosing
Type It.
Current SQL Condition area (SQL Link Condition)
This area displays the current SQL condition. You can add, delete, or edit any
line in the condition.
Current SQL Condition list
View the current SQL condition.
If lines in the condition have been grouped, the group is indented. (Lines
in a group are evaluated before lines outside the group.)
Edit
Copy the selected line to the Condition section so you can edit it.
Group
Group the selected lines.
Select the first and last lines that you want in the group. Click Group.
When you run the query, lines inside the group are evaluated before the
rest of the condition.
Ungroup
Delete the parentheses from the selected line and from the matching ending
or beginning line of the group.
Delete
Remove the selected line from the condition.
Clear All
Remove all lines from the current SQL condition.
Condition area (SQL Link Condition)
Edit an existing line in the condition or add new lines.
To edit an existing line, select the line in the Current SQL Condition list. Edit
the information in the Condition area. Click Update.
To add a new line, select the operator (And/Or/Not). Select a column and an
operator and specify a value. Click Add Condition.
And/Or/Not options
Determine how the condition is combined with other conditions.
SQL Link Condition dialog box | 1867

And specifies that both conditions must be met for the object to be included
in the query.
Or specifies that either condition can be met for the object to be included
in the query.
And Not specifies that the first condition must be met and the second
condition must not be met for the object to be included in the query.
Or Not specifies that either the first conditions can be met or the second
condition cannot be met for the object to be included in the query.
Column list
Select a column from the list.
The list displays columns from the current table.
Operator list
Select an operator from the list.
DescriptionOperator
The value of the selected property or data is equal to the value
you enter in the Value box.
=
The value of the selected property or data is greater than the
value you enter in the Value box.
>
The value of the selected property or data is greater than or equal
to the value you enter in the Value box.
>=
The value of the selected property or data is less than the value
you enter in the Value box.
<
The value of the selected property or data is less than or equal to
the value you enter in the Value box.
<=
The value of the selected property or data is not equal to the
value you enter in the Value box.
<>
The value of the selected property or data matches any of the
values you enter in the Value box. When you use the IN operator,
IN
you must enclose each value in single quotation marks, separate
the values with commas, and enclose the entire list in parentheses,
for example, ('1','2','3').
The value of the selected property or data is empty. Do not enter
a value in the Value box.
IS NULL
1868 | Chapter 33 Query Dialog Boxes
DescriptionOperator
The value of the selected property or data contains the value you
enter in the Value box. Applies to string (character) data types
LIKE
only. Use the percent sign (%) as a wild-card character. For ex-
ample, to retrieve all objects that have a value starting with B,
choose the LIKE operator and enter B% in the Value box. For in-
formation on the wild-card characters supported by your database
system, refer to the documentation for your database system
software.
Value box
Specify the value to search for.
The value must match the data type of the column.
If the string contains a single quotation mark, precede the single quotation
mark with another single quotation mark.
For dates, use the format TIMESTAMP'YYYY-MM-DD 00:00:00', for example,
TIMESTAMP'1993-06-20 11:24:00'.
To use wild-card characters with string values, use the LIKE operator. For
example, to retrieve all objects that have a value starting with B, choose the
LIKE operator and enter B%. Refer to the documentation for your database
software to see which wild-card characters are supported.
Add Condition
Add the condition line to the Current SQL Condition list.
The new line is added to the bottom of the list. If any line in the list is
selected, the new line is added above it.
Update
Update the selected condition in the Current SQL Condition list.
Other Controls
Link template list
Select the link template that specifies the table containing the data to use
for this query condition.
This list displays only the link templates available in the source(s) you are
querying. For example, if you are querying source (attached) drawings, the
list will display only the link templates in your source drawings. If you are
querying the current drawing, the list will display only the link templates
in the current drawing.
You can query only one link template in a SQL condition. To query a
different link template, create a new SQL condition.
SQL Link Condition dialog box | 1869
History
Display the SQL Condition History dialog box (page 1866), where you select
from a list of SQL conditions you previously added.
Type It
Display the Type SQL Condition dialog box (page 1870), where you enter your
SQL condition.
Type SQL Condition dialog box
NOTE This functionality applies only to drawing objects.
Use this dialog box to create or modify a SQL condition, if you are familiar
with SQL.
To retrieve drawing objects based on linked SQL data (page 1253)
Click Home tab ➤ Data panel ➤ Define Query.
History
To modify a condition you used previously, select it from the list. The
condition is copied to the Enter SQL Condition area, where you can modify
it.
Link Template
Select the link template that specifies the table to use with this condition.
The SQL condition tests information linked from this table to the queried
objects. Because queries apply only to objects in active source drawing, this
list displays only link templates in your source drawings.
Enter SQL Condition
To create a new condition, enter it in the box.
1870 | Chapter 33 Query Dialog Boxes
SQL Condition Syntax
SQL has a strict grammatical structure and syntax. Here are some rules to
follow when you define SQL statements.
■Character values (data type CHAR) must be enclosed in single quotation
marks ('XXX').
■If the column has a data type of string or data, enclose the column name
in double quotes. If the column has a numeric data type, do not enclose
the column name in double quotes.
■Database values are case sensitive, but field (column) names are not.
■Do not end each statement with a semicolon (;) as in standard SQL syntax.
■For dates, use the format TIMESTAMP'YYYY-MM-DD 00:00:00'. For example:
"DATE">TIMESTAMP'1993-06-20 11:24:00'
■Do not use AutoCAD Map 3D or DOS wild cards such as * or ? as part of
column values or names.
■Do not use SQL keywords as identifiers. Examples of keywords are SQL
commands and data types such as CHAR, GROUP, SQL, TABLE, USER,
SECTION, BY, and CURRENT. Examples of identifiers are table and column
names. For example, if you try to create a table with a column name of
CURRENT, AutoCAD Map 3D displays an error message.
AutoCAD Map 3D supports standard SQL syntax as formally defined in the
ANSI X3.135-1989 SQL standard.
Type SQL Condition dialog box | 1871
1872
Raster Image Dialog Boxes
MAPIFRAME (Image Frame command)
Use this command to turn on or off the display of frames.
To display image frames (page 495)
NOTE This option does not affect images you inserted with Data Connect. See
Overview of Adding Rasters and Surfaces (page 437)
Image Correlation dialog box
Use this dialog box to correlate an image within the drawing when you insert
it.
To insert a raster image (page 460)
To correlate an image during insertion (page 464)
Click Home tab ➤ Data panel ➤ Insert An Image.
NOTE This option does not affect images you inserted with Data Connect. See
Overview of Adding Rasters and Surfaces (page 437)
The Source tab displays correlation information from the selected correlation
source. The Insertion tab shows how these settings apply to the current drawing.
34
1873
Correlation Source list
Select a correlation source for the image. If a resource or world file exists
for the image, it is in this list.
Insertion Point area
View the insertion point (X, Y, and Z coordinates) for the lower-left corner
of the image frame. On the Source tab, this information is in the units
specified in the Units area at the bottom of the tab. On the Insertion tab,
this information is in current drawing units.
Rotation box
Enter the amount of rotation in current drawing angle units for the image.
This value uses the lower-left corner as the base point.
Scale box
Enter a scale factor for the image. A scale factor greater than 1 enlarges the
image. For example, to make the image twice as large, enter 2.
Density box
Enter the dots (or pixels) per unit for the image.
Units list
Select the units for the insertion point and density. For example, if your
image was scanned at 300 dpi, select Inches.
Apply
Apply your changes.
Pick
Click Pick (on the Insertion tab) to draw a frame for the image. For more
information, see To adjust the image frame manually during insertion (page
465).
Frame Color box
View the current color for the image frame and for the foreground of a
bitonal image. Usually, this is the current AutoCAD Map 3D color. However,
when you insert a bitonal image, AutoCAD Map 3D first looks for the
foreground color in the image header file or in a resource file. If it cannot
find the color information, then the foreground color defaults to the current
AutoCAD Map 3D color. To change the color, click Select (on the Insertion
tab).
1874 | Chapter 34 Raster Image Dialog Boxes
Image Information dialog box
Use this dialog box to view data about the selected images in your drawing.
To display the Image Information dialog box (page 475)
Click Insert tab ➤ Image panel ➤ Information.
File area
View the image name, location, file type, size, and date it was created and
modified.
Image area
View the image density, depth, width, height, and color type.
Object area
View the linetype and layer of the image frame.
Correlation area
View the insertion point, scale, and rotation of the selected image.
NOTE If you select more than one image, and the information varies for different
images, then “Varies” is displayed.
Image Management dialog box
Use this dialog box to view information about images in your drawing.
To display the Image Management dialog box (page 474)
Click Insert tab ➤ Image panel ➤ Image Management.
View the names of the images that were inserted into the drawing, the current
display order, and other image information. Each image in your drawing, even
Image Information dialog box | 1875
if it is unnamed or a copy, is listed. To indicate copies, the dialog box numbers
them in the following format: imagename:1, imagename:2.
The images are listed in display order. The image at the top of the list is
displayed on top and drawn last. To modify the image display order, click an
image name and drag it up or down in the list.
Image
The name of the image file.
File
The full path name for the image file.
Layer
The layer on which the image is located.
Created
The date that the file was created.
Density
Dots per inch that the image was scanned at. Synonymous with resolution.
Depth
Every pixel of an image has information associated with it that defines its
color. The amount of information stored with each pixel is referred to as
depth. The more information that is stored with each bit, the greater the
number of colors that can be represented.
Type
The format type of the image.
Visible
The display status of the image.
Last Modified
The date that the image was last modified.
File Size
The file size of the image in bytes.
Layout
Click Layout to display the Image Management Layout dialog box (page
1877), where you can determine which topic columns are displayed and their
order.
To view additional information about an image, select the image and
right-click. Click Information to display the Image Information dialog box.
1876 | Chapter 34 Raster Image Dialog Boxes
NOTE You can change the size and position of this dialog box. Any changes you
make will be retained in future sessions.
Image Management Layout dialog box
Use this dialog box to control which topic columns are displayed and the
order in which they are displayed in the Image Management dialog box.
To display the Image Management dialog box (page 474)
Click Insert tab ➤ Image panel ➤ Image Management.
Image Topics list
Select or clear the check box next to a topic to display or remove that topic
column. You can drag a selected topic up or down.
Description area
Provide a brief description of the selected topic in the Image Topics list.
Image Select dialog box
Use this dialog box to control the selection of multiple images in your drawing.
To select an image by pressing Shift + left-click (page 493)
Click Home tab ➤ Data panel ➤ Insert An Image.
NOTE This option does not affect images you inserted with Data Connect. See
Overview of Adding Rasters and Surfaces (page 437)
You can select images by placing your cursor over them and pressing Shift +
left-click. If you select more than one image, the Image Select dialog box is
displayed.
Image Management Layout dialog box | 1877
List of images
View each image you inserted into the drawing. Selected images are
highlighted. Click an image name to select or deselect it.
Select All
Click to select all the images in your drawing.
Select None
Click to remove all selected images from the selection set.
Insert Image dialog box
Use this dialog box to insert raster images whose formats are not supported
by Data Connect (page 437)
To insert a raster image (page 460)
Click Home tab ➤ Data panel ➤ Insert An Image.
Select one or more images to insert into a drawing. You can view information
about an image and preview the image before you insert it.
NOTE If the FILEDIA variable is set to 0, then this dialog box is not displayed and
you can type the name of the image to insert on the command line.
Look In
Select the drive and folder that contains the image.
File Name
Type or select the name of the image or images to insert.
Files Of Type
From the list of available image formats, select the type of file to display in
the list.
Show Frame(s) Only
Select this option to insert only a frame placeholder for the image. The
image is not loaded into memory and not displayed. This is useful if you
are inserting a group of images and don't want to wait for each image to
1878 | Chapter 34 Raster Image Dialog Boxes

display. (To display the image later, select the image frame. Right-click the
image frame ➤ Image ➤ Show Image.)
If this option is not selected, the image is loaded into memory and displayed
as it is inserted.
Modify Correlation
Display the Image Correlation dialog box (page 1873) when you click Open.
The Image Correlation dialog box lets you review and modify the correlation
settings for the image. This option is not available if multiple images are
selected. If you do not select this option, the image is inserted using its
default correlation settings. Default settings are determined by searching
for correlation data in the following order.
1World file
2Resource file (.res extension)
3Tab files (.tab extension)
4Image file
5Defaults set in the Raster Extension Options dialog box
Information >>
Display information about the image file and preview the image.
Raster Extension Options dialog box
Use this dialog box to configure options for raster images you insert with the
Insert An Image dialog box.
Setting Raster Image Options (page 249)
Click Insert tab ➤ Image panel ➤ angle-arrow.
NOTE This option does not affect images you inserted with Data Connect. See
Overview of Adding Rasters and Surfaces (page 437)
Configure raster image options using the following tabs:
Raster Extension Options dialog box | 1879

Paths
Use the Paths tab to set the directory for resource files. Resource files store
information about an image insertion point, scale, rotation, and density.
Resource files have the same base name as the raster image with an .res
extension.
Resource File Directory
Specify the directory where AutoCAD Map 3D searches for resource files.
Click to locate a directory. This directory applies only to resource (.res)
files and not to other correlation sources.
When you insert an image, AutoCAD Map 3D looks for a resource file
associated with the image in the Resource File Directory path. If it locates
a resource file, you can select it as the source of correlation information. If
you leave the resource file path blank, AutoCAD Map 3D searches the
directory or directories the images were inserted from.
Use Resource File Directory Before Using Image Directory
Informs AutoCAD Map 3D to search for resource files in the resource file
directory before searching the image path stored in the drawing.
General
Use the General tab to set how frames are displayed, the display quality of
images, image detach options, and the Shift + left-click setting.
Display Preferences
Image Frame list
Specify how AutoCAD Map 3D displays the image frames in your drawing.
Hide the frames by selecting Frames Off, display frames in front of the
images by selecting Frame Drawn Above Image, or display frames behind
the images by selecting Frame Drawn Below Image.
Display Quality High
Dither the pixels onscreen so that the changes between shades and colors
are more gradual. This setting is recommended for color and grayscale
images.
Display Quality Draft option
Do not dither the pixels. This setting is recommended for bitonal images.
1880 | Chapter 34 Raster Image Dialog Boxes

Image Detach Preferences
Ask Before Detach
Have AutoCAD Map 3D prompt you to detach an image if there are no
more frames in the drawing that reference the image.
Always Detach
Automatically detach an image when you erase the image frames.
Never Detach
Keep the image attached, even if you erase the frames.
Shift + Left Click
Shift + Left Click Image Select
Enable selection of images by placing your cursor over them and clicking
the left mouse button while pressing Shift. This feature is useful when you
are zoomed in to the image and cannot see the image frame.
Image Defaults
Use the Image Defaults tab to set correlation defaults. Most images have
correlation data that is stored in the image file header, or in a resource file,
World file, or tab file. However, some images may not have any correlation
data. For those cases, you can specify default correlation data. In addition, if
the correlation source does not include information on the scale or the density,
AutoCAD Map 3D uses the default values on this tab when inserting the image.
TIP Setting the correlation defaults can save you time if you have multiple images
that require the same insertion point, scale, rotation, and density.
Insertion Values
X
Enter the default AutoCAD Map 3D X coordinate to define the lower-left
corner of images.
Y
Enter the default AutoCAD Map 3D Y coordinate to define the lower-left
corner of images.
Z
Enter the default AutoCAD Map 3D Z coordinate to define the lower-left
corner of images.
Rotation
Enter a default rotation for images.
Raster Extension Options dialog box | 1881
Scale
Enter a default numeric scaling factor for images. For example, to make the
image twice as large, enter 2 in the Scale box.
Density
Density
Type a default density (or resolution) for images. You should set the this
value to the most common density value at which your images are scanned.
Insertion Point and Density Units list
Select the default insertion point and density units for the images. For
example, a common North American scanning resolution is 300 dpi (300
dots per inch). To set this value as your default density, type 300 in the
Density edit box and select inches as the Units. If you insert images that
have density value and density unit information stored in the correlation
source, then these defaults are not used.
For an illustration of how to set the density value and units for an image,
see Setting Image Density (page 467).
Memory
Use the Memory tab to specify the amount of memory (RAM) that AutoCAD
Map 3D can use for images before using a temporary swap file. You can also
define the location of the temporary swap file.
Temporary File Location
Temporary File Location
The location to use for your temporary swap file. Click to locate a drive
and directory. AutoCAD Map 3D uses this temporary swap file when the
memory limit has been exceeded.
NOTE Close and restart AutoCAD Map 3D to put these settings into effect.
RAM Settings
Physical RAM
View the amount of physical RAM in your system.
Memory Limit
View the amount of RAM that AutoCAD Map 3D will use before creating a
swap file.
NOTE Increasing the default amount may degrade your system’s performance.
Be sure to leave enough RAM for your operating system and other applications.
1882 | Chapter 34 Raster Image Dialog Boxes
Default
Restore the memory setting to the default RAM amount, 25% of the total
physical memory.
MB, KB, and Bytes
Specify the units (megabytes, kilobytes, or bytes) for defining the Memory
Limit.
Transparency Color dialog box
Use this dialog box to specify the color that should appear transparent in the
image.
To change the color that is transparent (page 500)
Click Insert tab ➤ Image panel ➤ angle-arrow.
NOTE This option does not affect images you inserted with Data Connect. See
Overview of Adding Rasters and Surfaces (page 437)
Click Select and pick a color on the image. When transparency is turned on,
the selected color is transparent.
Setting transparency color is available only if the image is loaded and the
Raster Extension is loaded. To load the image, select the image, then right-click
the image frame ➤ Image ➤ Show Image. To load the Raster Extension,
choose a Raster Extension command.
NOTE The transparency color is stored in the drawing as an AutoCAD Map 3D
custom object. If you send the drawing to other users, they can see the
transparency color only by opening the drawing in AutoCAD Map 3D or Autodesk
Raster Design. If they open the drawing in AutoCAD, they see a message that
AutoCAD cannot reference the custom object and will not display the transparent
color.
Transparency Color dialog box | 1883
1884
Saving Objects Dialog
Boxes
ADEREMOBJS (Remove Objects from Save Set command)
Use this command to unlock selected locked objects in the current drawing and
remove them from the save set.
To remove objects from the save set and unlock the objects (page 759)
Click Home tab ➤ Data panel ➤ ➤ Remove Objects From Save Set.
NOTE This command affects drawing objects only. For information about saving
changes to geospatial feature data, see Updating Edits Automatically (page 698).
Respond to the prompts:
Erased/<Select>:
Enter e to remove all objects that have been erased from the current drawing.
Enter s or press Enter to select individual objects.
Select objects:
Use an object selection method to select the objects to unlock and remove
from the save set. Press Enter when you finish.
Press Enter to confirm.
35
1885
Objects that are locked in their source drawings are unlocked so that other
users can edit them. They are removed from the list to be saved back to source
drawings.
Any changes made to the objects in the current drawing still exist in the
drawing. To save these changes to a new file, click ➤ Save As ➤
AutoCAD Drawing.
Objects that were erased from the current drawing remain erased from the
drawing, but they will not be erased from source drawings.
ADESELOBJS (Select Objects for Save Back command)
Use this command to add objects the save set and lock the objects.
To add objects to the save set and lock the objects (page 751)
Click Home tab ➤ Data panel ➤ ➤ Add To Save Set.
NOTE This command affects drawing objects only. For information about saving
changes to geospatial feature data, see Updating Edits Automatically (page 698).
If object locking is on, adding an object to the save set locks the object to
prevent anyone else from editing it while you are using it. When an object is
locked, other users can view it, but they cannot edit it.
Respond to the prompts:
Add objects to save set: Select/<allNew>:
Enter s to individually select objects, or press Enter to add all objects created
since opening the current drawing.
Select objects:
Use an object selection method.
If you plan to edit more than one object, lock them all at the start of your
editing session. That way, no other users can modify or lock them before you
get to them.
1886 | Chapter 35 Saving Objects Dialog Boxes
If an object is on a locked layer in the source drawing, you cannot add it to
the save set. If you are working in paper space, you cannot add objects to the
save set.
Objects in the save set are saved to source drawings when you use the Save
Objects to Source Drawings dialog box (page 1887) command.
ADESHOWOBJS (Show Objects in Save Set command)
Use this command to highlight all objects in the current drawing that are
marked to be saved to source drawings.
To view objects in the save set (page 752)
Click Home tab ➤ Data panel ➤ ➤ Show Objects In Save Set.
NOTE This command affects drawing objects only. For information about saving
changes to geospatial feature data, see Updating Edits Automatically (page 698).
To remove the highlighting, press Enter.
Save Objects to Source Drawings dialog box
Use this dialog box to save the objects that are currently in the save set back
to source drawings.
To save queried objects back to attached source drawings (page 754)
Click Home tab ➤ Data panel ➤ ➤ Save To Source.
NOTE This command affects drawing objects only. For information about saving
changes to geospatial feature data, see Updating Edits Automatically (page 698).
ADESHOWOBJS (Show Objects in Save Set command) | 1887
If you are saving new objects, specify the source drawings to save objects to
and the method used to save objects. Queried objects are saved back to their
original layer in their original source drawing.
You must have Edit Drawing privileges to save objects to source drawings. See
the User Administration dialog box (page 1934).
Status area
View the number of queried objects and the number of newly created objects
that are in the save set.
Save Queried Objects
Save queried objects to source drawings. Queried objects are saved back to
their original layer in their original source drawing.
If you have redefined a block, layer, or text style definition and you want
to save the new definition, be sure the option to save the definition is
selected on the Save Back tab of the AutoCAD Map Options dialog box (page
1908).
Save Newly Created Objects
Save objects created in the current drawing to source drawings.
Under Save Order For Newly Created Objects, specify the source drawings
to save objects to and the method used to save objects.
Save Order for Newly Created Objects
Specify the method to use when saving objects created in the current drawing.
Objects are saved by the first method that applies to them.
Area
Save objects to the first source drawing in the list within whose boundary
they lie. This is useful for tiled drawings. This method does not save objects
outside the boundary of the source drawings.
You can specify the drawing boundary by setting save back extents in the
Drawing Settings dialog box (page 1923). If no save back extents are set, the
drawing extents are used as the boundary. If an object lies partially outside
the save back extents, the drawing extents are modified to include the
object, but the save back extents are not changed.
Layer
Save objects to the first source drawing in the list that includes a layer of
the same name as the layer the object is on in the current drawing. This is
useful for stacked drawings. This method does not save objects on layers in
the current drawing that have no corresponding layer in the source drawings.
1888 | Chapter 35 Saving Objects Dialog Boxes
Selective
Specify which objects to save and which drawings to save them in. Objects
are saved to the same layer as they are on in the current drawing. If the
source drawing does not have a layer of the same name, one is created. This
method applies to all objects, so you cannot specify other save back methods
after this one.
Drawings to Save New Objects to list
Specify which drawings to save objects to. If you use the Selective method,
AutoCAD Map 3D prompts for the objects to save to each selected drawing.
Select All
Highlight all drawings in the list.
Clear All
Remove the highlighting from all drawings in the list.
Filter
Turn on the current drawing filter.
When the filter is on, only drawings that match the filter are displayed. If
the parent drawing of a nested drawing is filtered, the nested drawing is
not displayed, even if it matches the filter.
To create or change the filter, click Filter. In the Drawing Set Display Filter
dialog box (page 1922), you can create separate filters for file names and
descriptions.
Who Has It Information dialog box
Use this dialog box to find out who has an object locked, what source drawing
and current drawing it comes from, and the date and time it was locked.
To find out who locked an object (page 735)
Click Home tab ➤ Data panel ➤ ➤ Show Who Has It.
NOTE This command affects drawing objects only. For information about locking
geospatial feature data, see Checking Out Features (page 695).
Who Has It Information dialog box | 1889
1890
Survey Dialog Boxes
New Data Store dialog box
Use the New Data Store dialog box to create a specialized data store for survey
data.
To create a survey data store (page 1000)
On the Survey tab of the Task Pane, click Data ➤ New Survey Data Store.
NOTE This dialog box creates a specialized survey data store only. To create other
types of geospatial data stores, see Creating a Data Store (page 586). To create a
data store for external data that you will attach to drawing objects, see Setting Up
Data Sources for Drawings (page 204).
File Location
Click to enter a file name and save location for your new Survey Data
Store. Survey Data Stores are always in SDF format.
Coordinate System Assignment
Enter the coordinate system code for your new Survey Data Store. Click
to select the coordinate system from a list.
36
1891
Project Properties dialog box
Use the Project Properties dialog box to view and edit properties for a project
in the Survey Data Store.
To view or edit project properties (page 1002)
On the Survey tab of the Task Pane, right-click a project ➤ Properties.
NOTE This functionality is for geospatial survey data only.
Click the Categorized View button to view project properties by category.
Click the Alphabetized View button to view project properties in alphabetical
order.
Project
Display information about the Project, such as Name, File Name, LandXML
version, and so on. Click in a field to edit the Project information.
Constrained fields display valid options in a drop-down list.
Application
Display information about the application that created the data. Click in a
field to edit the Application information. Constrained fields display valid
options in a drop-down list.
CoordinateSystem
Display information about the coordinate system of the Project. Click in a
field to edit the coordinate system information. Constrained fields display
valid options in a drop-down list.
Units
Display information about a Project’s units of measure. Click in a field to
edit the measurement unit information. Constrained fields display valid
options in a drop-down list.
1892 | Chapter 36 Survey Dialog Boxes

Survey Properties dialog box
Use the Survey Properties dialog box to view information about a specific
survey in a Survey Data Store.
To view or edit survey properties (page 1004)
On the Survey tab of the Task Pane, right-click a survey ➤ Properties.
NOTE This functionality is for geospatial survey data only.
Click the Categorized View button to view survey properties by category.
Click the Alphabetized View button to view survey properties in alphabetical
order.
Survey
Display properties for a given survey, such as Name, Description, Start Time,
End Time, Surveyor, and so on. Click in a field to edit the survey
information. Constrained fields display valid options in a drop-down list.
Equipment
Display information about the equipment used to collect the survey data.
Click in a field to edit the equipment information. Constrained fields display
valid options in a drop-down list.
FieldNotes
Display any field notes entered by the surveyor, such as coordinate geometry
data. Click the FieldNotes field to display the Field Note Editor.
Units
Display information about a survey’s units of measure. Click in a field to
edit the measurement unit information. Constrained fields display valid
options in a drop-down list.
Survey Properties dialog box | 1893
Point Group Properties dialog box
Use the Point Group Properties dialog box to view information about a point
group in a Survey Data Store.
To view or edit point group properties (page 1005)
On the Survey tab of the Task Pane, right-click a point group ➤ Properties.
NOTE This functionality is for geospatial survey data only.
Click the Categorized View button to view point group properties by
category.
Click the Alphabetized View button to view point group properties in
alphabetical order.
Point Group
Display information about the point group, such as Name, State, Zone
Number, and so on. Click in a field to edit the point group information.
Constrained fields display valid options in a drop-down list.
Field Note Editor
Use the Field Note Editor to view and edit field notes entered by a surveyor
at the time of a survey. Field notes may contain measurements for calculating
unreachable points using coordinate geometry, for example.
To view or edit survey properties (page 1003)
1894 | Chapter 36 Survey Dialog Boxes
On the Survey tab of the Task Pane, right-click a survey ➤ Properties. In the
Survey Properties palette, click the Field Notes entry.
NOTE This functionality is for geospatial survey data only.
Field Notes
View and edit the field notes for a survey.
Create Surface dialog box
Use this dialog box to create raster surfaces from survey data.
To create a surface from a source filesurface:create surface from fileIn the Tool-
based Ribbon Works... (page 1009)
Click Create tab ➤ 3D Surface panel ➤ Create From Points.
Source
Click to add source data. To add data from a source file, click File. To add
data from a data connection, click Connection. To add point data from
AcDb points already in your map, click Points in Drawing.
Click to remove source data.
Click to move source data down the order list. If you have not specified a
coordinate system for your map, AutoCAD Map 3D uses the first valid
coordinate system in the source data list.
Create Surface dialog box | 1895

Click to move source data up the order list. If you have not specified a
coordinate system for your map, AutoCAD Map 3D uses the first valid
coordinate system in the source data list.
Formatting
Select Format
Select the format of the source data. Formats describe the layout of the data
in your source files using the following convention:
■P is point ID
■E is Easting, or longitudinal values
■N is Northing or latitudinal values
■Z is elevation values
■D is description
Make sure that you select the correct format plus delimiter type (comma or
space) for your data source.
The Autodesk Uploadable File format is as follows: User-Defined (point ID,
description, or any other type of data), X, Y, Z. It is a comma-separated
format, and uses the # character for comment text.
Z-Unit
Select the vertical (Z) unit of your data: meters, US feet, or international
feet.
Preview
An excerpt from your data source. Check the Preview pane to confirm that
you are adding or connecting to the proper data file or source.
Coordinate System Assignment
Enter Code
Specify the coordinate system of the source data. Click to choose the
coordinate system from a list. You must specify a coordinate system for
each data source individually.
1896 | Chapter 36 Survey Dialog Boxes
Destination
Output File Name
Enter the save name and location of the GeoTIFF file. Click to browse
to a save location.
Layer Name
Enter a name for the new Display Manager raster layer.
Source Data dialog box
Use this dialog box to select the data connection source for creating a surface.
You must first connect to your data using Data Connect. For FDO data, only
point and line data are supported. Surface features such as parcels are not
supported, and will not appear in this dialog box. If you are connecting to an
SDF file that contains point data and line data, both points and lines will be
added as source data.
To create a surface from a data connection (page 1010)
Click Create tab ➤ 3D Surface panel ➤ Create From Points.
Point Cloud Manager
Use the Point Cloud Manager to manage LiDAR data and create indexed point
cloud data store (.isd) files.
To specify a coordinate system for your point cloud data storeIn the , click the
Coordinate System f... (page 1016)
Click Create tab ➤ Point Cloud panel ➤ Create Index
Add File Add a LAS, ASCII, or ISD file to the Point Cloud Manager for
processing.
Source Data dialog box | 1897
Create Group Create a merge group to assign multiple source files to a single
output file.
Remove From Group Remove a file from a merge group. The file remains in
the Point Cloud Manager.
Remove Group Remove a merge group from the Point Cloud Manager. Files
that are in the merge group remain in the Point Cloud Manager.
Remove File Remove a file from the Point Cloud Manager.
Cancel Processing Cancel the current conversion process.
Source Display the name of the source file or merge group. Click to select
a new source file. Click the merge group Source field to rename a merge group.
Output The file name and save location for the indexed point cloud data store
to be generated. Click the Output field to change the output file name and
save location.
Coordinate System Set the coordinate system for the point cloud data store.
By default, this field displays the coordinate code for the source file. To select
another coordinate system for your point cloud data store, click and select
the appropriate code from the list.
Filter The filter type applied to the source data. To filter your source data,
click the Filter field to display the Filter Point Cloud dialog box (page 1900).
Date Created The date and time that the point cloud data store was created.
This field is not editable.
Generate Index Generate an indexed point cloud data store file for the selected
source files or merge group.
Add to Map Add a point cloud to the map, and a point cloud layer to the
Display Manager, for an indexed point cloud data store.
Surface Manager
Use the Surface Manager to create raster-based surfaces from point cloud data.
To create a surface from a point cloudIn the Display Manager, right-click a point
cloud layer and se... (page 1022)
1898 | Chapter 36 Survey Dialog Boxes
Click Create tab ➤ 3D Surface panel ➤ Create From Point Cloud.
Add File Add a point cloud data store (.isd) file to the Surface Manager for
processing.
Create Group Create a merge group to assign multiple source files to a single
surface.
Remove From Group Remove a file from a merge group. The file remains in
the Surface Manager.
Remove Group Remove a merge group from the Surface Manager. Files that
are in the merge group remain in the Surface Manager.
Remove File Remove a file from the Surface Manager.
Cancel Processing The current surface creation process.
Source Display the name of the source file or merge group. Click to select
a new source file. Click the merge group Source field to rename a merge group.
Filter The filter type applied to the source data. To filter your source data,
click the Filter field to display the Filter Point Cloud dialog box (page 1900).
Parameters Specify the type of surface that AutoCAD Map 3D will create
(GeoTIFF or ESRI ASC). To specify parameters for your surface, click the
Parameters field to display the Grid Parameters dialog box (page 1901).
Output The file name and save location for the generated surface file. Click
the Output field to change the output file name and save location.
Date Created The date and time that the surface was created. This field is not
editable.
Generate Grid Generate a surface file for the selected source files or merge
group.
Add to Map Add a surface to the map and a raster layer to the Display
Manager.
Surface Manager | 1899

Filter Point Cloud dialog box
Use the Filter Point Cloud dialog box to filter your LiDAR or point cloud data
by classification, elevation, intensity, or location on your map.
To filter point cloud dataIn the Display Manager, right-click a point cloud layer
and select Filter ... (page 1025)
Click Create tab ➤ Point Cloud panel ➤ Create Index
Filter By Select a filter type from the drop-down list. You can filter by
classification, elevation, intensity, or location on your map.
Define Filter Define the filter to apply to your data:
■Classification: select the classified values you want to include in your data.
Shift-click or control-click to select multiple values.
■Elevation: type the elevation ranges you want to display in your map. Use
hyphens to define ranges and commas to separate them; for example,
150-200, 350-400, 1200-2000.
■Intensity: filter data based on LiDAR intensity values. Use hyphens to
define ranges and commas to separate them; for example, 0.25-2.00,
3.50-4.00, 120.00-200.00.
■Spatial: Click the Locate on Map button to create a spatial filter. You can
create a spatial filter based on a circle, rectangle, polygon, or proximity to
an object on your map.
Clear Filter Clear the values for the filter that you have applied.
Apply Filter Apply the filter you have defined to your data.
Cancel Cancel the filter operation and closes the Filter Point Cloud dialog
box.
1900 | Chapter 36 Survey Dialog Boxes
Grid Parameters dialog box
Use the Grid Parameters dialog box to specify the surface type, name, save
location, resolution, and gap filling parameters for a surface.
To create a surface from a point cloudIn the Display Manager, right-click a point
cloud layer and se... (page 1022)
Click Create tab ➤ 3D Surface panel ➤ Create From Point Cloud.
Surface Type Specify whether AutoCAD Map 3D creates a GeoTIFF or ESRI
ASC surface.
File Name The name and save location of your surface file. To change the file
name and save location, click .
Parameters
Cell Size Specify the number of point cloud units per output cell (raster pixel).
This parameter determines the output size of the raster surface. For a 300 x
500 meter point cloud, setting the cell size to 0.5 results in a 600 x 1000 pixel
raster image.
Cell Units The unit of measurement for your point cloud cell size. Cell units
can be measured in meters, feet, US survey feet, and international feet. By
default, cell units are measured in meters.
Search Radius Specify the input point weight. The vertical (Z) value for each
cell is calculated from the Z-values of all points in the cell. Those closest to
the center are weighted highest, while those at the search radius limit are
weighted half as much as the center points. Increase the search radius to give
more weight to Z-values for remote points. Decrease the search radius to give
less weight to Z-values for remote points.
Fill Gaps Fills gaps in your surface. Check the Fill Gaps box, and select the
appropriate method: Nearest Neighbor, Normal Distribution, Normal
Distribution Smooth, Square Distance, or Square Distance Smooth.
Grid Parameters dialog box | 1901

Point Cloud Style dialog box
Use the Point Cloud Style dialog box to style your point cloud data based on
classification, elevation, or LiDAR intensity value.
To style point data by classificationIn the Display Manager, right-click the point
cloud layer to st... (page 677)
Click Point Cloud tab ➤ Style panel ➤ Set Style.
Classification Tab
Classification AutoCAD Map 3D assigns a default color to each point class.
To change the color for a point class, select a new color from the drop-down
list. If you do not see the color that you want in the drop-down list, click More
Colors. The Select Color dialog box appears. You can select an Index Color,
True Color, or Color Book.
Elevation Tab
Minimum Value The minimum elevation value of your point cloud data.
This field is not editable.
Maximum Value The maximum elevation value of your point cloud data.
This field is not editable.
Number of Rules Enter the number of rules for the elevation scale range. The
default number of rules is five. Rules are distributed evenly over the range of
elevation data in your point cloud.
Style Range The From and To values for the colors in your style range. To
change a color for your style range, select a new color from the drop-down
list. If you do not see the color that you want in the drop-down list, click More
Colors. The Select Color dialog box appears. You can select an Index Color,
True Color, or Color Book.
Intensity Tab
Minimum Value The minimum intensity value of your point cloud data.
This field is not editable.
Maximum Value The maximum intensity value of your point cloud data.
This field is not editable.
1902 | Chapter 36 Survey Dialog Boxes
Number of Rules Enter the number of rules for the intensity scale range. The
default number of rules is five. Rules are distributed evenly over the range of
intensity data in your point cloud.
Style Range The From and To values for the colors in your style range. To
change a color for your style range, select a new color from the drop-down
list. If you do not see the color that you want in the drop-down list, click More
Colors. The Select Color dialog box appears. You can select an Index Color,
True Color, or Color Book.
Point Cloud Style dialog box | 1903
1904
Setting Map Options
Dialog Boxes
MAPABOUT (About AutoCAD Map 3D command)
Use this command to display the About AutoCAD Map 3D screen, which shows
the version number and date of AutoCAD Map 3D.
MAPAUTOCHECKOUT
Use this command to specify whether or not geospatial features are automatically
checked out when edited.
To check out features automatically (page 696)
In the Tool-based Ribbon Workspace, click Feature Edit tab ➤ Edit Set panel
➤ Auto Checkout.
NOTE This command affects geospatial feature data only. For information about
locking drawing objects in a multi-user environment, see Turning On Object Locking
(page 733).
37
1905
MAPDOCKWSPACE (Dock Task Pane command)
Use this command to dock or undock the Task Pane.
Use these techniques for the Task pane
Double-click the title bar (floating) or the double bar at the top of the pane
(docked).
MAPEDITSETAUTO
Use this command to specify whether or not edits to features are automatically
reflected in the feature source.
NOTE You cannot undo this operation.
To update edits automatically (page 700)
In the Tool-based Ribbon Workspace, click Feature Edit tab ➤ Edit Set panel
➤ Automatic Update.
NOTE This command affects geospatial feature data only. For information about
updating attached drawing objects , see Setting Save Back Options (page 763).
MAPFEATUREEDITTOOLS
Use this command to specify whether geospatial features are checked out as
AutoCAD drawing objects or as features.
To specify Feature Edit Options (page 240)
1906 | Chapter 37 Setting Map Options Dialog Boxes
Feature Editing Options dialog box (page 1929)
These settings determine how you work with your data.
Features checked out as geospatial
features
Features checked out as AutoCAD
drawing objects
Allows you to use some common ACAD
editing commands in addition to geospa-
Allows you to use many common ACAD
editing commands
tial feature-specific editing commands (for
example, MAPFEATURESPLIT (page 1652)
and MAPFEATUREMERGE (page 1651))
Edited features are represented as geospa-
tial geometries (for example, MAPPOLY-
GONS).
Edited features represented as AutoCAD
geometries (for example, closed polylines
are used to represent polygonal features)
Supports multipart (multipolygons, mul-
tilines, and multipoints) geospatial features
and editing, such as the Hawaiian islands.
Most existing custom or third-party editing
applications (LISP, VB or ObjectARX)
should continue to work. Some may re-
quire minor updates.
Preserves and allows you to edit M and Z
values.
Some existing AutoCAD Map 3D editing
commands will continue to work on fea-
tures (for example, rubbersheeting [ADER-
SHEET (page 1648)]).
Allows you to use feature styling.Allows you to use feature styling.
MAPWSFOCUS
Use this command to set the keyboard or mouse focus to the Task Pane. You
can also set the focus by clicking in the Task Pane.
To return the focus to the command line, press ESC or click in the command
line area. Whenever you return to AutoCAD Map 3D after using another
application, the focus is reset to the command line.
MAPWSFOCUS | 1907

MAPWSPACE (Task Pane command)
Use this command to hide or show the Task Pane.
To hide or display the Task Pane within your current session (page 221)
In the Tool-based Ribbon Workspace, click View tab ➤ Palettes panel ➤ Map
Task Pane.
MAPWSREFRESH
Use this command to refresh the Task Pane. This is sometimes necessary if
Map Explorer does not reflect your recent changes to the drawing or if the
icons in the Display Manager need to be refreshed.
To refresh Map Explorer (page 221)
Right-click a clear area in Map Explorer, and click Refresh.
AutoCAD Map Options dialog box
Use this dialog box to define options for the Task Pane, drawings, drawing
queries, save options for drawing objects, drawing data sources, coordinate
systems, and the system.
To use the AutoCAD Map Options dialog box (page 218)
In the Tool-based Ribbon Workspace, click Map Setup tab ➤ Map panel ➤ angle-
arrow.
Task Pane (page 1909)
1908 | Chapter 37 Setting Map Options Dialog Boxes

Current Drawing (page 1909)
Query (page 1911)
Save Back (page 1913)
Data Source (page 1914)
Multi-User (page 1915)
System (page 1916)
Coordinate Systems tab (page 1916)
Task Pane
Specify Task Pane options.
Map Explorer Categories To Display
Select the categories to display in Map Explorer. When you turn off the
display of the category, all functionality associated with the category is still
available.
TIP To reduce screen clutter, turn off the display of categories you don’t use.
These settings are user-specific and will affect any drawing that you open.
These settings will take effect the next time you start AutoCAD Map 3D.
Show Task Pane on startup
Show or hide the Task Pane at startup.
Show Properties Palette on startup
Show or hide the Properties palette at startup.
Current Drawing
Specify options for attached drawings, coordinate transformations, and
drawing-specific data sources.
Activate Attached Drawings
Specify the default active/inactive status for drawings you attach to the
current drawing and whether the active status is saved with the current
drawing.
Coordinate Transformation Adjustments
Specify how AutoCAD Map 3D performs coordinate transformations.
AutoCAD Map Options dialog box | 1909

NOTE These options affect attached drawings only. For information about
changing the coordinate system for geospatial data, see Changing Coordinate
Systems (page 311).
Adjust Sizes And Scales - For Changes In Units
Specify whether the units used in the coordinate system of an attached
drawing are scaled to the units used in the coordinate system of the current
drawing.
For example, if an attached drawing uses meters and the current drawing
uses U.S. Survey Feet, you can scale text and blocks so that their size or scale
measures in feet rather than meters.
If you do not set the For Changes In Units option, AutoCAD Map 3D doesn't
size or scale text and block objects. In that case, a block that is five meters
long in an attached drawing will be five feet long when you bring it into
the current drawing.
Do not change this setting after you bring objects into the current drawing,
or you may introduce unintended changes to text and blocks when you
save them back to their source drawings.
Adjust Sizes And Scales - For Map Distortion
Adjust the size and scale of text and blocks to correct for map distortion
introduced when you represent a spherical object (earth) in a Cartesian
coordinate system.
For example, two objects, located at the northern and southern extremes
of a map, of equal length in coordinate system X will remain the same
length when transformed to coordinate system Y.
If you don't select this option, the two objects will be scaled to different
lengths in coordinate system Y according to the relative map distortion (or
grid scale factor).
This option is not available if For Changes In Units under Adjust Sizes And
Scales is not selected.
Adjust Rotations - For Map Distortion
Adjust the angle of text and blocks to correct for map distortion due to the
convergence angle (the deviation of the Y axis of a Cartesian coordinate
system from true north).
Adjust Rotations - For Zero-Rotation Objects
Specify that text and blocks that have a rotation value of zero in the source
drawing are adjusted to correct distortion due to the convergence angle
(the deviation of the Y axis of a Cartesian coordinate system from true
north).
If you set this option, AutoCAD Map 3D calculates the convergence angle
for text and blocks with a zero rotation value. If you don't set this option,
1910 | Chapter 37 Setting Map Options Dialog Boxes

AutoCAD Map 3D does not rotate text and blocks with a zero rotation value
even if there is a convergence angle.
This option is not available if For Map Distortion under Adjust Rotations
is not selected.
Adjust Elevations
Adjust the elevation (Z axis) of objects when you select For Changes In
Units and For Map Distortion under Adjust Sizes And Scales.
Data Source Options
Specify drawing-specific data source options.
NOTE These options affect data stores linked to drawing objects only. For
information about filtering geospatial feature data, see Filtering Features When
You Add Them to a Map (page 309).
Number Of SQL Conditions To Keep In History List
Specify the maximum number of SQL conditions that are stored in the SQL
Condition History dialog box and in the Table Filter History dialog box.
Once the history list is full, the oldest, or first added, condition is removed
from the list to make room for a new condition. If memory is limited on
your system, keep this number low.
Query
Query Options
Use the Query tab to specify query options and default settings for queries.
NOTE These options affect queries for drawing objects only. For information about
filtering geospatial feature data, see Filtering Features When You Add Them to a
Map (page 309).
Save Current Query With Drawing
Save the current query definition with the current drawing, even if you
have not saved the query. When you next open this drawing, the query
loads as the current query definition.
Use Case Sensitivity When Matching Text Values
Specify whether text values in Property Condition queries must match the
case used in the query definition.
Create Selection Set From Queried Objects
Specify whether the selection set contains the items retrieved by the query.
To use this selection set when editing, enter p (to use the previous selection
set) when prompted to select objects. (As soon as you select other objects,
AutoCAD Map Options dialog box | 1911
AutoCAD Map 3D clears this selection set and replaces it with your new
selection.)
If your query finds a large number of objects, this feature can take time. If
you do not need to put the objects into a selection set, clear this check box
to save time during queries.
Create Associative Hatch Objects
Specify whether AutoCAD Map 3D creates associative hatch objects for
hatch objects created by the ADEFILLPOLYG, ADEQUERY (using alter
properties), MAPTOPOQUERY, and MAPTHEMATIC (using fill) commands.
If this box is not selected, hatch objects created by these commands are
non-associative hatch objects.
Preview Queries
Set options to use when displaying blocks and raster images in Preview Query
mode.
Show Insertion Point Only
Specify whether to show only the insertion point of inserted blocks in a
Preview query and not the objects. An insertion point is represented as an
X.
Show Image Clipping Boundary Only
Specify whether a Preview query displays only the clipping boundary of
raster images.
Preview Definitions From
Specify the location to use for definitions of layers, linetypes, blocks, etc.
when running a query in Preview mode.
Select Current to speed up the preview, though some items may not display
exactly as they will when the query is executed in Draw mode.
Location Queries
Set options to use when creating Location queries.
Boundary Color For And/Or Conditions
Specify the boundary color for And and Or conditions when you edit a
Location query and click Show.
Boundary Color For Not Conditions
Specify the boundary color for Not conditions when you edit a Location
query and click Show.
1912 | Chapter 37 Setting Map Options Dialog Boxes

Reference Entire Bounding Area For Objects
Specify whether Location queries reference the entire bounding area of
hatch, solid, and raster objects or only the bounding edge. (The bounding
edge for raster objects is the clipping boundary.)
When you select this option, a hatch boundary is treated as an area. If the
query location is on any part of the hatch object, even if it touches only a
hatch boundary, the whole hatch object (the hatch and the hatch boundary)
is included in the selection.
When you clear this option, the hatch boundary is treated as an edge. The
query location must intersect or enclose the boundary edge of the hatch
object to include the object in the selection. If the query selects only the
space inside the hatch area, but not the hatch boundary, the hatch object
(the hatch and the hatch boundary) is not selected.
This setting affects the ADEQUERY, MAPTOPOQUERY, and MAPTHEMATIC
commands.
Determine Block Locations Using
Specify whether AutoCAD Map 3D uses the block's insertion point or its
bounding box as its location to determine whether a block meets a Location
condition.
Determine Text Locations Using
Specify whether AutoCAD Map 3D uses the text's insertion point or its
bounding box as its location to determine whether text meets a Location
condition.
Default Joining Operator
Specify the default joining operator to use in the Define Query dialog box.
And
Specify that both conditions must be met for the object to be included in
the query.
Or
Specify that either condition can be met for the object to be included in
the query.
Save Back
Use the Save Back tab to specify options for saving queried objects back to
attached drawings.
NOTE These options affect save back options for drawing objects only. For
information about saving changes to geospatial feature data, see Updating Edits
Automatically (page 698).
AutoCAD Map Options dialog box | 1913

Save Set
Set options for adding objects to the save set.
Save Back To Source Drawings
Specify the behavior of objects when you save them back to their source
drawings.
Redefine Block Definitions On Save Back
Save changes to block definitions back to attached drawings.
Redefine Layer Definitions On Save Back
Save changes to layer definitions back to attached drawings.
Redefine Text Style Definitions On Save Back
Save changes to text style definitions back to attached drawings.
Create History File Of Changes
Create a file of all changes made to each source drawing. The history file
has the same name as the source drawing file, but has the extension .hst.
Create Backup File Of Source Drawing
Create a back up file of attached drawings before saving changes. Backup
drawing files have the extension .bak.
Data Source
Display Of Multiple Tables
Use the Data Source tab to set options for Data View behavior, data source
path name display, and database file associations.
NOTE These options affect Data View, which is available for drawing objects only.
For information about the Data Table, which displays geospatial feature properties,
see Overview of the Data Table (page 1127).
Specify the number of Data Views to use when displaying tables.
Show Each Table In A Separate Data View
Open a new Data View window for each open table. Move between tables
by clicking on the window you want.
Show All Tables In One Data View
Open only one Data View window. When you open a new table, the previous
table is automatically closed.
Data Views
Specify the behavior of the Data View.
1914 | Chapter 37 Setting Map Options Dialog Boxes

Open In Read-Only Mode
Open the Data View in read-only mode. When this option is selected, you
cannot edit data in the Data View.
Save Format And Style Changes With Drawing
Save all formatting changes, such as column width, font, color, or borders,
that you make in the Data View.
Keep On Top
Specify whether the Data View window remains on top of all other windows,
even when it is not the active window.
Associate Database Versions With File Extensions
Click Associate to display the Associate Database Versions dialog box where
you specify the database version to use for each database file extension.
When you drop a database file on the Map Explorer tab, AutoCAD Map 3D
checks the file extension and uses the specified version of the database
software.
Default Provider For Microsoft Access Databases
Select the default driver to use when you drop an MDB file onto the Map
Explorer tab.
Multi-User
Multi-User Options
Use the Multi-User tab to specify options for user login and object locking.
You must have Superuser privileges to modify multi-user options.
NOTE These options affect multi-user options for drawing objects only. For
information about locking and sharing geospatial feature data, see Checking Out
Features (page 695).
Set options that apply to all users in a multi-user environment.
Force User Login
Require users to log in before using AutoCAD Map 3D.
Enable Object Locking
Lock objects that are selected for the save set. If an object is locked, other
AutoCAD Map 3D users can view it, but cannot edit it.
AutoCAD users who do not have AutoCAD Map 3D cannot open a drawing
that an AutoCAD Map 3D user has open.
You cannot disable object locking while drawings are active.
AutoCAD Map Options dialog box | 1915
System
If you enabled Force User Login on the Multi User tab, you must log in as a
Superuser to edit System options.
Log File Options
Use the System tab to specify system settings.
Log files keep track of error messages and other AutoCAD Map 3D system
messages. If the log file is active, it is updated each time you use AutoCAD
Map 3D. To save space on your disk, you can delete or archive the log file and
start a new one.
Log File Active
Store error messages and other AutoCAD Map 3D system messages in the
log file.
Log File Name
Specify a name for the log file. Click Browse to search through existing
names or to change the drive or directory. If you do not specify a name,
AutoCAD Map 3D creates the acadmap.log file in the current directory.
Message Level
Specify which kind of error messages to store in the log file.
Number Of Drawings Loaded In Memory At Once
Specify the number of drawings that AutoCAD Map 3D can have open in
memory at the same time. This number does not limit the number of active
drawings. AutoCAD Map 3D opens and closes files in memory as it needs
them.
If your system has a lot of memory, you can enter a larger number (up to
200) to make queries faster.
Default Query File Directory
Specify the default directory for queries saved to external files.
Default Cache File Directory
Specify the default directory where your cache files are stored. Click Clear
Cache to enhance performance of AutoCAD Map 3D.
Coordinate Systems tab
Coordinate System Definitions Stored In Drawing
Specify the program behavior when opening drawings that contain coordinate
system definitions. For more information about coordinate systems, see
Assigning Coordinate Systems (page 149).
1916 | Chapter 37 Setting Map Options Dialog Boxes
Ignore Definitions
Have the program ignore coordinate system definitions when opening
drawing files.
Prompt User To Add Definitions to Dictionaries
Have the program prompt you for action when opening drawing files that
contain coordinate system definitions.
Automatically Add Definitions To Dictionary
Specify that, when opening drawing files that contain coordinate system
definitions, the program will automatically add the coordinate system
definitions from the drawing file to your coordinate system dictionary.
Geodetic Distance
Units For Display
Specify the units to use to display geodetic distances.
Coordinate Geometry Setup dialog box
Use this dialog box to specify settings to use with the Coordinate Geometry
functions.
To set coordinate geometry options (page 234)
Click Home tab ➤ Draw panel ➤ COGO drop-down ➤ COGO Options.
Set North Direction
Direction From Y Axis If North on your map is not on the Y axis, specify
the direction from the Y axis to North on your map. Enter a number that
represents the angular distance measured clockwise from the Y axis.
This option sets the ANGBASE system variable.
Elevation Settings
Prompt For 3D Data Input Select this option to have AutoCAD Map
3D prompt for 3D data, such as elevation, grade, or slope. If this option is
not selected, all elevations are assumed to be 0.
Coordinate Geometry Setup dialog box | 1917
Input Units Settings
Set the units for coordinate geometry input. Linear Units are US Feet,
International Feet, Meters, or Chains. Angle Formats are Decimal Degrees,
Degrees/Minutes/Seconds, Grads, Radians, and Surveyor’s Units.
Azimuth Measurements
Define Bearings Relative To North Select this option if bearings in
your map are relative to North.
Define Bearings Relative to South Select this option if bearings in your
map are relative to South. This is most often the case for maps of the
southern hemisphere.
Create Text Log
When you select this option, AutoCAD Map 3D writes the content of the
COGO Input dialog box (page 1668) to the AutoCAD Text Window when you
create a point using that dialog box.
Define/Modify Drawing Set dialog box
Use this dialog to define or modify the drawing set for the current drawing.
Attach drawings that you will use with the current drawing. Activate only
those drawings you want to search for the current query.
To attach drawings (page 158)
Click Home tab ➤ Data panel ➤ ➤ Define Drawing Set.
NOTE These options affect drawing objects only. For information about filtering
geospatial feature data, see Filtering Features When You Add Them to a Map (page
309).
In addition, you can change drawing settings such as description, simple
transformation, or save back extents.
AutoCAD Map 3D stores the changes you make to the drawing set with the
current drawing. The next time you open this drawing, your new settings will
be in effect.
Attached Drawings list
View all drawings attached to the current drawing.
1918 | Chapter 37 Setting Map Options Dialog Boxes
The first column specifies if the drawing is active. Only active drawings are
searched during queries.
■Yes indicates the drawing is active.
■Locked indicates the drawing is inactive, and you have locks on objects
in the drawing.
■No indicates the drawing is inactive.
If the drawing has a description assigned to it, that description appears in
the list instead of the file name. For information on how to assign a
description to a drawing, see Drawing Settings dialog box.
Activate
Activate all selected drawings.
Queries search only active drawings; they do not search inactive drawings.
Deactivate
Deactivate all selected drawings.
Queries do not search deactivated drawings. Queries search only active
drawings.
If you deactivate a drawing that contains objects you've locked, the status
of the drawing changes to Locked.
Select All
Highlight all drawings in the list.
Clear All
Remove the highlighting from all drawings in the list.
Drawing Settings
Display the Drawing Settings dialog box (page 1923), where you can change
the drawing description, simple transformation settings, or save back extents.
Show Nested
When selected, the Attached Drawings list displays nested drawings attached
to active drawings. Nested drawings attached to inactive drawings are not
displayed.
If a drawing has nested drawings, a plus sign (+) appears before the drawing
name.
A nested drawing is a drawing that is not attached directly to the current
drawing, but is attached to a drawing in the drawing set.
When not selected, only top-level drawings appear in the Attached Drawings
list.
Define/Modify Drawing Set dialog box | 1919
Filter
Select Filter to turn on the current drawing filter.
When the filter is on, only drawings that match the filter are displayed. If
the parent drawing of a nested drawing is filtered, the nested drawing is
not displayed, even if it matches the filter.
To create or change the filter, click Filter. In the Drawing Set Display Filter
dialog box (page 1922), you can create separate filters for file names and
descriptions.
Attach
Display the Select Drawings to Attach dialog box (page 1811), where you can
attach additional source drawings to the current drawing.
To attach drawings to a source drawing, open the source drawing directly,
and then attach the drawings.
To open the source drawing, click ➤ Open ➤ AutoCAD Drawing.
Detach
Detach the selected drawings from the current drawing.
If you detach a parent drawing, all nested drawings attached to that drawing
are also detached.
Drawing Maintenance dialog box
Use this dialog box to remove locks from drawings and create drawing indexes.
To create a drawing index (page 1294)
To release all locked objects (page 736)
Click Map Setup tab ➤ Map panel ➤ ➤ Drawing Maintenance.
NOTE These options affect drawing objects only. For information about locking
and sharing geospatial feature data, see Checking Out Features (page 695).
Use the options in the Active Drawings area to see which drawings currently
have locks.
Use the options in the Locks area to see which users have objects locked, and
to remove those locks. This feature is useful if a system goes down while objects
are locked.
1920 | Chapter 37 Setting Map Options Dialog Boxes
To display information in the Locks area, click User List.
Active Drawings
Use this area to see which drawings currently have locks.
Active Drawings list
View all attached active drawings for the current drawing.
■To display information about locked objects in a drawing, select the
drawing in the list. Click User List. The area at the bottom of the screen
updates to show the names of users who have locks on objects in the
drawing, and the number of objects they have locked.
■To update indexes for a drawing, select the drawing in the list, click
Drawing Index.
Select All
Highlight all drawings in the list.
Clear All
Remove the highlighting from all drawings in the list.
Filter
Select Filter to turn on the current drawing filter.
When the filter is on, only drawings that match the filter are displayed. If
the parent drawing of a nested drawing is filtered, the nested drawing is
not displayed, even if it matches the filter.
To create or change the filter, click Filter. In the Drawing Set Display Filter
dialog box (page 1922), you can create separate filters for file names and
descriptions.
Drawings Index
Display the Index Maintenance dialog box (page 1931), where you can specify
which types of indexes to create for the selected drawings.
User List
Update the display of users that have locks on objects in source drawings.
Locks
Use this area to see which users have objects locked, and to remove those
locks. This feature is useful if a system goes down while objects are locked.
To display information in this area, click User List.
Drawing Maintenance dialog box | 1921
User Name list
View all users who have locks on objects in the selected drawings. The
Number Of Objects Locked column shows how many locked objects each
user has.
To update this list, select an active drawing. Click User List.
Select All
Highlight all drawings in the list.
Clear All
Remove the highlighting from all drawings in the list.
Remove Locks
Unlock objects locked by the selected users. Be careful not to unlock objects
that other users are currently editing, as this may cause work to be lost.
Only Superusers can remove locks for other users.
Drawing Set Display Filter dialog box
Use this dialog box to specify separate filters for file names and for descriptions.
To attach drawings (page 158)
Click Home tab ➤ Data panel ➤ ➤ Define Drawing Set.
Filters can include wild-card characters:
Asterisk (*) represents any set of letters.
Question mark (?) represents any single letter.
For example, if you enter *\ch* in the file name filter field, the drawing list
displays all file names that start with the letters ch in all directories.
To display drawings in a specific directory, enter the path to that directory.
For example, enter c:\office1\* to view all drawings in the office1 directory.
When specifying drives, use the drive aliases assigned in the Drive Alias
Administration dialog box (page 1928)
Nested drawings are also filtered. If the parent drawing is filtered out, none
of its nested drawings appear in the list. If the parent drawing appears in the
list, the filter applies to the nested drawings.
1922 | Chapter 37 Setting Map Options Dialog Boxes
To display all drawings, enter *\*.dwg in the File Name box. To display all
descriptions, enter * in the Description box.
Drawing Settings dialog box
Use this dialog box to change the drawing description, specify simple
transformation settings, or define save back extents.
To create a drawing description (page 166)
To set transformation options (page 169)
To set save back extents (page 170)
Click Home tab ➤ Data panel ➤ ➤ Define Drawing Set.
NOTE These options affect drawing objects only. For information about saving
changes to geospatial feature data, see Updating Edits Automatically (page 698).
To change settings for a drawing, select the drawing in the list. Enter the new
information in the fields in the dialog box. When you finish, click Apply. You
can then select a new drawing.
Specify the transformation of objects in the source drawing as they are brought
into the current drawing. AutoCAD Map 3D stores this information with the
current drawing. The source drawing does not change. This feature is useful
if you want to overlay drawings or tile them.
Active Drawings list
Select the drawing to change.
This list displays all the active drawings in the drawing set. If a coordinate
system code is assigned to the drawing, that code is displayed in the left
column.
Filter
Select Filter to turn on the current drawing filter.
When the filter is on, only drawings that match the filter are displayed. If
the parent drawing of a nested drawing is filtered, the nested drawing is
not displayed, even if it matches the filter.
To create or change the filter, click Filter. In the Drawing Set Display Filter
dialog box (page 1922), you can create separate filters for file names and
descriptions.
Drawing Settings dialog box | 1923
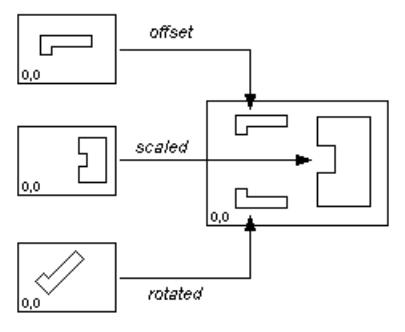
Drawing Description box
Enter a new description for the selected drawing.
Descriptions make it easy for you to remember what is in a drawing. If a
description is assigned to the drawing, it appears in the drawing list instead
of the file name.
Simple Transformation area
Specify the transformation of objects in the source drawing as they are brought
into the current drawing. AutoCAD Map 3D stores this information with the
current drawing. The source drawing does not change. This feature is useful
if you want to overlay drawings or tile them.
If the document has a coordinate system code assigned to it, you cannot use
the simple transformation section.
When objects are saved back to their source drawings, their original scale,
offset, and rotation are restored. To permanently transform an object, use the
ADETRANSFORM (Transform command) (page 1649) command.
Simple Transformation
Turn the simple transformation settings on and off.
When cleared, the settings are not used.
If the document has a global coordinate system code assigned to it, you
cannot use the simple transformation option.
Simple transformations let you tile, scale, or overlay drawings.
Scale box
Specify the change in scale of objects from the source drawing to the current
drawing.
1924 | Chapter 37 Setting Map Options Dialog Boxes

Enter a real number. For example, enter 2 to double the size of objects, or
enter .5 to halve the size of objects.
Rotation box
Specify the rotation of objects from the source drawing to the current
drawing.
Enter an angle. For example, enter 90 to rotate objects 90 degrees in the
current direction. (To view or change the current direction, open the source
drawing and use the DDUNITS command.)
Offset (X,Y) box
Specify the offset of objects from the source drawing to the current drawing.
Enter two real numbers (one for X and one for Y), separated by a comma.
For example, enter 5,-4 to offset objects 5 units to the right and 4 units
down. (To view or change the current unit, open the source drawing and
use the DDUNITS command.)
If you specify save back extents for the drawing, those extents are also offset.
Pick <
Display the drawing, where you can specify points to determine the scale,
rotation, and offset.
■The difference between the old base point and the new base point is the
offset for objects in the source drawing.
■The difference in angle between the two old points and the two new
points is the rotation. 0,0 is the base point for the rotation.
■The ratio of the length between the two new points to the length
between the two old points is the change in scale.
Save Back Extents area
Specify the area that is saved back to the source drawing. By specifying save
back extents, you can prevent boundaries from expanding and intruding on
the boundaries of adjacent drawings. These save back extents are stored with
the source drawing.
Save Back Extents list
View the coordinates of the current save back extents.
Define <
Display your drawing, where you can select points to specify the save back
extents.
NOTE This displays the current window. To view or change the extents for the
entire drawing, zoom to drawing extents before starting this command. To
Drawing Settings dialog box | 1925
zoom drawing extents, click View tab ➤ Navigate panel ➤ Zoom
drop-down ➤ Extents.
Show <
Display the current save back extents in the current drawing. Save back
extents are indicated by a dotted line.
NOTE This shows only the extents displayed in the current window. To view
the extents for the entire drawing, zoom to drawing extents before starting this
command. To zoom drawing extents, click View tab ➤ Navigate panel ➤ Zoom
drop-down ➤ Extents.
Reset
Reset the values to the original drawing extents adjusted for simple
transformations.
The default save back extents are the extents of the source drawing adjusted
for simple transformation.
Drawing Statistics dialog box
Use this dialog box to view information about the active source drawings in
the current drawing.
To view information about attached drawings (page 172)
Click Map Setup tab ➤ Map panel ➤ ➤ Drawing Statistics.
NOTE This option is for drawings only. To view information about geospatial
feature data, see Viewing Data for a Selected Layer, Join, Unfiltered Feature Class,
or Non-Spatial Data Table (page 1134). To see the currently connected feature
sources, use Map Explorer.
Select the drawings you want information about. Click an information button.
AutoCAD Map 3D searches the selected source drawings and displays the
information in the box at the bottom of the screen.
1926 | Chapter 37 Setting Map Options Dialog Boxes
Active Drawings list
View all the active attached drawings in the current drawing.
■Use Select All to select all drawings.
■Use Clear All to remove the highlighting from all items.
■Use Filter to filter the list of drawings.
Filter
Select Filter to turn on the current drawing filter.
When the filter is on, only drawings that match the filter are displayed. If
the parent drawing of a nested drawing is filtered, the nested drawing is
not displayed, even if it matches the filter.
To create or change the filter, click Filter. In the Drawing Set Display Filter
dialog box (page 1922), you can create separate filters for file names and
descriptions.
Object Counts
View the number and type of objects in the source drawing.
Symbol Tables
View symbol tables and their values for each of the selected drawings.
Symbol tables include Blocks, Layers, Linetypes, Text Styles, and Regapps,
which are registered applications that contain xdata (extended data) within
the drawing.
Object Data
For the selected drawings, view
■Link Templates
■Object Data tables
■Attributes
Object Classes
View object classes used in the selected drawings and the number of features
in each feature class.
Drawing Statistics dialog box | 1927
Drive Alias Administration dialog box
AutoCAD Map 3D creates a drive alias for drive C. You must create drive aliases
for all other drives that you use.
To create a drive alias (page 161)
Click Home tab ➤ Data panel ➤ ➤ Define Drawing Set.
NOTE This option is for attached drawings only. For information about connecting
to geospatial feature data, see Overview of Bringing In GIS Features (page 305).
Drive aliases are useful as typing shortcuts or as a reminder of what drawings
are contained in the directory. In addition, they make it easy for multiple
users to share drawings.
The alias you assign appears in the Drive list whenever you select drawings.
To modify an existing drive alias, select it in the list, enter a new Actual Path,
and click Update.
To create a new drive alias, enter a new Drive Alias, enter an Actual Path, and
click Add.
Drive List
View aliases you created.
Drive Alias box
Enter the alias to use.
The name must be unique, use only alphanumeric characters (including
hyphen and underscore), contain no spaces or colons, and start with a
character.
Actual Path box
Enter the path, including drive or server name and directories.
If you are not sure of the drive or directory, click Browse.
Xrefs and raster objects use their assigned paths and are not affected by drive
aliases.
1928 | Chapter 37 Setting Map Options Dialog Boxes
Feature Editing Options dialog box
Use this dialog box to set options for automatically checking out features and
updating feature sources, whether features are checked out as drawing objects
or geospatial features, how to split polygonal features, and how often you are
prompted to check in features.
To specify Feature Edit Options (page 240)
MAPFEATUREEDITTOOLS (page 1906)
NOTE These options are for geospatial feature data only. For information on
working with attached drawings in a multi-user environment, see Overview of
Sharing Attached Drawings (page 730).
Check Out And Update Features
Specify options for automatically checking out features and updating feature
source.
Automatically Check Out Features When Edited.
Specify that features are automatically checked out when you edit them.
Automatically Update Feature Source With Edits
Specify that edits to features are automatically reflected in the feature source
Feature Checkout Options
Specify whether features are checked out as drawing objects or geospatial
features.
AutoCAD Drawing Objects
Specify that features are checked out as AutoCAD drawing objects.
NOTE Features checked out as AutoCAD drawing objects will be listed as custom
features when you use the LIST command. In addition, custom LISP applications
may not work with custom features.
Geospatial Features
Specify that features are checked out as geospatial features.
Feature Editing Options dialog box | 1929

This setting determines the way you work with your data.
Features checked out as geospatial
features
Features checked out as AutoCAD
drawing objects
Allows you to use some common ACAD
editing commands in addition to geospa-
Allows you to use many common ACAD
editing commands
tial feature-specific editing commands (for
example, MAPFEATURESPLIT (page 1652)
and MAPFEATUREMERGE (page 1651))
Edited features are represented as geospa-
tial geometries (for example, MAPPOLY-
GONS).
Edited features represented as AutoCAD
geometries (for example, closed polylines
are used to represent polygonal features)
Supports multipart (multipolygons, mul-
tilines, and multipoints) geospatial features
and editing, such as the Hawaiian islands.
Most existing custom or third-party editing
applications (LISP, VB or ObjectARX)
should continue to work. Some may re-
quire minor updates.
Preserves and allows you to edit M and Z
values.
Some existing AutoCAD Map 3D editing
commands will continue to work on fea-
tures, for example, rubbersheeting (ADER-
SHEET (page 1648)).
Allows you to use feature styling.Allows you to use feature styling.
Split Prompt Options
Specify how features are created after a split and whether these prompts display
during the split operation.
Feature Geometry
Select Create New to split features into two parts. Select Create Multi-Part
to split features into more than two parts.
Feature ID
Select Generate New Feature ID to create a new unique ID for each feature
that results from the split. Select Use Existing to use the ID of the original
feature for all resulting features.
Do Not Show These Prompts When Executing Split
Select this option to use the settings in this dialog box for all split operations.
When you split a feature, you will see only the prompt for drawing a new
1930 | Chapter 37 Setting Map Options Dialog Boxes
line for the split or selecting an existing line or polygon within the feature
to define the split.
If you do not select this option, all prompts will appear, but the default
values for the prompts will be what you specify in this dialog box.
Other Options
Specify whether or not you are prompted to check in features and how often.
Prompt To Check In Every
Specify that you will be prompted to check in features at intervals of the
specified value.
Generate Object Data Index dialog box
Use this dialog box to select the tables and fields to include in the index.
To create a drawing index (page 1294)
Click Map Setup tab ➤ Map panel ➤ ➤ Drawing Maintenance.
NOTE This option is for drawing object data only. For information about geospatial
feature properties, see Overview of the Data Table (page 1125).
In the Object Data Tables list, select a table. In the Fields list, select the object
data fields to include in the index. If a table has fields selected for the index,
the table is checked in the list.
Index Maintenance dialog box
Use this dialog box to specify which types of indexes to create for the selected
source drawings.
To create a drawing index (page 1294)
Generate Object Data Index dialog box | 1931
Click Map Setup tab ➤ Map panel ➤ ➤ Drawing Maintenance.
NOTE This option is for drawing object data only. For information about filtering
geospatial feature data, see Filtering Feature Layers (page 1216).
Indexes speed up queries, but they add to the size of your source drawings. If
size is an issue, create indexes for just the types of queries you perform most
often. For example, if you mostly perform queries based on location, create
just a location index.
■To create an index, select the check box for the type of index you want.
To create an object data index, click Object Data. At the Generate Object
Data Index dialog box (page 1931) select the tables and fields to index.
To improve the performance of object data and SQL queries, create object
data and SQL indexes for all drawings in the data set, even if they do not
contain object data or SQL link information.
■To remove an existing index, select the check box for that type of index.
To remove an object data index, click Object Data. At the Remove Object
Data Index dialog box (page 1933) select the tables and fields to remove from
the index.
Removing an index reduces the size of the drawing, and reduces the time
it takes to save the drawing.
Because indexes are saved in the source drawing, you can create indexes only
if the drawing is not in a read-only directory and you have Edit Drawing
privileges. See User Administration dialog box (page 1934).
Once you create an index, AutoCAD Map 3D automatically updates the index
each time you change the drawing and save the changes back. However, you
will need to recreate the index in the following circumstances:
■If you notice that queries are taking longer. Over time, automatic updates
can cause degeneration of an index. It is a good idea to periodically use
this command to recreate the indexes.
■If you modify a drawing with AutoCAD or with AutoCAD Map 3D when
the drawing is not attached, you need to use this command to recreate the
indexes.
1932 | Chapter 37 Setting Map Options Dialog Boxes
NOTE To check if a source drawing has an index created, select the drawing in
the Drawing Maintenance dialog box. Click Drawing Index to display the Index
Maintenance dialog box. If the source drawing contains a usable index, the check
box for that index is not selected. If the drawing does not contain an index, or if
the index is out of date, the check box for the index is selected.
Remove Object Data Index dialog box
Use this dialog box to remove object data fields from an index.
To remove a drawing index (page 1294)
Click Map Setup tab ➤ Map panel ➤ ➤ Drawing Maintenance.
NOTE This option is for drawing object data only. For information about filtering
geospatial feature data, see Filtering Feature Layers (page 1216).
In the Object Data Tables list, select a table. In the Fields list, select the object
data fields to remove. If a table has fields selected to be removed from the
index, the table is checked in the list.
Select Alias dialog box
Use this dialog box to select the alias to use with this drawing.
To create a drive alias (page 161)
Click Home tab ➤ Data panel ➤ ➤ Define Drawing Set.
NOTE This option is for attached drawings only. For information about connecting
to geospatial feature data, see Overview of Bringing In GIS Features (page 305).
More than one alias is associated with the path to the file you selected. Select
the alias to use with this drawing
Remove Object Data Index dialog box | 1933
Undefined Alias Referenced dialog box
Use this dialog box to resolve problems with undefined drive aliases.
To attach drawings (page 154)
Click Home tab ➤ Data panel ➤ ➤ Define Drawing Set.
NOTE This option is for attached drawings only. For information about connecting
to geospatial feature data, see Overview of Bringing In GIS Features (page 305).
The drawing you are activating or attaching has an alias assigned to it that is
not defined.
■To attach this drawing without defining an alias, click Skip. You cannot
activate the drawing until you define a path for the alias. To define the
alias later, see To create a drive alias (page 161).
■To define a path for the alias now, click Define. In the Drive Alias
Administration dialog box (page 1928), define a drive alias.
User Administration dialog box
Use this dialog box to add or delete users or modify user settings
To add a new user (page 83)
Click Map Setup tab ➤ Map panel ➤ ➤ User Administration.
Do any of the following:
■To add a user, enter information in the User Profile section. Click Add.
■To delete a user, select the name and click Delete.
1934 | Chapter 37 Setting Map Options Dialog Boxes
■To modify a user, select the name and change information in the User
Profile section. Click Update.
User List
View all users set up for AutoCAD Map 3D.
Login Name box
Specify the login name for the user.
■Each login name must be unique.
■Login names are not case-sensitive.
■The login name cannot contain spaces or any of the following characters.
" / \ [ ] ; : | = , + ? < >
Password box
Specify the password for the user.
■Passwords are case-sensitive.
■Passwords cannot contain spaces.
For a new user, you can set the password to PASSWORD and have the user
change it.
To be effective, passwords should have a combination of numbers and
uppercase and lowercase letters.
Privileges
Select privileges for the user.
Superuser
Let the user perform user administration tasks, set system options, and
perform any other AutoCAD Map 3D operation.
Alter Drawing Set
Let the user attach and detach drawings. If this option is not selected, the
user can activate and deactivate drawings, but cannot attach and detach
them.
Alter Object Class
Let the user define and edit object class definitions. If this option is not
selected, users can only assign object classes and change the current feature
definition file.
User Administration dialog box | 1935
Edit Drawing
Let the user edit objects and save them back to source drawings. If this
option is not selected, the user can edit objects but cannot save them back
to source drawings.
Draw Query
Let the user execute Draw mode queries, which copy objects into the current
drawing. If this option is not selected, users can do Preview and Report
mode queries only.
User Information dialog box
This dialog box displays information about the current AutoCAD Map 3D
user.
To change your privileges, see your system administrator.
Login Name
View the name used to log in to AutoCAD Map 3D.
Privileges
View the privileges of the current user.
Superuser
Let the user perform user administration tasks, set system options, and
perform any other AutoCAD Map 3D operation.
Alter Drawing Set
Let the user attach and detach drawings. If this option is not selected, the
user can activate and deactivate drawings, but cannot attach and detach
them.
Alter Feature Class
Let the user define and edit feature class definitions. If this option is not
selected, users can only assign feature classes and change the current feature
definition file.
Edit Drawing
Let the user edit objects and save them back to source drawings. If this
option is not selected, the user can edit objects but cannot save them back
to source drawings.
1936 | Chapter 37 Setting Map Options Dialog Boxes
Draw Query
Let the user execute Draw mode queries, which copy objects into the current
drawing. If this option is not selected, users can do Preview and Report
mode queries only.
User Login dialog box
Log in to AutoCAD Map 3D on this computer. If you do not know your login
name or password, check with your system administrator
To log in to AutoCAD Map 3D (page 142)
Click Map Setup tab ➤ Map panel ➤ ➤ User Login.
Some actions, such as modifying object data tables and removing locks for
other users, require Superuser access. To log in as a Superuser, enter the login
name Superuser. Enter the password SUPERUSER. In offices where the system
administrator reserves the Superuser login name, contact your system
administrator to gain access to object data tables, object locks, or system
options.
If user login is not required, you can log in at any time, even if you did not
log in at the beginning of your current AutoCAD Map 3D session. For example,
you can log in under your own name, or as a different user, while working in
a drawing with active source drawings.
User Login dialog box | 1937
1938
Topology Dialog Boxes
NOTE Topology functionality applies only to drawing objects.
MAPEDITDIR (Edit Direction command)
NOTE This functionality applies only to drawing objects.
Use this command to edit the direction of a selected linear object in an existing
topology while maintaining the integrity of the topology information.
To edit the direction of a link (page 873)
Respond to the prompts:
Enter topology name (? for list) <toponame>:
Enter the name of the topology for which you want to modify direction. To
display a list of all loaded topologies, enter ?.
Select objects:
Use any selection method to select the objects.
Enter new value (Bi-directional/From->To/To->From)<B>:
Enter B for bi-directional, F for From->To, or T for To->From.
MAPEDITRES1 (Edit Direct Resistance command)
NOTE This functionality applies only to drawing objects.
38
1939
Use this command to edit the direct resistance of a selected link or node in
an existing topology while maintaining the integrity of the topology
information.
To edit the resistance of a link or node in a network topology (page 875)
Respond to the prompts:
Enter topology name (? for list) <toponame>:
Enter the name of the topology for which you want to modify resistance.
To display a list of all loaded topologies, enter ?.
Edit resistance of (Links/Nodes) <L>:
Enter L for Links or N for Nodes.
Select objects:
Use any selection method to select the objects.
Enter new direct resistance <1.000>:
Enter a new value.
MAPEDITRES2 (Edit Reverse Resistance command)
NOTE This functionality applies only to drawing objects.
Use this command to edit the reverse resistance of a selected link an existing
topology while maintaining the integrity of the topology information.
To edit the resistance of a link or node in a network topology (page 875)
Respond to the prompts:
Enter topology name (? for list) <toponame>:
Enter the name of the topology for which you want to modify resistance.
To display a list of all loaded topologies, enter ?.
Select objects:
Use any selection method to select the objects.
1940 | Chapter 38 Topology Dialog Boxes

Enter new reverse resistance <1.000>:
Enter a new value.
MAPLINKADD (Add Topology Link command)
NOTE This functionality applies only to drawing objects.
WARNING This command will not be supported in future releases. This is the
old command for adding a link to a topology. The new command is MAPAL.
Use this command to add a link to an existing network or polygon topology
while maintaining the integrity of the topology information.
To create a link and add it to a topology (page 880)
MAPAL
Respond to the prompts:
Enter topology name (? for list) <toponame>:
Enter the name of the topology to add the link to. To display a list of all
loaded topologies, enter ?.
Enter first point:
Enter the coordinates for the first point of the line, or select the point.
Arc/Close/Halfwidth/Length/Undo/Width/<Endpoint of line>:
For information about this prompt, see the PLINE command in the AutoCAD
help.
You can use MAPLINKADD to add a link in three ways:
■In space (connecting no existing nodes). Two new nodes are created at the
link endpoints in space.
■From one existing node to a point in space. A new node is created at the
end point in space.
■From one existing node to another existing node.
MAPLINKADD (Add Topology Link command) | 1941
A topology must have a node at the end points of all link objects. This node
is part of the topology data structure and is assigned a topology ID. However,
a node can be implicit (referenced in the topology data structure) or explicit
(a physical object in the drawing). Use the MAPNODADD (Add Topology Node
command) (page 1944) or MAPNODINS (Insert Topology Node command) (page
1947) command to create a new node.
When you add a link to a topology, AutoCAD Map 3D creates a node when
necessary. If the link joins two existing nodes, no new nodes are created.
Remember these features of nodes and links:
■A node can reference many links.
■A link can reference only two nodes.
■Only one node can exist at a specific point.
If the new link splits an existing area in a polygon topology into two areas,
AutoCAD Map 3D creates a new centroid and updates the existing centroid.
MAPLINKDEL (Delete Topology Link command)
NOTE This functionality applies only to drawing objects.
WARNING This command will not be supported in future releases. This is the
old command for deleting a link in a network topology. The new command is
MAPDL.
Use this command to delete a link from an existing network or polygon
topology while maintaining the integrity of the topology information.
To delete a link, node, or polygon (page 889)
MAPDL
Respond to the prompts:
Enter topology name (? for list) <toponame>:
Enter the name of the topology to delete the link from. To display a list of
all loaded topologies, enter ?.
1942 | Chapter 38 Topology Dialog Boxes
Select object:
Use any selection method to select the object to delete.
MAPLINKEDIT (Edit Topology Link command)
NOTE This functionality applies only to drawing objects.
Use this command to edit a link in an existing network or polygon topology
while maintaining the integrity of the topology information.
To reposition a node at the end point of a link (page 863)
Respond to the prompts:
Enter topology name (? for list) <toponame>:
Enter the name of the topology to modify. To display a list of all loaded
topologies, enter ?.
Select link to edit:
Select the object using any selection method.
For information about the prompts, see the PEDIT command in the AutoCAD
help.
You cannot delete the first or last vertex of a polyline.
MAPLINKREV (Reverse Direction of Topology Link command)
NOTE This functionality applies only to drawing objects.
WARNING This command will not be supported in future releases. This is the
old command for reversing a link in a network topology. The new command is
MAPRL.
Use this command to reverse the direction of a link in an existing network
topology while maintaining the topology information.
To edit the direction of a link (page 873)
MAPLINKEDIT (Edit Topology Link command) | 1943
MAPRL
Respond to the prompts:
Enter topology name (? for list) <toponame>:
Enter the name of the topology to modify. To display a list of all loaded
topologies, enter ?.
Select link to edit:
Use any selection method to select the object whose direction you want to
reverse.
MAPLINKUPD (Update Topology Link command)
NOTE This functionality applies only to drawing objects.
When you modify a link using standard editing commands, the topology
information associated with the link is not updated. Use this command to
have the topology relationship information on the link updated. (If you
modified the link using an AutoCAD Map 3D topology command, such as
MAPLINKEDIT, the topology information was automatically updated and you
do not need to use this command.)
To update a topology (page 892)
Respond to the prompts:
Enter topology name (? for list) <toponame>:
Enter the name of the topology to modify. To display a list of all loaded
topologies, enter ?.
Select link to update:
Use any selection method to select the object to update.
MAPNODADD (Add Topology Node command)
NOTE This functionality applies only to drawing objects.
1944 | Chapter 38 Topology Dialog Boxes
WARNING This command will not be supported in future releases. This is the
old command for adding a node to a topology. The new command is MAPAN.
Use this command to add a an existing block or point to a topology while
maintaining the integrity of the topology information.
To create a node on an existing link (page 878)
MAPAN
Respond to the prompts:
Enter topology name (? for list) <toponame>:
Enter the name of the topology to add the node to. To display a list of all
loaded topologies, enter ?.
Select block or point to add:
Select an existing block or point.
You can use this operation to create a new block object at the location of an
existing implicit node. MAPNODADD prompts you to select the new block
or point object.
You cannot add a new node to a topology with this command. To insert a
node on an existing link, use the MAPNODINS (Insert Topology Node
command) (page 1947) command.
MAPNODDEL (Delete Topology Node command)
NOTE This functionality applies only to drawing objects.
WARNING This command will not be supported in future releases. This is the
old command for deleting a node in a topology. The new command is MAPDN.
MAPNODDEL (Delete Topology Node command) | 1945
Use this command to delete a node from an existing topology while
maintaining the integrity of the topology information.
To delete a link, node, or polygon (page 889)
MAPDN
Respond to the prompts:
Enter topology name (? for list) <toponame>:
Enter the name of the topology to delete the node from. To display a list
of all loaded topologies, enter ?.
Select node to delete:
Use any selection method to select the node to delete.
If the node has only one link, choose whether to delete the dangling link.
If the node has two links, the two links are combined. Choose which set of
object data to preserve.
You cannot delete a node that has more than two links.
MAPNODEDIT (Edit Topology Node command)
NOTE This functionality applies only to drawing objects.
Use this command to move a node in an existing topology while maintaining
the integrity of the topology information.
To edit a node (page 860)
Respond to the prompts:
Enter topology name (? for list) <toponame>:
Enter the name of the topology to modify. To display a list of all loaded
topologies, enter ?.
1946 | Chapter 38 Topology Dialog Boxes
Select node to update:
Use any selection method to select the object to edit.
Specify new insertion point:
Enter the coordinates of a point or select a point onscreen. If a node already
exists in the new location, you are prompted to delete one of the nodes.
The node is moved to the new location, and all associated links move their
endpoints.
MAPNODINS (Insert Topology Node command)
NOTE This functionality applies only to drawing objects.
WARNING This command will not be supported in future releases. This is the
old command for inserting a node in a topology. The new command is MAPIN.
Use this command to insert a node on an existing link while maintaining the
integrity of the topology information.
To create a node on an existing link (page 878)
MAPIN
Respond to the prompts:
Enter topology name (? for list) <toponame>:
Enter the name of the topology to modify. To display a list of all loaded
topologies, enter ?.
Specify insertion point:
Enter the coordinates of a point or select a point on the screen. If any block
definitions exist in the drawing, you are prompted for a block to reference.
The default block name is the last block name referenced in the drawing.
To add a node at the end of a dangling link, or to add a node not on a link,
use the MAPNODADD (Add Topology Node command) (page 1944) command.
MAPNODINS (Insert Topology Node command) | 1947
MAPNODUPD (Update Topology Node command)
NOTE This functionality applies only to drawing objects.
Use this command to have the topology relationship data on the node updated.
To update a topology (page 892)
When you modify a node using standard editing commands, the topology
data associated with the node is not updated. (If you modified the node using
an AutoCAD Map 3D topology command, such as MAPNODEDIT, the topology
data was updated automatically and you do not need to use this command.)
Respond to the prompts:
Enter topology name (? for list) <toponame>:
Enter the name of the topology to modify. To display a list of all loaded
topologies, enter ?.
Select node to update:
Use any selection method to select the object to update.
MAPPOLYADD (Add Topology Polygon command)
NOTE This functionality applies only to drawing objects.
WARNING This command will not be supported in future releases. This is the
old command for adding a polygon to a polygon topology. The new command
is MAPAP.
Use this command to add a centroid in an existing topology while maintaining
the integrity of the topology information.
To add a polygon to a polygon topology using existing linework (page 884)
MAPAP
1948 | Chapter 38 Topology Dialog Boxes
Respond to the prompts:
Enter topology name (? for list) <toponame>:
Enter the name of the topology to modify. To display a list of all loaded
topologies, enter ?.
Select objects:
Enter the coordinates of a point or select a point on screen. The point must
be in a defined area that does not currently contain a centroid.
MAPPOLYDEL (Delete Topology Polygon command)
NOTE This functionality applies only to drawing objects.
WARNING This command will not be supported in future releases. This is the
old command for deleting a polygon from a polygon topology. The new command
is MAPDP.
Use this command to delete a polygon from an existing topology while
maintaining the integrity of the topology information.
To delete a link, node, or polygon (page 889)
MAPDP
Respond to the prompts:
Enter topology name (? for list) <toponame>:
Enter the name of the topology to modify. To display a list of all loaded
topologies, enter ?.
Select objects:
Use any selection method to select the centroid of the polygon to delete.
MAPPOLYUPD (Update Topology Polygon command)
NOTE This functionality applies only to drawing objects.
MAPPOLYDEL (Delete Topology Polygon command) | 1949
Use this command to have the topology data on the polygon updated.
To update a topology (page 892)
When you modify a polygon using standard editing commands, the topology
data associated with the polygon is not updated. (If you modified the polygon
using an AutoCAD Map 3D topology command, such as MAPPOLYADD,
AutoCAD Map 3D updated the topology for you.)
Respond to the prompts:
Enter topology name (? for list) <toponame>:
Enter the name of the topology to modify. To display a list of all loaded
topologies, enter ?.
Select object:
Use any selection method to select the centroid of the polygon to update.
AutoCAD Map Confirmation dialog box - MAPTOPOADMIN
Delete
NOTE This functionality applies only to drawing objects.
Use this dialog box to confirm the deletion of topology objects.
To delete a link, node, or polygon (page 889)
MAPDL
MAPDN
MAPDP
If you select Delete Topology Objects, the referenced objects are deleted from
the current drawing, if either of the following conditions exist:
■It was loaded from the source and all objects were created when loaded.
■It was loaded from the current drawing.
1950 | Chapter 38 Topology Dialog Boxes
AutoCAD Map Confirmation dialog box - MAPTOPOEDIT
NOTE This functionality applies only to drawing objects.
Use this dialog box to confirm the change to an object shared by multiple
topologies.
To edit a topology (page 854)
MAPTOPOEDIT
The object you are modifying is referenced by more than one topology. If you
modify the object in the selected topology, the other topologies may be invalid.
You must To update a topology (page 892) the other topologies.
AutoCAD Map Confirmation dialog box - MAPTOPOADMIN
Rename
Use this dialog box to confirm the renaming of a topology.
To change the name, description, or both of a topology (page 925)
Click Map Setup tab ➤ Topology panel ➤ Rename.
Before you rename a topology:
■Attach all source drawings that are referenced by the topology. If the source
drawings are not attached, you could corrupt your data set.
■Load the topology. The topology needs to be completely represented, either
in source files or in the current drawing.
■You cannot rename a topology if there are any queried objects in the
current drawing. You must save all queried objects back to their source
AutoCAD Map Confirmation dialog box - MAPTOPOEDIT | 1951

drawings or detach them from their source drawings before you can rename
any topology.
■Be sure the Create Backup File Of Source Drawing option is not selected
on the Save Back tab of the AutoCAD Map Options dialog box (page 1908).
You cannot undo this rename operation using the UNDO command.
Centroid Objects dialog box
NOTE This functionality applies only to drawing objects.
Use this dialog box to select the centroids to include when you create a
topology.
To create a topology (page 825)
Click Create tab ➤ Topology panel ➤ New.
Centroid information is stored as object data and saved with the map. Each
centroid is given a unique ID number, which is automatically processed
whenever you use a topology command.
Object Selection
Select Automatically / Manually options
■Select Automatically selects all objects that meet the object type and
filter criteria.
■Select Manually lets you manually select objects for the topology. Click
Select < to select objects.
Filter Selected Objects
If this option is selected, only objects that are on the specified layers or
blocks are selected. The filters are used for both automatic and manual
selection of objects. If this option is not selected, the filters are ignored.
1952 | Chapter 38 Topology Dialog Boxes
Layer Filters box
Specify which layers to search for objects to be used for the topology. Enter
an asterisk (*) to search all layers. To select from a list of layers, click Layers.
Block Filters box
Specify which blocks to search for objects to be used for the topology.
■To search all blocks, enter an asterisk (*).
■To select from a list of block definitions in the drawing set, click Blocks.
■To select point objects, enter ACAD_POINT.
Object Creation
Create on Layer box
If new nodes or centroids are created, specify on which layer they should
be placed. To select from a list of layers, click Layers.
Create Using box
If new nodes or centriods are created, specify what block to use to create
them.
■To select from a list of block definitions in the drawing set, click Blocks.
■To create nodes or centroids as a point, leave the box blank or enter
ACAD_POINT.
Create Closed Polylines dialog box
NOTE This functionality applies only to drawing objects.
Use this dialog box to create polylines from a polygon topology.
To create closed polylines from a polygon topology (page 898)
Click Create tab ➤ Topology panel ➤ Create Closed Polylines.
Create Closed Polylines dialog box | 1953
Topology Name
Name box
Select the topology you want.
The list displays topologies loaded from the current drawing. If the topology
you want is not listed, click Load and load it.
Type
Displays the type of the selected topology.
Description
Displays the description of the selected topology.
Number of Polygons Referenced
Displays the number of polygons referenced by the selected topology. If
the topology is loaded as partial, this is the number of polygons in the
partial subset.
How to Close
Create on Layer box
Specify a layer for the new plines.
Click Layers to select from a list of layers in the current drawing or enter a
new layer name.
Group Complex Polygons
Select this option to group all closed plines that make up the original
complex topology polygon. A complex polygon is one that includes islands.
If the islands themselves have nested islands or other polygons, these nested
polygons will form a separate grouping automatically, creating different
levels of grouping. If two or more inner polygons are not nested but share
the same outer boundary, they will be treated as one group.
Copy Object Data from Centroid to Pline
Select this option to copy object data from the centroid to the closed pline
that is created.
Object data on islands are copied to the outer polygon edge.
Copy Database Links from Centroid to Pline check box
Select this option to copy database links from the centroid to the closed
pline that is created.
Database links on islands are copied to the outer polygon edge.
1954 | Chapter 38 Topology Dialog Boxes
Create Network Topology - Create New Nodes dialog box
NOTE This functionality applies only to drawing objects.
Use this dialog box to create node objects at the endpoint of links when you
create a network topology.
To create a network topology (page 831)
Click Create tab ➤ Topology panel ➤ New.
Create New Nodes
Specify whether or not to create nodes in the current object to complete
the topology. (Nodes are optional.)
Layer
If new nodes are created, you can specify a new layer or click the down
arrow to select from a list of layers in the drawing set.
Point Object for Node Creation
If new nodes are created, specify what block to use to create them.
■To create nodes using a block defined in the drawing set, click the down
arrow and select from the list.
■To create nodes using a block saved as a DWG file, click Browse, and
select the file you want to use. Selecting this file will insert the entire
DWG as a single block.
■To create nodes as a point, select ACAD_POINT.
Cancel
Close the dialog box without creating the topology.
Back
Display the previous dialog box in the list.
Next
Disabled because this is the last dialog box in the list.
Create Network Topology - Create New Nodes dialog box | 1955

Finish
Create the topology using the current settings. Enter a unique name for the
topology and click Finish.
Create Network Topology - Select Links dialog box
NOTE This functionality applies only to drawing objects.
Use this dialog box to select the links for a network topology.
To create a network topology (page 831)
Click Create tab ➤ Topology panel ➤ New.
Select the links to include in the topology. You can select all links in the map
or select them manually. You can also filter (restrict) link selection to a subset
of links, in which you include only the links that are on specified layers and
in specified object classes.
Link information is stored as object data and saved with the map. Each link
is given a unique ID number, which is automatically processed whenever you
use a topology command.
Select All
Include all links that meet the filter criteria.
Select Manually
Include only the links that you manually select in the map. Click Select
Objects to select the links. Only links that meet the filter criteria will be
selected.
Layers
Specify the layers to use to filter (restrict) link selection to a subset of links,
in which you include only the links that are on the specified layers. This
filter is used for both automatic and manual selection of objects. To select
from a list of layers in the map, click Select Layers. To use all layers, enter
an asterisk (*) or leave the box blank.
1956 | Chapter 38 Topology Dialog Boxes
Object Classes
Specify the object classes to use to filter (restrict) link selection to a subset
of links, in which you include only the links that are in the specified object
classes. To select from a list of object classes in the map, click Select Object
Classes. To use all object classes, enter an asterisk (*) or leave the box blank.
Cancel
Close the dialog box without creating the topology.
Back
Display the previous dialog box in the list.
Next
Click to display the Create Network Topology - Select Nodes dialog box
(page 1957).
Finish
Create the topology using the current settings. Enter a unique name for the
topology and click Finish.
Create Network Topology - Select Nodes dialog box
NOTE This functionality applies only to drawing objects.
Use this dialog box to select the nodes to include in a network topology.
To create a network topology (page 831)
Click Create tab ➤ Topology panel ➤ New.
Nodes are useful when performing some types of analysis. You can select all
nodes in the map or select them manually. You can also filter (restrict) node
selection to a subset of nodes, in which you include only the nodes that are
on specified layers, are of specified block types, or in specified object classes.
Node information is stored as object data and saved with the map. Each node
is given a unique ID number, which is automatically processed whenever you
use a topology command.
Create Network Topology - Select Nodes dialog box | 1957
Select All
Include all nodes that meet the filter criteria.
Select Manually
Include only the nodes that you manually select in the map. Click Select
Objects to select the nodes. Only nodes that meet the filter criteria will be
selected.
Layers
Specify the layers to use to filter (restrict) node selection to a subset of nodes,
in which you include only the nodes that are on the specified layers. This
filter is used for both automatic and manual selection of objects. To select
from a list of layers in the map, click Select Layers. To use all layers, enter
an asterisk (*) or leave the box blank.
Block Names
Specify which blocks to search for nodes to be used in the topology. To
search all blocks, enter an asterisk (*) or leave the box blank. To select from
a list of block definitions in the drawing set, click Select Blocks. To select
point objects, select ACAD_POINT from the list.
Object Classes
Specify the object classes to use to filter (restrict) node selection to a subset
of nodes, in which you include only the nodes that are in the specified
object classes. To select from a list of object classes in the map, click Select
Object Classes. To use all object classes, enter an asterisk (*) or leave the
box blank.
Cancel
Close the dialog box without creating the topology.
Back
Display the previous dialog box in the list.
Next
Click to display the Create Network Topology - Create New Nodes dialog
box (page 1955).
Finish
Create the topology using the current settings. Enter a unique name for the
topology and click Finish.
1958 | Chapter 38 Topology Dialog Boxes

Create Node Topology - Select Nodes dialog box
NOTE This functionality applies only to drawing objects.
Use this dialog box to select the nodes to include in a node topology.
To create a node topology (page 827)
Click Create tab ➤ Topology panel ➤ New.
You can select all nodes in the map or select them manually. You can also
filter (restrict) node selection to a subset of nodes, in which you include only
the nodes that are on specified layers, are of specified block types, or in
specified object classes.
Node information is stored as object data and saved with the map. Each node
is given a unique ID number, which is automatically processed whenever you
use a topology command.
Select All
Include all nodes that meet the filter criteria.
Select Manually
Include only the nodes that you manually select in the map. Click the Select
Objects to select the nodes. Only nodes that meet the filter criteria will be
selected.
Layers
Specify the layers to use to filter (restrict) node selection to a subset of nodes,
in which you include only the nodes that are on the specified layers. This
filter is used for both automatic and manual selection of objects. To select
from a list of layers in the map, click Select Layers. To use all layers, enter
an asterisk (*) or leave the box blank.
Block Names
Specify which blocks to search for nodes to be used in the topology. To
search all blocks, enter an asterisk (*) or leave the box blank. To select from
a list of block definitions in the drawing set, click Select Blocks. To select
point objects, select ACAD_POINT from the list.
Create Node Topology - Select Nodes dialog box | 1959

Object Classes
Specify the object classes to use to filter (restrict) node selection to a subset
of nodes, in which you include only the nodes that are in the specified
object classes. To select from a list of object classes in the map, click Select
Object Classes. To use all object classes, enter an asterisk (*) or leave the
box blank.
Cancel
Close the dialog box without creating the topology.
Back
Display the previous dialog box in the list.
Next
Disabled because this is the last dialog box in the list.
Finish
Create the topology using the current settings. Enter a unique name for the
topology and click Finish.
Create Polygon Topology - Create New Centroids dialog box
NOTE This functionality applies only to drawing objects.
Use this dialog box to create centroids for any areas that are missing centroids
and to specify the layer and block to use for the new centroids.
To create a polygon topology (page 836)
Click Create tab ➤ Topology panel ➤ New.
If you do not select the Create Missing Centroids option, and an area is missing
a centroid, you are notified that the topology has not been created. The areas
that are missing centroids are marked or highlighted using the error markers
you specify in the Create Polygon Topology - Set Error Markers dialog box
(page 1967).
Create Missing Centroids
Creates centroids where needed.
1960 | Chapter 38 Topology Dialog Boxes

Layer
Specify the layer on which to place the new centroids. Enter a layer name
or click the down arrow to select from a list of layers in the drawing set. If
a layer you want is not listed, it may be frozen or locked.
Point Object for Centroid Creation
Specify the block to use to represent the new centroids. To create centroids
using an existing block, click the down arrow and select the name of the
block from the list. To use a point instead of a block, select ACAD_POINT.
To use a block saved as a DWG file, click Browse, and select the file.
Cancel
Close the dialog box without creating the topology.
Back
Display the previous dialog box in the list.
Next
Click to display the Create Polygon Topology - Set Error Markers dialog box
(page 1967).
Finish
Create the topology using the current settings. Enter a unique name for the
topology and click Finish.
Create Polygon Topology - Create New Nodes dialog box
NOTE This functionality applies only to drawing objects.
Use this dialog box to specify whether to create explicit node objects at the
endpoints of links when creating a polygon topology. If so, specify the layer
on which to place the new nodes and the block to use to create the nodes.
To create a polygon topology (page 836)
Click Create tab ➤ Topology panel ➤ New.
Create Polygon Topology - Create New Nodes dialog box | 1961

Create New Nodes
Specify whether nodes that are not present in the current object selection
should be created to complete the topology. (Explicit nodes are optional.)
Layer
If new nodes are created, specify on which layer they should be placed. You
can specify a new layer or click the down arrow to select from a list of layers
in the drawing set.
Point Object for Node Creation
If new nodes are created, specify what block to use to create them.
■To create nodes using a block defined in the drawing set, click the down
arrow and select from the list.
■To create nodes using a block saved as a DWG file, click Browse, and
select the file you want to use. Selecting this file will insert the entire
DWG as a single block.
■To create nodes as a point, select ACAD_POINT.
Cancel
Close the dialog box without creating the topology.
Back
Display the previous dialog box in the list.
Next
Click to display the Create Polygon Topology - Select Centroids dialog box
(page 1962).
Finish
Create the topology using the current settings. Enter a unique name for the
topology and click Finish.
Create Polygon Topology - Select Centroids dialog box
NOTE This functionality applies only to drawing objects.
1962 | Chapter 38 Topology Dialog Boxes

Use this dialog box to select the point and block objects to use as centroids
for the polygons.
To create a polygon topology (page 836)
Click Create tab ➤ Topology panel ➤ New.
Each polygon in a polygon topology has a centroid, which is a point or block
element within the polygon, and contains information about the area it
encloses. Centroid information is stored as object data and saved with the
map. Each centroid is given a unique ID number, which is automatically
processed whenever you use a topology command.
You can select all point or block elements in the map or select them manually.
You can also filter (restrict) object selection to a subset of objects, in which
you include only the objects that are on specified layers, are of specified block
types, or in specified object classes.
Select All
Use all point or block objects that meet the filter criteria as centroids.
Select Manually
Include only the point or block objects that you manually select in the map.
Click Select Objects to select the objects. Only objects that meet the filter
criteria will be selected.
Layers
Specify the layers to use to filter (restrict) object selection to a subset of
objects, in which you include only the objects that are on the specified
layers. This filter is used for both automatic and manual selection of objects.
To select from a list of layers in the map, click Select Layers. To use all layers,
enter an asterisk (*) or leave the box blank.
Block Names
Specify the point or block objects to use to filter object selection. To use all
points and blocks, enter an asterisk (*) or leave the box blank. To select
from a list of block definitions in the drawing set, click Select Blocks. To
select point objects, select ACAD_POINT.
Create Polygon Topology - Select Centroids dialog box | 1963
Object Classes
Specify the object classes to use to filter (restrict) object selection to a subset
of objects, in which you include only the objects that are in the specified
object classes. To select from a list of object classes in the map, click Select
Object Classes. To use all object classes, enter an asterisk (*) or leave the
box blank.
Cancel
Close the dialog box without creating the topology.
Back
Display the previous dialog box in the list.
Next
Click to display the Create Polygon Topology - Create New Centroids dialog
box (page 1960).
Finish
Create the topology using the current settings. The Finish is available after
you enter a valid, unique name for the topology.
Create Polygon Topology - Select Links dialog box
NOTE This functionality applies only to drawing objects.
Every area forms a polygon; and each polygon in a polygon topology consists
of a set of links. When you create polygon topology, use this dialog box to
select the links to include in the topology.
To create a polygon topology (page 836)
Click Create tab ➤ Topology panel ➤ New.
You can select all links in the map or select them manually. You can also filter
(restrict) link selection to a subset of links, in which you include only the links
that are on specified layers and in specified object classes.
1964 | Chapter 38 Topology Dialog Boxes

Link information is stored as object data and saved with the map. Each link
is given a unique ID number, which is automatically processed whenever you
use a topology command.
Select All
Include all links that meet the filter criteria.
Select Manually
Include only the links that you manually select in the map. Click the Select
Objects to select the links. Only links that meet the filter criteria will be
selected.
Layers
Specify the layers to use to filter (restrict) link selection to a subset of links,
in which you include only the links that are on the specified layers. This
filter is used for both automatic and manual selection of objects. To select
from a list of layers in the map, click Select Layers. To use all layers, enter
an asterisk (*) or leave the box blank.
Object Classes
Specify the object classes to use to filter (restrict) link selection to a subset
of links, in which you include only the links that are in the specified object
classes. To select from a list of object classes in the map, click Select Object
Classes. To use all object classes, enter an asterisk (*) or leave the box blank.
Cancel
Close the dialog box without creating the topology.
Back
Display the previous dialog box in the list.
Next
Click to display the Create Polygon Topology - Select Nodes dialog box
(page 1965).
Finish
Create the topology using the current settings. Enter a unique name for the
topology and click Finish.
Create Polygon Topology - Select Nodes dialog box
NOTE This functionality applies only to drawing objects.
Create Polygon Topology - Select Nodes dialog box | 1965
When you create a polygon topology, use this dialog box to select the nodes
you want to be part of the topology.
To create a polygon topology (page 836)
Click Create tab ➤ Topology panel ➤ New.
Nodes are useful when performing some types of analysis. You can select all
nodes in the map or select them manually. You can also filter (restrict) node
selection to a subset of nodes, in which you include only the nodes that are
on specified layers, are of specified block types, or in specified object classes.
Node information is stored as object data and saved with the map. Each node
is given a unique ID number, which is automatically processed whenever you
use a topology command.
Select All
Include all nodes that meet the filter criteria.
Select Manually
Include only the nodes that you manually select in the map. Click the Select
Objects to select the nodes. Only nodes that meet the filter criteria will be
selected.
Layers
Specify the layers to use to filter (restrict) node selection to a subset of nodes,
in which you include only the nodes that are on the specified layers. This
filter is used for both automatic and manual selection of objects. To select
from a list of layers in the map, click Select Layers. To use all layers, enter
an asterisk (*) or leave the box blank.
Block Names
Specify which blocks to search for nodes to be used in the topology. To
search all blocks, enter an asterisk (*) or leave the box blank. To select from
a list of block definitions in the drawing set, click Select Blocks. To select
point objects, select ACAD_POINT from the list.
Object Classes
Specify the object classes to use to filter (restrict) node selection to a subset
of nodes, in which you include only the nodes that are in the specified
object classes. To select from a list of object classes in the map, click Select
1966 | Chapter 38 Topology Dialog Boxes

Object Classes. To use all object classes, enter an asterisk (*) or leave the
box blank.
Cancel
Close the dialog box without creating the topology.
Back
Display the previous dialog box in the list.
Next
Click to display the Create Polygon Topology - Create New Nodes dialog
box (page 1961).
Finish
Create the topology using the current settings. The Finish is available after
you enter a valid, unique name for the topology.
Create Polygon Topology - Set Error Markers dialog box
NOTE This functionality applies only to drawing objects.
Use this dialog box to specify how to mark errors in your polygon topology.
If you mark errors with blocks, specify the size, shape, and color of the marker
blocks.
To create a polygon topology (page 836)
Click Create tab ➤ Topology panel ➤ New.
AutoCAD Map 3D automatically checks for missing centroids and intersections.
These are considered serious errors and if detected, prevent topology creation.
You can choose whether you want Map to check for other potential problems,
including duplicate objects, incomplete areas, and sliver polygons.
Marker Parameters
Specify whether or not to highlight errors and/or mark them with blocks. Also
specify the marker size.
Create Polygon Topology - Set Error Markers dialog box | 1967
Highlight Errors
Highlight errors in red (nodes or centroids are highlighted with a red X).
To remove the highlighting, use the REDRAW, REGEN, or SAVE command.
Mark Errors With Blocks
Mark errors with blocks of the shape and color you specify below. To remove
a marker block, select it and then press Delete.
Marker Size
Specify the marker size as a percent of the screen size. A value between 3%
and 7% is usually suitable.
Missing Centroids
Mark each area with a missing centroid with a block of the shape and color
you specify. This option is disabled if you selected the Create Missing
Centroids option on the previous dialog box.
Intersections
Mark each duplicate object with a block of the shape and color you specify.
Duplicate Centroids
Select the check box to mark each area in the drawing with more than one
centroid. If you don't select the check box, AutoCAD Map 3D creates a
topology even if an area contains more than one point object which qualifies
to be a centroid. The topology data is added to only one of the centroid
objects.
Incomplete Areas
Select the check box to detect links that are not part of a closed area. If you
don't select this option, AutoCAD Map 3D ignores links that are not part
of a closed area and they do not receive any topology data.
Highlight Sliver Polygons
Select the check box to check for sliver polygons and mark their centroids
with red Xs. Sliver polygons are long, thin polygons, which can occur if
data is digitized or drawn inaccurately. Map will create your topology
regardless of the sliver polygons, but you should check that your data is
accurate.
Cancel
Close the dialog box without creating the topology.
Back
Display the previous dialog box in the list.
1968 | Chapter 38 Topology Dialog Boxes
Next
Disabled because this is the last dialog box in the list.
Finish
Create the topology using the current settings.
Create Topology - Select Topology dialog box
NOTE This functionality applies only to drawing objects.
Use this dialog box to select the type of topology to create and to specify the
topology name and description.
To create a polygon topology (page 836)
Click Create tab ➤ Topology panel ➤ New.
Before you create network or polygon topologies, you should clean up your
map to make sure it doesn't have certain types of errors. Node topologies do
not usually require cleanup. Click Tools tab ➤ Map Edit panel ➤ Clean Up.
For more information, see Cleaning Up Drawing Data (page 765).
Topology Type
Select the type of topology to create: node, network, or polygon.
■Node topologies involve independent points. Some examples of node
topologies are street lights, city-maintained trees, or drill holes for core
samples.Cleaning Up Maps (page 767)
Create Topology - Select Topology dialog box | 1969
■Network topologies involve linear objects, and can have nodes where
linear objects connect. In addition, linear objects can have direction or
resistance. Some examples of network topologies are a water distribution
network, a river network, or a street network.
■Polygon topologies involve polygons that define areas. Some examples
of polygon topologies are city blocks, land parcels, and political
boundaries.
Topology Name
Enter a unique name for the topology. Names can contain letters, numbers,
and the underscore, hyphen, and dollar characters. Always use unique
names for a topology; topologies with the same name may become corrupt
if you insert one drawing with a topology into another.
Topology Description
Enter a description for the topology. Providing a description can help you
and other users identify the topology more easily.
Cancel
Close the dialog box without creating the topology.
Back
Disabled because this is the first dialog box in the list.
Next
Display the next dialog box. This varies, depending on the type of topology
you are creating.
1970 | Chapter 38 Topology Dialog Boxes
Finish
Create the topology using the current settings. Enter a unique name for the
topology and click Finish.
Create Topology Warning dialog box
NOTE This functionality applies only to drawing objects.
Use this dialog box to indicate whether you want to continue creating the
topology.
To create a polygon topology (page 836)
Click Create tab ➤ Topology panel ➤ New.
You selected 25,000 links for your topology. Creating a topology of this size
may take longer to create.
■To continue creating the topology, click OK.
■To return to the previous dialog box without creating a topology, click
Cancel.
If you don't want to see this warning again, select Do Not Warn Me Before
Creating A Large Topology.
Delete Topology dialog box
NOTE This functionality applies only to drawing objects.
Use this dialog box to delete an entire topology.
To delete a topology (page 926)
Create Topology Warning dialog box | 1971
Click Map Setup tab ➤ Topology panel ➤ Delete.
When you delete a topology, the topology relationship data is automatically
deleted from objects referenced by the selected topology.
Select Delete Geometry to delete the referenced objects from the current
drawing.
You can delete a topology under the following conditions:
■It was loaded from source and all objects were created at load.
■It was loaded from the current drawing and completed.
Edit Direct Resistance dialog box
NOTE This functionality applies only to drawing objects.
Use this dialog box to edit the direct resistance of a selected link or node in
an existing topology while maintaining the integrity of the topology
information.
To edit the resistance of a link or node in a network topology (page 850)
MAPEDITRES1 (Edit Direct Resistance command) (page 1939)
MAPEDITRES2 (Edit Reverse Resistance command) (page 1940)
Value box
Displays the direct resistance for the object. Enter a new value and click
OK.
The value must be numeric.
Edit Direction dialog box
NOTE This functionality applies only to drawing objects.
1972 | Chapter 38 Topology Dialog Boxes
Use this dialog box to edit the direction of a selected linear object in an existing
topology while maintaining the integrity of the topology information.
To specify the direction for a link (page 847)
MAPEDITDIR
MAPRL
Direction box
Select the direction for the link from the list and click OK. You can choose
Bi-Directional, From -> To , or To -> From.
Edit Reverse Resistance dialog box
NOTE This functionality applies only to drawing objects.
Use this dialog box to edit the reverse resistance of the selected link in an
existing topology while maintaining the integrity of the topology information.
To edit the resistance of a link or node in a network topology (page 850)
MAPEDITRES1
MAPEDITRES2
Value box
Displays the reverse resistance for the object. Enter a new value and click
OK.
The value must be numeric.
Edit Topology dialog box
NOTE This functionality applies only to drawing objects.
Edit Reverse Resistance dialog box | 1973
WARNING This command will not be supported in future releases. This is the
old command for editing geometry, direction, and resistance in a topology. There
are several new commands for editing topologies, such as MAPAN, MAPDL,
MAPMP. For a complete list, see Editing Topologies (page 851).
Use this dialog box to modify objects in a topology without damaging the
topology relationship data. If you modified objects using standard editing
commands, use the Update option to correct the topology relationship data
for that object.
To edit a topology (page 854)
Topology Name area
Select a topology from the list of loaded topologies. When you modify the
selected object, the topology data for that object will be updated in the
selected topology.
NOTE If the object is referenced by more than one topology, you will need to
use the update option to modify the other topologies.
If the topology you want is not loaded, click Load.
Object Type
Select the object type to edit. Object options are unavailable if they do not
match the topology type you are choosing.
Edit Operation
Specify the edit operation to perform on the selected object type.
Click OK to perform the specified operation and make your selections.
To cancel the topology edit operation, click Close.
Node ObjectsPolygon ObjectsLink Objects
MAPNODEDIT (Edit Topology
Node command) (page 1946)
MAPPOLYDEL (Delete Topology
Polygon command) (page 1949)
MAPLINKEDIT (Edit Topology Link
command) (page 1943)
MAPNODADD (Add Topology
Node command) (page 1944)
MAPPOLYADD (Add Topology
Polygon command) (page 1948)
MAPLINKADD (Add Topology Link
command) (page 1941)
MAPNODINS (Insert Topology
Node command) (page 1947)
MAPPOLYUPD (Update Topo-
logy Polygon command) (page
1949)
MAPLINKDEL (Delete Topology
Link command) (page 1942)
1974 | Chapter 38 Topology Dialog Boxes
Node ObjectsPolygon ObjectsLink Objects
MAPNODDEL (Delete Topology
Node command) (page 1945)
MAPLINKREV (Reverse Direction
of Topology Link command) (page
1943)
MAPNODUPD (Update Topology
Node command) (page 1948)
MAPLINKUPD (Update Topology
Link command) (page 1944)
MAPEDITRES1 (Edit Direct Resist-
ance command) (page 1939)
MAPEDITDIR (Edit Direction com-
mand) (page 1939)
MAPEDITRES1 (Edit Direct Resist-
ance command) (page 1939)
MAPEDITRES2 (Edit Reverse Resist-
ance command) (page 1940)
Link Objects dialog box
NOTE This functionality applies only to drawing objects.
When you create a topology, use this dialog box to select the links to include
in the topology.
To create a topology (page 825)
Link information is stored as object data and saved with the map. Each link
is given a unique ID number, which is automatically processed whenever you
use a topology command.
Select Automatically/Manually options
■Select Automatically selects all objects that meet the object type and
filter criteria.
■Select Manually lets you manually select objects for the topology. Click
Select < to select objects.
Link Objects dialog box | 1975
Filter Selected Objects
If this option is selected, only objects that are on the specified layers or
blocks are selected. The filters are used for both automatic and manual
selection of objects.
If this option is not selected, the filters are ignored.
Layer Filters box
Specify which layers to search for objects to be used for the topology.
Enter an asterisk (*) to search all layers.
To select from a list of layers, click Layers.
Load Topology Conflict dialog box
NOTE This functionality applies only to drawing objects.
Use this dialog box to load the topology from either the source drawing or
the current drawing.
To load a topology (page 907)
Click Analyze tab ➤ Drawing Object panel ➤ Load Topology.
This dialog box is displayed when AutoCAD Map 3D detects duplicate topology
names in a source drawing and the current drawing.
Click OK.
Load Topology dialog box
NOTE This functionality applies only to drawing objects.
Use this dialog box to load a topology.
To load a topology (page 907)
1976 | Chapter 38 Topology Dialog Boxes

Click Analyze tab ➤ Drawing Object panel ➤ Load Topology.
Topology Location options
Select whether to load a topology that is in a source drawing or in the
current drawing.
Name
Select the topology to load. If the list does not display the topology you
want, be sure you have selected the correct in the Topology Location area.
The list of topology names comes from the object data tables. These tables
may exist in the current drawing but the topology objects may only exist
in the source drawings.
Type
Displays the type of the selected topology.
Description
Displays the description of the selected topology.
Create Topology Objects When Loaded
If the selected topology is from a source drawing, select this check box to
copy the topology objects into the current drawing as the topology is loaded.
If this option is not selected, the objects are loaded but are not copied into
the current drawing.
Select Topology Objects For Save Back
Select this option to add objects in the current drawing to the save back set
if they are referenced by the selected topology.
Audit Geometry Of Topology Objects
Select this option to verify that objects for the selected topology are
geometrically correct. Any objects that are not correct are highlighted.
Complete Existing Topology Objects
If the selected topology is from the current drawing, select this option to
complete any incomplete objects in the topology.
Use this option to ensure that the objects in the current drawing are available
for topology editing. Map queries all the objects from the source drawings
that are required to create a self-contained subset of the topology objects.
Load Topology dialog box | 1977
Load Topology From Source Drawing dialog box
NOTE This functionality applies only to drawing objects.
Use this dialog to set options when loading a topology from a source drawing.
To load a topology (page 907)
Click Analyze tab ➤ Drawing Object panel ➤ Load Topology.
Topology Objects
Create Topology Objects When Loaded
If the selected topology is from a source drawing, select this check box to
copy the topology objects into the current drawing as the topology is loaded.
If this option is not selected, the objects are loaded but are not copied into
the current drawing.
Select Topology Objects For Save Back
Select this option to add objects in the current drawing to the save back set
if they are referenced by the selected topology. This means that the objects
will be saved back to their source drawings and replace the original objects.
Topology Verification
Audit Geometry of Topology Objects
Select this option to verify that objects for the selected topology are
geometrically correct. Any objects that are not correct are highlighted.
Network Topology Analysis - Choose Locations dialog box
NOTE This functionality applies only to drawing objects.
Use this dialog box to specify the locations to use for your network analysis.
To perform a shortest path trace (page 1326)
To perform a best route analysis (page 1330)
To perform a flood trace (page 1334)
1978 | Chapter 38 Topology Dialog Boxes

Click Analyze tab ➤ Drawing Object panel ➤ Network Analysis.
When you choose points, AutoCAD Map 3D locates the closest node to the
point you select.
■Shortest path — Specify a starting point and ending point.
■Best route — Specify a starting point and one or more visit points.
■Flood trace — Specify a start point only.
Start Point
Select a start point. Click Select Point to select a point in the map. Press
Enter to return to this dialog box. All three forms of network analysis require
a start point.
Visit Point
Select one or more visit points for best route analysis. Click Select Point to
select points in the map. While in the map, click a point to select it. Accept
the point, cancel the selected point, or select additional points:
■To accept the point and return to the dialog box, press Enter, or
right-click and click Enter.
■To discard the point and return to the dialog box, press ESC, or right-click
and click Cancel.
■To accept the point and specify another point, right-click. Click Next
Point.
End Point
Selects an end point for a shortest path analysis. Click Select Point to select
a point in the map. Press Enter to return to this dialog box.
List of Locations
The points you specify are displayed in the list.
■To see the location of a point in the map, select the coordinates in the
list. Click Preview.
■To remove a point from the list, select the coordinates. Click Delete.
Load
Use settings that you previously saved.
Network Topology Analysis - Choose Locations dialog box | 1979
Save
Save the current settings so you can use them again.
Cancel
Close the dialog box without performing the network analysis.
Back
Display the previous dialog box.
Next
Display the Network Topology Analysis - Resistance and Direction dialog
box (page 1981).
Finish
Perform the network analysis using the current settings. For a shortest path
trace, the Finish is available after you select a start point and an end point.
For a flood trace, the Finish is available after you select a start point.
Network Topology Analysis - Output dialog box
NOTE This functionality applies only to drawing objects.
Use this dialog box to view the results of the network analysis onscreen.
To perform a shortest path trace (page 1326)
To perform a best route analysis (page 1330)
To perform a flood trace (page 1334)
Click Analyze tab ➤ Drawing Object panel ➤ Network Analysis.
You can specify a name and description for the new topology.
Highlight
Show the results of the analysis on screen using the color specified in the
Color.
Color
Select the color you want to use to highlight the results of the analysis in
the map. To clear the color when you finish viewing the results in the map,
at the Command prompt, enter redrawall.
1980 | Chapter 38 Topology Dialog Boxes

Create Topology
Create a new topology using the results of the analysis.
Name
Enter a unique name for the new topology. Topology names can contain
letters, numbers, and the underscore and hyphen characters.
Description
Enter a description for the new topology.
Load
Use settings that you previously saved.
Save
Save the current settings so you can use them again.
Cancel
Close the dialog box without performing the network analysis.
Back
Display the previous dialog box.
Next
Disabled because this is the last dialog box in the list.
Finish
Perform the network analysis using the current settings. For a shortest path
trace, the Finish is available after you select a start point and an end point.
For best route analysis, the Finish is available after you select a start point
and at least one visit point. For a flood trace, the Finish is available after
you select a start point.
Network Topology Analysis - Resistance and Direction dialog
box
NOTE This functionality applies only to drawing objects.
Network Topology Analysis - Resistance and Direction dialog box | 1981
Use this dialog box to specify how to determine resistance for links and nodes
and to specify how to determine the direction of link objects for the network
analysis.
To perform a shortest path trace (page 1326)
To perform a best route analysis (page 1330)
To perform a flood trace (page 1334)
Click Analyze tab ➤ Drawing Object panel ➤ Network Analysis.
Direction
Specify how to determine the direction of link objects for the analysis.
Link Direction
Enter a value or enter the location of the data to use to determine the
direction of the links. To select the location of the data from a list, click
Expression Builder. Select the data to use. You can also enter any valid
expression. See Expression Evaluator (page 1541). If you leave the box blank,
bi-directional (0) is used.
Link Direction is...If the expression evaluates to...
Bi-directional>0 or a character
The physical directionA positive number
The reverse of the physical directionA negative number
Reverse
Select this option to use the reverse of the direction indicated in the Link
Direction field.
Resistance
Specify how to determine resistance for links and nodes. Enter the location
of the data to use to determine the direct resistance and reverse resistance
of link objects and the resistance of nodes. To use values in an object data
table or external database, click Expression Builder. Select the data to use.
You can also enter any valid expression.
■Link Direct Resistance — Specify the resistance to travel in the direction
that a link was created. If you leave the box blank, the length of the line
(.LENGTH) is used.
1982 | Chapter 38 Topology Dialog Boxes
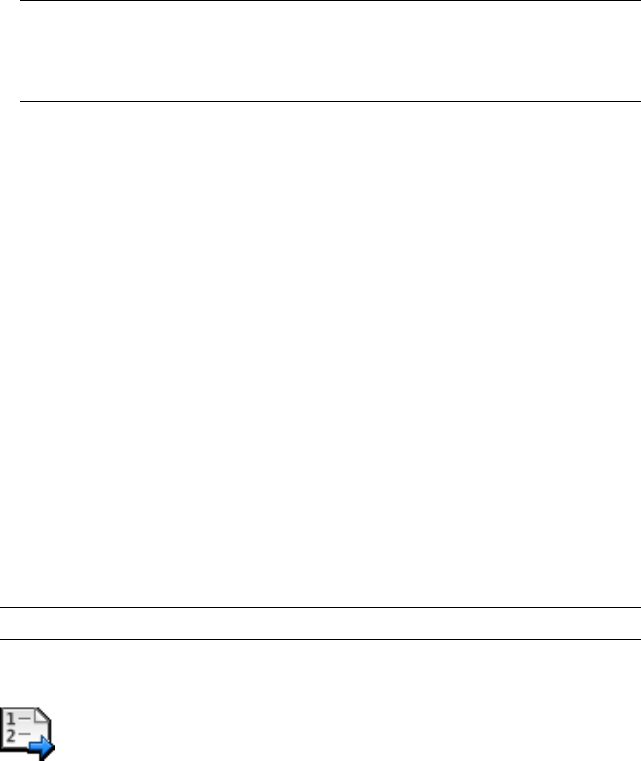
■Link Reverse Resistance — Specify the resistance in the opposite direction
along a link. If you leave the box blank, the length of the line (.LENGTH)
is used.
■Node Resistance — Specify the resistance to cross the node, for example,
resistance for a valve in a pipe network, or a junction in a road network.
If you leave the box blank, zero (0) is used.
■Specify a minimum and maximum resistance for the trace.
TIP The best route cannot be be calculated if the network topology contains
negative resistance values or if all resistance values equal zero (or use expressions
that evaluate to zero). If all resistance values equal zero, every route is as good
as another, and there is no "best route."
Load
Use settings that you previously saved.
Save
Save the current settings so you can use them again.
Cancel
Close the dialog box without performing the network analysis.
Back
Display the previous dialog box.
Next
Click to display the Network Topology Analysis - Output dialog box (page
1980).
Finish
Perform the network analysis using the current settings.
Network Topology Analysis - Select Method dialog box
NOTE This functionality applies only to drawing objects.
Use this dialog box to specify the type of network analysis to perform.
To perform a shortest path trace (page 1326)
To perform a best route analysis (page 1330)
To perform a flood trace (page 1334)
Network Topology Analysis - Select Method dialog box | 1983
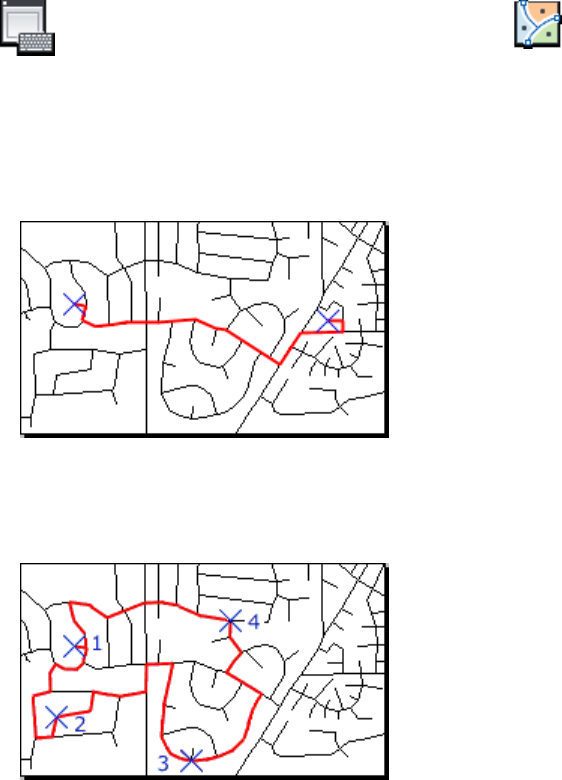
Click Analyze tab ➤ Drawing Object panel ➤ Network Analysis.
Shortest Path
Calculates the optimal route between two nodes. For example, you could
find the shortest distance between an accident site and a hospital. A path
trace between the start and end points must have a total resistance of more
than the minimum and less than the maximum.
Best Route
Finds the optimal route from a start point, to one or more intermediate
points, and back to the start point. The distance between nodes takes into
consideration the direction and resistance of intermediate links and nodes.
Flood Trace
Shows all possible routes from a chosen node, summing the resistance value
of each link and node it travels through. The path stops when the sum
reaches the maximum resistance set for the trace. For example, you could
create a flood trace of a fifteen-minute travel time from a start point by
referencing street length and speed limit.
1984 | Chapter 38 Topology Dialog Boxes
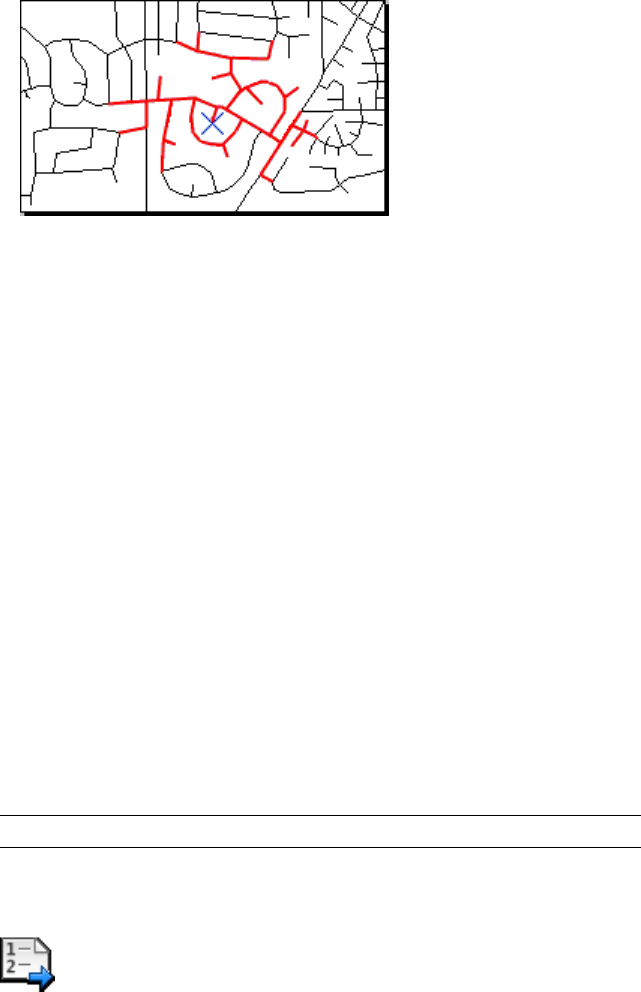
Load
Use settings that you previously saved.
Save
Save the current settings so you can use them again.
Cancel
Close the dialog box without performing the network analysis.
Back
Disabled because this is the first dialog box in the list.
Next
Click to display the Network Topology Analysis - Choose Locations dialog
box (page 1978).
Finish
Perform the network analysis using the current settings. For a shortest path
trace, the Finish is available after you select a start point and an end point.
For best route analysis, the Finish is available after you select a start point
and at least one visit point. For a flood trace, the Finish is available after
you select a start point.
Node Objects dialog box - Network and Polygon Topologies)
NOTE This functionality applies only to drawing objects.
Use this dialog box to select the nodes to include in the topology when you
create a topology.
To create a topology (page 825)
Node Objects dialog box - Network and Polygon Topologies) | 1985

Click Create tab ➤ Topology panel ➤ New.
Node information is stored as object data and saved with the map. Each node
is given a unique ID number, which is automatically processed whenever you
use a topology command.
Select Automatically/Manually options
■Select Automatically selects all objects that meet the object type and
filter criteria.
■Select Manually lets you manually select objects for the topology. Click
Select < to select objects.
Filter Selected Objects
If this option is selected, only objects that are on the specified layers or
blocks are selected. The filters are used for both automatic and manual
selection of objects.
If this option is not selected, the filters are ignored.
Layer Filters box
Specify which layers to search for objects to be used for the topology.
Enter an asterisk (*) to search all layers.
To select from a list of layers, click Layers.
Block Filters box
Specify which blocks to search for objects to be used for the topology.
■To search all blocks, enter an asterisk (*).
■To select from a list of block definitions in the drawing set, click Blocks.
■To select point objects, enter ACAD_POINT.
Create Node Objects
Specify whether nodes that are not present in the current object selection
should be created to complete the topology. (Nodes are optional.)
Create on Layer box
If new nodes or centroids are created, specify on which layer they should
be placed.
To select from a list of layers, click Layers.
1986 | Chapter 38 Topology Dialog Boxes

Create Using box
If new nodes or centriods are created, specify what block to use to create
them.
■To select from a list of block definitions in the drawing set, click Blocks.
■To create nodes or centroids as a point, leave the box blank or enter
ACAD_POINT.
Node Objects dialog box (Node topology)
NOTE This functionality applies only to drawing objects.
Use this dialog box to select the nodes to include in the topology when you
create a topology.
To create a topology (page 825)
Click Create tab ➤ Topology panel ➤ New.
Node information is stored as object data and saved with the map. Each node
is given a unique ID number, which is automatically processed whenever you
use a topology command.
Select Automatically/Manually options
■Select all objects that meet the object type and filter criteria
automatically.
■Select objects for the topology by hand. Click Select to select objects.
Filter Selected Objects
If this option is selected, only objects that are on the specified layers or
blocks are selected. The filters are used for both automatic and manual
selection of objects.
If this option is not selected, the filters are ignored.
Layer Filters box
Specify which layers to search for objects to be used for the topology.
Enter an asterisk (*) to search all layers.
Node Objects dialog box (Node topology) | 1987
To select from a list of layers, click Layers.
Block Filters box
Specify which blocks to search for objects to be used for the topology.
■To search all blocks, enter an asterisk (*).
■To select from a list of block definitions in the drawing set, click Blocks.
■To select point objects, enter ACAD_POINT.
Rename Topology dialog box
NOTE This functionality applies only to drawing objects.
Use this dialog box to rename a topology.
To change the name, description, or both of a topology (page 925)
Click Map Setup tab ➤ Topology panel ➤ Rename.
Before you rename a topology, check the following:
■Attach all source drawings that are referenced by the topology. If the source
drawings are not attached, you could corrupt your data set.
■Make sure the topology is loaded. The topology needs to be completely
represented, either in source files or in the current drawing.
■You cannot rename a topology if there are any queried objects in the
current drawing. You must save all queried objects back to their source
drawings or detach them from their source drawings before you can rename
any topology.
■Be sure the Create Backup File Of Source Drawing option is not selected
on the Save Back tab of the AutoCAD Map Options dialog box (page 1908).
■You cannot undo this rename operation using the UNDO command.
1988 | Chapter 38 Topology Dialog Boxes
New Name
Enter a new name for the topology. Names can contain letters, numbers,
and the underscore and hyphen characters. Names cannot contain spaces.
New Description
Enter a description for the topology.
Select Data dialog box - Topology Overlay
NOTE This functionality applies only to drawing objects. To perform an overlay
analysis for geospatial feature data, see Overlaying Two Feature Sources (page
1309).
Use this dialog box to select the data to attach to the result topology when
performing a topology overlay.
To find sliver polygons when overlaying two topologies (page 843)
Click Analyze tab ➤ Drawing Object panel ➤ Object Overlay.
The selected fields and columns are incorporated into a new object data table
that is attached to the result topology.
Source Data Area
Select fields and columns. You can combine data from different tables.
To select a field from an object data table, select the Object Data option,
and then select the table from the list. In the Available Fields/Columns list,
select the fields to use. Click >>.
To select a column from an external database, select the SQL Data option,
and then select the link template from the list. In the Available
Fields/Columns list, select the columns to use. Click >>.
The Link Template list includes only link templates for the drawing where
the topology is loaded. That is, if you loaded the topology from source
drawings, the list displays link templates defined in the source drawing; if
you loaded the topology from the current drawing, the list displays link
templates in the current drawing. In addition, be sure the appropriate data
source is attached and connected in the current drawing.
Select Data dialog box - Topology Overlay | 1989

Destination Data Area
Specify a table name and description for the new object data table that will
be created for the result topology.
A table name cannot include spaces. It must start with an alphanumeric
character. The table name must be unique.
Available Fields/Columns List
Lists the fields in the selected object data table or the selected external
database.
To add fields or columns to the new object data table, select them from the
list. Click >>.
Selected Fields/Columns List
Lists the fields that will be created in the new object data table. This table
can include values from more than one object data table and external
database.
Topology Buffer - Create New Centroids and Nodes dialog box
NOTE This functionality applies only to drawing objects. To do a buffer analysis
for geospatial feature data, see Buffering Features in Your Map (page 1306).
Use this dialog box to specify the block to use to create nodes and centroids
in the resulting buffer topology.
To buffer a topology (page 1347)
Click Analyze tab ➤ Drawing Object panel ➤ Object Buffer.
Point Object for Centroid Creation
Specify the block used to represent centroids.
■To select from a list of block definitions in the drawing set, click the
down arrow.
■To create centroids from a block saved as a DWG file, click [...] and select
the file to use.
■To create centroids as a point, leave the box blank or enter ACAD_POINT.
1990 | Chapter 38 Topology Dialog Boxes
Point Object for Node Creation
Specify the block used to represent nodes.
■To select from a list of block definitions in the drawing set, click the
down arrow.
■To create nodes from a block saved as a DWG file, click [...] and select
the file you want to use.
■To create nodes as a point, leave the box blank or enter ACAD_POINT.
Finish
Creates the buffer using the current settings after you specify the buffer
distance and enter a valid topology name.
Topology Buffer - New Topology dialog box
NOTE This functionality applies only to drawing objects. To do a buffer analysis
for geospatial feature data, see Buffering Features in Your Map (page 1306).
Use this dialog box to specify settings for viewing the resulting buffer topology
onscreen.
To buffer a topology (page 1347)
Click Analyze tab ➤ Drawing Object panel ➤ Object Buffer.
You can specify the name, description, and layer for the new topology.
Highlight
Show the results of the analysis on screen using the color specified in the
Color.
Color
Select the color you want to use to highlight the results of the analysis in
the map. To clear the color when you finish viewing the results in the map,
at the Command prompt, enter redrawall.
Topology Buffer - New Topology dialog box | 1991

Name
Enter a unique name for the new topology. Topology names can contain
letters, numbers, and the underscore and hyphen characters.
Description
Enter a description for the new topology.
Layer
Specify a layer for the new topology. To select from a list of layers in the
current drawing, click the down arrow. To create a new layer, type the name
in the box.
NOTE Do not specify a locked layer. If you do, AutoCAD Map 3D can complete
only part of the buffer process (it can create the buffer geometry but not the
buffer topology). To use a locked layer, unlock it first.
Cancel
Close the dialog box without creating a buffer.
Back
Display the previous dialog box.
Next
Click to display the Topology Buffer - Create New Centroids and Nodes
dialog box (page 1990).
Finish
Creates the buffer using the current settings. The Finish is available after
you specify the buffer distance and enter a valid topology name.
Topology Buffer - Set Buffer Distance dialog box
NOTE This functionality applies only to drawing objects. To do a buffer analysis
for geospatial feature data, see Buffering Features in Your Map (page 1306).
Use this dialog box to specify the distance from the object to the buffer. The
buffer will extend the specified distance from the objects. You can enter a
number, an expression, a field in an object data table, or an external database.
To buffer a topology (page 1347)
1992 | Chapter 38 Topology Dialog Boxes
Click Analyze tab ➤ Drawing Object panel ➤ Object Buffer.
A buffer is a zone that is drawn around a topology. Using a buffer, you can
easily identify objects within a specified offset of elements in node, network,
and polygon topologies.
Buffer Distance
Enter distance from the object to the buffer. The buffer will extend the
specified distance from the objects. To create a buffer inside an existing
polygon, enter a negative value for the buffer offset. The buffer offset can
be any of the following:
■Numeric value. To decrease the size of existing polygons, enter a negative
value.
■An expression that evaluates to a numeric value. For information on
valid expressions, see Expression Evaluator Functions and Variables.
■A value in an object data table. Click Expression Builder to select the
table and field.
■A value in an external database. Click Expression Builder to select the
link template and column.
NOTE If you are creating a buffer around a polygon and want to use a value
in an object data table or an external database, the data must be attached
to the centroid of the polygon.
Expression Builder
Click to select a field in an object data table or an external database from
a list of available data.
Next
Click to display the Topology Buffer - New Topology dialog box (page 1991).
Finish
Creates the buffer using the current settings after you specify the buffer
distance and enter a valid topology name.
Topology Buffer - Set Buffer Distance dialog box | 1993

Topology Dissolve - Create New Centroids and Nodes dialog box
NOTE This functionality applies only to drawing objects.
Use this dialog box to specify the block to use to create nodes and centroids
in the resulting dissolve topology.
To dissolve a composite topology (page 1343)
Click Analyze tab ➤ Drawing Object panel ➤ Dissolve.
Point Object for Centroid Creation
Specify the block used to represent centroids.
■To select from a list of block definitions in the drawing set, click the
down arrow.
■To create centroids from a block saved as a DWG file, click Browse. Select
the file to use.
■To create centroids a point, leave the box blank or enter ACAD_POINT.
Point Object for Node Creation
Specify the block used to represent nodes.
■To select from a list of block definitions in the drawing set, click the
down arrow.
■To create nodes from a block saved as a DWG file, click Browse. Select
the file to use.
■To create nodes as a point, leave the box blank or enter ACAD_POINT.
Cancel
Close the dialog box without performing the dissolve.
Back
Display the previous dialog box.
Next
Disabled because this is the last dialog box in the list.
1994 | Chapter 38 Topology Dialog Boxes
Finish
Dissolves the topology using the current settings. The Finish is available
after you specify the dissolve parameter and enter a valid topology name.
Topology Dissolve - Create Nodes dialog box
NOTE This functionality applies only to drawing objects.
Use this dialog box to specify whether or not to create new nodes at the
endpoints of links where they are missing in the resulting dissolve topology.
If so, you specify the block to use to create the nodes.
To dissolve a composite topology (page 1343)
Click Analyze tab ➤ Drawing Object panel ➤ Dissolve.
Create New Nodes For Topology
Select this check box to create new nodes as needed at the endpoints of
links in the resulting topology. This is optional, but can be useful if you are
going to analyze the resulting topology later on.
Point Object for Node Creation
Specify the block used to represent nodes.
■To create nodes using a block defined in the drawing set, click the down
arrow and select a block from the list.
■To create nodes using a block saved as a DWG file, click Browse. Select
the file to use. This inserts the entire DWG as a single block.
■To create nodes as a point, select ACAD_POINT.
Cancel
Close the dialog box without performing the dissolve.
Back
Display the previous dialog box.
Next
Disabled because this is the last dialog box in the list.
Topology Dissolve - Create Nodes dialog box | 1995
Finish
Dissolves the topology using the current settings. The Finish is available
after you specify the dissolve parameter and enter a valid topology name.
Topology Dissolve - New Topology dialog box
NOTE This functionality applies only to drawing objects.
Use this dialog box to specify settings for viewing the resulting dissolve
topology onscreen.
To dissolve a composite topology (page 1343)
Click Analyze tab ➤ Drawing Object panel ➤ Dissolve.
You can specify the name, description, and layer for the new topology.
Highlight
Show the results of the analysis on screen using the color specified in the
Color.
Color
Select the color you want to use to highlight the results of the analysis in
the map. To clear the color when you finish viewing the results in the map,
at the Command prompt, enter redrawall.
Name
Enter a unique name for the new topology. Topology names can contain
letters, numbers, and the underscore and hyphen characters.
Description
Enter a description for the new topology.
Layer
Specify a layer for the new topology. To select from a list of layers in the
current drawing, click the down arrow. To create a new layer, type the name
in the box.
1996 | Chapter 38 Topology Dialog Boxes
Cancel
Close the dialog box without performing the dissolve.
Back
Display the previous dialog box.
Next
Click to display the Topology Dissolve - Object Data dialog box (page 1997).
Finish
Dissolves the topology using the current settings. The Finish is available
after you specify the dissolve parameter and enter a valid topology name.
Topology Dissolve - Object Data dialog box
NOTE This functionality applies only to drawing objects.
Use this dialog box to createor specify the result table (the object data table
that will store the dissolve result field data).
You can reference an existing object data table or define a new one. The
dissolve field can be an object data variable or any expression.
To dissolve a composite topology (page 1343)
Click Analyze tab ➤ Drawing Object panel ➤ Dissolve.
The dissolve operation starts with a single item and "joins" all adjacent objects
that share the same value for this item. The resulting topology data includes
only the field used to perform the dissolve.
For example, you could perform a dissolve operation on a map of zip code
boundaries that reference a county name as a data field. Dissolving the zip
codes by county results in the county boundaries as a geometry. The result
data holds the county name. In that case, the result table stores the result field
consisting of the county name.
Object Data Table
Select an object data table from the list of tables in the current drawing.
Topology Dissolve - Object Data dialog box | 1997

Object Data Field
Select a field from the list of fields in the selected table. To add a new field,
click Define.
Define
Click to add a new object data field.
Finish
Dissolves the topology using the current settings after you specify the
dissolve parameter and enter a valid topology name.
Topology Dissolve - Set Parameter dialog box
NOTE This functionality applies only to drawing objects.
Use this dialog box to select the data on which to base the dissolve.
To dissolve a composite topology (page 1343)
Click Analyze tab ➤ Drawing Object panel ➤ Dissolve.
When you perform a dissolve, you create a new topology by combining
polygons that share the same data value in a specified field. This field is called
the dissolve field. The dissolve field can be an object data field or a column
in a linked external database.
Dissolve By
Select the data on which to base the dissolve. This is often referred to as the
dissolve field.
■To use object data or data in an external data base, click Expression
Builder. Select the data to use.
Note that the Dissolve command uses only data that is attached or linked
to the centroid of the polygon. It does not use data attached to a polygon
border.
■You can also enter any valid expression. See Expression Evaluator (page
1541).
1998 | Chapter 38 Topology Dialog Boxes
Any two adjacent polygons or connected lines that have the same value for
this field are combined into a single polygon or line.
Cancel
Close the dialog box without performing the dissolve.
Back
Disabled because this is the first dialog box in the list.
Next
Click to display the Topology Dissolve - New Topology dialog box (page
1996).
Finish
Dissolves the topology using the current settings. The Finish is available
after you specify the dissolve parameter and enter a valid topology name.
Topology Overlay Analysis - Analysis Type dialog box
NOTE This functionality applies only to drawing objects. To do an overlay analysis
for geospatial feature data, see Overlaying Two Feature Sources (page 1309).
Use this dialog box to select the type of overlay analysis to perform: Intersect,
Union, Identity, Erase, Clip, or Paste.
To find sliver polygons when overlaying two topologies (page 843)
Click Analyze tab ➤ Drawing Object panel ➤ Object Overlay.
To overlay topologies, both must be loaded into the current drawing. Click
Analyze tab ➤ Drawing Object panel ➤ Load Topology.
Overlay Analysis Operations
Select an overlay operation:
■Intersect – Only areas that appear in both the source and overlay
topologies are in the result topology.
Topology Overlay Analysis - Analysis Type dialog box | 1999
Source Overlay Result
■Union – Areas that appear in either the source or the overlay topologies
are in the result topology.
Source Overlay Result
■Identity – The result topology includes areas that appear in the source
topology and areas in the overlay topology that are within the source
topology boundary.
Source Overlay Result
■Erase – The result topology includes areas that appear in the source
topology except where it is covered by the overlay topology. The area
covered by the overlay topology is erased from the source topology area.
Source Overlay Result
2000 | Chapter 38 Topology Dialog Boxes
■Clip – The result topology includes areas that appear in the source
topology except where they are outside the boundary of the overlay
topology. The source topology is clipped to the outer boundary of the
overlay topology.
Source Overlay Result
■Paste – The overlay topology is "pasted" on the source topology. The
result topology includes the overlay topology and any areas of the source
topology that extend beyond the boundaries of the overlay topology.
Source Overlay Result
Load
Use settings that you previously saved.
Save
Save the current settings so you can use them again.
Cancel
Close the dialog box without performing the topology overlay analysis.
Back
Disabled because this is the first dialog box in the list.
Next
Click to display the Topology Overlay Analysis - Select Overlay Topology
dialog box (page 2007).
Topology Overlay Analysis - Analysis Type dialog box | 2001

Finish
Perform the topology overlay using the current settings. The Finish is
available after you select the overlay topology and enter a valid topology
name for the resulting topology.
Topology Overlay Analysis - Create New Centroids and Nodes
dialog box
NOTE This functionality applies only to drawing objects. To do an overlay analysis
for geospatial feature data, see Overlaying Two Feature Sources (page 1309).
Use this dialog box to specify the block to use to create nodes and centroids
in the resulting overlay topology.
To find sliver polygons when overlaying two topologies (page 843)
Click Analyze tab ➤ Drawing Object panel ➤ Object Overlay.
Point Object for Centroid Creation
Specify the block used to represent centroids.
■To create centroids using using a block defined in the drawing set, click
the down arrow and select a block from the list.
■To create centroids using a block saved as a DWG file, click Browse.
Select the file to use. This inserts the entire DWG as a single block.
■To create centroids as a point, select ACAD_POINT.
Point Object for Node Creation
Specify the block used to represent nodes.
■To create nodes using a block defined in the drawing set, click the down
arrow and select a block from the list.
■To create nodes using a block saved as a DWG file, click Browse. Select
the file to use. This inserts the entire DWG as a single block.
■To create nodes as a point, select ACAD_POINT.
2002 | Chapter 38 Topology Dialog Boxes

Load
Use settings that you previously saved.
Save
Save the current settings so you can use them again.
Cancel
Close the dialog box without performing the topology overlay.
Back
Display the previous dialog box.
Next
Disabled because this is the last dialog box in the list.
Finish
Perform the topology overlay using the current settings. The Finish is
available after you select the overlay topology and enter a valid topology
name for the resulting topology.
Topology Overlay Analysis - Create Nodes dialog box
NOTE This functionality applies only to drawing objects. To do an overlay analysis
for geospatial feature data, see Overlaying Two Feature Sources (page 1309).
Use this dialog box to specify whether or not to create new nodes at the
endpoints of links where they are missing in the resulting overlay topology.
If so, you specify the block to use to create the nodes.
To find sliver polygons when overlaying two topologies (page 843)
Click Analyze tab ➤ Drawing Object panel ➤ Object Overlay.
Create New Nodes For Topology
Select this check box to create new nodes as needed at the endpoints of
links in the resulting topology. This is optional, but can be useful if you are
going to analyze the resulting topology later on.
Topology Overlay Analysis - Create Nodes dialog box | 2003
Point Object for Node Creation
Specify the block used to represent nodes.
■To create nodes using a block defined in the drawing set, click the down
arrow and select a block from the list.
■To create nodes using a block saved as a DWG file, click Browse. Select
the file to use. This inserts the entire DWG as a single block.
■To create nodes as a point, select ACAD_POINT.
Load
Use settings that you previously saved.
Save
Save the current settings so you can use them again.
Cancel
Close the dialog box without performing the topology overlay.
Back
Display the previous dialog box.
Next
Disabled because this is the last dialog box in the list.
Finish
Perform the topology overlay using the current settings. The Finish is
available after you select the overlay topology and enter a valid topology
name for the resulting topology.
Topology Overlay Analysis - Output Topology dialog box
NOTE This functionality applies only to drawing objects. To do an overlay analysis
for geospatial feature data, see Overlaying Two Feature Sources (page 1309).
Use this dialog box to specify settings for viewing the resulting overlay topology
onscreen.
To find sliver polygons when overlaying two topologies (page 843)
2004 | Chapter 38 Topology Dialog Boxes

Click Analyze tab ➤ Drawing Object panel ➤ Object Overlay.
You can specify the name, description, and layer for the new topology.
Highlight
Show the results of the analysis on screen using the color specified in the
Color.
Color
Select the color you want to use to highlight the results of the analysis in
the map. To clear the color when you finish viewing the results in the map,
at the Command prompt, enter redrawall.
Name
Enter a unique name for the new topology. Topology names can contain
letters, numbers, and the underscore and hyphen characters.
Description
Enter a description for the new topology.
Layer
Specify a layer for the new topology. To select from a list of layers in the
current drawing, click the down arrow. To create a new layer, type the name
in the box.
Load
Use settings that you previously saved.
Save
Save the current settings so you can use them again.
Cancel
Close the dialog box without performing the topology overlay.
Back
Display the previous dialog box.
Next
Click to display the Topology Overlay Analysis - Output Attributes dialog
box (page 2006)
Topology Overlay Analysis - Output Topology dialog box | 2005
Finish
Perform the topology overlay using the current settings. The Finish is
available after you select the overlay topology and enter a valid topology
name for the resulting topology.
Topology Overlay Analysis - Output Attributes dialog box
NOTE This functionality applies only to drawing objects. To do an overlay analysis
for geospatial feature data, see Overlaying Two Feature Sources (page 1309).
Use this dialog box to select the data to attach to the result topology when
performing a topology overlay.
To find sliver polygons when overlaying two topologies (page 843)
Click Analyze tab ➤ Drawing Object panel ➤ Object Overlay.
The selected fields and columns are incorporated into a new object data table
that is attached to the result topology.
Source Attributes for New Topology
To copy data from the source topology to the result topology, click
Expression Builder. In the Expression Chooser dialog box, select the object
data fields or external database columns to copy.
Overlay Attributes for New Topology
To copy data from the overlay topology to the result topology, click
Expression Builder. In the Expression Chooser dialog box, select the object
data fields or external database columns to copy.
Expression Builder s
Click to display the Expression Chooser dialog box, where you can select
the data to include in the resulting topology.
New Object Data Table Name
Enter a name for the object data table that will store the data in the new
topology. The Table Name should be a new name.
2006 | Chapter 38 Topology Dialog Boxes

New Table Description
Enter a description for the new object data table in the resulting topology.
Load
Use settings that you previously saved.
Save
Save the current settings so you can use them again.
Cancel
Close the dialog box without performing the topology overlay.
Back
Display the previous dialog box.
Next
Click to display the next dialog box. Next is disabled if your source topology
is a node topology.
Finish
Perform the topology overlay using the current settings. The Finish is
available after you select the overlay topology and enter a valid topology
name for the resulting topology.
Topology Overlay Analysis - Select Overlay Topology dialog box
NOTE This functionality applies only to drawing objects. To do an overlay analysis
for geospatial feature data, see Overlaying Two Feature Sources (page 1309).
Use this dialog box to select the polygon topology to use as the overlay
topology.
To find sliver polygons when overlaying two topologies (page 843)
Click Analyze tab ➤ Drawing Object panel ➤ Object Overlay.
Polygon Topology to Overlay
Select the polygon topology to use as the overlay topology.
Topology Overlay Analysis - Select Overlay Topology dialog box | 2007
Load
Use settings that you previously saved.
Save
Save the current settings so you can use them again.
Cancel
Close the dialog box without performing the topology overlay.
Back
Display the previous dialog box.
Next
Click to display the Topology Overlay Analysis - Output Topology dialog
box (page 2004).
Finish
Perform the topology overlay using the current settings. The Finish is
available after you select the overlay topology and enter a valid topology
name for the resulting topology.
Topology Query dialog box
NOTE This functionality applies only to drawing objects.
Use this dialog box to execute topology relationship queries using the following
tools.
To query a topology (page 1353)
Click Create tab ➤ Topology panel ➤ Define Query.
Query Topology area
Select the topology to query.
If the topology is not loaded, click Load and select the topology you want.
Result Topology area
Select a result topology type.
2008 | Chapter 38 Topology Dialog Boxes

None
Objects are retrieved into the current drawing, but no topology data is
created.
Temporary
Objects are retrieved into the current drawing, and the topology data is
loaded into memory. This data is not saved to the objects.
You can use a temporary topology with the following commands: Buffer,
Dissolve, Overlay, Trace, Unload, Rename, Statistics, and Delete. You cannot
edit a temporary topology.
As soon as you close the current drawing, the temporary topology is removed
from memory.
Click Map Setup tab ➤ Topology panel ➤ Rename. Specify a name
without an asterisk.
Permanent
Objects are retrieved into the current drawing, and a new topology is created.
If you create a temporary or permanent topology, specify a name and
description for the topology.
Topology names can contain letters, numbers, and the underscore and
hyphen characters. For temporary topologies, the name must begin with
an asterisk (*).
Define Query
Display the Define Query dialog box (page 1838), where you can create a query
by defining conditions.
The dialog box you use for a topology query is the same as for a standard
query using the ADEQUERY command, except for the Property option in
the Query Type area.
Load Query
Display the Load Internal Query dialog box (page 1848), where you can select
an existing query to load.
When you choose Define Topology Query, you use the same dialog boxes as
you do for a standard query. The dialog box options are the same for topology
queries and standard queries using the ADEQUERY command, except for
choices in the Property option in the Query Type area.
Topology and standard queries differ in the following ways:
■Topology queries work with only one topology, while standard queries
work with all objects in the attached drawings. Use a topology query when
working only with topologies, or when to select one topology or query.
Topology Query dialog box | 2009
■You can base topology property queries on polygon values of Area, Length,
Perimeter, and Direction. Linear objects also have predefined object data
for Direct Resistance and Direction.
■Property alterations work differently with polygon topologies.
■For Report mode, additional dot variables, .TOPONAME, and .TOPOTYPE,
are available for topology queries. The dot variables .DRAWING, AREA,
and .PERIMETER yield different results in topology queries.
Topology Query Result dialog box
NOTE This functionality applies only to drawing objects.
Use this dialog box to specify the type of topology to create with the queried
objects. If you create a temporary or permanent topology, specify a name and
description for the topology.
To query a topology (page 1353)
Click Create tab ➤ Topology panel ➤ Define Query.
Topology names can contain letters, numbers, and the underscore and hyphen
characters. For temporary topologies, the name must begin with an asterisk
(*).
None
Objects are retrieved into the current drawing, but no topology data is
created.
Temporary
Objects are retrieved into the current drawing, and the topology data is
loaded into memory. This data is not saved to the objects.
You can use a temporary topology with the following commands: Buffer,
Dissolve, Overlay, Trace, Unload, Rename, Statistics, and Delete. You cannot
edit a temporary topology.
As soon as you close the current drawing, the temporary topology is removed
from memory.
2010 | Chapter 38 Topology Dialog Boxes
Click Map Setup tab ➤ Topology panel ➤ Rename. Specify a name
without an asterisk.
Permanent
Objects are retrieved into the current drawing, and a new topology is created.
Topology Selection dialog box
NOTE This functionality applies only to drawing objects.
Use this dialog box to select a topology.
To load a topology (page 907)
To unload a topology (page 908)
To audit, recreate, or complete a topology (page 920)
To delete a topology (page 926)
Click Analyze tab ➤ Drawing Object panel ➤ Load Topology.
Click a topology and click OK.
If the topology you want is not listed, check the following:
■If you are selecting a topology to rename, unload, view statistics, audit,
etc., it may not be listed because it has not been loaded yet.
■If you are selecting a topology to load, it may not be listed because it's
already loaded.
Topology Statistics dialog box
NOTE This functionality applies only to drawing objects.
Use this dialog box to view information about the selected topology.
To view topology statistics (page 916)
Topology Selection dialog box | 2011

Click Map Setup tab ➤ Topology panel ➤ Statistics.
Selected Topology area
Name
Displays the name of the current topology.
Description
Displays the description of the topology.
Type
Displays the type of topology. Topologies can be Node, Network, or Polygon.
Extents area
This area displays the coordinates of the lower-left corner and upper-right
corner of the bounding rectangle for the selected topology.
Object Counts area
This area displays the total number of nodes, links, and polygons in the
selected topology.
Details area
This area displays area and perimeter information for polygon topologies,
and length information for network topologies. It does not apply to node
topologies.
Perimeter is the sum of all of the edges in a polygon topology (not just the
outer edge of the topology).
Variance is the average of the squares of any given area, perimeter, or length
minus the square of the average.
Deviation is the square root of variance.
2012 | Chapter 38 Topology Dialog Boxes
Viewing Dialog Boxes
Quick View Drawings dialog box
Use this dialog box to select drawings to include in the Quick View.
To view objects in source drawings (page 746)
Click Map Setup tab ➤ Map panel ➤ Quick View Drawings.
NOTE This functionality is for drawing objects only. To bring geospatial feature data
into your map, see Overview of Bringing In GIS Features (page 305).
Quick View displays all objects in the selected active source drawings. You can
zoom and pan, but you cannot edit the objects. When you regenerate or redraw,
the objects are cleared from the current drawing.
Select Active Drawings to Quick View
Lists all active drawings attached to the current drawing. Click the drawing to
view. Use Select All and Clear All to quickly highlight or remove highlighting
from all drawings in the list.
Filters
Turns the current drawing filter on or off. When the filter is on, only drawings
that match the filter are displayed. If the parent drawing of a nested drawing
is filtered, the nested drawing is not displayed, even if it matches the filter.
39
2013
Filters
Displays the Drawing Set Display Filter dialog box, where you can create or
change the filters for file names and descriptions.
Zoom to the Extents of Selected Drawings
Zoom the current drawing to the extents of the selected source drawings.
Zoom Drawing Extents dialog box
Use this dialog box to zoom to the extents of a set of drawings.
To zoom to the extents of selected drawings (page 745)
Click Map Setup tab ➤ Map panel ➤ Zoom Drawing Extents.
NOTE You can also zoom to the extents of the current drawing from the View
tab on the ribbon, or to the extents of a specific Display Manager layer by
right-clicking the layer and clicking Zoom To Extents.
Select the drawings you want. Click OK. The display zooms to the extents of
the selected drawings. Drawing extents are the bounds of the area occupied
by objects.
Select Active Drawings to Zoom list
Lists all active drawings attached to the current drawing.
Select the drawings to use to define the extents.
Select All
Highlight all drawings in the list.
Clear All
Remove the highlighting from all drawings in the list.
Filter
Select Filter to turn the current drawing filter on or off.
When the filter is on, only drawings that match the filter are displayed. If
the parent drawing of a nested drawing is filtered, the nested drawing is
not displayed, even if it matches the filter.
2014 | Chapter 39 Viewing Dialog Boxes
To create or change the filter, click Filter. In the Drawing Set Display Filter
dialog box (page 1922), you can create separate filters for file names and
descriptions.
Define Document View dialog box
Use this dialog box to define a document view to view external documents
attached to an object.
At the Command prompt, enter adedefdocview.
NOTE This functionality is for drawing objects only. To see database information
linked to geospatial features, see Overview of Joins (page 507).
To create a new document view, enter a new name in the Name field. Specify
the location of the document name, the document type, and the application
to use to display the document, and click Add.
To modify an existing document view, select it in the list. Enter new
information in the Document View Definition section, and click Update.
Document view definitions are stored in the current drawing and not in the
source drawings.
Document View Definitions
Displays the document views defined in this drawing.
To modify a view, select it and edit the information that appears in the
Document View Definition section.
Delete
Delete the selected document view definition.
NOTE If you have associated documents that use this view, be sure to define
a new view for those documents.
Delete All
Delete all document views in the list.
NOTE If you have associated documents that use these views, be sure to define
new views for those documents.
Define Document View dialog box | 2015
Name
Enter a name for a new document view.
Names cannot contain spaces.
Description
Enter a description for the document view.
Expression
Enter information on where to find the name of the document associated
with an object:
■If the name of the associated document is stored in an object data table,
click Expression and select the table and field that contains the document
name.
When you attach a record from this object data table to an object, the
document listed in the specified field will be associated with the object.
■If the name of the associated document is stored in an external database,
click Expression and select the link template and column.
When you attach a record from this database to an object, the document
listed in the specified column will be associated with the object.
■If the name of the associated document is stored elsewhere, for example,
by giving the document the same name as the layer the object is on,
enter an expression that specifies the location of the document name.
For information on valid expressions, see Expression Evaluator (page
1541).
■You can type the name of a specific file. This file is then associated with
every object.
Directory
Enter the directory where documents for this view are stored.
If you are unsure of the location, click [...] to locate the directory.
Ext
Enter the three-letter file extension for documents using this view.
For example, if you are creating a view for Word documents, enter doc. If
the data attached to an object specifies a file name and extension, the
extension in this field is ignored. If the data attached to the object does not
specify the extension, AutoCAD Map 3D uses the extension in the field
when searching for the document.
Command Line
Enter the command to run the associated application.
2016 | Chapter 39 Viewing Dialog Boxes
For example, if you are creating a view for a Word document, enter the path
and file name for the Word program file.
If you are unsure of the location, click [...] to search your directories and
locate the application file.
Launch Method
Select a launch method.
■Select Default if the application specified for Command Line is a
Windows application.
■Select User if the application specified for Command Line is an ARX
application. Enter the name of the viewing function. The function must
be defined in the ARX application and made available through the use
of acedDefun( ). AutoCAD Map 3D uses acedInvoke( ) to access the
user-defined function. For more information about acedDefun( ),
acedInvoke( ), or on how to create ARX applications, refer to the
AutoCAD Object ARX online help.
If you are unsure, select Default.
Define Key View dialog box
Use this dialog box to specify which layers are displayed at different key view
zoom levels. For example, you can display fewer layers when zoomed out, but
display complete details when zoomed in.
At the Command prompt, enter adedefkeyview.
NOTE This functionality is for drawing layers only. To specify styling options at
dofferent zoom levels for geospatial feature layers, see Defining Scale Ranges (page
643).
To add a new condition, enter a drawing window width and specify the layers
to display at that width. Click Layers to select from a list of the layers in the
active drawings. When you finish, click Add.
To modify an existing condition, select the condition to modify and click
Edit. Add or delete layers. When you finish, click Update.
Key views are saved with the current drawing and apply to layers in the current
drawing and all active drawings.
Define Key View dialog box | 2017

Current Key View Definition List
Display the drawing window width conditions defined in this drawing.
Edit
Copy the selected condition to the bottom of the screen, where you can
change the width and add or remove layers.
Delete
Delete the selected condition.
Clear List
Delete all conditions.
Width > box
Enter the width to define.
The width is the distance across the drawing window as measured in drawing
units. The more you zoom in, the smaller this number is.
TIP Before you use the ADEDEFKEYVIEW command, use the DISTANCE
command to measure the width of the window at the zoom magnifications you
want to define.
Show Only These Layers box
Specify the layers to display when the drawing window displays a greater
width than specified in the Width box. Separate layer names with a comma.
Click Layers to select from a list of layers in the active drawings. You can
use wild-card characters to specify a set of layers.
Layers
Display a list of layers in the active drawings. Select the layers to display at
the specified window width.
Whenever the number of drawing units displayed in the drawing window
becomes greater than a defined key view condition, AutoCAD Map 3D displays
the layers specified for that condition.
When you use key views, AutoCAD Map 3D previews the specified layers from
source drawings. Objects already in the current drawing are not affected by
key views.
2018 | Chapter 39 Viewing Dialog Boxes
Document View dialog box
More than one document is associated with the object you selected. Select
the document type you want from the list. Click View.
At the Command prompt, enter adedocview.
NOTE This functionality is for drawing objects only.
Select Document View list
Lists the document types for this object. Select a document type. Click View
to start the associated application and view the associated document.
Select Object
Select a new object and view its associated documents.
View
View the document associated with the selected document type.
Key View dialog box
Select a zoom level or pan the current zoom. AutoCAD Map 3D previews
objects from source drawings for only the key view layers specified for the
selected magnification. Objects already in the current drawing are not affected
by key views.
At the Command prompt, enter adekeyview.
NOTE This functionality is for drawing layers only. To specify styling options at
different zoom levels for geospatial feature layers, see Defining Scale Ranges (page
643).
Zoom Window
Zoom to a window that you specify onscreen, showing only the key layers
for that magnification.
Zoom Previous
Zoom to the previous view, showing only the key layers for that
magnification.
Document View dialog box | 2019
Zoom Extents
Zoom to the extents of all active drawings, showing only the key layers for
that magnification.
Zoom Out
Zoom out .8x, showing only the key layers for that magnification.
Pan
Pan the current view using one of these methods:
Displacement
At the first prompt, specify the displacement. At the second prompt, press
Enter. The drawing moves by the amount you specified.
Points
At the first prompt, specify a point. At the second prompt, specify a new
point. The drawing moves so the first point is moved to the location of the
second point.
Redisplay
View the selected layers for the current magnification.
2020 | Chapter 39 Viewing Dialog Boxes
Workflow Designer
MAPWORKFLOWOPEN
Opens the specified saved workflow for the current map. Open workflows appear
in the list in the Workflow panel on the Tools tab. Workflows in this list are
available to run or edit.
To create a workflow (page 287)
MAPWORKFLOWRUN
Runs the specified workflow. You must save the current workflow to run it. If
the workflow has already been saved, you must open it to run it. To open a
workflow, click its name in the list in the Workflow panel on the Tools tab.
Click Open Workflow From File in this list to open a workflow that does not
already appear in the list.
To run a workflow (page 278)
NOTE Use the MapWorkflowBatchRun command to open and run a workflow file
from within a script file. This is useful for executing automated workflows.
40
2021
Workflow Designer
Use the Workflow Designer to create or edit a workflow. The name of the
current workflow appears in the title bar.
To edit a workflow (page 284)
To create a workflow (page 287)
Click Tools tab ➤ Workflow panel ➤ Edit.
Workspace Controls
The tools at the top of the Workflow Designer control the appearance of the
design space. They provide clipboard functions for activities, and let you open,
save, and print workflows.
New
Create a workflow definition.
Open
Open an existing workflow. The Open dialog box displays the location of
the most recently opened workflow.
Save
Save the current workflow. Workflows are saved with a .xoml extension.
You must save a workflow before you can run it.
Save As
Save the current workflow with a new name. You can alter some activity
parameters to save different versions of a workflow, for example, to overlay
different features.
Print
Print the diagram for the current workflow as it appears in the design space.
Expand any activities that are closed if you want them to appear in the
printout.
Undo/Redo
Reverse or reinstate changes you have made to workflow activities. You can
undo back to the first change you made during the current workflow editing
2022 | Chapter 40 Workflow Designer

session. However, you cannot undo changes to parameter settings in input
editors.
Cut/Copy/Paste
Use a workflow clipboard to cut, copy, and paste activities. You can copy
an activity from one workflow and paste it into another workflow.
Run
Run the current workflow. If you have unsaved changes, you are prompted
to save them. Running a workflow from within Workflow Designer validates
each step. A green check mark appears if the activity is successful. An
exclamation mark appears if a parameter is missing or invalid. A red X
appears if the activity fails.
Pan/Magnify/Show The Entire Workflow
Change the display of the workflow within the Workflow Designer design
space.
You can also click to fit the workflow in the design space.
Show/Hide Activities Panel
Display or hide the panel that lists the activities you can add to a workflow.
Show/Hide Properties Panel
Display or hide the panel that shows the parameter values for the selected
activity.
Refresh Design Surface
Redisplay the workflow.
Help
Display this Help topic.
Activities Panel
The panel at the right side of the Workflow Designer window contains all
activities that you can add to a workflow. For a list of these activities, see
Workflow Activity Input dialog boxes (page 2025).
Workflow Design Space
The area containing the activities for the current workflow is the design space.
Place activities below this icon. It is the starting point for the workflow.
Workflow Designer | 2023
Workflow Activities
Double-click an activity box to see its parameters. Each activity box displays
the following:
■An icon indicating whether it is a command, a layer, a description, or
a link to another workflow.
■The activity title (by default, the name of the activity in the Activities
Panel). All activities have an optional Display Name property. If you
change that property, the new name appears.
■Parameters. To change the parameters, double-click the activity box or
click . See Workflow Activity Input dialog boxes (page 2025).
■Command panel. Hover over an activity box to see its command panel.
You can delete, disable, or enable any activity. You can edit parameters
and toggle the prompt that allows you to replace parameters at run time.
NOTE Drag and drop activities to rearrange them. To move multiple activities
at a time, hold down the Shift key and drag a selection box around the activities.
Then hold down the Shift key and drag to the new location.
Place activities above this icon. It is the end point for the workflow.
Settings Panel
In the Settings panel, you can view and edit values for the parameters of the
current activity. To show or hide the Settings panel for the selected activity,
click
Status Area
The area at the bottom of the Workflow Designer window is the status area.
Workflow Status
While a workflow is running, the Workflow Status displays the command
that is executing and any errors that occur. When the workflow is finished
executing, click the Workflow Status link to open the log window.
2024 | Chapter 40 Workflow Designer
Workflow Activity Input dialog boxes
Use the workflow activity input dialog boxes to specify or change the
parameters for a workflow activity.
To edit a workflow (page 284)
To create a workflow (page 287)
Click Tools tab ➤ Workflow panel ➤ Edit.
The Workflow Designer includes activity dialog boxes for the following
activities. For detailed information about utility activities, see the Windows
Workflow Foundation documentation.
Utility Activities
Insert activities that are not AutoCAD Map 3D-specific. These activities include:
Describe Directory
Loops through all the files in a specified folder, allowing you to execute an
operation on each one. You can include a filter definition to select a subset
of files.
For Each
(Beta) Loops through a set of retrieved objects to perform an operation on
each of them. For example, save each retrieved feature layer to an SDF file.
In the Windows Workflow Foundation, this activity is called Replicator. Do
not use this option unless you have experience in C# programming or
Microsoft workflow technology. To set parameters for this activity, click
in the Workflow Designer toolbar. In the Properties palette that displays,
click the cell for the parameter to set. Click the browse button that appears
to select parameters from a list, if available.
If Else
(Beta) Selects a statement for execution based on the value of a Boolean
expression. Do not use this option unless you have experience in C#
programming or Microsoft workflow technology. To set parameters for this
activity, click in the Workflow Designer toolbar. In the Properties palette
that displays, click the cell for the parameter to set. Click the browse button
that appears to select parameters from a list, if available.
Workflow Activity Input dialog boxes | 2025

Parallel
Activities that enclose sets of serial activities. Each set can run independently
of the other. For example, when adding connection activities, add them
inside a parallel activity. That way, if one connection fails, others can still
execute.
Prompt User
Specifies a Yes/No dialog box to display at this point in the run-time
workflow. For example, you can create a prompt whose title bar reads
“Warning,” and contains the text: “The workflow will now convert your
SHP files to SDF format. Continue?”
Sequence
Activities that enclose sets of activities. Each set is performed in sequence,
and if one activity in the sequence fails, the others cannot execute. For
example, if a connection fails, a subsequent layer-creation activity that
requires that connection cannot execute.
While
(Beta) Executes a statement or a block of statements until a specified
expression evaluates to false. Do not use this option unless you have
experience in C# programming or Microsoft workflow technology. To set
parameters for this activity, click in the Workflow Designer toolbar. In
the Properties palette that displays, click the cell for the parameter to set.
Click the browse button that appears to select parameters from a list, if
available.
AutoCAD Map 3D Activities
Insert AutoCAD Map 3D-specific activities. Click the activity name listed here
to see a full description of its parameters.
■Add Feature Layer (page 2028): Creates a Display Manager layer using the
specified data store connection. For an overlay that specifies feature layers,
you must include this activity.
■Add Group (page 2029): Creates a group with the specified name.
■Add Map (page 2030): Adds the specified display map to the current map
file. You can change the display to show the new map.
■Change Feature Layer Properties (page 2030): Changes certain properties for
the specified layer.
2026 | Chapter 40 Workflow Designer
■Change Feature Layer Symbol (page 2031): Sets the styling parameters for
the specified feature layer.
■Change Group Properties (page 2033): Changes the visibility, name, and
parent group of a specified group in the Display Manager.
■Connect To Data Store (page 2034): Connects to the specified data store but
does not add data to the map. For an overlay that specifies feature classes,
rather than layers, this activity is sufficient (you do not have to create a
layer).
■Create Buffer Layer (page 2036): Analyzes features by proximity. Specify a
geospatial feature in your map and the distance for the buffer. AutoCAD
Map 3D creates a polygon around the feature or features you have selected
at the distance you specify. It saves the buffer polygon to a new layer.
■Display Feature Attributes (page 2037): Displays the Data Table for the
specified feature and selection set.
■Highlight Features/Remove Highlighting (page 2038): Highlights specified
features in the map (or removes highlighting from any features that are
already highlighted).
■List Current Connections (page 2039): Lists the names of connections in the
current map. You cannot specify parameters for this activity, other than
a Display Name.
■List Feature Classes (page 2039): Lists the feature classes for the specified data
store connection in the current map.
■List Feature Layer Properties (page 2040): Lists the name of the specified layer
in Display Manager, as well as any group it belongs to.
■Load Layer File (page 2040): Adds a saved .layer file to the map. When you
load a .layer file, AutoCAD Map 3D adds the source file to Map Explorer,
creates the connection, adds the feature layer to the Display Manager, and
styles the layer correctly.
■Perform Overlay (page 2041): Compares the spatial relationship of two layers
or feature classes.
■Remove Connection (page 2043): Removes the specified connection to a data
source.
■Remove Feature Layer (page 2044): Removes the specified feature layer.
■Remove Group (page 2044): Removes the specified group.
Workflow Activity Input dialog boxes | 2027
■Remove Map: Deletes the specified display map from the current map file.
■Rename Map: Specifies a different name for the specified display map.
■Run AutoCAD Command (page 2046): Executes any AutoCAD command-line
instruction supported by AutoCAD Map 3D. If the command requires a
selection set or displays a dialog box, the workflow pauses (during run
time) to allow for selection or input.
■Run Workflow (page 2047): Invokes another workflow at this point in the
current workflow.
■Save Layer File (page 2048): Saves a Display Manager layer to a .layer file. You
can save layers from all display maps in your map file.
■Select Features (page 2049): Selects individual features in the current display
map. You can select the features by layer, by location, or by prompting for
a manual selection at workflow run time.
■Switch Map (page 2050): Changes the current display to the specified display
map.
■Zoom To Extents (page 2050): Zooms to the extents of the specified target.
Add Feature Layer
This Workflow Designer activity (page 2025) creates a Display Manager layer
using the specified data store connection. For an overlay that specifies feature
layers, you must include this activity.
To edit a workflow (page 284)
To create a workflow (page 287)
Click Tools tab ➤ Workflow panel ➤ Edit.
The output of this activity is a Display Manager layer name.
Connection ID
Enter a connection ID for the data store that this layer represents, or click
to use the ID property of a preceding activity.
2028 | Chapter 40 Workflow Designer
Optional Parameters
■Display Name: Enter a title for this activity.
■Feature Class: Click and select a feature class or layer from a preceding
activity.
NOTE For WMS feature sources, feature classes are displayed as
WMS_Schema:0 0, WMS_Schema:0 1, and so on, rather than with descriptive
names. For descriptions of the feature classes, examine the connection
information in the Data Connect window
■Group: Specify a group for this layer to use in Display Manager.
■Layer Name: Specify the name of the Display Manager layer for this
feature class.
■Zoom To Extents: Select this option to zoom to the layer extents after
the feature is added.
Prompt For Parameters At Run Time
Select this option to pause for input at run time.
Add Group
This Workflow Designer activity (page 2025) creates a group with the specified
name. For information about groups, see Organizing Layers in Your Map (page
300).
To edit a workflow (page 284)
To create a workflow (page 287)
Click Tools tab ➤ Workflow panel ➤ Edit.
The output of this activity is a Display Manager group name.
Name
Enter a name for this group.
Optional Parameters
■Display Name: Enter a title for this activity.
Add Group | 2029

Prompt For Parameters At Run Time
Select this option to pause for input at run time.
Add Map
This Workflow Designer activity (page 2025) adds the specified display map to
the current map file. You can change the display to show the new map.
To edit a workflow (page 284)
To create a workflow (page 287)
Click Tools tab ➤ Workflow panel ➤ Edit.
The output of this activity is a Display Manager map name.
Name
Enter a name for this map.
Optional Parameters
■Display Name: Enter a title for this activity.
■Switch To New Map: Change the display to the new map.
Prompt For Parameters At Run Time
Select this option to pause for input at run time.
Change Feature Layer Properties
This Workflow Designer activity (page 2025) changes certain properties for the
specified layer.
To edit a workflow (page 284)
To create a workflow (page 287)
Click Tools tab ➤ Workflow panel ➤ Edit.
2030 | Chapter 40 Workflow Designer

This activity does not produce any outputs that can be bound to subsequent
activities. However, it can change a layer or group name, which can affect
subsequent activities.
Name
Enter the name of the layer to change.
Visible
Specify whether to make the layer visible or not, or to leave its visibility
unchanged.
Name
Specify the name of the layer.
Group
Move the layer into a different parent group, or select No Change to leave
it in the current one. The parent group must exist, or must be created by a
previous activity in the workflow. To place the group at the root level,
specify the Root Group (Map) parameter.
Selectable
Specify whether to make the layer selectable or not, or to leave its
selectability unchanged.
Draw Order Position
Change the position of this layer, relative to other layers in Display Manager.
To leave the layer in its current position, specify -1.
Optional Parameters
■Display Name: Enter a title for this activity.
Prompt For Parameters At Run Time
Select this option to pause for input at run time.
Change Feature Layer Symbol
This Workflow Designer activity (page 2025) sets the styling parameters for the
specified feature layer.
To edit a workflow (page 284)
To create a workflow (page 287)
Change Feature Layer Symbol | 2031

Click Tools tab ➤ Workflow panel ➤ Edit.
This activity does not produce any outputs that can be bound to subsequent
activities.
Layer Name
Enter the name of the layer to change. To see the current values for this
layer (if it is already in the map), click Current Values.
Style Point
If the geometry of this layer is a point, specify and style the point symbol
that represents it in Display Manager. You can specify a particular parameter
or specify that the point maintain its original parameter for any setting
except the symbol itself. For information about these settings, see Style
Point dialog box (page 1637).
Style Line
If the geometry of this layer is a line, style the line that represents it in
Display Manager. You can specify a particular parameter or specify that the
line maintain its original parameter for any setting. For information about
these settings, see Style Line dialog box (page 1636).
Style Polygon
If the geometry of this layer is a polygon, style the polygon that represents
it in Display Manager. You can specify a particular parameter or specify that
the polygon maintain its original parameter for any setting. For information
about these settings, see Style Polygon dialog box (page 1639).
Optional Parameters
■Display Name: Enter a title for this activity.
Prompt For Parameters At Run Time
Select this option to pause for input at run time.
2032 | Chapter 40 Workflow Designer

Change Group Properties
This Workflow Designer activity (page 2025) changes the visibility, name, and
parent group of a specified group in the Display Manager. For information
about groups, see Organizing Layers in Your Map (page 300).
To edit a workflow (page 284)
To create a workflow (page 287)
Click Tools tab ➤ Workflow panel ➤ Edit.
This activity does not produce any outputs that can be bound to subsequent
activities. However, it can change the group name, which can affect subsequent
activities.
Group
Enter the name of the group to change.
Visible
Specify whether to make the group visible or not, or to leave its visibility
unchanged.
Name
Specify a new name for the group, or select No Change to leave it as
currently named.
Group
Move the group into a different parent group. The parent group must exist,
or must be created by a previous activity in the workflow. To place the group
at the root level, specify the Root Group (Map) parameter.
Optional Parameters
■Display Name: Enter a title for this activity.
Prompt For Parameters At Run Time
Select this option to pause for input at run time.
Change Group Properties | 2033
Connect To Data Store
This Workflow Designer activity (page 2025) connects to the specified data store
but does not add data to the map. For an overlay that specifies feature classes,
rather than layers, this activity is sufficient (you do not have to create a layer).
NOTE The parameters vary according to the type of data store you connect to.
For example, a database requires login information, while a file requires a file
name. All users must provide login credentials when running the workflow, even
if you enter your own credentials when you create it.
To edit a workflow (page 284)
To create a workflow (page 287)
Click Tools tab ➤ Workflow panel ➤ Edit.
The output of this activity is a Connection ID.
Provider
Select the provider type for this connection.
File-based Data Stores
For more information about these options, see Bringing In Features from SHP
(page 335), Bringing In Features from SDF (page 337), and Bringing In Features
From SQLite (page 330).
File Name
Enter or navigate to the data store file.
ArcSDE Data Stores
For more information about these options, see Bringing In Features from
ArcSDE (page 316).
Server Name
Enter the name of the server where this data store is located.
Instance Name
Enter the name of the instance to connect to.
2034 | Chapter 40 Workflow Designer
Data Store
Enter the data store name for this service. For Oracle and MySQL data stores,
you can display all data stores if desired.
Version
Enter the version of the data store to connect to.
Other Database Data Stores
For more information about these options, see Bringing In Features from
Oracle (page 312), Bringing In Features from SQL Server (page 323), Bringing In
Features from SQL Server Spatial (page 326), and Bringing In Features from
MySQL (page 332).
Service Name
Enter or navigate to the data store file or folder.
Data Store
Enter the data store name for this service. For Oracle and MySQL data stores,
you can display all data stores if desired.
Version
Enter the version of the data store to connect to. (Oracle only)
ODBC Data Stores
For more information about these options, see Accessing Data from ODBC
(page 342).
Service Name
Enter or navigate to the data store file or folder.
Source Type
Specify whether this data store is a Data Source Name (DSN) or a connection
string.
Source
Enter or navigate to the ODBC source.
Raster Data Stores
For more information about these options, see Adding Raster-Based Surfaces
to Your Map (page 441).
Source File or Folder
Enter or navigate to the data store file or folder.
Connect To Data Store | 2035

WMS Data Stores
For more information about these options, see Adding an Image from a WMS
(Web Map Service) (page 445).
Server Name Or URL
Enter or navigate to the server where this data store is located, or enter its
URL.
Version
Choose a supported version from the list.
WFS Data Stores
For more information about these options, see Bringing In Features from WFS
(page 346).
Server Name
Enter or navigate to the server where this data store is located.
Optional Parameters
■Display Name: Enter a title for this activity.
Prompt For Parameters At Run Time
Select this option to pause for input at run time.
Create Buffer Layer
This Workflow Designer activity (page 2025) analyzes features by proximity.
Specify a geospatial feature in your map and the distance for the buffer.
AutoCAD Map 3D creates a polygon around the feature or features you have
selected at the distance you specify. It saves the buffer polygon to a new layer.
For more information about buffers, see Buffering Features in Your Map (page
1306).
To edit a workflow (page 284)
To create a workflow (page 287)
Click Tools tab ➤ Workflow panel ➤ Edit.
The output of this activity is a Display Manager layer that represents a buffer.
You can also create an SDF file containing this layer.
2036 | Chapter 40 Workflow Designer
Selection Set
Specify the feature to base the buffer analysis on.
Distance
Specify the buffer distance or prompt for a distance when the workflow is
run.
Unit
Specify the measurement unit for the distance.
Save To SDF
To save the resulting buffer layer as an SDF file, specify a name and location
for the file.
Merge Results
Select from the following:
■No Merging: Overlapping buffers are not merged. The number of
resulting buffers is equal to the number of features being buffered.
■Merge All Buffers: All overlapping buffers are merged into a single buffer
and then combined into a single polygon.
■Merge Overlapping Buffers: Only the overlapping buffers are merged.
Optional Parameters
■Display Name: Enter a title for this activity.
Prompt For Parameters At Run Time
Select this option to pause for input at run time.
Display Feature Attributes
This Workflow Designer activity (page 2025) displays the Data Table for the
specified feature and selection set.
To edit a workflow (page 284)
To create a workflow (page 287)
Click Tools tab ➤ Workflow panel ➤ Edit.
Display Feature Attributes | 2037

This activity does not produce any outputs that can be bound to subsequent
activities.
Source Type
Specify how to select the features whose attributes you will display. You
can display an entire feature source or a selection set.
If you choose to select by feature source, specify the connection ID and a
feature class name for that feature source. If you choose to select by selection
set, indicate which features to select.
Optional Parameters
■Display Name: Enter a title for this activity.
Prompt For Parameters At Run Time
Select this option to pause for input at run time.
Highlight Features/Remove Highlighting
This Workflow Designer activity (page 2025) highlights specified features in the
map (or removes highlighting from any features that are already highlighted).
To edit a workflow (page 284)
To create a workflow (page 287)
Click Tools tab ➤ Workflow panel ➤ Edit.
This activity does not produce any outputs that can be bound to subsequent
activities.
Selected Features
Specify the features affected by the highlighting change. For example, you
can specify all features added or produced by a previous activity.
Optional Parameters
■Display Name: Enter a title for this activity.
■Highlight: Select this option to highlight the features; clear this option
to remove highlighting from the features.
2038 | Chapter 40 Workflow Designer
Prompt For Parameters At Run Time
Select this option to pause for input at run time.
List Current Connections
This Workflow Designer activity (page 2025) lists the names of connections in
the current map. You cannot specify parameters for this activity, other than
a Display Name.
To edit a workflow (page 284)
To create a workflow (page 287)
Click Tools tab ➤ Workflow panel ➤ Edit.
The output of this activity is the Connection IDs for all current connections.
Optional Parameters
■Display Name: Enter a title for this activity.
List Feature Classes
This Workflow Designer activity (page 2025) lists the feature classes for the
specified data store connection in the current map.
To edit a workflow (page 284)
To create a workflow (page 287)
Click Tools tab ➤ Workflow panel ➤ Edit.
The output of this activity is the feature class names and connection IDs for
the specified data store.
Connection ID
Enter a connection ID for the data store whose feature classes you want to
list, or click to use the ID property of a preceding activity.
List Current Connections | 2039

Optional Parameters
■Display Name: Enter a title for this activity.
Prompt For Parameters At Run Time
Select this option to pause for input at run time.
List Feature Layer Properties
This Workflow Designer activity (page 2025) lists the name of the specified layer
in Display Manager, as well as any group it belongs to.
To edit a workflow (page 284)
To create a workflow (page 287)
Click Tools tab ➤ Workflow panel ➤ Edit.
The output of this activity is the layer and group names for the specified
Display Manager layer.
Layer Name
Enter the name of the layer.
Optional Parameters
■Display Name: Enter a title for this activity.
Prompt For Parameters At Run Time
Select this option to pause for input at run time.
Load Layer File
This Workflow Designer activity (page 2025) adds a saved .layer file to the map.
When you load a .layer file, AutoCAD Map 3D adds the source file to Map
Explorer, creates the connection, adds the feature layer to the Display Manager,
2040 | Chapter 40 Workflow Designer

and styles the layer correctly. For information about layer files, see Saving and
Loading Styled Feature Layers (page 651).
To edit a workflow (page 284)
To create a workflow (page 287)
Click Tools tab ➤ Workflow panel ➤ Edit.
The output of this activity is a Display Manager layer that displays the specified
.layer file.
File Name
Enter the name of the .layeror browse to it.
Optional Parameters
■Display Name: Enter a title for this activity.
Prompt For Parameters At Run Time
Select this option to pause for input at run time.
Perform Overlay
This Workflow Designer activity (page 2025) compares the spatial relationship
of two layers or feature classes. For information about the overlay operation,
see Overlaying Two Feature Sources (page 1309).
To edit a workflow (page 284)
To create a workflow (page 287)
Click Tools tab ➤ Workflow panel ➤ Edit.
The output of this activity is a new Display Manager layer that is the result of
the Overlay operation.
Perform Overlay | 2041

Data Type
Specify whether the overlay compares feature classes or Display Manager
layers. Both the source and overlay must be the same type (you cannot
compare a feature class to a layer).
Source/Overlay
If you select Layers as the Data Type, select the Source Layer and Overlay
Layer. These layers are the output of preceding Add Feature Layer activities.
If you select Feature Classes as the Data Type select a Source Feature Class
ID (the output of a preceding activity). Then select the Source Feature Source
for that feature class (if it is not selected automatically). Do the same for
the Overlay Feature Class.
Output File
Enter a location and file name for the output (overlay) SDF file. Click to
navigate to a location.
Overlay Type
Select the type of comparison to do. For a complete description of these
options, see Overlaying Two Feature Sources (page 1309).
Optional Parameters
■Display Name: Enter a title for this activity.
■Sliver Tolerance: Specify when small polygons resulting from the overlay
operation become separate features and when they are added to larger
polygons.
■Units: Select the units used in determining the sliver Minimum and
Maximum settings. The coordinate system determines the available
choices for the source layer. If the sliver roundness is higher than
the Maximum value, it becomes a separate polygon in the output.
If the sliver roundness is lower than the Minimum value, it merges
with its neighbor polygon in the output. To see reasonable values
for the selected data set, click Suggest. To ignore slivers, click Don’t
Remove Slivers.
■Ordinate Tolerance: Specify when two nodes or vertices of a line or
polygon are treated as separate points.
■Units: Select the units used in determining the Length setting. The
coordinate system determiens the available choices for the source
layer.
2042 | Chapter 40 Workflow Designer
■Length : Set the minimum distance at which two nodes or vertices
of a line or polygon are treated as separate points. The default value
is determined from the spatial context for the sources.
■Output Properties: Specify which properties from the source and (if
applicable) overlay inputs are included in the output. “Identifiers Only”
writes the primary identifiers to the output. “Non-Identifiers” writes
only the non-key attributes (creating auto-generated primary identifiers
for the output features). The default value is “All”.
Prompt For Parameters At Run Time
Select this option to pause for input at run time.
Remove Connection
This Workflow Designer activity (page 2025) removes the specified connection
to a data source.
To edit a workflow (page 284)
To create a workflow (page 287)
Click Tools tab ➤ Workflow panel ➤ Edit.
This activity does not produce any outputs that can be bound to subsequent
activities. However, the removal of a connection can affect subsequent
activities.
Connection ID
Select an existing connection or the outcome of a previous activity.
Optional Parameters
■Display Name: Enter a title for this activity.
Prompt For Parameters At Run Time
Select this option to pause for input at run time.
Remove Connection | 2043

Remove Feature Layer
This Workflow Designer activity (page 2025) removes the specified feature layer.
To edit a workflow (page 284)
To create a workflow (page 287)
Click Tools tab ➤ Workflow panel ➤ Edit.
This activity does not produce any outputs that can be bound to subsequent
activities. However, the removal of a layer can affect subsequent activities.
Layer Name
Enter the name of an existing layer, or select a layer created by a previous
activity.
Optional Parameters
■Display Name: Enter a title for this activity.
Prompt For Parameters At Run Time
Select this option to pause for input at run time.
Remove Group
This Workflow Designer activity (page 2025) removes the specified group.
To edit a workflow (page 284)
To create a workflow (page 287)
Click Tools tab ➤ Workflow panel ➤ Edit.
This activity does not produce any outputs that can be bound to subsequent
activities. However, the removal of a layer can affect subsequent activities.
Group Name
Enter the name of an existing group, or select a group created by a previous
activity.
2044 | Chapter 40 Workflow Designer
Optional Parameters
■Display Name: Enter a title for this activity.
Prompt For Parameters At Run Time
Select this option to pause for input at run time.
Remove Map
This Workflow Designer activity (page 2025) removes the specified display map.
To edit a workflow (page 284)
To create a workflow (page 287)
Click Tools tab ➤ Workflow panel ➤ Edit.
This activity does not produce any outputs that can be bound to subsequent
activities. However, the removal of a map can affect subsequent activities.
Map
Enter the name of an existing display map, or select a map created by a
previous activity.
Optional Parameters
■Display Name: Enter a title for this activity.
Prompt For Parameters At Run Time
Select this option to pause for input at run time.
Rename Map
This Workflow Designer activity (page 2025) changes the name of the specified
display map.
To edit a workflow (page 284)
To create a workflow (page 287)
Remove Map | 2045
Click Tools tab ➤ Workflow panel ➤ Edit.
This activity does not produce any outputs that can be bound to subsequent
activities. However, the removal of a map can affect subsequent activities.
Map
Enter the name of an existing display map, or select a map created by a
previous activity.
New Name
Enter a new name for the specified map, or select a map created by a previous
activity.
Optional Parameters
■Display Name: Enter a title for this activity.
Prompt For Parameters At Run Time
Select this option to pause for input at run time.
Run AutoCAD Command
This Workflow Designer activity (page 2025) executes any AutoCAD command
supported by AutoCAD Map 3D that can be run from the command line. If
the command requires a selection set or input from a dialog box, the workflow
pauses (during run time). The person running the workflow must specify a
selection set (or dialog box input) during run time.
To edit a workflow (page 284)
To create a workflow (page 287)
Click Tools tab ➤ Workflow panel ➤ Edit.
This activity does not necessarily produce any outputs that can be bound to
subsequent activities.
Command
Type the command-line entry for the AutoCAD command to execute.
2046 | Chapter 40 Workflow Designer
Optional Parameters
■Display Name: Enter a title for this activity.
■Parameters: Enter any parameters for the command, or prompt for them
at run time.
NOTE If the command displays dialog boxes or requires a selection set, you
must provide this input manually at run-time. You cannot automate these
responses.
Prompt For Parameters At Run Time
Select this option to pause for input at run time.
Run Workflow
This Workflow Designer activity (page 2025) invokes another workflow at this
point in the current workflow.
To edit a workflow (page 284)
To create a workflow (page 287)
Click Tools tab ➤ Workflow panel ➤ Edit.
This activity does not necessarily produce any outputs that can be bound to
subsequent activities. However, the workflow you run may contain activities
that produce outputs.
File Name
Enter or navigate to the file containing the workflow to run. By default, the
Workflow Designer looks for the workflow in the same folder as the current
workflow.
NOTE To preview the workflow, specify its file name in the activity and then
click in the Workflow Designer toolbar. In the Properties palette that displays,
click the Preview cell containing the name of the workflow, then click the browse
button that appears. The referenced workflow appears in a separate window.
Run Workflow | 2047

Optional Parameters
■Display Name: Enter a title for this activity.
Prompt For Parameters At Run Time
Select this option to pause for input at run time.
Save Layer File
This Workflow Designer activity (page 2025) saves a Display Manager layer to a
.layer file. You can save layers from all display maps in your map file. For
information about layer files, see Saving and Loading Styled Feature Layers
(page 651).
To edit a workflow (page 284)
To create a workflow (page 287)
Click Tools tab ➤ Workflow panel ➤ Edit.
The output of this activity is a .layer file.
Map
Select the display map that contains the layer to save. Select an existing
display map or a display map that results from a previous activity.
Layer Name
Select an existing layer or a layer that results from a previous activity to
save.
Output Folder
Enter or navigate to the folder for the new layer file.
Optional Parameters
■Display Name: Enter a title for this activity.
■Map: Select the display map in which this layer is located.
Prompt For Parameters At Run Time
Select this option to pause for input at run time.
2048 | Chapter 40 Workflow Designer

Select Features
This Workflow Designer activity (page 2025) selects individual features in the
current display map. You can select the features by layer, by location, or by
prompting for a manual selection at workflow run time.
To edit a workflow (page 284)
To create a workflow (page 287)
Click Tools tab ➤ Workflow panel ➤ Edit.
The output of this activity is a selection set.
Selection Method
Choose one of the following:
■Prompt: The workflow will pause at run time to allow manual selection
of features.
■Select By Layer: Selects all features on the specified layer.
■Select By Location: Selects features that either cross or are contained by
the intersection of the two layers you specify.
Optional Parameters
■Display Name: Enter a title for this activity.
■SetPickFirst: Select this option to store the data in the selection (no
matter it was selected) into the AutoCAD PICKFIRST cache for further
use.
Prompt For Parameters At Run Time
Select this option to pause for input at run time.
Select Features | 2049
Switch Map
This Workflow Designer activity (page 2025) changes the current display to the
specified display map.
To edit a workflow (page 284)
To create a workflow (page 287)
Click Tools tab ➤ Workflow panel ➤ Edit.
The output of this activity is a new current map.
Map Name
Enter the name of an existing display map, or a map created by a previous
activity.
Optional Parameters
■Display Name: Enter a title for this activity.
Prompt For Parameters At Run Time
Select this option to pause for input at run time.
Zoom To Extents
This Workflow Designer activity (page 2025) zooms to the extents of the specified
target.
To edit a workflow (page 284)
To create a workflow (page 287)
Click Tools tab ➤ Workflow panel ➤ Edit.
This activity does not produce any outputs that can be bound to subsequent
activities.
2050 | Chapter 40 Workflow Designer
Target
Specify what to zoom to: a map, a layer, a selection set, or an extent. Then
specify which map, layer, selection set, or extent to zoom to.
Optional Parameters
■Display Name: Enter a title for this activity.
Prompt For Parameters At Run Time
Select this option to pause for input at run time.
Zoom To Extents | 2051
2052
Programming Interfaces
Learn how to use the AutoCAD Map 3D Application Programming Interfaces (APIs), including:
■ActiveX
■AutoLISP
■Feature Data Objects (FDO)
■Geospatial Platform
■.NET
■ObjectARX
For more information, click Help > Additional Resources > Developer Help.
41
2053
2054
Glossary
.layer file Layer definition file. In AutoCAD Map 3D, a file that saves all of the
information required to recreate a layer, that is, the references to the source
data and the styles that have been applied to it.
adjacent sheet block An annotation (page 2055) block used to indicate adjacent
tiles.
anchor point The location on a drawing object that determines the position
of any annotation attached to that object.
annotation A way to display related values on a drawing object. To annotate
geospatial features, use a label (page 2066).
annotation definitions Specially created blocks (page 2056) containing attributes
with Map expression (page 2062) assigned to the attribute properties. Used with
drawing data.
annotation template The information to display in an annotation and the
layout of that information. Annotation templates are stored as specially named
blocks within your drawing. They can include text and graphics.
as-built Data that depicts the final installed configuration (physical or
functional). As-built data incorporates any field markups on the original
construction drawings.
as-designed Data that depicts the original plan for construction or installation,
for example, the design for a new electric service or a new pipe installation.
aspect Direction of ground slope.
attributes or attribute data Tabular data that describes the characteristics of
feature (page 2063) or drawing objects (page 2061), for example, the number of
lanes and pavement-type belonging to a road. For features, attributes can be
stored with the geometry, or stored in a database and joined to feature data.
For drawing objects, attributes are stored in a database and linked to selected
drawing objects. See also property (page 2071), external data (page 2062) and object
data (page 2070).
Glossary | 2055
auto-generated field (metadata) A type of field in the Metadata feature, the
value of which is derived from the data source, and populated automatically
by AutoCAD Map 3D. Metadata auto-generation is triggered by selecting the
resource in the Metadata Viewer. See also: forced-update field (page 2064)
AutoCAD layer A layer in AutoCAD. An AutoCAD layer differs from a map
layer you create in Display Manager (page 2060). See also layer (page 2066), drawing
layer (page 2060), feature layer (page 2063), or surface layer (page 2076).
Autodesk Design Review The free viewer and editor for the DWF file format
(formerly DWF Viewer).
azimuth A clockwise angle measured from a reference meridian. Also known
as north azimuth. It can range from 0 to 360 degrees. A negative azimuth is
converted to a clockwise value.
bearing An angle measured from North or South, whichever is nearest, with
the added designation of East or West. The angle is always less than 90 degrees
(PI/2 radians or 100 grads) and is usually referenced by a quadrant number.
best route analysis Calculates the shortest path or optimal route from a start
point in a drawing, one or more intermediate points, and back to the start
point. For example, the best route to follow on a street map when visiting
multiple customer sites.
blocks In AutoCAD or AutoCAD Map 3D, compound objects that have been
saved for reuse in the drawing or in multiple drawings, for example, a North
arrow. In MapGuide Studio, blocks are converted into symbols when they are
loaded. See also symbol (page 2076).
buffer A zone of a specific radius created around a selected feature. Used to
select features within a specific distance of another feature. In AutoCAD Map
3D, you can define buffers for drawing topologies and for features, but you
define them differently.
buffer fence A fence, or line, at a specified distance from a center line. Used
to define a selection boundary.
bulge For contours that contain curves, the bulge value is a maximum
mid-ordinate distance along a polyline curve. If the mid-ordinate distance is
longer than specified, then points are added to better define the shape of the
curve.
The bulge factor can add more vertices to a polyline curve, making it appear
more curve-like. The smaller the value, the more vertices are added.
2056 | Glossary
Cartesian coordinate system A global coordinate system (page 2065) defined
using three perpendicular axes (X, Y, and Z) to specify locations in
three-dimensional space. Compare with spherical coordinate system (page 2075).
cartographic coordinate system A global coordinate system (page 2065) that is
referenced directly to an ellipsoid (page 2062). Compare with geodetic coordinate
system (page 2064).
centroids Points or blocks (page 2056) that are part of a polygon in a drawing
topology. The centroid holds information about the area and perimeter of the
polygon.
chained join An advanced type of join, where two or more secondary tables
are joined to a primary table in a chain-like fashion, that is primary linked to
secondary linked to another secondary, and so on.
checkout The action of locking features in a data store before editing them.
See also explicit checkout (page 2062), implicit checkout (page 2065).
class See feature class (page 2063) and object class (page 2069).
classified DWG An AutoCAD Map 3D DWG (drawing) file that contains object
classes, and uses them to represent real-world objects in the drawing. A DWG
file that contains object class definitions, but does not have any objects to
which these definitions are applied, is not considered a classified DWG.
clustered nodes Nodes within a specified tolerance of one another.
COGO Short for Coordinate Geometry. COGO inquiry commands extract
geometric information from drawing objects such as lines, curves, closed
polylines, and polygons. This information is useful if you want to verify the
accuracy of your data, or send the data to the field. Inquiry commands are
specific to drawing objects. They do not work on features.
column A specific category of information in a table, such as Address or
Diameter, also called a FGDC CSDGM Standard (page 2063). See also table (page
2076).
compound element (metadata) A group of data elements in the FGDC CSDGM
Standard (page 2063). A compound element can consist of individual data
elements, other compound elements, or both.
conformal projection, conformality Conformal projections maintain local
angles. A map projection is conformal when the scale is the same in every
direction at any point. Meridians and parallels intersect at right angles; the
shape of small areas and angles with very short sides are preserved. Most larger
area sizes are distorted.
Glossary | 2057
conic projection A map projection in which the surface of the Earth is drawn
as it would appear if projected on a cone wrapped around the earth. The
Lambert Conformal Conic is often used for maps of the continental United
States, France, and other countries.
constraint In a database, a restriction specified for a certain feature class (page
2063), which is validated when a new feature is added to that class. For example,
a "minor road" feature class may have a constraint that specifies that the speed
attribute must always be 25, 30, or 50 miles per hour.
continuous data Data that can fall anywhere in a broad range. When creating
a theme, continuous data is usually organized into smaller ranges that show
data trends. For example, property value is continuous data that can be placed
into the ranges 0 to $50,000, $50,000 to $100,000, and over $100,000, with
each range displayed in a different color. Compare with discrete data (page
2060).
contour lines A line that connects points of the same elevation or value
relative to a specified reference datum. The lines can help you determine the
elevation at a specific location on a surface, help clarify and analyze the 3D
surface terrain, and help with things like navigation.
control points Locations with established latitude and longitude, and often
elevation, used for accuracy and precise location of maps. A system of geodetic
control points covers the entire United States. Similar systems exist for all
countries, such as Bench Marks and Trigonometry Points in the United
Kingdom. See also monuments (page 2069), geodetic coordinate system (page 2064).
coordinate geometry commands See COGO (page 2057).
coordinate system See global coordinate system (page 2065).
Create Surface Manager The main user interface for creating grid surfaces
from point cloud data.
credentials The user ID and password required to connect to a database.
cylindrical projection A map projection, in which the surface of the Earth
is drawn as it would appear if projected on a cylinder wrapped around the
earth in a north-south direction. Compare with transverse cylindrical projection
(page 2078). See also Mercator projection (page 2068) and conic projection (page
2058).
dangle A link or line, one end of which lacks a connection to another link or
node.
2058 | Glossary
Data Connect The window you use to connect a geospatial data store (page
2059) to your map. You specify each feature class (page 2063) from that data store
to add to your map.
data element (metadata) A single piece of data that can be entered directly,
as a value in a field. In the Metadata feature, single data elements are expressed
as fields to be completed with values defined in the FGDC CSDGM Standard
(page 2063). See also: compound element (metadata) (page 2057).
data provider A recognized FDO (page 2062) feature source provider, used to
connect to geospatial data.
data source A UDL (universal data link) file that points to a collection of data
and provides information on how to access the data.
data store In FDO (page 2062), a collection of feature classes contained in a
single storage location. The data store consists of an integrated set of objects,
which are modeled by classes or feature classes defined within one or more
schemas. Data stores can be either file-based, such as SDF, or a database, such
as Oracle Spatial. See also FDO provider (page 2063) and feature class (page 2063).
Data Table In AutoCAD Map 3D, a grid based on FDO (page 2062) data, in which
you can view and edit attributes of selected map features, perform searches,
and work with selection sets.
Data View In AutoCAD Map 3D, the grid in which you can view and edit
external database tables that are linked to drawing objects.
database query A set of conditions for specifying the selection of records from
a database. External database queries, also called views, are created using your
database software and can be run from the Map Explorer (page 2068) tab of the
Task Pane (page 2076). See also map query (page 2068).
datum A mathematical model that provides a smooth approximation of the
earths surface. Each datum includes both an ellipsoid, which specifies the size
and shape of the earth, and a base point for latitude and longitude. If two
maps use different datums, points on the map may not line up. Also called a
geodetic coordinate system (page 2064).
DEM Digital Elevation Model. A file that contains a representation of surface
terrain. The surface is stored as a grid in which each cell can have any one of
several different meanings, such as elevation, color, density, and so on.
digitize To convert existing data from paper maps, aerial photos, or raster
images into digital form by tracing the maps on a digitizer. Object locations
are recorded as X,Y coordinates.
Glossary | 2059
discrete data Data that falls into explicit categories. For a feature layer (page
2063) that uses a theme (page 2077), each value is displayed differently. For
example, an agricultural thematic map might show each crop in a different
color. Compare with continuous data (page 2058).
display information A description of the appearance of a drawing object:
includes items such as layer, color, hatch pattern, and line type.
Display Manager A view of the Task Pane (page 2076) that shows each Display
Manager layer (page 2060) in your current display map, and has commands for
styling and managing those layers. To view Display Manager, select its tab in
the Task Pane.
Display Manager layer A set of objects in Display Manager (page 2060). The set
could be all the objects on a layer or in a feature class (page 2063), or objects that
share a certain property. Each layer can be styled or themed individually.
display map A set of map presentations, consisting of Display Manager layers,
that can be stored in a DWG file. See Display Manager layer (page 2060).
display properties Same as display information (page 2060).
dissolve To remove the boundaries that exist between polygons sharing a
specific attribute.
dither To use a pattern of solid dots to simulate more colors than are available
when displaying images.
domain (metadata) In the Metadata feature, the domain refers to element
values that are defined as valid within the FGDC CSDGM Standard (page 2063).
A domain can be a list of pre-defined values in a menu, a range of numbers,
free-form text, or any other type of value that can be assigned to a given field.
dot variable Variable that refers to an object property. It consists of a period
(.) followed by the variable name for that property. Dot variables can be entered
in expressions used for building a template file for Report mode queries and
for property alteration. See also query (page 2072) and expression (page 2062).
draping The process of overlaying feature (page 2063) or a raster (page 2072) image
on a surface so that the features or the image reflect the underlying terrain.
draping The process of overlaying a set of feature (page 2063) or a raster (page
2072) image on a surface so that the features or the image reflect the underlying
terrain.
drawing layer A layer in Display Manager (page 2060) that contains drawing
objects (page 2061) from a DWG file. See also AutoCAD layer (page 2056), feature
layer (page 2063), layer (page 2066), surface layer (page 2076).
2060 | Glossary
drawing layer A layer in Display Manager (page 2060) that contains drawing
objects from a DWG file. See also AutoCAD layer (page 2056), drawing layer (page
2060), feature layer (page 2063), and surface layer (page 2076). drawing object Objects
that exist in a drawing (DWG) file or come from an attached drawing. Compare
to features.drawing source In AutoCAD Map 3D, a drawing source is a drawing
(DWG) file and also its associated information, such as attached drawing files,
drawing-based feature classes, linked template data, and topologies.
drawing objects Objects that exist in a drawing file (DWG) or come from an
attached drawing. Compare to feature (page 2063).
drawing set The set of source drawings attached to a drawing. See source
drawing (page 2074).
drawing source In AutoCAD Map 3D, a drawing source is a drawing (DWG)
file and also its associated information, such as attached drawing files,
drawing-based feature classes, linked template data, and topologies. Compare
with feature source (page 2063).
drive alias The mechanism that points to the folder where attached DWG
files are stored.
drive alias In AutoCAD Map 3D, the mechanism that points to the folder
where attached DWG files are stored.
DTED Digital Terrain Elevation Data.
duplicate objects Objects that share the same start and end points. Object
types that can be considered duplicate include linear objects, points, blocks,
text, and mtext.
DWF An Autodesk file format for sharing 2D, 3D, and spatially enabled design
data. DWF files are easy to publish and view on the web. See also georeferenced
DWF (page 2064), Autodesk Design Review (page 2056).
DWG Drawing file. The Autodesk file format for storing 2D, 3D, and spatially
enabled design data.
edge matching A DWG cleanup function available in AutoCAD Map 3D that
allows for distortion between adjacent maps, and produces a true match of
drawing objects at the edges of maps.
EditSet When users decide to lock objects in Oracle Spatial, those objects are
immediately locked. Edits of locked objects are put into an EditSet. You can
then update the database, which updates the locked records with the contents
of the EditSet.
Glossary | 2061
element (Oracle Spatial database) The basic building block of an Oracle
Spatial geometry (Oracle Spatial database) (page 2064). The supported spatial
element types are points, line strings, and polygons. For example, elements
might model water wells (point clusters), roads (line strings), and county
boundaries (polygons).
elevation The vertical distance from a datum to a point or object on the
surface of the Earth. The datum is generally considered to be at sea level.
Equivalent to the Z coordinate in an XYZ coordinate system.
ellipsoid An approximation of the shape of the Earth that does not account
for variations caused by the nonuniform density of the earth. Synonymous
with spheroid (page 2075). See also geoid (page 2064).
equal area A map projection in which every part, as well as the whole, has
the same area as the corresponding part on the earth, at the same reduced
scale. No flat map can be equal area and represent true shape.
equidistant projections Projections showing true distances only from the
center of the projection or along a special set of lines. No flat map can be both
equidistant and equal area.
exaggeration See vertical exaggeration (page 2078).
explicit checkout The action of checking out features using the Check Out
Features command. See also checkout (page 2057), implicit checkout (page 2065).
export profile A file with a .epf extension that stores settings for an export
operation.
expression An automatic calculation used to specify values for URL, tooltip,
and feature labels. For example, you might create a text expression that
specifies a state name and population for a label. To express the population
in millions, you might apply a number expression that divides the population
value by 1,000,000.
expression evaluator The mechanism that analyzes the statement you enter
in the Expression box in the Output Report Options dialog box or the Property
Alteration dialog box.
external data Attribute data linked to a drawing object but contained in a
database apart from the drawing file. See also attributes or attribute data (page
2055) and object data (page 2070).
FDO Feature Data Objects (FDO) data access technology. An Autodesk software
standard and general purpose API for accessing features and geospatial data
regardless of the underlying data store. See also feature (page 2063), feature class
(page 2063).
2062 | Glossary
FDO provider An implementation of the FDO (page 2062) API that provides
access to data in a particular data store, such as an Oracle or ArcSDE database,
or to a file-based data store, such as SDF or SHP.
feature An abstraction of a natural or man-made real world object. A spatial
feature has one or more geometric properties. For example, a road feature
might be represented by a line, and a hydrant might be represented by a point.
A non-spatial feature does not have geometry, but can be related to a spatial
feature that does. For example, a road feature may contain a sidewalk feature
that is defined as not containing any geometry. In AutoCAD Map 3D, features
are accessed and added to maps using Data Connect (FDO (page 2062)). See also
attributes or attribute data (page 2055). Compare to drawing objects (page 2061).
feature class For feature data, a schema element that describes a type of
real-world object. It includes a class name and property definitions. Commonly
used to refer to a set of features of a particular class, for example, the feature
class "roads" or the feature class "hydrants." See also FDO (page 2062), property
(page 2071), schema (page 2073).
Feature Data Objects See FDO (page 2062).
feature layer A layer in Display Manager (page 2060) containing feature (page
2063) from a feature source such as SDF, ESRI SHP, or ArcSDE. Feature layers are
brought in using Data Connect. See also AutoCAD layer (page 2056), layer (page
2066), drawing layer (page 2060), or surface layer (page 2076).
feature source In AutoCAD Map 3D, any source of feature data that has been
connected by means of FDO (page 2062). In MapGuide Studio, one of the two
types of resources created either by loading file-based data or by connecting
to a spatial database. Feature sources are stored in the repository either in SDF
3 format or as database connections and contain raw geometry only. Compare
with drawing source (page 2061).
FGDC CSDGM Standard Content Standard for Digital Geospatial Metadata.
A standard XML schema for publishing and sharing GIS metadata (page 2069),
released by the United States Federal Geographic Data Committee (FGDC) in
1998. The schema is comprised of seven major sections, each of which contains
several individual data elements and compound elements. Depending upon
the nature of the GIS data, each section, element, and compound element is
mandatory, optional, or conditional (mandatory if applicable).
field A specific category of information in a data file, such as Address or
Diameter. Also called a column (page 2057). See also table (page 2076).
filtered record A record that matches the conditions of an SQL filter or spatial
filter and is therefore available for selection.
Glossary | 2063
flood trace For a network topology (page 2069), a trace that begins at a specified
point and traces out in all directions for a specified distance or resistance.
forced-update field A type of auto-generated field (metadata) (page 2056) in the
Metadata feature, the value of which is required to be derived from the data
source within a GIS resource (metadata) (page 2072), according to the rules of
the FGDC CSDGM Standard (page 2063). Forced-update fields are updated each
time metadata is updated.
generalization A method of reducing the number of vertices in the source
data by a specific percentage.
geodetic coordinate system A coordinate system that is referenced directly
to a datum. Compare with cartographic coordinate system (page 2057).
geographic analysis Analytical techniques that identify existing conditions
of a geographic location, a spatial area, or a linear network, and predict the
effects of certain future events on these features.
geographic data Information about geographic features. See feature (page
2063).
geoid An ellipsoid with a highly irregular surface used to describe the shape
of the earth. See also ellipsoid (page 2062).
geometry (Oracle Spatial database) The representation of a spatial feature
(page 2063), modeled as an ordered set of primitive elements. See element (Oracle
Spatial database) (page 2062).
geometry mapping The process of transforming the geometry elements of
AutoCAD Map 3D objects to Oracle Spatial geometry, and transforming the
geometry elements of the records back to AutoCAD Map 3D objects.
georeferenced DWF A DWF file published by AutoCAD Map 3D or AutoCAD
Civil 3D 2008 that contains a global coordinate system and defined latitude
and longitude coordinates based on the WGS84 datum. See also DWF (page
2061), Autodesk Design Review (page 2056).
georeferenced image An image that references real-world coordinates in its
correlation source. Example: Georeferenced images include GeoSPOT, GeoTIFF,
and images that use world files as their correlation source.
GeoTIFF A type of tagged image file format (TIFF) that supports georeferencing
information.
GIS (Geographic Information System) A computerized decision support
system that integrates geographic data, attribute data, and other spatially
2064 | Glossary
referenced data. A GIS is used to capture, store, retrieve, analyze, and display
spatial data.
global coordinate system A method that converts the spherical coordinates
of the Earth representing latitude and longitude into an AutoCAD Map 3D
drawings Cartesian coordinate system, and accounts for the curvature of the
surface of the Earth with a projection. A coordinate system is usually defined
by a projection, an ellipsoid definition, a datum definition, one or more
standard parallels, and a central meridian.
graticule A network of geographic lines, such as latitude and longitude lines.
See also grid reference system (page 2065).
grid reference system A grid-based Cartesian coordinate system. The Universal
Transverse Mercator (UTM) (page 2078) coordinate system is a grid reference
system.
grid surface See surface (page 2076).
Grid Zone Designator (GZD) The first part of a grid reference system (page
2065)coordinate. The grid zone designator specifies the 6 by 8 degree UTM zone
number and latitude letter.
hatch A regular pattern used to fill an area with a series of cross-angled lines.
hillshading The addition of shading to a surface to suggest
three-dimensionality, shadow, or degrees of light and dark. Hillshading adds
shading by casting the light of the sun across a surface from the direction and
angle you specify.
implicit checkout The action of checking out features by selecting them,
without using the Check Out Features command. See also checkout (page 2057),
explicit checkout (page 2062).
index file A point cloud data store file created by the Point Cloud Manager
(page 2071). Index files allow AutoCAD Map 3D to access point cloud data more
quickly and efficiently.
inner join A type of join where records in the primary table are displayed
only if there is a matching record in the joined secondary table. See also join,
left outer join.
intersection (expression) Two or more conditions joined with the logical
operator And. An item is selected only if the item meets all specified conditions.
Compare with union (page 2078).
intersection (geometry) The location where one line, surface, or solid crosses
another so as to have one or more points in common.
Glossary | 2065
join A relationship that is established between attribute data and feature
sources for the purposes of creating a new view of the data or for ad-hoc
analysis.
JPG2000 An advanced raster image format from Joint Photographics Expert
Group, featuring options for lossless compression, wavelet compression,
incremental decompression, and support for up to 48-bit color.
key column One or more columns in a table whose values are used to uniquely
identify a record. To provide useful links, a key column should contain a
unique value for each record. Also called a key field.
key value A value stored on an object that specifies that value to match in
the key field of a table.
key view In a map book, an overview of the entire map with the current tile
boundaries displayed.
label Text placed on or near map feature (page 2063) to describe or identify
them.
LAS LiDAR Aerial Survey. LAS is an industry standared file format defined by
the American Society of Photogrammetry and Remote Sensing. The LAS
standard includes LiDAR point classification.
latitude The first part of a spherical coordinate system used to record positions
on the earths surface. Latitude indicates the angular distance north or south
of the equator. See also longitude (page 2067).
layer A resource that references a feature source or a drawing source. The layer
contains styling and theming information, and optionally a collection of scale
ranges. You add a layer to your map using Display Manager (page 2060). Specific
types of layers are drawing layer (page 2060), feature layer (page 2063), and surface
layer (page 2076).
layout template In a map book, a named composition of viewports and
annotation (page 2055) in paperspace. It includes the intended paper size and
output scale for plotting and publishing. See also map book template (page
2067).
left outer join A type of join where all records in the primary table are
displayed, whether they have a matching record in the joined secondary table
or not.
LiDAR Light Detection And Ranging. A remote-sensing method that can be
used to generate an image of a surface.
2066 | Glossary
link (external databases) The connection between a drawing object and its
related database data. The link data is stored on the linked drawing object and
contains the name of the link template and the key value used to identify the
associated record in the linked table. An object may have more than one link.
link (geometry) An element of geometry that connects nodes. In a polygon
topology, a link defines a polygon edge. Links can contain vertices and true
arcs, and can be represented as a line, polyline, or arc. See also node (page 2069).
link template A data structure that contains the path information to a database
table and specifies one or more key fields in that table.
lock To make all or part of a disk file read-only so that it cannot be modified
by other users on a network. Object locking applies to objects that are being
edited by another user. File locking applies to entire files, for example when
an AutoCAD user wants to open a file while the file is being edited in AutoCAD
Map 3D.
logical operator A symbol such as And, Or, Not, =, >, >=, <, and <= used to
define logical relationships.
long transaction Transactions that extend over hours, days, or months, unlike
the more typical database transactions that last for only seconds. Long
transactions support atomicity, consistency, and durability, and can be
committed or rolled back.
longitude The second part of a spherical coordinate system used to record
positions on the earths surface. Longitude measures angular distance east or
west of the prime meridian, which runs through Greenwich, England. See
also latitude (page 2066).
main viewport The viewport that represents a map tile in a sheet. See also
viewport (paper space) (page 2078).
map A collection of layers displayed within a consistent coordinate system
and extents. See also layer (page 2066).
Map Book Manages your map book (page 2067) and contains commands for
creating, editing, and publishing them. To view Map Book, click its tab in the
Task Pane (page 2076).
map book A publishing option that divides a map into tiles and formats them
into pages with a legend and an index/key. Create and edit map books from
the Map Book tab in the Task Pane (page 2076).
map book template A special type of sheet set template used by a map book
to generate sheets. The map tiles are generated based on the layout and
viewport placeholder properties.
Glossary | 2067
Map Explorer Manages your mapping resources. To view Map Explorer, click
its tab in the Task Pane (page 2076).
map projection A systematic representation of a spherical body, such as the
earth, in a flat (planar) surface. Each map projection has specific properties
that make it suitable for specific mapping needs.
map query A set of conditions that specify the selection of drawing objects
from source drawings. Conditions in a Map query can be based on the location
or properties of an object or on data stored in the drawing or in a linked
database table. See also topology query (page 2077) and database query (page
2059).
map tile A specific region of a map (model space view) for use on an individual
sheet.
MapGuide Enterprise A software platform for distributing spatial data over
the Internet or on an intranet. MapGuide Enterprise is supported by Autodesk.
MapGuide Open Source A software platform for distributing spatial data over
the Internet or on an intranet. MapGuide Open Source is supported by the
community (www.mapguide.osgeo.org)
MapGuide Server The component of MapGuide Open Source or MapGuide
Enterprise that hosts services and responds to requests from client applications
through TCP/IP protocol.
MapGuide Viewer (AJAX viewer) The version of the MapGuide Viewer
component that does not need a download (also known as “zero-client
viewer”). It works with Microsoft Internet Explorer, running on Windows, or
with browsers such as Firefox on other operating systems, such as MacOS or
Linux.
MapGuide Viewer (DWF Viewer) The version of the MapGuide Viewer
component that is based on a Microsoft ActiveX Control and has full support
for the DWF format. It works with the Microsoft Internet Explorer browser
only.
MapGuide Web Server Extensions The MapGuide component that exposes
the services offered by the MapGuide Server to client applications over the
Internet or on an intranet using HTTP protocol.
Mercator projection A map projection, designed by Gerhardus Mercator, in
which the surface of the Earth is drawn as it would appear if projected on a
cylinder wrapped around the earth. See also cylindrical projection (page 2058).
meridian A great circle passing through both poles, corresponding to a line
of longitude.
2068 | Glossary
metadata Data about data. In the GIS context, metadata consists of
information that describes the essential characteristics of geospatial data sets.
See also FGDC CSDGM Standard (page 2063).
Military Grid Reference System (MGRS) A Universal Transverse Mercator
(UTM) projection (page 2078)- and Universal Polar Stereographic (UPS)-based
grid reference system (page 2065) used by the United States military and NATO.
monuments Features with known coordinates, used to establish accurate and
precise location on a map. See also control points (page 2058).
Mpolygon A polygon object. A polygon differs from a closed polyline in that
it stores information about its inner and outer boundaries.
naming scheme The method of determining an individual map tile name.
Examples include column/row, sequential, and data driven.
network analysis, network flood trace See flood trace (page 2064).
network topology A description of the spatial relationship between linear
drawing objects (links and, sometimes, nodes). For example, a network
topology can represent pipelines, streets, electrical transmission lines, and
rivers.
node A single point or a link end point or intersection in a topology. A node
can be represented as a block or point object.
node topology A description of the spatial relationship between geographic
point objects in a drawing. Examples of node topologies include point sources
of pollution and road signs.
normalizing In a theme, the scaling of data values relative to another data
value. A common example is adjusting the thematic value based on the area,
length, or perimeter of the entity.
object class All the drawing objects that have been created using a specific
object class definition. Use object classification to organize objects in your
drawing based on the real-world features they represent, such as roads. Object
classes allow you to create new objects that automatically have the appropriate
properties and values for objects in your drawing. See also feature class (page
2063).
object class definition A definition of how to create a classified drawing
object in a drawing. An object class definition can include information about
the object type, default properties of the object, or default data that should
be attached to the object.
Glossary | 2069
object data Attribute data attached to an object and stored in the drawing
file. Compare with external data (page 2062).
OGC Open Geospatial Consortium. A non-profit, international, voluntary
consensus standards organization that leads the development of standards for
geospatial and location based services. (www.opengeospatial.org)
one-to-many join A join in which one record in the primary table corresponds
to more than one record in the secondary table.
one-to-one join A join in which one record in the primary table corresponds
to one record in the secondary table.
OpenGIS Agent The component of the MapGuide Server Web Extensions
that implements several OpenGIS Web-mapping protocols to expose the
services offered by the MapGuide Server to standards-based OpenGIS clients.
Oracle schema See schema (page 2073).
Oracle Spatial (OSE) feature An earlier version of the Feature Data Objects
(FDO (page 2062)) feature, used to store maps in Oracle Spatial.
OSGeo Open Source Geospatial Foundation. A foundation created to support
and build the highest-quality open source geospatial software. The goalof the
foundation is to encourage the use and collaborative development of
community-led projects. (www.osgeo.org)
overlay To create a new topology by combining elements of two distinct
topologies. At least one of the original topologies must be a polygon topology.
overlay analysis In AutoCAD Map 3D, a tool that provides spatial and data
analysis capabilities for two sets of geospatial features.
package In MapGuide, a compressed file that can speed up the process of
loading data onto the server. Large source-data files can be zipped up in this
file format and saved to a network location or copied to a CD.
parallel A degree of latitude that circles the earth parallel to the Equator.
path trace For a network topology, a trace begins at a specified point, finds
the shortest distance to another point and is based on resistance (the length
by default).
persistent locking The ability to edit checked-out objects while you are offline,
and then save your changes back to the data source when you return online.
placeholder Specifies location and size of elements (viewports, scale bar, north
arrow, legend) in a map sheet.
2070 | Glossary
plot template block An AutoCAD block that contains plotting information
such as title page text, plot layouts, legend, and other map annotation (page
2055).
point cloud A collection of points represented as an AutoCAD object.
Point Cloud Manager The main user interface for converting LiDAR data to
a point cloud database file format.
polygon A polygon is a closed area that stores information about its inner
and outer boundaries, and about other polygons nested within it or grouped
with it. In a polygon topology, the polygon can be enclosed by any lines or
arcs in the drawing. In addition, AutoCAD Map 3D supports a polygon object,
sometimes called an Mpolygon (page 2069) or mapping polygon.
polygon topology A description of the spatial relationship between geographic
area features. Polygon topologies contain geometric links, nodes, and centroids.
Examples of polygon topologies are land use and land cover maps, political
boundaries, parcels, and soil types.
primary key The property whose value uniquely identifies each feature within
a feature class. Many feature classes use a single property for this purpose, for
example, FeatureId. However, a feature class could have a list of properties
such as street number, street name, and street type to uniquely identify a
house address. You cannot edit primary key values for joined data.
prime meridian The line of longitude drawn through Greenwich, England,
used as the origin for longitude measurements.
profile User-defined settings specific to a given drawing.
property For feature (page 2063) data, a single attribute of a class. A class is
described by one or more property definitions. For example, a Road feature
class (page 2063) may have properties called Name, NumberLanes, or Location.
See also attributes or attribute data (page 2055).
property alteration definition The definition of properties you want to
change during a query.
property data Values associated with a geographic object, such as river depth,
road width, or pipe diameter. In AutoCAD Map 3D, these items are represented
as block attributes, values in object data tables, or values in a linked external
database.
pseudo node An unnecessary node in a geometric link. A pseudo node can
be used to store information about geographic point location or to represent
change from one link to another.
Glossary | 2071
publish To generate output from a map book.
purge To remove all unused object definitions from an open drawing.
query A set of executable statements that retrieve specific objects. For example,
a layer-based query that displays only the objects on the layers that contain
state and district boundaries. See map query (page 2068), topology query (page
2077), and database query (page 2059).
Query Library The set of queries saved in a drawing. You can add, delete, and
modify queries in the Query Library.
ramp A sequence of display properties used to render a theme; for example,
a sequence of colors, line styles, or hatch patterns.
range of values In a theme, a segment of data along a continuum, such as
property value, temperature, or population.
raster Images containing individual dots (called pixels or cells) with color
values, arranged in a rectangular, evenly spaced array. Aerial photographs and
satellite images are examples of raster images used in mapping. Compare with
vector (page 2078).
raster-based surface layer See surface layer (page 2076).
reference point For a symbol, the point that controls the position of a symbol
over a feature in a map. The default reference point is the center of the symbol.
registration The preparation of a map for digitizing by calibrating a digitizing
table to convert an analog source to a digital file. See digitize (page 2059).
resistance Resistance is a measure of how hard it is to travel a link. The default
measure of resistance is the length of the link. You can set the resistance to
be related to what the link represents, such as pipe diameter or traffic speed.
resolution In a raster image, the density of pixels-per-inch (PPI) or
dots-per-inch.
resource In MapGuide, a feature source, drawing source, or application
component that is stored in the resource repository and can be reused and
shared.
resource (metadata) In the Metadata feature, a resource is a generic term
meaning any type of data set for which AutoCAD Map 3D can generate
metadata (page 2069). A resource could be a feature class, an object class, a
schema, or a file.
resource repository In MapGuide, an XML database that stores the resources
created either by loading file-based data or by connecting to databases.
2072 | Glossary
rubber sheeting An editing method, used only when necessary, that attempts
to correct errors by stretching a map to fit known control points or
monuments.
rule (for feature themes) A feature theme consists of a collection of rules.
Each rule specifies a style and feature label for the features that meet the
specified condition. You can add a legend label to provide a description of
the condition of a rule. As a layer is drawn, each feature (page 2063) is compared
to the rules in the order that they are listed. The first rule for which the feature
meets the condition is used to specify the style and feature label for that
feature.
save set Objects that have been created or modified in the current drawing
and are marked to be saved back to source drawings.
scale The ratio of the distance on a paper map to the distance on the ground.
If a paper map has a scale of 1:100,000 (also represented as 1/100000), then
a distance of 1 unit on the paper map corresponds to 100,000 units on the
ground. On a digital map, scale represents the scale of the map from which
the digital map was derived.
scale threshold You can define different stylizations at different scale
thresholds. For example, turn on the display of road names only when the
drawing scale factor is below 1:5000.
schema The definition of multiple feature classes and the relationships between
them. A schema is the logical description of the data types used to model
real-world objects, and does not reference the actual data instances (a particular
road or land parcel). Rather, it is metadata. See also feature class (page 2063).
SDF Spatial Data File. An open source file-based geodatabase that can contain
multiple feature classes or types of data stored in tables with attributes and
geometry. See SDF 2 (page 2073), SDF 3 (page 2073).
SDF 2 The previous version of the SDF file format. It was the native file format
for Autodesk MapGuide (the last release was Autodesk MapGuide 6.5). Each
SDF 2 file generally contained one feature class (page 2063) or type of data, for
example points, lines, polygons, or text.
SDF 3 The current version of the SDF format. It is the native format for
MapGuide Enterprise and MapGuide Open Source. Each SDF 3 file can contain
multiple feature classes or types of data stored in tables with attributes and
geometry. See feature class (page 2063).
service An Oracle database.
shading See hillshading (page 2065).
Glossary | 2073
sheet An individual named object in a sheet set that can be published.
References a layout. In a DWF file, a plot layout containing a specific view of
the original data.
sheet set A named collection of sheets and subsets for publishing.
sheet subset A named collection of sheets within a sheet set. An individual
sheet can only be a member of a single subset.
sheet template A drawing file that defines a title block and a layout for use
in sheets. Can be specified for sheet sets and sheet subsets.
shortest path trace See path trace (page 2070).
site The collection of servers that process MapGuide requests.
Site Administrator A web-based application, installed with MapGuide Server,
for managing a site and its servers.
Site Explorer The tree view in MapGuide Studio that displays the resources
stored in the resource repository.
site server In a site, the server that contains the resource repository.
slope A method of reporting surface inclination as a ratio that expresses the
horizontal distance in which the elevation changes by one linear unit. For
example, if the ground rises 3 units over a horizontal distance of 15 linear
units (meters or feet), the slope is 5:1 (5 to 1).
source drawing A drawing file attached to another drawing. The set of all
source drawings attached to a drawing is called the drawing set. Use a query
to retrieve selected objects from multiple source drawings.
spatial A generic term used to reference the mathematical concept of
n-dimensional data.
spatial analysis The process of understanding, extracting, or creating
information about a set of objects. Spatial analysis includes techniques used
to determine the distribution of objects over a network or area, and the
relationships between those objects. The location of, proximity to, and
orientation of objects can be analyzed with spatial analysis. It is useful for
evaluating suitability and capability, for estimating and predicting, and for
interpreting.
spatial context The general metadata or parameters within which the
geometry for a collection of features resides. In particular, the spatial context
includes the definition of the coordinate system, spheroid parameters, units,
spatial extents, and so on, for a collection of geometries owned by features.
2074 | Glossary
spatial data Information about the location and shape of geographic features,
and the relationships between those features. See also feature (page 2063).
Spatial Data File See SDF (page 2073).
spatial database A database containing information indexed by location.
spatial filter A selection of objects that specify which records to display in
the active table or query. When a spatial filter is active, the Data View displays
only those records linked to selected objects. Compare with SQL filter (page
2075).
spatial index An index created in an Oracle Spatial database by dividing the
extents of the drawings in the database into rectangular tiles. AutoCAD Map
3D uses the index to locate the geometry to be imported.
spherical coordinate system A coordinate system measured on the surface
of a sphere and expressed as angular distances. Compare with Cartesian
coordinate system (page 2057).
spheroid See ellipsoid (page 2062).
SQL filter A series of SQL expressions that specify which records to select in
the active table or query. When an SQL filter is active, the Data View displays
only those records that match the filter criteria. Compare with spatial filter
(page 2075).
style Settings that specify how to display the feature (page 2063) or drawing
objects in a Display Manager layer. For example, a polygon style that makes
parcel polygons 50% transparent and which appears at a scale of 1:50000.
One or more styles can be applied to a single element.
style library Use the style library to store the styles you use frequently. You
can drag and drop these styles onto any element in any other display map.
styling The process of assigning display characteristics (such as line color, line
pattern, fill color, fill pattern, and so on) to feature (page 2063) (points, polylines,
polygons). See also theming (page 2077).
stylization Visually or textually changing the display of drawing objects
according to the assigned styles, rather than displaying them with their native
object properties. See also style (page 2075).
superuser A user who controls user IDs, passwords, and access to sensitive
procedures.
supplementing distance The maximum distance between 3D polyline vertices.
If the distance between vertices is greater than specified, then points are added
Glossary | 2075
along the 3D polyline in equal increments that are less than or equal to the
supplementing distance.
supplementing factors Add vertices along 3D polylines that are long and
contain few vertices. The supplementing distance is the maximum distance
between vertices. If the distance between vertices is greater than specified,
then points are added along the 3D polyline in equal increments that are less
than or equal to the supplementing distance. The smaller the distance, the
greater the number of supplemented points.
surface A network of elevation data. AutoCAD Map 3D supports raster-based
grid surfaces, such as DEM, DTED, and ESRI Grid. In these types of surfaces,
the points of a surface are connected into a grid, which are then used to
interpolate contours, and to generate profiles and cross-sections. A surface
represents the ground condition at a particular time or event.
surface layer A layer in Display Manager (page 2060) containing a raster-based
surface such as a Digital Elevation Model (DEM), an ESRI Grid file, or Digital
Terrain Elevation Data (DTED). A surface layer is brought in using Data
Connect. See also feature layer (page 2063), drawing layer (page 2060), AutoCAD
layer (page 2056).
swing tie A type of measurement taken by a surveyor using a known distance
plus an angular offset. A tie is a direct measurement, made with a tape or
chain. Swing refers to the angle offset of the tie.
symbol A bitmap or vector image that is used to represent a point.
symbol library In MapGuide Studio, a collection of related symbols. Image
files are converted into symbols when they are brought into the symbol library.
The symbol library is stored in the resource repository.
symbol table A term referring to the storage of named objects, including
linetypes, layers, text styles, and blocks.
table A set of data arranged in records (rows) and fields (columns). When a
table is displayed in a grid, records display in horizontal rows and fields display
in vertical columns. Each field value in the table displays in a cell.
Task Pane A AutoCAD Map 3D window that provides the tools you require
to accomplish your main mapping tasks: creating, displaying, styling,
analyzing, and publishing maps. The Task Pane contains tabbed views: Map
Explorer (page 2068), Display Manager (page 2060), Survey, and Map Book (page
2067). Map Explorer enables you to manage the resources you use to create your
maps. Display Manager provides tools to create maps, and create styles and
themes. With Map Book, you can print, publish and share maps. You can
resize and move the Task Pane palette.
2076 | Glossary
task workflow An overview of the steps to perform common GIS tasks.
template file A file that formats another file, such as a text file for saving
information from queried objects. See also dot variable (page 2060), query (page
2072), and link template (page 2067).
text layer Static text stored as a separate SDF data store, independent from
the current map. You can precisely position text on the layer, and style and
rotate the text.
thematic map See theme (page 2077).
theme A theme is a special style used to vary the stylization based on some
property of the objects. For example, instead of just coloring the lakes blue,
you could vary the shade of blue based on the depth of the lake. Instead of
just altering the line width of the roads, you could vary the line width based
on traffic flow.
theming The process of styling feature (page 2063) according to an attribute
value. See also styling (page 2075).
tiling scheme The method of breaking a large map into multiple smaller tiles.
Options include by area, by number, and custom.
tolerance A radius around a node or linear object used to search for drawing
errors.
tolerance (drawing cleanup) The minimum distance allowed between linear
objects or nodes during drawing cleanup. If two linear objects or nodes are
separated by a distance less than the tolerance, AutoCAD Map 3D corrects the
error.
Topobase An Autodesk data management solution for utility companies,
municipalities, and engineering firms. Autodesk Topobase consists of a set of
industry-specific modules built on AutoCAD Map 3D and MapGuide, all of
which use Oracle as the central data store.
topology A set of geometric relationships between drawing objects, including
links, nodes, and centroids. Topology describes how lines, nodes, and polygons
connect and relate to each other, and forms the basis for advanced GIS
functions such as network tracing, spatial analysis, buffer analysis, overlay
analysis, and dissolving a polygon topology.
topology query An extension to a Map query that applies to a loaded topology.
See also map query (page 2068).
transparent command A command started while another is in progress.
Precede transparent commands with an apostrophe.
Glossary | 2077
transverse cylindrical projection A map projection, in which the surface of
the Earth is drawn as it would appear if projected on a cylinder wrapped around
the earth in an east-west direction. Compare with cylindrical projection (page
2058).
UDL (Universal Data Link) File with.udl extension that includes the name
and location of the database table and the software used to create the file.
Windows uses a UDL file to identify a data source. Using the information in
this file, programs such as AutoCAD Map 3D can view and update data from
external databases.
undershoot Two or more lines within a specified tolerance of each other that
do not meet.
union Two or more conditions joined with the logical operator Or. An item
is selected only if the item meets at least one of the specified criteria. Compare
with intersection (expression) (page 2065).
United States National Grid (USNG) A Universal Transverse Mercator (UTM)
projection (page 2078)-based grid reference system (page 2065)for the United States.
Universal Transverse Mercator (UTM) projection A specific implementation
of the Mercator projection, designed for use around the world. See also Mercator
projection (page 2068).
vector A mathematical calculation of an object with precise direction and
length. Vector data is stored as X,Y coordinates that form points, lines, and
areas. Compare with raster (page 2072).
versioning A database function that allows multiple copies of a spatial dataset
to be stored and tracked by date of creation, data of change, and so on.
vertical exaggeration An increase of vertical scale relative to horizontal scale,
used to make elevation changes easier to differentiate.
viewport (paper space) A view of modelspace from a layout.
wavelet A multiple resolution image file compressed using a lossy compression
that enables large graphics to load much faster due to the reduction in file
size. Wavelet compression is based on a mathematical algorithm in which
graphic images can be reduced to a small fraction of their original size.
weeding The removal of points along a selected 3D polyline, which may
represent a contour. The weeding factors determine the number of points
removed. You can use weeding to reduce the amount of point information
taken from the contours that may not be necessary to generate an accurate
surface.
2078 | Glossary
weeding factors You can use the weeding factor settings to reduce redundant
points along 3D polylines by ignoring vertices that are close together or along
a straight line. A larger distance and deflection angle will weed a greater
number of points. Distance is an absolute measure and the angle is measured
in degrees. The larger the distance value, the greater the number of weeded
points. The weeding factors must be less than the supplementing factors.
A point is weeded by calculating its location in relation to the vertices before
and after it. If the length between these three points is less than the weeding
length value, and the deflection angle is less than the weeding angle value,
then the middle point is not added to the contour data file.
WFS Web Feature Service. A web service based on the specification defined
by the OGC. Acts as a source of feature (page 2063) data.
WMS Web Map Service. A web service based on the specification defined by
the OGC. Produces an image (for example, a PNG or JPG image) of geospatial
data.
workflow An automated set of tasks that can be arranged to run in series or
parallel. The output of one task can be used as the input of another task. The
user can configure the sequence and parameters for execution graphically.
workflow activity A single step in a workflow that executes a command or
set of commands.
workflow binding A relationship between activities such that the output of
one activity is used as the input of another.
workspace Contains the commands and tools for specific tasks. The Tool-based
Ribbon workspace is tailored to those familiar with the AutoCAD ribbon, while
the Task-based Ribbon workspace is optimized for working with AutoCAD
Map 3D.
To change your workspace, click the name of the current workspace in the
status bar and select a different workspace from the list.
zero-client viewer See MapGuide Viewer (AJAX viewer) (page 2068).
zoom To change the display magnification so that it focuses on progressively
smaller areas (when you zoom in) or larger areas (when you zoom out) of an
image.
zoom extents To magnify a drawing based on its extents so that the view
shows the largest possible view of all spatial objects.
Glossary | 2079
2080
Index
.bmp files
inserting with Raster Extension 455
.ddf files (SDTS format) 413
importing 414
.dgn files 405, 408, 1435
exporting to 1435
importing 405, 408
.dib files
inserting with Raster Extension 455
.dpf files 781
.dwg files
exporting maps to 1460
.dwk files 227, 730, 735
.dxf files 391
exporting 1459
importing 391
.eoo files
exporting 396
importing 396
.gml files 412
exporting to 1429
importing 412
.ini files 249
and drive aliases 161
customizing 264
for import and export 269
.jpg files
adding with Data Connect 443–444
.mif files 400
exporting to 1431
importing 400
.mil files
inserting with Raster Extension 455
.pct files
inserting with Raster Extension 455
.pcx images
inserting with Raster Extension 455
.png files
adding with Data Connect 443–444
.rst files
inserting with Raster Extension 455
.sdf files 338, 387, 1413
exporting 1413, 1417
importing 387
saving Display Manager layers
as 1470
using as a data source 338
.shp files 335–336, 399
adding feature data to maps 336
converting to drawing objects 335
importing 399
.sif files 1417
.sqlite files 331
exporting 1447
using as a data source 331
.sys files 249
.tab files 402, 404, 1433
exporting to 1433
importing 402, 404
.tga files
inserting with Raster Extension 455
.tif files
adding with Data Connect 443–444
.vml files 1449
exporting to 1449
.vpf files 416–417
importing 416–417
2D
adding rasters to maps 444
draping over 3D surfaces 1193
viewing 1193
3D
orbit options 1196
surfaces 1192
viewing 1193, 1196
3D surfaces
draping 2D data on 1193
video 1194
walkthroughs 1196
Index | 2081
A
abstract classes
in Schema Editor 1739
acadmap.ini file 161, 249
acadmap.sys file 249
ACADOPTIONS command 89
ACADPUBLISH command 1371, 1373
ACADSAVE command 742
ACADSAVEAS command 1459
accessing 314, 319, 324, 331, 333, 336,
338, 341, 344, 378
ArcSDE data in maps 319
Autodesk SDF data in maps 338
Microsoft Access data in maps 344
MySQL data in maps 333
ODBC data in maps 344
Oracle data in maps 314
PostGIS data in maps 341
SHP files in maps 336
SQL Server data in maps 324
SQLite data in maps 331
vs importing data for maps 378
WFS data in maps 348
activating source drawings 160
activities
for workflows 281
Add Class Property dialog box
(Export) 1726
Add Feature Layer activity
for workflows 2028
Add Group activity
for workflows 2029
Add Map activity
for workflows 2030
Add To Map With Query 310
adding 314, 319, 324, 331, 333, 336,
338, 341, 444, 751, 764, 878,
880, 884, 937, 1056
2D rasters to maps 444
annotation to maps 1103
ArcSDE data to maps 319
Autodesk SDF data to maps 338
database records in Data View 1056
digital elevation models to
maps 442
digital terrain elevation data to
maps 442
distances 1157
drawings to save sets for maps 751
drawings to the current map 158
ESRI grid files to maps 442
ESRI SHP data to maps 336
linear objects to topology 880
MySQL data to maps 333
nodes to topology 878
objects to save set 764
Oracle data to maps 314
polygons to topology 884
PostGIS data to maps 341
raster images to maps 442
raster-based surfaces to maps 442
SHP data to maps 336
SQL Server data to maps 324
SQLite data to maps 331
surfaces to maps 442
text to drawing objects 1278
text to objects 937
WFS (Web Feature Service) data to
maps 348
WMS (Web Map Service) data to
maps 447
ADEATTACHDATA command 1062,
1065, 1794
ADEDEFCRDSYS command 91
ADEDEFDATA command 200–201,
1456, 1805
ADEDRAWINGS command 156, 159,
1918
ADEDWGCLEAN command
(discontinued) 1533
ADEDWGMAINT command 736, 1295,
1920
ADEDWGSTAT command 166, 173,
1926
ADEEDITDATA command 1070, 1795
ADEFILLPOLYG command 940, 1647
ADEGENLINK command 533, 1063,
1068, 1457, 1807
ADEQUERY command 1238, 1262,
1289, 1478, 1480, 1838
2082 | Index
ADEQUERYLIB command 181, 183,
1858
ADEQVIEWDWGS command 747, 2013
ADEREMOBJS command 742, 760, 1885
ADERSHEET command 935, 1648
ADERUNQUERY command 180, 1861
ADERUNXQUERY command 180
ADESAVEOBJS command 742, 749, 754,
756, 1887
ADESELOBJS command 742, 752, 1886
ADESETCRDSYS command 147–148,
1296, 1598
ADESHOWOBJS command 753, 1887
ADETEXTLOC command 937, 1799
ADETRANSFORM command 932, 1649
ADEWHOHASIT command 735
ADEZEXTENTS command 745, 2014
adjacent arrows
for map books 1385
aerial imagery
purchasing 72
samples 63
affine transformation
and digitizing 133
aliases for drives 161
aligning 154, 931
attached drawings 154
drawing objects in maps 931
drawings 169
maps 154
Alter Block Insertion dialog box 1622
Alter Line Format dialog box 1622
Alter Linetype dialog box 1623
Alter Lineweight dialog box 1624
Alter Plotstyle dialog box 1624
Alternate Font dialog box (drawing
queries) 1835
analyzing data
overview 1121
anchoring 770
objects for Drawing Cleanup 770
angle information 1160
displaying 1160
ANGLE variable 1546
annotating
maps (video) 1089
annotation 186, 1100, 1103, 1105–1108
adding for drawing layers 660, 1176
applying for drawing layer
themes 1176
attaching to drawing objects in
maps 1103
changing templates 196
defining templates 192
deleting in maps 1108
deleting references to templates 197
deleting templates 197
editing on an annotation layer 1116
for drawing layer themes 1186
inserting in maps 1103
legends (video) 1117
refreshing in maps 1105
templates 186
templates from xrefs 186
text layers (video) 1109, 1111,
1113, 1115
updating in maps 1107
Annotation Delete dialog box 1569
annotation layers
adding text to 1114
creating 1110
styling 1112
Annotation Refresh dialog box 1569
Annotation Text dialog box 1570
Annotation Update dialog box 1571
apostrophe 1027
and coordinate geometry
commands 1027
apparent intersection 773, 779, 803
and Drawing Cleanup 803
marking for cleanup 779
selecting 773
tolerance for extending 773
appending 1413, 1424
when exporting to SDF 1413
when exporting to SHP 1424
Arc/INFO Coverages 381, 394, 1419
export defaults 269
exporting 1405
exporting to 1419
importing 381, 394
Index | 2083
arcs 776, 1032, 1034, 1036, 1038, 1040,
1042, 1044
converting to polylines during
Drawing Cleanup 776
displaying COGO information
for 1161
specifying with angle and
distance 1032
specifying with azimuth and
distance 1042
specifying with bearing and
distance 1034
specifying with deflection and
distance 1038
specifying with distance and
offset 1044
specifying with two bearings 1036
specifying with two distances 1040
ArcSDE 316
adding feature data to maps 319
exporting drawing data to 1423
importing data from 392
moving DWG data to 629
provider capabilities in maps 316
schemas 579
setting up for 318
working with data 581
ArcView ShapeFile 381
exporting as folder 269
exporting to 1424
importing 381
importing as folder 269
area
altering drawing objects based
on 1265
finding drawing objects by 1244
specifying save back extents 170
style options for 650
AREA variable 1546
arithmetic functions 1541
aspect
and theming 1202
theming surfaces for 1203
Assign Global Coordinate System dialog
box 1598
Associate Database Versions dialog
box 1675
associating 507, 512
data with map features 512
association properties
in Schema Editor 1739
associations
data and map features 507
associative hatch 247
Attach Object Class Definition File dialog
box 1781
Attach Object Data dialog box 1793
Attach/Detach Object Data dialog
box 1794
ATTACHDEF command 996, 1781
attached drawings
querying (video) 24, 1235, 1238,
1242, 1245, 1249
attaching 158, 523
data sources for drawings 209
data to drawing objects in maps 523
drawings to the current map 158
external data to maps 209, 523
queries to the current drawing 180
text to drawing objects 1278
attribute data 291, 364, 426, 434–435,
507, 509, 512, 532
adding drawing objects to maps
by 364
adding to features 509
adding using joins 507, 512
altering drawing objects based
on 1267
and maps 291
and queries 1300
displaying as text 435
exporting 1405, 1473
exporting text enclosed in a
polyline 1455
finding drawing objects by 1248
importing 426, 434
including when publishing to
DWF 1367
joining to features (video) 37
linking records to drawing
objects 532
2084 | Index
linking to drawing objects in
maps 1067
overview 27
reports 1473
viewing (video) 27
viewing for features 1125
Attribute Data dialog box 1699
Attribute Domain Values Editor 1773
Attribute Editor (metadata) 1756
auditing
metadata 1509
topology 920
Australian coordinate systems 109
changes 110
grid data files 109
AutoCAD Civil 3D 545
bringing data into AutoCAD Map
3D 545
AutoCAD Color Index 1552
AutoCAD commands 701
editing features with 701, 715–716
AutoCAD layers 356, 419, 421
adding drawing objects to maps 356
adding to Display Manager
(video) 352, 634
assigning object classes during
import 421
importing into AutoCAD Map
3D 419
AutoCAD Map 3D 77, 84, 142
checking version 1905
coordinate system files 113
customizing 84, 216–217
logging in as Superuser 142
opening display maps in previous
versions 1460
sample data 62
setting options 216–217
setting up 77
templates 62
tutorials 58
user interface tour 2
user privileges 142
AutoCAD Map Confirmation dialog box
(drawing topology) 1950–1951
AutoCAD Map Messages dialog box 1799
AutoCAD Map Options dialog box 1908
AutoCAD Raster Design images
inserting with Raster Extension 455
AutoCommitting changes in the Data
View 1056
Autodesk Design Review 1365, 1369,
1372
Autodesk digital animation
inserting with Raster Extension 455
Autodesk DWF Viewer 1365
Autodesk MapGuide 389
exporting to version 6.5 and
earlier 1417–1418
exporting to version 6.5 or earlier
(video) 1376
importing from 389
publishing to current Enterprise
version 1378
Autodesk MapGuide Export dialog
box 1580
Autodesk mapGuide Import dialog
box 1582
Autodesk SDF 337–338, 388
about file format 387
adding feature data to maps 338
and Bulk Copy 617
provider capabilities for maps 337
AutoLISP variables 1551
automatic checkout
video 713
automatic drawing cleanup 783
automatic save file 757
automatic update 698
changing default setting 88
for feature data 698
automating tasks 278, 281
autox.sv$ file 757
azimuth base 234
setting to South 234
B
backup files 764
balancing polygon boundaries 955
base feature classes
in Schema Editor 1739
Index | 2085
base object classes 123
base or abstract classes (inheritance)
setting in schemas 612
BB 1036
best route analysis 845, 849, 1328, 1330
and direct resistance 849
and direction 845
BIL images
inserting with Raster Extension 455
bitonal images
inserting with Raster Extension 455
block attributes 532
and queries 1300
finding drawing objects by 1248
linking data to drawing objects in
maps 532
linking to drawing objects in
maps 1067
variables 1549
Block Mapping dialog box 1701
block names
altering drawing objects based
on 1265
finding drawing objects by 1244
block queries 1296
and property queries 1296
in preview mode 1296
BLOCKNAME variable 1546
blocks 225, 428, 532, 761, 764, 1067,
1296
adjusting for map distortion 225
altering name with queries 1261
and property alteration 1296
exploding when saving back from
maps 761
for drawing layers 660
importing into AutoCAD Map
3D 428
linking to data for maps 532
linking to records
automatically 1067
options 225
querying 1300
redefining on save back 764
saving to source drawings from
maps 761
scaling for drawing layer
themes 1176
specifying color 1285
specifying for digitized nodes 138
theming for drawing layers 1176
units 225
BMP files
inserting with Raster Extension 455
boundaries 756, 941, 945, 955, 963, 978
breaking drawing objects at 941
changing for polygons in maps 963
displaying for polygons 978
inner and outer for polygons 955
query location 1241
trimming objects at 945
using to save drawing objects 756
Boundary Break command 941
boxes
Responsible Party Editor (ISO
Metadata) dialog box 1776
Break Objects at Boundary dialog
box 1666
breaking 941
drawing objects at boundaries 941
brightness
for drawing layers 660
Browse/Search dialog box 1800
Buffer Warning dialog box 1560
bufferfence boundary for query
location 1241
buffers
and topology 1347
creating (video) 1302
for drawing objects 1347
for features 1308
for geospatial features 1306
overlapping (video) 1302
using to select features (video) 1302
using with location queries
(video) 1302, 1306
warnings 1306
buffers (video) 37
BULGE variable 1546
Bulk Copy
alternatives to 617
and Autodesk SDF 617
2086 | Index
and coordinate systems 617
and geometry issues 625–626
and SHP files 617
and SQL Server Spatial 617
copying data from one feature source
to another 621
copying foreign schemas 621
data types 623
ignoring errors 1744
log files 626
overview 617
video 616–617
widening conversion 623
Bulk Copy (video) 43
Bulk Copy dialog box 1744
Bursa/Wolfe conversion method 94
buying data 62
C
caching 722
calculated fields
video 1125, 1132
calculated properties
and joined data 519
creating 1133
calibration
and digitizing maps 136
options when digitizing 133
CALS images
inserting with Raster Extension 455
Canadian National Transformation 112
cancelling check out for features 698
Cartesian coordinate system 143
adjusting for distortion in maps 225
and digitizing 133
categories 97, 101
for coordinate systems 97, 101
for queries 182
cells (in database) 1056
editing in Data View 1056
CENTER variable 1546
central meridian 143
Centroid Objects dialog box (drawing
topology) 1952
CENTROID variable 1546
centroids 430, 836, 839, 937
creating for closed polylines 950
creating for polygon topology 836
creating for polygons 433, 887,
950, 977
creating if missing 839
importing to in AutoCAD Map
3D 430
moving data to 430, 887
moving label point 937
removing duplicates 839
CG4 images
inserting with Raster Extension 455
Change Category dialog box (drawing
queries) 1835
Change Feature Layer Properties activity
for workflows 2030
Change Feature Layer Symbol activity
for workflows 2031
Change Group Properties activity
for workflows 2033
check out features
automatically 696
checking in
features (video) 693
checking in features 694
checking out
features (video) 695, 701
checking out features 696, 698
and automatic update 698
and locking 696
and working offline 696
cancelling 698
circles 776
boundary for query location 1241
converting to 2D polylines during
Drawing Cleanup 776
converting to arcs during Drawing
Cleanup 776
Citation Editor (ISO Metadata) dialog
box 1777
Citation Information Editor 1759
Civil 3D 543, 545
bringing data into AutoCAD Map
3D 545
Index | 2087
bringing data into AutoCAD Map 3D
(video) 9, 43
exporting data to SHP 545
objects supported by AutoCAD Map
3D 543
video 543
classified DWG 988–989
Classified Property List dialog box (object
classification) 1782
CLASSIFY command 990
Classify dialog box (object
classification) 1782
Classify Objects dialog box 1783
classifying objects 988–989, 993
cleanup 767, 770, 773, 776, 779, 781–
783, 785, 788, 791, 794, 796,
799, 801, 803, 806, 808, 810,
814–815, 819, 838
actions 788
anchoring objects 770
apparent intersection 803
breaking crossing objects 799, 838
correcting errors automatically 783
correcting errors interactively 785
correction methods 782
dangling objects 810
deleting duplicates 794
displaying markers 785
elevation for new objects 776
erasing short linear objects 796
extending undershoots 801
for topology 788
layers for new objects 776
line width for new objects 776
markers 779
order of actions 773
order of operations 788
overview 766
profiles 781
pseudo nodes 808
reviewing errors before
correcting 785
selecting actions 773, 791
selecting objects 770
simplifying objects 814
snapping clustered nodes 806
tolerance for 773
weeding 819
zero-length objects 815
Cleanup Methods dialog box page 1585
clip overlay 1309
closed polylines 433, 898
creating centroids for 433, 950, 977
creating from polygon topology 898
creating from polygons during
export 1458
clustered nodes 773, 779, 806
marking for cleanup 779
snapping 806
tolerance for deleting 773
COGO 1027–1028, 1032, 1034, 1036–
1037, 1040, 1042, 1044–1045
angle and distance 1032
azimuth and distance 1042
bearing and distance 1034
bearing/bearing 1036
deflection and distance 1037
distance/distance 1040
entering commands 1028
input commands 1027
inverse report 1045
orthogonal/offset 1044
transparent commands 1027
Color Range Editor dialog box (object
classification) 1783
COLOR variable 1546
colors
altering drawing objects based
on 1265
altering using queries 1261
and styles 650
changing for blocks 1285
digitizing 138
finding drawing objects by 1244
for drawing layers 660
for lines 649
for surface themes 1205
in expressions 1552
list of 1552
setting feature default 1552
theming for drawing layers 1176
2088 | Index
using to modify thematic
objects 1261
Column dialog box 1676
Column Values dialog box 1678
columns (in database tables) 526, 1058–
1059
for link templates in maps 526
formatting in Data View 1058
hiding or freezing in Data
View 1059
combining maps 158
comma-separated files
and user locale 1474
exporting from Data Table 1142,
1474
command line 87
inserting images 471
showing by default in geospatial and
drawing workspaces 87
commands 1519, 1533
blocked during refedit 1537
changed from previous
releases 1519
committing changes in the Data
View 1056
complete topology 920
complex linear objects 779, 814, 819
marking for cleanup 779
simplifying 814, 819
composite line styles 649
for drawing layers 662
Computer Aided Acquisition images
inserting with Raster Extension 455
conditional functions 1543
conditions 369
using to add drawing objects to
maps 369
conditions for queries (drawing
objects) 1237
block attribute conditions 1248
combining 1256
data conditions 1248
editing 1258
link data conditions 1248
location conditions 1241
object data conditions 1248
overview 1238
precedence 1256
property conditions 1244
SQL conditions 1253
Configure Data Source dialog box 1679
configuring
data sources 213
digitizers 132
conformal projections 143
Connect Data Source dialog box 1679
Connect To Data Store activity
for workflows 2034
connecting 314, 319, 324, 331, 333,
336, 338, 341, 344
compared to importing 15
data sources for drawings 215
to ArcSDE data sources for maps 319
to Autodesk SDF data sources for
maps 338
to Microsoft Access data for
maps 344
to MySQL data in maps 333
to ODBC data for maps 344
to Oracle data sources for maps 314
to PostGIS data sources for
maps 341
to SHP files for maps 336
to SQL Server data for maps 324
to SQLite data sources for maps 331
to WFS data 348
using Data Connect (video) 3, 9, 13
connection pooling 88
constraints
in schemas (video) 43
setting in schemas 601, 612
setting in schemas (video) 599
Contact Information Editor 1763
continuous distances 1159
base option 1159
contour layers
video 1187
contour lines 799, 814, 1073, 1189
and Drawing Cleanup 799
deleting 1191
digitizing 1073
editing 1191
Index | 2089
overview 1189
simplifying with Drawing
Cleanup 814
video 1189
control points for digitizing 1073
conversion functions 1544
convert
DWG data 1405
to other format 1405
Convert DWG To... 1405
Convert Object Data to Database Links
dialog box 1680
converting 381, 534, 776, 898, 971
current map to DWG (video) 628
data from one format to
another 617
drawing objects during Drawing
Cleanup 776
drawings from other formats 381
elevation during Drawing
Cleanup 776
files from other programs 381
geospatial features to DWG
format 381
layers during Drawing Cleanup 776
line width during Drawing
Cleanup 776
maps to DGN 1438
maps to GML 1430
maps to MapInfo 1432
maps to MapInfo TAB 1434
maps to MicroStation Design 1438
maps to other formats 1408, 1421
maps to SDF 1416
maps to Shape Multiclass 1445
maps to SHP 1428
maps to SQLite 1448
maps to Vector Markup
Language 1450
maps to VML 1450
object data to database tables 534
overview 1405
polygons to polylines during
export 1458
polygons to polylines in AutoCAD
Map 3D 898
polylines from 3D to 2D during
Drawing Cleanup 776
polylines to polygons 971
coordinate conversion 424
during export 1405
during import 424
coordinate geometry 1006, 1027–1028,
1032, 1034, 1036–1037, 1040,
1042, 1044–1045
angle and distance 1032
azimuth and distance 1042
bearing and distance 1034
bearing/bearing 1036
commands 1148
creating survey points using
coordinate geometry 1006
deflection and distance 1037
displaying information for lines and
arcs 1161
distance/distance 1040
inverse report 1045
measuring 1154
options 234, 1154
orthogonal/offset 1044
Coordinate Geometry Setup dialog
box 1917
Coordinate System Translation dialog
box 1703
coordinate systems 92, 94–95, 97–98,
101, 103–104, 109–110, 112–113,
143, 146, 231, 308, 953
and Bulk Copy 617
and feature sources in maps 308
assigning to current drawing 147
assigning to source drawings 146
Australia and New Zealand 109
basing on datum 92
basing on ellipsoid 92
categories 97, 101
changes to Australian 110
converting when adding data 311
correcting when adding data 311
datum shift issues for North American
users 112
defining 92
defining a datum 94
2090 | Index
defining an ellipsoid 95
deleting 98
digitizing points 953
files 113
for current drawing (video) 143
for source drawings 143
GDC files 104
geodetic 149
grid data catalog (GDC) files 103–
104
ignoring in Bulk Copy 1744
latitude and longitude 92
measuring geodetic distance 1153
modifying 98
options 225, 231
overriding with Bulk Copy 621
overview 143
removing from drawings 150, 1296
selecting 590
specifying for export 1405
tracking coordinates 1150
transformation options 231
transforming for a drawing 152
video 11
viewing for source drawing 151
coordinate tracker
specifying options 232
coordinate transformation 146
options 231
coordinate transformation (video) 143
coordinates 451, 953, 1148
changing format for 1150
digitizing 953
measuring 1148
specifying for raster images 451
tracking 1148, 1150
Copy Scale dialog box 1624
copying
data from one feature source to
another 621
display layers 639
correcting topology 920
Coverages 381, 394, 1419
export defaults 269
exporting to 1419
importing 381, 394
Create A Calculation 1133
Create a Join dialog box 1603
Create Buffer dialog box 1559
Create Buffer Layer activity
for workflows 2036
Create Centroids dialog box 1801
Create Closed Polylines dialog box
(drawing topology) 1953
Create Data Store dialog box 1605, 1747
Create Map Book dialog box 1827
Create Metadata Template dialog
box 1758
Create Network Topology Create New
Nodes dialog box 1955
Create Network Topology Select Links
dialog box 1956
Create Network Topology Select Nodes
dialog box 1957
Create Node Topology Select Nodes dialog
box 1959
Create Polygon Topology Create New
Centroids dialog box 1960
Create Polygon Topology Create New
Nodes dialog box 1961
Create Polygon Topology Select Centoids
dialog box 1963
Create Polygon Topology Select Links
dialog box 1964
Create Polygon Topology Select Nodes
dialog box 1966
Create Polygon Topology Set Error Markers
dialog box 1967
Create Polygons From Topology dialog
box 1823
Create Surface dialog box 1895
Create Topology Select Topology dialog
box 1969
Create Topology Warning dialog
box 1971
creating 94–95, 97, 687–689, 691, 825,
827, 831, 836, 960, 988
classified drawing objects 988
coordinate system categories 97
datums 94
ellipsoids 95
feature classes in schemas 598
Index | 2091
features (video) 684, 686, 691
geospatial features 687
linestring features 691
map books 1390
maps 298
metadata 1486
multilinestring features 691
multipoint features 688
multipolygon features 689
network topology 831, 836
node topology 827
point features 688
polygon features 689
polygons in maps 960
properties in schemas 598
query indexes 1294
schemas 598
themes for feature layers 1168
topology 825
workflows 281
crossing linear objects 779, 799, 838
breaking 799, 838
marking for cleanup 779
customizing 84–85, 225, 229, 269, 764
.ini files 264
AutoCAD Map 3D 84, 216–217, 249
automatically highlighting linked
objects 1227
coordinate system 231
coordinate transformation 225
data sources 225, 236, 243
Data View 238
digitizing 138
drawing origin 169
drawing settings 225
export 269
import 269
log files 229
map books 1394
mapexport.ini 269
mapimport.ini 269
multi-user settings 227
overview 216–217
queries 245
save back settings 764
saving options 249
system settings 229
Task Pane 221
workspaces for AutoCAD Map
3D 85
D
dangling objects 773, 779, 810
and Drawing Cleanup 810
marking for cleanup 779
tolerance for deleting 773
data 209, 426, 434–435, 507, 523, 827,
831, 836, 914, 1048, 1056, 1064,
1066–1067, 1069, 1083, 1085
altering drawing objects based
on 1267
analyzing 1121
and maps 291
attaching data sources 209
attaching multiple records to drawing
objects 1066
attaching object data to drawing
objects 1064
attaching to drawing objects
automatically 1067
attaching to objects 209
attaching while digitizing 138,
1083, 1085
configuring data sources 213
converting 1405
copying from one feature source to
another 621
displaying as text 435
editing external data in Data
View 1056
editing object data 1069
exporting 1405
external data 209
external data for drawing
objects 1048
finding drawing objects by 1248
finding for features 1212
finding patterns 1121
for network topology 831
for node topology 827
for polygon topology 836
2092 | Index
highlighting in Data Table 1139
importing 426, 434
joining to features 507
linking to drawing objects in
maps 523
migrating 617
modifying object data tables 202
round-trip from DWG and
back 1467
samples included with AutoCAD Map
3D 62
saving changes in Data View 1056
viewing for topology 914
viewing with Data View 1048
data access 540–541
extending capabilities 540–541
data attributes
for properties in Schema
Editor 1739
Data Condition dialog box (drawing
queries) 1836
data conditions for queries 1248
editing 1258
Data Connect
accessing feature sources with 308
adding images 440
creating feature sources 588, 592
data formats
converting between 617
data properties
in Schema Editor 1739
Data Source Name (DSN) 209, 213, 344
creating in Windows XP 344
data sources 209, 215, 243, 312, 316,
330, 332, 335, 337, 340, 342,
346, 392, 410
ArcSDE 316
attaching 209
Autodesk SDF 337
combining in maps 13
configuring automatically 213
configuring coordinate
geometry 234
configuring manually 213
connecting 215
creating 588, 592
customizing 243
default database versions 243
detaching 209
disconnecting 215
for maps 291
importing ArcSDE data 392
importing Oracle data 410
Microsoft Access 342
MySQL 332
ODBC 342
options 225, 236, 243
Oracle 312
PostGIS 340
PostgreSQL 340
SDF 337
SHP 335
SQLite 330
UDL (Universal Data Link) file
for 209
WFS 346
data stores
copying data between (video) 616–
617
creating 588, 592
creating for database providers 586
creating for file-based providers 586
creating for SQLite 565
creating with SQL Server Spatial 561
definition 551
deleting 593
overview 551
Data Table 701, 712, 1127
auto-hiding 1127
calculated properties 1133
dialog box 1613
displaying 1127
editing features with 701, 712
exporting data from 1473
exporting from 1142, 1474
filtering 1212
finding data 1212
highlighting areas in map 1137
highlighting rows of data 1139
making transparent 1127
overview 1125
removing highlighting in map 1138
Index | 2093
searching feature data 1207, 1210
selecting data 1212
selecting data with 1131
selecting features 1207, 1210
video 1130, 1136, 1138, 1140–1141
videos 1125
viewing data for all feature
classes 1135
viewing feature class data 1135
viewing joined data 1135
viewing non-spatial data 1136
zooming to a view 1141
Data to Attach dialog box 1616
data types
supported by OSGeo FDO Provider for
SQL Server Spatial 562
when converting with Bulk
Copy 623
Data View 526–527, 529, 539, 1048,
1053, 1056, 1222
adding records 1056
and database queries 1053
Auto Commit 1056
changing alignment 1058
changing colors 1058
changing columns 1058
changing fonts 1058
checking records linked to drawing
objects 1222
copying data to Windows
Clipboard 1056
customizing 1058–1059
deleting records 1056
editing records 1056, 1225
filtering 1231
filtering by location 1234
filtering records 1222
finding records 1222, 1225
hiding and showing columns 1059
highlighting objects in
drawings 1222, 1227
highlighting records linked to drawing
objects 1229
link template paths 539
link templates 526
linked tables 527
linking records to drawing
objects 529
navigating 1048
opening tables 1053
options 238
overview 1048
printing 1222
printing data from 1473
printing tables 1475
saving changes to data 1056
spatial filter 1234
SQL queries 1230
SQL queries for drawing data 1231
viewing external data for drawing
objects 1147
database link index 1294
database queries 1053
database tables 213, 215, 434–435, 523,
526–527, 529, 532, 539, 1048,
1053, 1056, 1071
adding records 1056
altering drawing objects based
on 1270
and Data View 1048
attaching 213
attaching to drawing 209
connecting 215
converting object data to 1071
default version 243
deleting records 1056
disconnecting 215
displaying as text 435
editing in Data View 1056
filtering 1231
filtering by location 1234
finding records 1222
highlighting linked drawing
objects 1227
highlighting records linked to drawing
objects 1229
importing links 434
key columns for link templates 526
link template paths 539
link templates for maps 526
linked 527
2094 | Index
linking records to drawing
objects 529
linking to drawing objects in
maps 523, 532
navigating in Data View 1048
opening in Data View 1053
opening linked 527
printing from Data View 1475
querying 1053
saving changes 1056
searching 1225
SQL conditions 1253
UDL (Universal Data Link) file
for 209, 213
viewing external data 1048
database views
accessing from native schemas 603
exposing in AutoCAD Map 3D 603
mapping to feature classes 603, 605
databases 209, 215, 291, 523, 529, 532–
534, 1048, 1056, 1085
adding records 1056
altering drawing objects based
on 1270
and Data View 1048
and maps 291
and object data 533
attaching 209
attaching to maps 206
configuring 213
connecting 215
converting from object data 534
default version 243
deleting records 1056
detaching 209
disconnecting 215
editing in Data View 1056
filtering 1231
filtering by location 1234
finding records 1222
highlighting linked drawing
objects 1227
highlighting records linked to drawing
objects 1229
linking records to drawing
objects 529
linking to drawing objects in
maps 523, 532
linking to while digitizing 1085
navigating in Data View 1048
opening queries for 206
saving changes 1056
searching 1225
setting up users for AutoCAD Map
3D 584–585
SQL conditions 1253
UDL (Universal Data Link) file
for 209, 213
viewing for drawing objects 1048
viewing in Data View 1147
viewing properties 206
DATAVIEWHEADERANDFOOTER
command 1476
DATAVIEWPAGESSETUP
command 1476
DATAVIEWPRINT command 1477
datum (for coordinate system) 94, 99,
110
changes to Australian 110
defining 94
deleting 99
geodetic coordinate systems 149
modifying 99
shift issues 112
DB files
attaching to drawing 209
setting default version 243
dBASE
attaching database to drawing 209
setting default version 243
DBF files
attaching to drawing 209
setting default version 243
DDIST 1040
defaults
database versions 209
for object classes 125
for object data fields 201
Define Annotation Template dialog
box 1572
Define Hatch dialog box 1625
Index | 2095
Define Link Template dialog box 1682–
1683
Define New Category dialog box (drawing
queries) 1838
Define New Object Data Field dialog
box 1578
Define New Object Data Table dialog
box 1803
Define Object Classification dialog
box 1785
Define Object Data dialog box 1805
Define Query dialog box (drawing
queries) 1838
Define Range Table dialog box (drawing
queries) 1843
Define Text dialog box 1626
Define Text dialog box (drawing
queries) 1846
Define/Modify Drawing Set dialog
box 1918
defining 92, 94–95
coordinate systems 92
datums 94
ellipsoids 95
object classes 119–120
definition file 995
for object classes 995
Delete Topology dialog box 1971
deleting 889, 899, 1056
annotation from maps 1108
coordinate system assignment 150
coordinate system categories 101
coordinate systems 98
data stores 593
database links 537
database records 1056
datums 99
ellipsoids 100
feature classes in schemas 614
feature sources 593
joins 515
links (linear objects) from
topology 889
map book tiles 1403
map books 1403
nodes from topology 889
object data tables 202
points (nodes) from topology 889
polygons from topology 889
properties from schemas (video) 610
properties in schemas 614
schemas in feature sources 614
topology 899, 926
DEM (Digital Elevation Model) 437,
440–441
adding to maps 437
adding with Data Connect 440, 442
density 451
specifying for raster images 451
Describe Directory activity
for workflows 2025
descriptions
for object data fields 201
for source drawings 166
Design File Input Settings dialog box
(Import) 1734
Design File Output Settings dialog box
(Export) 1736
Design Web Format
publishing map books to 1401
publishing maps to 1365, 1369,
1372
Detach Data Source dialog box 1684
detaching 751
data sources 209
drawings from maps 751
deviation
and calibration 133
DGN files 381, 405, 408, 1435
changing export default to imperial
units 269
changing the default seed file 269
exporting 1405
exporting to 1435
importing 381, 405, 408
seed file for 1435
units of measurement 269
dialog boxes 1559
Add Class Property (Export) 1726
Alter Block Insertion 1622
Alter Line Format 1622
Alter Linetype 1623
2096 | Index
Alter Lineweight 1624
Alter Plotstyle 1624
Alternate Font (drawing
queries) 1835
Annotation Delete 1569
Annotation Refresh 1569
Annotation Text 1570
Annotation Update 1571
Assign Global Coordinate
System 1598
Associate Database Versions 1675
Attach Object Class Definition
File 1781
Attach Object Data 1793
Attach/Detach Object Data 1794
Attribute Data 1699
Attribute Domain Values
Editor 1773
Attribute Editor (metadata) 1756
AutoCAD Map Confirmation (drawing
topology) 1950–1951
AutoCAD Map Messages 1799
AutoCAD Map Options 1908
Autodesk MapGuide Export 1580
Autodesk MapGuide Import 1582
Block Mapping 1701
Break Objects at Boundary 1666
Browse/Search 1800
Buffer Warning 1560
Bulk Copy 1744
Centroid Objects (drawing
topology) 1952
Change Category (drawing
queries) 1835
Citation Editor (ISO Metadata) 1777
Citation Information Editor 1759
Classified Property List (object
classification) 1782
Classify (object classification) 1782
Classify Objects 1783
Cleanup Methods page 1585
Color Range Editor (object
classification) 1783
Column 1676
Column Values 1678
Configure Data Source 1679
Connect Data Source 1679
Contact Information Editor 1763
Convert Object Data to Database
Links 1680
Coordinate Geometry Setup 1917
Coordinate System Translation 1703
Copy Scale 1624
Create a Join 1603
Create Buffer 1559
Create Centroids 1801
Create Closed Polylines (drawing
topology) 1953
Create Data Store 1605, 1747
Create Map Book 1827
Create Metadata Template 1758
Create Network Topology Create New
Nodes 1955
Create Network Topology Select
Links 1956
Create Network Topology Select
Nodes 1957
Create Node Topology Select
Nodes 1959
Create Polygon Topology Create New
Centroids 1960
Create Polygon Topology Create New
Nodes 1961
Create Polygon Topology Select
Centoids 1963
Create Polygon Topology Select
Links 1964
Create Polygon Topology Select
Nodes 1966
Create Polygon Topology Set Error
Markers 1967
Create Polygons From
Topology 1823
Create Topology Select
Topology 1969
Create Topology Warning 1971
Data Condition (drawing
queries) 1836
Data Expression 1802
Data to Attach 1616
Define Annotation Template 1572
Define Hatch 1625
Index | 2097
Define Link Template 1682–1683
Define New Category (drawing
queries) 1838
Define New Object Data Field 1578
Define New Object Data Table 1803
Define Object Classification 1785
Define Object Data 1805
Define Query (drawing
queries) 1838
Define Range Table (drawing
queries) 1843
Define Text 1626
Define Text (drawing queries) 1846
Define/Modify Drawing Set 1918
Delete Topology 1971
Design File Input Settings
(Import) 1734
Design File Output Settings
(Export) 1736
Detach Data Source 1684
Digitize Setup 1617
Disconnect Data Source 1684
Drawing Cleanup 1585, 1587–1588,
1591, 1595
Drawing Cleanup Errors 1593
Drawing Maintenance 1920
Drawing Set Display Filter 1922
Drawing Settings 1923
Drawing Statistics 1926
Drive Alias Administration 1928
Edit a Join 1603
Edit Direct Resistance (drawing
topology) 1972
Edit Direction (drawing
topology) 1973
Edit Expression 1574
Edit Object Data 1795
Edit Reverse Resistance (drawing
topology) 1973
EditText (text layers) 1628
Error Markers page 1587
Export 1704
Export Metadata 1757
Expression 1541, 1807
External Database Mapping 1732
Feature Class Mapping
(Export) 1727
Feature Editing Options 1929
Feature Information 1606
Feature Source Administration 1606
Feature Source Connection 1607
Feature Source Scope 1606
Generate Contour 1561
Generate Data Links 1807
Generate Object Data Index 1931
Hatch Options (drawing
queries) 1847
Header/Footer 1685
Hillshade Settings 1562
Horizontal Coordinate System
Definition Editor (FGDC
Metadata) 1768
Identify Map Book Layout
Placeholders 1829
Image Correlation (Insert Image
command) 1873
Image Information 1875
Image Management (Insert Image
command) 1875
Image Management Layout (Insert
Image command) 1877
Image Select (Insert Image
command) 1877
Import 1711
Import Data Mapping 1732
Import Metadata Options 1757
Import Old Theme 1628
Index Maintenance 1931
Insert Annotation 1574
Insert Image 1878
Layer Mapping (Import FDO) 1719
Layer Range Editor (object
classification) 1789
Linetype Range Editor (object
classification) 1789
Lineweight Range Editor (obejct
classification) 1790
Link Objects (drawing
topology) 1975
Link Template Data Entry 1619
2098 | Index
Link Template Key Column
Entry 1620
Link Template Properties 1686
Load Internal Query (drawing
queries) 1848
Load Topology 1976
Load Topology Conflict 1976
Load Topology From Source
Drawing 1978
Location Condition (drawing
queries) 1849
Manage Joins 1607
Map Book Properties 1830, 1832
Metadata Editor 1754
Metadata Options 1756
Metadata Viewer 1751
Network Topology Analysis Choose
Locations 1978
Network Topology Analysis
Output 1980
Network Topology Analysis Resistance
and Direction 1982
Network Topology Analysis Select
Method 1983
New Annotation Template
Name 1576
New Layer 1579, 1810
New Object Class Definition
File 1790
New Property (object
classification) 1791
New Range Table (drawing
queries) 1852
New Scale 1629
Node Objects (drawing
topology) 1985, 1987
Object Class Attribute
Mapping 1710
Object Data Mapping 1732
Output Report Options (drawing
queries) 1852
Overlay Analysis, Set Output And
Settings 1565
Overlay Analysis, Source and Overlay
Type 1563
Page Setup 1686
Plotstyle Range Editor (object
classification) 1792
Point Mapping 1733
Polygon Fill Properties 1824
Property Condition (drawing
queries) 1855
Property Value Mapping
(Export) 1728
Publish to Autodesk
MapGuide 1577
Publish to MapGuide Results 1379
Publish To MapGuide results 1578
Query Library Administration
(drawing queries) 1858
Quick View Drawings 2013
Range of Values 1629
Raster Extension Options (Insert
Image command) 1879
Remove Object Data Index 1933
Rename Category (drawing
queries) 1860
Rename Range Table (drawing
queries) 1860
Rename Table 1797
Rename Topology 1988
Responsible Party Editor (ISO
Metadata) 1776
Run Library Query (drawing
queries) 1861
Save Current Query (drawing
queries) 1862
Save Features 1608
Save Objects to Source
Drawings 1887
Save Version 1750
Schema Editor 1739
Select Actions page 1588
Select Alias 1933
Select Block 1810
Select Coordinate System 1609
Select Data 1811
Select Data (drawing topology) 1989
Select Database Version 1688
Select Display Element 1631
Select Drawings to Assign Coordinate
System 1599
Index | 2099
Select Drawings to Attach 1811
Select Existing Link Template 1689
Select Feature Classes (Display
Manager) 1631
Select Images (Display
Manager) 1631
Select Layers (Display
Manager) 1631
Select Link Template 1690
Select Link Template Key 1797
Select Link Templates 1690
Select Objects page 1595
Select Plot Set to Convert 1831
Select Query 1691
Select Table 1691
Select Topologies (Display
Manager) 1631
Set Property Alterations (drawing
queries) 1863
Sort (records) 1692
Source Drawing Scope 1633
Spatial Data Organization
Editor 1764
Split and Merge Rules 1669
SQL Condition History (drawing
queries) 1866
SQL Expression (link
templates) 1814
SQL Link Condition (drawing
queries) 1866
Standard Order Process Editor 1774
Style Band 1633
Style Label 1634
Style Line 1636
Style Point 1637
Style Polygon 1639
Style Text Layer 1640
Table Filter 1693
Table Filter History 1696
Table Properties 1696
Thematic Mapping 1642
Thematic Values 1644
Theme (features) 1645
Tile Properties 1831
Time Period Information
Editor 1761
Topology Buffer Create New Centroids
and Nodes 1990
Topology Buffer New
Topology 1991
Topology Buffer Set Buffer
Distance 1992
Topology Dissolve Create New
Centroids and Nodes 1994
Topology Dissolve Create
Nodes 1995
Topology Dissolve New
Topology 1996
Topology Dissolve Object Data 1997
Topology Dissolve Set
Parameter 1998
Topology Overlay Analysis Analysis
Type 1999
Topology Overlay Analysis Create
New Centroids and
Nodes 2002
Topology Overlay Analysis Create
Nodes 2003
Topology Overlay Analysis Output
Attributes 2006
Topology Overlay Analysis
OutputTopology 2004
Topology Overlay Analysis Select
Overlay Topology 2007
Topology Query 2008
Topology Query Result 2010
Topology Selection 2011
Topology Statistics 2011
Transparency Color (Insert Image
command) 1883
Trim Objects at Boundary 1672
Type SQL Condition (drawing
queries) 1870
Undefined Alias Referenced 1934
User Administration 1934
User Credentials 1610
User Information 1936
User Login 1937
using wild-card characters 1537
View Query Statement 1610
Who Has It Information 1889
Workflow Designer 2022
2100 | Index
Workflow Designer activity
input 2025
Workflow Designer parameters 2025
Zoom Drawing Extents 2014
Zoom Scale 1697
DIB images
inserting with Raster Extension 455
Digital Elevation Model 437, 440–441
adding to maps 437
sample images 63
digital elevation models 1188
adding contour lines 1190
analyzing 1188
applying hillshading 1200
applying vertical exaggeration 1200
changing theme colors 1205
draping vector data on 1193
Digital Terrain Elevation Data 437, 440–
441
adding to maps 437
digital terrain modeling 1009
DigitalGlobe 62
Digitize Setup dialog box 1617
digitizing 131–132, 767, 841, 1073,
1080–1081, 1083, 1085
and alignment 1073
and external data 1085
and LABELPOINT 1081
and object data 1080, 1083
and registering maps 136
and rotation 1081
and sliver polygons 841
calibration options 133
configuration 132
correcting errors 767
drawings 1073
layers 138
maps 131, 1073
options 138
overview 1073
setting up 130
tablet 130–131
transformation types 133
using coordinates 953
width 138
with MAPDIGITIZE 1080–1081
dimensions 761
saving to source drawings from
maps 761
direct resistance 849
for links in network topology 849
direction 845, 863
changing for links in topology 873
editing for topology 863
for links in network topology 845
directories
drive aliases for 161
for external queries 229
Disconnect Data Source dialog box 1684
Display Feature Attributes activity
for workflows 2037
Display Manager 350, 352, 440
adding drawing objects to maps 352
adding images to maps 440
and drawing layers 350
and Properties palette 1124
combining styles 662
controlling display order 637
creating styles for drawing
layers 660
creating themes 1168
displaying 221, 635
draw order 300
exporting layers 1470
groups 300
layers 300
legend 1117
Map Base layer 352
modifying styles for drawing
layers 663
multiple display maps 639
overview 634
refreshing 635
repairing broken connections 350
saving layers 1470
scale threshold 668
sharing maps 1460
Style Library 665–666
styles for drawing objects 652
themes for drawing layers 1181
theumbnails for drawing
layers 1181
Index | 2101
thumbnails for layers 300
updating 635
using 641, 654
using layers in MapGuide
2007 1470
video 634, 636
display maps
and map files 7
display order 300
controlling in the Display
Manager 637
for layers in maps 300
display styles
combining 662
controlling display order 637
for drawing layers 660
legend 1117
modifying 663
modifying for scale thresholds 668
referencing 666
saving 665
viewing at all scales 670
displaying 474
angle information 1160
COGO information for lines and
arcs 1161
map draw order 637
raster image information 474
save back extents 170
source drawing information 172
dissolving 808
pseudo nodes 808
topology 1343
distances
adding 1157
and buffers 1308
best route 1330
buffering a topology by 1347
continuous 1159
finding shortest 1326
flood trace 1334
horizontal between points 1162
measuring geodetic distance 1153
distortion in maps 934
distribution methods 1165
equal 1165
individual values 1165
Jenks (natural breaks) 1165
quantile 1165
standard deviation 1165
dot variables 937, 1264, 1546
LABELPT 937
Draw mode queries 1287–1288, 1291
draw order 302
and Display Manager 300
changing for map layers 302
in Display Manager 637
video 634, 636
Drawing Cleanup 766–767, 770, 773,
776, 779, 781–783, 785, 788,
791, 794, 796, 799, 801, 803,
806, 808, 810, 814–815, 819, 838–
839
actions 788
anchoring objects 770
and sliver polygons 839
apparent intersection 803
Automatic mode 783
breaking crossing objects 799, 838
correcting errors automatically 783
correcting errors interactively 785
correction methods 782
dangling objects 810
deleting duplicates 794
displaying markers 785
elevation for new objects 776
erasing short linear objects 796
extending undershoots 801
for topology 788
Interactive mode 785
layers for new objects 776
line width for new objects 776
markers 779
order of actions 773
order of operations 788
overview 766
profiles 781
pseudo nodes 808
reviewing errors before
correcting 785
selecting actions 773, 791
selecting objects 770
2102 | Index
simplifying objects 814
snapping clustered nodes 806
tolerance for 773
using 767
video 727, 766
weeding 819
zero-length objects 815
Drawing Cleanup dialog box 1585,
1587–1588, 1591, 1595
Drawing Cleanup Errors dialog box 1593
drawing data 681
combining with feature data for
maps 291
overview of editing in AutoCAD Map
3D 681
drawing layers 350, 419
creating themes for 1178, 1181
importing into AutoCAD Map
3D 419
styles for 657
styling with annotation 1186
styling with hatch patterns 1184
styling with ramps 1183
styling with text height 1185
themes for 1176
vs. AutoCAD layers 350
Drawing Maintenance dialog box 1920
drawing objects 291, 352, 356–357, 359,
362, 364, 367, 369, 381, 523,
529, 531–532, 534, 537, 692,
717, 727, 730, 733, 735–736,
738, 746, 748, 751–752, 754, 756–
759, 764, 770, 776, 794, 796,
799, 801, 803, 806, 808, 810,
814–815, 819, 836, 838, 852,
892, 911, 931, 937, 939, 941,
945, 947, 988–989, 991, 993,
1064, 1066–1067, 1069, 1073,
1083, 1085
adding distances 1157
adding hatch during a query 1283
adding text with queries 1278
adding to a map (video) 9
adding to Display Manager
layers 356
adding to maps by attribute
data 364
adding to maps by location 359
adding to maps by object class 357
adding to maps by property 362
adding to maps by topology 367
adding to maps with multiple
conditions 369
adding to save sets 751
aligning 931
altering based on queries 1267,
1270
altering with queries 1261, 1263,
1265
anchoring for cleanup 770
and labels 937
and maps 291, 350
apparent intersection 803
associative hatch 247
attaching external data while
digitizing 1085
attaching multiple records to 1066
attaching object data
automatically 1067
attaching object data
manually 1064
attaching object data while
digitizing 1083
attributes in Properties palette 1146
breaking at a boundary edge 941,
943
breaking crossing objects 799, 838
centroids and topology 836
classified properties 991
classifying 120, 988–989
combining query conditions 1256
combining with geospatial
features 9
converting during Drawing
Cleanup 776
converting to features in AutoCAD
Map 3D 692
counting 172
creating using object classes 988
dangling objects 810
database links 1222
Index | 2103
defining expressions for 1275
defining label point 1280
deleting duplicates 794
digitizing 1073
Display Manager styles for 654
displaying thematically 1261
dissolving pseudo nodes 808
editing for topology 852
editing in map source drawings 748
editing in maps 947
editing in source drawings 163
editing links to external data 537
editing object class data 991
editing object data 1069
editing query conditions 1258
entering geometry when
creating 1027
erasing on save back 764
erasing short linear objects 796
executing queries 1287
exporting 1405
exporting Oracle 1462–1463
exporting styled (video) 1453
exporting to ArcSDE 1423
exporting to DGN 1438
exporting to GML (Geography Markup
Language) 1430
exporting to MapInfo 1432
exporting to MapInfo TAB 1434
exporting to MicroStation
Design 1438
exporting to other file
formats 1408, 1421
exporting to SDF 1416
exporting to SDF (video) 1405
exporting to SDF or Oracle and back
again 1467
exporting to Shape Multiclass 1445
exporting to SHP 1428
exporting to SQLite 1448
exporting to Vector Markup
Language 1450
exporting to VML 1450
extending undershoots 801
filling 939
filtering records by location 1234
filtering with SQL queries 1231
finding 1219
finding by location 1241
finding by property 1244
finding with queries 1237
grips in maps 947
highlighting in Data View 1227
highlighting linked records in Data
View 1229
highlighting locked objects 752
highlighting topology associated
with 911
importing 381
including in maps 352
linking to data using object
data 531
linking to external data for
maps 534
linking to external data in maps 532
linking to external database
records 523, 529
listing for queries 1477
locking 751
locking in AutoCAD Map 3D 730,
733
merging with existing features 717
moving 931
multi-user editing (video) 727, 730,
734, 738
object properties and layer
properties 1242
overview for AutoCAD Map 3D 727
overview of editing in AutoCAD Map
3D 681
previewing in map source
drawings 746
querying 1237
querying (video) 1235, 1238, 1242,
1245, 1249
Quick Select 1219–1220
releasing locks in AutoCAD Map
3D 736
removing from save set 759
retrieving by groups 1296
retrieving during queries 1288
retrieving hatched areas 1296
2104 | Index
rotating 931
saving as DXF 1459
saving in AutoCAD Map 3D 738
saving to new drawings 758
saving to source drawings 754, 756
saving to the current map 757
scaling 931
selecting 1219
selecting by properties 1219
selecting for cleanup 770
selecting with object
classification 993
sharing 730
simplifying complex objects 814
snapping clustered nodes 806
SQL conditions 1249
SQL queries 1230
styles for 652
styling on import 385
text insertion point 937
transforming 931
trimming at a boundary edge 945
updating for topology 892
using topologies (video) 1319
viewing information for 1144
viewing locked objects 752
viewing locks in AutoCAD Map
3D 735
weeding 819
zero-length objects 815
drawing origin
modifying for source drawings 169
drawing set 83, 154
activating drawings 160
adding drawings 158
creating 156
modifying settings 164
options 225
overview 154
privileges 83
Drawing Set Display Filter dialog
box 1922
Drawing Statistics dialog box 1926
drawing workspace 84
showing command line by
default 87
drawings 83, 154, 157–158, 169, 209,
215, 381, 730, 735, 738, 745–
746, 748, 751, 754, 756–758,
761, 767, 822, 934, 1073
activating 160
activating automatically 225
adding queries 180
aligning 154, 169
and xrefs 157
assigning coordinate system 146–
147
attaching databases to 206
attaching to maps 158
attributes in Properties Palette 1146
backup files 764
cleaning 767
connecting data sources 215
coordinate systems 152
correcting errors 767
creating from existing drawings 738
creating with saved drawing
objects 758
descriptions 166
detaching 751
detaching data sources 209
digitizing 1073
disconnecting data sources 215
distorting 934
distortion 225
dragging onto the Task Pane 158
drawing set 154
drive aliases for 161
editing in AutoCAD Map 3D 748
global coordinate systems 146–147,
152
importing 381
indexing 1294
nested 157, 160
offset for source drawings 169
opening source drawings 163
options 225, 249
previewing 746
problems saving 761
querying 1237
Quick View 746
Index | 2105
removing coordinate system
assignment 150, 1296
retrieving objects from 1237
rotating source drawings 169
rubber sheeting 934
save back extents 170, 756
saving 738, 751, 1460
saving objects to 757
saving queried objects to 754, 756
scaling source drawings 169
settings 164
sharing 161, 730, 751
stretching 934
tiled 756
tiles 154
topology 822
transforming 169
transforming coordinate system 152
updating 754, 756
user privileges for 83
viewing coordinate systems 151
viewing information 172
viewing locks 735
zooming to extents in AutoCAD Map
3D 745
Drive Alias Administration dialog
box 1928
drive aliases 161, 1928
creating 161
driver options 397, 1424, 1443
DGN version 7 and 8 405, 1435
ESRI Arc/INFO Coverages 394, 1419
MapInfo MIF/MID files 1431
setting default 236
SHP files 397, 1424
SHP Multiclass 1443
when importing 381
DSN (Data Source Name) 209, 213, 344
creating in Windows XP 344
DTED (Digital Terrain Elevation Data
) 437, 440–441
adding to maps 437
DTM (digital terrain modeling) 1009
DTM layer 1009
duplicate objects 773, 779, 794
deleting 794
marking for cleanup 779
tolerance for deleting 773
DWF
publish map book as (video) 46
publishing map books to
(video) 1360, 1366, 1381,
1389
publishing map books to
(video)) 1400
DWF (Design Web Format)
and attribute data 1367
publishing map books to 1401
publishing maps to 1365, 1369,
1372
setting publishing options 1367
DWG
exporting current map to
(video) 1405
exporting maps to (video) 1459
exporting styled objects (video) 628
exporting to GIS (video) 628
DWG files
querying (video) 352, 358
DWG format
converting data to 377–378, 381
exporting maps to 1460
moving data to geospatial
formats 629
DWGNAME variable 1546
DWK files 227, 730, 735
DXF files 391
exporting drawing data to 1459
importing 391
E
EANGLE variable 1546
ECW images
adding with Data Connect 443–444
edges 941, 945, 951, 978
breaking drawing objects at 941
displaying for polygons 978
matching for maps 951
trimming objects at 945
Edit a Join dialog box 1603
2106 | Index
Edit Direct Resistance dialog box (drawing
topology) 1972
Edit Direction dialog box (drawing
topology) 1973
Edit Expression dialog box 1574
Edit Object Data dialog box 1795
Edit Reverse Resistance dialog box
(drawing topology) 1973
Edit Text Layer dialog box (text
layers) 1628
editing 83, 712, 748, 852, 860, 863, 867,
894, 947, 963, 991, 1056, 1069
attached drawings 748
coordinate system categories 101
coordinate systems 98
data in Data View 1056
datums 99
drawing descriptions 166
drawing objects in map source
drawings 748
drawing objects in maps using
grips 947
ellipsoids 100
external data in Data View 1056
feature classes in schemas 612
features (video) 684, 701
features with Data Table 712
linear objects in topology 863
map books 1397
metadata 1499
nodes in topology 860, 863
object class data 991
object data 1069
object data tables 202
partial topology 894
polygons in maps 963
polygons in topology 867
privileges 83
properties in schemas 612
property alteration definition 1286
queried objects 1261
queries 184
query conditions 1258
schemas in feature sources 612
source drawings 748
topology 852, 894
EED expressions 1551
EED index 1294
EHANDLE variable 1546
electric symbols
samples 69
elements (Display Manager) 352, 356,
359, 362, 364, 367, 369
adding drawing objects to maps by
attribute data 364
adding drawing objects to maps by
property 362
adding drawing objects to maps by
topology 367
bringing in drawing objects 352
combining styles 662
controlling display order 637
creating styles 660
drawing objects by location 359
grouping drawing objects by
layer 356
modifying styles 663
scale thresholds 668
using multiple conditions to add
drawing objects to
maps 369
viewing styles at all scales 670
elevation 776
altering drawing objects based
on 1265
altering with queries 1261
coloring surfaces by (video) 37
displaying with contour lines 1189–
1190
finding drawing objects by 1244
for objects created during Drawing
Cleanup 776
purchasing data 72
ELEVATION variable 1546
ellipsoid 95, 100
defining 95
deleting 100
modifying 100
emergency response symbols
samples 69
Enhanced Compressed Wavelet images
adding with Data Connect 443–444
Index | 2107
enlarged map sections 943
EOO files
exporting 396
importing 396
EPSG numbers
and SRID numbers 590
EPSG values
for Web Map Service (WMS) 447
equal distribution 1165
equality functions 1543
ER Mapper images
inserting with Raster Extension 455
erase overlay 1309
erasing
saved back drawing objects 758
Error Markers dialog box page 1587
errors 767, 782–783, 785
cleaning up 767
correcting automatically 783
correcting in maps 927
correcting interactively 785
correction methods in Drawing
Cleanup 782
displaying cleanup markers 785
resolving for Publish to
MapGuide 1379
reviewing during Drawing
Cleanup 785
ESRI Arc/INFO Coverages 381, 394, 1419
export defaults 269
exporting 1405
exporting to 1419
importing 381, 394
ESRI ArcSDE
exporting to 1422
importing from 392
schemas 579
working with data 581
ESRI data 540
ESRI grid files 440–441, 1188
adding contour lines 1190
adding to maps 437
adding with Data Connect 440, 442
analyzing 1188
ESRI Personal Database 540
accessing 541
ESRI ShapeFiles 336, 1443–1444
adding feature data to maps 336
converting to drawing objects 335
exporting 1405
exporting multiclass 1444
exporting to 1424
importing 397, 399
multiclass 1443
provider capabilities for maps 335
EWIDTH variable 1546
exaggeration 1199
applying to surfaces 1200
Excel
attaching spreadsheet to
drawing 209
setting default version 243
setting up database ranges 578
explicit nodes 1339
Export dialog box 1704
Export Metadata dialog box 1757
export settings 269
exporting 269, 396, 401, 1429
.gml files 1429
.ini file for 269
and profiles 263
Arc/INFO Coverages 396
Arc/INFO Coverages and line
segments 269
ArcView ShapeFiles as folder 269
attribute data 1405, 1473
coordinate conversion 1405
Coverages 396
current map to DWG (video) 1459
drawing objects in maps 1408,
1416, 1421, 1430, 1432,
1434, 1438, 1448, 1450
drawing objectsto Shape
Multiclass 1445
drawing objectsto SHP 1428
DWG to GIS (video) 628
DWG to SDF or Oracle and
back 1467
DXF files 1459
EOO files 396
ESRI Arc/INFO Coverages 396
external data 1405
2108 | Index
feature data from Data Table
(video) 1141
from Data Table 1142, 1474
Geography Markup Language 1429
GML 1429
GML (Geography Markup
Language) 1405
layers (video) 1469
layers as SDF (video) 1469
layers from Display Manager 1470
layers to SDF (video) 1376, 1405
line segmentation 269
MapGuide SDF 2 files 1417
MapInfo MIF/MID 401, 1405
MapInfo TAB 1405
maps to DWG format 1460
metadata 1513
MicroStation DGN 1405
MicroStation DGN (in imperial
units) 269
multiple layers to a single feature
class 1442
mutliple feature classes 1440
object data 1405
object properties 269
Ordinance Survey of Great Britain
GML v2 1429
overview 1405
polygons 1458
procedure overview 1408, 1421
queries 180
saving settings for 1405
schemas 608
SDF 2 files 1417
SQLite 1405
styled drawing objects (video) 1453
styled DWG objects (video) 628
supported formats 1412
supported object types 1411
text as points 1405
text enclosed in a polyline 1455
to ArcSDE 1423
to DGN 1438
to GML (Geography Markup
Language) 1430
to image files 1465
to MapInfo 1432
to MapInfo TAB 1434
to MicroStation Design 1438
to Oracle 1462–1463
to SDF 1416
to SQLite 1448
to Vector Markup Language 1450
to VML 1450
toSQLite 1447
VML 1449
VML (Vector Markup
Language) 1405
vs. saving as SDF 1469
Expression dialog box 1807
expression evaluator 1541
expressions
arithmetic 1541
AutoLISP 1551
block attributes 1549
conditional functions 1543
conversion 1544
defining for drawing objects 1275
dot variables 1546
EED 1551
entity 1545
equality 1543
object classification 1551
object data variables 1549
pi 1545
range 1545
reusing in queries 1541
SQL 1549
string-handling 1543
style 1545
symbol-handling 1544
tips on using 1553
using as labels 1093
using colors in 1552
using to select features 1130
variables 1546
extending 779, 801, 803
to apparent intersection 803
undershoots 779, 801
extents 745, 756
setting save back extents 170
using to save drawing objects 756
Index | 2109
zooming to for drawings 745
external data 209, 215, 364, 434, 523,
529, 532, 534, 537, 1048, 1056,
1071, 1085
adding drawing objects to maps
by 364
adding text to queried objects 1278
altering drawing objects based
on 1270
attaching 209
attaching while digitizing 138, 1085
committing changes in Data
View 1056
configuring 213
connecting 215
converting from object data 534
converting object data to 1071
database links 1222
detaching 209
disconnecting 215
editing in Data View 1056
exporting 1405
for drawing objects 1048
importing 434
lediting links 537
linking to drawing objects 532
linking to drawing objects in
maps 523, 534
linking to objects manually 529
options 236, 238, 243
printing using report queries 1477
saving changes 1056
SQL conditions 1253
using to dissolve topology 1343
viewing for drawing objects 1144
viewing in Data View 1147
External Database Mapping dialog
box 1732
external queries
adding to library 180
default directory 229
extracting feature geometry 716
F
fade
for drawing layers 660
false origins 91
FDO
overview of schemas 554
FDO and non-FDO-enabled schemas 561
FDO developer help 59
FDO features 308, 507, 512, 686–687,
698
and automatic update 698
and joins 507
and maps 303
bringing into maps 308
creating and editing 686
creating joins 512
creating new 687
defining scale for layers 644
labeling 1093
loading styles 652
managing 551
overview 551
overview of editing 681
provider capabilities 305
saving styles 652
styles for 641
FDO providers 312, 316, 330, 332, 335,
337, 340, 342, 346, 540–541
adding 541
ArcSDE 316
Autodesk SDF 337
creating data stores 588
deleting data stores 593
Microsoft Access 342
MySQL 332
ODBC 342
Oracle 312
overview 547
PostGIS 340
PostgreSQL 340
Schema Editor 596
SDF 337
SHP 335
SQLite 330
WFS 346
2110 | Index
FDO-enabled data stores
and Bulk Copy 617
FDOATTACH command
(discontinued) 1533
FDOCONFIGURE command
(discontinued) 1533
FDOCONNECT command
(discontinued) 1533
FDODETACH command
(discontinued) 1533
FDODISASSOCIATE command
(discontinued) 1533
FDODISCONNECT command
(discontinued) 1533
FDOEDITSETADD command
(discontinued) 1533
FDOEDITSETREMOVE command
(discontinued) 1533
FDOEDITSETSAVE command
(discontinued) 1533
FDOEDITSETSHOW command
(discontinued) 1533
FDOLOCKS command 1606
FDOLOCKS command
(discontinued) 1533
FDOSCHEMA command
(discontinued) 1533
FDOSHOWOWNER command 1606
FdoUserManager utility 584–585
Feature Class Mapping dialog box
(Export) 1727
feature classes
appending features to (video) 43
appending to schemas (video) 594,
610
creating in schemas 598
definition 551
deleting in schemas 614
editing in schemas 612
exporting multiple 1440
exporting multiple layers to 1442
mapping to database views 603, 605
metadata for 1486
overview 551
querying (video) 24
setting physical configuration 612
settings in Schema Editor 1739
undoing schema changes 615
feature data 686, 725
and maps 291
combining with drawing data for
maps 291
creating and editing 686
exporting to DWG format 1460
understanding 681
versioning 725
feature editing options
setting 240
Feature Editing Options dialog box 1929
Feature Information dialog box 1606
feature layers
repairing broken connections 350
Feature Overlay 1316
Feature Source Administration dialog
box 1606
Feature Source Connection dialog
box 1607
feature source layers
overview 551
Feature Source Scope dialog box 1606
feature sources 291, 305, 308, 312, 316,
330, 332, 335, 337, 340, 342,
346, 392, 410, 700, 725
accessing in maps 308
and coordinate systems in maps 308
and locking 305
and maps 291
and persistent locking 305
and schema editing 305
and versioning 305
ArcSDE 316
Autodesk SDF 337
connecting to (video) 305
copying from one to another 621
copying from one to another
(video) 616–617
creating 588, 592
deleting 593
importing ArcSDE data 392
importing Oracle data 410
Microsoft Access 342
MySQL 332
Index | 2111
ODBC 342
Oracle 312
overview 19, 305
PostGIS 340
PostgreSQL 340
removing highlighting in map 1138
Schema Editor 596
SDF 337
setting up 583
SHP 335
SQLite 330
updating automatically 700
versioning 723, 725
viewing data for all 1135
WFS 346
FEATUREDEF command 122, 124, 126,
1785
features 308, 314, 319, 324, 331, 333,
336, 338, 341, 344, 507, 512,
681, 684, 686–689, 691–692, 694,
696, 698, 700–701, 705, 712, 716–
717, 722, 725, 1008
accessing WFS data 348
adding (video) 9
adding ArcSDE data to maps 319
adding Autodesk SDF data to
maps 338
adding Microsoft Access data to
maps 344
adding MySQL data to maps 333
adding ODBC data to maps 344
adding Oracle data to maps 314
adding PostGIS data to maps 341
adding properties 512
adding SHP data to maps 336
adding SQL Server data to maps 324
adding SQLite data to maps 331
and automatic update 698
and generated IDs 686
and joined properties 507
and joins 507
and locking 684
and maps 303
and multiuser environment 684
and persistent locking 698
and revision numbers 698
appending features (video) 31
appending to feature classes
(video) 43
bringing into maps 308
buffering 1308
cancelling check out 698
checking in 694
checking in (video) 693, 721
checking out 696
checking out (video) 721
checking out automatically 696
checking out(video) 695, 701
copying from one feature source to
another 621
create from DWG objects (video) 19
creating (video) 684, 686, 691
creating and editing 686
creating from geometry 692
creating geospatial features from
survey points 1008
creating joins 512
creating linestring 691
creating multilinestring 691
creating multipoint 688
creating multipolygont 689
creating new 687
creating point 688
creating polygon 689
creating themes for 1168
creation methods 686
defining scale for layers 644
editing (video) 19, 684, 701, 721
editing commands 705
editing offline 722
editing with AutoCAD
commands 715–716
editing with Data Table 712
editing with Properties palette 718
filtering 1210
filtering by conditions 1217
finding 1207, 1210
finding and selecting 1209
finding in Data Table 1212
highlighting in map 1137
joining attributes to (video) 37
labeling 651, 1093
2112 | Index
labeling (video) 185–186, 190, 194,
640, 645, 648, 1091, 1096,
1098
loading styles 652
merging 710
overview 551
overview of editing 681
provider capabilities in maps 305
saving styles 652
searching for 1214
selecting 1207
selecting (video) 1130
selecting checked out 694
selecting in Data Table 1131, 1212
selecting with queries 1130
splitting 708
splitting (video) 706
styles for 641
styling (video) 34
theming (video) 37
updating automatically 700
updating geometry 717
versioning 723, 725
viewing attribute data 1125
viewing attributes (video) 27
viewing data for 1135
features classes
appending features to (video) 31
Federal Geospatial Data Committee
standard for metadata 1481
fence boundary for query location 1241
FGDC CSDGM Standard
downloading 1481
for metadata 1481
fields (in records) 426, 434–435, 1071
adding to tables 202
creating for object data 201
displaying as text 435
exporting with objects 1405
finding drawing objects by 1248
importing 426, 434
modifying for object data 202
SQL conditions 1253
when converting object data to
database tables 1071
file formats
for exporting 1405
for exporting from AutoCAD Map
3D 1412
for importing data to maps 378
for raster files outside Data
Connect 455
SDF 2 files 1417
SIF files 1417
file sharing 730
file-based data sources 291
and maps 291
files 381
for query results 1477
grid data catalog (GDC) 103–104
importing 381
fill 939, 960, 963, 978
adding to closed polylines 939
adding to queried drawing
objects 1283
changing default for polygons in
maps 963
changing for polygons in maps 963
default for polygons in maps 978
for areas 650
gradients for polygons in maps 960,
978
specifying for polygons in maps 960
filtering
features using conditions 1217
geospatial features when adding to
maps 310
filters
conditions for features in
maps 1217
spatial (Data View) 1234
finding
drawing objects 1219
features 1207
fixed screen area
for digitizing 132
FLC images
inserting with Raster Extension 455
FLI images
inserting with Raster Extension 455
Index | 2113
floating screen area
for digitizing 132
flood trace analysis 1334
and direct resistance 849
and direction 845
fly through for surfaces 1196
folders
drive aliases for 161
fonts
setting for export and import 269
For Each activity
for workflows 2025
formats
for importing data to maps 378
supported for map export 1412
FoxPro
attaching database to drawing 209
setting default version 243
frame color 451
specifying for raster images 451
FSD files 1513
functions 1541
arithmetic 1541
conditional 1543
conversion 1544
entity 1545
equality 1543
pi 1545
range 1545
string-handling functions 1543
style 1545
symbol-handling 1544
G
GDAL provider 540
GDC files 104
Generate Contour dialog box 1561
Generate Data Links dialog box 1807
Generate Object Data Index dialog
box 1931
geodata 62
geodata portal 72
geodatabase 540–541
accessing ESRI data 541
geodetic coordinate systems 590
determining 149
geodetic distance
measuring 1153
geographic analysis
video 1319
geography data types 562
Geography Markup Language
(GML) 381, 412–413, 608, 1429
exporting 1405, 1429
exporting as schema 608
exporting to 1429
importing 381, 412–413
importing as schema 608
geometry 692, 705, 716–717, 1027
and Bulk Copy 625–626
creating features from 692
editing for features 705, 716
entering when creating objects 1027
properties in Schema Editor 1739
updating for features 717
geometry data types 562
geometry types
supported by OSGeo FDO Provider for
SQL Server Spatial 562
georeferencing 455
and publishing to DWF 1365, 1369,
1371–1372
and raster images 455
with rubber sheeting (video) 932
geospatial data
understanding hierarchy 551
geospatial feature layers
repairing broken connections 350
geospatial features 687, 698, 1137
buffering 1308
combining with maps 9
converting to DWG format 377–
378, 381
creating new 687
creating themes for 1168
defining scale for layers 644
definition 551
exporting data for 1474
filtering 1210
filtering using conditions 1217
2114 | Index
filtering when adding to maps 310
finding 1207, 1210
finding and selecting 1209
finding in Data Table 1212
labeling 1093
loading styles 652
managing 551
overview 551
overview of providers 547
overview of schemas 554
saving styles 652
searching for 1214
selecting 1207
selecting in Data Table 1212
selecting with queries 1130
styles for 641
viewing attribute data 1125
viewing data for 1135
geospatial workspace 84
showing command line by
default 87
GeoSpot images
inserting with Raster Extension 455
GeoTIFF images
inserting with Raster Extension 455
GIS features 308, 507, 512, 681, 686–
687, 698
and automatic update 698
and joins 507
and maps 303
bringing into maps 308
creating and editing 686
creating joins 512
creating new 687
overview of editing 681
provider capabilities 305
global coordinate systems 91
GML (Geography Markup
Language) 381, 412, 608, 1429
exporting 1429
exporting as schema 608
exporting maps 1405
exporting to 1429
importing 381, 412–413
importing as schema 608
GP4 images
inserting with Raster Extension 455
GPS data 342
and ODBC 342
grade 1162
displaying 1162
graticule 1362
reference system 1362
grid
Military Grid Reference System
(MGRS) 1362
reference grid 1362
reference system 1362
grid data catalog (GDC) files 103–105,
108–109
Australia 109
New Zealand 109
setting up for US 108
United States 105
grips in maps 947
grouping layers in maps 301
groups 301, 764
altering drawing objects based
on 1265
and Display Manager 300
changing for layers 301
finding drawing objects by 1244
querying 1300
removing on save back 764
unused 764
Groups button 301
H
hatch 761, 939, 978
adding to closed polylines 939
adding to queried drawing
objects 1283
and queries 247
associative 247
boundaries when saving 761
default for polygons 978
displaying for polygons 978
for drawing layers 660
querying 1300
Index | 2115
saving to source drawings from
maps 761
scaling for drawing layer
themes 1176
theming for drawing layers 1176,
1184
Hatch Options dialog box (drawing
queries) 1847
Header/Footer dialog box 1685
height
altering with queries 1261
and theming 1202
theming surfaces for 1203
HEIGHT variable 1546
help 61
printing 61
hiding
Data Table 1127
Data View columns 1059
map books 1398
map status bar 87
Task Pane 221
Highlight Features activity
for workflows 2038
highlighting 752, 911
drawing objects linked to external
data 1227
features in maps 1137
locked objects 752
records linked to drawing
objects 1229
removing from features in
maps 1138
rows in Data Table 1139
topology associated with
objects 911
highlighting features
video 1136, 1138
Hillshade Settings dialog box 1562
hillshading
applying to surfaces 1200
video 1199
Horizontal Coordinate System Definition
Editor (FGDC Metadata) dialog
box 1768
horizontal distance 1162
displaying 1162
hyperlinks 389
exporting to SDF 2 files 1417
importing from SDF 1 or 2 files 389
I
Identify Map Book Layout Placeholders
dialog box 1829
identity overlay 1309
If Else activities
for workflows 2025
IG4 images
inserting with Raster Extension 455
IGS images
inserting with Raster Extension 455
IKONOS images
adding to maps 437
Image Correlation dialog box (Insert Image
command) 1873
image formats
exporting drawing data to 1465
Image Information dialog box 1875
Image Insertion dialog box 451
Image Management dialog box (Insert
Image command) 1875
Image Management Layout dialog box
(Insert Image command) 1877
Image Select dialog box (Insert Image
command) 1877
Image Systems Gray Scale images
inserting with Raster Extension 455
Image Systems Group 4 images
inserting with Raster Extension 455
ImageConnect 62
images
adding to a layer (video) 437
adding with Data Connect 440
inserting (video) 437, 459
inserting at command line 471
inserting with Raster Extension 455
imperial units
for exported MicroStation DGN
files 269
implicit nodes 1339
2116 | Index
Import Data Mapping dialog box 1732
Import dialog box 1711
Import Metadata Options dialog
box 1757
Import Old Theme dialog box 1628
importing 269, 377–378, 381, 388–389,
391–392, 396, 399, 401, 404,
408, 410, 413–415, 417–419, 421,
424, 426, 428, 434–435
.ddf files (SDTS format) 414
.gml files 413
.ini file for 269
.shp files 399
.tab files 404
.vpf files 417
and assigning object classes 421
and coordinate conversion 424
and profiles 263
and styling drawing objects 385
Arc/INFO Coverages 381, 396
ArcSDE data 392
ArcView ShapeFiles 381
ArcView ShapeFiles as folder 269
areas 418
attribute data 426, 428, 434–435
AutoCAD layers into AutoCAD Map
3D 419
Autodesk MapGuide files 389
blocks 428
compared to connecting 15
data 377, 435
data types for AutoCAD Map
3D 426, 434
databases 209
DGN files 408
driver options 381
DXF files 391
EOO files 396
ESRI Arc/INFO Coverages 396
ESRI ShapeFiles 399
external data 381, 426, 434–435
file-based 269
folder-based 269
GML (Geography Markup
Language) 381, 413
layers into AutoCAD Map 3D 419
limiting area 418
MapGuide files 389
MapInfo MIF/MID as folder 269
MapInfo MIF/MID files 381, 401
MapInfo TAB 381, 404
metadata 1511
MicroStation DGN 381, 408
MIF/MID files as folder 269
object data 426, 434–435
object properties 269
Oracle data 410
Ordinance Survey of Great Britain
GML v2 381, 413
overview 381
plot map sets for map books 1392
point data as text 428
preparation for maps 378
queries 180
schemas 608
schemas (video) 43, 606
SDF 1 or 2 files 389
SDF 1, 2, or 3 388
SDTS (Spatial Data Transfer
Standard) 381, 414
ShapeFiles 399
SHP files 399
SHP files as folder 269
Spatial Data Transfer Standard 414
spatial filters for 418
SQLite 381, 415
SQLite files 414
supported formats for maps 378
TAB files 404
TAB files as folder 269
Vector Product Format as folder 269
Vector Product Format files 417
VPF (Vector Product Format) 381,
417
VPF as folder 269
vs. accessing data for maps 378
incomplete topology 920
Index Maintenance dialog box 1931
indexes
creating for drawings 1294
individual values distribution 1165
Index | 2117
information 474, 916
for raster images 474
printing using report queries 1477,
1479
specifying type for tables 201
viewing for raster images 474
viewing for source drawings 172
viewing for topology 916
inheritance (base or abstract classes)
setting in schemas 612
Insert Annotation dialog box 1574
insert errors
ignoring in Bulk Copy 1744
Insert Image dialog box 1878
insertion point 451, 937
for labels 937
for text in maps 937
specifying for raster images (Data
Connect) 451
insets for maps 943
installing
sample data 63
integers 426, 434
importing 426, 434
Intermap 62
internal queries
executing 178, 1288
international coordinate systems 143
intersect overlay 1309
intersecting lines 1160
displaying acute angles 1160
displaying obtuse angles 1160
invalid geometry
and SQL Server Spatial 326
islands 836, 920, 955, 963, 971, 974
adding to polygons in maps 963
converting to polygons 974
creating from grouped polylines 971
creating in polygons 955
for topology 836, 898, 920
rebalancing in maps 963
when exporting polygons 1458
within boundaries 836
ISO 19139 metadata 1483
J
Jenks distribution 1165
Jet provider for Microsoft Access 209
JFIF images
adding to maps 437
inserting with Raster Extension 455
join keys 509
joins 507
about 507, 509
advanced techniques 509
and calculated properties 519
and non-matching data 509
creating 512
deleting 515
editing joined data 517
exporting data 520
managing 515
modifying 515
publishing data 520
removing 515
saving 520
sharing data 520
video 37, 507, 509, 514
viewing in Data Table 1135
Joint Photographic Experts Group
images 437
adding with Data Connect 440
JPEG images 437
adding with Data Connect 440,
443–444
JPEG2 images 437
adding with Data Connect 440,
443–444
justification
setting for export and import 269
K
key columns for link templates 526
keyview viewport
for map books 1385
KIF files
exporting 1417
2118 | Index
L
L74 images
adding to maps 437
label point 937, 1280
changing 937
defining 937
defining for drawing objects 1280
specifying while digitizing 138
labeling
features 651
features (video) 640, 645, 648
LABELPT variable 937, 1546
labels 937
adding to features (video) 1089,
1091
allowing to obscure points 1097
for contour lines 1191
for features (video) 185–186, 190,
194, 1096, 1098
insertion point 937
on features 1093
on points 1099
Lambert Conformal Conic
projection 143
land cover map 840
land use map 840
LANDSAT FAST images
adding to maps 437
latitude
when digitizing 133
layer CS code
for Web Map Service (WMS) 447
Layer Mapping dialog box (Import
FDO) 1719
Layer Range Editor dialog box (object
classification) 1789
LAYER variable 1546
layers 300–301, 350, 357, 359, 362, 419,
421, 764
adding drawing objects to by
property 362
altering drawing objects based
on 1265
altering with queries 1261
and map styles 300
and scale ranges (video) 648
assigning object classes during
import 421
changing draw order 302
changing groups for 301
changing thumbnail 302
changing thumbnail styles in Display
Manager 301
copying 639
creating for drawing objects in
maps 356
defining scale for 644
display order in maps 300
draw order 637
drawing vs. AutoCAD layers 350
exporting 1405
exporting to a feature class 1442
exporting to SDF (video) 1376,
1405, 1469
finding drawing objects by 1244
for drawing objects in maps by
location 359
for drawing objects in maps by object
class 357
for styled drawing objects 652
grouping in maps 301
importing 381
importing into AutoCAD Map
3D 419
managing (video) 634, 636
redefining on save back 764
saving to .layer files (video) 1405,
1469
specifying for digitized objects 138
updating in Display Manager 635
using wild-card characters 1537
viewing data for 1135
layout
for map books 1388
LDF files
loading 652
saving 652
legends
adding to maps (video) 1089
creating 1117–1118, 1181
samples 62, 71
Index | 2119
viewport for map books 1385
legends (video) 185–186, 190, 194
legends(video) 1117
length
altering drawing objects based
on 1265
finding drawing objects by 1244
LENGTH variable 1546
levels
importing 381
library for queries 174, 178
LiDAR
ASCII format 1012
data
bringing in 374
filtering 1016
importing 374
managing 1015
overview 1012
supported versions 374
file types 1012
LAS file format 1012
LIDAR data 342
and ODBC 342
line features
theming 1174
line width 776
assigning for drawing layer
themes 1176
for objects created during Drawing
Cleanup 776
linear objects 767, 773, 779, 794, 796,
799, 801, 803, 806, 808, 814–
815, 819, 831, 838, 847, 850,
863, 873, 875, 880, 889, 892,
1073
adding to topology 880
breaking crossing 799, 838
changing direction in topology 873
changing resistance in topology 875
cleaning up 767
dangling objects 810
deleting duplicates 794
digitizing 1073
dissolving 1343
dissolving pseudo nodes 808
editing 863
erasing short 796
extending to apparent
intersection 803
extending undershoots 801
marking for cleanup 779
removing from topology 889
segmentation during export 269
simplifying 814
snapping clustered nodes 806
specifying direction 847, 850
tolerance for deleting duplicates 773
topology 831
updating for topology 892
weeding 819
zero-length objects 815
lines 808, 815, 1032, 1034, 1036, 1038,
1040, 1042, 1044
digitizing 138
displaying COGO information
for 1161
dissolving pseudo nodes 808
scale ranges for 649
segmentation during export 269
specifying with angle and
distance 1032
specifying with azimuth and
distance 1042
specifying with bearing and
distance 1034
specifying with deflection and
distance 1038
specifying with distance and
offset 1044
specifying with two bearings 1036
specifying with two distances 1040
styles for 649, 662
zero-length 815
linestring features 691
creating 691
linestyles 1176
theming for drawing layers 1176
Linetype Range Editor dialog box (object
classification) 1789
LINETYPE variable 1546
2120 | Index
linetypes
altering drawing objects based
on 1265
altering with queries 1261
finding drawing objects by 1244
for drawing layers 660
setting for export and import 269
specifying for digitized objects 138
theming for drawing layers 1176
Lineweight Range Editor dialog box (obejct
classification) 1790
lineweights 381
finding drawing objects by 1244
for drawing layers 660
for imported lines 381
setting for export and import 269
theming for drawing layers 1176
link data 434
altering drawing objects based
on 1267
importing 434
link index 1294
Link Objects dialog box (drawing
topology) 1975
Link Template Data Entry dialog
box 1619
Link Template Key Column Entry dialog
box 1620
Link Template Properties dialog
box 1686
link templates 526–527, 539
about 525
creating for maps 526
deleting 539
editing paths 539
opening linked database tables 527
linking 507, 512, 523, 529, 531–532,
534, 537, 1064, 1085
data sources to drawings 209
data to drawing objects 1064
drawing objects to object data 531
records to drawing objects 529
records to drawing objects in
maps 523, 532, 534, 537
records to drawing objects while
digitizing 1085
using joins 507, 512
links (database) 435, 1085
altering drawing objects based
on 1270
creating while digitizing 1085
Data View 1222
deleting 537
displaying as text 435
editing 537
filtering by location 1234
importing 434
overview 1222
to external data 523, 529, 532, 534
links (linear objects) 796, 799, 801, 803,
806, 808, 814–815, 838, 847,
850, 863, 873, 875, 880, 889, 892
adding to topology 880
breaking crossing 799, 838
changing direction in topology 873
changing resistance in topology 875
cleaning up 767
dangling objects 810
deleting 794
digitizing 1073
dissolving 1343
dissolving pseudo nodes 808
editing 863
erasing short 796
extending to apparent
intersection 803
extending undershoots 801
marking for cleanup 779
removing from topology 889
simplifying 814
snapping clustered nodes 806
specifying direction 847, 850
topology 831
updating for topology 892
weeding 819
zero-length objects 815
List Current Connections activity
for workflows 2039
List Feature Classes activity
for workflows 2039
List Feature Layer Properties activity
for workflows 2040
Index | 2121
lists
for schema property values 599
LizardTech images
inserting with Raster Extension 455
Load Internal Query dialog box (drawing
queries) 1848
Load Layer File activity
for workflows 2041
Load Topology Conflict dialog box 1976
Load Topology dialog box 1976
Load Topology From Source Drawing
dialog box 1978
loading 899
feature styles 652
queries 184
schemas 608
topology 899, 907
location 359, 539
adding drawing objects to maps
by 359
for source drawings 169
link templates 539
Location Condition dialog box (drawing
queries) 1849
location conditions for queries 1241
editing 1258
location index 1294
location queries
using with buffers (video) 1302,
1306
locking 305, 684, 696, 730, 733, 735–
736, 751, 759, 764
and working offline 696
drawing objects 730, 733, 751
drawings 730
enabling in schema 612
features 684
for feature sources in maps 305
in Schema Editor 1739
removing locks from drawing
objects 759
removing locks on save back 764
viewing lock owners 735
viewing locked drawing objects 752
LOCKSTAT variable 1546
log files
for Bulk Copy 626
for MapGuide publishing 1379
options 229
logging in 142
forcing 227
long transactions 323
and SQL Server 323
in Schema Editor 1739
versioning 612
longitude
when digitizing 133
M
M dimensions 562, 610
Manage Joins dialog box 1607
managing
FDO data 551
joins 515
versions 723
versions of data 725
Map Base (Display Manager) 352
Map Book Properties dialog box 1830,
1832
map books
adjacent arrows 1385
and sheet sets 1381
creating 1390
creating (video) 1360
creating from saved settings 1395
deleting 1403
editing 1397
editing settings 1396
hiding 1398
importing plot map sets 1392
keyview viewport 1385
layout placeholders 1388
legend viewport 1385
MBS files 1394
overview 1381, 1383
printing 1402
publishing (video) 1381, 1389
publishing to DWF 1401
publishing to DWF (video) 46,
1360, 1366
2122 | Index
publishing to DWF with
attributes 1400
publishing to plotter 1402
rebuilding 1391
renaming 1402
saving settings 1394
setting up templates 1385–1386
sheet templates 1386
video 46, 1381
viewing 1397–1398
viewing layouts 1400
viewing properties 1399
viewing tiles 1399
Map Books
sample templates 63, 66
map files
and data stores 3
and display maps 7
map status bar
hiding 87
MAP2SDF command 1419
MAPABOUT command 1905
MAPAL command 881
MAPAN command 879
MAPANBUFFER command 1348
MAPANDISSOLVE command 1345
MAPANNINSERT command 1570, 1574
MAPANNTEMPLATE command 1572
MAPANOVERLAY command 1341
MAPANTOPONET command 1322,
1328, 1332, 1336
MAPATTACHDB command 210
MAPAUTOCHECKOUT command 1905
MAPBL command 864
MAPBOOKCREATE command 1383,
1391
MAPBOOKCREATEFROMSETTINGS
command 1384, 1394–1395
MAPBOOKEDITSETTINGS
command 1384, 1394, 1396
MAPBOOKIMPORTPLOTSET
command 1384, 1392
MAPBOOKPLACEHOLDER
command 1384, 1389
MAPBOOKSAVESETTINGS
command 1385, 1393, 1395
MAPBREAK command 942, 1666
MAPBROWSELINK command 1054
MAPBROWSETBL command 1054, 1691
MAPBUFFER command
(discontinued) 1533
MAPCLEAN command 769
MAPCLPLINE command 1953
MAPCOGO command 1651
MAPCONFIGDB command 214, 1679
MAPCONNECTDB command 215, 1679
MAPCONNECTIONPOOLING
command 89
MAPCREATE command
(discontinued) 1533
MAPCREATECENTROIDS
command 887, 977
MAPDATAGRID command 712, 1613
MAPDEFINELT command 527, 1682–
1683, 1690
MAPDELETELINKS command 538, 1690
MAPDELETELT command 540
MAPDETACHDB command 210, 1684
MAPDIGISETUP command 131, 139,
1617
MAPDIGITIZE command 138, 1080–
1082, 1615
setting options 138
MAPDISCONNECTDB command 215,
1684
MAPDISPLAYLIBRARY command 1621
MAPDISPLAYMANAGER command 1621
MAPDISSOLVE command
(discontinued) 1533
MAPDIST command 1153, 1597
MAPDL command 890
MAPDN command 890
MAPDOCKWSPACE command 1906
MAPDP command 890
MAPDVP command 868
MAPDWFOPTIONS command 1368
MAPEDITDIR command 848, 874, 1939,
1973
MAPEDITRES1 command 1940, 1972
MAPEDITRES2 command 1940, 1973
MAPEDITSETAUTO command 1906
Index | 2123
MAPEDITSETAUTODEFAULT
command 89
MAPEXPORT command 261, 264, 1410,
1457, 1704
mapexport.ini 269
customizing 264
MAPFDOBUFFERCREATE
command 1302, 1306, 1309
MAPFEATUREEDITTOOLS
command 1906
MAPFEATUREMERGE command 1651
MAPFEATURESPLIT command 1652
MAPFIGNORESPLITMERGERULES
command 1653
MAPFLOOD command
(discontinued) 1533
mapforeignfileproperties.ini
customizing 264
mapgisoverlay 1309
MapGuide 389
exporting to version 6.5 and
earlier 1417–1418
importing from 389
publishing to (video) 3, 1376
publishing to current Enterprise
version 1378
publishing to Open Source
version 1378
resolving publishing errors 1379
video 46, 1360
viewing log file after
publishing 1379
MAPIFRAME command 492, 495, 1873
MAPIINFO command 475, 1875
MAPIINSERT command 459, 1873, 1878
MAPIL command 881
MAPIMANAGE command 475, 478,
481, 1875, 1877
MAPIMPORT command 262, 264, 384,
387, 389, 394, 397, 400, 402,
404, 409, 412–414, 416–417, 1711
mapimport.ini 269
customizing 264
MAPIN command 879
MapInfo MIF/MID 381, 400, 1431
exporting 1405
exporting to 1431
importing 381, 400
importing as folder 269
MapInfo TAB 381, 402, 404
exporting 1405
exporting to 1433
importing 381, 402, 404
importing as folder 269
MAPIOPTIONS command 253, 1879
MAPJL command 865
MAPLINESTRINGCREATE
command 1654
MAPLINESTRINGEDIT 705
MAPLINESTRINGEDIT command 1655
MAPLINKADD command
(discontinued) 1533, 1941
MAPLINKDEL command
(discontinued) 1533, 1942
MAPLINKEDIT command 1943
MAPLINKMANAGER command 538
MAPLINKREV command
(discontinued) 1533, 1943
MAPLINKUPD command 892, 1944
MAPLOGIN command 142, 1937
MAPML command 865
MAPMN command 861
MAPMP command 868
MAPMPEDIT command 1818
MAPMULTILINESTRINGCREATE
command 1656
MAPMULTILINESTRINGEDIT
command 1658
MAPMULTILINESTRNGEDIT 705
MAPMULTIPOINTCREATE
command 1659
MAPMULTIPOINTEDIT 705
MAPMULTIPOINTEDIT command 1659
MAPMULTIPOLYGONCREATE
command 1660
MAPMULTIPOLYGONEDIT 705
MAPMULTIPOLYGONEDIT
command 1662
MAPNODADD command
(discontinued) 1533, 1945
MAPNODDEL command
(discontinued) 1533, 1946
2124 | Index
MAPNODEDIT 1946
MAPNODINS command
(discontinued) 1533, 1947
MAPNODUPD command 892, 1948
MAPOD2ASE command 533–534, 536,
1680, 1689
MAPOPTIONS command 88, 216–218,
222, 226, 228, 230, 232, 237,
239, 244, 246, 249, 743, 765,
1908
MAPOVERLAY command
(discontinued) 1533
MAPPLOT command 1364
MAPPOINTCREATE command 1663
MAPPOLYADD command
(discontinued) 1533, 1948
MAPPOLYDEL command
(discontinued) 1533, 1949
MAPPOLYGONCREATE command 1663
MAPPOLYGONEDIT 705
MAPPOLYGONEDIT command 1665
MAPPOLYLINETOPOLYGON
command 972, 1817
MAPPOLYUPD command 892, 1950
MAPPROPSLT command 540, 1686
MAPPUBLISHTOMAPGUIDE
command 1379, 1381
MAPRL command 865, 874
MAPRUNDBQUERY command 1054,
1691
maps 147, 298, 300, 302, 308, 381, 746,
758, 767, 822, 852, 927, 932,
934, 941, 943, 951, 1073
adding GIS features 308
aligning 169
and data 291
and GIS features 303
and Quick View 746
annotating (video) 1089
assigning coordinate system 146–
147
attaching drawings 154, 158
breaking drawing objects at
boundaries 941, 943
changing draw order for layers 302
changing thumbnail for layers 302
cleaning 767
contents of 3
converting to DWG (video) 628
coordinate system 143
creating 298
creating and editing overview 19
creating map books 1390
creating multiple display maps 639
creating with saved drawing
objects 758
digitizing 1073, 1080–1081
discontinuous edges 951
distorting 934, 951
distortion 225
draw order for layers 637
editing tools 927
editing topology 852
enlargements 943
exporting to DWG (video) 1459
exporting to DWG format 1460
importing data for 381
insets 943
irregular 951
joining at seams 951
layer display order 300
legends 1117
matching 934
matching edges 951
on web sites 46
options 216–217
output formats 1360
overview 3
overview of map creation 296
overview of printing 1357
previewing 746
publishing 1360
publishing as web pages 1374
publishing in HTML format 1374
publishing overview 1357
publishing to Autodesk MapGuide
Enterprise 1378
publishing to MapGuide Open
Source 1378
publishing to plotter 1364
publshing to DWF format 1372
rebuilding map books 1391
Index | 2125
registering for digitizing 136
rubber sheeting 932, 934
sample data for AutoCAD Map
3D 62, 71
scale 169, 638
sections 169
sharing 46, 1357, 1460
styles 631
tiling 951
topology 822
transforming 169
transforming coordinate system 152
trimming drawing objects at
boundaries 945
MAPSDFIN command 390
MAPSELECTCLASSIFIED command 994,
1779
MAPSELECTUNCLASSIFIED
command 994, 1780
MAPSELECTUNDEFINED
command 995, 1780
MAPSHOWGEOM command 903, 912
MAPSHOWTOPO command 903, 912
MAPSTATUSBAR command 89
MAPTOPOADMIN command
(discontinued) 1533
MAPTOPOADMIN Delete
command 1950
MAPTOPOADMIN Rename
command 1951
MAPTOPOAUDIT command 904, 921
MAPTOPOCOMP command 904, 921
MAPTOPODEL command 906, 926
MAPTOPOEDIT command 1951
MAPTOPOEDIT command
(discontinued) 1533, 1974
MAPTOPOLOAD command 902, 908
MAPTOPOLOGYTOPOLYGONS
command 975, 1823
MAPTOPOQUERY command 1354, 2008
MAPTOPORECR command 904, 921
MAPTOPOREN command 906, 925
MAPTOPOSTATS command 903, 916
MAPTRACE command
(discontinued) 1533
MAPTRACKCS command 1152
MAPTRIM command 946, 1672
MAPUSEMPOLYGON command 980,
1818
MAPUSERADMIN command 84, 1934
MAPVIEWLINK command 1054, 1797
MAPVIEWTBL command 1055
MAPWORKFLOWBATCHRUN
command 2021
MAPWORKFLOWOPEN command 2021
MAPWORKFLOWRUN command 2021
MAPWSACTION command 1536
MAPWSFOCUS command 1907
MAPWSPACE command 1908
MAPWSREFRESH command 1908
markers 785
for Drawing Cleanup 779, 785
matching 951
map edges 951
maximum speed for links and nodes 850
measuring 1148
continuous distances 1159
coordinate geometry 1154
coordinates 1148
distances 1157
geodetic distance 1153
Mentor coordinate systems 590
Mercator projection 143
merge rules
ignoring 708
merging
features 710
metadata
about 1481
adding records 1505, 1507
applying templates 1492
Attribute Domain Values
Editor 1773
auditing 1509
boxes
Responsible Party Editor
(ISO) 1776
Citation Editor (ISO) 1777
Citation Information Editor 1759
Contact Information Editor 1763
copying and pasting 1504
creating 1486
2126 | Index
creating templates 1492
deactivating templates 1495
default template 1494
deleting records 1505
editing 1499
exporting 1513
exporting templates 1496
free-form fields 1501–1502
Horizontal Coordinate System
Definition Editor (FGDC
Metadata) 1768
importing 1511
importing templates 1492
ISO 19139 1483
previewing templates 1494
printing 1515
publishing 1515
record navigator 1507
removing templates 1497
renaming templates 1493
samples 63
setting options 1484–1485
setting options for 241
sharing 1510
Spatial Data Organization
Editor 1764
Standard Order Process Editor 1774
standards for 1481
stylesheets for 1489
templates 1490
Time Period Information
Editor 1761
updating automatically 1484
video 1481, 1486, 1498
viewing 1486
viewing a summary 1753
metadata (video) 30
Metadata Editor 1754
Metadata Options dialog box 1756
Metadata Viewer 1751
exporting data from 1473
importing stylesheets 1489
Summary tab 1753
MGRS 1362
Microsoft Access 342, 344
adding feature data to maps 344
provider capabilities for maps 342
Microsoft Excel
attaching spreadsheet to
drawing 209
setting default version 243
setting up database ranges 578
Microsoft Jet 4.0 provider 209
Microsoft Visual FoxPro
attaching database to drawing 209
setting default version 243
MicroStation DGN 381, 405, 408, 1435
changing export default to imperial
units 269
changing the default seed file 269
exporting 1405
exporting to 1435
importing 381, 405, 408
seed file for 1435
units of measurement 269
MIF/MID files 269, 381, 400, 1431
exporting 1405
exporting to 1431
importing 381, 400
importing as folder 269
migrating data
overview 617
MIL images
inserting with Raster Extension 455
Military Grid Reference System
(MGRS) 1362
model space
queries in 1235
modifying
coordinate system categories 101
coordinate systems 98
datums 99
ellipsoids 100
object data tables 202
monuments for digitizing 1073
motion path animation 1196
MPEDIT command (See
MAPMPEDIT) 1818
MPFILL command 968, 980
MPOLYGON command 962
MPSPLIT command 969, 1821
Index | 2127
MrSID images 437
adding with Data Connect 440,
443–444
MTD files 1513
multi-page DWF 1365
multi-polygon
and SHP files 572
multi-polygons
and SHP files 335, 397
creating 689
Multi-Resolution Seamless Image Database
images 437
adding with Data Connect 440
multi-user editing
for drawing files (video) 727, 730,
734, 738
video 19
multilinestring features 691
creating 691
multiple features 1444
exporting from AutoCAD Map
3D 1444
multiple user options 216
multipoint features 688
creating 688
multipolygon features 689
creating 689
multiuser environment 684
and editing 684
locking drawings 730
options 227, 249
MySQL 332–333
adding feature data to maps 333
provider capabilities for maps 332
schemas 567
working with data 569
N
naming
object data tables 201
naming restrictions 610
natural breaks distribution 1165
NAVTEQ 62
nested drawings 157
activating 160
network topologiy
video 829
network topology 829, 831, 847, 849–
850, 873, 875, 1073
and object data 829
best route 1330, 1334
changing link direction 873
changing resistance 875
creating 831
creating (video) 727
digitizing objects for 1073
direct resistance 849
editing 852
overview 829
path trace analysis 845
shortest path 1326
specifying link direction 847, 850
testing integrity 1334
travel time 1326
video 822
Network Topology Analysis Choose
Locations dialog box 1978
Network Topology Analysis Output dialog
box 1980
Network Topology Analysis Resistance and
Direction dialog box 1982
Network Topology Analysis Select Method
dialog box 1983
New Annotation Template Name dialog
box 1576
New Layer dialog box 1579
New Object Class Definition File dialog
box 1790
New Property dialog box (object
classification) 1791
New Range Table dialog box (drawing
queries) 1852
New Scale dialog box 1629
New Zealand grid data files 109
NEWDEF command 130, 1790
NITF images
adding to maps 437
Node Objects dialog box (drawing
topology) 1985, 1987
node topology 826–827, 1073
and object data 826
2128 | Index
creating 827
digitizing objects for 1073
overview 826
nodes (Map Explorer)
displaying 221
nodes (topology) 138, 773, 779, 806,
808, 810, 814–815, 827, 860,
863, 870, 875, 878, 889, 892,
953, 1073
adding 878
changing appearance 870
changing resistance in topology 875
clustered 806
creating 827
dangling objects 810
digitizing 138, 1073
digitizing by coordinates 953
dissolving pseudo nodes 808
dissolving psuedo nodes 779
editing 860
explicit 1339
implicit 1339
importing 428
marking for cleanup 779
pseudo 808
query location 1241
removing from topology 889
repositioning 863
simplifying lines 814
snapping clusters 779, 806
styling 870
tolerance for deleting clusters 773
updating for topology 892
weeding 814
zero-length objects 815
non-feature classes
in Schema Editor 1739
non-planar polygons 689, 704
non-spatial data
viewing in Data Table 1136
North American datum shift issues 112
north arrows
samples 62, 71
not-null
for schema property values 599
notes
adding to maps 1089
numbers
specifying type for tables 201
numeric ranges
for property queries 1244
for queries 1242
O
Object Class Attribute Mapping dialog
box 1710
object classes 357, 421, 991, 995
adding drawing objects to maps
by 357
adding text to queried objects 1278
assigning during import 421
defining 119–120, 123
defining range of values 125
definition file 995
editing data 991
files 129
finding drawing objects by 1244
hierarchies 122–123
metadata for 1486
modifying definitions 127
range of allowable values 124
renaming 120
setting property ranges 125
using to modify thematic
objects 1261
viewing information about 1144
object classification 83, 117, 981, 983,
988–989, 991, 993, 995
and export 1440
assigning to existing drawing
objects 989
base classes 123
creating files 129
creating objects using 988
defining objects 120, 123, 125
definition file 995
editing data 991
files 128
general procedure 983
modifying definitions 127
Index | 2129
overview 117, 981
privileges 83
removing from drawing objects 989
selecting objects using 993
setting up 118
variables 1551
object data 364, 426, 430, 434–435, 531,
533–534, 826, 829, 833, 887, 913–
914, 1061, 1064, 1066–1067,
1069, 1071, 1080, 1083
adding drawing objects to maps
by 364
adding text to queried objects 1278
altering drawing objects based
on 1267
and database links 533
and digitizing 1080
and network topology 829
and node topology 826
and polygon topology 833
attaching multiple records 1066
attaching to drawing objects 1064
attaching to drawing objects
automatically 1067
attaching while digitizing 138, 1083
converting to a linked database
table 1071
converting to external data 534,
1071
creating tables 201
displaying as text 435
editing 1069
exporting 1405
exporting text enclosed in a
polyline 1455
finding drawing objects by 1248
for polygon topology 1064
for topology 913
importing 426, 434
indexing 1294
linking automatically to records 531
linking to enclosed blocks and
text 1067
listing tables in source drawings 172
modifying tables 202
moving to polygon centroids 430,
887
overview 1061
printing using report queries 1477
using to dissolve topology 1343
variables 1549
viewing for drawing objects 1144
viewing for topology 914
viewing in Properties palette 1146
Object Data Mapping dialog box 1732
object locking 730, 733, 735–736
enabling 227
overview 730
releasing locks 736
turning on 733
viewing lock owners 735
object type
altering drawing objects based
on 1265
finding drawing objects by 1244
ODBC 342, 344
adding feature data to maps 344
compliant databases 209
provider capabilities for maps 342
schemas 576
setting up 577
video 305, 342
viewing data in Data Table 1136
working with data 577
offline
editing features 722
offset
for source drawings 169
OGC Basic Web Map Service 447
using with maps 447
OGR provider 540
one-to-many joins 509
one-to-one joins 509
online
returning 722
open source providers 540–541
adding 541
opening 527, 1053
attached drawings 163
database tables in Data View 1053
linked database tables 527
2130 | Index
source drawings 163
options 169, 225, 229, 249, 764, 781,
922
acadmap.ini file 249
acadmap.sys file 249
AutoCAD Map 3D 216–217, 249
coordinate system 231
coordinate transformation 225
data sources 225, 236, 243
Data View 238
digitizing 138
drawing origin 169
drawing scale 169
feature editing 240
for coordinate geometry 234
for drawings 225
log files 229
map books 1394
metadata 241
multi-user 227
overview 216–217
queries 245
Raster Extension 249
rotation 169
save back 764
save back extents 170
saving 249
saving for Drawing Cleanup 781
saving for topology 922
setting while attaching
drawings 158
split prompts 709
system 229
Task Pane 221
transformation 169
Oracle 312, 410
adding feature data to maps 314
exporting drawing data to 1462–
1463
exporting from DWG and
back 1467
importing data from 410
moving DWG data to 629
provider capabilities for maps 312
schemas 554
version-enabling 554, 557
working with data 558
ORACONNECT command
(discontinued) 1533
ORADISCONNECT command
(discontinued) 1533
ORAERUPDATE command
(discontinued) 1533
ORAEXPORT command
(discontinued) 1533
ORAIMPORT command
(discontinued) 1533
ORAINDEX command
(discontinued) 1533
orbiting 1196
surfaces in 3D 1196
Order button 301
Ordinance Survey of Great Britain
exporting GML v2 1429
exporting to 1429
importing 412
importing GML v2 381, 413
origin
modifying for source drawings 169
orthogonal transformation
and digitizing 133
osgeo 540–541
downloading providers from 541
OSGeo FDO Provider for SQL Server
Spatial
and Schema Editor 610
supported data types 562
supported geometry types 562
OSNAP
and AutoCAD Map 3D 688, 713
Output Report Options dialog box
(drawing queries) 1852
output reports for queries 1477, 1479
overlay analysis
for DWG topology (video) 822,
829, 841, 1319
for feature classes(video) 1309
using drawing topologies
(video) 1336
Overlay Analysis dialog box, Set Output
And Settings 1565
Index | 2131
Overlay Analysis dialog box, Source and
Overlay Type 1563
overlay topology 843
to find sliver polygons 843
overlays
creating 1316
overview 1309
types 1309
overposting 1097
overshoots 773, 810
and dangling objects 810
tolerance for deleting 773
P
Page Setup dialog box 1686
PAGESETUP command 1388
panning
surfaces in 3D 1196
paper space
and map topology 822
queries in 1235
Paradox
attaching database to drawing 209
setting default version 243
Parallel activities
for workflows 2025
parameters
for Workflow activities 2022, 2025
parcel data
samples 63
parcels 836, 969
creating polygon topology for 836
splitting polygons for 969
passwords 83, 142
default 142
for AutoCAD Map 3D users 83
paste overlay 1309
path trace analysis 1326
and direct resistance 849
and direction 845
paths 539
for link templates 539
patterns
filling areas with 650
finding in data 1121
PCT images
inserting with Raster Extension 455
PCX images
inserting with Raster Extension 455
Perform Overlay activity
for workflows 2041
performance 1538
improving 1538
improving by working offline 722
improving for queries 150, 1292,
1294, 1296
PERIMETER variable 1546
persistent locking 305, 684, 698
and automatic update 698
for feature sources in maps 305
personal geodatabase 540
accessing ESRI data 541
photographs 440
adding with Data Connect 440
physical configuration
setting for feature classes 612
setting for properties 612
PICT images
inserting with Raster Extension 455
pipes 831, 847, 873, 875
changing direction in topology 873
changing resistance in topology 875
creating network topology 831
specifying direction 847
tracing in topology 1334
plot map sets
importing for map books 1392
plot styles
finding drawing objects by 1244
theming for drawing layers 1176
Plotstyle Range Editor dialog box (object
classification) 1792
plotters
publishing map books to 1402
publishing maps to 1364
PNG images 437
adding with Data Connect 440,
443–444
point boundary for query location 1241
point cloud
adjusting display density 375
2132 | Index
bringing in point cloud data 375
creating a Display Manager layer from
a point cloud object 375
creating a new data store from filtered
point cloud data 1024
creating a point cloud data
store 1019
creating a point cloud group in
Display Manager 1019
creating surfaces from point cloud
data 1021
exporting point cloud data
to ASCII format 1451
to LAS format 1451
to SDF format 1451
filtering point cloud data 1024
importing point cloud data 375
index file 1013, 1019
overview 1012–1013
point cloud data store 375, 1013,
1019
point cloud drawing object 375,
1013
point cloud groups 1019
styling point cloud data
by classification 675
by elevation 675
by LiDAR intensity value 675
by RGB value 675
working with AutoCAD Civil 3D point
cloud objects 375
working with point cloud data 1013
point cloud manager 374, 1015
adding a file 374
creating a merge group 1015
filtering data 1016
merging files 1017
removing a merge group 1016
specifying coordinate systems 1015
point data 342
and ODBC 342
point features 688
creating 688
theming 1175
point groups
deleting 1005
renaming 1004
Point Mapping dialog box 1733
points 1006–1008, 1032, 1034, 1036,
1038, 1040, 1042, 1044, 1046
and fixed labels 1099
and symbols (video) 645
assigning survey points to point
groups 1006
creating geospatial features from
survey points 1008
creating raster surfaces from 1009
creating survey points 1006
creating survey points using
coordinate geometry 1006
deleting survey points 1007
determining relationships
between 1046
displaying angles between 1160
displaying grade between 1162
displaying horizontal distance
between 1162
displaying slope between 1162
obscuring with labels 1097
removing survey points from a point
group survey points 1007
scale ranges for 646
specifying with angle and
distance 1032
specifying with azimuth and
distance 1042
specifying with bearing and
distance 1034
specifying with deflection and
distance 1038
specifying with distance and
offset 1044
specifying with two bearings 1036
specifying with two distances 1040
styles for 646
styling 1637
styling with symbols (video) 640
symbols for 646
viewing survey point data in the
points table 1008
viewing survey points 1008
Index | 2133
points (geometric) 428, 953
boundary for query location 1241
digitizing by coordinates 953
importing as text 428
query location 1241
points (nodes) 767, 773, 779, 806, 808,
810, 814–815, 827, 850, 860,
870, 875, 878, 889, 892, 953,
1073
adding to topology 878
and topology 827
changing appearance in
topology 870
changing resistance in topology 875
cleaning up 767
clustered 806
dangling objects 810
digitizing 1073
digitizing by coordinates 953
editing in topology 860
explicit 1339
implicit 1339
importing as text 428
marking for cleanup 779
pseudo 808
removing from topology 889
simplifying lines 814
specifying resistance 850
tolerance for deleting clusters 773
updating for topology 892
weeding 814
zero-length objects 815
points of interest symbols 70
POLYDISPLAY command 980
polygon boundary for query
location 1241
polygon features 689
creating 689
splitting 708
theming 1172
theming (video) 1171
Polygon Fill Properties dialog box 1824
polygon topology 833, 836, 840, 843,
1073
and Drawing Cleanup 838
and missing centroids 839
and object data 833
and sliver polygons 839, 843
creating 836
digitizing objects for 1073
exporting 1458
for land cover map 840
for land use map 840
overlaying 1339
overview 833
polygons 430, 836, 841, 867, 884, 887,
889, 892, 898, 920, 955, 960,
963, 969, 971, 974, 978, 1064
adding boundaries 963
adding fill 650
adding holes 963
adding islands 963
adding to topology 884
and gradient fill 960, 978
and islands 955
attaching object data 1064
boundaries for 955
changing fill 963
converting polylines to 971
converting to polylines during
export 1458
converting to polylines from
topology 898
converting topology to 974
creating centroids 433
creating centroids for 836, 887,
950, 977
creating in maps 960
default fill 978
disabling for maps 978
displaying boundaries 978
displaying edges 978
dissolving 1343
dividing 867, 969
editing 963
editing in topology 867
exporting 1458
exporting polylines as 1405
filling 960
finding drawing objects by 1244
importing into AutoCAD Map
3D 430
2134 | Index
incomplete in topology 920
inner and outer boundaries 955
merging in topology 867
nested 971, 974
overview of using in maps 955
query location 1241
rebalancing 963
removing from topology 889
slivers 841
splitting 969
splitting in topology 867
topology 836
updating for topology 892
polyline segments 814–815, 819
simplifying 814
weeding 819
zero-length 815
polylines 776, 808, 814–815, 819, 863,
898, 920, 939, 971
and Drawing Cleanup 776
converting 3D to 2D 776
converting drawing objects to 776
converting to polygons 971
creating from polygon topology 898
creating from polygons during
export 1458
digitizing 138
dissolving pseudo nodes 808
editing in topology 863
exporting as polygons 1405
exporting text enclosed in 1455
filling 939
incomplete in topology 920
simplifying 814
supplementing 819
weeding 819
zero-length 815
Portable Network Graphic images 437
adding with Data Connect 440
PostGIS 340–341
adding feature data to maps 341
provider capabilities for maps 340
using as a data source 341
PostgreSQL/PostGIS
provider capabilities for maps 340
Preview mode queries 1287–1288, 1290
previewing 746
drawing objects in attached
drawings 746
queries 178, 1288, 1290
source drawings for maps 746
previous releases of AutoCAD 754
updating source drawings 754
primary key (identifier properties)
setting in schemas 612
printing
Data View tables 1475
map books 1402
metadata 1515
overview 1357
query reports 1477
privacy 56
privileges for users 83
problem-solving 761
saving drawings 761
profiles 781, 922
compatibility across product
versions 263
for Drawing Cleanup 781
for import/export 263
for topology 922
projections 143
projective transformation
and digitizing 133
Prompt User activities
for workflows 2025
prompts
for splitting features 709
properties 362, 507, 512
adding drawing objects to maps
by 362
altering drawing objects based
on 1265
and joins 507, 512
constraining 601
constraining (video) 599
creating in schemas 598
deleting in schemas 614
editing for features 718
editing in schemas 612
finding drawing objects by 1244
for attached databases 206
Index | 2135
map books 1399
setting identifier (primary key) in
schemas 612
setting physical configuration 612
undoing schema changes 615
using as labels 1093
viewing for drawing objects 1146
viewing for features 1127
PROPERTIES command 992
Properties palette
and Display Manager 1124
drawing attributes 1146
editing feature data 718
property alteration 1296
adding hatch to objects 1283
adding text to objects 1278
based on external data 1270
based on object data 1267
based on object properties 1265
modifying 1286
overview 1261
text insertion point 937
topology queries 1353
with queries 1263
Property Condition dialog box (drawing
queries) 1855
property conditions for queries 1244
editing 1258
property index 1294
property settings
in Schema Editor 1739
Property Value Mapping dialog box
(Export) 1728
providers
capabilities in maps 305
pseudo nodes 808
dissolving 808
Publish to Autodesk MapGuide dialog
box 1577
Publish to MapGuide Results dialog
box 1379
Publish To MapGuide Results dialog
box 1578
publishing
attribute data 1367
map books to DWF format 1401
map books to plotters 1402
maps 1360
maps as web pages 1374
maps to plotters 1364
metadata 1515
options for DWF 1367
overview for maps 1357
to MapGuide 1378
purchasing data 62
Q
QSELECT command 1220
quantile distribution 1165
queries 83, 369, 756, 894, 1053
adding drawing objects to maps
with 369
adding hatch to retrieved drawing
objects 1283
adding text to retrieved
objects 1278
altering properties of retrieved
objects 1261, 1263, 1265,
1267, 1270
and numeric ranges 1242
and raster images 1296
and topology 894
block attribute conditions 1248
boundary for 1241
categories 182
combining conditions 1256
database 1053
default directory 229
defining for drawing data 1237
Draw mode 1287–1288, 1291
drawings with xrefs 1296
editing after saving 184
editing conditions 1258
executing 1287
external 177, 180
for attached databases 206
for features 1207
improving performance 150, 1292,
1294, 1296
indexes for 1294
issues with groups 1300
2136 | Index
issues with hatch 1300
joining conditions 1258
library 174, 178
link data conditions 1248
loading 184
location and buffer (video) 1302,
1306
location conditions 1241
model space 1235
modes 1288
modifying property alterations 1286
object data conditions 1248
operators 1256
options 245
overview 1235
paper space 1235
precedence of conditions 1256
Preview mode 1287–1288, 1290
previewing 1290
privileges for 83
problem solving 1300
property conditions 1244
Report mode 1287–1288, 1477,
1479
rerunning 178
running 1477
saving 177
saving objects back to source
drawings 754, 756
selecting feature data with 1130
SQL conditions 1249, 1253
storing 174
topology 1353
using expressions 1541
using wild-card characters 1537
video 1235, 1238, 1245, 1249
with blocks of same name 1296
writing results to file 1477
xrefs 1300
query library
adding external queries 180
categories 182
overview 174
running stored queries 178
saving queries 177
Query Library Administration dialog box
(drawing queries) 1858
querying
drawings (video) 24
features (video) 24
querying features
video 305
Quick Select 1219
for drawing objects 1219–1220
Quick View 746
redrawing the screen 746
Quick View Drawings dialog box 2013
Quickbird images
adding to maps 437
R
RADIUS variable 1546
ramps
for drawing layer themes 1183
Range of Values dialog box (for
theming) 1629
range table 1272
creating 1272
ranges
finding drawing objects using 1244
for object classes 125
for schema property values 599
for themes (video) 1163
Raster Design 451
and image location 451
inserting images with Raster
Extension 455
Raster Extension 454
correlation defaults 257
correlation source 251
detaching images 255
display quality 254
frame options 253
inserting images with 455
memory use 259
options 249
resource file directory 251
selection methods 256
Raster Extension Options dialog box
(Insert Image command) 1879
Index | 2137
raster images 291, 437, 440–442, 449–
451, 453–455, 465, 468, 471, 473–
475, 478–479, 481–482, 485–490,
493–494, 496, 498–499, 501, 503–
504
2D 444
adding contour lines 1190
adding to maps 437
adding with Data Connect 440, 442
adjusting brightness 673
adjusting contrast 673
analyzing 1188
and maps 291
and REGEN 459
and transparency 449
changing transparency 450
displaying extents 674
displaying in color or greyscale 674
exporting drawing objects to 1465
formats not supported by Data
Connect 453–455, 459,
462, 465, 467–468, 471, 473,
475, 478–479, 481–482, 485–
490, 493–494, 496, 498–499,
501, 503–504
formats supported by Data
Connect 443, 445
information for 474
inserting from the command
line 471
inserting manually 451
metadata for 1486
resampling 674
setting insertion point 451
setting single-color
transparency 673
styles for 672
viewing information 474
web-based 445
Raster Object Enabler 453
raster surface 1009
raster-based surfaces 437, 440–442
adding to maps 437
adding with Data Connect 440, 442
Rebuild Sheet Set 1381
records
viewing for drawing objects 1144
records (database records) 426, 434–435,
523, 529, 532, 534, 537, 1056,
1064, 1067, 1069, 1083, 1085
adding in Data View 1056
altering drawing objects based
on 1270
attaching multiple to drawing
objects 1066
attaching to drawing objects
automatically 1067
attaching while digitizing 138,
1083, 1085
copying 1056
deleting in Data View 1056
displaying as text 435
editing in Data View 1056
editing in object data 1069
editing links 537
exporting with objects 1405
filtering 1231
filtering by location 1234
finding drawing objects by 1248
finding in Data View 1222, 1225
importing 426, 434
linking automatically to drawing
objects 532
linking to drawing objects 523,
529, 1064
linking to drawing objects in
maps 534
object data 201
printing 1475
SQL conditions 1253
records (metadata) 1507
redrawing the screen 746
after Quick View 746
REFEDIT command 1537
commands blocked during 1537
reference systems
adding 1362
Military Grid Reference System
(MGRS) 1362
registering maps 136
2138 | Index
relational database tables 342
and feature classes 342
setting up users for AutoCAD Map
3D 584
relational databases
setting up users for AutoCAD Map
3D 585
releasing locks for drawing objects 736
Remove Connection activity
for workflows 2043
Remove Feature Layer activity
for workflows 2044
Remove Group activity
for workflows 2044–2045
Remove Highlighting activity
for workflows 2038
Remove Object Data Index dialog
box 1933
removing
coordinate system assignment 150
Rename Category dialog box (drawing
queries) 1860
Rename Range Table dialog box (drawing
queries) 1860
Rename Table dialog box 1797
Rename Topology dialog box 1988
renaming 899, 925
map books 1402
object data fields 202
object data tables 202
topology 899, 925
Report mode queries 1287–1288, 1477,
1479
reports
creating during a query 1477, 1479
for attribute data 1473
template for 1479
topology 1353
residual calibration 133
resistance 850, 860, 863, 875
and network topology 850
editing for topology 860, 863
for links and nodes in topology 875
using in best route analysis 1330
using in flood trace analysis 1334
using in path trace analysis 1326
resource file directory
Raster Extension 251
resources
copying metadata 1504
reusing
expressions in queries 1541
layers from Display Manager 1470
revision numbers 698
and automatic update 698
RGB color system
importing objects using 269
rights 83
RLC 1 and 2 images
adding to maps 437
RLC images
inserting with Raster Extension 455
RLE images
inserting with Raster Extension 455
RMS error 133
roads 831, 847, 873, 875
changing direction in topology 873
changing resistance in topology 875
creating network topology 831
specifying direction 847
tracing in topology 1334
rotating 931
drawing objects in maps 931
drawings 169
rotation
altering with queries 1261
using to specify image location 451
ROTATION variable 1546
routes
finding best 1330
finding shortest 1326
flood trace 1334
RST images
inserting with Raster Extensions 455
rubber sheeting 932, 934
maps 934
video 927, 932
Run AutoCAD Command activity
for workflows 2046
Run Library Query dialog box (drawing
queries) 1861
Index | 2139
Run Workflow activity
for workflows 2047
running
workflows 278
S
sample data
downloading 63
for AutoCAD Map 3D 62
on product CDs 63
symbol libraries 70
SANGLE variable 1546
satellite imagery
purchasing 72
samples 63
save back 761, 764
improving performance 1296
options 764
problem-solving 761
save back extents 170, 756
resetting 170
using to save drawing objects 756
viewing 170
Save Current Query dialog box (drawing
queries) 1862
Save Features dialog box 1608
Save Layer File activity
for workflows 2048
Save Objects to Source Drawings dialog
box 1887
save sets 730, 750–752, 754, 756, 759,
761, 764
adding drawing objects
automatically 764
adding objects to 751
for maps 750
object locking 730
options 764
problem-solving 761
removing drawing objects from 759
saving queried objects to source
drawings 754, 756
turning off prompt 764
viewing objects in 752
Save Version dialog box 1750
saving 738, 751, 754, 756–758, 761, 917
drawing objects 738
drawing objects as raster
images 1465
drawing objects to new drawing 758
drawing objects to source
drawings 754, 756
drawings 738
drawings and exploding blocks 761
feature styles 652
layers as SDF (video) 1469
layers from Display Manager 1470
new drawing objects to
drawings 751
objects to the current map 757
options for drawings 764
problem-solving 761
queries 177
schemas 608
topology 917, 1354
vs. exporting as SDF 1469
scale 451
setting for map 638
specifying for raster images 451
scale bars
samples 62, 71
scale factors
altering with queries 1261
for drawing objects 931
for source drawings 169
for text 225
scale ranges
defining for layers in Display
Manager 644
understanding 643
video 640, 643
scale reduction factor 91
scale thresholds (Display Manager)
creating 668
modifying 668
viewing all styles 670
scaling 931
drawing objects in maps 931
drawings 169
Schema Editor 608
abstract classes (inheritance) 612
2140 | Index
and OSGeo FDO Provider for SQL
Server Spatial 610
backing up schemas 608
base classes 612
constraints 612
creating schemas 598
deleting schemas 614
editing schemas 612
enabling long transactions 612
exporting schemas 608
identifier properties (primary
key) 612
importing schemas 608
overview 596
physical configuration 612
undoing schema changes 615
versioning 612
viewing schemas 609
Schema Editor dialog box 1739
schemas 608
and Bulk Copy 1744
appending feature classes
(video) 610
appending feature classes to
(video) 594
ArcSDE 579
backing up 608
constrained properties (video) 594
constraints 601
constraints (video) 599
copying foreign 621
creating 598
defintiion 551
deleting 614
deleting properties (video) 594, 610
editing 612
exporting with Schema Editor 608
importing 381
importing (video) 582, 586, 594,
606
importing with Schema Editor 608
MySQL 567
ODBC 576
Oracle 554
overview 551, 554
overview of procedures 595
Schema Editor 596
SDF 569
SHP 572
SQL Server 559
SQL Server Spatial 561
SQLite 565
undoing changes to 615
using native views 603
viewing 609
WFS (Web Feature Service) 581
screen pointing area
for digitizing 132
SDF 44, 388
creating files (video) 43
exporting layers to (video) 1376
viewing contents (video) 1453
SDF 1 or 2 files
importing 389
SDF 2 files
exporting 1417–1418
SDF data stores 586
SDF files
creating 588
creating (video) 582, 586, 594
exporting from DWG and
back 1467
exporting to 1413
exporting vs. saving 1469
importing 387
moving DWG data to 629
provider capabilities for maps 337
saving Display Manager layers
as 1470
schemas 569
working with data 571
SDTS (Spatial Data Transfer
Standard) 381, 413–414
importing 381, 414
overview 413
Search To Select 1131
searching
DataTable 1131
for features 1214
seed file
default for exporting DGN files 269
for DGN files 1435
Index | 2141
Select Actions dialog box page 1588
Select Alias dialog box 1933
Select Coordinate System dialog
box 1609
Select Data dialog box 1811
Select Data dialog box (drawing
topology) 1989
Select Database Version dialog box 1688
Select Display Element dialog box 1631
Select Drawings to Assign Coordinate
System dialog box 1599
Select Drawings to Attach dialog
box 1811
Select Existing Link Template dialog
box 1689
Select Feature Classes dialog box (Display
Manager) 1631
Select Features activity
for workflows 2049
Select Images dialog box (Display
Manager) 1631
Select Layers dialog box (Display
Manager) 1631
Select Link Template dialog box 1690
Select Link Template Key dialog
box 1797
Select Link Templates dialog box 1690
Select Objects dialog box page 1595
Select Plot Set to Convert dialog
box 1831
Select Query dialog box 1691
Select Table dialog box 1691
Select Topologies dialog box (Display
Manager) 1631
selecting 694, 770, 993
checked out features 694
classified objects 993
drawing objects 1219–1220
features 1207
objects for Drawing Cleanup 770
records in databases 1225
selecting features
using buffers (video) 1302
Sequence activities
for workflows 2025
server CS code
for Web Map Service (WMS) 447
Set Property Alterations dialog box
(drawing queries) 1863
SETELEMENTS command 1829
setup 77
overview 77
Seven Parameter Transformation
conversion method 94
Shape Multiclass 1443–1444
exporting 1405, 1444
exporting to 1443
ShapeFile 335–336, 381, 1424
adding feature data to maps 336
converting to drawing objects 335
exporting as folder 269
exporting multiclass 1444
exporting to 1424
folder option 1424
importing 381, 397
importing as folder 269
importing vs. adding.to maps 335
provider capabilities for maps 335
SHAPENAME variable 1546
sheet sets
and map books 1381
short linear objects 773, 779, 796
erasing 796
marking for cleanup 779
tolerance for deleting 773
shortest path analysis
video 1319, 1324
shortest path trace 1326
Show Foreign Data Stores 314, 324, 333
SHP data stores 586
SHP files 335–336, 397, 1424
adding feature data to maps 336
and Bulk Copy 617
creating 588
exporting data from Civil 3D 545
exporting multiclass 1444
exporting to 1424
importing 381, 397, 399
importing vs. adding 335
multiclass 1443
provider capabilities for maps 335
2142 | Index
schemas 572
working with data 574
SID images
inserting with Raster Extension 455
SIF files
exporting 1417
SIZE variable 1546
SL King Provider 540
sliver polygons 839, 841, 843
finding when creating topology 843
finding when overlaying
topologies 843
removing 839
slope 1162
and theming 1202
displaying 1162
theming surfaces for 1203
snapping nodes 806
soil drawings
samples 63
solid fill 939
adding to closed polylines 939
Sort dialog box (records) 1692
Source Data dialog box 1897
Source Drawing Scope dialog box 1633
source drawings 730, 738, 745–746,
748, 754, 756, 764, 852, 917, 951
activating 160
aligning 169
assigning coordinate system 146
attaching to the current
drawing 158
backup files 764
descriptions 166
drive aliases for 161
editing in AutoCAD Map 3D 748
editing topology 852
global coordinate systems 146
indexing 1294
locking 730
matching edges 951
offset for 169
opening 163
previewing objects in 746
querying 1237
Quick View 746
retrieving objects from 1237
rotating 169
save back extents 170, 756
saving objects to 738
saving queried objects to 754, 756
saving topology to 917
scaling 169
settings 164
symbol table information 172
tiled 154, 756
transforming 169
viewing coordinate systems 151
viewing information 172
zooming to extents 745
source files
for maps 3
spatial analysis
video 1319
spatial contexts
editing 311
selecting coordinate systems for 590
spatial data
metadata for 1486
Spatial Data File 44, 388
Spatial Data Organization Editor 1764
Spatial Data Transfer Standard files 381
importing 381, 414
overview 413
spatial databases
overview 551
spatial filters 418
during import 418
spatial filters (Data View) 1234
spatial indexes
and Bulk Copy 625–626
speed 875
for links and nodes in
topology 850, 875
Split and Merge Rules dialog box 1669
split prompts
setting options 709
split rultes
ignoring 708
splitting
features (video) 706
polygon features 708
Index | 2143
SPOT images
inserting with Raster Extension 455
SQL Condition History dialog box
(drawing queries) 1866
SQL conditions 364
dates 1253
editing 1258
for drawing queries 1249
maximum number in history
list 225
operators 1253
quotation marks 1253
selecting drawing objects for maps
by 364
strings 1253
troubleshooting 1253
SQL Expression dialog box (link
templates) 1814
SQL Link Condition dialog box (drawing
queries) 1866
SQL links index 1294
SQL queries
for drawing data in Data View 1231
for drawing objects 1230
SQL Server 323–324
adding feature data to maps 324
and long transactions 323
provider capabilities for maps 323
schemas 559
working with data 561, 564, 566
SQL Server Spatial 326
and Bulk Copy 617
authentication options 326
creating data stores 561, 592
geography type for geodetic
coordinate system 326
invalid geometry 326
provider capabilities for maps 326
schemas 561
SQL variables 1549
SQLite 330
adding feature data to maps 331
creating data stores 565
exporting to 1405
importing 381, 415
provider capabilities for maps 330
schemas 565
SQLite data stores 586
SQLite files
creating 588
exporting to 1447
importing 414
SRID numbers
and EPSG numbers 590
standard deviation 1165
and digitizing 133
Standard Order Process Editor 1774
state plane coordinate systems 143
statistics 474, 916
for raster images 474
for source drawings 172
for topology 916
printing using report queries 1477,
1479
viewing for raster images 474
street centerline data
samples 63
stretching drawings 934
STRING variable 1546
string-handling functions 1543
Style Band dialog box 1633
Style Label dialog box 1634
Style Library 665–666
Style Line dialog box 1636
Style Point dialog box 1637
Style Polygon dialog box 1639
Style Text Layer dialog box 1640
STYLE variable 1546
styles 300
and map layers 300
and symbols 660
combining 662
composite styles for drawing
layers 662
composite styles for lines 649
for areas 650
for contour lines 1191
for display elements 665
for drawing layers 657, 660, 662
for drawing objects 652, 654
for features 641
for lines 649
2144 | Index
for maps 631
for points 646
modifying for drawing layers 663
referencing 666
saving in library 665
stylesheets
for metadata 1489
styling
and scale ranges (video) 643, 648
drawing objects on import 385
features (video) 3, 7, 34
using themes (video) 1163
Superuser 83, 142, 202, 227, 730, 733,
736
default password 142
forcing user login 227
logging in as 142
modifying object data tables 202
options 227
releasing locks 736
setting up privileges 83
turning on object locking 730, 733
surface
connecting to raster surfaces through
Data Connect 1021
create surface from data
connection 1010
create surface from file 1009
create surface from point
data 1009, 1011
creating surfaces from point cloud
data 1021
ESRI ASC 1021
GeoTIFF 1021
raster surface 1009
viewing surfaces 1021
surfaces 437, 440–442
3D (video) 1187, 1192, 1194
adding contour lines 1190
adding to maps 437
adding with Data Connect 440, 442
analyzing 1188
and contour lines 1189
applying hillshading 1200
applying vertical exaggeration 1200
changing theme colors 1205
coloring by elevation (video) 37,
1187, 1199, 1204
coloring surfaces based on elevation
(video) 1204
draping 2D data on 1193
draping layers on (video) 1192
draping layers on (video) slope
analysis
video 1187
fly through 1196
hillshading (video) 1199
motion path animation 1196
orbiting 1196
panning 1196
slope analysis (video) 1202
swiveling 1196
theming to display height, slope, or
aspect 1203
vertical exaggeration (video) 1199
video 1187
viewing in 3D 1196
walk through 1196
zooming in 3D 1196
survey 371, 373, 998, 1000–1008, 1471
adding a point group 1003
point groups 1003–1005
project 1001–1003
adding a point group 1001
removing a project from a survey
data store 1002
removing a survey 1003
renaming 1002
removing a survey from a
project 1003
renaming 1003
survey data store 1000
connecting to 1000
creating 1000
editing 612
viewing active data store
only 1000
working with survey data 998
survey data store
importing ASCII point data 373
importing LandXML data 371
Index | 2145
survey points 342, 1003–1008
and ODBC 342
assigning survey points to point
groups 1006
creating geospatial features from
survey points 1008
creating survey points 1006
creating survey points using
coordinate geometry 1006
deleting survey points 1007
exporting to a LandXML file 1471
importing ASCII point data 373
importing LandXML data 371
point groups 1003–1005
removing survey points from a point
group 1007
viewing survey point data in the
points table 1008
viewing survey points 1008
SWIDTH variable 1546
Switch Map activity
for workflows 2050
swiveling surfaces in 3D 1196
symbol libraries
samples 69
symbol tables
viewing for source drawings 172
symbol-handling functions 1544
symbols 62
adding to point layers 646
combining styles 662
for drawing layers 660
for point features (video) 640, 645
general use 70
samples 69
symmetric difference overlay 1309
system-generated properties
in Schema Editor 1739
T
TAB files 381, 402, 404
exporting 1405
exporting to 1433
importing 381, 402, 404
importing as folder 269
Table Filter dialog box 1693
Table Filter History dialog box 1696
Table Properties dialog box 1696
tables (database tables) 209, 215, 523,
526–527, 529, 532, 534, 537,
539, 1048, 1053, 1056, 1085
adding records in Data View 1056
and Data View 1048
attaching to drawings 209
connecting 215
converting from object data 534
deleting link templates 539
deleting links 537
deleting records in Data View 1056
detaching from drawings 209
disconnecting 215
editing database path 539
editing in Data View 1056
editing links 537
filtering records 1231
filtering records by location 1234
finding records 1222
key columns 526
link templates 526
linked 527
linking records to drawing
objects 529
linking to drawing objects in
maps 523, 532
linking to while digitizing 1085
navigating in Data View 1048
opening 527
opening in Data View 1053
options 238
printing 1475
querying 1053
saving changes in Data View 1056
searching 1225
SQL conditions 1253
UDL (Universal Data Link) file
for 209, 213
viewing for drawing objects 1048
tables (object data) 202, 435, 534, 827,
831, 836, 914, 1064, 1066–1067,
1069, 1083
adding fields 202
2146 | Index
attaching multiple records to drawing
objects 1066
attaching records to drawing
objects 1064
attaching to drawing objects
automatically 1067
converting to database tables 534
creating 201
creating while digitizing 1083
deleting 202
displaying as text 435
editing 202, 1069
exporting 1405
for network topology 831
for node topology 827
for polygon topology 836
importing 426, 434
modifying fields 202
renaming 202
viewing for topology 914
tablet for digitizing 130, 132
TABLET mode 1080
and digitizing¶ 1080
TAG variable 1546
Tagged Image File Format images 444
adding with Data Connect 440,
443–444
TARGA images
inserting with Raster Extension 455
Task Pane
data source options 236
Display Manager tab 634–635, 654
hiding 221, 1908
making transparent 221
options 221
refreshing 221
showing 1908
templates 62
and annotation 1105, 1107–1108
applying for metadata 1492
creating for metadata 1492
deactivating for metadata 1495
exporting from metadata 1496
for map books 66, 1386
for metadata 1484–1485, 1490
for query reports 1479
for styling drawing objects 385
importing for metadata 1492
installed location for 66
previewing for metadata 1494
removing from metadata 1497
renaming for metadata 1493
samples 66
setting default for metadata 1494
text 428, 435, 532, 937
adding for drawing layers 1176
adding to annotation layers 1114
adding to queried objects 1278
adjusting for map distortion 225
altering drawing objects based
on 1265
altering with queries 1261
attaching to objects in maps 937
displaying data as 435
exporting as points 1405
exporting when enclosed in a
polyline 1455
finding drawing objects by 1244
for drawing layers 660
height for drawing layer
themes 1176
importing points as 428
insertion point 937
label point 937
linking to external data for
maps 532
options 225
specifying type for tables 201
units 225
text layers
creating 1110
text layers (video) 1109, 1111, 1113,
1115
text styles 764
altering drawing objects based
on 1265
altering with queries 1261
finding drawing objects by 1244
for drawing layer themes 1185
redefining on save back 764
when importing points into
maps 428
Index | 2147
texture maps 1192
TGA images
inserting with Raster Extension 455
Thematic Mapping dialog box 1642
thematic maps
legend 1117
Thematic Values dialog box 1644
Theme dialog box (features) 1645
themes
based on height, slope, or
aspect 1202
by layer type 1163
changing colors for 1205
creating for drawing layers 1176,
1181
creating for feature layers 1168
distribution methods 1165
for drawing data 1178
methods to use 1165
ranges for (video) 1165
transparency 1172, 1174–1175
using for analysis 1163
video 1163, 1165, 1171
theming
features (video) 7, 37
thickness
altering drawing objects based
on 1265
altering with queries 1261
finding drawing objects by 1244
THICKNESS variable 1546
third party providers 540–541
adding 541
thumbnail 302
changing for map layers 302
TIFF images
adding with Data Connect 440,
443–444
Tile Properties dialog box 1831
tiled drawings 756, 951
matching edges 951
saving back to 756
tiles
deleting from map books 1403
renaming for map books 1402
viewing and editing in map
books 1397
viewing in map books 1399
Time Period Information Editor 1761
tolerance for Drawing Cleanup 773
topographic map 1189
topology 367, 430, 788, 806, 808, 810,
814–815, 822, 825–827, 829, 831,
833, 836, 838, 840–841, 847,
850, 852, 860, 863, 867, 870,
873, 875, 878, 880, 884, 887,
889, 892, 894, 899, 907, 911,
913–914, 916–917, 920, 922, 925–
926, 974, 1073
adding drawing objects to maps
by 367
adding linear objects 880
adding links 852
adding nodes 852, 878
adding polygons 852, 884
analysis settings 922
analyzing (video) 1319
and clip operations 1336
and Drawing Cleanup 788, 838
and erase operations 1336
and identity 1336
and paste operations 1336
and union operations 1336
auditing 920
best route 1330
buffering 1347
changing appearance of nodes 870
changing link direction 873
changing resistance 875
clustered nodes 806
combining 1339
completing 920
converting to polygons 974
correcting 920
creating 825, 827, 831, 836
creating centroids for
polygons 430, 836, 887
dangling objects 810
deleting 899, 926
deleting objects 852
digitizing objects for 1073
2148 | Index
dissolving 1343
dividing polygons 867
editing 852, 860, 873
editing partial 894
editing polygons 867
errors 920
exporting 1458
flood trace 1334
highlighting objects 911
islands 920
land cover map 840
land use map 840
left-right relationships 836
links 831
loading 899, 907
managing 899
merging polygons 867
network topology 829, 831
node topology 827
object data for 913
object data stored for best
route 1328
overlay analysis (video) 1336
overlaying 1339
overview 822
polygon topology 836
profiles for 922
pseudo nodes 808
querying 894, 1353
removing objects 889
renaming 899, 925
repositioning nodes 863
result 1354
saving 1354
saving to source drawings 917
shortest path trace 1326
simplifying lines 814
sliver polygons 841
specifying link direction 847, 850
splitting polygons 867
temporary 1354
testing integrity 920
unloading 907
updating manually 892
video 822, 899, 906
viewing object data 914
viewing statistics for 916
weeding nodes 814
zero-length objects 815
Topology Buffer Create New Centroids and
Nodes dialog box 1990
Topology Buffer New Topology dialog
box 1991
Topology Buffer Set Buffer Distance dialog
box 1992
Topology Dissolve Create New Centroids
and Nodes dialog box 1994
Topology Dissolve Create Nodes dialog
box 1995
Topology Dissolve New Topology dialog
box 1996
Topology Dissolve Object Data dialog
box 1997
Topology Dissolve Set Parameter dialog
box 1998
Topology Overlay Analysis Analysis Type
dialog box 1999
Topology Overlay Analysis Create New
Centroids and Nodes dialog
box 2002
Topology Overlay Analysis Create Nodes
dialog box 2003
Topology Overlay Analysis Output
Attributes dialog box 2006
Topology Overlay Analysis
OutputTopology dialog
box 2004
Topology Overlay Analysis Select Overlay
Topology dialog box 2007
Topology Query dialog box 2008
Topology Query Result dialog box 2010
Topology Selection dialog box 2011
Topology Statistics dialog box 2011
TOPONAME variable 1546
TOPOTYPE variable 1546
trace analysis
best route 1330
flood trace 1334
shortest path 1326
tracking coordinates 1148–1150
setting coordinate tracker
options 232
Index | 2149
using coordinate system for attached
drawing 1150
transactions
long (versioning) 612
transforming 931
coordinates 225, 231
drawing objects in maps 931
entire source drawing 169
transparency
and styles 650
and themes 1172, 1174–1175
for polygon features (video) 1171
for raster images 449
for Task Pane 221
in themes 1171
video 640
Transparency Color dialog box (Insert
Image command) 1883
transparent commands 1027–1028
using 1028
Transverse Mercator projection 143
Trim Objects at Boundary dialog
box 1672
trimming objects 945
troubleshooting
broken connections in Display
Manager 350
buffers 1308
Bulk Copy 625–626
data stores from previous versions of
AutoCAD Map 3D 325
drawing queries 1296, 1300
error messages when editing
schemas 610
invalid data for SQL Server
Spatial 326
SQL conditions 1249, 1253
True Colors
importing objects using 269
TrueVision images
inserting with Raster Extension 455
tutorials
AutoCAD Map 3D 58
Type SQL Condition dialog box (drawing
queries) 1870
TYPE variable 1546
U
UDL (Universal Data Link) file
editing 213
overview 209
UNCLASSIFY command 990
Undefined Alias Referenced dialog
box 1934
undershoots 773, 779, 801
extending 801
marking for cleanup 779
tolerance for extending 773
undoing
feature class changes in
schemas 615
property changes in schemas 615
schema changes in feature
sources 615
union overlay 1309
uniquness
for schema property values 599
United States grid data files 105
units
default 225
units of measurement
converting for text 225
default for exporting DGN files 269
Universal Transverse Mercator
System 143
unloading topology 907
unlocking drawing objects 736, 759
unmatched data or geometric type
errors
ignoring in Bulk Copy 1744
Update Edits Automatically 722
changing default setting 88
enabling 700
turning off 722
updating topology 892
URL variable 1546
URLs 389
exporting to SDF 2 files 1417
importing from SDF 1 or 2 files 389
Use FDO Enabled Schema 561
User Administration dialog box 1934
User Coordinate System (UCS) 1154
2150 | Index
User Credentials dialog box 1610
User Information dialog box 1936
user interface in AutoCAD Map 3D 85
User Login dialog box 1937
users 83
database and AutoCAD Map 3D 585
rights 83
valid usernames 83
V
validation
and SQL Server Spatial 326
variables 937, 1541, 1546
AutoLISP 1551
block attributes 1549
dot variables 1546
LABELPT 937
object class properties 1551
object data 1549
SQL 1549
vector data 1193
draping on 3D surfaces 1193
purchasing 72
Vector Markup Language (VML) files
exporting 1405
exporting to 1449
Vector Product Format (VPF)
importing as folder 269
Vector Product Format (VPF) files
importing 381, 416–417
version-enabling
Oracle 557
versioning 305, 723, 725
and Bulk Copy 1744
for feature data 725
for feature sources in maps 305
long transactions 612
versions 725
activating for feature data 725
creating for feature data 725
discarding for feature data 725
vertical exaggeration
video 1187, 1199
videos
adding AutoCAD layers to Display
Manager 352, 634
adding multiple images to a single
layer 437
analyzing topologies 1319
appending feature classes to a
schema 594
appending feature classes to
schemas 610
appending features to a feature
class 31
appending features to feature
classes 43
automatic checkout 713
bringing in a subset of data 305
bringing in data from Civil 3D 9,
43, 543
bringing in data from ODBC 305,
342
bringing in data from web
servers 305, 346, 437, 445
bringing in drawing objects 9
bringing in features 9
buffers 37, 1302
Bulk Copy 43, 616–617
calculated fields 1125, 1132
checking in features 693, 721
checking out features 695, 701, 721
coloring surfaces by elevation 37,
1187, 1199, 1204
complete list of 51
connecting to data 13
connecting to data sources 3, 9
connecting to feature sources 305
constrained properties 599
constraining fields in a schema 43
constrants 594
contour layers 1187
contour lines 1189
converting a map to DWG
format 628
coordinate system 143
coordinate systems 11
coordinate transformation 143
Index | 2151
copying data between data
stores 616–617
creating data stores 582, 586, 594
creating features 684, 686, 691
creating features from AutoCAD
objects 19
creating SDF files 43
Data Table 1125, 1130, 1136, 1138,
1140–1141
deleting properties from
schemas 594, 610
Display Manager 634, 636
draping layers on surfaces 1187,
1192
draw order 634, 636
drawing cleanup 727, 766
editing features 684, 701, 721
editing features in a database 19
exporting current map to
DWG 1405
exporting DWG data to GIS 628
exporting DWG to SDF 1405
exporting feature data 1141
exporting layers to SDF 1376, 1405,
1469
exporting styled DWG data 628
exporting styled DWG objects 1453
exporting the current map to
DWG 1459
georeferencing 932
highlighting features 1136, 1138
how exported maps look in
DWG 1459
importing schemas 43, 582, 586,
594, 606
inserting images 437, 459
joining attributes to features 37
joins 507, 509, 514
labeling features 185–186, 190, 194,
640, 645, 648, 1089, 1091,
1096, 1098
layers and scale ranges 640
legends 185–186, 190, 194, 1089,
1117
making features transparent 640
managing layers 634, 636
map books 46, 1360, 1381
MapGuide 46, 1360, 1376
metadata 30, 1481, 1486, 1498
multi-user editing for drawing
files 727, 730, 734, 738
multi-user editing of drawings 19
network topology 727, 822, 829
overlay analysis using drawing
topologies 1336
overlay analysis using feature
classes 1309
overlay analysis using
topologies 1319
overlaying two topologies 822, 829,
841
publishing map books 1389
publishing map books to DWF 46,
1360, 1366
publishing map books with attributes
to DWF 1381, 1389, 1400
publishing to MapGuide 3
queries 1235, 1238, 1242, 1245,
1249
querying attached drawings 24
querying attached DWG files 352,
358
querying feature classes 24
raster-based surfaces 1187
replacing points with symbols 640,
645
rubber sheeting 927, 932
saving layers to .layer files 1405,
1469
scale ranges 643, 648
scale ranges for styles 640
selecting features 1130
shortest path analysis 822, 829,
1324
slope analysis 1187, 1202
splitting polygonal features 706
styling and scale ranges 643, 648
styling features 3, 7, 34
surfaces 1187
text layers 1109, 1111, 1113, 1115
themes 1165, 1171
theming data 1163
2152 | Index
theming features 7, 37
theming polygons 1171
topologies 1319
topology 822, 899, 906
using 3D view 1187, 1192, 1194
vertical exaggeration 1187, 1199
viewing attribute data for
features 27
viewing the contents of SDF
files 1453
zooming to features 1140
View Query Statement dialog box 1610
viewing 474, 746, 914, 916, 1048
coordinate system assignment 151
database tables 1048
drawing objects in attached drawings
for maps 746
external data for drawing
objects 1048
in 3D 1196
map book properties 1399
map book tiles 1399
map books 1397–1398
metadata 1486
raster image information 474
save back extents 170
schemas 609
source drawing information 172
source drawings for maps 746
statistics for source drawings 172
topology data 914
topology statistics 916
using Quick View 746
views
database 603
viewscale expressions 1545
viewtwist expressions 1545
Visual FoxPro
attaching database to drawing 209
setting default version 243
VML (Vector Markup Language)
files 1449
exporting 1405
exporting to 1449
VPF (Vector Product Format)
importing as folder 269
VPF (Vector Product Format) files
importing 381, 416–417
W
walk through for surfaces 1196
water data
samples 63
water symbols
samples 69
watersheds 836
creating polygon topology for 836
weather data
purchasing 72
Web Feature Service (WFS) 346
adding feature data to maps 348
metadata for 1486
provider capabilities for maps 346
Web Map Service (WMS)
adding images to maps 447
specifying version 447
making background transparent 447
metadata for 1486
provider capabilities 445
specifying format 447
web pages
exporting to 1449
publishing maps as 1374
web-based raster images 445
weeding 814, 819
and bulge 816
and supplementing factors 816
defined 816
lines with Drawing Cleanup 814,
819
polylines 819
wells
creating topology for 827
WFS
video 346
WFS (Web Feature Service) 346
adding feature data to maps 348
metadata for 1486
provider capabilities for maps 346
schemas 581
working with data 582
Index | 2153
While activities
for workflows 2025
Who Has It Information dialog box 1889
widening conversion
and Bulk Copy 623
width
altering with queries 1261
digitizing 138
wild-card characters 1537
using in dialog boxes 1537
using in expressions 1553
windows
finding all objects in 1241
Windows authentication
and SQL Server Spatial 326
WKT
and coordinate systems 590
WMS
video 305, 437, 445
WMS (Web Map Service)
adding images to maps 437, 447
adding surfaces to maps 441
adding with Data Connect 440
metadata for 1486
provider capabilities 445
Workflow Designer
changing the display 289
Workflow Designer parameter dialog
box 2022, 2025
Workflow Designer window 2022
workflows
activity dialog boxes 2025
activity parameters 281
Add Feature Layer activity 2028
Add Group activity 2029
Add Map activity 2030
binding parameters 281
Change Feature Layer Properties
activity 2030
Change Feature Layer Symbol
activity 2031
Change Group Properties
activity 2033
Connect To Data Store activity 2034
Create Buffer Layer activity 2036
creating 281, 284, 287
Display Feature Attributes
activity 2037
editing 284
for automating activities 275
Highlight Features activity 2038
List Current Connections
activity 2039
List Feature Classes activity 2039
List Feature Layer Properties
activity 2040
Load Layer File activity 2041
overview 275
parallel and sequenced
activities 281
Perform Overlay activity 2041
Remove Connection activity 2043
Remove Feature Layer activity 2044
Remove Group activity 2044–2045
Remove Highlighting activity 2038
Run AutoCAD Command
activity 2046
Run Workflow activity 2047
running 278
Save Layer File activity 2048
Select Features activity 2049
settings 289
Switch Map activity 2050
utility activities 2025
Workflow Designer 2022
Zoom To Extents activity 2050
working offline 696, 722
and checking out features 696
workspaces 84–85
creating for AutoCAD Map 3D 85
in AutoCAD Map 3D 84
World Coordinate System (WCS) 1154
X
XLS files
attaching to drawing 209
setting default version 243
XMI files
importing as schemas 608
XML files 608
exporting schemas as 608
2154 | Index
for object class definitions 129
importing as schemas 608
xrefs 157
and drawings 157
querying 1300
XSCALE variable 1546
Y
YSCALE variable 1546
Z
Z dimensions 562, 610
zero-length objects 815
identifying and removing 815
Zoom Drawing Extents dialog box 2014
Zoom Scale dialog box 1697
Zoom To Extents activity
for workflows 2050
zooming 745
Display Manager 670
surfaces in 3D 1196
to drawing extents 745
to raster image extents 674
using Data Table 1141
zooming to features
video 1140
ZSCALE variable 1546
Index | 2155
2156
