eQ 3 WS200US Wireless Weather Station User Manual Manual
eQ-3 Limited Wireless Weather Station Manual
eQ 3 >
Manual

Operating Instructions
Weather station
„WS 200US“
ELV Electronics Ltd. · Hongkong
2
These operating instructions belong with this product. They contain important information
for putting it into service and operating it. This should be noted also when this product is
passed on to a third party.
Therefore look after these operating instructions for future reference!
A list of contents with the corresponding page numbers can be found in the index on page 4.
1st English edition May 2006
Documentation © 2006 ELV Electronics Limited
All rights reserved. This handbook must not be reproduced in any form, even in excerpts, or
duplicated or processed using electronic, mechanical or chemical procedures without written
permission of the publisher.
This handbook may contain mistakes and printing errors. The information in this handbook is
regularly checked and corrections made in the next issue. We accept no liability for technical
mistakes or printing errors, or their consequences.
All trademarks and patents are acknowledged.
Printed in Hong Kong
Modifications due to technical improvements may be made without prior notification.
00066548 Y2006 V1.0
3
Introduction
Dear Customer,
Thank you for purchasing this product.
The product has been EMC-tested and thus meets the requirements of the valid national
guidelines. See also FCC Information.
In order to maintain this condition and ensure safe operation, you, as the user, have to observe
this operating manual.
Prior to using the product for the first time, please read the entire operating manual and observe
all operating and safety instructions.
We should already like to point out now the correct order for commissioning the
products. Please also observe the installation and calibration instructions in this
operating manual as well as the information about impairment of radio transmission
between the sensors and base station.
All company names and product descriptions listed herein are the trademarks of the re-
spective manufacturers. All rights are reserved.
F
4
Table of Contents
Page
1. Intended Use .................................................................................................................... 6
2. Scope of Delivery ............................................................................................................. 6
3. Explanation of Symbols................................................................................................... 7
4. Features and Functions................................................................................................... 7
a) Base Station ................................................................................................................. 7
b) Multipurpose Sensor .................................................................................................... 9
c) Outdoor Sensor ........................................................................................................... 9
5. Safety Instructions ........................................................................................................... 9
6. Battery and Accumulator Information ......................................................................... 10
7. Preparation and Start-up .............................................................................................. 11
a) Start-up of the Multipurpose Sensor ......................................................................... 11
b) Start-up of Other Sensors .......................................................................................... 14
c) Start-up of the Base Station ...................................................................................... 14
d) Registration of Sensors during Operation ................................................................. 15
8. Indications of the LC Display ........................................................................................ 16
9. Configuration and Operation ........................................................................................ 18
a) Basic Settings, Configuration .................................................................................... 18
Calling-up the configuration mode ............................................................................ 19
Setting the date and time .......................................................................................... 19
Entering degrees of latitude and longitude ................................................................ 20
Setting the time zone ................................................................................................. 21
Assigning the march indication .................................................................................. 21
Selecting the unit for the temperature indication ....................................................... 22
Selecting the unit for the wind speed ........................................................................ 22
Exiting the configuration mode .................................................................................. 22
b) Operation .................................................................................................................. 23
Selecting the indoor temperature .............................................................................. 23
Selecting the outdoor temperature ............................................................................ 23
Selecting the outdoor sensor ..................................................................................... 23
Indicating the MIN/MAX values.................................................................................. 23
Indicating the time/date for the single extreme value ................................................ 24
Deleting the MIN/MAX values .................................................................................... 25
Setting the contrast of the LC display ....................................................................... 25
5
Page
c) Further Functions ....................................................................................................... 26
Indication of the moon phases .................................................................................. 26
Wiz Kid ....................................................................................................................... 26
Weather forecast ........................................................................................................ 26
Wind symbol indication (wind cone) .......................................................................... 27
Comfort indicator ....................................................................................................... 27
Frost warning ............................................................................................................. 27
Storm warning............................................................................................................ 27
10. Replacing the Battery .................................................................................................... 28
a) Base Station ............................................................................................................... 28
b) Multipurpose Sensor, Outdoor Sensors..................................................................... 28
11. Troubleshooting ............................................................................................................. 29
12. Coverage ........................................................................................................................ 31
13. Maintenance and Cleaning ........................................................................................... 32
a) General ....................................................................................................................... 32
b) Cleaning the Base Station ......................................................................................... 32
c) Cleaning the Multipurpose Sensor and the Outdoor Sensors ................................... 33
14. Handling .......................................................................................................................... 34
a) General ....................................................................................................................... 34
b) Base Station ............................................................................................................... 34
c) Multipurpose Sensor .................................................................................................. 34
15. Explanation of Terms ..................................................................................................... 35
16. Disposal .......................................................................................................................... 37
a) General ....................................................................................................................... 37
b) Disposal Instructions for Batteries/Accumulators ..................................................... 37
17. Technical Data ................................................................................................................ 38
18. FCC-Information ............................................................................................................ 39
Appendix A: Position table (longitude/latitude) ............................................................... 40
Appendix B: Table of time zones ..................................................................................... 58
19. Brief Instructions ........................................................................................................... 59

6
1. Intended Use
The Weather Station WS 200US is a high-quality universal weather measuring system which is
able to process a large number of weather data and additional information and can indicate both
current values and forecasts.
All relevant data are simultaneously presented on the LC display, further data can be indicated
by pressing a key.
A special feature is the figure of the ”Wiz Kid”. The clothes he wears show the current outdoor
temperature range, his hair and scarf reflect the range of the current wind speed and his umbrella
indicates prognosticated rain.
The forecasts of the basis station are to be considered orientation values. They do not represent
an absolutely accurate prognosis. The manufacturer does not take over any responsibility for
incorrect indications, measured values or weather forecasts and the consequences thereof.
This product is designed for private use and is not suitable for medical purposes or for informing
the public.
The components of this product are not a toy, they contain fragile glass and ceramic parts.
Set up all the components in such a manner that they are out of the reach of children.
The product is operated by batteries. All external sensors transmit their data to the base station
via radio in the range of 433 MHz (coverage up to 100m in the free field).
Use other than that described above will lead to damage to the product.
Please read the complete operating instructions before use. They contain important
information for correct installation, functioning and operation.
2. Scope of Delivery
• Weather Station WS 200US
• Plastic foot for the weather station
• Operating instructions

7
3. Explanation of Symbols
The symbol with the lightening in the triangle is used when your health is at risk, e.g.
through an electric shock
An exclamation mark in a triangle indicates important information in these operating
instructions which must be observed without fail.
The ”hand” symbol can be found when you are to be given tips and information on
operation.
4. Features and Functions
a) Base Station
Indication of indoor temperature and air humidity
• temperature indication in °C or °F / air-humidity indication in % rH (% relative air humidity))
• can be switched to the indication of the inside dew point
• storage of minimum/maximum temperatures with the corresponding times/dates of
measurement
• storage of minimum/maximum air humidity with the corresponding times/dates of measurement
• Climatic comfort zone indicator
• graphical representation of the march of temperature over the last 24 hours
Indication of an outdoor sensor (temperature and air humidity)
• indication of the data of the multipurpose sensor or of the 8 outdoor sensors for temperature/
air humidity
• optional indication of temperature, dew point or perceived temperature (windchill)
• storage of minimum and maximum temperatures with the corresponding times/dates of
measurement
• storage of minimum and maximum air humidity with the corresponding times/dates of
measurement
• Graphical representation of the march of temperature over the last 24 hours
Indication of wind speed
• wind speed indication with selectable units: km/h, m/s, mph
• storage of the maximum wind speed values with the corresponding times/dates of measurement
• additional graphical representation (wind cone) for light, moderate and strong winds
F
8
Indication of the march of air pressure/indication of the tendency of
air pressure
• graphical representation of the pressure march over the last 24 hours
• storage of the minimum and maximum air pressure values with the corresponding times/
dates of measurement
• indication of the tendency of air pressure in 5 different steps: strongly increasing, increasing,
unchanging, decreasing, strongly decreasing
Symbol indication of the weather forecast
• symbols for: rainy, cloudy, bright, sunny
Indication of time and date
• integrated quartz clock
Indication of sunrise and sunset
• based on the locations which are to be entered individually, a calculation is possible in the range
from -60°N to +60°N
Indication of the phases of the moon
• indication of the current phase of the moon in 8 steps: new moon, waxing moon, full moon,
waning moon (with intermediate steps)
Warning functions
• frost warning for a temperature decreasing below 4°C (symbol: ice crystal)
• storm warning for a sharp air pressure decrease within a short period of time (symbol: danger
sign)
”Wiz Kid” weather indicator
Following the almost forgotten weather house, in which a person with an umbrella steps out of
the door in case of bad weather and a person lightly dressed appears in case of good weather,
the WS 200US is provided with the ”Wiz Kid”.
The behaviour of this figure depends on various weather factors so that you can see at a glance
which dressing you should put on if you want to go outside.
This indicator does not only reflect the current measured values for outdoor temperature, air
humidity and wind, but also the weather forecast data.
Therefore, many different presentations and kinds of clothing of ”Wiz Kid” are provided
and shown according to the weather situation.
• The clothing of ”Wiz Kid” depends on the outdoor temperature measured at the multipurpose
sensor and ranges from swimming shorts up to the complete winter dressing including a cap,
a muffler and gloves.
• At wind speeds higher than 20 km/h (moderate wind) the hair of ”Wiz Kid” blow in the wind and
if he has put a muffler on – dependent on the temperature, too – it also blows in the wind.
• If the weather forecast predicts rain, the ”Wiz Kid” will take his umbrella with him.
F

9
b) Multipurpose Sensor
• Radio transmission of:
- wind speed
- temperature
- air humidity
C) Outdoor Sensor
• Radio transmission of:
- temperature
- air humidity
5. Safety Instructions
The warranty will lapse for damage due to non-compliance with these operating
instructions. We shall not be held liable for any consequential damage or loss!
We shall not accept liability for damage to property or personal injury caused by
incorrect handling or non-compliance with the safety instructions. Any claim to warranty
will lapse in such cases.
Dear Customer, the following safety and risk instructions are intended not only for the
protection of your health but also for the protection of the device. Please read through the
following points attentively:
Do not use this product in hospitals or medical institutions. The outdoor sensor does only emit
relatively weak radio signals. These radio signals could, however, lead to malfunctions in life-
supporting systems. The same may possibly apply to other areas.
The weather station is only designed for dry rooms. Do not expose it to direct sunlight, high
temperatures, coldness or excessive dampness and humidity.
The multipurpose sensor (and separately/additionally available outdoor sensors) is suitable for
operation in non-protected outdoor areas.
For safety and licensing (CE) reasons, unauthorised conversion of and/or modifications to the
product are not permitted.
Do not leave packaging material lying around carelessly. Plastic foil/bags and polystyrene parts
etc. could become dangerous toys for children.
Handle the product with care. It can be damaged through impact, blows or by being dropped
even from a low height.

10
6. Battery and Accumulator Information
• Batteries/accumulators must be kept out of the reach of children.
• Make sure that the batteries/accumulators are inserted with the correct polarity.
• Do not leave the batteries/accumulators lying around in the open; there is a risk of their being
swallowed by children or domestic animals. If swallowed, immediately contact a doctor.
• Leaking or damaged batteries/accumulators can cause burning if they come into contact with
the skin. For this reason you should use suitable protective gloves.
• Make sure that batteries/accumulators are not short-circuited or thrown into a fire. There is a
risk of explosion!
• Never dismantle batteries/accumulators!
• Batteries may not be recharged. There is a risk of explosion!
• In case of longer periods of non-use (e.g. during storage) remove the inserted batteries/
accumulators to avoid damage by a leaking battery/accumulator.
• Always replace the whole set of batteries/accumulators. Do not mix batteries/accumulators
of different types/manufacturers.
• Never mix batteries with accumulators!
Please note:
The weather station, multipurpose sensor and possibly used outdoor sensors can
be operated by accumulators. However, due to the lower voltage of accumulators
(accumulator = 1.2 V, battery = 1.5 V) the operating life can be decreased. Moreover,
the radio coverage will be reduced, in rare cases even malfunctions can be caused.
Therefore, the following rule applies:
If you face any problem during the operation based on accumulators, use batteries
instead of them. We recommend you to operate the weather station, multipurpose
sensor and possibly existing outdoor sensors only with high-quality alkaline batter-
ies.
Please refer to chapter 16 for the environmental-friendly disposal of batteries
and accumulators.
F
11
7. Preparation and Start-up
Please note:
First start up all provided sensors (multipurpose sensor and possibly exist-
ing outdoor sensors) (insert batteries) before starting up the weather station
itself.
If you fail to follow this order of proceeding, it may be that the base station is
not able to identify the provided sensors!
It is principally recommended to test the base station with all its sensors (supplied multipurpose
sensor and possibly existing outdoor sensors) first in a room, before installing the sensors
outside.
The distance between the base station and the sensors must be at least 2m to avoid
interference. Do not place the sensors side by side, but install them throughout the
area (e.g. if you have purchased several additional sensors).
If you find out that one of the sensors is not received after the installation, you can take it for
granted that the radio reception is too weak.
You avoid complex and time-consuming troubleshooting, if you perform this first functional test.
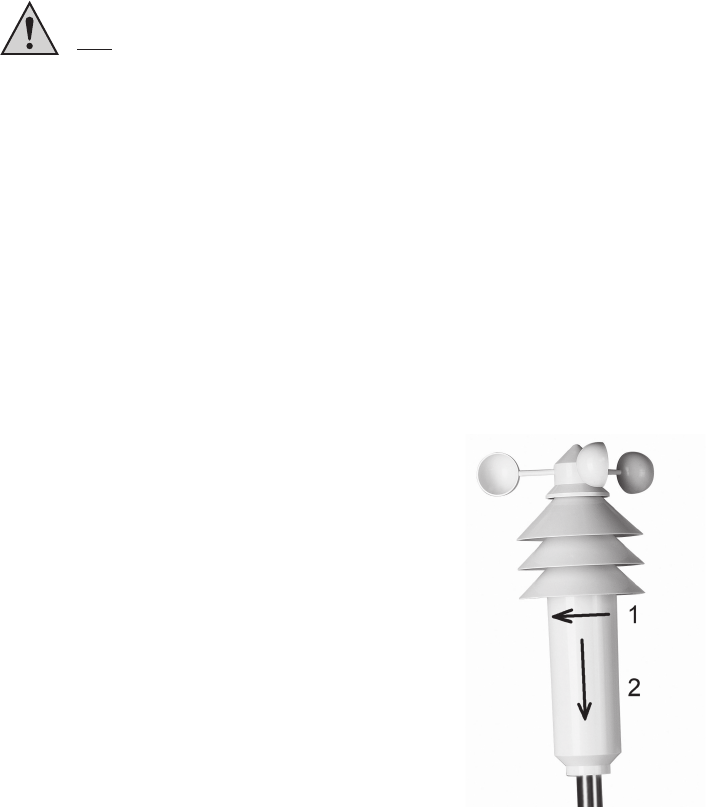
a) Start-up of the Multipurpose Sensor
• Open the housing of the multipurpose sensor. First, turn
the lower cover of the housing a little bit towards the arrow
as shown on the right (1) and then pull it carefully
downwards (2).
• There are two options to mount the sensor on a mast:
1. Own installation mast, e.g. purchased in the DIY
superstore
2. Optionally available installation mast matched to the
system (not included in the scope of delivery, is to be
ordered separately)
Fig. 1
F
12
• Screw out the two small screws at the bottom
of the multipurpose sensor a little bit.
• Insert the supplied mounting rod of 25cm from
into the multipurpose sensor the bottom in such
a way that the two holes in the mounting rod
are directly positioned under the screws.
• Then tighten the two screws carefully (screws
are to be screwed into the holes of the mounting
rod).
• The mast required must have a diameter of
between 25mm and 45mm. It can either be a
free mast or a mounting angle, e.g. for a satellite
dish.
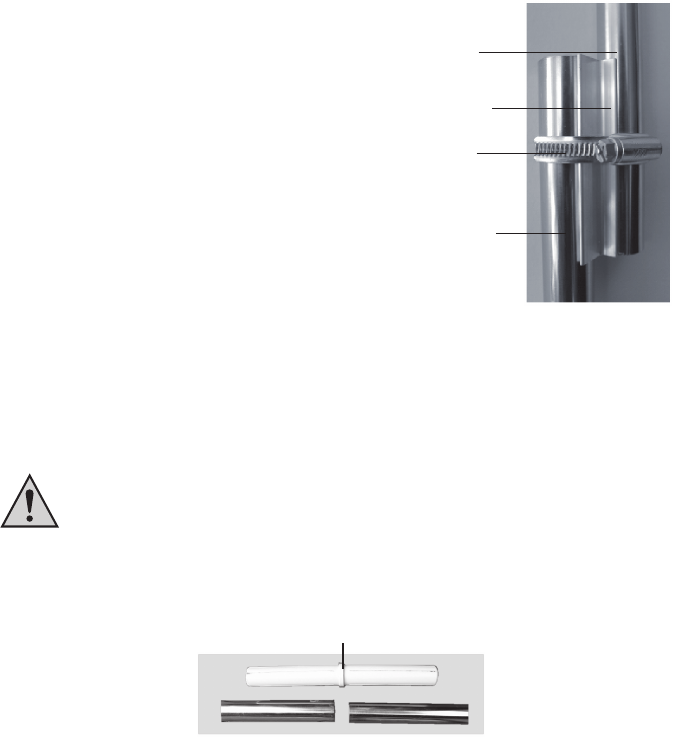
• Position the shaped aluminium part on one
side of this mast/mounting angle and put a
hose band clip over the two parts.
• Set the short mounting rod of the sensor against the other side of the shaped aluminium part
(on the right side in Figure 2 above) and tighten the hose band clip by using a screwdriver.
2. Optionally available installation mast (not included in the scope of delivery)
If you want to drive the rod with the flat tip (serves as an earth tip) into the ground by
means of a hammer, use a suited wooden clump in any case to protect the mast.
Otherwise, the upper end of the rod will be damaged (installation of the sensor mast
will not be possible any longer), guarantee will lapse!
• Assemble the single parts of the sensor mast. Plastic couplers combine the individual rods.
plastic coupler
Fig. 2b
• The flat rod end serves as an earth tip.
Proceed as follows for mounting:
1. Own individual installation mast
supplied
mounting rod
supplied shaped
aluminium part
mounting clip
installation mast
Fig. 2a
13
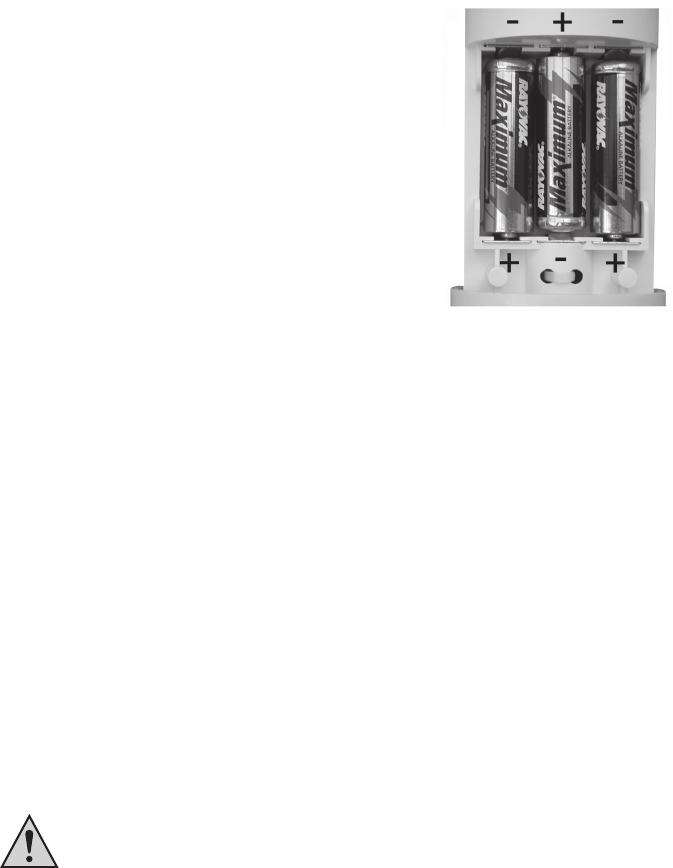
• After the installation of the mast, insert three batteries (AA/
Mignon) with the correct polarity into the battery compart-
ment. You will find the corresponding image in the battery
compartment (see also figure 3 on the right).
If possible use alkaline batteries.
As already described in chapter 6, accumulators
can be used, too. They, however, can have a nega-
tive influence on the operating life, coverage and
operational safety.
• During the following 5 minutes, the sensor is in the so called
synchronisation mode in which it sends one data package
every 4 seconds.
During this period of time you should insert the batteries
into the base station so that it can identify the sensor.
Fig. 3
• Then close the housing of the multipurpose sensor again, slide the cover upwards and lock it
by turning it to the right (reverse direction than shown in Fig. 1).
• To avoid unnecessary long ways for checking the functions, the final positioning, e.g. in the
garden, should be performed only after a successfully completed functional test as described
at the beginning of this chapter.
The correct location of the multipurpose sensor is decisive for obtaining the most accurate
measuring values.
The temperature sensor inside the housing of the multipurpose sensor is positioned at
the top below the ”umbrellas” in a ventilated area of the housing. Therefore, in direct
sunlight only a slightly higher temperature value will be measured.
Please ensure that the wind sensor at the tip of the multipurpose sensor is not posi-
tioned too close to houses, trees etc., because this could falsify the measured values
of the wind speed.
That’s why, the multipurpose sensor should be set up in a free space, e.g. in the
garden.
• The mast must firmly stick in the soil with the multipurpose sensor being positioned
approximately 2 m above the ground.
When selecting the place of installation, consider the safety for children, pets,
vehicles etc.
If the multipurpose sensor falls down, there is risk of injury or damage to vehicles
or other objects.
Make sure that there are no pipes (e.g. hose pipes for irrigating systems or
similar) at the place where the earth rod is inserted/driven into the ground.
F
F
14
b) Start-up of Other Sensors
If you want to use several additional temperature/air humidity sensors suited to the Weather
Station WS 200US, insert the batteries into the sensor(s) now. A maximum number of 8 of such
sensors can be operated.
The installation, addressing and start-up of the sensor is to be performed according to their
operating instructions.
c) Start-up of the Base Station
The base station is designed to indicate all registered and calculated data on a clearly arranged
LC display. The sensors for indoor use (temperature, air humidity, air pressure) are also included
in the housing of the base station.
For this reason, ensure during the start-up or installation of the base station that a heating or
ventilation system (e.g. an air-conditioning system) is not in its proximity, because false data
could be indicated in such a case. Avoid direct sunlight, too!
Keep to the following order of steps during the start-up:
• Open the battery compartment on the back side of the base station (remove the foot first, if
necessary!).
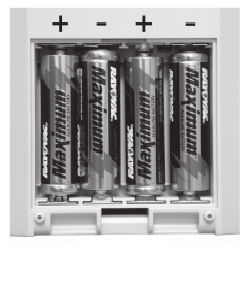
• Insert four batteries (AA/Mignon) in the battery com-
partment paying attention to the correct polarity. You
will find the corresponding image in the battery
compartment (see also figure 4 on the right).
If possible use alkaline batteries.
As already described in chapter 6, accumu-
lators can be used, too. They, however, can
have a negative influence on the operating
life, coverage and operational safety.
• Close the battery compartment again.
• If the batteries are inserted, all segments of the LC
display will be shown briefly.
Fig. 4
• Afterwards, the base station activates the synchronisation mode for 15 minutes. In this period
of time all sensors received will be indicated one after the other.
If all your installed sensors have already been received, you can cause a premature
exit of the synchronisation mode by pressing any button, provided that all sensors
have already completed their own synchronisation mode.
If you face any problem in the identification of one sensor, you should wait as long
as the synchronisation time is finished. This process takes 15 minutes.
F
F

15
• After the synchronisation, the normal display of all weather data is shown.
Only sunrise and sunset as well as the phase of the moon have not been indicated
yet, because time and data are to be set before.
• Configure the base station as described in chapter 9 ”Configuration and Operation”.
• The base station can either be hung up on the wall (a suited opening is provided on the back
side) or placed on a foot onto a surface.
If you drive a nail into the wall or drill a hole for a plug with screw for this
purpose, pay attention that no power, gas or water pipes can be damaged,
grave danger!
• If you want to use the foot, first put the front central spike of the foot into the supports on the
back side of the base station. Then, swing the foot a little bit back till the two rear spikes lock
into the catch supports at the bottom of the base station.
d) Registration of Sensors during Normal Operation
When starting up the product, all available suited sensors are registered at the base station in
the synchronisation mode and then received during normal operation
(time required for the synchronisation of the base station takes about 15 minutes after inserting
the batteries, time required for the synchronisation of the sensors takes about 5 minutes after
inserting the batteries).
To register further new, additionally purchased sensors (or sensors lost during the battery replace-
ment) you do not need to follow the procedure of the initial start-up.
All data saved (minimum and maximum values, time etc.) would be lost during this
kind of proceeding.
Every day, the base station performs a synchronisation test at 8 a.m. and 6 p.m. so that it can
identify new sensors (or a sensor with battery replacement) automatically.
But if the new sensor is not indicated, the problem may be found in the coverage
(see chapter 12 ”Coverage”).
F
F
F
16
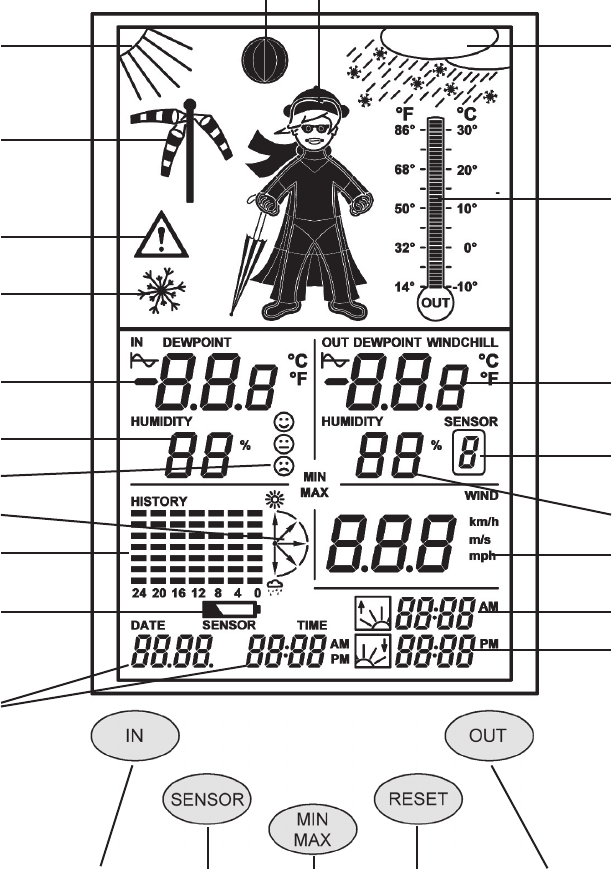
8. Indications of the LC Display
17 16
15 15
18
14
19
20
1 13
2
12
3
4 11
5 10
6 9
8
7
A B C D E

17
1 indoor temperature
2 indoor air humidity
3 comfort zone indicator (for indicating comfortable/uncomfortable climate)
4 indication of the air pressure tendency
5 graphical presentation of the march (history), according to the unit selected
6 indication of empty battery (”LoBat”)
7 time and date indication
8 sunset time
9 sunrise time
10 current wind speed
11 current air-humidity value of the selected outdoor sensor
12 sensor number (no indication, if the multipurpose sensor has been selected)
13 current temperature value of the selected outdoor sensor
14 analogue temperature indication of the multipurpose sensor
15 symbols for the weather forecast (sunny, bright, cloudy, rainy)
16 animated ”Wiz Kid” symbol
17 symbol for the phase of the moon
18 additional graphical representation (wind cone) for light, moderate and strong winds
19 bad weather warning
20 frost warning
Control key functions in normal operation (see chapter ”Configuration” for further functions):
A IN Switching the indoor temperature indication between temperature/dew point
B SENSOR Selection of the outdoor sensor
C MIN/MAX Selection of the minimum or maximum value indication
D RESET No function
E OUT Switching the outdoor temperature indication between
temperature/dew point/windchill
Other symbols/terms:
Indicates that this value is presented in the march indication (5)
DEWPOINT Dew point
WIND CHILL Perceived temperature
MIN/MAX Minimum or maximum indication is active
18
9. Configuration and Operation
When the batteries have been inserted into the sensors and the batteries have been inserted
subsequently into the base station (this order is to be strictly followed), the data transmitted via
radio by the sensors should appear in the LC display of the base station.
a) Basic Settings, Configuration
The following settings are still required for operation:
• year, month, day, hour, minute
• latitude and longitude degrees of your location
• time zone
Only after these settings, the phase of the moon, MIN-/MAX-data and the sunrise/
sunset times as well as the date and time will be indicated.
Additional setting options:
• assignment of the march indication (air pressure, indoor or outdoor temperature; standard:
air pressure)
• unit of the temperature measurement (standard: °C)
• unit of the wind speed measurement (standard: km/h)
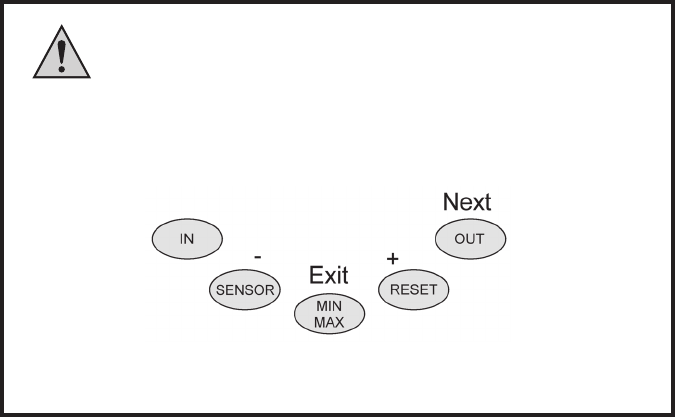
In the configuration mode the keys have the following functions:
Imprint Function Description
IN (not used, no function)
SENSOR - Decrease value
MIN/MAX EXIT Exit the configuration mode
RESET + Increase value
OUT NEXT Go to next setting
This key layout is also given on the back side of the weather station.
F
19
Please note:
If you press the + or - key during the individual settings a little bit longer, the values
will be changed rapidly.
After each setting procedure you can exit the configuration mode by pressing the
EXIT key or you can go the the next setting by activating the NEXT key.
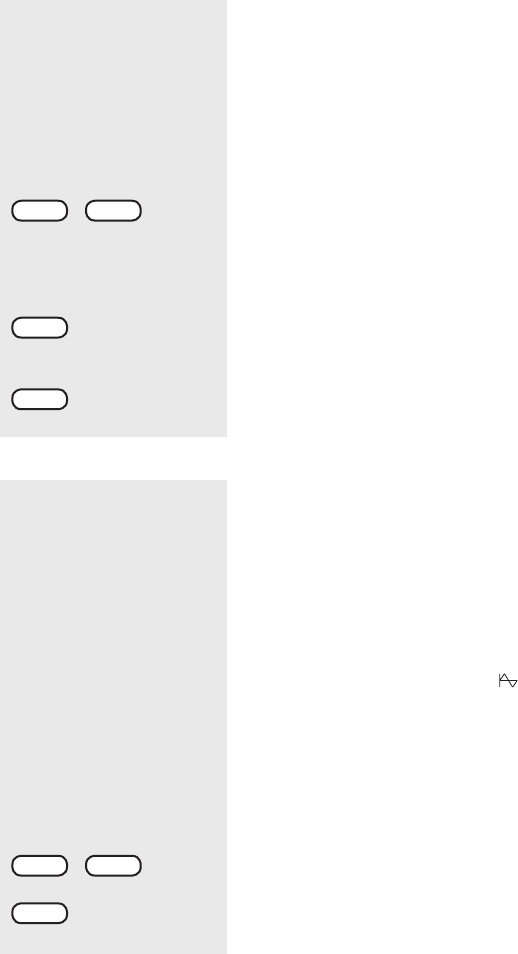
The configuration is performed according to the following order:
year Æ month Æ day Æ minutes Æ hours Æ latitude degree (LA = latitude) Æ
Längengrad (LO = “Longitude”) Æ Zeitzone (ti) Æ assignment of the march indication Æ
temperature unit Æ wind unit
Afterwards, the setting order restarts from the beginning.
IN >2 seconds
+-
+-
+-
NEXT
NEXT
NEXT
NEXT
+-
+-
NEXT
hours
minutes
day
month
year
Calling-up the configuration mode
Press the IN key for approx. 2 seconds till the display
changes.
The configuration mode can be closed at any time by
pressing the EXIT key (= MIN/MAX). See ”Exiting the
Configuration Mode”.
Setting the date and time
Set the current year via the + and - keys.
Press the NEXT key.
Set the month via the + and - keys.
Press the NEXT key.
Set the day via the + and - keys.
Press the NEXT key.
Set the minutes via the + and - keys.
Press the NEXT key.
Set the hours via the + and - keys.
Press the NEXT key, afterwards you can set the latitude
degree (in the display appears LA = latitude). See next page.
F
F

20
Entering the degrees of latitude/longitude
The entry of the location of the weather station is required
for the calculation of sunrise and sunset times.
The degree of latitude can be entered in the range from
-60.0° to +60.0°.
The degree of longitude can be entered in the range from
0.0° to 360.0°.
The position of Washington D.C. is programmed by the
manufacturer.
You can determine your location in different ways:
• You find a table with the coordinates of all US counties in
the chapter ”Position Table”. Select a town close to you
and enter its coordinates.
• If you possess a GPS navigation device, e.g. in your car
or a mobile one, you can take over its location information
and then you have your exact position.
• You can also get the exact coordinates via the Internet.
It provides numerous pages which contain information on
navigation.
Please consider the fact that the data for sunrise or sunset
are only exact at the sea or for a totally even landscape. Hills,
high forests etc. alter these values for your location.
Even for ideal positions the data may vary by some minutes,
because an approximation formula is used for the calculation.
Set the degree of latitude via the + and - keys.
For example: 52.5°, entry: 525
Press the NEXT key. Afterwards, the degree of longitude
can be entered. In the display these data are indicated by
LO (= longitude).
Set the degree of longitude via the + and - keys.
For example: 13.4°, entry: 0134
Press the NEXT key. Now, set the time zone. ”ti” is faded
into the display.
+-
NEXT
NEXT
+-
longitude
latitude
21
Setting the time zone
The entry of the time zone is required for the calculation of
sunrise and sunset times.
Enter the difference to the GMT (Greenwich Mean Time) =
UTC (Universal Time).
In the appendix is a table showing the time zone difference
from UTC for North America time zones.
Set the current value for your time zone via the + and - keys.
To ensure the correct functioning of the weather station, all
settings required have been performed at this point. The
extended settings are not necessary for normal operation.
Press the EXIT key to close the configuration mode and turn
back to the normal mode. Afterwards, the base station is in
normal operating mode.
Press the NEXT key to set further values if required. See
below.
NEXT
assigning
the
march
direction
+-
+-
NEXT
close the
configuration
mode
EXIT
time
zone
extended
configurations
or
Assigning the march indication
The following representations can be assigned to the course
indication:
• air pressure
• indoor temperature
• outdoor temperature
If the march indication is assigned to one of the two tem-
perature indications, the symbol “ ” appears additionally
in the corresponding display field.
Fading-in/Identification in the display field:
P = air pressure
O = outdoor temperature
I = indoor temperature
Select the assignment desired via the + and - keys.
Press the NEXT key. Now, the unit of the temperature
indication can be selected.
22
Selecting the unit for the temperature
indication
The following units can be selected:
°C = grade Centigrade (basic setting)
°F = grade Fahrenheit
Here, the indication is presented with the analogue tem-
perature indication, in the normal operating mode in all
temperature display fields.
Select the unit desired for indicating the temperature via the
+ and - keys.
Press the NEXT key. Now, the unit of the wind speed can be
selected.
NEXT
unit
for
temperature
indication
+-
NEXT
unit
for
wind speed
+-
EXIT
Selecting the unit for the wind speed
The following units can be selected:
km/h = kilometres per hour
m/s = meters per second
mph = miles per hour
The indication is given in the WIND field.
Select the unit desired for indicating the wind speed via the
+ and - keys.
If you press the NEXT key, the year will appear
again and the order of entries will start from the
beginning. Now, you could either check or change
the entries.
Exiting the configuration mode
Press the EXIT key to close the entry. This can be done at
any position, e.g. after entering the time.
The data already entered will be saved automatically.
F
23
b) Operation
Selecting the indoor temperature indication
In the normal operation mode, the indoor temperature and air humidity are presented in the IN
display field.
Press the IN key repeatedly to switch between
• indoor temperature
• corresponding dew point (= DEWPOINT)
Selecting the outdoor temperature indication
In the normal operation mode, the outdoor temperature and air humidity are presented in the
OUT display field.
Press the OUT key repeatedly to switch between
• outdoor temperature
• corresponding dew point (= DEWPOINT)
• perceived temperature (= WINDCHILL)
Selecting the outdoor sensor
In the Sensor display field the currently selected outdoor sensor and its sensor number are
shown. Only active sensors (received in the synchronisation phase) are indicated.
To select the outdoor sensors or the multi-purpose sensor, press the SENSOR key as often as
it is required to indicate the sensor number desired.
• For the outdoor sensors 1-8 the corresponding sensor number (1-8) is displayed.
• For the multipurpose sensor a sensor number will not displayed, the faded in SENSOR
(beside the outdoor air humidity) will disappear.
Indicating the MIN/MAX values
The minimum and maximum values obtained for the measured values of the indoor/outdoor
temperatures and air humidity since the last deletion of data are saved.
For the wind speed measurement, only the MAX value is saved.
All MIN and MAX values are saved together with the corresponding times and dates
of the extreme values.
If the MIN/MAX keys are pressed several times, the display will switch between the indication of
the minimum values, the indication of the maximum values and the normal display.
F

24
Proceed as follows for calling up the saved data:
• Calling up minimum values
Press the MIN/MAX key. MIN appears in the centre of the display.
Now, the minimum values are indicated in the corresponding display fields. For the wind
speed a value will not be given (because the minimum value would always be ”0”).
• Calling up maximum values
Press the MIN/MAX key once again (starting from the normal display press the key twice).
MAX appears in the centre of the display.
The maximum values are indicated in the corresponding display fields.
• Go back to normal display
If you press the MIN/MAX key again, you go back to the normal display, MAX appears in the
display.
Indicating the time/date for the single extreme value
If required, you can indicate the time and date at which each single value was measured.
Proceed as follows:
• First, select either the indication of the minimum values (press the MIN/MAX key once, MIN
is shown in the LC display) or the indication of the maximum values (press the MIN/MAX key
twice, MAX is shown in the LC display).
• Now, the value desired can be displayed by pressing the SENSOR key several times.
Order of indication:
indoor temperature Æ indoor air humidity Æ outdoor temperature Æ outdoor air humidity
Æ wind speed (MAX value only)
Each time, only one display field is shown with its extreme value, at the bottom the
point of time and date appear at which the extreme value was measured.
• By a next pressure on the SENSOR key you come back to the overview display of all extreme
values (MIN or MAX, depending on your selection of the minimum or maximum values).
F
F
F

25
Deleting the MIN/MAX values
The extreme values can either be deleted in the group (all minimum or all maximum values) or
individually.
Delete single value
• Press the MIN/MAX key once to display the minimum values or twice to display the maximum
values.
• Select the value you want to delete by activating the SENSOR key.
• Press and hold the RESET key longer than two seconds to delete the value selected.
Delete group
• Press the MIN/MAX key once to display the minimum values or twice to display the maximum
values.
• Press the RESET key longer than two seconds to delete the group selected.
Setting the contrast of the LC display
The contrast of the LC display can be set according to your requirements. For doing this, an
opening for setting the contrast is located between the suspending ear and the battery compart-
ment on the back side of the weather station. Using a small flat-blade screwdriver you can set
the desired display contrast.
Do not use force in doing so, turn the setting controller very carefully!

26
c) Further Functions
Indication of the moon phase
The moon phases are indicated by the following symbols:
full moon waxing moon new moon waning moon
Fig. 7
The indication of the moon phases will only be displayed, if time/date are entered.
Wiz Kid
As an animated figure the ”Wiz Kid” shows several weather factors simultaneously:
• Outdoor temperature (multipurpose sensor only)
Depending on the outdoor temperature measured at the multipurpose sensor, the clothing of
”Wiz Kid” change from swimming shorts to complete winter clothing including a cap, a muffler
and gloves.
• Rain
If the weather forecast predicts rain, the ”Wiz Kid” will take his umbrella with him.
• Wind speed
At wind speeds of more than 20km/h (moderate wind) the hair of ”Wiz Kid” blows in the
wind.
If he has put on a scarf, this one will also blow in the wind.
Weather forecast
The symbols describing the weather forecast of the weather station are positioned at the top of
the display and deliver the following prognoses:
clouds with rain ➜ rainy
clouds ➜ cloudy
clouds with sun ➜ bright
sun ➜ sunny
F
27
Wind symbol indication (wind cone)
The wind cone symbol shows at a glance whether the wind is light, moderate or strong at the
moment.
wind cone hangs down ➜ light wind (< 10km/h)
wind cone is lifted to half the height ➜ moderate wind (1…20km/h)
wind cone is standing horizontally ➜ strong wind (> 20km/h)
Comfort indicator
The comfort indicator (J K L) reflects the room air conditions (relationship of temperature
to air humidity). Please refer to the chapter ”Explanation of Terms” for finding a value table of
the indication ranges.
Frost warning
The frost warning (ice crystal symbol) will be displayed, if the temperature decreases below 4°C.
The frost warning will be deactivated as soon as the temperature increases above 5°C.
Storm warning
The storm warning (danger signal symbol) will be activated, if the air pressure decreases con-
siderably within a short period of time. As soon as the air pressure increases again above 5°C
the frost warning will be deactivated.

28
10. Replacing the Battery
The replacement interval varies significantly for batteries and accumulators. High-
quality alkaline batteries are the most efficient ones, whereas accumulators or cheap
zinc-carbon batteries require a more frequent replacement.
a) Base Station
If the battery empty symbol ( ) is displayed, the batteries have to be replaced.
• Always replace the whole set of batteries.
• Never mix full and semi-full batteries.
• Always use four batteries of the same type and manufacturer.
• Never use batteries and accumulators together.
• As already mentioned before, the station can be operated by accumulators, but if batteries
are used, the operating time will be much longer.
• Proceed as described in chapter 7 c) to replace the batteries.
Please note:
After replacing the batteries, all data/values saved in the base station (e.g. time, data
etc.) are deleted and have to be entered anew.
b) Multipurpose Sensor, Outdoor Sensors
If the indication of the individual sensor is not displayed over a period of more than 24 hours,
the batteries are to be replaced as described in chapters 7a) and b).
Check, if the failed data transfer is caused by an interfered radio transmission. In this
case an indication will not be given in the display of the base station neither.
Another possible source of the problem could be for example a metal part placed in
the radio line. Such a problem can be detected by the fact that the data transmission
of other sensors being closer positioned also fail. (See chapter 11 on next page.)
F
F
F
29
11. Troubleshooting
Observe all safety instructions included in these operating instructions!
Problem
No reception
Interference of other
devices by the
outdoor sensors
Problems during
synchronisation
Possible solutions
• The distance between the base station and the outdoor sensors is
too long. Change the place of installation of the outdoor sensors.
• Objects or shielding materials impair the radio reception. Change the
place of installation of the outdoor sensors and the base station.
• The batteries of the outdoor sensors are weak or almost empty. As
a test, insert new batteries into the outdoor sensors.
• Another transmitter at the same or adjacent frequency interferes the
radio signal of the outdoor sensors. This could be wireless phones,
wireless loudspeakers or similar systems.
In most cases, such products are not operated continuously. That
means that the radio reception will be perfect on the following day
and its more difficult to detect the cause of the problem.
If it is possible, set another frequency for these devices. This step
can eliminate the reception problem of the weather station.
• The outdoor sensors emit their data to the base station at intervals
of approximately 3 minutes for the duration of 0.1 second (100ms).
In this short period of time
other devices are possibly interfered. For example, a very short in-
terfering signal can be heard in a wireless phone every 3 minutes.
• When the batteries are inserted into the outdoor sensors and the
base station (keep strictly to this order of proceeding!!), these devices
are in the synchronisation mode. Here, a data telegram is emitted
every 4 seconds. This accelerates the detection and registration
process of the outdoor sensors at the base station.
To force a new synchronisation, take the batteries out of the base
station and the outdoor sensors. Afterwards, wait at least 50 seconds
before inserting the batteries again into the outdoor sensors and
finally in the base station (this sequence is to be observed in any
case, first insert the batteries into all the existing outdoor sensors
and only then insert the batteries into the base station).
However, all the data/values saved in the base station (e.g. minimum
values, maximum values, but also dates and times) will be lost
then.
• Before installing the outdoor sensors for example in your garden,
carry out a functional test as described at the beginning of chapter 7.
30
Problem
Sunrise/sunset
times are not
indicated
Sunrise/sunset
times are wrongly
indicated
Minimum and
maximum values
are not indicated
Moon phase is
not indicated
Possible solutions
• The base station has not been configured. Configure the base
station according to the chapter ”Configuration”.
• The longitude or latitude is set incorrectly. Enter the correct position
(chapter ”Configuration”).
• Time zone is set incorrectly. Enter the correct time zone for your
position (chapter ”Configuration”).
• The date is wrong. Enter the correct date (chapter ”Configuration”).
• The base station has not been configured. Configure the base
station according to the chapter ”Configuration”. Set the time and
date.
• The base station has not been configured. Configure the base
station according to the chapter ”Configuration”. Set the time and
date.
31
12. Coverage
The coverage of the transmission of the radio signals to the base station can reach up to 100m
under optimal conditions. This is also often designated as ”free-field coverage”.
This ideal arrangement (e.g. base station and outdoor sensor on a plane, even meadow
without trees, houses etc.), however, is never reality.
Normally, the base station is installed inside the house, the multipurpose sensor in the garden
and further outdoor sensors are positioned in outbuildings (e.g. in a aviary) or in the garage.
The coverage can be considerably limited by:
• walls, reinforced concrete ceilings
• coated/vapour-deposited insulating glass panes
• vehicles
• trees, brushes, earth, rocks
• the proximity to metallic & conductive objects (e.g. heating elements)
• the proximity to the human body
• broad-band interference, e.g. in residence areas (DECT telephones, mobile phones, wireless
loudspeakers, other radio weather stations, baby phones etc.)
• the proximity to electric motors, transformers, power supply units, computers
• the proximity to improperly shielded or uncovered operating computers or other electric
appliances
However, a guarantee for a specific coverage is not possible as the local circumstances
are different for different places of installation.
If the base station does not receive data from the multipurpose sensor or from pos-
sibly additional other sensors (despite new batteries), reduce the distance between
the outdoor sensors and the base station, change the place of installation.
F
F

32
13. Maintenance and Cleaning
a) General
Check the technical safety of the weather station, such as damage to the housing, at regular
intervals.
When it can be assumed that a safe operation is no longer possible, the product must be put
out of service and precautions taken to ensure that it is not used unintentionally. Remove the
batteries.
It must be assumed that safe operation is not possible any longer, if
• the station is visibly damaged,
• the device does not operate any longer and
• it has been stored for long periods under unfavourable conditions or
• it has been subject to considerable stress in transit.
The safety instructions below must be observed before the weather station is cleaned or
maintained:
Before cleaning, servicing or repair works, the batteries must be removed.
None of the components inside the station is to be maintained by the user. The hous-
ing must not be opened.
Repair work must always be carried out by qualified experts familiar with the hazards
involved and with the relevant regulations.
b) Cleaning the Base Station
Dust may be removed easily by using a vacuum cleaner and a clean, soft brush. Hold the opening
of the vacuum cleaner close to the base station (do not contact it, scratches could be caused!)
and remove the dust by means of the brush. The vacuum cleaner soaks up the dust that has
been blown up.
A soft, dry and lint-free cloth can also be used to clean the outside of the product.
For more resistant dirt, you may moisten the cloth slightly in lukewarm water.
Never use aggressive cleaning agents or chemical solutions, which could damage the housing
or even impair operation.

33
c) Cleaning the Multipurpose Sensor and the Outdoor Sensors
After a longer period of operation in the open, dust can deposit at the plastic surface of the
outdoor sensors. It can be removed rapidly with a cloth slightly moistened in water.
Never use a garden hose to clean the outdoor sensors, because they are only pro-
tected against rain coming from the sky above but not against jets of water coming
from the sides or below.

34
14. Handling
Observe all safety instructions included in these operating instructions!
a) General
The product may not be opened or disassembled (apart from the battery replacement described
in these operating instructions).
None of the components inside the product is to be maintained by the user. Moreover, the licence
(CE) and warranty will lapse in such cases.
Do not drop the product, it will be damaged even if it falls down from a low height.
b) Base Station
Avoid the following unfavourable ambient conditions during the operation of the base station:
- damp or air humidity which is too high
- extreme cold or heat
- direct sunlight
- dust or combustible gases, vapours or solvents
- strong vibrations
- strong magnetic fields such as those found in the vicinity of machinery or loudspeakers.
Do not use the product immediately after it has been taken from a cold environment to a warm
one. The condensation water produced may destroy the product.
Wait until the base station has reached room temperature. This may take several hours!
Select such a place of installation that the base station stands safely and cannot fall down. There
is risk of injury due to its weight.
You should protect scratch-sensitive or valuable furniture surfaces by means of suited supports
before setting up the base station.
c) Multipurpose Sensor
Although the multipurpose sensor is protected against rain coming from above, it is not protected
against water from the sides or below. Therefore, never splash the station, e.g. by means of a
garden hose or another irrigation system.
Select such a place of installation that children can not tilt the multipurpose sensor. Do not set
it up in the proximity of vehicles, glass doors/windows or similar objects!
35
15. Explanation of Terms
Perceived temperature
See “Windchill”
Comfort indicator
The symbols of the comfort indicator (the three different smilies (L K J) reflect the room
air conditions and will be shown according to the following table:
Temperature Humidity
20% 30% 35% 40% 45% 50% 55% 60% 65% 70%
<18°C L L L L L L L L L L
18 -19.9°C L L L K K K K K K L
20 -21.9°C L L L K J J J J K L
22 -23.9°C L L K J J J J K L L
24 -25.9°C L K J J J J K L L L
26 -27.9°C L K K K K K K L L L
> 28°C L L L L L L L L L L
Depending on the relationship between temperature and air humidity, clearly limited areas of
comfortable or uncomfortable air conditions can be defined.
At a temperature of 25°C an air humidity below 30% is perceived to be too dry (e.g. heating air)
and a humidity above 60% to be sultry.
Dew point
The dew point is a point of temperature which depends on the coincidence of a certain air pres-
sure, temperature and air humidity.
At this point of temperature the condensation of the air humidity starts, the so called dewing, the
air humidity condenses out and settles in form of a liquid (mist, vapour).
If the dew point for the water vapour is below 0°C, it condenses as snow or hoar.
Weather forecast
The weather forecast of the weather station is reflected in different weather symbols which are
calculated from the rate of increase or decrease of the air pressure (tendency).
This changing rate of the air pressure is the decisive factor for the forecast of the weather to be
expected, the absolute value plays only a secondary role here. Generally one can say that an
increasing air pressure means better weather, whereas a decreasing air pressure means that the
weather will become worse.
36
Windchill (equivalent temperature, perceived temperature)
Under certain conditions, men perceive temperatures totally different than shown by a thermom-
eter. At low temperatures, we perceive the temperature at our naked skin the lower the more
rapidly an additional wind blows.
The windchill is defined as a cooling effect for naked skin having a theoretical surface temperature
of 33°C and at a wind speed of more than 2.6m/s.
The higher the wind speed and the lower the actual ambient temperature, the more perceptible
is the windchill effect.
The ”perceived temperature” can almost be compared to the so called felt temperature which
additionally considers such effects as the radiation of sunlight, the luminous reflectance of the
clouds, the light wave length etc..
Wind speed table (Beaufort)
Beaufort Wind speed Designation
0 0 – 0.7km/h calm
1 0.7 – 5.4km/h very soft breeze
2 5.5 – 11.9km/h light breeze
3 12.0 – 19.4km/h weak breeze
4 19.5 – 28.5km/h moderate breeze
5 28.6 – 38.7km/h fresh breeze
6 38.8 – 49.8km/h strong wind
7 49.9 – 61.7km/h stiff wind
8 61.8 – 74.6km/h stormy wind
9 74.7 – 88.9km/h storm
10 89.0 – 102.4km/h heavy storm
11 102.5 – 117.4km/h violent storm
12 > 117.4km/h hurricane
37
16. Disposal
a) General
Once the product becomes unusable, dispose of it in accordance with the relevant statutory
regulations.
b) Disposal Instructions for Battery/Accumulators
You, as the ultimate consumer, are required by law (Battery Ordinance) to return all spent
batteries/accumulators. Disposing of spent batteries/accumulators in the household waste
is prohibited!
Batteries/accumulators containing hazardous substances are marked by the opposite
symbols. These symbols also indicate that it is prohibited to dispose of these batteries
in the household waste.
The heavy metals concerned are: Cd=cadmium, Hg=mercury, Pb=lead (the designa-
tion is written on the accumulator e.g. under the rubbish can symbols depicted at
the left).
You can hand in your used batteries/accumulators at the official collection points of
your community at no cost, at our outlets or everywhere where batteries/accumula-
tors are sold.
You thus fulfil your statutory obligations and contribute to the protection of the environment.
38
17. Technical Data
Measurement interval of the outdoor sensors:...approx. 3 minutes
Measurement interval of the indoor sensors: ..... approx. 10 minutes
Transmitting frequency: ...................................... 433.92 MHz
Coverage in the open field: ................................ max. 100m (Observe chapter 12!)
Inside temperature range: ................................. 0°C to +59.9°C
Resolution: ......................................................... 0.1°C
Accuracy: ........................................................... ±0.8°C
Outdoor temperature range
(multipurpose sensor): ........................................ -29.9°C to +79.9°C
Resolution: ......................................................... 0.1°C
Accuracy: ........................................................... ±0.8°C
Measurement range of relative air humidity
(indoor/outdoor): ................................................. 1% - 99 %
Resolution: ......................................................... 1%
Accuracy: ........................................................... ±5% rH (30–70% rH)
Wind speed: ....................................................... 0 to 200km/h
Resolution: ......................................................... up to100km/h 0.1km/h; above 100km/h: 1km/h
Voltage supply:
Base station: ....................................................... 4 x 1.5 V batteries, AA, Mignon,
(alkaline type recommended)
Multipurpose sensor: .......................................... 3 x 1.5 V batteries, AA, Mignon
(alkaline type recommended)
Dimensions (W x H x D) base station: ................ approx. 136mm * 198mm * 35mm (without foot)
39
18. FCC Information
FCC ID: RNT-WS200US
Changes or modifications not expressly approved in writing by ELV Electronics Limited may void
the user’s authority to operate the equipment.
NOTE: This equipment has been tested and found to comply with the limits for a Class B digital
device, pursuant to Part 15 of the FCC Rules. These limits are designed to provide reasonable
protection against harmful interference in a residential installation. This equipment generates,
uses and can radiate radio frequency energy and, if not installed and used in accordance with
the instructions, may cause harmful interference to radio communications. However, there is
no guarantee that interference will not occur in a particular installation. If this equipment does
cause harmful interference to radio or television reception, which can be determined by turning
the equipment off and on, the user is encouraged to try to correct the interference by one or
more of the following measures:
- Reorient or relocate the receiving antenna.
- Increase the separation between the equipment and receiver.
- Connect the equipment into an outlet on a circuit different from that to which the receiver is
connected.
- Consult the dealer or an experienced radio/TV technician for help.
The internal antenna used for this mobile transmitter must provide a separation distance of at
least 20 cm from all persons and must not be co-located or operating in conjunction with any
other antenna or transmitter.
This device complies with Part 15 of the FCC Rules. Operation is subject to the following two
conditions:
(1) this device may not cause harmful interference, and
(2) this device must accept any interference received, including interference that may cause
undesired operation.
40
27
Appendix A: Table of latitude/longitude for US counties.
Source: US Census Bureau. Data is provided "as-is". Not responsible for errors.
State County Latitude Longitude
AL Autauga County 32.5 273.4
AL Baldwin County 30.6 272.3
AL Barbour County 31.9 274.7
AL Bibb County 33.0 272.9
AL Blount County 34.0 273.4
AL Bullock County 32.1 274.3
AL Butler County 31.7 273.3
AL Calhoun County 33.7 274.2
AL Chambers County 32.9 274.7
AL Cherokee County 34.2 274.4
AL Chilton County 32.9 273.3
AL Choctaw County 32.0 271.7
AL Clarke County 31.7 272.2
AL Clay County 33.3 274.2
AL Cleburne County 33.6 274.5
AL Coffee County 31.4 274.0
AL Colbert County 34.7 272.3
AL Conecuh County 31.4 273.0
AL Coosa County 33.0 273.8
AL Covington County 31.3 273.6
AL Crenshaw County 31.7 273.7
AL Cullman County 34.2 273.2
AL Dale County 31.4 274.4
AL Dallas County 32.4 272.9
AL DeKalb County 34.5 274.2
AL Elmore County 32.6 273.8
AL Escambia County 31.1 272.8
AL Etowah County 34.0 274.0
AL Fayette County 33.7 272.2
AL Franklin County 34.5 272.2
AL Geneva County 31.1 274.2
AL Greene County 32.8 272.0
AL Hale County 32.8 272.4
AL Henry County 31.5 274.7
AL Houston County 31.2 274.6
AL Jackson County 34.8 274.1
AL Jefferson County 33.5 273.2
AL Lamar County 33.8 271.9
AL Lauderdale County 34.9 272.4
AL Lawrence County 34.6 272.7
AL Lee County 32.6 274.7
AL Limestone County 34.8 273.0
AL Lowndes County 32.2 273.3
AL Macon County 32.4 274.3
AL Madison County 34.7 273.4
AL Marengo County 32.3 272.2
AL Marion County 34.1 272.1
AL Marshall County 34.3 273.7
AL Mobile County 30.7 271.9
AL Monroe County 31.6 272.6
AL Montgomery County 32.3 273.7
AL Morgan County 34.5 273.1
AL Perry County 32.6 272.7
AL Pickens County 33.3 271.9
AL Pike County 31.8 274.1
AL Randolph County 33.3 274.6
AL Russell County 32.4 274.9
AL St. Clair County 33.7 273.7
AL Shelby County 33.3 273.3
AL Sumter County 32.6 271.8
AL Talladega County 33.4 273.8
AL Tallapoosa County 32.9 274.2
AL Tuscaloosa County 33.2 272.5
AL Walker County 33.8 272.7
AL Washington County 31.4 271.8
AL Wilcox County 32.0 272.7
AL Winston County 34.2 272.6
AK Aleutians East Borough 55.1 198.0
AK Aleutians West 52.3 187.5
AK Anchorage Municipality 61.2 210.2
AK Bethel 60.9 198.8
AK Bristol Bay Borough 58.7 203.2
AK Denali Borough 63.9 210.9
AK Dillingham 59.2 201.4
AK Fairbanks North Star Borough 64.8 212.4
AK Haines Borough 59.2 224.5
AK Juneau City and Borough 58.4 225.5
AK Kenai Peninsula Borough 60.3 209.0
AK Ketchikan Gateway Borough 55.4 228.4
AK Kodiak Island Borough 57.7 207.3
AK Lake and Peninsula Borough 58.6 203.6
AK Matanuska-Susitna Borough 61.8 210.5
AK Nome Census Area 64.8 195.7
AK North Slope Borough 70.6 206.1
AK Northwest Arctic Borough 66.8 199.4
AK Prince of Wales 55.6 227.4
AK Sitka City and Borough 57.1 224.7
AK Skagway-Hoonah-Angoon 58.3 224.5
AK Southeast Fairbanks 63.6 216.1
AK Valdez-Cordova 61.5 214.7
AK Wade Hampton 62.1 196.3
AK Wrangell-Petersburg 56.7 226.9
AK Yakutat City and Borough 59.8 219.7
AK Yukon-Koyukuk 65.1 208.1
AZ Apache County 35.6 250.6
AZ Cochise County 31.8 250.1
AZ Coconino County 35.8 248.5
AZ Gila County 33.7 249.0
AZ Graham County 32.9 250.2
AZ Greenlee County 33.1 250.7
AZ La Paz County 33.9 246.0
AZ Maricopa County 33.5 247.9
AZ Mohave County 35.3 245.9
AZ Navajo County 35.4 249.7
AZ Pima County 32.2 248.9
AZ Pinal County 33.0 248.5
AZ Santa Cruz County 31.5 249.1
AZ Yavapai County 34.7 247.6
AZ Yuma County 32.7 245.6
AR Arkansas County 34.4 268.6
AR Ashley County 33.2 268.2
AR Baxter County 36.3 267.6
AR Benton County 36.4 265.8
AR Boone County 36.3 266.9
AR Bradley County 33.5 267.9
AR Calhoun County 33.6 267.5
AR Carroll County 36.4 266.4
AR Chicot County 33.3 268.7
AR Clark County 34.1 266.8
AR Clay County 36.4 269.6
AR Cleburne County 35.5 267.9
AR Cleveland County 33.9 267.8
AR Columbia County 33.2 266.8
AR Conway County 35.2 267.3
AR Craighead County 35.8 269.4
AR Crawford County 35.5 265.7
AR Crittenden County 35.2 269.7
AR Cross County 35.3 269.2
AR Dallas County 33.9 267.4
AR Desha County 33.8 268.6
AR Drew County 33.6 268.3
AR Faulkner County 35.1 267.6
AR Franklin County 35.5 266.1
AR Fulton County 36.4 268.3
AR Garland County 34.5 266.9
AR Grant County 34.3 267.5
AR Greene County 36.1 269.5
AR Hempstead County 33.7 266.4
AR Hot Spring County 34.3 267.1
AR Howard County 34.1 266.0
AR Independence County 35.8 268.4
AR Izard County 36.1 268.1
AR Jackson County 35.6 268.8
AR Jefferson County 34.2 268.0
AR Johnson County 35.5 266.5
AR Lafayette County 33.3 266.4
AR Lawrence County 36.1 268.9
AR Lee County 34.8 269.2
AR Lincoln County 34.0 268.3
AR Little River County 33.7 265.8
AR Logan County 35.2 266.2
AR Lonoke County 34.8 268.1
AR Madison County 36.0 266.3
AR Marion County 36.3 267.3
AR Miller County 33.4 266.0
AR Mississippi County 35.8 270.0
AR Monroe County 34.7 268.8
AR Montgomery County 34.6 266.4
AR Nevada County 33.7 266.7
AR Newton County 36.0 266.8
AR Ouachita County 33.6 267.1
AR Perry County 35.0 267.1
AR Phillips County 34.5 269.2
AR Pike County 34.2 266.3
AR Poinsett County 35.6 269.4
AR Polk County 34.5 265.7
AR Pope County 35.3 266.9
AR Prairie County 34.8 268.5
AR Pulaski County 34.8 267.7

41
27
Appendix A: Table of latitude/longitude for US counties.
Source: US Census Bureau. Data is provided "as-is". Not responsible for errors.
State County Latitude Longitude
AL Autauga County 32.5 273.4
AL Baldwin County 30.6 272.3
AL Barbour County 31.9 274.7
AL Bibb County 33.0 272.9
AL Blount County 34.0 273.4
AL Bullock County 32.1 274.3
AL Butler County 31.7 273.3
AL Calhoun County 33.7 274.2
AL Chambers County 32.9 274.7
AL Cherokee County 34.2 274.4
AL Chilton County 32.9 273.3
AL Choctaw County 32.0 271.7
AL Clarke County 31.7 272.2
AL Clay County 33.3 274.2
AL Cleburne County 33.6 274.5
AL Coffee County 31.4 274.0
AL Colbert County 34.7 272.3
AL Conecuh County 31.4 273.0
AL Coosa County 33.0 273.8
AL Covington County 31.3 273.6
AL Crenshaw County 31.7 273.7
AL Cullman County 34.2 273.2
AL Dale County 31.4 274.4
AL Dallas County 32.4 272.9
AL DeKalb County 34.5 274.2
AL Elmore County 32.6 273.8
AL Escambia County 31.1 272.8
AL Etowah County 34.0 274.0
AL Fayette County 33.7 272.2
AL Franklin County 34.5 272.2
AL Geneva County 31.1 274.2
AL Greene County 32.8 272.0
AL Hale County 32.8 272.4
AL Henry County 31.5 274.7
AL Houston County 31.2 274.6
AL Jackson County 34.8 274.1
AL Jefferson County 33.5 273.2
AL Lamar County 33.8 271.9
AL Lauderdale County 34.9 272.4
AL Lawrence County 34.6 272.7
AL Lee County 32.6 274.7
AL Limestone County 34.8 273.0
AL Lowndes County 32.2 273.3
AL Macon County 32.4 274.3
AL Madison County 34.7 273.4
AL Marengo County 32.3 272.2
AL Marion County 34.1 272.1
AL Marshall County 34.3 273.7
AL Mobile County 30.7 271.9
AL Monroe County 31.6 272.6
AL Montgomery County 32.3 273.7
AL Morgan County 34.5 273.1
AL Perry County 32.6 272.7
AL Pickens County 33.3 271.9
AL Pike County 31.8 274.1
AL Randolph County 33.3 274.6
AL Russell County 32.4 274.9
AL St. Clair County 33.7 273.7
AL Shelby County 33.3 273.3
AL Sumter County 32.6 271.8
AL Talladega County 33.4 273.8
AL Tallapoosa County 32.9 274.2
AL Tuscaloosa County 33.2 272.5
AL Walker County 33.8 272.7
AL Washington County 31.4 271.8
AL Wilcox County 32.0 272.7
AL Winston County 34.2 272.6
AK Aleutians East Borough 55.1 198.0
AK Aleutians West 52.3 187.5
AK Anchorage Municipality 61.2 210.2
AK Bethel 60.9 198.8
AK Bristol Bay Borough 58.7 203.2
AK Denali Borough 63.9 210.9
AK Dillingham 59.2 201.4
AK Fairbanks North Star Borough 64.8 212.4
AK Haines Borough 59.2 224.5
AK Juneau City and Borough 58.4 225.5
AK Kenai Peninsula Borough 60.3 209.0
AK Ketchikan Gateway Borough 55.4 228.4
AK Kodiak Island Borough 57.7 207.3
AK Lake and Peninsula Borough 58.6 203.6
AK Matanuska-Susitna Borough 61.8 210.5
AK Nome Census Area 64.8 195.7
AK North Slope Borough 70.6 206.1
AK Northwest Arctic Borough 66.8 199.4
AK Prince of Wales 55.6 227.4
AK Sitka City and Borough 57.1 224.7
AK Skagway-Hoonah-Angoon 58.3 224.5
AK Southeast Fairbanks 63.6 216.1
AK Valdez-Cordova 61.5 214.7
AK Wade Hampton 62.1 196.3
AK Wrangell-Petersburg 56.7 226.9
AK Yakutat City and Borough 59.8 219.7
AK Yukon-Koyukuk 65.1 208.1
AZ Apache County 35.6 250.6
AZ Cochise County 31.8 250.1
AZ Coconino County 35.8 248.5
AZ Gila County 33.7 249.0
AZ Graham County 32.9 250.2
AZ Greenlee County 33.1 250.7
AZ La Paz County 33.9 246.0
AZ Maricopa County 33.5 247.9
AZ Mohave County 35.3 245.9
AZ Navajo County 35.4 249.7
AZ Pima County 32.2 248.9
AZ Pinal County 33.0 248.5
AZ Santa Cruz County 31.5 249.1
AZ Yavapai County 34.7 247.6
AZ Yuma County 32.7 245.6
AR Arkansas County 34.4 268.6
AR Ashley County 33.2 268.2
AR Baxter County 36.3 267.6
AR Benton County 36.4 265.8
AR Boone County 36.3 266.9
AR Bradley County 33.5 267.9
AR Calhoun County 33.6 267.5
AR Carroll County 36.4 266.4
AR Chicot County 33.3 268.7
AR Clark County 34.1 266.8
AR Clay County 36.4 269.6
AR Cleburne County 35.5 267.9
AR Cleveland County 33.9 267.8
AR Columbia County 33.2 266.8
AR Conway County 35.2 267.3
AR Craighead County 35.8 269.4
AR Crawford County 35.5 265.7
AR Crittenden County 35.2 269.7
AR Cross County 35.3 269.2
AR Dallas County 33.9 267.4
AR Desha County 33.8 268.6
AR Drew County 33.6 268.3
AR Faulkner County 35.1 267.6
AR Franklin County 35.5 266.1
AR Fulton County 36.4 268.3
AR Garland County 34.5 266.9
AR Grant County 34.3 267.5
AR Greene County 36.1 269.5
AR Hempstead County 33.7 266.4
AR Hot Spring County 34.3 267.1
AR Howard County 34.1 266.0
AR Independence County 35.8 268.4
AR Izard County 36.1 268.1
AR Jackson County 35.6 268.8
AR Jefferson County 34.2 268.0
AR Johnson County 35.5 266.5
AR Lafayette County 33.3 266.4
AR Lawrence County 36.1 268.9
AR Lee County 34.8 269.2
AR Lincoln County 34.0 268.3
AR Little River County 33.7 265.8
AR Logan County 35.2 266.2
AR Lonoke County 34.8 268.1
AR Madison County 36.0 266.3
AR Marion County 36.3 267.3
AR Miller County 33.4 266.0
AR Mississippi County 35.8 270.0
AR Monroe County 34.7 268.8
AR Montgomery County 34.6 266.4
AR Nevada County 33.7 266.7
AR Newton County 36.0 266.8
AR Ouachita County 33.6 267.1
AR Perry County 35.0 267.1
AR Phillips County 34.5 269.2
AR Pike County 34.2 266.3
AR Poinsett County 35.6 269.4
AR Polk County 34.5 265.7
AR Pope County 35.3 266.9
AR Prairie County 34.8 268.5
AR Pulaski County 34.8 267.7
28
AR Randolph County 36.3 269.0
AR St. Francis County 35.0 269.3
AR Saline County 34.6 267.4
AR Scott County 34.9 265.9
AR Searcy County 35.9 267.3
AR Sebastian County 35.3 265.6
AR Sevier County 34.0 265.7
AR Sharp County 36.2 268.5
AR Stone County 35.9 267.8
AR Union County 33.2 267.4
AR Van Buren County 35.6 267.6
AR Washington County 36.1 265.8
AR White County 35.3 268.3
AR Woodruff County 35.2 268.8
AR Yell County 35.0 266.6
CA Alameda County 37.7 237.9
CA Alpine County 38.6 240.1
CA Amador County 38.4 239.3
CA Butte County 39.6 238.4
CA Calaveras County 38.2 239.4
CA Colusa County 39.2 237.8
CA Contra Costa County 37.9 237.9
CA Del Norte County 41.7 235.9
CA El Dorado County 38.8 239.4
CA Fresno County 36.6 240.1
CA Glenn County 39.6 237.7
CA Humboldt County 40.7 236.0
CA Imperial County 33.0 244.5
CA Inyo County 36.7 242.3
CA Kern County 35.3 241.3
CA Kings County 36.2 240.2
CA Lake County 39.0 237.2
CA Lassen County 40.6 239.3
CA Los Angeles County 34.1 241.8
CA Madera County 37.0 240.0
CA Marin County 38.0 237.4
CA Mariposa County 37.6 240.0
CA Mendocino County 39.4 236.6
CA Merced County 37.2 239.3
CA Modoc County 41.5 239.2
CA Mono County 37.9 241.0
CA Monterey County 36.5 238.5
CA Napa County 38.4 237.7
CA Nevada County 39.3 239.2
CA Orange County 33.7 242.1
CA Placer County 39.0 239.1
CA Plumas County 40.0 239.1
CA Riverside County 33.8 243.2
CA Sacramento County 38.6 238.6
CA San Benito County 36.7 238.7
CA San Bernardino County 34.4 243.0
CA San Diego County 32.9 242.9
CA San Francisco County 37.8 237.6
CA San Joaquin County 37.9 238.7
CA San Luis Obispo County 35.4 239.4
CA San Mateo County 37.5 237.7
CA Santa Barbara County 34.6 239.9
CA Santa Clara County 37.3 238.1
CA Santa Cruz County 37.0 238.0
CA Shasta County 40.7 237.9
CA Sierra County 39.6 239.5
CA Siskiyou County 41.6 237.5
CA Solano County 38.2 237.9
CA Sonoma County 38.4 237.2
CA Stanislaus County 37.6 239.0
CA Sutter County 39.1 238.3
CA Tehama County 40.1 237.9
CA Trinity County 40.7 236.9
CA Tulare County 36.2 240.8
CA Tuolumne County 38.0 239.8
CA Ventura County 34.3 241.0
CA Yolo County 38.6 238.2
CA Yuba County 39.2 238.6
CO Adams County 39.9 255.1
CO Alamosa County 37.5 254.2
CO Arapahoe County 39.6 255.2
CO Archuleta County 37.2 252.9
CO Baca County 37.3 257.5
CO Bent County 38.1 256.9
CO Boulder County 40.1 254.8
CO Chaffee County 38.7 253.9
CO Cheyenne County 38.8 257.5
CO Clear Creek County 39.7 254.4
CO Conejos County 37.2 253.9
CO Costilla County 37.3 254.5
CO Crowley County 38.2 256.2
CO Custer County 38.1 254.6
CO Delta County 38.8 252.1
CO Denver County 39.7 255.0
CO Dolores County 37.8 251.4
CO Douglas County 39.5 255.1
CO Eagle County 39.6 253.3
CO Elbert County 39.3 255.7
CO El Paso County 38.9 255.3
CO Fremont County 38.4 254.7
CO Garfield County 39.5 252.3
CO Gilpin County 39.8 254.5
CO Grand County 40.1 253.9
CO Gunnison County 38.6 253.0
CO Hinsdale County 37.8 252.7
CO Huerfano County 37.6 255.0
CO Jackson County 40.6 253.7
CO Jefferson County 39.7 254.9
CO Kiowa County 38.4 257.4
CO Kit Carson County 39.3 257.5
CO Lake County 39.2 253.7
CO La Plata County 37.3 252.2
CO Larimer County 40.5 254.8
CO Las Animas County 37.2 255.6
CO Lincoln County 39.1 256.4
CO Logan County 40.7 256.9
CO Mesa County 39.1 251.5
CO Mineral County 37.7 253.1
CO Moffat County 40.6 251.9
CO Montezuma County 37.4 251.4
CO Montrose County 38.4 251.8
CO Morgan County 40.3 256.2
CO Otero County 38.0 256.3
CO Ouray County 38.1 252.2
CO Park County 39.2 254.3
CO Phillips County 40.6 257.6
CO Pitkin County 39.2 253.1
CO Prowers County 38.1 257.6
CO Pueblo County 38.2 255.4
CO Rio Blanco County 40.0 251.7
CO Rio Grande County 37.6 253.7
CO Routt County 40.5 253.1
CO Saguache County 38.1 253.8
CO San Juan County 37.8 252.3
CO San Miguel County 38.0 251.6
CO Sedgwick County 40.9 257.7
CO Summit County 39.6 253.9
CO Teller County 38.9 254.8
CO Washington County 40.1 256.9
CO Weld County 40.3 255.3
CO Yuma County 40.0 257.5
CT Fairfield County 41.2 286.6
CT Hartford County 41.8 287.3
CT Litchfield County 41.8 286.8
CT Middlesex County 41.4 287.5
CT New Haven County 41.4 287.1
CT New London County 41.4 287.9
CT Tolland County 41.9 287.6
CT Windham County 41.8 288.0
DE Kent County 39.1 284.4
DE New Castle County 39.7 284.4
DE Sussex County 38.7 284.7
DC District of Columbia 38.9 283.0
FL Alachua County 29.7 277.6
FL Baker County 30.3 277.8
FL Bay County 30.2 274.4
FL Bradford County 29.9 277.9
FL Brevard County 28.2 279.3
FL Broward County 26.1 279.8
FL Calhoun County 30.4 274.8
FL Charlotte County 27.0 277.9
FL Citrus County 28.9 277.5
FL Clay County 30.0 278.2
FL Collier County 26.2 278.3
FL Columbia County 30.2 277.4
FL DeSoto County 27.2 278.1
FL Dixie County 29.6 276.9
FL Duval County 30.3 278.4
FL Escambia County 30.5 272.7
FL Flagler County 29.5 278.8
FL Franklin County 29.8 275.2
FL Gadsden County 30.6 275.4
FL Gilchrist County 29.7 277.2
FL Glades County 26.9 278.8
FL Gulf County 29.9 274.7
FL Hamilton County 30.5 277.1
FL Hardee County 27.5 278.2
FL Hendry County 26.7 278.8
FL Hernando County 28.5 277.5
FL Highlands County 27.4 278.6
FL Hillsborough County 28.0 277.6
FL Holmes County 30.9 274.2
FL Indian River County 27.7 279.5
FL Jackson County 30.8 274.8
FL Jefferson County 30.5 276.1
Source: US Census Bureau. Data is provided "as-is". Not responsible for errors.

42
29
FL Lafayette County 30.0 276.8
FL Lake County 28.8 278.3
FL Lee County 26.6 278.2
FL Leon County 30.5 275.7
FL Levy County 29.3 277.3
FL Liberty County 30.3 275.1
FL Madison County 30.4 276.6
FL Manatee County 27.5 277.5
FL Marion County 29.1 277.9
FL Martin County 27.1 279.7
FL Miami-Dade County 25.8 279.7
FL Monroe County 24.8 278.8
FL Nassau County 30.6 278.3
FL Okaloosa County 30.6 273.4
FL Okeechobee County 27.3 279.1
FL Orange County 28.5 278.6
FL Osceola County 28.2 278.7
FL Palm Beach County 26.6 279.8
FL Pasco County 28.3 277.5
FL Pinellas County 27.9 277.3
FL Polk County 28.0 278.2
FL Putnam County 29.6 278.2
FL St. Johns County 29.9 278.6
FL St. Lucie County 27.3 279.6
FL Santa Rosa County 30.6 273.0
FL Sarasota County 27.2 277.6
FL Seminole County 28.7 278.7
FL Sumter County 28.8 277.9
FL Suwannee County 30.2 277.0
FL Taylor County 30.1 276.4
FL Union County 30.0 277.6
FL Volusia County 29.0 278.9
FL Wakulla County 30.1 275.6
FL Walton County 30.6 273.8
FL Washington County 30.6 274.4
GA Appling County 31.7 277.7
GA Atkinson County 31.3 277.1
GA Bacon County 31.6 277.5
GA Baker County 31.3 275.6
GA Baldwin County 33.1 276.8
GA Banks County 34.3 276.5
GA Barrow County 34.0 276.3
GA Bartow County 34.2 275.2
GA Ben Hill County 31.7 276.7
GA Berrien County 31.2 276.8
GA Bibb County 32.8 276.3
GA Bleckley County 32.4 276.7
GA Brantley County 31.2 278.0
GA Brooks County 30.9 276.4
GA Bryan County 32.1 278.6
GA Bulloch County 32.4 278.2
GA Burke County 33.1 278.0
GA Butts County 33.3 276.0
GA Calhoun County 31.5 275.3
GA Camden County 30.9 278.3
GA Candler County 32.4 277.9
GA Carroll County 33.6 274.9
GA Catoosa County 34.9 274.8
GA Charlton County 30.8 277.9
GA Chatham County 32.0 278.9
GA Chattahoochee County 32.3 275.2
GA Chattooga County 34.5 274.6
GA Cherokee County 34.2 275.5
GA Clarke County 34.0 276.6
GA Clay County 31.6 275.0
GA Clayton County 33.6 275.6
GA Clinch County 30.9 277.3
GA Cobb County 33.9 275.4
GA Coffee County 31.5 277.2
GA Colquitt County 31.2 276.2
GA Columbia County 33.5 277.8
GA Cook County 31.2 276.6
GA Coweta County 33.4 275.2
GA Crawford County 32.7 276.0
GA Crisp County 31.9 276.2
GA Dade County 34.9 274.5
GA Dawson County 34.4 275.9
GA Decatur County 30.9 275.4
GA DeKalb County 33.8 275.7
GA Dodge County 32.2 276.8
GA Dooly County 32.2 276.2
GA Dougherty County 31.6 275.8
GA Douglas County 33.7 275.3
GA Early County 31.3 275.1
GA Echols County 30.7 277.1
GA Effingham County 32.3 278.7
GA Elbert County 34.1 277.1
GA Emanuel County 32.6 277.7
GA Evans County 32.2 278.1
GA Fannin County 34.9 275.7
GA Fayette County 33.4 275.5
GA Floyd County 34.3 274.8
GA Forsyth County 34.2 275.9
GA Franklin County 34.4 276.8
GA Fulton County 33.8 275.6
GA Gilmer County 34.7 275.5
GA Glascock County 33.2 277.4
GA Glynn County 31.2 278.5
GA Gordon County 34.5 275.1
GA Grady County 30.9 275.8
GA Greene County 33.6 276.8
GA Gwinnett County 34.0 275.9
GA Habersham County 34.6 276.5
GA Hall County 34.3 276.2
GA Hancock County 33.3 277.0
GA Haralson County 33.8 274.8
GA Harris County 32.7 275.1
GA Hart County 34.4 277.0
GA Heard County 33.3 274.9
GA Henry County 33.5 275.8
GA Houston County 32.6 276.3
GA Irwin County 31.6 276.7
GA Jackson County 34.1 276.4
GA Jasper County 33.3 276.3
GA Jeff Davis County 31.8 277.4
GA Jefferson County 33.1 277.6
GA Jenkins County 32.8 278.0
GA Johnson County 32.7 277.3
GA Jones County 33.0 276.5
GA Lamar County 33.1 275.8
GA Lanier County 31.0 276.9
GA Laurens County 32.5 277.1
GA Lee County 31.7 275.8
GA Liberty County 31.8 278.5
GA Lincoln County 33.8 277.5
GA Long County 31.8 278.2
GA Lowndes County 30.8 276.7
GA Lumpkin County 34.5 276.0
GA McDuffie County 33.5 277.5
GA McIntosh County 31.5 278.6
GA Macon County 32.4 276.0
GA Madison County 34.1 276.8
GA Marion County 32.4 275.5
GA Meriwether County 33.0 275.3
GA Miller County 31.2 275.3
GA Mitchell County 31.2 275.8
GA Monroe County 33.0 276.1
GA Montgomery County 32.2 277.5
GA Morgan County 33.6 276.5
GA Murray County 34.8 275.2
GA Muscogee County 32.5 275.1
GA Newton County 33.6 276.1
GA Oconee County 33.9 276.6
GA Oglethorpe County 33.9 276.9
GA Paulding County 33.9 275.2
GA Peach County 32.6 276.2
GA Pickens County 34.5 275.6
GA Pierce County 31.3 277.8
GA Pike County 33.1 275.6
GA Polk County 34.0 274.8
GA Pulaski County 32.2 276.5
GA Putnam County 33.3 276.6
GA Quitman County 31.9 275.0
GA Rabun County 34.9 276.6
GA Randolph County 31.8 275.3
GA Richmond County 33.4 278.0
GA Rockdale County 33.7 276.0
GA Schley County 32.2 275.7
GA Screven County 32.7 278.4
GA Seminole County 31.0 275.1
GA Spalding County 33.3 275.7
GA Stephens County 34.6 276.7
GA Stewart County 32.1 275.2
GA Sumter County 32.1 275.8
GA Talbot County 32.7 275.5
GA Taliaferro County 33.6 277.1
GA Tattnall County 32.0 278.0
GA Taylor County 32.5 275.8
GA Telfair County 32.0 277.1
GA Terrell County 31.8 275.6
GA Thomas County 30.9 276.1
GA Tift County 31.5 276.5
GA Toombs County 32.2 277.6
GA Towns County 34.9 276.2
GA Treutlen County 32.4 277.4
GA Troup County 33.0 275.0
GA Turner County 31.7 276.4
GA Twiggs County 32.7 276.6
GA Union County 34.9 276.0
GA Upson County 32.9 275.7
Source: US Census Bureau. Data is provided "as-is". Not responsible for errors.

43
29
FL Lafayette County 30.0 276.8
FL Lake County 28.8 278.3
FL Lee County 26.6 278.2
FL Leon County 30.5 275.7
FL Levy County 29.3 277.3
FL Liberty County 30.3 275.1
FL Madison County 30.4 276.6
FL Manatee County 27.5 277.5
FL Marion County 29.1 277.9
FL Martin County 27.1 279.7
FL Miami-Dade County 25.8 279.7
FL Monroe County 24.8 278.8
FL Nassau County 30.6 278.3
FL Okaloosa County 30.6 273.4
FL Okeechobee County 27.3 279.1
FL Orange County 28.5 278.6
FL Osceola County 28.2 278.7
FL Palm Beach County 26.6 279.8
FL Pasco County 28.3 277.5
FL Pinellas County 27.9 277.3
FL Polk County 28.0 278.2
FL Putnam County 29.6 278.2
FL St. Johns County 29.9 278.6
FL St. Lucie County 27.3 279.6
FL Santa Rosa County 30.6 273.0
FL Sarasota County 27.2 277.6
FL Seminole County 28.7 278.7
FL Sumter County 28.8 277.9
FL Suwannee County 30.2 277.0
FL Taylor County 30.1 276.4
FL Union County 30.0 277.6
FL Volusia County 29.0 278.9
FL Wakulla County 30.1 275.6
FL Walton County 30.6 273.8
FL Washington County 30.6 274.4
GA Appling County 31.7 277.7
GA Atkinson County 31.3 277.1
GA Bacon County 31.6 277.5
GA Baker County 31.3 275.6
GA Baldwin County 33.1 276.8
GA Banks County 34.3 276.5
GA Barrow County 34.0 276.3
GA Bartow County 34.2 275.2
GA Ben Hill County 31.7 276.7
GA Berrien County 31.2 276.8
GA Bibb County 32.8 276.3
GA Bleckley County 32.4 276.7
GA Brantley County 31.2 278.0
GA Brooks County 30.9 276.4
GA Bryan County 32.1 278.6
GA Bulloch County 32.4 278.2
GA Burke County 33.1 278.0
GA Butts County 33.3 276.0
GA Calhoun County 31.5 275.3
GA Camden County 30.9 278.3
GA Candler County 32.4 277.9
GA Carroll County 33.6 274.9
GA Catoosa County 34.9 274.8
GA Charlton County 30.8 277.9
GA Chatham County 32.0 278.9
GA Chattahoochee County 32.3 275.2
GA Chattooga County 34.5 274.6
GA Cherokee County 34.2 275.5
GA Clarke County 34.0 276.6
GA Clay County 31.6 275.0
GA Clayton County 33.6 275.6
GA Clinch County 30.9 277.3
GA Cobb County 33.9 275.4
GA Coffee County 31.5 277.2
GA Colquitt County 31.2 276.2
GA Columbia County 33.5 277.8
GA Cook County 31.2 276.6
GA Coweta County 33.4 275.2
GA Crawford County 32.7 276.0
GA Crisp County 31.9 276.2
GA Dade County 34.9 274.5
GA Dawson County 34.4 275.9
GA Decatur County 30.9 275.4
GA DeKalb County 33.8 275.7
GA Dodge County 32.2 276.8
GA Dooly County 32.2 276.2
GA Dougherty County 31.6 275.8
GA Douglas County 33.7 275.3
GA Early County 31.3 275.1
GA Echols County 30.7 277.1
GA Effingham County 32.3 278.7
GA Elbert County 34.1 277.1
GA Emanuel County 32.6 277.7
GA Evans County 32.2 278.1
GA Fannin County 34.9 275.7
GA Fayette County 33.4 275.5
GA Floyd County 34.3 274.8
GA Forsyth County 34.2 275.9
GA Franklin County 34.4 276.8
GA Fulton County 33.8 275.6
GA Gilmer County 34.7 275.5
GA Glascock County 33.2 277.4
GA Glynn County 31.2 278.5
GA Gordon County 34.5 275.1
GA Grady County 30.9 275.8
GA Greene County 33.6 276.8
GA Gwinnett County 34.0 275.9
GA Habersham County 34.6 276.5
GA Hall County 34.3 276.2
GA Hancock County 33.3 277.0
GA Haralson County 33.8 274.8
GA Harris County 32.7 275.1
GA Hart County 34.4 277.0
GA Heard County 33.3 274.9
GA Henry County 33.5 275.8
GA Houston County 32.6 276.3
GA Irwin County 31.6 276.7
GA Jackson County 34.1 276.4
GA Jasper County 33.3 276.3
GA Jeff Davis County 31.8 277.4
GA Jefferson County 33.1 277.6
GA Jenkins County 32.8 278.0
GA Johnson County 32.7 277.3
GA Jones County 33.0 276.5
GA Lamar County 33.1 275.8
GA Lanier County 31.0 276.9
GA Laurens County 32.5 277.1
GA Lee County 31.7 275.8
GA Liberty County 31.8 278.5
GA Lincoln County 33.8 277.5
GA Long County 31.8 278.2
GA Lowndes County 30.8 276.7
GA Lumpkin County 34.5 276.0
GA McDuffie County 33.5 277.5
GA McIntosh County 31.5 278.6
GA Macon County 32.4 276.0
GA Madison County 34.1 276.8
GA Marion County 32.4 275.5
GA Meriwether County 33.0 275.3
GA Miller County 31.2 275.3
GA Mitchell County 31.2 275.8
GA Monroe County 33.0 276.1
GA Montgomery County 32.2 277.5
GA Morgan County 33.6 276.5
GA Murray County 34.8 275.2
GA Muscogee County 32.5 275.1
GA Newton County 33.6 276.1
GA Oconee County 33.9 276.6
GA Oglethorpe County 33.9 276.9
GA Paulding County 33.9 275.2
GA Peach County 32.6 276.2
GA Pickens County 34.5 275.6
GA Pierce County 31.3 277.8
GA Pike County 33.1 275.6
GA Polk County 34.0 274.8
GA Pulaski County 32.2 276.5
GA Putnam County 33.3 276.6
GA Quitman County 31.9 275.0
GA Rabun County 34.9 276.6
GA Randolph County 31.8 275.3
GA Richmond County 33.4 278.0
GA Rockdale County 33.7 276.0
GA Schley County 32.2 275.7
GA Screven County 32.7 278.4
GA Seminole County 31.0 275.1
GA Spalding County 33.3 275.7
GA Stephens County 34.6 276.7
GA Stewart County 32.1 275.2
GA Sumter County 32.1 275.8
GA Talbot County 32.7 275.5
GA Taliaferro County 33.6 277.1
GA Tattnall County 32.0 278.0
GA Taylor County 32.5 275.8
GA Telfair County 32.0 277.1
GA Terrell County 31.8 275.6
GA Thomas County 30.9 276.1
GA Tift County 31.5 276.5
GA Toombs County 32.2 277.6
GA Towns County 34.9 276.2
GA Treutlen County 32.4 277.4
GA Troup County 33.0 275.0
GA Turner County 31.7 276.4
GA Twiggs County 32.7 276.6
GA Union County 34.9 276.0
GA Upson County 32.9 275.7
Source: US Census Bureau. Data is provided "as-is". Not responsible for errors.
30
GA Walker County 34.8 274.7
GA Walton County 33.8 276.3
GA Ware County 31.2 277.6
GA Warren County 33.4 277.3
GA Washington County 32.9 277.2
GA Wayne County 31.6 278.1
GA Webster County 32.0 275.4
GA Wheeler County 32.1 277.3
GA White County 34.6 276.3
GA Whitfield County 34.8 275.0
GA Wilcox County 32.0 276.5
GA Wilkes County 33.8 277.3
GA Wilkinson County 32.8 276.8
GA Worth County 31.6 276.2
HI Hawaii County 19.7 204.6
HI Honolulu County 21.4 202.0
HI Kalawao County 21.2 203.0
HI Kauai County 22.0 200.5
HI Maui County 20.9 203.4
ID Ada County 43.6 243.7
ID Adams County 44.9 243.6
ID Bannock County 42.8 247.7
ID Bear Lake County 42.3 248.6
ID Benewah County 47.2 243.4
ID Bingham County 43.2 247.6
ID Blaine County 43.4 245.8
ID Boise County 44.0 244.1
ID Bonner County 48.3 243.3
ID Bonneville County 43.5 248.1
ID Boundary County 48.8 243.6
ID Butte County 43.7 246.8
ID Camas County 43.4 245.2
ID Canyon County 43.6 243.3
ID Caribou County 42.7 248.3
ID Cassia County 42.4 246.4
ID Clark County 44.2 247.7
ID Clearwater County 46.7 244.1
ID Custer County 44.2 245.9
ID Elmore County 43.1 244.5
ID Franklin County 42.2 248.1
ID Fremont County 44.2 248.5
ID Gem County 44.0 243.5
ID Gooding County 42.9 245.2
ID Idaho County 45.9 244.1
ID Jefferson County 43.8 247.9
ID Jerome County 42.7 245.7
ID Kootenai County 47.7 243.2
ID Latah County 46.8 243.2
ID Lemhi County 44.9 246.2
ID Lewis County 46.2 243.6
ID Lincoln County 43.0 245.8
ID Madison County 43.8 248.3
ID Minidoka County 42.7 246.3
ID Nez Perce County 46.4 243.1
ID Oneida County 42.2 247.6
ID Owyhee County 42.8 243.8
ID Payette County 44 243.1
ID Power County 42.8 247.2
ID Shoshone County 47.4 244.0
ID Teton County 43.7 248.9
ID Twin Falls County 42.5 245.4
ID Valley County 44.7 244.1
ID Washington County 44.4 243.1
IL Adams County 40.0 268.7
IL Alexander County 37.1 270.7
IL Bond County 38.9 270.6
IL Boone County 42.3 271.2
IL Brown County 40.0 269.3
IL Bureau County 41.4 270.5
IL Calhoun County 39.2 269.3
IL Carroll County 42.1 270.0
IL Cass County 40.0 269.7
IL Champaign County 40.1 271.8
IL Christian County 39.5 270.7
IL Clark County 39.3 272.2
IL Clay County 38.7 271.5
IL Clinton County 38.6 270.6
IL Coles County 39.5 271.7
IL Cook County 41.8 272.2
IL Crawford County 39.0 272.2
IL Cumberland County 39.3 271.7
IL DeKalb County 41.9 271.3
IL De Witt County 40.2 271.1
IL Douglas County 39.8 271.8
IL DuPage County 41.9 271.9
IL Edgar County 39.7 272.3
IL Edwards County 38.4 272.0
IL Effingham County 39.1 271.4
IL Fayette County 39.0 271.0
IL Ford County 40.6 271.8
IL Franklin County 38.0 271.0
IL Fulton County 40.5 269.8
IL Gallatin County 37.8 271.8
IL Greene County 39.4 269.6
IL Grundy County 41.3 271.6
IL Hamilton County 38.1 271.5
IL Hancock County 40.4 268.8
IL Hardin County 37.5 271.7
IL Henderson County 40.8 269.1
IL Henry County 41.4 269.9
IL Iroquois County 40.7 272.2
IL Jackson County 37.8 270.7
IL Jasper County 39.0 271.9
IL Jefferson County 38.3 271.1
IL Jersey County 39.1 269.7
IL Jo Daviess County 42.4 269.8
IL Johnson County 37.5 271.1
IL Kane County 41.9 271.7
IL Kankakee County 41.1 272.2
IL Kendall County 41.6 271.6
IL Knox County 40.9 269.7
IL Lake County 42.3 272
IL La Salle County 41.3 271.1
IL Lawrence County 38.7 272.3
IL Lee County 41.8 270.6
IL Livingston County 40.9 271.4
IL Logan County 40.1 270.6
IL McDonough County 40.5 269.3
IL McHenry County 42.3 271.6
IL McLean County 40.5 271.1
IL Macon County 39.9 271.0
IL Macoupin County 39.2 270.1
IL Madison County 38.8 270.0
IL Marion County 38.6 271.0
IL Marshall County 41.0 270.7
IL Mason County 40.3 270.1
IL Massac County 37.2 271.3
IL Menard County 40.0 270.2
IL Mercer County 41.2 269.3
IL Monroe County 38.3 269.8
IL Montgomery County 39.2 270.5
IL Morgan County 39.7 269.8
IL Moultrie County 39.6 271.4
IL Ogle County 42.0 270.7
IL Peoria County 40.8 270.3
IL Perry County 38.1 270.7
IL Piatt County 40.0 271.4
IL Pike County 39.6 269.1
IL Pope County 37.4 271.4
IL Pulaski County 37.2 270.9
IL Putnam County 41.2 270.7
IL Randolph County 38.1 270.2
IL Richland County 38.7 271.9
IL Rock Island County 41.5 269.5
IL St. Clair County 38.5 270
IL Saline County 37.8 271.5
IL Sangamon County 39.8 270.4
IL Schuyler County 40.1 269.4
IL Scott County 39.6 269.5
IL Shelby County 39.4 271.2
IL Stark County 41.1 270.2
IL Stephenson County 42.3 270.4
IL Tazewell County 40.6 270.5
IL Union County 37.5 270.8
IL Vermilion County 40.2 272.3
IL Wabash County 38.4 272.2
IL Warren County 40.9 269.4
IL Washington County 38.4 270.6
IL Wayne County 38.4 271.6
IL White County 38.1 271.8
IL Whiteside County 41.8 270.1
IL Will County 41.5 272.0
IL Williamson County 37.7 271.0
IL Winnebago County 42.3 270.9
IL Woodford County 40.8 270.8
IN Adams County 40.7 275.1
IN Allen County 41.1 274.9
IN Bartholomew County 39.2 274.1
IN Benton County 40.6 272.7
IN Blackford County 40.5 274.7
IN Boone County 40.0 273.5
IN Brown County 39.2 273.8
IN Carroll County 40.6 273.4
IN Cass County 40.7 273.7
IN Clark County 38.4 274.3
IN Clay County 39.4 272.9
IN Clinton County 40.3 273.5
IN Crawford County 38.3 273.6
IN Daviess County 38.7 272.9
IN Dearborn County 39.1 275.1
Source: US Census Bureau. Data is provided "as-is". Not responsible for errors.

44
31
IN Decatur County 39.3 274.5
IN DeKalb County 41.4 275.0
IN Delaware County 40.2 274.6
IN Dubois County 38.4 273.1
IN Elkhart County 41.6 274.1
IN Fayette County 39.6 274.8
IN Floyd County 38.3 274.1
IN Fountain County 40.1 272.7
IN Franklin County 39.4 274.9
IN Fulton County 41.1 273.8
IN Gibson County 38.3 272.4
IN Grant County 40.5 274.4
IN Greene County 39.1 273.0
IN Hamilton County 40.0 273.9
IN Hancock County 39.8 274.2
IN Harrison County 38.2 273.9
IN Hendricks County 39.8 273.5
IN Henry County 39.9 274.6
IN Howard County 40.5 273.9
IN Huntington County 40.8 274.5
IN Jackson County 38.9 274.0
IN Jasper County 41.0 272.9
IN Jay County 40.4 275.0
IN Jefferson County 38.8 274.6
IN Jennings County 39.0 274.4
IN Johnson County 39.5 273.9
IN Knox County 38.7 272.6
IN Kosciusko County 41.3 274.2
IN LaGrange County 41.6 274.6
IN Lake County 41.5 272.6
IN LaPorte County 41.6 273.2
IN Lawrence County 38.8 273.5
IN Madison County 40.1 274.3
IN Marion County 39.8 273.9
IN Marshall County 41.3 273.7
IN Martin County 38.7 273.2
IN Miami County 40.8 273.9
IN Monroe County 39.2 273.5
IN Montgomery County 40.0 273.1
IN Morgan County 39.5 273.6
IN Newton County 41.0 272.6
IN Noble County 41.4 274.6
IN Ohio County 38.9 275.1
IN Orange County 38.6 273.5
IN Owen County 39.3 273.2
IN Parke County 39.8 272.8
IN Perry County 38.0 273.3
IN Pike County 38.4 272.8
IN Porter County 41.5 272.9
IN Posey County 38.0 272.2
IN Pulaski County 41.0 273.3
IN Putnam County 39.7 273.2
IN Randolph County 40.2 275
IN Ripley County 39.2 274.8
IN Rush County 39.6 274.5
IN St. Joseph County 41.7 273.8
IN Scott County 38.7 274.2
IN Shelby County 39.5 274.2
IN Spencer County 38.0 273.0
IN Starke County 41.3 273.3
IN Steuben County 41.7 275.0
IN Sullivan County 39.1 272.6
IN Switzerland County 38.8 275.0
IN Tippecanoe County 40.4 273.1
IN Tipton County 40.3 274.0
IN Union County 39.6 275.1
IN Vanderburgh County 38.0 272.4
IN Vermillion County 39.8 272.6
IN Vigo County 39.5 272.6
IN Wabash County 40.9 274.2
IN Warren County 40.3 272.6
IN Warrick County 38.0 272.7
IN Washington County 38.6 273.9
IN Wayne County 39.8 275.0
IN Wells County 40.7 274.8
IN White County 40.7 273.2
IN Whitley County 41.2 274.5
IA Adair County 41.3 265.5
IA Adams County 41.0 265.3
IA Allamakee County 43.3 268.6
IA Appanoose County 40.8 267.1
IA Audubon County 41.7 265.1
IA Benton County 42.1 267.9
IA Black Hawk County 42.5 267.7
IA Boone County 42.0 266.1
IA Bremer County 42.8 267.7
IA Buchanan County 42.5 268.1
IA Buena Vista County 42.7 264.8
IA Butler County 42.7 267.2
IA Calhoun County 42.4 265.4
IA Carroll County 42.0 265.1
IA Cass County 41.4 265.0
IA Cedar County 41.8 268.9
IA Cerro Gordo County 43.1 266.7
IA Cherokee County 42.7 264.4
IA Chickasaw County 43.1 267.7
IA Clarke County 41.0 266.2
IA Clay County 43.1 264.8
IA Clayton County 42.9 268.7
IA Clinton County 41.9 269.6
IA Crawford County 42.0 264.6
IA Dallas County 41.7 266.0
IA Davis County 40.7 267.6
IA Decatur County 40.7 266.2
IA Delaware County 42.5 268.6
IA Des Moines County 40.9 268.8
IA Dickinson County 43.4 264.9
IA Dubuque County 42.5 269.2
IA Emmet County 43.4 265.3
IA Fayette County 42.8 268.1
IA Floyd County 43.1 267.2
IA Franklin County 42.7 266.8
IA Fremont County 40.7 264.4
IA Greene County 42.0 265.6
IA Grundy County 42.4 267.2
IA Guthrie County 41.7 265.5
IA Hamilton County 42.4 266.3
IA Hancock County 43.1 266.3
IA Hardin County 42.4 266.8
IA Harrison County 41.7 264.2
IA Henry County 41.0 268.5
IA Howard County 43.4 267.7
IA Humboldt County 42.8 265.8
IA Ida County 42.4 264.5
IA Iowa County 41.7 267.9
IA Jackson County 42.2 269.4
IA Jasper County 41.7 266.9
IA Jefferson County 41.0 268.0
IA Johnson County 41.7 268.4
IA Jones County 42.1 268.8
IA Keokuk County 41.3 267.8
IA Kossuth County 43.2 265.8
IA Lee County 40.6 268.6
IA Linn County 42.0 268.4
IA Louisa County 41.2 268.7
IA Lucas County 41.0 266.7
IA Lyon County 43.4 263.8
IA Madison County 41.3 266.0
IA Mahaska County 41.3 267.4
IA Marion County 41.3 266.9
IA Marshall County 42.0 267.0
IA Mills County 41.0 264.4
IA Mitchell County 43.3 267.2
IA Monona County 42.1 264.0
IA Monroe County 41.0 267.2
IA Montgomery County 41.0 264.8
IA Muscatine County 41.5 268.9
IA O’Brien County 43.1 264.4
IA Osceola County 43.4 264.4
IA Page County 40.7 264.8
IA Palo Alto County 43.1 265.3
IA Plymouth County 42.8 263.8
IA Pocahontas County 42.7 265.3
IA Polk County 41.6 266.4
IA Pottawattamie County 41.3 264.3
IA Poweshiek County 41.7 267.5
IA Ringgold County 40.7 265.8
IA Sac County 42.4 264.9
IA Scott County 41.6 269.4
IA Shelby County 41.7 264.7
IA Sioux County 43.1 263.8
IA Story County 42.0 266.5
IA Tama County 42.1 267.5
IA Taylor County 40.7 265.3
IA Union County 41.0 265.7
IA Van Buren County 40.7 268.1
IA Wapello County 41.0 267.6
IA Warren County 41.4 266.4
IA Washington County 41.3 268.3
IA Wayne County 40.7 266.7
IA Webster County 42.4 265.8
IA Winnebago County 43.4 266.3
IA Winneshiek County 43.3 268.2
IA Woodbury County 42.4 263.8
IA Worth County 43.4 266.7
IA Wright County 42.7 266.2
KS Allen County 37.9 264.7
KS Anderson County 38.2 264.7
KS Atchison County 39.5 264.7
KS Barber County 37.2 261.4
Source: US Census Bureau. Data is provided "as-is". Not responsible for errors.

45
31
IN Decatur County 39.3 274.5
IN DeKalb County 41.4 275.0
IN Delaware County 40.2 274.6
IN Dubois County 38.4 273.1
IN Elkhart County 41.6 274.1
IN Fayette County 39.6 274.8
IN Floyd County 38.3 274.1
IN Fountain County 40.1 272.7
IN Franklin County 39.4 274.9
IN Fulton County 41.1 273.8
IN Gibson County 38.3 272.4
IN Grant County 40.5 274.4
IN Greene County 39.1 273.0
IN Hamilton County 40.0 273.9
IN Hancock County 39.8 274.2
IN Harrison County 38.2 273.9
IN Hendricks County 39.8 273.5
IN Henry County 39.9 274.6
IN Howard County 40.5 273.9
IN Huntington County 40.8 274.5
IN Jackson County 38.9 274.0
IN Jasper County 41.0 272.9
IN Jay County 40.4 275.0
IN Jefferson County 38.8 274.6
IN Jennings County 39.0 274.4
IN Johnson County 39.5 273.9
IN Knox County 38.7 272.6
IN Kosciusko County 41.3 274.2
IN LaGrange County 41.6 274.6
IN Lake County 41.5 272.6
IN LaPorte County 41.6 273.2
IN Lawrence County 38.8 273.5
IN Madison County 40.1 274.3
IN Marion County 39.8 273.9
IN Marshall County 41.3 273.7
IN Martin County 38.7 273.2
IN Miami County 40.8 273.9
IN Monroe County 39.2 273.5
IN Montgomery County 40.0 273.1
IN Morgan County 39.5 273.6
IN Newton County 41.0 272.6
IN Noble County 41.4 274.6
IN Ohio County 38.9 275.1
IN Orange County 38.6 273.5
IN Owen County 39.3 273.2
IN Parke County 39.8 272.8
IN Perry County 38.0 273.3
IN Pike County 38.4 272.8
IN Porter County 41.5 272.9
IN Posey County 38.0 272.2
IN Pulaski County 41.0 273.3
IN Putnam County 39.7 273.2
IN Randolph County 40.2 275
IN Ripley County 39.2 274.8
IN Rush County 39.6 274.5
IN St. Joseph County 41.7 273.8
IN Scott County 38.7 274.2
IN Shelby County 39.5 274.2
IN Spencer County 38.0 273.0
IN Starke County 41.3 273.3
IN Steuben County 41.7 275.0
IN Sullivan County 39.1 272.6
IN Switzerland County 38.8 275.0
IN Tippecanoe County 40.4 273.1
IN Tipton County 40.3 274.0
IN Union County 39.6 275.1
IN Vanderburgh County 38.0 272.4
IN Vermillion County 39.8 272.6
IN Vigo County 39.5 272.6
IN Wabash County 40.9 274.2
IN Warren County 40.3 272.6
IN Warrick County 38.0 272.7
IN Washington County 38.6 273.9
IN Wayne County 39.8 275.0
IN Wells County 40.7 274.8
IN White County 40.7 273.2
IN Whitley County 41.2 274.5
IA Adair County 41.3 265.5
IA Adams County 41.0 265.3
IA Allamakee County 43.3 268.6
IA Appanoose County 40.8 267.1
IA Audubon County 41.7 265.1
IA Benton County 42.1 267.9
IA Black Hawk County 42.5 267.7
IA Boone County 42.0 266.1
IA Bremer County 42.8 267.7
IA Buchanan County 42.5 268.1
IA Buena Vista County 42.7 264.8
IA Butler County 42.7 267.2
IA Calhoun County 42.4 265.4
IA Carroll County 42.0 265.1
IA Cass County 41.4 265.0
IA Cedar County 41.8 268.9
IA Cerro Gordo County 43.1 266.7
IA Cherokee County 42.7 264.4
IA Chickasaw County 43.1 267.7
IA Clarke County 41.0 266.2
IA Clay County 43.1 264.8
IA Clayton County 42.9 268.7
IA Clinton County 41.9 269.6
IA Crawford County 42.0 264.6
IA Dallas County 41.7 266.0
IA Davis County 40.7 267.6
IA Decatur County 40.7 266.2
IA Delaware County 42.5 268.6
IA Des Moines County 40.9 268.8
IA Dickinson County 43.4 264.9
IA Dubuque County 42.5 269.2
IA Emmet County 43.4 265.3
IA Fayette County 42.8 268.1
IA Floyd County 43.1 267.2
IA Franklin County 42.7 266.8
IA Fremont County 40.7 264.4
IA Greene County 42.0 265.6
IA Grundy County 42.4 267.2
IA Guthrie County 41.7 265.5
IA Hamilton County 42.4 266.3
IA Hancock County 43.1 266.3
IA Hardin County 42.4 266.8
IA Harrison County 41.7 264.2
IA Henry County 41.0 268.5
IA Howard County 43.4 267.7
IA Humboldt County 42.8 265.8
IA Ida County 42.4 264.5
IA Iowa County 41.7 267.9
IA Jackson County 42.2 269.4
IA Jasper County 41.7 266.9
IA Jefferson County 41.0 268.0
IA Johnson County 41.7 268.4
IA Jones County 42.1 268.8
IA Keokuk County 41.3 267.8
IA Kossuth County 43.2 265.8
IA Lee County 40.6 268.6
IA Linn County 42.0 268.4
IA Louisa County 41.2 268.7
IA Lucas County 41.0 266.7
IA Lyon County 43.4 263.8
IA Madison County 41.3 266.0
IA Mahaska County 41.3 267.4
IA Marion County 41.3 266.9
IA Marshall County 42.0 267.0
IA Mills County 41.0 264.4
IA Mitchell County 43.3 267.2
IA Monona County 42.1 264.0
IA Monroe County 41.0 267.2
IA Montgomery County 41.0 264.8
IA Muscatine County 41.5 268.9
IA O’Brien County 43.1 264.4
IA Osceola County 43.4 264.4
IA Page County 40.7 264.8
IA Palo Alto County 43.1 265.3
IA Plymouth County 42.8 263.8
IA Pocahontas County 42.7 265.3
IA Polk County 41.6 266.4
IA Pottawattamie County 41.3 264.3
IA Poweshiek County 41.7 267.5
IA Ringgold County 40.7 265.8
IA Sac County 42.4 264.9
IA Scott County 41.6 269.4
IA Shelby County 41.7 264.7
IA Sioux County 43.1 263.8
IA Story County 42.0 266.5
IA Tama County 42.1 267.5
IA Taylor County 40.7 265.3
IA Union County 41.0 265.7
IA Van Buren County 40.7 268.1
IA Wapello County 41.0 267.6
IA Warren County 41.4 266.4
IA Washington County 41.3 268.3
IA Wayne County 40.7 266.7
IA Webster County 42.4 265.8
IA Winnebago County 43.4 266.3
IA Winneshiek County 43.3 268.2
IA Woodbury County 42.4 263.8
IA Worth County 43.4 266.7
IA Wright County 42.7 266.2
KS Allen County 37.9 264.7
KS Anderson County 38.2 264.7
KS Atchison County 39.5 264.7
KS Barber County 37.2 261.4
Source: US Census Bureau. Data is provided "as-is". Not responsible for errors.
32
KS Barton County 38.4 261.2
KS Bourbon County 37.9 265.2
KS Brown County 39.8 264.4
KS Butler County 37.8 263.1
KS Chase County 38.3 263.4
KS Chautauqua County 37.1 263.7
KS Cherokee County 37.1 265.2
KS Cheyenne County 39.8 258.3
KS Clark County 37.2 260.2
KS Clay County 39.4 262.9
KS Cloud County 39.5 262.3
KS Coffey County 38.2 264.3
KS Comanche County 37.3 260.7
KS Cowley County 37.2 263.1
KS Crawford County 37.5 265.2
KS Decatur County 39.8 259.6
KS Dickinson County 38.8 262.9
KS Doniphan County 39.8 264.9
KS Douglas County 38.9 264.7
KS Edwards County 37.9 260.7
KS Elk County 37.4 263.8
KS Ellis County 38.9 260.7
KS Ellsworth County 38.7 261.8
KS Finney County 38.0 259.2
KS Ford County 37.7 260.1
KS Franklin County 38.6 264.7
KS Geary County 39.0 263.2
KS Gove County 39.0 259.5
KS Graham County 39.3 260.1
KS Grant County 37.6 258.7
KS Gray County 37.7 259.6
KS Greeley County 38.5 258.2
KS Greenwood County 37.9 263.8
KS Hamilton County 38.0 258.2
KS Harper County 37.2 261.9
KS Harvey County 38.0 262.6
KS Haskell County 37.5 259.1
KS Hodgeman County 38.1 260.1
KS Jackson County 39.4 264.2
KS Jefferson County 39.2 264.6
KS Jewell County 39.8 261.8
KS Johnson County 38.9 265.2
KS Kearny County 38.0 258.7
KS Kingman County 37.6 261.9
KS Kiowa County 37.6 260.7
KS Labette County 37.2 264.7
KS Lane County 38.5 259.5
KS Leavenworth County 39.2 265.0
KS Lincoln County 39.0 261.8
KS Linn County 38.2 265.2
KS Logan County 39.0 258.9
KS Lyon County 38.4 263.9
KS McPherson County 38.4 262.4
KS Marion County 38.3 262.9
KS Marshall County 39.8 263.5
KS Meade County 37.3 259.6
KS Miami County 38.6 265.1
KS Mitchell County 39.4 261.8
KS Montgomery County 37.1 264.3
KS Morris County 38.7 263.4
KS Morton County 37.1 258.2
KS Nemaha County 39.8 264.0
KS Neosho County 37.6 264.6
KS Ness County 38.5 260.1
KS Norton County 39.8 260.1
KS Osage County 38.6 264.3
KS Osborne County 39.4 261.2
KS Ottawa County 39.1 262.3
KS Pawnee County 38.2 260.8
KS Phillips County 39.8 260.7
KS Pottawatomie County 39.3 263.7
KS Pratt County 37.6 261.3
KS Rawlins County 39.8 258.9
KS Reno County 38.0 262.0
KS Republic County 39.8 262.4
KS Rice County 38.3 261.8
KS Riley County 39.3 263.3
KS Rooks County 39.4 260.7
KS Rush County 38.5 260.7
KS Russell County 38.9 261.2
KS Saline County 38.8 262.4
KS Scott County 38.5 259.1
KS Sedgwick County 37.7 262.6
KS Seward County 37.1 259.1
KS Shawnee County 39.0 264.3
KS Sheridan County 39.4 259.5
KS Sherman County 39.3 258.3
KS Smith County 39.8 261.2
KS Stafford County 38.0 261.3
KS Stanton County 37.6 258.3
KS Stevens County 37.2 258.7
KS Sumner County 37.3 262.6
KS Thomas County 39.4 259.0
KS Trego County 38.9 260.2
KS Wabaunsee County 39.0 263.8
KS Wallace County 38.9 258.2
KS Washington County 39.8 262.9
KS Wichita County 38.5 258.6
KS Wilson County 37.5 264.2
KS Woodson County 37.9 264.3
KS Wyandotte County 39.1 265.3
KY Adair County 37.1 274.7
KY Allen County 36.7 273.8
KY Anderson County 38.0 275.0
KY Ballard County 37.1 271.0
KY Barren County 37.0 274.1
KY Bath County 38.1 276.2
KY Bell County 36.7 276.3
KY Boone County 39.0 275.3
KY Bourbon County 38.2 275.8
KY Boyd County 38.4 277.3
KY Boyle County 37.6 275.2
KY Bracken County 38.7 275.9
KY Breathitt County 37.5 276.7
KY Breckinridge County 37.8 273.5
KY Bullitt County 38.0 274.3
KY Butler County 37.2 273.3
KY Caldwell County 37.2 272.1
KY Calloway County 36.6 271.7
KY Campbell County 39.0 275.6
KY Carlisle County 36.9 271.0
KY Carroll County 38.7 274.9
KY Carter County 38.3 277.0
KY Casey County 37.3 275.1
KY Christian County 36.9 272.5
KY Clark County 38.0 275.8
KY Clay County 37.2 276.3
KY Clinton County 36.7 274.9
KY Crittenden County 37.3 271.9
KY Cumberland County 36.8 274.6
KY Daviess County 37.8 272.9
KY Edmonson County 37.2 273.8
KY Elliott County 38.1 276.9
KY Estill County 37.7 276.0
KY Fayette County 38.0 275.5
KY Fleming County 38.4 276.3
KY Floyd County 37.6 277.3
KY Franklin County 38.2 275.1
KY Fulton County 36.5 270.9
KY Gallatin County 38.7 275.1
KY Garrard County 37.6 275.4
KY Grant County 38.7 275.4
KY Graves County 36.7 271.4
KY Grayson County 37.5 273.7
KY Green County 37.3 274.5
KY Greenup County 38.6 277.1
KY Hancock County 37.9 273.2
KY Hardin County 37.7 274.1
KY Harlan County 36.9 276.8
KY Harrison County 38.4 275.7
KY Hart County 37.3 274.1
KY Henderson County 37.8 272.4
KY Henry County 38.4 274.8
KY Hickman County 36.7 271.0
KY Hopkins County 37.3 272.5
KY Jackson County 37.4 276.0
KY Jefferson County 38.2 274.3
KY Jessamine County 37.9 275.4
KY Johnson County 37.8 277.2
KY Kenton County 39.0 275.5
KY Knott County 37.3 277.0
KY Knox County 36.9 276.1
KY Larue County 37.5 274.3
KY Laurel County 37.1 275.9
KY Lawrence County 38.1 277.3
KY Lee County 37.6 276.3
KY Leslie County 37.1 276.6
KY Letcher County 37.1 277.2
KY Lewis County 38.5 276.7
KY Lincoln County 37.5 275.3
KY Livingston County 37.2 271.7
KY Logan County 36.9 273.1
KY Lyon County 37.0 271.9
KY McCracken County 37.1 271.3
KY McCreary County 36.7 275.5
KY McLean County 37.5 272.8
KY Madison County 37.7 275.7
KY Magoffin County 37.7 276.9
KY Marion County 37.6 274.7
KY Marshall County 36.9 271.7
Source: US Census Bureau. Data is provided "as-is". Not responsible for errors.

46
33
KY Martin County 37.8 277.5
KY Mason County 38.6 276.2
KY Meade County 37.9 273.9
KY Menifee County 38.0 276.4
KY Mercer County 37.8 275.2
KY Metcalfe County 37.0 274.4
KY Monroe County 36.7 274.3
KY Montgomery County 38.0 276.1
KY Morgan County 37.9 276.7
KY Muhlenberg County 37.2 272.9
KY Nelson County 37.8 274.5
KY Nicholas County 38.3 276.0
KY Ohio County 37.5 273.1
KY Oldham County 38.4 274.6
KY Owen County 38.5 275.2
KY Owsley County 37.4 276.3
KY Pendleton County 38.7 275.6
KY Perry County 37.2 276.8
KY Pike County 37.4 277.6
KY Powell County 37.8 276.1
KY Pulaski County 37.1 275.4
KY Robertson County 38.5 275.9
KY Rockcastle County 37.4 275.7
KY Rowan County 38.2 276.6
KY Russell County 37.0 274.9
KY Scott County 38.2 275.4
KY Shelby County 38.2 274.8
KY Simpson County 36.7 273.4
KY Spencer County 38.0 274.7
KY Taylor County 37.4 274.7
KY Todd County 36.8 272.8
KY Trigg County 36.8 272.1
KY Trimble County 38.6 274.6
KY Union County 37.6 272.1
KY Warren County 37.0 273.6
KY Washington County 37.7 274.8
KY Wayne County 36.8 275.2
KY Webster County 37.5 272.3
KY Whitley County 36.8 275.9
KY Wolfe County 37.7 276.5
KY Woodford County 38.1 275.3
LA Acadia Parish 30.3 267.6
LA Allen Parish 30.7 267.2
LA Ascension Parish 30.2 269.1
LA Assumption Parish 29.9 268.9
LA Avoyelles Parish 31.1 267.9
LA Beauregard Parish 30.7 266.7
LA Bienville Parish 32.4 267.0
LA Bossier Parish 32.6 266.3
LA Caddo Parish 32.5 266.2
LA Calcasieu Parish 30.2 266.7
LA Caldwell Parish 32.1 267.9
LA Cameron Parish 29.9 266.8
LA Catahoula Parish 31.7 268.1
LA Claiborne Parish 32.8 267.0
LA Concordia Parish 31.6 268.5
LA De Soto Parish 32.1 266.2
LA East Baton Rouge Parish 30.5 268.9
LA East Carroll Parish 32.8 268.8
LA East Feliciana Parish 30.8 268.9
LA Evangeline Parish 30.7 267.6
LA Franklin Parish 32.1 268.3
LA Grant Parish 31.6 267.4
LA Iberia Parish 30.0 268.2
LA Iberville Parish 30.3 268.7
LA Jackson Parish 32.3 267.4
LA Jefferson Parish 29.9 269.8
LA Jefferson Davis Parish 30.2 267.2
LA Lafayette Parish 30.2 268.0
LA Lafourche Parish 29.6 269.4
LA La Salle Parish 31.7 267.8
LA Lincoln Parish 32.6 267.3
LA Livingston Parish 30.5 269.2
LA Madison Parish 32.4 268.8
LA Morehouse Parish 32.8 268.1
LA Natchitoches Parish 31.7 266.9
LA Orleans Parish 30.0 269.9
LA Ouachita Parish 32.5 267.9
LA Plaquemines Parish 29.6 270.2
LA Pointe Coupee Parish 30.6 268.5
LA Rapides Parish 31.3 267.5
LA Red River Parish 32.1 266.7
LA Richland Parish 32.4 268.3
LA Sabine Parish 31.6 266.4
LA St. Bernard Parish 29.9 270.1
LA St. Charles Parish 29.9 269.6
LA St. Helena Parish 30.8 269.3
LA St. James Parish 30.0 269.2
LA St. John the Baptist Parish 30.1 269.5
LA St. Landry Parish 30.5 267.9
LA St. Martin Parish 30.2 268.2
LA St. Mary Parish 29.7 268.6
LA St. Tammany Parish 30.4 270.1
LA Tangipahoa Parish 30.6 269.5
LA Tensas Parish 32.0 268.7
LA Terrebonne Parish 29.5 269.3
LA Union Parish 32.8 267.6
LA Vermilion Parish 30.0 267.8
LA Vernon Parish 31.1 266.8
LA Washington Parish 30.8 270.0
LA Webster Parish 32.7 266.7
LA West Baton Rouge Parish 30.5 268.7
LA West Carroll Parish 32.8 268.6
LA West Feliciana Parish 30.9 268.6
LA Winn Parish 31.9 267.4
ME Androscoggin County 44.1 289.8
ME Aroostook County 46.6 291.7
ME Cumberland County 43.8 289.7
ME Franklin County 44.9 289.6
ME Hancock County 44.5 291.6
ME Kennebec County 44.4 290.2
ME Knox County 44.1 290.9
ME Lincoln County 44.0 290.5
ME Oxford County 44.3 289.3
ME Penobscot County 45.2 291.3
ME Piscataquis County 45.6 290.7
ME Sagadahoc County 43.9 290.1
ME Somerset County 45.1 290.1
ME Waldo County 44.5 290.9
ME Washington County 44.9 292.4
ME York County 43.4 289.3
MD Allegany County 39.6 281.2
MD Anne Arundel County 39.1 283.4
MD Baltimore County 39.4 283.4
MD Calvert County 38.5 283.5
MD Caroline County 38.9 284.2
MD Carroll County 39.6 283.0
MD Cecil County 39.6 284.0
MD Charles County 38.5 283.0
MD Dorchester County 38.5 284.0
MD Frederick County 39.5 282.6
MD Garrett County 39.5 280.7
MD Harford County 39.5 283.7
MD Howard County 39.2 283.1
MD Kent County 39.3 283.9
MD Montgomery County 39.1 282.9
MD Prince George’s County 38.9 283.1
MD Queen Anne’s County 39.0 283.9
MD St. Mary’s County 38.3 283.4
MD Somerset County 38.1 284.2
MD Talbot County 38.8 283.9
MD Washington County 39.6 282.2
MD Wicomico County 38.4 284.4
MD Worcester County 38.3 284.7
MD Baltimore city 39.3 283.4
MA Barnstable County 41.7 289.7
MA Berkshire County 42.4 286.8
MA Bristol County 41.8 288.9
MA Dukes County 41.4 289.4
MA Essex County 42.6 289.0
MA Franklin County 42.6 287.4
MA Hampden County 42.1 287.4
MA Hampshire County 42.3 287.4
MA Middlesex County 42.5 288.7
MA Nantucket County 41.3 289.9
MA Norfolk County 42.2 288.8
MA Plymouth County 42.0 289.2
MA Suffolk County 42.3 288.9
MA Worcester County 42.3 288.2
MI Alcona County 44.7 276.4
MI Alger County 46.4 273.4
MI Allegan County 42.6 274.1
MI Alpena County 45.0 276.5
MI Antrim County 45.0 274.8
MI Arenac County 44.1 276.1
MI Baraga County 46.7 271.6
MI Barry County 42.6 274.7
MI Bay County 43.6 276.1
MI Benzie County 44.6 274.0
MI Berrien County 42.0 273.6
MI Branch County 41.9 274.9
MI Calhoun County 42.3 274.9
MI Cass County 41.9 274.0
MI Charlevoix County 45.2 274.9
MI Cheboygan County 45.5 275.5
MI Chippewa County 46.3 275.5
MI Clare County 44.0 275.1
MI Clinton County 42.9 275.4
MI Crawford County 44.7 275.4
MI Delta County 45.9 273.1
Source: US Census Bureau. Data is provided "as-is". Not responsible for errors.

47
33
KY Martin County 37.8 277.5
KY Mason County 38.6 276.2
KY Meade County 37.9 273.9
KY Menifee County 38.0 276.4
KY Mercer County 37.8 275.2
KY Metcalfe County 37.0 274.4
KY Monroe County 36.7 274.3
KY Montgomery County 38.0 276.1
KY Morgan County 37.9 276.7
KY Muhlenberg County 37.2 272.9
KY Nelson County 37.8 274.5
KY Nicholas County 38.3 276.0
KY Ohio County 37.5 273.1
KY Oldham County 38.4 274.6
KY Owen County 38.5 275.2
KY Owsley County 37.4 276.3
KY Pendleton County 38.7 275.6
KY Perry County 37.2 276.8
KY Pike County 37.4 277.6
KY Powell County 37.8 276.1
KY Pulaski County 37.1 275.4
KY Robertson County 38.5 275.9
KY Rockcastle County 37.4 275.7
KY Rowan County 38.2 276.6
KY Russell County 37.0 274.9
KY Scott County 38.2 275.4
KY Shelby County 38.2 274.8
KY Simpson County 36.7 273.4
KY Spencer County 38.0 274.7
KY Taylor County 37.4 274.7
KY Todd County 36.8 272.8
KY Trigg County 36.8 272.1
KY Trimble County 38.6 274.6
KY Union County 37.6 272.1
KY Warren County 37.0 273.6
KY Washington County 37.7 274.8
KY Wayne County 36.8 275.2
KY Webster County 37.5 272.3
KY Whitley County 36.8 275.9
KY Wolfe County 37.7 276.5
KY Woodford County 38.1 275.3
LA Acadia Parish 30.3 267.6
LA Allen Parish 30.7 267.2
LA Ascension Parish 30.2 269.1
LA Assumption Parish 29.9 268.9
LA Avoyelles Parish 31.1 267.9
LA Beauregard Parish 30.7 266.7
LA Bienville Parish 32.4 267.0
LA Bossier Parish 32.6 266.3
LA Caddo Parish 32.5 266.2
LA Calcasieu Parish 30.2 266.7
LA Caldwell Parish 32.1 267.9
LA Cameron Parish 29.9 266.8
LA Catahoula Parish 31.7 268.1
LA Claiborne Parish 32.8 267.0
LA Concordia Parish 31.6 268.5
LA De Soto Parish 32.1 266.2
LA East Baton Rouge Parish 30.5 268.9
LA East Carroll Parish 32.8 268.8
LA East Feliciana Parish 30.8 268.9
LA Evangeline Parish 30.7 267.6
LA Franklin Parish 32.1 268.3
LA Grant Parish 31.6 267.4
LA Iberia Parish 30.0 268.2
LA Iberville Parish 30.3 268.7
LA Jackson Parish 32.3 267.4
LA Jefferson Parish 29.9 269.8
LA Jefferson Davis Parish 30.2 267.2
LA Lafayette Parish 30.2 268.0
LA Lafourche Parish 29.6 269.4
LA La Salle Parish 31.7 267.8
LA Lincoln Parish 32.6 267.3
LA Livingston Parish 30.5 269.2
LA Madison Parish 32.4 268.8
LA Morehouse Parish 32.8 268.1
LA Natchitoches Parish 31.7 266.9
LA Orleans Parish 30.0 269.9
LA Ouachita Parish 32.5 267.9
LA Plaquemines Parish 29.6 270.2
LA Pointe Coupee Parish 30.6 268.5
LA Rapides Parish 31.3 267.5
LA Red River Parish 32.1 266.7
LA Richland Parish 32.4 268.3
LA Sabine Parish 31.6 266.4
LA St. Bernard Parish 29.9 270.1
LA St. Charles Parish 29.9 269.6
LA St. Helena Parish 30.8 269.3
LA St. James Parish 30.0 269.2
LA St. John the Baptist Parish 30.1 269.5
LA St. Landry Parish 30.5 267.9
LA St. Martin Parish 30.2 268.2
LA St. Mary Parish 29.7 268.6
LA St. Tammany Parish 30.4 270.1
LA Tangipahoa Parish 30.6 269.5
LA Tensas Parish 32.0 268.7
LA Terrebonne Parish 29.5 269.3
LA Union Parish 32.8 267.6
LA Vermilion Parish 30.0 267.8
LA Vernon Parish 31.1 266.8
LA Washington Parish 30.8 270.0
LA Webster Parish 32.7 266.7
LA West Baton Rouge Parish 30.5 268.7
LA West Carroll Parish 32.8 268.6
LA West Feliciana Parish 30.9 268.6
LA Winn Parish 31.9 267.4
ME Androscoggin County 44.1 289.8
ME Aroostook County 46.6 291.7
ME Cumberland County 43.8 289.7
ME Franklin County 44.9 289.6
ME Hancock County 44.5 291.6
ME Kennebec County 44.4 290.2
ME Knox County 44.1 290.9
ME Lincoln County 44.0 290.5
ME Oxford County 44.3 289.3
ME Penobscot County 45.2 291.3
ME Piscataquis County 45.6 290.7
ME Sagadahoc County 43.9 290.1
ME Somerset County 45.1 290.1
ME Waldo County 44.5 290.9
ME Washington County 44.9 292.4
ME York County 43.4 289.3
MD Allegany County 39.6 281.2
MD Anne Arundel County 39.1 283.4
MD Baltimore County 39.4 283.4
MD Calvert County 38.5 283.5
MD Caroline County 38.9 284.2
MD Carroll County 39.6 283.0
MD Cecil County 39.6 284.0
MD Charles County 38.5 283.0
MD Dorchester County 38.5 284.0
MD Frederick County 39.5 282.6
MD Garrett County 39.5 280.7
MD Harford County 39.5 283.7
MD Howard County 39.2 283.1
MD Kent County 39.3 283.9
MD Montgomery County 39.1 282.9
MD Prince George’s County 38.9 283.1
MD Queen Anne’s County 39.0 283.9
MD St. Mary’s County 38.3 283.4
MD Somerset County 38.1 284.2
MD Talbot County 38.8 283.9
MD Washington County 39.6 282.2
MD Wicomico County 38.4 284.4
MD Worcester County 38.3 284.7
MD Baltimore city 39.3 283.4
MA Barnstable County 41.7 289.7
MA Berkshire County 42.4 286.8
MA Bristol County 41.8 288.9
MA Dukes County 41.4 289.4
MA Essex County 42.6 289.0
MA Franklin County 42.6 287.4
MA Hampden County 42.1 287.4
MA Hampshire County 42.3 287.4
MA Middlesex County 42.5 288.7
MA Nantucket County 41.3 289.9
MA Norfolk County 42.2 288.8
MA Plymouth County 42.0 289.2
MA Suffolk County 42.3 288.9
MA Worcester County 42.3 288.2
MI Alcona County 44.7 276.4
MI Alger County 46.4 273.4
MI Allegan County 42.6 274.1
MI Alpena County 45.0 276.5
MI Antrim County 45.0 274.8
MI Arenac County 44.1 276.1
MI Baraga County 46.7 271.6
MI Barry County 42.6 274.7
MI Bay County 43.6 276.1
MI Benzie County 44.6 274.0
MI Berrien County 42.0 273.6
MI Branch County 41.9 274.9
MI Calhoun County 42.3 274.9
MI Cass County 41.9 274.0
MI Charlevoix County 45.2 274.9
MI Cheboygan County 45.5 275.5
MI Chippewa County 46.3 275.5
MI Clare County 44.0 275.1
MI Clinton County 42.9 275.4
MI Crawford County 44.7 275.4
MI Delta County 45.9 273.1
Source: US Census Bureau. Data is provided "as-is". Not responsible for errors.
34
MI Dickinson County 45.9 272
MI Eaton County 42.6 275.2
MI Emmet County 45.5 275.1
MI Genesee County 43.0 276.3
MI Gladwin County 44.0 275.6
MI Gogebic County 46.4 270.2
MI Grand Traverse County 44.7 274.4
MI Gratiot County 43.3 275.4
MI Hillsdale County 41.9 275.4
MI Houghton County 47.0 271.4
MI Huron County 43.8 276.9
MI Ingham County 42.7 275.5
MI Ionia County 43.0 274.9
MI Iosco County 44.4 276.4
MI Iron County 46.2 271.4
MI Isabella County 43.6 275.2
MI Jackson County 42.2 275.6
MI Kalamazoo County 42.3 274.4
MI Kalkaska County 44.7 274.9
MI Kent County 43.0 274.4
MI Keweenaw County 47.4 271.8
MI Lake County 44.0 274.2
MI Lapeer County 43.1 276.8
MI Leelanau County 44.9 274.2
MI Lenawee County 41.9 275.9
MI Livingston County 42.6 276.1
MI Luce County 46.5 274.4
MI Mackinac County 46.0 275.0
MI Macomb County 42.6 277.0
MI Manistee County 44.3 273.9
MI Marquette County 46.5 272.4
MI Mason County 44.0 273.7
MI Mecosta County 43.6 274.6
MI Menominee County 45.5 272.4
MI Midland County 43.6 275.7
MI Missaukee County 44.3 274.9
MI Monroe County 41.9 276.5
MI Montcalm County 43.3 274.8
MI Montmorency County 45.0 275.9
MI Muskegon County 43.3 273.8
MI Newaygo County 43.5 274.2
MI Oakland County 42.6 276.7
MI Oceana County 43.6 273.7
MI Ogemaw County 44.3 275.9
MI Ontonagon County 46.7 270.7
MI Osceola County 44.0 274.7
MI Oscoda County 44.7 275.8
MI Otsego County 45.0 275.4
MI Ottawa County 42.9 274.0
MI Presque Isle County 45.4 276.1
MI Roscommon County 44.4 275.3
MI Saginaw County 43.4 276.0
MI St. Clair County 42.9 277.4
MI St. Joseph County 41.9 274.5
MI Sanilac County 43.4 277.2
MI Schoolcraft County 46.1 273.8
MI Shiawassee County 42.9 275.9
MI Tuscola County 43.5 276.6
MI Van Buren County 42.3 274.0
MI Washtenaw County 42.3 276.2
MI Wayne County 42.3 276.8
MI Wexford County 44.3 274.4
MN Aitkin County 46.6 266.5
MN Anoka County 45.2 266.7
MN Becker County 46.9 264.3
MN Beltrami County 47.7 265.2
MN Benton County 45.7 265.9
MN Big Stone County 45.4 263.6
MN Blue Earth County 44.1 266.0
MN Brown County 44.3 265.3
MN Carlton County 46.6 267.4
MN Carver County 44.8 266.3
MN Cass County 46.9 265.6
MN Chippewa County 45.0 264.4
MN Chisago County 45.5 267.1
MN Clay County 46.9 263.4
MN Clearwater County 47.5 264.6
MN Cook County 47.9 269.5
MN Cottonwood County 44.0 264.8
MN Crow Wing County 46.5 265.9
MN Dakota County 44.8 266.9
MN Dodge County 44.0 267.2
MN Douglas County 45.9 264.6
MN Faribault County 43.7 266.0
MN Fillmore County 43.7 267.9
MN Freeborn County 43.7 266.6
MN Goodhue County 44.4 267.3
MN Grant County 45.9 264.0
MN Hennepin County 45.0 266.6
MN Houston County 43.7 268.5
MN Hubbard County 47.1 265.1
MN Isanti County 45.6 266.7
MN Itasca County 47.4 266.4
MN Jackson County 43.7 264.9
MN Kanabec County 45.9 266.7
MN Kandiyohi County 45.2 265.0
MN Kittson County 48.8 263.1
MN Koochiching County 48.4 266.3
MN Lac qui Parle County 45.0 263.8
MN Lake County 47.5 268.5
MN Lake of the Woods County 48.7 265.2
MN Le Sueur County 44.4 266.3
MN Lincoln County 44.4 263.7
MN Lyon County 44.4 264.2
MN McLeod County 44.8 265.7
MN Mahnomen County 47.3 264.2
MN Marshall County 48.3 263.5
MN Martin County 43.7 265.5
MN Meeker County 45.1 265.5
MN Mille Lacs County 45.9 266.4
MN Morrison County 46.0 265.7
MN Mower County 43.7 267.2
MN Murray County 44.0 264.3
MN Nicollet County 44.3 265.9
MN Nobles County 43.7 264.3
MN Norman County 47.3 263.5
MN Olmsted County 44.0 267.6
MN Otter Tail County 46.4 264.3
MN Pennington County 48.1 263.9
MN Pine County 46.1 267.2
MN Pipestone County 44.0 263.7
MN Polk County 47.8 263.6
MN Pope County 45.6 264.6
MN Ramsey County 45.0 266.9
MN Red Lake County 47.9 263.9
MN Redwood County 44.4 264.8
MN Renville County 44.7 265.1
MN Rice County 44.3 266.7
MN Rock County 43.7 263.8
MN Roseau County 48.8 264.2
MN St. Louis County 47.4 267.6
MN Scott County 44.7 266.5
MN Sherburne County 45.4 266.2
MN Sibley County 44.6 265.8
MN Stearns County 45.5 265.5
MN Steele County 44.0 266.8
MN Stevens County 45.6 264.0
MN Swift County 45.3 264.3
MN Todd County 46.1 265.1
MN Traverse County 45.8 263.5
MN Wabasha County 44.3 267.8
MN Wadena County 46.5 265.0
MN Waseca County 44.0 266.4
MN Washington County 45.0 267.1
MN Watonwan County 44.0 265.4
MN Wilkin County 46.3 263.5
MN Winona County 44.0 268.3
MN Wright County 45.2 266.1
MN Yellow Medicine County 44.7 264.2
MS Adams County 31.5 268.6
MS Alcorn County 34.9 271.5
MS Amite County 31.2 269.2
MS Attala County 33.1 270.4
MS Benton County 34.8 270.8
MS Bolivar County 33.8 269.2
MS Calhoun County 33.9 270.7
MS Carroll County 33.5 270.1
MS Chickasaw County 33.9 271.1
MS Choctaw County 33.3 270.7
MS Claiborne County 32.0 269.1
MS Clarke County 32.1 271.3
MS Clay County 33.6 271.3
MS Coahoma County 34.2 269.4
MS Copiah County 31.9 269.6
MS Covington County 31.6 270.5
MS DeSoto County 34.9 270.0
MS Forrest County 31.3 270.7
MS Franklin County 31.5 269.1
MS George County 30.9 271.4
MS Greene County 31.2 271.4
MS Grenada County 33.8 270.2
MS Hancock County 30.4 270.5
MS Harrison County 30.4 270.9
MS Hinds County 32.3 269.7
MS Holmes County 33.1 269.9
MS Humphreys County 33.1 269.5
MS Issaquena County 32.8 269.0
MS Itawamba County 34.3 271.6
MS Jackson County 30.5 271.4
MS Jasper County 32.0 270.9
Source: US Census Bureau. Data is provided "as-is". Not responsible for errors.
48
35
MS Jefferson County 31.7 269.0
MS Jefferson Davis County 31.6 270.2
MS Jones County 31.7 270.8
MS Kemper County 32.8 271.3
MS Lafayette County 34.4 270.5
MS Lamar County 31.2 270.5
MS Lauderdale County 32.4 271.3
MS Lawrence County 31.6 269.9
MS Leake County 32.7 270.5
MS Lee County 34.3 271.3
MS Leflore County 33.6 269.7
MS Lincoln County 31.5 269.6
MS Lowndes County 33.5 271.6
MS Madison County 32.6 269.9
MS Marion County 31.2 270.2
MS Marshall County 34.8 270.5
MS Monroe County 33.9 271.5
MS Montgomery County 33.5 270.3
MS Neshoba County 32.7 270.9
MS Newton County 32.4 270.9
MS Noxubee County 33.1 271.4
MS Oktibbeha County 33.4 271.1
MS Panola County 34.4 270.0
MS Pearl River County 30.7 270.4
MS Perry County 31.2 271.0
MS Pike County 31.2 269.6
MS Pontotoc County 34.2 271.0
MS Prentiss County 34.6 271.5
MS Quitman County 34.3 269.7
MS Rankin County 32.3 270.0
MS Scott County 32.4 270.5
MS Sharkey County 32.9 269.2
MS Simpson County 31.9 270.1
MS Smith County 32.0 270.5
MS Stone County 30.8 270.9
MS Sunflower County 33.6 269.4
MS Tallahatchie County 33.9 269.8
MS Tate County 34.6 270.0
MS Tippah County 34.8 271.1
MS Tishomingo County 34.7 271.8
MS Tunica County 34.7 269.6
MS Union County 34.5 271.0
MS Walthall County 31.1 269.9
MS Warren County 32.3 269.1
MS Washington County 33.4 269.0
MS Wayne County 31.6 271.3
MS Webster County 33.6 270.8
MS Wilkinson County 31.2 268.7
MS Winston County 33.1 270.9
MS Yalobusha County 34.1 270.3
MS Yazoo County 32.8 269.6
MO Adair County 40.2 267.4
MO Andrew County 40.0 265.2
MO Atchison County 40.4 264.6
MO Audrain County 39.2 268.2
MO Barry County 36.7 266.2
MO Barton County 37.5 265.7
MO Bates County 38.2 265.6
MO Benton County 38.3 266.7
MO Bollinger County 37.3 270.0
MO Boone County 39.0 267.7
MO Buchanan County 39.7 265.2
MO Butler County 36.7 269.6
MO Caldwell County 39.7 266.0
MO Callaway County 38.8 268.1
MO Camden County 38.1 267.2
MO Cape Girardeau County 37.4 270.4
MO Carroll County 39.4 266.5
MO Carter County 36.9 269.1
MO Cass County 38.7 265.6
MO Cedar County 37.7 266.1
MO Chariton County 39.5 267.0
MO Christian County 37.0 266.8
MO Clark County 40.4 268.3
MO Clay County 39.3 265.5
MO Clinton County 39.6 265.6
MO Cole County 38.5 267.8
MO Cooper County 38.9 267.2
MO Crawford County 38.0 268.7
MO Dade County 37.4 266.2
MO Dallas County 37.7 267.0
MO Daviess County 40.0 266.0
MO DeKalb County 39.9 265.6
MO Dent County 37.6 268.5
MO Douglas County 36.9 267.5
MO Dunklin County 36.3 269.9
MO Franklin County 38.4 269.0
MO Gasconade County 38.4 268.5
MO Gentry County 40.2 265.6
MO Greene County 37.2 266.7
MO Grundy County 40.1 266.4
MO Harrison County 40.3 266.0
MO Henry County 38.4 266.2
MO Hickory County 37.9 266.7
MO Holt County 40.1 264.8
MO Howard County 39.1 267.3
MO Howell County 36.8 268.1
MO Iron County 37.5 269.3
MO Jackson County 39.0 265.5
MO Jasper County 37.1 265.6
MO Jefferson County 38.3 269.5
MO Johnson County 38.7 266.2
MO Knox County 40.1 267.9
MO Laclede County 37.7 267.4
MO Lafayette County 39.1 266.2
MO Lawrence County 37.1 266.2
MO Lewis County 40.1 268.3
MO Lincoln County 39.0 269.1
MO Linn County 39.8 266.9
MO Livingston County 39.8 266.4
MO McDonald County 36.6 265.6
MO Macon County 39.8 267.4
MO Madison County 37.5 269.7
MO Maries County 38.1 268.1
MO Marion County 39.8 268.5
MO Mercer County 40.4 266.4
MO Miller County 38.2 267.5
MO Mississippi County 36.8 270.7
MO Moniteau County 38.6 267.4
MO Monroe County 39.5 268.0
MO Montgomery County 38.9 268.5
MO Morgan County 38.4 267.2
MO New Madrid County 36.6 270.3
MO Newton County 36.9 265.6
MO Nodaway County 40.4 265.1
MO Oregon County 36.6 268.6
MO Osage County 38.5 268.1
MO Ozark County 36.6 267.5
MO Pemiscot County 36.2 270.2
MO Perry County 37.7 270.2
MO Pettis County 38.7 266.7
MO Phelps County 37.9 268.2
MO Pike County 39.4 268.9
MO Platte County 39.3 265.3
MO Polk County 37.6 266.6
MO Pulaski County 37.8 267.8
MO Putnam County 40.5 267.0
MO Ralls County 39.5 268.5
MO Randolph County 39.4 267.5
MO Ray County 39.3 266.0
MO Reynolds County 37.4 269.0
MO Ripley County 36.6 269.2
MO St. Charles County 38.8 269.3
MO St. Clair County 38.1 266.2
MO Ste. Genevieve County 37.9 269.8
MO St. Francois County 37.8 269.5
MO St. Louis County 38.7 269.6
MO Saline County 39.1 266.8
MO Schuyler County 40.5 267.5
MO Scotland County 40.4 267.9
MO Scott County 37.0 270.4
MO Shannon County 37.1 268.6
MO Shelby County 39.8 267.9
MO Stoddard County 36.8 270.0
MO Stone County 36.7 266.5
MO Sullivan County 40.2 266.9
MO Taney County 36.7 266.8
MO Texas County 37.3 268.0
MO Vernon County 37.8 265.7
MO Warren County 38.8 268.9
MO Washington County 38.0 269.2
MO Wayne County 37.1 269.5
MO Webster County 37.3 267.1
MO Worth County 40.5 265.6
MO Wright County 37.2 267.5
MO St. Louis city 38.6 269.8
MT Beaverhead County 45.2 247.1
MT Big Horn County 45.5 252.5
MT Blaine County 48.5 251.0
MT Broadwater County 46.3 248.5
MT Carbon County 45.3 250.9
MT Carter County 45.6 255.5
MT Cascade County 47.4 248.7
MT Chouteau County 47.9 249.6
MT Custer County 46.3 254.2
MT Daniels County 48.8 254.6
MT Dawson County 47.2 255.2
MT Deer Lodge County 46.1 247.0
MT Fallon County 46.4 255.6
MT Fergus County 47.1 250.6
Source: US Census Bureau. Data is provided "as-is". Not responsible for errors.

49
35
MS Jefferson County 31.7 269.0
MS Jefferson Davis County 31.6 270.2
MS Jones County 31.7 270.8
MS Kemper County 32.8 271.3
MS Lafayette County 34.4 270.5
MS Lamar County 31.2 270.5
MS Lauderdale County 32.4 271.3
MS Lawrence County 31.6 269.9
MS Leake County 32.7 270.5
MS Lee County 34.3 271.3
MS Leflore County 33.6 269.7
MS Lincoln County 31.5 269.6
MS Lowndes County 33.5 271.6
MS Madison County 32.6 269.9
MS Marion County 31.2 270.2
MS Marshall County 34.8 270.5
MS Monroe County 33.9 271.5
MS Montgomery County 33.5 270.3
MS Neshoba County 32.7 270.9
MS Newton County 32.4 270.9
MS Noxubee County 33.1 271.4
MS Oktibbeha County 33.4 271.1
MS Panola County 34.4 270.0
MS Pearl River County 30.7 270.4
MS Perry County 31.2 271.0
MS Pike County 31.2 269.6
MS Pontotoc County 34.2 271.0
MS Prentiss County 34.6 271.5
MS Quitman County 34.3 269.7
MS Rankin County 32.3 270.0
MS Scott County 32.4 270.5
MS Sharkey County 32.9 269.2
MS Simpson County 31.9 270.1
MS Smith County 32.0 270.5
MS Stone County 30.8 270.9
MS Sunflower County 33.6 269.4
MS Tallahatchie County 33.9 269.8
MS Tate County 34.6 270.0
MS Tippah County 34.8 271.1
MS Tishomingo County 34.7 271.8
MS Tunica County 34.7 269.6
MS Union County 34.5 271.0
MS Walthall County 31.1 269.9
MS Warren County 32.3 269.1
MS Washington County 33.4 269.0
MS Wayne County 31.6 271.3
MS Webster County 33.6 270.8
MS Wilkinson County 31.2 268.7
MS Winston County 33.1 270.9
MS Yalobusha County 34.1 270.3
MS Yazoo County 32.8 269.6
MO Adair County 40.2 267.4
MO Andrew County 40.0 265.2
MO Atchison County 40.4 264.6
MO Audrain County 39.2 268.2
MO Barry County 36.7 266.2
MO Barton County 37.5 265.7
MO Bates County 38.2 265.6
MO Benton County 38.3 266.7
MO Bollinger County 37.3 270.0
MO Boone County 39.0 267.7
MO Buchanan County 39.7 265.2
MO Butler County 36.7 269.6
MO Caldwell County 39.7 266.0
MO Callaway County 38.8 268.1
MO Camden County 38.1 267.2
MO Cape Girardeau County 37.4 270.4
MO Carroll County 39.4 266.5
MO Carter County 36.9 269.1
MO Cass County 38.7 265.6
MO Cedar County 37.7 266.1
MO Chariton County 39.5 267.0
MO Christian County 37.0 266.8
MO Clark County 40.4 268.3
MO Clay County 39.3 265.5
MO Clinton County 39.6 265.6
MO Cole County 38.5 267.8
MO Cooper County 38.9 267.2
MO Crawford County 38.0 268.7
MO Dade County 37.4 266.2
MO Dallas County 37.7 267.0
MO Daviess County 40.0 266.0
MO DeKalb County 39.9 265.6
MO Dent County 37.6 268.5
MO Douglas County 36.9 267.5
MO Dunklin County 36.3 269.9
MO Franklin County 38.4 269.0
MO Gasconade County 38.4 268.5
MO Gentry County 40.2 265.6
MO Greene County 37.2 266.7
MO Grundy County 40.1 266.4
MO Harrison County 40.3 266.0
MO Henry County 38.4 266.2
MO Hickory County 37.9 266.7
MO Holt County 40.1 264.8
MO Howard County 39.1 267.3
MO Howell County 36.8 268.1
MO Iron County 37.5 269.3
MO Jackson County 39.0 265.5
MO Jasper County 37.1 265.6
MO Jefferson County 38.3 269.5
MO Johnson County 38.7 266.2
MO Knox County 40.1 267.9
MO Laclede County 37.7 267.4
MO Lafayette County 39.1 266.2
MO Lawrence County 37.1 266.2
MO Lewis County 40.1 268.3
MO Lincoln County 39.0 269.1
MO Linn County 39.8 266.9
MO Livingston County 39.8 266.4
MO McDonald County 36.6 265.6
MO Macon County 39.8 267.4
MO Madison County 37.5 269.7
MO Maries County 38.1 268.1
MO Marion County 39.8 268.5
MO Mercer County 40.4 266.4
MO Miller County 38.2 267.5
MO Mississippi County 36.8 270.7
MO Moniteau County 38.6 267.4
MO Monroe County 39.5 268.0
MO Montgomery County 38.9 268.5
MO Morgan County 38.4 267.2
MO New Madrid County 36.6 270.3
MO Newton County 36.9 265.6
MO Nodaway County 40.4 265.1
MO Oregon County 36.6 268.6
MO Osage County 38.5 268.1
MO Ozark County 36.6 267.5
MO Pemiscot County 36.2 270.2
MO Perry County 37.7 270.2
MO Pettis County 38.7 266.7
MO Phelps County 37.9 268.2
MO Pike County 39.4 268.9
MO Platte County 39.3 265.3
MO Polk County 37.6 266.6
MO Pulaski County 37.8 267.8
MO Putnam County 40.5 267.0
MO Ralls County 39.5 268.5
MO Randolph County 39.4 267.5
MO Ray County 39.3 266.0
MO Reynolds County 37.4 269.0
MO Ripley County 36.6 269.2
MO St. Charles County 38.8 269.3
MO St. Clair County 38.1 266.2
MO Ste. Genevieve County 37.9 269.8
MO St. Francois County 37.8 269.5
MO St. Louis County 38.7 269.6
MO Saline County 39.1 266.8
MO Schuyler County 40.5 267.5
MO Scotland County 40.4 267.9
MO Scott County 37.0 270.4
MO Shannon County 37.1 268.6
MO Shelby County 39.8 267.9
MO Stoddard County 36.8 270.0
MO Stone County 36.7 266.5
MO Sullivan County 40.2 266.9
MO Taney County 36.7 266.8
MO Texas County 37.3 268.0
MO Vernon County 37.8 265.7
MO Warren County 38.8 268.9
MO Washington County 38.0 269.2
MO Wayne County 37.1 269.5
MO Webster County 37.3 267.1
MO Worth County 40.5 265.6
MO Wright County 37.2 267.5
MO St. Louis city 38.6 269.8
MT Beaverhead County 45.2 247.1
MT Big Horn County 45.5 252.5
MT Blaine County 48.5 251.0
MT Broadwater County 46.3 248.5
MT Carbon County 45.3 250.9
MT Carter County 45.6 255.5
MT Cascade County 47.4 248.7
MT Chouteau County 47.9 249.6
MT Custer County 46.3 254.2
MT Daniels County 48.8 254.6
MT Dawson County 47.2 255.2
MT Deer Lodge County 46.1 247.0
MT Fallon County 46.4 255.6
MT Fergus County 47.1 250.6
Source: US Census Bureau. Data is provided "as-is". Not responsible for errors.
36
MT Flathead County 48.3 245.7
MT Gallatin County 45.7 248.8
MT Garfield County 47.2 253.0
MT Glacier County 48.6 247.2
MT Golden Valley County 46.4 250.9
MT Granite County 46.4 246.6
MT Hill County 48.6 250.0
MT Jefferson County 46.1 247.9
MT Judith Basin County 47.0 249.8
MT Lake County 47.7 245.9
MT Lewis and Clark County 46.8 247.8
MT Liberty County 48.6 249.0
MT Lincoln County 48.6 244.6
MT McCone County 47.6 254.3
MT Madison County 45.4 248.1
MT Meagher County 46.6 249.1
MT Mineral County 47.1 245.0
MT Missoula County 46.9 246.0
MT Musselshell County 46.6 251.6
MT Park County 45.7 249.5
MT Petroleum County 47.0 251.7
MT Phillips County 48.4 252.2
MT Pondera County 48.2 247.8
MT Powder River County 45.4 254.4
MT Powell County 46.6 247.2
MT Prairie County 46.9 254.6
MT Ravalli County 46.2 245.9
MT Richland County 47.8 255.5
MT Roosevelt County 48.2 255.0
MT Rosebud County 46.0 253.3
MT Sanders County 47.6 244.9
MT Sheridan County 48.7 255.5
MT Silver Bow County 46.0 247.4
MT Stillwater County 45.6 250.6
MT Sweet Grass County 45.9 250.1
MT Teton County 47.8 247.8
MT Toole County 48.6 248.2
MT Treasure County 46.3 252.7
MT Valley County 48.3 253.4
MT Wheatland County 46.4 250.1
MT Wibaux County 47.0 255.8
MT Yellowstone County 45.8 251.5
NE Adams County 40.6 261.5
NE Antelope County 42.2 261.9
NE Arthur County 41.6 258.3
NE Banner County 41.5 256.3
NE Blaine County 41.9 260.0
NE Boone County 41.7 262.0
NE Box Butte County 42.2 257.1
NE Boyd County 42.9 261.3
NE Brown County 42.5 260.1
NE Buffalo County 40.8 260.9
NE Burt County 41.9 263.7
NE Butler County 41.2 262.9
NE Cass County 40.9 263.9
NE Cedar County 42.6 262.8
NE Chase County 40.5 258.3
NE Cherry County 42.7 258.9
NE Cheyenne County 41.2 257.0
NE Clay County 40.5 262.0
NE Colfax County 41.6 262.9
NE Cuming County 41.9 263.2
NE Custer County 41.4 260.4
NE Dakota County 42.4 263.5
NE Dawes County 42.7 256.8
NE Dawson County 40.8 260.1
NE Deuel County 41.1 257.7
NE Dixon County 42.5 263.2
NE Dodge County 41.5 263.4
NE Douglas County 41.3 263.9
NE Dundy County 40.1 258.4
NE Fillmore County 40.5 262.4
NE Franklin County 40.2 261.1
NE Frontier County 40.5 259.6
NE Furnas County 40.2 260.1
NE Gage County 40.2 263.3
NE Garden County 41.5 257.7
NE Garfield County 41.8 261.0
NE Gosper County 40.6 260.2
NE Grant County 41.9 258.3
NE Greeley County 41.6 261.5
NE Hall County 40.9 261.6
NE Hamilton County 40.9 262.0
NE Harlan County 40.2 260.6
NE Hayes County 40.5 258.9
NE Hitchcock County 40.2 259.0
NE Holt County 42.5 261.3
NE Hooker County 42.0 258.9
NE Howard County 41.2 261.5
NE Jefferson County 40.2 262.9
NE Johnson County 40.4 263.7
NE Kearney County 40.5 261.0
NE Keith County 41.2 258.3
NE Keya Paha County 42.9 260.3
NE Kimball County 41.2 256.3
NE Knox County 42.6 262.1
NE Lancaster County 40.8 263.3
NE Lincoln County 41.1 259.2
NE Logan County 41.5 259.5
NE Loup County 41.9 260.6
NE McPherson County 41.6 259.0
NE Madison County 42.0 262.5
NE Merrick County 41.2 262.0
NE Morrill County 41.7 256.9
NE Nance County 41.4 262.1
NE Nemaha County 40.4 264.2
NE Nuckolls County 40.2 262.0
NE Otoe County 40.7 263.9
NE Pawnee County 40.1 263.8
NE Perkins County 40.8 258.4
NE Phelps County 40.5 260.6
NE Pierce County 42.3 262.4
NE Platte County 41.5 262.5
NE Polk County 41.2 262.4
NE Red Willow County 40.2 259.5
NE Richardson County 40.1 264.3
NE Rock County 42.5 260.5
NE Saline County 40.5 262.9
NE Sarpy County 41.1 264.0
NE Saunders County 41.2 263.4
NE Scotts Bluff County 41.9 256.3
NE Seward County 40.9 262.9
NE Sheridan County 42.6 257.6
NE Sherman County 41.2 261.0
NE Sioux County 42.4 256.2
NE Stanton County 41.9 262.8
NE Thayer County 40.2 262.4
NE Thomas County 42.0 259.4
NE Thurston County 42.2 263.4
NE Valley County 41.5 261.0
NE Washington County 41.5 263.8
NE Wayne County 42.2 262.9
NE Webster County 40.2 261.5
NE Wheeler County 41.9 261.5
NE York County 40.9 262.4
NV Churchill County 39.5 241.3
NV Clark County 36.1 244.9
NV Douglas County 39.0 240.3
NV Elko County 41.0 244.6
NV Esmeralda County 37.8 242.4
NV Eureka County 40.0 243.7
NV Humboldt County 41.3 242.2
NV Lander County 40.0 243.0
NV Lincoln County 37.8 245.3
NV Lyon County 39.2 240.7
NV Mineral County 38.5 241.5
NV Nye County 37.9 243.4
NV Pershing County 40.4 241.7
NV Storey County 39.4 240.4
NV Washoe County 39.7 240.2
NV White Pine County 39.3 245.1
NV Carson City 39.2 240.2
NH Belknap County 43.5 288.6
NH Carroll County 43.8 288.8
NH Cheshire County 42.9 287.8
NH Coos County 44.6 288.7
NH Grafton County 43.9 288.1
NH Hillsborough County 42.9 288.4
NH Merrimack County 43.3 288.4
NH Rockingham County 43.0 288.9
NH Strafford County 43.3 289.0
NH Sullivan County 43.3 287.8
NJ Atlantic County 39.4 285.4
NJ Bergen County 40.9 285.9
NJ Burlington County 40.0 285.2
NJ Camden County 39.9 285.0
NJ Cape May County 39.1 285.2
NJ Cumberland County 39.4 284.9
NJ Essex County 40.8 285.8
NJ Gloucester County 39.8 284.9
NJ Hudson County 40.7 285.9
NJ Hunterdon County 40.6 285.1
NJ Mercer County 40.3 285.3
NJ Middlesex County 40.5 285.6
NJ Monmouth County 40.3 285.9
NJ Morris County 40.9 285.5
NJ Ocean County 39.9 285.8
NJ Passaic County 40.9 285.8
NJ Salem County 39.6 284.6
NJ Somerset County 40.6 285.4
Source: US Census Bureau. Data is provided "as-is". Not responsible for errors.

50
37
NJ Sussex County 41.1 285.3
NJ Union County 40.7 285.7
NJ Warren County 40.8 285.0
NM Bernalillo County 35.1 253.4
NM Catron County 34.0 251.6
NM Chaves County 33.4 255.6
NM Cibola County 35.0 252.0
NM Colfax County 36.6 255.3
NM Curry County 34.5 256.7
NM De Baca County 34.4 255.8
NM Dona Ana County 32.3 253.2
NM Eddy County 32.5 255.7
NM Grant County 32.7 251.8
NM Guadalupe County 34.9 255.2
NM Harding County 35.9 256.1
NM Hidalgo County 32.0 251.3
NM Lea County 32.7 256.7
NM Lincoln County 33.6 254.5
NM Los Alamos County 35.9 253.7
NM Luna County 32.2 252.3
NM McKinley County 35.6 251.6
NM Mora County 36.0 255.1
NM Otero County 32.8 254.2
NM Quay County 35.1 256.4
NM Rio Arriba County 36.4 253.3
NM Roosevelt County 34.1 256.6
NM Sandoval County 35.5 253.2
NM San Juan County 36.6 251.7
NM San Miguel County 35.5 254.9
NM Santa Fe County 35.6 254.0
NM Sierra County 33.1 252.7
NM Socorro County 34.2 253.0
NM Taos County 36.5 254.4
NM Torrance County 34.8 254.0
NM Union County 36.5 256.6
NM Valencia County 34.7 253.2
NY Albany County 42.7 286.2
NY Allegany County 42.2 282.0
NY Bronx County 40.8 286.1
NY Broome County 42.1 284.1
NY Cattaraugus County 42.2 281.4
NY Cayuga County 42.9 283.4
NY Chautauqua County 42.2 280.7
NY Chemung County 42.1 283.2
NY Chenango County 42.5 284.4
NY Clinton County 44.7 286.4
NY Columbia County 42.3 286.3
NY Cortland County 42.6 283.9
NY Delaware County 42.2 285.0
NY Dutchess County 41.7 286.2
NY Erie County 42.9 281.2
NY Essex County 44.2 286.3
NY Franklin County 44.6 285.7
NY Fulton County 43.1 285.6
NY Genesee County 43.0 281.8
NY Greene County 42.3 286.0
NY Hamilton County 43.6 285.5
NY Herkimer County 43.2 285.0
NY Jefferson County 44.0 284.1
NY Kings County 40.6 286.0
NY Lewis County 43.8 284.5
NY Livingston County 42.7 282.2
NY Madison County 42.9 284.3
NY Monroe County 43.2 282.4
NY Montgomery County 42.9 285.6
NY Nassau County 40.7 286.4
NY New York County 40.8 286.0
NY Niagara County 43.1 281.2
NY Oneida County 43.2 284.6
NY Onondaga County 43.0 283.8
NY Ontario County 42.9 282.7
NY Orange County 41.4 285.7
NY Orleans County 43.3 281.8
NY Oswego County 43.4 283.8
NY Otsego County 42.6 285.0
NY Putnam County 41.4 286.3
NY Queens County 40.7 286.2
NY Rensselaer County 42.7 286.4
NY Richmond County 40.6 285.9
NY Rockland County 41.1 286.0
NY St. Lawrence County 44.6 284.8
NY Saratoga County 43.0 286.2
NY Schenectady County 42.8 286.0
NY Schoharie County 42.6 285.6
NY Schuyler County 42.4 283.1
NY Seneca County 42.8 283.2
NY Steuben County 42.3 282.6
NY Suffolk County 40.8 287.0
NY Sullivan County 41.7 285.3
NY Tioga County 42.1 283.7
NY Tompkins County 42.5 283.5
NY Ulster County 41.9 285.9
NY Warren County 43.5 286.2
NY Washington County 43.3 286.6
NY Wayne County 43.1 282.9
NY Westchester County 41.1 286.2
NY Wyoming County 42.7 281.8
NY Yates County 42.6 282.9
NC Alamance County 36.1 280.6
NC Alexander County 35.9 278.8
NC Alleghany County 36.5 278.9
NC Anson County 35.0 279.9
NC Ashe County 36.4 278.5
NC Avery County 36.1 278.1
NC Beaufort County 35.5 283.1
NC Bertie County 36.1 283.0
NC Bladen County 34.6 281.4
NC Brunswick County 34.0 281.8
NC Buncombe County 35.6 277.5
NC Burke County 35.7 278.4
NC Cabarrus County 35.4 279.4
NC Caldwell County 35.9 278.5
NC Camden County 36.4 283.8
NC Carteret County 34.7 283.2
NC Caswell County 36.4 280.7
NC Catawba County 35.7 278.8
NC Chatham County 35.7 280.7
NC Cherokee County 35.1 276.0
NC Chowan County 36.1 283.4
NC Clay County 35.0 276.2
NC Cleveland County 35.3 278.5
NC Columbus County 34.3 281.3
NC Craven County 35.1 282.9
NC Cumberland County 35.1 281.1
NC Currituck County 36.4 284.0
NC Dare County 35.8 284.3
NC Davidson County 35.8 279.8
NC Davie County 35.9 279.5
NC Duplin County 34.9 282.0
NC Durham County 36.0 281.1
NC Edgecombe County 35.9 282.4
NC Forsyth County 36.1 279.8
NC Franklin County 36.1 281.7
NC Gaston County 35.3 278.8
NC Gates County 36.4 283.3
NC Graham County 35.4 276.2
NC Granville County 36.3 281.3
NC Greene County 35.5 282.3
NC Guilford County 36.1 280.2
NC Halifax County 36.3 282.3
NC Harnett County 35.4 281.2
NC Haywood County 35.5 277.0
NC Henderson County 35.3 277.5
NC Hertford County 36.3 283.0
NC Hoke County 35.0 280.8
NC Hyde County 35.5 283.8
NC Iredell County 35.7 279.1
NC Jackson County 35.3 276.8
NC Johnston County 35.5 281.6
NC Jones County 35.0 282.6
NC Lee County 35.5 280.8
NC Lenoir County 35.3 282.4
NC Lincoln County 35.5 278.8
NC McDowell County 35.7 278.0
NC Macon County 35.2 276.6
NC Madison County 35.8 277.3
NC Martin County 35.8 282.9
NC Mecklenburg County 35.2 279.2
NC Mitchell County 36.0 277.9
NC Montgomery County 35.3 280.1
NC Moore County 35.2 280.5
NC Nash County 36.0 282.1
NC New Hanover County 34.2 282.1
NC Northampton County 36.4 282.5
NC Onslow County 34.7 282.6
NC Orange County 36.0 280.9
NC Pamlico County 35.1 283.2
NC Pasquotank County 36.3 283.8
NC Pender County 34.5 282.1
NC Perquimans County 36.2 283.5
NC Person County 36.4 281.0
NC Pitt County 35.6 282.6
NC Polk County 35.3 277.8
NC Randolph County 35.7 280.2
NC Richmond County 35.0 280.3
NC Robeson County 34.7 280.9
NC Rockingham County 36.4 280.2
NC Rowan County 35.6 279.5
NC Rutherford County 35.4 278.1
NC Sampson County 35.0 281.6
Source: US Census Bureau. Data is provided "as-is". Not responsible for errors.

51
37
NJ Sussex County 41.1 285.3
NJ Union County 40.7 285.7
NJ Warren County 40.8 285.0
NM Bernalillo County 35.1 253.4
NM Catron County 34.0 251.6
NM Chaves County 33.4 255.6
NM Cibola County 35.0 252.0
NM Colfax County 36.6 255.3
NM Curry County 34.5 256.7
NM De Baca County 34.4 255.8
NM Dona Ana County 32.3 253.2
NM Eddy County 32.5 255.7
NM Grant County 32.7 251.8
NM Guadalupe County 34.9 255.2
NM Harding County 35.9 256.1
NM Hidalgo County 32.0 251.3
NM Lea County 32.7 256.7
NM Lincoln County 33.6 254.5
NM Los Alamos County 35.9 253.7
NM Luna County 32.2 252.3
NM McKinley County 35.6 251.6
NM Mora County 36.0 255.1
NM Otero County 32.8 254.2
NM Quay County 35.1 256.4
NM Rio Arriba County 36.4 253.3
NM Roosevelt County 34.1 256.6
NM Sandoval County 35.5 253.2
NM San Juan County 36.6 251.7
NM San Miguel County 35.5 254.9
NM Santa Fe County 35.6 254.0
NM Sierra County 33.1 252.7
NM Socorro County 34.2 253.0
NM Taos County 36.5 254.4
NM Torrance County 34.8 254.0
NM Union County 36.5 256.6
NM Valencia County 34.7 253.2
NY Albany County 42.7 286.2
NY Allegany County 42.2 282.0
NY Bronx County 40.8 286.1
NY Broome County 42.1 284.1
NY Cattaraugus County 42.2 281.4
NY Cayuga County 42.9 283.4
NY Chautauqua County 42.2 280.7
NY Chemung County 42.1 283.2
NY Chenango County 42.5 284.4
NY Clinton County 44.7 286.4
NY Columbia County 42.3 286.3
NY Cortland County 42.6 283.9
NY Delaware County 42.2 285.0
NY Dutchess County 41.7 286.2
NY Erie County 42.9 281.2
NY Essex County 44.2 286.3
NY Franklin County 44.6 285.7
NY Fulton County 43.1 285.6
NY Genesee County 43.0 281.8
NY Greene County 42.3 286.0
NY Hamilton County 43.6 285.5
NY Herkimer County 43.2 285.0
NY Jefferson County 44.0 284.1
NY Kings County 40.6 286.0
NY Lewis County 43.8 284.5
NY Livingston County 42.7 282.2
NY Madison County 42.9 284.3
NY Monroe County 43.2 282.4
NY Montgomery County 42.9 285.6
NY Nassau County 40.7 286.4
NY New York County 40.8 286.0
NY Niagara County 43.1 281.2
NY Oneida County 43.2 284.6
NY Onondaga County 43.0 283.8
NY Ontario County 42.9 282.7
NY Orange County 41.4 285.7
NY Orleans County 43.3 281.8
NY Oswego County 43.4 283.8
NY Otsego County 42.6 285.0
NY Putnam County 41.4 286.3
NY Queens County 40.7 286.2
NY Rensselaer County 42.7 286.4
NY Richmond County 40.6 285.9
NY Rockland County 41.1 286.0
NY St. Lawrence County 44.6 284.8
NY Saratoga County 43.0 286.2
NY Schenectady County 42.8 286.0
NY Schoharie County 42.6 285.6
NY Schuyler County 42.4 283.1
NY Seneca County 42.8 283.2
NY Steuben County 42.3 282.6
NY Suffolk County 40.8 287.0
NY Sullivan County 41.7 285.3
NY Tioga County 42.1 283.7
NY Tompkins County 42.5 283.5
NY Ulster County 41.9 285.9
NY Warren County 43.5 286.2
NY Washington County 43.3 286.6
NY Wayne County 43.1 282.9
NY Westchester County 41.1 286.2
NY Wyoming County 42.7 281.8
NY Yates County 42.6 282.9
NC Alamance County 36.1 280.6
NC Alexander County 35.9 278.8
NC Alleghany County 36.5 278.9
NC Anson County 35.0 279.9
NC Ashe County 36.4 278.5
NC Avery County 36.1 278.1
NC Beaufort County 35.5 283.1
NC Bertie County 36.1 283.0
NC Bladen County 34.6 281.4
NC Brunswick County 34.0 281.8
NC Buncombe County 35.6 277.5
NC Burke County 35.7 278.4
NC Cabarrus County 35.4 279.4
NC Caldwell County 35.9 278.5
NC Camden County 36.4 283.8
NC Carteret County 34.7 283.2
NC Caswell County 36.4 280.7
NC Catawba County 35.7 278.8
NC Chatham County 35.7 280.7
NC Cherokee County 35.1 276.0
NC Chowan County 36.1 283.4
NC Clay County 35.0 276.2
NC Cleveland County 35.3 278.5
NC Columbus County 34.3 281.3
NC Craven County 35.1 282.9
NC Cumberland County 35.1 281.1
NC Currituck County 36.4 284.0
NC Dare County 35.8 284.3
NC Davidson County 35.8 279.8
NC Davie County 35.9 279.5
NC Duplin County 34.9 282.0
NC Durham County 36.0 281.1
NC Edgecombe County 35.9 282.4
NC Forsyth County 36.1 279.8
NC Franklin County 36.1 281.7
NC Gaston County 35.3 278.8
NC Gates County 36.4 283.3
NC Graham County 35.4 276.2
NC Granville County 36.3 281.3
NC Greene County 35.5 282.3
NC Guilford County 36.1 280.2
NC Halifax County 36.3 282.3
NC Harnett County 35.4 281.2
NC Haywood County 35.5 277.0
NC Henderson County 35.3 277.5
NC Hertford County 36.3 283.0
NC Hoke County 35.0 280.8
NC Hyde County 35.5 283.8
NC Iredell County 35.7 279.1
NC Jackson County 35.3 276.8
NC Johnston County 35.5 281.6
NC Jones County 35.0 282.6
NC Lee County 35.5 280.8
NC Lenoir County 35.3 282.4
NC Lincoln County 35.5 278.8
NC McDowell County 35.7 278.0
NC Macon County 35.2 276.6
NC Madison County 35.8 277.3
NC Martin County 35.8 282.9
NC Mecklenburg County 35.2 279.2
NC Mitchell County 36.0 277.9
NC Montgomery County 35.3 280.1
NC Moore County 35.2 280.5
NC Nash County 36.0 282.1
NC New Hanover County 34.2 282.1
NC Northampton County 36.4 282.5
NC Onslow County 34.7 282.6
NC Orange County 36.0 280.9
NC Pamlico County 35.1 283.2
NC Pasquotank County 36.3 283.8
NC Pender County 34.5 282.1
NC Perquimans County 36.2 283.5
NC Person County 36.4 281.0
NC Pitt County 35.6 282.6
NC Polk County 35.3 277.8
NC Randolph County 35.7 280.2
NC Richmond County 35.0 280.3
NC Robeson County 34.7 280.9
NC Rockingham County 36.4 280.2
NC Rowan County 35.6 279.5
NC Rutherford County 35.4 278.1
NC Sampson County 35.0 281.6
Source: US Census Bureau. Data is provided "as-is". Not responsible for errors.
38
NC Scotland County 34.8 280.5
NC Stanly County 35.3 279.8
NC Stokes County 36.4 279.7
NC Surry County 36.4 279.3
NC Swain County 35.4 276.6
NC Transylvania County 35.2 277.2
NC Tyrrell County 35.8 283.8
NC Union County 35.0 279.4
NC Vance County 36.3 281.6
NC Wake County 35.8 281.3
NC Warren County 36.4 281.9
NC Washington County 35.9 283.4
NC Watauga County 36.2 278.3
NC Wayne County 35.4 282.0
NC Wilkes County 36.2 278.8
NC Wilson County 35.7 282.1
NC Yadkin County 36.2 279.3
NC Yancey County 35.9 277.7
ND Adams County 46.1 257.4
ND Barnes County 46.9 261.9
ND Benson County 48.1 260.6
ND Billings County 47.0 256.6
ND Bottineau County 48.8 259.2
ND Bowman County 46.1 256.6
ND Burke County 48.8 257.5
ND Burleigh County 46.9 259.4
ND Cass County 46.9 262.9
ND Cavalier County 48.8 261.5
ND Dickey County 46.1 261.5
ND Divide County 48.8 256.5
ND Dunn County 47.3 257.4
ND Eddy County 47.7 261.0
ND Emmons County 46.3 259.8
ND Foster County 47.5 261.1
ND Golden Valley County 46.9 256.1
ND Grand Forks County 47.9 262.7
ND Grant County 46.4 258.3
ND Griggs County 47.5 261.8
ND Hettinger County 46.4 257.5
ND Kidder County 47.0 260.2
ND LaMoure County 46.4 261.5
ND Logan County 46.5 260.5
ND McHenry County 48.2 259.3
ND McIntosh County 46.1 260.5
ND McKenzie County 47.8 256.6
ND McLean County 47.6 258.8
ND Mercer County 47.3 258.3
ND Morton County 46.8 258.7
ND Mountrail County 48.2 257.7
ND Nelson County 47.9 261.8
ND Oliver County 47.1 258.6
ND Pembina County 48.8 262.5
ND Pierce County 48.2 260.0
ND Ramsey County 48.2 261.2
ND Ransom County 46.5 262.3
ND Renville County 48.7 258.4
ND Richland County 46.2 263.1
ND Rolette County 48.8 260.2
ND Sargent County 46.1 262.4
ND Sheridan County 47.6 259.7
ND Sioux County 46.1 259.1
ND Slope County 46.4 256.6
ND Stark County 46.9 257.3
ND Steele County 47.5 262.3
ND Stutsman County 47.0 261.1
ND Towner County 48.7 260.8
ND Traill County 47.5 262.8
ND Walsh County 48.4 262.3
ND Ward County 48.3 258.5
ND Wells County 47.6 260.3
ND Williams County 48.3 256.5
OH Adams County 38.8 276.5
OH Allen County 40.8 275.9
OH Ashland County 40.8 277.7
OH Ashtabula County 41.8 279.2
OH Athens County 39.4 277.9
OH Auglaize County 40.5 275.7
OH Belmont County 40.0 279.1
OH Brown County 38.9 276.1
OH Butler County 39.4 275.5
OH Carroll County 40.6 278.9
OH Champaign County 40.1 276.2
OH Clark County 39.9 276.2
OH Clermont County 39.1 275.8
OH Clinton County 39.4 276.2
OH Columbiana County 40.8 279.3
OH Coshocton County 40.3 278.1
OH Crawford County 40.8 277.1
OH Cuyahoga County 41.5 278.3
OH Darke County 40.1 275.4
OH Defiance County 41.3 275.5
OH Delaware County 40.3 277.0
OH Erie County 41.4 277.4
OH Fairfield County 39.8 277.4
OH Fayette County 39.6 276.5
OH Franklin County 40.0 277.0
OH Fulton County 41.6 275.9
OH Gallia County 38.8 277.7
OH Geauga County 41.5 278.8
OH Greene County 39.7 276.1
OH Guernsey County 40.0 278.5
OH Hamilton County 39.2 275.5
OH Hancock County 41.0 276.3
OH Hardin County 40.7 276.4
OH Harrison County 40.3 278.9
OH Henry County 41.3 275.9
OH Highland County 39.2 276.4
OH Hocking County 39.5 277.6
OH Holmes County 40.6 278.1
OH Huron County 41.2 277.4
OH Jackson County 39.0 277.4
OH Jefferson County 40.4 279.3
OH Knox County 40.4 277.6
OH Lake County 41.7 278.7
OH Lawrence County 38.5 277.5
OH Licking County 40.1 277.5
OH Logan County 40.4 276.2
OH Lorain County 41.4 277.9
OH Lucas County 41.6 276.4
OH Madison County 39.9 276.6
OH Mahoning County 41.1 279.3
OH Marion County 40.6 276.9
OH Medina County 41.1 278.1
OH Meigs County 39.1 278.0
OH Mercer County 40.5 275.4
OH Miami County 40.1 275.8
OH Monroe County 39.7 278.9
OH Montgomery County 39.8 275.8
OH Morgan County 39.6 278.2
OH Morrow County 40.5 277.2
OH Muskingum County 40.0 278.0
OH Noble County 39.8 278.5
OH Ottawa County 41.5 277.0
OH Paulding County 41.1 275.4
OH Perry County 39.7 277.8
OH Pickaway County 39.6 277.0
OH Pike County 39.1 277.0
OH Portage County 41.2 278.7
OH Preble County 39.7 275.4
OH Putnam County 41.0 275.9
OH Richland County 40.8 277.5
OH Ross County 39.3 277.0
OH Sandusky County 41.4 276.9
OH Scioto County 38.8 277.1
OH Seneca County 41.1 276.8
OH Shelby County 40.3 275.8
OH Stark County 40.8 278.6
OH Summit County 41.1 278.5
OH Trumbull County 41.2 279.2
OH Tuscarawas County 40.5 278.5
OH Union County 40.3 276.6
OH Van Wert County 40.9 275.4
OH Vinton County 39.2 277.5
OH Warren County 39.4 275.8
OH Washington County 39.4 278.5
OH Wayne County 40.8 278.1
OH Williams County 41.5 275.4
OH Wood County 41.4 276.4
OH Wyandot County 40.9 276.7
OK Adair County 35.9 265.4
OK Alfalfa County 36.7 261.7
OK Atoka County 34.4 263.9
OK Beaver County 36.7 259.5
OK Beckham County 35.3 260.4
OK Blaine County 35.9 261.6
OK Bryan County 34.0 263.7
OK Caddo County 35.1 261.7
OK Canadian County 35.5 262.1
OK Carter County 34.2 262.8
OK Cherokee County 35.9 265.0
OK Choctaw County 34.0 264.5
OK Cimarron County 36.8 257.6
OK Cleveland County 35.2 262.6
OK Coal County 34.6 263.7
OK Comanche County 34.6 261.6
OK Cotton County 34.3 261.6
OK Craig County 36.7 264.8
OK Creek County 36.0 263.7
OK Custer County 35.6 261.1
OK Delaware County 36.5 265.2
Source: US Census Bureau. Data is provided "as-is". Not responsible for errors.

52
39
OK Dewey County 36.0 261.0
OK Ellis County 36.3 260.2
OK Garfield County 36.4 262.2
OK Garvin County 34.7 262.7
OK Grady County 35.1 262.1
OK Grant County 36.8 262.2
OK Greer County 34.9 260.5
OK Harmon County 34.7 260.1
OK Harper County 36.8 260.3
OK Haskell County 35.2 264.9
OK Hughes County 35.1 263.7
OK Jackson County 34.6 260.6
OK Jefferson County 34.1 262.1
OK Johnston County 34.3 263.3
OK Kay County 36.8 262.8
OK Kingfisher County 35.9 262.1
OK Kiowa County 34.9 261.0
OK Latimer County 34.9 264.7
OK Le Flore County 35.0 265.3
OK Lincoln County 35.7 263.1
OK Logan County 35.9 262.6
OK Love County 33.9 262.8
OK McClain County 35.0 262.5
OK McCurtain County 34.1 265.2
OK McIntosh County 35.4 264.4
OK Major County 36.3 261.6
OK Marshall County 34.0 263.3
OK Mayes County 36.3 264.8
OK Murray County 34.5 263.0
OK Muskogee County 35.7 264.6
OK Noble County 36.4 262.8
OK Nowata County 36.8 264.4
OK Okfuskee County 35.4 263.7
OK Oklahoma County 35.5 262.5
OK Okmulgee County 35.6 264.0
OK Osage County 36.6 263.6
OK Ottawa County 36.9 265.2
OK Pawnee County 36.3 263.4
OK Payne County 36.1 263.0
OK Pittsburg County 34.9 264.3
OK Pontotoc County 34.8 263.3
OK Pottawatomie County 35.3 263.1
OK Pushmataha County 34.4 264.6
OK Roger Mills County 35.7 260.3
OK Rogers County 36.3 264.4
OK Seminole County 35.2 263.4
OK Sequoyah County 35.5 265.2
OK Stephens County 34.5 262.1
OK Texas County 36.7 258.5
OK Tillman County 34.4 261.1
OK Tulsa County 36.1 264.1
OK Wagoner County 36.0 264.5
OK Washington County 36.7 264.1
OK Washita County 35.3 261.0
OK Woods County 36.7 261.2
OK Woodward County 36.4 260.7
OR Baker County 44.7 242.2
OR Benton County 44.5 236.7
OR Clackamas County 45.3 237.5
OR Clatsop County 46.0 236.2
OR Columbia County 45.9 237.0
OR Coos County 43.2 235.9
OR Crook County 44.2 239.5
OR Curry County 42.4 235.7
OR Deschutes County 44.0 238.7
OR Douglas County 43.3 236.7
OR Gilliam County 45.3 239.8
OR Grant County 44.5 241.1
OR Harney County 43.5 241.0
OR Hood River County 45.6 238.4
OR Jackson County 42.4 237.2
OR Jefferson County 44.6 238.8
OR Josephine County 42.4 236.6
OR Klamath County 42.7 238.3
OR Lake County 42.7 239.4
OR Lane County 44.0 236.9
OR Lincoln County 44.7 236.1
OR Linn County 44.5 237.3
OR Malheur County 43.6 242.6
OR Marion County 44.9 237.2
OR Morrow County 45.4 240.4
OR Multnomah County 45.5 237.4
OR Polk County 44.9 236.6
OR Sherman County 45.5 239.3
OR Tillamook County 45.5 236.2
OR Umatilla County 45.6 241.2
OR Union County 45.3 242.0
OR Wallowa County 45.6 242.7
OR Wasco County 45.3 238.7
OR Washington County 45.5 237.1
OR Wheeler County 44.7 240.0
OR Yamhill County 45.2 236.8
PA Adams County 39.9 282.8
PA Allegheny County 40.4 280.0
PA Armstrong County 40.8 280.5
PA Beaver County 40.7 279.7
PA Bedford County 40.0 281.5
PA Berks County 40.4 284.1
PA Blair County 40.5 281.6
PA Bradford County 41.8 283.5
PA Bucks County 40.3 285.0
PA Butler County 40.9 280.1
PA Cambria County 40.4 281.2
PA Cameron County 41.4 281.8
PA Carbon County 40.9 284.3
PA Centre County 40.9 282.2
PA Chester County 40.0 284.3
PA Clarion County 41.2 280.6
PA Clearfield County 41.0 281.5
PA Clinton County 41.2 282.5
PA Columbia County 41.0 283.6
PA Crawford County 41.7 279.9
PA Cumberland County 40.2 282.9
PA Dauphin County 40.3 283.2
PA Delaware County 39.9 284.6
PA Elk County 41.4 281.3
PA Erie County 42.1 279.9
PA Fayette County 40.0 280.3
PA Forest County 41.5 280.7
PA Franklin County 39.9 282.3
PA Fulton County 39.9 281.9
PA Greene County 39.9 279.8
PA Huntingdon County 40.4 282.0
PA Indiana County 40.6 280.9
PA Jefferson County 41.1 281.0
PA Juniata County 40.6 282.7
PA Lackawanna County 41.4 284.4
PA Lancaster County 40.1 283.7
PA Lawrence County 41.0 279.7
PA Lebanon County 40.3 283.6
PA Lehigh County 40.6 284.5
PA Luzerne County 41.2 284.1
PA Lycoming County 41.3 283.0
PA McKean County 41.8 281.4
PA Mercer County 41.3 279.7
PA Mifflin County 40.6 282.4
PA Monroe County 41.1 284.7
PA Montgomery County 40.2 284.7
PA Montour County 41.0 283.4
PA Northampton County 40.7 284.7
PA Northumberland County 40.9 283.3
PA Perry County 40.4 282.8
PA Philadelphia County 40.0 284.9
PA Pike County 41.3 285.0
PA Potter County 41.8 282.1
PA Schuylkill County 40.7 283.8
PA Snyder County 40.8 283.0
PA Somerset County 40.0 281.0
PA Sullivan County 41.5 283.5
PA Susquehanna County 41.8 284.2
PA Tioga County 41.8 282.8
PA Union County 41.0 283.0
PA Venango County 41.4 280.2
PA Warren County 41.8 280.7
PA Washington County 40.2 279.9
PA Wayne County 41.6 284.7
PA Westmoreland County 40.3 280.4
PA Wyoming County 41.5 284.0
PA York County 39.9 283.3
RI Bristol County 41.7 288.7
RI Kent County 41.7 288.5
RI Newport County 41.5 288.7
RI Providence County 41.9 288.5
RI Washington County 41.5 288.4
SC Abbeville County 34.2 277.5
SC Aiken County 33.6 278.3
SC Allendale County 33.0 278.7
SC Anderson County 34.5 277.4
SC Bamberg County 33.2 278.9
SC Barnwell County 33.3 278.6
SC Beaufort County 32.4 279.3
SC Berkeley County 33.1 280.0
SC Calhoun County 33.7 279.2
SC Charleston County 32.8 280.0
SC Cherokee County 35.1 278.4
SC Chester County 34.7 278.9
SC Chesterfield County 34.7 279.8
SC Clarendon County 33.7 279.8
SC Colleton County 32.9 279.3
SC Darlington County 34.3 280.0
Source: US Census Bureau. Data is provided "as-is". Not responsible for errors.

53
39
OK Dewey County 36.0 261.0
OK Ellis County 36.3 260.2
OK Garfield County 36.4 262.2
OK Garvin County 34.7 262.7
OK Grady County 35.1 262.1
OK Grant County 36.8 262.2
OK Greer County 34.9 260.5
OK Harmon County 34.7 260.1
OK Harper County 36.8 260.3
OK Haskell County 35.2 264.9
OK Hughes County 35.1 263.7
OK Jackson County 34.6 260.6
OK Jefferson County 34.1 262.1
OK Johnston County 34.3 263.3
OK Kay County 36.8 262.8
OK Kingfisher County 35.9 262.1
OK Kiowa County 34.9 261.0
OK Latimer County 34.9 264.7
OK Le Flore County 35.0 265.3
OK Lincoln County 35.7 263.1
OK Logan County 35.9 262.6
OK Love County 33.9 262.8
OK McClain County 35.0 262.5
OK McCurtain County 34.1 265.2
OK McIntosh County 35.4 264.4
OK Major County 36.3 261.6
OK Marshall County 34.0 263.3
OK Mayes County 36.3 264.8
OK Murray County 34.5 263.0
OK Muskogee County 35.7 264.6
OK Noble County 36.4 262.8
OK Nowata County 36.8 264.4
OK Okfuskee County 35.4 263.7
OK Oklahoma County 35.5 262.5
OK Okmulgee County 35.6 264.0
OK Osage County 36.6 263.6
OK Ottawa County 36.9 265.2
OK Pawnee County 36.3 263.4
OK Payne County 36.1 263.0
OK Pittsburg County 34.9 264.3
OK Pontotoc County 34.8 263.3
OK Pottawatomie County 35.3 263.1
OK Pushmataha County 34.4 264.6
OK Roger Mills County 35.7 260.3
OK Rogers County 36.3 264.4
OK Seminole County 35.2 263.4
OK Sequoyah County 35.5 265.2
OK Stephens County 34.5 262.1
OK Texas County 36.7 258.5
OK Tillman County 34.4 261.1
OK Tulsa County 36.1 264.1
OK Wagoner County 36.0 264.5
OK Washington County 36.7 264.1
OK Washita County 35.3 261.0
OK Woods County 36.7 261.2
OK Woodward County 36.4 260.7
OR Baker County 44.7 242.2
OR Benton County 44.5 236.7
OR Clackamas County 45.3 237.5
OR Clatsop County 46.0 236.2
OR Columbia County 45.9 237.0
OR Coos County 43.2 235.9
OR Crook County 44.2 239.5
OR Curry County 42.4 235.7
OR Deschutes County 44.0 238.7
OR Douglas County 43.3 236.7
OR Gilliam County 45.3 239.8
OR Grant County 44.5 241.1
OR Harney County 43.5 241.0
OR Hood River County 45.6 238.4
OR Jackson County 42.4 237.2
OR Jefferson County 44.6 238.8
OR Josephine County 42.4 236.6
OR Klamath County 42.7 238.3
OR Lake County 42.7 239.4
OR Lane County 44.0 236.9
OR Lincoln County 44.7 236.1
OR Linn County 44.5 237.3
OR Malheur County 43.6 242.6
OR Marion County 44.9 237.2
OR Morrow County 45.4 240.4
OR Multnomah County 45.5 237.4
OR Polk County 44.9 236.6
OR Sherman County 45.5 239.3
OR Tillamook County 45.5 236.2
OR Umatilla County 45.6 241.2
OR Union County 45.3 242.0
OR Wallowa County 45.6 242.7
OR Wasco County 45.3 238.7
OR Washington County 45.5 237.1
OR Wheeler County 44.7 240.0
OR Yamhill County 45.2 236.8
PA Adams County 39.9 282.8
PA Allegheny County 40.4 280.0
PA Armstrong County 40.8 280.5
PA Beaver County 40.7 279.7
PA Bedford County 40.0 281.5
PA Berks County 40.4 284.1
PA Blair County 40.5 281.6
PA Bradford County 41.8 283.5
PA Bucks County 40.3 285.0
PA Butler County 40.9 280.1
PA Cambria County 40.4 281.2
PA Cameron County 41.4 281.8
PA Carbon County 40.9 284.3
PA Centre County 40.9 282.2
PA Chester County 40.0 284.3
PA Clarion County 41.2 280.6
PA Clearfield County 41.0 281.5
PA Clinton County 41.2 282.5
PA Columbia County 41.0 283.6
PA Crawford County 41.7 279.9
PA Cumberland County 40.2 282.9
PA Dauphin County 40.3 283.2
PA Delaware County 39.9 284.6
PA Elk County 41.4 281.3
PA Erie County 42.1 279.9
PA Fayette County 40.0 280.3
PA Forest County 41.5 280.7
PA Franklin County 39.9 282.3
PA Fulton County 39.9 281.9
PA Greene County 39.9 279.8
PA Huntingdon County 40.4 282.0
PA Indiana County 40.6 280.9
PA Jefferson County 41.1 281.0
PA Juniata County 40.6 282.7
PA Lackawanna County 41.4 284.4
PA Lancaster County 40.1 283.7
PA Lawrence County 41.0 279.7
PA Lebanon County 40.3 283.6
PA Lehigh County 40.6 284.5
PA Luzerne County 41.2 284.1
PA Lycoming County 41.3 283.0
PA McKean County 41.8 281.4
PA Mercer County 41.3 279.7
PA Mifflin County 40.6 282.4
PA Monroe County 41.1 284.7
PA Montgomery County 40.2 284.7
PA Montour County 41.0 283.4
PA Northampton County 40.7 284.7
PA Northumberland County 40.9 283.3
PA Perry County 40.4 282.8
PA Philadelphia County 40.0 284.9
PA Pike County 41.3 285.0
PA Potter County 41.8 282.1
PA Schuylkill County 40.7 283.8
PA Snyder County 40.8 283.0
PA Somerset County 40.0 281.0
PA Sullivan County 41.5 283.5
PA Susquehanna County 41.8 284.2
PA Tioga County 41.8 282.8
PA Union County 41.0 283.0
PA Venango County 41.4 280.2
PA Warren County 41.8 280.7
PA Washington County 40.2 279.9
PA Wayne County 41.6 284.7
PA Westmoreland County 40.3 280.4
PA Wyoming County 41.5 284.0
PA York County 39.9 283.3
RI Bristol County 41.7 288.7
RI Kent County 41.7 288.5
RI Newport County 41.5 288.7
RI Providence County 41.9 288.5
RI Washington County 41.5 288.4
SC Abbeville County 34.2 277.5
SC Aiken County 33.6 278.3
SC Allendale County 33.0 278.7
SC Anderson County 34.5 277.4
SC Bamberg County 33.2 278.9
SC Barnwell County 33.3 278.6
SC Beaufort County 32.4 279.3
SC Berkeley County 33.1 280.0
SC Calhoun County 33.7 279.2
SC Charleston County 32.8 280.0
SC Cherokee County 35.1 278.4
SC Chester County 34.7 278.9
SC Chesterfield County 34.7 279.8
SC Clarendon County 33.7 279.8
SC Colleton County 32.9 279.3
SC Darlington County 34.3 280.0
Source: US Census Bureau. Data is provided "as-is". Not responsible for errors.
40
SC Dillon County 34.4 280.6
SC Dorchester County 33.0 279.7
SC Edgefield County 33.8 278.1
SC Fairfield County 34.4 278.9
SC Florence County 34.1 280.3
SC Georgetown County 33.4 280.7
SC Greenville County 34.9 277.6
SC Greenwood County 34.2 277.9
SC Hampton County 32.8 278.9
SC Horry County 33.8 281.1
SC Jasper County 32.4 279.0
SC Kershaw County 34.3 279.4
SC Lancaster County 34.7 279.3
SC Laurens County 34.5 278.0
SC Lee County 34.2 279.7
SC Lexington County 33.9 278.8
SC McCormick County 33.9 277.7
SC Marion County 34.2 280.7
SC Marlboro County 34.6 280.3
SC Newberry County 34.3 278.4
SC Oconee County 34.7 277.0
SC Orangeburg County 33.5 279.2
SC Pickens County 34.8 277.3
SC Richland County 34.0 279.0
SC Saluda County 34.0 278.3
SC Spartanburg County 35.0 278.0
SC Sumter County 33.9 279.6
SC Union County 34.7 278.4
SC Williamsburg County 33.6 280.3
SC York County 35.0 278.9
SD Aurora County 43.7 261.5
SD Beadle County 44.4 261.7
SD Bennett County 43.2 258.3
SD Bon Homme County 43.0 262.1
SD Brookings County 44.3 263.2
SD Brown County 45.5 261.6
SD Brule County 43.8 260.9
SD Buffalo County 44.0 260.7
SD Butte County 44.8 256.4
SD Campbell County 45.8 260.0
SD Charles Mix County 43.2 261.5
SD Clark County 44.9 262.3
SD Clay County 42.9 263.0
SD Codington County 44.9 262.8
SD Corson County 45.8 258.9
SD Custer County 43.7 256.5
SD Davison County 43.7 261.9
SD Day County 45.4 262.4
SD Deuel County 44.7 263.3
SD Dewey County 45.2 259.0
SD Douglas County 43.4 261.6
SD Edmunds County 45.4 260.8
SD Fall River County 43.3 256.4
SD Faulk County 45.1 260.9
SD Grant County 45.2 263.3
SD Gregory County 43.2 260.8
SD Haakon County 44.2 258.5
SD Hamlin County 44.7 262.8
SD Hand County 44.5 261.0
SD Hanson County 43.7 262.2
SD Harding County 45.6 256.5
SD Hughes County 44.4 259.8
SD Hutchinson County 43.3 262.3
SD Hyde County 44.6 260.5
SD Jackson County 43.8 258.3
SD Jerauld County 44.1 261.4
SD Jones County 44.0 259.3
SD Kingsbury County 44.4 262.5
SD Lake County 44.0 262.9
SD Lawrence County 44.4 256.2
SD Lincoln County 43.3 263.3
SD Lyman County 43.9 260.2
SD McCook County 43.7 262.6
SD McPherson County 45.8 260.7
SD Marshall County 45.7 262.4
SD Meade County 44.4 256.9
SD Mellette County 43.6 259.2
SD Miner County 44.0 262.4
SD Minnehaha County 43.6 263.3
SD Moody County 44.0 263.3
SD Pennington County 44.0 256.9
SD Perkins County 45.6 257.6
SD Potter County 45.0 260.1
SD Roberts County 45.6 263.1
SD Sanborn County 44.0 261.9
SD Shannon County 43.3 257.5
SD Spink County 44.9 261.6
SD Stanley County 44.4 259.4
SD Sully County 44.7 259.9
SD Todd County 43.2 259.2
SD Tripp County 43.4 260.1
SD Turner County 43.3 262.9
SD Union County 42.8 263.3
SD Walworth County 45.5 259.9
SD Yankton County 43.0 262.6
SD Ziebach County 45.0 258.3
TN Anderson County 36.1 275.8
TN Bedford County 35.5 273.6
TN Benton County 36.1 271.9
TN Bledsoe County 35.6 274.8
TN Blount County 35.8 276.0
TN Bradley County 35.2 275.1
TN Campbell County 36.4 275.9
TN Cannon County 35.8 273.9
TN Carroll County 36.0 271.6
TN Carter County 36.3 277.8
TN Cheatham County 36.3 272.9
TN Chester County 35.4 271.4
TN Claiborne County 36.5 276.3
TN Clay County 36.6 274.5
TN Cocke County 35.9 276.9
TN Coffee County 35.5 273.9
TN Crockett County 35.8 270.9
TN Cumberland County 35.9 275.0
TN Davidson County 36.2 273.2
TN Decatur County 35.6 271.9
TN DeKalb County 36.0 274.1
TN Dickson County 36.1 272.6
TN Dyer County 36.1 270.6
TN Fayette County 35.2 270.6
TN Fentress County 36.4 275.1
TN Franklin County 35.2 273.9
TN Gibson County 36.0 271.1
TN Giles County 35.2 273.0
TN Grainger County 36.3 276.5
TN Greene County 36.2 277.2
TN Grundy County 35.4 274.3
TN Hamblen County 36.2 276.7
TN Hamilton County 35.1 274.8
TN Hancock County 36.5 276.8
TN Hardeman County 35.2 271.0
TN Hardin County 35.2 271.8
TN Hawkins County 36.4 277.1
TN Haywood County 35.6 270.7
TN Henderson County 35.6 271.6
TN Henry County 36.3 271.7
TN Hickman County 35.8 272.6
TN Houston County 36.3 272.3
TN Humphreys County 36.1 272.2
TN Jackson County 36.4 274.3
TN Jefferson County 36.1 276.6
TN Johnson County 36.4 278.2
TN Knox County 36.0 276.0
TN Lake County 36.3 270.5
TN Lauderdale County 35.8 270.5
TN Lawrence County 35.2 272.6
TN Lewis County 35.5 272.5
TN Lincoln County 35.1 273.4
TN Loudon County 35.7 275.7
TN McMinn County 35.4 275.4
TN McNairy County 35.2 271.4
TN Macon County 36.5 274.0
TN Madison County 35.6 271.2
TN Marion County 35.1 274.4
TN Marshall County 35.5 273.2
TN Maury County 35.6 272.9
TN Meigs County 35.5 275.2
TN Monroe County 35.5 275.7
TN Montgomery County 36.5 272.6
TN Moore County 35.3 273.6
TN Morgan County 36.1 275.4
TN Obion County 36.4 270.9
TN Overton County 36.4 274.7
TN Perry County 35.6 272.1
TN Pickett County 36.6 274.9
TN Polk County 35.1 275.5
TN Putnam County 36.2 274.5
TN Rhea County 35.6 275.1
TN Roane County 35.9 275.5
TN Robertson County 36.5 273.1
TN Rutherford County 35.9 273.6
TN Scott County 36.4 275.5
TN Sequatchie County 35.4 274.6
TN Sevier County 35.8 276.5
TN Shelby County 35.1 270.1
TN Smith County 36.2 274.0
TN Stewart County 36.5 272.2
TN Sullivan County 36.5 277.6
TN Sumner County 36.4 273.5
TN Tipton County 35.5 270.3
Source: US Census Bureau. Data is provided "as-is". Not responsible for errors.

54
41
TN Trousdale County 36.4 273.8
TN Unicoi County 36.1 277.6
TN Union County 36.3 276.2
TN Van Buren County 35.7 274.5
TN Warren County 35.7 274.2
TN Washington County 36.3 277.6
TN Wayne County 35.2 272.2
TN Weakley County 36.3 271.3
TN White County 35.9 274.5
TN Williamson County 35.9 273.1
TN Wilson County 36.2 273.7
TX Anderson County 31.8 264.4
TX Andrews County 32.3 257.4
TX Angelina County 31.3 265.3
TX Aransas County 28.0 263.0
TX Archer County 33.7 261.3
TX Armstrong County 35.0 258.6
TX Atascosa County 28.9 261.5
TX Austin County 29.9 263.8
TX Bailey County 34.1 257.2
TX Bandera County 29.7 260.9
TX Bastrop County 30.1 262.7
TX Baylor County 33.6 260.7
TX Bee County 28.4 262.3
TX Bell County 31.1 262.5
TX Bexar County 29.5 261.5
TX Blanco County 30.2 261.6
TX Borden County 32.7 258.6
TX Bosque County 31.9 262.4
TX Bowie County 33.4 265.7
TX Brazoria County 29.2 264.6
TX Brazos County 30.6 263.7
TX Brewster County 30.0 256.6
TX Briscoe County 34.5 258.7
TX Brooks County 27.1 261.8
TX Brown County 31.8 261.0
TX Burleson County 30.4 263.4
TX Burnet County 30.7 261.8
TX Caldwell County 29.8 262.3
TX Calhoun County 28.5 263.4
TX Callahan County 32.3 260.6
TX Cameron County 26.1 262.4
TX Camp County 33.0 265.0
TX Carson County 35.4 258.7
TX Cass County 33.1 265.7
TX Castro County 34.5 257.7
TX Chambers County 29.8 265.3
TX Cherokee County 31.9 264.8
TX Childress County 34.5 259.8
TX Clay County 33.8 261.8
TX Cochran County 33.7 257.2
TX Coke County 31.9 259.5
TX Coleman County 31.8 260.6
TX Collin County 33.1 263.4
TX Collingsworth County 34.9 259.8
TX Colorado County 29.6 263.5
TX Comal County 29.8 261.8
TX Comanche County 32.0 261.4
TX Concho County 31.3 260.1
TX Cooke County 33.6 262.8
TX Coryell County 31.3 262.2
TX Cottle County 34.1 259.7
TX Crane County 31.4 257.5
TX Crockett County 30.7 258.6
TX Crosby County 33.6 258.7
TX Culberson County 31.3 255.4
TX Dallam County 36.2 257.3
TX Dallas County 32.8 263.2
TX Dawson County 32.7 258.1
TX Deaf Smith County 34.9 257.5
TX Delta County 33.4 264.3
TX Denton County 33.1 262.9
TX DeWitt County 29.1 262.7
TX Dickens County 33.6 259.2
TX Dimmit County 28.5 260.2
TX Donley County 35.0 259.2
TX Duval County 27.7 261.5
TX Eastland County 32.3 261.2
TX Ector County 31.9 257.6
TX Edwards County 30.0 259.8
TX Ellis County 32.4 263.2
TX El Paso County 31.8 253.6
TX Erath County 32.2 261.8
TX Falls County 31.3 263.0
TX Fannin County 33.6 263.8
TX Fayette County 29.9 263.1
TX Fisher County 32.8 259.6
TX Floyd County 34.1 258.7
TX Foard County 34.0 260.2
TX Fort Bend County 29.6 264.3
TX Franklin County 33.1 264.8
TX Freestone County 31.7 263.8
TX Frio County 28.9 260.9
TX Gaines County 32.8 257.3
TX Galveston County 29.4 265.1
TX Garza County 33.2 258.7
TX Gillespie County 30.3 261.1
TX Glasscock County 31.9 258.5
TX Goliad County 28.7 262.6
TX Gonzales County 29.5 262.5
TX Gray County 35.4 259.1
TX Grayson County 33.7 263.4
TX Gregg County 32.5 265.2
TX Grimes County 30.5 264.0
TX Guadalupe County 29.6 262.0
TX Hale County 34.1 258.2
TX Hall County 34.5 259.3
TX Hamilton County 31.8 261.9
TX Hansford County 36.3 258.7
TX Hardeman County 34.3 260.3
TX Hardin County 30.3 265.7
TX Harris County 29.8 264.6
TX Harrison County 32.5 265.6
TX Hartley County 35.9 257.4
TX Haskell County 33.2 260.2
TX Hays County 30.0 262.0
TX Hemphill County 35.8 259.7
TX Henderson County 32.2 264.1
TX Hidalgo County 26.2 261.8
TX Hill County 32.0 262.8
TX Hockley County 33.6 257.6
TX Hood County 32.4 262.2
TX Hopkins County 33.1 264.4
TX Houston County 31.3 264.6
TX Howard County 32.2 258.6
TX Hudspeth County 31.5 254.6
TX Hunt County 33.1 263.9
TX Hutchinson County 35.7 258.6
TX Irion County 31.3 259.0
TX Jack County 33.2 261.8
TX Jackson County 28.9 263.4
TX Jasper County 30.8 266.0
TX Jeff Davis County 30.7 255.9
TX Jefferson County 30.0 265.9
TX Jim Hogg County 27.1 261.3
TX Jim Wells County 27.7 261.9
TX Johnson County 32.4 262.7
TX Jones County 32.8 260.1
TX Karnes County 28.9 262.1
TX Kaufman County 32.6 263.7
TX Kendall County 29.9 261.3
TX Kenedy County 26.9 262.3
TX Kent County 33.2 259.3
TX Kerr County 30.0 260.8
TX Kimble County 30.5 260.3
TX King County 33.6 259.7
TX Kinney County 29.3 259.6
TX Kleberg County 27.5 262.1
TX Knox County 33.5 260.3
TX Lamar County 33.7 264.4
TX Lamb County 34.1 257.6
TX Lampasas County 31.1 261.8
TX La Salle County 28.4 260.8
TX Lavaca County 29.4 263.0
TX Lee County 30.3 263.1
TX Leon County 31.3 263.9
TX Liberty County 30.2 265.2
TX Limestone County 31.6 263.4
TX Lipscomb County 36.3 259.7
TX Live Oak County 28.3 261.9
TX Llano County 30.7 261.4
TX Loving County 31.8 256.4
TX Lubbock County 33.6 258.1
TX Lynn County 33.2 258.2
TX McCulloch County 31.2 260.7
TX McLennan County 31.5 262.8
TX McMullen County 28.4 261.5
TX Madison County 31.0 264.0
TX Marion County 32.8 265.6
TX Martin County 32.3 258.1
TX Mason County 30.8 260.8
TX Matagorda County 28.9 264.0
TX Maverick County 28.7 259.6
TX Medina County 29.3 261.0
TX Menard County 30.9 260.2
TX Midland County 32.0 257.9
TX Milam County 30.8 263.0
TX Mills County 31.5 261.4
TX Mitchell County 32.3 259.1
TX Montague County 33.7 262.3
Source: US Census Bureau. Data is provided "as-is". Not responsible for errors.

55
41
TN Trousdale County 36.4 273.8
TN Unicoi County 36.1 277.6
TN Union County 36.3 276.2
TN Van Buren County 35.7 274.5
TN Warren County 35.7 274.2
TN Washington County 36.3 277.6
TN Wayne County 35.2 272.2
TN Weakley County 36.3 271.3
TN White County 35.9 274.5
TN Williamson County 35.9 273.1
TN Wilson County 36.2 273.7
TX Anderson County 31.8 264.4
TX Andrews County 32.3 257.4
TX Angelina County 31.3 265.3
TX Aransas County 28.0 263.0
TX Archer County 33.7 261.3
TX Armstrong County 35.0 258.6
TX Atascosa County 28.9 261.5
TX Austin County 29.9 263.8
TX Bailey County 34.1 257.2
TX Bandera County 29.7 260.9
TX Bastrop County 30.1 262.7
TX Baylor County 33.6 260.7
TX Bee County 28.4 262.3
TX Bell County 31.1 262.5
TX Bexar County 29.5 261.5
TX Blanco County 30.2 261.6
TX Borden County 32.7 258.6
TX Bosque County 31.9 262.4
TX Bowie County 33.4 265.7
TX Brazoria County 29.2 264.6
TX Brazos County 30.6 263.7
TX Brewster County 30.0 256.6
TX Briscoe County 34.5 258.7
TX Brooks County 27.1 261.8
TX Brown County 31.8 261.0
TX Burleson County 30.4 263.4
TX Burnet County 30.7 261.8
TX Caldwell County 29.8 262.3
TX Calhoun County 28.5 263.4
TX Callahan County 32.3 260.6
TX Cameron County 26.1 262.4
TX Camp County 33.0 265.0
TX Carson County 35.4 258.7
TX Cass County 33.1 265.7
TX Castro County 34.5 257.7
TX Chambers County 29.8 265.3
TX Cherokee County 31.9 264.8
TX Childress County 34.5 259.8
TX Clay County 33.8 261.8
TX Cochran County 33.7 257.2
TX Coke County 31.9 259.5
TX Coleman County 31.8 260.6
TX Collin County 33.1 263.4
TX Collingsworth County 34.9 259.8
TX Colorado County 29.6 263.5
TX Comal County 29.8 261.8
TX Comanche County 32.0 261.4
TX Concho County 31.3 260.1
TX Cooke County 33.6 262.8
TX Coryell County 31.3 262.2
TX Cottle County 34.1 259.7
TX Crane County 31.4 257.5
TX Crockett County 30.7 258.6
TX Crosby County 33.6 258.7
TX Culberson County 31.3 255.4
TX Dallam County 36.2 257.3
TX Dallas County 32.8 263.2
TX Dawson County 32.7 258.1
TX Deaf Smith County 34.9 257.5
TX Delta County 33.4 264.3
TX Denton County 33.1 262.9
TX DeWitt County 29.1 262.7
TX Dickens County 33.6 259.2
TX Dimmit County 28.5 260.2
TX Donley County 35.0 259.2
TX Duval County 27.7 261.5
TX Eastland County 32.3 261.2
TX Ector County 31.9 257.6
TX Edwards County 30.0 259.8
TX Ellis County 32.4 263.2
TX El Paso County 31.8 253.6
TX Erath County 32.2 261.8
TX Falls County 31.3 263.0
TX Fannin County 33.6 263.8
TX Fayette County 29.9 263.1
TX Fisher County 32.8 259.6
TX Floyd County 34.1 258.7
TX Foard County 34.0 260.2
TX Fort Bend County 29.6 264.3
TX Franklin County 33.1 264.8
TX Freestone County 31.7 263.8
TX Frio County 28.9 260.9
TX Gaines County 32.8 257.3
TX Galveston County 29.4 265.1
TX Garza County 33.2 258.7
TX Gillespie County 30.3 261.1
TX Glasscock County 31.9 258.5
TX Goliad County 28.7 262.6
TX Gonzales County 29.5 262.5
TX Gray County 35.4 259.1
TX Grayson County 33.7 263.4
TX Gregg County 32.5 265.2
TX Grimes County 30.5 264.0
TX Guadalupe County 29.6 262.0
TX Hale County 34.1 258.2
TX Hall County 34.5 259.3
TX Hamilton County 31.8 261.9
TX Hansford County 36.3 258.7
TX Hardeman County 34.3 260.3
TX Hardin County 30.3 265.7
TX Harris County 29.8 264.6
TX Harrison County 32.5 265.6
TX Hartley County 35.9 257.4
TX Haskell County 33.2 260.2
TX Hays County 30.0 262.0
TX Hemphill County 35.8 259.7
TX Henderson County 32.2 264.1
TX Hidalgo County 26.2 261.8
TX Hill County 32.0 262.8
TX Hockley County 33.6 257.6
TX Hood County 32.4 262.2
TX Hopkins County 33.1 264.4
TX Houston County 31.3 264.6
TX Howard County 32.2 258.6
TX Hudspeth County 31.5 254.6
TX Hunt County 33.1 263.9
TX Hutchinson County 35.7 258.6
TX Irion County 31.3 259.0
TX Jack County 33.2 261.8
TX Jackson County 28.9 263.4
TX Jasper County 30.8 266.0
TX Jeff Davis County 30.7 255.9
TX Jefferson County 30.0 265.9
TX Jim Hogg County 27.1 261.3
TX Jim Wells County 27.7 261.9
TX Johnson County 32.4 262.7
TX Jones County 32.8 260.1
TX Karnes County 28.9 262.1
TX Kaufman County 32.6 263.7
TX Kendall County 29.9 261.3
TX Kenedy County 26.9 262.3
TX Kent County 33.2 259.3
TX Kerr County 30.0 260.8
TX Kimble County 30.5 260.3
TX King County 33.6 259.7
TX Kinney County 29.3 259.6
TX Kleberg County 27.5 262.1
TX Knox County 33.5 260.3
TX Lamar County 33.7 264.4
TX Lamb County 34.1 257.6
TX Lampasas County 31.1 261.8
TX La Salle County 28.4 260.8
TX Lavaca County 29.4 263.0
TX Lee County 30.3 263.1
TX Leon County 31.3 263.9
TX Liberty County 30.2 265.2
TX Limestone County 31.6 263.4
TX Lipscomb County 36.3 259.7
TX Live Oak County 28.3 261.9
TX Llano County 30.7 261.4
TX Loving County 31.8 256.4
TX Lubbock County 33.6 258.1
TX Lynn County 33.2 258.2
TX McCulloch County 31.2 260.7
TX McLennan County 31.5 262.8
TX McMullen County 28.4 261.5
TX Madison County 31.0 264.0
TX Marion County 32.8 265.6
TX Martin County 32.3 258.1
TX Mason County 30.8 260.8
TX Matagorda County 28.9 264.0
TX Maverick County 28.7 259.6
TX Medina County 29.3 261.0
TX Menard County 30.9 260.2
TX Midland County 32.0 257.9
TX Milam County 30.8 263.0
TX Mills County 31.5 261.4
TX Mitchell County 32.3 259.1
TX Montague County 33.7 262.3
Source: US Census Bureau. Data is provided "as-is". Not responsible for errors.
42
TX Montgomery County 30.3 264.5
TX Moore County 35.9 258.1
TX Morris County 33.1 265.3
TX Motley County 34.1 259.2
TX Nacogdoches County 31.6 265.4
TX Navarro County 32.1 263.5
TX Newton County 30.8 266.3
TX Nolan County 32.4 259.6
TX Nueces County 27.7 262.5
TX Ochiltree County 36.3 259.2
TX Oldham County 35.4 257.4
TX Orange County 30.1 266.2
TX Palo Pinto County 32.8 261.7
TX Panola County 32.2 265.7
TX Parker County 32.8 262.2
TX Parmer County 34.5 257.2
TX Pecos County 30.9 257.3
TX Polk County 30.8 265.1
TX Potter County 35.3 258.2
TX Presidio County 30.0 255.8
TX Rains County 32.9 264.2
TX Randall County 35.1 258.1
TX Reagan County 31.3 258.5
TX Real County 29.8 260.1
TX Red River County 33.6 264.9
TX Reeves County 31.3 256.4
TX Refugio County 28.3 262.8
TX Roberts County 35.8 259.2
TX Robertson County 31.0 263.4
TX Rockwall County 32.9 263.6
TX Runnels County 31.8 260.0
TX Rusk County 32.2 265.2
TX Sabine County 31.3 266.1
TX San Augustine County 31.4 265.8
TX San Jacinto County 30.6 264.9
TX San Patricio County 28.0 262.5
TX San Saba County 31.2 261.2
TX Schleicher County 30.9 259.5
TX Scurry County 32.7 259.0
TX Shackelford County 32.7 260.7
TX Shelby County 31.8 265.9
TX Sherman County 36.3 258.1
TX Smith County 32.3 264.7
TX Somervell County 32.2 262.2
TX Starr County 26.5 261.2
TX Stephens County 32.7 261.1
TX Sterling County 31.8 259.0
TX Stonewall County 33.2 259.8
TX Sutton County 30.5 259.4
TX Swisher County 34.5 258.3
TX Tarrant County 32.8 262.7
TX Taylor County 32.4 260.2
TX Terrell County 30.2 257.9
TX Terry County 33.2 257.7
TX Throckmorton County 33.2 260.8
TX Titus County 33.2 265.0
TX Tom Green County 31.4 259.5
TX Travis County 30.3 262.2
TX Trinity County 31.0 264.8
TX Tyler County 30.8 265.6
TX Upshur County 32.7 265.1
TX Upton County 31.3 257.9
TX Uvalde County 29.3 260.3
TX Val Verde County 29.6 259.0
TX Van Zandt County 32.6 264.2
TX Victoria County 28.8 263.0
TX Walker County 30.7 264.5
TX Waller County 30.0 264.0
TX Ward County 31.5 257.0
TX Washington County 30.2 263.6
TX Webb County 27.6 260.6
TX Wharton County 29.3 263.8
TX Wheeler County 35.4 259.7
TX Wichita County 33.9 261.4
TX Wilbarger County 34.1 260.8
TX Willacy County 26.5 262.2
TX Williamson County 30.6 262.3
TX Wilson County 29.2 261.9
TX Winkler County 31.8 256.9
TX Wise County 33.2 262.3
TX Wood County 32.8 264.6
TX Yoakum County 33.1 257.2
TX Young County 33.2 261.3
TX Zapata County 27.0 260.8
TX Zavala County 28.9 260.2
UT Beaver County 38.3 247.0
UT Box Elder County 41.6 247.5
UT Cache County 41.8 248.2
UT Carbon County 39.6 249.2
UT Daggett County 40.9 250.5
UT Davis County 41.0 248.1
UT Duchesne County 40.2 249.7
UT Emery County 39.2 249.1
UT Garfield County 37.8 248.1
UT Grand County 38.8 250.5
UT Iron County 37.8 246.8
UT Juab County 39.7 247.7
UT Kane County 37.3 247.6
UT Millard County 39.1 247.1
UT Morgan County 41.1 248.4
UT Piute County 38.3 247.9
UT Rich County 41.7 248.7
UT Salt Lake County 40.7 248.1
UT San Juan County 37.4 250.5
UT Sanpete County 39.4 248.4
UT Sevier County 38.8 248.1
UT Summit County 40.8 248.7
UT Tooele County 40.4 247.3
UT Uintah County 40.3 250.4
UT Utah County 40.2 248.3
UT Wasatch County 40.5 248.6
UT Washington County 37.2 246.5
UT Wayne County 38.3 248.7
UT Weber County 41.2 248.0
VT Addison County 44.0 286.8
VT Bennington County 43.0 286.9
VT Caledonia County 44.5 287.9
VT Chittenden County 44.5 286.9
VT Essex County 44.7 288.3
VT Franklin County 44.9 287.0
VT Grand Isle County 44.8 286.7
VT Lamoille County 44.6 287.4
VT Orange County 44.0 287.6
VT Orleans County 44.8 287.8
VT Rutland County 43.6 286.9
VT Washington County 44.2 287.4
VT Windham County 43.0 287.3
VT Windsor County 43.6 287.5
VA Accomack County 37.8 284.4
VA Albemarle County 38.0 281.5
VA Alleghany County 37.8 280.0
VA Amelia County 37.3 282.0
VA Amherst County 37.6 280.9
VA Appomattox County 37.4 281.2
VA Arlington County 38.9 282.9
VA Augusta County 38.1 280.9
VA Bath County 38.0 280.3
VA Bedford County 37.3 280.4
VA Bland County 37.1 278.9
VA Botetourt County 37.5 280.2
VA Brunswick County 36.8 282.1
VA Buchanan County 37.3 278.0
VA Buckingham County 37.6 281.5
VA Campbell County 37.2 280.9
VA Caroline County 38.0 282.6
VA Carroll County 36.7 279.3
VA Charles City County 37.3 282.9
VA Charlotte County 37.0 281.4
VA Chesterfield County 37.4 282.5
VA Clarke County 39.1 282.0
VA Craig County 37.5 279.8
VA Culpeper County 38.5 282.0
VA Cumberland County 37.5 281.7
VA Dickenson County 37.1 277.6
VA Dinwiddie County 37.1 282.4
VA Essex County 37.9 283.1
VA Fairfax County 38.8 282.8
VA Fauquier County 38.7 282.2
VA Floyd County 36.9 279.6
VA Fluvanna County 37.9 281.7
VA Franklin County 37.0 280.1
VA Frederick County 39.2 281.8
VA Giles County 37.3 279.3
VA Gloucester County 37.4 283.5
VA Goochland County 37.7 282.1
VA Grayson County 36.6 278.8
VA Greene County 38.3 281.5
VA Greensville County 36.7 282.4
VA Halifax County 36.7 281.1
VA Hanover County 37.7 282.6
VA Henrico County 37.6 282.5
VA Henry County 36.7 280.1
VA Highland County 38.4 280.4
VA Isle of Wight County 36.9 283.3
VA James City County 37.3 283.2
VA King and Queen County 37.7 283.1
VA King George County 38.3 282.8
VA King William County 37.7 283.0
VA Lancaster County 37.7 283.5
VA Lee County 36.7 276.9
Source: US Census Bureau. Data is provided "as-is". Not responsible for errors.

56
43
VA Loudoun County 39.1 282.4
VA Louisa County 38.0 282.0
VA Lunenburg County 36.9 281.8
VA Madison County 38.4 281.7
VA Mathews County 37.4 283.7
VA Mecklenburg County 36.7 281.7
VA Middlesex County 37.6 283.5
VA Montgomery County 37.2 279.6
VA Nelson County 37.8 281.1
VA New Kent County 37.5 283.0
VA Northampton County 37.4 284.1
VA Northumberland County 37.9 283.6
VA Nottoway County 37.1 281.9
VA Orange County 38.2 281.9
VA Page County 38.6 281.5
VA Patrick County 36.7 279.7
VA Pittsylvania County 36.8 280.6
VA Powhatan County 37.6 282.1
VA Prince Edward County 37.2 281.6
VA Prince George County 37.2 282.7
VA Prince William County 38.7 282.6
VA Pulaski County 37.1 279.3
VA Rappahannock County 38.7 281.8
VA Richmond County 37.9 283.3
VA Roanoke County 37.3 280.0
VA Rockbridge County 37.8 280.6
VA Rockingham County 38.5 281.2
VA Russell County 36.9 277.9
VA Scott County 36.7 277.4
VA Shenandoah County 38.9 281.4
VA Smyth County 36.8 278.4
VA Southampton County 36.7 282.9
VA Spotsylvania County 38.2 282.4
VA Stafford County 38.4 282.6
VA Surry County 37.1 283.1
VA Sussex County 36.9 282.7
VA Tazewell County 37.1 278.4
VA Warren County 38.9 281.8
VA Washington County 36.7 278.0
VA Westmoreland County 38.2 283.2
VA Wise County 37.0 277.4
VA Wythe County 36.9 278.9
VA York County 37.2 283.5
VA Alexandria city 38.8 282.9
VA Bedford city 37.3 280.5
VA Bristol city 36.6 277.8
VA Buena Vista city 37.7 280.6
VA Charlottesville city 38.0 281.5
VA Chesapeake city 36.8 283.7
VA Clifton Forge city 37.8 280.2
VA Colonial Heights city 37.3 282.6
VA Covington city 37.8 280.0
VA Danville city 36.6 280.6
VA Emporia city 36.7 282.5
VA Fairfax city 38.9 282.7
VA Falls Church city 38.9 282.8
VA Franklin city 36.7 283.1
VA Fredericksburg city 38.3 282.5
VA Galax city 36.7 279.1
VA Hampton city 37.0 283.6
VA Harrisonburg city 38.4 281.1
VA Hopewell city 37.3 282.7
VA Lexington city 37.8 280.6
VA Lynchburg city 37.4 280.8
VA Manassas city 38.8 282.5
VA Manassas Park city 38.8 282.5
VA Martinsville city 36.7 280.1
VA Newport News city 37.1 283.5
VA Norfolk city 36.9 283.7
VA Norton city 36.9 277.4
VA Petersburg city 37.2 282.6
VA Poquoson city 37.1 283.6
VA Portsmouth city 36.8 283.7
VA Radford city 37.1 279.4
VA Richmond city 37.5 282.5
VA Roanoke city 37.3 280
VA Salem city 37.3 279.9
VA Staunton city 38.2 280.9
VA Suffolk city 36.7 283.4
VA Virginia Beach city 36.8 283.9
VA Waynesboro city 38.1 281.1
VA Williamsburg city 37.3 283.3
VA Winchester city 39.2 281.8
WA Adams County 47.0 241.3
WA Asotin County 46.3 242.9
WA Benton County 46.2 240.6
WA Chelan County 47.6 239.6
WA Clallam County 48.1 236.2
WA Clark County 45.7 237.5
WA Columbia County 46.3 242.0
WA Cowlitz County 46.2 237.3
WA Douglas County 47.7 240.1
WA Ferry County 48.5 241.5
WA Franklin County 46.4 241.0
WA Garfield County 46.4 242.5
WA Grant County 47.2 240.6
WA Grays Harbor County 47.1 236.2
WA Island County 48.2 237.4
WA Jefferson County 47.9 236.8
WA King County 47.5 237.8
WA Kitsap County 47.6 237.4
WA Kittitas County 47.1 239.3
WA Klickitat County 45.9 239.0
WA Lewis County 46.6 237.3
WA Lincoln County 47.6 241.6
WA Mason County 47.3 236.9
WA Okanogan County 48.5 240.4
WA Pacific County 46.5 236.2
WA Pend Oreille County 48.5 242.7
WA Pierce County 47.2 237.6
WA San Juan County 48.6 237.0
WA Skagit County 48.5 237.8
WA Skamania County 45.9 238.0
WA Snohomish County 48.0 237.9
WA Spokane County 47.7 242.6
WA Stevens County 48.4 242.2
WA Thurston County 47.0 237.2
WA Wahkiakum County 46.3 236.5
WA Walla Walla County 46.1 241.6
WA Whatcom County 48.8 237.6
WA Whitman County 46.9 242.6
WA Yakima County 46.5 239.5
WV Barbour County 39.1 280.0
WV Berkeley County 39.5 282.0
WV Boone County 38.1 278.3
WV Braxton County 38.7 279.3
WV Brooke County 40.3 279.4
WV Cabell County 38.4 277.7
WV Calhoun County 38.9 278.9
WV Clay County 38.5 278.9
WV Doddridge County 39.3 279.3
WV Fayette County 38.0 278.9
WV Gilmer County 38.9 279.2
WV Grant County 39.1 280.8
WV Greenbrier County 37.9 279.5
WV Hampshire County 39.3 281.4
WV Hancock County 40.5 279.4
WV Hardy County 39.0 281.1
WV Harrison County 39.3 279.7
WV Jackson County 38.8 278.3
WV Jefferson County 39.3 282.2
WV Kanawha County 38.3 278.4
WV Lewis County 39.0 279.5
WV Lincoln County 38.2 277.9
WV Logan County 37.8 278.0
WV McDowell County 37.4 278.4
WV Marion County 39.5 279.8
WV Marshall County 39.9 279.3
WV Mason County 38.8 278.0
WV Mercer County 37.3 278.8
WV Mineral County 39.4 281.1
WV Mingo County 37.7 277.8
WV Monongalia County 39.6 280.0
WV Monroe County 37.6 279.4
WV Morgan County 39.6 281.7
WV Nicholas County 38.3 279.2
WV Ohio County 40.1 279.3
WV Pendleton County 38.7 280.7
WV Pleasants County 39.4 278.8
WV Pocahontas County 38.3 280.0
WV Preston County 39.5 280.3
WV Putnam County 38.5 278.1
WV Raleigh County 37.8 278.8
WV Randolph County 38.8 280.1
WV Ritchie County 39.2 278.9
WV Roane County 38.7 278.6
WV Summers County 37.7 279.2
WV Taylor County 39.3 280.0
WV Tucker County 39.1 280.4
WV Tyler County 39.5 279.1
WV Upshur County 38.9 279.8
WV Wayne County 38.2 277.5
WV Webster County 38.5 279.6
WV Wetzel County 39.6 279.3
WV Wirt County 39.0 278.6
WV Wood County 39.3 278.5
WV Wyoming County 37.6 278.5
WI Adams County 44.0 270.2
WI Ashland County 46.3 269.3
WI Barron County 45.4 268.2
Source: US Census Bureau. Data is provided "as-is". Not responsible for errors.

57
43
VA Loudoun County 39.1 282.4
VA Louisa County 38.0 282.0
VA Lunenburg County 36.9 281.8
VA Madison County 38.4 281.7
VA Mathews County 37.4 283.7
VA Mecklenburg County 36.7 281.7
VA Middlesex County 37.6 283.5
VA Montgomery County 37.2 279.6
VA Nelson County 37.8 281.1
VA New Kent County 37.5 283.0
VA Northampton County 37.4 284.1
VA Northumberland County 37.9 283.6
VA Nottoway County 37.1 281.9
VA Orange County 38.2 281.9
VA Page County 38.6 281.5
VA Patrick County 36.7 279.7
VA Pittsylvania County 36.8 280.6
VA Powhatan County 37.6 282.1
VA Prince Edward County 37.2 281.6
VA Prince George County 37.2 282.7
VA Prince William County 38.7 282.6
VA Pulaski County 37.1 279.3
VA Rappahannock County 38.7 281.8
VA Richmond County 37.9 283.3
VA Roanoke County 37.3 280.0
VA Rockbridge County 37.8 280.6
VA Rockingham County 38.5 281.2
VA Russell County 36.9 277.9
VA Scott County 36.7 277.4
VA Shenandoah County 38.9 281.4
VA Smyth County 36.8 278.4
VA Southampton County 36.7 282.9
VA Spotsylvania County 38.2 282.4
VA Stafford County 38.4 282.6
VA Surry County 37.1 283.1
VA Sussex County 36.9 282.7
VA Tazewell County 37.1 278.4
VA Warren County 38.9 281.8
VA Washington County 36.7 278.0
VA Westmoreland County 38.2 283.2
VA Wise County 37.0 277.4
VA Wythe County 36.9 278.9
VA York County 37.2 283.5
VA Alexandria city 38.8 282.9
VA Bedford city 37.3 280.5
VA Bristol city 36.6 277.8
VA Buena Vista city 37.7 280.6
VA Charlottesville city 38.0 281.5
VA Chesapeake city 36.8 283.7
VA Clifton Forge city 37.8 280.2
VA Colonial Heights city 37.3 282.6
VA Covington city 37.8 280.0
VA Danville city 36.6 280.6
VA Emporia city 36.7 282.5
VA Fairfax city 38.9 282.7
VA Falls Church city 38.9 282.8
VA Franklin city 36.7 283.1
VA Fredericksburg city 38.3 282.5
VA Galax city 36.7 279.1
VA Hampton city 37.0 283.6
VA Harrisonburg city 38.4 281.1
VA Hopewell city 37.3 282.7
VA Lexington city 37.8 280.6
VA Lynchburg city 37.4 280.8
VA Manassas city 38.8 282.5
VA Manassas Park city 38.8 282.5
VA Martinsville city 36.7 280.1
VA Newport News city 37.1 283.5
VA Norfolk city 36.9 283.7
VA Norton city 36.9 277.4
VA Petersburg city 37.2 282.6
VA Poquoson city 37.1 283.6
VA Portsmouth city 36.8 283.7
VA Radford city 37.1 279.4
VA Richmond city 37.5 282.5
VA Roanoke city 37.3 280
VA Salem city 37.3 279.9
VA Staunton city 38.2 280.9
VA Suffolk city 36.7 283.4
VA Virginia Beach city 36.8 283.9
VA Waynesboro city 38.1 281.1
VA Williamsburg city 37.3 283.3
VA Winchester city 39.2 281.8
WA Adams County 47.0 241.3
WA Asotin County 46.3 242.9
WA Benton County 46.2 240.6
WA Chelan County 47.6 239.6
WA Clallam County 48.1 236.2
WA Clark County 45.7 237.5
WA Columbia County 46.3 242.0
WA Cowlitz County 46.2 237.3
WA Douglas County 47.7 240.1
WA Ferry County 48.5 241.5
WA Franklin County 46.4 241.0
WA Garfield County 46.4 242.5
WA Grant County 47.2 240.6
WA Grays Harbor County 47.1 236.2
WA Island County 48.2 237.4
WA Jefferson County 47.9 236.8
WA King County 47.5 237.8
WA Kitsap County 47.6 237.4
WA Kittitas County 47.1 239.3
WA Klickitat County 45.9 239.0
WA Lewis County 46.6 237.3
WA Lincoln County 47.6 241.6
WA Mason County 47.3 236.9
WA Okanogan County 48.5 240.4
WA Pacific County 46.5 236.2
WA Pend Oreille County 48.5 242.7
WA Pierce County 47.2 237.6
WA San Juan County 48.6 237.0
WA Skagit County 48.5 237.8
WA Skamania County 45.9 238.0
WA Snohomish County 48.0 237.9
WA Spokane County 47.7 242.6
WA Stevens County 48.4 242.2
WA Thurston County 47.0 237.2
WA Wahkiakum County 46.3 236.5
WA Walla Walla County 46.1 241.6
WA Whatcom County 48.8 237.6
WA Whitman County 46.9 242.6
WA Yakima County 46.5 239.5
WV Barbour County 39.1 280.0
WV Berkeley County 39.5 282.0
WV Boone County 38.1 278.3
WV Braxton County 38.7 279.3
WV Brooke County 40.3 279.4
WV Cabell County 38.4 277.7
WV Calhoun County 38.9 278.9
WV Clay County 38.5 278.9
WV Doddridge County 39.3 279.3
WV Fayette County 38.0 278.9
WV Gilmer County 38.9 279.2
WV Grant County 39.1 280.8
WV Greenbrier County 37.9 279.5
WV Hampshire County 39.3 281.4
WV Hancock County 40.5 279.4
WV Hardy County 39.0 281.1
WV Harrison County 39.3 279.7
WV Jackson County 38.8 278.3
WV Jefferson County 39.3 282.2
WV Kanawha County 38.3 278.4
WV Lewis County 39.0 279.5
WV Lincoln County 38.2 277.9
WV Logan County 37.8 278.0
WV McDowell County 37.4 278.4
WV Marion County 39.5 279.8
WV Marshall County 39.9 279.3
WV Mason County 38.8 278.0
WV Mercer County 37.3 278.8
WV Mineral County 39.4 281.1
WV Mingo County 37.7 277.8
WV Monongalia County 39.6 280.0
WV Monroe County 37.6 279.4
WV Morgan County 39.6 281.7
WV Nicholas County 38.3 279.2
WV Ohio County 40.1 279.3
WV Pendleton County 38.7 280.7
WV Pleasants County 39.4 278.8
WV Pocahontas County 38.3 280.0
WV Preston County 39.5 280.3
WV Putnam County 38.5 278.1
WV Raleigh County 37.8 278.8
WV Randolph County 38.8 280.1
WV Ritchie County 39.2 278.9
WV Roane County 38.7 278.6
WV Summers County 37.7 279.2
WV Taylor County 39.3 280.0
WV Tucker County 39.1 280.4
WV Tyler County 39.5 279.1
WV Upshur County 38.9 279.8
WV Wayne County 38.2 277.5
WV Webster County 38.5 279.6
WV Wetzel County 39.6 279.3
WV Wirt County 39.0 278.6
WV Wood County 39.3 278.5
WV Wyoming County 37.6 278.5
WI Adams County 44.0 270.2
WI Ashland County 46.3 269.3
WI Barron County 45.4 268.2
Source: US Census Bureau. Data is provided "as-is". Not responsible for errors.
44
WI Bayfield County 46.5 268.8
WI Brown County 44.5 272.0
WI Buffalo County 44.4 268.2
WI Burnett County 45.9 267.6
WI Calumet County 44.1 271.8
WI Chippewa County 45.0 268.7
WI Clark County 44.8 269.4
WI Columbia County 43.5 270.7
WI Crawford County 43.2 269.0
WI Dane County 43.1 270.6
WI Dodge County 43.4 271.3
WI Door County 45.0 272.7
WI Douglas County 46.5 268.1
WI Dunn County 44.9 268.1
WI Eau Claire County 44.8 268.6
WI Florence County 45.8 271.6
WI Fond du Lac County 43.8 271.5
WI Forest County 45.6 271.2
WI Grant County 42.9 269.3
WI Green County 42.7 270.4
WI Green Lake County 43.8 271.0
WI Iowa County 43.0 269.9
WI Iron County 46.3 269.8
WI Jackson County 44.3 269.1
WI Jefferson County 43.0 271.2
WI Juneau County 43.9 269.9
WI Kenosha County 42.6 272.0
WI Kewaunee County 44.5 272.4
WI La Crosse County 43.9 268.8
WI Lafayette County 42.7 269.9
WI Langlade County 45.2 270.9
WI Lincoln County 45.3 270.3
WI Manitowoc County 44.1 272.2
WI Marathon County 44.9 270.3
WI Marinette County 45.3 272.1
WI Marquette County 43.8 270.6
WI Menominee County 44.9 271.4
WI Milwaukee County 43.0 272.0
WI Monroe County 43.9 269.4
WI Oconto County 45.0 271.8
WI Oneida County 45.7 270.5
WI Outagamie County 44.3 271.6
WI Ozaukee County 43.3 272.1
WI Pepin County 44.6 268.0
WI Pierce County 44.7 267.5
WI Polk County 45.5 267.5
WI Portage County 44.5 270.5
WI Price County 45.7 269.6
WI Racine County 42.7 272.0
WI Richland County 43.4 269.6
WI Rock County 42.7 271.0
WI Rusk County 45.4 268.9
WI St. Croix County 45.0 267.5
WI Sauk County 43.4 270.1
WI Sawyer County 45.9 268.7
WI Shawano County 44.8 271.2
WI Sheboygan County 43.7 272.1
WI Taylor County 45.2 269.5
WI Trempealeau County 44.3 268.6
WI Vernon County 43.6 269.2
WI Vilas County 46.0 270.5
WI Walworth County 42.6 271.5
WI Washburn County 45.9 268.2
WI Washington County 43.4 271.8
WI Waukesha County 43.0 271.7
WI Waupaca County 44.5 271.0
WI Waushara County 44.1 270.7
WI Winnebago County 44.1 271.4
WI Wood County 44.4 270.0
WY Albany County 41.4 254.3
WY Big Horn County 44.5 251.9
WY Campbell County 44.1 254.5
WY Carbon County 41.7 253.1
WY Converse County 42.9 254.5
WY Crook County 44.6 255.4
WY Fremont County 43.1 251.3
WY Goshen County 42.1 255.7
WY Hot Springs County 43.7 251.7
WY Johnson County 44.1 253.4
WY Laramie County 41.2 255.2
WY Lincoln County 42.2 249.3
WY Natrona County 42.9 253.5
WY Niobrara County 43.0 255.5
WY Park County 44.6 251.0
WY Platte County 42.2 255.1
WY Sheridan County 44.8 253.0
WY Sublette County 42.8 250.0
WY Sweetwater County 41.6 250.8
WY Teton County 43.6 249.3
WY Uinta County 41.3 249.4
WY Washakie County 44.0 252.3
WY Weston County 43.9 255.4
PR Adjuntas Municipio 18.2 293.3
PR Aguada Municipio 18.4 292.8
PR Aguadilla Municipio 18.5 292.9
PR Aguas Buenas Municipio 18.3 293.9
PR Aibonito Municipio 18.1 293.7
PR A±asco Municipio 18.3 292.9
PR Arecibo Municipio 18.4 293.3
PR Arroyo Municipio 18.0 293.9
PR Barceloneta Municipio 18.5 293.4
PR Barranquitas Municipio 18.2 293.7
PR Bayam?n Municipio 18.4 293.8
PR Cabo Rojo Municipio 18.1 292.8
PR Caguas Municipio 18.2 294.0
PR Camuy Municipio 18.4 293.1
PR Can?vanas Municipio 18.4 294.1
PR Carolina Municipio 18.4 294.0
PR Cata±o Municipio 18.4 293.9
PR Cayey Municipio 18.1 293.8
PR Ceiba Municipio 18.3 294.3
PR Ciales Municipio 18.3 293.5
PR Cidra Municipio 18.2 293.8
PR Coamo Municipio 18.1 293.6
PR Comer?o Municipio 18.2 293.8
PR Corozal Municipio 18.3 293.7
PR Culebra Municipio 18.3 294.7
PR Dorado Municipio 18.4 293.7
PR Fajardo Municipio 18.3 294.3
PR Florida Municipio 18.4 293.4
PR Gußnica Municipio 18.0 293.1
PR Guayama Municipio 18.0 293.9
PR Guayanilla Municipio 18.0 293.2
PR Guaynabo Municipio 18.4 293.9
PR Gurabo Municipio 18.3 294.0
PR Hatillo Municipio 18.4 293.2
PR Hormigueros Municipio 18.1 292.9
PR Humacao Municipio 18.1 294.2
PR Isabela Municipio 18.5 293.0
PR Jayuya Municipio 18.2 293.4
PR Juana D?az Municipio 18.0 293.5
PR Juncos Municipio 18.2 294.1
PR Lajas Municipio 18.0 293.0
PR Lares Municipio 18.3 293.1
PR Las Mar?as Municipio 18.2 293.0
PR Las Piedras Municipio 18.2 294.1
PR Lo?za Municipio 18.4 294.1
PR Luquillo Municipio 18.4 294.3
PR Manat? Municipio 18.4 293.5
PR Maricao Municipio 18.2 293.0
PR Maunabo Municipio 18.0 294.1
PR Mayag?ez Municipio 18.2 292.9
PR Moca Municipio 18.4 292.9
PR Morovis Municipio 18.3 293.6
PR Naguabo Municipio 18.2 294.3
PR Naranjito Municipio 18.3 293.7
PR Orocovis Municipio 18.2 293.6
PR Patillas Municipio 18.0 294.0
PR Pe±uelas Municipio 18.1 293.3
PR Ponce Municipio 18.0 293.4
PR Quebradillas Municipio 18.5 293.1
PR Rinc?n Municipio 18.3 292.8
PR R?o Grande Municipio 18.4 294.2
PR Sabana Grande Municipio 18.1 293.1
PR Salinas Municipio 18.0 293.7
PR San Germßn Municipio 18.1 293.0
PR San Juan Municipio 18.4 293.9
PR San Lorenzo Municipio 18.2 294.0
PR San Sebastißn Municipio 18.3 293.0
PR Santa Isabel Municipio 18.0 293.6
PR Toa Alta Municipio 18.4 293.8
PR Toa Baja Municipio 18.4 293.8
PR Trujillo Alto Municipio 18.3 294.0
PR Utuado Municipio 18.3 293.3
PR Vega Alta Municipio 18.4 293.7
PR Vega Baja Municipio 18.4 293.6
PR Vieques Municipio 18.1 294.5
PR Villalba Municipio 18.1 293.5
PR Yabucoa Municipio 18.1 294.1
PR Yauco Municipio 18.1 293.1
Source: US Census Bureau. Data is provided "as-is". Not responsible for errors.
58
45
Appendix B: Table of time zone difference from UTC
Enter the difference from UTC (Coordinated Universal Time)/GMT (Greenwich Mean
Time) for your time zone when you configure the Professional Weather Station as
par section 3.1. Do not consider daylight saving time when making this entry. Follow
instuctions for setting the status of daylight saving time as a separate entry.
Time Zone Major Cities Symbol Difference
from UTC
Atlantic Time San Juan AST 20
Eastern Time Boston, New York, Washington DC, EST 19
Miami
Central Time Minneapolis, New Orleans, Houston, CST 18
Chicago
Mountain Time Salt Lake City, Boise, Denver MST 17
Pacific Time Seattle, San Francisco, Los Angeles, PST 16
Las Vegas
Alaska Time Fairbanks AKST 15
Hawaii-Aleutian Honolulu HAST 14
Time
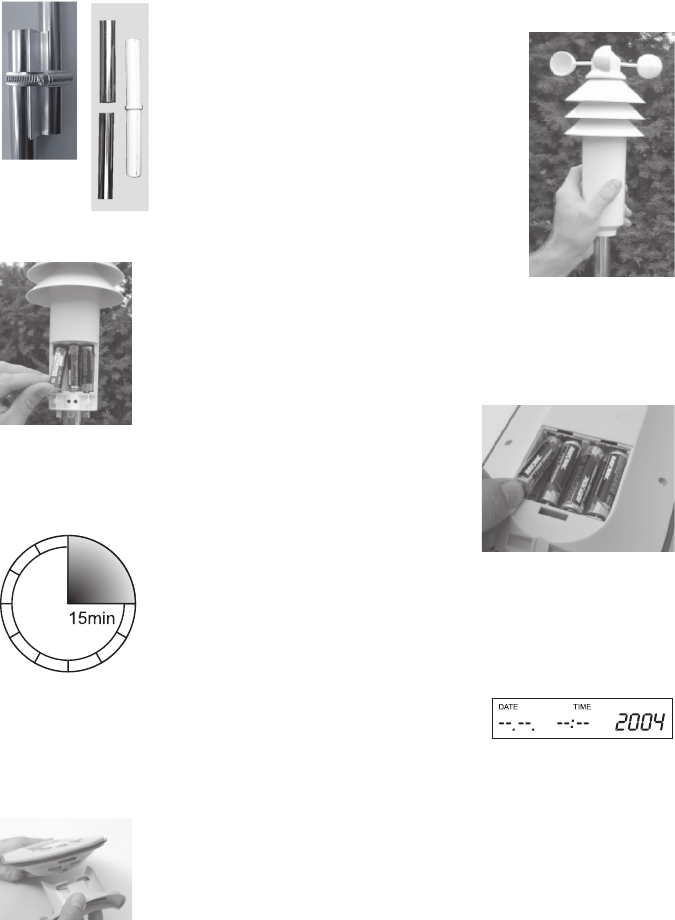
59
19. Brief Instructions
3 Step 1
Install the mast (own mast or sepa-
rately purchased mast) and put on the
multipurpose sensor
(See from Page 11)
Step 2 4
Open the battery compartment of the
multipurpose sensor, turn the lower
part to the left and slide it downwards
(See from Page 11)
3 Step 3
Insert the batteries into the multipur-
pose sensor, close the battery com-
partment
(See Page 13)
Step 4 4
Insert the batteries into the base sta-
tion; DO NOT PRESS ANY KEY at the
base station!
(See Page 14)
3 Step 5
Wait 15 minutes to allow the base
station to identify the sensor(s)
(See Page 14)
Step 6 4
Configure the base station (set the
date, time, etc.)
(See from Page 18)
3 Step 7
Set up the base station by using a foot
or hanging it on the wall
(See Page 15)
45
Appendix B: Table of time zone difference from UTC
Enter the difference from UTC (Coordinated Universal Time)/GMT (Greenwich Mean
Time) for your time zone when you configure the Professional Weather Station as
par section 3.1. Do not consider daylight saving time when making this entry. Follow
instuctions for setting the status of daylight saving time as a separate entry.
Time Zone Major Cities Symbol Difference
from UTC
Atlantic Time San Juan AST 20
Eastern Time Boston, New York, Washington DC, EST 19
Miami
Central Time Minneapolis, New Orleans, Houston, CST 18
Chicago
Mountain Time Salt Lake City, Boise, Denver MST 17
Pacific Time Seattle, San Francisco, Los Angeles, PST 16
Las Vegas
Alaska Time Fairbanks AKST 15
Hawaii-Aleutian Honolulu HAST 14
Time

60
Key Functions
Short key pressure:
Switching between the indoor temperature indication and the dew point temperature
Long key pressure (min. 2 seconds, till the display changes):
Call-up of the configuration mode (see back of the housing for key layout)
If applicable, selection of additional outdoor sensors (display of SENSOR and
sensor number (1….8))
(if only the multipurpose sensor is used, the display will not change)
In the IN/MAX mode: indication of the point of time at which the MIN/MAX value
has been measured
Call-up of the MIN/MAX values:
press once: MIN values (MIN appears in the display)
press twice: MAX values (MAX appears in the display)
press three times: back to normal display
During the MIN or MAX display, use the SENSOR key to call up/indicate the point
of time at which the MIN/MAX value has been measured
Sequence of indication:
indoor temperature Æ indoor air humidity Æ outdoor temperature Æ
outdoor air humidity Æ wind speed (MAX value only)
Deletion of the currently displayed MIN/MAX value(s):
Press the RESET key for at least 2 seconds till the values indicated
are deleted (lines appear instead of numeric values)
In the MIN/MAX mode:
Long key pressure (at least for 2 seconds) deletes the corresponding MIN/MAX
values
Switching between the outdoor temperature indication and the windchill temperature
OUT
SENSOR
IN
RESET
MIN
MAX